Reseña del mini PC GMK NucBox M5: AMD Zen 2 se hace esperar

El NucBox M5 es el último mini PC básico de GMK en contraste con la serie NucBox K, más cara. Utiliza opciones de procesador más antiguas con el fin de mantener los costes bajos.
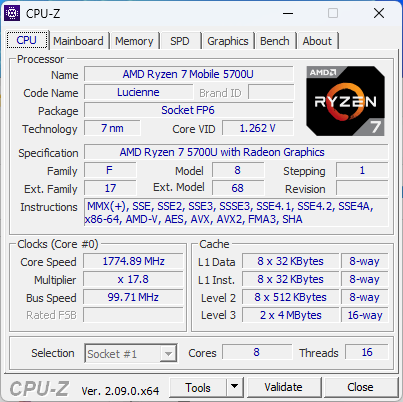
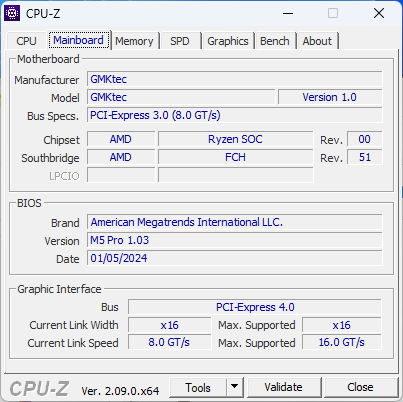
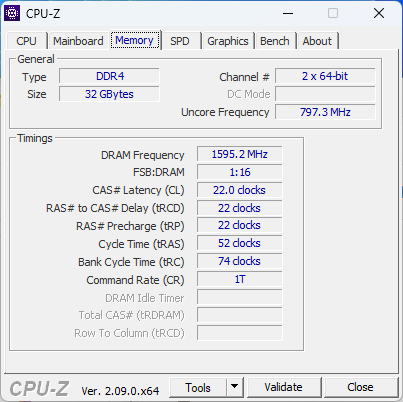
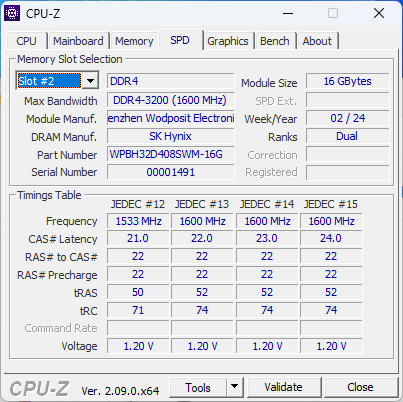
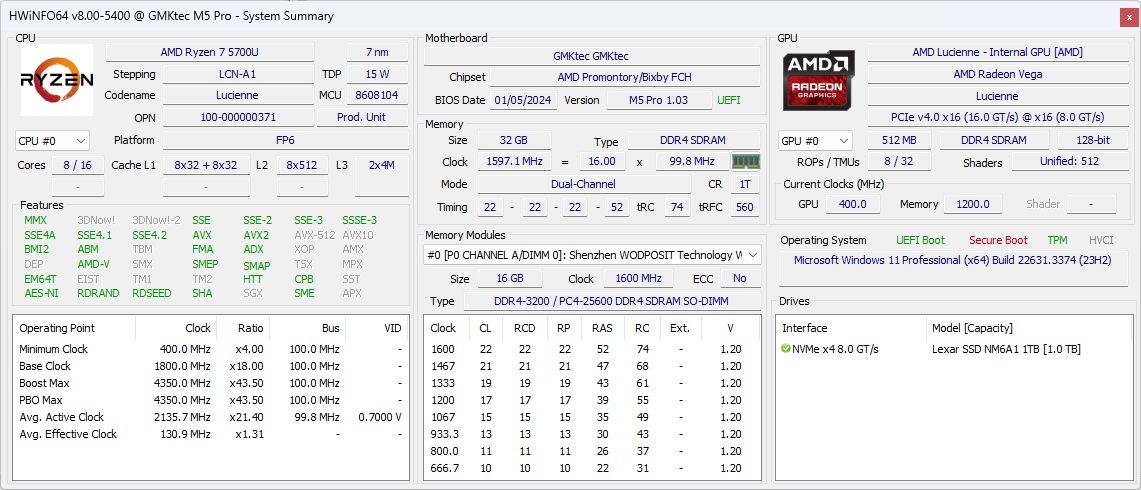
Nuestra unidad de prueba viene configurada con la CPU Zen 2 Ryzen 7 5700U, 32 GB de RAM DDR4-3200 y 1 TB de almacenamiento por aproximadamente 470 dólares. SKUs barebone también están disponibles sin RAM o almacenamiento a partir de $ 320, pero todas las opciones por lo demás vienen con el mismo procesador.
Las alternativas al NucBox M4 incluyen otros mini PC económicos como el Beelink SER5, BMax B7 Powero el Maxtang MTN-FP750.
Más opiniones sobre GMKtec:
Posibles contendientes en la comparación
Valoración | Fecha | Modelo | Peso | Altura | Tamaño | Resolución | Precio |
|---|---|---|---|---|---|---|---|
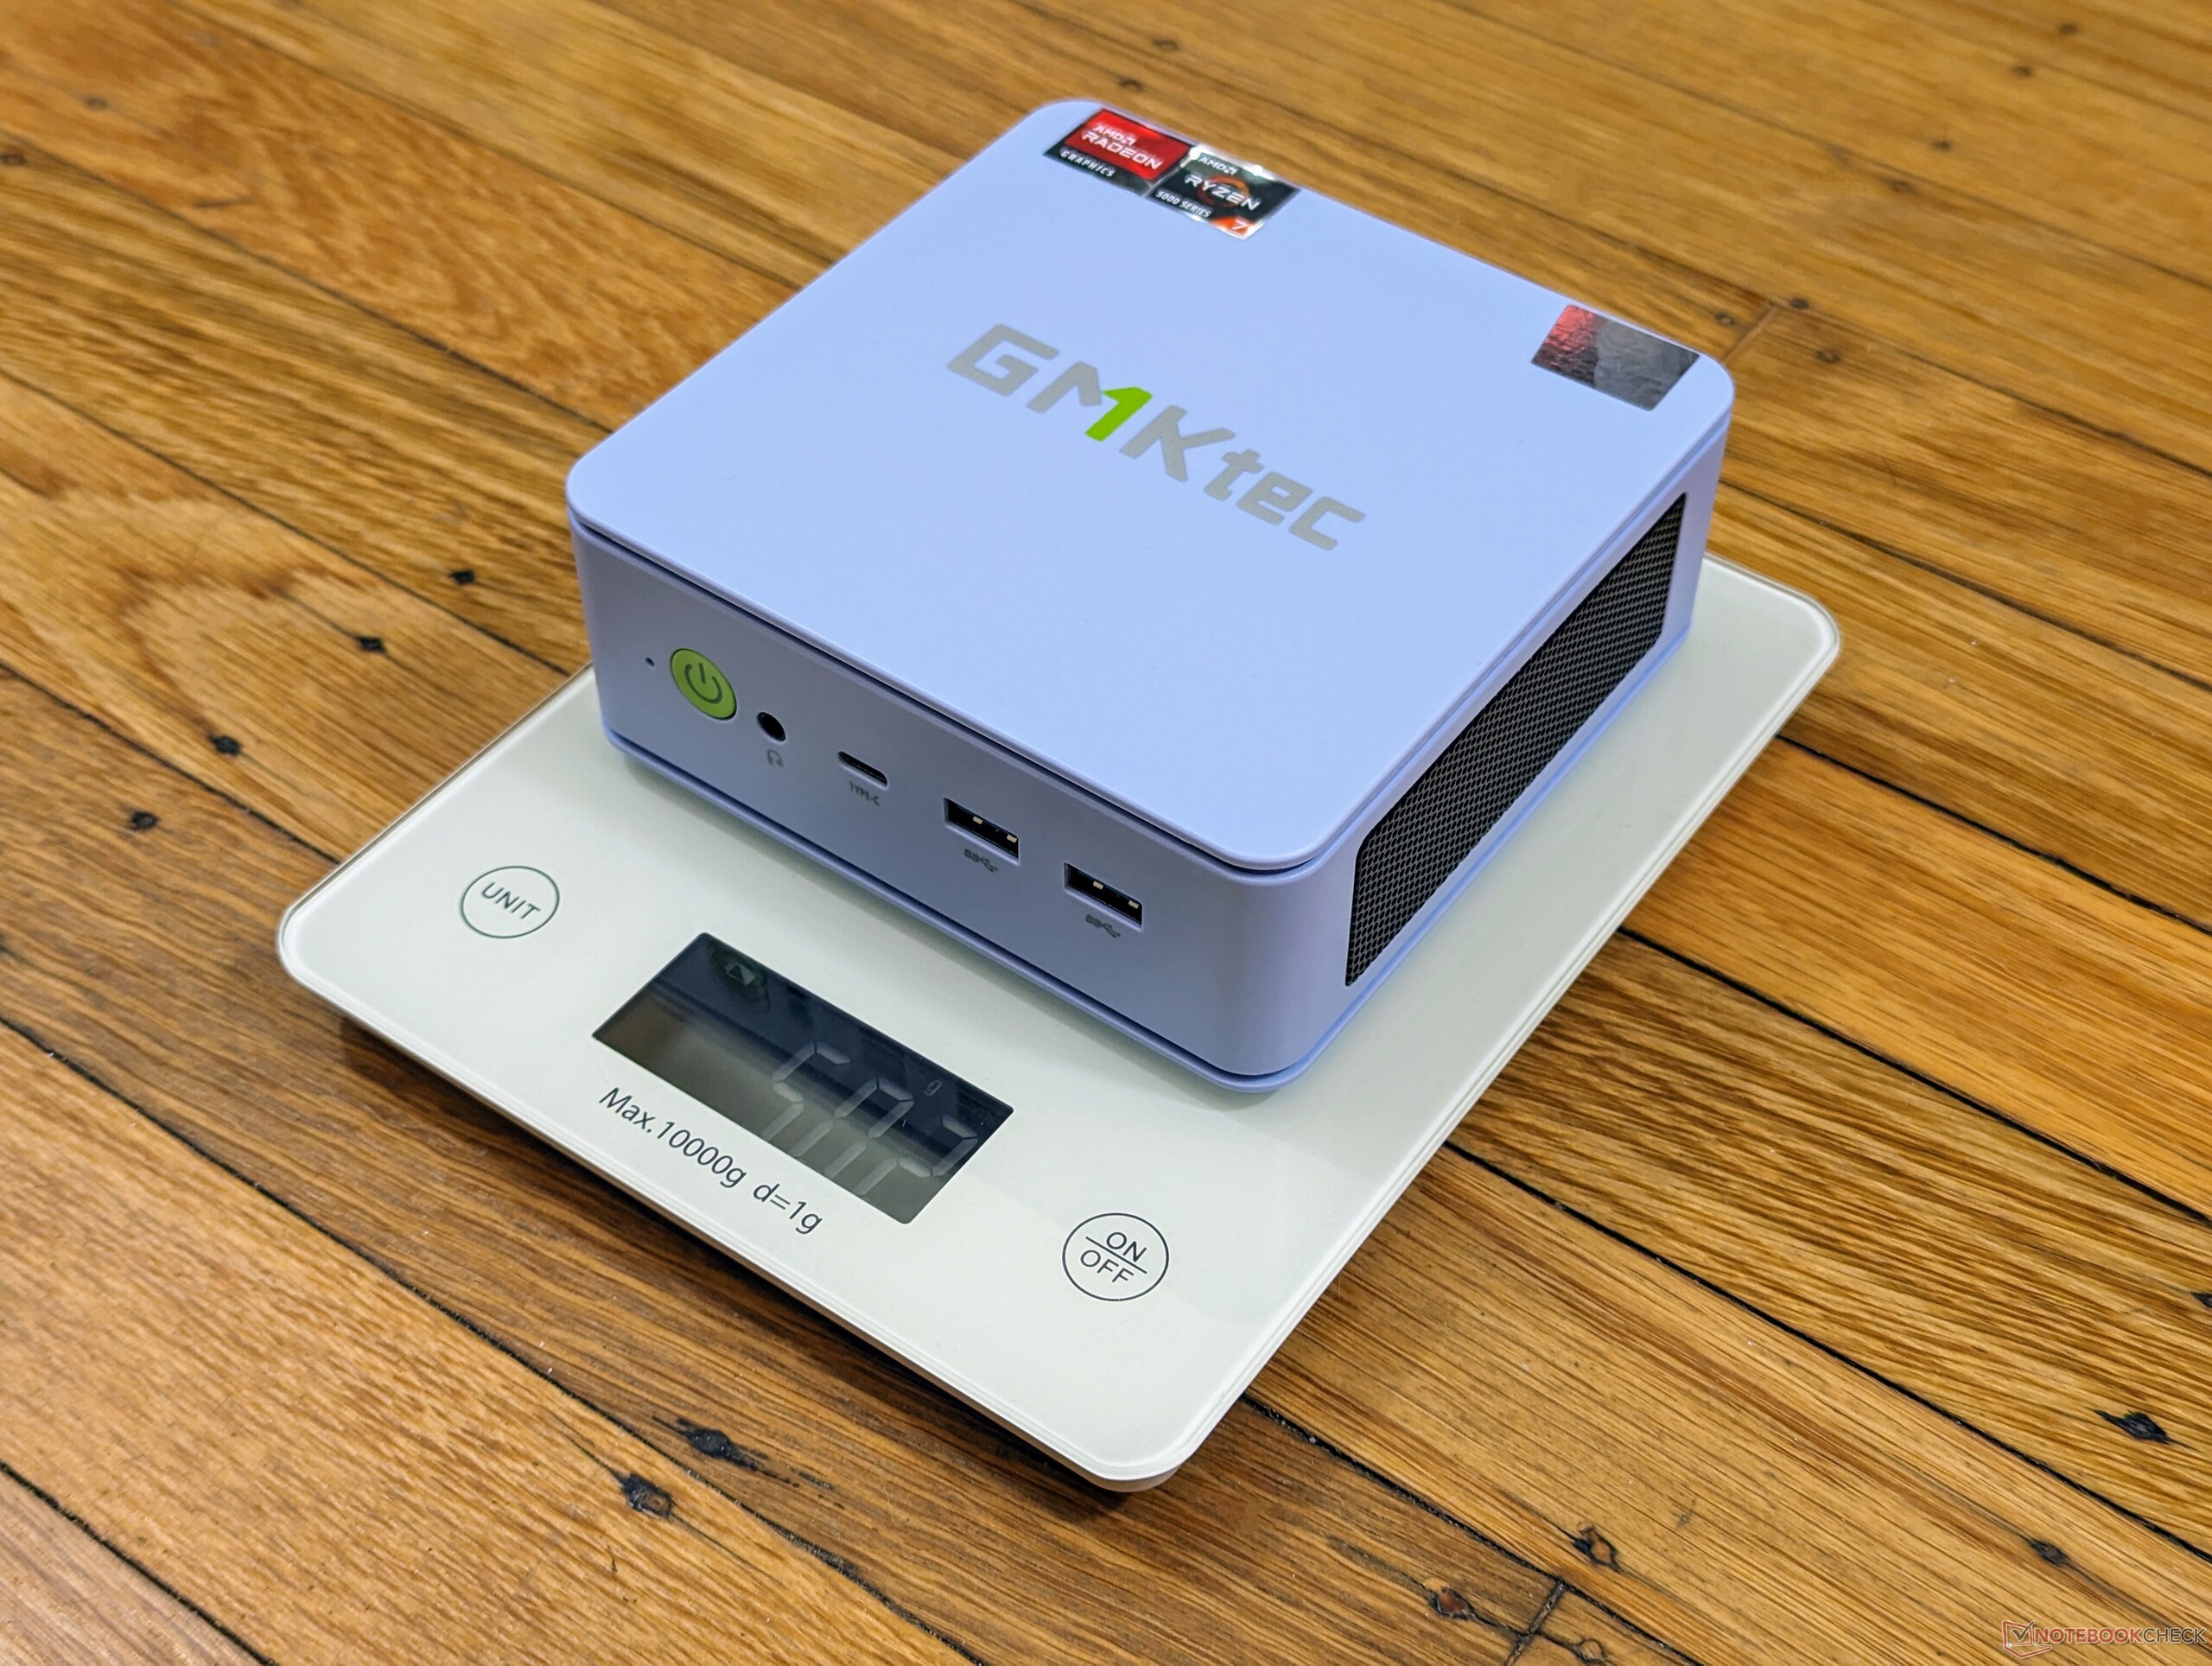
| 78.9 % v7 (old) | 04/2024 | GMK NucBox M5 R7 5700U, Vega 8 | 505 g | 48 mm | x | ||
| 81.1 % v7 (old) | 12/2023 | GMK NucBox M4 i9-11900H, UHD Graphics Xe 32EUs (Tiger Lake-H) | 951 g | 37 mm | x | ||
| 83.6 % v7 (old) | 04/2024 | GMK NucBox K6 R7 7840HS, Radeon 780M | 514 g | 47 mm | x | ||
| 83.4 % v7 (old) | 04/2024 | Acemagic F2A Ultra 7 155H, Arc 8-Core | 768 g | 57 mm | x | ||
| 82.6 % v7 (old) | 03/2024 | Geekom A7 R9 7940HS, Radeon 780M | 417 g | 38 mm | x | ||
| 83.1 % v7 (old) | 08/2023 | Intel NUC 13 Pro Desk Edition Kit i7-1360P, Iris Xe G7 96EUs | 558 g | 37 mm | x |
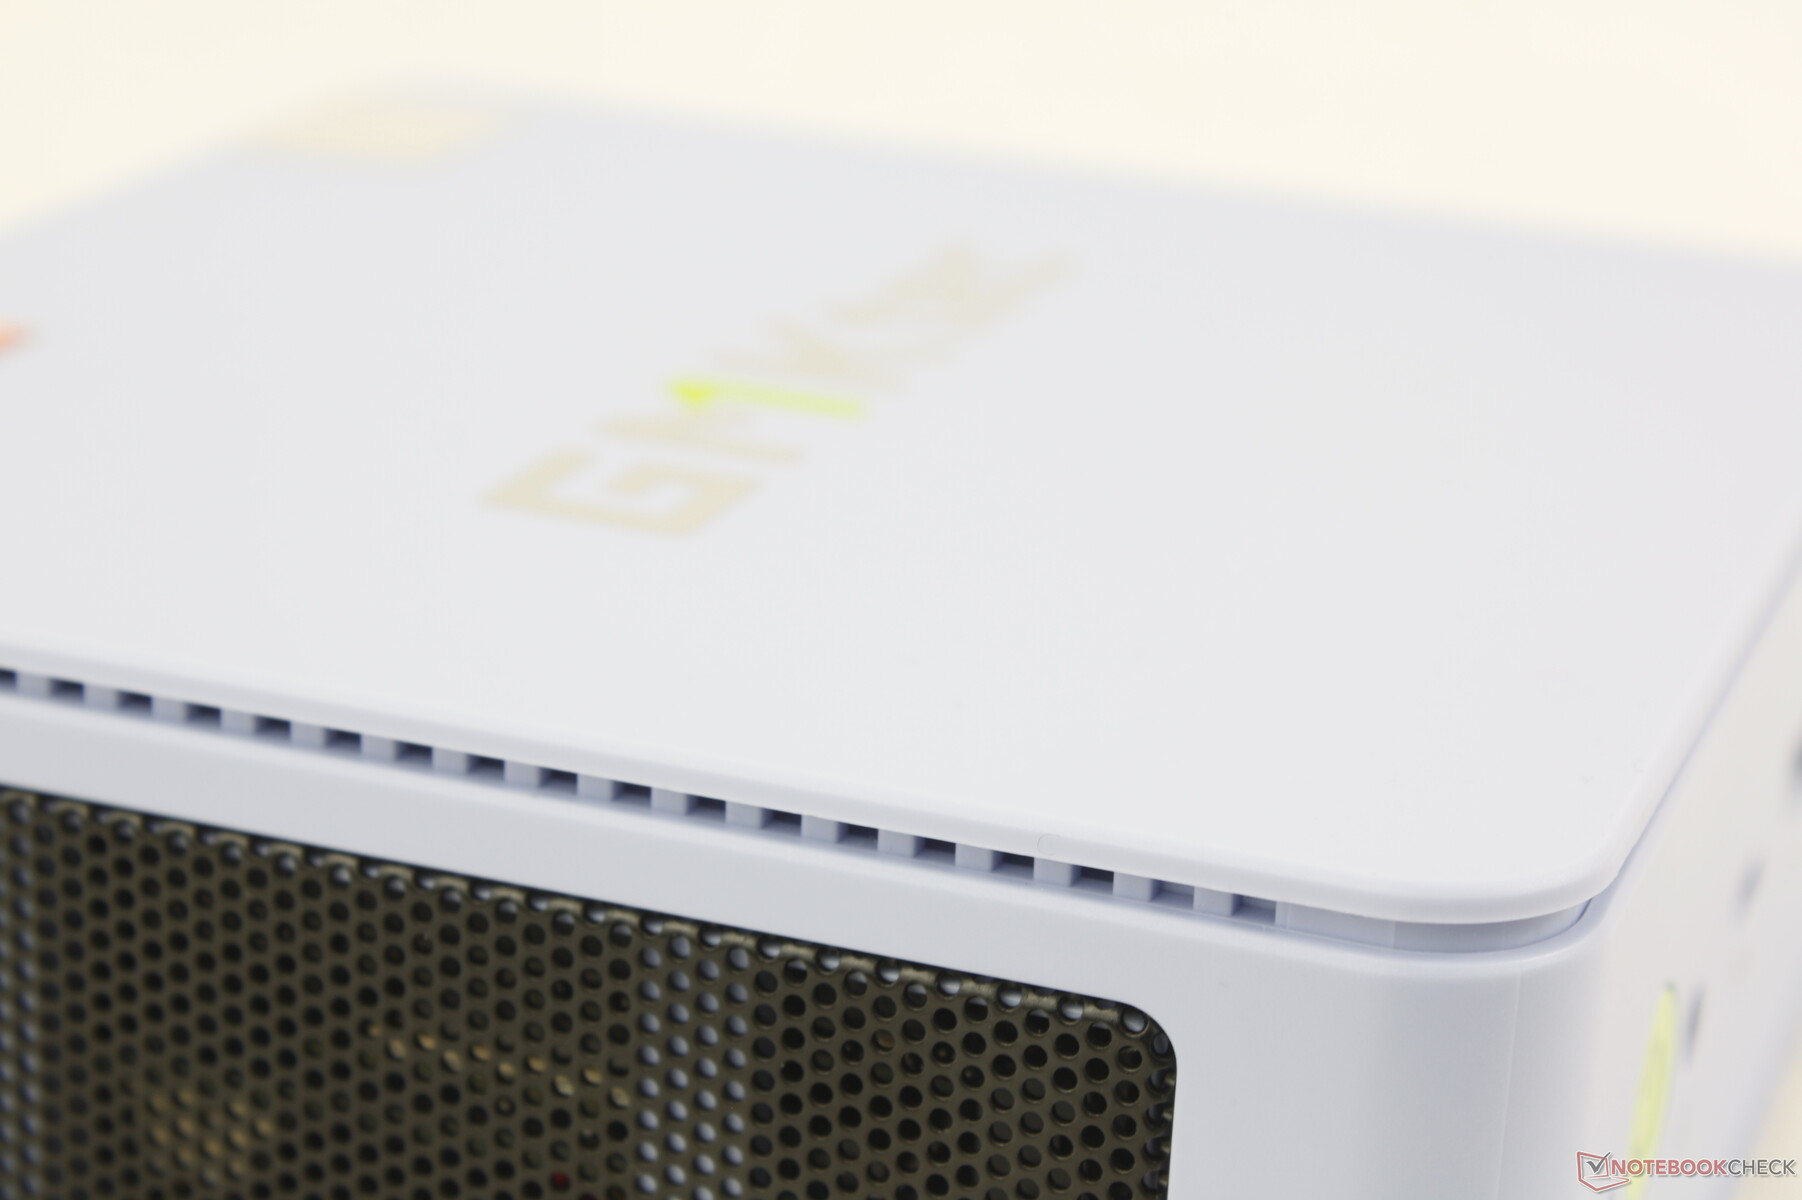
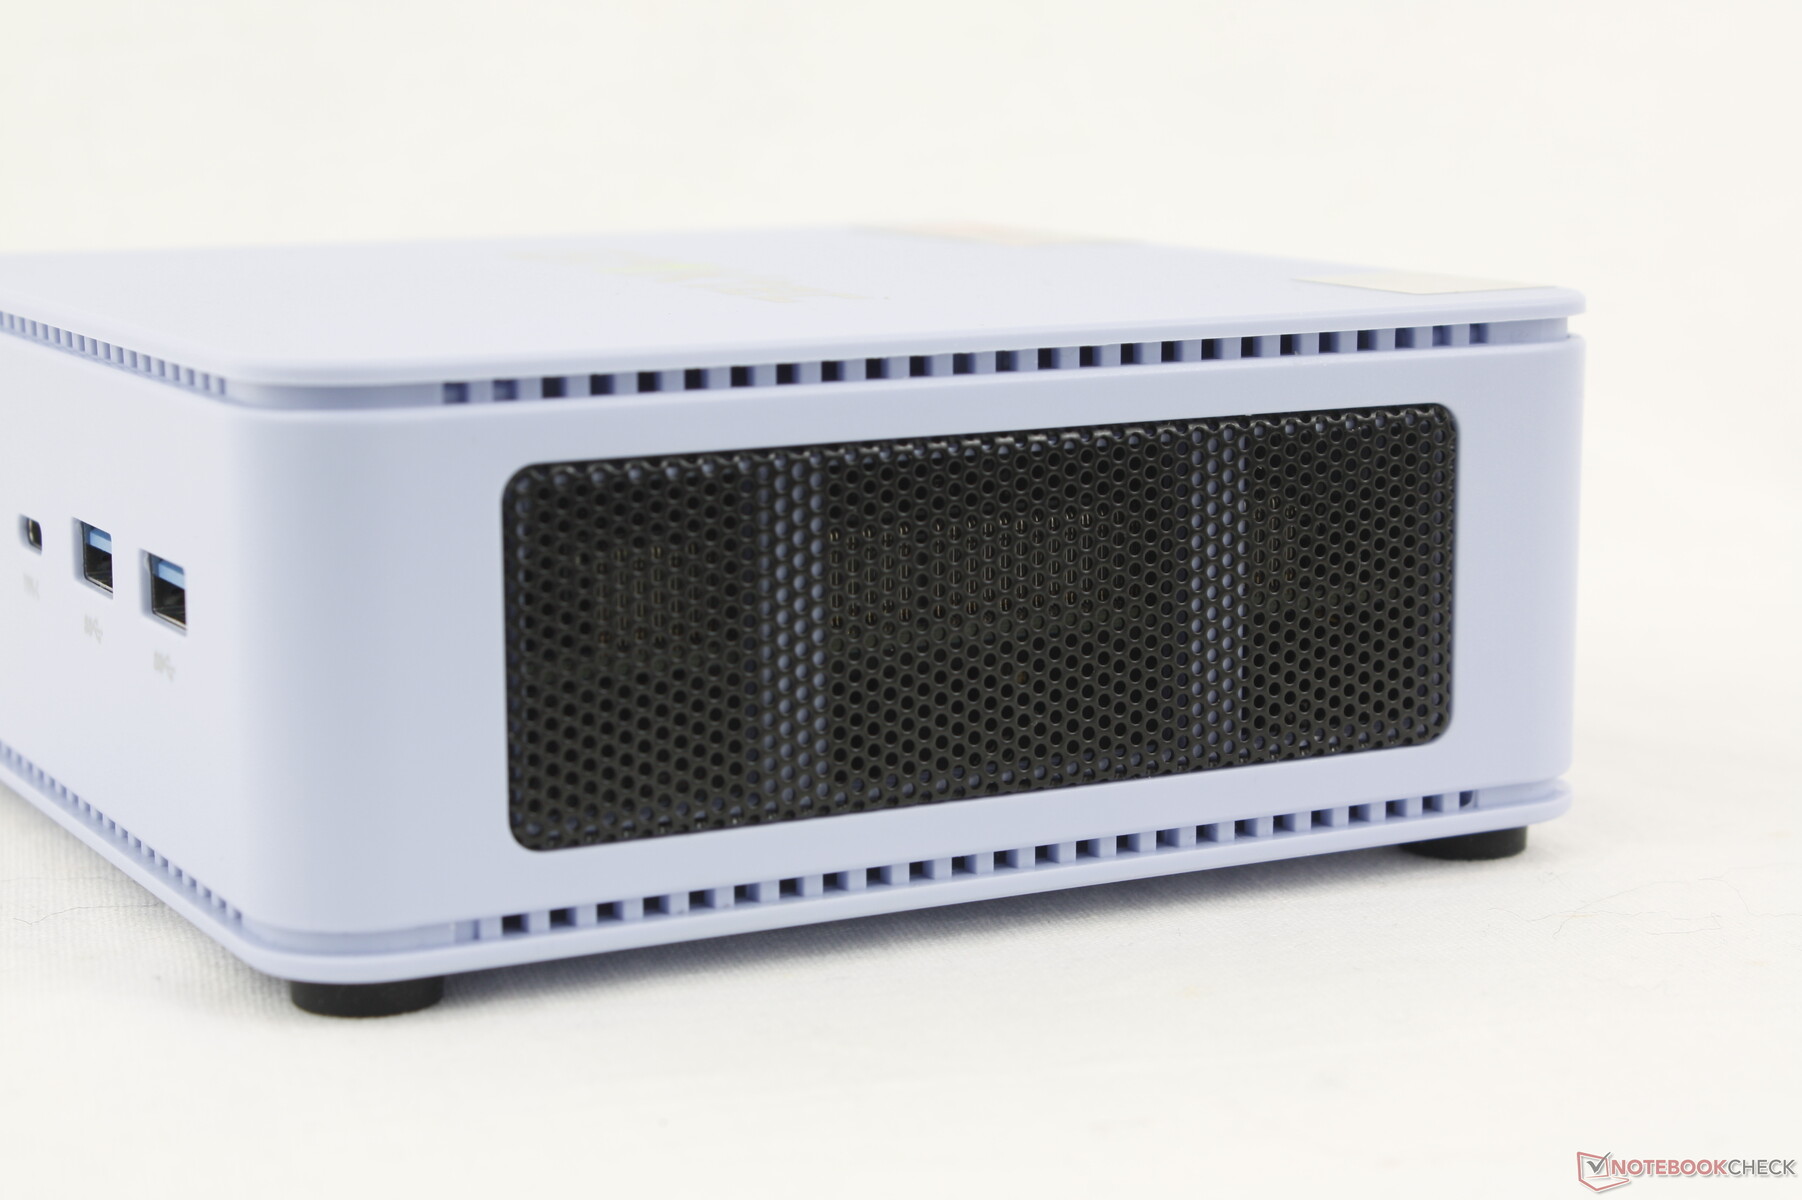
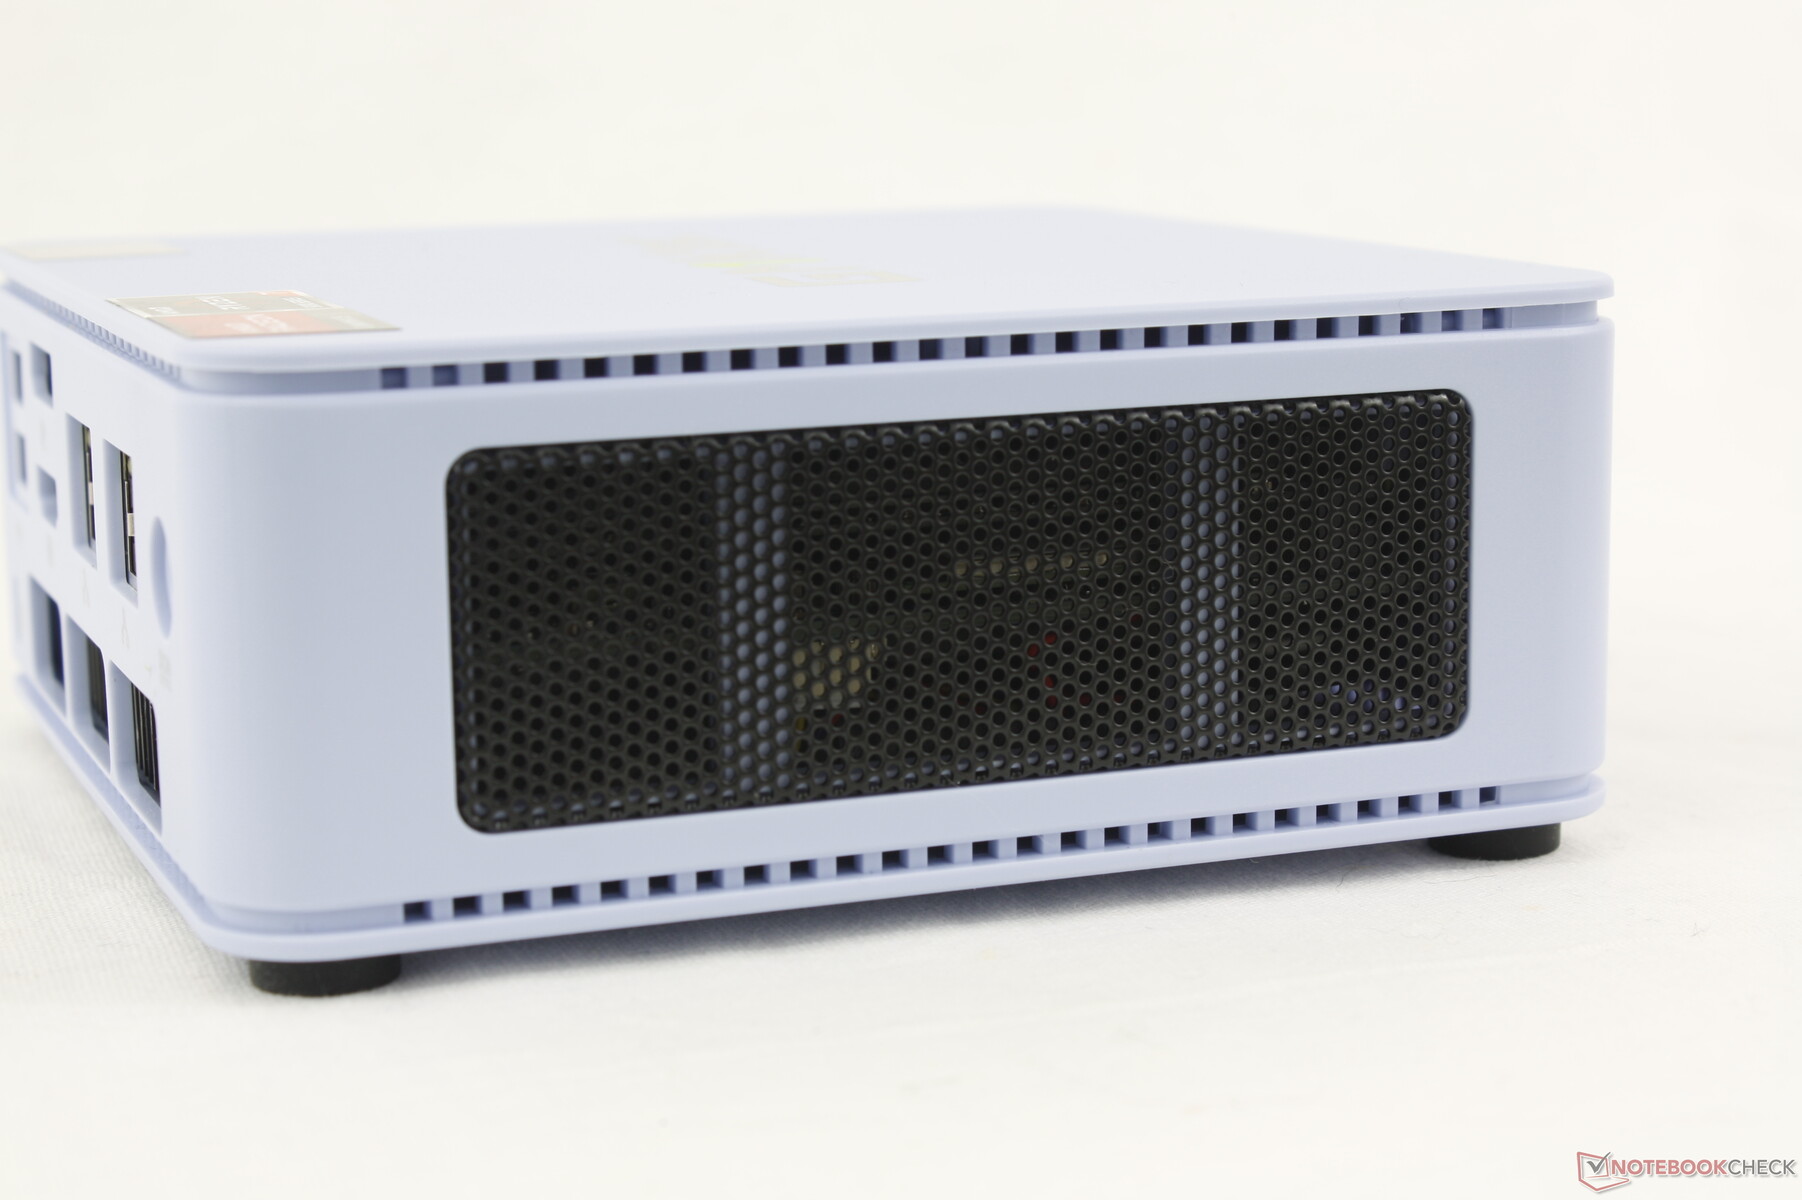
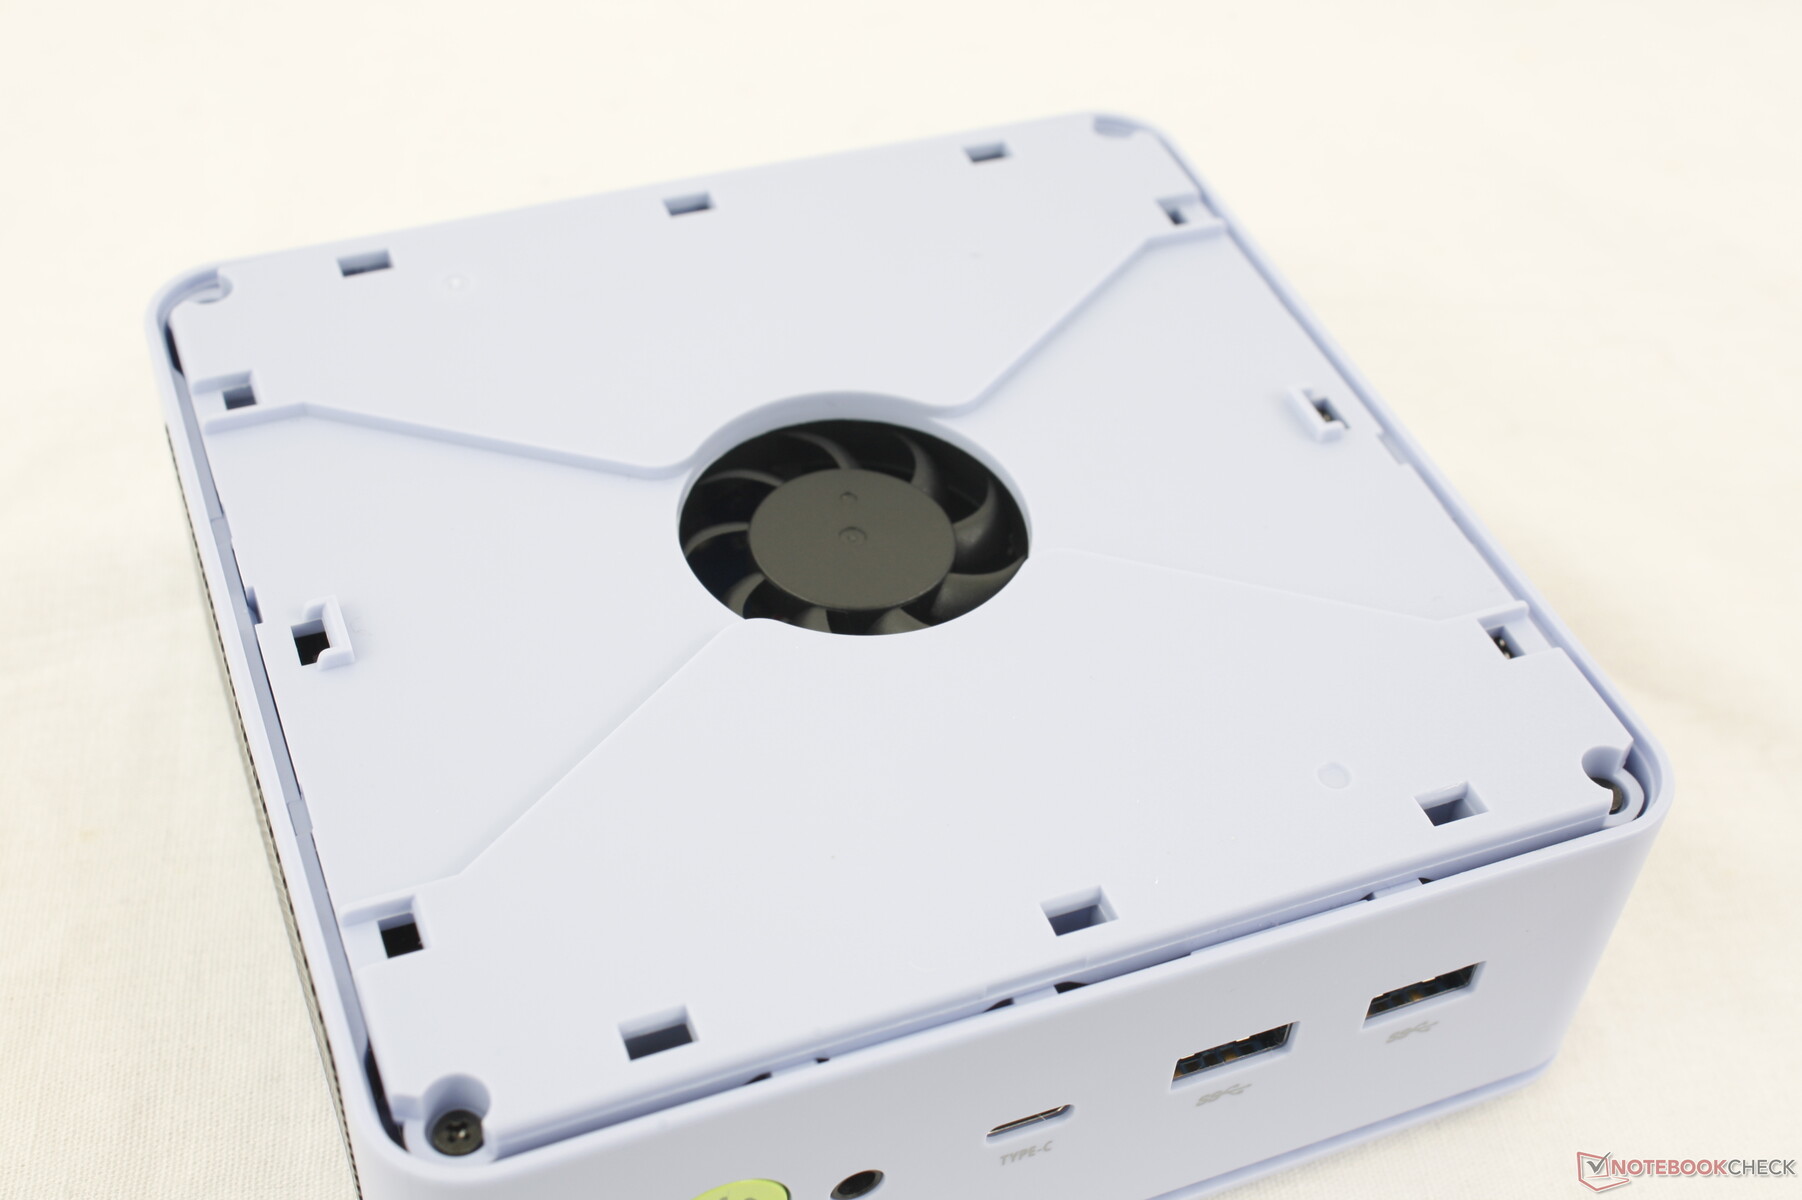
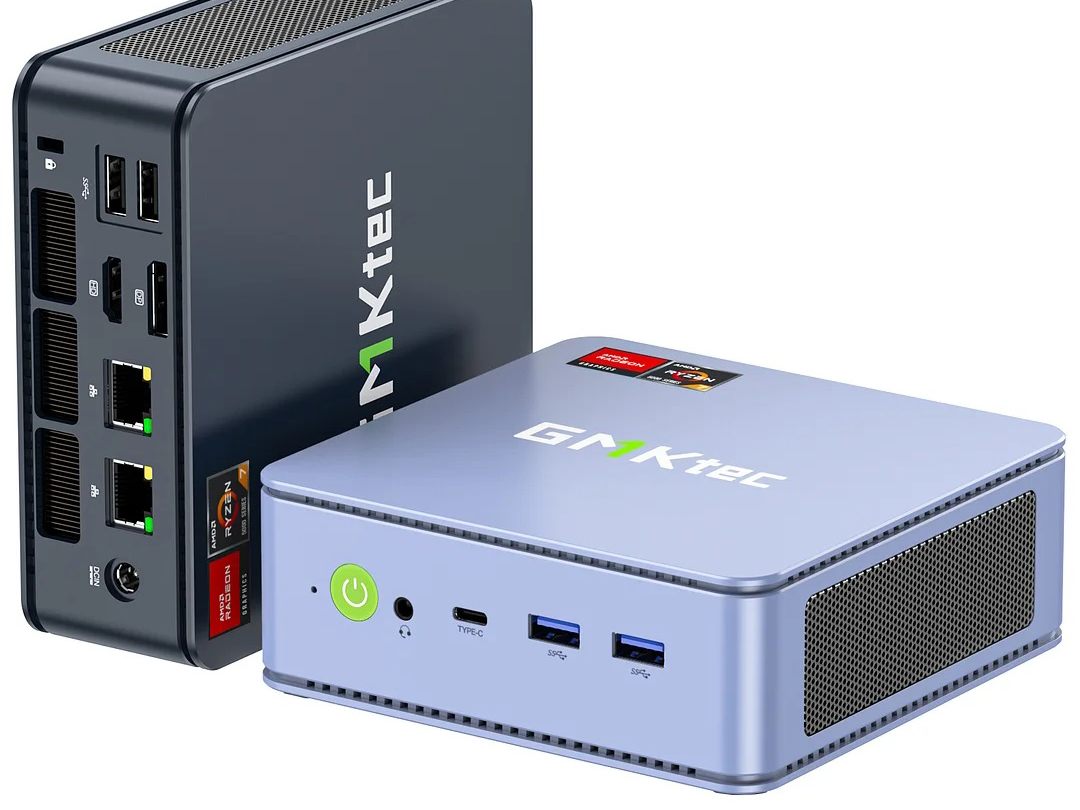
Caso - Diseño renovado con ventilación mejorada
El chasis es visualmente idéntico al del NucBox K6. Sin embargo, en el caso de la NucBox M5, los laterales del chasis son de plástico en lugar de metal, probablemente para mantener los costes bajos.
Cuando se compara con el antiguo y mayoritariamente metálico NucBox M4 el M5 es significativamente más pequeño y pesa casi la mitad.
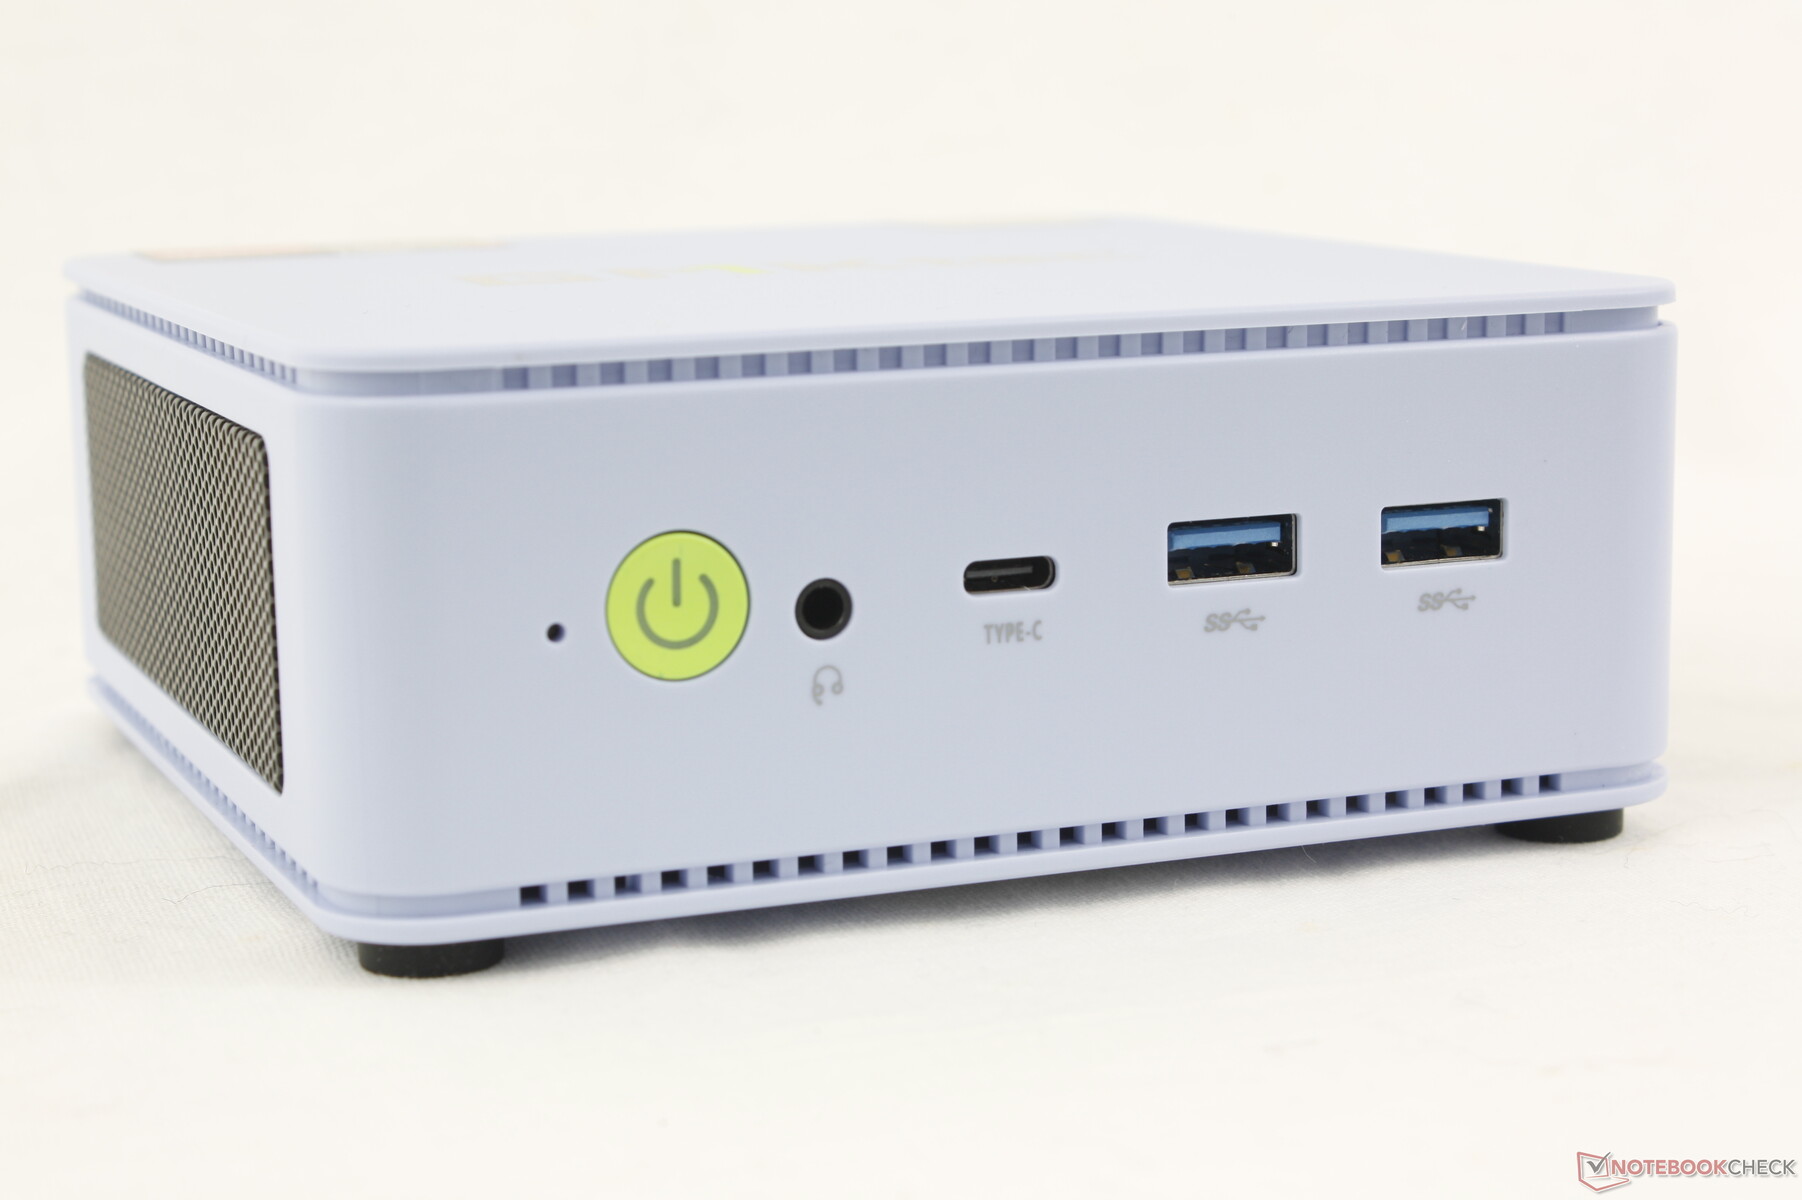
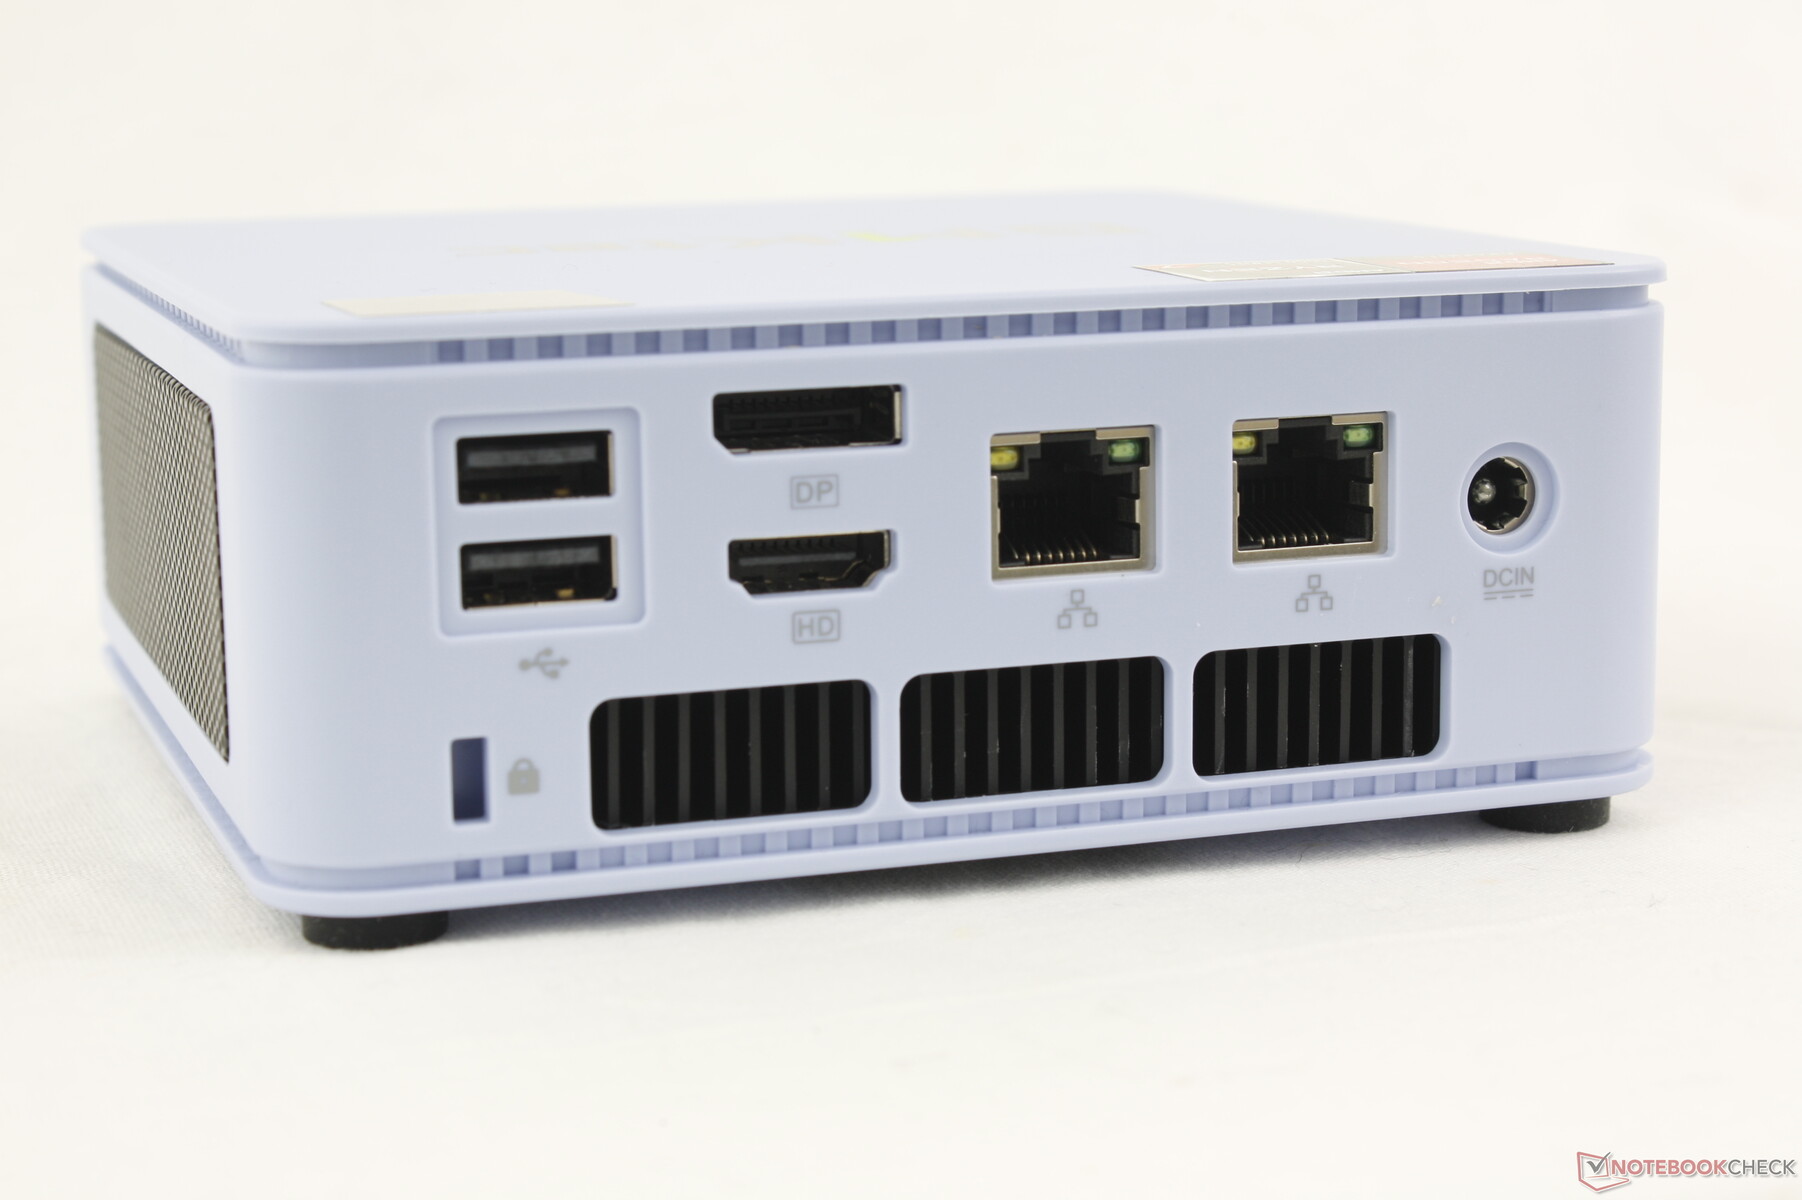
Conectividad
Las opciones de puerto son las mismas que en el NucBox K6 pero con dos rebajas clave. El único puerto USB-C carece ahora de soporte USB4 y Thunderbolt mientras que uno de los puertos USB-A traseros es ahora 2.0 en lugar de 3.2.
Comunicación
| Networking | |
| iperf3 transmit AXE11000 | |
| GMK NucBox M5 | |
| Intel NUC 13 Pro Desk Edition Kit | |
| Geekom A7 | |
| GMK NucBox M4 | |
| Acemagic F2A | |
| GMK NucBox K6 | |
| iperf3 receive AXE11000 | |
| GMK NucBox M5 | |
| GMK NucBox K6 | |
| Intel NUC 13 Pro Desk Edition Kit | |
| Geekom A7 | |
| Acemagic F2A | |
| GMK NucBox M4 | |
| iperf3 transmit AXE11000 6GHz | |
| Acemagic F2A | |
| Intel NUC 13 Pro Desk Edition Kit | |
| GMK NucBox M5 | |
| Geekom A7 | |
| GMK NucBox K6 | |
| iperf3 receive AXE11000 6GHz | |
| Acemagic F2A | |
| Intel NUC 13 Pro Desk Edition Kit | |
| Geekom A7 | |
| GMK NucBox M5 | |
| GMK NucBox K6 | |
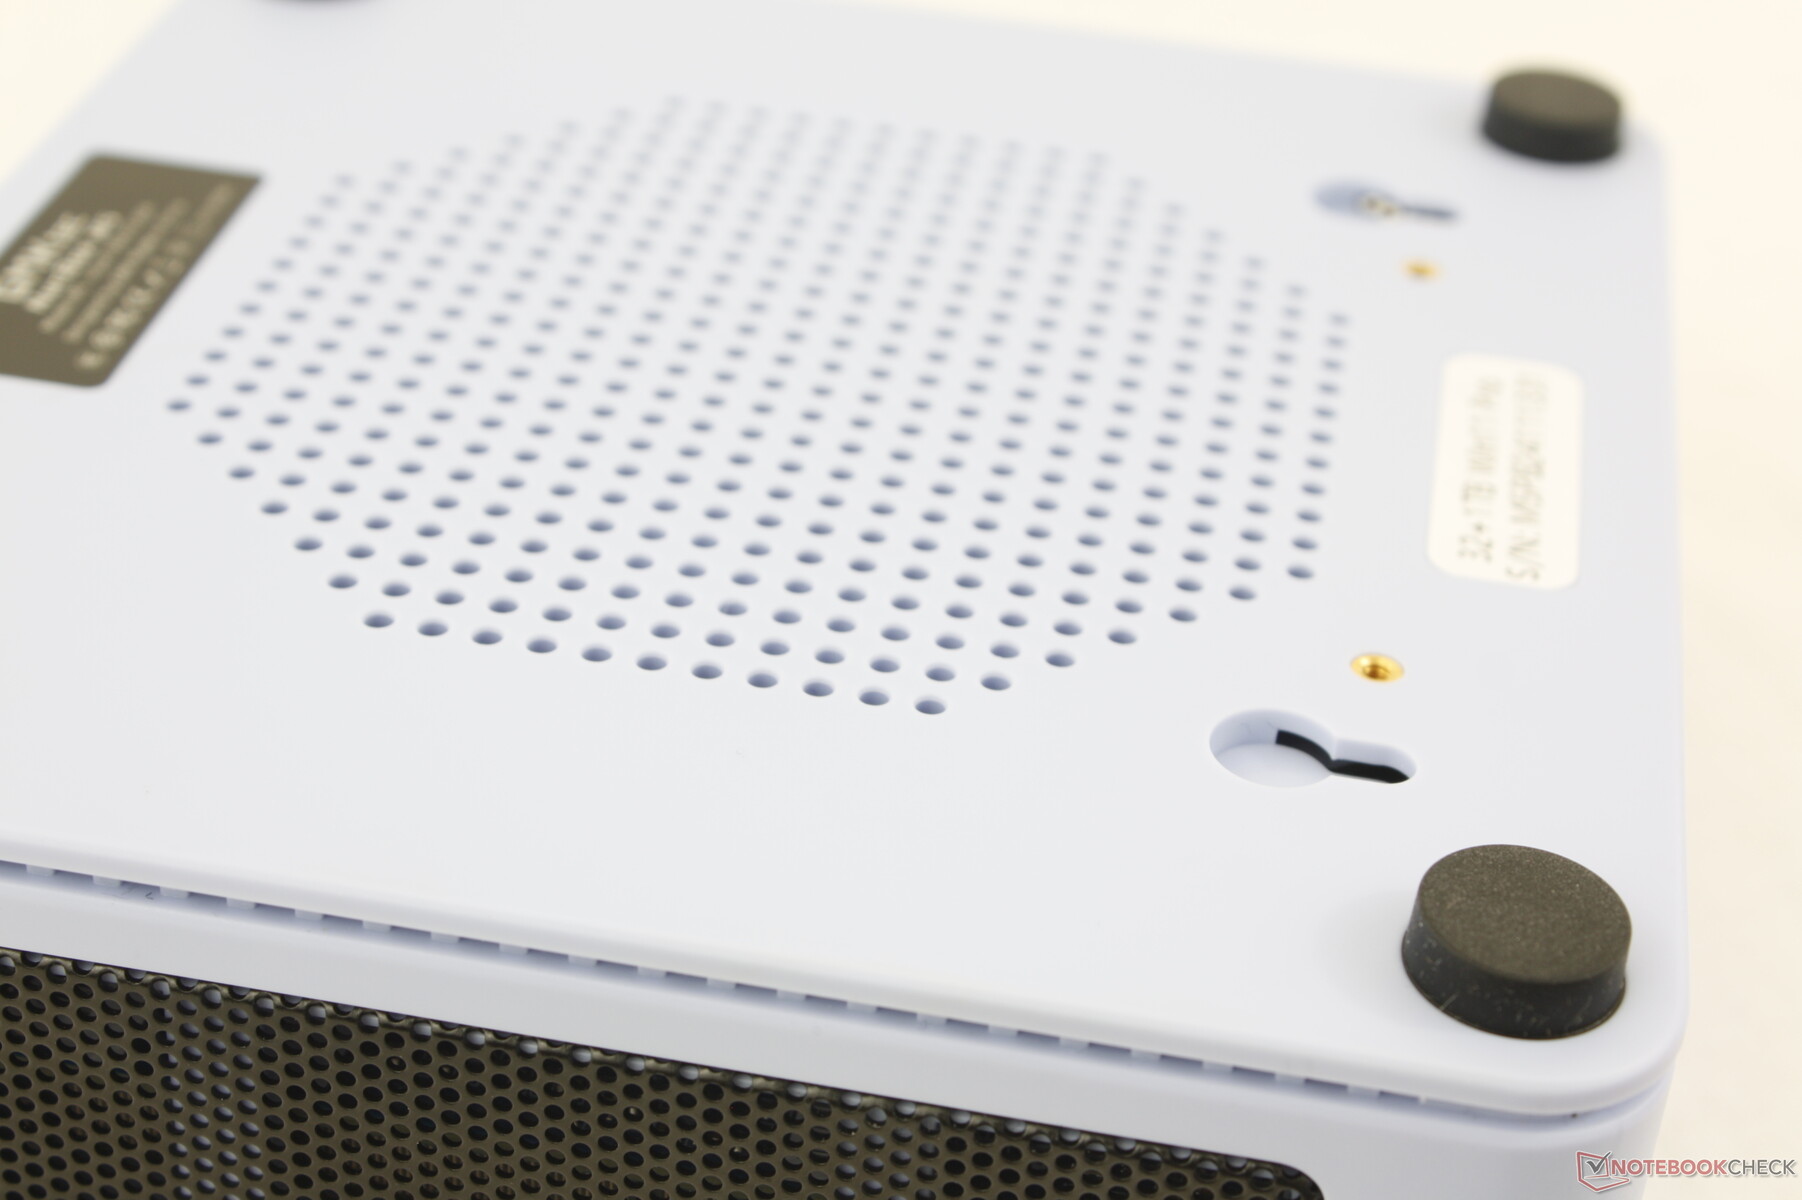
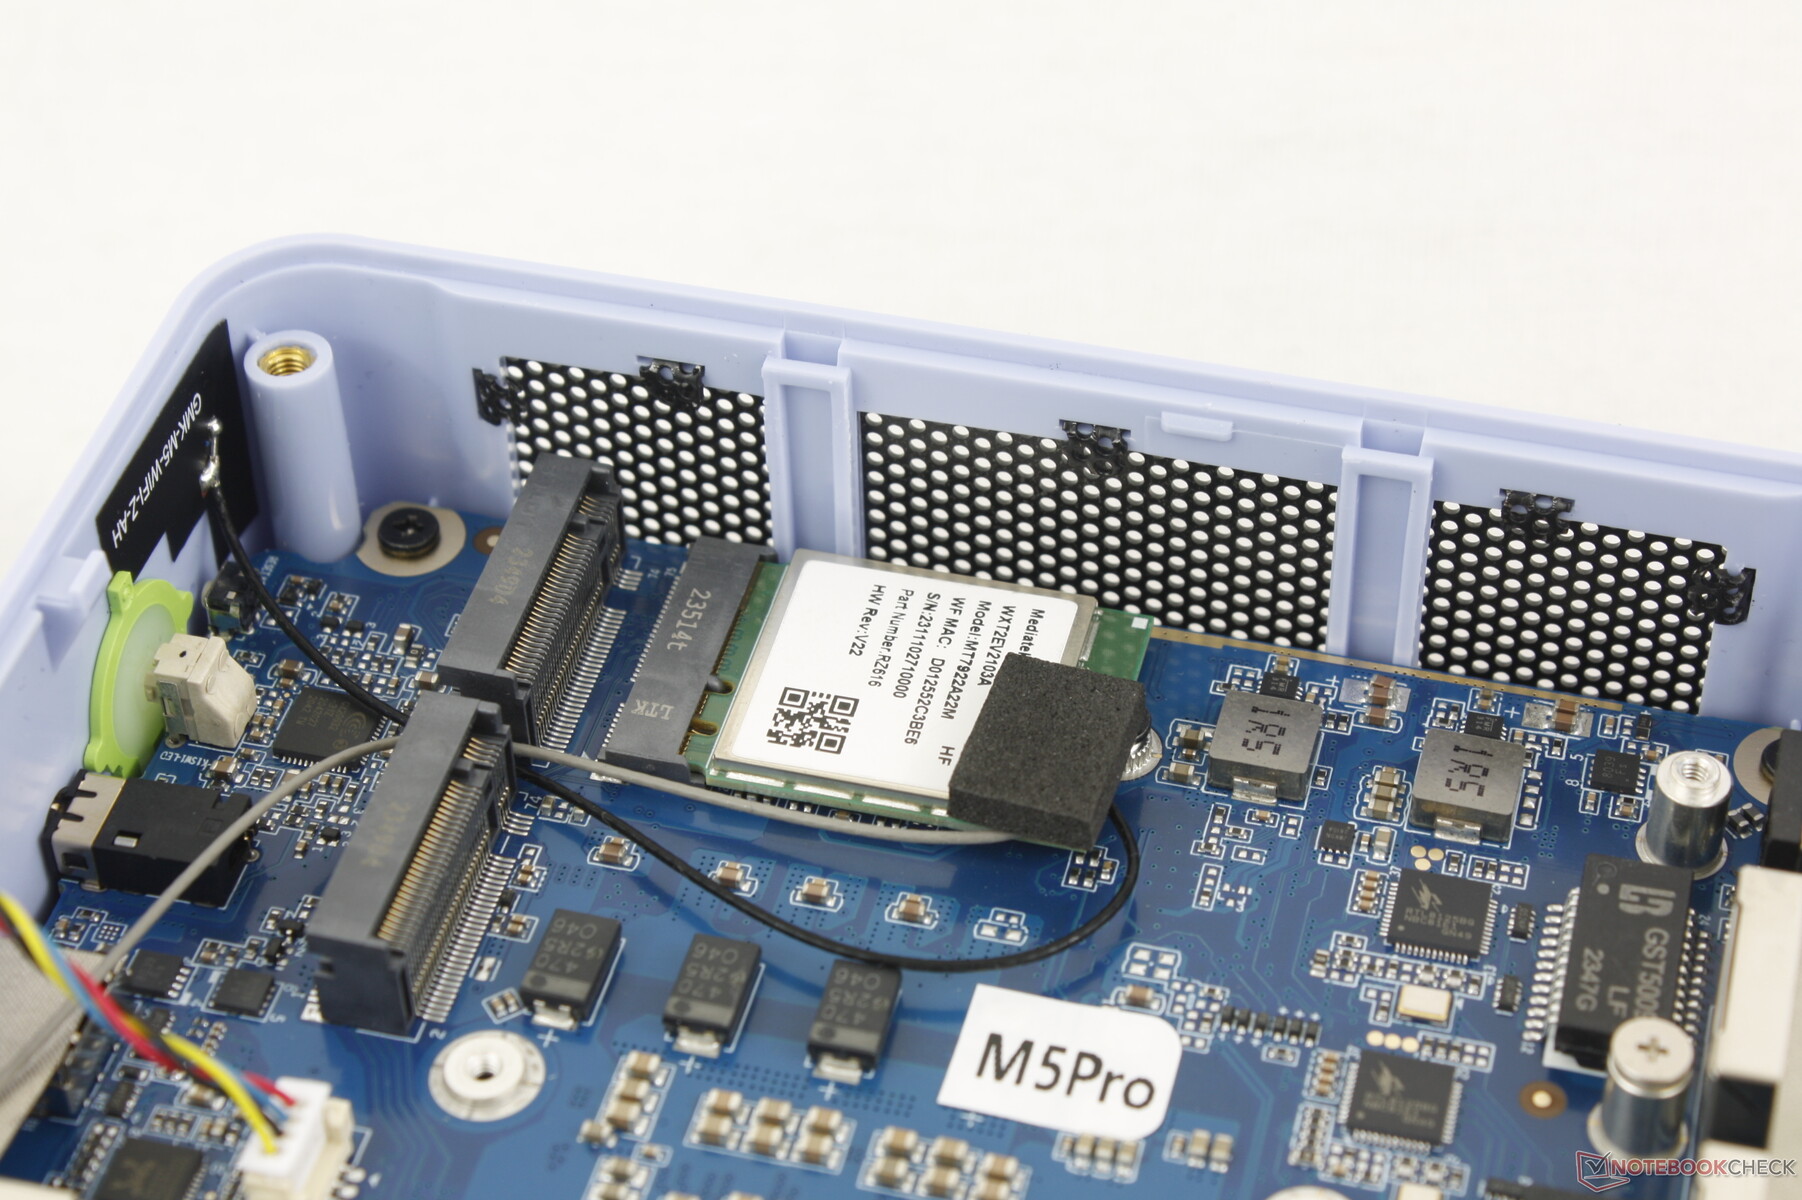
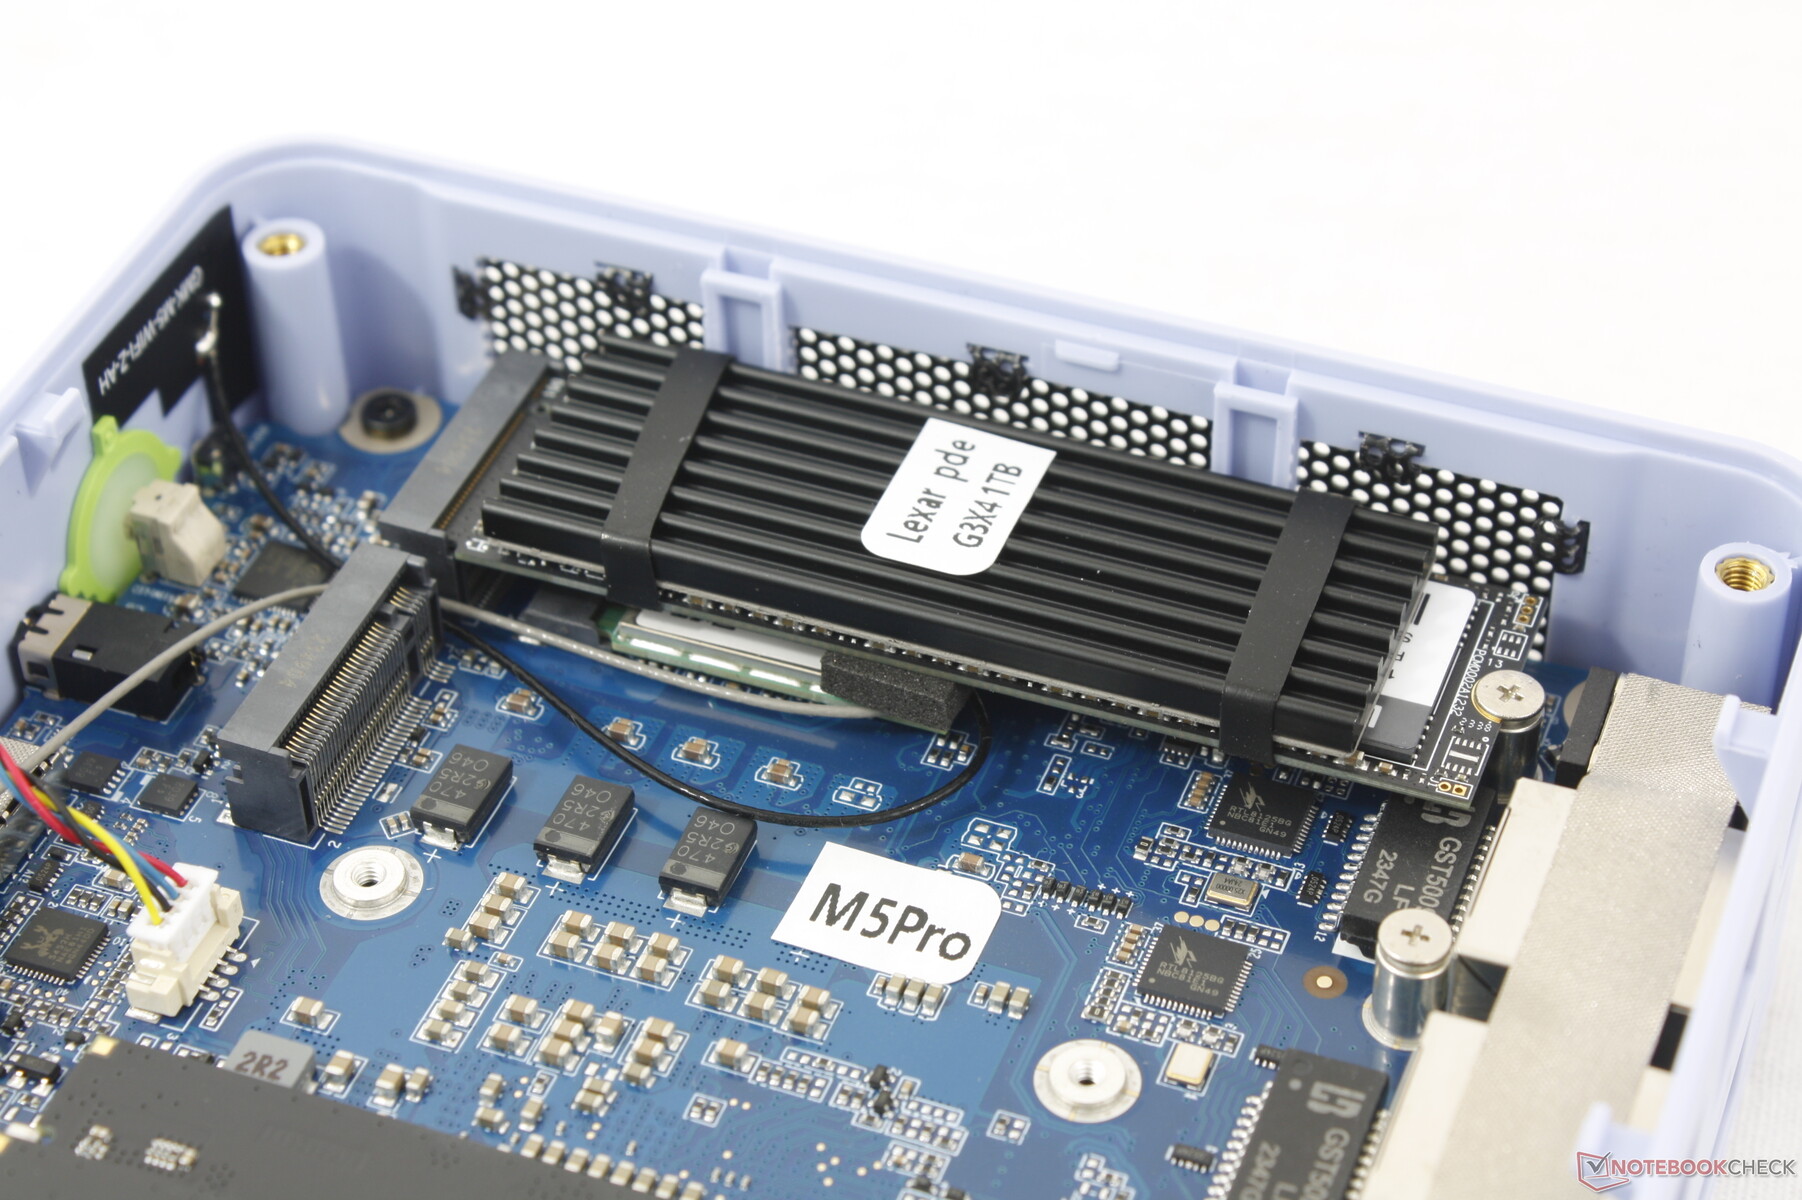
Mantenimiento
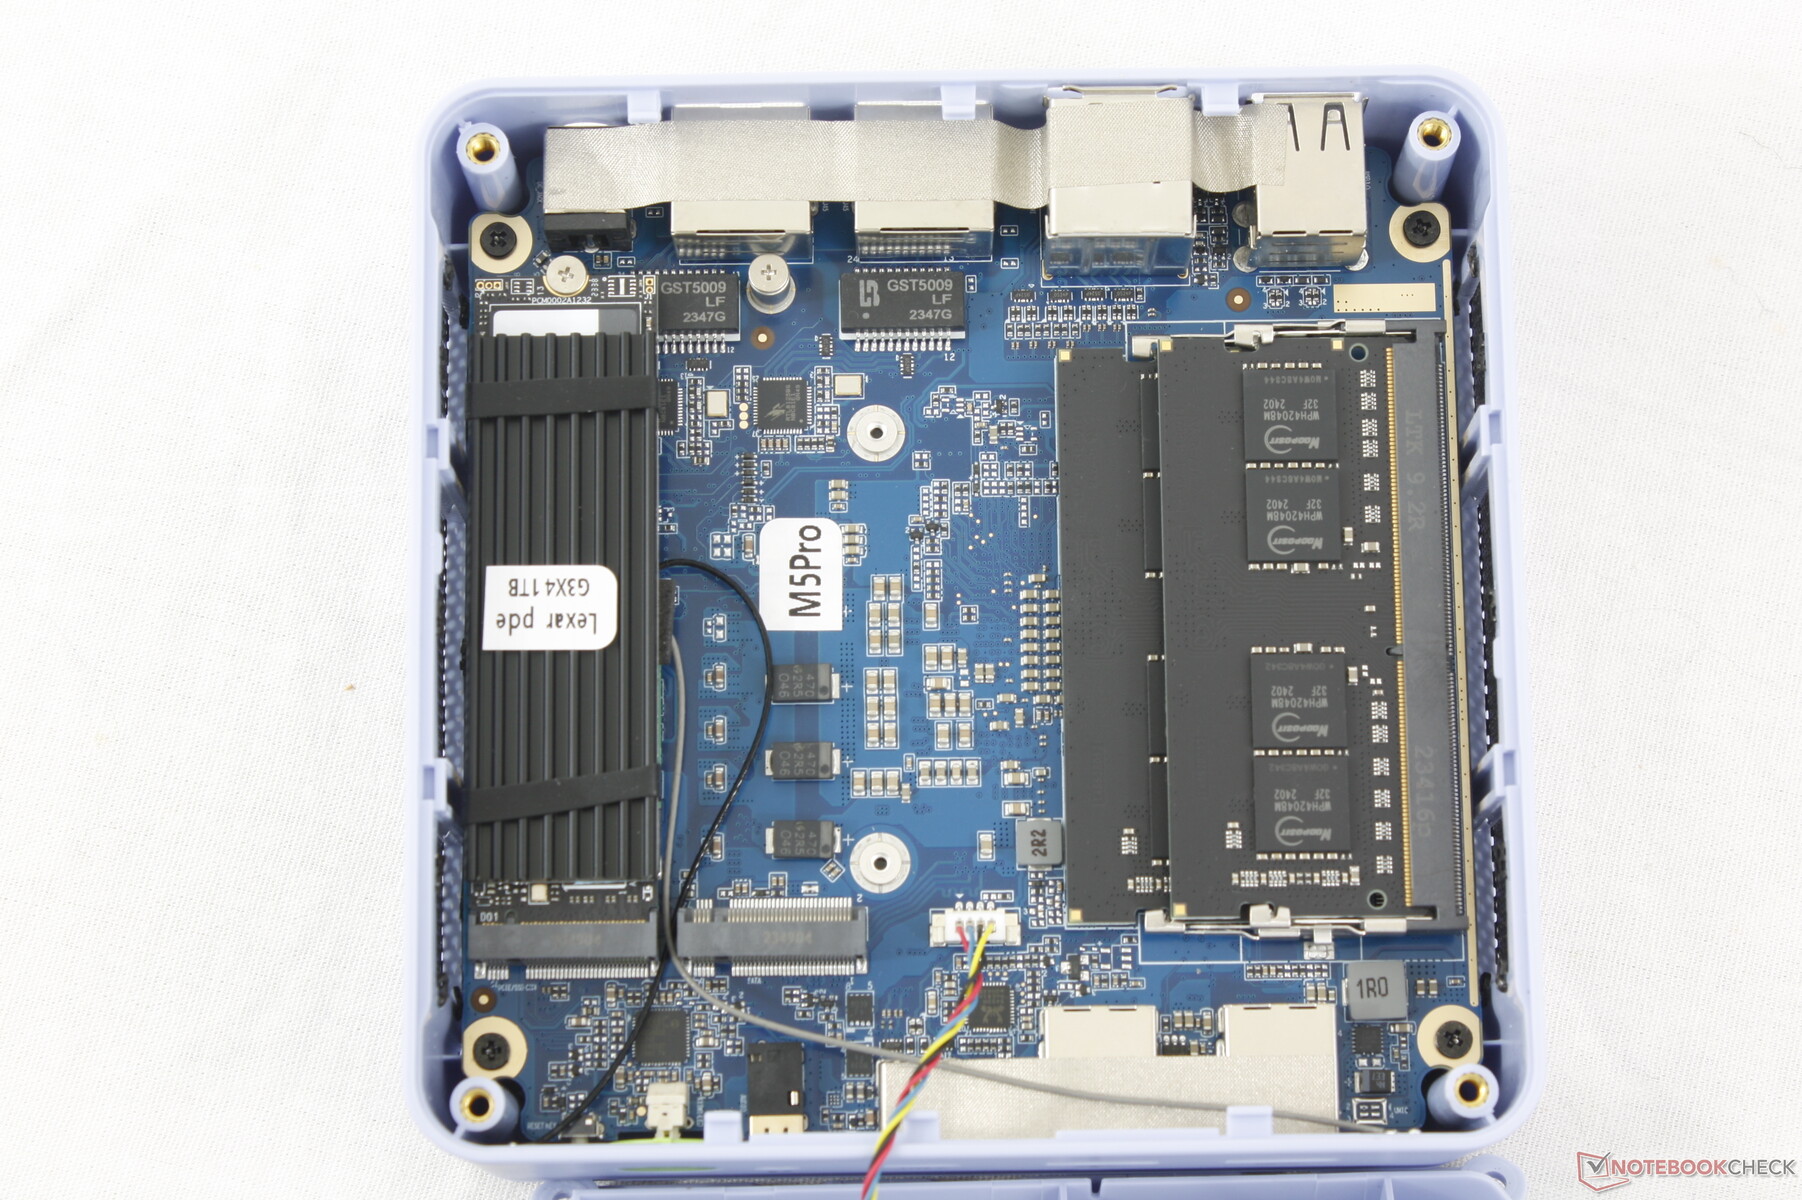
La cubierta superior se retira para revelar la cubierta del ventilador que hay debajo y cuatro tornillos Phillips para acceder fácilmente a las dos ranuras SODIMM DDR4, las dos ranuras SSD M.2 2280 y el módulo WLAN. Mientras tanto, la cubierta inferior no es extraíble, por lo que es más difícil acceder al otro lado de la placa base.
Accesorios y garantía
La caja de venta incluye un cable HDMI y un soporte de montaje VESA extraíble junto con el adaptador de CA y la documentación. Se aplica la garantía limitada estándar del fabricante de un año si se adquiere en EE.UU.
Rendimiento - Zen 2 no vale la pena en 2024
Condiciones de prueba
Pusimos Windows en modo Rendimiento antes de ejecutar los puntos de referencia que aparecen a continuación. El sistema viene sin bloatware ni aplicaciones específicas del fabricante para una experiencia Windows limpia.
Procesador
El rendimiento de la CPU es más lento de lo esperado. Nuestro Ryzen 7 5700U funcionaría entre un 20 y un 25 por ciento más lento que el portátil medio de nuestra base de datos equipado exactamente con el mismo procesador. Sigue corriendo a toda velocidad alrededor de cualquier solución móvil Celeron, Pentium o Atom, pero el rendimiento bruto sigue siendo un poco decepcionante ya que sabemos que el Ryzen 7 5700U es capaz de mucho más.
El rendimiento general está codo con codo con el Intel de 11ª generación Core i7-1165G7 que se encuentra en los antiguos 2021 Serie NUC11.
Cinebench R15 Multi Loop
Cinebench R23: Multi Core | Single Core
Cinebench R20: CPU (Multi Core) | CPU (Single Core)
Cinebench R15: CPU Multi 64Bit | CPU Single 64Bit
Blender: v2.79 BMW27 CPU
7-Zip 18.03: 7z b 4 | 7z b 4 -mmt1
Geekbench 6.7: Multi-Core | Single-Core
Geekbench 5.5: Multi-Core | Single-Core
HWBOT x265 Benchmark v2.2: 4k Preset
LibreOffice : 20 Documents To PDF
R Benchmark 2.5: Overall mean
| CPU Performance rating | |
| GMK NucBox K6 | |
| Geekom A7 | |
| Acemagic F2A | |
| Intel NUC X15 LAPAC71H | |
| Intel NUC 13 Pro Desk Edition Kit | |
| GMK NucBox K2 | |
| GMK NucBox M4 | |
| Acer TravelMate P4 TMP416-51-55KN -2! | |
| Medio AMD Ryzen 7 5700U | |
| GMK NucBox M5 | |
| Intel NUC11ATKPE, N6005 -2! | |
| Intel NUC11ATKC2, N4505 -2! | |
| GMK NucBox 3 -2! | |
| Cinebench R20 / CPU (Multi Core) | |
| Acemagic F2A | |
| Intel NUC X15 LAPAC71H | |
| Geekom A7 | |
| GMK NucBox K6 | |
| Intel NUC 13 Pro Desk Edition Kit | |
| GMK NucBox K2 | |
| GMK NucBox M4 | |
| Acer TravelMate P4 TMP416-51-55KN | |
| Medio AMD Ryzen 7 5700U (1887 - 3877, n=21) | |
| GMK NucBox M5 | |
| Intel NUC11ATKPE, N6005 | |
| Intel NUC11ATKC2, N4505 | |
| GMK NucBox 3 | |
| Cinebench R20 / CPU (Single Core) | |
| Intel NUC 13 Pro Desk Edition Kit | |
| Geekom A7 | |
| GMK NucBox K6 | |
| Intel NUC X15 LAPAC71H | |
| Acemagic F2A | |
| Acer TravelMate P4 TMP416-51-55KN | |
| GMK NucBox M4 | |
| GMK NucBox K2 | |
| GMK NucBox M5 | |
| Medio AMD Ryzen 7 5700U (471 - 495, n=21) | |
| Intel NUC11ATKPE, N6005 | |
| Intel NUC11ATKC2, N4505 | |
| GMK NucBox 3 | |
| Cinebench R15 / CPU Single 64Bit | |
| GMK NucBox K6 | |
| Geekom A7 | |
| Intel NUC 13 Pro Desk Edition Kit | |
| Acemagic F2A | |
| Intel NUC X15 LAPAC71H | |
| GMK NucBox K2 | |
| GMK NucBox M4 | |
| Acer TravelMate P4 TMP416-51-55KN | |
| GMK NucBox M5 | |
| Medio AMD Ryzen 7 5700U (181 - 190, n=19) | |
| Intel NUC11ATKPE, N6005 | |
| Intel NUC11ATKC2, N4505 | |
| GMK NucBox 3 | |
| Geekbench 6.7 / Multi-Core | |
| Geekom A7 | |
| GMK NucBox K6 | |
| Intel NUC X15 LAPAC71H | |
| Acemagic F2A | |
| Intel NUC 13 Pro Desk Edition Kit | |
| GMK NucBox K2 | |
| GMK NucBox M4 | |
| GMK NucBox M5 | |
| Medio AMD Ryzen 7 5700U (4983 - 6260, n=5) | |
| Geekbench 6.7 / Single-Core | |
| Geekom A7 | |
| GMK NucBox K6 | |
| Intel NUC 13 Pro Desk Edition Kit | |
| Intel NUC X15 LAPAC71H | |
| Acemagic F2A | |
| GMK NucBox M4 | |
| GMK NucBox K2 | |
| GMK NucBox M5 | |
| Medio AMD Ryzen 7 5700U (1550 - 1625, n=5) | |
| HWBOT x265 Benchmark v2.2 / 4k Preset | |
| Geekom A7 | |
| GMK NucBox K6 | |
| Acemagic F2A | |
| Intel NUC X15 LAPAC71H | |
| GMK NucBox K2 | |
| Intel NUC 13 Pro Desk Edition Kit | |
| GMK NucBox M4 | |
| Acer TravelMate P4 TMP416-51-55KN | |
| Medio AMD Ryzen 7 5700U (6.08 - 12.1, n=20) | |
| GMK NucBox M5 | |
| Intel NUC11ATKPE, N6005 | |
| GMK NucBox 3 | |
| Intel NUC11ATKC2, N4505 | |
| LibreOffice / 20 Documents To PDF | |
| GMK NucBox 3 | |
| Intel NUC11ATKPE, N6005 | |
| Intel NUC11ATKC2, N4505 | |
| Medio AMD Ryzen 7 5700U (52.4 - 75.5, n=20) | |
| GMK NucBox M5 | |
| Geekom A7 | |
| Acer TravelMate P4 TMP416-51-55KN | |
| Intel NUC 13 Pro Desk Edition Kit | |
| GMK NucBox K2 | |
| Acemagic F2A | |
| GMK NucBox K6 | |
| GMK NucBox M4 | |
| Intel NUC X15 LAPAC71H | |
Cinebench R23: Multi Core | Single Core
Cinebench R20: CPU (Multi Core) | CPU (Single Core)
Cinebench R15: CPU Multi 64Bit | CPU Single 64Bit
Blender: v2.79 BMW27 CPU
7-Zip 18.03: 7z b 4 | 7z b 4 -mmt1
Geekbench 6.7: Multi-Core | Single-Core
Geekbench 5.5: Multi-Core | Single-Core
HWBOT x265 Benchmark v2.2: 4k Preset
LibreOffice : 20 Documents To PDF
R Benchmark 2.5: Overall mean
* ... más pequeño es mejor
AIDA64: FP32 Ray-Trace | FPU Julia | CPU SHA3 | CPU Queen | FPU SinJulia | FPU Mandel | CPU AES | CPU ZLib | FP64 Ray-Trace | CPU PhotoWorxx
| Performance rating | |
| Geekom A7 | |
| GMK NucBox K6 | |
| Acemagic F2A | |
| GMK NucBox M4 | |
| Intel NUC 13 Pro Desk Edition Kit | |
| Medio AMD Ryzen 7 5700U | |
| GMK NucBox M5 | |
| AIDA64 / FP32 Ray-Trace | |
| GMK NucBox K6 | |
| Geekom A7 | |
| Acemagic F2A | |
| GMK NucBox M4 | |
| Intel NUC 13 Pro Desk Edition Kit | |
| Medio AMD Ryzen 7 5700U (5679 - 12346, n=20) | |
| GMK NucBox M5 | |
| AIDA64 / FPU Julia | |
| GMK NucBox K6 | |
| Geekom A7 | |
| Acemagic F2A | |
| Medio AMD Ryzen 7 5700U (39042 - 69580, n=20) | |
| Intel NUC 13 Pro Desk Edition Kit | |
| GMK NucBox M4 | |
| GMK NucBox M5 | |
| AIDA64 / CPU SHA3 | |
| GMK NucBox K6 | |
| Geekom A7 | |
| Acemagic F2A | |
| GMK NucBox M4 | |
| Intel NUC 13 Pro Desk Edition Kit | |
| Medio AMD Ryzen 7 5700U (1103 - 2231, n=20) | |
| GMK NucBox M5 | |
| AIDA64 / CPU Queen | |
| Geekom A7 | |
| GMK NucBox K6 | |
| Acemagic F2A | |
| GMK NucBox M4 | |
| Medio AMD Ryzen 7 5700U (57016 - 99178, n=20) | |
| Intel NUC 13 Pro Desk Edition Kit | |
| GMK NucBox M5 | |
| AIDA64 / FPU SinJulia | |
| GMK NucBox K6 | |
| Geekom A7 | |
| Medio AMD Ryzen 7 5700U (6837 - 14169, n=20) | |
| Acemagic F2A | |
| GMK NucBox M5 | |
| GMK NucBox M4 | |
| Intel NUC 13 Pro Desk Edition Kit | |
| AIDA64 / FPU Mandel | |
| GMK NucBox K6 | |
| Geekom A7 | |
| Acemagic F2A | |
| GMK NucBox M4 | |
| Medio AMD Ryzen 7 5700U (20179 - 36523, n=20) | |
| Intel NUC 13 Pro Desk Edition Kit | |
| GMK NucBox M5 | |
| AIDA64 / CPU AES | |
| Geekom A7 | |
| GMK NucBox K6 | |
| Acemagic F2A | |
| GMK NucBox M4 | |
| Intel NUC 13 Pro Desk Edition Kit | |
| Medio AMD Ryzen 7 5700U (26066 - 64646, n=20) | |
| GMK NucBox M5 | |
| AIDA64 / CPU ZLib | |
| Acemagic F2A | |
| GMK NucBox K6 | |
| Geekom A7 | |
| Intel NUC 13 Pro Desk Edition Kit | |
| GMK NucBox M4 | |
| Medio AMD Ryzen 7 5700U (440 - 776, n=20) | |
| GMK NucBox M5 | |
| AIDA64 / FP64 Ray-Trace | |
| GMK NucBox K6 | |
| Geekom A7 | |
| Acemagic F2A | |
| GMK NucBox M4 | |
| Intel NUC 13 Pro Desk Edition Kit | |
| Medio AMD Ryzen 7 5700U (2985 - 6784, n=20) | |
| GMK NucBox M5 | |
| AIDA64 / CPU PhotoWorxx | |
| GMK NucBox K6 | |
| Geekom A7 | |
| Acemagic F2A | |
| Intel NUC 13 Pro Desk Edition Kit | |
| GMK NucBox M5 | |
| GMK NucBox M4 | |
| Medio AMD Ryzen 7 5700U (6903 - 25066, n=20) | |
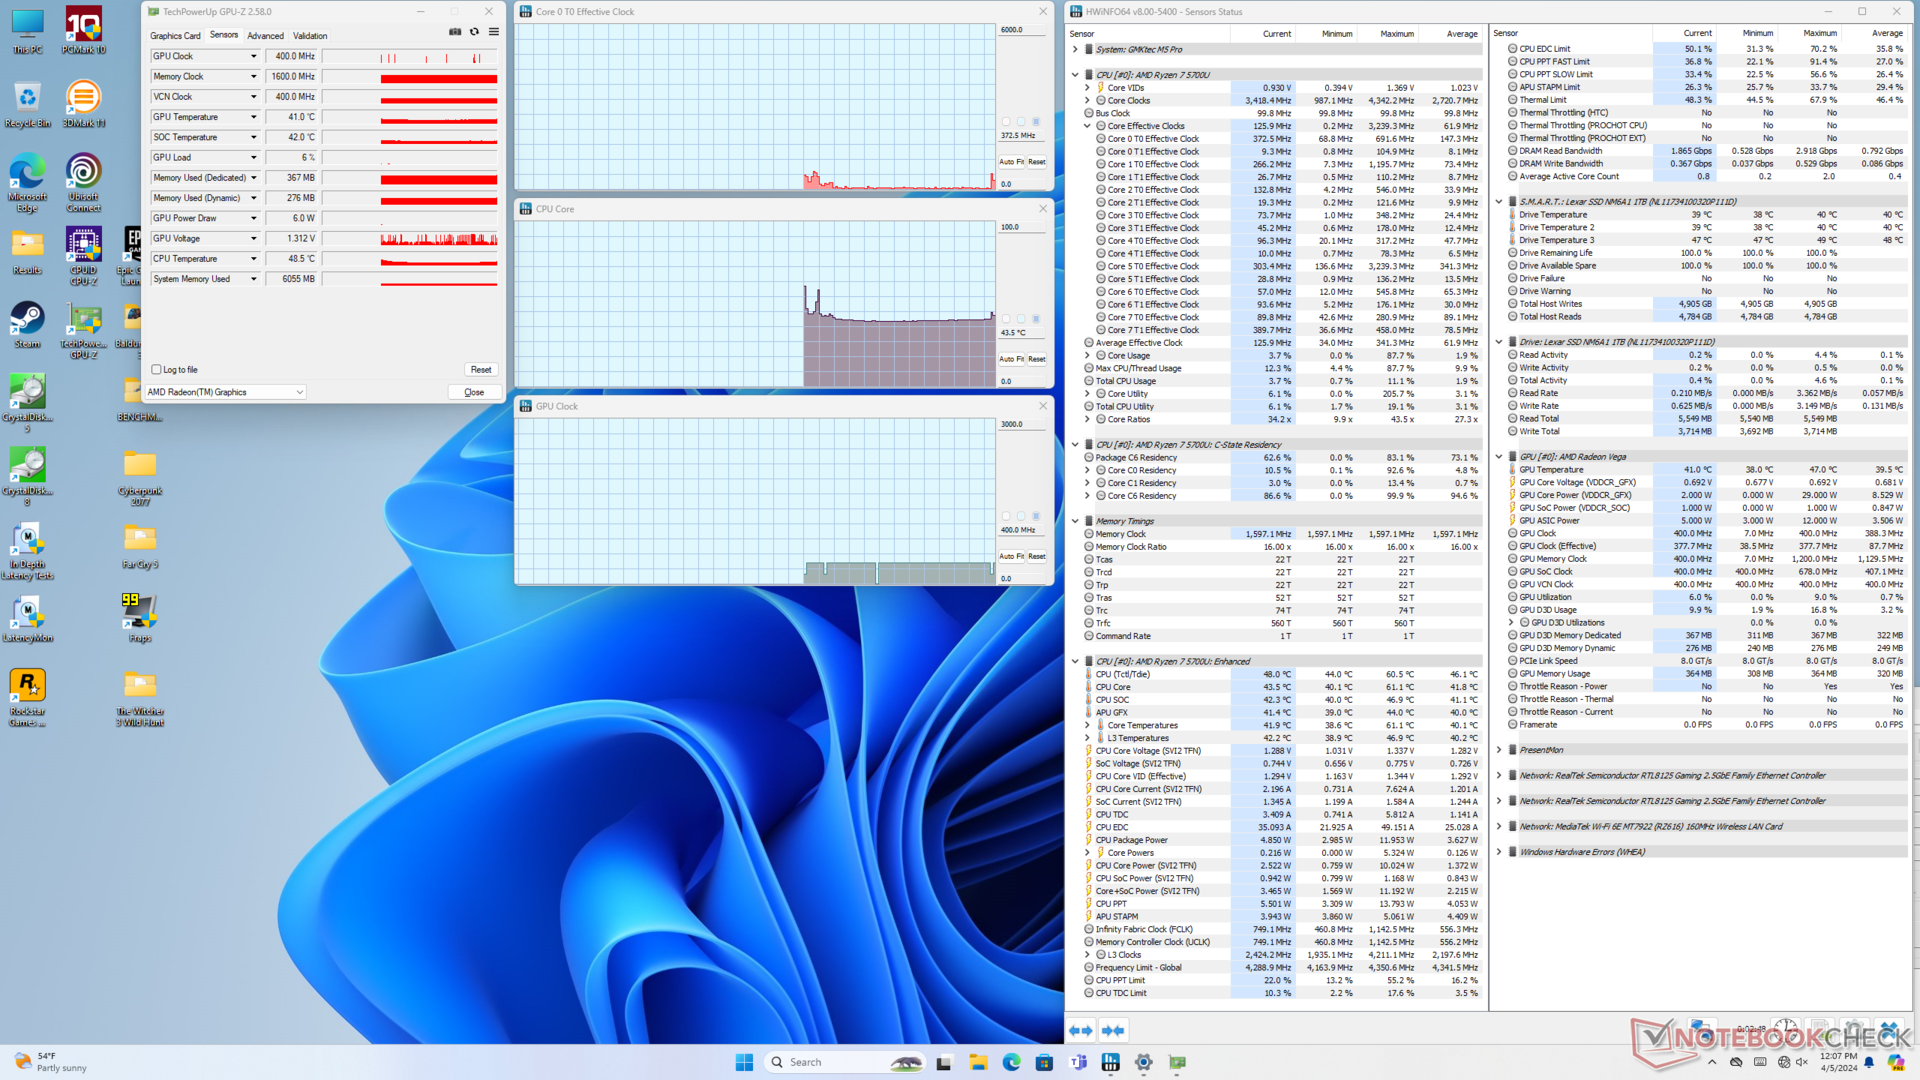
Prueba de estrés
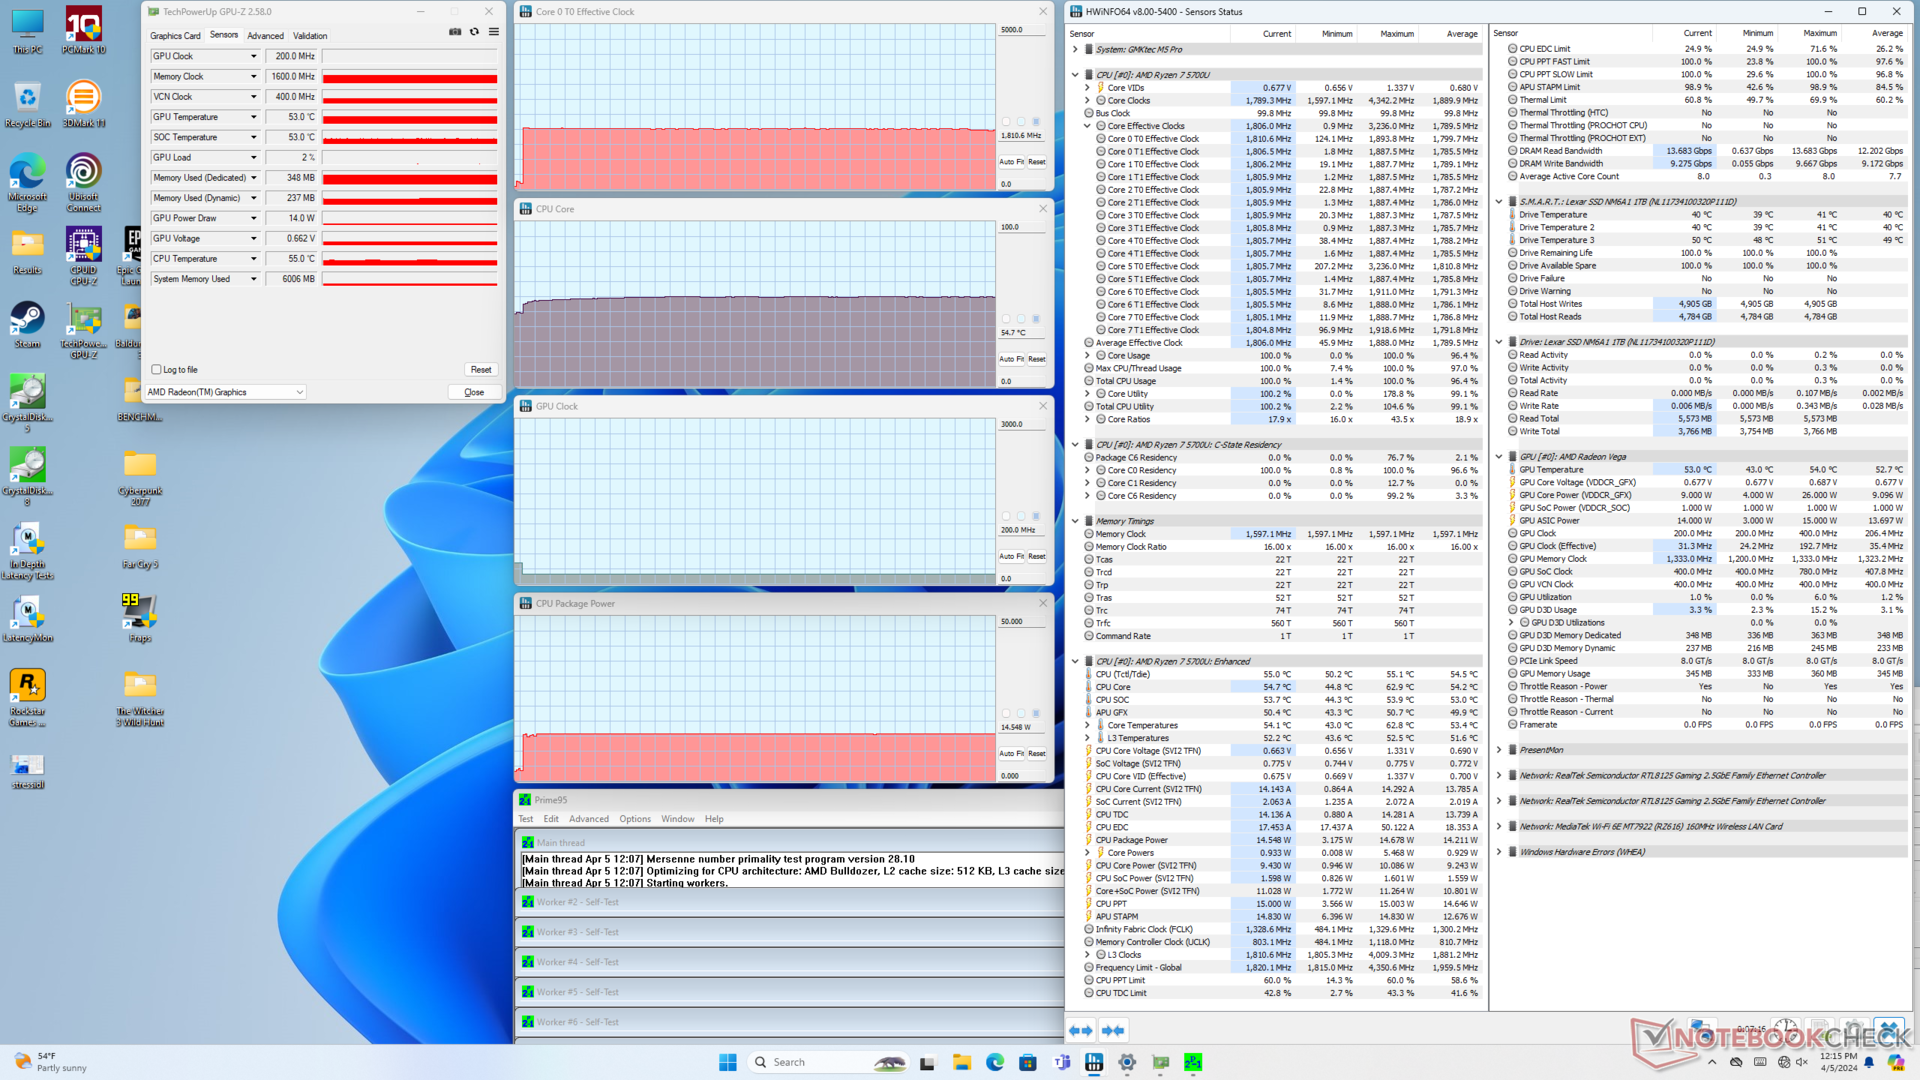
Al ejecutar Prime95 para estresar la CPU, las velocidades de reloj y el consumo de energía de la placa se disparaban hasta 1,9 GHz y 15 W, respectivamente. Creemos que el procesador es capaz de alcanzar potencias superiores de hasta 28 W, especialmente porque la temperatura del núcleo es de sólo 55 C bajo estrés, pero la potencia del paquete está aparentemente limitada a 15 W en el NucBox M5 incluso después de comprobar dos veces cualquier configuración de la BIOS o los perfiles de energía de Windows. El bajo límite de 15 W también explica el rendimiento más lento de lo esperado, como se mencionó anteriormente en la sección del procesador.
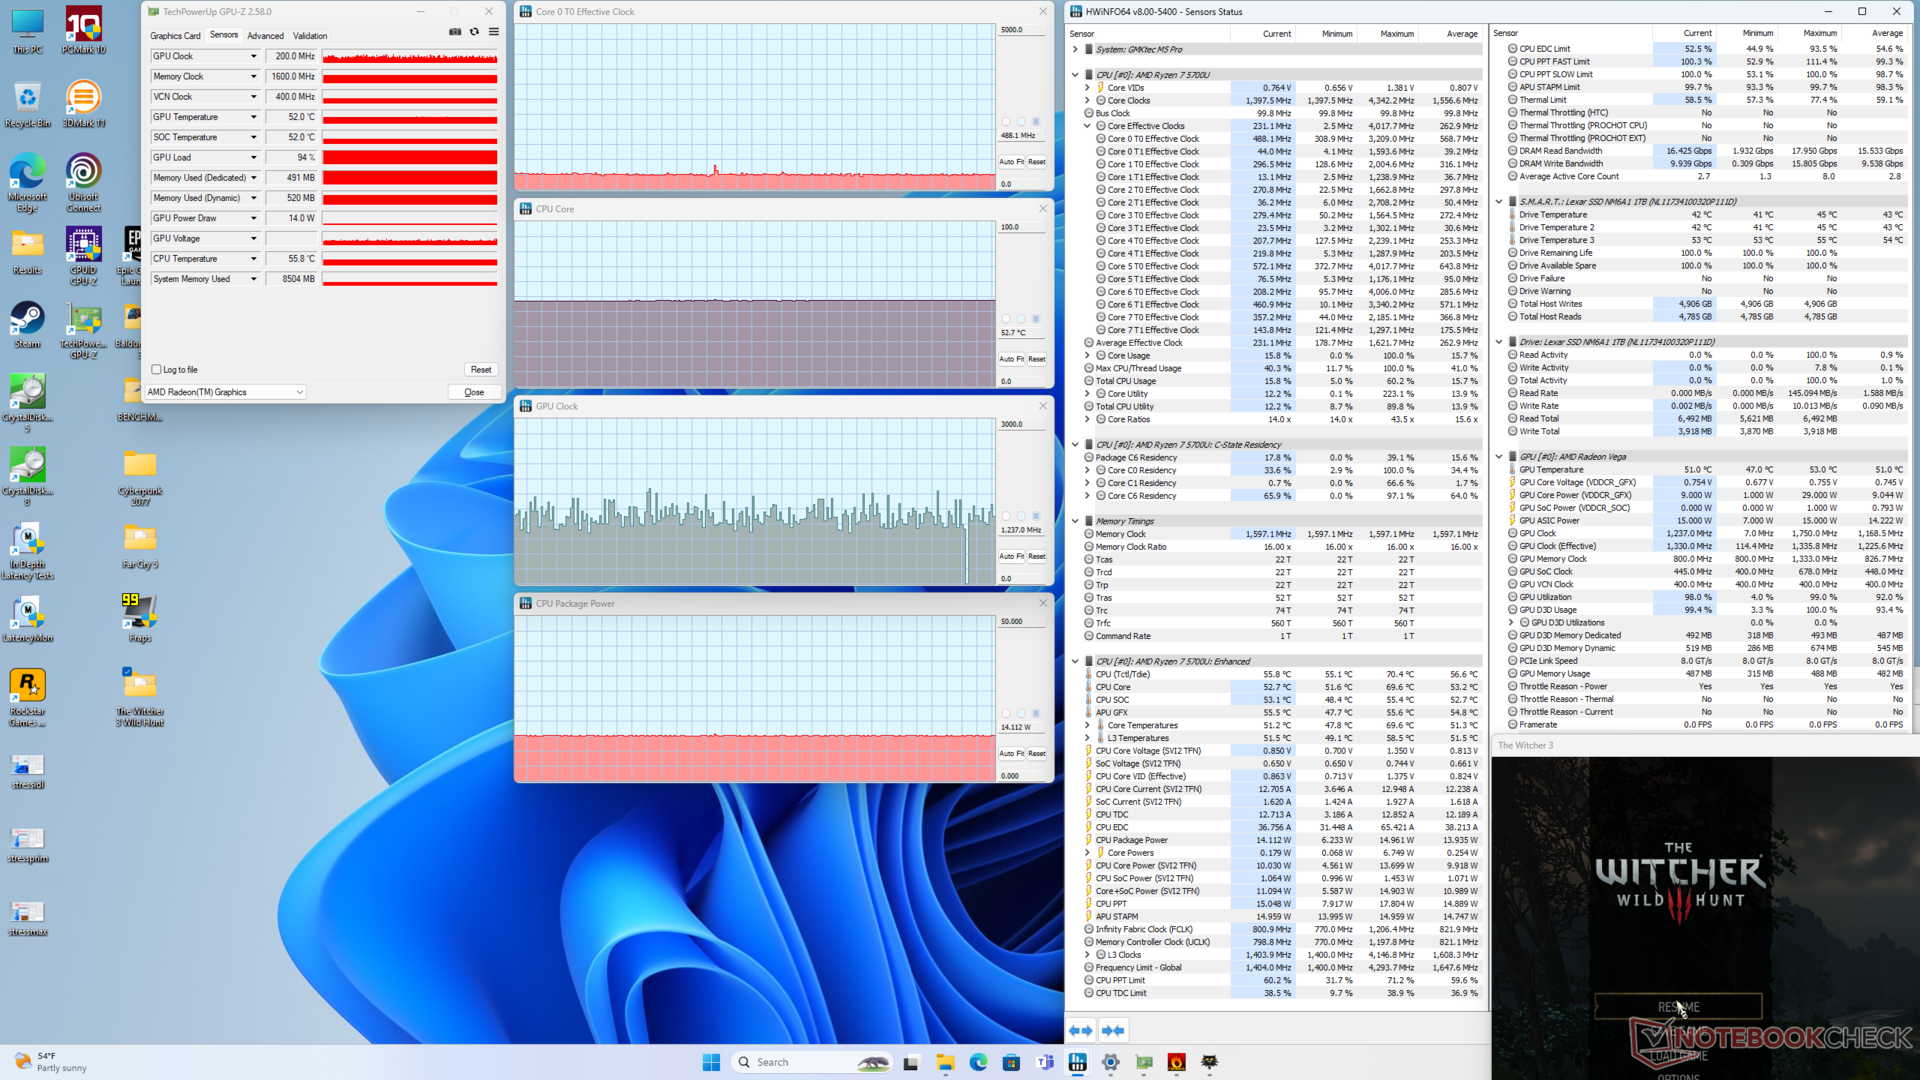
La temperatura del núcleo se estabilizaba en sólo 55 C cuando funcionaba Witcher 3 en comparación con los 70 C del mucho más rápido Beelink SER6 Pro.
| Reloj dela CPU (GHz) | Reloj de la GPU (MHz) | Temperatura media de la CPU (°C) | |
| Sistema en reposo | -- | -- | 43 |
| Prime95 Estrés | 1.8 | -- | 55 |
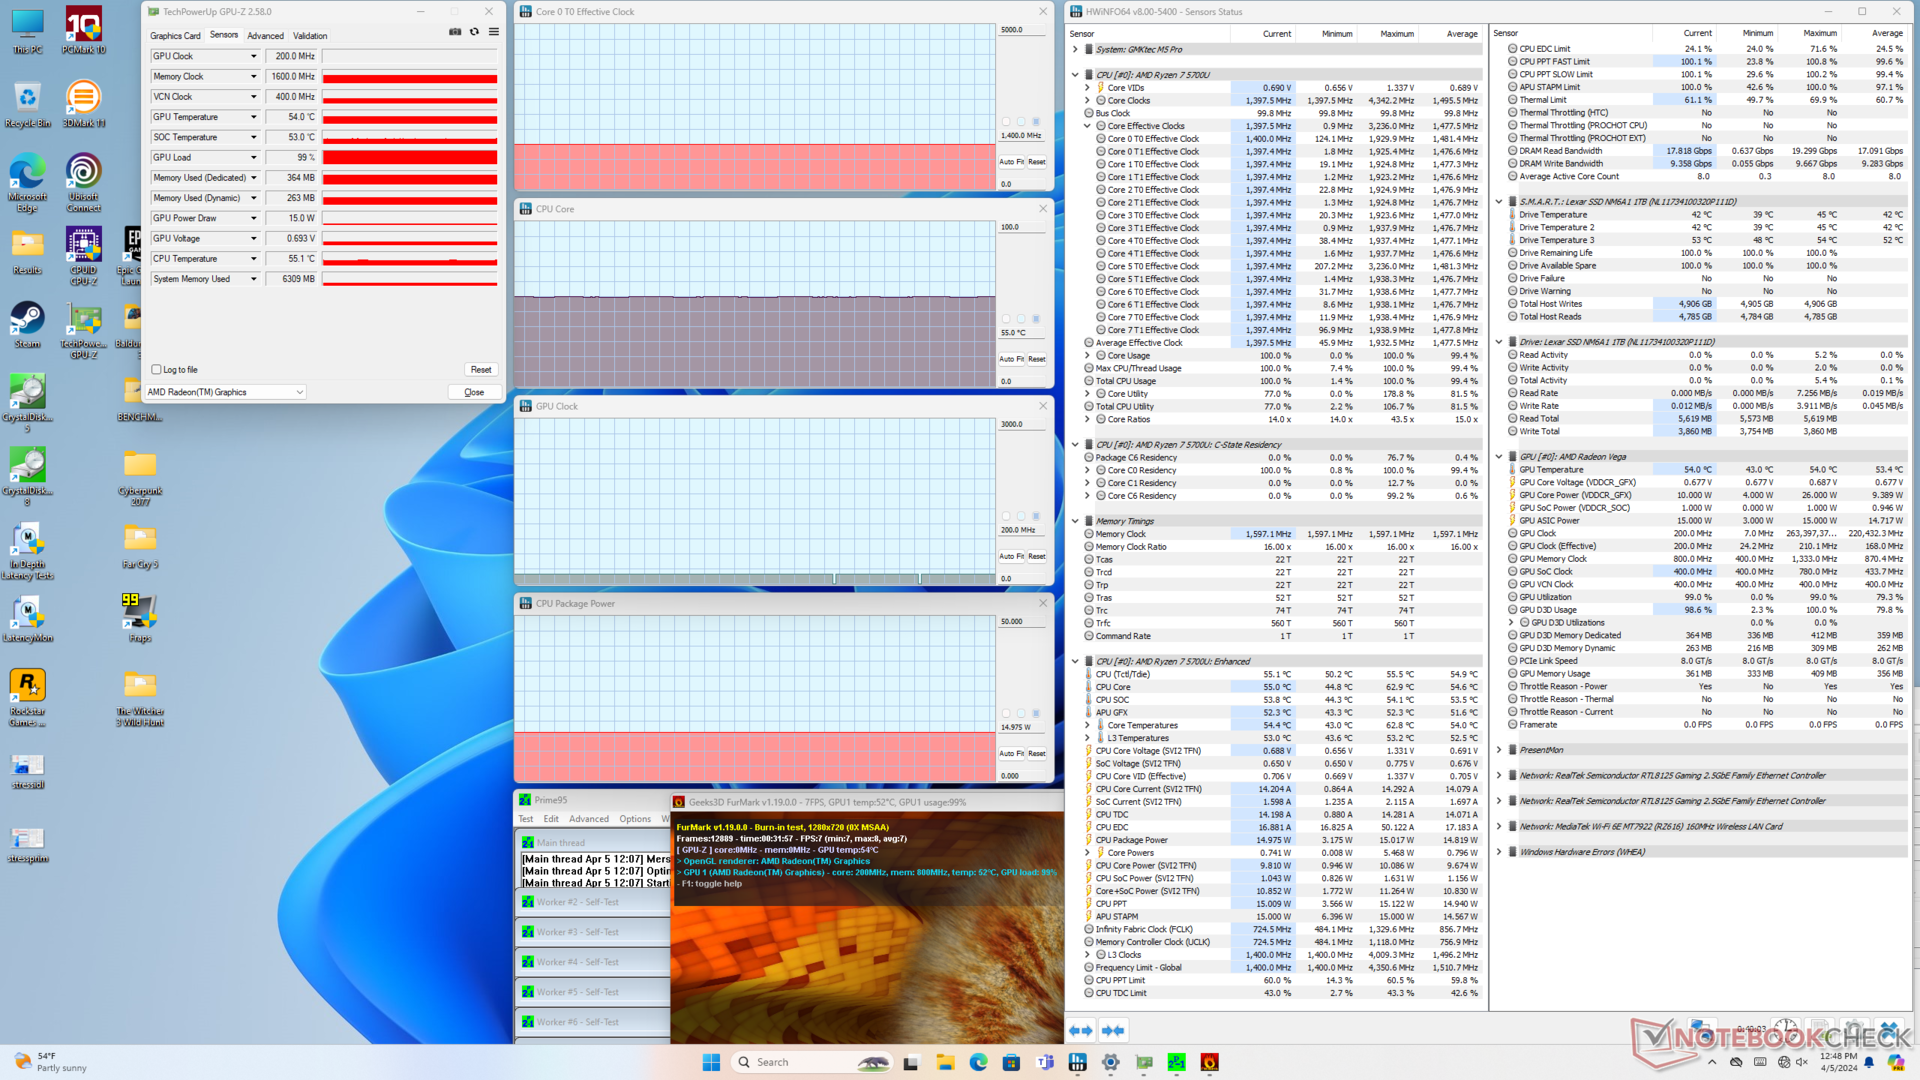
| Estrés Prime95+ FurMark | 1,4 | 200 | 55 |
| Witcher 3 Estrés | ~0,5 | ~1237 | 53 |
Rendimiento del sistema
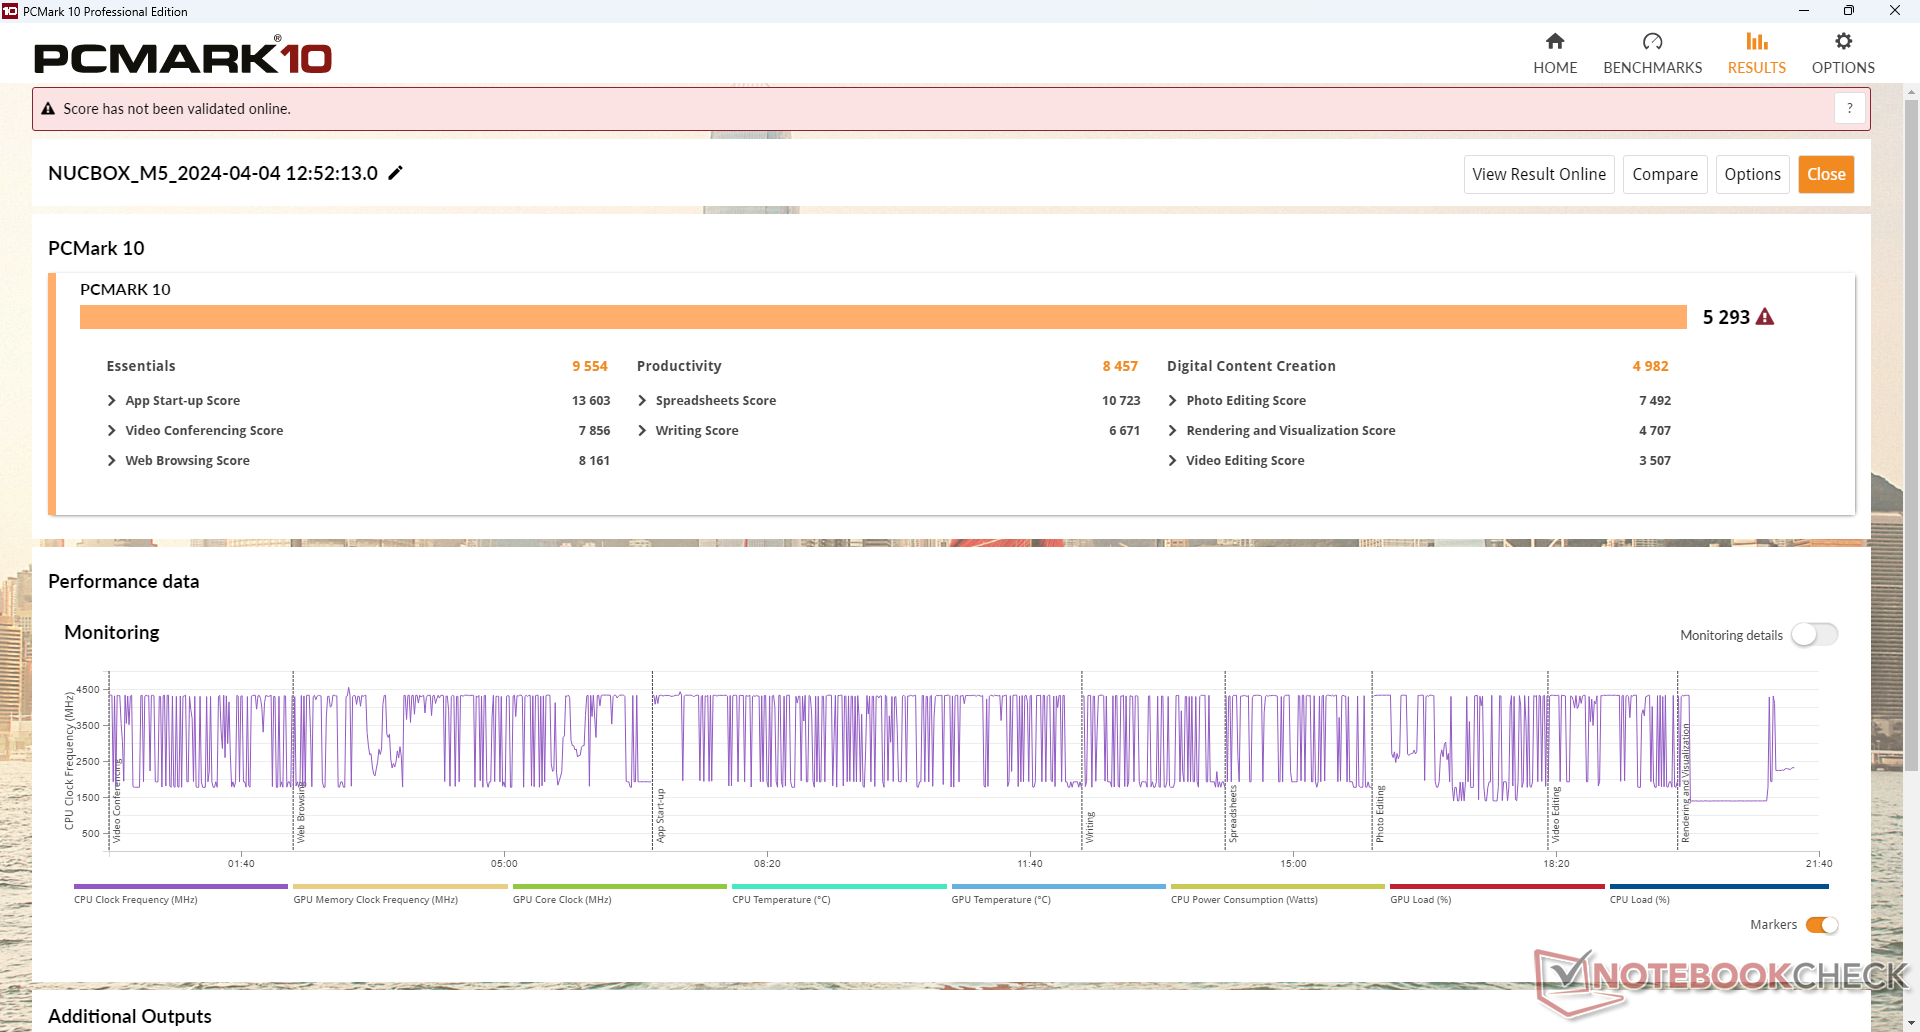
Los resultados de PCMark están por detrás de muchos mini PC actuales que funcionan con procesadores de última generación, como el GMK NucBox K6 o el Intel NUC 13 Pro. La puntuación de la subprueba de creación de contenidos digitales es especialmente baja debido a la lentitud de la GPU integrada.
CrossMark: Overall | Productivity | Creativity | Responsiveness
WebXPRT 3: Overall
WebXPRT 4: Overall
Mozilla Kraken 1.1: Total
| PCMark 10 / Score | |
| GMK NucBox K6 | |
| Geekom A7 | |
| Acemagic F2A | |
| Intel NUC 13 Pro Desk Edition Kit | |
| GMK NucBox M4 | |
| GMK NucBox M5 | |
| Medio AMD Ryzen 7 5700U, AMD Radeon RX Vega 8 (Ryzen 4000/5000) (4325 - 5518, n=15) | |
| PCMark 10 / Essentials | |
| GMK NucBox K6 | |
| Acemagic F2A | |
| Geekom A7 | |
| Intel NUC 13 Pro Desk Edition Kit | |
| GMK NucBox M4 | |
| GMK NucBox M5 | |
| Medio AMD Ryzen 7 5700U, AMD Radeon RX Vega 8 (Ryzen 4000/5000) (8025 - 10091, n=15) | |
| PCMark 10 / Productivity | |
| GMK NucBox K6 | |
| Geekom A7 | |
| Acemagic F2A | |
| GMK NucBox M5 | |
| Medio AMD Ryzen 7 5700U, AMD Radeon RX Vega 8 (Ryzen 4000/5000) (7001 - 8457, n=15) | |
| GMK NucBox M4 | |
| Intel NUC 13 Pro Desk Edition Kit | |
| PCMark 10 / Digital Content Creation | |
| Acemagic F2A | |
| Geekom A7 | |
| GMK NucBox K6 | |
| Intel NUC 13 Pro Desk Edition Kit | |
| GMK NucBox M4 | |
| Medio AMD Ryzen 7 5700U, AMD Radeon RX Vega 8 (Ryzen 4000/5000) (3738 - 5964, n=15) | |
| GMK NucBox M5 | |
| CrossMark / Overall | |
| GMK NucBox K6 | |
| Geekom A7 | |
| Acemagic F2A | |
| GMK NucBox M4 | |
| Intel NUC 13 Pro Desk Edition Kit | |
| GMK NucBox M5 | |
| Medio AMD Ryzen 7 5700U, AMD Radeon RX Vega 8 (Ryzen 4000/5000) (866 - 1183, n=8) | |
| CrossMark / Productivity | |
| GMK NucBox K6 | |
| Geekom A7 | |
| Acemagic F2A | |
| GMK NucBox M4 | |
| Intel NUC 13 Pro Desk Edition Kit | |
| GMK NucBox M5 | |
| Medio AMD Ryzen 7 5700U, AMD Radeon RX Vega 8 (Ryzen 4000/5000) (931 - 1191, n=8) | |
| CrossMark / Creativity | |
| Geekom A7 | |
| GMK NucBox K6 | |
| Acemagic F2A | |
| Intel NUC 13 Pro Desk Edition Kit | |
| GMK NucBox M4 | |
| GMK NucBox M5 | |
| Medio AMD Ryzen 7 5700U, AMD Radeon RX Vega 8 (Ryzen 4000/5000) (907 - 1197, n=8) | |
| CrossMark / Responsiveness | |
| GMK NucBox K6 | |
| Acemagic F2A | |
| Geekom A7 | |
| GMK NucBox M4 | |
| Intel NUC 13 Pro Desk Edition Kit | |
| GMK NucBox M5 | |
| Medio AMD Ryzen 7 5700U, AMD Radeon RX Vega 8 (Ryzen 4000/5000) (605 - 1159, n=8) | |
| WebXPRT 3 / Overall | |
| Geekom A7 | |
| GMK NucBox K6 | |
| Intel NUC 13 Pro Desk Edition Kit | |
| GMK NucBox M4 | |
| Acemagic F2A | |
| GMK NucBox M5 | |
| Medio AMD Ryzen 7 5700U, AMD Radeon RX Vega 8 (Ryzen 4000/5000) (197.4 - 222, n=14) | |
| WebXPRT 4 / Overall | |
| Geekom A7 | |
| GMK NucBox K6 | |
| Intel NUC 13 Pro Desk Edition Kit | |
| Acemagic F2A | |
| GMK NucBox M4 | |
| Medio AMD Ryzen 7 5700U, AMD Radeon RX Vega 8 (Ryzen 4000/5000) (158.5 - 225, n=5) | |
| GMK NucBox M5 | |
| Mozilla Kraken 1.1 / Total | |
| Medio AMD Ryzen 7 5700U, AMD Radeon RX Vega 8 (Ryzen 4000/5000) (791 - 835, n=15) | |
| GMK NucBox M5 | |
| GMK NucBox M4 | |
| Acemagic F2A | |
| GMK NucBox K6 | |
| Geekom A7 | |
| Intel NUC 13 Pro Desk Edition Kit | |
* ... más pequeño es mejor
| PCMark 10 Score | 5293 puntos | |
ayuda | ||
| AIDA64 / Memory Copy | |
| GMK NucBox K6 | |
| Geekom A7 | |
| Acemagic F2A | |
| Intel NUC 13 Pro Desk Edition Kit | |
| GMK NucBox M4 | |
| GMK NucBox M5 | |
| Medio AMD Ryzen 7 5700U (15867 - 39326, n=20) | |
| AIDA64 / Memory Read | |
| Acemagic F2A | |
| GMK NucBox K6 | |
| Geekom A7 | |
| GMK NucBox M4 | |
| GMK NucBox M5 | |
| Intel NUC 13 Pro Desk Edition Kit | |
| Medio AMD Ryzen 7 5700U (17632 - 47190, n=20) | |
| AIDA64 / Memory Write | |
| Geekom A7 | |
| GMK NucBox K6 | |
| Acemagic F2A | |
| GMK NucBox M5 | |
| GMK NucBox M4 | |
| Intel NUC 13 Pro Desk Edition Kit | |
| Medio AMD Ryzen 7 5700U (11554 - 47048, n=20) | |
| AIDA64 / Memory Latency | |
| Acemagic F2A | |
| GMK NucBox M5 | |
| Medio AMD Ryzen 7 5700U (84.9 - 113, n=20) | |
| Intel NUC 13 Pro Desk Edition Kit | |
| Geekom A7 | |
| GMK NucBox K6 | |
| GMK NucBox M4 | |
* ... más pequeño es mejor
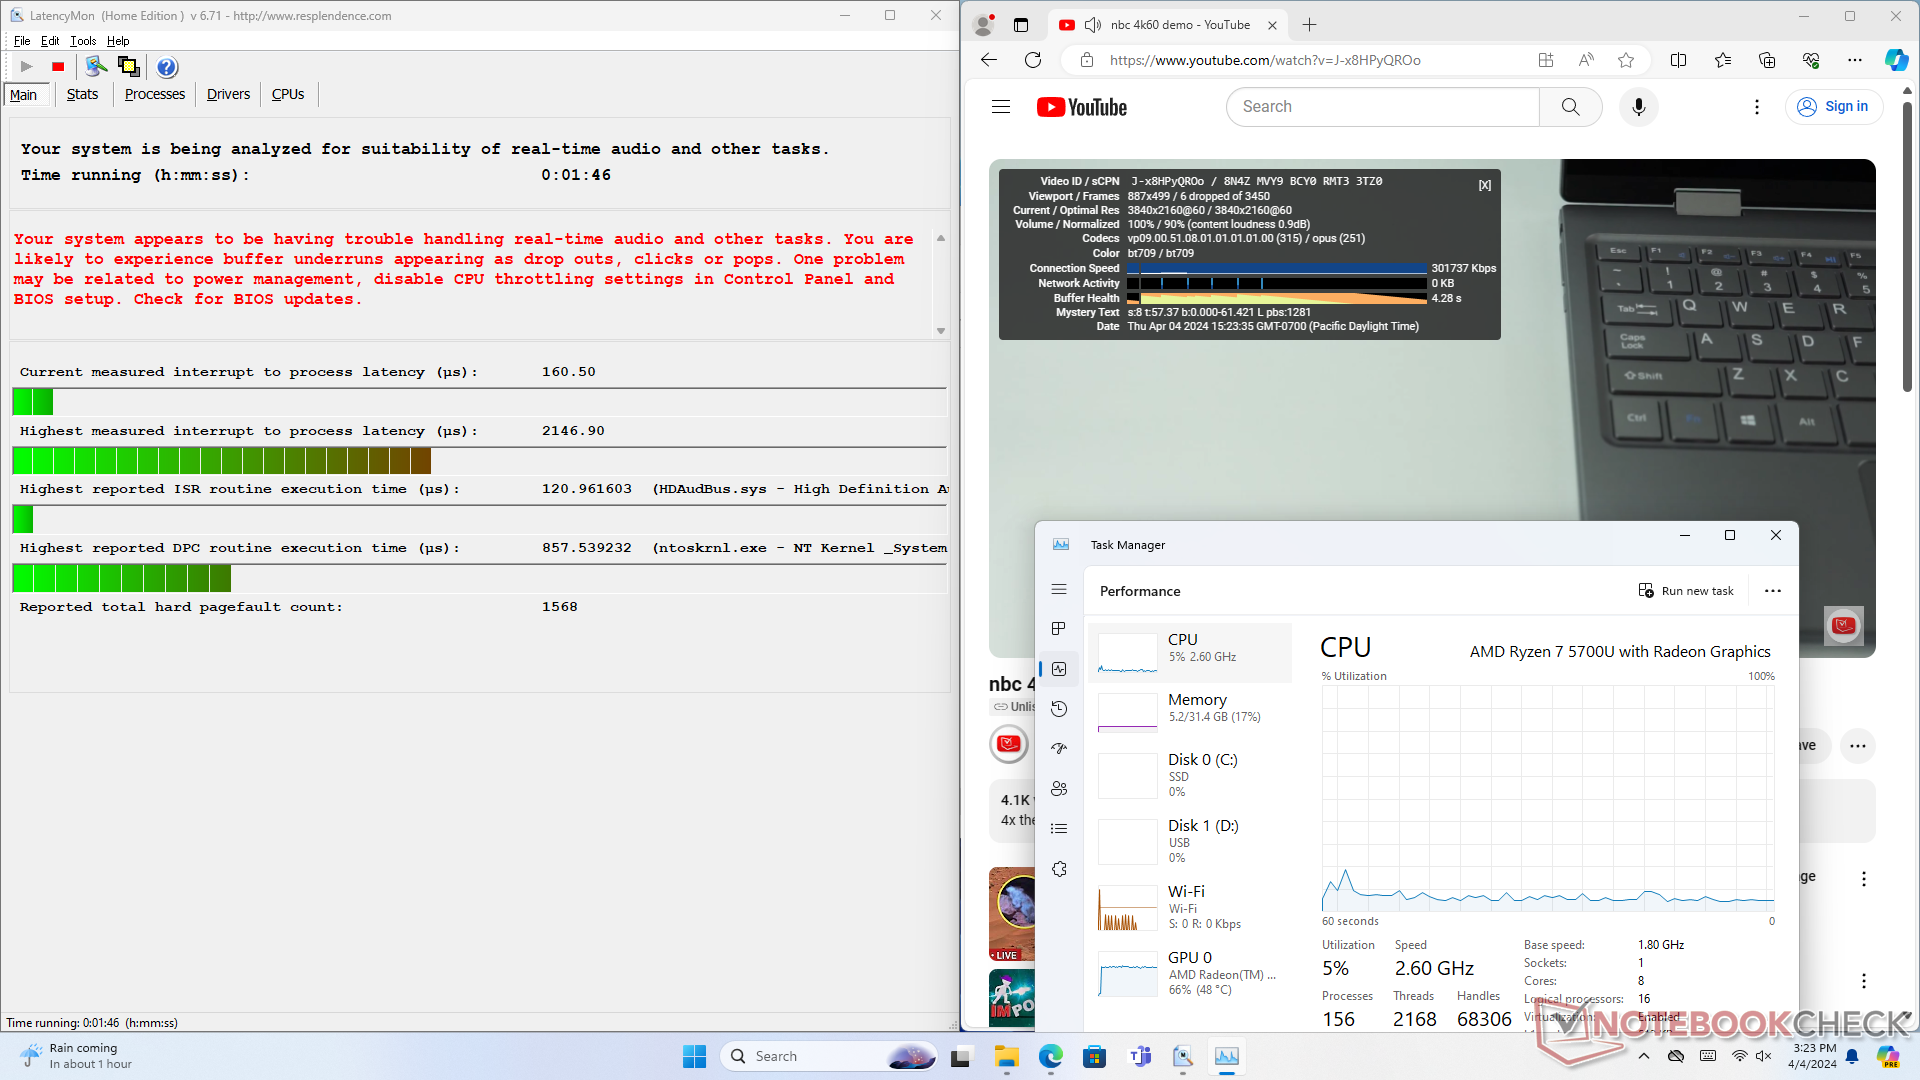
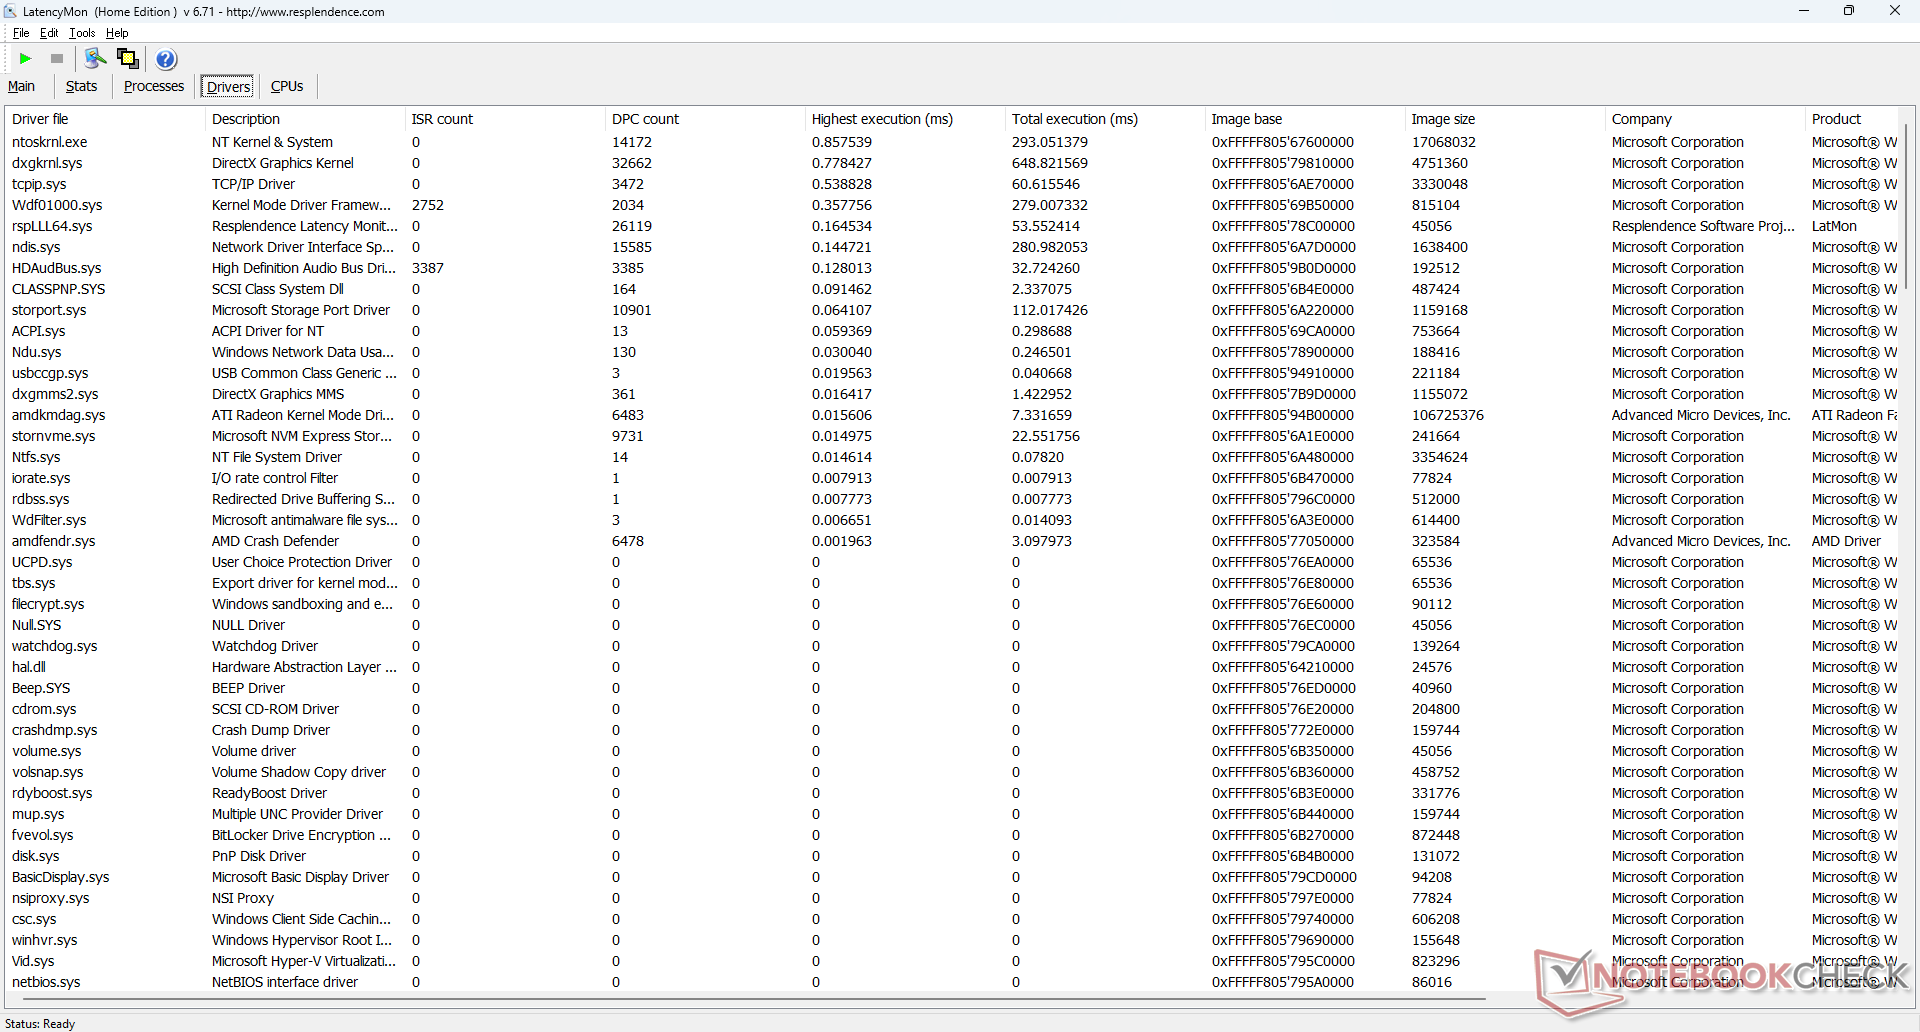
Latencia del CPD
LatencyMon revela problemas menores de CPD al abrir varias pestañas del navegador de nuestra página principal. la reproducción de vídeo 4K a 60 FPS también presenta imperfecciones, con 6 fotogramas caídos registrados durante un lapso de tiempo de un minuto.
| DPC Latencies / LatencyMon - interrupt to process latency (max), Web, Youtube, Prime95 | |
| GMK NucBox K6 | |
| Acemagic F2A | |
| GMK NucBox M5 | |
| Geekom A7 | |
| Intel NUC 13 Pro Desk Edition Kit | |
| GMK NucBox M4 | |
* ... más pequeño es mejor
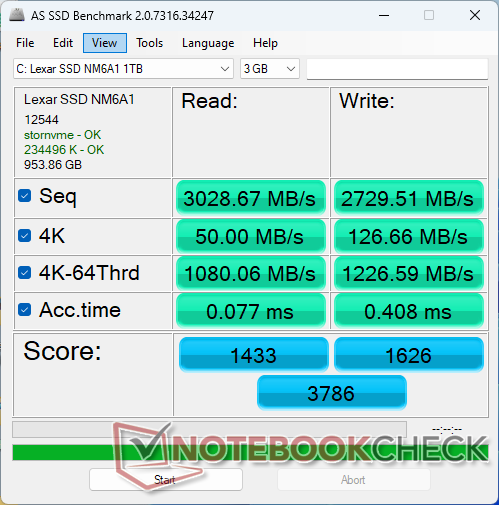
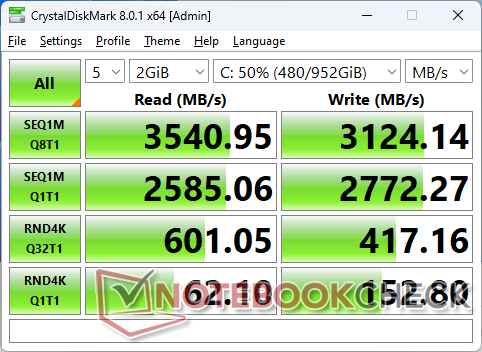
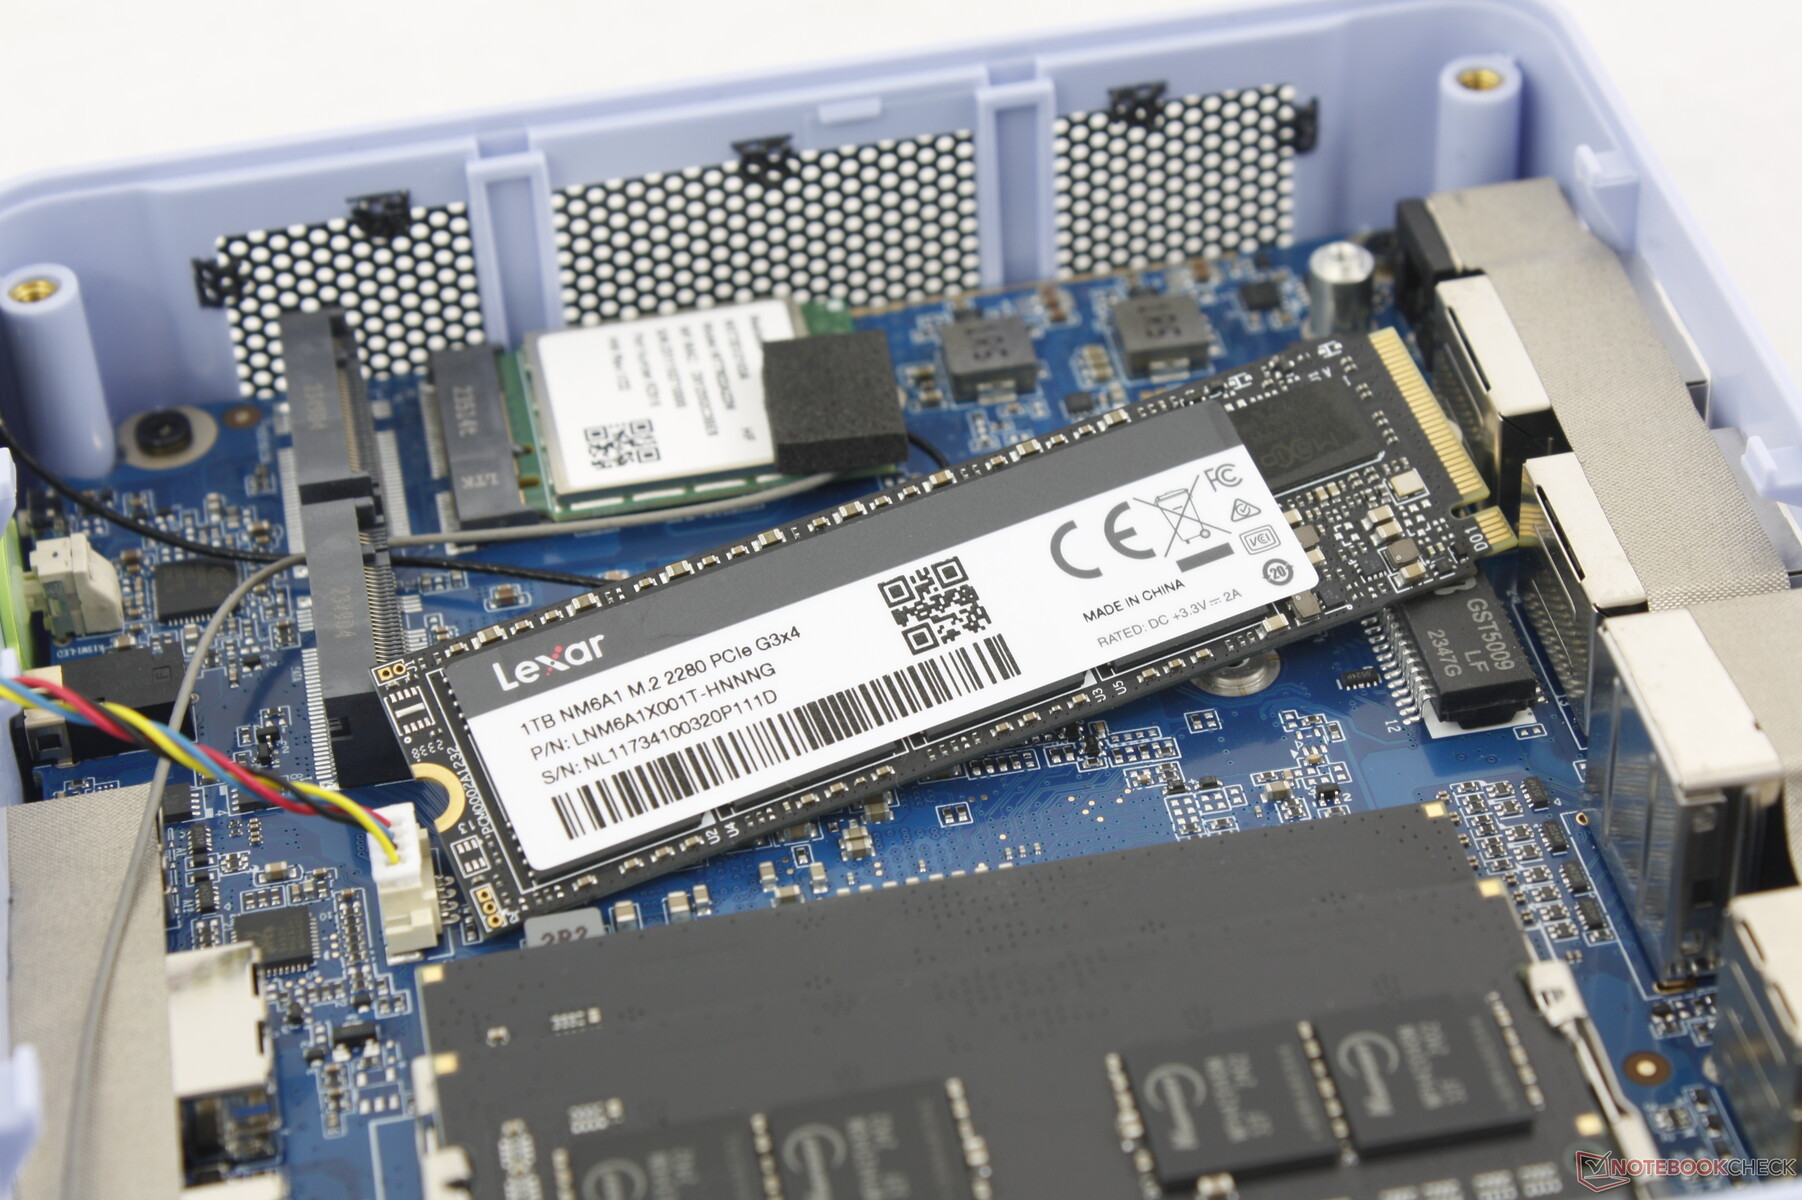
Dispositivos de almacenamiento
Al igual que en la NucBox M4, la M5 se entrega con un Unidad SSD NVMe PCIe4 x4 de Lexar para unas velocidades de transferencia constantes de hasta 3600 MB/s. Las velocidades de escritura secuencial son bastante buenas también con 3100 MB/s para ser una de las mejores SSD PCIe4 de gama media.

| Drive Performance rating - Percent | |
| GMK NucBox K6 | |
| Intel NUC 13 Pro Desk Edition Kit | |
| Geekom A7 | |
| Acemagic F2A | |
| GMK NucBox M5 | |
| GMK NucBox M4 | |
* ... más pequeño es mejor
Disk Throttling: DiskSpd Read Loop, Queue Depth 8
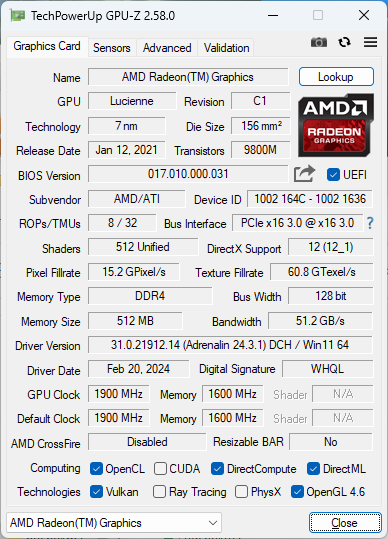
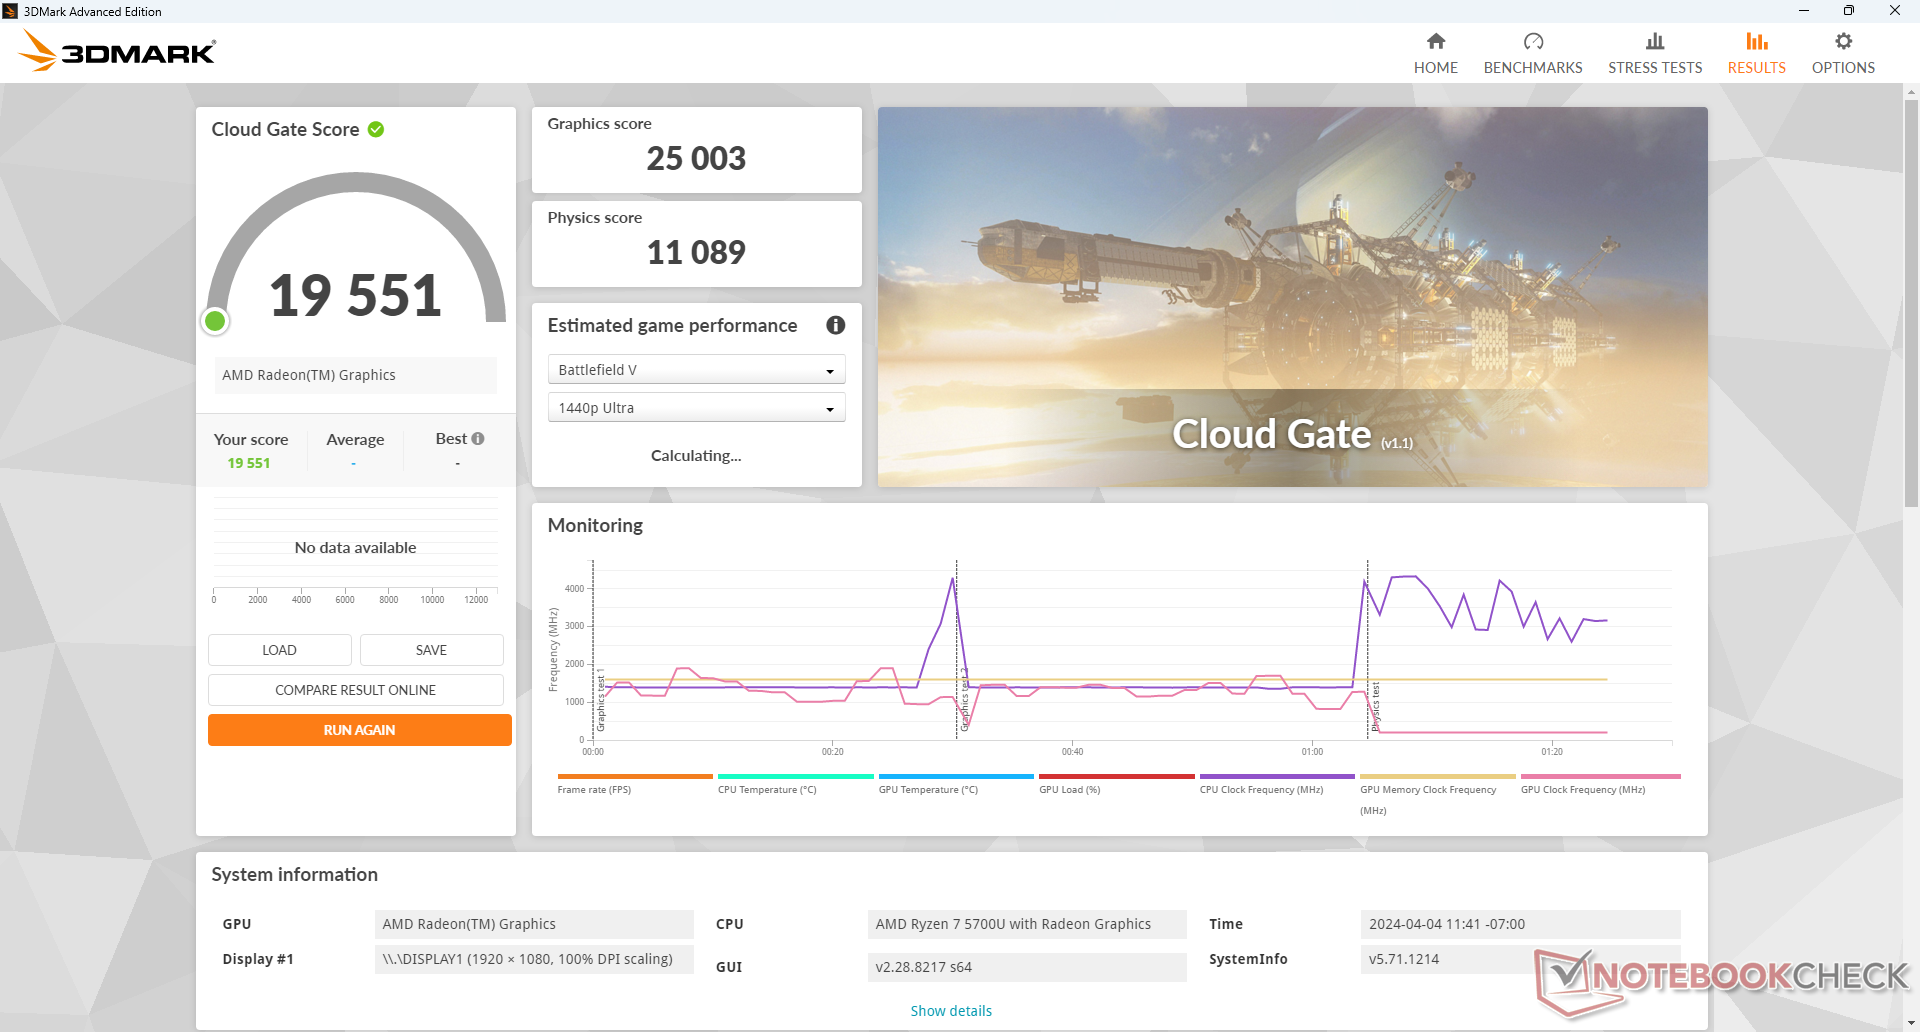
Rendimiento de la GPU - Radeon RX Vega 8 anticuada
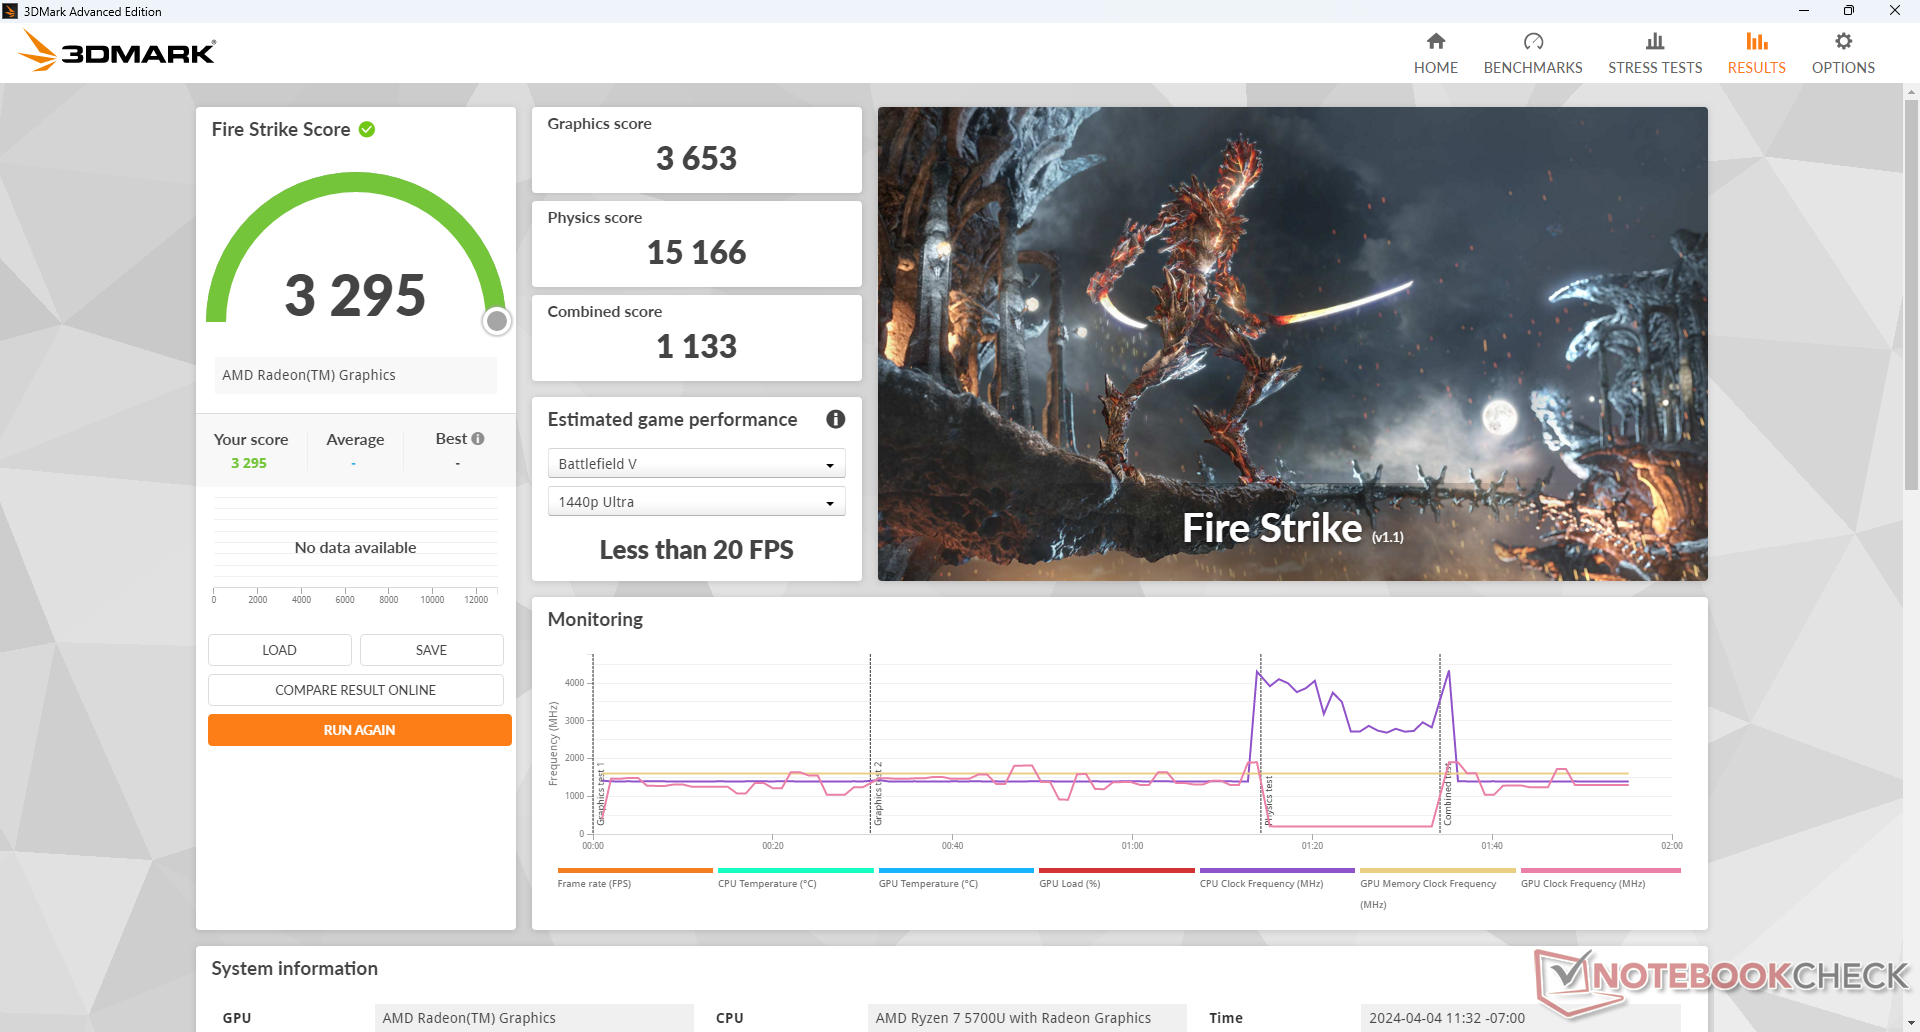
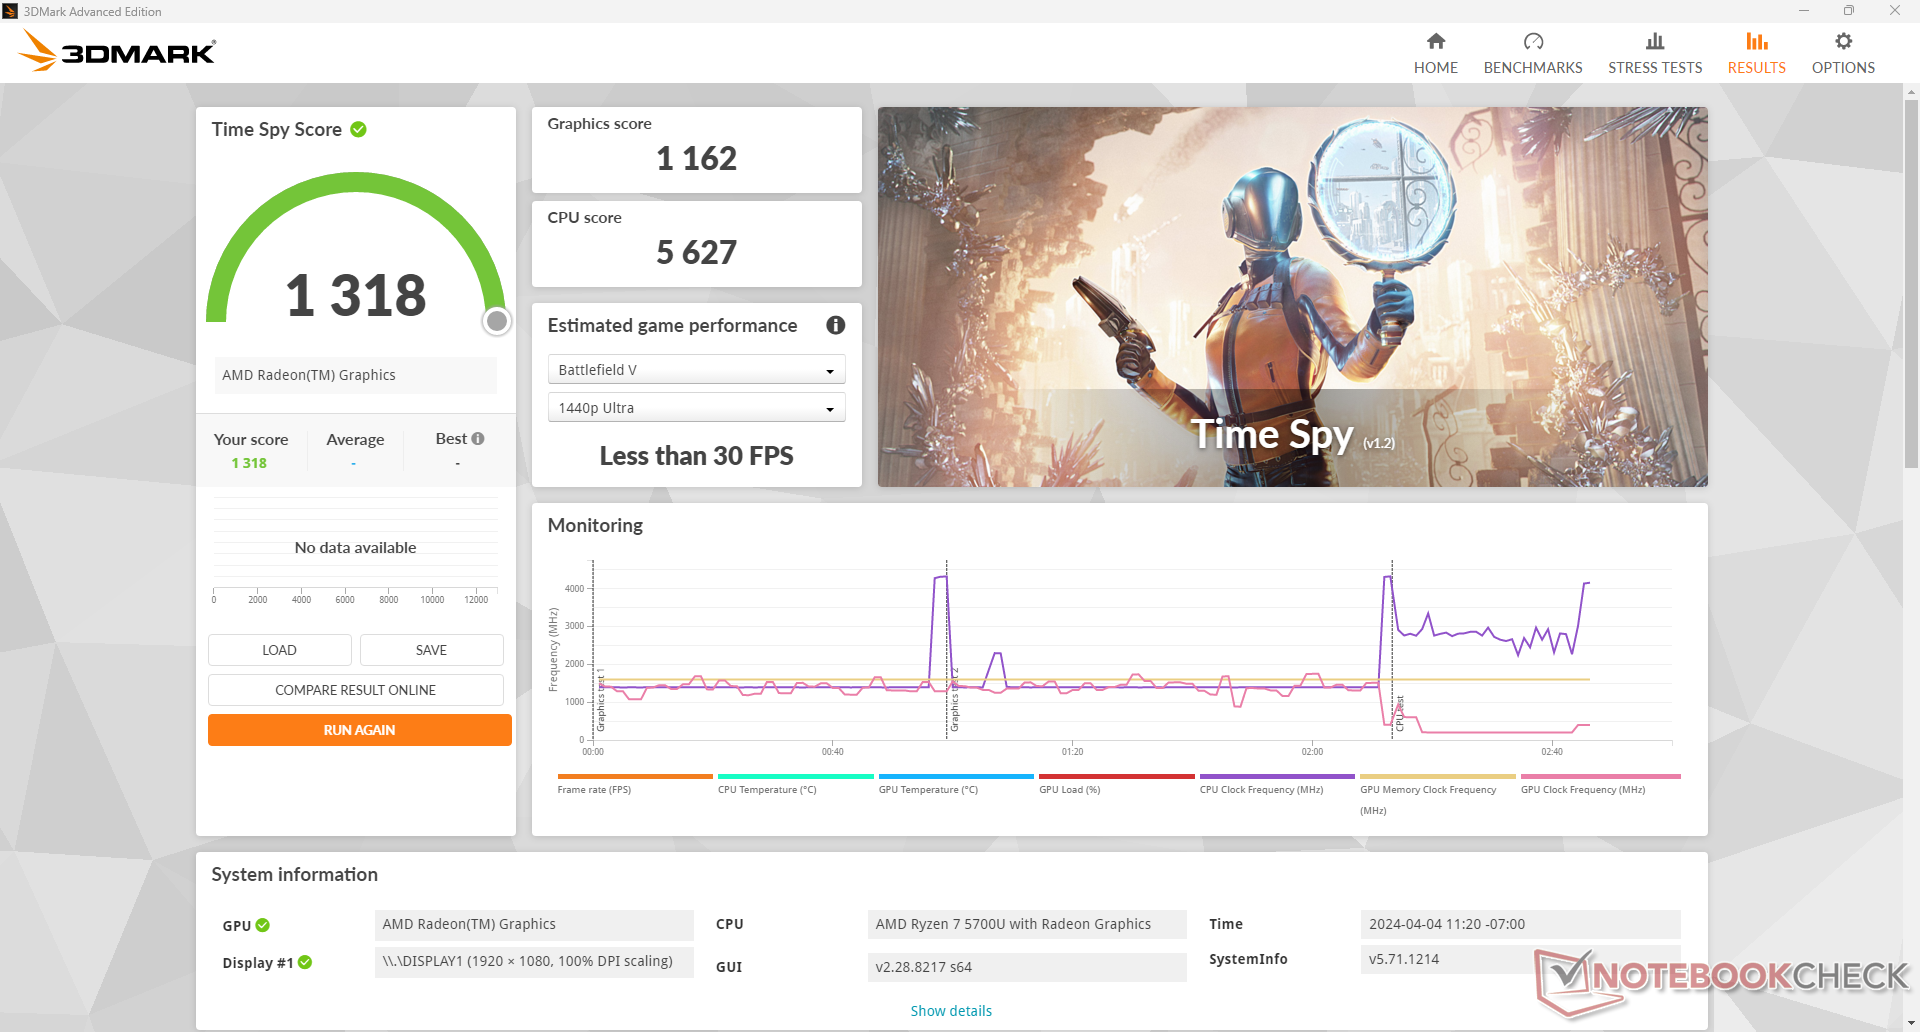
La integrada Radeon RX Vega 8 es anterior a la Radeon 680M y 780M que ahora dominan los mini PC y portátiles de gama media o superior. Es significativamente más lenta que la Radeon 680M, entre un 50 y un 60 por ciento, para estar más en línea con la Gráficos Iris Xe G7 96EU en las CPU Intel de 11ª generación. La Radeon RX Vega 8 no puede ejecutar localmente la mayoría de los juegos a velocidades de fotogramas razonables.
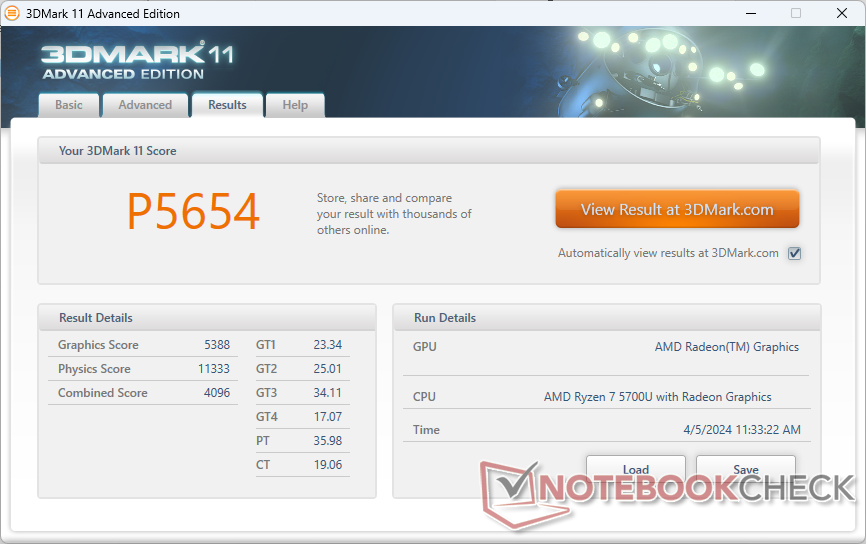
| 3DMark 11 Performance | 5654 puntos | |
| 3DMark Cloud Gate Standard Score | 19551 puntos | |
| 3DMark Fire Strike Score | 3295 puntos | |
| 3DMark Time Spy Score | 1318 puntos | |
ayuda | ||
* ... más pequeño es mejor
| Performance rating - Percent | |
| GMK NucBox K6 | |
| Geekom A7 -1! | |
| Acemagic F2A | |
| Intel NUC 13 Pro Desk Edition Kit | |
| GMK NucBox M5 | |
| GMK NucBox M4 -1! | |
| The Witcher 3 - 1920x1080 Ultra Graphics & Postprocessing (HBAO+) | |
| Geekom A7 | |
| GMK NucBox K6 | |
| Acemagic F2A | |
| Intel NUC 13 Pro Desk Edition Kit | |
| GMK NucBox M5 | |
| GMK NucBox M4 | |
| Final Fantasy XV Benchmark - 1920x1080 High Quality | |
| GMK NucBox K6 | |
| Geekom A7 | |
| Acemagic F2A | |
| Intel NUC 13 Pro Desk Edition Kit | |
| GMK NucBox M5 | |
| Strange Brigade - 1920x1080 ultra AA:ultra AF:16 | |
| GMK NucBox K6 | |
| Acemagic F2A | |
| Intel NUC 13 Pro Desk Edition Kit | |
| GMK NucBox M5 | |
| GMK NucBox M4 | |
| Dota 2 Reborn - 1920x1080 ultra (3/3) best looking | |
| GMK NucBox K6 | |
| Geekom A7 | |
| Acemagic F2A | |
| Intel NUC 13 Pro Desk Edition Kit | |
| GMK NucBox M5 | |
| GMK NucBox M4 | |
| X-Plane 11.11 - 1920x1080 high (fps_test=3) | |
| Geekom A7 | |
| GMK NucBox K6 | |
| Intel NUC 13 Pro Desk Edition Kit | |
| Acemagic F2A | |
| GMK NucBox M5 | |
| GMK NucBox M4 | |
| Cyberpunk 2077 | |
| 1280x720 Low Preset (FSR off) | |
| Intel NUC X15 LAPAC71H | |
| GMK NucBox K6 | |
| Acemagic F2A | |
| Medio AMD Radeon RX Vega 8 (Ryzen 4000/5000) (16.6 - 35.2, n=4) | |
| GMK NucBox M5 | |
| 1920x1080 Low Preset (FSR off) | |
| Intel NUC X15 LAPAC71H | |
| GMK NucBox K6 | |
| Acemagic F2A | |
| Medio AMD Radeon RX Vega 8 (Ryzen 4000/5000) (9.9 - 19.9, n=5) | |
| GMK NucBox M5 | |
| 1920x1080 Medium Preset (FSR off) | |
| Intel NUC X15 LAPAC71H | |
| GMK NucBox K6 | |
| Acemagic F2A | |
| Medio AMD Radeon RX Vega 8 (Ryzen 4000/5000) (7.7 - 14.8, n=4) | |
| GMK NucBox M5 | |
| 1920x1080 High Preset (FSR off) | |
| Intel NUC X15 LAPAC71H | |
| GMK NucBox K6 | |
| Acemagic F2A | |
| GMK NucBox M5 | |
| Medio AMD Radeon RX Vega 8 (Ryzen 4000/5000) (5.71 - 12.3, n=5) | |
| 1920x1080 Ultra Preset (FSR off) | |
| Intel NUC X15 LAPAC71H | |
| GMK NucBox K6 | |
| Acemagic F2A | |
| Medio AMD Radeon RX Vega 8 (Ryzen 4000/5000) (8.23 - 10.5, n=2) | |
| F1 22 | |
| 1280x720 Ultra Low Preset AA:T AF:16x | |
| Geekom A7 | |
| GMK NucBox K6 | |
| GMK NucBox K2 | |
| Acemagic F2A | |
| Intel NUC 13 Pro Desk Edition Kit | |
| Medio AMD Radeon RX Vega 8 (Ryzen 4000/5000) (40.8 - 89.3, n=8) | |
| GMK NucBox M5 | |
| 1920x1080 Low Preset AA:T AF:16x | |
| GMK NucBox K6 | |
| Geekom A7 | |
| GMK NucBox K2 | |
| Acemagic F2A | |
| Intel NUC 13 Pro Desk Edition Kit | |
| GMK NucBox M5 | |
| Medio AMD Radeon RX Vega 8 (Ryzen 4000/5000) (22.1 - 48.8, n=12) | |
| 1920x1080 Medium Preset AA:T AF:16x | |
| Geekom A7 | |
| GMK NucBox K6 | |
| GMK NucBox K2 | |
| Acemagic F2A | |
| Intel NUC 13 Pro Desk Edition Kit | |
| GMK NucBox M5 | |
| Medio AMD Radeon RX Vega 8 (Ryzen 4000/5000) (19.7 - 42.4, n=13) | |
| 1920x1080 High Preset AA:T AF:16x | |
| GMK NucBox K6 | |
| Geekom A7 | |
| Acemagic F2A | |
| GMK NucBox K2 | |
| Intel NUC 13 Pro Desk Edition Kit | |
| GMK NucBox M5 | |
| Medio AMD Radeon RX Vega 8 (Ryzen 4000/5000) (15.1 - 31.2, n=11) | |
| 1920x1080 Ultra High Preset AA:T AF:16x | |
| Intel NUC 13 Pro Desk Edition Kit | |
| Geekom A7 | |
| GMK NucBox K6 | |
| Medio AMD Radeon RX Vega 8 (Ryzen 4000/5000) (11 - 22.5, n=8) | |
| GMK NucBox M5 | |
| Acemagic F2A | |
| GMK NucBox K2 | |
| Baldur's Gate 3 | |
| 1920x1080 Low Preset AA:SM | |
| Intel NUC X15 LAPAC71H | |
| GMK NucBox K6 | |
| GMK NucBox M5 | |
| Medio AMD Radeon RX Vega 8 (Ryzen 4000/5000) (9.78 - 17.6, n=4) | |
| 1920x1080 Medium Preset AA:T | |
| Intel NUC X15 LAPAC71H | |
| GMK NucBox K6 | |
| Medio AMD Radeon RX Vega 8 (Ryzen 4000/5000) (7.5 - 14.4, n=3) | |
| 1920x1080 High Preset AA:T | |
| Intel NUC X15 LAPAC71H | |
| GMK NucBox K6 | |
| Medio AMD Radeon RX Vega 8 (Ryzen 4000/5000) (6.11 - 11.7, n=3) | |
Witcher 3 FPS Chart
| bajo | medio | alto | ultra | |
|---|---|---|---|---|
| The Witcher 3 (2015) | 67.6 | 43.3 | 22 | 13.7 |
| Dota 2 Reborn (2015) | 99.7 | 80.6 | 50.5 | 47.6 |
| Final Fantasy XV Benchmark (2018) | 35.2 | 18 | 13.1 | |
| X-Plane 11.11 (2018) | 40.4 | 27.3 | 25.1 | |
| Far Cry 5 (2018) | 42 | 20 | 19 | 17 |
| Strange Brigade (2018) | 79.8 | 32.4 | 26.8 | 22.7 |
| Tiny Tina's Wonderlands (2022) | 27.3 | 21.5 | 13.8 | 10.3 |
| F1 22 (2022) | 35.7 | 32.3 | 23.8 | 16.8 |
| Baldur's Gate 3 (2023) | 14.2 | |||
| Cyberpunk 2077 (2023) | 13.8 | 10.9 | 9.17 |
Emisiones
Ruido del sistema
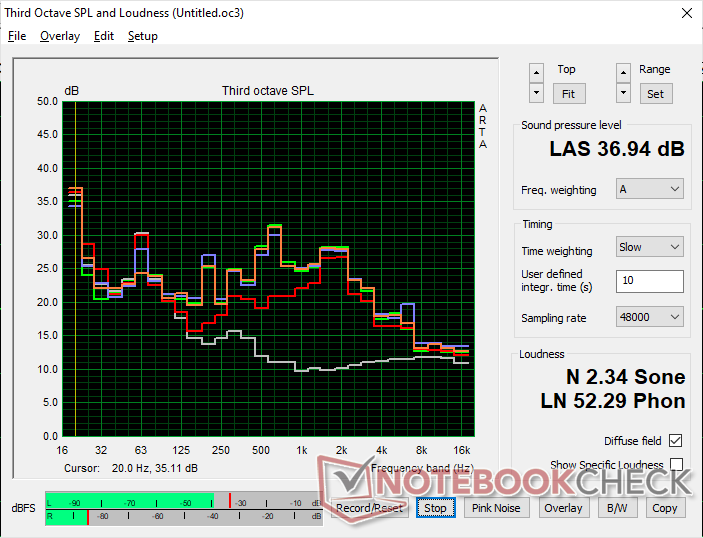
El ruido del ventilador está siempre presente en un piso de 33,8 dB(A) sin importar la carga en pantalla o la configuración del perfil. El zumbido silencioso es audible en un entorno HTPC como el salón, pero no es lo suficientemente alto como para distraer.
El rango de RPM del ventilador es, afortunadamente, bastante estrecho, por lo que la diferencia entre el ruido máximo y mínimo del ventilador es relativamente pequeña. Por ejemplo, somos capaces de registrar un máximo de sólo 37 dB(A) en comparación con los más de 48 dB(A) del NucBox K6 o el Acemagic F2A.
Ruido
| Ocioso |
| 33.8 / 33.8 / 33.8 dB(A) |
| Carga |
| 36.5 / 36.9 dB(A) |
 | ||
30 dB silencioso 40 dB(A) audible 50 dB(A) ruidosamente alto |
||
min: | ||
| GMK NucBox M5 Vega 8, R7 5700U, Lexar 1024GB LNM6A1X001T-HNNNG | GMK NucBox M4 UHD Graphics Xe 32EUs (Tiger Lake-H), i9-11900H, Lexar NM620 512GB | GMK NucBox K6 Radeon 780M, R7 7840HS, MasonSemi 1TB MC7000 | Acemagic F2A Arc 8-Core, Ultra 7 155H, Kingston OM8SEP1024Q-A0 | Geekom A7 Radeon 780M, R9 7940HS, Acer N5000 | Intel NUC 13 Pro Desk Edition Kit Iris Xe G7 96EUs, i7-1360P, Samsung PM9A1 MZVL2512HCJQ | |
|---|---|---|---|---|---|---|
| Noise | 12% | -9% | -3% | -9% | 2% | |
| apagado / medio ambiente * (dB) | 23.4 | 22.7 3% | 23.2 1% | 24.9 -6% | 25.4 -9% | 25.2 -8% |
| Idle Minimum * (dB) | 33.8 | 24.4 28% | 31.3 7% | 25.4 25% | 33.3 1% | 28.1 17% |
| Idle Average * (dB) | 33.8 | 24.4 28% | 31.3 7% | 25.7 24% | 33.6 1% | 28.2 17% |
| Idle Maximum * (dB) | 33.8 | 28 17% | 33.4 1% | 25.7 24% | 33.7 -0% | 28.3 16% |
| Load Average * (dB) | 36.5 | 28 23% | 47.5 -30% | 47.8 -31% | 43.3 -19% | 42 -15% |
| Witcher 3 ultra * (dB) | 36.8 | 33.7 8% | 43.6 -18% | 45.23 -23% | 43.2 -17% | |
| Load Maximum * (dB) | 36.9 | 44.6 -21% | 47.7 -29% | 49 -33% | 43.3 -17% | 42.1 -14% |
* ... más pequeño es mejor
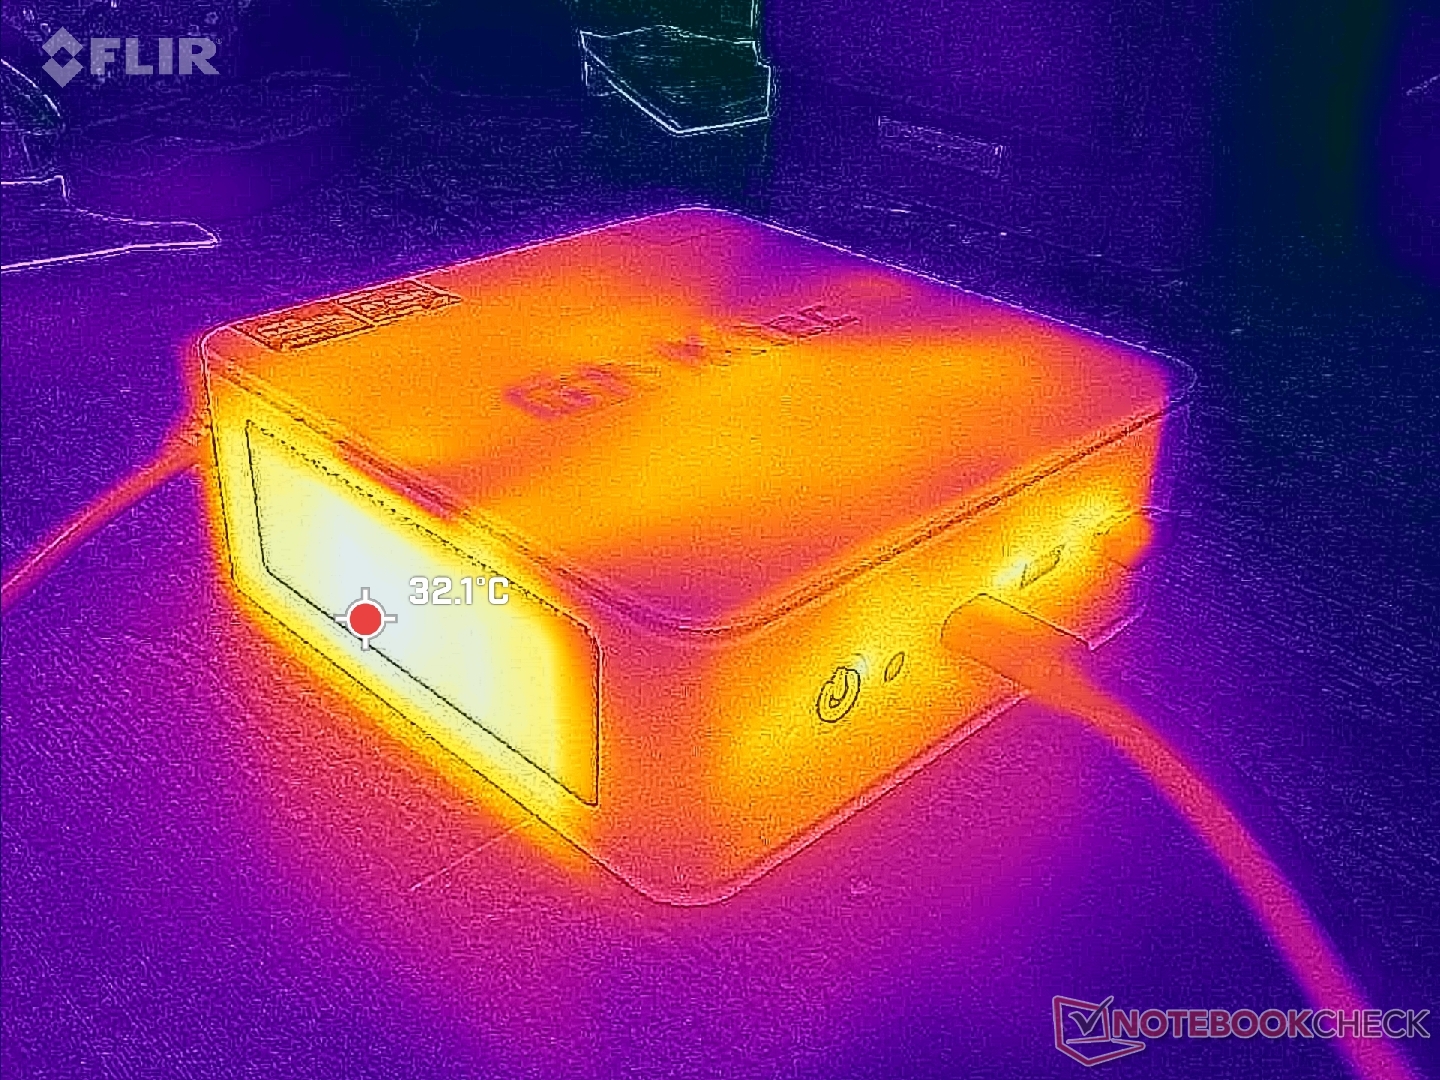
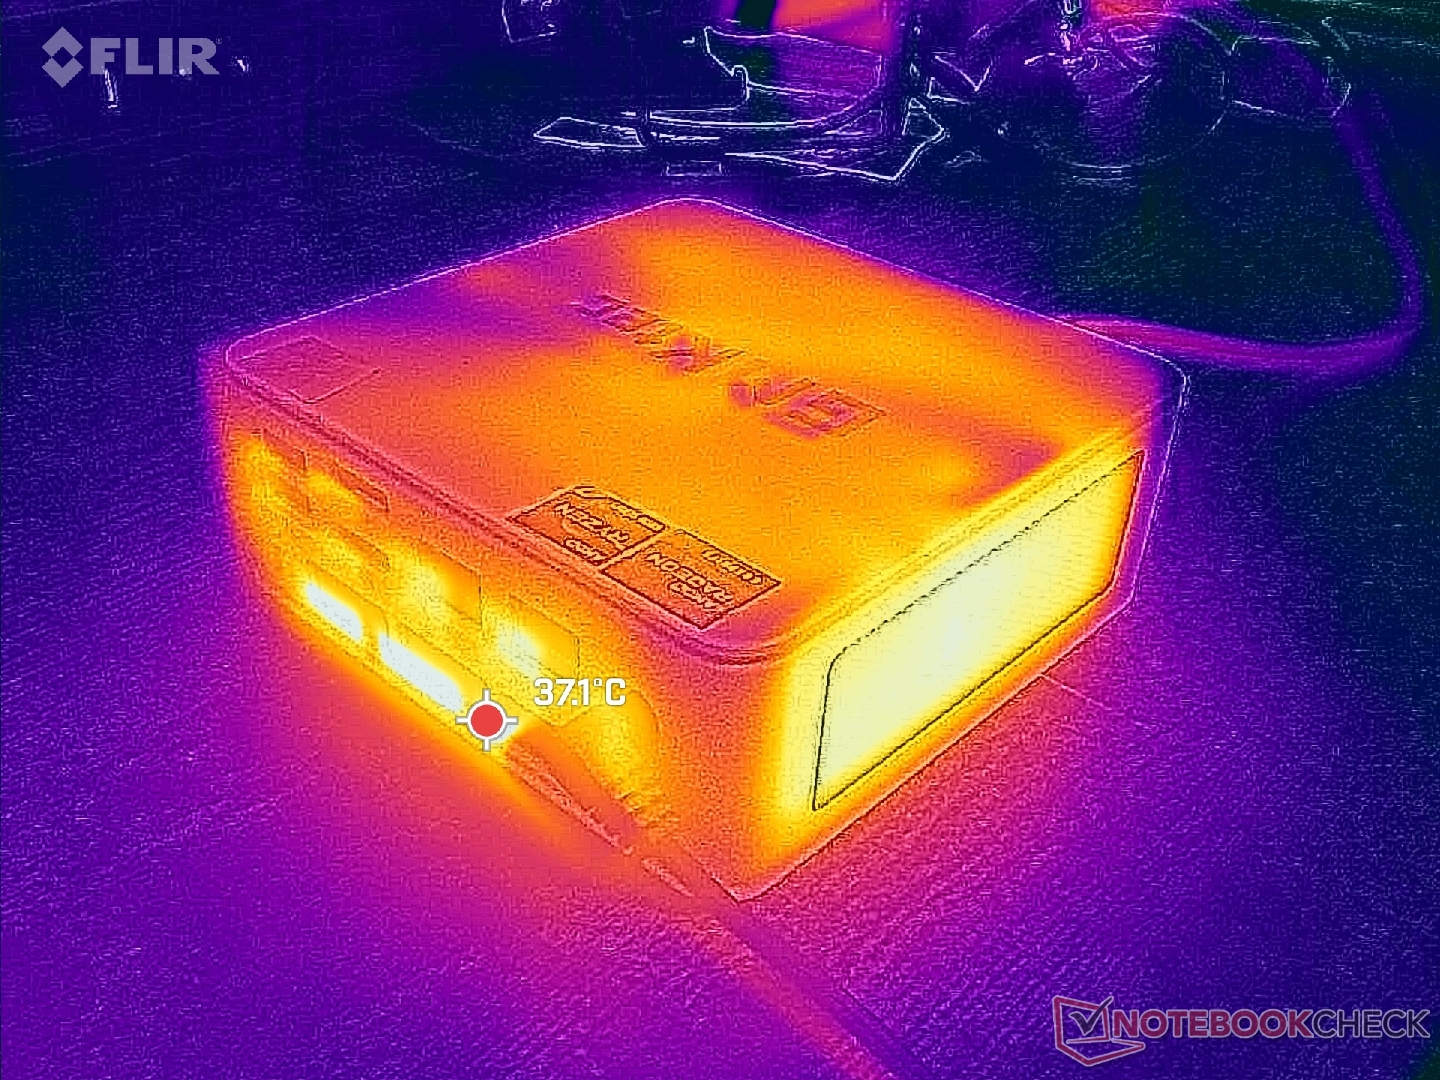
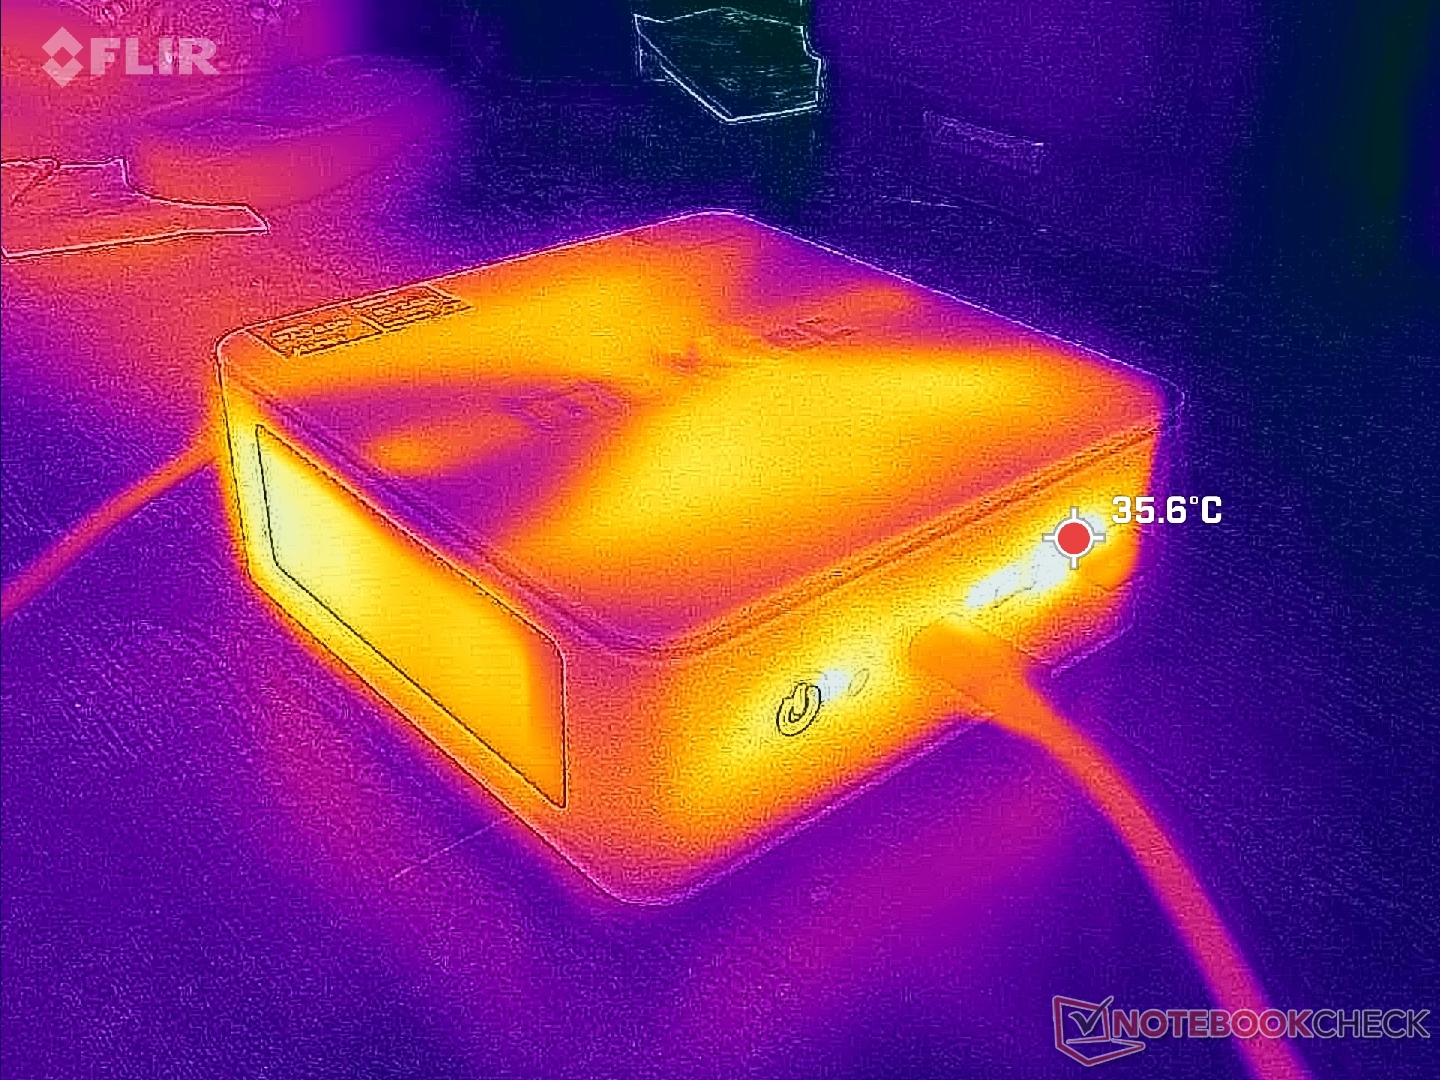
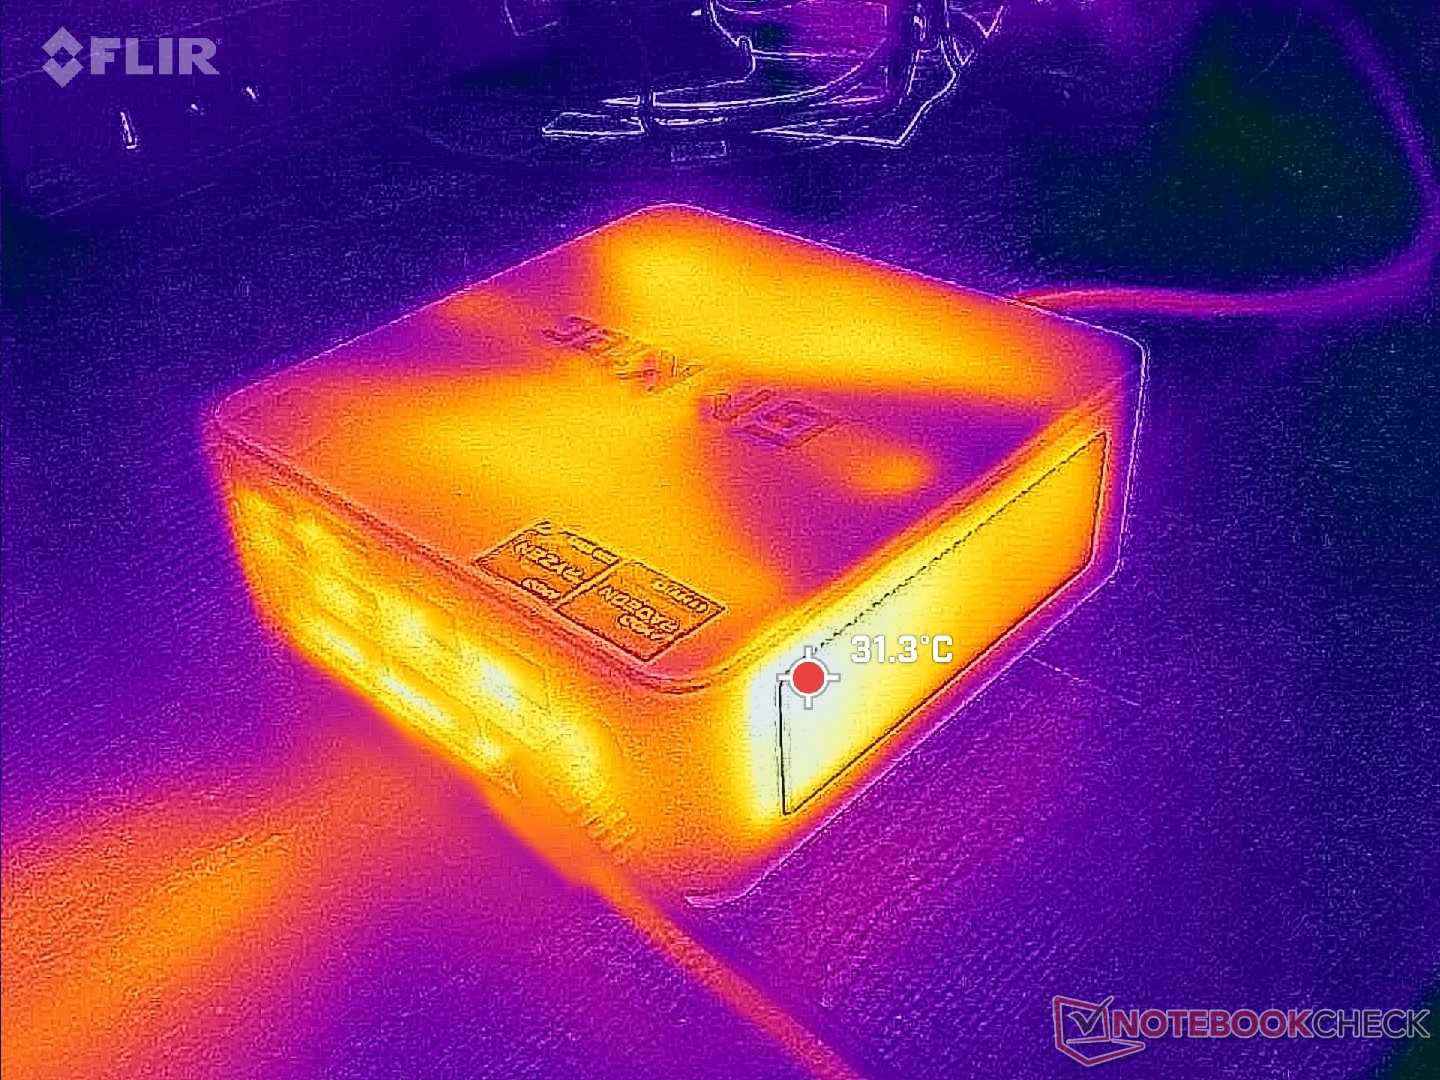
Temperatura
Las temperaturas superficiales no son un problema debido a la ventilación superflua alrededor del chasis. El sistema utiliza dos ventiladores al igual que en el NucBox K6 aunque un ventilador probablemente habría sido suficiente teniendo en cuenta la CPU Core serie U de bajo consumo.
Gestión de la energía
Consumo de energía
Ejecutando Witcher 3 para representar cargas altas típicas consumiría unos 35 W o algo menos de la mitad de lo que demanda el NucBox K6. El ahorro de energía es suficiente para hacer que el NucBox M5 sea más eficiente que la mayoría de los otros mini PC, lo que también se correlaciona con el bajo ruido máximo del ventilador y el techo TDP. Sin embargo, el rendimiento de la CPU y la GPU se resienten en consecuencia.
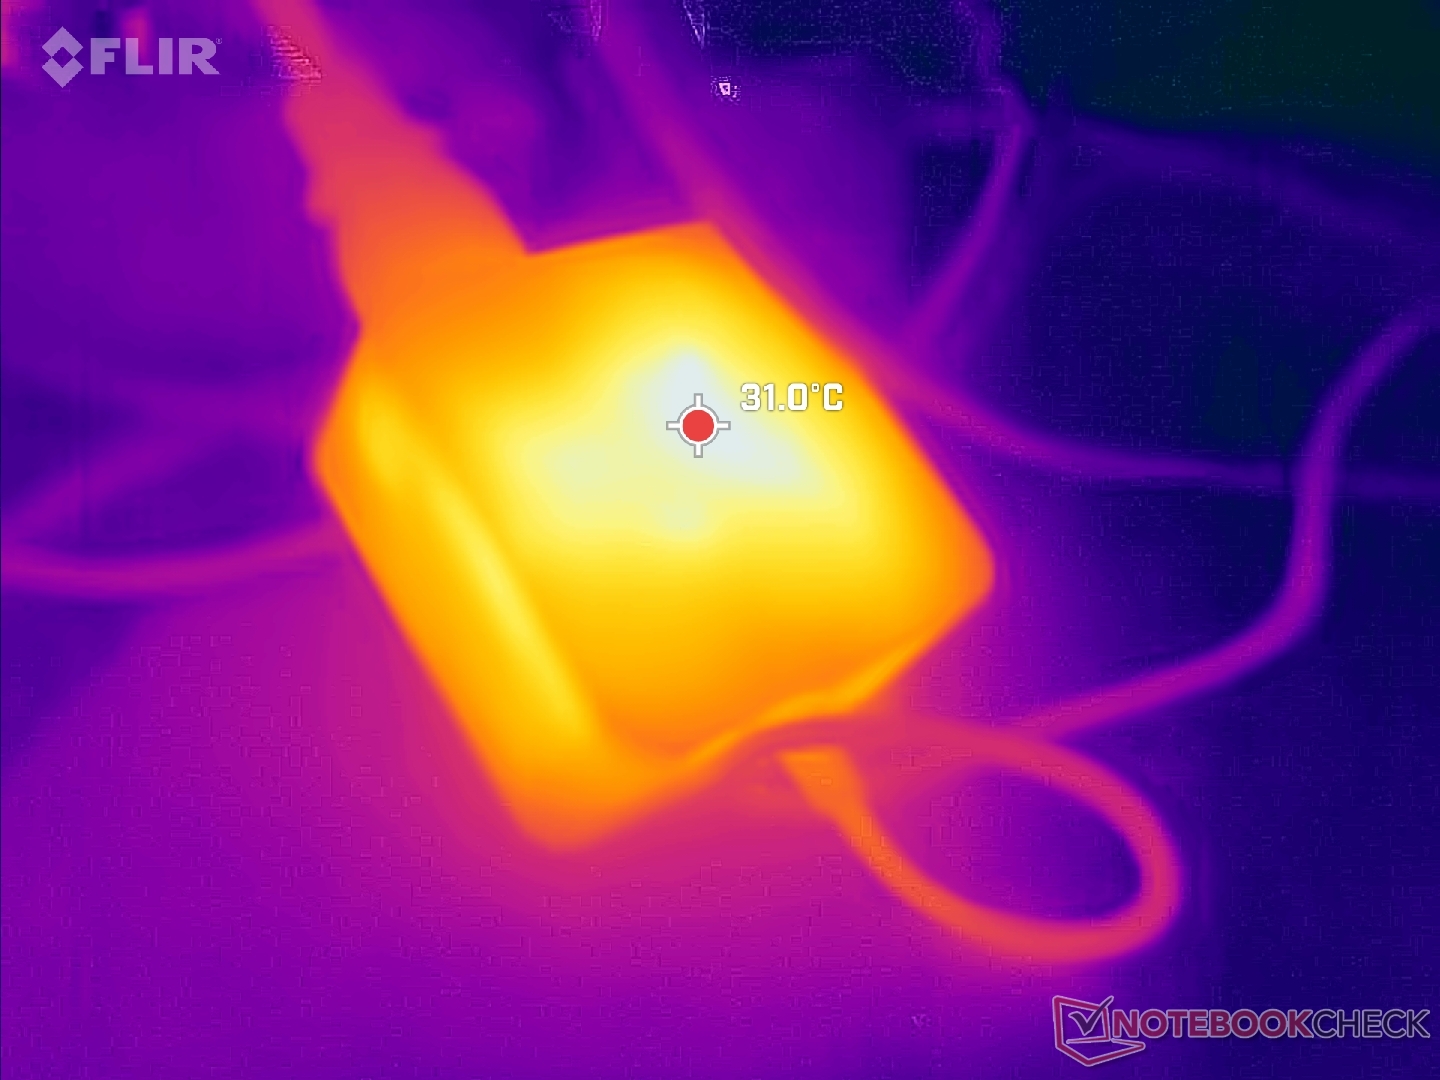
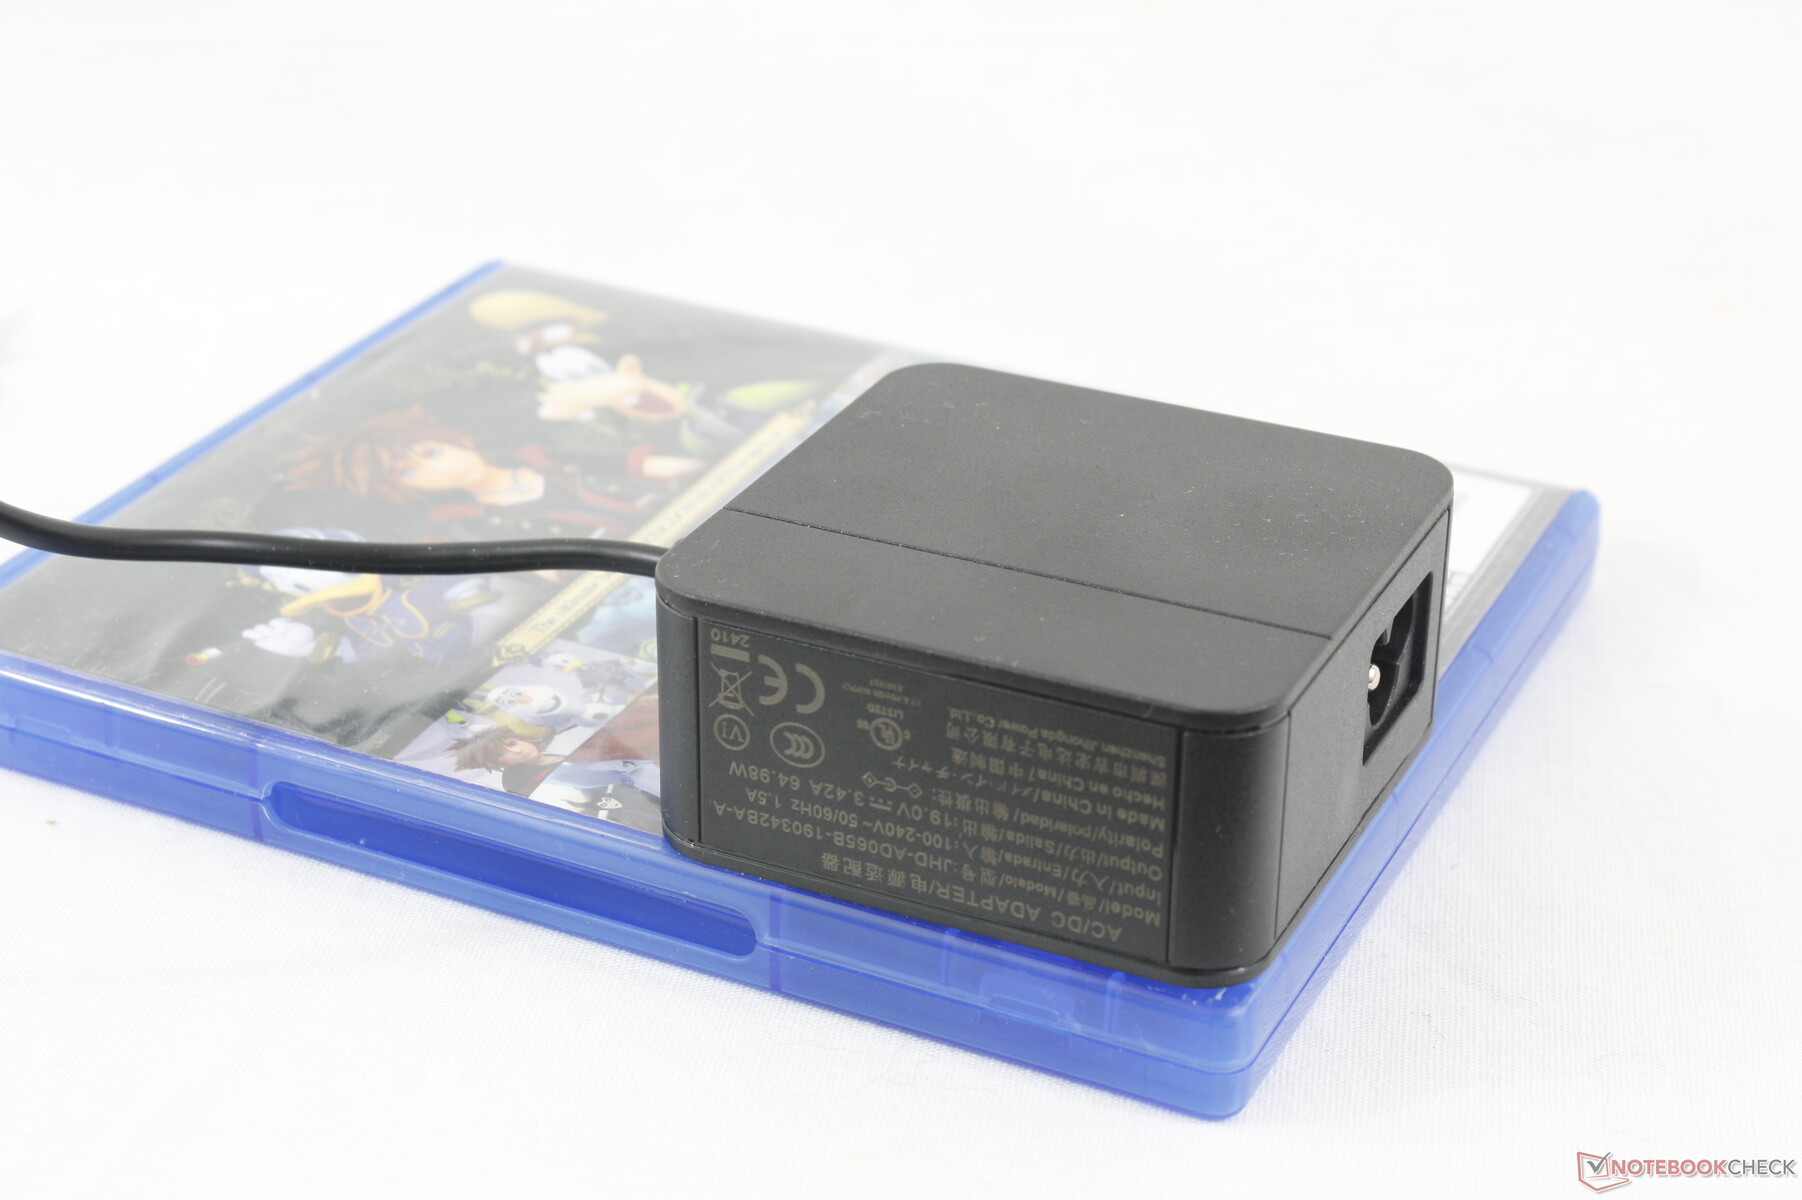
El modelo se entrega con un adaptador de CA de 65 W mucho más pequeño (~6,8 x 6,8 x 3,2 cm) en comparación con el adaptador de 130 W que se entrega con el NucBox K6. Se admiten adaptadores de CA USB-C de terceros.
(Nota del editor: Esta sección se actualizará cuando finalicen las reparaciones de nuestro multímetro Metrahit Energy a finales de este mes. Rogamos disculpen las molestias)
| Off / Standby | |
| Ocioso | |
| Carga |
|
Clave:
min: | |
| GMK NucBox M5 R7 5700U, Vega 8, Lexar 1024GB LNM6A1X001T-HNNNG, , x, | GMK NucBox M4 i9-11900H, UHD Graphics Xe 32EUs (Tiger Lake-H), Lexar NM620 512GB, , x, | GMK NucBox K6 R7 7840HS, Radeon 780M, MasonSemi 1TB MC7000, , x, | Acemagic F2A Ultra 7 155H, Arc 8-Core, Kingston OM8SEP1024Q-A0, , x, | Geekom A7 R9 7940HS, Radeon 780M, Acer N5000, , x, | Intel NUC 13 Pro Desk Edition Kit i7-1360P, Iris Xe G7 96EUs, Samsung PM9A1 MZVL2512HCJQ, , x, | |
|---|---|---|---|---|---|---|
| Power Consumption | -153% | -96% | -123% | -64% | -88% | |
| Idle Minimum * (Watt) | 5.9 | 15.2 -158% | 6.7 -14% | 9.1 -54% | 3.8 36% | 7 -19% |
| Idle Average * (Watt) | 6.2 | 17.2 -177% | 7 -13% | 10.3 -66% | 4.8 23% | 9.2 -48% |
| Idle Maximum * (Watt) | 6.4 | 17.4 -172% | 7.6 -19% | 14.4 -125% | 6.5 -2% | 11.8 -84% |
| Load Average * (Watt) | 28.2 | 40 -42% | 74.3 -163% | 54.9 -95% | 71.9 -155% | 45 -60% |
| Witcher 3 ultra * (Watt) | 27.5 | 50.6 -84% | 75 -173% | |||
| Load Maximum * (Watt) | 29.5 | 112.8 -282% | 85.7 -191% | 110.4 -274% | 94.7 -221% | 97.2 -229% |
* ... más pequeño es mejor
Power Consumption Witcher 3 / Stresstest
Power Consumption external Monitor
Pro
Contra
Veredicto - Existen mejores opciones
La NucBox M5 se vende actualmente entre 300 y 380 dólares con RAM y almacenamiento. Mientras tanto, el NucBox K6 se puede encontrar por 500 dólares y ofrece de 2 a 2,5 veces el rendimiento de la CPU y la GPU sin ser más grande ni más pesada. No hace falta decir que es difícil recomendar la NucBox M5 cuando GMktec ya ofrece una alternativa objetivamente mejor por no mucho más. Incluso fuera de GMK, el Beelink SER6 se puede encontrar por menos de 500 dólares con un rendimiento mucho más rápido que el NucBox M5.
El NucBox M5 no es necesariamente un mal sistema, pero hay un puñado de mini PC mucho más rápidos disponibles por el mismo rango de precios <500 $.
Hay algunas características destacables del NucBox M5, como los puertos duales RJ-45 a 2,5 Gbps, los ventiladores duales y el disipador térmico SSD, todos ellos relativamente poco comunes en los mini PC económicos. No obstante, el pobre rendimiento por dólar eclipsa cualquier ventaja que pueda tener el modelo.
Precio y disponibilidad
GMK NucBox M5
- 04/10/2024 v7 (old)
Allen Ngo
Transparencia
La selección de los dispositivos que se van a reseñar corre a cargo de nuestro equipo editorial. La muestra de prueba fue proporcionada al autor en calidad de préstamo por el fabricante o el minorista a los efectos de esta reseña. El prestamista no tuvo ninguna influencia en esta reseña, ni el fabricante recibió una copia de la misma antes de su publicación. No había ninguna obligación de publicar esta reseña. Como empresa de medios independiente, Notebookcheck no está sujeta a la autoridad de fabricantes, minoristas o editores.
Así es como prueba Notebookcheck
Cada año, Notebookcheck revisa de forma independiente cientos de portátiles y smartphones utilizando procedimientos estandarizados para asegurar que todos los resultados son comparables. Hemos desarrollado continuamente nuestros métodos de prueba durante unos 20 años y hemos establecido los estándares de la industria en el proceso. En nuestros laboratorios de pruebas, técnicos y editores experimentados utilizan equipos de medición de alta calidad. Estas pruebas implican un proceso de validación en varias fases. Nuestro complejo sistema de clasificación se basa en cientos de mediciones y puntos de referencia bien fundamentados, lo que mantiene la objetividad.Price comparison

