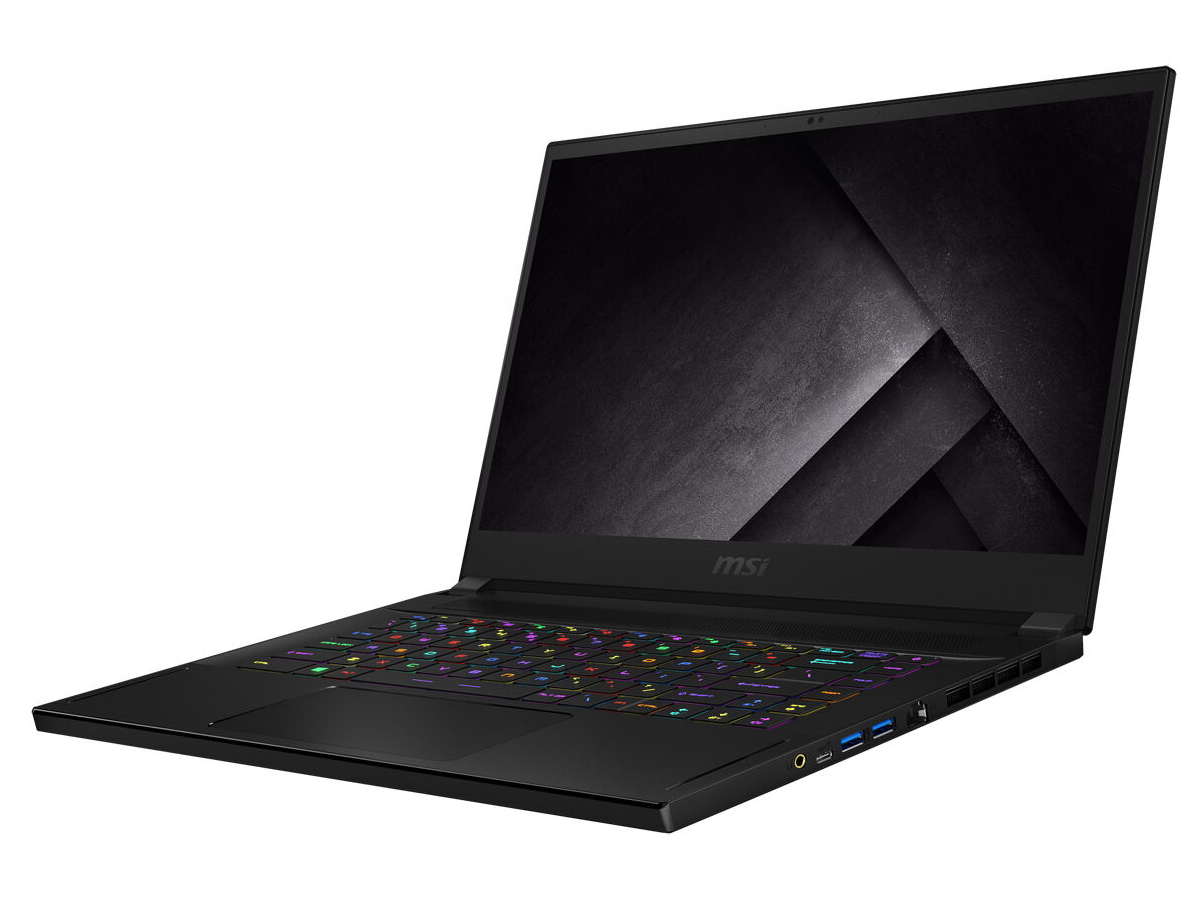
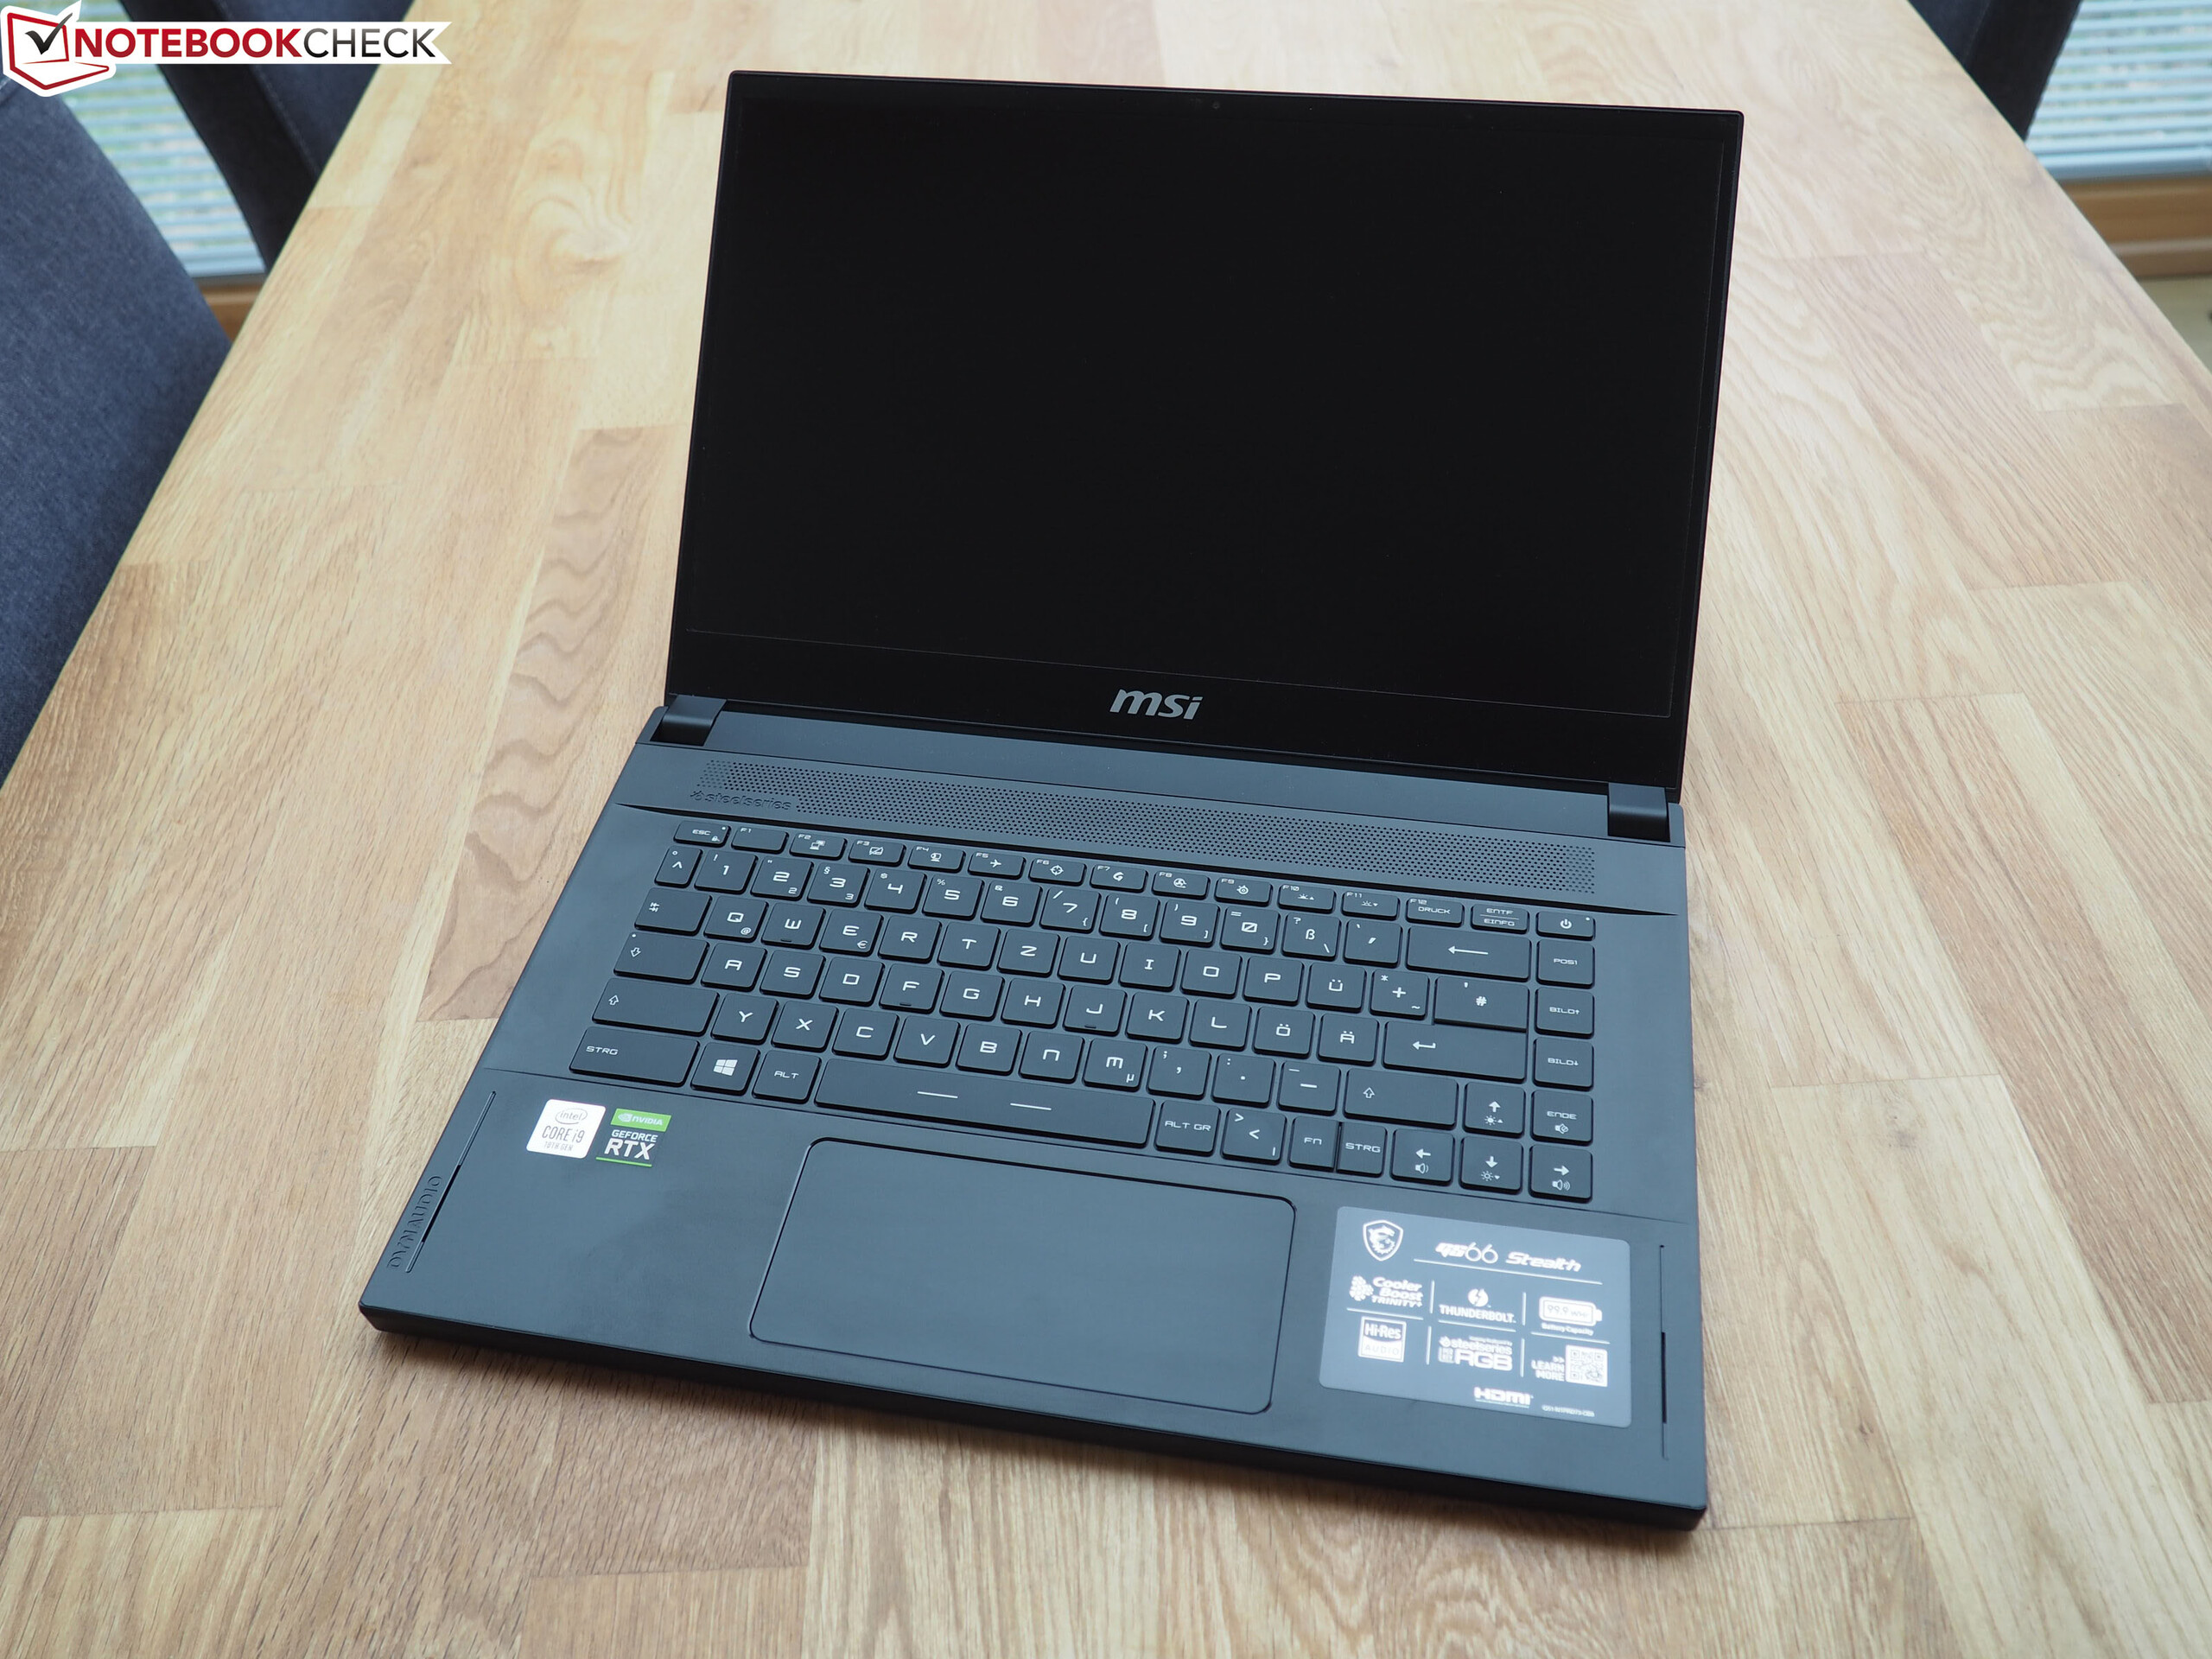
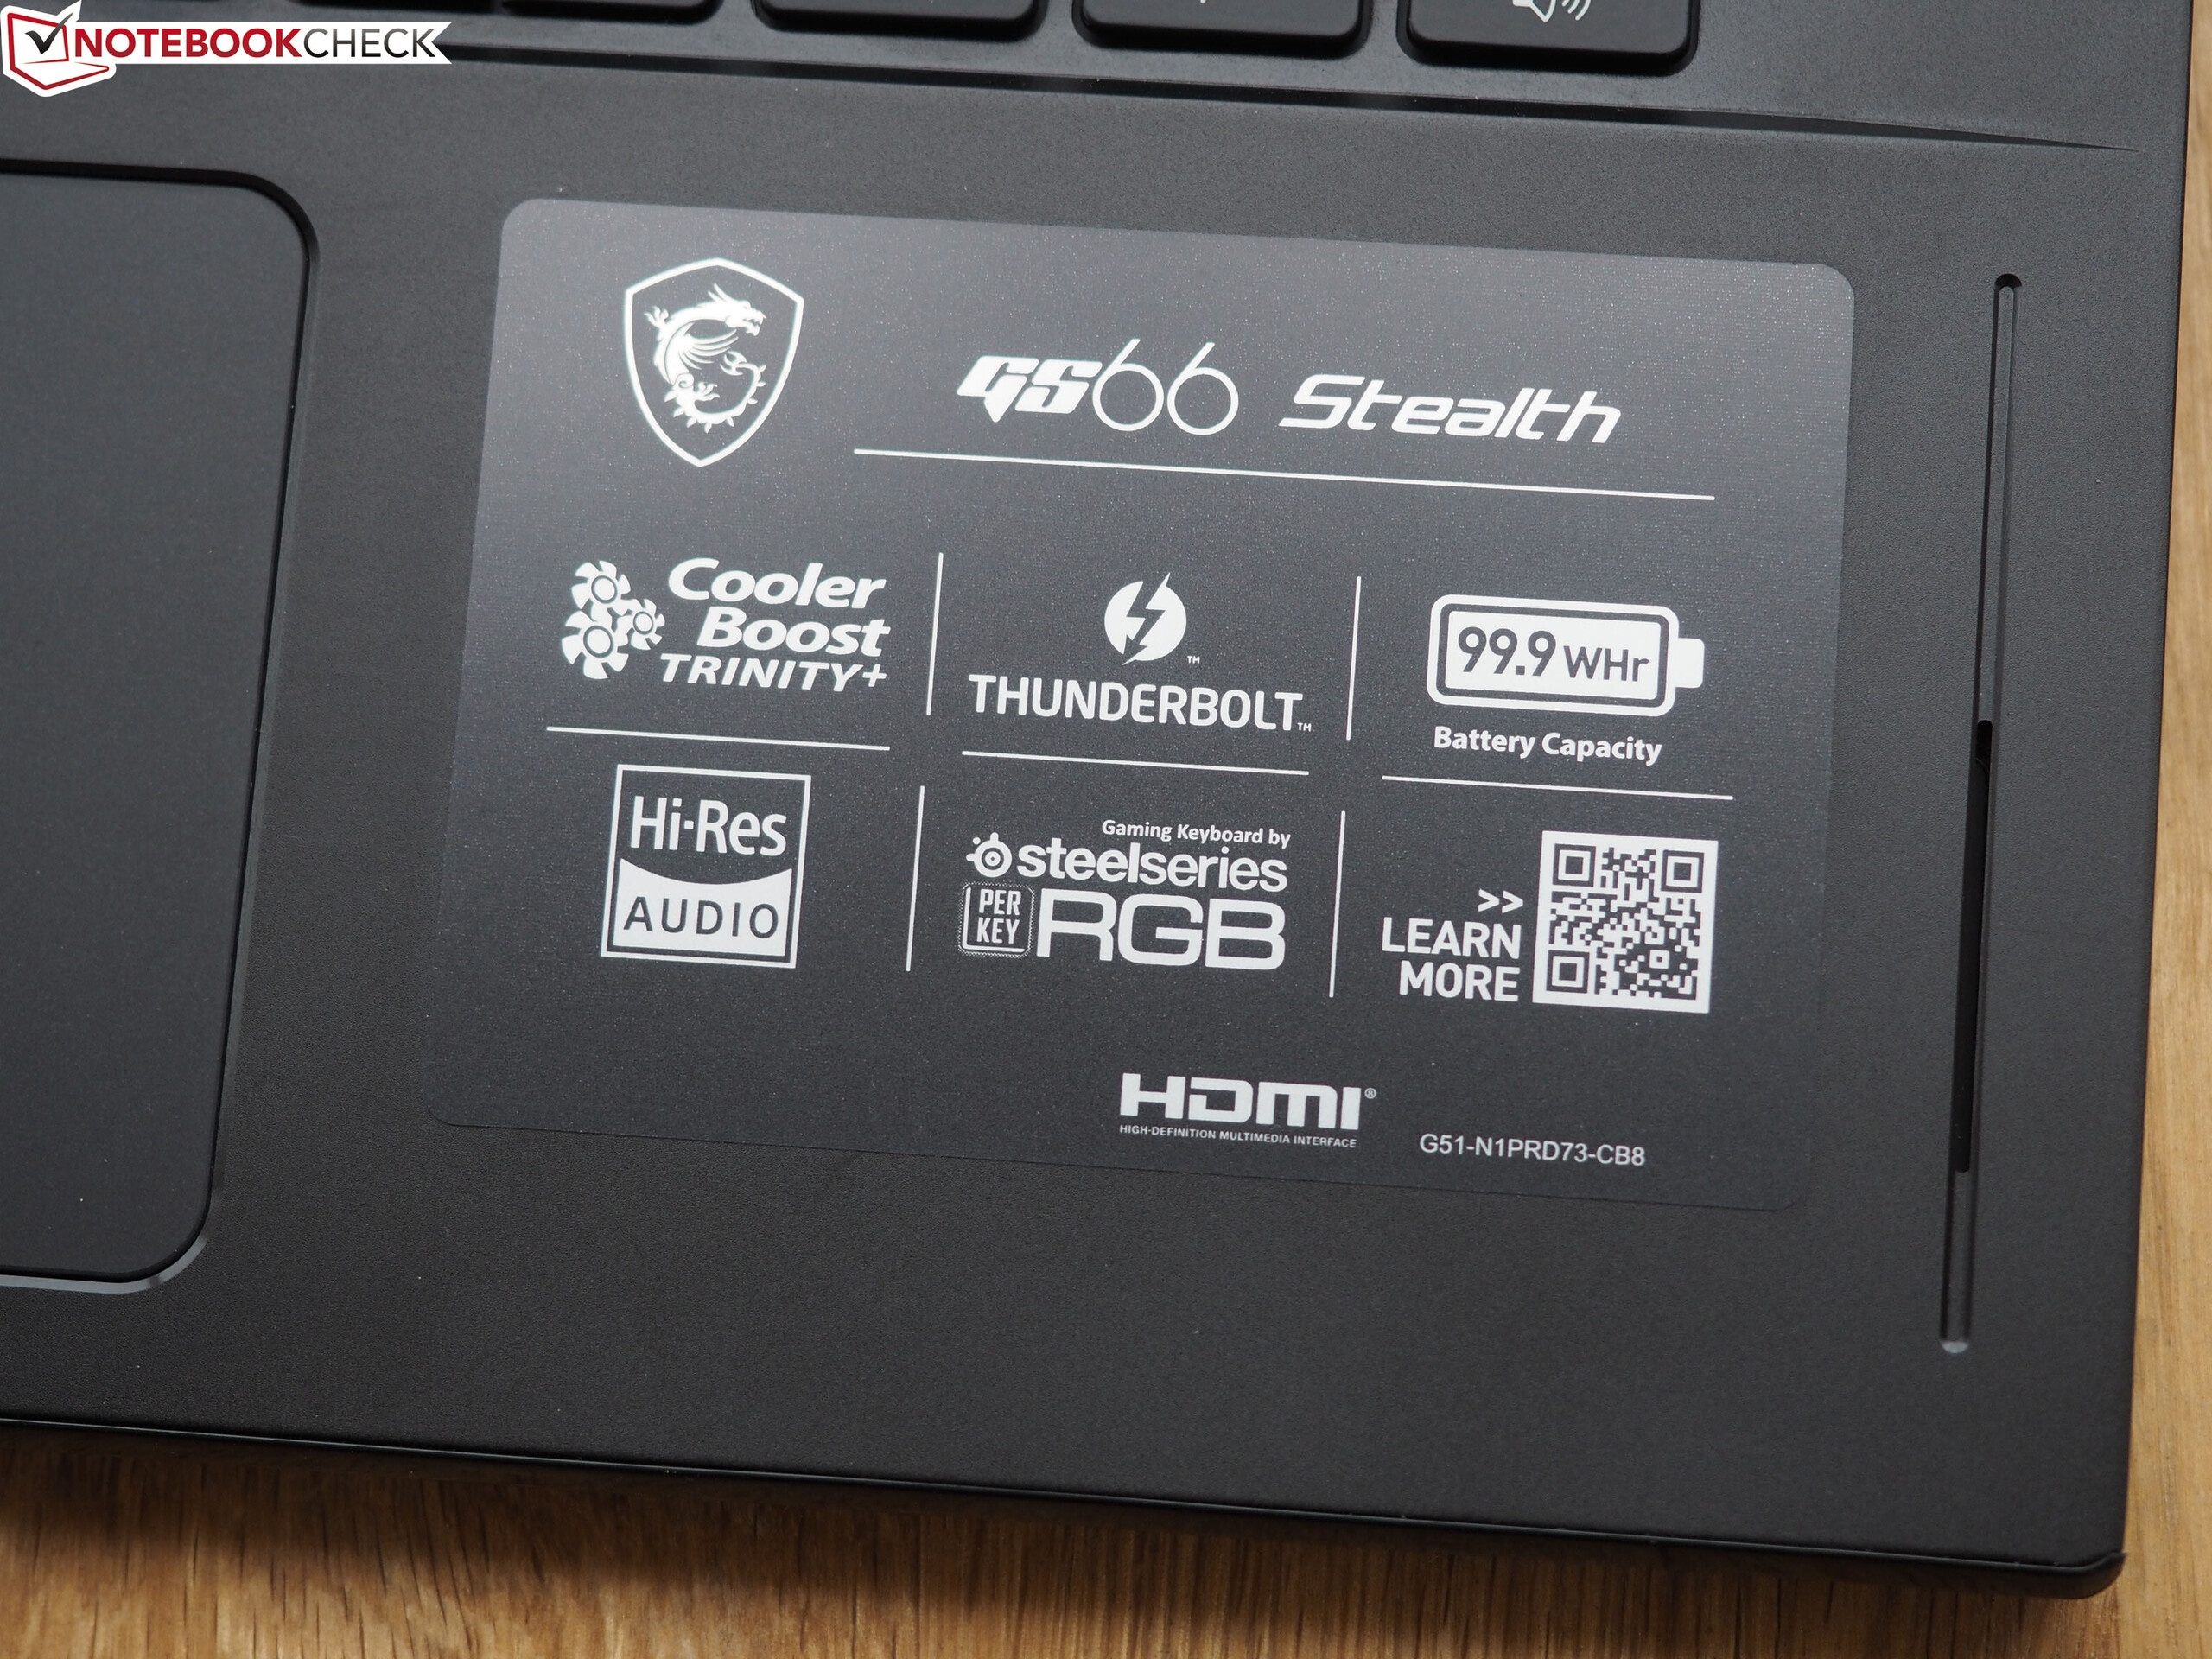
Review del MSI GS66 Stealth 10SE: Un elegante portátil para juegos con una pantalla de 240 Hz

En términos técnicos, el portátil para juegos MSI GS66 Stealth 10SE de 15,6 pulgadas es una versión ligeramente aguada del GS66 Stealth 10SFS, que ya hemos revisado, y también se vende a un precio más bajo que este último. El dispositivo de prueba que se nos ha proporcionado está alimentado por un procesador Core i7-10750H hexa-core y un núcleo de gráficos GeForce RTX 2060. Los competidores incluyen dispositivos como el Dell G5 15 SE, el Lenovo Legion 5 15IMH05H, el Asus TUF A15 FA506IV, el Schenker XMG Core 15 GK5CP6V, y el Razer Blade 15.
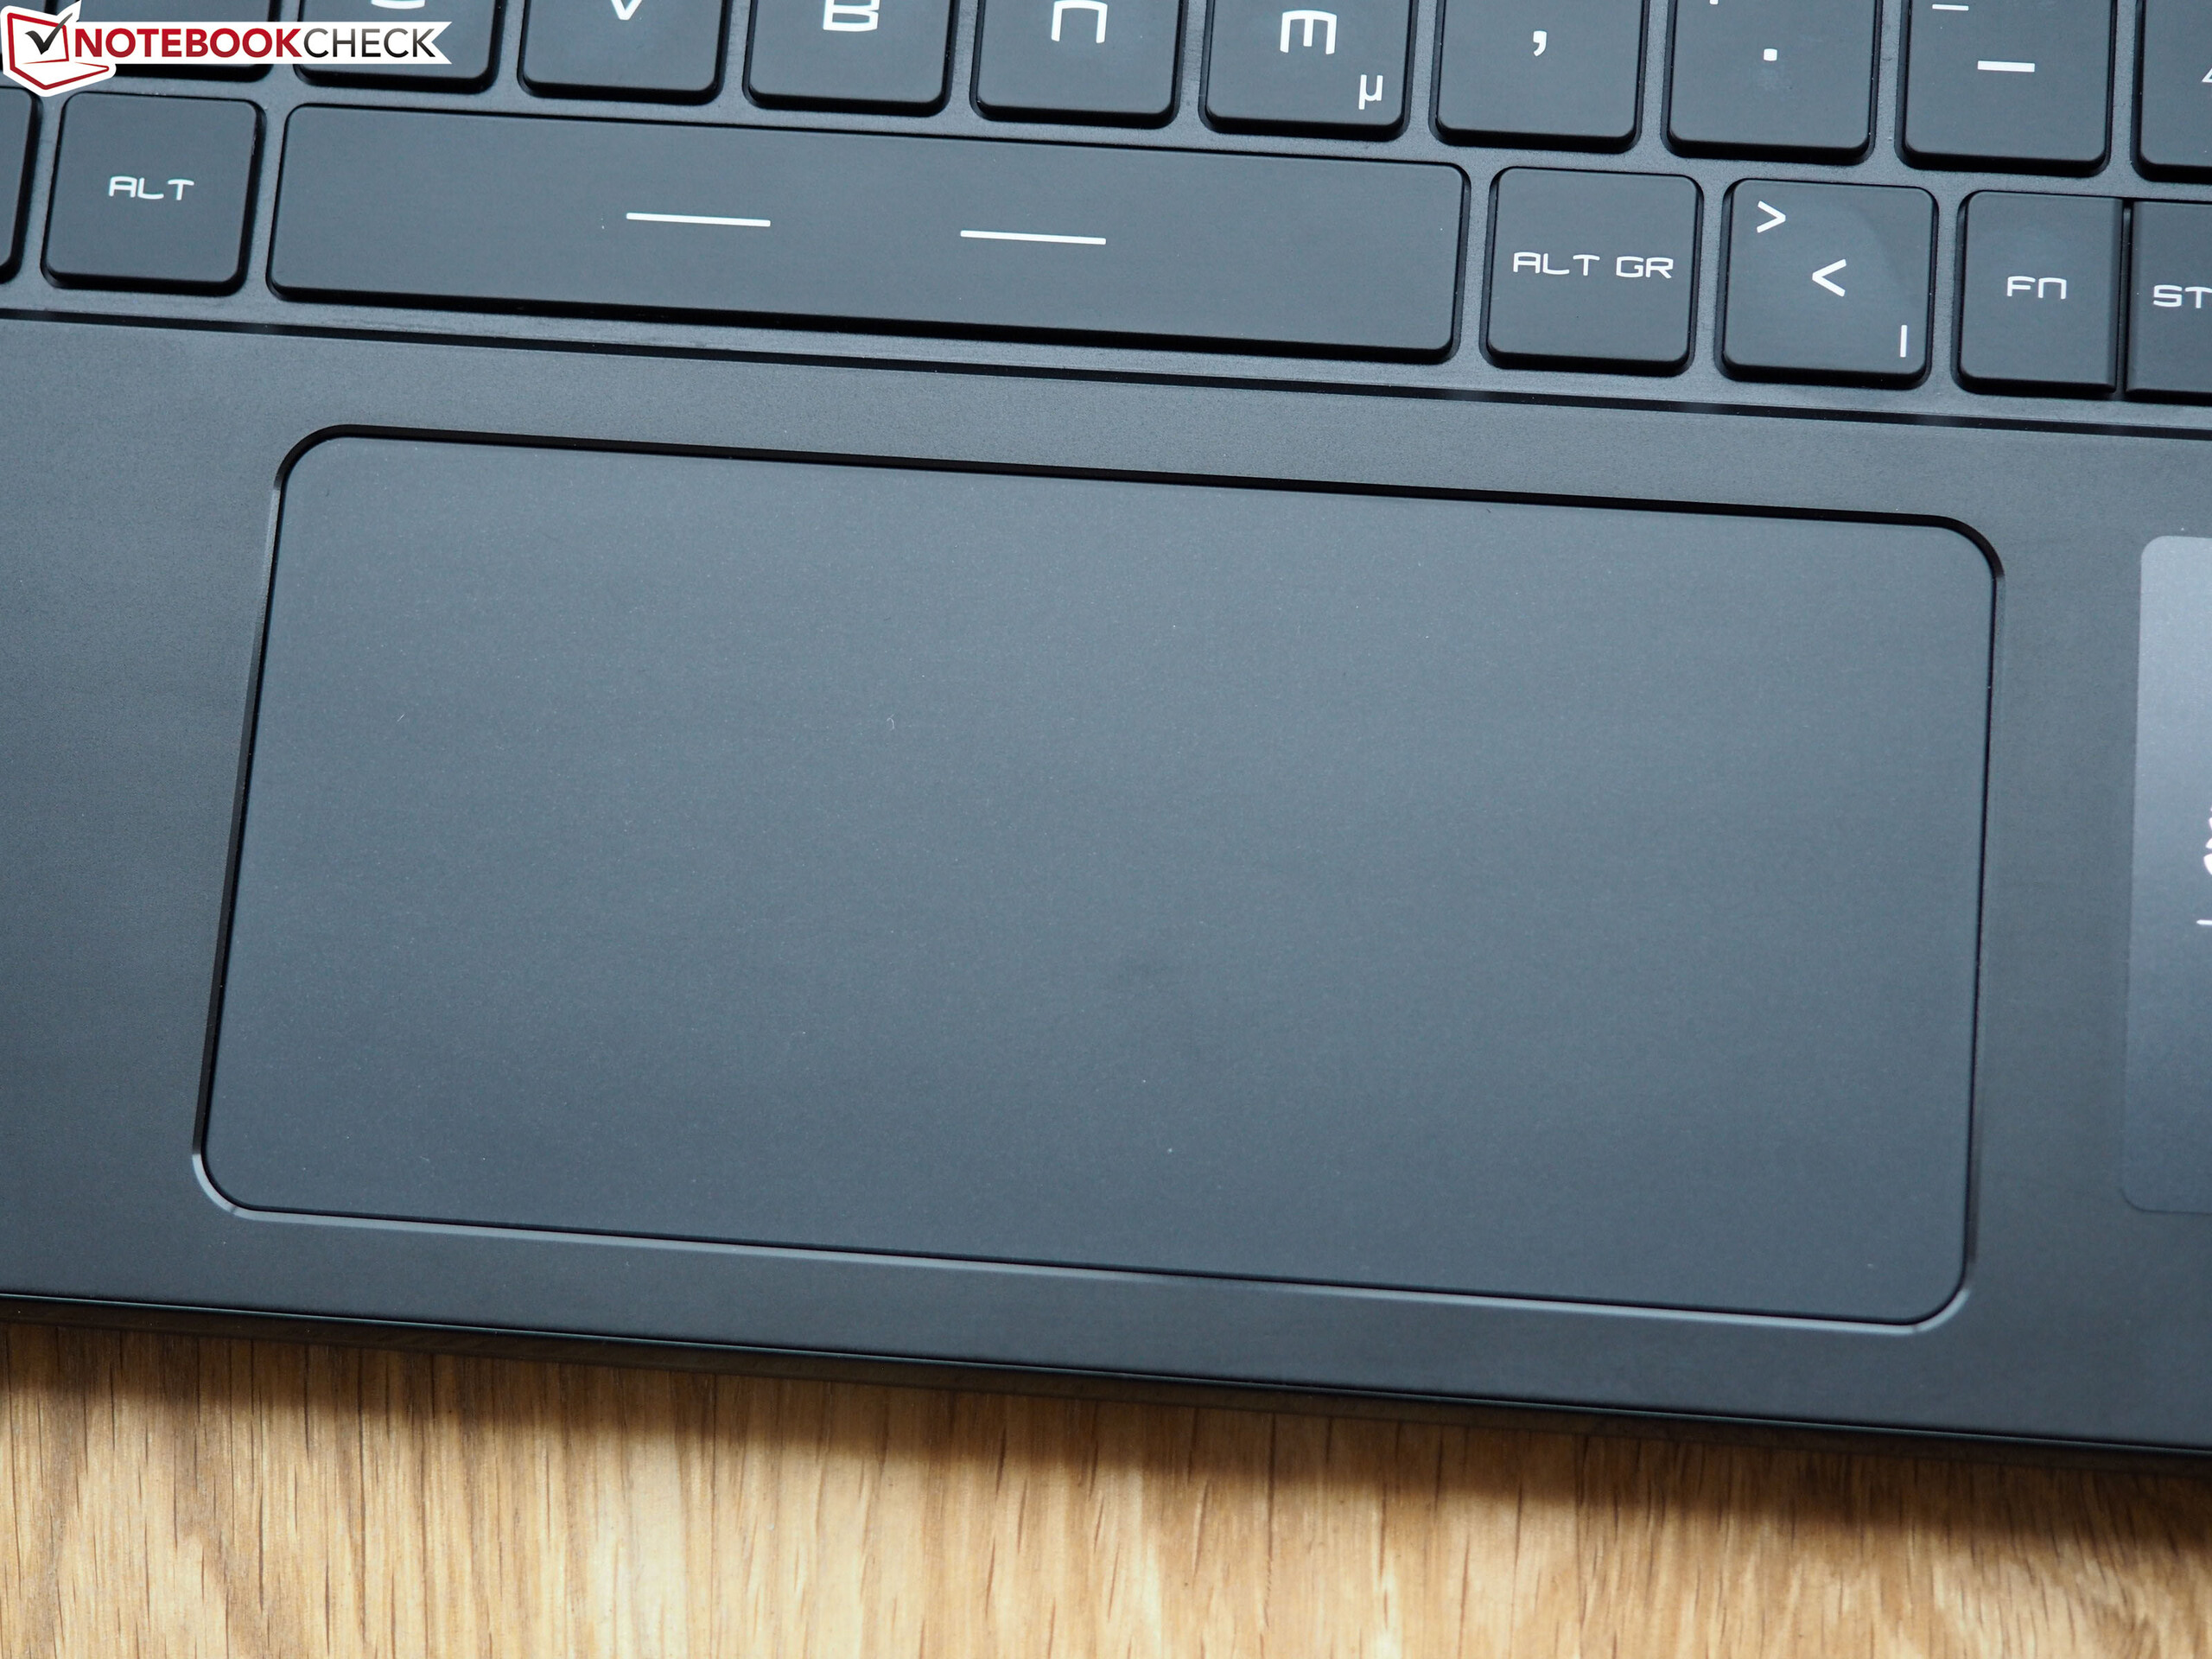
Dado que los dos modelos GS66 son idénticos en su construcción, no iremos más lejos en la caja, la conectividad, los dispositivos de entrada y los altavoces. La información correspondiente se puede encontrar en la revisión del GS66 10SFS.
Valoración | Fecha | Modelo | Peso | Altura | Tamaño | Resolución | Precio |
|---|---|---|---|---|---|---|---|
| 82.5 % v7 (old) | 08/2020 | MSI GS66 Stealth 10SE-045 i7-10750H, GeForce RTX 2060 Mobile | 2.2 kg | 19.8 mm | 15.60" | 1920x1080 | |
| 84.2 % v7 (old) | 09/2019 | Razer Blade 15 GTX 1660 Ti i7-9750H, GeForce GTX 1660 Ti Mobile | 2.1 kg | 19.9 mm | 15.60" | 1920x1080 | |
| 83.7 % v7 (old) | 06/2020 | Dell G5 15 SE 5505 P89F R7 4800H, Radeon RX 5600M | 2.4 kg | 21.6 mm | 15.60" | 1920x1080 | |
| 83.3 % v7 (old) | 07/2020 | Lenovo Legion 5 15IMH05H i5-10300H, GeForce RTX 2060 Mobile | 2.5 kg | 26.1 mm | 15.60" | 1920x1080 | |
| 82.7 % v7 (old) | 06/2020 | Asus TUF Gaming A15 FA506IV-HN172 R7 4800H, GeForce RTX 2060 Mobile | 2.2 kg | 24.9 mm | 15.60" | 1920x1080 | |
| 81.3 % v7 (old) | 02/2020 | Schenker XMG Core 15 GK5CP6V i7-9750H, GeForce GTX 1660 Ti Mobile | 2 kg | 26 mm | 15.60" | 1920x1080 |


Pantalla - GS66 con panel de respuesta de 240 Hz
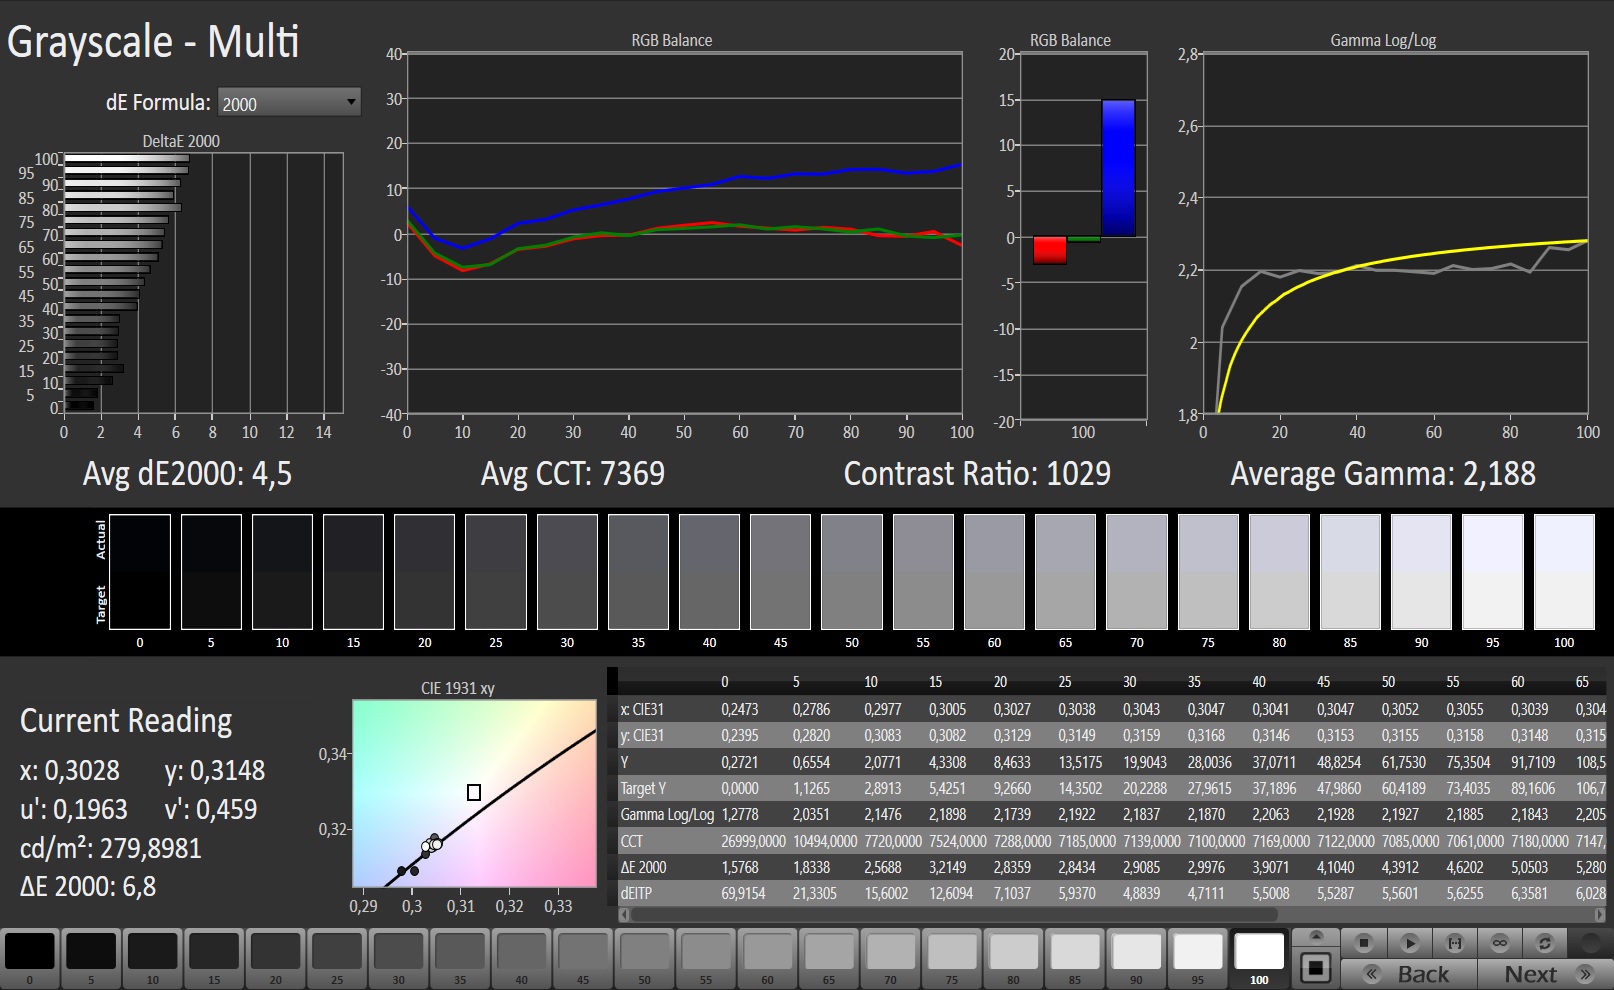
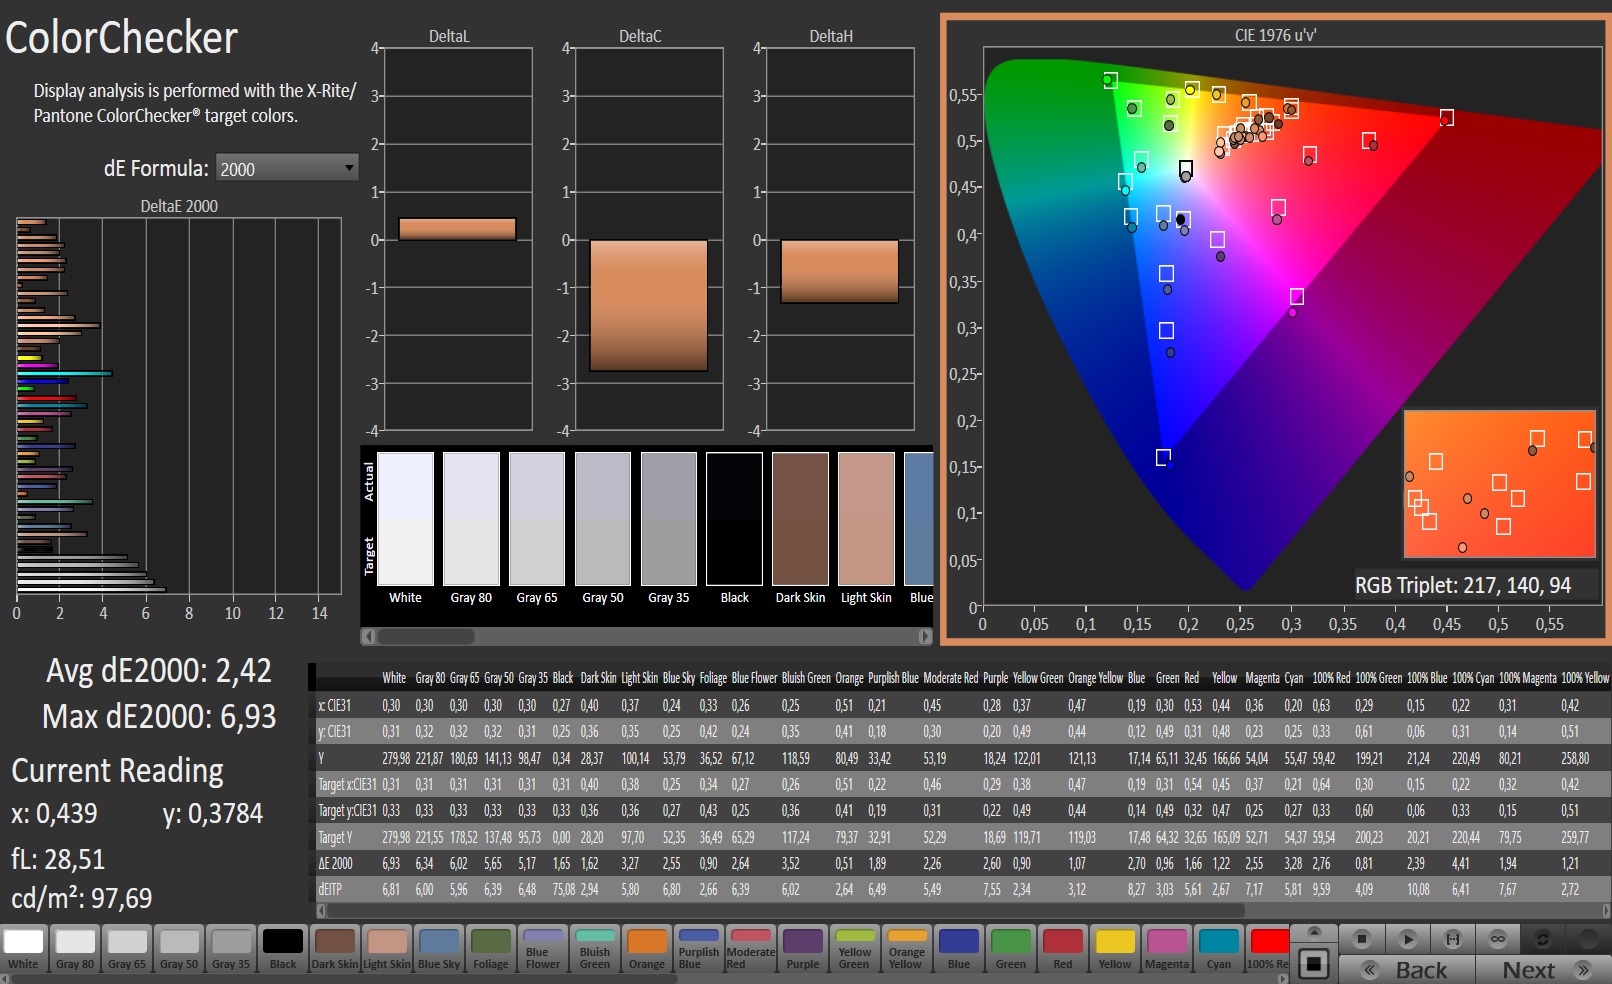
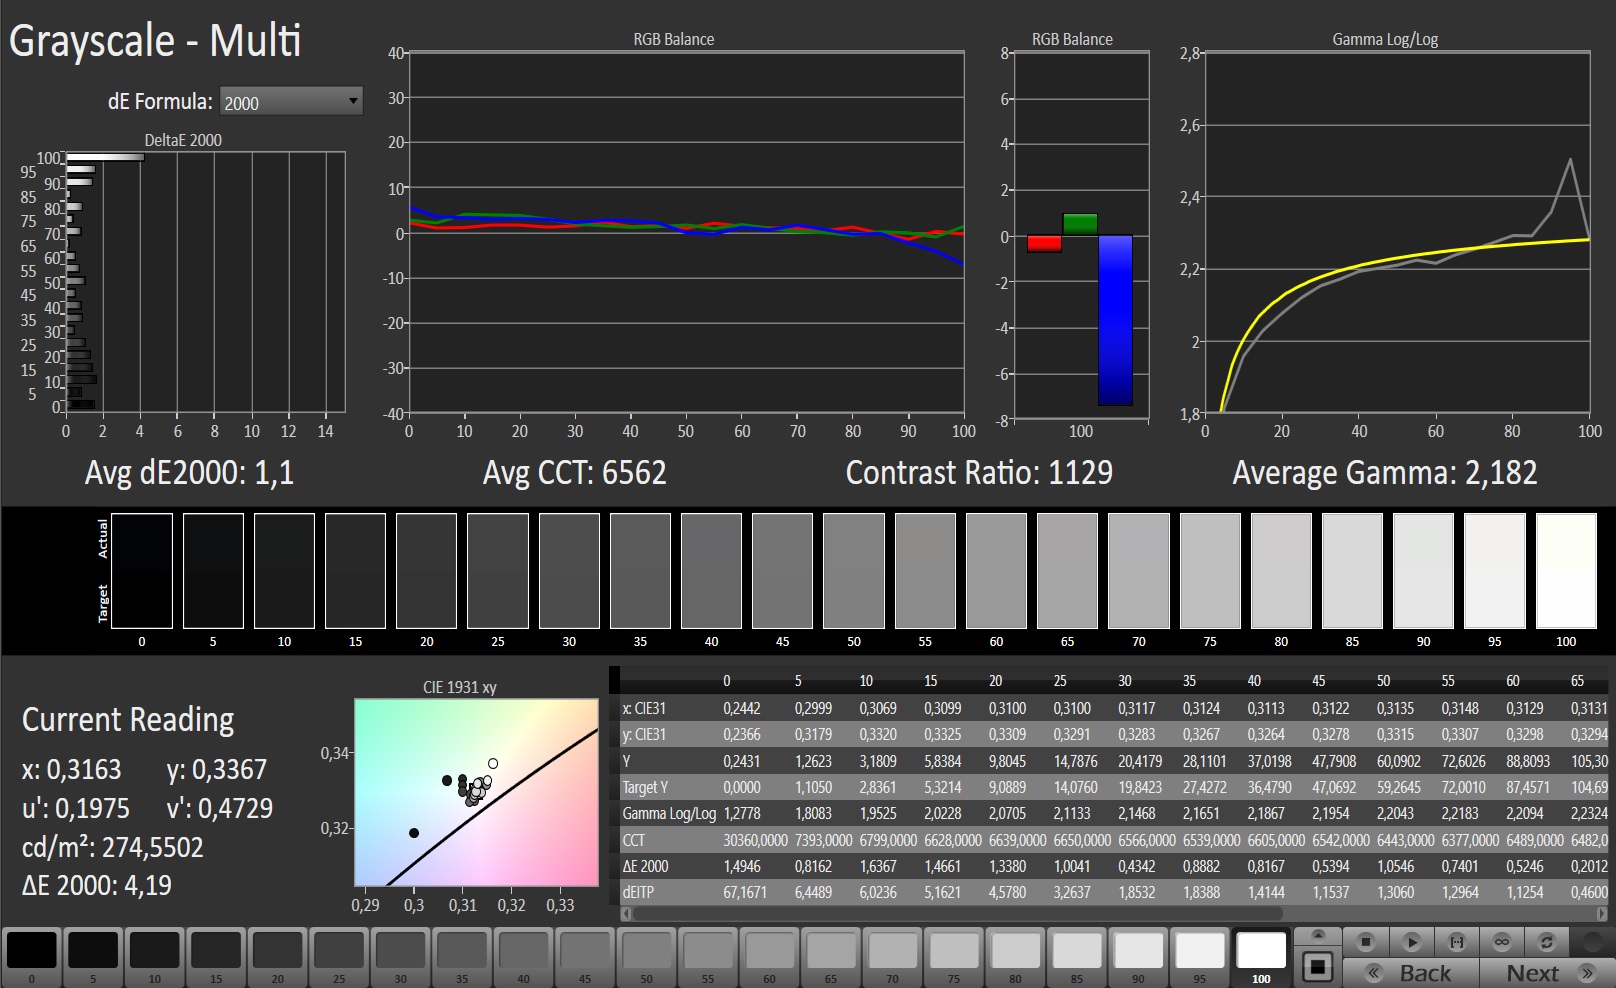
MSI equipa el portátil con un panel de 240 Hz en el formato de 15,6 pulgadas que ofrece buenos tiempos de respuesta. La pantalla tiene una resolución nativa de 1920x1080 píxeles. Aunque ofrece un buen contraste (1.007:1), el brillo máximo (259 cd/m²) es relativamente bajo. Consideramos que los valores superiores a 300 cd/m² son buenos.
Desafortunadamente, la pantalla parpadea a una frecuencia de 23.580 Hz con niveles de brillo del 19% e inferiores. Sin embargo, incluso los usuarios sensibles no deberían tener problemas por dolores de cabeza y/o problemas oculares debido a la alta frecuencia.
| |||||||||||||||||||||||||
iluminación: 91 %
Brillo con batería: 272 cd/m²
Contraste: 1007:1 (Negro: 0.27 cd/m²)
ΔE ColorChecker Calman: 2.42 | ∀{0.5-29.43 Ø4.73}
calibrated: 0.88
ΔE Greyscale Calman: 4.5 | ∀{0.09-98 Ø4.97}
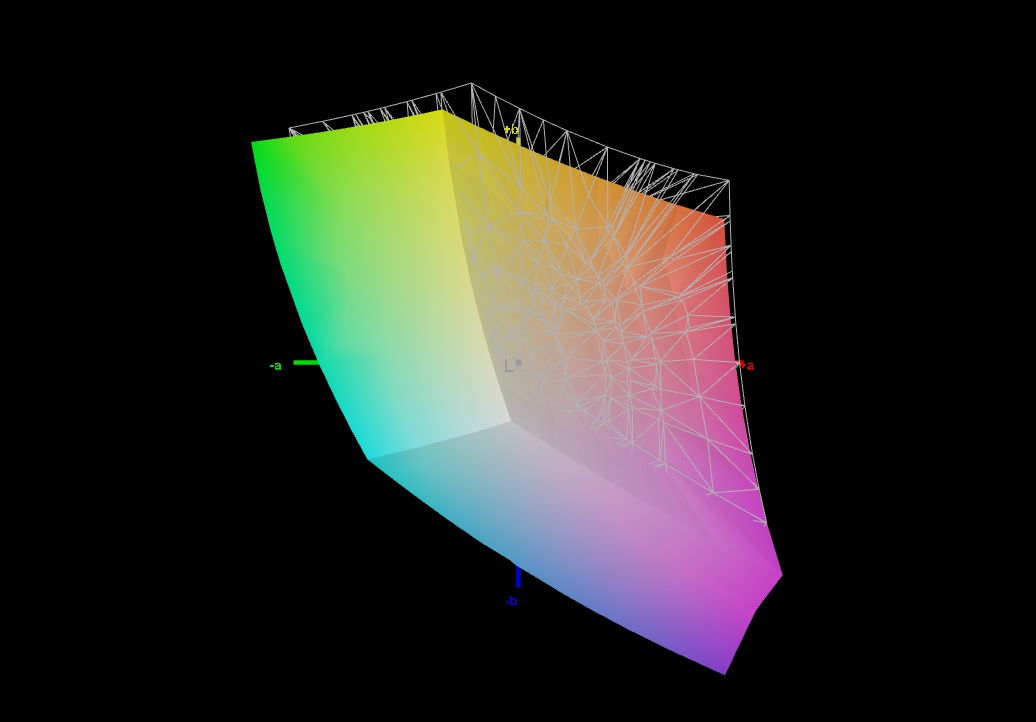
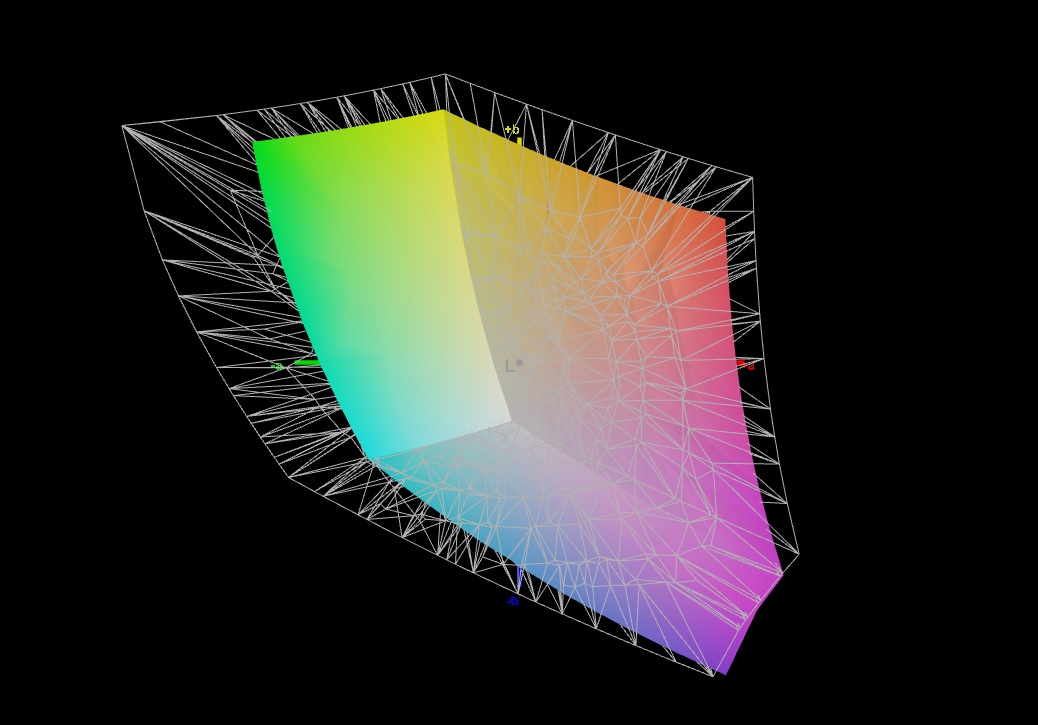
91% sRGB (Argyll 1.6.3 3D)
69% AdobeRGB 1998 (Argyll 1.6.3 3D)
68.9% AdobeRGB 1998 (Argyll 3D)
98.3% sRGB (Argyll 3D)
67.5% Display P3 (Argyll 3D)
Gamma: 2.188
CCT: 7369 K
| MSI GS66 Stealth 10SE-045 Sharp LQ156M1JW03, IPS, 1920x1080, 15.6" | MSI GS66 Stealth 10SFS AUO B156HAN12.0 (AUO328E), IPS, 1920x1080, 15.6" | Razer Blade 15 GTX 1660 Ti BOE NV156FHM-N4K, IPS, 1920x1080, 15.6" | Dell G5 15 SE 5505 P89F BOE NV156FH, WVA, 1920x1080, 15.6" | Lenovo Legion 5 15IMH05H BOE CQ NV156FHM-NX1, IPS, 1920x1080, 15.6" | Asus TUF Gaming A15 FA506IV-HN172 LM156LF-2F01, IPS, 1920x1080, 15.6" | Schenker XMG Core 15 GK5CP6V BOEhydis NV156FHM-N4G (BOE084D), IPS, 1920x1080, 15.6" | |
|---|---|---|---|---|---|---|---|
| Display | 2% | -4% | -7% | -42% | -41% | -6% | |
| Display P3 Coverage (%) | 67.5 | 69.5 3% | 65.3 -3% | 63 -7% | 38.8 -43% | 38.92 -42% | 63.3 -6% |
| sRGB Coverage (%) | 98.3 | 99.6 1% | 91.8 -7% | 90.1 -8% | 57.8 -41% | 58.5 -40% | 91.2 -7% |
| AdobeRGB 1998 Coverage (%) | 68.9 | 70.8 3% | 66.5 -3% | 64.1 -7% | 40.09 -42% | 40.22 -42% | 65 -6% |
| Response Times | -5% | -5% | -37% | -90% | -157% | 14% | |
| Response Time Grey 50% / Grey 80% * (ms) | 12 ? | 14 ? -17% | 13.6 ? -13% | 20.4 ? -70% | 26 ? -117% | 34 ? -183% | 8.8 ? 27% |
| Response Time Black / White * (ms) | 10.4 ? | 9.6 ? 8% | 10 ? 4% | 10.8 ? -4% | 17 ? -63% | 24 ? -131% | 10.4 ? -0% |
| PWM Frequency (Hz) | 23580 ? | 200 ? | 198.4 ? | ||||
| Screen | 6% | -26% | -25% | -58% | -64% | -8% | |
| Brightness middle (cd/m²) | 272 | 316 16% | 312.7 15% | 292 7% | 301 11% | 280 3% | 324 19% |
| Brightness (cd/m²) | 259 | 311 20% | 305 18% | 290 12% | 277 7% | 254 -2% | 296 14% |
| Brightness Distribution (%) | 91 | 92 1% | 90 -1% | 77 -15% | 77 -15% | 88 -3% | 88 -3% |
| Black Level * (cd/m²) | 0.27 | 0.21 22% | 0.27 -0% | 0.27 -0% | 0.26 4% | 0.15 44% | 0.27 -0% |
| Contrast (:1) | 1007 | 1505 49% | 1158 15% | 1081 7% | 1158 15% | 1867 85% | 1200 19% |
| Colorchecker dE 2000 * | 2.42 | 3.03 -25% | 4.57 -89% | 3.99 -65% | 5.12 -112% | 5.89 -143% | 4.07 -68% |
| Colorchecker dE 2000 max. * | 6.93 | 7.32 -6% | 6.81 2% | 6.11 12% | 8.86 -28% | 19 -174% | 6.39 8% |
| Colorchecker dE 2000 calibrated * | 0.88 | 1.1 -25% | 2.91 -231% | 3.02 -243% | 4.88 -455% | 4.79 -444% | 1.49 -69% |
| Greyscale dE 2000 * | 4.5 | 3.9 13% | 4.3 4% | 3.3 27% | 3.47 23% | 4.08 9% | 4.01 11% |
| Gamma | 2.188 101% | 2.42 91% | 2.29 96% | 2.25 98% | 2.37 93% | 2.33 94% | 2.6 85% |
| CCT | 7369 88% | 7439 87% | 7098 92% | 7047 92% | 7062 92% | 7303 89% | 7350 88% |
| Color Space (Percent of AdobeRGB 1998) (%) | 69 | 65 -6% | 59.4 -14% | 58.1 -16% | 37 -46% | 37 -46% | 59 -14% |
| Color Space (Percent of sRGB) (%) | 91 | 100 10% | 91.3 0% | 89.7 -1% | 57 -37% | 58 -36% | 91 0% |
| Media total (Programa/Opciones) | 1% /
4% | -12% /
-19% | -23% /
-23% | -63% /
-59% | -87% /
-72% | 0% /
-5% |
* ... más pequeño es mejor
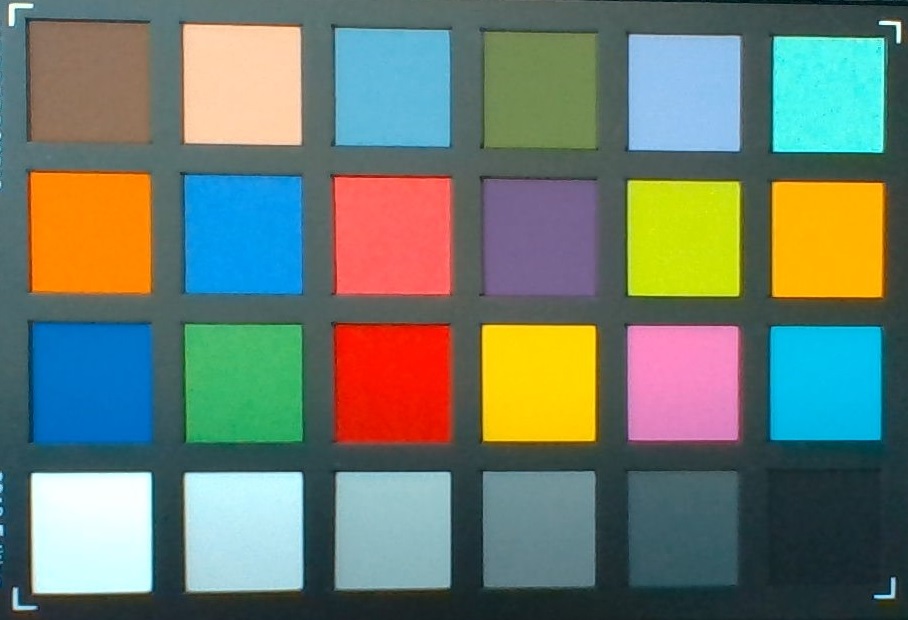
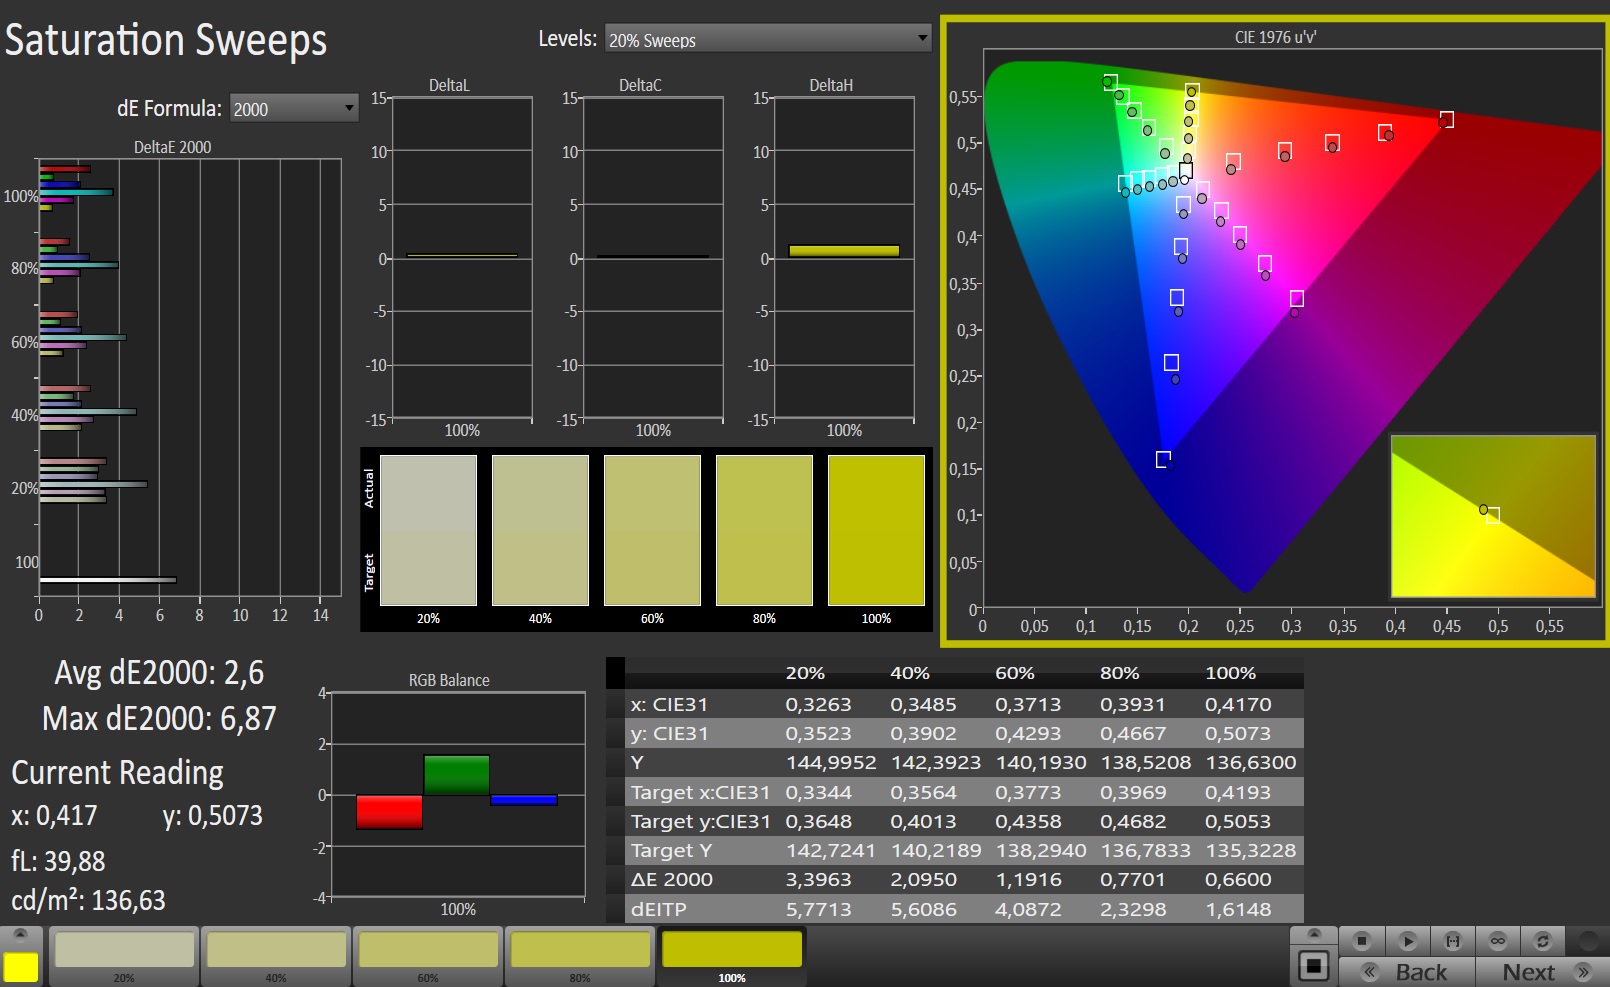
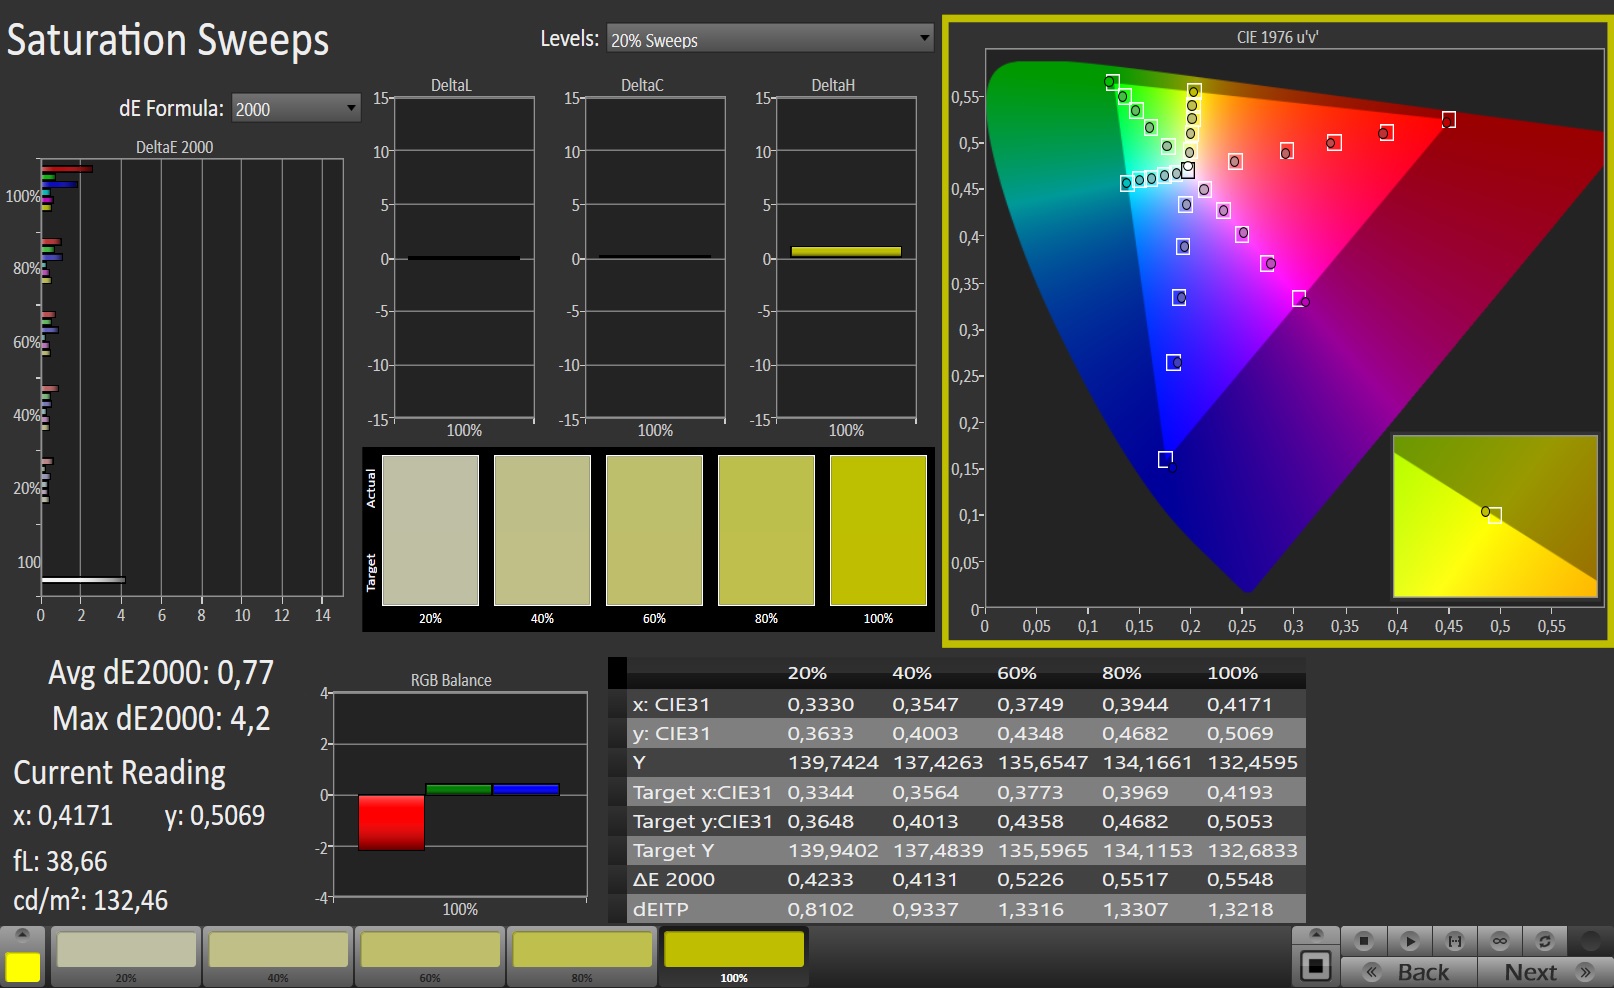
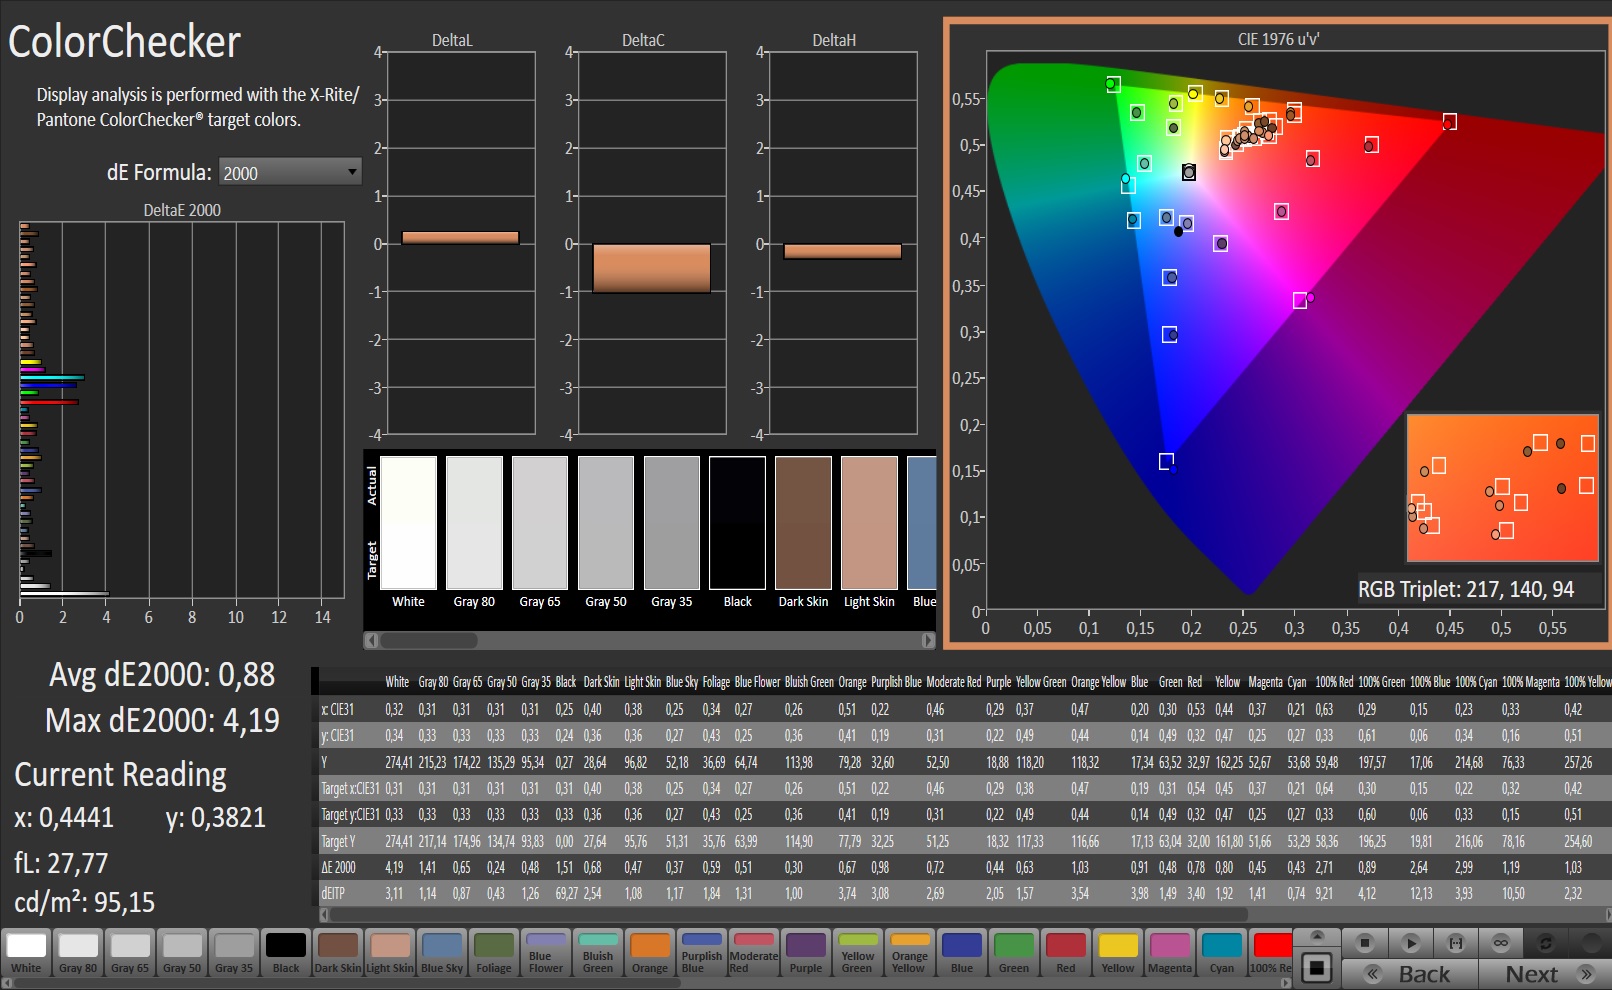
Fuera de la caja, la pantalla ya muestra una gran reproducción del color. Con una desviación de color Delta E 2000 de 2,42, el objetivo (Delta E menos de 3) se cumple. La pantalla no sufre de un tinte azul. Además, la calibración proporciona mejoras en términos de reproducción del color. De esta manera, la desviación de color se reduce a 0,88, y las escalas de grises se muestran de manera más equilibrada. Los espacios de color AdobeRGB (69%) y sRGB (91%) no están completamente mapeados.
Tiempos de respuesta del display
| ↔ Tiempo de respuesta de Negro a Blanco | ||
|---|---|---|
| 10.4 ms ... subida ↗ y bajada ↘ combinada | ↗ 6 ms subida | 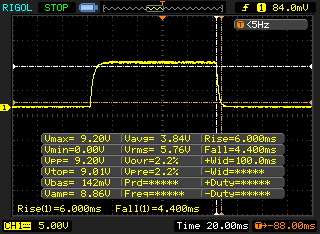 |
| ↘ 4.4 ms bajada | ||
| La pantalla mostró buenos tiempos de respuesta en nuestros tests pero podría ser demasiado lenta para los jugones competitivos. En comparación, todos los dispositivos de prueba van de ##min### (mínimo) a 240 (máximo) ms. » 28 % de todos los dispositivos son mejores. Esto quiere decir que el tiempo de respuesta medido es mejor que la media (19.9 ms) de todos los dispositivos testados. | ||
| ↔ Tiempo de respuesta 50% Gris a 80% Gris | ||
| 12 ms ... subida ↗ y bajada ↘ combinada | ↗ 7.6 ms subida | 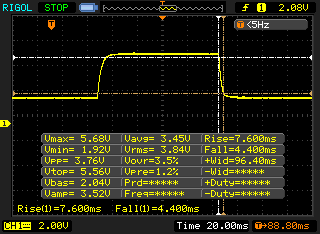 |
| ↘ 4.4 ms bajada | ||
| La pantalla mostró buenos tiempos de respuesta en nuestros tests pero podría ser demasiado lenta para los jugones competitivos. En comparación, todos los dispositivos de prueba van de ##min### (mínimo) a 636 (máximo) ms. » 25 % de todos los dispositivos son mejores. Esto quiere decir que el tiempo de respuesta medido es mejor que la media (31.1 ms) de todos los dispositivos testados. | ||
Parpadeo de Pantalla / PWM (Pulse-Width Modulation)
| Parpadeo de Pantalla / PWM detectado | 23580 Hz | ≤ 19 % de brillo | 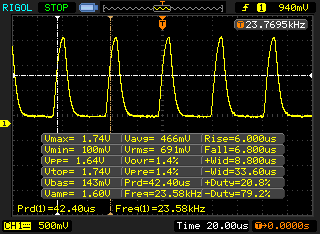 |
La retroiluminación del display parpadea a 23580 Hz (seguramente usa PWM - Pulse-Width Modulation) a un brillo del 19 % e inferior. Sobre este nivel de brillo no debería darse parpadeo / PWM. La frecuencia de 23580 Hz es bastante alta, por lo que la mayoría de gente sensible al parpadeo no debería ver parpadeo o tener fatiga visual. Comparación: 52 % de todos los dispositivos testados no usaron PWM para atenuar el display. Si se usó, medimos una media de 7794 (mínimo: 5 - máxmo: 343500) Hz. | |||
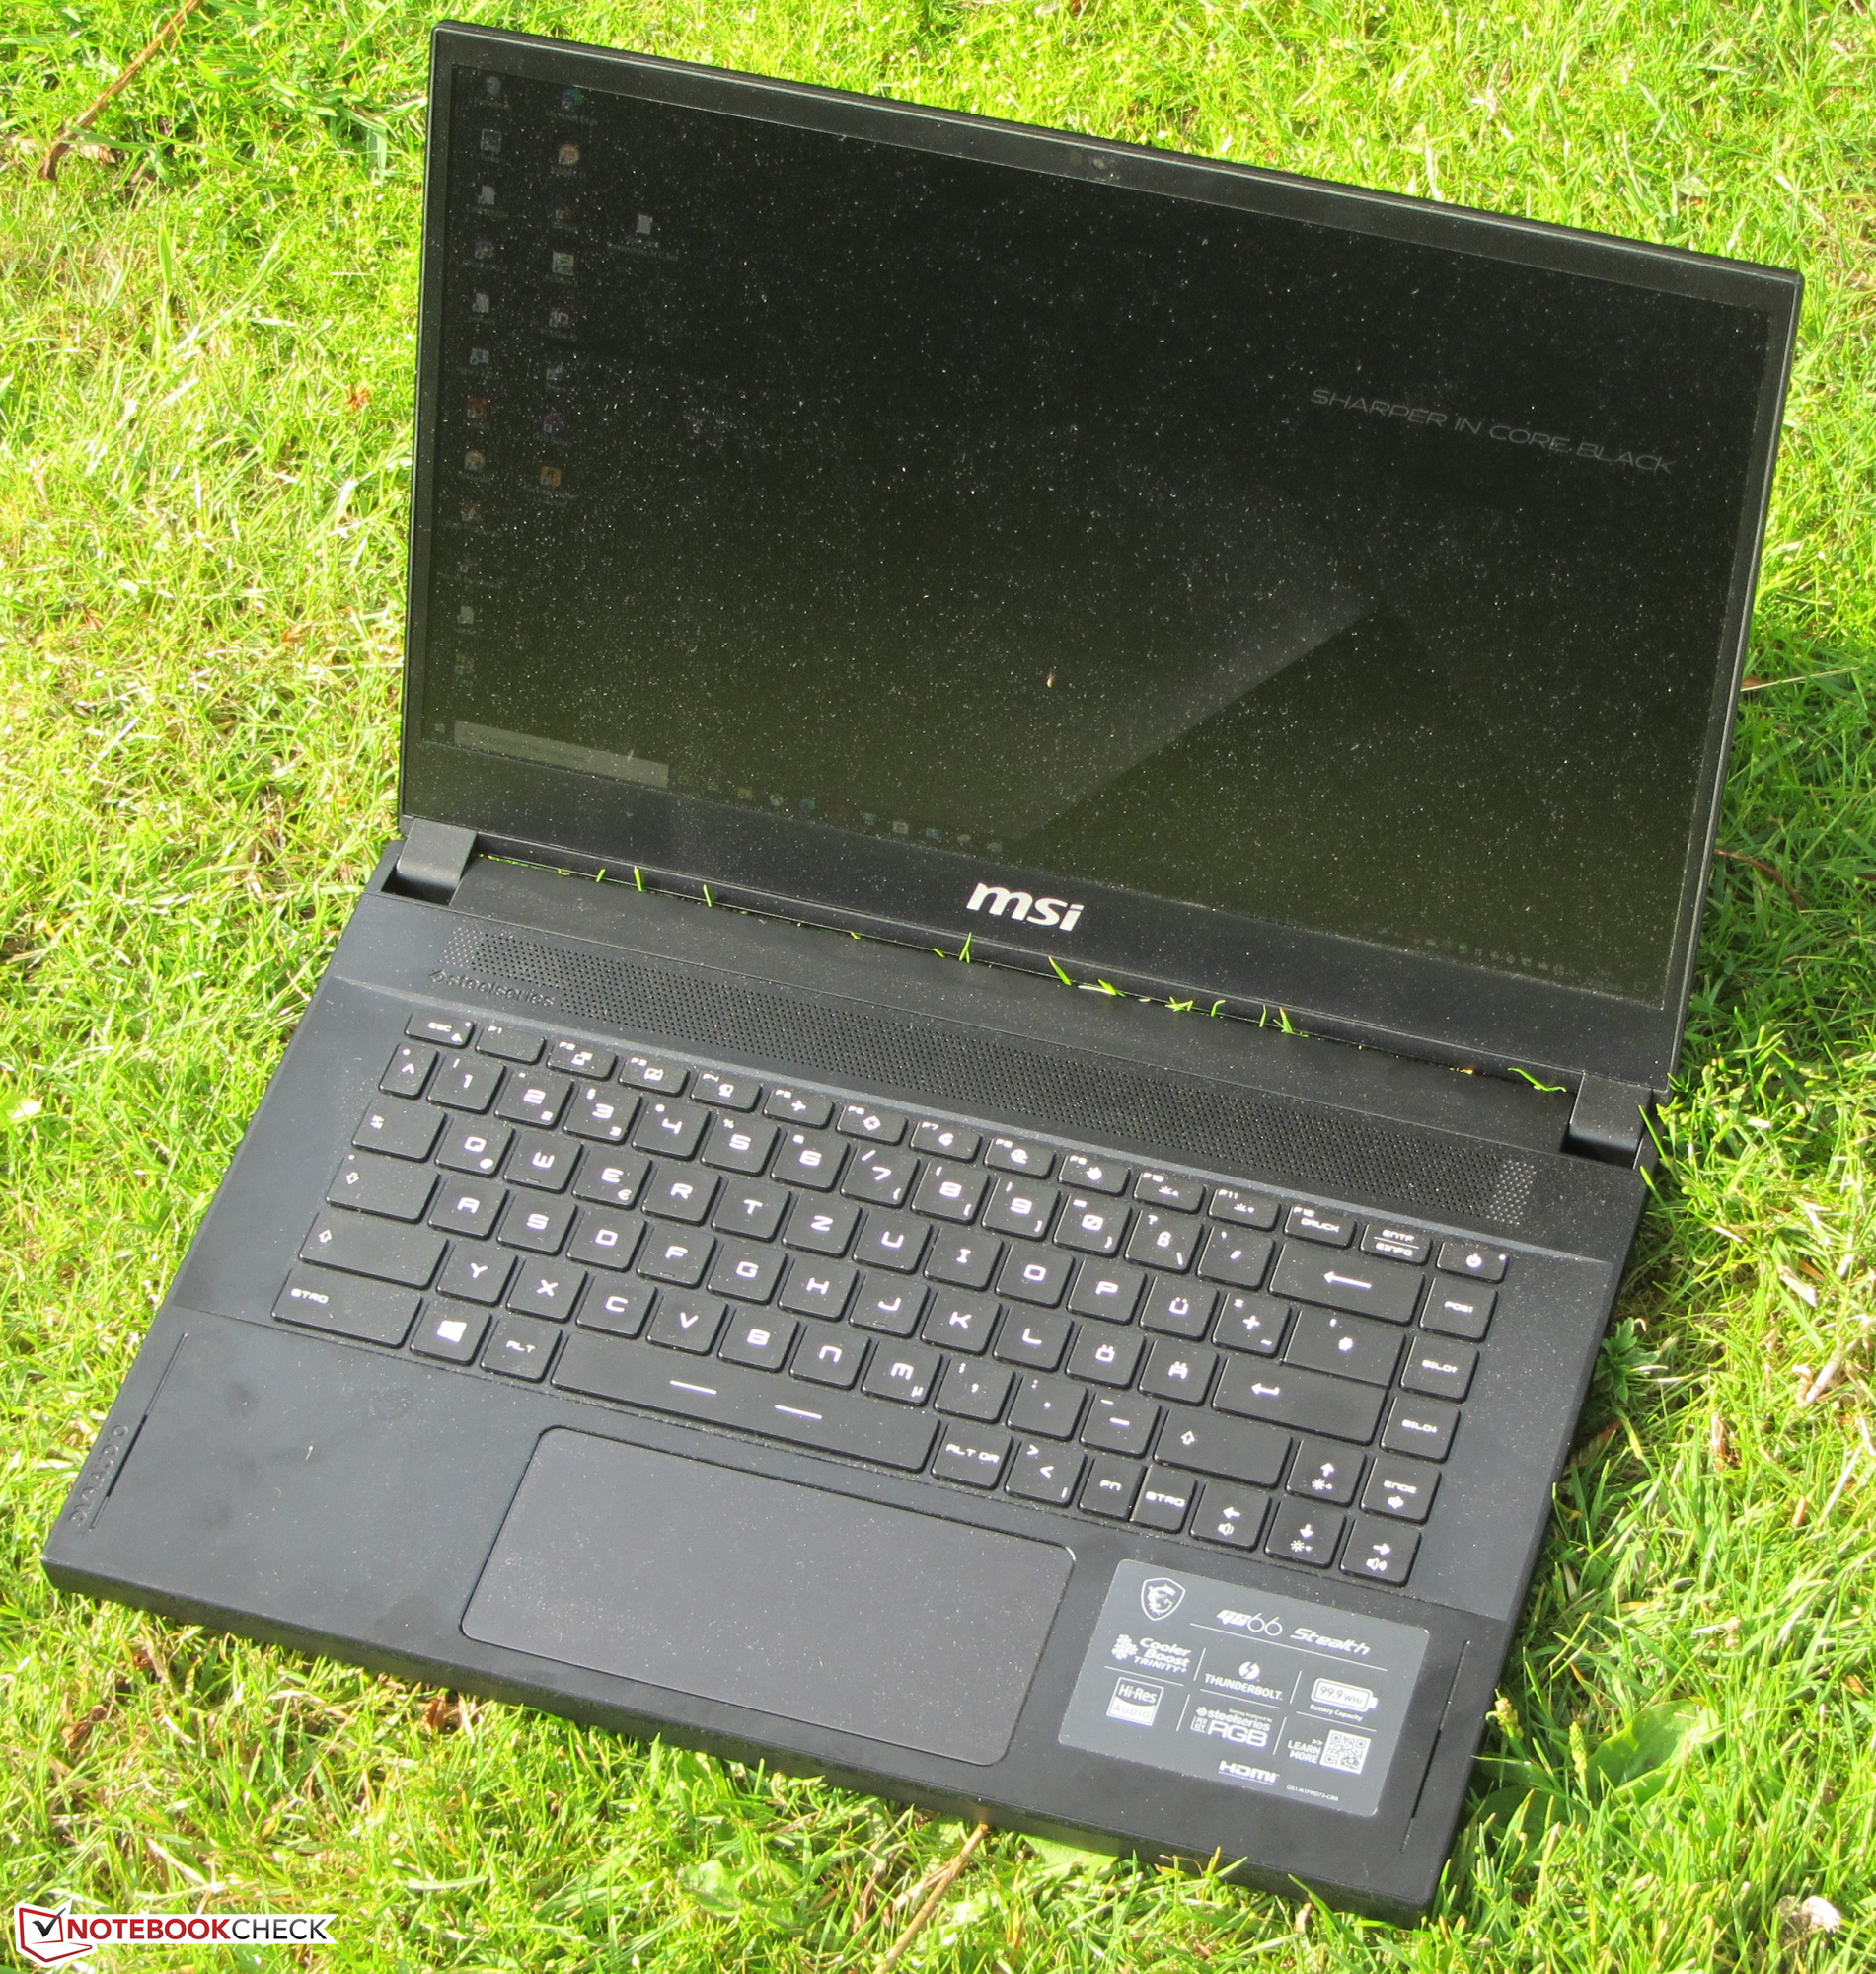
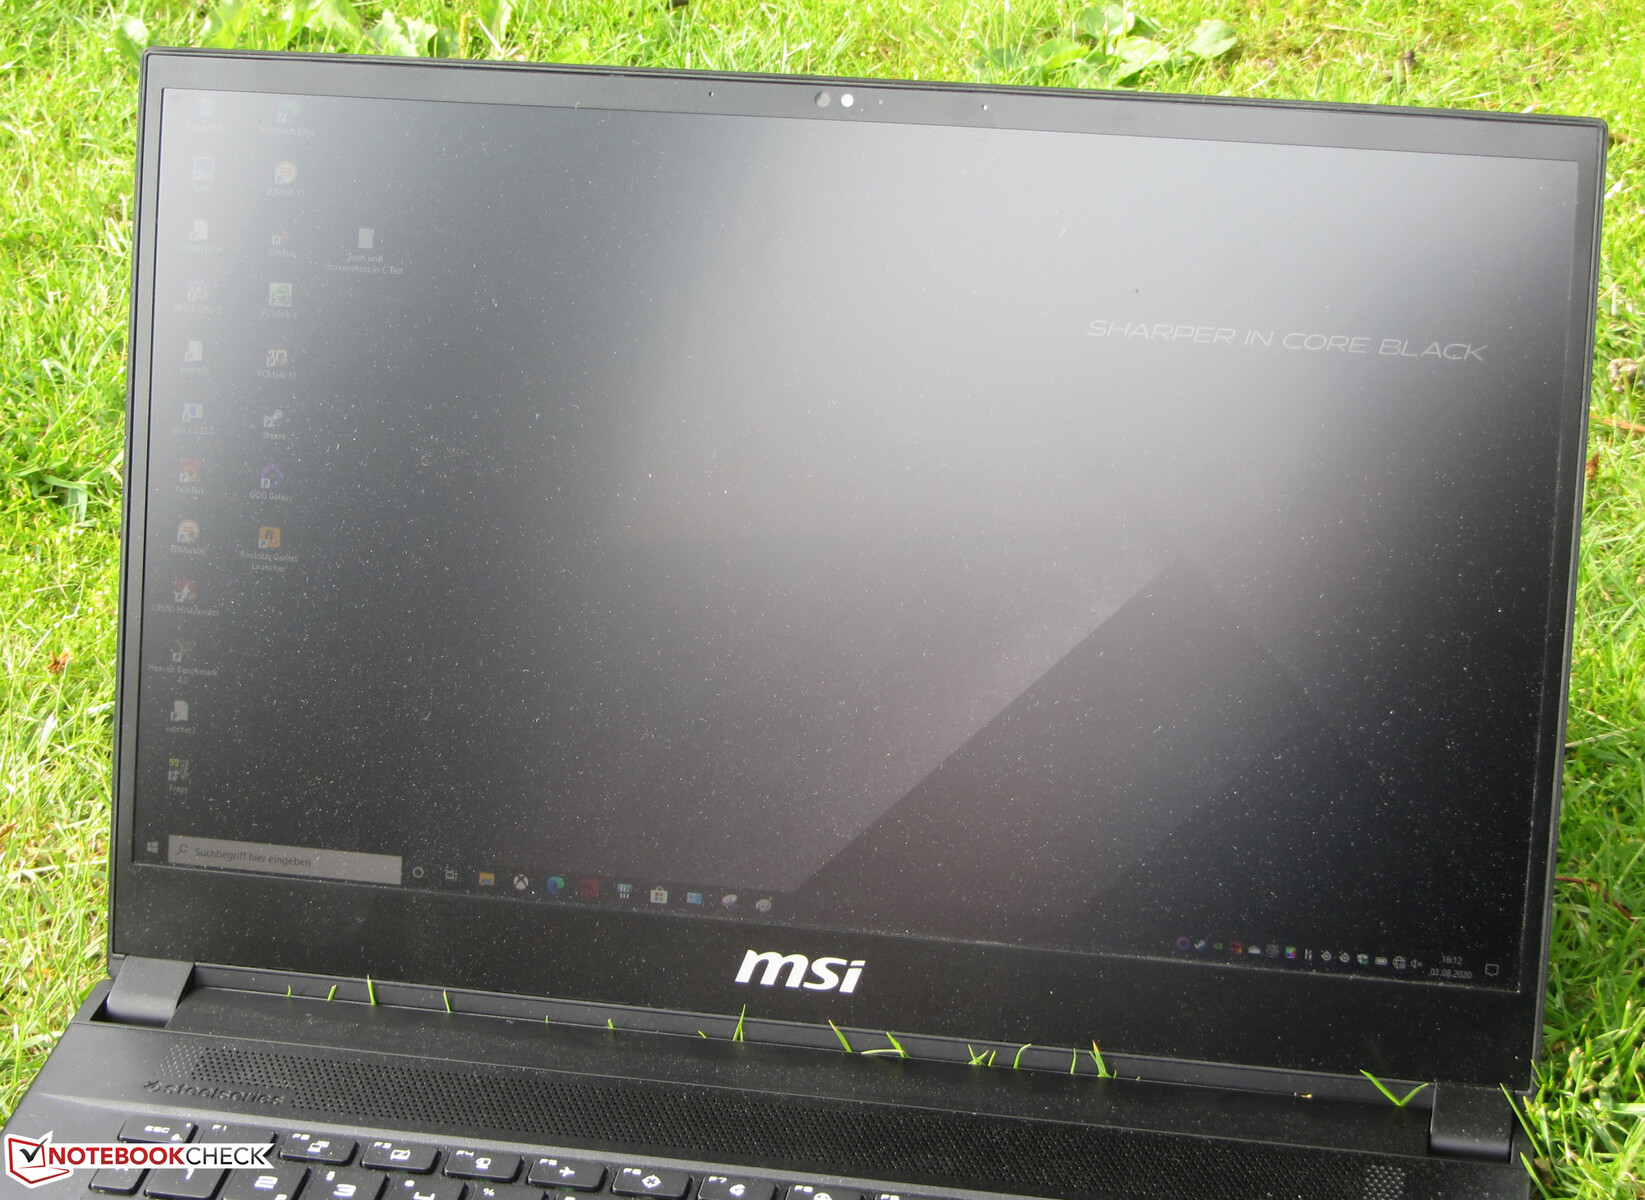
MSI equipa el portátil con un panel IPS estable de ángulo de visión. Por consiguiente, la pantalla puede ser leída desde cualquier posición. En el exterior, la pantalla puede ser leída cuando el sol no es demasiado brillante.

Rendimiento - Suficiente para los próximos años
MSI tiene un portátil para juegos de 15,6 pulgadas en su gama con el GS66 Stealth 10SE. Lleva todos los juegos modernos a la pantalla sin problemas y también se destaca en todas las demás áreas de aplicación. Hay que pagar unos 1.900 euros (~$2.257) por nuestro dispositivo de prueba. Como resultado, es actualmente el representante más barato de la serie. Existen otras variantes de configuración.
Condiciones de la prueba
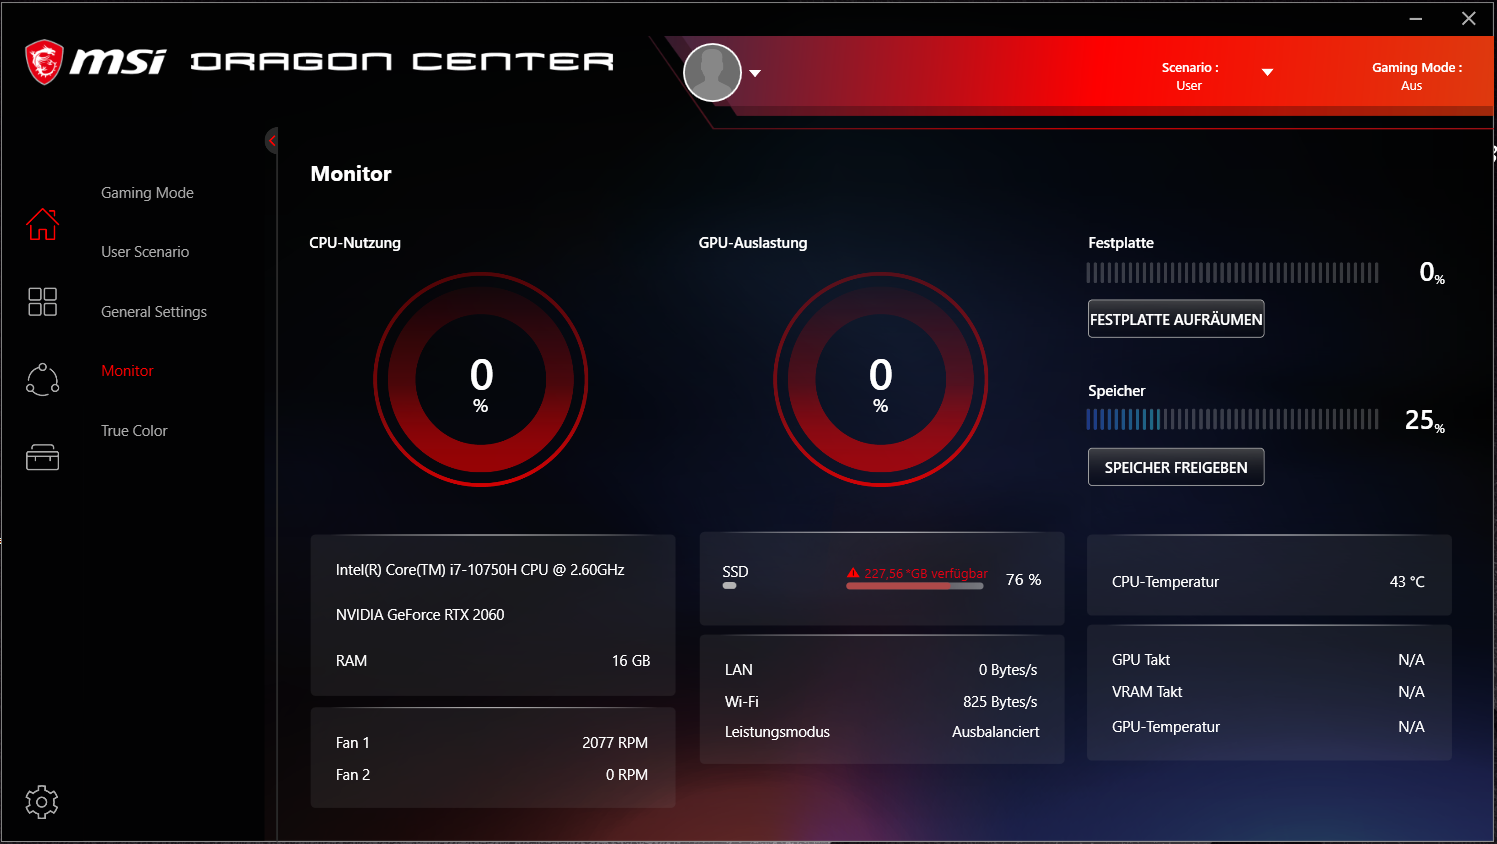
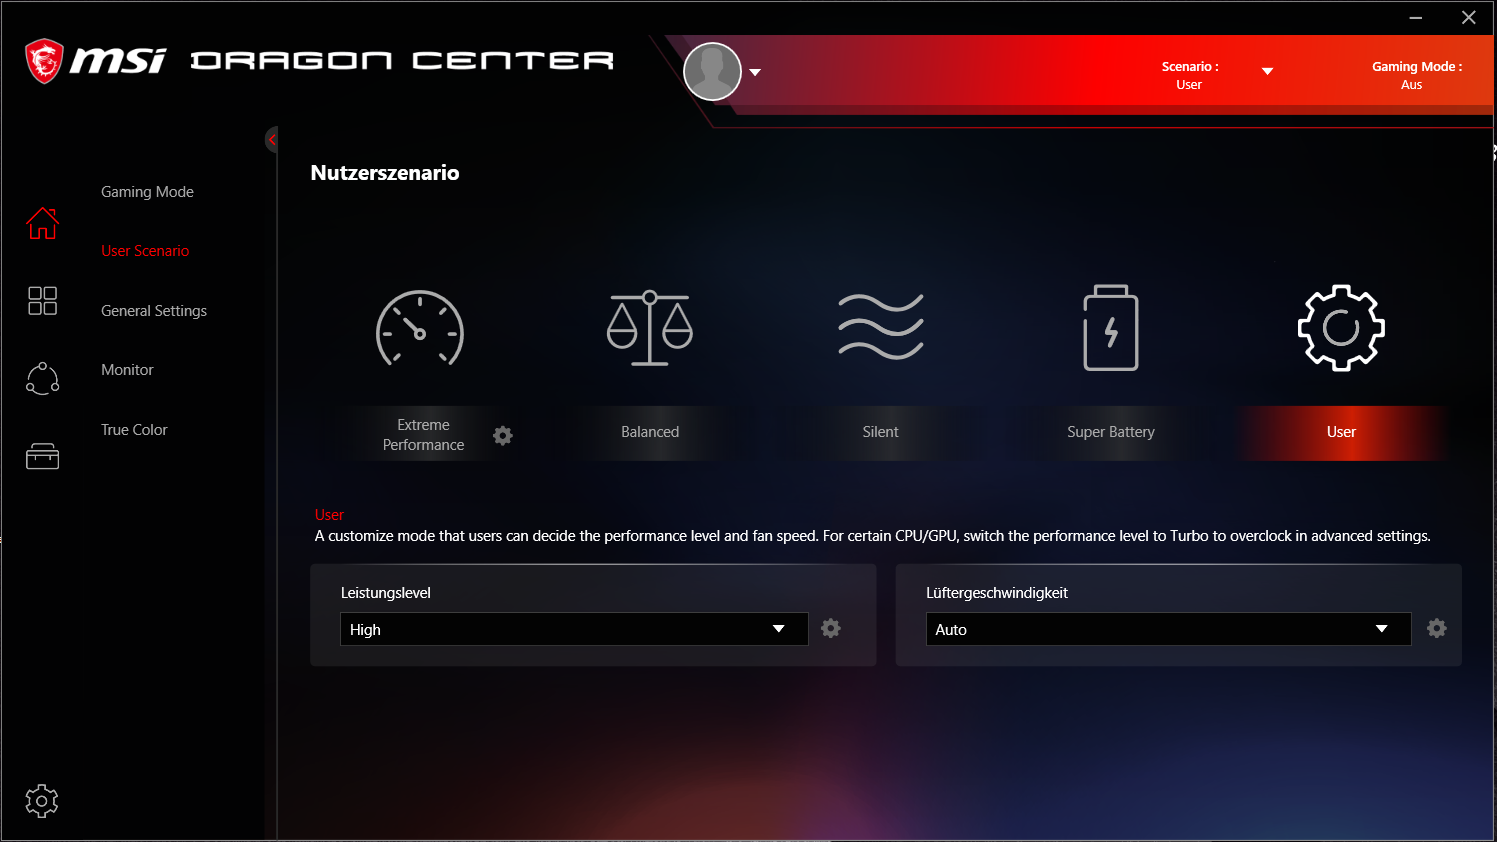
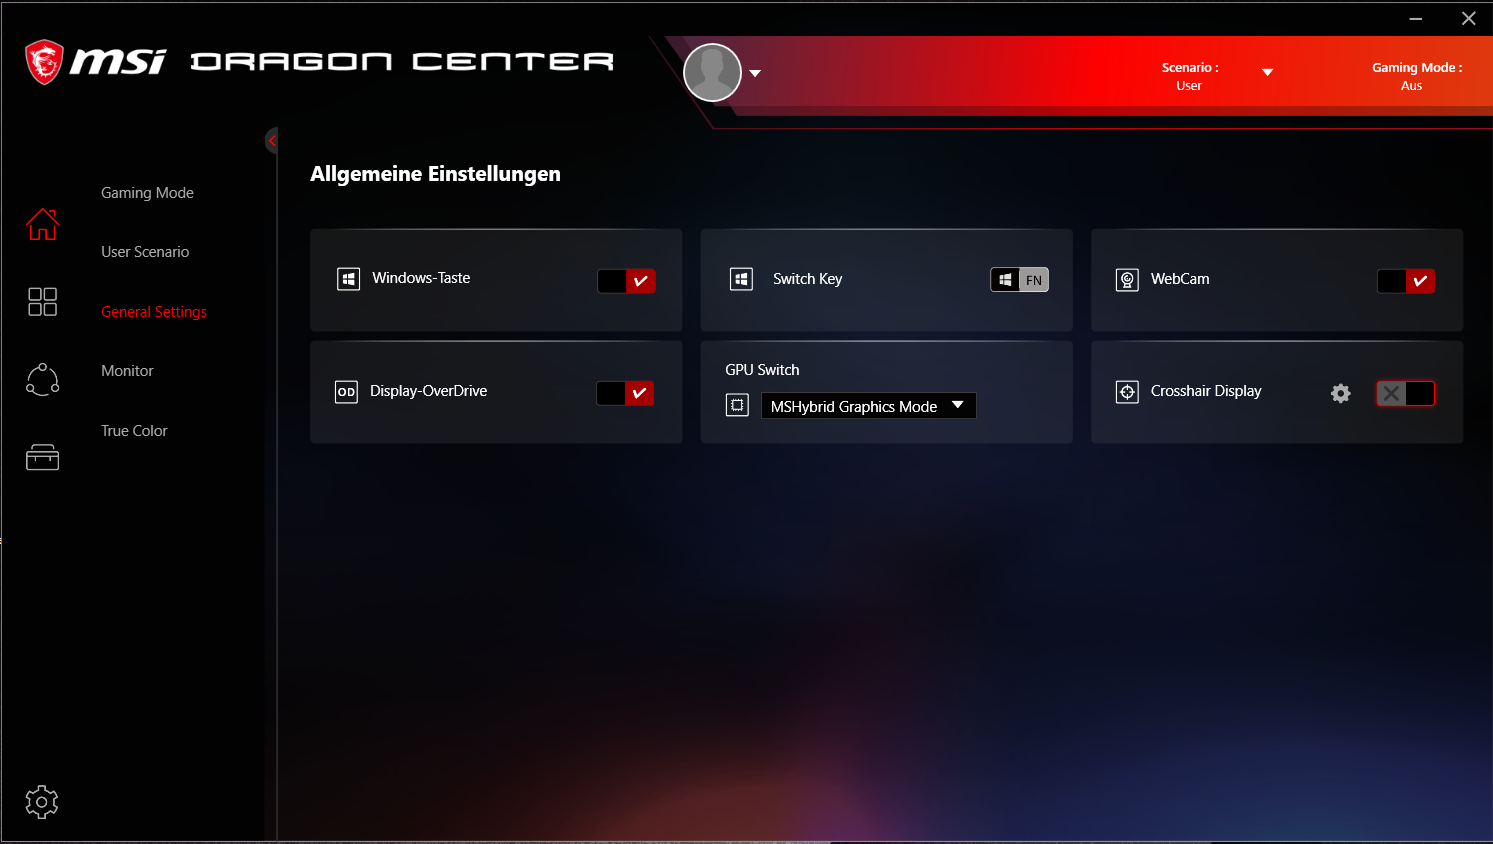
El software preinstalado de Dragon Center ofrece una variedad de perfiles de rendimiento para elegir que tienen un impacto en el ruido y la potencia de computación. Hemos llevado a cabo todas las pruebas con el perfil de rendimiento "Usuario". Se seleccionó el nivel de rendimiento "Alto" y se activó el control automático del ventilador. Además, la GPU integrada está activada.
Procesdaor
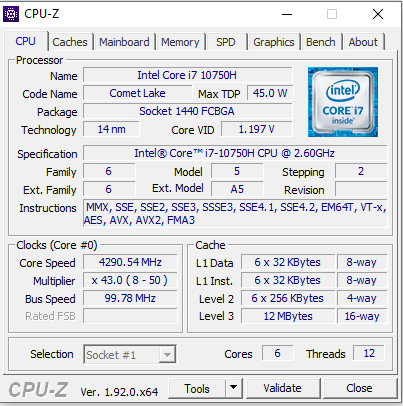
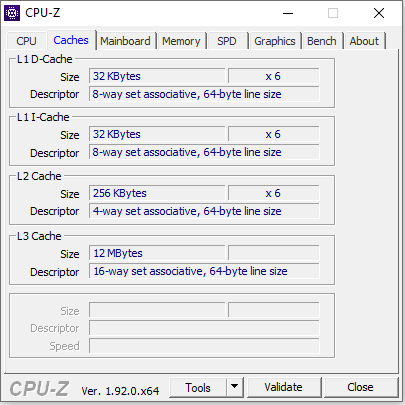
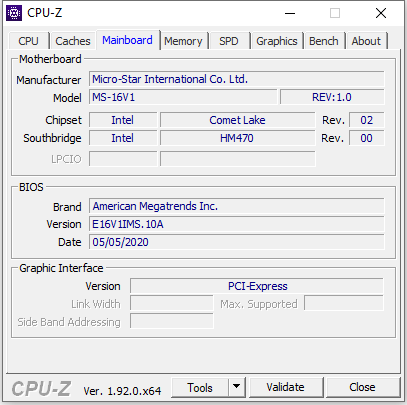
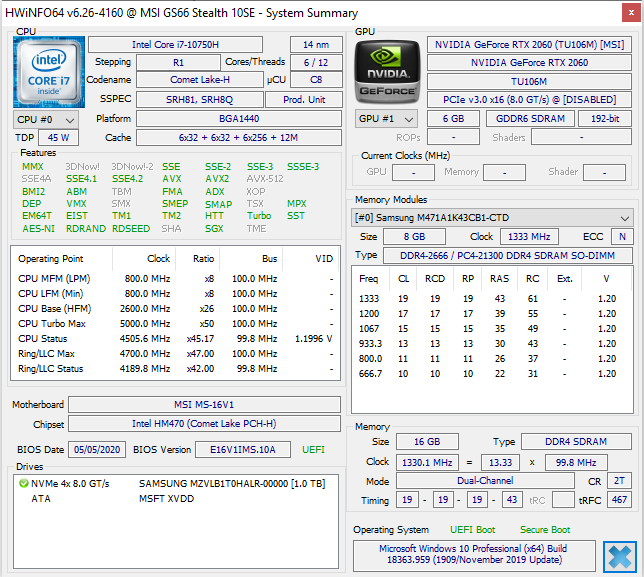
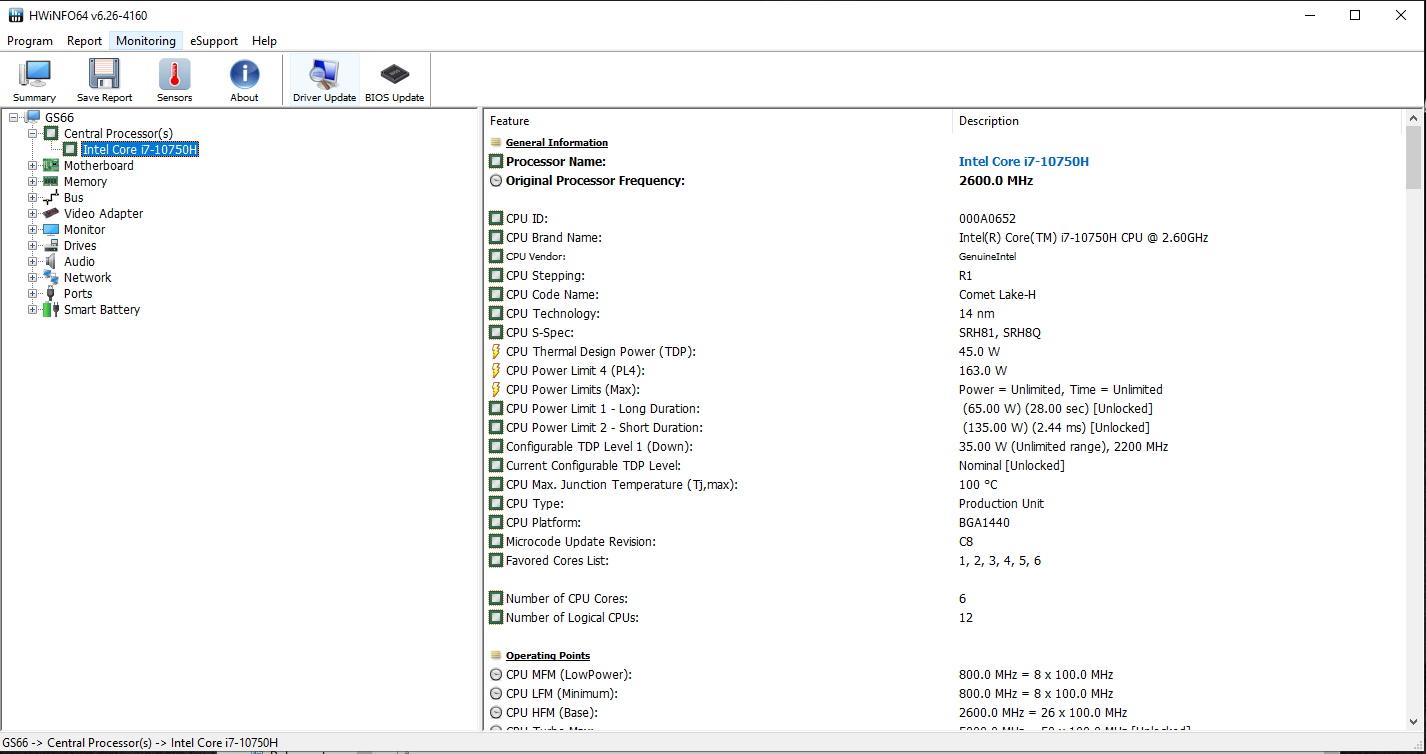
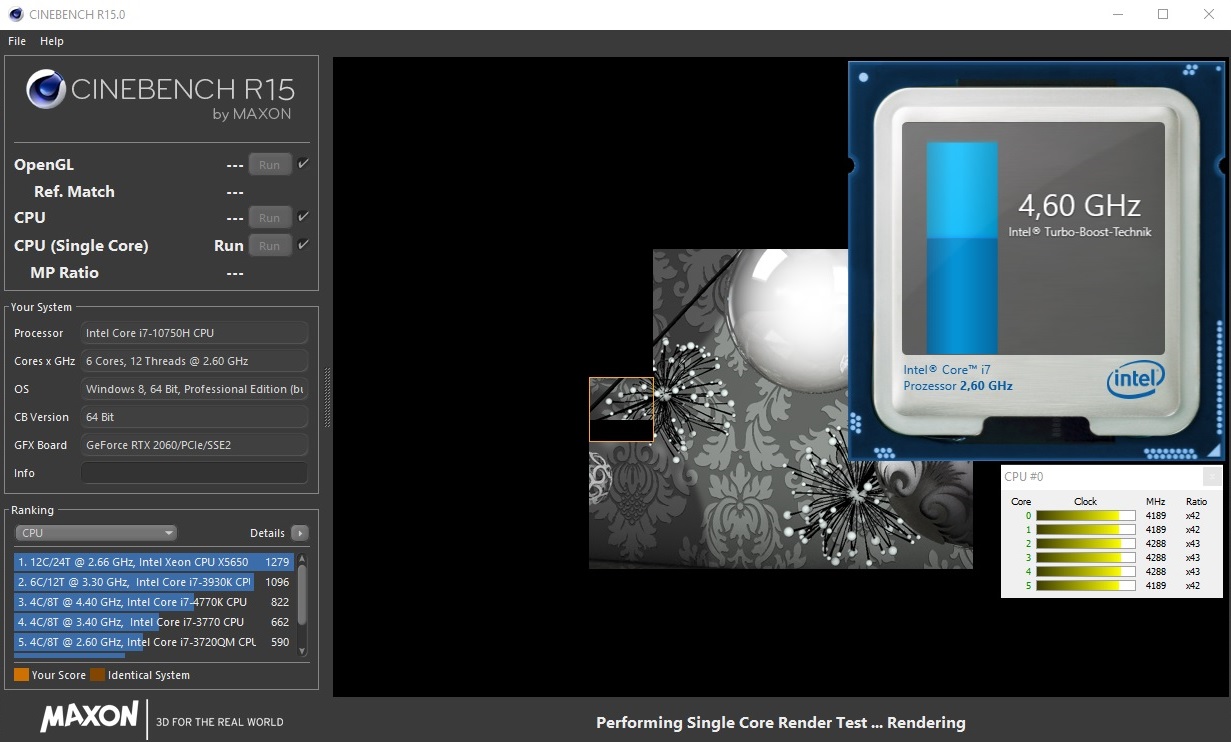
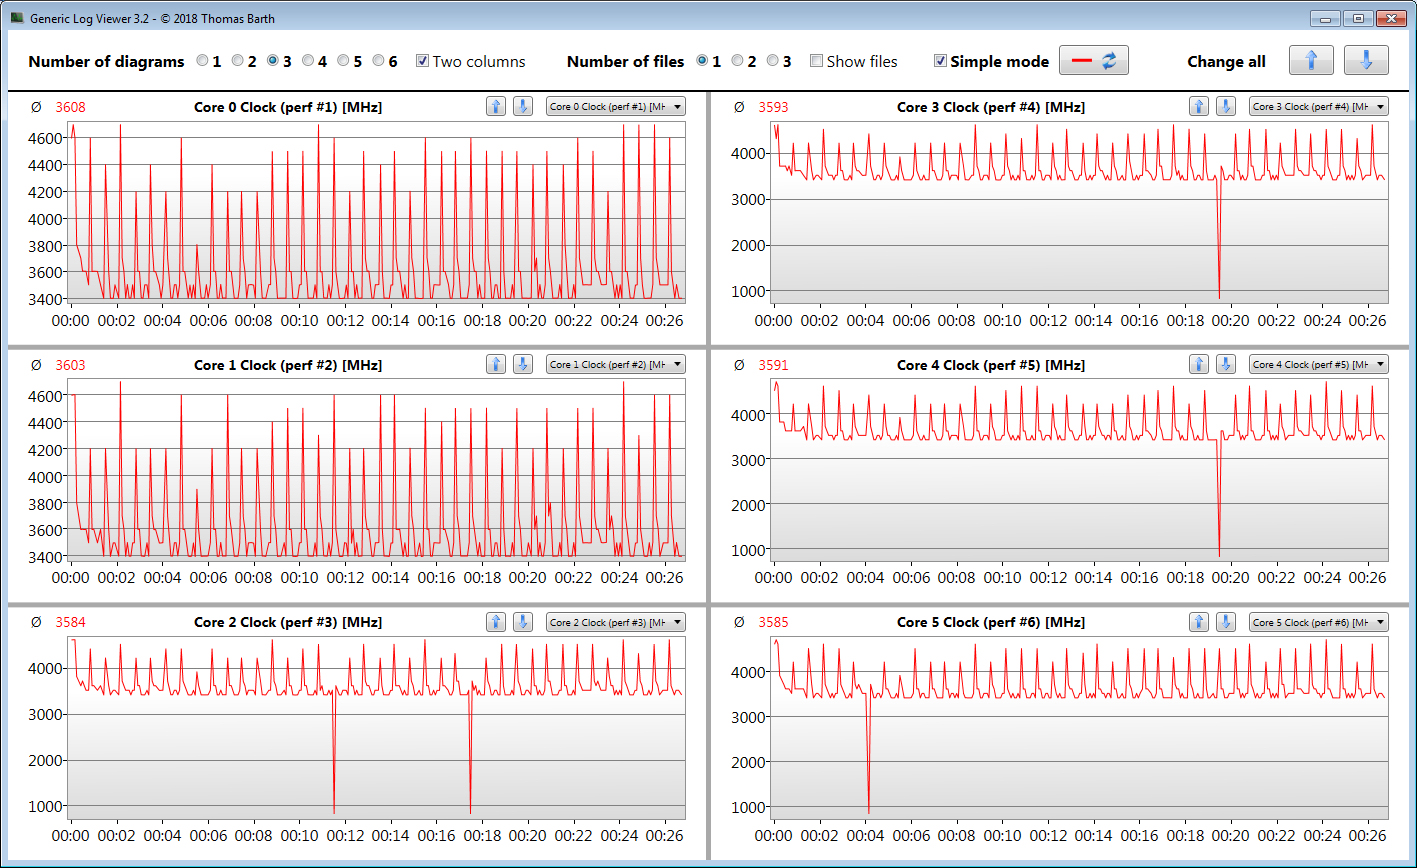
El procesador Core i7-10750H hexa-core incorporado (Comet Lake) representa un buen compromiso entre rendimiento, consumo de energía y precio. El CPU funciona a una velocidad base de 2,3 GHz. La velocidad puede aumentarse para que oscile entre 4,3 GHz (seis núcleos) y 5 GHz (un núcleo) mediante Turbo. Además, se admite el Hyper-Threading (dos hilos por núcleo).
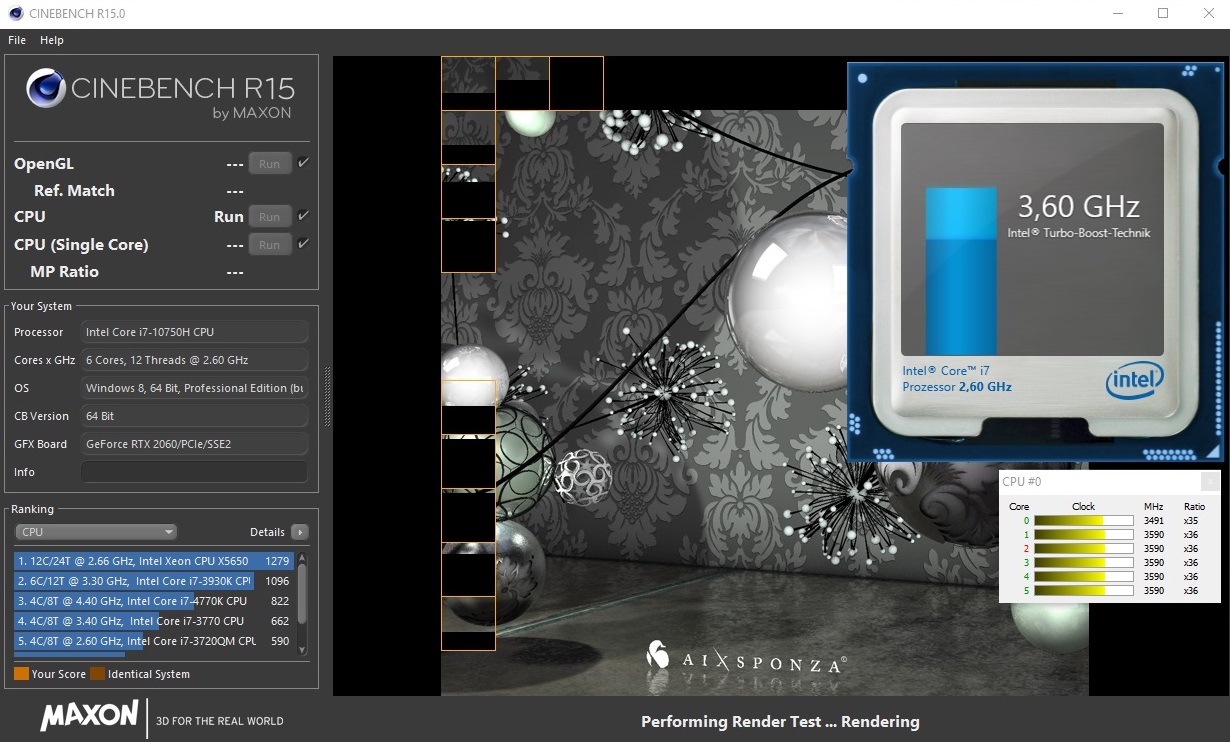
El procesador procesa brevemente la prueba multihilo del Cinebench R15 de referencia a 4 a 4,1 GHz. La velocidad entonces baja a 3,6 a 3,8 GHz. La prueba de un solo hilo se realiza a 4,2 a 4,6 GHz. Con la energía de las baterías, las velocidades son de 2,6 a 2,9 GHz (multihilo) y de 2,6 a 4,2 GHz (un solo hilo), respectivamente.
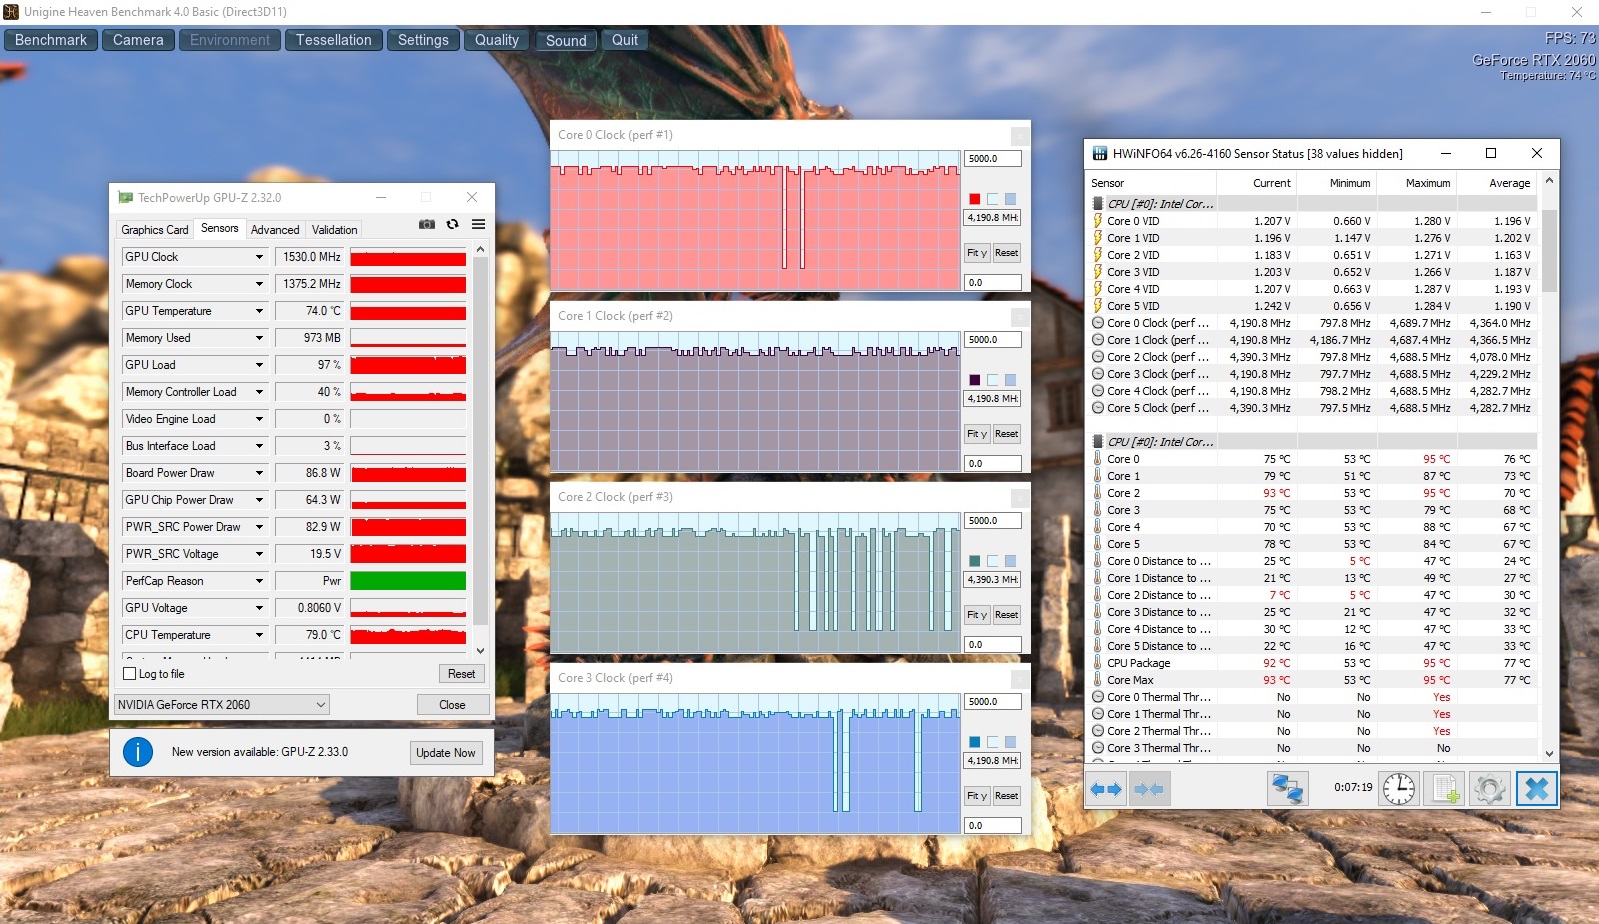
Verificamos si el Turbo de la CPU también se usa consistentemente cuando se conecta ejecutando la prueba multihilo del Cinebench R15 en un bucle continuo durante al menos 30 minutos. El Turbo se usa en un nivel moderado.
* ... más pequeño es mejor
Rendimiento del sistema
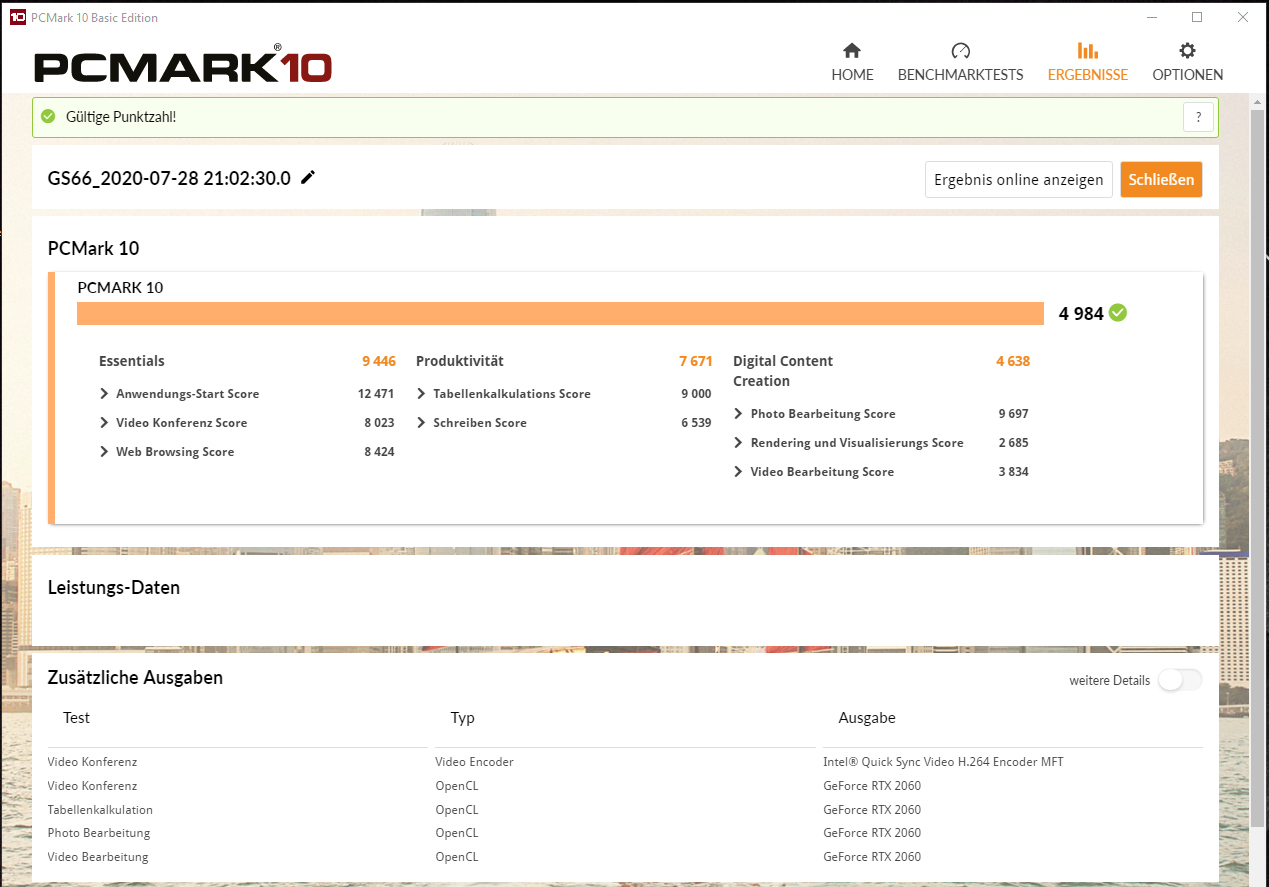
El portátil MSI proporcionará suficiente potencia de cálculo para todas las áreas de aplicación comunes en los próximos años. Un potente procesador hexa-core, una memoria de doble canal y una rápida SSD NVMe hacen que el sistema sea rápido y fluido. Además, la GPU de gama alta lleva todos los juegos de ordenador modernos sin problemas a la pantalla. Esto va acompañado de buenos resultados en los benchmarks de PCMark.
| PCMark 8 Home Score Accelerated v2 | 4539 puntos | |
| PCMark 8 Creative Score Accelerated v2 | 4314 puntos | |
| PCMark 8 Work Score Accelerated v2 | 5908 puntos | |
| PCMark 10 Score | 4984 puntos | |
ayuda | ||
Latencias DPC
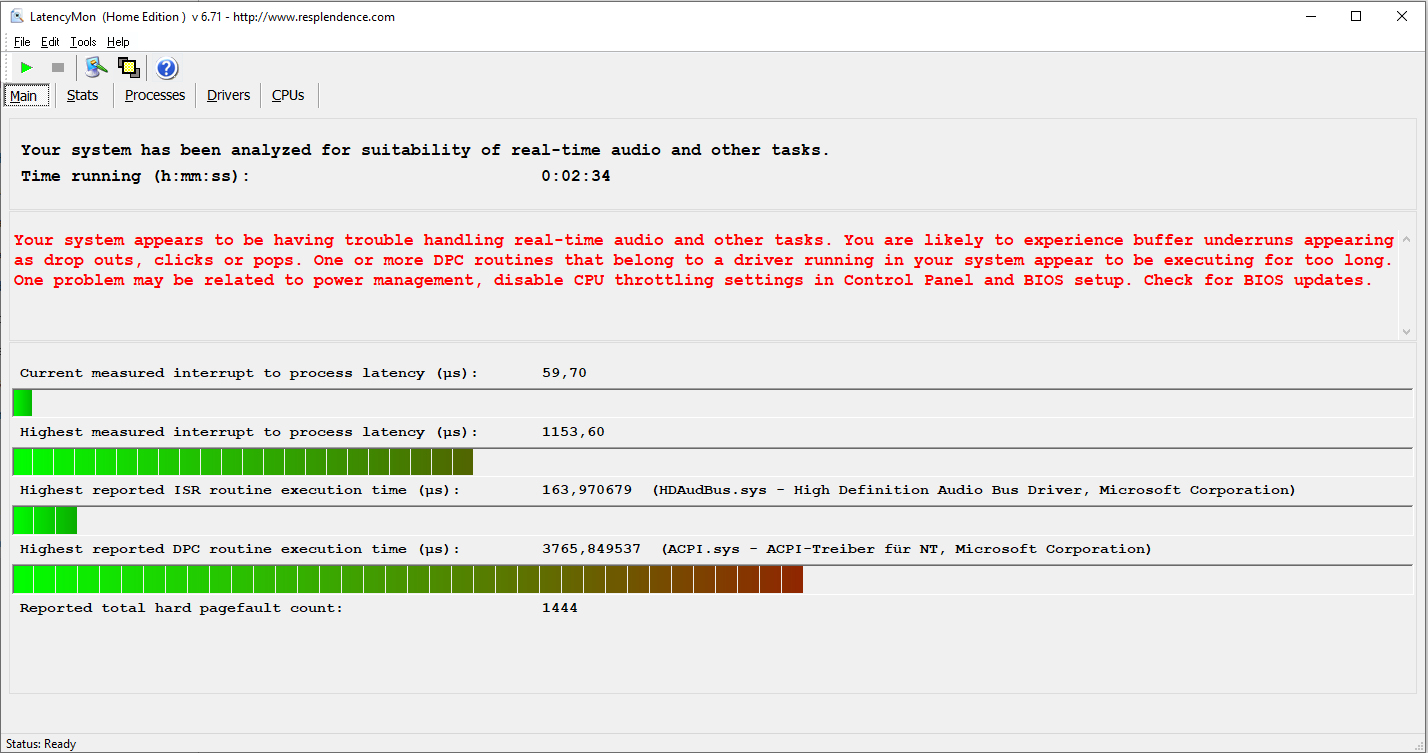
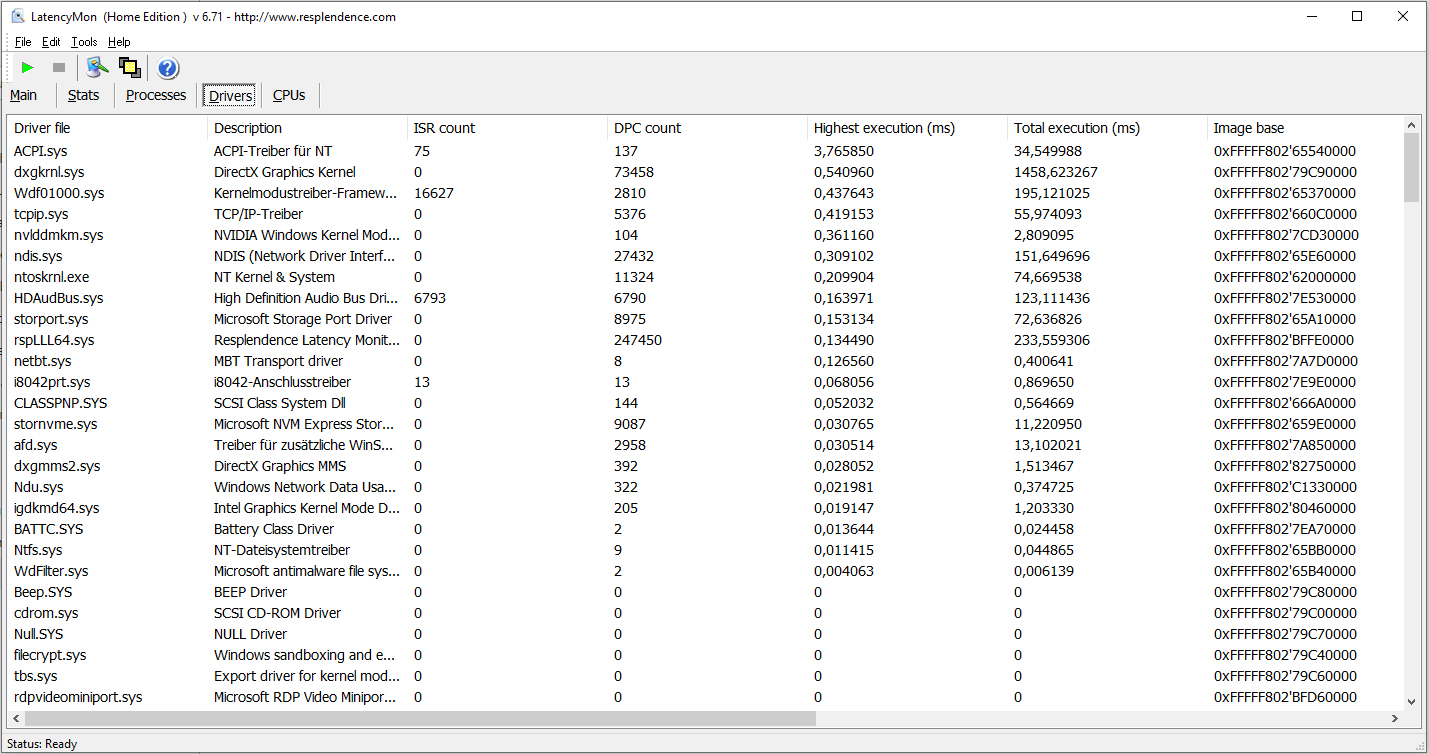
En nuestra prueba de monitor de latencia estandarizada (navegación por la web, reproducción de vídeo 4K, Prime95 de alta carga), pudimos observar problemas con las latencias DPC. El sistema no parece ser adecuado para la edición de vídeo y audio en tiempo real.
| DPC Latencies / LatencyMon - interrupt to process latency (max), Web, Youtube, Prime95 | |
| Dell G5 15 SE 5505 P89F | |
| MSI GS66 Stealth 10SFS | |
| Gigabyte Aero 15 OLED XB-8DE51B0SP | |
| MSI GS66 10SGS | |
| MSI GS66 Stealth 10SE-045 | |
| Razer Blade 15 RZ09-0328 | |
| Asus TUF Gaming A15 FA506IV-HN172 | |
| Lenovo Legion 5 15IMH05H | |
* ... más pequeño es mejor
Almacenamiento
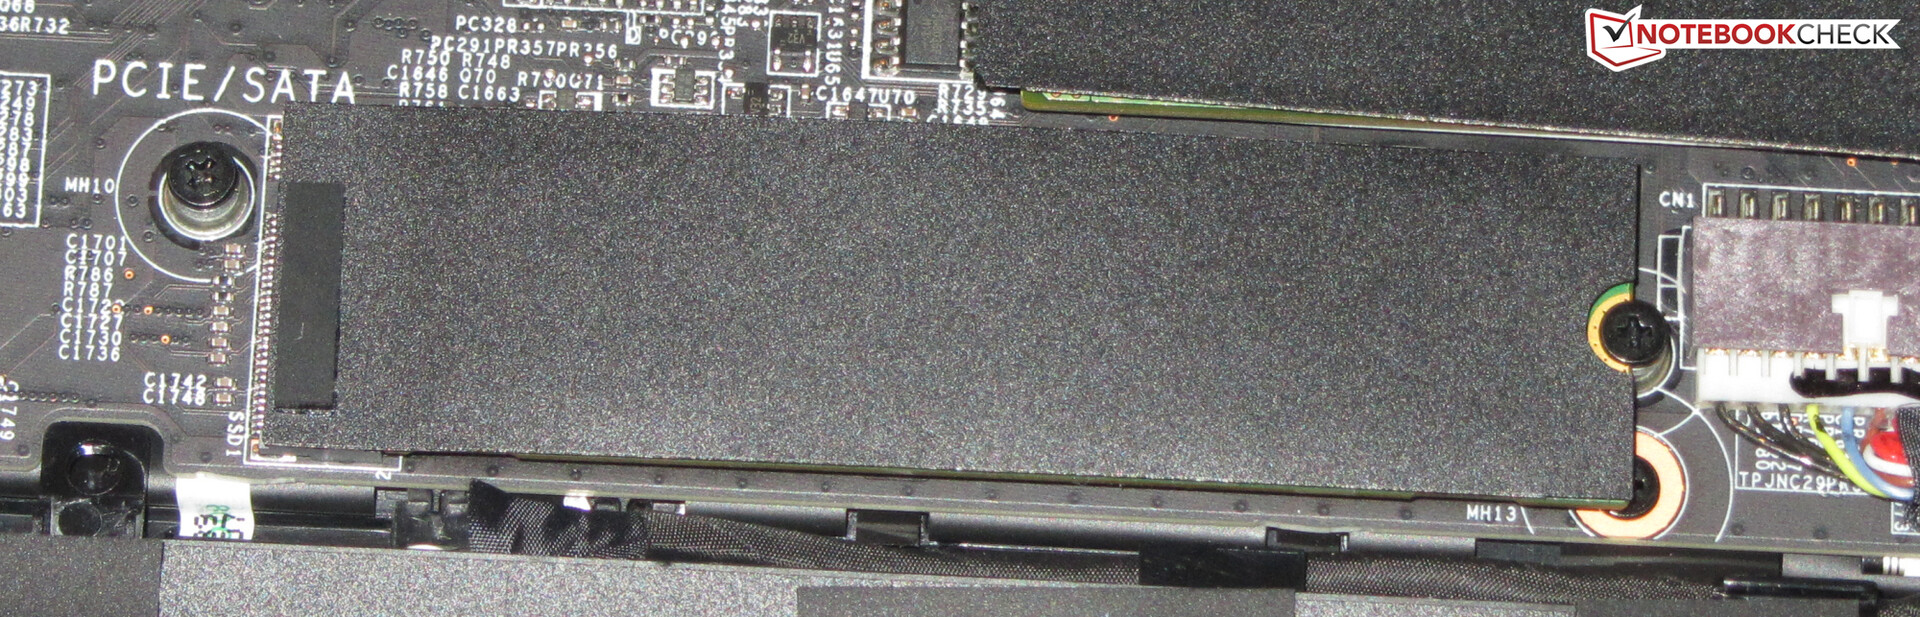
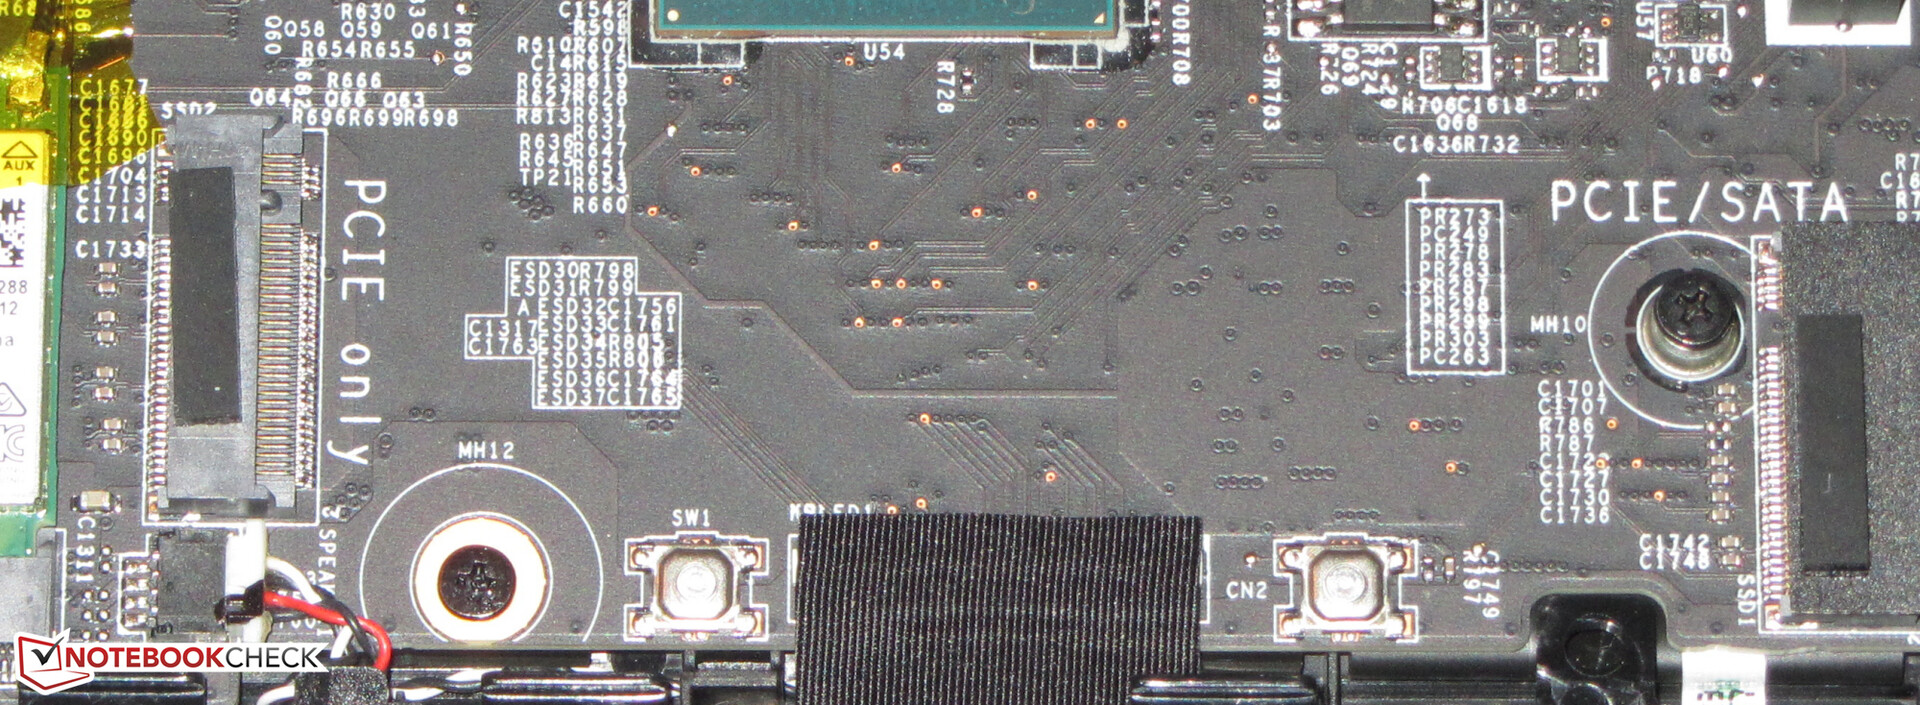
La unidad del sistema es un SSD NVMe (formato M.2 2280) de Samsung que ofrece 1 TB de espacio de almacenamiento. El SSD ofrece muy buenas tasas de transferencia. El portátil sigue ofreciendo espacio para un segundo NVMe SSD.
| MSI GS66 Stealth 10SE-045 Samsung SSD PM981 MZVLB1T0HALR | Dell G5 15 SE 5505 P89F Samsung PM991 MZ9LQ512HALU | Lenovo Legion 5 15IMH05H Samsung PM991 MZALQ512HALU | Asus TUF Gaming A15 FA506IV-HN172 Kingston OM8PCP3512F-AB | Schenker XMG Core 15 GK5CP6V Samsung SSD 970 EVO Plus 500GB | MSI GS66 Stealth 10SFS Samsung SSD PM981 MZVLB1T0HALR | Razer Blade 15 GTX 1660 Ti Samsung SSD PM981 MZVLB256HAHQ | |
|---|---|---|---|---|---|---|---|
| CrystalDiskMark 5.2 / 6 | -20% | -21% | -18% | -14% | -4% | -14% | |
| Write 4K (MB/s) | 156.3 | 142.1 -9% | 145.4 -7% | 219.8 41% | 102 -35% | 131.3 -16% | 135 -14% |
| Read 4K (MB/s) | 47.65 | 46.43 -3% | 51.6 8% | 50.2 5% | 41.39 -13% | 45.84 -4% | 41.1 -14% |
| Write Seq (MB/s) | 2374 | 1108 -53% | 1007 -58% | 979 -59% | 1649 -31% | 2370 0% | 1427 -40% |
| Read Seq (MB/s) | 2045 | 1622 -21% | 1145 -44% | 1990 -3% | 1367 -33% | 1509 -26% | 1494 -27% |
| Write 4K Q32T1 (MB/s) | 431.3 | 467 8% | 468.4 9% | 516 20% | 379 -12% | 481.5 12% | 494.9 15% |
| Read 4K Q32T1 (MB/s) | 509 | 525 3% | 528 4% | 298.3 -41% | 401.2 -21% | 560 10% | 578 14% |
| Write Seq Q32T1 (MB/s) | 2385 | 1203 -50% | 1381 -42% | 982 -59% | 3276 37% | 2392 0% | 1417 -41% |
| Read Seq Q32T1 (MB/s) | 3505 | 2288 -35% | 2291 -35% | 1907 -46% | 3417 -3% | 3232 -8% | 3251 -7% |
| Write 4K Q8T8 (MB/s) | 981 | ||||||
| Read 4K Q8T8 (MB/s) | 300.9 | ||||||
| AS SSD | -61% | -48% | -45% | -7% | -17% | -48% | |
| Seq Read (MB/s) | 2612 | 1386 -47% | 2012 -23% | 1682 -36% | 2261 -13% | 1065 -59% | 1829 -30% |
| Seq Write (MB/s) | 2368 | 1234 -48% | 1261 -47% | 904 -62% | 2393 1% | 2360 0% | 1315 -44% |
| 4K Read (MB/s) | 51.1 | 41.32 -19% | 43.66 -15% | 60.2 18% | 54.6 7% | 48.09 -6% | 51.3 0% |
| 4K Write (MB/s) | 135.9 | 128 -6% | 109.3 -20% | 164.8 21% | 118.4 -13% | 110.7 -19% | 106 -22% |
| 4K-64 Read (MB/s) | 1635 | 854 -48% | 851 -48% | 472.5 -71% | 1376 -16% | 1635 0% | 917 -44% |
| 4K-64 Write (MB/s) | 1831 | 721 -61% | 780 -57% | 845 -54% | 2299 26% | 1829 0% | 1212 -34% |
| Access Time Read * (ms) | 0.042 | 0.098 -133% | 0.117 -179% | 0.087 -107% | 0.07 -67% | 0.071 -69% | 0.063 -50% |
| Access Time Write * (ms) | 0.028 | 0.095 -239% | 0.036 -29% | 0.02 29% | 0.031 -11% | 0.034 -21% | 0.104 -271% |
| Score Read (Points) | 1947 | 1034 -47% | 1096 -44% | 701 -64% | 1657 -15% | 1790 -8% | 1152 -41% |
| Score Write (Points) | 2204 | 973 -56% | 1016 -54% | 1101 -50% | 2657 21% | 2176 -1% | 1450 -34% |
| Score Total (Points) | 5138 | 2536 -51% | 2643 -49% | 2143 -58% | 5175 1% | 4950 -4% | 3177 -38% |
| Copy ISO MB/s (MB/s) | 2334 | 1284 -45% | 1481 -37% | 675 -71% | 1539 -34% | ||
| Copy Program MB/s (MB/s) | 569 | 401.9 -29% | 467.5 -18% | 248.4 -56% | 513 -10% | ||
| Copy Game MB/s (MB/s) | 1401 | 1013 -28% | 734 -48% | 535 -62% | 1150 -18% | ||
| Media total (Programa/Opciones) | -41% /
-46% | -35% /
-38% | -32% /
-35% | -11% /
-10% | -11% /
-12% | -31% /
-36% |
* ... más pequeño es mejor

Lectura de carga continua: DiskSpd Read Loop, Queue Depth 8
Tarjeta gráfica
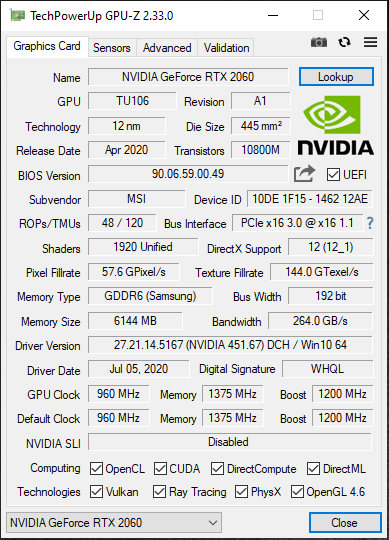
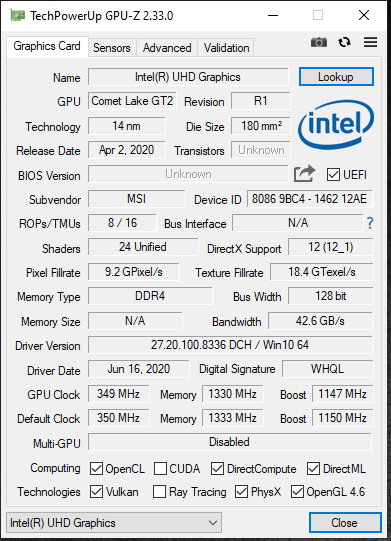
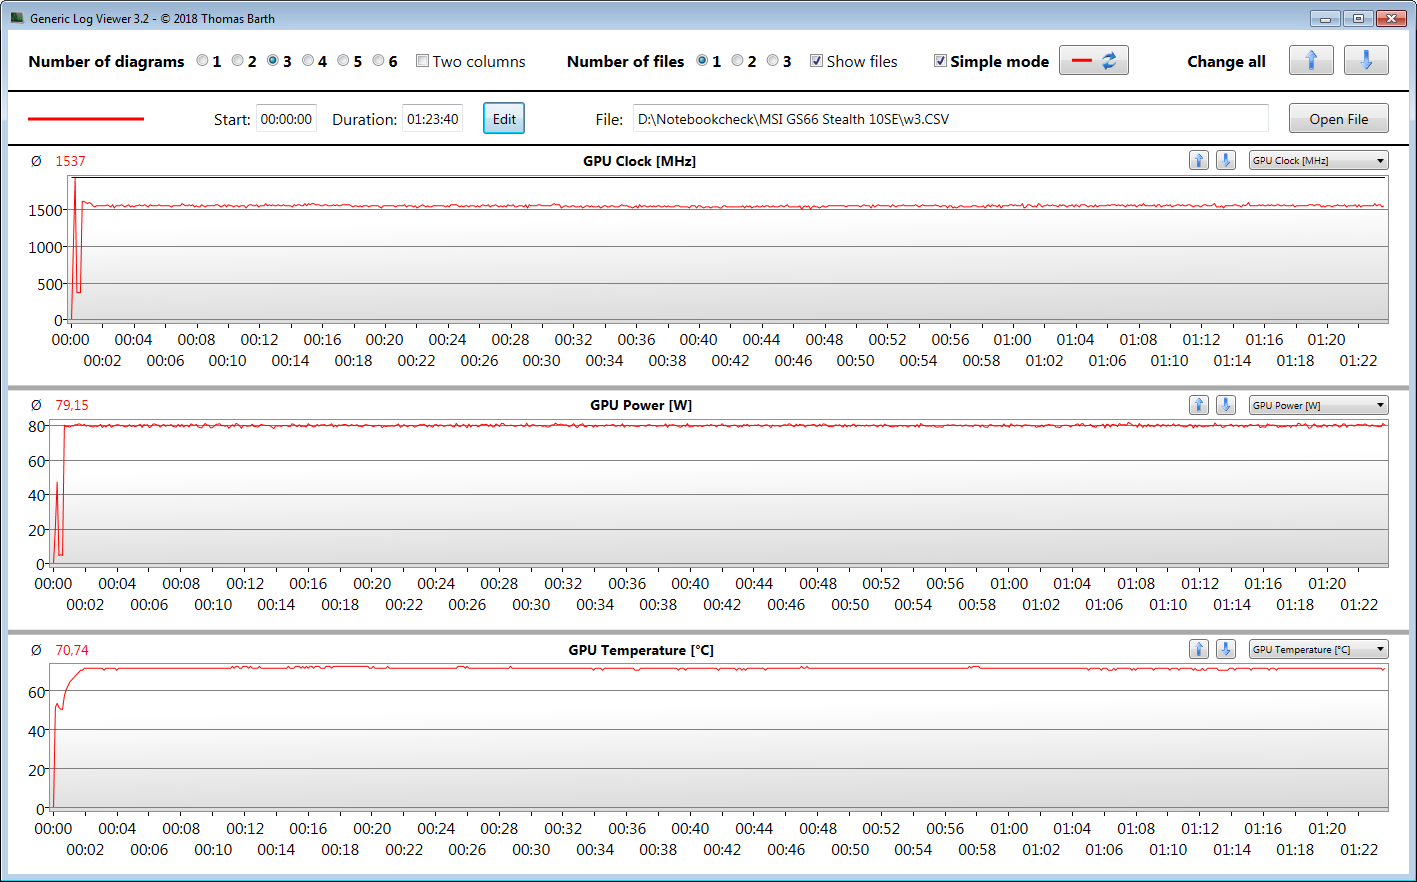
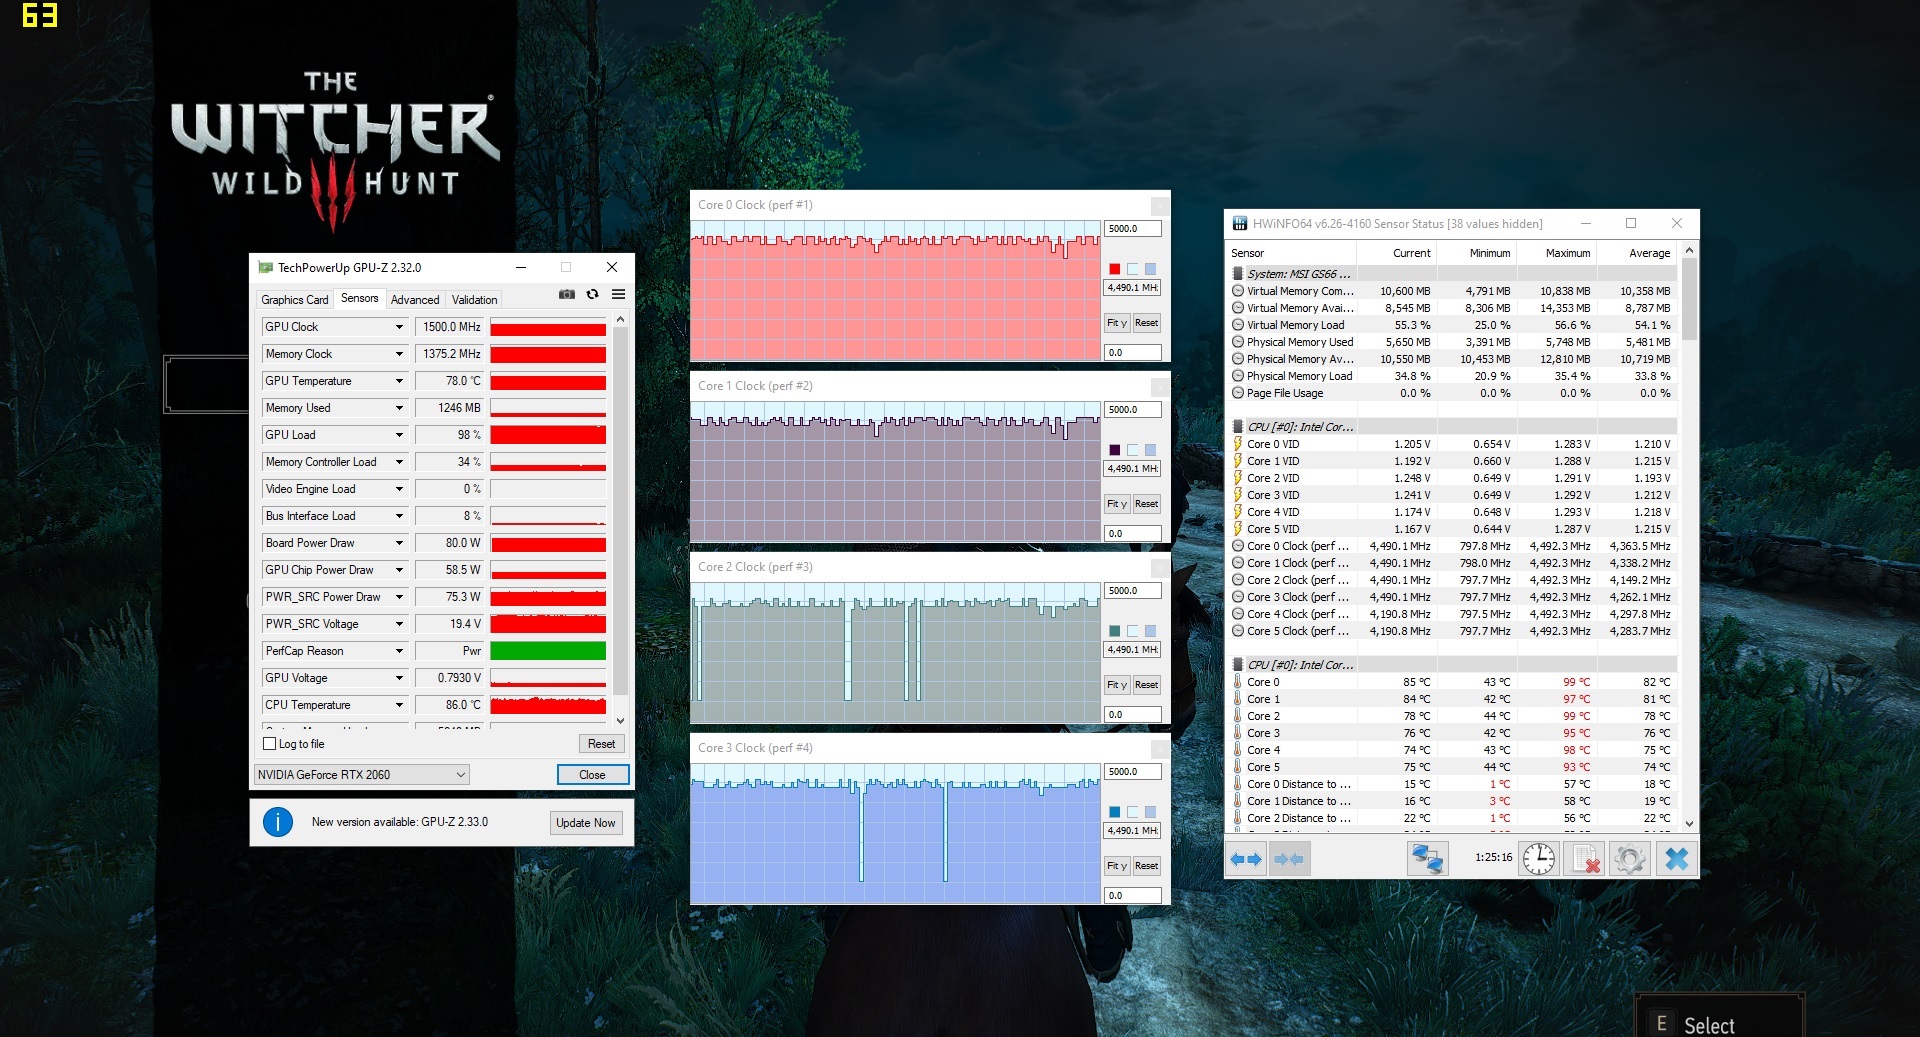
El núcleo de gráficos de la GeForce RTX 2060 (Turing) es compatible con DirectX 12 y funciona a una velocidad base de 960 MHz. Un aumento de hasta 1.200 MHz es posible cuando se impulsa. Se pueden alcanzar velocidades más altas si la GPU no alcanza un umbral de temperatura y/o energía especificado. De esta forma, registramos un máximo de 1.919 MHz. Nuestra prueba de The Witcher 3 se realiza a una velocidad media de 1.537 MHz. Además, la GPU puede hacer uso de la rápida memoria de gráficos GDDR6 (6.144 MB).
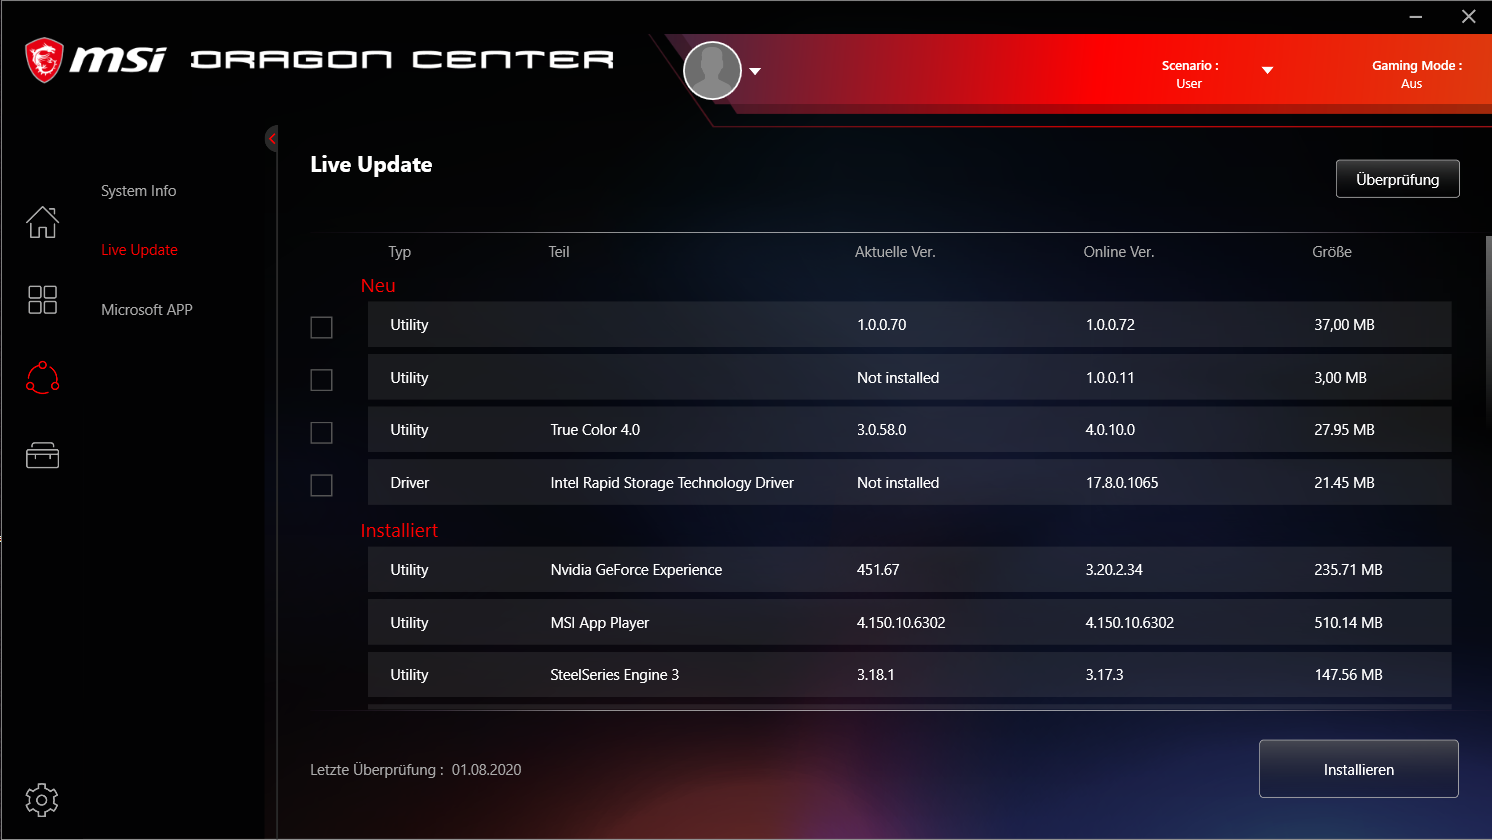
Los resultados de las pruebas de 3DMark están a un nivel normal para la GPU instalada aquí. La GPU UHD Graphics 630 integrada en el procesador está activa, y el portátil funciona con la solución de conmutación de gráficos Optimus de Nvidia. Optimus puede ser desactivado dentro del software Dragon Center si es necesario.

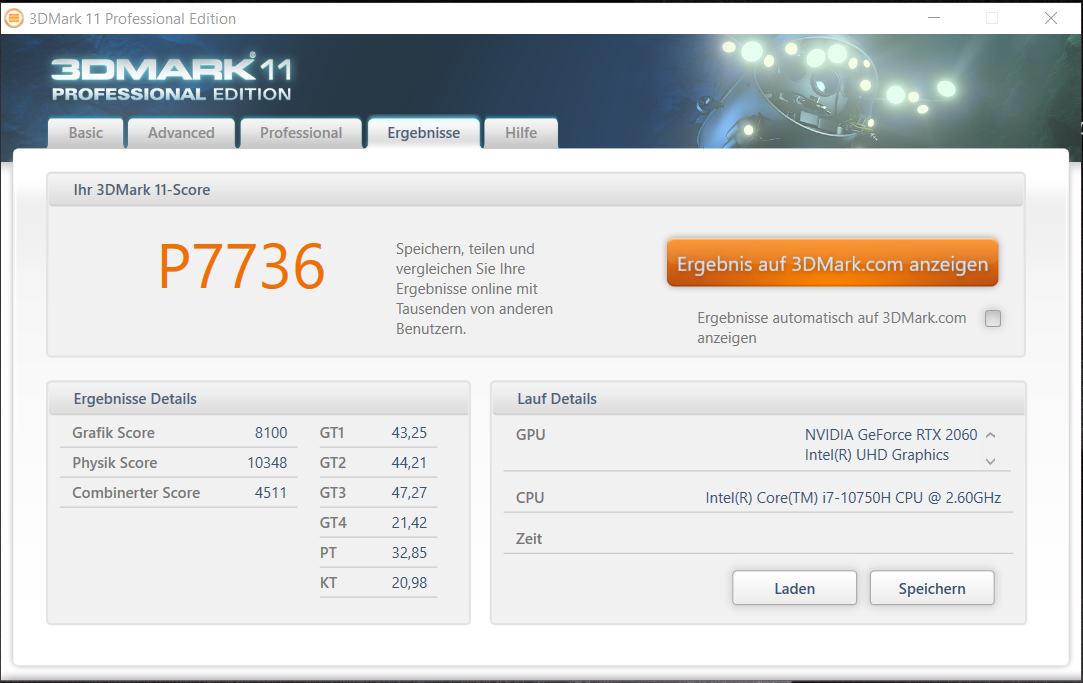
| 3DMark 11 Performance | 18163 puntos | |
| 3DMark Cloud Gate Standard Score | 36138 puntos | |
| 3DMark Fire Strike Score | 14290 puntos | |
| 3DMark Time Spy Score | 6038 puntos | |
ayuda | ||
El rendimiento de los juegos
El hecho de que el GS66 pueda llevar a la pantalla todos los juegos de ordenador modernos sin problemas no debería ser una sorpresa dado su potente hardware. Siempre se puede seleccionar una resolución Full HD y ajustes de alta a máxima calidad. La GPU también puede manejar resoluciones más allá de Full HD (para ello habría que conectar un monitor apropiado). Sin embargo, el nivel de calidad debe reducirse en ese caso.
| BioShock Infinite - 1920x1080 Ultra Preset, DX11 (DDOF) | |
| Lenovo Legion 5 15IMH05H | |
| MSI GS66 Stealth 10SE-045 | |
| Razer Blade 15 GTX 1660 Ti | |
| Asus TUF Gaming A15 FA506IV-HN172 | |
| Metro Exodus - 1920x1080 Ultra Quality AF:16x | |
| Gigabyte Aero 15 OLED XB-8DE51B0SP | |
| MSI GS66 10SGS | |
| Dell G5 15 SE 5505 P89F | |
| MSI GS66 Stealth 10SE-045 | |
| Far Cry 5 - 1920x1080 Ultra Preset AA:T | |
| Media de la clase Gaming (70 - 151, n=10, últimos 2 años) | |
| MSI GS66 Stealth 10SE-045 | |
| Lenovo Legion 5 15IMH05H | |
| Call of Duty Modern Warfare 2019 - 1920x1080 Maximum Settings AA:T2X Filmic SM | |
| Schenker XMG Core 15 GK5CP6V | |
| MSI GS66 Stealth 10SE-045 | |
| Red Dead Redemption 2 - 1920x1080 High Settings | |
| Gigabyte Aero 15 OLED XB-8DE51B0SP | |
| Lenovo Legion 5 15IMH05H | |
| MSI GS66 Stealth 10SE-045 | |
| Schenker XMG Core 15 GK5CP6V | |
Para verificar si las frecuencias de cuadro se mantienen en gran medida constantes incluso durante un período de tiempo prolongado, dejamos que el juego The Witcher 3 se ejecute durante unos 60 minutos con una resolución Full HD y una configuración de máxima calidad. El personaje encarnado por el jugador no se mueve durante todo este período. No se encontró una caída en la velocidad de fotogramas.
| bajo | medio | alto | ultra | |
|---|---|---|---|---|
| BioShock Infinite (2013) | 336 | 290 | 268.3 | 135.8 |
| The Witcher 3 (2015) | 280.6 | 196.7 | 117.7 | 63.4 |
| Far Cry 5 (2018) | 128 | 96 | 90 | 86 |
| Shadow of the Tomb Raider (2018) | 114 | 93 | 86 | 77 |
| Metro Exodus (2019) | 140.9 | 69.9 | 53.4 | 42.2 |
| Call of Duty Modern Warfare 2019 (2019) | 143.9 | 97.3 | 80.8 | 70.7 |
| Red Dead Redemption 2 (2019) | 118.5 | 81.9 | 54.9 | 35.1 |
| Doom Eternal (2020) | 209.2 | 136.9 | 124.6 | 121.9 |
| Gears Tactics (2020) | 243.5 | 144.4 | 95.9 | 62.8 |
| F1 2020 (2020) | 230 | 150 | 131 | 93 |
| Death Stranding (2020) | 146.6 | 102 | 93.1 | 91 |
Emisiones - Los tres ventiladores del MSI Stealth aparecen con fuerza
Emisiones de ruido
Los ventiladores del GS66 ya pueden aparecer considerablemente en uso inactivo. De esta manera, medimos niveles de presión sonora de hasta 40 dB(A). Sin embargo, los ventiladores también son silenciosos de vez en cuando, y entonces el silencio prevalece. En otras palabras: No hay un comportamiento claro del ventilador. Además, los niveles de presión sonora aumentan aún más bajo carga. Registramos valores de 54 dB(A) (prueba de esfuerzo) y 48 dB(A) (La prueba de Witcher 3), respectivamente. Los juegos no son nada divertidos sin unos auriculares aquí.
Ruido
| Ocioso |
| 29 / 30 / 40 dB(A) |
| Carga |
| 51 / 54 dB(A) |
 | ||
30 dB silencioso 40 dB(A) audible 50 dB(A) ruidosamente alto |
||
min: | ||
| MSI GS66 Stealth 10SE-045 i7-10750H, GeForce RTX 2060 Mobile | MSI GS66 Stealth 10SFS i9-10980HK, GeForce RTX 2070 Super Max-Q | Razer Blade 15 GTX 1660 Ti i7-9750H, GeForce GTX 1660 Ti Mobile | Dell G5 15 SE 5505 P89F R7 4800H, Radeon RX 5600M | Lenovo Legion 5 15IMH05H i5-10300H, GeForce RTX 2060 Mobile | Asus TUF Gaming A15 FA506IV-HN172 R7 4800H, GeForce RTX 2060 Mobile | Schenker XMG Core 15 GK5CP6V i7-9750H, GeForce GTX 1660 Ti Mobile | Media de la clase Gaming | |
|---|---|---|---|---|---|---|---|---|
| Noise | -6% | 4% | 11% | 4% | 4% | -0% | 11% | |
| apagado / medio ambiente * (dB) | 25 | 30 -20% | 28.5 -14% | 28 -12% | 30.7 -23% | 30.2 -21% | 30 -20% | 24.1 ? 4% |
| Idle Minimum * (dB) | 29 | 32 -10% | 30.3 -4% | 28 3% | 30.7 -6% | 30.2 -4% | 30 -3% | 25.8 ? 11% |
| Idle Average * (dB) | 30 | 34 -13% | 30.5 -2% | 28 7% | 30.7 -2% | 30.2 -1% | 31 -3% | 27.4 ? 9% |
| Idle Maximum * (dB) | 40 | 39 2% | 30.5 24% | 28 30% | 30.7 23% | 30.2 24% | 33 17% | 30 ? 25% |
| Load Average * (dB) | 51 | 53 -4% | 41 20% | 28 45% | 36.6 28% | 40 22% | 48 6% | 43 ? 16% |
| Witcher 3 ultra * (dB) | 48 | 48 -0% | 48 -0% | 50.6 -5% | 47 2% | 49 -2% | 51 -6% | |
| Load Maximum * (dB) | 54 | 53 2% | 51.9 4% | 50.6 6% | 50.9 6% | 49 9% | 51 6% | 54 ? -0% |
* ... más pequeño es mejor
Temperatura
Nuestra prueba de estrés (Prime95 y FurMark funcionan durante al menos una hora) se realiza con el procesador y el núcleo de gráficos a 2,5 a 2,7 GHz y 1.390 a 1.400 MHz, respectivamente. Con la energía de la batería, las velocidades son de 1,9 a 2 GHz (CPU) y 1.300 a 1.350 MHz (GPU), respectivamente. La prueba de esfuerzo representa un escenario extremo que no ocurre en la vida cotidiana. Utilizamos esta prueba para comprobar si el sistema se mantiene estable incluso a plena carga.
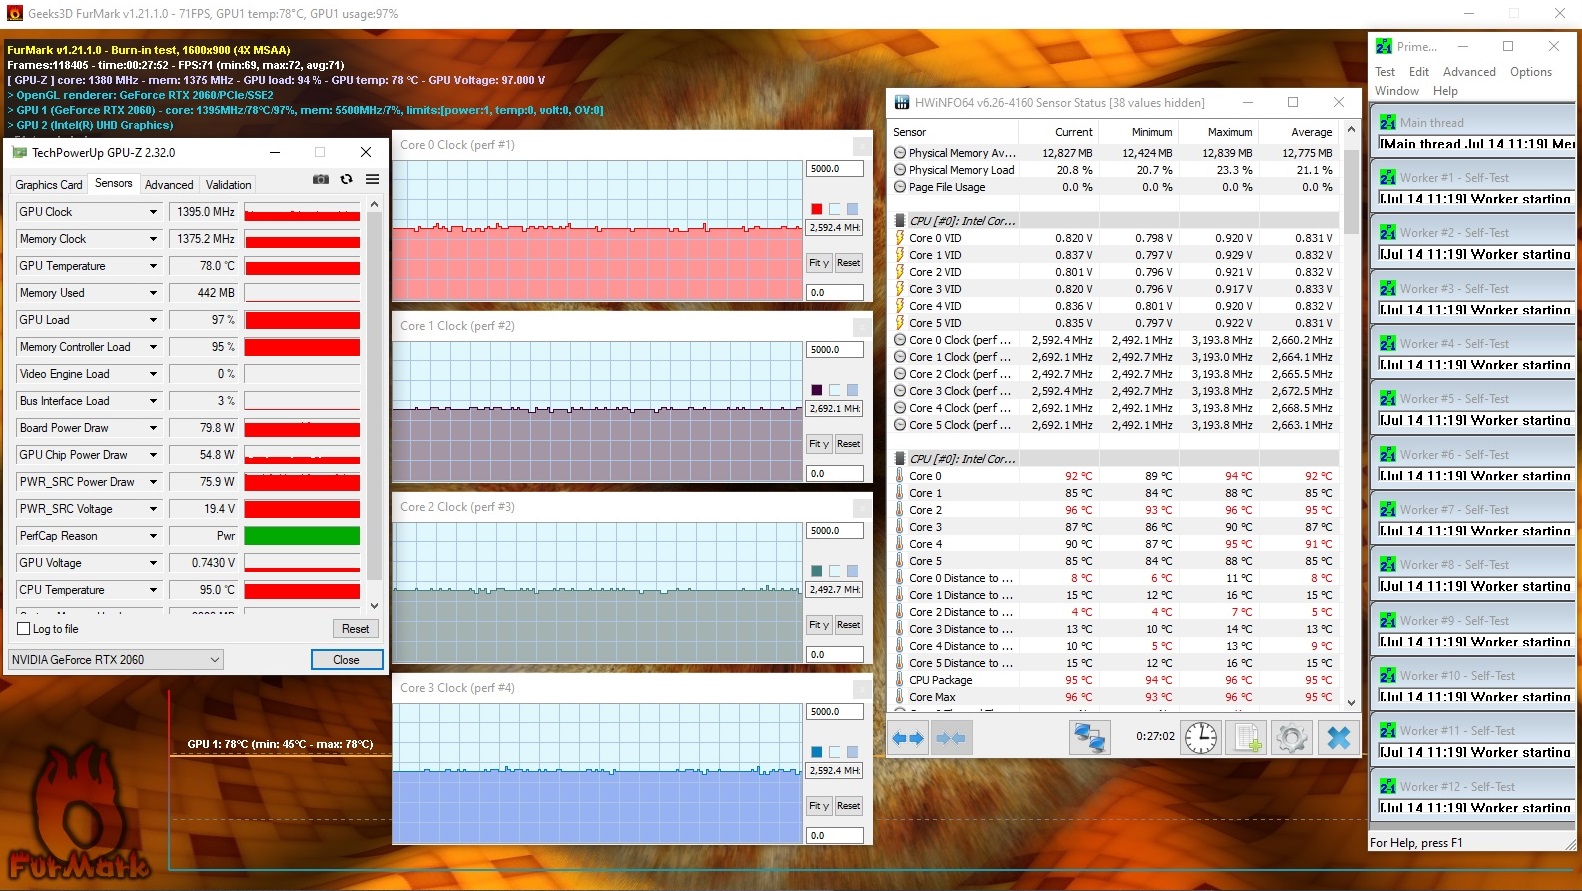
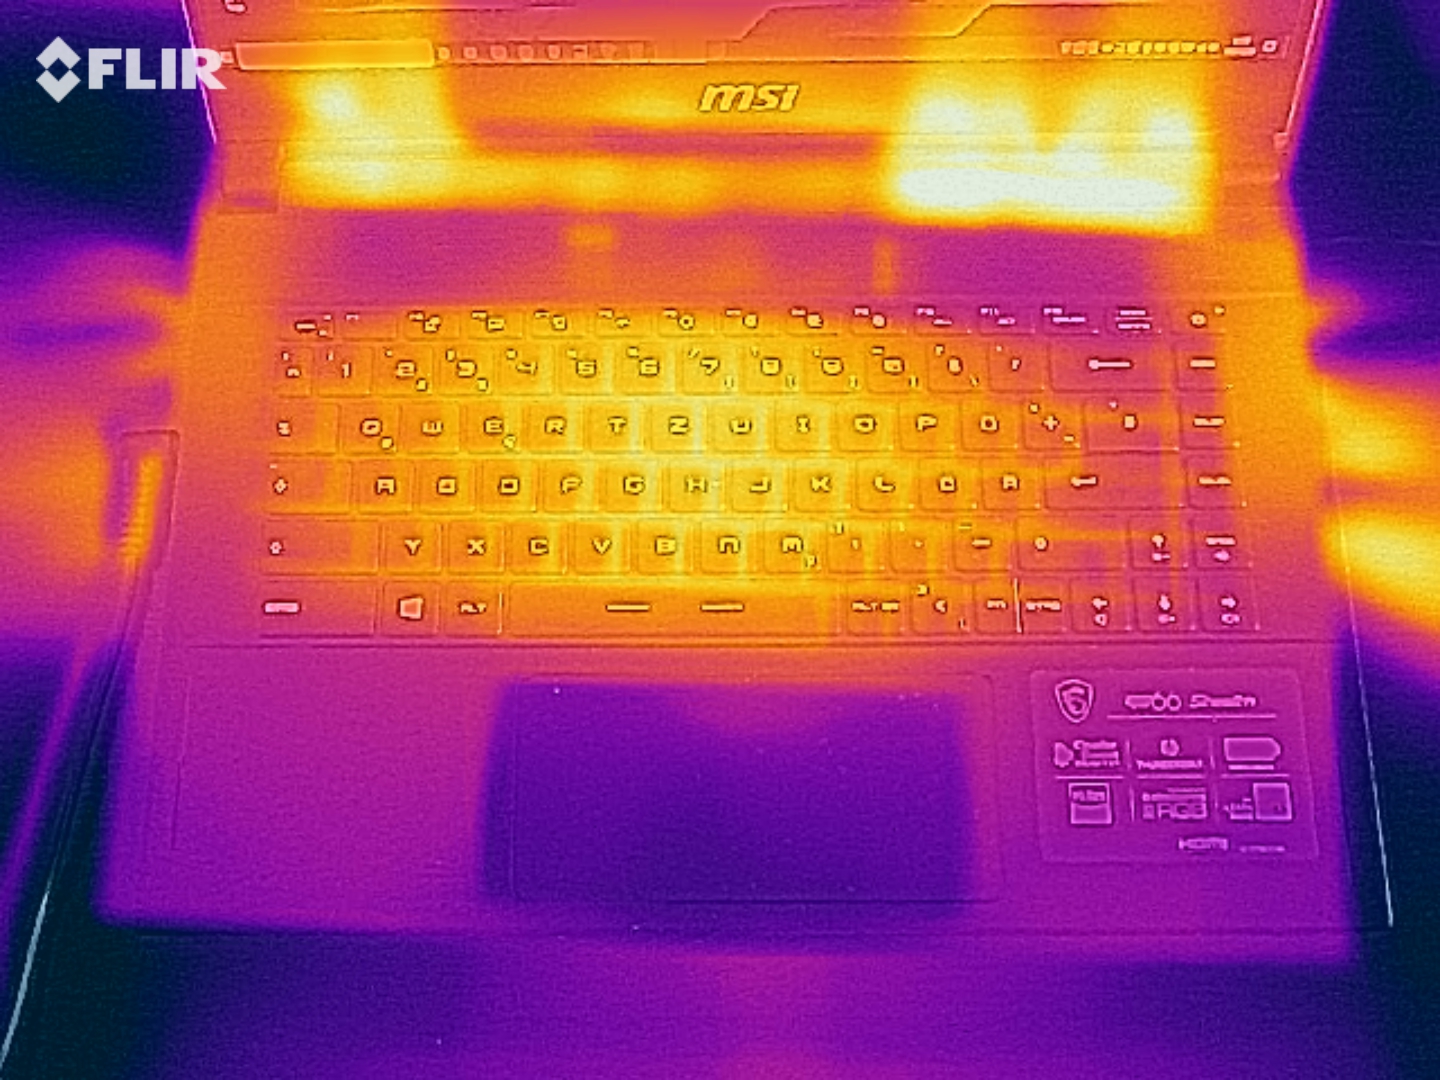
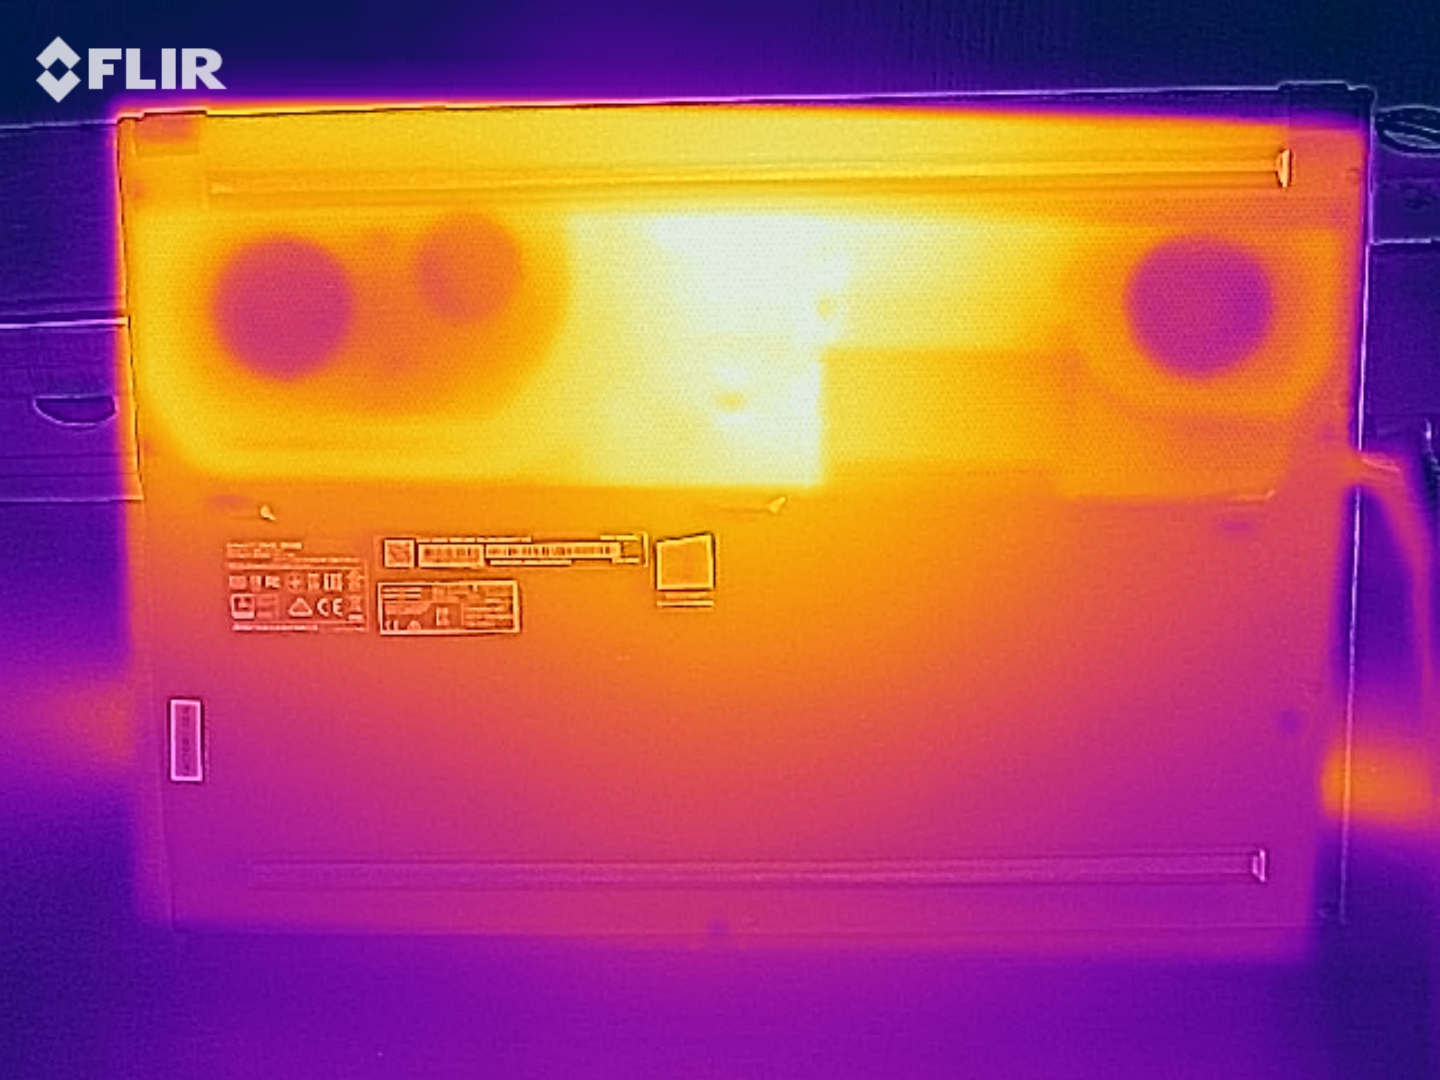
El portátil MSI se calienta notablemente bajo carga pero no excesivamente. Durante la prueba de estrés, registramos temperaturas superiores a los 50 °C en algunos puntos de medición. El desarrollo del calor es un poco más fuerte cuando realizamos nuestra prueba de The Witcher 3. Como resultado, el ordenador no debe ser colocado en el regazo. En el uso diario, las temperaturas están en el rango verde.
(-) La temperatura máxima en la parte superior es de 53 °C / 127 F, frente a la media de 40.4 °C / 105 F, que oscila entre 21.2 y 68.8 °C para la clase Gaming.
(-) El fondo se calienta hasta un máximo de 53 °C / 127 F, frente a la media de 43.2 °C / 110 F
(+) En reposo, la temperatura media de la parte superior es de 27.4 °C / 81# F, frente a la media del dispositivo de 33.9 °C / 93 F.
(-) Jugando a The Witcher 3, la temperatura media de la parte superior es de 42.6 °C / 109 F, frente a la media del dispositivo de 33.9 °C / 93 F.
(+) Los reposamanos y el panel táctil alcanzan como máximo la temperatura de la piel (35 °C / 95 F) y, por tanto, no están calientes.
(-) La temperatura media de la zona del reposamanos de dispositivos similares fue de 28.8 °C / 83.8 F (-6.2 °C / -11.2 F).
| MSI GS66 Stealth 10SE-045 i7-10750H, GeForce RTX 2060 Mobile | MSI GS66 Stealth 10SFS i9-10980HK, GeForce RTX 2070 Super Max-Q | Razer Blade 15 GTX 1660 Ti i7-9750H, GeForce GTX 1660 Ti Mobile | Dell G5 15 SE 5505 P89F R7 4800H, Radeon RX 5600M | Lenovo Legion 5 15IMH05H i5-10300H, GeForce RTX 2060 Mobile | Asus TUF Gaming A15 FA506IV-HN172 R7 4800H, GeForce RTX 2060 Mobile | Schenker XMG Core 15 GK5CP6V i7-9750H, GeForce GTX 1660 Ti Mobile | Media de la clase Gaming | |
|---|---|---|---|---|---|---|---|---|
| Heat | -0% | -17% | -3% | 8% | 9% | 2% | -0% | |
| Maximum Upper Side * (°C) | 53 | 53 -0% | 52 2% | 53 -0% | 46.3 13% | 42.9 19% | 48 9% | 45.2 ? 15% |
| Maximum Bottom * (°C) | 53 | 55 -4% | 52.2 2% | 57.6 -9% | 44.4 16% | 49.9 6% | 59 -11% | 48 ? 9% |
| Idle Upper Side * (°C) | 29 | 28 3% | 38 -31% | 27.4 6% | 28.1 3% | 27.8 4% | 27 7% | 31.1 ? -7% |
| Idle Bottom * (°C) | 29 | 29 -0% | 40.4 -39% | 31 -7% | 29.4 -1% | 27 7% | 28 3% | 34.2 ? -18% |
* ... más pequeño es mejor
Altavoces
MSI GS66 Stealth 10SE-045 análisis de audio
(+) | los altavoces pueden reproducir a un volumen relativamente alto (#86 dB)
Graves 100 - 315 Hz
(-) | casi sin bajos - de media 30.3% inferior a la mediana
(±) | la linealidad de los graves es media (8.1% delta a frecuencia anterior)
Medios 400 - 2000 Hz
(±) | medias más altas - de media 7.7% más altas que la mediana
(±) | la linealidad de los medios es media (7.3% delta respecto a la frecuencia anterior)
Altos 2 - 16 kHz
(+) | máximos equilibrados - a sólo 3.3% de la mediana
(+) | los máximos son lineales (6% delta a la frecuencia anterior)
Total 100 - 16.000 Hz
(±) | la linealidad del sonido global es media (24% de diferencia con la mediana)
En comparación con la misma clase
» 86% de todos los dispositivos probados de esta clase eran mejores, 4% similares, 9% peores
» El mejor tuvo un delta de 6%, la media fue 18%, el peor fue ###max##%
En comparación con todos los dispositivos probados
» 72% de todos los dispositivos probados eran mejores, 6% similares, 22% peores
» El mejor tuvo un delta de 4%, la media fue 24%, el peor fue ###max##%
Gestión de la energía - El portátil MSI ofrece una sólida duración de la batería
El consumo de energía
Registramos un consumo máximo de energía de 31 vatios en uso inactivo - bastante para un portátil con Optimus activado. La competencia en parte consume considerablemente menos energía. Además, la prueba de estrés permite que la demanda aumente hasta 186 vatios. Medimos un promedio de consumo de energía de 146 vatios durante nuestra prueba de The Witcher 3. La potencia nominal del adaptador de corriente es de 180 vatios.
| Off / Standby | |
| Ocioso | |
| Carga |
|
Clave:
min: | |
| MSI GS66 Stealth 10SE-045 i7-10750H, GeForce RTX 2060 Mobile | MSI GS66 Stealth 10SFS i9-10980HK, GeForce RTX 2070 Super Max-Q | Razer Blade 15 GTX 1660 Ti i7-9750H, GeForce GTX 1660 Ti Mobile | Dell G5 15 SE 5505 P89F R7 4800H, Radeon RX 5600M | Lenovo Legion 5 15IMH05H i5-10300H, GeForce RTX 2060 Mobile | Asus TUF Gaming A15 FA506IV-HN172 R7 4800H, GeForce RTX 2060 Mobile | Schenker XMG Core 15 GK5CP6V i7-9750H, GeForce GTX 1660 Ti Mobile | Media de la clase Gaming | |
|---|---|---|---|---|---|---|---|---|
| Power Consumption | -16% | -41% | 22% | 33% | 22% | 15% | -22% | |
| Idle Minimum * (Watt) | 7 | 13 -86% | 18.7 -167% | 6.5 7% | 3.2 54% | 5.4 23% | 9 -29% | 13.2 ? -89% |
| Idle Average * (Watt) | 18 | 16 11% | 30.7 -71% | 10.6 41% | 8.3 54% | 10 44% | 12 33% | 18.9 ? -5% |
| Idle Maximum * (Watt) | 31 | 27 13% | 33.9 -9% | 11 65% | 8.7 72% | 10.5 66% | 18 42% | 24.3 ? 22% |
| Load Average * (Watt) | 107 | 109 -2% | 93.4 13% | 84.1 21% | 82 23% | 135 -26% | 86 20% | 108 ? -1% |
| Witcher 3 ultra * (Watt) | 146 | 155 -6% | 158.9 -9% | 152.9 -5% | 151 -3% | 144 1% | 126 14% | |
| Load Maximum * (Watt) | 186 | 236 -27% | 195.3 -5% | 180.4 3% | 195 -5% | 147 21% | 173 7% | 254 ? -37% |
* ... más pequeño es mejor
Duración de la batería
El portátil para juegos alcanza un tiempo de ejecución de 6:21 h en nuestra prueba práctica de WLAN (acceso a sitios web mediante un script). Además, el de 15,6 pulgadas completa nuestra prueba de vídeo después de las 6:35 h. Dejamos que el cortometraje Big Buck Bunny (codificación H.264, 1920x1080 píxeles) se ejecute en un bucle continuo aquí. Condiciones de la prueba: Las funciones de ahorro de energía y los módulos inalámbricos (sólo durante la prueba de vídeo) se desactivan, y el brillo de la pantalla se regula a unos 150 cd/m².
| MSI GS66 Stealth 10SE-045 i7-10750H, GeForce RTX 2060 Mobile, 99.9 Wh | Dell G5 15 SE 5505 P89F R7 4800H, Radeon RX 5600M, 51 Wh | Lenovo Legion 5 15IMH05H i5-10300H, GeForce RTX 2060 Mobile, 60 Wh | Asus TUF Gaming A15 FA506IV-HN172 R7 4800H, GeForce RTX 2060 Mobile, 48 Wh | Schenker XMG Core 15 GK5CP6V i7-9750H, GeForce GTX 1660 Ti Mobile, 46 Wh | MSI GS66 10SGS i7-10750H, GeForce RTX 2080 Super Max-Q, 99.99 Wh | MSI GS66 Stealth 10SFS i9-10980HK, GeForce RTX 2070 Super Max-Q, 99.99 Wh | Razer Blade 15 GTX 1660 Ti i7-9750H, GeForce GTX 1660 Ti Mobile, 65 Wh | Media de la clase Gaming | |
|---|---|---|---|---|---|---|---|---|---|
| Duración de Batería | 15% | 32% | 12% | -39% | 18% | 10% | -14% | 14% | |
| Reader / Idle (h) | 9 | 11.2 24% | 14.1 57% | 9.8 9% | 6.1 -32% | 10.2 13% | 8.4 -7% | 8.71 ? -3% | |
| H.264 (h) | 6.6 | 9.2 39% | 5.4 -18% | 8.26 ? 25% | |||||
| WiFi v1.3 (h) | 6.4 | 6.2 -3% | 7.2 13% | 6.2 -3% | 3.6 -44% | 6.9 8% | 6.1 -5% | 5.5 -14% | 7.02 ? 10% |
| Load (h) | 1.2 | 1.5 25% | 1.4 17% | 1.9 58% | 0.7 -42% | 1.6 33% | 1.7 42% | 1.47 ? 23% |
Pro
Contra
Veredicto
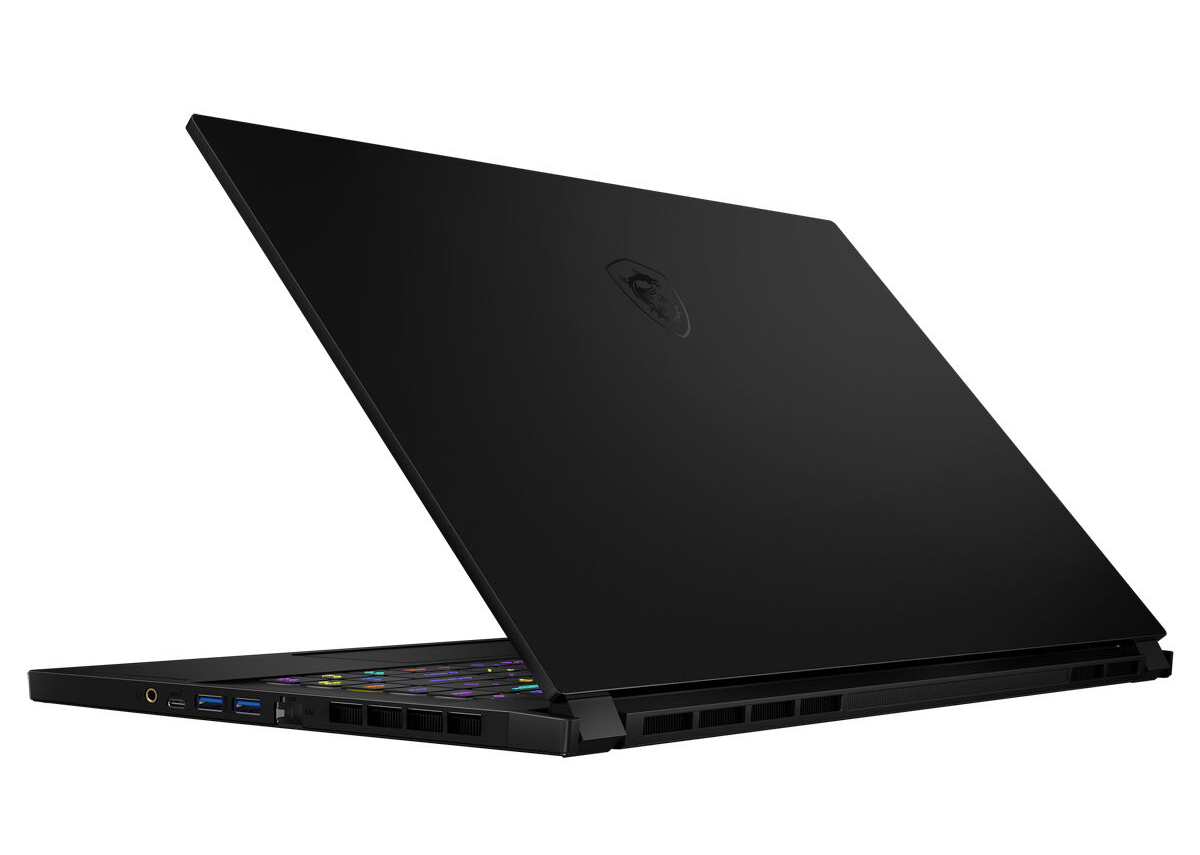
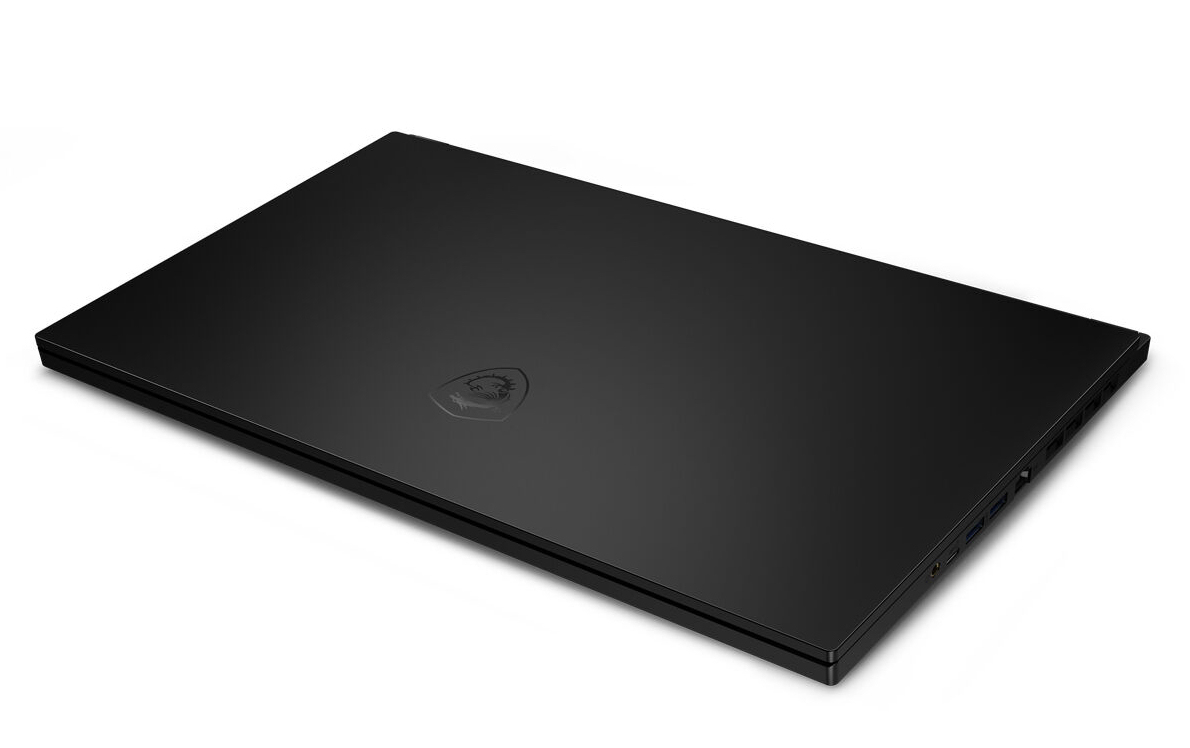
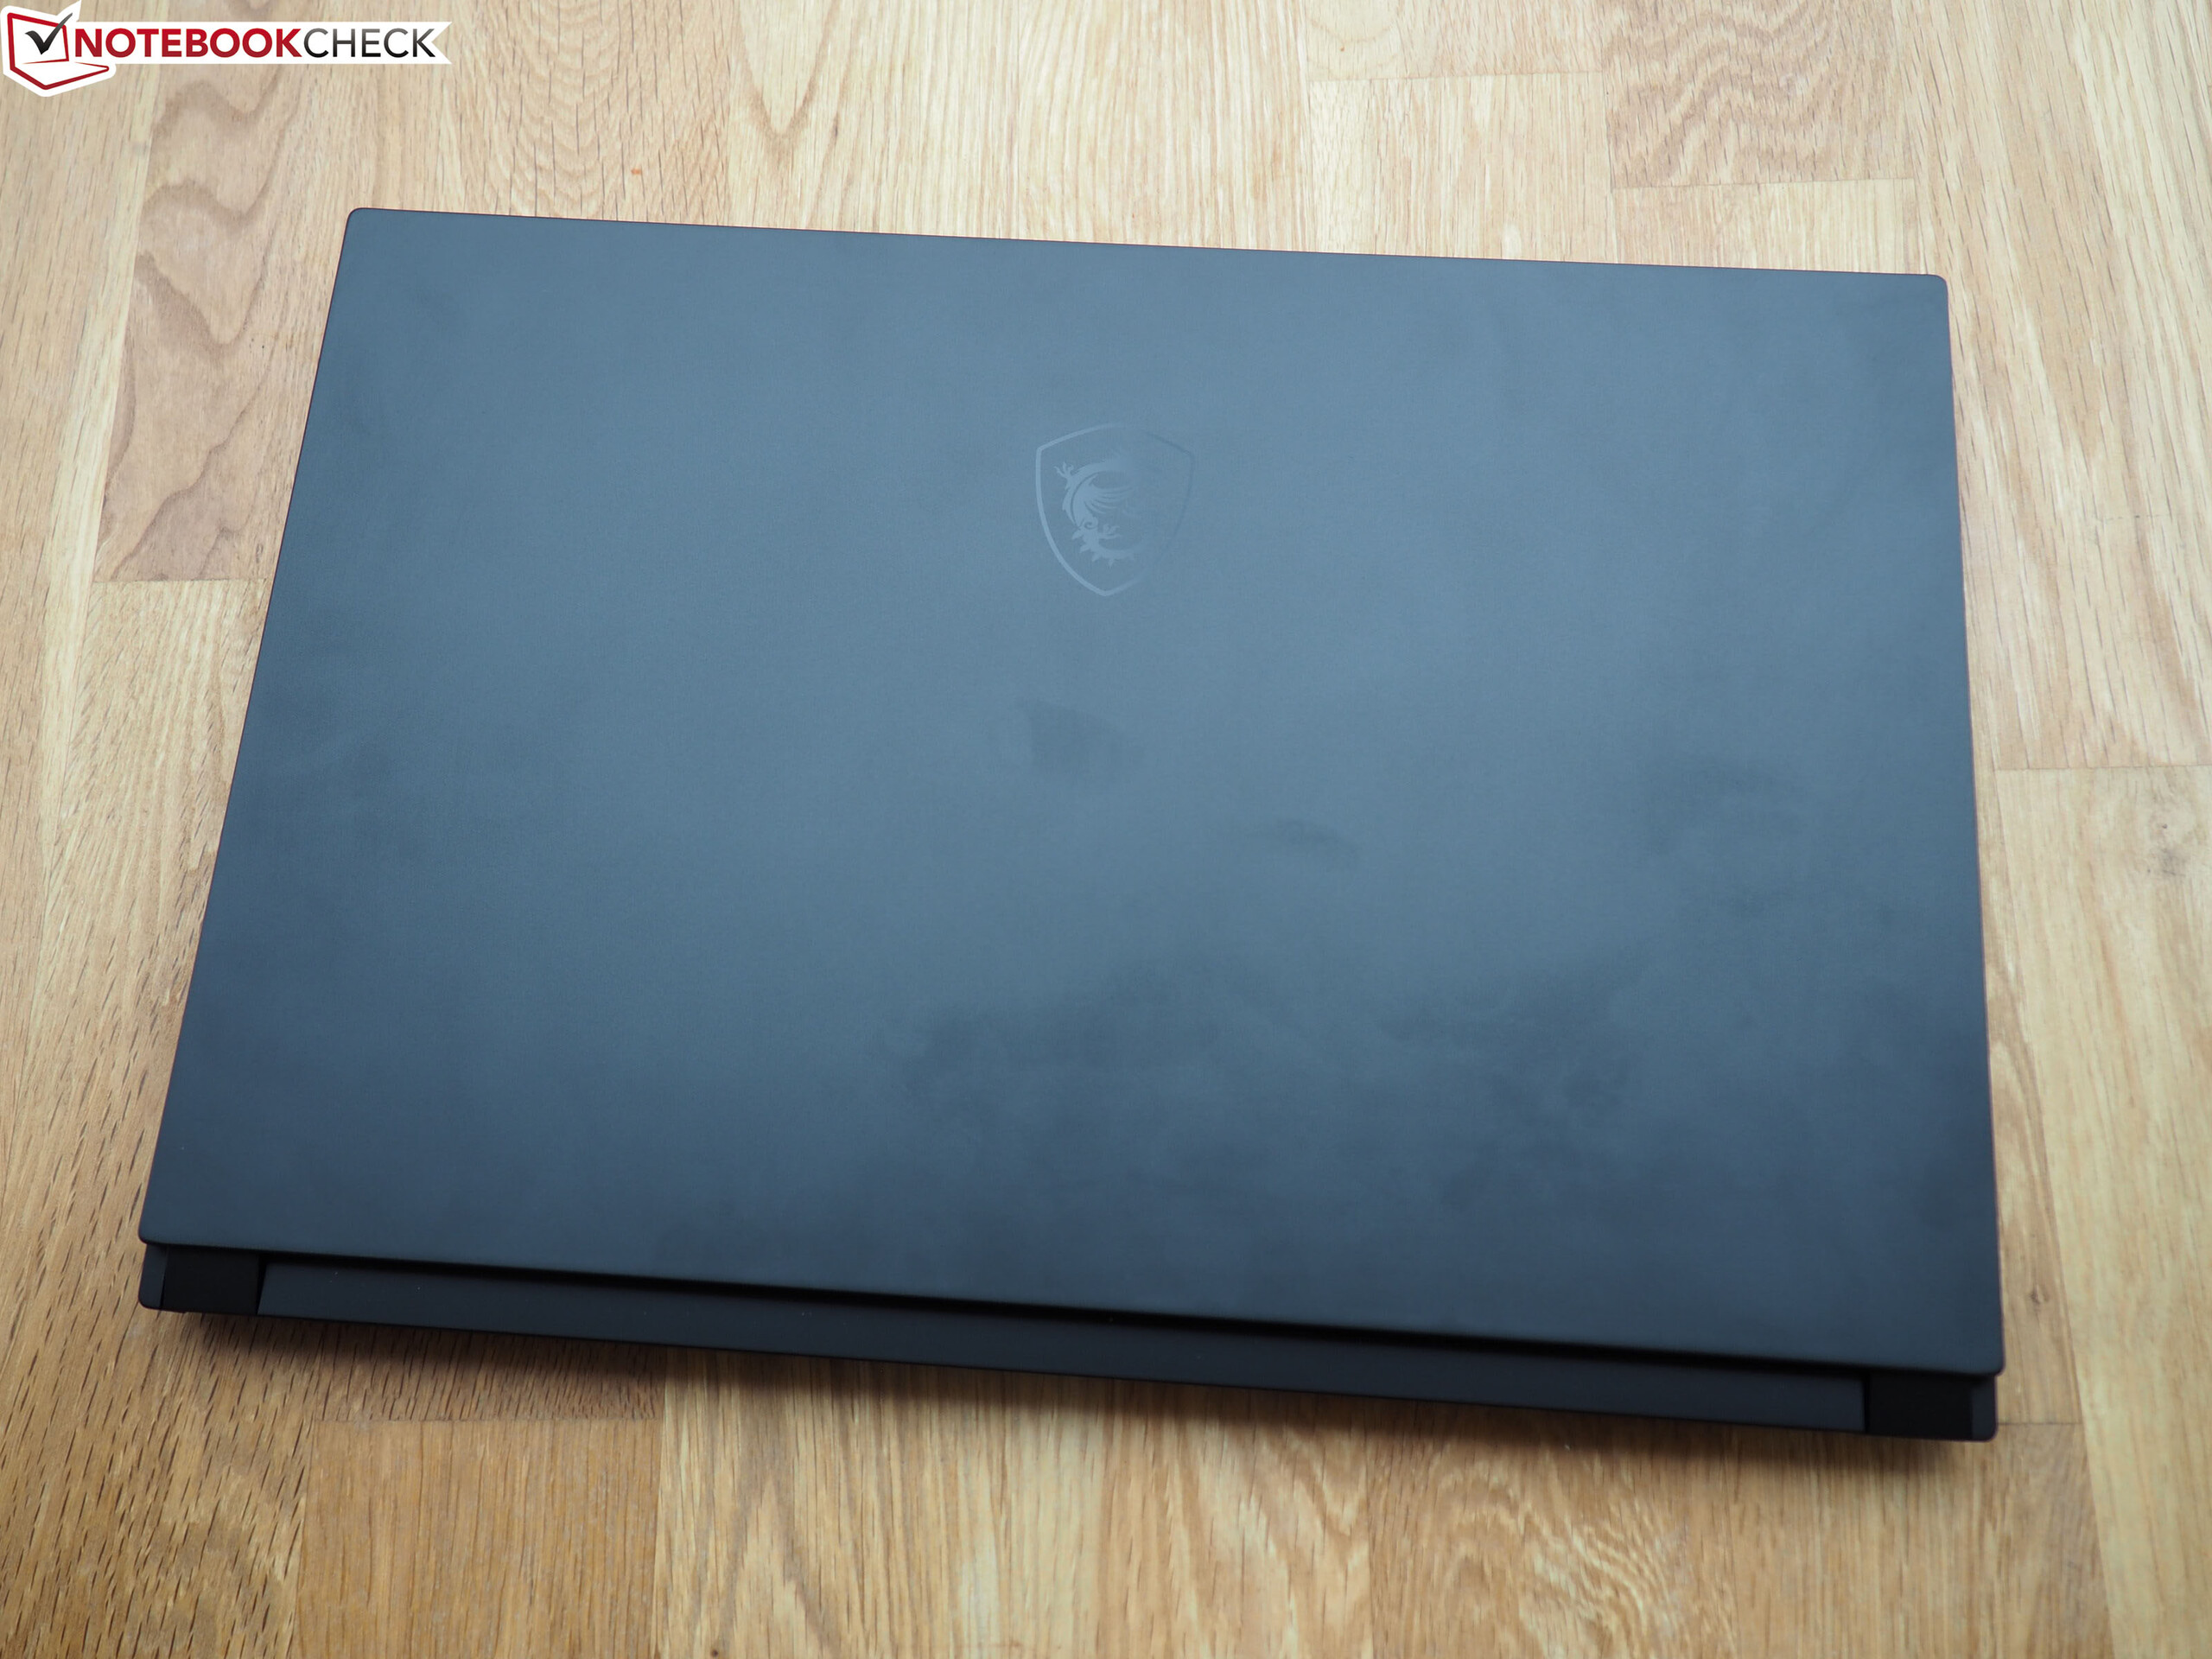
El MSI GS66 tiene una elegante y compacta carcasa de metal que ha demostrado ser muy susceptible a las huellas dactilares. En el interior del chasis hay un procesador Core i7-10750H y un núcleo de gráficos GeForce RTX 2060, que juntos llevan todos los juegos de ordenador modernos sin problemas a la pantalla mate Full HD. Siempre se pueden seleccionar ajustes de alta a máxima calidad.
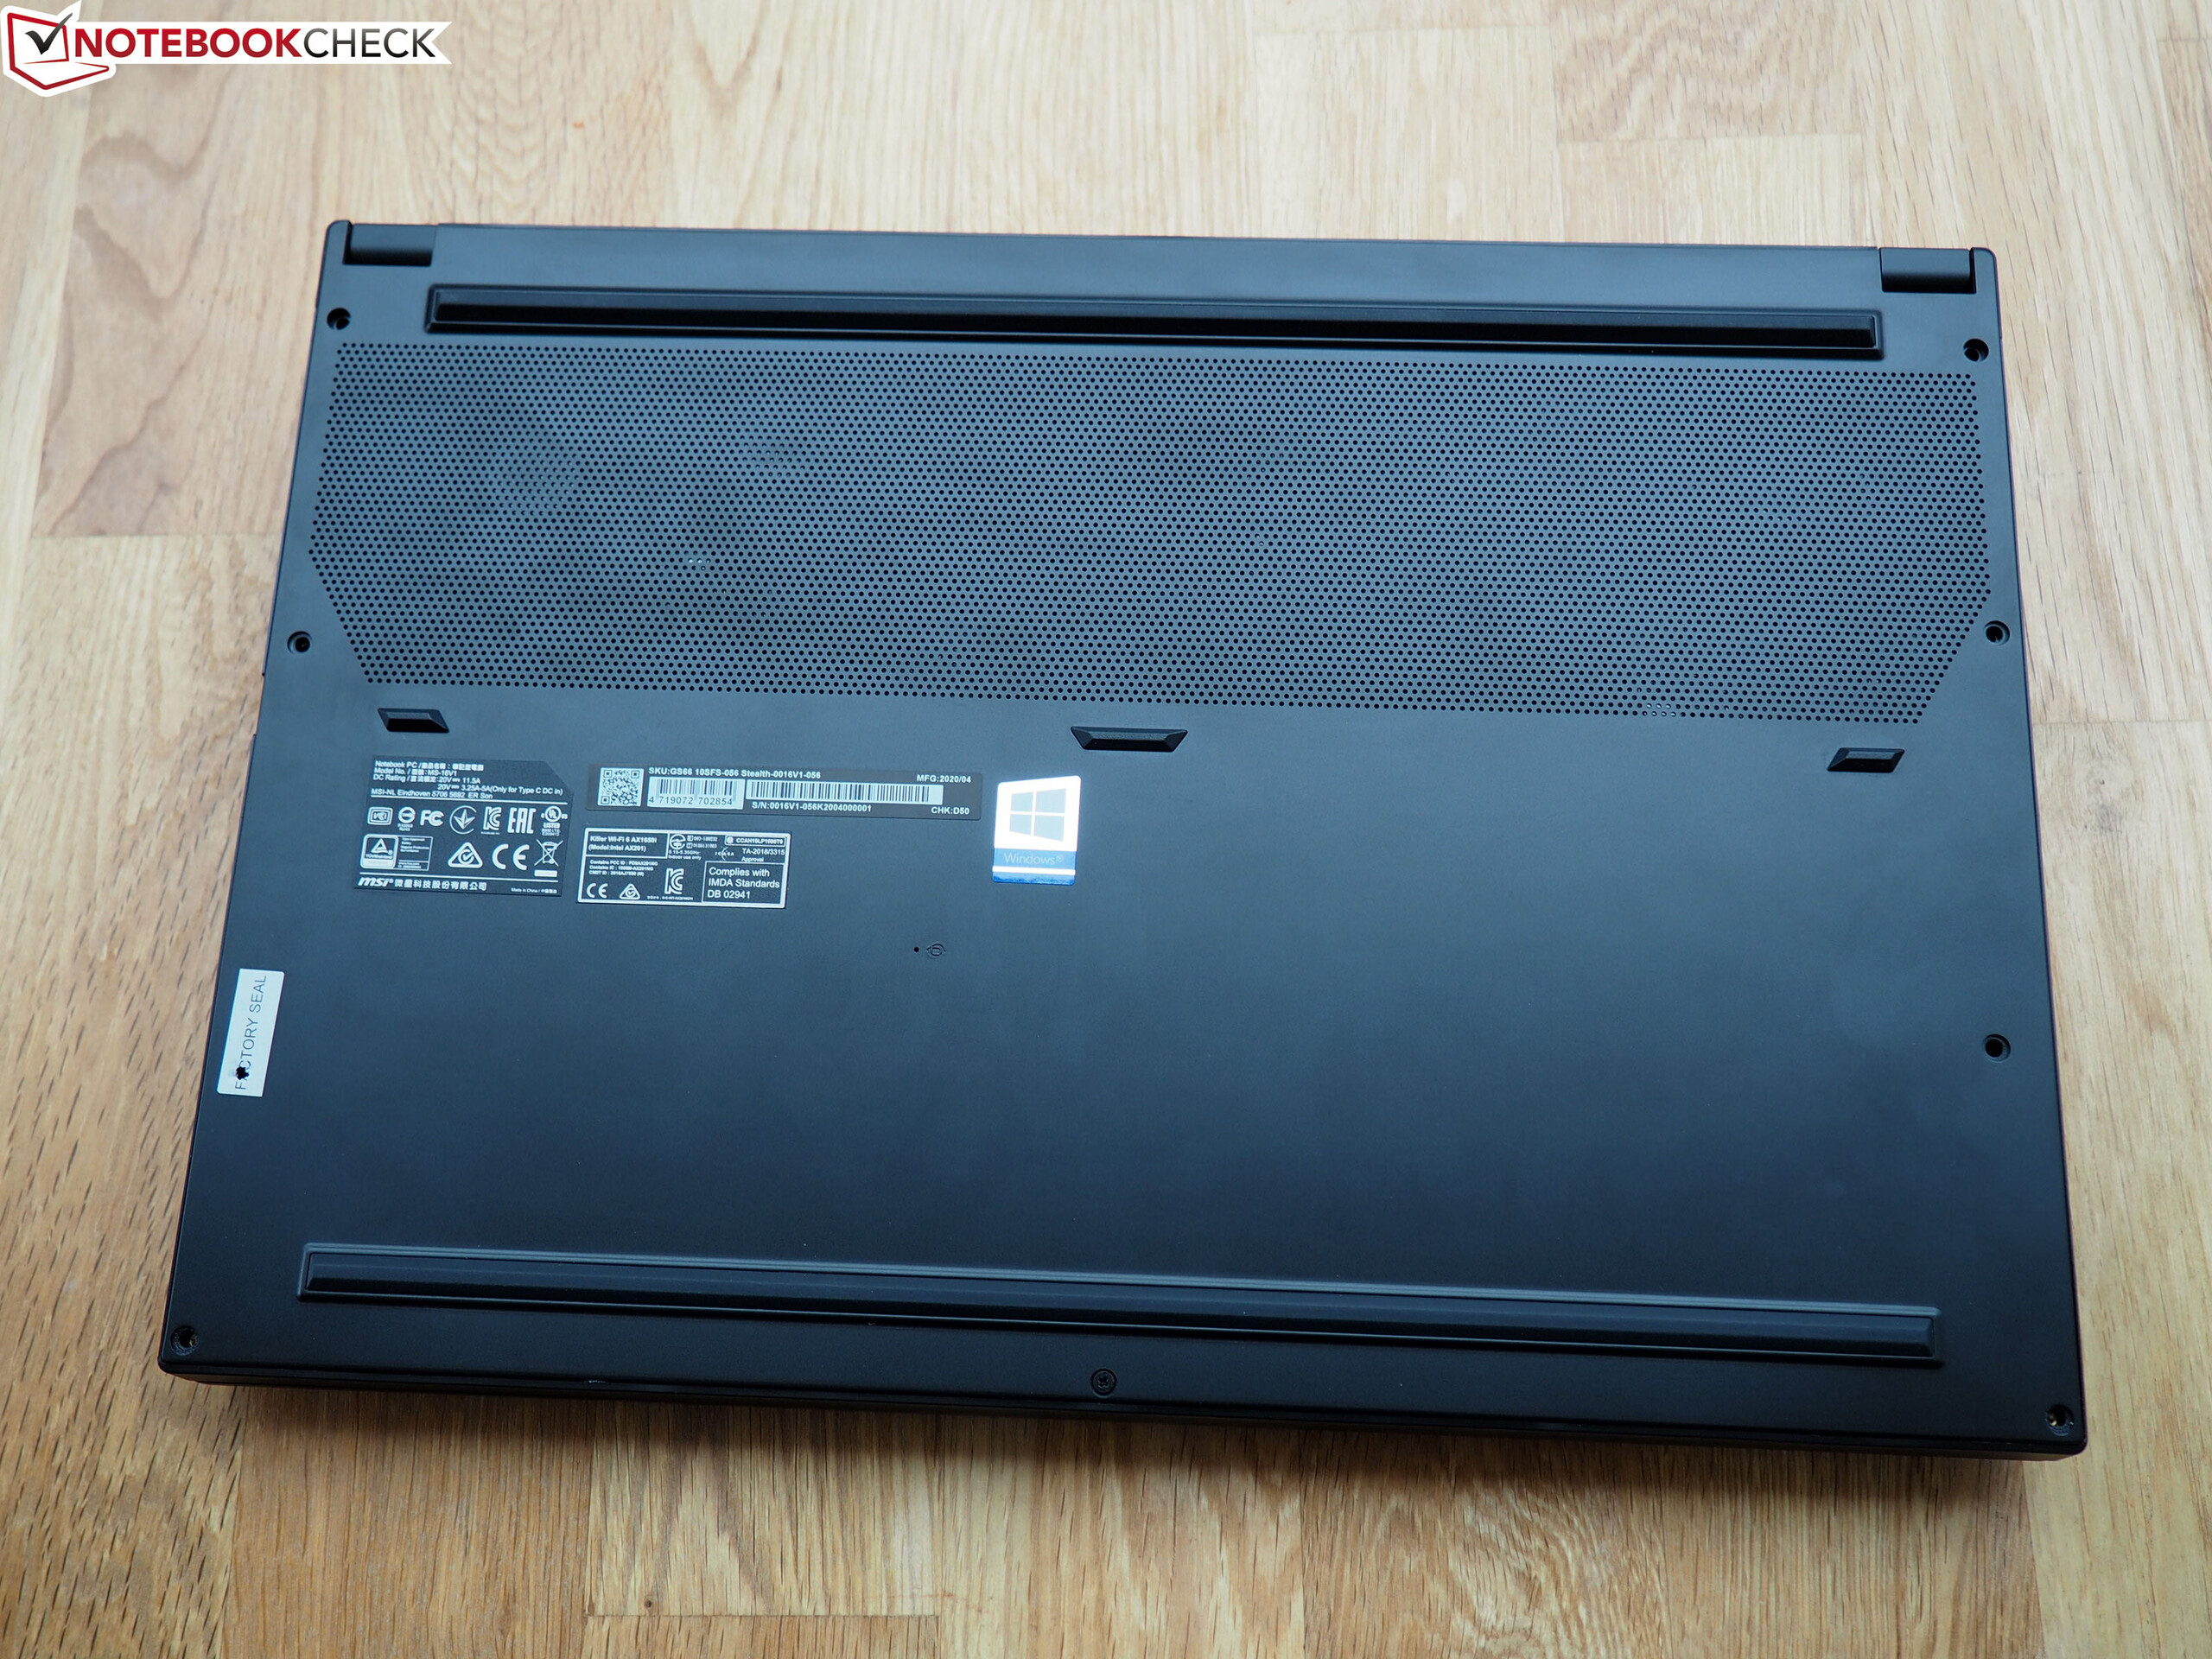
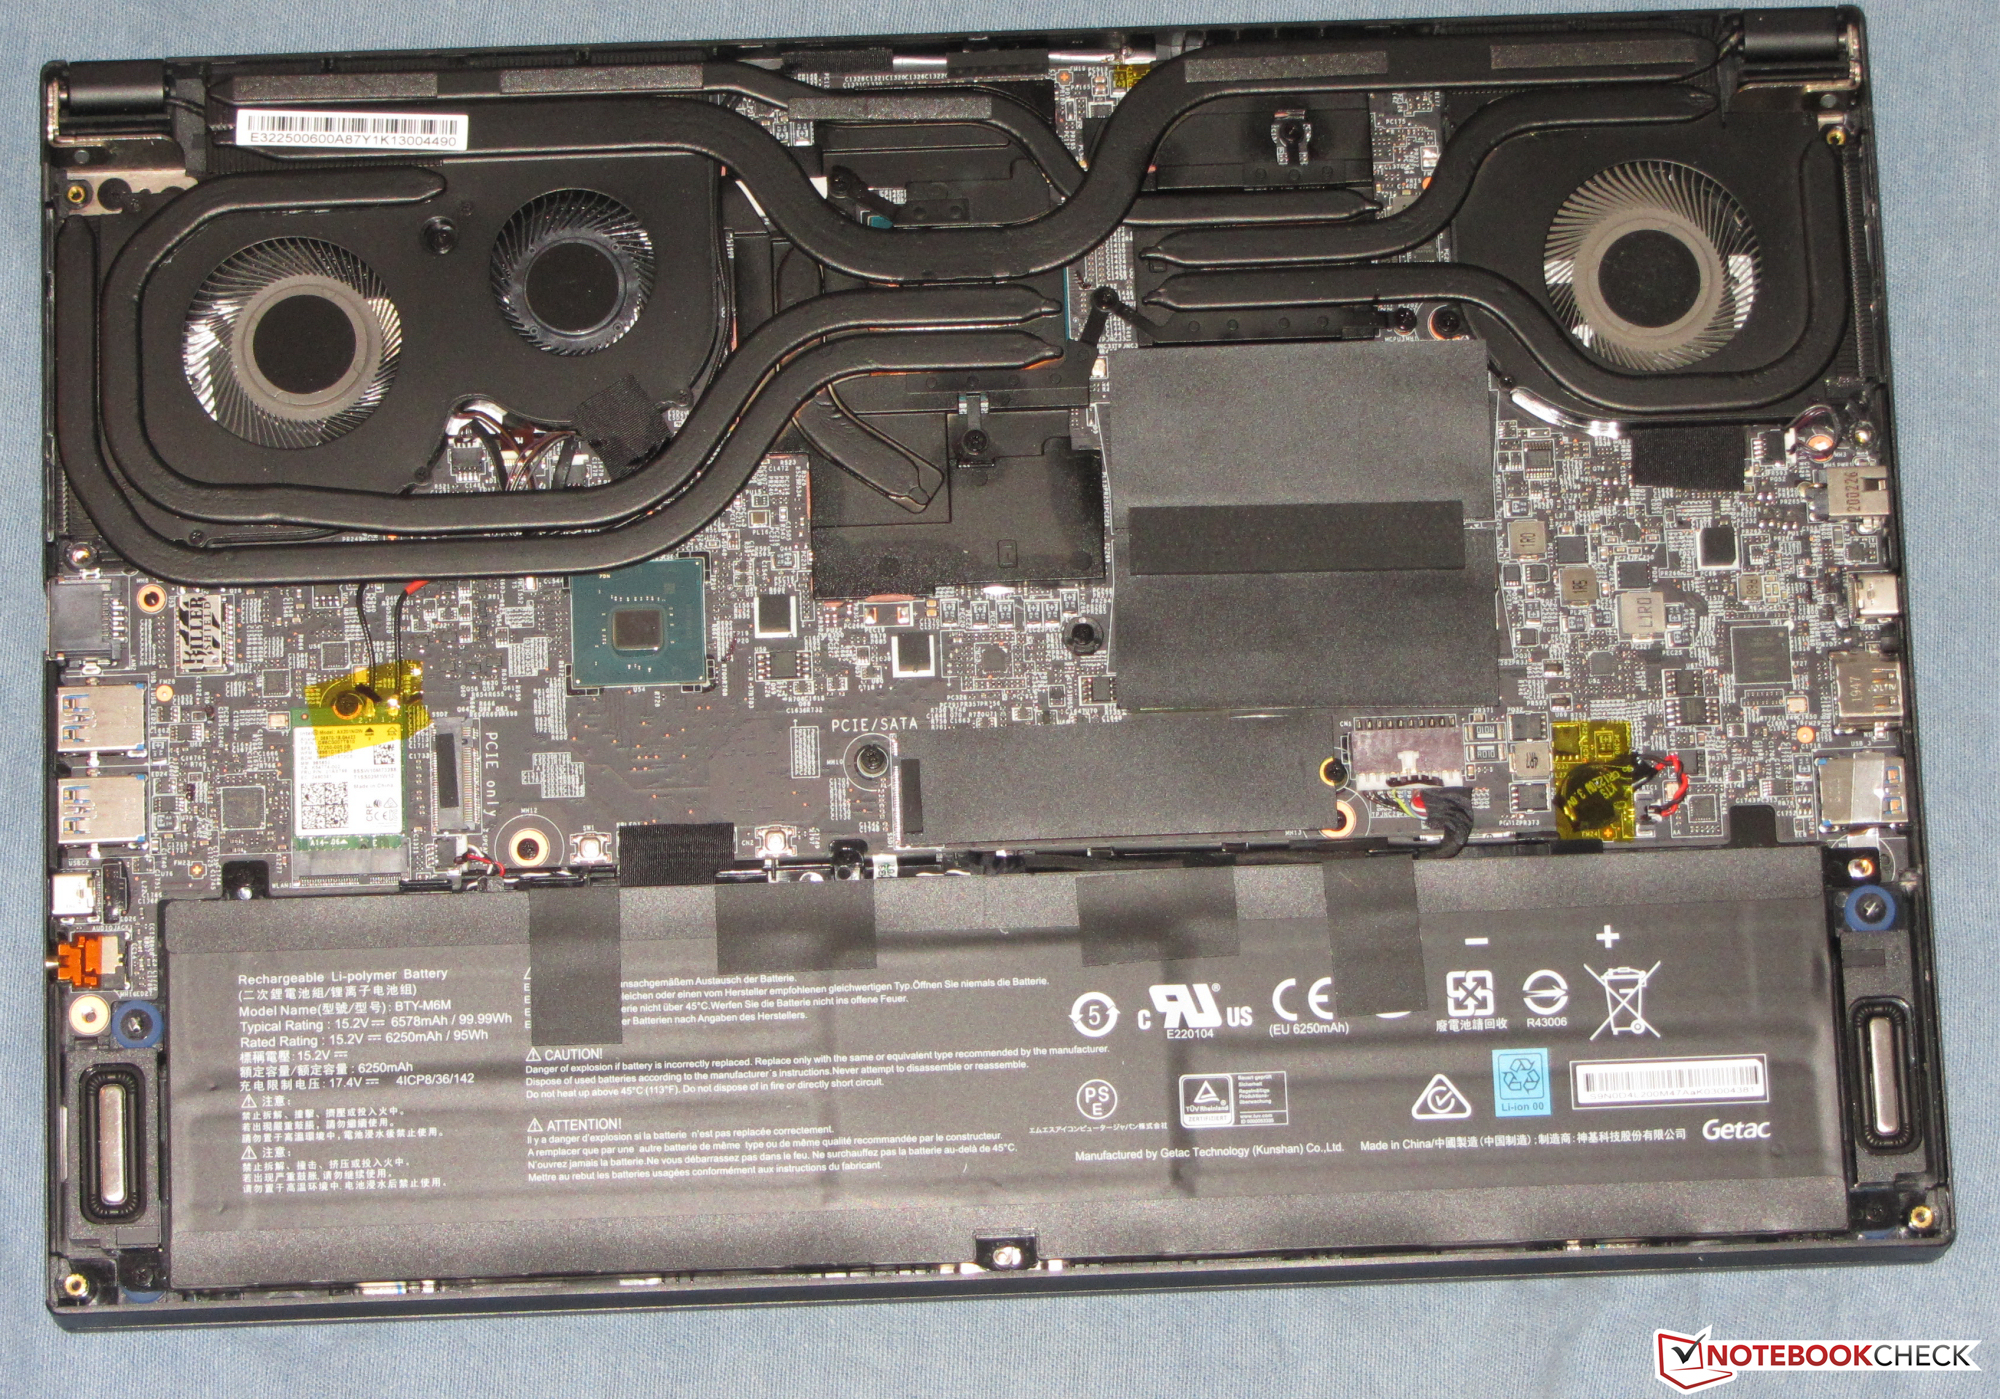
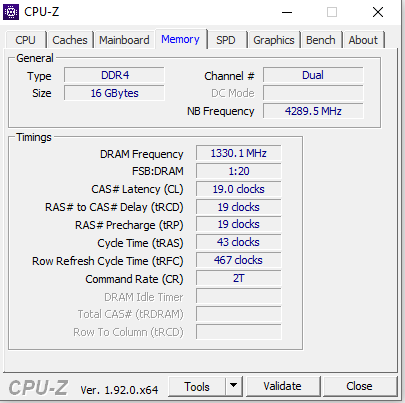
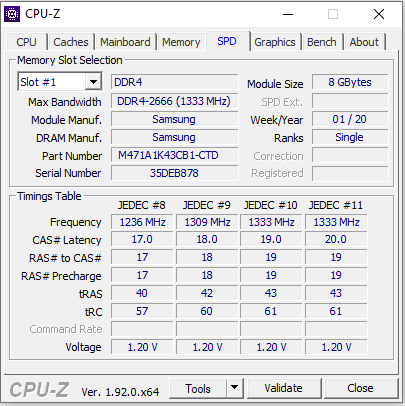
El hardware tiene acceso a 16 GB de RAM (modo de doble canal). Es posible una actualización de hasta 64 GB. Un rápido SSD NVMe de 1 TB proporciona el espacio de almacenamiento necesario. En caso de que el espacio de almacenamiento se agote, el portátil podría ampliarse con una segunda SSD NVMe. Las medidas de mantenimiento/actualización requieren la retirada de la tapa inferior del maletín.
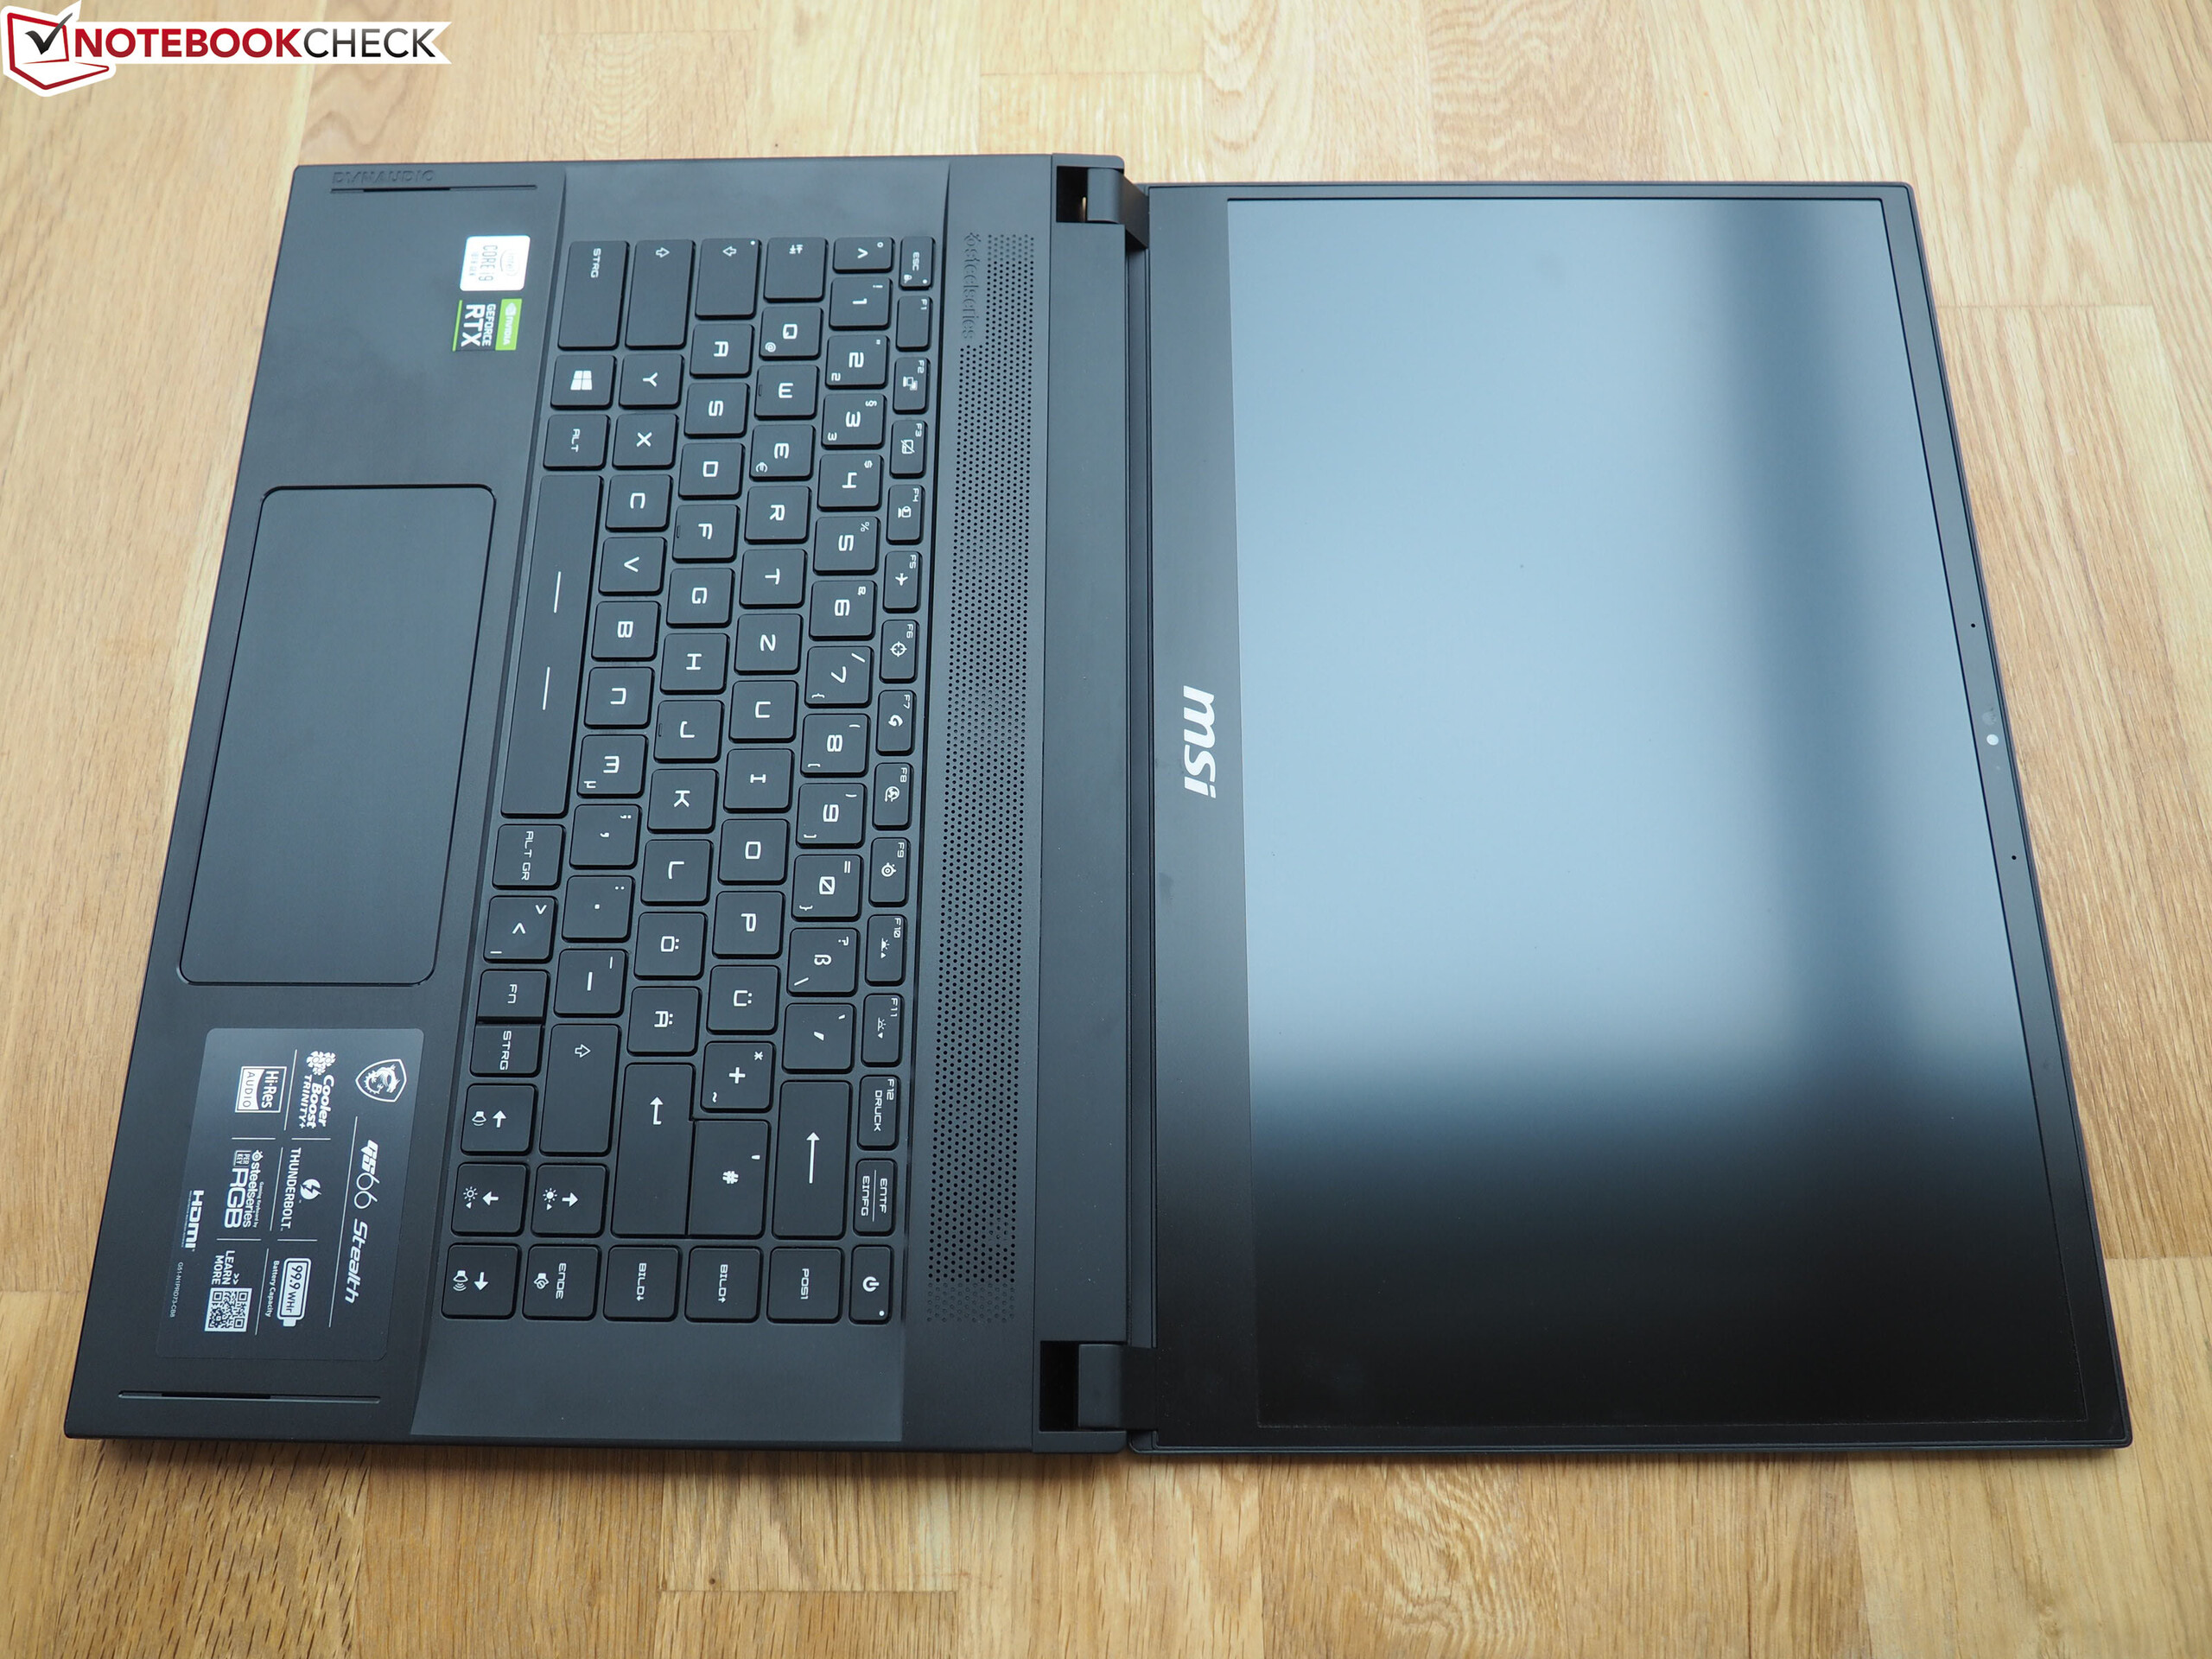
Lo más destacado del portátil es la pantalla IPS de 240 Hz.
La pantalla marca puntos con tiempos de respuesta cortos, ángulos de visión estables, buen contraste y una gran reproducción del color. Por otro lado, el brillo máximo es bajo. Un portátil en este rango de precio debería ofrecer más en este sentido.
En principio, los tiempos de funcionamiento de la batería son más que adecuados para un portátil para juegos. Pero si los ves en relación con la capacidad de la batería (99,9 Wh), las cosas se ven diferentes. Los competidores obtienen tiempos de funcionamiento similares o parcialmente mejores de las baterías que sólo tienen la mitad de la capacidad de la batería de la GS66. El alto consumo de energía en uso inactivo y bajo carga es notable aquí.
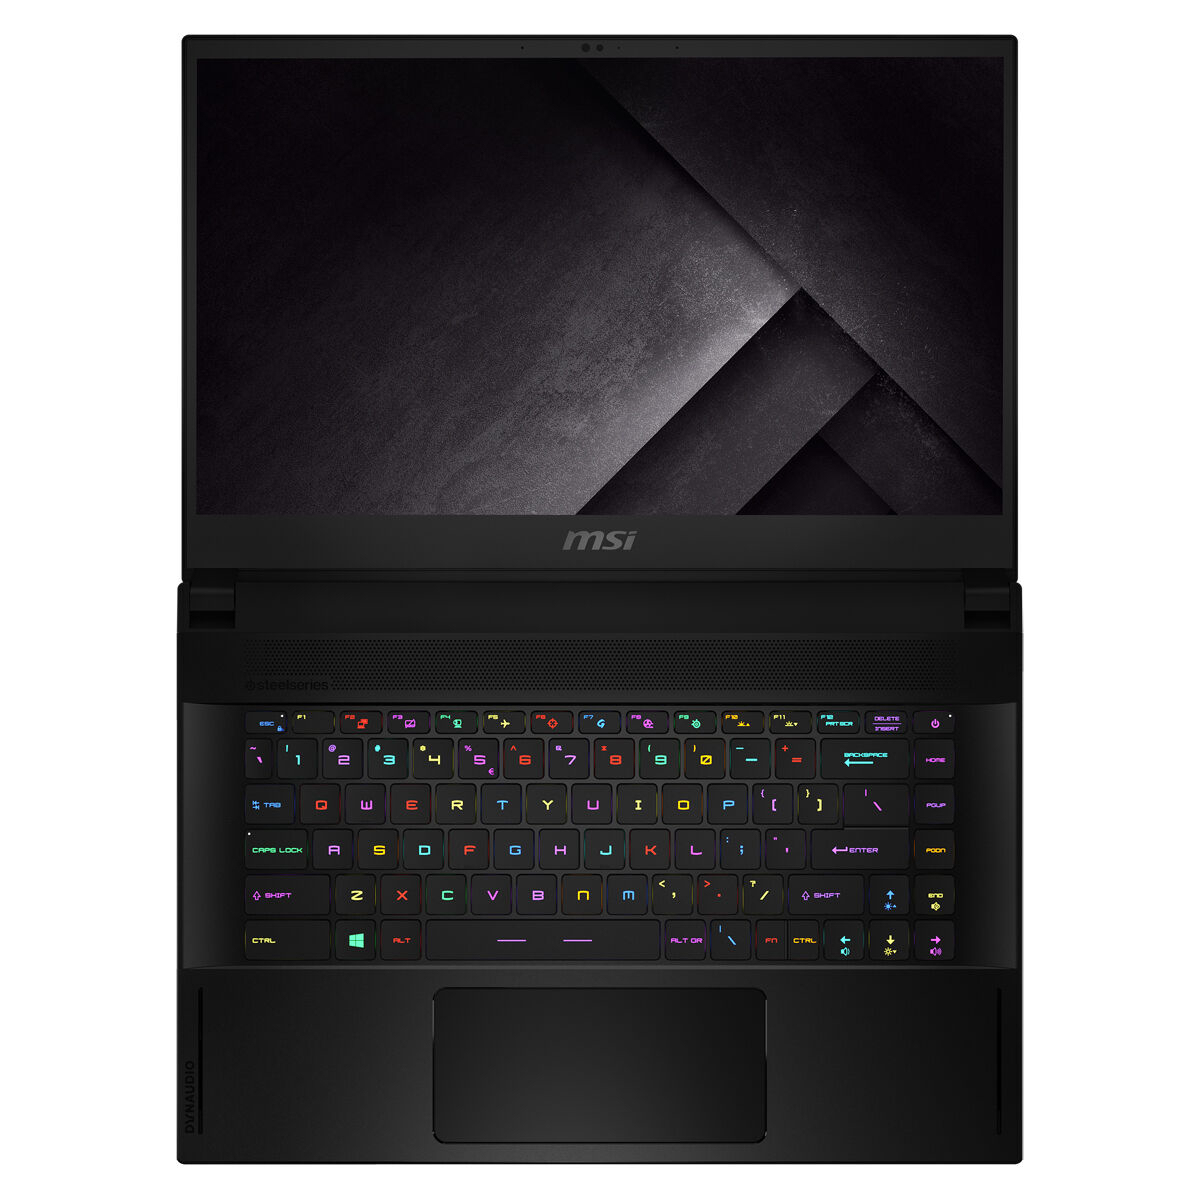
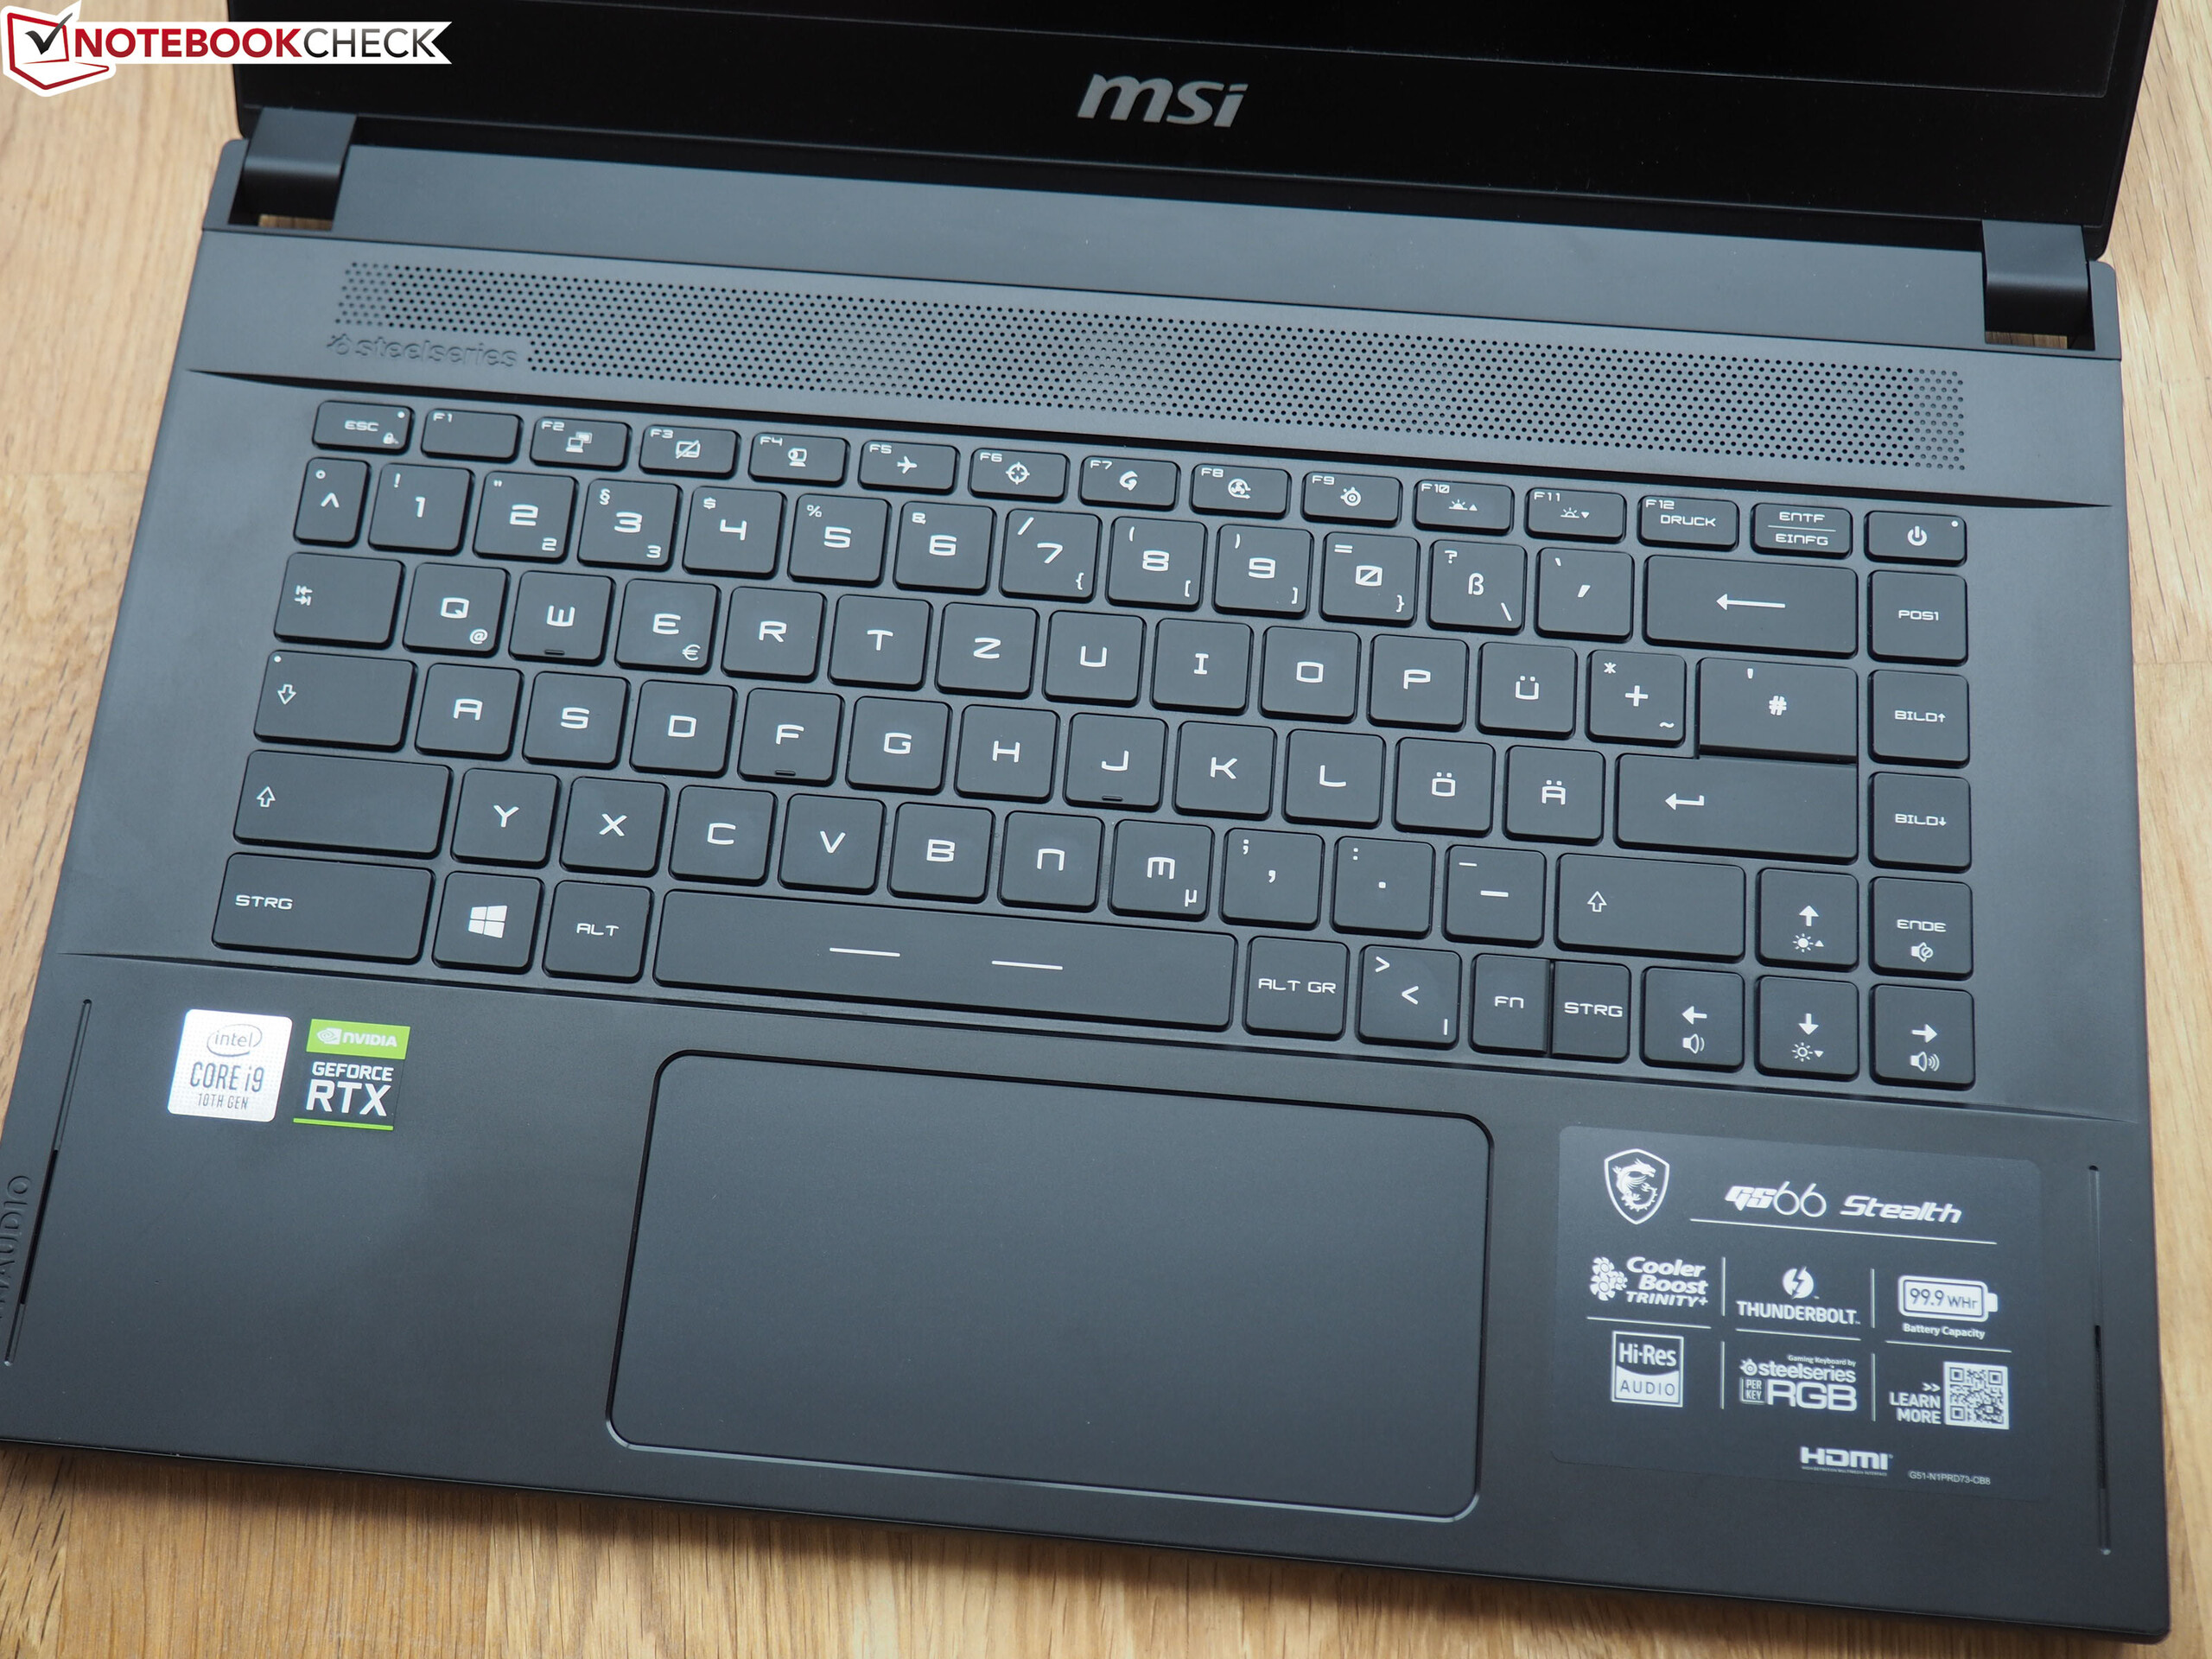
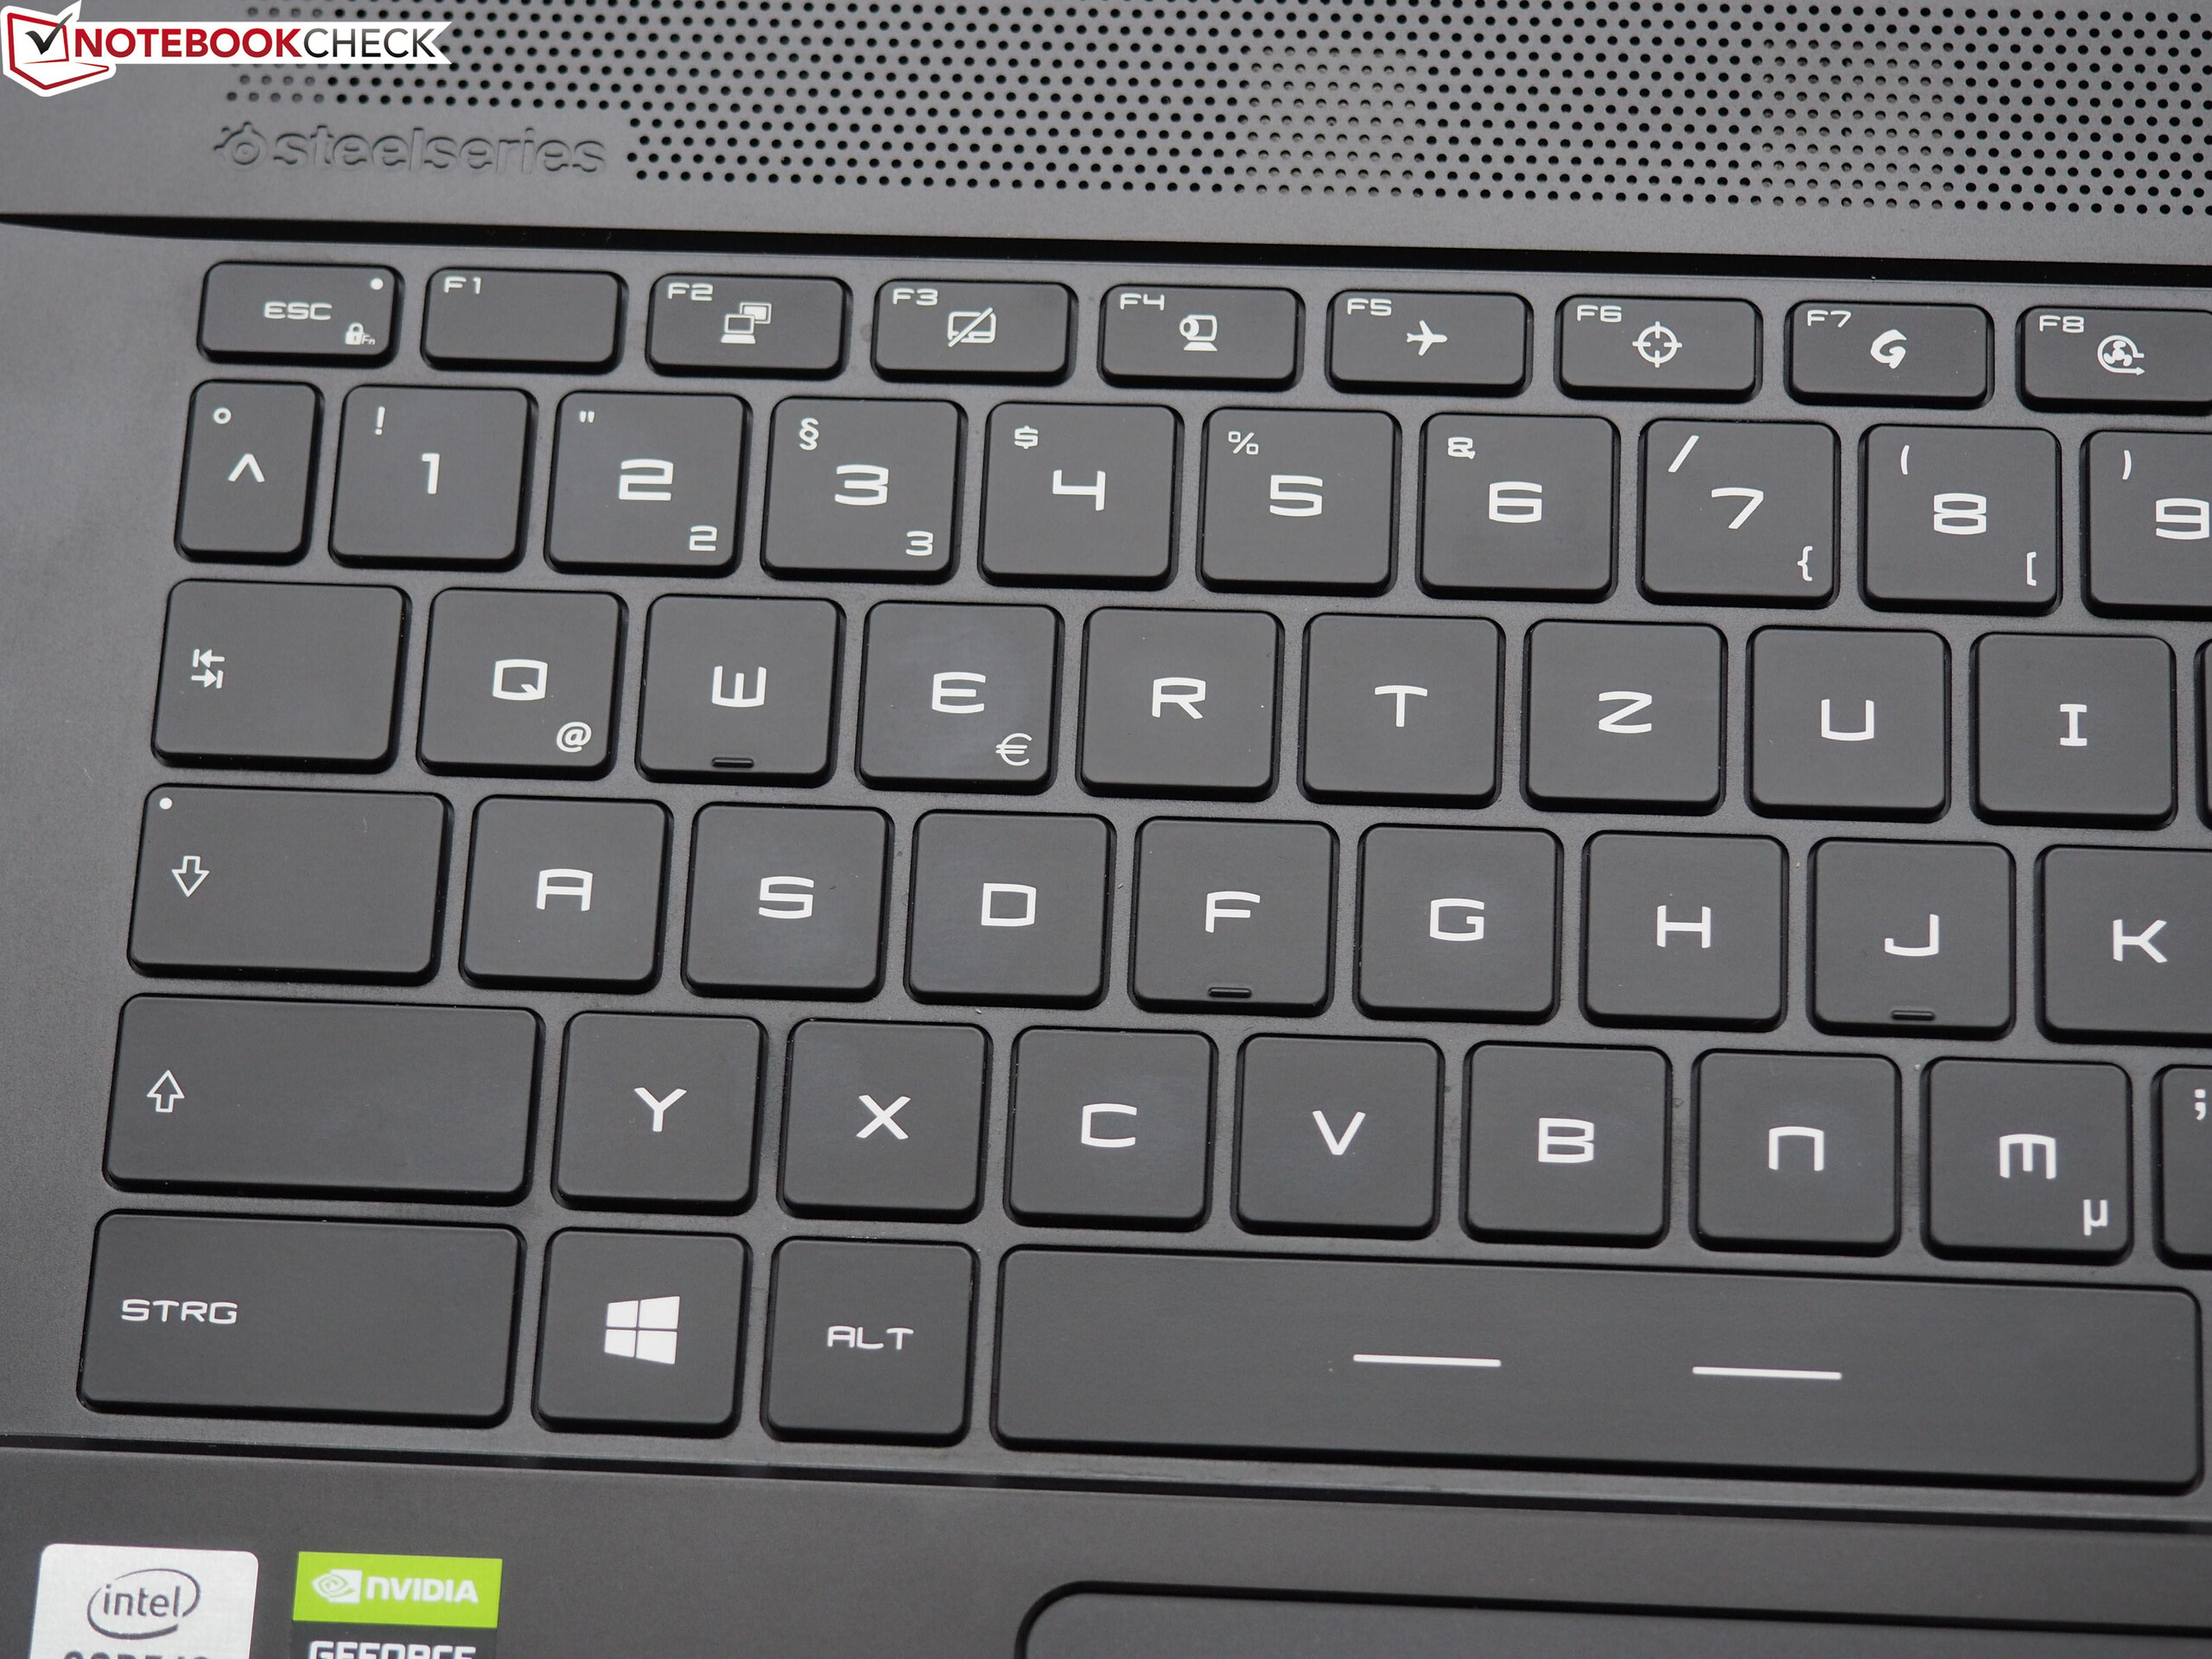
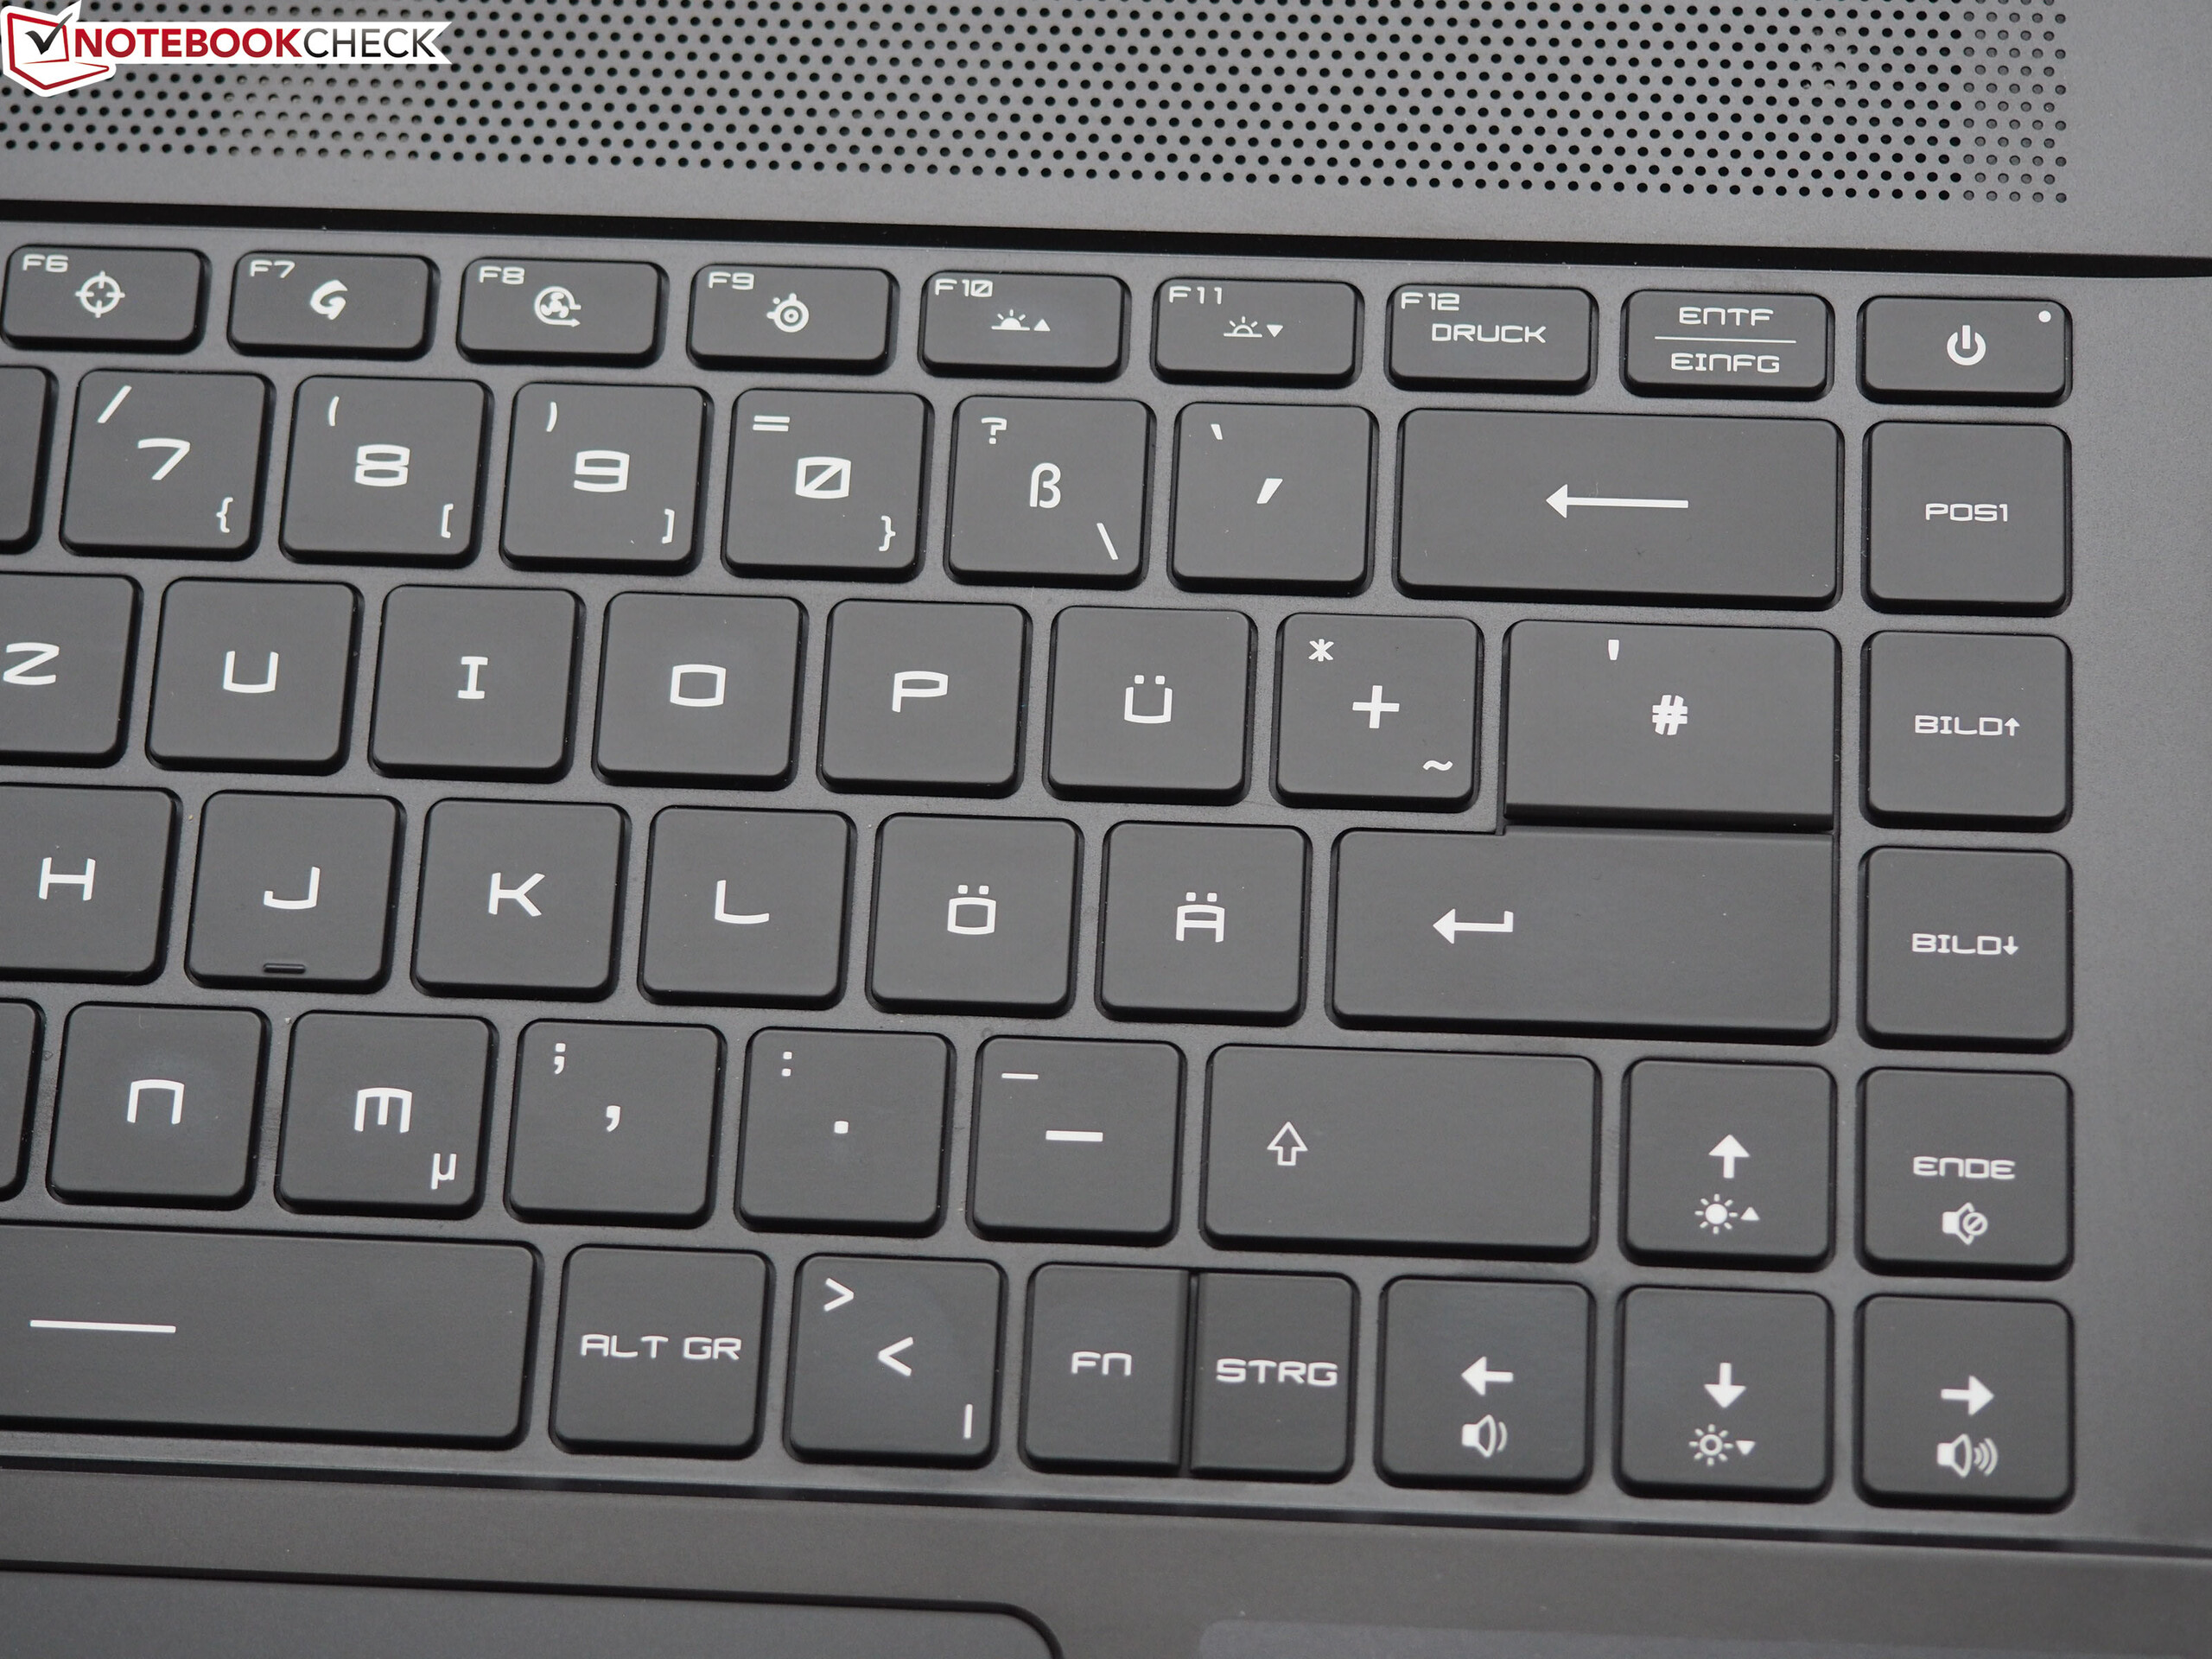
El teclado chiclet (iluminación RGB) ha demostrado ser adecuado para el uso diario. Además, la completa configuración de puertos incluye, entre otras cosas, un puerto Thunderbolt 3 que permite la conexión de amplias soluciones de acoplamiento o una GPU externa. La batería no se puede cargar a través de los puertos Thunderbolt 3 o el USB Type-C 3.2 Gen 2. Conectamos un adaptador de corriente de 45 vatios pero no pudimos activar un proceso de carga con él.
MSI GS66 Stealth 10SE-045
- 08/05/2020 v7 (old)
Sascha Mölck
Price comparison
