Notebookcheck Logo

Estreno del rendimiento del Intel Core i9-13900HK: Análisis del portátil Alienware x16 R1

gráficos RTX de 175 W y apenas 19 mm de grosor. Los portátiles Alienware han sido tradicionalmente más grandes y pesados que las alternativas de MSI, Asus o Razer, pero Dell quiere demostrar que un portátil Alienware puede seguir siendo delgado e igual de potente con el último Alienware x16 R1. Ciertamente no decepciona, al menos en lo que a gráficos se refiere.
Alienware x16 R1
Alienware x16 R1

Presentado en CES 2023el Alienware x16 R1 es el segundo modelo de 16 pulgadas de la familia, tras el Alienware m16, más grueso y potente, que aún no hemos analizado. Los dos modelos complementan a los ya existentes 14 pulgadas, 15 pulgadas, 17 pulgadas y 18 pulgadas Alienware que ya existen en el mercado.

Nuestra unidad de pruebas es una configuración de gama alta con la CPU Raptor Lake Core i9-13900HK de 13ª generación, GPU GeForce RTX 4080 y pantalla IPS de 16,0 pulgadas 2560 x 1600 240 Hz por unos 3350 dólares. Hay disponibles configuraciones más baratas o más caras que van desde el Core i7-13620H, pantalla 1200p y GPU RTX 4050 hasta la RTX 4090 por 2200 dólares hasta más de 4000 dólares.

Las alternativas al Alienware x16 R1 incluyen otros portátiles para juegos de 16 pulgadas como el Lenovo Legion Pro 7, Asus ROG Zephyrus M16, Razer Blade 16, o el HP Omen 16. Esta categoría de tamaño ha ido ganando popularidad en los últimos años.

Más opiniones sobre Dell:

Alienware x16 R1
Procesador
Intel Core i9-13900HK 14 x 1.9 - 5.4 GHz, 178 W PL2 / Short Burst, 123 W PL1 / Sustained, Raptor Lake-H
Adaptador gráfico
NVIDIA GeForce RTX 4080 Laptop GPU - 12 GB VRAM, Núcleo: 2125 MHz, Memoría: 2263 MHz, 175 W TDP, GDDR6, 535.98, MUX, Advanced Optimus
Memoría
32 GB 
, LPDDR5, 6000 MT/s, Dual-Channel
pantalla
16.00 pulgadas 16:10, 2560 x 1600 pixels 189 PPI, BOE NE16NZ4, IPS, Dell P/N: 7CGF2, Controller: BOE0B04, lustroso: no, 240 Hz
Placa base
Intel Alder Lake-P PCH
Disco duro
SK hynix PC801 HFS001TEJ9X101N, 1024 GB 
Tarjeta de sonido
Intel Raptor Lake-P/U/H PCH - cAVS
Conexiones
2 USB 3.0, 2 USB 3.1 Gen2, 1 Thunderbolt, USB-C Power Delivery (PD), 1 HDMI, 2 DisplayPort, Audio Conexiones: 3.5 mm headset, Card Reader: MicroSD
Equipamento de red
Killer Wi-Fi 6E AX1675i 160MHz Wireless Network Adapter (a/b/g/n = Wi-Fi 4/ac = Wi-Fi 5/ax = Wi-Fi 6/), Bluetooth 5.2
Tamaño
Alto x ancho x profundidad (en mm): 18.57 x 364.74 x 289.81
Battería
90 Wh Litio-Polimero
Sistema Operativo
Microsoft Windows 11 Home
Camera
Webcam: 1080p30
Primary Camera: 2 MPix
Características adicionales
Altavoces: 2 W x2 tweeters, 3 W x4 woofers, Teclado: CherryMX ultra low-profile mechanical, Luz de Teclado: si, My Alienware, Alienware Command Center, 12 Meses Garantía
Peso
2.632 kg, Suministro de Electricidad: 991 g
Precio
2150 USD
Note: The manufacturer may use components from different suppliers including display panels, drives or memory sticks with similar specifications.


Posibles contendientes en la comparación

Valoración
Fecha
Modelo
Peso
Altura
Tamaño
Resolución
Best Price
88.4 %
06/2023
Alienware x16 R1
i9-13900HK, NVIDIA GeForce RTX 4080 Laptop GPU
2.6 kg18.57 mm16.00"2560x1600
88.8 %
06/2023
Lenovo Legion Pro 7 RTX4090
i9-13900HX, NVIDIA GeForce RTX 4090 Laptop GPU
2.7 kg26 mm16.00"2560x1600
89.4 %
03/2023
Asus ROG Zephyrus M16 GU604VY-NM042X
i9-13900H, NVIDIA GeForce RTX 4090 Laptop GPU
2.3 kg22.9 mm16.00"2560x1600
91.2 %
02/2023
Razer Blade 16 Early 2023
i9-13950HX, NVIDIA GeForce RTX 4080 Laptop GPU
2.4 kg21.99 mm16.00"2560x1600
86.1 %
10/2022
Dell G16 7620
i7-12700H, GeForce RTX 3060 Laptop GPU
2.6 kg26.9 mm16.00"2560x1600
86.1 %
01/2023
Alienware m17 R5 (R9 6900HX, RX 6850M XT)
R9 6900HX, Radeon RX 6850M XT
3.4 kg26.7 mm17.00"3840x2160

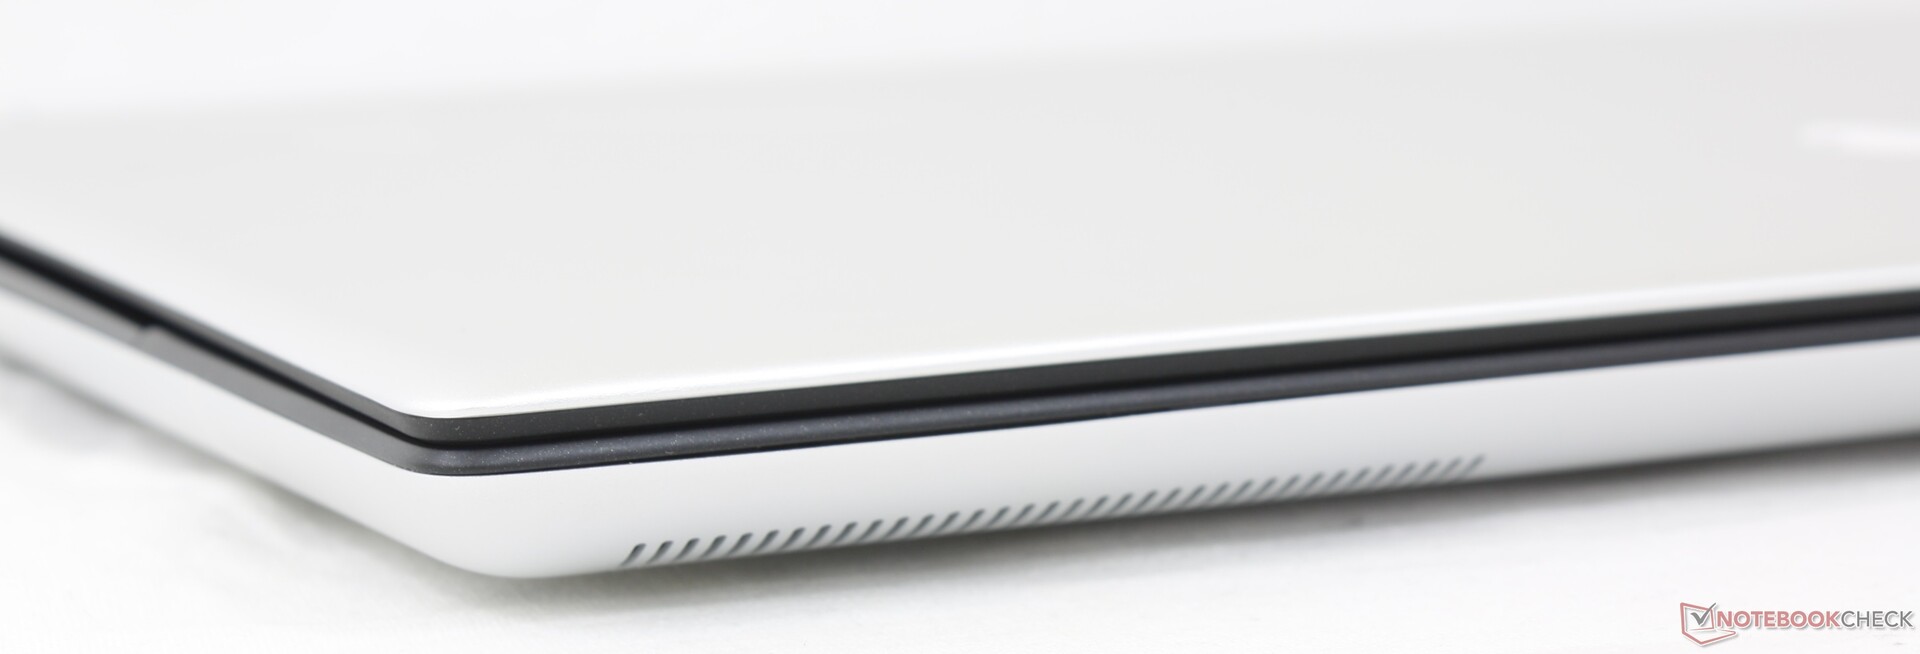
Carcasa - Distinctly Alienware

El chasis tiene mucho en común con el Alienware x15 R2 y X17 R2 ya que todos comparten el lenguaje de diseño Legend 3. Los dos tonos de blanco y negro, el aluminio anodizado y la aleación de magnesio, y el anillo RGB a lo largo de la parte trasera ayudan a distinguir visualmente la serie Alienware del océano de otros portátiles para juegos. Que sea más atractivo o deseable que los modelos de la competencia depende de las preferencias del usuario.

La rigidez del chasis es excelente, especialmente alrededor de la base, donde la torsión y la deformación son mínimas. La tapa y las bisagras, sin embargo, no son tan rígidas como nos gustaría si las comparamos con las pantallas más rígidas de la Serie Asus Strix Scar o el Blade 16.

Con menos de 19 mm, el Alienware x16 es uno de los portátiles para juegos de 16 pulgadas más delgados del mercado, más delgado incluso que el Razer Blade 16. Por desgracia, el sistema es más ancho y largo para ocupar mucho más espacio, por lo que su volumen total no es menor que el de muchos competidores. Por ejemplo, el Alienware es casi 4 mm más delgado que el Blade 16, pero es más largo en más de 40 mm y más pesado en unos 200 gramos como consecuencia.

Sólo una opción de color disponible - Lunar Silver
Bordes y esquinas afilados en la parte trasera del chasis
Tapa abierta al ángulo máximo (~120 grados)
La rigidez de la bisagra es decentemente uniforme en todos los ángulos con sólo un poco de tambaleo
No hay acabado brillante en el diseño exterior, pero las superficies negras mate siguen siendo imanes para las huellas dactilares
Las rejillas de ventilación hexagonales son un elemento básico del diseño de Alienware

Comparación de tamaños

397.3 mm 298.71 mm 26.7 mm 3.4 kg363 mm 262 mm 26 mm 2.7 kg357.26 mm 272.11 mm 26.9 mm 2.6 kg364.74 mm 289.81 mm 18.57 mm 2.6 kg355 mm 246 mm 22.9 mm 2.3 kg355 mm 244 mm 21.99 mm 2.4 kg297 mm 210 mm 1 mm 5.7 g

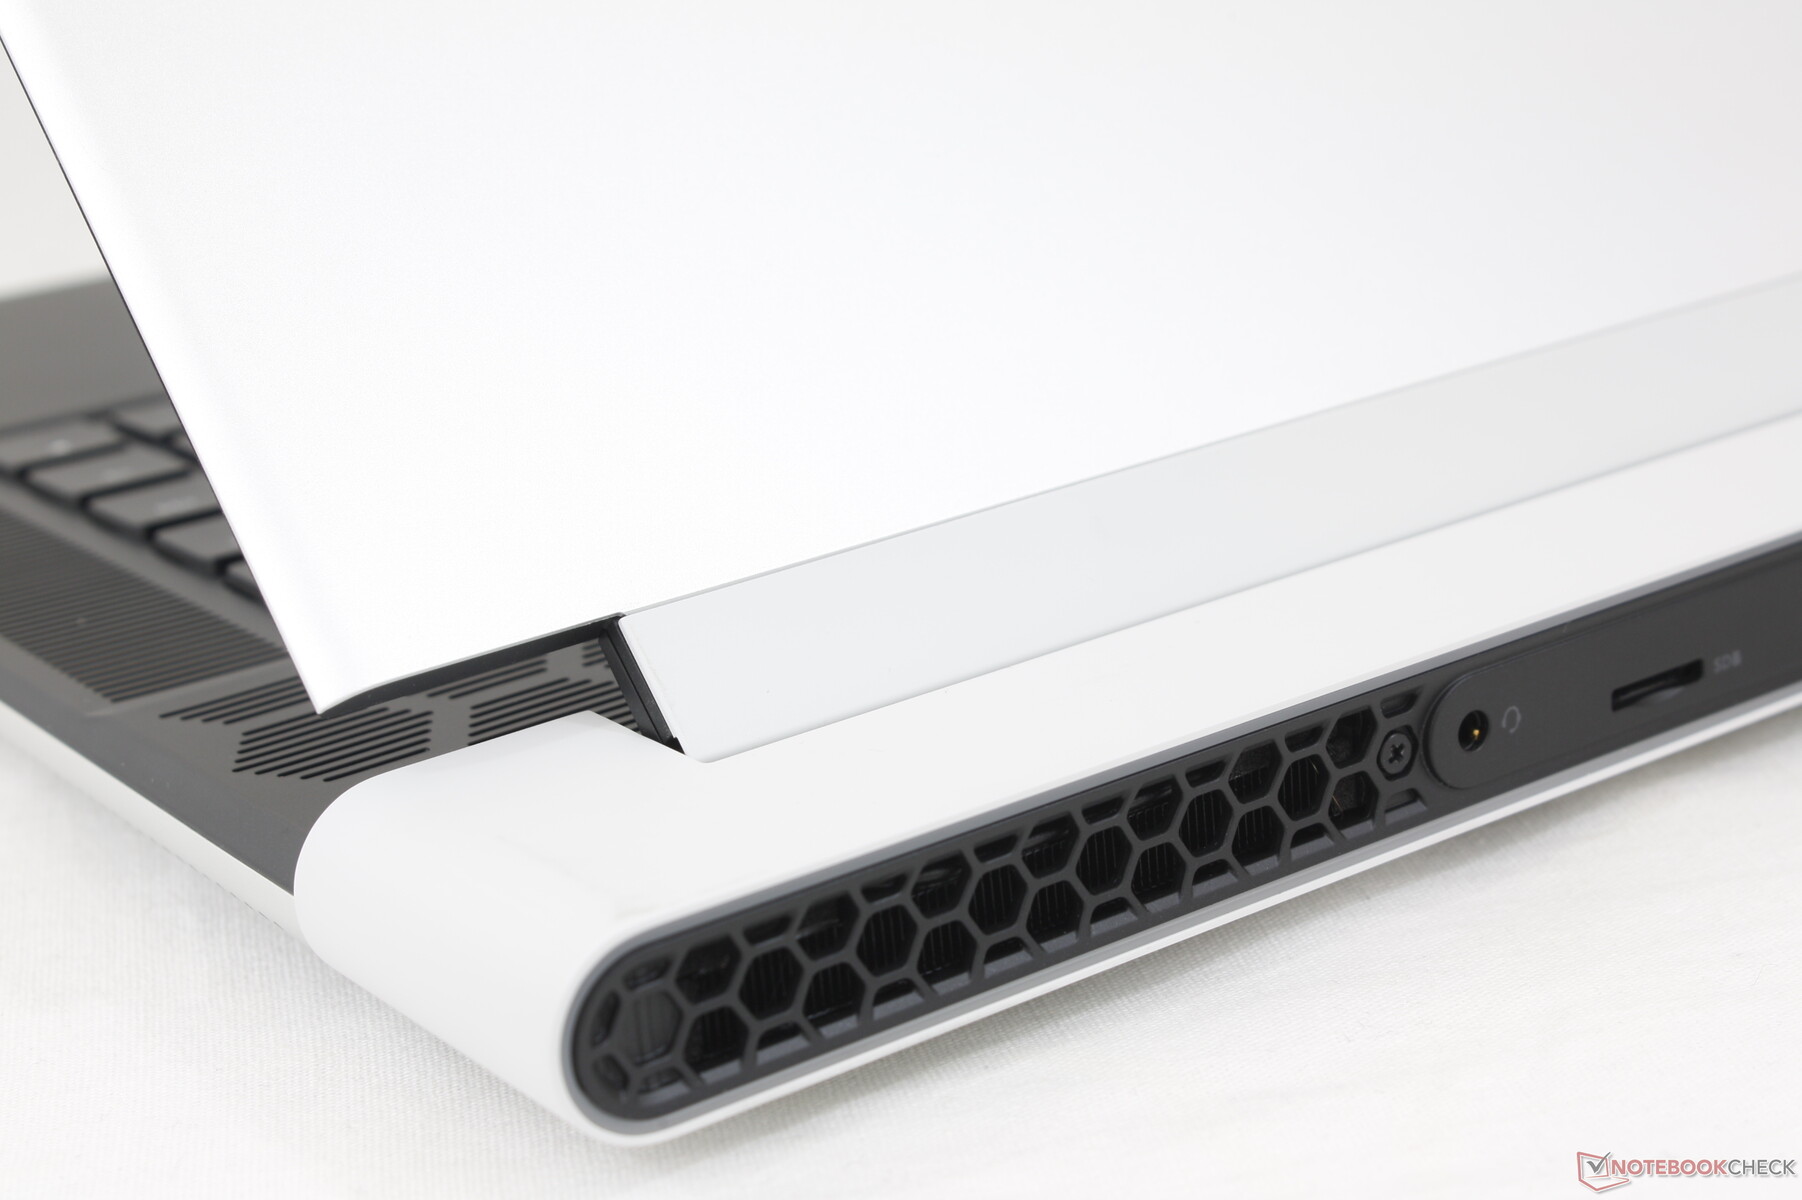
Conectividad - Nada en los laterales

Todos los puertos están en la parte trasera, lo que puede ser una bendición y una molestia a la vez. Por un lado, la falta de puertos laterales significa que no hay cables antiestéticos o de distracción. Por otro lado, la posición de los puertos no es ideal, especialmente para los puertos USB más utilizados.

Hay que tener en cuenta que Thunderbolt 4 solo es compatible con uno de los dos puertos USB-C.

Frontal: Sin puertos
Correcto: Sin puertos
Parte trasera: auriculares de 3,5 mm, 1 USB-C con Thunderbolt 4 + USB4 + PD + DisplayPort 1.4, 1 USB-C 3.2 Gen. 2 con PD + DisplayPort 1.4, HDMI 2.1, 2 USB-A 3.2 Gen. 1, Mini DisplayPort 1.4, adaptador de CA
Izquierda: sin puertos

Lector de tarjetas SD

AS SSD informa de una velocidad de lectura secuencial de 256,1 MB/s mientras que una prueba en el mundo real transfiriendo 1 GB de fotos sería mucho más lenta a sólo 57 MB/s con nuestra tarjeta de prueba MicroSD UHS-II incluso después de múltiples reintentos.

A diferencia de la mayoría de portátiles, el lector MicroSD se encuentra en la parte trasera del chasis en lugar de en los laterales.

La MicroSD se coloca a ras del borde para un transporte seguro
SD Card Reader
average JPG Copy Test (av. of 3 runs)
Asus ROG Zephyrus M16 GU604VY-NM042X
Intel Core i9-13900H
185.7 (176.29min - 198.35max) MB/s +226%
Razer Blade 16 Early 2023
Intel Core i9-13950HX (AV PRO microSD 128 GB V60)
125 MB/s +119%
Alienware x16 R1
Intel Core i9-13900HK (AV PRO microSD 128 GB V60)
57 MB/s
maximum AS SSD Seq Read Test (1GB)
Alienware x16 R1
Intel Core i9-13900HK (AV PRO microSD 128 GB V60)
256.1 MB/s
Razer Blade 16 Early 2023
Intel Core i9-13950HX (AV PRO microSD 128 GB V60)
207.6 MB/s -19%
Asus ROG Zephyrus M16 GU604VY-NM042X
Intel Core i9-13900H
191.89 MB/s -25%

Comunicación

Módulo WLAN M.2 extraíble. El rendimiento es excelente, pero las velocidades de transmisión son más variables de lo esperado
Networking
iperf3 transmit AXE11000
Lenovo Legion Pro 7 16IRX8H
Killer Wi-Fi 6E AX1675i 160MHz Wireless Network Adapter
1579 (848min - 1696max) MBit/s +55%
Razer Blade 16 Early 2023
Intel Wi-Fi 6E AX211
1155 (495min - 1441max) MBit/s +13%
Alienware x16 R1
Killer Wi-Fi 6E AX1675i 160MHz Wireless Network Adapter
1022 (714min - 1142max) MBit/s
Alienware m17 R5 (R9 6900HX, RX 6850M XT)
MediaTek MT7921
981 MBit/s -4%
Dell G16 7620
Intel Wi-Fi 6 AX201
891 (795min - 967max) MBit/s -13%
iperf3 receive AXE11000
Lenovo Legion Pro 7 16IRX8H
Killer Wi-Fi 6E AX1675i 160MHz Wireless Network Adapter
1619 (1537min - 1665max) MBit/s +25%
Razer Blade 16 Early 2023
Intel Wi-Fi 6E AX211
1328 (1093min - 1448max) MBit/s +3%
Alienware x16 R1
Killer Wi-Fi 6E AX1675i 160MHz Wireless Network Adapter
1295 (1225min - 1358max) MBit/s
Dell G16 7620
Intel Wi-Fi 6 AX201
1115 (996min - 1190max) MBit/s -14%
Alienware m17 R5 (R9 6900HX, RX 6850M XT)
MediaTek MT7921
968 MBit/s -25%
iperf3 transmit AXE11000 6GHz
Asus ROG Zephyrus M16 GU604VY-NM042X
Intel Wi-Fi 6E AX211
1615 (840min - 1682max) MBit/s +31%
Razer Blade 16 Early 2023
Intel Wi-Fi 6E AX211
1371 (1036min - 1505max) MBit/s +12%
Alienware x16 R1
Killer Wi-Fi 6E AX1675i 160MHz Wireless Network Adapter
1229 (817min - 1342max) MBit/s
iperf3 receive AXE11000 6GHz
Asus ROG Zephyrus M16 GU604VY-NM042X
Intel Wi-Fi 6E AX211
1645 (1614min - 1670max) MBit/s +24%
Razer Blade 16 Early 2023
Intel Wi-Fi 6E AX211
1494 (1283min - 1580max) MBit/s +13%
Alienware x16 R1
Killer Wi-Fi 6E AX1675i 160MHz Wireless Network Adapter
1327 (955min - 1382max) MBit/s
05010015020025030035040045050055060065070075080085090095010001050110011501200125013001350Tooltip
Alienware x16 R1; iperf3 transmit AXE11000 6GHz; iperf 3.1.3: Ø1229 (817-1342)
Alienware x16 R1; iperf3 receive AXE11000 6GHz; iperf 3.1.3: Ø1327 (955-1382)

Cámara web

Una webcam de 2MP viene de serie junto con IR para soporte de Hello. No hay obturador de privacidad en absoluto, sin embargo.
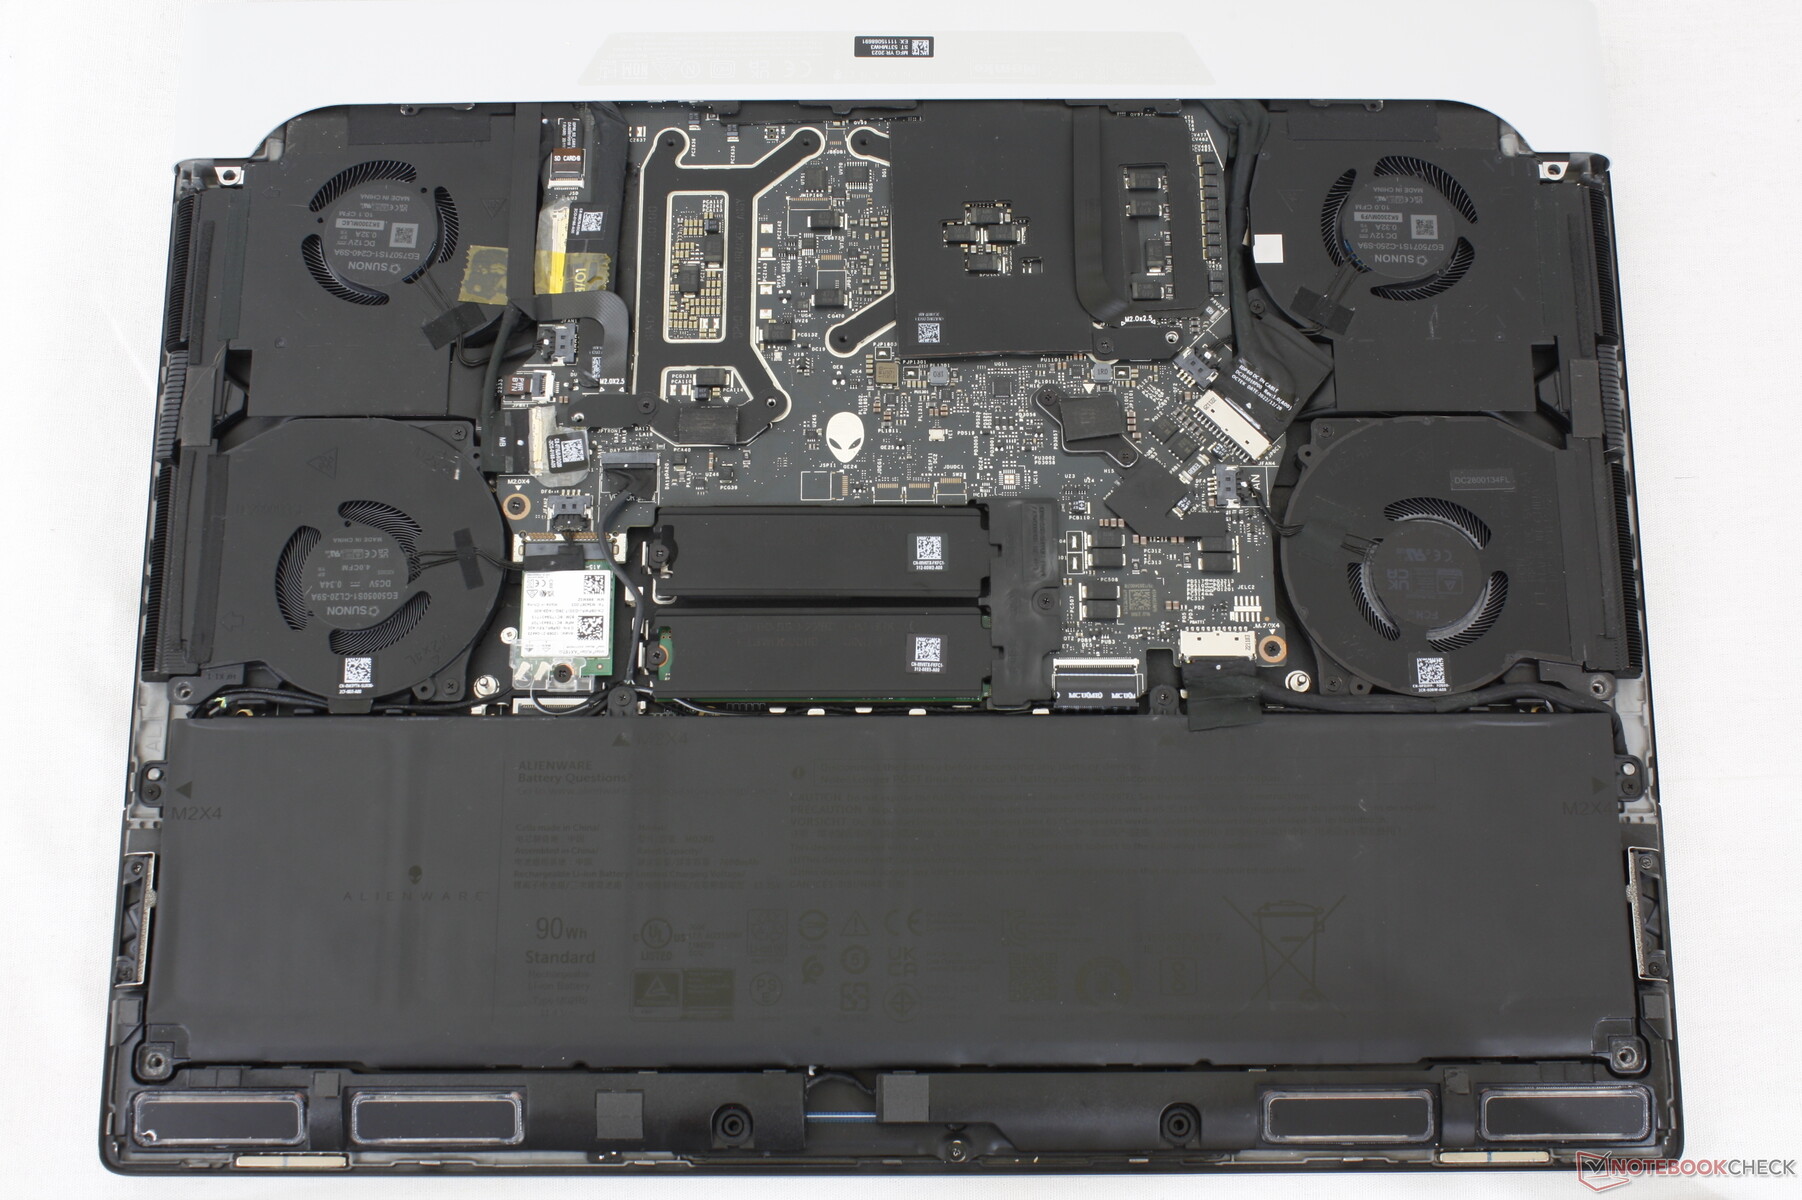
ColorChecker
13.4 ∆E
11.1 ∆E
15.3 ∆E
16.4 ∆E
14 ∆E
9.7 ∆E
8.6 ∆E
11.2 ∆E
12.9 ∆E
12.6 ∆E
9.4 ∆E
8 ∆E
8.4 ∆E
10.4 ∆E
14.3 ∆E
6 ∆E
13 ∆E
9.4 ∆E
8.4 ∆E
7.1 ∆E
8.4 ∆E
8.9 ∆E
9.5 ∆E
7.1 ∆E
ColorChecker Alienware x16 R1: 10.56 ∆E min: 6 - max: 16.4 ∆E

Mantenimiento

El panel inferior se fija con sólo seis tornillos Phillips para facilitar su extracción. Los propietarios tienen acceso directo a dos ranuras SSD M.2 2280, la batería y el módulo WLAN extraíble.

Alienware x16 R1 interno

Accesorios y garantía

No hay más extras en la caja que el adaptador de CA y la documentación. Se aplica la habitual garantía limitada de un año del fabricante si se compra en EE.UU.

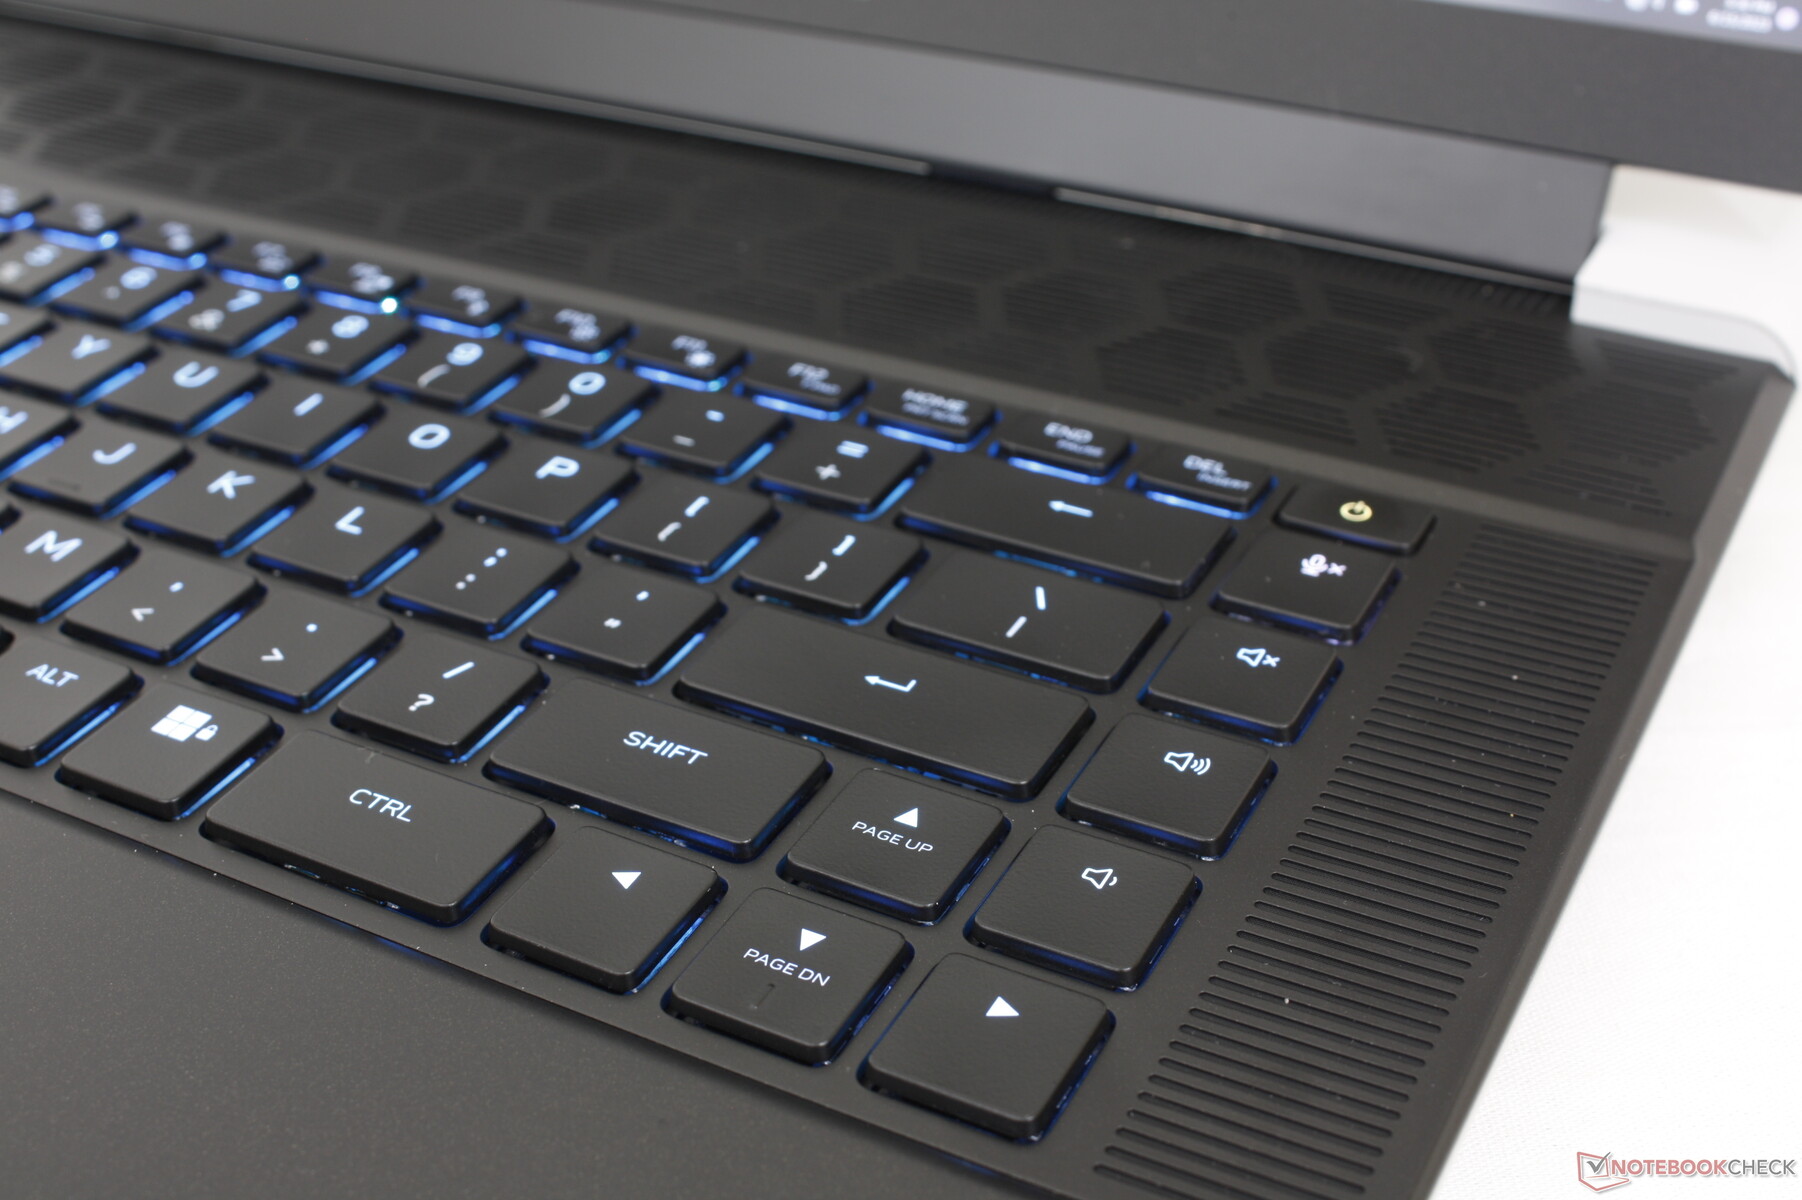
Dispositivos de entrada - Las teclas mecánicas son ruidosas y orgullosas

Teclado

Dell ofrece dos opciones de teclado: teclas estándar de membrana y teclas CherryMX de perfil ultrabajo con iluminación RGB por tecla. Nuestra unidad de pruebas viene equipada con estas últimas y la experiencia de tecleo es la noche y el día en comparación con las teclas de membrana de la mayoría de portátiles para juegos. El recorrido de las teclas de 1,8 mm es más profundo que el más típico de 1,5 mm y la respuesta es mucho más firme y contundente para una sensación más satisfactoria. Es difícil volver a escribir en algo como el Razer Blade 16 después de estar acostumbrado a las teclas CherryMX del Alienware x16.

El principal inconveniente, por supuesto, es el ruido significativamente más fuerte de las teclas mecánicas. Por tanto, puede que quieras considerar la opción estándar no mecánica si pretendes usar el portátil en ambientes sensibles al ruido como aulas o dormitorios estrechos.

Panel táctil

El clickpad es uno de los más pequeños para un portátil de juegos de 16 pulgadas, con sólo 11,2 x 6,5 cm, frente a los 17 x 9,7 cm y 12 x 7,5 cm de los Blade 16 y Legion Pro 5 16respectivamente. El menor tamaño se debe a que la gran solución de refrigeración y las rejillas de ventilación ocupan más espacio a lo largo de la mitad trasera del sistema. El deslizamiento es suave, con sólo una ligera adherencia cuando se mueve a velocidades más lentas para clics más precisos.

La retroalimentación al hacer clic es ligera y muy superficial para una sensación insatisfactoria. Basándonos en esto y en la pequeña superficie, está claro que Dell espera que la mayoría de los usuarios tengan un ratón USB listo para usar.

Todos los símbolos de las teclas se iluminan cuando la retroiluminación está activada, mientras que algunos símbolos secundarios permanecían apagados en los antiguos diseños de Alienware
El teclado dispone de retroiluminación RGB, al igual que el teclado. Sin embargo, sólo está disponible en algunos SKUs
Las teclas CherryMX de perfil ultrabajo son muy ruidosas y chasqueantes, pero también resultan muy satisfactorias para teclear
Teclas de flecha de tamaño completo, a diferencia de la mayoría de portátiles en los que las teclas de flecha suelen estar apretadas

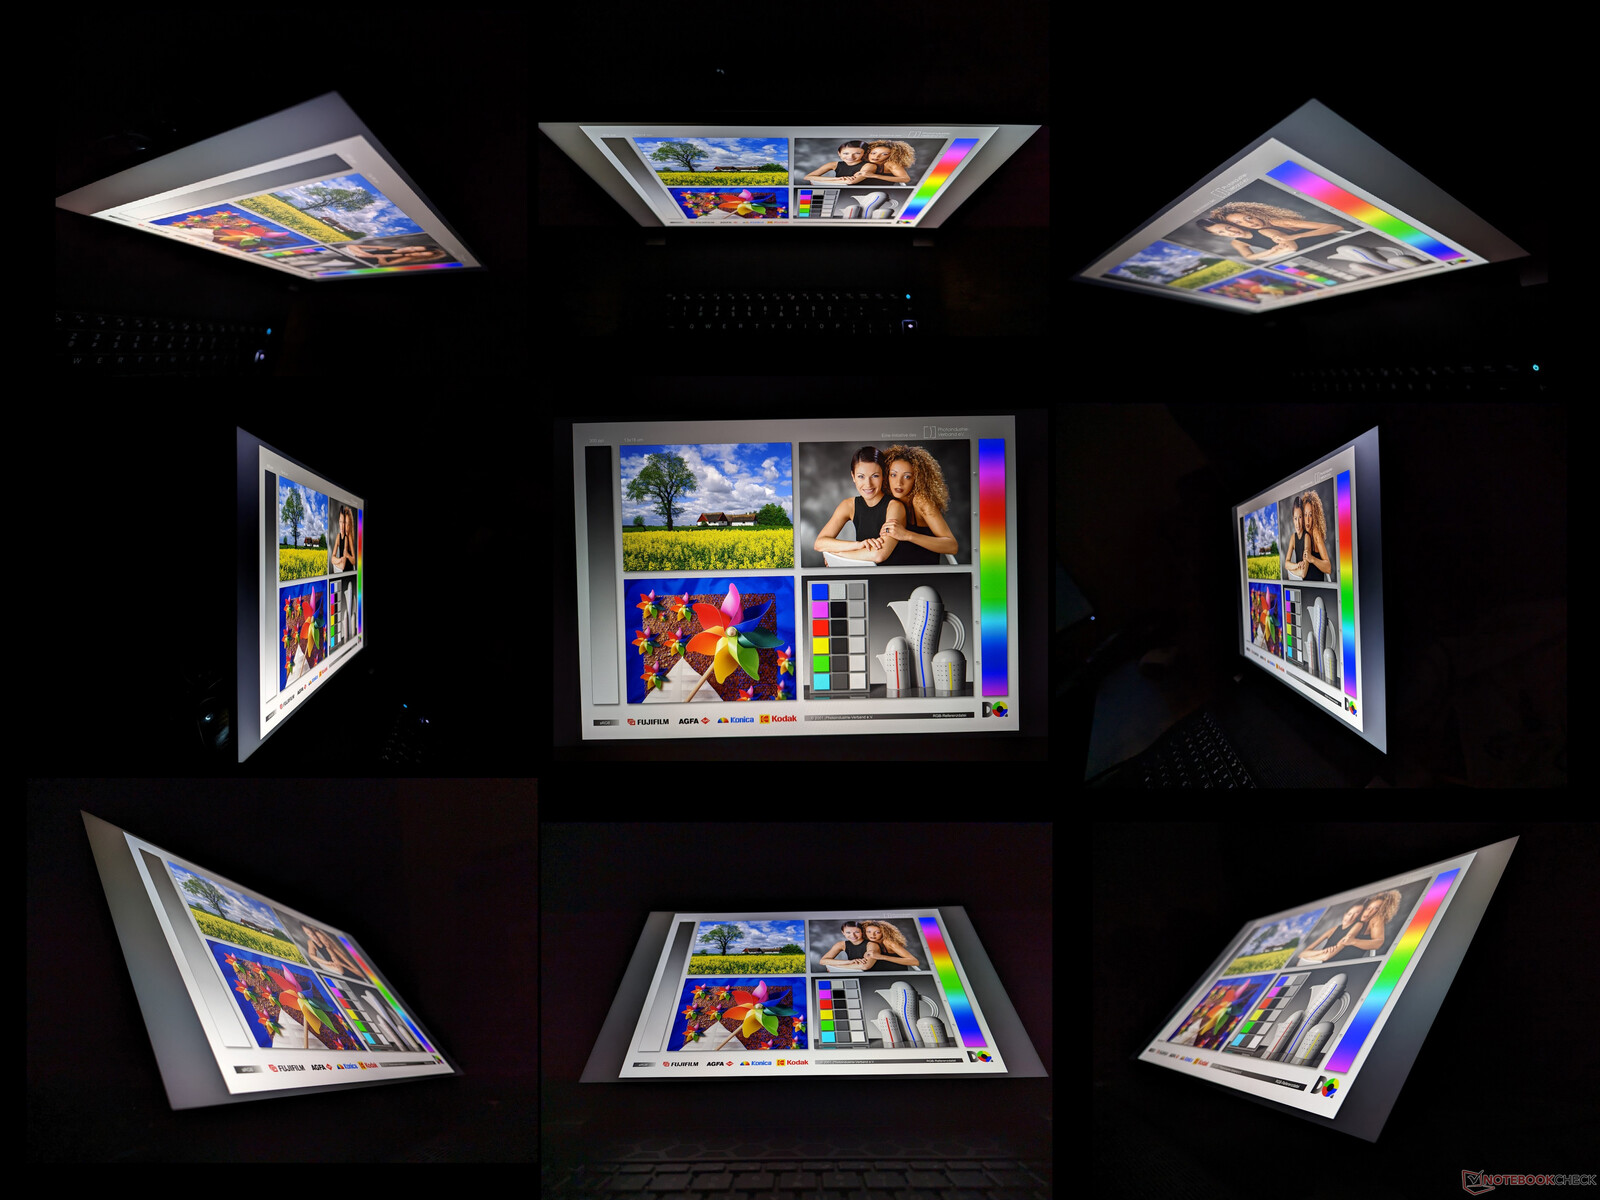
Pantalla - No hay mala opción

Hay tres opciones de pantalla disponibles y nuestras mediciones reflejan sólo la opción en negrita:

  • 2560 x 1600, 165 Hz, 3 ms, 100% sRGB, G-Sync
  • 1920 x 1200, 480 Hz, 3 ms, 100% DCI-P3, G-Sync
  • 2560 x 1600, 240 Hz, 3 ms, 100% DCI-P3, G-Sync

Desde luego, no hay ningún panel malo o "incorrecto", ya que todos los paneles son aptos para jugar con sus rápidas frecuencias de actualización y rápidos tiempos de respuesta. Dicho esto, nuestro panel 1600p240 configurado es el punto óptimo para la mayoría de los usuarios, ya que la opción 1200p480 sacrifica resolución y la opción 1600p165 tiene colores menos profundos. La experiencia de visualización es comparable a la del Blade 16 y mejor que la del Dell G16 y el Lenovo Legion Pro 7 16 en términos de gama cromática.

Sin cristal de borde a borde, OLED ni opciones 4K
Biseles laterales estrechos pero con un bisel inferior mucho más grueso
Sangrado de contraluz irregular en las esquinas
El panel mate es casi tan nítido como el brillante
275.7
cd/m²
303
cd/m²
289.1
cd/m²
276.5
cd/m²
302.2
cd/m²
283
cd/m²
270.5
cd/m²
283.5
cd/m²
278
cd/m²
Temperatura del cuarto
BOE NE16NZ4 tested with X-Rite i1Pro 2
Máximo: 303 cd/m² (Nits) Médio: 284.6 cd/m² Minimum: 15.92 cd/m²
iluminación: 89 %
Brillo con batería: 302.2 cd/m²
Contraste: 1162:1 (Negro: 0.26 cd/m²)
ΔE Color 1.63 | 0.5-29.43 Ø5, calibrated: 1.17
ΔE Greyscale 2.5 | 0.57-98 Ø5.3
88.6% AdobeRGB 1998 (Argyll 2.2.0 3D)
100% sRGB (Argyll 2.2.0 3D)
99.2% Display P3 (Argyll 2.2.0 3D)
Gamma: 2.23
Alienware x16 R1
BOE NE16NZ4, IPS, 2560x1600, 16.00
Asus ROG Zephyrus M16 GU604VY-NM042X
BOE0B74 (NE160QDM-NM4, IPS, 2560x1600, 16.00
Razer Blade 16 Early 2023
CSOT T3 MNG007DA4-1, IPS, 2560x1600, 16.00
Dell G16 7620
BOE NE16QDM, IPS, 2560x1600, 16.00
Alienware m17 R5 (R9 6900HX, RX 6850M XT)
AU Optronics AUODBA3, IPS, 3840x2160, 17.00
Lenovo Legion Pro 7 16IRX8H
MNG007DA2-3 (CSO1628), IPS, 2560x1600, 16.00
Display
1%
0%
-18%
-1%
-17%
Display P3 Coverage
99.2
99.33
0%
98.5
-1%
68.3
-31%
97.2
-2%
69.1
-30%
sRGB Coverage
100
99.9
0%
100
0%
98
-2%
99.6
0%
99.7
0%
AdobeRGB 1998 Coverage
88.6
90.01
2%
89.7
1%
70.5
-20%
88.4
0%
71.2
-20%
Response Times
-542%
-23%
-35%
-118%
-49%
Response Time Grey 50% / Grey 80% *
5.1 ?(2.4, 2.7)
50.8 ?(27.6, 23.2)
-896%
6.6 ?(3.4, 3.2)
-29%
8.6 ?(3.4, 5.2)
-69%
16.4 ?(7.8, 8.6)
-222%
12.3 ?(5.7, 6.6)
-141%
Response Time Black / White *
10.3 ?(5.4, 4.9)
29.6 ?(25, 4.6)
-187%
12 ?(6.8, 5.2)
-17%
10.4 ?(5.2, 5.2)
-1%
11.6 ?(6.2, 5.4)
-13%
5.9 ?(2.2, 3.7)
43%
PWM Frequency
12000
Screen
247%
-8%
-4%
-80%
31%
Brightness middle
302.2
634
110%
456.8
51%
369.4
22%
484
60%
511
69%
Brightness
285
627
120%
437
53%
348
22%
449
58%
469
65%
Brightness Distribution
89
92
3%
83
-7%
83
-7%
87
-2%
86
-3%
Black Level *
0.26
0.03
88%
0.35
-35%
0.32
-23%
0.55
-112%
0.4
-54%
Contrast
1162
21133
1719%
1305
12%
1154
-1%
880
-24%
1278
10%
Colorchecker dE 2000 *
1.63
0.89
45%
3.7
-127%
1.78
-9%
4.8
-194%
0.95
42%
Colorchecker dE 2000 max. *
4.13
1.79
57%
6.42
-55%
4.41
-7%
7.48
-81%
2.07
50%
Colorchecker dE 2000 calibrated *
1.17
0.91
22%
0.66
44%
1.22
-4%
4.74
-305%
0.91
22%
Greyscale dE 2000 *
2.5
1.13
55%
2.6
-4%
3.2
-28%
5.5
-120%
0.6
76%
Gamma
2.23 99%
2.47 89%
2.3 96%
2.2 100%
2.42 91%
2.176 101%
CCT
6590 99%
6497 100%
6108 106%
6750 96%
6148 106%
6545 99%
Media total (Programa/Opciones)
-98% / 81%
-10% / -8%
-19% / -11%
-66% / -68%
-12% / 9%

* ... más pequeño es mejor

frente a sRGB
frente a sRGB
vs. P3
vs. P3

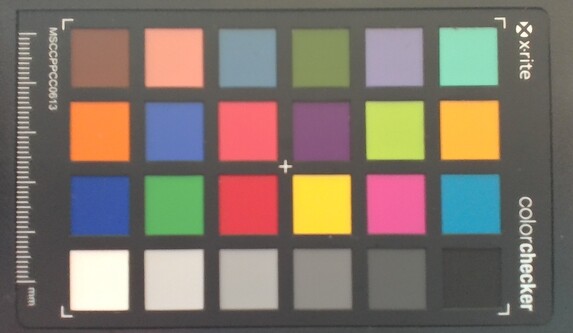
La pantalla está bien calibrada de fábrica, con unos valores deltaE medios de escala de grises y color de sólo 2,5 y 1,63, respectivamente. Si se intentara calibrar aún más la pantalla con nuestro colorímetro X-Rite se obtendrían ganancias muy pequeñas, por lo que no es necesaria una calibración por parte del usuario final.

Escala de grises antes del calibrado
Barridos de saturación antes de la calibración
ColorChecker antes de la calibración
Escala de grises después del calibrado
Barridos de saturación tras la calibración
ColorChecker después de la calibración

Tiempos de respuesta del display

Los tiempos de respuesta del display muestran lo rápido que puede cambiar la pantalla de un color al siguiente. Tiempos lentos de respuesta pueden llevar a imágenes persistentes alrededor de objetos en movimiento o a displays borrosos. Particularmente los aficionados a los juegos 3D frenéticos deberían usar una pantalla con tiempos de respuesta rápidos.
       Tiempo de respuesta de Negro a Blanco
10.3 ms ... subida ↗ y bajada ↘ combinada↗ 5.4 ms subida
↘ 4.9 ms bajada
La pantalla mostró buenos tiempos de respuesta en nuestros tests pero podría ser demasiado lenta para los jugones competitivos.
En comparación, todos los dispositivos de prueba van de ##min### (mínimo) a 240 (máximo) ms. » 23 % de todos los dispositivos son mejores.
Esto quiere decir que el tiempo de respuesta medido es mejor que la media (21.4 ms) de todos los dispositivos testados.
       Tiempo de respuesta 50% Gris a 80% Gris
5.1 ms ... subida ↗ y bajada ↘ combinada↗ 2.4 ms subida
↘ 2.7 ms bajada
La pantalla mostró tiempos de respuesta muy rápidos en nuestros tests y debería ser adecuada para juegos frenéticos.
En comparación, todos los dispositivos de prueba van de ##min### (mínimo) a 636 (máximo) ms. » 12 % de todos los dispositivos son mejores.
Esto quiere decir que el tiempo de respuesta medido es mejor que la media (33.7 ms) de todos los dispositivos testados.

Parpadeo de Pantalla / PWM (Pulse-Width Modulation)

Para atenuar el brillo de pantalla algunos portátiles están encendiendo y apagando la retroiluminación muy rápidamente. Esto se hace a una frecuencia que no debiera detectarse a simple vista. Si la frecuencia es demasiado lenta, la gente sensible podría experimentar problemas visuales, dolores de cabeza e incluso ver parpadeos.
Parpadeo de Pantalla / PWM no detectado

Comparación: 53 % de todos los dispositivos testados no usaron PWM para atenuar el display. Si se usó, medimos una media de 17803 (mínimo: 5 - máxmo: 3846000) Hz.

La visibilidad en exteriores no es tan buena como en otros portátiles para juegos de 16 pulgadas como elZephyrus M16blade 16, o Legion Pro 7 16 ya que la pantalla del Alienware es notablemente más tenue. Combina esto con el tamaño relativamente grande y el Alienware x16 R1 definitivamente no es un portátil apto para exteriores a pesar del diseño delgado del chasis.

Al aire libre bajo la luz del sol
Al aire libre, a la sombra
Al aire libre bajo la luz del sol
Amplios ángulos de visión IPS. Los colores y el contraste sólo se degradan si se ve desde ángulos extremos

Rendimiento: CPU exigente, GPU impresionante


Condiciones de ensayo

Configuramos nuestra unidad en modo Overdrive a través de Alienware Command Center (ACC) y en modo Alto Rendimiento a través de Windows antes de ejecutar los benchmarks a continuación. También nos aseguramos de configurar los gráficos sólo en modo dGPU en lugar de Optimus a través del Panel de Control de Nvidia. Lamentablemente, los perfiles de energía ACC no están sincronizados con Windows, por lo que es posible tener perfiles conflictivos activos (es decir, uno configurado en Ahorro de energía y el otro en Rendimiento).

ACC no debe confundirse con My Alienware. El primero es un centro de control para las constantes vitales del sistema, los ajustes RGB, los perfiles de energía y los ajustes de juego, mientras que el segundo es un nexo para el soporte de Dell, la conexión móvil y los accesorios opcionales.

Todos los modelos admiten Advanced Optimus o MUX. Hay que tener en cuenta que G-Sync está activo para el monitor interno si se configura sólo en modo dGPU.

Pantalla de inicio del Centro de Comando Alienware
Ajustes de color del teclado, el clickpad y el anillo RGB
Constantes vitales del sistema en tiempo real
Temperatura vital del sistema. No hay manera de mostrar todas las lecturas simultáneamente
Mi pantalla de inicio de Alienware
Mi Alienware ofrece asistencia para la solución de problemas

Procesador

Es importante tener en cuenta que el modelo alcanza un máximo del Core i9-13900HK y no el Core i9-13900HX este último puede ofrecer un rendimiento multihilo entre un 50 y un 60 por ciento más rápido. El rendimiento general de nuestro Core i7-13900HK es, por tanto, casi idéntico al del menos caro Core i9-13900H y comparable al del competidor Ryzen 7 7745HX. Para un rendimiento más rápido, los jugadores pueden considerar el grueso Alienware m16 o Lenovo Legion Pro 7 en su lugar, ya que pueden ser configurados con el Core i7-13900HX.

Si se pasa al menos costoso i7-13620H o i7-13700H se espera que afecte al rendimiento del procesador entre un 15 y un 20 por ciento.MSI Katana 17 y el Dell XPS 17 9730.

Cinebench R15 Multi Loop

0235470705940117514101645188021152350258528203055329035253760399542304465Tooltip
Alienware x16 R1 Intel Core i9-13900HK: Ø2834 (2768.93-2949.63)
Lenovo Legion Pro 7 RTX4090 Intel Core i9-13900HX: Ø4469 (4358.72-4684.94)
Asus ROG Zephyrus M16 GU604VY-NM042X Intel Core i9-13900H: Ø2914 (2871.5-3068.66)
Razer Blade 16 Early 2023 Intel Core i9-13950HX: Ø4512 (4463.29-4528.99)
Dell G16 7620 Intel Core i7-12700H: Ø2526 (2479.7-2651.64)
Alienware m17 R5 (R9 6900HX, RX 6850M XT) AMD Ryzen 9 6900HX: Ø2287 (2247.19-2314.81)
CPU Performance Rating: Percent
Cinebench R20: CPU (Multi Core) | CPU (Single Core)
Cinebench R23: Multi Core | Single Core
Cinebench R15: CPU Multi 64Bit | CPU Single 64Bit
Blender: v2.79 BMW27 CPU
7-Zip 18.03: 7z b 4 | 7z b 4 -mmt1
Geekbench 5.5: Multi-Core | Single-Core
HWBOT x265 Benchmark v2.2: 4k Preset
LibreOffice : 20 Documents To PDF
R Benchmark 2.5: Overall mean
CPU Performance Rating
Asus Zephyrus Duo 16 GX650PY-NM006W
AMD Ryzen 9 7945HX
86.3 pt
Lenovo Legion Pro 7 RTX4090
Intel Core i9-13900HX
83.1 pt
Razer Blade 16 Early 2023
Intel Core i9-13950HX
75.4 pt
Alienware x16 R1 -1!
Intel Core i9-13900HK
67.9 pt
Average Intel Core i9-13900HK -1!
 
67.9 pt
Asus ROG Zephyrus M16 GU604VY-NM042X
Intel Core i9-13900H
66.3 pt
Lenovo Legion Pro 5 16ARX8
AMD Ryzen 7 7745HX
65.9 pt
MSI GE67 HX 12UGS
Intel Core i7-12800HX
65.1 pt
Dell G16 7620
Intel Core i7-12700H
55.5 pt
Lenovo Legion 5 Pro 16ARH7H RTX 3070 Ti
AMD Ryzen 7 6800H
52 pt
Alienware m17 R5 (R9 6900HX, RX 6850M XT)
AMD Ryzen 9 6900HX
50.6 pt
HP Omen 16-c0077ng -1!
AMD Ryzen 7 5800H
41.4 pt
Cinebench R20 / CPU (Multi Core)
Asus Zephyrus Duo 16 GX650PY-NM006W
AMD Ryzen 9 7945HX
13457 Points +78%
Lenovo Legion Pro 7 RTX4090
Intel Core i9-13900HX
11637 Points +54%
Razer Blade 16 Early 2023
Intel Core i9-13950HX
8697 Points +15%
MSI GE67 HX 12UGS
Intel Core i7-12800HX
8564 Points +14%
Alienware x16 R1
Intel Core i9-13900HK
7542 Points
Average Intel Core i9-13900HK
  ()
7542 Points 0%
Asus ROG Zephyrus M16 GU604VY-NM042X
Intel Core i9-13900H
7411 Points -2%
Lenovo Legion Pro 5 16ARX8
AMD Ryzen 7 7745HX
7072 Points -6%
Dell G16 7620
Intel Core i7-12700H
6582 Points -13%
Lenovo Legion 5 Pro 16ARH7H RTX 3070 Ti
AMD Ryzen 7 6800H
5661 Points -25%
Alienware m17 R5 (R9 6900HX, RX 6850M XT)
AMD Ryzen 9 6900HX
5306 Points -30%
HP Omen 16-c0077ng
AMD Ryzen 7 5800H
4726 Points -37%
Cinebench R20 / CPU (Single Core)
Lenovo Legion Pro 7 RTX4090
Intel Core i9-13900HX
780 Points +4%
Asus Zephyrus Duo 16 GX650PY-NM006W
AMD Ryzen 9 7945HX
756 Points +1%
Asus ROG Zephyrus M16 GU604VY-NM042X
Intel Core i9-13900H
751 Points 0%
Alienware x16 R1
Intel Core i9-13900HK
749 Points
Average Intel Core i9-13900HK
  ()
749 Points 0%
Razer Blade 16 Early 2023
Intel Core i9-13950HX
742 Points -1%
Lenovo Legion Pro 5 16ARX8
AMD Ryzen 7 7745HX
717 Points -4%
MSI GE67 HX 12UGS
Intel Core i7-12800HX
676 Points -10%
Dell G16 7620
Intel Core i7-12700H
662 Points -12%
Alienware m17 R5 (R9 6900HX, RX 6850M XT)
AMD Ryzen 9 6900HX
612 Points -18%
Lenovo Legion 5 Pro 16ARH7H RTX 3070 Ti
AMD Ryzen 7 6800H
599 Points -20%
HP Omen 16-c0077ng
AMD Ryzen 7 5800H
551 Points -26%
Cinebench R23 / Multi Core
Asus Zephyrus Duo 16 GX650PY-NM006W
AMD Ryzen 9 7945HX
34521 (32987.6min - 34521.3max) Points +75%
Lenovo Legion Pro 7 RTX4090
Intel Core i9-13900HX
31109 Points +58%
Razer Blade 16 Early 2023
Intel Core i9-13950HX
26736 (22394.1min - 26736.1max) Points +36%
MSI GE67 HX 12UGS
Intel Core i7-12800HX
22456 (19998.9min - 22456.2max) Points +14%
Alienware x16 R1
Intel Core i9-13900HK
19704 (18499.8min - 19703.9max) Points
Average Intel Core i9-13900HK
  ()
19704 Points 0%
Asus ROG Zephyrus M16 GU604VY-NM042X
Intel Core i9-13900H
19469 (17696.3min - 19468.6max) Points -1%
Lenovo Legion Pro 5 16ARX8
AMD Ryzen 7 7745HX
18060 (17729.5min - 18059.9max) Points -8%
Dell G16 7620
Intel Core i7-12700H
17181 (15714.9min - 17181.1max) Points -13%
Lenovo Legion 5 Pro 16ARH7H RTX 3070 Ti
AMD Ryzen 7 6800H
14660 (14400.8min - 14660.4max) Points -26%
Alienware m17 R5 (R9 6900HX, RX 6850M XT)
AMD Ryzen 9 6900HX
13872 Points -30%
HP Omen 16-c0077ng
AMD Ryzen 7 5800H
12173 Points -38%
Cinebench R23 / Single Core
Lenovo Legion Pro 7 RTX4090
Intel Core i9-13900HX
2039 Points +4%
Razer Blade 16 Early 2023
Intel Core i9-13950HX
2029 Points +4%
Asus ROG Zephyrus M16 GU604VY-NM042X
Intel Core i9-13900H
1974 Points +1%
Alienware x16 R1
Intel Core i9-13900HK
1960 Points
Average Intel Core i9-13900HK
  ()
1960 Points 0%
Asus Zephyrus Duo 16 GX650PY-NM006W
AMD Ryzen 9 7945HX
1940 Points -1%
Lenovo Legion Pro 5 16ARX8
AMD Ryzen 7 7745HX
1846 Points -6%
MSI GE67 HX 12UGS
Intel Core i7-12800HX
1812 Points -8%
Dell G16 7620
Intel Core i7-12700H
1726 Points -12%
Alienware m17 R5 (R9 6900HX, RX 6850M XT)
AMD Ryzen 9 6900HX
1554 Points -21%
Lenovo Legion 5 Pro 16ARH7H RTX 3070 Ti
AMD Ryzen 7 6800H
1543 Points -21%
HP Omen 16-c0077ng
AMD Ryzen 7 5800H
1415 Points -28%
Cinebench R15 / CPU Multi 64Bit
Asus Zephyrus Duo 16 GX650PY-NM006W
AMD Ryzen 9 7945HX
5554 (5255.55min - 5554.01max) Points +88%
Lenovo Legion Pro 7 RTX4090
Intel Core i9-13900HX
4685 (4358.72min - 4684.94max) Points +59%
Razer Blade 16 Early 2023
Intel Core i9-13950HX
4529 (4463.29min - 4528.99max) Points +54%
MSI GE67 HX 12UGS
Intel Core i7-12800HX
3383 (3163.31min - 3383.24max) Points +15%
Asus ROG Zephyrus M16 GU604VY-NM042X
Intel Core i9-13900H
3069 (2871.5min - 3068.66max) Points +4%
Lenovo Legion Pro 5 16ARX8
AMD Ryzen 7 7745HX
2978 (2861.03min - 2977.96max) Points +1%
Alienware x16 R1
Intel Core i9-13900HK
2950 (2768.93min - 2949.63max) Points
Average Intel Core i9-13900HK
  ()
2950 Points 0%
Dell G16 7620
Intel Core i7-12700H
2652 (2479.7min - 2651.64max) Points -10%
Lenovo Legion 5 Pro 16ARH7H RTX 3070 Ti
AMD Ryzen 7 6800H
2366 (2324.37min - 2366.02max) Points -20%
Alienware m17 R5 (R9 6900HX, RX 6850M XT)
AMD Ryzen 9 6900HX
2315 (2247.19min - 2314.81max) Points -22%
HP Omen 16-c0077ng
AMD Ryzen 7 5800H
2030 (1981.18min - 2029.63max) Points -31%
Cinebench R15 / CPU Single 64Bit
Asus Zephyrus Duo 16 GX650PY-NM006W
AMD Ryzen 9 7945HX
307 Points +10%
Lenovo Legion Pro 5 16ARX8
AMD Ryzen 7 7745HX
294 Points +5%
Asus ROG Zephyrus M16 GU604VY-NM042X
Intel Core i9-13900H
292 Points +5%
Lenovo Legion Pro 7 RTX4090
Intel Core i9-13900HX
289 Points +4%
Alienware x16 R1
Intel Core i9-13900HK
279 Points
Average Intel Core i9-13900HK
  ()
279 Points 0%
Razer Blade 16 Early 2023
Intel Core i9-13950HX
274 Points -2%
MSI GE67 HX 12UGS
Intel Core i7-12800HX
260 Points -7%
Alienware m17 R5 (R9 6900HX, RX 6850M XT)
AMD Ryzen 9 6900HX
250 Points -10%
Lenovo Legion 5 Pro 16ARH7H RTX 3070 Ti
AMD Ryzen 7 6800H
248 Points -11%
Dell G16 7620
Intel Core i7-12700H
246 Points -12%
HP Omen 16-c0077ng
AMD Ryzen 7 5800H
229 Points -18%
Blender / v2.79 BMW27 CPU
HP Omen 16-c0077ng
AMD Ryzen 7 5800H
251.8 Seconds *
Alienware m17 R5 (R9 6900HX, RX 6850M XT)
AMD Ryzen 9 6900HX
221 Seconds *
Lenovo Legion 5 Pro 16ARH7H RTX 3070 Ti
AMD Ryzen 7 6800H
213 Seconds *
Dell G16 7620
Intel Core i7-12700H
184 Seconds *
Lenovo Legion Pro 5 16ARX8
AMD Ryzen 7 7745HX
174 Seconds *
Asus ROG Zephyrus M16 GU604VY-NM042X
Intel Core i9-13900H
166 Seconds *
MSI GE67 HX 12UGS
Intel Core i7-12800HX
153.1 Seconds *
Razer Blade 16 Early 2023
Intel Core i9-13950HX
114 Seconds *
Lenovo Legion Pro 7 RTX4090
Intel Core i9-13900HX
105 Seconds *
Asus Zephyrus Duo 16 GX650PY-NM006W
AMD Ryzen 9 7945HX
93 Seconds *
7-Zip 18.03 / 7z b 4
Asus Zephyrus Duo 16 GX650PY-NM006W
AMD Ryzen 9 7945HX
135927 MIPS +76%
Lenovo Legion Pro 7 RTX4090
Intel Core i9-13900HX
122148 MIPS +58%
Razer Blade 16 Early 2023
Intel Core i9-13950HX
109330 MIPS +42%
Asus ROG Zephyrus M16 GU604VY-NM042X
Intel Core i9-13900H
79032 MIPS +2%
Alienware x16 R1
Intel Core i9-13900HK
77190 MIPS
Average Intel Core i9-13900HK
  ()
77190 MIPS 0%
MSI GE67 HX 12UGS
Intel Core i7-12800HX
76947 MIPS 0%
Lenovo Legion Pro 5 16ARX8
AMD Ryzen 7 7745HX
75557 MIPS -2%
Dell G16 7620
Intel Core i7-12700H
65012 MIPS -16%
Lenovo Legion 5 Pro 16ARH7H RTX 3070 Ti
AMD Ryzen 7 6800H
64817 MIPS -16%
Alienware m17 R5 (R9 6900HX, RX 6850M XT)
AMD Ryzen 9 6900HX
61988 MIPS -20%
7-Zip 18.03 / 7z b 4 -mmt1
Asus Zephyrus Duo 16 GX650PY-NM006W
AMD Ryzen 9 7945HX
7319 MIPS +25%
Lenovo Legion Pro 5 16ARX8
AMD Ryzen 7 7745HX
7244 MIPS +24%
Lenovo Legion Pro 7 RTX4090
Intel Core i9-13900HX
6931 MIPS +18%
Razer Blade 16 Early 2023
Intel Core i9-13950HX
6445 MIPS +10%
Asus ROG Zephyrus M16 GU604VY-NM042X
Intel Core i9-13900H
6245 MIPS +6%
Alienware x16 R1
Intel Core i9-13900HK
5864 MIPS
Average Intel Core i9-13900HK
  ()
5864 MIPS 0%
Lenovo Legion 5 Pro 16ARH7H RTX 3070 Ti
AMD Ryzen 7 6800H
5803 MIPS -1%
Alienware m17 R5 (R9 6900HX, RX 6850M XT)
AMD Ryzen 9 6900HX
5734 MIPS -2%
MSI GE67 HX 12UGS
Intel Core i7-12800HX
5624 MIPS -4%
HP Omen 16-c0077ng
AMD Ryzen 7 5800H
5423 MIPS -8%
Dell G16 7620
Intel Core i7-12700H
5343 MIPS -9%
Geekbench 5.5 / Multi-Core
Lenovo Legion Pro 7 RTX4090
Intel Core i9-13900HX
20510 Points +37%
Asus Zephyrus Duo 16 GX650PY-NM006W
AMD Ryzen 9 7945HX
19583 Points +31%
Razer Blade 16 Early 2023
Intel Core i9-13950HX
18152 Points +21%
Asus ROG Zephyrus M16 GU604VY-NM042X
Intel Core i9-13900H
15410 Points +3%
Alienware x16 R1
Intel Core i9-13900HK
14985 Points
Average Intel Core i9-13900HK
  ()
14985 Points 0%
MSI GE67 HX 12UGS
Intel Core i7-12800HX
14213 Points -5%
Lenovo Legion Pro 5 16ARX8
AMD Ryzen 7 7745HX
12378 Points -17%
Dell G16 7620
Intel Core i7-12700H
11862 Points -21%
Lenovo Legion 5 Pro 16ARH7H RTX 3070 Ti
AMD Ryzen 7 6800H
10355 Points -31%
Alienware m17 R5 (R9 6900HX, RX 6850M XT)
AMD Ryzen 9 6900HX
10021 Points -33%
HP Omen 16-c0077ng
AMD Ryzen 7 5800H
7326 Points -51%
Geekbench 5.5 / Single-Core
Asus Zephyrus Duo 16 GX650PY-NM006W
AMD Ryzen 9 7945HX
2132 Points +10%
Lenovo Legion Pro 5 16ARX8
AMD Ryzen 7 7745HX
2040 Points +5%
Lenovo Legion Pro 7 RTX4090
Intel Core i9-13900HX
2012 Points +4%
Asus ROG Zephyrus M16 GU604VY-NM042X
Intel Core i9-13900H
1974 Points +2%
Alienware x16 R1
Intel Core i9-13900HK
1942 Points
Average Intel Core i9-13900HK
  ()
1942 Points 0%
Razer Blade 16 Early 2023
Intel Core i9-13950HX
1805 Points -7%
MSI GE67 HX 12UGS
Intel Core i7-12800HX
1759 Points -9%
Dell G16 7620
Intel Core i7-12700H
1656 Points -15%
Alienware m17 R5 (R9 6900HX, RX 6850M XT)
AMD Ryzen 9 6900HX
1575 Points -19%
Lenovo Legion 5 Pro 16ARH7H RTX 3070 Ti
AMD Ryzen 7 6800H
1566 Points -19%
HP Omen 16-c0077ng
AMD Ryzen 7 5800H
1336 Points -31%
HWBOT x265 Benchmark v2.2 / 4k Preset
Asus Zephyrus Duo 16 GX650PY-NM006W
AMD Ryzen 9 7945HX
34.8 fps +59%
Lenovo Legion Pro 7 RTX4090
Intel Core i9-13900HX
32.2 fps +47%
Razer Blade 16 Early 2023
Intel Core i9-13950HX
28.7 fps +31%
MSI GE67 HX 12UGS
Intel Core i7-12800HX
24.9 fps +14%
Lenovo Legion Pro 5 16ARX8
AMD Ryzen 7 7745HX
23.2 fps +6%
Alienware x16 R1
Intel Core i9-13900HK
21.9 fps
Average Intel Core i9-13900HK
  ()
21.9 fps 0%
Asus ROG Zephyrus M16 GU604VY-NM042X
Intel Core i9-13900H
21.7 fps -1%
Dell G16 7620
Intel Core i7-12700H
18.8 fps -14%
Lenovo Legion 5 Pro 16ARH7H RTX 3070 Ti
AMD Ryzen 7 6800H
18.5 fps -16%
Alienware m17 R5 (R9 6900HX, RX 6850M XT)
AMD Ryzen 9 6900HX
16.8 fps -23%
HP Omen 16-c0077ng
AMD Ryzen 7 5800H
15.2 fps -31%
LibreOffice / 20 Documents To PDF
HP Omen 16-c0077ng
AMD Ryzen 7 5800H
92.3 s * -108%
Asus Zephyrus Duo 16 GX650PY-NM006W
AMD Ryzen 9 7945HX
60.4 s * -36%
Alienware m17 R5 (R9 6900HX, RX 6850M XT)
AMD Ryzen 9 6900HX
57.3 s * -29%
Dell G16 7620
Intel Core i7-12700H
53.8 s * -21%
Lenovo Legion 5 Pro 16ARH7H RTX 3070 Ti
AMD Ryzen 7 6800H
52.8 s * -19%
Asus ROG Zephyrus M16 GU604VY-NM042X
Intel Core i9-13900H
50.5 s * -14%
Razer Blade 16 Early 2023
Intel Core i9-13950HX
47.5 s * -7%
Alienware x16 R1
Intel Core i9-13900HK
44.4 s *
Average Intel Core i9-13900HK
  ()
44.4 s * -0%
MSI GE67 HX 12UGS
Intel Core i7-12800HX
42 s * +5%
Lenovo Legion Pro 7 RTX4090
Intel Core i9-13900HX
40.6 s * +9%
Lenovo Legion Pro 5 16ARX8
AMD Ryzen 7 7745HX
37.9 s * +15%
R Benchmark 2.5 / Overall mean
HP Omen 16-c0077ng
AMD Ryzen 7 5800H
0.516 sec * -21%
Dell G16 7620
Intel Core i7-12700H
0.505 sec * -18%
Lenovo Legion 5 Pro 16ARH7H RTX 3070 Ti
AMD Ryzen 7 6800H
0.4894 sec * -14%
Alienware m17 R5 (R9 6900HX, RX 6850M XT)
AMD Ryzen 9 6900HX
0.486 sec * -14%
MSI GE67 HX 12UGS
Intel Core i7-12800HX
0.459 sec * -7%
Alienware x16 R1
Intel Core i9-13900HK
0.4278 sec *
Average Intel Core i9-13900HK
  ()
0.4278 sec * -0%
Lenovo Legion Pro 5 16ARX8
AMD Ryzen 7 7745HX
0.421 sec * +2%
Razer Blade 16 Early 2023
Intel Core i9-13950HX
0.4121 sec * +4%
Asus ROG Zephyrus M16 GU604VY-NM042X
Intel Core i9-13900H
0.412 sec * +4%
Lenovo Legion Pro 7 RTX4090
Intel Core i9-13900HX
0.401 sec * +6%
Asus Zephyrus Duo 16 GX650PY-NM006W
AMD Ryzen 9 7945HX
0.3982 sec * +7%

* ... más pequeño es mejor

Cinebench R15 CPU Multi 64Bit
2950 Points
Cinebench R15 OpenGL 64Bit
222 fps
Cinebench R15 Ref. Match 64Bit
99.6 %
Cinebench R15 CPU Single 64Bit
279 Points
ayuda
Performance Rating
Lenovo Legion Pro 7 RTX4090
Intel Core i9-13900HX, NVIDIA GeForce RTX 4090 Laptop GPU
99.7 pt
Razer Blade 16 Early 2023
Intel Core i9-13950HX, NVIDIA GeForce RTX 4080 Laptop GPU
96.4 pt
Asus ROG Zephyrus M16 GU604VY-NM042X
Intel Core i9-13900H, NVIDIA GeForce RTX 4090 Laptop GPU
72.8 pt
Alienware x16 R1
Intel Core i9-13900HK, NVIDIA GeForce RTX 4080 Laptop GPU
72 pt
Average Intel Core i9-13900HK
 
72 pt
Alienware m17 R5 (R9 6900HX, RX 6850M XT)
AMD Ryzen 9 6900HX, Radeon RX 6850M XT
64.1 pt
Dell G16 7620
Intel Core i7-12700H, GeForce RTX 3060 Laptop GPU
59.4 pt
AIDA64 / FP32 Ray-Trace
Lenovo Legion Pro 7 RTX4090
Intel Core i9-13900HX, NVIDIA GeForce RTX 4090 Laptop GPU
27200 KRay/s +48%
Razer Blade 16 Early 2023
Intel Core i9-13950HX, NVIDIA GeForce RTX 4080 Laptop GPU
25857 KRay/s +41%
Asus ROG Zephyrus M16 GU604VY-NM042X
Intel Core i9-13900H, NVIDIA GeForce RTX 4090 Laptop GPU
18961 KRay/s +3%
Alienware x16 R1
Intel Core i9-13900HK, NVIDIA GeForce RTX 4080 Laptop GPU
18326 KRay/s
Average Intel Core i9-13900HK
  ()
18326 KRay/s 0%
Alienware m17 R5 (R9 6900HX, RX 6850M XT)
AMD Ryzen 9 6900HX, Radeon RX 6850M XT
16202 KRay/s -12%
Dell G16 7620
Intel Core i7-12700H, GeForce RTX 3060 Laptop GPU
14879 KRay/s -19%
AIDA64 / FPU Julia
Lenovo Legion Pro 7 RTX4090
Intel Core i9-13900HX, NVIDIA GeForce RTX 4090 Laptop GPU
135707 Points +46%
Razer Blade 16 Early 2023
Intel Core i9-13950HX, NVIDIA GeForce RTX 4080 Laptop GPU
125944 Points +36%
Alienware m17 R5 (R9 6900HX, RX 6850M XT)
AMD Ryzen 9 6900HX, Radeon RX 6850M XT
104841 Points +13%
Asus ROG Zephyrus M16 GU604VY-NM042X
Intel Core i9-13900H, NVIDIA GeForce RTX 4090 Laptop GPU
93802 Points +1%
Alienware x16 R1
Intel Core i9-13900HK, NVIDIA GeForce RTX 4080 Laptop GPU
92925 Points
Average Intel Core i9-13900HK
  ()
92925 Points 0%
Dell G16 7620
Intel Core i7-12700H, GeForce RTX 3060 Laptop GPU
78004 Points -16%
AIDA64 / CPU SHA3
Lenovo Legion Pro 7 RTX4090
Intel Core i9-13900HX, NVIDIA GeForce RTX 4090 Laptop GPU
6705 MB/s +60%
Razer Blade 16 Early 2023
Intel Core i9-13950HX, NVIDIA GeForce RTX 4080 Laptop GPU
6350 MB/s +52%
Asus ROG Zephyrus M16 GU604VY-NM042X
Intel Core i9-13900H, NVIDIA GeForce RTX 4090 Laptop GPU
4207 MB/s 0%
Alienware x16 R1
Intel Core i9-13900HK, NVIDIA GeForce RTX 4080 Laptop GPU
4190 MB/s
Average Intel Core i9-13900HK
  ()
4190 MB/s 0%
Dell G16 7620
Intel Core i7-12700H, GeForce RTX 3060 Laptop GPU
3692 MB/s -12%
Alienware m17 R5 (R9 6900HX, RX 6850M XT)
AMD Ryzen 9 6900HX, Radeon RX 6850M XT
3457 MB/s -17%
AIDA64 / CPU Queen
Lenovo Legion Pro 7 RTX4090
Intel Core i9-13900HX, NVIDIA GeForce RTX 4090 Laptop GPU
134965 Points +14%
Razer Blade 16 Early 2023
Intel Core i9-13950HX, NVIDIA GeForce RTX 4080 Laptop GPU
133226 Points +13%
Asus ROG Zephyrus M16 GU604VY-NM042X
Intel Core i9-13900H, NVIDIA GeForce RTX 4090 Laptop GPU
120181 Points +2%
Alienware x16 R1
Intel Core i9-13900HK, NVIDIA GeForce RTX 4080 Laptop GPU
118166 Points
Average Intel Core i9-13900HK
  ()
118166 Points 0%
Alienware m17 R5 (R9 6900HX, RX 6850M XT)
AMD Ryzen 9 6900HX, Radeon RX 6850M XT
105169 Points -11%
Dell G16 7620
Intel Core i7-12700H, GeForce RTX 3060 Laptop GPU
102006 Points -14%
AIDA64 / FPU SinJulia
Razer Blade 16 Early 2023
Intel Core i9-13950HX, NVIDIA GeForce RTX 4080 Laptop GPU
15813 Points +41%
Lenovo Legion Pro 7 RTX4090
Intel Core i9-13900HX, NVIDIA GeForce RTX 4090 Laptop GPU
15447 Points +37%
Alienware m17 R5 (R9 6900HX, RX 6850M XT)
AMD Ryzen 9 6900HX, Radeon RX 6850M XT
12918 Points +15%
Asus ROG Zephyrus M16 GU604VY-NM042X
Intel Core i9-13900H, NVIDIA GeForce RTX 4090 Laptop GPU
11631 Points +3%
Alienware x16 R1
Intel Core i9-13900HK, NVIDIA GeForce RTX 4080 Laptop GPU
11249 Points
Average Intel Core i9-13900HK
  ()
11249 Points 0%
Dell G16 7620
Intel Core i7-12700H, GeForce RTX 3060 Laptop GPU
9924 Points -12%
AIDA64 / FPU Mandel
Lenovo Legion Pro 7 RTX4090
Intel Core i9-13900HX, NVIDIA GeForce RTX 4090 Laptop GPU
67013 Points +47%
Razer Blade 16 Early 2023
Intel Core i9-13950HX, NVIDIA GeForce RTX 4080 Laptop GPU
63308 Points +39%
Alienware m17 R5 (R9 6900HX, RX 6850M XT)
AMD Ryzen 9 6900HX, Radeon RX 6850M XT
57695 Points +26%
Asus ROG Zephyrus M16 GU604VY-NM042X
Intel Core i9-13900H, NVIDIA GeForce RTX 4090 Laptop GPU
46487 Points +2%
Alienware x16 R1
Intel Core i9-13900HK, NVIDIA GeForce RTX 4080 Laptop GPU
45616 Points
Average Intel Core i9-13900HK
  ()
45616 Points 0%
Dell G16 7620
Intel Core i7-12700H, GeForce RTX 3060 Laptop GPU
35933 Points -21%
AIDA64 / CPU AES
Lenovo Legion Pro 7 RTX4090
Intel Core i9-13900HX, NVIDIA GeForce RTX 4090 Laptop GPU
128778 MB/s +56%
Razer Blade 16 Early 2023
Intel Core i9-13950HX, NVIDIA GeForce RTX 4080 Laptop GPU
125644 MB/s +52%
Asus ROG Zephyrus M16 GU604VY-NM042X
Intel Core i9-13900H, NVIDIA GeForce RTX 4090 Laptop GPU
85007 MB/s +3%
Alienware x16 R1
Intel Core i9-13900HK, NVIDIA GeForce RTX 4080 Laptop GPU
82540 MB/s
Average Intel Core i9-13900HK
  ()
82540 MB/s 0%
Dell G16 7620
Intel Core i7-12700H, GeForce RTX 3060 Laptop GPU
72634 MB/s -12%
Alienware m17 R5 (R9 6900HX, RX 6850M XT)
AMD Ryzen 9 6900HX, Radeon RX 6850M XT
54897 MB/s -33%
AIDA64 / CPU ZLib
Lenovo Legion Pro 7 RTX4090
Intel Core i9-13900HX, NVIDIA GeForce RTX 4090 Laptop GPU
1936 MB/s +55%
Razer Blade 16 Early 2023
Intel Core i9-13950HX, NVIDIA GeForce RTX 4080 Laptop GPU
1850 MB/s +48%
Alienware x16 R1
Intel Core i9-13900HK, NVIDIA GeForce RTX 4080 Laptop GPU
1249 MB/s
Average Intel Core i9-13900HK
  ()
1249 MB/s 0%
Asus ROG Zephyrus M16 GU604VY-NM042X
Intel Core i9-13900H, NVIDIA GeForce RTX 4090 Laptop GPU
1204 MB/s -4%
Dell G16 7620
Intel Core i7-12700H, GeForce RTX 3060 Laptop GPU
1045 MB/s -16%
Alienware m17 R5 (R9 6900HX, RX 6850M XT)
AMD Ryzen 9 6900HX, Radeon RX 6850M XT
854 MB/s -32%
AIDA64 / FP64 Ray-Trace
Lenovo Legion Pro 7 RTX4090
Intel Core i9-13900HX, NVIDIA GeForce RTX 4090 Laptop GPU
14508 KRay/s +45%
Razer Blade 16 Early 2023
Intel Core i9-13950HX, NVIDIA GeForce RTX 4080 Laptop GPU
13844 KRay/s +38%
Asus ROG Zephyrus M16 GU604VY-NM042X
Intel Core i9-13900H, NVIDIA GeForce RTX 4090 Laptop GPU
10342 KRay/s +3%
Alienware x16 R1
Intel Core i9-13900HK, NVIDIA GeForce RTX 4080 Laptop GPU
10018 KRay/s
Average Intel Core i9-13900HK
  ()
10018 KRay/s 0%
Alienware m17 R5 (R9 6900HX, RX 6850M XT)
AMD Ryzen 9 6900HX, Radeon RX 6850M XT
8777 KRay/s -12%
Dell G16 7620
Intel Core i7-12700H, GeForce RTX 3060 Laptop GPU
7997 KRay/s -20%
AIDA64 / CPU PhotoWorxx
Razer Blade 16 Early 2023
Intel Core i9-13950HX, NVIDIA GeForce RTX 4080 Laptop GPU
50834 MPixel/s +3%
Lenovo Legion Pro 7 RTX4090
Intel Core i9-13900HX, NVIDIA GeForce RTX 4090 Laptop GPU
50637 MPixel/s +2%
Alienware x16 R1
Intel Core i9-13900HK, NVIDIA GeForce RTX 4080 Laptop GPU
49539 MPixel/s
Average Intel Core i9-13900HK
  ()
49539 MPixel/s 0%
Asus ROG Zephyrus M16 GU604VY-NM042X
Intel Core i9-13900H, NVIDIA GeForce RTX 4090 Laptop GPU
48325 MPixel/s -2%
Dell G16 7620
Intel Core i7-12700H, GeForce RTX 3060 Laptop GPU
34982 MPixel/s -29%
Alienware m17 R5 (R9 6900HX, RX 6850M XT)
AMD Ryzen 9 6900HX, Radeon RX 6850M XT
30343 MPixel/s -39%

Rendimiento del sistema

PCMark 10 Estándar
PCMark 10 Estándar
PCMark 10 / Score
Alienware x16 R1
NVIDIA GeForce RTX 4080 Laptop GPU, i9-13900HK, SK hynix PC801 HFS001TEJ9X101N
8365 Points
Average Intel Core i9-13900HK, NVIDIA GeForce RTX 4080 Laptop GPU
  ()
8365 Points 0%
Asus ROG Zephyrus M16 GU604VY-NM042X
NVIDIA GeForce RTX 4090 Laptop GPU, i9-13900H, Samsung PM9A1 MZVL22T0HBLB
8277 Points -1%
Lenovo Legion Pro 7 RTX4090
NVIDIA GeForce RTX 4090 Laptop GPU, i9-13900HX, Samsung PM9A1 MZVL21T0HCLR
8158 Points -2%
Razer Blade 16 Early 2023
NVIDIA GeForce RTX 4080 Laptop GPU, i9-13950HX, SSSTC CA6-8D1024
7888 Points -6%
Alienware m17 R5 (R9 6900HX, RX 6850M XT)
Radeon RX 6850M XT, R9 6900HX, SSSTC CA6-8D1024
7292 Points -13%
Dell G16 7620
GeForce RTX 3060 Laptop GPU, i7-12700H, WDC PC SN810 512GB
7211 Points -14%
PCMark 10 / Essentials
Asus ROG Zephyrus M16 GU604VY-NM042X
NVIDIA GeForce RTX 4090 Laptop GPU, i9-13900H, Samsung PM9A1 MZVL22T0HBLB
11659 Points +4%
Alienware x16 R1
NVIDIA GeForce RTX 4080 Laptop GPU, i9-13900HK, SK hynix PC801 HFS001TEJ9X101N
11161 Points
Average Intel Core i9-13900HK, NVIDIA GeForce RTX 4080 Laptop GPU
  ()
11161 Points 0%
Lenovo Legion Pro 7 RTX4090
NVIDIA GeForce RTX 4090 Laptop GPU, i9-13900HX, Samsung PM9A1 MZVL21T0HCLR
11091 Points -1%
Razer Blade 16 Early 2023
NVIDIA GeForce RTX 4080 Laptop GPU, i9-13950HX, SSSTC CA6-8D1024
11078 Points -1%
Dell G16 7620
GeForce RTX 3060 Laptop GPU, i7-12700H, WDC PC SN810 512GB
10263 Points -8%
Alienware m17 R5 (R9 6900HX, RX 6850M XT)
Radeon RX 6850M XT, R9 6900HX, SSSTC CA6-8D1024
10250 Points -8%
PCMark 10 / Productivity
Asus ROG Zephyrus M16 GU604VY-NM042X
NVIDIA GeForce RTX 4090 Laptop GPU, i9-13900H, Samsung PM9A1 MZVL22T0HBLB
11046 Points +12%
Alienware x16 R1
NVIDIA GeForce RTX 4080 Laptop GPU, i9-13900HK, SK hynix PC801 HFS001TEJ9X101N
9890 Points
Average Intel Core i9-13900HK, NVIDIA GeForce RTX 4080 Laptop GPU
  ()
9890 Points 0%
Alienware m17 R5 (R9 6900HX, RX 6850M XT)
Radeon RX 6850M XT, R9 6900HX, SSSTC CA6-8D1024
9090 Points -8%
Lenovo Legion Pro 7 RTX4090
NVIDIA GeForce RTX 4090 Laptop GPU, i9-13900HX, Samsung PM9A1 MZVL21T0HCLR
9089 Points -8%
Dell G16 7620
GeForce RTX 3060 Laptop GPU, i7-12700H, WDC PC SN810 512GB
8878 Points -10%
Razer Blade 16 Early 2023
NVIDIA GeForce RTX 4080 Laptop GPU, i9-13950HX, SSSTC CA6-8D1024
8271 Points -16%
PCMark 10 / Digital Content Creation
Lenovo Legion Pro 7 RTX4090
NVIDIA GeForce RTX 4090 Laptop GPU, i9-13900HX, Samsung PM9A1 MZVL21T0HCLR
14614 Points +2%
Razer Blade 16 Early 2023
NVIDIA GeForce RTX 4080 Laptop GPU, i9-13950HX, SSSTC CA6-8D1024
14535 Points +1%
Alienware x16 R1
NVIDIA GeForce RTX 4080 Laptop GPU, i9-13900HK, SK hynix PC801 HFS001TEJ9X101N
14394 Points
Average Intel Core i9-13900HK, NVIDIA GeForce RTX 4080 Laptop GPU
  ()
14394 Points 0%
Asus ROG Zephyrus M16 GU604VY-NM042X
NVIDIA GeForce RTX 4090 Laptop GPU, i9-13900H, Samsung PM9A1 MZVL22T0HBLB
11949 Points -17%
Alienware m17 R5 (R9 6900HX, RX 6850M XT)
Radeon RX 6850M XT, R9 6900HX, SSSTC CA6-8D1024
11296 Points -22%
Dell G16 7620
GeForce RTX 3060 Laptop GPU, i7-12700H, WDC PC SN810 512GB
11170 Points -22%
CrossMark / Overall
Asus ROG Zephyrus M16 GU604VY-NM042X
NVIDIA GeForce RTX 4090 Laptop GPU, i9-13900H, Samsung PM9A1 MZVL22T0HBLB
1972 Points +2%
Alienware x16 R1
NVIDIA GeForce RTX 4080 Laptop GPU, i9-13900HK, SK hynix PC801 HFS001TEJ9X101N
1937 Points
Average Intel Core i9-13900HK, NVIDIA GeForce RTX 4080 Laptop GPU
  ()
1937 Points 0%
Dell G16 7620
GeForce RTX 3060 Laptop GPU, i7-12700H, WDC PC SN810 512GB
1783 Points -8%
Alienware m17 R5 (R9 6900HX, RX 6850M XT)
Radeon RX 6850M XT, R9 6900HX, SSSTC CA6-8D1024
1597 Points -18%
Razer Blade 16 Early 2023
NVIDIA GeForce RTX 4080 Laptop GPU, i9-13950HX, SSSTC CA6-8D1024
1592 Points -18%
CrossMark / Productivity
Asus ROG Zephyrus M16 GU604VY-NM042X
NVIDIA GeForce RTX 4090 Laptop GPU, i9-13900H, Samsung PM9A1 MZVL22T0HBLB
1845 Points +1%
Alienware x16 R1
NVIDIA GeForce RTX 4080 Laptop GPU, i9-13900HK, SK hynix PC801 HFS001TEJ9X101N
1832 Points
Average Intel Core i9-13900HK, NVIDIA GeForce RTX 4080 Laptop GPU
  ()
1832 Points 0%
Dell G16 7620
GeForce RTX 3060 Laptop GPU, i7-12700H, WDC PC SN810 512GB
1682 Points -8%
Alienware m17 R5 (R9 6900HX, RX 6850M XT)
Radeon RX 6850M XT, R9 6900HX, SSSTC CA6-8D1024
1565 Points -15%
Razer Blade 16 Early 2023
NVIDIA GeForce RTX 4080 Laptop GPU, i9-13950HX, SSSTC CA6-8D1024
1509 Points -18%
CrossMark / Creativity
Asus ROG Zephyrus M16 GU604VY-NM042X
NVIDIA GeForce RTX 4090 Laptop GPU, i9-13900H, Samsung PM9A1 MZVL22T0HBLB
2233 Points +9%
Alienware x16 R1
NVIDIA GeForce RTX 4080 Laptop GPU, i9-13900HK, SK hynix PC801 HFS001TEJ9X101N
2054 Points
Average Intel Core i9-13900HK, NVIDIA GeForce RTX 4080 Laptop GPU
  ()
2054 Points 0%
Dell G16 7620
GeForce RTX 3060 Laptop GPU, i7-12700H, WDC PC SN810 512GB
1948 Points -5%
Razer Blade 16 Early 2023
NVIDIA GeForce RTX 4080 Laptop GPU, i9-13950HX, SSSTC CA6-8D1024
1780 Points -13%
Alienware m17 R5 (R9 6900HX, RX 6850M XT)
Radeon RX 6850M XT, R9 6900HX, SSSTC CA6-8D1024
1738 Points -15%
CrossMark / Responsiveness
Alienware x16 R1
NVIDIA GeForce RTX 4080 Laptop GPU, i9-13900HK, SK hynix PC801 HFS001TEJ9X101N
1917 Points
Average Intel Core i9-13900HK, NVIDIA GeForce RTX 4080 Laptop GPU
  ()
1917 Points 0%
Asus ROG Zephyrus M16 GU604VY-NM042X
NVIDIA GeForce RTX 4090 Laptop GPU, i9-13900H, Samsung PM9A1 MZVL22T0HBLB
1658 Points -14%
Dell G16 7620
GeForce RTX 3060 Laptop GPU, i7-12700H, WDC PC SN810 512GB
1627 Points -15%
Razer Blade 16 Early 2023
NVIDIA GeForce RTX 4080 Laptop GPU, i9-13950HX, SSSTC CA6-8D1024
1342 Points -30%
Alienware m17 R5 (R9 6900HX, RX 6850M XT)
Radeon RX 6850M XT, R9 6900HX, SSSTC CA6-8D1024
1315 Points -31%
PCMark 10 Score
8365 puntos
ayuda
AIDA64 / Memory Copy
Lenovo Legion Pro 7 RTX4090
Intel Core i9-13900HX, NVIDIA GeForce RTX 4090 Laptop GPU
78367 MB/s +5%
Razer Blade 16 Early 2023
Intel Core i9-13950HX, NVIDIA GeForce RTX 4080 Laptop GPU
77060 MB/s +3%
Alienware x16 R1
Intel Core i9-13900HK, NVIDIA GeForce RTX 4080 Laptop GPU
74460 MB/s
Average Intel Core i9-13900HK
  ()
74460 MB/s 0%
Asus ROG Zephyrus M16 GU604VY-NM042X
Intel Core i9-13900H, NVIDIA GeForce RTX 4090 Laptop GPU
70473 MB/s -5%
Dell G16 7620
Intel Core i7-12700H, GeForce RTX 3060 Laptop GPU
54685 MB/s -27%
Alienware m17 R5 (R9 6900HX, RX 6850M XT)
AMD Ryzen 9 6900HX, Radeon RX 6850M XT
50334 MB/s -32%
AIDA64 / Memory Read
Lenovo Legion Pro 7 RTX4090
Intel Core i9-13900HX, NVIDIA GeForce RTX 4090 Laptop GPU
86932 MB/s +28%
Razer Blade 16 Early 2023
Intel Core i9-13950HX, NVIDIA GeForce RTX 4080 Laptop GPU
84869 MB/s +25%
Asus ROG Zephyrus M16 GU604VY-NM042X
Intel Core i9-13900H, NVIDIA GeForce RTX 4090 Laptop GPU
70351 MB/s +4%
Alienware x16 R1
Intel Core i9-13900HK, NVIDIA GeForce RTX 4080 Laptop GPU
67737 MB/s
Average Intel Core i9-13900HK
  ()
67737 MB/s 0%
Dell G16 7620
Intel Core i7-12700H, GeForce RTX 3060 Laptop GPU
65740 MB/s -3%
Alienware m17 R5 (R9 6900HX, RX 6850M XT)
AMD Ryzen 9 6900HX, Radeon RX 6850M XT
50996 MB/s -25%
AIDA64 / Memory Write
Alienware x16 R1
Intel Core i9-13900HK, NVIDIA GeForce RTX 4080 Laptop GPU
85917 MB/s
Average Intel Core i9-13900HK
  ()
85917 MB/s 0%
Razer Blade 16 Early 2023
Intel Core i9-13950HX, NVIDIA GeForce RTX 4080 Laptop GPU
80441 MB/s -6%
Lenovo Legion Pro 7 RTX4090
Intel Core i9-13900HX, NVIDIA GeForce RTX 4090 Laptop GPU
76779 MB/s -11%
Asus ROG Zephyrus M16 GU604VY-NM042X
Intel Core i9-13900H, NVIDIA GeForce RTX 4090 Laptop GPU
71007 MB/s -17%
Dell G16 7620
Intel Core i7-12700H, GeForce RTX 3060 Laptop GPU
57178 MB/s -33%
Alienware m17 R5 (R9 6900HX, RX 6850M XT)
AMD Ryzen 9 6900HX, Radeon RX 6850M XT
55214 MB/s -36%
AIDA64 / Memory Latency
Alienware x16 R1
Intel Core i9-13900HK, NVIDIA GeForce RTX 4080 Laptop GPU
101 ns *
Average Intel Core i9-13900HK
  ()
101 ns * -0%
Dell G16 7620
Intel Core i7-12700H, GeForce RTX 3060 Laptop GPU
100.6 ns * -0%
Razer Blade 16 Early 2023
Intel Core i9-13950HX, NVIDIA GeForce RTX 4080 Laptop GPU
99.5 ns * +1%
Alienware m17 R5 (R9 6900HX, RX 6850M XT)
AMD Ryzen 9 6900HX, Radeon RX 6850M XT
94.6 ns * +6%
Asus ROG Zephyrus M16 GU604VY-NM042X
Intel Core i9-13900H, NVIDIA GeForce RTX 4090 Laptop GPU
88 ns * +13%
Lenovo Legion Pro 7 RTX4090
Intel Core i9-13900HX, NVIDIA GeForce RTX 4090 Laptop GPU
85.4 ns * +15%

* ... más pequeño es mejor

Latencia del CPD

LatencyMon revela problemas de CPD al abrir varias pestañas de nuestra página de inicio. por lo demás, la reproducción de vídeo 4K a 60 FPS es perfecta, sin caídas de fotogramas.

LatencyMon
LatencyMon
Lista de controladores
DPC Latencies / LatencyMon - interrupt to process latency (max), Web, Youtube, Prime95
Lenovo Legion Pro 7 RTX4090
NVIDIA GeForce RTX 4090 Laptop GPU, i9-13900HX, Samsung PM9A1 MZVL21T0HCLR
10673.4 μs * -667%
Asus ROG Zephyrus M16 GU604VY-NM042X
NVIDIA GeForce RTX 4090 Laptop GPU, i9-13900H, Samsung PM9A1 MZVL22T0HBLB
4080.9 μs * -193%
Razer Blade 16 Early 2023
NVIDIA GeForce RTX 4080 Laptop GPU, i9-13950HX, SSSTC CA6-8D1024
2448.6 μs * -76%
Alienware x16 R1
NVIDIA GeForce RTX 4080 Laptop GPU, i9-13900HK, SK hynix PC801 HFS001TEJ9X101N
1391.6 μs *
Alienware m17 R5 (R9 6900HX, RX 6850M XT)
Radeon RX 6850M XT, R9 6900HX, SSSTC CA6-8D1024
1366.3 μs * +2%
Dell G16 7620
GeForce RTX 3060 Laptop GPU, i7-12700H, WDC PC SN810 512GB
912.5 μs * +34%

* ... más pequeño es mejor

Dispositivos de almacenamiento

El PCIe4 x4 SK Hynix PC801 de nuestra unidad puede alcanzar velocidades de lectura de hasta 7.100 MB/s, comparables a las de la popular Samsung PM9A1. Por desgracia, la unidad tiene problemas para mantener su velocidad de transferencia máxima durante periodos prolongados, probablemente debido a una refrigeración insuficiente. Cuando se ejecuta DiskSpd en bucle, por ejemplo, las tasas de lectura caen hasta 3400 MB/s a los pocos minutos de la prueba de estrés, como muestra el gráfico siguiente. Los resultados no mejoraban después de repetir la prueba.

MDL 8
MDL 8
AS SSD
AS SSD
Cada accionamiento tiene su propio disipador de calor de aluminio
SK hynix PC801 HFS001TEJ9X101N
CDM 5/6 Read Seq Q32T1: 7015 MB/s
CDM 5/6 Write Seq Q32T1: 6097 MB/s
CDM 5/6 Read 4K Q32T1: 672.1 MB/s
CDM 5/6 Write 4K Q32T1: 576.6 MB/s
CDM 5 Read Seq: 5410 MB/s
CDM 5 Write Seq: 5431 MB/s
CDM 5/6 Read 4K: 88.82 MB/s
CDM 5/6 Write 4K: 324.3 MB/s
Drive Performance Rating - Percent
Alienware x16 R1
SK hynix PC801 HFS001TEJ9X101N
93.6 pt
Lenovo Legion Pro 7 RTX4090
Samsung PM9A1 MZVL21T0HCLR
76.5 pt
Dell G16 7620
WDC PC SN810 512GB
70.1 pt
Asus ROG Zephyrus M16 GU604VY-NM042X
Samsung PM9A1 MZVL22T0HBLB
63.6 pt
Razer Blade 16 Early 2023
SSSTC CA6-8D1024
62.8 pt
Alienware m17 R5 (R9 6900HX, RX 6850M XT)
SSSTC CA6-8D1024
50.8 pt
DiskSpd
seq read
Alienware x16 R1
SK hynix PC801 HFS001TEJ9X101N
4854 (4834.59min - 4853.8max) MB/s
Dell G16 7620
WDC PC SN810 512GB
4103 (4046.12min - 4103.29max) MB/s -15%
Lenovo Legion Pro 7 RTX4090
Samsung PM9A1 MZVL21T0HCLR
4022 (3986.26min - 4021.71max) MB/s -17%
Asus ROG Zephyrus M16 GU604VY-NM042X
Samsung PM9A1 MZVL22T0HBLB
3917 (3883.93min - 3916.78max) MB/s -19%
Razer Blade 16 Early 2023
SSSTC CA6-8D1024
3844 (3257.93min - 3843.87max) MB/s -21%
Alienware m17 R5 (R9 6900HX, RX 6850M XT)
SSSTC CA6-8D1024
3428 (3412.07min - 3428.49max) MB/s -29%
seq write
Alienware x16 R1
SK hynix PC801 HFS001TEJ9X101N
5181 (5148.95min - 5181.43max) MB/s
Dell G16 7620
WDC PC SN810 512GB
4351 (4255.54min - 4351.38max) MB/s -16%
Lenovo Legion Pro 7 RTX4090
Samsung PM9A1 MZVL21T0HCLR
4166 (4098.46min - 4166.41max) MB/s -20%
Asus ROG Zephyrus M16 GU604VY-NM042X
Samsung PM9A1 MZVL22T0HBLB
3365 (3321.68min - 3365.3max) MB/s -35%
Alienware m17 R5 (R9 6900HX, RX 6850M XT)
SSSTC CA6-8D1024
3243 (3188.93min - 3243.04max) MB/s -37%
Razer Blade 16 Early 2023
SSSTC CA6-8D1024
3242 (1498min - 3241.78max) MB/s -37%
seq q8 t1 read
Alienware x16 R1
SK hynix PC801 HFS001TEJ9X101N
7039 (6585.73min - 7039.12max) MB/s
Asus ROG Zephyrus M16 GU604VY-NM042X
Samsung PM9A1 MZVL22T0HBLB
6988 (5851.89min - 6987.92max) MB/s -1%
Razer Blade 16 Early 2023
SSSTC CA6-8D1024
6872 (4963.33min - 6872.25max) MB/s -2%
Alienware m17 R5 (R9 6900HX, RX 6850M XT)
SSSTC CA6-8D1024
6861 MB/s -3%
Dell G16 7620
WDC PC SN810 512GB
6835 (5788.14min - 6835.21max) MB/s -3%
Lenovo Legion Pro 7 RTX4090
Samsung PM9A1 MZVL21T0HCLR
6541 (5499.99min - 6540.68max) MB/s -7%
seq q8 t1 write
Alienware x16 R1
SK hynix PC801 HFS001TEJ9X101N
6130 (6090.53min - 6130.49max) MB/s
Asus ROG Zephyrus M16 GU604VY-NM042X
Samsung PM9A1 MZVL22T0HBLB
5151 (5119.78min - 5150.82max) MB/s -16%
Lenovo Legion Pro 7 RTX4090
Samsung PM9A1 MZVL21T0HCLR
4875 (4823.87min - 4875.46max) MB/s -20%
Alienware m17 R5 (R9 6900HX, RX 6850M XT)
SSSTC CA6-8D1024
4831 (4610.18min - 4830.79max) MB/s -21%
Dell G16 7620
WDC PC SN810 512GB
4429 (4321.97min - 4429.45max) MB/s -28%
Razer Blade 16 Early 2023
SSSTC CA6-8D1024
4244 (427.59min - 4244.22max) MB/s -31%
4k q1 t1 read
Lenovo Legion Pro 7 RTX4090
Samsung PM9A1 MZVL21T0HCLR
91.1 (90.01min - 91.14max) MB/s +15%
Alienware x16 R1
SK hynix PC801 HFS001TEJ9X101N
78.9 (75.25min - 78.94max) MB/s
Asus ROG Zephyrus M16 GU604VY-NM042X
Samsung PM9A1 MZVL22T0HBLB
74.1 (72.59min - 74.06max) MB/s -6%
Razer Blade 16 Early 2023
SSSTC CA6-8D1024
56.5 (49.8min - 56.49max) MB/s -28%
Dell G16 7620
WDC PC SN810 512GB
54.4 (53.6min - 54.36max) MB/s -31%
Alienware m17 R5 (R9 6900HX, RX 6850M XT)
SSSTC CA6-8D1024
52.5 (50.71min - 52.46max) MB/s -33%
4k q1 t1 write
Alienware x16 R1
SK hynix PC801 HFS001TEJ9X101N
319 (315.85min - 318.62max) MB/s
Dell G16 7620
WDC PC SN810 512GB
278 (269.55min - 278.46max) MB/s -13%
Lenovo Legion Pro 7 RTX4090
Samsung PM9A1 MZVL21T0HCLR
237 (231.68min - 236.68max) MB/s -26%
Razer Blade 16 Early 2023
SSSTC CA6-8D1024
220 (56.84min - 219.56max) MB/s -31%
Asus ROG Zephyrus M16 GU604VY-NM042X
Samsung PM9A1 MZVL22T0HBLB
155.5 (148.87min - 155.46max) MB/s -51%
Alienware m17 R5 (R9 6900HX, RX 6850M XT)
SSSTC CA6-8D1024
126.7 (123.88min - 126.69max) MB/s -60%
4k q32 t16 read
Alienware x16 R1
SK hynix PC801 HFS001TEJ9X101N
5493 (5479.8min - 5492.89max) MB/s
Lenovo Legion Pro 7 RTX4090
Samsung PM9A1 MZVL21T0HCLR
4080 (4076.32min - 4080.19max) MB/s -26%
Dell G16 7620
WDC PC SN810 512GB
3318 (3312.29min - 3317.96max) MB/s -40%
Razer Blade 16 Early 2023
SSSTC CA6-8D1024
3111 (2388.54min - 3111.42max) MB/s -43%
Alienware m17 R5 (R9 6900HX, RX 6850M XT)
SSSTC CA6-8D1024
843 (833.55min - 843.1max) MB/s -85%
Asus ROG Zephyrus M16 GU604VY-NM042X
Samsung PM9A1 MZVL22T0HBLB
713 (705.93min - 712.59max) MB/s -87%
4k q32 t16 write
Alienware x16 R1
SK hynix PC801 HFS001TEJ9X101N
3566 (3534.97min - 3565.94max) MB/s
Lenovo Legion Pro 7 RTX4090
Samsung PM9A1 MZVL21T0HCLR
3530 (3471.69min - 3529.94max) MB/s -1%
Dell G16 7620
WDC PC SN810 512GB
2716 (1283.18min - 2716.43max) MB/s -24%
Razer Blade 16 Early 2023
SSSTC CA6-8D1024
1282 (960.6min - 1281.78max) MB/s -64%
Asus ROG Zephyrus M16 GU604VY-NM042X
Samsung PM9A1 MZVL22T0HBLB
468 (459.96min - 467.77max) MB/s -87%
Alienware m17 R5 (R9 6900HX, RX 6850M XT)
SSSTC CA6-8D1024
288 (123min - 287.76max) MB/s -92%
AS SSD
Score Total
Alienware x16 R1
SK hynix PC801 HFS001TEJ9X101N
10477 Points
Lenovo Legion Pro 7 RTX4090
Samsung PM9A1 MZVL21T0HCLR
7739 Points -26%
Dell G16 7620
WDC PC SN810 512GB
7323 Points -30%
Razer Blade 16 Early 2023
SSSTC CA6-8D1024
7311 Points -30%
Asus ROG Zephyrus M16 GU604VY-NM042X
Samsung PM9A1 MZVL22T0HBLB
5508 Points -47%
Alienware m17 R5 (R9 6900HX, RX 6850M XT)
SSSTC CA6-8D1024
4008 Points -62%
Score Read
Alienware x16 R1
SK hynix PC801 HFS001TEJ9X101N
3793 Points
Razer Blade 16 Early 2023
SSSTC CA6-8D1024
3308 Points -13%
Lenovo Legion Pro 7 RTX4090
Samsung PM9A1 MZVL21T0HCLR
2986 Points -21%
Dell G16 7620
WDC PC SN810 512GB
2763 Points -27%
Asus ROG Zephyrus M16 GU604VY-NM042X
Samsung PM9A1 MZVL22T0HBLB
1572 Points -59%
Alienware m17 R5 (R9 6900HX, RX 6850M XT)
SSSTC CA6-8D1024
1250 Points -67%
Score Write
Alienware x16 R1
SK hynix PC801 HFS001TEJ9X101N
4751 Points
Lenovo Legion Pro 7 RTX4090
Samsung PM9A1 MZVL21T0HCLR
3277 Points -31%
Asus ROG Zephyrus M16 GU604VY-NM042X
Samsung PM9A1 MZVL22T0HBLB
3232 Points -32%
Dell G16 7620
WDC PC SN810 512GB
3145 Points -34%
Razer Blade 16 Early 2023
SSSTC CA6-8D1024
2428 Points -49%
Alienware m17 R5 (R9 6900HX, RX 6850M XT)
SSSTC CA6-8D1024
2211 Points -53%
Seq Read
Alienware x16 R1
SK hynix PC801 HFS001TEJ9X101N
5827.72 MB/s
Asus ROG Zephyrus M16 GU604VY-NM042X
Samsung PM9A1 MZVL22T0HBLB
5370 MB/s -8%
Razer Blade 16 Early 2023
SSSTC CA6-8D1024
5144.76 MB/s -12%
Alienware m17 R5 (R9 6900HX, RX 6850M XT)
SSSTC CA6-8D1024
4716 MB/s -19%
Lenovo Legion Pro 7 RTX4090
Samsung PM9A1 MZVL21T0HCLR
4597.53 MB/s -21%
Dell G16 7620
WDC PC SN810 512GB
4223.27 MB/s -28%
Seq Write
Alienware x16 R1
SK hynix PC801 HFS001TEJ9X101N
5764.61 MB/s
Dell G16 7620
WDC PC SN810 512GB
4120.02 MB/s -29%
Lenovo Legion Pro 7 RTX4090
Samsung PM9A1 MZVL21T0HCLR
3645.36 MB/s -37%
Razer Blade 16 Early 2023
SSSTC CA6-8D1024
3058.47 MB/s -47%
Asus ROG Zephyrus M16 GU604VY-NM042X
Samsung PM9A1 MZVL22T0HBLB
2984 MB/s -48%
Alienware m17 R5 (R9 6900HX, RX 6850M XT)
SSSTC CA6-8D1024
2671 MB/s -54%
4K Read
Alienware x16 R1
SK hynix PC801 HFS001TEJ9X101N
79.4 MB/s
Dell G16 7620
WDC PC SN810 512GB
76.3 MB/s -4%
Asus ROG Zephyrus M16 GU604VY-NM042X
Samsung PM9A1 MZVL22T0HBLB
75.5 MB/s -5%
Lenovo Legion Pro 7 RTX4090
Samsung PM9A1 MZVL21T0HCLR
60.99 MB/s -23%
Razer Blade 16 Early 2023
SSSTC CA6-8D1024
49.65 MB/s -37%
Alienware m17 R5 (R9 6900HX, RX 6850M XT)
SSSTC CA6-8D1024
49.14 MB/s -38%
4K Write
Alienware x16 R1
SK hynix PC801 HFS001TEJ9X101N
280.17 MB/s
Dell G16 7620
WDC PC SN810 512GB
233.93 MB/s -17%
Asus ROG Zephyrus M16 GU604VY-NM042X
Samsung PM9A1 MZVL22T0HBLB
211 MB/s -25%
Lenovo Legion Pro 7 RTX4090
Samsung PM9A1 MZVL21T0HCLR
202.92 MB/s -28%
Razer Blade 16 Early 2023
SSSTC CA6-8D1024
144.8 MB/s -48%
Alienware m17 R5 (R9 6900HX, RX 6850M XT)
SSSTC CA6-8D1024
120.14 MB/s -57%
4K-64 Read
Alienware x16 R1
SK hynix PC801 HFS001TEJ9X101N
3130.95 MB/s
Razer Blade 16 Early 2023
SSSTC CA6-8D1024
2744.3 MB/s -12%
Lenovo Legion Pro 7 RTX4090
Samsung PM9A1 MZVL21T0HCLR
2465.26 MB/s -21%
Dell G16 7620
WDC PC SN810 512GB
2264.67 MB/s -28%
Asus ROG Zephyrus M16 GU604VY-NM042X
Samsung PM9A1 MZVL22T0HBLB
959 MB/s -69%
Alienware m17 R5 (R9 6900HX, RX 6850M XT)
SSSTC CA6-8D1024
728.79 MB/s -77%
4K-64 Write
Alienware x16 R1
SK hynix PC801 HFS001TEJ9X101N
3894.32 MB/s
Asus ROG Zephyrus M16 GU604VY-NM042X
Samsung PM9A1 MZVL22T0HBLB
2723 MB/s -30%
Lenovo Legion Pro 7 RTX4090
Samsung PM9A1 MZVL21T0HCLR
2709.86 MB/s -30%
Dell G16 7620
WDC PC SN810 512GB
2499.28 MB/s -36%
Razer Blade 16 Early 2023
SSSTC CA6-8D1024
1944.47 MB/s -50%
Alienware m17 R5 (R9 6900HX, RX 6850M XT)
SSSTC CA6-8D1024
1824.12 MB/s -53%
Access Time Read
Dell G16 7620
WDC PC SN810 512GB
0.068 ms * -127%
Lenovo Legion Pro 7 RTX4090
Samsung PM9A1 MZVL21T0HCLR
0.04 ms * -33%
Alienware m17 R5 (R9 6900HX, RX 6850M XT)
SSSTC CA6-8D1024
0.031 ms * -3%
Alienware x16 R1
SK hynix PC801 HFS001TEJ9X101N
0.03 ms *
Razer Blade 16 Early 2023
SSSTC CA6-8D1024
0.028 ms * +7%
Asus ROG Zephyrus M16 GU604VY-NM042X
Samsung PM9A1 MZVL22T0HBLB
0.02 ms * +33%
Access Time Write
Razer Blade 16 Early 2023
SSSTC CA6-8D1024
0.082 ms * -58%
Alienware x16 R1
SK hynix PC801 HFS001TEJ9X101N
0.052 ms *
Dell G16 7620
WDC PC SN810 512GB
0.048 ms * +8%
Alienware m17 R5 (R9 6900HX, RX 6850M XT)
SSSTC CA6-8D1024
0.032 ms * +38%
Lenovo Legion Pro 7 RTX4090
Samsung PM9A1 MZVL21T0HCLR
0.026 ms * +50%
Asus ROG Zephyrus M16 GU604VY-NM042X
Samsung PM9A1 MZVL22T0HBLB
0.02 ms * +62%

* ... más pequeño es mejor

Disk Throttling: DiskSpd Read Loop, Queue Depth 8

036072010801440180021602520288032403600396043204680504054005760612064806840Tooltip
Alienware x16 R1: Ø6459 (3458.84-7110.81)

Rendimiento de la GPU - 175 W GeForce RTX 4080

La GeForce RTX 4080 de nuestro Alienware x16 es entre un 5 y un 10 por ciento más rápida que la media de portátiles de nuestra base de datos equipados con la misma GPU RTX 4080. La ventaja puede no parecer mucho, pero es suficiente para impulsar el sistema a ser uno de los portátiles de juego RTX 4080 más rápidos que puedes comprar. los resultados de 3DMark están a solo un 10 por ciento de los del RTX 4090 delasus Zephyrus Duo 16por ejemplo.

Curiosamente, las puntuaciones 3DMark caerían sólo unos pocos puntos porcentuales cuando se ejecuta en el rendimiento más silencioso y modos equilibrados en lugar de en el modo Overdrive más alto como se muestra en la siguiente tabla. Es importante tener esto en cuenta en las secciones de Pruebas de Estrés y Ruido del Sistema.

Cambiar a la RTX 4070 afectará al rendimiento entre un 30 y un 35 por ciento, mientras que la actualización a la RTX 4090 aumentará el rendimiento en un 10 por ciento.

Configuración del perfil de energíaFire Strike Puntuación físicaFire Strike Puntuación GPUFire Strike Puntuación combinada
Overdrive298574347813071
Rendimiento27890 (-7%)43605 (-0%)12961 (-1%)
Equilibrado28704 (-4%)41909 (-4%)12476 (-5%)


3DMark 11
3DMark 11
Fire Strike
Fire Strike
Fire Strike Ultra
Fire Strike Ultra
Time Spy
Time Spy
Port Royal
Port Royal
Vía rápida
Vía rápida
3DMark Performance Rating - Percent
NVIDIA GeForce RTX 4080 Founders Edition
NVIDIA GeForce RTX 4080, Intel Core i9-13900K
100 pt
Asus Zephyrus Duo 16 GX650PY-NM006W -1!
NVIDIA GeForce RTX 4090 Laptop GPU, AMD Ryzen 9 7945HX
73.4 pt
Alienware x16 R1
NVIDIA GeForce RTX 4080 Laptop GPU, Intel Core i9-13900HK
69.2 pt
Razer Blade 16 Early 2023
NVIDIA GeForce RTX 4080 Laptop GPU, Intel Core i9-13950HX
65.7 pt
Average NVIDIA GeForce RTX 4080 Laptop GPU
 
64.2 pt
Lenovo Legion 7 16IAX7-82TD004SGE -2!
NVIDIA GeForce RTX 3080 Ti Laptop GPU, Intel Core i9-12900HX
49.5 pt
Alienware m17 R5 (R9 6900HX, RX 6850M XT) -2!
AMD Radeon RX 6850M XT, AMD Ryzen 9 6900HX
48.5 pt
Lenovo Legion 5 Pro 16ARH7H RTX 3070 Ti -1!
NVIDIA GeForce RTX 3070 Ti Laptop GPU, AMD Ryzen 7 6800H
46.2 pt
Lenovo Legion Pro 5 16ARX8
NVIDIA GeForce RTX 4070 Laptop GPU, AMD Ryzen 7 7745HX
45.7 pt
Lenovo Legion Pro 5 16IRX8
NVIDIA GeForce RTX 4060 Laptop GPU, Intel Core i7-13700HX
40.6 pt
HP Omen 16-c0077ng -2!
AMD Radeon RX 6600M, AMD Ryzen 7 5800H
34.7 pt
Asus TUF A15 FA507 -1!
NVIDIA GeForce RTX 4050 Laptop GPU, AMD Ryzen 7 7735HS
33.6 pt
Dell G16 7620 -1!
NVIDIA GeForce RTX 3060 Laptop GPU, Intel Core i7-12700H
33.5 pt
3DMark
1920x1080 Fire Strike Graphics
NVIDIA GeForce RTX 4080 Founders Edition
NVIDIA GeForce RTX 4080, Intel Core i9-13900K
58893 Points +35%
Asus Zephyrus Duo 16 GX650PY-NM006W
NVIDIA GeForce RTX 4090 Laptop GPU, AMD Ryzen 9 7945HX
47798 Points +10%
Alienware x16 R1
NVIDIA GeForce RTX 4080 Laptop GPU, Intel Core i9-13900HK
43478 Points
Average NVIDIA GeForce RTX 4080 Laptop GPU
  (33058 - 45220, n=19)
40637 Points -7%
Razer Blade 16 Early 2023
NVIDIA GeForce RTX 4080 Laptop GPU, Intel Core i9-13950HX
40570 Points -7%
Alienware m17 R5 (R9 6900HX, RX 6850M XT)
AMD Radeon RX 6850M XT, AMD Ryzen 9 6900HX
34948 Points -20%
Lenovo Legion 7 16IAX7-82TD004SGE
NVIDIA GeForce RTX 3080 Ti Laptop GPU, Intel Core i9-12900HX
33025 Points -24%
Lenovo Legion 5 Pro 16ARH7H RTX 3070 Ti
NVIDIA GeForce RTX 3070 Ti Laptop GPU, AMD Ryzen 7 6800H
31289 Points -28%
Lenovo Legion Pro 5 16ARX8
NVIDIA GeForce RTX 4070 Laptop GPU, AMD Ryzen 7 7745HX
30936 Points -29%
Lenovo Legion Pro 5 16IRX8
NVIDIA GeForce RTX 4060 Laptop GPU, Intel Core i7-13700HX
26561 Points -39%
HP Omen 16-c0077ng
AMD Radeon RX 6600M, AMD Ryzen 7 5800H
24460 Points -44%
Asus TUF A15 FA507
NVIDIA GeForce RTX 4050 Laptop GPU, AMD Ryzen 7 7735HS
22899 Points -47%
Dell G16 7620
NVIDIA GeForce RTX 3060 Laptop GPU, Intel Core i7-12700H
21584 Points -50%
3840x2160 Fire Strike Ultra Graphics
NVIDIA GeForce RTX 4080 Founders Edition
NVIDIA GeForce RTX 4080, Intel Core i9-13900K
17122 Points +52%
Alienware x16 R1
NVIDIA GeForce RTX 4080 Laptop GPU, Intel Core i9-13900HK
11237 Points
Razer Blade 16 Early 2023
NVIDIA GeForce RTX 4080 Laptop GPU, Intel Core i9-13950HX
10815 Points -4%
Average NVIDIA GeForce RTX 4080 Laptop GPU
  (8783 - 11273, n=10)
10483 Points -7%
Lenovo Legion 5 Pro 16ARH7H RTX 3070 Ti
NVIDIA GeForce RTX 3070 Ti Laptop GPU, AMD Ryzen 7 6800H
7572 Points -33%
Lenovo Legion Pro 5 16ARX8
NVIDIA GeForce RTX 4070 Laptop GPU, AMD Ryzen 7 7745HX
6911 Points -38%
Lenovo Legion Pro 5 16IRX8
NVIDIA GeForce RTX 4060 Laptop GPU, Intel Core i7-13700HX
6251 Points -44%
Dell G16 7620
NVIDIA GeForce RTX 3060 Laptop GPU, Intel Core i7-12700H
5241 Points -53%
2560x1440 Time Spy Graphics
NVIDIA GeForce RTX 4080 Founders Edition
NVIDIA GeForce RTX 4080, Intel Core i9-13900K
28133 Points +44%
Asus Zephyrus Duo 16 GX650PY-NM006W
NVIDIA GeForce RTX 4090 Laptop GPU, AMD Ryzen 9 7945HX
20033 Points +2%
Alienware x16 R1
NVIDIA GeForce RTX 4080 Laptop GPU, Intel Core i9-13900HK
19565 Points
Razer Blade 16 Early 2023
NVIDIA GeForce RTX 4080 Laptop GPU, Intel Core i9-13950HX
18441 Points -6%
Average NVIDIA GeForce RTX 4080 Laptop GPU
  (13282 - 19663, n=19)
17606 Points -10%
Lenovo Legion Pro 5 16ARX8
NVIDIA GeForce RTX 4070 Laptop GPU, AMD Ryzen 7 7745HX
12617 Points -36%
Lenovo Legion 7 16IAX7-82TD004SGE
NVIDIA GeForce RTX 3080 Ti Laptop GPU, Intel Core i9-12900HX
12325 Points -37%
Lenovo Legion 5 Pro 16ARH7H RTX 3070 Ti
NVIDIA GeForce RTX 3070 Ti Laptop GPU, AMD Ryzen 7 6800H
11923 Points -39%
Alienware m17 R5 (R9 6900HX, RX 6850M XT)
AMD Radeon RX 6850M XT, AMD Ryzen 9 6900HX
11912 Points -39%
Lenovo Legion Pro 5 16IRX8
NVIDIA GeForce RTX 4060 Laptop GPU, Intel Core i7-13700HX
10855 Points -45%
Dell G16 7620
NVIDIA GeForce RTX 3060 Laptop GPU, Intel Core i7-12700H
8855 Points -55%
Asus TUF A15 FA507
NVIDIA GeForce RTX 4050 Laptop GPU, AMD Ryzen 7 7735HS
8692 Points -56%
HP Omen 16-c0077ng
AMD Radeon RX 6600M, AMD Ryzen 7 5800H
8207 Points -58%
2560x1440 Time Spy Score
NVIDIA GeForce RTX 4080 Founders Edition
NVIDIA GeForce RTX 4080, Intel Core i9-13900K
26494 Points +45%
Asus Zephyrus Duo 16 GX650PY-NM006W
NVIDIA GeForce RTX 4090 Laptop GPU, AMD Ryzen 9 7945HX
18602 Points +2%
Alienware x16 R1
NVIDIA GeForce RTX 4080 Laptop GPU, Intel Core i9-13900HK
18236 Points
Razer Blade 16 Early 2023
NVIDIA GeForce RTX 4080 Laptop GPU, Intel Core i9-13950HX
17601 Points -3%
Average NVIDIA GeForce RTX 4080 Laptop GPU
  (13636 - 19518, n=19)
17110 Points -6%
Lenovo Legion 7 16IAX7-82TD004SGE
NVIDIA GeForce RTX 3080 Ti Laptop GPU, Intel Core i9-12900HX
12751 Points -30%
Lenovo Legion Pro 5 16ARX8
NVIDIA GeForce RTX 4070 Laptop GPU, AMD Ryzen 7 7745HX
12431 Points -32%
Lenovo Legion 5 Pro 16ARH7H RTX 3070 Ti
NVIDIA GeForce RTX 3070 Ti Laptop GPU, AMD Ryzen 7 6800H
11758 Points -36%
Alienware m17 R5 (R9 6900HX, RX 6850M XT)
AMD Radeon RX 6850M XT, AMD Ryzen 9 6900HX
11666 Points -36%
Lenovo Legion Pro 5 16IRX8
NVIDIA GeForce RTX 4060 Laptop GPU, Intel Core i7-13700HX
11312 Points -38%
Dell G16 7620
NVIDIA GeForce RTX 3060 Laptop GPU, Intel Core i7-12700H
9224 Points -49%
Asus TUF A15 FA507
NVIDIA GeForce RTX 4050 Laptop GPU, AMD Ryzen 7 7735HS
8902 Points -51%
HP Omen 16-c0077ng
AMD Radeon RX 6600M, AMD Ryzen 7 5800H
8353 Points -54%
2560x1440 Speed Way Score
NVIDIA GeForce RTX 4080 Founders Edition
NVIDIA GeForce RTX 4080, Intel Core i9-13900K
7169 Points +49%
Asus Zephyrus Duo 16 GX650PY-NM006W
NVIDIA GeForce RTX 4090 Laptop GPU, AMD Ryzen 9 7945HX
5208 Points +8%
Alienware x16 R1
NVIDIA GeForce RTX 4080 Laptop GPU, Intel Core i9-13900HK
4807 Points
Razer Blade 16 Early 2023
NVIDIA GeForce RTX 4080 Laptop GPU, Intel Core i9-13950HX
4642 Points -3%
Average NVIDIA GeForce RTX 4080 Laptop GPU
  (3702 - 4920, n=13)
4498 Points -6%
Lenovo Legion Pro 5 16ARX8
NVIDIA GeForce RTX 4070 Laptop GPU, AMD Ryzen 7 7745HX
3034 Points -37%
Lenovo Legion Pro 5 16IRX8
NVIDIA GeForce RTX 4060 Laptop GPU, Intel Core i7-13700HX
2685 Points -44%
Asus TUF A15 FA507
NVIDIA GeForce RTX 4050 Laptop GPU, AMD Ryzen 7 7735HS
1999 Points -58%
3DMark 11 - 1280x720 Performance GPU
NVIDIA GeForce RTX 4080 Founders Edition
NVIDIA GeForce RTX 4080, Intel Core i9-13900K
86838 Points +42%
Asus Zephyrus Duo 16 GX650PY-NM006W
NVIDIA GeForce RTX 4090 Laptop GPU, AMD Ryzen 9 7945HX
62240 Points +2%
Alienware x16 R1
NVIDIA GeForce RTX 4080 Laptop GPU, Intel Core i9-13900HK
61043 Points
Razer Blade 16 Early 2023
NVIDIA GeForce RTX 4080 Laptop GPU, Intel Core i9-13950HX
56565 Points -7%
Average NVIDIA GeForce RTX 4080 Laptop GPU
  (45199 - 63128, n=21)
56535 Points -7%
Lenovo Legion 7 16IAX7-82TD004SGE
NVIDIA GeForce RTX 3080 Ti Laptop GPU, Intel Core i9-12900HX
43337 Points -29%
Alienware m17 R5 (R9 6900HX, RX 6850M XT)
AMD Radeon RX 6850M XT, AMD Ryzen 9 6900HX
41942 Points -31%
Lenovo Legion Pro 5 16ARX8
NVIDIA GeForce RTX 4070 Laptop GPU, AMD Ryzen 7 7745HX
41090 Points -33%
Lenovo Legion 5 Pro 16ARH7H RTX 3070 Ti
NVIDIA GeForce RTX 3070 Ti Laptop GPU, AMD Ryzen 7 6800H
40796 Points -33%
Lenovo Legion Pro 5 16IRX8
NVIDIA GeForce RTX 4060 Laptop GPU, Intel Core i7-13700HX
37654 Points -38%
HP Omen 16-c0077ng
AMD Radeon RX 6600M, AMD Ryzen 7 5800H
31859 Points -48%
Asus TUF A15 FA507
NVIDIA GeForce RTX 4050 Laptop GPU, AMD Ryzen 7 7735HS
31690 Points -48%
Dell G16 7620
NVIDIA GeForce RTX 3060 Laptop GPU, Intel Core i7-12700H
29412 Points -52%
3DMark 11 Performance
43381 puntos
3DMark Fire Strike Score
33417 puntos
3DMark Time Spy Score
18236 puntos
ayuda
Blender
v3.3 Classroom HIP/AMD
Alienware m17 R5 (R9 6900HX, RX 6850M XT)
AMD Radeon RX 6850M XT, AMD Ryzen 9 6900HX
77 Seconds *
v3.3 Classroom OPTIX/RTX
Dell G16 7620
NVIDIA GeForce RTX 3060 Laptop GPU, Intel Core i7-12700H
31 Seconds * -107%
Lenovo Legion 7 16IAX7-82TD004SGE
NVIDIA GeForce RTX 3080 Ti Laptop GPU, Intel Core i9-12900HX
23 Seconds * -53%
Lenovo Legion 5 Pro 16ARH7H RTX 3070 Ti
NVIDIA GeForce RTX 3070 Ti Laptop GPU, AMD Ryzen 7 6800H
22 Seconds * -47%
Lenovo Legion Pro 5 16IRX8
NVIDIA GeForce RTX 4060 Laptop GPU, Intel Core i7-13700HX
21 Seconds * -40%
Lenovo Legion Pro 5 16ARX8
NVIDIA GeForce RTX 4070 Laptop GPU, AMD Ryzen 7 7745HX
19 Seconds * -27%
Average NVIDIA GeForce RTX 4080 Laptop GPU
  (13 - 20, n=18)
15.3 Seconds * -2%
Razer Blade 16 Early 2023
NVIDIA GeForce RTX 4080 Laptop GPU, Intel Core i9-13950HX
15 Seconds * -0%
Alienware x16 R1
NVIDIA GeForce RTX 4080 Laptop GPU, Intel Core i9-13900HK
15 Seconds *
Asus Zephyrus Duo 16 GX650PY-NM006W
NVIDIA GeForce RTX 4090 Laptop GPU, AMD Ryzen 9 7945HX
13 Seconds * +13%
NVIDIA GeForce RTX 4080 Founders Edition
NVIDIA GeForce RTX 4080, Intel Core i9-13900K
10 Seconds * +33%
v3.3 Classroom CUDA
Dell G16 7620
NVIDIA GeForce RTX 3060 Laptop GPU, Intel Core i7-12700H
52 Seconds * -148%
Lenovo Legion Pro 5 16IRX8
NVIDIA GeForce RTX 4060 Laptop GPU, Intel Core i7-13700HX
40 Seconds * -90%
Lenovo Legion 7 16IAX7-82TD004SGE
NVIDIA GeForce RTX 3080 Ti Laptop GPU, Intel Core i9-12900HX
36 Seconds * -71%
Lenovo Legion 5 Pro 16ARH7H RTX 3070 Ti
NVIDIA GeForce RTX 3070 Ti Laptop GPU, AMD Ryzen 7 6800H
36 Seconds * -71%
Lenovo Legion Pro 5 16ARX8
NVIDIA GeForce RTX 4070 Laptop GPU, AMD Ryzen 7 7745HX
33 Seconds * -57%
Average NVIDIA GeForce RTX 4080 Laptop GPU
  (21 - 28, n=19)
23 Seconds * -10%
Razer Blade 16 Early 2023
NVIDIA GeForce RTX 4080 Laptop GPU, Intel Core i9-13950HX
22 Seconds * -5%
Alienware x16 R1
NVIDIA GeForce RTX 4080 Laptop GPU, Intel Core i9-13900HK
21 Seconds *
Asus Zephyrus Duo 16 GX650PY-NM006W
NVIDIA GeForce RTX 4090 Laptop GPU, AMD Ryzen 9 7945HX
20 Seconds * +5%
v3.3 Classroom CPU
Alienware m17 R5 (R9 6900HX, RX 6850M XT)
AMD Radeon RX 6850M XT, AMD Ryzen 9 6900HX
369 Seconds * -29%
Lenovo Legion 5 Pro 16ARH7H RTX 3070 Ti
NVIDIA GeForce RTX 3070 Ti Laptop GPU, AMD Ryzen 7 6800H
355 Seconds * -24%
Dell G16 7620
NVIDIA GeForce RTX 3060 Laptop GPU, Intel Core i7-12700H
326 Seconds * -14%
Alienware x16 R1
NVIDIA GeForce RTX 4080 Laptop GPU, Intel Core i9-13900HK
287 Seconds *
Lenovo Legion Pro 5 16ARX8
NVIDIA GeForce RTX 4070 Laptop GPU, AMD Ryzen 7 7745HX
277 Seconds * +3%
Lenovo Legion 7 16IAX7-82TD004SGE
NVIDIA GeForce RTX 3080 Ti Laptop GPU, Intel Core i9-12900HX
268 Seconds * +7%
Lenovo Legion Pro 5 16IRX8
NVIDIA GeForce RTX 4060 Laptop GPU, Intel Core i7-13700HX
264 Seconds * +8%
Average NVIDIA GeForce RTX 4080 Laptop GPU
  (177 - 337, n=19)
231 Seconds * +20%
Razer Blade 16 Early 2023
NVIDIA GeForce RTX 4080 Laptop GPU, Intel Core i9-13950HX
207 Seconds * +28%
Asus Zephyrus Duo 16 GX650PY-NM006W
NVIDIA GeForce RTX 4090 Laptop GPU, AMD Ryzen 9 7945HX
147 Seconds * +49%
NVIDIA GeForce RTX 4080 Founders Edition
NVIDIA GeForce RTX 4080, Intel Core i9-13900K
136 Seconds * +53%

* ... más pequeño es mejor

Rendimiento en juegos

Todos los juegos se pueden jugar a la resolución QHD+ nativa con frecuencias de cuadro estables iguales o superiores a 60 FPS. Incluso es posible jugar a 4K en un monitor externo con la mayoría de los ajustes al máximo, incluidos Returnal y F122. Para frecuencias de cuadro de tres dígitos, sin embargo, querrás activar DLSS 2 o DLSS 3 donde esté disponible para aprovechar mejor la alta frecuencia de actualización del monitor.

Performance Rating - Percent
NVIDIA GeForce RTX 4080 Founders Edition -1!
Intel Core i9-13900K, NVIDIA GeForce RTX 4080
100 pt
Razer Blade 16 Early 2023
Intel Core i9-13950HX, NVIDIA GeForce RTX 4080 Laptop GPU
80.5 pt
Asus Zephyrus Duo 16 GX650PY-NM006W
AMD Ryzen 9 7945HX, NVIDIA GeForce RTX 4090 Laptop GPU
78.3 pt
Alienware x16 R1
Intel Core i9-13900HK, NVIDIA GeForce RTX 4080 Laptop GPU
71.3 pt
Lenovo Legion Pro 5 16ARX8
AMD Ryzen 7 7745HX, NVIDIA GeForce RTX 4070 Laptop GPU
64.1 pt
Lenovo Legion Pro 5 16IRX8 -1!
Intel Core i7-13700HX, NVIDIA GeForce RTX 4060 Laptop GPU
60.4 pt
Lenovo Legion 7 16IAX7-82TD004SGE
Intel Core i9-12900HX, NVIDIA GeForce RTX 3080 Ti Laptop GPU
58 pt
Average of class Gaming
 
57.4 pt
Lenovo Legion 5 Pro 16ARH7H RTX 3070 Ti
AMD Ryzen 7 6800H, NVIDIA GeForce RTX 3070 Ti Laptop GPU
54.5 pt
Dell G16 7620
Intel Core i7-12700H, NVIDIA GeForce RTX 3060 Laptop GPU
51.2 pt
Alienware m17 R5 (R9 6900HX, RX 6850M XT)
AMD Ryzen 9 6900HX, AMD Radeon RX 6850M XT
48.1 pt
Asus TUF A15 FA507
AMD Ryzen 7 7735HS, NVIDIA GeForce RTX 4050 Laptop GPU
42.8 pt
HP Omen 16-c0077ng
AMD Ryzen 7 5800H, AMD Radeon RX 6600M
37.8 pt
The Witcher 3 - 1920x1080 Ultra Graphics & Postprocessing (HBAO+)
NVIDIA GeForce RTX 4080 Founders Edition
Intel Core i9-13900K, NVIDIA GeForce RTX 4080
254 (227min, 227P1) fps +59%
Asus Zephyrus Duo 16 GX650PY-NM006W
AMD Ryzen 9 7945HX, NVIDIA GeForce RTX 4090 Laptop GPU
178.6 (172min, 173P1) fps +11%
Razer Blade 16 Early 2023
Intel Core i9-13950HX, NVIDIA GeForce RTX 4080 Laptop GPU
176.8 (159min) fps +10%
Alienware x16 R1
Intel Core i9-13900HK, NVIDIA GeForce RTX 4080 Laptop GPU
160.2 (154min) fps
Alienware m17 R5 (R9 6900HX, RX 6850M XT)
AMD Ryzen 9 6900HX, AMD Radeon RX 6850M XT
126.2 fps -21%
Lenovo Legion Pro 5 16ARX8
AMD Ryzen 7 7745HX, NVIDIA GeForce RTX 4070 Laptop GPU
119.8 (114min) fps -25%
Average of class Gaming
  (8.61 - 216, n=216, last 2 years)
118.3 fps -26%
Lenovo Legion 5 Pro 16ARH7H RTX 3070 Ti
AMD Ryzen 7 6800H, NVIDIA GeForce RTX 3070 Ti Laptop GPU
117 (106min) fps -27%
Lenovo Legion 7 16IAX7-82TD004SGE
Intel Core i9-12900HX, NVIDIA GeForce RTX 3080 Ti Laptop GPU
114.4 (108min, 109P1) fps -29%
Lenovo Legion Pro 5 16IRX8
Intel Core i7-13700HX, NVIDIA GeForce RTX 4060 Laptop GPU
107.6 (101min) fps -33%
Dell G16 7620
Intel Core i7-12700H, NVIDIA GeForce RTX 3060 Laptop GPU
86.6 (83min) fps -46%
HP Omen 16-c0077ng
AMD Ryzen 7 5800H, AMD Radeon RX 6600M
84 fps -48%
Asus TUF A15 FA507
AMD Ryzen 7 7735HS, NVIDIA GeForce RTX 4050 Laptop GPU
82.2 (79min, 80P1) fps -49%
GTA V - 1920x1080 Highest Settings possible AA:4xMSAA + FX AF:16x
NVIDIA GeForce RTX 4080 Founders Edition
Intel Core i9-13900K, NVIDIA GeForce RTX 4080
172.4 (4.4min, 142.9P1) fps +43%
Razer Blade 16 Early 2023
Intel Core i9-13950HX, NVIDIA GeForce RTX 4080 Laptop GPU
140.7 (3.02min, 100P1) fps +17%
Asus Zephyrus Duo 16 GX650PY-NM006W
AMD Ryzen 9 7945HX, NVIDIA GeForce RTX 4090 Laptop GPU
134 (7.27min, 90.9P1) fps +11%
Alienware x16 R1
Intel Core i9-13900HK, NVIDIA GeForce RTX 4080 Laptop GPU
120.3 (9.92min, 83.3P1) fps
Lenovo Legion Pro 5 16ARX8
AMD Ryzen 7 7745HX, NVIDIA GeForce RTX 4070 Laptop GPU
119.9 (3.81min, 76.9P1) fps 0%
Lenovo Legion Pro 5 16IRX8
Intel Core i7-13700HX, NVIDIA GeForce RTX 4060 Laptop GPU
119.6 (3.03min, 76.9P1) fps -1%
Lenovo Legion 7 16IAX7-82TD004SGE
Intel Core i9-12900HX, NVIDIA GeForce RTX 3080 Ti Laptop GPU
111.4 (6.89min, 66.7P1) fps -7%
Dell G16 7620
Intel Core i7-12700H, NVIDIA GeForce RTX 3060 Laptop GPU
108.7 (6.55min, 71.4P1) fps -10%
Average of class Gaming
  (6.38 - 167.7, n=208, last 2 years)
107.9 fps -10%
Lenovo Legion 5 Pro 16ARH7H RTX 3070 Ti
AMD Ryzen 7 6800H, NVIDIA GeForce RTX 3070 Ti Laptop GPU
104 (6.17min, 71.4P1) fps -14%
Alienware m17 R5 (R9 6900HX, RX 6850M XT)
AMD Ryzen 9 6900HX, AMD Radeon RX 6850M XT
92.6 (7.62min, 55.6P1) fps -23%
Asus TUF A15 FA507
AMD Ryzen 7 7735HS, NVIDIA GeForce RTX 4050 Laptop GPU
83.5 (2.82min, 58.8P1) fps -31%
HP Omen 16-c0077ng
AMD Ryzen 7 5800H, AMD Radeon RX 6600M
71 (9.84min, 50P1) fps -41%
Final Fantasy XV Benchmark - 1920x1080 High Quality
NVIDIA GeForce RTX 4080 Founders Edition
Intel Core i9-13900K, NVIDIA GeForce RTX 4080
224 fps +36%
Asus Zephyrus Duo 16 GX650PY-NM006W
AMD Ryzen 9 7945HX, NVIDIA GeForce RTX 4090 Laptop GPU
169.6 fps +3%
Alienware x16 R1
Intel Core i9-13900HK, NVIDIA GeForce RTX 4080 Laptop GPU
164.2 fps
Razer Blade 16 Early 2023
Intel Core i9-13950HX, NVIDIA GeForce RTX 4080 Laptop GPU
157.8 fps -4%
Lenovo Legion 7 16IAX7-82TD004SGE
Intel Core i9-12900HX, NVIDIA GeForce RTX 3080 Ti Laptop GPU
121.2 fps -26%
Lenovo Legion Pro 5 16ARX8
AMD Ryzen 7 7745HX, NVIDIA GeForce RTX 4070 Laptop GPU
119.9 fps -27%
Lenovo Legion 5 Pro 16ARH7H RTX 3070 Ti
AMD Ryzen 7 6800H, NVIDIA GeForce RTX 3070 Ti Laptop GPU
115.6 fps -30%
Alienware m17 R5 (R9 6900HX, RX 6850M XT)
AMD Ryzen 9 6900HX, AMD Radeon RX 6850M XT
113.6 fps -31%
Average of class Gaming
  (9.13 - 194.9, n=218, last 2 years)
112.2 fps -32%
Lenovo Legion Pro 5 16IRX8
Intel Core i7-13700HX, NVIDIA GeForce RTX 4060 Laptop GPU
109.8 fps -33%
Dell G16 7620
Intel Core i7-12700H, NVIDIA GeForce RTX 3060 Laptop GPU
89.4 fps -46%
Asus TUF A15 FA507
AMD Ryzen 7 7735HS, NVIDIA GeForce RTX 4050 Laptop GPU
81.5 fps -50%
HP Omen 16-c0077ng
AMD Ryzen 7 5800H, AMD Radeon RX 6600M
77.8 fps -53%
Strange Brigade - 1920x1080 ultra AA:ultra AF:16
Asus Zephyrus Duo 16 GX650PY-NM006W
AMD Ryzen 9 7945HX, NVIDIA GeForce RTX 4090 Laptop GPU
333 (38min, 227P1) fps +2%
Alienware x16 R1
Intel Core i9-13900HK, NVIDIA GeForce RTX 4080 Laptop GPU
325 (45min, 233P1) fps
Razer Blade 16 Early 2023
Intel Core i9-13950HX, NVIDIA GeForce RTX 4080 Laptop GPU
323 (61.7min, 222P1) fps -1%
Alienware m17 R5 (R9 6900HX, RX 6850M XT)
AMD Ryzen 9 6900HX, AMD Radeon RX 6850M XT
230 (121.4min, 165.6P1) fps -29%
Lenovo Legion Pro 5 16ARX8
AMD Ryzen 7 7745HX, NVIDIA GeForce RTX 4070 Laptop GPU
223 (89min, 167.8P1) fps -31%
Lenovo Legion 5 Pro 16ARH7H RTX 3070 Ti
AMD Ryzen 7 6800H, NVIDIA GeForce RTX 3070 Ti Laptop GPU
217 (41.5min, 154.4P1) fps -33%
Average of class Gaming
  (14.6 - 421, n=215, last 2 years)
209 fps -36%
Dell G16 7620
Intel Core i7-12700H, NVIDIA GeForce RTX 3060 Laptop GPU
155.5 (51.7min, 115.4P1) fps -52%
HP Omen 16-c0077ng
AMD Ryzen 7 5800H, AMD Radeon RX 6600M
155 fps -52%
Asus TUF A15 FA507
AMD Ryzen 7 7735HS, NVIDIA GeForce RTX 4050 Laptop GPU
147 fps -55%
Lenovo Legion 7 16IAX7-82TD004SGE
Intel Core i9-12900HX, NVIDIA GeForce RTX 3080 Ti Laptop GPU
137.6 (22.6min, 94P1) fps -58%
Dota 2 Reborn - 1920x1080 ultra (3/3) best looking
NVIDIA GeForce RTX 4080 Founders Edition
Intel Core i9-13900K, NVIDIA GeForce RTX 4080
238.3 (202.7min) fps +62%
Razer Blade 16 Early 2023
Intel Core i9-13950HX, NVIDIA GeForce RTX 4080 Laptop GPU
194.7 (160min) fps +33%
Lenovo Legion Pro 5 16ARX8
AMD Ryzen 7 7745HX, NVIDIA GeForce RTX 4070 Laptop GPU
182 (152.8min) fps +24%
Asus Zephyrus Duo 16 GX650PY-NM006W
AMD Ryzen 9 7945HX, NVIDIA GeForce RTX 4090 Laptop GPU
179.7 (153.7min) fps +22%
Lenovo Legion 7 16IAX7-82TD004SGE
Intel Core i9-12900HX, NVIDIA GeForce RTX 3080 Ti Laptop GPU
168 (144.9min) fps +14%
Lenovo Legion Pro 5 16IRX8
Intel Core i7-13700HX, NVIDIA GeForce RTX 4060 Laptop GPU
161.8 (140.3min) fps +10%
Dell G16 7620
Intel Core i7-12700H, NVIDIA GeForce RTX 3060 Laptop GPU
147.2 (128.6min) fps 0%
Alienware x16 R1
Intel Core i9-13900HK, NVIDIA GeForce RTX 4080 Laptop GPU
146.8 (121.7min) fps
Average of class Gaming
  (26.9 - 220, n=227, last 2 years)
143.9 fps -2%
Lenovo Legion 5 Pro 16ARH7H RTX 3070 Ti
AMD Ryzen 7 6800H, NVIDIA GeForce RTX 3070 Ti Laptop GPU
126.6 (111.8min) fps -14%
Asus TUF A15 FA507
AMD Ryzen 7 7735HS, NVIDIA GeForce RTX 4050 Laptop GPU
115.8 (102.7min) fps -21%
HP Omen 16-c0077ng
AMD Ryzen 7 5800H, AMD Radeon RX 6600M
105.6 (88.2min) fps -28%
Alienware m17 R5 (R9 6900HX, RX 6850M XT)
AMD Ryzen 9 6900HX, AMD Radeon RX 6850M XT
94 (75.5min) fps -36%
X-Plane 11.11 - 1920x1080 high (fps_test=3)
NVIDIA GeForce RTX 4080 Founders Edition
Intel Core i9-13900K, NVIDIA GeForce RTX 4080
166.3 fps +60%
Razer Blade 16 Early 2023
Intel Core i9-13950HX, NVIDIA GeForce RTX 4080 Laptop GPU
137 fps +31%
Lenovo Legion Pro 5 16IRX8
Intel Core i7-13700HX, NVIDIA GeForce RTX 4060 Laptop GPU
121.9 fps +17%
Lenovo Legion 7 16IAX7-82TD004SGE
Intel Core i9-12900HX, NVIDIA GeForce RTX 3080 Ti Laptop GPU
120.2 fps +15%
Asus Zephyrus Duo 16 GX650PY-NM006W
AMD Ryzen 9 7945HX, NVIDIA GeForce RTX 4090 Laptop GPU
117.8 fps +13%
Lenovo Legion Pro 5 16ARX8
AMD Ryzen 7 7745HX, NVIDIA GeForce RTX 4070 Laptop GPU
117.8 fps +13%
Alienware x16 R1
Intel Core i9-13900HK, NVIDIA GeForce RTX 4080 Laptop GPU
104.2 fps
Average of class Gaming
  (12.4 - 166.2, n=233, last 2 years)
102.9 fps -1%
Dell G16 7620
Intel Core i7-12700H, NVIDIA GeForce RTX 3060 Laptop GPU
102.6 fps -2%
Lenovo Legion 5 Pro 16ARH7H RTX 3070 Ti
AMD Ryzen 7 6800H, NVIDIA GeForce RTX 3070 Ti Laptop GPU
83.9 fps -19%
Asus TUF A15 FA507
AMD Ryzen 7 7735HS, NVIDIA GeForce RTX 4050 Laptop GPU
77.8 fps -25%
HP Omen 16-c0077ng
AMD Ryzen 7 5800H, AMD Radeon RX 6600M
45.3 fps -57%
Alienware m17 R5 (R9 6900HX, RX 6850M XT)
AMD Ryzen 9 6900HX, AMD Radeon RX 6850M XT
43.3 fps -58%
Final Fantasy XV Benchmark
1280x720 Lite Quality
NVIDIA GeForce RTX 4080 Founders Edition
Intel Core i9-13900K, NVIDIA GeForce RTX 4080
236 fps +12%
Lenovo Legion Pro 5 16ARX8
AMD Ryzen 7 7745HX, NVIDIA GeForce RTX 4070 Laptop GPU
229 fps +9%
Lenovo Legion 7 16IAX7-82TD004SGE
Intel Core i9-12900HX, NVIDIA GeForce RTX 3080 Ti Laptop GPU
223 fps +6%
Lenovo Legion Pro 5 16IRX8
Intel Core i7-13700HX, NVIDIA GeForce RTX 4060 Laptop GPU
222 fps +5%
Average NVIDIA GeForce RTX 4080 Laptop GPU
  (180.4 - 234, n=13)
212 fps 0%
Alienware x16 R1
Intel Core i9-13900HK, NVIDIA GeForce RTX 4080 Laptop GPU
211 fps
Razer Blade 16 Early 2023
Intel Core i9-13950HX, NVIDIA GeForce RTX 4080 Laptop GPU
195.8 fps -7%
Lenovo Legion 5 Pro 16ARH7H RTX 3070 Ti
AMD Ryzen 7 6800H, NVIDIA GeForce RTX 3070 Ti Laptop GPU
187.2 fps -11%
Dell G16 7620
Intel Core i7-12700H, NVIDIA GeForce RTX 3060 Laptop GPU
176.7 fps -16%
1920x1080 Standard Quality
NVIDIA GeForce RTX 4080 Founders Edition
Intel Core i9-13900K, NVIDIA GeForce RTX 4080
234 fps +20%
Asus Zephyrus Duo 16 GX650PY-NM006W
AMD Ryzen 9 7945HX, NVIDIA GeForce RTX 4090 Laptop GPU
210 fps +7%
Alienware x16 R1
Intel Core i9-13900HK, NVIDIA GeForce RTX 4080 Laptop GPU
195.5 fps
Average NVIDIA GeForce RTX 4080 Laptop GPU
  (152.8 - 225, n=14)
194.3 fps -1%
Razer Blade 16 Early 2023
Intel Core i9-13950HX, NVIDIA GeForce RTX 4080 Laptop GPU
184.1 fps -6%
Lenovo Legion Pro 5 16ARX8
AMD Ryzen 7 7745HX, NVIDIA GeForce RTX 4070 Laptop GPU
172.5 fps -12%
Lenovo Legion 7 16IAX7-82TD004SGE
Intel Core i9-12900HX, NVIDIA GeForce RTX 3080 Ti Laptop GPU
163.9 fps -16%
Lenovo Legion Pro 5 16IRX8
Intel Core i7-13700HX, NVIDIA GeForce RTX 4060 Laptop GPU
161.2 fps -18%
Lenovo Legion 5 Pro 16ARH7H RTX 3070 Ti
AMD Ryzen 7 6800H, NVIDIA GeForce RTX 3070 Ti Laptop GPU
156 fps -20%
Dell G16 7620
Intel Core i7-12700H, NVIDIA GeForce RTX 3060 Laptop GPU
123.3 fps -37%
1920x1080 High Quality
NVIDIA GeForce RTX 4080 Founders Edition
Intel Core i9-13900K, NVIDIA GeForce RTX 4080
224 fps +36%
Asus Zephyrus Duo 16 GX650PY-NM006W
AMD Ryzen 9 7945HX, NVIDIA GeForce RTX 4090 Laptop GPU
169.6 fps +3%
Alienware x16 R1
Intel Core i9-13900HK, NVIDIA GeForce RTX 4080 Laptop GPU
164.2 fps
Average NVIDIA GeForce RTX 4080 Laptop GPU
  (129 - 182.1, n=19)
158.8 fps -3%
Razer Blade 16 Early 2023
Intel Core i9-13950HX, NVIDIA GeForce RTX 4080 Laptop GPU
157.8 fps -4%
Lenovo Legion 7 16IAX7-82TD004SGE
Intel Core i9-12900HX, NVIDIA GeForce RTX 3080 Ti Laptop GPU
121.2 fps -26%
Lenovo Legion Pro 5 16ARX8
AMD Ryzen 7 7745HX, NVIDIA GeForce RTX 4070 Laptop GPU
119.9 fps -27%
Lenovo Legion 5 Pro 16ARH7H RTX 3070 Ti
AMD Ryzen 7 6800H, NVIDIA GeForce RTX 3070 Ti Laptop GPU
115.6 fps -30%
Alienware m17 R5 (R9 6900HX, RX 6850M XT)
AMD Ryzen 9 6900HX, AMD Radeon RX 6850M XT
113.6 fps -31%
Lenovo Legion Pro 5 16IRX8
Intel Core i7-13700HX, NVIDIA GeForce RTX 4060 Laptop GPU
109.8 fps -33%
Dell G16 7620
Intel Core i7-12700H, NVIDIA GeForce RTX 3060 Laptop GPU
89.4 fps -46%
HP Omen 16-c0077ng
AMD Ryzen 7 5800H, AMD Radeon RX 6600M
77.8 fps -53%
2560x1440 High Quality
NVIDIA GeForce RTX 4080 Founders Edition
Intel Core i9-13900K, NVIDIA GeForce RTX 4080
198.4 fps +50%
Asus Zephyrus Duo 16 GX650PY-NM006W
AMD Ryzen 9 7945HX, NVIDIA GeForce RTX 4090 Laptop GPU
142.1 fps +7%
Alienware x16 R1
Intel Core i9-13900HK, NVIDIA GeForce RTX 4080 Laptop GPU
132.4 fps
Average NVIDIA GeForce RTX 4080 Laptop GPU
  (98 - 142, n=18)
123.9 fps -6%
Razer Blade 16 Early 2023
Intel Core i9-13950HX, NVIDIA GeForce RTX 4080 Laptop GPU
120.1 fps -9%
Lenovo Legion Pro 5 16ARX8
AMD Ryzen 7 7745HX, NVIDIA GeForce RTX 4070 Laptop GPU
119.9 fps -9%
Lenovo Legion 7 16IAX7-82TD004SGE
Intel Core i9-12900HX, NVIDIA GeForce RTX 3080 Ti Laptop GPU
92.8 fps -30%
Lenovo Legion 5 Pro 16ARH7H RTX 3070 Ti
AMD Ryzen 7 6800H, NVIDIA GeForce RTX 3070 Ti Laptop GPU
90.4 fps -32%
Alienware m17 R5 (R9 6900HX, RX 6850M XT)
AMD Ryzen 9 6900HX, AMD Radeon RX 6850M XT
84.5 fps -36%
Lenovo Legion Pro 5 16IRX8
Intel Core i7-13700HX, NVIDIA GeForce RTX 4060 Laptop GPU
79.4 fps -40%
Dell G16 7620
Intel Core i7-12700H, NVIDIA GeForce RTX 3060 Laptop GPU
67.1 fps -49%
HP Omen 16-c0077ng
AMD Ryzen 7 5800H, AMD Radeon RX 6600M
54.8 fps -59%
3840x2160 High Quality
NVIDIA GeForce RTX 4080 Founders Edition
Intel Core i9-13900K, NVIDIA GeForce RTX 4080
115.4 fps +51%
Alienware x16 R1
Intel Core i9-13900HK, NVIDIA GeForce RTX 4080 Laptop GPU
76.2 fps
Razer Blade 16 Early 2023
Intel Core i9-13950HX, NVIDIA GeForce RTX 4080 Laptop GPU
74.1 fps -3%
Average NVIDIA GeForce RTX 4080 Laptop GPU
  (60.8 - 79.5, n=10)
73 fps -4%
Lenovo Legion Pro 5 16ARX8
AMD Ryzen 7 7745HX, NVIDIA GeForce RTX 4070 Laptop GPU
49.2 fps -35%
Alienware m17 R5 (R9 6900HX, RX 6850M XT)
AMD Ryzen 9 6900HX, AMD Radeon RX 6850M XT
48.8 fps -36%
Lenovo Legion Pro 5 16IRX8
Intel Core i7-13700HX, NVIDIA GeForce RTX 4060 Laptop GPU
45.4 fps -40%
The Witcher 3
1024x768 Low Graphics & Postprocessing
NVIDIA GeForce RTX 4080 Founders Edition
Intel Core i9-13900K, NVIDIA GeForce RTX 4080
790 (678min, 697.14P1) fps +86%
Razer Blade 16 Early 2023
Intel Core i9-13950HX, NVIDIA GeForce RTX 4080 Laptop GPU
609.6 (582min) fps +43%
Lenovo Legion Pro 5 16ARX8
AMD Ryzen 7 7745HX, NVIDIA GeForce RTX 4070 Laptop GPU
597 (520min) fps +40%
Average NVIDIA GeForce RTX 4080 Laptop GPU
  (426 - 642, n=11)
555 fps +30%
Lenovo Legion Pro 5 16IRX8
Intel Core i7-13700HX, NVIDIA GeForce RTX 4060 Laptop GPU
521.8 (460min) fps +23%
Alienware x16 R1
Intel Core i9-13900HK, NVIDIA GeForce RTX 4080 Laptop GPU
425.6 (390min) fps
Dell G16 7620
Intel Core i7-12700H, NVIDIA GeForce RTX 3060 Laptop GPU
415.2 (388min) fps -2%
Lenovo Legion 5 Pro 16ARH7H RTX 3070 Ti
AMD Ryzen 7 6800H, NVIDIA GeForce RTX 3070 Ti Laptop GPU
370.5 (360min) fps -13%
Alienware m17 R5 (R9 6900HX, RX 6850M XT)
AMD Ryzen 9 6900HX, AMD Radeon RX 6850M XT
222 fps -48%
1366x768 Medium Graphics & Postprocessing
NVIDIA GeForce RTX 4080 Founders Edition
Intel Core i9-13900K, NVIDIA GeForce RTX 4080
694 (597min, 608.2P1) fps +97%
Average NVIDIA GeForce RTX 4080 Laptop GPU
  (353 - 568, n=12)
468 fps +33%
Razer Blade 16 Early 2023
Intel Core i9-13950HX, NVIDIA GeForce RTX 4080 Laptop GPU
462.7 (403min) fps +31%
Lenovo Legion Pro 5 16ARX8
AMD Ryzen 7 7745HX, NVIDIA GeForce RTX 4070 Laptop GPU
415.1 (392min) fps +18%
Lenovo Legion Pro 5 16IRX8
Intel Core i7-13700HX, NVIDIA GeForce RTX 4060 Laptop GPU
369.3 (345min) fps +5%
Alienware x16 R1
Intel Core i9-13900HK, NVIDIA GeForce RTX 4080 Laptop GPU
352.7 (330min) fps
Lenovo Legion 5 Pro 16ARH7H RTX 3070 Ti
AMD Ryzen 7 6800H, NVIDIA GeForce RTX 3070 Ti Laptop GPU
308.8 (292min) fps -12%
Lenovo Legion 7 16IAX7-82TD004SGE
Intel Core i9-12900HX, NVIDIA GeForce RTX 3080 Ti Laptop GPU
279 fps -21%
Dell G16 7620
Intel Core i7-12700H, NVIDIA GeForce RTX 3060 Laptop GPU
260.5 (246min) fps -26%
Alienware m17 R5 (R9 6900HX, RX 6850M XT)
AMD Ryzen 9 6900HX, AMD Radeon RX 6850M XT
198.2 fps -44%
1920x1080 High Graphics & Postprocessing (Nvidia HairWorks Off)
NVIDIA GeForce RTX 4080 Founders Edition
Intel Core i9-13900K, NVIDIA GeForce RTX 4080
545 (469min, 478.44P1) fps +78%
Asus Zephyrus Duo 16 GX650PY-NM006W
AMD Ryzen 9 7945HX, NVIDIA GeForce RTX 4090 Laptop GPU
361 fps +18%
Razer Blade 16 Early 2023
Intel Core i9-13950HX, NVIDIA GeForce RTX 4080 Laptop GPU
353.5 (306min) fps +15%
Average NVIDIA GeForce RTX 4080 Laptop GPU
  (246 - 385, n=13)
329 fps +7%
Alienware x16 R1
Intel Core i9-13900HK, NVIDIA GeForce RTX 4080 Laptop GPU
306.5 (289min) fps
Lenovo Legion Pro 5 16ARX8
AMD Ryzen 7 7745HX, NVIDIA GeForce RTX 4070 Laptop GPU
257.3 (239min) fps -16%
Lenovo Legion 7 16IAX7-82TD004SGE
Intel Core i9-12900HX, NVIDIA GeForce RTX 3080 Ti Laptop GPU
251 fps -18%
Lenovo Legion 5 Pro 16ARH7H RTX 3070 Ti
AMD Ryzen 7 6800H, NVIDIA GeForce RTX 3070 Ti Laptop GPU
226 (209min) fps -26%
Lenovo Legion Pro 5 16IRX8
Intel Core i7-13700HX, NVIDIA GeForce RTX 4060 Laptop GPU
215.8 (197min) fps -30%
Alienware m17 R5 (R9 6900HX, RX 6850M XT)
AMD Ryzen 9 6900HX, AMD Radeon RX 6850M XT
188.6 fps -38%
Dell G16 7620
Intel Core i7-12700H, NVIDIA GeForce RTX 3060 Laptop GPU
167.2 (160min) fps -45%
HP Omen 16-c0077ng
AMD Ryzen 7 5800H, AMD Radeon RX 6600M
135 fps -56%
1920x1080 Ultra Graphics & Postprocessing (HBAO+)
NVIDIA GeForce RTX 4080 Founders Edition
Intel Core i9-13900K, NVIDIA GeForce RTX 4080
254 (227min, 227P1) fps +59%
Asus Zephyrus Duo 16 GX650PY-NM006W
AMD Ryzen 9 7945HX, NVIDIA GeForce RTX 4090 Laptop GPU
178.6 (172min, 173P1) fps +11%
Razer Blade 16 Early 2023
Intel Core i9-13950HX, NVIDIA GeForce RTX 4080 Laptop GPU
176.8 (159min) fps +10%
Average NVIDIA GeForce RTX 4080 Laptop GPU
  (130.4 - 186.1, n=19)
168.1 fps +5%
Alienware x16 R1
Intel Core i9-13900HK, NVIDIA GeForce RTX 4080 Laptop GPU
160.2 (154min) fps
Alienware m17 R5 (R9 6900HX, RX 6850M XT)
AMD Ryzen 9 6900HX, AMD Radeon RX 6850M XT
126.2 fps -21%
Lenovo Legion Pro 5 16ARX8
AMD Ryzen 7 7745HX, NVIDIA GeForce RTX 4070 Laptop GPU
119.8 (114min) fps -25%
Lenovo Legion 5 Pro 16ARH7H RTX 3070 Ti
AMD Ryzen 7 6800H, NVIDIA GeForce RTX 3070 Ti Laptop GPU
117 (106min) fps -27%
Lenovo Legion 7 16IAX7-82TD004SGE
Intel Core i9-12900HX, NVIDIA GeForce RTX 3080 Ti Laptop GPU
114.4 (108min, 109P1) fps -29%
Lenovo Legion Pro 5 16IRX8
Intel Core i7-13700HX, NVIDIA GeForce RTX 4060 Laptop GPU
107.6 (101min) fps -33%
Dell G16 7620
Intel Core i7-12700H, NVIDIA GeForce RTX 3060 Laptop GPU
86.6 (83min) fps -46%
HP Omen 16-c0077ng
AMD Ryzen 7 5800H, AMD Radeon RX 6600M
84 fps -48%
GTA V
1024x768 Lowest Settings possible
NVIDIA GeForce RTX 4080 Founders Edition
Intel Core i9-13900K, NVIDIA GeForce RTX 4080
187.9 (1.839min, 200P1) fps +1%
Lenovo Legion 7 16IAX7-82TD004SGE
Intel Core i9-12900HX, NVIDIA GeForce RTX 3080 Ti Laptop GPU
187.1 (2.03min, 200P1) fps +1%
Lenovo Legion Pro 5 16IRX8
Intel Core i7-13700HX, NVIDIA GeForce RTX 4060 Laptop GPU
186.7 (1.531min, 166.7P1) fps 0%
Razer Blade 16 Early 2023
Intel Core i9-13950HX, NVIDIA GeForce RTX 4080 Laptop GPU
186.6 (1.605min, 111.1P1) fps 0%
Lenovo Legion Pro 5 16ARX8
AMD Ryzen 7 7745HX, NVIDIA GeForce RTX 4070 Laptop GPU
185.8 (2.31min, 142.9P1) fps 0%
Alienware x16 R1
Intel Core i9-13900HK, NVIDIA GeForce RTX 4080 Laptop GPU
185.8 (2.17min, 142.9P1) fps
Dell G16 7620
Intel Core i7-12700H, NVIDIA GeForce RTX 3060 Laptop GPU
185.6 (1.885min, 142.9P1) fps 0%
Average NVIDIA GeForce RTX 4080 Laptop GPU
  (172.9 - 187.3, n=13)
185 fps 0%
Lenovo Legion 5 Pro 16ARH7H RTX 3070 Ti
AMD Ryzen 7 6800H, NVIDIA GeForce RTX 3070 Ti Laptop GPU
181.5 (2.22min, 142.9P1) fps -2%
Alienware m17 R5 (R9 6900HX, RX 6850M XT)
AMD Ryzen 9 6900HX, AMD Radeon RX 6850M XT
173.2 (3.96min, 111.1P1) fps -7%
1920x1080 Lowest Settings possible
NVIDIA GeForce RTX 4080 Founders Edition
Intel Core i9-13900K, NVIDIA GeForce RTX 4080
188 (4.46min, 200P1) fps +1%
Razer Blade 16 Early 2023
Intel Core i9-13950HX, NVIDIA GeForce RTX 4080 Laptop GPU
187 (1.525min, 166.7P1) fps 0%
Lenovo Legion Pro 5 16ARX8
AMD Ryzen 7 7745HX, NVIDIA GeForce RTX 4070 Laptop GPU
186.6 (2.44min, 166.7P1) fps 0%
Lenovo Legion Pro 5 16IRX8
Intel Core i7-13700HX, NVIDIA GeForce RTX 4060 Laptop GPU
186.5 (1.909min, 166.7P1) fps 0%
Alienware x16 R1
Intel Core i9-13900HK, NVIDIA GeForce RTX 4080 Laptop GPU
186.4 (2.31min, 166.7P1) fps
Average NVIDIA GeForce RTX 4080 Laptop GPU
  (174.9 - 187.8, n=13)
185.1 fps -1%
Dell G16 7620
Intel Core i7-12700H, NVIDIA GeForce RTX 3060 Laptop GPU
182.8 (2.06min, 125P1) fps -2%
Lenovo Legion 5 Pro 16ARH7H RTX 3070 Ti
AMD Ryzen 7 6800H, NVIDIA GeForce RTX 3070 Ti Laptop GPU
180.8 (2.41min, 125P1) fps -3%
Alienware m17 R5 (R9 6900HX, RX 6850M XT)
AMD Ryzen 9 6900HX, AMD Radeon RX 6850M XT
173.7 (4.15min, 125P1) fps -7%
1366x768 Normal/Off AF:4x
NVIDIA GeForce RTX 4080 Founders Edition
Intel Core i9-13900K, NVIDIA GeForce RTX 4080
187.8 (4.09min, 200P1) fps +4%
Asus Zephyrus Duo 16 GX650PY-NM006W
AMD Ryzen 9 7945HX, NVIDIA GeForce RTX 4090 Laptop GPU
186.7 (2.09min, 166.7P1) fps +3%
Lenovo Legion 7 16IAX7-82TD004SGE
Intel Core i9-12900HX, NVIDIA GeForce RTX 3080 Ti Laptop GPU
186.5 (1.596min, 166.7P1) fps +3%
Razer Blade 16 Early 2023
Intel Core i9-13950HX, NVIDIA GeForce RTX 4080 Laptop GPU
185.2 (1.569min, 111.1P1) fps +3%
Lenovo Legion Pro 5 16ARX8
AMD Ryzen 7 7745HX, NVIDIA GeForce RTX 4070 Laptop GPU
185.1 (1.907min, 166.7P1) fps +3%
Lenovo Legion Pro 5 16IRX8
Intel Core i7-13700HX, NVIDIA GeForce RTX 4060 Laptop GPU
184 (2.01min, 142.9P1) fps +2%
Average NVIDIA GeForce RTX 4080 Laptop GPU
  (170 - 187.6, n=15)
183.7 fps +2%
Alienware x16 R1
Intel Core i9-13900HK, NVIDIA GeForce RTX 4080 Laptop GPU
180.4 (2.21min, 125P1) fps
Dell G16 7620
Intel Core i7-12700H, NVIDIA GeForce RTX 3060 Laptop GPU
179.9 (2.49min, 142.9P1) fps 0%
Lenovo Legion 5 Pro 16ARH7H RTX 3070 Ti
AMD Ryzen 7 6800H, NVIDIA GeForce RTX 3070 Ti Laptop GPU
176.5 (3.27min, 125P1) fps -2%
Alienware m17 R5 (R9 6900HX, RX 6850M XT)
AMD Ryzen 9 6900HX, AMD Radeon RX 6850M XT
168.3 (5.75min, 125P1) fps -7%
1920x1080 Normal/Off AF:4x
NVIDIA GeForce RTX 4080 Founders Edition
Intel Core i9-13900K, NVIDIA GeForce RTX 4080
187.7 (5.03min, 200P1) fps +3%
Razer Blade 16 Early 2023
Intel Core i9-13950HX, NVIDIA GeForce RTX 4080 Laptop GPU
185.7 (1.577min, 111.1P1) fps +2%
Lenovo Legion Pro 5 16IRX8
Intel Core i7-13700HX, NVIDIA GeForce RTX 4060 Laptop GPU
185 (2.26min, 142.9P1) fps +2%
Lenovo Legion Pro 5 16ARX8
AMD Ryzen 7 7745HX, NVIDIA GeForce RTX 4070 Laptop GPU
184.4 (1.822min, 142.9P1) fps +1%
Average NVIDIA GeForce RTX 4080 Laptop GPU
  (169.3 - 187.7, n=17)
183.4 fps +1%
Alienware x16 R1
Intel Core i9-13900HK, NVIDIA GeForce RTX 4080 Laptop GPU
181.8 (2.58min, 125P1) fps
Dell G16 7620
Intel Core i7-12700H, NVIDIA GeForce RTX 3060 Laptop GPU
180.6 (3.51min, 142.9P1) fps -1%
Lenovo Legion 5 Pro 16ARH7H RTX 3070 Ti
AMD Ryzen 7 6800H, NVIDIA GeForce RTX 3070 Ti Laptop GPU
176 (0.878min, 125P1) fps -3%
Alienware m17 R5 (R9 6900HX, RX 6850M XT)
AMD Ryzen 9 6900HX, AMD Radeon RX 6850M XT
168.2 (5.09min, 111.1P1) fps -7%
1920x1080 High/On (Advanced Graphics Off) AA:2xMSAA + FX AF:8x
NVIDIA GeForce RTX 4080 Founders Edition
Intel Core i9-13900K, NVIDIA GeForce RTX 4080
187.5 (3.4min, 200P1) fps +6%
Lenovo Legion 7 16IAX7-82TD004SGE
Intel Core i9-12900HX, NVIDIA GeForce RTX 3080 Ti Laptop GPU
183.4 (2.86min, 142.9P1) fps +4%
Razer Blade 16 Early 2023
Intel Core i9-13950HX, NVIDIA GeForce RTX 4080 Laptop GPU
183.4 (1.889min, 125P1) fps +4%
Asus Zephyrus Duo 16 GX650PY-NM006W
AMD Ryzen 9 7945HX, NVIDIA GeForce RTX 4090 Laptop GPU
182.4 (2.29min, 125P1) fps +3%
Lenovo Legion Pro 5 16IRX8
Intel Core i7-13700HX, NVIDIA GeForce RTX 4060 Laptop GPU
178.9 (3.96min, 125P1) fps +1%
Lenovo Legion Pro 5 16ARX8
AMD Ryzen 7 7745HX, NVIDIA GeForce RTX 4070 Laptop GPU
178.6 (3.09min, 125P1) fps +1%
Average NVIDIA GeForce RTX 4080 Laptop GPU
  (164.7 - 186.7, n=14)
178.6 fps +1%
Alienware x16 R1
Intel Core i9-13900HK, NVIDIA GeForce RTX 4080 Laptop GPU
176.4 (3.4min, 125P1) fps
Dell G16 7620
Intel Core i7-12700H, NVIDIA GeForce RTX 3060 Laptop GPU
176.2 (4.01min, 125P1) fps 0%
Lenovo Legion 5 Pro 16ARH7H RTX 3070 Ti
AMD Ryzen 7 6800H, NVIDIA GeForce RTX 3070 Ti Laptop GPU
167.6 (3.33min, 125P1) fps -5%
Alienware m17 R5 (R9 6900HX, RX 6850M XT)
AMD Ryzen 9 6900HX, AMD Radeon RX 6850M XT
152 (5.06min, 76.9P1) fps -14%
HP Omen 16-c0077ng
AMD Ryzen 7 5800H, AMD Radeon RX 6600M
146 (4.16min, 83.3P1) fps -17%
1920x1080 Highest Settings possible AA:4xMSAA + FX AF:16x
NVIDIA GeForce RTX 4080 Founders Edition
Intel Core i9-13900K, NVIDIA GeForce RTX 4080
172.4 (4.4min, 142.9P1) fps +43%
Razer Blade 16 Early 2023
Intel Core i9-13950HX, NVIDIA GeForce RTX 4080 Laptop GPU
140.7 (3.02min, 100P1) fps +17%
Asus Zephyrus Duo 16 GX650PY-NM006W
AMD Ryzen 9 7945HX, NVIDIA GeForce RTX 4090 Laptop GPU
134 (7.27min, 90.9P1) fps +11%
Average NVIDIA GeForce RTX 4080 Laptop GPU
  (102.9 - 152.7, n=18)
130.3 fps +8%
Alienware x16 R1
Intel Core i9-13900HK, NVIDIA GeForce RTX 4080 Laptop GPU
120.3 (9.92min, 83.3P1) fps
Lenovo Legion Pro 5 16ARX8
AMD Ryzen 7 7745HX, NVIDIA GeForce RTX 4070 Laptop GPU
119.9 (3.81min, 76.9P1) fps 0%
Lenovo Legion Pro 5 16IRX8
Intel Core i7-13700HX, NVIDIA GeForce RTX 4060 Laptop GPU
119.6 (3.03min, 76.9P1) fps -1%
Lenovo Legion 7 16IAX7-82TD004SGE
Intel Core i9-12900HX, NVIDIA GeForce RTX 3080 Ti Laptop GPU
111.4 (6.89min, 66.7P1) fps -7%
Dell G16 7620
Intel Core i7-12700H, NVIDIA GeForce RTX 3060 Laptop GPU
108.7 (6.55min, 71.4P1) fps -10%
Lenovo Legion 5 Pro 16ARH7H RTX 3070 Ti
AMD Ryzen 7 6800H, NVIDIA GeForce RTX 3070 Ti Laptop GPU
104 (6.17min, 71.4P1) fps -14%
Alienware m17 R5 (R9 6900HX, RX 6850M XT)
AMD Ryzen 9 6900HX, AMD Radeon RX 6850M XT
92.6 (7.62min, 55.6P1) fps -23%
HP Omen 16-c0077ng
AMD Ryzen 7 5800H, AMD Radeon RX 6600M
71 (9.84min, 50P1) fps -41%
2560x1440 Highest Settings possible AA:4xMSAA + FX AF:16x
NVIDIA GeForce RTX 4080 Founders Edition
Intel Core i9-13900K, NVIDIA GeForce RTX 4080
167.9 (3.18min, 125P1) fps +45%
Razer Blade 16 Early 2023
Intel Core i9-13950HX, NVIDIA GeForce RTX 4080 Laptop GPU
125.2 (3.73min, 83.3P1) fps +8%
Asus Zephyrus Duo 16 GX650PY-NM006W
AMD Ryzen 9 7945HX, NVIDIA GeForce RTX 4090 Laptop GPU
123.8 (0.3513min, 83.3P1) fps +7%
Average NVIDIA GeForce RTX 4080 Laptop GPU
  (100 - 140.7, n=17)
119.5 fps +4%
Alienware x16 R1
Intel Core i9-13900HK, NVIDIA GeForce RTX 4080 Laptop GPU
115.4 (4.72min, 83.3P1) fps
Lenovo Legion 5 Pro 16ARH7H RTX 3070 Ti
AMD Ryzen 7 6800H, NVIDIA GeForce RTX 3070 Ti Laptop GPU
98.8 (4.96min, 66.7P1) fps -14%
Lenovo Legion Pro 5 16ARX8
AMD Ryzen 7 7745HX, NVIDIA GeForce RTX 4070 Laptop GPU
93.2 (3.72min, 62.5P1) fps -19%
Lenovo Legion Pro 5 16IRX8
Intel Core i7-13700HX, NVIDIA GeForce RTX 4060 Laptop GPU
88.9 (3.45min, 55.6P1) fps -23%
Alienware m17 R5 (R9 6900HX, RX 6850M XT)
AMD Ryzen 9 6900HX, AMD Radeon RX 6850M XT
88.7 (5.83min, 55.6P1) fps -23%
Lenovo Legion 7 16IAX7-82TD004SGE
Intel Core i9-12900HX, NVIDIA GeForce RTX 3080 Ti Laptop GPU
82.4 (6.53min, 52.6P1) fps -29%
Dell G16 7620
Intel Core i7-12700H, NVIDIA GeForce RTX 3060 Laptop GPU
82.1 (4.59min, 55.6P1) fps -29%
HP Omen 16-c0077ng
AMD Ryzen 7 5800H, AMD Radeon RX 6600M
49.3 (8.22min, 35.7P1) fps -57%
3840x2160 Highest Settings possible AA:4xMSAA + FX AF:16x
NVIDIA GeForce RTX 4080 Founders Edition
Intel Core i9-13900K, NVIDIA GeForce RTX 4080
95.1 (3.84min, 66.7P1) fps +41%
Alienware x16 R1
Intel Core i9-13900HK, NVIDIA GeForce RTX 4080 Laptop GPU
67.5 (13.5min, 45.5P1) fps
Razer Blade 16 Early 2023
Intel Core i9-13950HX, NVIDIA GeForce RTX 4080 Laptop GPU
62.1 (4.66min, 37P1) fps -8%
Average NVIDIA GeForce RTX 4080 Laptop GPU
  (51.6 - 67.5, n=8)
61 fps -10%
Alienware m17 R5 (R9 6900HX, RX 6850M XT)
AMD Ryzen 9 6900HX, AMD Radeon RX 6850M XT
50.5 (1.341min, 32.3P1) fps -25%
Lenovo Legion Pro 5 16ARX8
AMD Ryzen 7 7745HX, NVIDIA GeForce RTX 4070 Laptop GPU
40.9 (3.49min, 28.6P1) fps -39%
Lenovo Legion Pro 5 16IRX8
Intel Core i7-13700HX, NVIDIA GeForce RTX 4060 Laptop GPU
39.1 (4.1min, 27P1) fps -42%
3840x2160 High/On (Advanced Graphics Off) AA:FX AF:8x
NVIDIA GeForce RTX 4080 Founders Edition
Intel Core i9-13900K, NVIDIA GeForce RTX 4080
186.1 (3.61min, 142.9P1) fps +30%
Razer Blade 16 Early 2023
Intel Core i9-13950HX, NVIDIA GeForce RTX 4080 Laptop GPU
143.7 (4.72min, 62.5P1) fps +1%
Alienware x16 R1
Intel Core i9-13900HK, NVIDIA GeForce RTX 4080 Laptop GPU
142.9 (7.52min, 90.9P1) fps
Average NVIDIA GeForce RTX 4080 Laptop GPU
  (120.3 - 159.7, n=8)
142.1 fps -1%
Alienware m17 R5 (R9 6900HX, RX 6850M XT)
AMD Ryzen 9 6900HX, AMD Radeon RX 6850M XT
98.5 (4.4min, 71.4P1) fps -31%
Lenovo Legion Pro 5 16ARX8
AMD Ryzen 7 7745HX, NVIDIA GeForce RTX 4070 Laptop GPU
93.7 (5.5min, 66.7P1) fps -34%
Lenovo Legion Pro 5 16IRX8
Intel Core i7-13700HX, NVIDIA GeForce RTX 4060 Laptop GPU
85.5 (8.37min, 58.8P1) fps -40%
Returnal
1920x1080 Low Preset
Average NVIDIA GeForce RTX 4080 Laptop GPU
  (116 - 150, n=4)
135.5 fps +17%
Alienware x16 R1
Intel Core i9-13900HK, NVIDIA GeForce RTX 4080 Laptop GPU
116 (44min) fps
Lenovo Legion Pro 5 16ARX8
AMD Ryzen 7 7745HX, NVIDIA GeForce RTX 4070 Laptop GPU
93 (50min) fps -20%
Lenovo Legion Pro 5 16IRX8
Intel Core i7-13700HX, NVIDIA GeForce RTX 4060 Laptop GPU
81 (44min) fps -30%
1920x1080 Medium Preset
Average NVIDIA GeForce RTX 4080 Laptop GPU
  (117 - 148, n=4)
133.5 fps +14%
Alienware x16 R1
Intel Core i9-13900HK, NVIDIA GeForce RTX 4080 Laptop GPU
117 (72min) fps
Lenovo Legion Pro 5 16ARX8
AMD Ryzen 7 7745HX, NVIDIA GeForce RTX 4070 Laptop GPU
90 (49min) fps -23%
Lenovo Legion Pro 5 16IRX8
Intel Core i7-13700HX, NVIDIA GeForce RTX 4060 Laptop GPU
79 (48min) fps -32%
1920x1080 High Preset
Average NVIDIA GeForce RTX 4080 Laptop GPU
  (114 - 137, n=4)
126 fps +11%
Alienware x16 R1
Intel Core i9-13900HK, NVIDIA GeForce RTX 4080 Laptop GPU
114 (58min) fps
Lenovo Legion Pro 5 16ARX8
AMD Ryzen 7 7745HX, NVIDIA GeForce RTX 4070 Laptop GPU
85 (44min) fps -25%
Lenovo Legion Pro 5 16IRX8
Intel Core i7-13700HX, NVIDIA GeForce RTX 4060 Laptop GPU
75 (43min) fps -34%
1920x1080 Epic Preset
Average NVIDIA GeForce RTX 4080 Laptop GPU
  (107 - 121, n=4)
111 fps +2%
Alienware x16 R1
Intel Core i9-13900HK, NVIDIA GeForce RTX 4080 Laptop GPU
109 (72min) fps
Lenovo Legion Pro 5 16ARX8
AMD Ryzen 7 7745HX, NVIDIA GeForce RTX 4070 Laptop GPU
77 (39min) fps -29%
Lenovo Legion Pro 5 16IRX8
Intel Core i7-13700HX, NVIDIA GeForce RTX 4060 Laptop GPU
70 (38min) fps -36%
2560x1440 Epic Preset
Average NVIDIA GeForce RTX 4080 Laptop GPU
  (79 - 92, n=4)
85.5 fps +8%
Alienware x16 R1
Intel Core i9-13900HK, NVIDIA GeForce RTX 4080 Laptop GPU
79 (37min) fps
Lenovo Legion Pro 5 16ARX8
AMD Ryzen 7 7745HX, NVIDIA GeForce RTX 4070 Laptop GPU
55 (37min) fps -30%
Lenovo Legion Pro 5 16IRX8
Intel Core i7-13700HX, NVIDIA GeForce RTX 4060 Laptop GPU
48 (28min) fps -39%
3840x2160 Epic Preset
Average NVIDIA GeForce RTX 4080 Laptop GPU
  (43 - 53, n=3)
46.7 fps +9%
Alienware x16 R1
Intel Core i9-13900HK, NVIDIA GeForce RTX 4080 Laptop GPU
43 (25min) fps
Lenovo Legion Pro 5 16ARX8
AMD Ryzen 7 7745HX, NVIDIA GeForce RTX 4070 Laptop GPU
29 (5min) fps -33%
Lenovo Legion Pro 5 16IRX8
Intel Core i7-13700HX, NVIDIA GeForce RTX 4060 Laptop GPU
25 (11min) fps -42%
X-Plane 11.11
1280x720 low (fps_test=1)
NVIDIA GeForce RTX 4080 Founders Edition
Intel Core i9-13900K, NVIDIA GeForce RTX 4080
251 fps +73%
Razer Blade 16 Early 2023
Intel Core i9-13950HX, NVIDIA GeForce RTX 4080 Laptop GPU
201 fps +38%
Lenovo Legion Pro 5 16ARX8
AMD Ryzen 7 7745HX, NVIDIA GeForce RTX 4070 Laptop GPU
186.3 fps +28%
Average NVIDIA GeForce RTX 4080 Laptop GPU
  (137.7 - 211, n=18)
178.6 fps +23%
Asus Zephyrus Duo 16 GX650PY-NM006W
AMD Ryzen 9 7945HX, NVIDIA GeForce RTX 4090 Laptop GPU
177.5 fps +22%
Lenovo Legion Pro 5 16IRX8
Intel Core i7-13700HX, NVIDIA GeForce RTX 4060 Laptop GPU
177.4 fps +22%
Lenovo Legion 7 16IAX7-82TD004SGE
Intel Core i9-12900HX, NVIDIA GeForce RTX 3080 Ti Laptop GPU
170.5 fps +17%
Dell G16 7620
Intel Core i7-12700H, NVIDIA GeForce RTX 3060 Laptop GPU
147.8 fps +2%
Alienware x16 R1
Intel Core i9-13900HK, NVIDIA GeForce RTX 4080 Laptop GPU
145.3 fps
Lenovo Legion 5 Pro 16ARH7H RTX 3070 Ti
AMD Ryzen 7 6800H, NVIDIA GeForce RTX 3070 Ti Laptop GPU
119.6 fps -18%
Alienware m17 R5 (R9 6900HX, RX 6850M XT)
AMD Ryzen 9 6900HX, AMD Radeon RX 6850M XT
66.9 fps -54%
1920x1080 med (fps_test=2)
NVIDIA GeForce RTX 4080 Founders Edition
Intel Core i9-13900K, NVIDIA GeForce RTX 4080
221 fps +64%
Razer Blade 16 Early 2023
Intel Core i9-13950HX, NVIDIA GeForce RTX 4080 Laptop GPU
177.7 fps +32%
Average NVIDIA GeForce RTX 4080 Laptop GPU
  (122 - 184.3, n=19)
158.7 fps +18%
Lenovo Legion Pro 5 16IRX8
Intel Core i7-13700HX, NVIDIA GeForce RTX 4060 Laptop GPU
156.3 fps +16%
Asus Zephyrus Duo 16 GX650PY-NM006W
AMD Ryzen 9 7945HX, NVIDIA GeForce RTX 4090 Laptop GPU
155.7 fps +16%
Lenovo Legion Pro 5 16ARX8
AMD Ryzen 7 7745HX, NVIDIA GeForce RTX 4070 Laptop GPU
155.2 fps +15%
Lenovo Legion 7 16IAX7-82TD004SGE
Intel Core i9-12900HX, NVIDIA GeForce RTX 3080 Ti Laptop GPU
150.5 fps +12%
Alienware x16 R1
Intel Core i9-13900HK, NVIDIA GeForce RTX 4080 Laptop GPU
134.5 fps
Dell G16 7620
Intel Core i7-12700H, NVIDIA GeForce RTX 3060 Laptop GPU
130.5 fps -3%
Lenovo Legion 5 Pro 16ARH7H RTX 3070 Ti
AMD Ryzen 7 6800H, NVIDIA GeForce RTX 3070 Ti Laptop GPU
103.6 fps -23%
Alienware m17 R5 (R9 6900HX, RX 6850M XT)
AMD Ryzen 9 6900HX, AMD Radeon RX 6850M XT
51 fps -62%
1920x1080 high (fps_test=3)
NVIDIA GeForce RTX 4080 Founders Edition
Intel Core i9-13900K, NVIDIA GeForce RTX 4080
166.3 fps +60%
Razer Blade 16 Early 2023
Intel Core i9-13950HX, NVIDIA GeForce RTX 4080 Laptop GPU
137 fps +31%
Average NVIDIA GeForce RTX 4080 Laptop GPU
  (95.3 - 141.3, n=20)
123.6 fps +19%
Lenovo Legion Pro 5 16IRX8
Intel Core i7-13700HX, NVIDIA GeForce RTX 4060 Laptop GPU
121.9 fps +17%
Lenovo Legion 7 16IAX7-82TD004SGE
Intel Core i9-12900HX, NVIDIA GeForce RTX 3080 Ti Laptop GPU
120.2 fps +15%
Asus Zephyrus Duo 16 GX650PY-NM006W
AMD Ryzen 9 7945HX, NVIDIA GeForce RTX 4090 Laptop GPU
117.8 fps +13%
Lenovo Legion Pro 5 16ARX8
AMD Ryzen 7 7745HX, NVIDIA GeForce RTX 4070 Laptop GPU
117.8 fps +13%
Alienware x16 R1
Intel Core i9-13900HK, NVIDIA GeForce RTX 4080 Laptop GPU
104.2 fps
Dell G16 7620
Intel Core i7-12700H, NVIDIA GeForce RTX 3060 Laptop GPU
102.6 fps -2%
Lenovo Legion 5 Pro 16ARH7H RTX 3070 Ti
AMD Ryzen 7 6800H, NVIDIA GeForce RTX 3070 Ti Laptop GPU
83.9 fps -19%
HP Omen 16-c0077ng
AMD Ryzen 7 5800H, AMD Radeon RX 6600M
45.3 fps -57%
Alienware m17 R5 (R9 6900HX, RX 6850M XT)
AMD Ryzen 9 6900HX, AMD Radeon RX 6850M XT
43.3 fps -58%
3840x2160 high (fps_test=3)
NVIDIA GeForce RTX 4080 Founders Edition
Intel Core i9-13900K, NVIDIA GeForce RTX 4080
140.5 fps +55%
Razer Blade 16 Early 2023
Intel Core i9-13950HX, NVIDIA GeForce RTX 4080 Laptop GPU
117.5 fps +30%
Average NVIDIA GeForce RTX 4080 Laptop GPU
  (82.8 - 143.7, n=10)
105.3 fps +16%
Lenovo Legion Pro 5 16IRX8
Intel Core i7-13700HX, NVIDIA GeForce RTX 4060 Laptop GPU
104.4 fps +15%
Lenovo Legion Pro 5 16ARX8
AMD Ryzen 7 7745HX, NVIDIA GeForce RTX 4070 Laptop GPU
99.5 fps +10%
Alienware x16 R1
Intel Core i9-13900HK, NVIDIA GeForce RTX 4080 Laptop GPU
90.5 fps
Alienware m17 R5 (R9 6900HX, RX 6850M XT)
AMD Ryzen 9 6900HX, AMD Radeon RX 6850M XT
27.5 fps -70%
Dota 2 Reborn
1280x720 min (0/3) fastest
NVIDIA GeForce RTX 4080 Founders Edition
Intel Core i9-13900K, NVIDIA GeForce RTX 4080
296.1 (255.8min) fps +66%
Lenovo Legion Pro 5 16ARX8
AMD Ryzen 7 7745HX, NVIDIA GeForce RTX 4070 Laptop GPU
238 (198.4min) fps +33%
Asus Zephyrus Duo 16 GX650PY-NM006W
AMD Ryzen 9 7945HX, NVIDIA GeForce RTX 4090 Laptop GPU
227 (193.4min) fps +27%
Razer Blade 16 Early 2023
Intel Core i9-13950HX, NVIDIA GeForce RTX 4080 Laptop GPU
218 (182.2min) fps +22%
Average NVIDIA GeForce RTX 4080 Laptop GPU
  (176.2 - 247, n=17)
211 fps +18%
Lenovo Legion 7 16IAX7-82TD004SGE
Intel Core i9-12900HX, NVIDIA GeForce RTX 3080 Ti Laptop GPU
206 (181.4min) fps +15%
Lenovo Legion Pro 5 16IRX8
Intel Core i7-13700HX, NVIDIA GeForce RTX 4060 Laptop GPU
196.6 (168.7min) fps +10%
Alienware x16 R1
Intel Core i9-13900HK, NVIDIA GeForce RTX 4080 Laptop GPU
178.8 (156min) fps
Dell G16 7620
Intel Core i7-12700H, NVIDIA GeForce RTX 3060 Laptop GPU
171.8 (150min) fps -4%
Lenovo Legion 5 Pro 16ARH7H RTX 3070 Ti
AMD Ryzen 7 6800H, NVIDIA GeForce RTX 3070 Ti Laptop GPU
150.4 (132.5min) fps -16%
Alienware m17 R5 (R9 6900HX, RX 6850M XT)
AMD Ryzen 9 6900HX, AMD Radeon RX 6850M XT
134.7 (115.7min) fps -25%
1366x768 med (1/3)
NVIDIA GeForce RTX 4080 Founders Edition
Intel Core i9-13900K, NVIDIA GeForce RTX 4080
259.8 (223.6min) fps +58%
Asus Zephyrus Duo 16 GX650PY-NM006W
AMD Ryzen 9 7945HX, NVIDIA GeForce RTX 4090 Laptop GPU
207 (177.5min) fps +26%
Razer Blade 16 Early 2023
Intel Core i9-13950HX, NVIDIA GeForce RTX 4080 Laptop GPU
204 (176.4min) fps +24%
Lenovo Legion Pro 5 16ARX8
AMD Ryzen 7 7745HX, NVIDIA GeForce RTX 4070 Laptop GPU
203 (175.4min) fps +24%
Average NVIDIA GeForce RTX 4080 Laptop GPU
  (152.4 - 216, n=18)
189.1 fps +15%
Lenovo Legion 7 16IAX7-82TD004SGE
Intel Core i9-12900HX, NVIDIA GeForce RTX 3080 Ti Laptop GPU
185.1 (160.8min) fps +13%
Lenovo Legion Pro 5 16IRX8
Intel Core i7-13700HX, NVIDIA GeForce RTX 4060 Laptop GPU
176.5 (151.7min) fps +8%
Alienware x16 R1
Intel Core i9-13900HK, NVIDIA GeForce RTX 4080 Laptop GPU
164 (145min) fps
Dell G16 7620
Intel Core i7-12700H, NVIDIA GeForce RTX 3060 Laptop GPU
159.3 (141.1min) fps -3%
Lenovo Legion 5 Pro 16ARH7H RTX 3070 Ti
AMD Ryzen 7 6800H, NVIDIA GeForce RTX 3070 Ti Laptop GPU
138 (119.9min) fps -16%
Alienware m17 R5 (R9 6900HX, RX 6850M XT)
AMD Ryzen 9 6900HX, AMD Radeon RX 6850M XT
116.5 (94.8min) fps -29%
1920x1080 high (2/3)
NVIDIA GeForce RTX 4080 Founders Edition
Intel Core i9-13900K, NVIDIA GeForce RTX 4080
251 (215.2min) fps +57%
Asus Zephyrus Duo 16 GX650PY-NM006W
AMD Ryzen 9 7945HX, NVIDIA GeForce RTX 4090 Laptop GPU
196.1 (167.3min) fps +23%
Razer Blade 16 Early 2023
Intel Core i9-13950HX, NVIDIA GeForce RTX 4080 Laptop GPU
196 (167.6min) fps +23%
Lenovo Legion Pro 5 16ARX8
AMD Ryzen 7 7745HX, NVIDIA GeForce RTX 4070 Laptop GPU
191.8 (164.9min) fps +20%
Lenovo Legion 7 16IAX7-82TD004SGE
Intel Core i9-12900HX, NVIDIA GeForce RTX 3080 Ti Laptop GPU
177.8 (154.9min) fps +11%
Average NVIDIA GeForce RTX 4080 Laptop GPU
  (140 - 202, n=19)
175.8 fps +10%
Lenovo Legion Pro 5 16IRX8
Intel Core i7-13700HX, NVIDIA GeForce RTX 4060 Laptop GPU
170.3 (144.6min) fps +7%
Alienware x16 R1
Intel Core i9-13900HK, NVIDIA GeForce RTX 4080 Laptop GPU
159.7 (140.3min) fps
Dell G16 7620
Intel Core i7-12700H, NVIDIA GeForce RTX 3060 Laptop GPU
159 (135.4min) fps 0%
Lenovo Legion 5 Pro 16ARH7H RTX 3070 Ti
AMD Ryzen 7 6800H, NVIDIA GeForce RTX 3070 Ti Laptop GPU
132.2 (115.7min) fps -17%
HP Omen 16-c0077ng
AMD Ryzen 7 5800H, AMD Radeon RX 6600M
115.7 (100.4min) fps -28%
Alienware m17 R5 (R9 6900HX, RX 6850M XT)
AMD Ryzen 9 6900HX, AMD Radeon RX 6850M XT
112.5 (94.7min) fps -30%
1920x1080 ultra (3/3) best looking
NVIDIA GeForce RTX 4080 Founders Edition
Intel Core i9-13900K, NVIDIA GeForce RTX 4080
238.3 (202.7min) fps +62%
Razer Blade 16 Early 2023
Intel Core i9-13950HX, NVIDIA GeForce RTX 4080 Laptop GPU
194.7 (160min) fps +33%
Lenovo Legion Pro 5 16ARX8
AMD Ryzen 7 7745HX, NVIDIA GeForce RTX 4070 Laptop GPU
182 (152.8min) fps +24%
Asus Zephyrus Duo 16 GX650PY-NM006W
AMD Ryzen 9 7945HX, NVIDIA GeForce RTX 4090 Laptop GPU
179.7 (153.7min) fps +22%
Lenovo Legion 7 16IAX7-82TD004SGE
Intel Core i9-12900HX, NVIDIA GeForce RTX 3080 Ti Laptop GPU
168 (144.9min) fps +14%
Average NVIDIA GeForce RTX 4080 Laptop GPU
  (136.2 - 194.7, n=19)
164.7 fps +12%
Lenovo Legion Pro 5 16IRX8
Intel Core i7-13700HX, NVIDIA GeForce RTX 4060 Laptop GPU
161.8 (140.3min) fps +10%
Dell G16 7620
Intel Core i7-12700H, NVIDIA GeForce RTX 3060 Laptop GPU
147.2 (128.6min) fps 0%
Alienware x16 R1
Intel Core i9-13900HK, NVIDIA GeForce RTX 4080 Laptop GPU
146.8 (121.7min) fps
Lenovo Legion 5 Pro 16ARH7H RTX 3070 Ti
AMD Ryzen 7 6800H, NVIDIA GeForce RTX 3070 Ti Laptop GPU
126.6 (111.8min) fps -14%
HP Omen 16-c0077ng
AMD Ryzen 7 5800H, AMD Radeon RX 6600M
105.6 (88.2min) fps -28%
Alienware m17 R5 (R9 6900HX, RX 6850M XT)
AMD Ryzen 9 6900HX, AMD Radeon RX 6850M XT
94 (75.5min) fps -36%
3840x2160 ultra (3/3) best looking
NVIDIA GeForce RTX 4080 Founders Edition
Intel Core i9-13900K, NVIDIA GeForce RTX 4080
232.6 (189.1min) fps +80%
Razer Blade 16 Early 2023
Intel Core i9-13950HX, NVIDIA GeForce RTX 4080 Laptop GPU
176.7 (125min) fps +37%
Lenovo Legion Pro 5 16ARX8
AMD Ryzen 7 7745HX, NVIDIA GeForce RTX 4070 Laptop GPU
151.5 (125.3min) fps +17%
Average NVIDIA GeForce RTX 4080 Laptop GPU
  (116.7 - 182.6, n=11)
148.9 fps +15%
Lenovo Legion Pro 5 16IRX8
Intel Core i7-13700HX, NVIDIA GeForce RTX 4060 Laptop GPU
142.9 (119.8min) fps +10%
Alienware x16 R1
Intel Core i9-13900HK, NVIDIA GeForce RTX 4080 Laptop GPU
129.4 (112.8min) fps
Alienware m17 R5 (R9 6900HX, RX 6850M XT)
AMD Ryzen 9 6900HX, AMD Radeon RX 6850M XT
77.5 (62.8min) fps -40%
Strange Brigade
1280x720 lowest AF:1
Lenovo Legion Pro 5 16ARX8
AMD Ryzen 7 7745HX, NVIDIA GeForce RTX 4070 Laptop GPU
636 (124.2min, 480P1) fps +36%
Asus Zephyrus Duo 16 GX650PY-NM006W
AMD Ryzen 9 7945HX, NVIDIA GeForce RTX 4090 Laptop GPU
518 (219min, 405P1) fps +10%
Alienware x16 R1
Intel Core i9-13900HK, NVIDIA GeForce RTX 4080 Laptop GPU
469 (215min, 328P1) fps
Average NVIDIA GeForce RTX 4080 Laptop GPU
  (324 - 572, n=13)
464 fps -1%
Razer Blade 16 Early 2023
Intel Core i9-13950HX, NVIDIA GeForce RTX 4080 Laptop GPU
438 (43.6min, 305P1) fps -7%
Dell G16 7620
Intel Core i7-12700H, NVIDIA GeForce RTX 3060 Laptop GPU
395 (75.1min, 291P1) fps -16%
Lenovo Legion 5 Pro 16ARH7H RTX 3070 Ti
AMD Ryzen 7 6800H, NVIDIA GeForce RTX 3070 Ti Laptop GPU
383 (246min, 284P1) fps -18%
Alienware m17 R5 (R9 6900HX, RX 6850M XT)
AMD Ryzen 9 6900HX, AMD Radeon RX 6850M XT
375 (193.7min, 270P1) fps -20%
Lenovo Legion 7 16IAX7-82TD004SGE
Intel Core i9-12900HX, NVIDIA GeForce RTX 3080 Ti Laptop GPU
361 (34.5min, 277P1) fps -23%
1920x1080 medium AA:medium AF:4
Asus Zephyrus Duo 16 GX650PY-NM006W
AMD Ryzen 9 7945HX, NVIDIA GeForce RTX 4090 Laptop GPU
400 (57.7min, 266P1) fps +7%
Average NVIDIA GeForce RTX 4080 Laptop GPU
  (272 - 461, n=14)
375 fps +1%
Alienware x16 R1
Intel Core i9-13900HK, NVIDIA GeForce RTX 4080 Laptop GPU
373 (161.6min, 270P1) fps
Razer Blade 16 Early 2023
Intel Core i9-13950HX, NVIDIA GeForce RTX 4080 Laptop GPU
365 (81.2min, 264P1) fps -2%
Lenovo Legion Pro 5 16ARX8
AMD Ryzen 7 7745HX, NVIDIA GeForce RTX 4070 Laptop GPU
334 (29.5min, 289P1) fps -10%
Lenovo Legion 5 Pro 16ARH7H RTX 3070 Ti
AMD Ryzen 7 6800H, NVIDIA GeForce RTX 3070 Ti Laptop GPU
298 (33.4min, 217P1) fps -20%
Alienware m17 R5 (R9 6900HX, RX 6850M XT)
AMD Ryzen 9 6900HX, AMD Radeon RX 6850M XT
291 (153.8min, 207P1) fps -22%
Dell G16 7620
Intel Core i7-12700H, NVIDIA GeForce RTX 3060 Laptop GPU
228 (77min, 154.9P1) fps -39%
Lenovo Legion 7 16IAX7-82TD004SGE
Intel Core i9-12900HX, NVIDIA GeForce RTX 3080 Ti Laptop GPU
194 (33.4min, 149.2P1) fps -48%
1920x1080 high AA:high AF:8
Asus Zephyrus Duo 16 GX650PY-NM006W
AMD Ryzen 9 7945HX, NVIDIA GeForce RTX 4090 Laptop GPU
370 (58.3min, 253P1) fps +6%
Razer Blade 16 Early 2023
Intel Core i9-13950HX, NVIDIA GeForce RTX 4080 Laptop GPU
351 (50.4min, 248P1) fps 0%
Alienware x16 R1
Intel Core i9-13900HK, NVIDIA GeForce RTX 4080 Laptop GPU
350 (58.2min, 255P1) fps
Average NVIDIA GeForce RTX 4080 Laptop GPU
  (263 - 400, n=15)
340 fps -3%
Lenovo Legion Pro 5 16ARX8
AMD Ryzen 7 7745HX, NVIDIA GeForce RTX 4070 Laptop GPU
260 (45.1min, 190.7P1) fps -26%
Alienware m17 R5 (R9 6900HX, RX 6850M XT)
AMD Ryzen 9 6900HX, AMD Radeon RX 6850M XT
256 (112.2min, 179.5P1) fps -27%
Lenovo Legion 5 Pro 16ARH7H RTX 3070 Ti
AMD Ryzen 7 6800H, NVIDIA GeForce RTX 3070 Ti Laptop GPU
248 (128.1min, 157.1P1) fps -29%
Dell G16 7620
Intel Core i7-12700H, NVIDIA GeForce RTX 3060 Laptop GPU
180.2 (68.9min, 132.8P1) fps -49%
HP Omen 16-c0077ng
AMD Ryzen 7 5800H, AMD Radeon RX 6600M
172 fps -51%
Lenovo Legion 7 16IAX7-82TD004SGE
Intel Core i9-12900HX, NVIDIA GeForce RTX 3080 Ti Laptop GPU
156 (44min, 107.5P1) fps -55%
1920x1080 ultra AA:ultra AF:16
Asus Zephyrus Duo 16 GX650PY-NM006W
AMD Ryzen 9 7945HX, NVIDIA GeForce RTX 4090 Laptop GPU
333 (38min, 227P1) fps +2%
Alienware x16 R1
Intel Core i9-13900HK, NVIDIA GeForce RTX 4080 Laptop GPU
325 (45min, 233P1) fps
Razer Blade 16 Early 2023
Intel Core i9-13950HX, NVIDIA GeForce RTX 4080 Laptop GPU
323 (61.7min, 222P1) fps -1%
Average NVIDIA GeForce RTX 4080 Laptop GPU
  (239 - 357, n=18)
311 fps -4%
Alienware m17 R5 (R9 6900HX, RX 6850M XT)
AMD Ryzen 9 6900HX, AMD Radeon RX 6850M XT
230 (121.4min, 165.6P1) fps -29%
Lenovo Legion Pro 5 16ARX8
AMD Ryzen 7 7745HX, NVIDIA GeForce RTX 4070 Laptop GPU
223 (89min, 167.8P1) fps -31%
Lenovo Legion 5 Pro 16ARH7H RTX 3070 Ti
AMD Ryzen 7 6800H, NVIDIA GeForce RTX 3070 Ti Laptop GPU
217 (41.5min, 154.4P1) fps -33%
Dell G16 7620
Intel Core i7-12700H, NVIDIA GeForce RTX 3060 Laptop GPU
155.5 (51.7min, 115.4P1) fps -52%
HP Omen 16-c0077ng
AMD Ryzen 7 5800H, AMD Radeon RX 6600M
155 fps -52%
Lenovo Legion 7 16IAX7-82TD004SGE
Intel Core i9-12900HX, NVIDIA GeForce RTX 3080 Ti Laptop GPU
137.6 (22.6min, 94P1) fps -58%
2560x1440 ultra AA:ultra AF:16
Asus Zephyrus Duo 16 GX650PY-NM006W
AMD Ryzen 9 7945HX, NVIDIA GeForce RTX 4090 Laptop GPU
257 (110.2min, 192.1P1) fps +8%
Razer Blade 16 Early 2023
Intel Core i9-13950HX, NVIDIA GeForce RTX 4080 Laptop GPU
237 (31min, 169P1) fps 0%
Alienware x16 R1
Intel Core i9-13900HK, NVIDIA GeForce RTX 4080 Laptop GPU
237 (50min, 181.5P1) fps
Average NVIDIA GeForce RTX 4080 Laptop GPU
  (179.5 - 248, n=17)
229 fps -3%
Alienware m17 R5 (R9 6900HX, RX 6850M XT)
AMD Ryzen 9 6900HX, AMD Radeon RX 6850M XT
171 (127.1min, 131.9P1) fps -28%
Lenovo Legion 5 Pro 16ARH7H RTX 3070 Ti
AMD Ryzen 7 6800H, NVIDIA GeForce RTX 3070 Ti Laptop GPU
160.5 (113.1min, 128.5P1) fps -32%
Lenovo Legion Pro 5 16ARX8
AMD Ryzen 7 7745HX, NVIDIA GeForce RTX 4070 Laptop GPU
146.4 (23.1min, 121.3P1) fps -38%
Dell G16 7620
Intel Core i7-12700H, NVIDIA GeForce RTX 3060 Laptop GPU
113 (69.2min, 91.2P1) fps -52%
Lenovo Legion 7 16IAX7-82TD004SGE
Intel Core i9-12900HX, NVIDIA GeForce RTX 3080 Ti Laptop GPU
107 (23.9min, 78.3P1) fps -55%
HP Omen 16-c0077ng
AMD Ryzen 7 5800H, AMD Radeon RX 6600M
101 fps -57%
3840x2160 ultra AA:ultra AF:16
Razer Blade 16 Early 2023
Intel Core i9-13950HX, NVIDIA GeForce RTX 4080 Laptop GPU
122.3 (35.5min, 104.4P1) fps +1%
Alienware x16 R1
Intel Core i9-13900HK, NVIDIA GeForce RTX 4080 Laptop GPU
120.5 (39min, 101.7P1) fps
Average NVIDIA GeForce RTX 4080 Laptop GPU
  (100.9 - 144.3, n=9)
119.5 fps -1%
Alienware m17 R5 (R9 6900HX, RX 6850M XT)
AMD Ryzen 9 6900HX, AMD Radeon RX 6850M XT
92.1 (74.7min, 78.7P1) fps -24%
Lenovo Legion Pro 5 16ARX8
AMD Ryzen 7 7745HX, NVIDIA GeForce RTX 4070 Laptop GPU
76.8 (63.5min, 65.8P1) fps -36%
Cyberpunk 2077 1.6
1920x1080 Low Preset
NVIDIA GeForce RTX 4080 Founders Edition
Intel Core i9-13900K, NVIDIA GeForce RTX 4080
246 (125.7min) fps +56%
Lenovo Legion Pro 5 16ARX8
AMD Ryzen 7 7745HX, NVIDIA GeForce RTX 4070 Laptop GPU
185.8 (36.2min) fps +18%
Alienware x16 R1
Intel Core i9-13900HK, NVIDIA GeForce RTX 4080 Laptop GPU
158 (68.7min) fps
Lenovo Legion Pro 5 16IRX8
Intel Core i7-13700HX, NVIDIA GeForce RTX 4060 Laptop GPU
150.7 (68.2min) fps -5%
Lenovo Legion 5 Pro 16ARH7H RTX 3070 Ti
AMD Ryzen 7 6800H, NVIDIA GeForce RTX 3070 Ti Laptop GPU
148.9 (58.5min) fps -6%
Average NVIDIA GeForce RTX 4080 Laptop GPU
  (121.1 - 158, n=5)
142.9 fps -10%
Dell G16 7620
Intel Core i7-12700H, NVIDIA GeForce RTX 3060 Laptop GPU
125.1 (59.4min) fps -21%
Razer Blade 16 Early 2023
Intel Core i9-13950HX, NVIDIA GeForce RTX 4080 Laptop GPU
121.1 (42.2min) fps -23%
Lenovo Legion 7 16IAX7-82TD004SGE
Intel Core i9-12900HX, NVIDIA GeForce RTX 3080 Ti Laptop GPU
89 fps -44%
1920x1080 Medium Preset
NVIDIA GeForce RTX 4080 Founders Edition
Intel Core i9-13900K, NVIDIA GeForce RTX 4080
248 (108.1min) fps +64%
Lenovo Legion Pro 5 16ARX8
AMD Ryzen 7 7745HX, NVIDIA GeForce RTX 4070 Laptop GPU
157.6 (53.3min) fps +4%
Alienware x16 R1
Intel Core i9-13900HK, NVIDIA GeForce RTX 4080 Laptop GPU
150.9 (65.6min) fps
Average NVIDIA GeForce RTX 4080 Laptop GPU
  (118.1 - 151.4, n=5)
138 fps -9%
Lenovo Legion Pro 5 16IRX8
Intel Core i7-13700HX, NVIDIA GeForce RTX 4060 Laptop GPU
136.6 (30.6min) fps -9%
Lenovo Legion 5 Pro 16ARH7H RTX 3070 Ti
AMD Ryzen 7 6800H, NVIDIA GeForce RTX 3070 Ti Laptop GPU
130.2 (64.8min) fps -14%
Razer Blade 16 Early 2023
Intel Core i9-13950HX, NVIDIA GeForce RTX 4080 Laptop GPU
118.1 (55.6min) fps -22%
Dell G16 7620
Intel Core i7-12700H, NVIDIA GeForce RTX 3060 Laptop GPU
105.4 (51.6min) fps -30%
Lenovo Legion 7 16IAX7-82TD004SGE
Intel Core i9-12900HX, NVIDIA GeForce RTX 3080 Ti Laptop GPU
78 fps -48%
1920x1080 High Preset
NVIDIA GeForce RTX 4080 Founders Edition
Intel Core i9-13900K, NVIDIA GeForce RTX 4080
218 (139.7min) fps +54%
Alienware x16 R1
Intel Core i9-13900HK, NVIDIA GeForce RTX 4080 Laptop GPU
141.2 (53.1min) fps
Asus Zephyrus Duo 16 GX650PY-NM006W
AMD Ryzen 9 7945HX, NVIDIA GeForce RTX 4090 Laptop GPU
136 fps -4%
Average NVIDIA GeForce RTX 4080 Laptop GPU
  (105.2 - 141.2, n=7)
126.1 fps -11%
Lenovo Legion Pro 5 16ARX8
AMD Ryzen 7 7745HX, NVIDIA GeForce RTX 4070 Laptop GPU
121.3 (34.2min) fps -14%
Razer Blade 16 Early 2023
Intel Core i9-13950HX, NVIDIA GeForce RTX 4080 Laptop GPU
113.8 (55.8min) fps -19%
Lenovo Legion Pro 5 16IRX8
Intel Core i7-13700HX, NVIDIA GeForce RTX 4060 Laptop GPU
106 (64.9min) fps -25%
Lenovo Legion 5 Pro 16ARH7H RTX 3070 Ti
AMD Ryzen 7 6800H, NVIDIA GeForce RTX 3070 Ti Laptop GPU
102.1 (59.5min) fps -28%
Dell G16 7620
Intel Core i7-12700H, NVIDIA GeForce RTX 3060 Laptop GPU
80.4 (51.2min) fps -43%
Lenovo Legion 7 16IAX7-82TD004SGE
Intel Core i9-12900HX, NVIDIA GeForce RTX 3080 Ti Laptop GPU
64 fps -55%
1920x1080 Ultra Preset
NVIDIA GeForce RTX 4080 Founders Edition
Intel Core i9-13900K, NVIDIA GeForce RTX 4080
197.4 (133.6min) fps +48%
Alienware x16 R1
Intel Core i9-13900HK, NVIDIA GeForce RTX 4080 Laptop GPU
133.6 (56min) fps
Asus Zephyrus Duo 16 GX650PY-NM006W
AMD Ryzen 9 7945HX, NVIDIA GeForce RTX 4090 Laptop GPU
130.6 (34.83min) fps -2%
Average NVIDIA GeForce RTX 4080 Laptop GPU
  (94.9 - 135.8, n=7)
119.6 fps -10%
Razer Blade 16 Early 2023
Intel Core i9-13950HX, NVIDIA GeForce RTX 4080 Laptop GPU
106.2 (47.5min) fps -21%
Lenovo Legion Pro 5 16ARX8
AMD Ryzen 7 7745HX, NVIDIA GeForce RTX 4070 Laptop GPU
98.9 (35.5min) fps -26%
Lenovo Legion Pro 5 16IRX8
Intel Core i7-13700HX, NVIDIA GeForce RTX 4060 Laptop GPU
87.4 (50.9min) fps -35%
Lenovo Legion 5 Pro 16ARH7H RTX 3070 Ti
AMD Ryzen 7 6800H, NVIDIA GeForce RTX 3070 Ti Laptop GPU
86 (55min) fps -36%
Dell G16 7620
Intel Core i7-12700H, NVIDIA GeForce RTX 3060 Laptop GPU
66.8 (46.2min) fps -50%
Lenovo Legion 7 16IAX7-82TD004SGE
Intel Core i9-12900HX, NVIDIA GeForce RTX 3080 Ti Laptop GPU
54 fps -60%
2560x1440 Ultra Preset
NVIDIA GeForce RTX 4080 Founders Edition
Intel Core i9-13900K, NVIDIA GeForce RTX 4080
130.4 (87.7min) fps +55%
Asus Zephyrus Duo 16 GX650PY-NM006W
AMD Ryzen 9 7945HX, NVIDIA GeForce RTX 4090 Laptop GPU
86 fps +2%
Alienware x16 R1
Intel Core i9-13900HK, NVIDIA GeForce RTX 4080 Laptop GPU
84.4 (52.5min) fps
Razer Blade 16 Early 2023
Intel Core i9-13950HX, NVIDIA GeForce RTX 4080 Laptop GPU
81.2 (32.5min) fps -4%
Average NVIDIA GeForce RTX 4080 Laptop GPU
  (63.4 - 88.6, n=7)
80.2 fps -5%
Lenovo Legion Pro 5 16ARX8
AMD Ryzen 7 7745HX, NVIDIA GeForce RTX 4070 Laptop GPU
58.1 (37.8min) fps -31%
Alienware m17 R5 (R9 6900HX, RX 6850M XT)
AMD Ryzen 9 6900HX, AMD Radeon RX 6850M XT
57 (44min) fps -32%
Lenovo Legion 5 Pro 16ARH7H RTX 3070 Ti
AMD Ryzen 7 6800H, NVIDIA GeForce RTX 3070 Ti Laptop GPU
54.4 (36.7min) fps -36%
Lenovo Legion Pro 5 16IRX8
Intel Core i7-13700HX, NVIDIA GeForce RTX 4060 Laptop GPU
51.7 (33.3min) fps -39%
Dell G16 7620
Intel Core i7-12700H, NVIDIA GeForce RTX 3060 Laptop GPU
41.6 (28.3min) fps -51%
Lenovo Legion 7 16IAX7-82TD004SGE
Intel Core i9-12900HX, NVIDIA GeForce RTX 3080 Ti Laptop GPU
36 fps -57%
3840x2160 Ultra Preset
NVIDIA GeForce RTX 4080 Founders Edition
Intel Core i9-13900K, NVIDIA GeForce RTX 4080
63.5 (42.2min) fps +65%
Razer Blade 16 Early 2023
Intel Core i9-13950HX, NVIDIA GeForce RTX 4080 Laptop GPU
40 (20.8min) fps +4%
Alienware x16 R1
Intel Core i9-13900HK, NVIDIA GeForce RTX 4080 Laptop GPU
38.5 (24.6min) fps
Average NVIDIA GeForce RTX 4080 Laptop GPU
  (29 - 40.2, n=6)
37.1 fps -4%
Alienware m17 R5 (R9 6900HX, RX 6850M XT)
AMD Ryzen 9 6900HX, AMD Radeon RX 6850M XT
26 (20min) fps -32%
Lenovo Legion Pro 5 16ARX8
AMD Ryzen 7 7745HX, NVIDIA GeForce RTX 4070 Laptop GPU
24.7 (16.3min) fps -36%
Lenovo Legion Pro 5 16IRX8
Intel Core i7-13700HX, NVIDIA GeForce RTX 4060 Laptop GPU
22.9 (16min) fps -41%
Tiny Tina's Wonderlands
1920x1080 Low Preset (DX12)
Average NVIDIA GeForce RTX 4080 Laptop GPU
  (257 - 344, n=4)
294 fps +15%
Lenovo Legion Pro 5 16ARX8
AMD Ryzen 7 7745HX, NVIDIA GeForce RTX 4070 Laptop GPU
263.6 fps +3%
Alienware x16 R1
Intel Core i9-13900HK, NVIDIA GeForce RTX 4080 Laptop GPU
256.6 fps
Lenovo Legion Pro 5 16IRX8
Intel Core i7-13700HX, NVIDIA GeForce RTX 4060 Laptop GPU
234.6 fps -9%
1920x1080 Medium Preset (DX12)
Average NVIDIA GeForce RTX 4080 Laptop GPU
  (217 - 297, n=4)
253 fps +16%
Lenovo Legion Pro 5 16ARX8
AMD Ryzen 7 7745HX, NVIDIA GeForce RTX 4070 Laptop GPU
217.3 fps 0%
Alienware x16 R1
Intel Core i9-13900HK, NVIDIA GeForce RTX 4080 Laptop GPU
217.3 fps
Lenovo Legion Pro 5 16IRX8
Intel Core i7-13700HX, NVIDIA GeForce RTX 4060 Laptop GPU
192.3 fps -12%
1920x1080 High Preset (DX12)
Average NVIDIA GeForce RTX 4080 Laptop GPU
  (177.1 - 213, n=4)
193.6 fps +6%
Alienware x16 R1
Intel Core i9-13900HK, NVIDIA GeForce RTX 4080 Laptop GPU
183.3 fps
Lenovo Legion Pro 5 16ARX8
AMD Ryzen 7 7745HX, NVIDIA GeForce RTX 4070 Laptop GPU
144.5 fps -21%
Lenovo Legion Pro 5 16IRX8
Intel Core i7-13700HX, NVIDIA GeForce RTX 4060 Laptop GPU
121.2 fps -34%
1920x1080 Badass Preset (DX12)
Asus Zephyrus Duo 16 GX650PY-NM006W
AMD Ryzen 9 7945HX, NVIDIA GeForce RTX 4090 Laptop GPU
171.5 fps +10%
Alienware x16 R1
Intel Core i9-13900HK, NVIDIA GeForce RTX 4080 Laptop GPU
156.4 fps
Average NVIDIA GeForce RTX 4080 Laptop GPU
  (112.9 - 167.1, n=7)
143.7 fps -8%
Lenovo Legion Pro 5 16ARX8
AMD Ryzen 7 7745HX, NVIDIA GeForce RTX 4070 Laptop GPU
112.1 fps -28%
Lenovo Legion Pro 5 16IRX8
Intel Core i7-13700HX, NVIDIA GeForce RTX 4060 Laptop GPU
92.7 fps -41%
2560x1440 Badass Preset (DX12)
Asus Zephyrus Duo 16 GX650PY-NM006W
AMD Ryzen 9 7945HX, NVIDIA GeForce RTX 4090 Laptop GPU
120 fps +8%
Alienware x16 R1
Intel Core i9-13900HK, NVIDIA GeForce RTX 4080 Laptop GPU
111.1 fps
Average NVIDIA GeForce RTX 4080 Laptop GPU
  (85 - 114.8, n=7)
103 fps -7%
Lenovo Legion Pro 5 16ARX8
AMD Ryzen 7 7745HX, NVIDIA GeForce RTX 4070 Laptop GPU
76.9 fps -31%
Lenovo Legion Pro 5 16IRX8
Intel Core i7-13700HX, NVIDIA GeForce RTX 4060 Laptop GPU
64.2 fps -42%
3840x2160 Badass Preset (DX12)
Alienware x16 R1
Intel Core i9-13900HK, NVIDIA GeForce RTX 4080 Laptop GPU
58.6 fps
Average NVIDIA GeForce RTX 4080 Laptop GPU
  (46.4 - 60.3, n=7)
54.6 fps -7%
Lenovo Legion Pro 5 16ARX8
AMD Ryzen 7 7745HX, NVIDIA GeForce RTX 4070 Laptop GPU
39.7 fps -32%
Lenovo Legion Pro 5 16IRX8
Intel Core i7-13700HX, NVIDIA GeForce RTX 4060 Laptop GPU
33.6 fps -43%
F1 22
1280x720 Ultra Low Preset AA:T AF:16x
NVIDIA GeForce RTX 4080 Founders Edition
Intel Core i9-13900K, NVIDIA GeForce RTX 4080
534 (375min, 333P1) fps +70%
Lenovo Legion Pro 5 16ARX8
AMD Ryzen 7 7745HX, NVIDIA GeForce RTX 4070 Laptop GPU
398 (275min, 248P1) fps +27%
Lenovo Legion Pro 5 16IRX8
Intel Core i7-13700HX, NVIDIA GeForce RTX 4060 Laptop GPU
342 (259min, 213P1) fps +9%
Average NVIDIA GeForce RTX 4080 Laptop GPU
  (282 - 408, n=8)
337 fps +7%
Alienware x16 R1
Intel Core i9-13900HK, NVIDIA GeForce RTX 4080 Laptop GPU
314 (242min, 210P1) fps
1920x1080 Low Preset AA:T AF:16x
NVIDIA GeForce RTX 4080 Founders Edition
Intel Core i9-13900K, NVIDIA GeForce RTX 4080
427 (291min, 235P1) fps +61%
Lenovo Legion Pro 5 16ARX8
AMD Ryzen 7 7745HX, NVIDIA GeForce RTX 4070 Laptop GPU
311 (208min, 174P1) fps +17%
Asus Zephyrus Duo 16 GX650PY-NM006W
AMD Ryzen 9 7945HX, NVIDIA GeForce RTX 4090 Laptop GPU
303 (197min, 160P1) fps +14%
Average NVIDIA GeForce RTX 4080 Laptop GPU
  (237 - 339, n=9)
285 fps +8%
Lenovo Legion Pro 5 16IRX8
Intel Core i7-13700HX, NVIDIA GeForce RTX 4060 Laptop GPU
276 (212min, 155P1) fps +4%
Alienware x16 R1
Intel Core i9-13900HK, NVIDIA GeForce RTX 4080 Laptop GPU
265 (201min, 158P1) fps
1920x1080 Medium Preset AA:T AF:16x
NVIDIA GeForce RTX 4080 Founders Edition
Intel Core i9-13900K, NVIDIA GeForce RTX 4080
431 (307min, 244P1) fps +66%
Lenovo Legion Pro 5 16ARX8
AMD Ryzen 7 7745HX, NVIDIA GeForce RTX 4070 Laptop GPU
300 (208min, 171P1) fps +16%
Asus Zephyrus Duo 16 GX650PY-NM006W
AMD Ryzen 9 7945HX, NVIDIA GeForce RTX 4090 Laptop GPU
286 (218min, 168P1) fps +10%
Lenovo Legion Pro 5 16IRX8
Intel Core i7-13700HX, NVIDIA GeForce RTX 4060 Laptop GPU
274 (216min, 158P1) fps +6%
Average NVIDIA GeForce RTX 4080 Laptop GPU
  (235 - 334, n=10)
274 fps +6%
Alienware x16 R1
Intel Core i9-13900HK, NVIDIA GeForce RTX 4080 Laptop GPU
259 (192min, 152P1) fps
1920x1080 High Preset AA:T AF:16x
NVIDIA GeForce RTX 4080 Founders Edition
Intel Core i9-13900K, NVIDIA GeForce RTX 4080
370 (288min, 216P1) fps +52%
Asus Zephyrus Duo 16 GX650PY-NM006W
AMD Ryzen 9 7945HX, NVIDIA GeForce RTX 4090 Laptop GPU
265 (193min, 148P1) fps +9%
Alienware x16 R1
Intel Core i9-13900HK, NVIDIA GeForce RTX 4080 Laptop GPU
244 (185min, 145P1) fps
Average NVIDIA GeForce RTX 4080 Laptop GPU
  (202 - 297, n=12)
243 fps 0%
Lenovo Legion Pro 5 16ARX8
AMD Ryzen 7 7745HX, NVIDIA GeForce RTX 4070 Laptop GPU
235 (204min, 151P1) fps -4%
Lenovo Legion Pro 5 16IRX8
Intel Core i7-13700HX, NVIDIA GeForce RTX 4060 Laptop GPU
208 (180min, 128P1) fps -15%
1920x1080 Ultra High Preset AA:T AF:16x
NVIDIA GeForce RTX 4080 Founders Edition
Intel Core i9-13900K, NVIDIA GeForce RTX 4080
172.9 (150min, 123P1) fps +57%
Asus Zephyrus Duo 16 GX650PY-NM006W
AMD Ryzen 9 7945HX, NVIDIA GeForce RTX 4090 Laptop GPU
114.3 (92min, 71P1) fps +4%
Alienware x16 R1
Intel Core i9-13900HK, NVIDIA GeForce RTX 4080 Laptop GPU
110 (98min, 74P1) fps
Average NVIDIA GeForce RTX 4080 Laptop GPU
  (72.3 - 124.2, n=13)
100.6 fps -9%
Lenovo Legion Pro 5 16ARX8
AMD Ryzen 7 7745HX, NVIDIA GeForce RTX 4070 Laptop GPU
84.1 (71min, 59P1) fps -24%
Lenovo Legion Pro 5 16IRX8
Intel Core i7-13700HX, NVIDIA GeForce RTX 4060 Laptop GPU
70.1 (60min, 58P1) fps -36%
2560x1440 Ultra High Preset AA:T AF:16x
NVIDIA GeForce RTX 4080 Founders Edition
Intel Core i9-13900K, NVIDIA GeForce RTX 4080
114.4 (100min, 94P1) fps +45%
Asus Zephyrus Duo 16 GX650PY-NM006W
AMD Ryzen 9 7945HX, NVIDIA GeForce RTX 4090 Laptop GPU
80.3 (70min, 58P1) fps +2%
Alienware x16 R1
Intel Core i9-13900HK, NVIDIA GeForce RTX 4080 Laptop GPU
79 (68min, 62P1) fps
Average NVIDIA GeForce RTX 4080 Laptop GPU
  (55.4 - 79, n=11)
71.2 fps -10%
Lenovo Legion Pro 5 16ARX8
AMD Ryzen 7 7745HX, NVIDIA GeForce RTX 4070 Laptop GPU
54.8 (47min, 45P1) fps -31%
Lenovo Legion Pro 5 16IRX8
Intel Core i7-13700HX, NVIDIA GeForce RTX 4060 Laptop GPU
44.8 (38min, 35P1) fps -43%
3840x2160 Ultra High Preset AA:T AF:16x
NVIDIA GeForce RTX 4080 Founders Edition
Intel Core i9-13900K, NVIDIA GeForce RTX 4080
58.9 (50min, 49P1) fps +51%
Alienware x16 R1
Intel Core i9-13900HK, NVIDIA GeForce RTX 4080 Laptop GPU
39 (33min, 32P1) fps
Average NVIDIA GeForce RTX 4080 Laptop GPU
  (25.8 - 39.6, n=8)
35.8 fps -8%
Lenovo Legion Pro 5 16ARX8
AMD Ryzen 7 7745HX, NVIDIA GeForce RTX 4070 Laptop GPU
26.4 (22min, 22P1) fps -32%
Lenovo Legion Pro 5 16IRX8
Intel Core i7-13700HX, NVIDIA GeForce RTX 4060 Laptop GPU
21.5 (18min, 17P1) fps -45%

Witcher 3 FPS Chart

0102030405060708090100110120130140150160170180Tooltip
Alienware x16 R1 i9-13900HK, NVIDIA GeForce RTX 4080 Laptop GPU: Ø169.2 (159-181)
bajo medio alto ultraQHD4K
GTA V (2015) 185.8 180.4 176.4 120.3 115.4 142.9
The Witcher 3 (2015) 425.6 352.7 306.5 160.2 115
Dota 2 Reborn (2015) 178.8 164 159.7 146.8 129.4
Final Fantasy XV Benchmark (2018) 211 195.5 164.2 132.4 76.2
X-Plane 11.11 (2018) 145.3 134.5 104.2 90.5
Strange Brigade (2018) 469 373 350 325 237 120.5
Shadow of the Tomb Raider (2018) 165 143 84
Far Cry 6 (2021) 121 112 73
Cyberpunk 2077 1.6 (2022) 158 150.9 141.2 133.6 84.4 38.5
Tiny Tina's Wonderlands (2022) 256.6 217.3 183.3 156.4 111.1 58.6
F1 22 (2022) 265 259 244 110 79 39
Call of Duty Modern Warfare 2 2022 (2022) 139 110 67
Returnal (2023) 116 117 114 109 79 43

Emisiones

Ruido del sistema: muchas opciones de perfil de potencia

El ruido de los ventiladores está directamente relacionado con la configuración del perfil de potencia ACC. Si no estás jugando, te recomendamos que configures el ACC en modo Equilibrado o Silencioso, ya que los ventiladores tienden a pulsar con mucha más frecuencia cuando están en modo Rendimiento u Overdrive.

Ejecutando Witcher 3 en los modos Rendimiento y Overdrive, el ruido del ventilador es de 50 dB(A) y 55 dB(A), respectivamente. Dado que la pérdida de velocidad de fotogramas es mínima entre los modos Rendimiento y Overdrive, como se mencionó anteriormente en la sección Rendimiento de la GPU, se puede disfrutar de una experiencia de juego notablemente más silenciosa en el modo Rendimiento. El ruido del ventilador sería aún más silencioso en el modo Equilibrado sin afectar significativamente la velocidad de cuadros. más de 50 dB(A) sigue siendo muy ruidoso, por supuesto, pero no deja de ser un rango habitual en modelos de la competencia como el Lenovo Legion Pro 7 o el Razer Blade 16.

La solución de refrigeración consta de cuatro ventiladores de 45 a 50 mm, pasta térmica de silicona de galio y cámara de vapor sólo para las SKU RTX 4080 y 4090
El ruido del ventilador es casi siempre audible, con algo menos de 26 dB(A) frente a un fondo silencioso de 22,7 dB(A), independientemente del ajuste o de la carga en pantalla
Perfil de ruido del ventilador (Blanco: Fondo, Rojo: Sistema inactivo, Azul: 3DMark 06, Naranja: Witcher 3 verde: Prime95+FurMark estrés)

Ruido

Ocioso
23.1 / 25.8 / 25.8 dB(A)
Carga
39.3 / 54.8 dB(A)
  red to green bar
 
 
30 dB
silencioso
40 dB(A)
audible
50 dB(A)
ruidosamente alto
 
min: dark, med: mid, max: light   Earthworks M23R, Arta (15 cm de distancia)   environment noise: 22.7 dB(A)
dB(A) 0102030405060708090Deep BassMiddle BassHigh BassLower RangeMidsHigher MidsLower HighsMid HighsUpper HighsSuper Highs2037.634.939.938.938.62530.829.328.326.926.63121.623.421.52223.44021.121.122.319.822.65023.325.823.822.226.56330.425.223.322.3288029.223.323.22030.110025.421.42018.527.212525.122.718.515.22716028.524.416.611.430.820029.52417.112.133.125031.825.516.712.13631533.926.317.21437.640035.328.217.511.939.85003629.216.710.639.763036.628.215.39.839.880036.727.513.59.140.110003727.413.29.141.1125037.927.913.19.142.2160038.527.812.89.642.6200040.228.713.910.244.8250040.228.514.810.345.1315039.929.113.210.745.5400039.228.812.21144.8500037.72512.311.243630035.319.81211.440.7800030.416.81211.437.81000027.91412.111.435.7125002712.812.111.434.31600020.511.211.610.528.9SPL49.939.325.822.754.8N73.10.70.49.8median 35.3median 26.3median 13.5median 11.2median 39.8Delta4.94.220.94.6hearing rangehide median Fan NoiseAlienware x16 R1
Alienware x16 R1
NVIDIA GeForce RTX 4080 Laptop GPU, i9-13900HK, SK hynix PC801 HFS001TEJ9X101N
Lenovo Legion Pro 7 RTX4090
NVIDIA GeForce RTX 4090 Laptop GPU, i9-13900HX, Samsung PM9A1 MZVL21T0HCLR
Asus ROG Zephyrus M16 GU604VY-NM042X
NVIDIA GeForce RTX 4090 Laptop GPU, i9-13900H, Samsung PM9A1 MZVL22T0HBLB
Razer Blade 16 Early 2023
NVIDIA GeForce RTX 4080 Laptop GPU, i9-13950HX, SSSTC CA6-8D1024
Dell G16 7620
GeForce RTX 3060 Laptop GPU, i7-12700H, WDC PC SN810 512GB
Alienware m17 R5 (R9 6900HX, RX 6850M XT)
Radeon RX 6850M XT, R9 6900HX, SSSTC CA6-8D1024
Noise
-17%
-10%
3%
-2%
2%
off / environment *
22.7
25
-10%
24
-6%
23
-1%
23.2
-2%
23
-1%
Idle Minimum *
23.1
28
-21%
24
-4%
23
-0%
28.3
-23%
23
-0%
Idle Average *
25.8
30
-16%
29.96
-16%
23
11%
28.8
-12%
28.11
-9%
Idle Maximum *
25.8
38
-47%
34.27
-33%
23.6
9%
28.9
-12%
28.11
-9%
Load Average *
39.3
48
-22%
35.89
9%
39
1%
32.4
18%
30.62
22%
Witcher 3 ultra *
49.9
53
-6%
57.5
-15%
51.6
-3%
48.3
3%
49.75
-0%
Load Maximum *
54.8
55
-0%
57.54
-5%
51.3
6%
48.1
12%
50.17
8%

* ... más pequeño es mejor

Temperatura

Las temperaturas superficiales pueden ser muy elevadas debido al diseño de perfil fino. Los puntos calientes pueden alcanzar unos 50 C en la parte superior e inferior, comparados con los 40 C del Blade 16. Afortunadamente, estos puntos calientes están hacia la parte trasera y lejos de los reposamuñecas. Afortunadamente, estos puntos calientes están hacia la parte trasera y lejos de los reposamuñecas.

Escape lateral y trasero
El adaptador de CA puede alcanzar más de 46 C cuando se ejecutan cargas exigentes como juegos
 43.4 °C47.2 °C39.2 °C 
 43 °C38 °C35 °C 
 29.4 °C25.4 °C27.2 °C 
Máximo: 47.2 °C
Médio: 36.4 °C
43.6 °C47.8 °C42.8 °C
37.8 °C44.2 °C42 °C
28.2 °C28.6 °C29.8 °C
Máximo: 47.8 °C
Médio: 38.3 °C
Conector de corriente  42 °C | Temperatura del cuarto 20 °C | Fluke 62 mini IR Thermometer
(±) The average temperature for the upper side under maximal load is 36.4 °C / 98 F, compared to the average of 33.8 °C / 93 F for the devices in the class Gaming.
(-) The maximum temperature on the upper side is 47.2 °C / 117 F, compared to the average of 40.4 °C / 105 F, ranging from 21.2 to 68.8 °C for the class Gaming.
(-) The bottom heats up to a maximum of 47.8 °C / 118 F, compared to the average of 43.2 °C / 110 F
(+) In idle usage, the average temperature for the upper side is 30.8 °C / 87 F, compared to the device average of 33.8 °C / 93 F.
(±) Playing The Witcher 3, the average temperature for the upper side is 38 °C / 100 F, compared to the device average of 33.8 °C / 93 F.
(+) The palmrests and touchpad are cooler than skin temperature with a maximum of 30.6 °C / 87.1 F and are therefore cool to the touch.
(±) The average temperature of the palmrest area of similar devices was 28.9 °C / 84 F (-1.7 °C / -3.1 F).
Sistema inactivo (arriba)
Sistema inactivo (abajo)
Witcher 3 estrés (arriba)
Witcher 3 tensión (abajo)
Tensión Prime95+FurMark (arriba)
Tensión Prime95+FurMark (abajo)
Alienware x16 R1
Intel Core i9-13900HK, NVIDIA GeForce RTX 4080 Laptop GPU
Lenovo Legion Pro 7 RTX4090
Intel Core i9-13900HX, NVIDIA GeForce RTX 4090 Laptop GPU
Asus ROG Zephyrus M16 GU604VY-NM042X
Intel Core i9-13900H, NVIDIA GeForce RTX 4090 Laptop GPU
Razer Blade 16 Early 2023
Intel Core i9-13950HX, NVIDIA GeForce RTX 4080 Laptop GPU
Dell G16 7620
Intel Core i7-12700H, NVIDIA GeForce RTX 3060 Laptop GPU
Alienware m17 R5 (R9 6900HX, RX 6850M XT)
AMD Ryzen 9 6900HX, AMD Radeon RX 6850M XT
Heat
-4%
6%
15%
14%
2%
Maximum Upper Side *
47.2
53
-12%
50
-6%
40
15%
47.6
-1%
53
-12%
Maximum Bottom *
47.8
59
-23%
58
-21%
37.6
21%
54
-13%
56
-17%
Idle Upper Side *
36.8
34
8%
26
29%
32.4
12%
23
37%
30
18%
Idle Bottom *
35.8
32
11%
28
22%
31.4
12%
24.6
31%
29
19%

* ... más pequeño es mejor

Prueba de resistencia

La velocidad de reloj de la CPU, el consumo de energía de la placa y la temperatura del núcleo se disparaban a 4,5 GHz, 178 W y 99 C, respectivamente, al iniciar el estrés Prime95. Al cabo de un par de minutos, la CPU se estabilizó en 3,8 GHz, 123 W y 99 C. Con temperaturas del núcleo tan altas, está claro que el procesador está llevando al límite la solución de refrigeración para mantener las velocidades de reloj Turbo Boost más altas posibles. Repitiendo esta misma prueba en el Blade 16, por ejemplo, la temperatura estable del núcleo sería de 82 C.

Cuando se ejecuta Witcher 3 en modo Overdrive para representar las cargas típicas de juego, la GPU se estabilizaría en torno a 166 W frente a un objetivo de 175 W. Curiosamente, el consumo de energía de la placa apenas caería a 161 W en modo equilibrado como se muestra en las capturas de pantalla a continuación para representar un déficit de rendimiento muy marginal en relación con el ruido del ventilador significativamente más silencioso en comparación con el modo Overdrive. Por lo tanto, los usuarios pueden considerar jugar en modo equilibrado en lugar de los modos más ruidosos Rendimiento u Overdrive.

Sistema inactivo
Sistema inactivo
Tensión Prime95 (modo Overdrive)
Tensión Prime95+FurMark (modo Overdrive)
Witcher 3 tensión (modo equilibrado)
Witcher 3 estrés (modo Performance)
Witcher 3 tensión (modo Overdrive)
RelojCPU (GHz) Reloj GPU (MHz) Temperatura mediaCPU (°C) Temperatura media GPU (°C)
Sistema en reposo -- -- 44 30
Prime95Stress 3.8 -- 99 51
Prime95+ FurMark Stress 2,5 - 3,6 2475 82 - 100 72 - 77
Witcher 3 Tensión (modoequilibrado) ~1,8 2460 81 85
Witcher 3 Tensión (modoPerformance) ~1,8 2460 80 82
Witcher 3 Tensión (modoOverdrive) ~2,2 2475 95 82

Altavoces

6 altavoces integrados (4 woofers de 3 W + 2 tweeters de 2 W)
Ruido rosa a volumen máximo. El volumen y la reproducción de graves son más altos y amplios que en la mayoría de portátiles
dB(A) 0102030405060708090Deep BassMiddle BassHigh BassLower RangeMidsHigher MidsLower HighsMid HighsUpper HighsSuper Highs203639.936252628.3263121.821.521.84021.422.321.45025.123.825.16333.423.333.4804923.24910058.52058.512563.218.563.216071.116.671.120075.517.175.525079.416.779.431581.817.281.840078.217.578.250076.816.776.863074.915.374.980073.213.573.2100070.113.270.1125073.813.173.8160075.112.875.120007713.977250078.114.878.1315077.913.277.9400073.812.273.8500072.112.372.1630072.31272.3800068.31268.31000065.912.165.91250065.912.165.91600067.811.667.8SPL87.325.887.3N79.40.779.4median 73.8median 13.5median 73.8Delta4.724.726.325.821.422.12624.925.127.622.532.523.448.72655.818.860.922.167.2267019.372.317.674.217.774.319.575.31571.711.871.311.27410.574.21072.710.17210.67210.97511.374.811.671.71269.71269.612.371.112.669.61270.111.269.824.784.70.666.6median 12median 71.73.42.2hearing rangehide median Pink NoiseAlienware x16 R1Apple MacBook Pro 16 2021 M1 Pro
Diagrama de frecuencia en comparación (¡las casillas de verificación se pueden marcar y desmarcar!)
Alienware x16 R1 audio analysis

(+) | speakers can play relatively loud (87.3 dB)
Bass 100 - 315 Hz
(±) | reduced bass - on average 7.3% lower than median
(±) | linearity of bass is average (9.1% delta to prev. frequency)
Mids 400 - 2000 Hz
(+) | balanced mids - only 2.2% away from median
(+) | mids are linear (3.8% delta to prev. frequency)
Highs 2 - 16 kHz
(+) | balanced highs - only 3.6% away from median
(+) | highs are linear (3.3% delta to prev. frequency)
Overall 100 - 16.000 Hz
(+) | overall sound is linear (7.9% difference to median)
Compared to same class
» 0% of all tested devices in this class were better, 1% similar, 99% worse
» The best had a delta of 6%, average was 18%, worst was 132%
Compared to all devices tested
» 1% of all tested devices were better, 0% similar, 99% worse
» The best had a delta of 4%, average was 25%, worst was 134%

Apple MacBook Pro 16 2021 M1 Pro audio analysis

(+) | speakers can play relatively loud (84.7 dB)
Bass 100 - 315 Hz
(+) | good bass - only 3.8% away from median
(+) | bass is linear (5.2% delta to prev. frequency)
Mids 400 - 2000 Hz
(+) | balanced mids - only 1.3% away from median
(+) | mids are linear (2.1% delta to prev. frequency)
Highs 2 - 16 kHz
(+) | balanced highs - only 1.9% away from median
(+) | highs are linear (2.7% delta to prev. frequency)
Overall 100 - 16.000 Hz
(+) | overall sound is linear (4.6% difference to median)
Compared to same class
» 0% of all tested devices in this class were better, 0% similar, 100% worse
» The best had a delta of 5%, average was 18%, worst was 45%
Compared to all devices tested
» 0% of all tested devices were better, 0% similar, 100% worse
» The best had a delta of 4%, average was 25%, worst was 134%

Gestión de la energía

Consumo de energía - Alto como se esperaba

El consumo de energía oscila entre 25 W y 50 W en reposo en el escritorio dependiendo del perfil de energía, la GPU y los ajustes de brillo. Este rango está en el lado alto incluso para la categoría, ya que otros modelos de 16 pulgadas como el Razer Blade 16 o el Alienware m17 pueden llegar a los 15 W con configuraciones de potencia mínima similares.

Los juegos exigen unos 263 W, lo que está entre el Asus ROG Strix G16 y el MSI GE78 HX cada uno con la misma GPU RTX 4080. Tal vez más notable, la RTX 4090 de potencia Asus ROG Zephyrus M16 consume un 20% menos de energía y ofrece aproximadamente el mismo rendimiento gráfico que nuestro Alienware con RTX 4080.

Hemos podido medir un consumo temporal máximo de 313 W con el adaptador de CA de 330 W y tamaño medio (~18.3 x 8.6 x 2.6 cm) cuando la CPU y la GPU están al 100% de uso. La velocidad de carga se ralentiza cuando se ejecutan cargas tan exigentes.

consumo 3DMark 06
consumo 3DMark 06
Witcher 3 consumo de energía 1080p Ultra
El consumo se disparaba hasta 252 W temporalmente al iniciar la tensión Prime95 antes de descender y estabilizarse en 195 W debido a las limitaciones térmicas
Prime95+FurMark tensión iniciada en la marca 10s
Consumo de corriente
Off / Standbydarklight 0.03 / 0.7 Watt
Ociosodarkmidlight 25.2 / 29.9 / 49.8 Watt
Carga midlight 105.4 / 313.8 Watt
 color bar
Clave: min: dark, med: mid, max: light        Metrahit Energy
Currently we use the Metrahit Energy, a professional single phase power quality and energy measurement digital multimeter, for our measurements. Find out more about it here. All of our test methods can be found here.
Alienware x16 R1
i9-13900HK, NVIDIA GeForce RTX 4080 Laptop GPU, SK hynix PC801 HFS001TEJ9X101N, IPS, 2560x1600, 16.00
Lenovo Legion Pro 7 RTX4090
i9-13900HX, NVIDIA GeForce RTX 4090 Laptop GPU, Samsung PM9A1 MZVL21T0HCLR, IPS, 2560x1600, 16.00
Asus ROG Zephyrus M16 GU604VY-NM042X
i9-13900H, NVIDIA GeForce RTX 4090 Laptop GPU, Samsung PM9A1 MZVL22T0HBLB, IPS, 2560x1600, 16.00
Razer Blade 16 Early 2023
i9-13950HX, NVIDIA GeForce RTX 4080 Laptop GPU, SSSTC CA6-8D1024, IPS, 2560x1600, 16.00
Dell G16 7620
i7-12700H, GeForce RTX 3060 Laptop GPU, WDC PC SN810 512GB, IPS, 2560x1600, 16.00
Alienware m17 R5 (R9 6900HX, RX 6850M XT)
R9 6900HX, Radeon RX 6850M XT, SSSTC CA6-8D1024, IPS, 3840x2160, 17.00
Power Consumption
5%
21%
12%
30%
33%
Idle Minimum *
25.2
20
21%
20
21%
15.2
40%
14.4
43%
13
48%
Idle Average *
29.9
25
16%
24
20%
22.8
24%
17.8
40%
16.5
45%
Idle Maximum *
49.8
35
30%
25
50%
49.8
-0%
31.5
37%
17
66%
Load Average *
105.4
136
-29%
107
-2%
121.2
-15%
101.2
4%
93
12%
Witcher 3 ultra *
263
282
-7%
208
21%
242
8%
176.9
33%
239
9%
Load Maximum *
313.8
320
-2%
267
15%
273.7
13%
242.9
23%
251
20%

* ... más pequeño es mejor

Power Consumption Witcher 3 / Stresstest

020406080100120140160180200220240260280300Tooltip
Alienware x16 R1 i9-13900HK, NVIDIA GeForce RTX 4080 Laptop GPU; Witcher 3 ultra: Ø263 (249-296)
Razer Blade 16 Early 2023 i9-13950HX, NVIDIA GeForce RTX 4080 Laptop GPU; Witcher 3 ultra: Ø242 (238-248)
Alienware x16 R1 i9-13900HK, NVIDIA GeForce RTX 4080 Laptop GPU; 1280x720 Prime95 28.10 and Furmark 1.25: Ø259 (217-314)
Razer Blade 16 Early 2023 i9-13950HX, NVIDIA GeForce RTX 4080 Laptop GPU; 1280x720 Prime95 28.10 and Furmark 1.25: Ø203 (150.8-274)
Alienware x16 R1 i9-13900HK, NVIDIA GeForce RTX 4080 Laptop GPU; Idle 150cd/m2: Ø28 (20.9-40.9)
Razer Blade 16 Early 2023 i9-13950HX, NVIDIA GeForce RTX 4080 Laptop GPU; Idle 150cd/m2: Ø15.5 (11.1-24.6)

Power Consumption external Monitor

0153045607590105120135150165180195210225240255Tooltip
Alienware x16 R1 i9-13900HK, NVIDIA GeForce RTX 4080 Laptop GPU; Prime95 V2810 Stress (external Monitor): Ø201 (186.7-252)
Razer Blade 16 Early 2023 i9-13950HX, NVIDIA GeForce RTX 4080 Laptop GPU; Prime95 V2810 Stress (external Monitor): Ø182.4 (173.7-211)
Alienware x16 R1 i9-13900HK, NVIDIA GeForce RTX 4080 Laptop GPU; Cinebench R15 Multi (external Monitor): Ø200 (190.5-212)
Razer Blade 16 Early 2023 i9-13950HX, NVIDIA GeForce RTX 4080 Laptop GPU; Cinebench R15 Multi (external Monitor): Ø191.7 (184.9-193.8)
Alienware x16 R1 i9-13900HK, NVIDIA GeForce RTX 4080 Laptop GPU; 1280x720 FurMark 1.19 GPU Stress Test (external Monitor): Ø236 (208-246)
Razer Blade 16 Early 2023 i9-13950HX, NVIDIA GeForce RTX 4080 Laptop GPU; 1280x720 FurMark 1.19 GPU Stress Test (external Monitor): Ø242 (232-253)
Alienware x16 R1 i9-13900HK, NVIDIA GeForce RTX 4080 Laptop GPU; 1920x1080 The Witcher 3 ultra (external Monitor): Ø257 (246-269)
Razer Blade 16 Early 2023 i9-13950HX, NVIDIA GeForce RTX 4080 Laptop GPU; 1920x1080 The Witcher 3 ultra (external Monitor): Ø236 (225-245)
Alienware x16 R1 i9-13900HK, NVIDIA GeForce RTX 4080 Laptop GPU; Idle 1min (external Monitor): Ø27.8 (19.9-52.6)
Razer Blade 16 Early 2023 i9-13950HX, NVIDIA GeForce RTX 4080 Laptop GPU; Idle 1min (external Monitor): Ø14.2 (11.6-16.9)

Duración de la batería

Sólo pudimos registrar 2,5 horas de autonomía durante nuestro test de navegación WLAN incluso con ACC en modo Batería y el sistema en modo iGPU Optimus. La repetición de las pruebas arrojaría cifras similares. No esperamos largas duraciones de portátiles de juego, pero esto sigue siendo mucho más corto comparado con las plataformas de la competencia. Dell afirma una autonomía de navegación de más de 7 horas, que sólo podemos obtener en reposo en el escritorio con el brillo al mínimo. Los resultados son inusuales ya que nuestroAlienware x17 duró el doble que nuestro Alienware x16 bajo el mismo test WLAN.

La carga de vacío a lleno tarda unas dos horas con el adaptador incluido. El sistema también se puede recargar con adaptadores USB-C, incluyendo los de 130 W que vienen con los modelos XPS.

Tiempo de Ejecución de la Batería
Ocioso (sin WLAN, min brillo)
7h 16min
WiFi Websurfing
2h 29min
Carga (máximo brillo)
0h 44min
Alienware x16 R1
i9-13900HK, NVIDIA GeForce RTX 4080 Laptop GPU, 90 Wh
Asus ROG Zephyrus M16 GU604VY-NM042X
i9-13900H, NVIDIA GeForce RTX 4090 Laptop GPU, 90 Wh
Razer Blade 16 Early 2023
i9-13950HX, NVIDIA GeForce RTX 4080 Laptop GPU, 95.2 Wh
Dell G16 7620
i7-12700H, GeForce RTX 3060 Laptop GPU, 84 Wh
Alienware m17 R5 (R9 6900HX, RX 6850M XT)
R9 6900HX, Radeon RX 6850M XT, 97 Wh
Lenovo Legion Pro 7 16IRX8H
i9-13900HX, NVIDIA GeForce RTX 4080 Laptop GPU, 99.9 Wh
Duración de Batería
184%
84%
32%
119%
91%
Reader / Idle
436
533
22%
426
-2%
385
-12%
WiFi v1.3
149
259
74%
365
145%
297
99%
290
95%
303
103%
Load
44
173
293%
81
84%
43
-2%
107
143%
124
182%
H.264
285
294

Pro

+ excelente rendimiento incluso con perfil de potencia equilibrado
+ más delgado que la mayoría de portátiles para juegos de 16 pulgadas
+ satisfactorio teclado mecánico de perfil ultrabajo
+ pantalla bien calibrada
+ audio excelente

Contra

- posición desfavorable de los puertos
- duración de la batería relativamente corta
- sin opciones 4K u OLED
- clickpad muy pequeño
- ocupa mucho espacio

Veredicto - Consigue perseguir tanto la delgadez como los gráficos

En revisión: Alienware x16 R1. Unidad de prueba proporcionada por Dell

Se suele decir que el rendimiento de un portátil es inversamente proporcional a su delgadez. El Alienware x16 desafía esto al ser uno de los más delgados en su categoría de tamaño y, al mismo tiempo, superar a competidores importantes como el Razer Blade 16, Asus ROG Strix G16o el HP Omen 17 en términos de rendimiento gráfico. Es impresionante que el modelo sea capaz de exprimir una GPU RTX GeForce de 175 W dado el perfil ultrafino.

Si buscas maximizar el rendimiento de la GPU minimizando la delgadez, el Alienware x16 debería estar entre los primeros de tu lista.

No obstante, hay varios inconvenientes, algunos de los cuales son exclusivos del Alienware x16. En primer lugar, sólo porque sea súper delgado no significa que sea súper pequeño o ligero ya que el sistema es muy grande en términos de longitud y anchura para compensar la altura Z más delgada. En segundo lugar, la falta de puertos a lo largo de los lados puede hacer que conectar monitores o accesorios sea un poco complicado cada vez. Y por último, el Core i9-13900HK ofrece sólo mejoras marginales sobre la última generaciónCore i9-12900H ya que no es ni de lejos tan potente como elCore i9-13900HX que está disponible en el Alienware m16 más grueso y no en el Alienware x16. Es probable que haya sido necesario hacer concesiones en el tamaño, la ubicación de los puertos y el rendimiento de la CPU para maximizar la potencia de la GPU.

Precio y disponibilidad

Dell ya está distribuyendo el Alienware x16 a los consumidores a partir de $2200 para la configuración base hasta $3350 USD para nuestra configuración analizada.

Alienware x16 R1 - 06/22/2023 v7
Allen Ngo

Acabado
85 / 98 → 87%
Teclado
90%
Ratón
74%
Conectividad
63 / 80 → 78%
Peso
59 / 10-66 → 87%
Battería
47 / 95 → 49%
Pantalla
87%
Rendimiento de juegos
100%
Rendimiento de la Aplicación
98%
Temperatura
84 / 95 → 88%
Ruido
81 / 90 → 90%
Audio
90%
Cámara
43 / 85 → 50%
Médio
77%
88%
Gaming - media ponderada

Transparency

The present review sample was made available to the author as a loan by the manufacturer or a shop for the purposes of review. The lender had no influence on this review, nor did the manufacturer receive a copy of this review before publication. There was no obligation to publish this review.

Pricecompare

Please share our article, every link counts!
> Análisis y pruebas de ordenadores portátiles y móviles teléfonos > Análisis > Estreno del rendimiento del Intel Core i9-13900HK: Análisis del portátil Alienware x16 R1
Allen Ngo, 2023-06-24 (Update: 2023-06-24)