El Intel Core i7-12800HX es una locura: Análisis del portátil MSI Raider GE67 HX 12UGS
El MSI GE67 es una serie de juegos de gama alta que se sitúa por encima de las series Katana GF o Vector GP, menos caras, pero por debajo de la serie Titan GT para entusiastas. Nuestra unidad de prueba GE67 es un sucesor directo del GE66 de 2020. En lugar de venir con CPUs Intel Comet Lake-H de 10ª generación y GPUs Nvidia GeForce Super, el GE67 viene con CPUs Alder Lake-H de 12ª generación y GPUs móviles GeForce Ti
Recomendamos consultar nuestro existentes dos análisis sobre el GE66, ya que el GE67 utiliza casi el mismo diseño de chasis y características. No obstante, hay algunas diferencias visuales relativamente menores que detallaremos en nuestro análisis a continuación
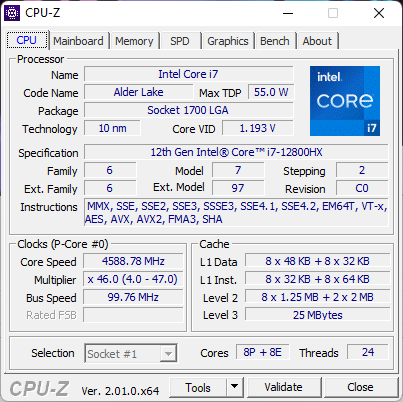
Nuestra unidad de prueba viene equipada con la CPU Core i7-12800HX de 16 núcleos, la GPU GeForce RTX 3070 Ti y un panel OLED QHD de 240 Hz que promete una cobertura completa de DCI-P3 por unos 2.500 dólares al por menor. Los competidores directos en este espacio incluyen otros portátiles para juegos de 15,6 pulgadas de gama alta como el Asus ROG Strix Scar 15, Razer Blade 15o elAlienware m15 R6.
Más opiniones de MSI:
Posibles contendientes en la comparación
Valoración | Fecha | Modelo | Peso | Altura | Tamaño | Resolución | Precio |
|---|---|---|---|---|---|---|---|
| 87.7 % v7 (old) | 07/2022 | MSI GE67 HX 12UGS i7-12800HX, GeForce RTX 3070 Ti Laptop GPU | 2.5 kg | 23.4 mm | 15.60" | 1920x1080 | |
| 87.4 % v7 (old) | 06/2022 | MSI Raider GE66 12UHS i9-12900HK, GeForce RTX 3080 Ti Laptop GPU | 2.4 kg | 23.4 mm | 15.60" | 3840x2160 | |
| 86.9 % v7 (old) | 03/2022 | MSI Vector GP66 12UGS i9-12900H, GeForce RTX 3070 Ti Laptop GPU | 2.3 kg | 23.4 mm | 15.60" | 1920x1080 | |
| 86.3 % v7 (old) | 06/2022 | Asus ROG Strix Scar 15 G533ZW-LN106WS i9-12900H, GeForce RTX 3070 Ti Laptop GPU | 2.3 kg | 27.2 mm | 15.60" | 2560x1440 | |
| 86.1 % v7 (old) | 11/2021 | Alienware m15 R6, i7-11800H RTX 3080 i7-11800H, GeForce RTX 3080 Laptop GPU | 2.5 kg | 22.85 mm | 15.60" | 1920x1080 | |
| 89.1 % v7 (old) | 03/2022 | Razer Blade 15 2022 i7-12800H, GeForce RTX 3080 Ti Laptop GPU | 2.1 kg | 16.99 mm | 15.60" | 2560x1440 |
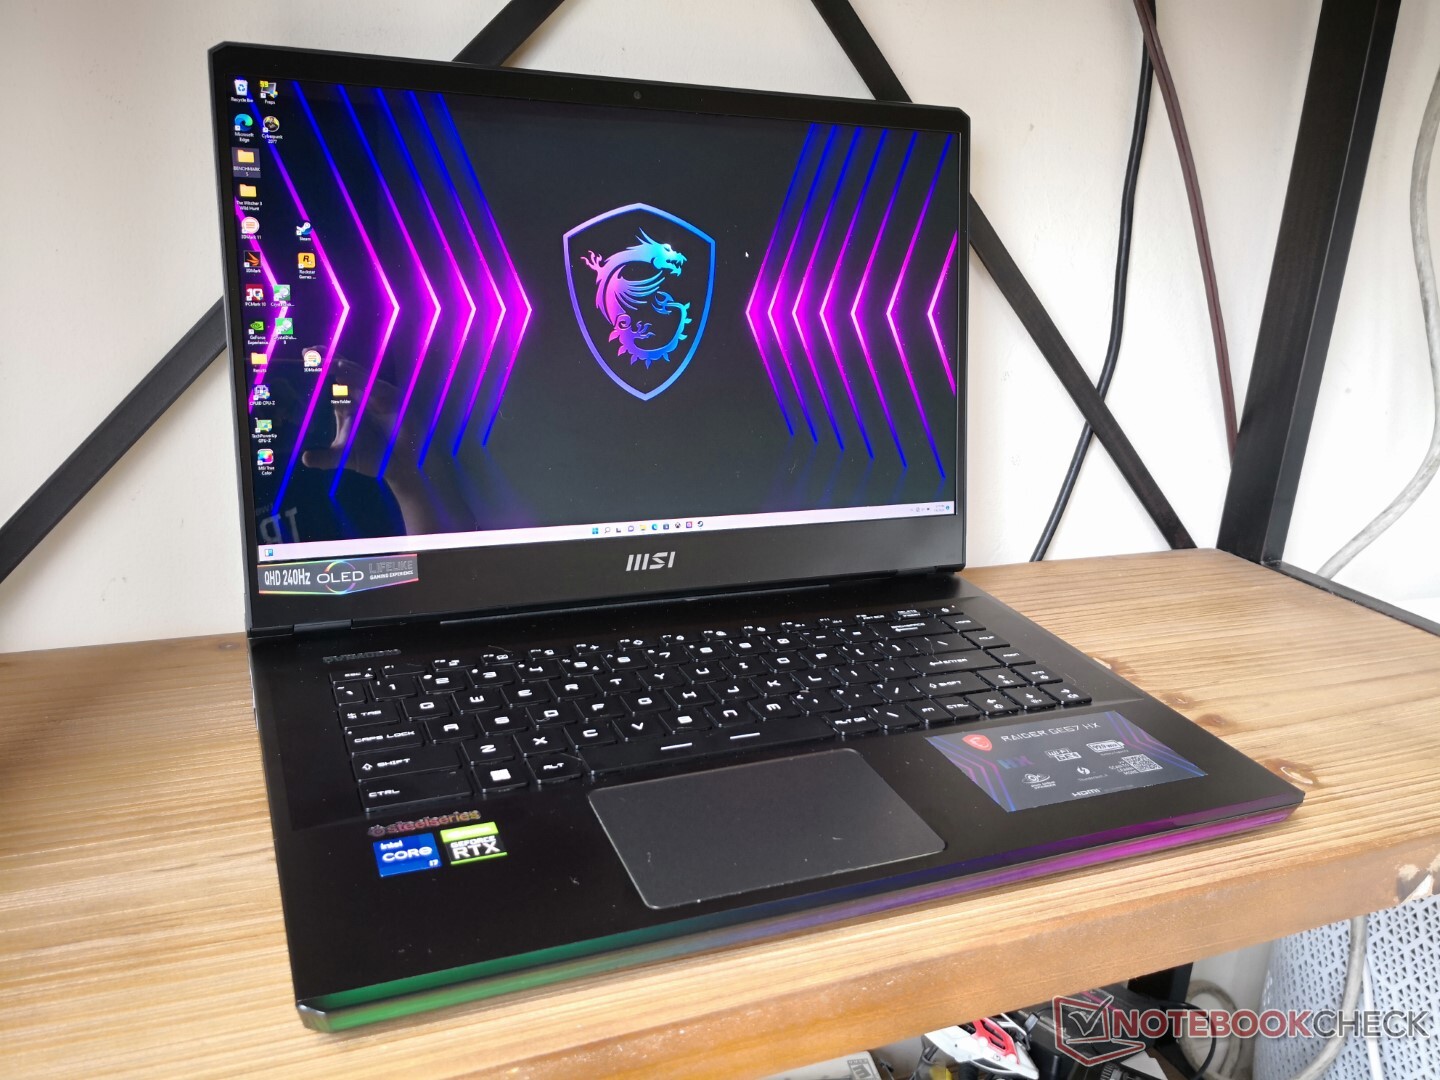
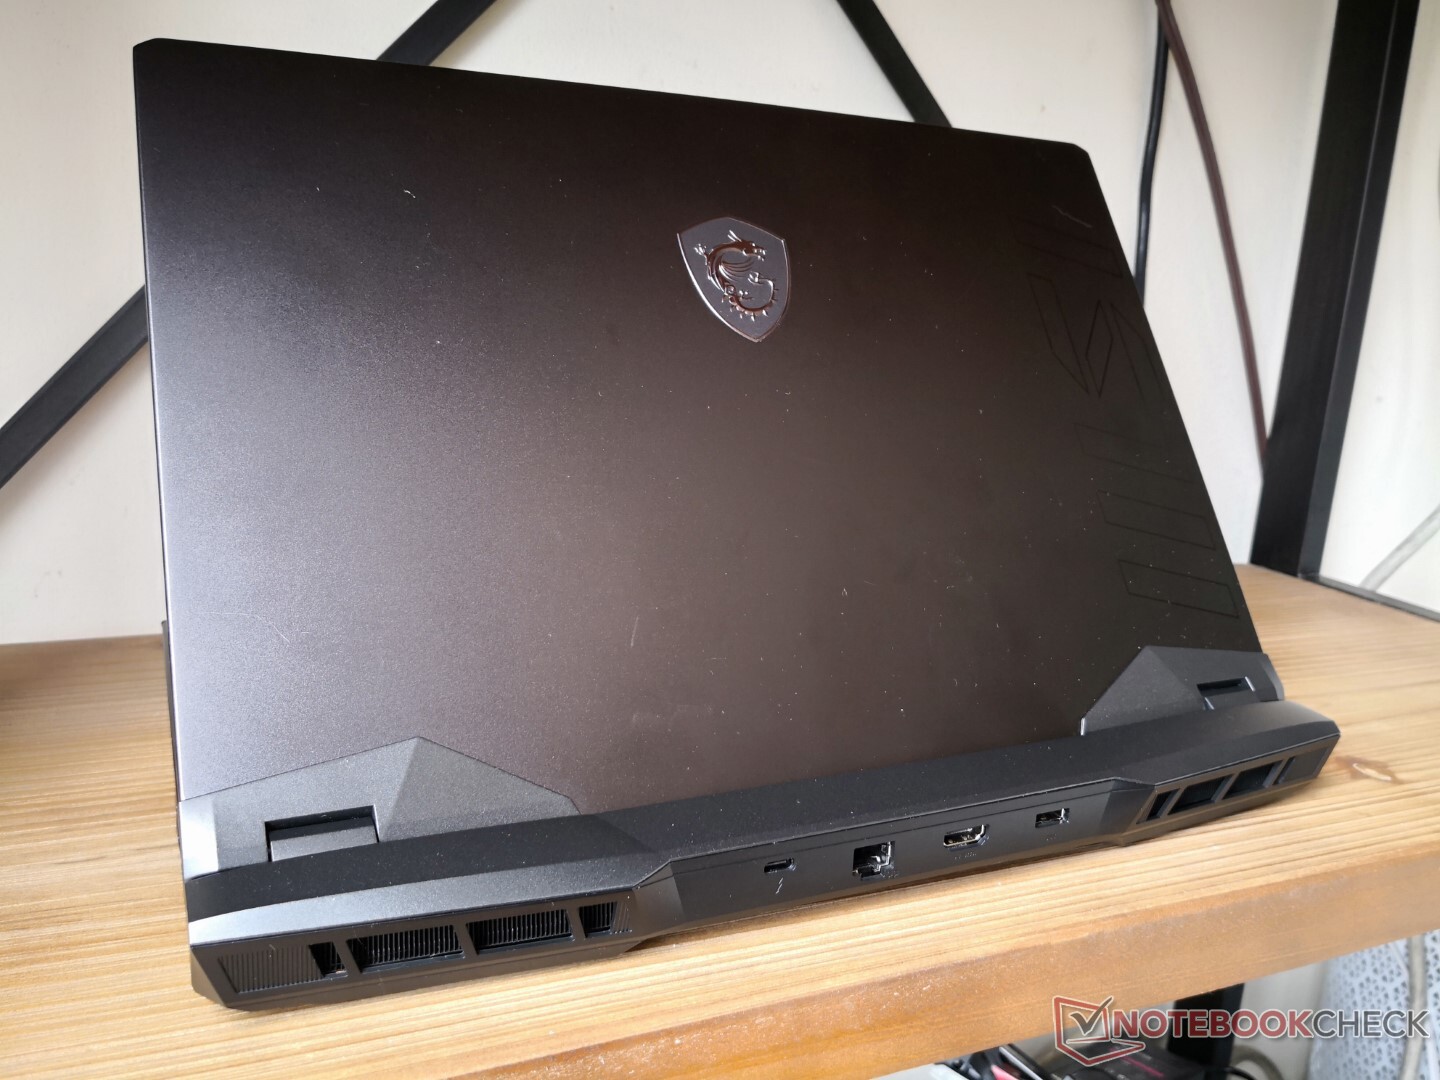
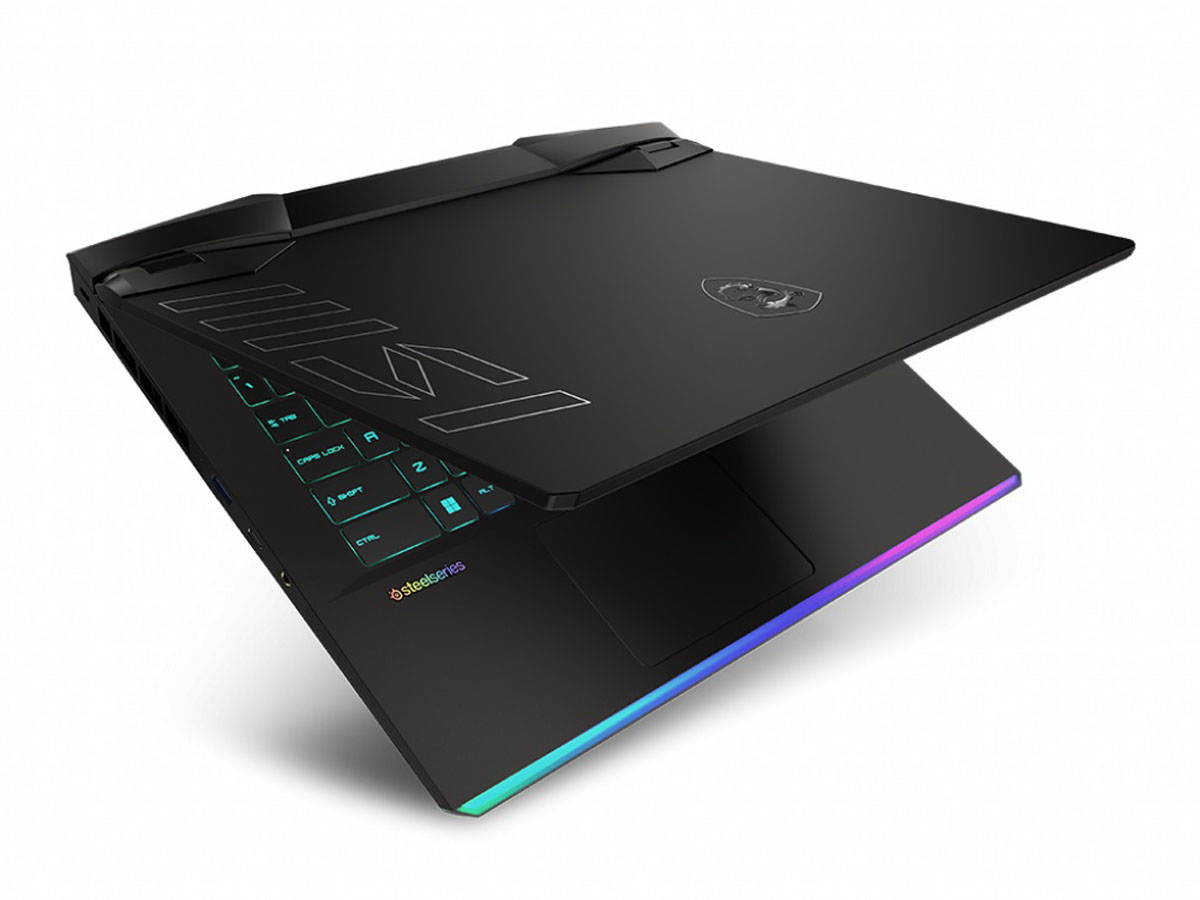
Caso - Igual por arriba, diferente por abajo
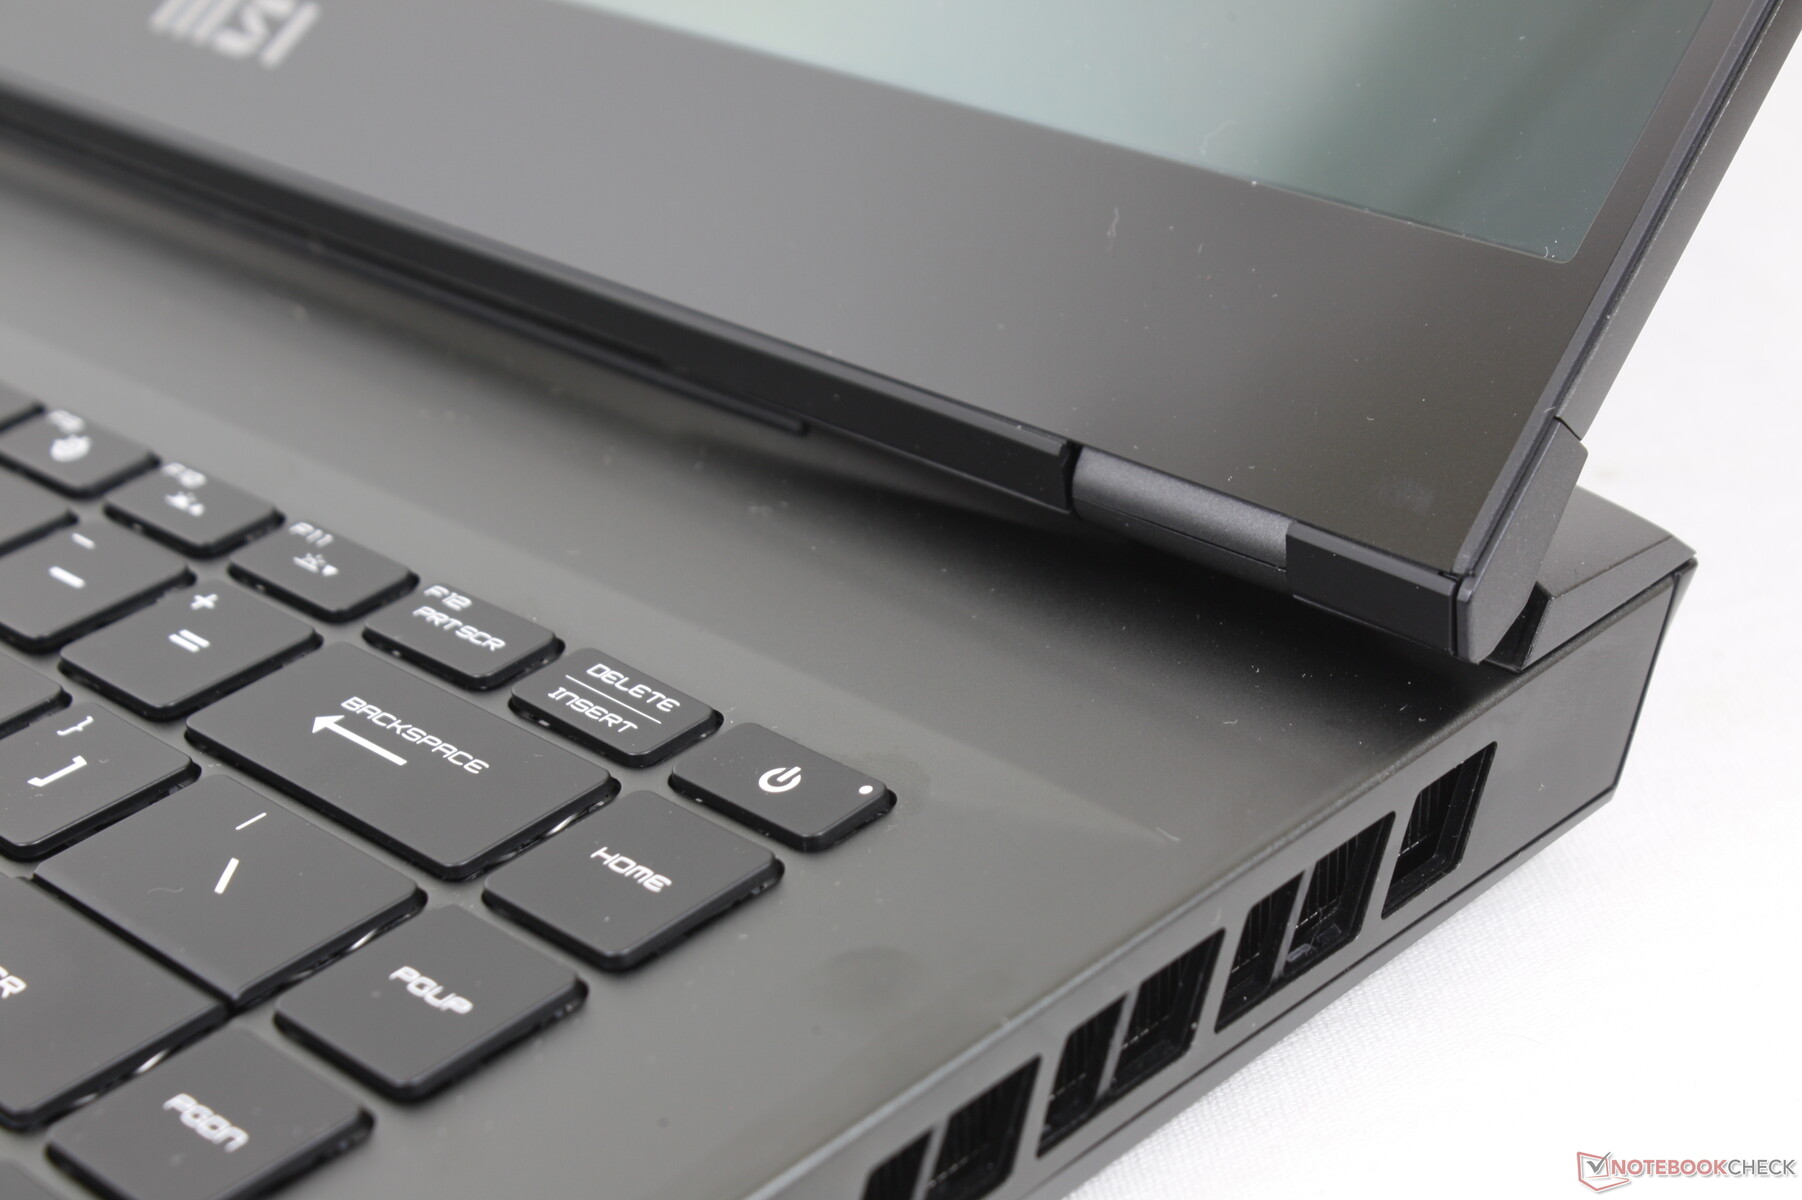
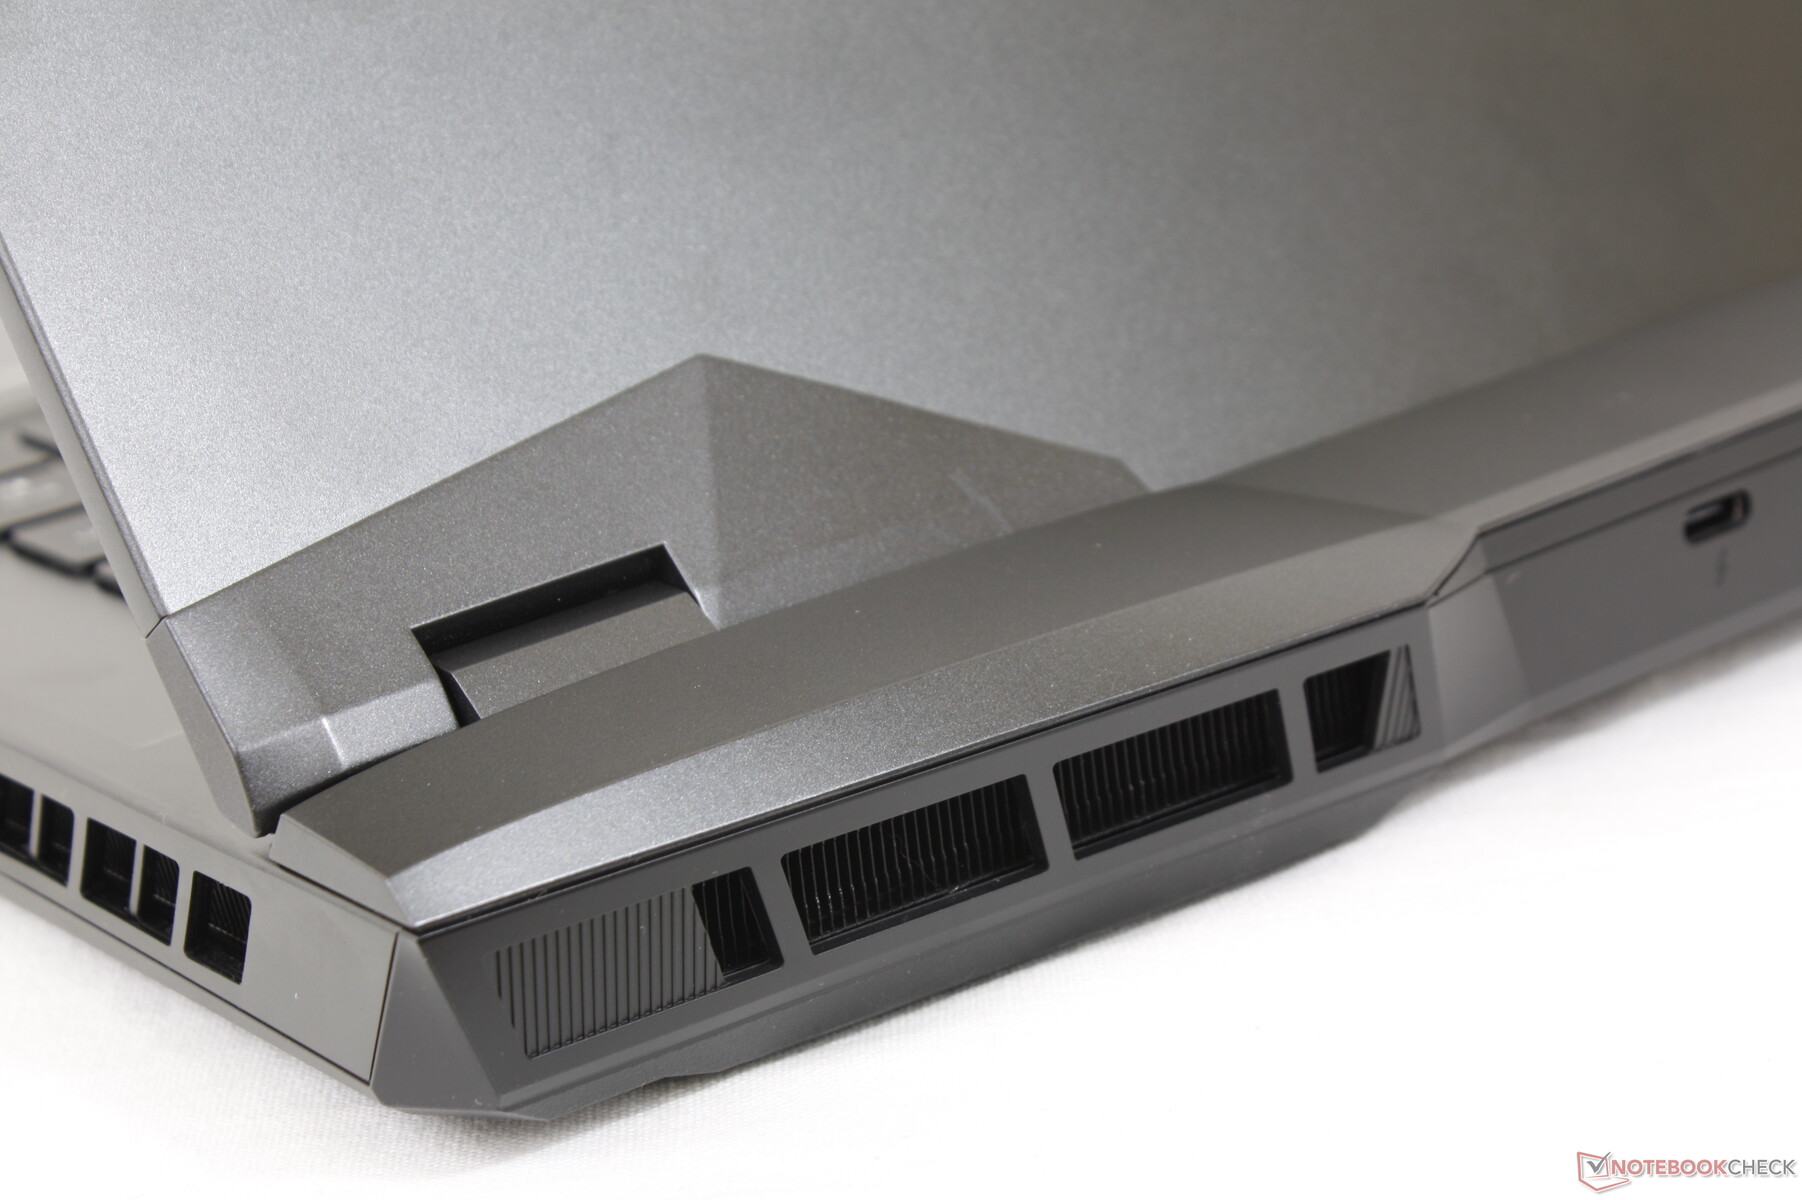
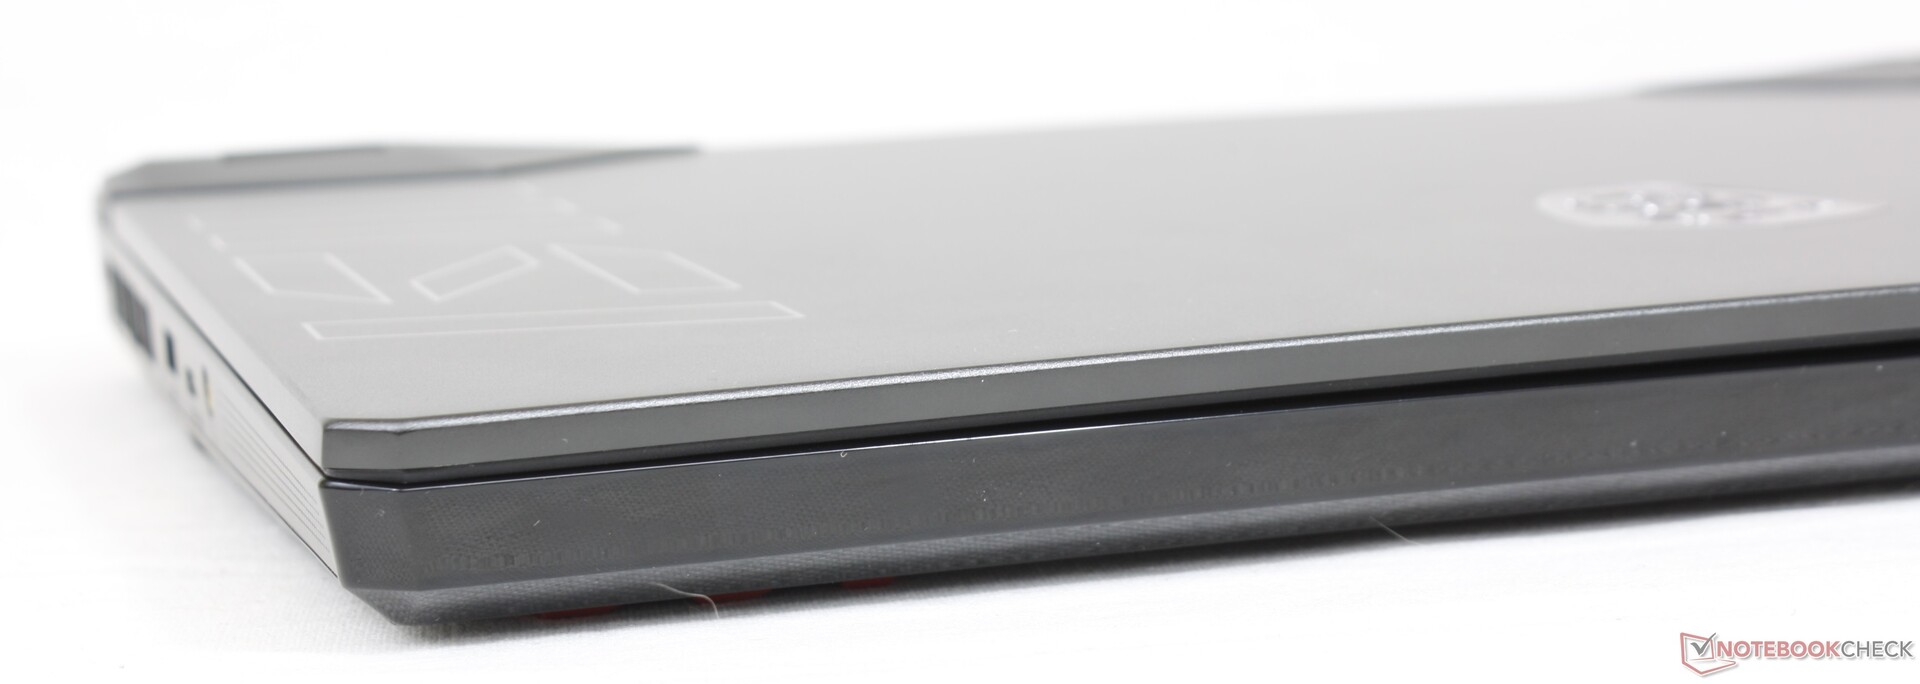
Aunque las dimensiones del chasis son exactamente las mismas que en el GE66, hay una serie de diferencias visuales. En primer lugar, el GE67 incluye un gran logotipo de MSI a lo largo del borde izquierdo de la tapa exterior que ayuda a distinguir más fácilmente entre el GE66 y el GE67. En segundo lugar, MSI ha rediseñado completamente la parte inferior del GE67, probablemente para mejorar el potencial de refrigeración general del modelo. Por lo demás, tanto el GE66 como el GE67 utilizan materiales metálicos similares para la tapa y la cubierta del teclado y plástico para la placa inferior. La característica barra de LEDs a lo largo del borde frontal permanece intacta.
El nuevo modelo es ligeramente más pesado que su predecesor en unos 100 g, probablemente debido a los pequeños cambios.
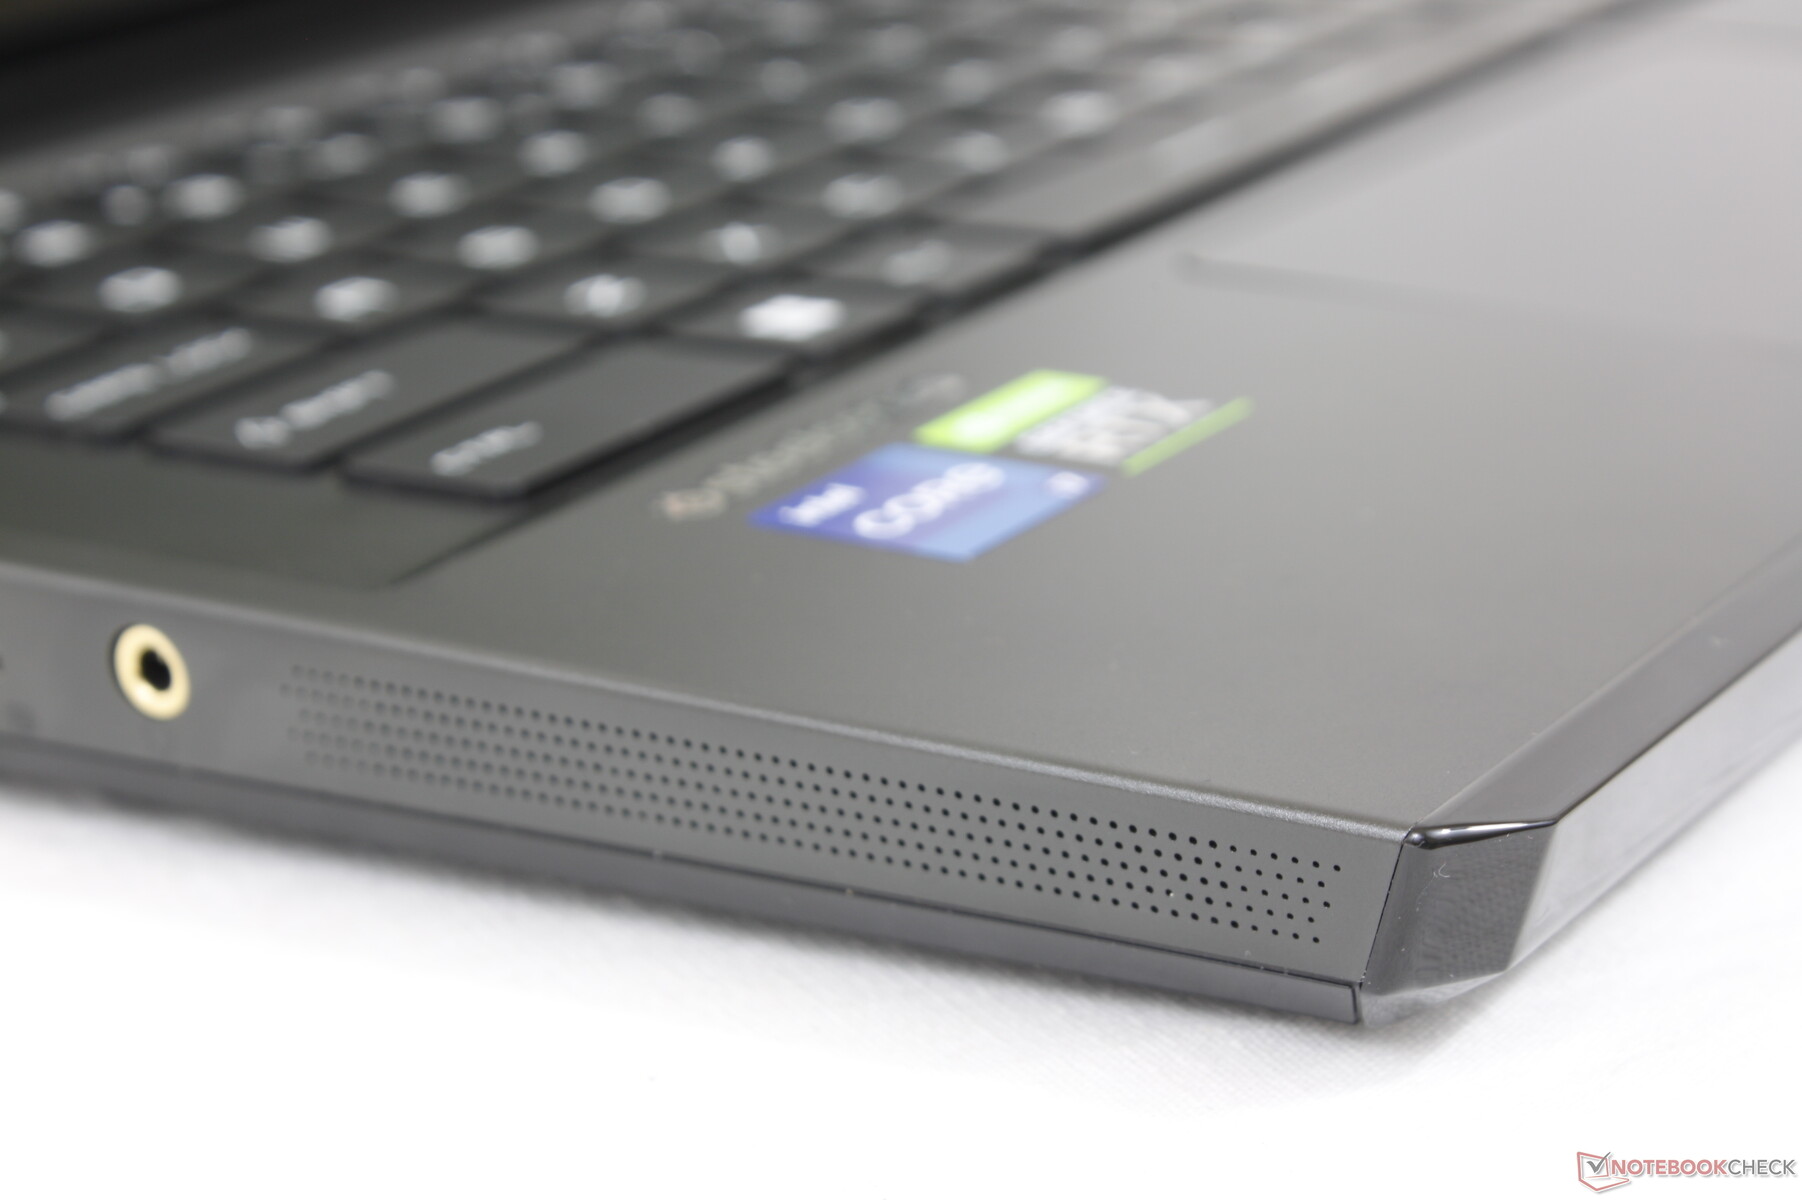
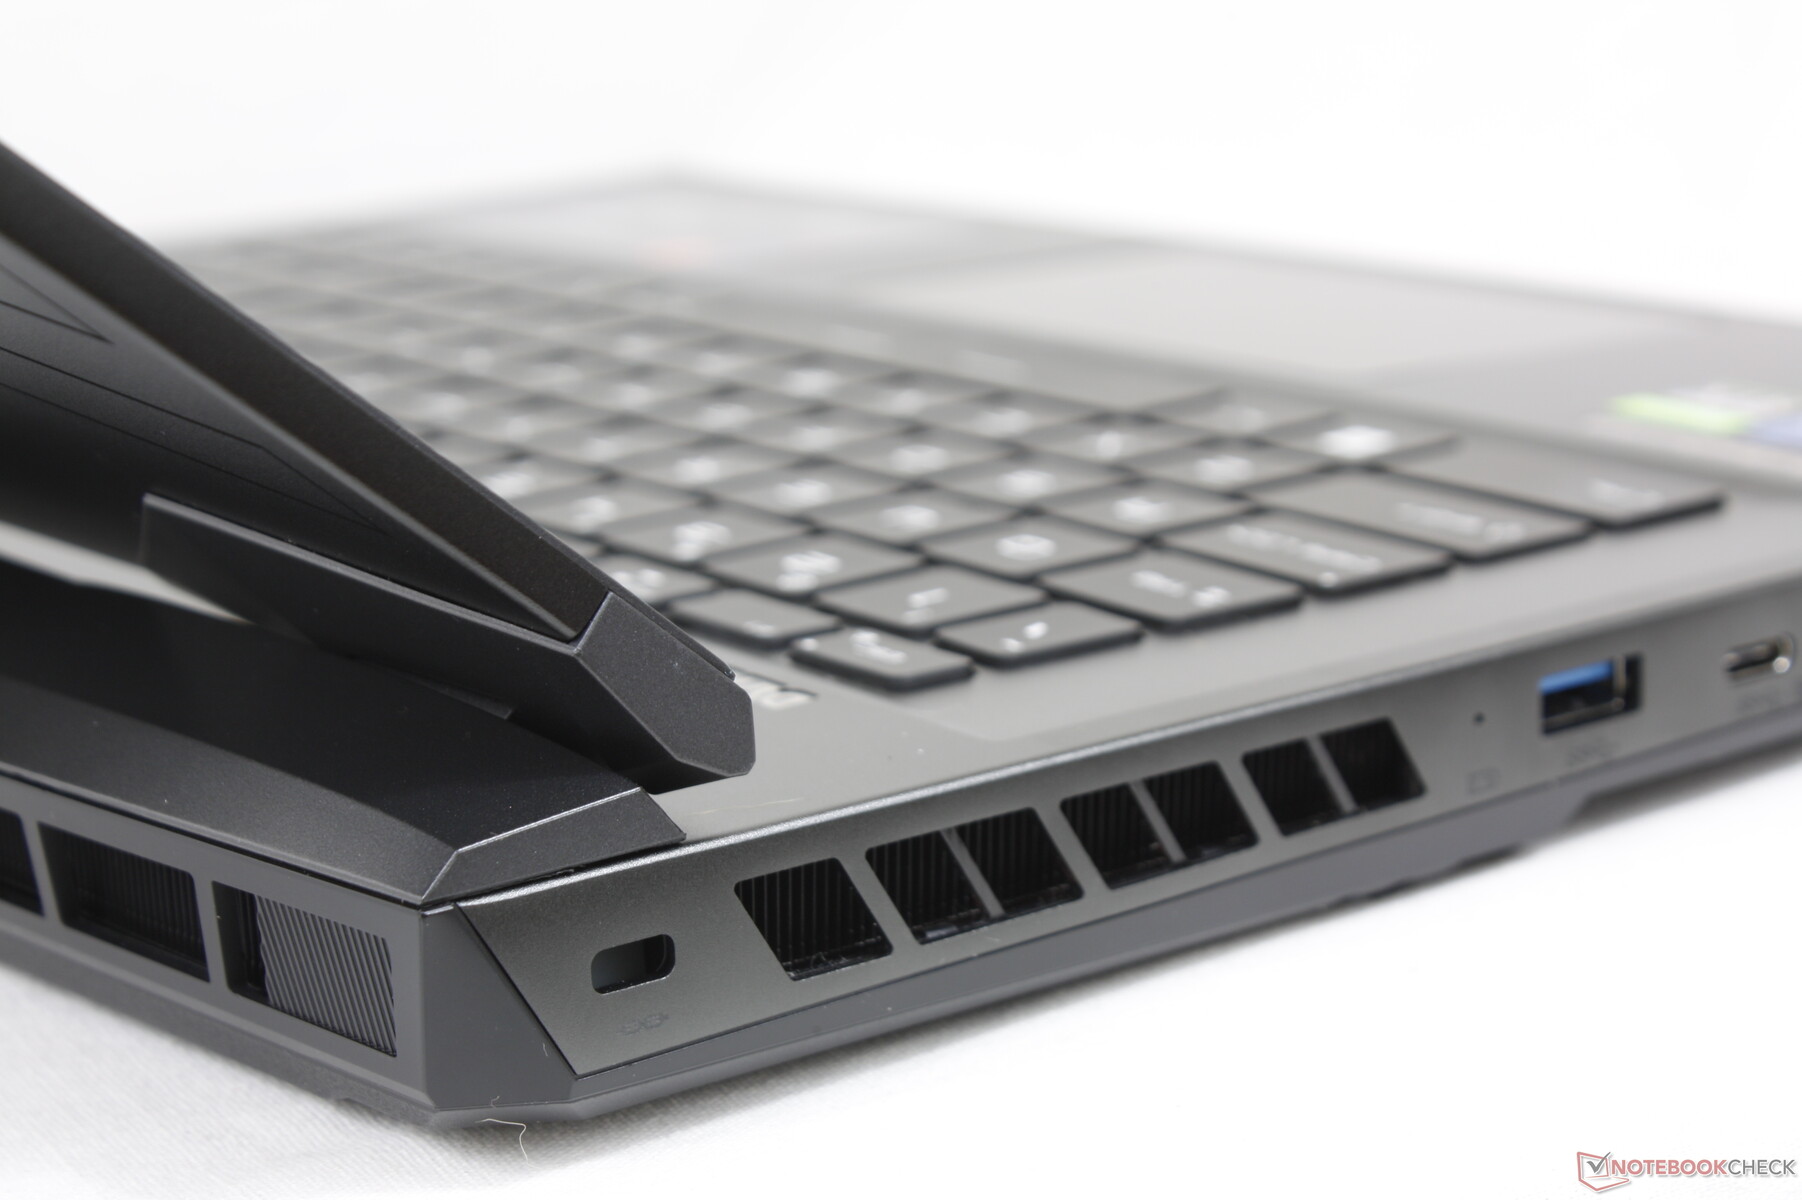
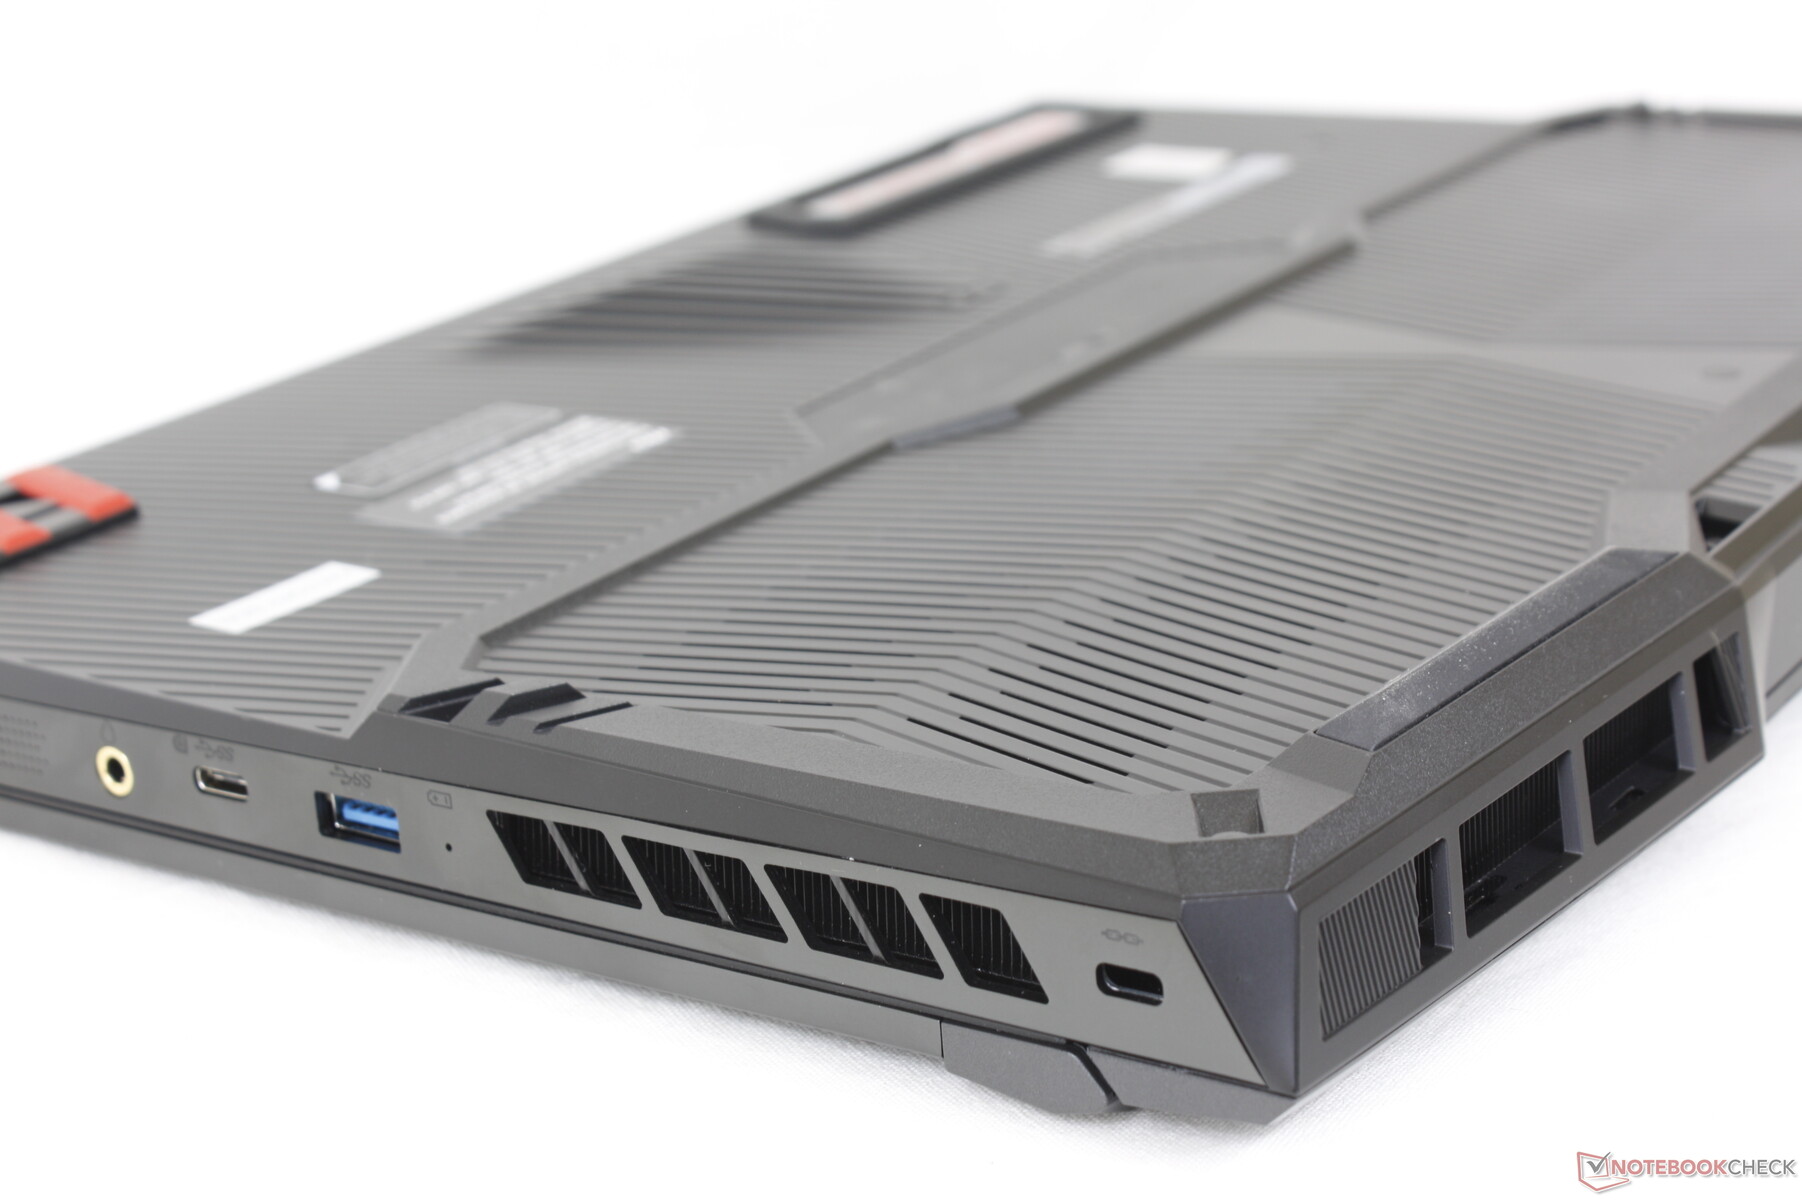
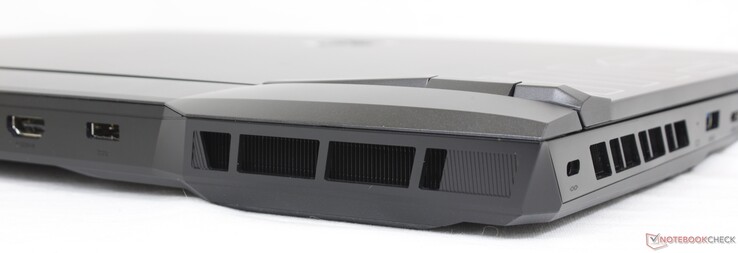
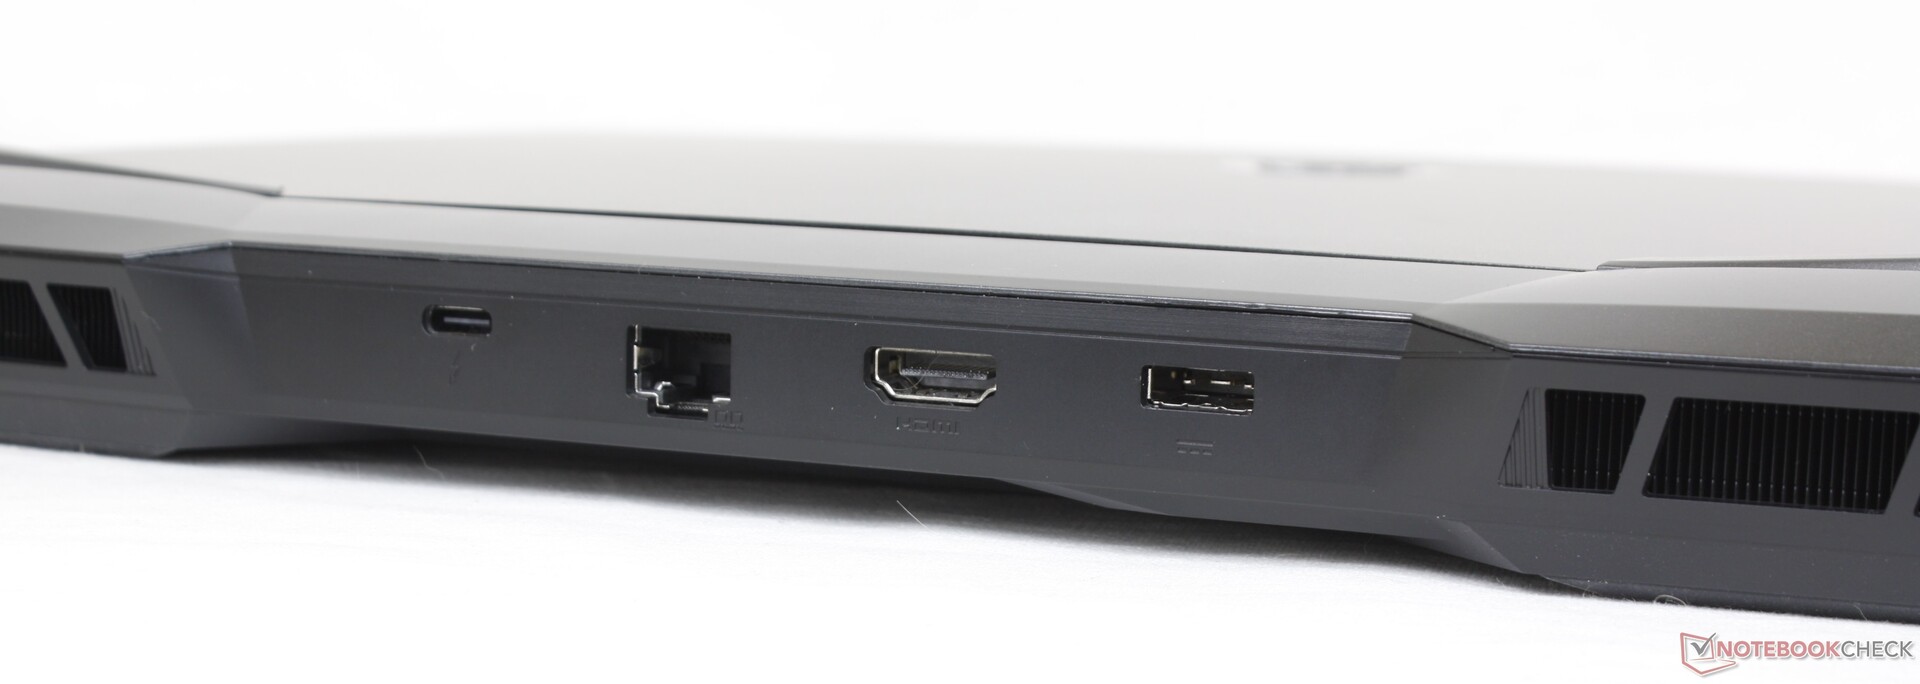
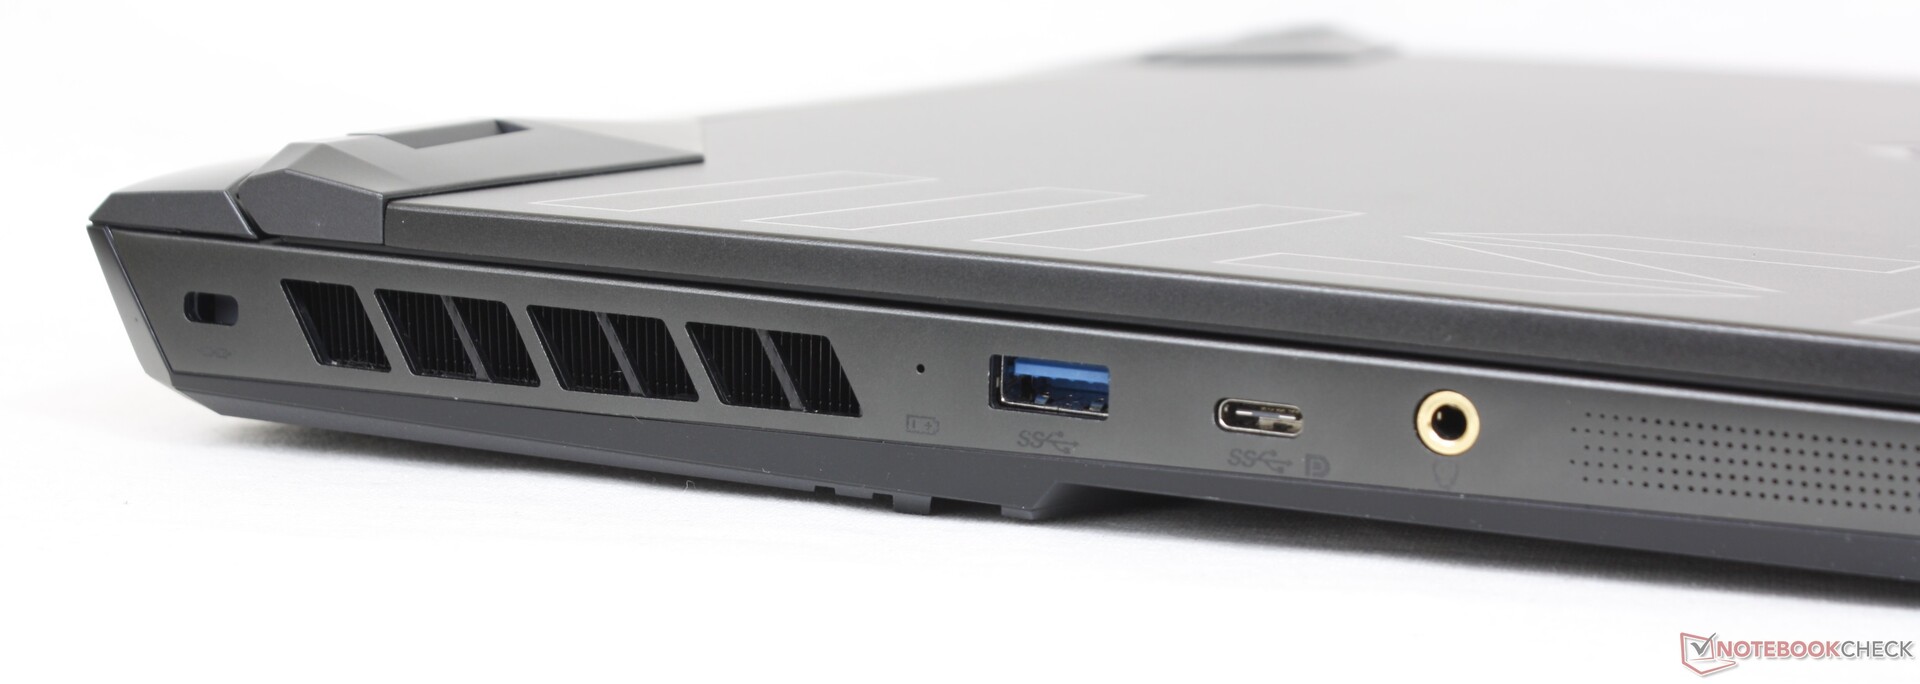
Conectividad - Ya no hay mini-puertos
El GE67 ha eliminado el mini-DisplayPort dedicado que estaba presente en el GE66. DisplayPort sigue siendo compatible con los dos puertos USB-C.
Como con otros portátiles de juego basados en la plataforma Alder-Lake-H como el Asus TUF Gaming F15 FX507ZM, la conectividad Thunderbolt 4 se desactivará si se ejecuta en modo de gráficos discretos.
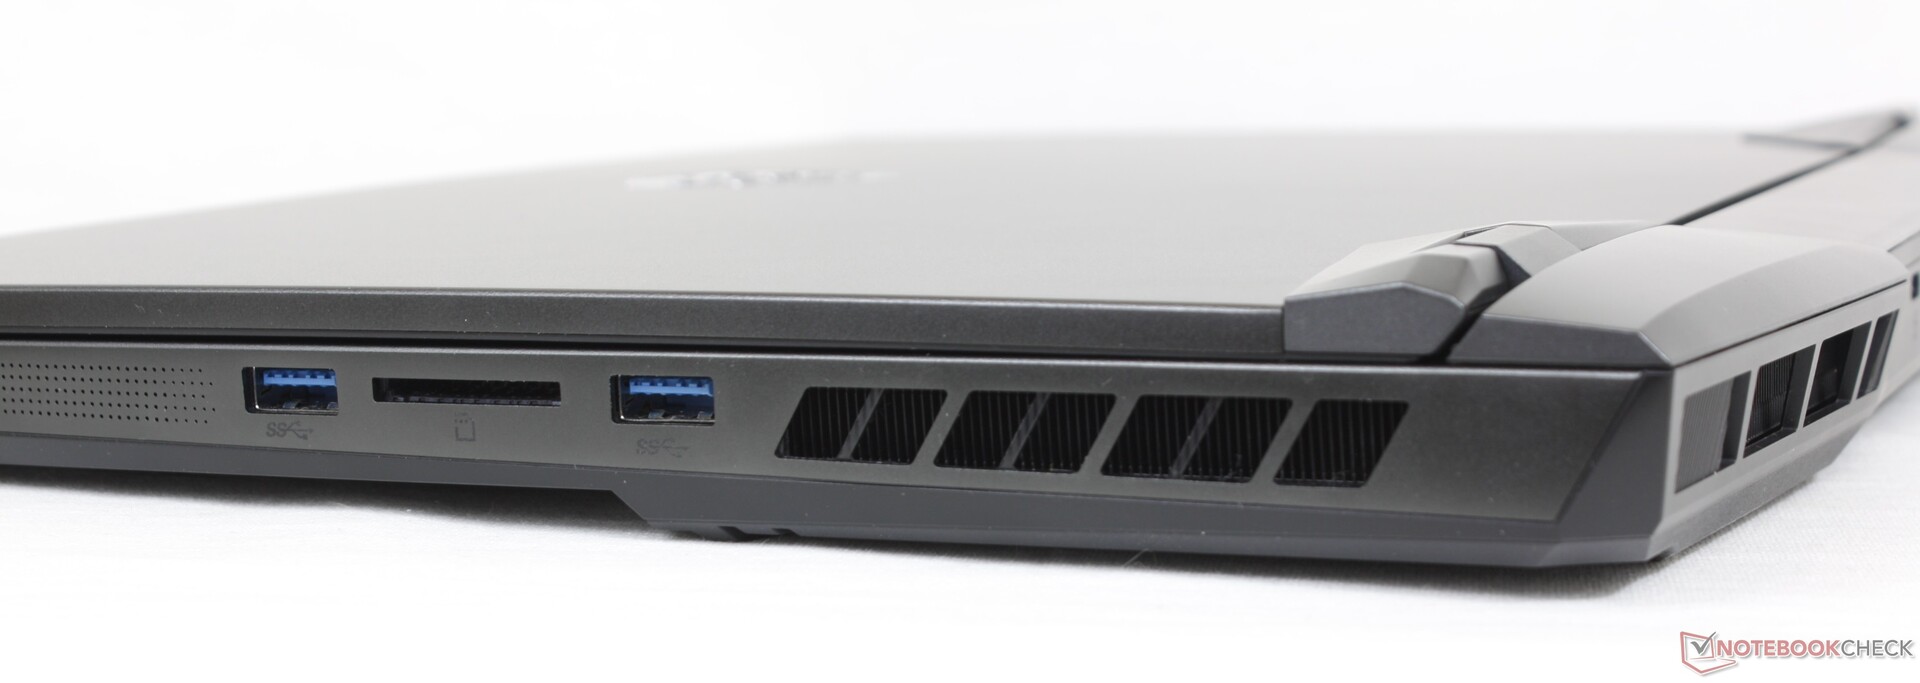
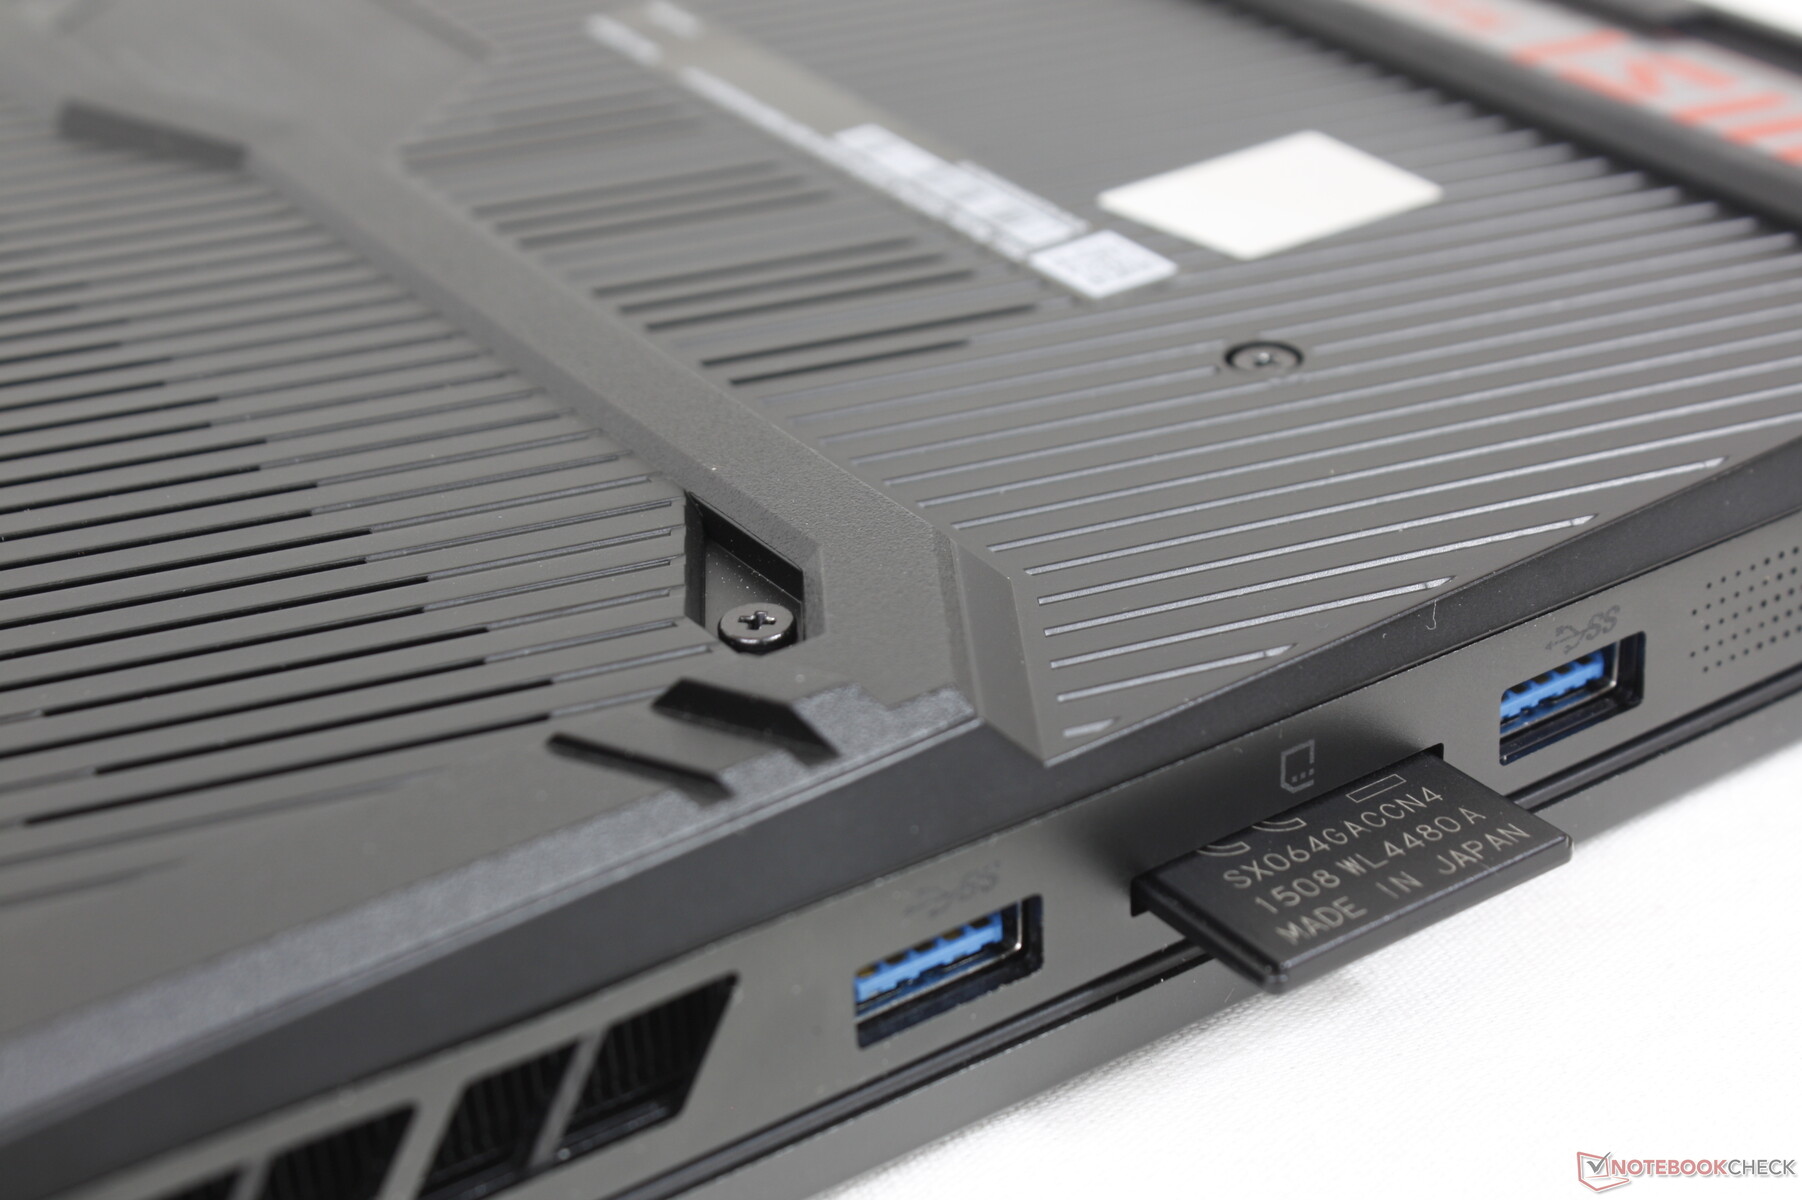
Lector de tarjetas SD
Las tasas de transferencia del lector de tarjetas SD integrado son lentas en relación con el precio de la configuración. Los usuarios verán un rendimiento de lector SD dos veces más rápido en modelos de la competencia como el Razer Blade 15 o el Asus ROG Zephyrus Duo 16.
| SD Card Reader | |
| average JPG Copy Test (av. of 3 runs) | |
| Razer Blade 15 2022 (Toshiba Exceria Pro SDXC 64 GB UHS-II) | |
| MSI GE67 HX 12UGS (Toshiba Exceria Pro SDXC 64 GB UHS-II) | |
| MSI Raider GE66 12UHS (AV PRO microSD 128 GB V60) | |
| maximum AS SSD Seq Read Test (1GB) | |
| Razer Blade 15 2022 (Toshiba Exceria Pro SDXC 64 GB UHS-II) | |
| MSI GE67 HX 12UGS (Toshiba Exceria Pro SDXC 64 GB UHS-II) | |
Comunicación
| Networking | |
| iperf3 transmit AX12 | |
| Razer Blade 15 2022 | |
| MSI Vector GP66 12UGS | |
| Alienware m15 R6, i7-11800H RTX 3080 | |
| iperf3 receive AX12 | |
| Razer Blade 15 2022 | |
| MSI Vector GP66 12UGS | |
| Alienware m15 R6, i7-11800H RTX 3080 | |
| iperf3 receive AXE11000 6GHz | |
| Asus ROG Strix Scar 15 G533ZW-LN106WS | |
| MSI GE67 HX 12UGS | |
| iperf3 transmit AXE11000 6GHz | |
| Asus ROG Strix Scar 15 G533ZW-LN106WS | |
| MSI GE67 HX 12UGS | |
Cámara web
No hay cambios en la webcam de 2 MP, lo que también significa que sigue sin haber obturador físico de privacidad o incluso soporte para Windows Hello. Los usuarios pueden desactivar la webcam electrónicamente a través de la tecla F4.
Hay que tener en cuenta que la luz de actividad de la webcam siempre parpadea cuando la webcam está activa. Esto es particularmente molesto durante las videollamadas y no podemos encontrar ninguna opción para apagar la luz parpadeante.


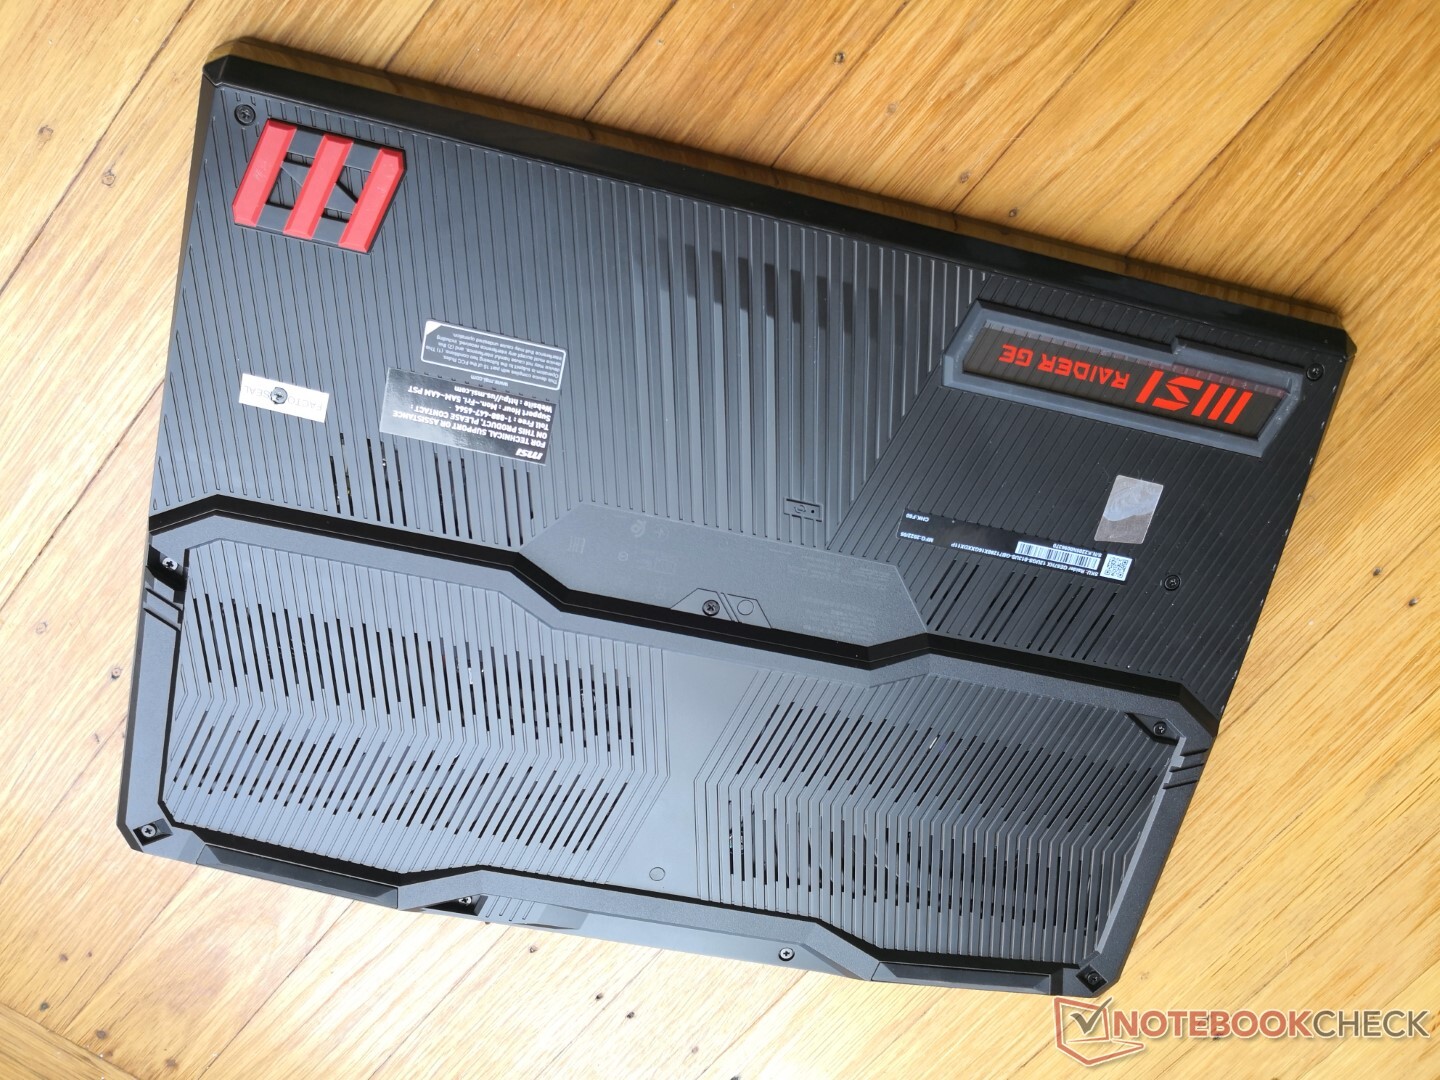
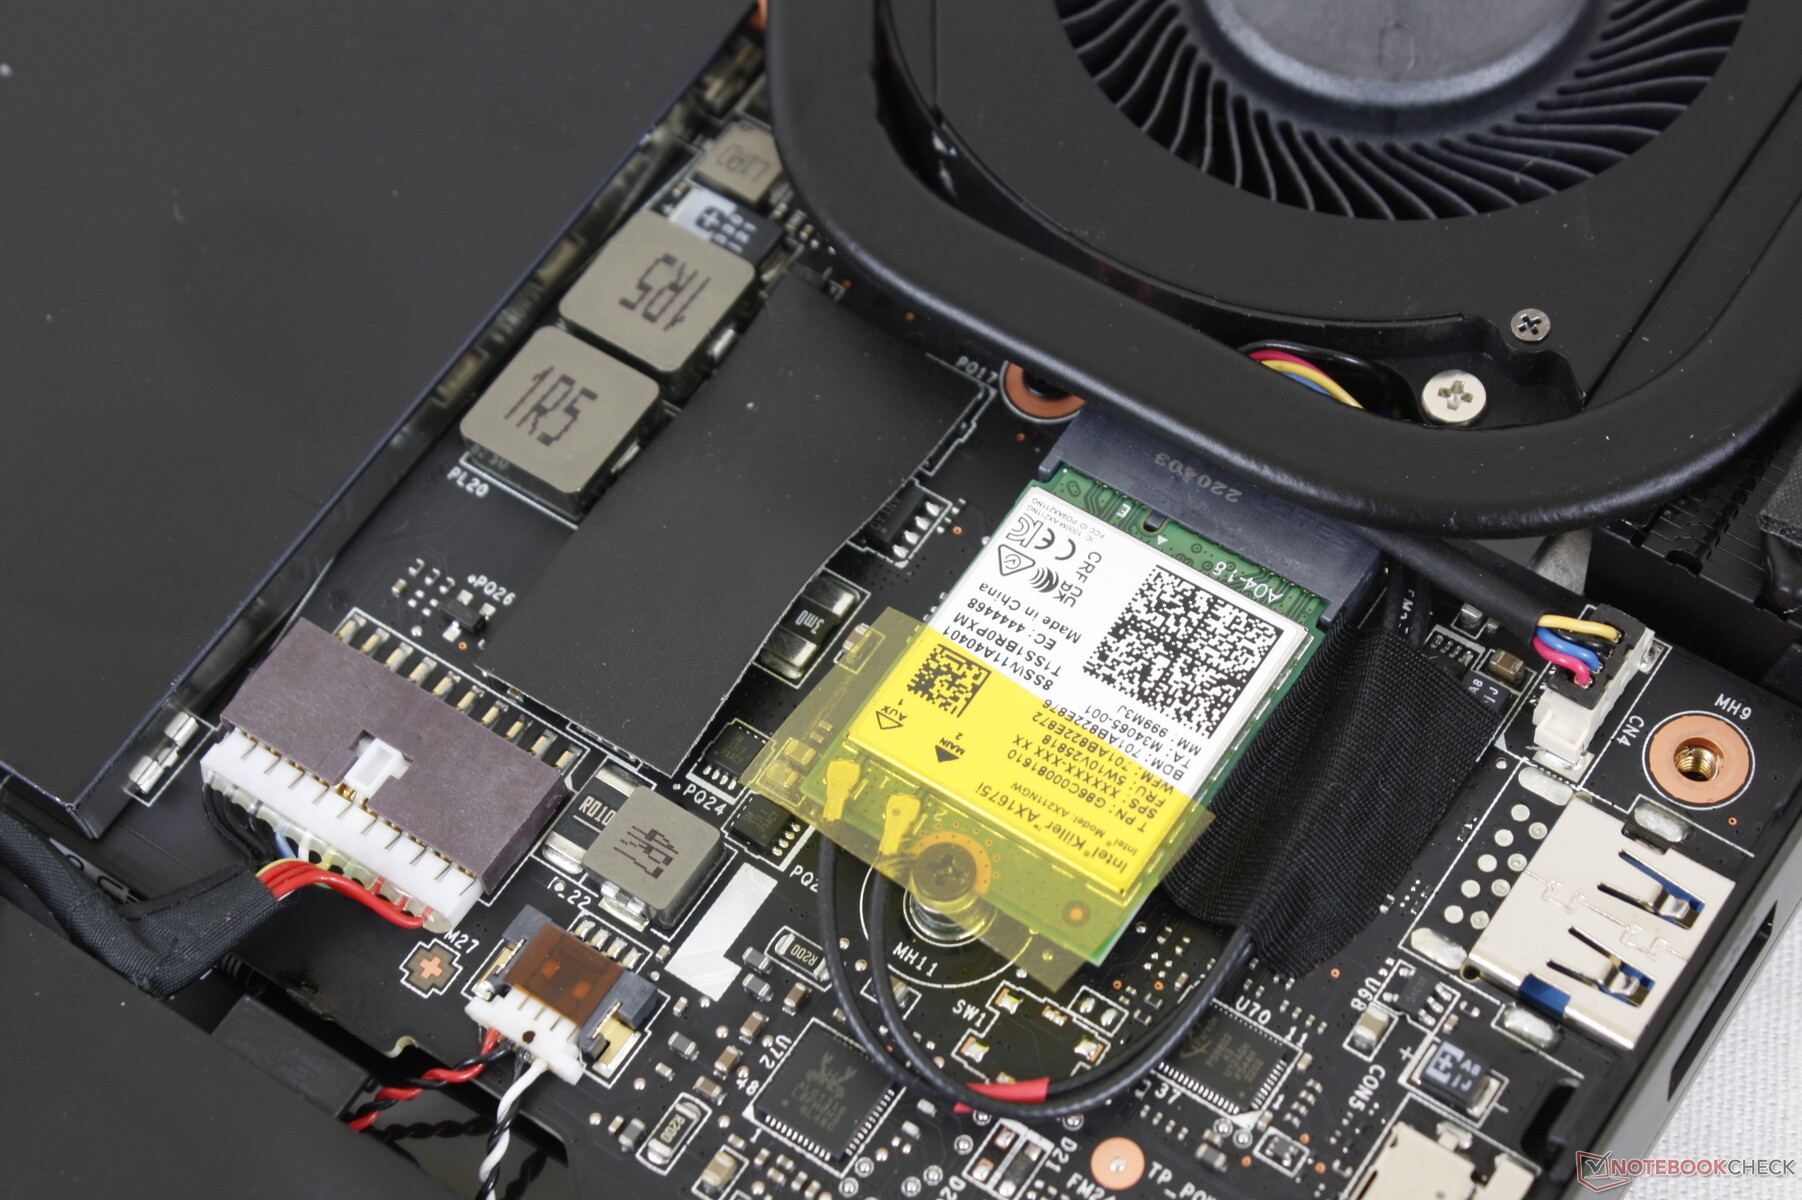
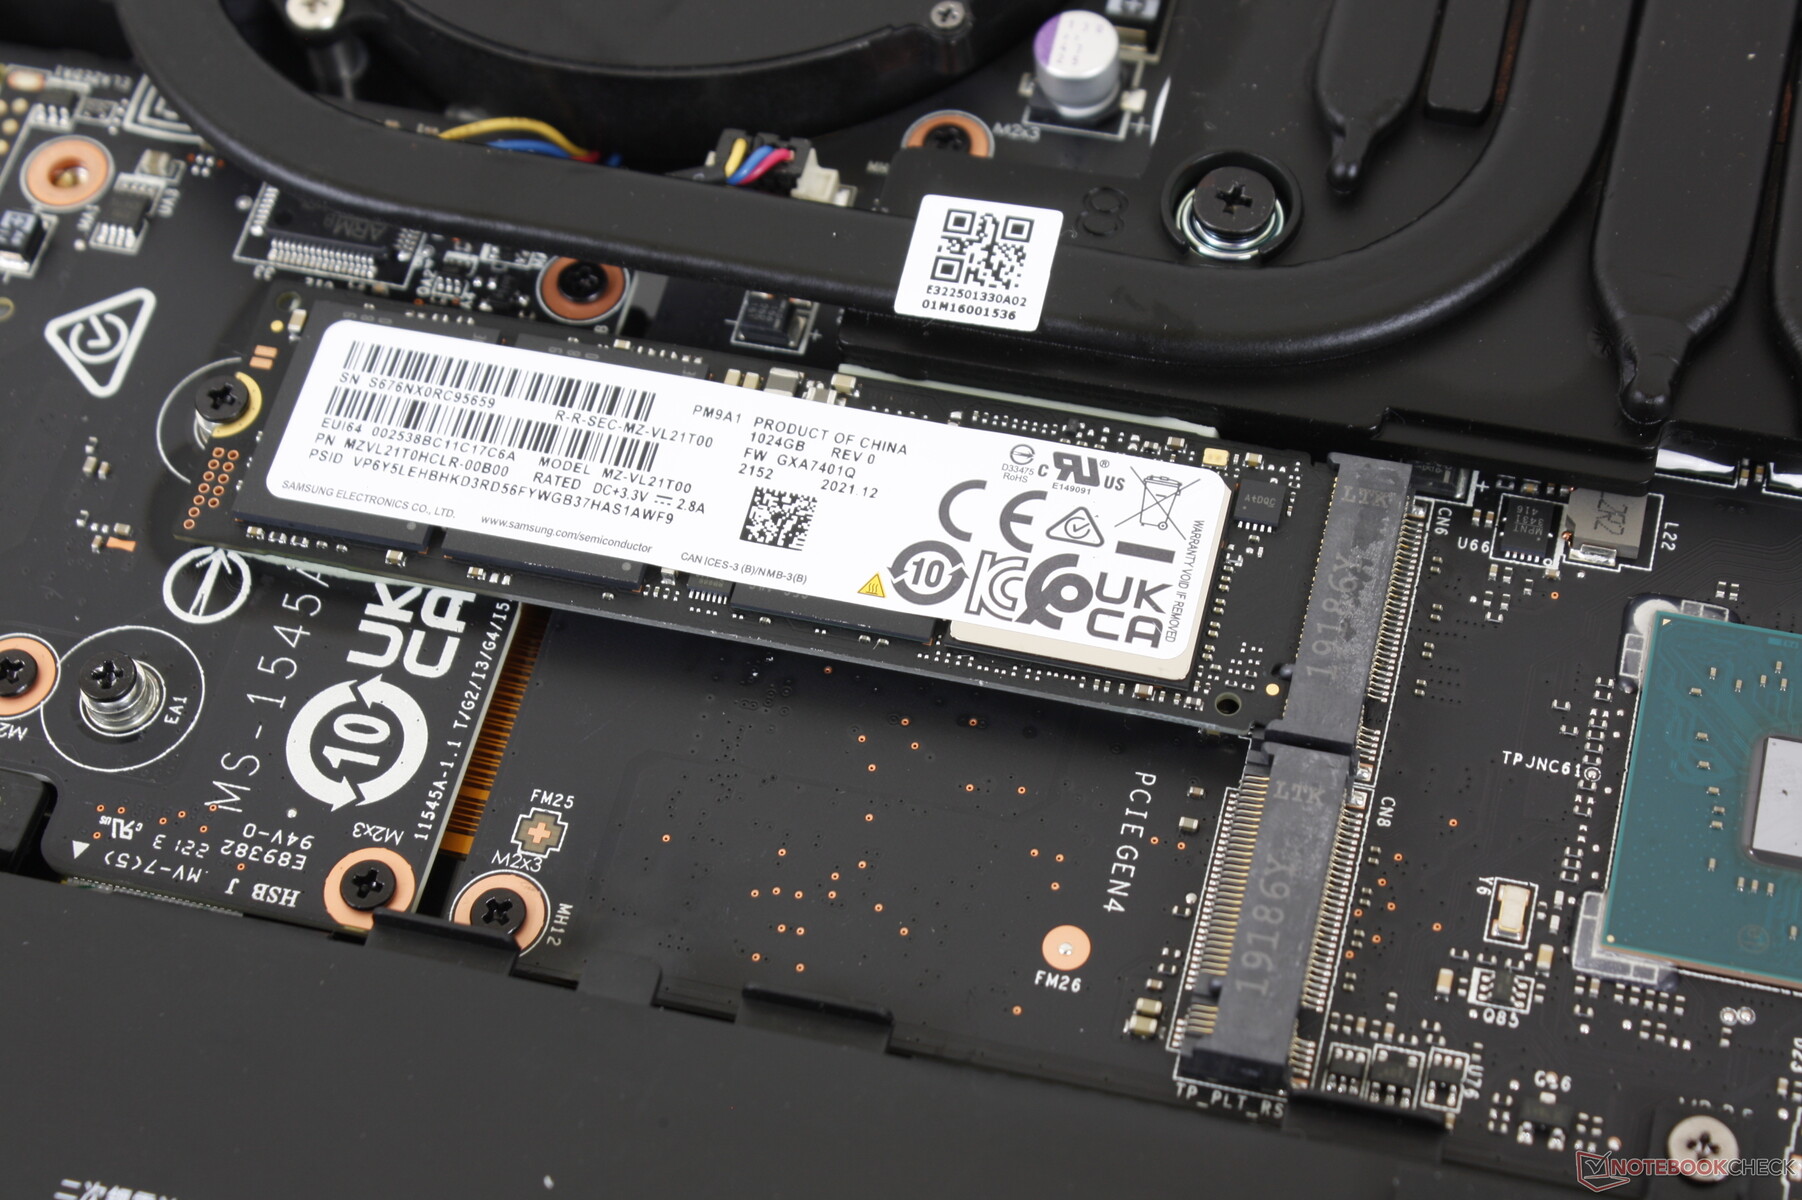
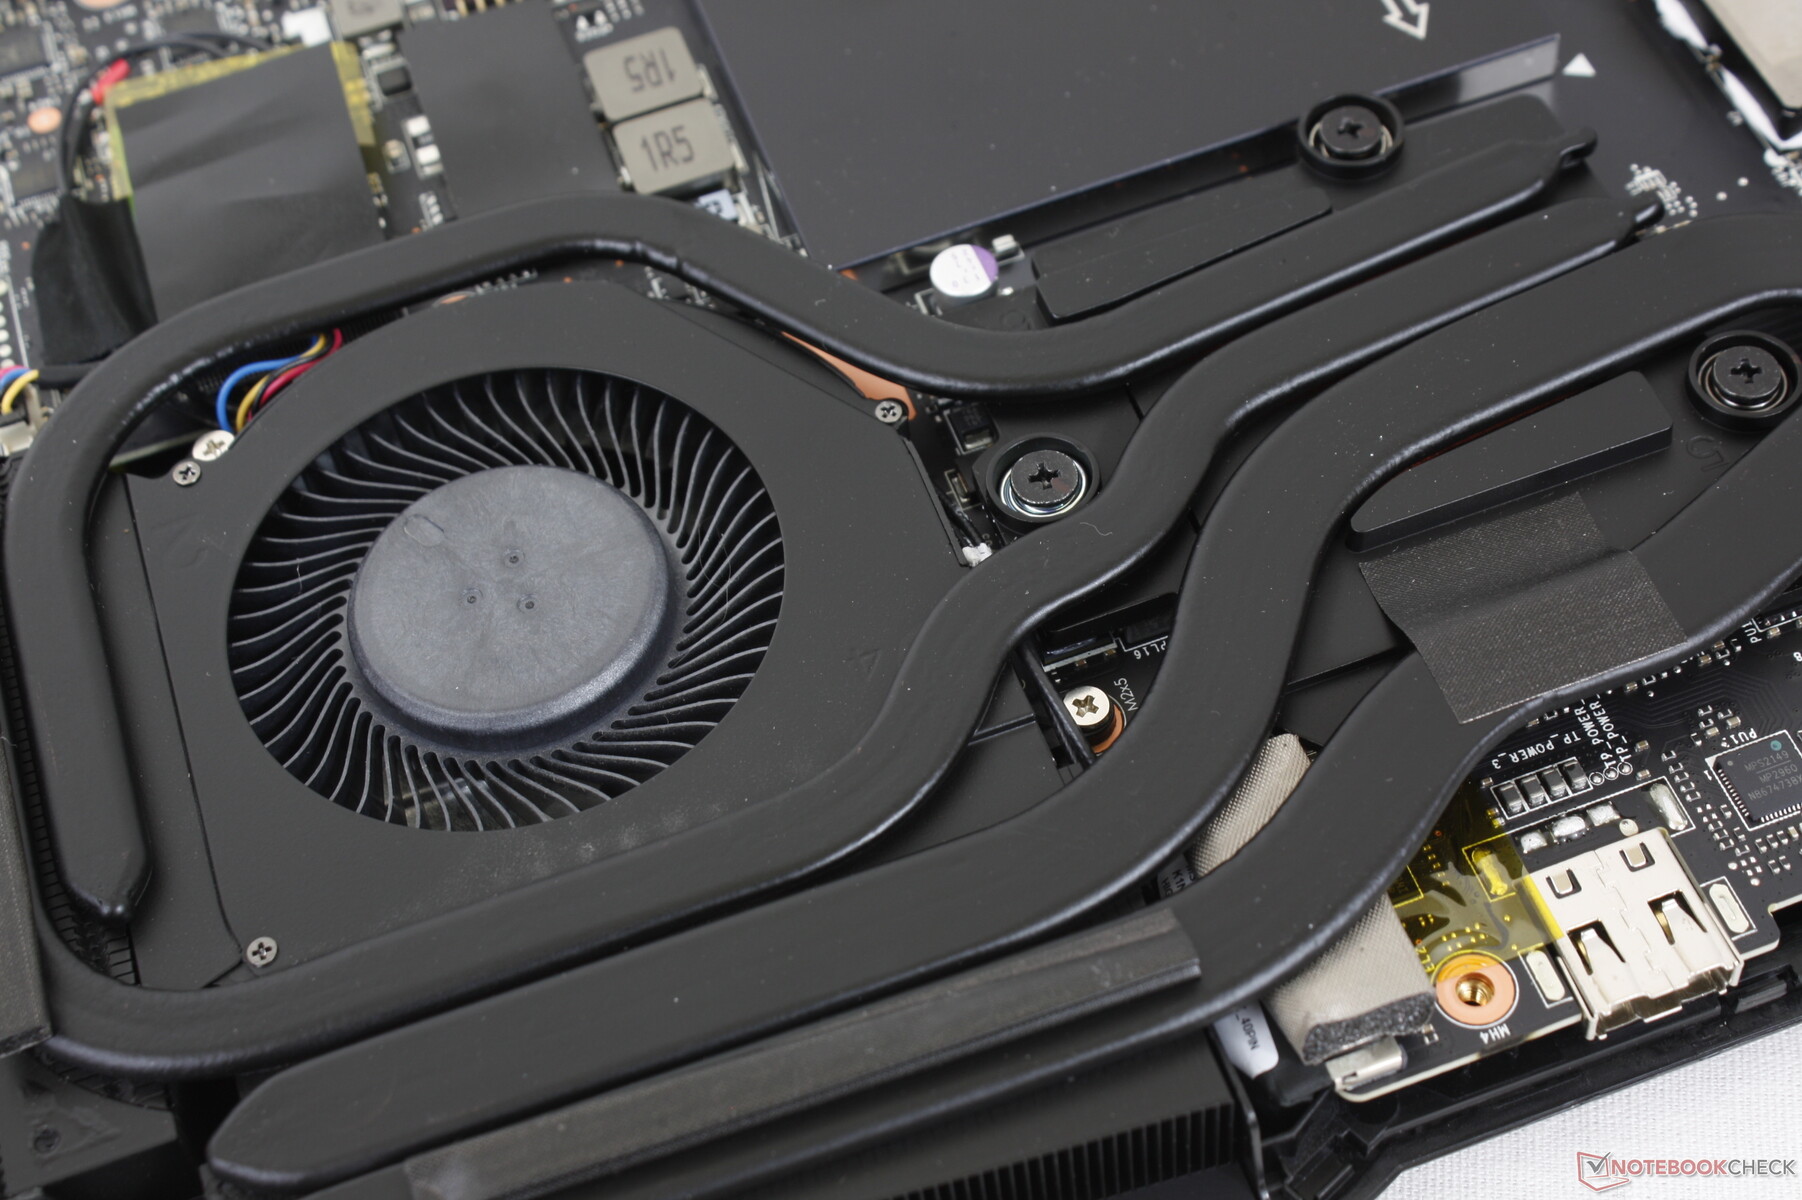
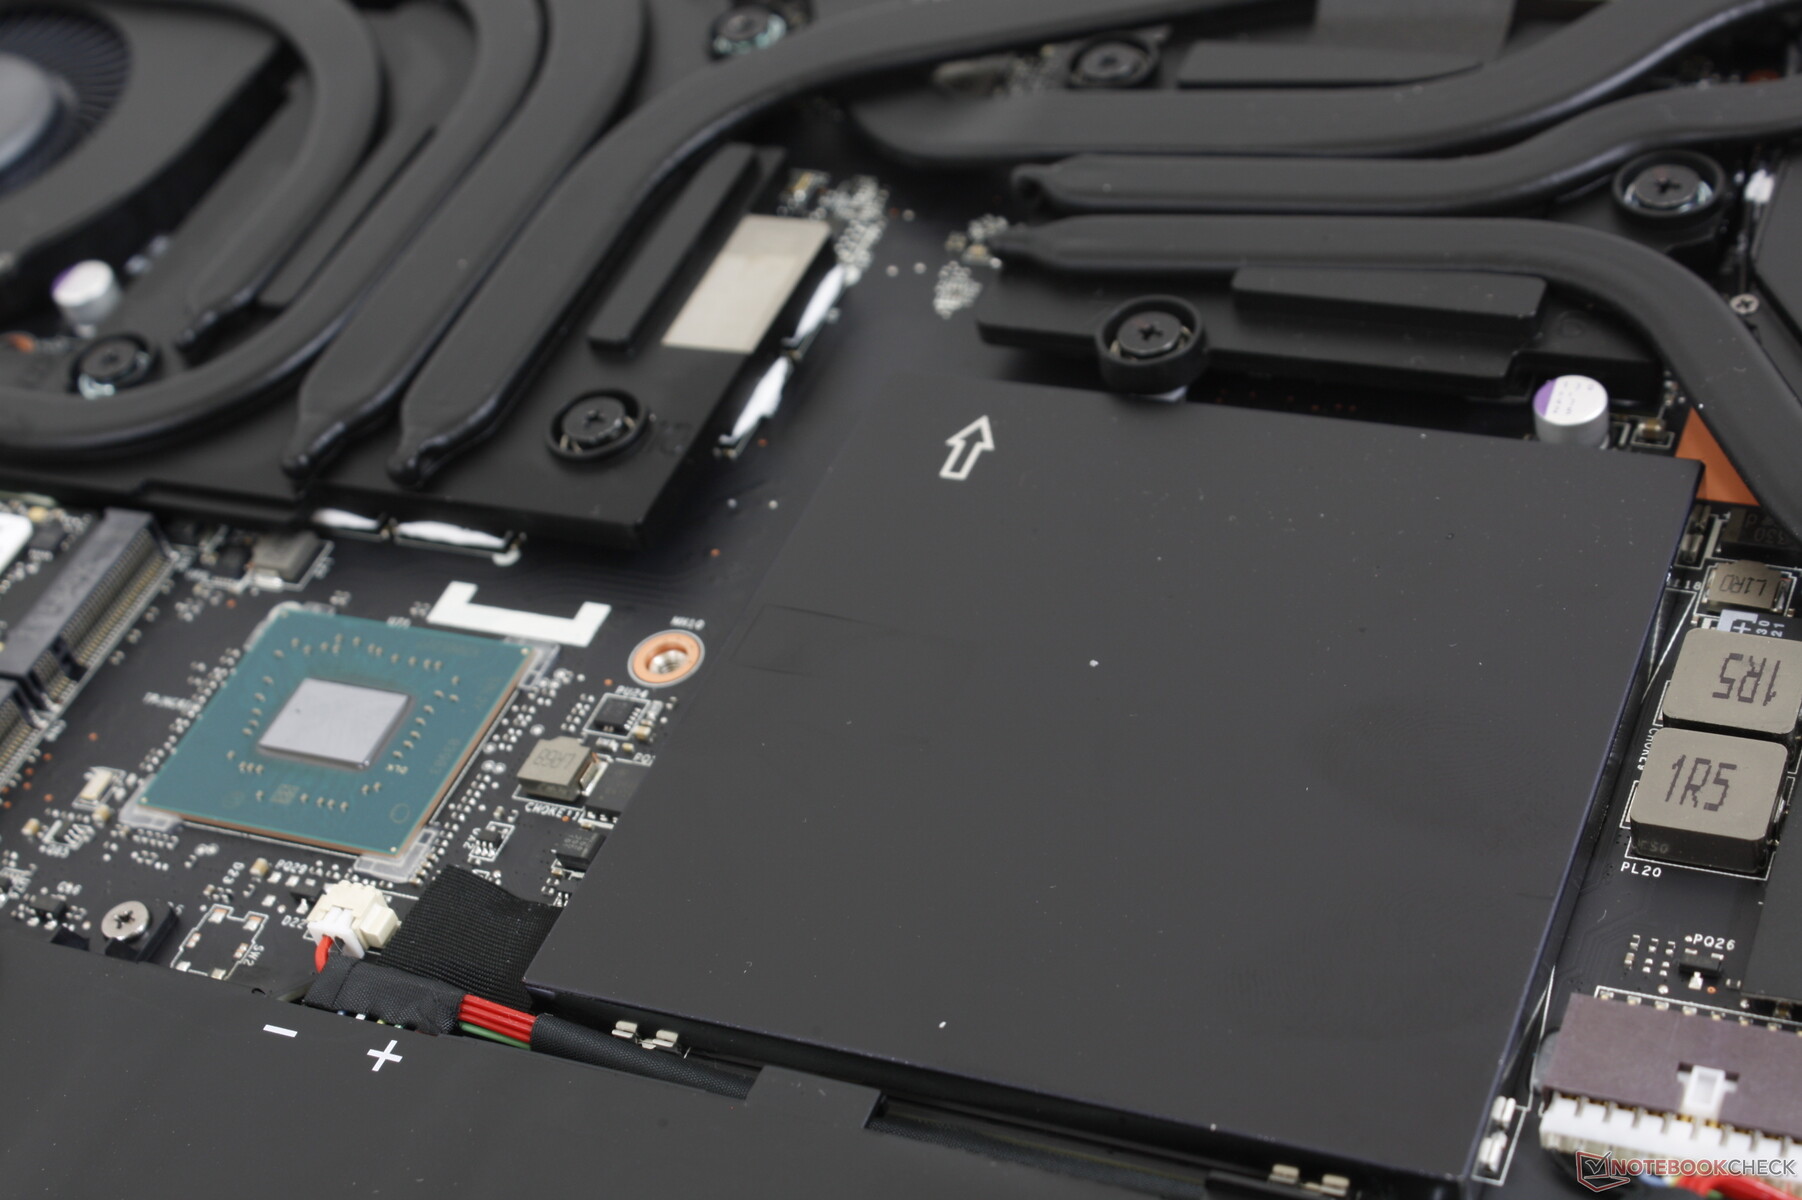
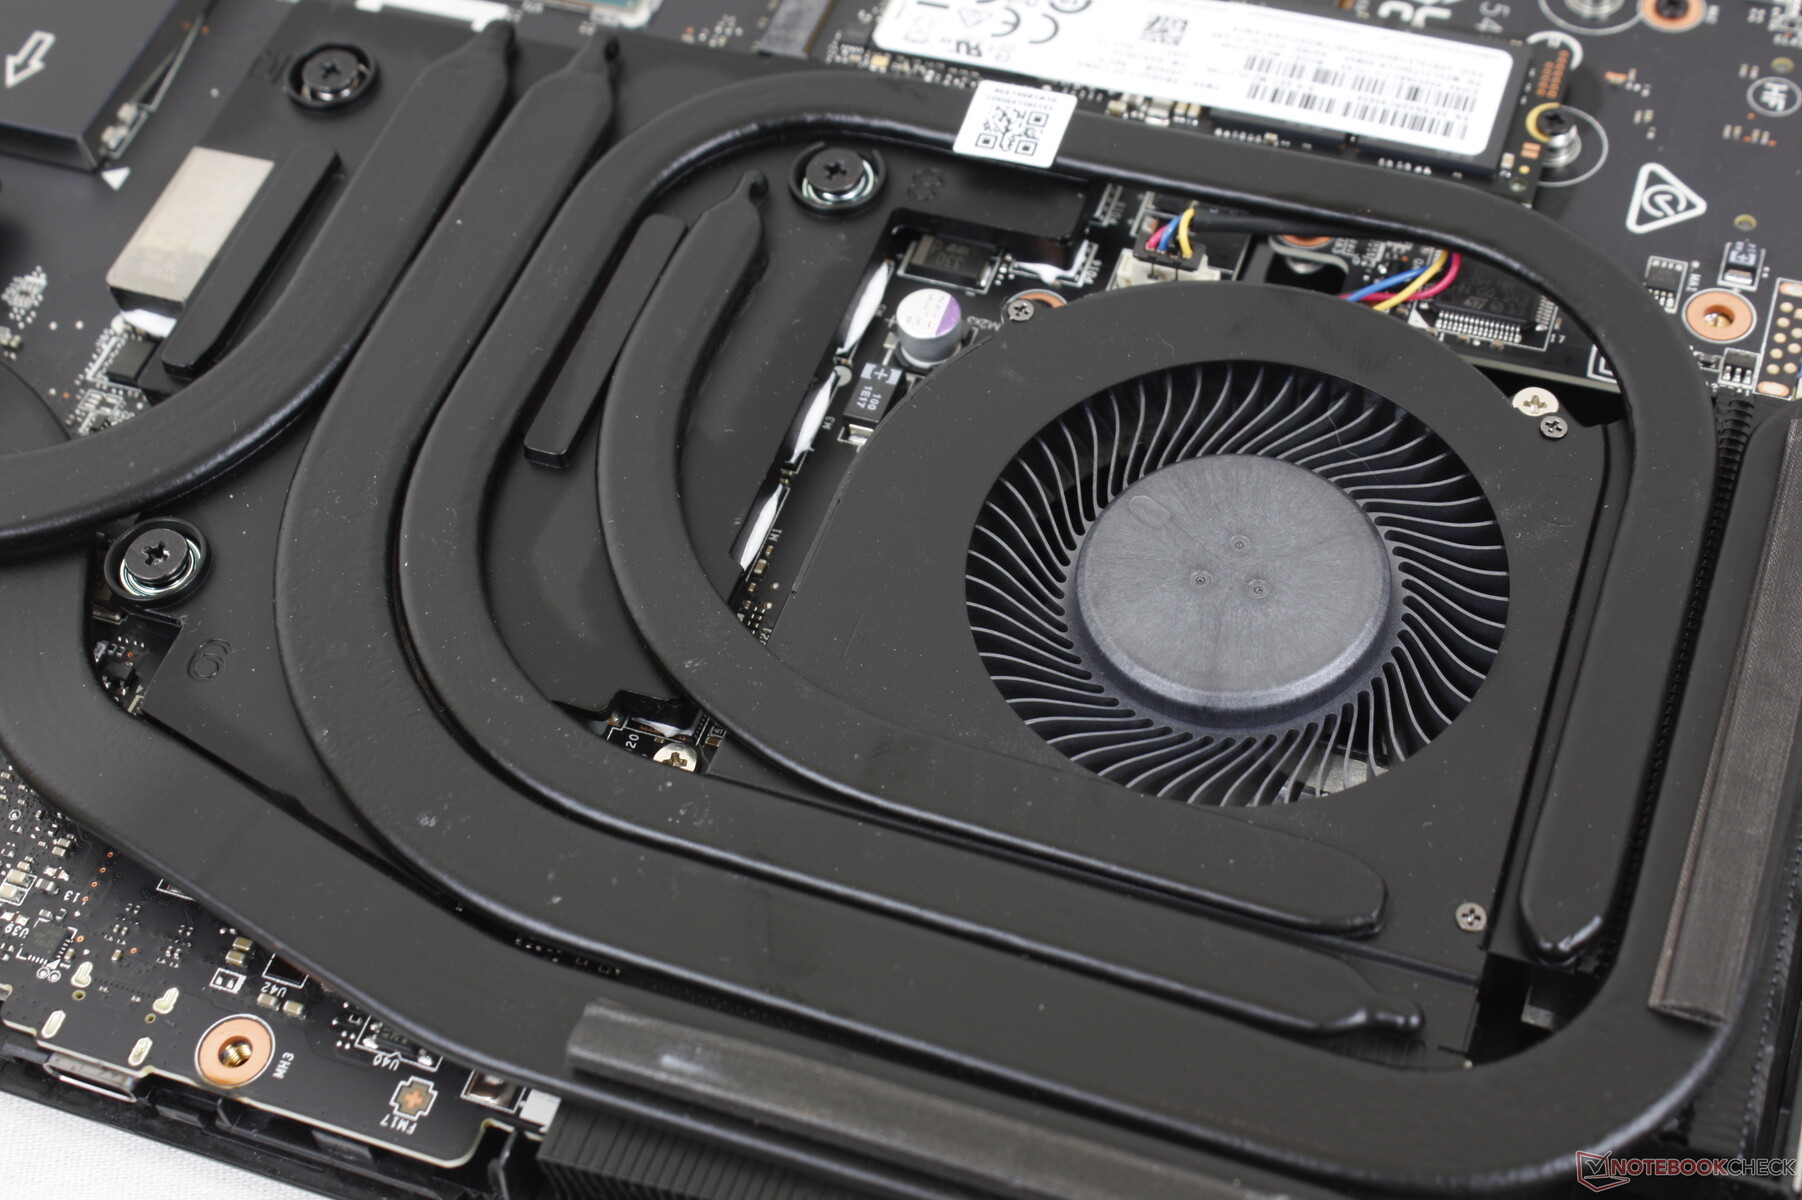
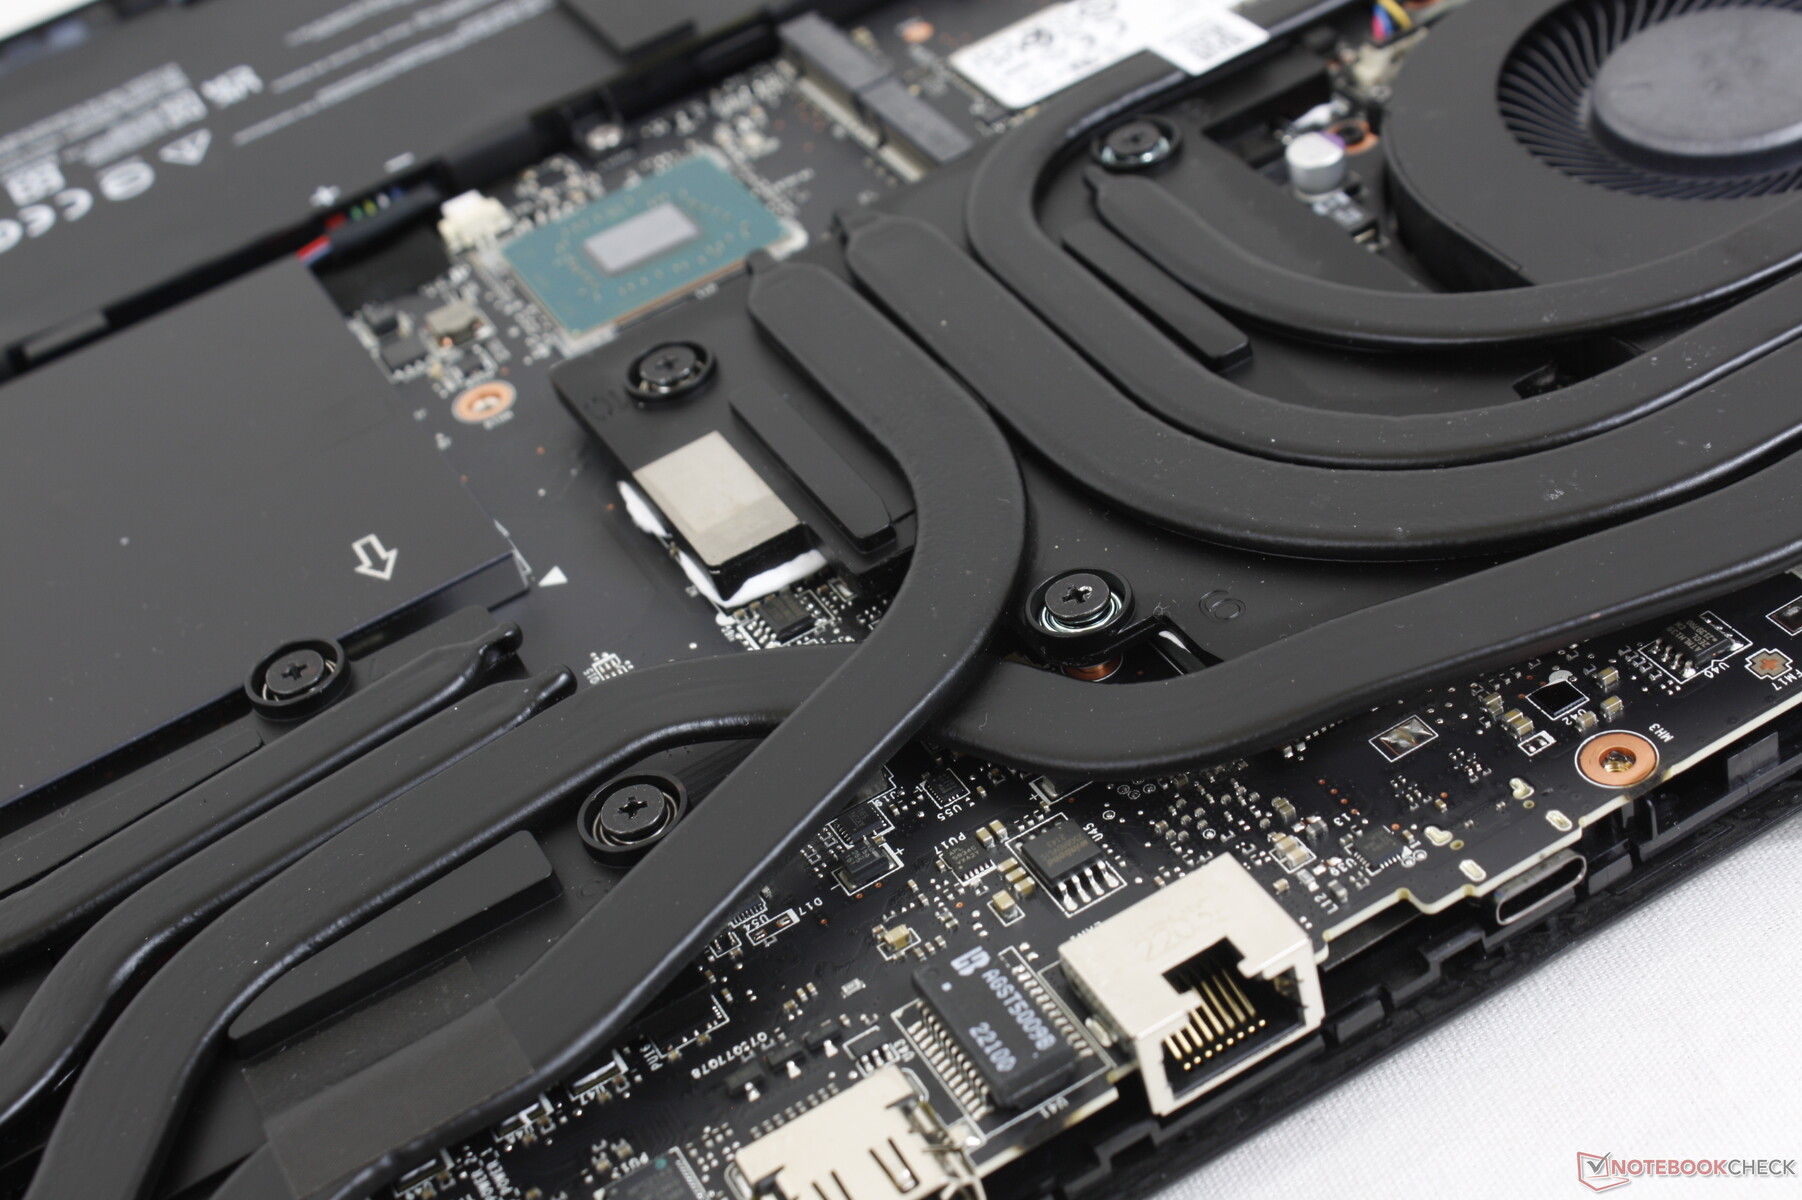
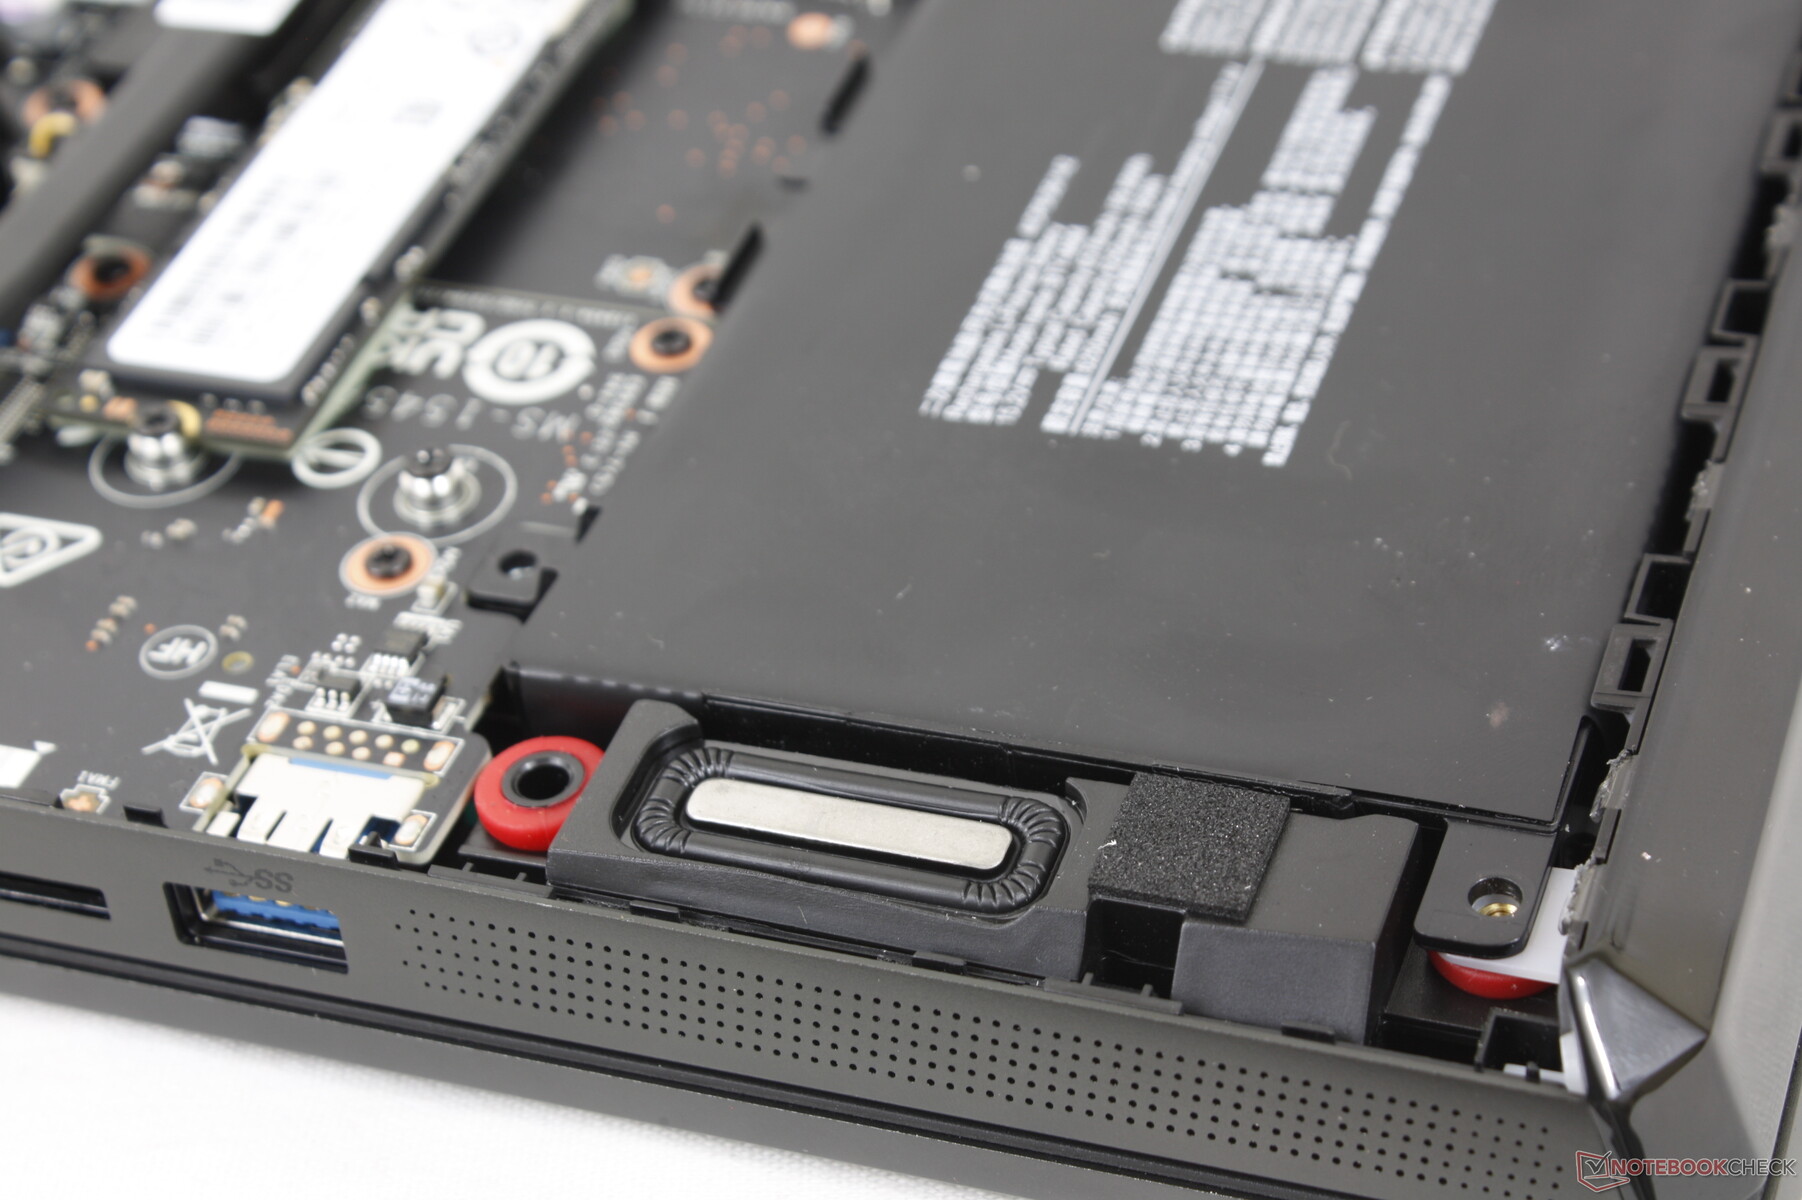
Mantenimiento
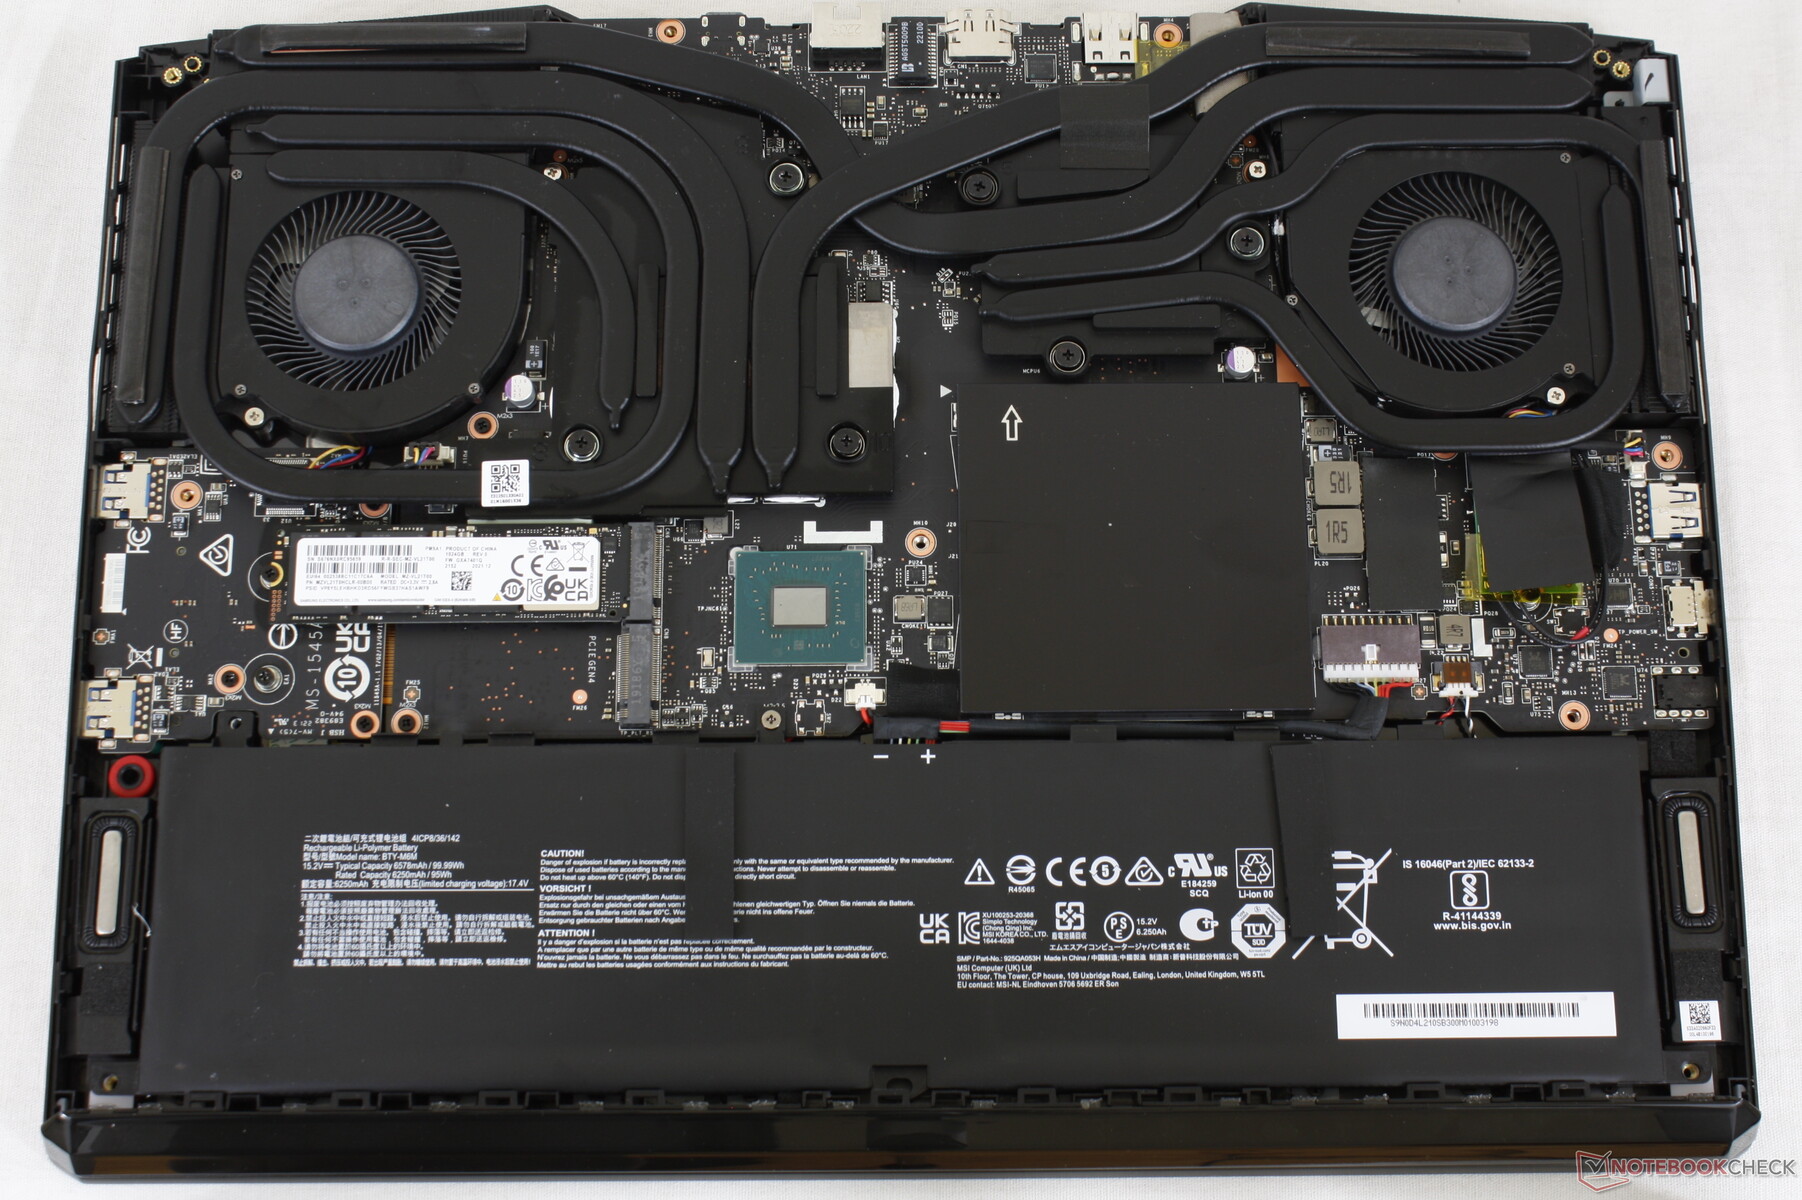
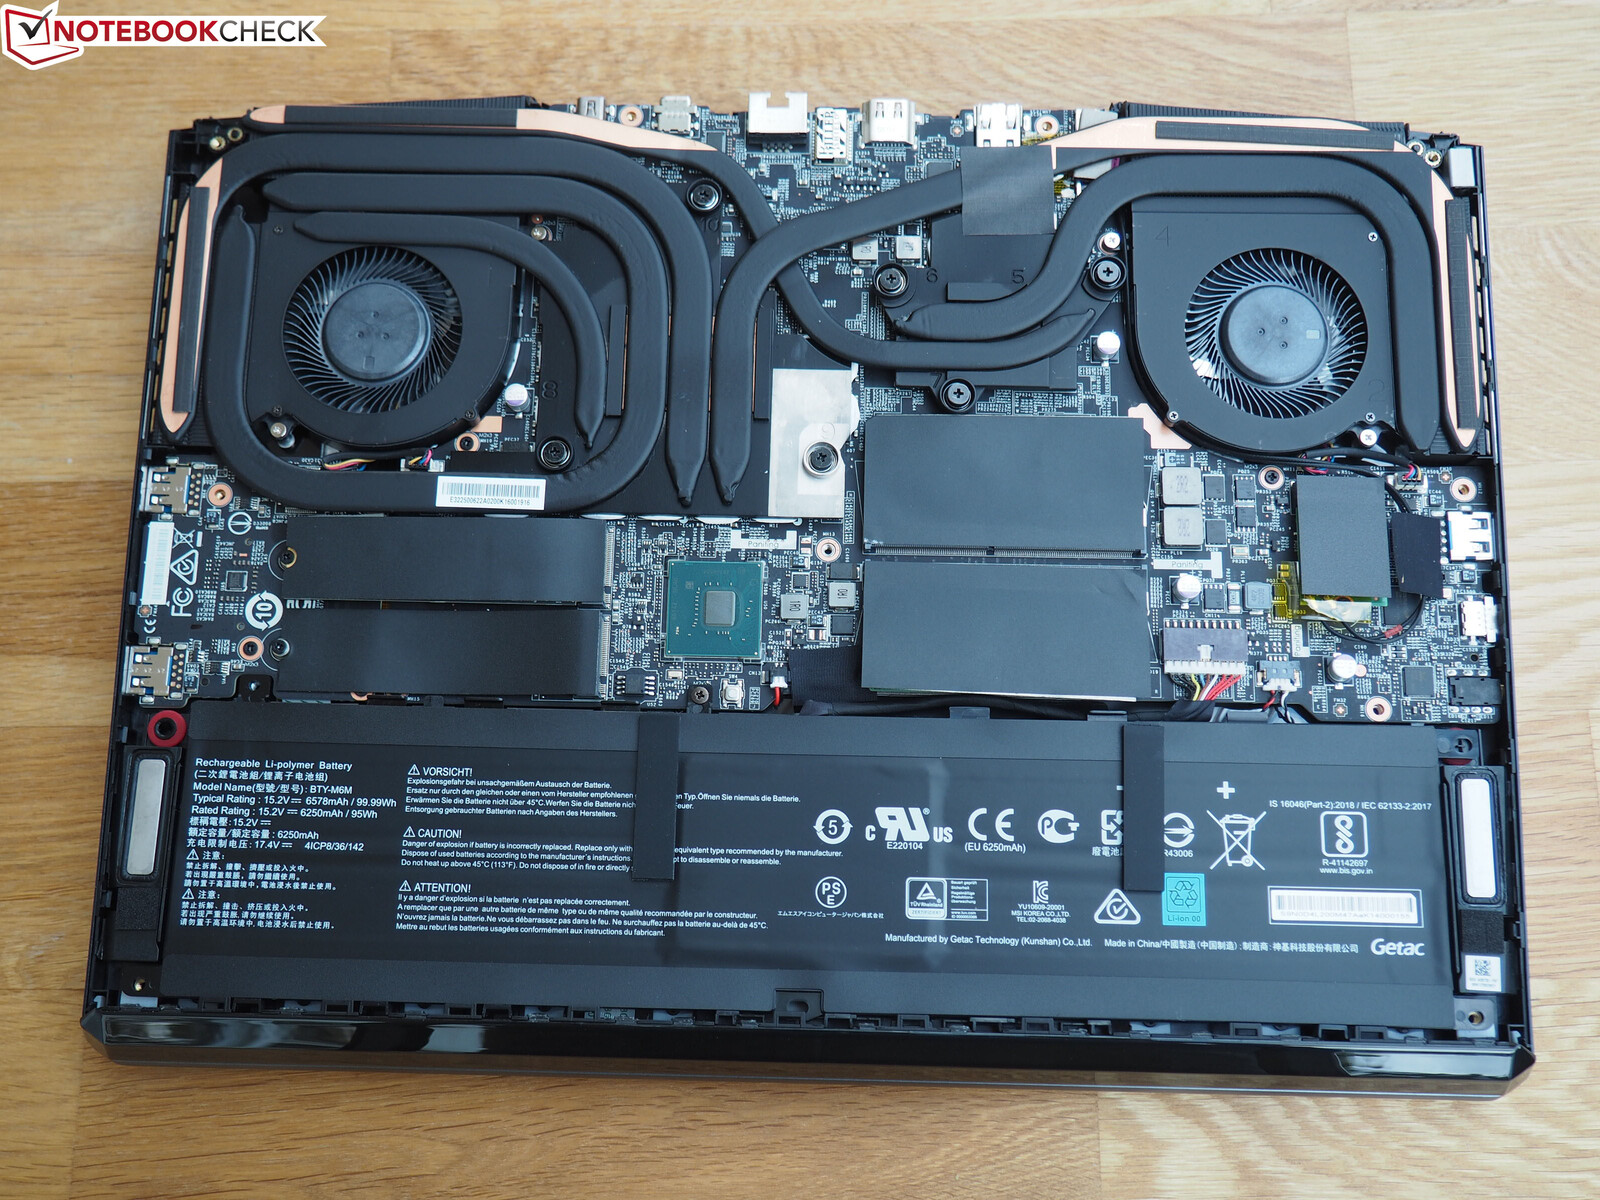
El panel inferior requiere un destornillador Philips y un borde plano para retirarlo. En comparación con el GE66, el GE67 tiene un tubo de calor adicional sobre la CPU, como se muestra a continuación, para mejorar la refrigeración.
Accesorios y garantía
La caja de venta al público incluye un gran paño de terciopelo, además del adaptador de CA y la documentación. Se aplica la garantía estándar del fabricante de un año si se compra en los Estados Unidos.
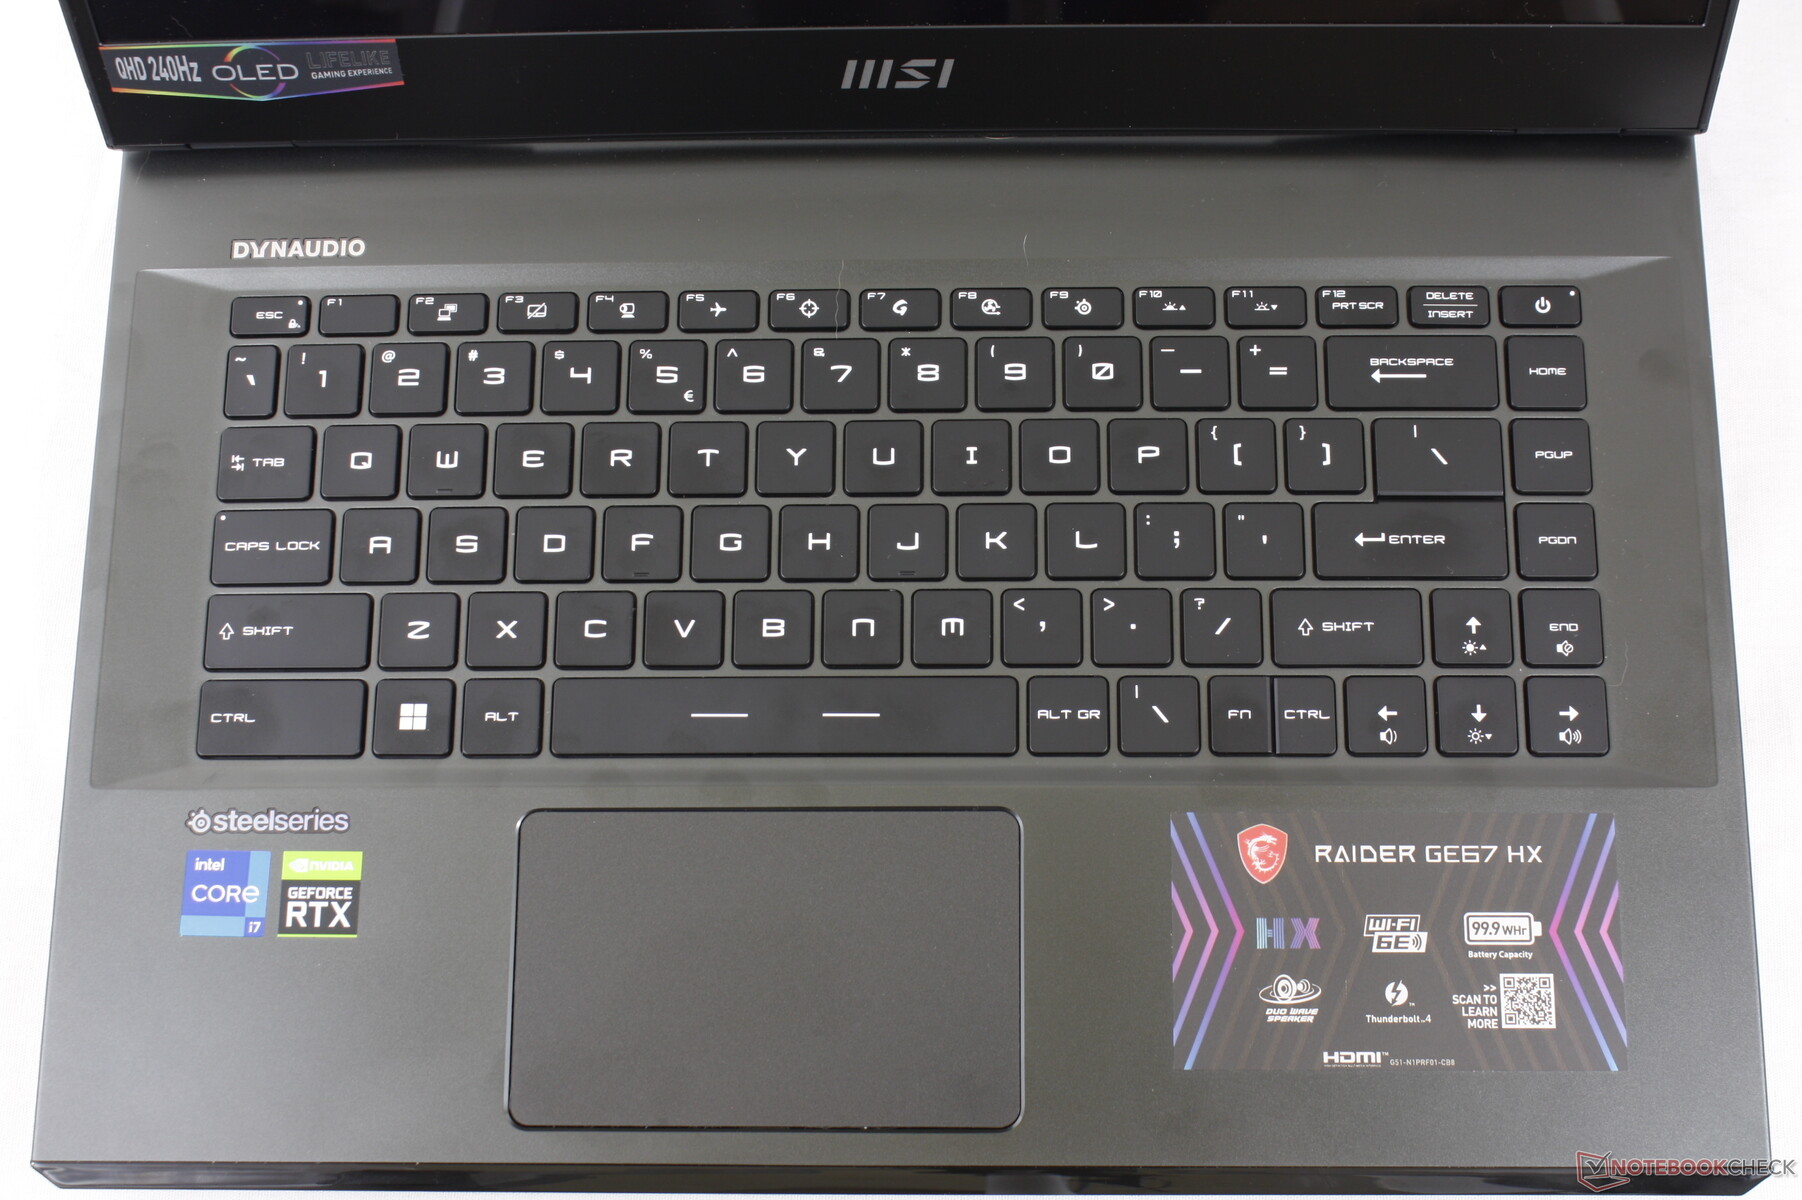
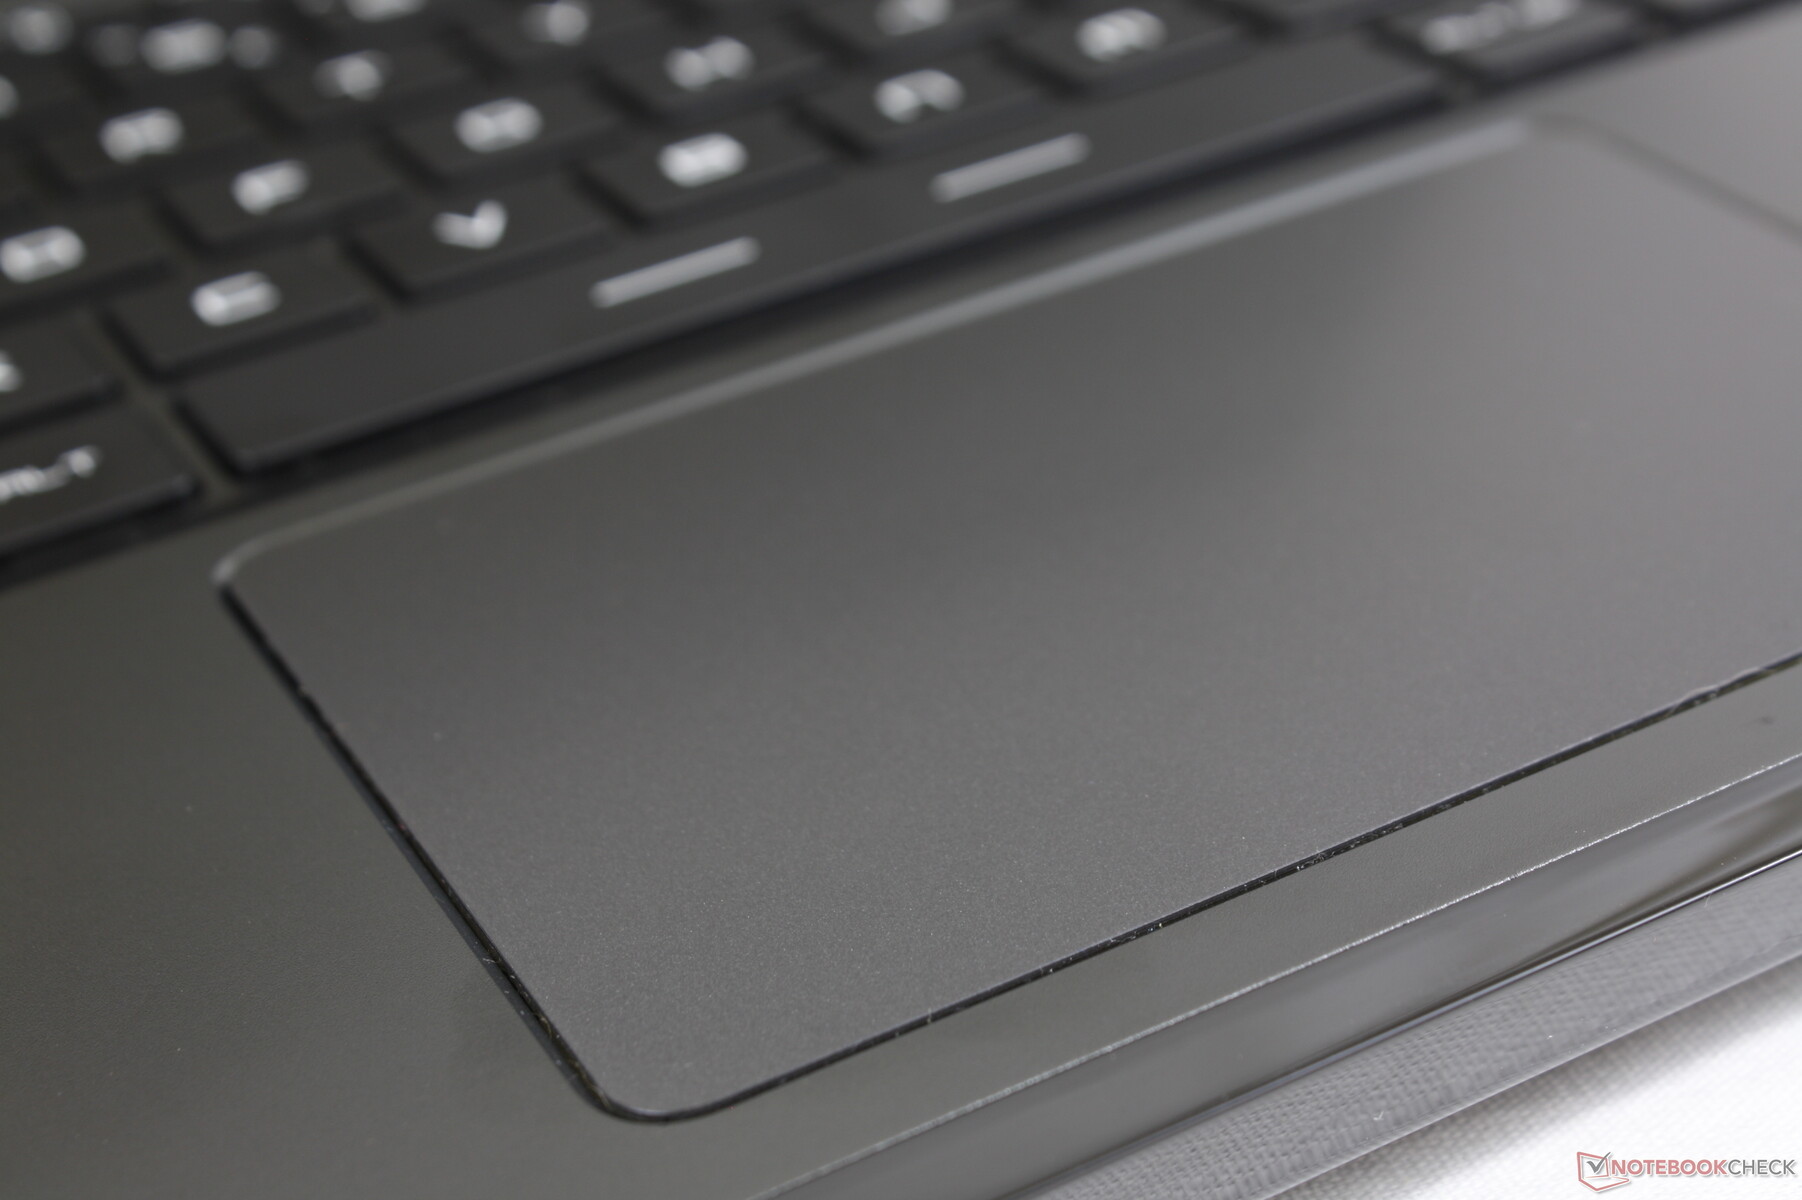
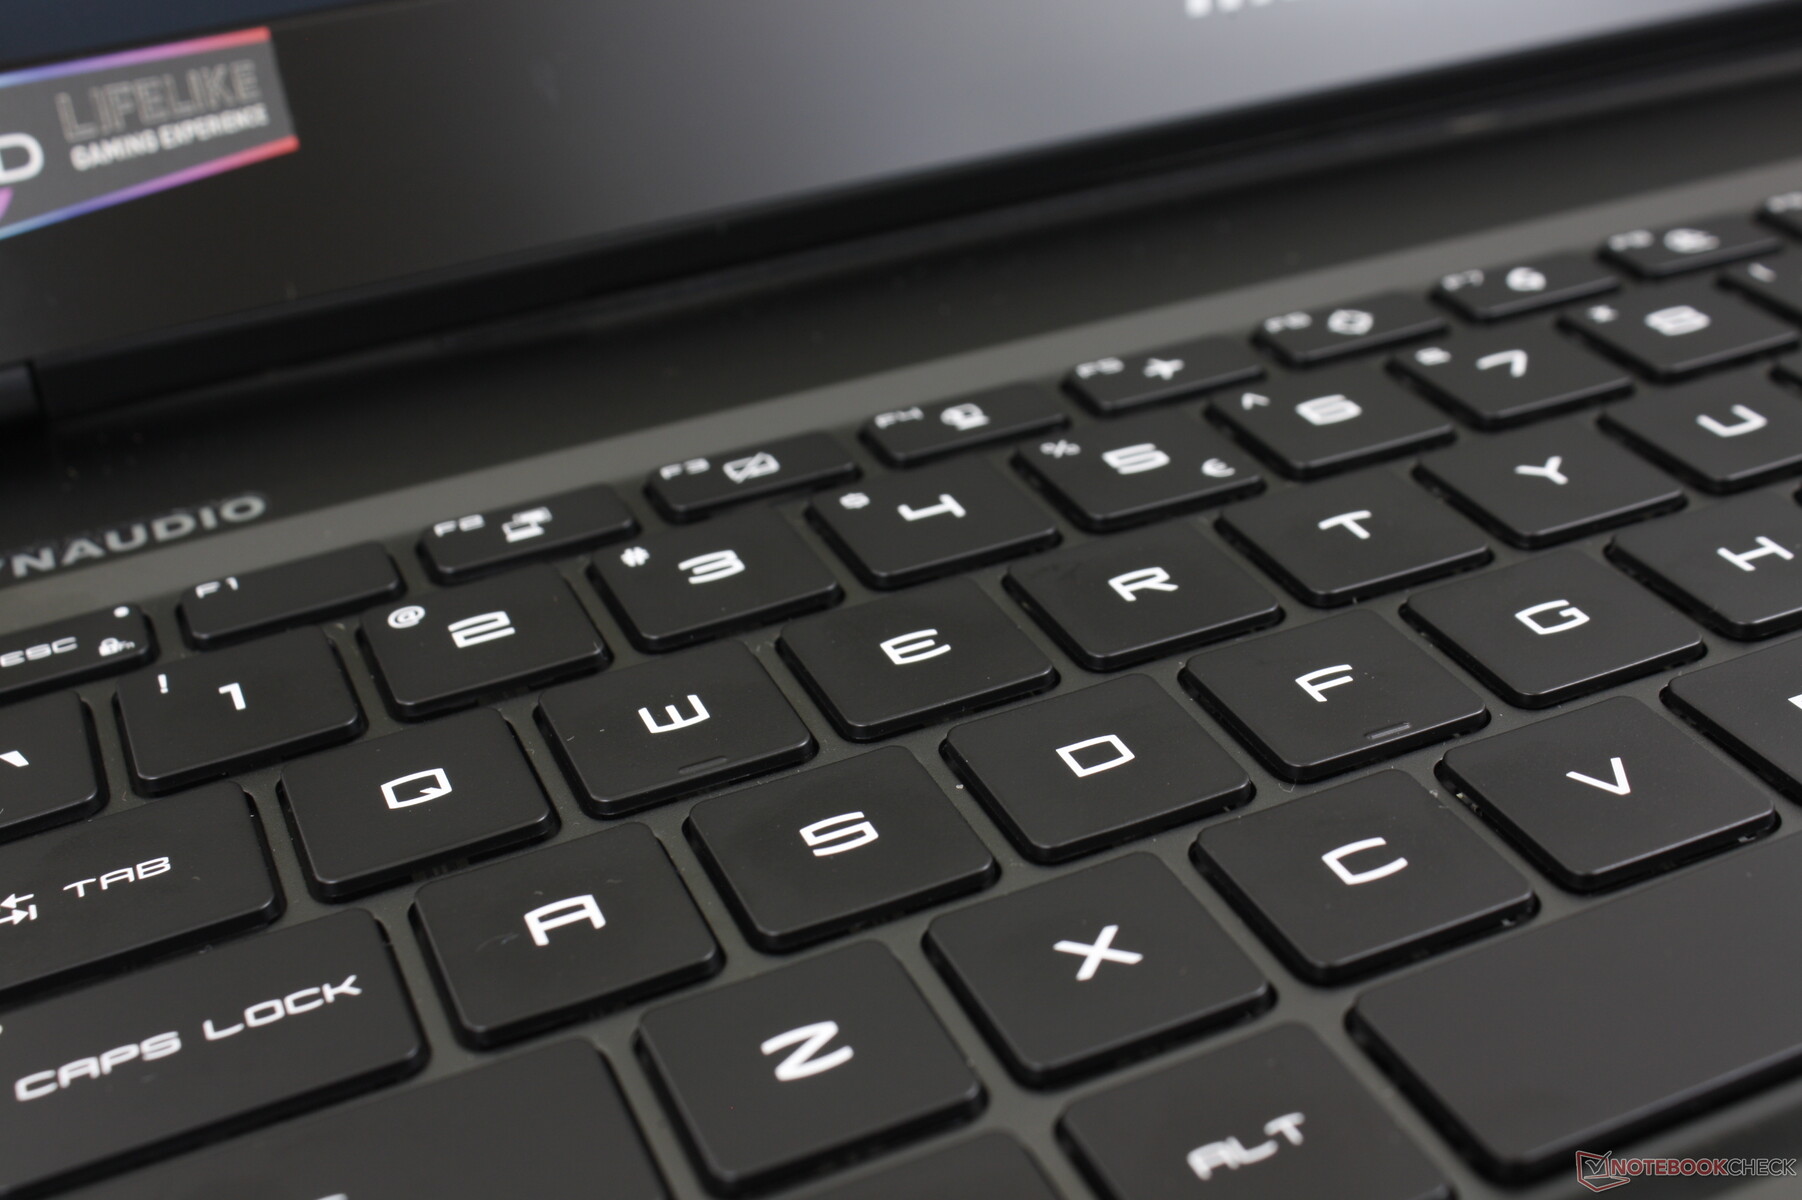
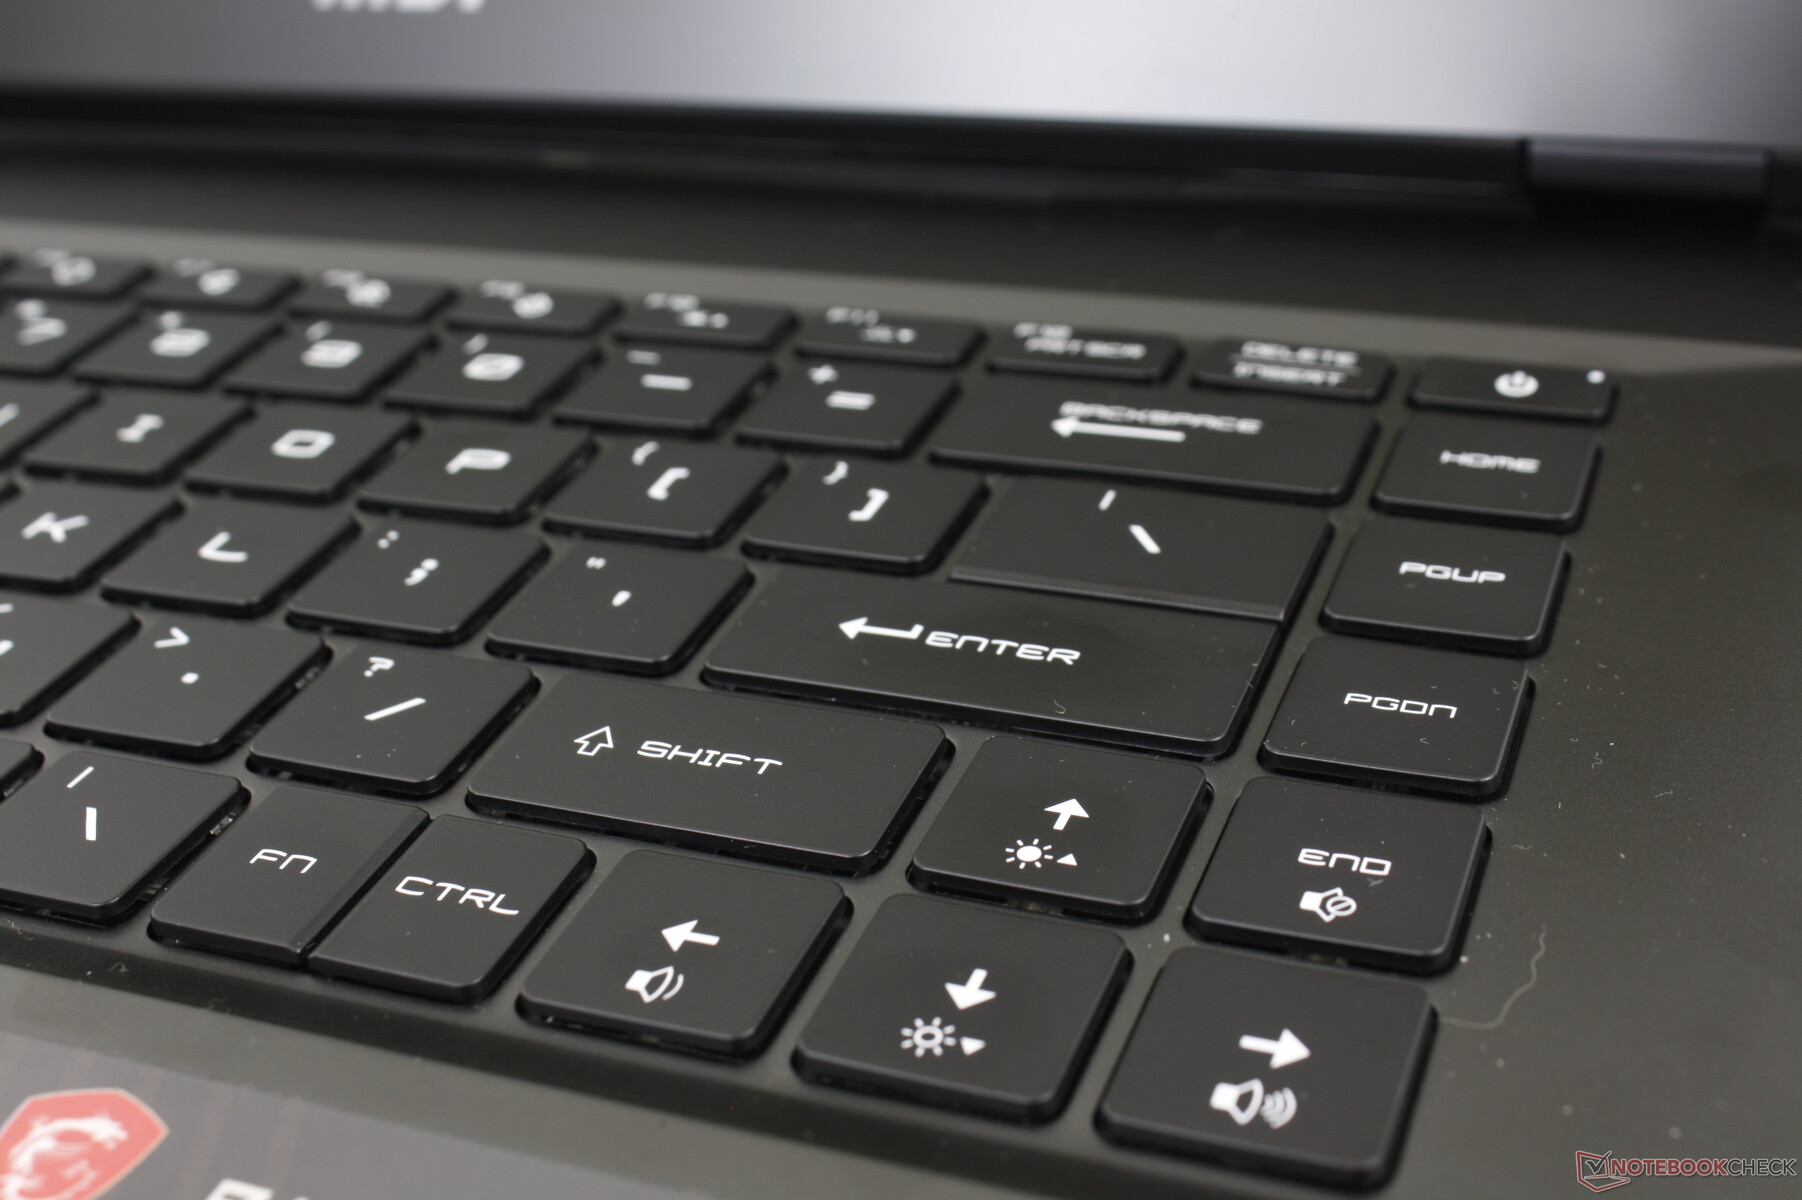
Dispositivos de entrada - No hay cambios importantes respecto a GE66
Teclado y panel táctil
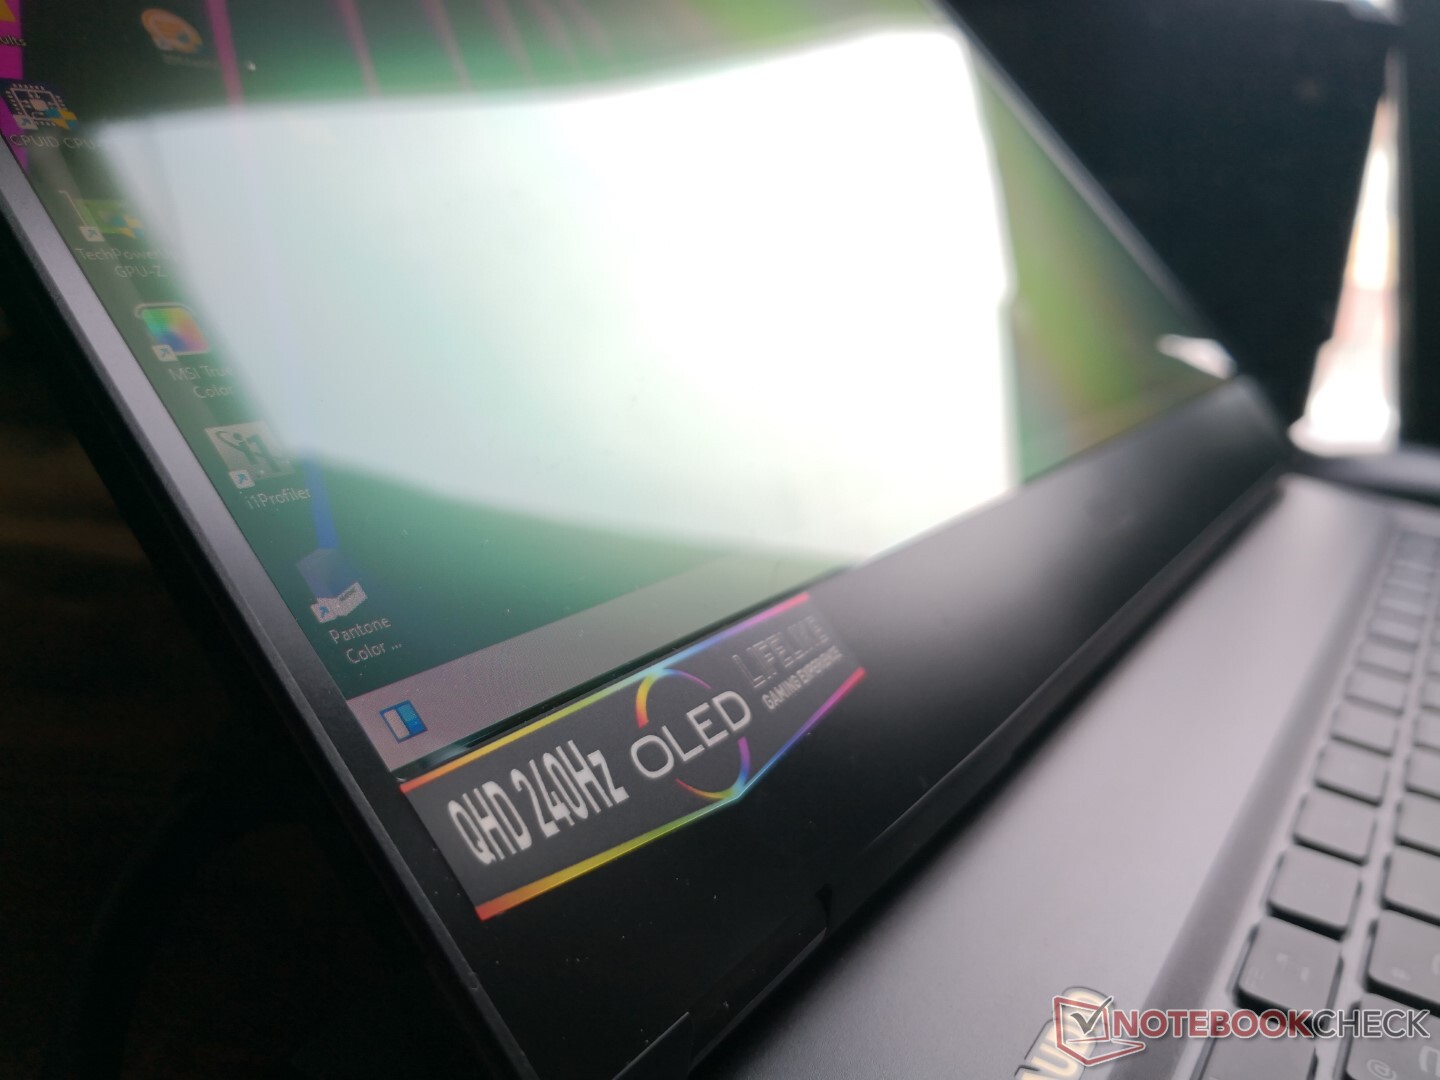
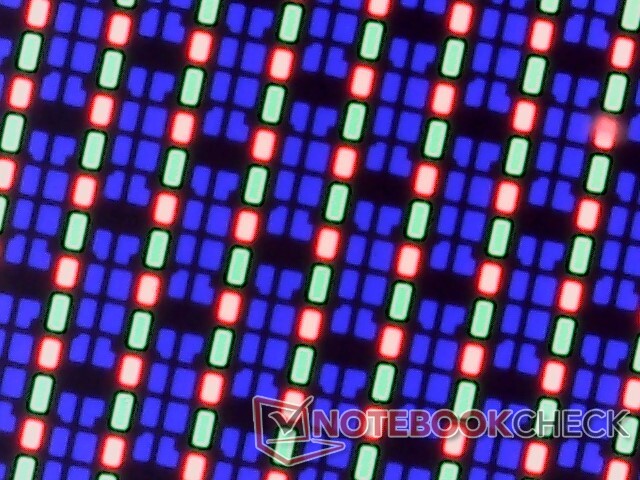
Pantalla - Casi ideal para los juegos
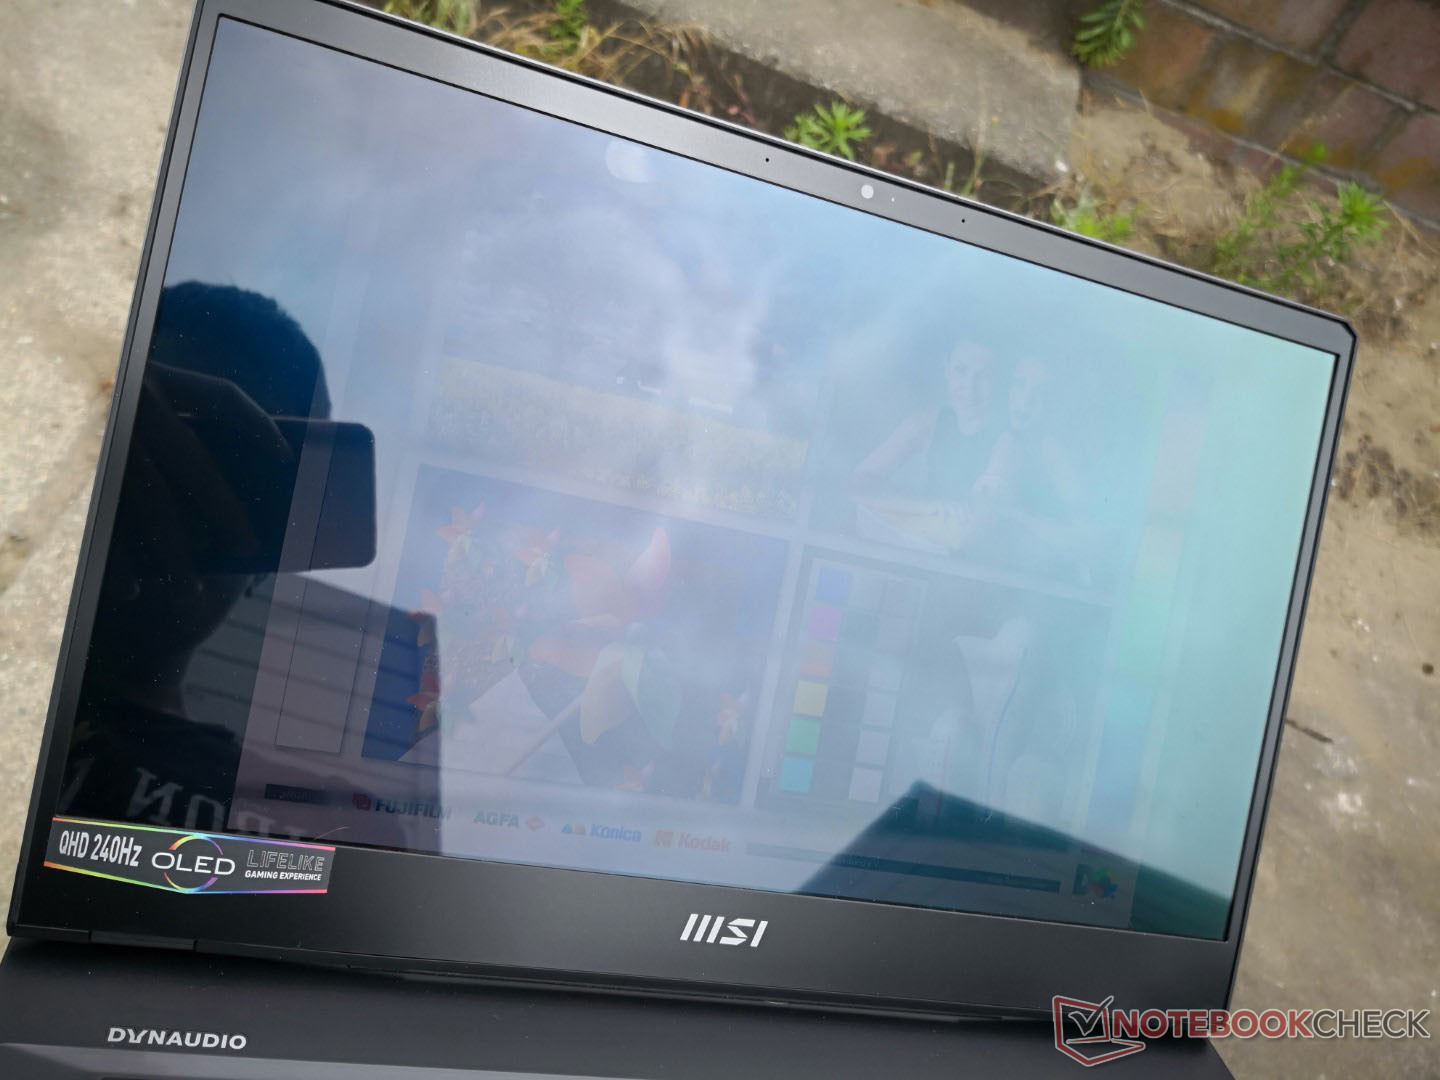
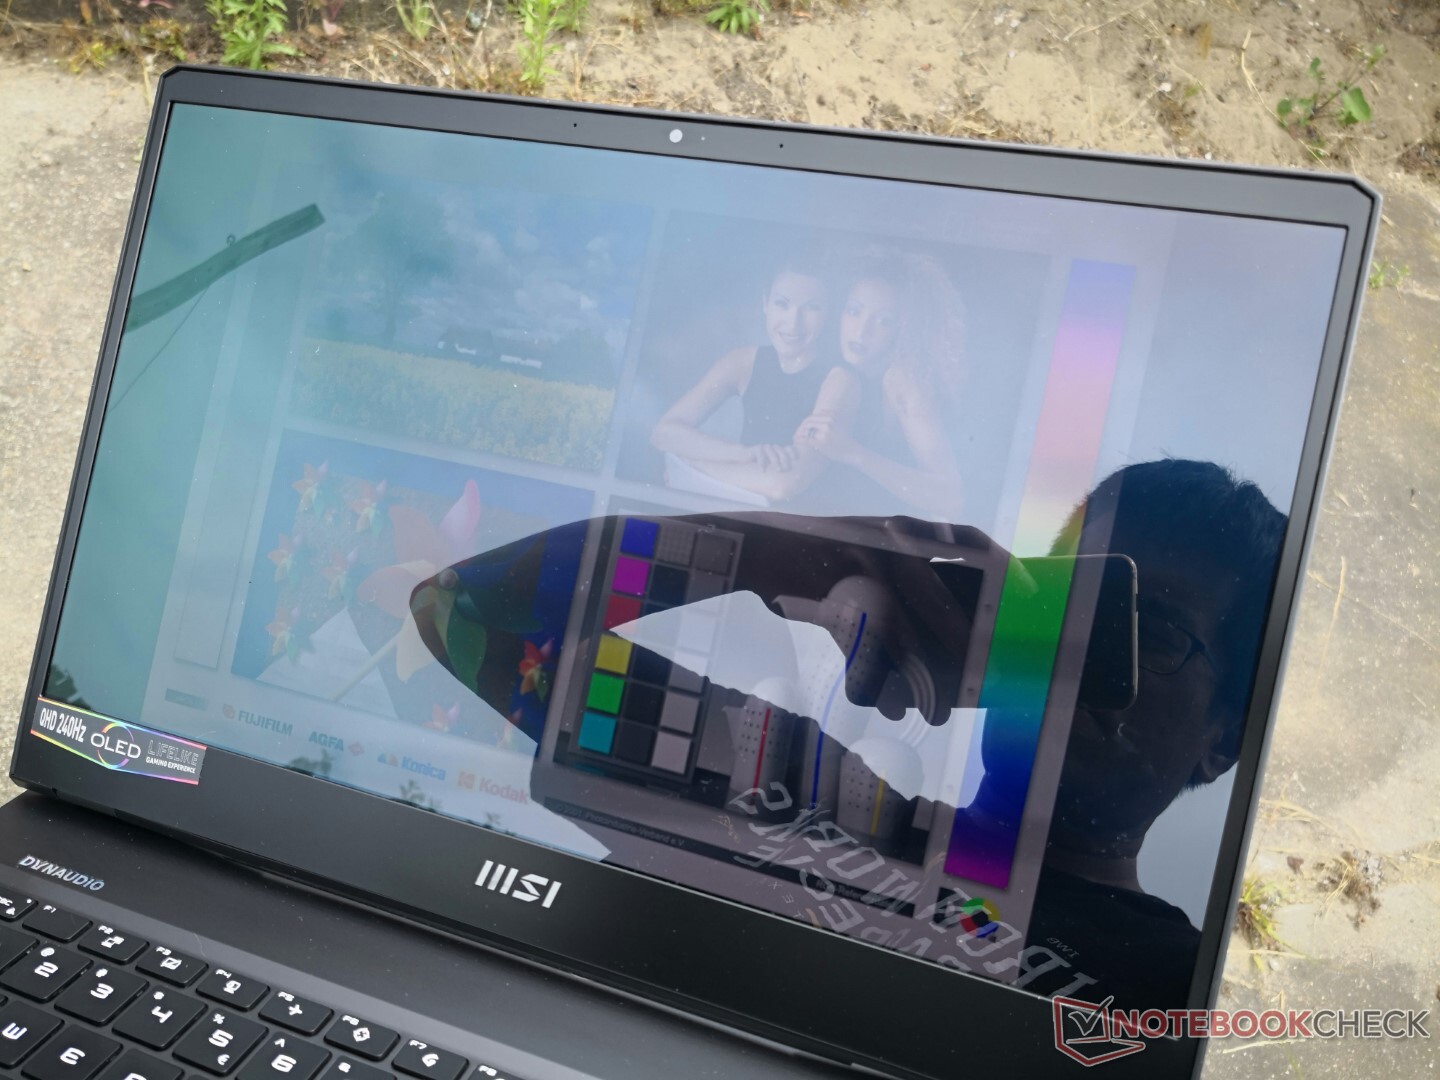
El MSI GE67 y el Razer Blade 15 son dos de los primeros portátiles que ofrecen opciones de pantalla QHD OLED de 240 Hz. Aunque sobre el papel esto puede parecer excelente, hay que tener en cuenta algunos asteriscos
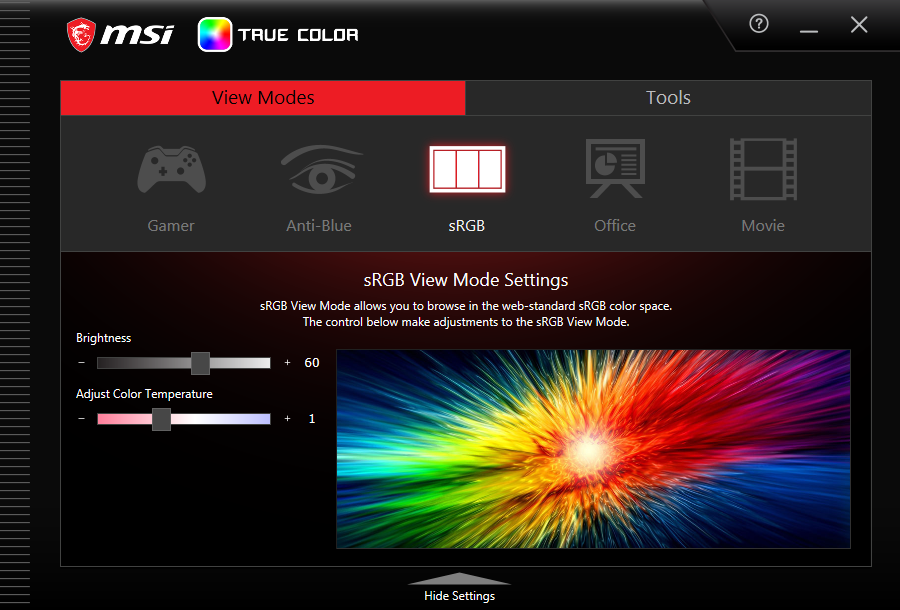
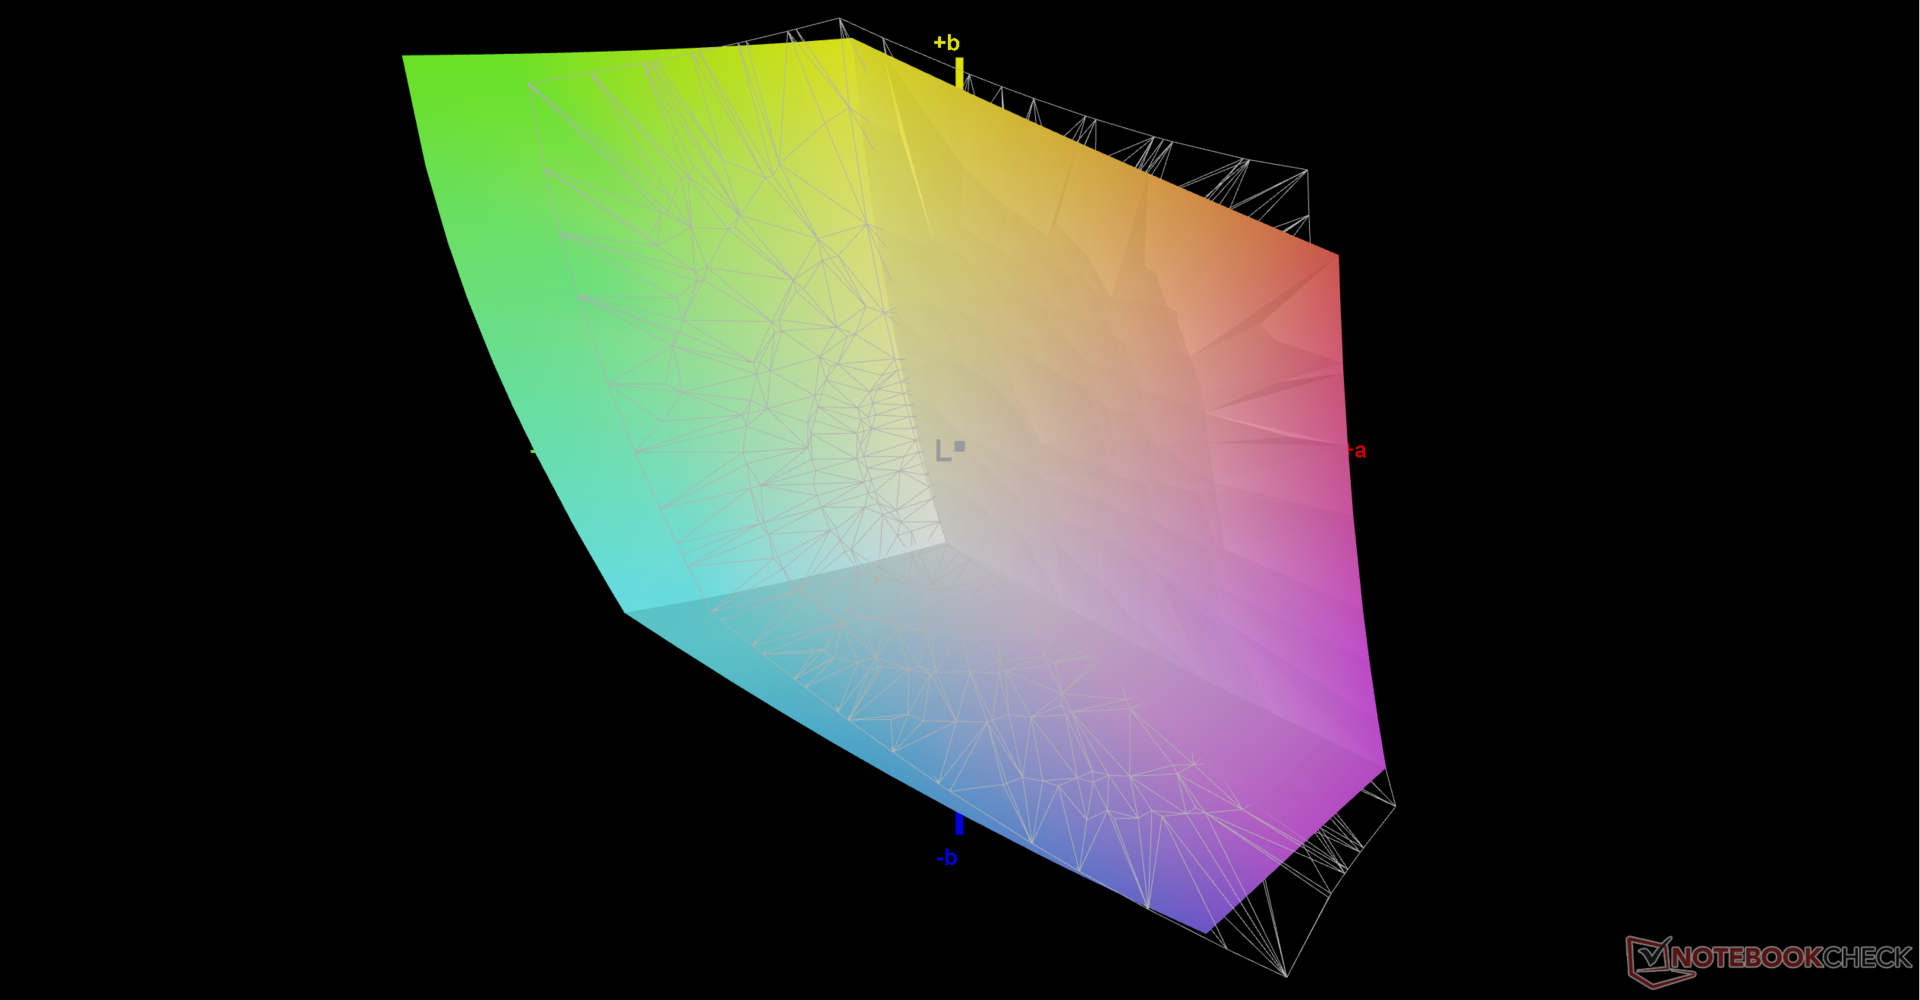
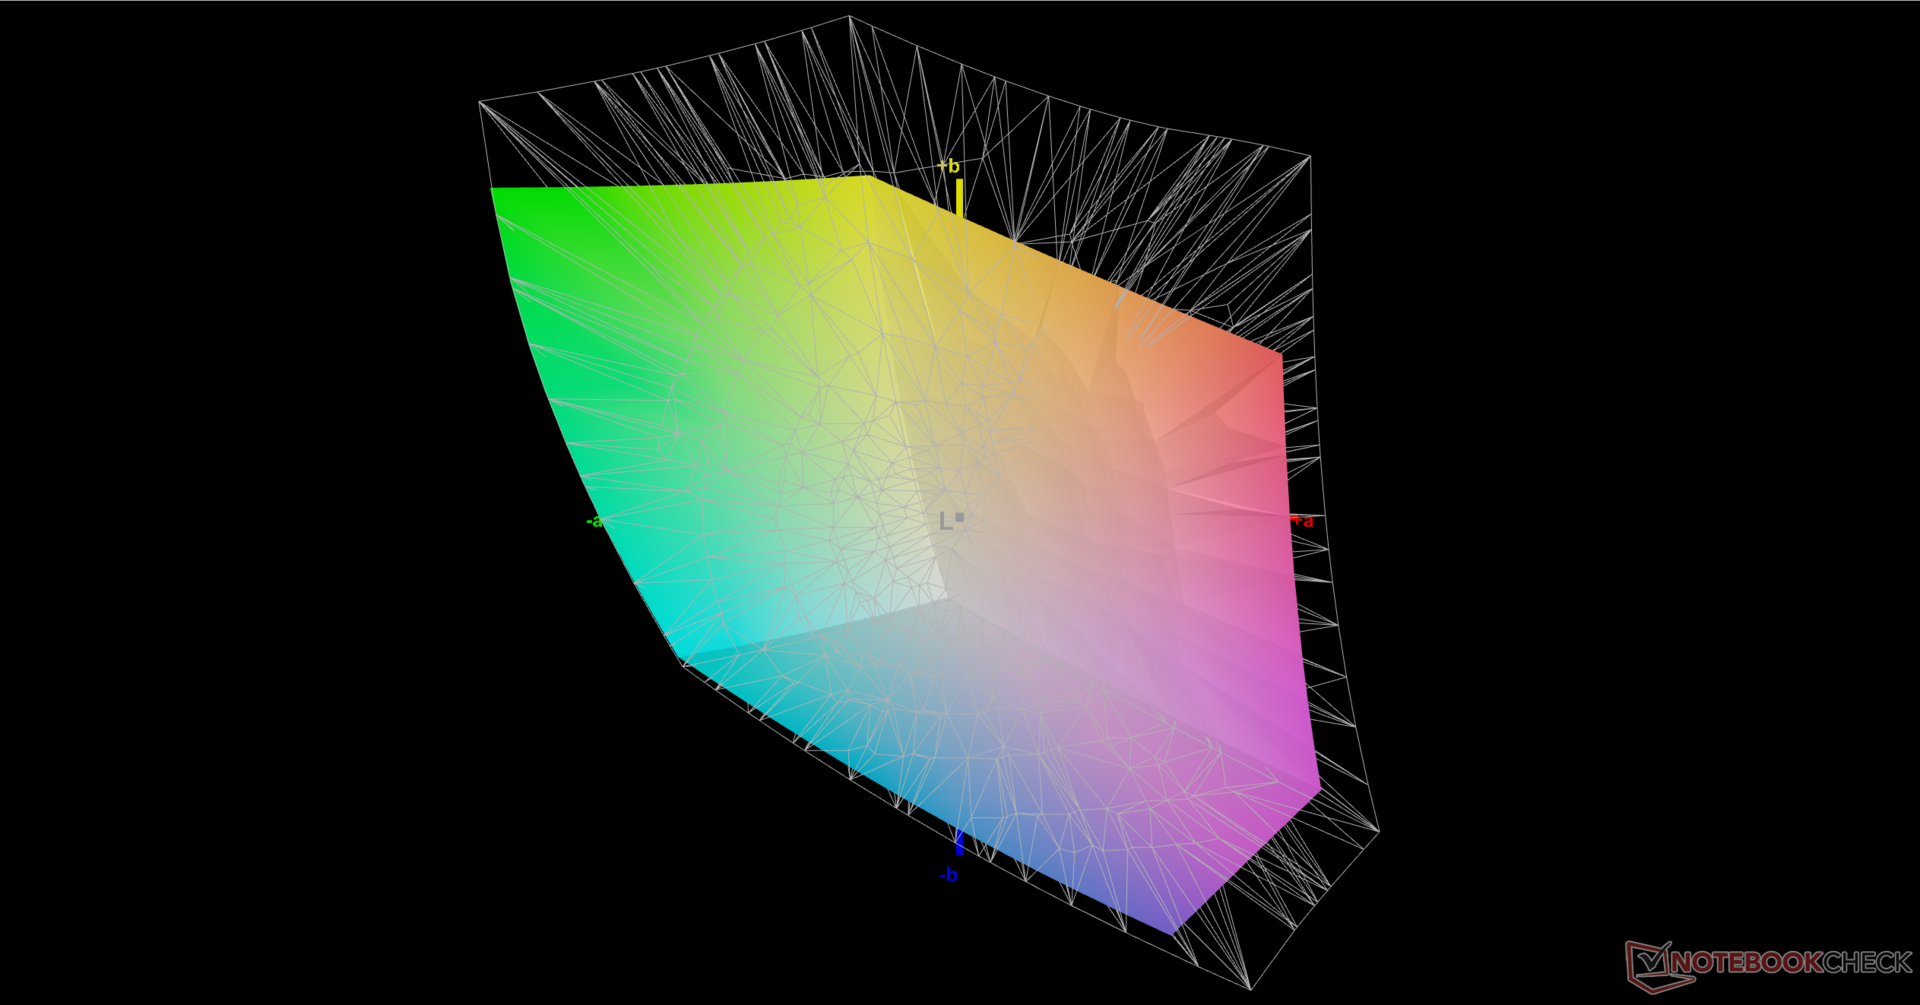
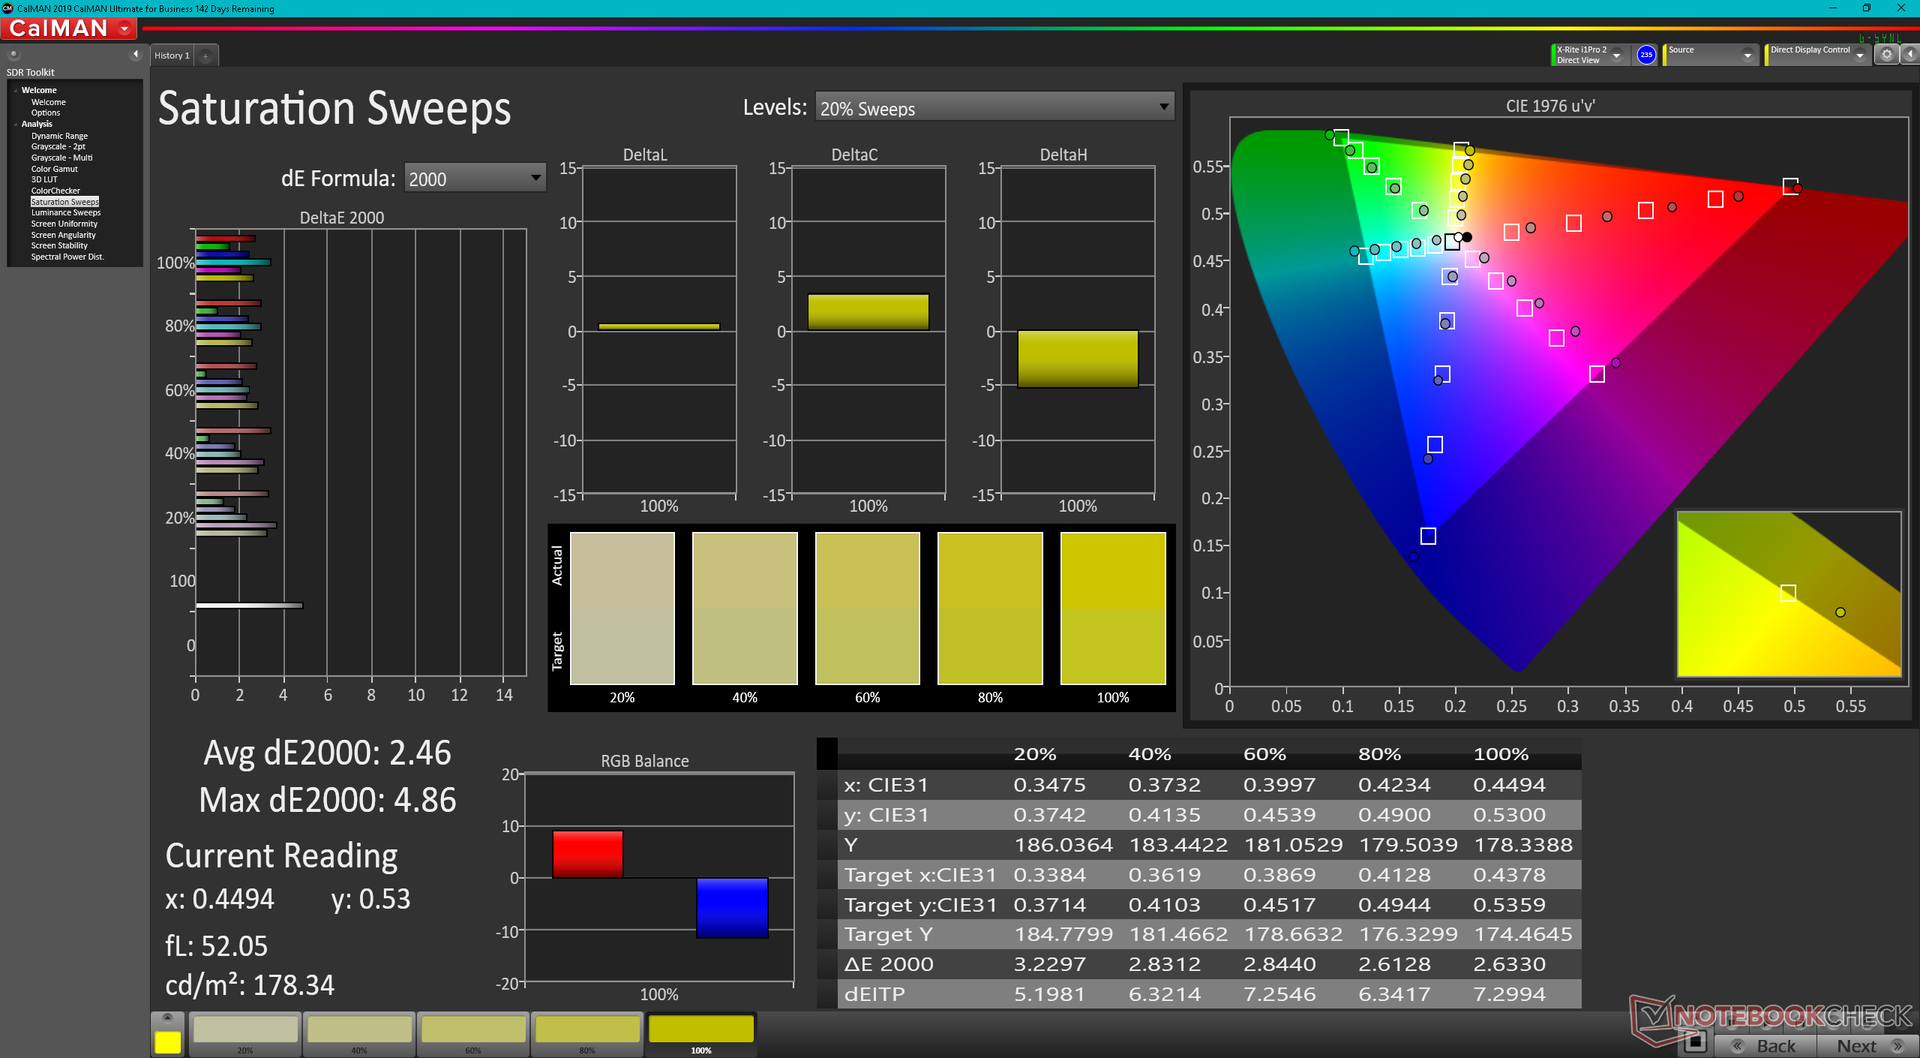
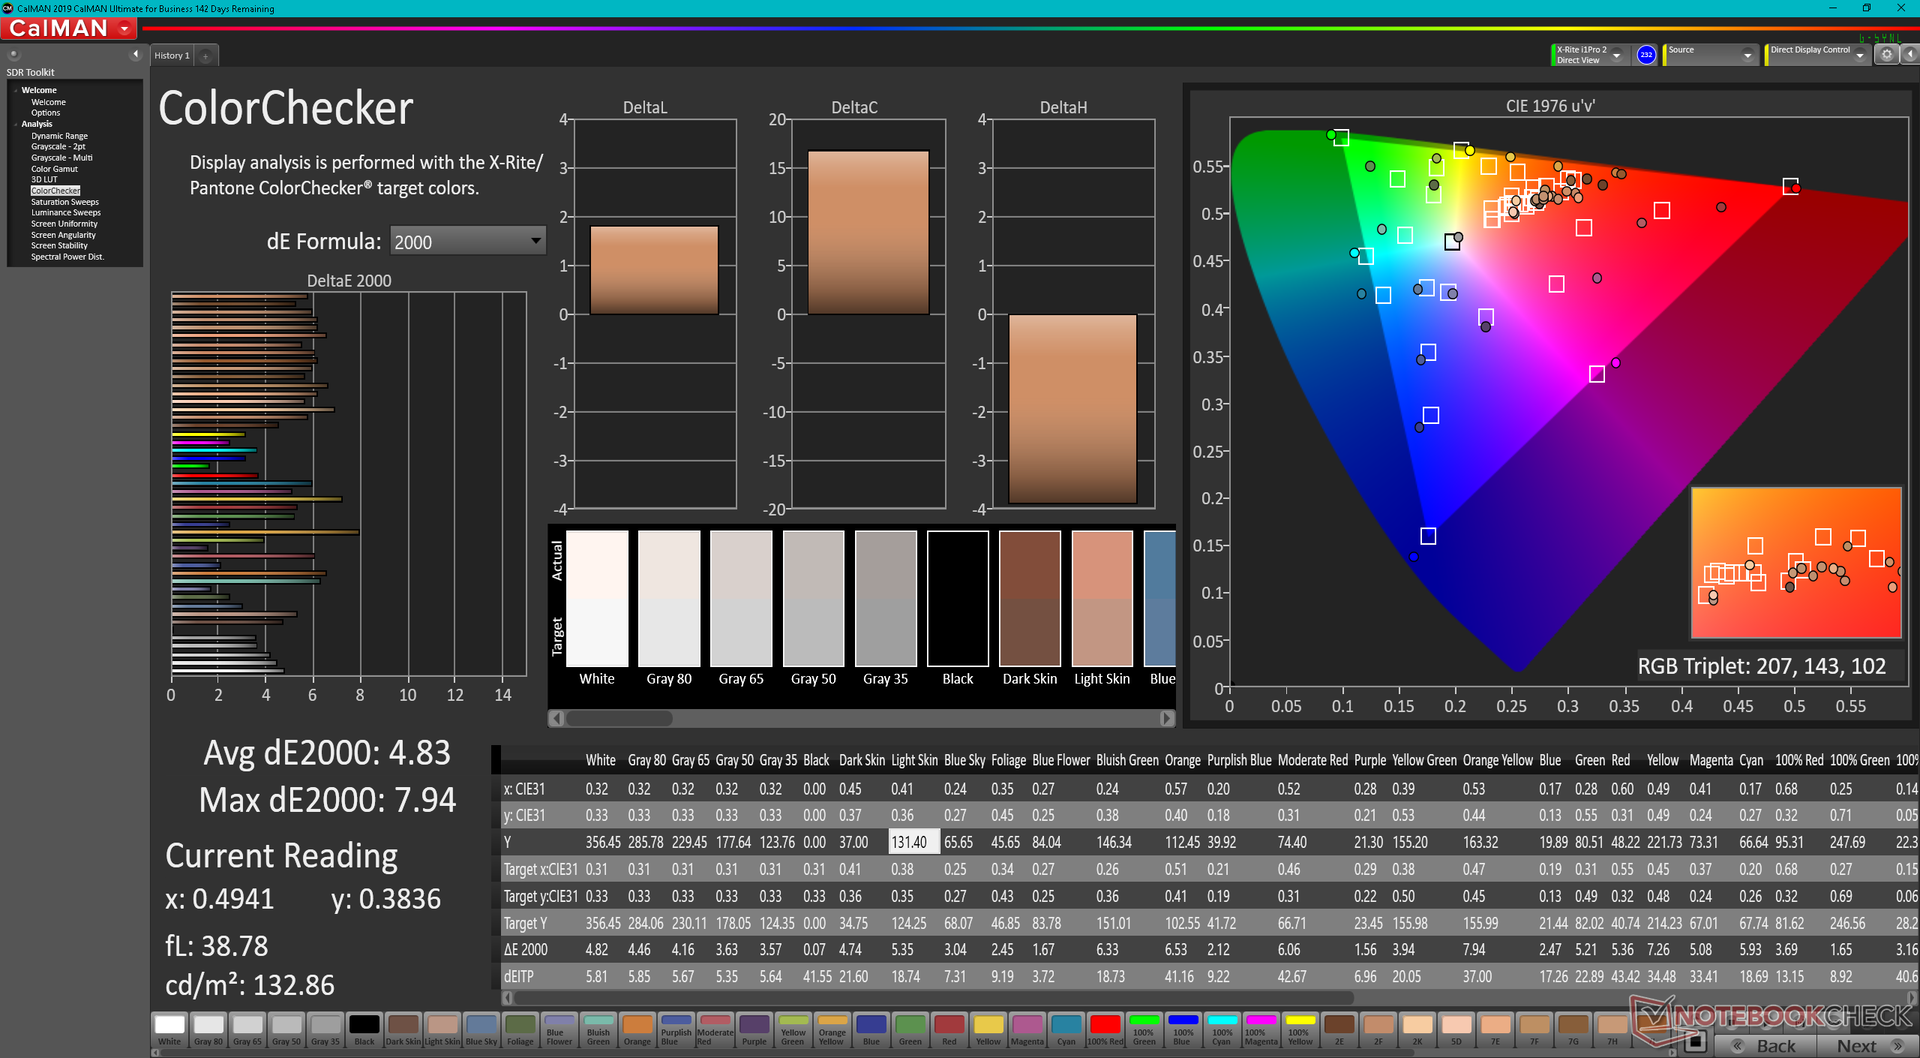
En primer lugar, la pantalla del GE67 no viene calibrada de fábrica, aunque el panel OLED anuncia una cobertura DCI-P3 completa. De hecho, sólo hemos podido registrar una cobertura de apenas el 72% y el propio software MSI True Color no tiene ninguna opción DCI-P3 para elegir. Cuando se le pidió un comentario, MSI respondió que el modo DCI-P3 es "más para los editores de vídeo y en nuestra serie de portátiles Creator" y que el GE67 implementa el modo Display P3 en su lugar
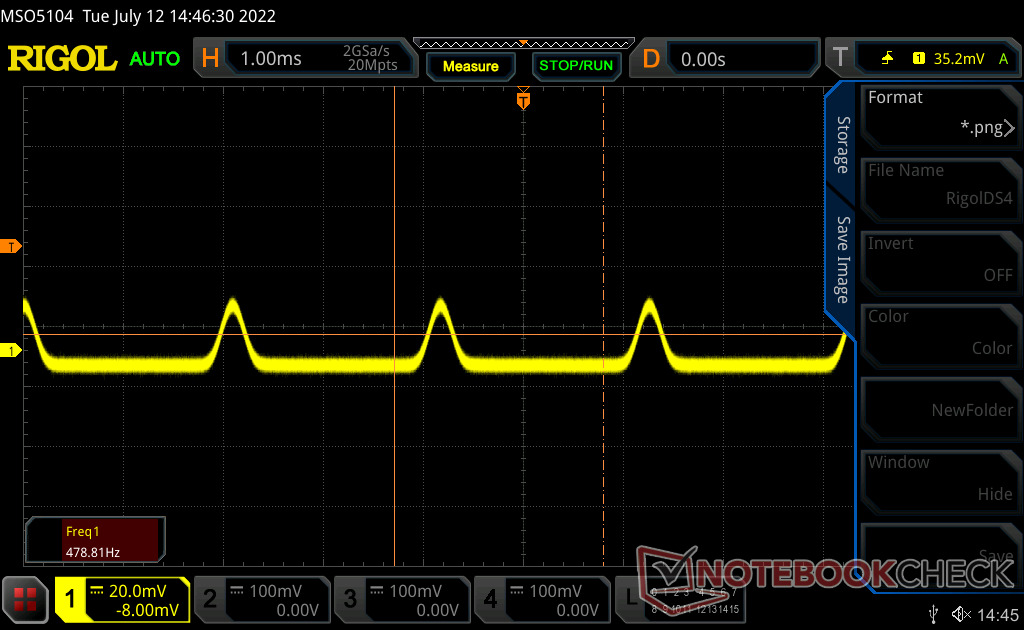
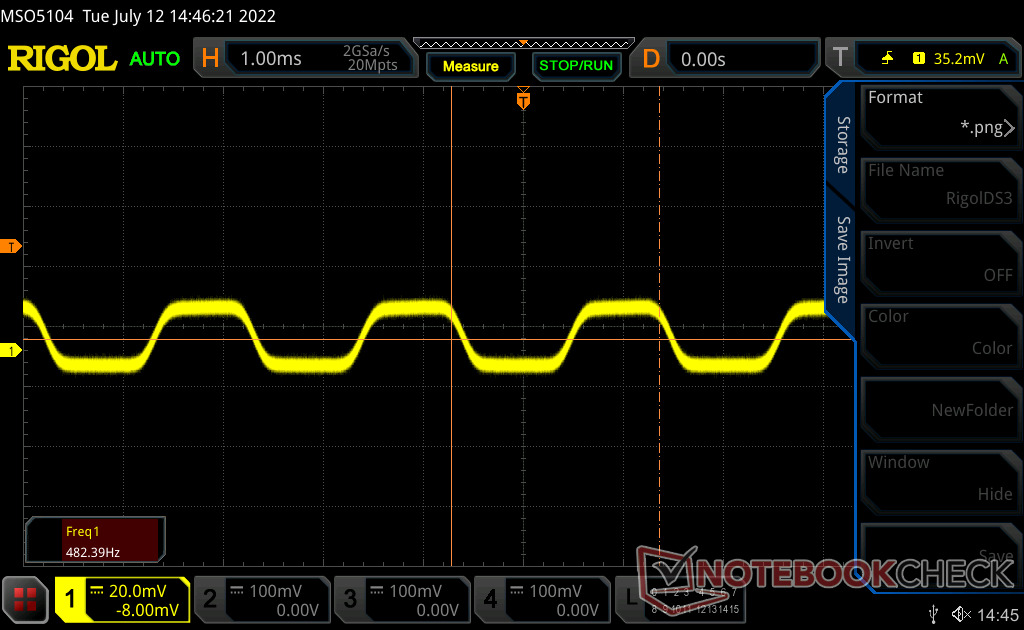
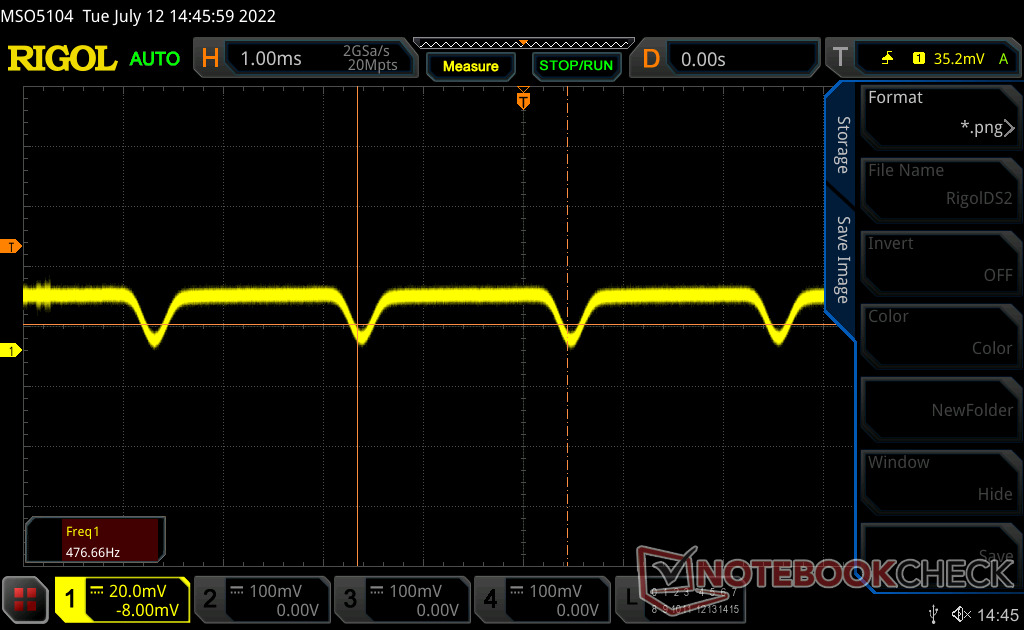
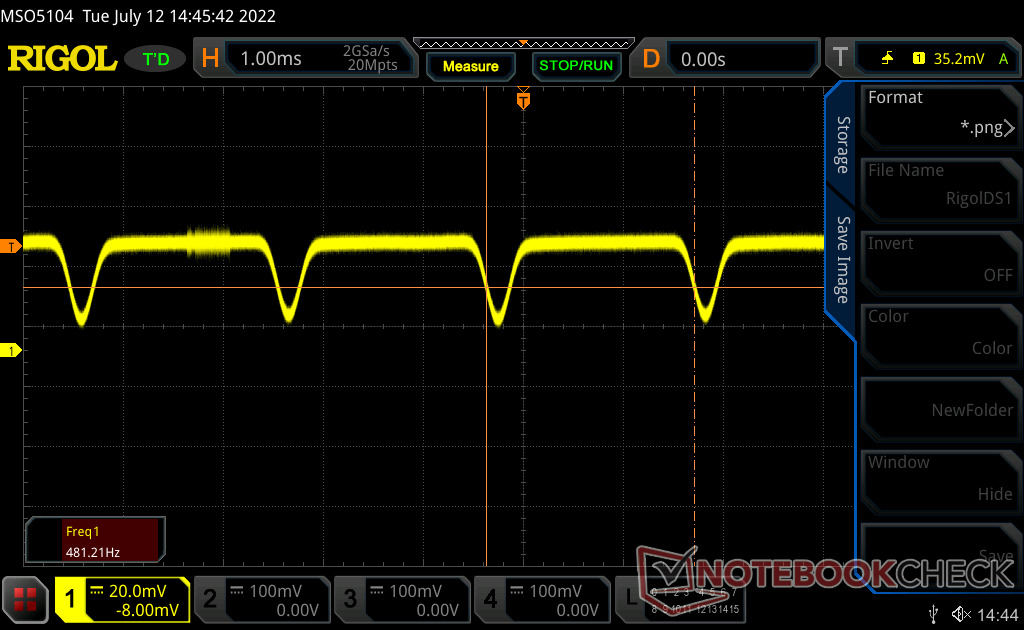
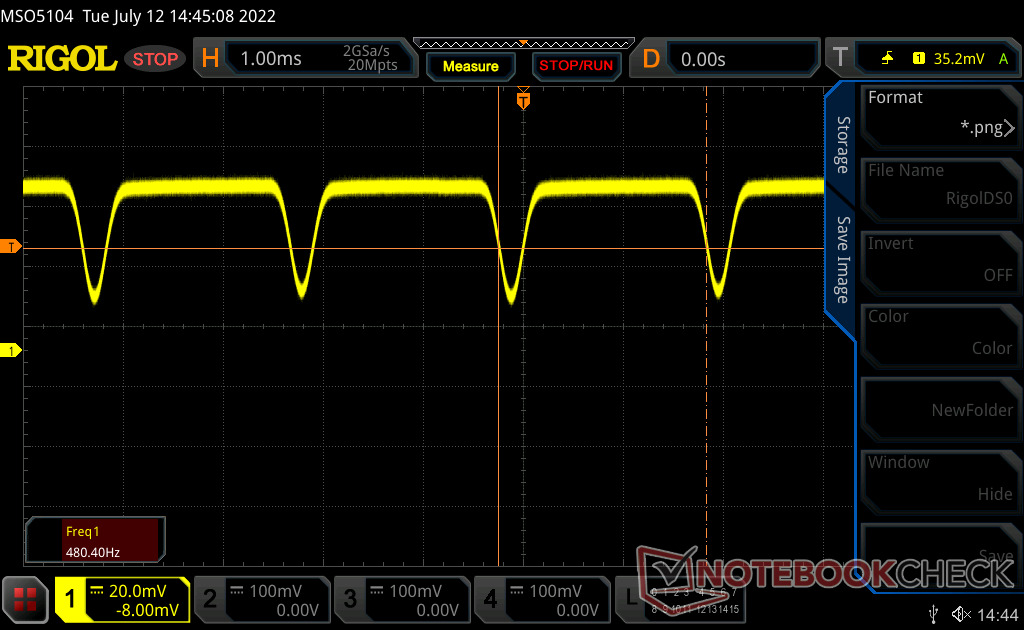
En segundo lugar, el panel muestra parpadeos a 480 Hz en todos los niveles de brillo, incluido el ajuste del 100%. Hemos registrado resultados similares en muchos recientes Asus Vivobook y Zenbook OLED. Si tus ojos son sensibles al parpadeo en pantalla, entonces puede ser mejor bajar el brillo o evitar usar el GE67 durante largos periodos
Por último, la pantalla interna no es compatible con G-Sync ni con la sincronización adaptativa
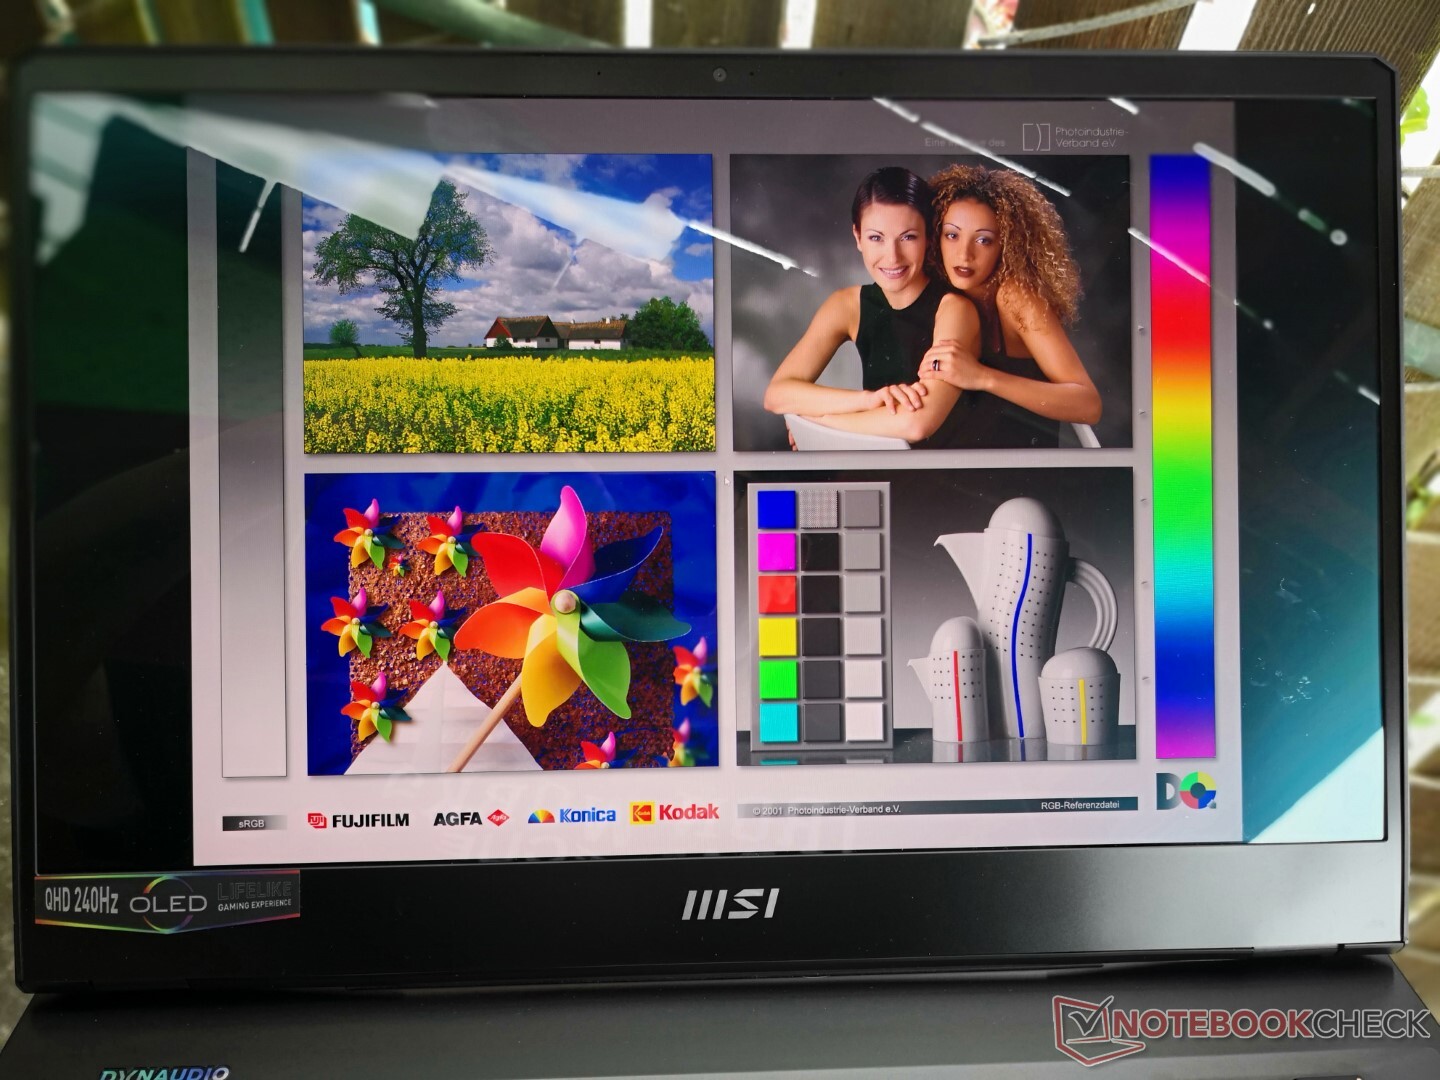
Aparte de los inconvenientes mencionados, el panel QHD OLED de 240 Hz ofrece una de las experiencias OLED más fluidas que hemos visto en los juegos. Los antiguos paneles OLED estaban limitados a 60 Hz que, si bien estaban perfectamente bien para fines de edición, no serían atractivos para los jugadores entusiastas. MSI ha moldeado la pantalla para fines de juego y menos para la edición o los profesionales aquí.

| |||||||||||||||||||||||||
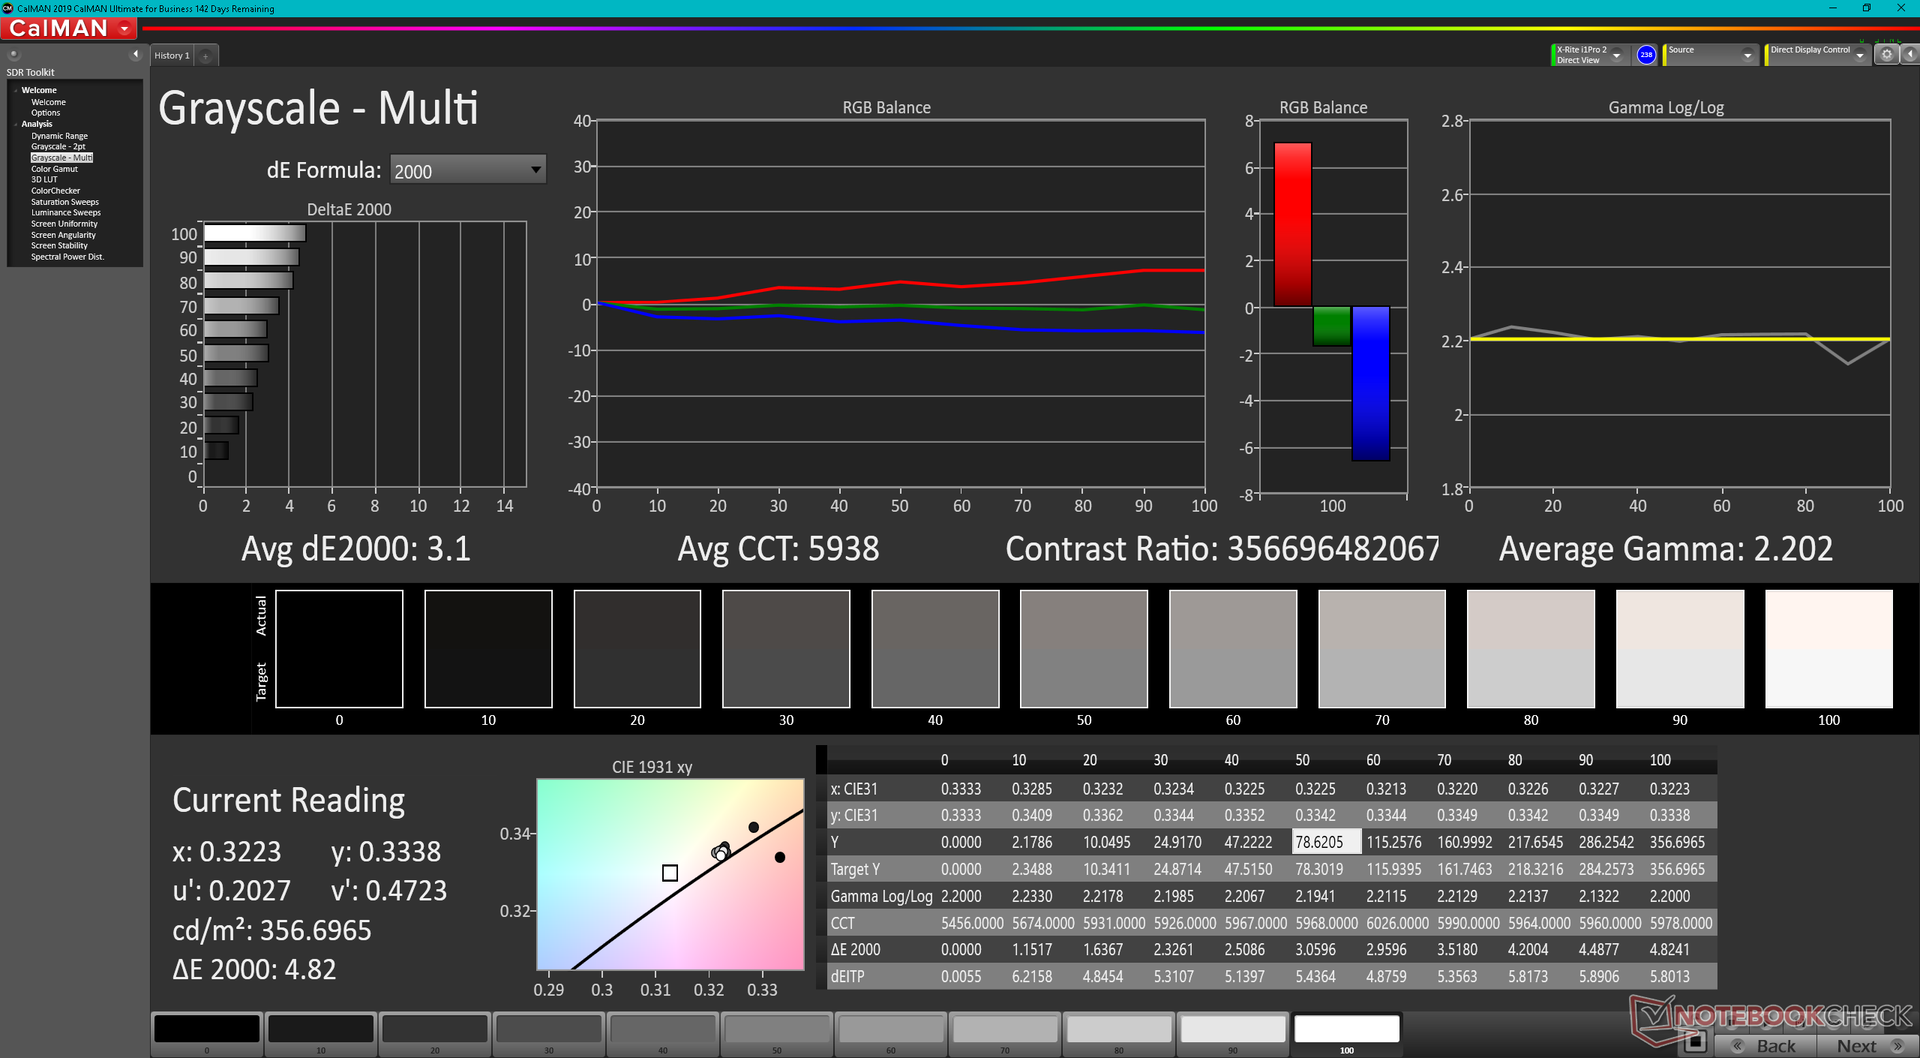
iluminación: 99 %
Brillo con batería: 356.1 cd/m²
Contraste: ∞:1 (Negro: 0 cd/m²)
ΔE ColorChecker Calman: 4.83 | ∀{0.5-29.43 Ø4.71}
ΔE Greyscale Calman: 3.1 | ∀{0.09-98 Ø4.96}
75.2% AdobeRGB 1998 (Argyll 3D)
89.7% sRGB (Argyll 3D)
71.7% Display P3 (Argyll 3D)
Gamma: 2.2
CCT: 5938 K
| MSI GE67 HX 12UGS Samsung ATNA562P02-0, OLED, 1920x1080, 15.6" | MSI Raider GE66 12UHS AUO51EB, IPS, 3840x2160, 15.6" | MSI Vector GP66 12UGS BOE NE156FHM-NZ3, IPS, 1920x1080, 15.6" | Asus ROG Strix Scar 15 G533ZW-LN106WS BOE CQ NE156QHM-NZ2, IPS-level, 2560x1440, 15.6" | Alienware m15 R6, i7-11800H RTX 3080 AU Optronics AUO9092 (B156HAN), IPS, 1920x1080, 15.6" | Razer Blade 15 2022 Sharp LQ156T1JW03, IPS, 2560x1440, 15.6" | |
|---|---|---|---|---|---|---|
| Display | 16% | 2% | 19% | 5% | 21% | |
| Display P3 Coverage (%) | 71.7 | 80.4 12% | 70.1 -2% | 96.2 34% | 74.1 3% | 99.1 38% |
| sRGB Coverage (%) | 89.7 | 98.4 10% | 99.5 11% | 99.9 11% | 99.5 11% | 99.9 11% |
| AdobeRGB 1998 Coverage (%) | 75.2 | 94.7 26% | 72.1 -4% | 84.5 12% | 75.7 1% | 86.8 15% |
| Response Times | -5260% | -2260% | -2134% | -1160% | -4230% | |
| Response Time Grey 50% / Grey 80% * (ms) | 0.25 ? | 18.8 ? -7420% | 5.8 ? -2220% | 7.86 ? -3044% 4.21 ? -1584% | 2.8 -1020% | 14.4 ? -5660% |
| Response Time Black / White * (ms) | 0.4 ? | 12.8 ? -3100% | 9.6 ? -2300% | 7.5 ? -1775% | 5.6 -1300% | 11.6 ? -2800% |
| PWM Frequency (Hz) | 480.4 ? | |||||
| Screen | -1% | 6% | 9% | 6% | 15% | |
| Brightness middle (cd/m²) | 356.1 | 351 -1% | 353.1 -1% | 346 -3% | 359 1% | 286 -20% |
| Brightness (cd/m²) | 358 | 347 -3% | 325 -9% | 329 -8% | 344 -4% | 271 -24% |
| Brightness Distribution (%) | 99 | 90 -9% | 85 -14% | 91 -8% | 85 -14% | 89 -10% |
| Black Level * (cd/m²) | 0.35 | 0.38 | 0.59 | 0.35 | 0.25 | |
| Colorchecker dE 2000 * | 4.83 | 2.54 47% | 2.24 54% | 3.06 37% | 3.3 32% | 2.74 43% |
| Colorchecker dE 2000 max. * | 7.94 | 8.36 -5% | 5 37% | 5.81 27% | 4.84 39% | 5.21 34% |
| Greyscale dE 2000 * | 3.1 | 4.1 -32% | 4 -29% | 3.66 -18% | 1.1 65% | |
| Gamma | 2.2 100% | 2.089 105% | 2.24 98% | 2.12 104% | 2.43 91% | 2.2 100% |
| CCT | 5938 109% | 7036 92% | 6864 95% | 7021 93% | 5896 110% | 6408 101% |
| Contrast (:1) | 1003 | 929 | 586 | 1026 | 1144 | |
| Colorchecker dE 2000 calibrated * | 0.67 | 1.02 | 2.57 | 3.28 | 2.52 | |
| Media total (Programa/Opciones) | -1748% /
-952% | -751% /
-407% | -702% /
-573% | -383% /
-206% | -1398% /
-755% |
* ... más pequeño es mejor
Tiempos de respuesta del display
| ↔ Tiempo de respuesta de Negro a Blanco | ||
|---|---|---|
| 0.4 ms ... subida ↗ y bajada ↘ combinada | ↗ 0.2 ms subida | 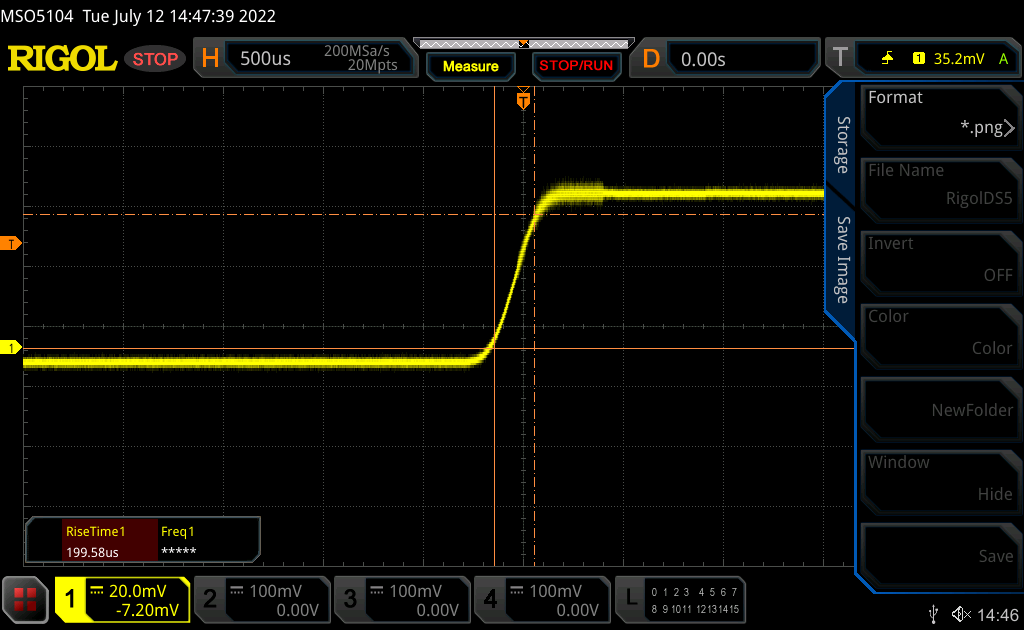 |
| ↘ 0.2 ms bajada | ||
| La pantalla mostró tiempos de respuesta muy rápidos en nuestros tests y debería ser adecuada para juegos frenéticos. En comparación, todos los dispositivos de prueba van de ##min### (mínimo) a 240 (máximo) ms. » 0 % de todos los dispositivos son mejores. Esto quiere decir que el tiempo de respuesta medido es mejor que la media (19.8 ms) de todos los dispositivos testados. | ||
| ↔ Tiempo de respuesta 50% Gris a 80% Gris | ||
| 0.25 ms ... subida ↗ y bajada ↘ combinada | ↗ 0.13 ms subida | 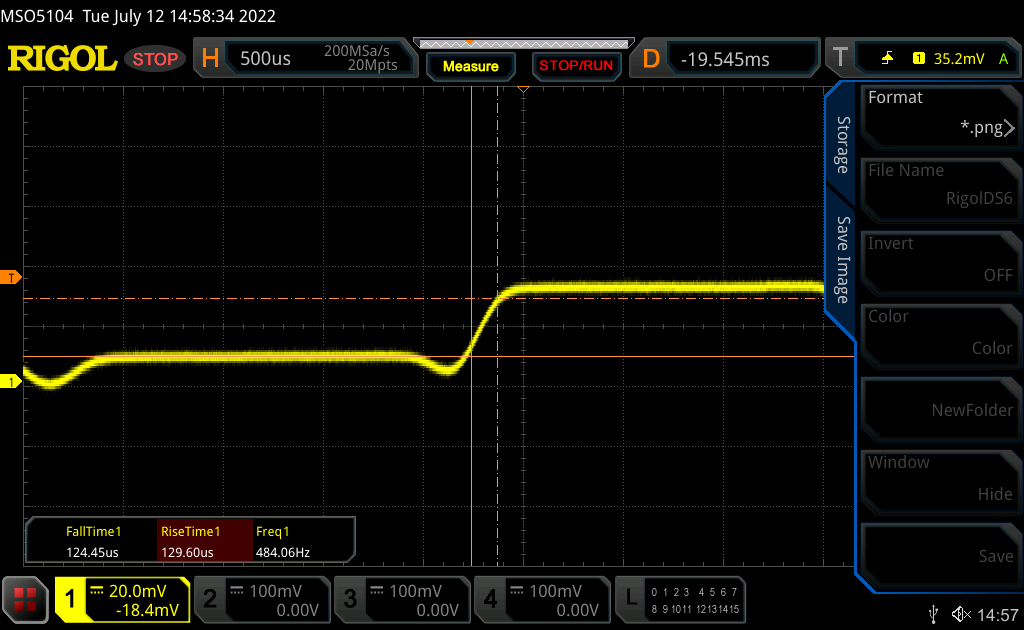 |
| ↘ 0.12 ms bajada | ||
| La pantalla mostró tiempos de respuesta muy rápidos en nuestros tests y debería ser adecuada para juegos frenéticos. En comparación, todos los dispositivos de prueba van de ##min### (mínimo) a 636 (máximo) ms. » 0 % de todos los dispositivos son mejores. Esto quiere decir que el tiempo de respuesta medido es mejor que la media (31 ms) de todos los dispositivos testados. | ||
Parpadeo de Pantalla / PWM (Pulse-Width Modulation)
| Parpadeo de Pantalla / PWM detectado | 480.4 Hz | ≤ 100 % de brillo |  |
La retroiluminación del display parpadea a 480.4 Hz (seguramente usa PWM - Pulse-Width Modulation) a un brillo del 100 % e inferior. Sobre este nivel de brillo no debería darse parpadeo / PWM. La frecuencia de 480.4 Hz es relativamente alta, por lo que la mayoría de gente no debería ver parpadeo o tener fatiga visual. Sin embargo, hay informes de que algunas personas pueden seguir viendo parpadeos a 500 Hz y superior, por lo que cuidado. Comparación: 52 % de todos los dispositivos testados no usaron PWM para atenuar el display. Si se usó, medimos una media de 7754 (mínimo: 5 - máxmo: 343500) Hz. | |||

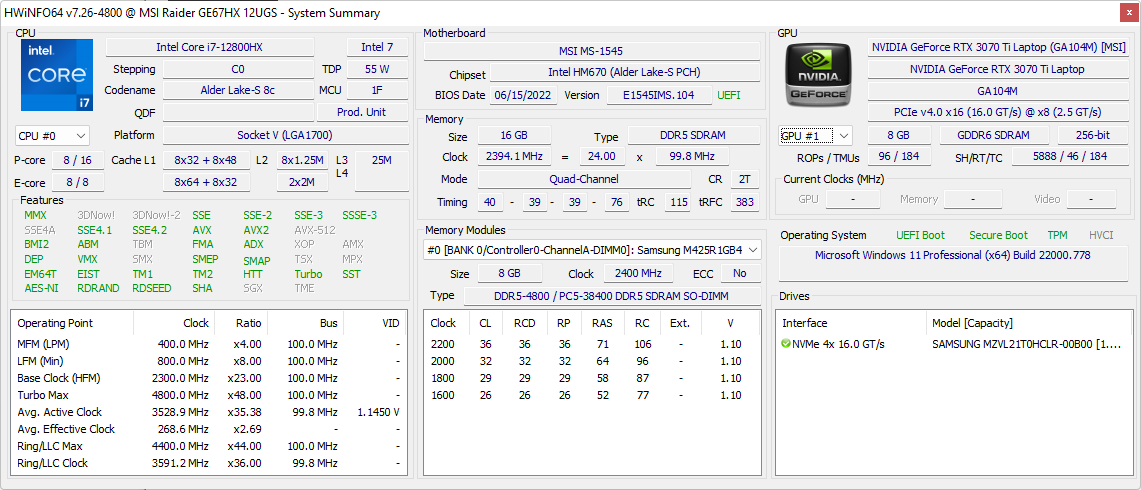
Rendimiento - 16 núcleos y 24 hilos
Condiciones de la prueba
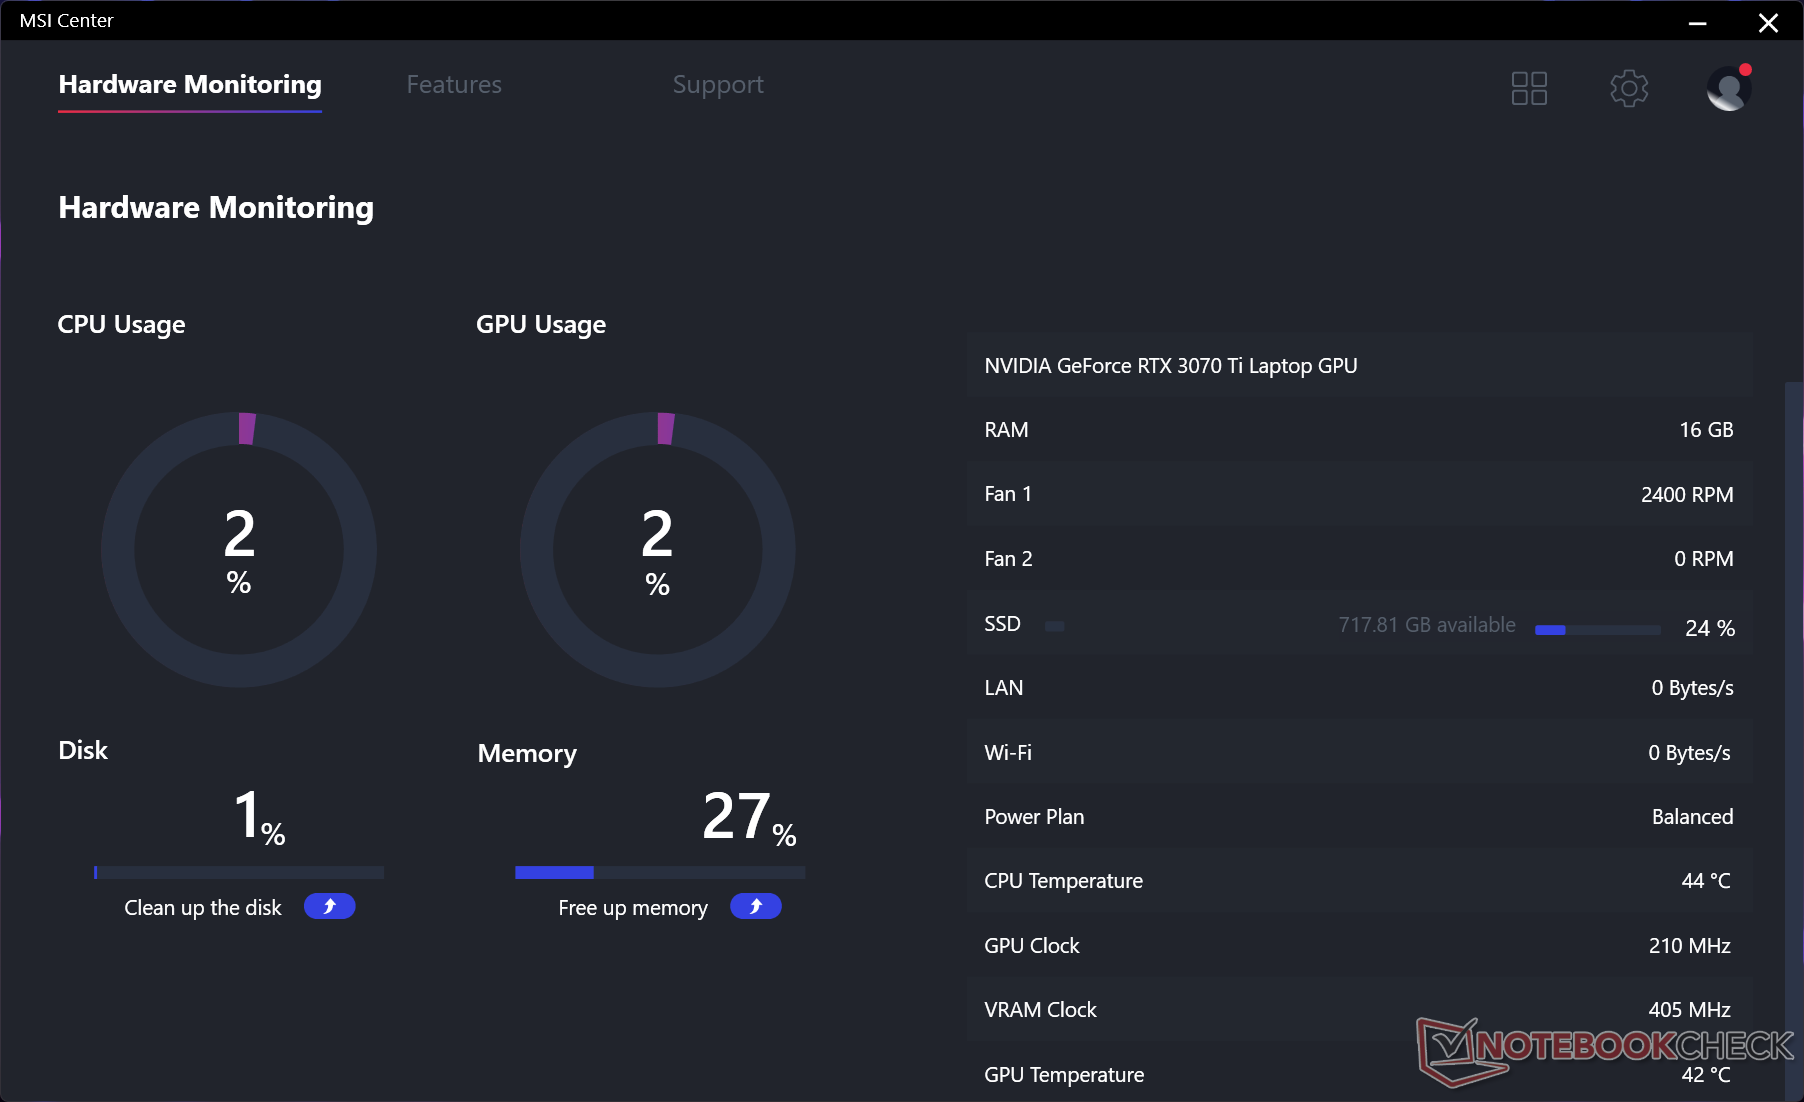
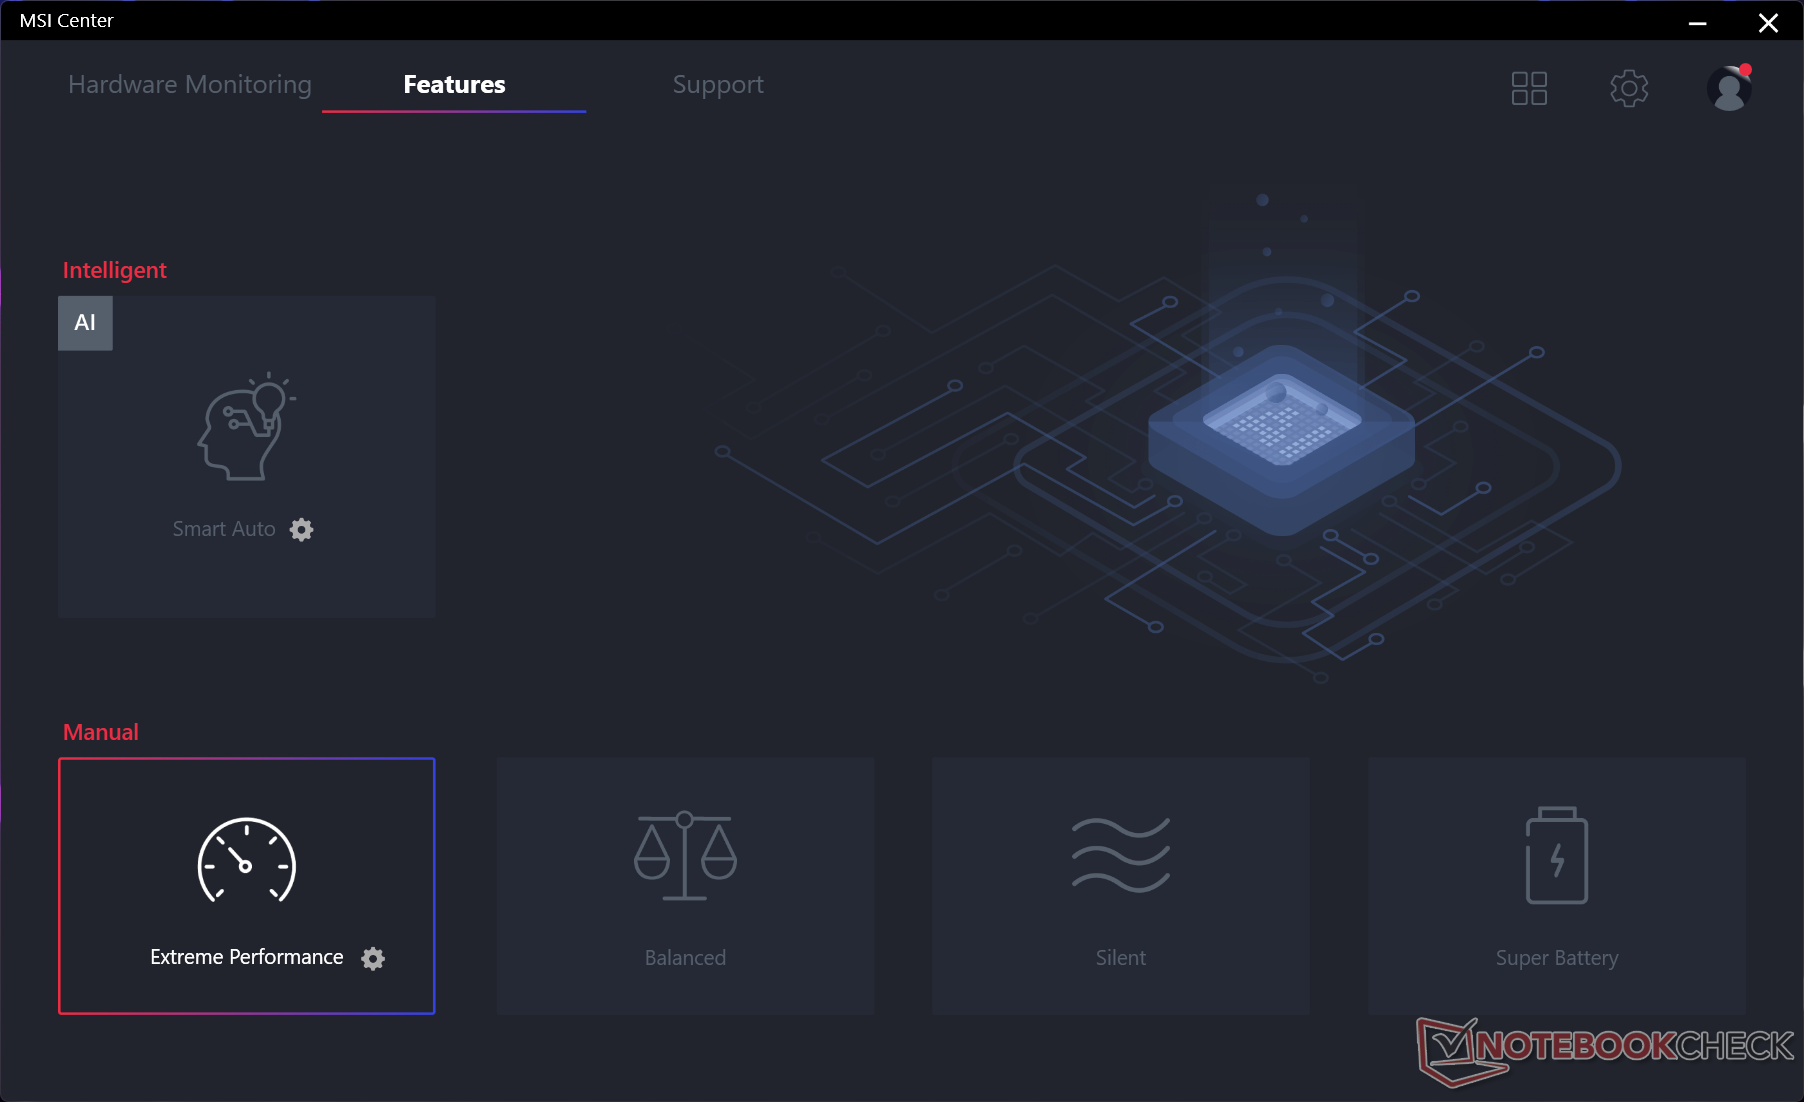
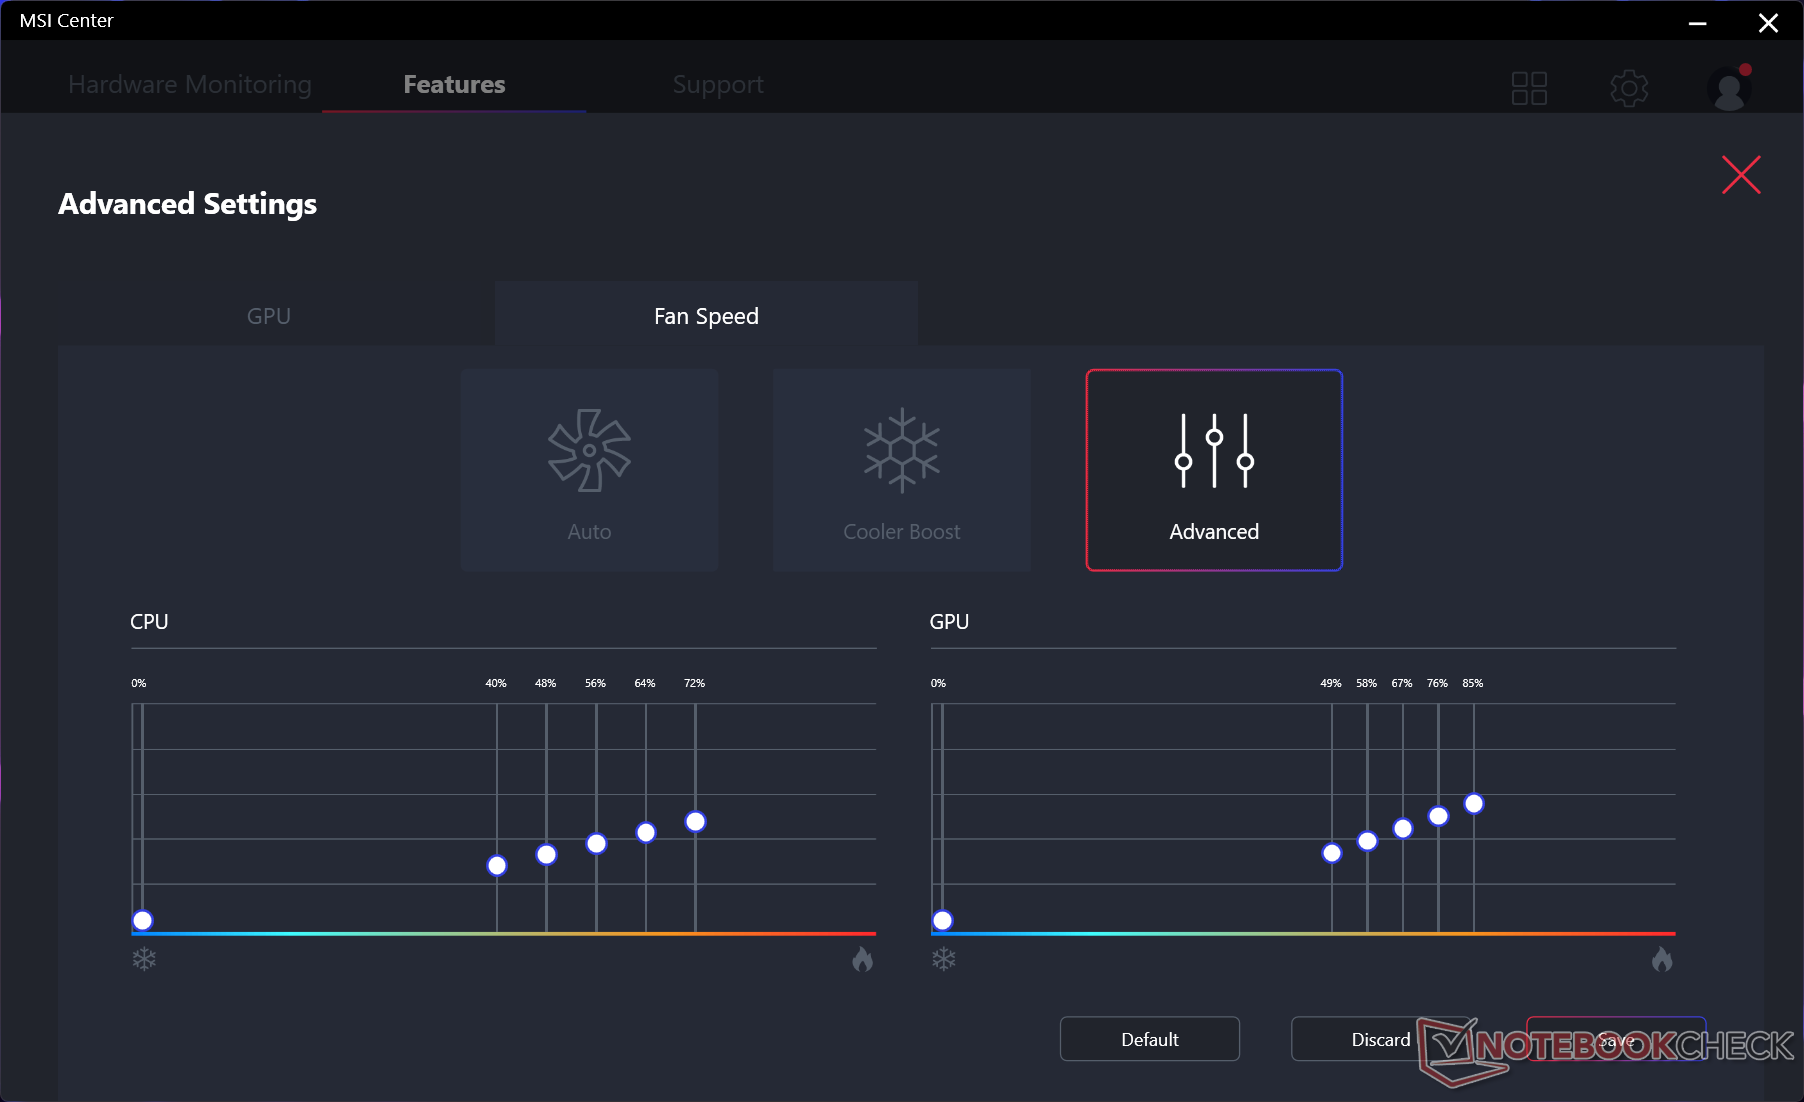
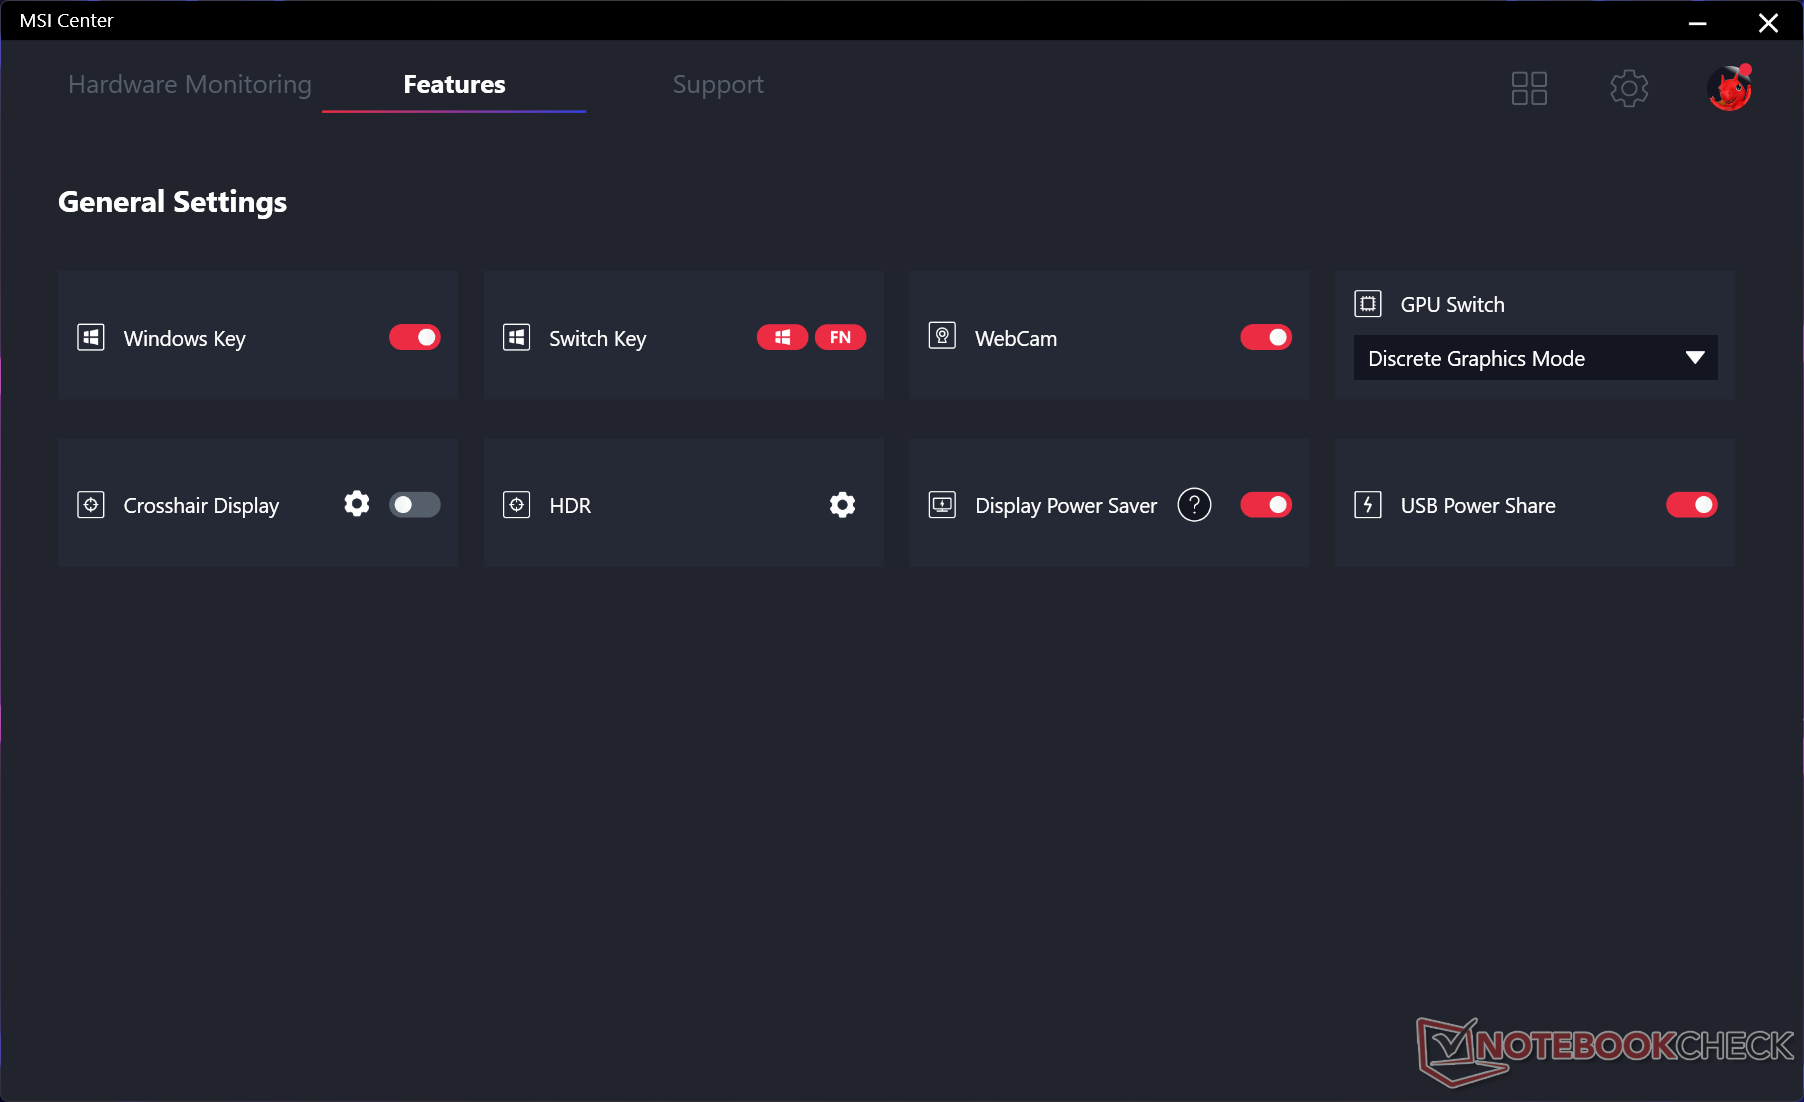
Configuramos nuestra unidad en modo Rendimiento a través de Windows, modo Rendimiento Extremo vis MSI Center, y la GPU discreta activa en lugar del modo MSHybrid antes de ejecutar cualquier prueba de rendimiento a continuación. Recomendamos a los usuarios que se familiaricen con el software preinstalado MSI Center, ya que aquí se pueden cambiar las características clave de rendimiento y auxiliares.
Procesador
ElCore i7-12800HX es sin duda uno de los aspectos más destacados del GE67 HX. El rendimiento multihilo en bruto es aproximadamente un 25 por ciento más rápido que elCore i9-12900HK en el GE66 del primer trimestre de 2022 y este delta es aún mayor cuando se compara con el Core i9-10980HK en el GE66 original de 2020. Supera fácilmente a cualquier procesador móvil de la línea Zen 3 de AMD. El Ryzen 9 5900HXpor ejemplo, es más lento entre un 40 y un 45% en cargas multihilo
La sostenibilidad del rendimiento también es muy buena, sin grandes caídas en la velocidad de reloj a lo largo del tiempo, incluso cuando se estresa durante largos períodos
El rendimiento de un solo hilo sigue siendo similar al del Core i9-12900HK a pesar de sus diferencias en el número de núcleos (16 frente a 14) y de hilos (24 frente a 20).
Cinebench R15 Multi Loop
Cinebench R23: Multi Core | Single Core
Cinebench R15: CPU Multi 64Bit | CPU Single 64Bit
Blender: v2.79 BMW27 CPU
7-Zip 18.03: 7z b 4 | 7z b 4 -mmt1
Geekbench 5.5: Multi-Core | Single-Core
HWBOT x265 Benchmark v2.2: 4k Preset
LibreOffice : 20 Documents To PDF
R Benchmark 2.5: Overall mean
| Cinebench R23 / Multi Core | |
| Intel Core i9-12900K | |
| MSI GE67 HX 12UGS | |
| Medio Intel Core i7-12800HX (n=1) | |
| MSI GE76 Raider | |
| Schenker XMG Neo 15 (i7-12700H, RTX 3080 Ti) | |
| Eurocom Raptor X15 | |
| Asus ROG Strix Scar 15 G533zm | |
| MSI Raider GE66 12UHS | |
| Schenker XMG Apex 15 NH57E PS | |
| MSI Delta 15 A5EFK | |
| Cinebench R23 / Single Core | |
| Intel Core i9-12900K | |
| MSI GE76 Raider | |
| MSI Raider GE66 12UHS | |
| MSI GE67 HX 12UGS | |
| Medio Intel Core i7-12800HX (n=1) | |
| Schenker XMG Neo 15 (i7-12700H, RTX 3080 Ti) | |
| Eurocom Raptor X15 | |
| Asus ROG Strix Scar 15 G533zm | |
| MSI Delta 15 A5EFK | |
| Schenker XMG Apex 15 NH57E PS | |
Cinebench R23: Multi Core | Single Core
Cinebench R15: CPU Multi 64Bit | CPU Single 64Bit
Blender: v2.79 BMW27 CPU
7-Zip 18.03: 7z b 4 | 7z b 4 -mmt1
Geekbench 5.5: Multi-Core | Single-Core
HWBOT x265 Benchmark v2.2: 4k Preset
LibreOffice : 20 Documents To PDF
R Benchmark 2.5: Overall mean
* ... más pequeño es mejor
AIDA64: FP32 Ray-Trace | FPU Julia | CPU SHA3 | CPU Queen | FPU SinJulia | FPU Mandel | CPU AES | CPU ZLib | FP64 Ray-Trace | CPU PhotoWorxx
| Performance rating | |
| Alienware m15 R6, i7-11800H RTX 3080 | |
| MSI GE67 HX 12UGS | |
| Medio Intel Core i7-12800HX | |
| Asus ROG Strix Scar 15 G533ZW-LN106WS | |
| MSI Raider GE66 12UHS | |
| MSI Vector GP66 12UGS | |
| Razer Blade 15 2022 | |
| AIDA64 / FP32 Ray-Trace | |
| Alienware m15 R6, i7-11800H RTX 3080 | |
| MSI GE67 HX 12UGS | |
| Medio Intel Core i7-12800HX (n=1) | |
| Asus ROG Strix Scar 15 G533ZW-LN106WS | |
| MSI Raider GE66 12UHS | |
| MSI Vector GP66 12UGS | |
| Razer Blade 15 2022 | |
| AIDA64 / FPU Julia | |
| Alienware m15 R6, i7-11800H RTX 3080 | |
| MSI GE67 HX 12UGS | |
| Medio Intel Core i7-12800HX (n=1) | |
| Asus ROG Strix Scar 15 G533ZW-LN106WS | |
| MSI Raider GE66 12UHS | |
| MSI Vector GP66 12UGS | |
| Razer Blade 15 2022 | |
| AIDA64 / CPU SHA3 | |
| Alienware m15 R6, i7-11800H RTX 3080 | |
| MSI GE67 HX 12UGS | |
| Medio Intel Core i7-12800HX (n=1) | |
| Asus ROG Strix Scar 15 G533ZW-LN106WS | |
| MSI Vector GP66 12UGS | |
| MSI Raider GE66 12UHS | |
| Razer Blade 15 2022 | |
| AIDA64 / CPU Queen | |
| MSI Vector GP66 12UGS | |
| MSI Raider GE66 12UHS | |
| Asus ROG Strix Scar 15 G533ZW-LN106WS | |
| Razer Blade 15 2022 | |
| Alienware m15 R6, i7-11800H RTX 3080 | |
| MSI GE67 HX 12UGS | |
| Medio Intel Core i7-12800HX (n=1) | |
| AIDA64 / FPU SinJulia | |
| MSI GE67 HX 12UGS | |
| Medio Intel Core i7-12800HX (n=1) | |
| Asus ROG Strix Scar 15 G533ZW-LN106WS | |
| Alienware m15 R6, i7-11800H RTX 3080 | |
| MSI Vector GP66 12UGS | |
| MSI Raider GE66 12UHS | |
| Razer Blade 15 2022 | |
| AIDA64 / FPU Mandel | |
| Alienware m15 R6, i7-11800H RTX 3080 | |
| MSI GE67 HX 12UGS | |
| Medio Intel Core i7-12800HX (n=1) | |
| Asus ROG Strix Scar 15 G533ZW-LN106WS | |
| MSI Raider GE66 12UHS | |
| MSI Vector GP66 12UGS | |
| Razer Blade 15 2022 | |
| AIDA64 / CPU AES | |
| Alienware m15 R6, i7-11800H RTX 3080 | |
| MSI GE67 HX 12UGS | |
| Medio Intel Core i7-12800HX (n=1) | |
| Asus ROG Strix Scar 15 G533ZW-LN106WS | |
| MSI Vector GP66 12UGS | |
| MSI Raider GE66 12UHS | |
| Razer Blade 15 2022 | |
| AIDA64 / CPU ZLib | |
| MSI GE67 HX 12UGS | |
| Medio Intel Core i7-12800HX (n=1) | |
| Asus ROG Strix Scar 15 G533ZW-LN106WS | |
| MSI Vector GP66 12UGS | |
| MSI Raider GE66 12UHS | |
| Razer Blade 15 2022 | |
| Alienware m15 R6, i7-11800H RTX 3080 | |
| AIDA64 / FP64 Ray-Trace | |
| Alienware m15 R6, i7-11800H RTX 3080 | |
| MSI GE67 HX 12UGS | |
| Medio Intel Core i7-12800HX (n=1) | |
| Asus ROG Strix Scar 15 G533ZW-LN106WS | |
| MSI Raider GE66 12UHS | |
| MSI Vector GP66 12UGS | |
| Razer Blade 15 2022 | |
| AIDA64 / CPU PhotoWorxx | |
| Razer Blade 15 2022 | |
| MSI Raider GE66 12UHS | |
| Asus ROG Strix Scar 15 G533ZW-LN106WS | |
| MSI GE67 HX 12UGS | |
| Medio Intel Core i7-12800HX (n=1) | |
| MSI Vector GP66 12UGS | |
| Alienware m15 R6, i7-11800H RTX 3080 | |
Rendimiento del sistema
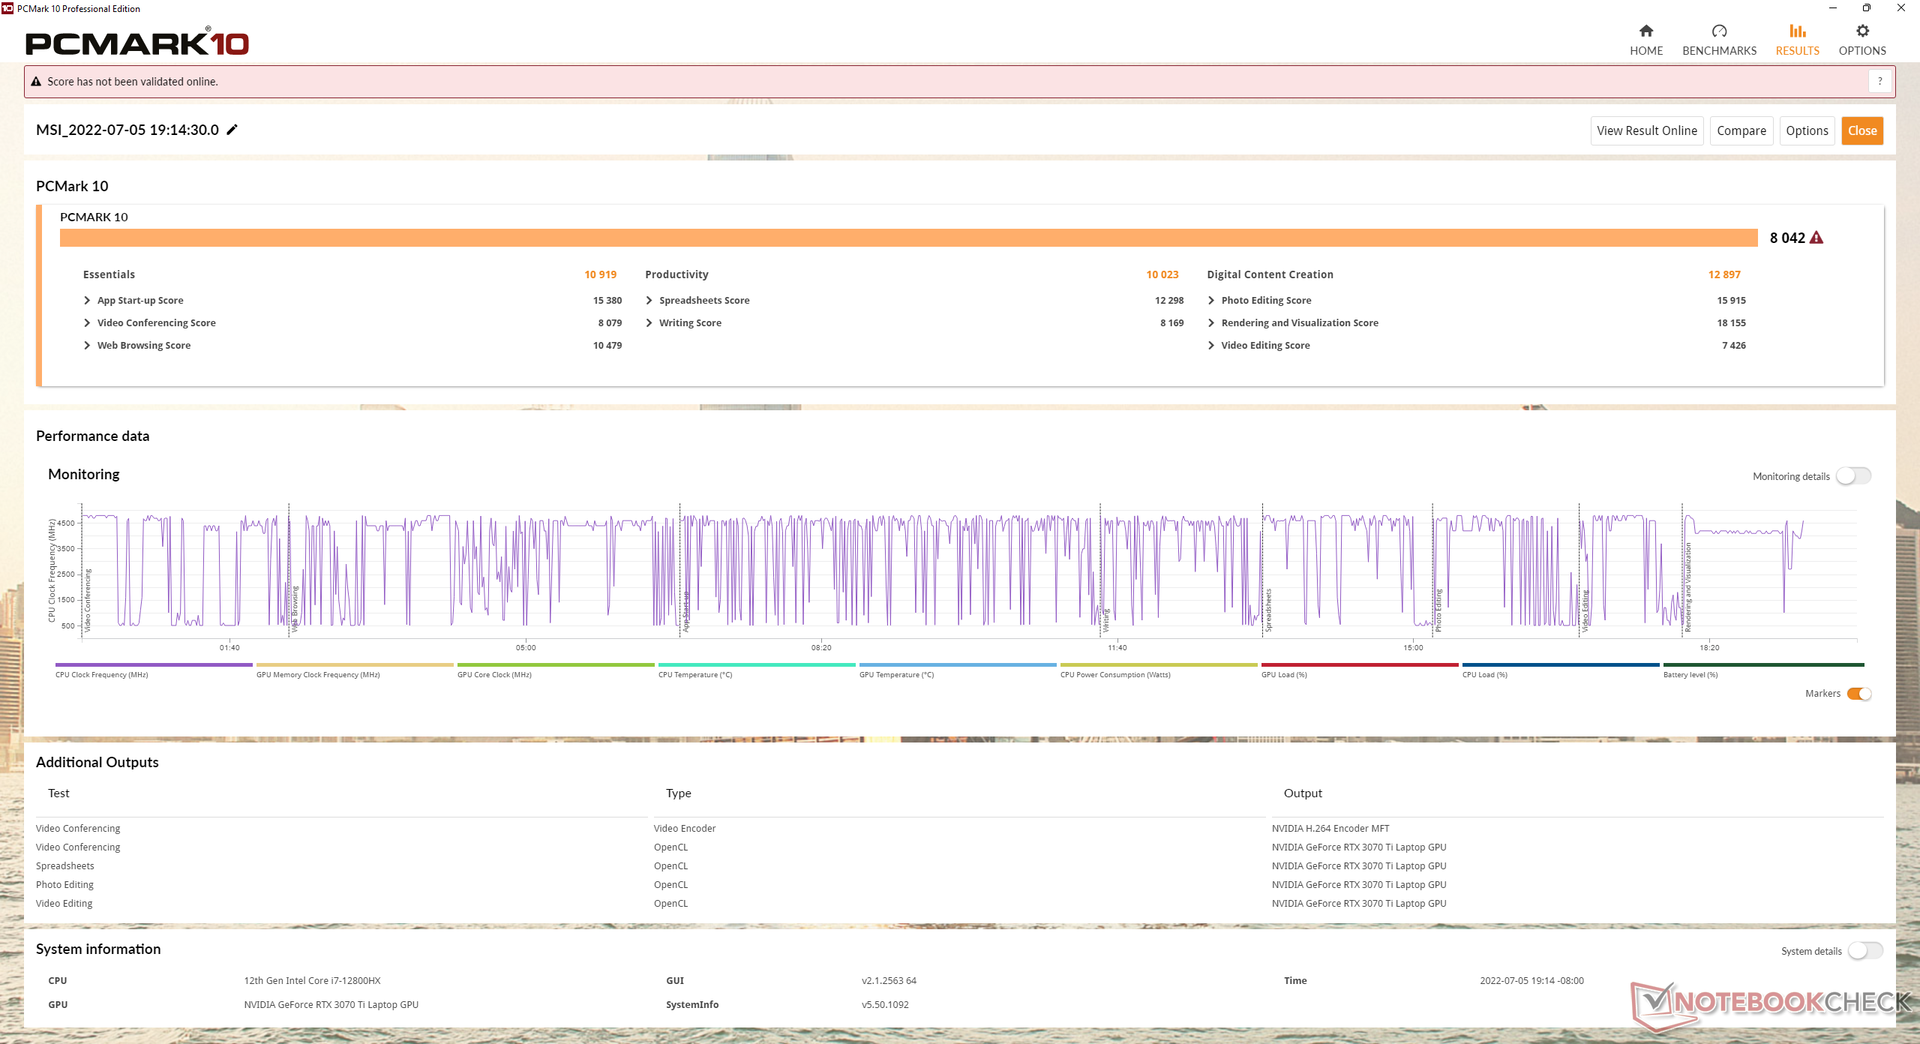
Los resultados de PCMark 10 son de los más altos de nuestra base de datos, con puntuaciones similares a las que observamos en el antiguo GE66 ejecutado con el más lento Core i9-12900HK pero más rápido GeForce RTX 3080 Ti.
Curiosamente, la subpuntuación de Creación de Contenido Digital baja de 12897 puntos a sólo 9568 puntos cuando está en modo MSHybrid.
CrossMark: Overall | Productivity | Creativity | Responsiveness
| PCMark 10 / Score | |
| MSI Raider GE66 12UHS | |
| MSI GE67 HX 12UGS | |
| Medio Intel Core i7-12800HX, NVIDIA GeForce RTX 3070 Ti Laptop GPU (n=1) | |
| MSI Vector GP66 12UGS | |
| Asus ROG Strix Scar 15 G533ZW-LN106WS | |
| Razer Blade 15 2022 | |
| Alienware m15 R6, i7-11800H RTX 3080 | |
| PCMark 10 / Essentials | |
| MSI Raider GE66 12UHS | |
| MSI Vector GP66 12UGS | |
| MSI GE67 HX 12UGS | |
| Medio Intel Core i7-12800HX, NVIDIA GeForce RTX 3070 Ti Laptop GPU (n=1) | |
| Razer Blade 15 2022 | |
| Asus ROG Strix Scar 15 G533ZW-LN106WS | |
| Alienware m15 R6, i7-11800H RTX 3080 | |
| PCMark 10 / Productivity | |
| Asus ROG Strix Scar 15 G533ZW-LN106WS | |
| MSI Raider GE66 12UHS | |
| MSI Vector GP66 12UGS | |
| MSI GE67 HX 12UGS | |
| Medio Intel Core i7-12800HX, NVIDIA GeForce RTX 3070 Ti Laptop GPU (n=1) | |
| Razer Blade 15 2022 | |
| Alienware m15 R6, i7-11800H RTX 3080 | |
| PCMark 10 / Digital Content Creation | |
| MSI GE67 HX 12UGS | |
| Medio Intel Core i7-12800HX, NVIDIA GeForce RTX 3070 Ti Laptop GPU (n=1) | |
| MSI Raider GE66 12UHS | |
| MSI Vector GP66 12UGS | |
| Razer Blade 15 2022 | |
| Asus ROG Strix Scar 15 G533ZW-LN106WS | |
| Alienware m15 R6, i7-11800H RTX 3080 | |
| CrossMark / Overall | |
| Asus ROG Strix Scar 15 G533ZW-LN106WS | |
| MSI GE67 HX 12UGS | |
| Medio Intel Core i7-12800HX, NVIDIA GeForce RTX 3070 Ti Laptop GPU (n=1) | |
| CrossMark / Productivity | |
| Asus ROG Strix Scar 15 G533ZW-LN106WS | |
| MSI GE67 HX 12UGS | |
| Medio Intel Core i7-12800HX, NVIDIA GeForce RTX 3070 Ti Laptop GPU (n=1) | |
| CrossMark / Creativity | |
| Asus ROG Strix Scar 15 G533ZW-LN106WS | |
| MSI GE67 HX 12UGS | |
| Medio Intel Core i7-12800HX, NVIDIA GeForce RTX 3070 Ti Laptop GPU (n=1) | |
| CrossMark / Responsiveness | |
| Asus ROG Strix Scar 15 G533ZW-LN106WS | |
| MSI GE67 HX 12UGS | |
| Medio Intel Core i7-12800HX, NVIDIA GeForce RTX 3070 Ti Laptop GPU (n=1) | |
| PCMark 10 Score | 8042 puntos | |
ayuda | ||
| AIDA64 / Memory Copy | |
| MSI Raider GE66 12UHS | |
| Razer Blade 15 2022 | |
| Asus ROG Strix Scar 15 G533ZW-LN106WS | |
| MSI GE67 HX 12UGS | |
| Medio Intel Core i7-12800HX (n=1) | |
| MSI Vector GP66 12UGS | |
| Alienware m15 R6, i7-11800H RTX 3080 | |
| AIDA64 / Memory Read | |
| MSI Raider GE66 12UHS | |
| Razer Blade 15 2022 | |
| Asus ROG Strix Scar 15 G533ZW-LN106WS | |
| MSI GE67 HX 12UGS | |
| Medio Intel Core i7-12800HX (n=1) | |
| Alienware m15 R6, i7-11800H RTX 3080 | |
| MSI Vector GP66 12UGS | |
| AIDA64 / Memory Write | |
| Razer Blade 15 2022 | |
| MSI Raider GE66 12UHS | |
| Asus ROG Strix Scar 15 G533ZW-LN106WS | |
| MSI GE67 HX 12UGS | |
| Medio Intel Core i7-12800HX (n=1) | |
| MSI Vector GP66 12UGS | |
| Alienware m15 R6, i7-11800H RTX 3080 | |
| AIDA64 / Memory Latency | |
| Asus ROG Strix Scar 15 G533ZW-LN106WS | |
| Alienware m15 R6, i7-11800H RTX 3080 | |
| MSI GE67 HX 12UGS | |
| Medio Intel Core i7-12800HX (n=1) | |
| MSI Raider GE66 12UHS | |
| MSI Vector GP66 12UGS | |
| Razer Blade 15 2022 | |
* ... más pequeño es mejor
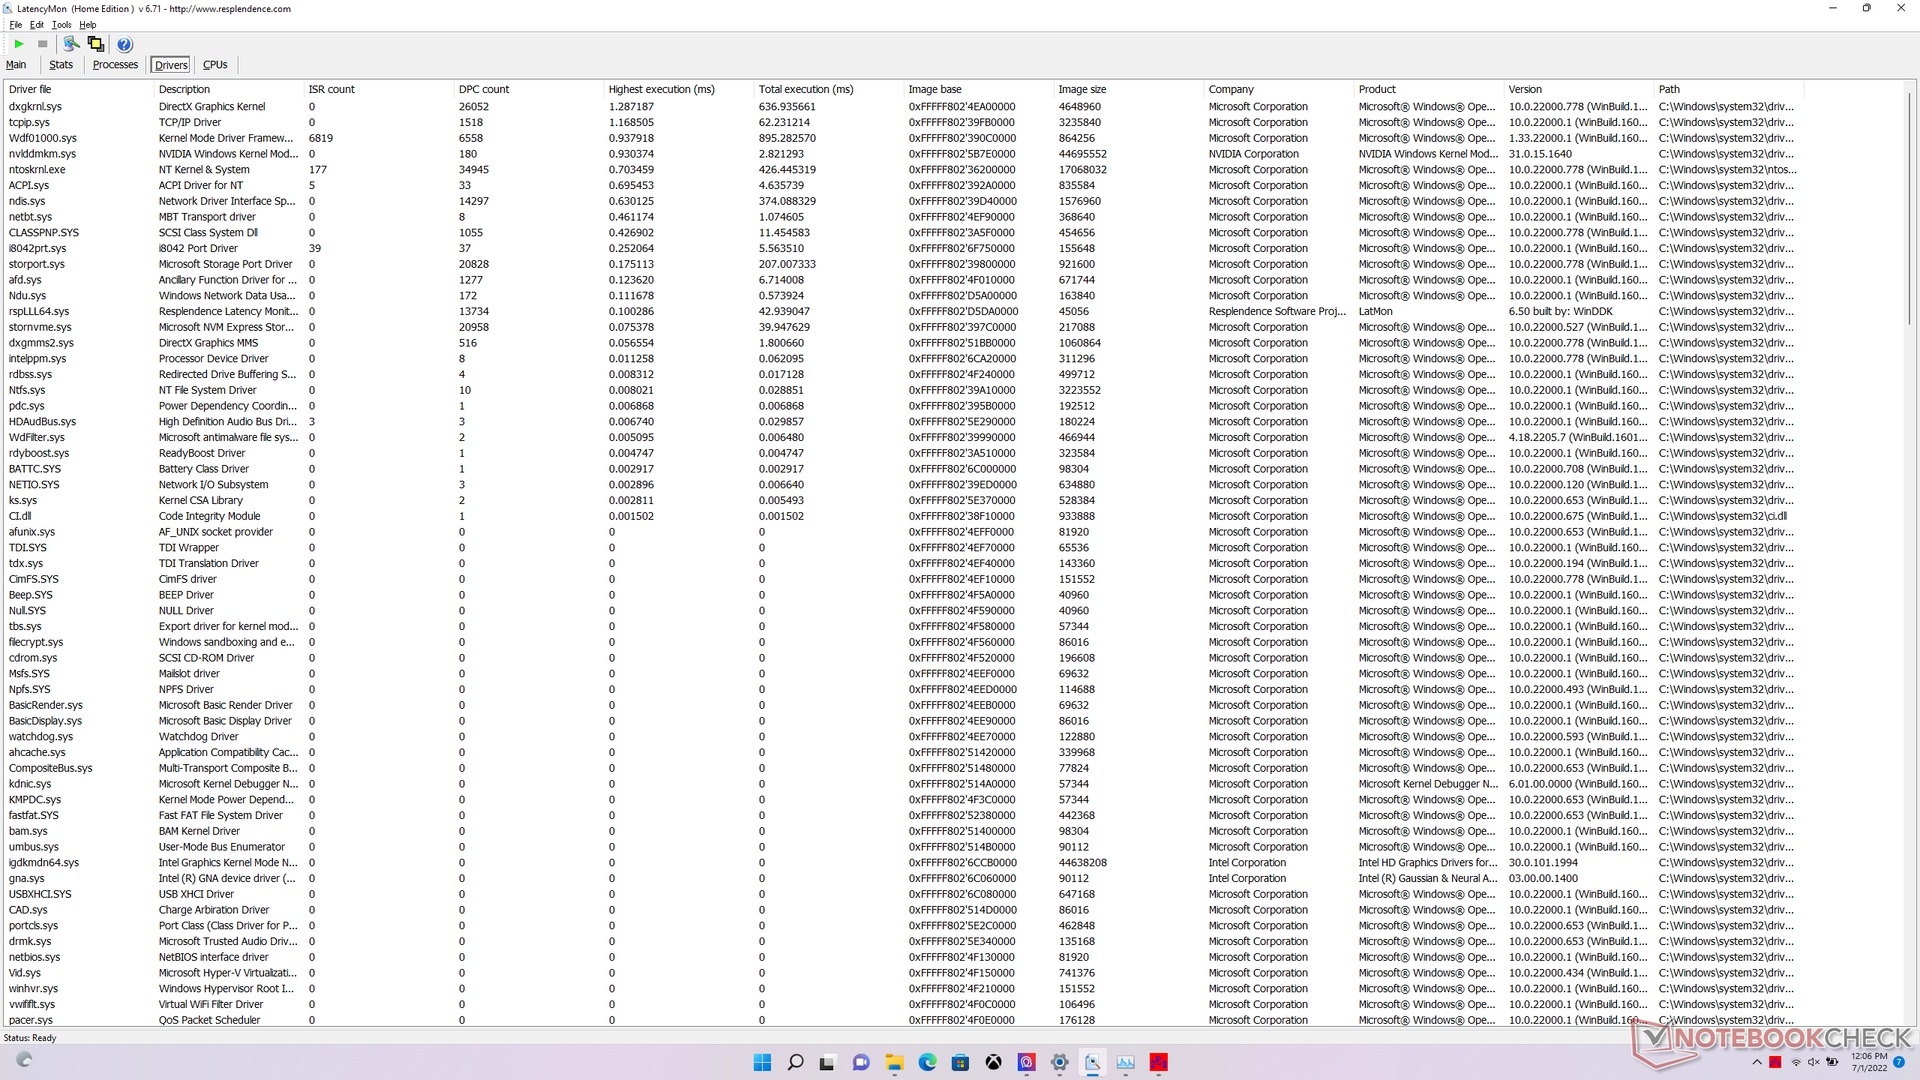
Latencia del CPD
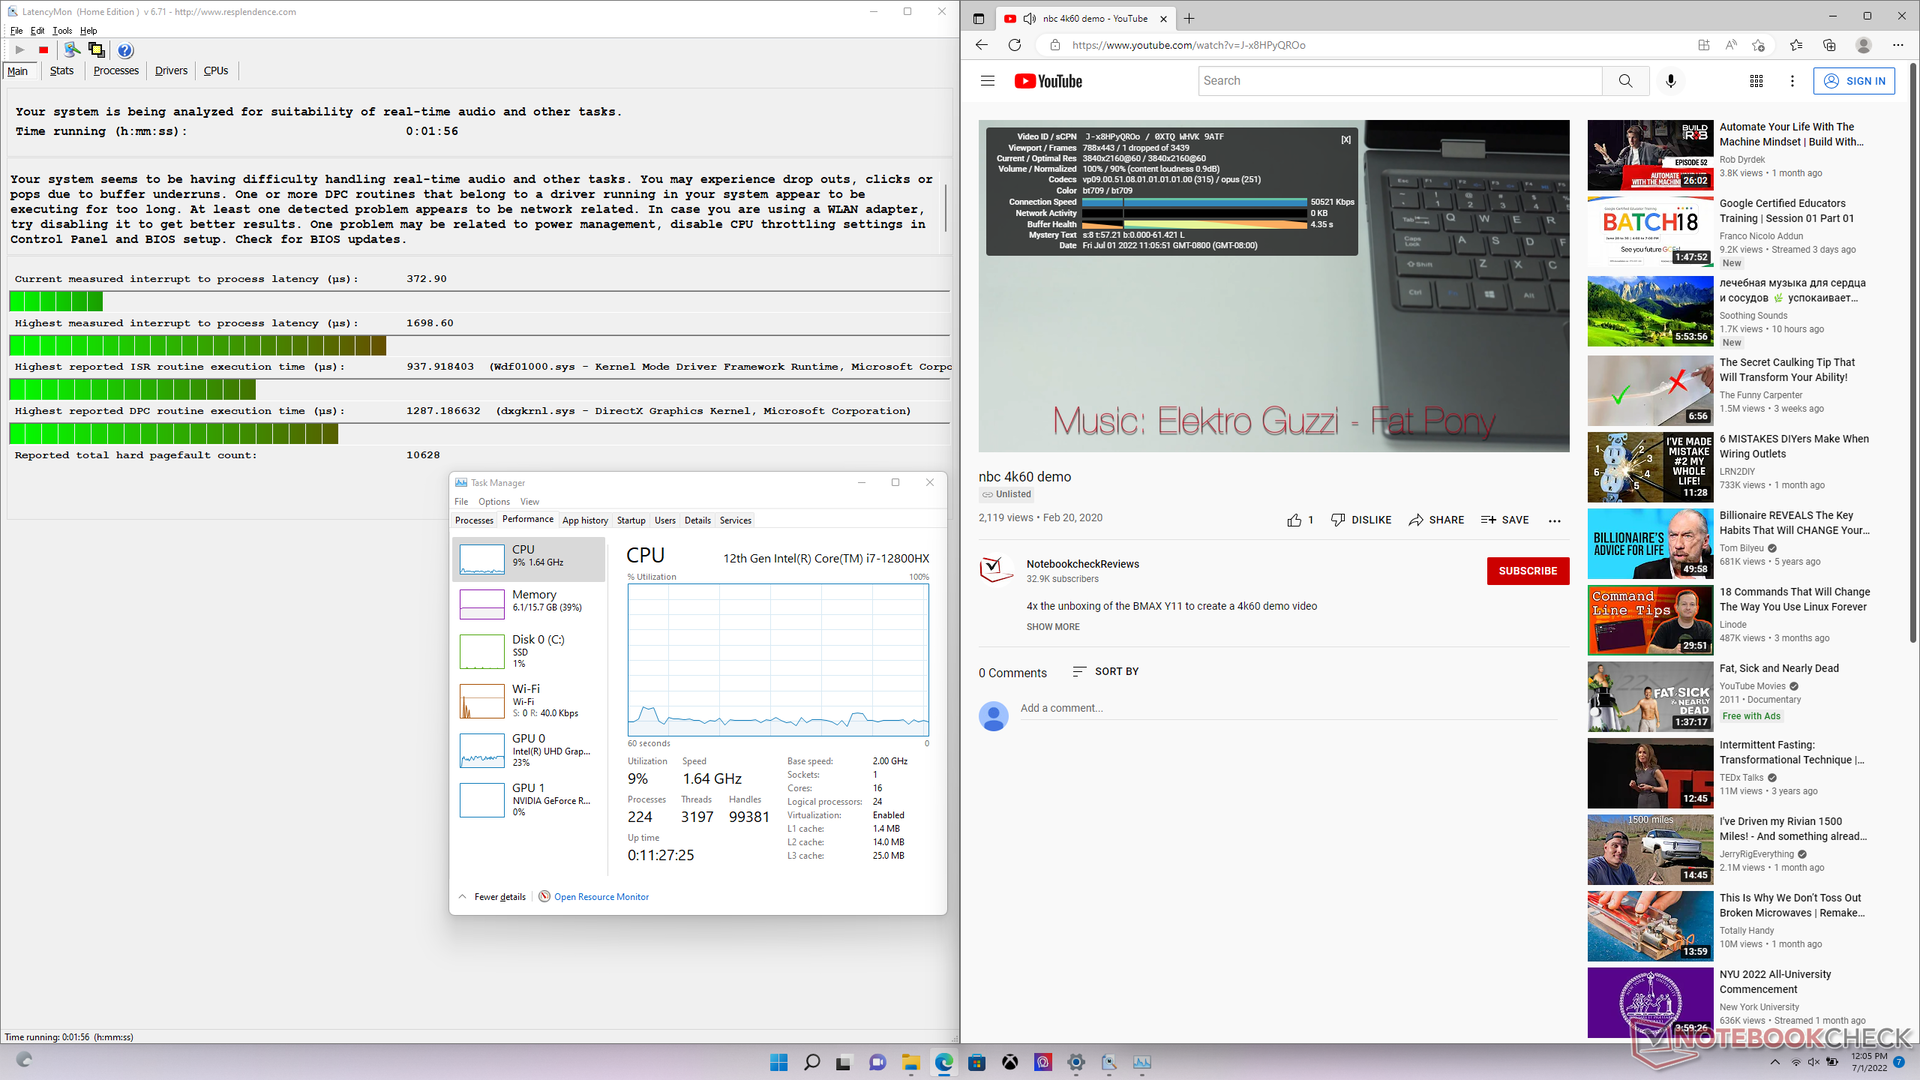
LatencyMon revela problemas menores de CPD al abrir varias pestañas del navegador en nuestra página de inicio. la reproducción de vídeo 4K a 60 FPS es, por lo demás, fluida, con sólo un fotograma perdido durante nuestra prueba de vídeo de 60 segundos.
| DPC Latencies / LatencyMon - interrupt to process latency (max), Web, Youtube, Prime95 | |
| MSI Raider GE66 12UHS | |
| MSI Vector GP66 12UGS | |
| MSI GE67 HX 12UGS | |
| Razer Blade 15 2022 | |
| Alienware m15 R6, i7-11800H RTX 3080 | |
| Asus ROG Strix Scar 15 G533ZW-LN106WS | |
* ... más pequeño es mejor
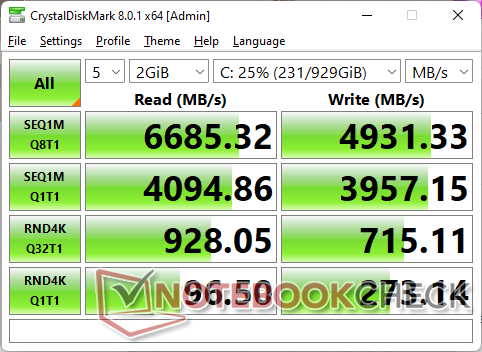
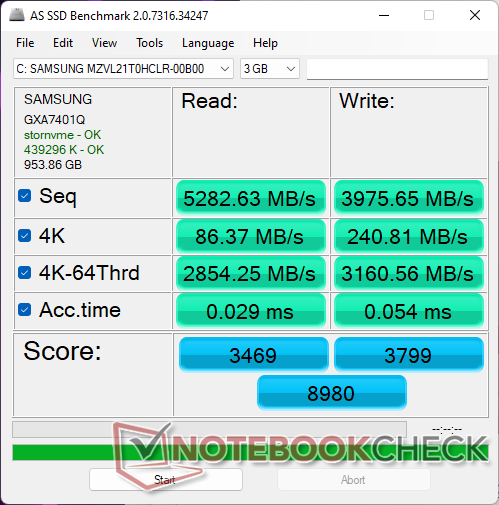
Dispositivos de almacenamiento - Estándar PCIe4 x4
Nuestra unidad viene con una unidad de 1 TBSamsung PM9A1 PCIe4 x4 NVMe SSD para velocidades de lectura y escritura secuenciales de hasta 7000 MB/s y 5100 MB/s, respectivamente. Por desgracia, nuestra unidad tenía problemas para mantener su velocidad de lectura máxima durante periodos prolongados, como muestra nuestra prueba de bucle DiskSpd. Las velocidades de lectura acabaron cayendo hasta los 1.500 MB/s, probablemente debido a los límites de temperatura y a la falta de un disipador de calor adecuado sobre la unidad SSD.

* ... más pequeño es mejor
Disk Throttling: DiskSpd Read Loop, Queue Depth 8
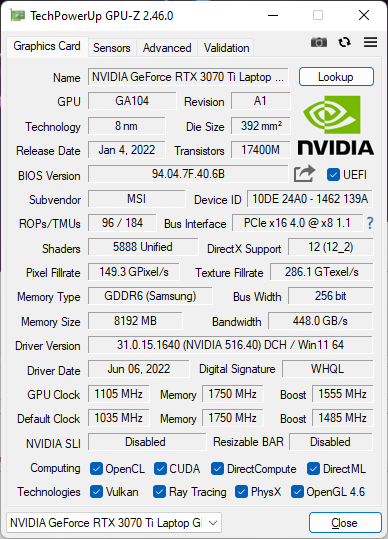
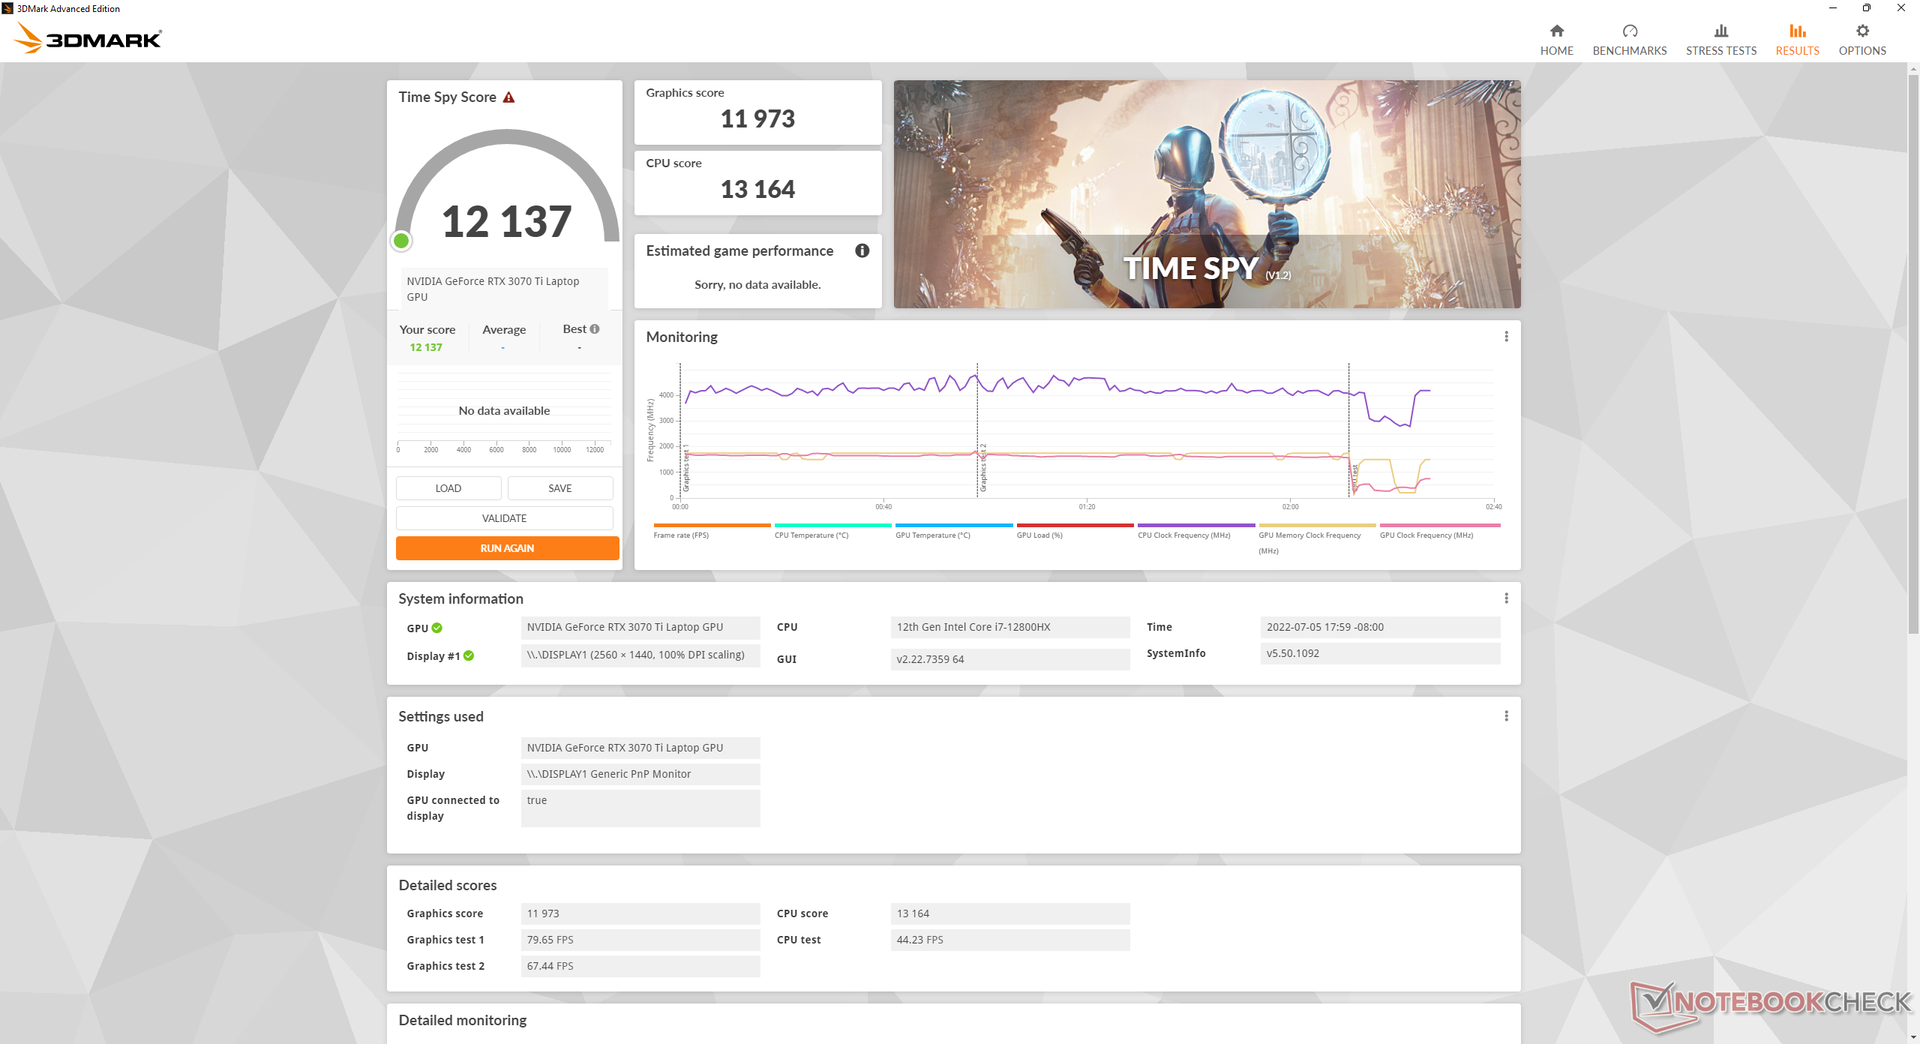
Rendimiento de la GPU: 150 W con 25 W de Dynamic Boost
GeForce los resultados de 3DMark son aproximadamente un 12% superiores a los de la media de portátiles de nuestra base de datos equipados con la misma GPU mobile RTX 3070 Ti. Estas cifras superiores a las esperadas pueden atribuirse al elevado objetivo de 150 W de la TGP y a la rápida memoria RAM DDR5, mientras que la mayoría de los portátiles para juegos siguen funcionando con GPUs de 130 W o menos y/o memoria RAM DDR4 más lenta. Las diferencias son suficientes para que nuestra GTX 3070 Ti para portátiles tenga un rendimiento similar al de la RTX 3080 Ti para portátiles
que funciona con la antigua GE66 del primer trimestre de 2022.</p>
Para los juegos, la GPU Nvidia tendría un rendimiento casi idéntico entre los modos MSHybrid y discreto.</p>
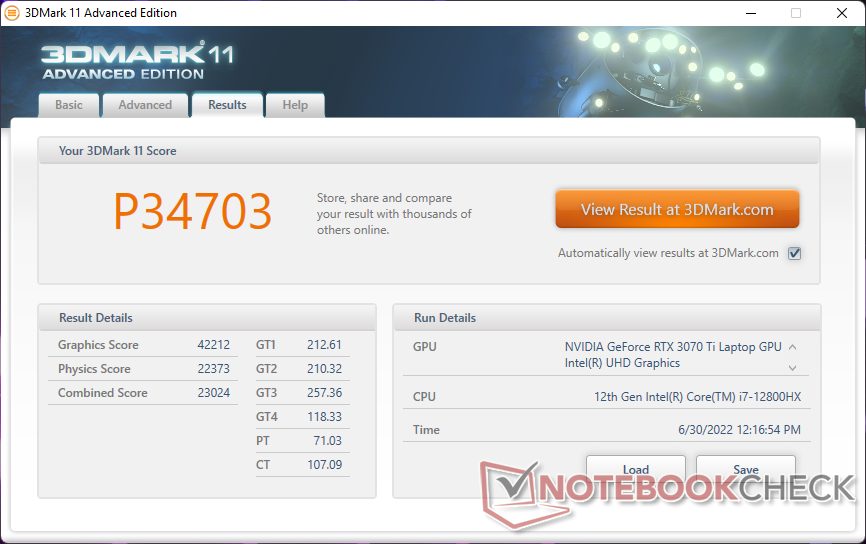
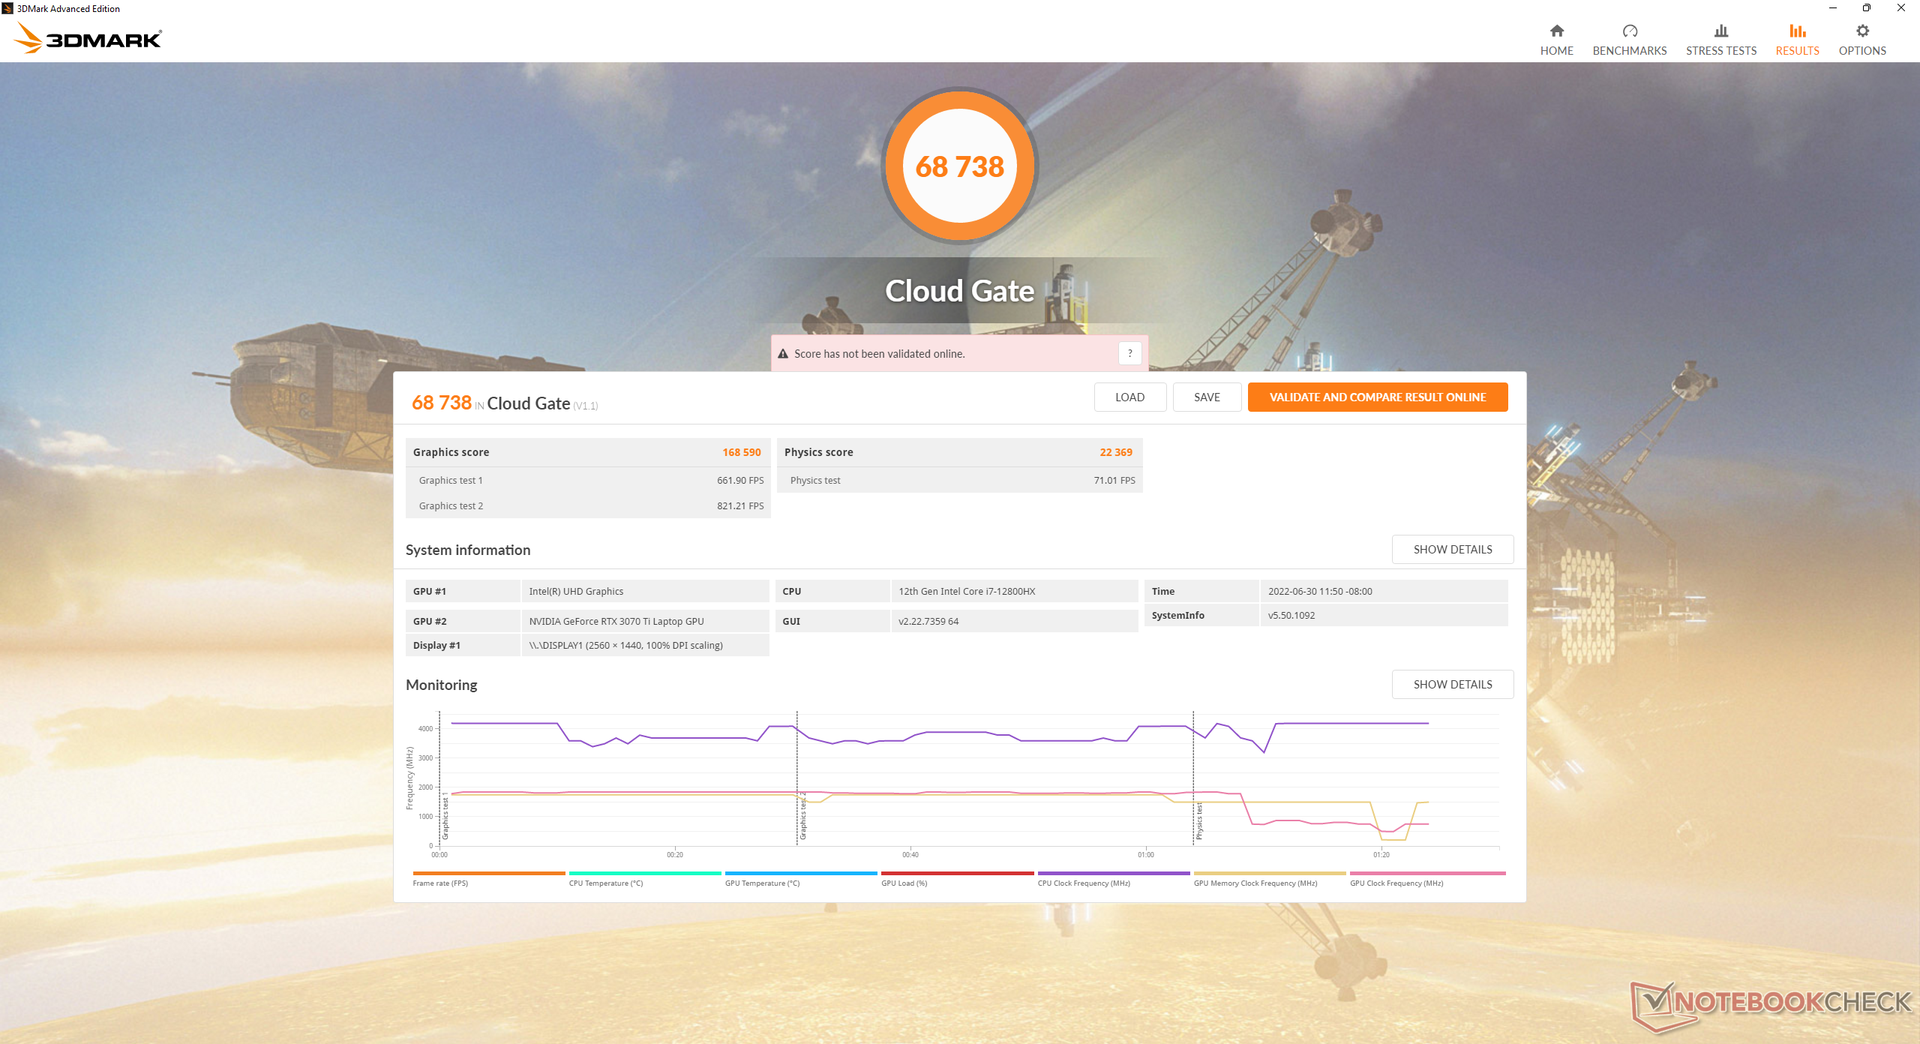
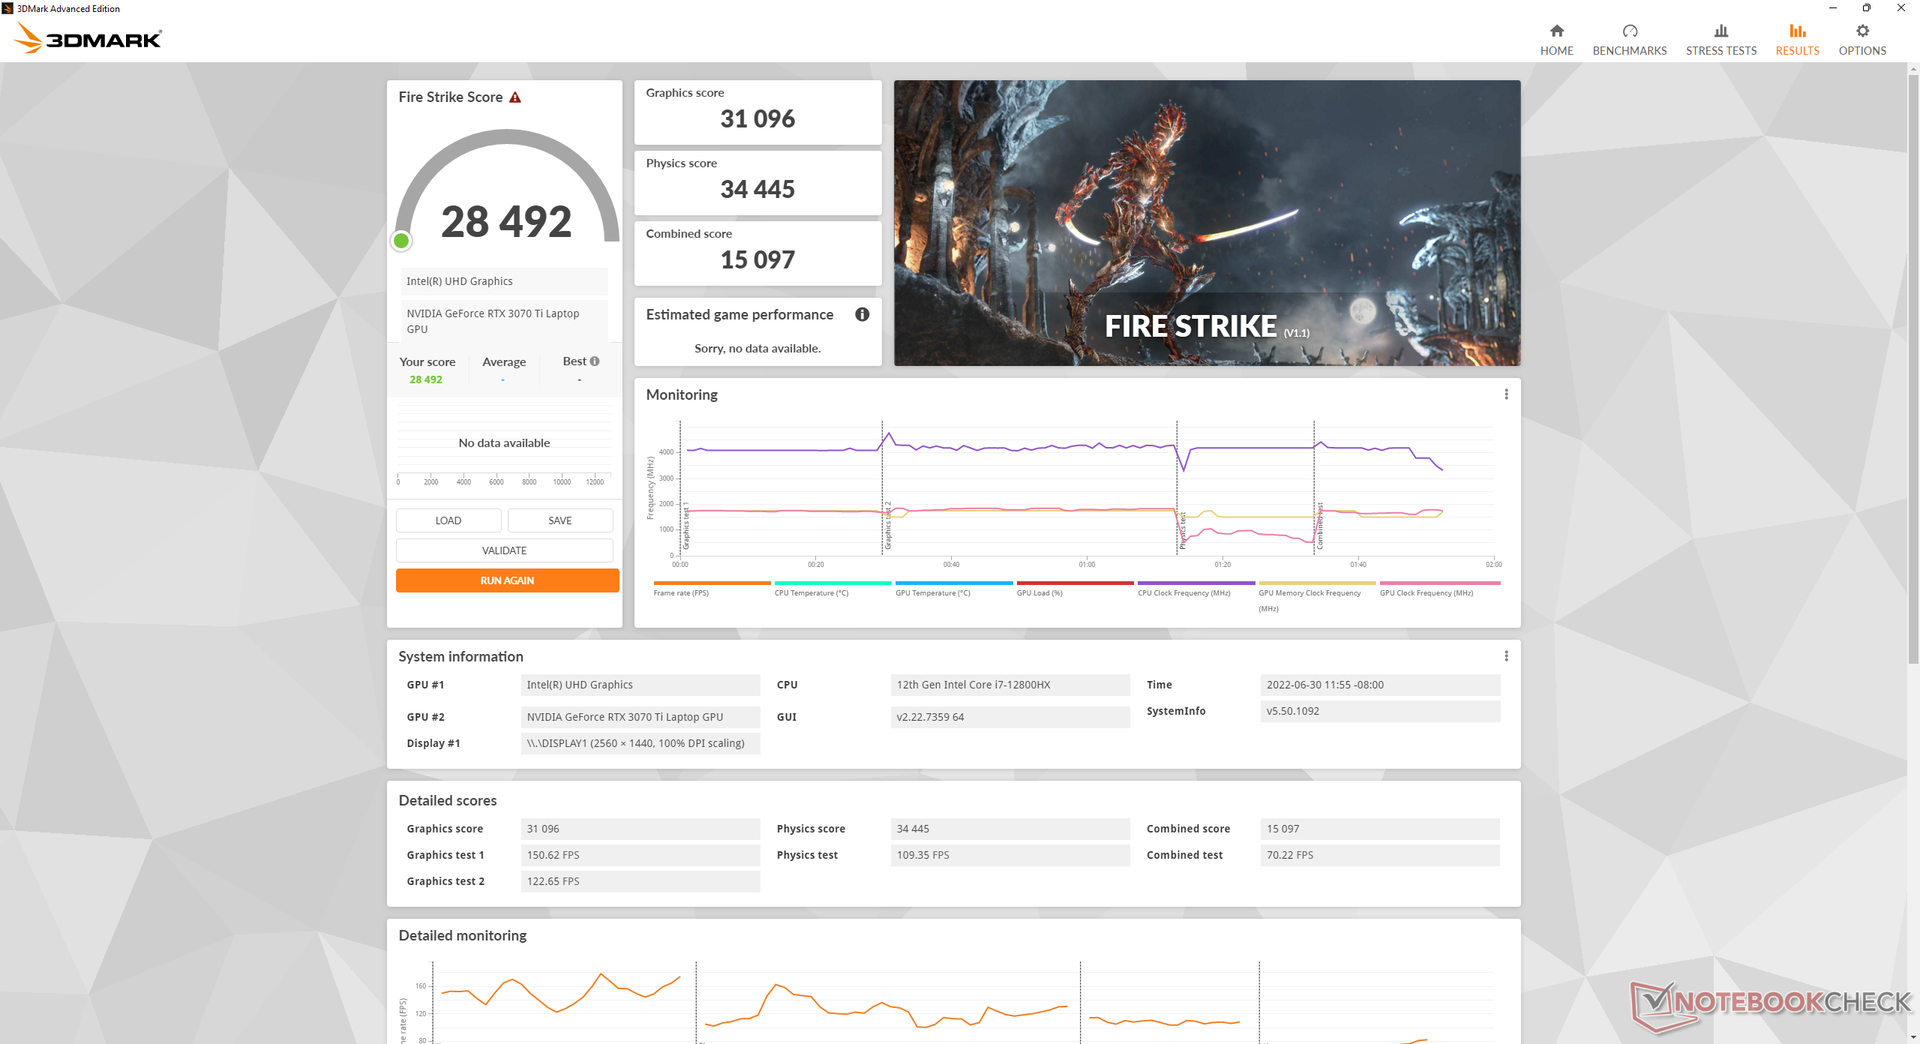
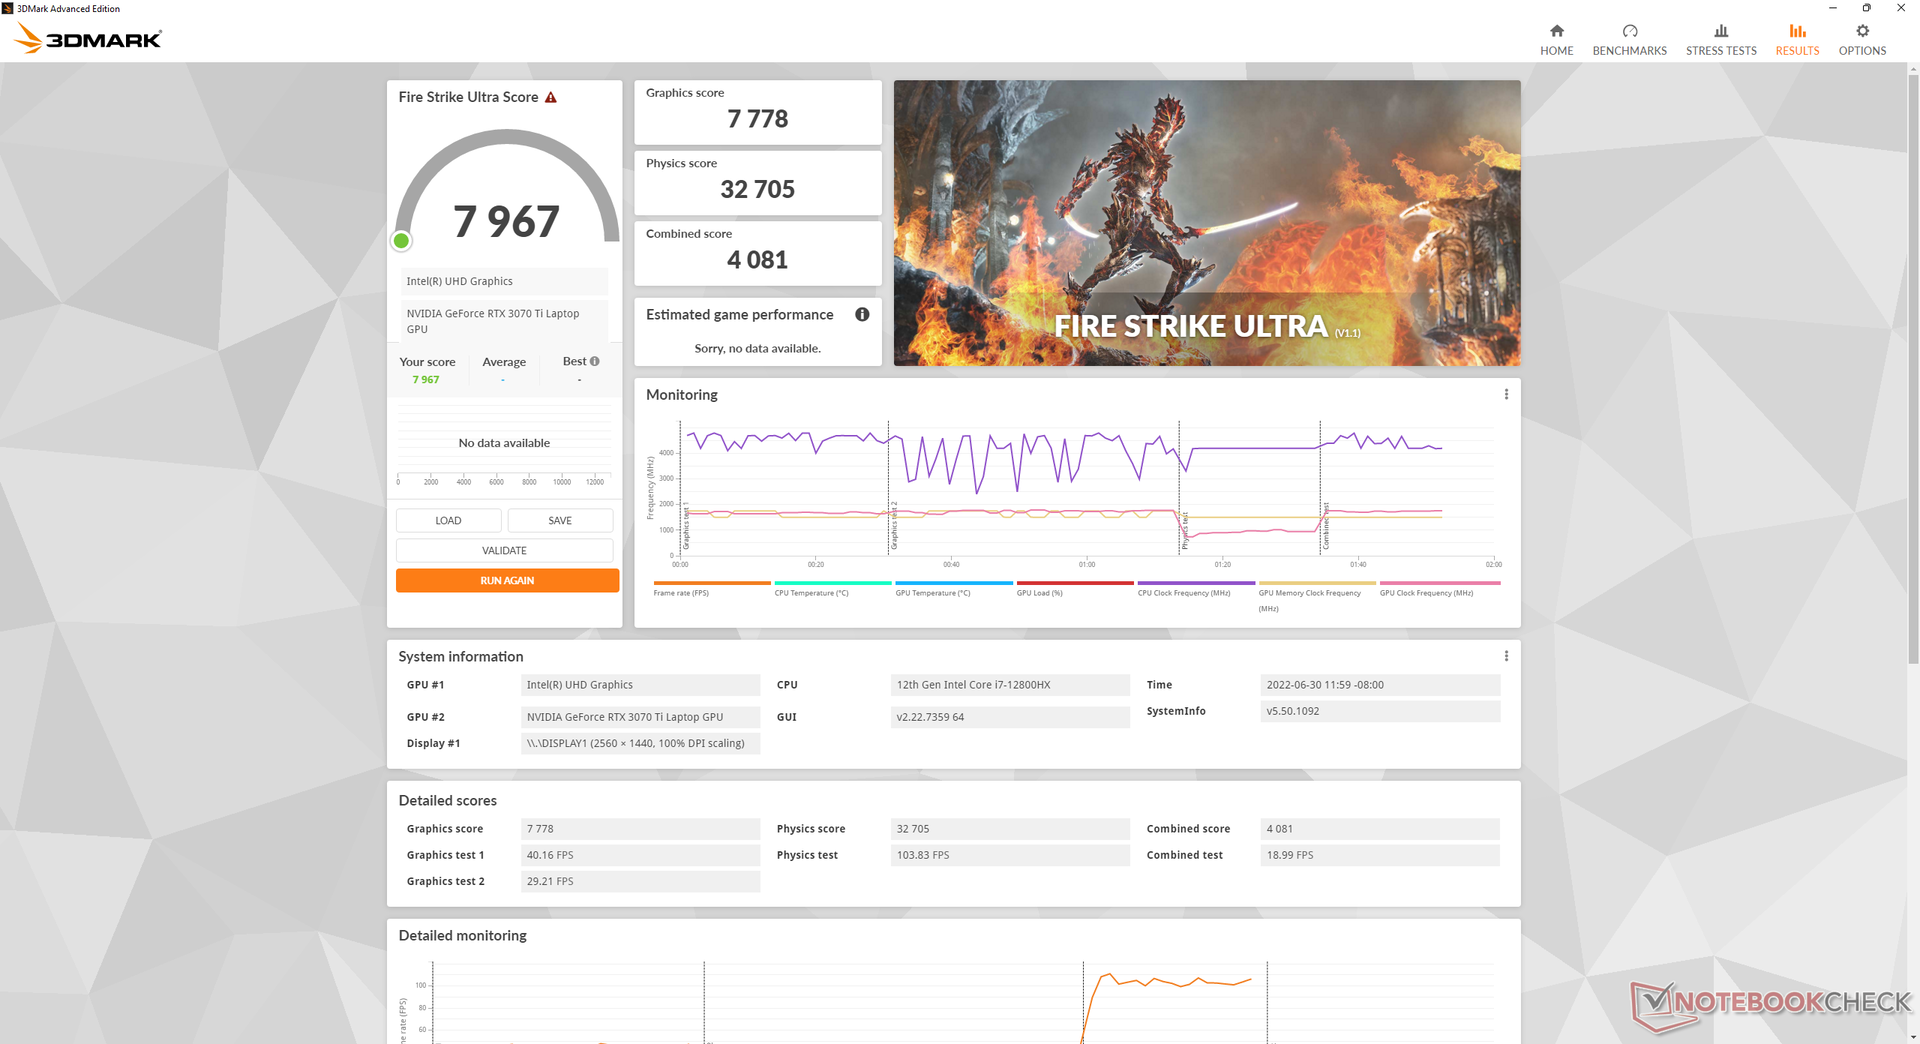
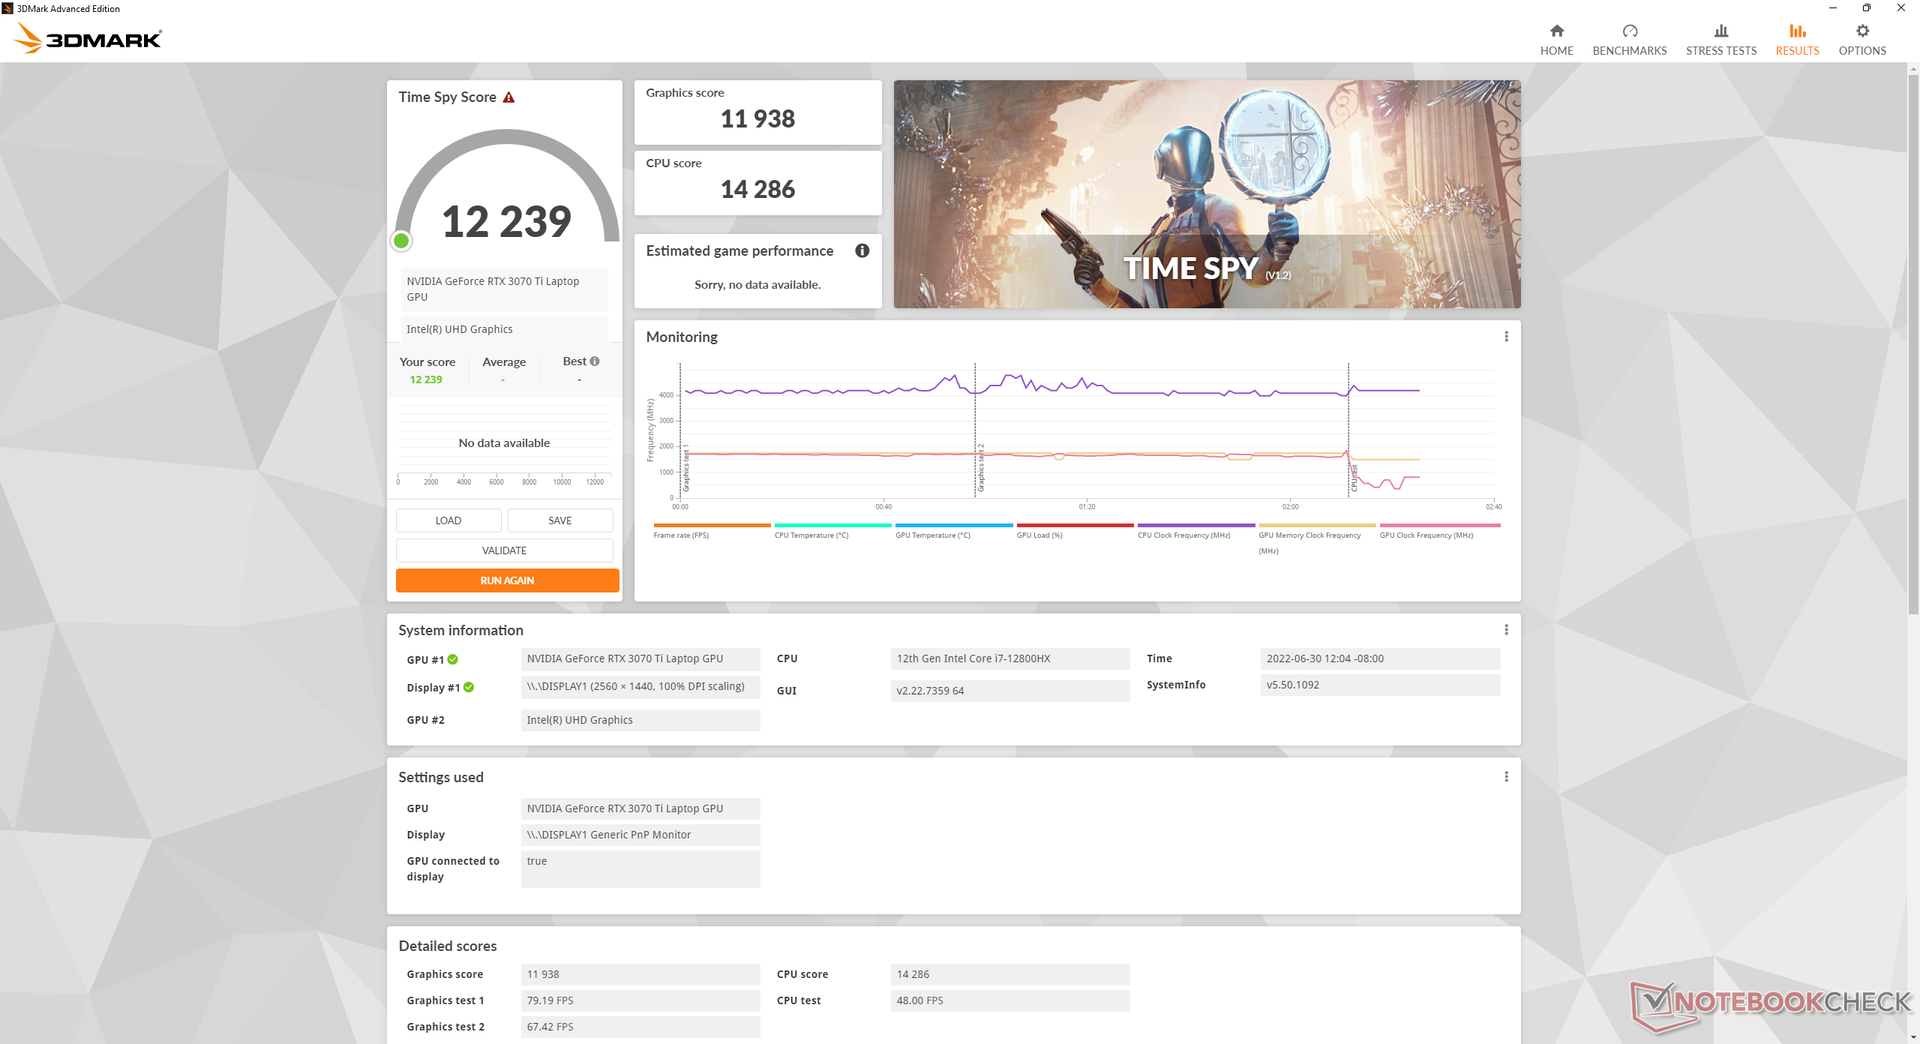
| 3DMark 11 Performance | 34703 puntos | |
| 3DMark Cloud Gate Standard Score | 68738 puntos | |
| 3DMark Fire Strike Score | 28492 puntos | |
| 3DMark Time Spy Score | 12239 puntos | |
ayuda | ||
Witcher 3 FPS Chart
| bajo | medio | alto | ultra | QHD | 4K | |
|---|---|---|---|---|---|---|
| GTA V (2015) | 186.8 | 184.7 | 178.1 | 122 | 108.7 | |
| The Witcher 3 (2015) | 426.4 | 329 | 223.3 | 112.7 | ||
| Dota 2 Reborn (2015) | 181.2 | 165.6 | 155.3 | 147.7 | 148.9 | |
| Final Fantasy XV Benchmark (2018) | 201 | 162.6 | 122.4 | 93 | ||
| X-Plane 11.11 (2018) | 145.5 | 133.4 | 105.9 | |||
| Strange Brigade (2018) | 453 | 288 | 235 | 207 | 154.1 | |
| Cyberpunk 2077 1.6 (2022) | 141.2 | 133.2 | 106 | 88.1 | 56.4 |
Emisiones
Ruido del sistema
El ruido del ventilador depende de los cinco perfiles de energía preestablecidos, como se menciona en las condiciones de prueba anteriores. Cuando está en reposo en el escritorio sin aplicaciones en ejecución, nuestra unidad es capaz de permanecer en silencio a 22,9 dB(A) incluso cuando se establece en el perfil de Rendimiento Extremo. Sin embargo, las pequeñas demandas como la navegación por la web o el streaming de vídeo inducirán un ruido del ventilador en el rango audible de 30 a 34 dB(A) sin importar la configuración del perfil. Ejecutar la primera escena de pruebas de 3DMark 06 en modo equilibrado induciría un ruido de ventilador de 44 dB(A), similar al que registramos en el GE66 o el Razer Blade 15.
Si se ejecuta Witcher 3 en modo equilibrado y en modo de rendimiento extremo, el ruido del ventilador será de 49,8 dB(A) y 55,7 dB(A), respectivamente. Consideramos que todo lo que esté en el rango de los 50 dB(A) es muy ruidoso, hasta el punto de que se recomiendan auriculares para jugar. No obstante, este rango es desgraciadamente común en muchos portátiles de juego para entusiastas, incluyendo el Vector GP66, el Asus ROG Strix Scar 15, o el Alienware m15 R6. Si Cooler Boost (es decir, el modo de máximo ruido del ventilador) está activo, el ruido del ventilador será aún mayor, con 57.4 dB(A). Los usuarios tendrán que jugar en el modo de Rendimiento Extremo en el GE67 para maximizar el TGP, como se verá en nuestra sección de Prueba de Estrés. El GE66 no era tan ruidoso en condiciones similares.
Ruido
| Ocioso |
| 22.9 / 22.9 / 22.9 dB(A) |
| Carga |
| 44.4 / 57.4 dB(A) |
 | ||
30 dB silencioso 40 dB(A) audible 50 dB(A) ruidosamente alto |
||
min: | ||
| MSI GE67 HX 12UGS GeForce RTX 3070 Ti Laptop GPU, i7-12800HX, Samsung PM9A1 MZVL21T0HCLR | MSI Raider GE66 12UHS GeForce RTX 3080 Ti Laptop GPU, i9-12900HK, Samsung PM9A1 MZVL22T0HBLB | MSI Vector GP66 12UGS GeForce RTX 3070 Ti Laptop GPU, i9-12900H | Asus ROG Strix Scar 15 G533ZW-LN106WS GeForce RTX 3070 Ti Laptop GPU, i9-12900H, Samsung PM9A1 MZVL22T0HBLB | Alienware m15 R6, i7-11800H RTX 3080 GeForce RTX 3080 Laptop GPU, i7-11800H, Samsung PM9A1 MZVL21T0HCLR | Razer Blade 15 2022 GeForce RTX 3080 Ti Laptop GPU, i7-12800H, SSSTC CA6-8D1024 | |
|---|---|---|---|---|---|---|
| Noise | -14% | -2% | -36% | -2% | -5% | |
| apagado / medio ambiente * (dB) | 22.7 | 26 -15% | 22.9 -1% | 26.86 -18% | 23 -1% | 25.4 -12% |
| Idle Minimum * (dB) | 22.9 | 27 -18% | 23.4 -2% | 39.07 -71% | 23 -0% | 26.2 -14% |
| Idle Average * (dB) | 22.9 | 30 -31% | 23.4 -2% | 39.07 -71% | 23 -0% | 26.2 -14% |
| Idle Maximum * (dB) | 22.9 | 39 -70% | 27.4 -20% | 39.07 -71% | 30 -31% | 28.4 -24% |
| Load Average * (dB) | 44.4 | 45 -1% | 36 19% | 53.34 -20% | 41.26 7% | 44.7 -1% |
| Witcher 3 ultra * (dB) | 55.7 | 45 19% | 58.2 -4% | 56.6 -2% | 53.4 4% | 44.7 20% |
| Load Maximum * (dB) | 57.4 | 47 18% | 58 -1% | 56.6 1% | 53.37 7% | 51.9 10% |
* ... más pequeño es mejor
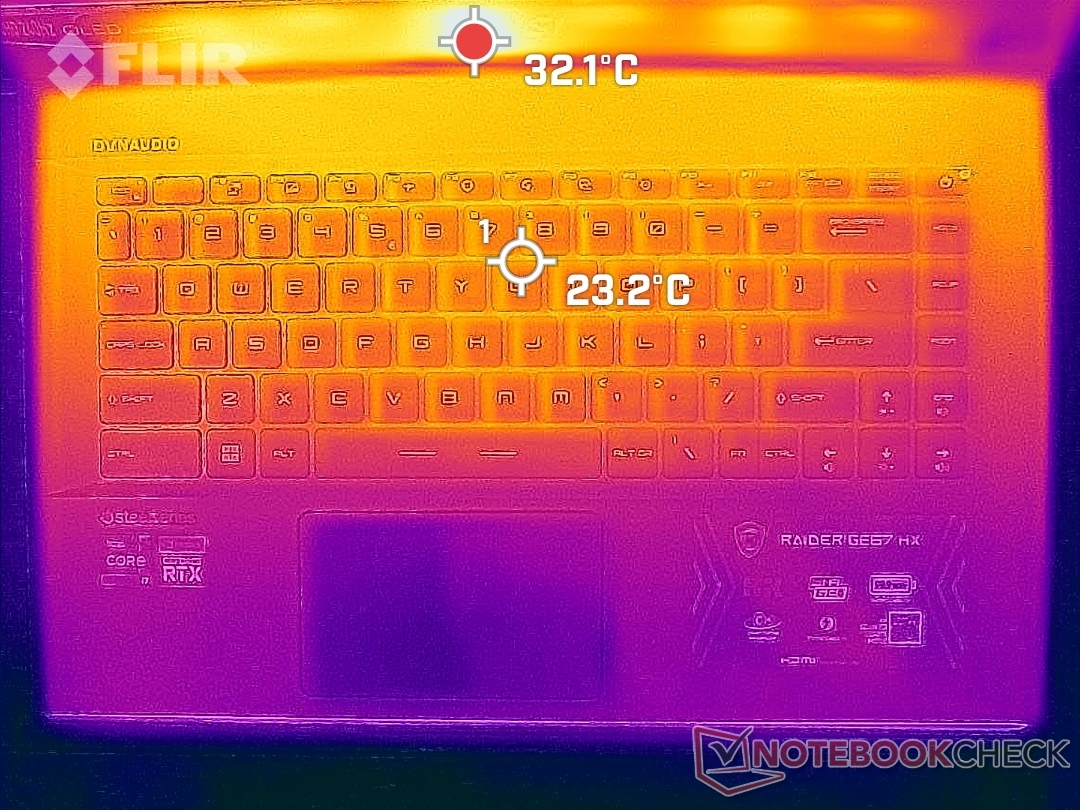
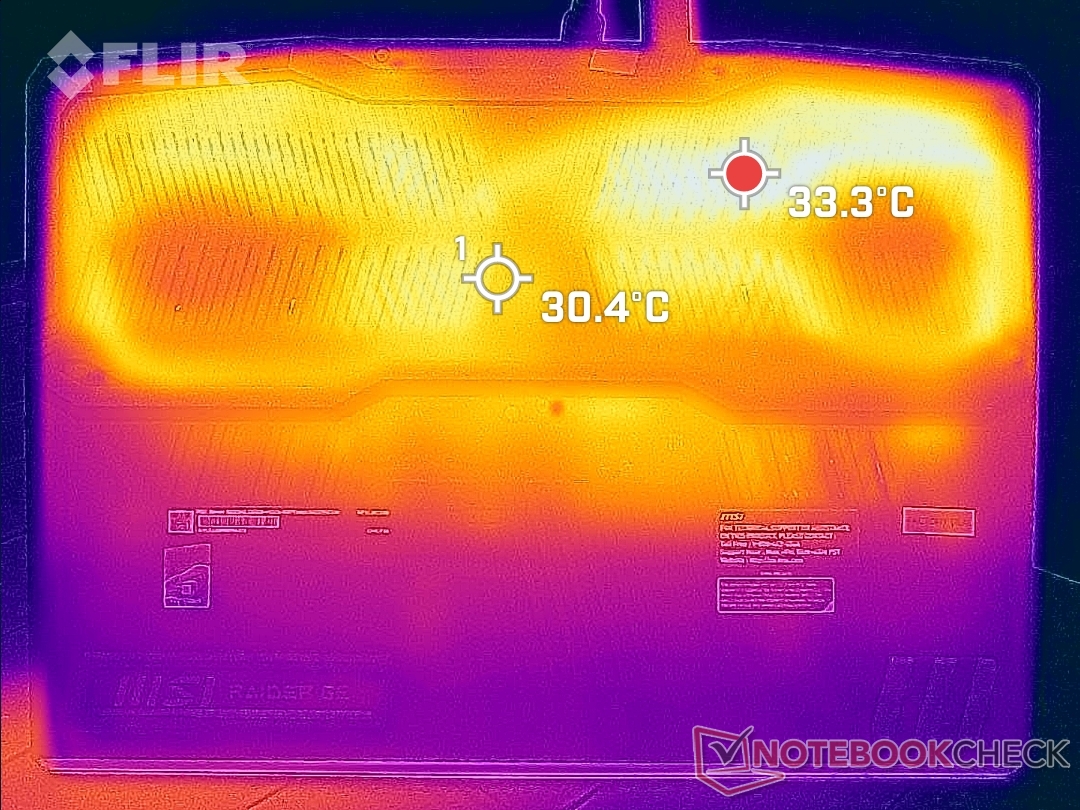
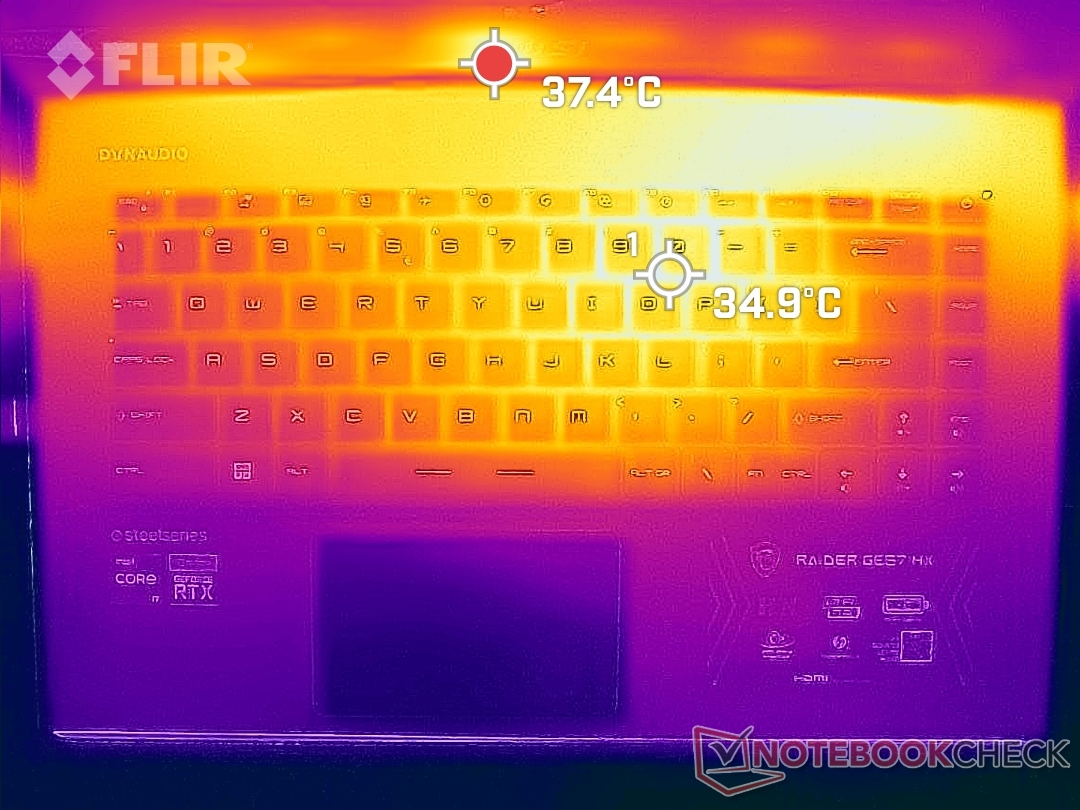
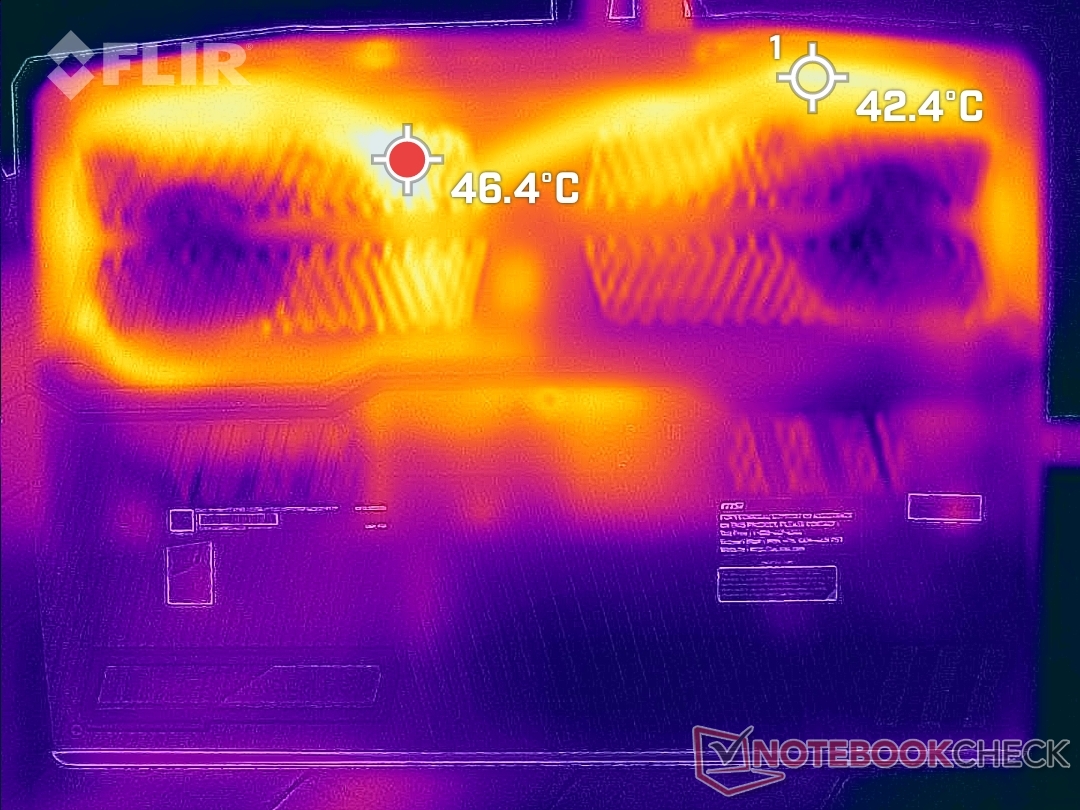
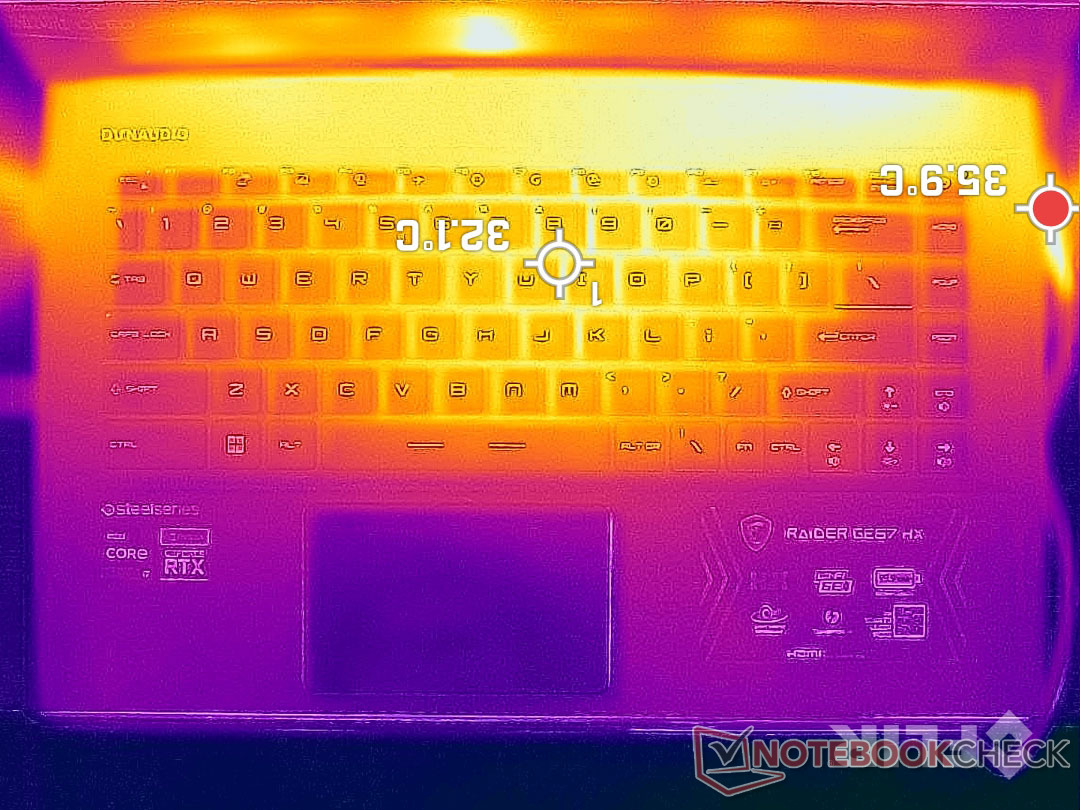
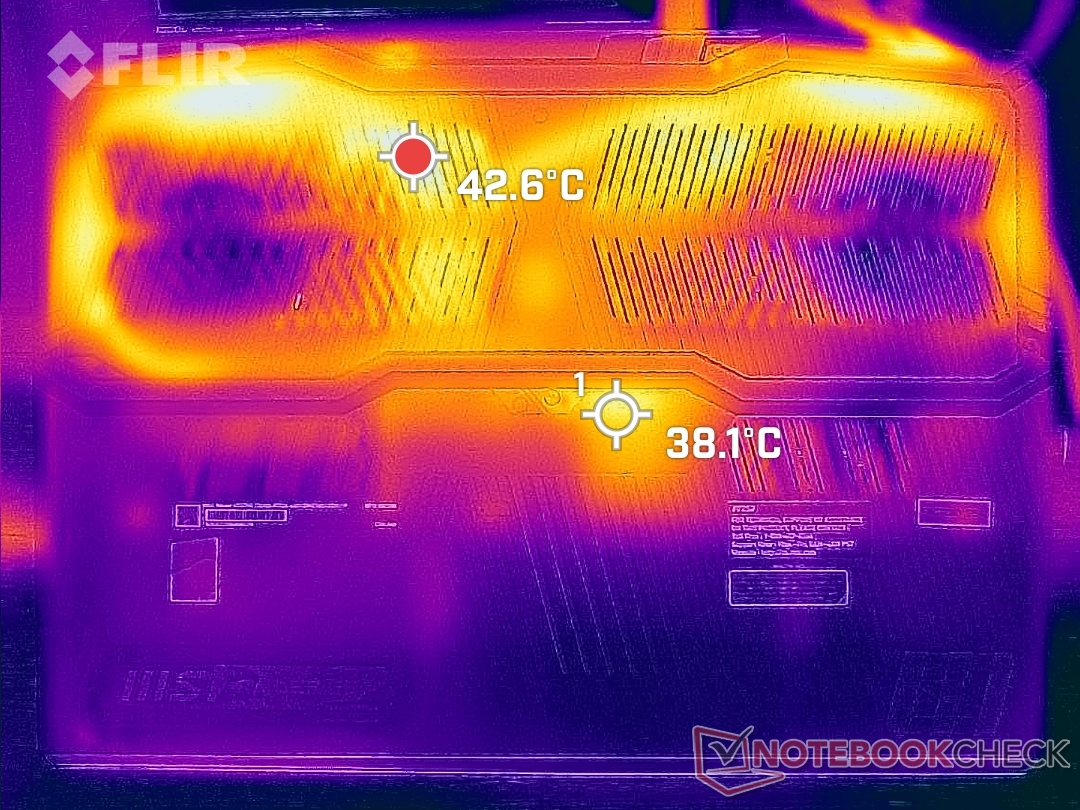
Temperatura
Las temperaturas de la superficie son más frías que las que observamos en el antiguo GE66. Cuando se juega, los puntos calientes en la cubierta del teclado y el panel inferior pueden alcanzar 35 C y 46 C, respectivamente. Estas zonas están hacia la parte trasera del chasis, como muestran los mapas de temperatura de abajo.
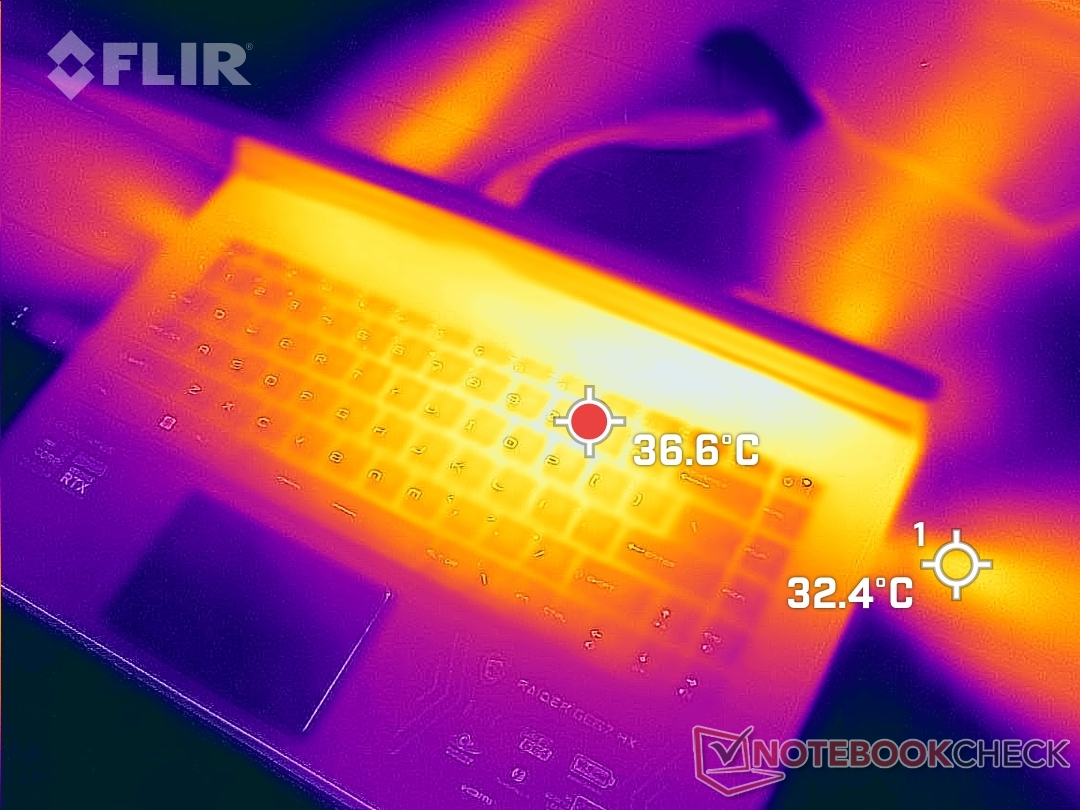
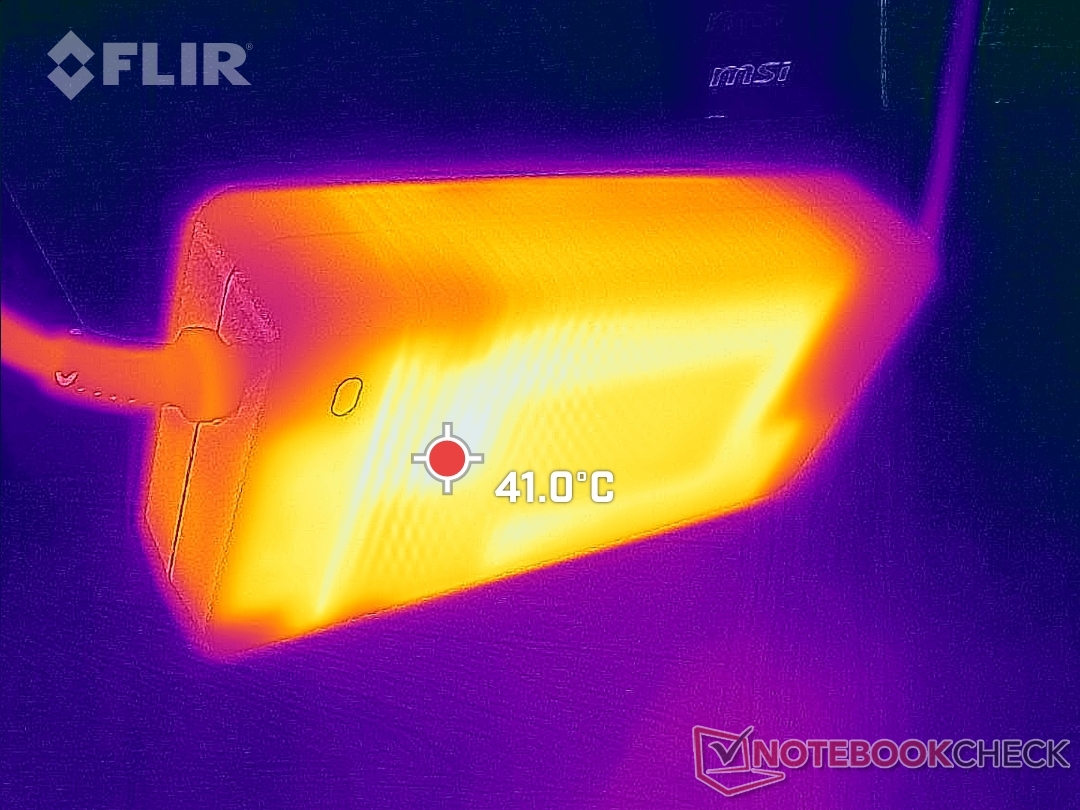
(+) La temperatura máxima en la parte superior es de 34.4 °C / 94 F, frente a la media de 40.4 °C / 105 F, que oscila entre 21.2 y 68.8 °C para la clase Gaming.
(±) El fondo se calienta hasta un máximo de 42 °C / 108 F, frente a la media de 43.2 °C / 110 F
(+) En reposo, la temperatura media de la parte superior es de 21.4 °C / 71# F, frente a la media del dispositivo de 33.9 °C / 93 F.
(+) Jugando a The Witcher 3, la temperatura media de la parte superior es de 27.9 °C / 82 F, frente a la media del dispositivo de 33.9 °C / 93 F.
(+) El reposamanos y el panel táctil están a una temperatura inferior a la de la piel, con un máximo de 20.4 °C / 68.7 F y, por tanto, son fríos al tacto.
(+) La temperatura media de la zona del reposamanos de dispositivos similares fue de 28.8 °C / 83.8 F (+8.4 °C / 15.1 F).
| MSI GE67 HX 12UGS Intel Core i7-12800HX, NVIDIA GeForce RTX 3070 Ti Laptop GPU | MSI Raider GE66 12UHS Intel Core i9-12900HK, NVIDIA GeForce RTX 3080 Ti Laptop GPU | MSI Vector GP66 12UGS Intel Core i9-12900H, NVIDIA GeForce RTX 3070 Ti Laptop GPU | Asus ROG Strix Scar 15 G533ZW-LN106WS Intel Core i9-12900H, NVIDIA GeForce RTX 3070 Ti Laptop GPU | Alienware m15 R6, i7-11800H RTX 3080 Intel Core i7-11800H, NVIDIA GeForce RTX 3080 Laptop GPU | Razer Blade 15 2022 Intel Core i7-12800H, NVIDIA GeForce RTX 3080 Ti Laptop GPU | |
|---|---|---|---|---|---|---|
| Heat | -36% | -19% | -29% | -45% | -32% | |
| Maximum Upper Side * (°C) | 34.4 | 54 -57% | 40.2 -17% | 42.6 -24% | 61 -77% | 50 -45% |
| Maximum Bottom * (°C) | 42 | 65 -55% | 43.8 -4% | 50.2 -20% | 58 -38% | 47 -12% |
| Idle Upper Side * (°C) | 24 | 30 -25% | 34.8 -45% | 36.2 -51% | 38 -58% | 37.4 -56% |
| Idle Bottom * (°C) | 33.2 | 35 -5% | 37 -11% | 40.2 -21% | 36 -8% | 38.4 -16% |
* ... más pequeño es mejor
Prueba de esfuerzo
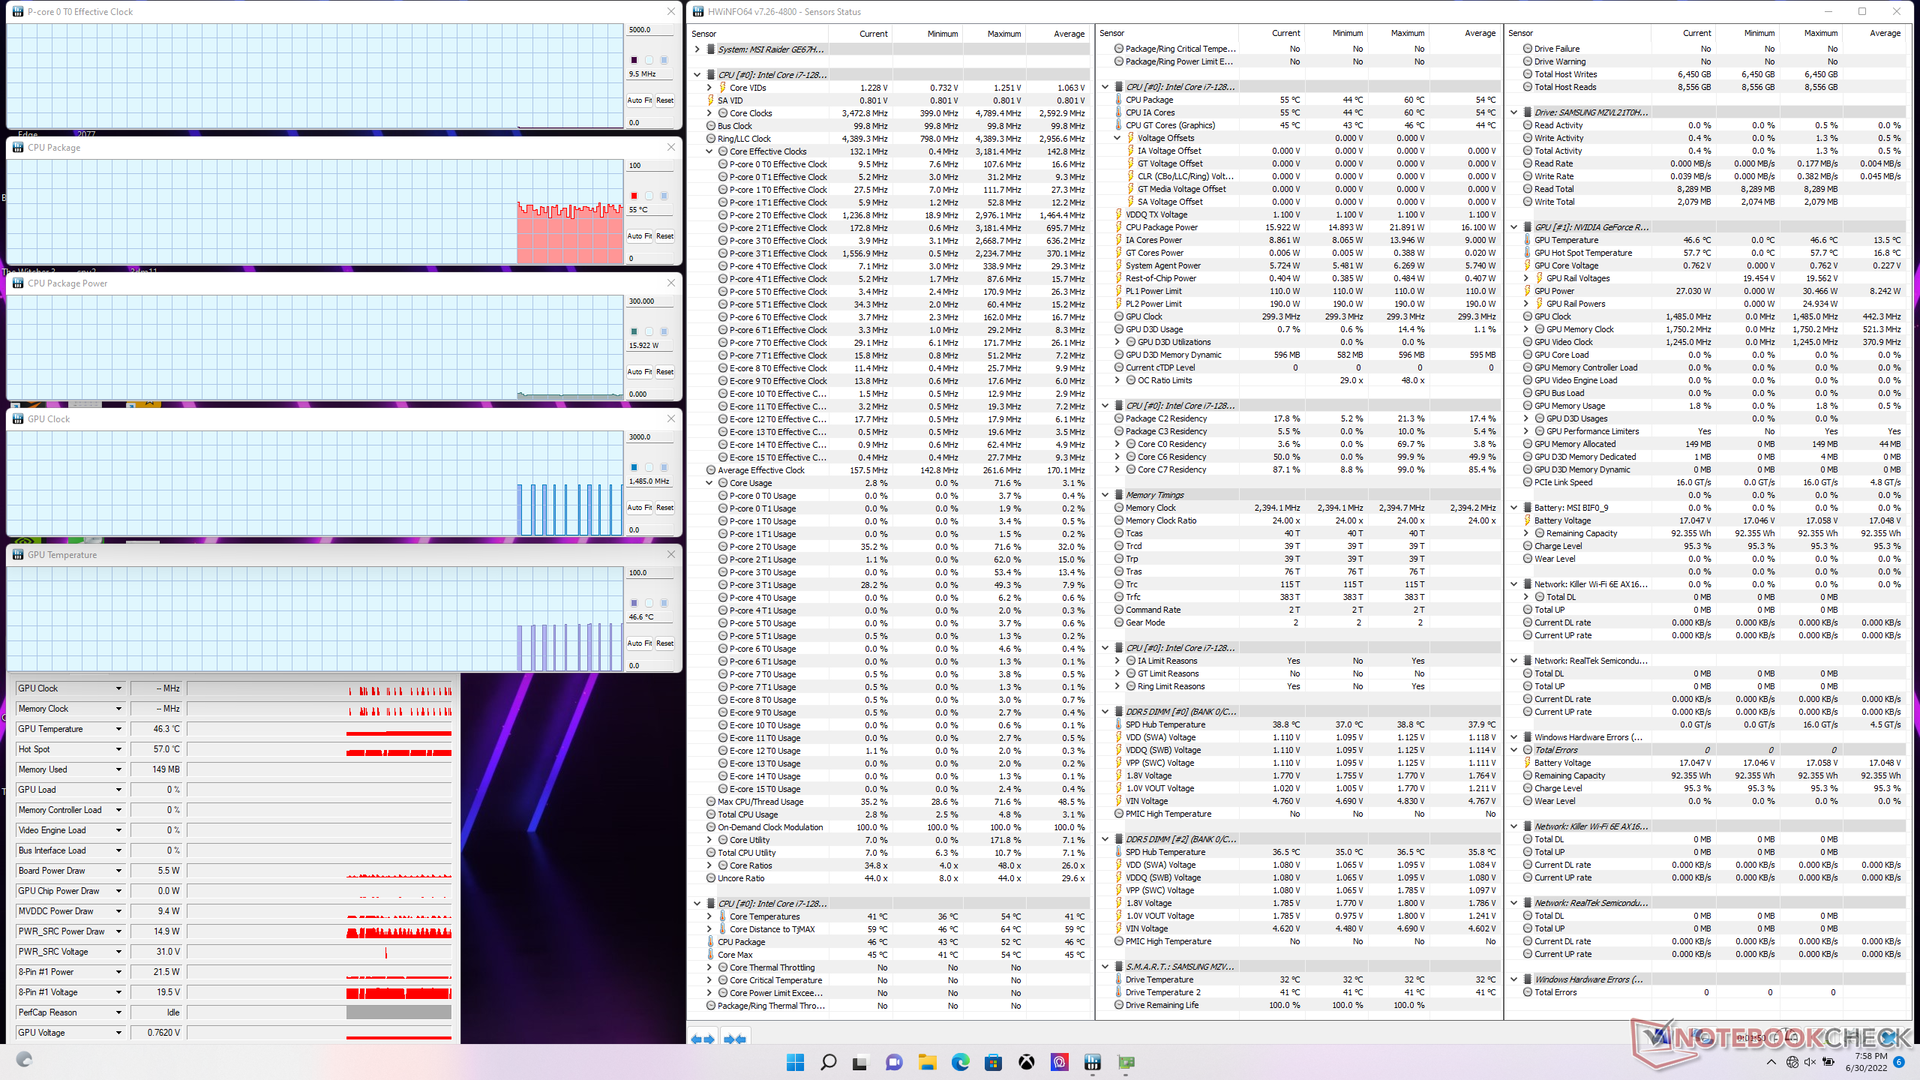
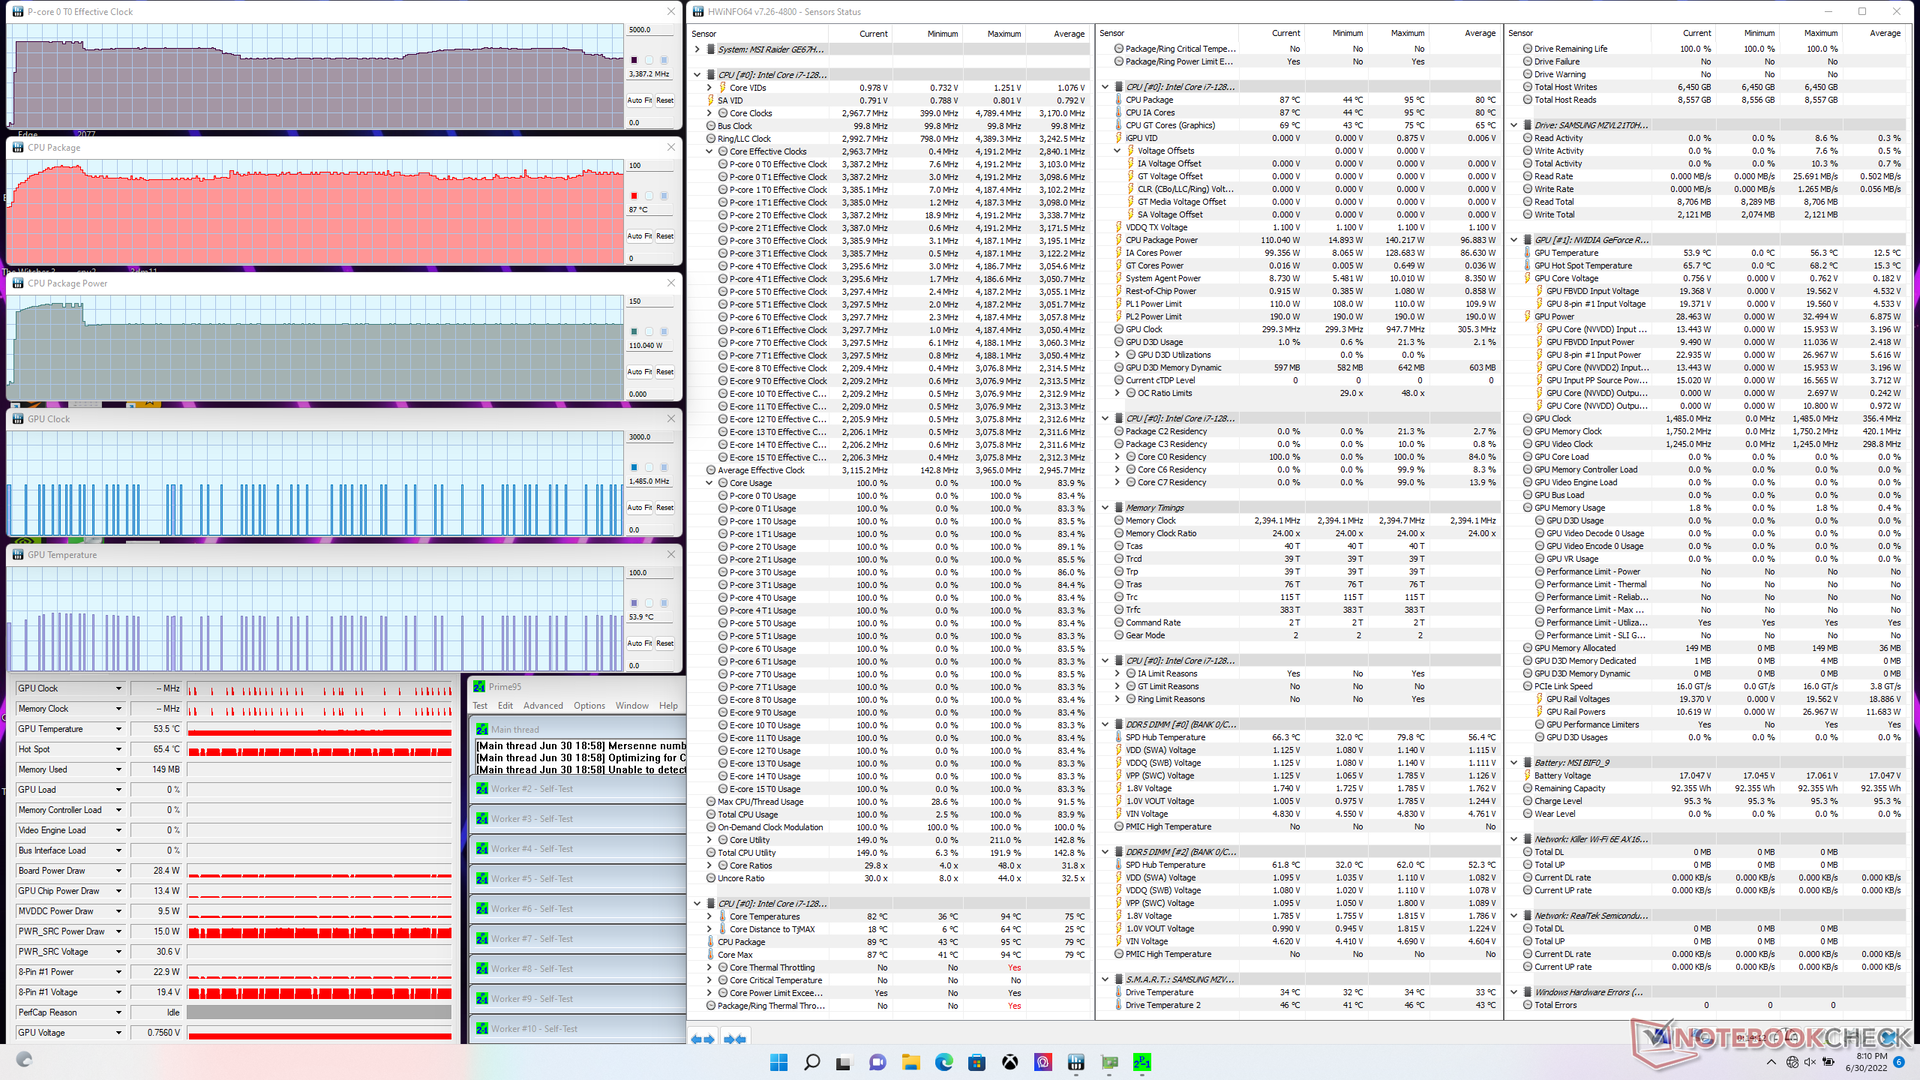
Cuando se estresa bajo Prime95, la CPU se eleva a 4,2 GHz hasta unos 90 segundos más tarde, cuando la temperatura del núcleo alcanza los 96 C. A partir de entonces, las velocidades de reloj caen en el rango de 3,4 a 3,7 GHz con el fin de mantener una temperatura más fría del núcleo de alrededor de 87 C. El consumo de energía del paquete de la CPU llega a ser de 140 W durante los primeros 90 segundos de la prueba antes de estabilizarse en 110 W. En comparación, el Core i7-12900HK en el antiguo GE66 se estabiliza en sólo 45 W en condiciones similares.
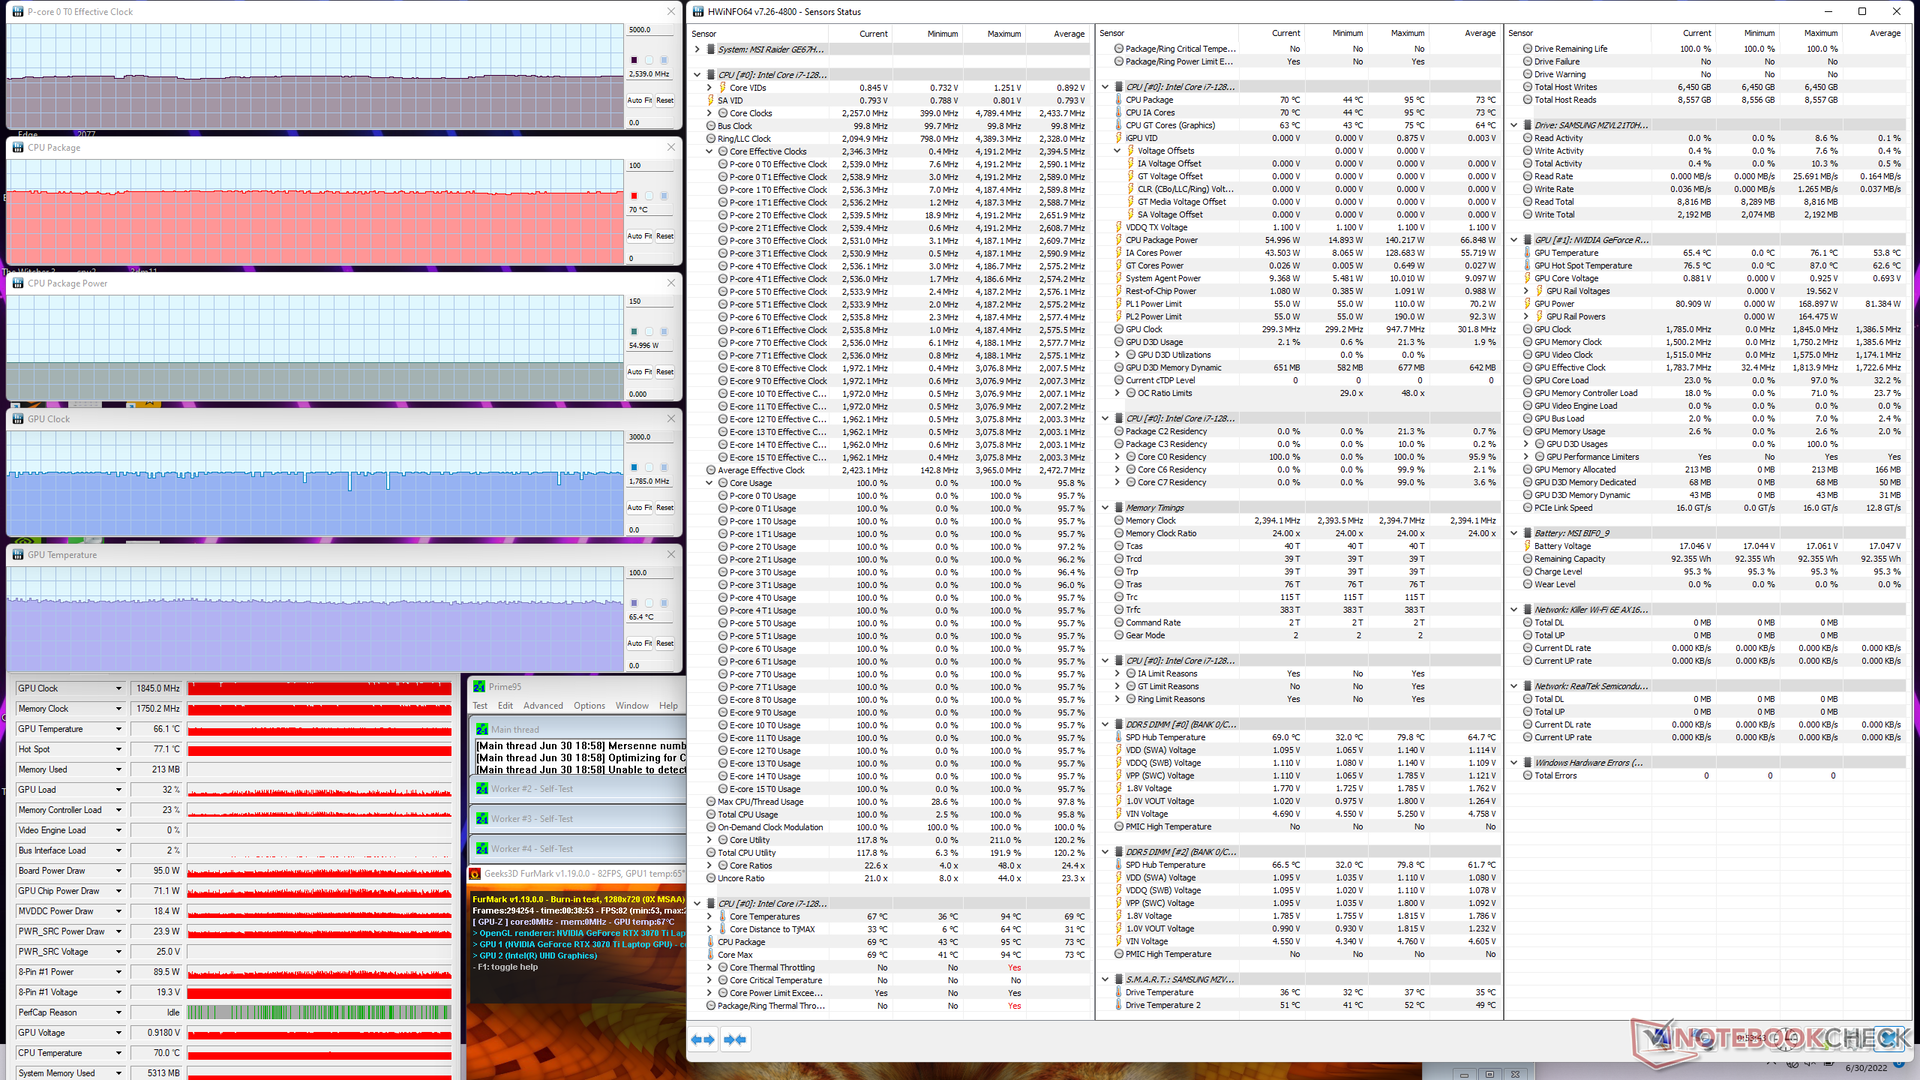
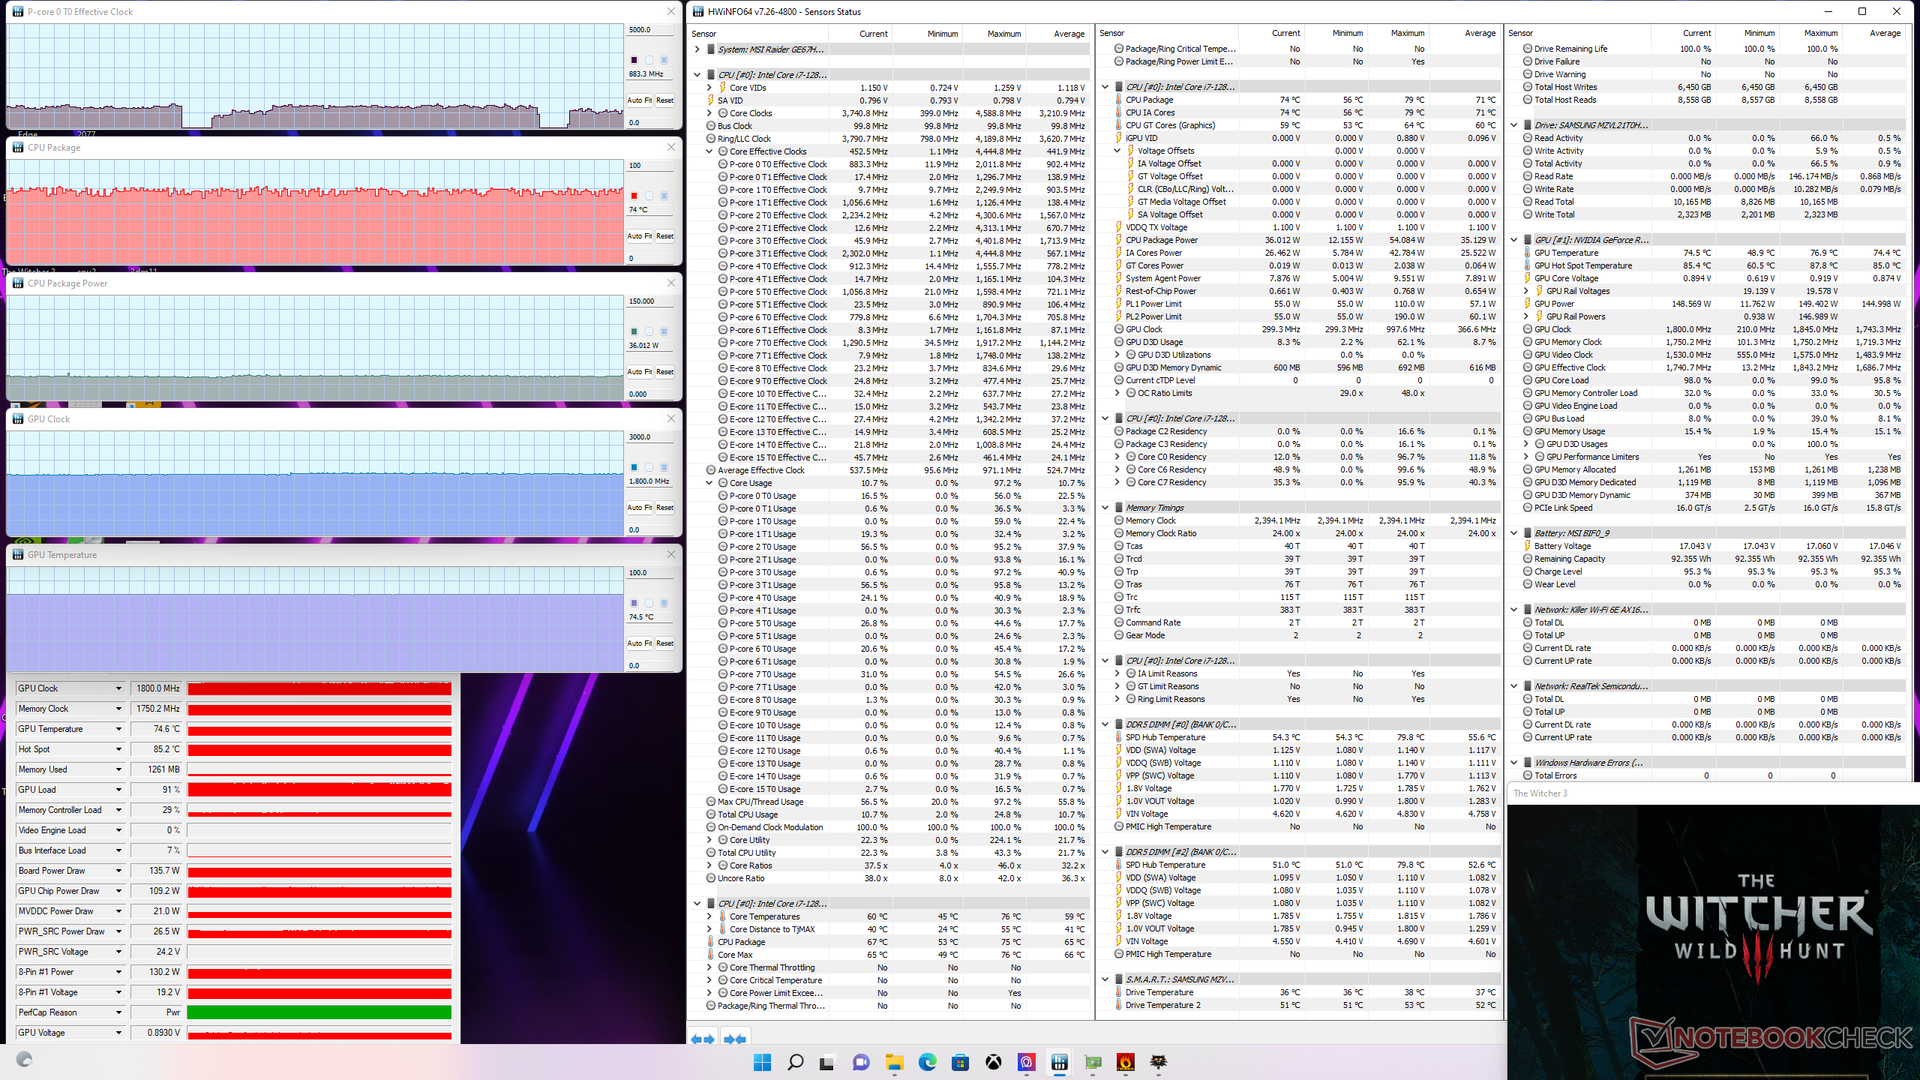
El consumo de energía de la tarjeta GPU alcanzaría un máximo de 148 W en el modo de rendimiento extremo, frente a unos 135 W en el perfil de energía equilibrado. Por lo tanto, es aconsejable activar el modo de rendimiento extremo para maximizar el potencial de la GPU. Las temperaturas medias de la CPU y la GPU son razonables: 69 C y 77 C, respectivamente, frente a los 71 C y 70 C del Vector GP66 que viene con la misma GPU GeForce RTX 3070 Ti pero una CPU de 11ª generación más lenta.
Vale la pena señalar que sólo pudimos alcanzar un consumo de energía de la placa GPU de sólo 148 W a pesar del anuncio de MSI de 150 W + 25 W de Dynamic Boost, incluso cuando se ejecuta en el modo de rendimiento extremo, al menos según GPU-Z.
Funcionar con baterías afecta al rendimiento. Una prueba en Fire Strike con batería arrojaría puntuaciones de Física y Gráficos de 22492 y 11614 puntos, respectivamente, comparado con 34445 y 31096 puntos cuando está conectado a la red eléctrica.
| Reloj dela CPU (GHz) | Reloj de la GPU (MHz) | Temperatura media dela CPU (°C) | Temperatura media de la GPU (°C) | |
| Sistema en reposo | -- | -- | 55 | 47 |
| Prime95 Stress | 3.4 - 3.7 | -- | 87 | 54 |
| Prime95+ FurMark Stress | 2,6 | 1845 | 70 | 65 |
| Witcher 3 Estrés (modoequilibrado) | 0,9 | 1800 | 74 | 75 |
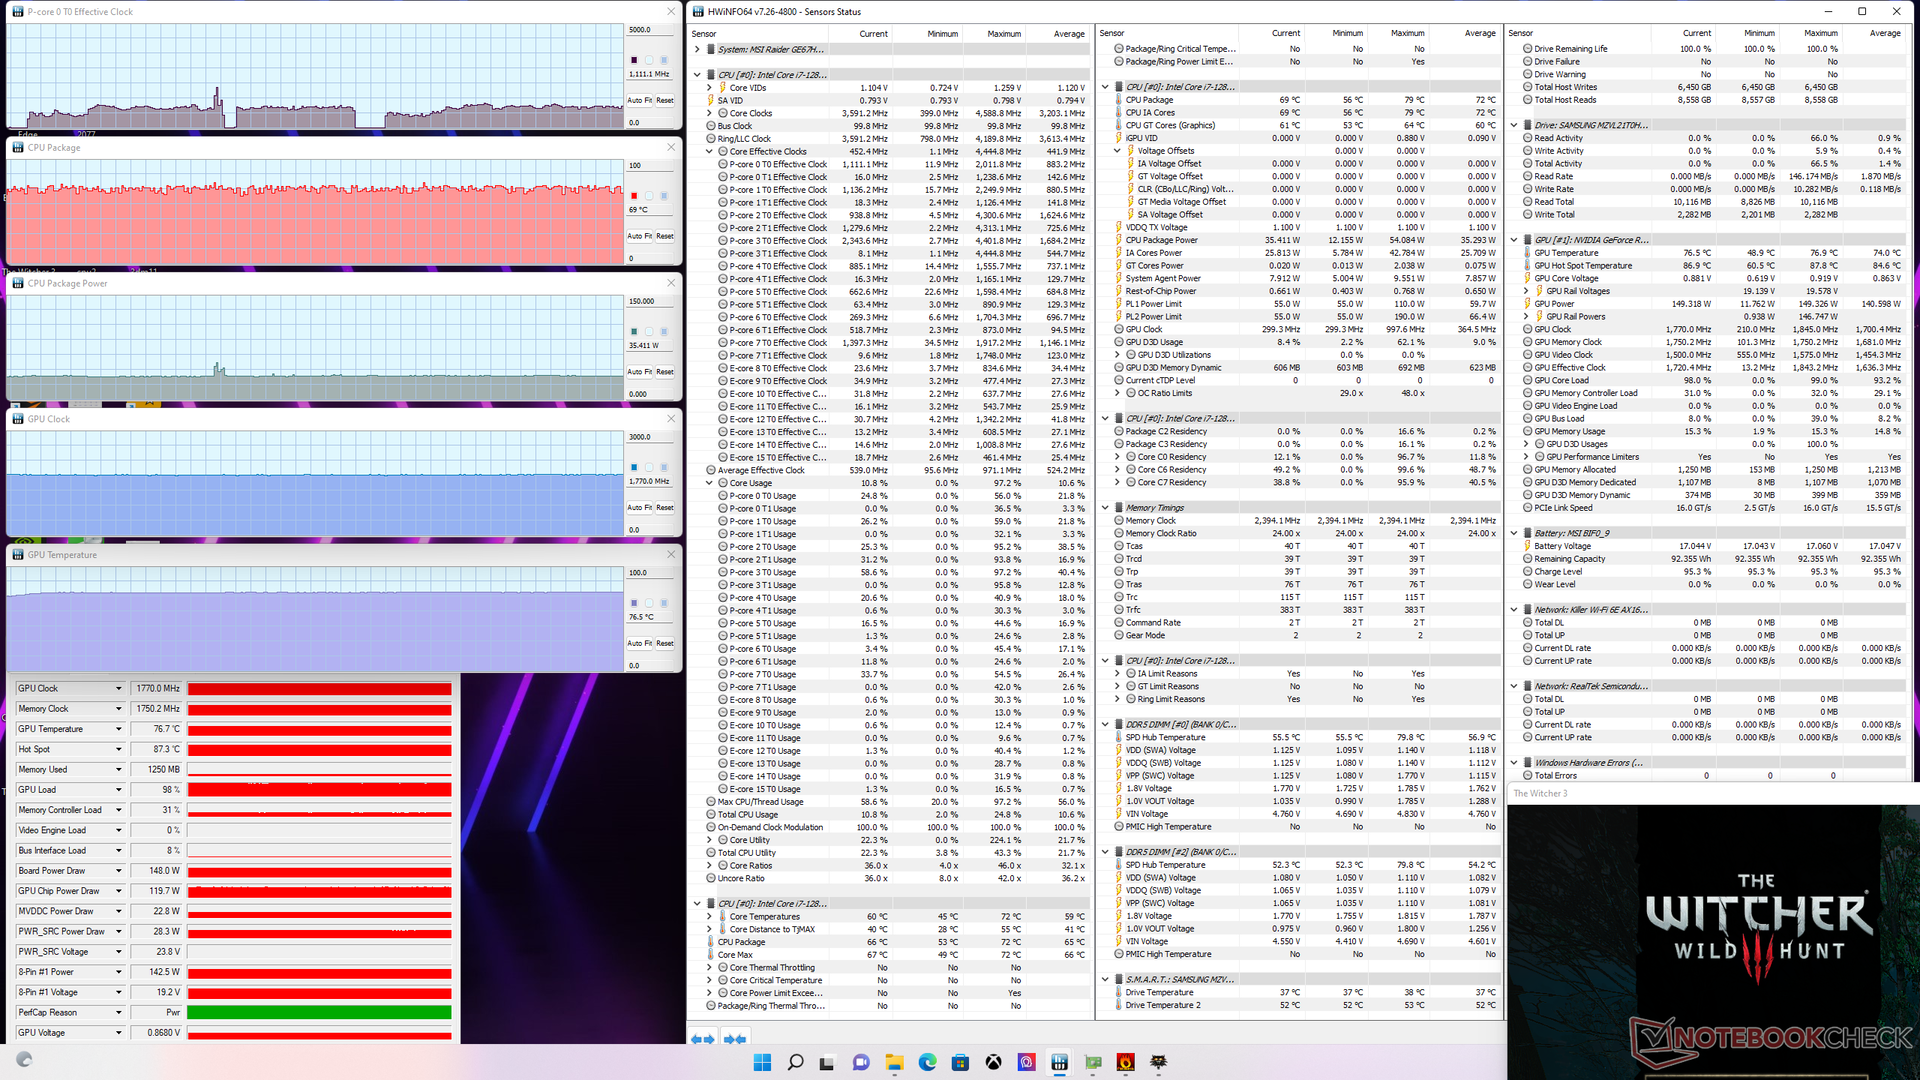
| Witcher 3 Estrés (modo derendimiento extremo) | 1,1 | 1770 | 69 | 77 |
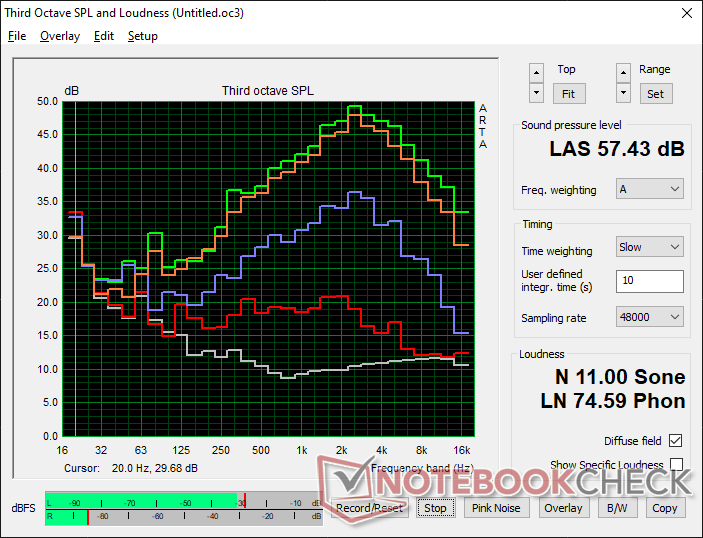
Altavoces
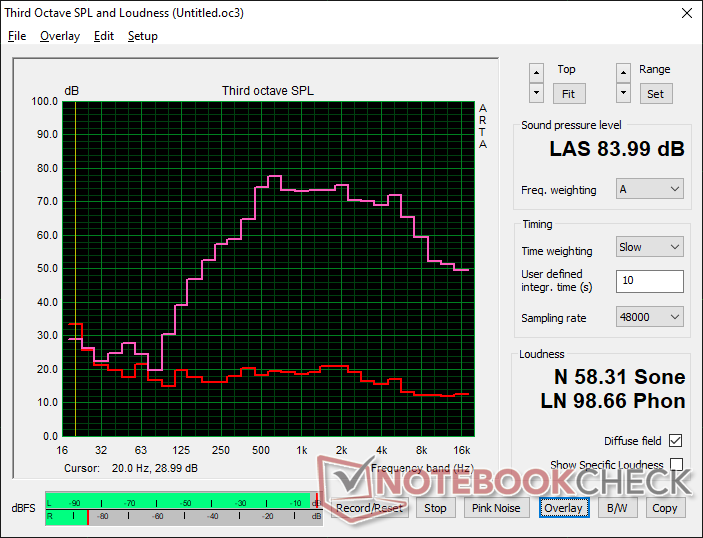
MSI GE67 HX 12UGS análisis de audio
(+) | los altavoces pueden reproducir a un volumen relativamente alto (#84 dB)
Graves 100 - 315 Hz
(-) | casi sin bajos - de media 17.9% inferior a la mediana
(±) | la linealidad de los graves es media (13.7% delta a frecuencia anterior)
Medios 400 - 2000 Hz
(±) | medias más altas - de media 7.9% más altas que la mediana
(+) | los medios son lineales (6.6% delta a la frecuencia anterior)
Altos 2 - 16 kHz
(±) | máximos más altos - de media 5.5% más altos que la mediana
(±) | la linealidad de los máximos es media (8.6% delta a frecuencia anterior)
Total 100 - 16.000 Hz
(±) | la linealidad del sonido global es media (22.1% de diferencia con la mediana)
En comparación con la misma clase
» 79% de todos los dispositivos probados de esta clase eran mejores, 6% similares, 15% peores
» El mejor tuvo un delta de 6%, la media fue 18%, el peor fue ###max##%
En comparación con todos los dispositivos probados
» 64% de todos los dispositivos probados eran mejores, 6% similares, 30% peores
» El mejor tuvo un delta de 4%, la media fue 23%, el peor fue ###max##%
Apple MacBook Pro 16 2021 M1 Pro análisis de audio
(+) | los altavoces pueden reproducir a un volumen relativamente alto (#84.7 dB)
Graves 100 - 315 Hz
(+) | buen bajo - sólo 3.8% lejos de la mediana
(+) | el bajo es lineal (5.2% delta a la frecuencia anterior)
Medios 400 - 2000 Hz
(+) | medios equilibrados - a sólo 1.3% de la mediana
(+) | los medios son lineales (2.1% delta a la frecuencia anterior)
Altos 2 - 16 kHz
(+) | máximos equilibrados - a sólo 1.9% de la mediana
(+) | los máximos son lineales (2.7% delta a la frecuencia anterior)
Total 100 - 16.000 Hz
(+) | el sonido global es lineal (4.6% de diferencia con la mediana)
En comparación con la misma clase
» 0% de todos los dispositivos probados de esta clase eran mejores, 0% similares, 100% peores
» El mejor tuvo un delta de 5%, la media fue 17%, el peor fue ###max##%
En comparación con todos los dispositivos probados
» 0% de todos los dispositivos probados eran mejores, 0% similares, 100% peores
» El mejor tuvo un delta de 4%, la media fue 23%, el peor fue ###max##%
Gestión de la energía - Consumo elevado y ladrillo de gran potencia
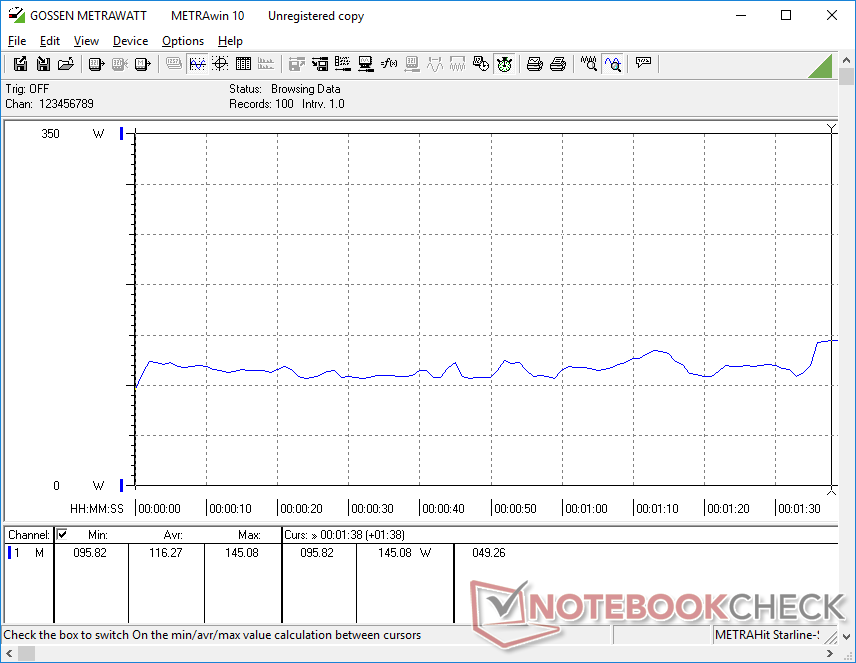
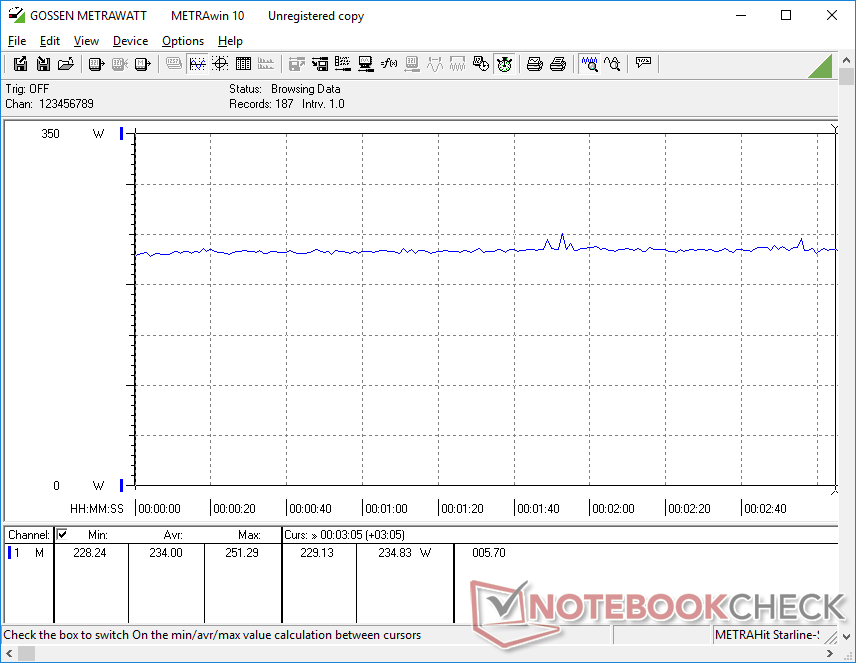
Consumo de energía
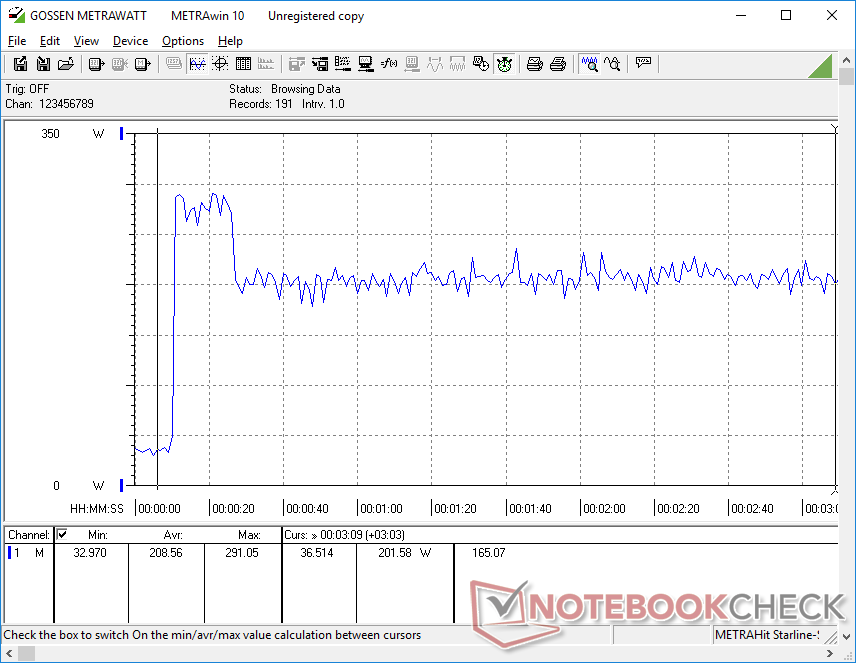
El consumo es notablemente superior al que registramos en el antiguo Core i9-12900HK GE66, especialmente cuando se ejecutan aplicaciones con mucha carga de CPU. Prime95, por ejemplo, consumiría unos 165 W en nuestro GE67 frente a sólo 90 W en el GE66, lo que representa un aumento del 83 por ciento. Es un precio elevado para el aumento del 35 al 40 por ciento en el rendimiento multihilo bruto entre el Core i9-12900HK y el Core i7-12800HX
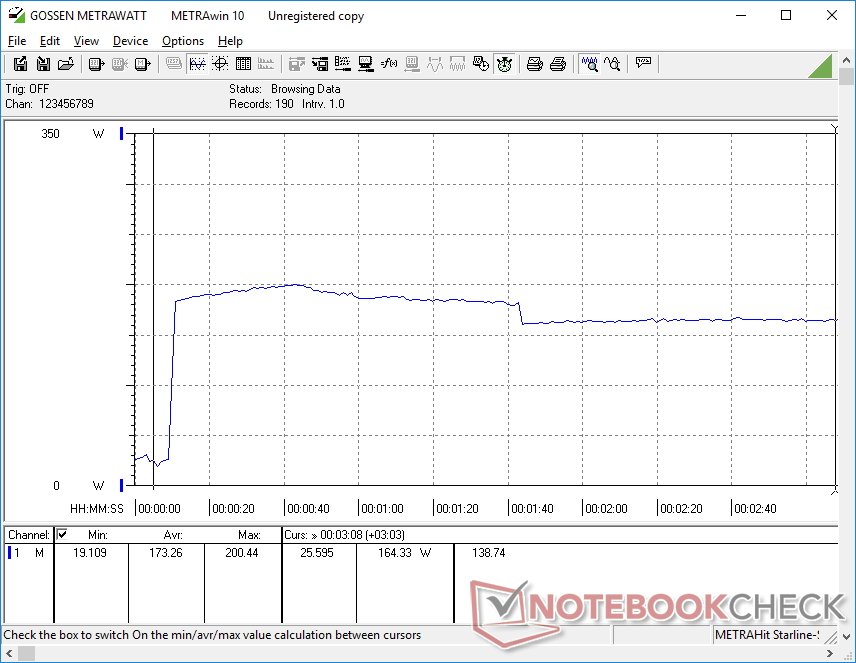
Si se ejecuta Witcher 3 consumiría unos 237 W, lo que vuelve a ser superior a los 202 W que registramos en el GE66. Incluso cuando se compara con otros portátiles de juego de alto rendimiento como el Asus ROG Strix Scar 15 o el Alienware m15 R6o el GE67, el consumo de energía es mayor en ambas ocasiones
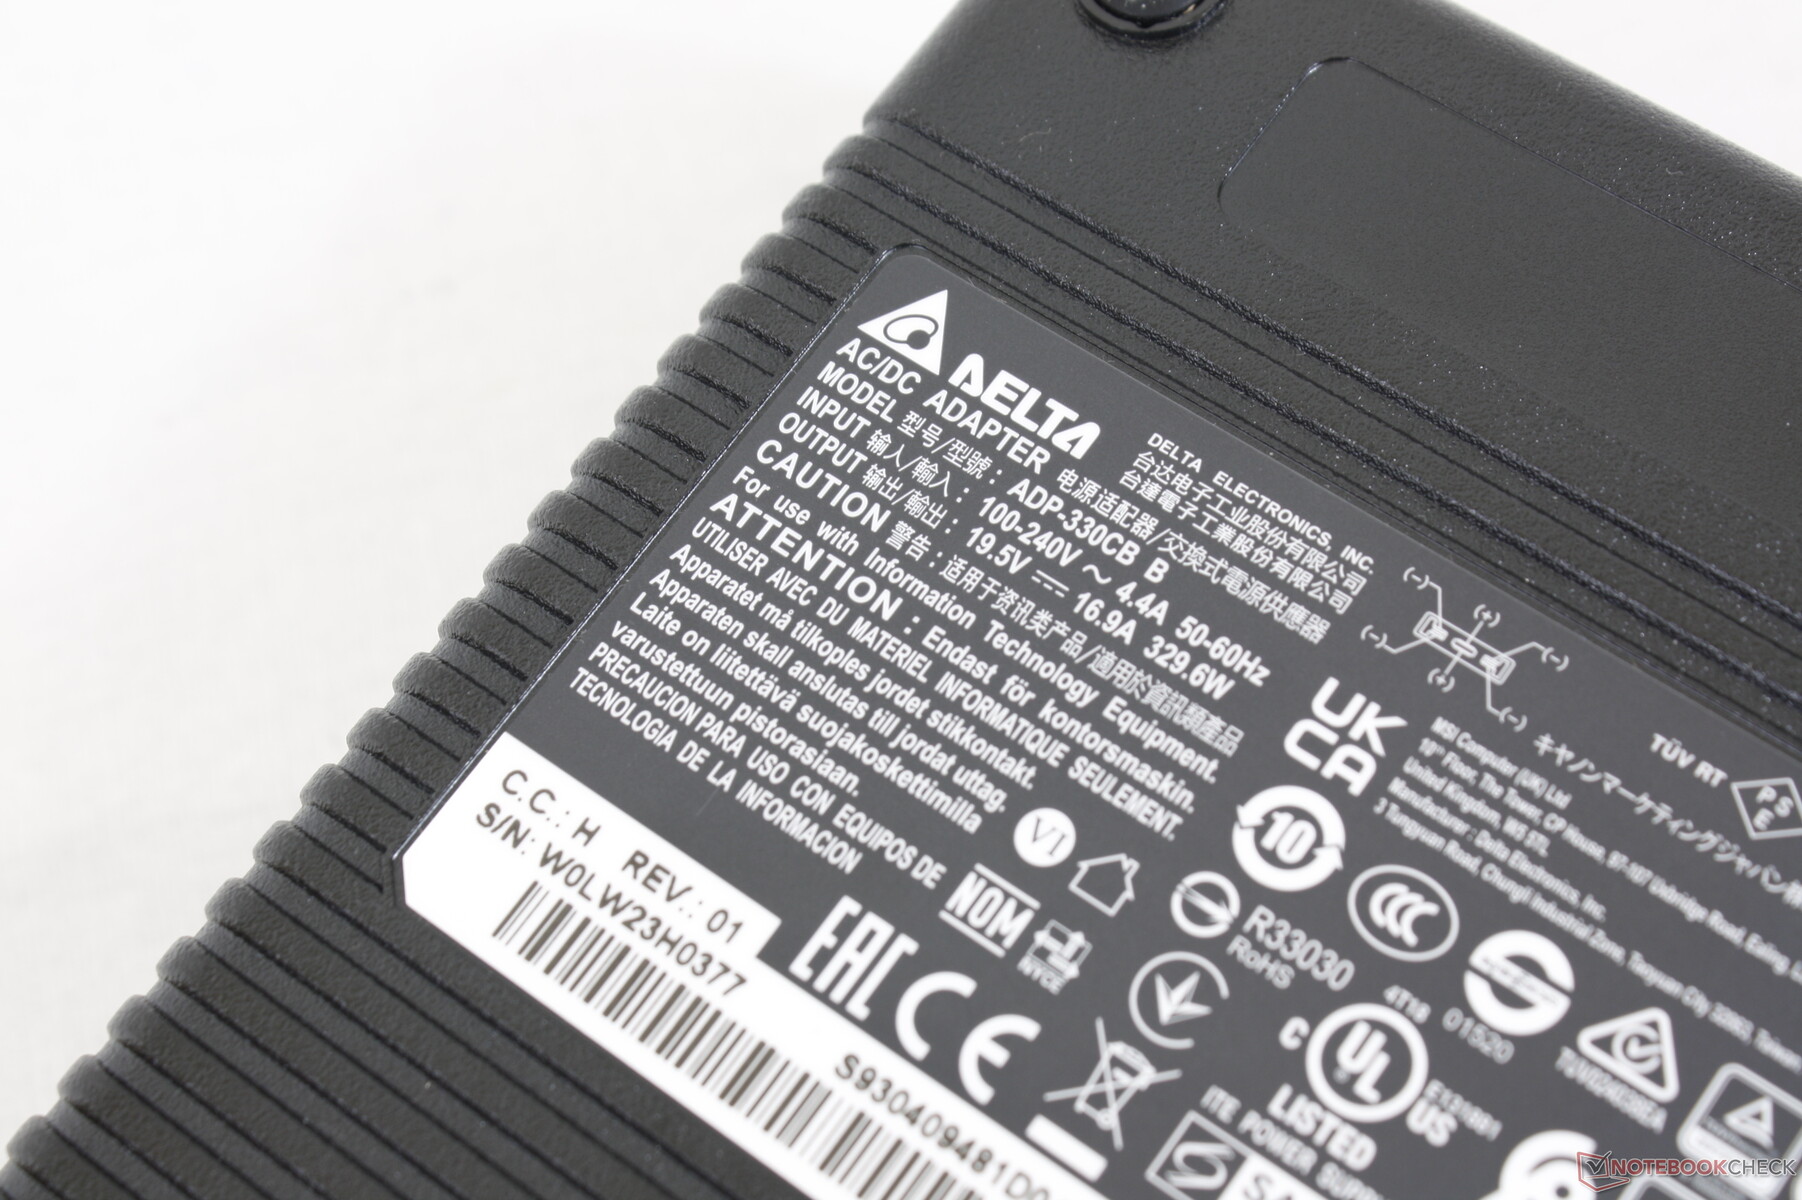
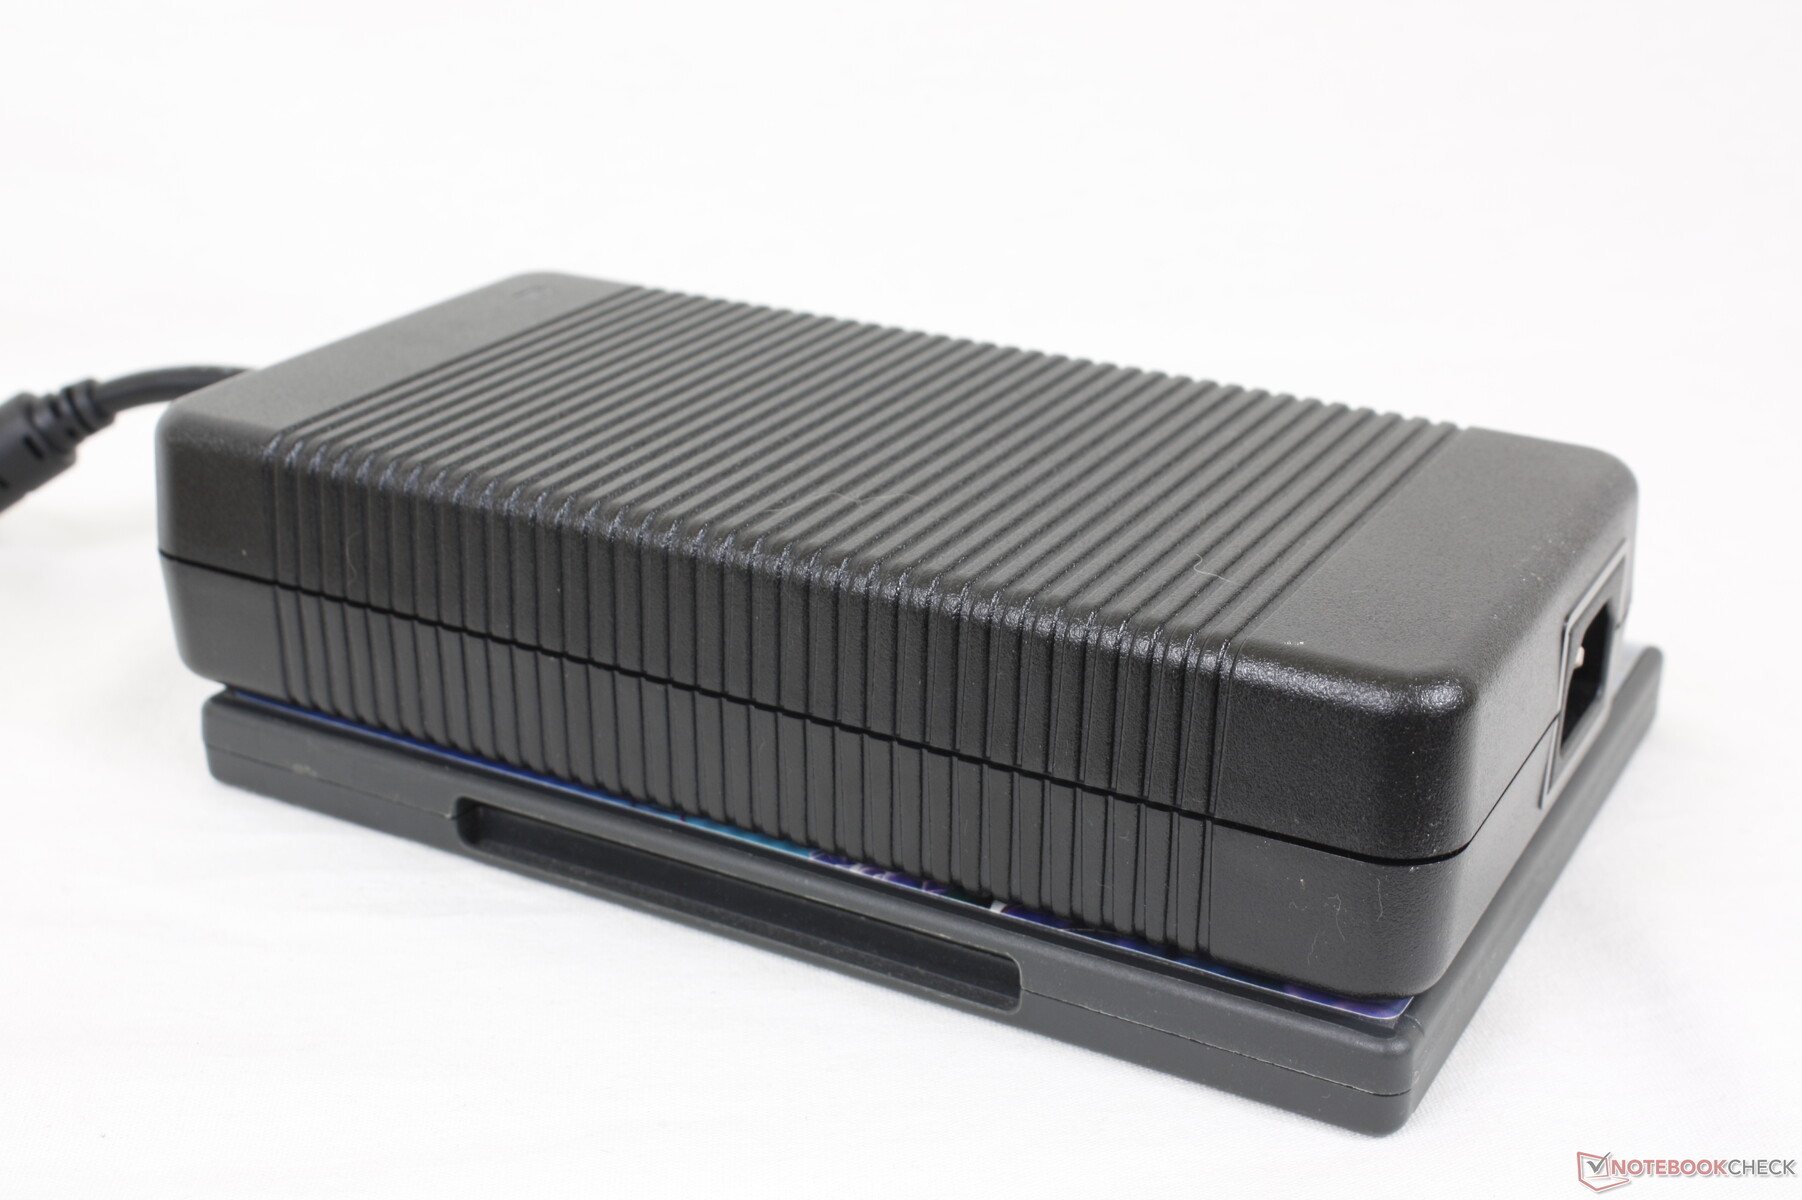
Registramos un consumo máximo de 291 W del enorme (~20 x 9,8 x 4,3 cm) y pesado (1,3 kg) bloque de alimentación de 330 W al ejecutar Prime95 y FurMark simultáneamente. Ten en cuenta que la mayoría de los portátiles para juegos vienen con adaptadores de corriente de 280 W o menos.
| Off / Standby | |
| Ocioso | |
| Carga |
|
Clave:
min: | |
| MSI GE67 HX 12UGS i7-12800HX, GeForce RTX 3070 Ti Laptop GPU, Samsung PM9A1 MZVL21T0HCLR, OLED, 1920x1080, 15.6" | MSI Raider GE66 12UHS i9-12900HK, GeForce RTX 3080 Ti Laptop GPU, Samsung PM9A1 MZVL22T0HBLB, IPS, 3840x2160, 15.6" | MSI Vector GP66 12UGS i9-12900H, GeForce RTX 3070 Ti Laptop GPU, , IPS, 1920x1080, 15.6" | Asus ROG Strix Scar 15 G533ZW-LN106WS i9-12900H, GeForce RTX 3070 Ti Laptop GPU, Samsung PM9A1 MZVL22T0HBLB, IPS-level, 2560x1440, 15.6" | Alienware m15 R6, i7-11800H RTX 3080 i7-11800H, GeForce RTX 3080 Laptop GPU, Samsung PM9A1 MZVL21T0HCLR, IPS, 1920x1080, 15.6" | Razer Blade 15 2022 i7-12800H, GeForce RTX 3080 Ti Laptop GPU, SSSTC CA6-8D1024, IPS, 2560x1440, 15.6" | |
|---|---|---|---|---|---|---|
| Power Consumption | 5% | -15% | 21% | 12% | -35% | |
| Idle Minimum * (Watt) | 16.1 | 16 1% | 17.5 -9% | 7.56 53% | 14 13% | 33.2 -106% |
| Idle Average * (Watt) | 17.1 | 19 -11% | 20.1 -18% | 13.5 21% | 18 -5% | 36.4 -113% |
| Idle Maximum * (Watt) | 26.6 | 26 2% | 47.3 -78% | 16.87 37% | 29 -9% | 37.6 -41% |
| Load Average * (Watt) | 116.3 | 110 5% | 107.3 8% | 128.9 -11% | 93 20% | 116.7 -0% |
| Witcher 3 ultra * (Watt) | 237 | 202 15% | 225 5% | 196.2 17% | 190 20% | 172 27% |
| Load Maximum * (Watt) | 291.1 | 242 17% | 277.7 5% | 274.86 6% | 203 30% | 228.6 21% |
* ... más pequeño es mejor
Power Consumption Witcher 3 / Stresstest
Power Consumption external Monitor
Duración de la batería - En realidad no está mal
La capacidad de la batería es la mayor permitida, con 99,9 Wh, ya que cualquier cantidad superior violaría las normas de seguridad de las baterías de litio de la FAA. Los usuarios pueden esperar una duración de la WLAN de unas 5,5 horas cuando se configura el perfil de energía equilibrado, que es similar a lo que registramos en el GE66 a pesar de sus diferencias de rendimiento.
La carga de vacío a lleno es lenta, de 2 a 2,5 horas. El sistema no se puede cargar por USB-C a diferencia de la serie Razer Blade o la mayoría de modelos Asus ROG.
| MSI GE67 HX 12UGS i7-12800HX, GeForce RTX 3070 Ti Laptop GPU, 99.9 Wh | MSI Raider GE66 12UHS i9-12900HK, GeForce RTX 3080 Ti Laptop GPU, 99 Wh | MSI Vector GP66 12UGS i9-12900H, GeForce RTX 3070 Ti Laptop GPU, 65 Wh | Asus ROG Strix Scar 15 G533ZW-LN106WS i9-12900H, GeForce RTX 3070 Ti Laptop GPU, 90 Wh | Alienware m15 R6, i7-11800H RTX 3080 i7-11800H, GeForce RTX 3080 Laptop GPU, 84 Wh | Razer Blade 15 2022 i7-12800H, GeForce RTX 3080 Ti Laptop GPU, 80 Wh | |
|---|---|---|---|---|---|---|
| Duración de Batería | -9% | -19% | -4% | -18% | -12% | |
| Reader / Idle (h) | 8.4 | 7.9 -6% | ||||
| WiFi v1.3 (h) | 5.6 | 5.7 2% | 5.7 2% | 8.4 50% | 5 -11% | 4.9 -12% |
| Load (h) | 2.1 | 1.7 -19% | 1 -52% | 0.9 -57% | 1.6 -24% | |
| H.264 (h) | 7.1 | 8.5 | 5.6 | |||
| Witcher 3 ultra (h) | 1.2 |
Pro
Contra
Veredicto - Mayor rendimiento, mayor factura de energía
Las ventajas de rendimiento del Core i7-12800HX son innegables. Cuando se compara con el Ryzen 7 5800H o incluso el Core i9-12900Hla CPU Intel HX puede ofrecer un rendimiento multihilo hasta un 80 por ciento más rápido que la primera y entre un 30 y un 60 por ciento más rápido que la segunda. Las ganancias son lo suficientemente significativas como para superar al Core i7-12700K en muchos casos. Los entusiastas y los jugadores que saben que pueden aprovechar el procesador, por ejemplo, para obtener una mayor velocidad de fotogramas en los juegos, encontrarán muchas cosas que les gustan de lo que puede ofrecer el GE67.
Todo ese rendimiento adicional no es gratuito. Mientras que el GE66 se entrega con un adaptador de CA de 280 W más delgado, el GE67 se entrega con un adaptador de CA más voluminoso de 330 W sólo para acomodar la CPU HX de 12ª generación, que consume mucha energía. El consumo de energía es, sin duda, mayor. Algunos usuarios pueden encontrar estas desventajas que valen la pena cuando se consideran las inmensas ganancias de la CPU, pero sigue siendo algo a tener en cuenta si desde una perspectiva de rendimiento por vatio.
El GE67 es uno de los portátiles para juegos de 15,6 pulgadas más rápidos gracias a la CPU Core i7-12800HX y la GPU GeForce RTX de 150 W. También es uno de los que más energía consume, ya que necesita un gran bloque de alimentación de 330 W para funcionar.
En cuanto a la pantalla QHD OLED de 240 Hz, es fácilmente el mejor panel OLED disponible actualmente para los juegos y combina muy bien con la CPU HX y la GPU GeForce RTX 3070 Ti de 150 W. Sin embargo, su implementación en el GE67 no es para fines de edición profesional, y el parpadeo puede afectar a una minoría de usuarios.
Precio y disponibilidad
El MSI GE67 aún no está disponible en Amazon o Best Buy en el momento de escribir este artículo. Sin embargo, puntos de venta como XoticPC y EXcaliberPC tienen unidades en stock a partir de 2.500 dólares.
MSI GE67 HX 12UGS
- 08/30/2022 v7 (old)
Allen Ngo
Price comparison

