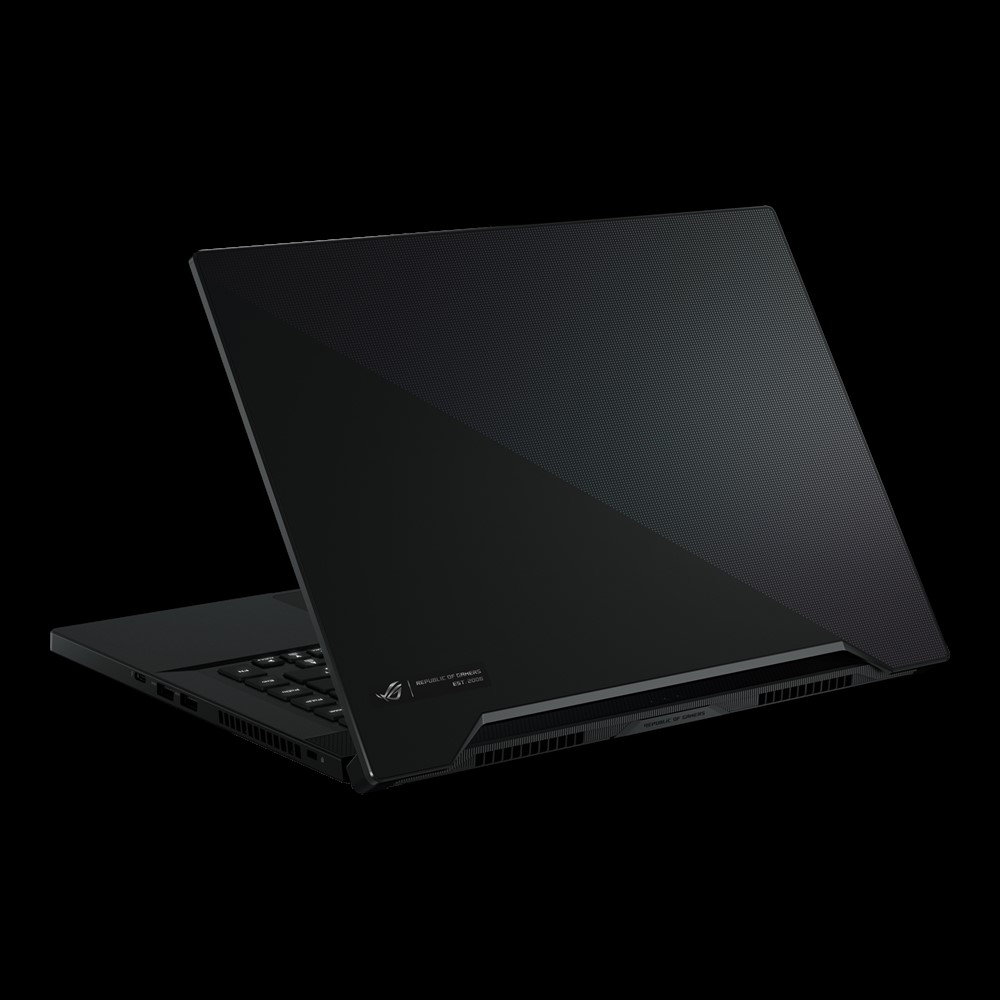
Asus Zephyrus M15 GU502LU vs. GU502LW: ¿Cuál es la diferencia?
La serie de 10ª generación de Intel Asus Zephyrus G15 GU502 viene en tres modelos discretos: el GU502LW, el GU502LV y el GU502LU, cada uno distinguido por sus diferentes opciones de GPU. Recientemente hemos comprobado el GU502LW con una GeForce RTX 2070 Max-Q y una pantalla de 4K y ahora veremos en qué se diferencia del GU502LU más barato con una GTX 1660 Ti y una pantalla FHD.
Más reviews de Asus:
Valoración | Fecha | Modelo | Peso | Altura | Tamaño | Resolución | Precio |
|---|---|---|---|---|---|---|---|
| 82.1 % v7 (old) | 10/2020 | Asus ROG Zephyrus M15 GU502LU-BI7N4 i7-10750H, GeForce GTX 1660 Ti Mobile | 2 kg | 18.9 mm | 15.60" | 1920x1080 | |
| 82.5 % v7 (old) | 10/2020 | Asus ROG Zephyrus M15 GU502L i7-10750H, GeForce RTX 2070 Max-Q | 2 kg | 18.9 mm | 15.60" | 3840x2160 | |
| 82.1 % v7 (old) | 09/2020 | HP Omen 15-ek0456ng i5-10300H, GeForce GTX 1660 Ti Mobile | 2.1 kg | 32 mm | 15.60" | 1920x1080 | |
| 82.1 % v7 (old) | 10/2020 | Gateway Creator Series 15.6 GWTN156-3BK i5-10300H, GeForce RTX 2060 Mobile | 2 kg | 19.9 mm | 15.60" | 1920x1080 | |
| 83.3 % v7 (old) | 07/2020 | Lenovo Legion 5 15IMH05H i5-10300H, GeForce RTX 2060 Mobile | 2.5 kg | 26.1 mm | 15.60" | 1920x1080 | |
| 83.2 % v7 (old) | 05/2020 | MSI GP65 10SFK-047US i7-10750H, GeForce RTX 2070 Mobile | 2.3 kg | 27.5 mm | 15.60" | 1920x1080 |
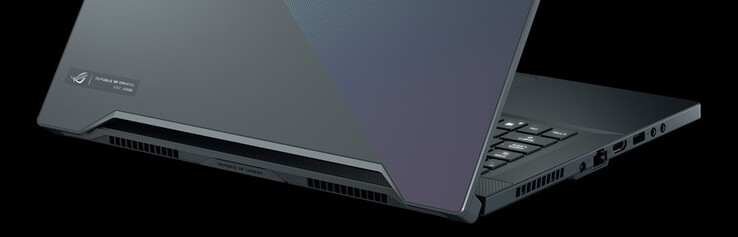
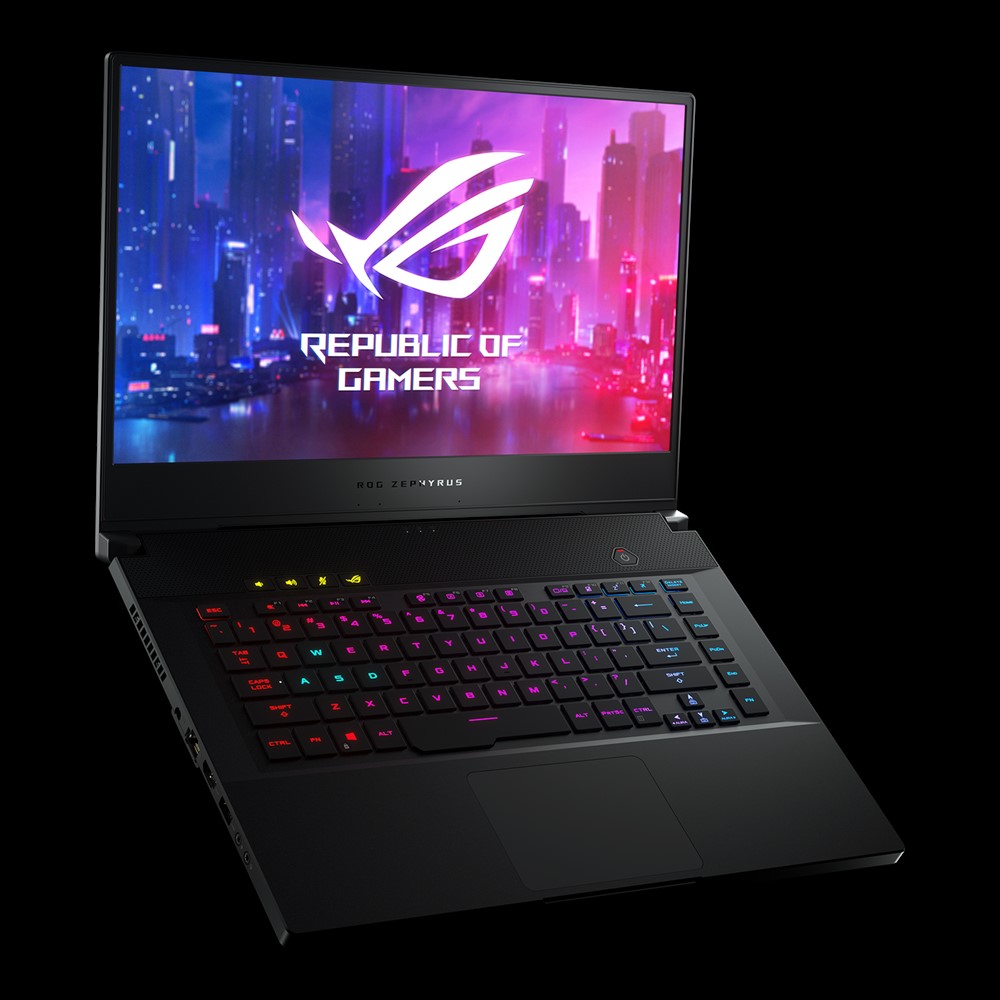
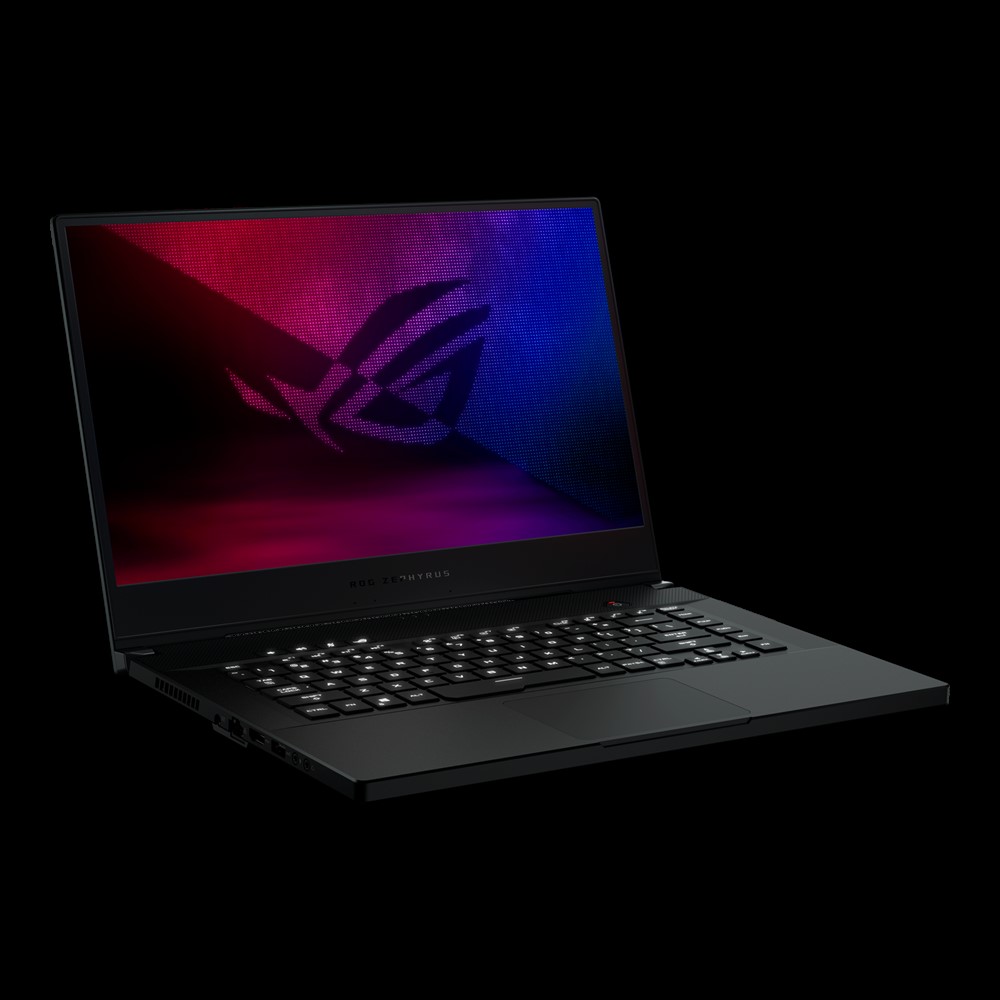
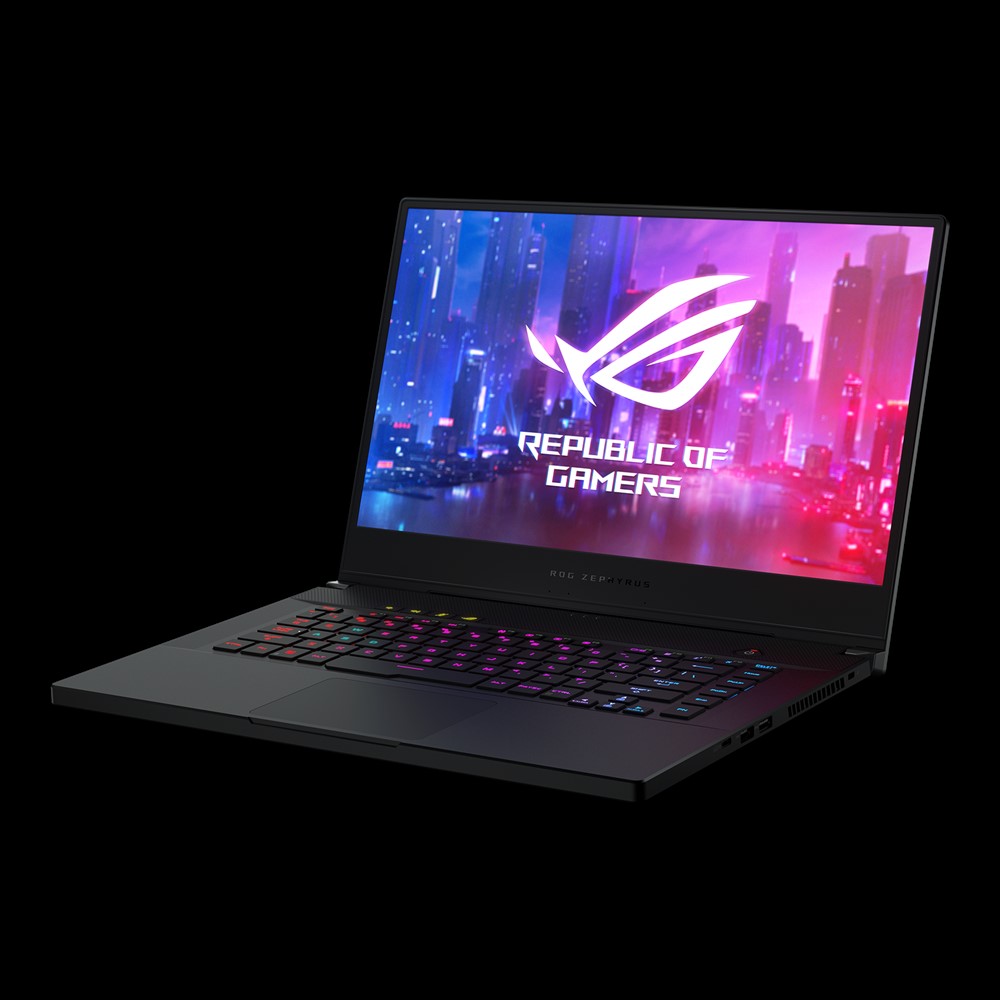
Carcasa
Comunicación
Display
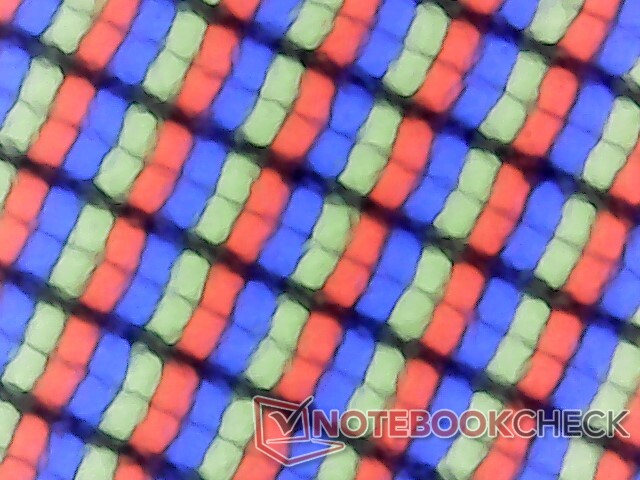
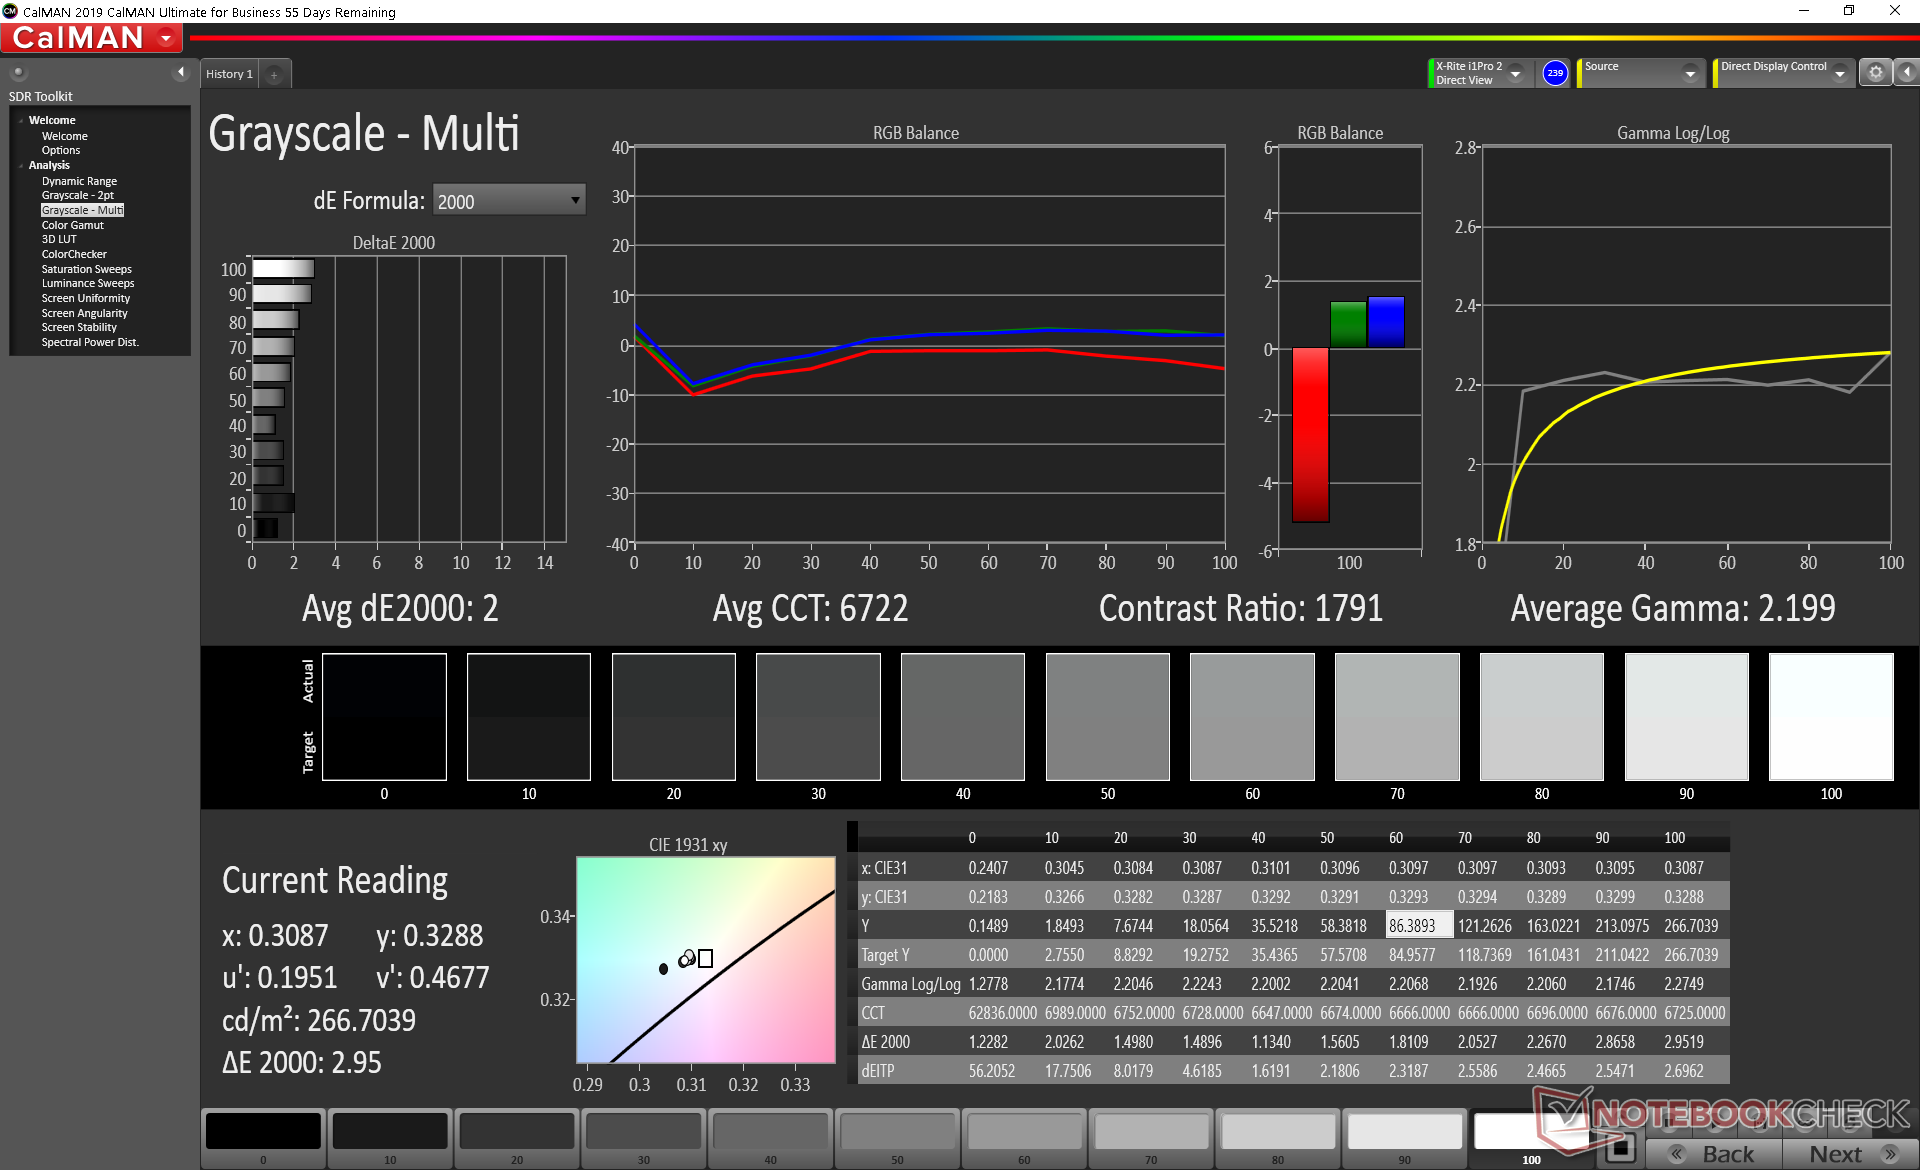
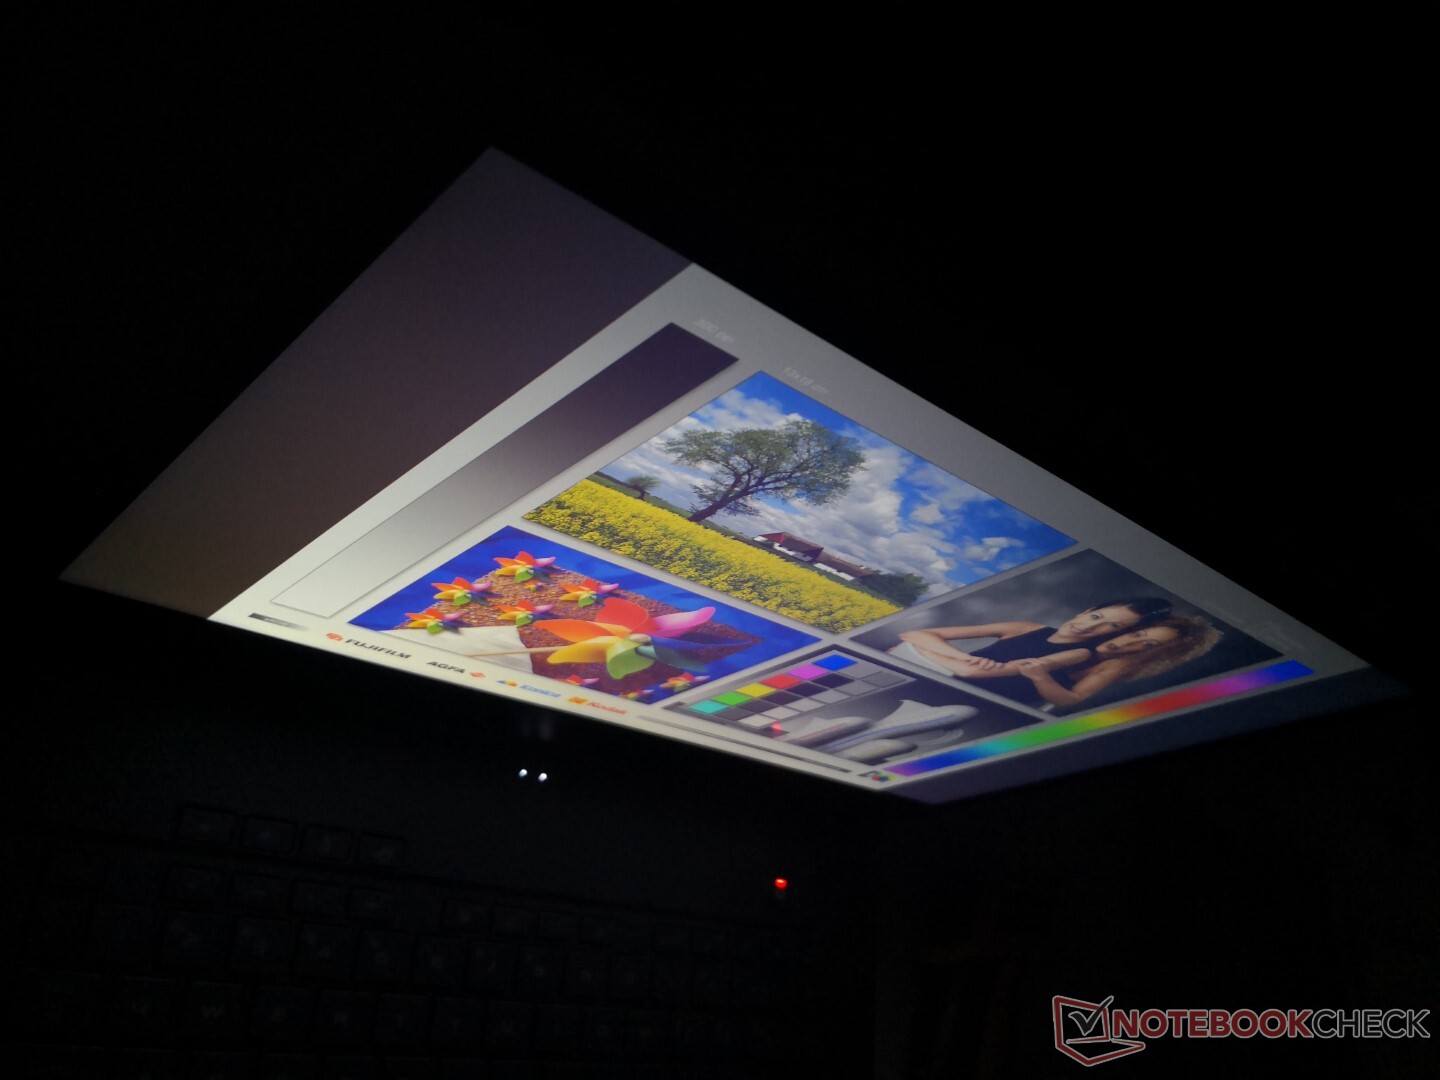
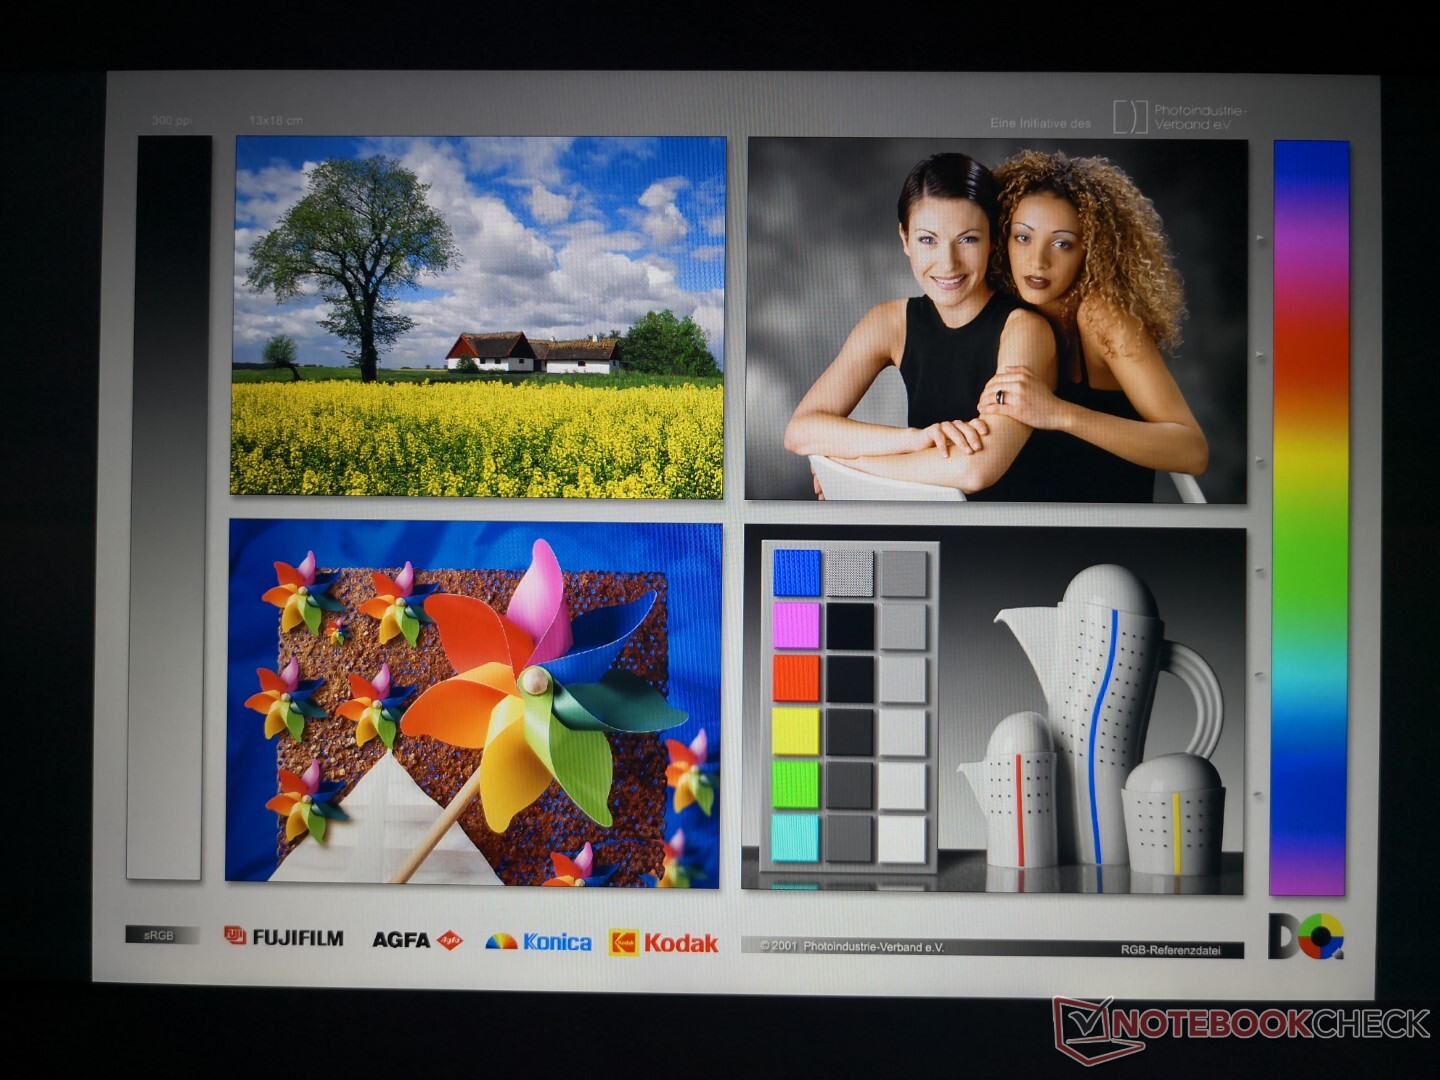
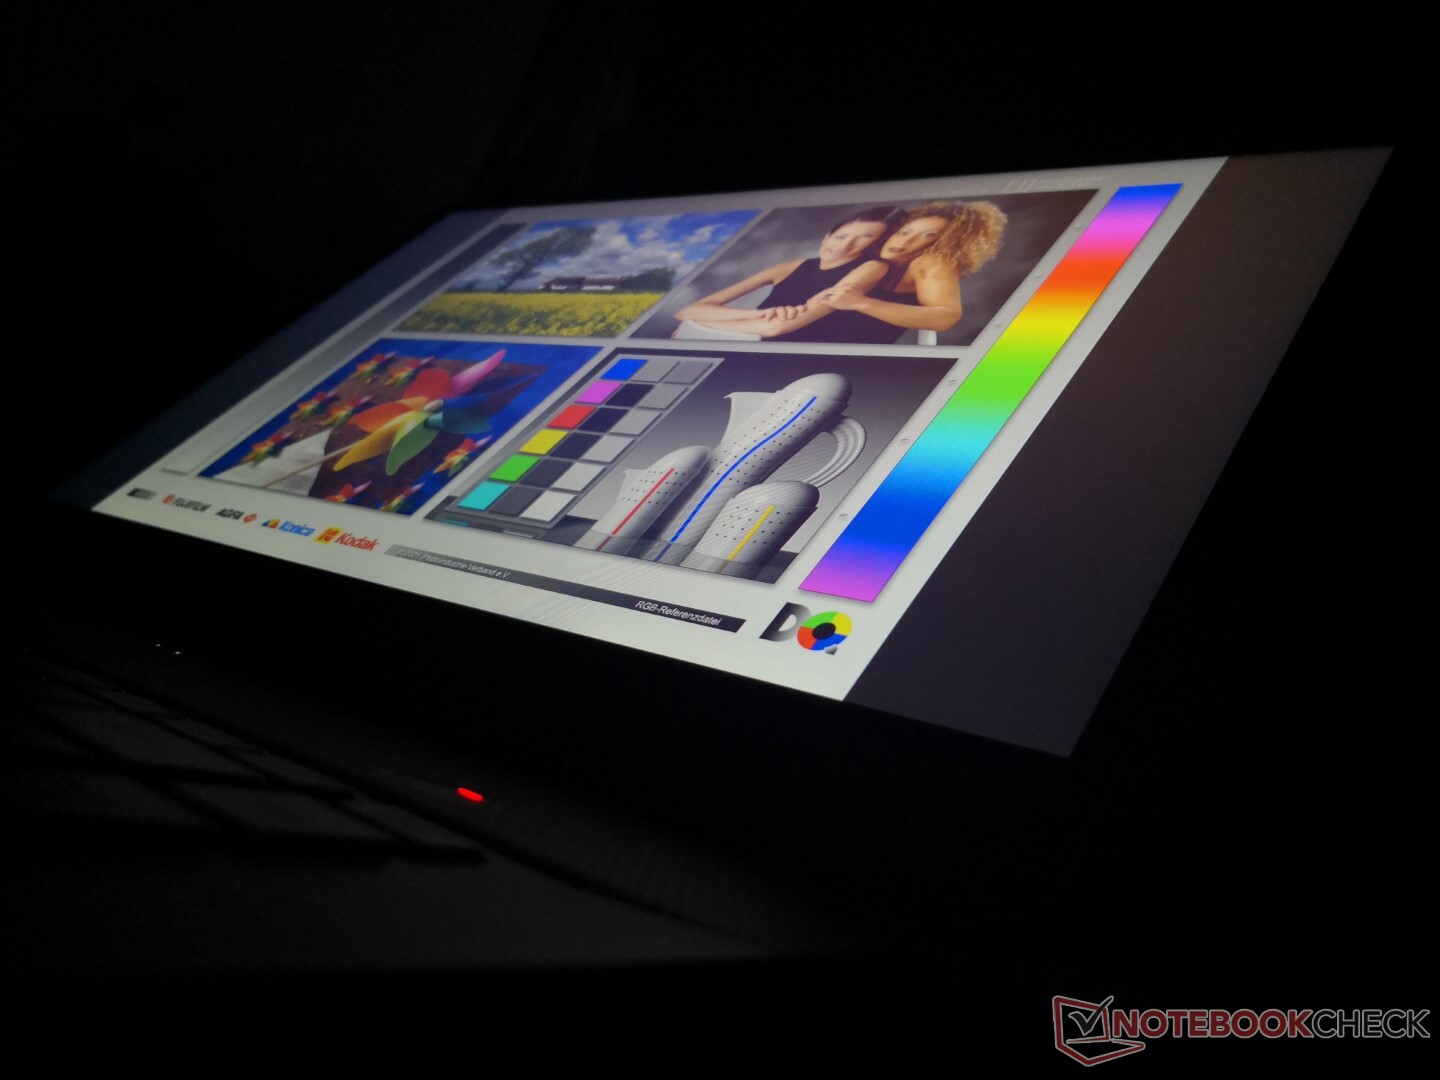
A diferencia del GU502LW y su panel 4K UHD de 60 Hz, nuestro menos costoso GU502LU viene con un panel de 144 Hz 1080p en su lugar. El principal problema es que este panel Panda LM156LF-2F01 en particular muestra tiempos de respuesta lentos y un notable efecto fantasma no apto para juegos rápidos, a diferencia de muchos paneles de LG Philips que ofrecen tiempos de respuesta de 5 ms o más. Otras cualidades como los colores, la relación de contraste y el brillo son pobres o medias, en el mejor de los casos, como se espera de un panel Panda.
| |||||||||||||||||||||||||
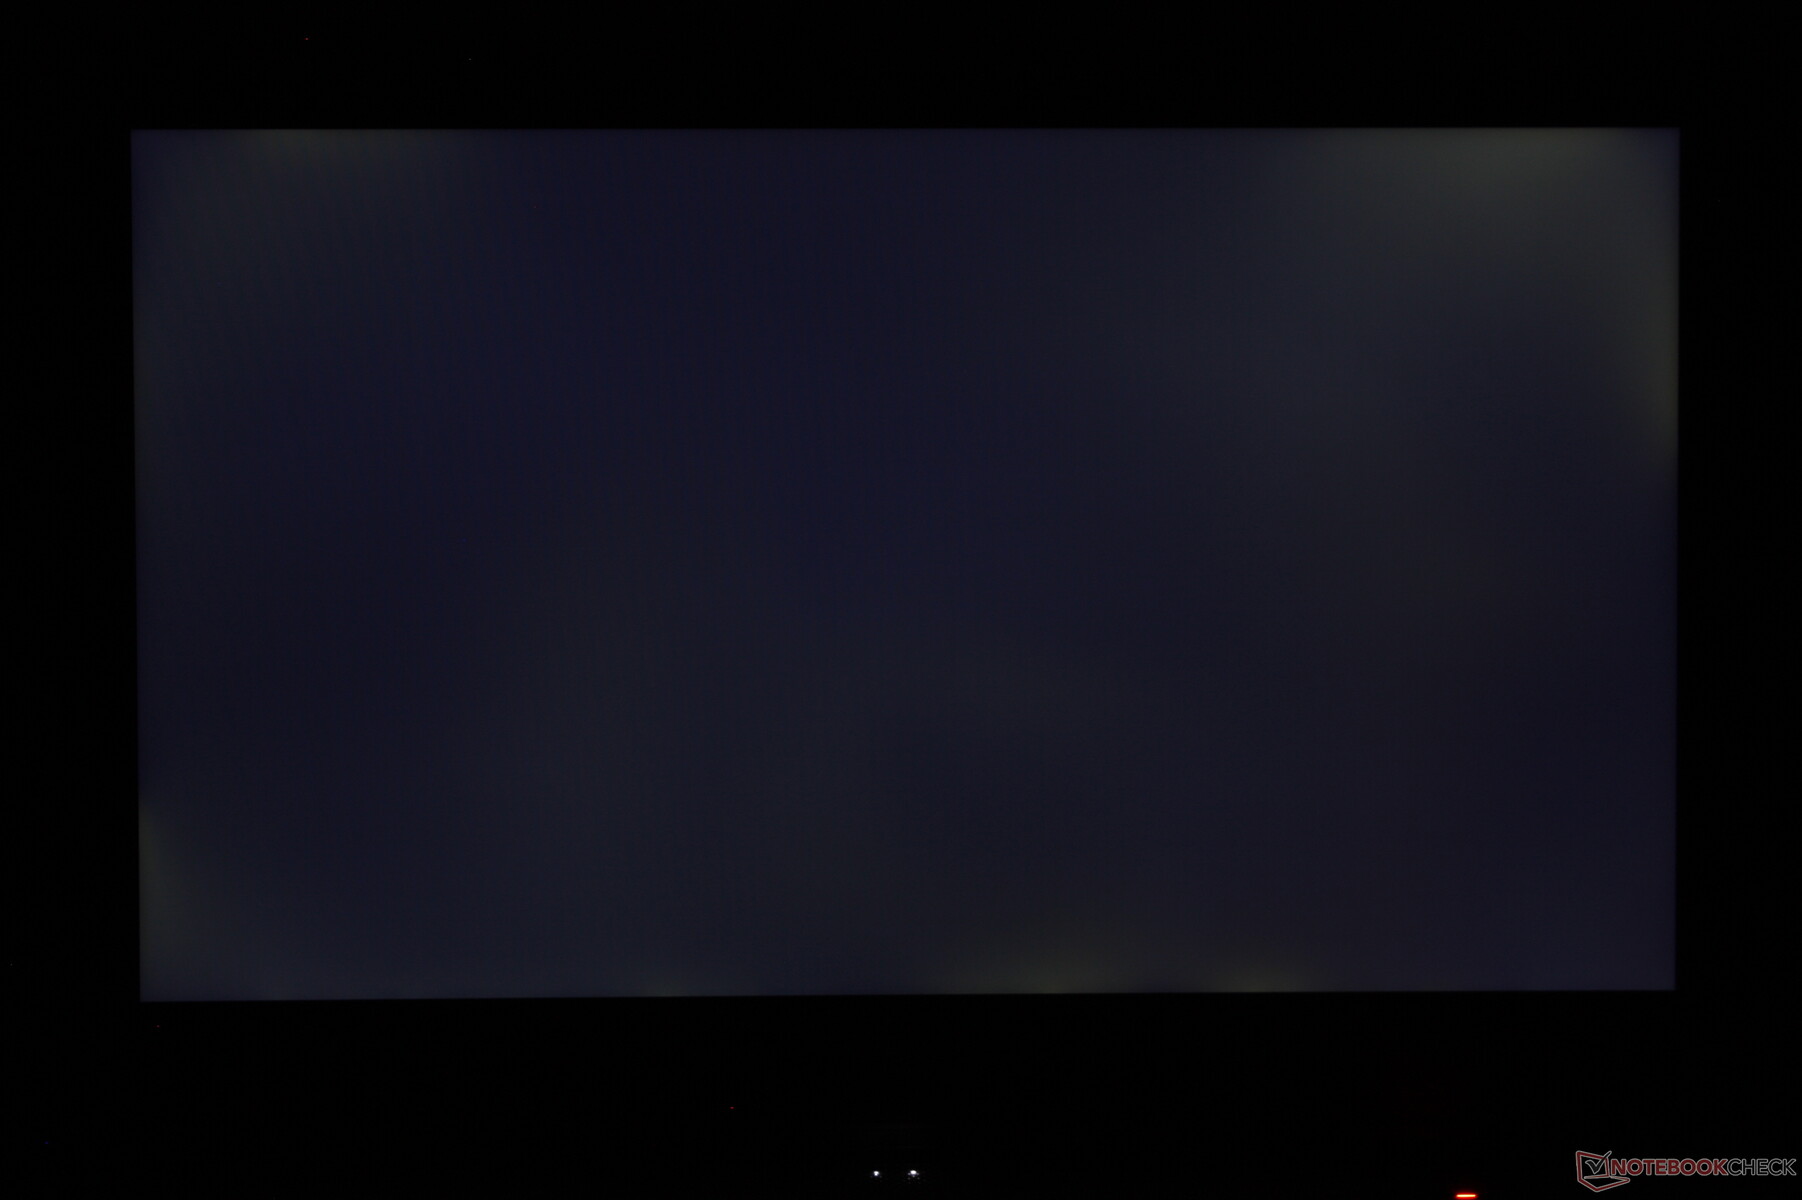
iluminación: 86 %
Brillo con batería: 282.5 cd/m²
Contraste: 831:1 (Negro: 0.34 cd/m²)
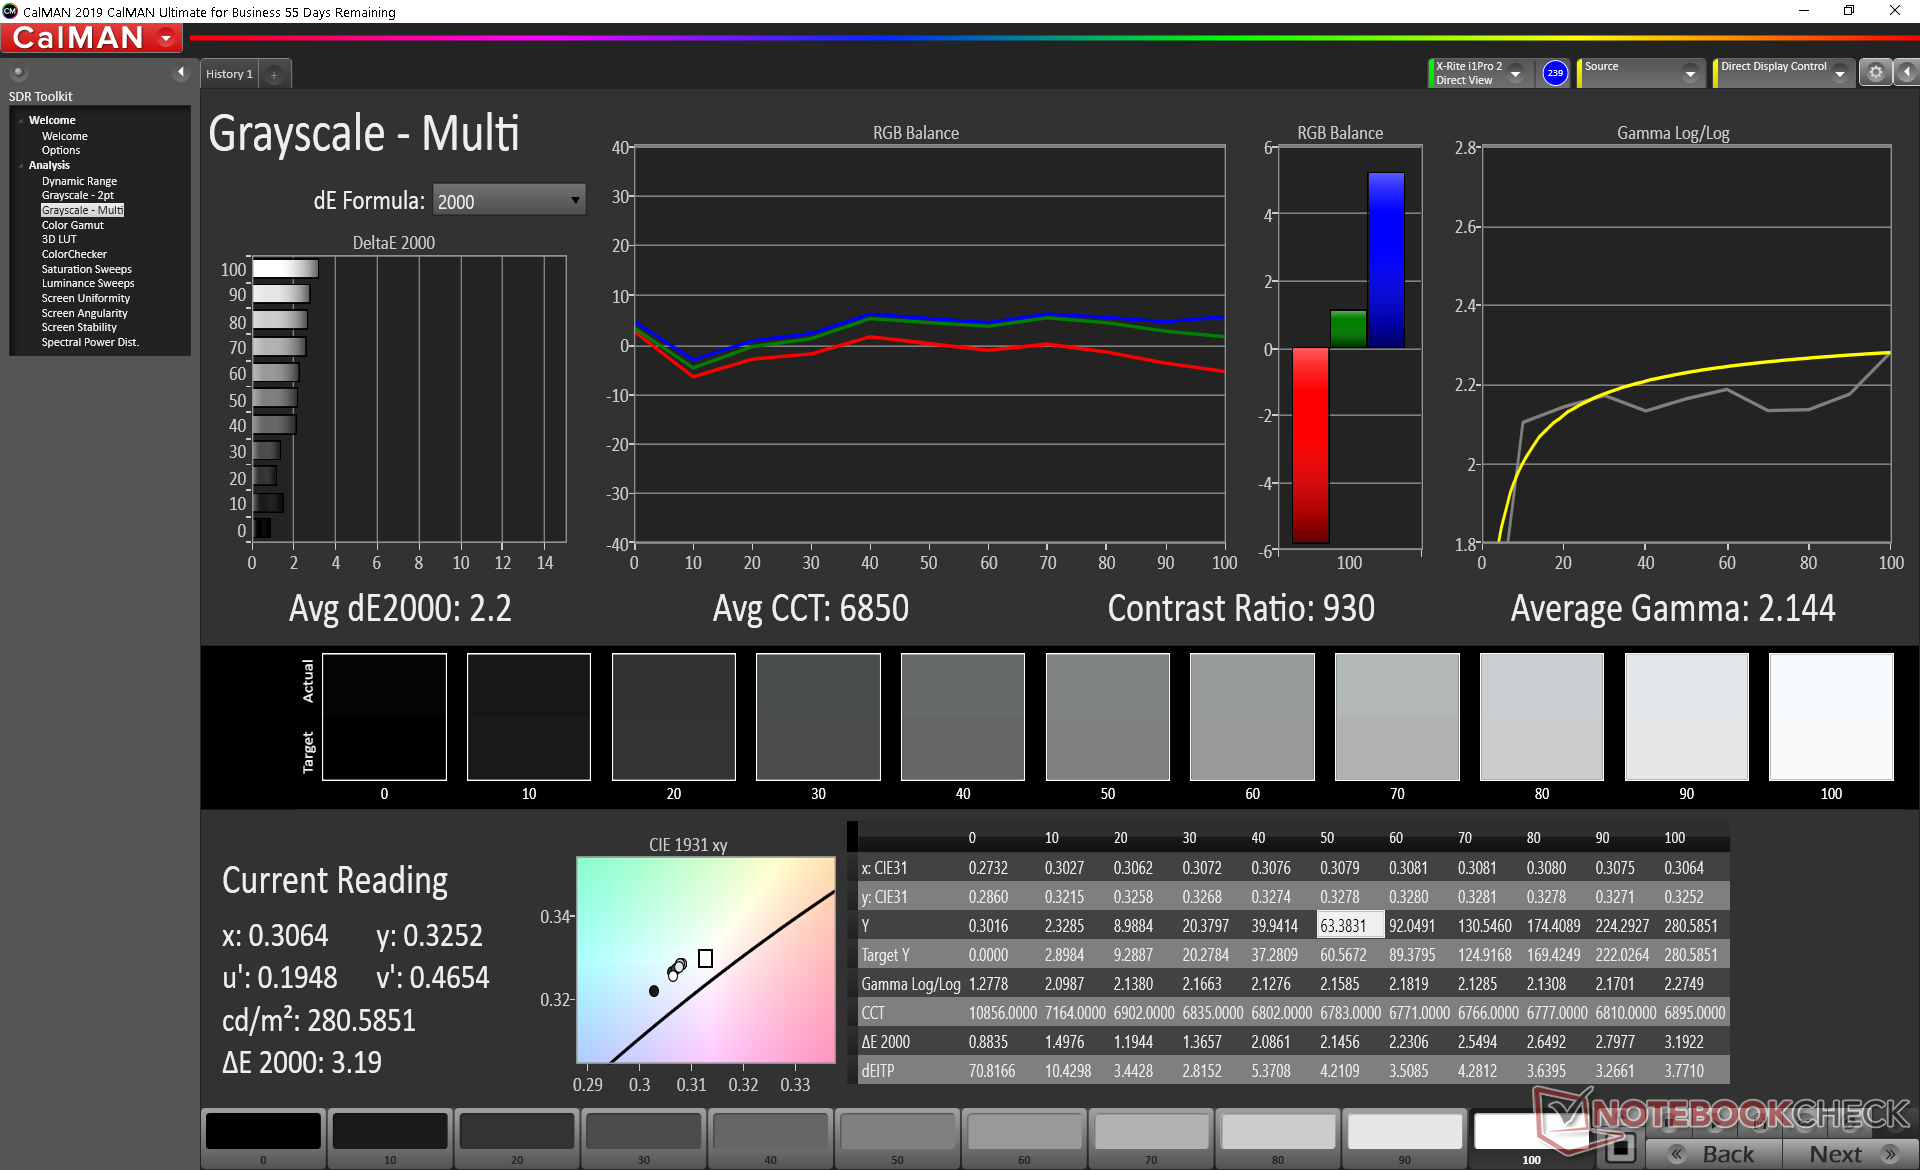
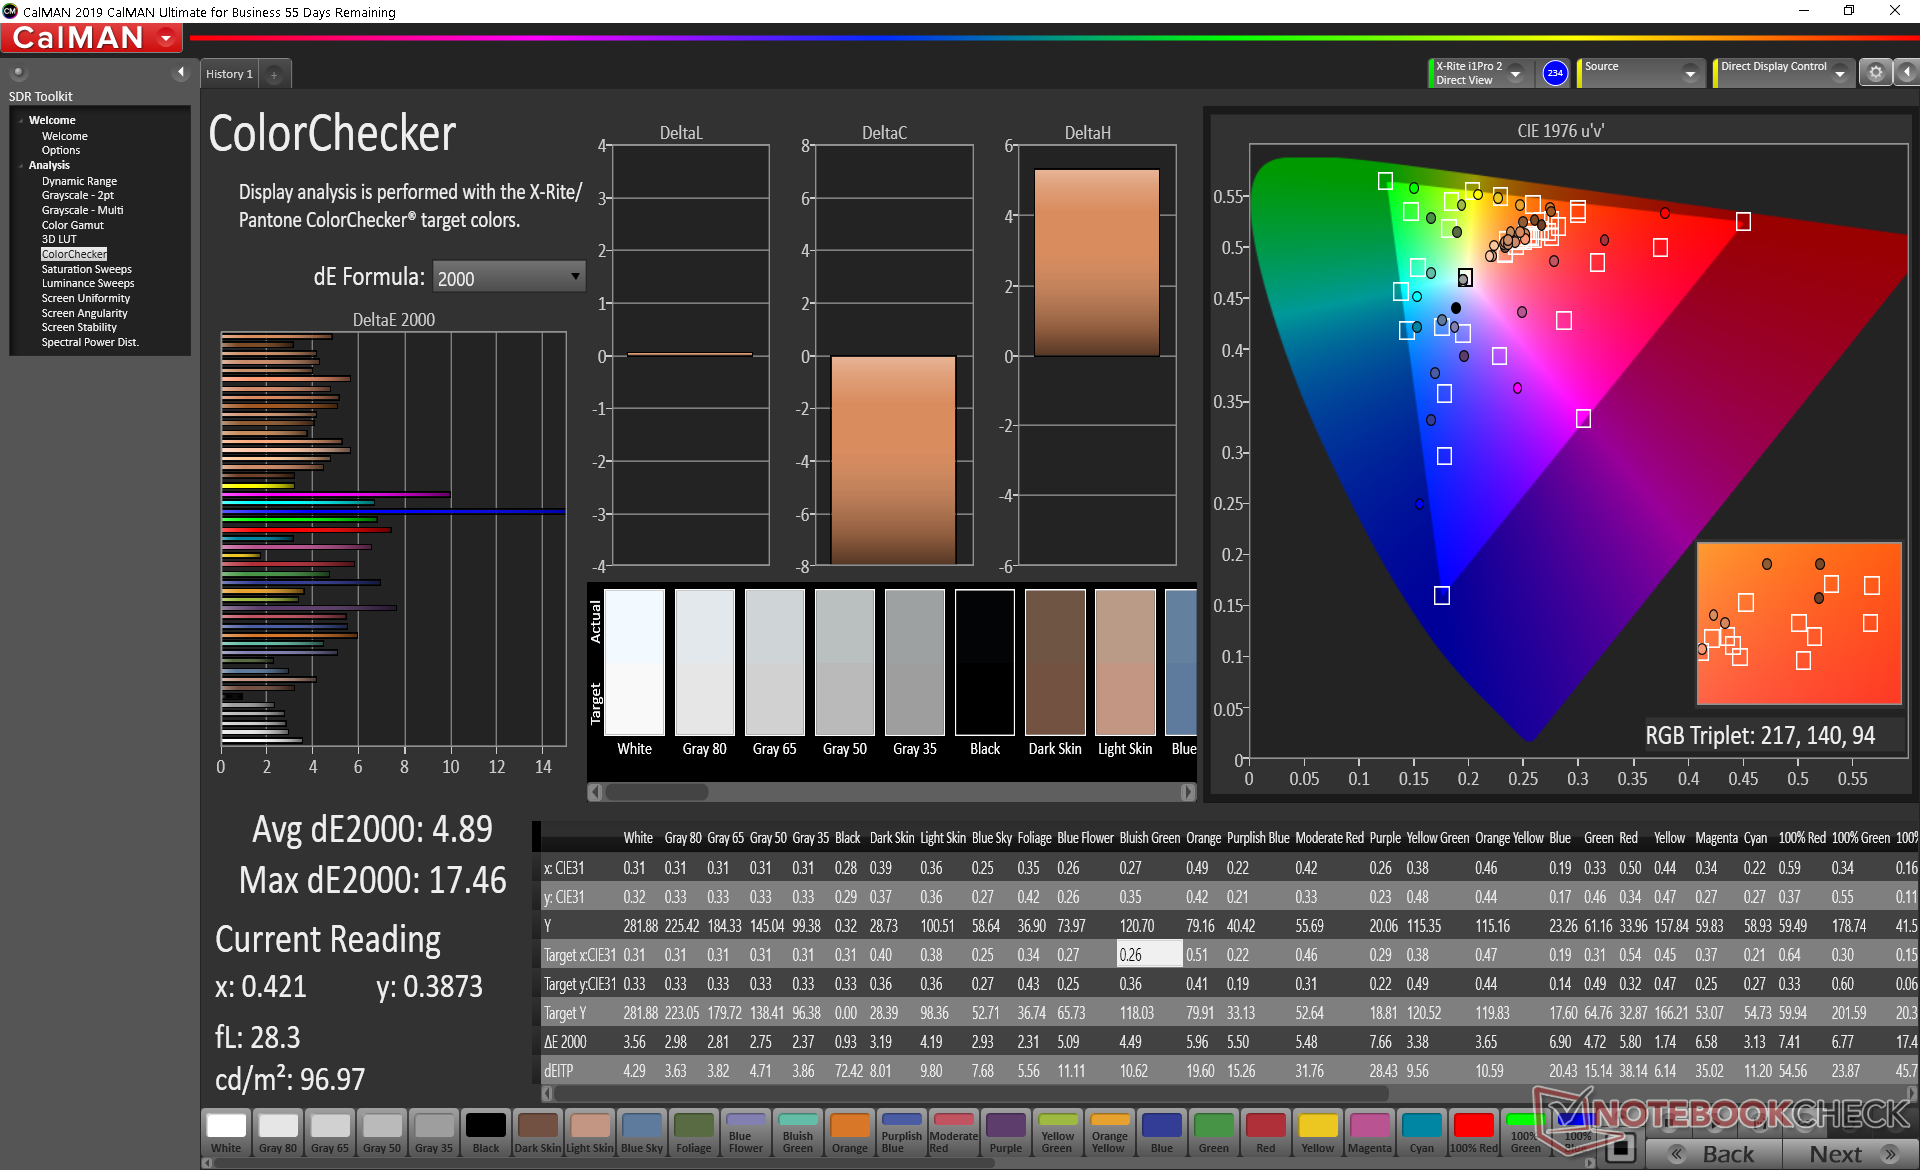
ΔE ColorChecker Calman: 4.89 | ∀{0.5-29.43 Ø4.72}
calibrated: 4.75
ΔE Greyscale Calman: 2.2 | ∀{0.09-98 Ø4.97}
58.5% sRGB (Argyll 1.6.3 3D)
37.2% AdobeRGB 1998 (Argyll 1.6.3 3D)
40.65% AdobeRGB 1998 (Argyll 3D)
59.1% sRGB (Argyll 3D)
39.32% Display P3 (Argyll 3D)
Gamma: 2.14
CCT: 6850 K
| Asus ROG Zephyrus M15 GU502LU-BI7N4 Panda LM156LF-2F01, IPS, 15.6", 1920x1080 | Asus ROG Zephyrus M15 GU502L AU Optronics B156ZAN03.1, IPS, 15.6", 3840x2160 | HP Omen 15-ek0456ng LGD05FE, IPS, 15.6", 1920x1080 | Gateway Creator Series 15.6 GWTN156-3BK BOE NV156FHM-NX1, IPS, 15.6", 1920x1080 | Lenovo Legion 5 15IMH05H BOE CQ NV156FHM-NX1, IPS, 15.6", 1920x1080 | MSI GP65 10SFK-047US LG Philips LP156WFG-SPB3, IPS, 15.6", 1920x1080 | |
|---|---|---|---|---|---|---|
| Display | 73% | 0% | -1% | 60% | ||
| Display P3 Coverage (%) | 39.32 | 69.4 77% | 39.86 1% | 38.8 -1% | 63.5 61% | |
| sRGB Coverage (%) | 59.1 | 99 68% | 58.4 -1% | 57.8 -2% | 94.4 60% | |
| AdobeRGB 1998 Coverage (%) | 40.65 | 70.5 73% | 41.18 1% | 40.09 -1% | 65.1 60% | |
| Response Times | -66% | 46% | -15% | 17% | 57% | |
| Response Time Grey 50% / Grey 80% * (ms) | 26 ? | 60 ? -131% | 17 ? 35% | 38.4 ? -48% | 26 ? -0% | 10.4 ? 60% |
| Response Time Black / White * (ms) | 25.6 ? | 25.6 ? -0% | 11 ? 57% | 20.8 ? 19% | 17 ? 34% | 12 ? 53% |
| PWM Frequency (Hz) | ||||||
| Screen | 59% | 30% | -16% | 4% | 21% | |
| Brightness middle (cd/m²) | 282.5 | 387 37% | 314 11% | 296.3 5% | 301 7% | 384.9 36% |
| Brightness (cd/m²) | 260 | 377 45% | 293 13% | 284 9% | 277 7% | 358 38% |
| Brightness Distribution (%) | 86 | 90 5% | 87 1% | 84 -2% | 77 -10% | 87 1% |
| Black Level * (cd/m²) | 0.34 | 0.23 32% | 0.22 35% | 0.38 -12% | 0.26 24% | 0.67 -97% |
| Contrast (:1) | 831 | 1683 103% | 1427 72% | 780 -6% | 1158 39% | 574 -31% |
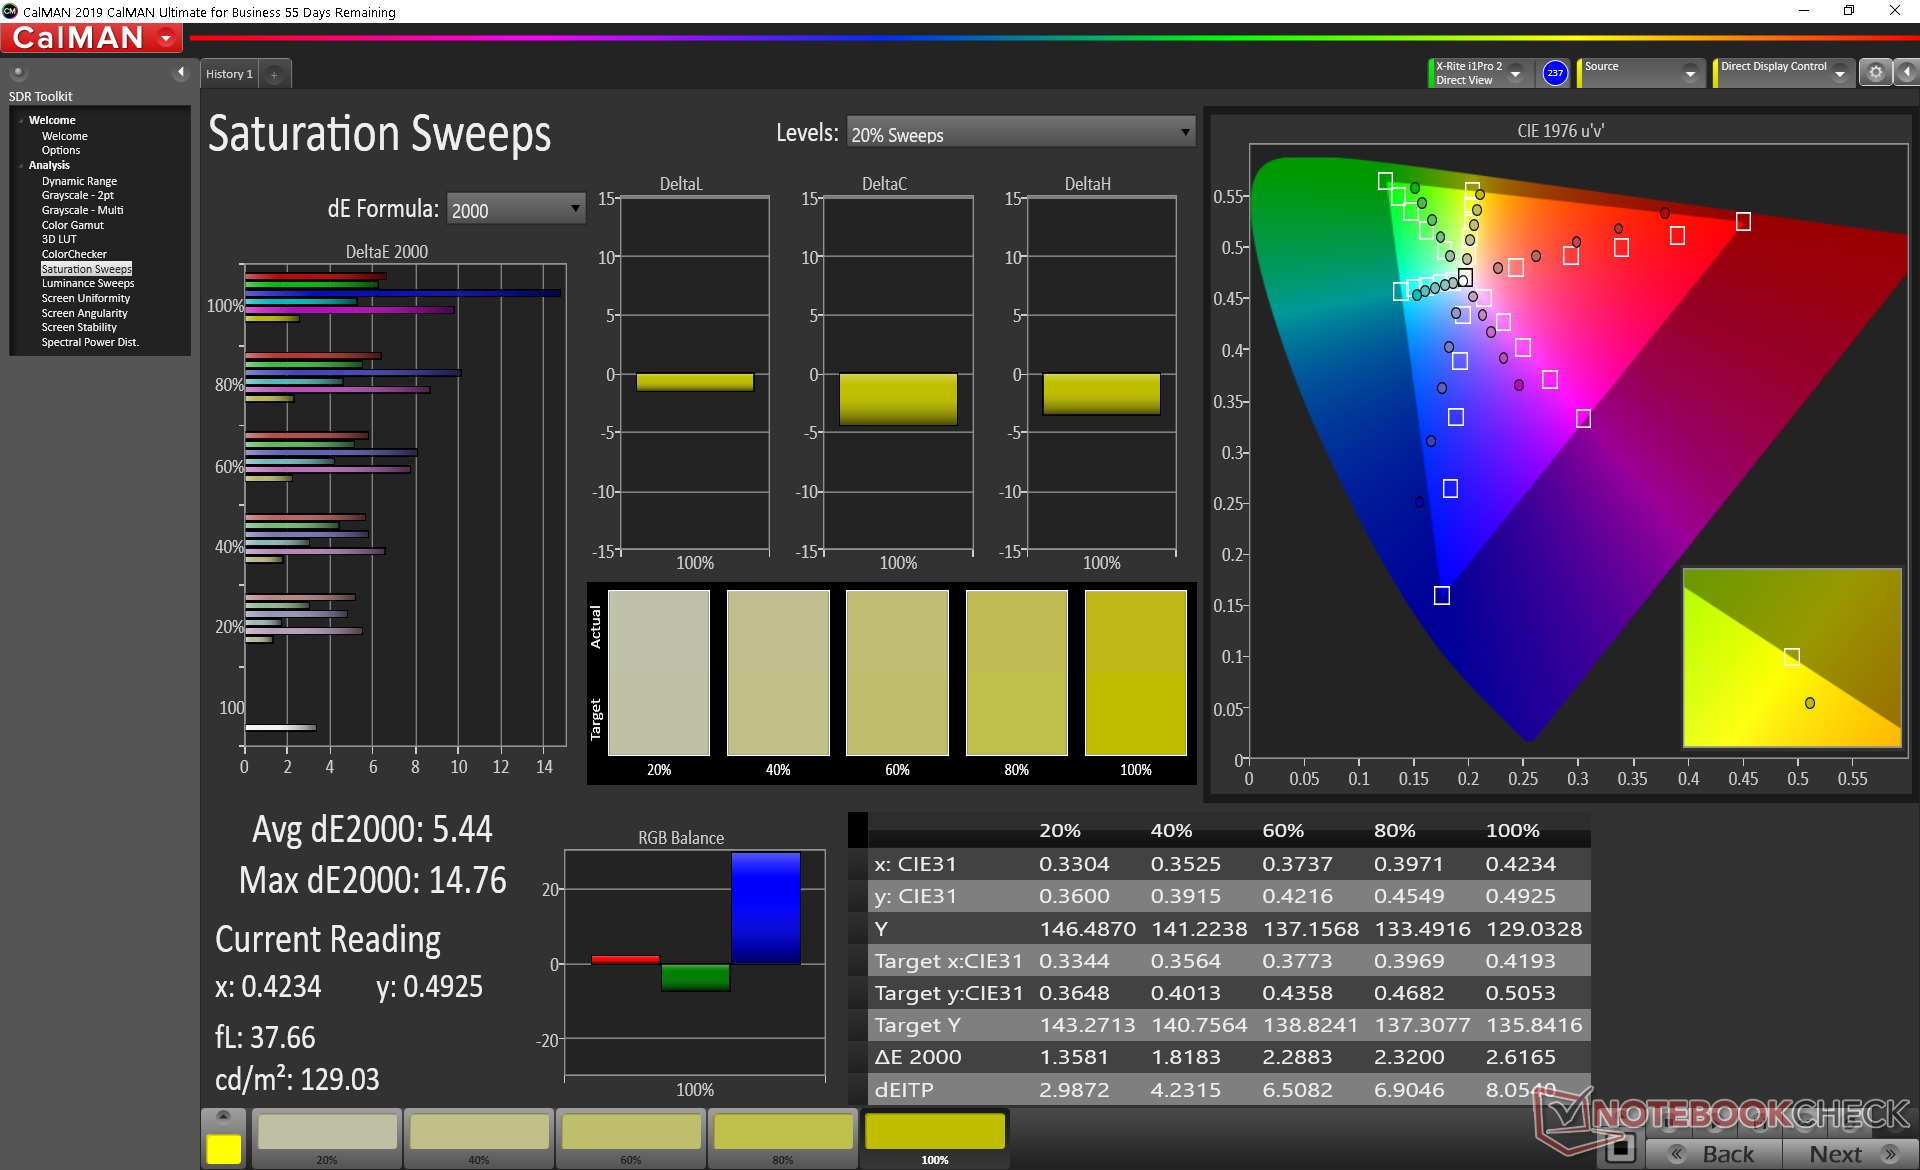
| Colorchecker dE 2000 * | 4.89 | 1.8 63% | 2.51 49% | 6.56 -34% | 5.12 -5% | 2.43 50% |
| Colorchecker dE 2000 max. * | 17.46 | 3.94 77% | 4.42 75% | 21.81 -25% | 8.86 49% | 4.58 74% |
| Colorchecker dE 2000 calibrated * | 4.75 | 0.7 85% | 1.71 64% | 5.34 -12% | 4.88 -3% | 2.03 57% |
| Greyscale dE 2000 * | 2.2 | 2.9 -32% | 3.26 -48% | 4.4 -100% | 3.47 -58% | 2.6 -18% |
| Gamma | 2.14 103% | 2.178 101% | 2.42 91% | 2.22 99% | 2.37 93% | 2.2 100% |
| CCT | 6850 95% | 6992 93% | 6150 106% | 6716 97% | 7062 92% | 6981 93% |
| Color Space (Percent of AdobeRGB 1998) (%) | 37.2 | 99 166% | 37.3 0% | 37 -1% | 59.7 60% | |
| Color Space (Percent of sRGB) (%) | 58.5 | 99 69% | 57.6 -2% | 57 -3% | 93.9 61% | |
| Media total (Programa/Opciones) | 22% /
46% | 38% /
33% | -10% /
-13% | 7% /
5% | 46% /
33% |
* ... más pequeño es mejor
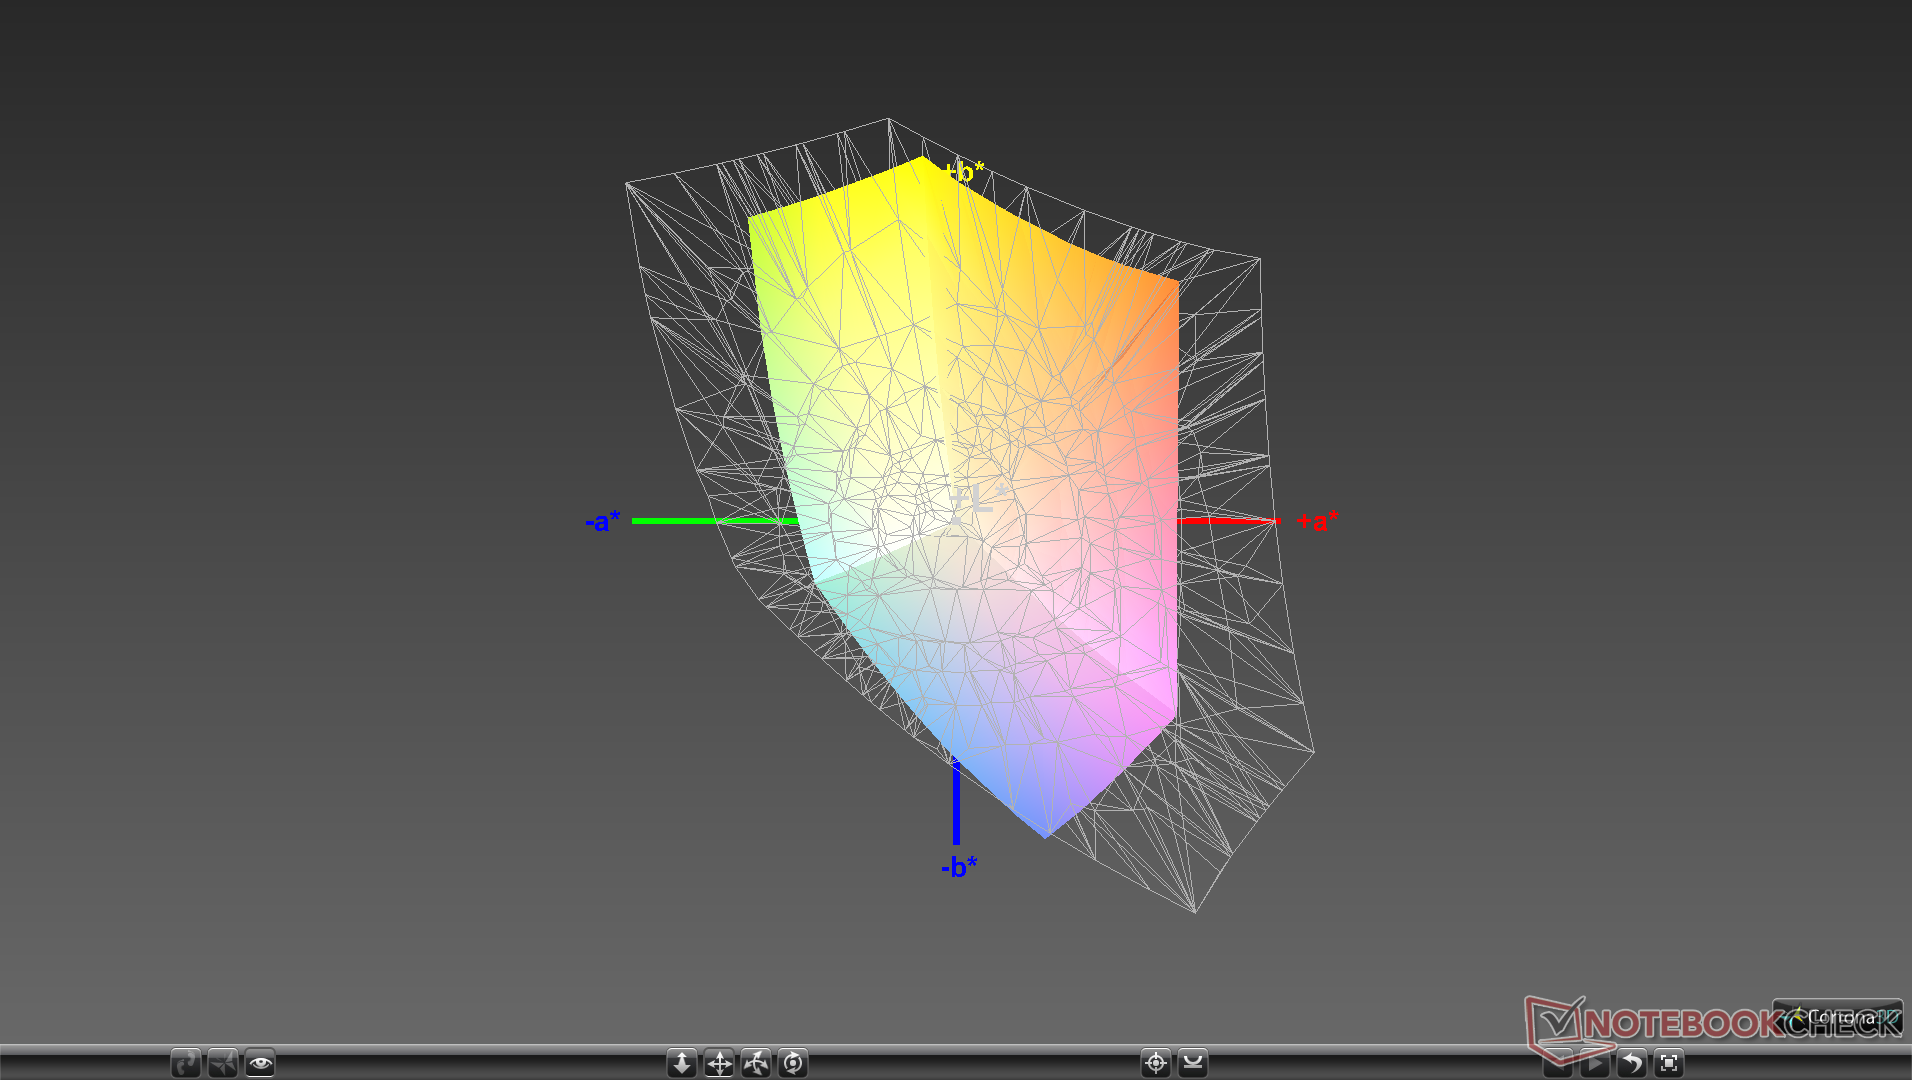
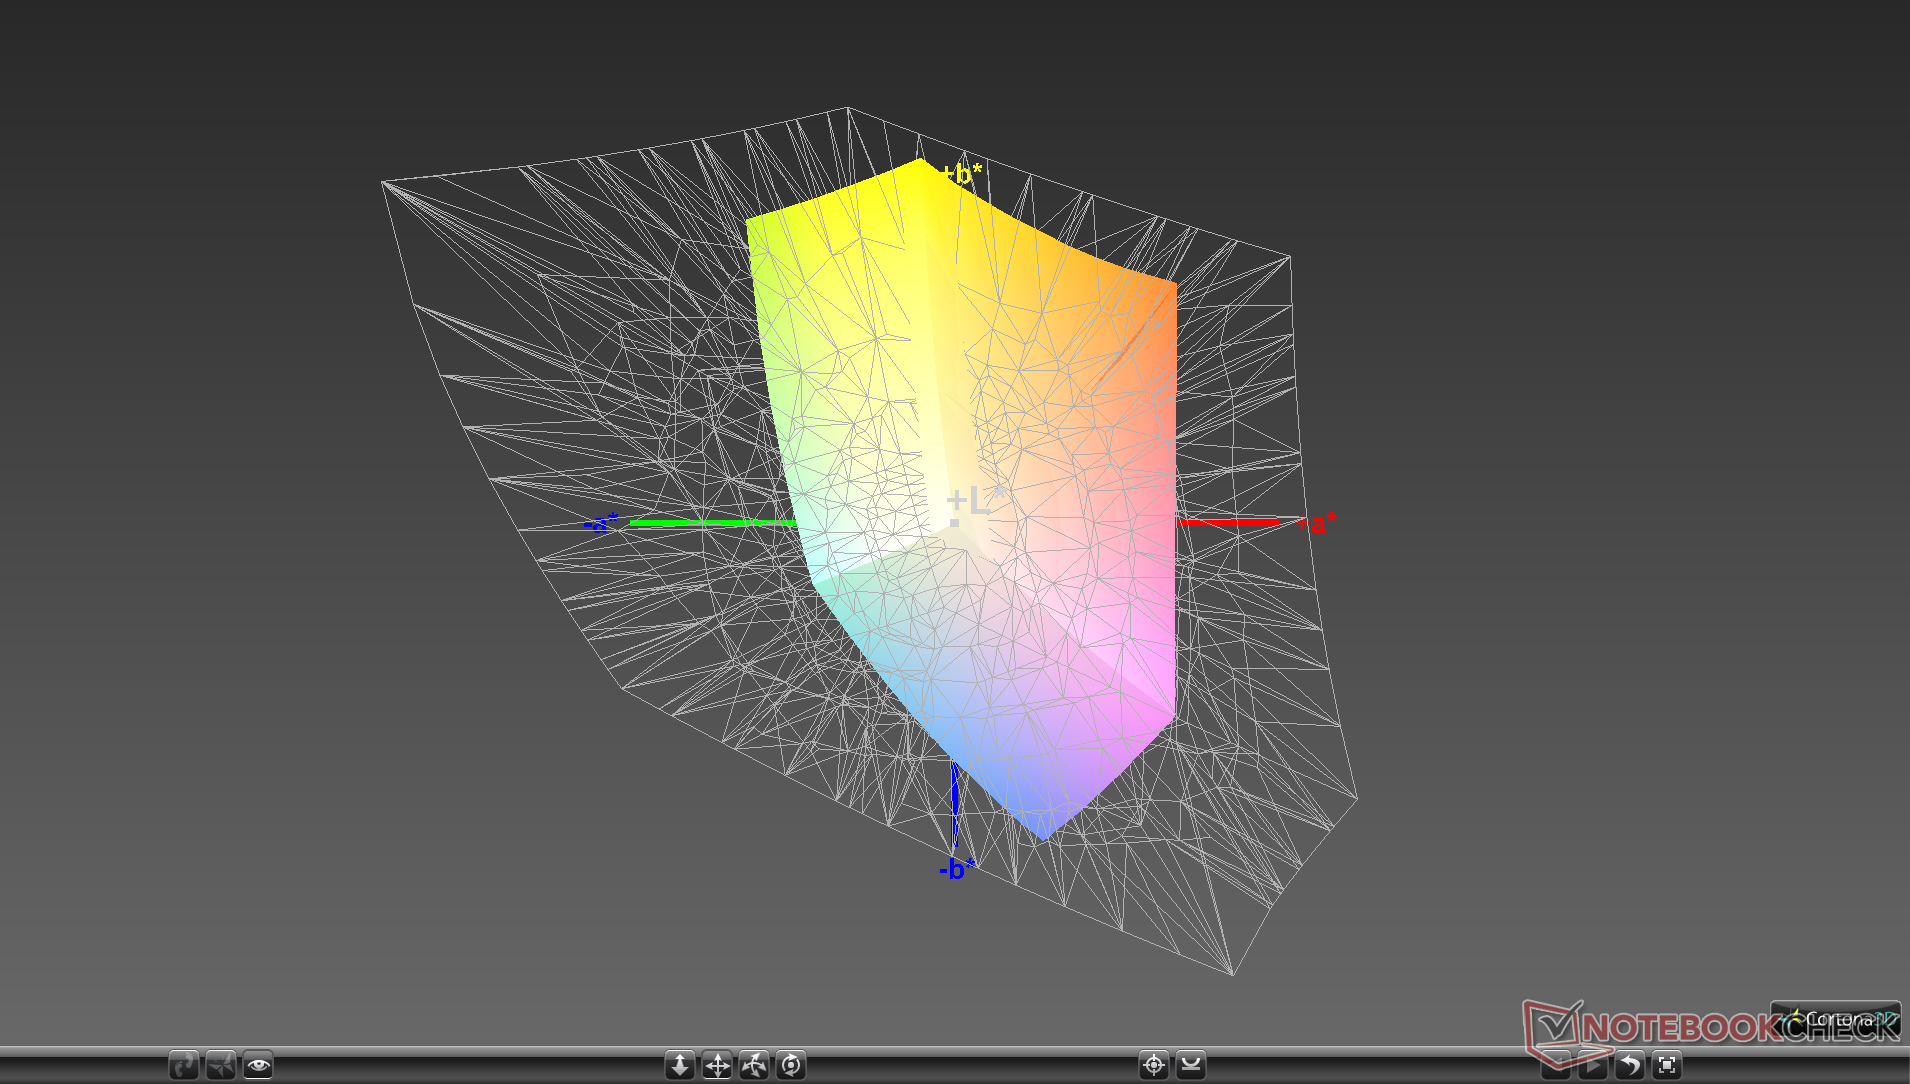
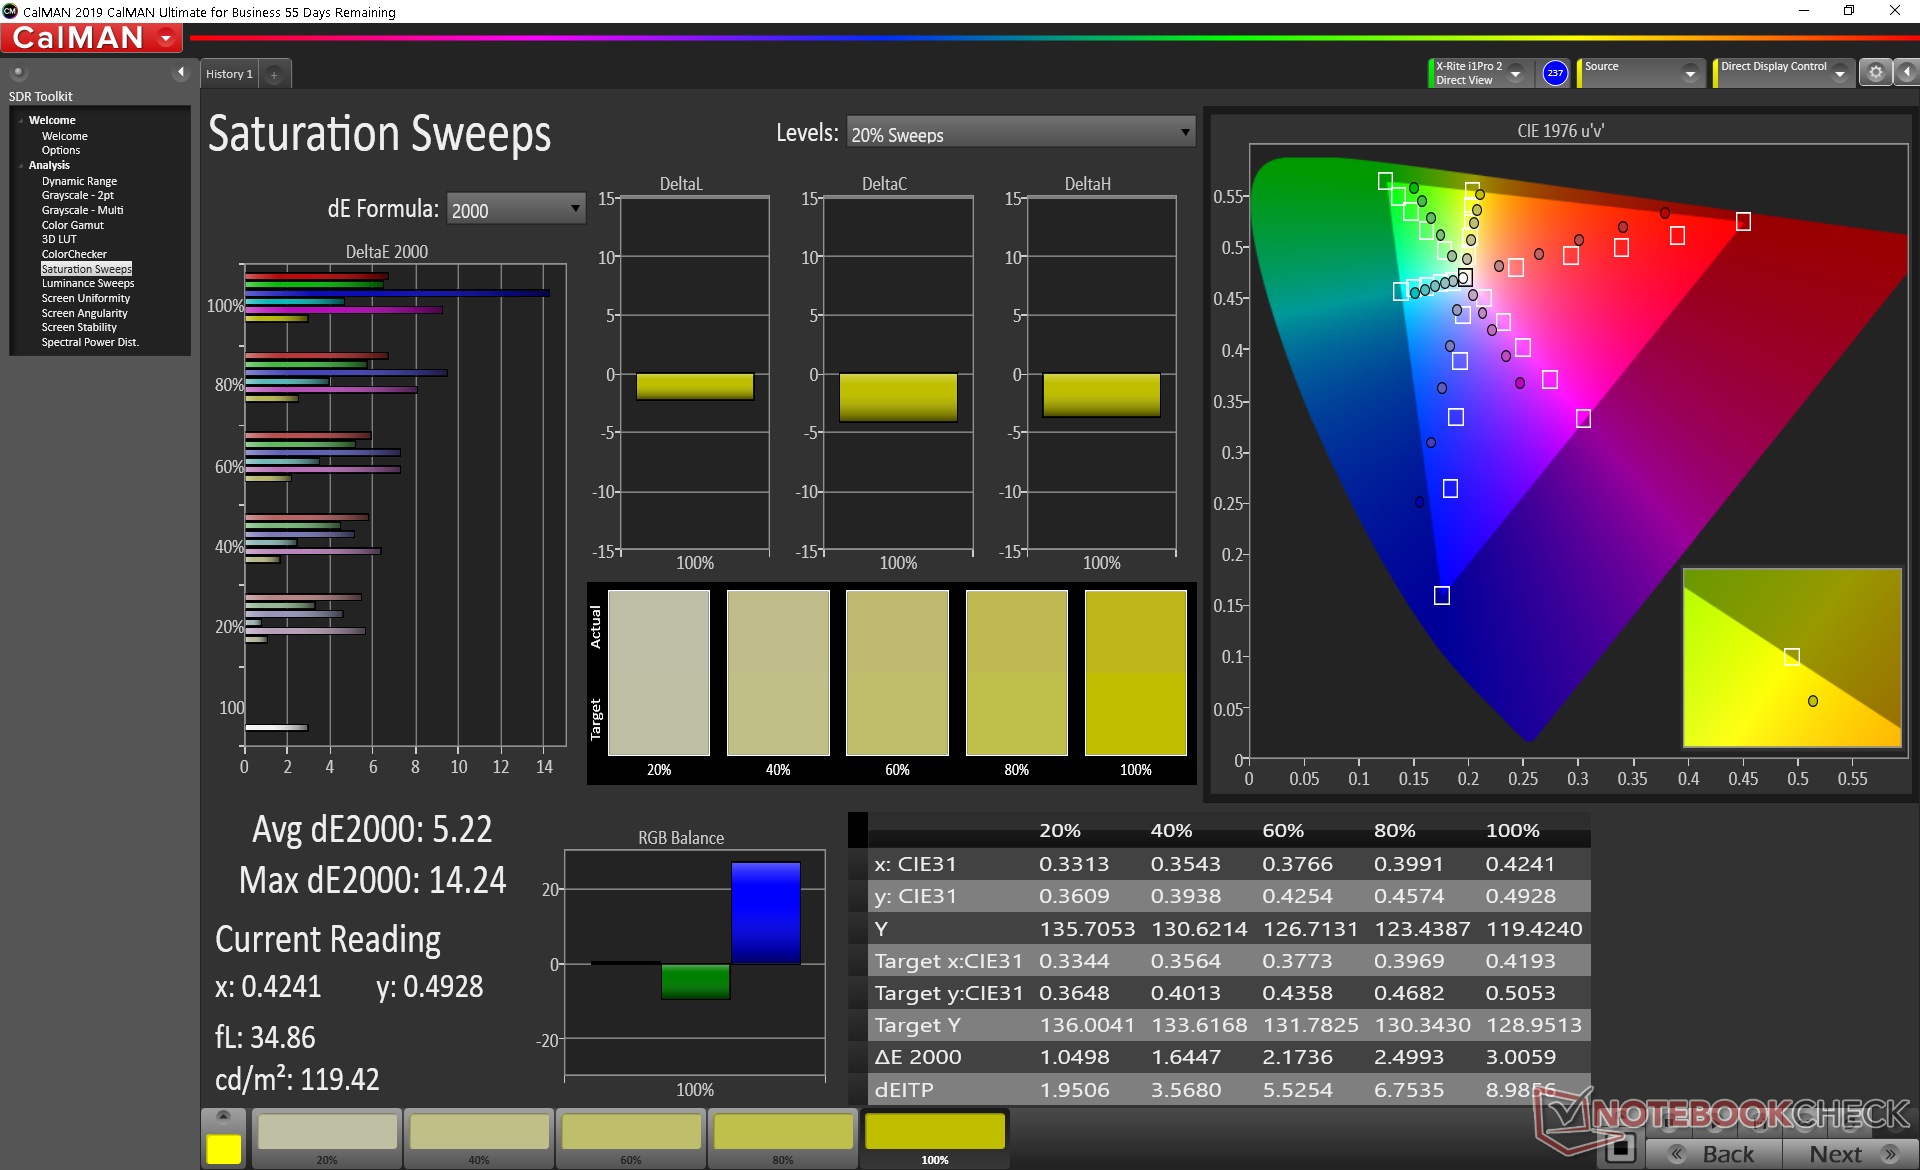
La pantalla está calibrada bastante bien fuera de la caja a pesar de la estrecha cobertura de 59 por ciento de sRGB. Aún así, la precisión del color sigue siendo inferior a los niveles de saturación más altos.

Tiempos de respuesta del display
| ↔ Tiempo de respuesta de Negro a Blanco | ||
|---|---|---|
| 25.6 ms ... subida ↗ y bajada ↘ combinada | ↗ 14.8 ms subida | 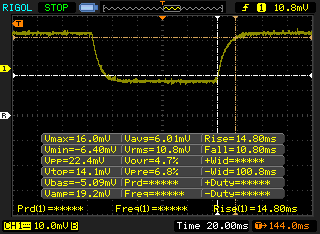 |
| ↘ 10.8 ms bajada | ||
| La pantalla mostró tiempos de respuesta relativamente lentos en nuestros tests pero podría ser demasiado lenta para los jugones. En comparación, todos los dispositivos de prueba van de ##min### (mínimo) a 240 (máximo) ms. » 61 % de todos los dispositivos son mejores. Eso quiere decir que el tiempo de respuesta es peor que la media (19.8 ms) de todos los dispositivos testados. | ||
| ↔ Tiempo de respuesta 50% Gris a 80% Gris | ||
| 26 ms ... subida ↗ y bajada ↘ combinada | ↗ 11.2 ms subida | 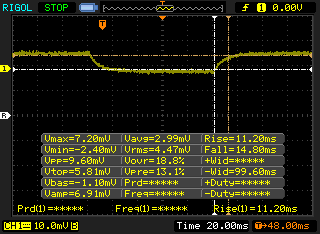 |
| ↘ 14.8 ms bajada | ||
| La pantalla mostró tiempos de respuesta relativamente lentos en nuestros tests pero podría ser demasiado lenta para los jugones. En comparación, todos los dispositivos de prueba van de ##min### (mínimo) a 636 (máximo) ms. » 36 % de todos los dispositivos son mejores. Esto quiere decir que el tiempo de respuesta medido es mejor que la media (31 ms) de todos los dispositivos testados. | ||
Parpadeo de Pantalla / PWM (Pulse-Width Modulation)
| Parpadeo de Pantalla / PWM no detectado |  | ||
Comparación: 52 % de todos los dispositivos testados no usaron PWM para atenuar el display. Si se usó, medimos una media de 7781 (mínimo: 5 - máxmo: 343500) Hz. | |||
Rendimiento
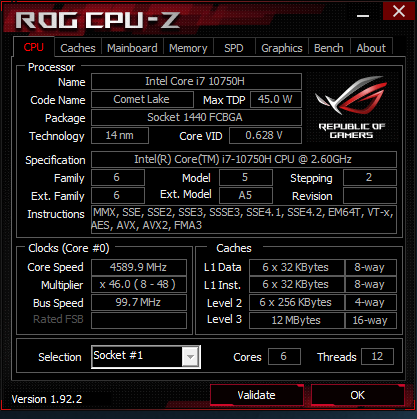
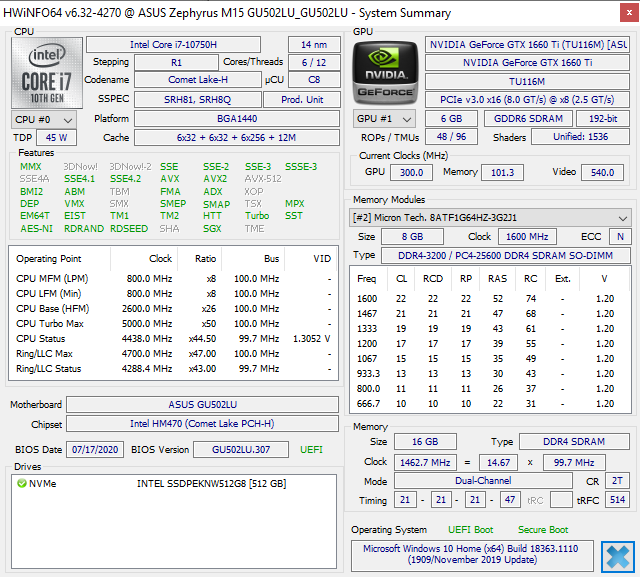
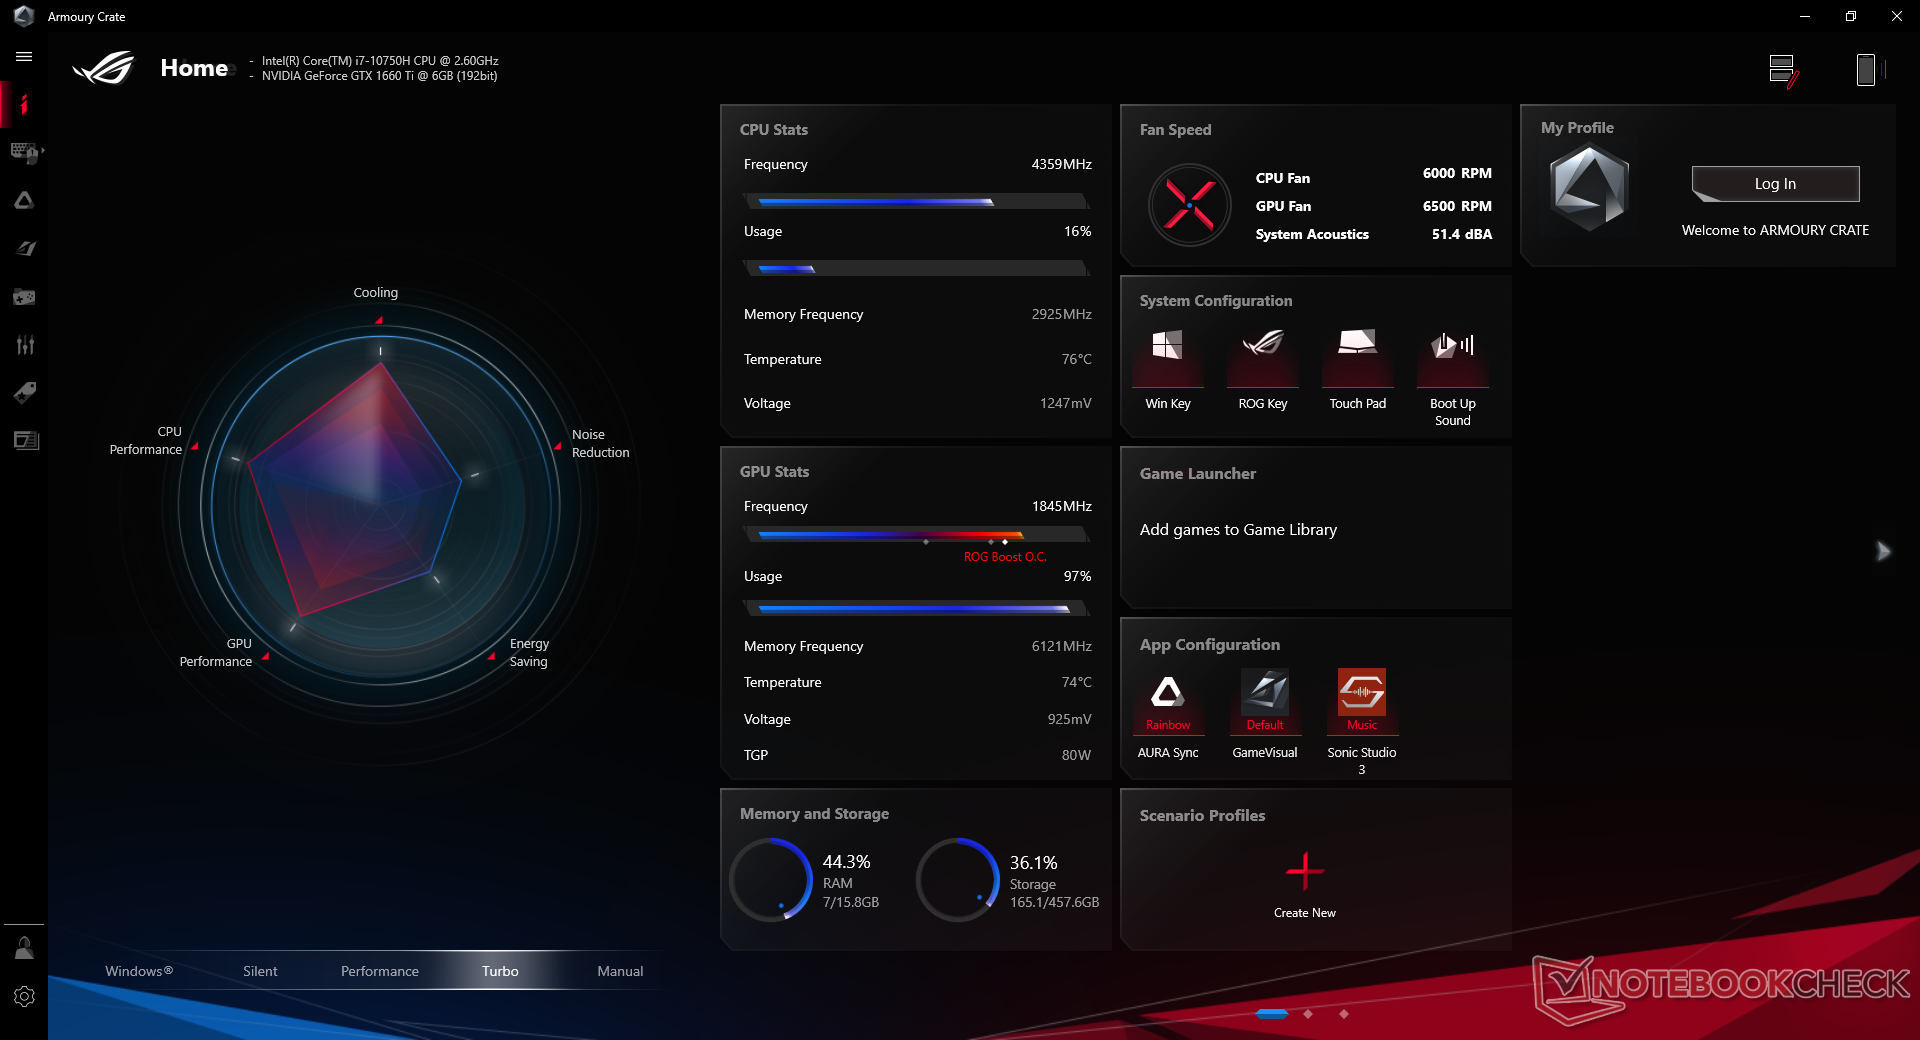
El GU502LU viene con la misma CPU Core i7-10750H que nuestro GU502LW aunque sus GPUs y pantallas sean diferentes. Sin embargo, el rendimiento de la CPU puede diferir dependiendo del perfil de potencia de Armoury Crate. Todos los puntos de referencia de rendimiento que se indican a continuación se registraron en modo Turbo, a menos que se indique lo contrario.
Procesador
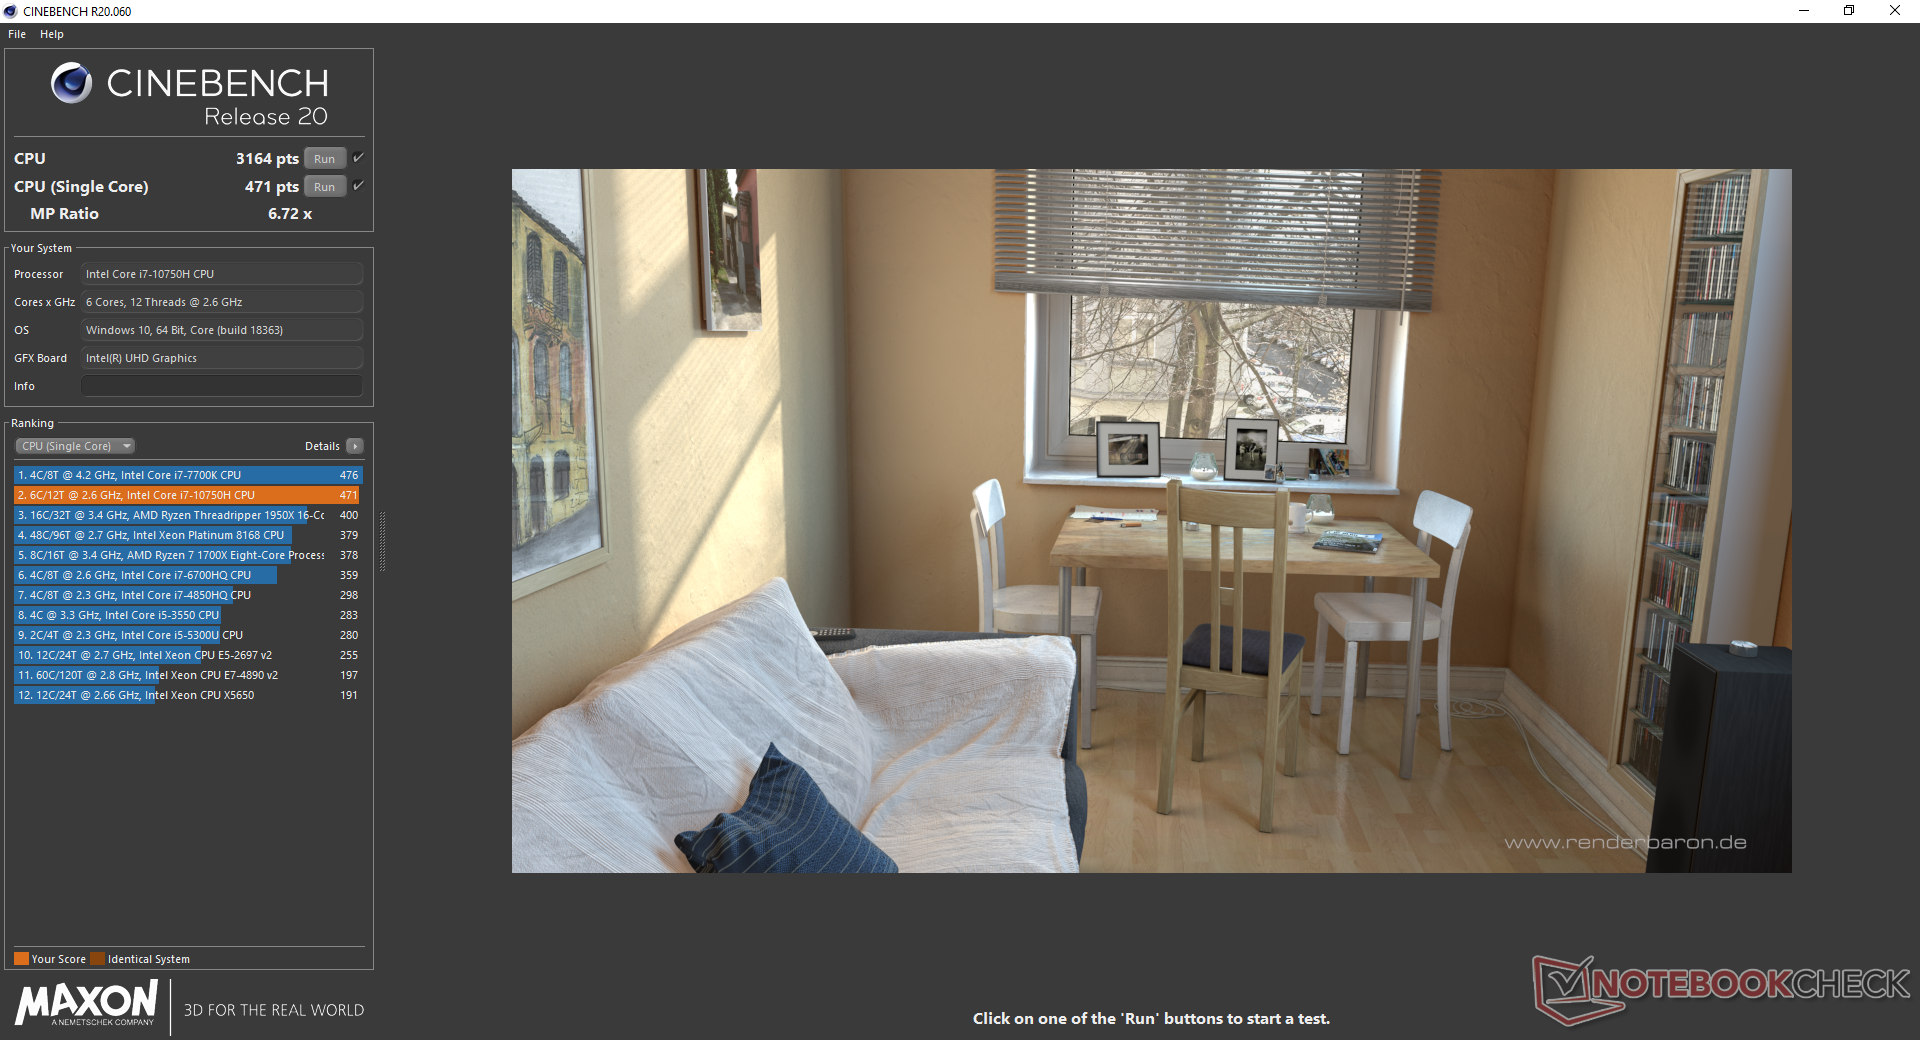
La sostenibilidad de Turbo Boost mejora si se ejecuta en modo Turbo, como se muestra en los resultados del bucle de nuestro CineBench R15 Multi-Thread a continuación. Si se ejecuta en el modo de rendimiento, el rendimiento de la CPU puede disminuir aproximadamente un 9 por ciento con el tiempo. El rendimiento general de la CPU sin procesar se acerca mucho al del Ryzen 5 4600H, que es más económico.
El rendimiento del procesador disminuye aún más si se ejecuta con la energía de la batería de 3164 puntos a 2528 puntos en CineBench R20. Ten en cuenta que el modo Turbo se desactiva automáticamente si el portátil no está conectado a una toma de corriente.


Cinebench R15: CPU Multi 64Bit | CPU Single 64Bit
Blender: v2.79 BMW27 CPU
7-Zip 18.03: 7z b 4 -mmt1 | 7z b 4
Geekbench 5.5: Single-Core | Multi-Core
HWBOT x265 Benchmark v2.2: 4k Preset
LibreOffice : 20 Documents To PDF
R Benchmark 2.5: Overall mean
| HWBOT x265 Benchmark v2.2 / 4k Preset | |
| MSI GT76 Titan DT 10SGS | |
| Asus Zephyrus S15 GX502L | |
| Asus ROG Strix Scar 15 G532LWS | |
| Eurocom Nightsky RX15 | |
| Asus ROG Zephyrus G15 GA502IU-ES76 | |
| MSI Bravo 15 A4DCR | |
| Asus ROG Zephyrus M15 GU502LU-BI7N4 | |
| HP Pavilion Gaming 15-ec1206ng | |
| Medio Intel Core i7-10750H (5.54 - 11.6, n=43) | |
| Schenker XMG Pro 15 | |
| LibreOffice / 20 Documents To PDF | |
| MSI Bravo 15 A4DCR | |
| HP Pavilion Gaming 15-ec1206ng | |
| Asus ROG Zephyrus G15 GA502IU-ES76 | |
| Medio Intel Core i7-10750H (43.1 - 99.2, n=43) | |
| Asus ROG Strix Scar 15 G532LWS | |
| Asus ROG Zephyrus M15 GU502LU-BI7N4 | |
| Asus Zephyrus S15 GX502L | |
| MSI GT76 Titan DT 10SGS | |
| R Benchmark 2.5 / Overall mean | |
| Schenker XMG Pro 15 | |
| Asus ROG Zephyrus M15 GU502LU-BI7N4 | |
| Medio Intel Core i7-10750H (0.578 - 0.708, n=42) | |
| HP Pavilion Gaming 15-ec1206ng | |
| MSI Bravo 15 A4DCR | |
| Asus Zephyrus S15 GX502L | |
| Asus ROG Zephyrus G15 GA502IU-ES76 | |
| MSI GT76 Titan DT 10SGS | |
| Asus ROG Strix Scar 15 G532LWS | |
* ... más pequeño es mejor
Rendimiento del sistema
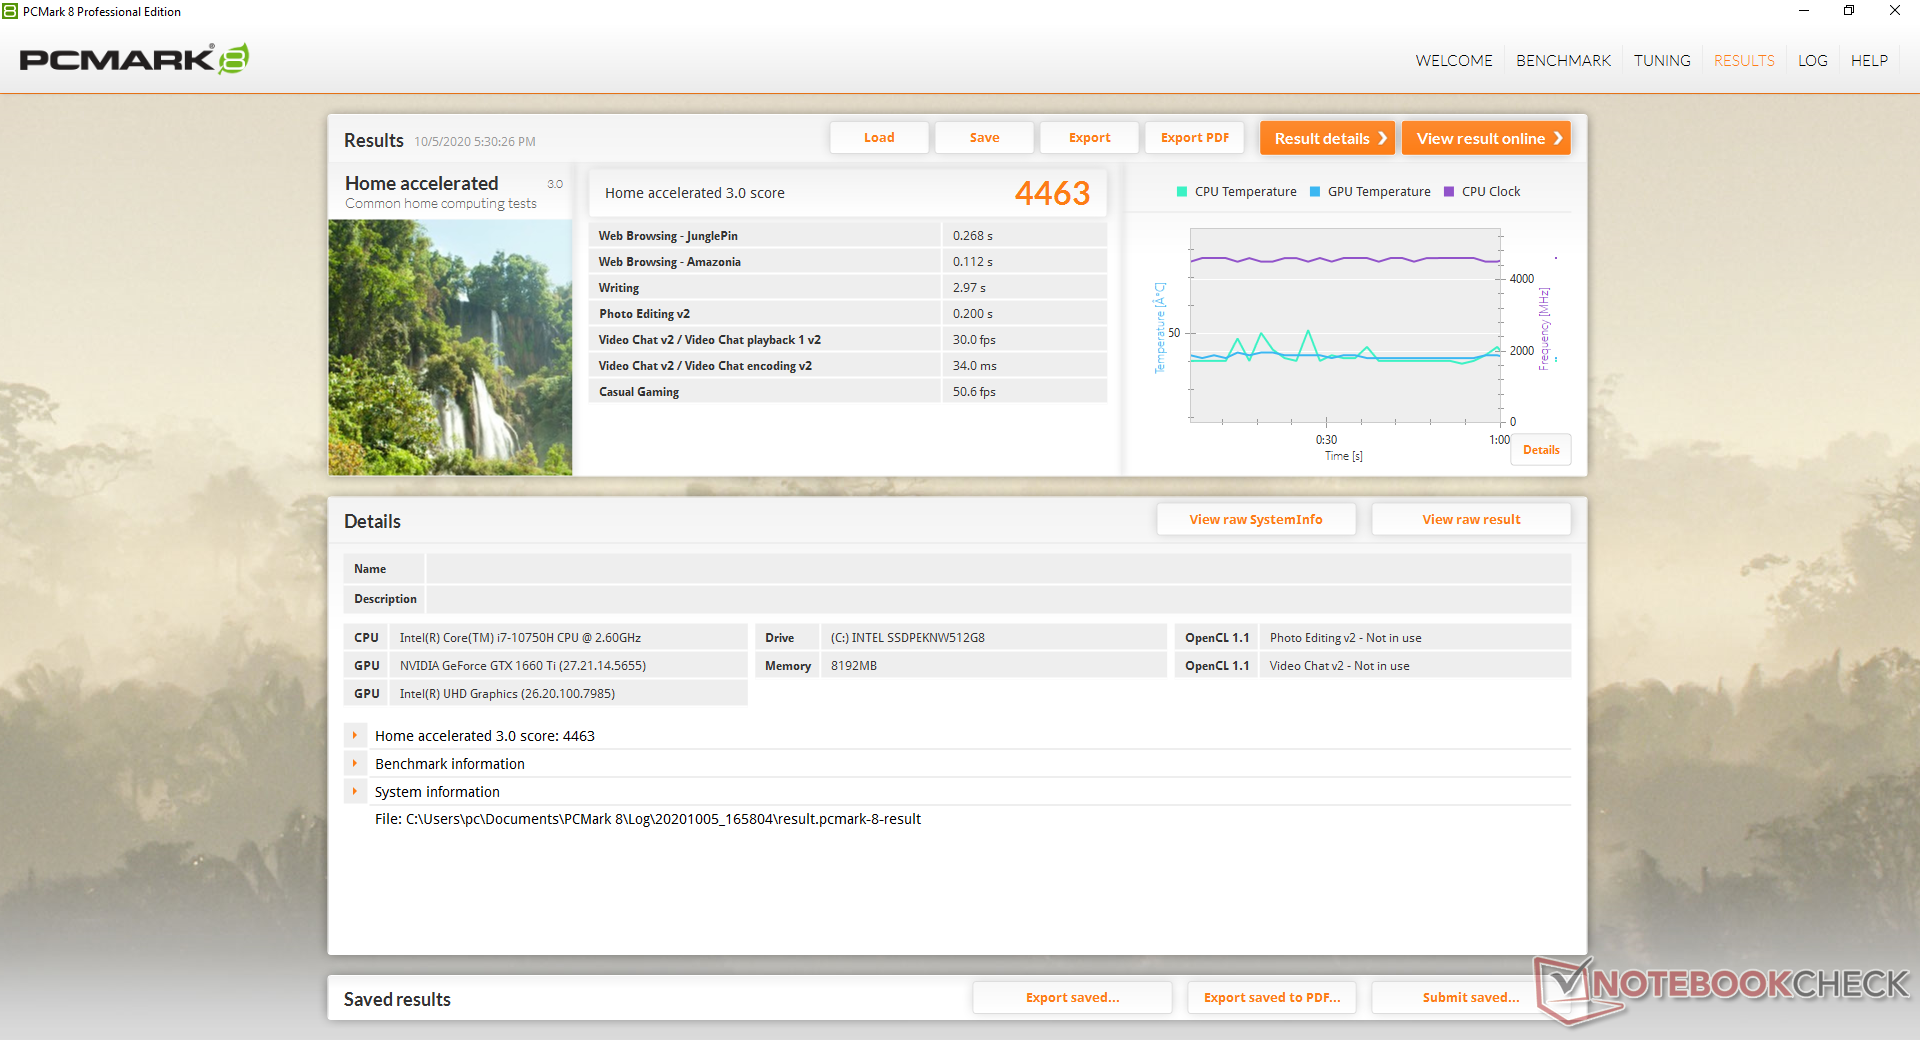
| PCMark 8 Home Score Accelerated v2 | 4463 puntos | |
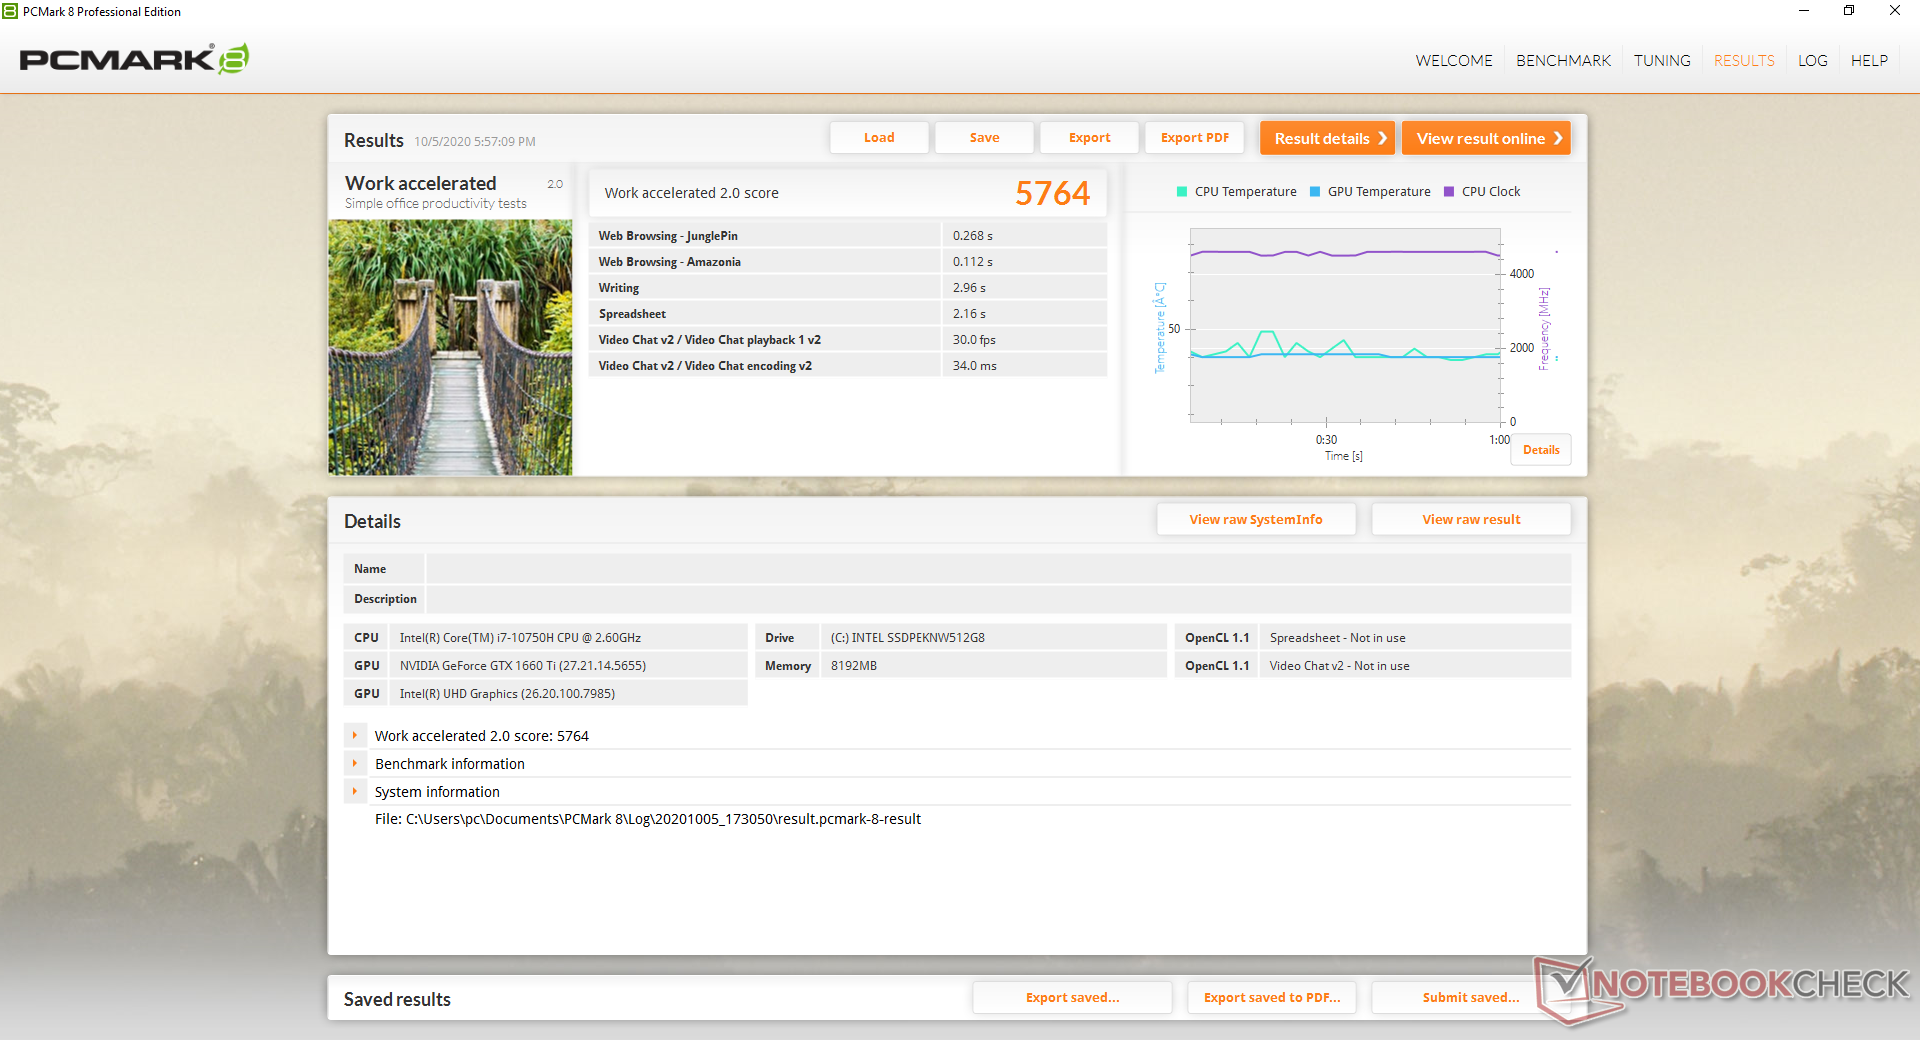
| PCMark 8 Work Score Accelerated v2 | 5764 puntos | |
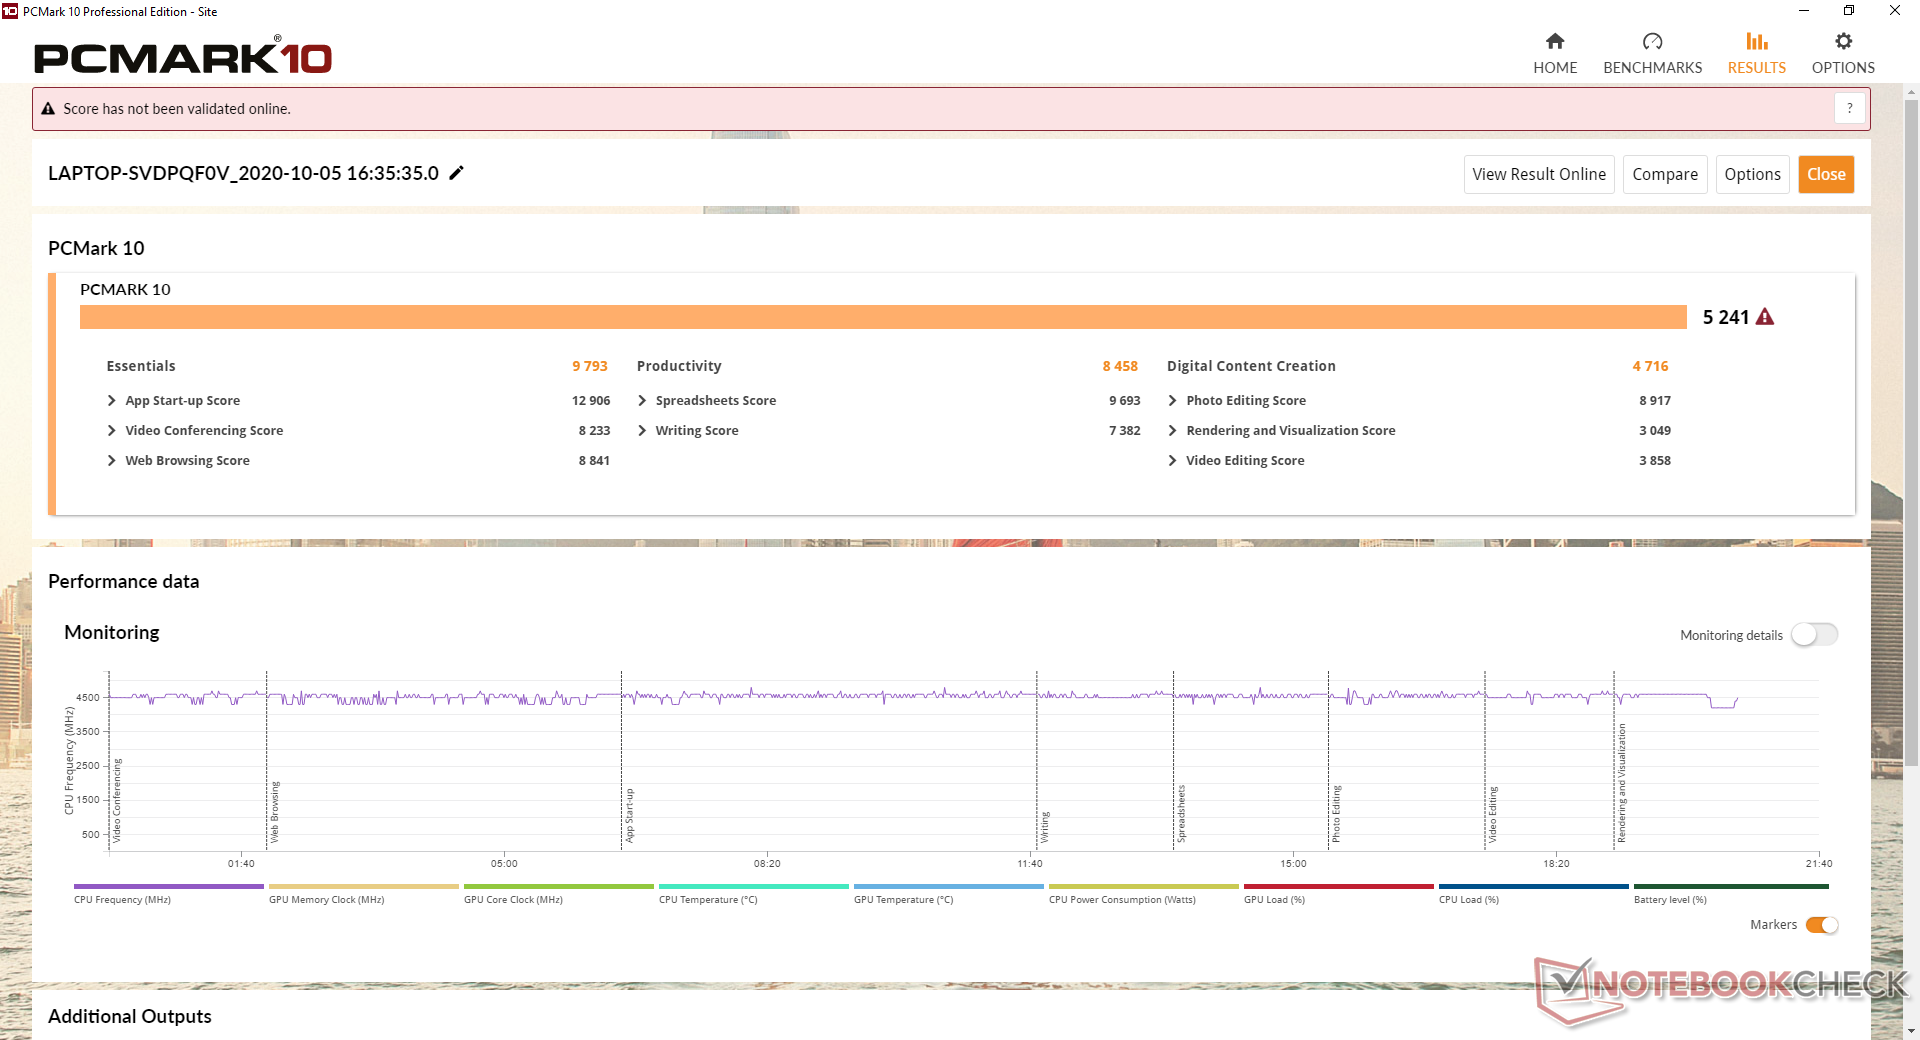
| PCMark 10 Score | 5241 puntos | |
ayuda | ||
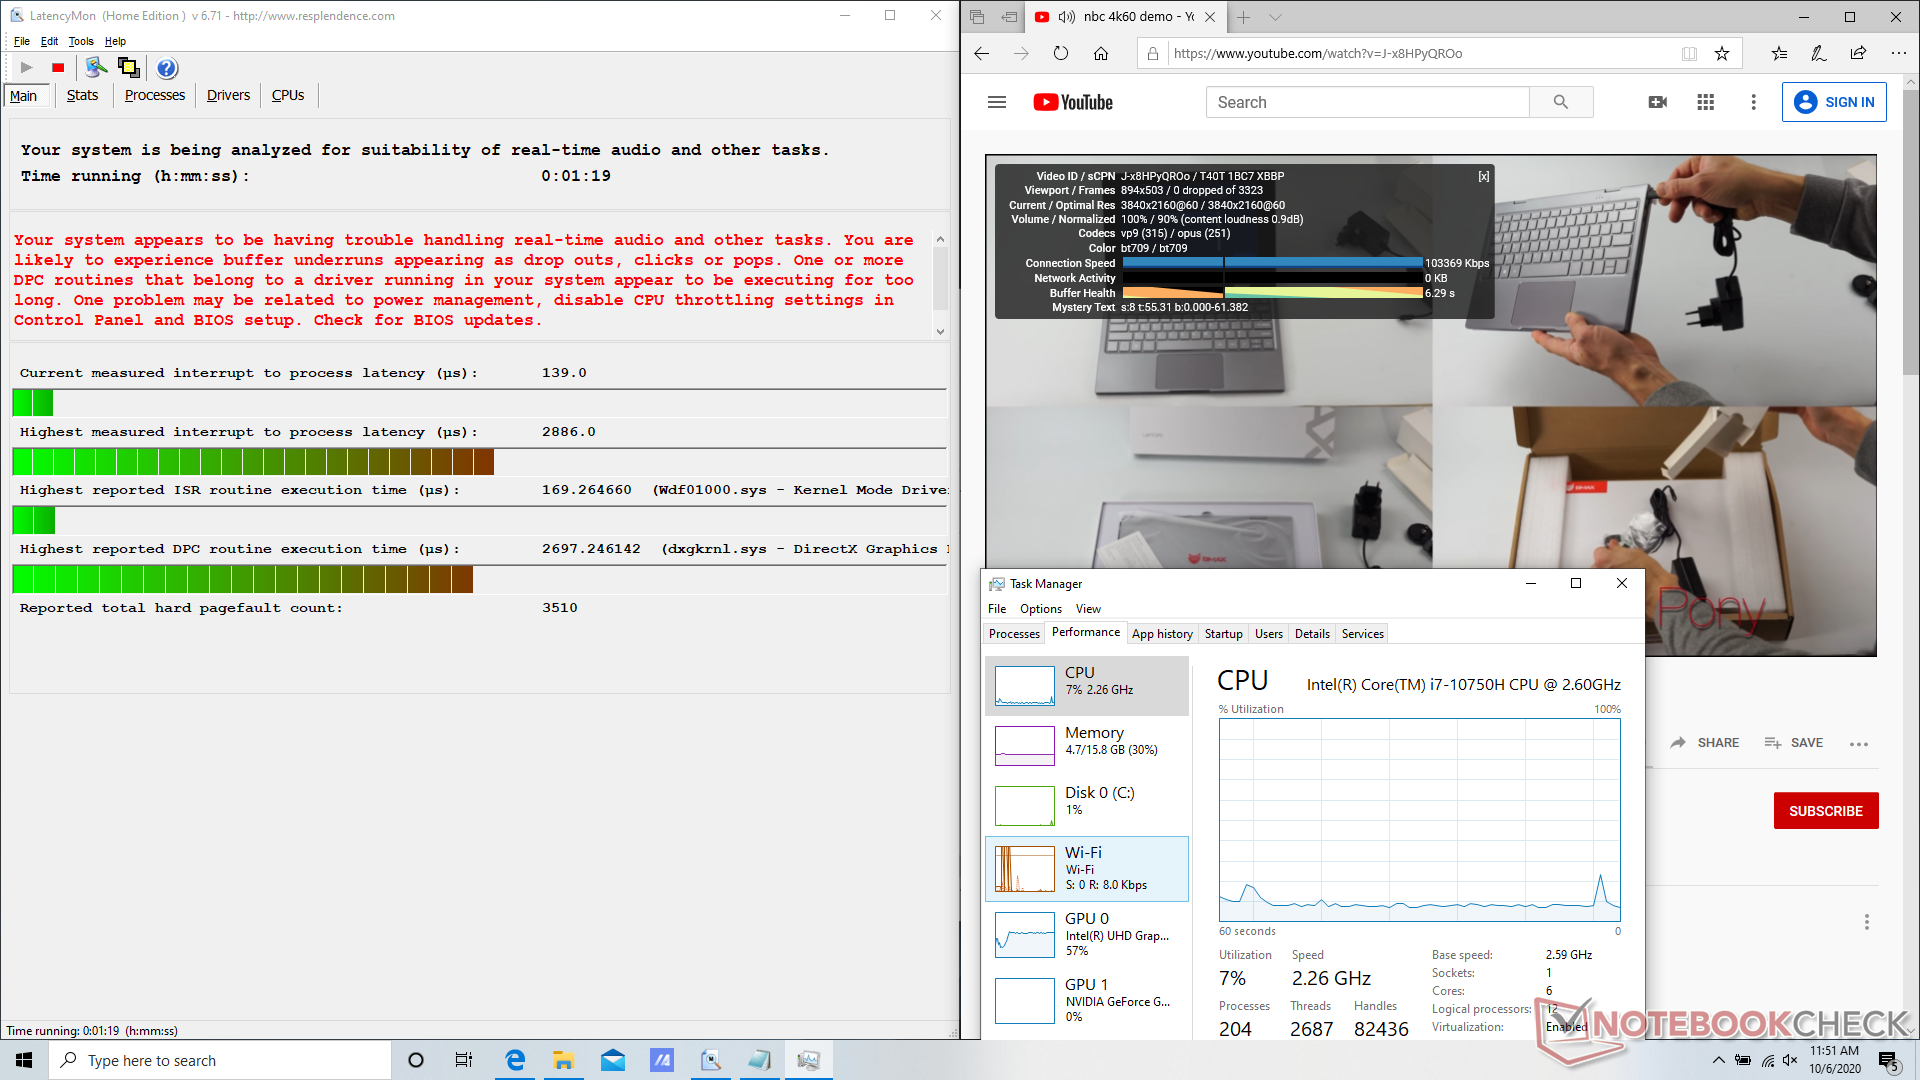
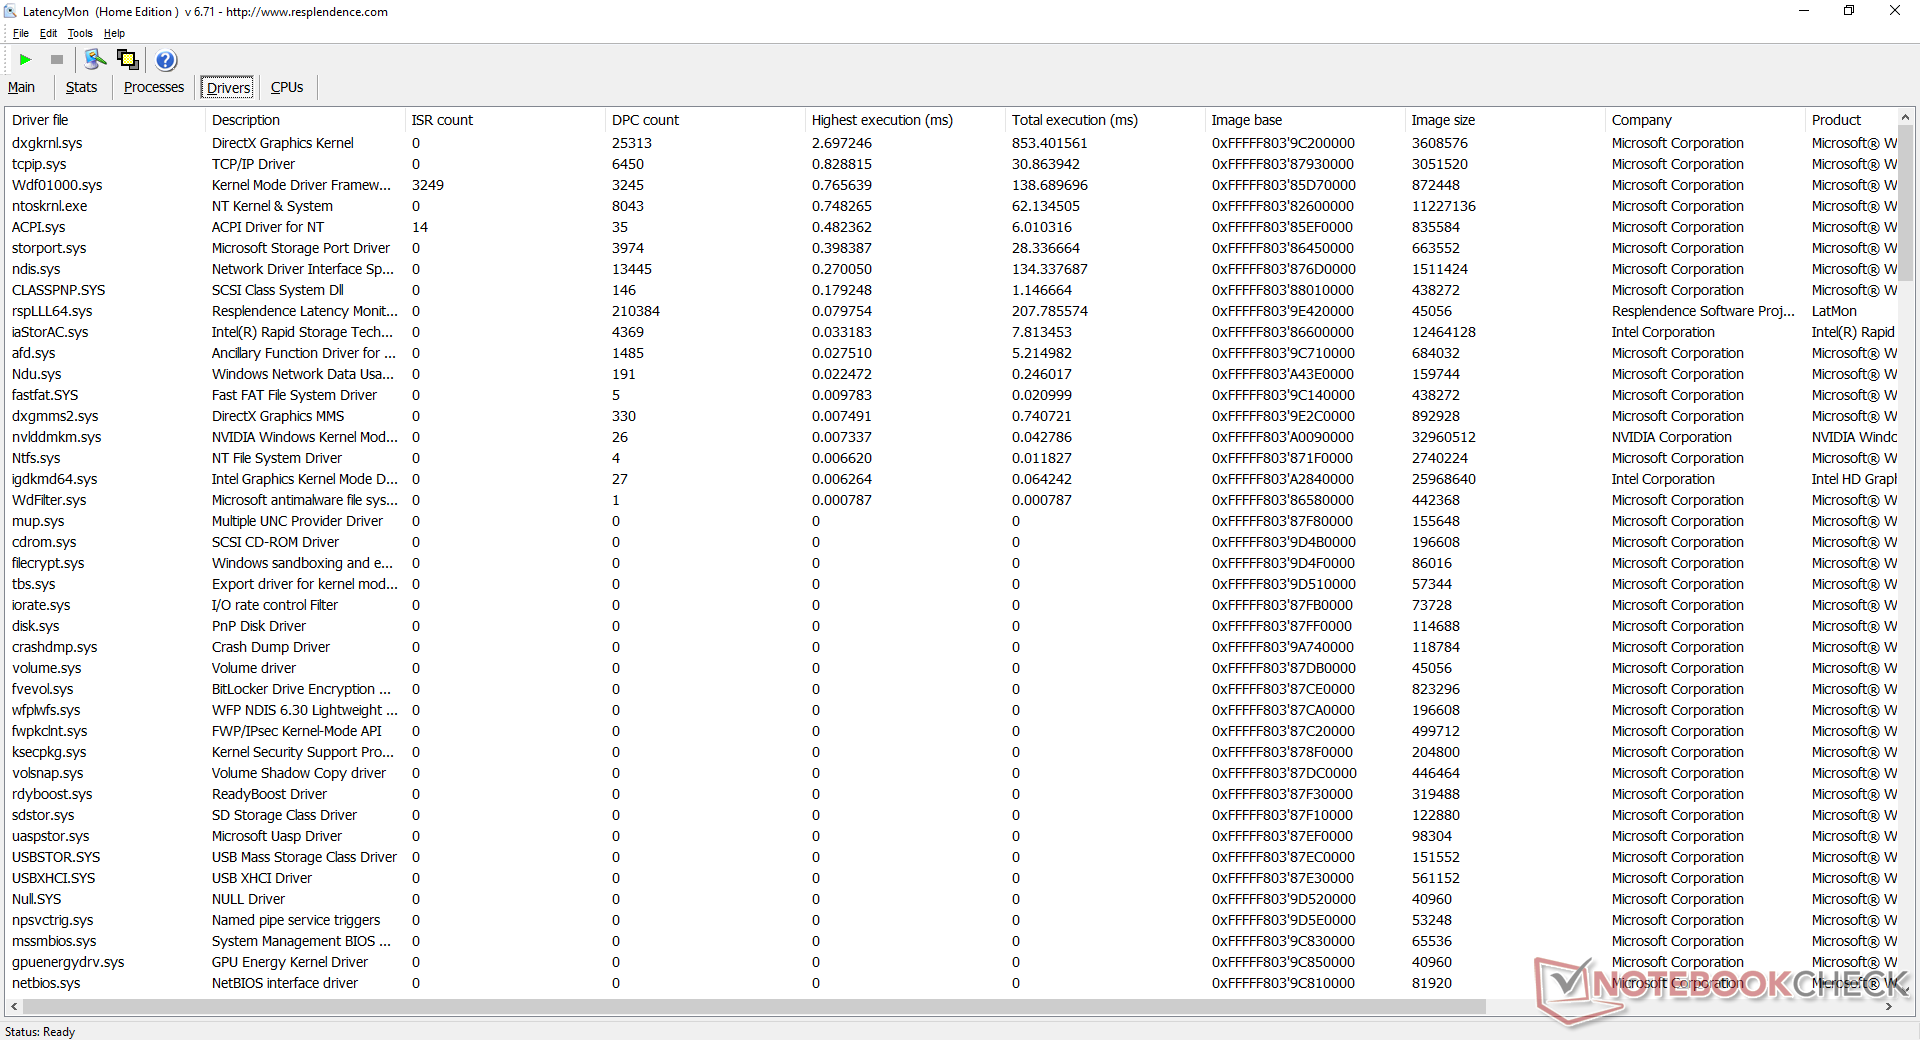
Latencia del DPC
LatencyMon muestra los problemas de latencia del DPC al abrir varias pestañas en nuestra página principal. La reproducción de 4K UHD a 60 FPS es, por lo demás, suave y sin caídas de cuadros.
| DPC Latencies / LatencyMon - interrupt to process latency (max), Web, Youtube, Prime95 | |
| HP Omen 15-ek0456ng | |
| Asus ROG Zephyrus M15 GU502LU-BI7N4 | |
| Gateway Creator Series 15.6 GWTN156-3BK | |
| Asus ROG Zephyrus M15 GU502L | |
| MSI GP65 10SFK-047US | |
| Lenovo Legion 5 15IMH05H | |
* ... más pequeño es mejor
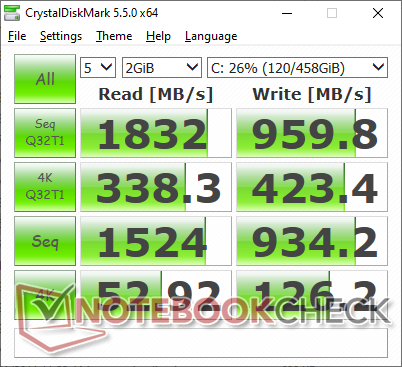
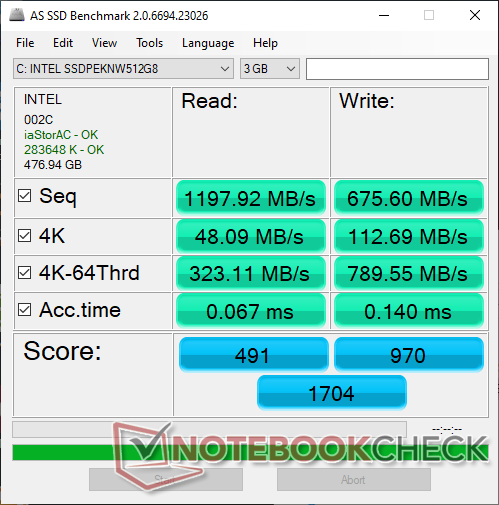
Dispositivos de almacenamiento
Hay dos bahías internas M.2 PCIe disponibles sin opciones de 2,5 pulgadas. La mayoría de los portátiles para juegos Asus se entregan con la SSD NVMe Intel 660p de gama media y nuestra GU502LU no es una excepción. Las series más caras Samsung PM981a o Toshiba XG6 ofrecerán velocidades de transferencia mucho más rápidas.
| Asus ROG Zephyrus M15 GU502LU-BI7N4 Intel SSD 660p SSDPEKNW512G8 | Asus ROG Zephyrus M15 GU502L 2x Intel SSD 660p SSDPEKNW512G8 (RAID 0) | HP Omen 15-ek0456ng Toshiba XG6 KXG60ZNV512G | Gateway Creator Series 15.6 GWTN156-3BK Phison PS5013 PM8256GPTCB4B8TF | Lenovo Legion 5 15IMH05H Samsung PM991 MZALQ512HALU | MSI GP65 10SFK-047US Samsung SSD PM981 MZVLB1T0HALR | |
|---|---|---|---|---|---|---|
| AS SSD | 53% | 109% | 11% | 37% | 148% | |
| Seq Read (MB/s) | 1198 | 2523 111% | 2053 71% | 1592 33% | 2012 68% | 2066 72% |
| Seq Write (MB/s) | 676 | 1578 133% | 2562 279% | 1057 56% | 1261 87% | 2418 258% |
| 4K Read (MB/s) | 48.09 | 50.4 5% | 42.46 -12% | 34.12 -29% | 43.66 -9% | 54.2 13% |
| 4K Write (MB/s) | 112.7 | 115.6 3% | 97.2 -14% | 120.4 7% | 109.3 -3% | 129 14% |
| 4K-64 Read (MB/s) | 323.1 | 634 96% | 1414 338% | 410.1 27% | 851 163% | 1865 477% |
| 4K-64 Write (MB/s) | 790 | 1114 41% | 1471 86% | 634 -20% | 780 -1% | 1878 138% |
| Access Time Read * (ms) | 0.067 | 0.095 -42% | 0.079 -18% | 0.072 -7% | 0.117 -75% | 0.042 37% |
| Access Time Write * (ms) | 0.14 | 0.038 73% | 0.039 72% | 0.105 25% | 0.036 74% | 0.091 35% |
| Score Read (Points) | 491 | 936 91% | 1662 238% | 613 25% | 1096 123% | 2126 333% |
| Score Write (Points) | 970 | 1388 43% | 1825 88% | 860 -11% | 1016 5% | 2249 132% |
| Score Total (Points) | 1704 | 2770 63% | 4364 156% | 1771 4% | 2643 55% | 5482 222% |
| Copy ISO MB/s (MB/s) | 898 | 2106 135% | 1913 113% | 1255 40% | 1481 65% | 2927 226% |
| Copy Program MB/s (MB/s) | 523 | 549 5% | 833 59% | 508 -3% | 467.5 -11% | 728 39% |
| Copy Game MB/s (MB/s) | 948 | 854 -10% | 1667 76% | 986 4% | 734 -23% | 1614 70% |
| CrystalDiskMark 5.2 / 6 | 43% | 46% | 21% | 17% | 63% | |
| Write 4K (MB/s) | 126.2 | 123 -3% | 120 -5% | 170.2 35% | 145.4 15% | 145 15% |
| Read 4K (MB/s) | 52.9 | 52.5 -1% | 36.09 -32% | 52.5 -1% | 51.6 -2% | 46.84 -11% |
| Write Seq (MB/s) | 934 | 1698 82% | 1778 90% | 1105 18% | 1007 8% | 2377 154% |
| Read Seq (MB/s) | 1524 | 2440 60% | 1362 -11% | 1507 -1% | 1145 -25% | 2185 43% |
| Write 4K Q32T1 (MB/s) | 423.4 | 450.4 6% | 429.1 1% | 380.8 -10% | 468.4 11% | 463.5 9% |
| Read 4K Q32T1 (MB/s) | 338.3 | 550 63% | 493.2 46% | 531 57% | 528 56% | 527 56% |
| Write Seq Q32T1 (MB/s) | 960 | 1794 87% | 2936 206% | 1253 31% | 1381 44% | 2395 149% |
| Read Seq Q32T1 (MB/s) | 1832 | 2812 53% | 3227 76% | 2543 39% | 2291 25% | 3470 89% |
| Write 4K Q8T8 (MB/s) | 1536 | |||||
| Read 4K Q8T8 (MB/s) | 1490 | |||||
| Media total (Programa/Opciones) | 48% /
50% | 78% /
87% | 16% /
15% | 27% /
30% | 106% /
117% |
* ... más pequeño es mejor

Estrangulamiento del disco: DiskSpd Read Loop, Queue Depth 8
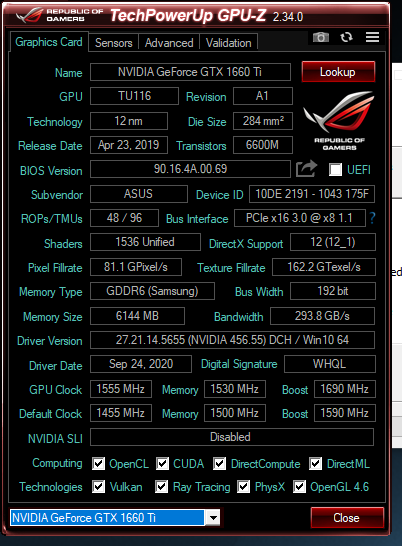
Rendimiento de la GPU
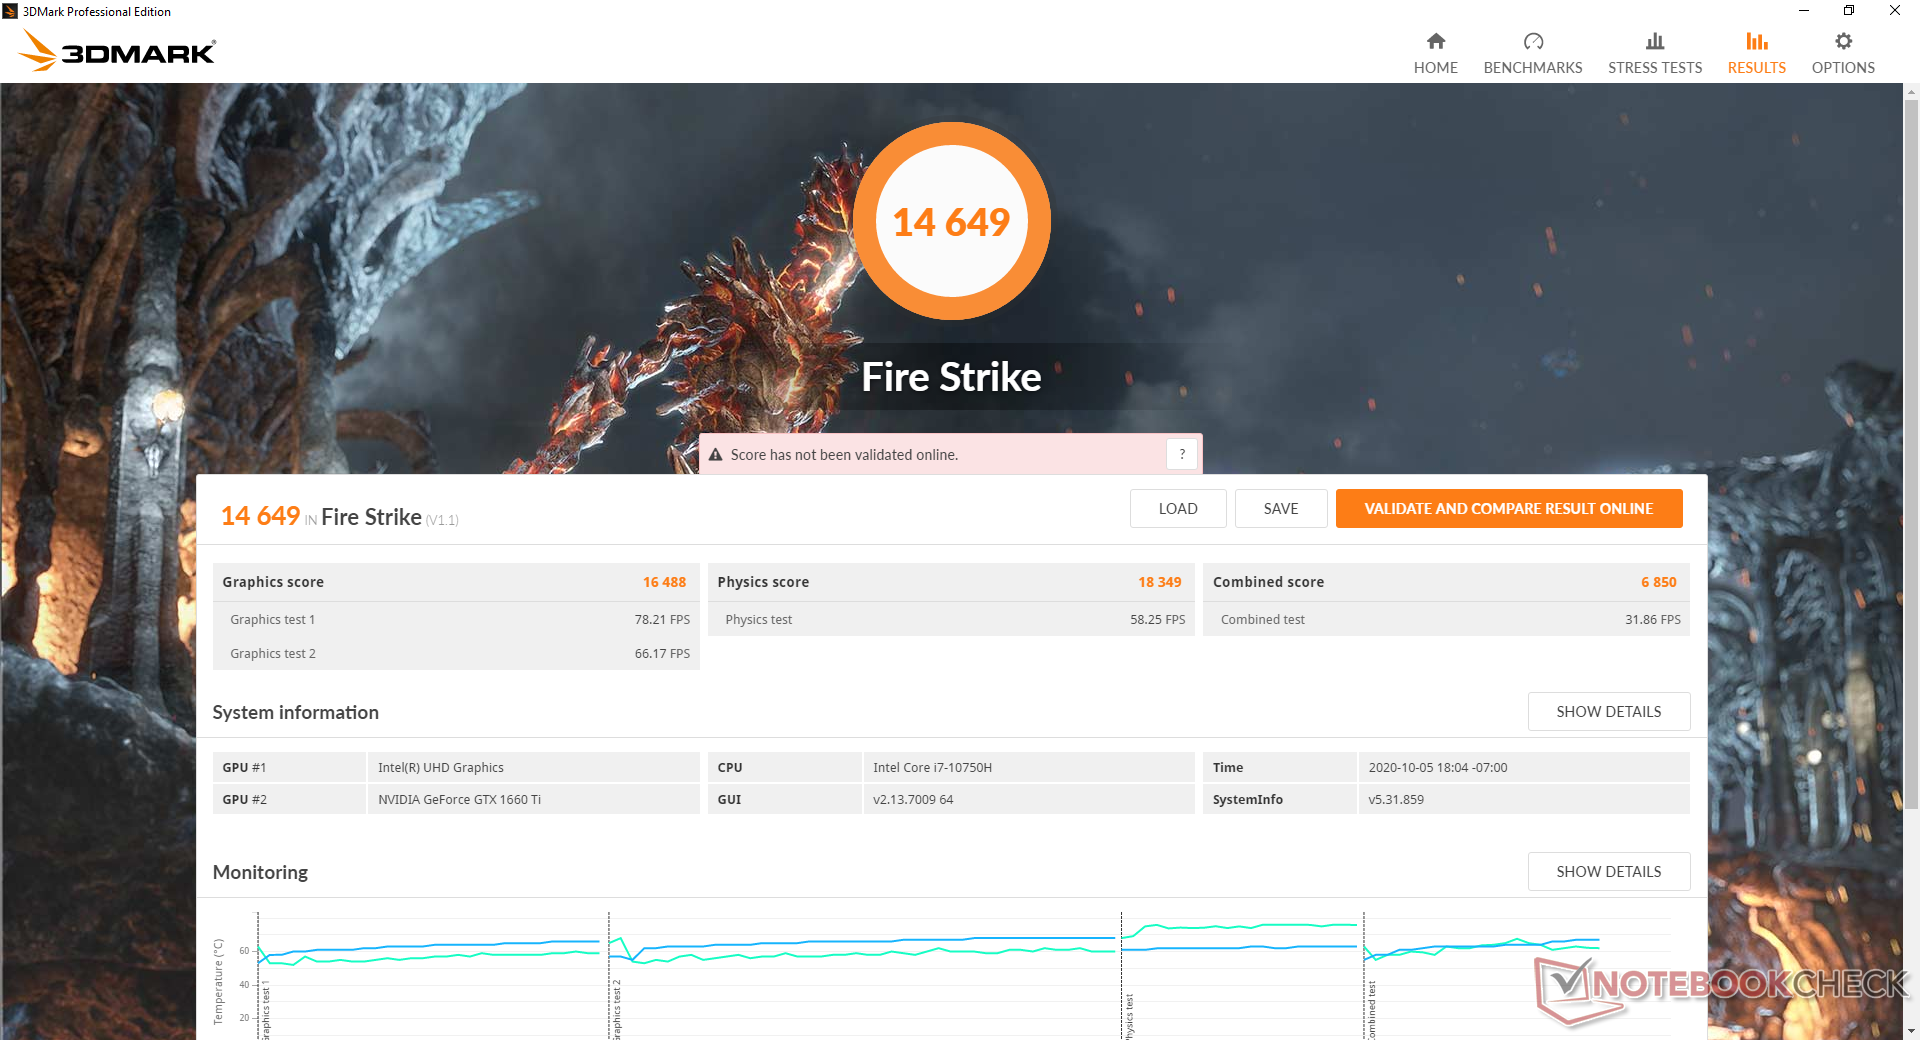
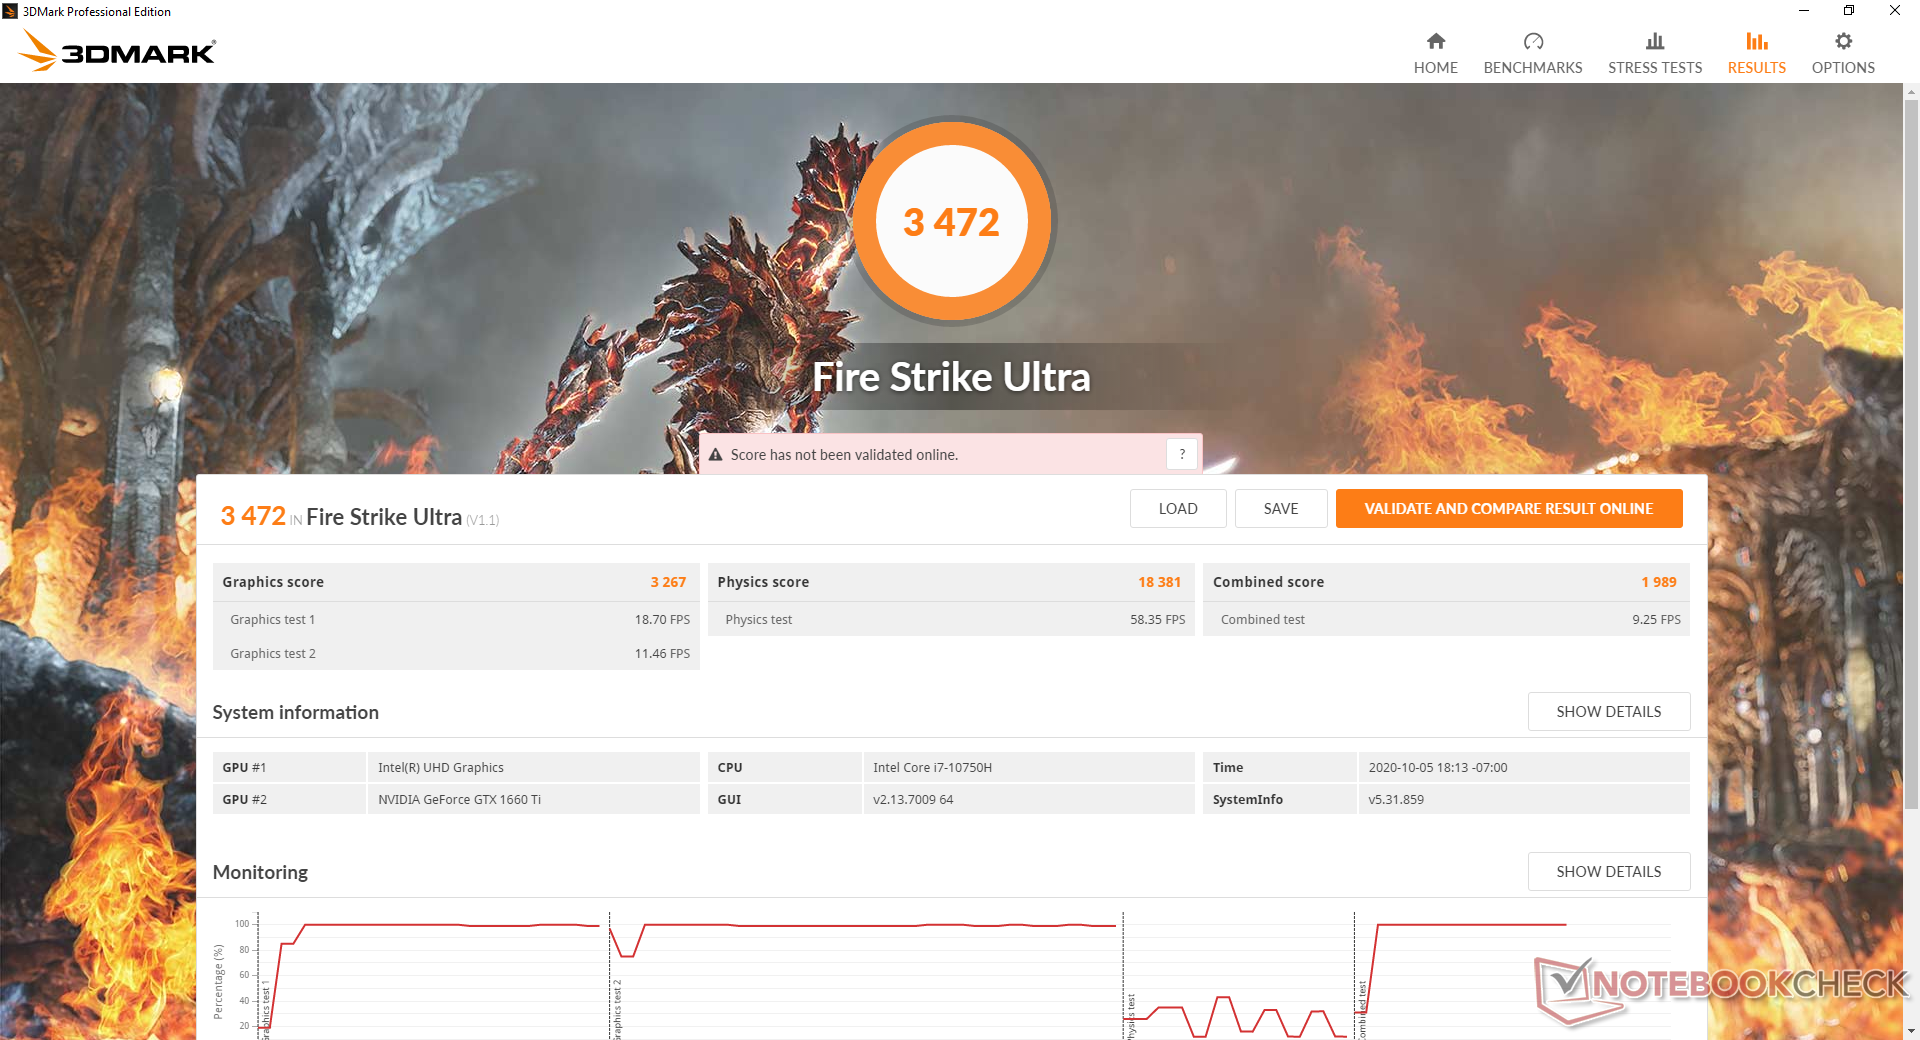
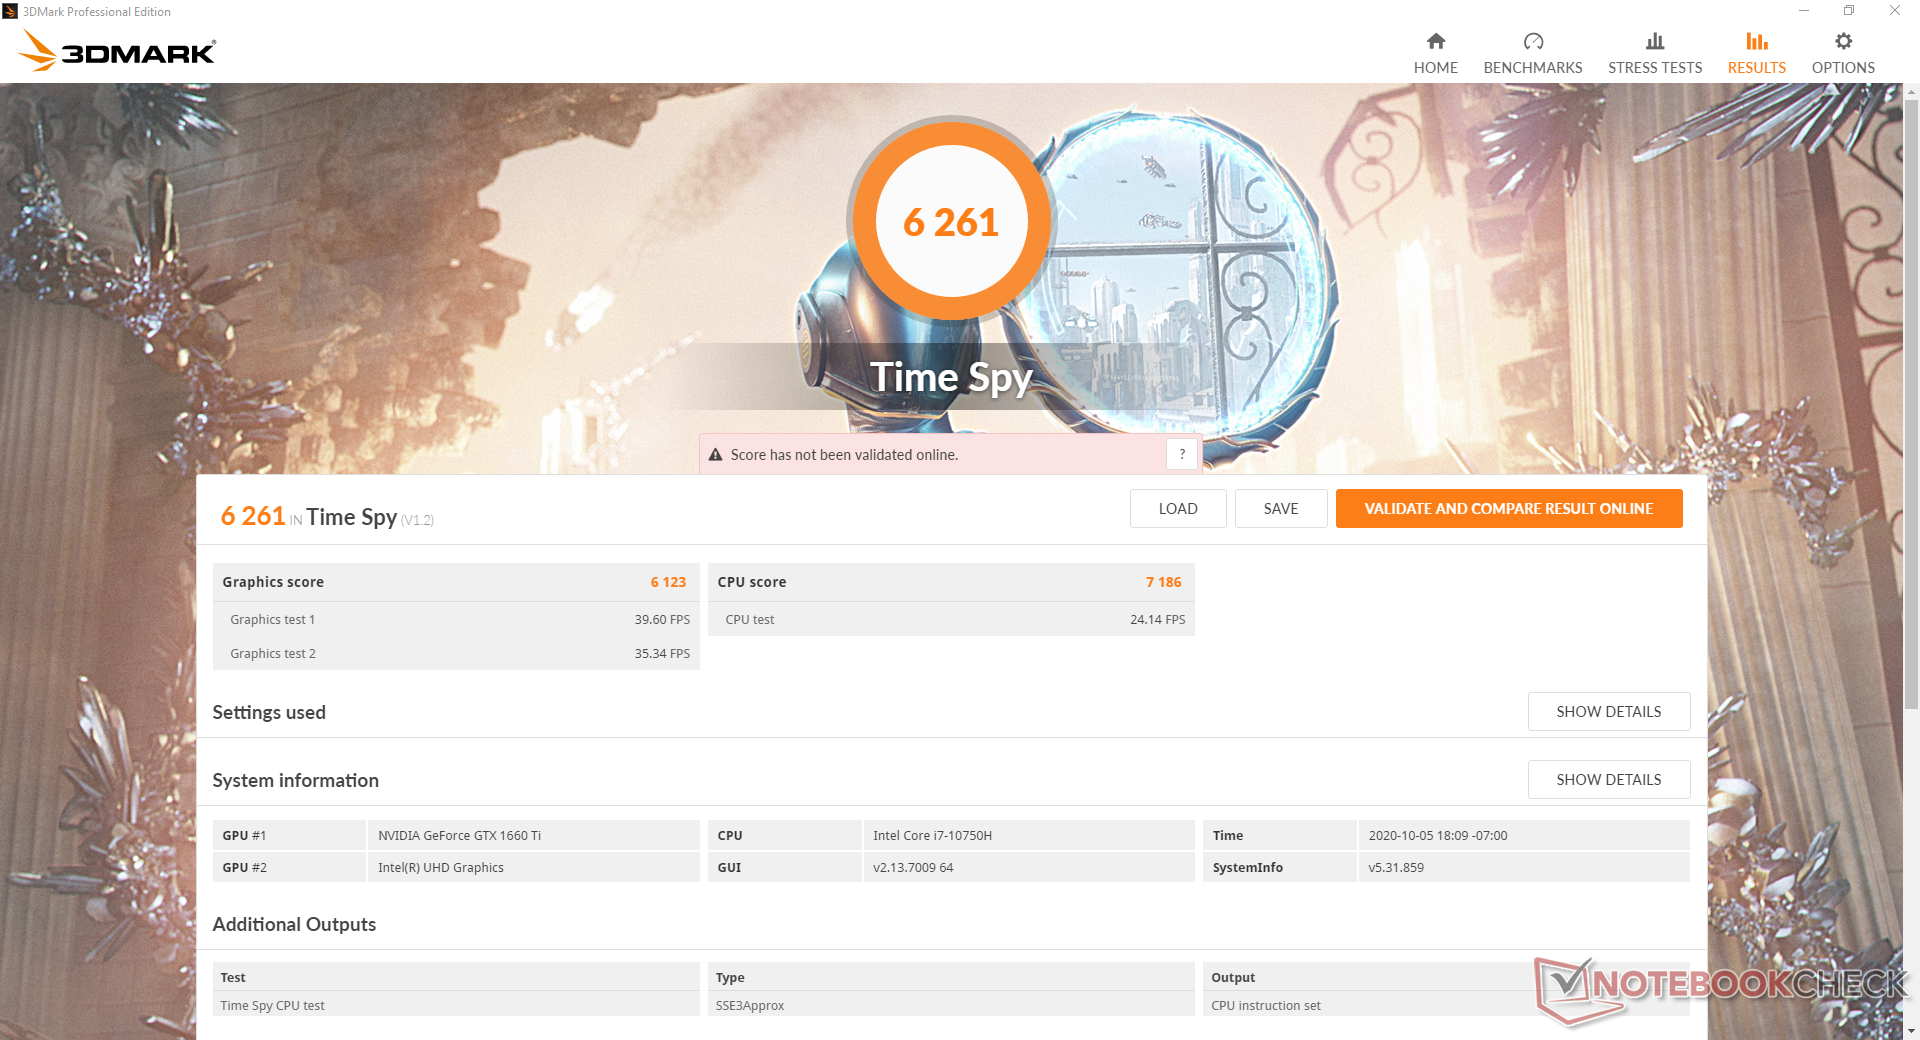
El GTX 1660 Ti en modo Turbo es sólo un 5 a 8 por ciento más lento que el RTX 2070 Max-Q en modo Performance. Cuando el RTX 2070 Max-Q se pone en modo Turbo, el delta aumenta a cerca del 20 por ciento. Tanto el rendimiento de la CPU como el de la GPU disminuirá aún más si funciona con la energía de la batería.
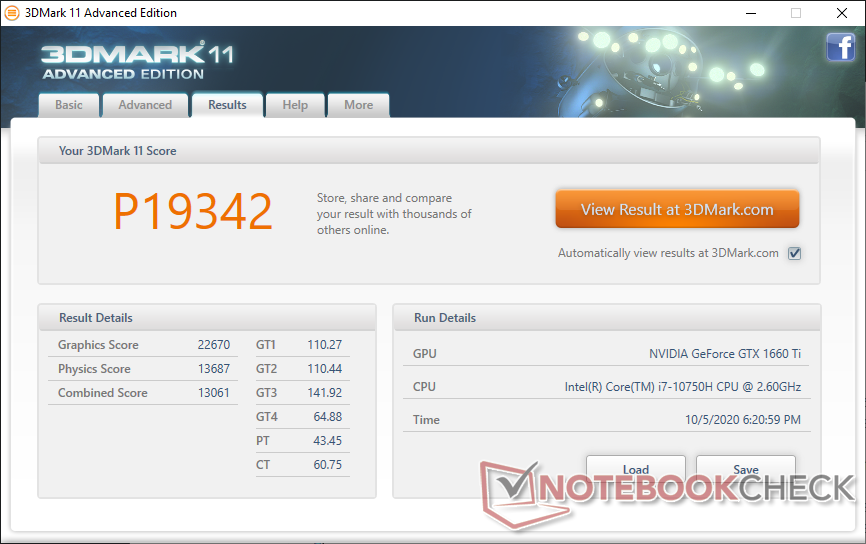


| 3DMark 11 Performance | 19342 puntos | |
| 3DMark Cloud Gate Standard Score | 38136 puntos | |
| 3DMark Fire Strike Score | 14649 puntos | |
| 3DMark Time Spy Score | 6261 puntos | |
ayuda | ||
| bajo | medio | alto | ultra | |
|---|---|---|---|---|
| GTA V (2015) | 178 | 171 | 140 | 76 |
| The Witcher 3 (2015) | 288.3 | 193.2 | 117.6 | 65.1 |
| Dota 2 Reborn (2015) | 150 | 135 | 124 | 118 |
| Final Fantasy XV Benchmark (2018) | 137 | 87.6 | 63.9 | |
| X-Plane 11.11 (2018) | 101 | 89 | 75.2 | |
| Strange Brigade (2018) | 311 | 150 | 122 | 104 |
Emisiones
Ruido de sistema
Los ventiladores están casi siempre activos y son audibles a unos 32 dB(A), incluso cuando están en modo silencioso. Mientras tanto, los juegos en el modo Performance inducirán un ruido de ventilador de 53 dB(A) en comparación con casi 61 dB(A) cuando está configurado en el modo Turbo. El modo Turbo exprimirá más el rendimiento, pero el aumento del ruido del ventilador es definitivamente notable.
| Asus ROG Zephyrus M15 GU502LU-BI7N4 GeForce GTX 1660 Ti Mobile, i7-10750H, Intel SSD 660p SSDPEKNW512G8 | Asus ROG Zephyrus M15 GU502L GeForce RTX 2070 Max-Q, i7-10750H, 2x Intel SSD 660p SSDPEKNW512G8 (RAID 0) | HP Omen 15-ek0456ng GeForce GTX 1660 Ti Mobile, i5-10300H, Toshiba XG6 KXG60ZNV512G | Gateway Creator Series 15.6 GWTN156-3BK GeForce RTX 2060 Mobile, i5-10300H, Phison PS5013 PM8256GPTCB4B8TF | Lenovo Legion 5 15IMH05H GeForce RTX 2060 Mobile, i5-10300H, Samsung PM991 MZALQ512HALU | MSI GP65 10SFK-047US GeForce RTX 2070 Mobile, i7-10750H, Samsung SSD PM981 MZVLB1T0HALR | |
|---|---|---|---|---|---|---|
| Noise | -7% | 3% | -2% | 3% | -6% | |
| apagado / medio ambiente * (dB) | 25.8 | 25 3% | 27 -5% | 26.5 -3% | 30.7 -19% | 29.3 -14% |
| Idle Minimum * (dB) | 25.8 | 31 -20% | 32.4 -26% | 26.5 -3% | 30.7 -19% | 31.9 -24% |
| Idle Average * (dB) | 33.2 | 32 4% | 32.4 2% | 26.5 20% | 30.7 8% | 31.9 4% |
| Idle Maximum * (dB) | 33.2 | 36 -8% | 32.4 2% | 32.4 2% | 30.7 8% | 33.5 -1% |
| Load Average * (dB) | 37.3 | 55 -47% | 32.5 13% | 55.4 -49% | 36.6 2% | 47 -26% |
| Witcher 3 ultra * (dB) | 60.8 | 53 13% | 47.2 22% | 55.3 9% | 47 23% | 53.8 12% |
| Load Maximum * (dB) | 60.8 | 57 6% | 51.9 15% | 55.3 9% | 50.9 16% | 56.7 7% |
* ... más pequeño es mejor
Ruido
| Ocioso |
| 25.8 / 33.2 / 33.2 dB(A) |
| Carga |
| 37.3 / 60.8 dB(A) |
 | ||
30 dB silencioso 40 dB(A) audible 50 dB(A) ruidosamente alto |
||
min: | ||
Temperatura
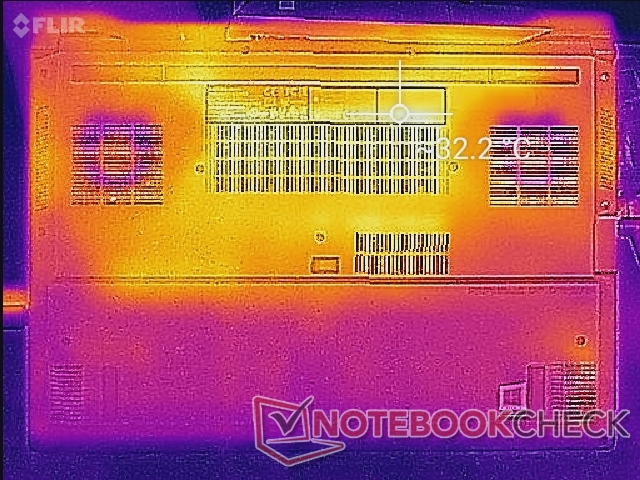
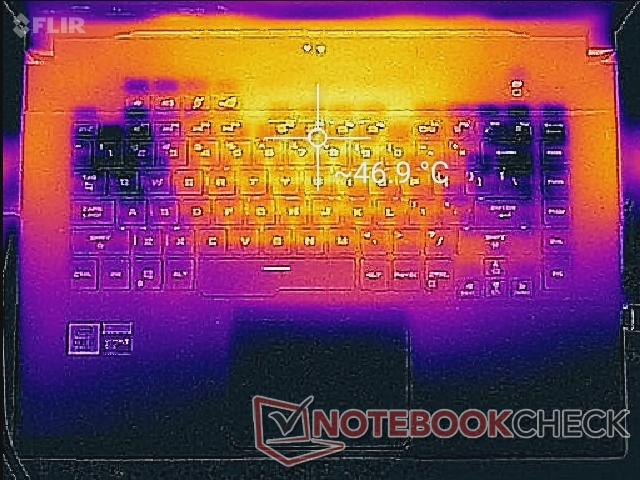
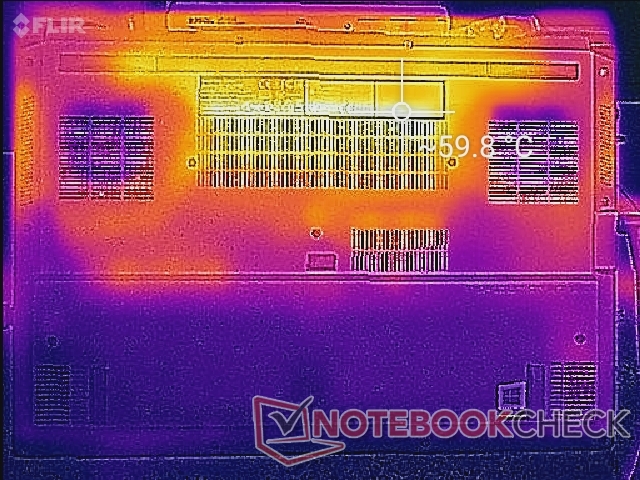
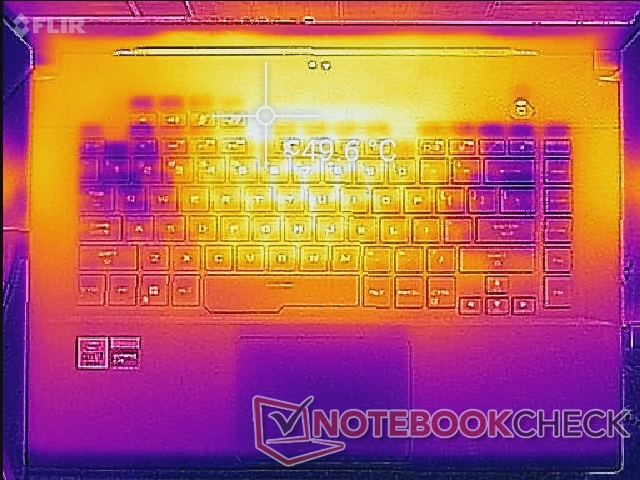
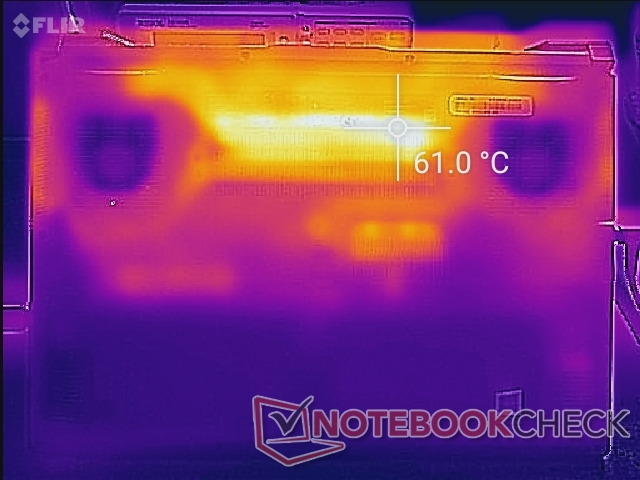
Las temperaturas de la superficie son más frías en el modo Turbo que en el modo Performance o en el modo Balanceado. El punto caliente del teclado, por ejemplo, es de 47 C en el modo Turbo comparado con 51 C en el modo Performance/Balanced debido a las mayores RPM del ventilador.
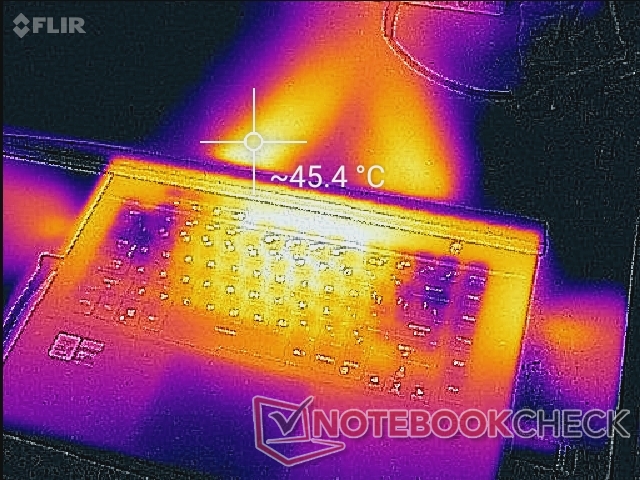
(-) La temperatura máxima en la parte superior es de 49.4 °C / 121 F, frente a la media de 40.4 °C / 105 F, que oscila entre 21.2 y 68.8 °C para la clase Gaming.
(-) El fondo se calienta hasta un máximo de 60 °C / 140 F, frente a la media de 43.2 °C / 110 F
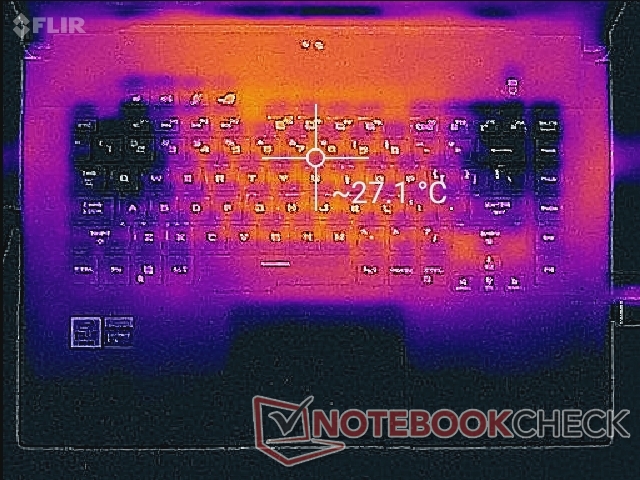
(+) En reposo, la temperatura media de la parte superior es de 26.2 °C / 79# F, frente a la media del dispositivo de 33.9 °C / 93 F.
(±) Jugando a The Witcher 3, la temperatura media de la parte superior es de 36 °C / 97 F, frente a la media del dispositivo de 33.9 °C / 93 F.
(+) El reposamanos y el panel táctil están a una temperatura inferior a la de la piel, con un máximo de 30 °C / 86 F y, por tanto, son fríos al tacto.
(±) La temperatura media de la zona del reposamanos de dispositivos similares fue de 28.8 °C / 83.8 F (-1.2 °C / -2.2 F).
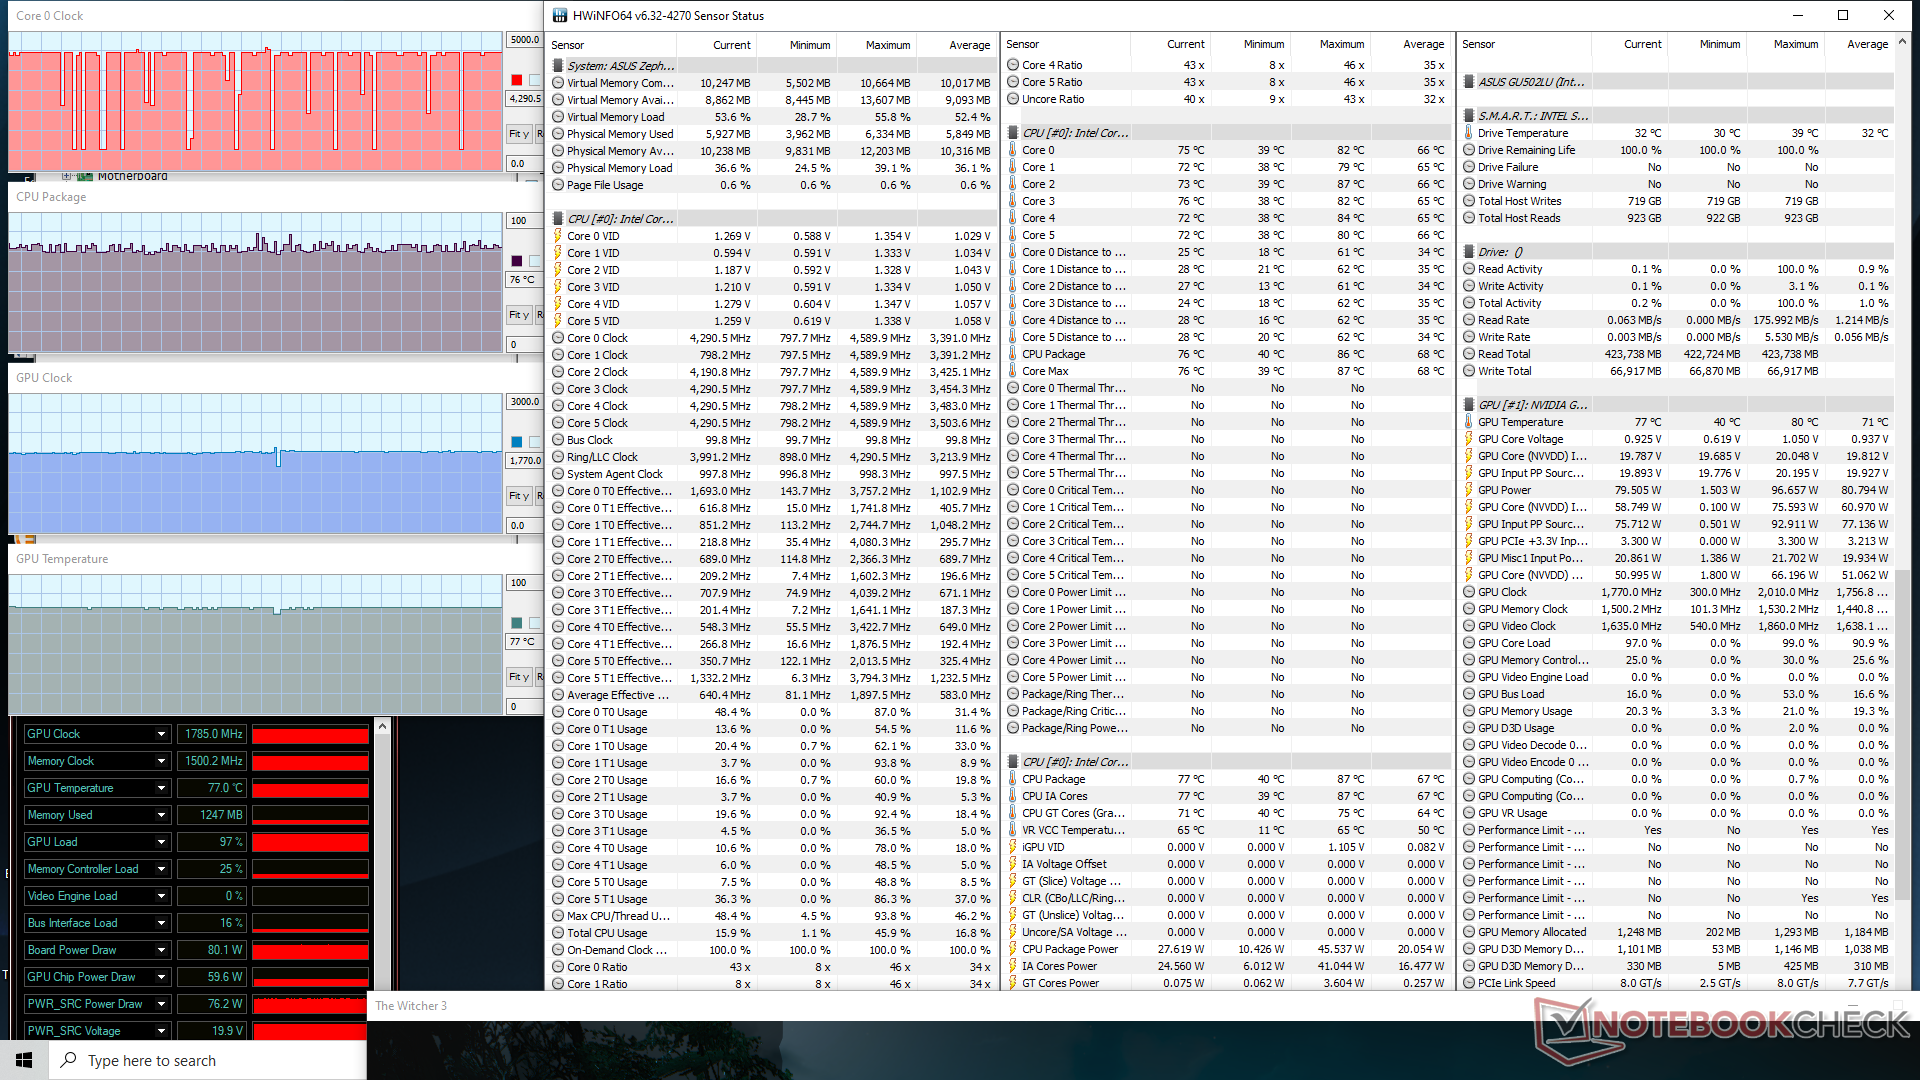
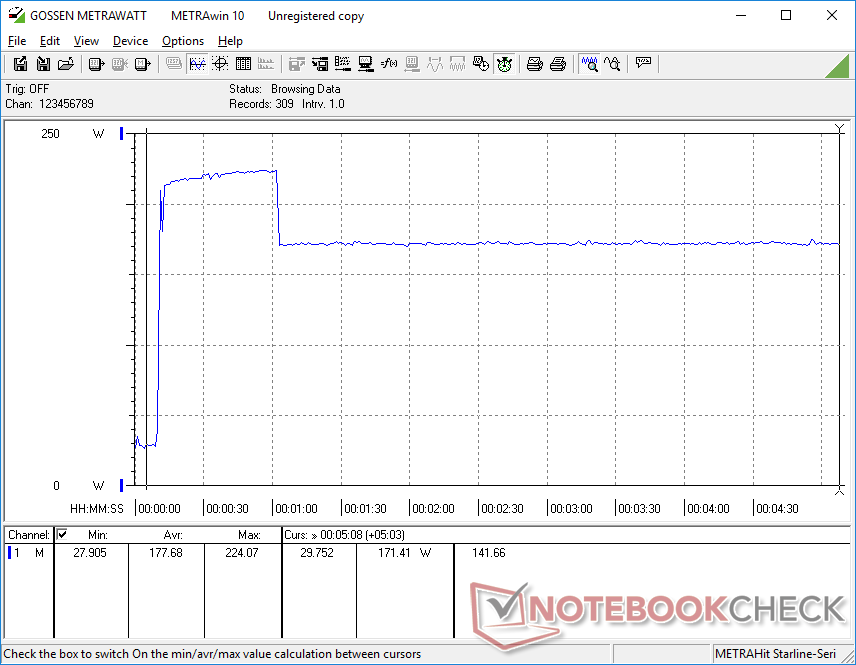
Prueba de estrés
Cuando bajo el estrés de Prime95 en el modo Turbo, la CPU es capaz de mantener una alta velocidad Turbo Boost de 4,2 GHz. Si está en modo Performance, las velocidades caerían y se estabilizarían en 3,7 a 3,8 GHz. Las velocidades y la temperatura de la GPU son más altas y más bajas, respectivamente, cuando se ejecutan en el modo Turbo en comparación con el modo Rendimiento.
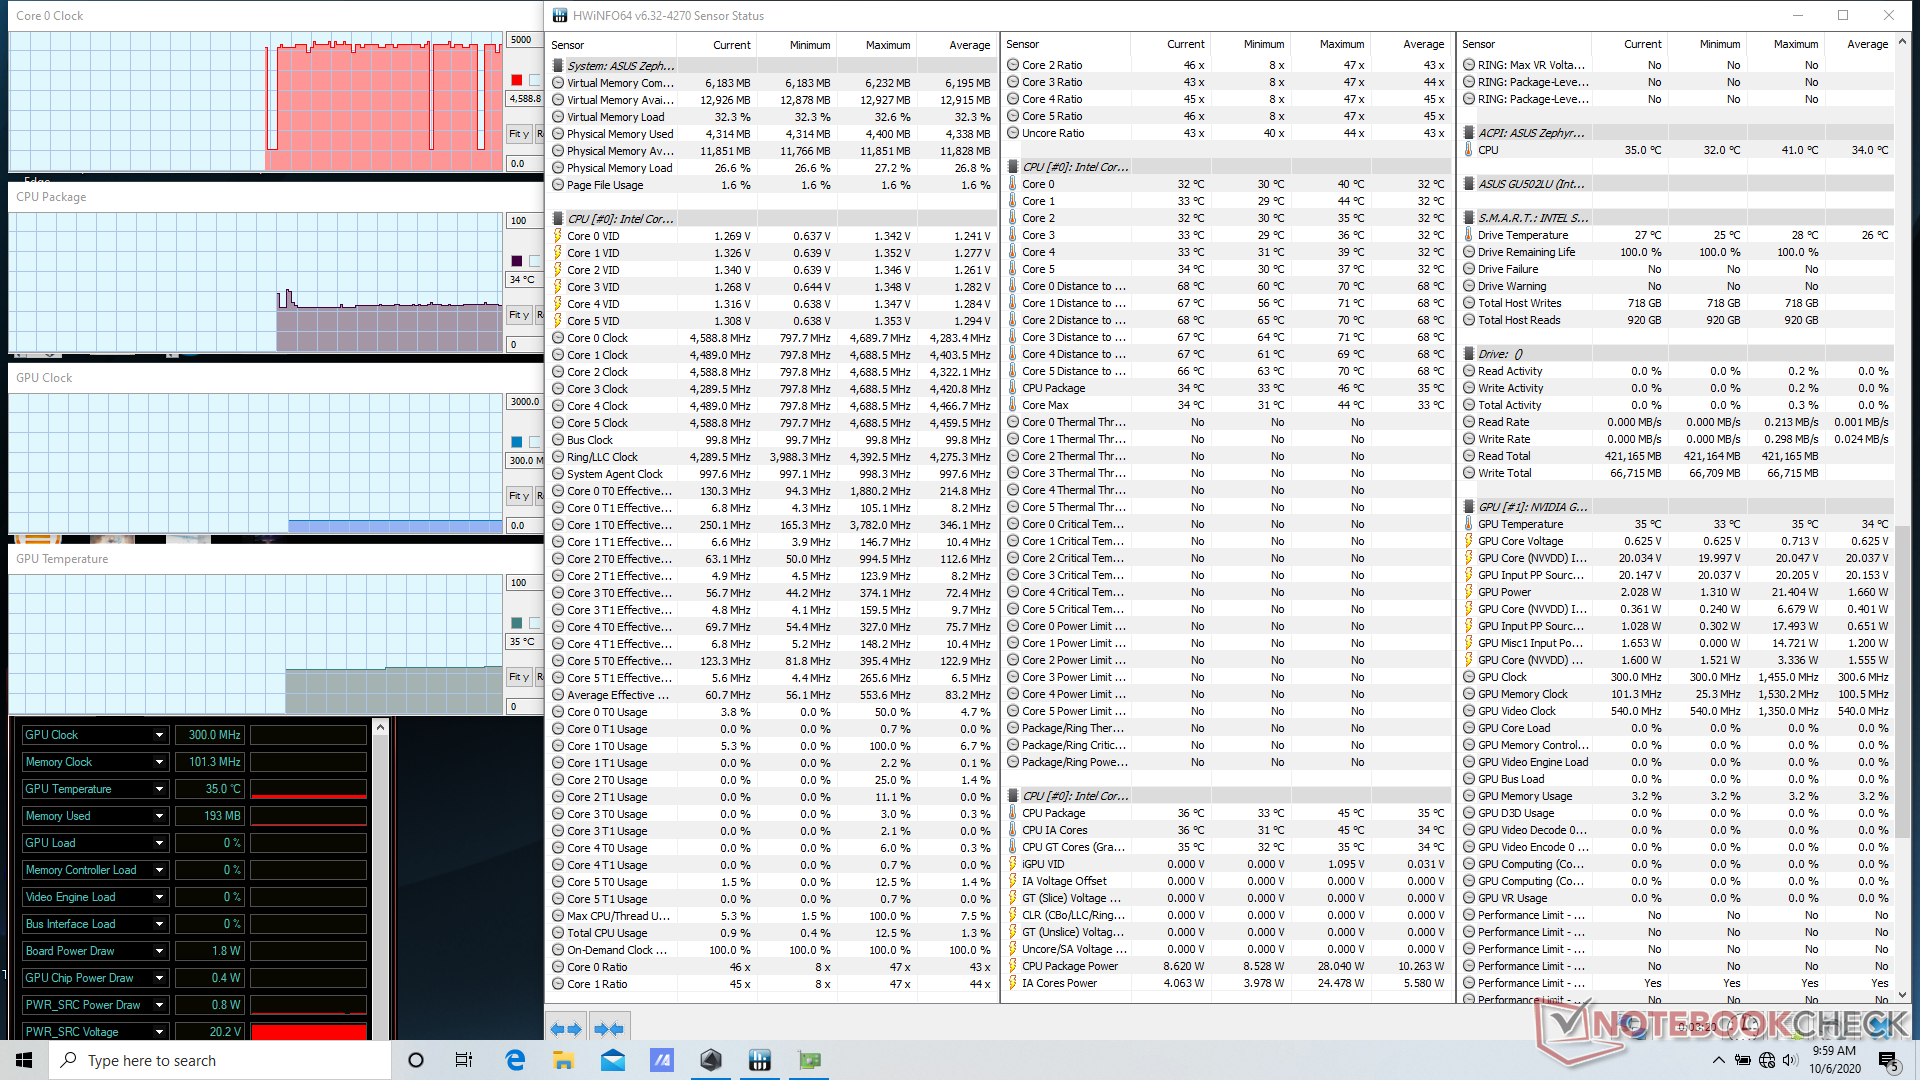
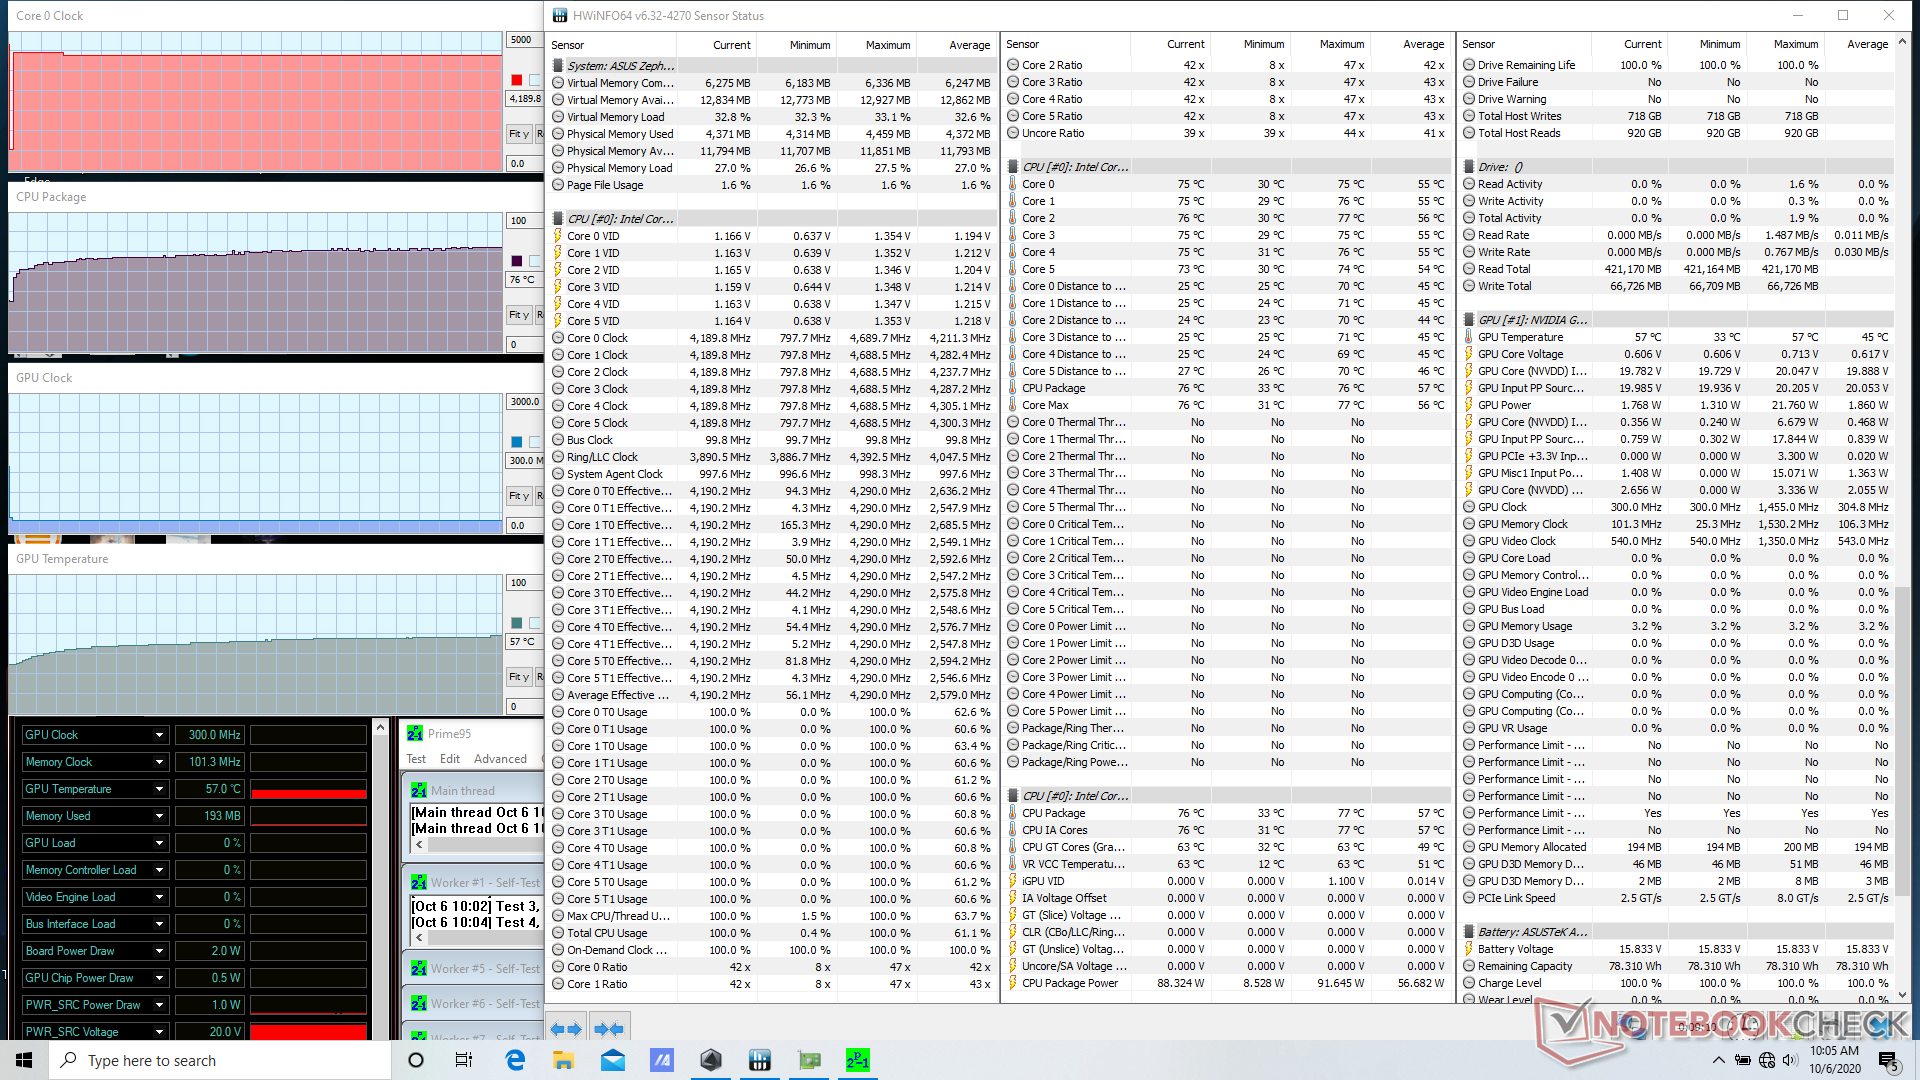
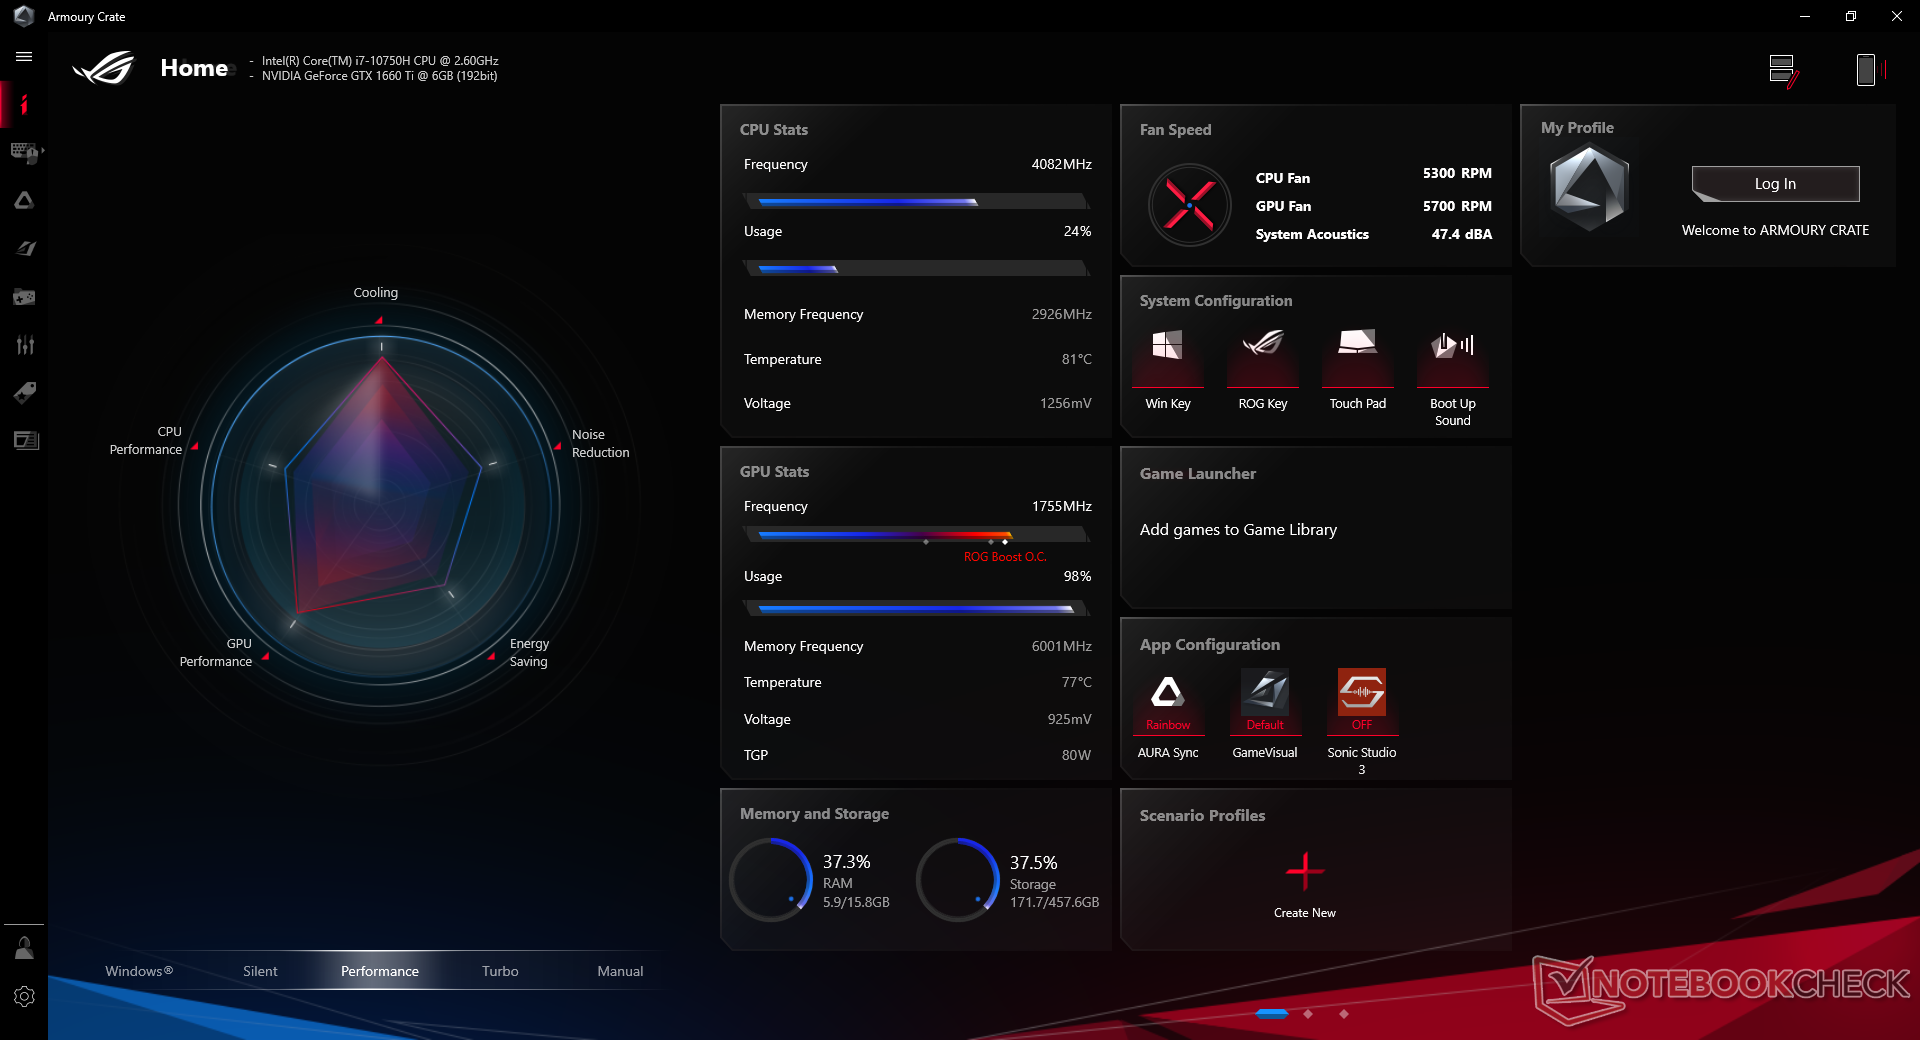
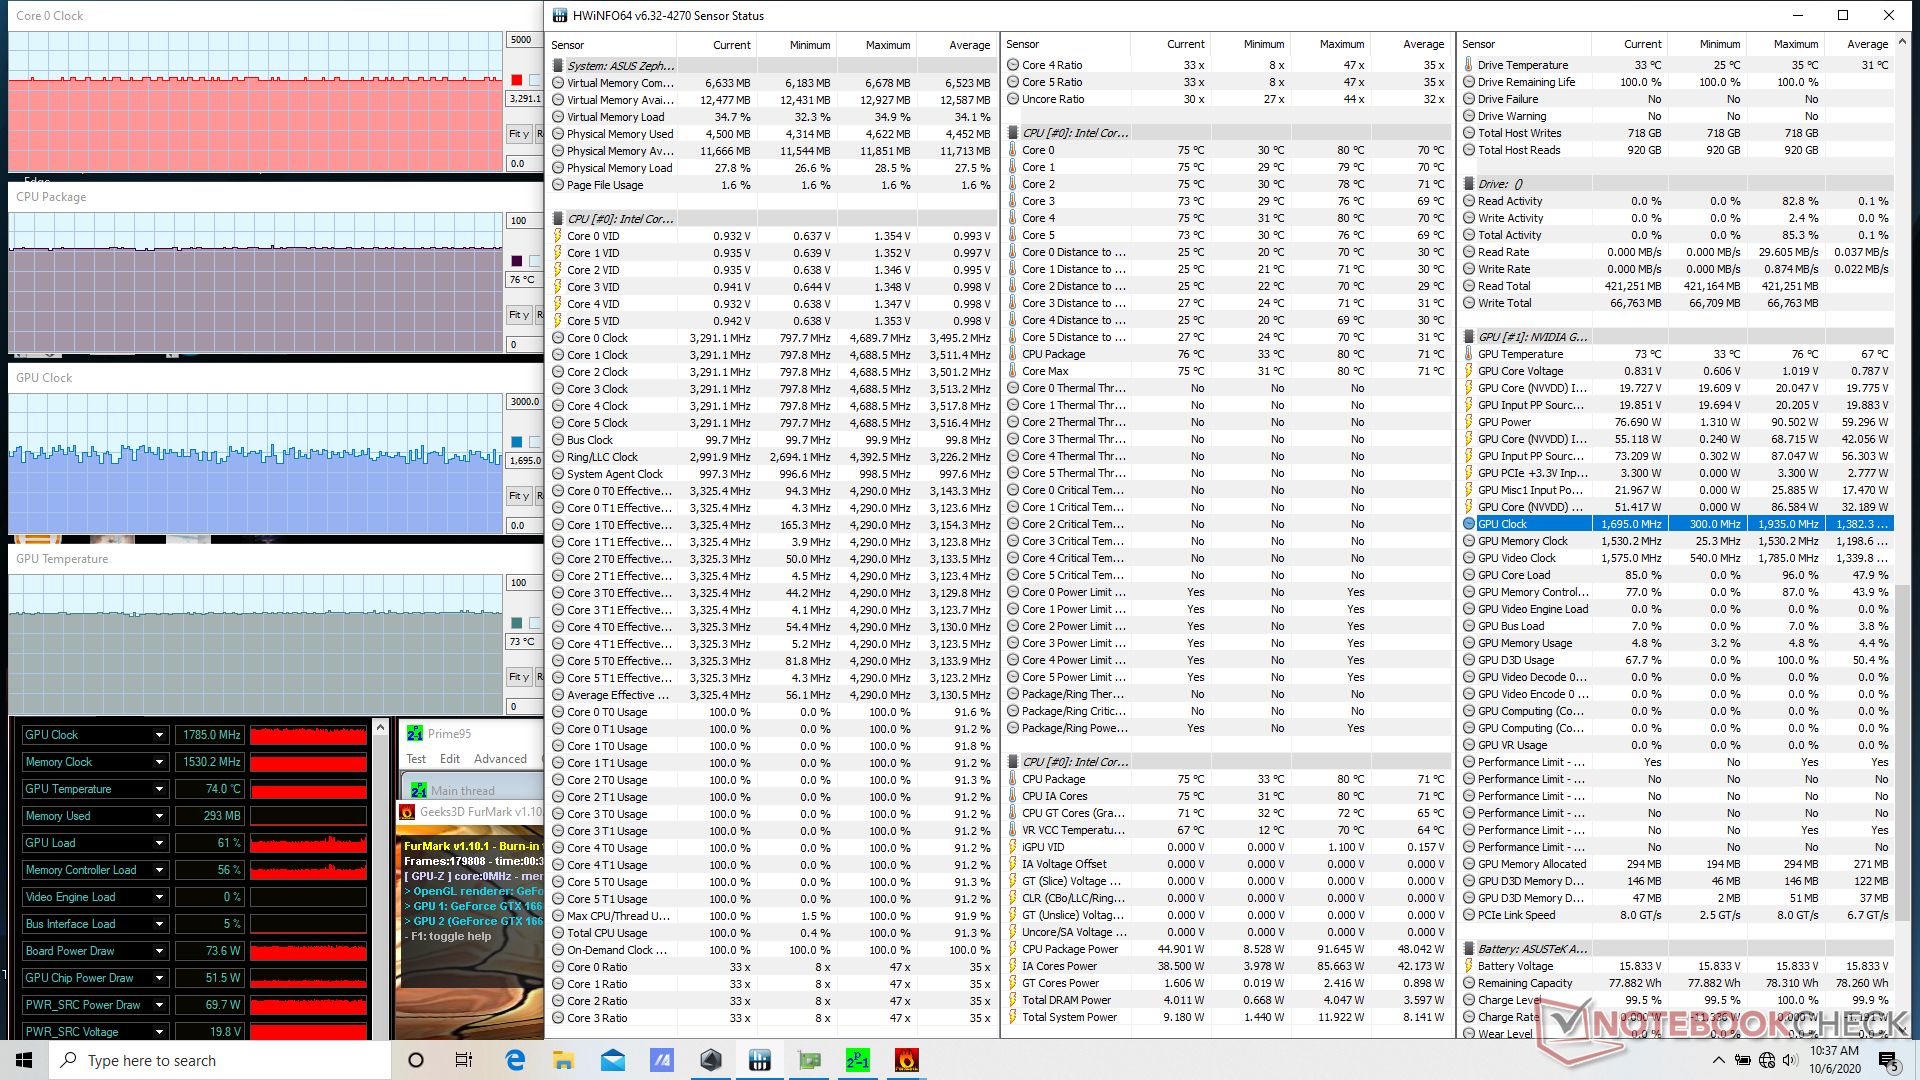
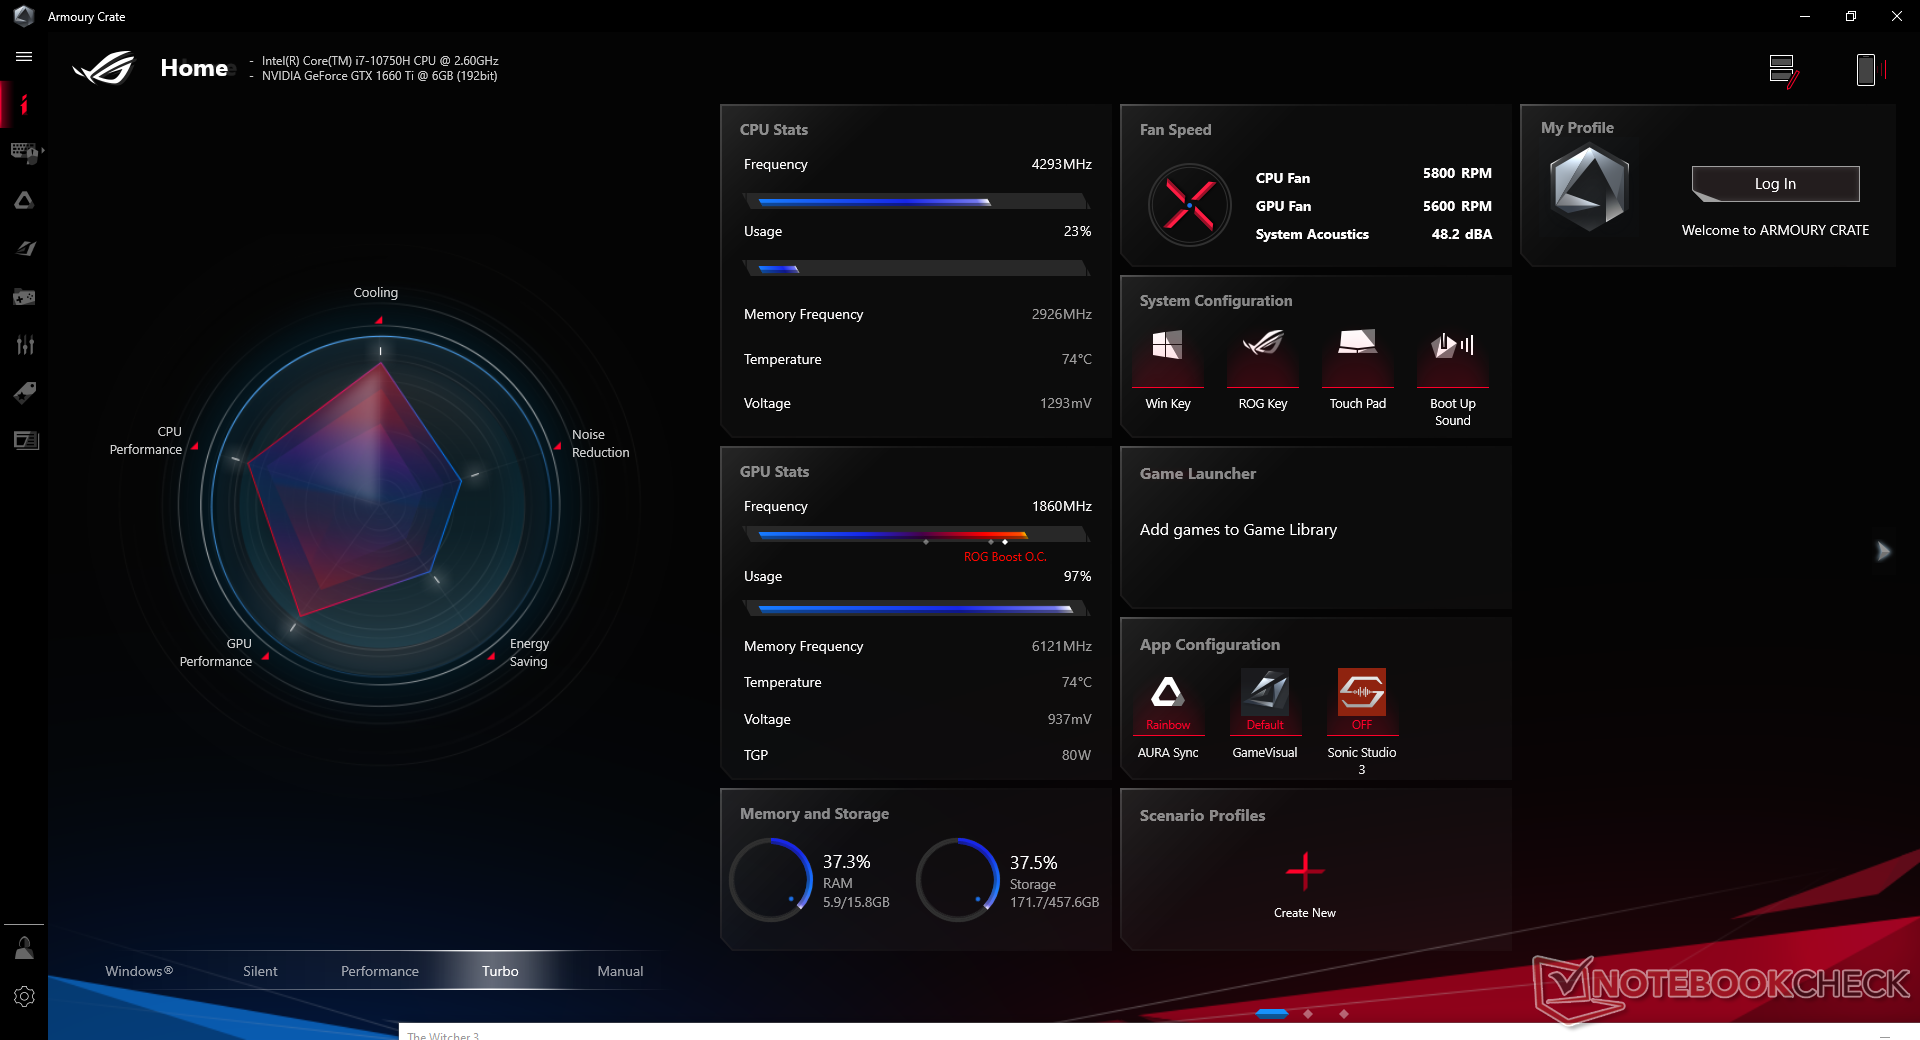
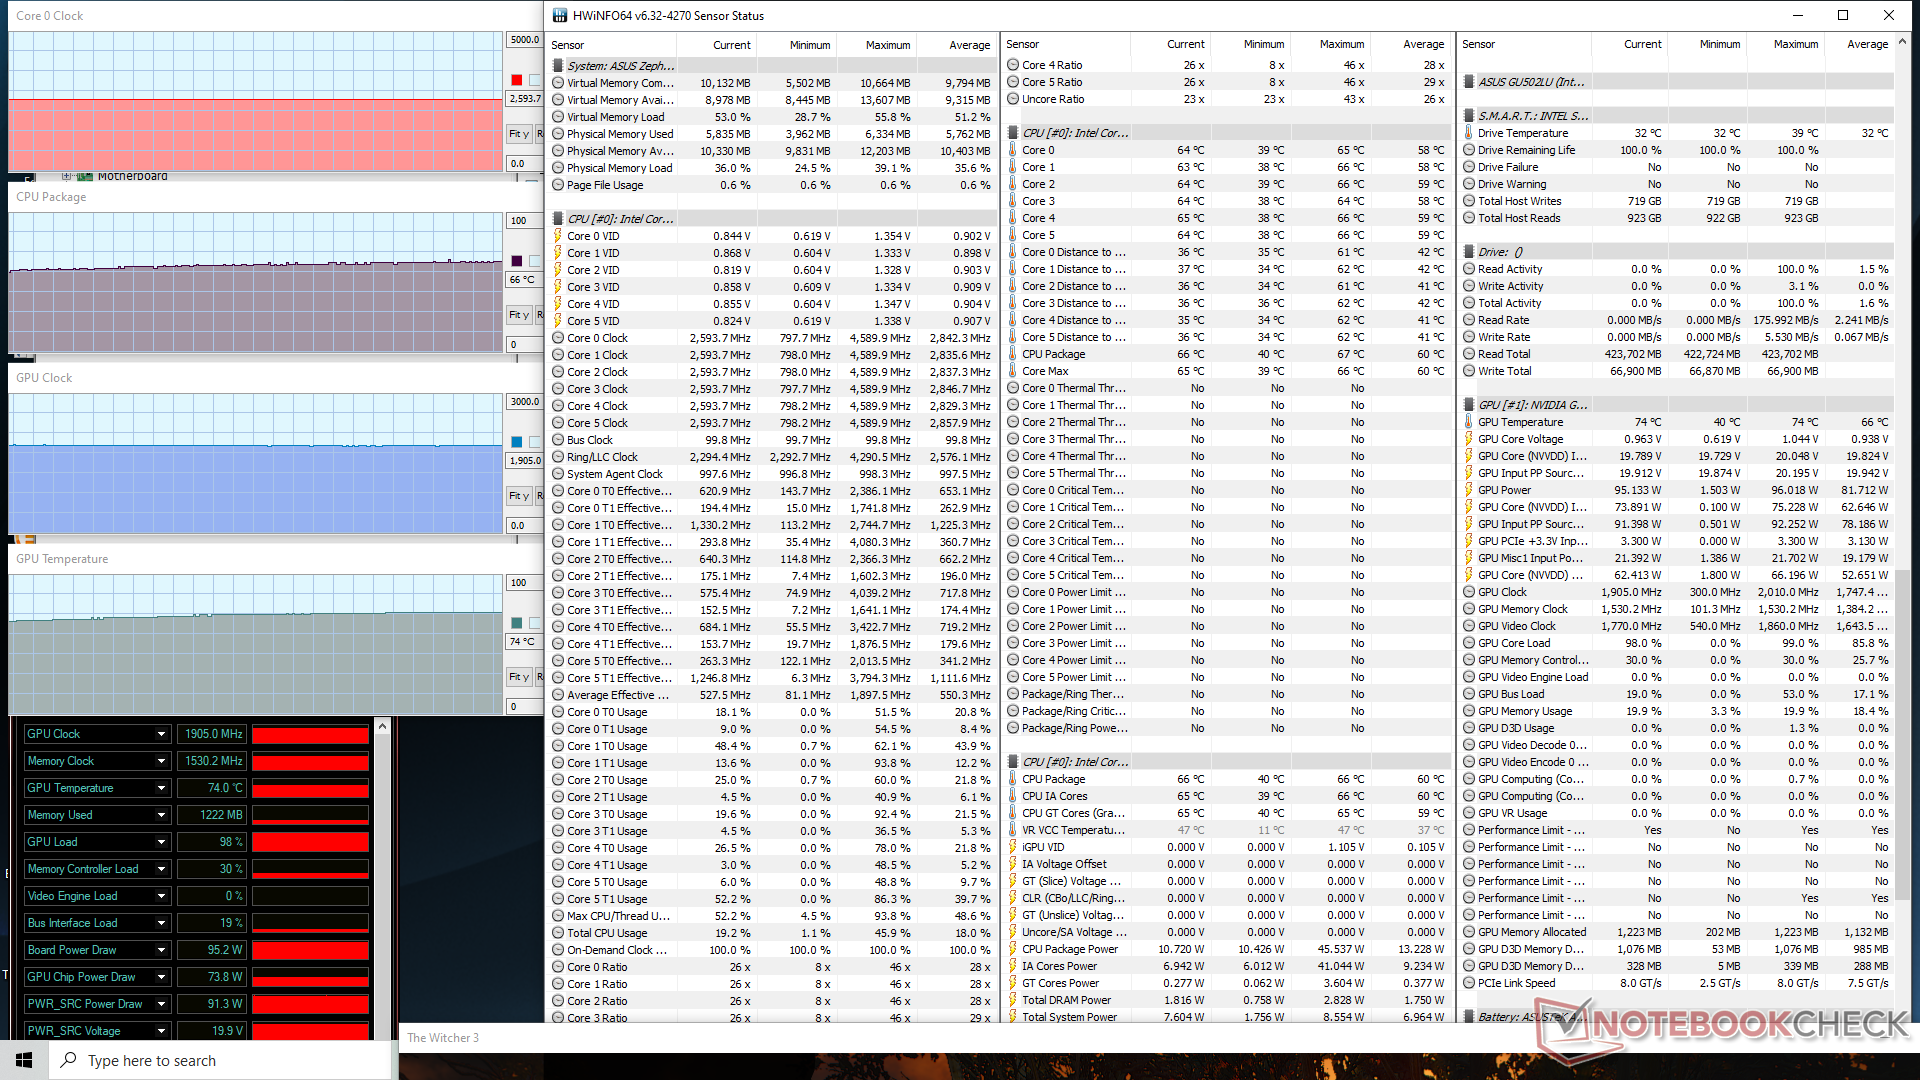
| CPU Clock (GHz) | GPU Clock (MHz) | Average CPU Temperature (°C) | Average GPU Temperature (°C) | |
| System Idle | -- | -- | 34 | 35 |
| Prime95 Stress (Performance mode) | 3.7 - 3.8 | -- | 77 | 63 |
| Prime95 Stress (Turbo mode) | 4.2 | -- | 76 | 57 |
| Prime95 + FurMark Stress (Turbo mode) | 3.3 | 1785 | 76 | 73 |
| Witcher 3 Stress (Performance mode) | 0.8 - 4.3 | 1785 | 76 | 77 |
| Witcher 3 stress (Turbo mode) | 2.6 | 1905 | 66 | 74 |
Altavoces

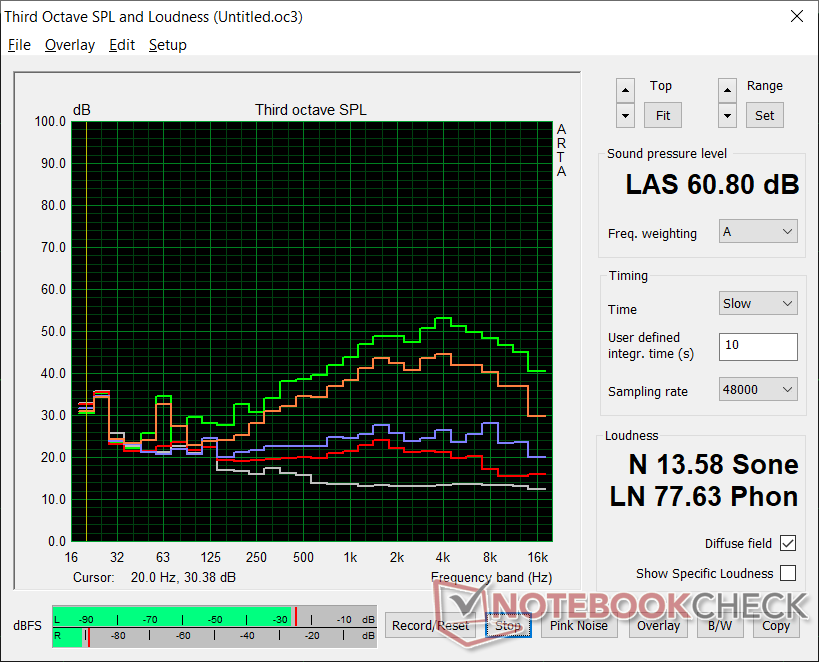
Asus ROG Zephyrus M15 GU502LU-BI7N4 análisis de audio
(+) | los altavoces pueden reproducir a un volumen relativamente alto (#83.9 dB)
Graves 100 - 315 Hz
(±) | lubina reducida - en promedio 9.4% inferior a la mediana
(±) | la linealidad de los graves es media (10.2% delta a frecuencia anterior)
Medios 400 - 2000 Hz
(+) | medios equilibrados - a sólo 2.2% de la mediana
(+) | los medios son lineales (5.2% delta a la frecuencia anterior)
Altos 2 - 16 kHz
(+) | máximos equilibrados - a sólo 3.7% de la mediana
(+) | los máximos son lineales (5.8% delta a la frecuencia anterior)
Total 100 - 16.000 Hz
(+) | el sonido global es lineal (9.9% de diferencia con la mediana)
En comparación con la misma clase
» 5% de todos los dispositivos probados de esta clase eran mejores, 2% similares, 94% peores
» El mejor tuvo un delta de 6%, la media fue 18%, el peor fue ###max##%
En comparación con todos los dispositivos probados
» 4% de todos los dispositivos probados eran mejores, 1% similares, 95% peores
» El mejor tuvo un delta de 4%, la media fue 24%, el peor fue ###max##%
Apple MacBook 12 (Early 2016) 1.1 GHz análisis de audio
(+) | los altavoces pueden reproducir a un volumen relativamente alto (#83.6 dB)
Graves 100 - 315 Hz
(±) | lubina reducida - en promedio 11.3% inferior a la mediana
(±) | la linealidad de los graves es media (14.2% delta a frecuencia anterior)
Medios 400 - 2000 Hz
(+) | medios equilibrados - a sólo 2.4% de la mediana
(+) | los medios son lineales (5.5% delta a la frecuencia anterior)
Altos 2 - 16 kHz
(+) | máximos equilibrados - a sólo 2% de la mediana
(+) | los máximos son lineales (4.5% delta a la frecuencia anterior)
Total 100 - 16.000 Hz
(+) | el sonido global es lineal (10.2% de diferencia con la mediana)
En comparación con la misma clase
» 7% de todos los dispositivos probados de esta clase eran mejores, 2% similares, 91% peores
» El mejor tuvo un delta de 5%, la media fue 18%, el peor fue ###max##%
En comparación con todos los dispositivos probados
» 5% de todos los dispositivos probados eran mejores, 1% similares, 94% peores
» El mejor tuvo un delta de 4%, la media fue 24%, el peor fue ###max##%
Gestión de la energía
Consumo de energía
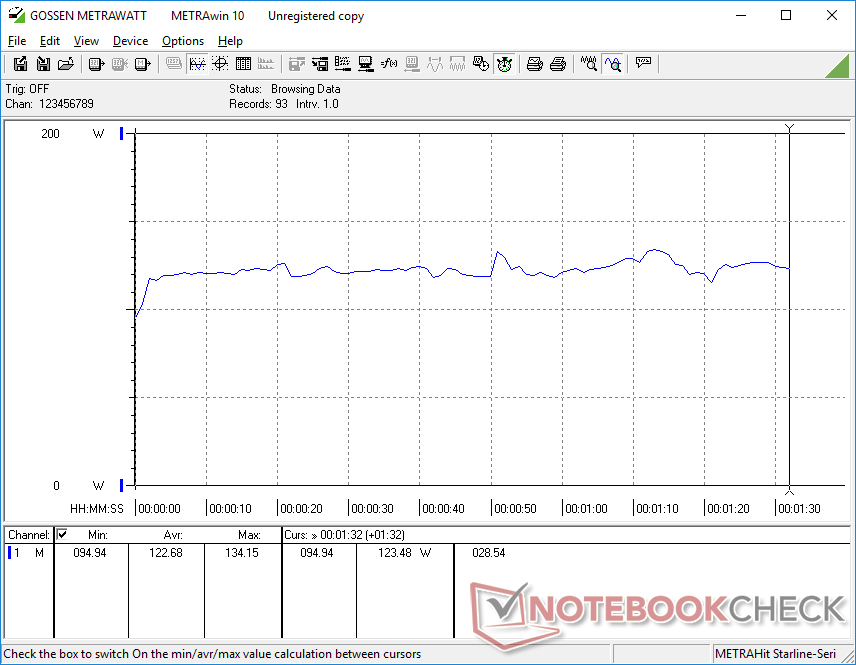
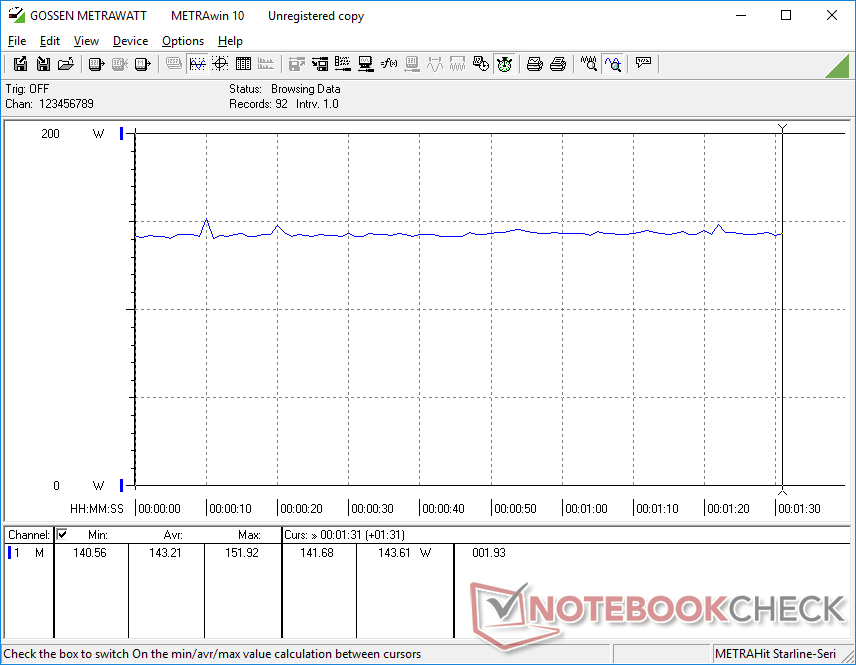
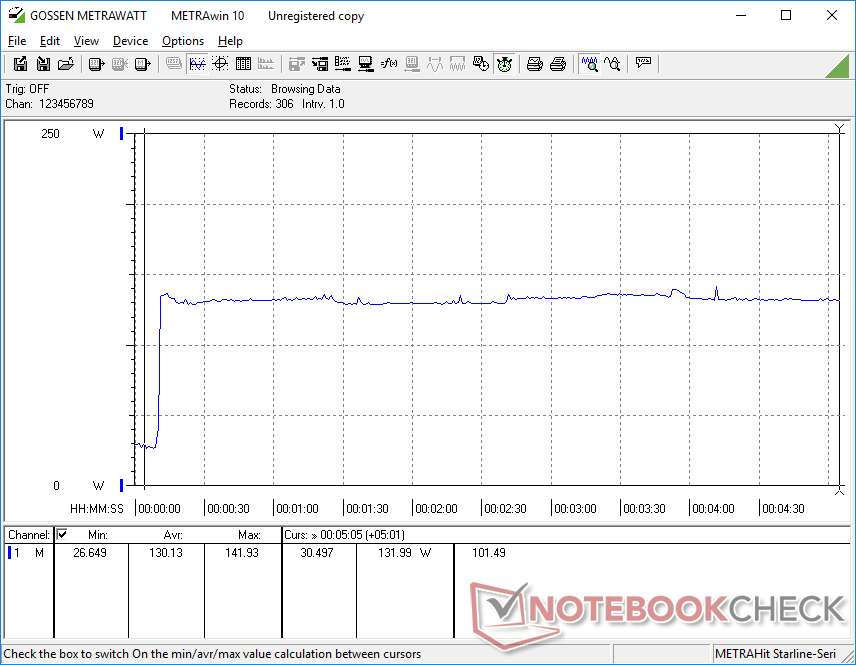
En el escritorio, el tiempo de inactividad se sitúa entre 10 W y 29 W, dependiendo del perfil de potencia y el brillo de la pantalla. El mensaje para llevar aquí es que el consumo de energía en los juegos está cerca del GU502LW aunque este último viene equipado con la más cara GPU RTX 2070 Max-Q.
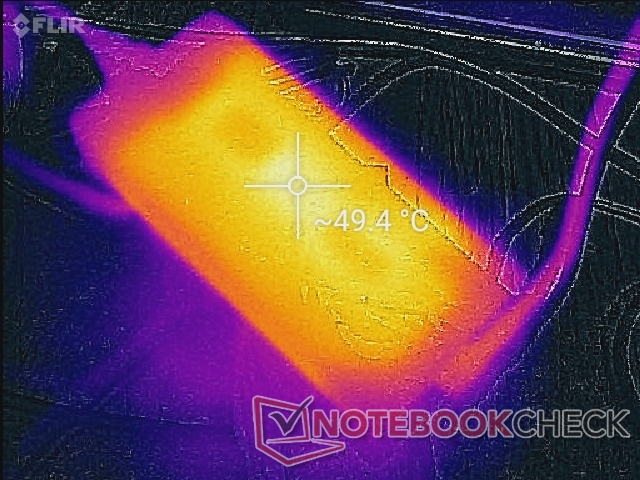
El adaptador de CA de tamaño medio (~16,5 x 7,6 x 3,2 cm) de 230 W permite la recarga mientras se ejecutan cargas exigentes.
| Off / Standby | |
| Ocioso | |
| Carga |
|
Clave:
min: | |
| Asus ROG Zephyrus M15 GU502LU-BI7N4 i7-10750H, GeForce GTX 1660 Ti Mobile, Intel SSD 660p SSDPEKNW512G8, IPS, 1920x1080, 15.6" | Asus ROG Zephyrus M15 GU502L i7-10750H, GeForce RTX 2070 Max-Q, 2x Intel SSD 660p SSDPEKNW512G8 (RAID 0), IPS, 3840x2160, 15.6" | HP Omen 15-ek0456ng i5-10300H, GeForce GTX 1660 Ti Mobile, Toshiba XG6 KXG60ZNV512G, IPS, 1920x1080, 15.6" | Gateway Creator Series 15.6 GWTN156-3BK i5-10300H, GeForce RTX 2060 Mobile, Phison PS5013 PM8256GPTCB4B8TF, IPS, 1920x1080, 15.6" | Lenovo Legion 5 15IMH05H i5-10300H, GeForce RTX 2060 Mobile, Samsung PM991 MZALQ512HALU, IPS, 1920x1080, 15.6" | MSI GP65 10SFK-047US i7-10750H, GeForce RTX 2070 Mobile, Samsung SSD PM981 MZVLB1T0HALR, IPS, 1920x1080, 15.6" | |
|---|---|---|---|---|---|---|
| Power Consumption | 6% | 17% | 2% | 38% | -8% | |
| Idle Minimum * (Watt) | 10 | 10 -0% | 9.2 8% | 9.9 1% | 3.2 68% | 14.2 -42% |
| Idle Average * (Watt) | 16.9 | 13 23% | 14.6 14% | 17 -1% | 8.3 51% | 18.8 -11% |
| Idle Maximum * (Watt) | 28.3 | 23 19% | 18.1 36% | 31.9 -13% | 8.7 69% | 23.9 16% |
| Load Average * (Watt) | 122.7 | 137 -12% | 84 32% | 90.5 26% | 82 33% | 96.9 21% |
| Witcher 3 ultra * (Watt) | 143.2 | 140 2% | 142 1% | 162.3 -13% | 151 -5% | 185 -29% |
| Load Maximum * (Watt) | 224.1 | 222 1% | 194 13% | 202.1 10% | 195 13% | 233.4 -4% |
* ... más pequeño es mejor
Duración de la batería
| Asus ROG Zephyrus M15 GU502LU-BI7N4 i7-10750H, GeForce GTX 1660 Ti Mobile, 76 Wh | Asus ROG Zephyrus M15 GU502L i7-10750H, GeForce RTX 2070 Max-Q, 76 Wh | HP Omen 15-ek0456ng i5-10300H, GeForce GTX 1660 Ti Mobile, 70.91 Wh | Gateway Creator Series 15.6 GWTN156-3BK i5-10300H, GeForce RTX 2060 Mobile, 46.74 Wh | Lenovo Legion 5 15IMH05H i5-10300H, GeForce RTX 2060 Mobile, 60 Wh | MSI GP65 10SFK-047US i7-10750H, GeForce RTX 2070 Mobile, 51 Wh | |
|---|---|---|---|---|---|---|
| Duración de Batería | -7% | 10% | 37% | 22% | -37% | |
| WiFi v1.3 (h) | 5.9 | 5.5 -7% | 6.5 10% | 8.1 37% | 7.2 22% | 3.7 -37% |
| Reader / Idle (h) | 8.6 | 11.7 | 14.1 | |||
| Load (h) | 1.5 | 1.7 | 1.4 |
Pro
Contra
Veredicto
El modo Turbo en los portátiles Asus Zephyrus impacta el rendimiento en un grado mayor cuando se compara con el modo Turbo en la mayoría de los portátiles MSI. Los usuarios no deberían confundir el modo Turbo con el modo Rendimiento, que funciona a velocidades más lentas y a temperaturas ligeramente más altas debido al menor techo de ruido del ventilador.
Aparte de los confusos perfiles de potencia y sus influencias en el rendimiento, el GU502LU podría ser mejor si consideramos el precio de venta de 1400 dólares. La GPU GTX 1660 Ti, el estrecho espacio de color y los lentos tiempos de respuesta de la pantalla son comunes en los portátiles para juegos económicos que se venden por cientos de dólares más baratos que este Asus. En cambio, el precio se inclina hacia el diseño del chasis relativamente fino y ligero, ya que las alternativas más baratas con las mismas especificaciones internas suelen ser más gruesas, más pesadas y posiblemente menos atractivas, como la serie Acer Nitro series, HP Pavilion Gaming, MSI GP65 o la serie Dell G3.
Rendimiento de juego económico por un precio medio. Los usuarios pagarán extra por el chasis más delgado, elegante y portátil. De lo contrario, podrán encontrar la misma CPU, GPU y pantalla en portátiles para juegos más baratos y pesados.
Asus ROG Zephyrus M15 GU502LU-BI7N4
- 10/12/2020 v7 (old)
Allen Ngo
Price comparison
