Análisis del HP Envy x360 2 en 1 16: Ryzen 7 8840HS vence a Core Ultra 7 155U

La serie Envy es la familia de gama media de HP que se sitúa entre la serie Pavilion, más económica, y la serie Spectre, el buque insignia más caro. En este caso, el nuevo Envy x360 16 puede verse como la versión asequible del Spectre x360 16 pero con opciones más potentes y características más lujosas que el Pavilion x360 15.
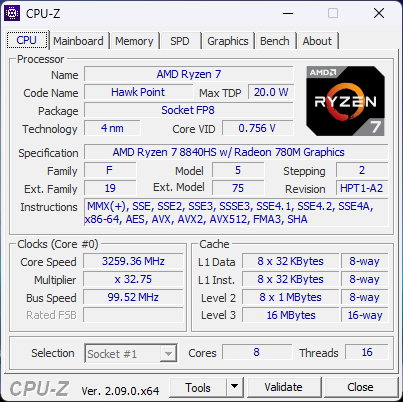
Nuestra unidad de prueba en revisión viene con la CPU AMD Ryzen 7 8840HS, gráficos integrados Radeon 780M y pantalla táctil OLED 1800p de 120 Hz por aproximadamente $1300 USD al menudeo. Las versiones Intel también están disponibles con el Core de 14ª generación Ultra 5 125U o Ultra 7 155U y pantalla táctil IPS de 1200p, pero todas las configuraciones vienen sólo con gráficos integrados. Este último diseño del Envy x360 16 sustituye efectivamente al del año pasado Envy x360 15.
Entre sus competidores se incluyen otros portátiles multimedia de 16 pulgadas como el Lenovo Yoga 7 2 en 1 16IML9, Samsung Galaxy Book4 Pro 360o el LG Gram 2 en 1 16.
Más opiniones sobre HP:
Posibles contendientes en la comparación
Valoración | Fecha | Modelo | Peso | Altura | Tamaño | Resolución | Precio |
|---|---|---|---|---|---|---|---|
| 87.2 % v7 (old) | 05/2024 | HP Envy x360 2-in-1 16-ad0097nr R7 8840HS, Radeon 780M | 1.8 kg | 18.3 mm | 16.00" | 2880x1800 | |
| 86.9 % v7 (old) | 09/2022 | HP Envy 16 h0112nr i7-12700H, GeForce RTX 3060 Laptop GPU | 2.3 kg | 19.8 mm | 16.00" | 3840x2400 | |
| 91.1 % v7 (old) | 03/2024 | HP Spectre x360 16 RTX 4050 Ultra 7 155H, GeForce RTX 4050 Laptop GPU | 2 kg | 19.8 mm | 16.00" | 2880x1800 | |
| 86.7 % v7 (old) | 04/2024 | Lenovo Yoga 7 2-in-1 16IML9 Ultra 5 125U, Graphics 4-Core iGPU (Arrow Lake) | 2.1 kg | 16.99 mm | 16.00" | 1920x1200 | |
| 87.8 % v7 (old) | 03/2024 | Samsung Galaxy Book4 Pro 360 Ultra 5 125H, Arc 7-Core | 1.7 kg | 13 mm | 16.00" | 2880x1800 | |
| 85.8 % v7 (old) | 11/2023 | LG Gram 2in1 16 16T90R - G.AA78G i7-1360P, Iris Xe G7 96EUs | 1.5 kg | 17.2 mm | 16.00" | 2560x1600 |
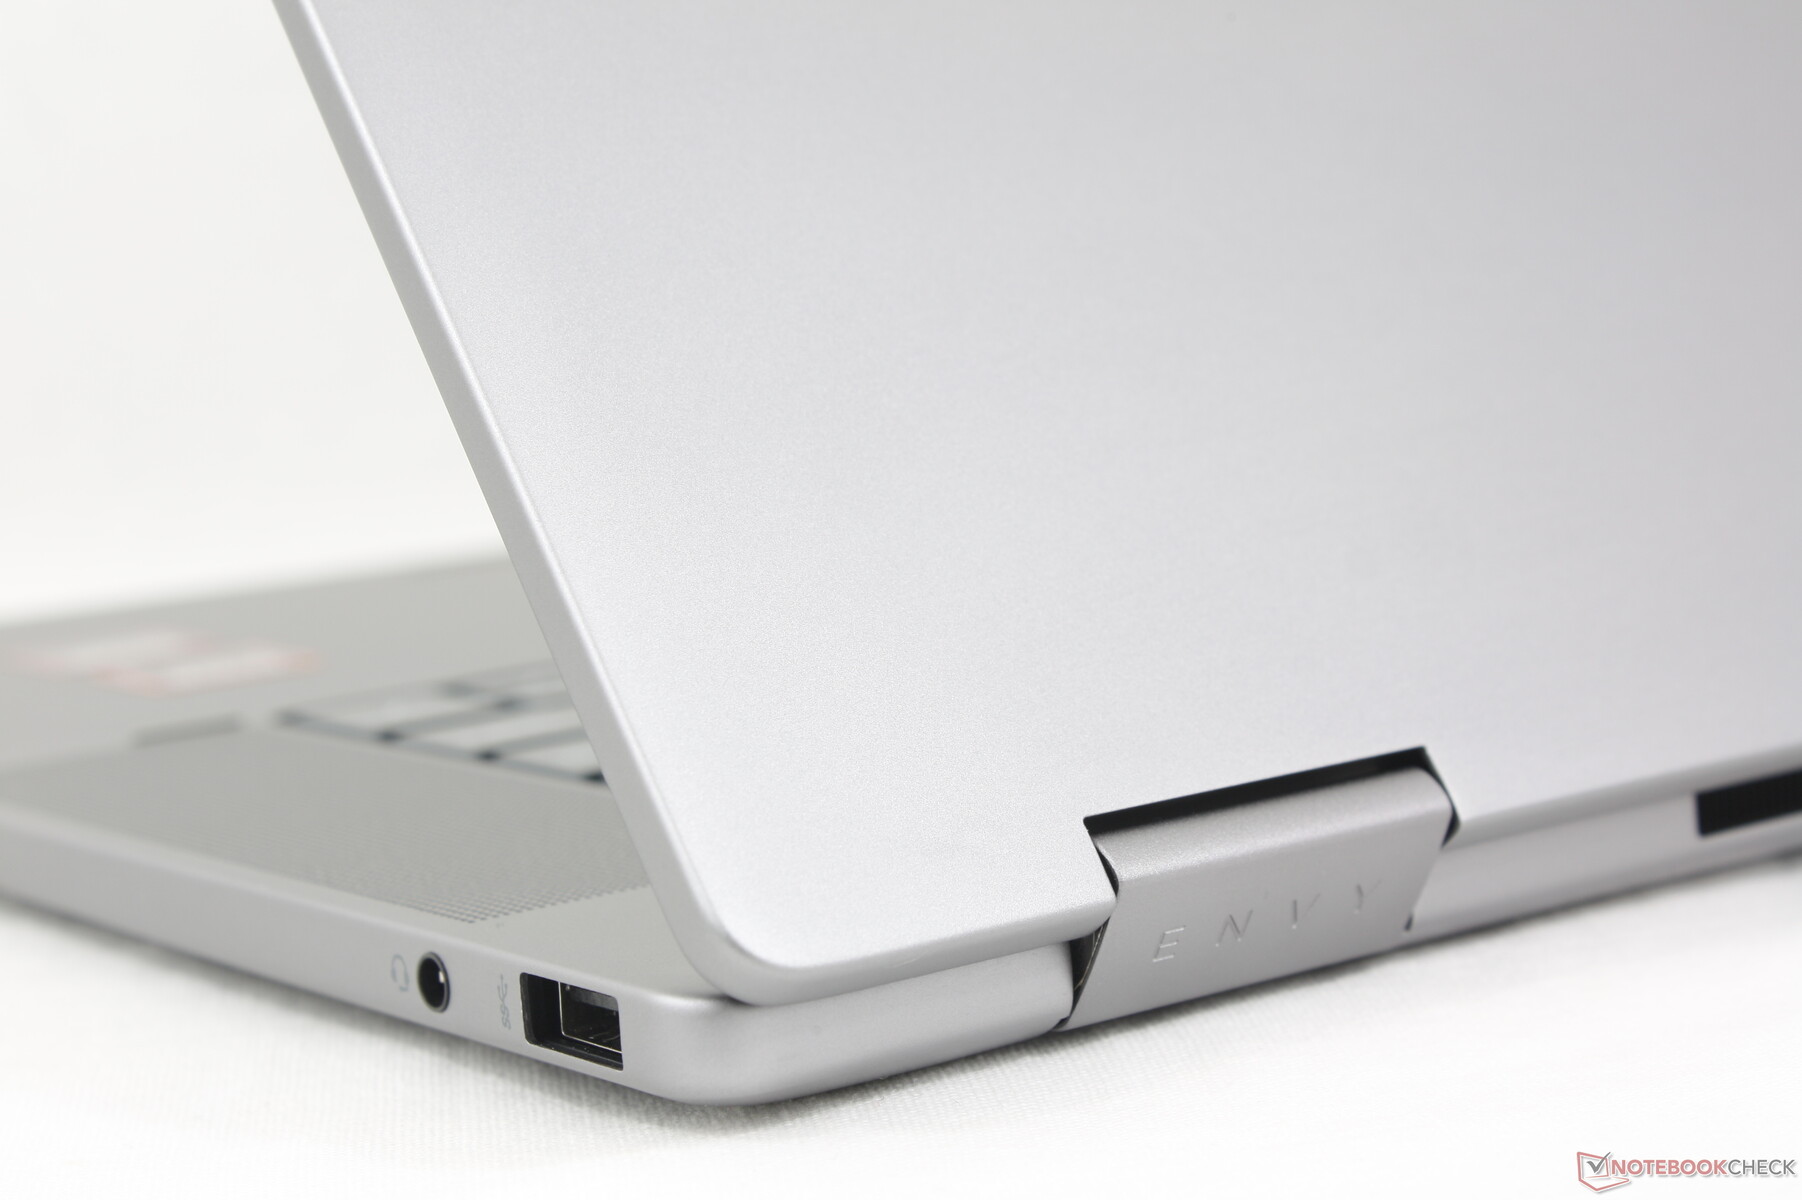
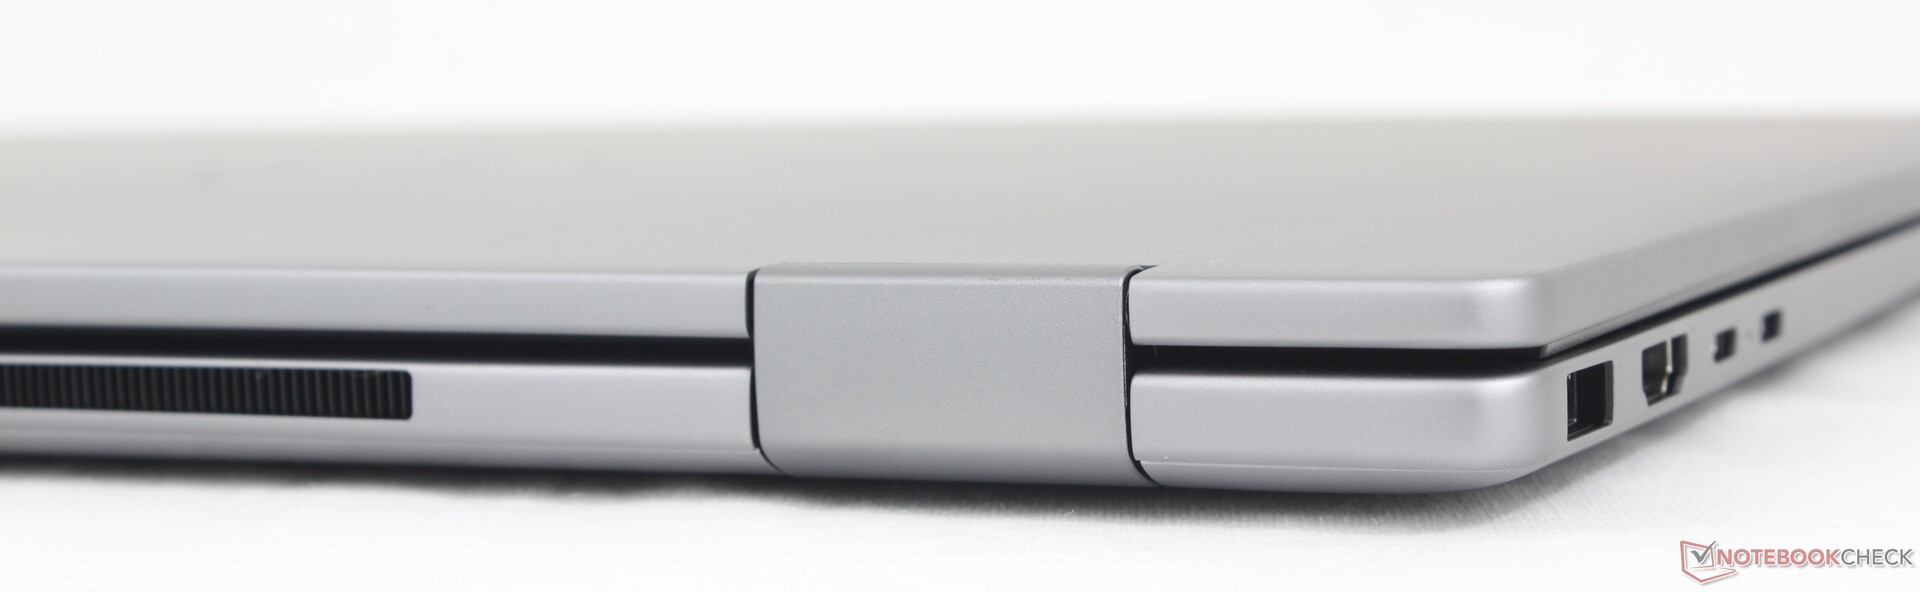
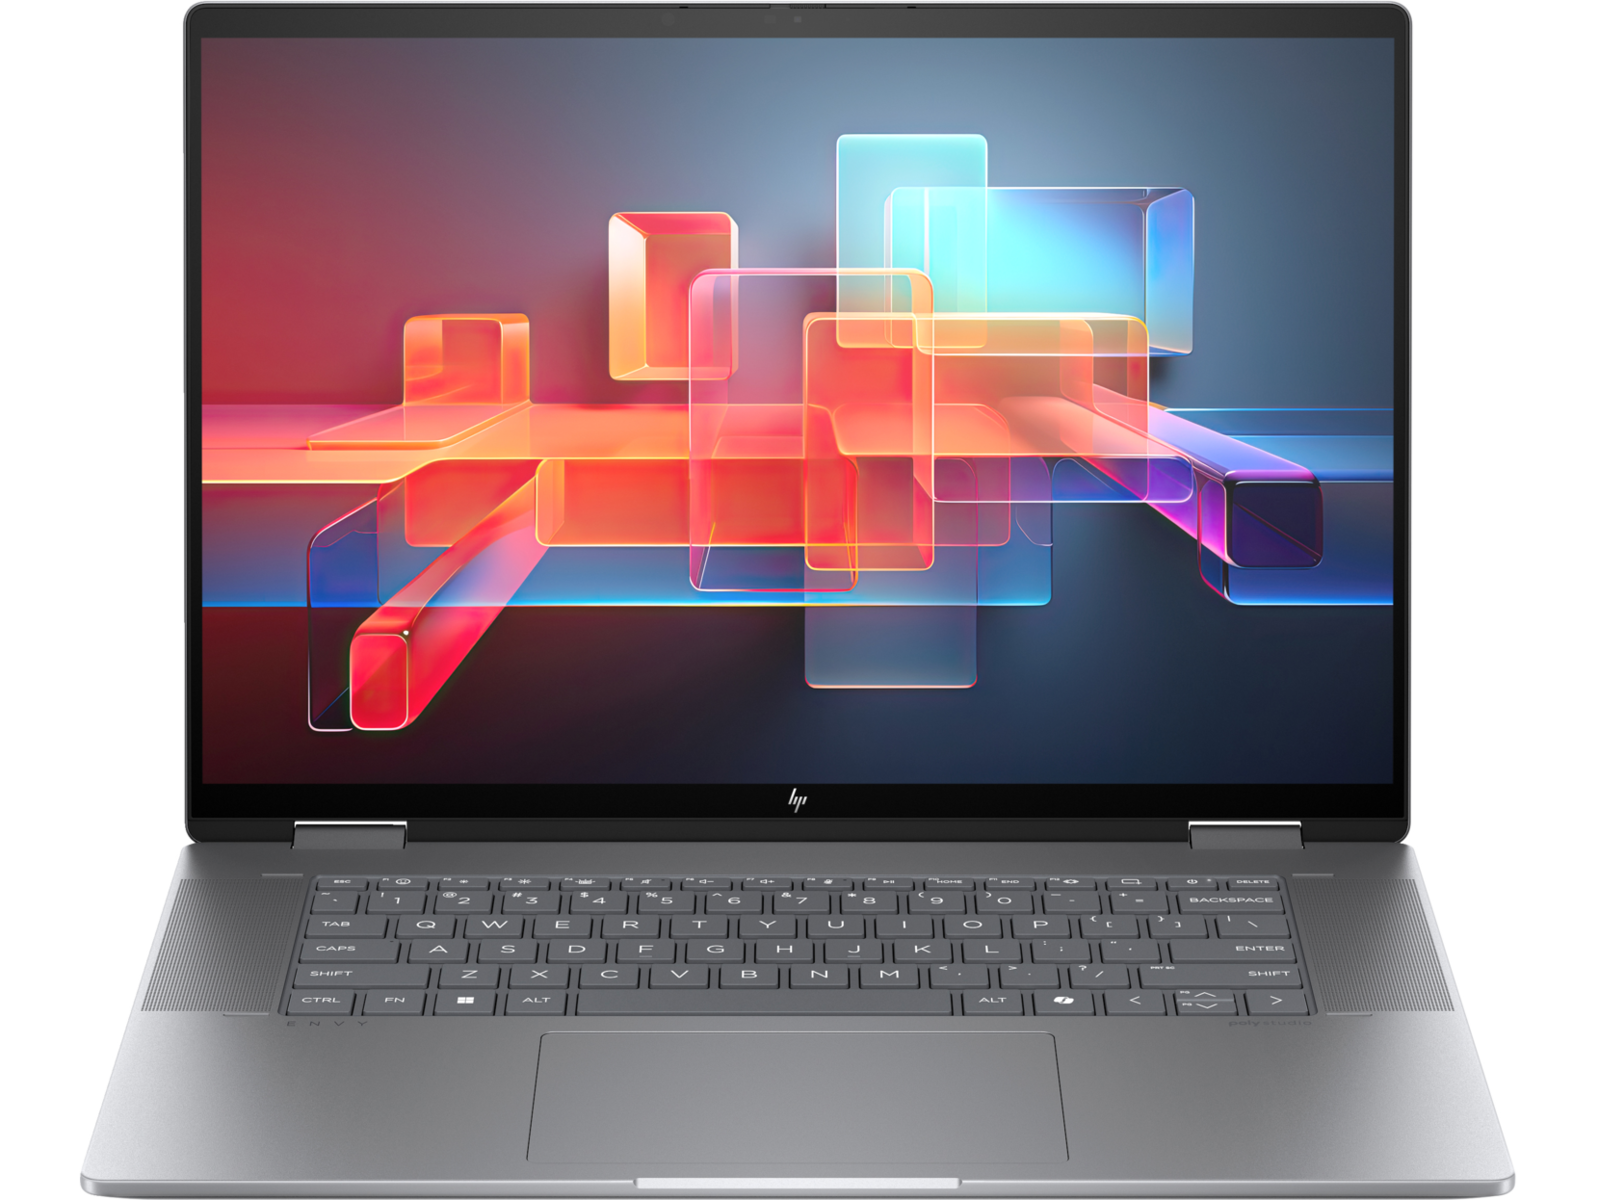
Caja - Plata lisa
El esqueleto consta de materiales de aluminio y teclas de plástico similares a los del Envy x360 15 para un aspecto y tacto similares. Las superficies son rígidas y de alta calidad aunque no parezcan tan lujosas como el diseño del Spectre. El chasis cede ligeramente más que en el Spectre cuando se aplica presión por el centro del teclado o cuando se intenta girar la base, pero no es notablemente ni peor ni mejor que en el Yoga 7 2 en 1 16IML9.
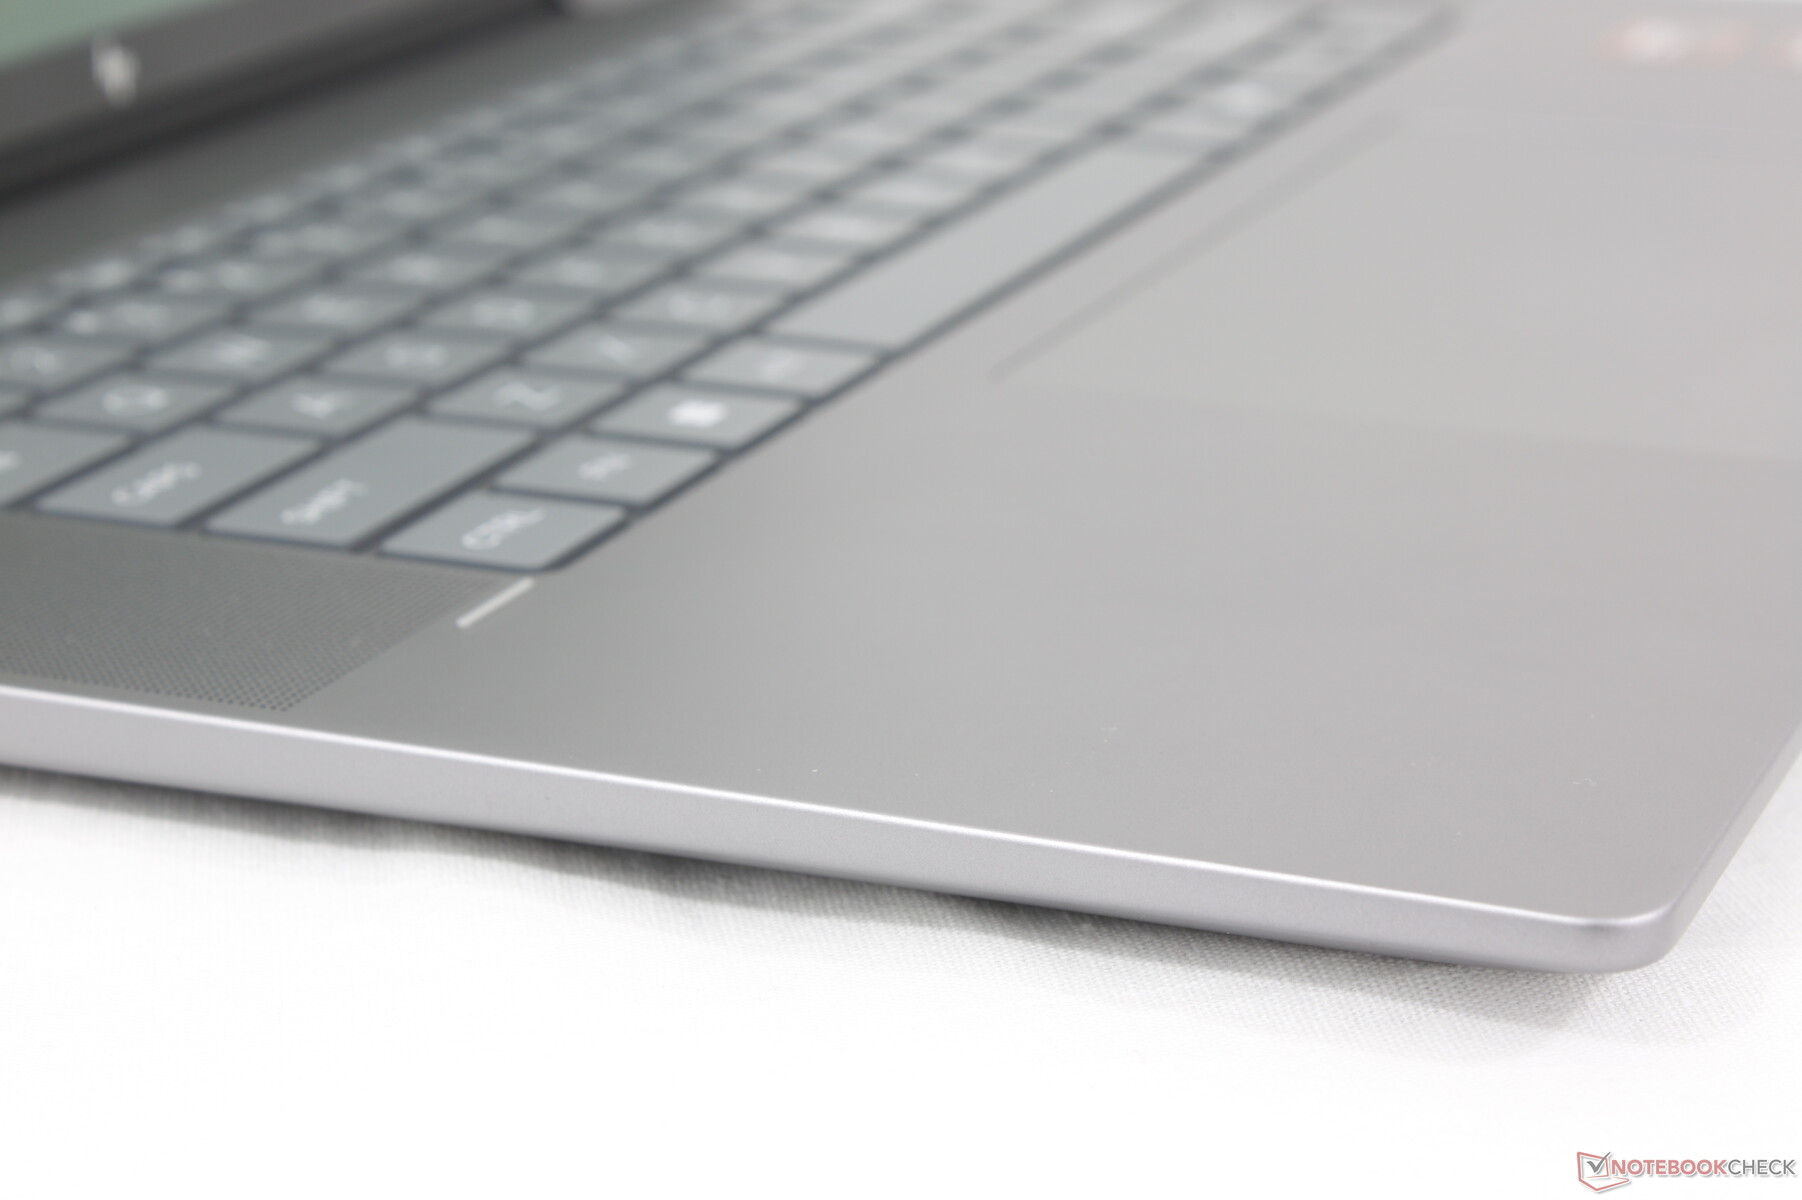
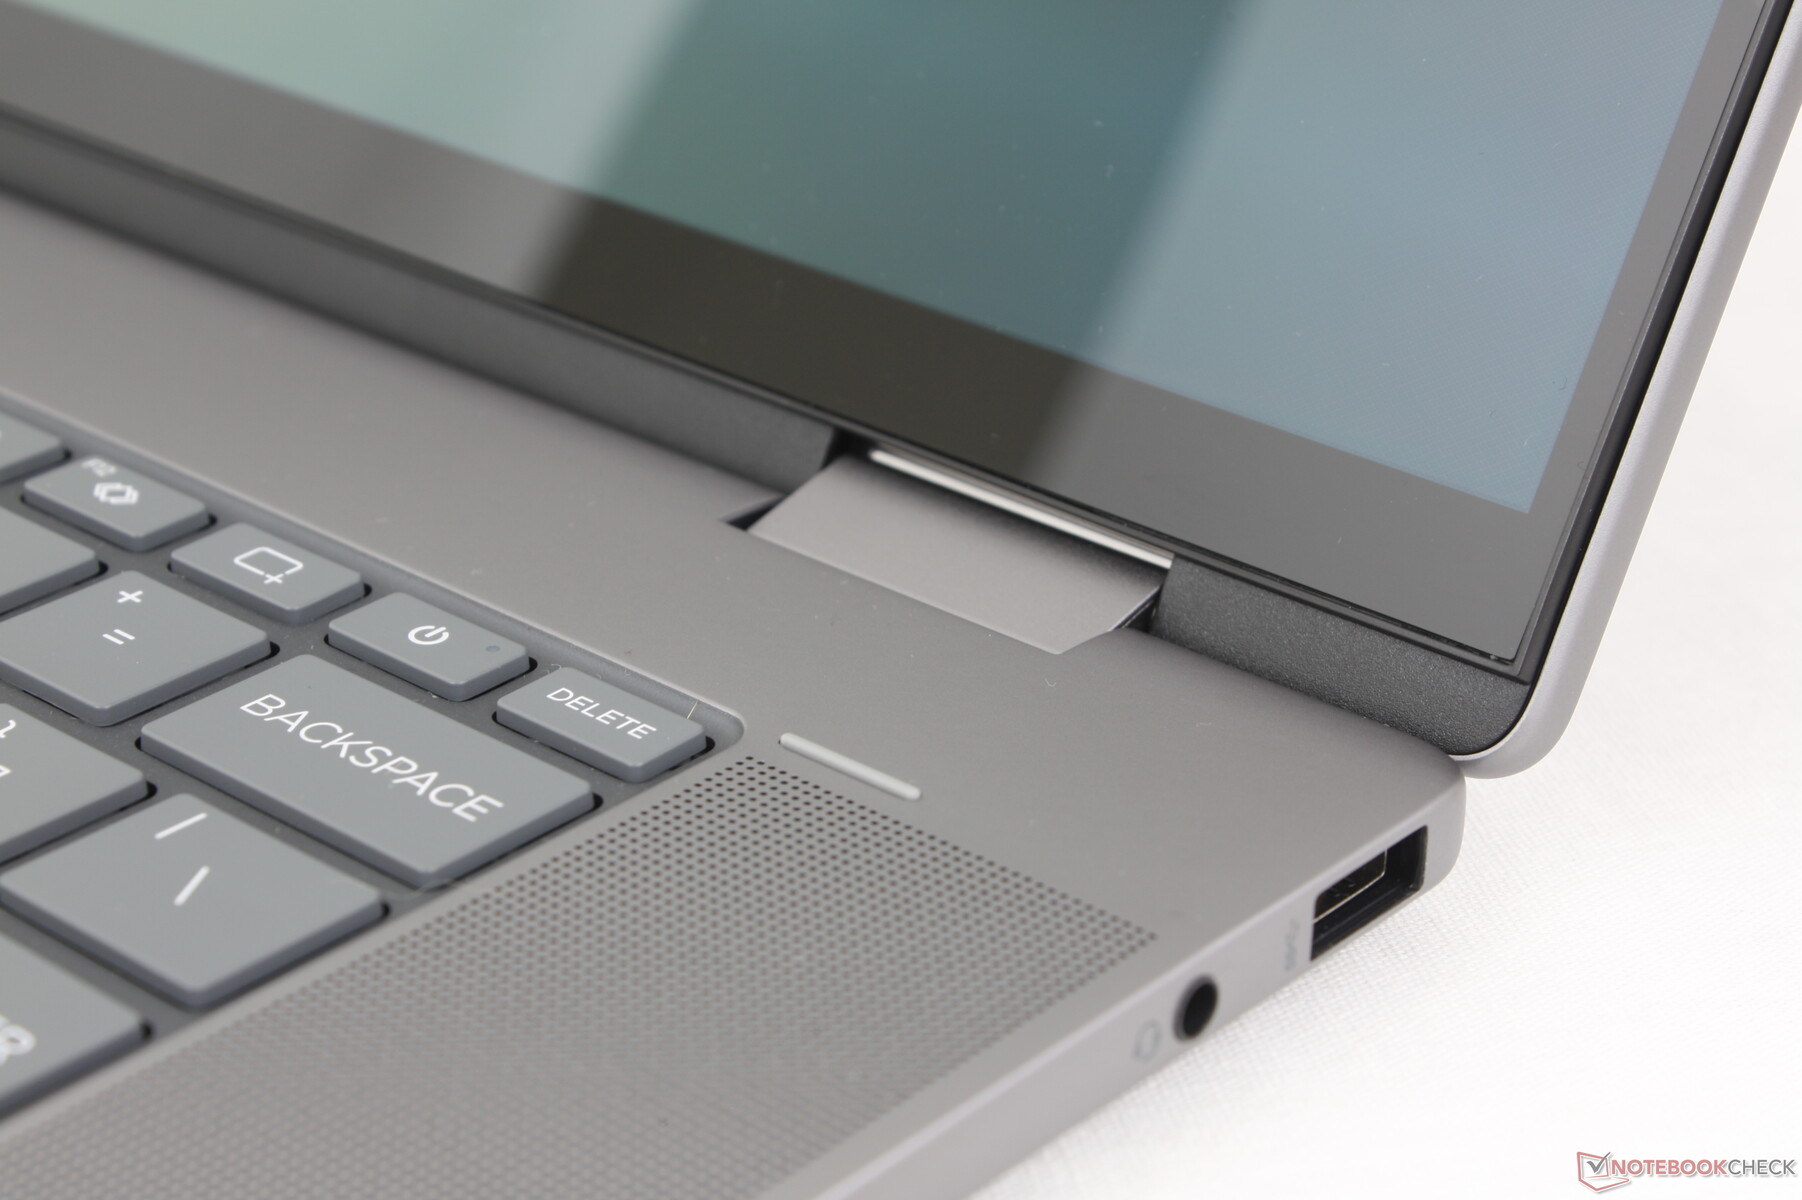
Una diferencia notable entre el Envy x360 16 y sus hermanos menores es la cubierta del teclado, que ahora se sitúa más baja que las rejillas de los altavoces circundantes y los reposamanos, mientras que las cubiertas del teclado del Envy x360 15 o del Spectre x360 16 se sitúan más altas. La nueva estética hace que el diseño del Envy x360 16 parezca más "MacBook Pro" a primera vista.
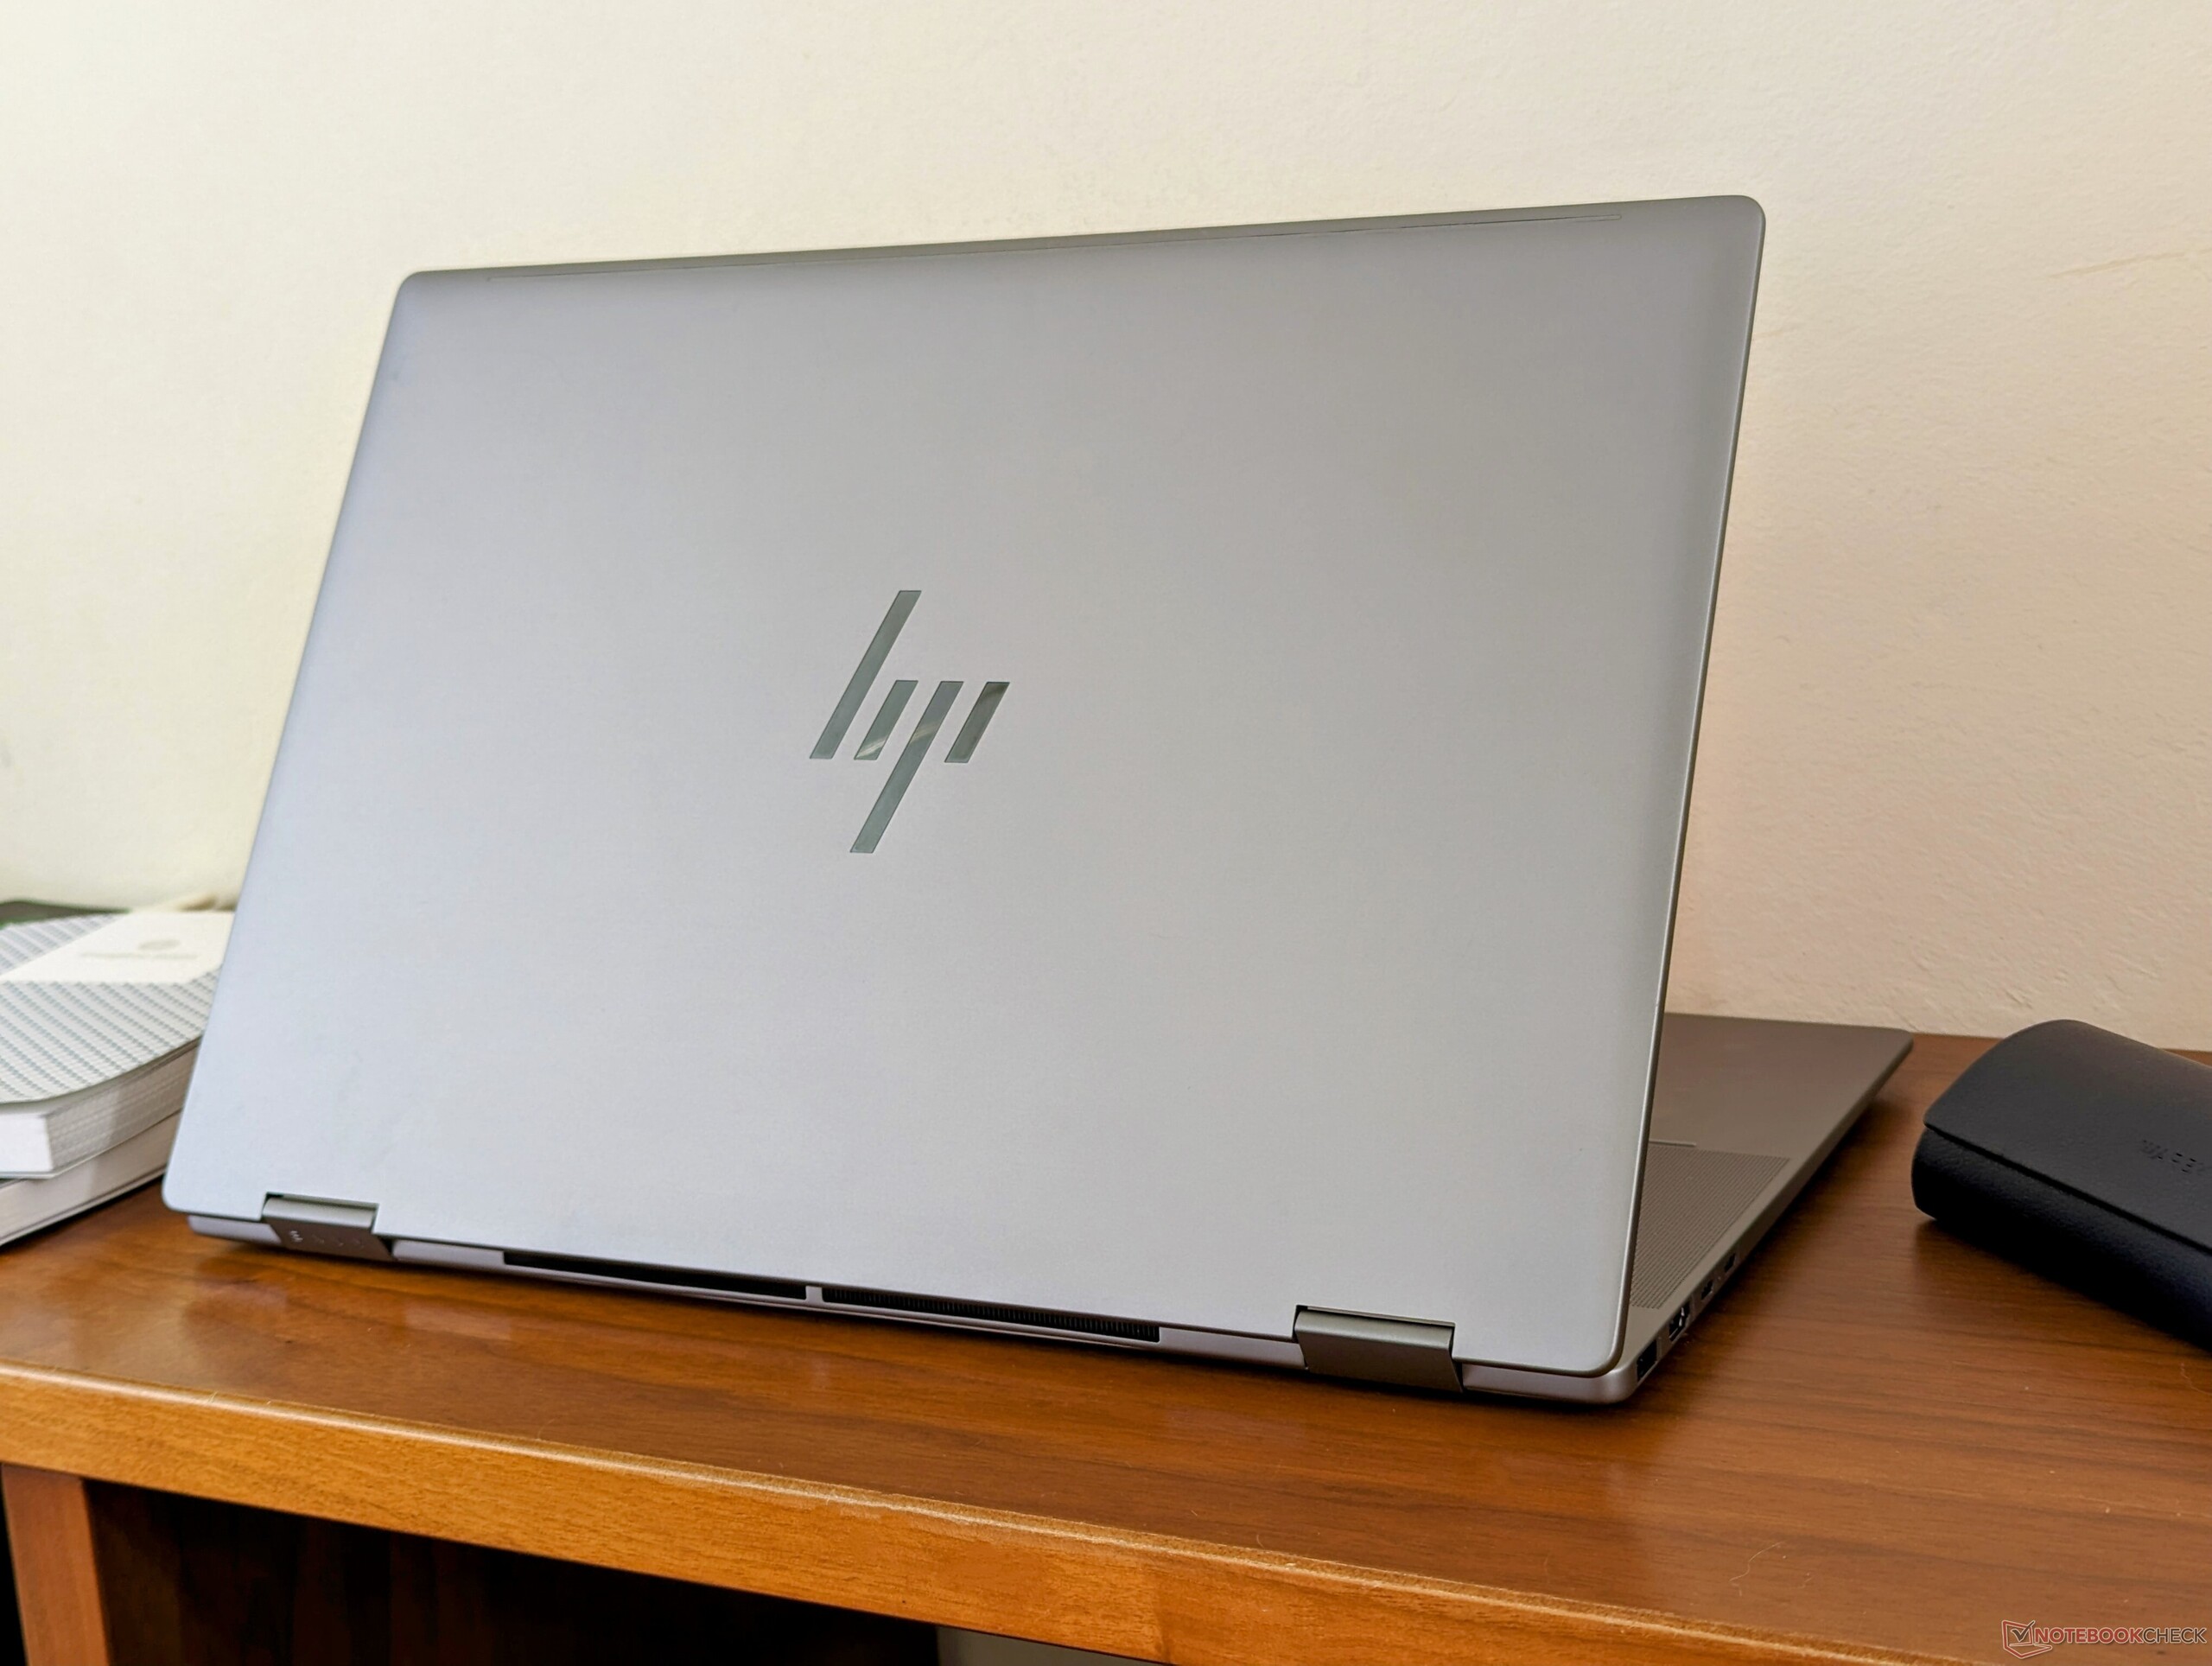
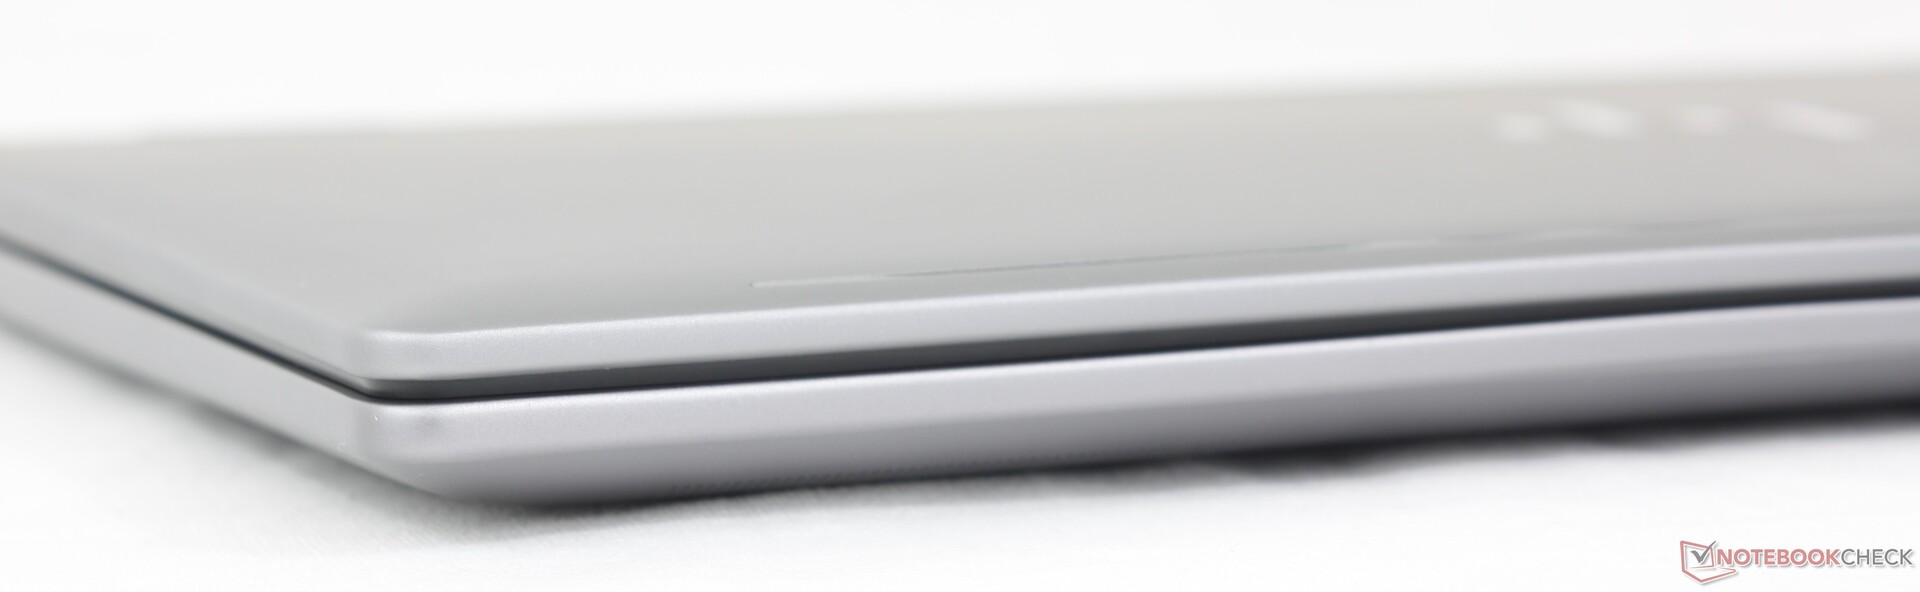
El nuevo modelo es a la vez más grueso y más grande que el Envy x360 15 saliente, mientras que el peso sigue siendo aproximadamente el mismo. Quizás lo más notable es que el Envy x360 16 es casi idéntico en sus tres dimensiones al más caro Specture x360 16, lo que significa que no es menos fácil de transportar a pesar de sus diferencias de precio.
Extrañamente, sólo hay una opción de color para el nuevo convertible Envy independientemente de la configuración. En comparación, los modelos Envy x360 más pequeños tienen un color alternativo Aluminio Negro Anochecer para acompañar al color Plata habitual. Las opciones multicolor habrían ayudado a distinguir visualmente entre las SKU Intel y AMD de la serie Envy x360 16.
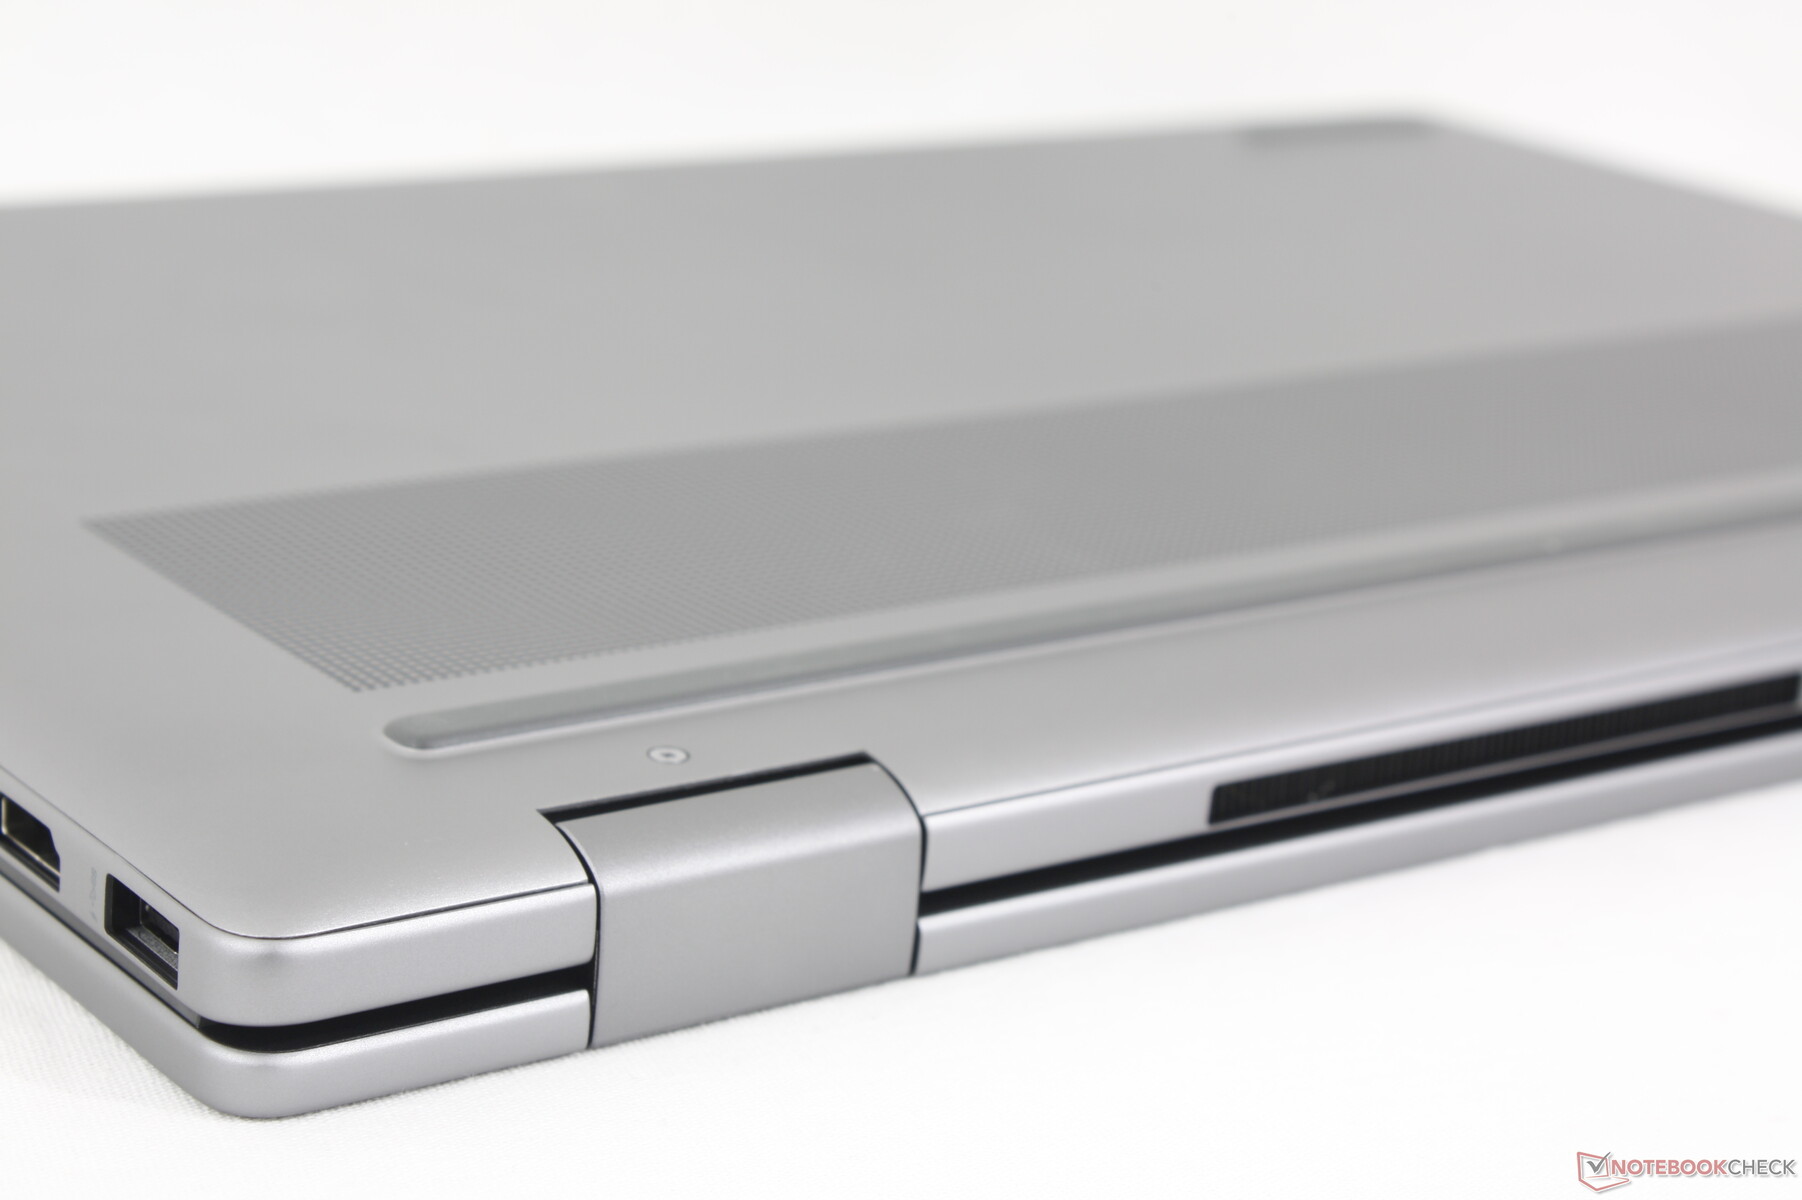
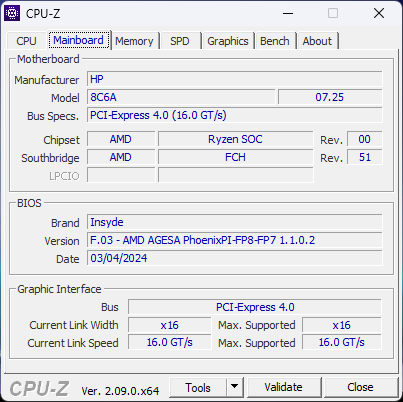
Conectividad - Sin Thunderbolt ni USB4 para AMD
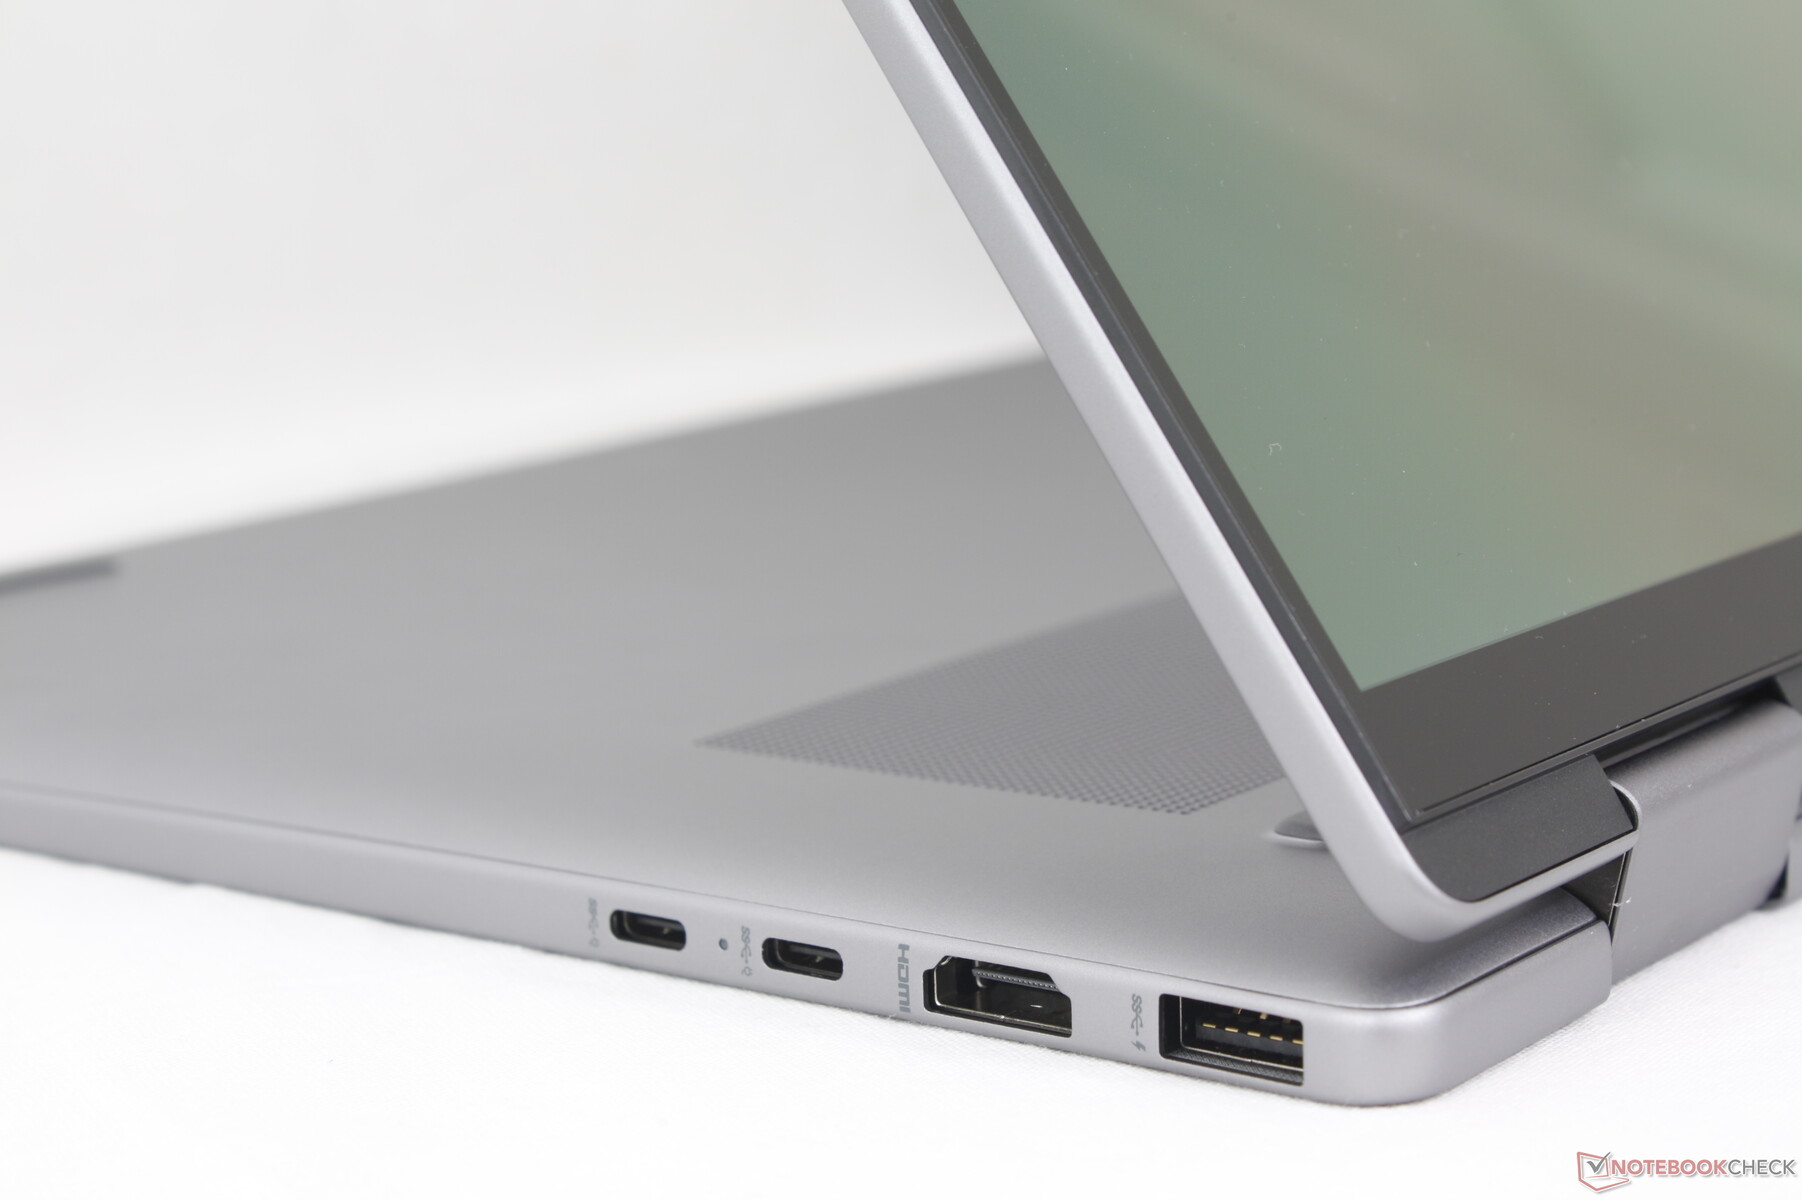
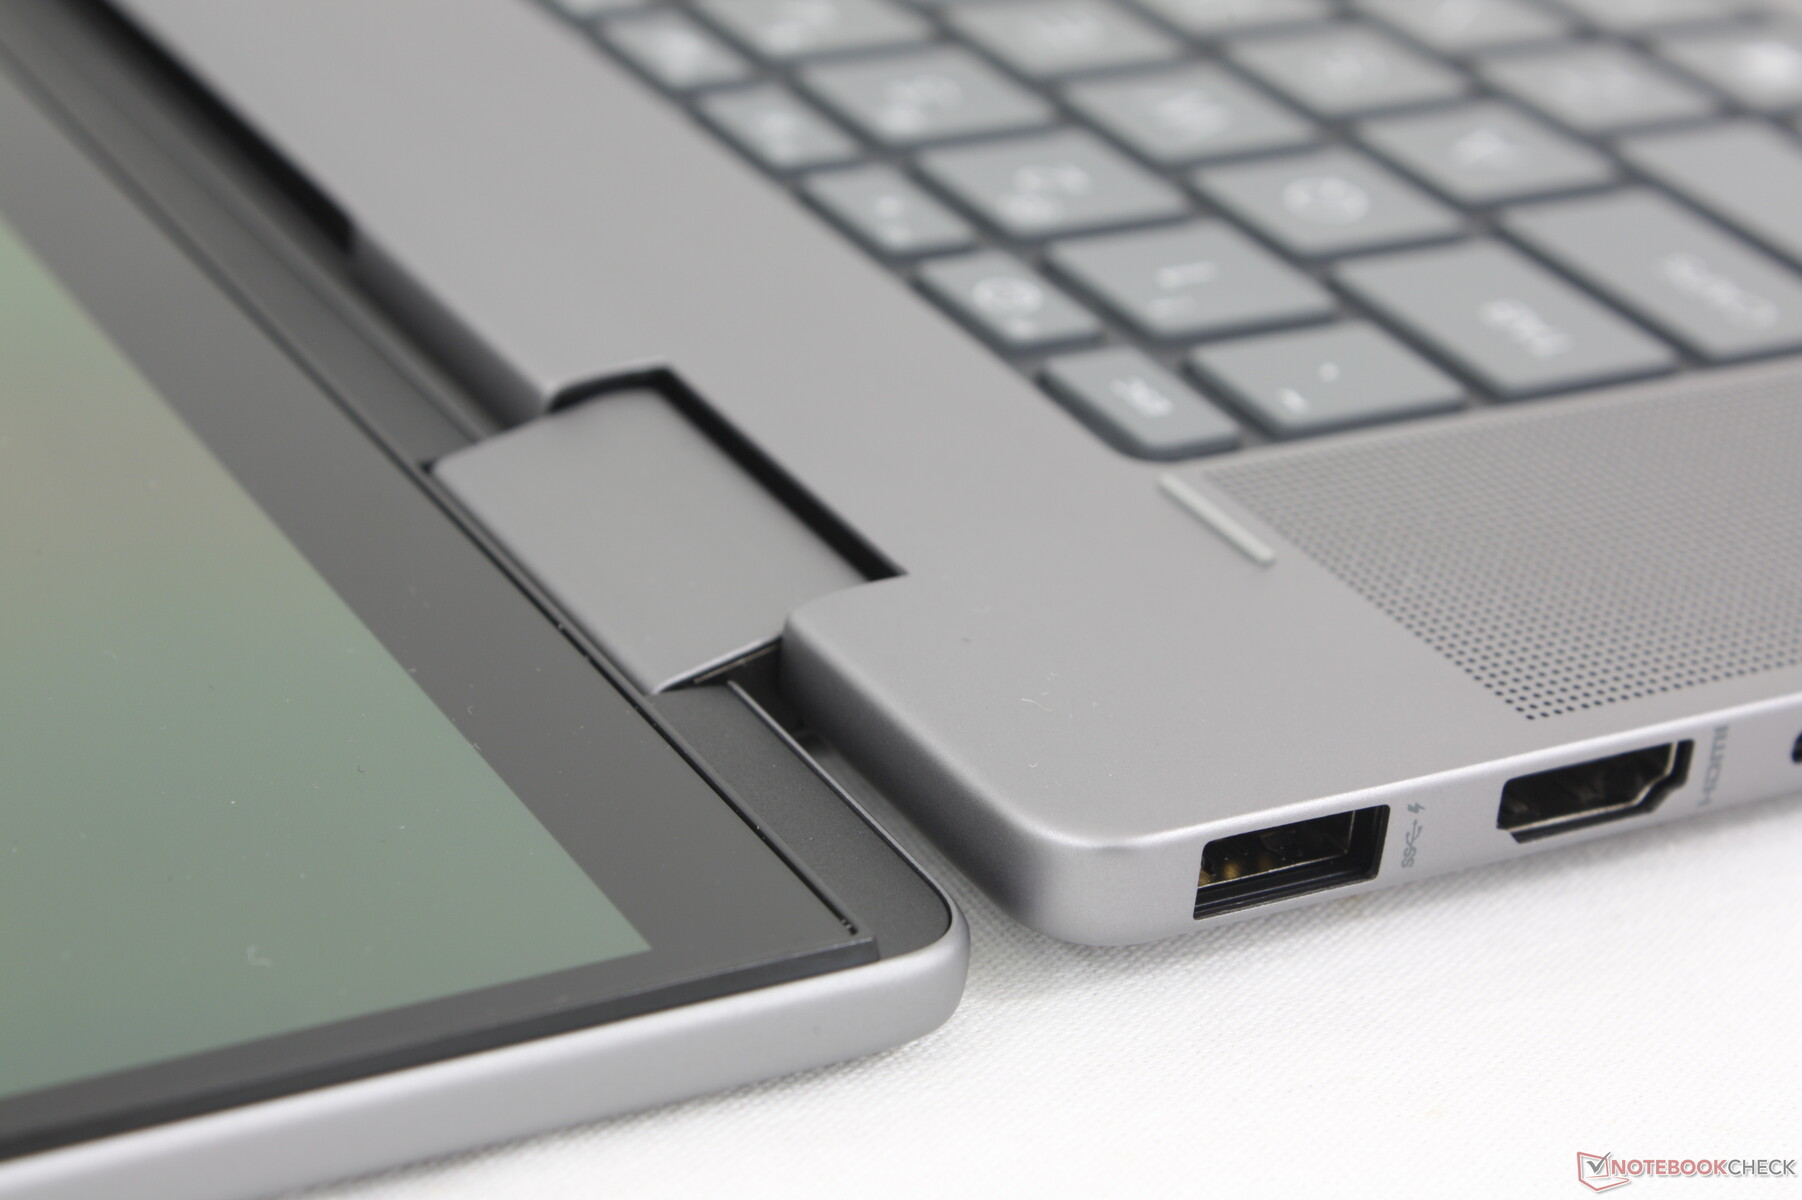
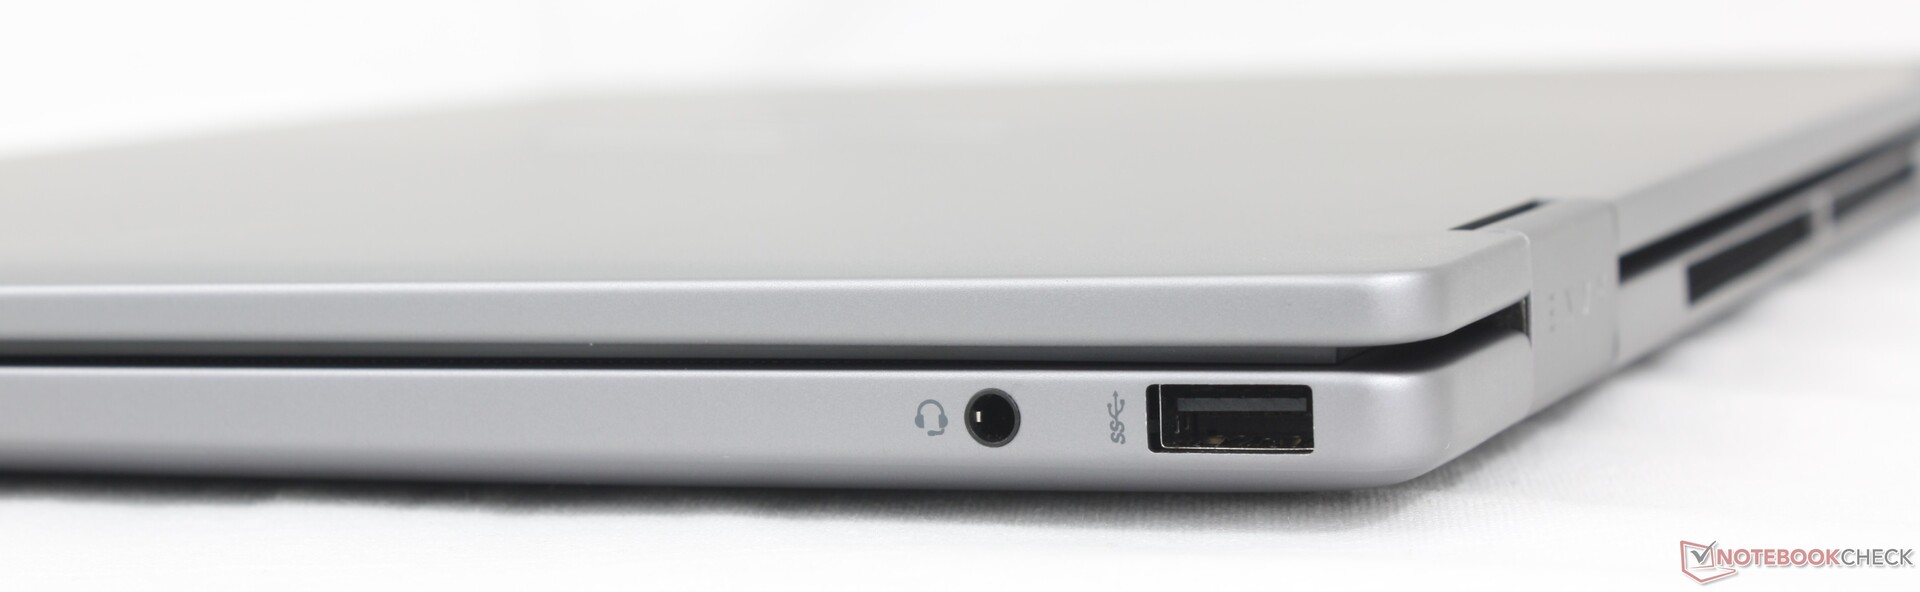
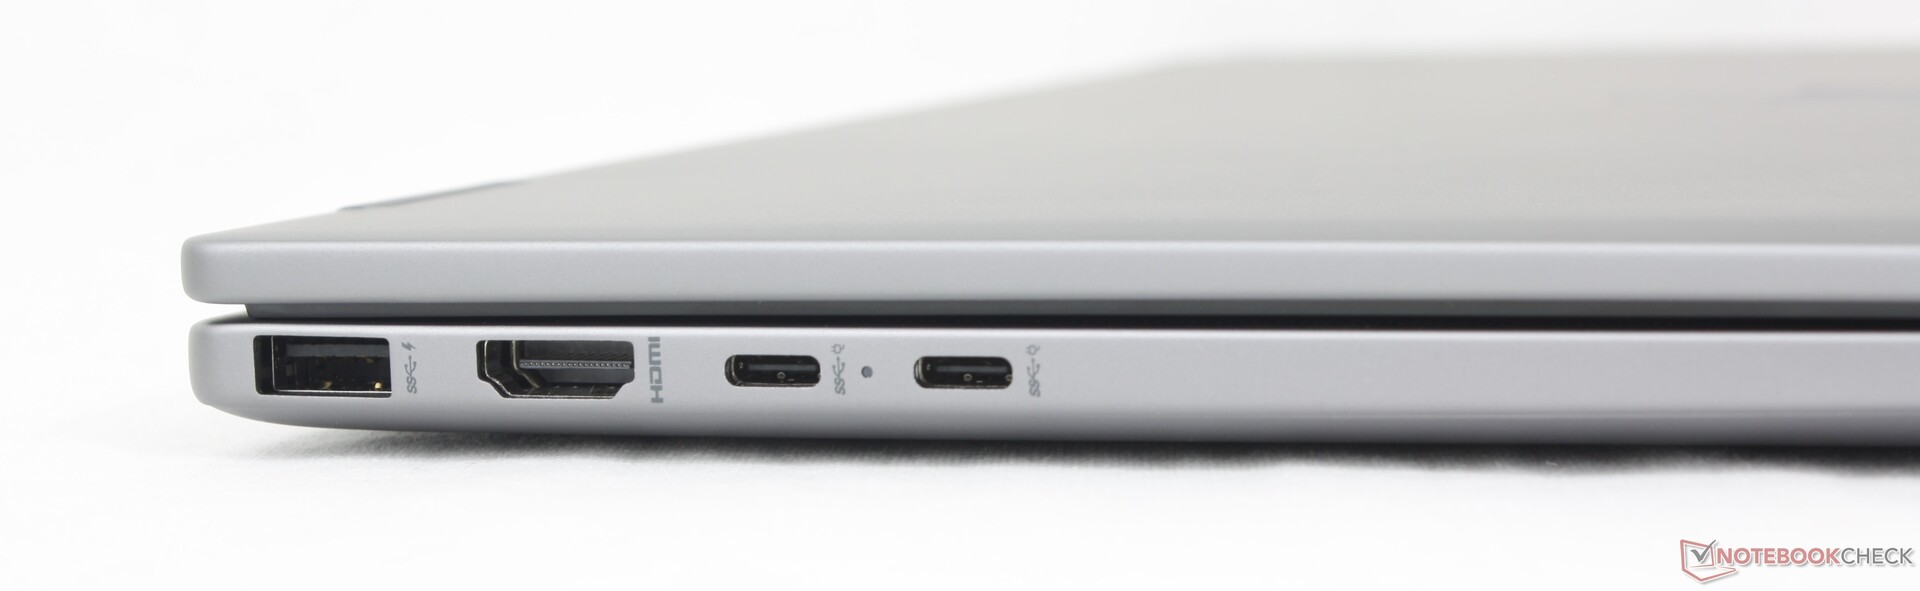
Todos los puertos han vuelto del Envy x360 15 2023 menos el lector de tarjetas SD. Para un portátil multimedia de este tamaño, la falta de un lector de tarjetas integrado es decepcionante para los fotógrafos que dependen de él para transferir medios.
Lamentablemente, los puertos USB4 y Thunderbolt no son compatibles con el nuevo Envy, ya que los dos puertos USB-C son cada uno de 10 Gbps solamente. En su lugar, los usuarios tendrán que considerar la versión Intel del Envy x360 16 o actualizar a la serie Spectre x360 16 para obtener compatibilidad con Thunderbolt.
Comunicación
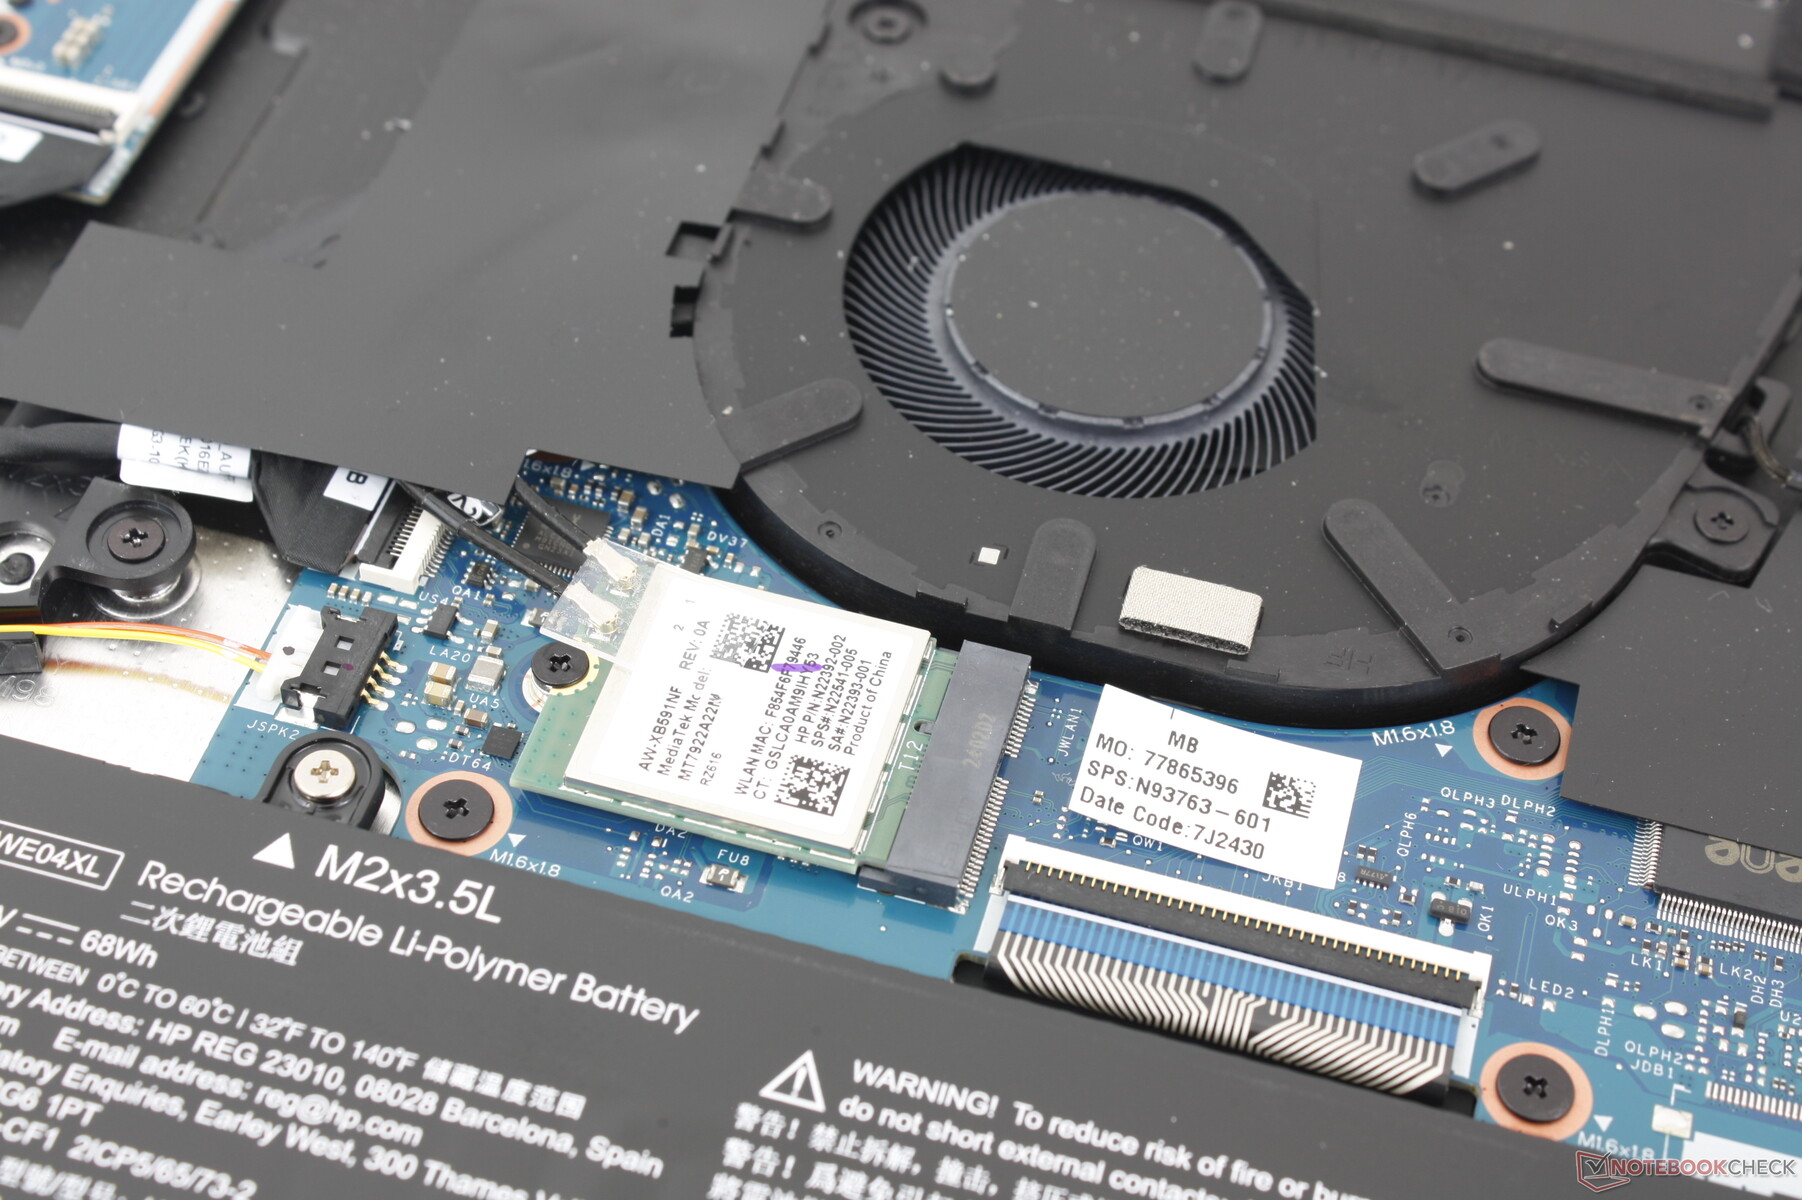
El MediaTek MT7922 viene de serie con conectividad Wi-Fi 6E y Bluetooth 5.3. Experimentamos excelentes velocidades de transferencia y ningún problema de conectividad durante nuestras pruebas Wi-Fi 6 y Wi-Fi 6E.
Cámara web
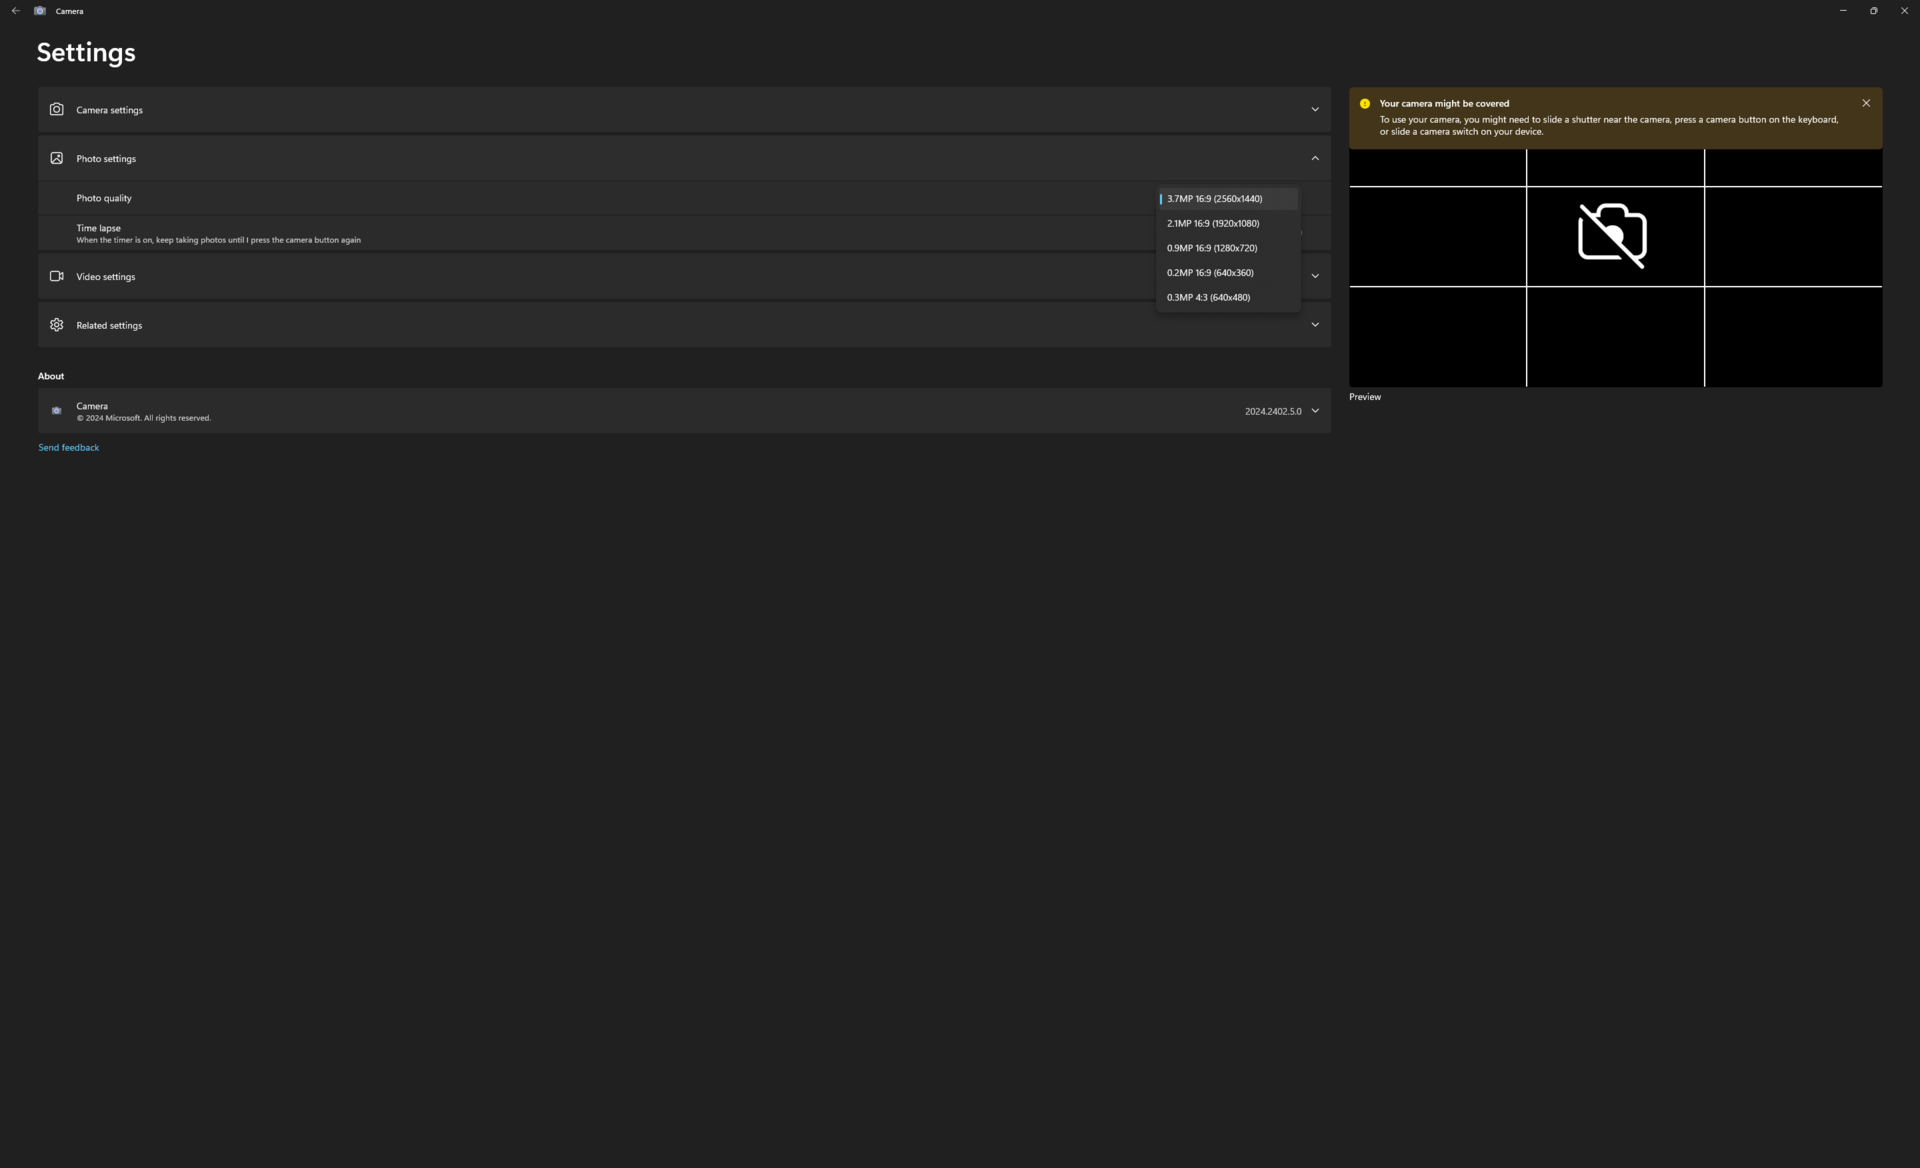
Aunque HP anuncia una cámara web de 5 MP, la aplicación de cámara de Windows sólo permite hasta 3,7 MP, como muestra la captura de pantalla de la derecha. Nos hemos puesto en contacto con HP para ver si esto funciona según lo previsto o si podría tratarse de un error.
Tanto los infrarrojos como un obturador de privacidad físico vienen de serie.


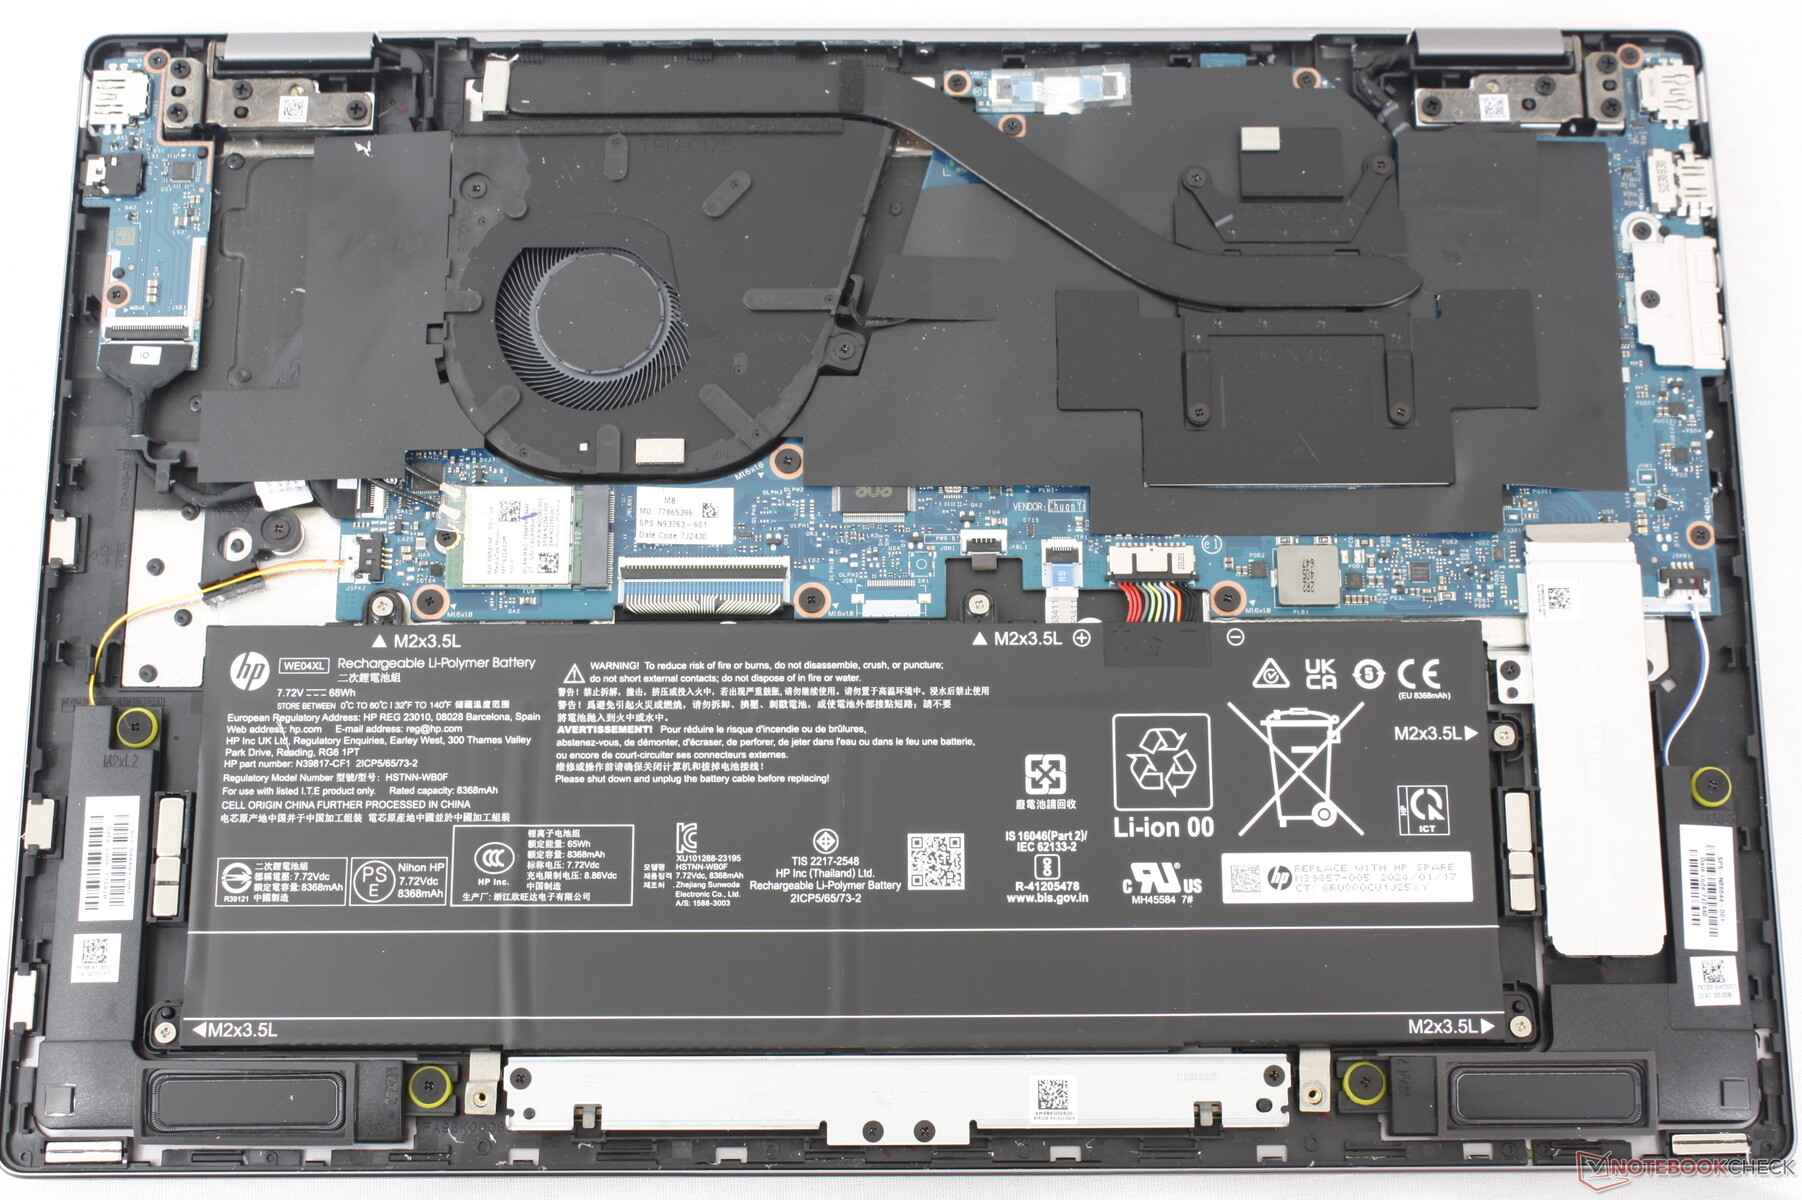
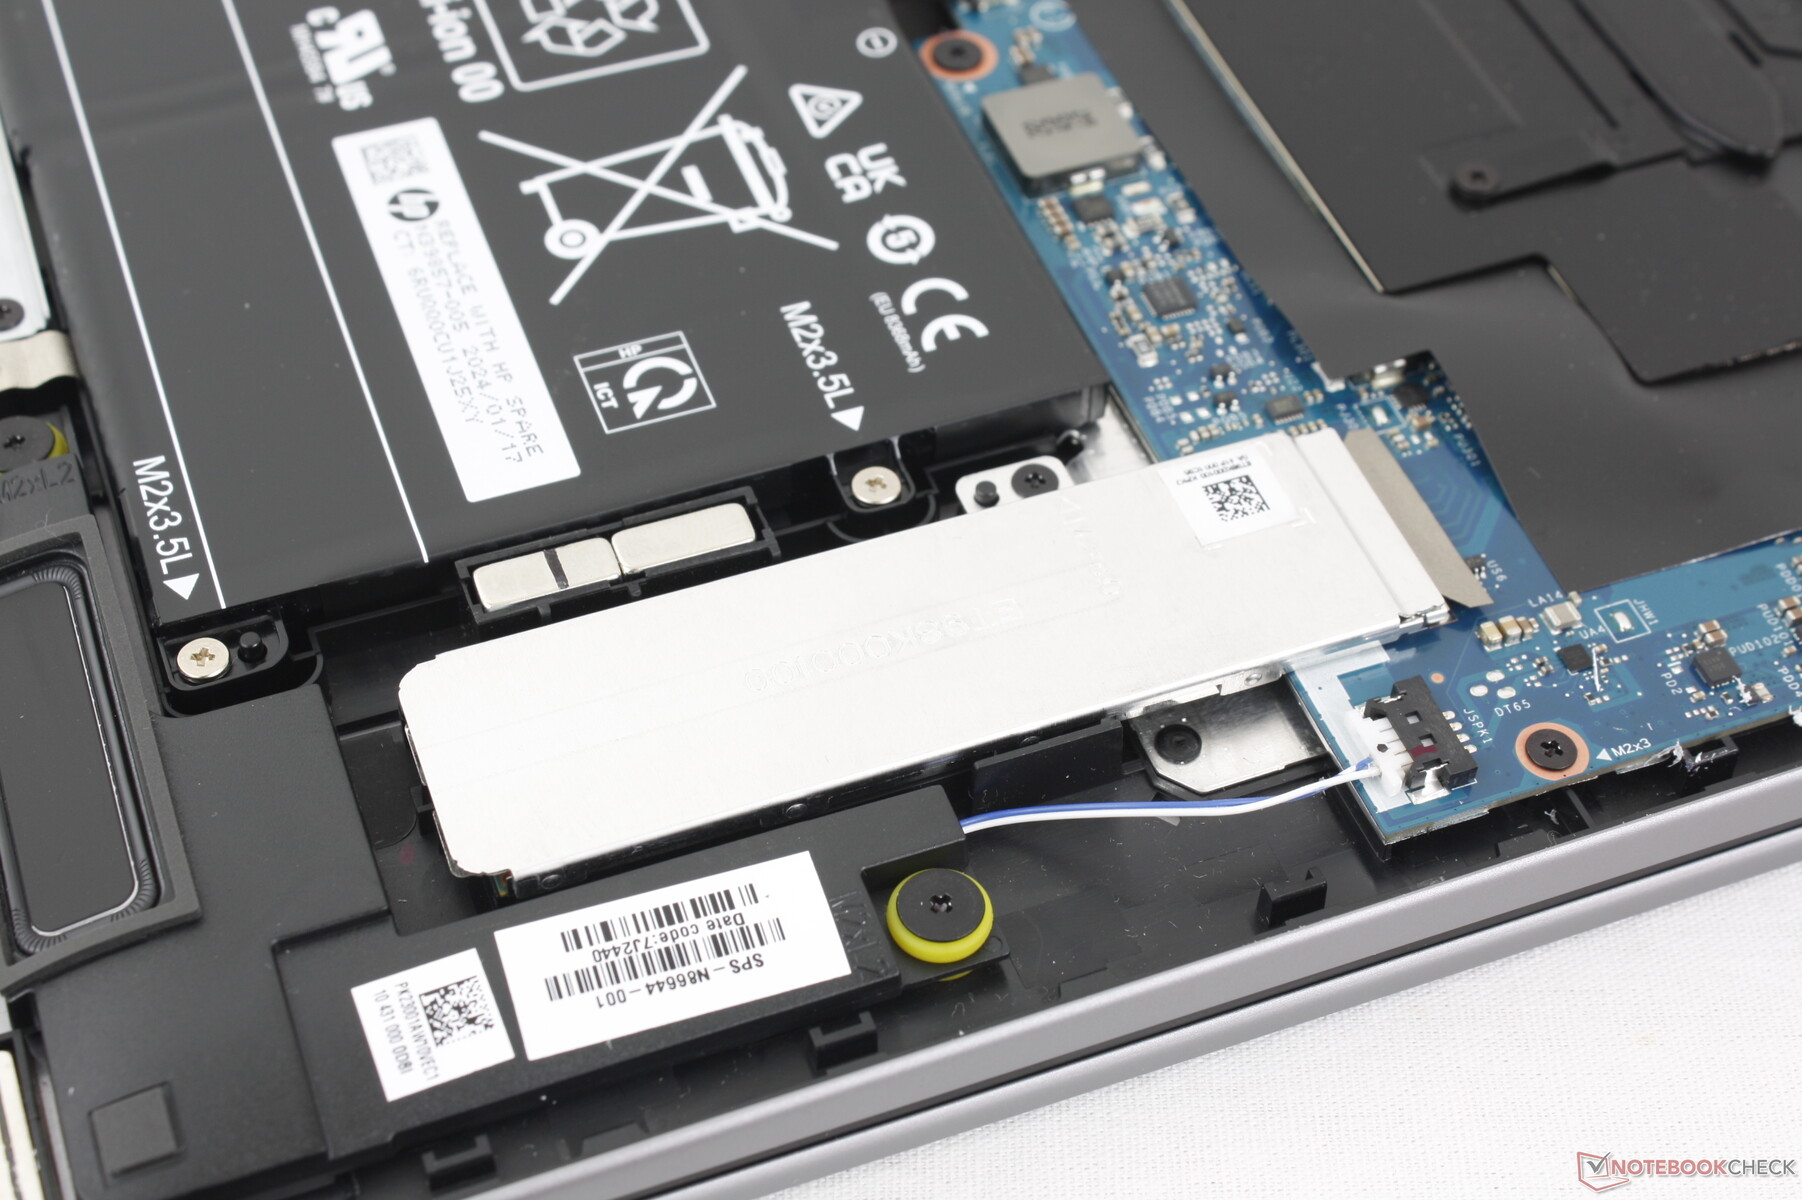
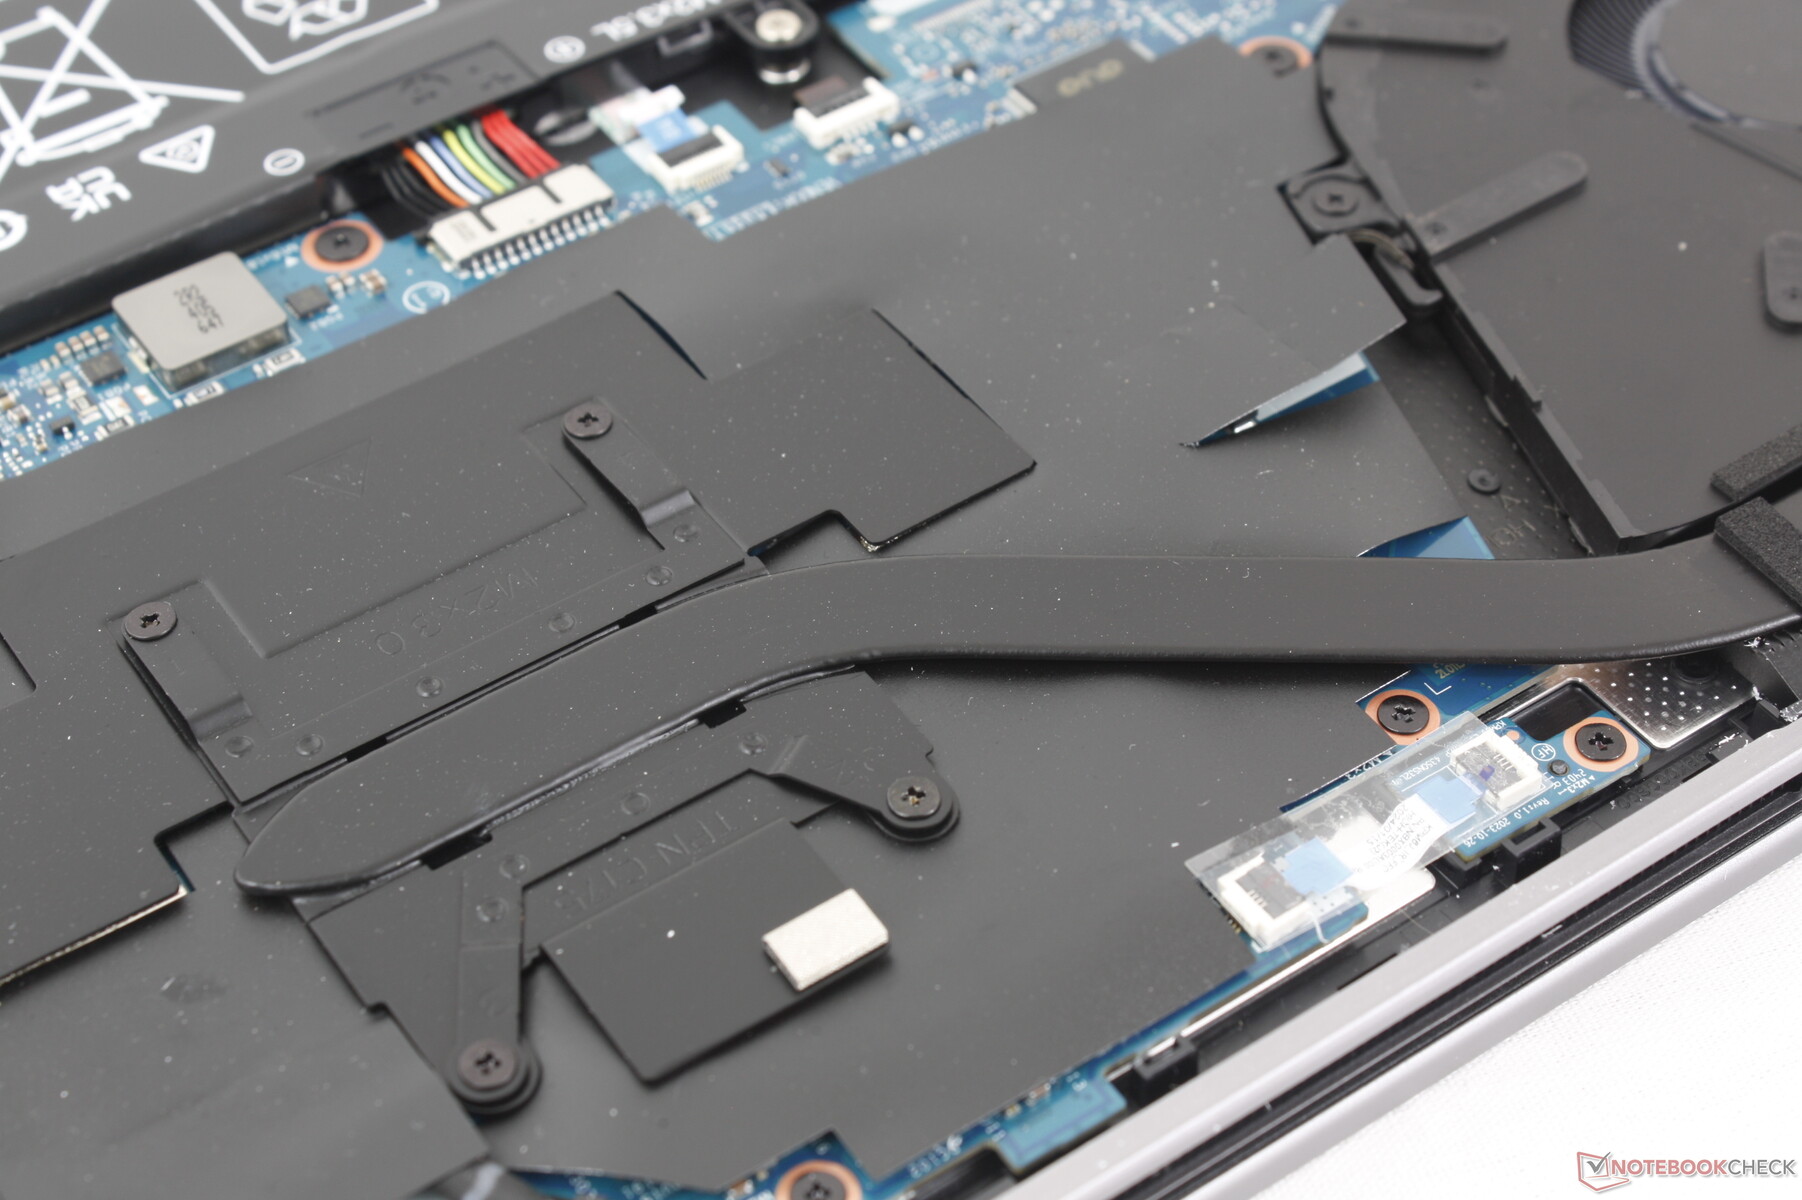
Mantenimiento
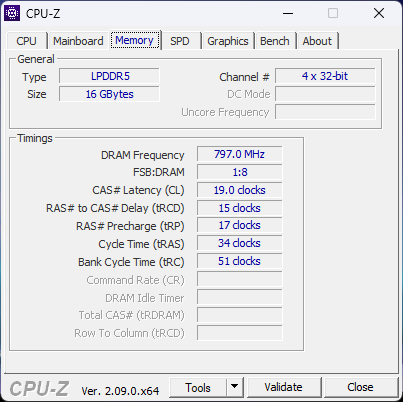
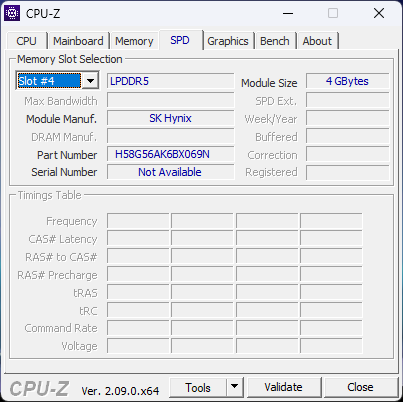
El panel inferior está asegurado por sólo cuatro tornillos Torx. Retirarlo, sin embargo, es otra historia, ya que los bordes son afilados y están extremadamente apretados para dificultar el mantenimiento más de lo necesario. Experimentamos exactamente este mismo problema en el Envy x360 15, lo que sugiere que HP no se ha molestado en mejorar este aspecto para el diseño del Envy x360 16. No hay mucho que mejorar una vez dentro ya que la RAM está soldada, de todos modos.
Accesorios y garantía
Un lápiz óptico activo es opcional. Se aplica la garantía limitada estándar del fabricante de un año si se adquiere en EE.UU.
Dispositivos de entrada - Espaciosos y cómodos
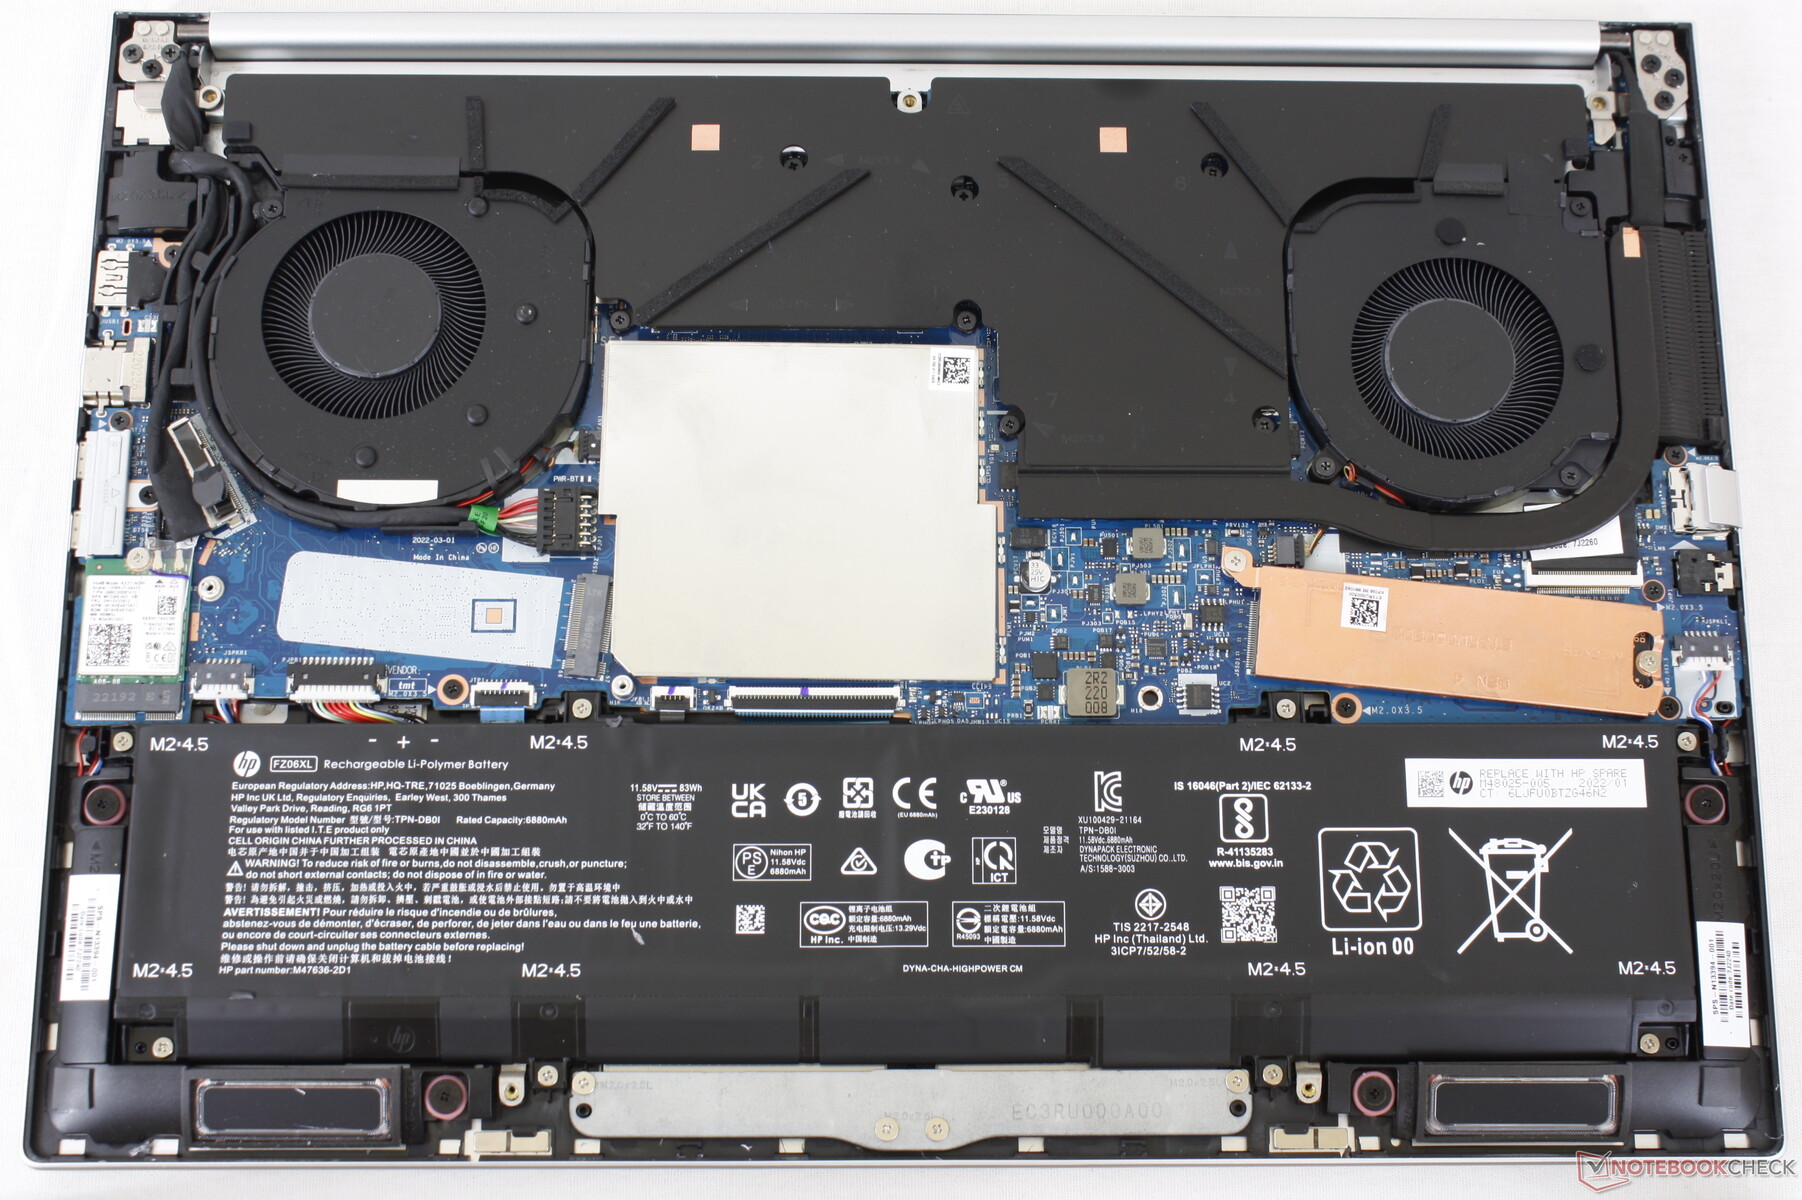
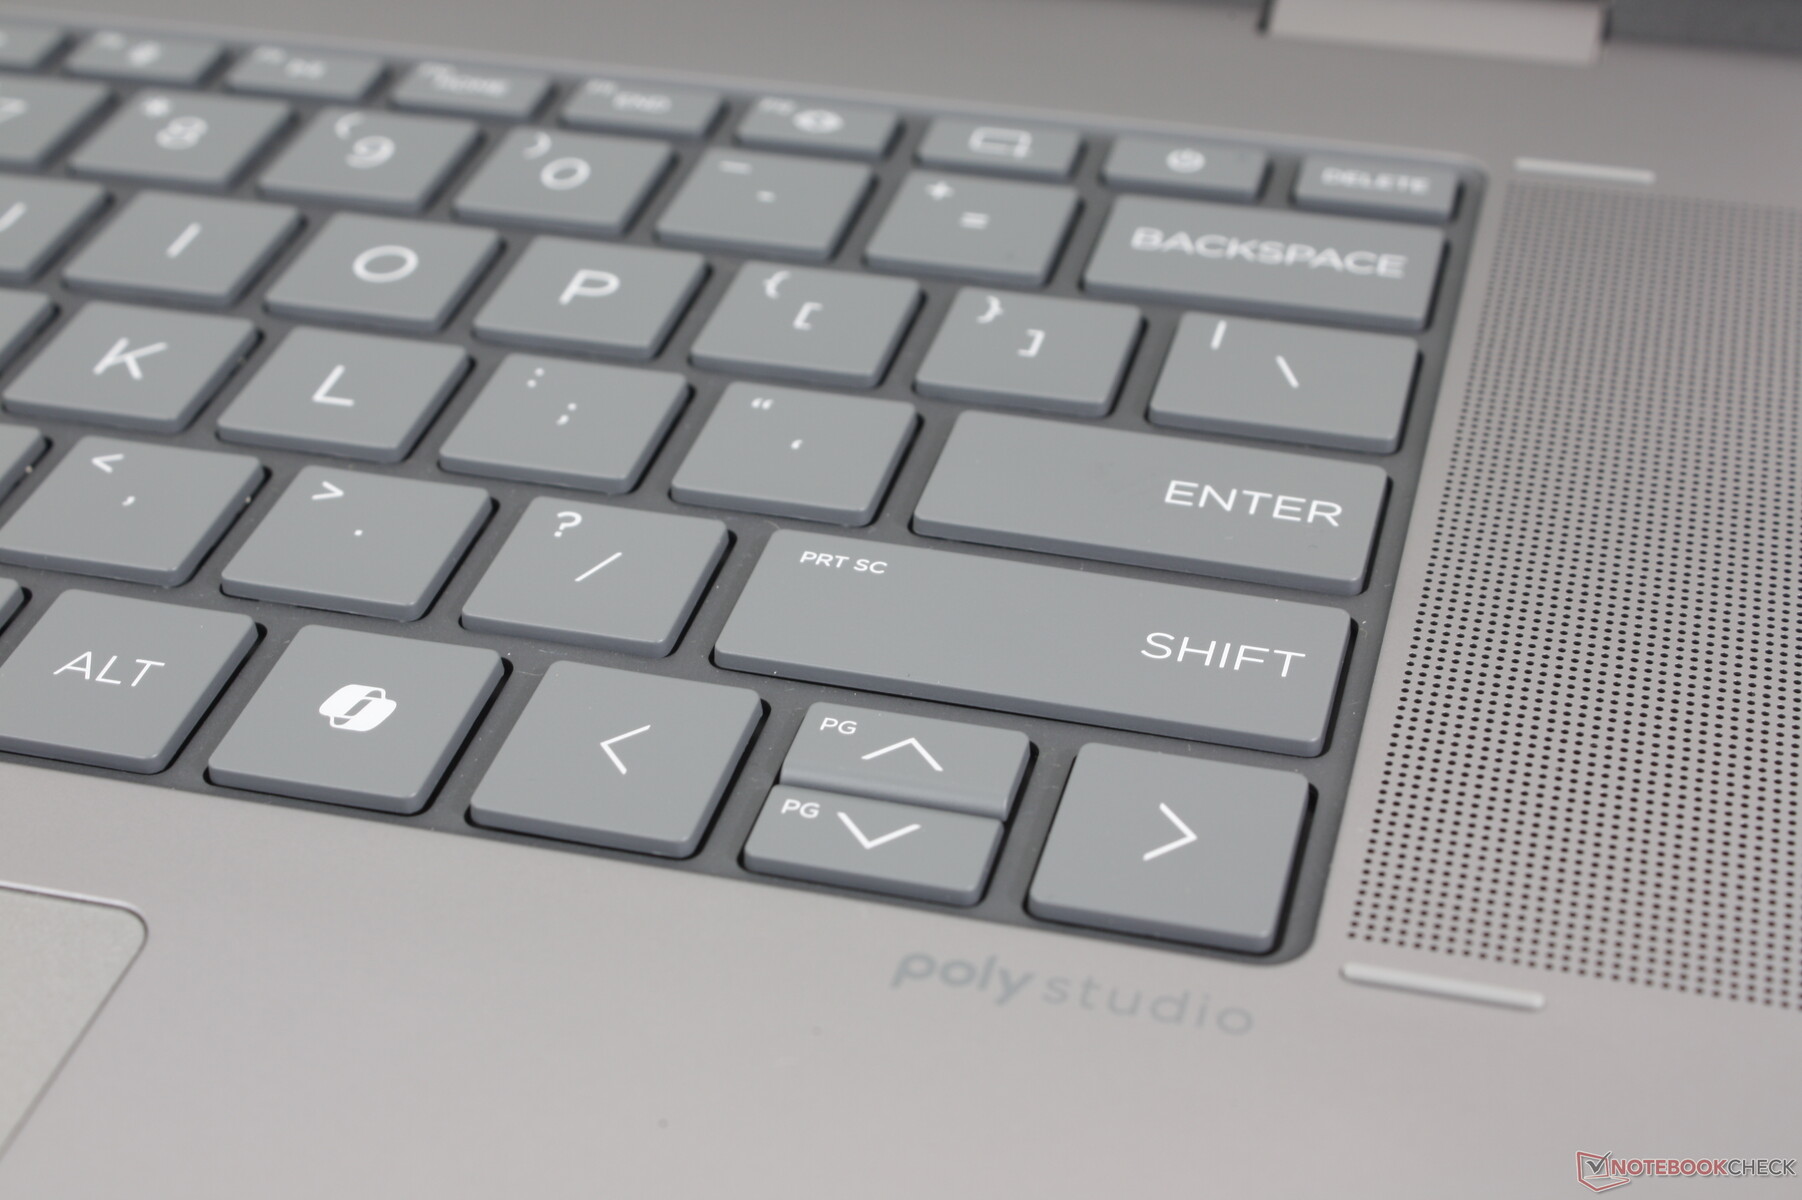
Teclado
La distribución de las teclas ha cambiado con respecto al Envy x360 15. La columna dedicada de teclas a lo largo del borde derecho (PgDn, PgUp, Fin, etc.) se ha eliminado y sus funciones se han fusionado ahora con el resto del teclado. Este cambio hace que la disposición esté visualmente más a la par con el Spectre x360 16, aunque sin el lector de huellas dactilares.
Por lo demás, la experiencia de tecleo es excelente y comparable a la de un Spectre, con una respuesta más nítida que en los competidores VivoBook o IdeaPad de la competencia. Las teclas GIF y personalizables en particular son dignas de mención, ya que la mayoría de portátiles multimedia no incluyen estas características.
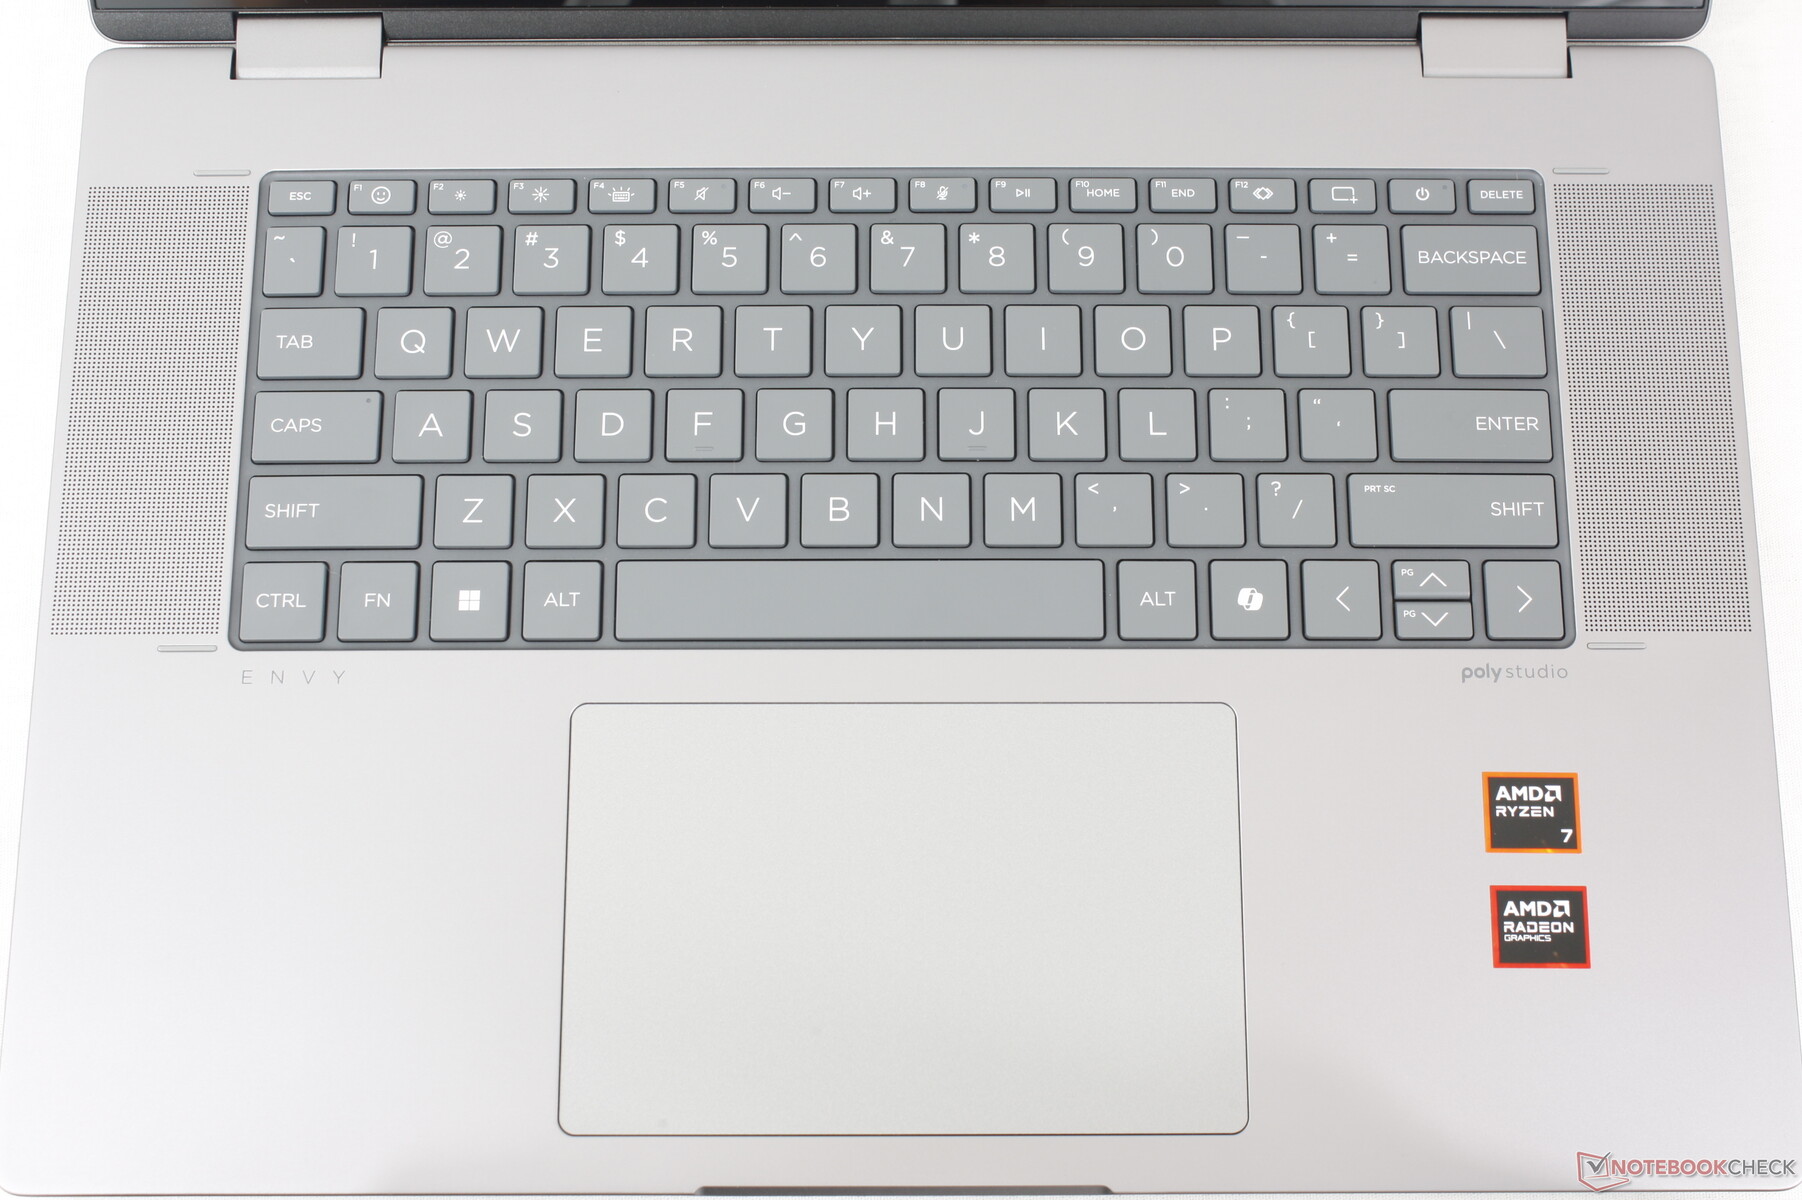
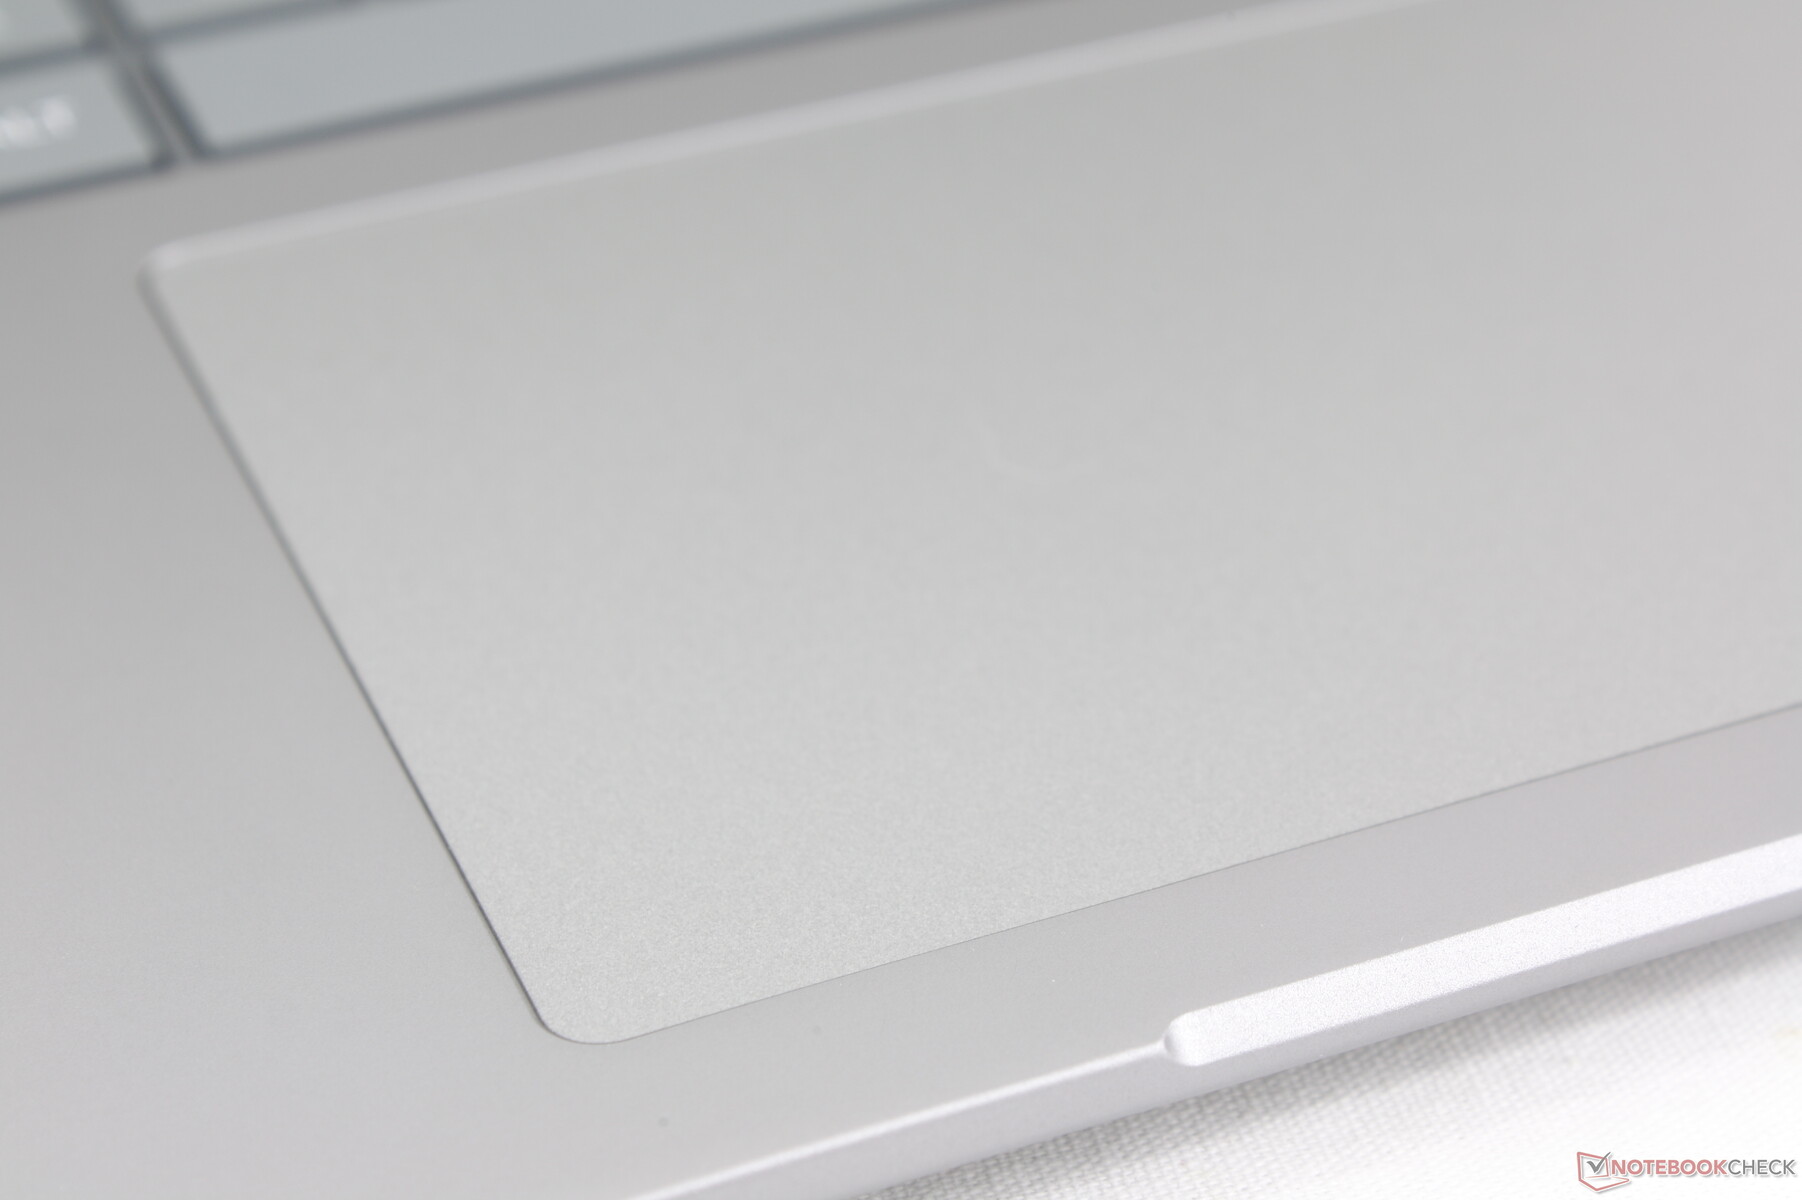
Panel táctil
El clickpad es más pequeño que el del Spectre x360 16 (13,5 x 8,8 cm frente a 16 x 10 cm). Aún así, se sigue sintiendo espacioso y suficientemente grande incluso para un factor de forma de 16 pulgadas. La tracción es suave con sólo un poco de adherencia al deslizarse a velocidades más lentas, mientras que la retroalimentación al hacer clic es un poco suave y podría haber sido más firme.

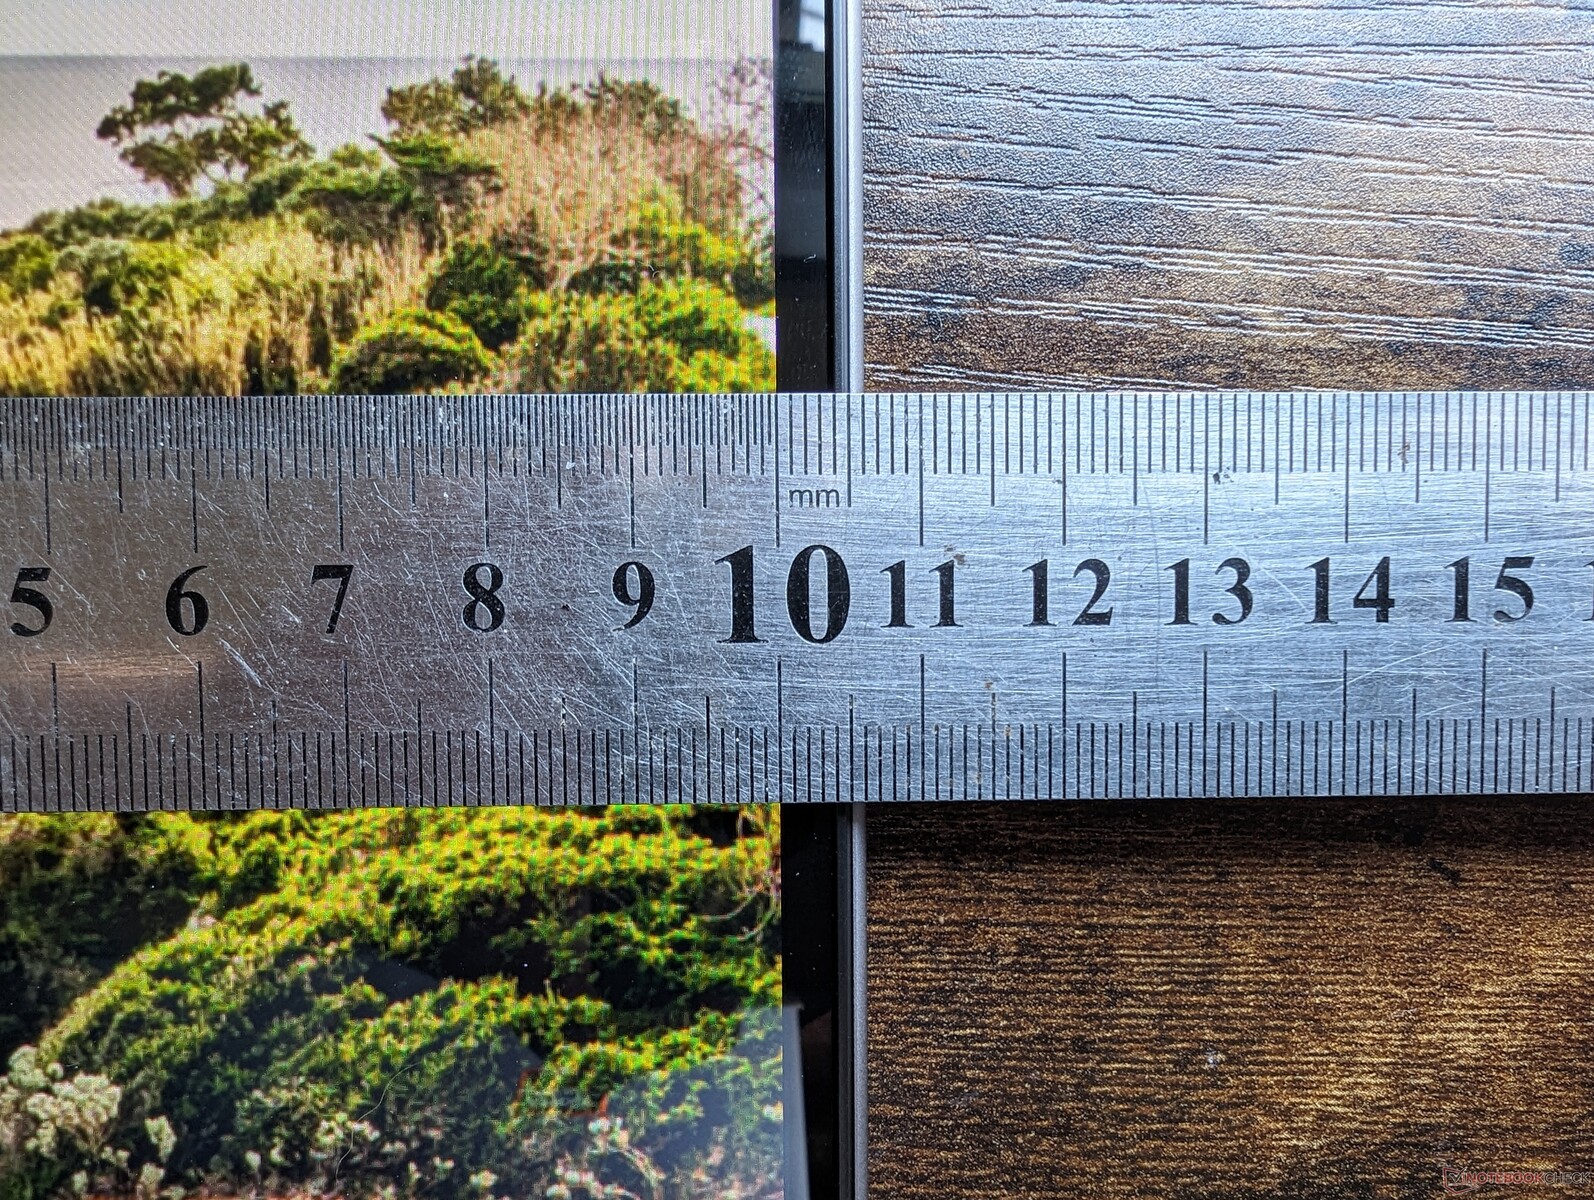
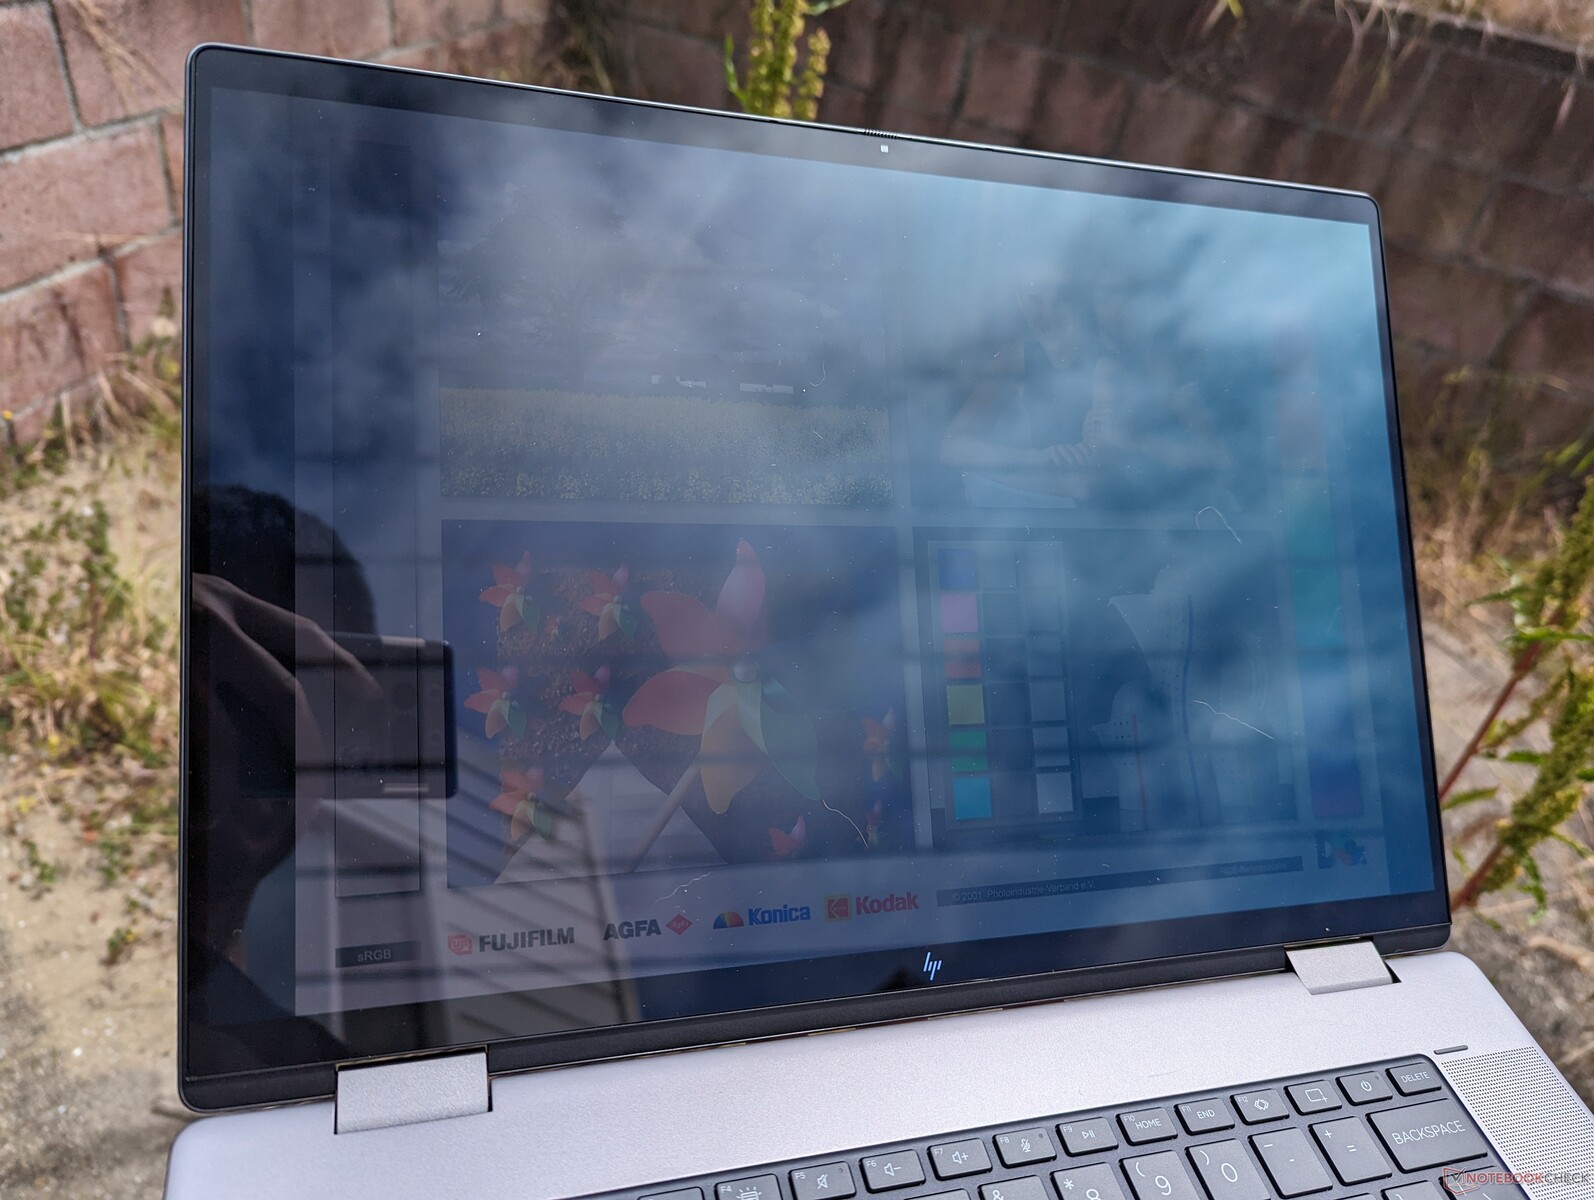
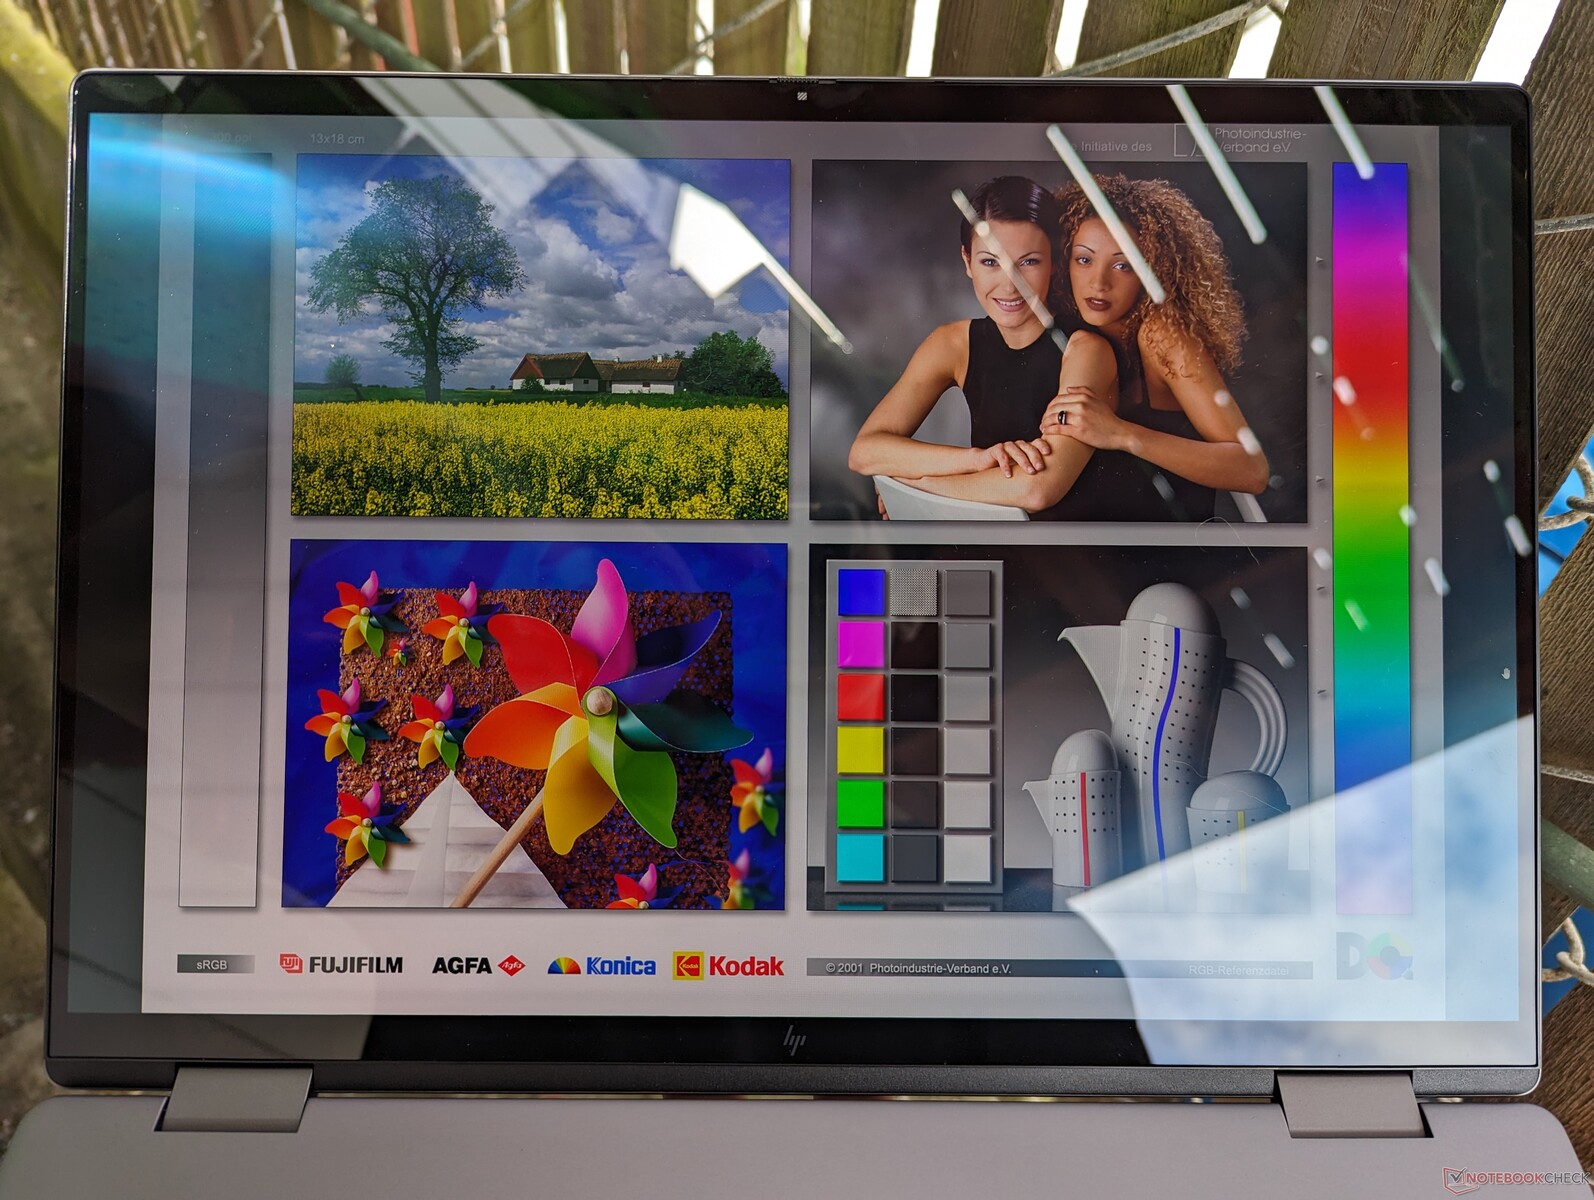
Pantalla - OLED de gama alta por un precio de gama media
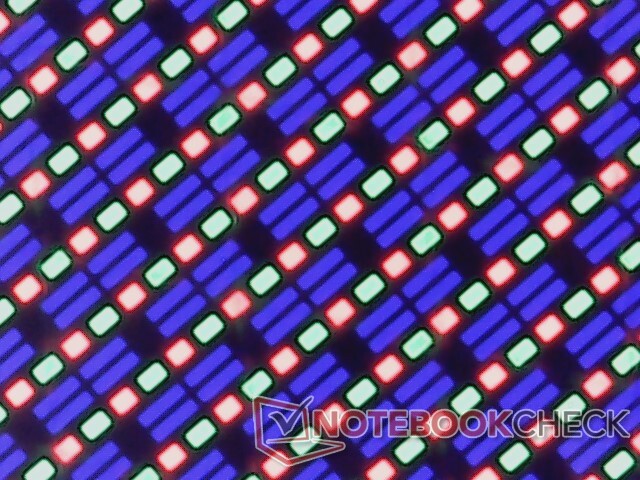
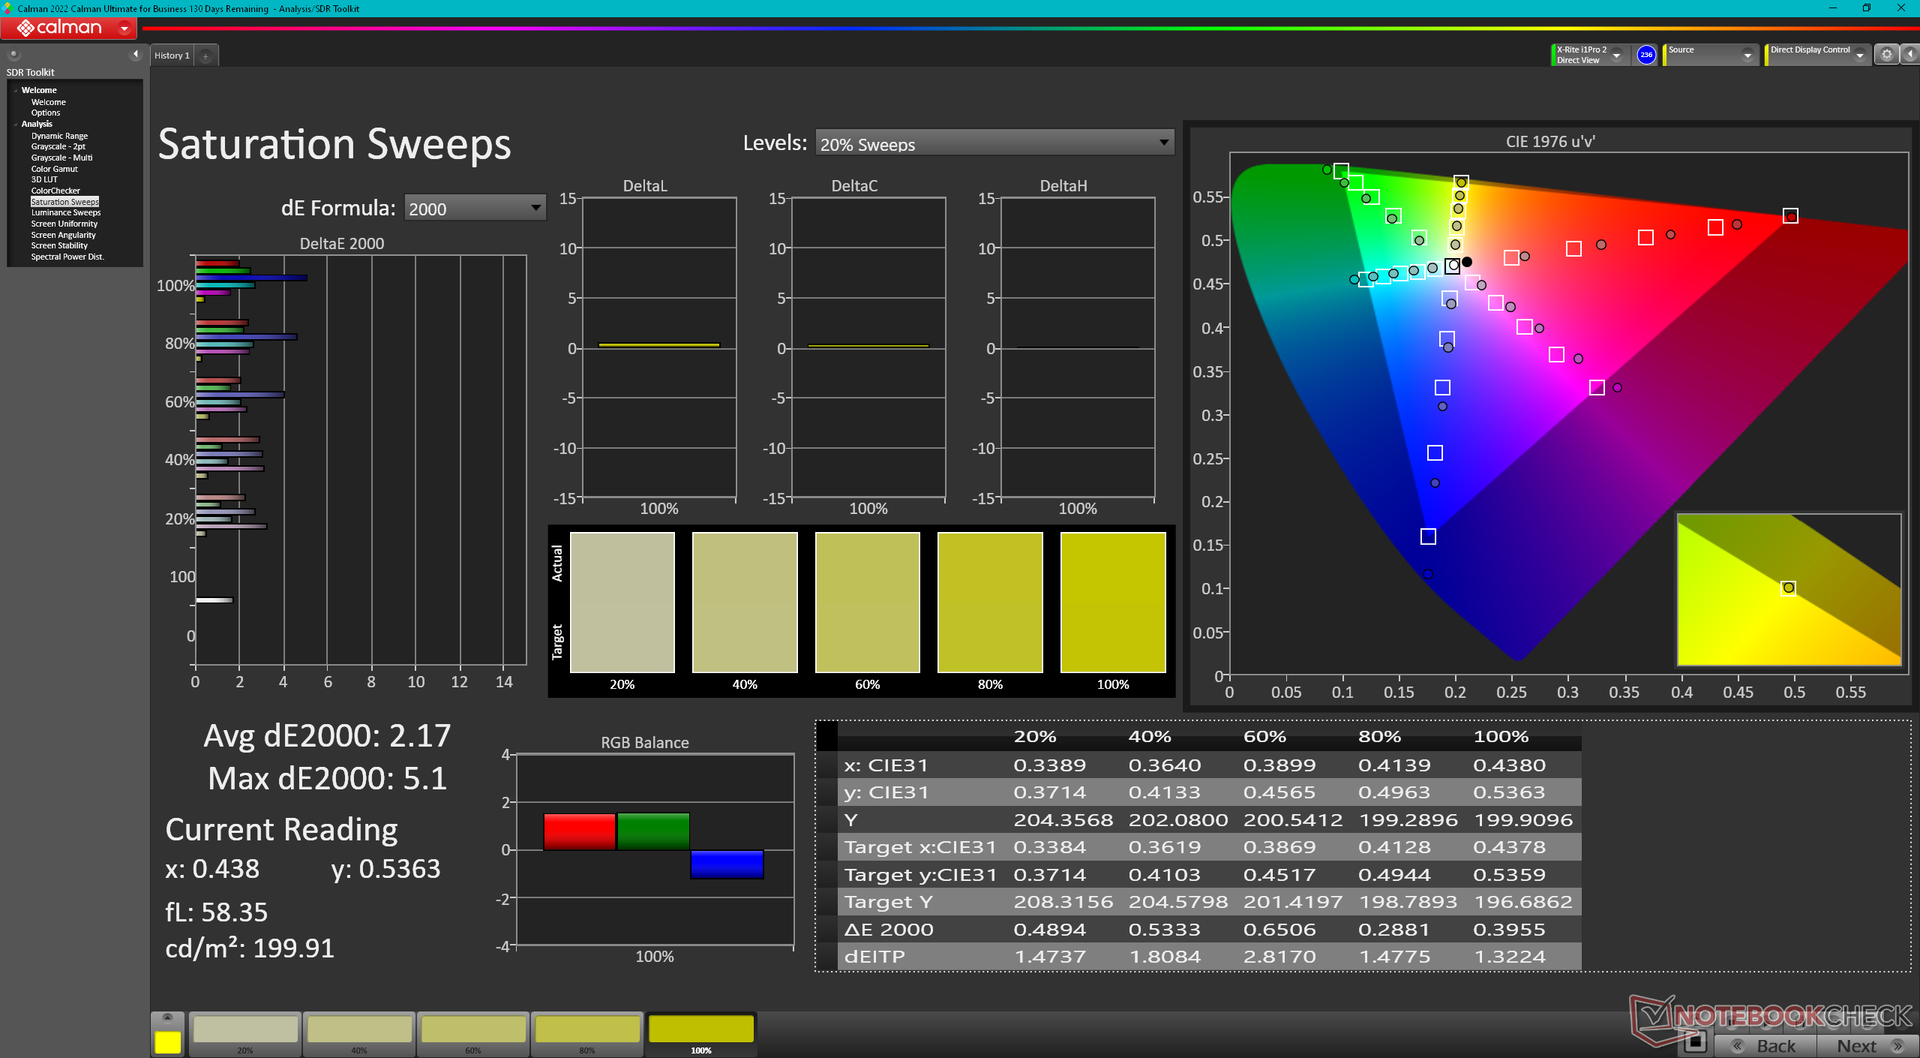
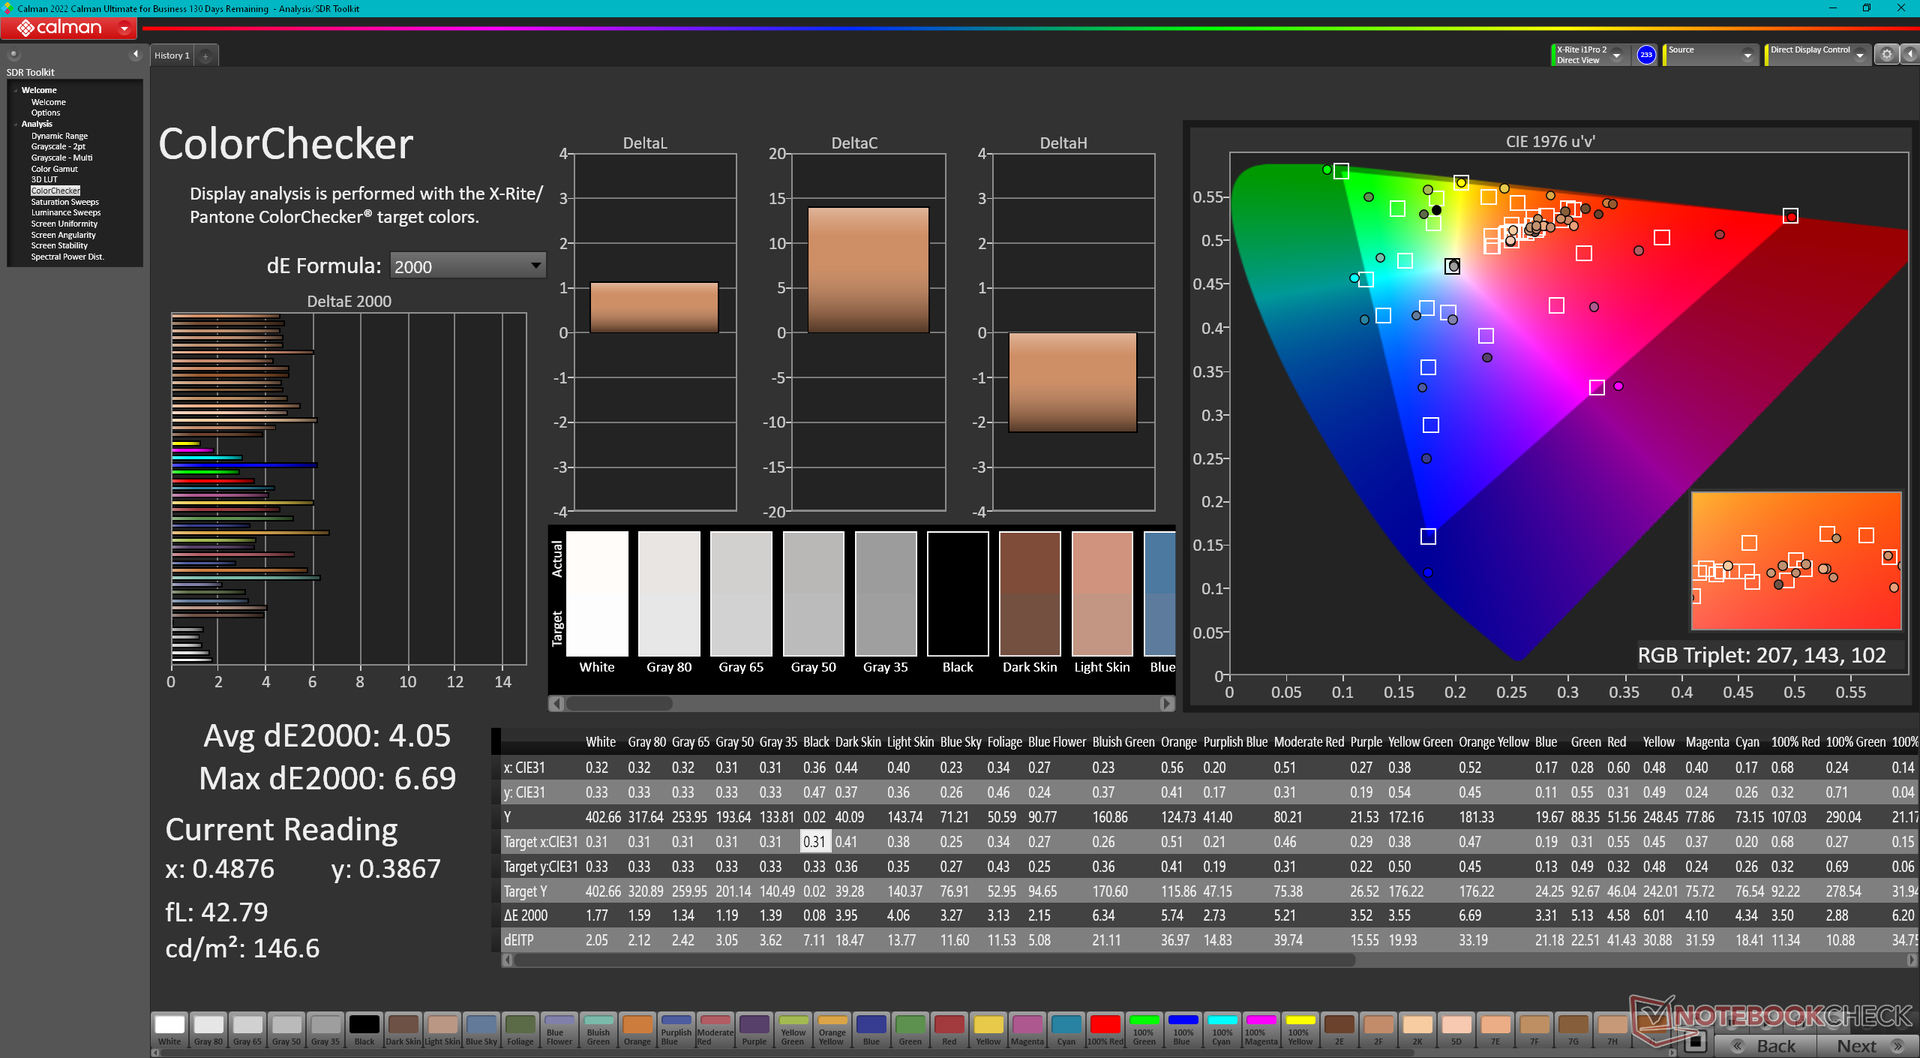
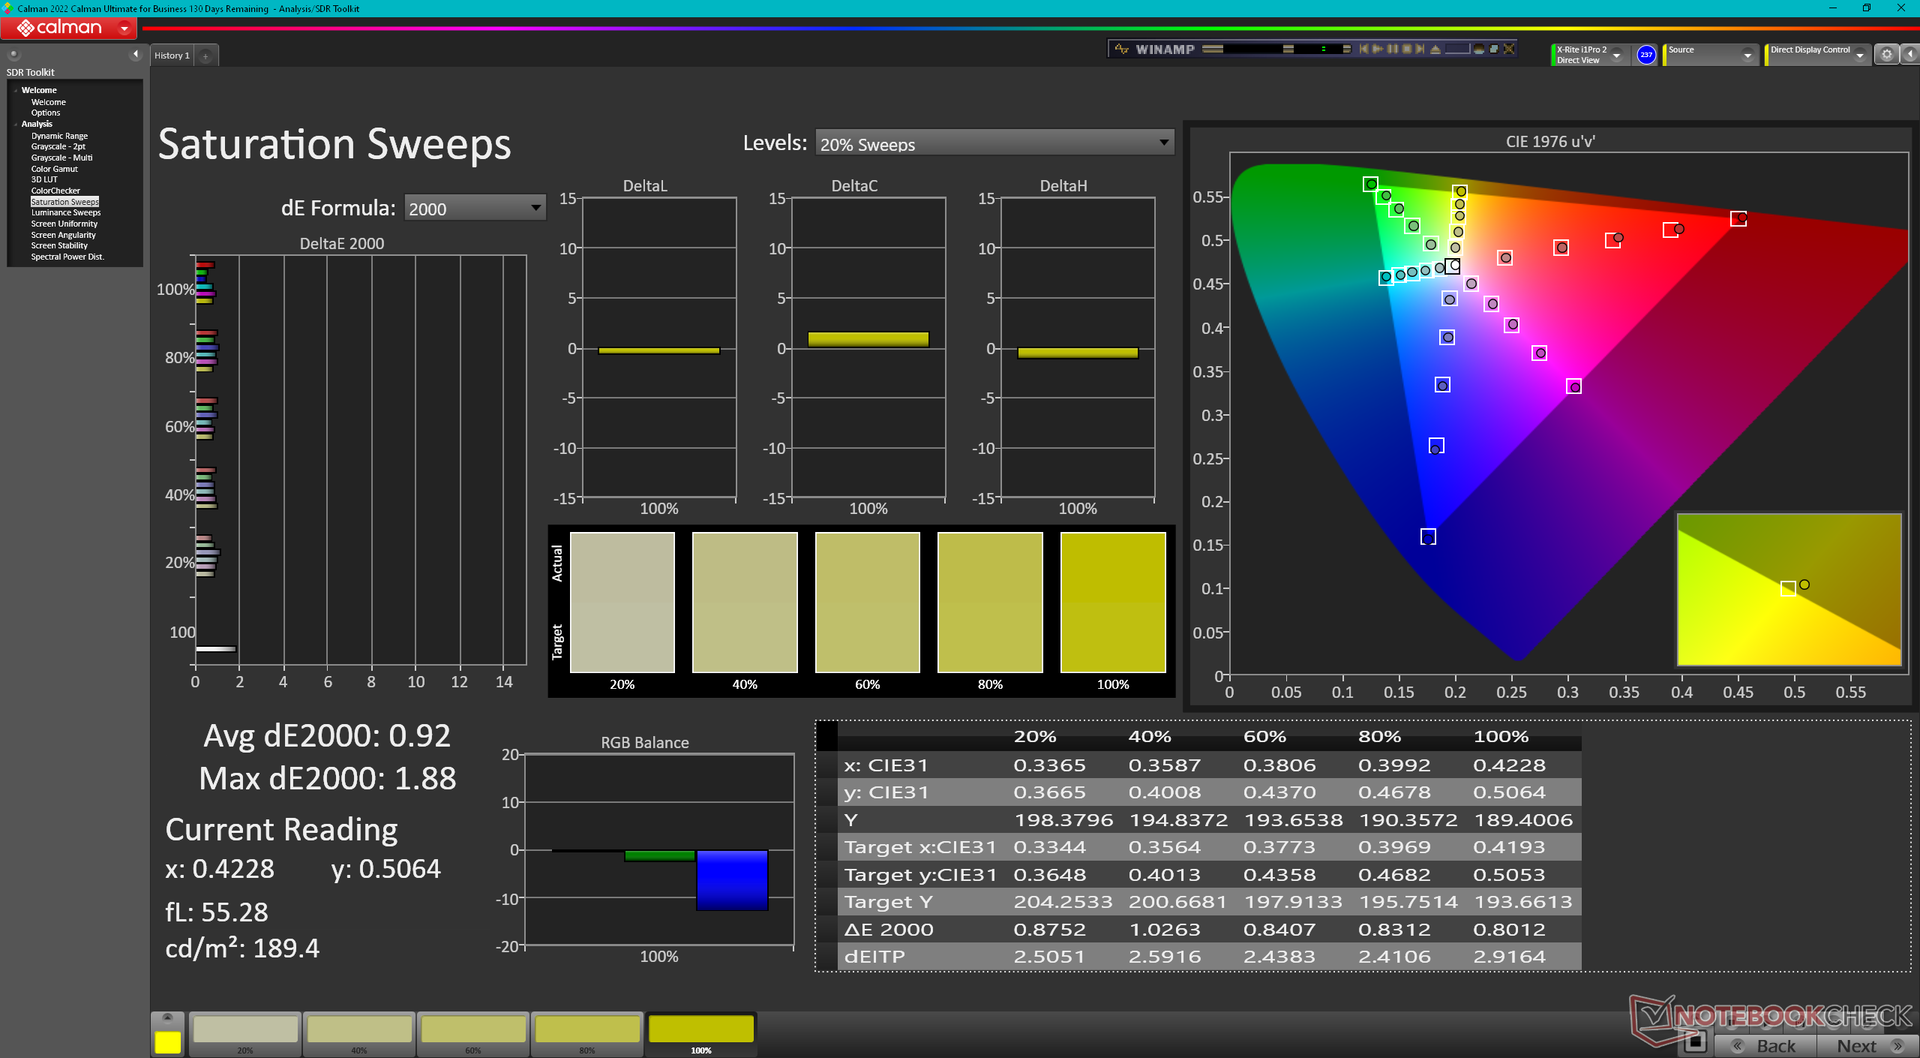
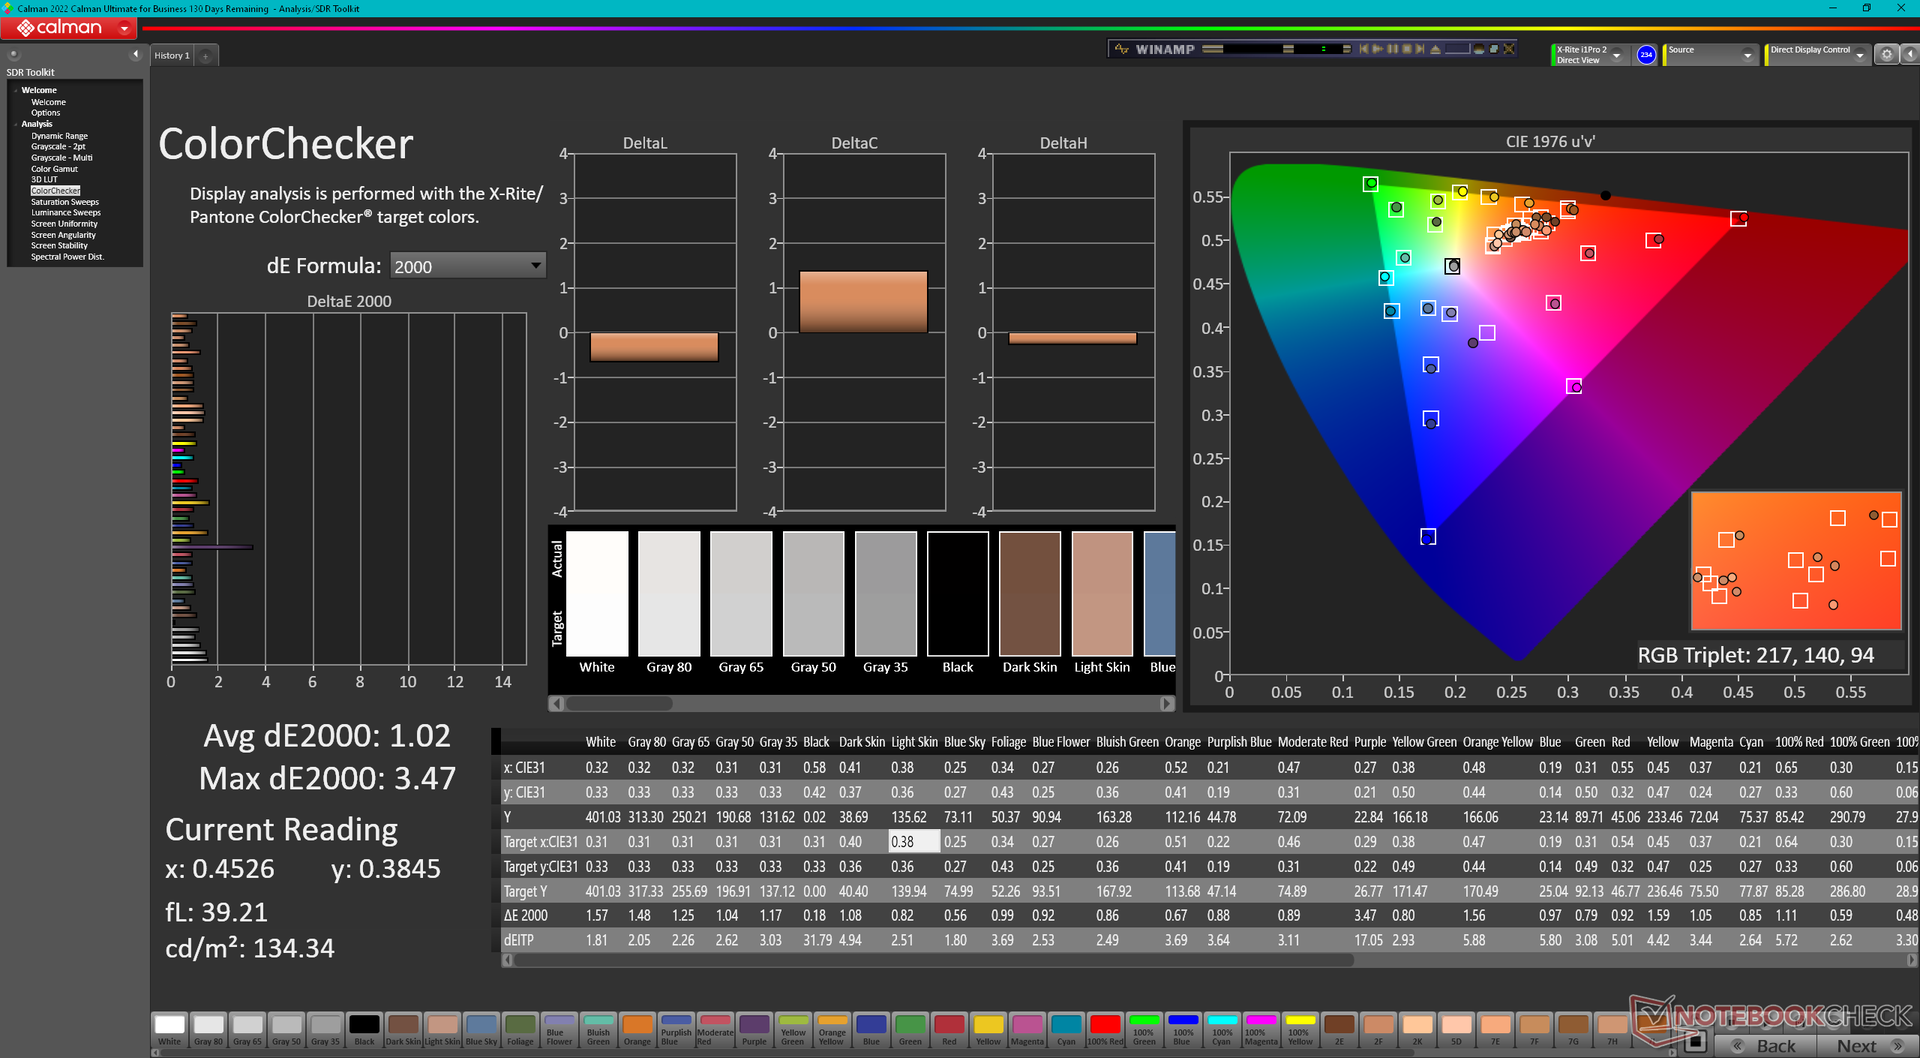
HP utiliza el mismo panel OLED Samsung SDC41A6 tanto para el Envy x360 16 como para el Spectre x360 16 a pesar de que este último es mucho más caro. La experiencia visual es, por tanto, idéntica entre los dos modelos hasta sus colores 100% DCI-P3, tiempos de respuesta rápidos, frecuencia de actualización de 120 Hz, brillo máximo de 400 nits e incluso tecnología de atenuación OLED DC. Se trata de una pantalla de gama alta para un portátil de gama media, lo que sitúa al Envy x360 16 un escalón por encima de otras alternativas de precio similar.
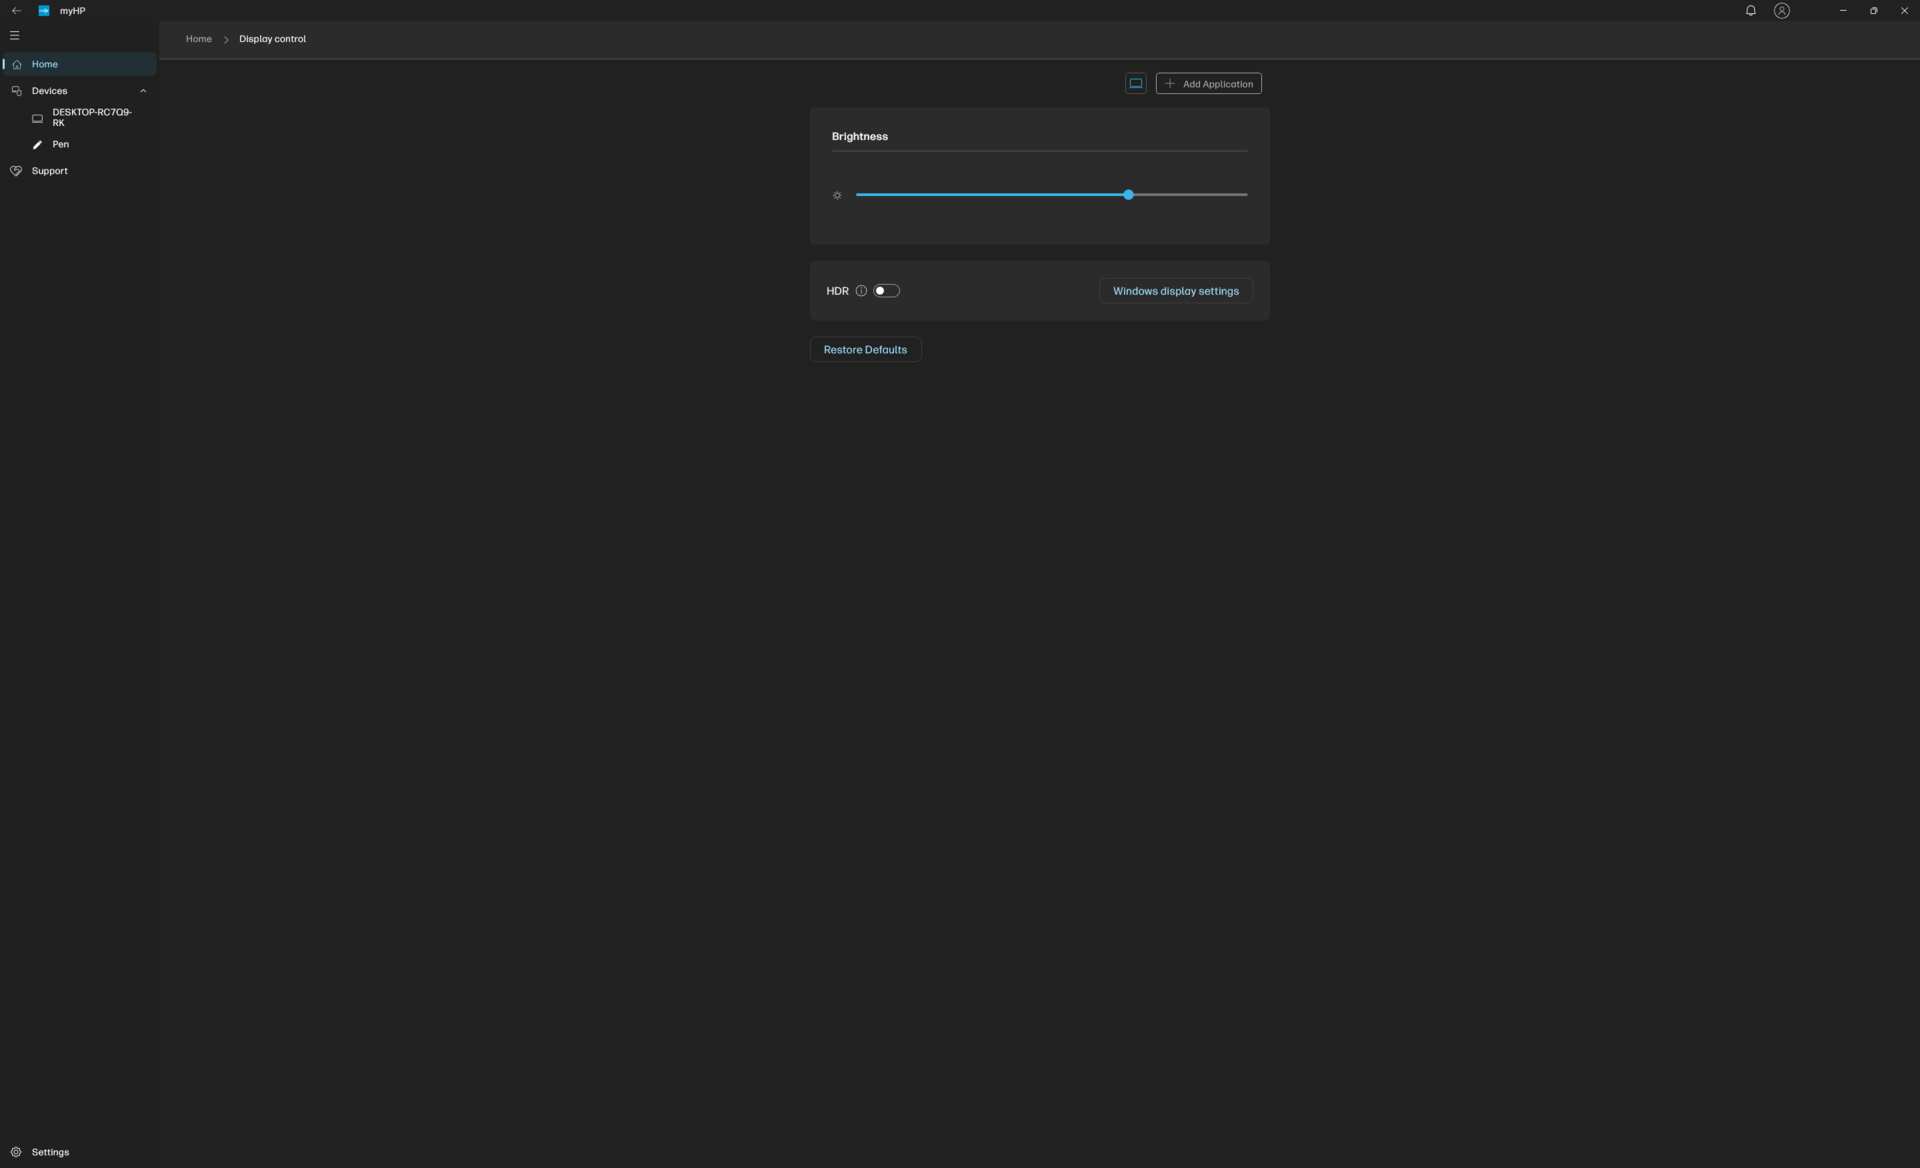
La pantalla puede ser tan brillante como 616 nits cuando HDR está activado. De lo contrario, el contenido SDR se limita a ~400 nits.
La pantalla de 120 Hz no admite frecuencia de actualización variable, por lo que en su lugar ofrece dos opciones de frecuencia de actualización fija: 48 Hz y 120 Hz. No hay selección de 60 Hz, a diferencia de lo que ocurre en la mayoría de los demás paneles.
| |||||||||||||||||||||||||
iluminación: 98 %
Brillo con batería: 399.4 cd/m²
Contraste: ∞:1 (Negro: 0 cd/m²)
ΔE ColorChecker Calman: 4.05 | ∀{0.5-29.43 Ø4.71}
calibrated: 1.02
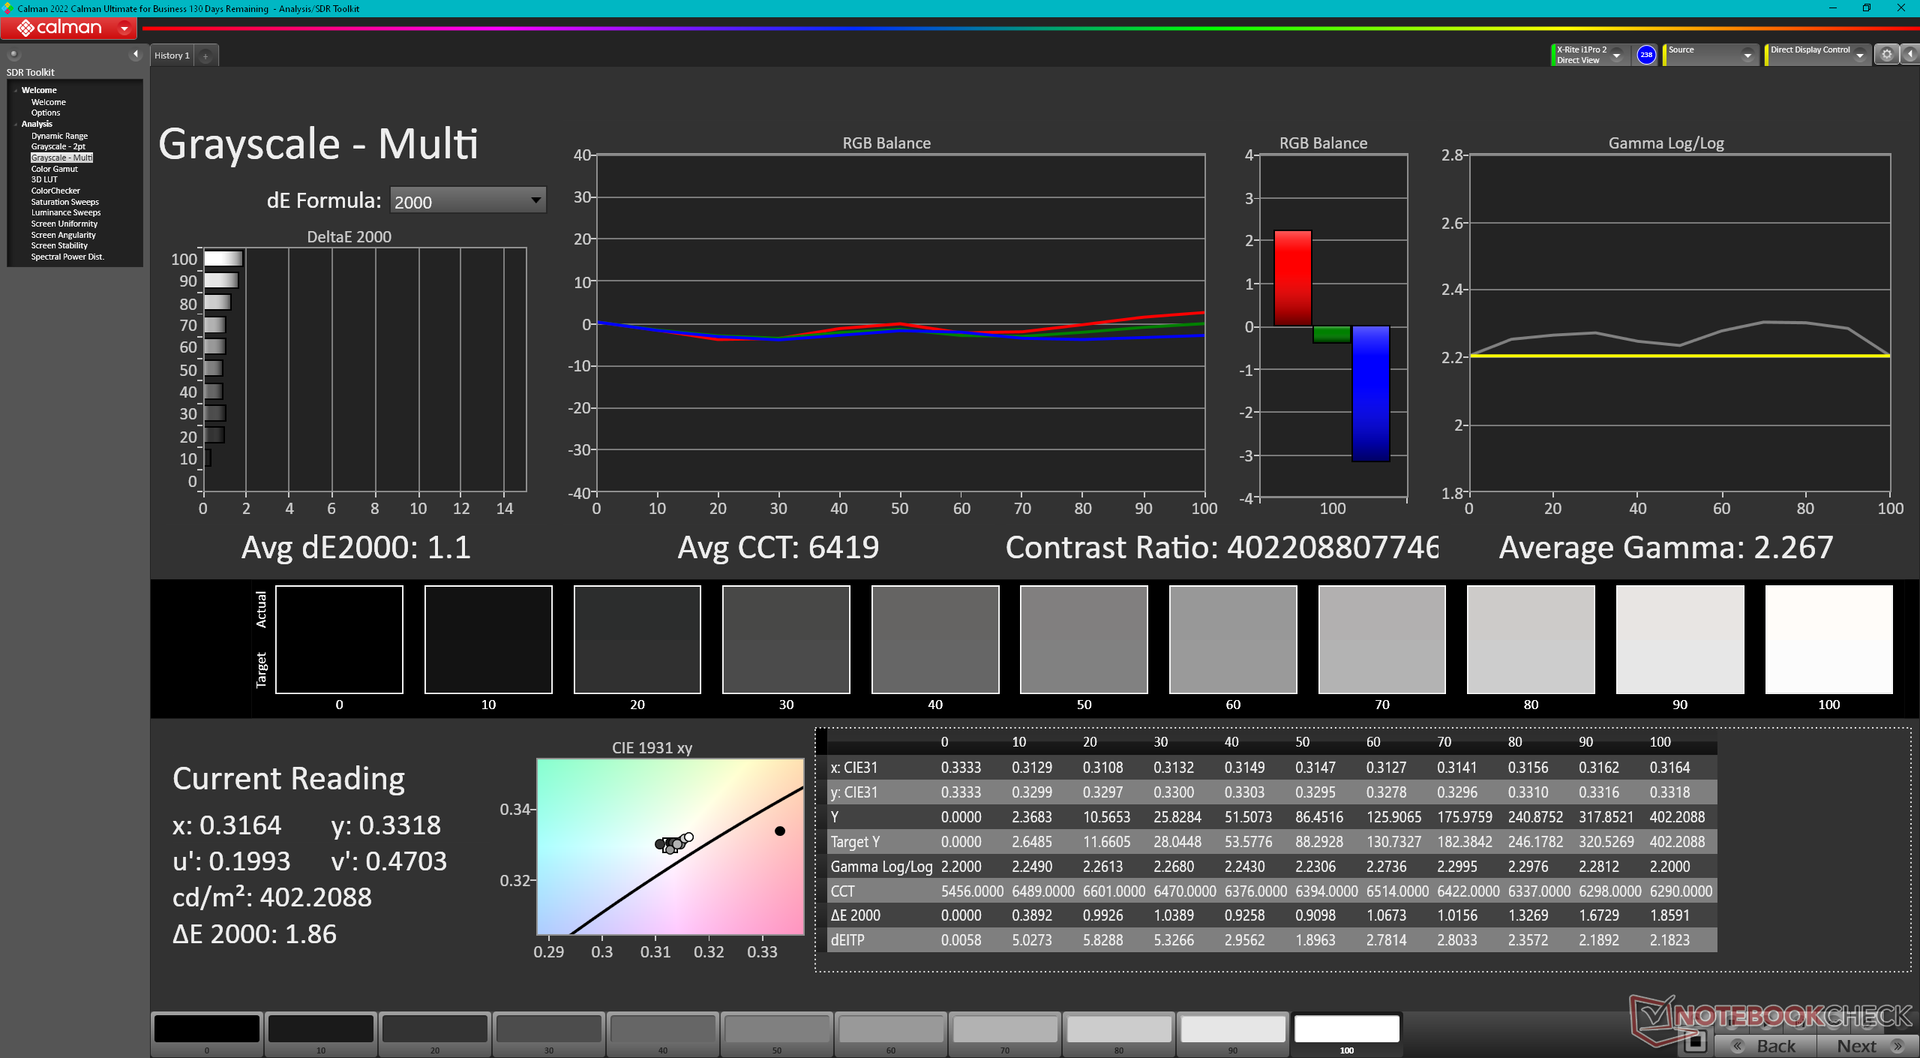
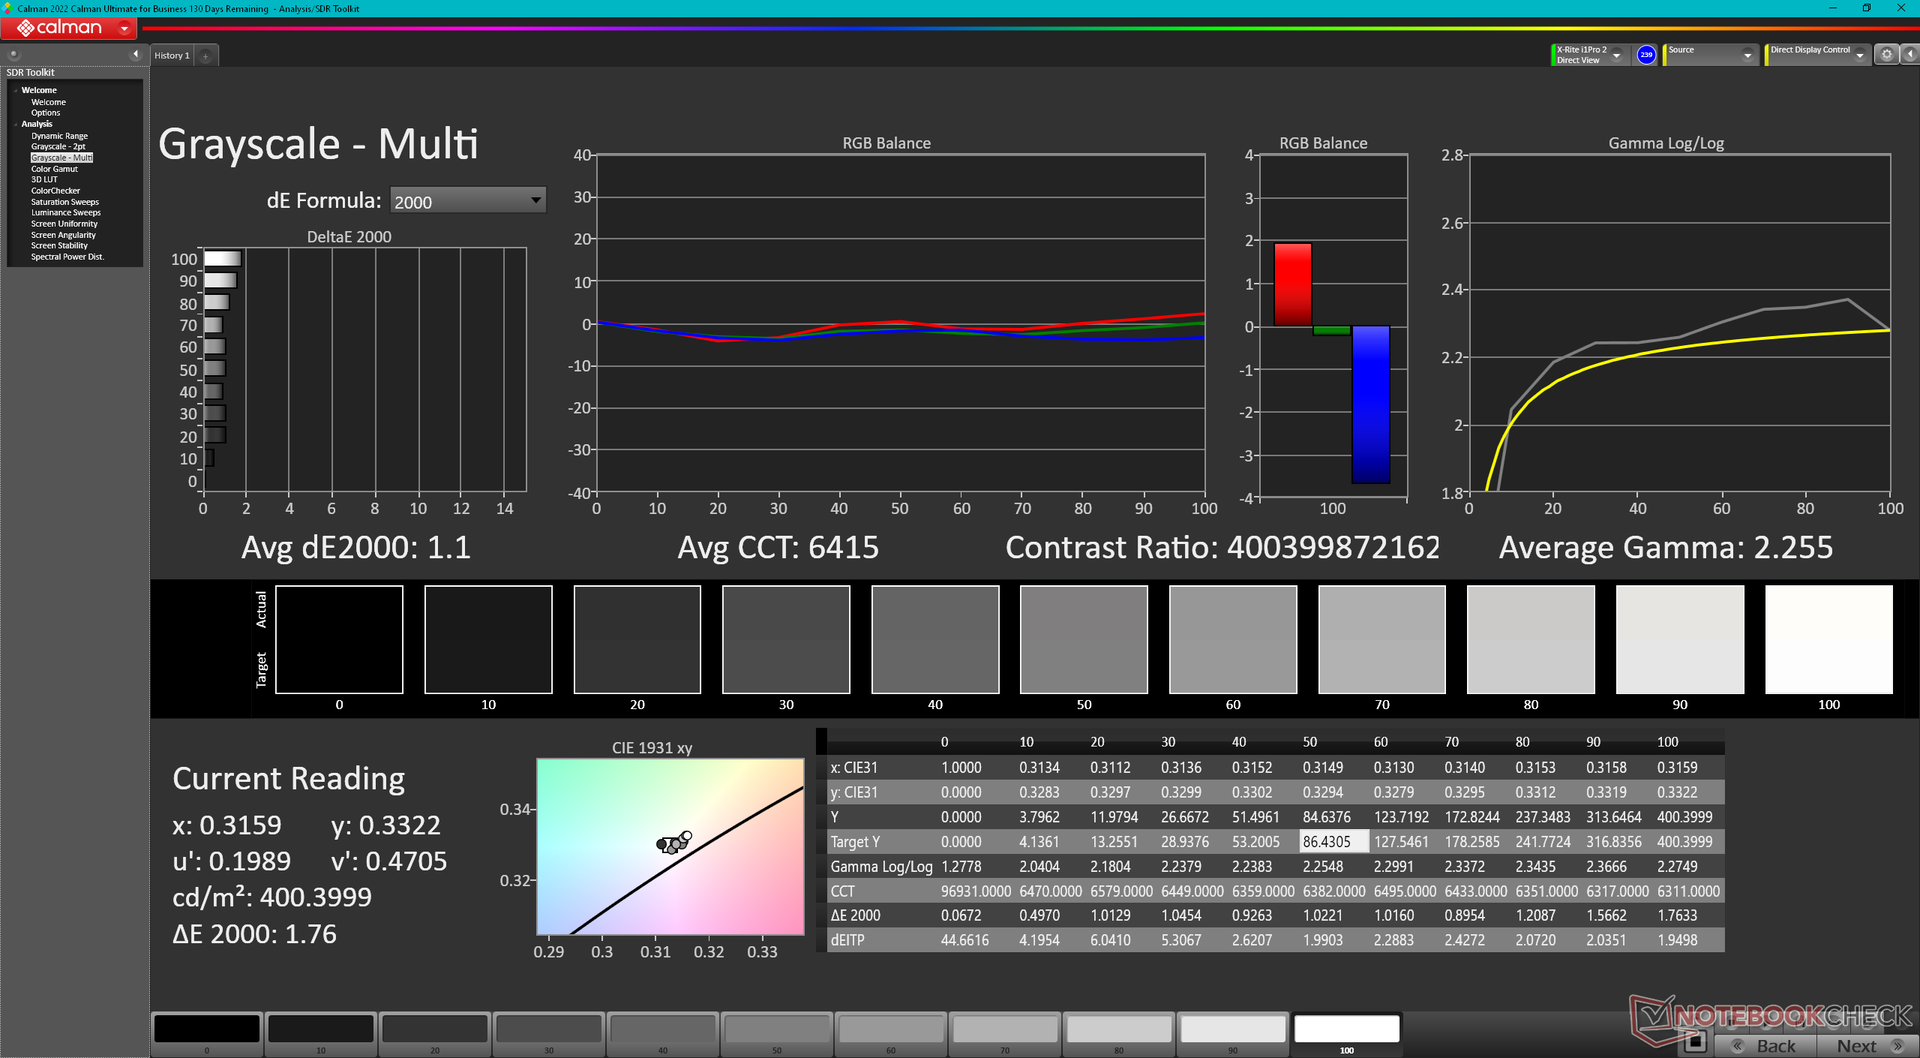
ΔE Greyscale Calman: 1.1 | ∀{0.09-98 Ø4.96}
96.5% AdobeRGB 1998 (Argyll 3D)
100% sRGB (Argyll 3D)
99.6% Display P3 (Argyll 3D)
Gamma: 2.27
CCT: 6419 K
| HP Envy x360 2-in-1 16-ad0097nr Samsung SDC41A6, OLED, 2880x1800, 16" | HP Envy 16 h0112nr Samsung SDC4174, OLED, 3840x2400, 16" | HP Spectre x360 16 RTX 4050 Samsung SDC41A6, OLED, 2880x1800, 16" | Lenovo Yoga 7 2-in-1 16IML9 LEN160FHD, IPS, 1920x1200, 16" | Samsung Galaxy Book4 Pro 360 ATNA60CL09-0, OLED, 2880x1800, 16" | LG Gram 2in1 16 16T90R - G.AA78G LP160WQ1-SPB2, IPS, 2560x1600, 16" | |
|---|---|---|---|---|---|---|
| Display | -3% | 0% | -51% | 0% | -5% | |
| Display P3 Coverage (%) | 99.6 | 99.3 0% | 99.6 0% | 40.9 -59% | 99.9 0% | 96.5 -3% |
| sRGB Coverage (%) | 100 | 100 0% | 100 0% | 61.4 -39% | 100 0% | 99.9 0% |
| AdobeRGB 1998 Coverage (%) | 96.5 | 88 -9% | 96.7 0% | 42.3 -56% | 96.6 0% | 84.6 -12% |
| Response Times | -132% | 3% | -3131% | 32% | -3502% | |
| Response Time Grey 50% / Grey 80% * (ms) | 0.8 ? | 2 ? -150% | 0.78 ? 2% | 32.1 ? -3913% | 0.49 ? 39% | 38.4 ? -4700% |
| Response Time Black / White * (ms) | 0.89 ? | 1.9 ? -113% | 0.86 ? 3% | 21.8 ? -2349% | 0.67 ? 25% | 21.4 ? -2304% |
| PWM Frequency (Hz) | 491.8 ? | 240.4 ? | 480 ? | 240 ? | ||
| Screen | 3% | -8% | -84% | 14% | -68% | |
| Brightness middle (cd/m²) | 399.4 | 328.8 -18% | 385.2 -4% | 313.3 -22% | 387 -3% | 329 -18% |
| Brightness (cd/m²) | 405 | 332 -18% | 387 -4% | 294 -27% | 392 -3% | 310 -23% |
| Brightness Distribution (%) | 98 | 97 -1% | 99 1% | 82 -16% | 98 0% | 88 -10% |
| Black Level * (cd/m²) | 0.35 | 0.39 | ||||
| Colorchecker dE 2000 * | 4.05 | 1.53 62% | 1.73 57% | 4.41 -9% | 1 75% | 3.52 13% |
| Colorchecker dE 2000 max. * | 6.69 | 6.04 10% | 3.95 41% | 15.75 -135% | 1.9 72% | 6.96 -4% |
| Colorchecker dE 2000 calibrated * | 1.02 | 1.84 -80% | 1.15 -13% | |||
| Greyscale dE 2000 * | 1.1 | 1.3 -18% | 2.6 -136% | 4.4 -300% | 1.7 -55% | 5.75 -423% |
| Gamma | 2.27 97% | 2.18 101% | 2.17 101% | 2.3 96% | 2.25 98% | 2.137 103% |
| CCT | 6419 101% | 6362 102% | 6133 106% | 7395 88% | 6325 103% | 7584 86% |
| Contrast (:1) | 895 | 844 | ||||
| Media total (Programa/Opciones) | -44% /
-23% | -2% /
-4% | -1089% /
-584% | 15% /
14% | -1192% /
-625% |
* ... más pequeño es mejor
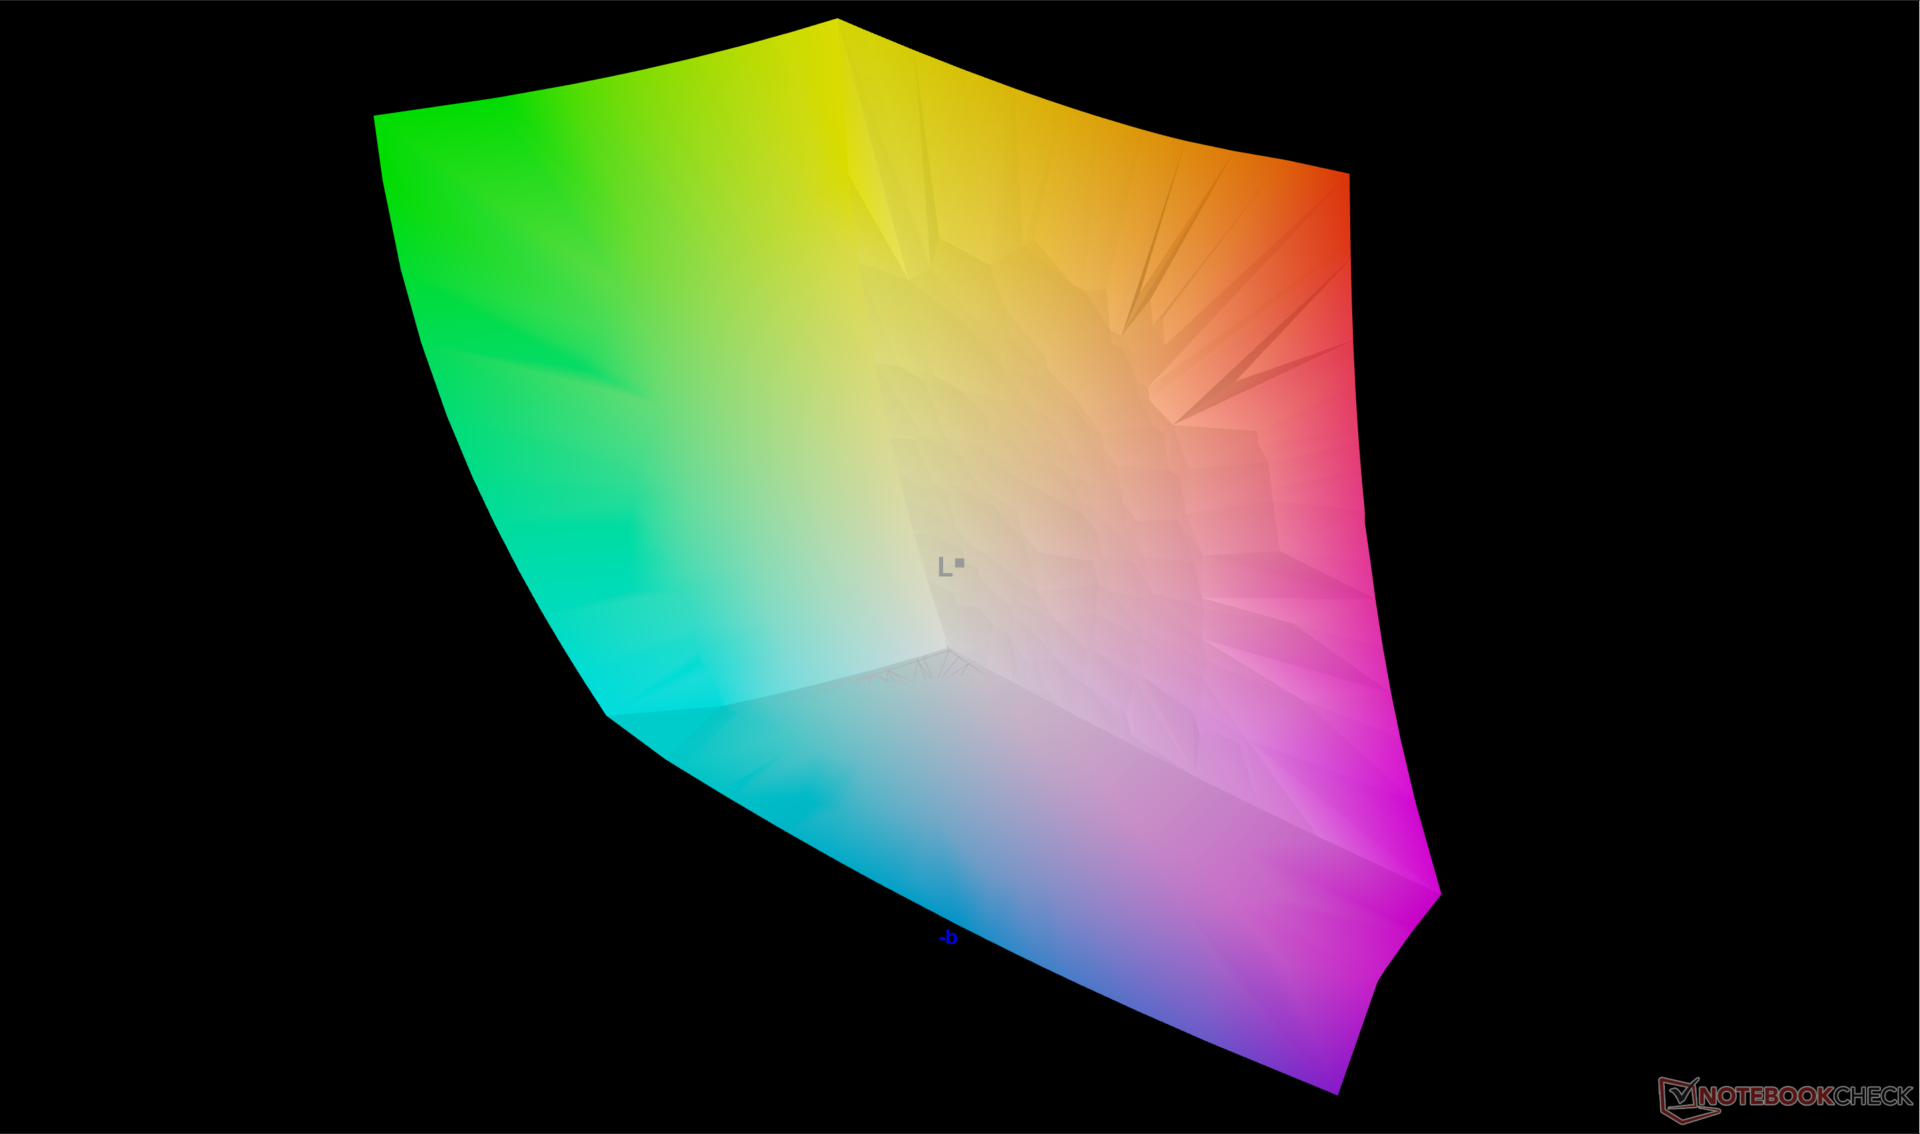
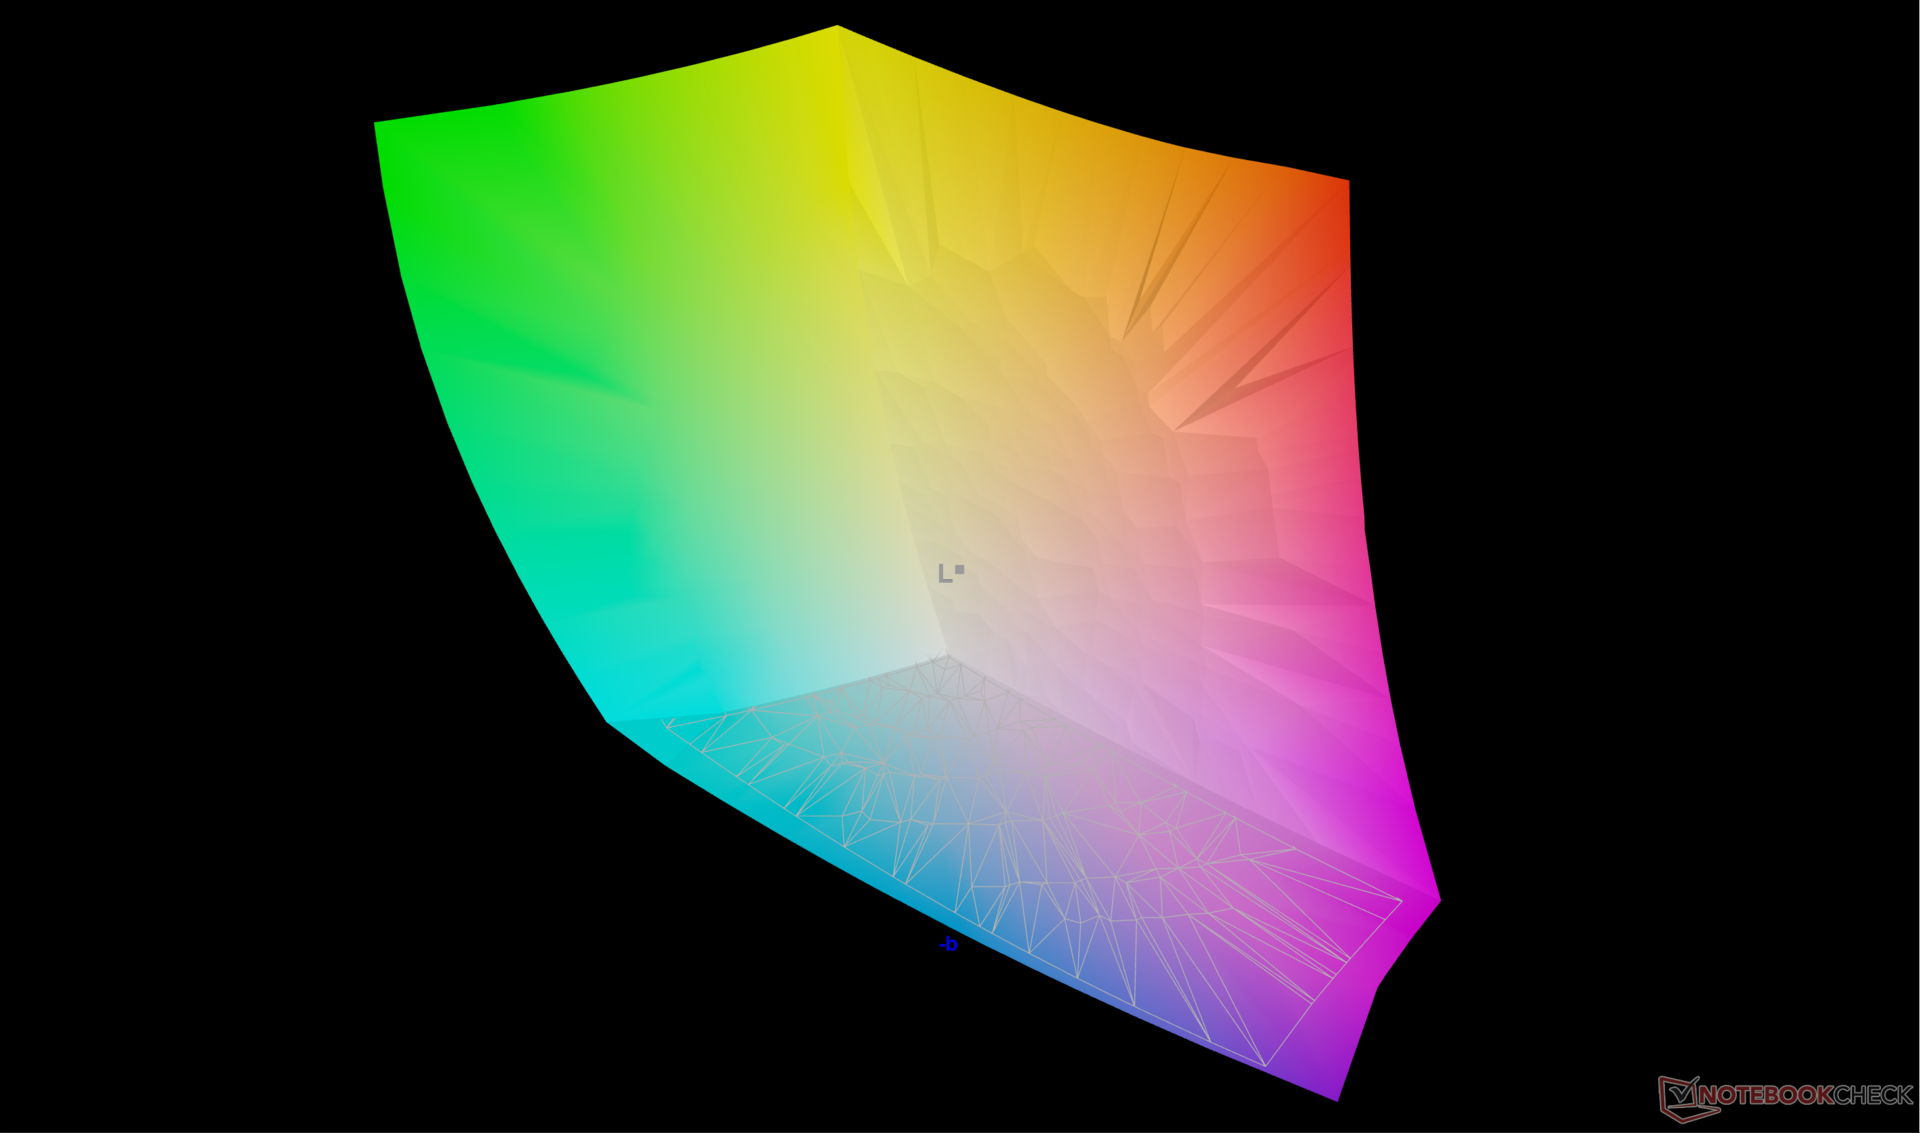
La pantalla está bien calibrada respecto a la norma P3, con unos valores medios de escala de grises y deltaE de color nada más sacarla de la caja de sólo 1,1 y 4,05, respectivamente.
Tiempos de respuesta del display
| ↔ Tiempo de respuesta de Negro a Blanco | ||
|---|---|---|
| 0.89 ms ... subida ↗ y bajada ↘ combinada | ↗ 0.42 ms subida | 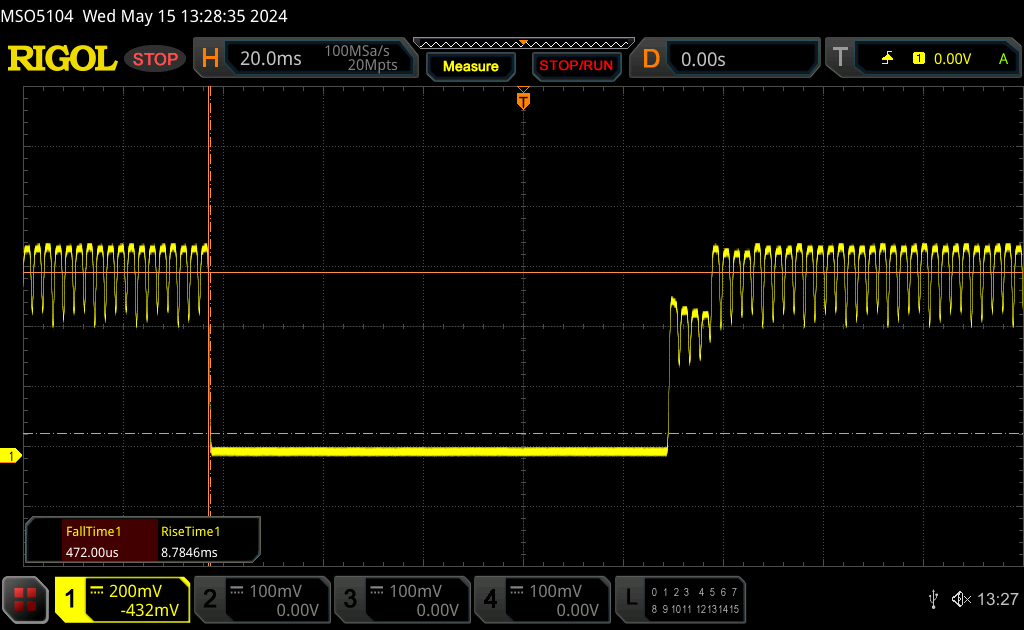 |
| ↘ 0.47 ms bajada | ||
| La pantalla mostró tiempos de respuesta muy rápidos en nuestros tests y debería ser adecuada para juegos frenéticos. En comparación, todos los dispositivos de prueba van de ##min### (mínimo) a 240 (máximo) ms. » 3 % de todos los dispositivos son mejores. Esto quiere decir que el tiempo de respuesta medido es mejor que la media (19.8 ms) de todos los dispositivos testados. | ||
| ↔ Tiempo de respuesta 50% Gris a 80% Gris | ||
| 0.8 ms ... subida ↗ y bajada ↘ combinada | ↗ 0.45 ms subida | 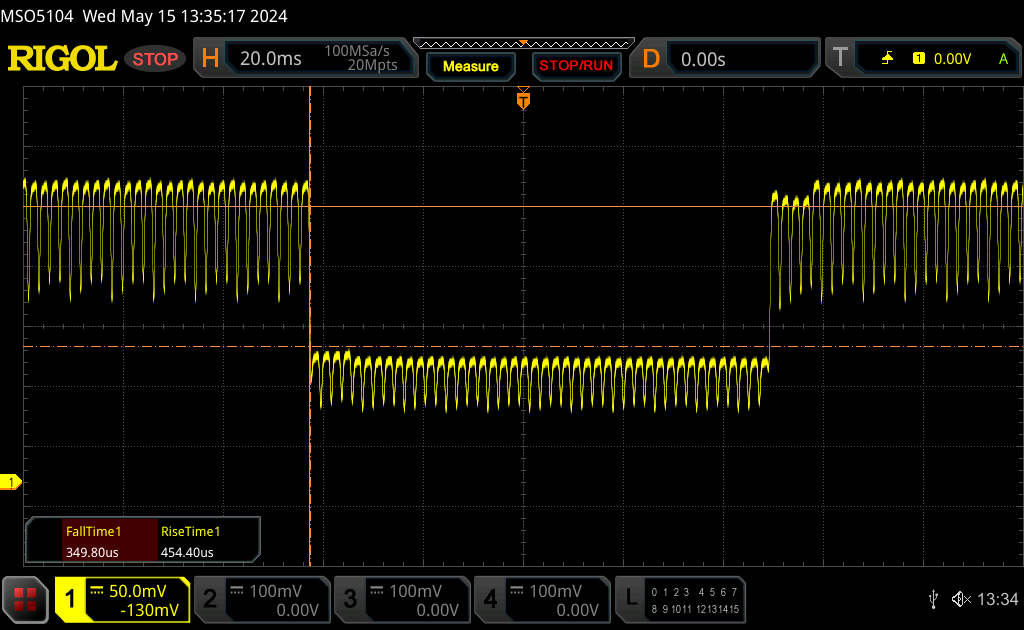 |
| ↘ 0.35 ms bajada | ||
| La pantalla mostró tiempos de respuesta muy rápidos en nuestros tests y debería ser adecuada para juegos frenéticos. En comparación, todos los dispositivos de prueba van de ##min### (mínimo) a 636 (máximo) ms. » 3 % de todos los dispositivos son mejores. Esto quiere decir que el tiempo de respuesta medido es mejor que la media (31 ms) de todos los dispositivos testados. | ||
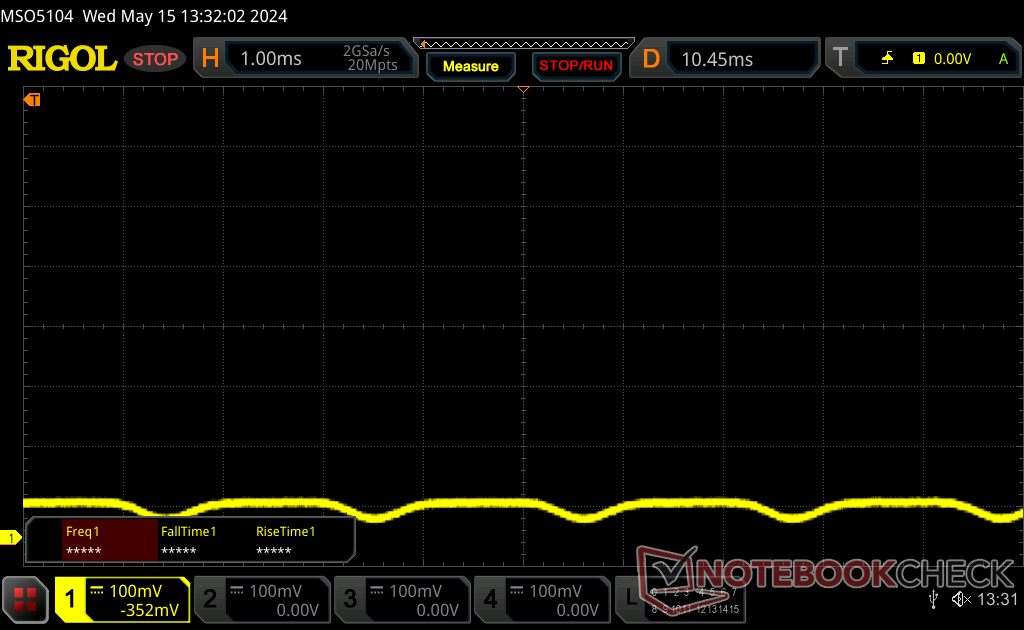
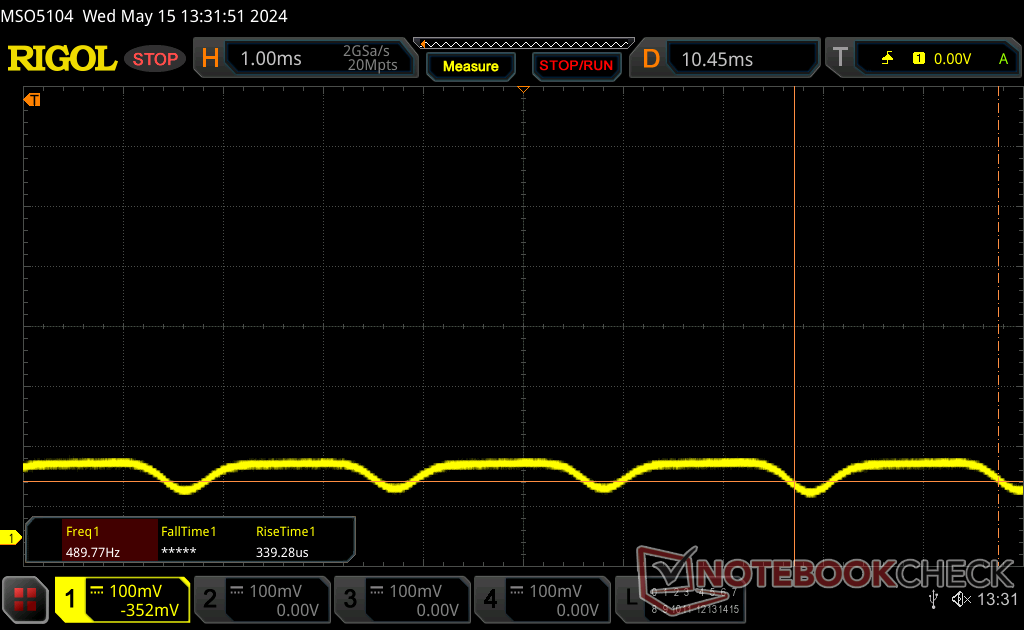
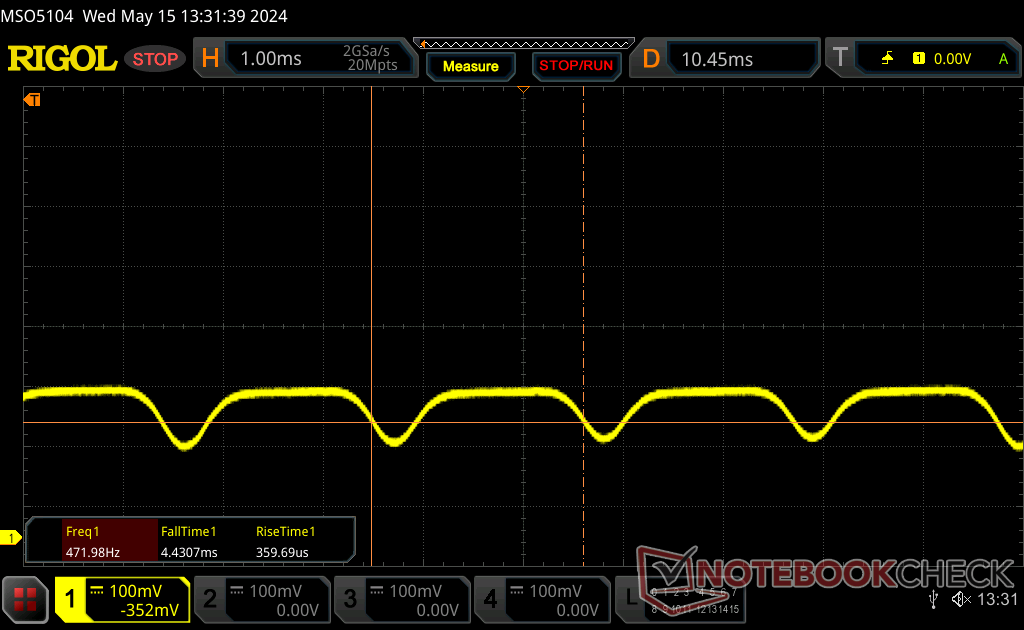
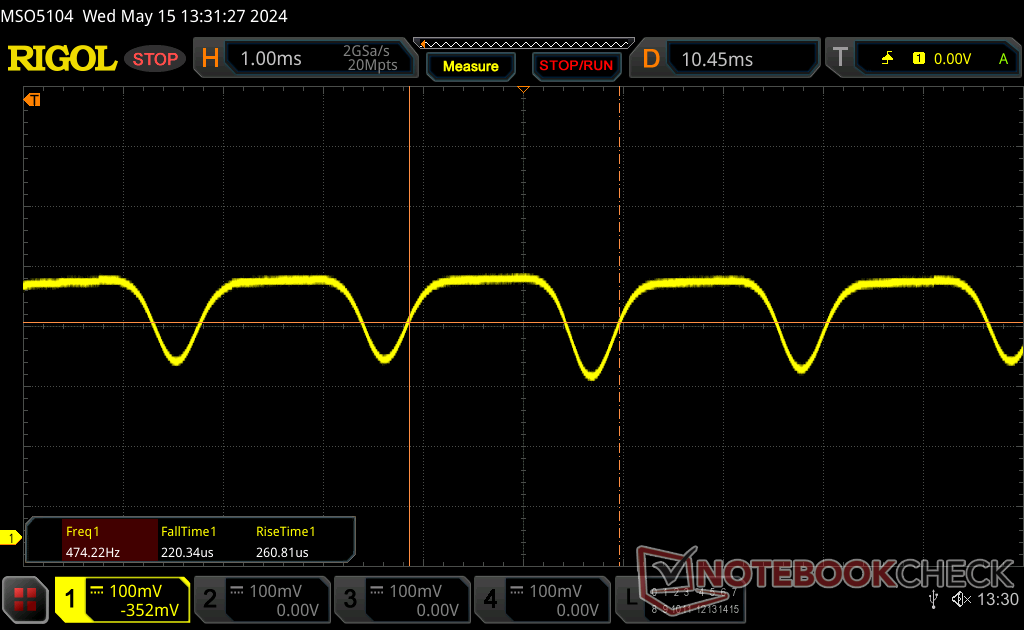
Parpadeo de Pantalla / PWM (Pulse-Width Modulation)
| Parpadeo de Pantalla / PWM detectado | 491.8 Hz | ≤ 100 % de brillo | 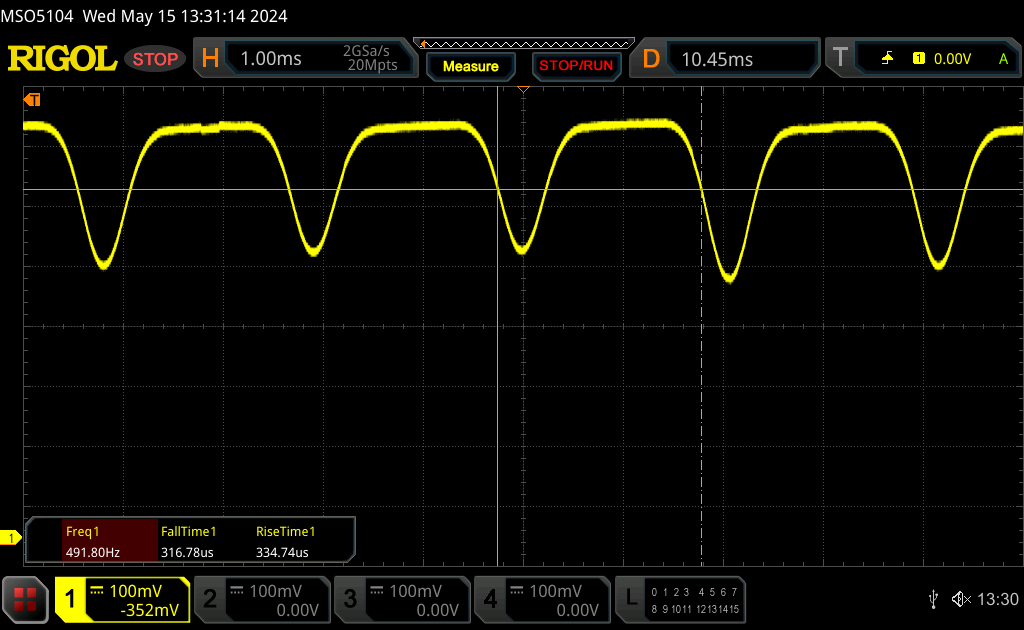 |
La retroiluminación del display parpadea a 491.8 Hz (seguramente usa PWM - Pulse-Width Modulation) a un brillo del 100 % e inferior. Sobre este nivel de brillo no debería darse parpadeo / PWM. La frecuencia de 491.8 Hz es relativamente alta, por lo que la mayoría de gente no debería ver parpadeo o tener fatiga visual. Sin embargo, hay informes de que algunas personas pueden seguir viendo parpadeos a 500 Hz y superior, por lo que cuidado. Comparación: 52 % de todos los dispositivos testados no usaron PWM para atenuar el display. Si se usó, medimos una media de 7757 (mínimo: 5 - máxmo: 343500) Hz. | |||
La modulación por ancho de pulsos está presente en todos los niveles de brillo, incluido el ajuste máximo. Su frecuencia se mantendría constante 492 Hz en todo el rango de brillo mientras que la mayoría de los otros paneles OLED pueden cambiar entre dos frecuencias diferentes dependiendo del nivel de brillo. Esto se debe a que HP utiliza la atenuación de CC mientras que la mayoría de los otros paneles OLED simplemente ciclan la retroiluminación en su lugar para controlar el brillo.
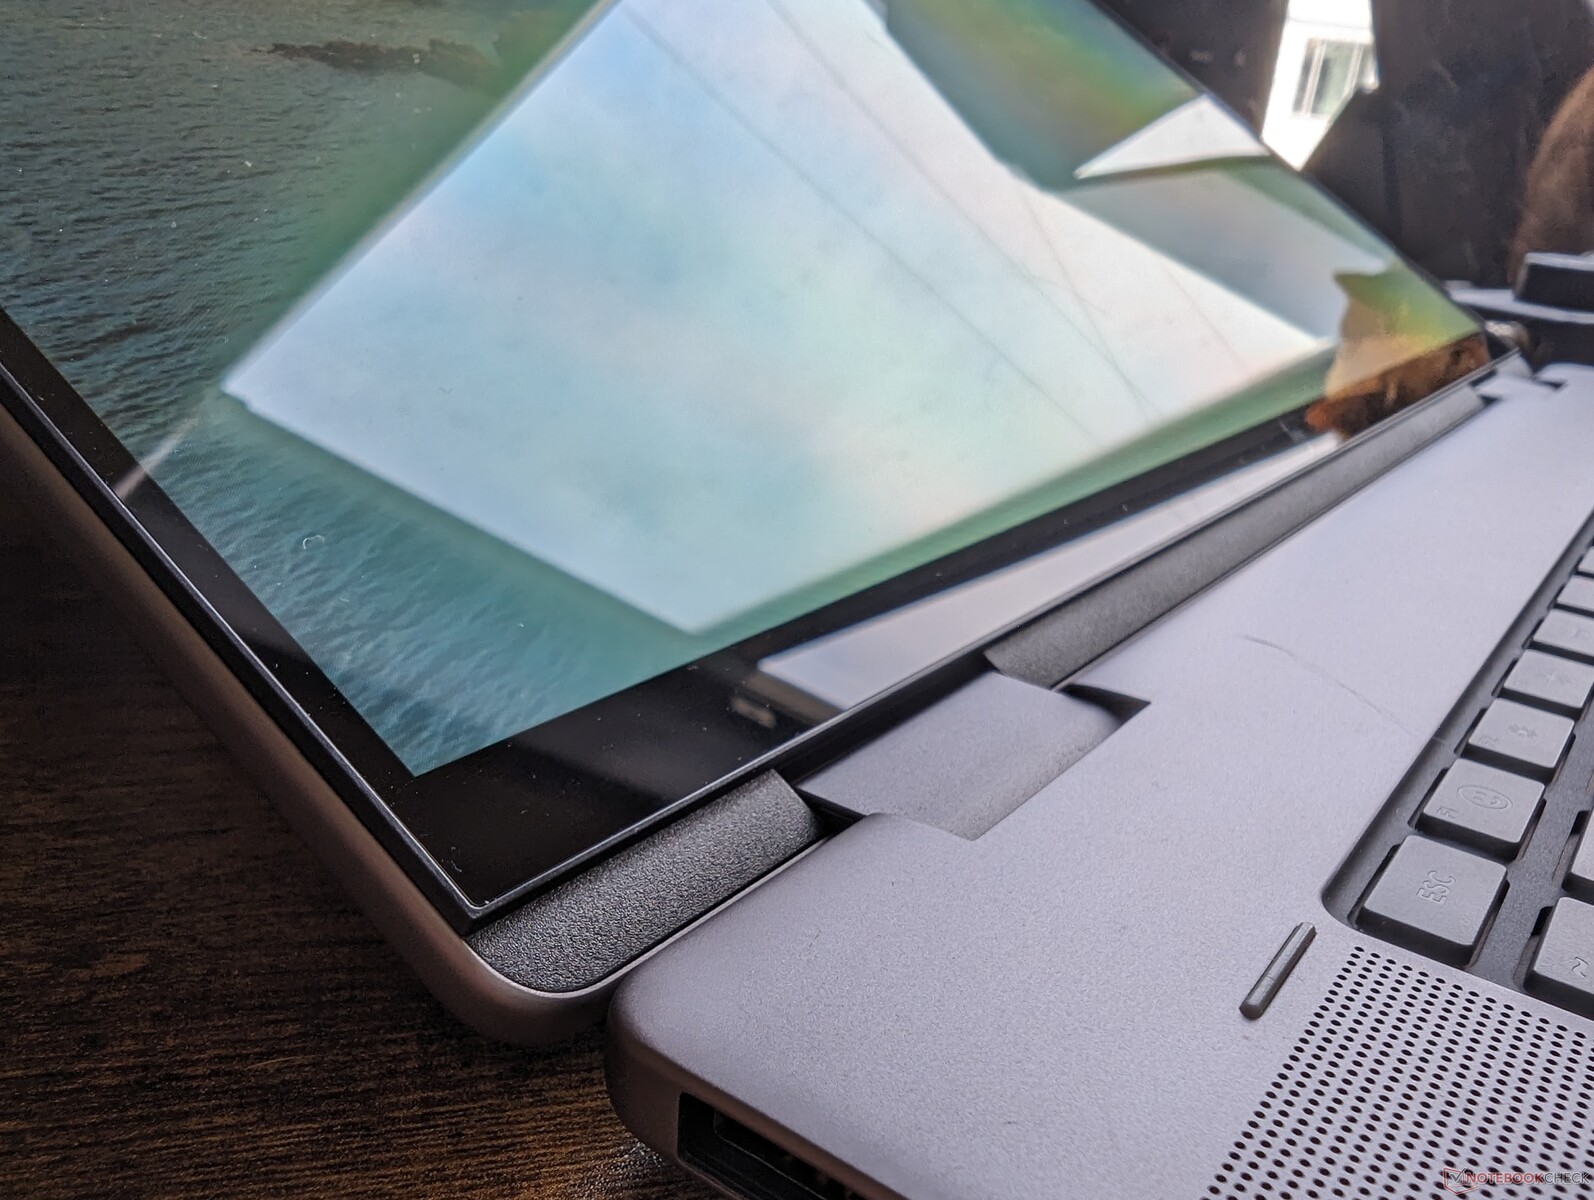
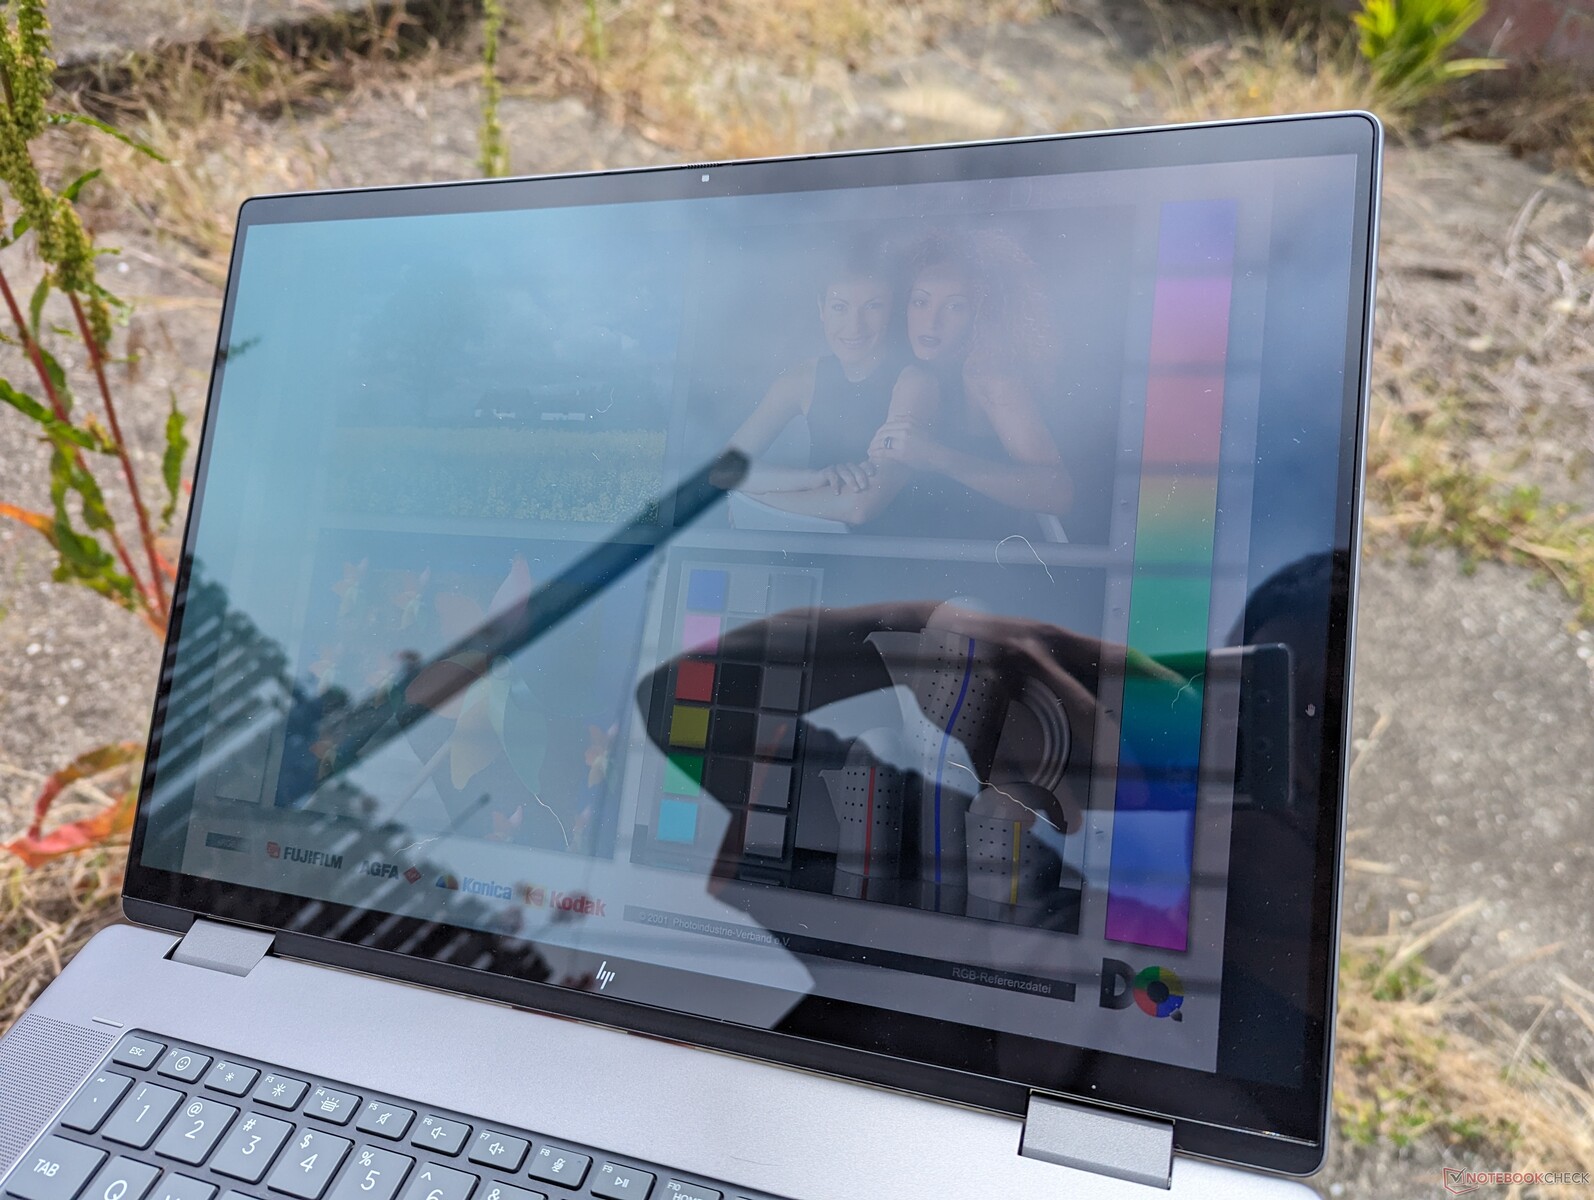
El deslumbramiento en la pantalla brillante es casi inevitable si se trabaja en exteriores. La retroiluminación no es lo suficientemente potente como para superar la iluminación ambiental, pero el resplandor aún puede reducirse a niveles más visibles si se está a la sombra.
Rendimiento - El Ryzen 7 8840HS no es necesariamente mejor que el Ryzen 7 7840HS
Condiciones de prueba
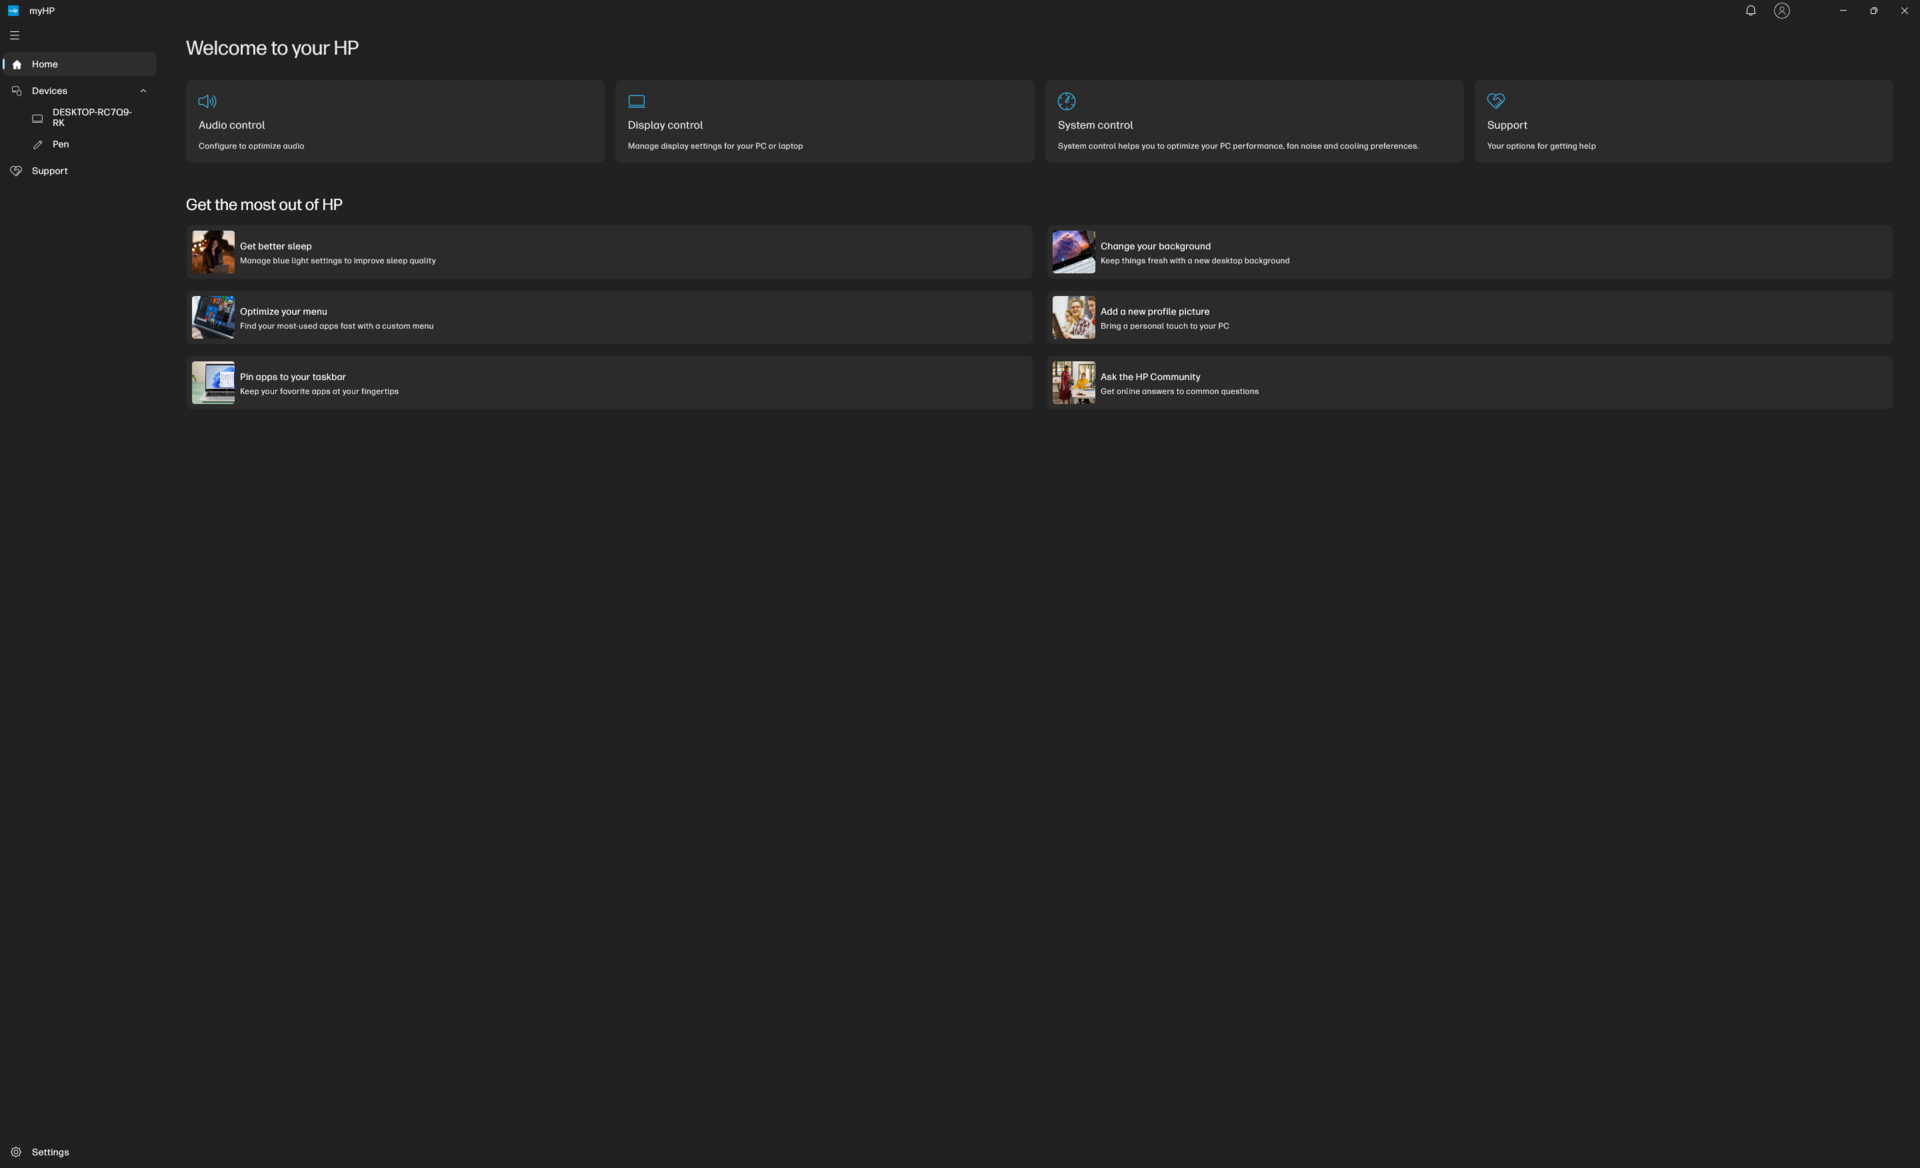
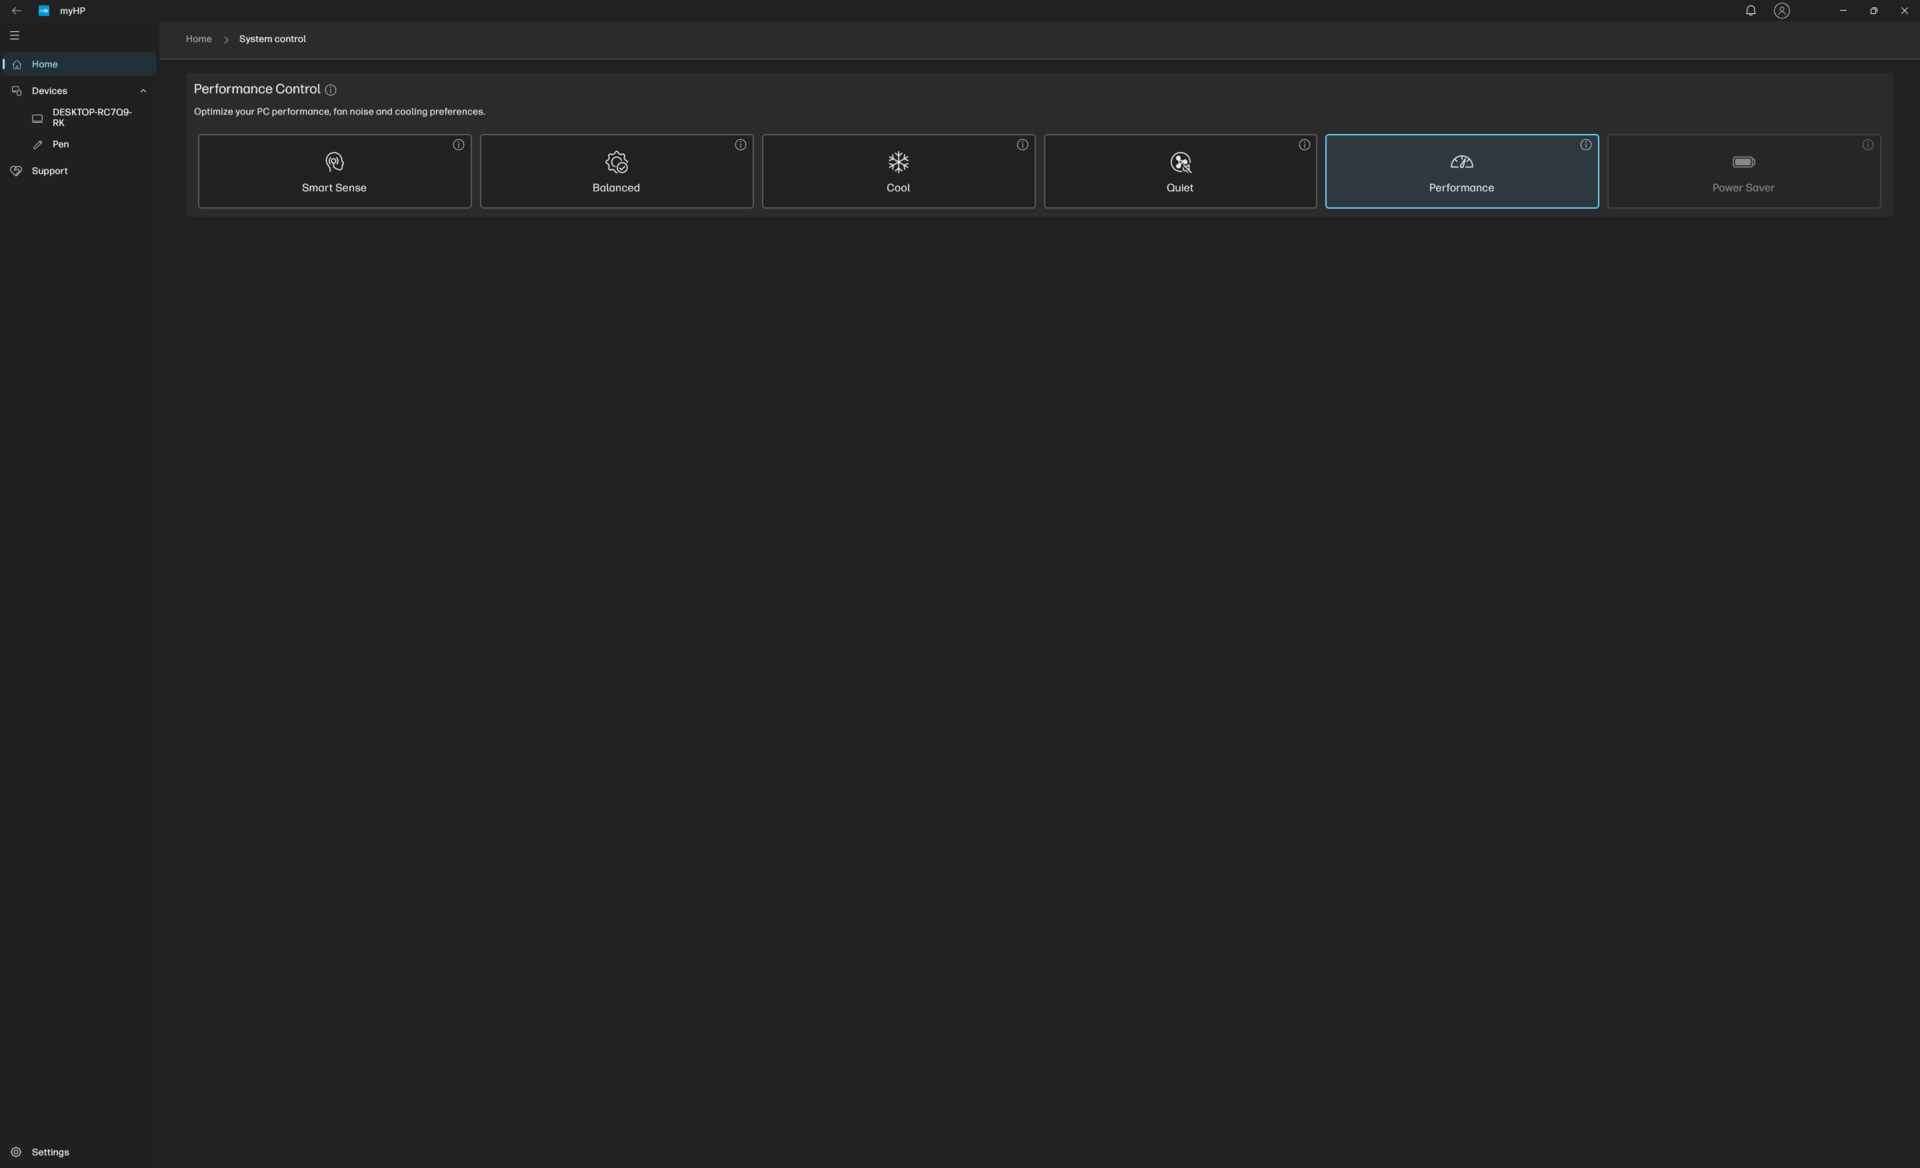
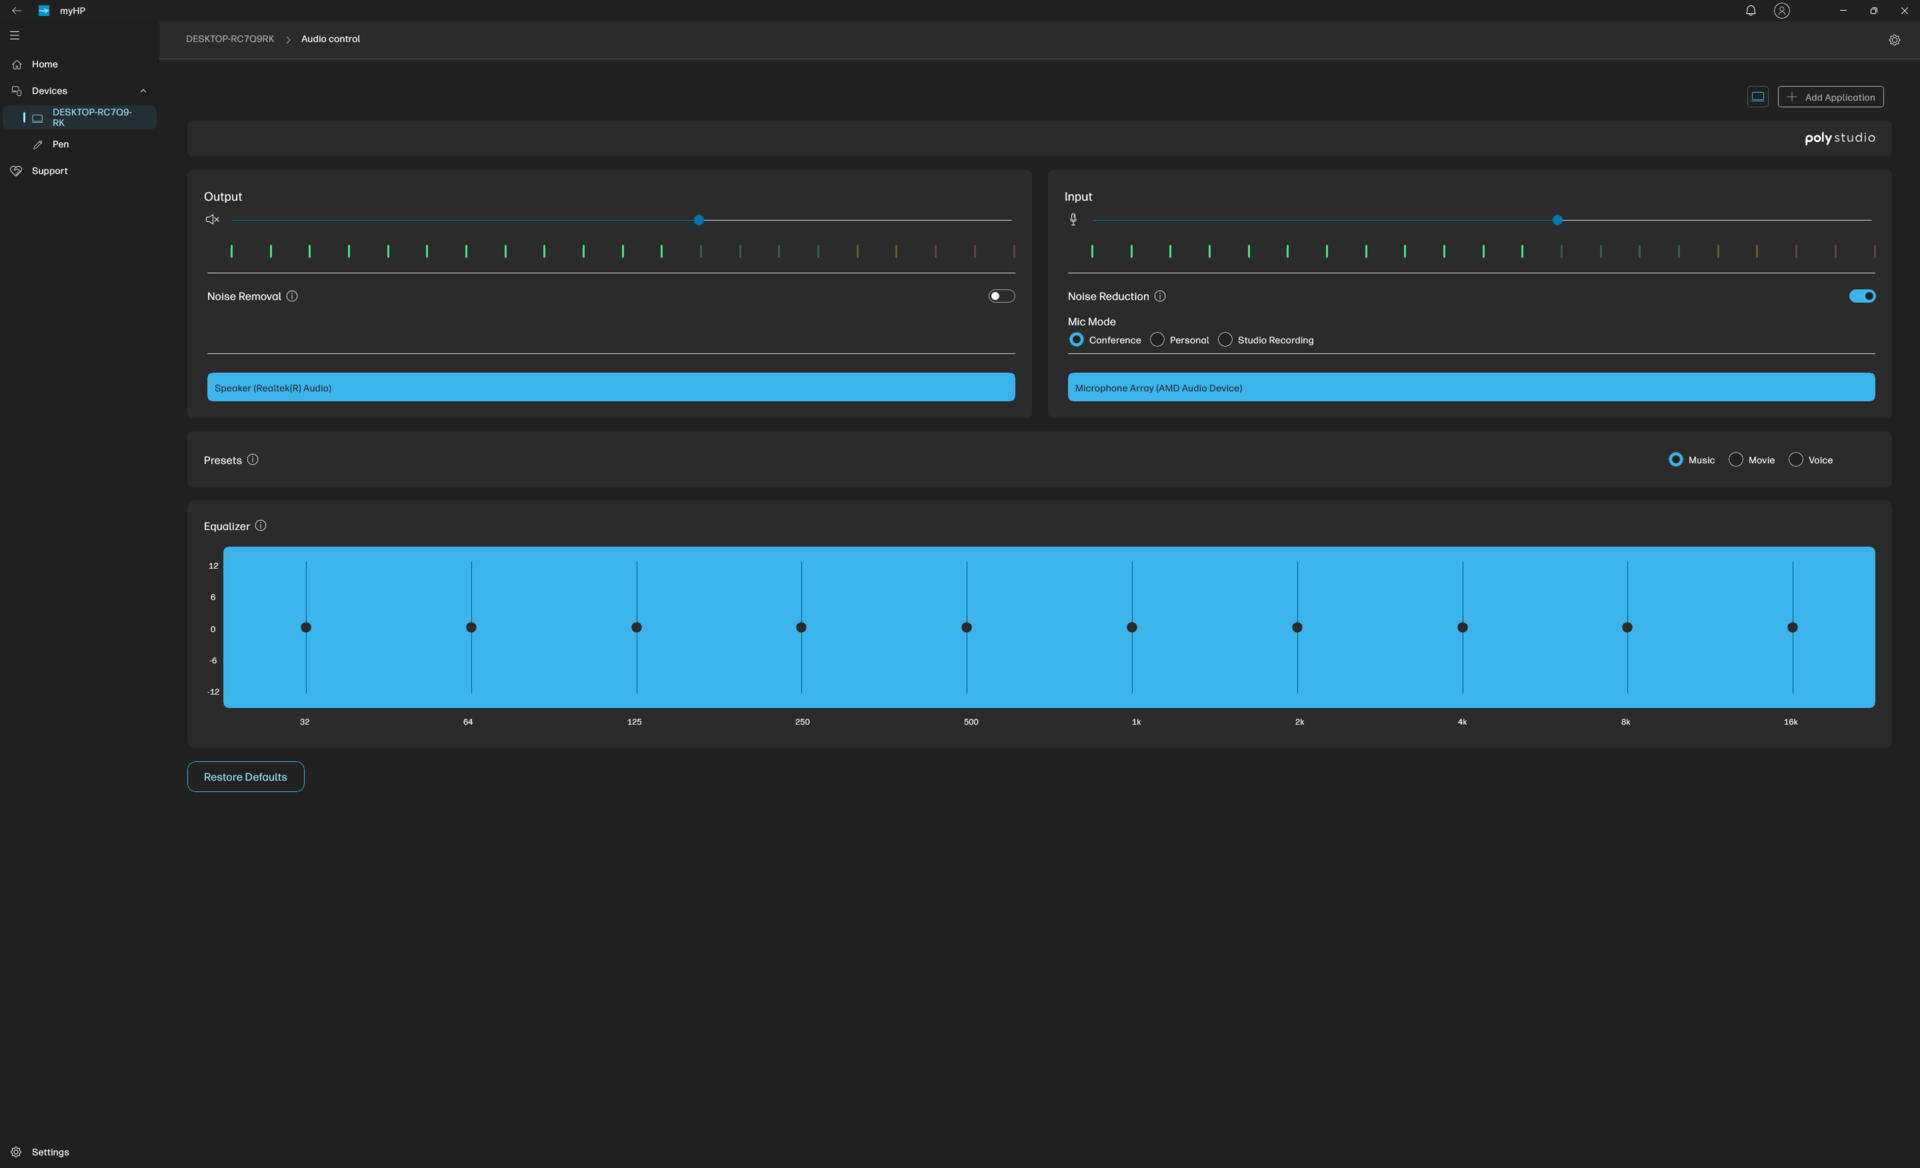
Ajustamos tanto MyHP como Windows al modo Rendimiento antes de ejecutar los puntos de referencia que se indican a continuación. Lamentablemente, el ajuste del perfil de energía a través de Windows no cambia automáticamente el perfil de energía en MyHP y viceversa. En comparación, los portátiles Dell le permiten sincronizar cómodamente diferentes conjuntos de perfiles de energía.
No cabe duda de que el software MyHP podría mejorar en términos de capacidad de respuesta y funciones. La propia aplicación se inicia muy lentamente y las opciones de pantalla palidecen en comparación con las opciones disponibles en los modelos Asus ZenBook/VivoBook OLED donde los usuarios pueden ajustar la temperatura del color, el nivel de luz azul, el protector de pantalla, la gama de colores y mucho más.
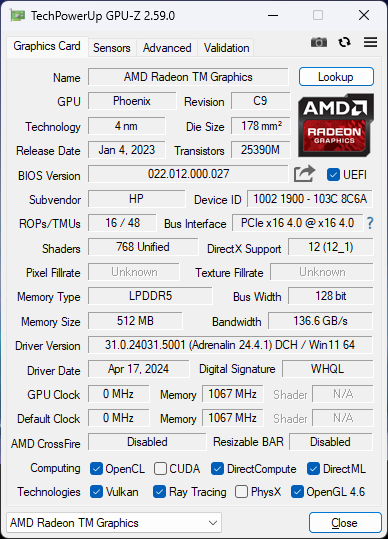
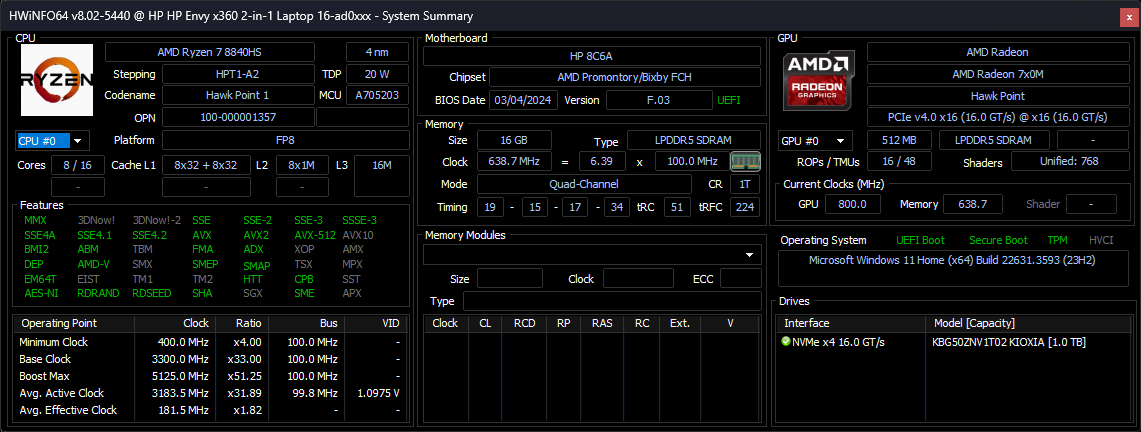
Procesador
El Ryzen 7 8840HS sustituye al Ryzen 7 7840HS que era una CPU móvil de clase gaming que se encontraba en portátiles de alto rendimiento como el Lenovo Legion Slim 7 16. Al igual que en la serie Meteor Lake de Intel, la nueva CPU de AMD integra una NPU para acelerar las aplicaciones locales de IA que se espera que se conviertan en habituales el año que viene.
Desafortunadamente, el rendimiento multihilo en bruto es más lento que el anterior Ryzen 7 7840HS en alrededor de un 15 a 20 por ciento, lo que no es insignificante. Se observó un déficit similar en el último Asus Zenbook 14 que también viene con la misma CPU que nuestro HP. El déficit puede atribuirse al menor rango de TDP de la nueva CPU (20 a 30 W frente a 35 a 54 W) y a la NPU "metida con calzador" que ocupa un valioso espacio en el troquel que de otro modo se habría reservado para funciones no relacionadas con la IA. Por lo tanto, el rendimiento general está más cerca del 12º gen Core i7-12700H que se encuentra en el 2022 Envy 16 clamshell.
El Ryzen 7 8840HS no es lento ni mucho menos, ya que sigue superando al Intel Core Ultra 5 125U y Ultra 7 155U Envy x360 16 en un 35 a 40 por ciento cada una. Sin embargo, para aprovechar realmente al máximo la CPU AMD, querrá ejecutar tareas locales de IA cuando estén más disponibles.
Cinebench R15 Multi Loop
Cinebench R23: Multi Core | Single Core
Cinebench R20: CPU (Multi Core) | CPU (Single Core)
Cinebench R15: CPU Multi 64Bit | CPU Single 64Bit
Blender: v2.79 BMW27 CPU
7-Zip 18.03: 7z b 4 | 7z b 4 -mmt1
Geekbench 6.7: Multi-Core | Single-Core
Geekbench 5.5: Multi-Core | Single-Core
HWBOT x265 Benchmark v2.2: 4k Preset
LibreOffice : 20 Documents To PDF
R Benchmark 2.5: Overall mean
* ... más pequeño es mejor
AIDA64: FP32 Ray-Trace | FPU Julia | CPU SHA3 | CPU Queen | FPU SinJulia | FPU Mandel | CPU AES | CPU ZLib | FP64 Ray-Trace | CPU PhotoWorxx
| Performance rating | |
| Medio AMD Ryzen 7 8840HS | |
| HP Envy x360 2-in-1 16-ad0097nr | |
| HP Spectre x360 16 RTX 4050 | |
| HP Envy 16 h0112nr | |
| LG Gram 2in1 16 16T90R - G.AA78G | |
| Samsung Galaxy Book4 Pro 360 | |
| Lenovo Yoga 7 2-in-1 16IML9 | |
| AIDA64 / FPU Julia | |
| Medio AMD Ryzen 7 8840HS (71472 - 93550, n=5) | |
| HP Envy x360 2-in-1 16-ad0097nr | |
| HP Spectre x360 16 RTX 4050 | |
| HP Envy 16 h0112nr | |
| LG Gram 2in1 16 16T90R - G.AA78G | |
| Lenovo Yoga 7 2-in-1 16IML9 | |
| Samsung Galaxy Book4 Pro 360 | |
| AIDA64 / CPU SHA3 | |
| Medio AMD Ryzen 7 8840HS (3559 - 4132, n=5) | |
| HP Envy x360 2-in-1 16-ad0097nr | |
| HP Spectre x360 16 RTX 4050 | |
| HP Envy 16 h0112nr | |
| LG Gram 2in1 16 16T90R - G.AA78G | |
| Lenovo Yoga 7 2-in-1 16IML9 | |
| Samsung Galaxy Book4 Pro 360 | |
| AIDA64 / CPU Queen | |
| HP Envy x360 2-in-1 16-ad0097nr | |
| Medio AMD Ryzen 7 8840HS (90515 - 111581, n=5) | |
| HP Envy 16 h0112nr | |
| LG Gram 2in1 16 16T90R - G.AA78G | |
| HP Spectre x360 16 RTX 4050 | |
| Samsung Galaxy Book4 Pro 360 | |
| Lenovo Yoga 7 2-in-1 16IML9 | |
| AIDA64 / FPU SinJulia | |
| Medio AMD Ryzen 7 8840HS (12168 - 13731, n=5) | |
| HP Envy x360 2-in-1 16-ad0097nr | |
| HP Spectre x360 16 RTX 4050 | |
| HP Envy 16 h0112nr | |
| Samsung Galaxy Book4 Pro 360 | |
| LG Gram 2in1 16 16T90R - G.AA78G | |
| Lenovo Yoga 7 2-in-1 16IML9 | |
| AIDA64 / FPU Mandel | |
| Medio AMD Ryzen 7 8840HS (38404 - 49687, n=5) | |
| HP Envy x360 2-in-1 16-ad0097nr | |
| HP Spectre x360 16 RTX 4050 | |
| HP Envy 16 h0112nr | |
| LG Gram 2in1 16 16T90R - G.AA78G | |
| Lenovo Yoga 7 2-in-1 16IML9 | |
| Samsung Galaxy Book4 Pro 360 | |
| AIDA64 / CPU ZLib | |
| HP Spectre x360 16 RTX 4050 | |
| HP Envy x360 2-in-1 16-ad0097nr | |
| HP Envy 16 h0112nr | |
| Medio AMD Ryzen 7 8840HS (468 - 930, n=5) | |
| LG Gram 2in1 16 16T90R - G.AA78G | |
| Lenovo Yoga 7 2-in-1 16IML9 | |
| Samsung Galaxy Book4 Pro 360 | |
| AIDA64 / FP64 Ray-Trace | |
| Medio AMD Ryzen 7 8840HS (9368 - 11880, n=5) | |
| HP Envy x360 2-in-1 16-ad0097nr | |
| HP Spectre x360 16 RTX 4050 | |
| HP Envy 16 h0112nr | |
| LG Gram 2in1 16 16T90R - G.AA78G | |
| Samsung Galaxy Book4 Pro 360 | |
| Lenovo Yoga 7 2-in-1 16IML9 | |
| AIDA64 / CPU PhotoWorxx | |
| HP Spectre x360 16 RTX 4050 | |
| Lenovo Yoga 7 2-in-1 16IML9 | |
| Samsung Galaxy Book4 Pro 360 | |
| LG Gram 2in1 16 16T90R - G.AA78G | |
| HP Envy 16 h0112nr | |
| Medio AMD Ryzen 7 8840HS (31491 - 35861, n=5) | |
| HP Envy x360 2-in-1 16-ad0097nr | |
Prueba de estrés
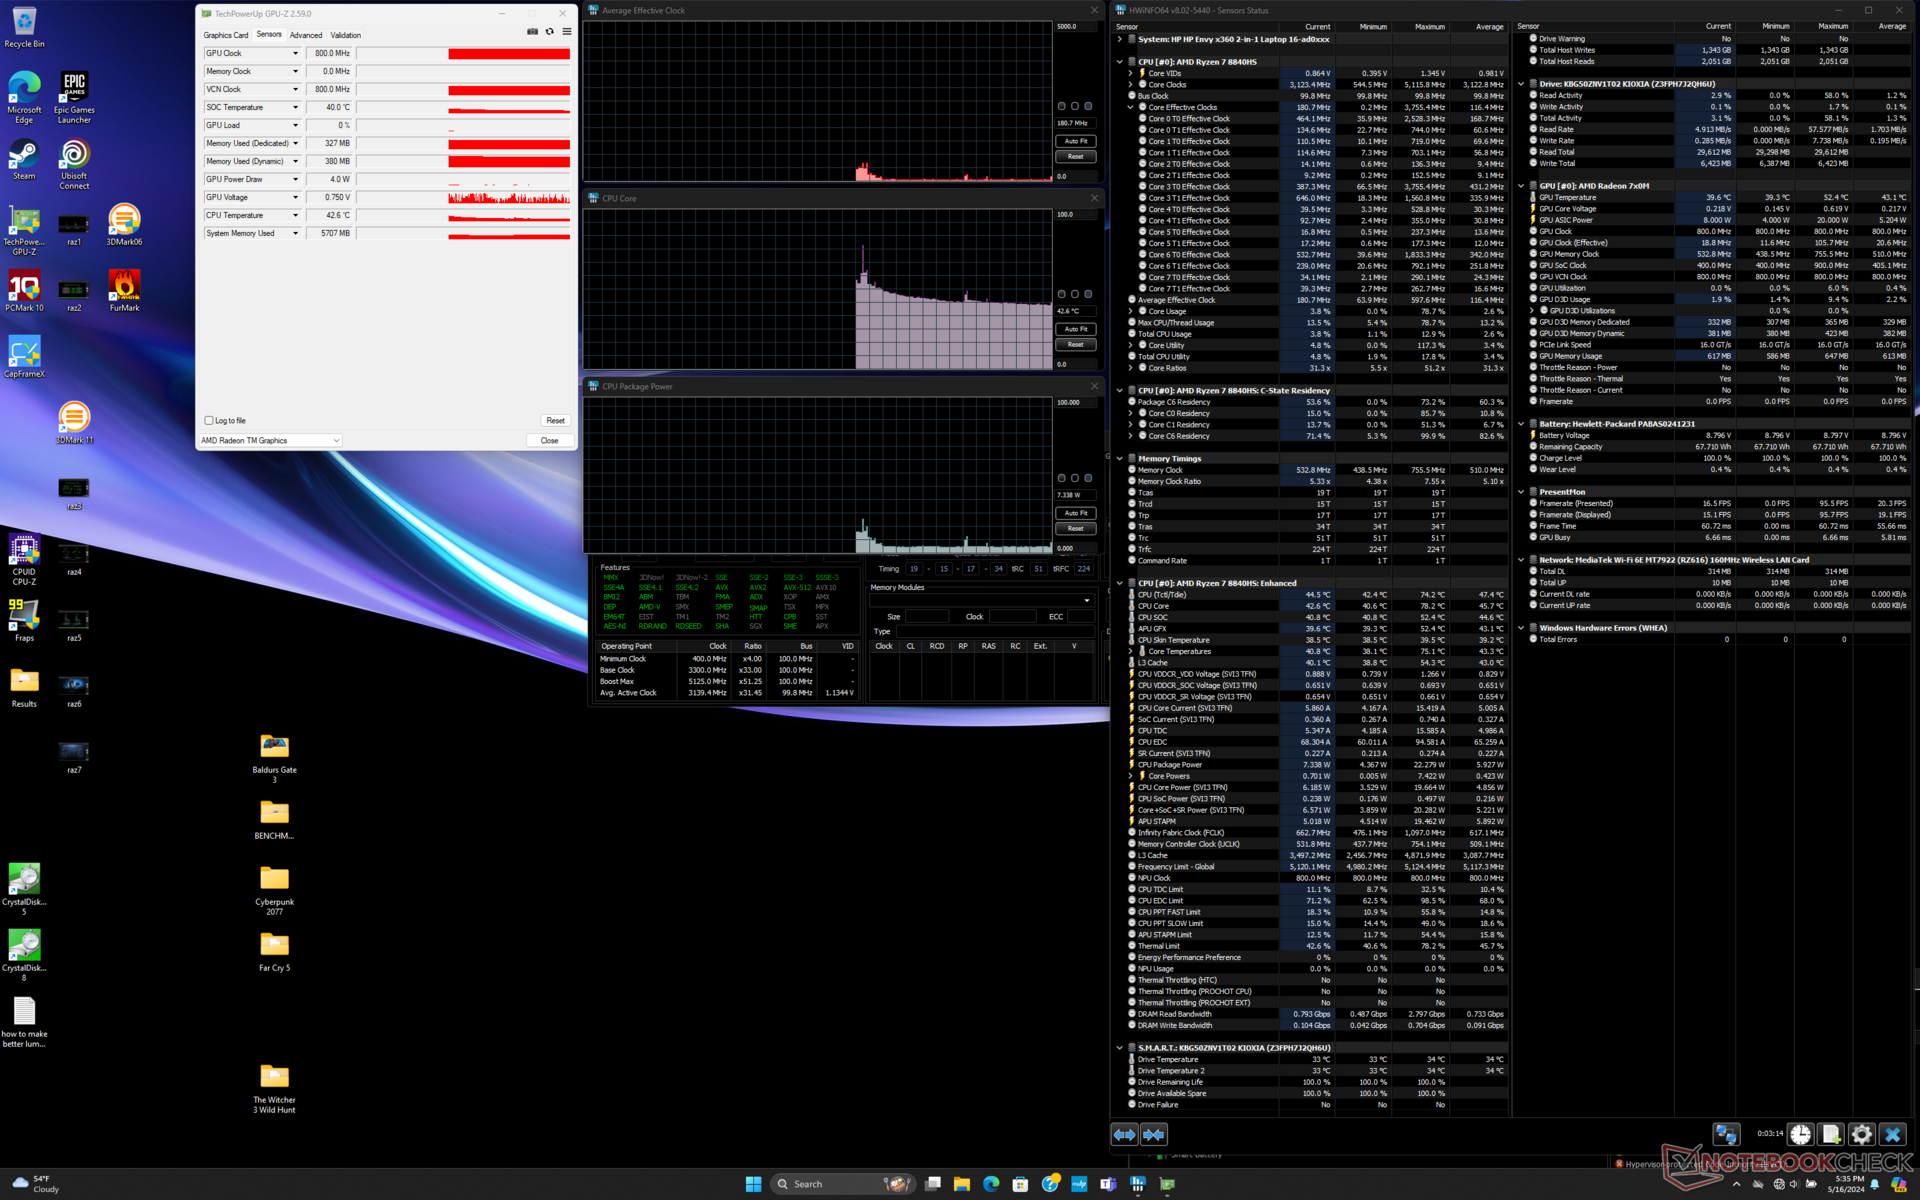
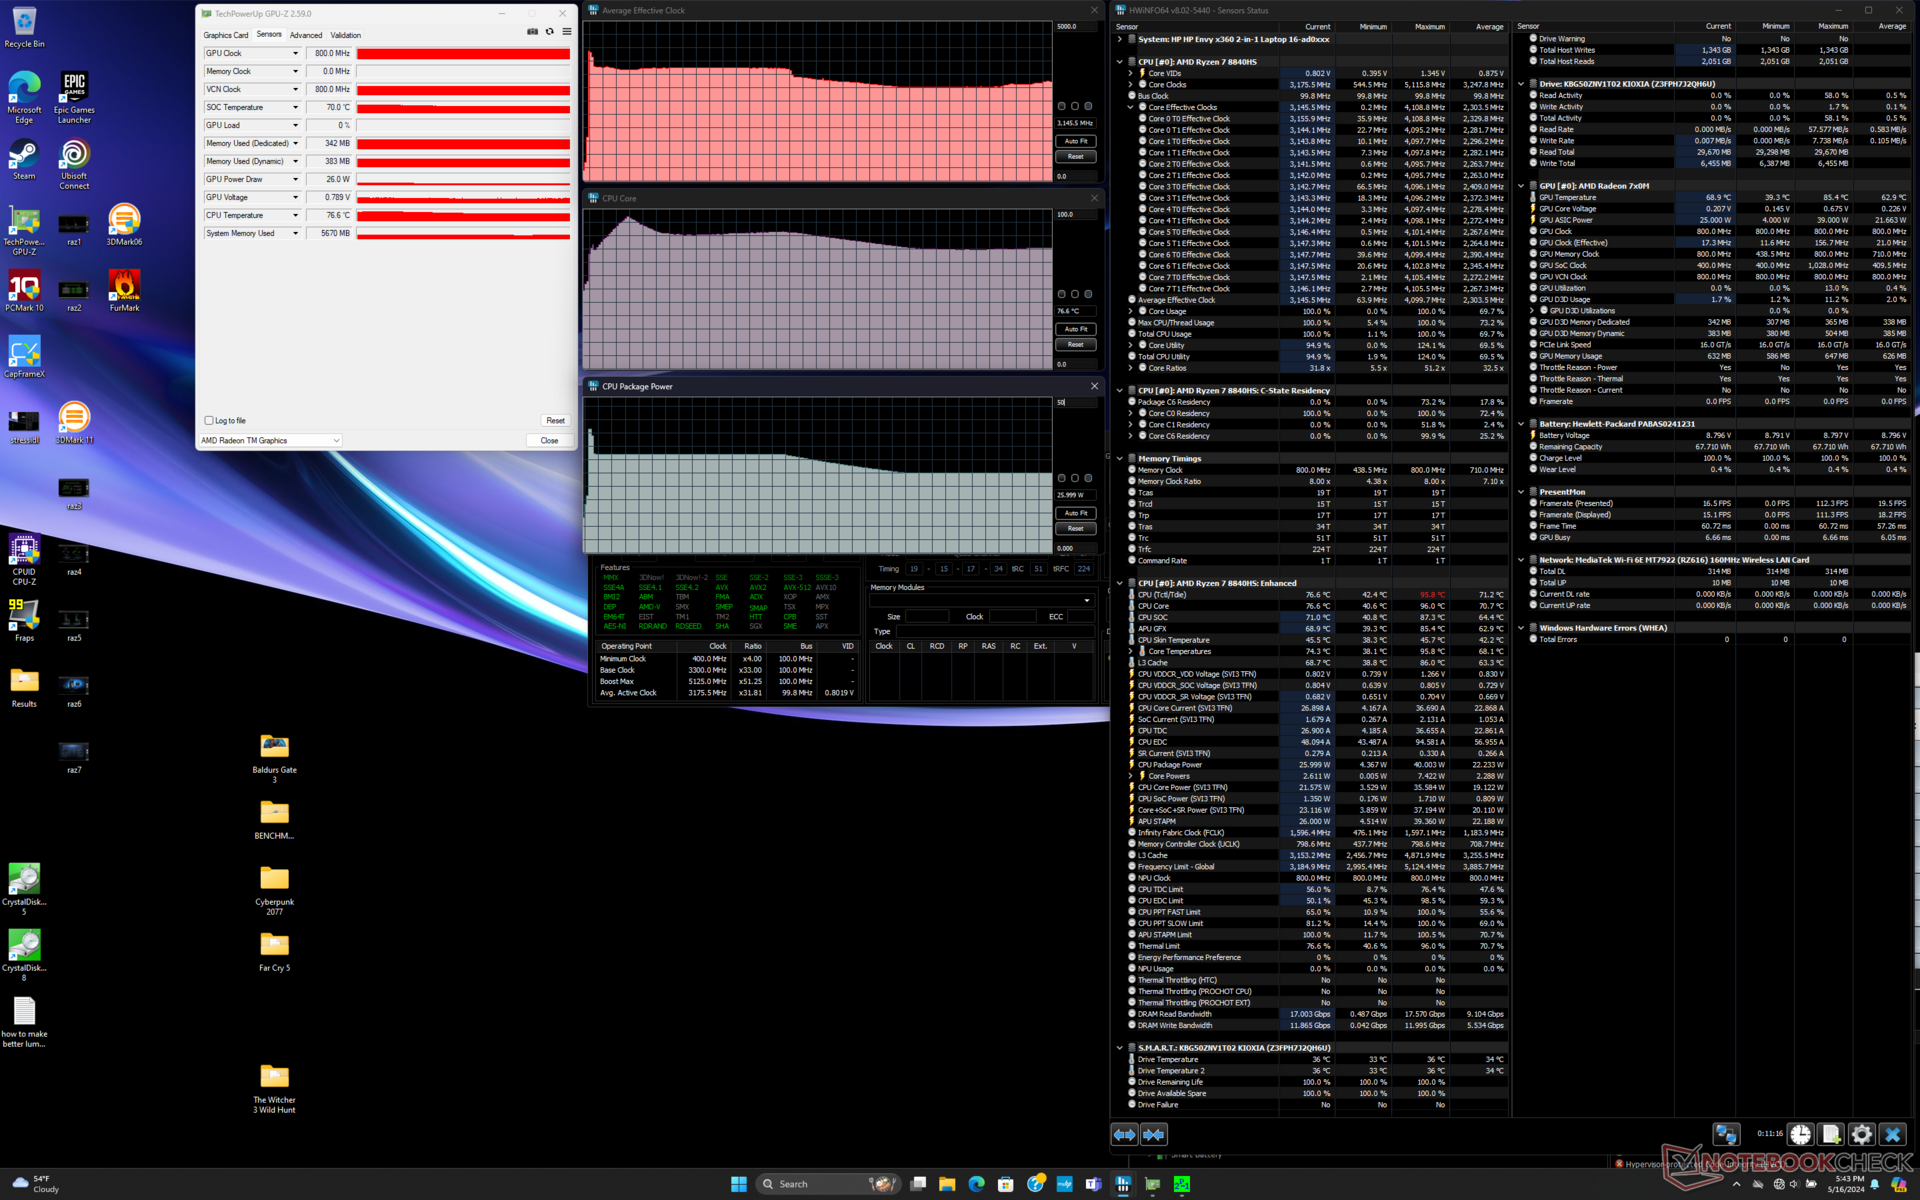
Ejecutar Prime95 hace que la CPU se dispare a 4,1 GHz y 40 W sólo durante el primer par de segundos antes de caer a 3,4 GHz y 32 W. Después de varios minutos, esto caería aún más a 3,1 GHz y 26 W para sugerir una sostenibilidad limitada de Turbo Core. La CPU Intel Core Ultra 7 en la Spectre x360 16 se estabilizaría a la misma temperatura que nuestra Envy x360 16 potenciada por AMD a 76 C quizás por coincidencia.
Ejecutando Witcher 3 en modo Rendimiento daría como resultado una temperatura estable de la CPU y una velocidad de reloj de la GPU de 68 C y 2180 MHz, respectivamente, en comparación con sólo 61 C y 1785 MHz cuando está en modo Equilibrado. Las diferencias coinciden con nuestros resultados de Fire Strike y las observaciones del ruido del ventilador entre los dos perfiles de potencia. La potencia del paquete de la CPU también se ve afectada, pasando de 26 W en el modo Rendimiento a 20 W en el modo Equilibrado.
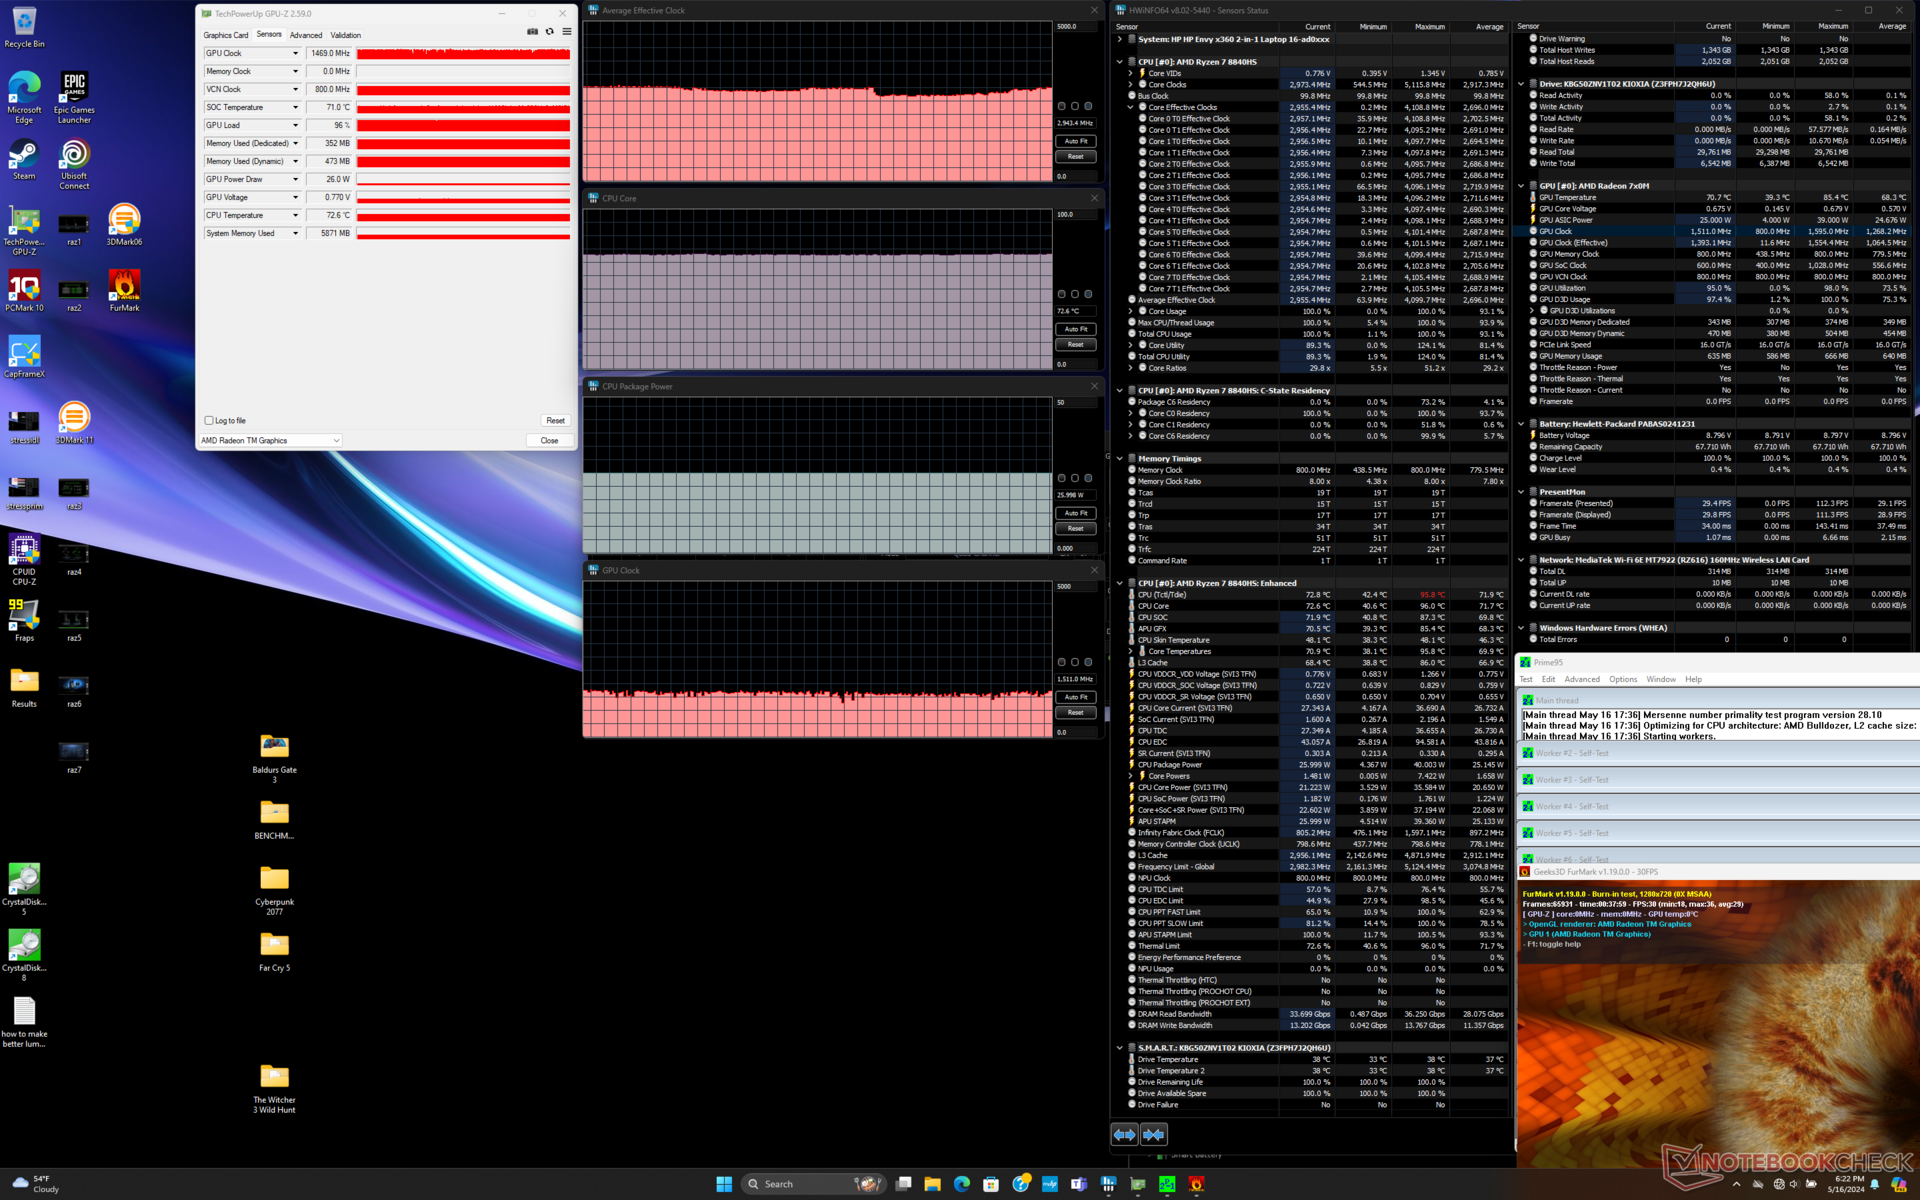
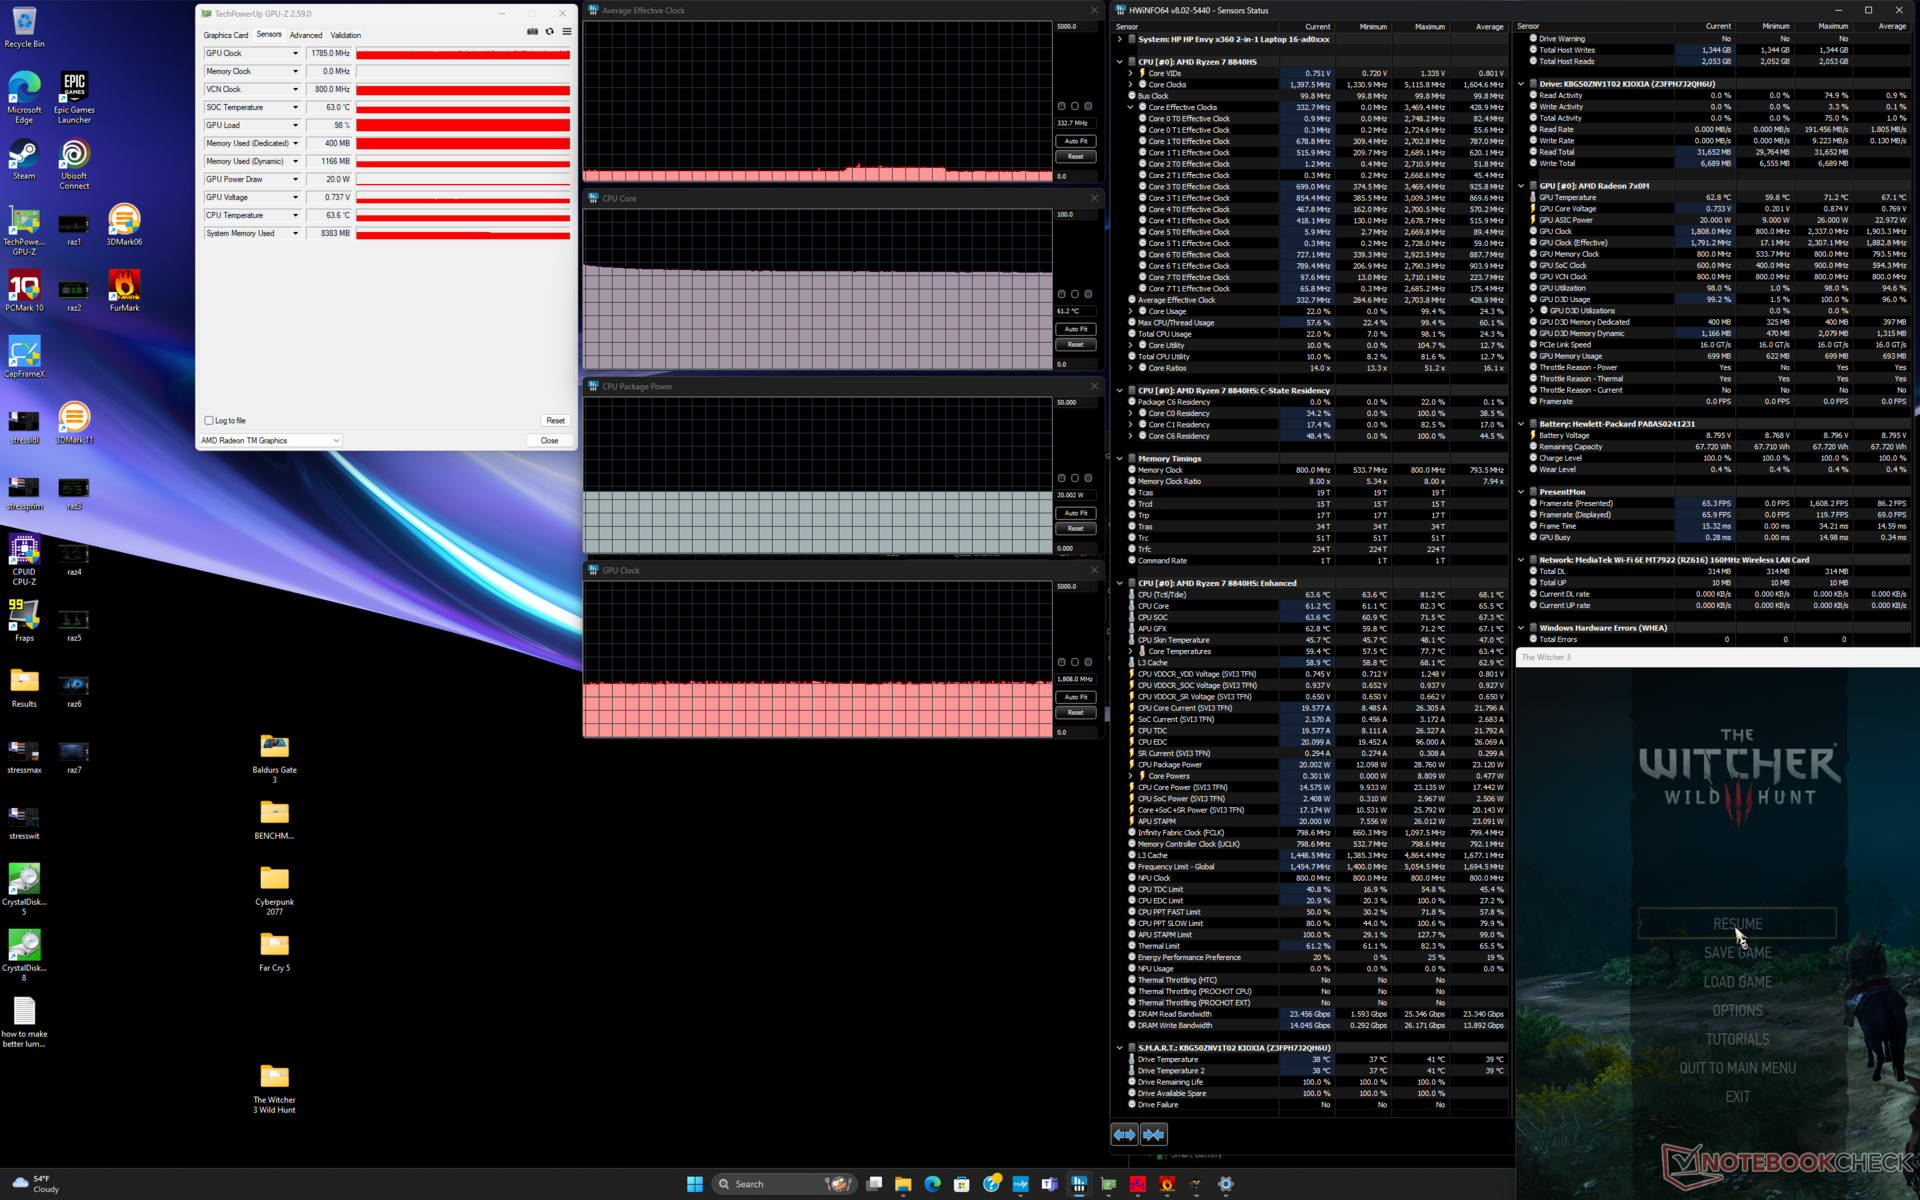
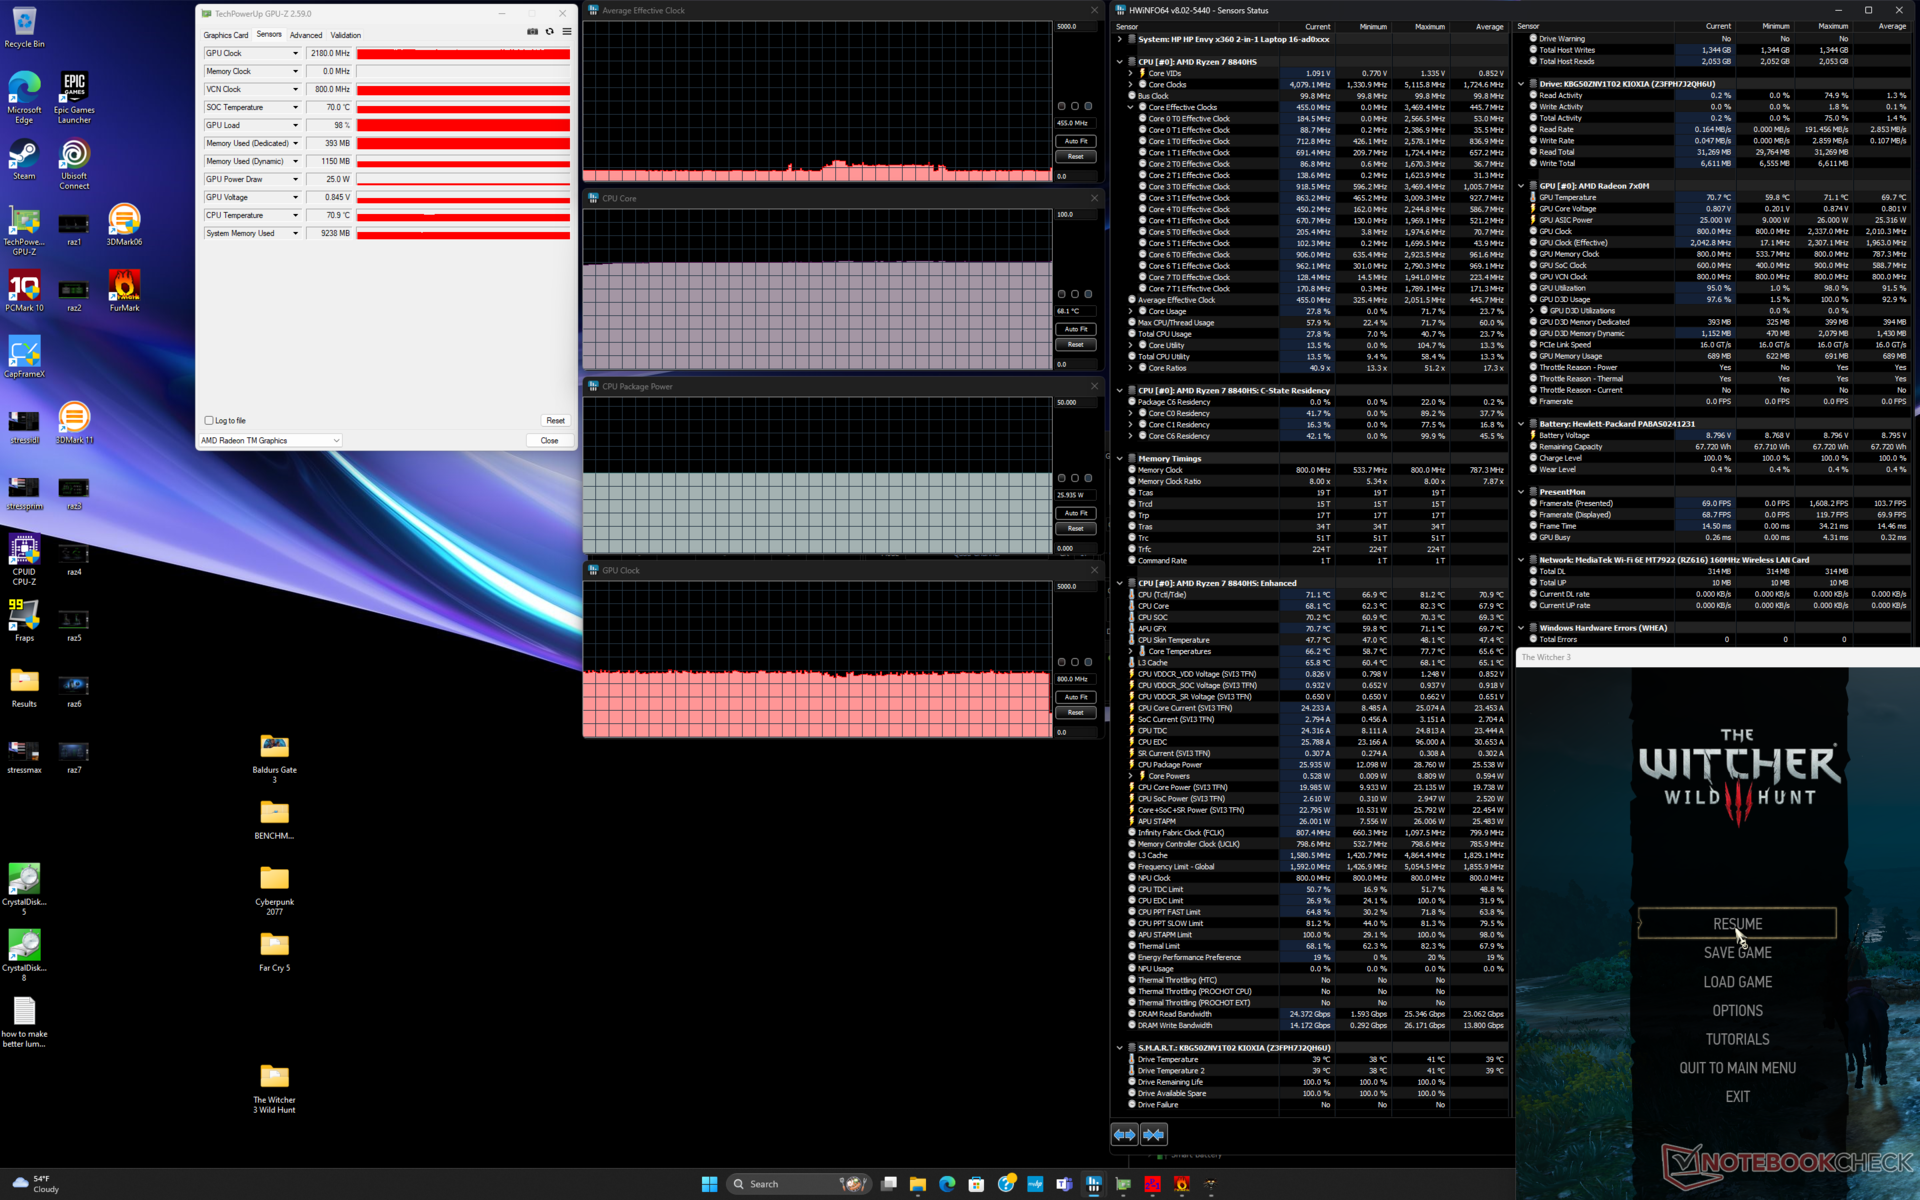
| Reloj medio de la CPU (GHz) | Reloj de la GPU (MHz) | Temperatura media de la CPU (°C) | |
| Sistema en reposo | -- | -- | 42 |
| Prime95 Stress | 3.1 | -- | 77 |
| Estrés Prime95+ FurMark | 2.9 | 1469 | 73 |
| Witcher 3 Estrés (modoequilibrado) | ~0,3 | 1785 | 61 |
| Witcher 3 Estrés (modoRendimiento) | ~0,5 | 2180 | 68 |
Rendimiento del sistema
Las puntuaciones de PCMark están muy por encima de las del año pasado Envy x360 15 especialmente en las subpruebas de Productividad y Creación de Contenidos Digitales, donde la potencia bruta de la CPU y la GPU realmente importan. El Envy x360 16 obtiene una puntuación media entre el Envy x360 15 y el Spectre x360 16.

CrossMark: Overall | Productivity | Creativity | Responsiveness
WebXPRT 3: Overall
WebXPRT 4: Overall
Mozilla Kraken 1.1: Total
| PCMark 10 / Score | |
| HP Envy 16 h0112nr | |
| Medio AMD Ryzen 7 8840HS, AMD Radeon 780M (6775 - 7213, n=5) | |
| HP Envy x360 2-in-1 16-ad0097nr | |
| HP Spectre x360 16 RTX 4050 | |
| Samsung Galaxy Book4 Pro 360 | |
| Lenovo Yoga 7 2-in-1 16IML9 | |
| LG Gram 2in1 16 16T90R - G.AA78G | |
| PCMark 10 / Essentials | |
| HP Envy 16 h0112nr | |
| LG Gram 2in1 16 16T90R - G.AA78G | |
| Lenovo Yoga 7 2-in-1 16IML9 | |
| Medio AMD Ryzen 7 8840HS, AMD Radeon 780M (10178 - 11449, n=5) | |
| Samsung Galaxy Book4 Pro 360 | |
| HP Envy x360 2-in-1 16-ad0097nr | |
| HP Spectre x360 16 RTX 4050 | |
| PCMark 10 / Productivity | |
| Medio AMD Ryzen 7 8840HS, AMD Radeon 780M (9706 - 10449, n=5) | |
| HP Envy x360 2-in-1 16-ad0097nr | |
| HP Spectre x360 16 RTX 4050 | |
| HP Envy 16 h0112nr | |
| Samsung Galaxy Book4 Pro 360 | |
| Lenovo Yoga 7 2-in-1 16IML9 | |
| LG Gram 2in1 16 16T90R - G.AA78G | |
| PCMark 10 / Digital Content Creation | |
| HP Envy 16 h0112nr | |
| Medio AMD Ryzen 7 8840HS, AMD Radeon 780M (8519 - 9163, n=5) | |
| HP Envy x360 2-in-1 16-ad0097nr | |
| HP Spectre x360 16 RTX 4050 | |
| Samsung Galaxy Book4 Pro 360 | |
| LG Gram 2in1 16 16T90R - G.AA78G | |
| Lenovo Yoga 7 2-in-1 16IML9 | |
| CrossMark / Overall | |
| HP Envy 16 h0112nr | |
| Medio AMD Ryzen 7 8840HS, AMD Radeon 780M (1643 - 1698, n=5) | |
| Lenovo Yoga 7 2-in-1 16IML9 | |
| HP Envy x360 2-in-1 16-ad0097nr | |
| Samsung Galaxy Book4 Pro 360 | |
| HP Spectre x360 16 RTX 4050 | |
| LG Gram 2in1 16 16T90R - G.AA78G | |
| CrossMark / Productivity | |
| HP Envy 16 h0112nr | |
| Medio AMD Ryzen 7 8840HS, AMD Radeon 780M (1605 - 1666, n=5) | |
| HP Envy x360 2-in-1 16-ad0097nr | |
| Samsung Galaxy Book4 Pro 360 | |
| LG Gram 2in1 16 16T90R - G.AA78G | |
| HP Spectre x360 16 RTX 4050 | |
| Lenovo Yoga 7 2-in-1 16IML9 | |
| CrossMark / Creativity | |
| HP Envy 16 h0112nr | |
| HP Spectre x360 16 RTX 4050 | |
| Medio AMD Ryzen 7 8840HS, AMD Radeon 780M (1739 - 1863, n=5) | |
| HP Envy x360 2-in-1 16-ad0097nr | |
| Samsung Galaxy Book4 Pro 360 | |
| LG Gram 2in1 16 16T90R - G.AA78G | |
| Lenovo Yoga 7 2-in-1 16IML9 | |
| CrossMark / Responsiveness | |
| HP Envy 16 h0112nr | |
| LG Gram 2in1 16 16T90R - G.AA78G | |
| Samsung Galaxy Book4 Pro 360 | |
| Medio AMD Ryzen 7 8840HS, AMD Radeon 780M (1334 - 1498, n=5) | |
| HP Envy x360 2-in-1 16-ad0097nr | |
| HP Spectre x360 16 RTX 4050 | |
| Lenovo Yoga 7 2-in-1 16IML9 | |
| WebXPRT 3 / Overall | |
| Medio AMD Ryzen 7 8840HS, AMD Radeon 780M (297 - 440, n=5) | |
| HP Envy 16 h0112nr | |
| HP Envy x360 2-in-1 16-ad0097nr | |
| HP Spectre x360 16 RTX 4050 | |
| Samsung Galaxy Book4 Pro 360 | |
| LG Gram 2in1 16 16T90R - G.AA78G | |
| Lenovo Yoga 7 2-in-1 16IML9 | |
| WebXPRT 4 / Overall | |
| HP Envy 16 h0112nr | |
| HP Spectre x360 16 RTX 4050 | |
| Medio AMD Ryzen 7 8840HS, AMD Radeon 780M (246 - 257, n=5) | |
| HP Envy x360 2-in-1 16-ad0097nr | |
| Samsung Galaxy Book4 Pro 360 | |
| Lenovo Yoga 7 2-in-1 16IML9 | |
| Mozilla Kraken 1.1 / Total | |
| LG Gram 2in1 16 16T90R - G.AA78G | |
| Lenovo Yoga 7 2-in-1 16IML9 | |
| Samsung Galaxy Book4 Pro 360 | |
| HP Envy x360 2-in-1 16-ad0097nr | |
| HP Spectre x360 16 RTX 4050 | |
| Medio AMD Ryzen 7 8840HS, AMD Radeon 780M (518 - 563, n=5) | |
| HP Envy 16 h0112nr | |
* ... más pequeño es mejor
| PCMark 10 Score | 6958 puntos | |
ayuda | ||
| AIDA64 / Memory Copy | |
| Samsung Galaxy Book4 Pro 360 | |
| HP Spectre x360 16 RTX 4050 | |
| Lenovo Yoga 7 2-in-1 16IML9 | |
| HP Envy x360 2-in-1 16-ad0097nr | |
| Medio AMD Ryzen 7 8840HS (62098 - 76766, n=5) | |
| LG Gram 2in1 16 16T90R - G.AA78G | |
| HP Envy 16 h0112nr | |
| AIDA64 / Memory Read | |
| HP Spectre x360 16 RTX 4050 | |
| Samsung Galaxy Book4 Pro 360 | |
| HP Envy 16 h0112nr | |
| Lenovo Yoga 7 2-in-1 16IML9 | |
| Medio AMD Ryzen 7 8840HS (50273 - 61739, n=5) | |
| LG Gram 2in1 16 16T90R - G.AA78G | |
| HP Envy x360 2-in-1 16-ad0097nr | |
| AIDA64 / Memory Write | |
| HP Spectre x360 16 RTX 4050 | |
| HP Envy x360 2-in-1 16-ad0097nr | |
| Medio AMD Ryzen 7 8840HS (78025 - 107658, n=5) | |
| LG Gram 2in1 16 16T90R - G.AA78G | |
| Samsung Galaxy Book4 Pro 360 | |
| Lenovo Yoga 7 2-in-1 16IML9 | |
| HP Envy 16 h0112nr | |
| AIDA64 / Memory Latency | |
| Lenovo Yoga 7 2-in-1 16IML9 | |
| HP Spectre x360 16 RTX 4050 | |
| Samsung Galaxy Book4 Pro 360 | |
| HP Envy x360 2-in-1 16-ad0097nr | |
| LG Gram 2in1 16 16T90R - G.AA78G | |
| Medio AMD Ryzen 7 8840HS (91 - 122.4, n=5) | |
| HP Envy 16 h0112nr | |
* ... más pequeño es mejor
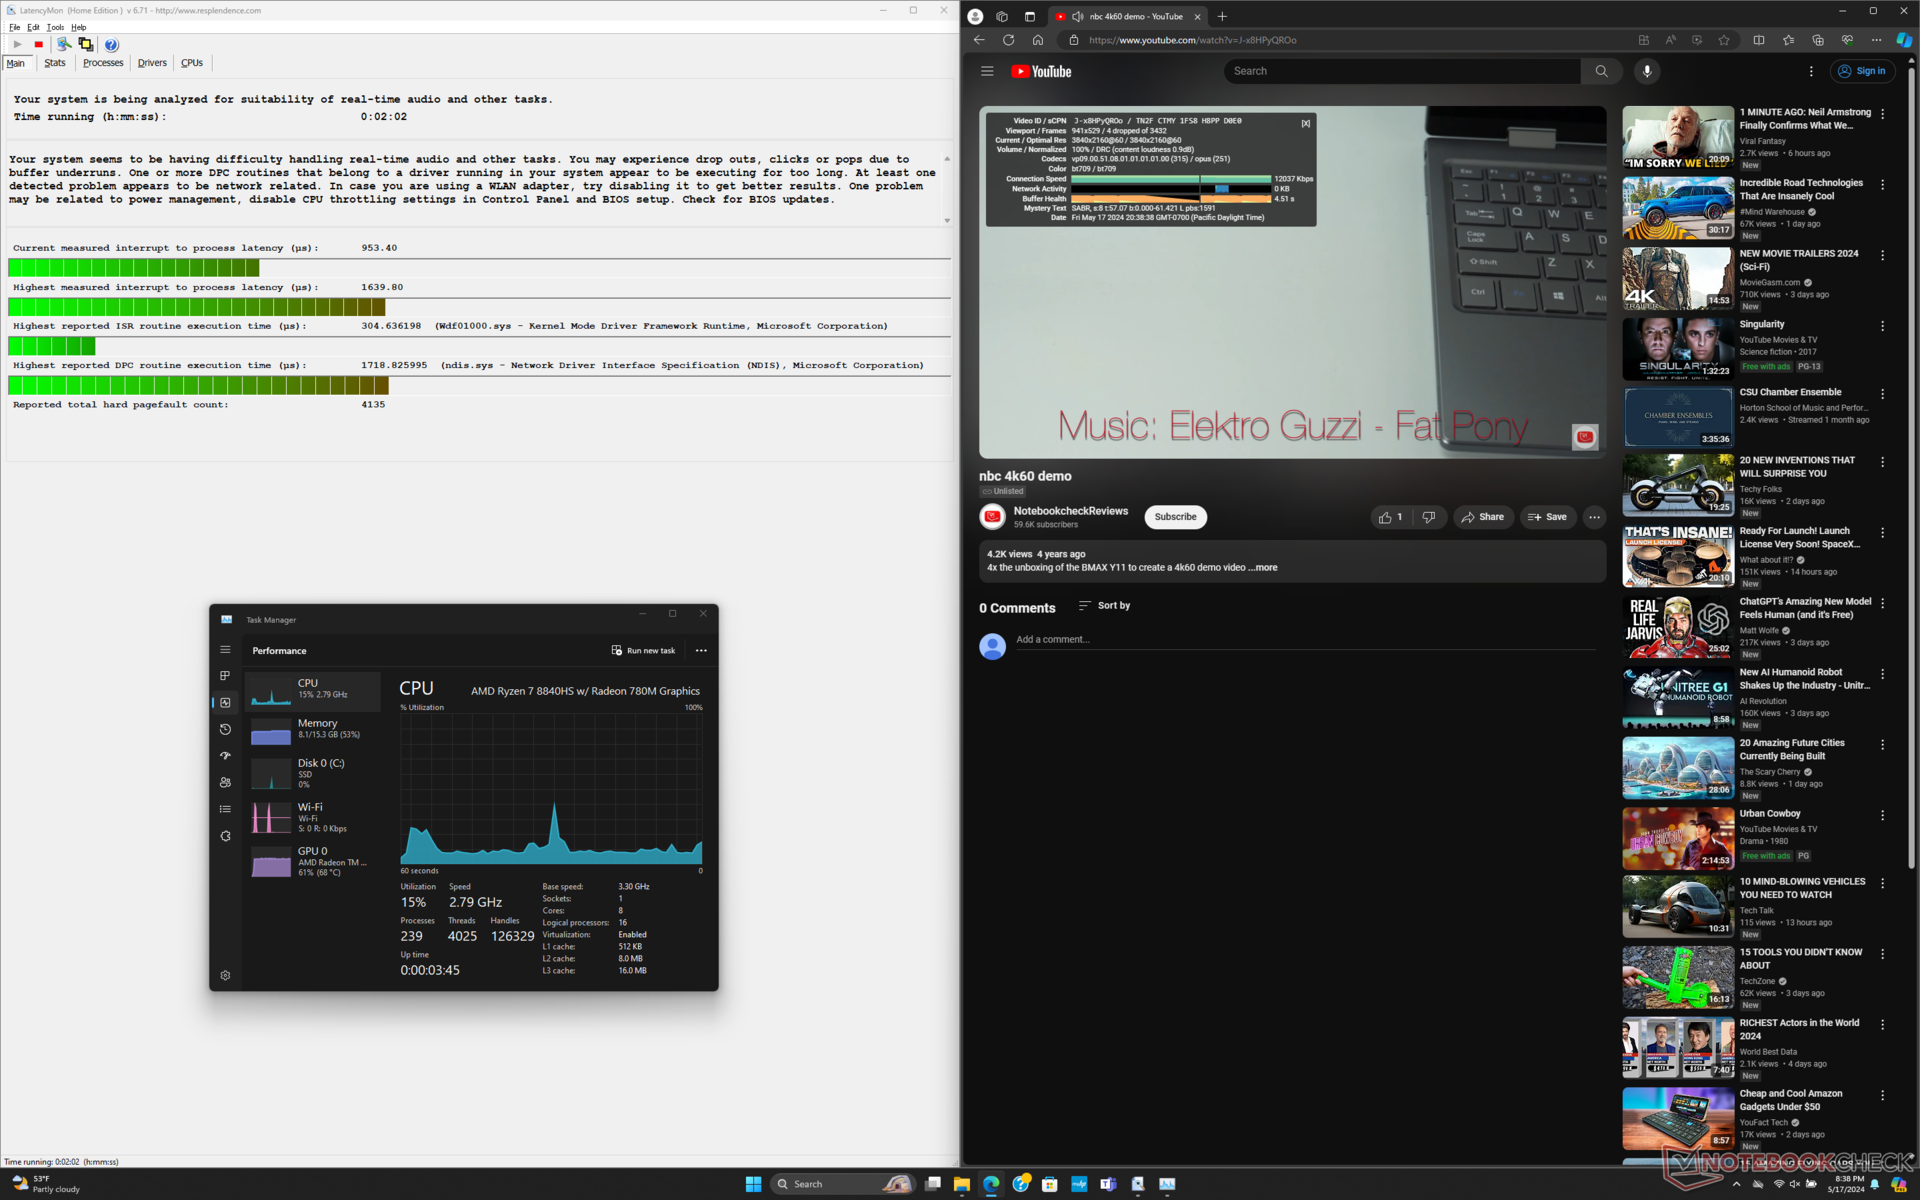
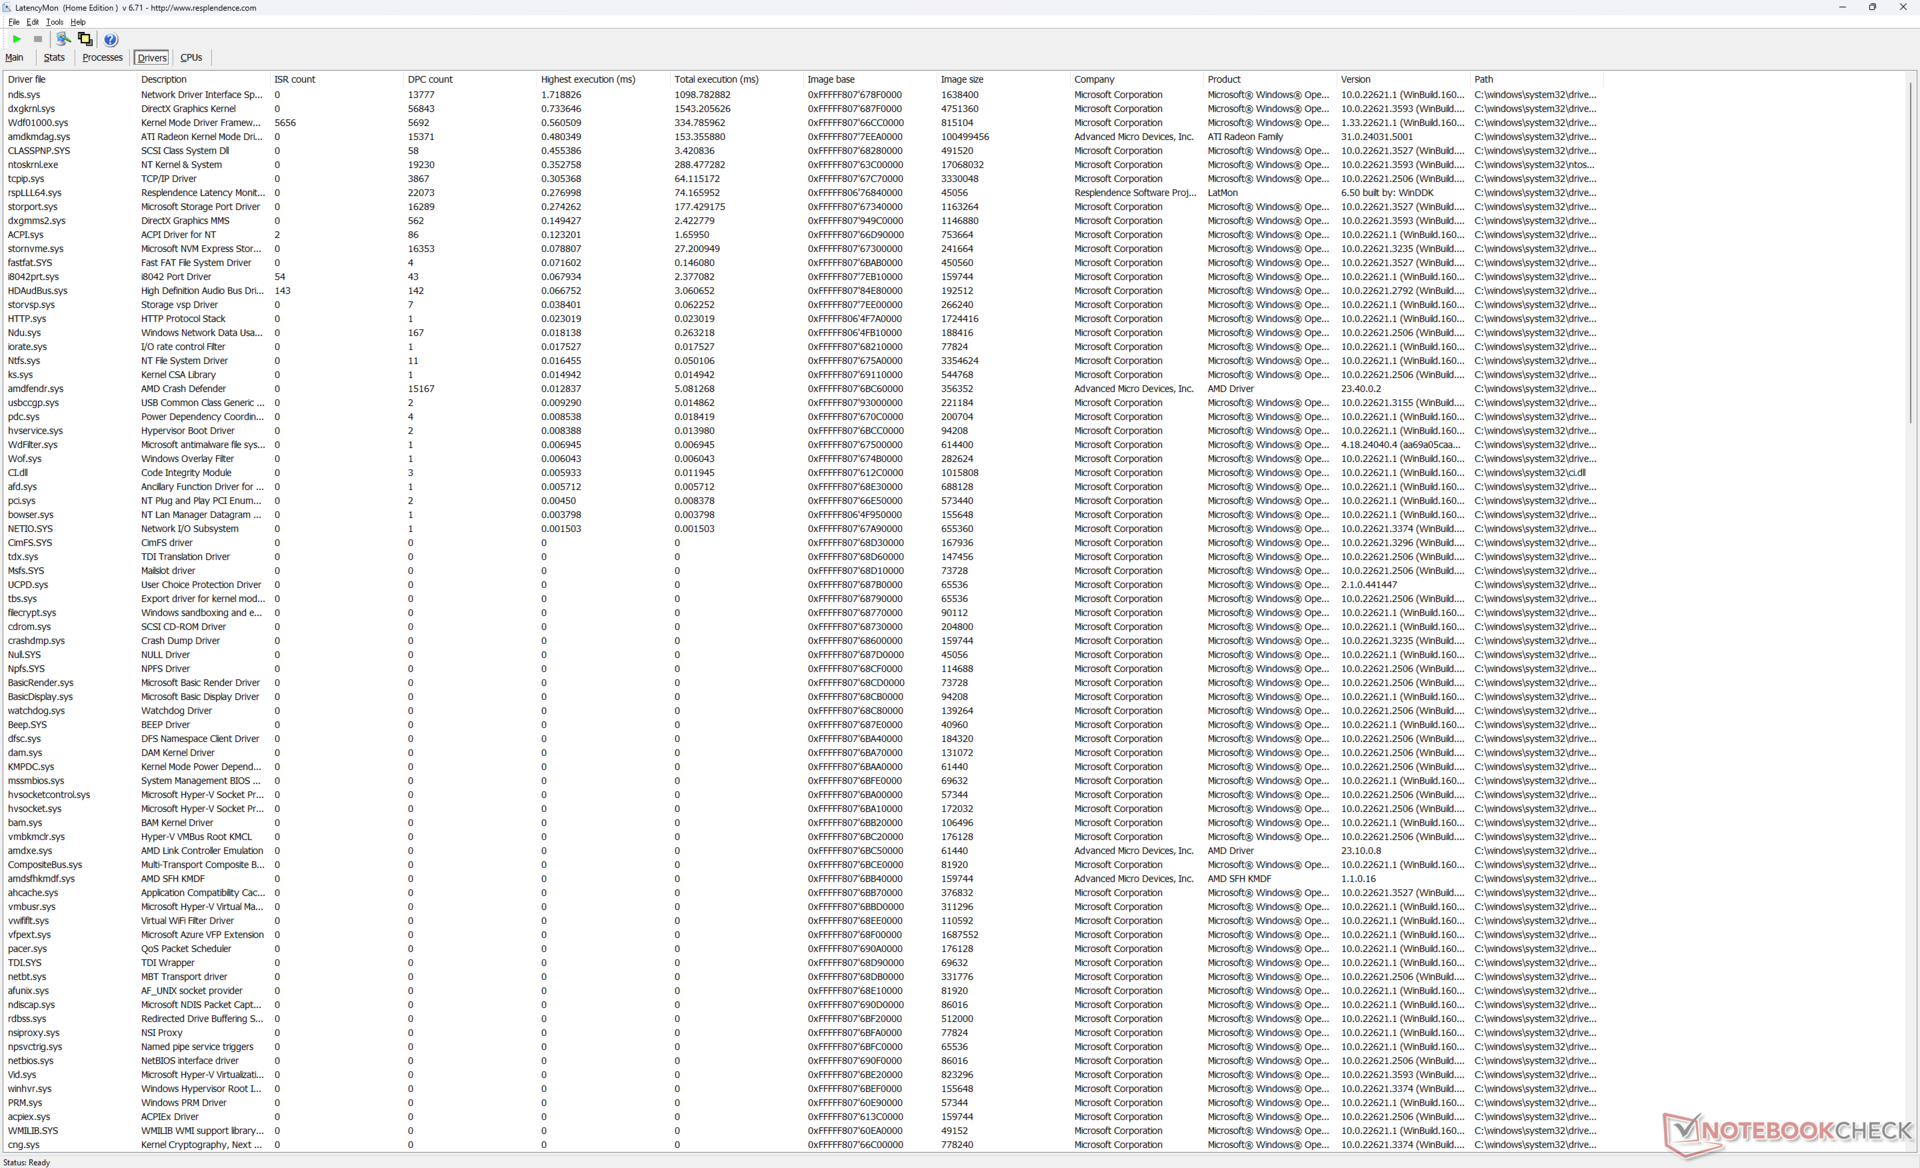
Latencia del CPD
LatencyMon revela problemas menores de CPD al abrir varias pestañas de nuestra página de inicio. la reproducción de vídeo 4K60 también es imperfecta, con 4 saltos de fotogramas registrados en un lapso de 60 segundos. Aunque los saltos de fotogramas no son lo suficientemente frecuentes como para ser perceptibles, lo ideal sería que no hubiera saltos en absoluto.
| DPC Latencies / LatencyMon - interrupt to process latency (max), Web, Youtube, Prime95 | |
| LG Gram 2in1 16 16T90R - G.AA78G | |
| Samsung Galaxy Book4 Pro 360 | |
| HP Spectre x360 16 RTX 4050 | |
| HP Envy x360 2-in-1 16-ad0097nr | |
| HP Envy 16 h0112nr | |
| Lenovo Yoga 7 2-in-1 16IML9 | |
* ... más pequeño es mejor
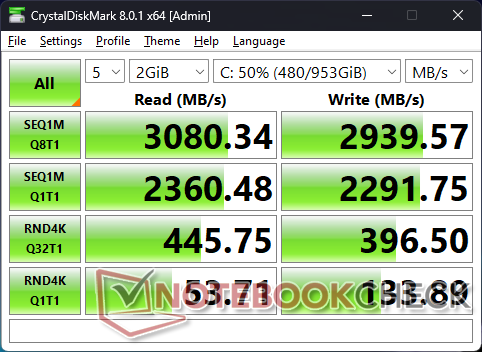
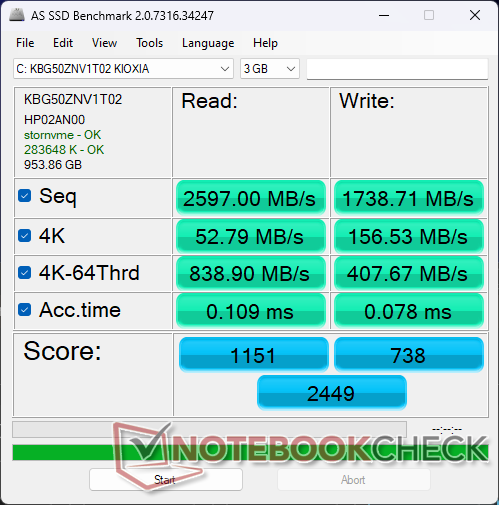
Dispositivos de almacenamiento
Nuestra unidad se envía con el Kioxia KBG50ZNV1T02 que es una SSD NVMe 2280 PCIe4 x4 económica con velocidades de lectura y escritura secuenciales de hasta 3500 MB/s y 2900 MB/s, respectivamente, en comparación con los 7000 MB/s de unidades de gama superior como la serie Samsung PM9A1. Las velocidades de transferencia caen ligeramente cuando se estresan, pero por lo demás el rendimiento es bueno para un sistema de gama media.

| Drive Performance rating - Percent | |
| LG Gram 2in1 16 16T90R - G.AA78G | |
| HP Envy 16 h0112nr | |
| Samsung Galaxy Book4 Pro 360 | |
| HP Spectre x360 16 RTX 4050 | |
| HP Envy x360 2-in-1 16-ad0097nr | |
| Lenovo Yoga 7 2-in-1 16IML9 | |
* ... más pequeño es mejor
Disk Throttling: DiskSpd Read Loop, Queue Depth 8
Rendimiento de la GPU
La Radeon 780M sigue siendo una bestia de GPU integrada incluso después de que Intel respondiera con la competidora Arc 8. los resultados de 3DMark muestran que es más similar a la Arc 7 pero muy por delante de las antiguas Iris Xe 96 UE.
Optar por la versión Intel del Envy x360 16 supondrá un descenso significativo del rendimiento gráfico. Esto se debe a que las versiones de Intel se suministran con CPU de la serie Core Ultra U en lugar de la serie Core Ultra H. Los gráficos Arc 7 y Arc 8 sólo están disponibles en las CPU Core Ultra H, mientras que la GPU integrada en los Core Ultra serie U tiene un rendimiento más parecido al de los Iris Xe 96 EU.
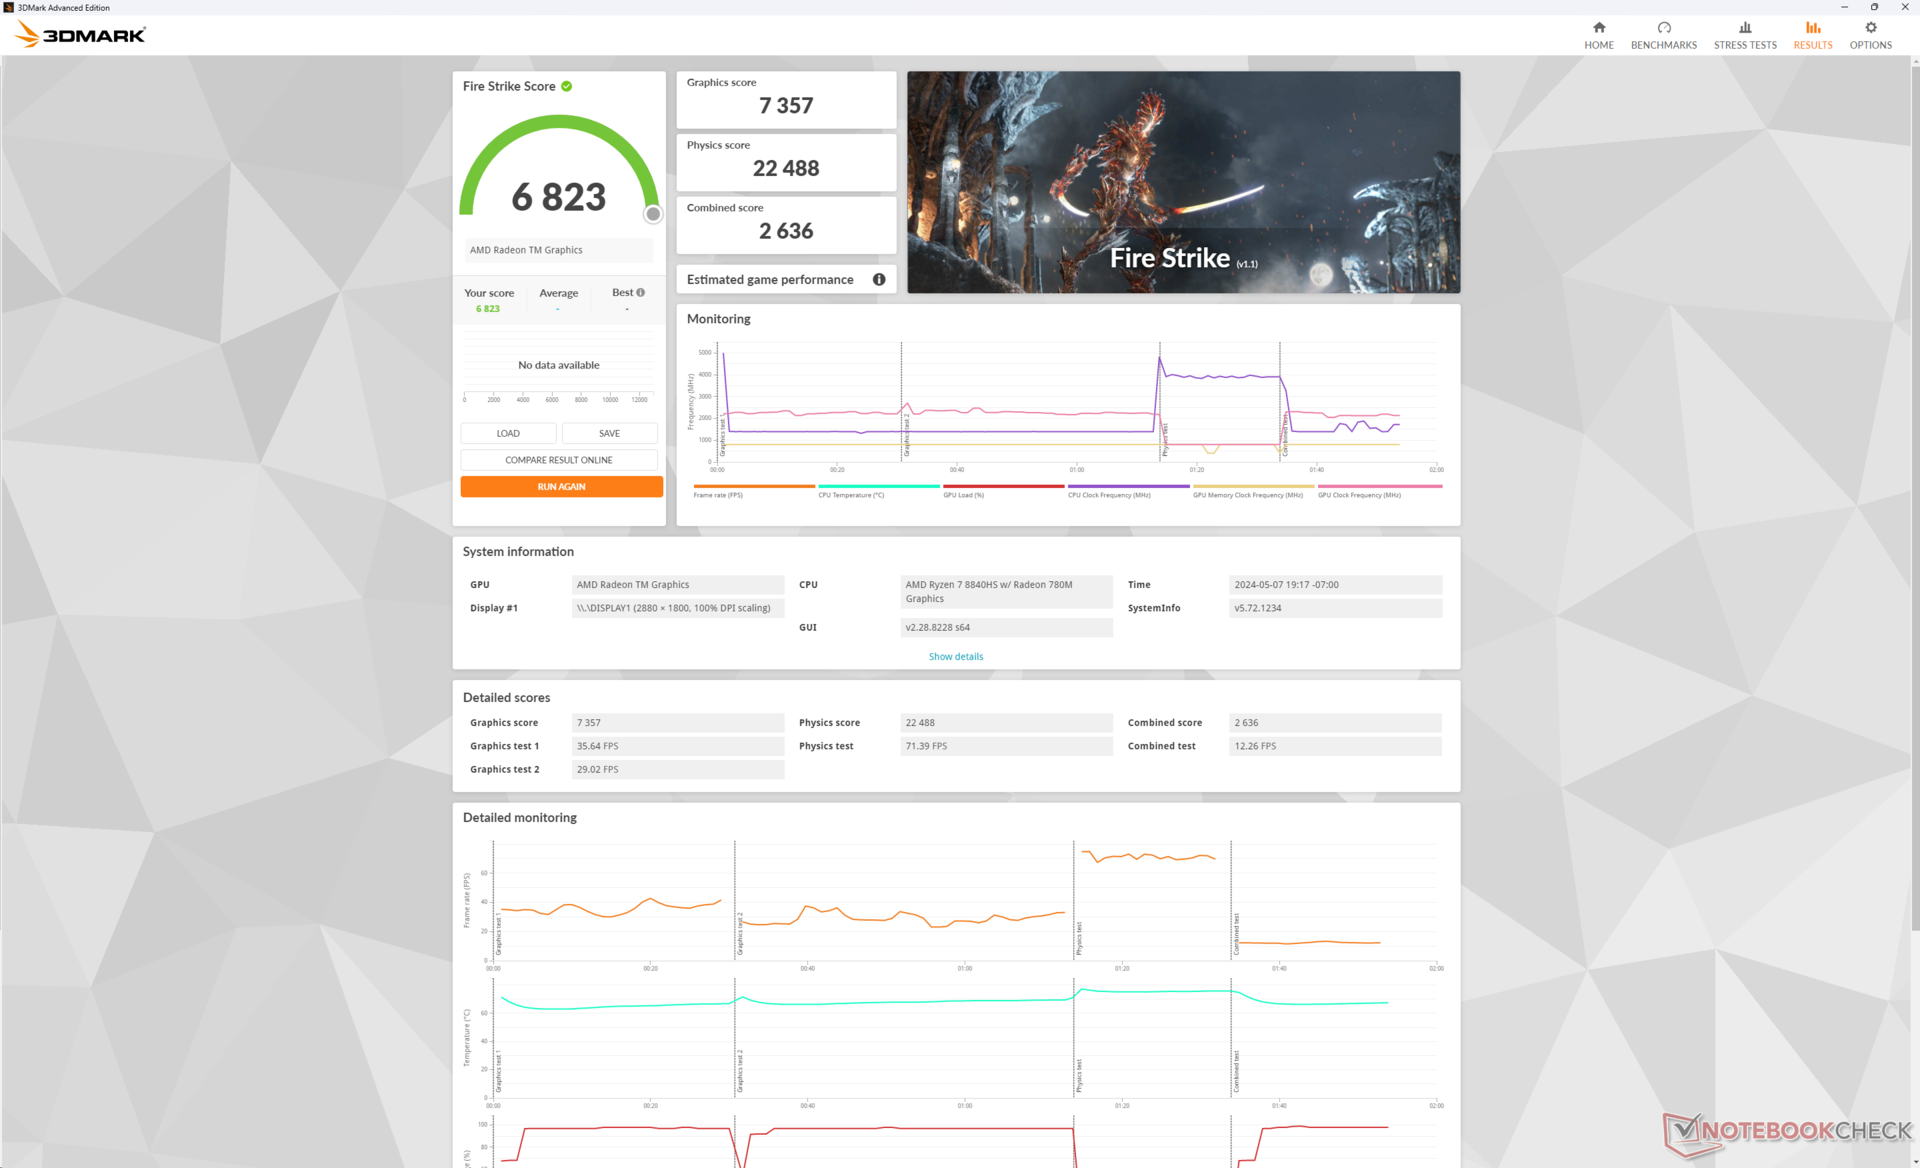
| Perfil de potencia | Puntuación de gráficos | Puntuación Física | Puntuación combinada |
| Modo Rendimiento | 7357 | 22488 | 2636 |
| Modo equilibrado | 6957 (-5%) | 20442 (-9%) | 2509 (-5%) |
| Batería | 4651 (-37%) | 18788 (-17%) | 1902 (-28%) |
Funcionar en modo Equilibrado repercute en el rendimiento hasta en un 10% según nuestra tabla Fire Strike anterior. Las RPM del ventilador se vuelven notablemente más letárgicas cuando se configura en modo Equilibrado para acompañar al rendimiento más lento.
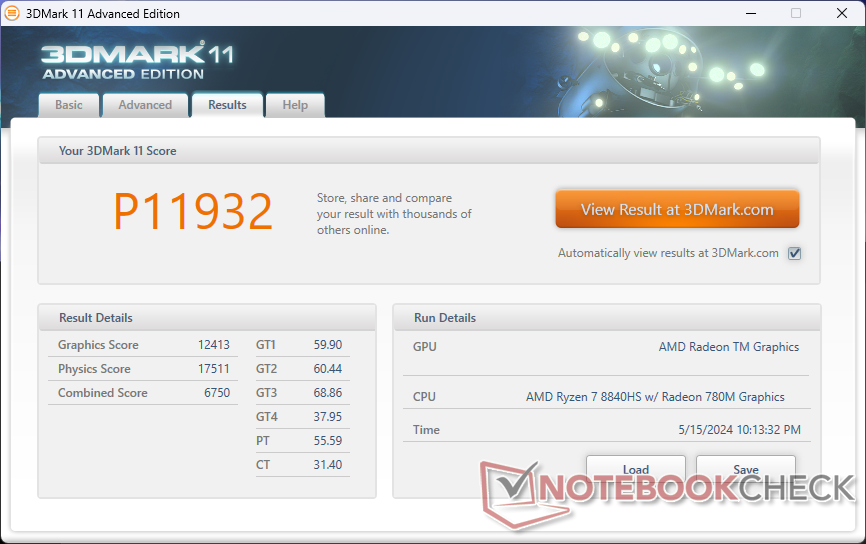
| 3DMark 11 Performance | 11932 puntos | |
| 3DMark Cloud Gate Standard Score | 32533 puntos | |
| 3DMark Fire Strike Score | 6823 puntos | |
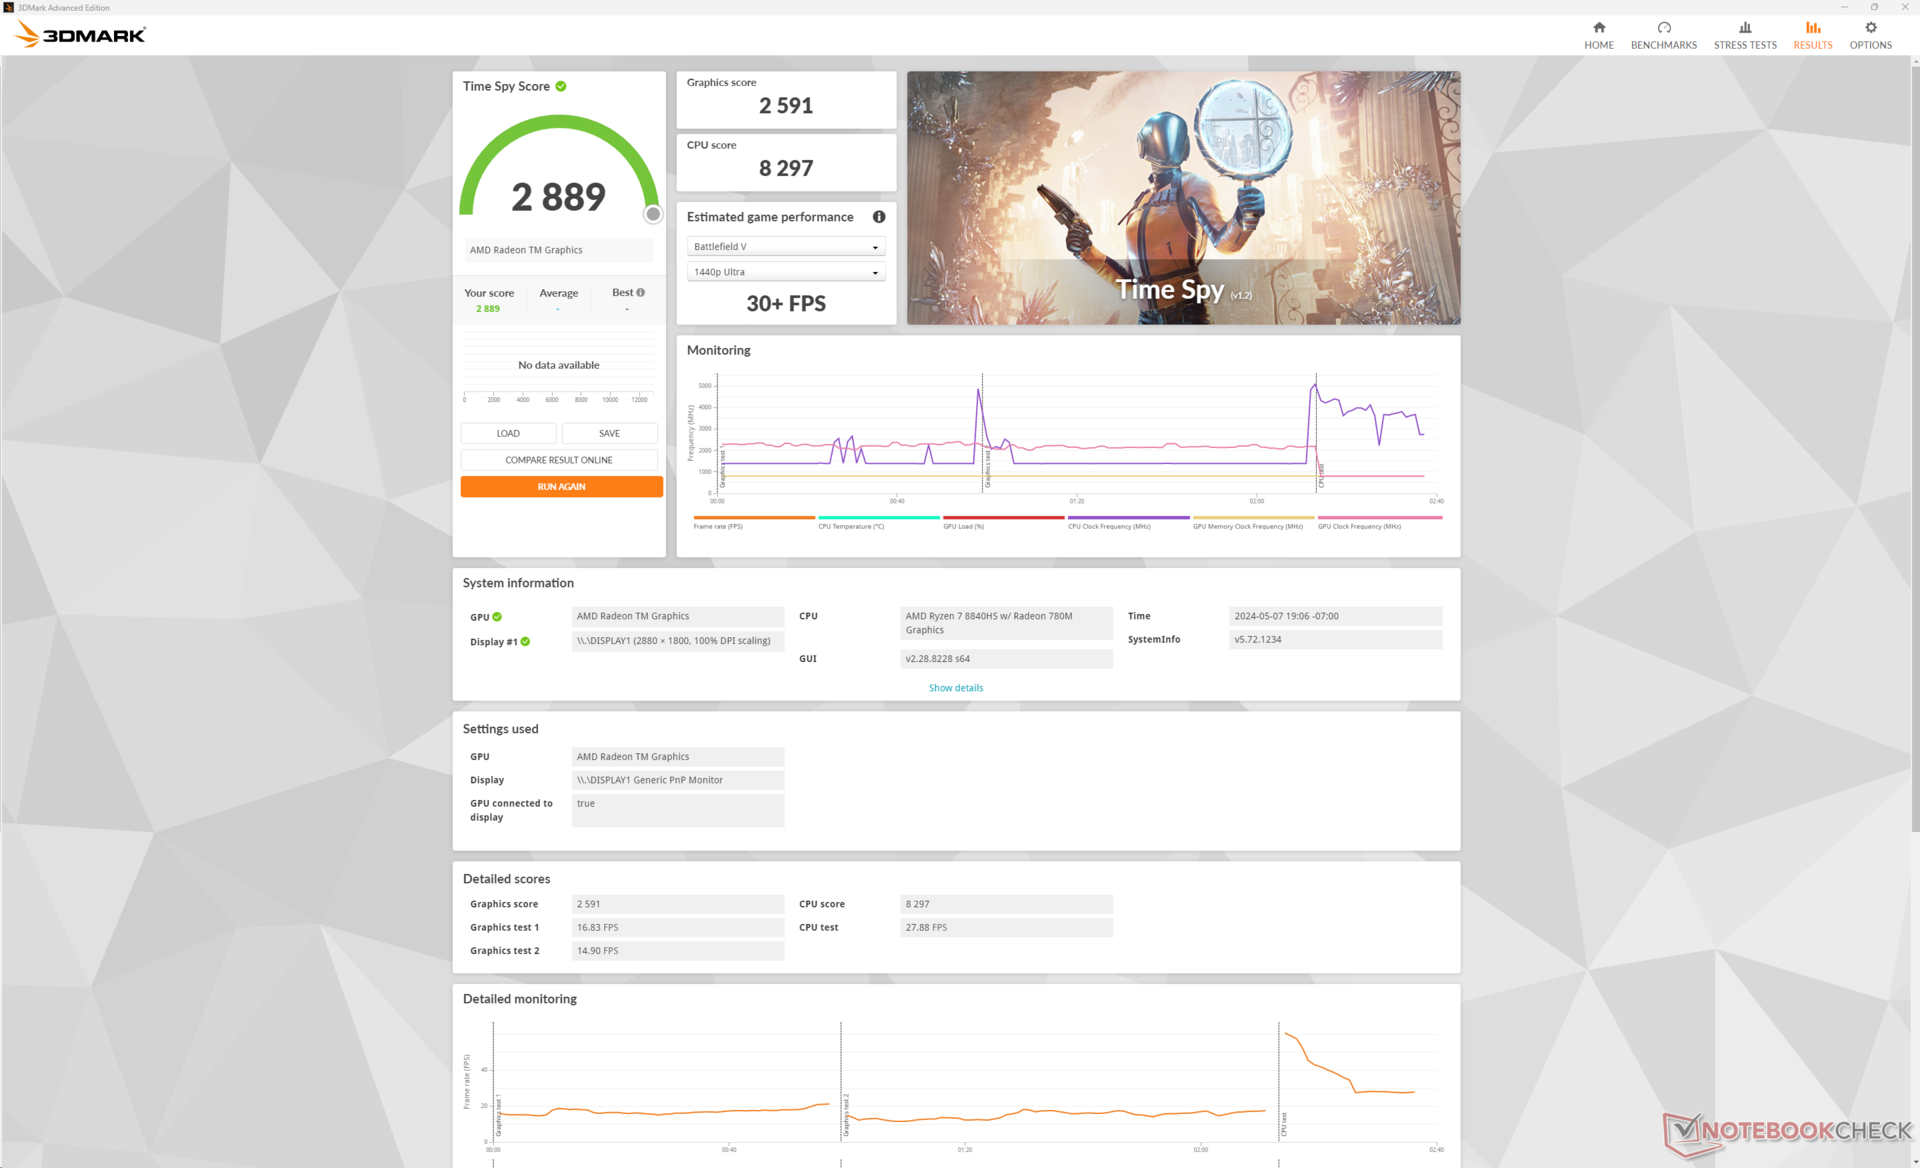
| 3DMark Time Spy Score | 2889 puntos | |
ayuda | ||
* ... más pequeño es mejor
Por desgracia, el rendimiento en los juegos es sistemáticamente más lento que el de la media de portátiles de nuestra base de datos equipados con la misma GPU Radeon 780M incluso cuando se configura en modo Rendimiento. Es probable que esto se deba a que el rendimiento bruto general del procesador del Ryzen 7 8840HS es más lento en comparación con el Ryzen 7 7840HS del año pasado, lo que crea escenarios más ligados a la CPU.
| The Witcher 3 - 1920x1080 Ultra Graphics & Postprocessing (HBAO+) | |
| HP Spectre x360 16 RTX 4050 | |
| HP Envy x360 2-in-1 16-ad0097nr | |
| Samsung Galaxy Book4 Pro 360 | |
| HP Envy x360 15-fe0072ng | |
| Lenovo Yoga 7 2-in-1 16IML9 | |
| LG Gram 2in1 16 16T90R - G.AA78G | |
| Final Fantasy XV Benchmark - 1920x1080 High Quality | |
| HP Spectre x360 16 RTX 4050 | |
| HP Envy x360 2-in-1 16-ad0097nr | |
| Samsung Galaxy Book4 Pro 360 | |
| LG Gram 2in1 16 16T90R - G.AA78G | |
| HP Envy x360 15-fe0072ng | |
| Lenovo Yoga 7 2-in-1 16IML9 | |
| Strange Brigade - 1920x1080 ultra AA:ultra AF:16 | |
| HP Spectre x360 16 RTX 4050 | |
| HP Envy x360 2-in-1 16-ad0097nr | |
| Samsung Galaxy Book4 Pro 360 | |
| Lenovo Yoga 7 2-in-1 16IML9 | |
| LG Gram 2in1 16 16T90R - G.AA78G | |
| HP Envy x360 15-fe0072ng | |
| Dota 2 Reborn - 1920x1080 ultra (3/3) best looking | |
| HP Spectre x360 16 RTX 4050 | |
| HP Envy x360 2-in-1 16-ad0097nr | |
| LG Gram 2in1 16 16T90R - G.AA78G | |
| Samsung Galaxy Book4 Pro 360 | |
| Lenovo Yoga 7 2-in-1 16IML9 | |
| HP Envy x360 15-fe0072ng | |
| X-Plane 11.11 - 1920x1080 high (fps_test=3) | |
| HP Spectre x360 16 RTX 4050 | |
| LG Gram 2in1 16 16T90R - G.AA78G | |
| Samsung Galaxy Book4 Pro 360 | |
| HP Envy x360 15-fe0072ng | |
| HP Envy x360 2-in-1 16-ad0097nr | |
| Lenovo Yoga 7 2-in-1 16IML9 | |
| Far Cry 5 - 1920x1080 Ultra Preset AA:T | |
| HP Spectre x360 16 RTX 4050 | |
| HP Envy x360 2-in-1 16-ad0097nr | |
| LG Gram 2in1 16 16T90R - G.AA78G | |
| Lenovo Yoga 7 2-in-1 16IML9 | |
| Baldur's Gate 3 | |
| 1280x720 Low Preset AA:SM | |
| Medio AMD Radeon 780M (30.7 - 67.6, n=34) | |
| HP Envy x360 2-in-1 16-ad0097nr | |
| Lenovo Yoga 7 2-in-1 16IML9 | |
| 1920x1080 Low Preset AA:SM | |
| Dell XPS 16 9640 | |
| HP Spectre x360 16 RTX 4050 | |
| Medio AMD Radeon 780M (20.2 - 44.1, n=47) | |
| HP Envy x360 2-in-1 16-ad0097nr | |
| Lenovo Yoga 7 2-in-1 16IML9 | |
| 1920x1080 Medium Preset AA:T | |
| Dell XPS 16 9640 | |
| HP Spectre x360 16 RTX 4050 | |
| HP Envy x360 2-in-1 16-ad0097nr | |
| Medio AMD Radeon 780M (15.7 - 36.8, n=50) | |
| 1920x1080 High Preset AA:T | |
| Dell XPS 16 9640 | |
| HP Spectre x360 16 RTX 4050 | |
| Medio AMD Radeon 780M (13.3 - 30.6, n=50) | |
| HP Envy x360 2-in-1 16-ad0097nr | |
| 1920x1080 Ultra Preset AA:T | |
| Dell XPS 16 9640 | |
| HP Spectre x360 16 RTX 4050 | |
| Medio AMD Radeon 780M (12.8 - 29.6, n=49) | |
| HP Envy x360 2-in-1 16-ad0097nr | |
Witcher 3 FPS Chart
| bajo | medio | alto | ultra | |
|---|---|---|---|---|
| The Witcher 3 (2015) | 129.2 | 47.6 | 28.8 | |
| Dota 2 Reborn (2015) | 123.7 | 103.7 | 73 | 65.4 |
| Final Fantasy XV Benchmark (2018) | 64.5 | 34.1 | 25.2 | |
| X-Plane 11.11 (2018) | 47.8 | 33.9 | 27.9 | |
| Far Cry 5 (2018) | 63 | 36 | 33 | 31 |
| Strange Brigade (2018) | 138.2 | 60.3 | 50.2 | 42.2 |
| Tiny Tina's Wonderlands (2022) | 49.8 | 38 | 24 | 19.5 |
| F1 22 (2022) | 70.2 | 60 | 46 | 12 |
| Baldur's Gate 3 (2023) | 35 | 28.5 | 22.6 | 22.2 |
| Cyberpunk 2077 (2023) | 35.5 | 27.8 | 22.1 | 19.1 |
Emisiones - Bajas con altas
Ruido del sistema
Las RPM del ventilador y su comportamiento están estrechamente ligados al perfil de potencia seleccionado. Si está en modo Equilibrado, el ventilador tiende a funcionar de forma notablemente más silenciosa y durante periodos más largos antes de necesitar aumentar la potencia. El ruido del ventilador al ejecutar 3DMark 06, por ejemplo, se mantendría en 23,8 dB(A) durante toda la primera escena del benchmark, mientras que saltaría a 28 dB(A) si se pone en modo Rendimiento. Se recomienda poner el MyHP en modo Equilibrado para limitar las pulsaciones del ventilador cuando se ejecutan tareas poco exigentes como la navegación web o el streaming de vídeo.
Somos capaces de registrar un nivel de ruido máximo de casi 44 dB(A) cuando se ejecuta Witcher 3 en modo Rendimiento. Esto convierte al Envy x360 16 en uno de los convertibles de 16 pulgadas más ruidosos por varios decibelios cuando se ejecutan cargas exigentes.
Ruido
| Ocioso |
| 23 / 23 / 23 dB(A) |
| Carga |
| 23.8 / 43.8 dB(A) |
 | ||
30 dB silencioso 40 dB(A) audible 50 dB(A) ruidosamente alto |
||
min: | ||
| HP Envy x360 2-in-1 16-ad0097nr Radeon 780M, R7 8840HS, KIOXIA BG5 KBG50ZNV1T02 | HP Envy 16 h0112nr GeForce RTX 3060 Laptop GPU, i7-12700H, Micron 3400 1TB MTFDKBA1T0TFH | HP Spectre x360 16 RTX 4050 GeForce RTX 4050 Laptop GPU, Ultra 7 155H, SK hynix PC801 HFS001TEJ9X101N | Lenovo Yoga 7 2-in-1 16IML9 Graphics 4-Core iGPU (Arrow Lake), Ultra 5 125U, SK hynix HFS512GEJ4X112N | Samsung Galaxy Book4 Pro 360 Arc 7-Core, Ultra 5 125H, Samsung PM9B1 512GB MZVL4512HBLU | LG Gram 2in1 16 16T90R - G.AA78G Iris Xe G7 96EUs, i7-1360P, Samsung PM9A1 MZVL21T0HCLR | |
|---|---|---|---|---|---|---|
| Noise | -20% | 3% | 1% | -8% | -7% | |
| apagado / medio ambiente * (dB) | 22.9 | 22.8 -0% | 23.3 -2% | 22.8 -0% | 24.1 -5% | 25.1 -10% |
| Idle Minimum * (dB) | 23 | 22.9 -0% | 23.6 -3% | 22.8 1% | 24.1 -5% | 25.1 -9% |
| Idle Average * (dB) | 23 | 22.9 -0% | 23.6 -3% | 22.8 1% | 24.1 -5% | 25.1 -9% |
| Idle Maximum * (dB) | 23 | 30.5 -33% | 23.6 -3% | 22.8 1% | 26.4 -15% | 26.1 -13% |
| Load Average * (dB) | 23.8 | 41.4 -74% | 29.2 -23% | 30.8 -29% | 35.2 -48% | 31.4 -32% |
| Witcher 3 ultra * (dB) | 43.8 | 51.1 -17% | 32.1 27% | 31 29% | 38.5 12% | 41.1 6% |
| Load Maximum * (dB) | 43.8 | 51.4 -17% | 32.1 27% | 40.8 7% | 39.2 11% | 36.6 16% |
* ... más pequeño es mejor
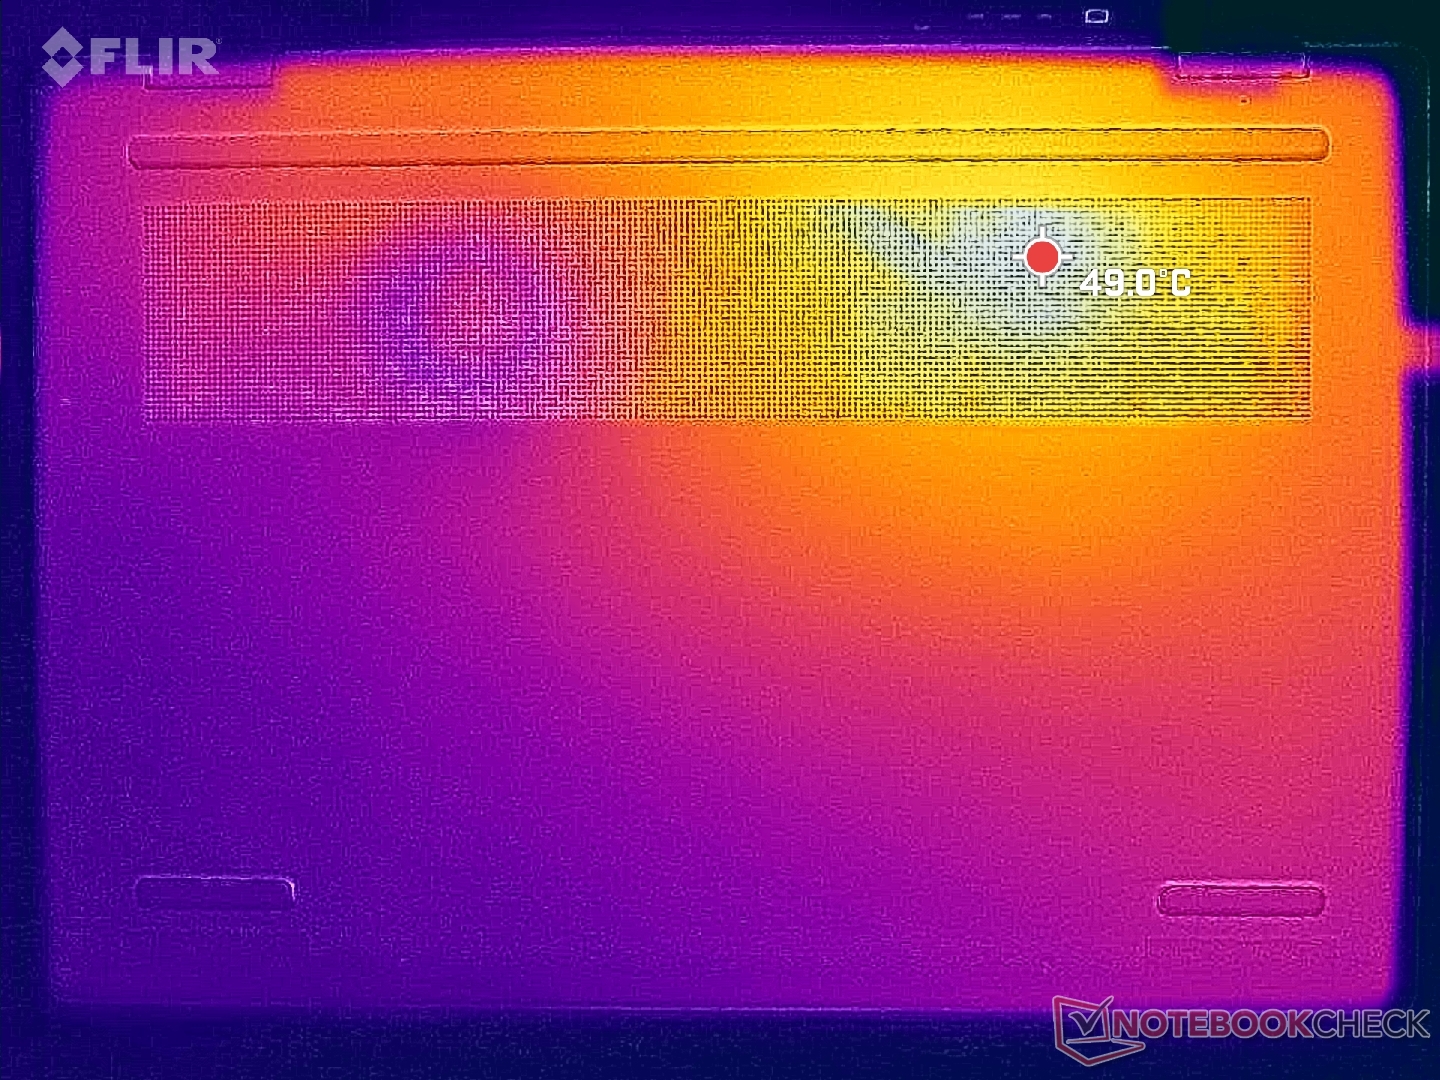
Temperatura
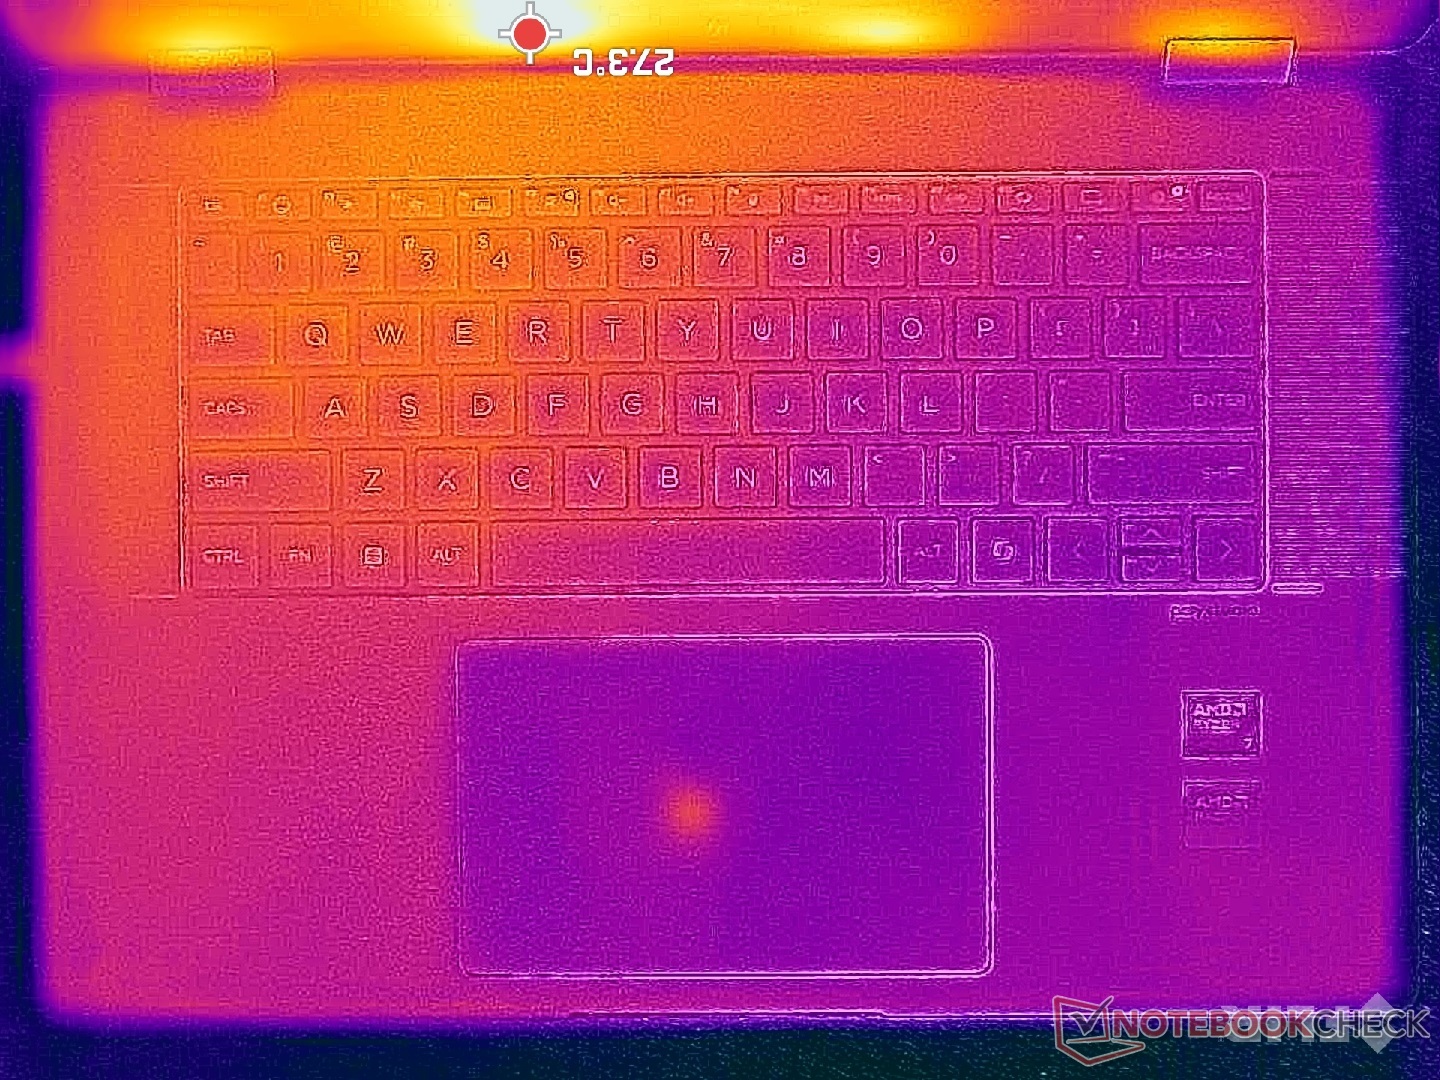
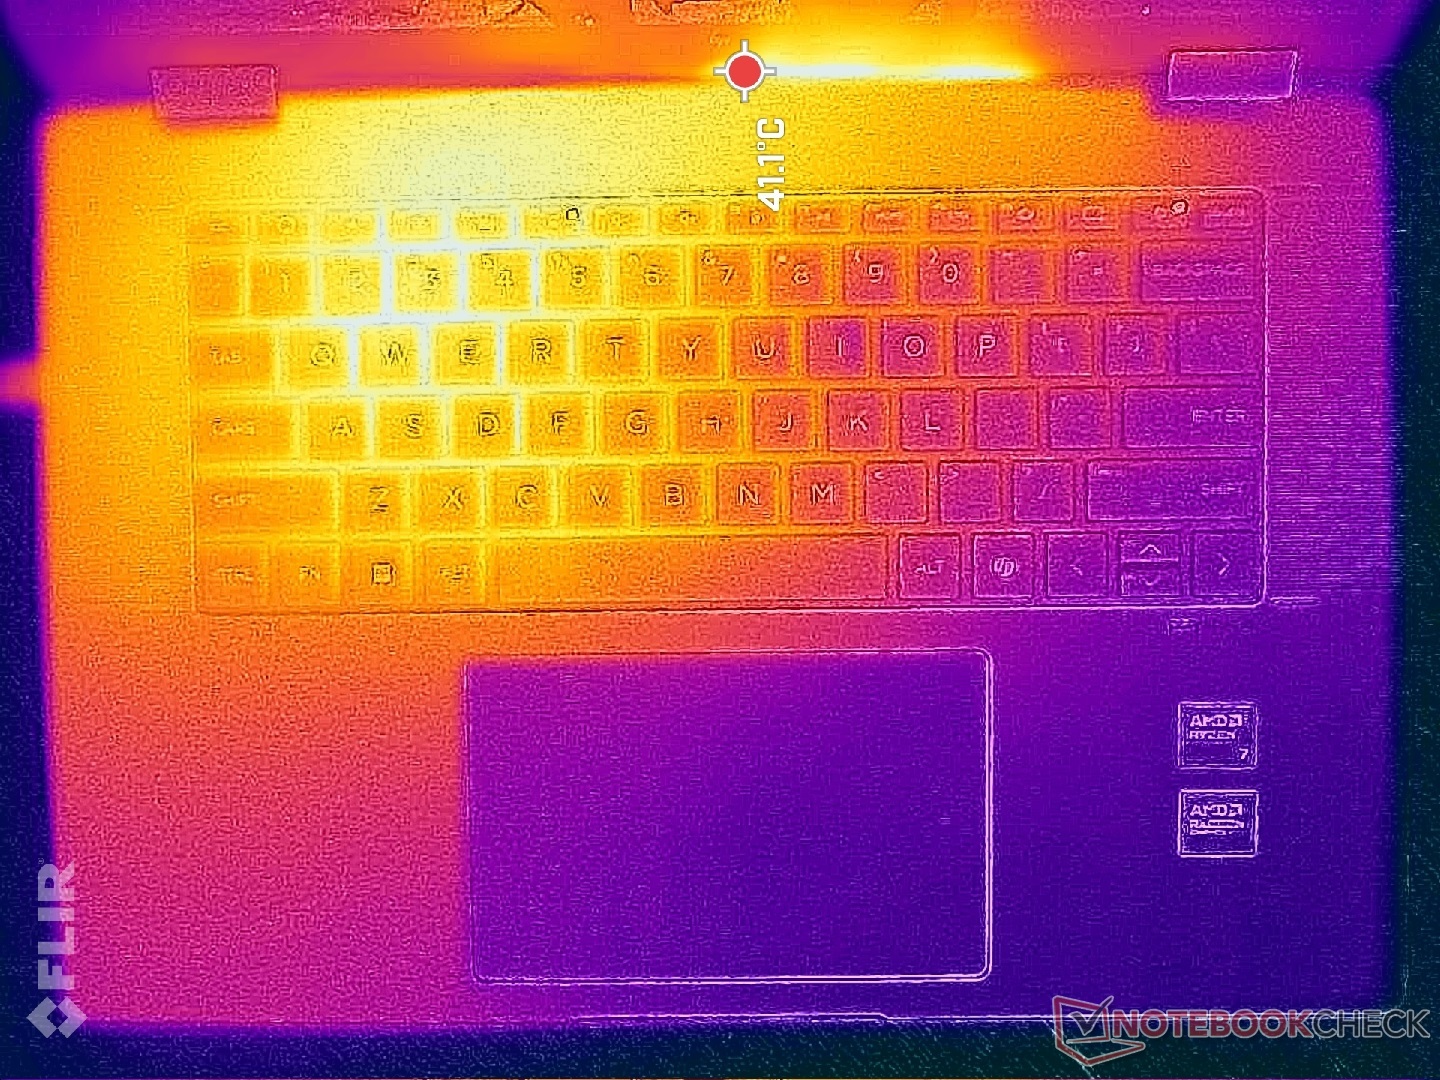
Los puntos calientes cerca de las teclas WASD pueden calentarse hasta 41 C en comparación con 38 C o sólo 36 C en el más lento Core U-powered Yoga 7 2 en 1 16IML9 o el Envy x360 15. El reposamanos izquierdo en particular puede estar notablemente más caliente que el derecho cuando está bajo carga, pero el calor afortunadamente nunca llega a ser demasiado incómodo.
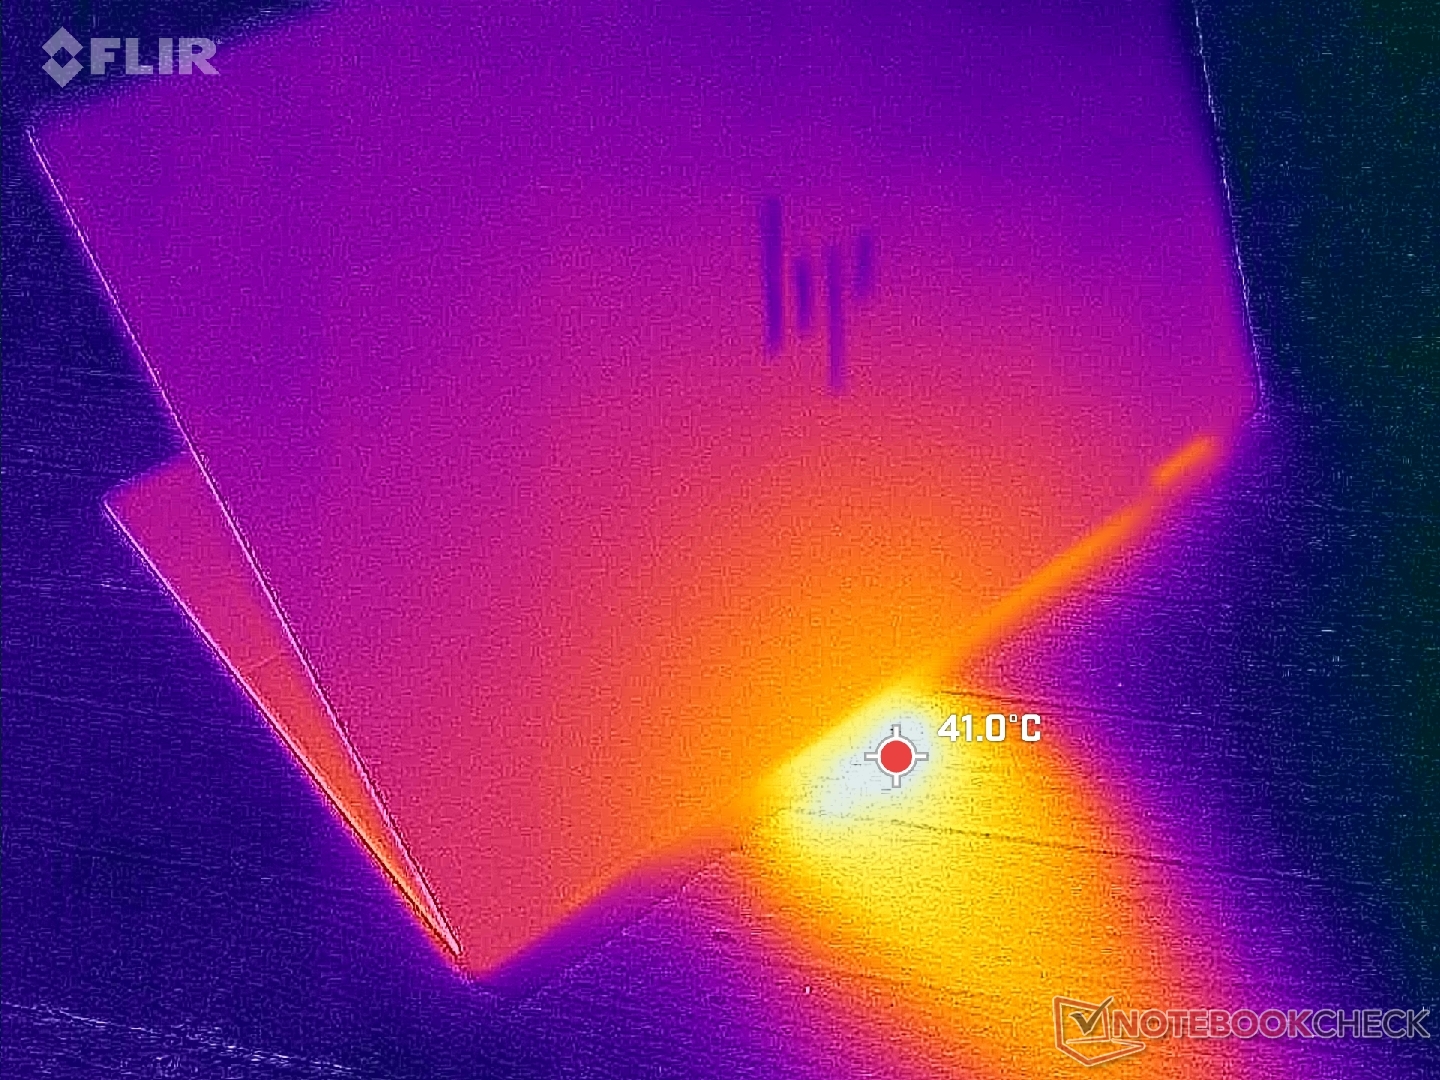
(±) La temperatura máxima en la parte superior es de 42.6 °C / 109 F, frente a la media de 35.4 °C / 96 F, que oscila entre 19.6 y 60 °C para la clase Convertible.
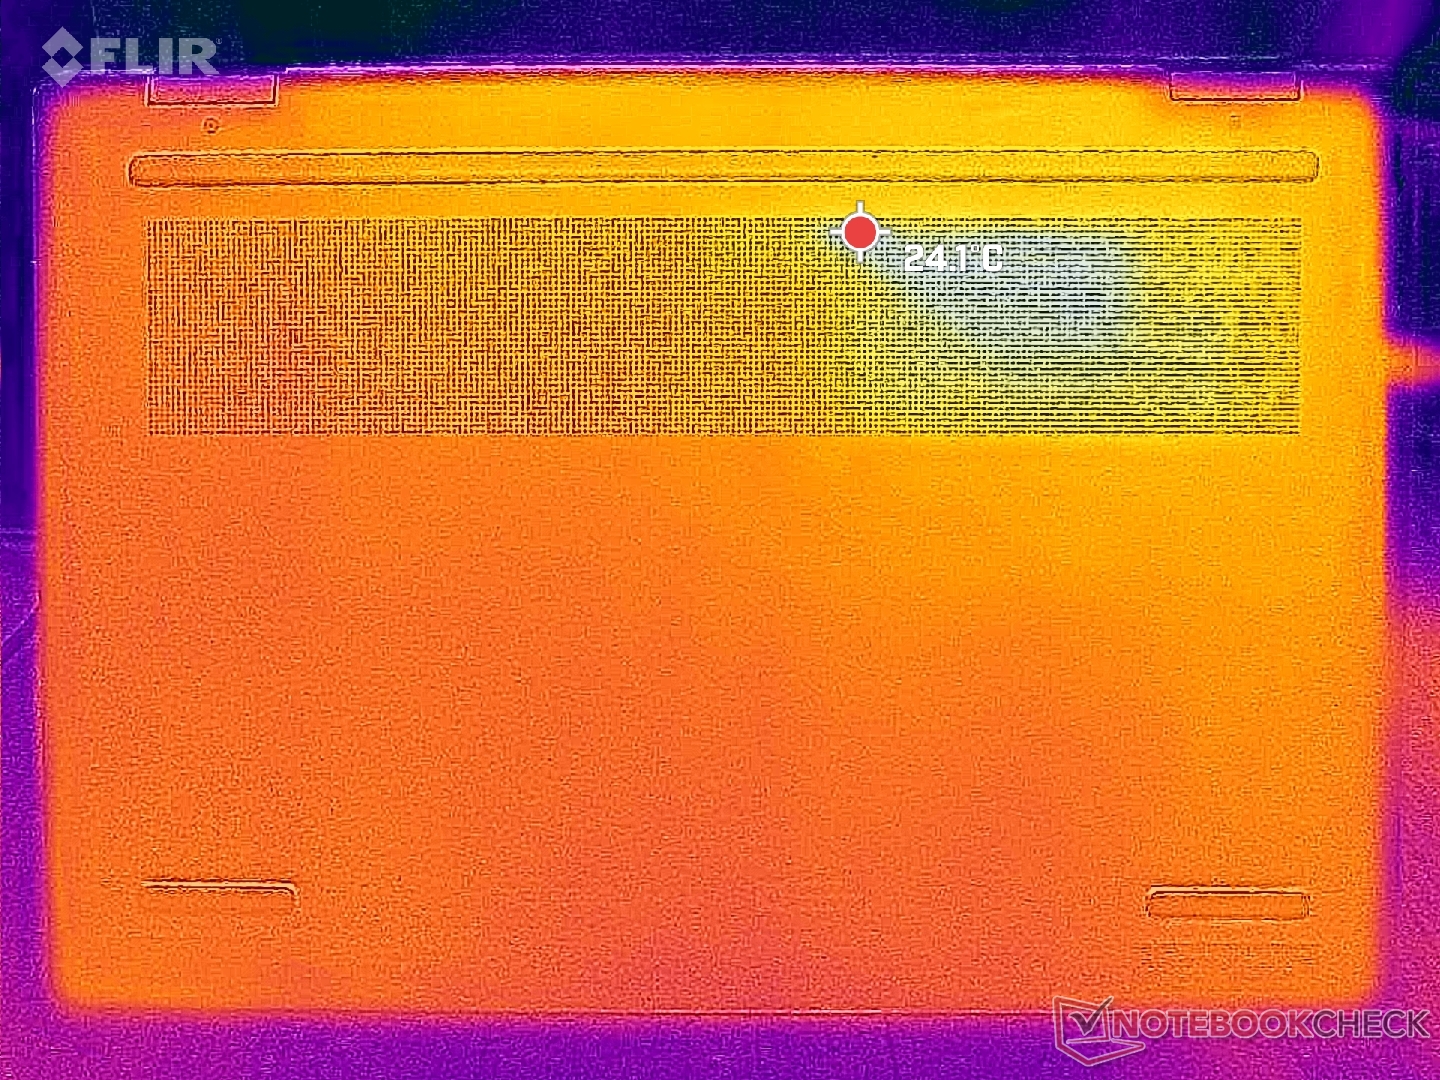
(-) El fondo se calienta hasta un máximo de 47.8 °C / 118 F, frente a la media de 36.9 °C / 98 F
(+) En reposo, la temperatura media de la parte superior es de 26.5 °C / 80# F, frente a la media del dispositivo de 30.3 °C / 87 F.
(+) Los reposamanos y el panel táctil alcanzan como máximo la temperatura de la piel (32.4 °C / 90.3 F) y, por tanto, no están calientes.
(-) La temperatura media de la zona del reposamanos de dispositivos similares fue de 28 °C / 82.4 F (-4.4 °C / -7.9 F).
| HP Envy x360 2-in-1 16-ad0097nr AMD Ryzen 7 8840HS, AMD Radeon 780M | HP Envy 16 h0112nr Intel Core i7-12700H, NVIDIA GeForce RTX 3060 Laptop GPU | HP Spectre x360 16 RTX 4050 Intel Core Ultra 7 155H, NVIDIA GeForce RTX 4050 Laptop GPU | Lenovo Yoga 7 2-in-1 16IML9 Intel Core Ultra 5 125U, Intel Graphics 4-Core iGPU (Meteor / Arrow Lake) | Samsung Galaxy Book4 Pro 360 Intel Core Ultra 5 125H, Intel Arc 7-Core iGPU | LG Gram 2in1 16 16T90R - G.AA78G Intel Core i7-1360P, Intel Iris Xe Graphics G7 96EUs | |
|---|---|---|---|---|---|---|
| Heat | -10% | 1% | 10% | 11% | -20% | |
| Maximum Upper Side * (°C) | 42.6 | 45.2 -6% | 39.6 7% | 37.8 11% | 38.6 9% | 55 -29% |
| Maximum Bottom * (°C) | 47.8 | 44 8% | 39.2 18% | 38.8 19% | 39.2 18% | 55.4 -16% |
| Idle Upper Side * (°C) | 27.4 | 33.6 -23% | 29 -6% | 25.4 7% | 25.2 8% | 34.9 -27% |
| Idle Bottom * (°C) | 27.8 | 32.6 -17% | 31.6 -14% | 26.8 4% | 25.7 8% | 30 -8% |
* ... más pequeño es mejor
Altavoces

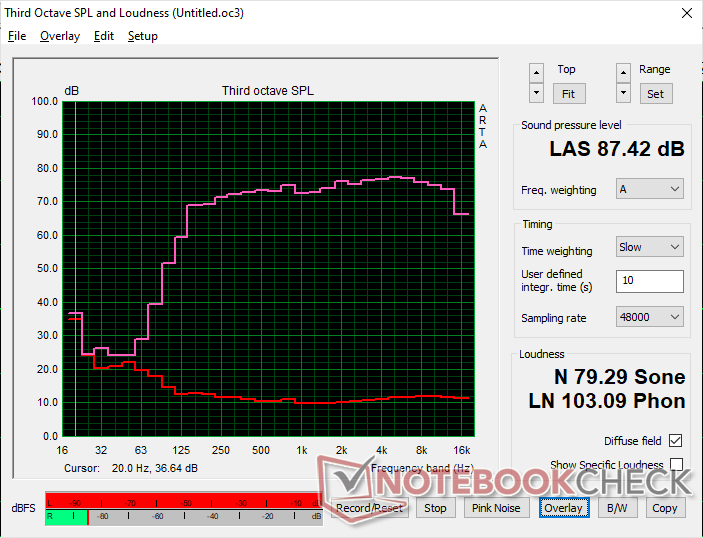
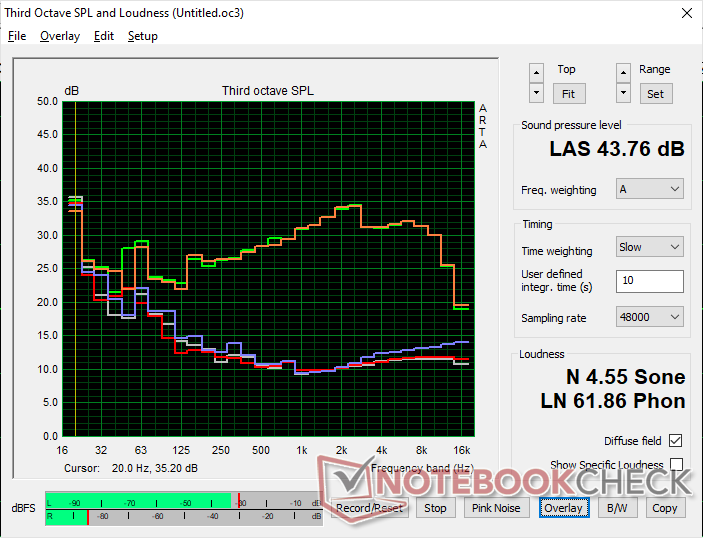
HP Envy x360 2-in-1 16-ad0097nr análisis de audio
(+) | los altavoces pueden reproducir a un volumen relativamente alto (#87.4 dB)
Graves 100 - 315 Hz
(±) | lubina reducida - en promedio 8.3% inferior a la mediana
(±) | la linealidad de los graves es media (8.7% delta a frecuencia anterior)
Medios 400 - 2000 Hz
(+) | medios equilibrados - a sólo 1% de la mediana
(+) | los medios son lineales (1.9% delta a la frecuencia anterior)
Altos 2 - 16 kHz
(+) | máximos equilibrados - a sólo 2.5% de la mediana
(+) | los máximos son lineales (1.2% delta a la frecuencia anterior)
Total 100 - 16.000 Hz
(+) | el sonido global es lineal (6.5% de diferencia con la mediana)
En comparación con la misma clase
» 0% de todos los dispositivos probados de esta clase eran mejores, 0% similares, 99% peores
» El mejor tuvo un delta de 6%, la media fue 20%, el peor fue ###max##%
En comparación con todos los dispositivos probados
» 1% de todos los dispositivos probados eran mejores, 0% similares, 99% peores
» El mejor tuvo un delta de 4%, la media fue 23%, el peor fue ###max##%
Apple MacBook Pro 16 2021 M1 Pro análisis de audio
(+) | los altavoces pueden reproducir a un volumen relativamente alto (#84.7 dB)
Graves 100 - 315 Hz
(+) | buen bajo - sólo 3.8% lejos de la mediana
(+) | el bajo es lineal (5.2% delta a la frecuencia anterior)
Medios 400 - 2000 Hz
(+) | medios equilibrados - a sólo 1.3% de la mediana
(+) | los medios son lineales (2.1% delta a la frecuencia anterior)
Altos 2 - 16 kHz
(+) | máximos equilibrados - a sólo 1.9% de la mediana
(+) | los máximos son lineales (2.7% delta a la frecuencia anterior)
Total 100 - 16.000 Hz
(+) | el sonido global es lineal (4.6% de diferencia con la mediana)
En comparación con la misma clase
» 0% de todos los dispositivos probados de esta clase eran mejores, 0% similares, 100% peores
» El mejor tuvo un delta de 5%, la media fue 17%, el peor fue ###max##%
En comparación con todos los dispositivos probados
» 0% de todos los dispositivos probados eran mejores, 0% similares, 100% peores
» El mejor tuvo un delta de 4%, la media fue 23%, el peor fue ###max##%
Gestión de la energía
Consumo de energía
El ralentí en el sobremesa demanda entre 5 W y 15 W, que es casi la mitad que el del Spectre x360 16 debido a la falta de una GPU dedicada en el modelo Envy. No obstante, querrá limitar el tiempo de pantalla con fondos blancos ya que el blanco demanda más energía en OLED que en IPS; hemos podido medir una diferencia de 9 W en nuestro Envy al mostrar una pantalla totalmente negra frente a una totalmente blanca cuando ambas están al máximo brillo.
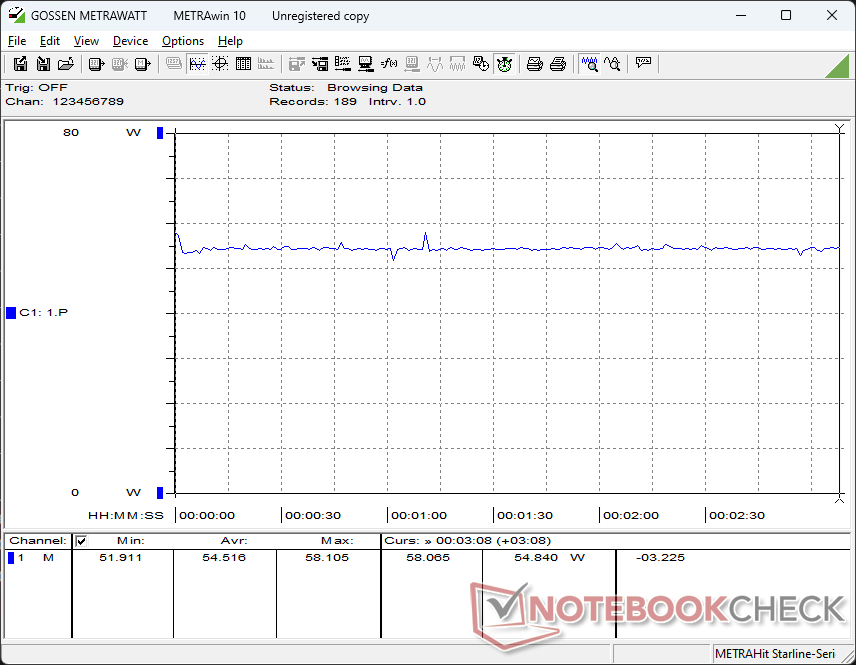
Ejecutando Witcher 3 consume 55 W frente a los 47 W del Samsung Galaxy Book4 Pro 16 o los 54 W del IdeaPad Pro 6 16 ambos equipados con el Arc 8 de la competencia. El rendimiento por vatio sigue siendo muy bueno y, en general, está a la altura de las alternativas Intel más recientes a pesar de que la solución AMD tiene casi dos años.
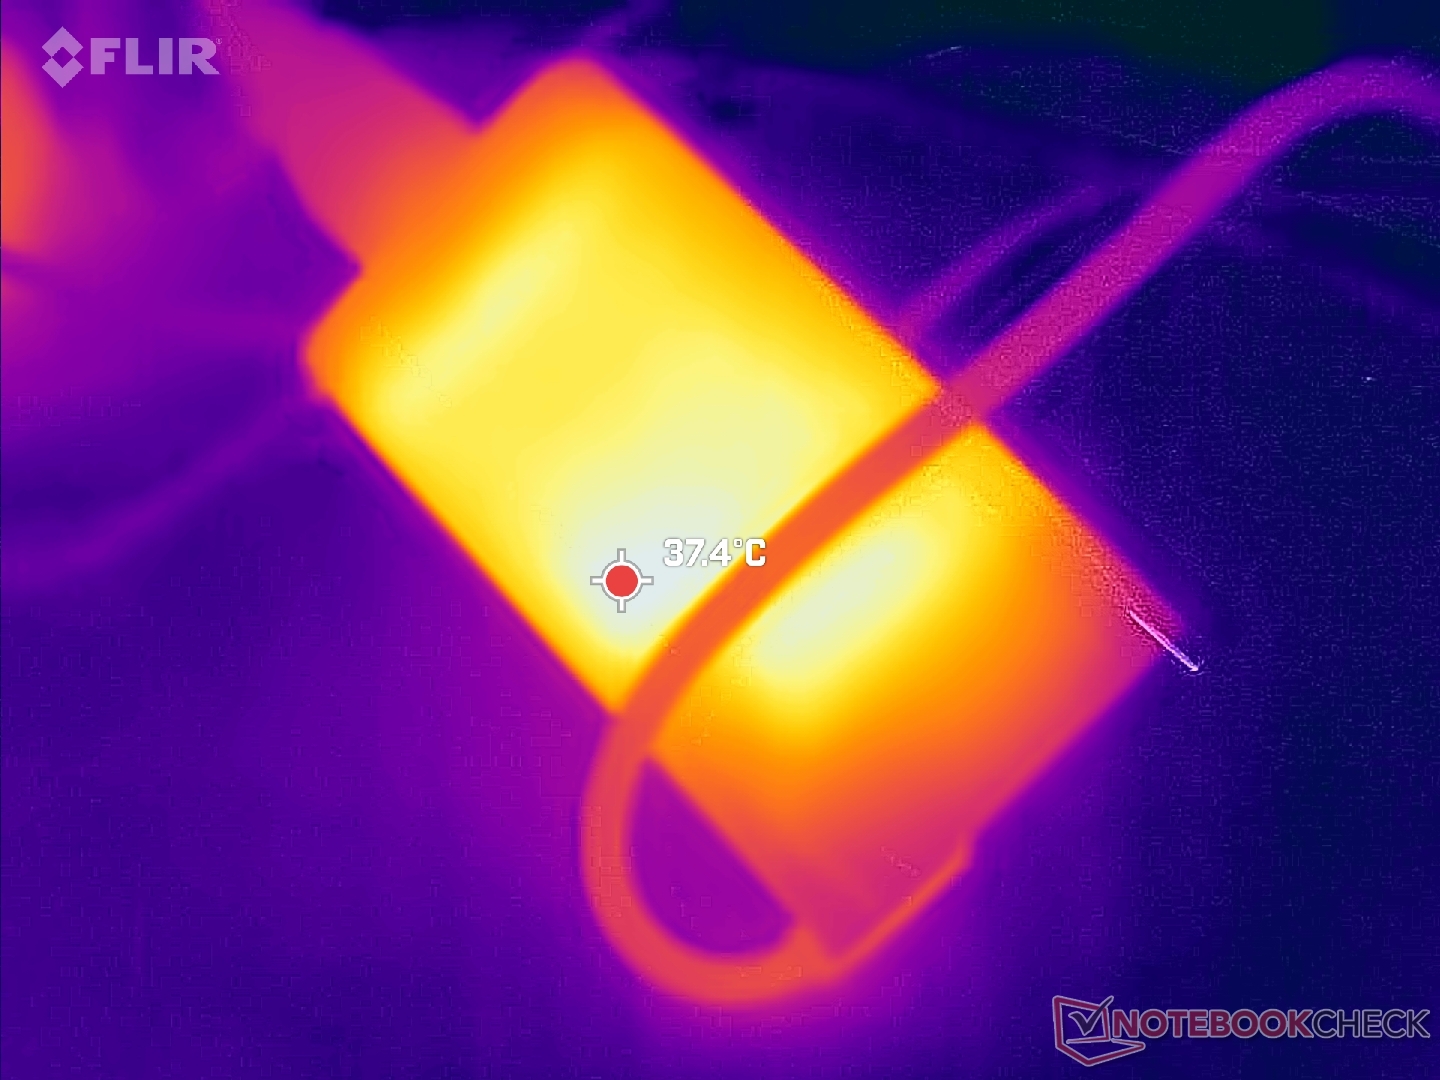
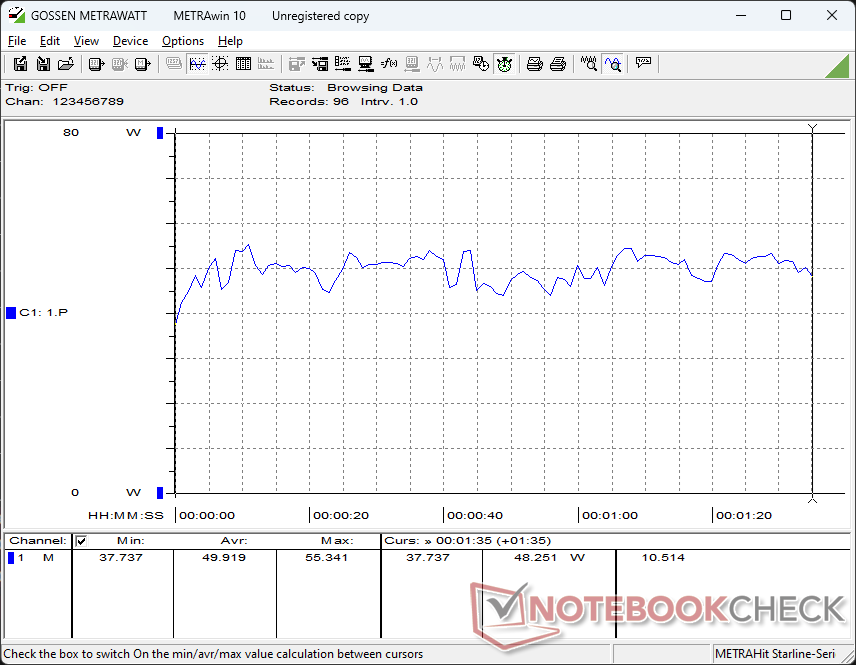
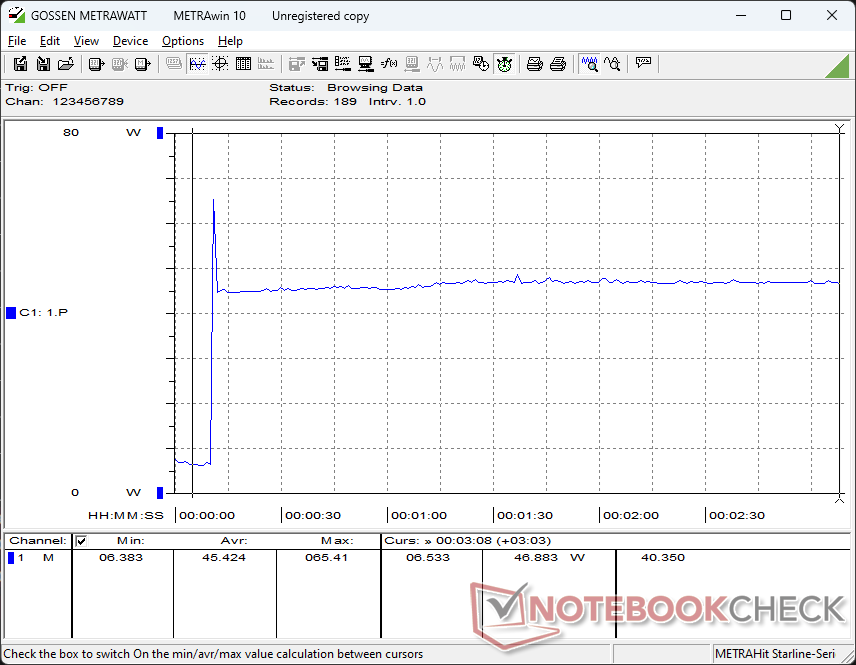
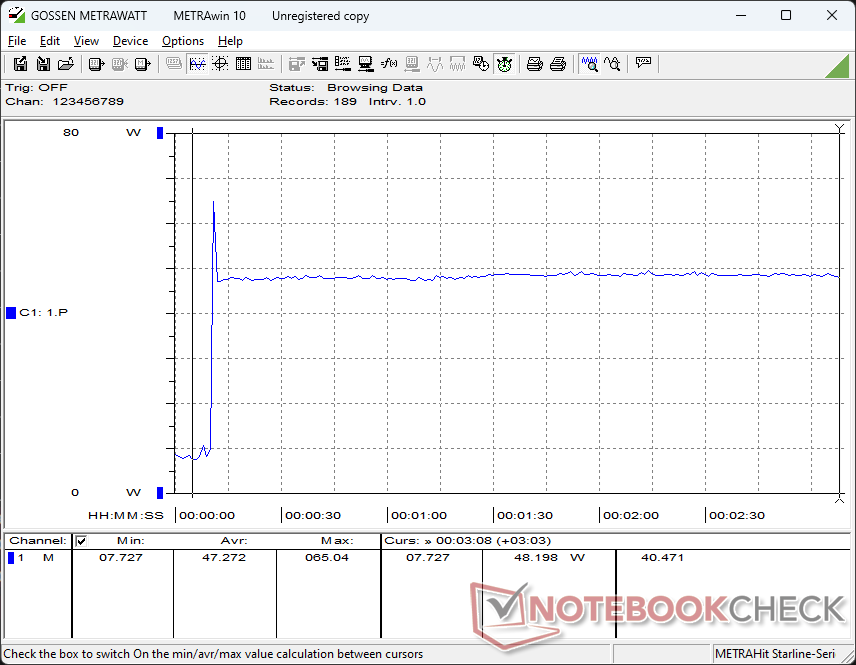
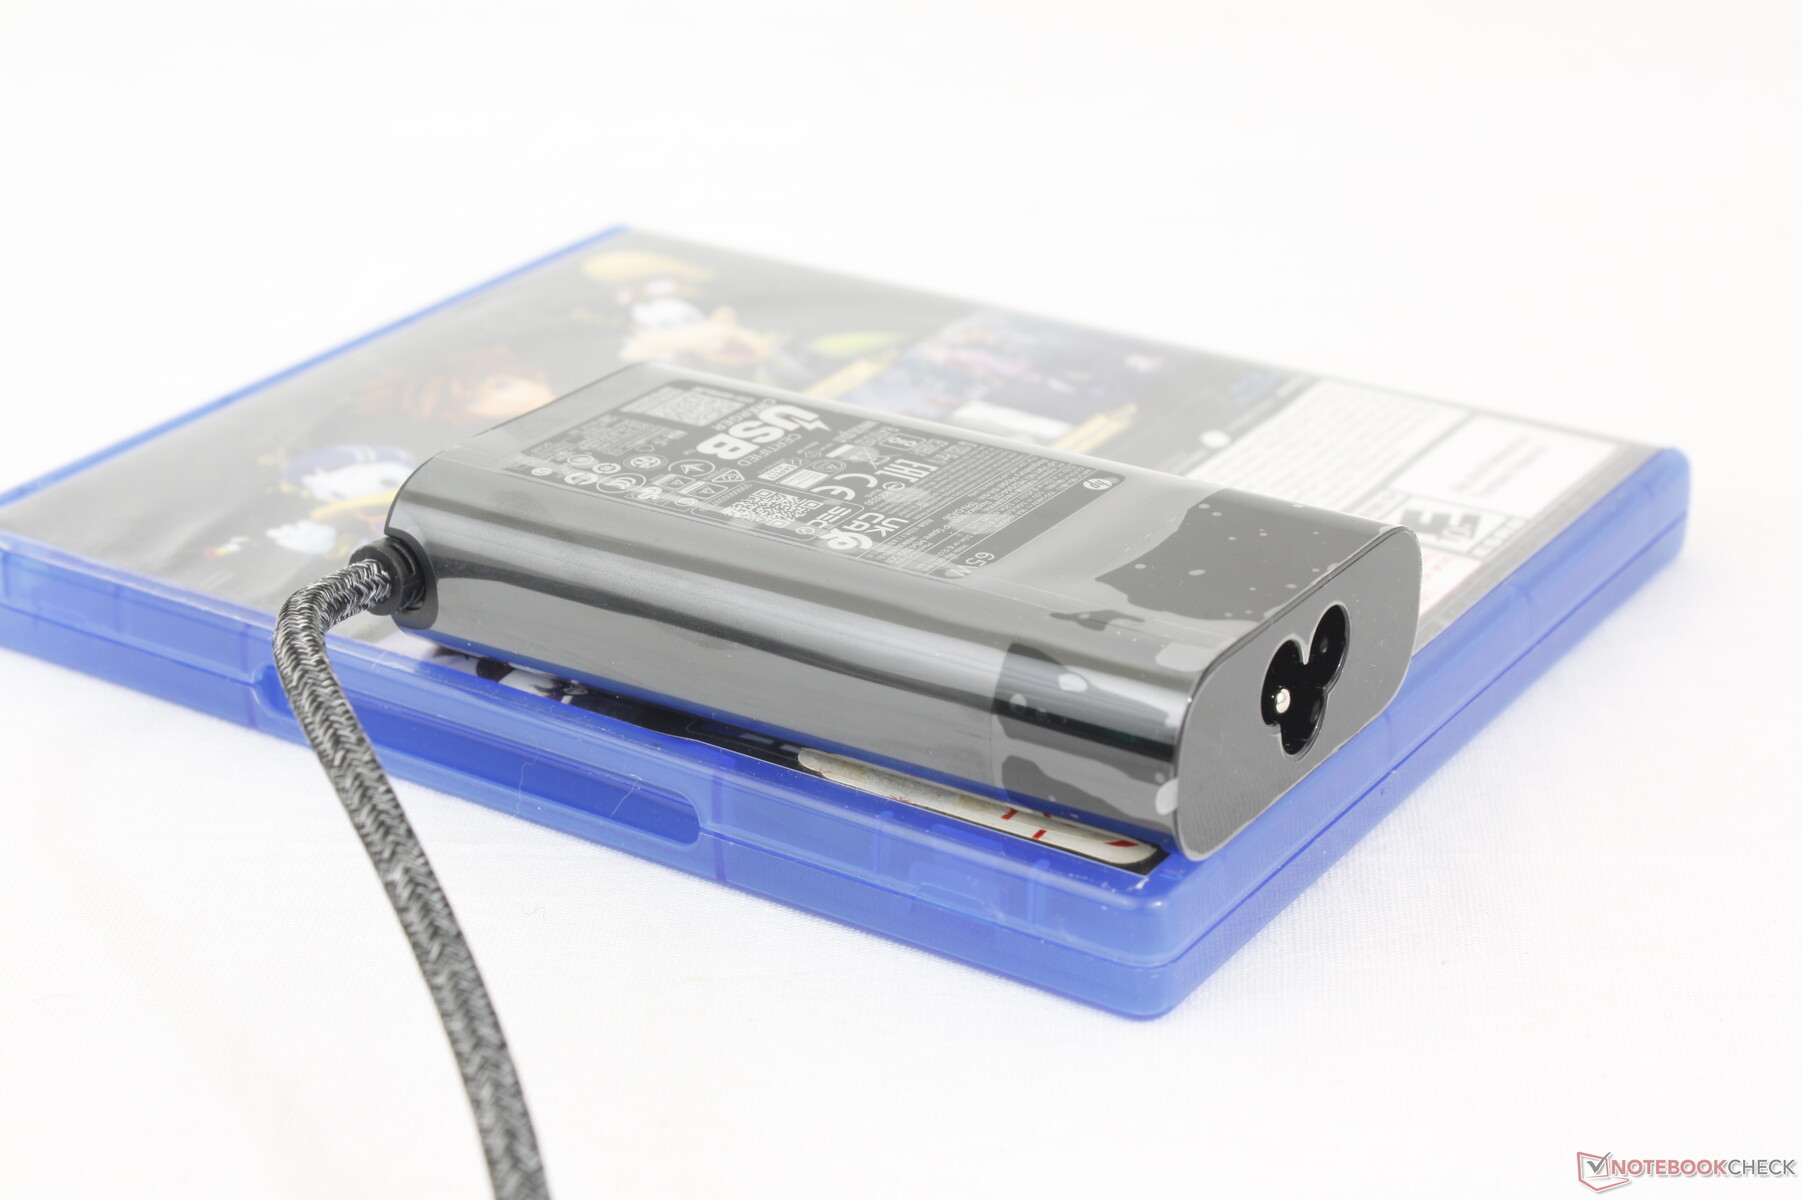
Somos capaces de medir un consumo máximo temporal de 66 W desde el pequeño (~9,6 x 5,5 x 2,2 cm) adaptador USB-C AC de 65 W cuando se ejecutan cargas extremas, como se muestra en las capturas de pantalla a continuación.
| Off / Standby | |
| Ocioso | |
| Carga |
|
Clave:
min: | |
| HP Envy x360 2-in-1 16-ad0097nr R7 8840HS, Radeon 780M, KIOXIA BG5 KBG50ZNV1T02, OLED, 2880x1800, 16" | HP Envy 16 h0112nr i7-12700H, GeForce RTX 3060 Laptop GPU, Micron 3400 1TB MTFDKBA1T0TFH, OLED, 3840x2400, 16" | HP Spectre x360 16 RTX 4050 Ultra 7 155H, GeForce RTX 4050 Laptop GPU, SK hynix PC801 HFS001TEJ9X101N, OLED, 2880x1800, 16" | Lenovo Yoga 7 2-in-1 16IML9 Ultra 5 125U, Graphics 4-Core iGPU (Arrow Lake), SK hynix HFS512GEJ4X112N, IPS, 1920x1200, 16" | Samsung Galaxy Book4 Pro 360 Ultra 5 125H, Arc 7-Core, Samsung PM9B1 512GB MZVL4512HBLU, OLED, 2880x1800, 16" | LG Gram 2in1 16 16T90R - G.AA78G i7-1360P, Iris Xe G7 96EUs, Samsung PM9A1 MZVL21T0HCLR, IPS, 2560x1600, 16" | |
|---|---|---|---|---|---|---|
| Power Consumption | -128% | -77% | 18% | 18% | -1% | |
| Idle Minimum * (Watt) | 5 | 10 -100% | 5.8 -16% | 3 40% | 3 40% | 5.5 -10% |
| Idle Average * (Watt) | 6.2 | 10.9 -76% | 12.3 -98% | 8.5 -37% | 6.3 -2% | 7.2 -16% |
| Idle Maximum * (Watt) | 14.7 | 27.8 -89% | 33.9 -131% | 8.9 39% | 6.5 56% | 12.9 12% |
| Load Average * (Watt) | 49.9 | 116.4 -133% | 83.3 -67% | 41.1 18% | 49.3 1% | 55 -10% |
| Witcher 3 ultra * (Watt) | 54.5 | 133.7 -145% | 89.1 -63% | 30.7 44% | 45.9 16% | 47 14% |
| Load Maximum * (Watt) | 65 | 209.8 -223% | 120.8 -86% | 64.6 1% | 65.5 -1% | 63.6 2% |
* ... más pequeño es mejor
Power Consumption Witcher 3 / Stresstest
Power Consumption external Monitor
Duración de las pilas
La capacidad de la batería es menor que en la mayoría de los otros portátiles de 16 pulgadas lo que, combinado con la exigente pantalla táctil OLED, conduce a tiempos de ejecución más cortos en general. Somos capaces de exprimir 7,5 horas de navegación en el mundo real del Envy antes del apagado automático en comparación con más de una hora o dos horas más en el Samsung Galaxy Book4 Pro 360 o el Spectre x360 16. No obstante, la duración de la batería sigue siendo bastante buena siempre que los propietarios no esperen un tiempo de actividad del nivel de un MacBook.
La carga desde vacío a plena capacidad con el adaptador de CA incluido tarda unos 90 minutos.
| HP Envy x360 2-in-1 16-ad0097nr R7 8840HS, Radeon 780M, 68 Wh | HP Envy 16 h0112nr i7-12700H, GeForce RTX 3060 Laptop GPU, 83 Wh | HP Spectre x360 16 RTX 4050 Ultra 7 155H, GeForce RTX 4050 Laptop GPU, 83 Wh | Lenovo Yoga 7 2-in-1 16IML9 Ultra 5 125U, Graphics 4-Core iGPU (Arrow Lake), 71 Wh | Samsung Galaxy Book4 Pro 360 Ultra 5 125H, Arc 7-Core, 76 Wh | LG Gram 2in1 16 16T90R - G.AA78G i7-1360P, Iris Xe G7 96EUs, 80 Wh | |
|---|---|---|---|---|---|---|
| Duración de Batería | 0% | 43% | 60% | 8% | 30% | |
| Reader / Idle (h) | 15.6 | 17.8 14% | ||||
| WiFi v1.3 (h) | 7.7 | 7.9 3% | 11 43% | 12.3 60% | 8.9 16% | 11.9 55% |
| Load (h) | 1.9 | 1.6 -16% | 1.9 0% | 2 5% | ||
| H.264 (h) | 14.7 |
Pro
Contra
Veredicto - Experiencia Spectre por menos
HP ofrece actualmente dos convertibles de 16 pulgadas a nivel de consumidor: el Envy x360 16 de gama media y el Spectre x360 16. Sorprendentemente, el Envy es más ligero que el Spectre a la vez que luce exactamente la misma pantalla táctil OLED y casi las mismas dimensiones. Las experiencias de usuario entre ambos modelos son, por tanto, mucho más parecidas de lo esperado a pesar de sus grandes diferencias de precio.
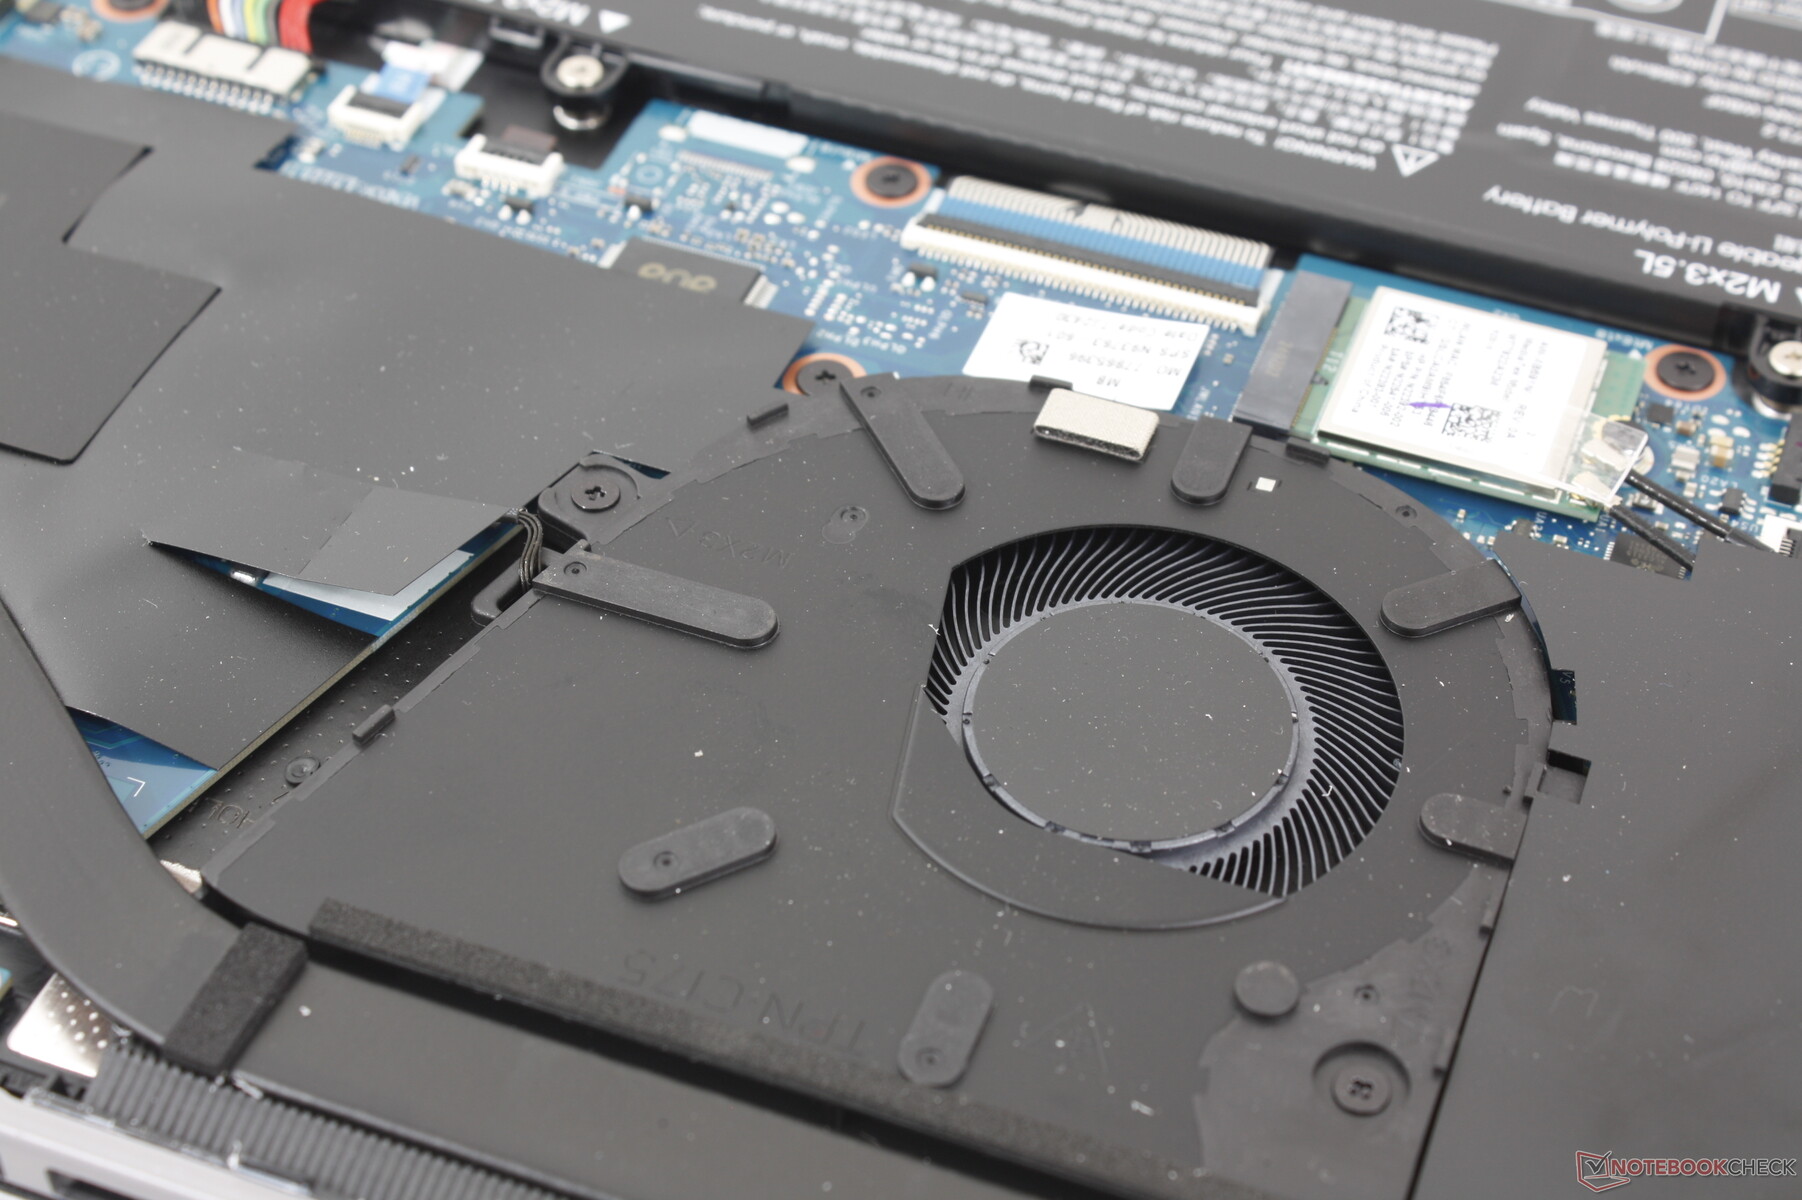
Todavía hay un puñado de razones para preferir el más caro Spectre x360 16 aparte del diseño más lujoso. El Envy x360 16 tiene una batería más pequeña, no tiene GPU dedicada y tiene una webcam de menor resolución. También tiende a funcionar más ruidosamente bajo carga debido a que sólo tiene un ventilador interno en lugar de dos. El Asus VivoBook Pro 16 es una alternativa decente al Envy x360 16 ya que incluye OLED, una dGPU para un rendimiento más rápido y una batería más grande a aproximadamente el mismo precio, pero los propietarios perderían el factor de forma 2 en 1.
El HP Envy x360 16 preparado para IA viene en sabores Intel y AMD y con características muy similares al más caro Spectre x360 16. Aunque las versiones AMD son notablemente más rápidas que las Intel, carecen de soporte USB4 y Thunderbolt para unas capacidades de acoplamiento más limitadas.
También tenemos que dar crédito al modelo por ofrecer ambas opciones de CPU, Intel Meteor Lake-U y AMD Hawk Point-HS, lo que no es común en otros portátiles. Las versiones AMD son indiscutiblemente más rápidas en términos de rendimiento bruto del procesador e incluso de rendimiento gráfico integrado. Sin embargo, los usuarios que valoran Thunderbolt no tendrán más remedio que ponerse del lado de Intel y lidiar con el procesador más lento. Es una lástima, pues, que las versiones AMD no sean compatibles con USB4, lo que las habría hecho más fácilmente recomendables frente a las opciones Envy basadas en Intel.
Precio y disponibilidad
HP ya está distribuyendo la Envy x360 16 como se analizó con el Ryzen 7 8840HS, 16 GB de RAM y 1 TB de SSD por $1300 USD.
HP Envy x360 2-in-1 16-ad0097nr
- 05/22/2024 v7 (old)
Allen Ngo
Transparencia
La selección de los dispositivos que se van a reseñar corre a cargo de nuestro equipo editorial. La muestra de prueba fue proporcionada al autor en calidad de préstamo por el fabricante o el minorista a los efectos de esta reseña. El prestamista no tuvo ninguna influencia en esta reseña, ni el fabricante recibió una copia de la misma antes de su publicación. No había ninguna obligación de publicar esta reseña. Como empresa de medios independiente, Notebookcheck no está sujeta a la autoridad de fabricantes, minoristas o editores.
Así es como prueba Notebookcheck
Cada año, Notebookcheck revisa de forma independiente cientos de portátiles y smartphones utilizando procedimientos estandarizados para asegurar que todos los resultados son comparables. Hemos desarrollado continuamente nuestros métodos de prueba durante unos 20 años y hemos establecido los estándares de la industria en el proceso. En nuestros laboratorios de pruebas, técnicos y editores experimentados utilizan equipos de medición de alta calidad. Estas pruebas implican un proceso de validación en varias fases. Nuestro complejo sistema de clasificación se basa en cientos de mediciones y puntos de referencia bien fundamentados, lo que mantiene la objetividad.Price comparison

