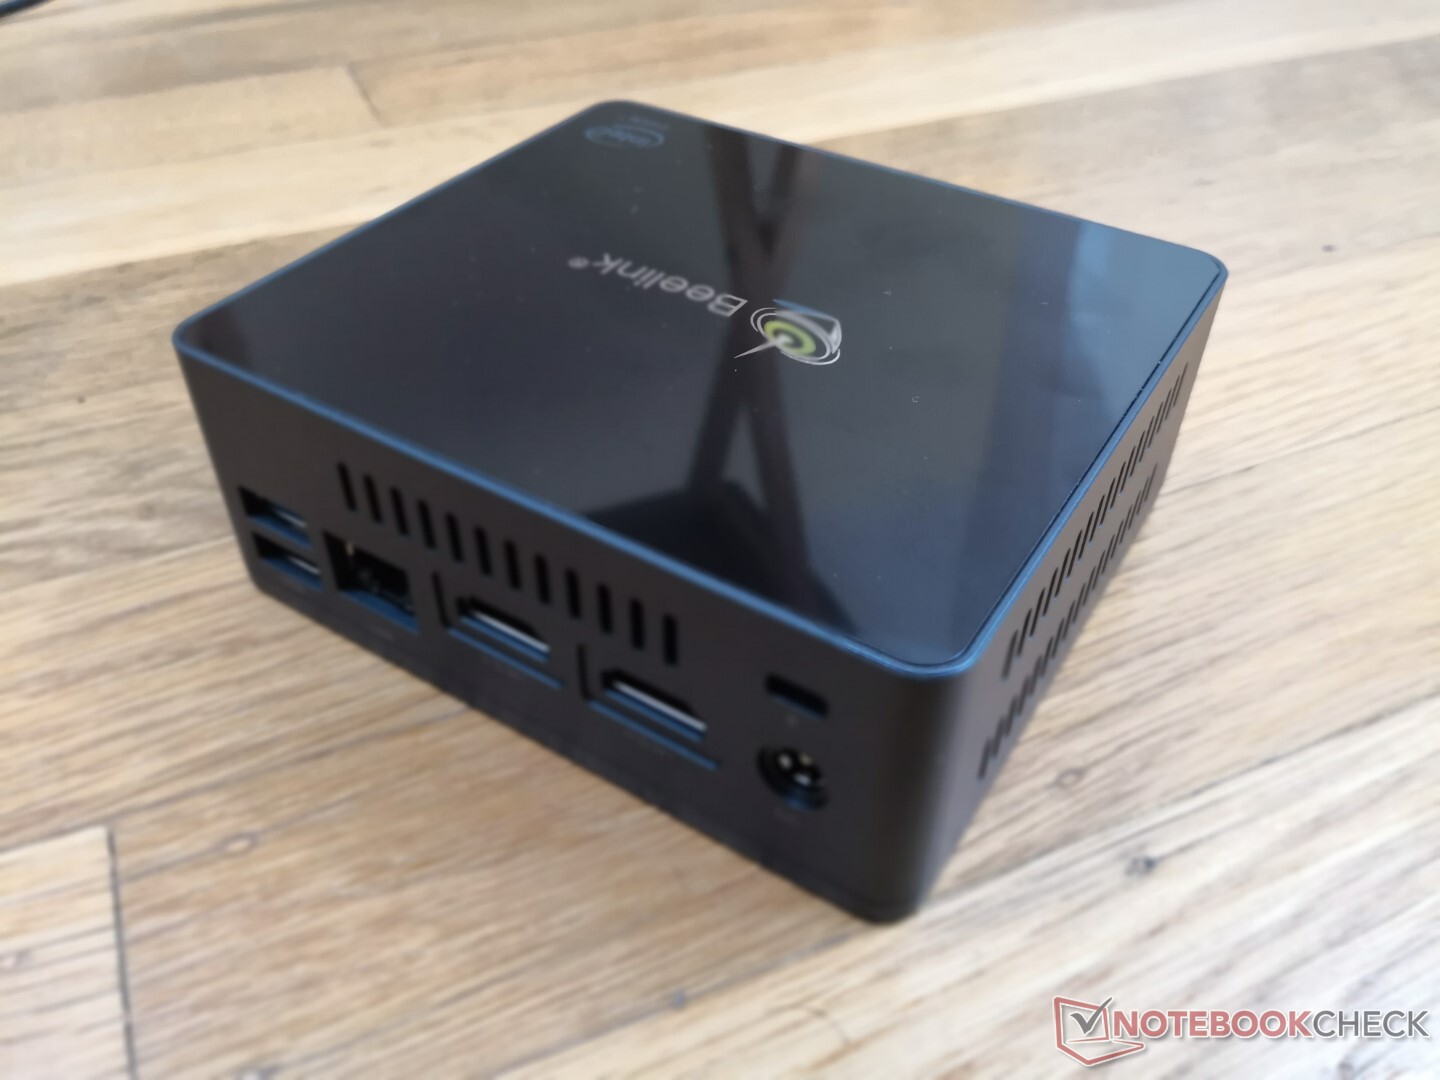
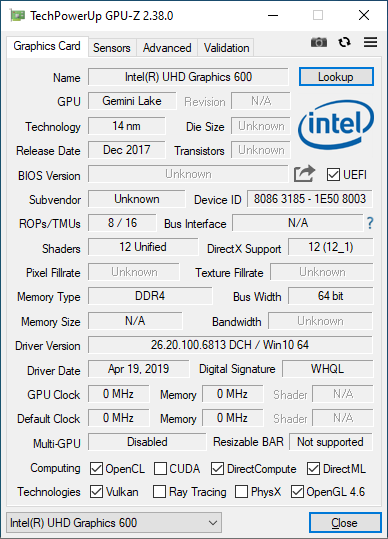
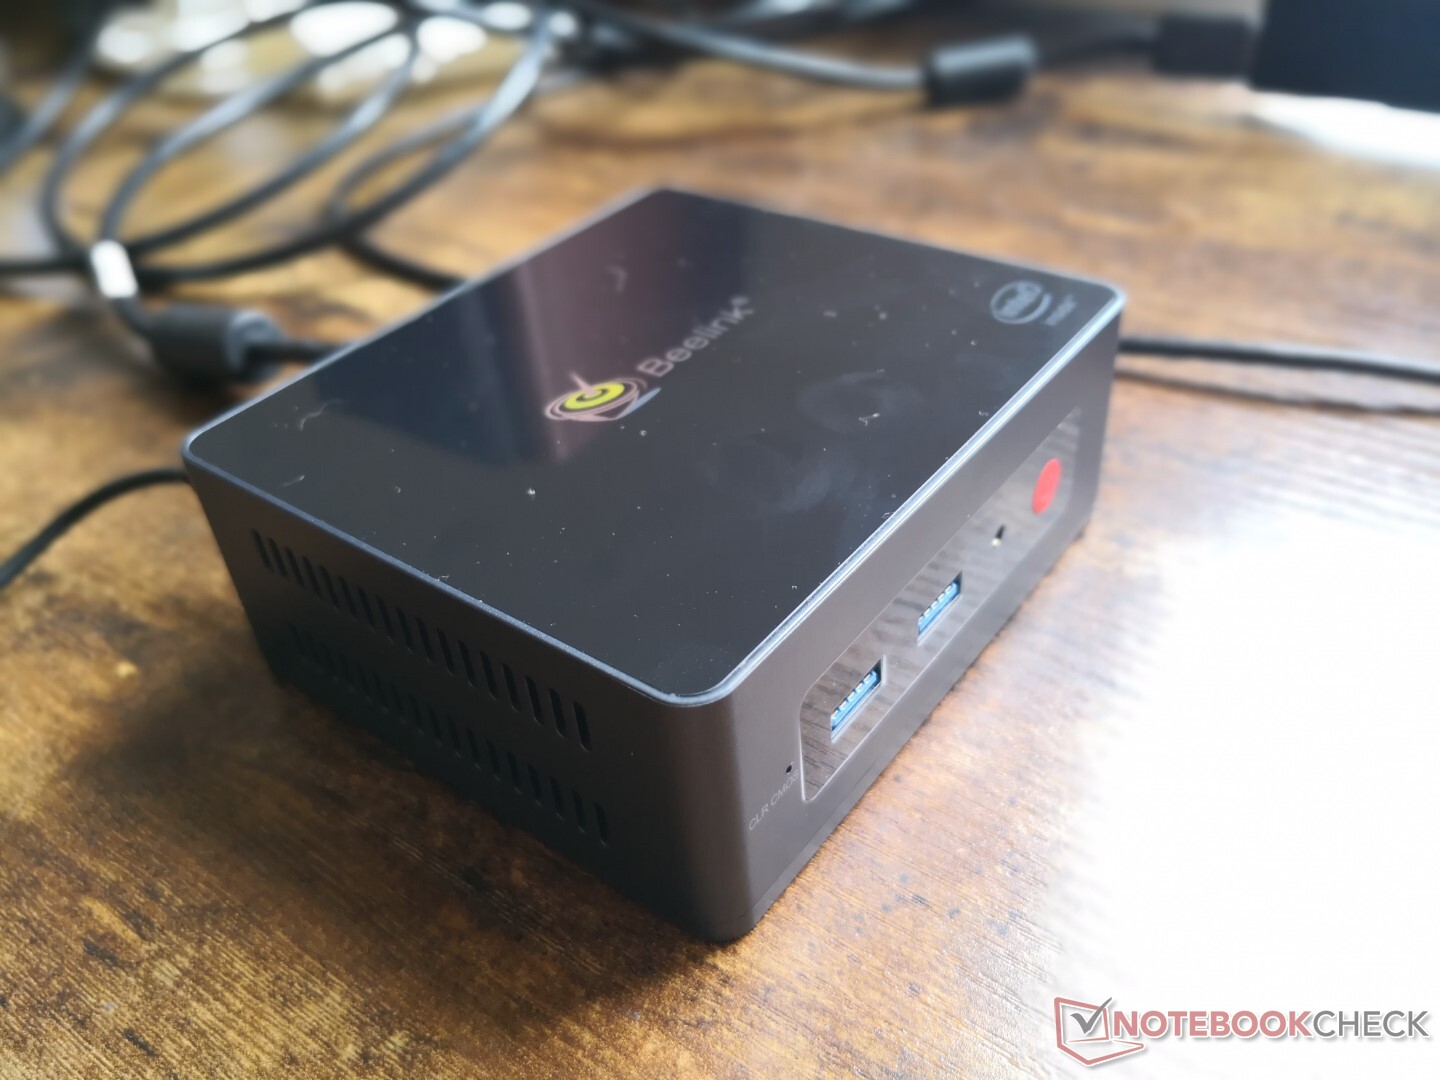
Análisis del mini PC Beelink GK: Un HTPC listo para usar
Al igual que GMK, Beelink ofrece una variedad de mini PC económicos en contraste con los que suelen ser más caros de Zotac o Intel. Sus opciones suelen venir completamente configuradas con RAM y almacenamiento para ser más plug-and-play y apropiadas para los usuarios que sólo quieren algo barato para navegar, hacer streaming y otras tareas poco exigentes con una mínima multitarea.
Beelink ofrece 8 GB de RAM y 128 GB de almacenamiento SSD por 229 dólares o los usuarios pueden duplicar el almacenamiento por sólo 20 dólares más. Se puede encontrar más información en su página de producto aquí
potential competitors in comparison
Valoración | Fecha | Modelo | Peso | Altura | Tamaño | Resolución | Precio |
|---|---|---|---|---|---|---|---|
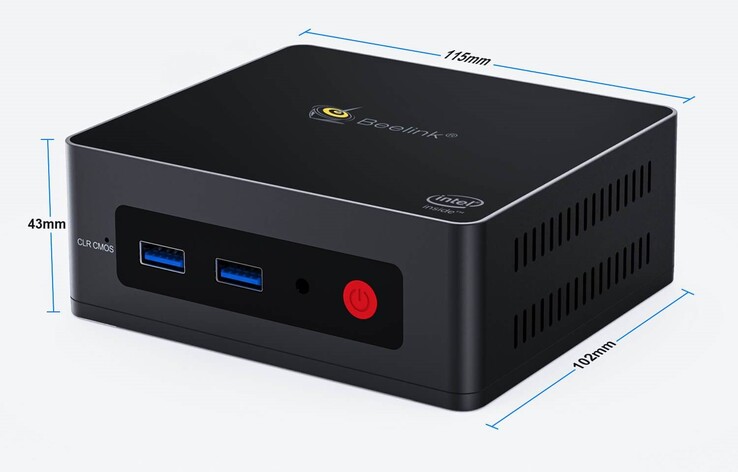
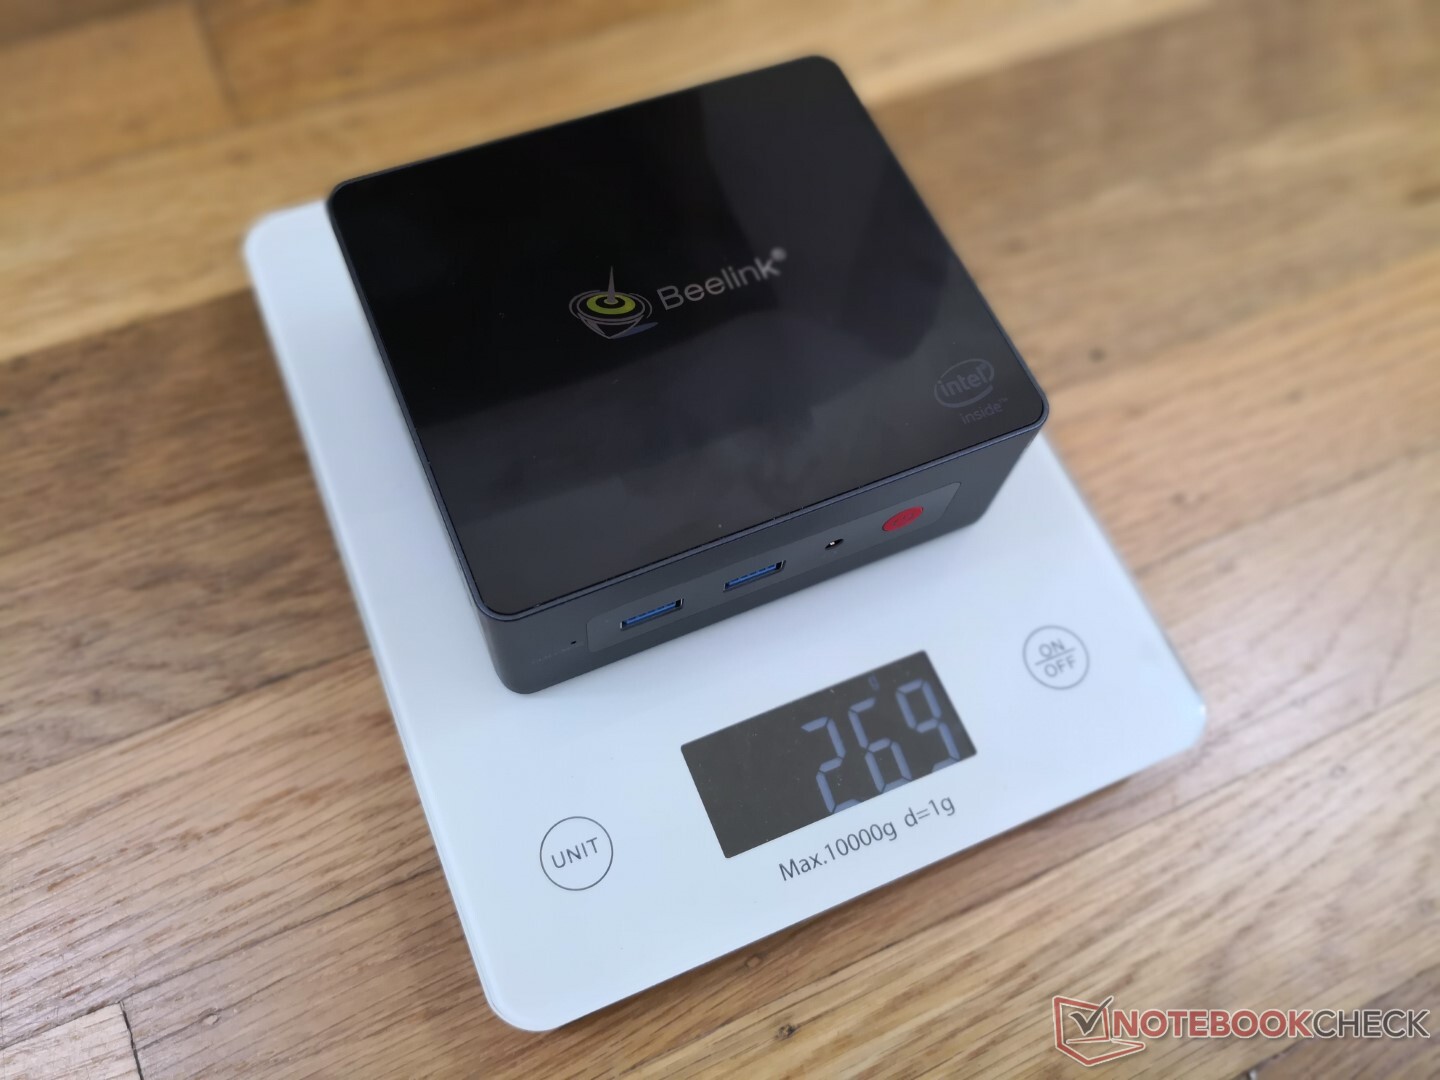
v (old) | 05/2021 | Beelink GK Mini Celeron J4125, UHD Graphics 600 | 269 g | 43 mm | x | ||
v (old) | 04/2021 | Intel NUC11TNKi5 i5-1135G7, Iris Xe G7 80EUs | 504 g | 37 mm | x | ||
v (old) | 03/2021 | GMK NucBox 2 i5-8259U, Iris Plus Graphics 655 | 430 g | 50 mm | x | ||
v (old) | Beelink SEi10 i3-1005G1, UHD Graphics G1 (Ice Lake 32 EU) | 350 g | 41 mm | x | |||
v (old) | 09/2018 | Zotac ZBOX-CI660 Nano i5-8550U, UHD Graphics 620 | 1.1 kg | 68 mm | x | ||
v (old) | 02/2021 | Intel NUC11PAQi7 i7-1165G7, Iris Xe G7 96EUs | 647 g | 56 mm | x |
Caso
Lo primero que notarán los usuarios al coger el GK Mini es lo increíblemente ligero que es. Las dimensiones no son muy diferentes de las del Intel NUC11TNKi5 y, sin embargo, el sistema Beelink pesa casi la mitad. Su conjunto de características más limitado, los materiales más finos del chasis y un rendimiento general más lento contribuyen a un peso significativamente menor.
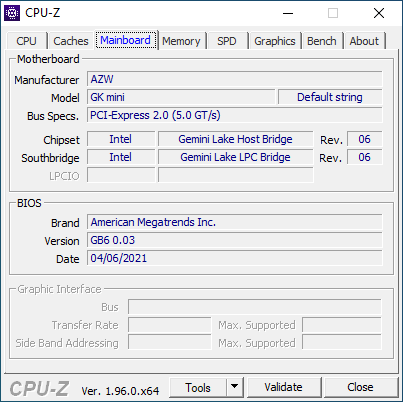
Conectividad
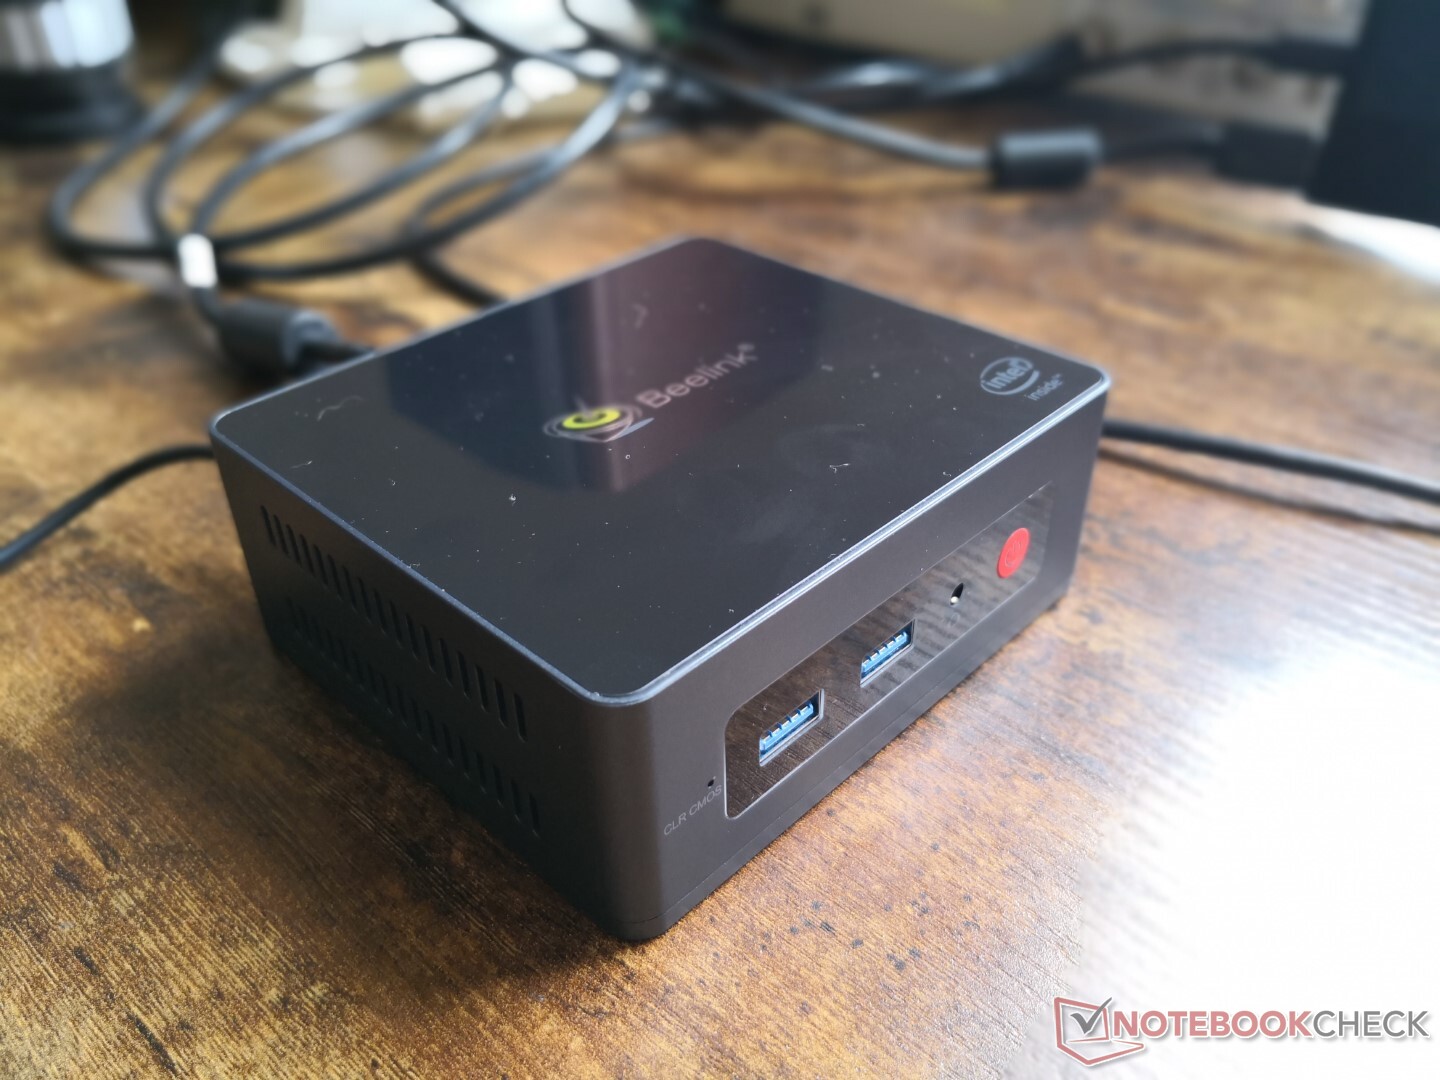
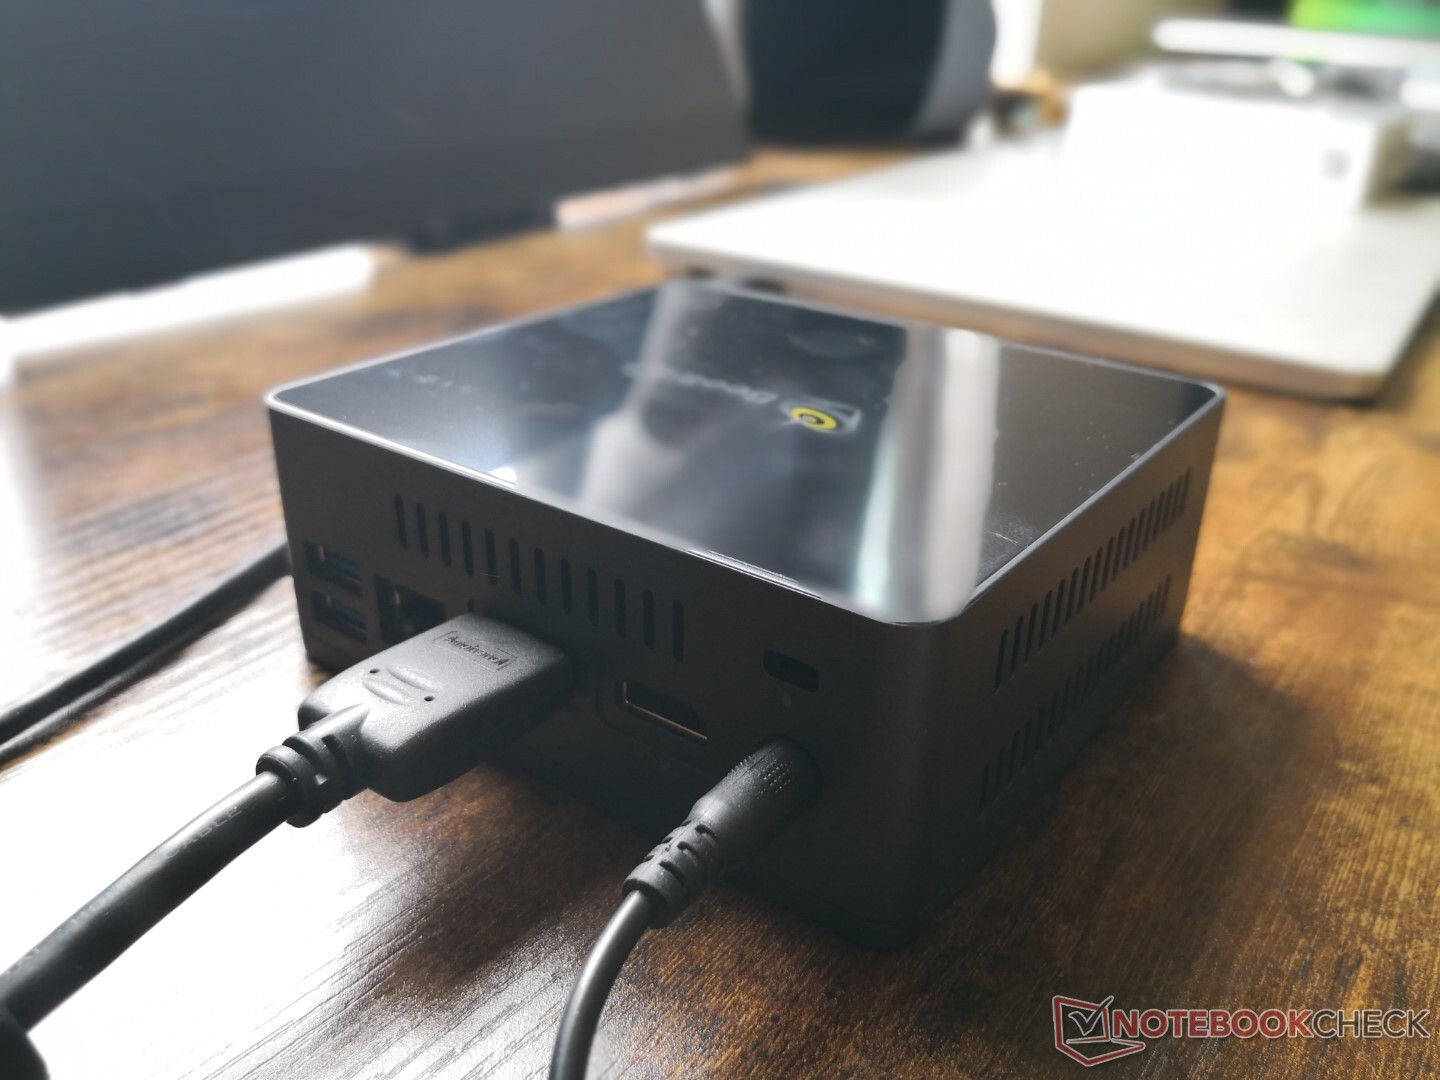
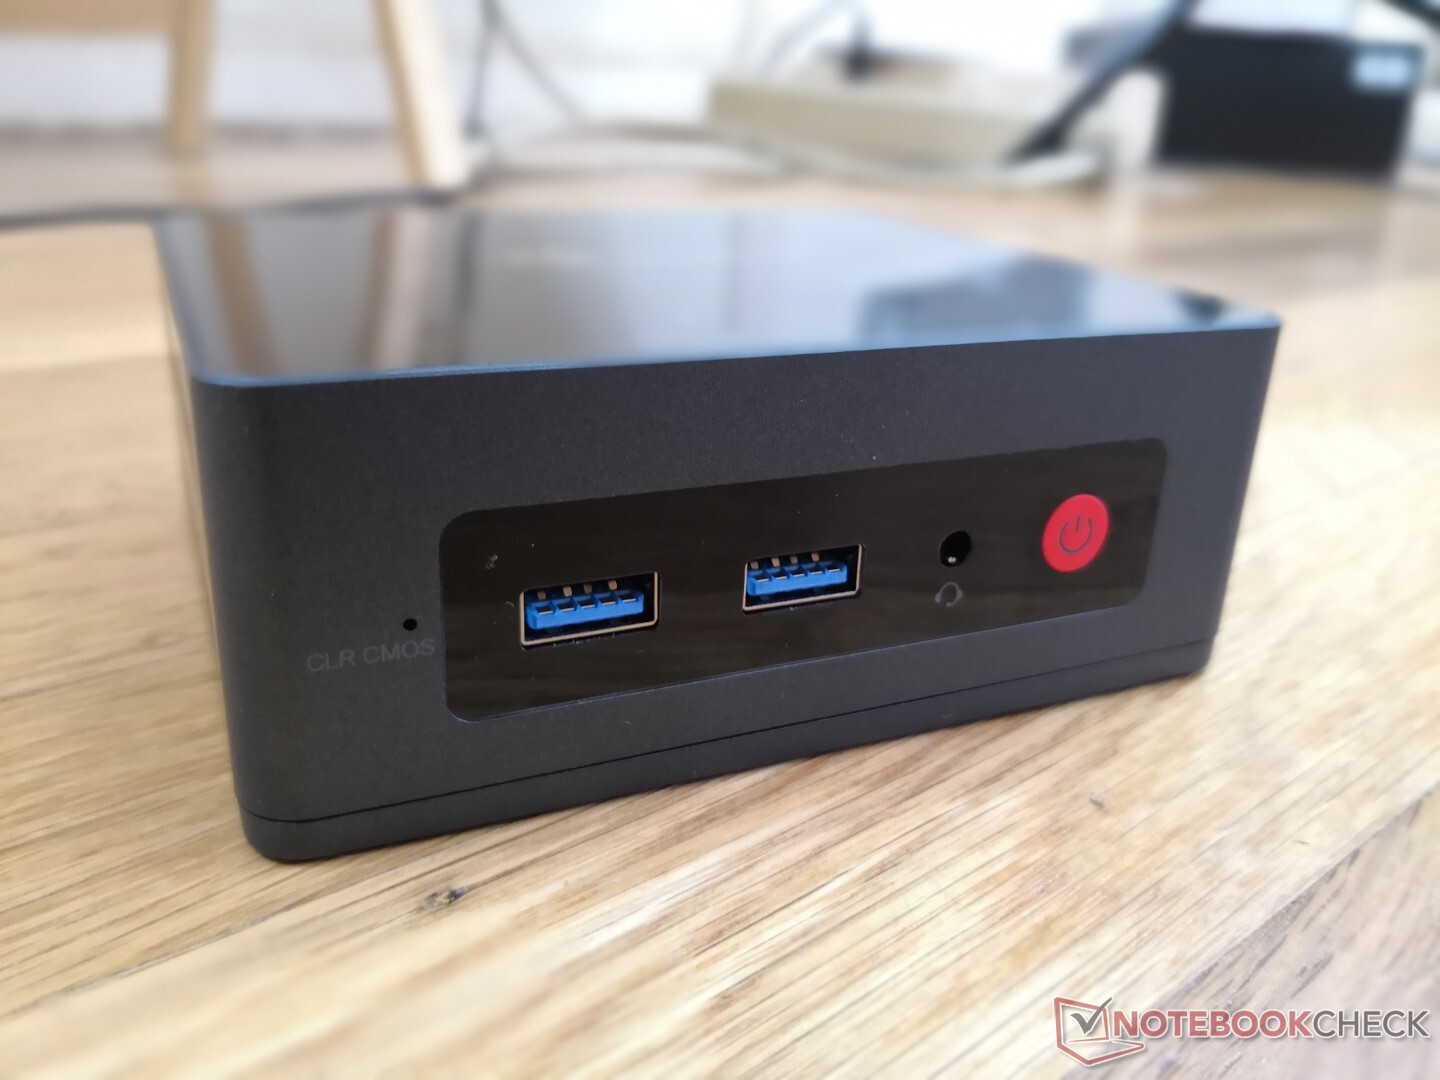
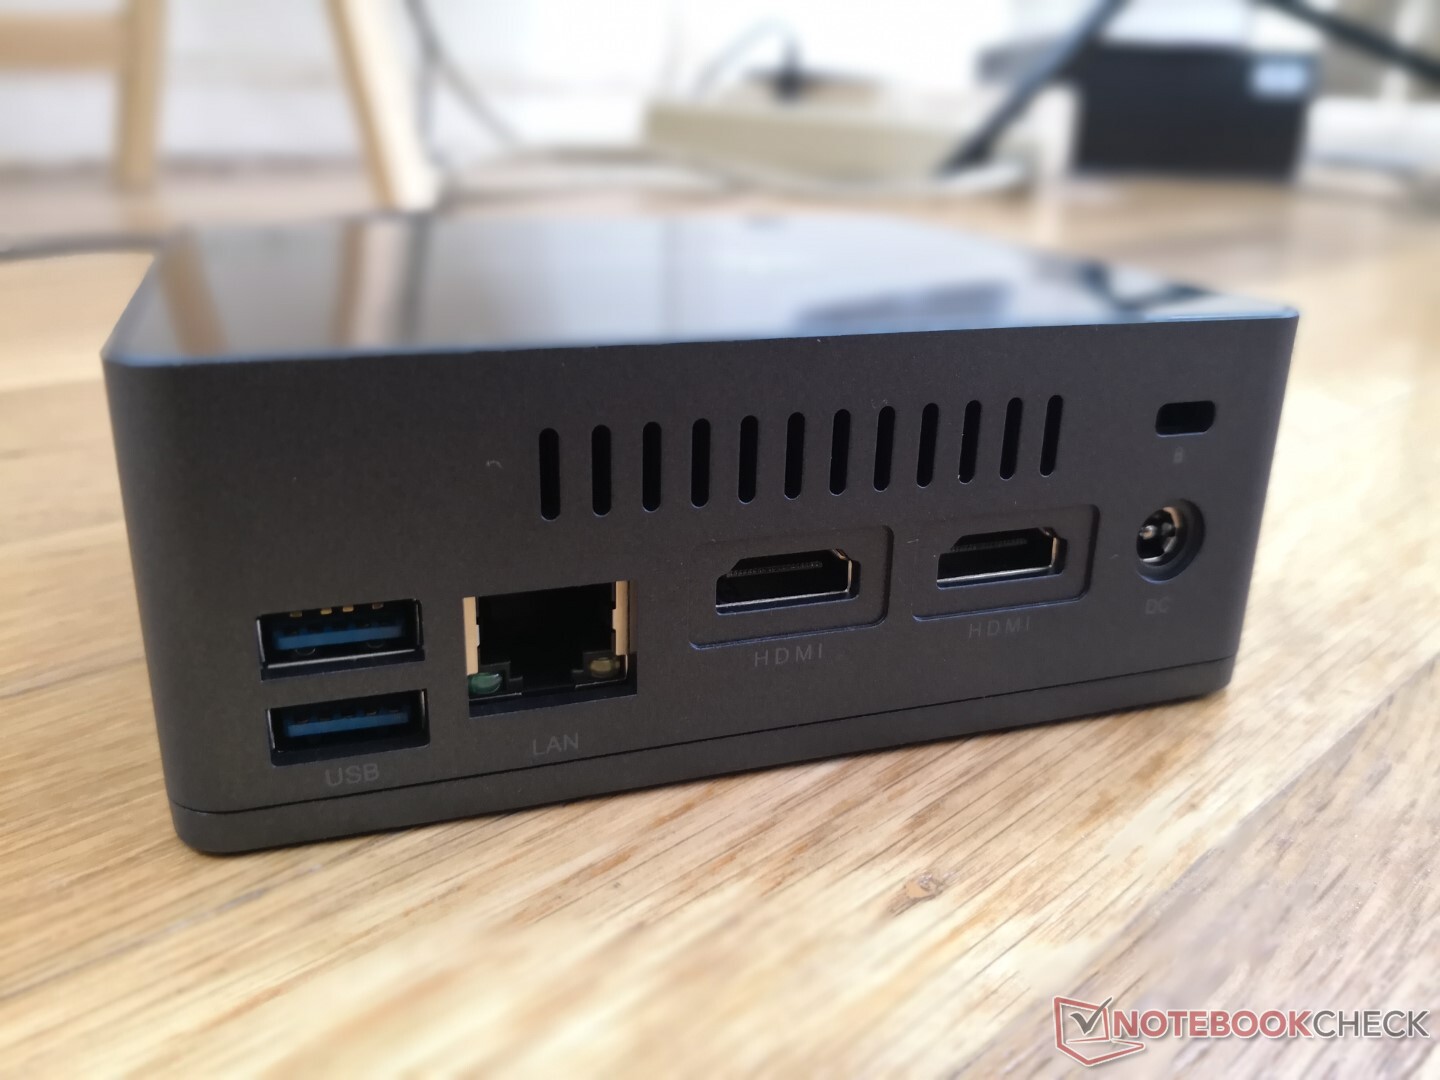
Las opciones de puerto incluyen cuatro puertos USB-A 3.0 y dos HDMI. Se admite la salida a 4K 60 Hz nativos. Por desgracia, tampoco hay puertos USB-C ni receptor IR.
Ten en cuenta que todos los puertos están al revés en comparación con la mayoría de NUCs y portátiles.
Comunicación
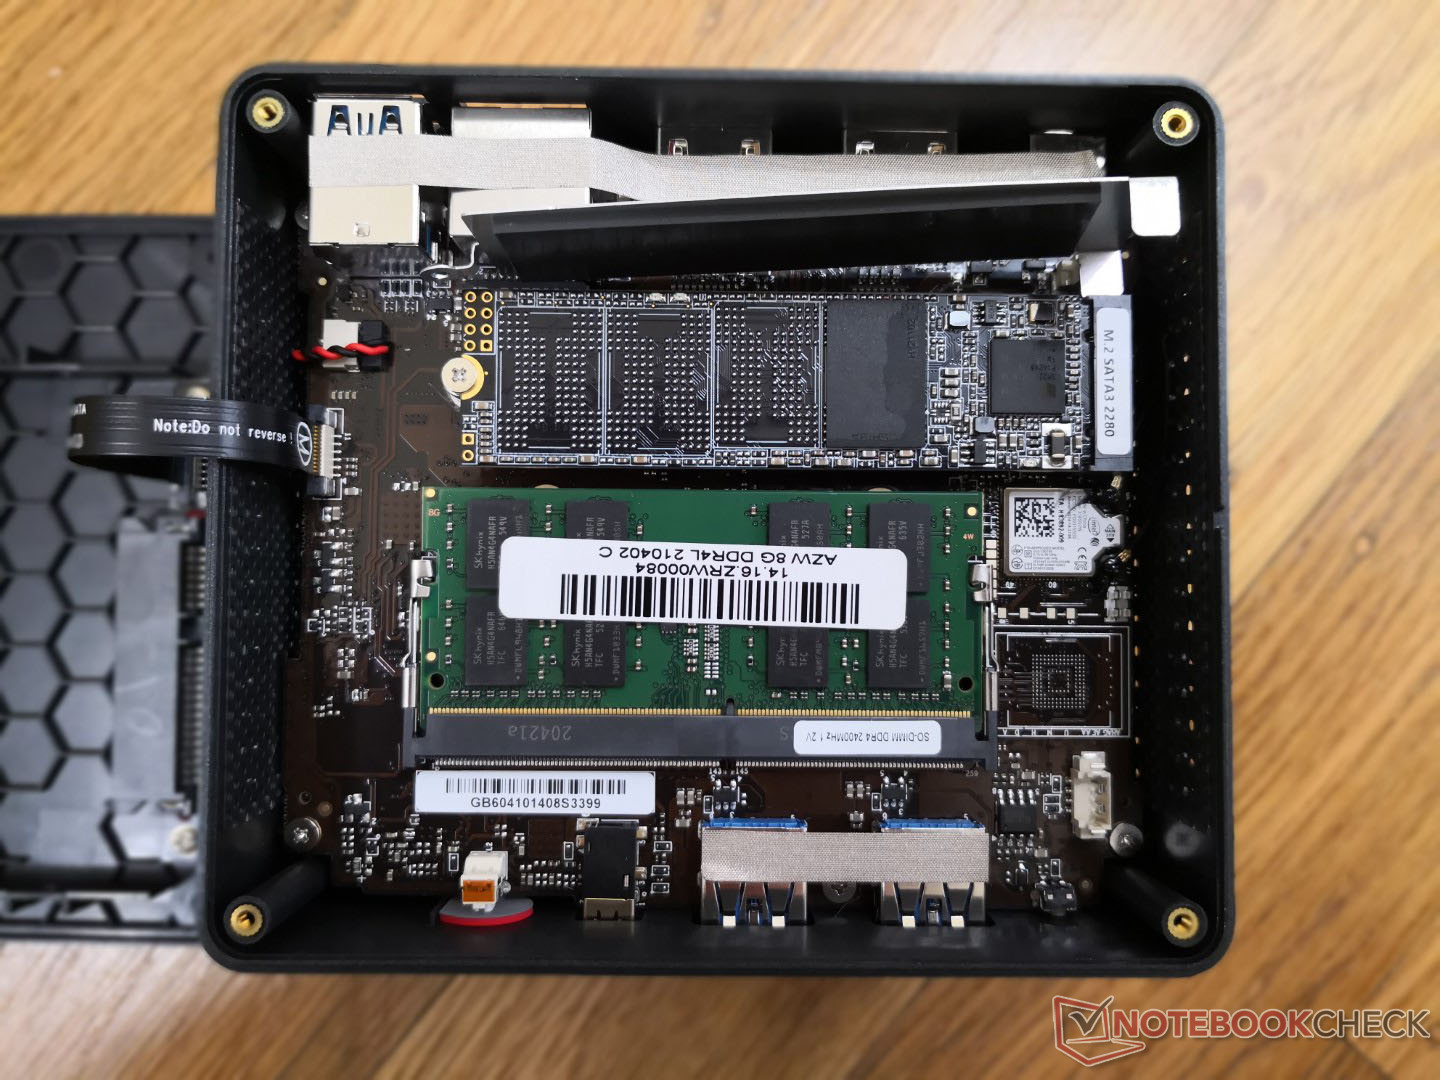
El módulo Intel 3165 proporciona velocidades de 1x1 Wi-Fi 5. Habríamos preferido un Intel 9560 como mínimo, pero el 3165 es suficiente para el streaming 1080p. Para 4K, recomendamos usar el puerto RJ-45 para un mayor ancho de banda.
| Networking | |
| iperf3 transmit AX12 | |
| Intel NUC11TNKi5 | |
| Beelink SEi10 | |
| Intel NUC11PAQi7 | |
| GMK NucBox 2 | |
| Zotac ZBOX-CI660 Nano | |
| Beelink GK Mini | |
| iperf3 receive AX12 | |
| Intel NUC11TNKi5 | |
| Beelink SEi10 | |
| Intel NUC11PAQi7 | |
| GMK NucBox 2 | |
| Beelink GK Mini | |
| Zotac ZBOX-CI660 Nano | |
Mantenimiento
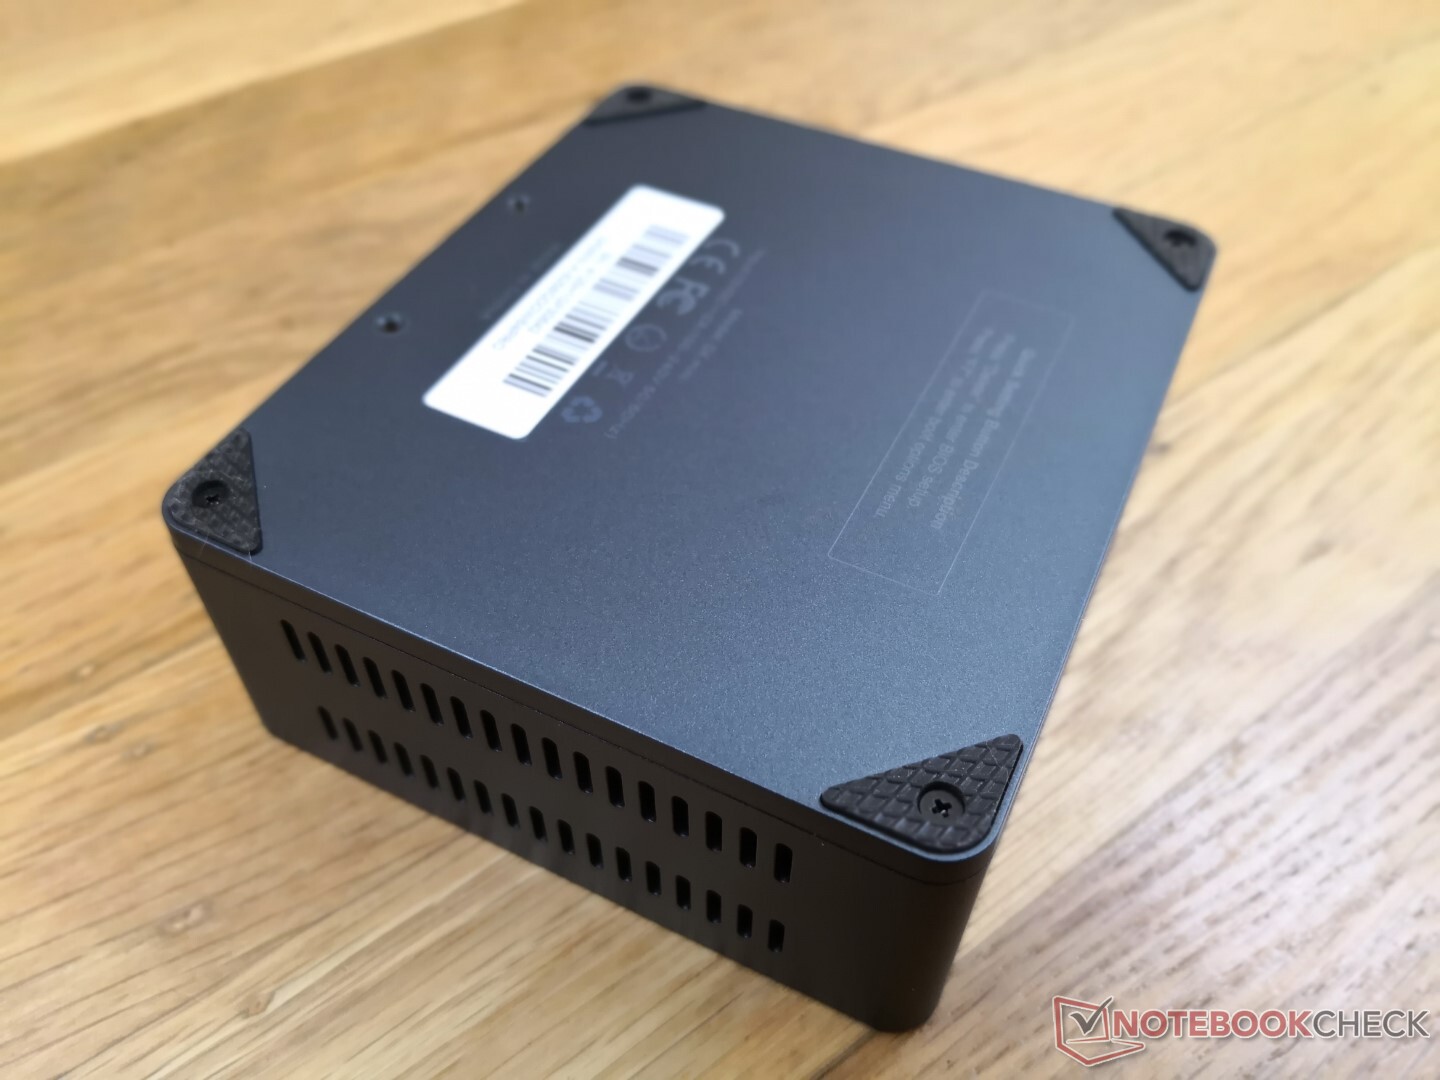
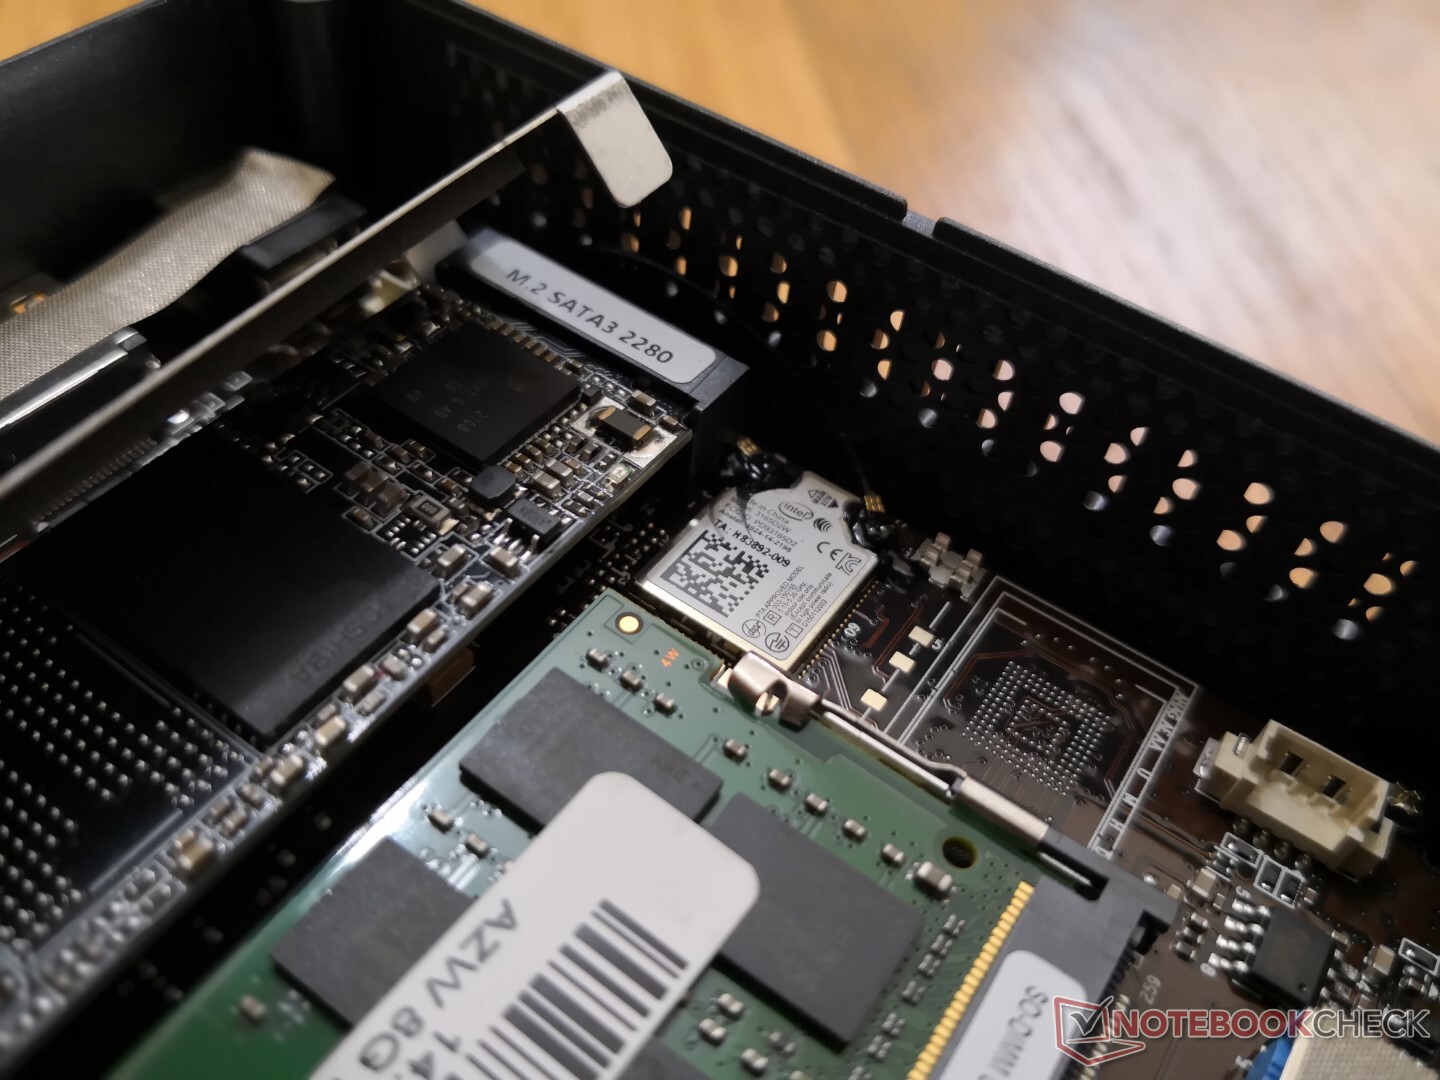
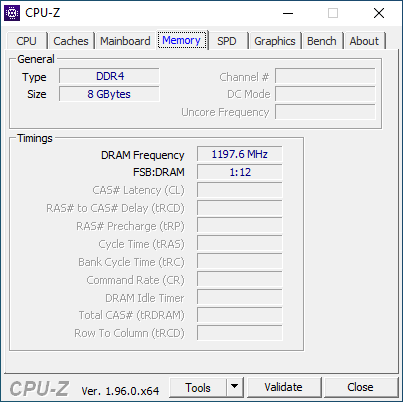
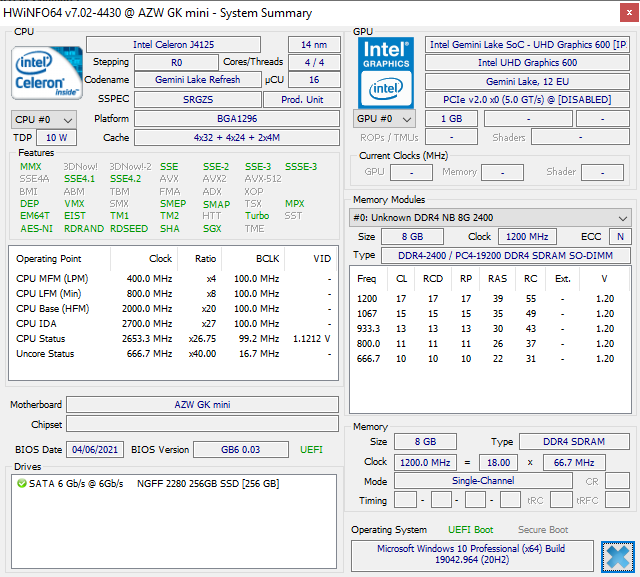
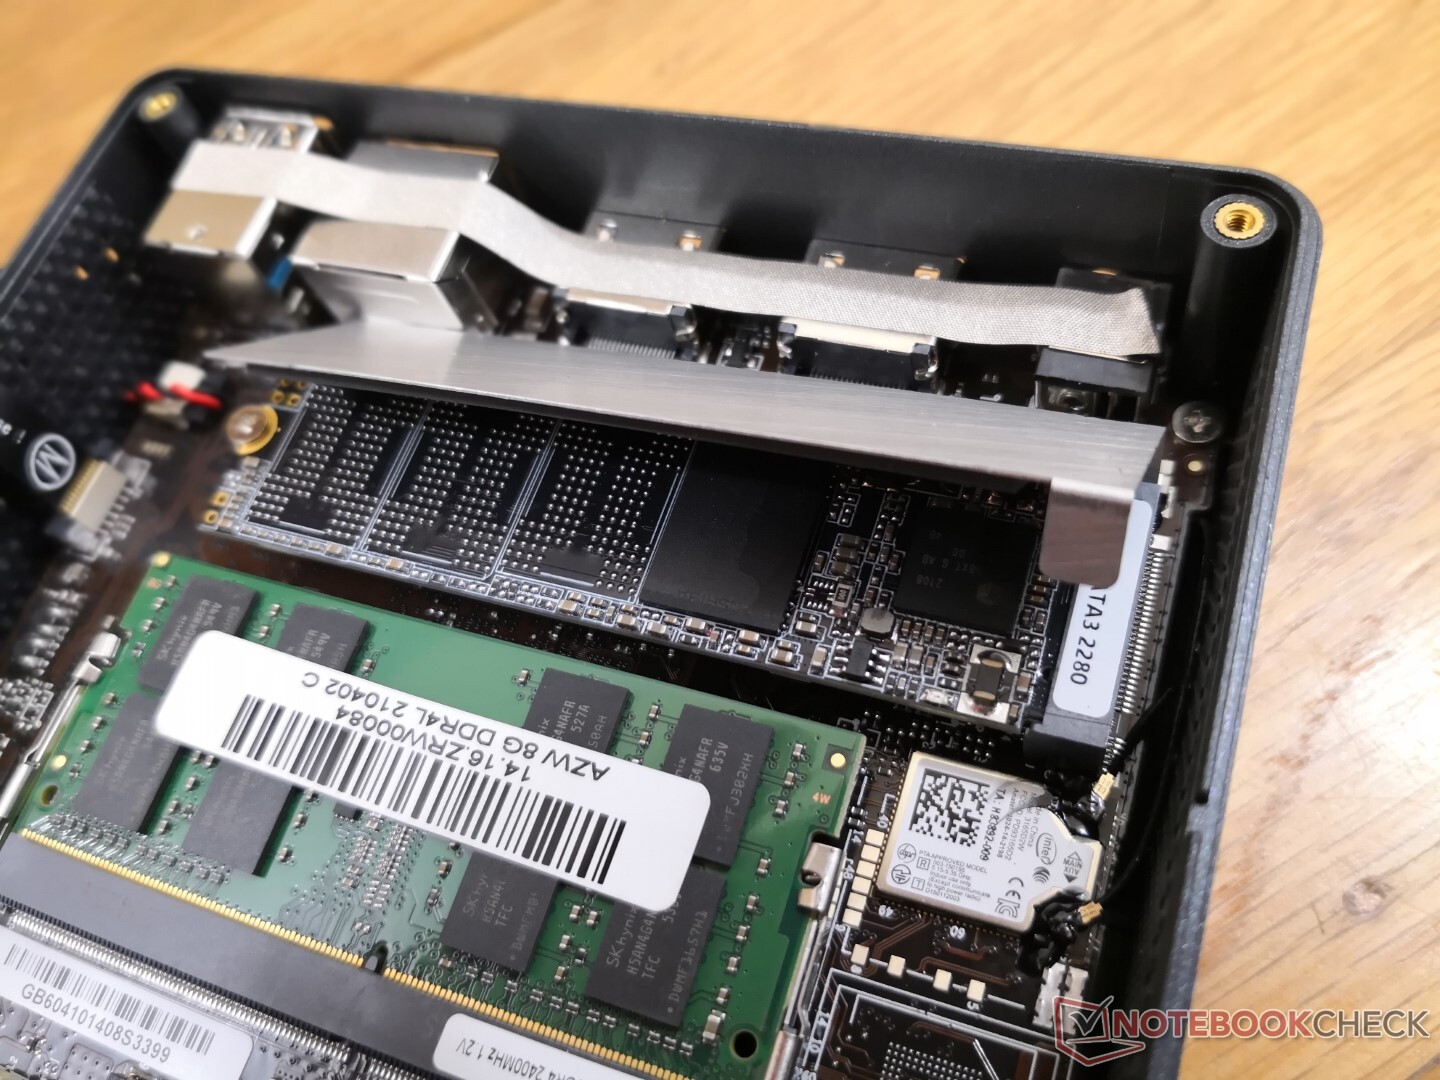
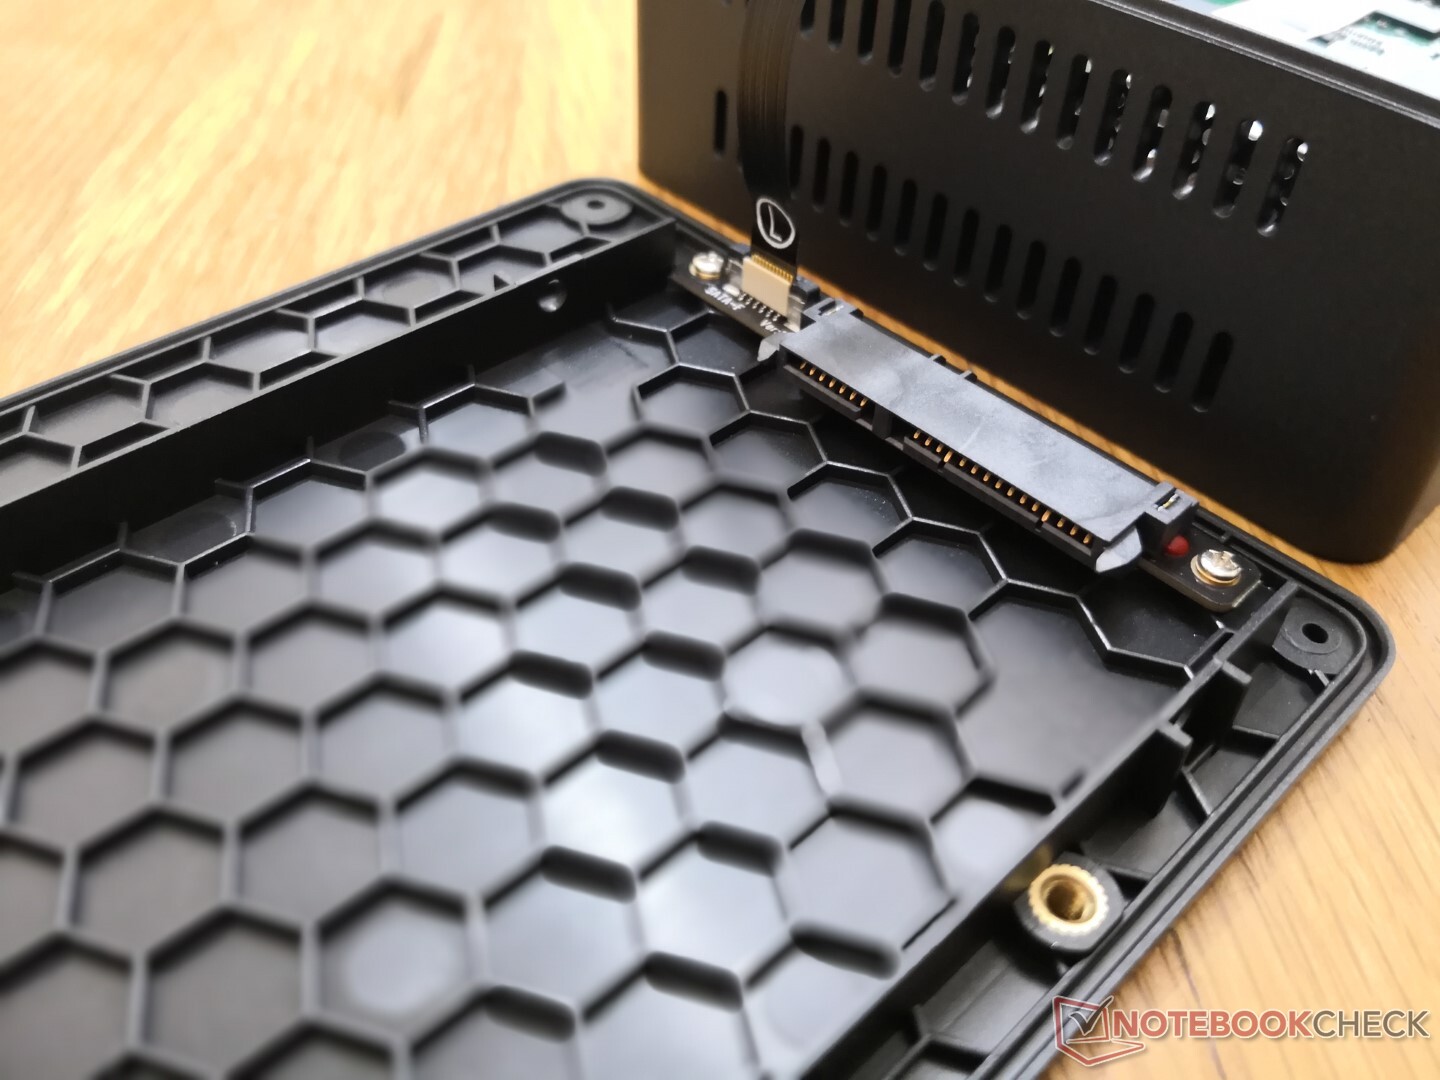
El panel inferior sólo requiere un destornillador Philips para retirarlo. Los usuarios pueden instalar hasta dos unidades de almacenamiento (M.2 2280 SATA III + 2,5 pulgadas SATA III) y un solo módulo de RAM, lo que significa que el sistema está limitado a una memoria RAM de un solo canal.
Accesorios y garantía
El embalaje incluye un soporte VESA extraíble que se fija a la parte inferior de la unidad. Se aplica una garantía limitada estándar de un año, pero reclamar dicha garantía puede ser difícil debido al envío al extranjero.
Rendimiento
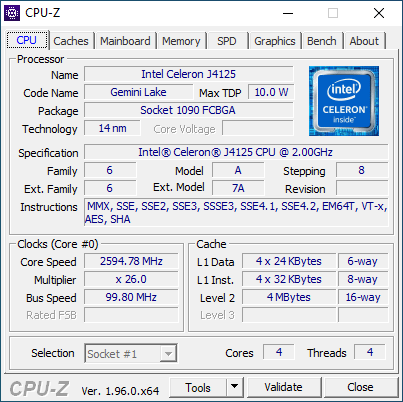
Procesador
El rendimiento de la CPU es aproximadamente un 30% y un 60% más lento que el Core i3-1005G1 en cargas multihilo y monohilo, respectivamente. Aun así, sigue siendo significativamente más rápido que el Atom x7-E3950 o la serie Celeron N4000.
El mismo Celeron J4125 También se puede encontrar en el GMK NucBox K1.
Cinebench R23: Multi Core | Single Core
Cinebench R15: CPU Multi 64Bit | CPU Single 64Bit
Blender: v2.79 BMW27 CPU
7-Zip 18.03: 7z b 4 -mmt1 | 7z b 4
Geekbench 5.5: Single-Core | Multi-Core
HWBOT x265 Benchmark v2.2: 4k Preset
LibreOffice : 20 Documents To PDF
R Benchmark 2.5: Overall mean
| Cinebench R20 / CPU (Multi Core) | |
| Intel NUC11PAQi7 | |
| Intel NUC11TNKi5 | |
| Acer Swift 3 SF314-42-R27B | |
| GMK NucBox 2 | |
| Fujitsu Lifebook U939 i5 | |
| Dell Inspiron 15 5000 5502 | |
| Dell Latitude 15 3510 NK2MC | |
| Beelink SEi10 | |
| Asus Vivobook 15 F512DA-SH31 | |
| Beelink GK Mini | |
| Chuwi LarkBook CWI509 | |
| Medio Intel Celeron J4125 (304 - 610, n=5) | |
| LincPlus P1 | |
| Chuwi LapBook Plus | |
| Cinebench R20 / CPU (Single Core) | |
| Intel NUC11PAQi7 | |
| Dell Inspiron 15 5000 5502 | |
| Intel NUC11TNKi5 | |
| Acer Swift 3 SF314-42-R27B | |
| Dell Latitude 15 3510 NK2MC | |
| Beelink SEi10 | |
| GMK NucBox 2 | |
| Fujitsu Lifebook U939 i5 | |
| Asus Vivobook 15 F512DA-SH31 | |
| Beelink GK Mini | |
| Medio Intel Celeron J4125 (155 - 174, n=5) | |
| Chuwi LarkBook CWI509 | |
| LincPlus P1 | |
| Chuwi LapBook Plus | |
| Cinebench R23 / Multi Core | |
| Intel NUC11PAQi7 | |
| Intel NUC11TNKi5 | |
| GMK NucBox 2 | |
| Dell Latitude 15 3510 NK2MC | |
| Beelink GK Mini | |
| Chuwi LarkBook CWI509 | |
| Medio Intel Celeron J4125 (860 - 1563, n=3) | |
| Cinebench R23 / Single Core | |
| Intel NUC11TNKi5 | |
| Dell Latitude 15 3510 NK2MC | |
| GMK NucBox 2 | |
| Beelink GK Mini | |
| Medio Intel Celeron J4125 (392 - 446, n=3) | |
| Cinebench R15 / CPU Multi 64Bit | |
| Intel NUC11PAQi7 | |
| Intel NUC11TNKi5 | |
| Zotac ZBOX-CI660 Nano | |
| GMK NucBox 2 | |
| Acer Swift 3 SF314-42-R27B | |
| Fujitsu Lifebook U939 i5 | |
| Beelink SEi10 | |
| Dell Inspiron 15 5000 5502 | |
| Asus Vivobook 15 F512DA-SH31 | |
| Dell Latitude 15 3510 NK2MC | |
| Beelink GK Mini | |
| Chuwi LarkBook CWI509 | |
| Medio Intel Celeron J4125 (148 - 271, n=5) | |
| Chuwi LapBook Plus | |
| LincPlus P1 | |
| Trekstor Yourbook C11B | |
| Cinebench R15 / CPU Single 64Bit | |
| Intel NUC11PAQi7 | |
| Intel NUC11TNKi5 | |
| Dell Inspiron 15 5000 5502 | |
| Acer Swift 3 SF314-42-R27B | |
| Fujitsu Lifebook U939 i5 | |
| Beelink SEi10 | |
| Zotac ZBOX-CI660 Nano | |
| GMK NucBox 2 | |
| Dell Latitude 15 3510 NK2MC | |
| Asus Vivobook 15 F512DA-SH31 | |
| Beelink GK Mini | |
| Chuwi LarkBook CWI509 | |
| Medio Intel Celeron J4125 (63.1 - 79.1, n=5) | |
| LincPlus P1 | |
| Trekstor Yourbook C11B | |
| Chuwi LapBook Plus | |
| Blender / v2.79 BMW27 CPU | |
| LincPlus P1 | |
| Chuwi LapBook Plus | |
| Medio Intel Celeron J4125 (2198 - 3860, n=5) | |
| Beelink GK Mini | |
| Asus Vivobook 15 F512DA-SH31 | |
| Dell Inspiron 15 5000 5502 | |
| Dell Latitude 15 3510 NK2MC | |
| Beelink SEi10 | |
| Fujitsu Lifebook U939 i5 | |
| Acer Swift 3 SF314-42-R27B | |
| GMK NucBox 2 | |
| Intel NUC11TNKi5 | |
| Intel NUC11PAQi7 | |
| 7-Zip 18.03 / 7z b 4 -mmt1 | |
| Intel NUC11PAQi7 | |
| Intel NUC11TNKi5 | |
| Dell Inspiron 15 5000 5502 | |
| Beelink SEi10 | |
| Dell Latitude 15 3510 NK2MC | |
| Acer Swift 3 SF314-42-R27B | |
| Fujitsu Lifebook U939 i5 | |
| GMK NucBox 2 | |
| Asus Vivobook 15 F512DA-SH31 | |
| Beelink GK Mini | |
| Medio Intel Celeron J4125 (2237 - 2444, n=5) | |
| LincPlus P1 | |
| Chuwi LarkBook CWI509 | |
| Chuwi LapBook Plus | |
| 7-Zip 18.03 / 7z b 4 | |
| Intel NUC11PAQi7 | |
| Intel NUC11TNKi5 | |
| GMK NucBox 2 | |
| Fujitsu Lifebook U939 i5 | |
| Acer Swift 3 SF314-42-R27B | |
| Dell Inspiron 15 5000 5502 | |
| Dell Latitude 15 3510 NK2MC | |
| Beelink SEi10 | |
| Asus Vivobook 15 F512DA-SH31 | |
| Beelink GK Mini | |
| Medio Intel Celeron J4125 (5694 - 8399, n=5) | |
| Chuwi LarkBook CWI509 | |
| Chuwi LapBook Plus | |
| LincPlus P1 | |
| Geekbench 5.5 / Single-Core | |
| Intel NUC11PAQi7 | |
| Intel NUC11TNKi5 | |
| Dell Inspiron 15 5000 5502 | |
| Beelink SEi10 | |
| Fujitsu Lifebook U939 i5 | |
| Acer Swift 3 SF314-42-R27B | |
| GMK NucBox 2 | |
| Dell Latitude 15 3510 NK2MC | |
| Asus Vivobook 15 F512DA-SH31 | |
| Beelink GK Mini | |
| Medio Intel Celeron J4125 (435 - 466, n=5) | |
| Chuwi LarkBook CWI509 | |
| LincPlus P1 | |
| Geekbench 5.5 / Multi-Core | |
| Intel NUC11PAQi7 | |
| Intel NUC11TNKi5 | |
| Fujitsu Lifebook U939 i5 | |
| GMK NucBox 2 | |
| Acer Swift 3 SF314-42-R27B | |
| Dell Inspiron 15 5000 5502 | |
| Beelink SEi10 | |
| Dell Latitude 15 3510 NK2MC | |
| Asus Vivobook 15 F512DA-SH31 | |
| Beelink GK Mini | |
| Chuwi LarkBook CWI509 | |
| Medio Intel Celeron J4125 (1198 - 1512, n=5) | |
| LincPlus P1 | |
| HWBOT x265 Benchmark v2.2 / 4k Preset | |
| Intel NUC11PAQi7 | |
| Intel NUC11TNKi5 | |
| GMK NucBox 2 | |
| Acer Swift 3 SF314-42-R27B | |
| Fujitsu Lifebook U939 i5 | |
| Beelink SEi10 | |
| Dell Inspiron 15 5000 5502 | |
| Dell Latitude 15 3510 NK2MC | |
| Asus Vivobook 15 F512DA-SH31 | |
| Beelink GK Mini | |
| Medio Intel Celeron J4125 (0.95 - 1.61, n=5) | |
| Chuwi LarkBook CWI509 | |
| Chuwi LapBook Plus | |
| LincPlus P1 | |
| LibreOffice / 20 Documents To PDF | |
| LincPlus P1 | |
| Medio Intel Celeron J4125 (124 - 168.4, n=5) | |
| Chuwi LarkBook CWI509 | |
| Beelink GK Mini | |
| Asus Vivobook 15 F512DA-SH31 | |
| GMK NucBox 2 | |
| Dell Inspiron 15 5000 5502 | |
| Acer Swift 3 SF314-42-R27B | |
| Fujitsu Lifebook U939 i5 | |
| Beelink SEi10 | |
| Intel NUC11TNKi5 | |
| Intel NUC11PAQi7 | |
| Dell Latitude 15 3510 NK2MC | |
| R Benchmark 2.5 / Overall mean | |
| LincPlus P1 | |
| Chuwi LarkBook CWI509 | |
| Medio Intel Celeron J4125 (1.525 - 1.579, n=5) | |
| Beelink GK Mini | |
| Asus Vivobook 15 F512DA-SH31 | |
| GMK NucBox 2 | |
| Beelink SEi10 | |
| Dell Latitude 15 3510 NK2MC | |
| Fujitsu Lifebook U939 i5 | |
| Acer Swift 3 SF314-42-R27B | |
| Dell Inspiron 15 5000 5502 | |
| Intel NUC11TNKi5 | |
| Intel NUC11PAQi7 | |
Cinebench R23: Multi Core | Single Core
Cinebench R15: CPU Multi 64Bit | CPU Single 64Bit
Blender: v2.79 BMW27 CPU
7-Zip 18.03: 7z b 4 -mmt1 | 7z b 4
Geekbench 5.5: Single-Core | Multi-Core
HWBOT x265 Benchmark v2.2: 4k Preset
LibreOffice : 20 Documents To PDF
R Benchmark 2.5: Overall mean
* ... más pequeño es mejor
Rendimiento del sistema
| PCMark 8 | |
| Home Score Accelerated v2 | |
| Intel NUC11PAQi7 | |
| Zotac ZBOX-CI660 Nano | |
| Beelink SEi10 | |
| Medio Intel Celeron J4125, Intel UHD Graphics 600 (n=1) | |
| Work Score Accelerated v2 | |
| Medio Intel Celeron J4125, Intel UHD Graphics 600 (n=1) | |
| Intel NUC11PAQi7 | |
| Beelink SEi10 | |
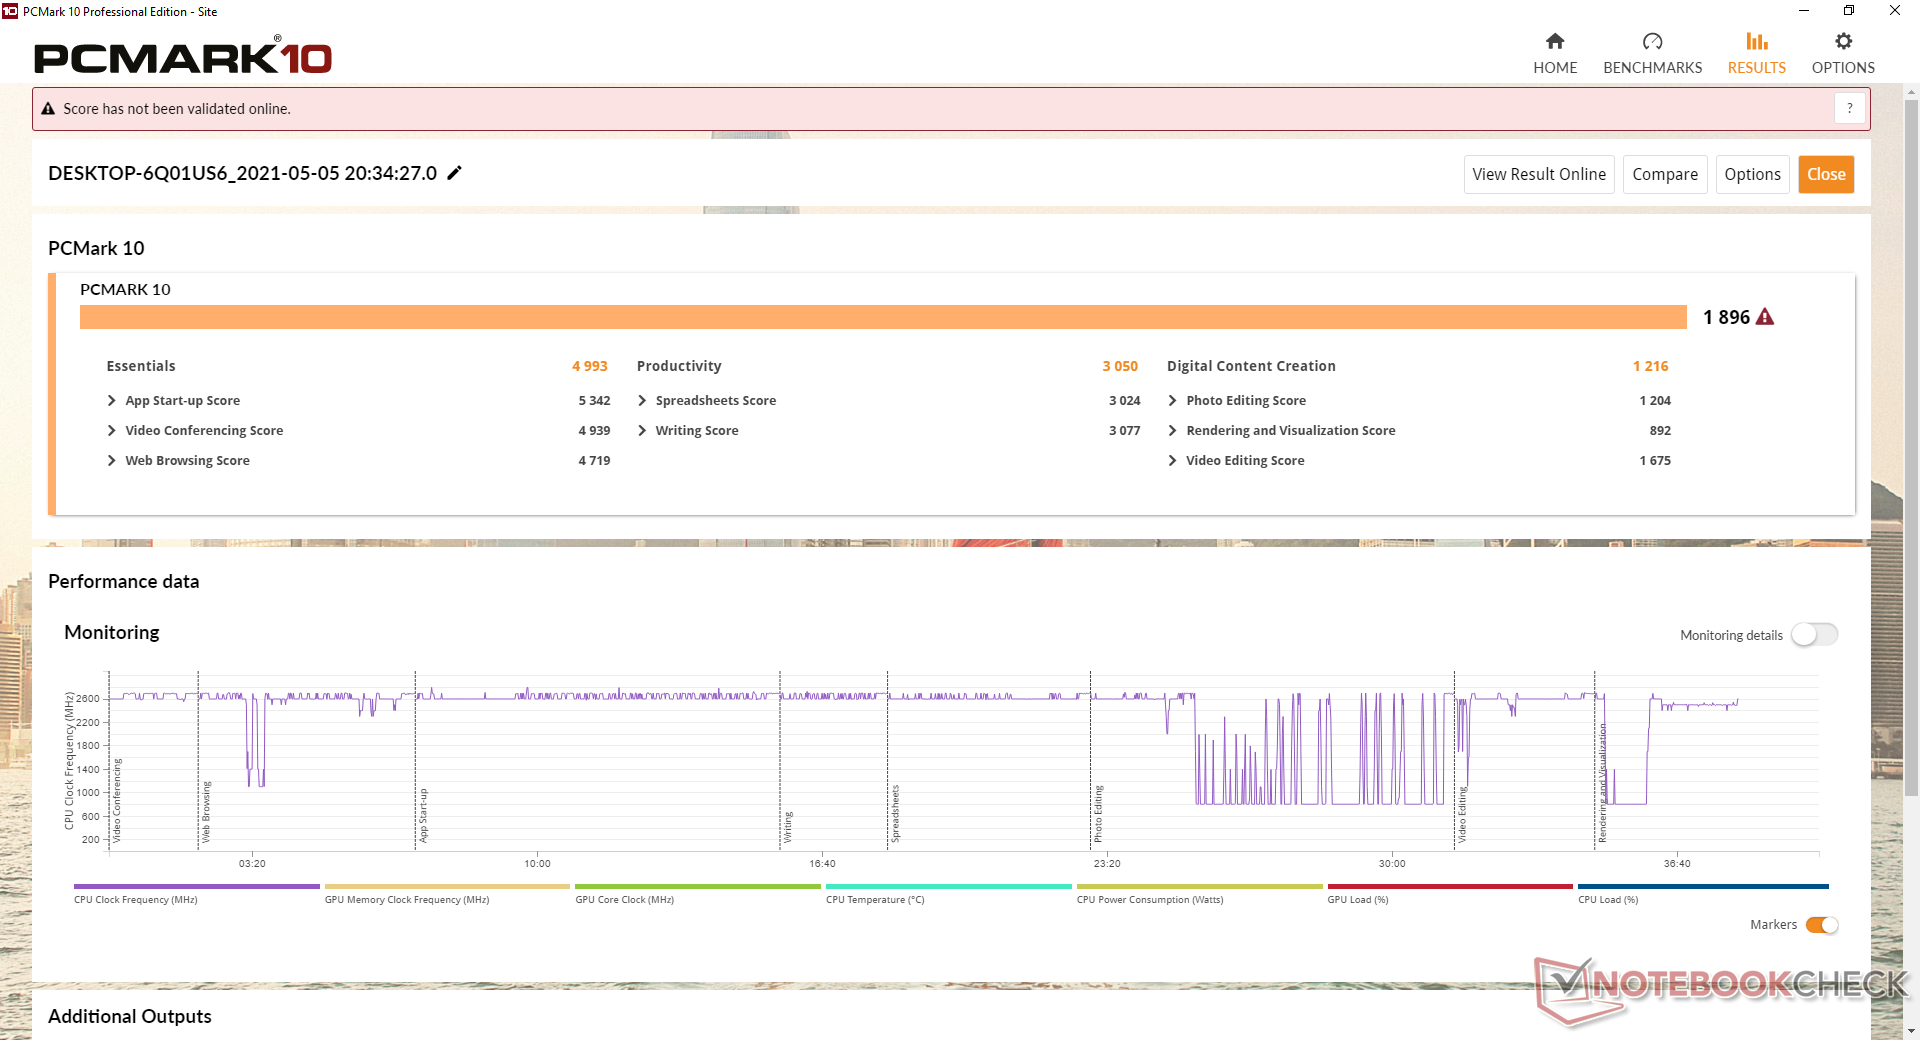
| PCMark 10 Score | 1898 puntos | |
ayuda | ||
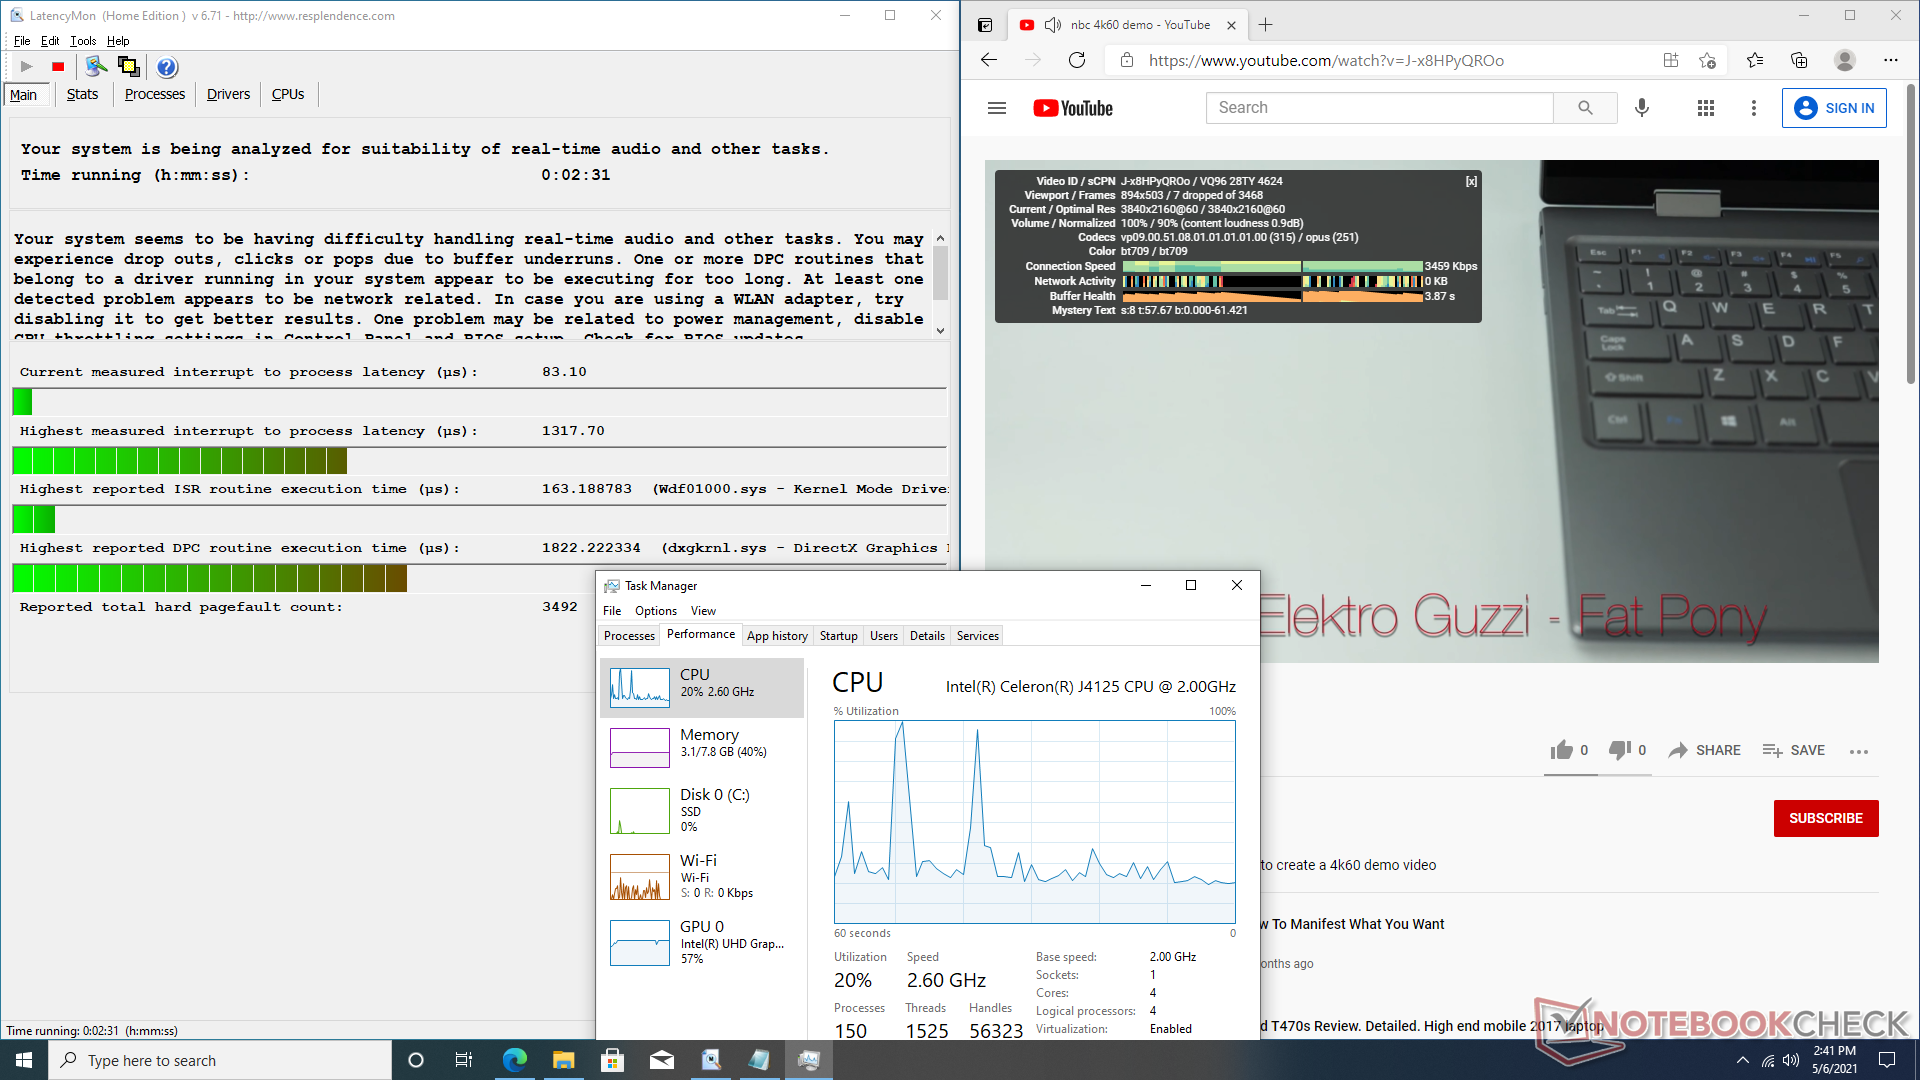
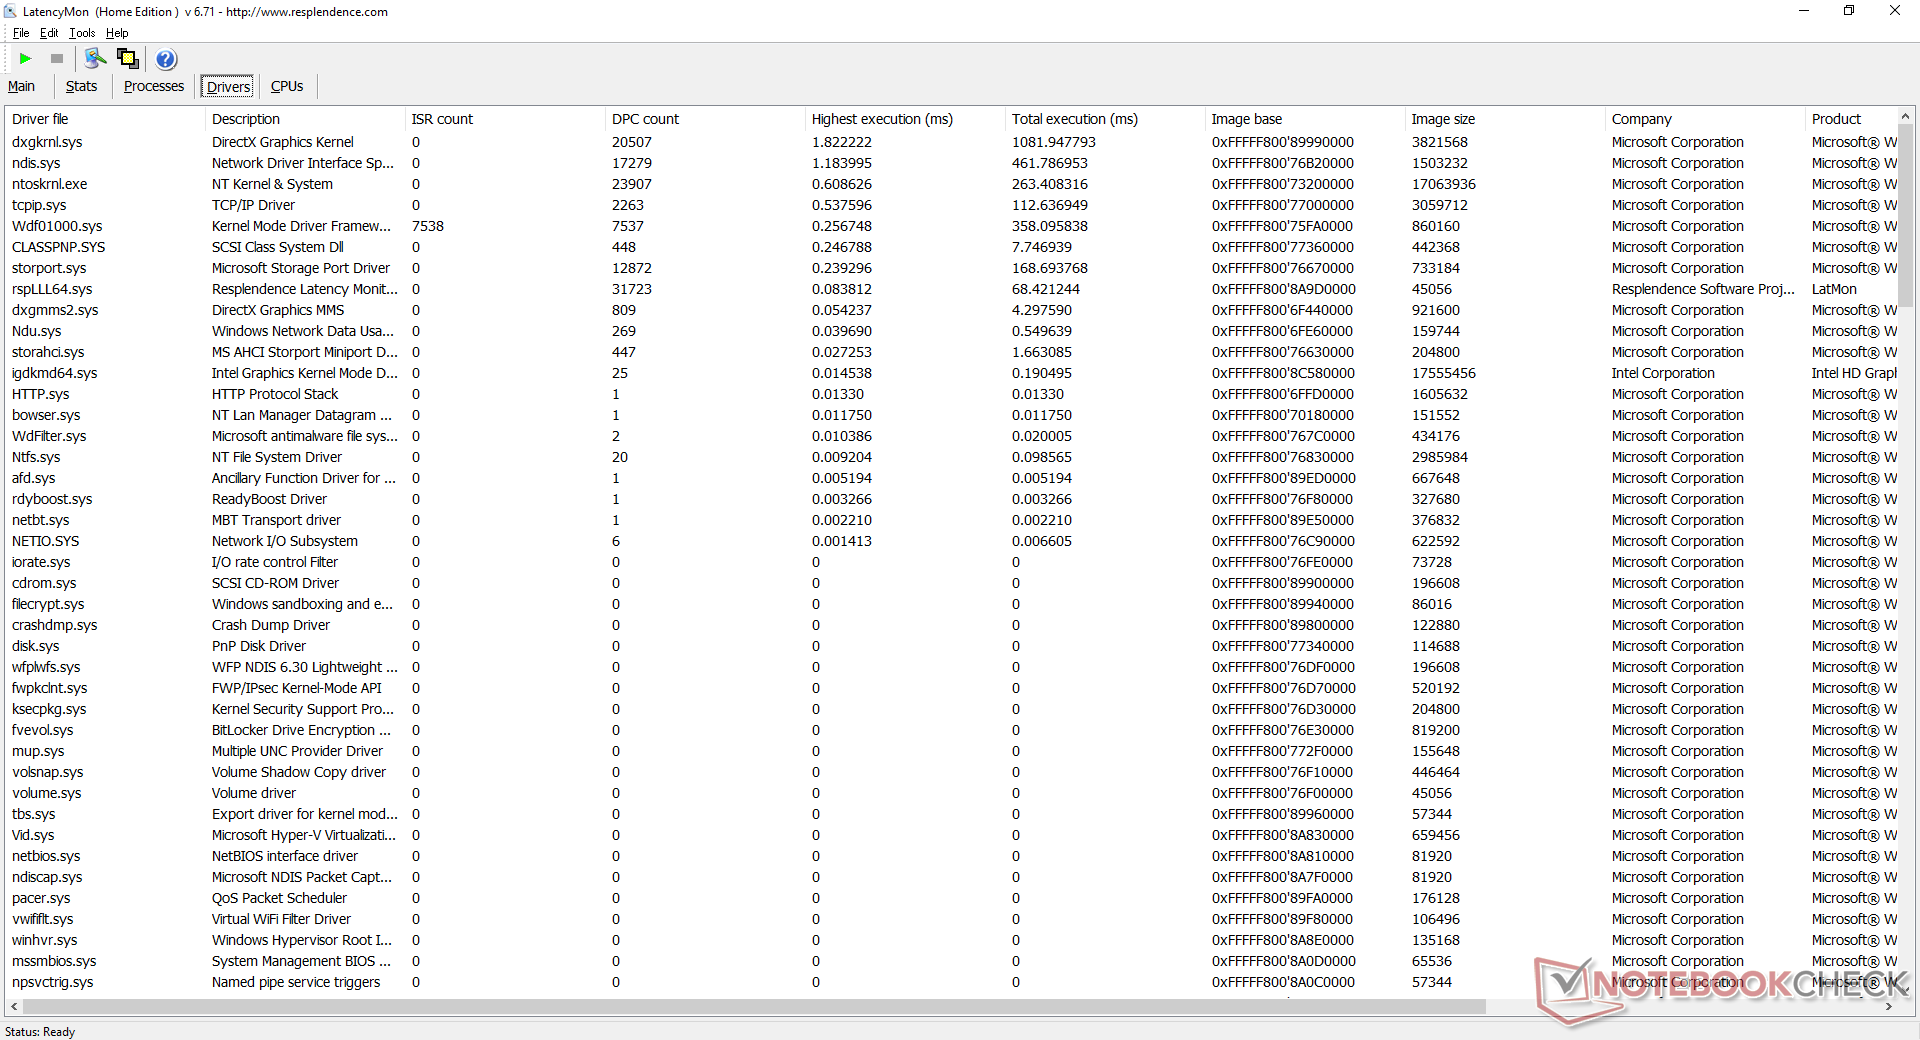
Latencia del CPD
LatencyMon revela problemas de latencia del CPD al abrir varias pestañas del navegador en nuestra página web. La reproducción de 4K a 60 FPS es fluida pero no perfecta, con 7 fotogramas perdidos durante una prueba de vídeo de un minuto de duración.
| DPC Latencies / LatencyMon - interrupt to process latency (max), Web, Youtube, Prime95 | |
| Beelink GK Mini | |
| Beelink SEi10 | |
| GMK NucBox 2 | |
| Intel NUC11PAQi7 | |
| Intel NUC11TNKi5 | |
* ... más pequeño es mejor
Dispositivos de almacenamiento
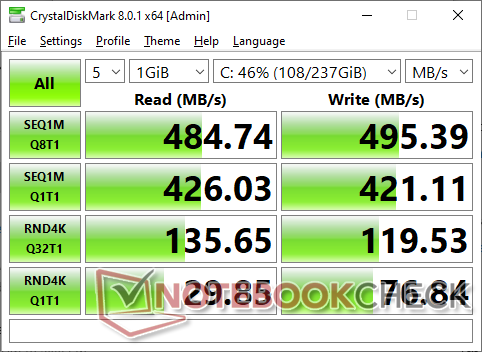
El sistema viene con un SSD genérico SATA III M.2 2280 de 256 GB con un controlador Silicon Motion SM2258XT. Aunque las tasas de transferencia no se acercan a las de la mayoría de SSDs NVMe, el rendimiento general es equilibrado teniendo en cuenta la CPU de bajo consumo.
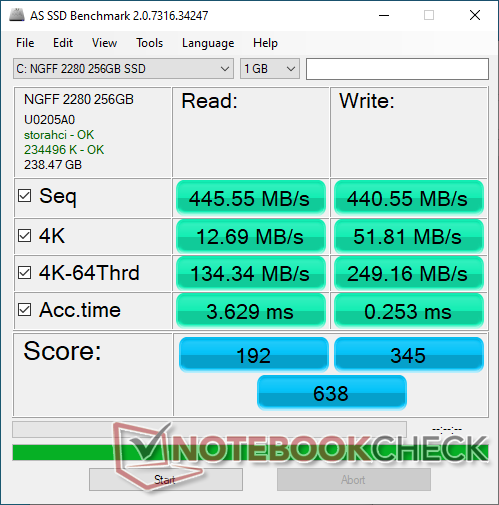
| Beelink GK Mini Silicon Motion SM2258XT 256GB | Intel NUC11TNKi5 Transcend M.2 SSD 430S TS512GMTS430S | GMK NucBox 2 Netac S930E8/256GPN | Beelink SEi10 Silicon Motion AZW 256G M.2280 NVMe 4X 200725 D | Intel NUC11PAQi7 Samsung SSD 980 Pro 500GB MZ-V8P500BW | |
|---|---|---|---|---|---|
| AS SSD | 40% | 152% | 63% | 617% | |
| Seq Read (MB/s) | 445.5 | 527 18% | 2069 364% | 1111 149% | 3257 631% |
| Seq Write (MB/s) | 440.5 | 469 6% | 1203 173% | 323.5 -27% | 3937 794% |
| 4K Read (MB/s) | 12.69 | 20.41 61% | 41.66 228% | 33.1 161% | 51.3 304% |
| 4K Write (MB/s) | 51.8 | 42.52 -18% | 136.9 164% | 66.2 28% | 75.7 46% |
| 4K-64 Read (MB/s) | 134.3 | 231.4 72% | 366.3 173% | 357.3 166% | 2283 1600% |
| 4K-64 Write (MB/s) | 249.2 | 285.3 14% | 340.5 37% | 154.8 -38% | 2206 785% |
| Access Time Read * (ms) | 3.629 | 0.124 97% | 0.064 98% | 0.066 98% | 0.056 98% |
| Access Time Write * (ms) | 0.253 | 0.269 -6% | 0.347 -37% | 0.616 -143% | 0.154 39% |
| Score Read (Points) | 192 | 304 58% | 615 220% | 501 161% | 2660 1285% |
| Score Write (Points) | 345 | 375 9% | 598 73% | 253 -27% | 2676 676% |
| Score Total (Points) | 638 | 839 32% | 1497 135% | 983 54% | 6725 954% |
| Copy ISO MB/s (MB/s) | 269.3 | 490.9 82% | 1186 340% | 1160 331% | 2030 654% |
| Copy Program MB/s (MB/s) | 173.9 | 415.9 139% | 428.6 146% | 121.1 -30% | 883 408% |
| Copy Game MB/s (MB/s) | 394.5 | 352.3 -11% | 435.7 10% | 364.4 -8% | 1817 361% |
| CrystalDiskMark 5.2 / 6 | 41% | 210% | 208% | 675% | |
| Write 4K (MB/s) | 73.4 | 65.9 -10% | 178.4 143% | 203 177% | 244.6 233% |
| Read 4K (MB/s) | 27.42 | 24.27 -11% | 61 122% | 63.2 130% | 80.4 193% |
| Write Seq (MB/s) | 416.8 | 456.4 10% | 1040 150% | 1114 167% | 4094 882% |
| Read Seq (MB/s) | 427.7 | 542 27% | 1919 349% | 1765 313% | 4099 858% |
| Write 4K Q32T1 (MB/s) | 119.5 | 331.3 177% | 417.7 250% | 423.9 255% | 715 498% |
| Read 4K Q32T1 (MB/s) | 137.7 | 295 114% | 325.6 136% | 389.2 183% | 783 469% |
| Write Seq Q32T1 (MB/s) | 498.2 | 506 2% | 1144 130% | 1104 122% | 5065 917% |
| Read Seq Q32T1 (MB/s) | 475.3 | 562 18% | 2379 401% | 1990 319% | 6884 1348% |
| Media total (Programa/Opciones) | 41% /
40% | 181% /
173% | 136% /
116% | 646% /
638% |
* ... más pequeño es mejor

Disk Throttling: DiskSpd Read Loop, Queue Depth 8
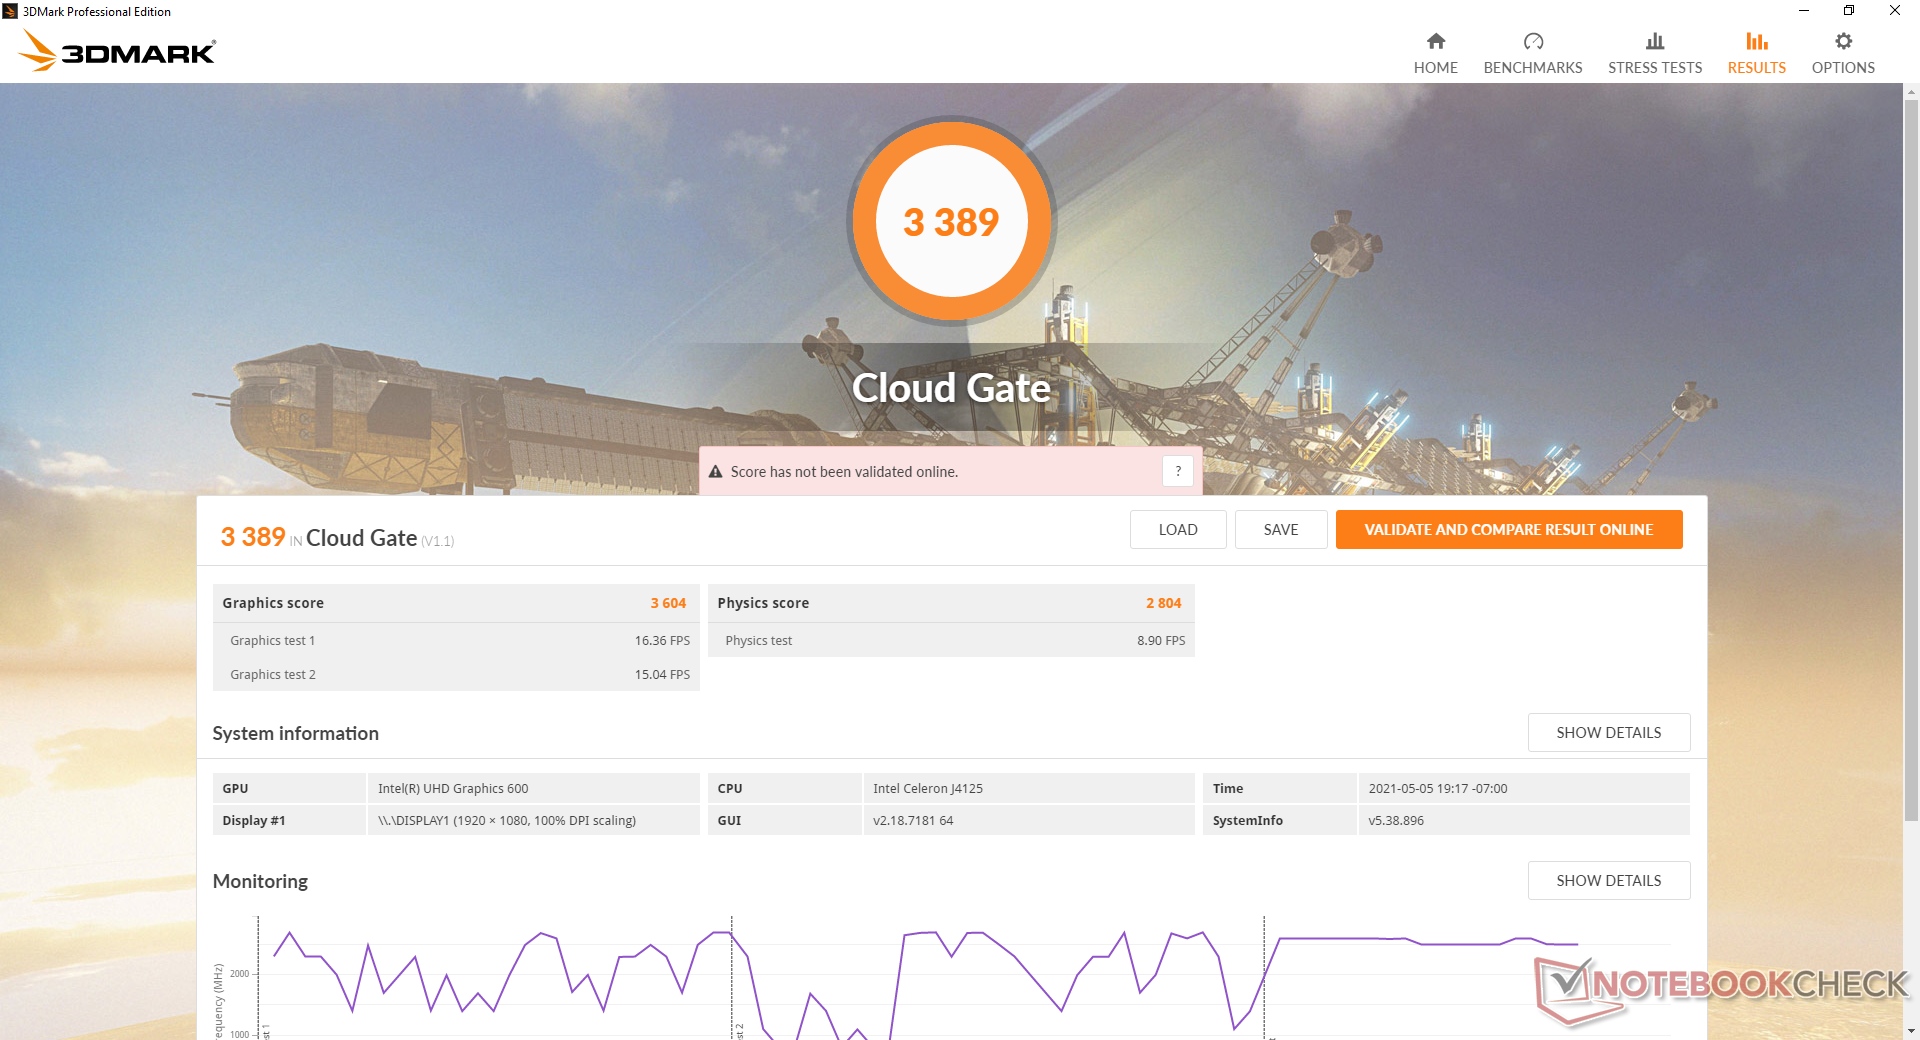
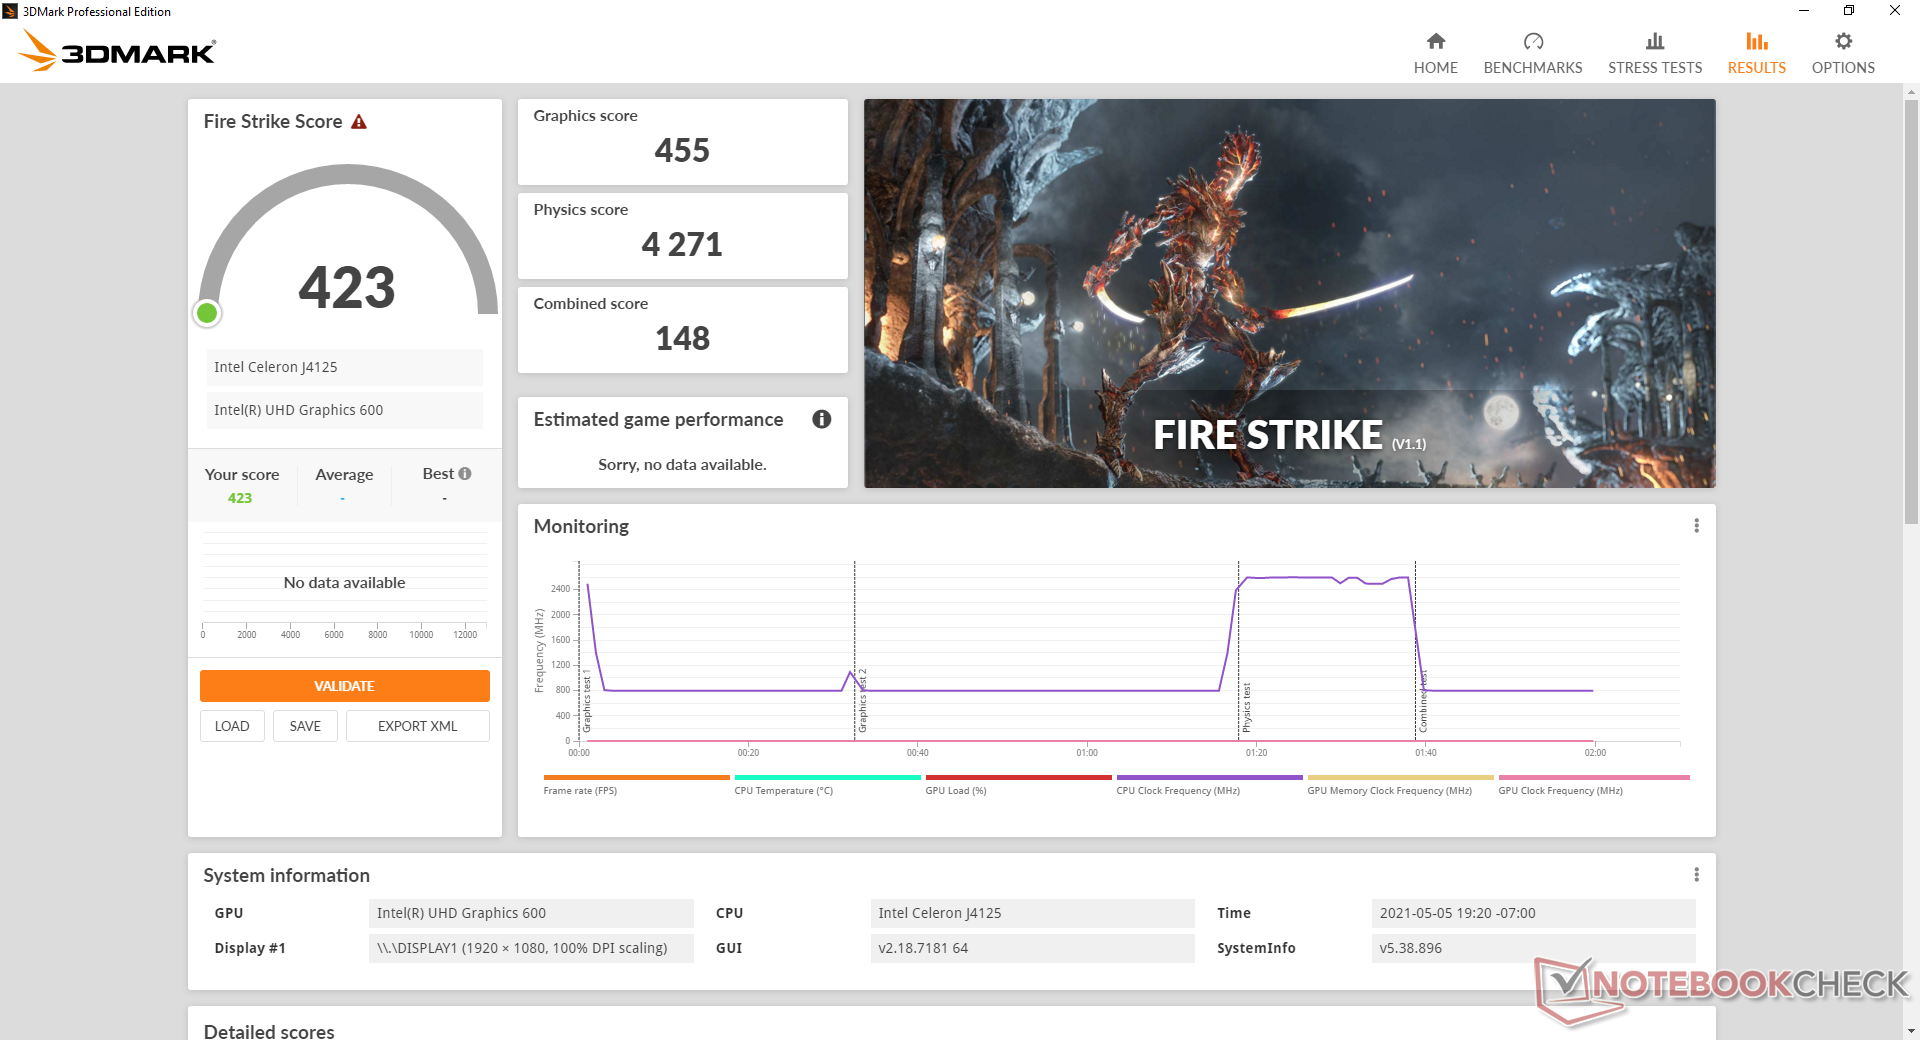
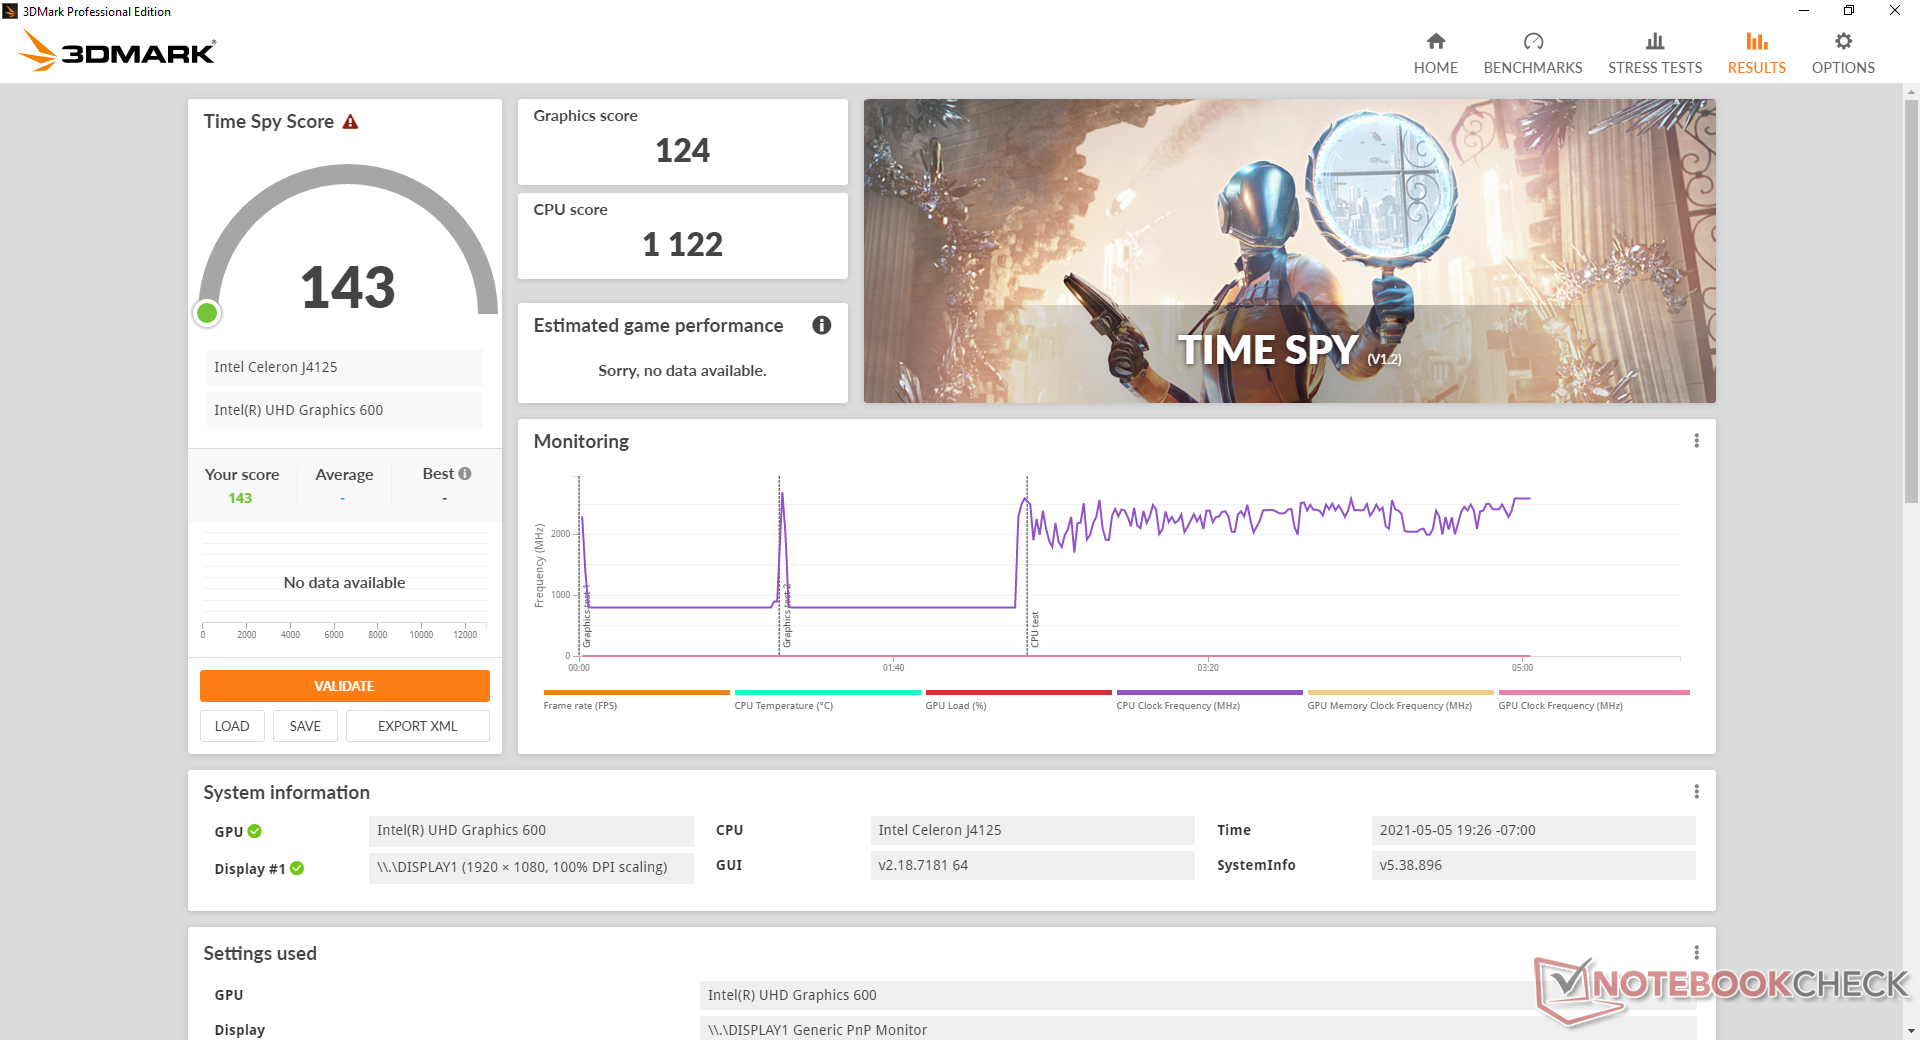
Rendimiento de la GPU
El rendimiento de los gráficos es significativamente más lento que el ya lento UHD Graphics 620. Afortunadamente, es suficiente para el streaming de vídeo 4K.
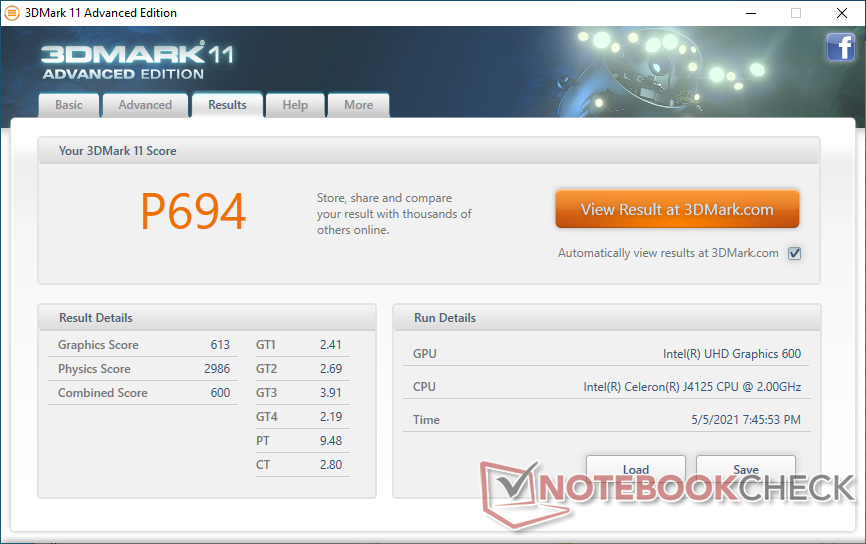
| 3DMark 11 Performance | 694 puntos | |
| 3DMark Cloud Gate Standard Score | 3389 puntos | |
| 3DMark Fire Strike Score | 423 puntos | |
| 3DMark Time Spy Score | 143 puntos | |
ayuda | ||
| bajo | medio | alto | ultra | |
|---|---|---|---|---|
| Dota 2 Reborn (2015) | 41.3 | 18.4 | 8.8 | 8 |
| Final Fantasy XV Benchmark (2018) | 5.33 | 2.34 | 1.63 | |
| X-Plane 11.11 (2018) | 8.89 | 5.8 | 5.39 |
Emissions
Ruido del sistema
El ventilador interno parece estar siempre activo incluso cuando está en reposo en el escritorio sin aplicaciones en ejecución. Las RPM tampoco parecen cambiar cuando se ejecutan cargas más altas, al menos en nuestra experiencia. Las RPM constantes son preferibles a las pulsaciones constantes, pero es una pena que la unidad nunca sea realmente silenciosa. Para salas de estar y configuraciones HTPC, la unidad estará lo suficientemente lejos como para que el ventilador no sea un problema.
Para algo realmente silencioso, el Zotac ZBOX-CI660 Nano sin ventilador o el Chuwi GBox pueden ser alternativas decentes para el streaming a 1080p.
| Beelink GK Mini UHD Graphics 600, Celeron J4125, Silicon Motion SM2258XT 256GB | Intel NUC11TNKi5 Iris Xe G7 80EUs, i5-1135G7, Transcend M.2 SSD 430S TS512GMTS430S | GMK NucBox 2 Iris Plus Graphics 655, i5-8259U, Netac S930E8/256GPN | Beelink SEi10 UHD Graphics G1 (Ice Lake 32 EU), i3-1005G1, Silicon Motion AZW 256G M.2280 NVMe 4X 200725 D | Zotac ZBOX-CI660 Nano UHD Graphics 620, i5-8550U, OCZ Vertex OCZSSD2-1VTX120G | Intel NUC11PAQi7 Iris Xe G7 96EUs, i7-1165G7, Samsung SSD 980 Pro 500GB MZ-V8P500BW | |
|---|---|---|---|---|---|---|
| Noise | -3% | 16% | -4% | 9% | ||
| apagado / medio ambiente * (dB) | 24.6 | 24.8 -1% | 25.6 -4% | 27.5 -12% | 25.6 -4% | |
| Idle Minimum * (dB) | 36.9 | 35.6 4% | 25.7 30% | 30.9 16% | 25.6 31% | |
| Idle Average * (dB) | 36.9 | 35.6 4% | 25.7 30% | 33.5 9% | 25.6 31% | |
| Idle Maximum * (dB) | 36.9 | 35.6 4% | 25.7 30% | 33.5 9% | 25.6 31% | |
| Load Average * (dB) | 37 | 36.2 2% | 35.3 5% | 38.5 -4% | 33.6 9% | |
| Load Maximum * (dB) | 37 | 47.6 -29% | 35.1 5% | 51.6 -39% | 54.5 -47% | |
| Witcher 3 ultra * (dB) | 38 | 33.6 |
* ... más pequeño es mejor
Ruido
| Ocioso |
| 36.9 / 36.9 / 36.9 dB(A) |
| Carga |
| 37 / 37 dB(A) |
 | ||
30 dB silencioso 40 dB(A) audible 50 dB(A) ruidosamente alto |
||
min: | ||
Temperatura
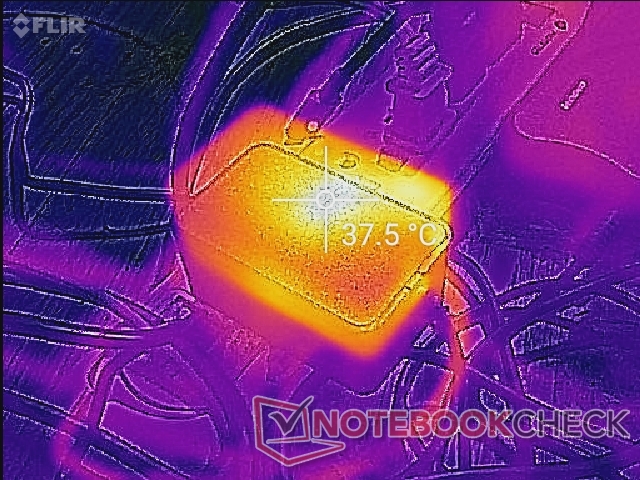
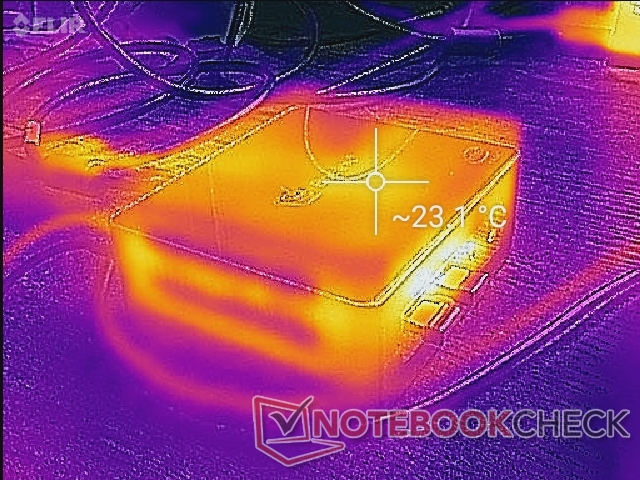
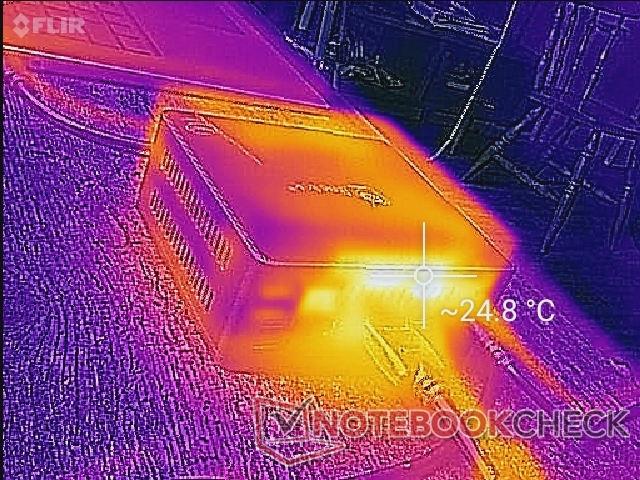
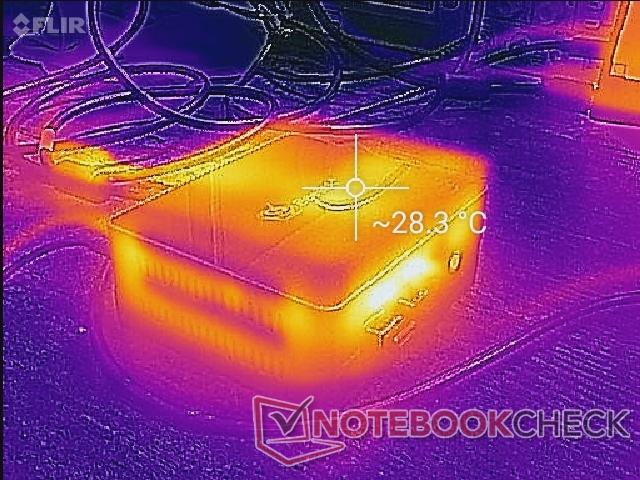
Las temperaturas de la superficie suelen ser frescas, incluso con cargas pesadas. La parte superior de la unidad se mantiene por debajo de los 30 C cuando funciona con Prime95. El punto caliente se encuentra a lo largo de la rejilla de ventilación trasera de la unidad, por donde se escapa el calor.
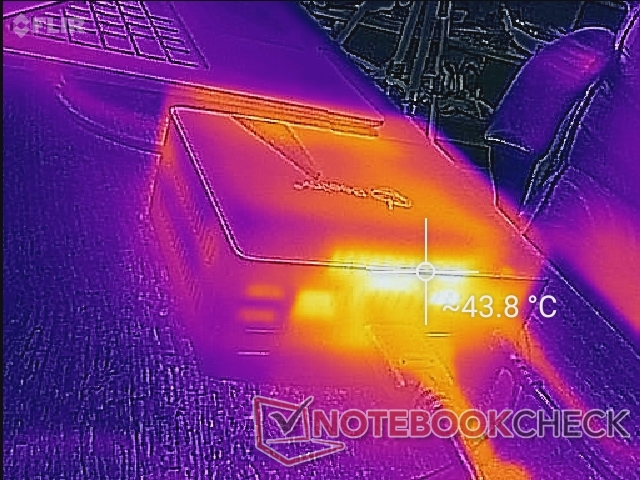
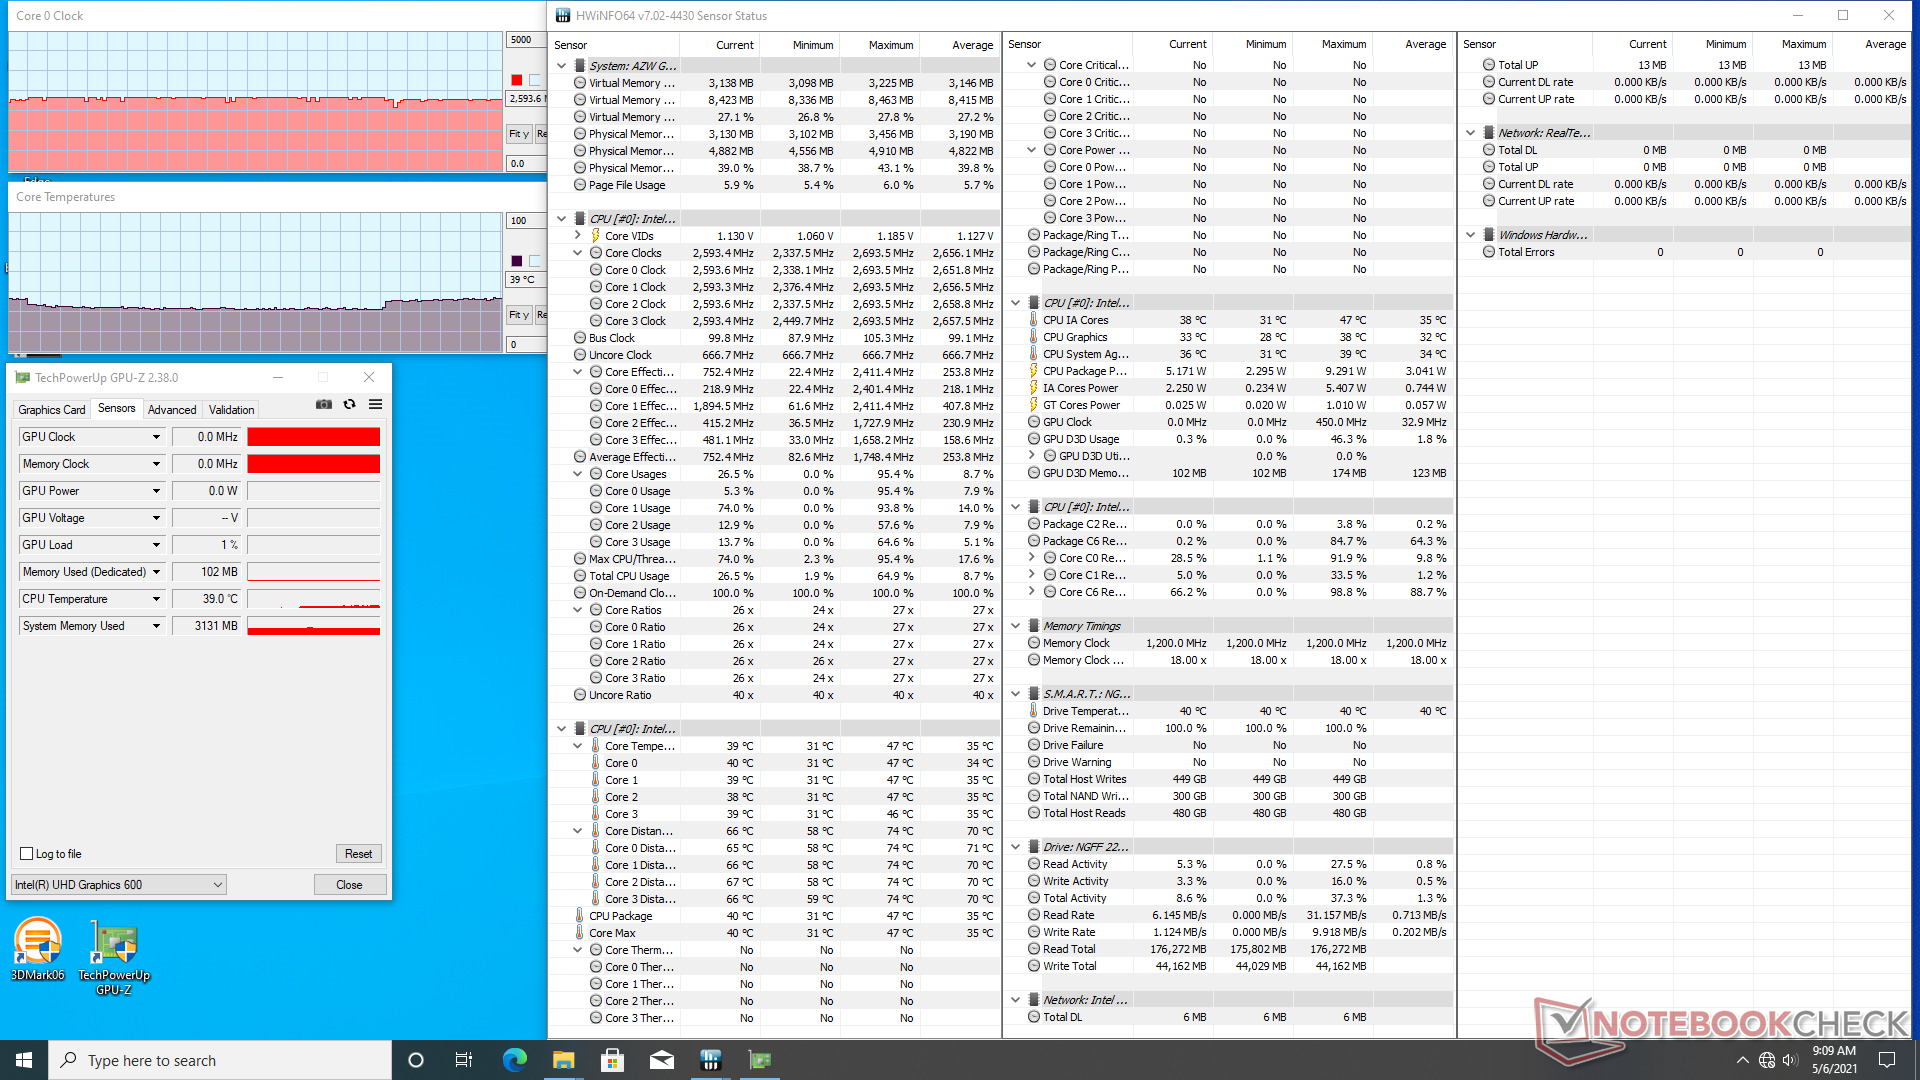
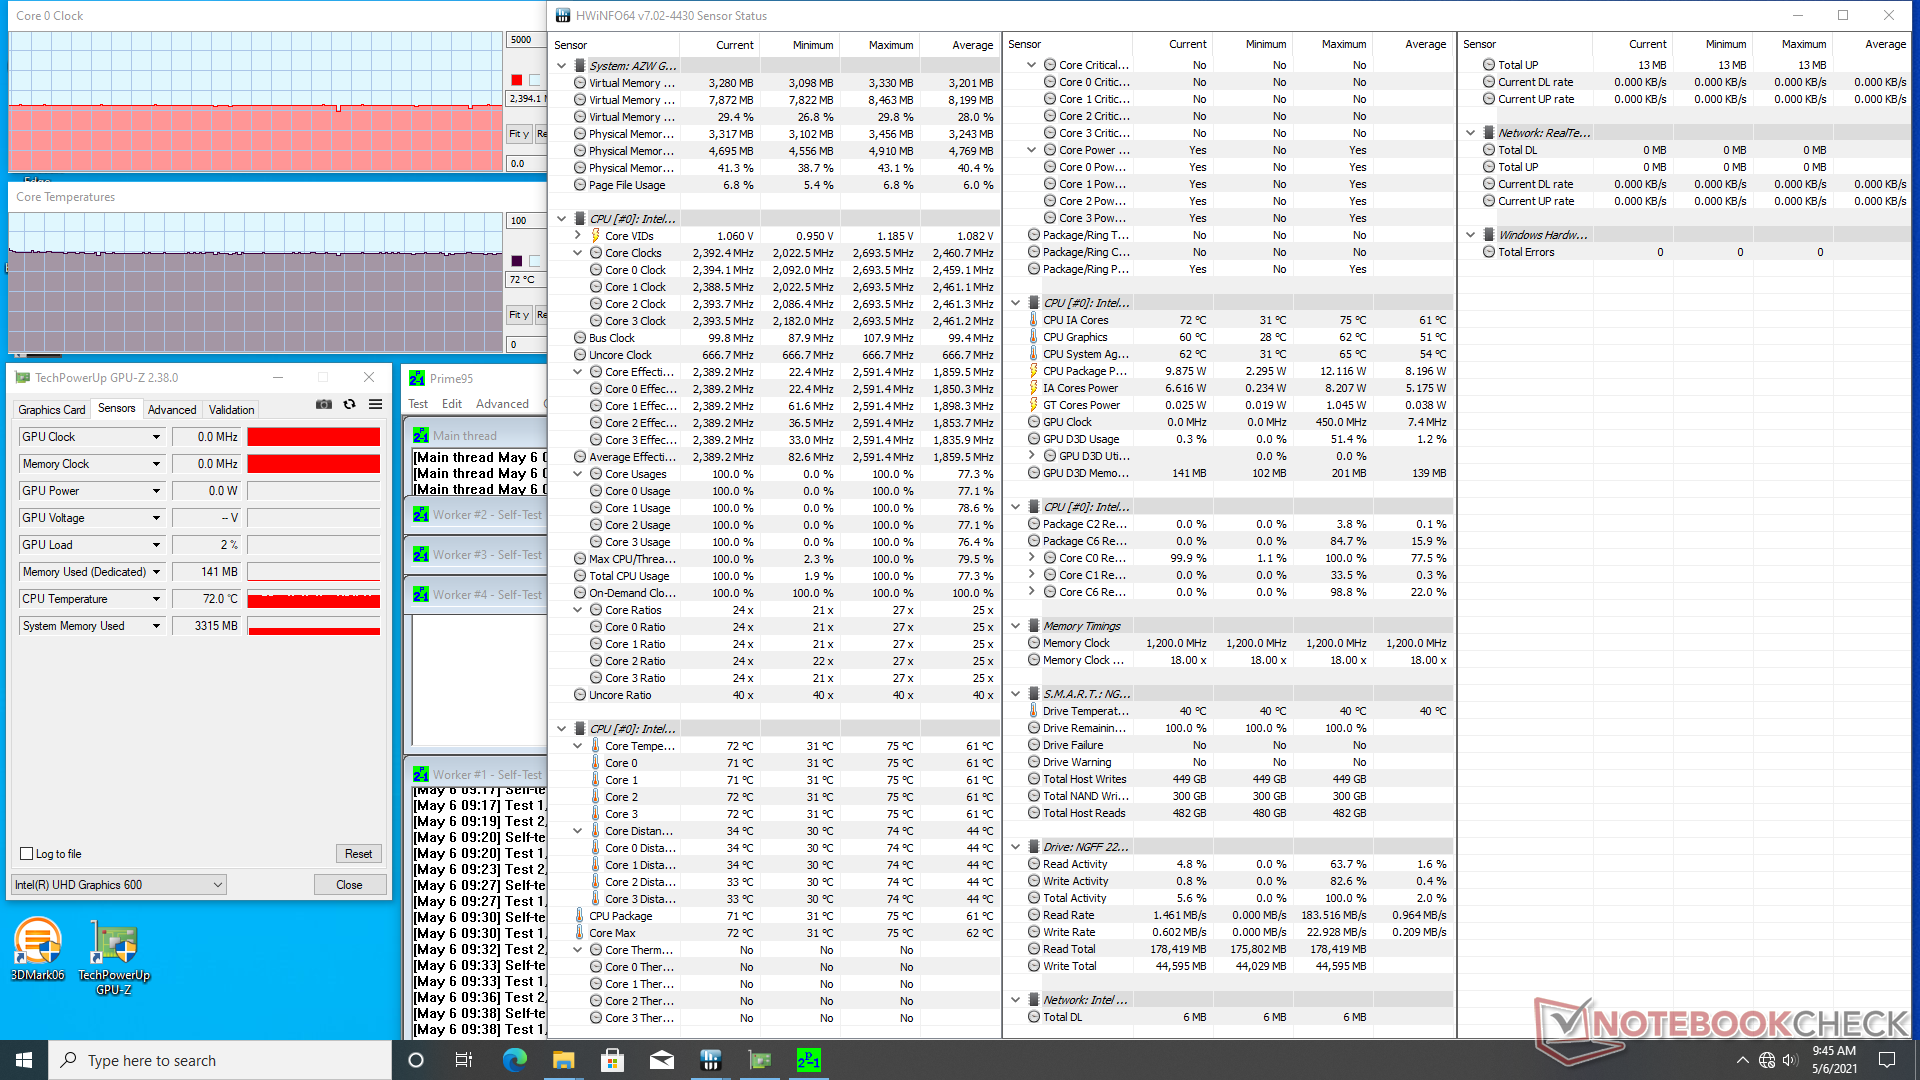
Prueba de esfuerzo
La ejecución de Prime95 hace que la CPU salte a 2,6 GHz durante unos 15 segundos antes de caer y estabilizarse en 2,4 GHz. La temperatura del núcleo se estabiliza en sólo 72 C.
| Relojde la CPU(GHz) | Reloj dela GPU(MHz) | Temperaturamediade la CPU (°C) | |
| Sistema en reposo | |||
| Estrés Prime95 | 2.4 | ----72 |
Energy Management
Consumo de energía
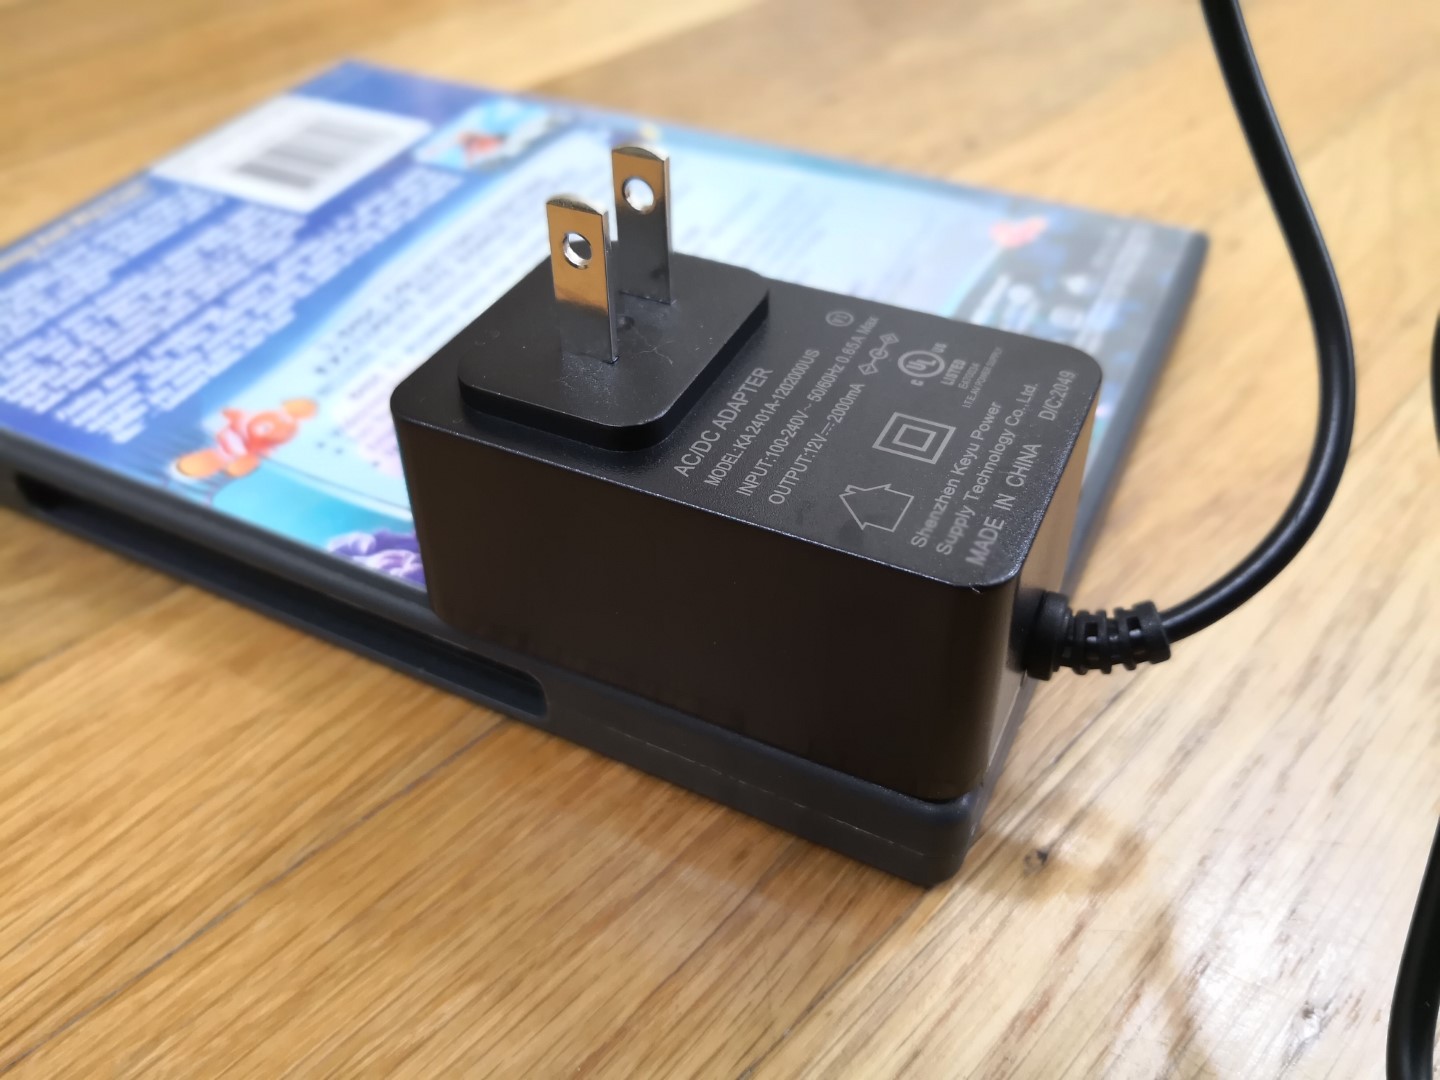
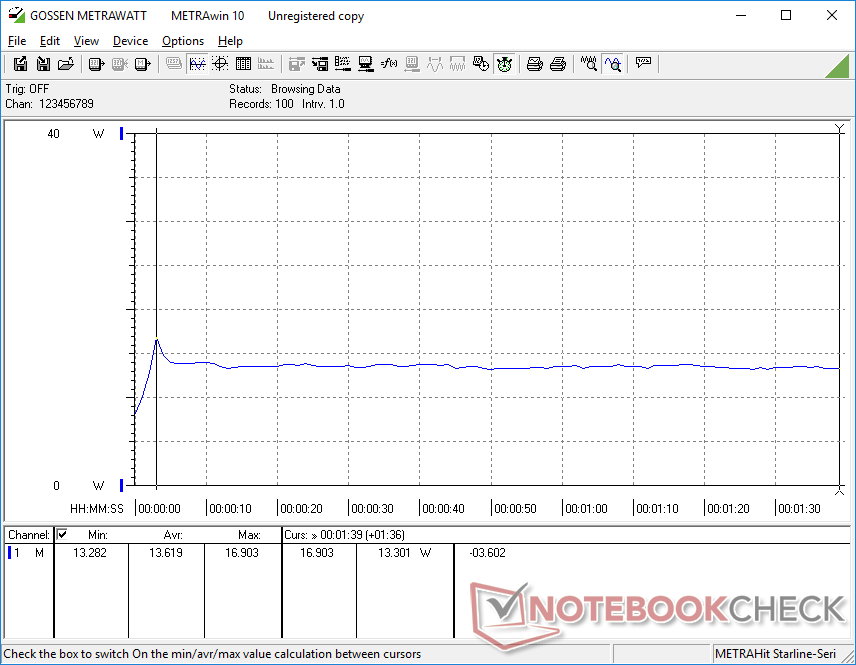
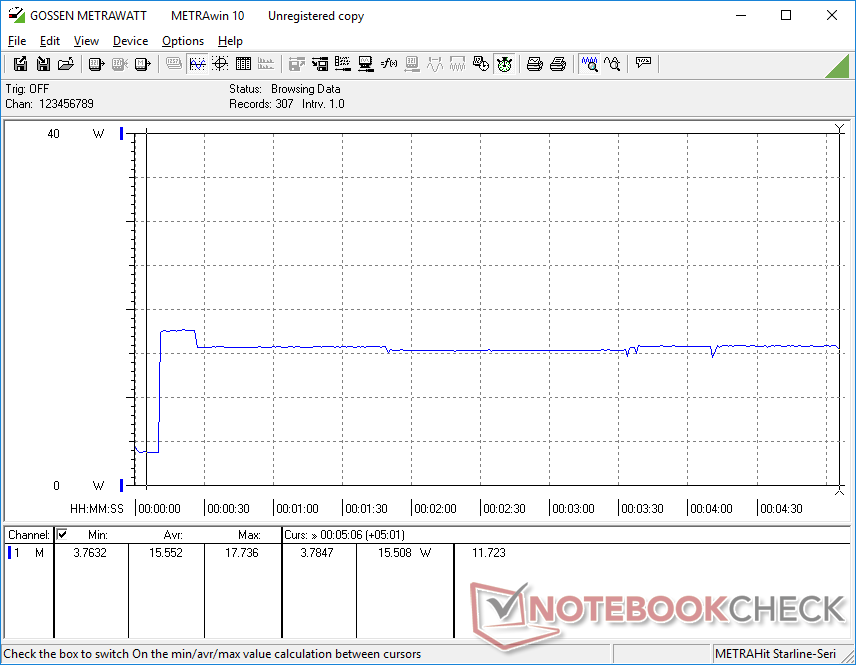
El sistema es muy eficiente desde el punto de vista energético gracias a la CPU de bajo consumo. El ralentí en el escritorio sólo consume entre 3 y 4 W, mientras que las cargas más altas, como los juegos, sólo consumen 14 W. Podemos registrar un máximo de sólo 17,8 W con el pequeño (~6,5 x 4,3 x 3 cm) adaptador de CA cuando la CPU está totalmente estresada.
| Off / Standby | |
| Ocioso | |
| Carga |
|
Clave:
min: | |
| Beelink GK Mini Celeron J4125, UHD Graphics 600, Silicon Motion SM2258XT 256GB, , x, | Intel NUC11TNKi5 i5-1135G7, Iris Xe G7 80EUs, Transcend M.2 SSD 430S TS512GMTS430S, , x, | GMK NucBox 2 i5-8259U, Iris Plus Graphics 655, Netac S930E8/256GPN, , x, | Beelink SEi10 i3-1005G1, UHD Graphics G1 (Ice Lake 32 EU), Silicon Motion AZW 256G M.2280 NVMe 4X 200725 D, , x, | Zotac ZBOX-CI660 Nano i5-8550U, UHD Graphics 620, OCZ Vertex OCZSSD2-1VTX120G, , x, | Intel NUC11PAQi7 i7-1165G7, Iris Xe G7 96EUs, Samsung SSD 980 Pro 500GB MZ-V8P500BW, , x, | |
|---|---|---|---|---|---|---|
| Power Consumption | -259% | -144% | -106% | -231% | -138% | |
| Idle Minimum * (Watt) | 3.2 | 11.5 -259% | 6.1 -91% | 6.3 -97% | 9.7 -203% | 5.6 -75% |
| Idle Average * (Watt) | 3.3 | 12.4 -276% | 6.8 -106% | 6.6 -100% | 9.8 -197% | 5.6 -70% |
| Idle Maximum * (Watt) | 3.7 | 12.9 -249% | 7.3 -97% | 6.7 -81% | 11.8 -219% | 6 -62% |
| Load Average * (Watt) | 13.6 | 40.7 -199% | 46.3 -240% | 25.9 -90% | 51.6 -279% | 31.4 -131% |
| Load Maximum * (Watt) | 17.8 | 73.5 -313% | 50.7 -185% | 46.7 -162% | 63.2 -255% | 80.5 -352% |
| Witcher 3 ultra * (Watt) | 43.9 | 39 |
* ... más pequeño es mejor
Pro
Contra
Veredicto
Los atributos más fuertes del Beelink son su facilidad de uso, las bajas temperaturas de funcionamiento y el precio de venta económico que atraerá a los usuarios de HTPC básicos de 1080p. Es una buena opción para los usuarios que no necesitan los últimos procesadores Core ix, Wi-Fi 6, opciones de almacenamiento NVMe o más de 8 GB de RAM. Seguramente querrás añadir una unidad secundaria SATA III de 2,5 pulgadas para ampliar el almacenamiento más adelante.
Un mini PC económico, ideal para el streaming básico a 1080p. Empieza a tener problemas cuando se introduce el 4K y la multitarea ligera.
Una desventaja notable del GK Mini es su falta de USB-C que podría haber añadido DisplayPort y Power Delivery para una mayor versatilidad. El streaming de vídeo 4K es decente hasta que empiezas a ejecutar otras tareas en segundo plano simultáneamente, como la navegación web. Los usuarios de HTPC más exigentes deberían invertir en algo más potente.
Precio y disponibilidad
En el momento de escribir este artículo, el Beelink GK Mini está a la venta en Amazon https://www.amazon.com/Beelink-Windows-Processor-Computer-Ethernet/dp/B092M91JSH?tag=nbcreviewsnet-20 por sólo 199 dólares.
No, or more than one (0) Rating for the given SpecsID 322754 found
Price comparison

