Intel Celeron J4125
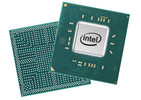
El Intel Celeron J4125 es un SoC de cuatro núcleos principalmente para mini PCs baratas y fue anunciado a finales de 2019. Funciona a 2-2,7 GHz (Single Core Burst) y está basado en la plataforma Gemini Lake (actualización 2019). En comparación con el predecesor, la actualización ofrece una velocidad de reloj ligeramente superior. Similar a los predecesores de Apolo Lake, el chip se fabrica en un proceso de 14 nm con FinFETs pero ofrece núcleos de procesador ligeramente mejorados, el doble de la cantidad de caché L2, un paquete más pequeño, una nueva generación de salidas de monitor (Gen 10) y un chip WiFi parcialmente integrado. Además de cuatro núcleos de CPU, el chip también incluye una GPU con capacidad DirectX 12, así como un controlador de memoria DDR4/LPDDR4 (de doble canal, hasta 2400 MHz). El procesador no es reemplazable ya que está soldado directamente a la placa base.
La arquitectura del procesador todavía se llama Goldmont Plus. Comparados con los antiguos núcleos de Goldmont en Apollo Lake, presentan una caché de nivel 2 incrementada (hasta 4 MB). Eso significa que el rendimiento por reloj debería ser un poco mejor, pero no cerca de los núcleos de CPU como Kaby Lake Y.
El rendimiento de la CPU del Celeron J4125 es en nuestras pruebas similar al de un Pentium Silver N5000 móvil (1,1 - 2,7 GHz Quad-Core a 6W). El rendimiento se sitúa en el nivel de entrada más bajo de los procesadores de 2020. Aún así, para tareas básicas como los trajes de oficina, navegando con una multitarea moderada el rendimiento del procesador debería estar bien.
El UHD Graphics 600 (Gemini Lake) se basa en la arquitectura Gen9 de Intel, que soporta DirectX 12 y también se utiliza para los adaptadores de gráficos Kaby Lake / Skylake / Apollo Lake (como el HD Graphics 520). Equipado con 12 EUs y un reloj de hasta 750 MHz, el rendimiento debe ser aproximadamente igual al de los antiguos HD Graphics 500 (Apollo Lake).
El chip también incluye un avanzado motor de vídeo con soporte de hardware para la reproducción de material VP9 y H.265 (profundidad de color de 8 bits).
Al igual que su predecesor, Intel especifica el TDP con 10 vatios (frente a 6 vatios para el móvil N4120, por ejemplo). Por lo tanto, el chip puede ser enfriado pasivamente en teoría, pero también son posibles los SKU con ventiladores.
Serie Intel Gemini Lake Nombre código Gemini Lake Refresh Serie: Gemini Lake Gemini Lake Refresh Velocidad de reloj 2000 - 2700 MHz Caché de Nivel 2 4 MB Número de Núcleos/Subprocesos 4 / 4 Consumo de Corriente (TDP = Thermal Design Power) 10 Watt Tecnología de producción 14 nm Temperatura Máx. 105 °C Conector FCBGA1090 Recursos Intel UHD Graphics 600 (12 EUs, 250 - 750 MHz), Quick Sync, AES-NI, max. 8 GB Dual-Channel DDR4/LPDDR4-2400 GPU Intel UHD Graphics 600 (250 - 750 MHz)64 Bit soporte para 64 Bit Architecture x86 Fecha de anuncio 11/04/2019 Enlace de Producto (externo) Intel Gemini Lake Celeron J4125
Benchmarks Performance Rating - CB R15 + R20 + 7-Zip + X265 + Blender + 3DM11 CPU
21 pt (25%)
...
...
Intel Core i9-12900H 220%
Cinebench R23 - Cinebench R23 CPU (Multi Core)
min: 1186 de promedio: 1375 mediana: 1374.5 (2%) max: 1563 Points
CPU TDP ? TDP 10 W 100% 76%
...
Intel Core m3-7Y32 -6%
AMD Ryzen Embedded R1606G 34%
...
Intel Core i9-12900H 1105%
Cinebench R23 - Cinebench R23 CPU (Single Core)
min: 438 de promedio: 442 mediana: 442 (22%) max: 446 Points
CPU TDP ? TDP 10 W 100% 98%
...
Intel Core m3-7Y32 44%
...
Intel Core i9-12900H 332%
Cinebench R20 - Cinebench R20 CPU (Single Core)
min: 161 de promedio: 169 mediana: 170.5 (22%) max: 174 Points
CPU TDP ? TDP 10 W 99% 100%
...
Intel Celeron J3355 -37%
...
Intel Core i9-12900H 334%
Cinebench R20 - Cinebench R20 CPU (Multi Core)
min: 304 de promedio: 475 mediana: 493 (2%) max: 610 Points
CPU TDP ? TDP 10 W 100% 88%
...
...
Intel Core i9-12900H 1224%
Cinebench R15 - Cinebench R15 CPU Multi 64 Bit
min: 207 de promedio: 242.3 mediana: 245.5 (3%) max: 271 Points
CPU TDP ? TDP 10 W 100% 81%
...
AMD A12-9720P -3%
...
Intel Core i9-12900H 986%
0 15 30 45 60 75 90 105 120 135 150 165 180 195 210 225 240 255 270 Tooltip
Cinebench R15 - Cinebench R15 CPU Single 64 Bit
min: 63.1 de promedio: 73.6 mediana: 76.2 (26%) max: 79.1 Points
CPU TDP ? TDP 10 W 100% 82%
...
AMD PRO A8-9600B -4%
Intel Celeron 3865U -2%
AMD A10-9620P -2%
AMD A12-9720P -1%
Intel Pentium 3825U 5%
...
Intel Core i9-12900H 274%
Cinebench R11.5 - Cinebench R11.5 CPU Multi 64 Bit
min: 3.06 de promedio: 3.1 mediana: 3.1 (6%) max: 3.09 Points
...
Intel Core i5-5350U -3%
Intel Core i5-7Y57 -2%
Intel Core i3-7130U 0%
Intel Core i7-2640M 2%
...
Intel Core i9-12900HK 973%
Cinebench R11.5 - Cinebench R11.5 CPU Single 64 Bit
min: 0.84 de promedio: 0.9 mediana: 0.9 (25%) max: 0.92 Points
...
Intel Celeron 3865U -2%
Intel Pentium 3825U 2%
...
Intel Core i9-12900H 275%
Cinebench R10 - Cinebench R10 Rend. Single (32bit)
min: 2070 de promedio: 2183 mediana: 2182.5 (19%) max: 2295 puntos
...
AMD A8-7410 -3%
AMD Turion II P540 -1%
Intel Core 2 Duo T5850 -1%
Intel Core 2 Duo P7370 0%
...
Cinebench R10 - Cinebench R10 Rend. Multi (32bit)
min: 7128 de promedio: 7232 mediana: 7231.5 (10%) max: 7335 puntos
...
Intel Core i3-5015U -4%
AMD A12-9720P 2%
AMD A10-9620P 3%
Intel Core i5-2415M 3%
...
Intel Core i9-12900H 737%
Cinebench R10 - Cinebench R10 Rend. Multi (64bit)
10705 Points (9%)
...
Intel Core i3-5157U 4%
...
AMD Ryzen 9 5900HS 571%
Cinebench R10 - Cinebench R10 Rend. Single (64bit)
3711 Points (23%)
...
...
wPrime 2.10 - wPrime 2.0 1024m *
min: 566 de promedio: 585 mediana: 584.5 (7%) max: 603 s
...
Intel Core i3-7130U -3%
AMD PRO A8-9600B -1%
AMD Pro A8-8600B 0%
...
VIA C3-M C3-M-1200 1346%
wPrime 2.10 - wPrime 2.0 32m *
min: 17.37 de promedio: 18.4 mediana: 18.4 (4%) max: 19.42 s
...
Intel Core i3-7130U -2%
Intel Core i5-6360U 0%
AMD Pro A8-8600B 2%
Intel Core i5-2415M 3%
...
min: 1048 de promedio: 1094 mediana: 1094 (6%) max: 1140 puntos
...
Intel Pentium N3700 -6%
AMD E2-7110 0%
Intel Celeron 3865U 1%
...
7-Zip 18.03 - 7-Zip 18.03 Multli Thread 4 runs
min: 5694 de promedio: 7344 mediana: 7642 (5%) max: 8399 MIPS
CPU TDP ? TDP 10 W 100% 72%
...
AMD Ryzen Embedded R1505G -6%
...
Intel Core i9-12900H 796%
7-Zip 18.03 - 7-Zip 18.03 Single Thread 4 runs
min: 2237 de promedio: 2355 mediana: 2370 (34%) max: 2444 MIPS
CPU TDP ? TDP 10 W 100% 93%
...
Intel Celeron J3355 -23%
AMD Ryzen Embedded R1505G 6%
...
Intel Core i9-12900H 156%
X264 HD Benchmark 4.0 - x264 Pass 2
min: 11.31 de promedio: 14 mediana: 14 (6%) max: 16.75 fps
...
AMD PRO A8-9600B -5%
Intel Core i3-5015U -4%
AMD Pro A8-8600B -4%
...
Intel Core i9-12900HK 1038%
X264 HD Benchmark 4.0 - x264 Pass 1
min: 52.6 de promedio: 65.8 mediana: 65.8 (18%) max: 78.9 fps
...
Intel Pentium 3825U -5%
Intel Celeron 2970M -5%
AMD Pro A8-8600B 3%
Intel Core i3-5015U 5%
AMD PRO A8-9600B 6%
...
Intel Core i9-12900HK 357%
HWBOT x265 Benchmark v2.2 - HWBOT x265 4k Preset
min: 1.26 de promedio: 1.5 mediana: 1.5 (3%) max: 1.61 fps
CPU TDP ? TDP 10 W 100% 83%
...
...
AMD Ryzen 9 6900HX 1147%
0 0.2 0.3 0.5 0.6 0.8 0.9 1.1 1.2 1.4 1.5 1.7 1.8 2 2.1 2.3 2.4 2.6 2.7 2.9 Tooltip
TrueCrypt - TrueCrypt Serpent
min: 0.178 de promedio: 0.2 mediana: 0.2 (6%) max: 0.182 GB/s
...
Intel Core i5-5257U -2%
Intel Core i5-6360U -1%
Intel Core i5-7Y57 1%
Intel Core i5-7267U 6%
Intel Core i7-6560U 6%
...
Intel Core i9-12900HK 733%
TrueCrypt - TrueCrypt Twofish
min: 0.262 de promedio: 0.3 mediana: 0.3 (5%) max: 0.266 GB/s
...
AMD Pro A8-8600B 4%
...
Intel Core i9-12900HK 885%
TrueCrypt - TrueCrypt AES
min: 1.8 de promedio: 1.9 mediana: 1.9 (7%) max: 1.9 GB/s
...
AMD A12-9720P -3%
Intel Core i5-7Y57 -3%
Intel Core i5-7200U 1%
Intel Core i7-6560U 3%
Intel Core i5-4200H 3%
Intel Core i5-6267U 3%
Intel Core i5-5257U 3%
...
Intel Core i9-12900HK 781%
Blender 2.79 - Blender 2.79 BMW27 CPU *
min: 2198 de promedio: 2500 mediana: 2385 (17%) max: 3032 Seconds
CPU TDP ? TDP 10 W 106% 100%
Intel Core i5-1038NG7 -100%
...
Intel Celeron 2970M 36%
...
R Benchmark 2.5 - R Benchmark 2.5 *
min: 1.525 de promedio: 1.6 mediana: 1.6 (34%) max: 1.579 sec
CPU TDP ? TDP 10 W 100% 101%
Intel Core i9-12900H -73%
...
...
3DMark 06 - CPU - 3DMark 06 - CPU
min: 3740 de promedio: 3805 mediana: 3804.5 (8%) max: 3869 Points
...
Intel Core i5-7Y57 -3%
Intel Core i3-7130U 0%
...
Intel Core i9-12900HK 342%
Super Pi mod 1.5 XS 1M - Super Pi mod 1.5 XS 1M *
min: 24.57 de promedio: 35.1 mediana: 35 (8%) max: 45.52 s
Intel Core i7-11390H -81%
...
AMD Phenom II X3 N850 0%
Intel Pentium M 725 0%
AMD Phenom II X4 N970 0%
Intel Core Duo T2300 0%
Intel Core Duo T2350 0%
AMD Athlon II P360 0%
AMD Turion II M520 0%
AMD V-Series V120 1%
AMD Athlon II P340 1%
AMD E2-7110 2%
Intel Core 2 Duo T5250 3%
...
VIA C3-M C3-M-1200 1221%
Super Pi mod 1.5 XS 2M - Super Pi mod 1.5 XS 2M *
min: 55.9 de promedio: 74.7 mediana: 74.7 (3%) max: 93.4 s
Intel Core i7-11390H -80%
...
AMD Athlon II P340 -4%
AMD A6 Pro-7050B -1%
AMD A4-3310MX 0%
AMD Turion II Ultra M600 0%
Qualcomm Snapdragon 850 0%
Intel Core Duo T2500 1%
...
Super Pi Mod 1.5 XS 32M - Super Pi mod 1.5 XS 32M *
min: 1845 de promedio: 4812 mediana: 4811.5 (21%) max: 7778 s
...
Intel Atom N455 -6%
Intel Atom 330 -5%
Intel Pentium M 725 -2%
Intel Mobile A A110 5%
Intel Celeron M 340 5%
Intel Mobile Pentium III-M P3M-1200 20%
Intel Pentium 4-M P4-M 1,7 21%
Intel Pentium M 713 29%
Intel Celeron M 630 MHz 37%
Intel Celeron M 373 50%
VIA C7-M C7-M-1600 220%
...
VIA C3-M C3-M-1200 368%
3DMark Vantage - 3DM Vant. Perf. CPU no Physx
7339 Points (7%)
...
Intel Pentium 3825U -4%
Intel Core i3-380M -1%
AMD Phenom II X4 N970 -1%
...
Intel Core i9-12900HK 954%
3DMark 11 - 3DM11 Performance Physics
min: 2693 de promedio: 2795 mediana: 2750 (10%) max: 2986 Points
CPU TDP ? TDP 10 W 100% 96%
...
Intel Core m5-6Y57 -2%
Intel Core m3-7Y32 -2%
AMD A12-9720P -1%
...
AMD Ryzen 9 6900HX 592%
3DMark - 3DMark Ice Storm Physics
29462 Points (19%)
...
Intel Core i5-4200H 2%
...
3DMark - 3DMark Ice Storm Extreme Physics
min: 29231 de promedio: 29417 mediana: 29416.5 (24%) max: 29602 Points
...
Intel Core i5-1038NG7 -7%
AMD Ryzen Embedded R1505G 3%
...
Intel Core i7-12700H 203%
3DMark - 3DMark Ice Storm Unlimited Physics
35705 Points (30%)
...
AMD 3015Ce -1%
Intel Core i3-7130U 1%
Intel Core i5-6360U 7%
...
AMD Ryzen 9 5900HS 159%
3DMark - 3DMark Cloud Gate Physics
min: 2253 de promedio: 2543 mediana: 2557 (6%) max: 2804 Points
CPU TDP ? TDP 10 W 100% 85%
...
Intel Core i3-5015U -5%
Intel Core i5-4310U -1%
Intel Core m3-7Y32 2%
Intel Core i3-7100U 3%
...
Intel Core i9-12900H 703%
3DMark - 3DMark Fire Strike Standard Physics
min: 3415 de promedio: 3815 mediana: 3787 (9%) max: 4271 Points
CPU TDP ? TDP 10 W 100% 86%
...
Intel Core i5-4310U 0%
Intel Core i3-7100U 2%
AMD Ryzen Embedded R1505G 8%
...
Intel Core i9-12900H 673%
3DMark - 3DMark Time Spy CPU
min: 876 de promedio: 994 mediana: 984 (5%) max: 1122 Points
CPU TDP ? TDP 10 W 100% 83%
...
Intel Atom x7-E3950 -33%
Intel Celeron 2970M -9%
...
Intel Core i9-12900H 1245%
Geekbench 4.1 - 4.4 - Geekbench 4.1 - 4.4 64 Bit Single-Core
min: 1922 de promedio: 1960 mediana: 1959.5 (23%) max: 1997 puntos
...
AMD E2-9010 -18%
AMD PRO A8-9600B 9%
...
Intel Core i9-12900HK 307%
Geekbench 4.1 - 4.4 - Geekbench 4.1 - 4.4 64 Bit Multi-Core
min: 5468 de promedio: 5615 mediana: 5614.5 (7%) max: 5761 puntos
...
AMD Ryzen Embedded R1505G -2%
Intel Core i3-7100U 5%
...
Intel Core i9-12900HK 803%
Geekbench 5.0 - Geekbench 5.0 64 Bit Single-Core
min: 453 de promedio: 458 mediana: 458 (23%) max: 463 puntos
...
AMD Ryzen Embedded R1505G 34%
Microsoft SQ1 59%
Intel Core i7-2860QM 65%
...
Intel Core i9-12900HK 305%
Geekbench 5.0 - Geekbench 5.0 64 Bit Multi-Core
min: 1482 de promedio: 1501 mediana: 1500.5 (5%) max: 1519 puntos
...
AMD Ryzen Embedded R1505G -9%
...
Intel Core i9-12900HK 809%
Geekbench 5.3 - Geekbench 5.1 - 5.4 64 Bit Single-Core
min: 435 de promedio: 454.5 mediana: 458.5 (22%) max: 466 puntos
CPU TDP ? TDP 10 W 98% 100%
...
Qualcomm Snapdragon 850 7%
...
Intel Core i9-12900H 309%
Geekbench 5.3 - Geekbench 5.1 - 5.4 64 Bit Multi-Core
min: 1198 de promedio: 1401 mediana: 1447.5 (5%) max: 1512 puntos
CPU TDP ? TDP 10 W 100% 82%
...
Intel Core i3-L13G4 -4%
AMD Ryzen Embedded R1505G -3%
Intel Core m3-7Y32 12%
Intel Core i3-10110Y 17%
...
Mozilla Kraken 1.1 - Kraken 1.1 Total Score *
min: 2216 de promedio: 2250 mediana: 2247.5 (3%) max: 2288 ms
CPU TDP ? TDP 10 W 100% 100%
...
Intel Core i5-4200H -4%
Intel Pentium 3825U 4%
...
WebXPRT 3 - WebXPRT 3 Score
min: 86.2 de promedio: 88.9 mediana: 87.2 (24%) max: 93.2 Points
CPU TDP ? TDP 10 W 93% 100%
...
...
Power Consumption - Prime95 Power Consumption - external Monitor *
min: 10.5 de promedio: 14.1 mediana: 14.3 (2%) max: 17.4 Watt
CPU TDP ? TDP 10 W 100% 101%
...
Intel Atom x7-E3950 -10%
...