Veredicto - Más esbelto y ligero que antes
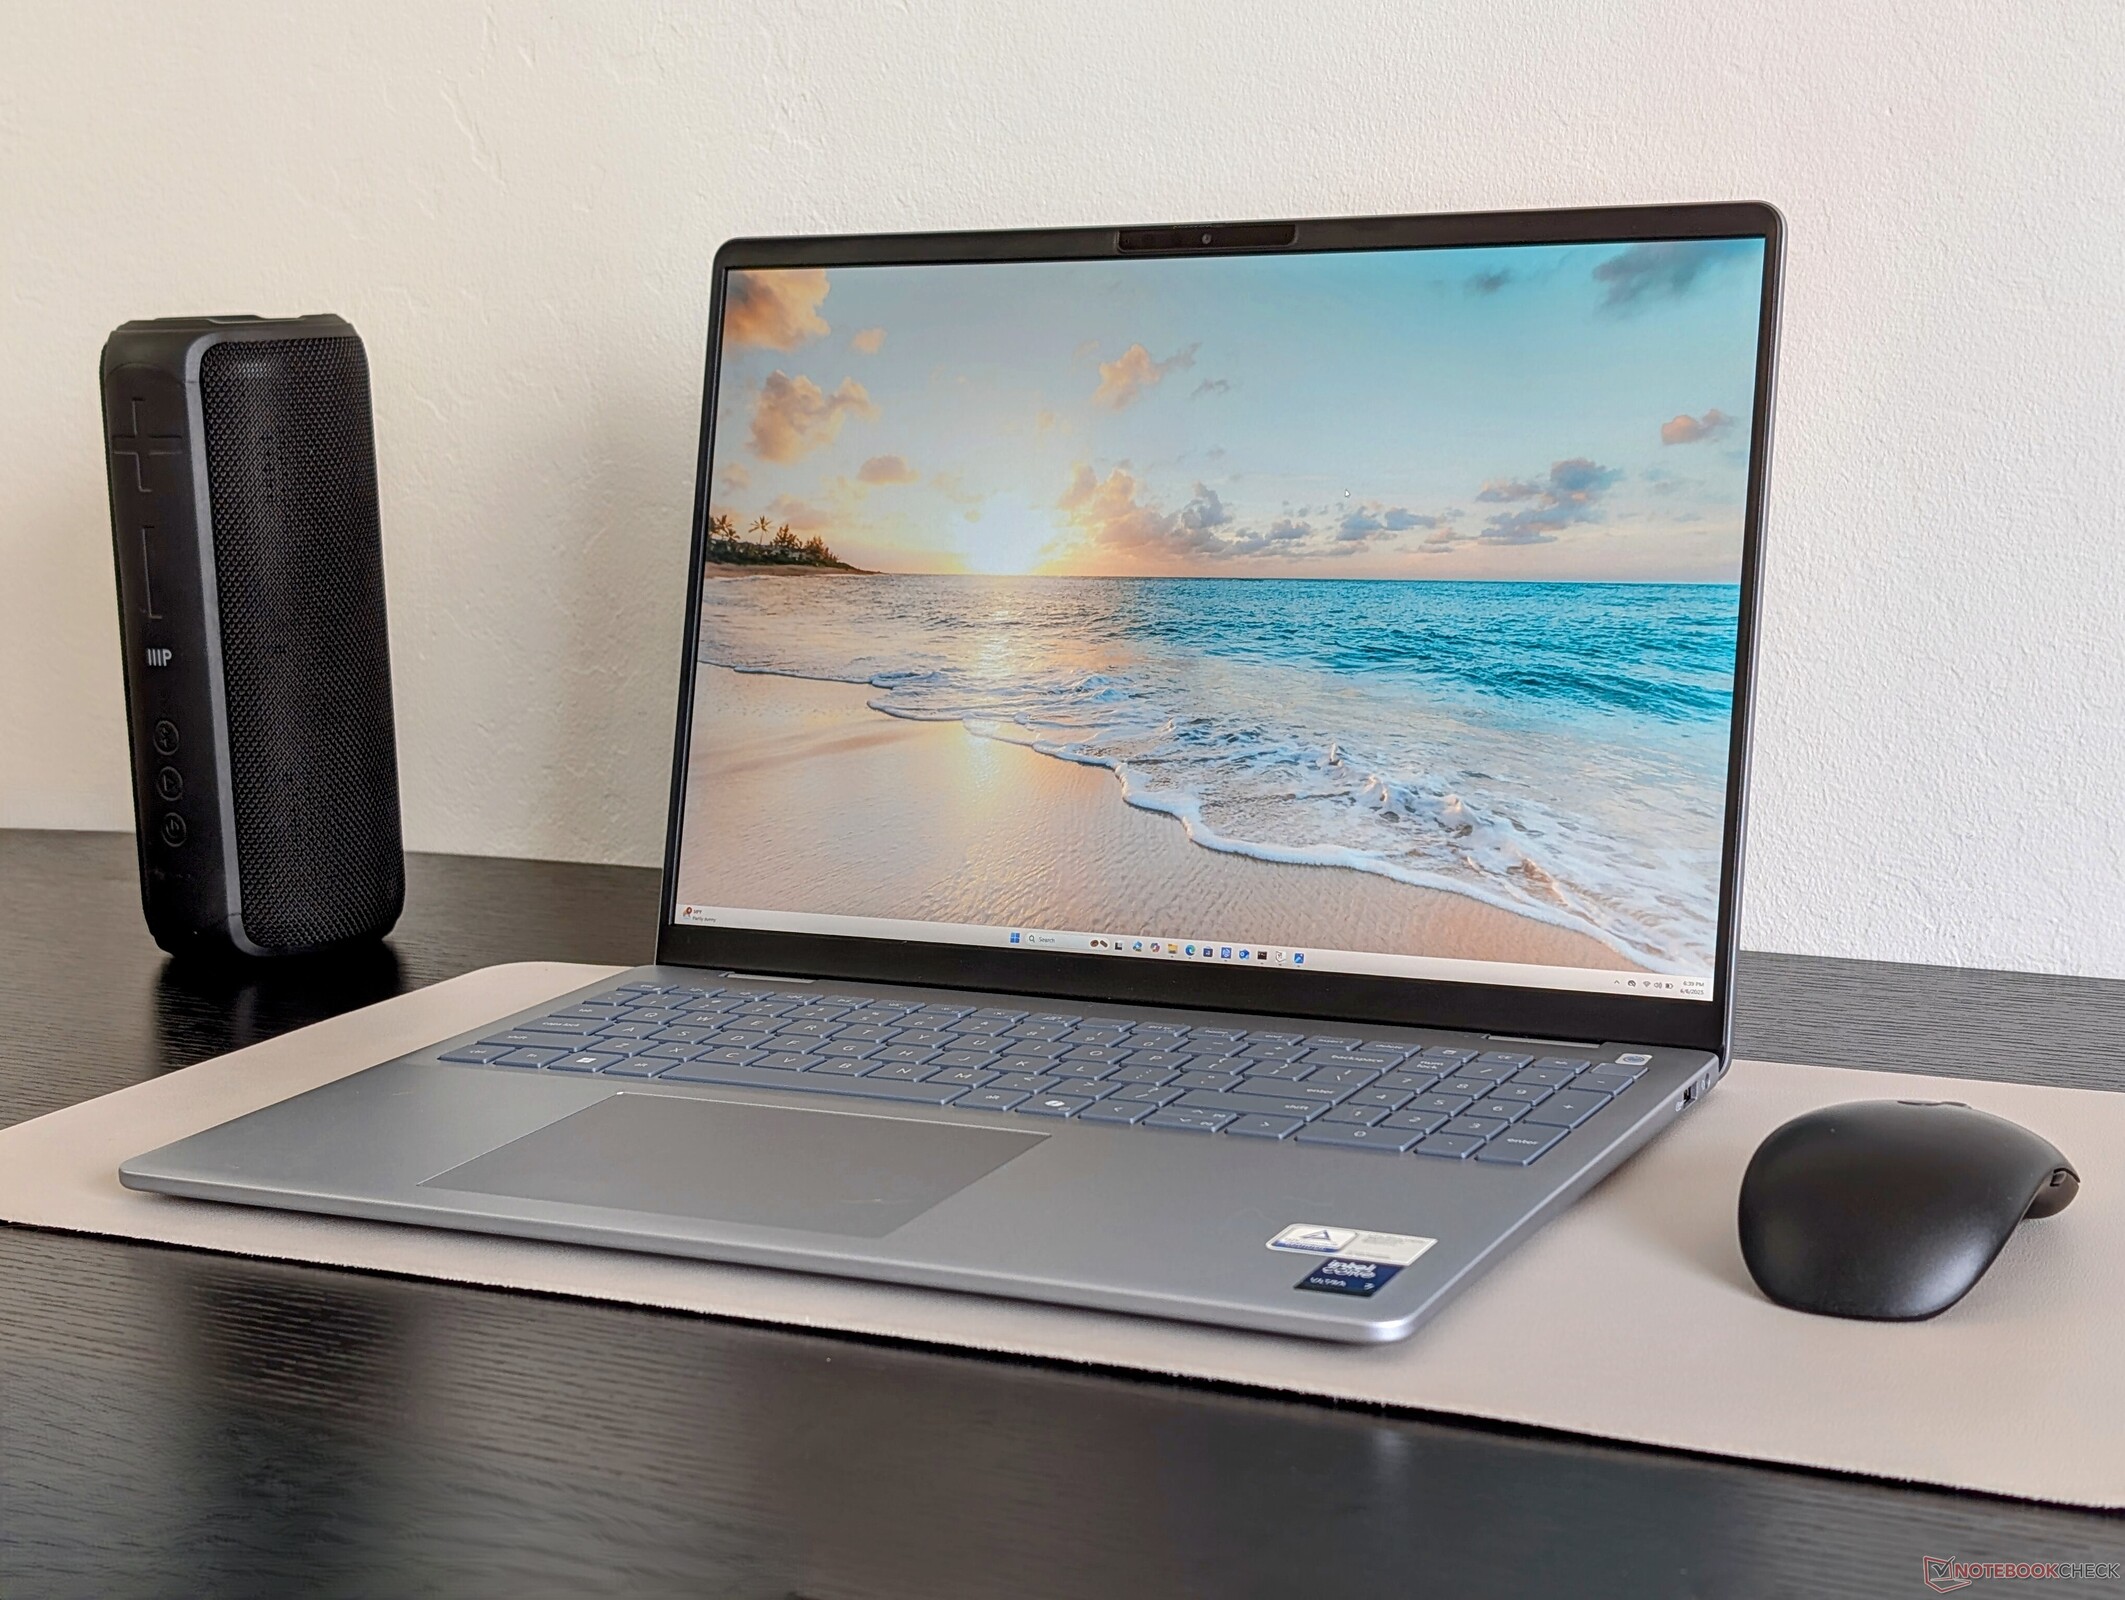
Aunque puede parecerse mucho a su predecesor el Inspiron 16 Plus 7640, el Dell 16 Plus es una bestia diferente gracias al cambio de una CPU Core Ultra-H a la más reciente Core Ultra-V Lunar Lake. El resultado es una máquina más esbelta, ligera y duradera que debería adaptarse mejor a un público multimedia más general. También apreciamos que su pantalla IPS 1600p120 venga de serie, lo que significa que no hay opciones de "gama baja" con paneles o colores pobres.
La principal pega del Dell 16 Plus es su falta de rendimiento para las aplicaciones más exigentes. El antiguo Inspiron 16 Plus 7640 o Inspiron 16 7640 2 en 1 llevan Core-H u opciones de GPU discreta para un rendimiento mucho más rápido que el Dell 16 Plus. También ofrecen la misma o incluso mejor experiencia de visualización por aproximadamente el mismo precio. Los usuarios que no necesiten la potencia extra encontrarán que el Dell 16 Plus es la opción más adecuada para viajar y editar ocasionalmente. Por lo demás, los más potentes Serie Dell Premium debería ser considerada.
Pro
Contra
Precio y disponibilidad
Dell está enviando ahora el Dell 16 Plus a partir de $ 1150 como se configura en nuestra revisión. La opción Core Ultra 9 también se está enviando en Amazon por $1400.
Índice
El Dell 16 Plus sustituye a la última generación de la serie Inspiron 16 Plus. Aunque el nombre y las opciones de procesador pueden ser bastante diferentes, sus características físicas siguen tomando prestado en gran medida del Inspiron 16 Plus 7640 o Inspiron 16 7640 2 en 1 como mostrará nuestro análisis.
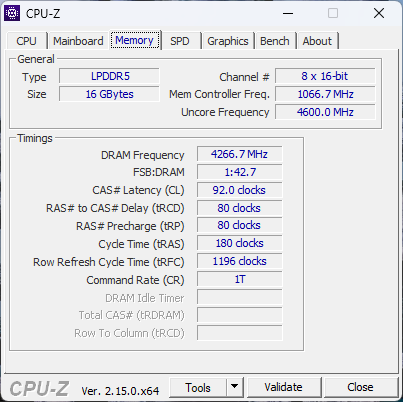
Nuestra unidad de prueba es una configuración intermedia con el Core Ultra 7 256V y pantalla IPS 1600p120 a partir de 1150 dólares. Los SKU de gama más alta ofrecen el Core Ultra 7 258V o el Core Ultra 9 288V con el doble de RAM y almacenamiento por 1650 dólares, mientras que otras opciones de pantalla incluyen IPS de 1200p o Mini-LED de 1600p.
Los competidores en este espacio incluyen otros portátiles multimedia de 16 pulgadas de gama media como el Lenovo IdeaPad Pro 5 16, HP Pavilion Plus 16o el Asus Vivobook 16.
Más opiniones sobre Dell:
Especificaciones
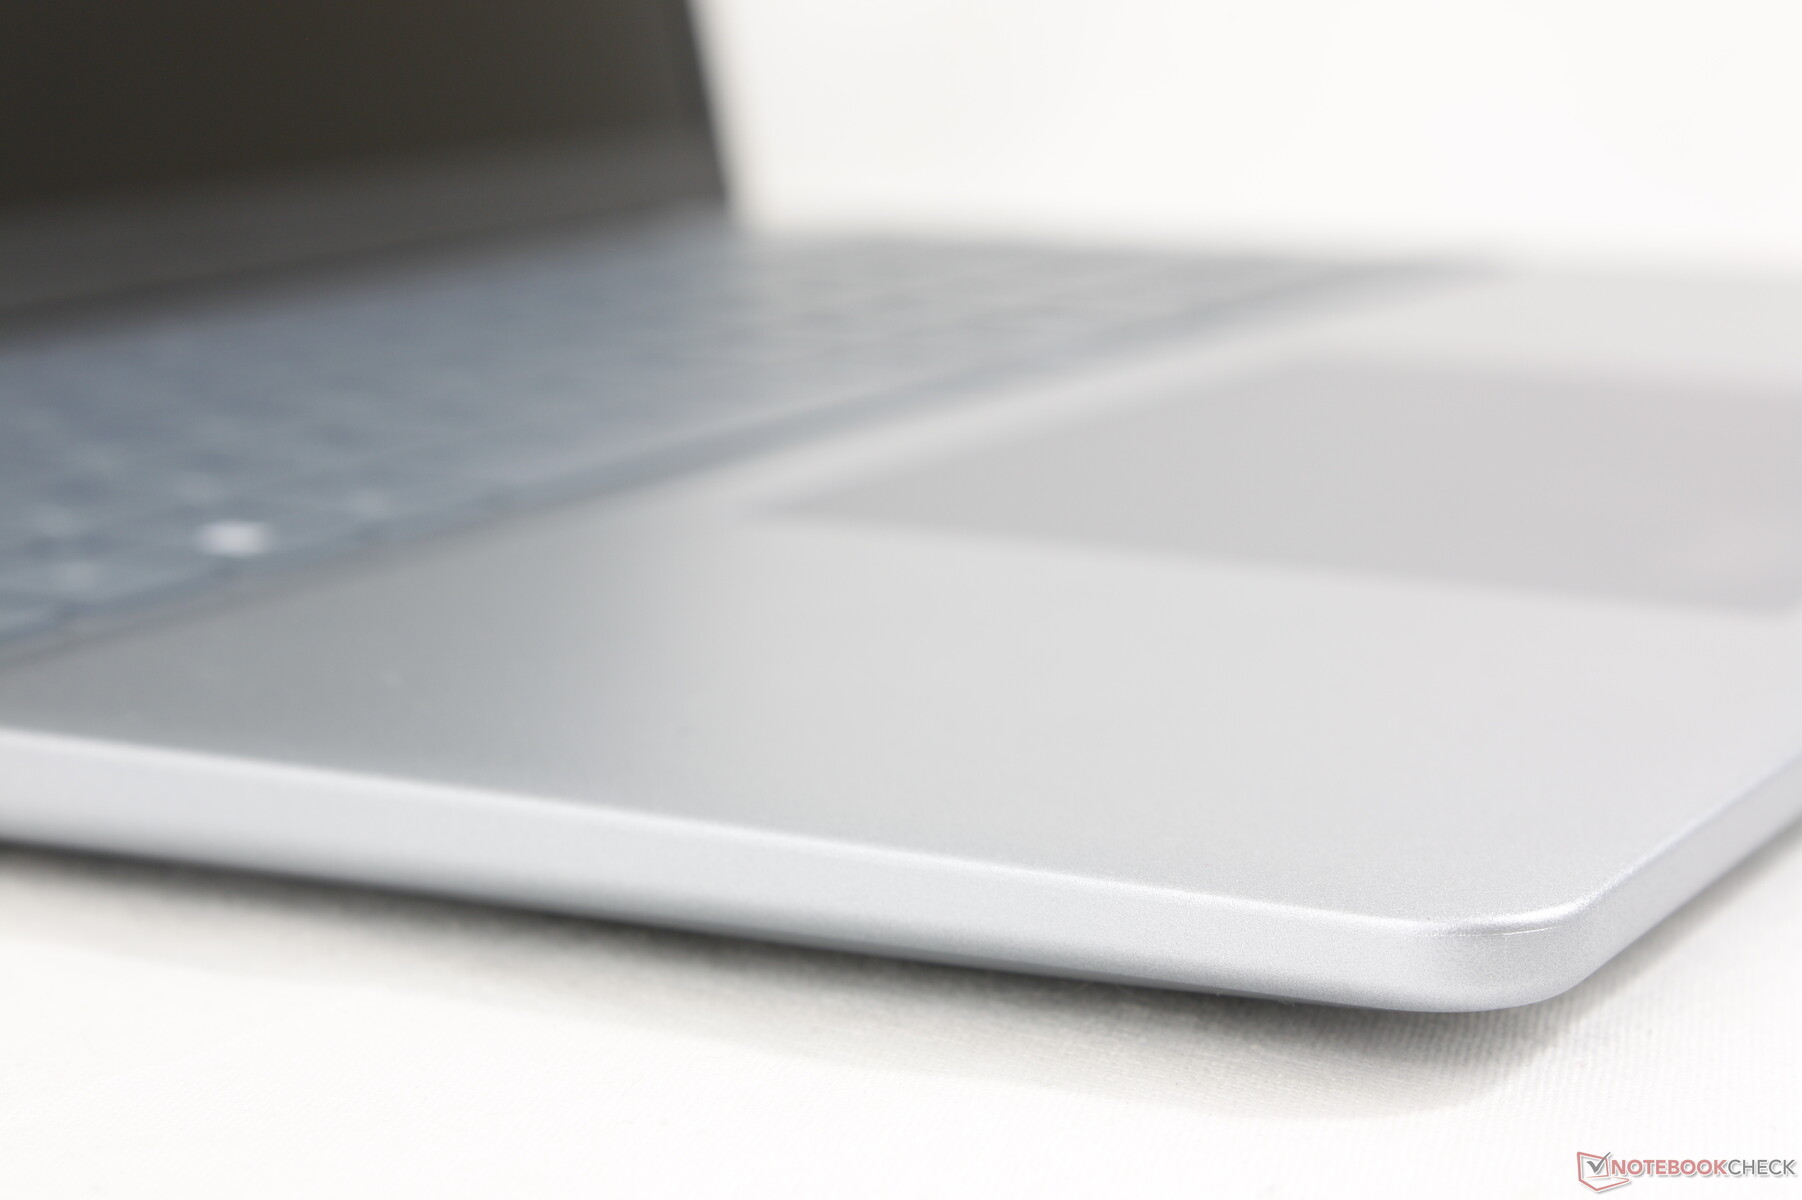
Caso
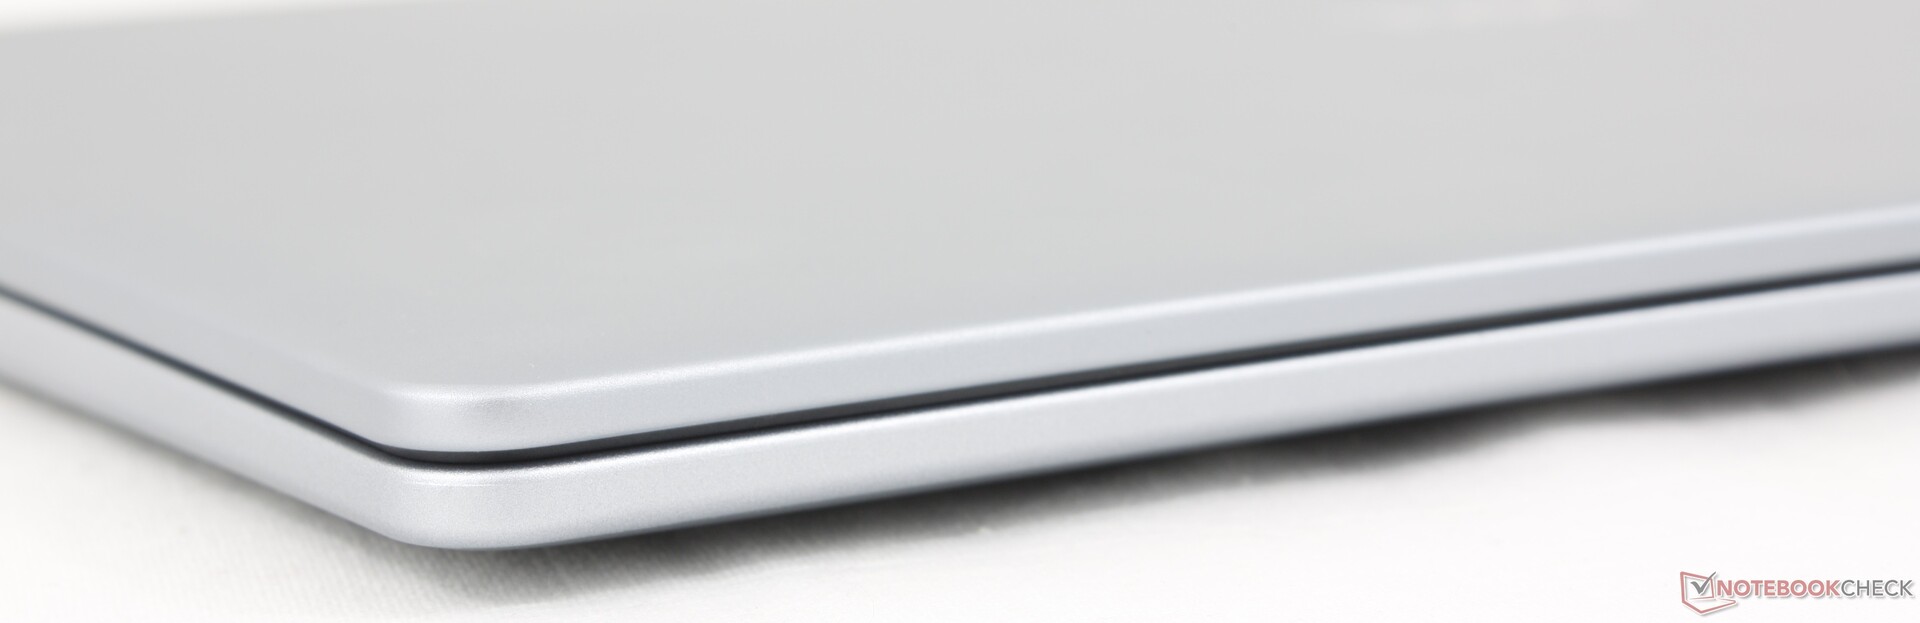
El suave chasis plateado mate debería parecer y sentirse familiar al instante para cualquiera que haya tenido experiencia con un modelo Inspiron. Los materiales y el diseño se han mantenido en gran medida iguales a los de la generación anterior para que las primeras impresiones sean similares. El chasis y la tapa se doblan más fácilmente en comparación con alternativas más caras como el XPS 16 o el Lenovo Yoga Pro 9 16, pero por lo demás es comparable al HP Pavilion Plus 16 o al Asus Vivobook 16.
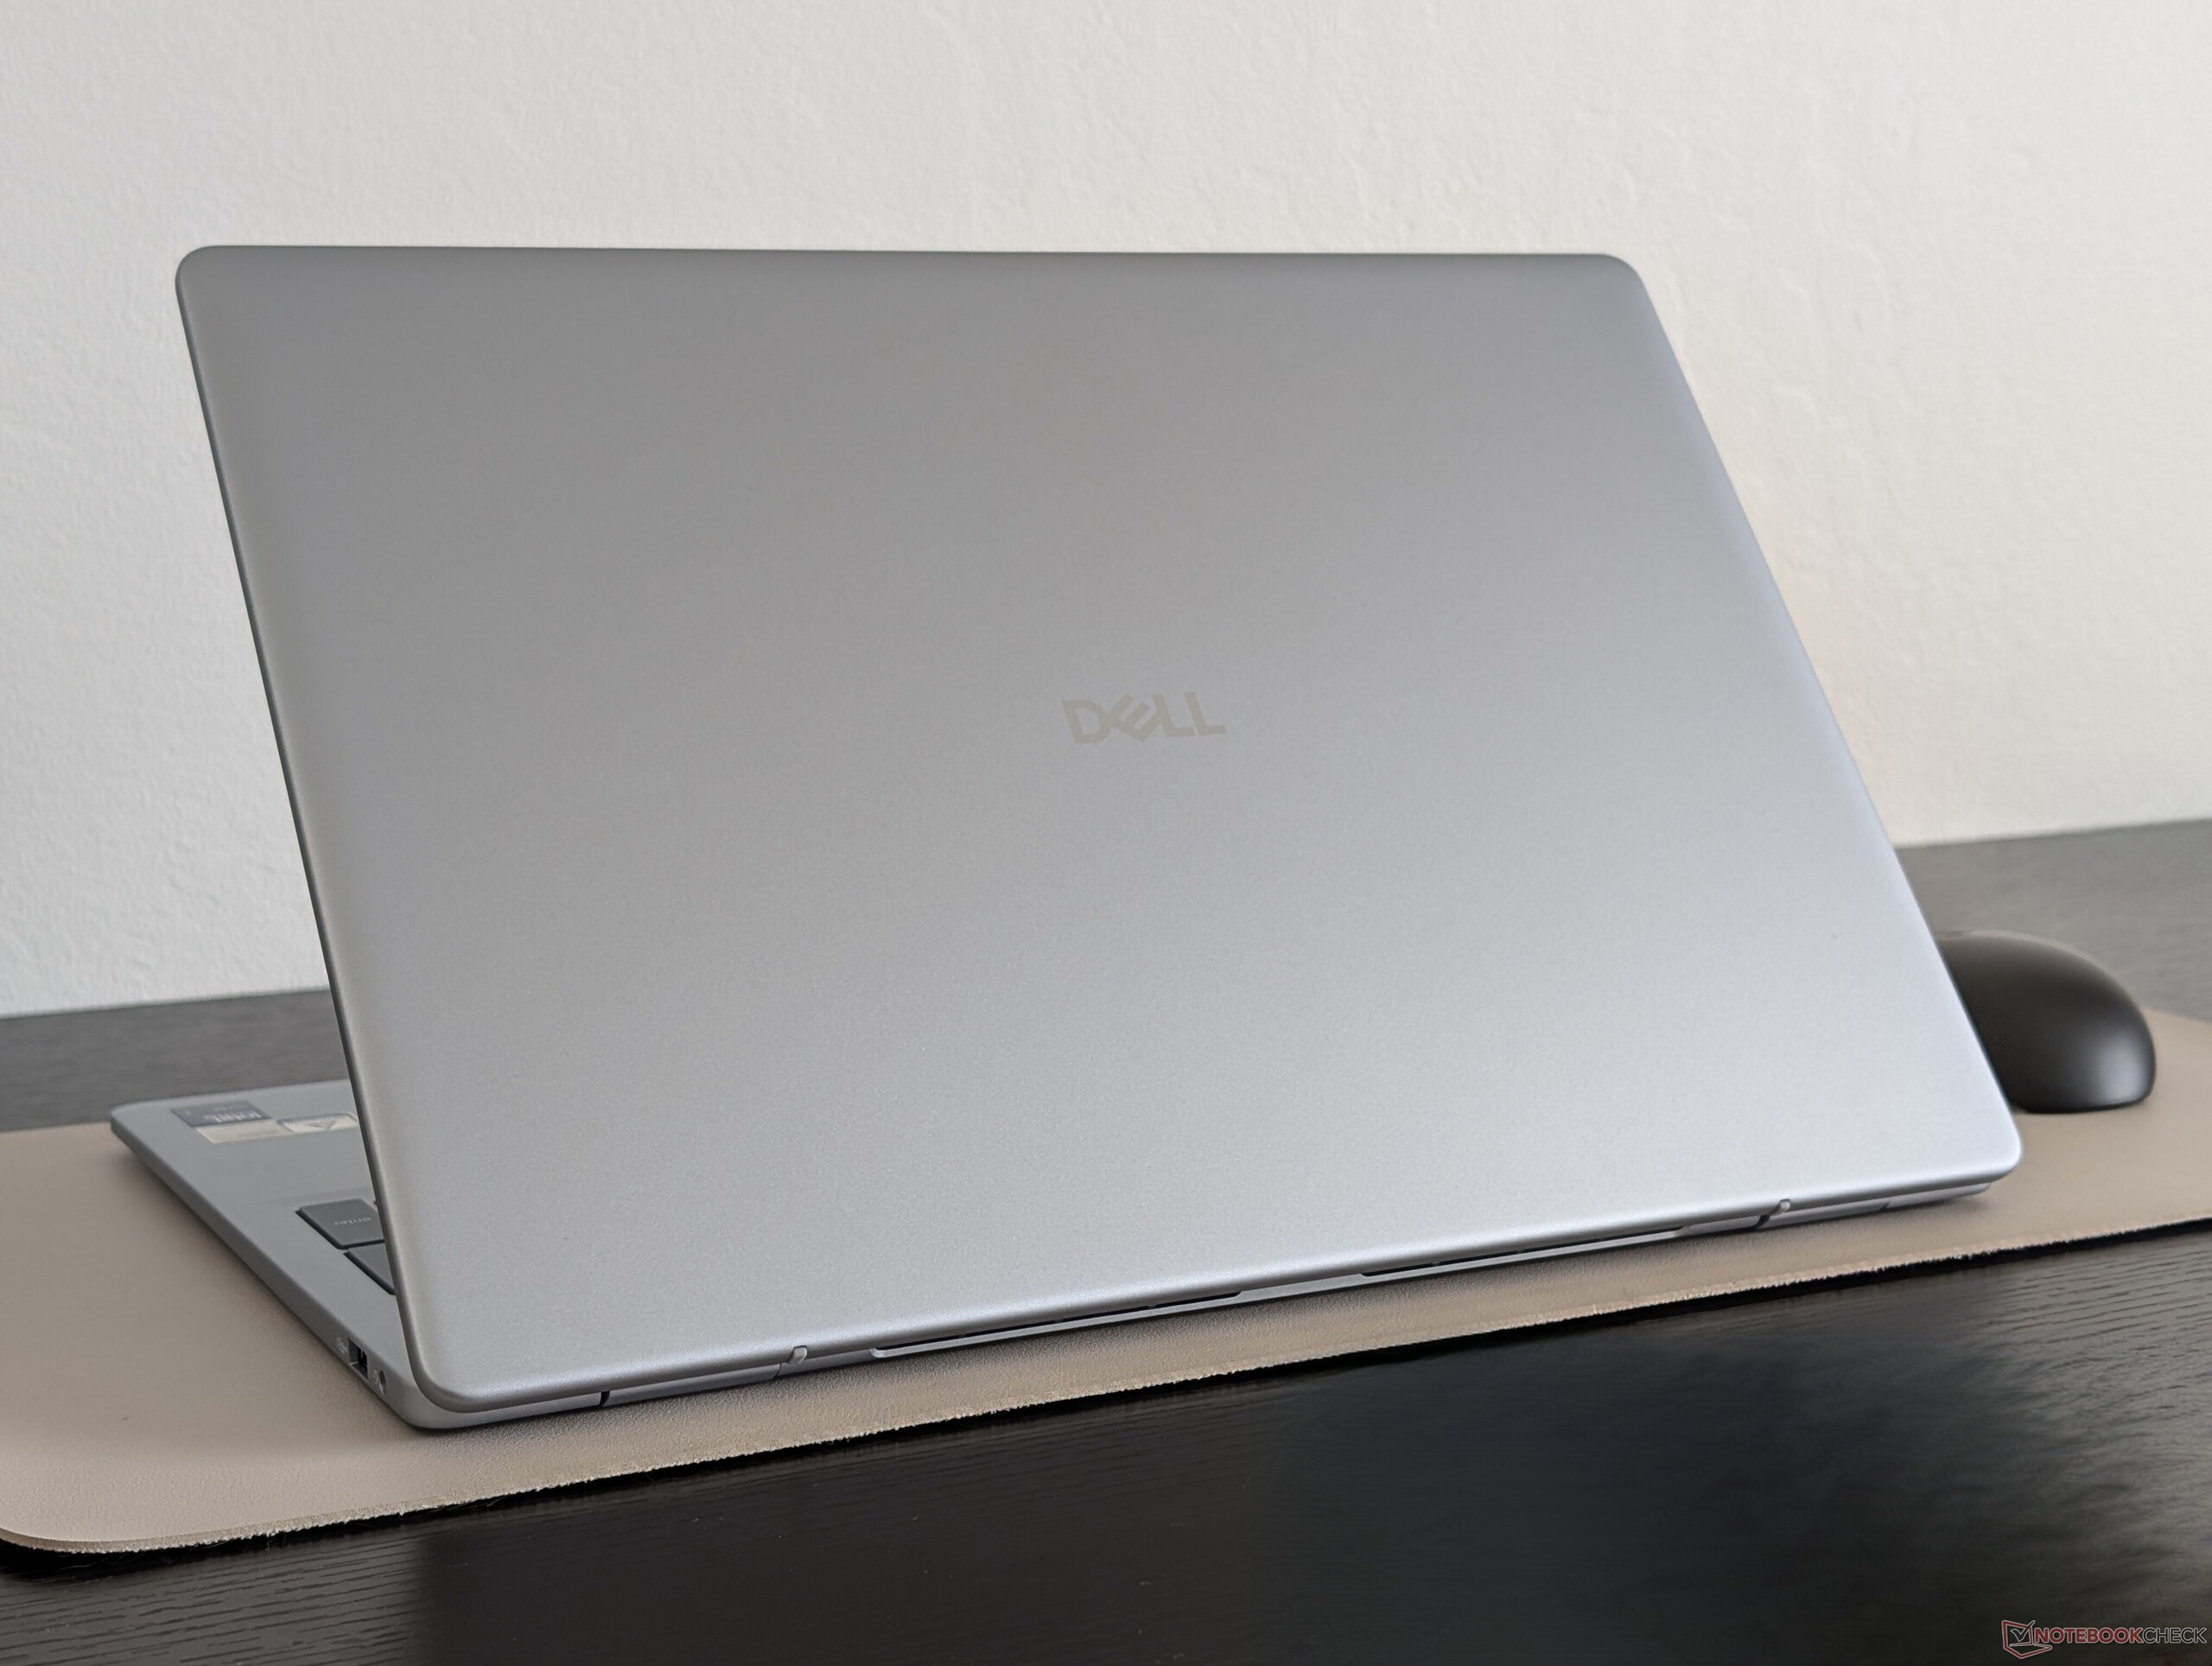
Las dimensiones son casi 1:1 con el Inspiron 16 Plus 7640 saliente si no sólo ligeramente más delgado. En cambio, la mayor diferencia entre ellos es el peso ya que el modelo más nuevo es aproximadamente 400 g más ligero debido en gran parte a la falta de cualquier opción de GPU discreta.
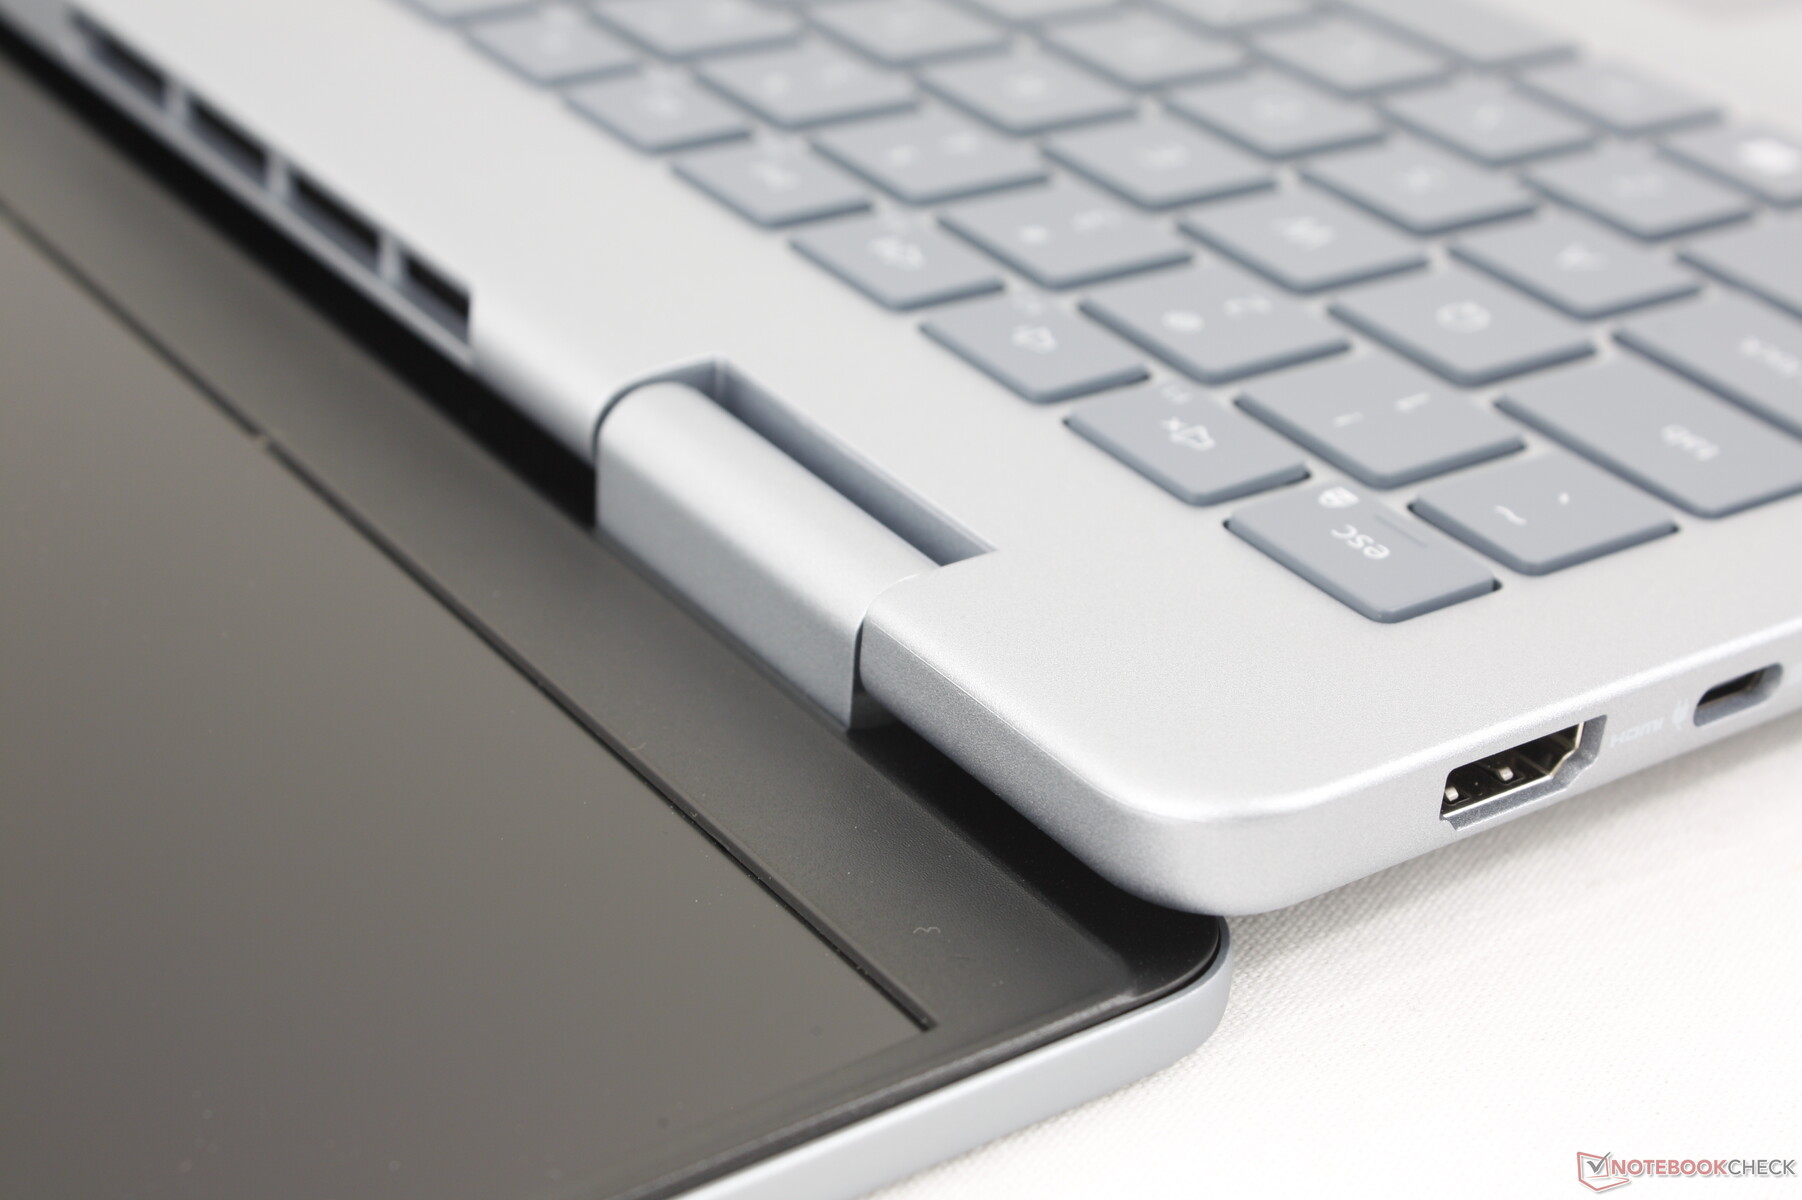
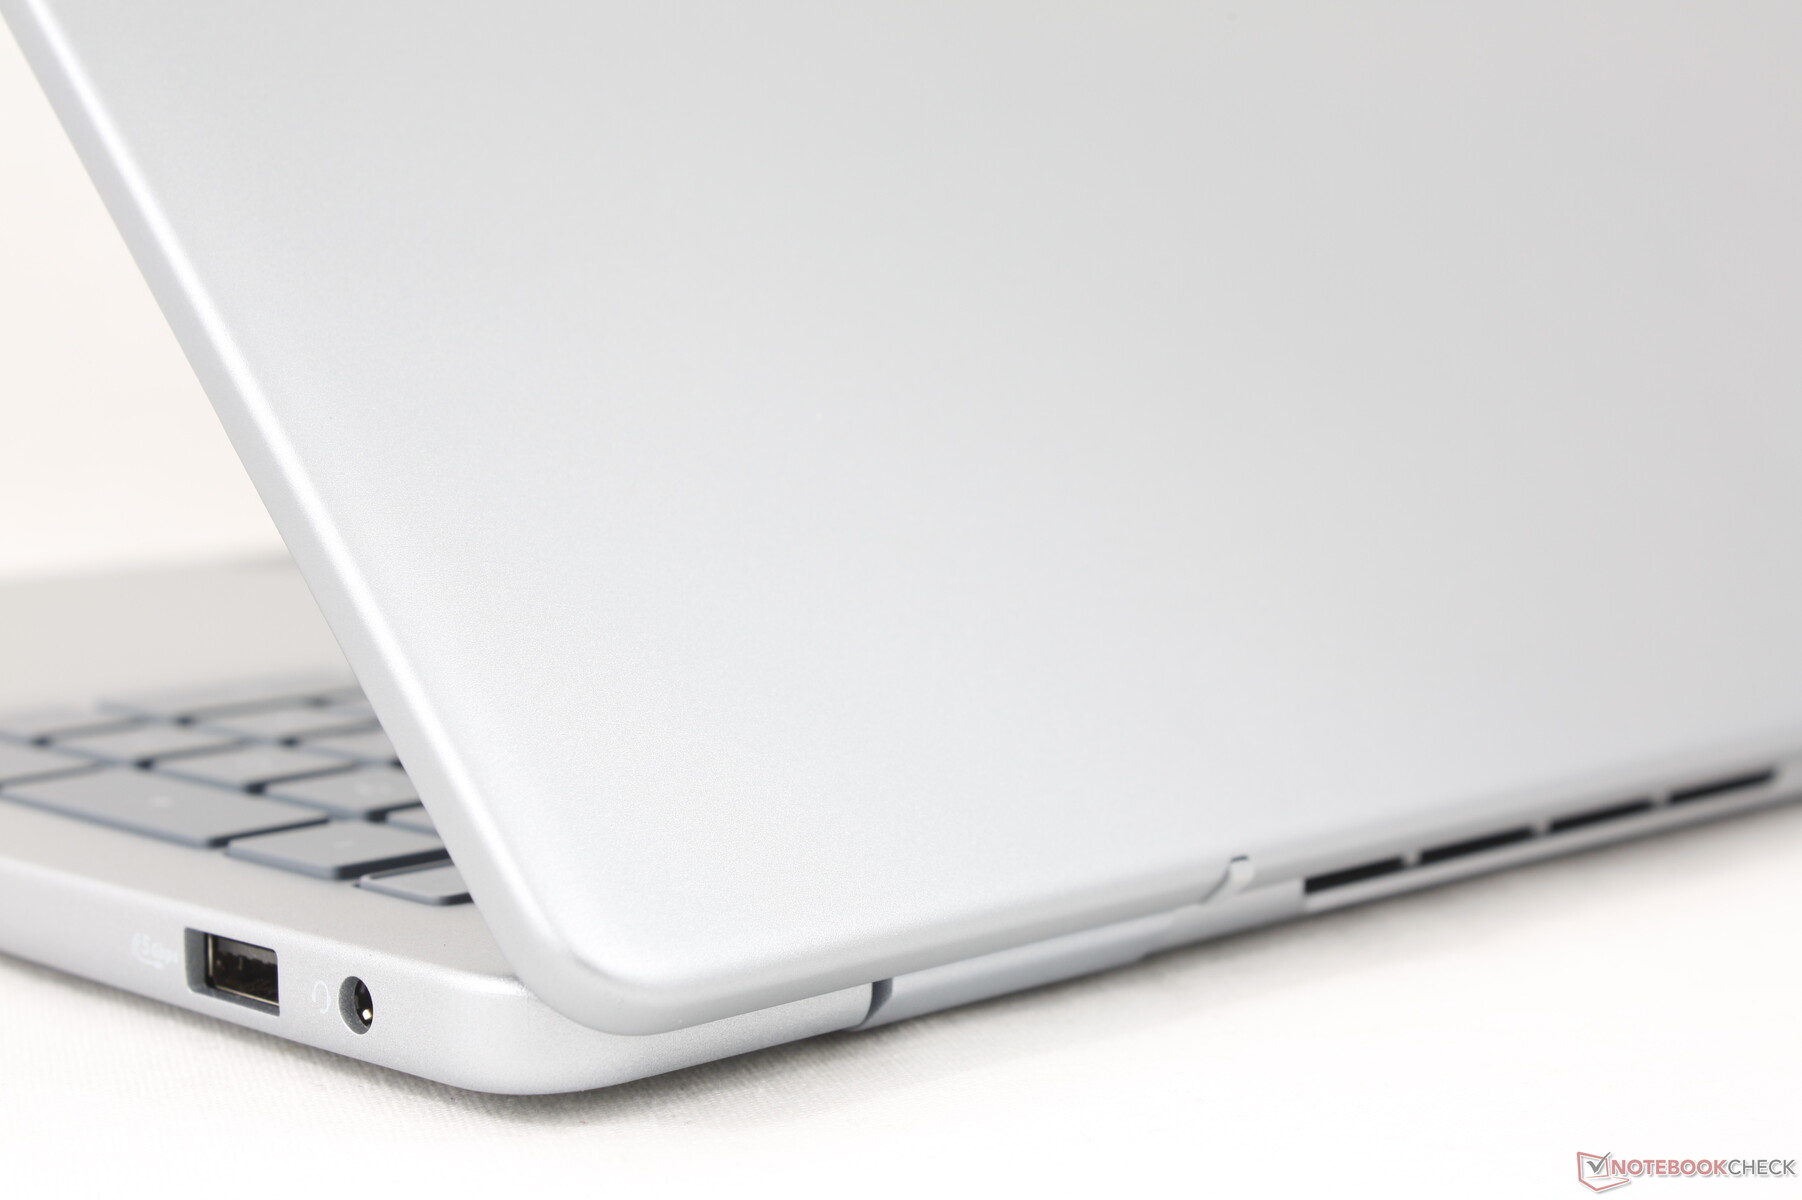
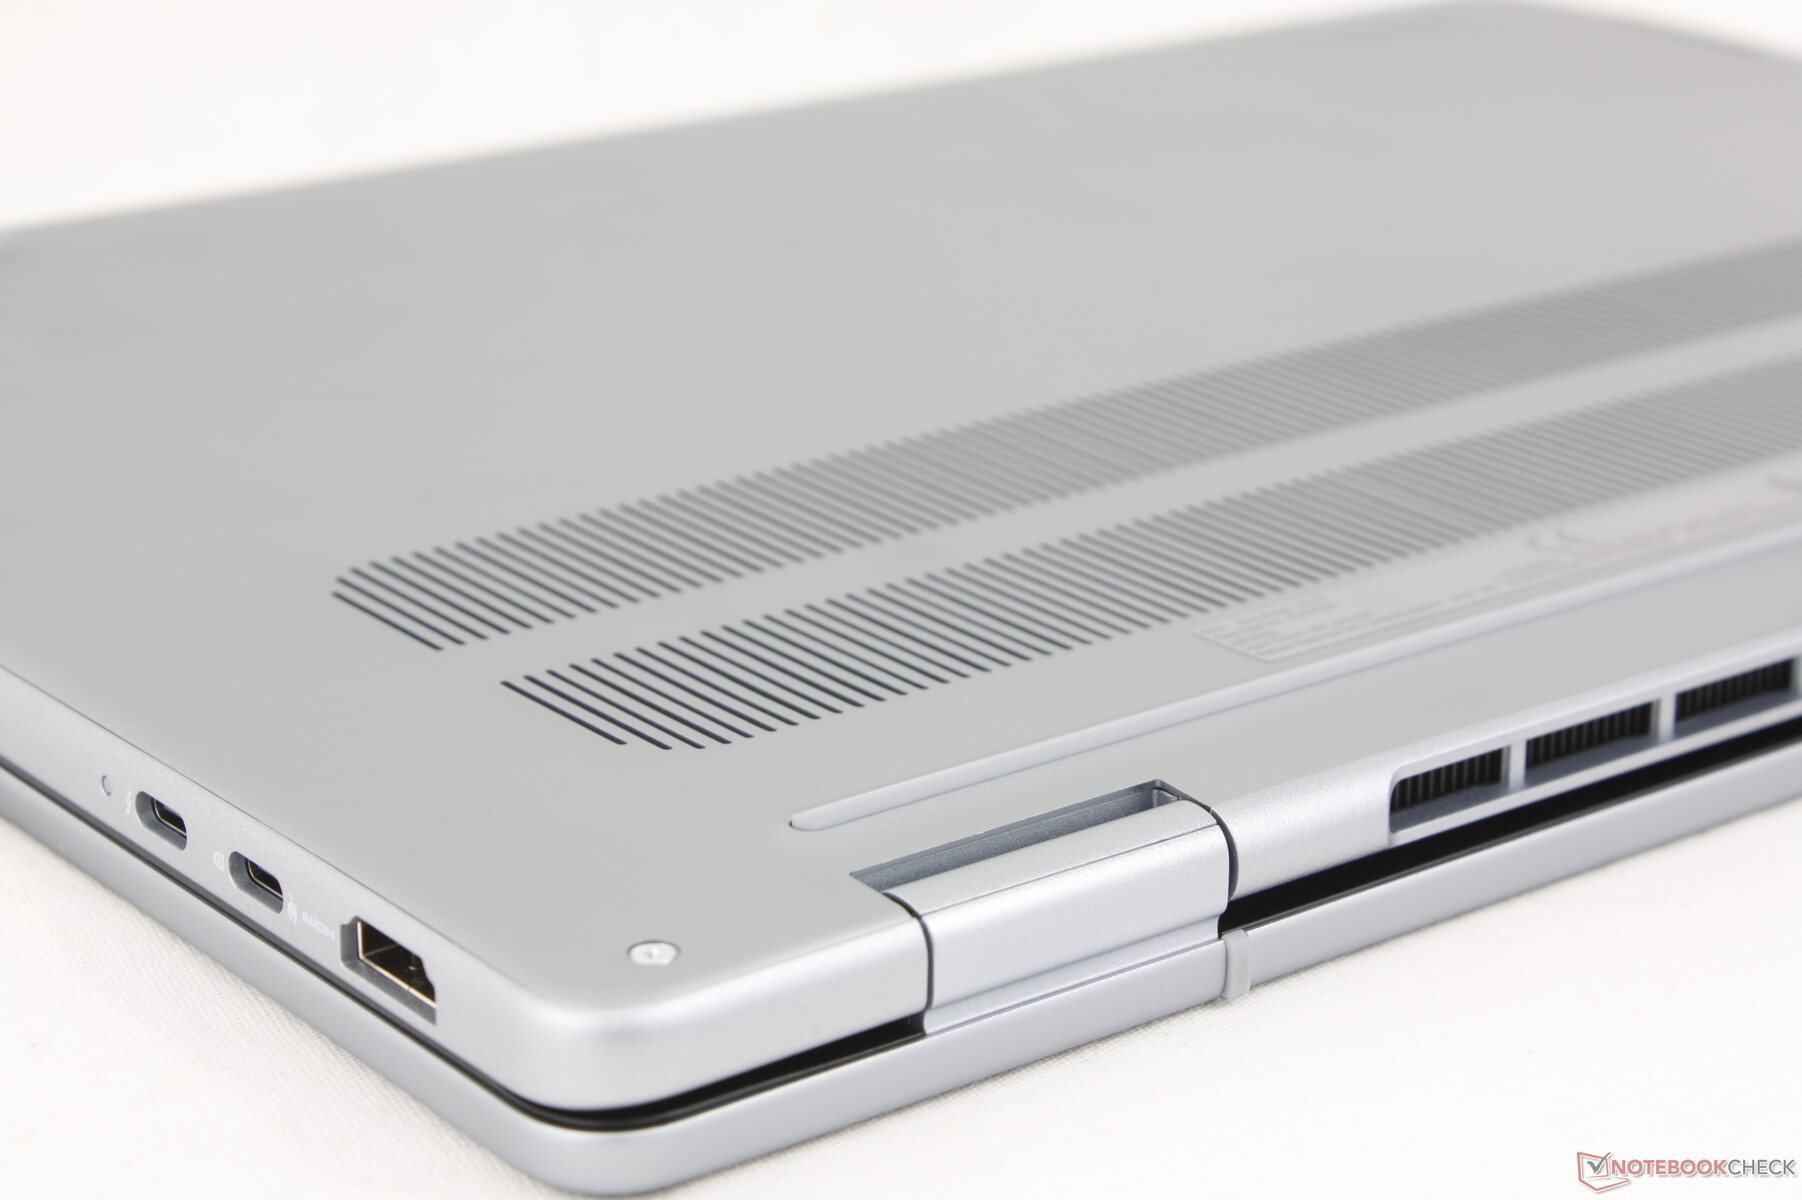
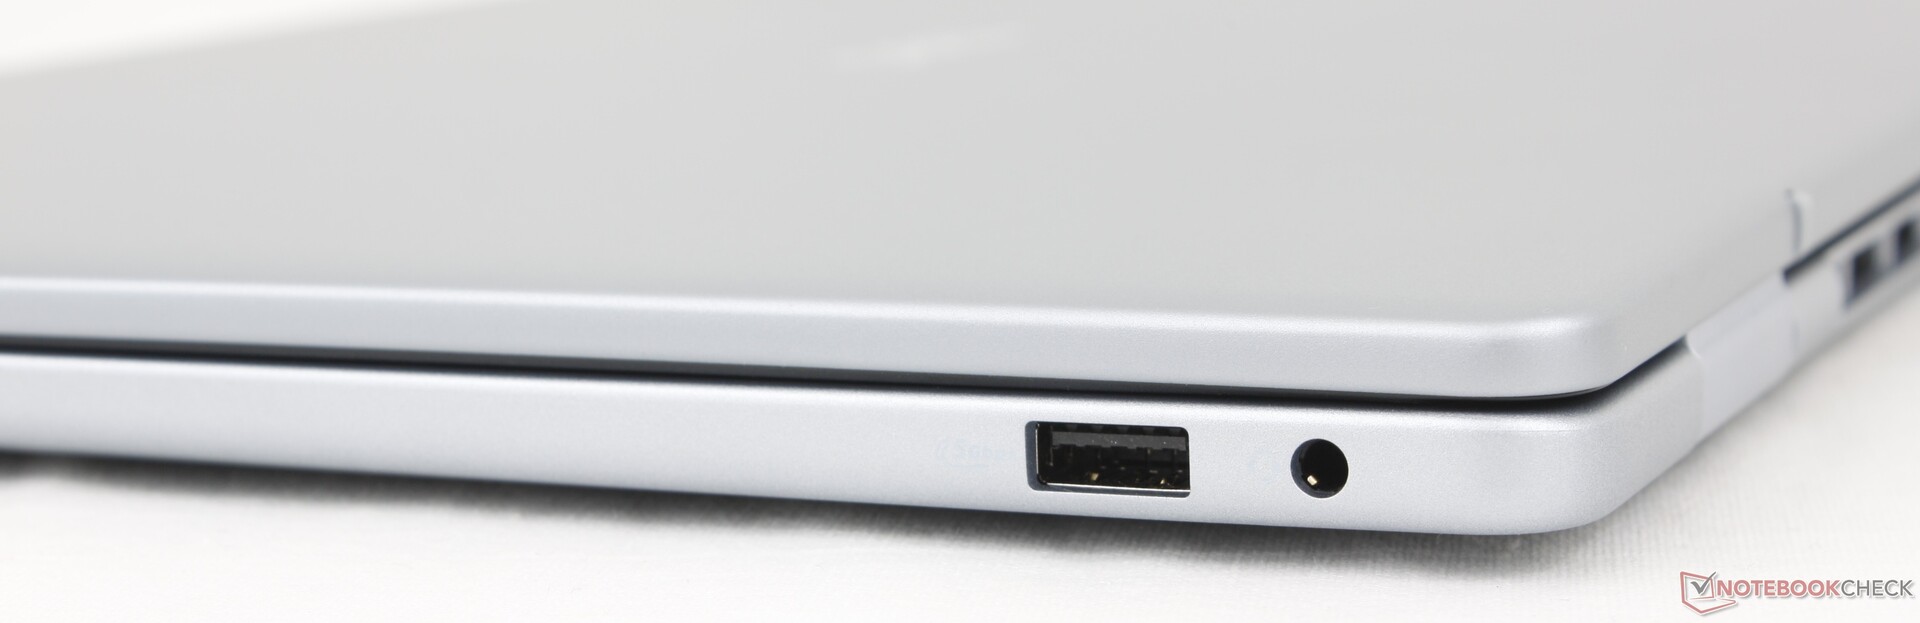
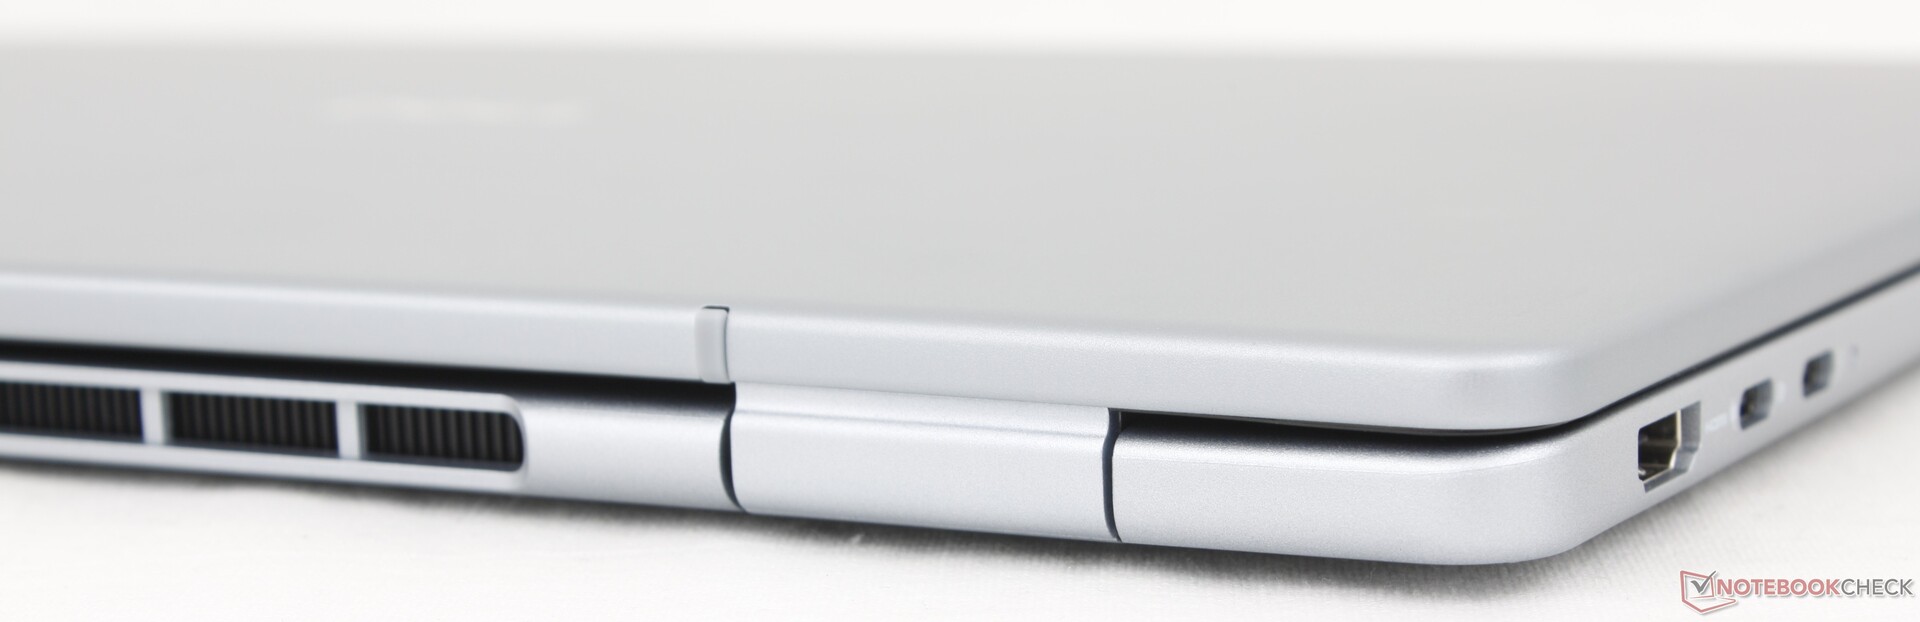
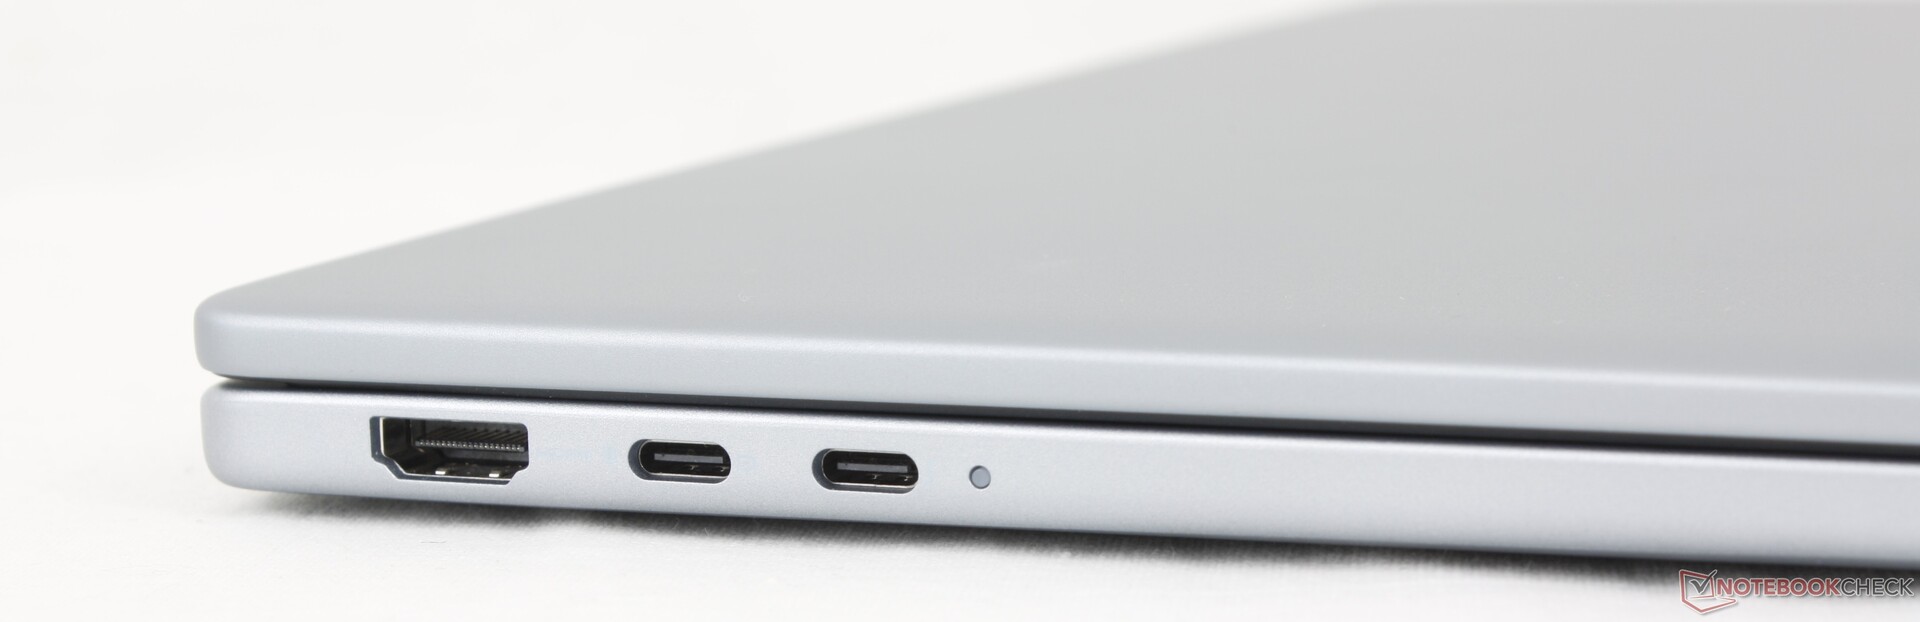
Conectividad
Hay menos puertos que los disponibles en el Inspiron 16 Plus 7640 o 7640 2 en 1 del año pasado. El Dell 16 Plus ha prescindido del lector de tarjetas SD y de uno de los puertos USB-A en favor de un segundo puerto USB-C. Tenga en cuenta que sólo uno de los dos puertos USB-C es compatible con Thunderbolt 4 y DisplayPort 2.1.
Comunicación
El Intel BE201 viene de serie con conectividad Wi-Fi 7 y Bluetooth 5.4.
| Networking | |
| iperf3 transmit AXE11000 | |
| Lenovo ThinkBook 16 G7+ AMD | |
| HP Pavilion Plus 16-ab0456tx | |
| Dell 16 Plus | |
| Asus Vivobook 16 M1606K | |
| Dell Inspiron 16 Plus 7640 | |
| iperf3 receive AXE11000 | |
| Lenovo ThinkBook 16 G7+ AMD | |
| HP Pavilion Plus 16-ab0456tx | |
| Dell 16 Plus | |
| Dell Inspiron 16 Plus 7640 | |
| Asus Vivobook 16 M1606K | |
| iperf3 transmit AXE11000 6GHz | |
| HP Pavilion Plus 16-ab0456tx | |
| Dell 16 Plus | |
| Acer Swift 16 AI SF16-51T-932H, Ultra 9 288V | |
| Dell Inspiron 16 Plus 7640 | |
| iperf3 receive AXE11000 6GHz | |
| Acer Swift 16 AI SF16-51T-932H, Ultra 9 288V | |
| HP Pavilion Plus 16-ab0456tx | |
| Dell 16 Plus | |
| Dell Inspiron 16 Plus 7640 | |
Cámara web
La cámara web de 2 MP viene de serie con un obturador de privacidad físico y por infrarrojos.


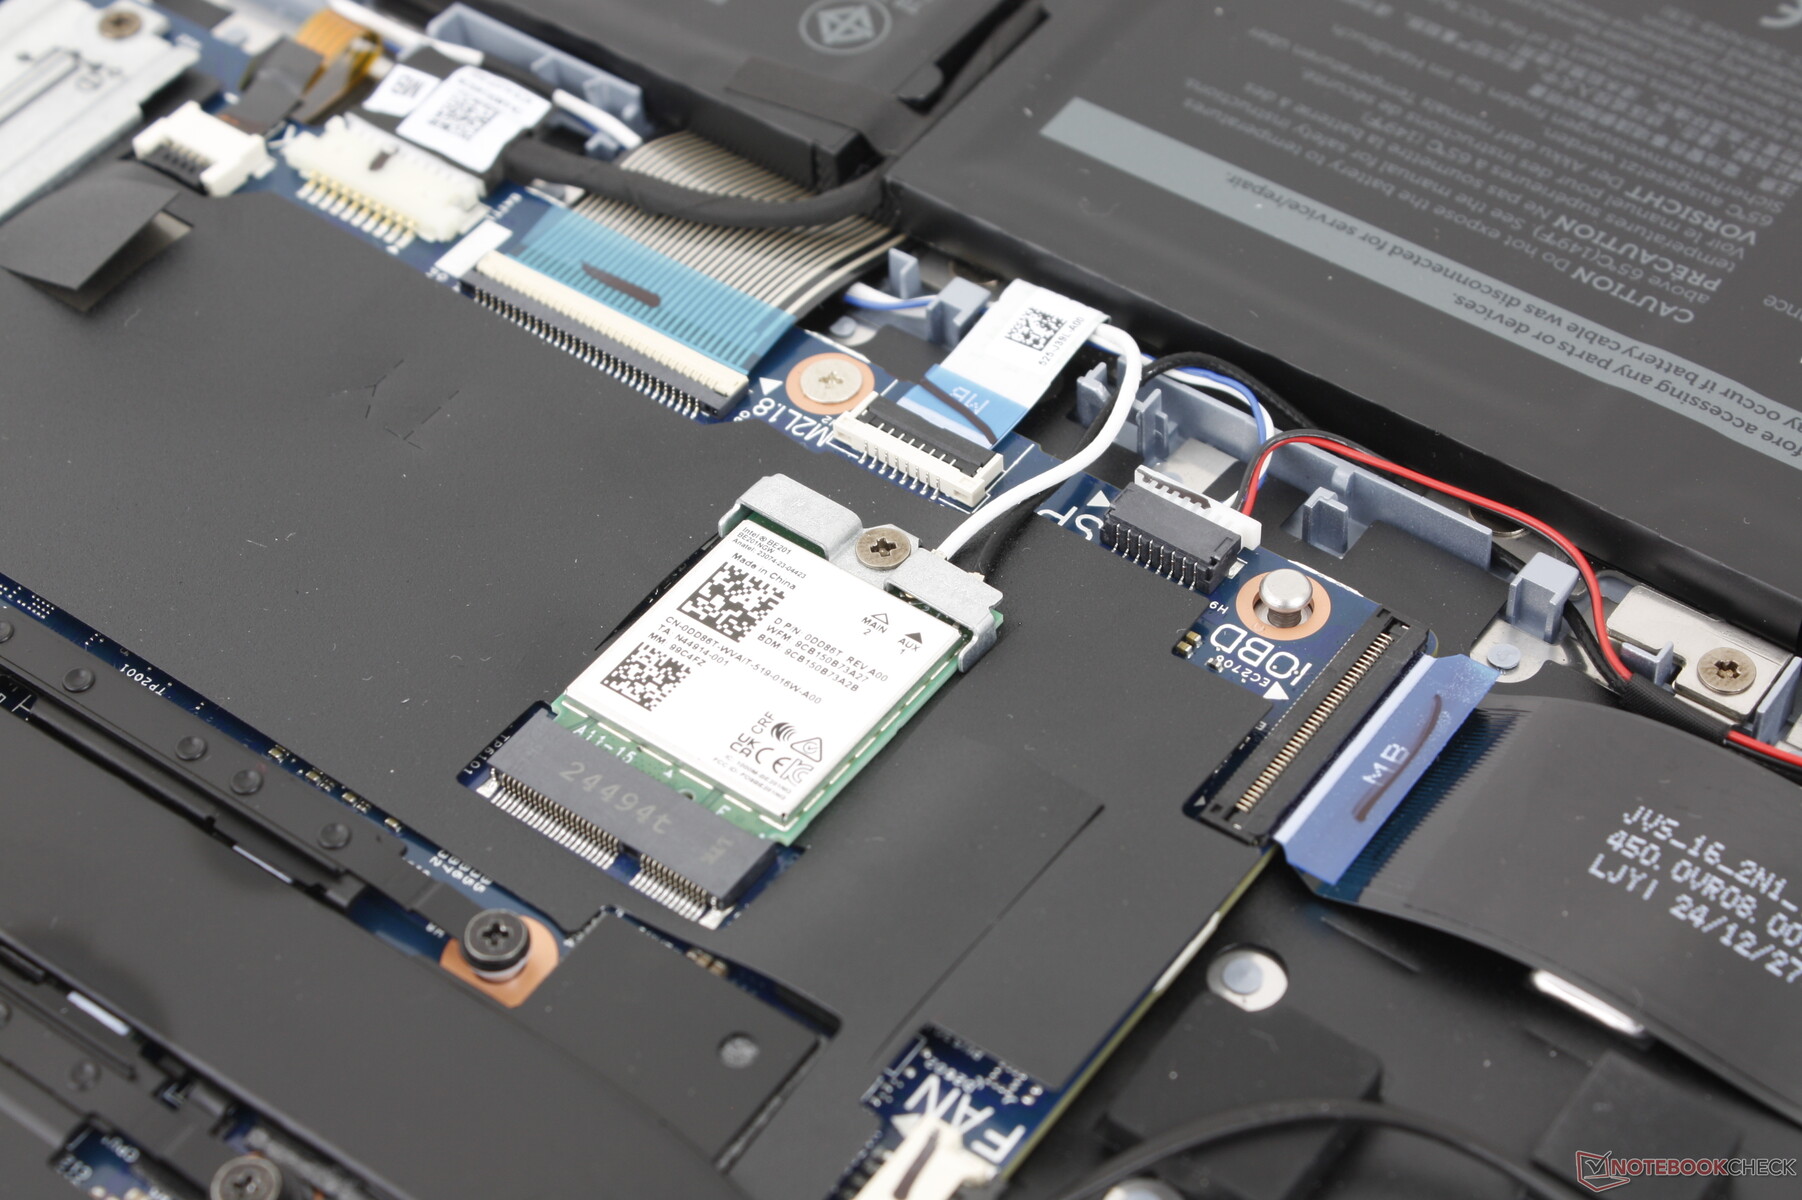
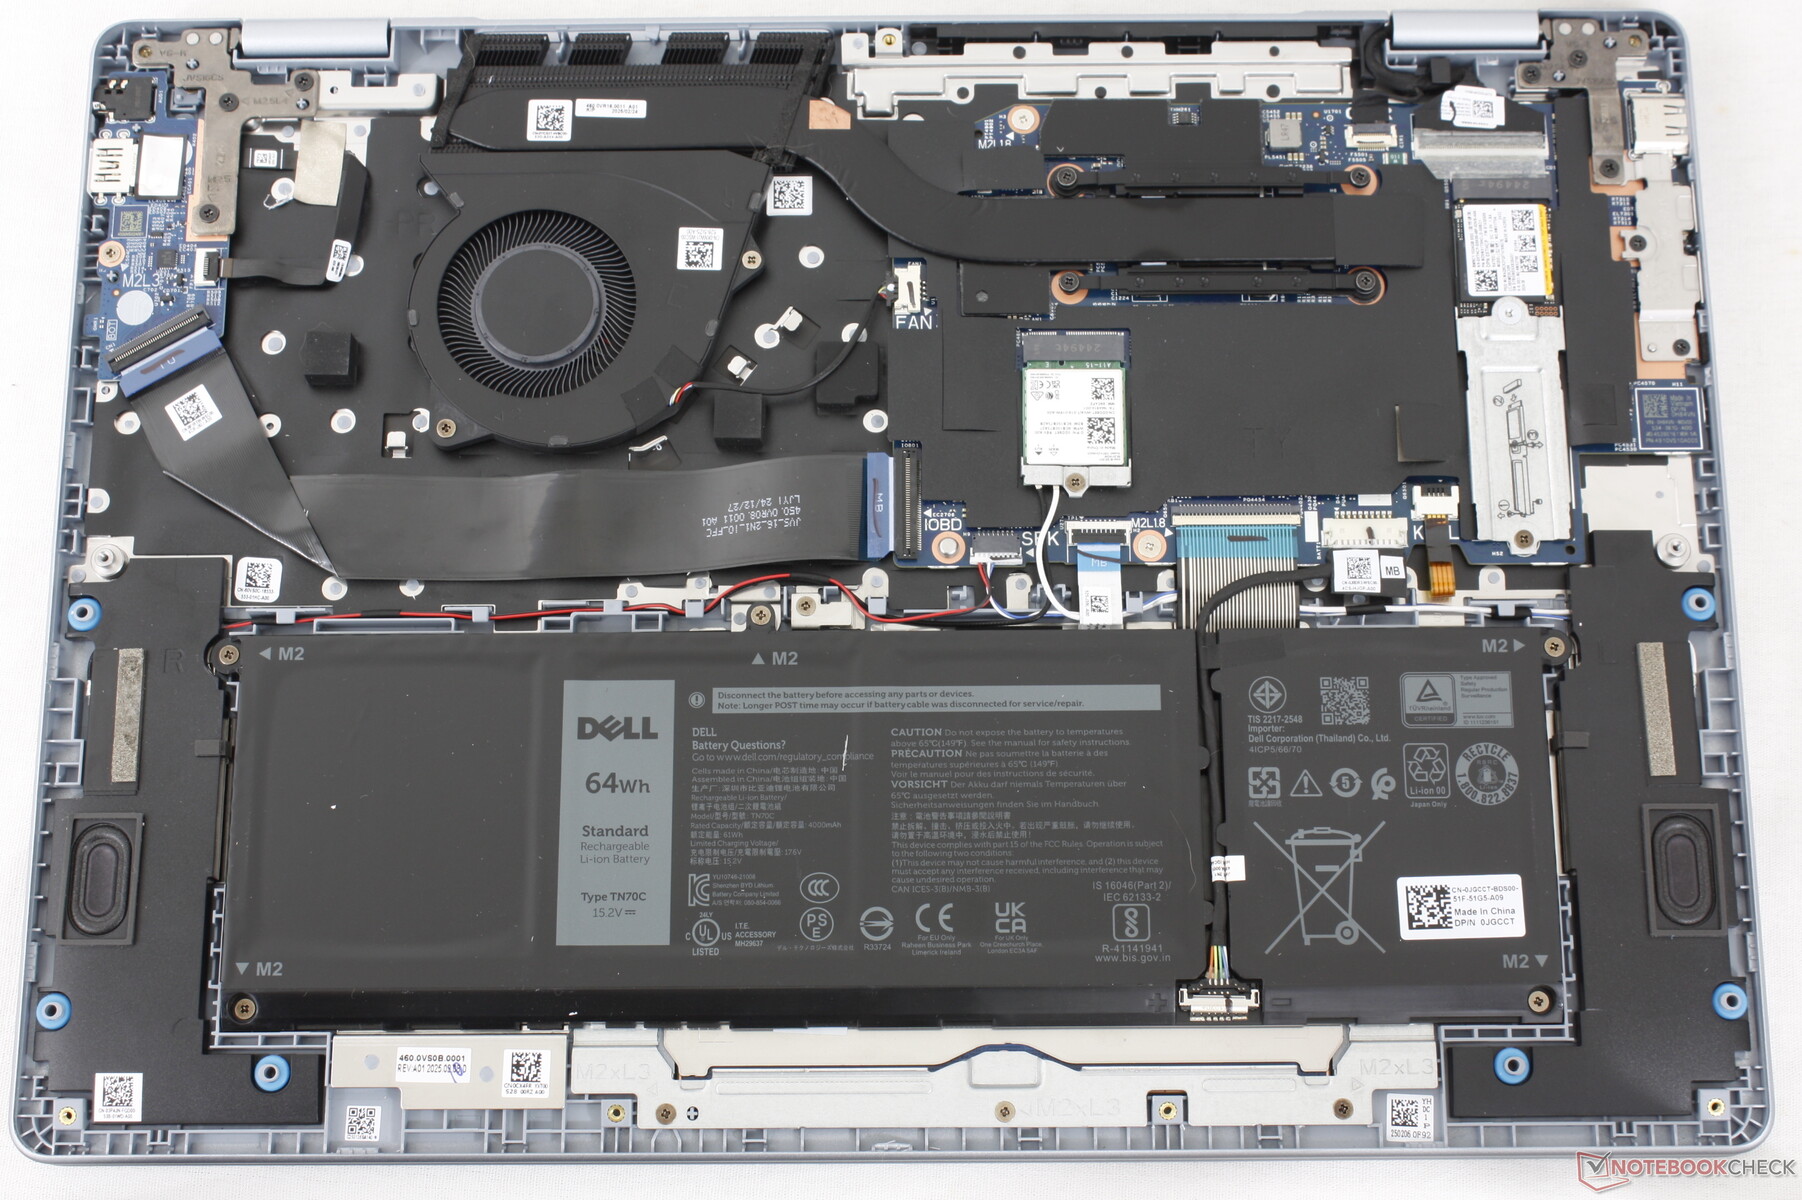
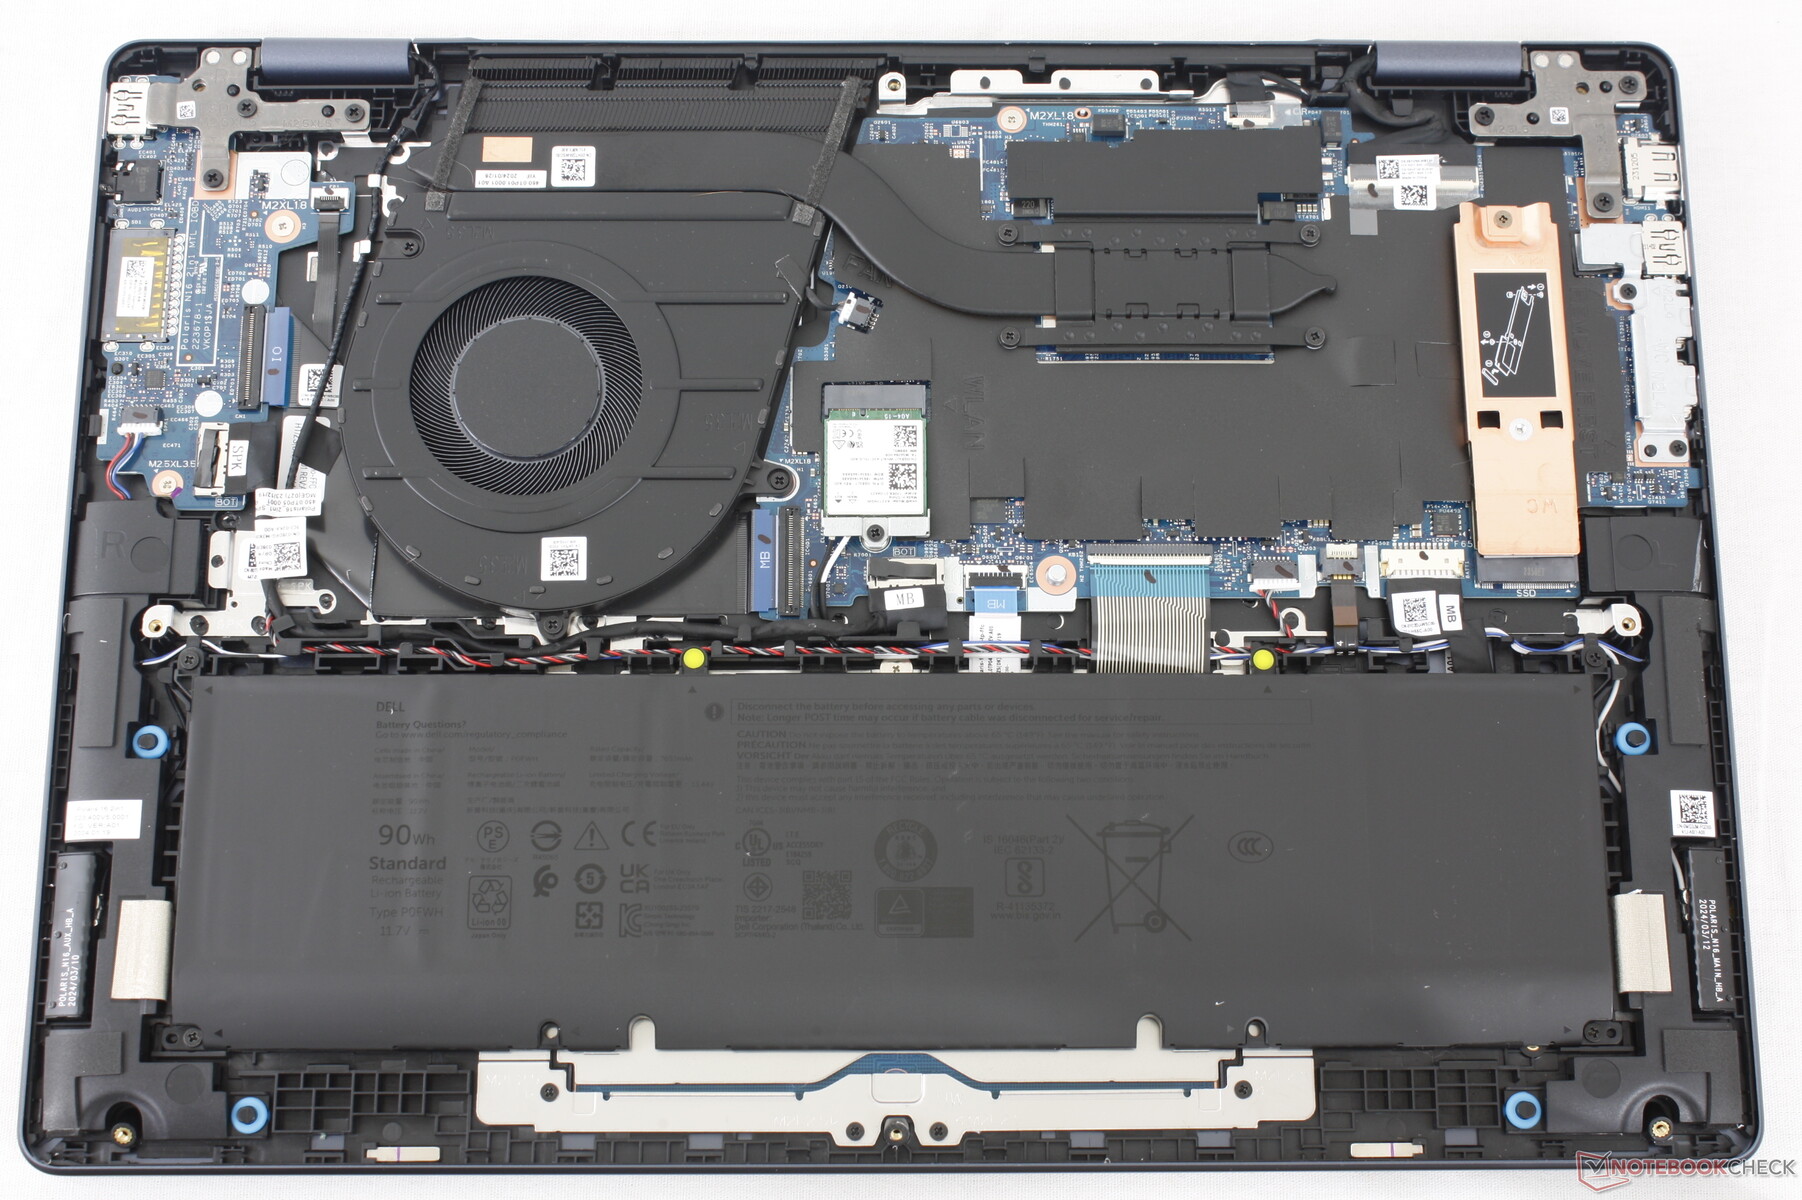
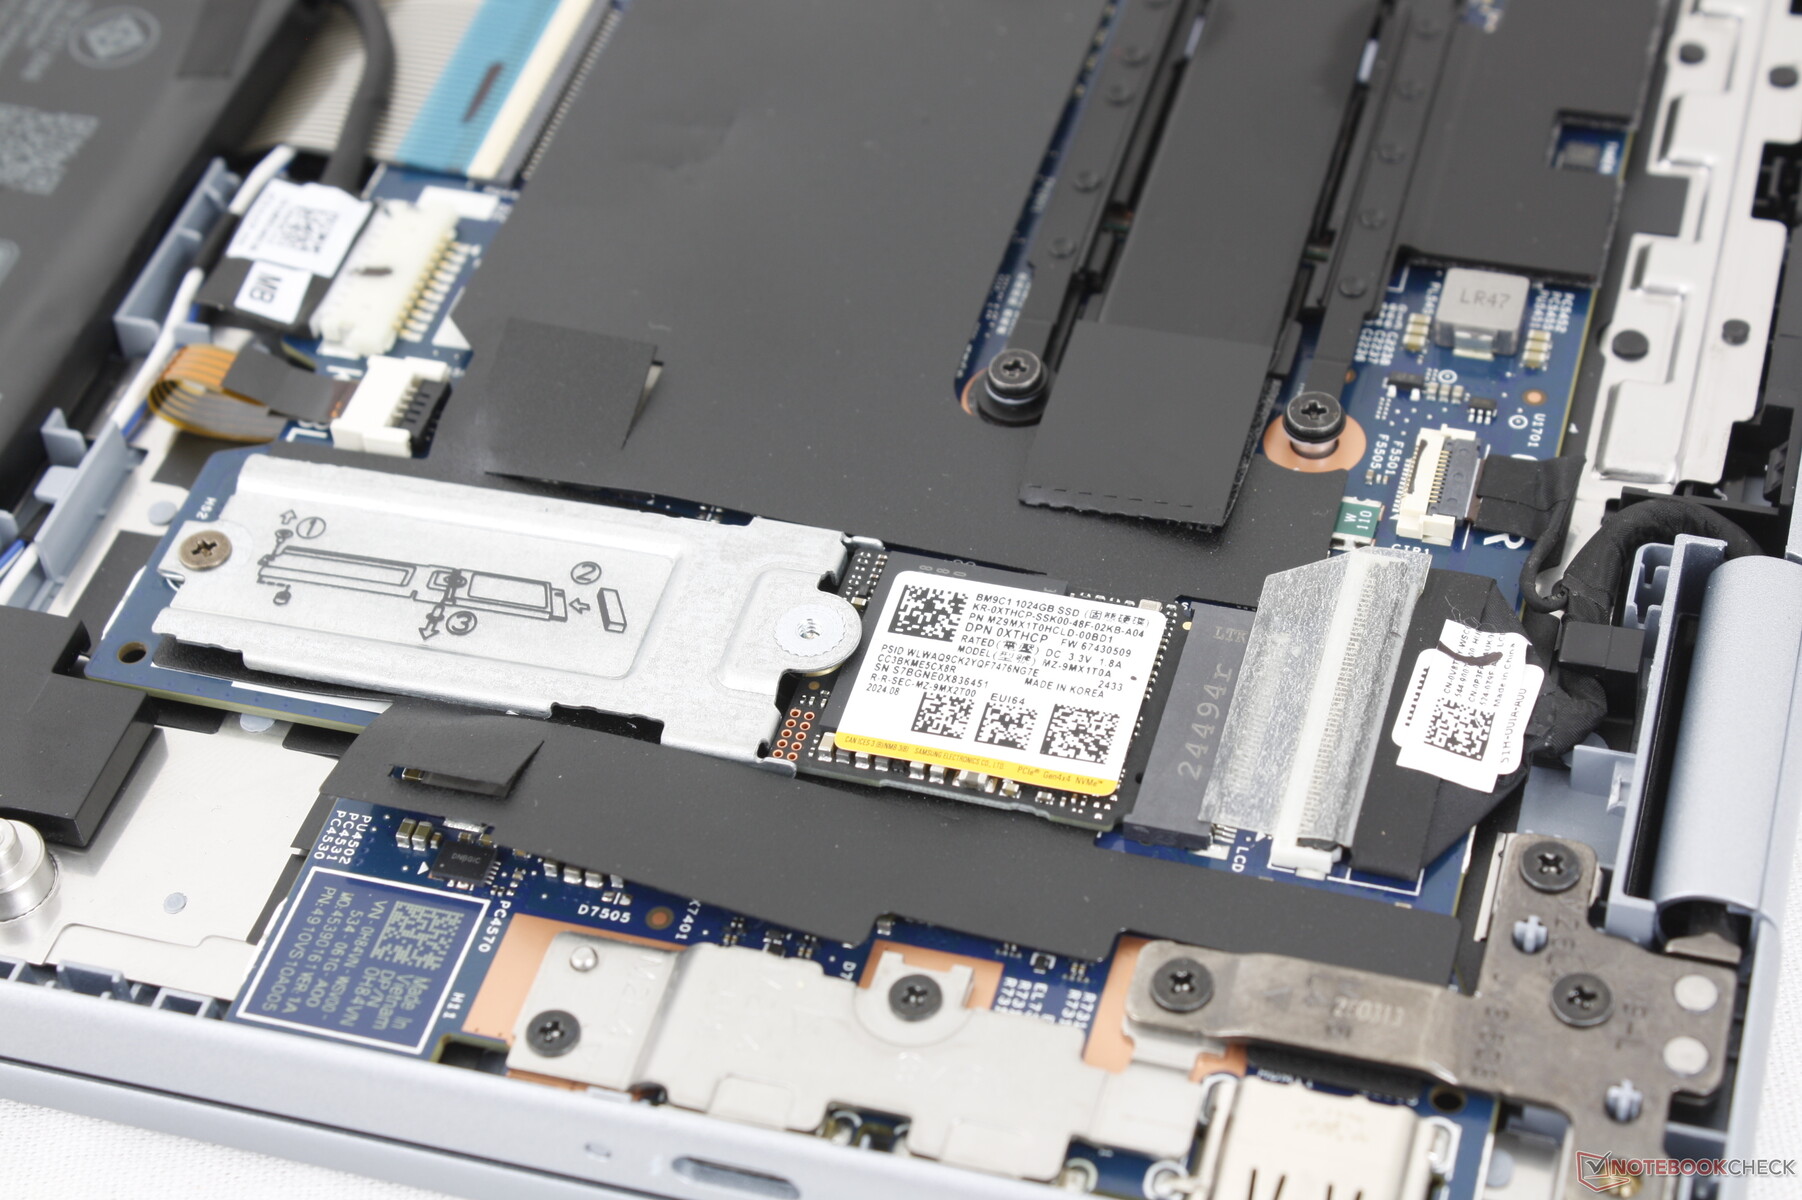
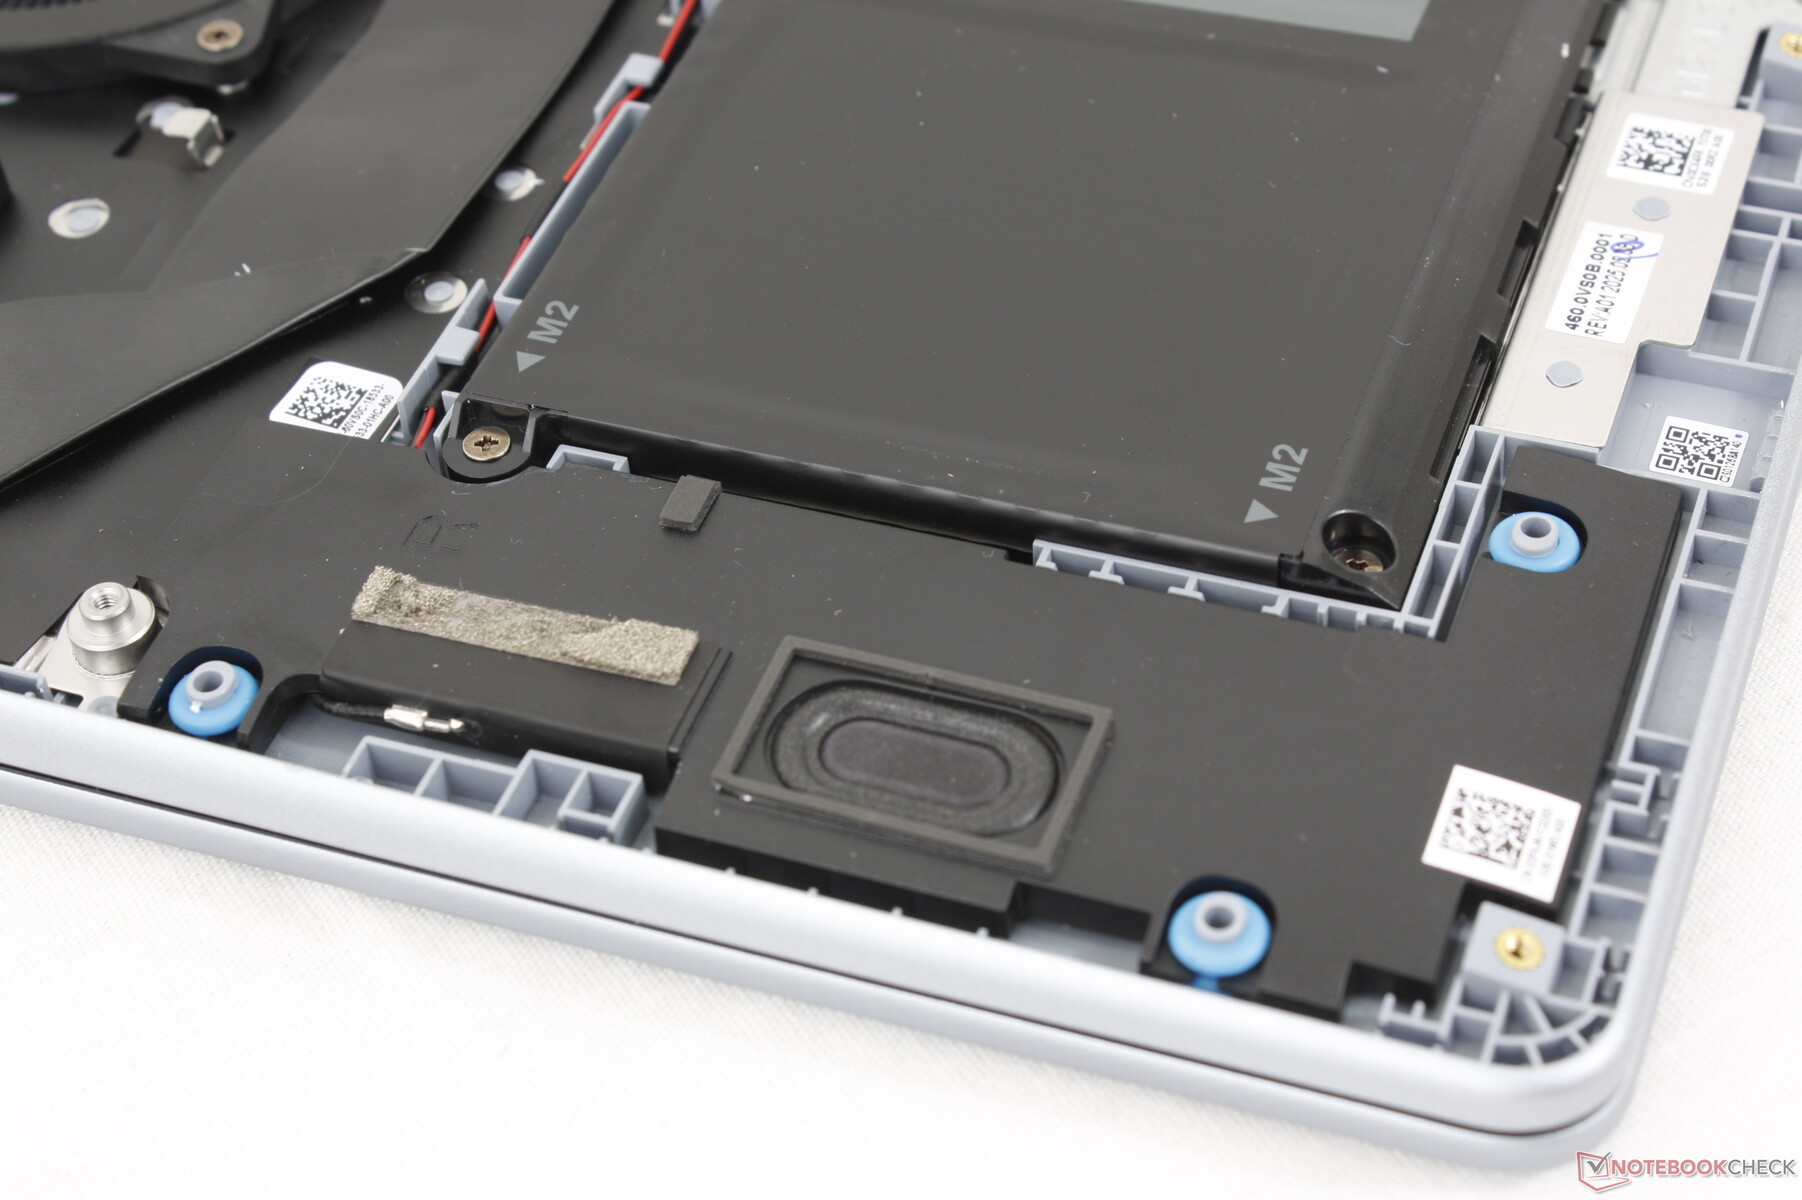
Mantenimiento
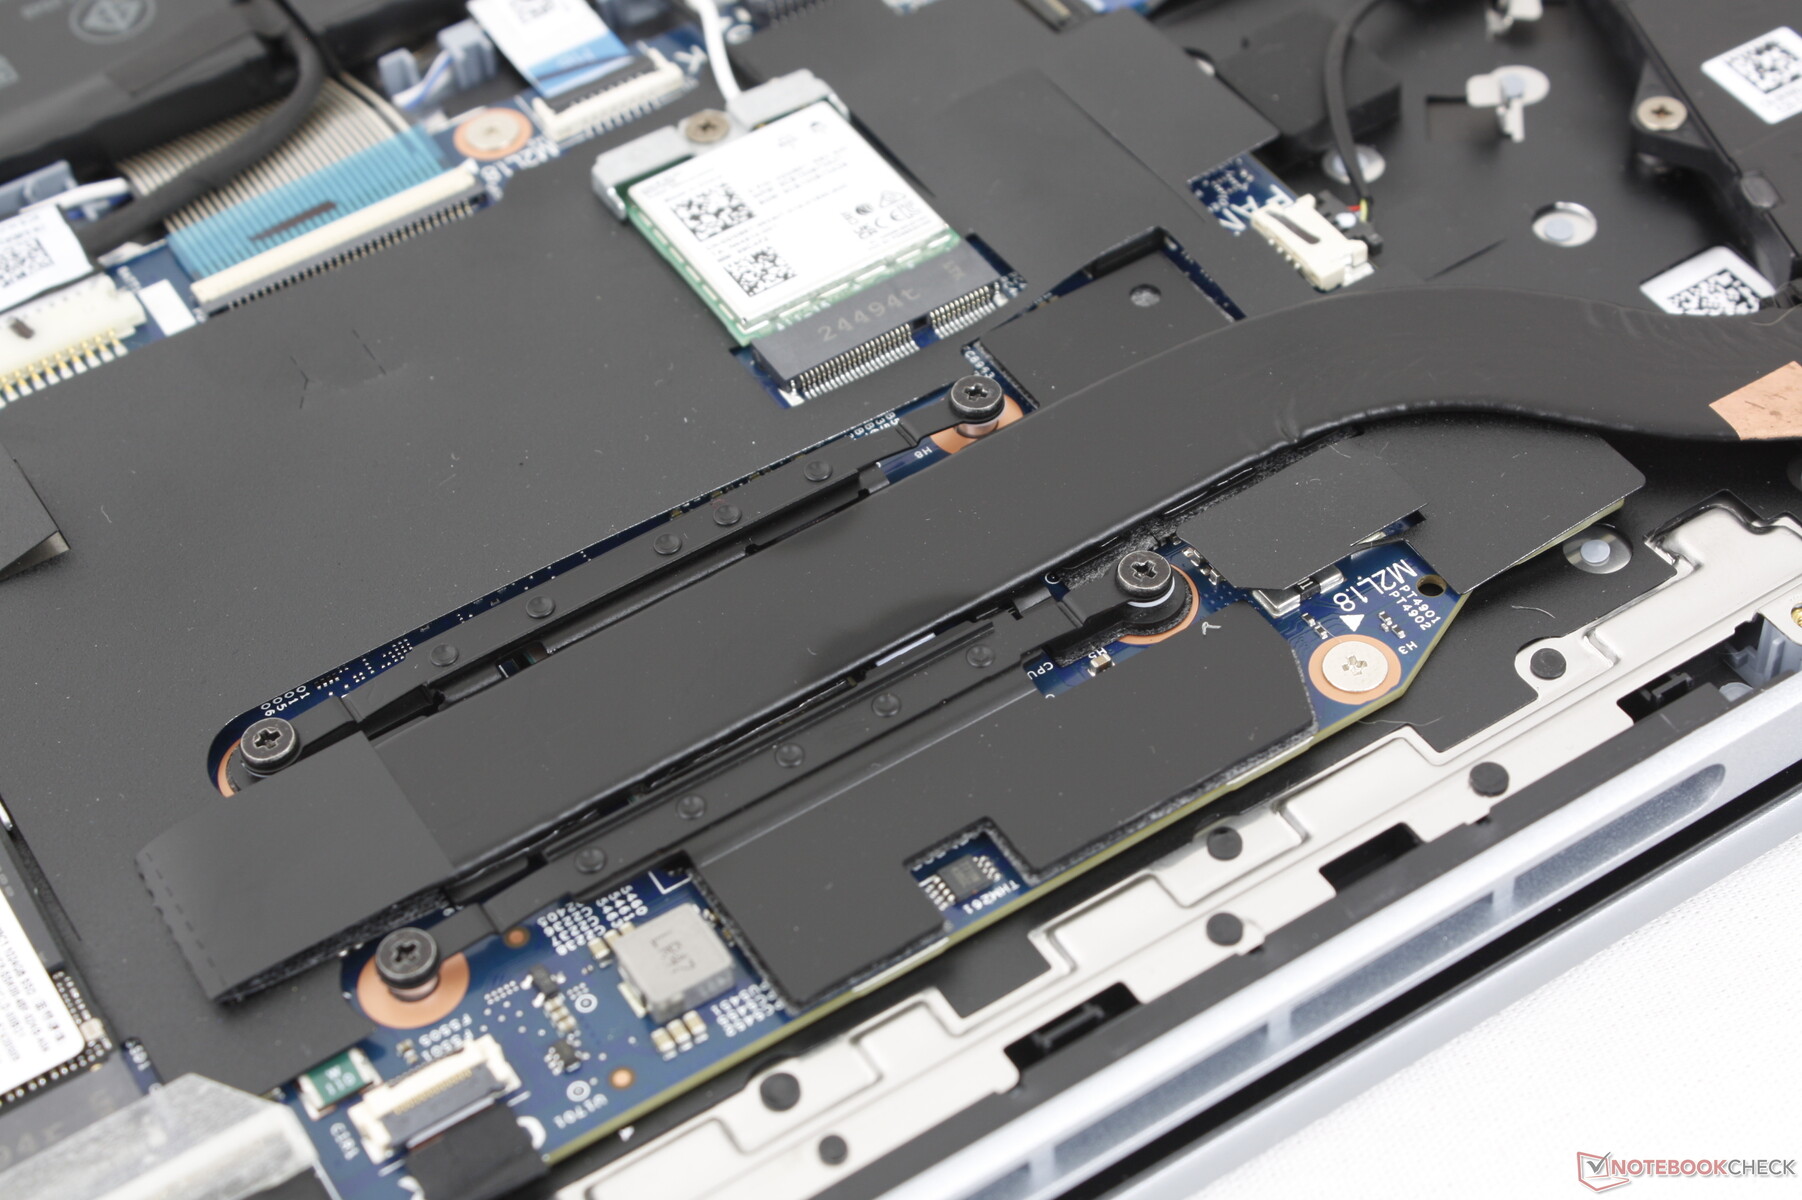
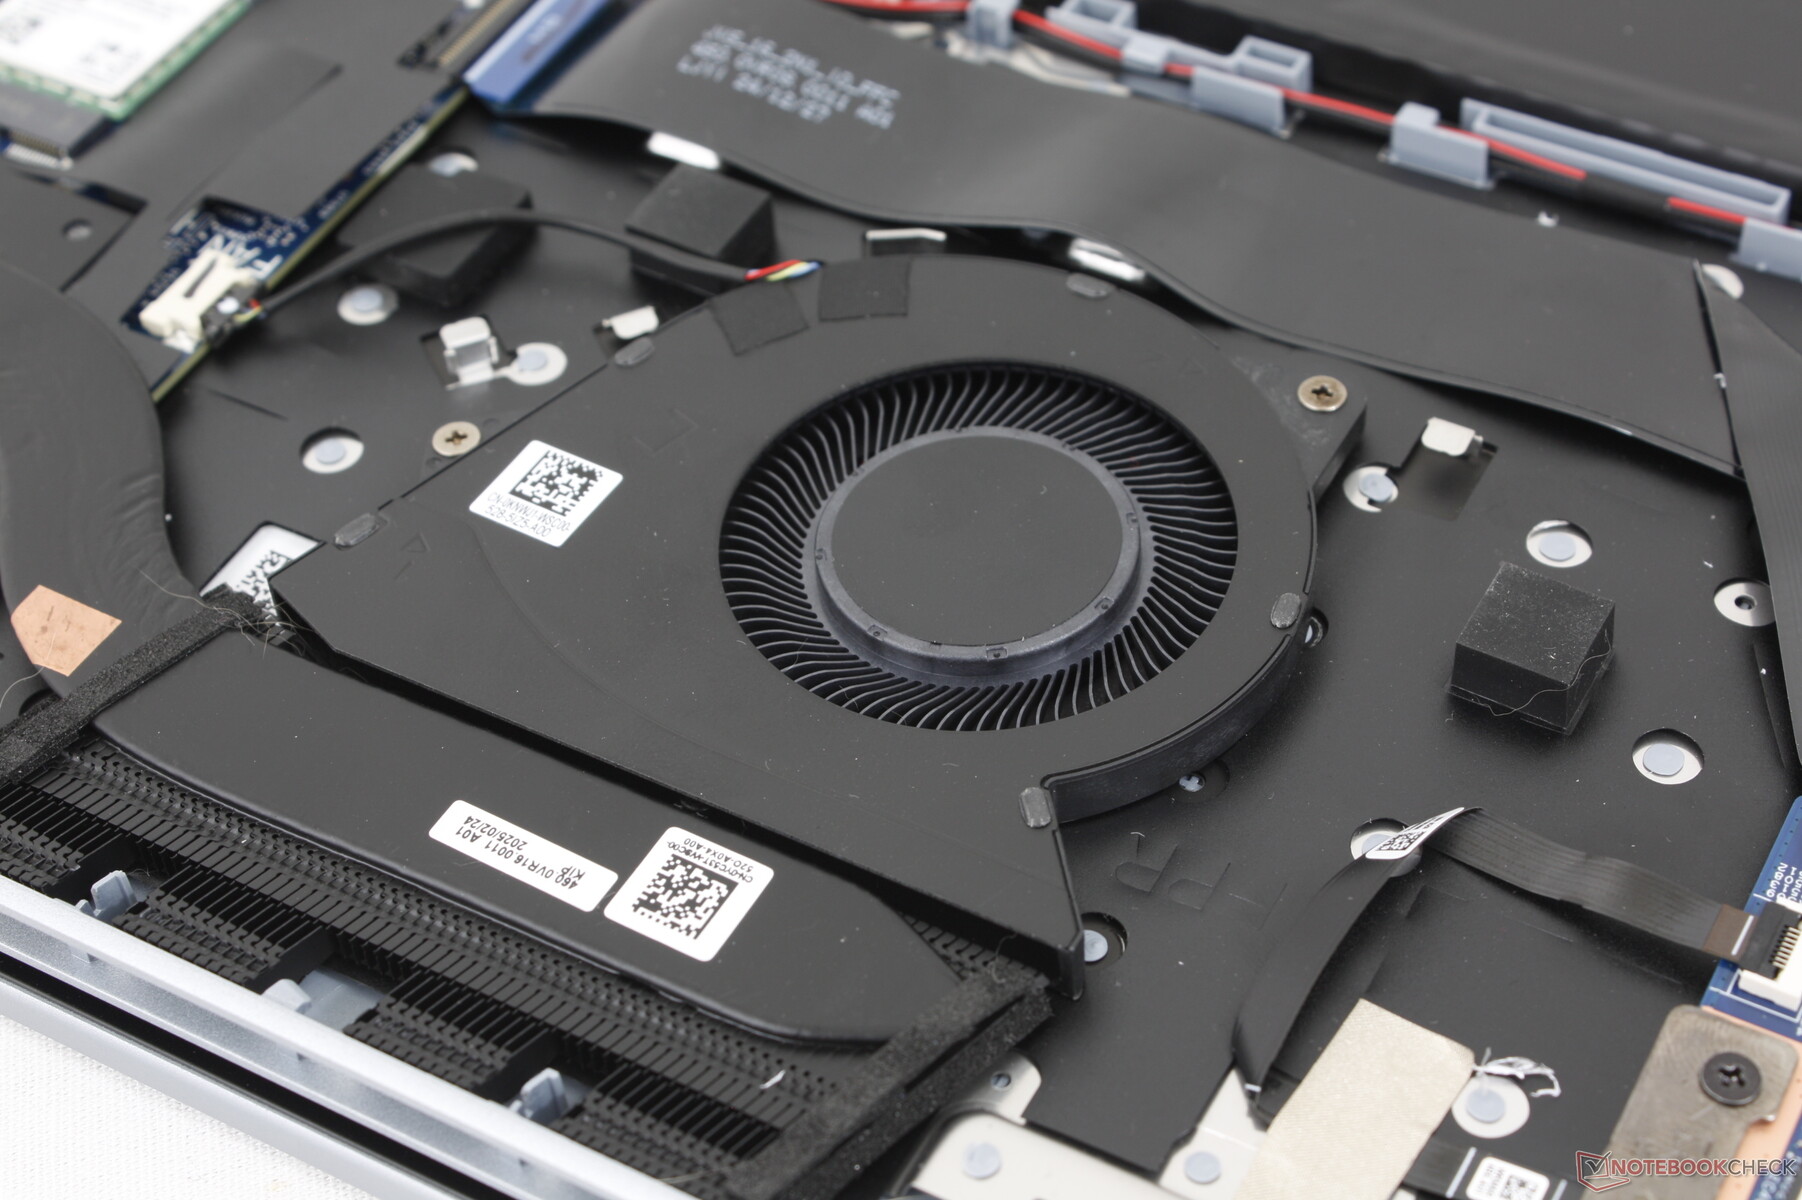
La parte inferior está asegurada por 8 tornillos Phillips para un mantenimiento sencillo. Sin embargo, se recomienda tener cuidado y utilizar un filo afilado, ya que los bordes del panel están más sujetos a la base que en la mayoría de los demás portátiles. Una vez dentro, los usuarios son recibidos sin módulos SODIMM extraíbles y con una única ranura M.2 2280 para almacenamiento.
El Dell 16 Plus comparte muchas características internas con el Inspiron 16 Plus 7640 2 en 1, como muestran las imágenes comparativas que aparecen a continuación.
Sostenibilidad
El modelo utiliza aluminio reciclado, acero y plástico de origen marino durante su fabricación, mientras que el envase es totalmente reciclable.
Accesorios y garantía
No hay más extras en la caja que el adaptador de CA y la documentación. Se aplica la habitual garantía limitada de un año del fabricante si se adquiere en EE.UU.
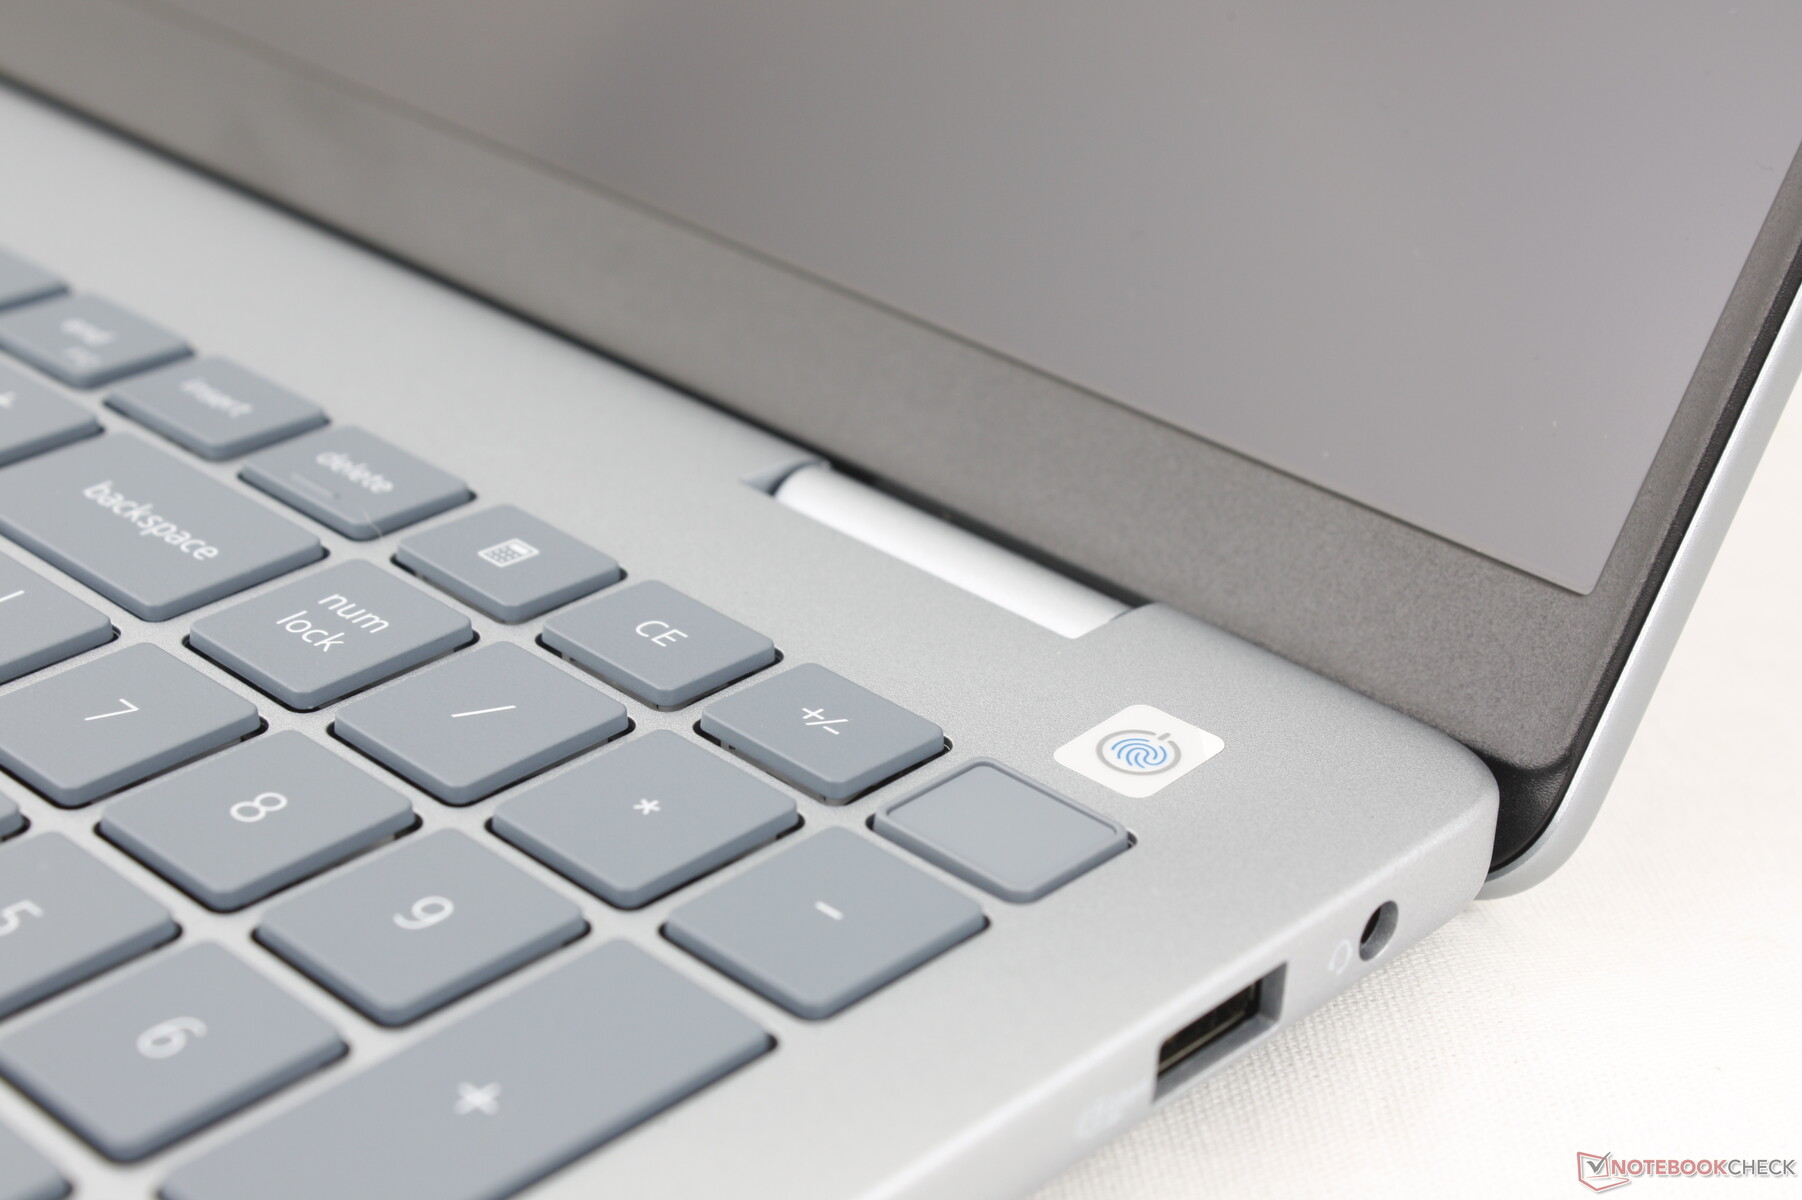
Dispositivos de entrada
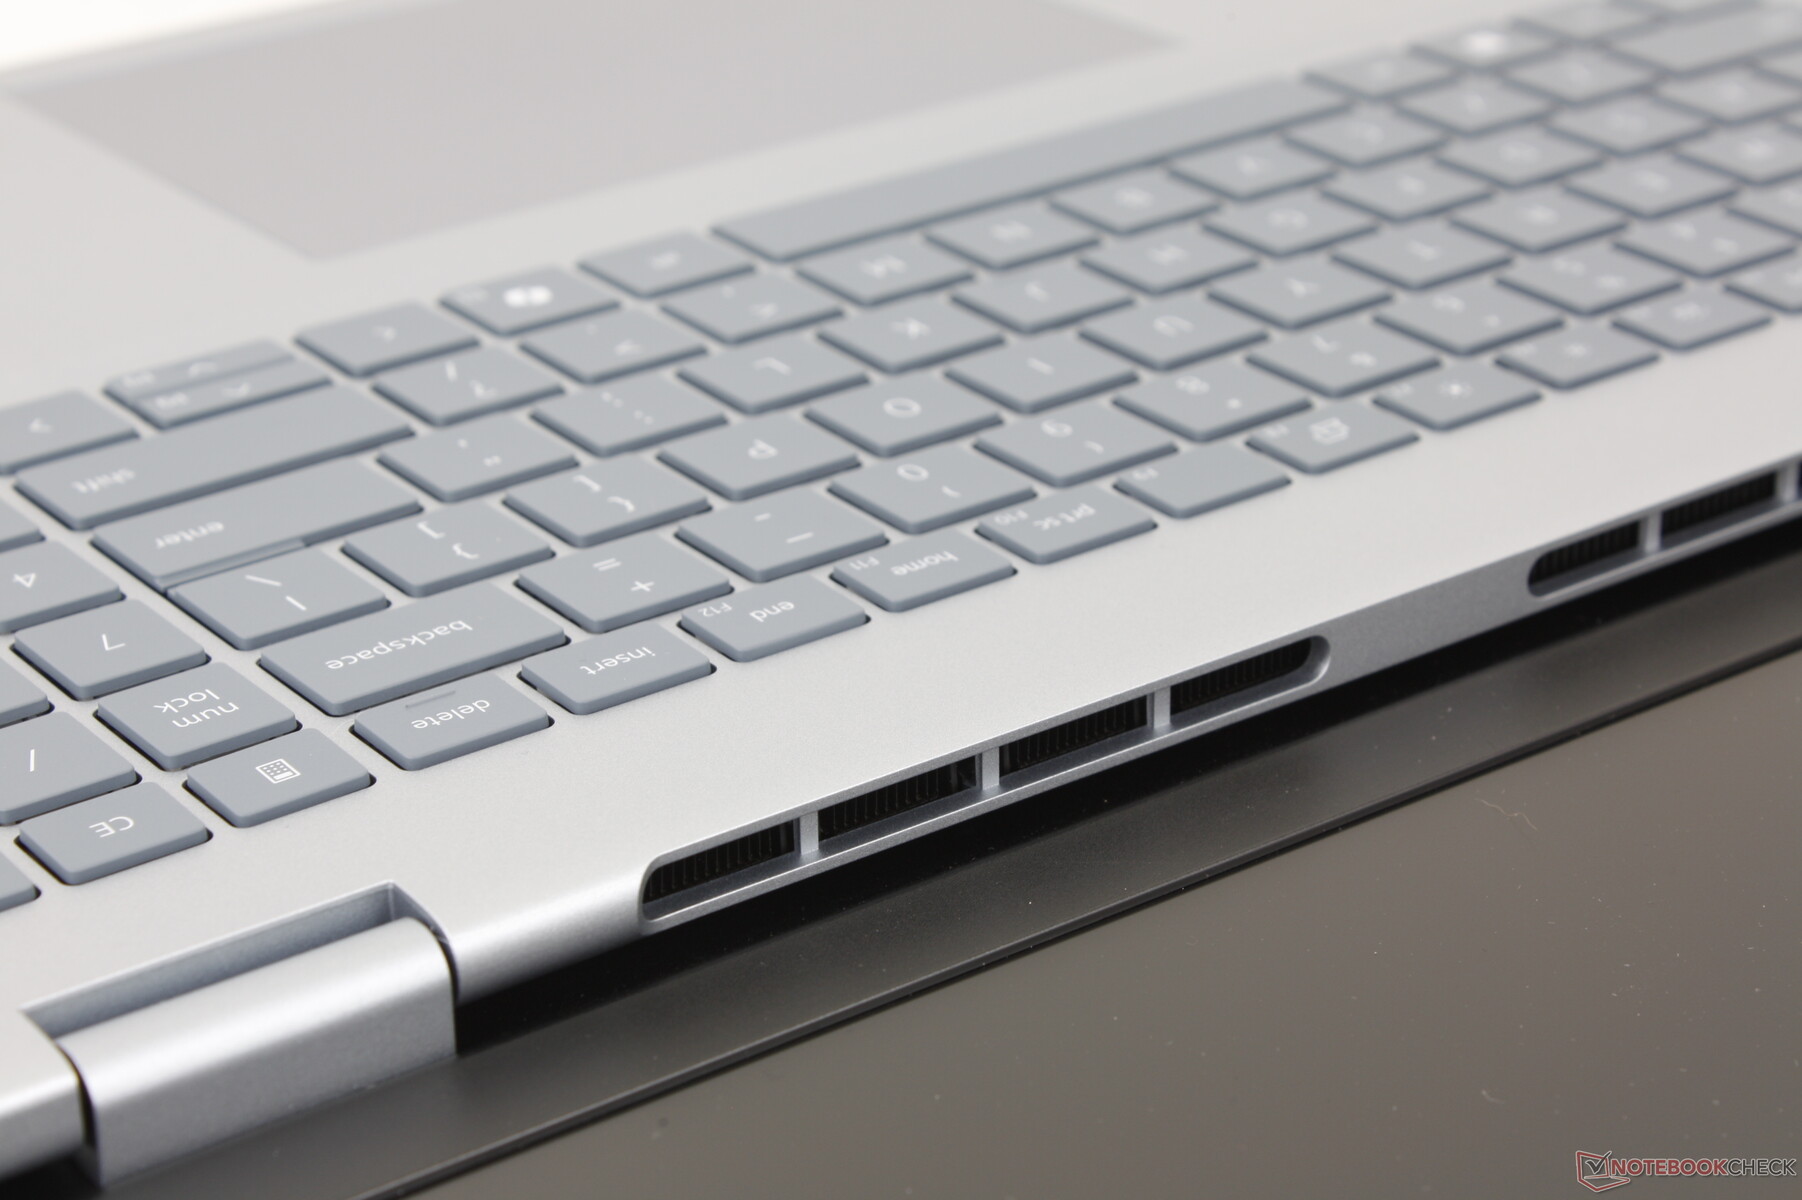
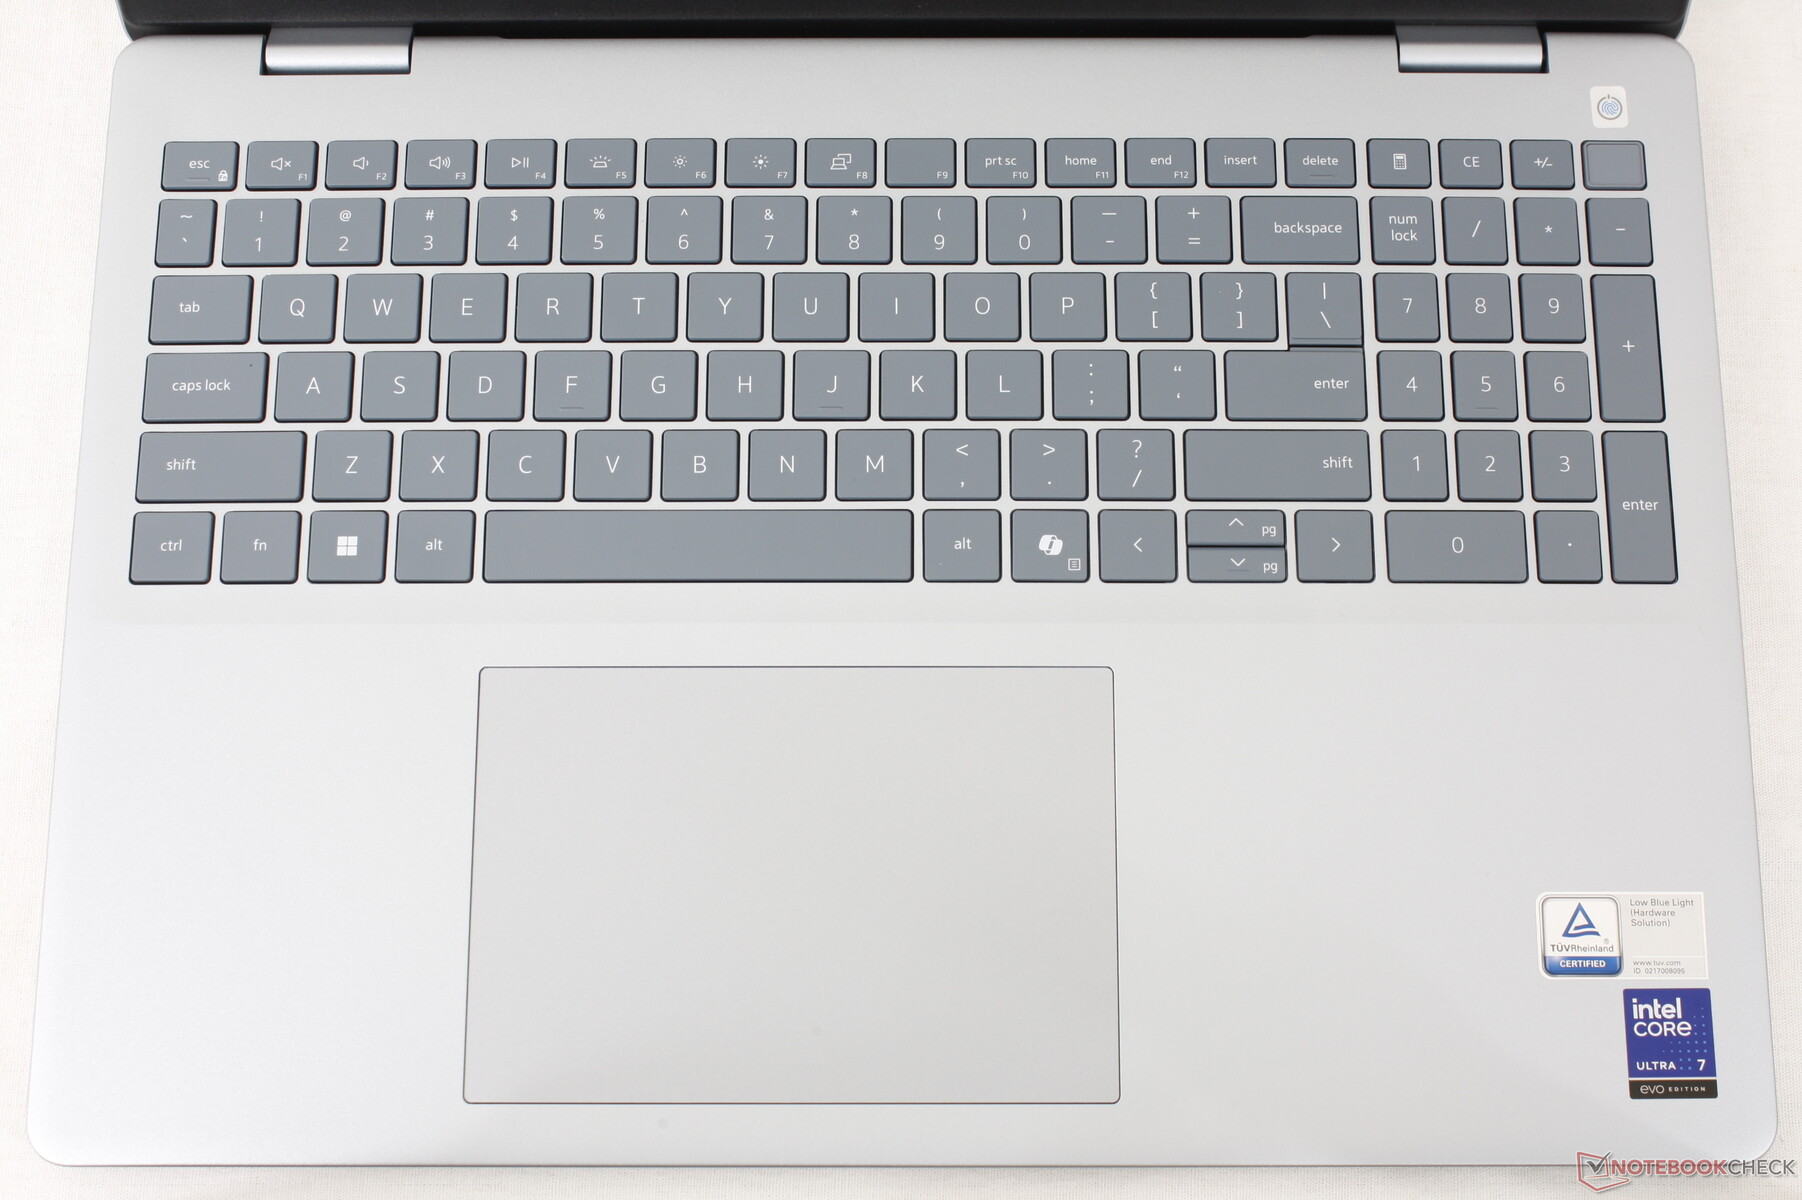
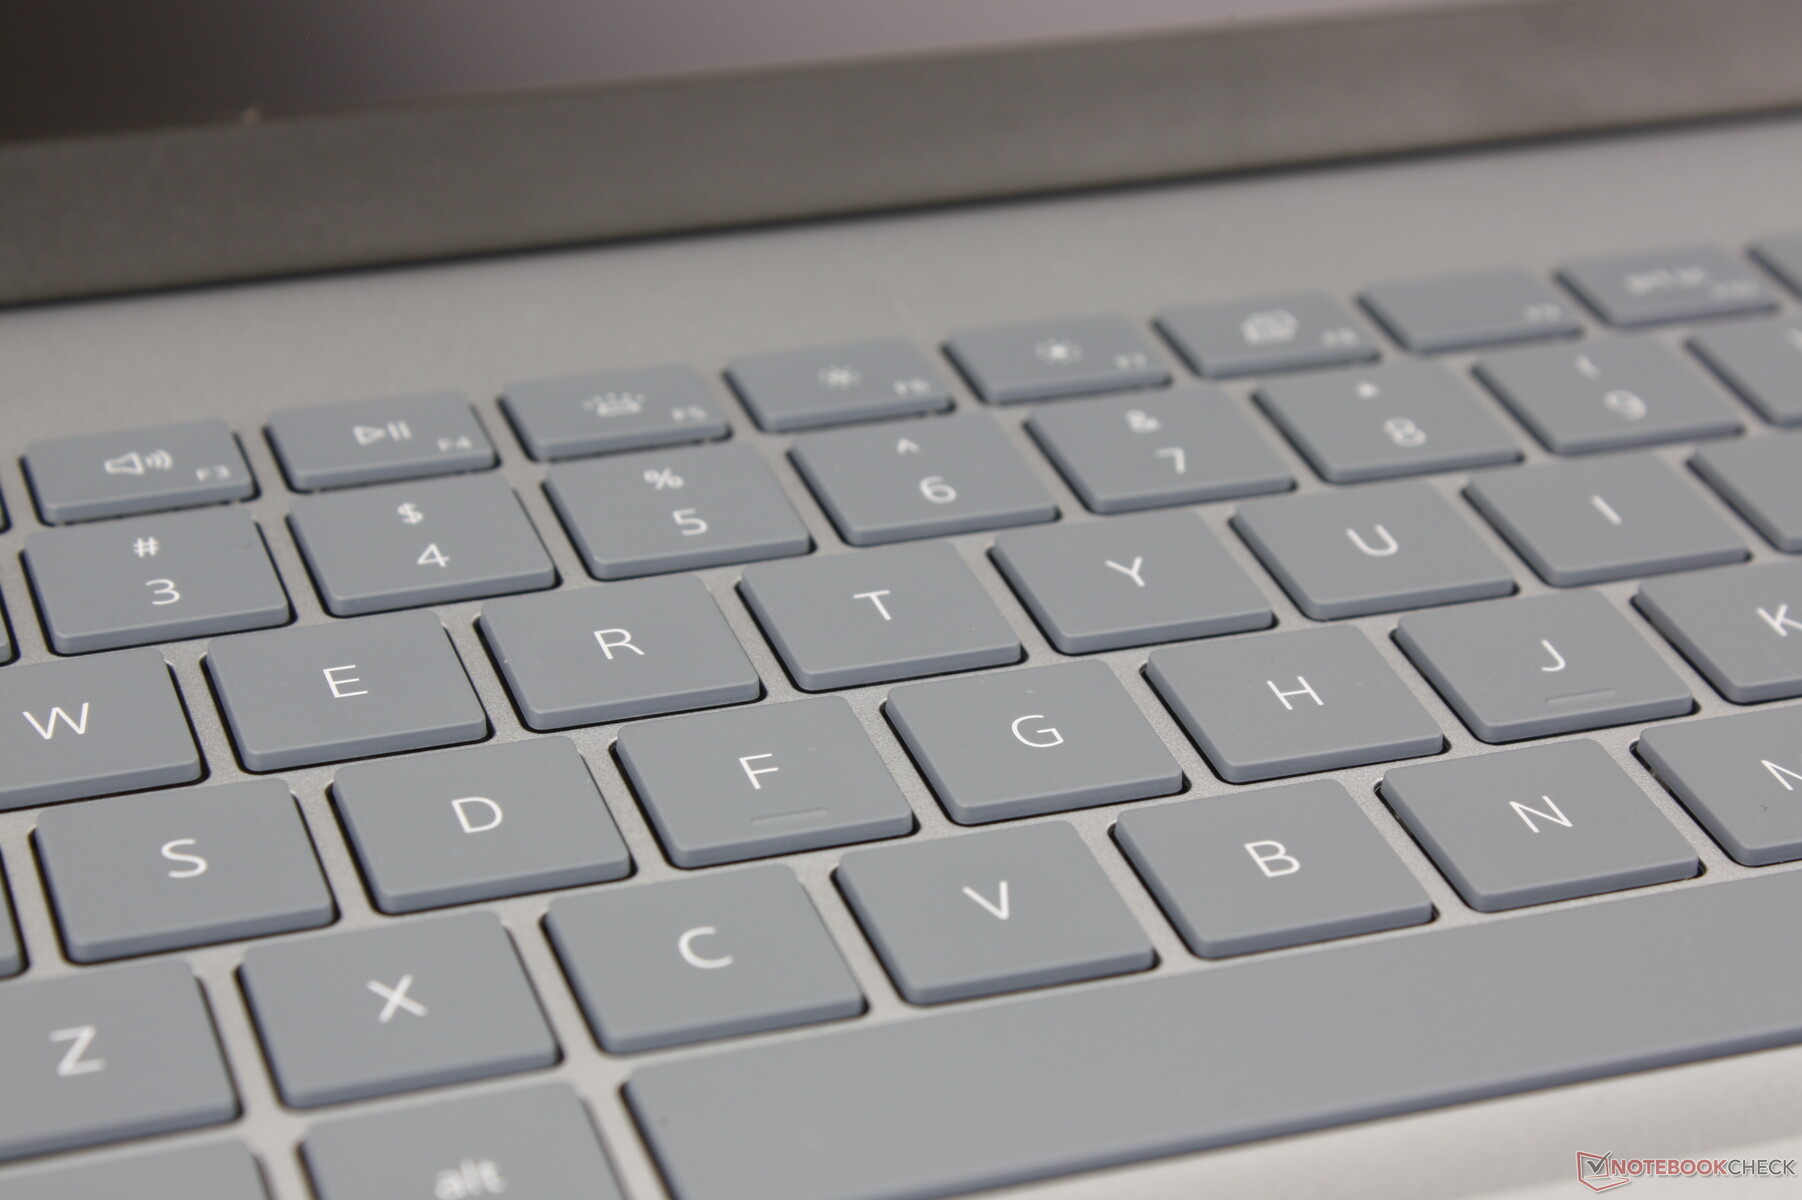
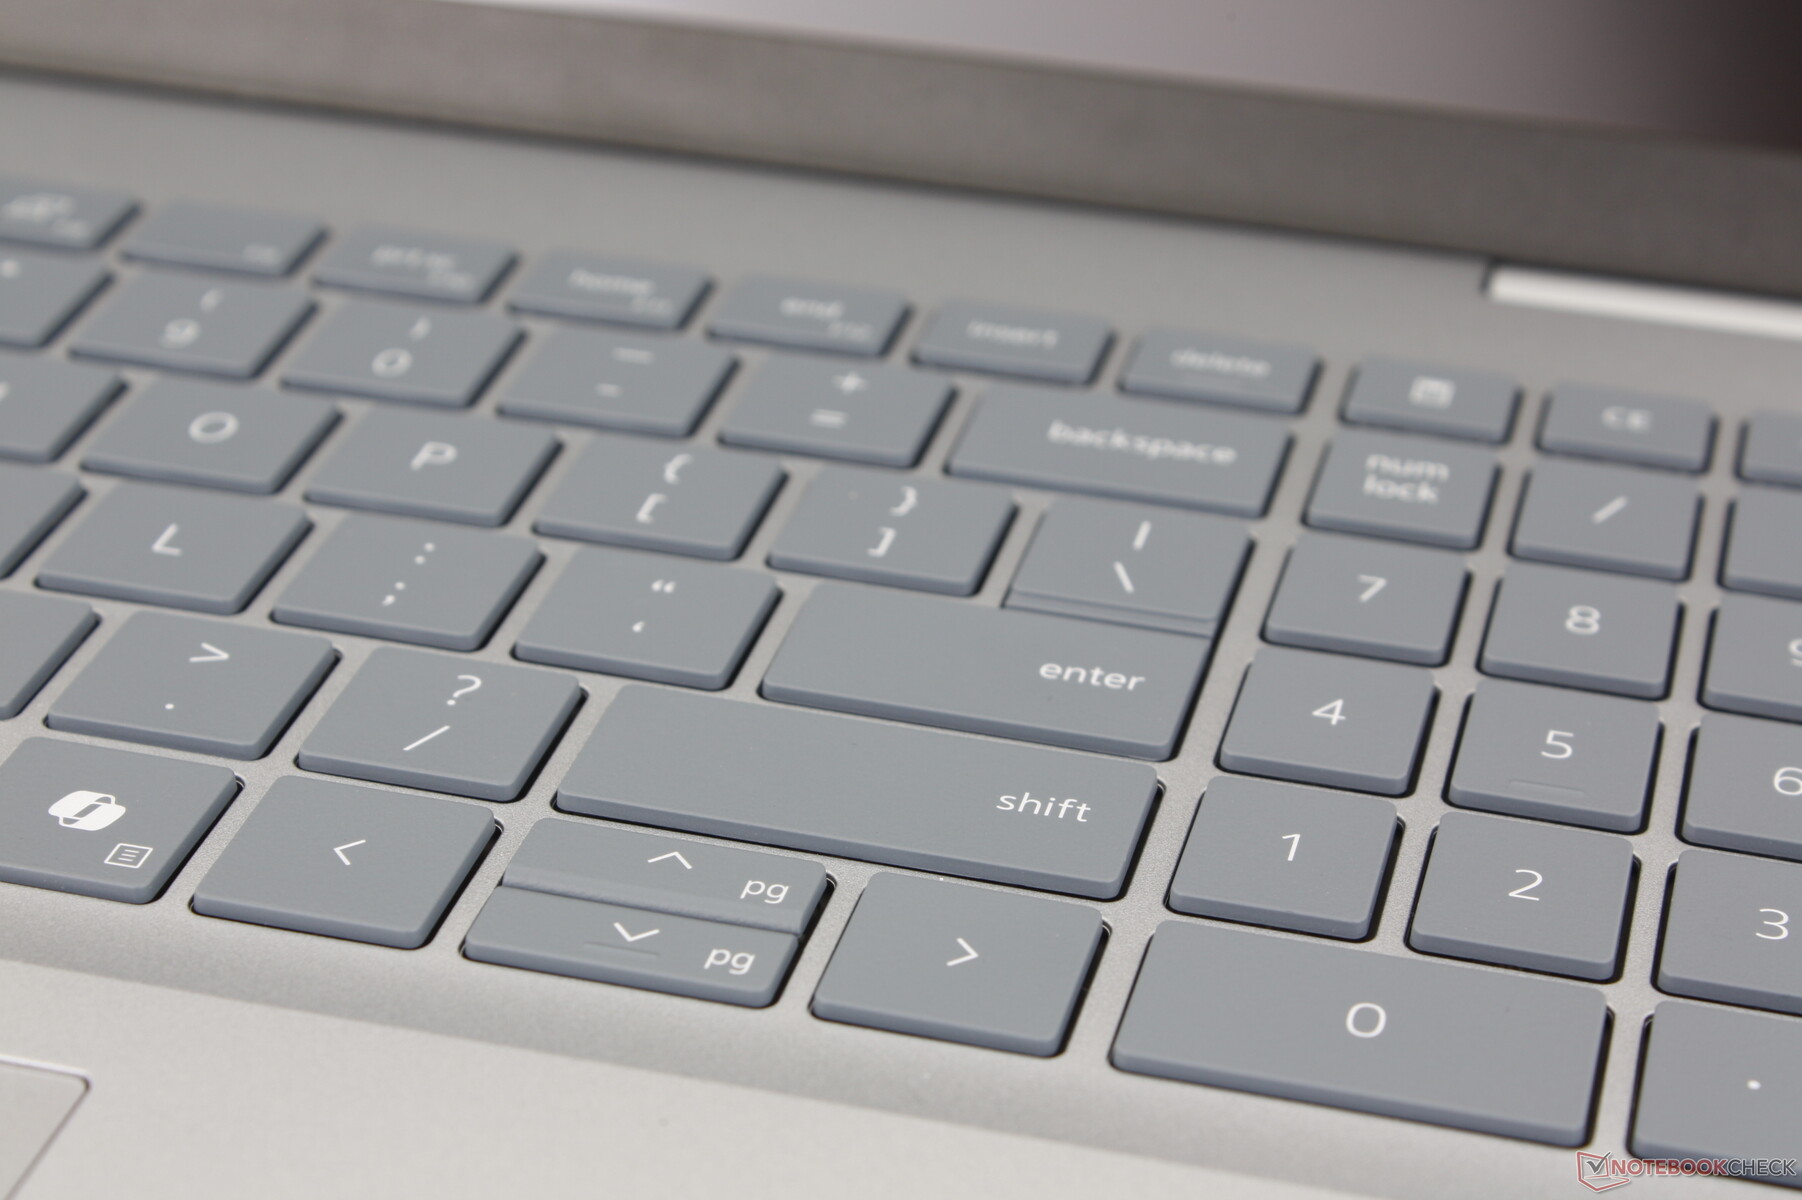
Teclado
El Dell 16 Plus introduce un teclado numérico integrado mientras que esta característica faltaba en la gama Inspiron 16 Plus 7640. Por lo demás, la experiencia de tecleo es similar a la de los modelos Inspiron de generaciones anteriores, para bien o para mal. La respuesta de las teclas es más suave, pero la barra espaciadora es bastante ruidosa y hace clic.
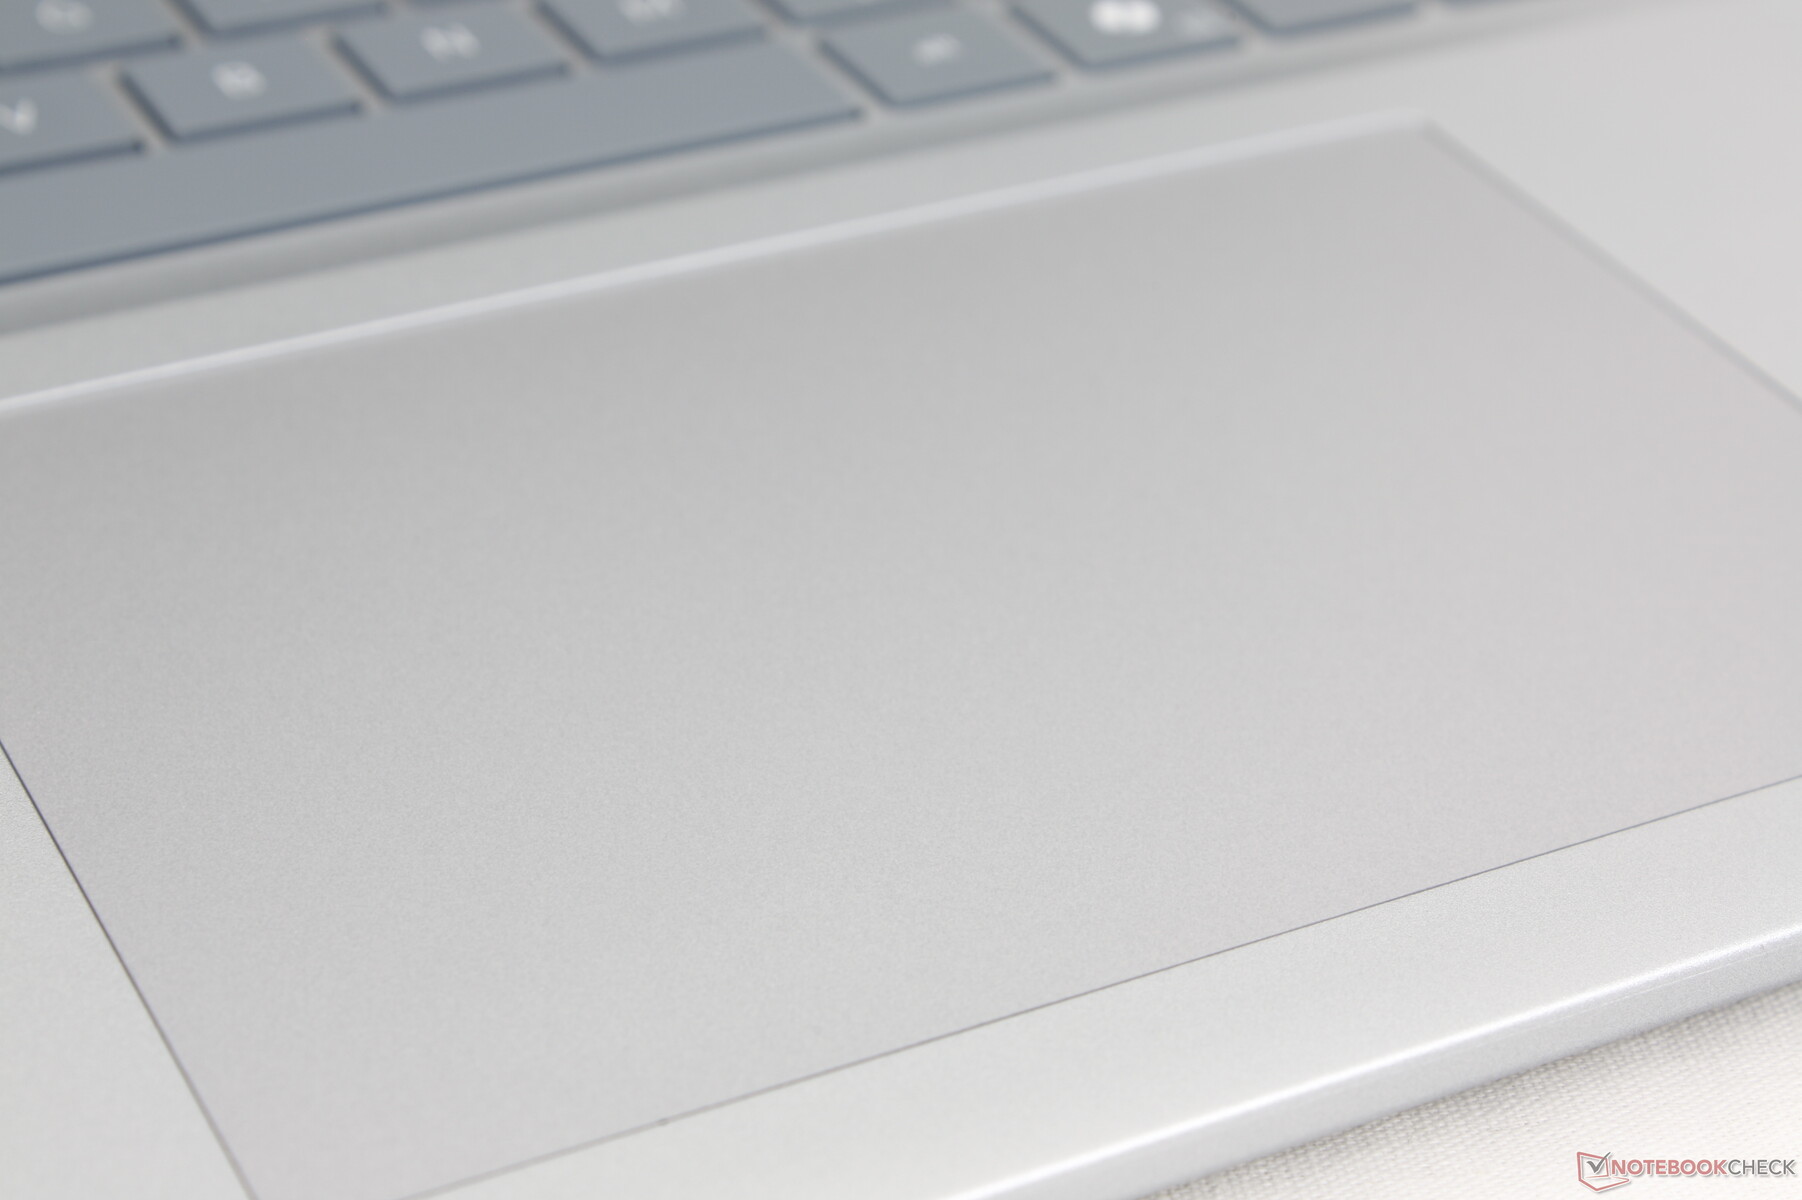
Panel táctil
Mientras que el teclado ha ampliado su funcionalidad, el clickpad sigue siendo el mismo que en el Inspiron 16 Plus 7640 2 en 1 hasta incluso el tamaño (13,3 x 9 cm). Es grande y espacioso para controlar cómodamente el cursor y las entradas multitáctiles, pero hacer clic en su superficie requiere más fuerza que en la mayoría de los demás portátiles.
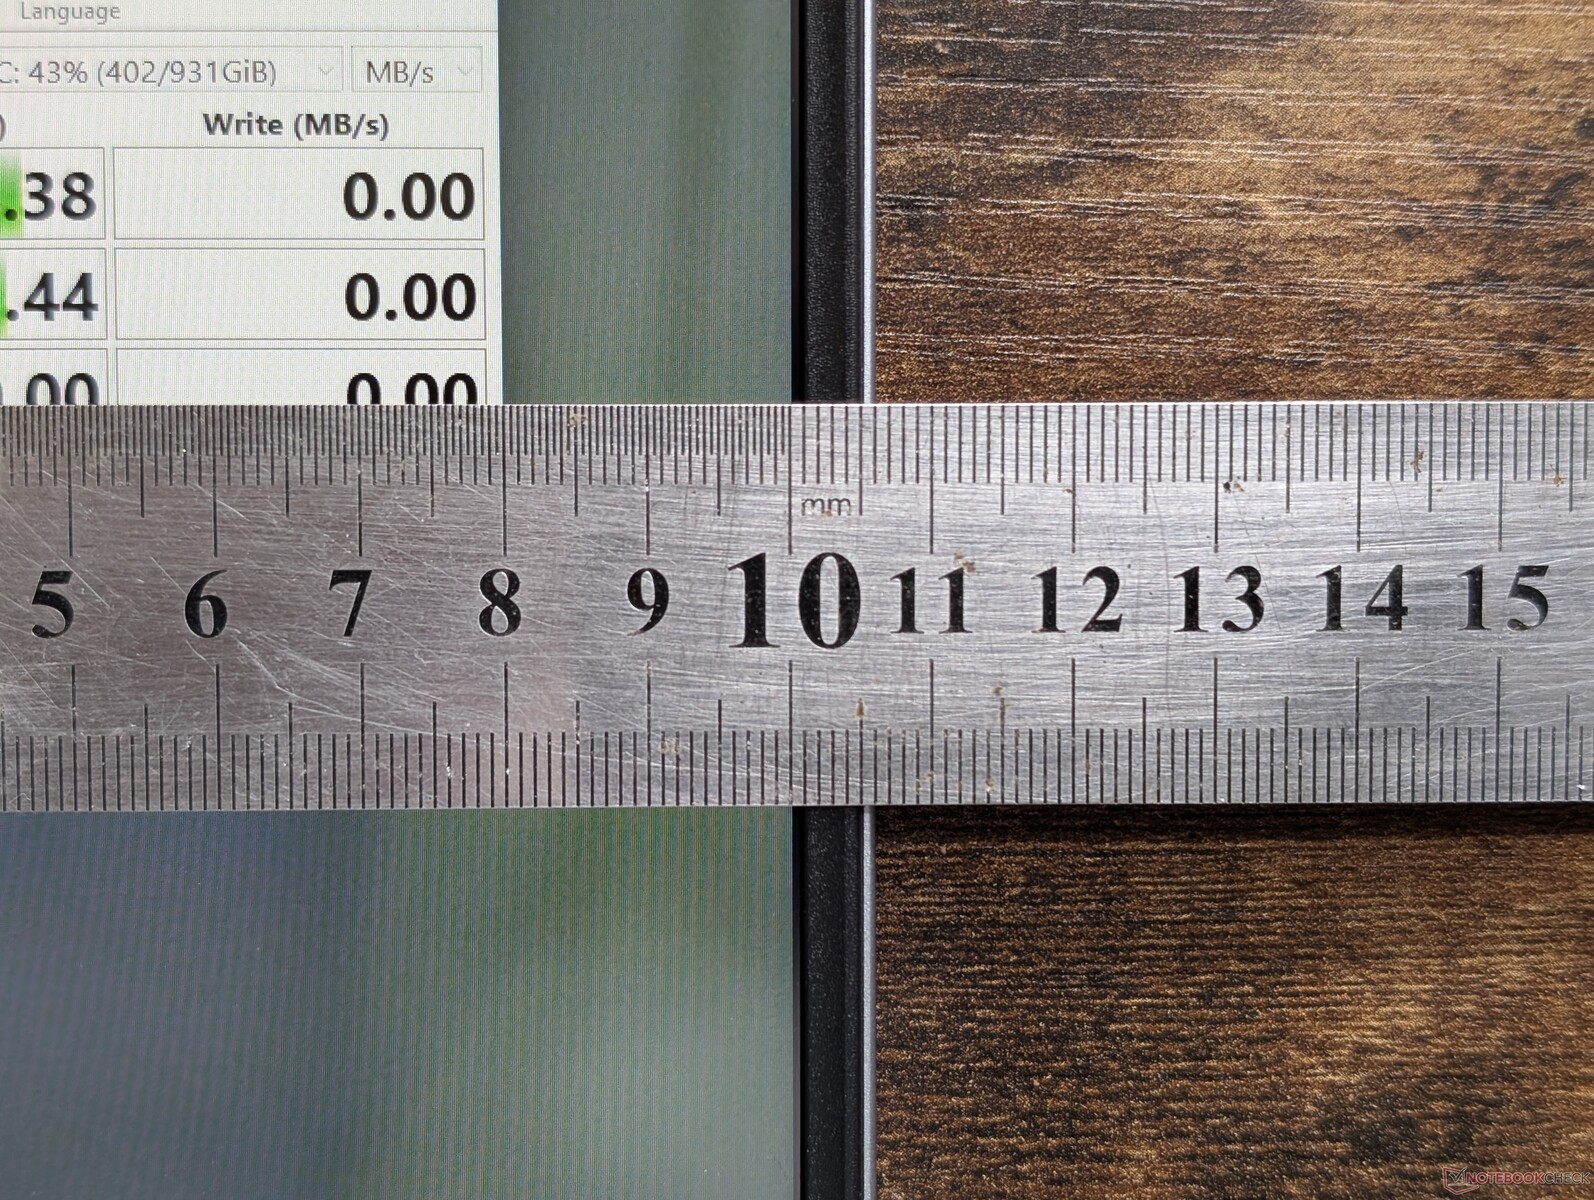
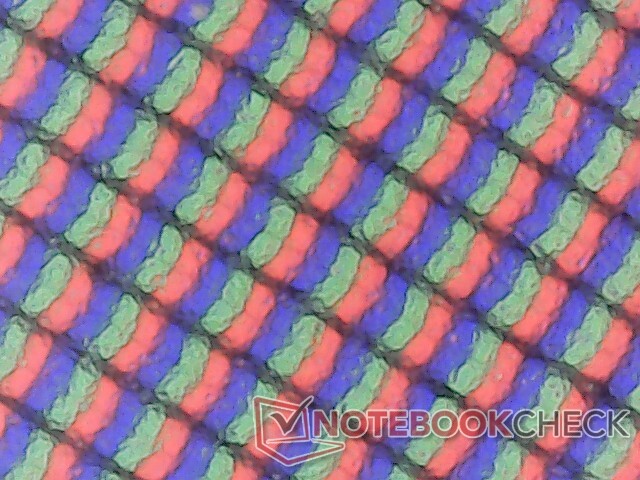
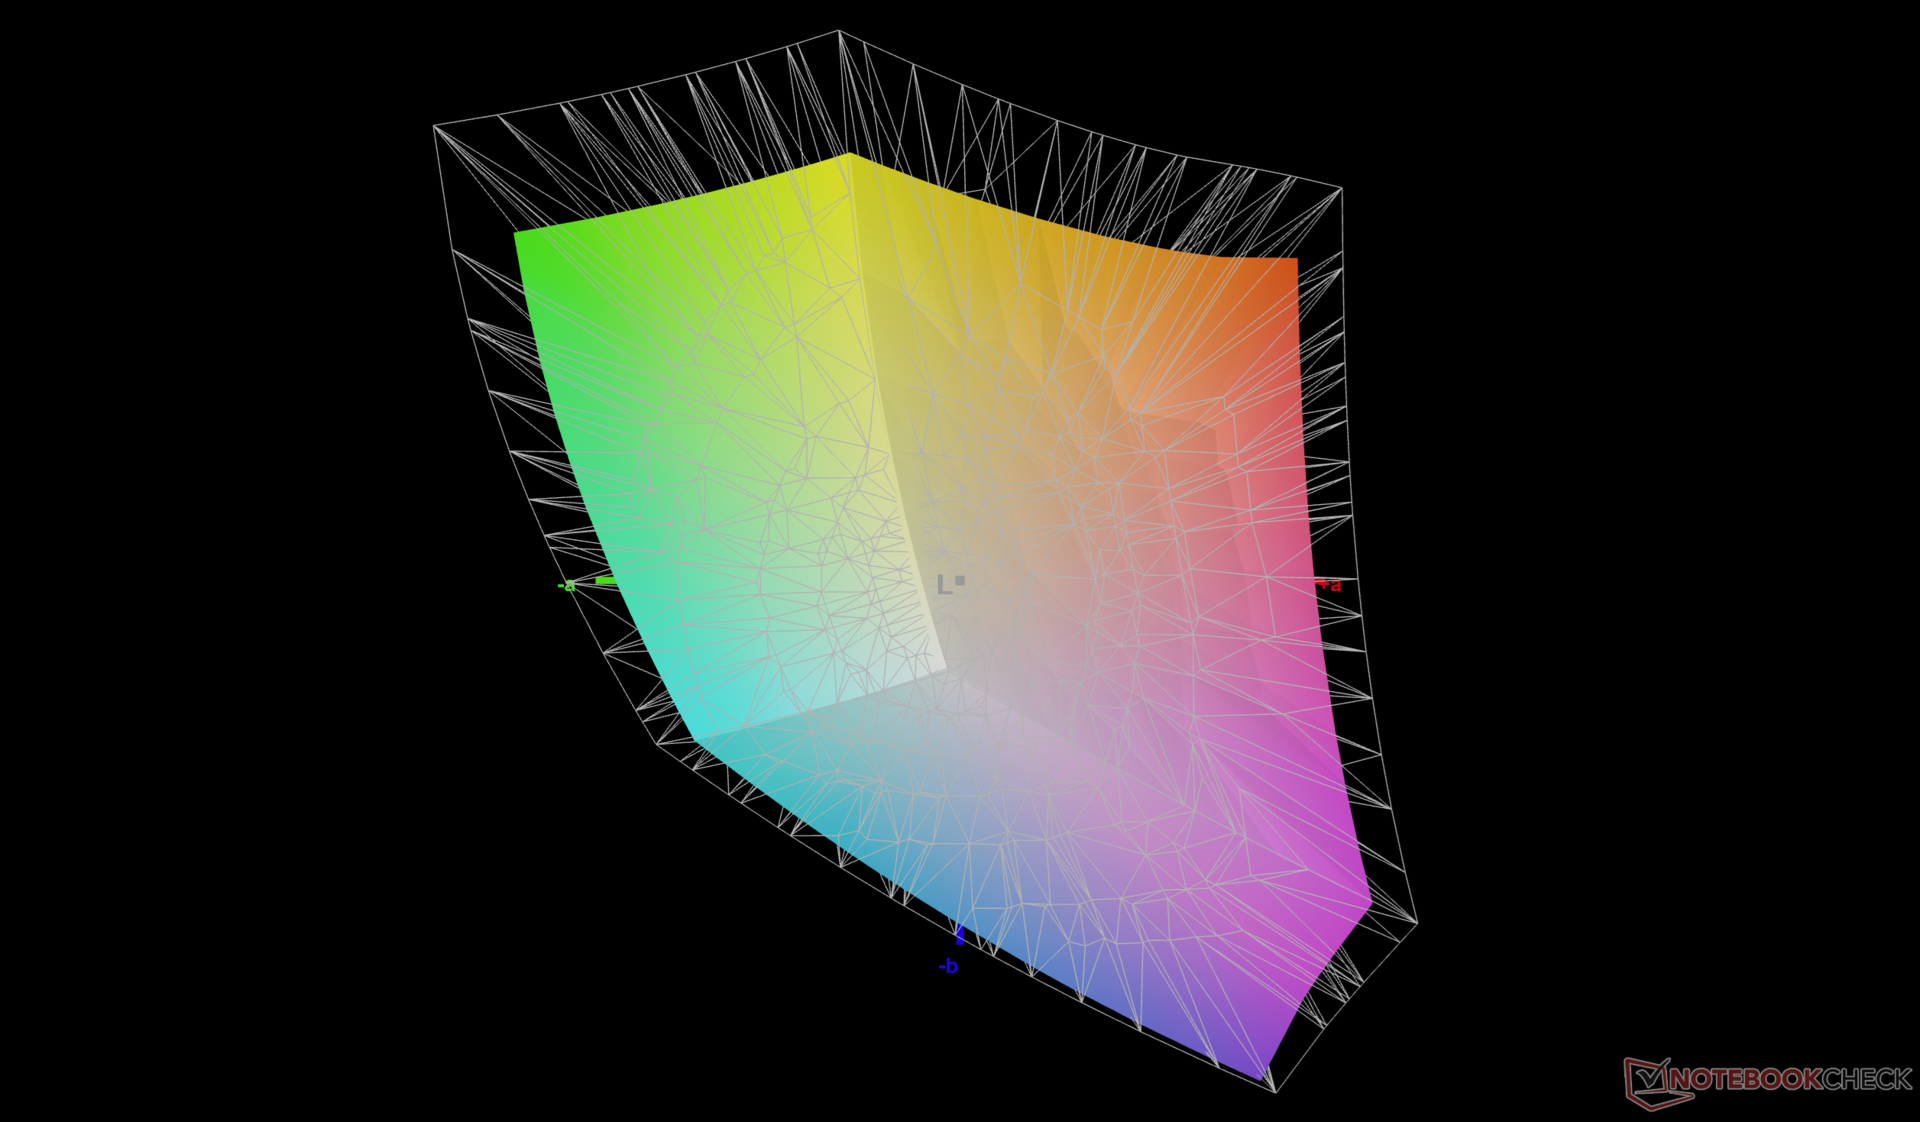
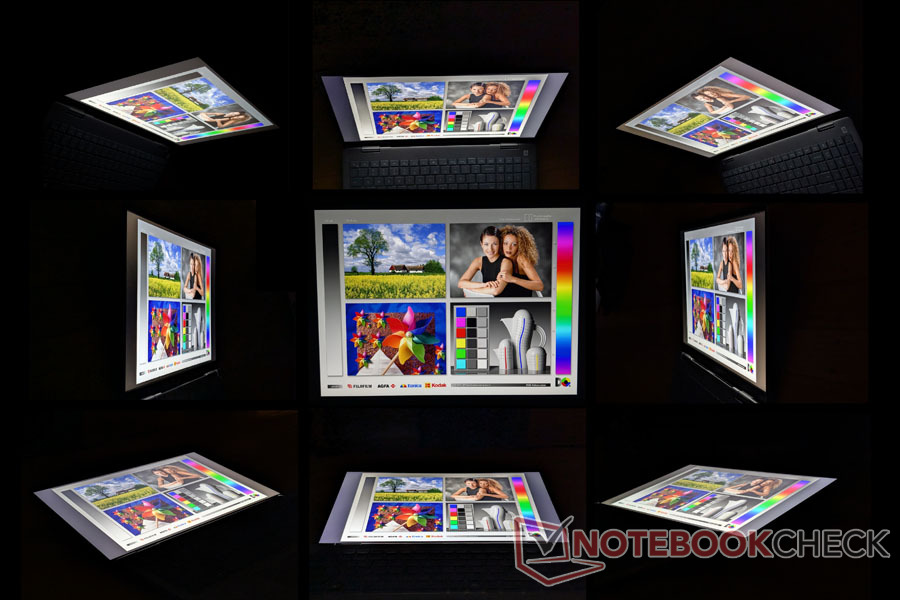
Pantalla - 120 Hz y colores sRGB completos
El Dell 16 Plus comparte el mismo panel IPS AU Optronics B160QAN que se encuentra en el Inspiron 16 Plus 7640 para obtener esencialmente la misma experiencia de visualización entre ambos. Aún así, nos hubiera gustado ver mejoras en el brillo y compatibilidad con HDR.
La configuración mini-LED de 90 Hz es más que probable que sea el mismo panel que se encuentra en el Inspiron 16 7640 2 en 1 del año pasado.
| |||||||||||||||||||||||||
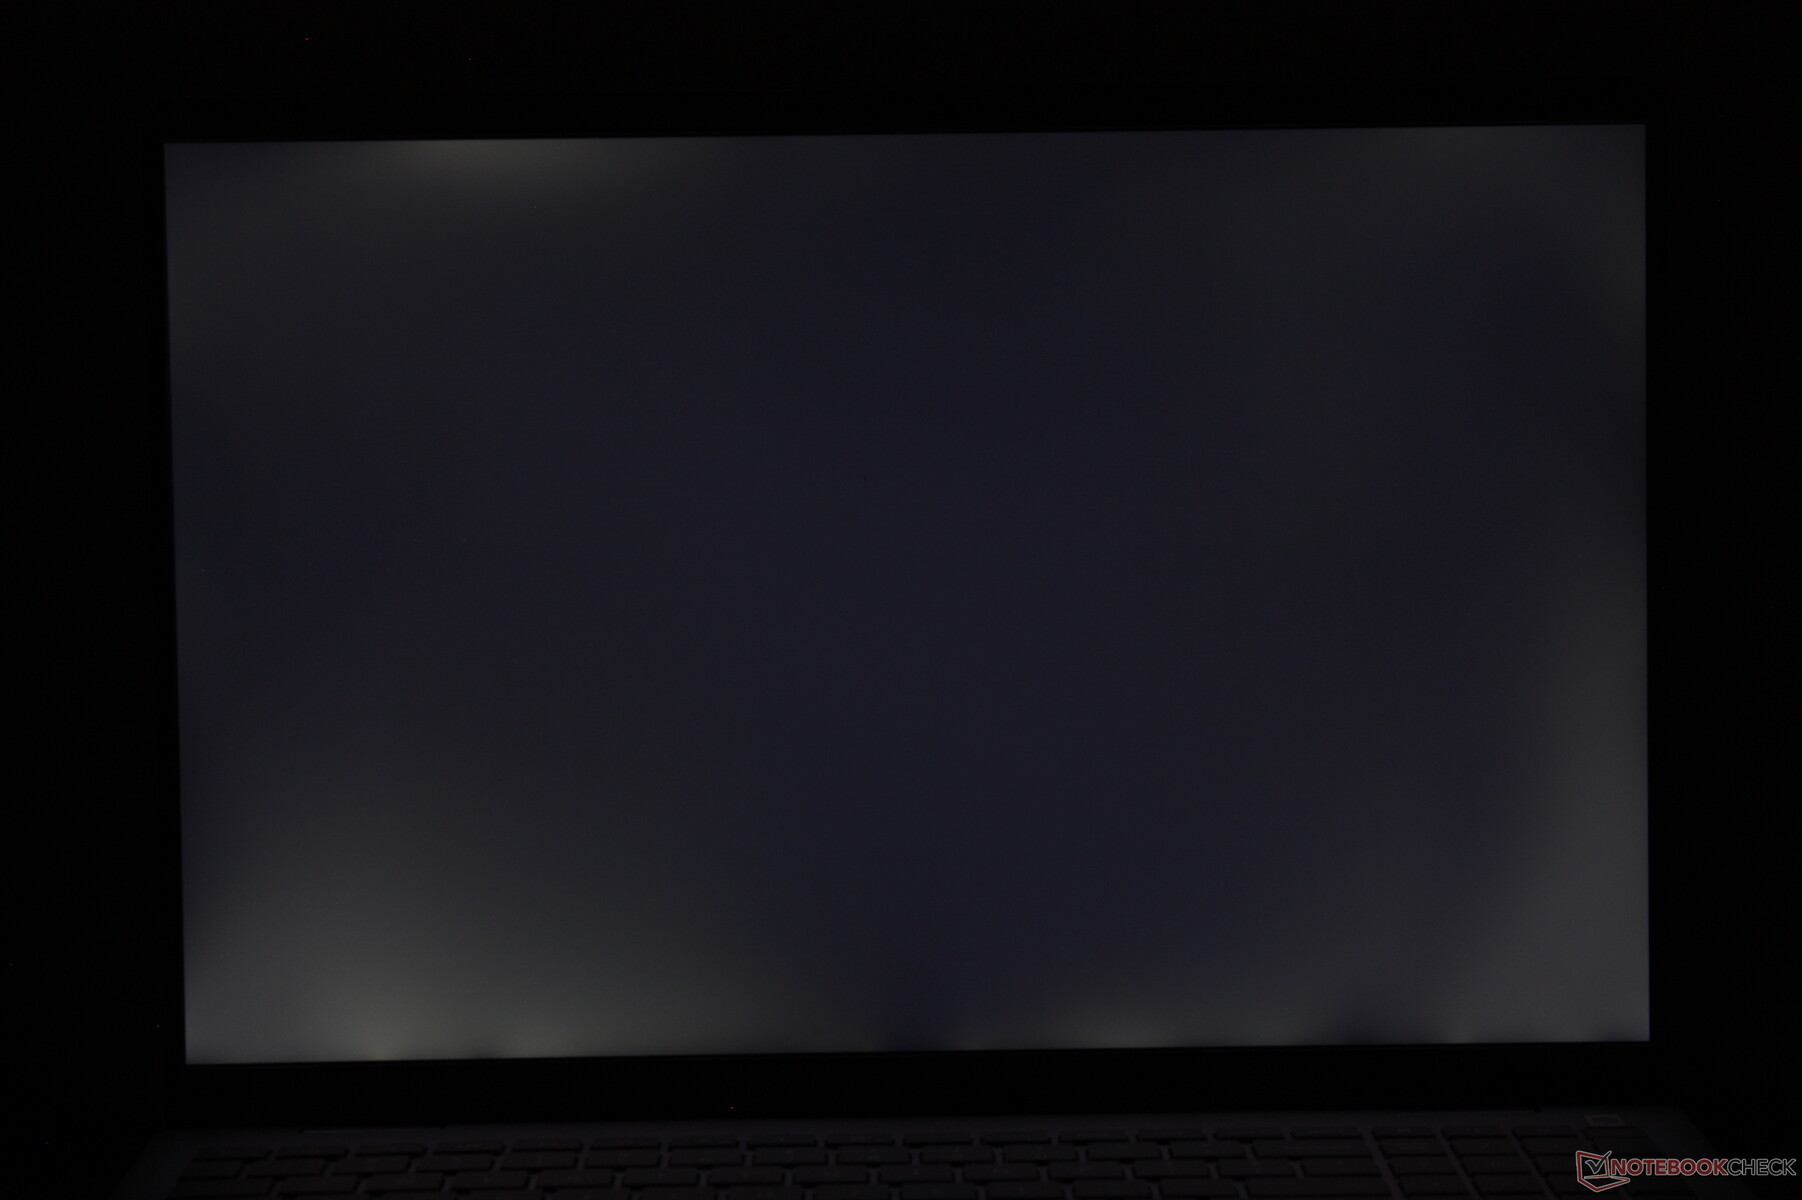
iluminación: 88 %
Brillo con batería: 335.6 cd/m²
Contraste: 1525:1 (Negro: 0.22 cd/m²)
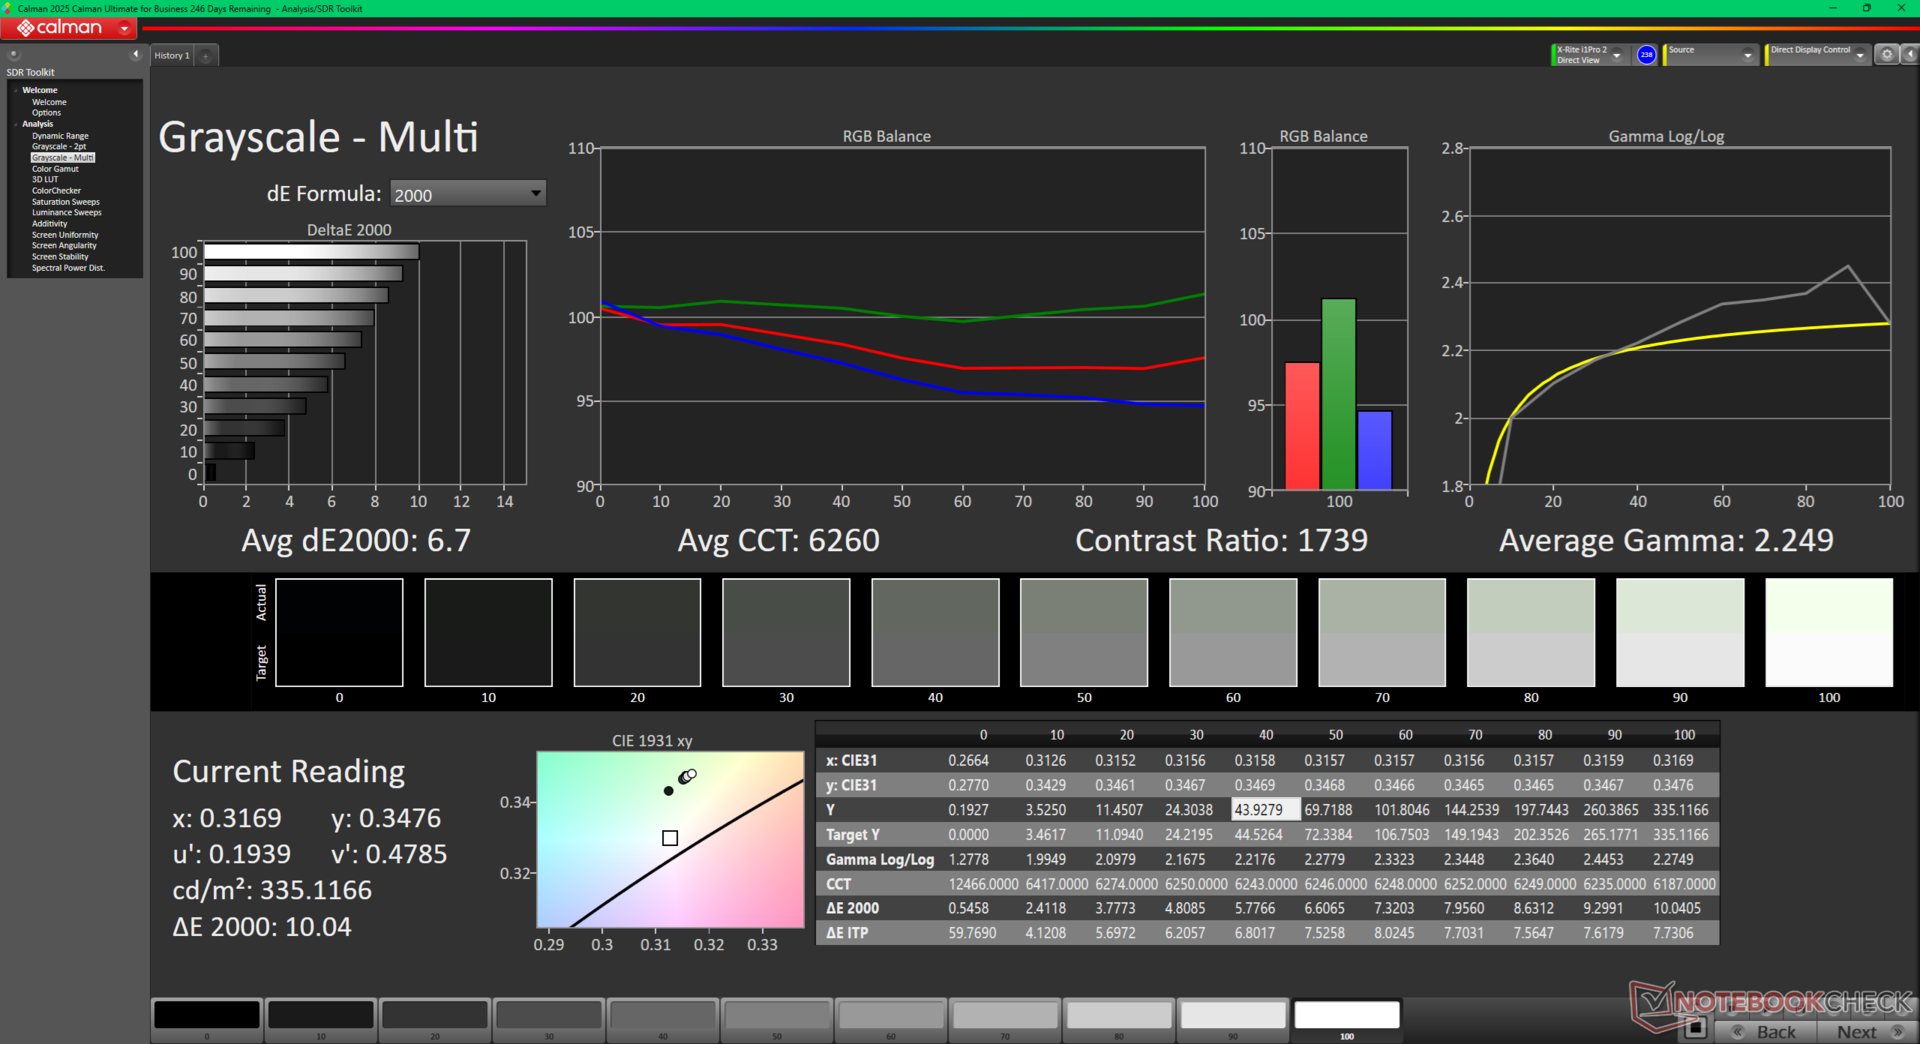
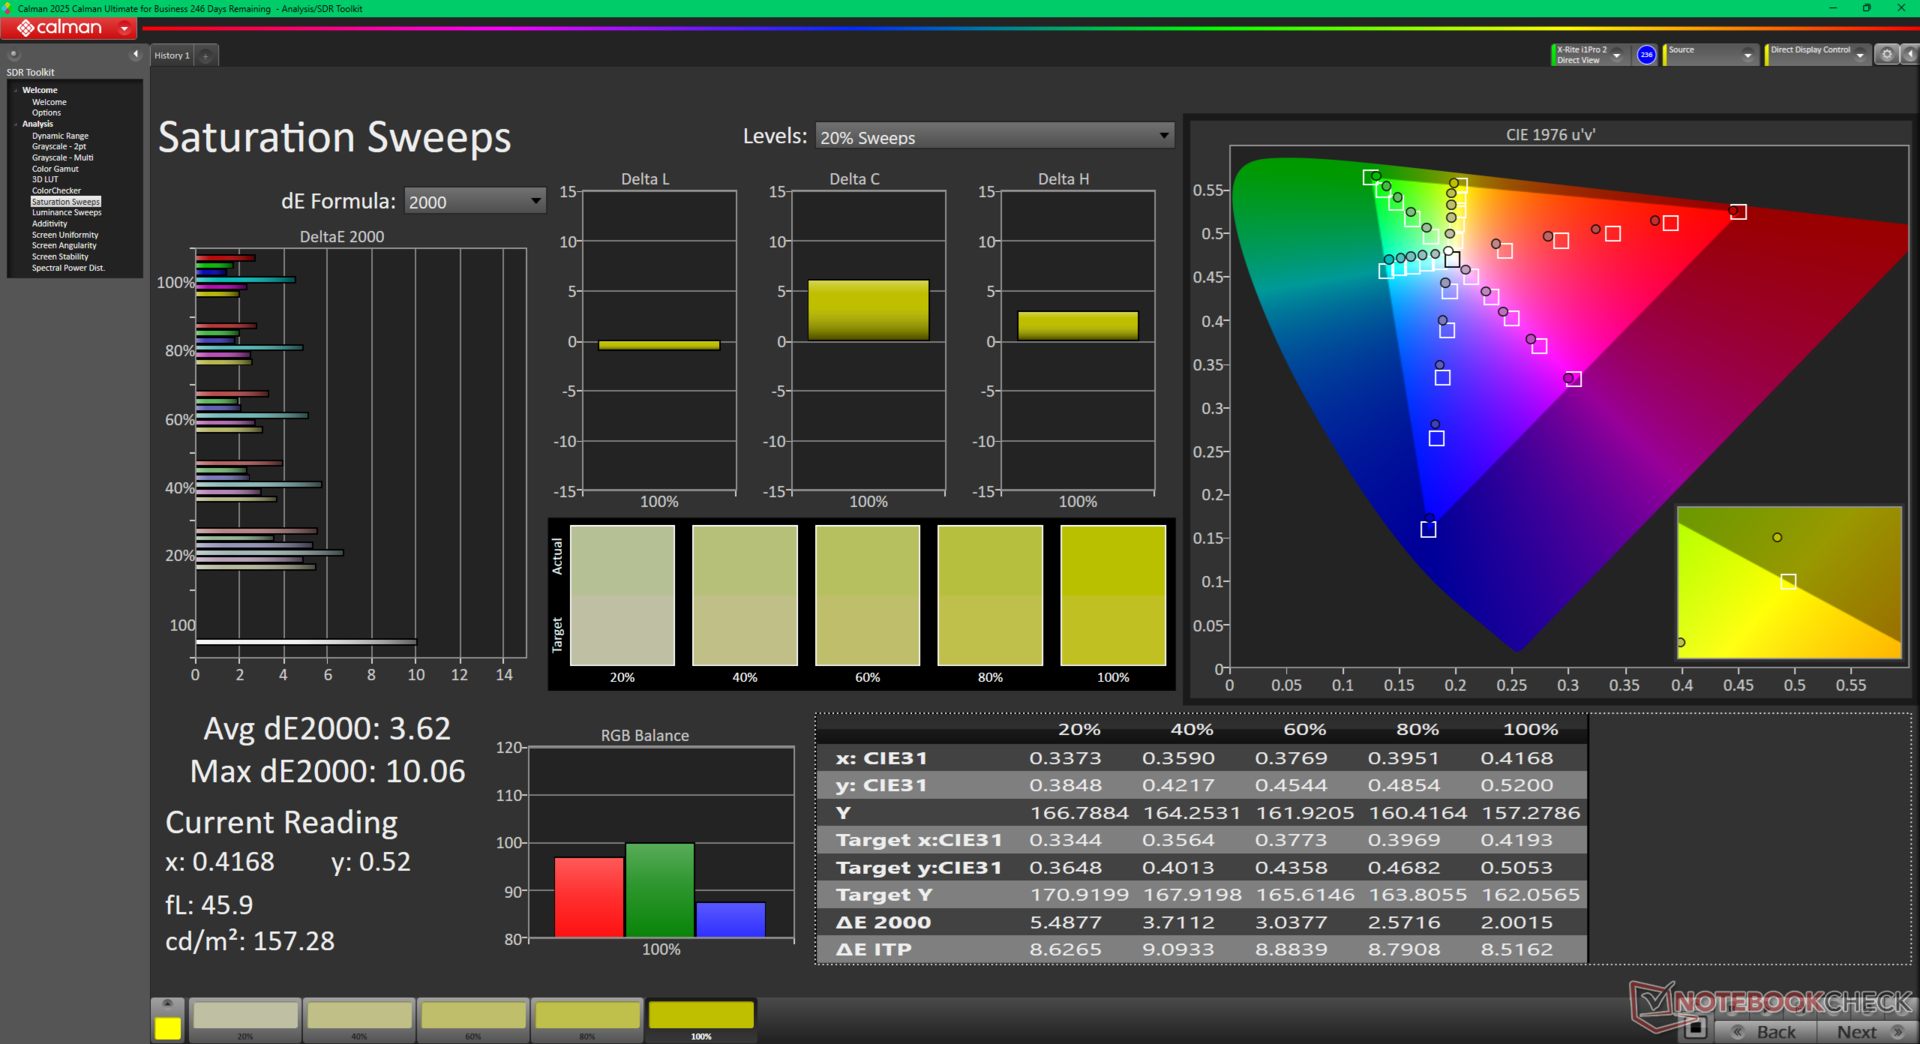
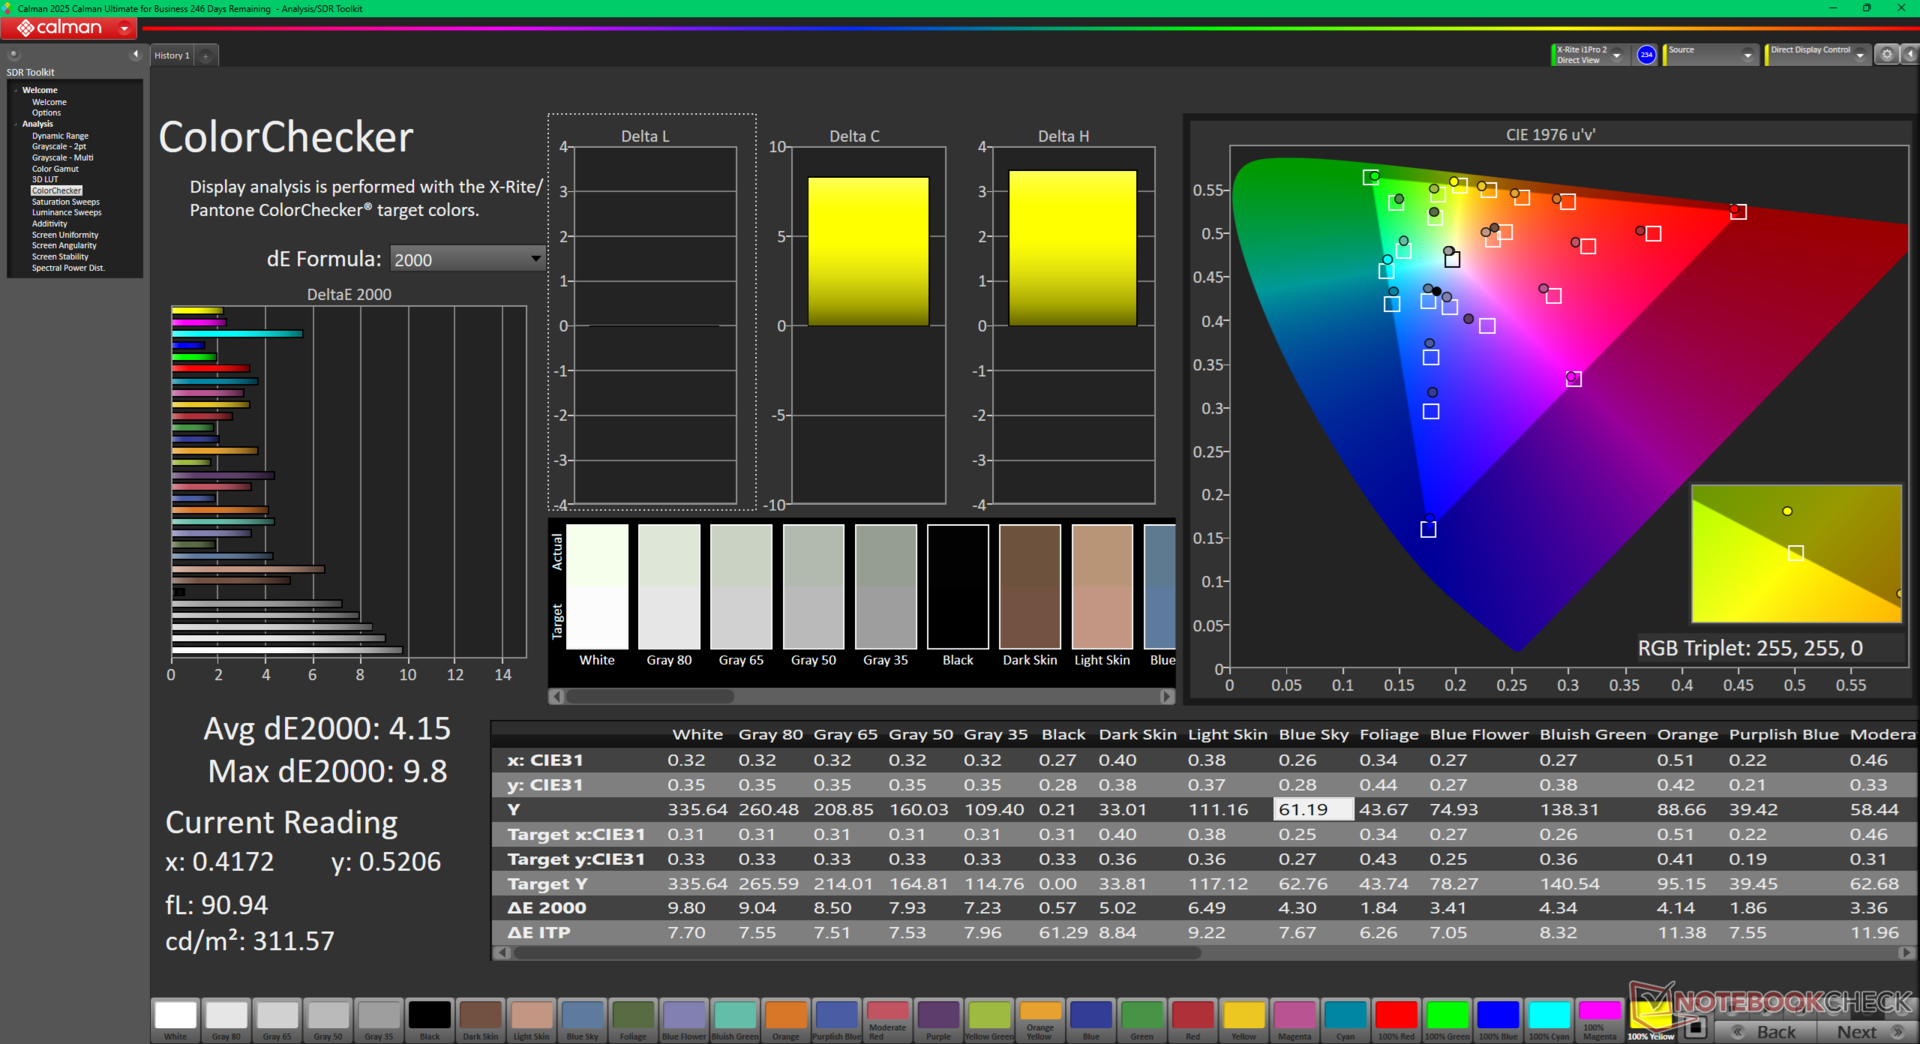
ΔE ColorChecker Calman: 4.15 | ∀{0.5-29.43 Ø4.71}
calibrated: 0.44
ΔE Greyscale Calman: 6.7 | ∀{0.09-98 Ø4.96}
78.4% AdobeRGB 1998 (Argyll 3D)
99.8% sRGB (Argyll 3D)
76.6% Display P3 (Argyll 3D)
Gamma: 2.25
CCT: 6260 K
| Dell 16 Plus AU Optronics B160QAN, IPS, 2560x1600, 16", 120 Hz | Dell Inspiron 16 Plus 7640 AU Optronics B160QAN, IPS, 2560x1600, 16", 120 Hz | Acer Swift 16 AI SF16-51T-932H, Ultra 9 288V SDC41B6, OLED, 2880x1800, 16", 120 Hz | Lenovo ThinkBook 16 G7+ AMD LEN160-3.2K, IPS, 3200x2000, 16", 165 Hz | HP Pavilion Plus 16-ab0456tx AU Optronics AUOFDA4, IPS, 2560x1600, 16", 120 Hz | Asus Vivobook 16 M1606K B160UAN04.3 (AUOA5AB), IPS, 1920x1200, 16", 60 Hz | |
|---|---|---|---|---|---|---|
| Display | -1% | 17% | 12% | -2% | -50% | |
| Display P3 Coverage (%) | 76.6 | 76 -1% | 99.9 30% | 96.3 26% | 74.6 -3% | 36.8 -52% |
| sRGB Coverage (%) | 99.8 | 99.8 0% | 100 0% | 100 0% | 99 -1% | 55.3 -45% |
| AdobeRGB 1998 Coverage (%) | 78.4 | 76.7 -2% | 94.6 21% | 86.9 11% | 76.5 -2% | 38 -52% |
| Response Times | 24% | 54% | 66% | 72% | -1% | |
| Response Time Grey 50% / Grey 80% * (ms) | 32.8 ? | 25.6 ? 22% | 4.8 ? 85% | 13.9 ? 58% | 9.06 ? 72% | 36 ? -10% |
| Response Time Black / White * (ms) | 23.4 ? | 17.6 ? 25% | 18 ? 23% | 6.3 ? 73% | 6.7 ? 71% | 21.4 ? 9% |
| PWM Frequency (Hz) | 481 | |||||
| PWM Amplitude * (%) | 39 | |||||
| Screen | 0% | 195% | 16% | -23% | -128% | |
| Brightness middle (cd/m²) | 335.6 | 314.7 -6% | 425 27% | 422 26% | 403 20% | 326 -3% |
| Brightness (cd/m²) | 308 | 291 -6% | 421 37% | 403 31% | 394 28% | 303 -2% |
| Brightness Distribution (%) | 88 | 89 1% | 98 11% | 93 6% | 90 2% | 89 1% |
| Black Level * (cd/m²) | 0.22 | 0.28 -27% | 0.0219 90% | 0.3 -36% | 0.34 -55% | 0.24 -9% |
| Contrast (:1) | 1525 | 1124 -26% | 19406 1173% | 1407 -8% | 1185 -22% | 1358 -11% |
| Colorchecker dE 2000 * | 4.15 | 1.62 61% | 1.73 58% | 1.7 59% | 3.13 25% | 6.48 -56% |
| Colorchecker dE 2000 max. * | 9.8 | 2.94 70% | 3.82 61% | 3.4 65% | 6.14 37% | 19.42 -98% |
| Colorchecker dE 2000 calibrated * | 0.44 | 1.08 -145% | 0.7 -59% | 1.65 -275% | 4.92 -1018% | |
| Greyscale dE 2000 * | 6.7 | 1.3 81% | 0.09 99% | 2.4 64% | 4.5 33% | 3.85 43% |
| Gamma | 2.25 98% | 2.26 97% | 2.346 94% | 2.19 100% | 2.18 101% | 2.79 79% |
| CCT | 6260 104% | 6385 102% | 6432 101% | 6989 93% | 6261 104% | 6739 96% |
| Media total (Programa/Opciones) | 8% /
3% | 89% /
132% | 31% /
23% | 16% /
-5% | -60% /
-93% |
* ... más pequeño es mejor
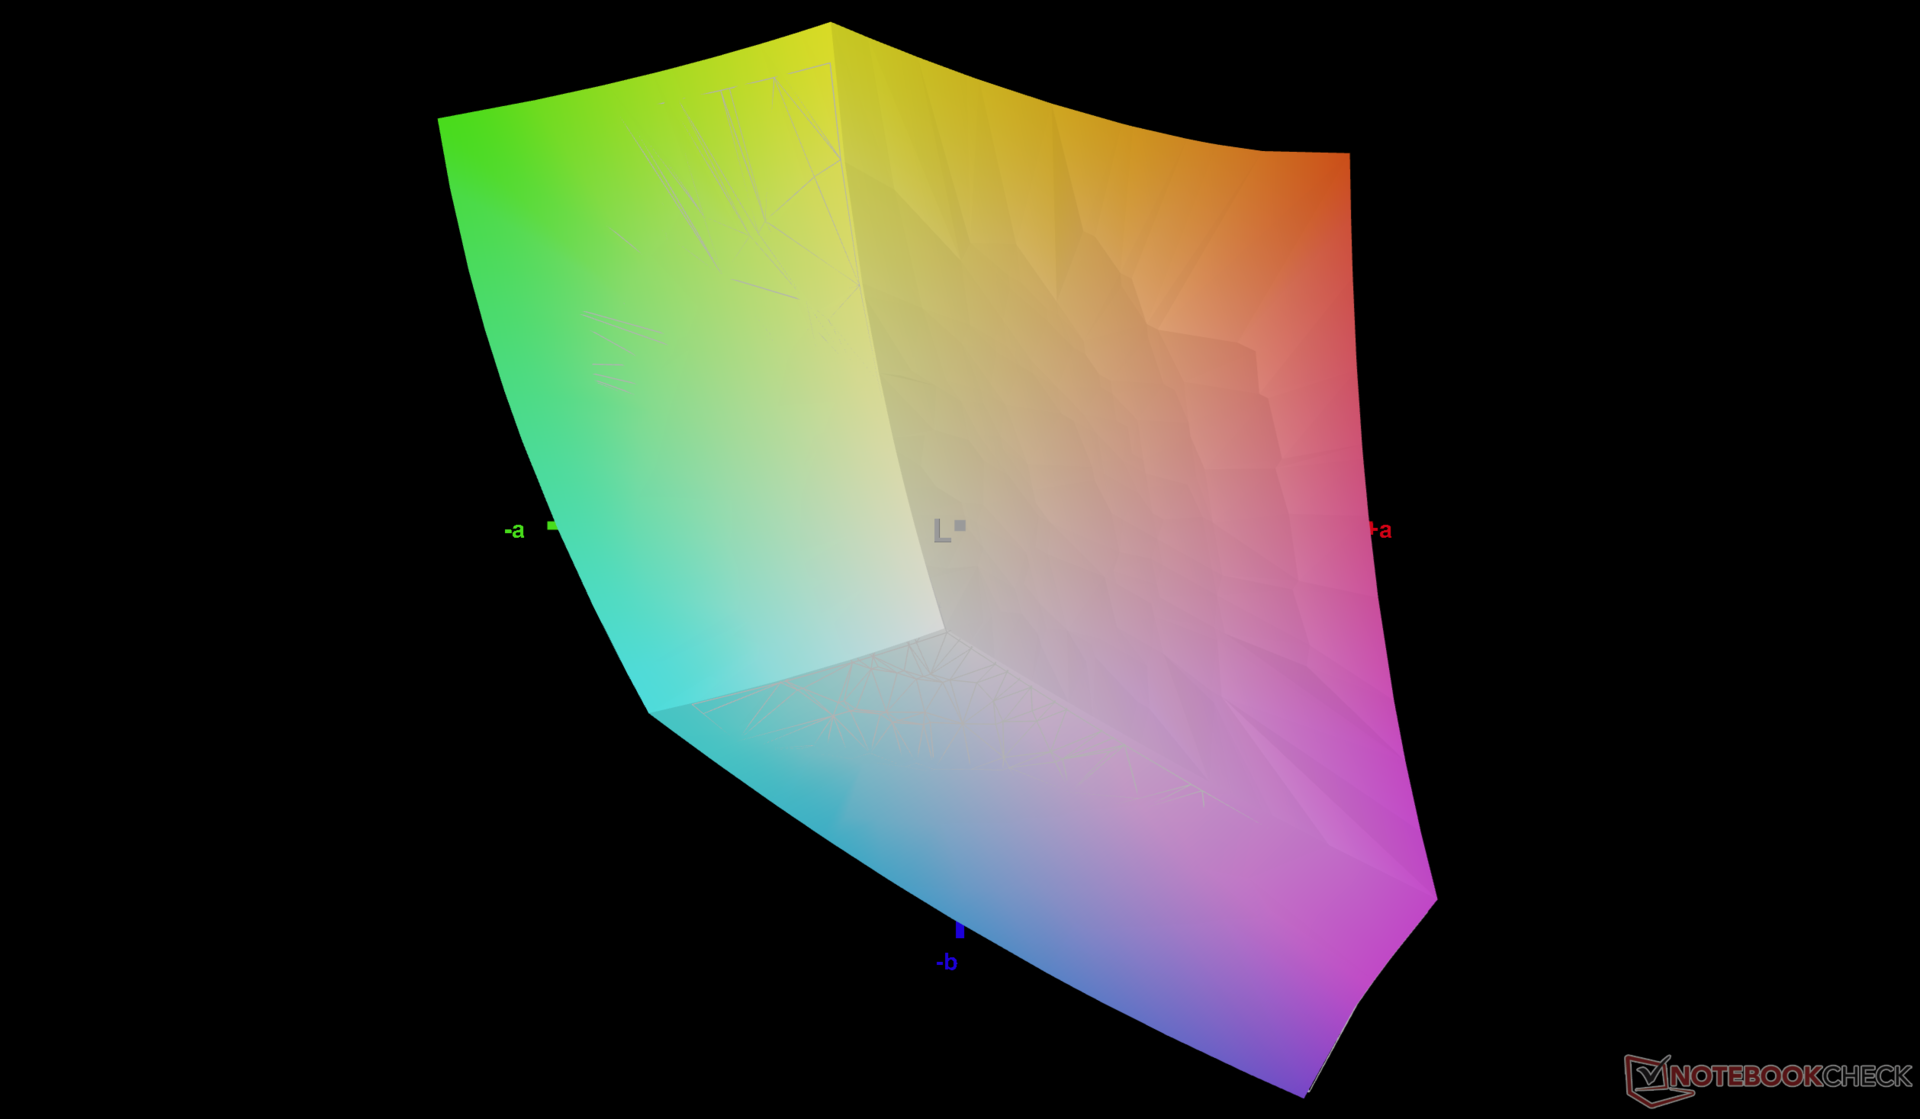
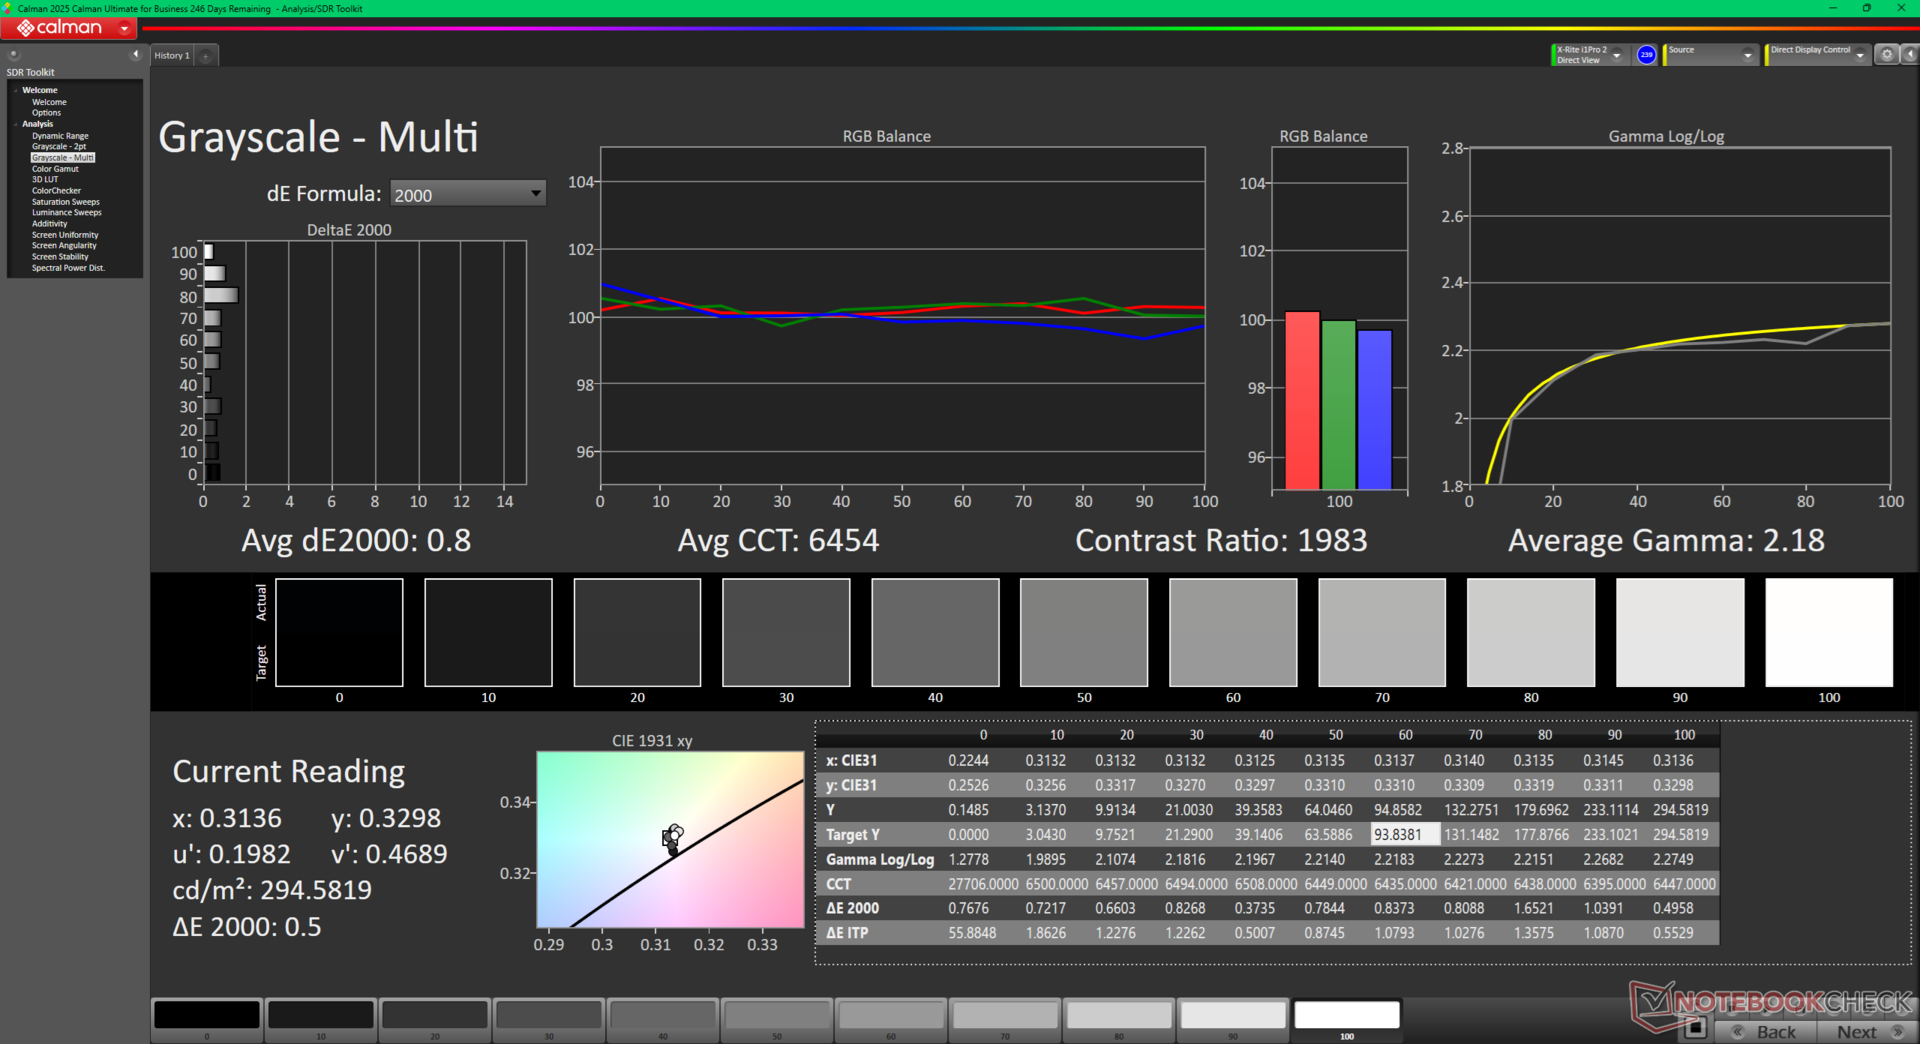
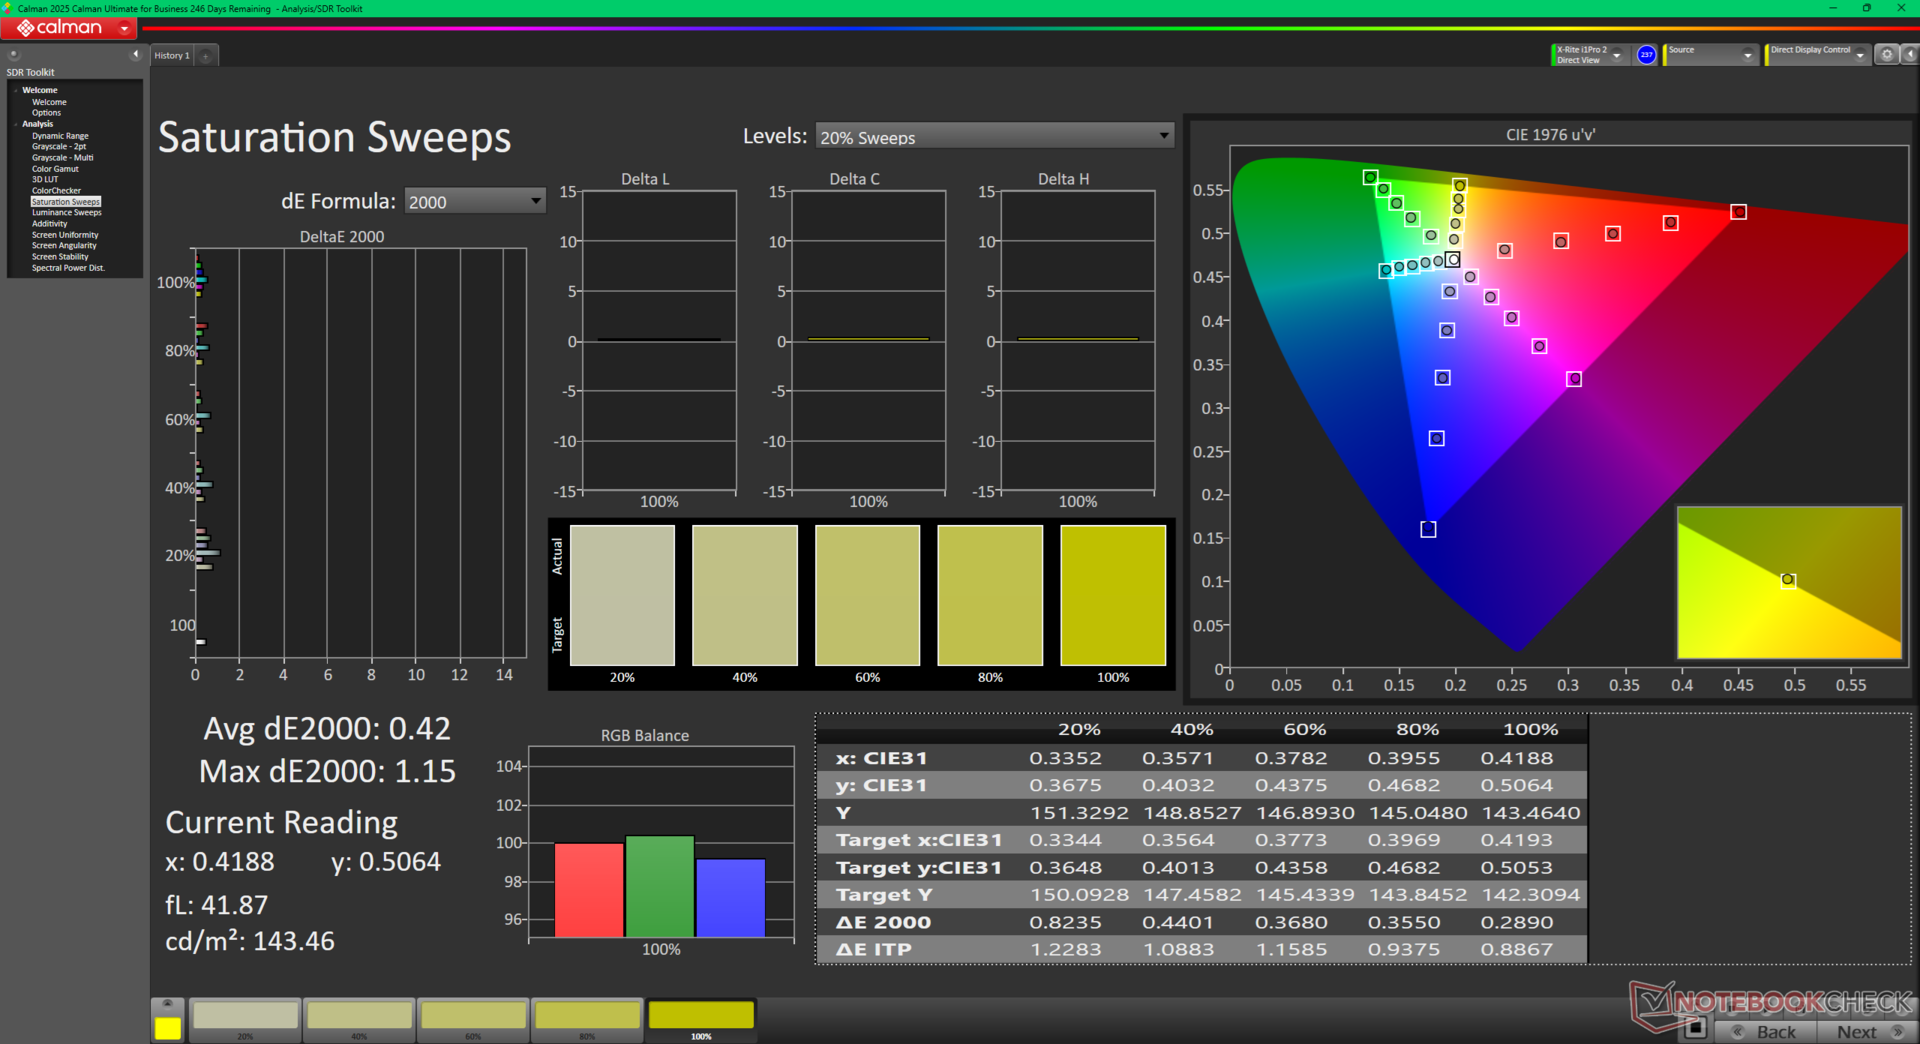
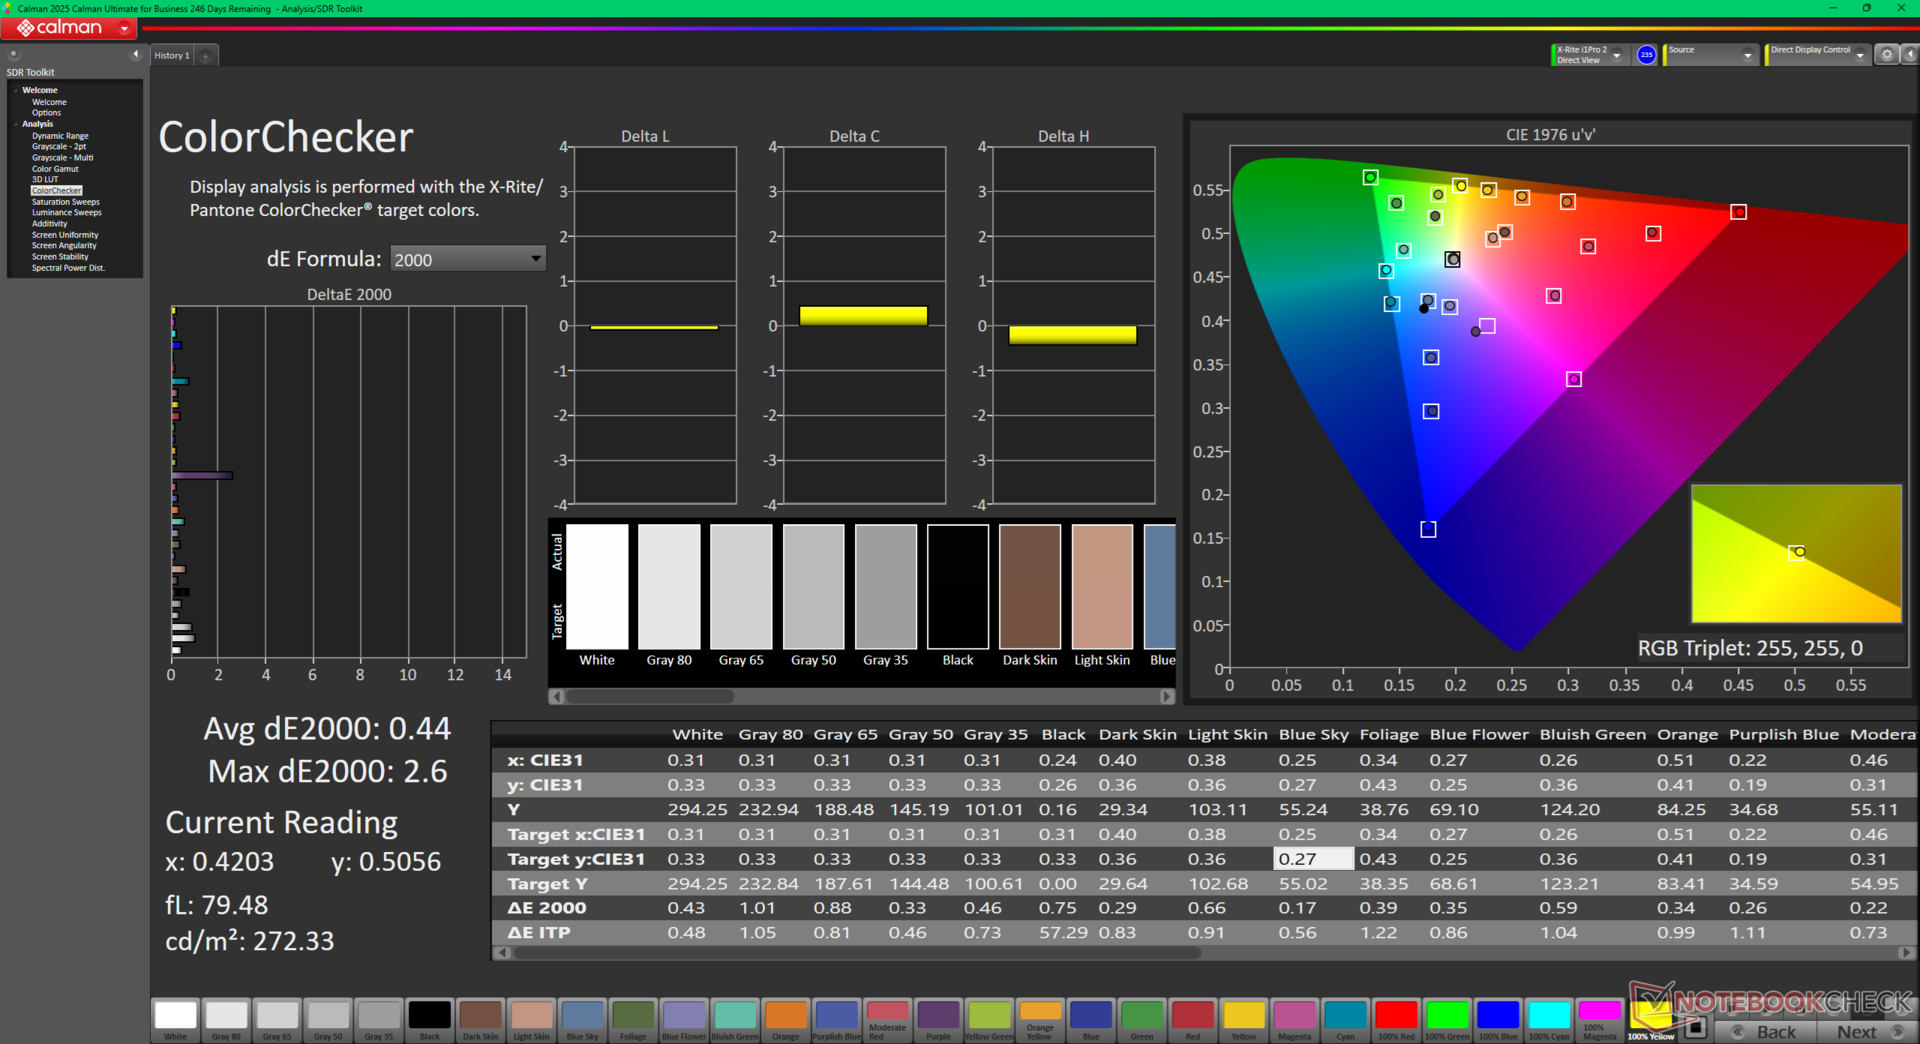
La pantalla no está bien calibrada nada más sacarla de la caja, algo habitual en la mayoría de portátiles de consumo de gama económica a media. Calibrar la pantalla nosotros mismos con un colorímetro X-Rite mejoraría enormemente los valores medios de escala de grises y deltaE de color de 6,7 y 4,15 a sólo 0,8 y 0,44, respectivamente, para aprovechar mejor toda la cobertura sRGB. Nuestro perfil ICM calibrado está disponible para su descarga gratuita más arriba.
Tiempos de respuesta del display
| ↔ Tiempo de respuesta de Negro a Blanco | ||
|---|---|---|
| 23.4 ms ... subida ↗ y bajada ↘ combinada | ↗ 11.6 ms subida | 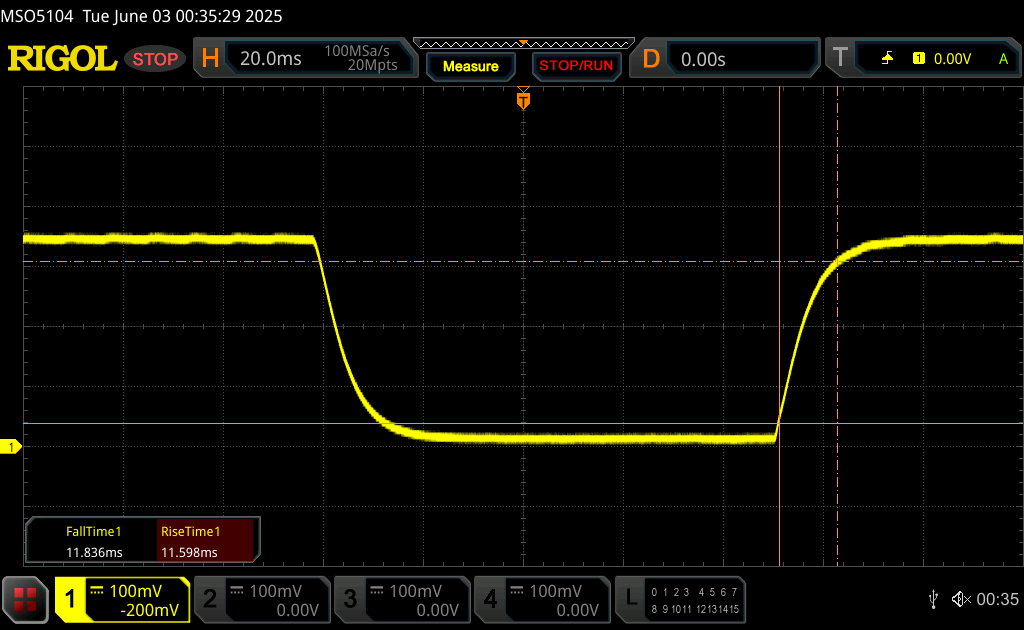 |
| ↘ 11.8 ms bajada | ||
| La pantalla mostró buenos tiempos de respuesta en nuestros tests pero podría ser demasiado lenta para los jugones competitivos. En comparación, todos los dispositivos de prueba van de ##min### (mínimo) a 240 (máximo) ms. » 54 % de todos los dispositivos son mejores. Eso quiere decir que el tiempo de respuesta es peor que la media (19.8 ms) de todos los dispositivos testados. | ||
| ↔ Tiempo de respuesta 50% Gris a 80% Gris | ||
| 32.8 ms ... subida ↗ y bajada ↘ combinada | ↗ 16.1 ms subida | 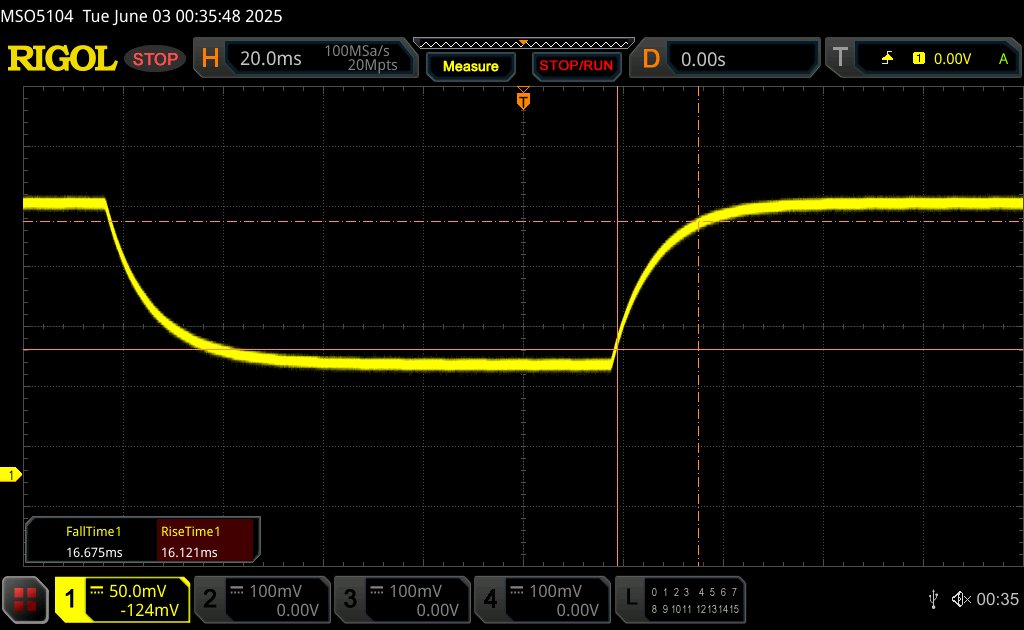 |
| ↘ 16.7 ms bajada | ||
| La pantalla mostró tiempos de respuesta lentos en nuestros tests y podría ser demasiado lenta para los jugones. En comparación, todos los dispositivos de prueba van de ##min### (mínimo) a 636 (máximo) ms. » 45 % de todos los dispositivos son mejores. Eso quiere decir que el tiempo de respuesta es similar al dispositivo testado medio (31 ms). | ||
Parpadeo de Pantalla / PWM (Pulse-Width Modulation)
| Parpadeo de Pantalla / PWM no detectado | 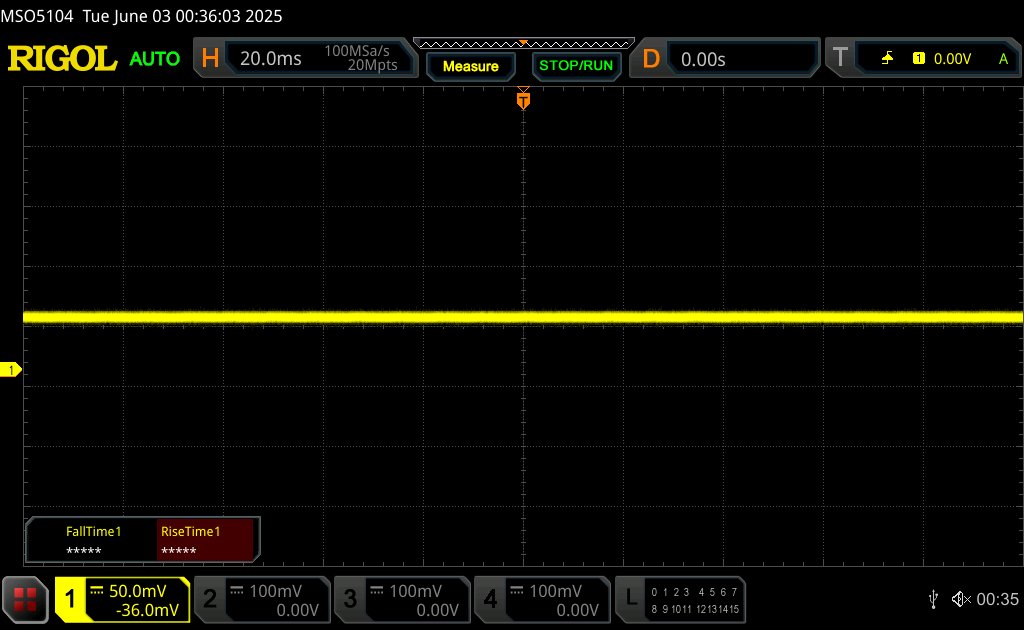 | ||
Comparación: 52 % de todos los dispositivos testados no usaron PWM para atenuar el display. Si se usó, medimos una media de 7757 (mínimo: 5 - máxmo: 343500) Hz. | |||
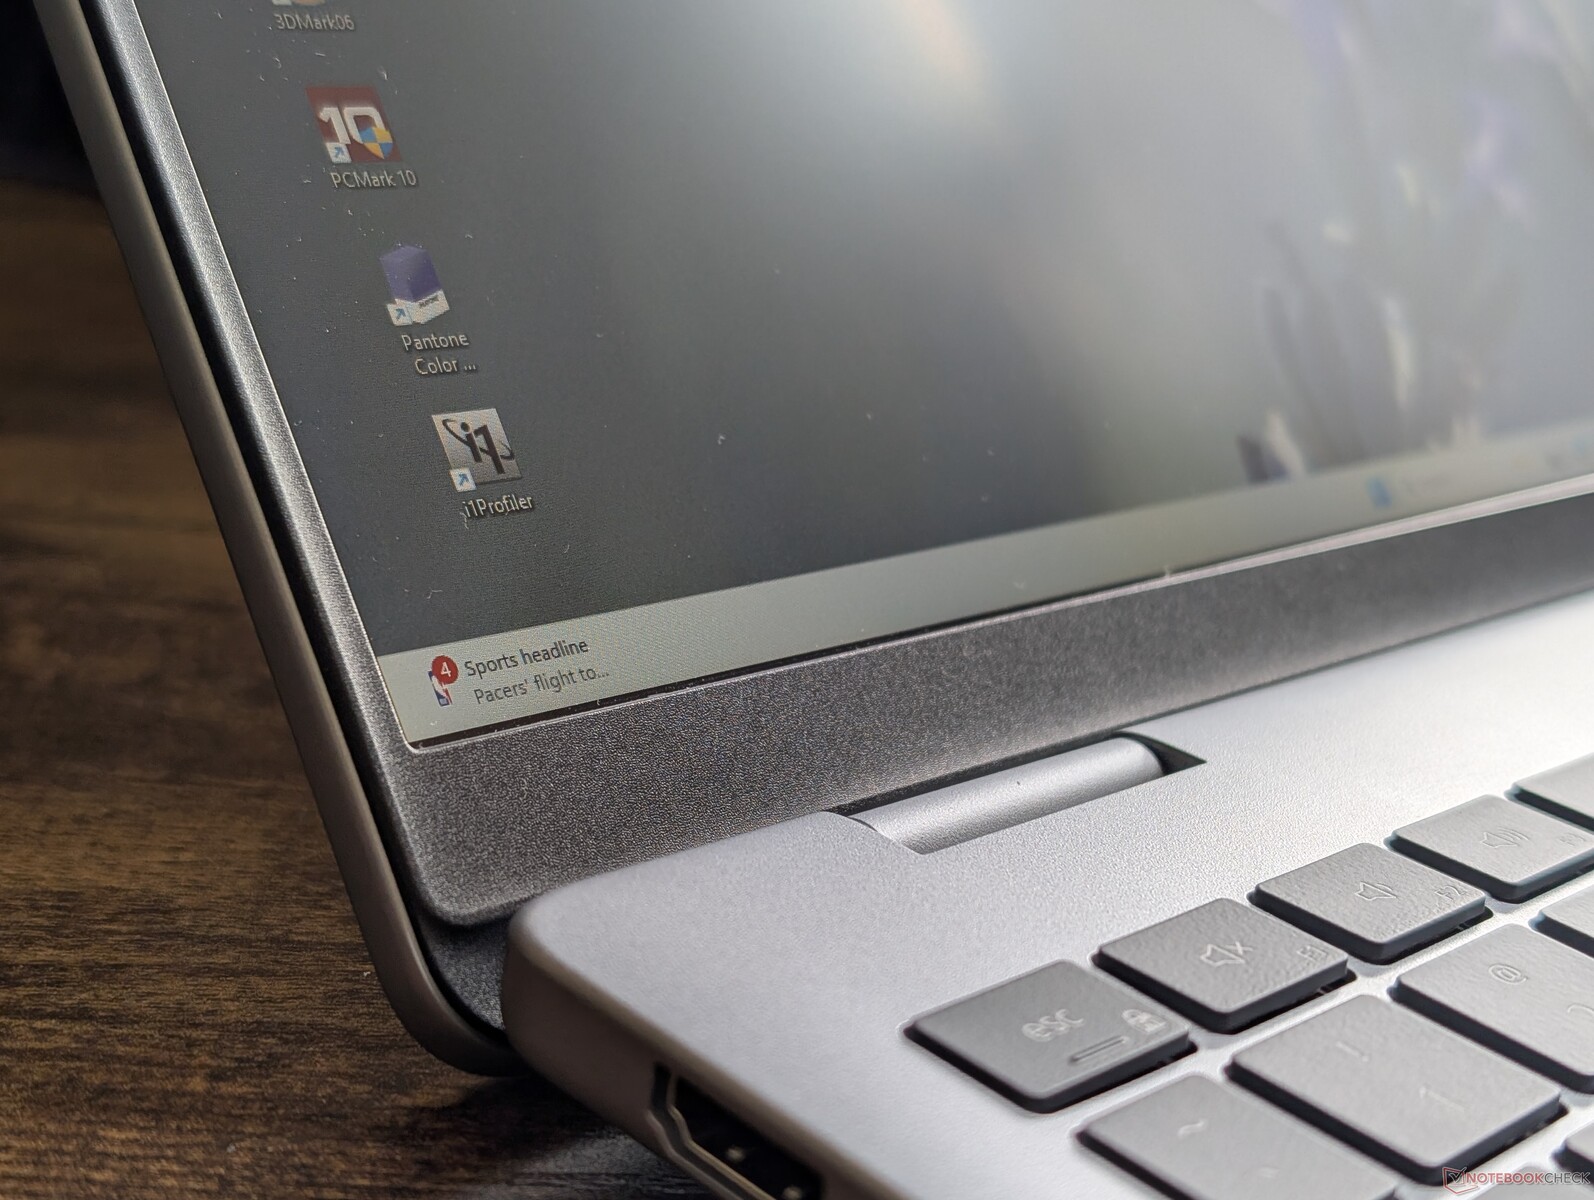
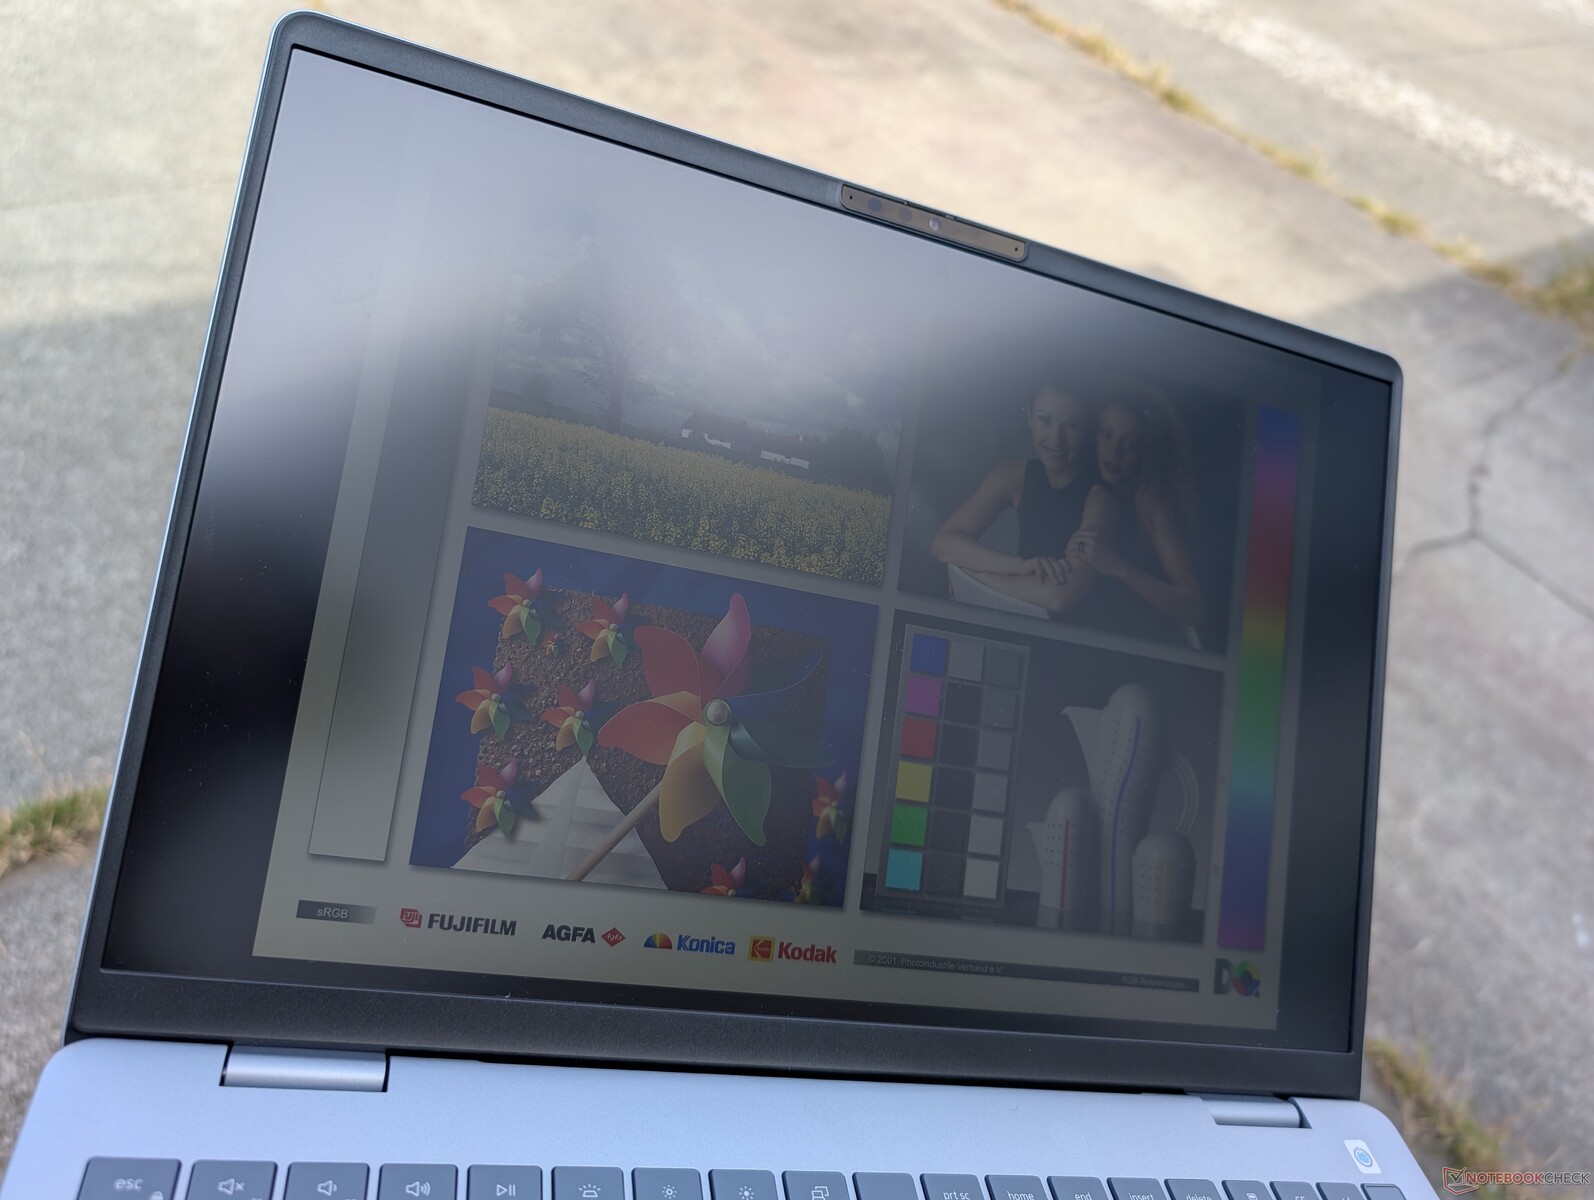
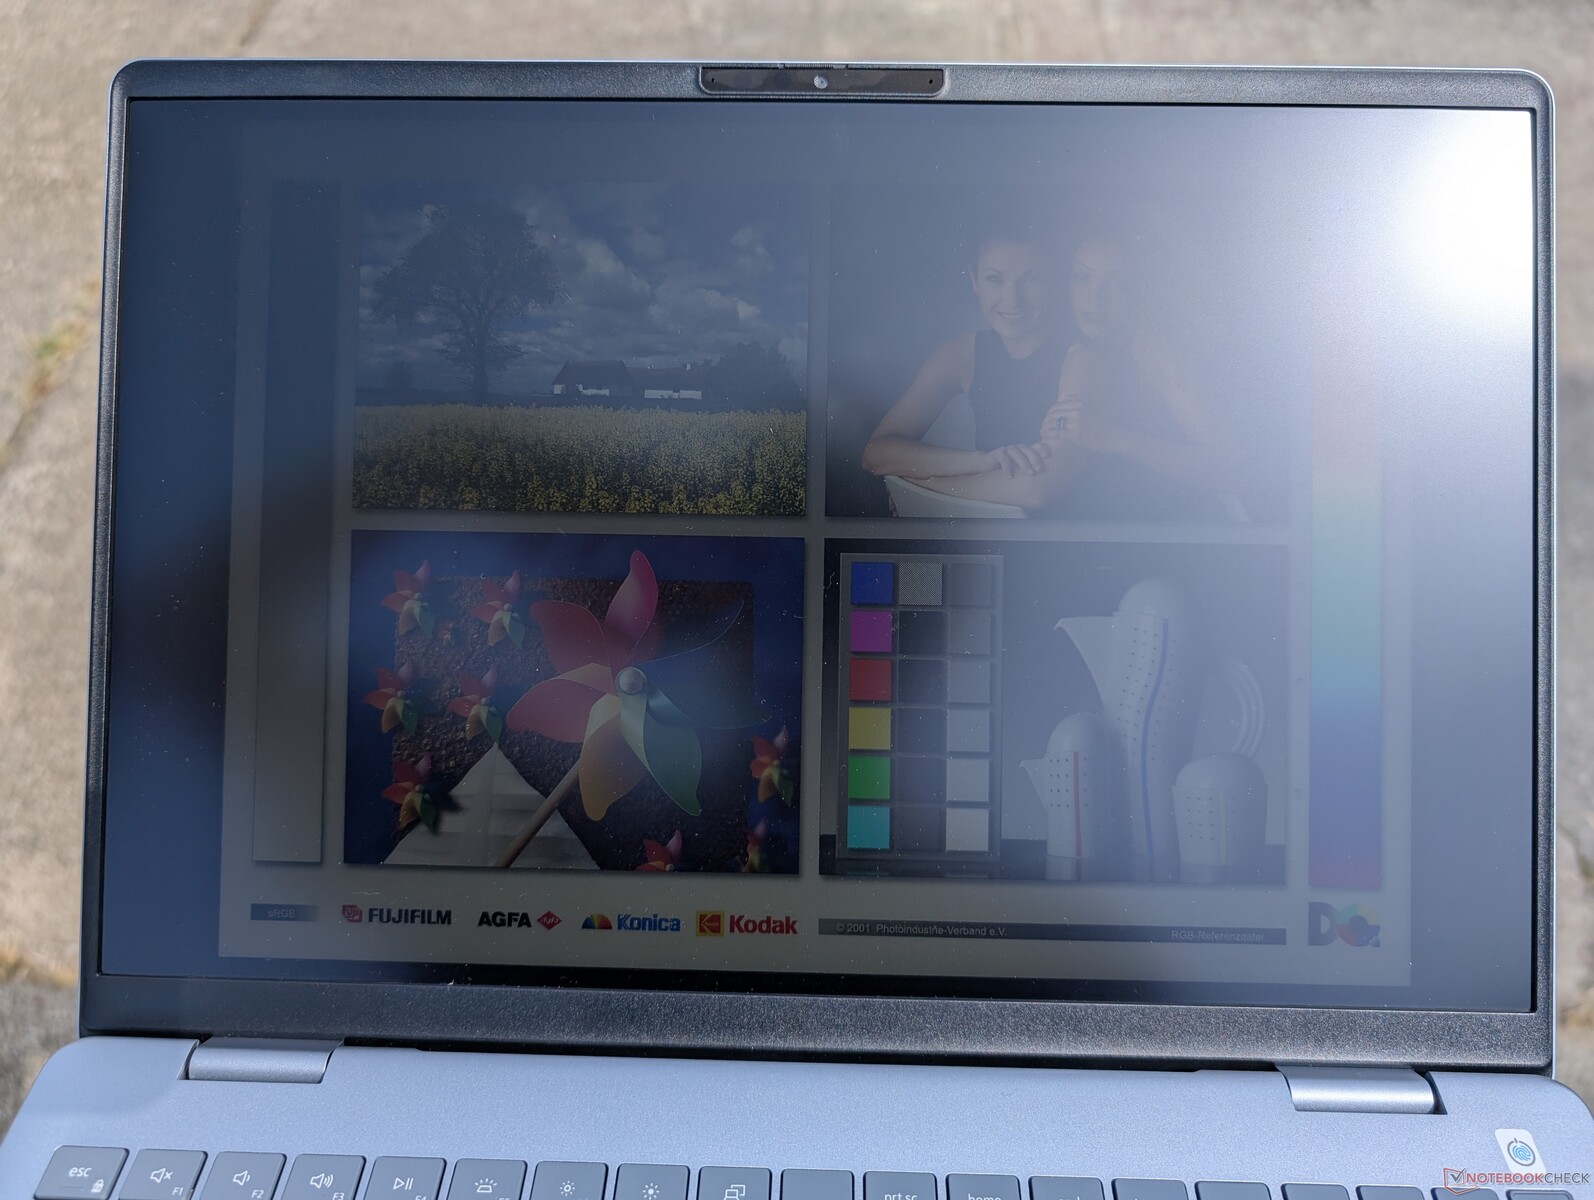
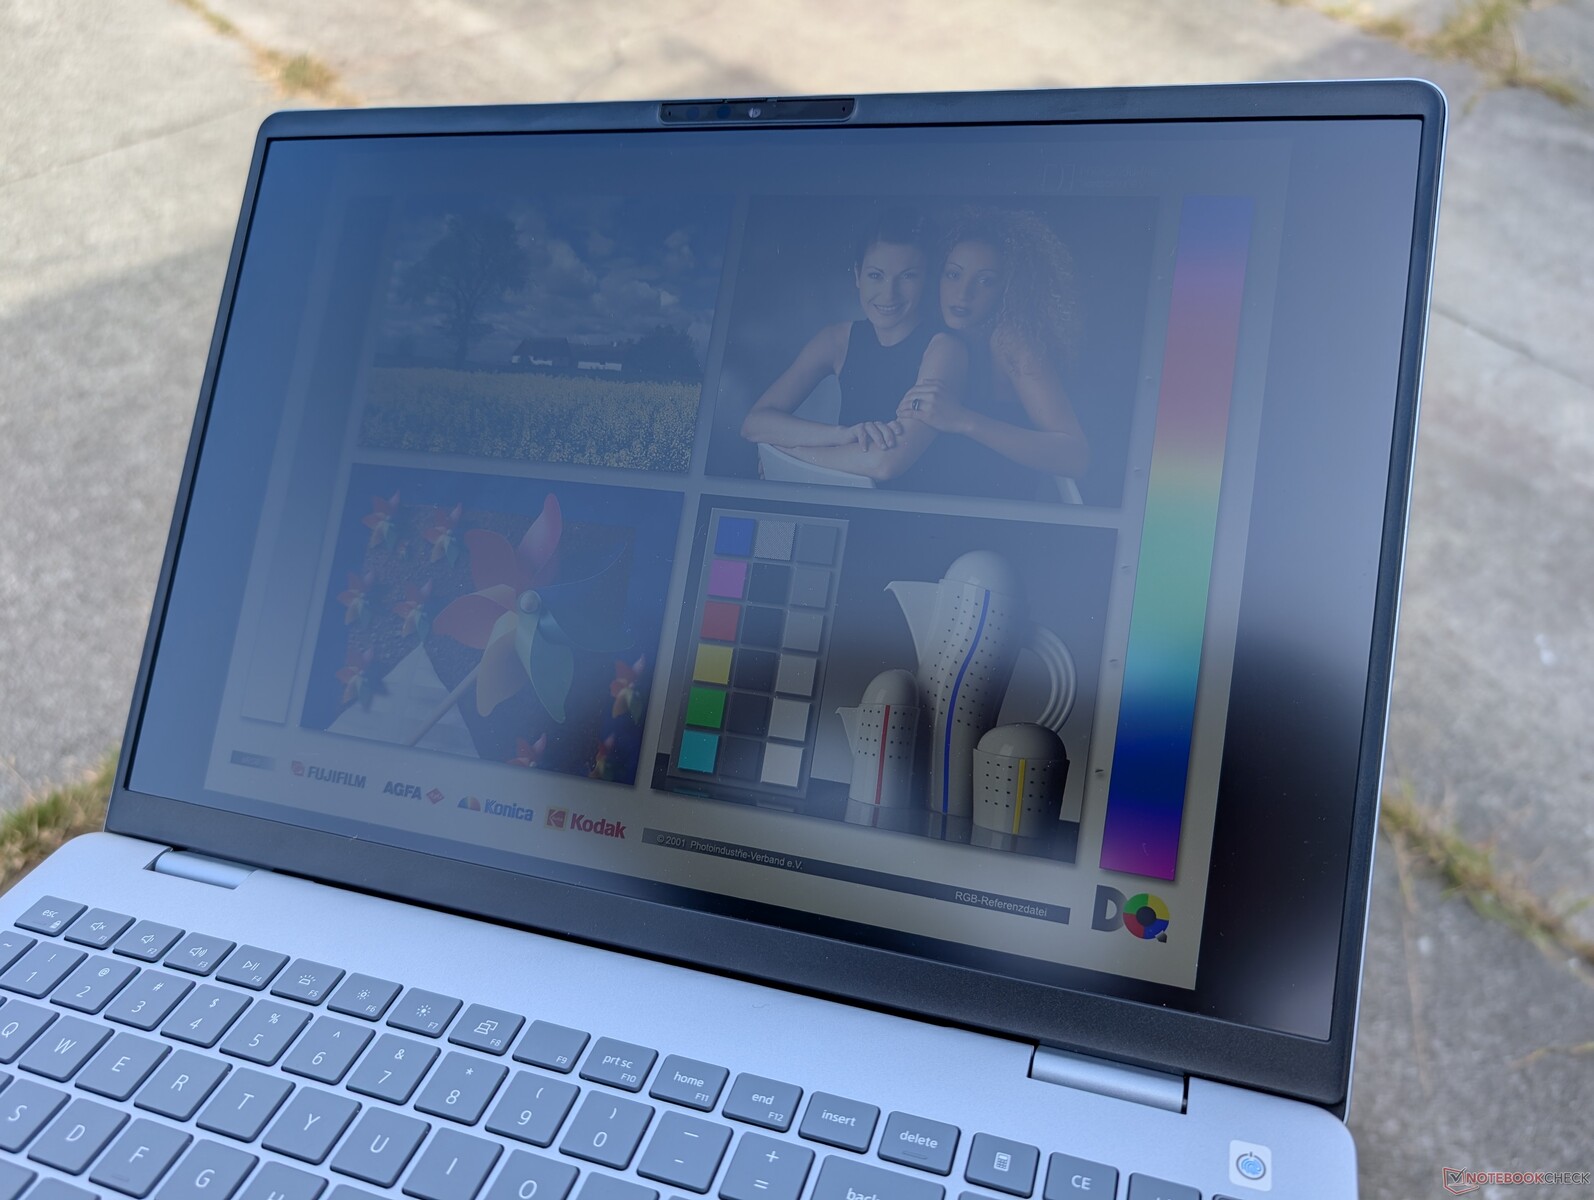
La visibilidad en exteriores es escasa ya que la pantalla no es lo suficientemente brillante como para superar el deslumbramiento.
Rendimiento - Más eficiente con gráficos integrados más rápidos
Condiciones de prueba
Configuramos Dell Optimizer en modo Rendimiento antes de ejecutar los puntos de referencia que se muestran a continuación. Los perfiles de energía de Dell se correlacionan con los perfiles de energía predeterminados de Windows y el cambio de un perfil se sincronizará con el otro.
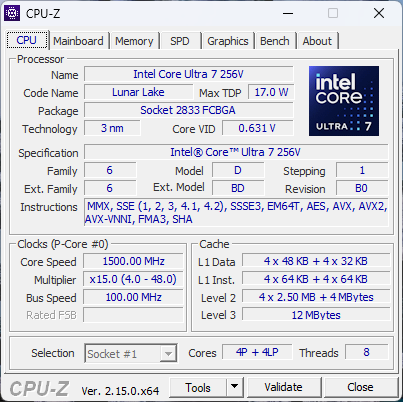
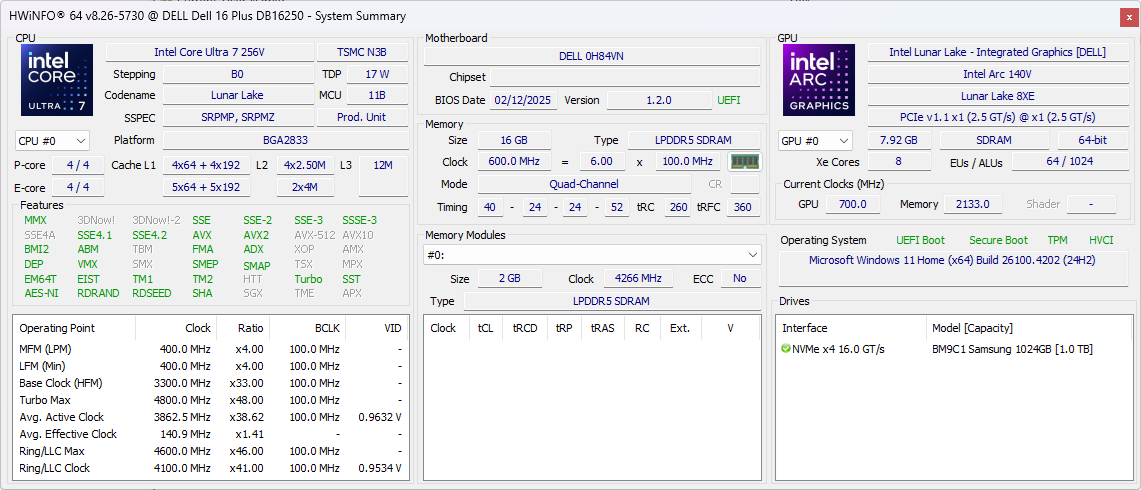
Procesador
El Core Ultra 7 256V apuesta por la eficiencia manteniendo los niveles de rendimiento bruto del procesador de la generación anterior Core Ultra 7 155U. Los modelos más antiguos con opciones Core H siguen siendo significativamente más rápidos, incluido el Inspiron 16 7640 2 en 1. La actualización al Core Ultra 9 288V se espera que traiga ganancias muy menores de menos del 10 por ciento en el mejor de los casos basado en nuestro tiempo con el Acer Swift 16 AI.
La sostenibilidad del rendimiento podría ser mejor, ya que somos capaces de registrar una caída del 20 por ciento con el tiempo al ejecutar nuestra prueba de bucle CineBench R15 xT, como se muestra en el gráfico siguiente.
Cinebench R15 Multi Loop
Cinebench R23: Multi Core | Single Core
Cinebench R20: CPU (Multi Core) | CPU (Single Core)
Cinebench R15: CPU Multi 64Bit | CPU Single 64Bit
Blender: v2.79 BMW27 CPU
7-Zip 18.03: 7z b 4 | 7z b 4 -mmt1
Geekbench 6.7: Multi-Core | Single-Core
Geekbench 5.5: Multi-Core | Single-Core
HWBOT x265 Benchmark v2.2: 4k Preset
LibreOffice : 20 Documents To PDF
R Benchmark 2.5: Overall mean
* ... más pequeño es mejor
AIDA64: FP32 Ray-Trace | FPU Julia | CPU SHA3 | CPU Queen | FPU SinJulia | FPU Mandel | CPU AES | CPU ZLib | FP64 Ray-Trace | CPU PhotoWorxx
| Performance rating | |
| Lenovo ThinkBook 16 G7+ AMD | |
| Asus Vivobook 16 M1606K | |
| HP Pavilion Plus 16-ab0456tx | |
| Dell Inspiron 16 Plus 7640 | |
| Acer Swift 16 AI SF16-51T-932H, Ultra 9 288V | |
| Medio Intel Core Ultra 7 256V | |
| Dell 16 Plus | |
| AIDA64 / FP32 Ray-Trace | |
| Lenovo ThinkBook 16 G7+ AMD | |
| Asus Vivobook 16 M1606K | |
| HP Pavilion Plus 16-ab0456tx | |
| Dell Inspiron 16 Plus 7640 | |
| Acer Swift 16 AI SF16-51T-932H, Ultra 9 288V | |
| Medio Intel Core Ultra 7 256V (10524 - 12898, n=7) | |
| Dell 16 Plus | |
| AIDA64 / FPU Julia | |
| Lenovo ThinkBook 16 G7+ AMD | |
| Asus Vivobook 16 M1606K | |
| HP Pavilion Plus 16-ab0456tx | |
| Dell Inspiron 16 Plus 7640 | |
| Acer Swift 16 AI SF16-51T-932H, Ultra 9 288V | |
| Medio Intel Core Ultra 7 256V (52443 - 62522, n=7) | |
| Dell 16 Plus | |
| AIDA64 / CPU SHA3 | |
| Lenovo ThinkBook 16 G7+ AMD | |
| Asus Vivobook 16 M1606K | |
| HP Pavilion Plus 16-ab0456tx | |
| Dell Inspiron 16 Plus 7640 | |
| Acer Swift 16 AI SF16-51T-932H, Ultra 9 288V | |
| Medio Intel Core Ultra 7 256V (2364 - 2915, n=7) | |
| Dell 16 Plus | |
| AIDA64 / CPU Queen | |
| HP Pavilion Plus 16-ab0456tx | |
| Dell Inspiron 16 Plus 7640 | |
| Lenovo ThinkBook 16 G7+ AMD | |
| Asus Vivobook 16 M1606K | |
| Acer Swift 16 AI SF16-51T-932H, Ultra 9 288V | |
| Medio Intel Core Ultra 7 256V (49622 - 49794, n=6) | |
| Dell 16 Plus | |
| AIDA64 / FPU SinJulia | |
| Lenovo ThinkBook 16 G7+ AMD | |
| Asus Vivobook 16 M1606K | |
| Dell Inspiron 16 Plus 7640 | |
| HP Pavilion Plus 16-ab0456tx | |
| Medio Intel Core Ultra 7 256V (4401 - 4434, n=7) | |
| Acer Swift 16 AI SF16-51T-932H, Ultra 9 288V | |
| Dell 16 Plus | |
| AIDA64 / FPU Mandel | |
| Lenovo ThinkBook 16 G7+ AMD | |
| Asus Vivobook 16 M1606K | |
| HP Pavilion Plus 16-ab0456tx | |
| Dell Inspiron 16 Plus 7640 | |
| Acer Swift 16 AI SF16-51T-932H, Ultra 9 288V | |
| Medio Intel Core Ultra 7 256V (27382 - 33019, n=7) | |
| Dell 16 Plus | |
| AIDA64 / CPU AES | |
| Lenovo ThinkBook 16 G7+ AMD | |
| Dell Inspiron 16 Plus 7640 | |
| HP Pavilion Plus 16-ab0456tx | |
| Asus Vivobook 16 M1606K | |
| Medio Intel Core Ultra 7 256V (38495 - 75938, n=7) | |
| Acer Swift 16 AI SF16-51T-932H, Ultra 9 288V | |
| Dell 16 Plus | |
| AIDA64 / CPU ZLib | |
| Lenovo ThinkBook 16 G7+ AMD | |
| Dell Inspiron 16 Plus 7640 | |
| Asus Vivobook 16 M1606K | |
| HP Pavilion Plus 16-ab0456tx | |
| Medio Intel Core Ultra 7 256V (536 - 632, n=7) | |
| Acer Swift 16 AI SF16-51T-932H, Ultra 9 288V | |
| Dell 16 Plus | |
| AIDA64 / FP64 Ray-Trace | |
| Lenovo ThinkBook 16 G7+ AMD | |
| Asus Vivobook 16 M1606K | |
| HP Pavilion Plus 16-ab0456tx | |
| Dell Inspiron 16 Plus 7640 | |
| Acer Swift 16 AI SF16-51T-932H, Ultra 9 288V | |
| Medio Intel Core Ultra 7 256V (5655 - 6878, n=7) | |
| Dell 16 Plus | |
| AIDA64 / CPU PhotoWorxx | |
| Acer Swift 16 AI SF16-51T-932H, Ultra 9 288V | |
| Medio Intel Core Ultra 7 256V (49906 - 57060, n=7) | |
| Dell 16 Plus | |
| Lenovo ThinkBook 16 G7+ AMD | |
| HP Pavilion Plus 16-ab0456tx | |
| Dell Inspiron 16 Plus 7640 | |
| Asus Vivobook 16 M1606K | |
Prueba de estrés
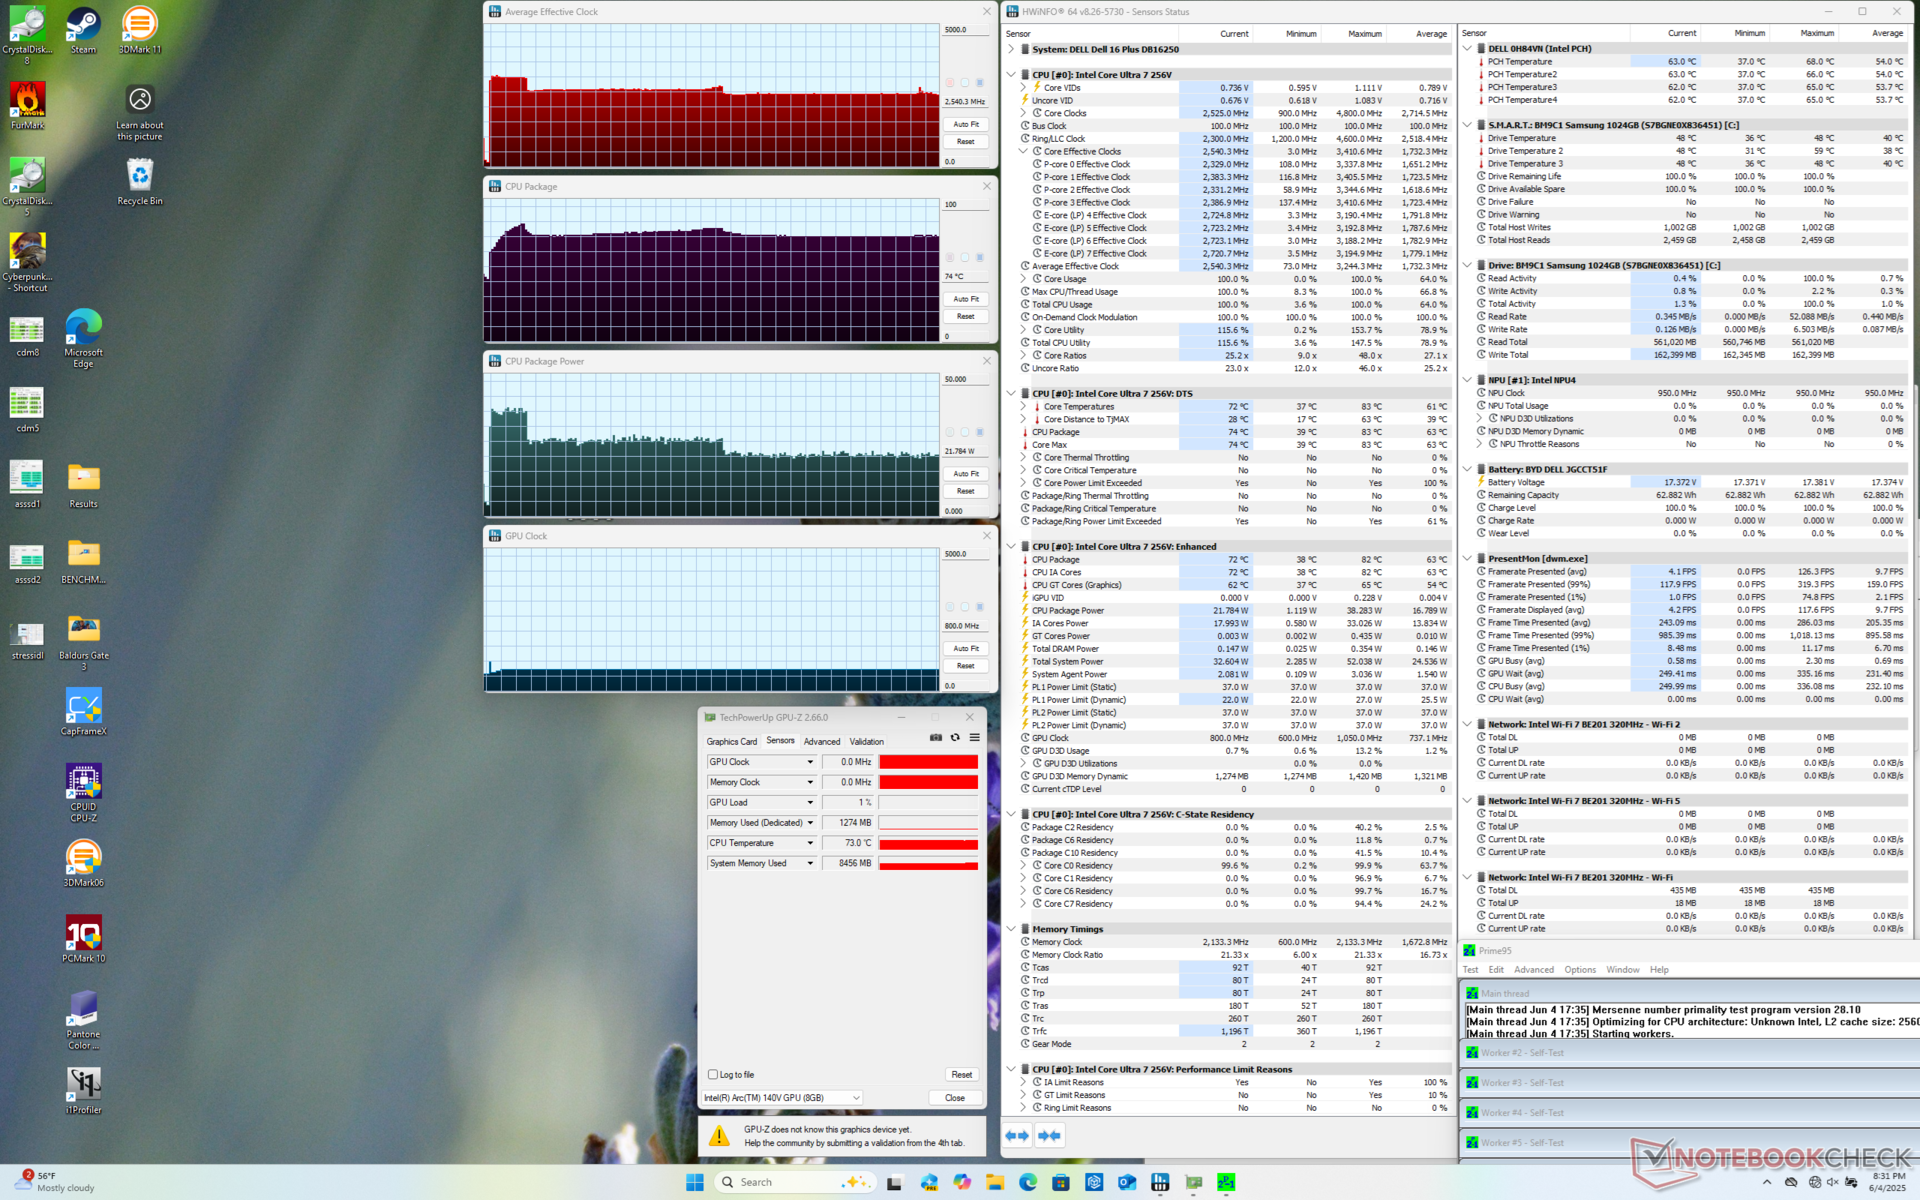
Al ejecutar el estrés Prime95, la CPU aumentaría a 3,2 GHz y 38 W durante unos 20 segundos antes de alcanzar los 83 C. A continuación, bajaría y se estabilizaría a 2,5 GHz y 21 W con el fin de mantener una temperatura del núcleo más fría de 74 C para representar el potencial limitado de Turbo Boost. Esto también se refleja en nuestra prueba de bucle CineBench R15 xT como se mencionó anteriormente.
Al ejecutar Cyberpunk 2077 para representar el estrés típico de los juegos, el procesador alcanzaría de nuevo un máximo de 74 C para ser significativamente más frío que lo que observamos en el Inspiron 16 7640 2 en 1.
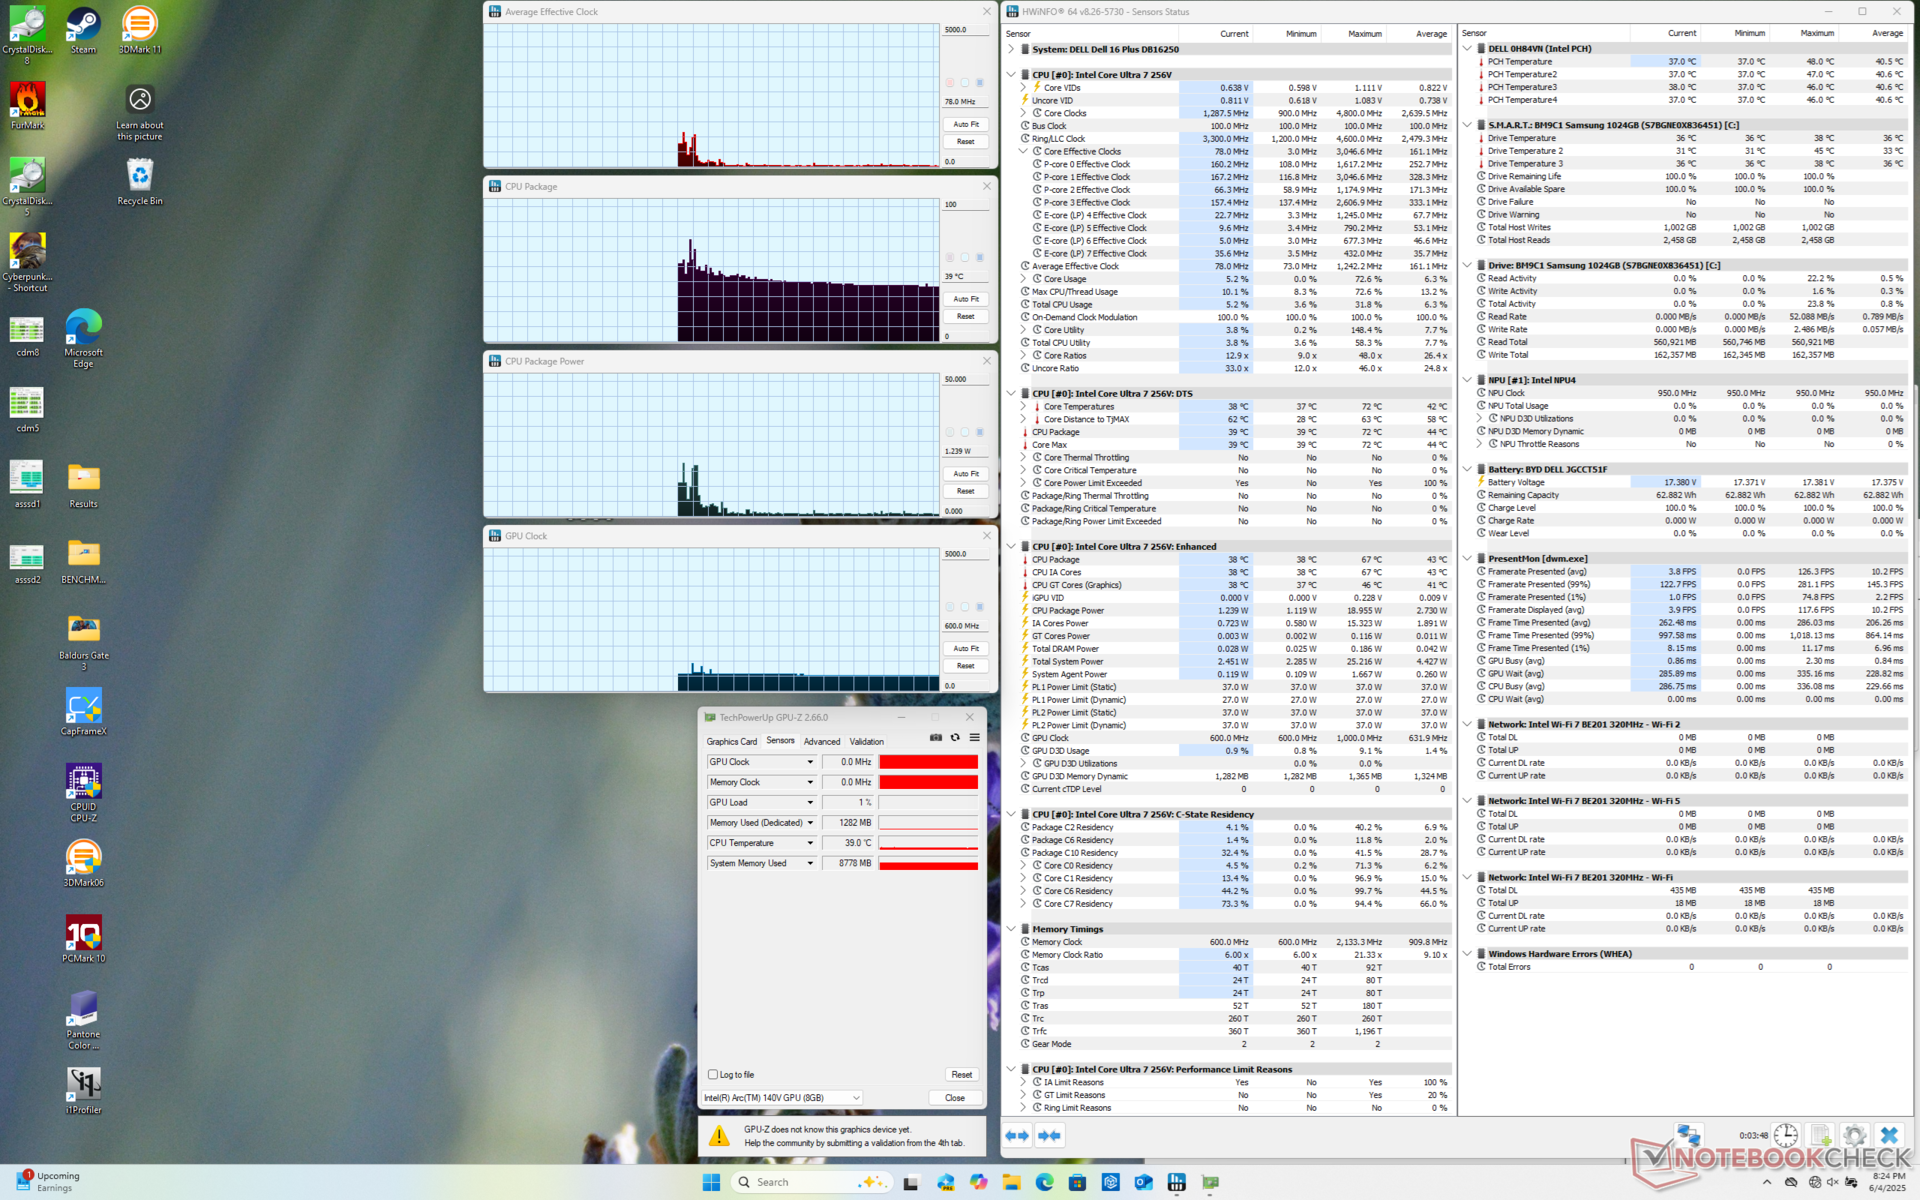
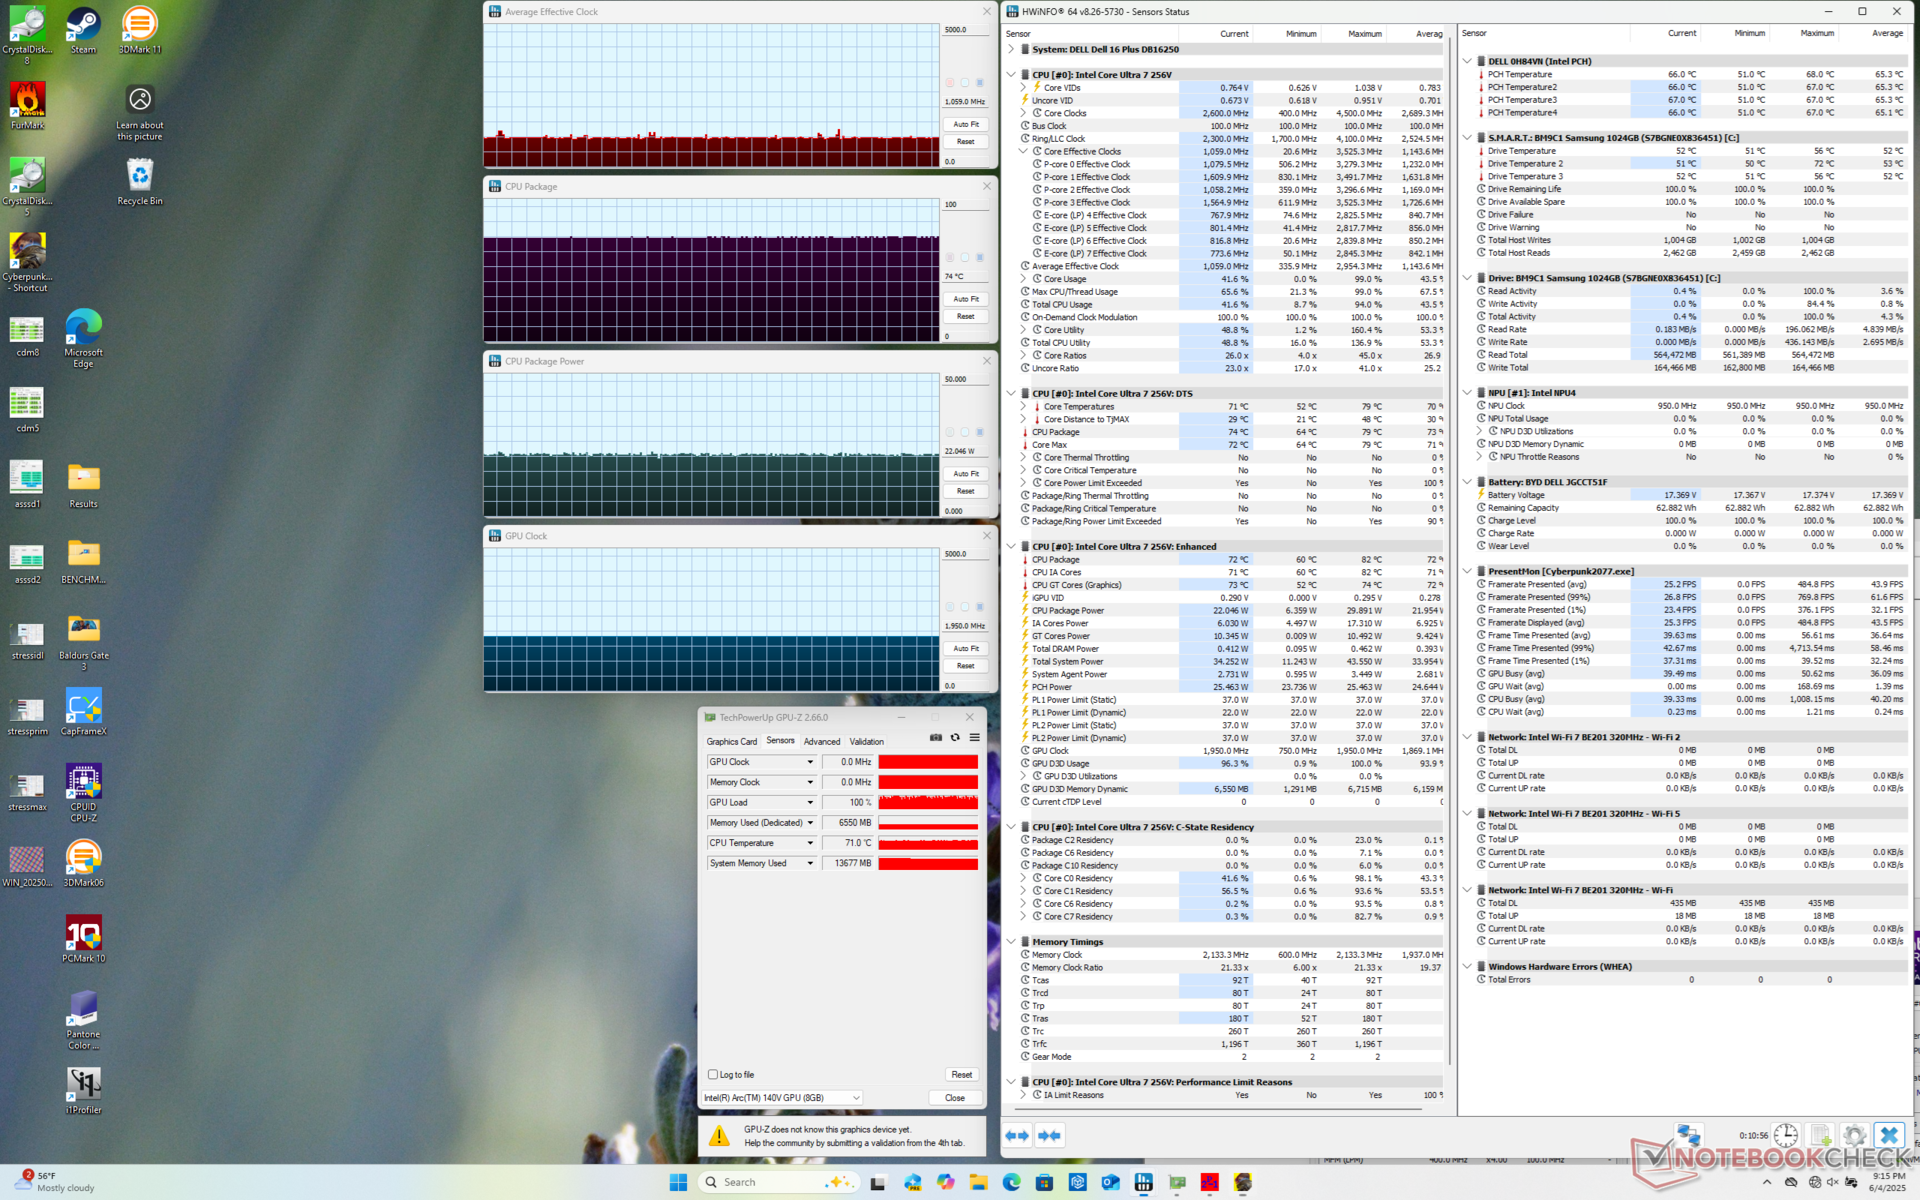
| Reloj medio de la CPU (GHz) | Reloj de la GPU (MHz) | Temperatura media de la CPU (°C) | |
| Sistema en reposo | -- | -- | 39 |
| Prime95 Stress | 2.5 | -- | 74 |
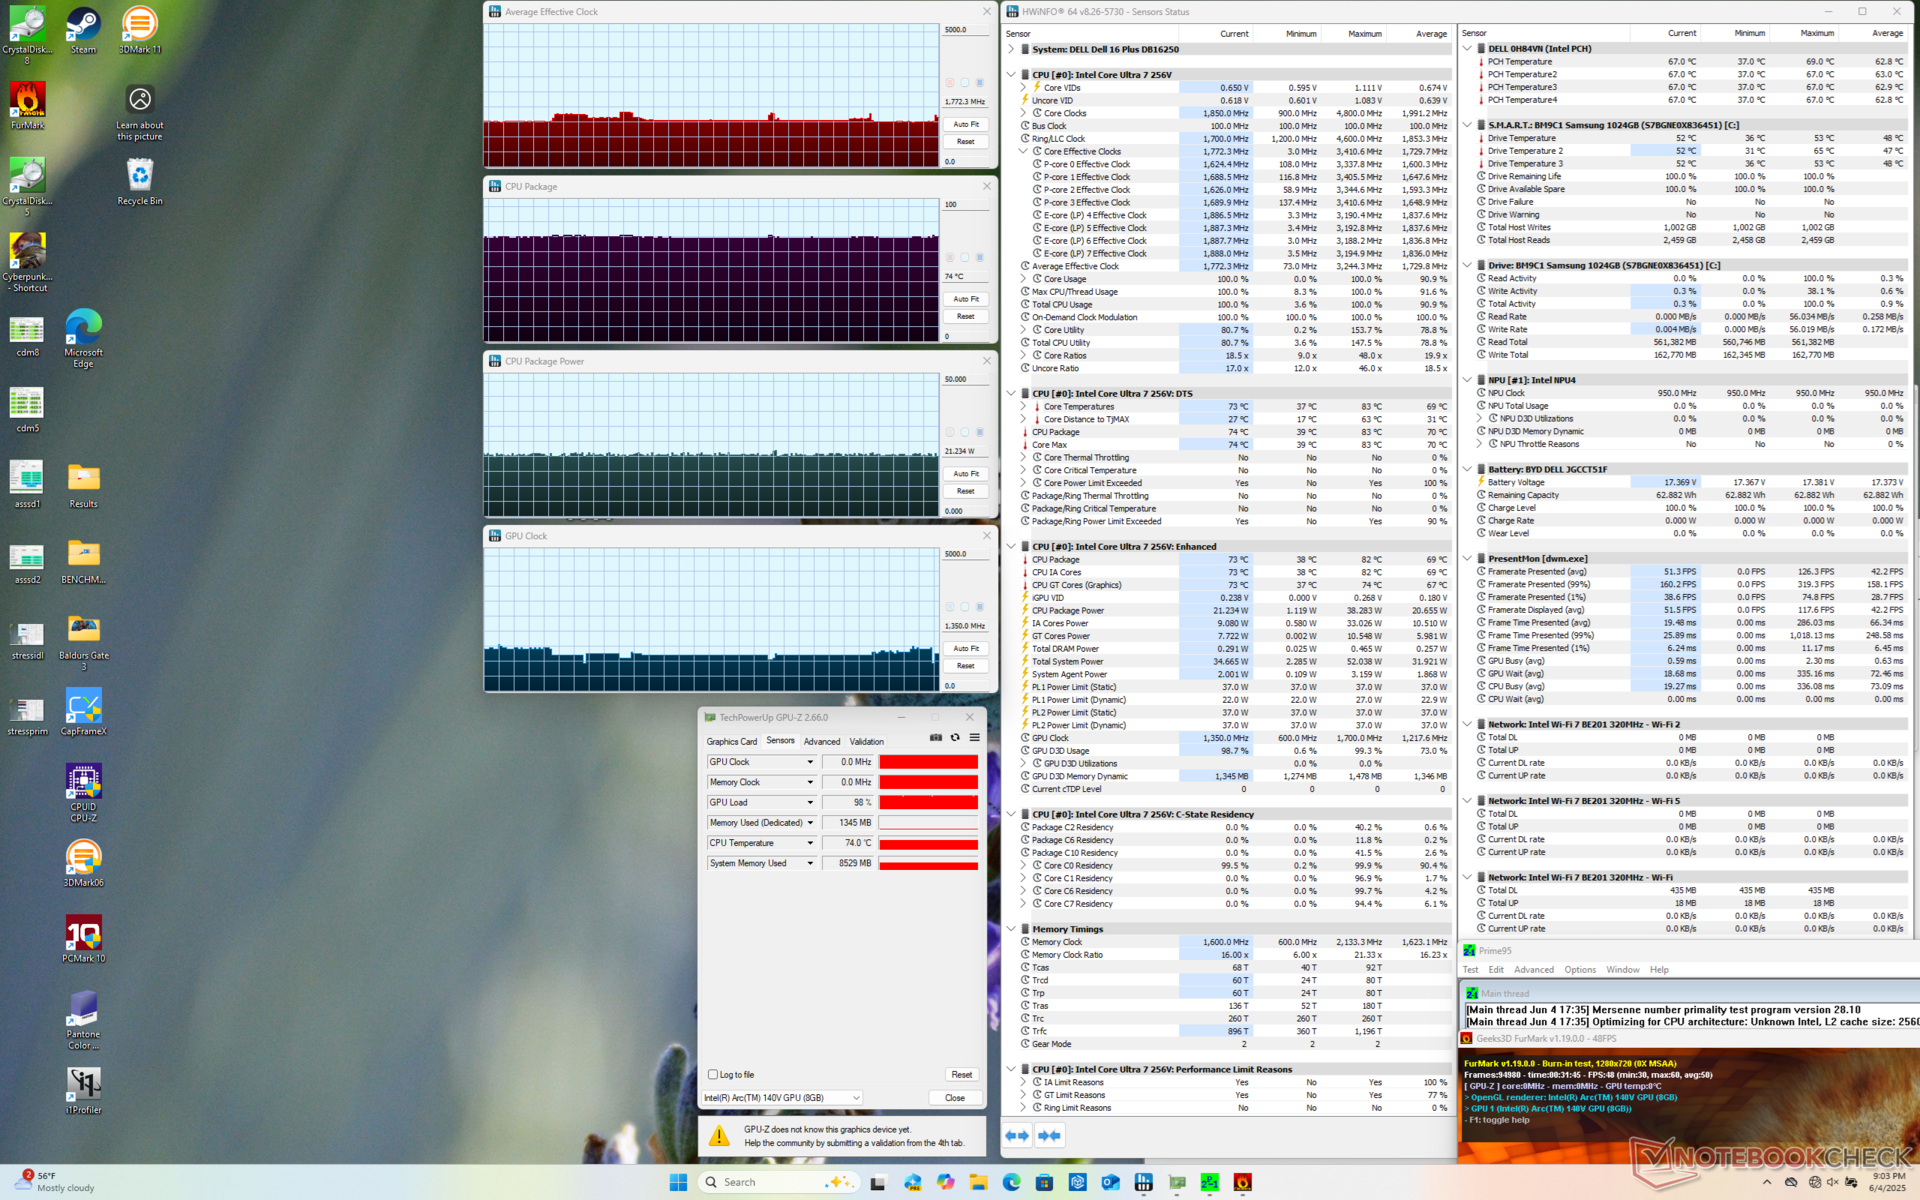
| Prime95 + FurMark Stress | 1.7 | 1350 | 74 |
| Cyberpunk 2077 Estrés | 1.0 | 1950 | 74 |
Rendimiento del sistema
Las puntuaciones en PCMark son comparables a las de los portátiles de 16 pulgadas de la competencia, incluidos incluso aquellos con CPU de la serie H más rápidas como el Asus Vivobook 16 M1606K. El rendimiento de la memoria RAM también es excelente gracias al diseño en paquete de Lunar Lake.
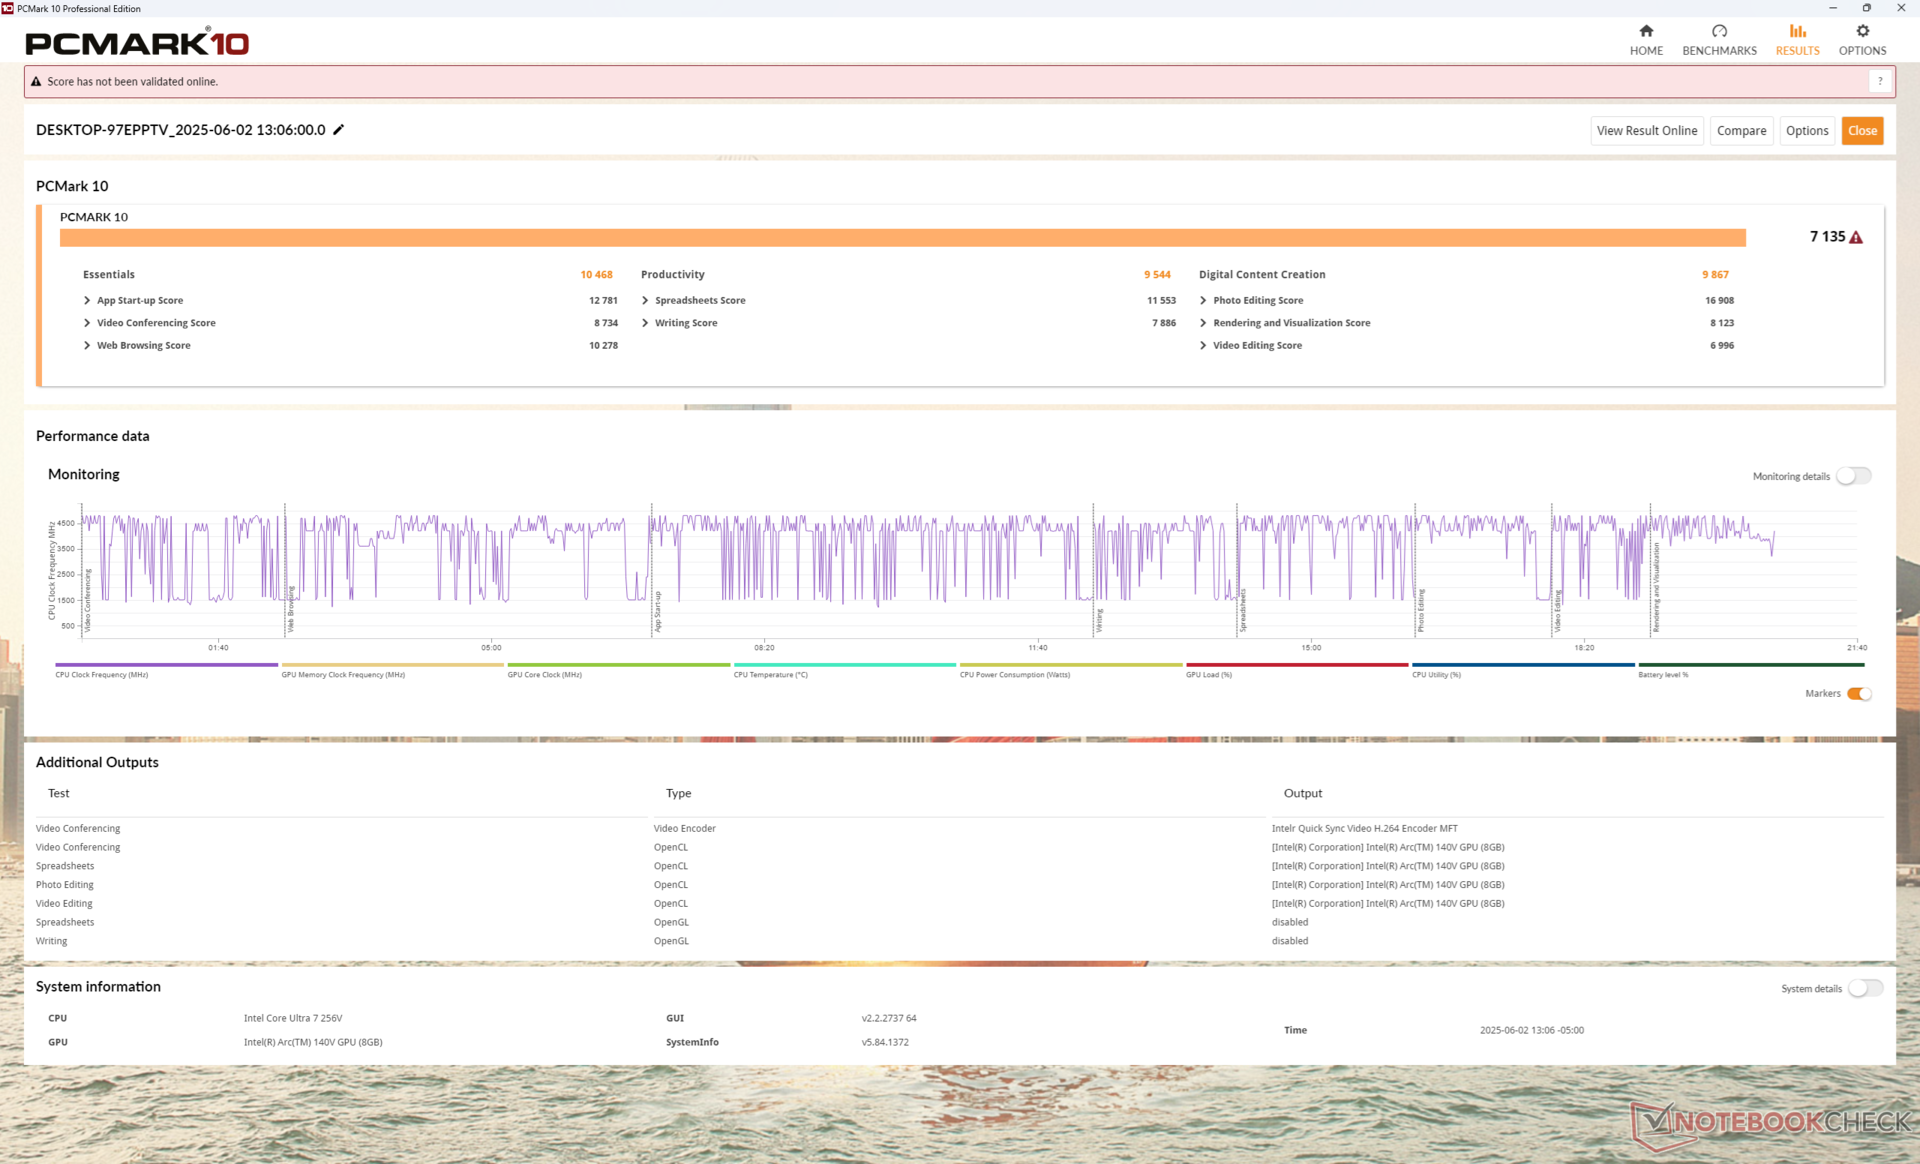
PCMark 10: Score | Essentials | Productivity | Digital Content Creation
CrossMark: Overall | Productivity | Creativity | Responsiveness
WebXPRT 3: Overall
WebXPRT 4: Overall
Mozilla Kraken 1.1: Total
| Performance rating | |
| Lenovo ThinkBook 16 G7+ AMD | |
| Acer Swift 16 AI SF16-51T-932H, Ultra 9 288V | |
| Dell 16 Plus | |
| Medio Intel Core Ultra 7 256V, Intel Arc Graphics 140V | |
| Asus Vivobook 16 M1606K | |
| HP Pavilion Plus 16-ab0456tx | |
| Dell Inspiron 16 Plus 7640 | |
| PCMark 10 / Score | |
| Lenovo ThinkBook 16 G7+ AMD | |
| Acer Swift 16 AI SF16-51T-932H, Ultra 9 288V | |
| Dell 16 Plus | |
| Medio Intel Core Ultra 7 256V, Intel Arc Graphics 140V (6677 - 7702, n=7) | |
| Dell Inspiron 16 Plus 7640 | |
| Asus Vivobook 16 M1606K | |
| HP Pavilion Plus 16-ab0456tx | |
| PCMark 10 / Essentials | |
| Asus Vivobook 16 M1606K | |
| Lenovo ThinkBook 16 G7+ AMD | |
| Acer Swift 16 AI SF16-51T-932H, Ultra 9 288V | |
| Dell 16 Plus | |
| Dell Inspiron 16 Plus 7640 | |
| Medio Intel Core Ultra 7 256V, Intel Arc Graphics 140V (9627 - 11365, n=7) | |
| HP Pavilion Plus 16-ab0456tx | |
| PCMark 10 / Productivity | |
| Lenovo ThinkBook 16 G7+ AMD | |
| Asus Vivobook 16 M1606K | |
| Medio Intel Core Ultra 7 256V, Intel Arc Graphics 140V (8161 - 12672, n=7) | |
| Dell 16 Plus | |
| Acer Swift 16 AI SF16-51T-932H, Ultra 9 288V | |
| HP Pavilion Plus 16-ab0456tx | |
| Dell Inspiron 16 Plus 7640 | |
| PCMark 10 / Digital Content Creation | |
| Dell Inspiron 16 Plus 7640 | |
| Lenovo ThinkBook 16 G7+ AMD | |
| Acer Swift 16 AI SF16-51T-932H, Ultra 9 288V | |
| Dell 16 Plus | |
| Medio Intel Core Ultra 7 256V, Intel Arc Graphics 140V (9481 - 10126, n=7) | |
| Asus Vivobook 16 M1606K | |
| HP Pavilion Plus 16-ab0456tx | |
| CrossMark / Overall | |
| HP Pavilion Plus 16-ab0456tx | |
| Lenovo ThinkBook 16 G7+ AMD | |
| Acer Swift 16 AI SF16-51T-932H, Ultra 9 288V | |
| Asus Vivobook 16 M1606K | |
| Medio Intel Core Ultra 7 256V, Intel Arc Graphics 140V (1636 - 1736, n=7) | |
| Dell Inspiron 16 Plus 7640 | |
| Dell 16 Plus | |
| CrossMark / Productivity | |
| Acer Swift 16 AI SF16-51T-932H, Ultra 9 288V | |
| HP Pavilion Plus 16-ab0456tx | |
| Medio Intel Core Ultra 7 256V, Intel Arc Graphics 140V (1563 - 1682, n=7) | |
| Asus Vivobook 16 M1606K | |
| Dell 16 Plus | |
| Lenovo ThinkBook 16 G7+ AMD | |
| Dell Inspiron 16 Plus 7640 | |
| CrossMark / Creativity | |
| Lenovo ThinkBook 16 G7+ AMD | |
| HP Pavilion Plus 16-ab0456tx | |
| Acer Swift 16 AI SF16-51T-932H, Ultra 9 288V | |
| Dell Inspiron 16 Plus 7640 | |
| Medio Intel Core Ultra 7 256V, Intel Arc Graphics 140V (1862 - 1962, n=7) | |
| Dell 16 Plus | |
| Asus Vivobook 16 M1606K | |
| CrossMark / Responsiveness | |
| HP Pavilion Plus 16-ab0456tx | |
| Asus Vivobook 16 M1606K | |
| Lenovo ThinkBook 16 G7+ AMD | |
| Dell Inspiron 16 Plus 7640 | |
| Acer Swift 16 AI SF16-51T-932H, Ultra 9 288V | |
| Medio Intel Core Ultra 7 256V, Intel Arc Graphics 140V (1215 - 1371, n=7) | |
| Dell 16 Plus | |
| WebXPRT 3 / Overall | |
| Lenovo ThinkBook 16 G7+ AMD | |
| Dell 16 Plus | |
| Acer Swift 16 AI SF16-51T-932H, Ultra 9 288V | |
| Medio Intel Core Ultra 7 256V, Intel Arc Graphics 140V (243 - 310, n=7) | |
| Asus Vivobook 16 M1606K | |
| Dell Inspiron 16 Plus 7640 | |
| HP Pavilion Plus 16-ab0456tx | |
| WebXPRT 4 / Overall | |
| Medio Intel Core Ultra 7 256V, Intel Arc Graphics 140V (282 - 286, n=7) | |
| Dell 16 Plus | |
| Acer Swift 16 AI SF16-51T-932H, Ultra 9 288V | |
| HP Pavilion Plus 16-ab0456tx | |
| Dell Inspiron 16 Plus 7640 | |
| Lenovo ThinkBook 16 G7+ AMD | |
| Asus Vivobook 16 M1606K | |
| Mozilla Kraken 1.1 / Total | |
| Dell Inspiron 16 Plus 7640 | |
| HP Pavilion Plus 16-ab0456tx | |
| Medio Intel Core Ultra 7 256V, Intel Arc Graphics 140V (470 - 480, n=7) | |
| Dell 16 Plus | |
| Acer Swift 16 AI SF16-51T-932H, Ultra 9 288V | |
| Asus Vivobook 16 M1606K | |
| Lenovo ThinkBook 16 G7+ AMD | |
* ... más pequeño es mejor
| PCMark 10 Score | 7135 puntos | |
ayuda | ||
| AIDA64 / Memory Copy | |
| Acer Swift 16 AI SF16-51T-932H, Ultra 9 288V | |
| Medio Intel Core Ultra 7 256V (99227 - 104459, n=7) | |
| Dell 16 Plus | |
| Lenovo ThinkBook 16 G7+ AMD | |
| HP Pavilion Plus 16-ab0456tx | |
| Dell Inspiron 16 Plus 7640 | |
| Asus Vivobook 16 M1606K | |
| AIDA64 / Memory Read | |
| Lenovo ThinkBook 16 G7+ AMD | |
| Dell 16 Plus | |
| Medio Intel Core Ultra 7 256V (86352 - 89848, n=7) | |
| Acer Swift 16 AI SF16-51T-932H, Ultra 9 288V | |
| Dell Inspiron 16 Plus 7640 | |
| HP Pavilion Plus 16-ab0456tx | |
| Asus Vivobook 16 M1606K | |
| AIDA64 / Memory Write | |
| Dell 16 Plus | |
| Medio Intel Core Ultra 7 256V (108692 - 117933, n=7) | |
| Acer Swift 16 AI SF16-51T-932H, Ultra 9 288V | |
| Lenovo ThinkBook 16 G7+ AMD | |
| HP Pavilion Plus 16-ab0456tx | |
| Dell Inspiron 16 Plus 7640 | |
| Asus Vivobook 16 M1606K | |
| AIDA64 / Memory Latency | |
| Dell Inspiron 16 Plus 7640 | |
| Lenovo ThinkBook 16 G7+ AMD | |
| Dell 16 Plus | |
| Medio Intel Core Ultra 7 256V (96.1 - 99.6, n=7) | |
| Acer Swift 16 AI SF16-51T-932H, Ultra 9 288V | |
| HP Pavilion Plus 16-ab0456tx | |
| Asus Vivobook 16 M1606K | |
* ... más pequeño es mejor
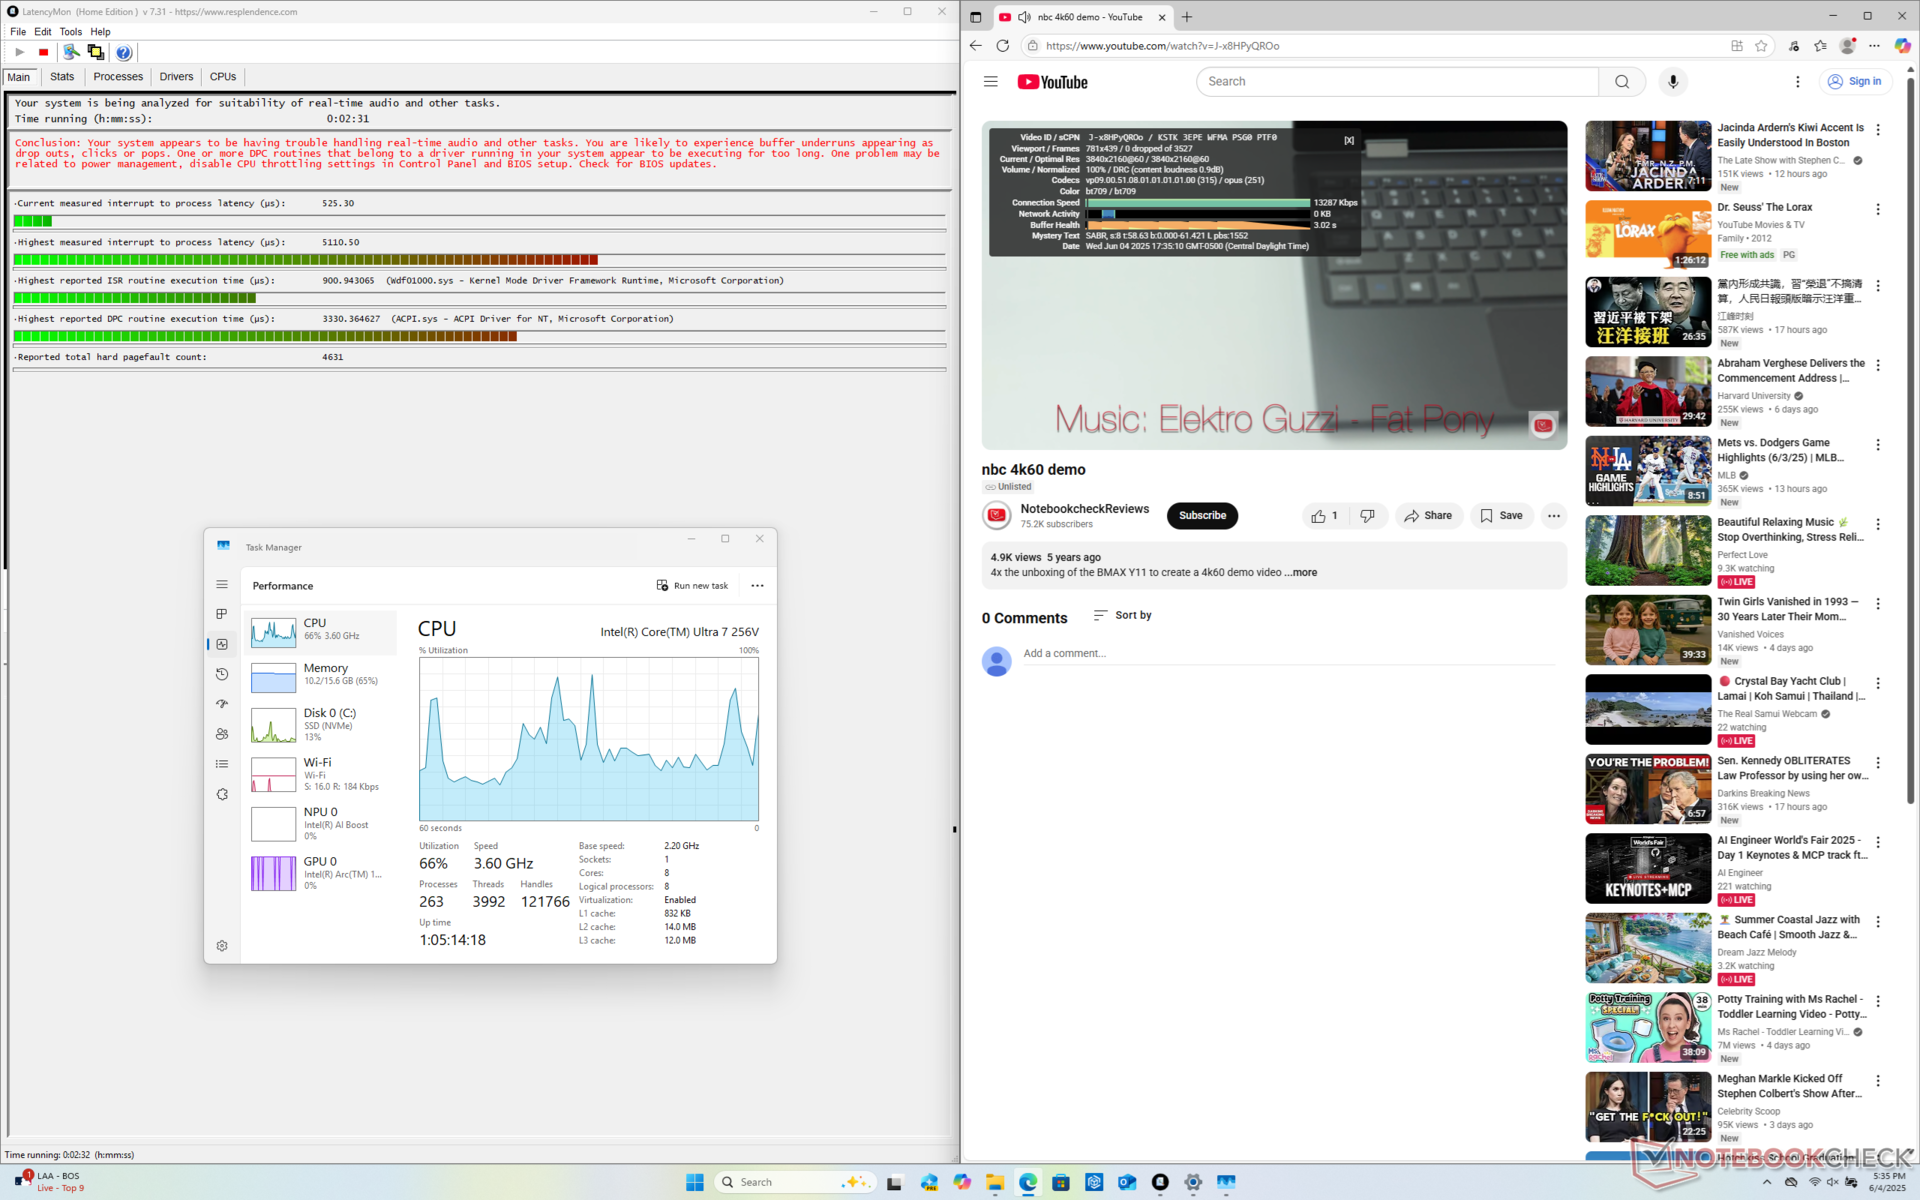
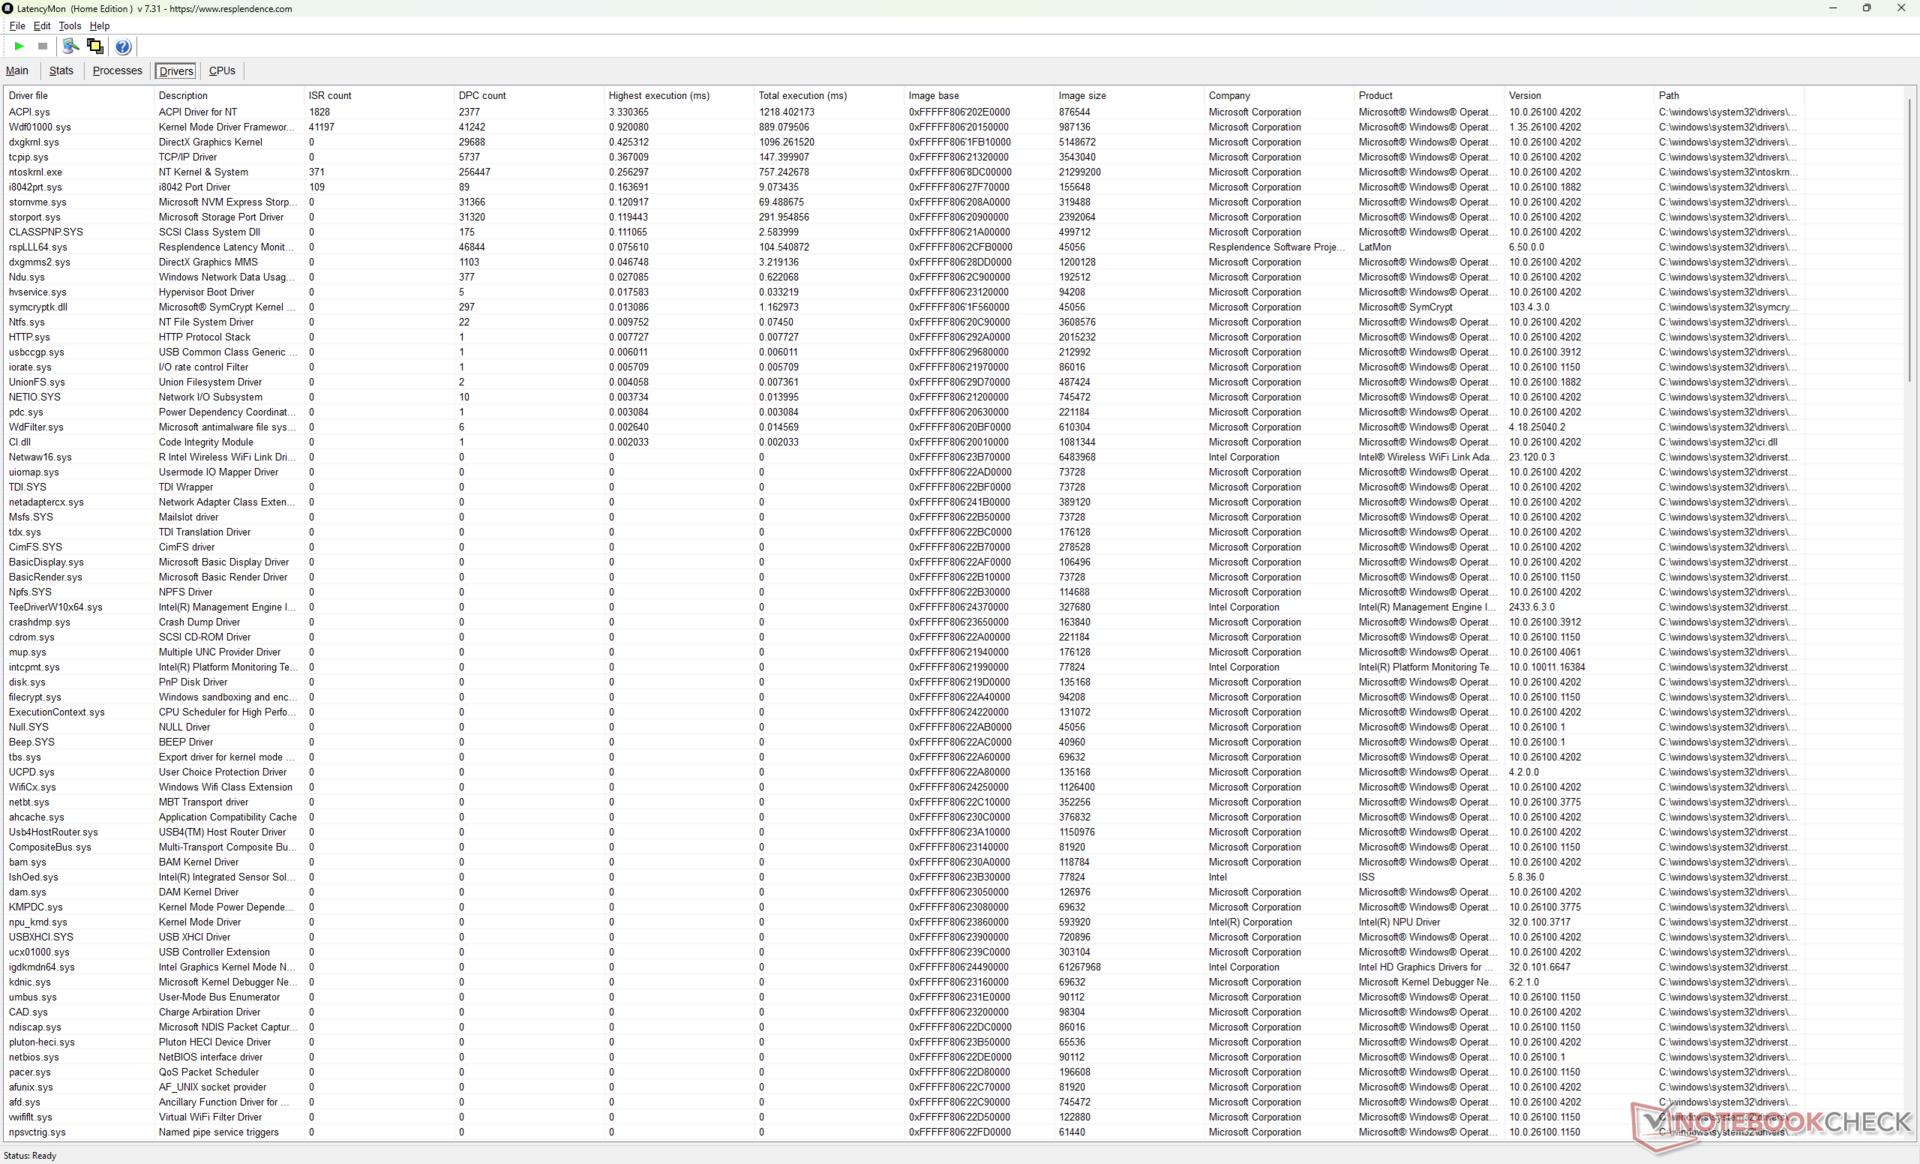
Latencia del CPD
LatencyMon revela problemas de CPD al abrir varias pestañas del navegador de nuestra página principal. Extrañamente, la actividad de la GPU oscilaba entre 0 y 100 por ciento al reproducir vídeo 4K60, mientras que la GPU se mantenía estable en ~40 por ciento en la mayoría de los demás portátiles Lunar Lake. Por lo demás, no se registran caídas de fotogramas para una experiencia de streaming 4K60 fluida.
| DPC Latencies / LatencyMon - interrupt to process latency (max), Web, Youtube, Prime95 | |
| HP Pavilion Plus 16-ab0456tx | |
| Dell 16 Plus | |
| Acer Swift 16 AI SF16-51T-932H, Ultra 9 288V | |
| Lenovo ThinkBook 16 G7+ AMD | |
| Asus Vivobook 16 M1606K | |
| Dell Inspiron 16 Plus 7640 | |
* ... más pequeño es mejor
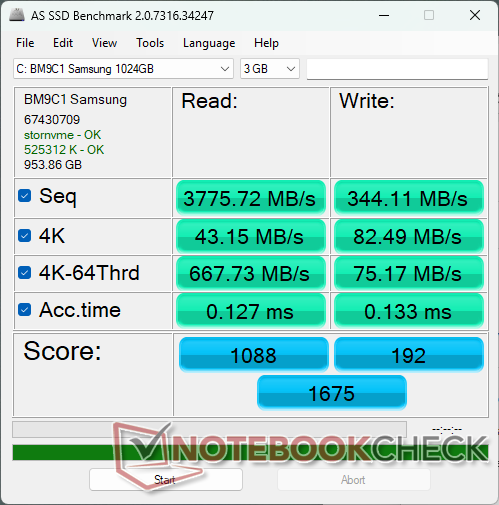
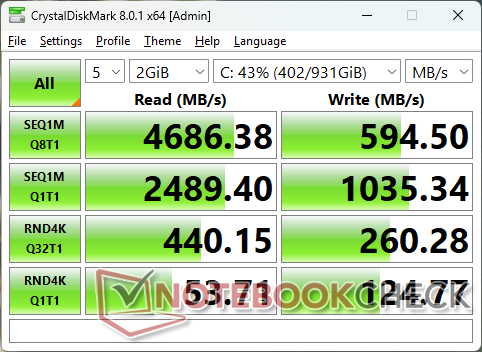
Dispositivos de almacenamiento
El Samsung BM9C1 es inferior al Micron 2550 del Inspiron 16 7640 2 en 1 del año pasado. Las tasas de transferencia no son tan estables ya que fluctuarían entre 3600 MB/s y 4900 MB/s e incluso tan bajas como 2200 MB/s durante nuestra prueba en bucle DiskSpd.

| Drive Performance rating - Percent | |
| HP Pavilion Plus 16-ab0456tx | |
| Asus Vivobook 16 M1606K | |
| Lenovo ThinkBook 16 G7+ AMD | |
| Dell Inspiron 16 Plus 7640 | |
| Acer Swift 16 AI SF16-51T-932H, Ultra 9 288V | |
| Dell 16 Plus | |
* ... más pequeño es mejor
Disk Throttling: DiskSpd Read Loop, Queue Depth 8
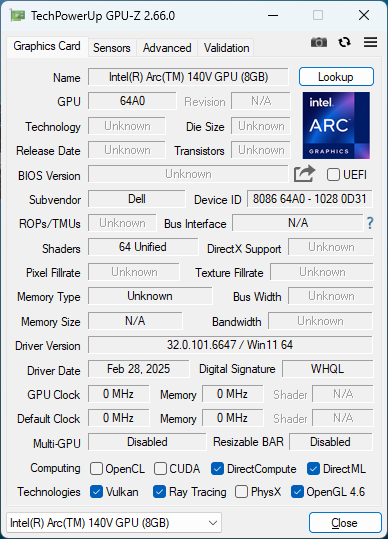
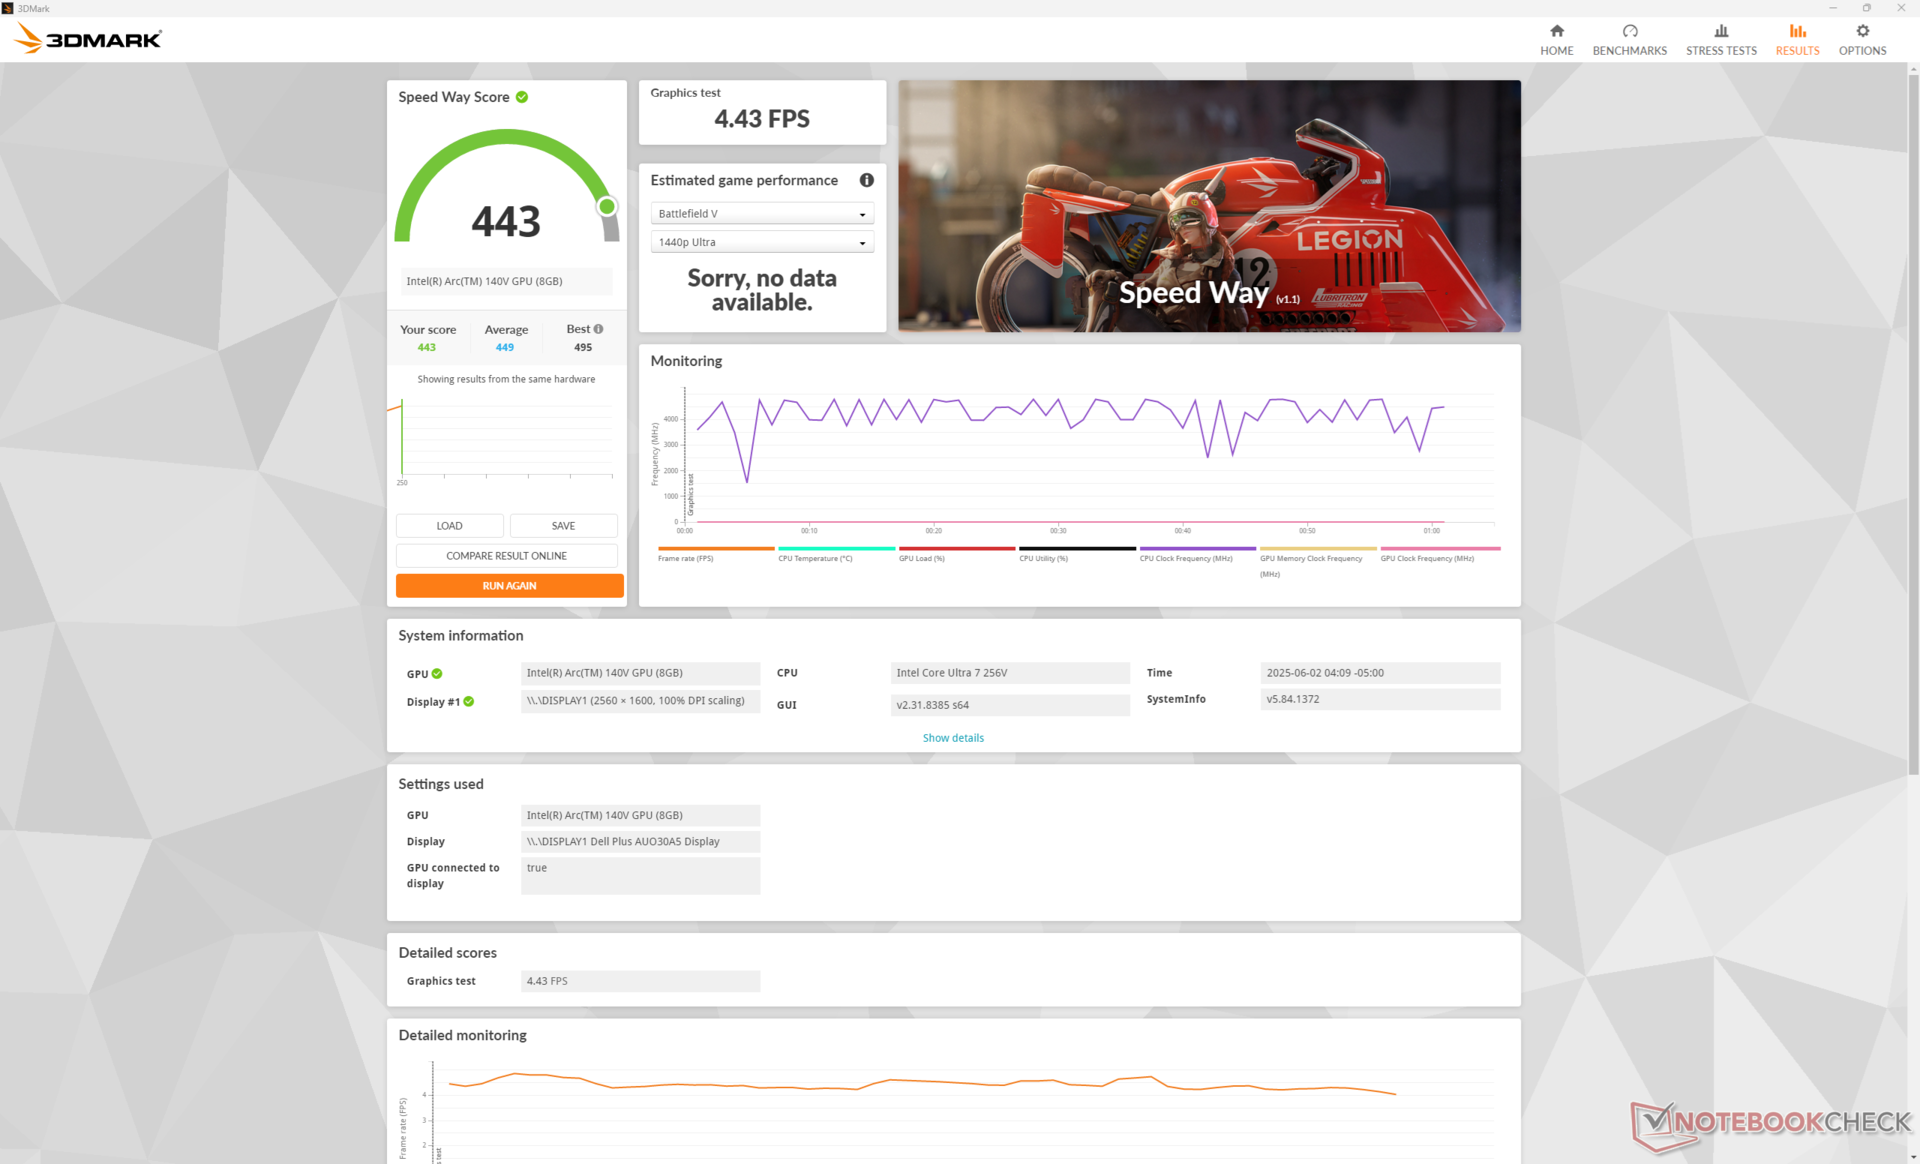
Rendimiento de la GPU
El Arco 140V es una mejora decente con respecto al Arc 8. De hecho, el Dell 16 Plus ejecuta la mayoría de los juegos hasta un 25% más rápido que el Inspiron 16 7640 2 en 1 del año pasado, a pesar de que este último incorpora una CPU Core-H mucho más rápida.
| Perfil de potencia | Puntuación gráfica | Puntuación física | Puntuación combinada |
| Modo de rendimiento | 9682 | 19037 | 3057 |
| Modo equilibrado | 8164 (-16%) | 16591 (-13%) | 2296 (-25%) |
| Batería | 8266 (-15%) | 16361 (-14%) | 2350 (-23%) |
Ejecutar en modo equilibrado en lugar de en modo de rendimiento repercute en el rendimiento general con bastante margen, como muestra nuestra tabla de resultados Fire Strike anterior.
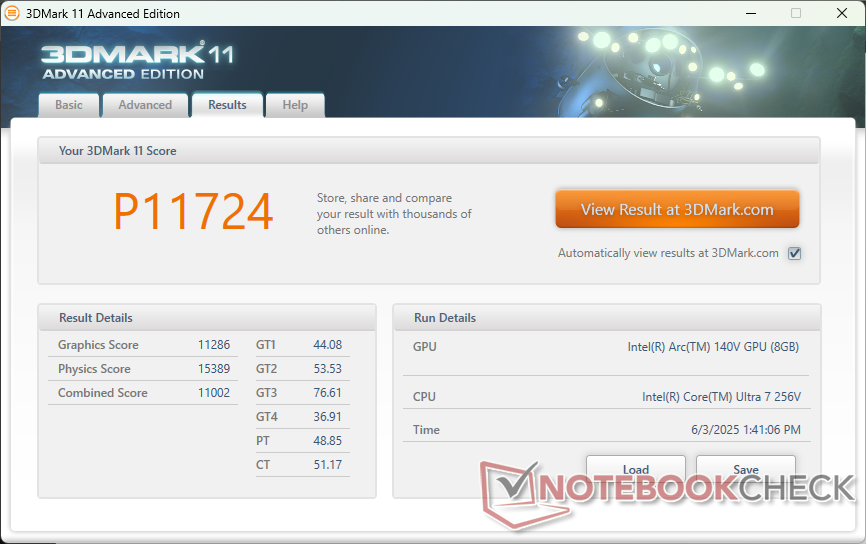

| 3DMark 11 Performance | 11724 puntos | |
| 3DMark Fire Strike Score | 8470 puntos | |
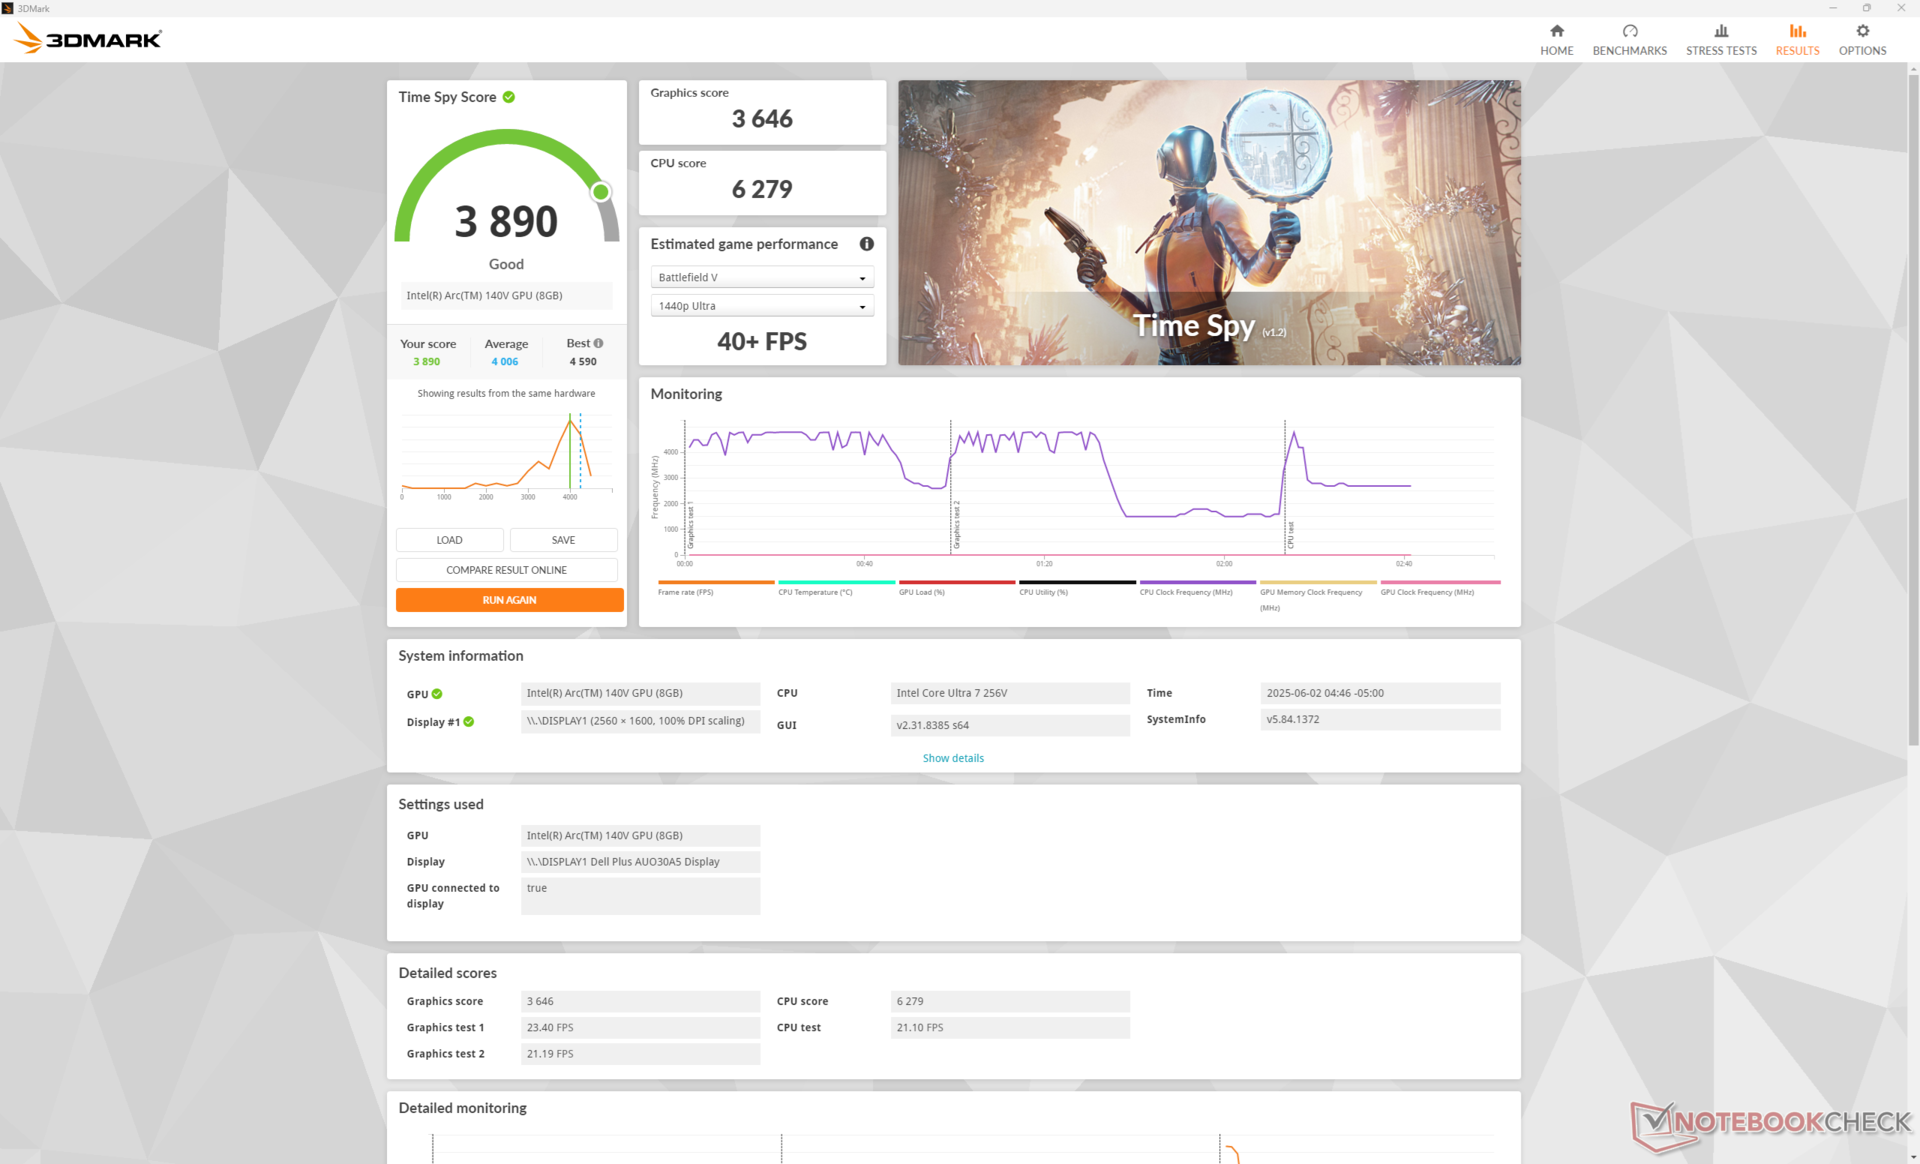
| 3DMark Time Spy Score | 3890 puntos | |
ayuda | ||
* ... más pequeño es mejor
Rendimiento en juegos
La mayoría de los títulos funcionan bien en el sistema a 1080p nativos y ajustes bajos, incluido Baldur's Gate 3. Títulos más exigentes como Cyberpunk 2077, sin embargo, pueden necesitar bajar a 720p para una experiencia más fluida.
| F1 24 | |
| 1920x1080 Low Preset AA:T AF:16x | |
| Medio Intel Arc Graphics 140V (54 - 99, n=25) | |
| Dell 16 Plus | |
| Lenovo ThinkPad T16 Gen 3 21MN005XGE | |
| 1920x1080 Medium Preset AA:T AF:16x | |
| Medio Intel Arc Graphics 140V (49.2 - 88.2, n=24) | |
| Dell 16 Plus | |
| Lenovo ThinkPad T16 Gen 3 21MN005XGE | |
| 1920x1080 High Preset AA:T AF:16x | |
| Medio Intel Arc Graphics 140V (34.4 - 66.4, n=27) | |
| Dell 16 Plus | |
| LG Gram Pro 16Z90TS-G.AU89G | |
| Lenovo ThinkPad T16 Gen 3 21MN005XGE | |
| 1920x1080 Ultra High Preset AA:T AF:16x | |
| Dell 16 Plus | |
| Medio Intel Arc Graphics 140V (14.6 - 22, n=25) | |
| Lenovo ThinkPad T16 Gen 3 21MN005XGE | |
Cyberpunk 2077 ultra FPS Chart
| bajo | medio | alto | ultra | |
|---|---|---|---|---|
| Dota 2 Reborn (2015) | 98.3 | 70.3 | 71.1 | 71.9 |
| Final Fantasy XV Benchmark (2018) | 80.5 | 45.7 | 33.3 | |
| X-Plane 11.11 (2018) | 51.2 | 39.7 | 35.7 | |
| Strange Brigade (2018) | 205 | 81 | 68 | 56.9 |
| Baldur's Gate 3 (2023) | 38.1 | 31 | 27.7 | 27 |
| Cyberpunk 2077 (2023) | 44.2 | 35.2 | 24.7 | 24.1 |
| F1 24 (2024) | 75.3 | 70.7 | 55.3 | 18.8 |
Emisiones
Ruido del sistema
El ventilador interno es generalmente letárgico en respuesta a las cargas, lo que significa que se acelera lentamente al iniciar o ejecutar aplicaciones más exigentes. Esto es bueno ya que pasa más tiempo antes de que el ruido del ventilador se haga más perceptible durante un uso intenso. Después de un tiempo, sin embargo, el sistema alcanza un nivel máximo similar al de la mayoría de los otros portátiles multimedia de 16 pulgadas, incluyendo el Acer Swift 16 AI o el Asus Vivobook 16.
Ruido
| Ocioso |
| 23.5 / 23.5 / 23.5 dB(A) |
| Carga |
| 31.9 / 46.9 dB(A) |
 | ||
30 dB silencioso 40 dB(A) audible 50 dB(A) ruidosamente alto |
||
min: | ||
| Dell 16 Plus Arc 140V, Core Ultra 7 256V, Samsung BM9C1 1024GB | Dell Inspiron 16 Plus 7640 GeForce RTX 4060 Laptop GPU, Ultra 7 155H, SK hynix BC901 HFS001TEJ4X164N | Acer Swift 16 AI SF16-51T-932H, Ultra 9 288V Arc 140V, Core Ultra 9 288V, Western Digital PC SN5000S SDEQNSJ-1T00 | Lenovo ThinkBook 16 G7+ AMD Radeon 880M, Ryzen AI 9 365, Samsung PM9C1a MZAL81T0HDLB | HP Pavilion Plus 16-ab0456tx GeForce RTX 3050 6GB Laptop GPU, i7-13700H, WDC PC SN810 1TB | Asus Vivobook 16 M1606K Radeon 860M, Ryzen AI 7 350, Micron 2500 1TB MTFDKBA1T0QGN | |
|---|---|---|---|---|---|---|
| Noise | -2% | -6% | -2% | -0% | 2% | |
| apagado / medio ambiente * (dB) | 23.4 | 23.8 -2% | 25.8 -10% | 24.5 -5% | 22.22 5% | 23 2% |
| Idle Minimum * (dB) | 23.5 | 24.2 -3% | 25.8 -10% | 24.5 -4% | 22.22 5% | 23 2% |
| Idle Average * (dB) | 23.5 | 24.2 -3% | 25.8 -10% | 24.5 -4% | 22.22 5% | 23 2% |
| Idle Maximum * (dB) | 23.5 | 24.2 -3% | 26.7 -14% | 25.9 -10% | 22.22 5% | 24.67 -5% |
| Load Average * (dB) | 31.9 | 28.9 9% | 36.2 -13% | 42.03 -32% | 31.72 1% | |
| Cyberpunk 2077 ultra * (dB) | 42.6 | 44.4 -4% | 40.1 6% | 41.53 3% | ||
| Load Maximum * (dB) | 46.9 | 51 -9% | 41.1 12% | 40.1 14% | 42.1 10% | 42.51 9% |
| Witcher 3 ultra * (dB) | 51 | 42.1 |
* ... más pequeño es mejor
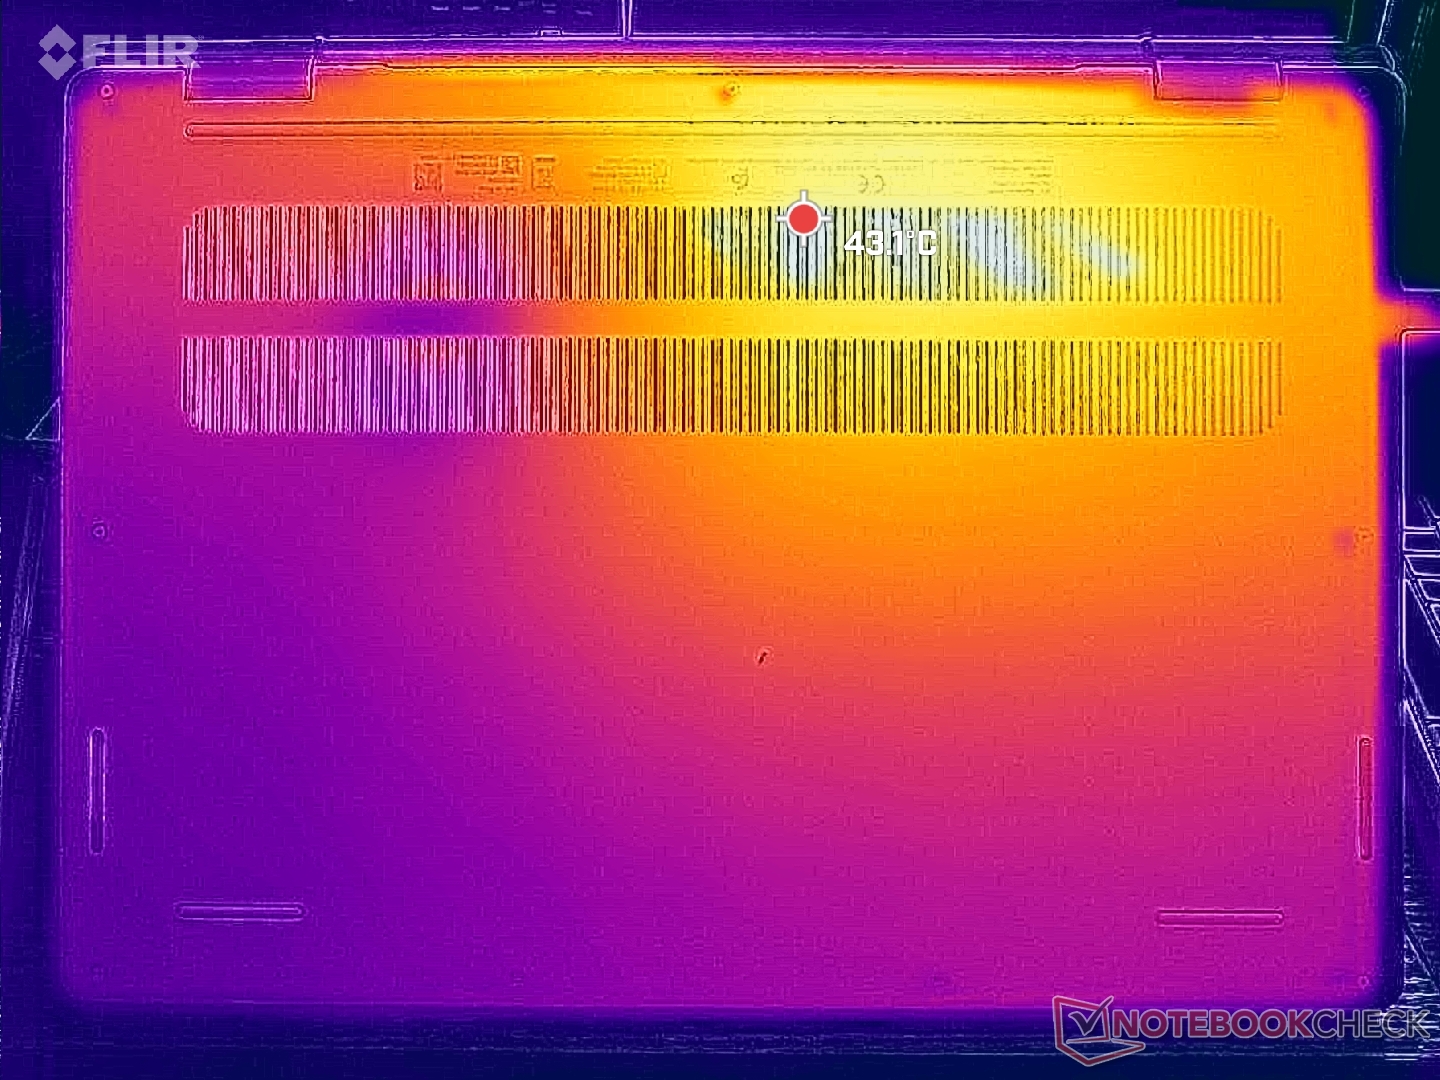
Temperatura
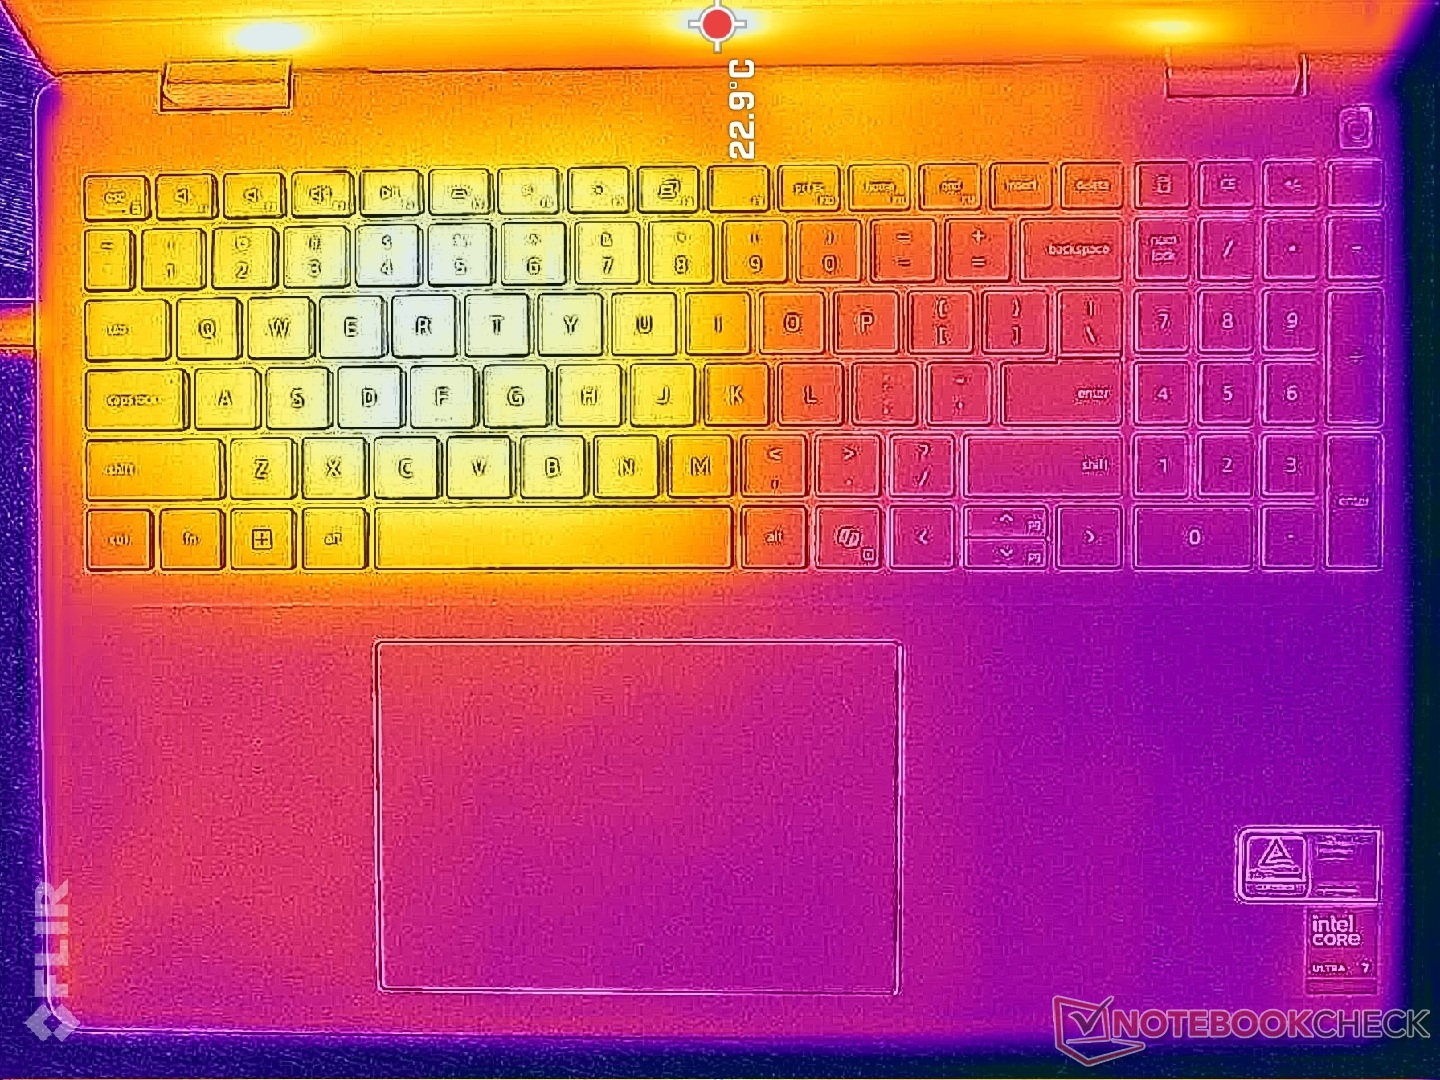
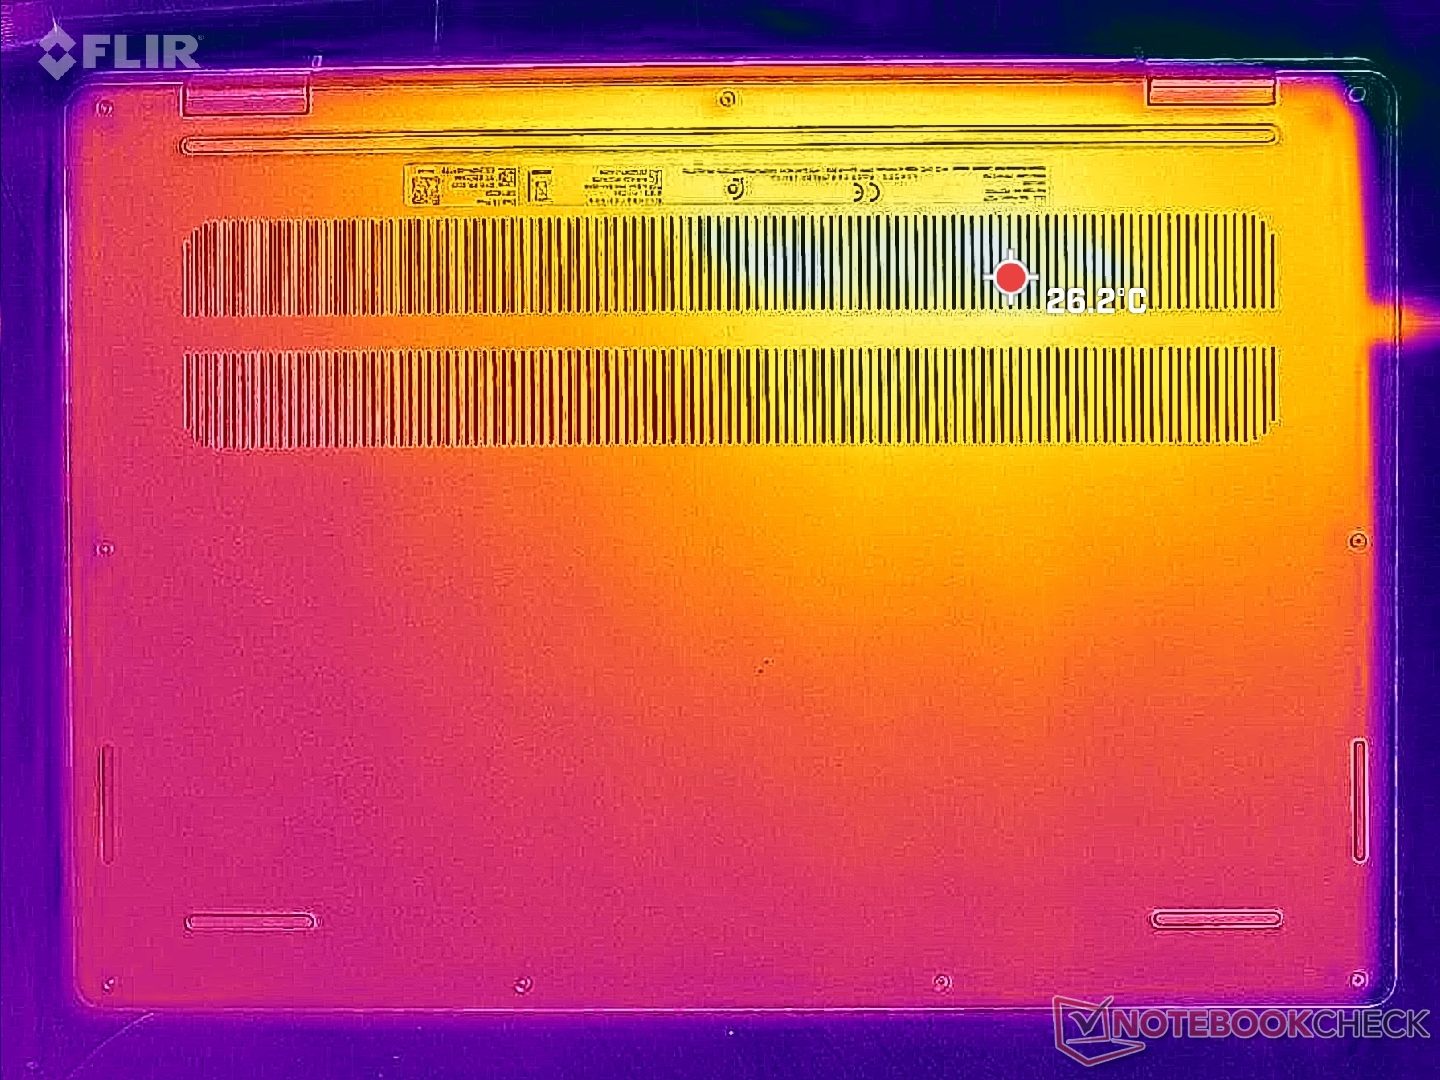
Las temperaturas de la superficie son notablemente más frías en comparación con la serie Inspiron 16 7640 saliente debido en gran parte a los cambios en el procesador. Los puntos calientes alcanzan un máximo en el rango bajo de 40 C en lugar del rango más alto de 40 C.
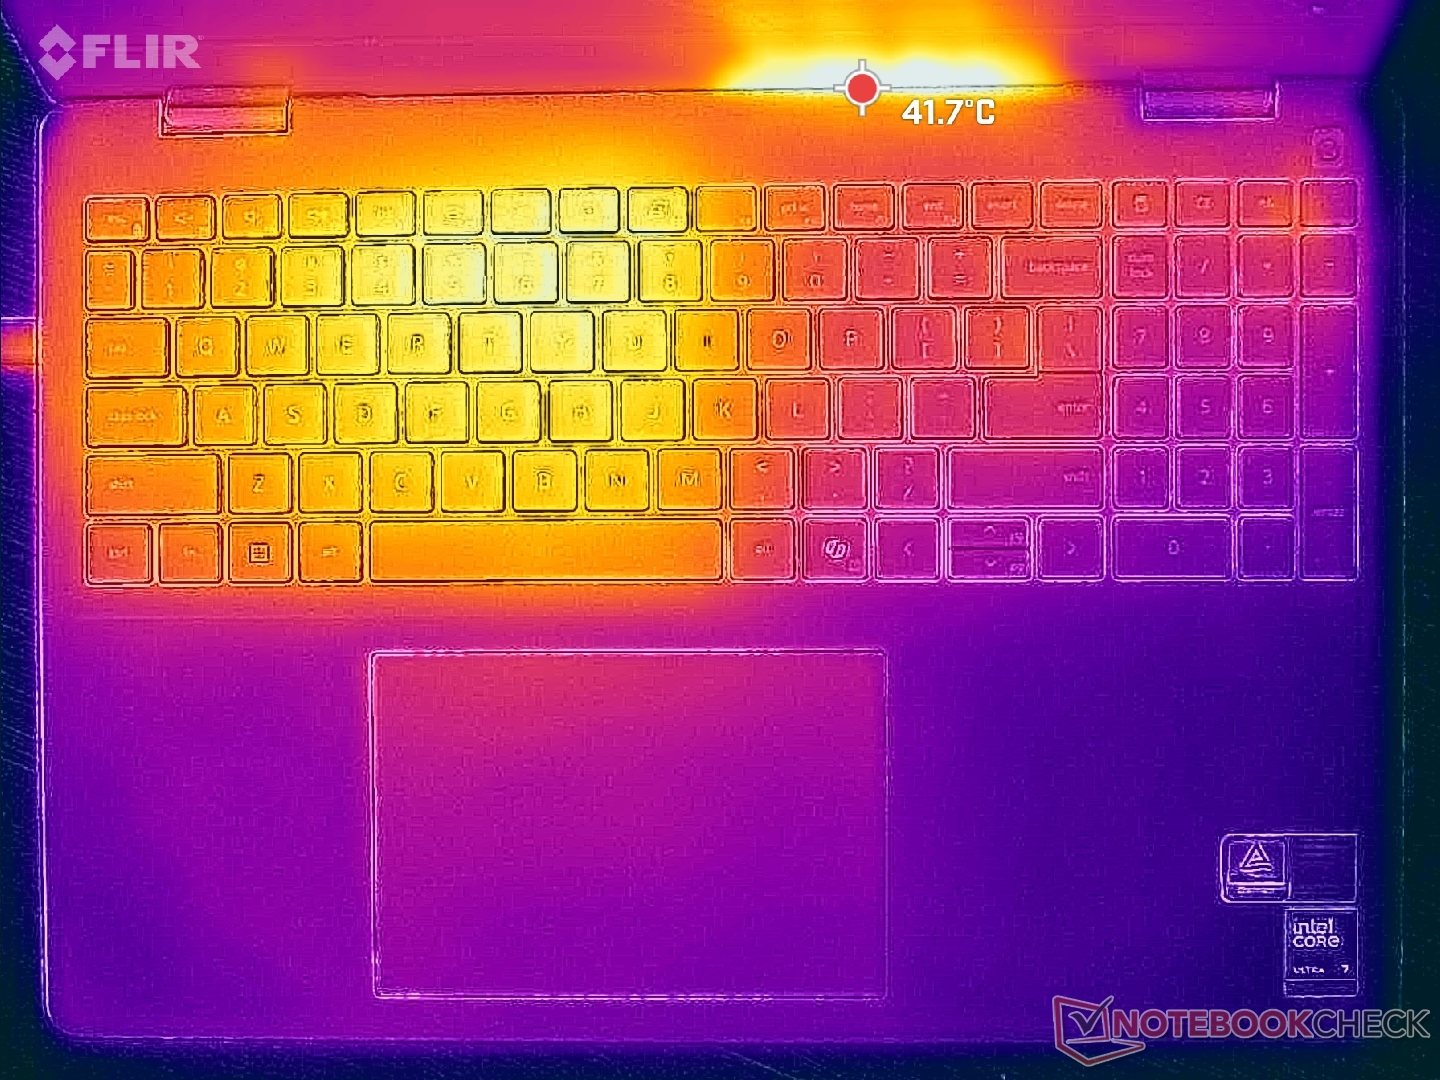
El sistema claramente no está diseñado para jugadores ya que la región WASD puede llegar a ser mucho más caliente que el resto del teclado como se muestra en los mapas de temperatura a continuación.
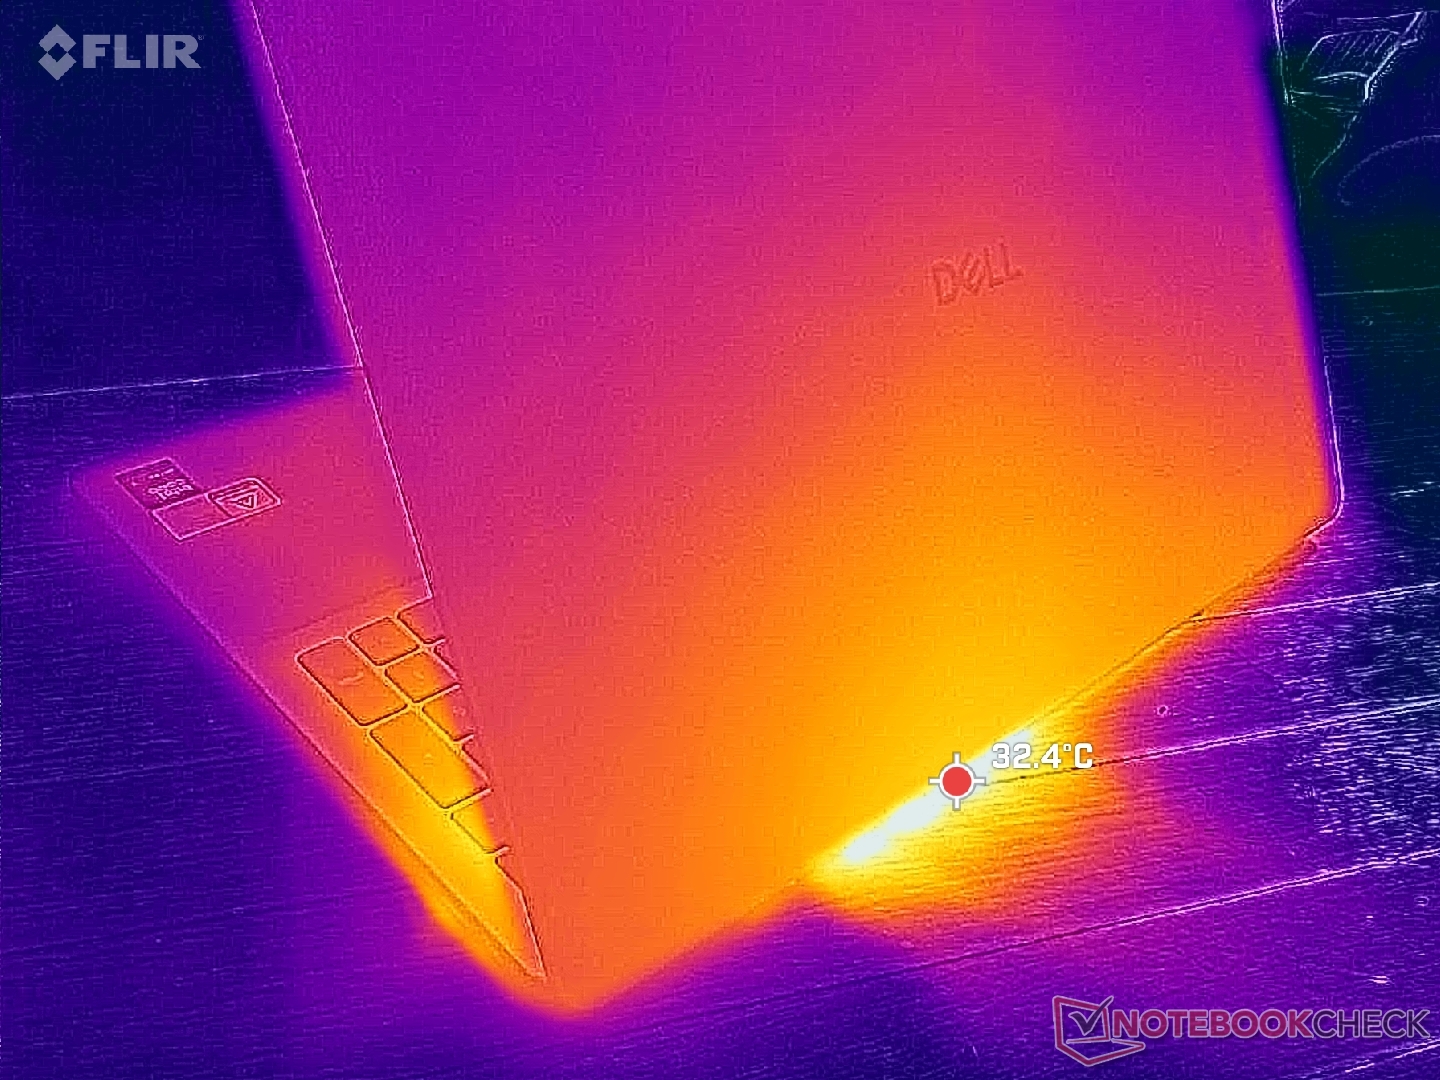
(±) La temperatura máxima en la parte superior es de 40.6 °C / 105 F, frente a la media de 36.8 °C / 98 F, que oscila entre 21 y 71 °C para la clase Multimedia.
(±) El fondo se calienta hasta un máximo de 40 °C / 104 F, frente a la media de 39.1 °C / 102 F
(+) En reposo, la temperatura media de la parte superior es de 27.2 °C / 81# F, frente a la media del dispositivo de 31.3 °C / 88 F.
(+) El reposamanos y el panel táctil están a una temperatura inferior a la de la piel, con un máximo de 25.8 °C / 78.4 F y, por tanto, son fríos al tacto.
(+) La temperatura media de la zona del reposamanos de dispositivos similares fue de 28.7 °C / 83.7 F (+2.9 °C / 5.3 F).
| Dell 16 Plus Intel Core Ultra 7 256V, Intel Arc Graphics 140V | Dell Inspiron 16 Plus 7640 Intel Core Ultra 7 155H, NVIDIA GeForce RTX 4060 Laptop GPU | Acer Swift 16 AI SF16-51T-932H, Ultra 9 288V Intel Core Ultra 9 288V, Intel Arc Graphics 140V | Lenovo ThinkBook 16 G7+ AMD AMD Ryzen AI 9 365, AMD Radeon 880M | HP Pavilion Plus 16-ab0456tx Intel Core i7-13700H, NVIDIA GeForce RTX 3050 6GB Laptop GPU | Asus Vivobook 16 M1606K AMD Ryzen AI 7 350, AMD Radeon 860M | |
|---|---|---|---|---|---|---|
| Heat | -9% | 7% | 9% | -24% | 0% | |
| Maximum Upper Side * (°C) | 40.6 | 43.4 -7% | 37.9 7% | 38.2 6% | 49.6 -22% | 48 -18% |
| Maximum Bottom * (°C) | 40 | 41.6 -4% | 31.5 21% | 37.9 5% | 45.8 -15% | 51 -27% |
| Idle Upper Side * (°C) | 29.2 | 32.8 -12% | 28.3 3% | 25.4 13% | 39.2 -34% | 22 25% |
| Idle Bottom * (°C) | 28.6 | 32.4 -13% | 29.7 -4% | 25.7 10% | 35.4 -24% | 23 20% |
* ... más pequeño es mejor
Altavoces
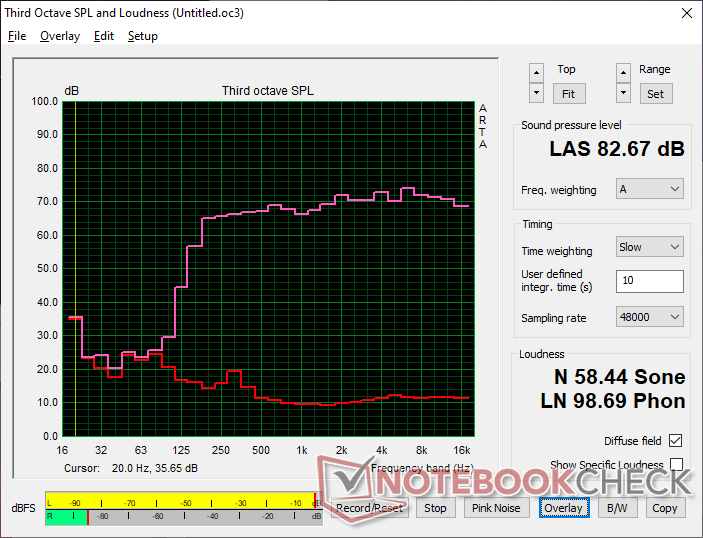
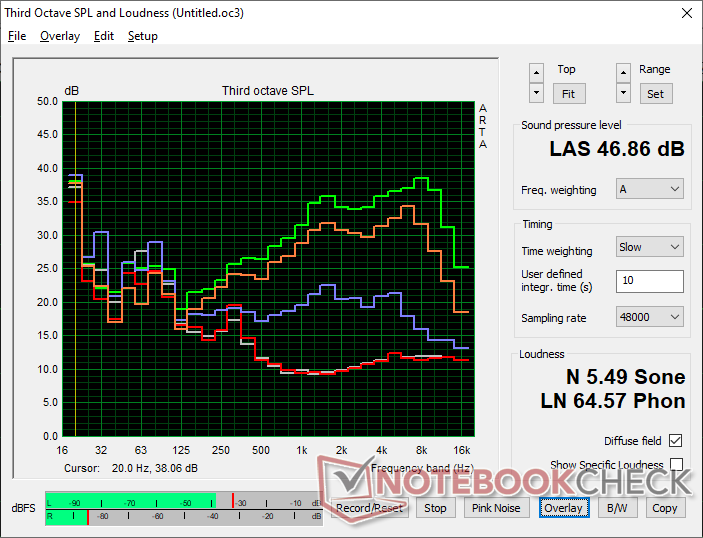
Dell 16 Plus análisis de audio
(+) | los altavoces pueden reproducir a un volumen relativamente alto (#82.7 dB)
Graves 100 - 315 Hz
(±) | lubina reducida - en promedio 14.1% inferior a la mediana
(±) | la linealidad de los graves es media (11.8% delta a frecuencia anterior)
Medios 400 - 2000 Hz
(+) | medios equilibrados - a sólo 1.6% de la mediana
(+) | los medios son lineales (2.4% delta a la frecuencia anterior)
Altos 2 - 16 kHz
(+) | máximos equilibrados - a sólo 2.9% de la mediana
(+) | los máximos son lineales (3.3% delta a la frecuencia anterior)
Total 100 - 16.000 Hz
(+) | el sonido global es lineal (10% de diferencia con la mediana)
En comparación con la misma clase
» 13% de todos los dispositivos probados de esta clase eran mejores, 2% similares, 84% peores
» El mejor tuvo un delta de 5%, la media fue 17%, el peor fue ###max##%
En comparación con todos los dispositivos probados
» 4% de todos los dispositivos probados eran mejores, 1% similares, 94% peores
» El mejor tuvo un delta de 4%, la media fue 23%, el peor fue ###max##%
Apple MacBook Pro 16 2021 M1 Pro análisis de audio
(+) | los altavoces pueden reproducir a un volumen relativamente alto (#84.7 dB)
Graves 100 - 315 Hz
(+) | buen bajo - sólo 3.8% lejos de la mediana
(+) | el bajo es lineal (5.2% delta a la frecuencia anterior)
Medios 400 - 2000 Hz
(+) | medios equilibrados - a sólo 1.3% de la mediana
(+) | los medios son lineales (2.1% delta a la frecuencia anterior)
Altos 2 - 16 kHz
(+) | máximos equilibrados - a sólo 1.9% de la mediana
(+) | los máximos son lineales (2.7% delta a la frecuencia anterior)
Total 100 - 16.000 Hz
(+) | el sonido global es lineal (4.6% de diferencia con la mediana)
En comparación con la misma clase
» 0% de todos los dispositivos probados de esta clase eran mejores, 0% similares, 100% peores
» El mejor tuvo un delta de 5%, la media fue 17%, el peor fue ###max##%
En comparación con todos los dispositivos probados
» 0% de todos los dispositivos probados eran mejores, 0% similares, 100% peores
» El mejor tuvo un delta de 4%, la media fue 23%, el peor fue ###max##%
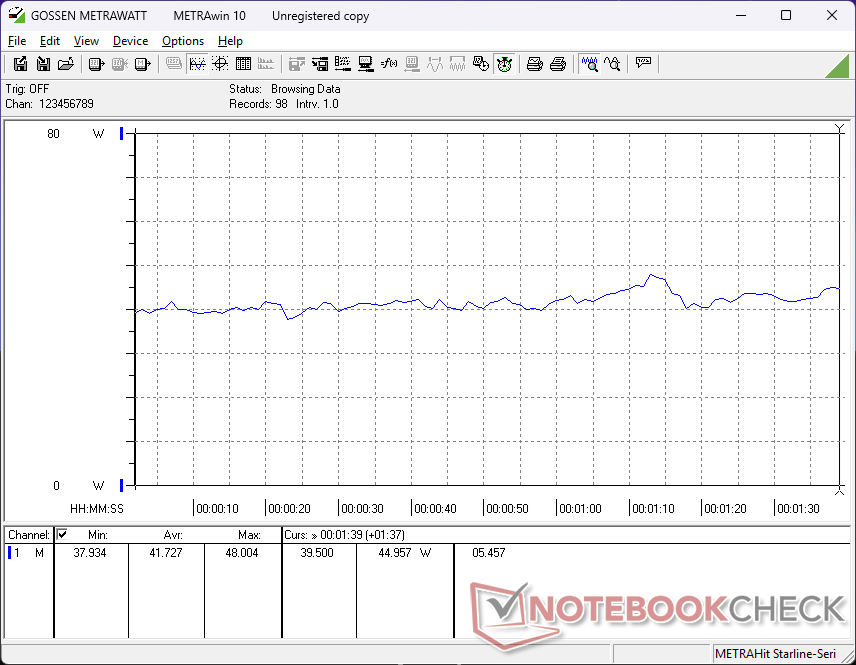
Gestión de la energía
Consumo energético: mayor rendimiento por vatio
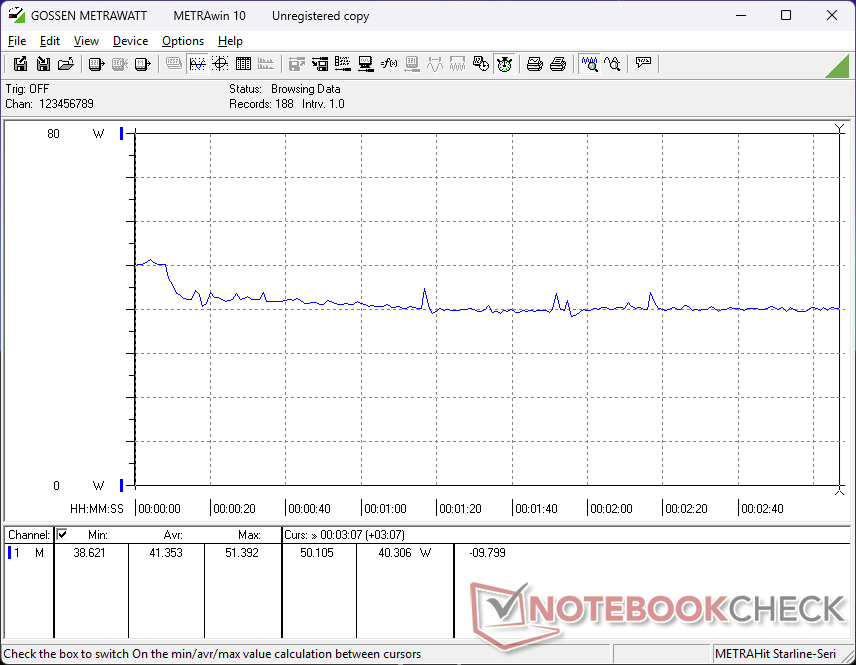
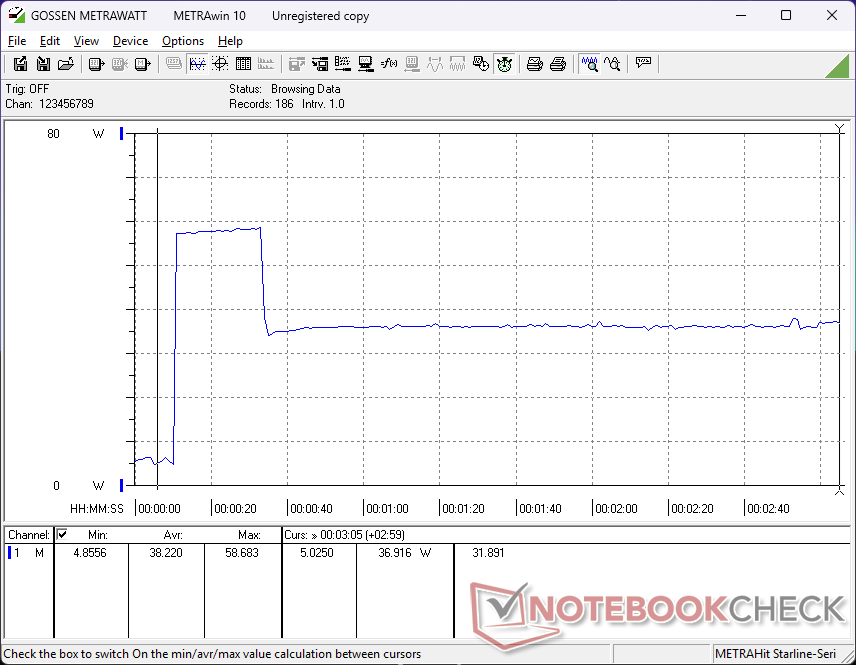
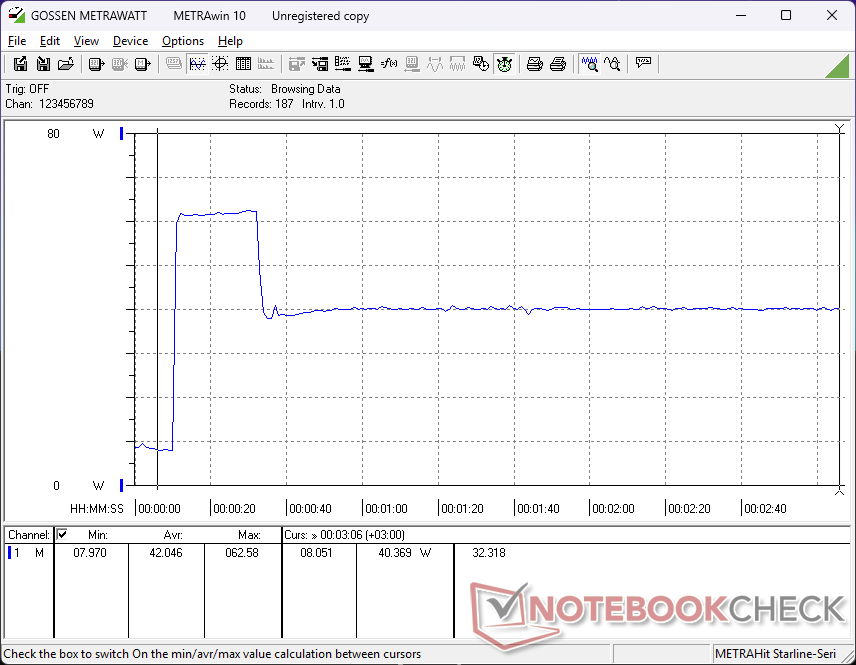
El consumo general es bastante bajo para un portátil de 16 pulgadas debido a la falta de una CPU de serie H, GPU discreta u opciones OLED, todas ellas mucho más exigentes que nuestra CPU de serie V, GPU integrada y panel IPS. Lo más notable es que el sistema consume sólo 41 W cuando se ejecuta Cyberpunk 2077 en comparación con los 67 W del Inspiron 16 7640 2 en 1 a pesar de que nuestro Dell 16 Plus puede ejecutar el juego aproximadamente un 25 por ciento más rápido.
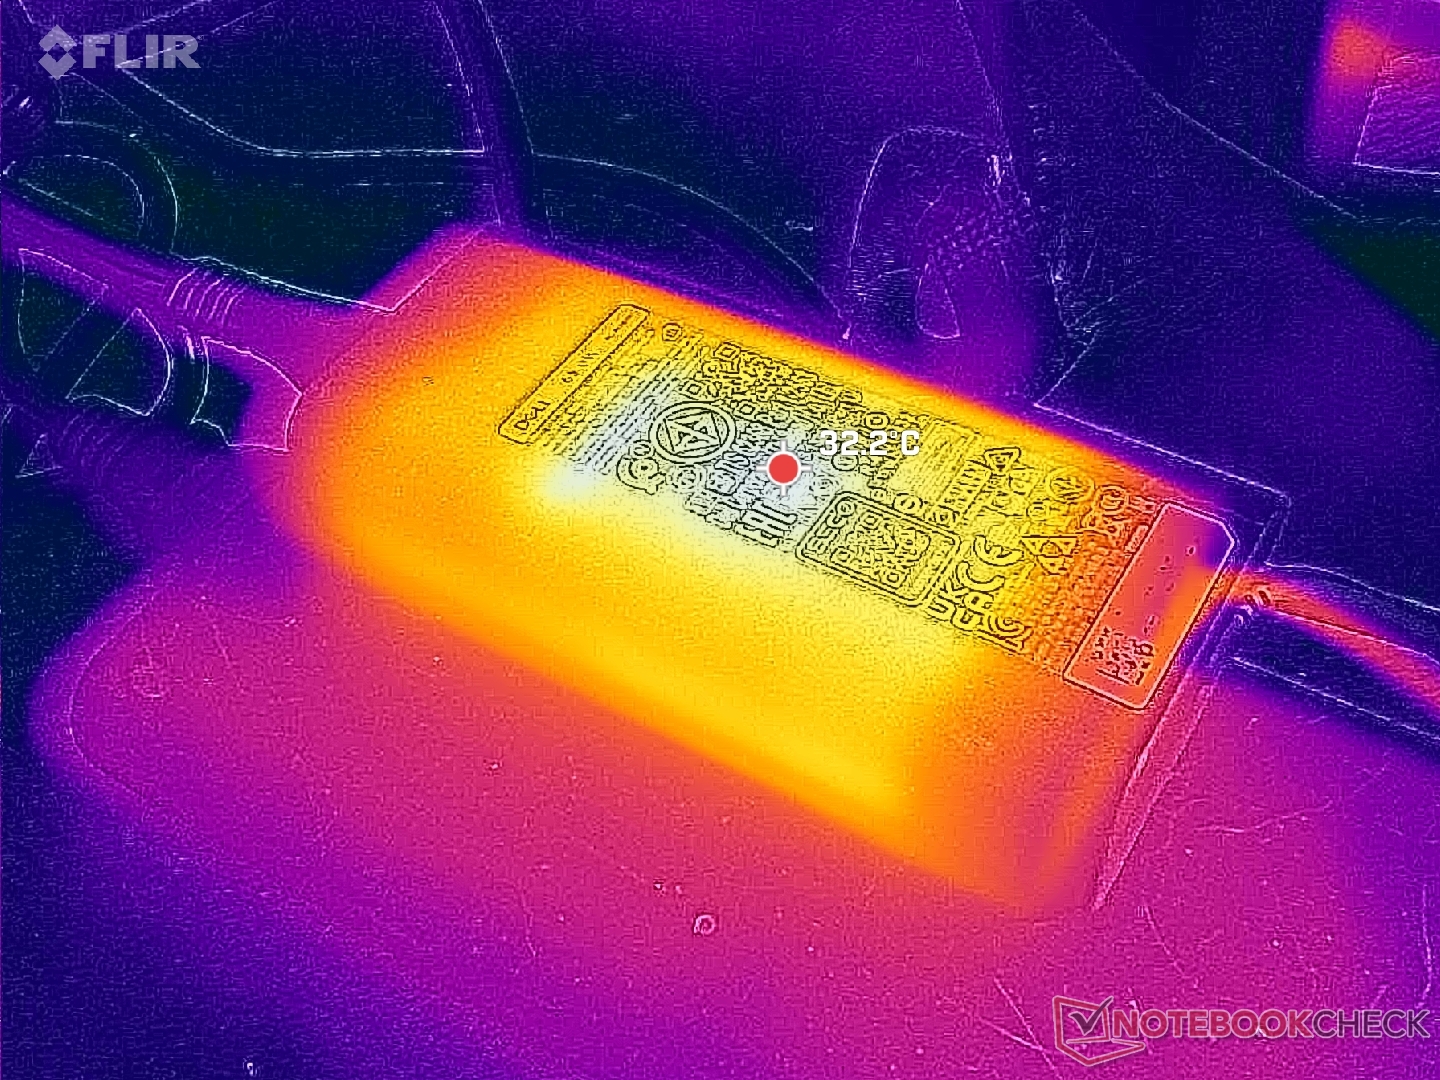
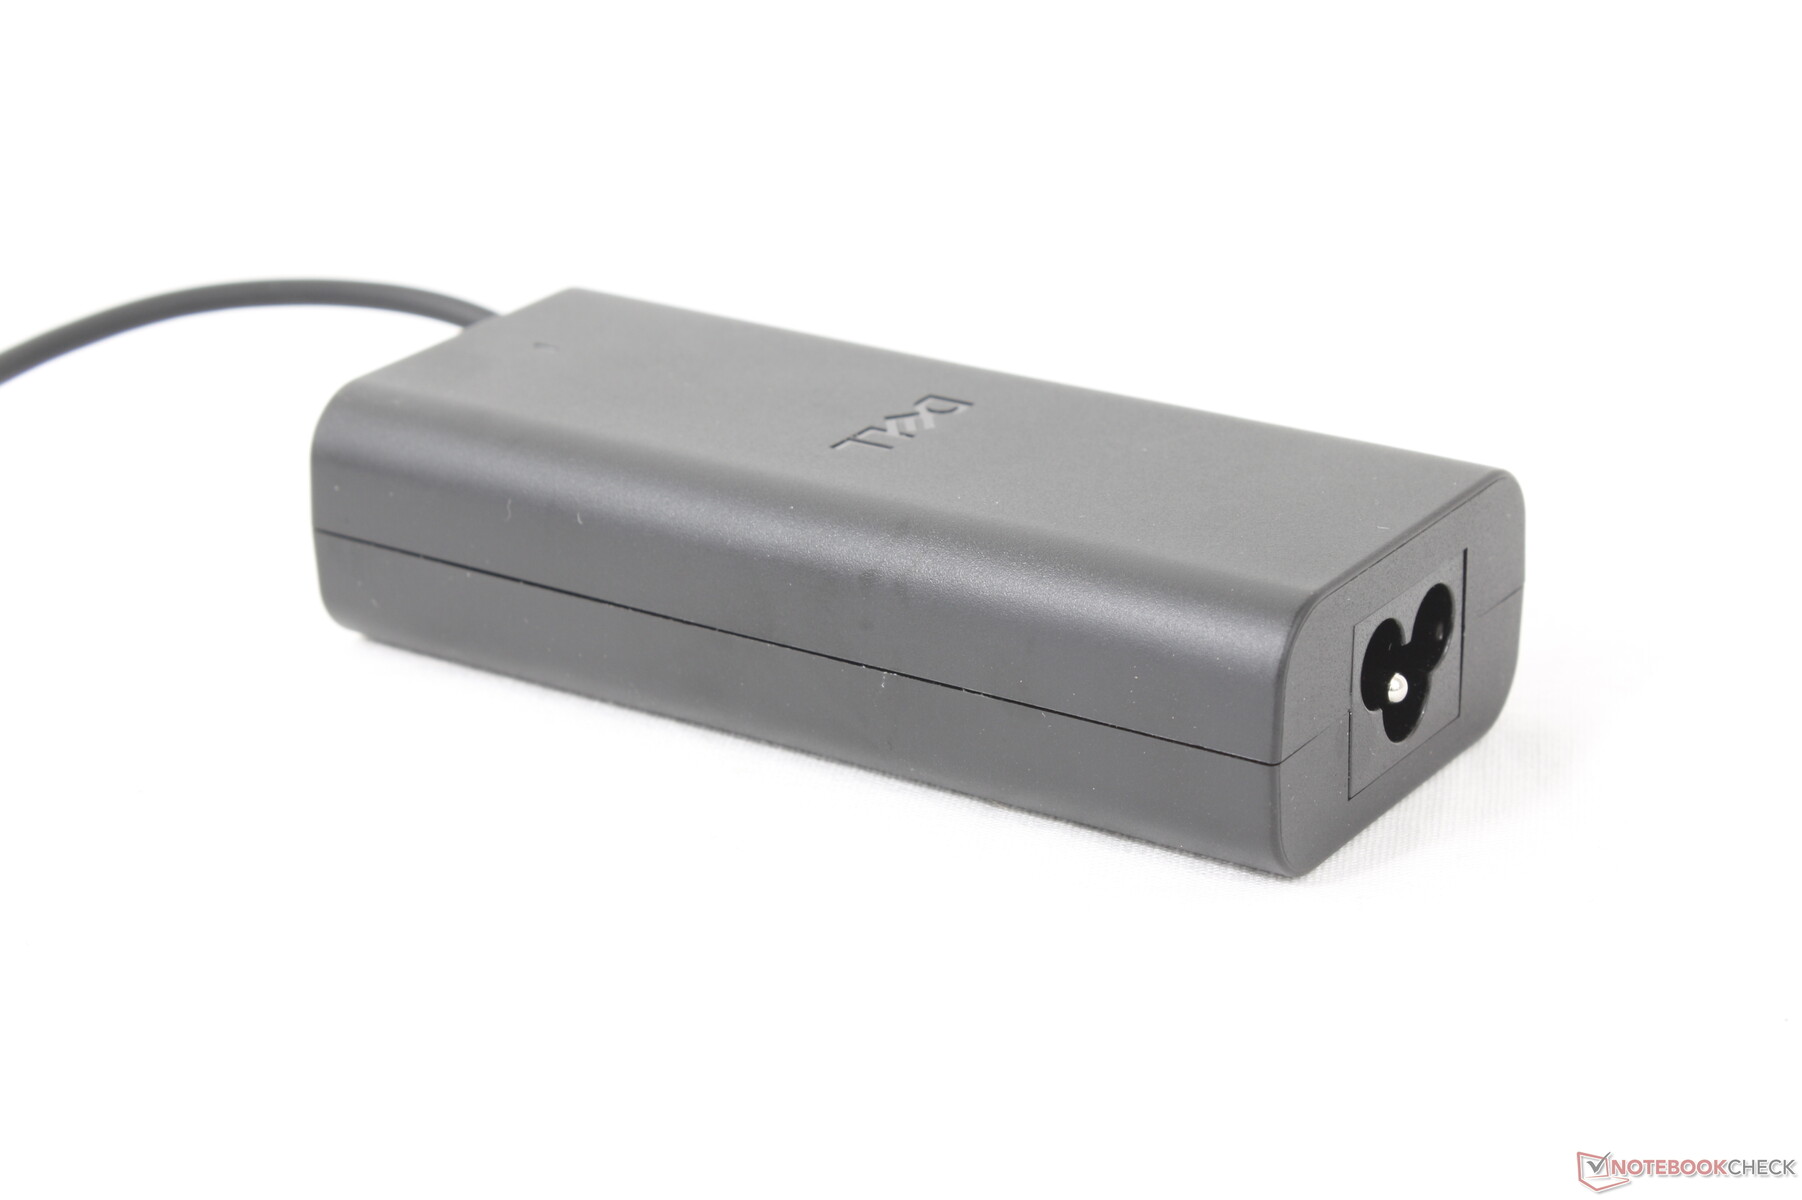
Conseguimos registrar un consumo máximo temporal de 62 W con el adaptador de CA USB-C pequeño-mediano (~11,2 x 5 x 2,8 cm) de 65 W.
| Off / Standby | |
| Ocioso | |
| Carga |
|
Clave:
min: | |
| Dell 16 Plus Core Ultra 7 256V, Arc 140V, Samsung BM9C1 1024GB, IPS, 2560x1600, 16" | Dell Inspiron 16 Plus 7640 Ultra 7 155H, GeForce RTX 4060 Laptop GPU, SK hynix BC901 HFS001TEJ4X164N, IPS, 2560x1600, 16" | Acer Swift 16 AI SF16-51T-932H, Ultra 9 288V Core Ultra 9 288V, Arc 140V, Western Digital PC SN5000S SDEQNSJ-1T00, OLED, 2880x1800, 16" | Lenovo ThinkBook 16 G7+ AMD Ryzen AI 9 365, Radeon 880M, Samsung PM9C1a MZAL81T0HDLB, IPS, 3200x2000, 16" | HP Pavilion Plus 16-ab0456tx i7-13700H, GeForce RTX 3050 6GB Laptop GPU, WDC PC SN810 1TB, IPS, 2560x1600, 16" | Asus Vivobook 16 M1606K Ryzen AI 7 350, Radeon 860M, Micron 2500 1TB MTFDKBA1T0QGN, IPS, 1920x1200, 16" | |
|---|---|---|---|---|---|---|
| Power Consumption | -64% | -22% | -93% | -60% | -36% | |
| Idle Minimum * (Watt) | 3.4 | 4.2 -24% | 5.7 -68% | 6.4 -88% | 3.3 3% | 4.7 -38% |
| Idle Average * (Watt) | 6.9 | 6.9 -0% | 7.4 -7% | 14.1 -104% | 7.3 -6% | 8.2 -19% |
| Idle Maximum * (Watt) | 7.4 | 15.2 -105% | 7.9 -7% | 14.3 -93% | 14.24 -92% | 9 -22% |
| Load Average * (Watt) | 41.7 | 70.4 -69% | 83.4 -100% | 91.7 -120% | 59 -41% | |
| Cyberpunk 2077 ultra external monitor * (Watt) | 38 | 77.5 -104% | 58 -53% | |||
| Cyberpunk 2077 ultra * (Watt) | 41.4 | 49.8 -20% | 79.8 -93% | 65 -57% | ||
| Load Maximum * (Watt) | 62 | 137.4 -122% | 65.41 -6% | 102.9 -66% | 115.8 -87% | 74 -19% |
| Witcher 3 ultra * (Watt) | 115.9 | 96.2 |
* ... más pequeño es mejor
Power Consumption Cyberpunk / Stress Test
Power Consumption external Monitor
Duración de las pilas
Los tiempos de ejecución son muy largos, como cabe esperar de un portátil alimentado por Lunar Lake. La duración de la batería WLAN es de algo más de 14 horas, incluso superior a la del Inspiron 16 Plus 7640, a pesar de que el Dell 16 Plus lleva un paquete de baterías un 30 por ciento más pequeño.
| Dell 16 Plus Core Ultra 7 256V, Arc 140V, 64 Wh | Dell Inspiron 16 Plus 7640 Ultra 7 155H, GeForce RTX 4060 Laptop GPU, 90 Wh | Acer Swift 16 AI SF16-51T-932H, Ultra 9 288V Core Ultra 9 288V, Arc 140V, 70 Wh | Lenovo ThinkBook 16 G7+ AMD Ryzen AI 9 365, Radeon 880M, 85 Wh | HP Pavilion Plus 16-ab0456tx i7-13700H, GeForce RTX 3050 6GB Laptop GPU, 68 Wh | Asus Vivobook 16 M1606K Ryzen AI 7 350, Radeon 860M, 42 Wh | |
|---|---|---|---|---|---|---|
| Duración de Batería | -6% | -6% | -23% | -26% | -52% | |
| WiFi v1.3 (h) | 14.1 | 13.3 -6% | 13.2 -6% | 10.8 -23% | 10.4 -26% | 6.8 -52% |
| H.264 (h) | 13.9 | 12 | 6.8 | |||
| Load (h) | 1.1 |
Valoración de Notebookcheck
Dell 16 Plus
- 06/06/2025 v8
Allen Ngo
 Total Sustainability Score:
 Potential Competitors in Comparison
Imagen | Modelo | Precio | Peso | Altura | Pantalla |
|---|---|---|---|---|---|
1. 81.8%  | Dell 16 Plus Intel Core Ultra 7 256V ⎘ Intel Arc Graphics 140V ⎘ 16 GB Memoría, 1024 GB SSD | Amazon: Precio de catálogo: 1150 USD | 1.8 kg | 16.99 mm | 16.00" 2560x1600 189 PPI IPS |
2. 83.4%  | Dell Inspiron 16 Plus 7640 Intel Core Ultra 7 155H ⎘ NVIDIA GeForce RTX 4060 Laptop GPU ⎘ 16 GB Memoría, 1024 GB SSD | Amazon: Precio de catálogo: 1300 USD | 2.2 kg | 19.9 mm | 16.00" 2560x1600 189 PPI IPS |
3. 85.3%  | Acer Swift 16 AI SF16-51T-932H, Ultra 9 288V Intel Core Ultra 9 288V ⎘ Intel Arc Graphics 140V ⎘ 32 GB Memoría, 1024 GB SSD | Amazon: | 1.5 kg | 15.95 mm | 16.00" 2880x1800 212 PPI OLED |
4. 86.6%  | Lenovo ThinkBook 16 G7+ AMD AMD Ryzen AI 9 365 ⎘ AMD Radeon 880M ⎘ 32 GB Memoría, 1024 GB SSD | Amazon: 1. $1,199.99 Lenovo ThinkBook 16 G7 Busin... 2. $999.95 Lenovo ThinkBook 16 G7 Busin... 3. $1,199.95 Lenovo ThinkBook 16 G7 Busin... Precio de catálogo: 1399€ | 1.9 kg | 16.9 mm | 16.00" 3200x2000 236 PPI IPS |
5. 88.7% v7 (old) 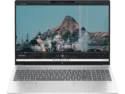 | HP Pavilion Plus 16-ab0456tx Intel Core i7-13700H ⎘ NVIDIA GeForce RTX 3050 6GB Laptop GPU ⎘ 16 GB Memoría, 1024 GB SSD | Amazon: 1. $799.99 HP Pavilion Plus 16 inch Lap... 2. $34.00 Laptop Right Fan for HP Pavi... 3. $439.99 HP Pavilion | 15.6" HD Displ... Precio de catálogo: 1350 USD | 1.9 kg | 19.9 mm | 16.00" 2560x1600 189 PPI IPS |
6. 77.6% 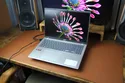 | Asus Vivobook 16 M1606K AMD Ryzen AI 7 350 ⎘ AMD Radeon 860M ⎘ 16 GB Memoría, 1024 GB SSD | Amazon: 1. $129.00 Replacement Screen 16.0" for... 2. $123.00 16.0" WUXGA 1920(RGB)*1200 f... 3. $689.00 ASUS Vivobook 16 Laptop, 16�... | 1.9 kg | 19.9 mm | 16.00" 1920x1200 142 PPI IPS |
Transparencia
La selección de los dispositivos que se van a reseñar corre a cargo de nuestro equipo editorial. La muestra de prueba fue proporcionada al autor en calidad de préstamo por el fabricante o el minorista a los efectos de esta reseña. El prestamista no tuvo ninguna influencia en esta reseña, ni el fabricante recibió una copia de la misma antes de su publicación. No había ninguna obligación de publicar esta reseña. Como empresa de medios independiente, Notebookcheck no está sujeta a la autoridad de fabricantes, minoristas o editores.
Así es como prueba Notebookcheck
Cada año, Notebookcheck revisa de forma independiente cientos de portátiles y smartphones utilizando procedimientos estandarizados para asegurar que todos los resultados son comparables. Hemos desarrollado continuamente nuestros métodos de prueba durante unos 20 años y hemos establecido los estándares de la industria en el proceso. En nuestros laboratorios de pruebas, técnicos y editores experimentados utilizan equipos de medición de alta calidad. Estas pruebas implican un proceso de validación en varias fases. Nuestro complejo sistema de clasificación se basa en cientos de mediciones y puntos de referencia bien fundamentados, lo que mantiene la objetividad.
