Análisis del portátil Eurocom C315 Blitz: Core i7-1360P es una bolsa mixta

El C315 Blitz es un portátil multimedia delgado y ligero de Eurocom de gama básica a media basado en el diseño del chasis Clevo X170KM. Las SKU oscilan entre el Core i5-1340P o el Core i7-1360P con una pantalla de 1080p o 2160p (4K). Nuestra unidad de revisión específica es una configuración de gama más alta con las opciones Core i7 y 4K.
Las alternativas al C315 Blitz incluyen otros portátiles multimedia o de oficina de 15,6 pulgadas como elAcer Aspire 5 A515 o elAsus VivoBook S15.
Más reseñas de Eurocom:
Posibles contendientes en la comparación
Valoración | Fecha | Modelo | Peso | Altura | Tamaño | Resolución | Precio |
|---|---|---|---|---|---|---|---|
| 83.4 % v7 (old) | 11/2023 | Eurocom C315 Blitz i7-1360P, Iris Xe G7 96EUs | 1.7 kg | 19.9 mm | 15.60" | 3840x2160 | |
| 84.3 % v7 (old) | 02/2022 | Schenker Work 15 Tiger Lake-H i7-11370H, Iris Xe G7 96EUs | 1.7 kg | 19.9 mm | 15.60" | 1920x1080 | |
| 86.6 % v7 (old) | 12/2023 | Lenovo ThinkPad L15 Gen 4 21H70021GE R7 PRO 7730U, Vega 8 | 1.9 kg | 19.93 mm | 15.60" | 1920x1080 | |
| 82 % v7 (old) | 09/2023 | Acer Aspire 5 A515-58GM-76S8 i7-1355U, GeForce RTX 2050 Mobile | 1.8 kg | 19.7 mm | 15.60" | 1920x1080 | |
| 83.2 % v7 (old) | 02/2023 | Asus VivoBook S15 M3502RA-L1029W R7 6800H, Radeon 680M | 1.9 kg | 18.8 mm | 15.60" | 1920x1080 | |
| 79.8 % v7 (old) | 08/2022 | Samsung Galaxy Book2 15 i7-1260P, A350M | 1.6 kg | 15 mm | 15.60" | 1920x1080 |
Caso
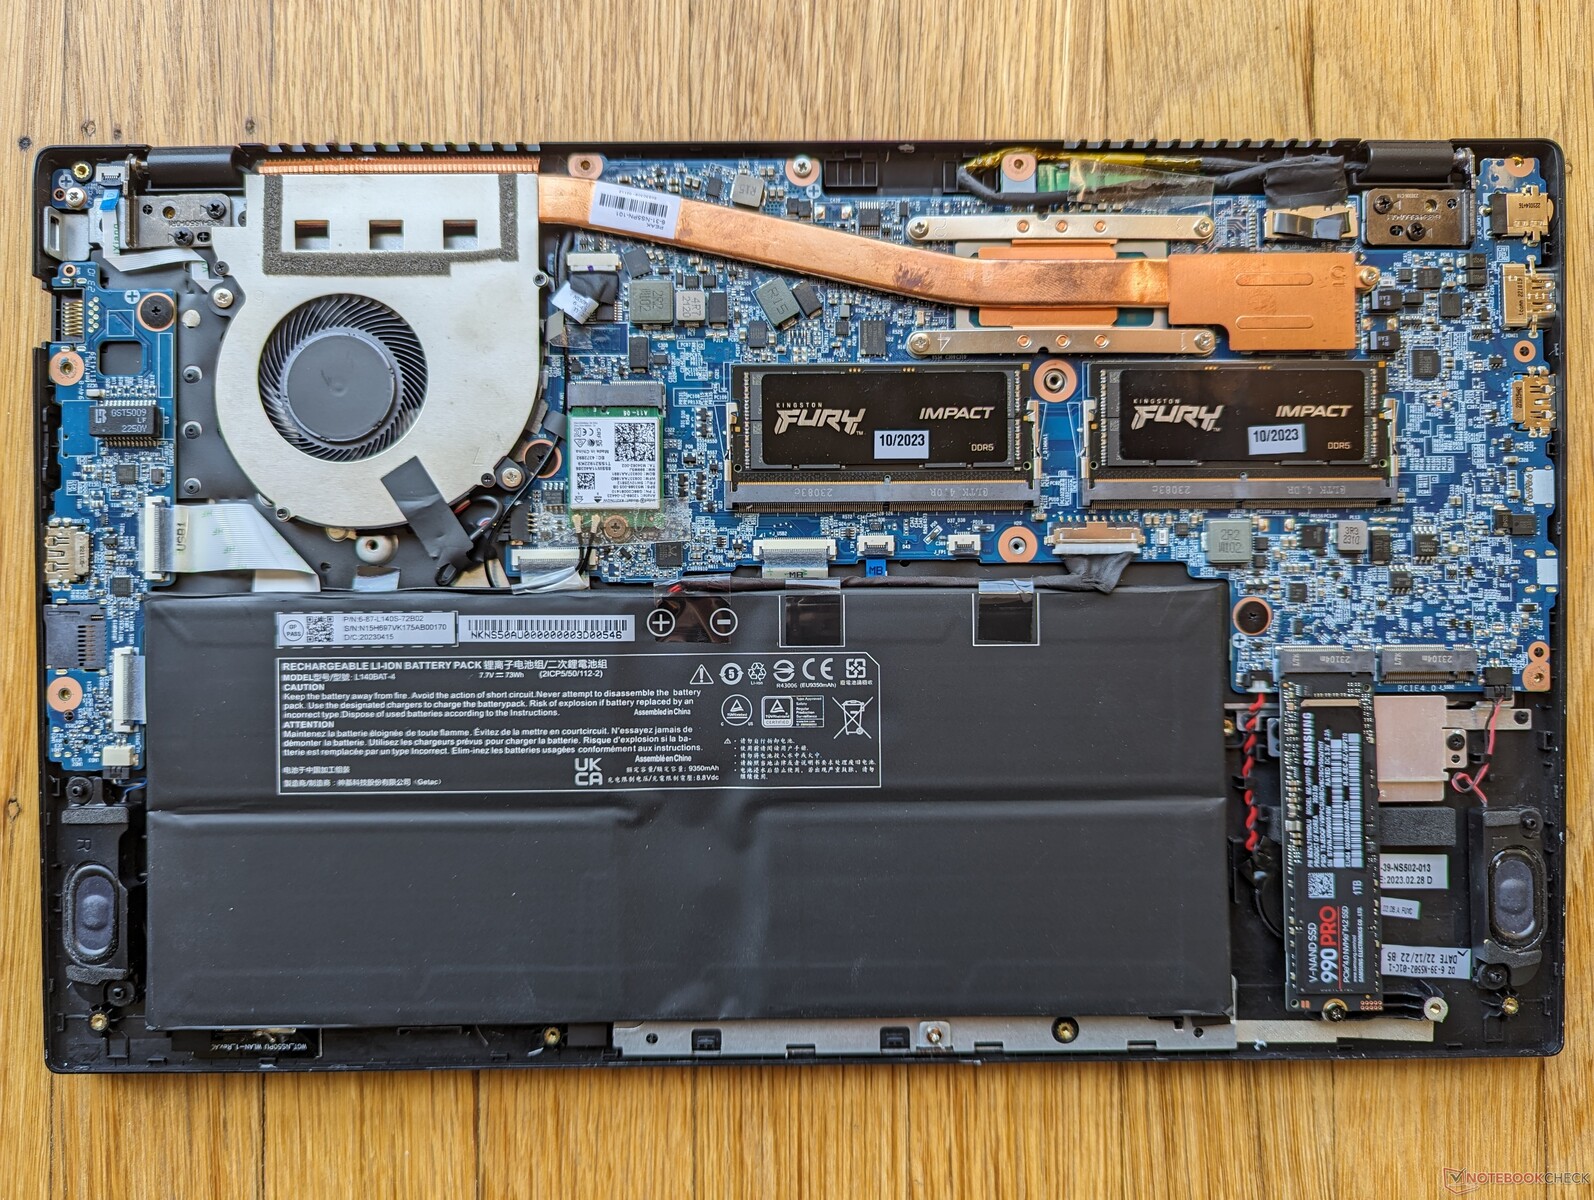
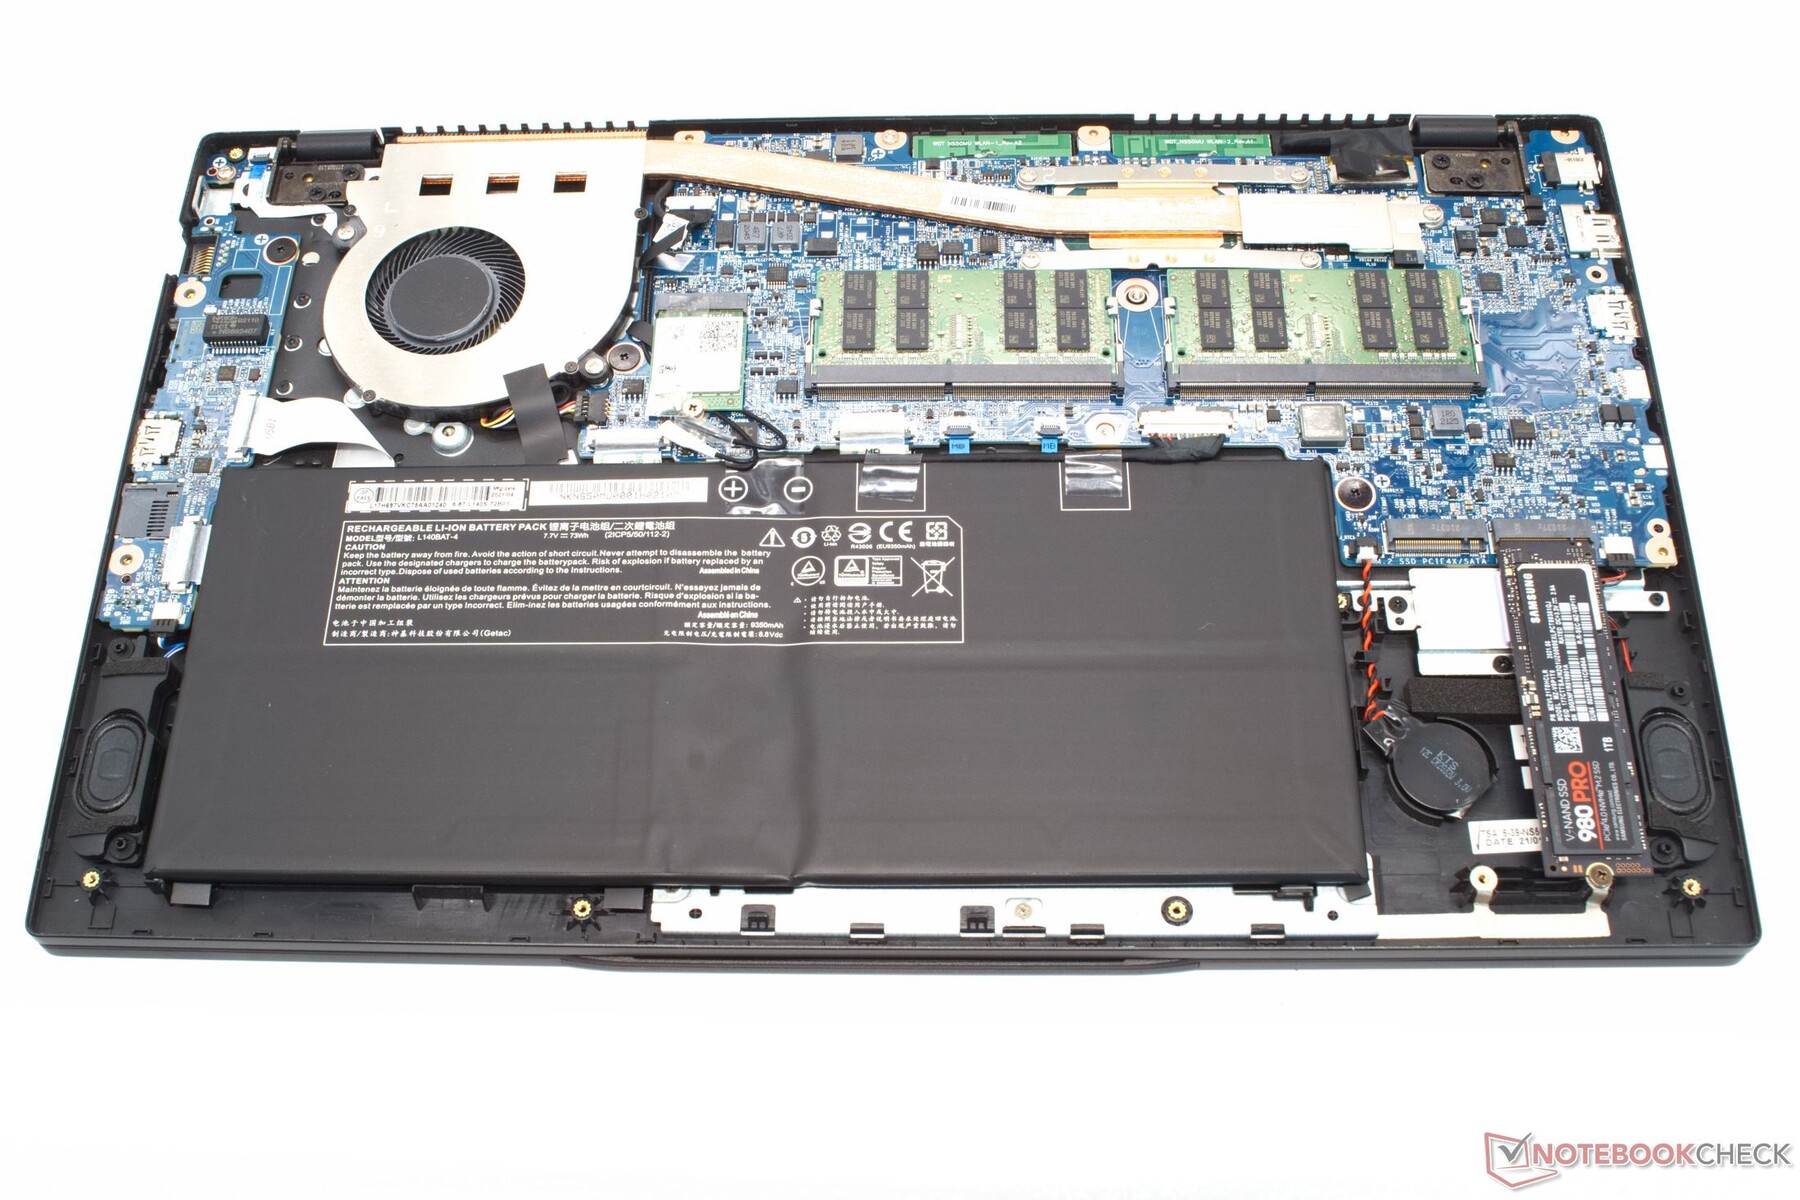
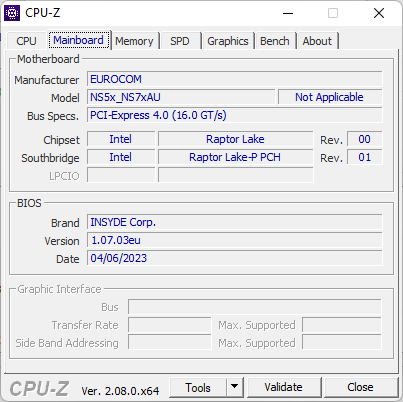
El chasis sigue siendo idéntico al del año pasado Schenker Work 15 ya que ambos se basan en el mismo chasis X170KM. Tenga en cuenta que solo uno de los dos puertos USB-C admite Thunderbolt, carga USB-C y salida DisplayPort.

Lector de tarjetas SD
| SD Card Reader | |
| average JPG Copy Test (av. of 3 runs) | |
| Schenker Work 15 Tiger Lake-H (Angelbird AV Pro V60) | |
| Eurocom C315 Blitz (Angelbird AV Pro V60) | |
| Lenovo ThinkPad L15 Gen 4 21H70021GE | |
| Samsung Galaxy Book2 15 (Angelbird AV Pro V60) | |
| maximum AS SSD Seq Read Test (1GB) | |
| Lenovo ThinkPad L15 Gen 4 21H70021GE | |
| Eurocom C315 Blitz (Angelbird AV Pro V60) | |
| Schenker Work 15 Tiger Lake-H (Angelbird AV Pro V60) | |
| Samsung Galaxy Book2 15 (Angelbird AV Pro V60) | |
Comunicación
| Networking | |
| iperf3 transmit AX12 | |
| Schenker Work 15 Tiger Lake-H | |
| iperf3 receive AX12 | |
| Schenker Work 15 Tiger Lake-H | |
| iperf3 transmit AXE11000 | |
| Samsung Galaxy Book2 15 | |
| Lenovo ThinkPad L15 Gen 4 21H70021GE | |
| Eurocom C315 Blitz | |
| Acer Aspire 5 A515-58GM-76S8 | |
| Asus VivoBook S15 M3502RA-L1029W | |
| iperf3 receive AXE11000 | |
| Lenovo ThinkPad L15 Gen 4 21H70021GE | |
| Samsung Galaxy Book2 15 | |
| Eurocom C315 Blitz | |
| Acer Aspire 5 A515-58GM-76S8 | |
| Asus VivoBook S15 M3502RA-L1029W | |
| iperf3 transmit AXE11000 6GHz | |
| Acer Aspire 5 A515-58GM-76S8 | |
| Lenovo ThinkPad L15 Gen 4 21H70021GE | |
| Eurocom C315 Blitz | |
| iperf3 receive AXE11000 6GHz | |
| Lenovo ThinkPad L15 Gen 4 21H70021GE | |
| Acer Aspire 5 A515-58GM-76S8 | |
| Eurocom C315 Blitz | |
Cámara web
Aunque Eurocom anuncia una webcam de 2 MP, la aplicación de cámara de Windows sólo le permite seleccionar hasta 1 MP o grabar a 720p30 como máximo.


Mantenimiento
Garantía
La garantía limitada estándar de un año se aplica si se adquiere en Estados Unidos. Eurocom ofrece planes de ampliación opcionales de hasta tres años.
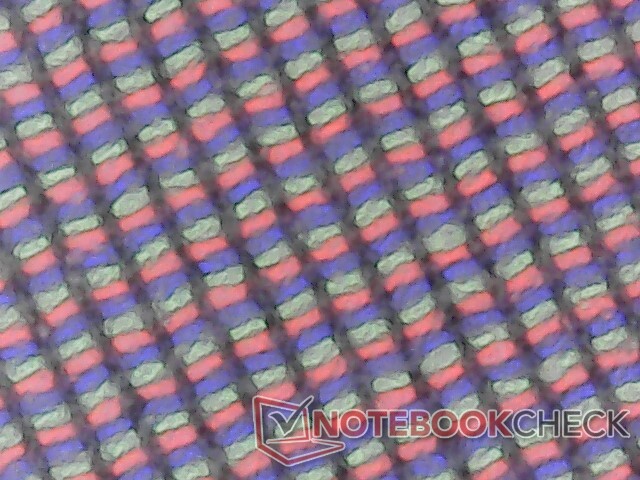
Mostrar
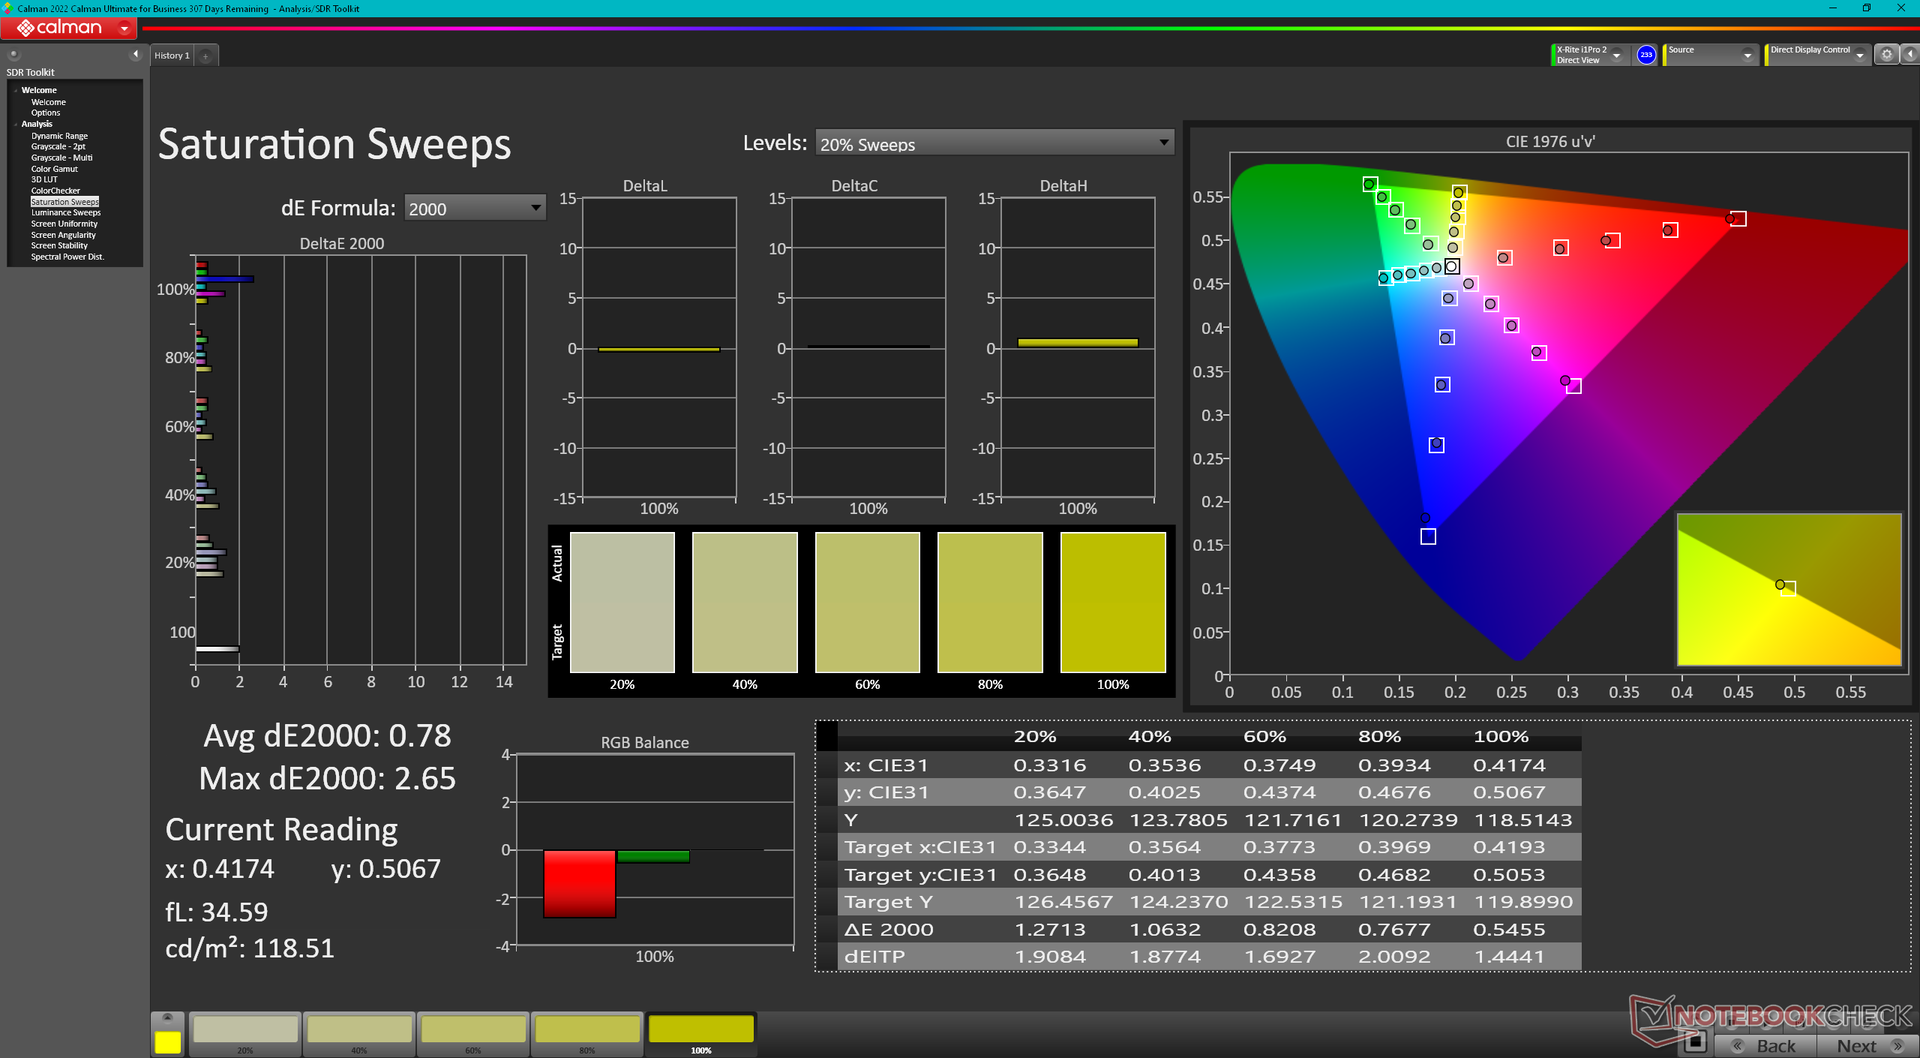
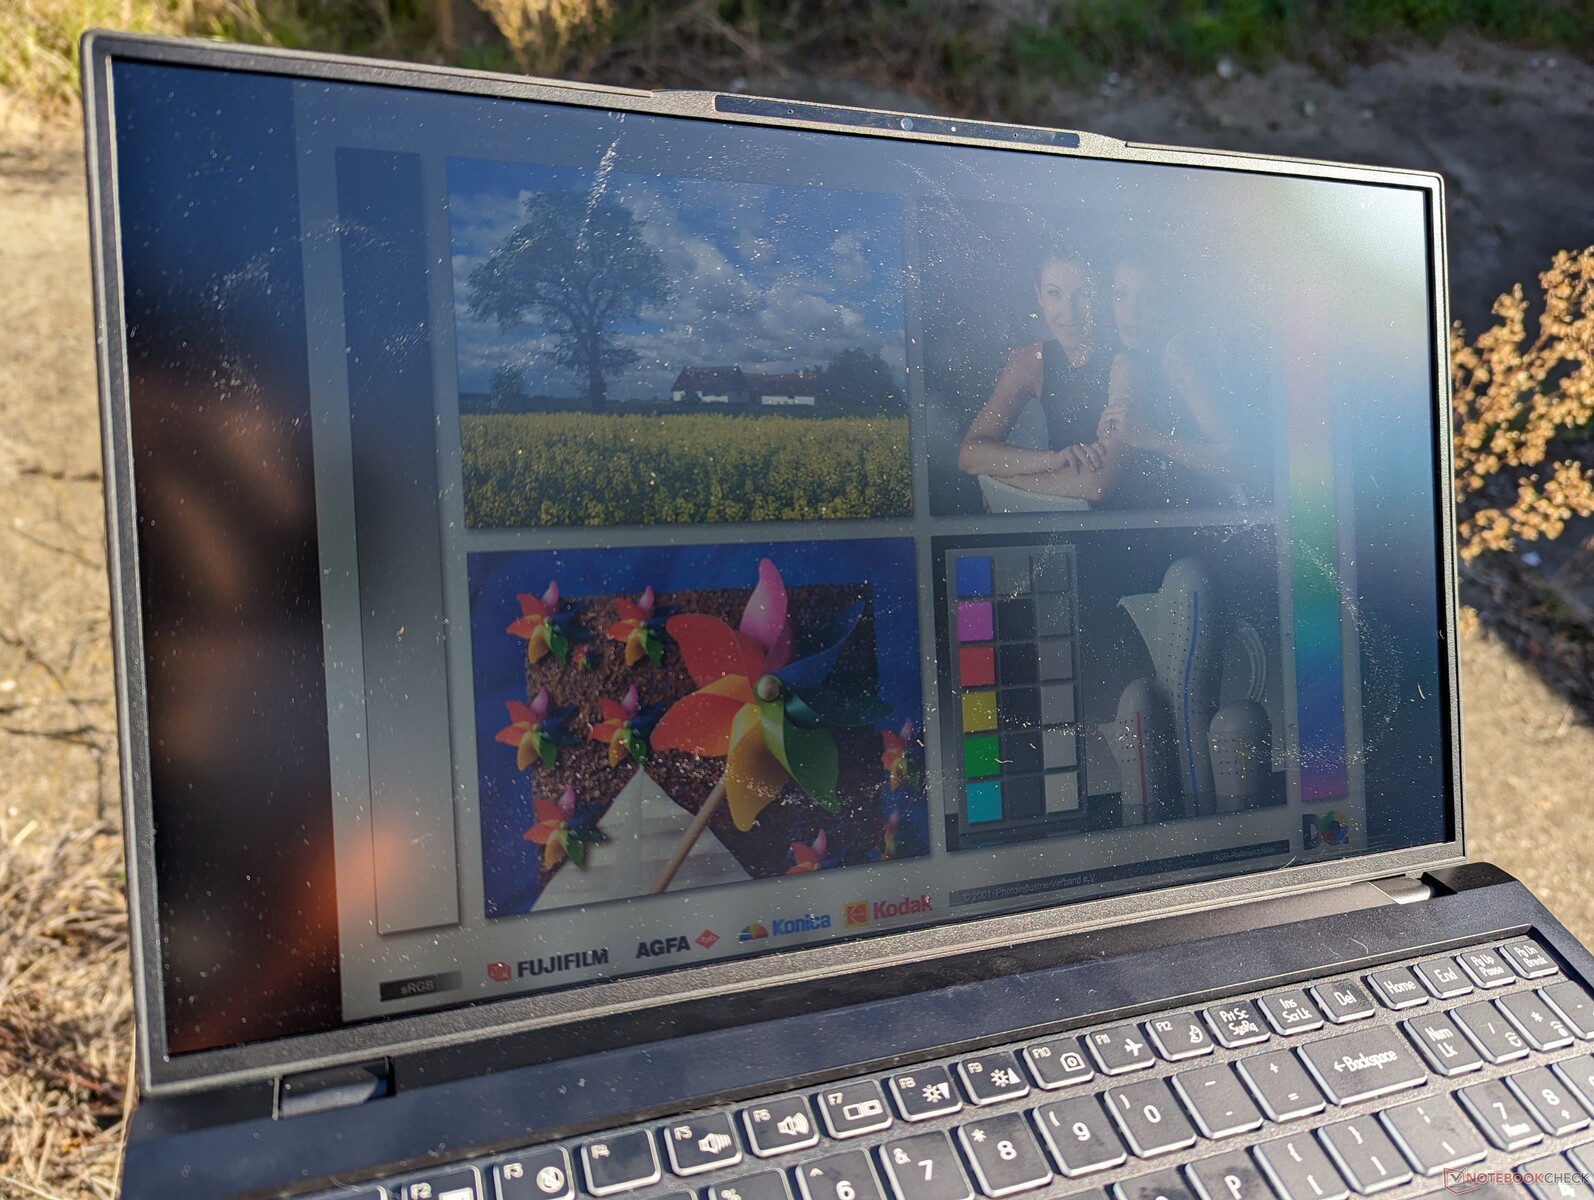
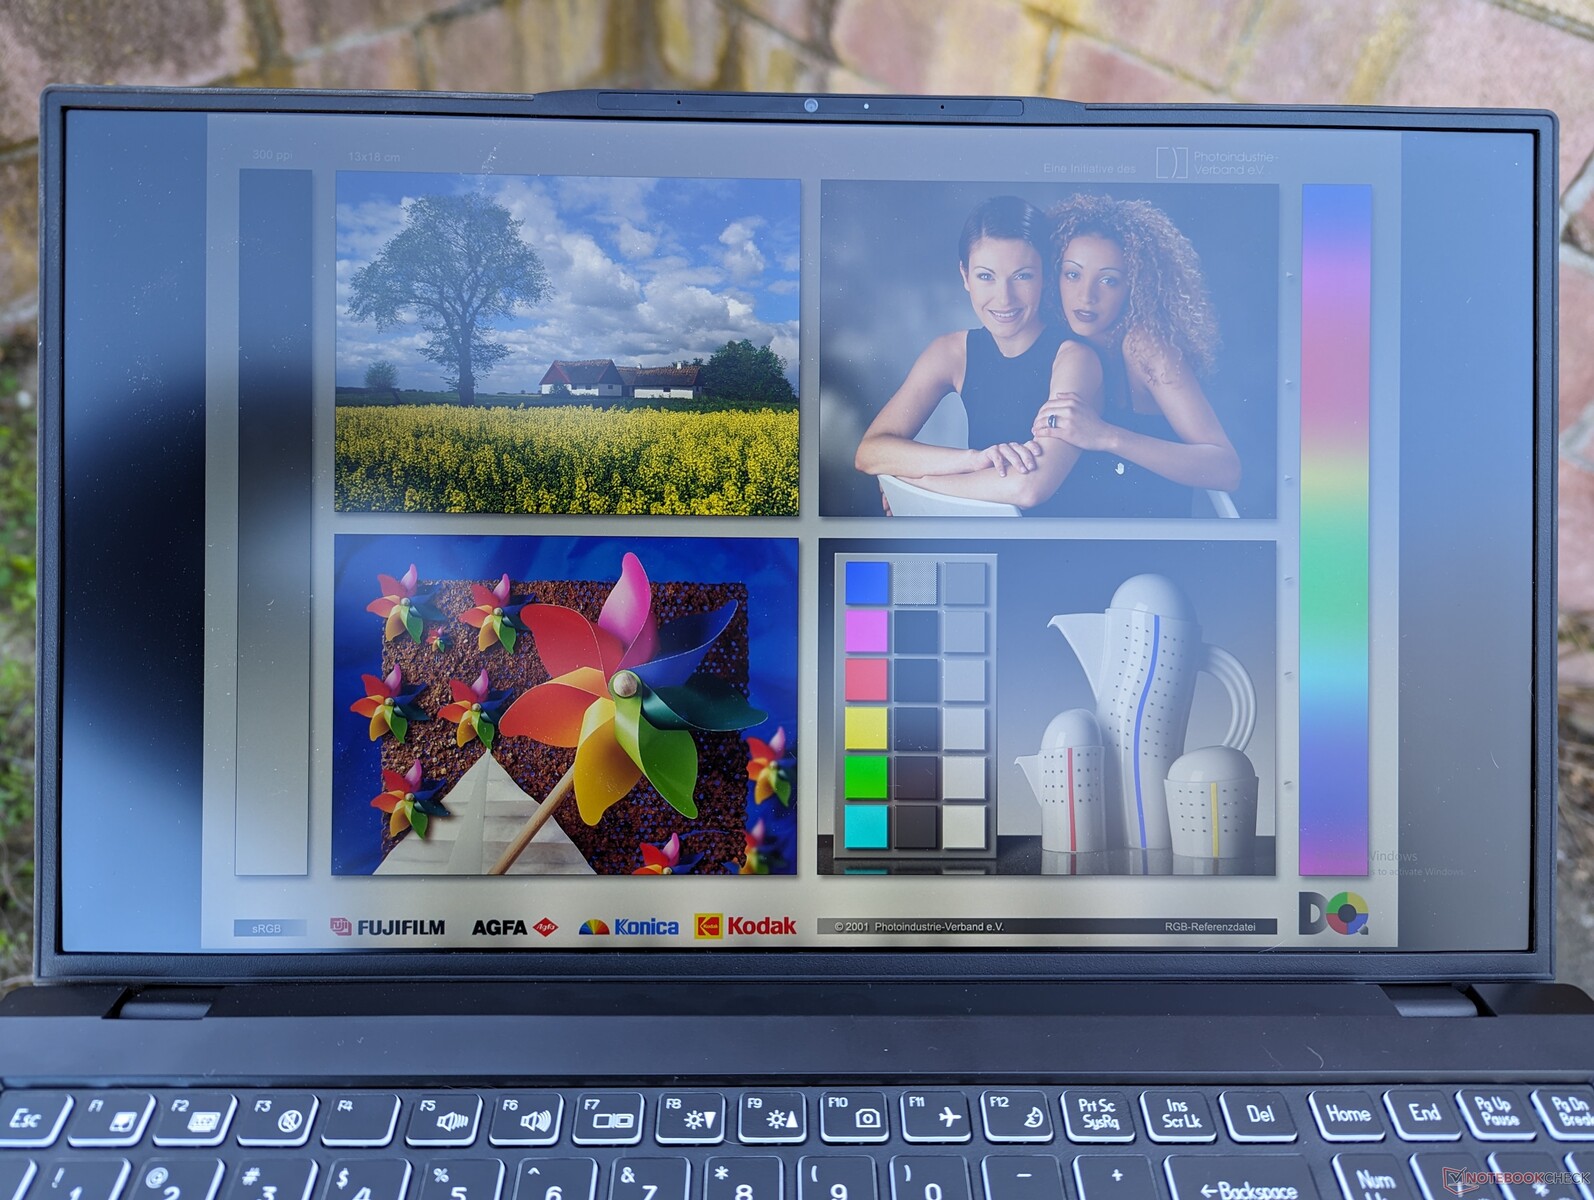
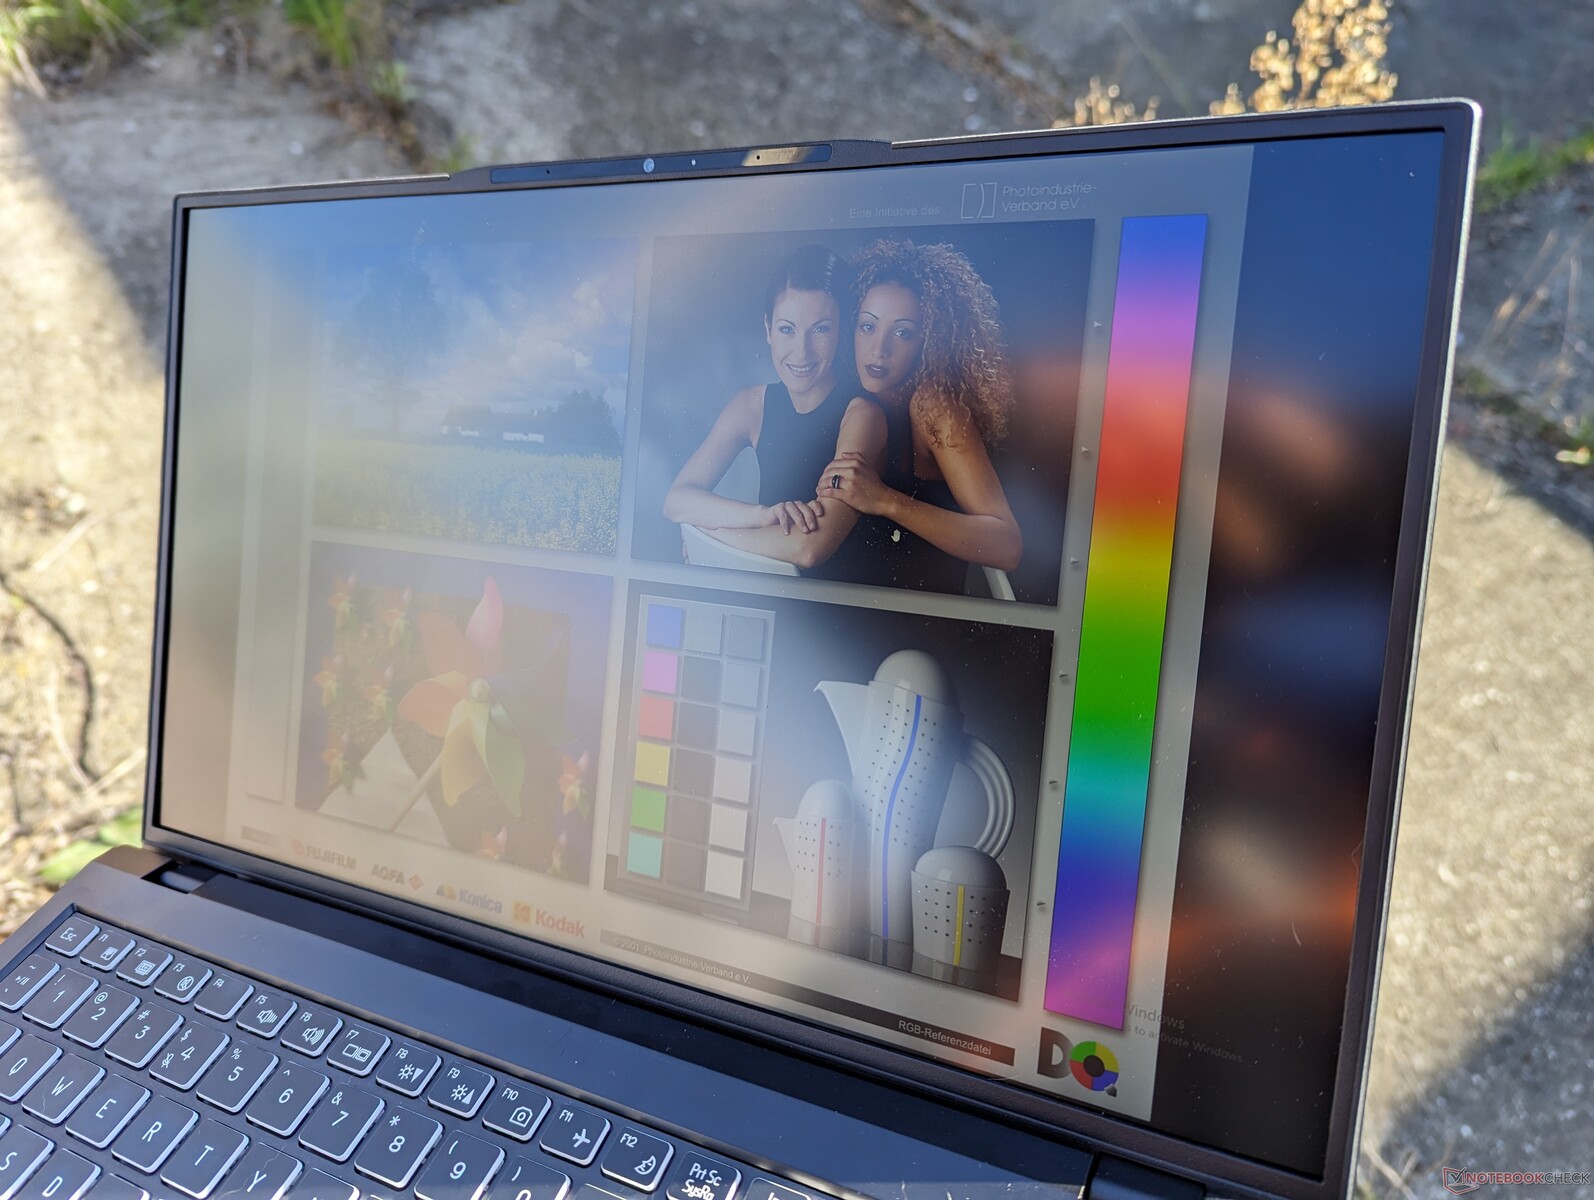
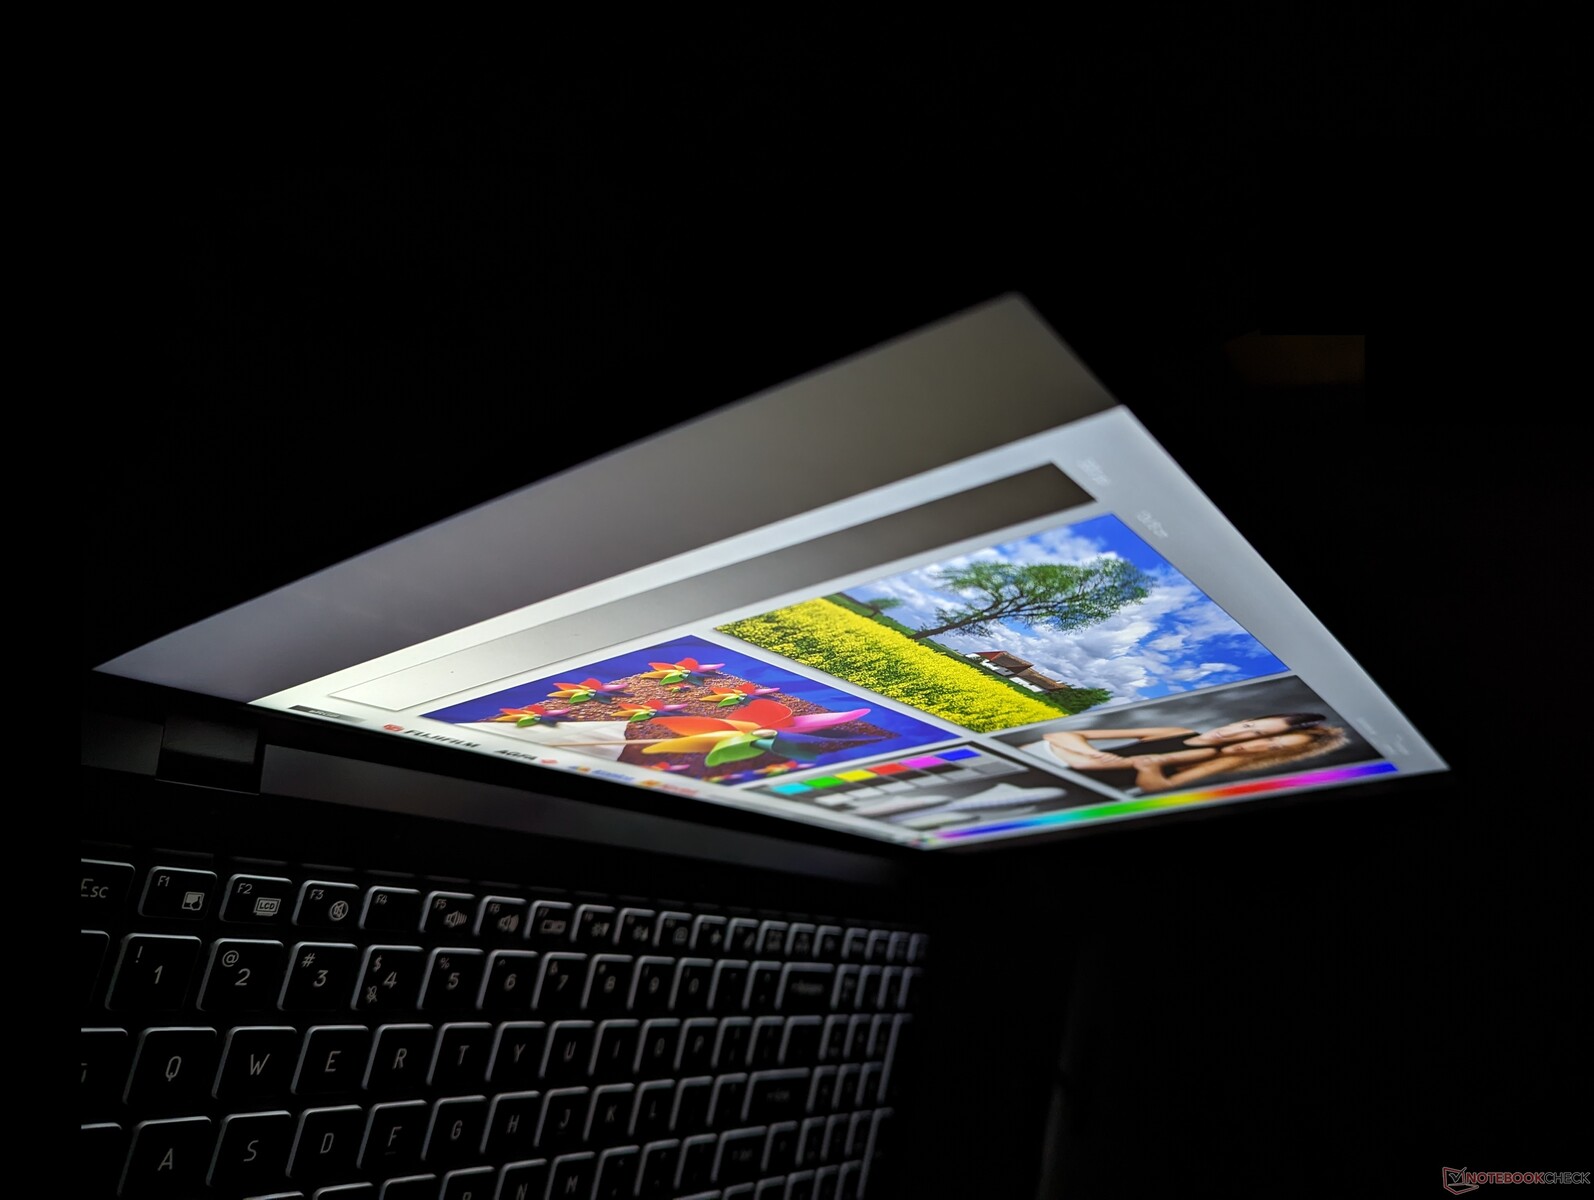
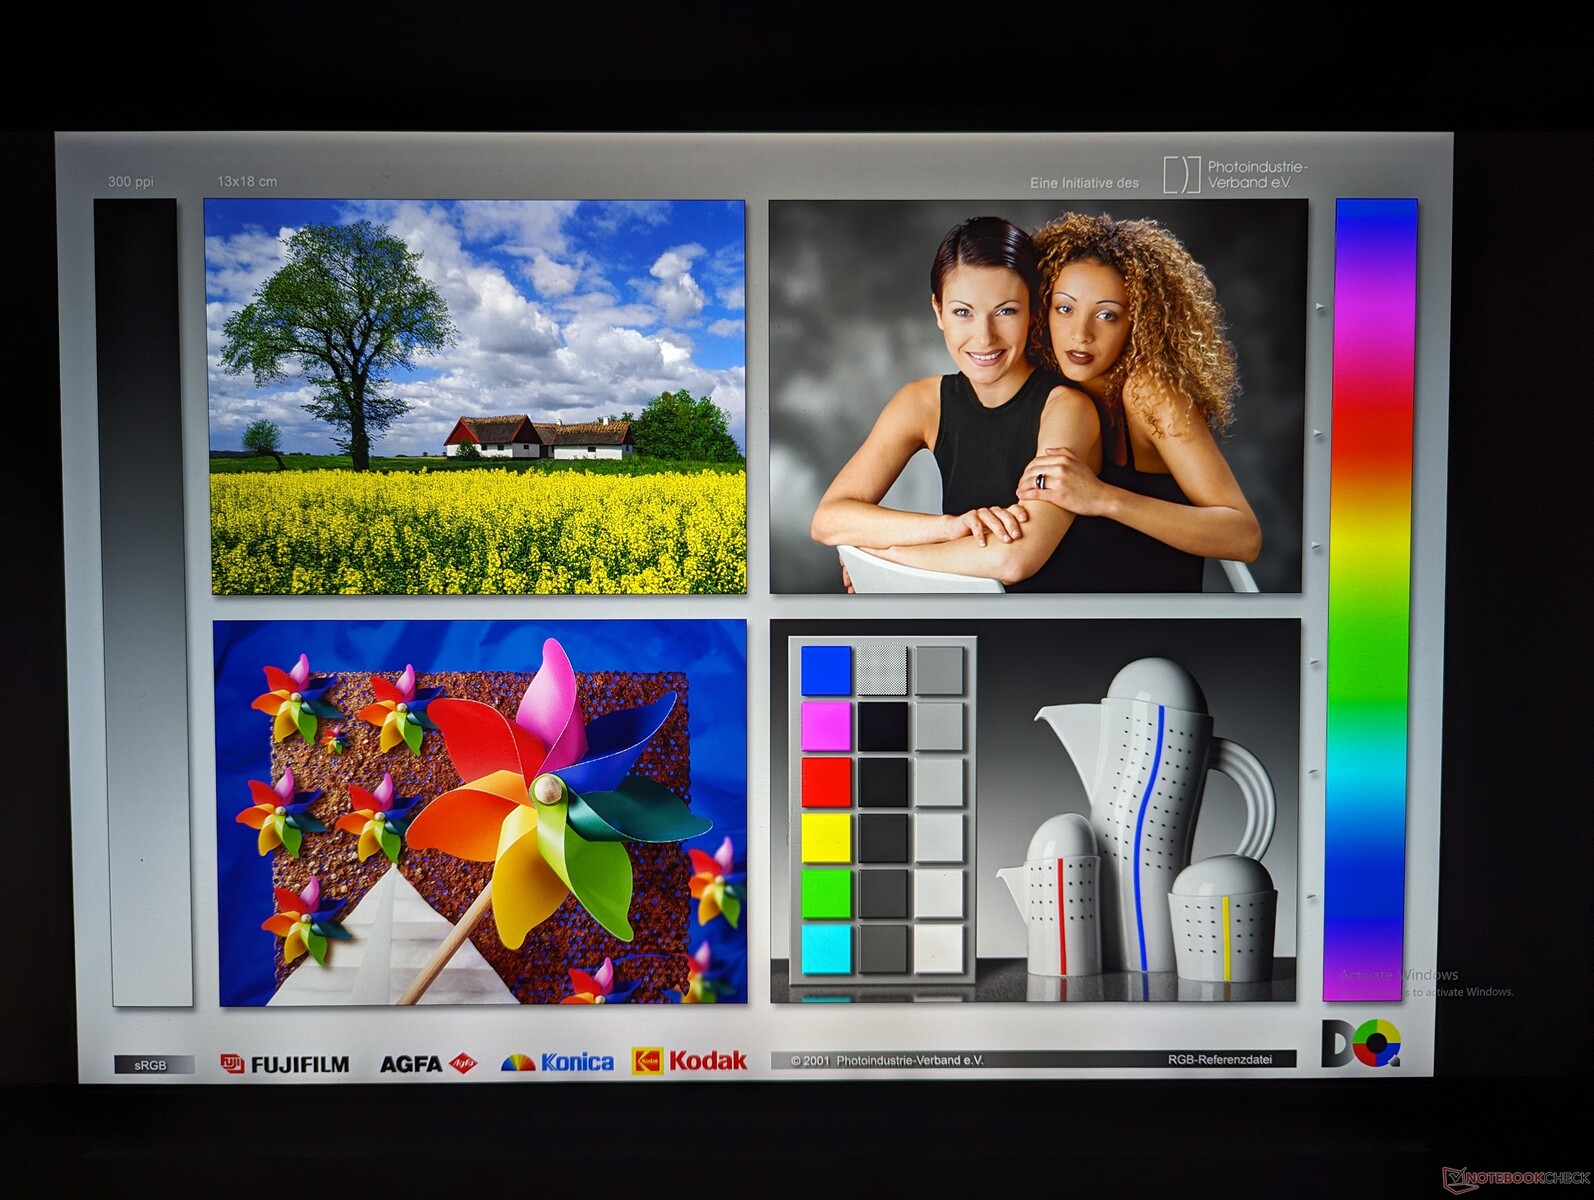
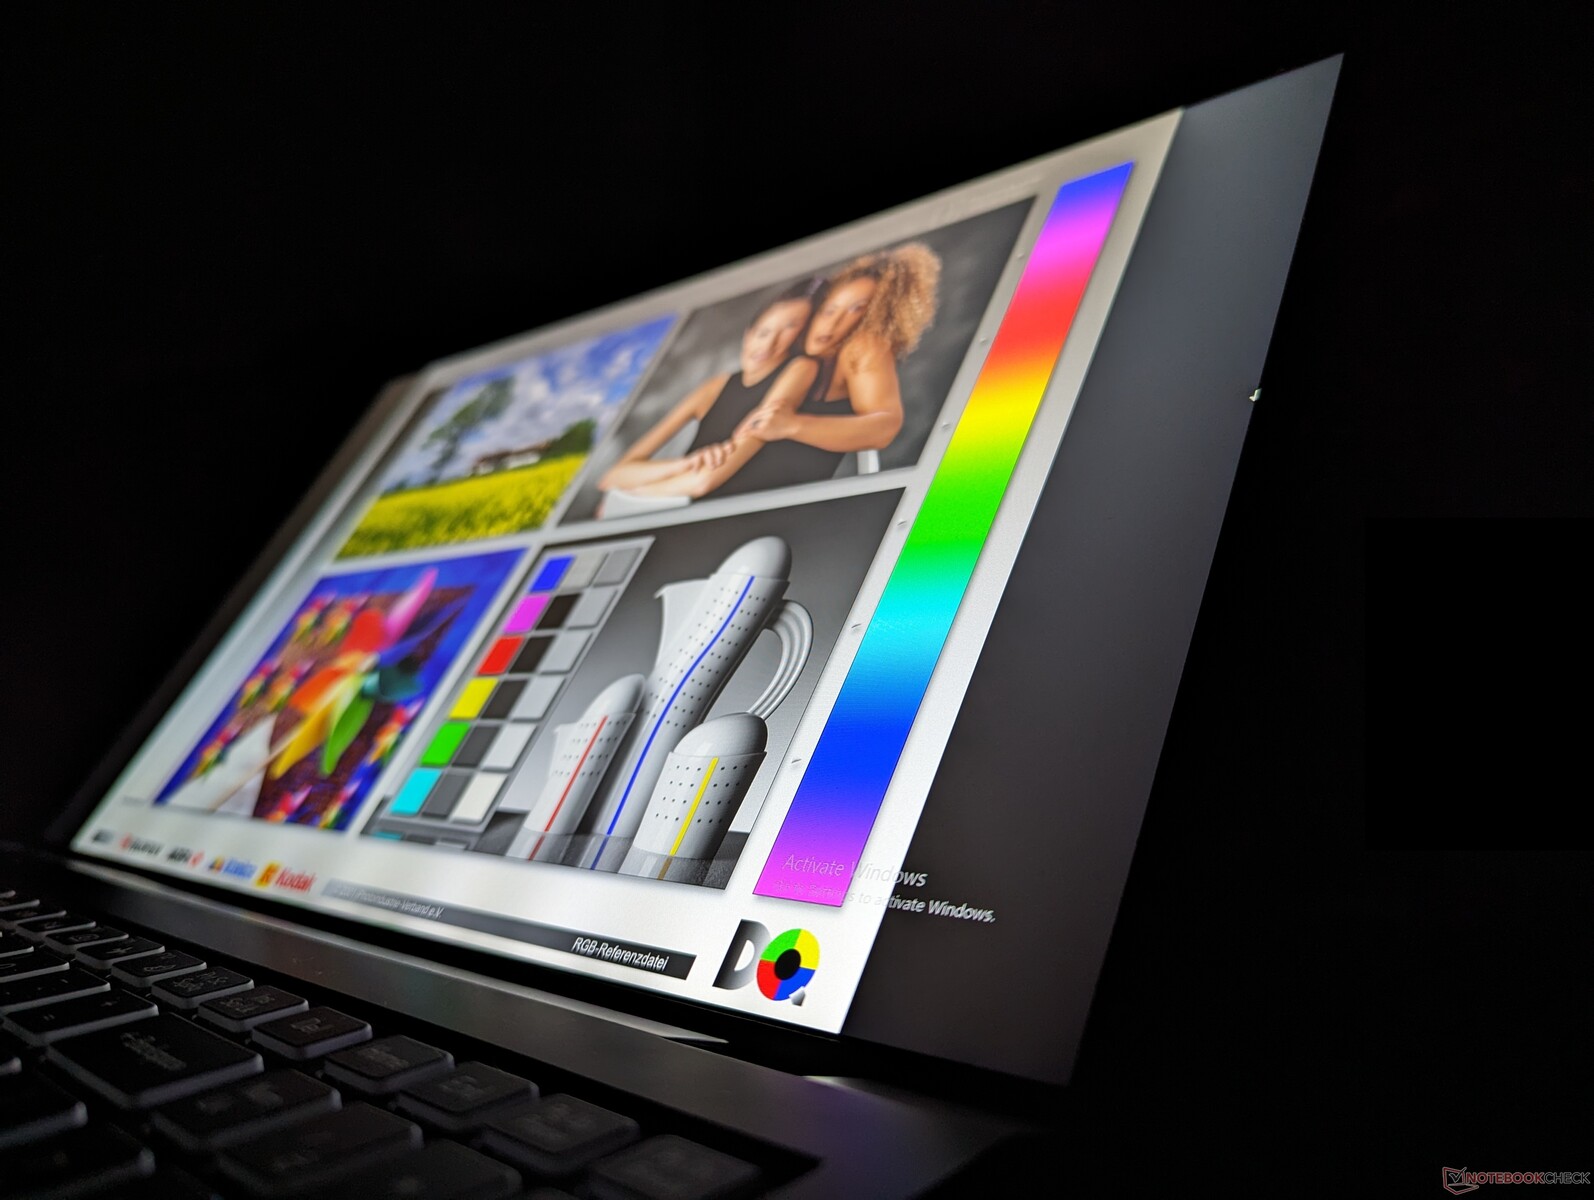
Nuestra configuración Eurocom luce un panel 4K de mayor resolución que el panel 1080p de nuestra Schenker. Sin embargo, los tiempos de respuesta en blanco y negro no han mejorado, por lo que las imágenes fantasma siguen siendo notables. Por desgracia, el C315 Blitz no ofrece opciones con HDR, cobertura completa DCI-P3, AdobeRGB o paneles con frecuencias de actualización superiores.
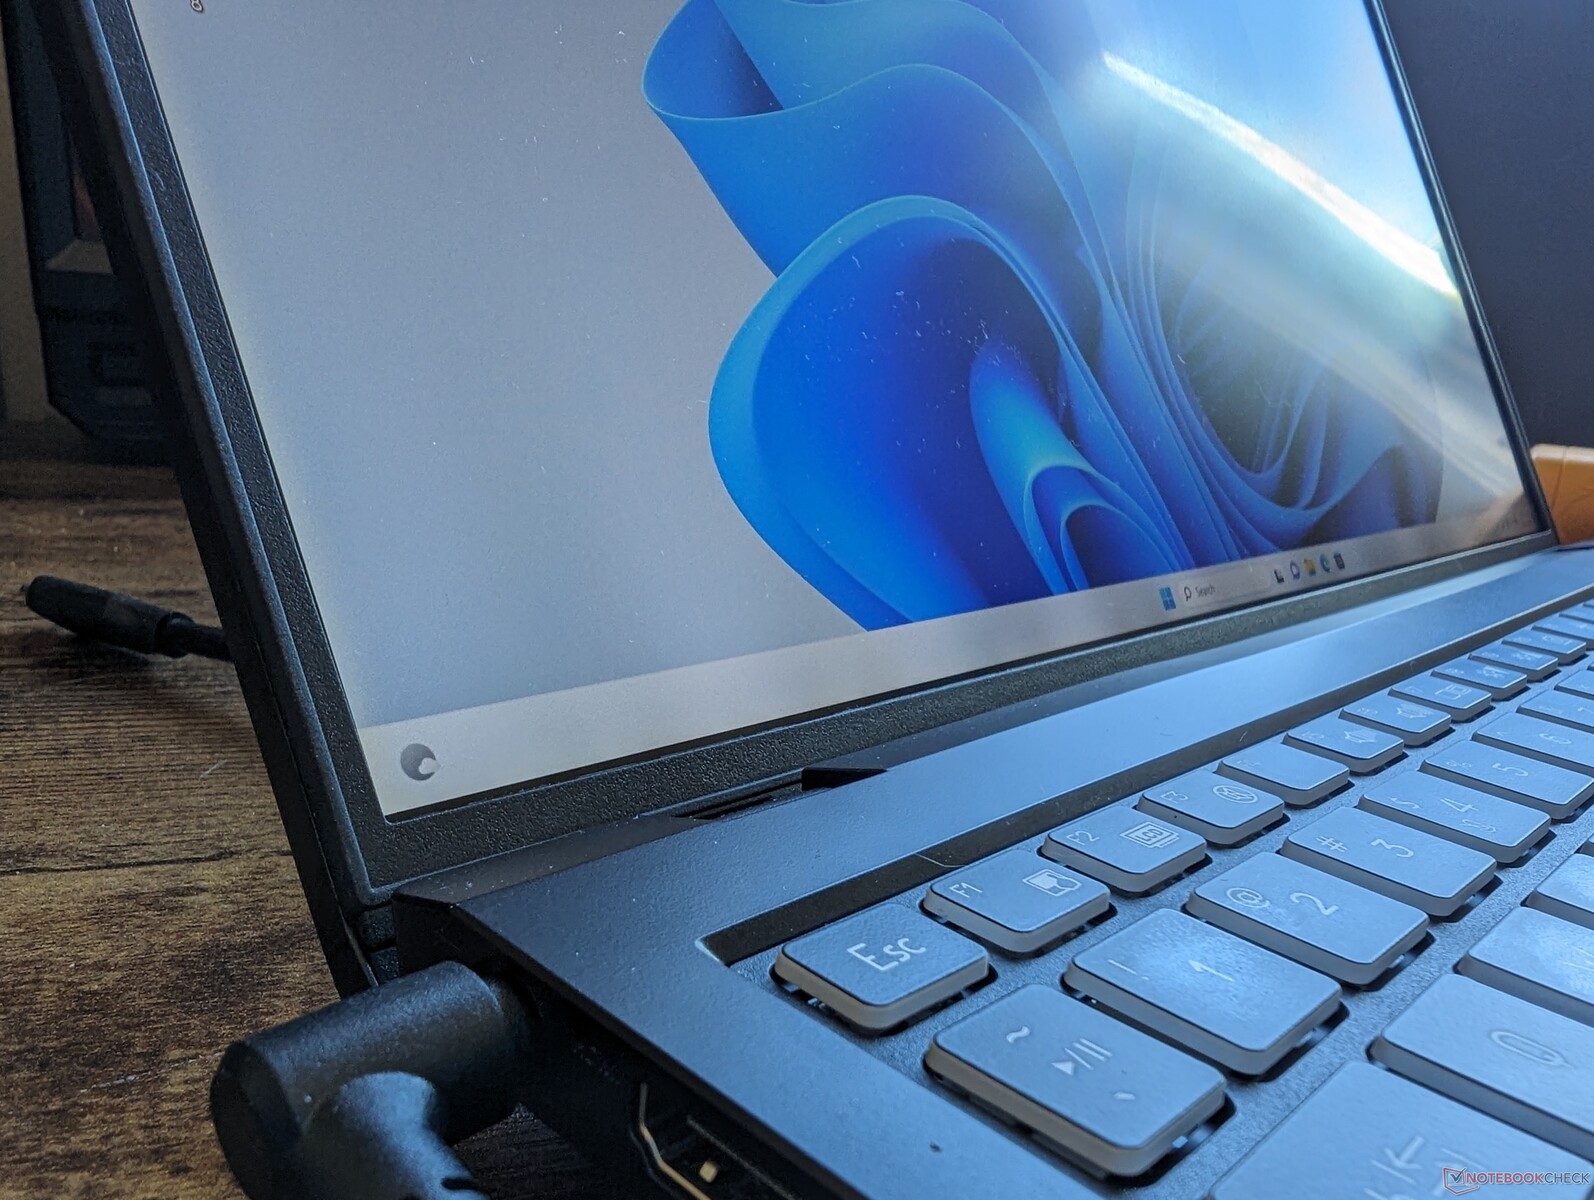
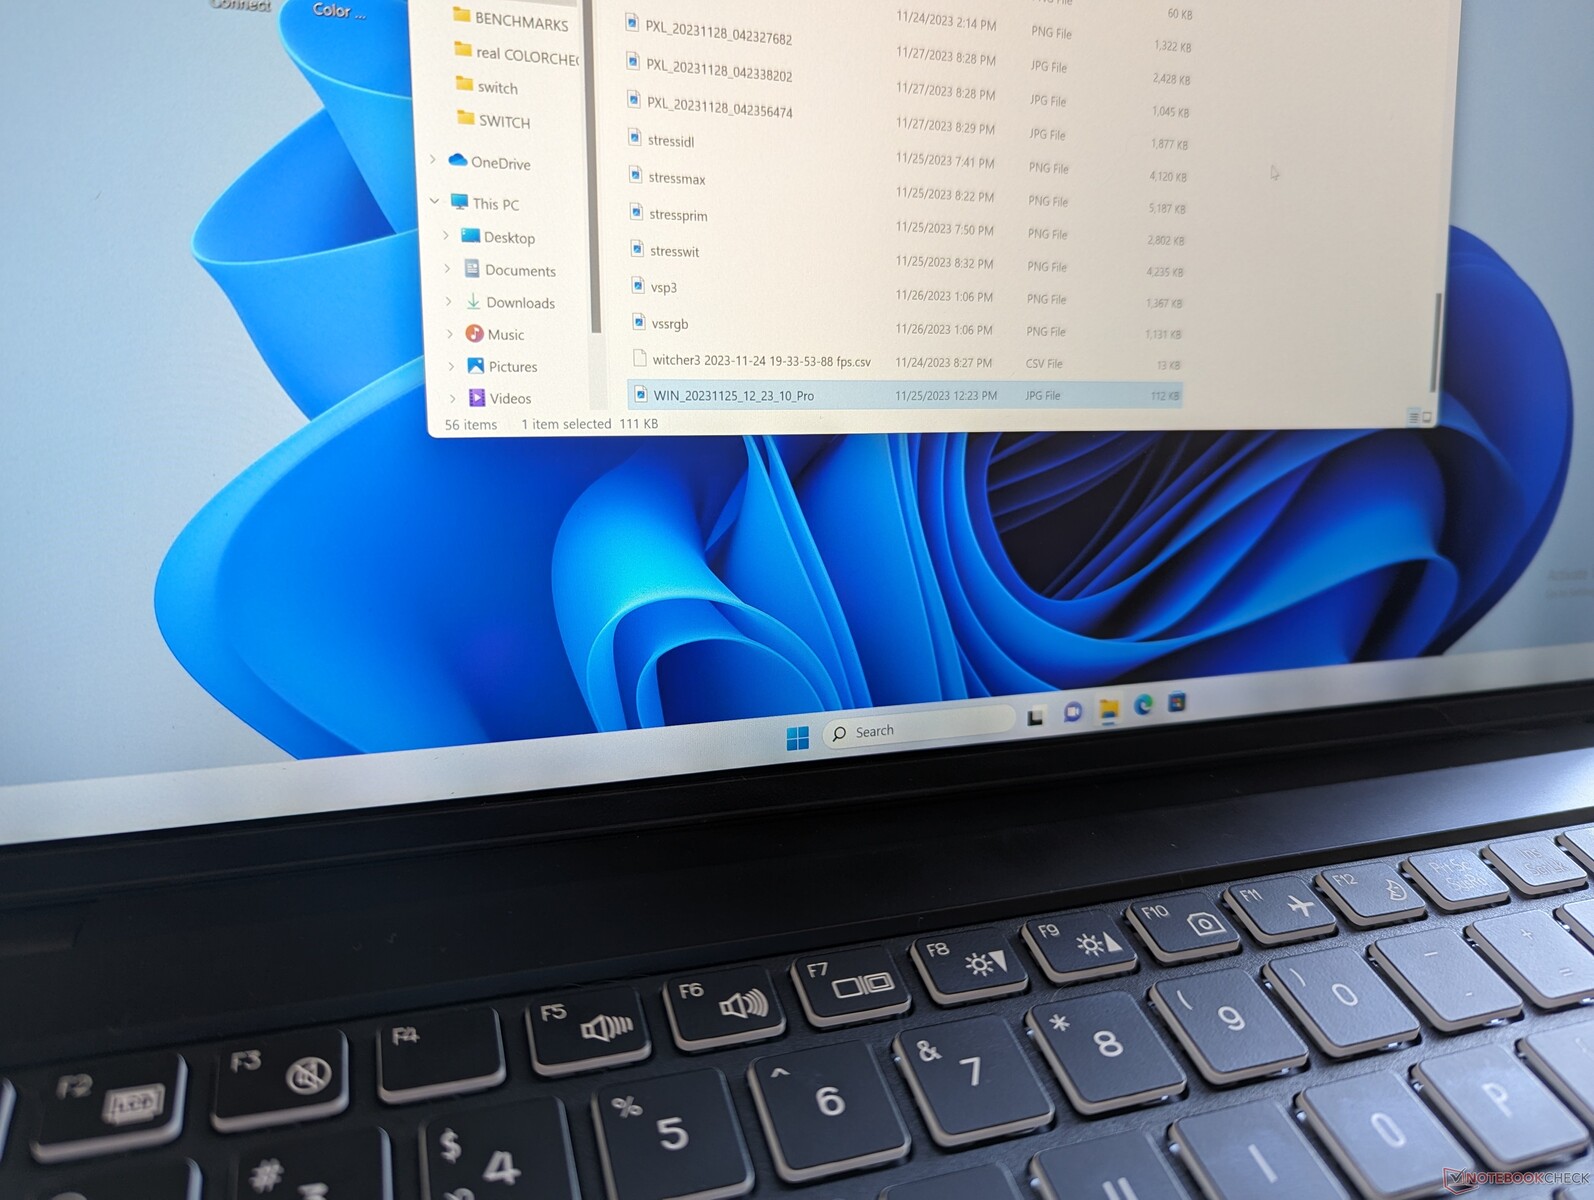
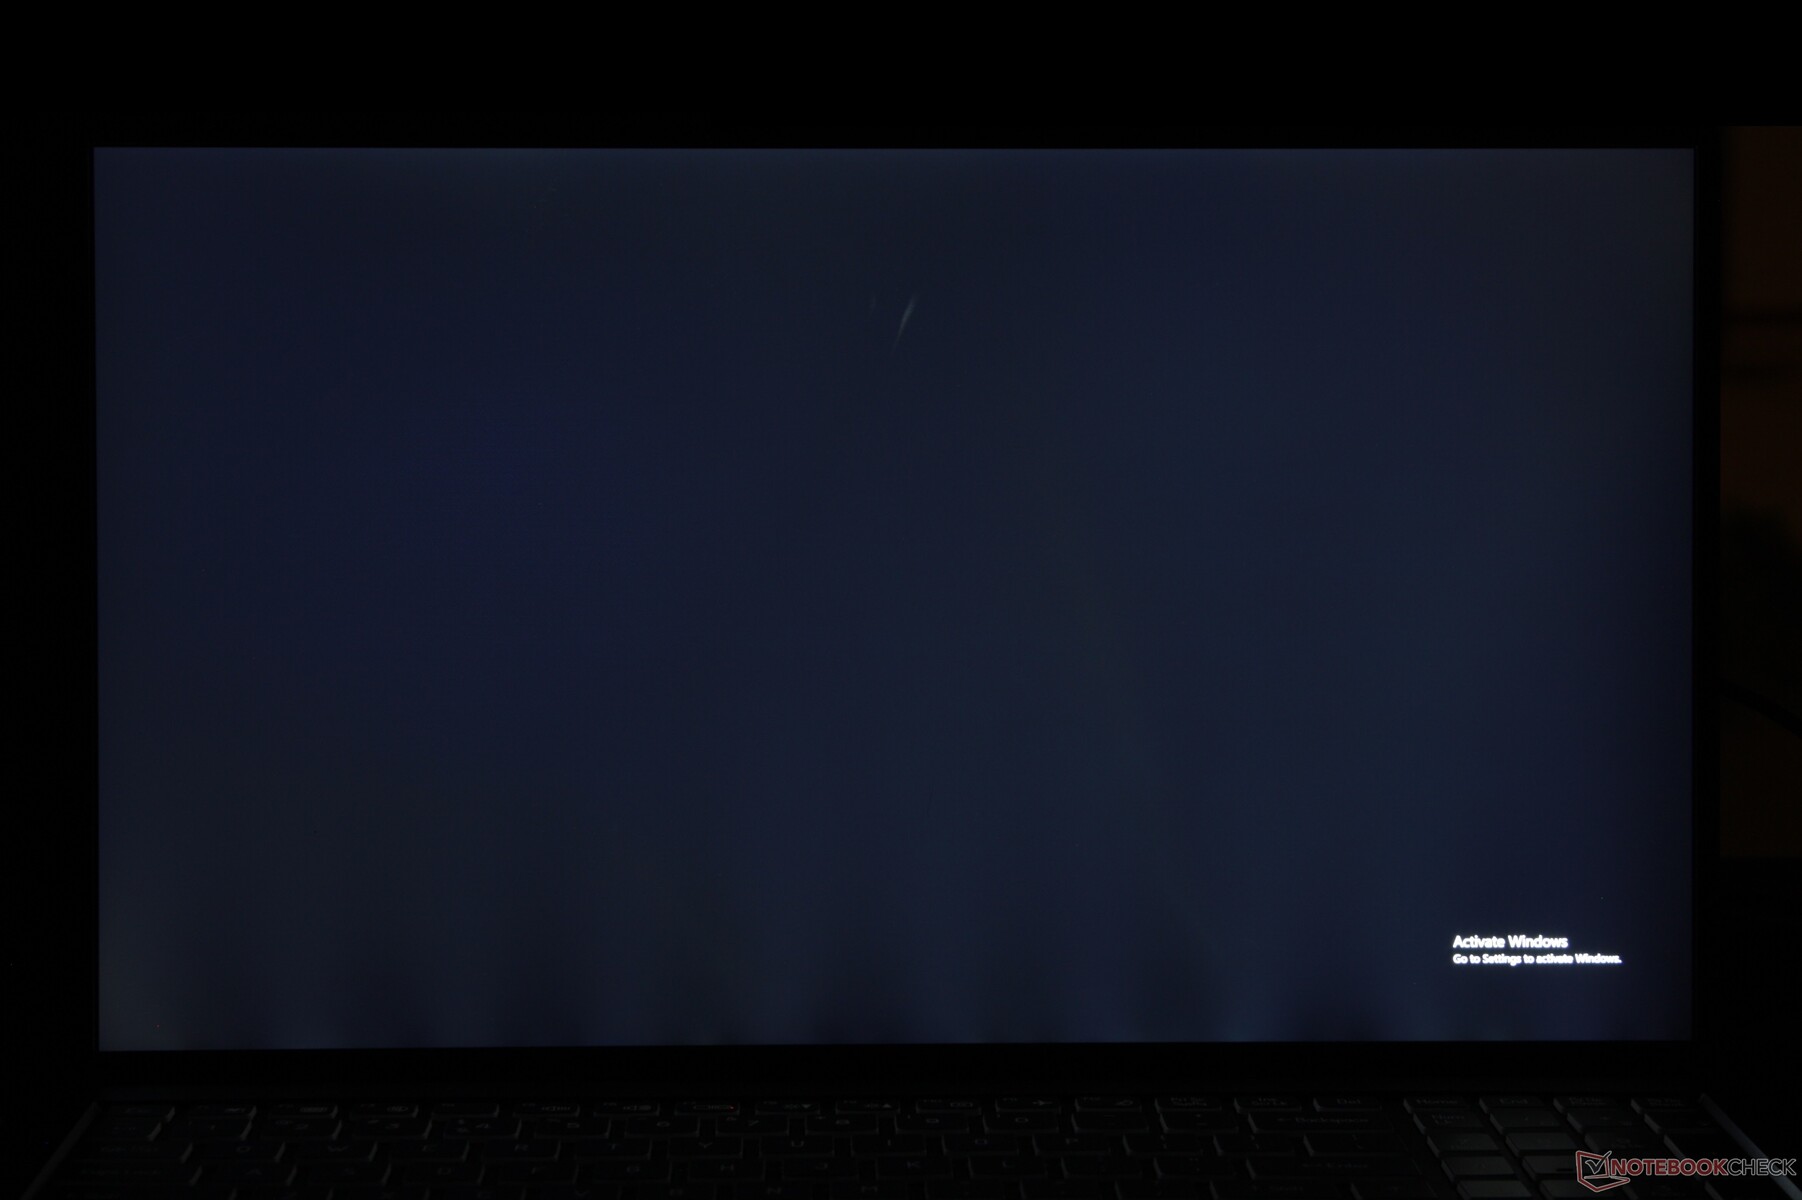
La pantalla de nuestra unidad de pruebas específica sufre de una hemorragia de retroiluminación extrema a lo largo del borde inferior, como muestran las imágenes de abajo. Le recomendamos que compruebe dos veces su compra para asegurarse de que no hay problemas con la pantalla.
| |||||||||||||||||||||||||
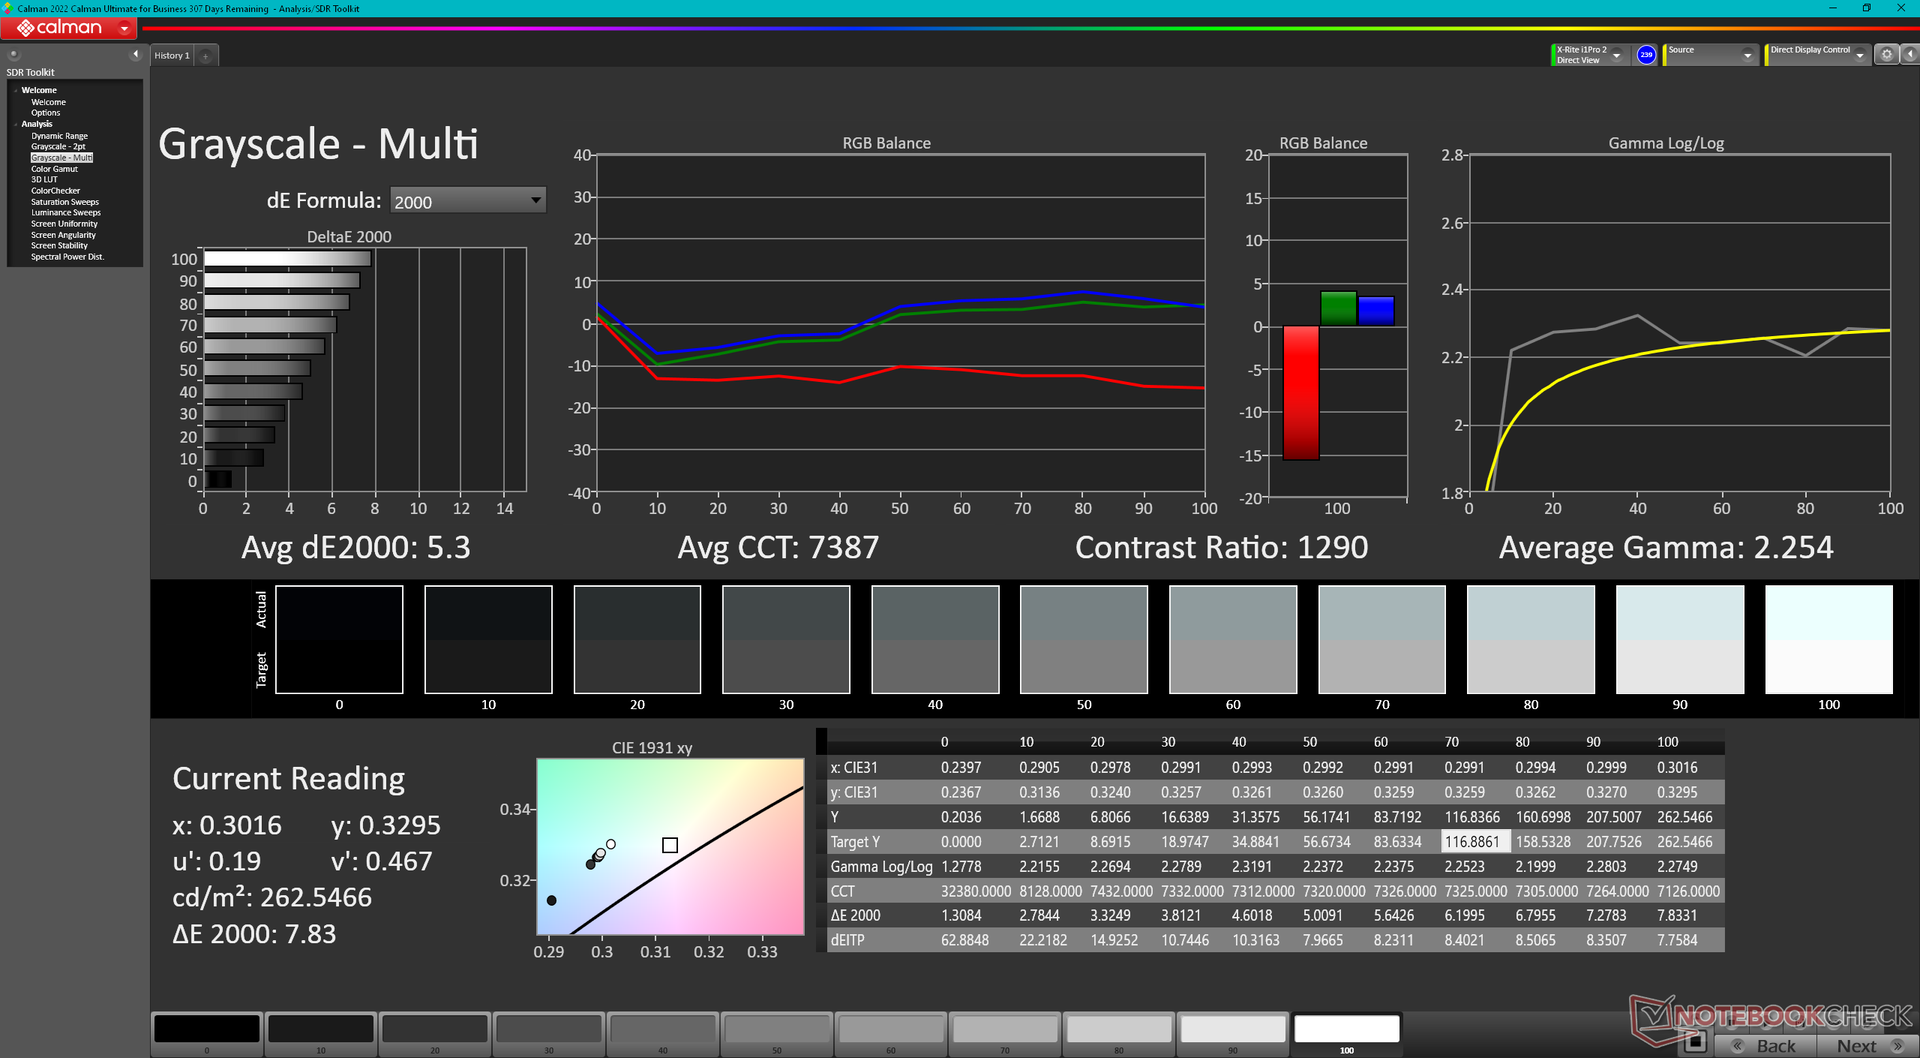
iluminación: 85 %
Brillo con batería: 262.5 cd/m²
Contraste: 1050:1 (Negro: 0.25 cd/m²)
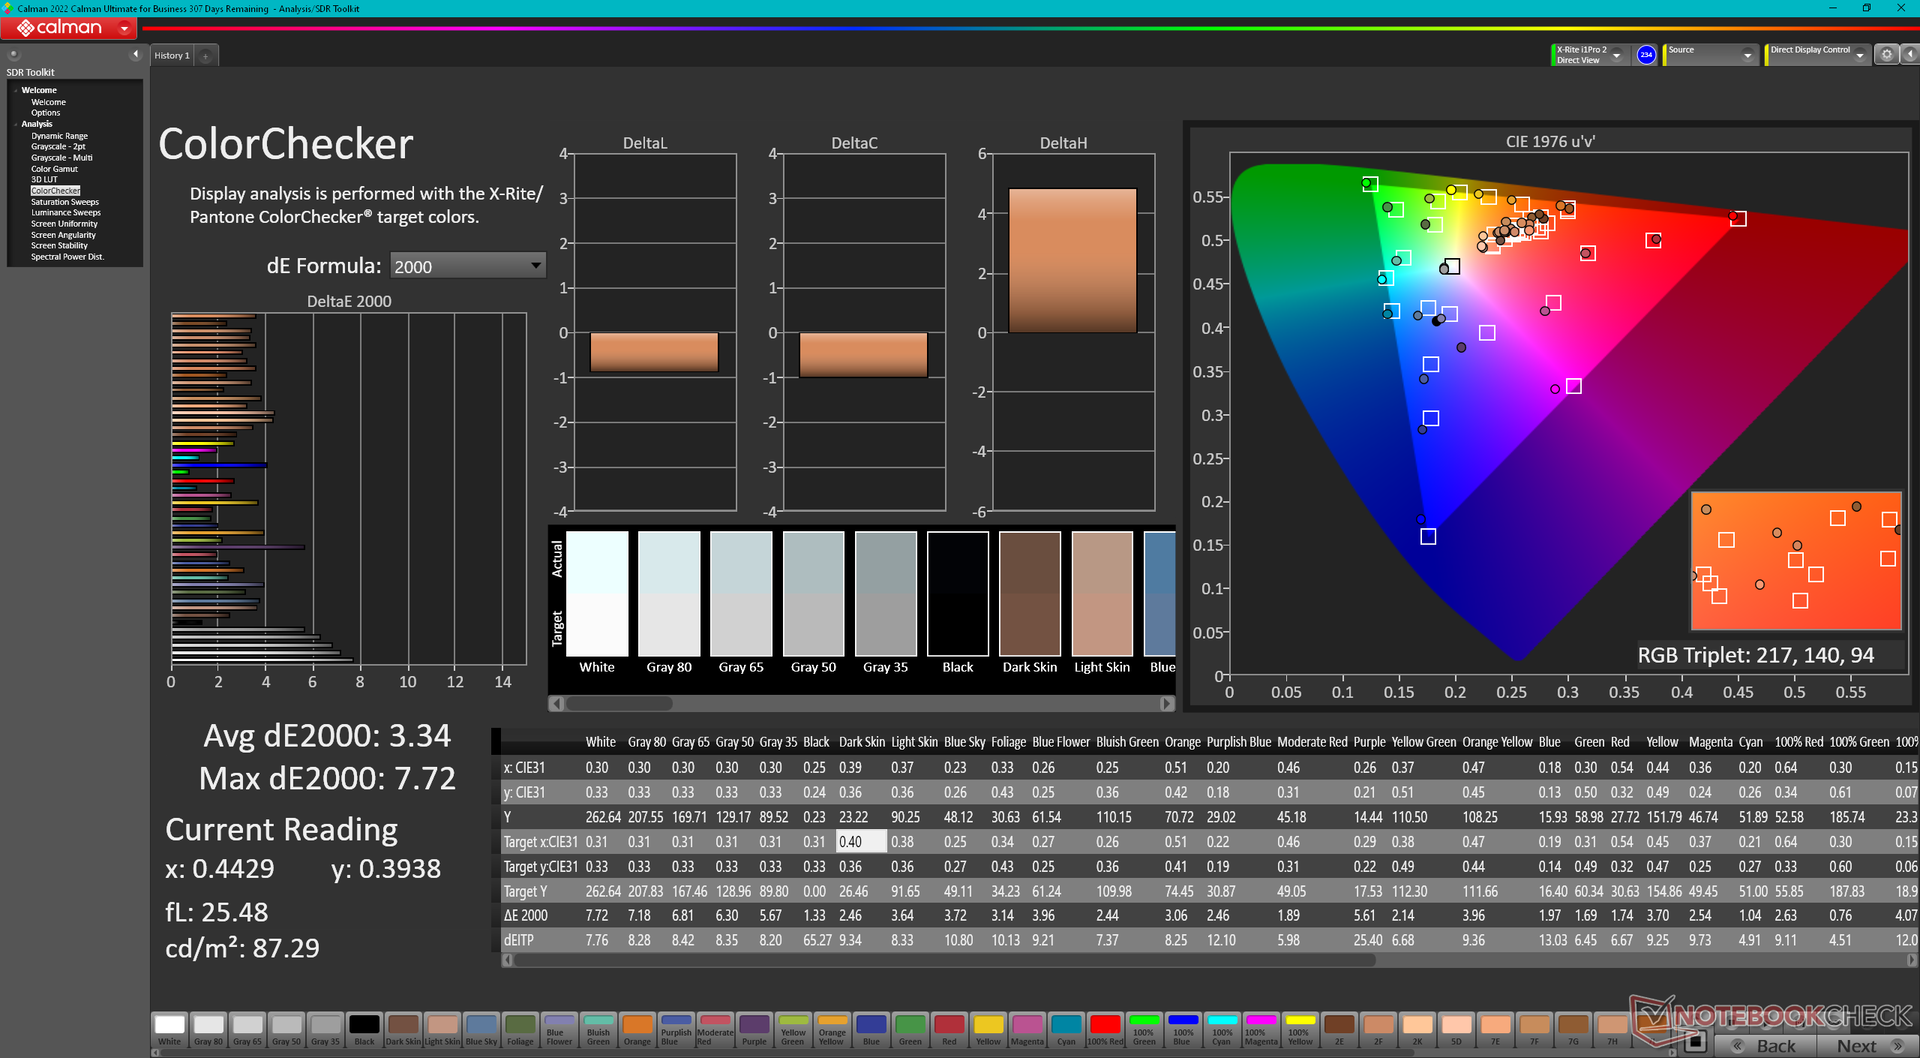
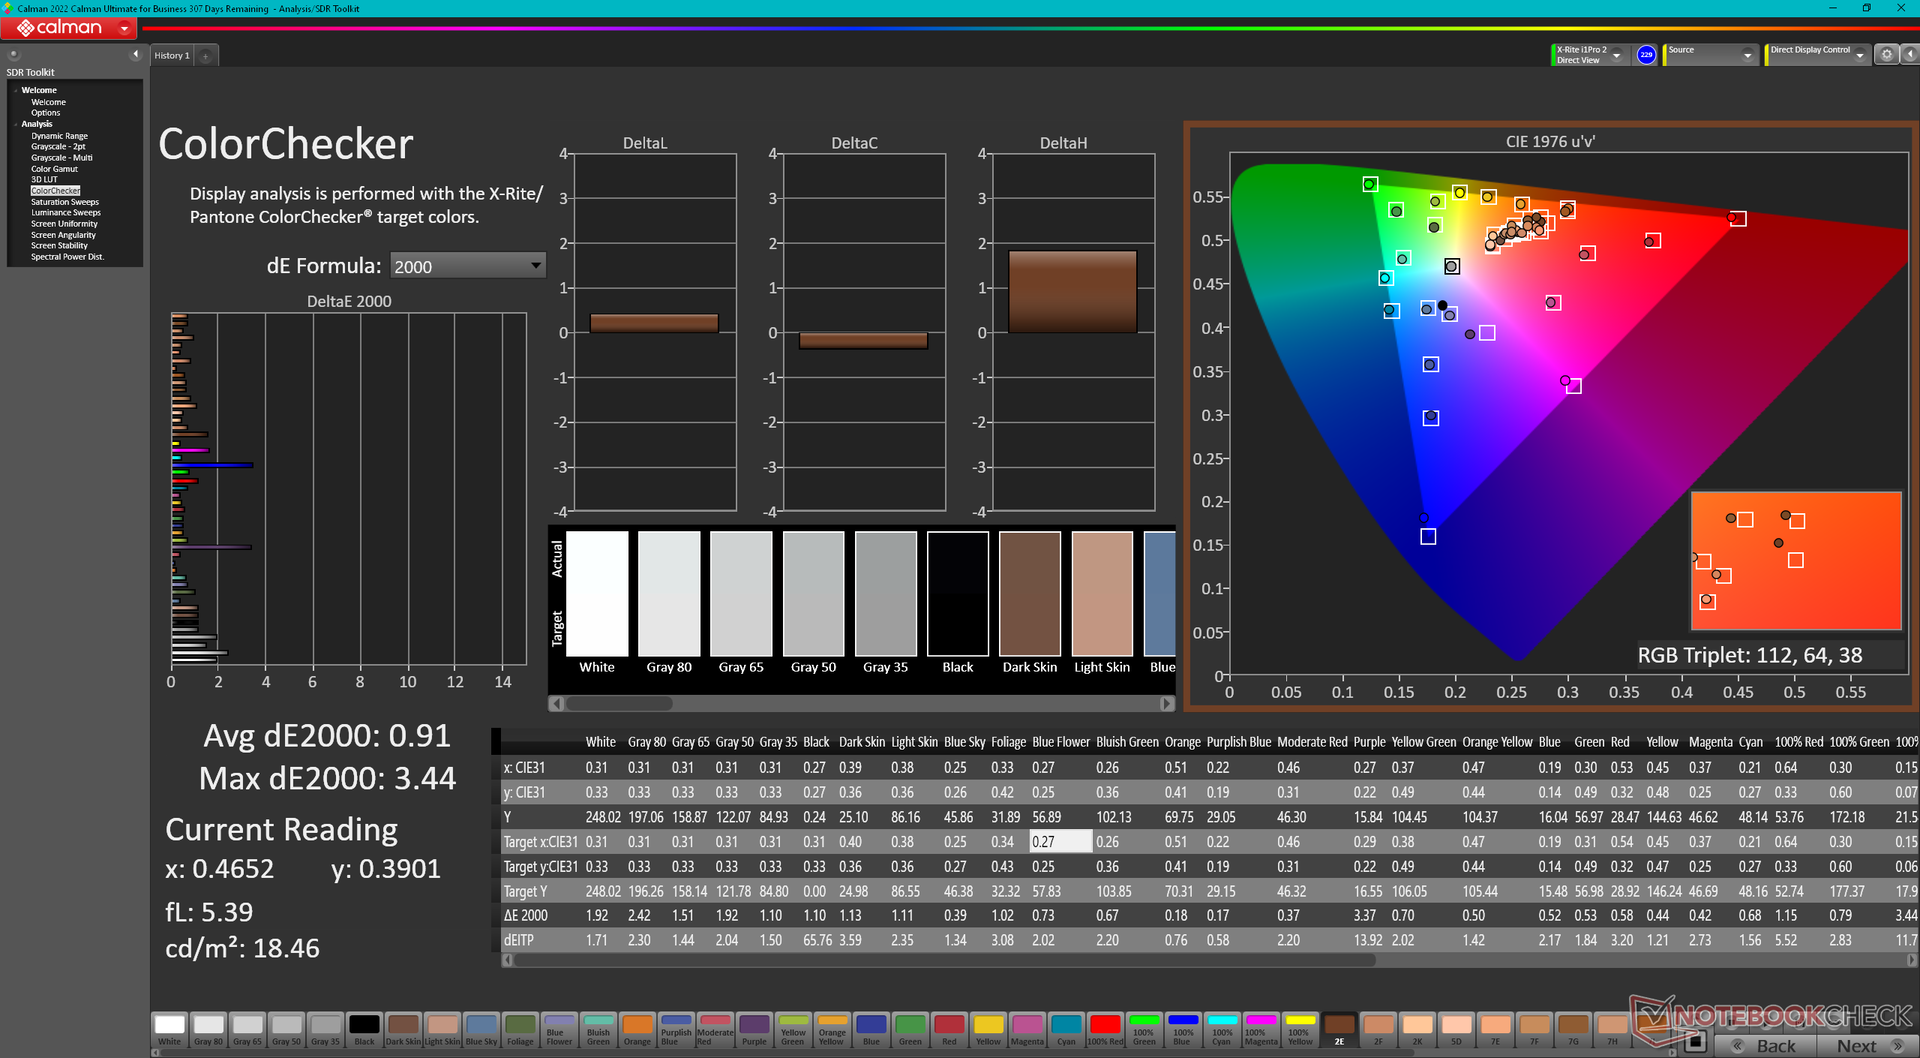
ΔE ColorChecker Calman: 3.34 | ∀{0.5-29.43 Ø4.71}
calibrated: 0.91
ΔE Greyscale Calman: 5.3 | ∀{0.09-98 Ø4.96}
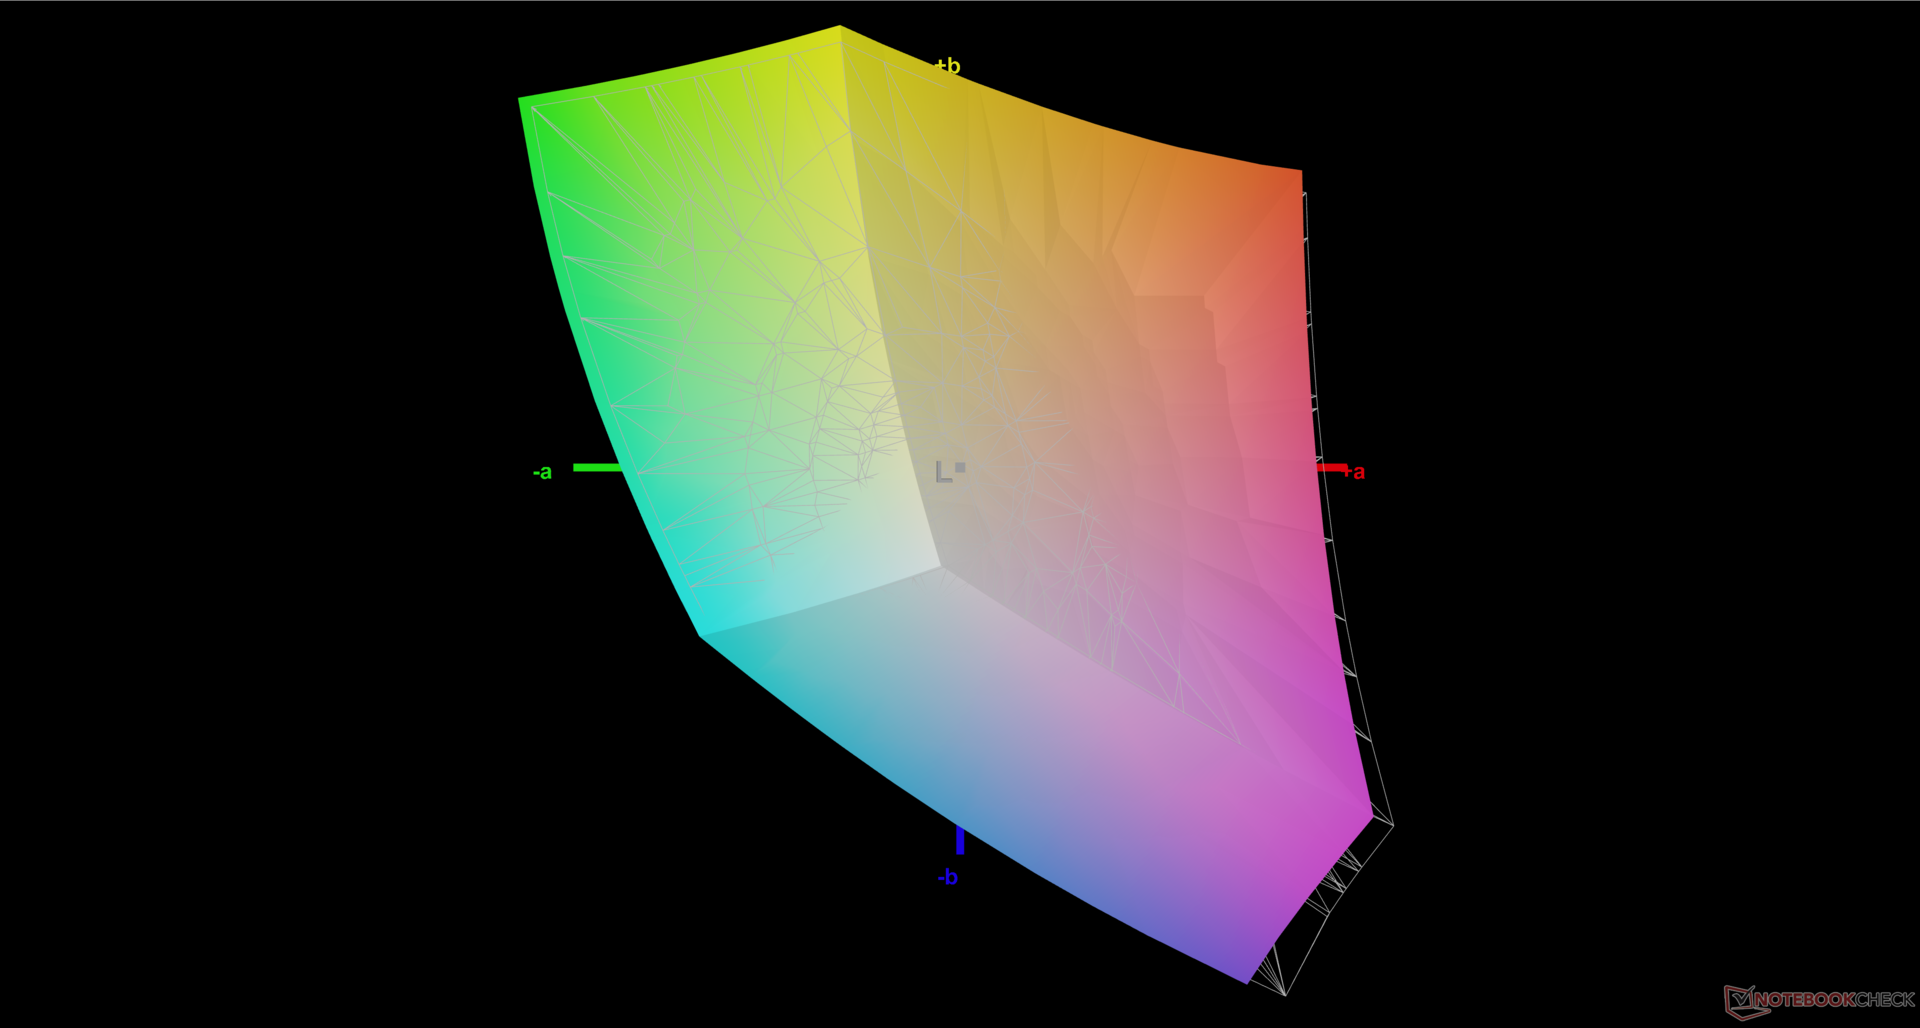
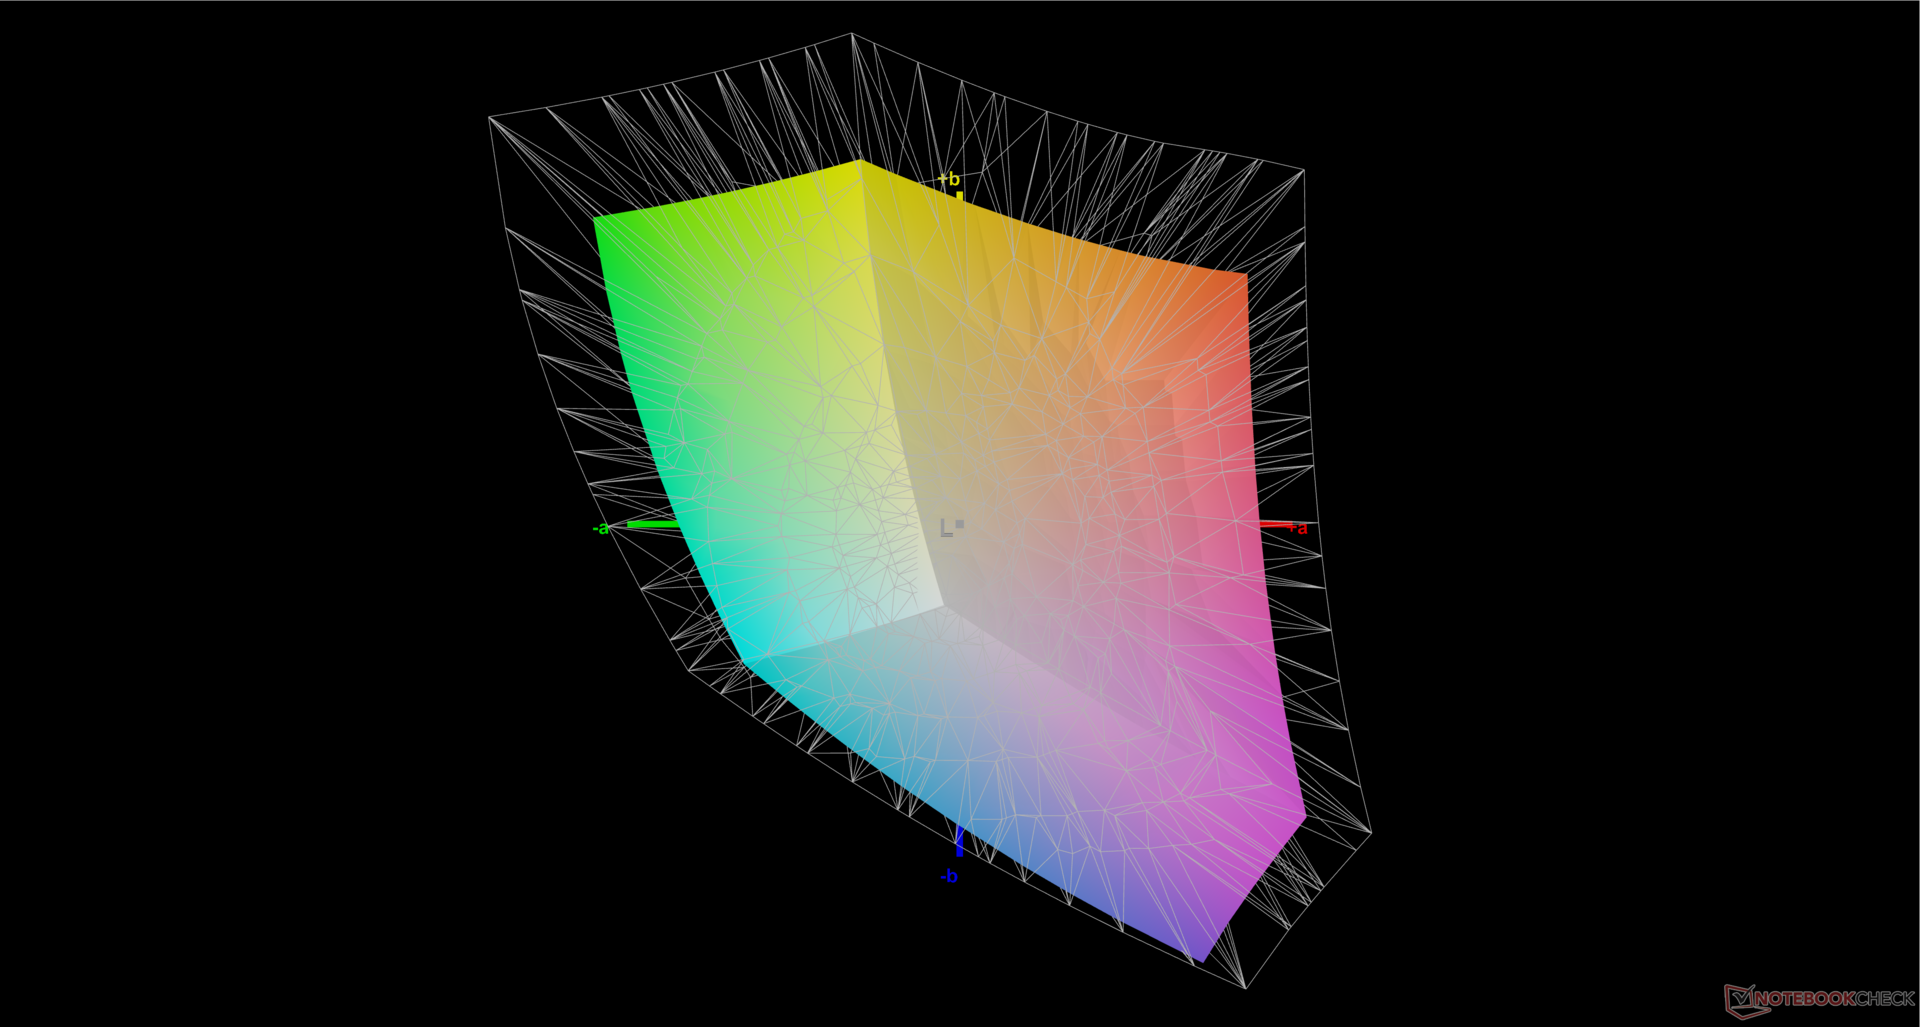
69.8% AdobeRGB 1998 (Argyll 3D)
96.5% sRGB (Argyll 3D)
67.7% Display P3 (Argyll 3D)
Gamma: 2.25
CCT: 7387 K
| Eurocom C315 Blitz BOE HF NE156QUM-N64, IPS, 3840x2160, 15.6" | Schenker Work 15 Tiger Lake-H BOE07D8, IPS, 1920x1080, 15.6" | Lenovo ThinkPad L15 Gen 4 21H70021GE N156HCA-E5B, IPS, 1920x1080, 15.6" | Acer Aspire 5 A515-58GM-76S8 LP156WFH-SPD5, IPS, 1920x1080, 15.6" | Asus VivoBook S15 M3502RA-L1029W Samsung SDC4161, OLED, 1920x1080, 15.6" | Samsung Galaxy Book2 15 NE156FHM-NS0, IPS, 1920x1080, 15.6" | |
|---|---|---|---|---|---|---|
| Display | -9% | -37% | -43% | 31% | -25% | |
| Display P3 Coverage (%) | 67.7 | 64.5 -5% | 41.8 -38% | 38.11 -44% | 99.9 48% | 49.6 -27% |
| sRGB Coverage (%) | 96.5 | 86.2 -11% | 62.5 -35% | 57.7 -40% | 100 4% | 74.8 -22% |
| AdobeRGB 1998 Coverage (%) | 69.8 | 62.9 -10% | 43.2 -38% | 39.41 -44% | 98.6 41% | 51.3 -27% |
| Response Times | -4% | 49% | 34% | 97% | 35% | |
| Response Time Grey 50% / Grey 80% * (ms) | 54.4 ? | 58.4 ? -7% | 24.4 ? 55% | 33.6 ? 38% | 0.74 99% | 32.3 ? 41% |
| Response Time Black / White * (ms) | 34.8 ? | 35.2 ? -1% | 19.7 ? 43% | 24.8 ? 29% | 2 ? 94% | 25 ? 28% |
| PWM Frequency (Hz) | 59 ? | |||||
| Screen | -25% | -53% | -77% | 8% | -42% | |
| Brightness middle (cd/m²) | 262.5 | 329 25% | 275 5% | 257.4 -2% | 378 44% | 337 28% |
| Brightness (cd/m²) | 260 | 316 22% | 252 -3% | 248 -5% | 378 45% | 325 25% |
| Brightness Distribution (%) | 85 | 92 8% | 84 -1% | 88 4% | 98 15% | 89 5% |
| Black Level * (cd/m²) | 0.25 | 0.3 -20% | 0.16 36% | 0.3209 -28% | 0.4 -60% | |
| Contrast (:1) | 1050 | 1097 4% | 1719 64% | 802 -24% | 843 -20% | |
| Colorchecker dE 2000 * | 3.34 | 5.4 -62% | 6.2 -86% | 6.26 -87% | 2.2 34% | 4.7 -41% |
| Colorchecker dE 2000 max. * | 7.72 | 10.1 -31% | 19.2 -149% | 18.28 -137% | 4.87 37% | 15.7 -103% |
| Colorchecker dE 2000 calibrated * | 0.91 | 2.5 -175% | 4.2 -362% | 4.99 -448% | 2.68 -195% | 2.8 -208% |
| Greyscale dE 2000 * | 5.3 | 5.1 4% | 4.1 23% | 3.7 30% | 1.43 73% | 5.4 -2% |
| Gamma | 2.25 98% | 2.1 105% | 1.91 115% | 2.186 101% | 2.47 89% | 2.07 106% |
| CCT | 7387 88% | 7609 85% | 6352 102% | 6606 98% | 6464 101% | 7727 84% |
| Media total (Programa/Opciones) | -13% /
-19% | -14% /
-35% | -29% /
-54% | 45% /
28% | -11% /
-27% |
* ... más pequeño es mejor
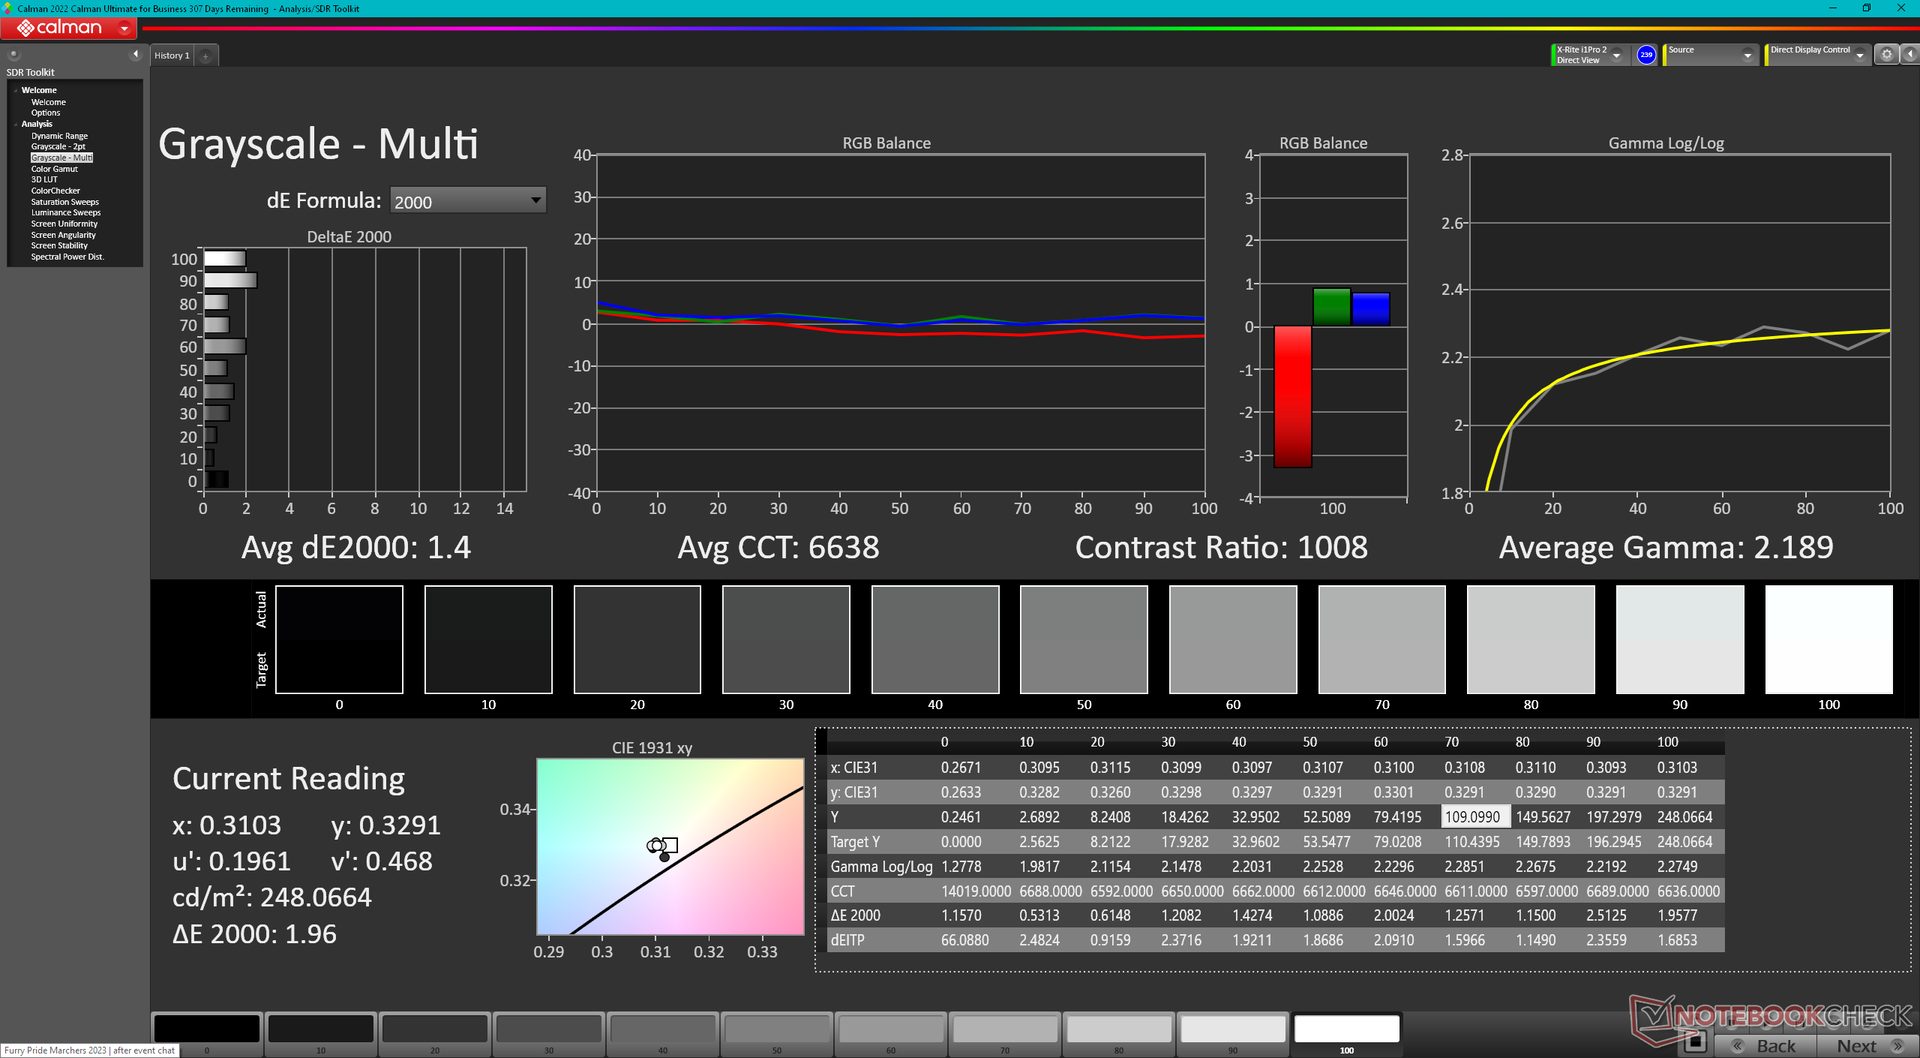
La pantalla no viene precalibrada. Sin embargo, Eurocom ofrece servicios de calibración opcionales para los usuarios que no tengan acceso a colorímetros. Somos capaces de obtener valores medios deltaE inferiores a <2 con nuestro propio colorímetro X-Rite.
Tiempos de respuesta del display
| ↔ Tiempo de respuesta de Negro a Blanco | ||
|---|---|---|
| 34.8 ms ... subida ↗ y bajada ↘ combinada | ↗ 16.8 ms subida | 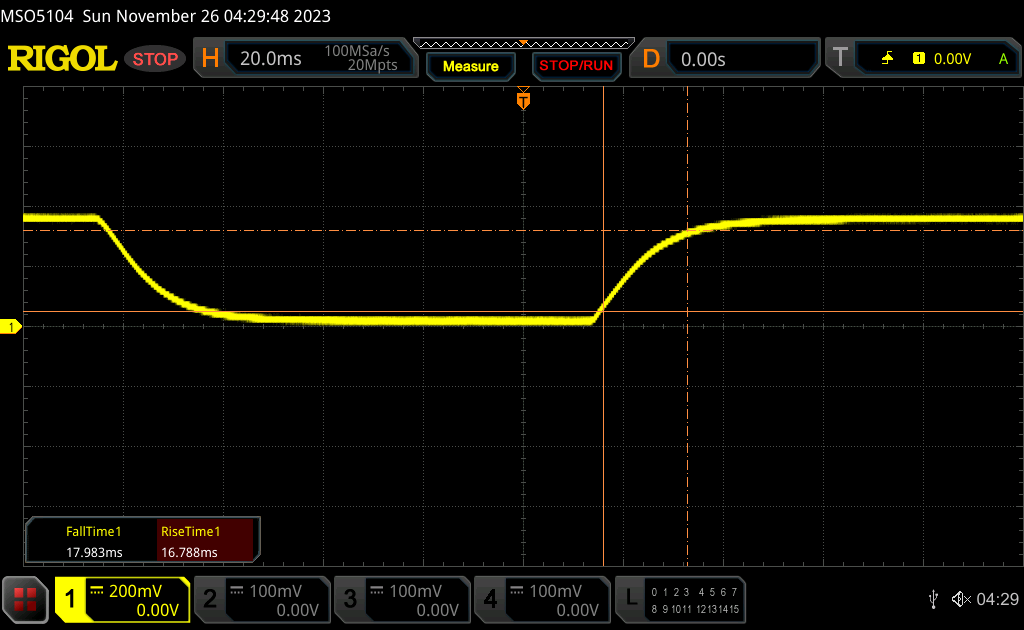 |
| ↘ 18 ms bajada | ||
| La pantalla mostró tiempos de respuesta lentos en nuestros tests y podría ser demasiado lenta para los jugones. En comparación, todos los dispositivos de prueba van de ##min### (mínimo) a 240 (máximo) ms. » 92 % de todos los dispositivos son mejores. Eso quiere decir que el tiempo de respuesta es peor que la media (19.8 ms) de todos los dispositivos testados. | ||
| ↔ Tiempo de respuesta 50% Gris a 80% Gris | ||
| 54.4 ms ... subida ↗ y bajada ↘ combinada | ↗ 25.3 ms subida | 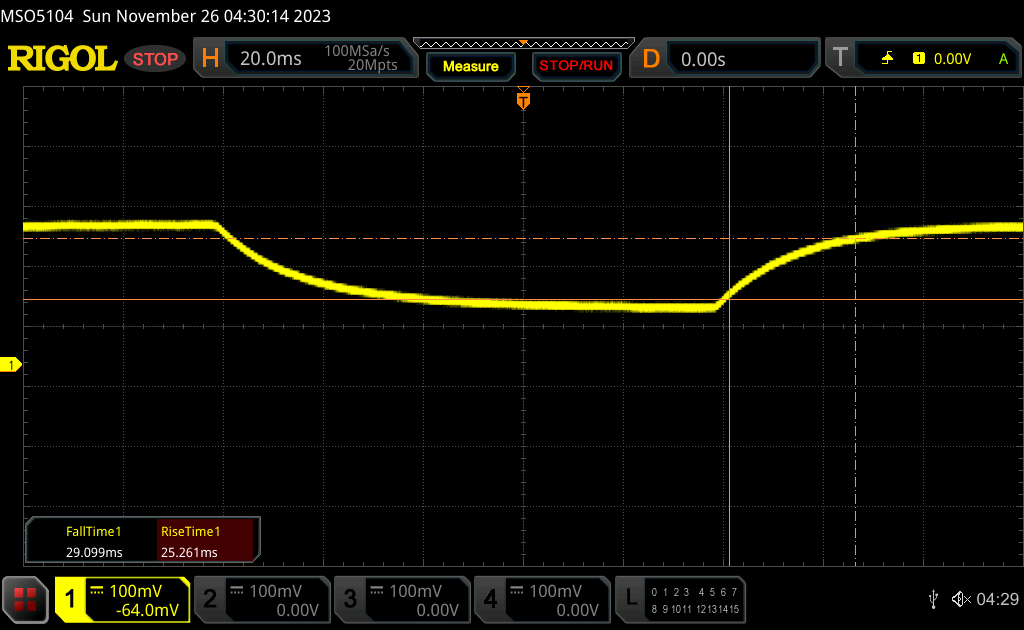 |
| ↘ 29.1 ms bajada | ||
| La pantalla mostró tiempos de respuesta lentos en nuestros tests y podría ser demasiado lenta para los jugones. En comparación, todos los dispositivos de prueba van de ##min### (mínimo) a 636 (máximo) ms. » 91 % de todos los dispositivos son mejores. Eso quiere decir que el tiempo de respuesta es peor que la media (31 ms) de todos los dispositivos testados. | ||
Parpadeo de Pantalla / PWM (Pulse-Width Modulation)
| Parpadeo de Pantalla / PWM no detectado | 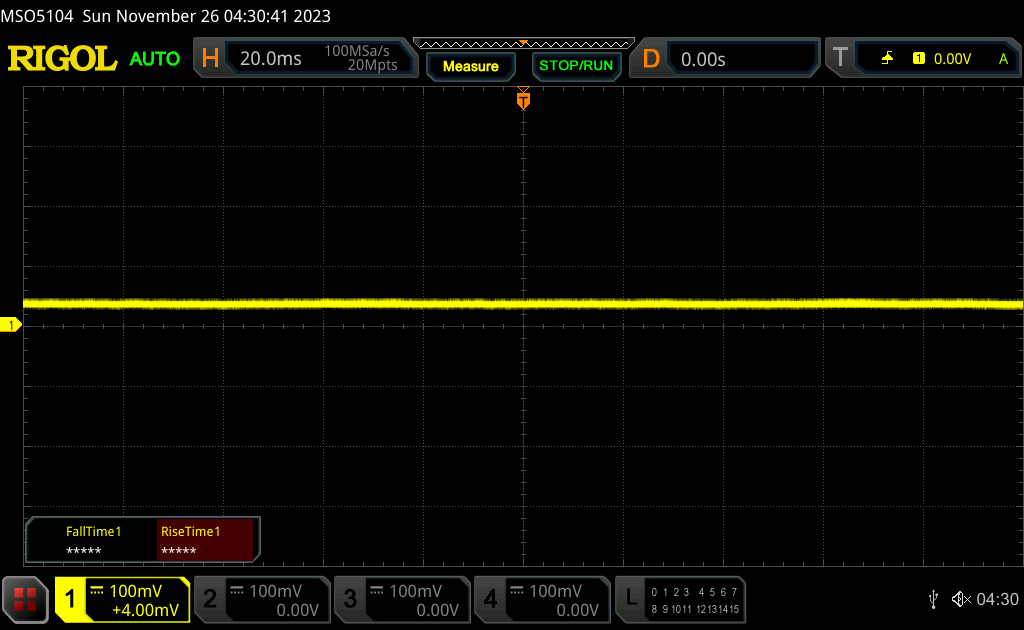 | ||
Comparación: 52 % de todos los dispositivos testados no usaron PWM para atenuar el display. Si se usó, medimos una media de 7754 (mínimo: 5 - máxmo: 343500) Hz. | |||
Rendimiento
Condiciones de prueba
Pusimos Windows en modo Rendimiento antes de ejecutar los puntos de referencia que se indican a continuación. El sistema no incluye ningún software especializado de "centro de control" para ajustar cualquier característica auxiliar o perfil de potencia adicional.
Procesador
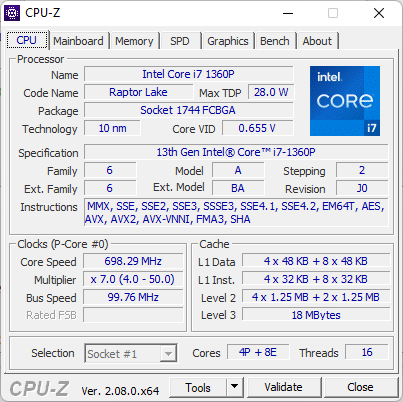
El Core i7-1360P es un poco mixto. Por un lado, ofrece un rendimiento similar al antiguo y más exigenteCore i7-11370H en el Schenker Work 15. Pero por otro lado, se queda corto frente a alternativas como elCore i7-1355U o elRyzen 7 5700U. También sufre de ralentización, ya que nuestra puntuación inicial en CineBench R15 xT de 1079 puntos caería alrededor de un 21 por ciento al ejecutar el benchmark en bucle.
La CPU Core i7 tiene definitivamente un rendimiento inferior en nuestro Eurocom. ElCore i5-1340P en elSamsung Galaxy Book3 Pro 360 16por ejemplo, funcionaría entre un 50 y un 70 por ciento más rápido según varias pruebas comparativas multihilo.
Cinebench R15 Multi Loop
Cinebench R23: Multi Core | Single Core
Cinebench R20: CPU (Multi Core) | CPU (Single Core)
Cinebench R15: CPU Multi 64Bit | CPU Single 64Bit
Blender: v2.79 BMW27 CPU
7-Zip 18.03: 7z b 4 | 7z b 4 -mmt1
Geekbench 5.5: Multi-Core | Single-Core
HWBOT x265 Benchmark v2.2: 4k Preset
LibreOffice : 20 Documents To PDF
R Benchmark 2.5: Overall mean
* ... más pequeño es mejor
AIDA64: FP32 Ray-Trace | FPU Julia | CPU SHA3 | CPU Queen | FPU SinJulia | FPU Mandel | CPU AES | CPU ZLib | FP64 Ray-Trace | CPU PhotoWorxx
| Performance rating | |
| Asus VivoBook S15 M3502RA-L1029W | |
| Lenovo ThinkPad L15 Gen 4 21H70021GE | |
| Medio Intel Core i7-1360P | |
| Acer Aspire 5 A515-58GM-76S8 | |
| Schenker Work 15 Tiger Lake-H | |
| Samsung Galaxy Book2 15 | |
| Eurocom C315 Blitz | |
| AIDA64 / FP32 Ray-Trace | |
| Asus VivoBook S15 M3502RA-L1029W | |
| Lenovo ThinkPad L15 Gen 4 21H70021GE | |
| Medio Intel Core i7-1360P (5610 - 11188, n=17) | |
| Acer Aspire 5 A515-58GM-76S8 | |
| Schenker Work 15 Tiger Lake-H | |
| Samsung Galaxy Book2 15 | |
| Eurocom C315 Blitz | |
| AIDA64 / FPU Julia | |
| Asus VivoBook S15 M3502RA-L1029W | |
| Lenovo ThinkPad L15 Gen 4 21H70021GE | |
| Medio Intel Core i7-1360P (29251 - 56942, n=16) | |
| Acer Aspire 5 A515-58GM-76S8 | |
| Schenker Work 15 Tiger Lake-H | |
| Eurocom C315 Blitz | |
| Samsung Galaxy Book2 15 | |
| AIDA64 / CPU SHA3 | |
| Asus VivoBook S15 M3502RA-L1029W | |
| Lenovo ThinkPad L15 Gen 4 21H70021GE | |
| Medio Intel Core i7-1360P (1444 - 2728, n=16) | |
| Acer Aspire 5 A515-58GM-76S8 | |
| Schenker Work 15 Tiger Lake-H | |
| Eurocom C315 Blitz | |
| Samsung Galaxy Book2 15 | |
| AIDA64 / CPU Queen | |
| Asus VivoBook S15 M3502RA-L1029W | |
| Lenovo ThinkPad L15 Gen 4 21H70021GE | |
| Medio Intel Core i7-1360P (65324 - 89266, n=16) | |
| Eurocom C315 Blitz | |
| Samsung Galaxy Book2 15 | |
| Acer Aspire 5 A515-58GM-76S8 | |
| Schenker Work 15 Tiger Lake-H | |
| AIDA64 / FPU SinJulia | |
| Asus VivoBook S15 M3502RA-L1029W | |
| Lenovo ThinkPad L15 Gen 4 21H70021GE | |
| Samsung Galaxy Book2 15 | |
| Medio Intel Core i7-1360P (4370 - 7269, n=16) | |
| Acer Aspire 5 A515-58GM-76S8 | |
| Schenker Work 15 Tiger Lake-H | |
| Eurocom C315 Blitz | |
| AIDA64 / FPU Mandel | |
| Asus VivoBook S15 M3502RA-L1029W | |
| Lenovo ThinkPad L15 Gen 4 21H70021GE | |
| Medio Intel Core i7-1360P (14104 - 28019, n=16) | |
| Acer Aspire 5 A515-58GM-76S8 | |
| Schenker Work 15 Tiger Lake-H | |
| Eurocom C315 Blitz | |
| Samsung Galaxy Book2 15 | |
| AIDA64 / CPU ZLib | |
| Asus VivoBook S15 M3502RA-L1029W | |
| Lenovo ThinkPad L15 Gen 4 21H70021GE | |
| Samsung Galaxy Book2 15 | |
| Medio Intel Core i7-1360P (420 - 807, n=16) | |
| Acer Aspire 5 A515-58GM-76S8 | |
| Eurocom C315 Blitz | |
| Schenker Work 15 Tiger Lake-H | |
| AIDA64 / FP64 Ray-Trace | |
| Asus VivoBook S15 M3502RA-L1029W | |
| Lenovo ThinkPad L15 Gen 4 21H70021GE | |
| Medio Intel Core i7-1360P (2906 - 5957, n=16) | |
| Acer Aspire 5 A515-58GM-76S8 | |
| Schenker Work 15 Tiger Lake-H | |
| Samsung Galaxy Book2 15 | |
| Eurocom C315 Blitz | |
| AIDA64 / CPU PhotoWorxx | |
| Medio Intel Core i7-1360P (29108 - 49328, n=16) | |
| Samsung Galaxy Book2 15 | |
| Eurocom C315 Blitz | |
| Schenker Work 15 Tiger Lake-H | |
| Asus VivoBook S15 M3502RA-L1029W | |
| Acer Aspire 5 A515-58GM-76S8 | |
| Lenovo ThinkPad L15 Gen 4 21H70021GE | |
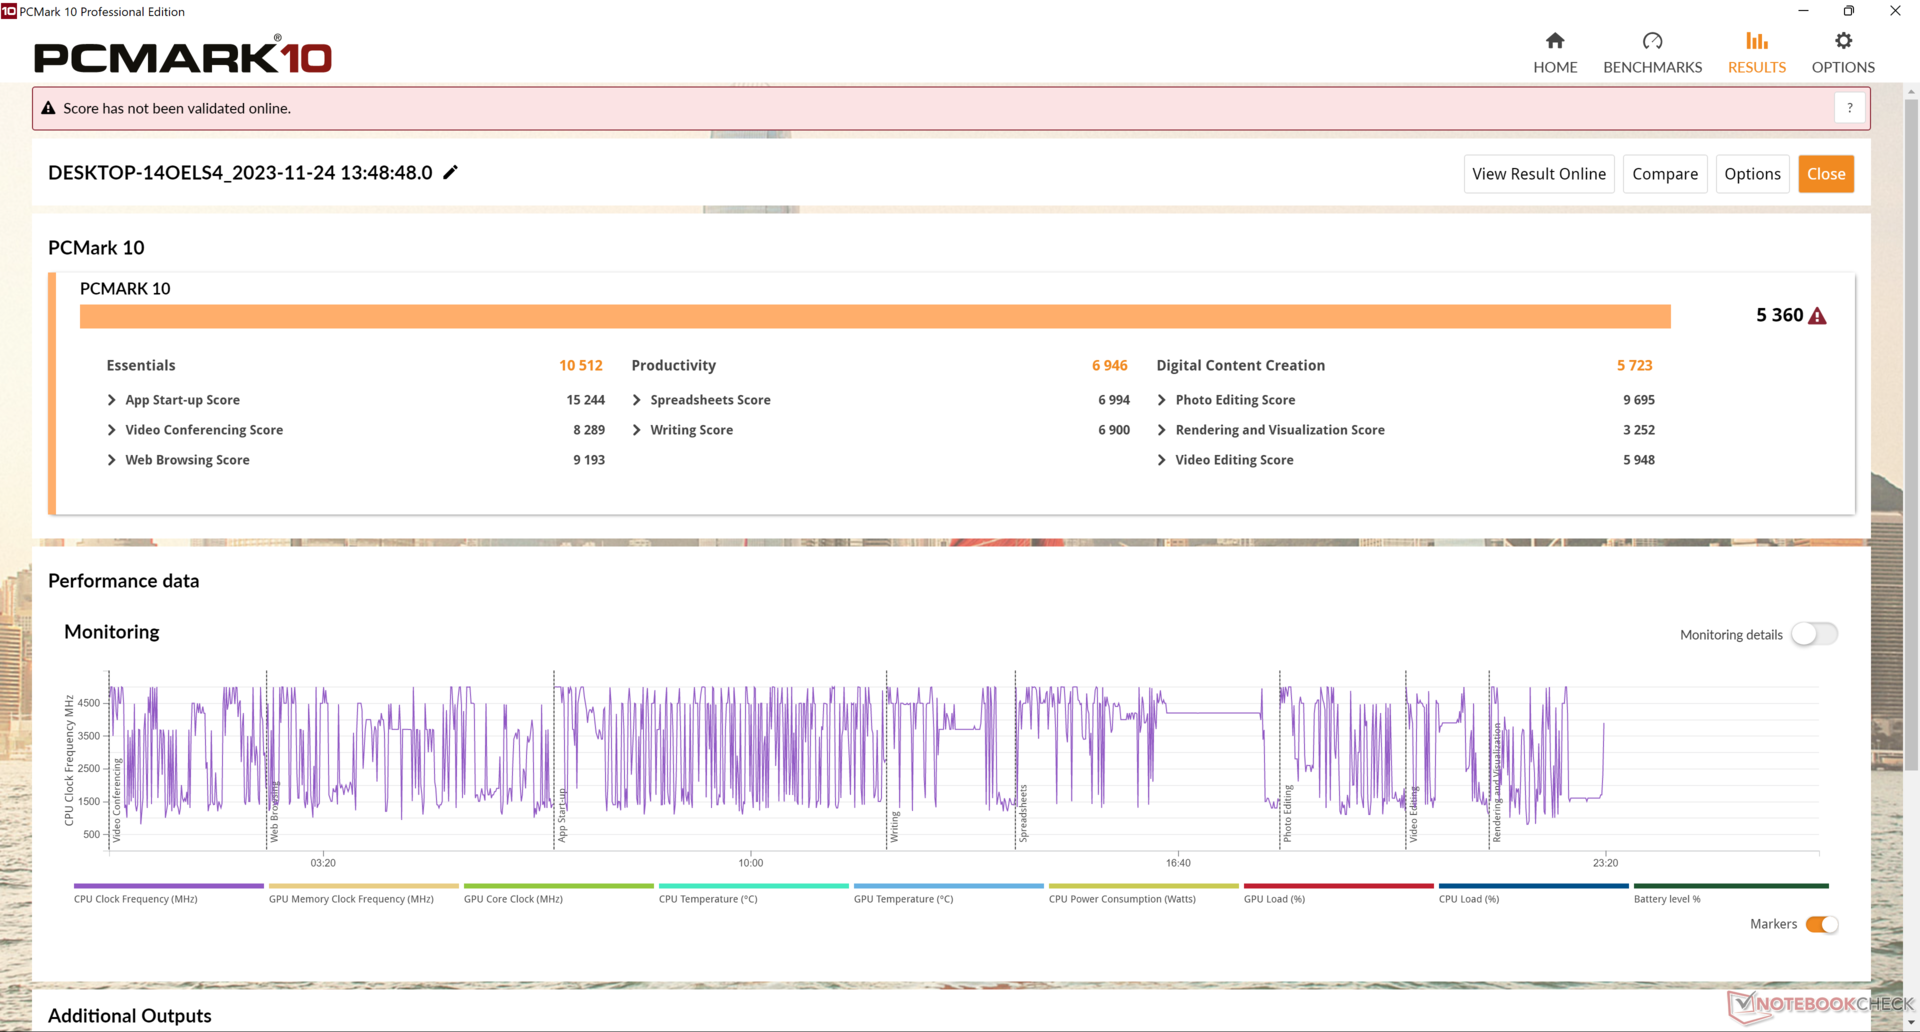
Rendimiento del sistema
Los resultados de PCMark son esencialmente idénticos a los del Schenker Work 15 funcionando con el Core i7-11370H más antiguo y más exigente en cuanto a potencia.
CrossMark: Overall | Productivity | Creativity | Responsiveness
| PCMark 10 / Score | |
| Asus VivoBook S15 M3502RA-L1029W | |
| Acer Aspire 5 A515-58GM-76S8 | |
| Medio Intel Core i7-1360P, Intel Iris Xe Graphics G7 96EUs (5360 - 6281, n=14) | |
| Samsung Galaxy Book2 15 | |
| Schenker Work 15 Tiger Lake-H | |
| Lenovo ThinkPad L15 Gen 4 21H70021GE | |
| Eurocom C315 Blitz | |
| PCMark 10 / Essentials | |
| Acer Aspire 5 A515-58GM-76S8 | |
| Medio Intel Core i7-1360P, Intel Iris Xe Graphics G7 96EUs (9883 - 12059, n=14) | |
| Schenker Work 15 Tiger Lake-H | |
| Eurocom C315 Blitz | |
| Asus VivoBook S15 M3502RA-L1029W | |
| Lenovo ThinkPad L15 Gen 4 21H70021GE | |
| Samsung Galaxy Book2 15 | |
| PCMark 10 / Productivity | |
| Asus VivoBook S15 M3502RA-L1029W | |
| Lenovo ThinkPad L15 Gen 4 21H70021GE | |
| Acer Aspire 5 A515-58GM-76S8 | |
| Medio Intel Core i7-1360P, Intel Iris Xe Graphics G7 96EUs (6572 - 8161, n=14) | |
| Schenker Work 15 Tiger Lake-H | |
| Eurocom C315 Blitz | |
| Samsung Galaxy Book2 15 | |
| PCMark 10 / Digital Content Creation | |
| Asus VivoBook S15 M3502RA-L1029W | |
| Acer Aspire 5 A515-58GM-76S8 | |
| Medio Intel Core i7-1360P, Intel Iris Xe Graphics G7 96EUs (5723 - 7612, n=14) | |
| Samsung Galaxy Book2 15 | |
| Schenker Work 15 Tiger Lake-H | |
| Eurocom C315 Blitz | |
| Lenovo ThinkPad L15 Gen 4 21H70021GE | |
| CrossMark / Overall | |
| Eurocom C315 Blitz | |
| Acer Aspire 5 A515-58GM-76S8 | |
| Medio Intel Core i7-1360P, Intel Iris Xe Graphics G7 96EUs (1527 - 1891, n=15) | |
| Asus VivoBook S15 M3502RA-L1029W | |
| Lenovo ThinkPad L15 Gen 4 21H70021GE | |
| CrossMark / Productivity | |
| Acer Aspire 5 A515-58GM-76S8 | |
| Eurocom C315 Blitz | |
| Medio Intel Core i7-1360P, Intel Iris Xe Graphics G7 96EUs (1503 - 1842, n=15) | |
| Asus VivoBook S15 M3502RA-L1029W | |
| Lenovo ThinkPad L15 Gen 4 21H70021GE | |
| CrossMark / Creativity | |
| Eurocom C315 Blitz | |
| Medio Intel Core i7-1360P, Intel Iris Xe Graphics G7 96EUs (1558 - 2003, n=15) | |
| Asus VivoBook S15 M3502RA-L1029W | |
| Acer Aspire 5 A515-58GM-76S8 | |
| Lenovo ThinkPad L15 Gen 4 21H70021GE | |
| CrossMark / Responsiveness | |
| Acer Aspire 5 A515-58GM-76S8 | |
| Eurocom C315 Blitz | |
| Medio Intel Core i7-1360P, Intel Iris Xe Graphics G7 96EUs (1311 - 1899, n=15) | |
| Asus VivoBook S15 M3502RA-L1029W | |
| Lenovo ThinkPad L15 Gen 4 21H70021GE | |
| PCMark 10 Score | 5360 puntos | |
ayuda | ||
| AIDA64 / Memory Copy | |
| Eurocom C315 Blitz | |
| Samsung Galaxy Book2 15 | |
| Medio Intel Core i7-1360P (44299 - 72748, n=16) | |
| Asus VivoBook S15 M3502RA-L1029W | |
| Schenker Work 15 Tiger Lake-H | |
| Acer Aspire 5 A515-58GM-76S8 | |
| Lenovo ThinkPad L15 Gen 4 21H70021GE | |
| AIDA64 / Memory Read | |
| Eurocom C315 Blitz | |
| Samsung Galaxy Book2 15 | |
| Medio Intel Core i7-1360P (44751 - 68945, n=16) | |
| Asus VivoBook S15 M3502RA-L1029W | |
| Schenker Work 15 Tiger Lake-H | |
| Acer Aspire 5 A515-58GM-76S8 | |
| Lenovo ThinkPad L15 Gen 4 21H70021GE | |
| AIDA64 / Memory Write | |
| Eurocom C315 Blitz | |
| Medio Intel Core i7-1360P (45887 - 93331, n=16) | |
| Samsung Galaxy Book2 15 | |
| Asus VivoBook S15 M3502RA-L1029W | |
| Schenker Work 15 Tiger Lake-H | |
| Acer Aspire 5 A515-58GM-76S8 | |
| Lenovo ThinkPad L15 Gen 4 21H70021GE | |
| AIDA64 / Memory Latency | |
| Lenovo ThinkPad L15 Gen 4 21H70021GE | |
| Medio Intel Core i7-1360P (85 - 110.5, n=16) | |
| Asus VivoBook S15 M3502RA-L1029W | |
| Eurocom C315 Blitz | |
| Schenker Work 15 Tiger Lake-H | |
| Acer Aspire 5 A515-58GM-76S8 | |
| Samsung Galaxy Book2 15 | |
* ... más pequeño es mejor
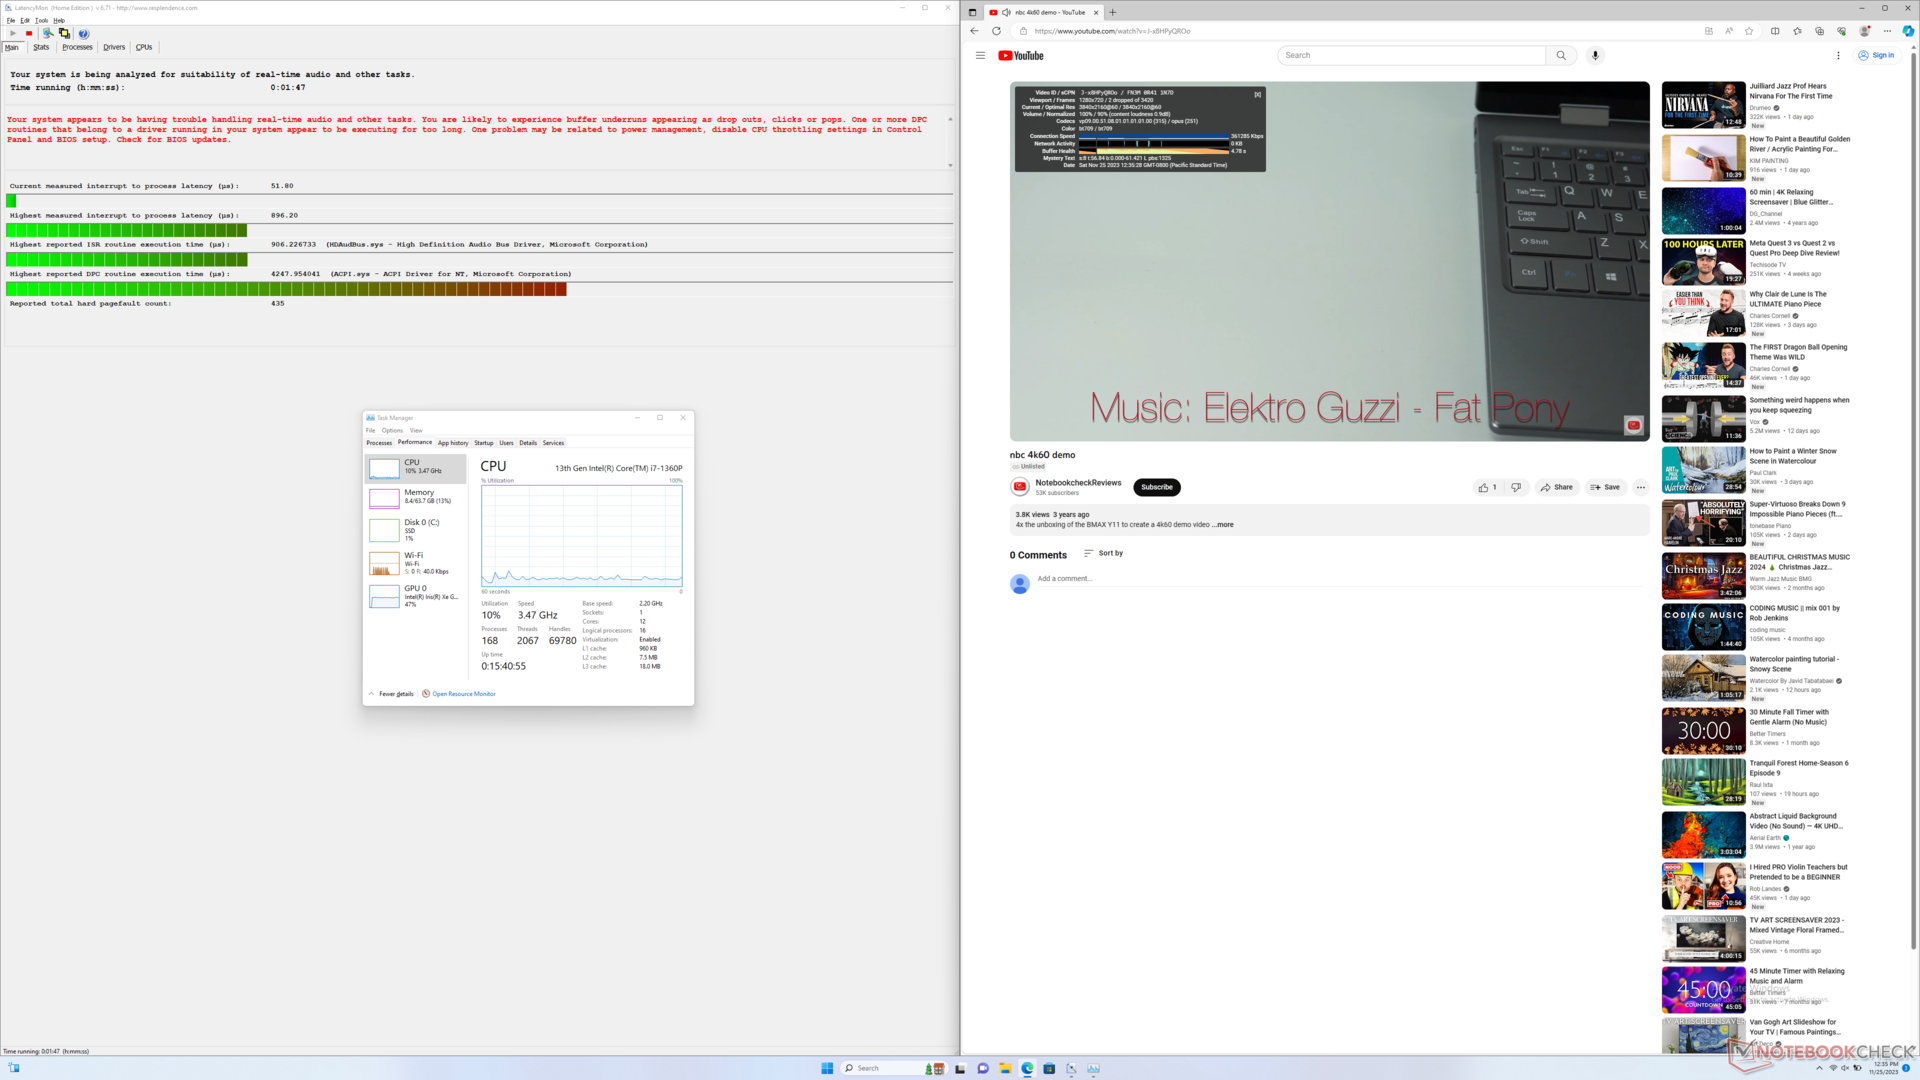
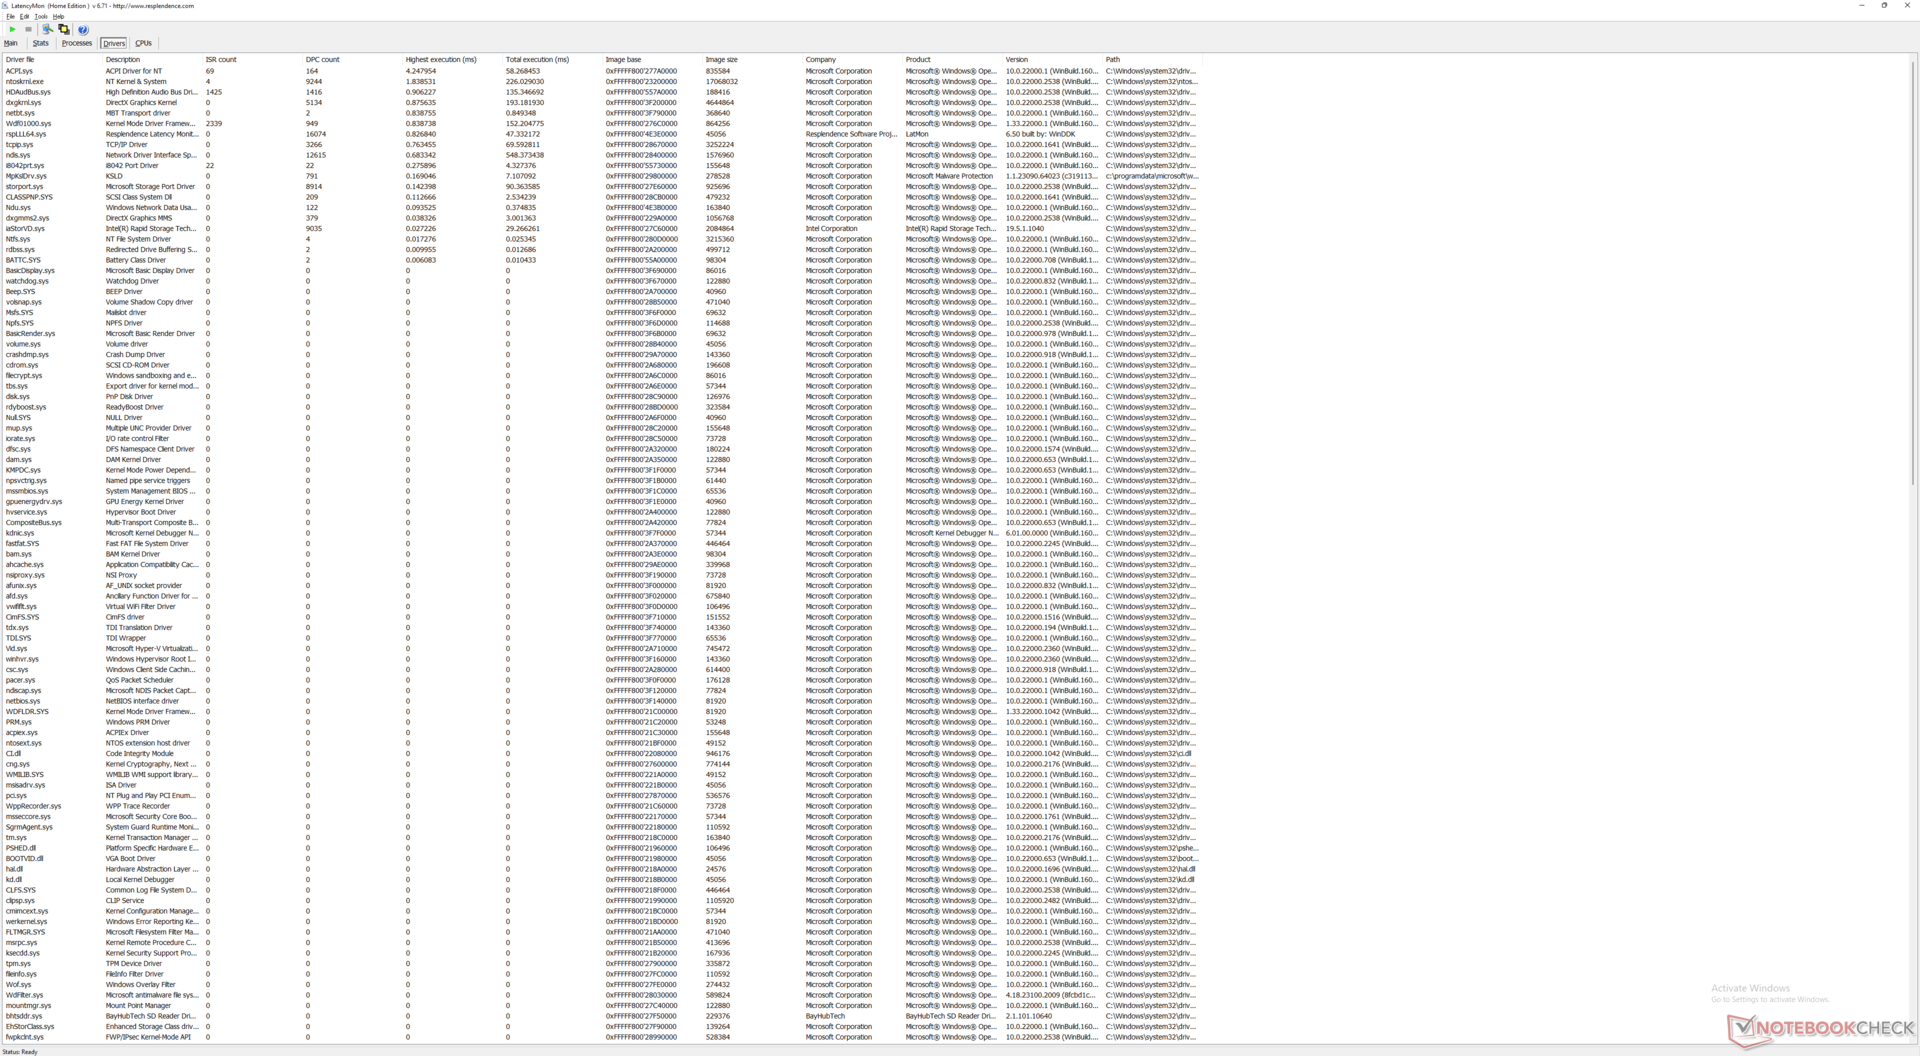
Latencia del CPD
LatencyMon revela problemas de CPD al abrir varias pestañas del navegador de nuestra página principal. la reproducción de vídeo 4K a 60 FPS es excelente, con solo dos fotogramas caídos registrados durante un lapso de tiempo de un minuto.
| DPC Latencies / LatencyMon - interrupt to process latency (max), Web, Youtube, Prime95 | |
| Lenovo ThinkPad L15 Gen 4 21H70021GE | |
| Schenker Work 15 Tiger Lake-H | |
| Acer Aspire 5 A515-58GM-76S8 | |
| Eurocom C315 Blitz | |
| Samsung Galaxy Book2 15 | |
| Asus VivoBook S15 M3502RA-L1029W | |
* ... más pequeño es mejor
Dispositivos de almacenamiento
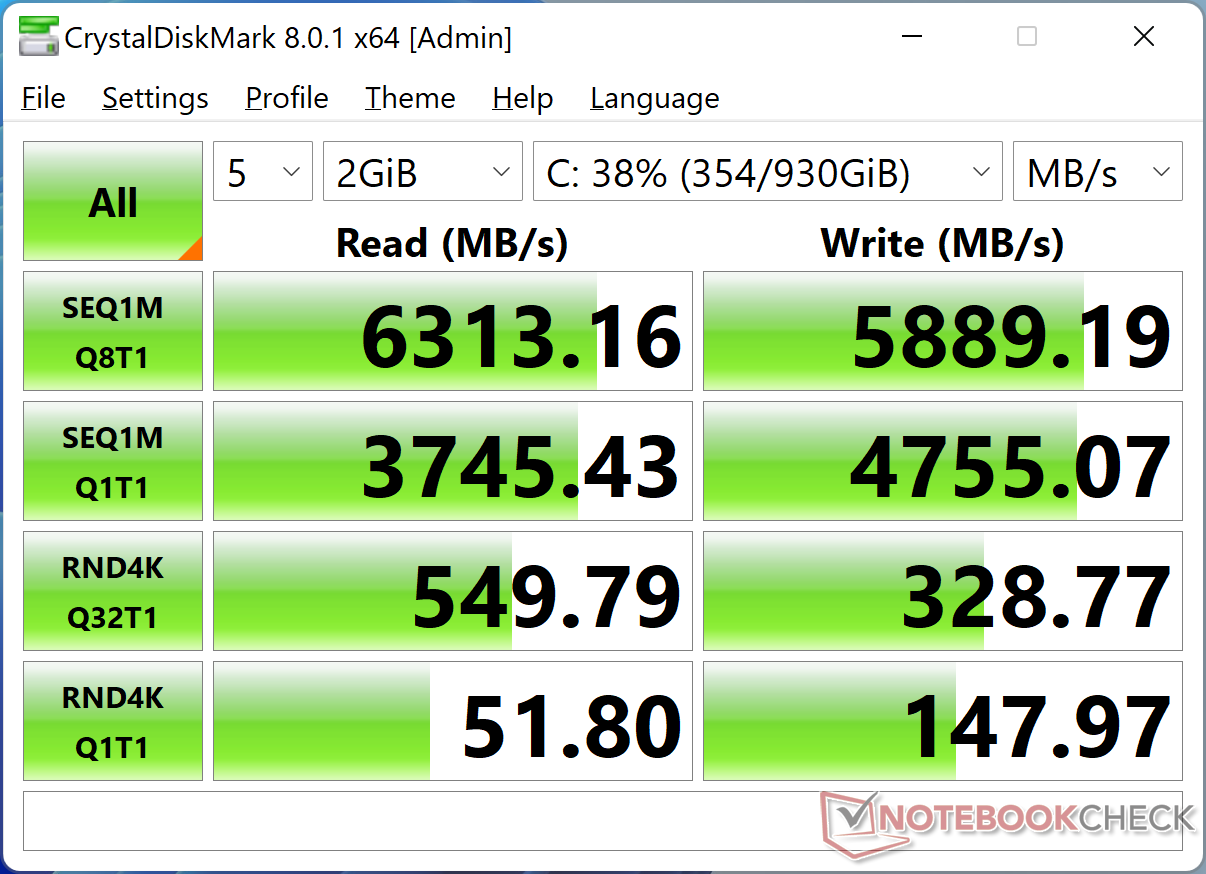
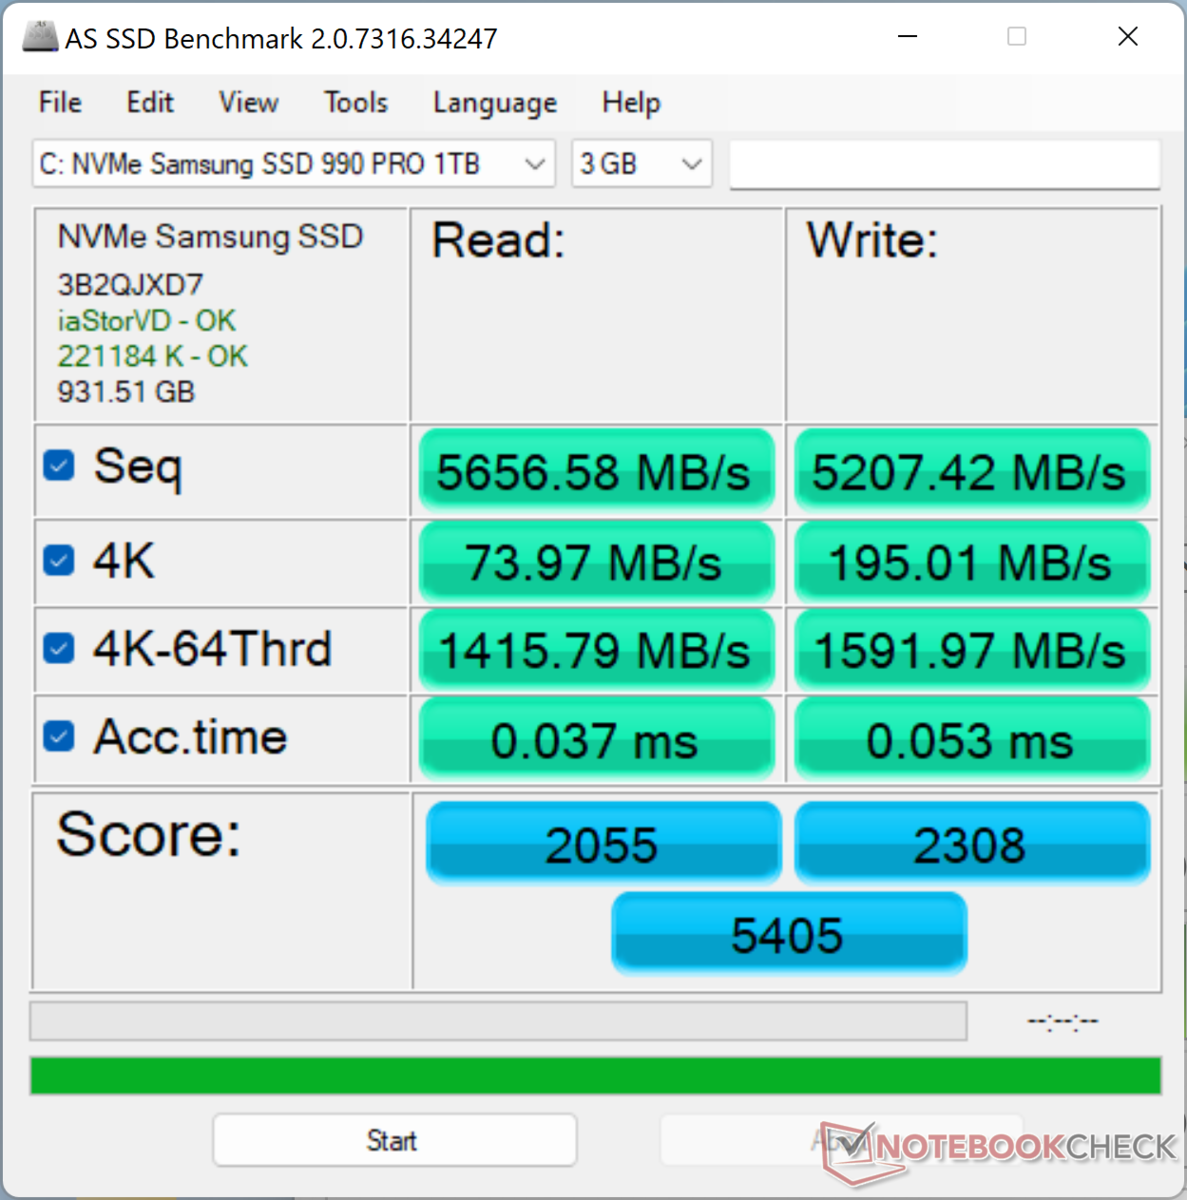
Nuestra unidad se entrega con un Samsung 990 Pro que promete velocidades de lectura y escritura secuenciales de hasta 7450 MB/s y 6900 MB/s, respectivamente. La unidad de nuestra unidad es capaz de sostener un máximo de 7100 MB/s sin problemas de estrangulamiento. La almohadilla térmica incluida en la SSD permite que el calor se disipe en la placa inferior metálica.

* ... más pequeño es mejor
Disk Throttling: DiskSpd Read Loop, Queue Depth 8
Rendimiento de la GPU
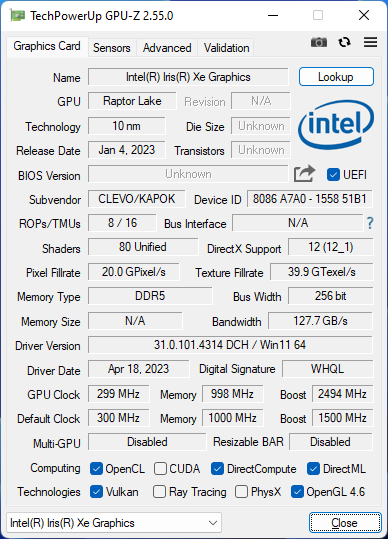
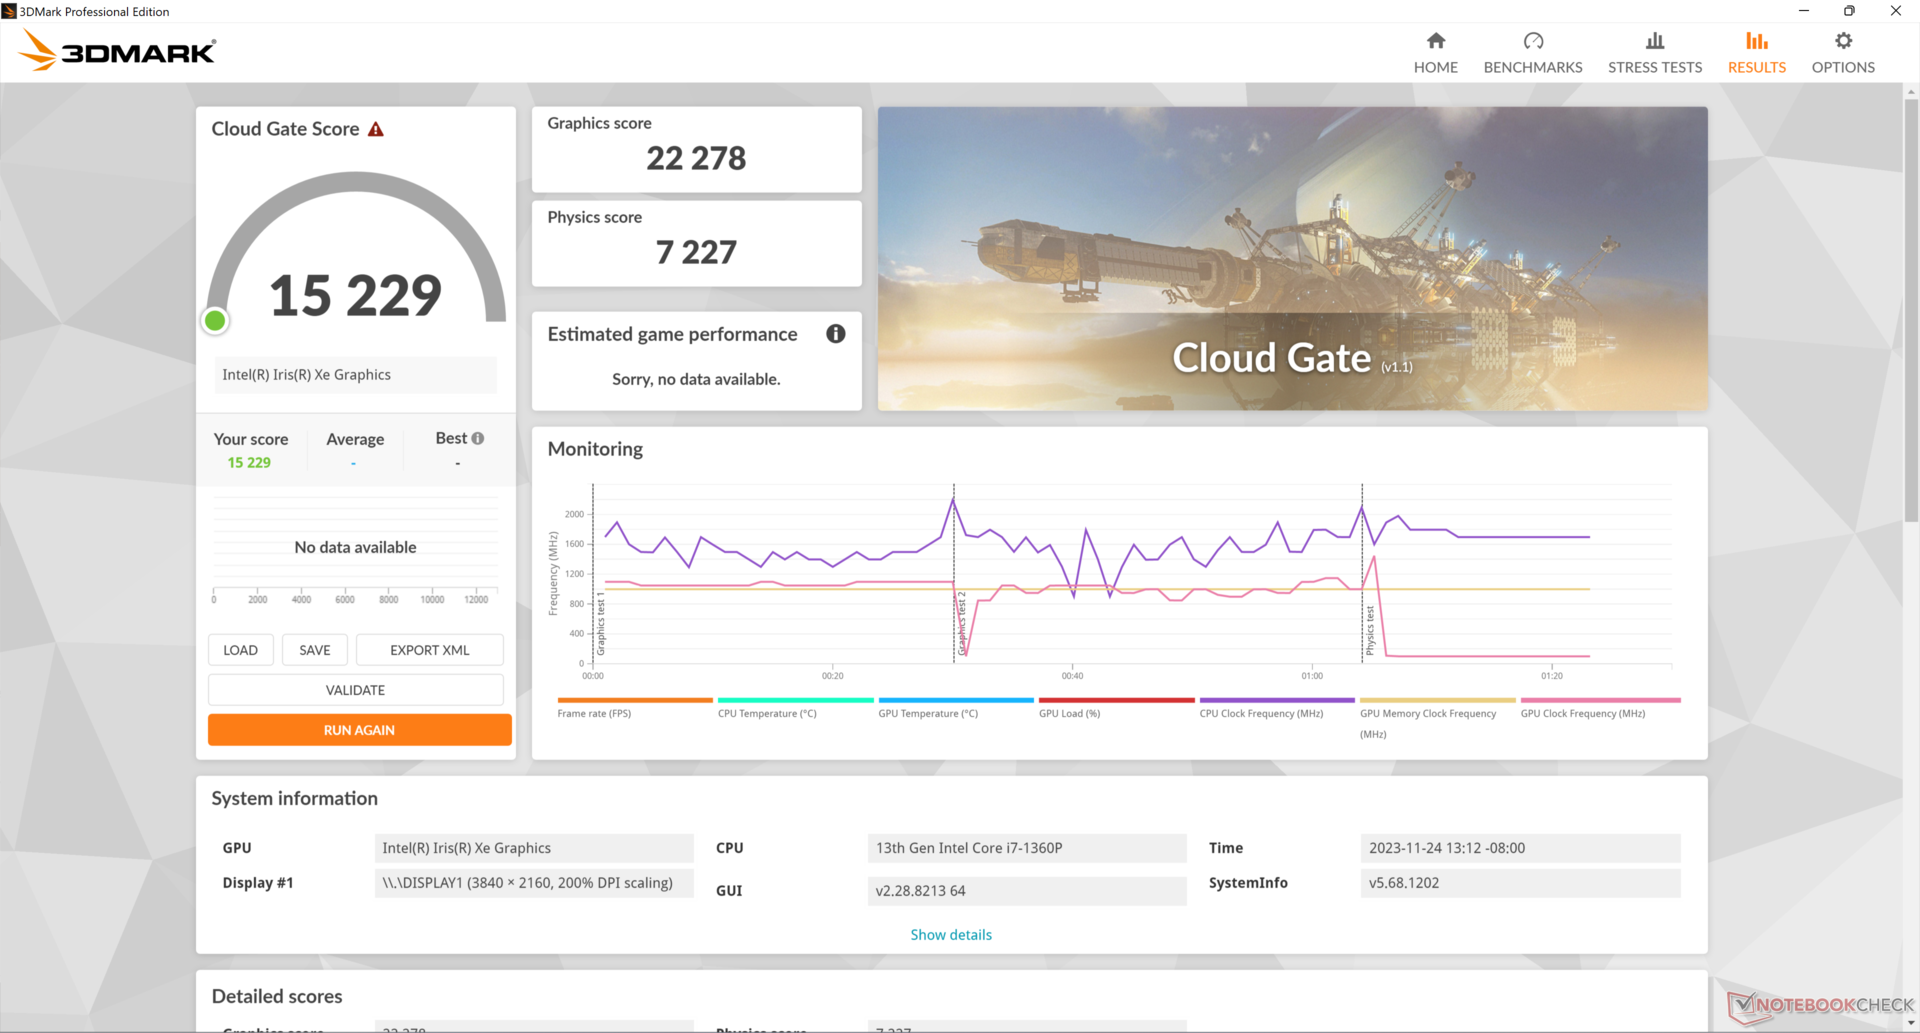
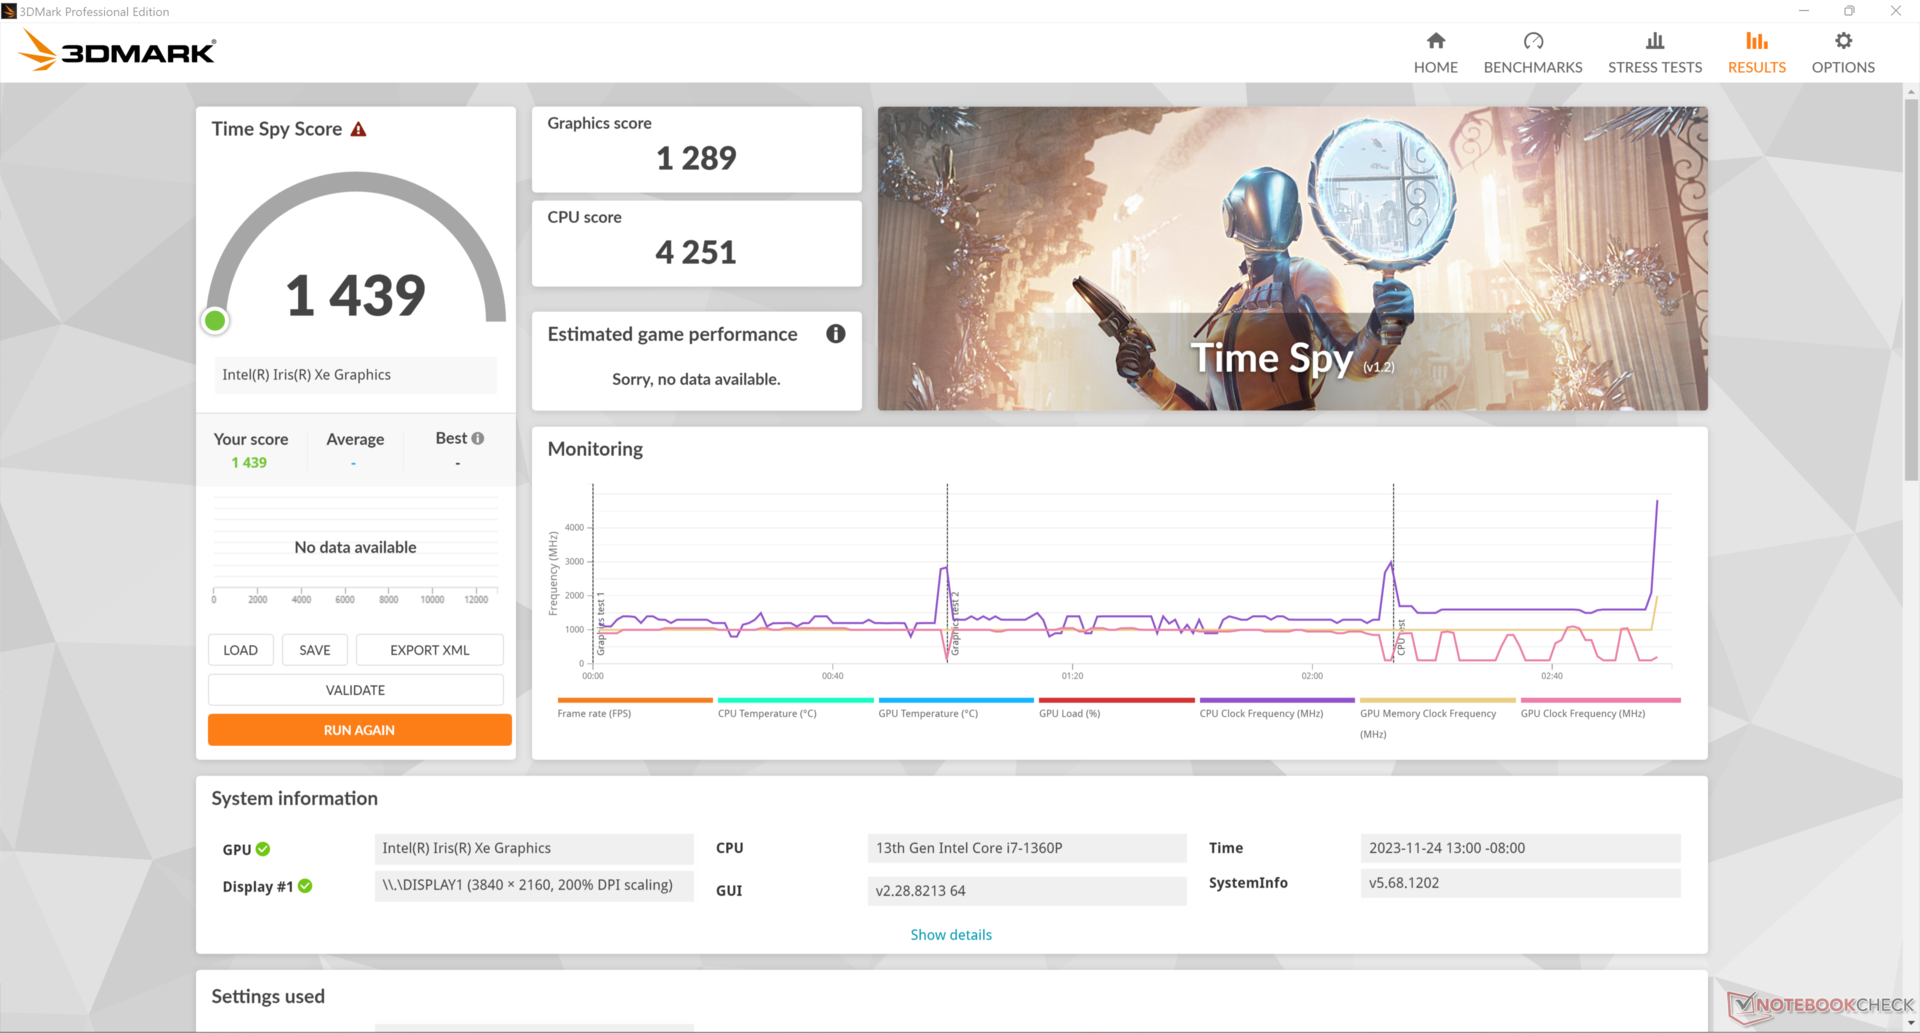
El sistema integrado Iris Xe 96 UE rinde ligeramente por debajo de la media en comparación con otros portátiles con la misma GPU. De hecho, nuestro Schenker Work 15 con el Core i7-11370H más antiguo devolvería puntuaciones 3DMark más altas que nuestro Eurocom a pesar de sus GPU similares.
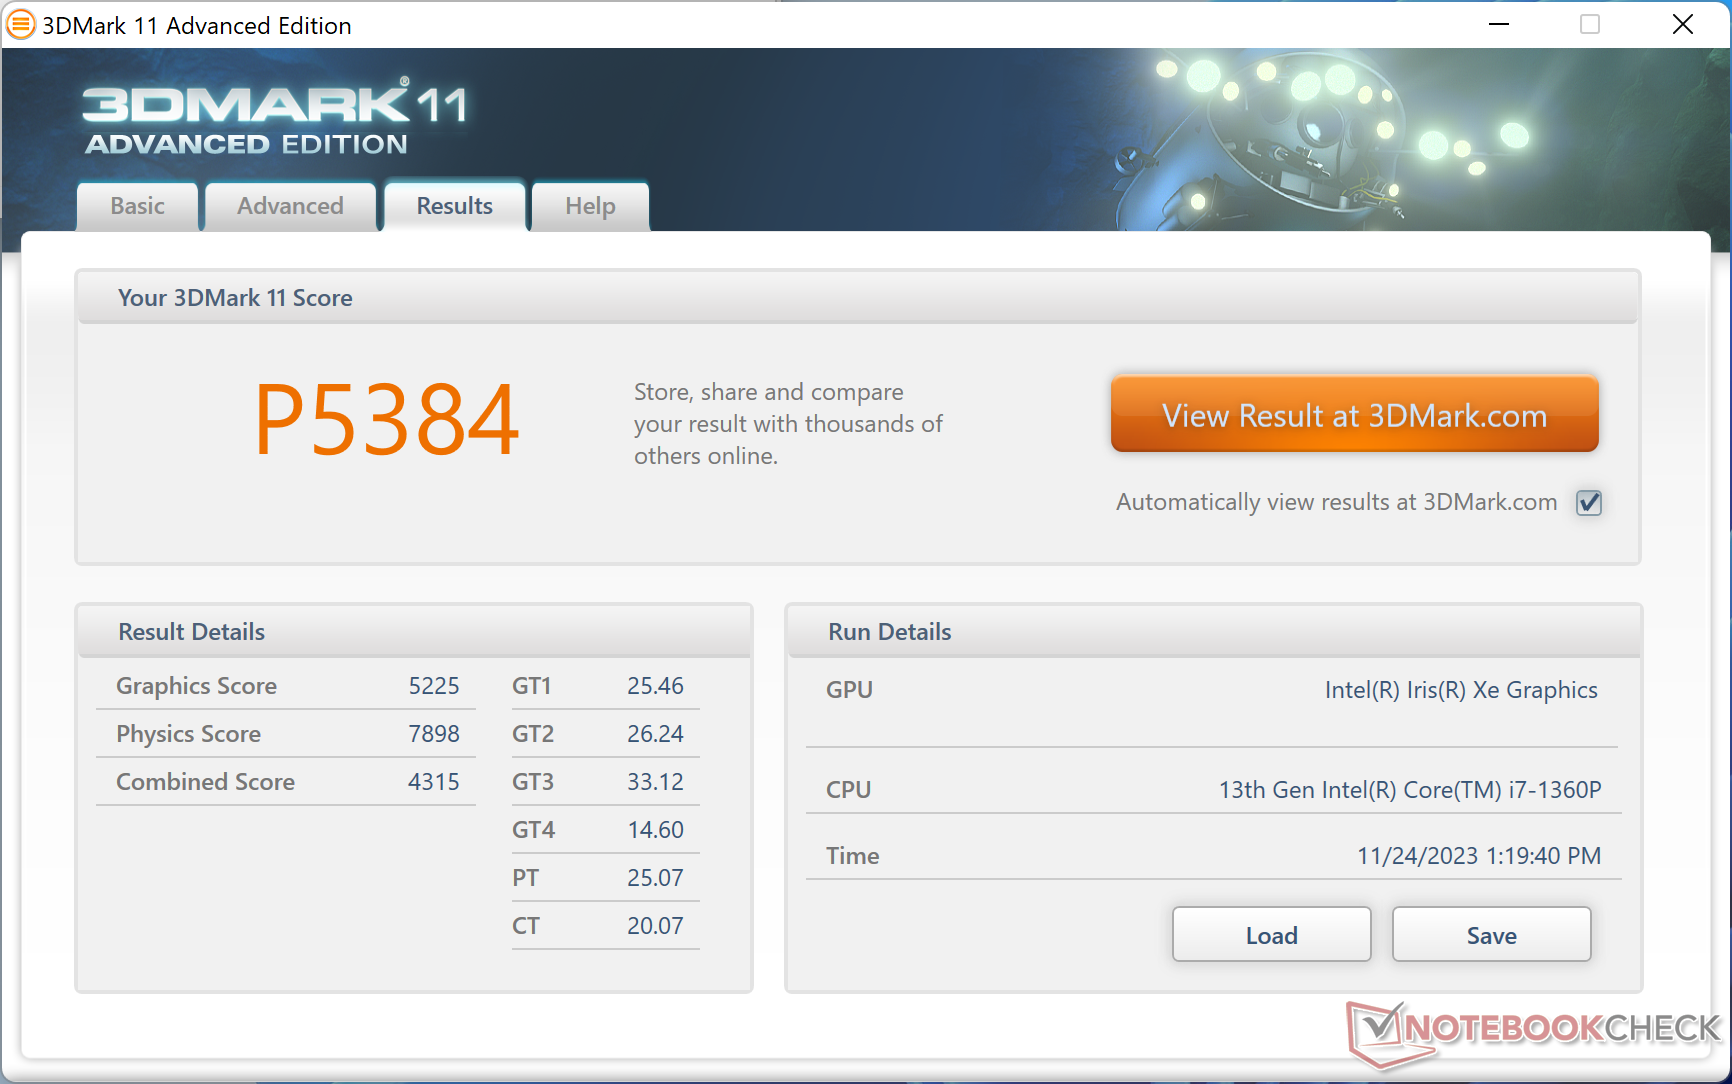
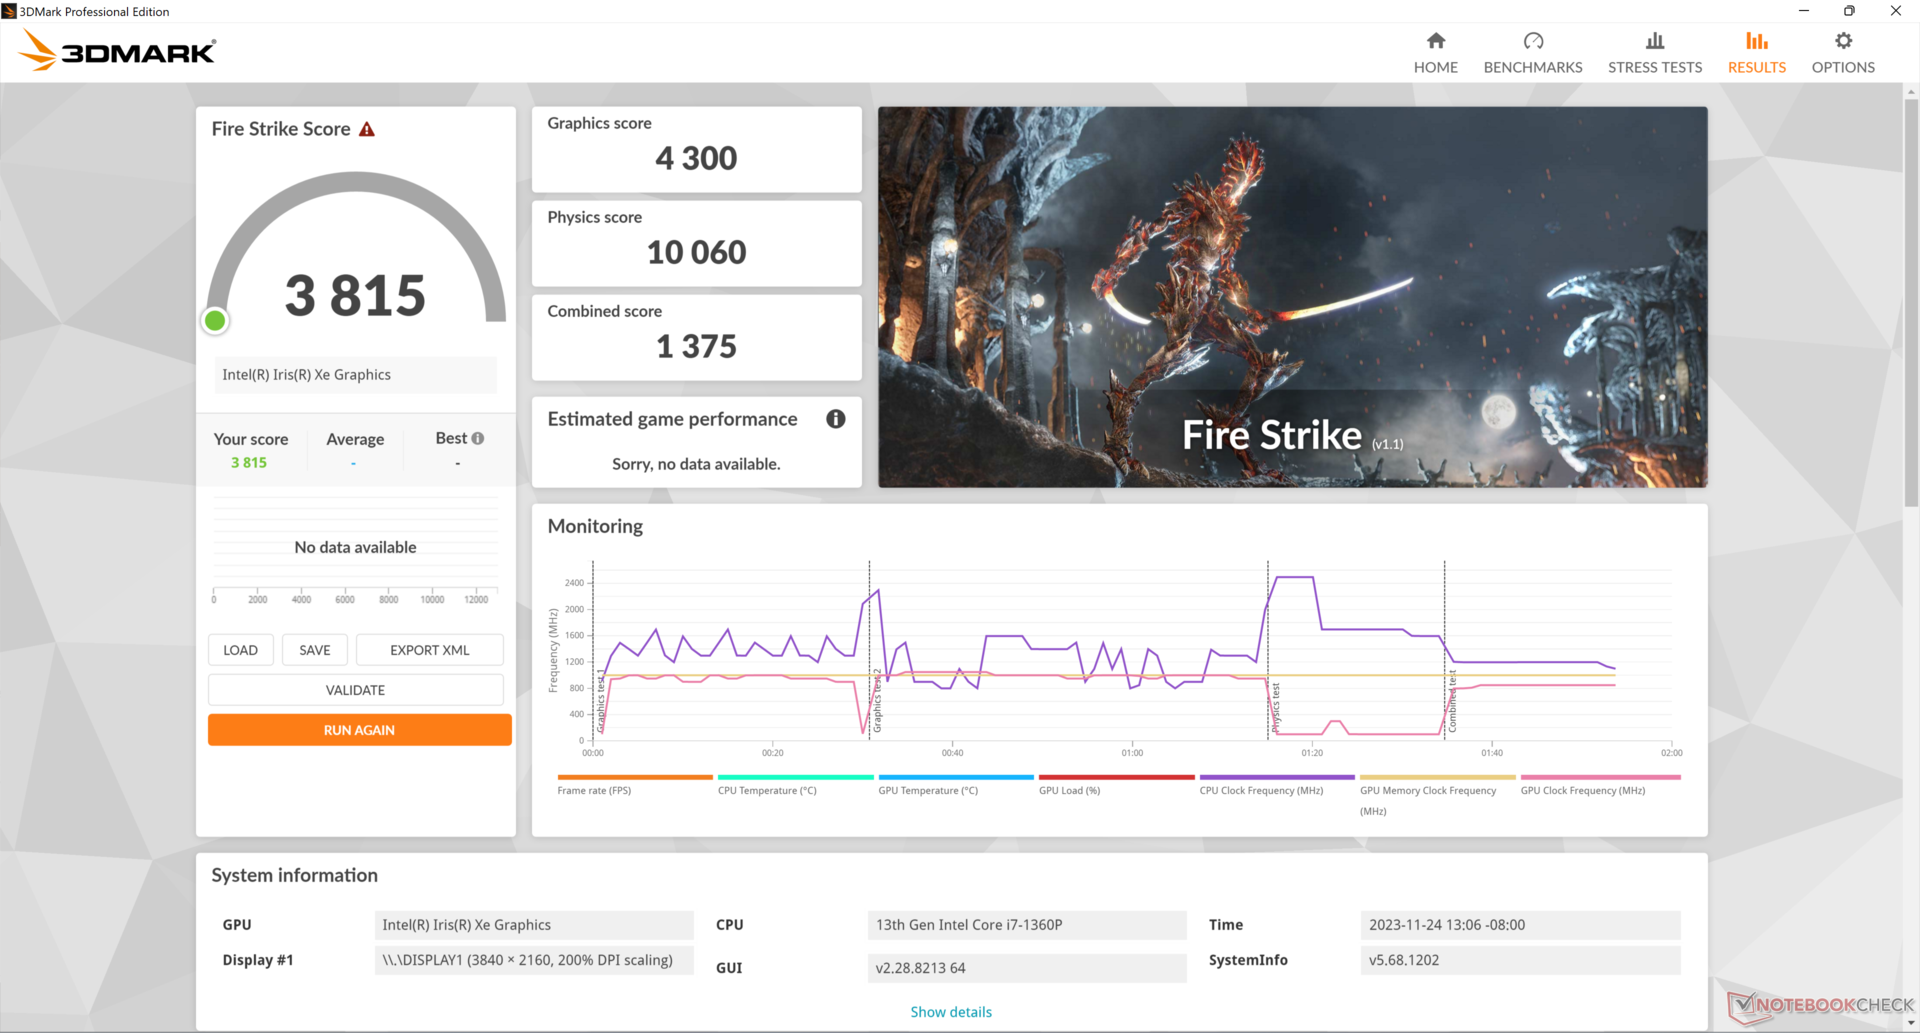
| 3DMark 11 Performance | 5384 puntos | |
| 3DMark Cloud Gate Standard Score | 15229 puntos | |
| 3DMark Fire Strike Score | 3815 puntos | |
| 3DMark Time Spy Score | 1439 puntos | |
ayuda | ||
* ... más pequeño es mejor
| Tiny Tina's Wonderlands - 1280x720 Lowest Preset (DX12) | |
| Medio Intel Iris Xe Graphics G7 96EUs (25.9 - 67.3, n=32) | |
| Eurocom C315 Blitz | |
Witcher 3 FPS Chart
| bajo | medio | alto | ultra | |
|---|---|---|---|---|
| GTA V (2015) | 84.7 | 72.7 | 22.5 | 9.68 |
| The Witcher 3 (2015) | 66.7 | 46.9 | 26.3 | 13 |
| Dota 2 Reborn (2015) | 96.8 | 66.3 | 48.6 | 40.9 |
| Final Fantasy XV Benchmark (2018) | 33.4 | 18.8 | 14 | |
| X-Plane 11.11 (2018) | 43.4 | 32.2 | 29.3 | |
| Far Cry 5 (2018) | 36 | 23 | 21 | 20 |
| Strange Brigade (2018) | 76.8 | 34.7 | 28.2 | 23.3 |
| Cyberpunk 2077 1.6 (2022) | 14.1 | |||
| Tiny Tina's Wonderlands (2022) | ||||
| F1 22 (2022) | 38.5 | 34.5 | 25.3 | 19.2 |
Emisiones
Ruido del sistema
El comportamiento del ruido del ventilador necesita un ajuste adicional. Cuando estaba conectado a la red eléctrica, el ventilador pulsaba ocasionalmente entre silencioso y 35 dB(A) incluso cuando estaba en reposo en el escritorio en modo de ahorro de energía. Sólo cuando funciona con batería el ventilador permanece en silencio sin pulsaciones innecesarias. Por lo demás, el ruido del ventilador al ejecutar cargas exigentes como juegos es casi idéntico al que observamos en el Schenker Work 15 con la CPU Core serie H más antigua.
Ruido
| Ocioso |
| 25.1 / 25.1 / 34.9 dB(A) |
| Carga |
| 42.1 / 44.2 dB(A) |
 | ||
30 dB silencioso 40 dB(A) audible 50 dB(A) ruidosamente alto |
||
min: | ||
| Eurocom C315 Blitz Iris Xe G7 96EUs, i7-1360P, Samsung 990 Pro 1 TB | Schenker Work 15 Tiger Lake-H Iris Xe G7 96EUs, i7-11370H, Samsung SSD 980 Pro 1TB MZ-V8P1T0BW | Lenovo ThinkPad L15 Gen 4 21H70021GE Vega 8, R7 PRO 7730U, SK hynix HFS512GEJ4X113N | Acer Aspire 5 A515-58GM-76S8 GeForce RTX 2050 Mobile, i7-1355U, Micron 2450 1TB MTFDKBA1T0TFK | Asus VivoBook S15 M3502RA-L1029W Radeon 680M, R7 6800H, WD PC SN735 SDBPNHH-512G | Samsung Galaxy Book2 15 A350M, i7-1260P, Samsung PM991 MZVLQ512HBLU | |
|---|---|---|---|---|---|---|
| Noise | 3% | 18% | 2% | -14% | -2% | |
| apagado / medio ambiente * (dB) | 22.5 | 24.4 -8% | 23.5 -4% | 25.04 -11% | 26 -16% | 24.3 -8% |
| Idle Minimum * (dB) | 25.1 | 24.4 3% | 23.5 6% | 26.3 -5% | 26 -4% | 24.3 3% |
| Idle Average * (dB) | 25.1 | 24.4 3% | 23.5 6% | 26.3 -5% | 26 -4% | 24.3 3% |
| Idle Maximum * (dB) | 34.9 | 26.7 23% | 23.5 33% | 26.3 25% | 28.1 19% | 29.8 15% |
| Load Average * (dB) | 42.1 | 43.8 -4% | 27.5 35% | 32.5 23% | 56.9 -35% | 47.5 -13% |
| Witcher 3 ultra * (dB) | 44.5 | 43.8 2% | 32.7 27% | 46.7 -5% | 47.5 -7% | |
| Load Maximum * (dB) | 44.2 | 44.8 -1% | 32.7 26% | 49 -11% | 62.6 -42% | 47.5 -7% |
* ... más pequeño es mejor
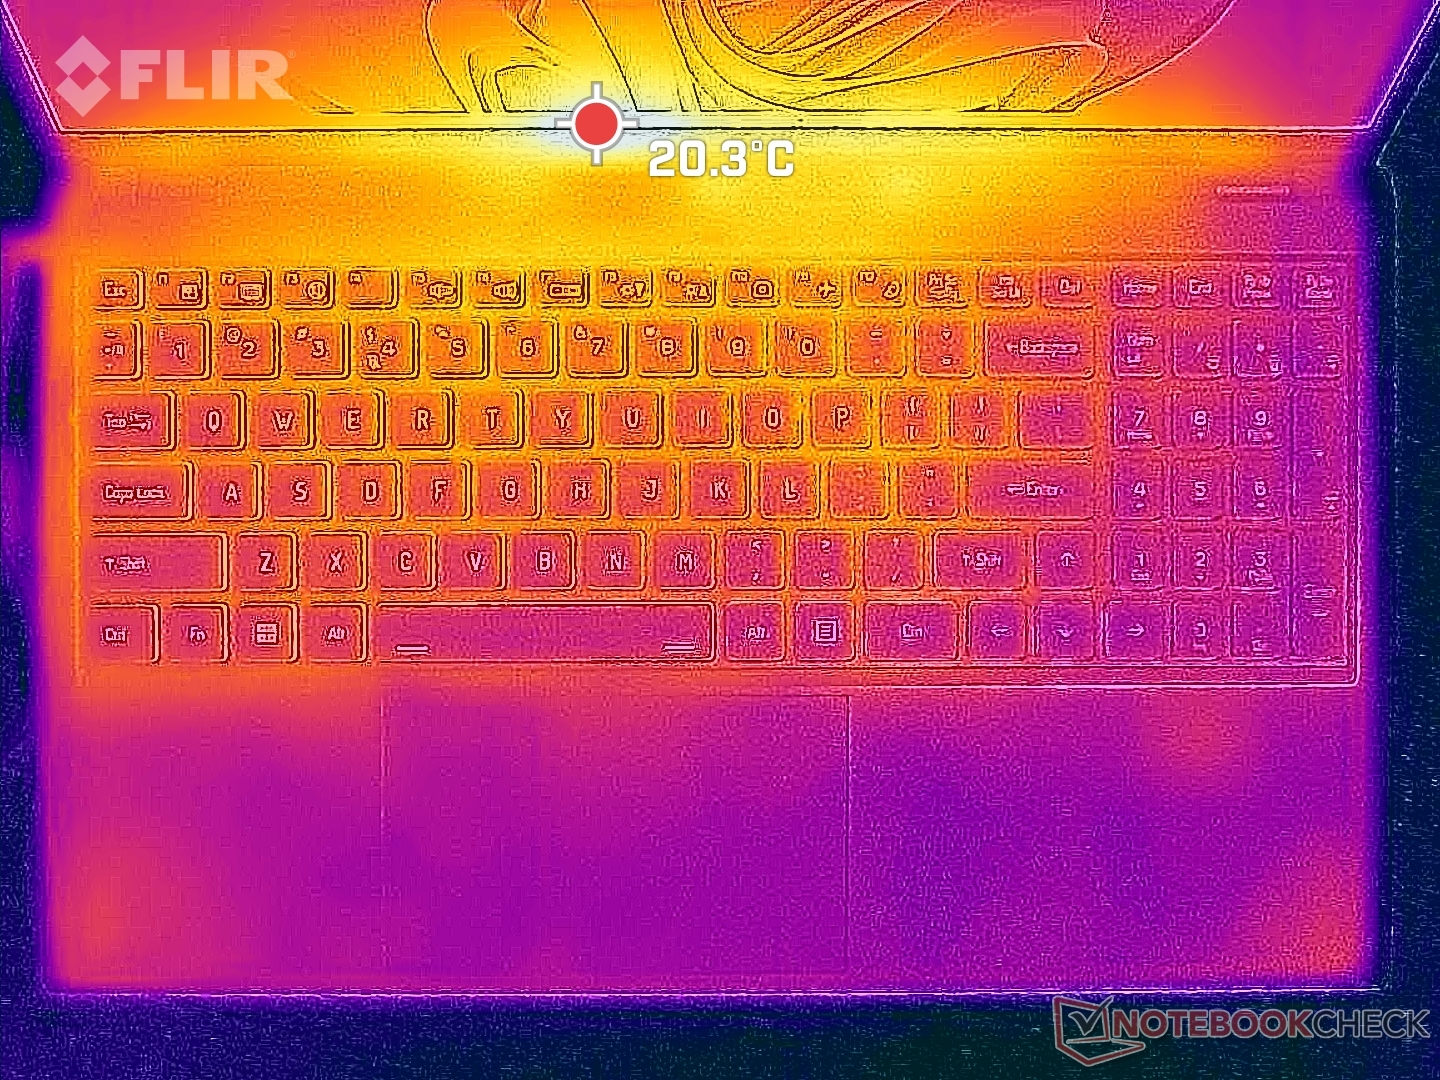
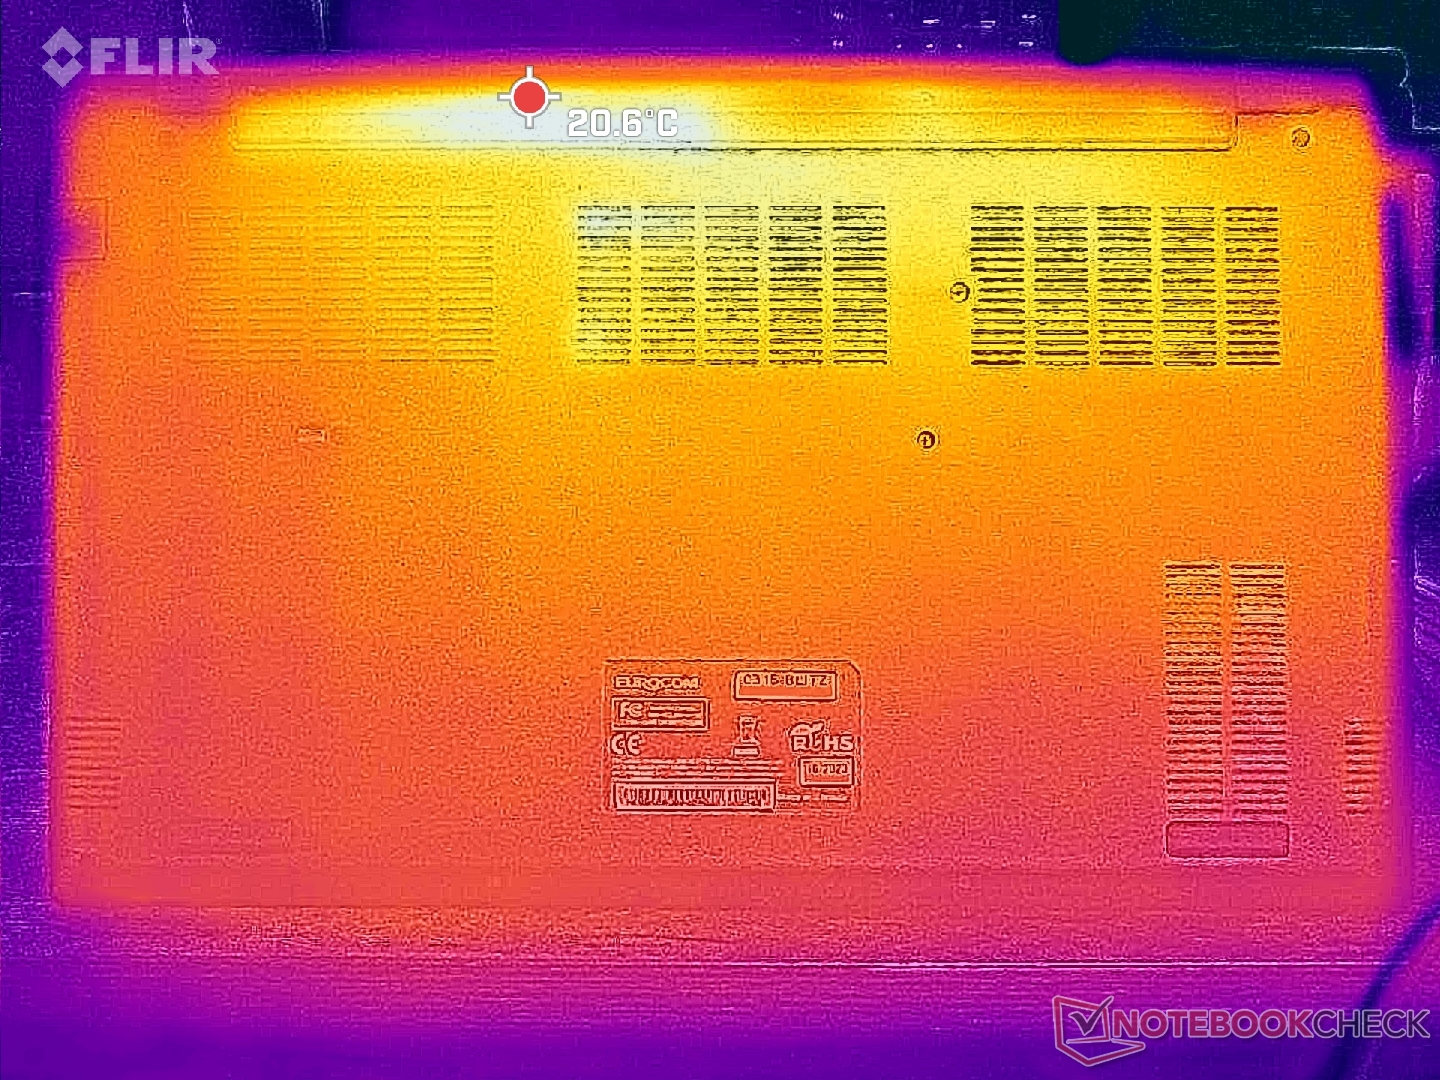
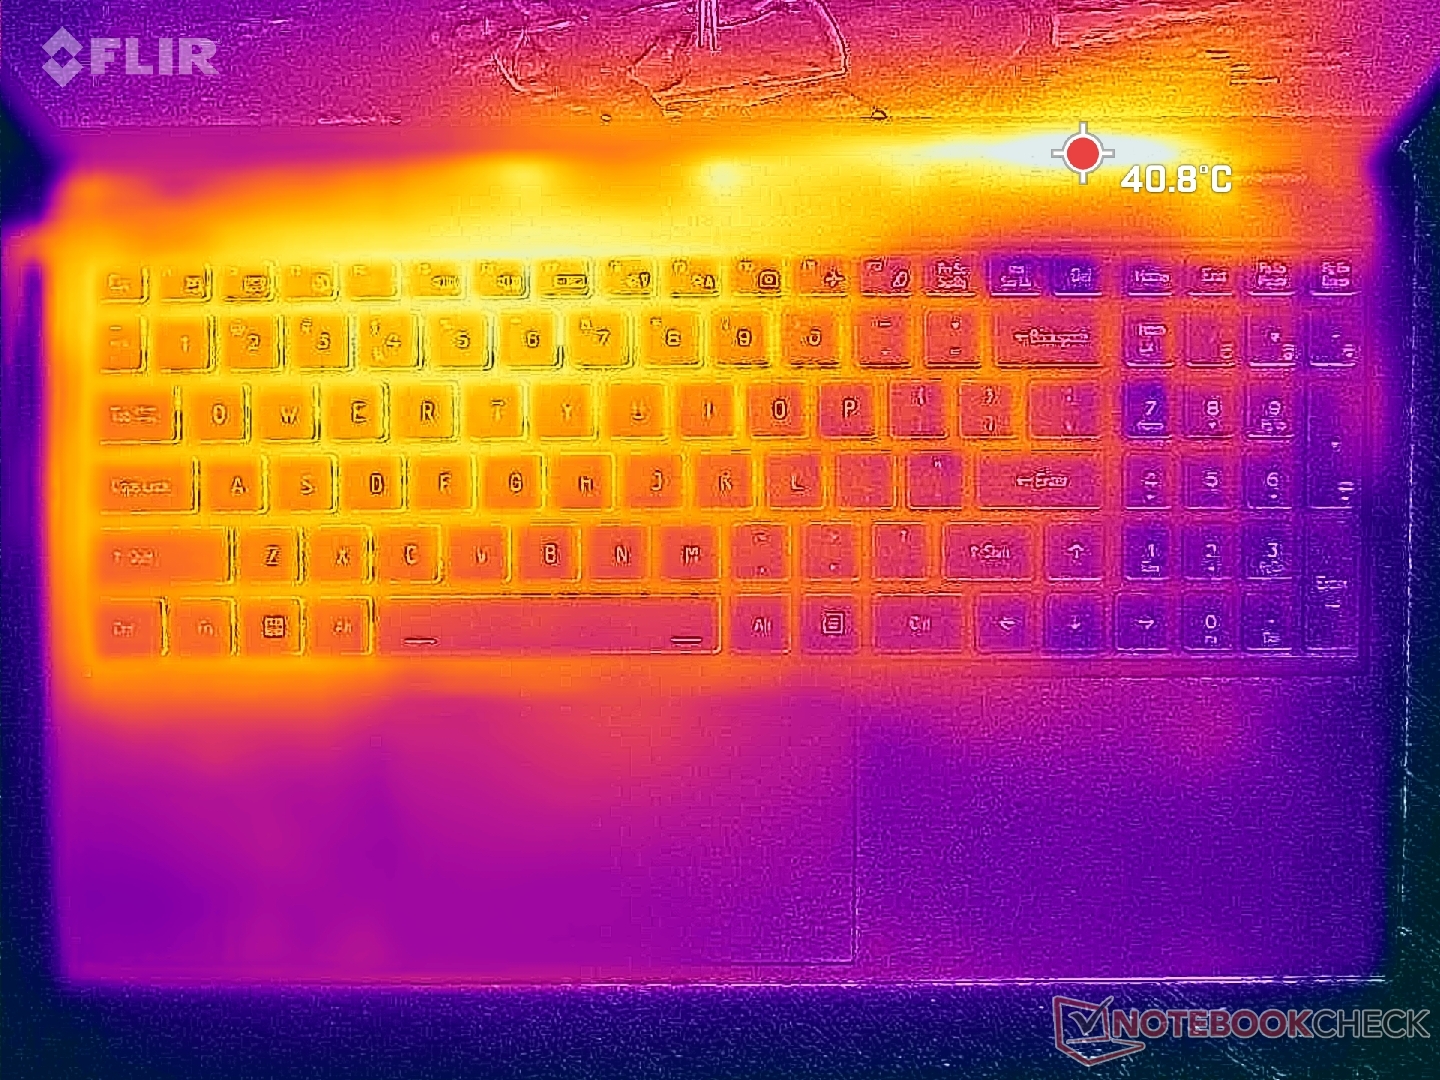
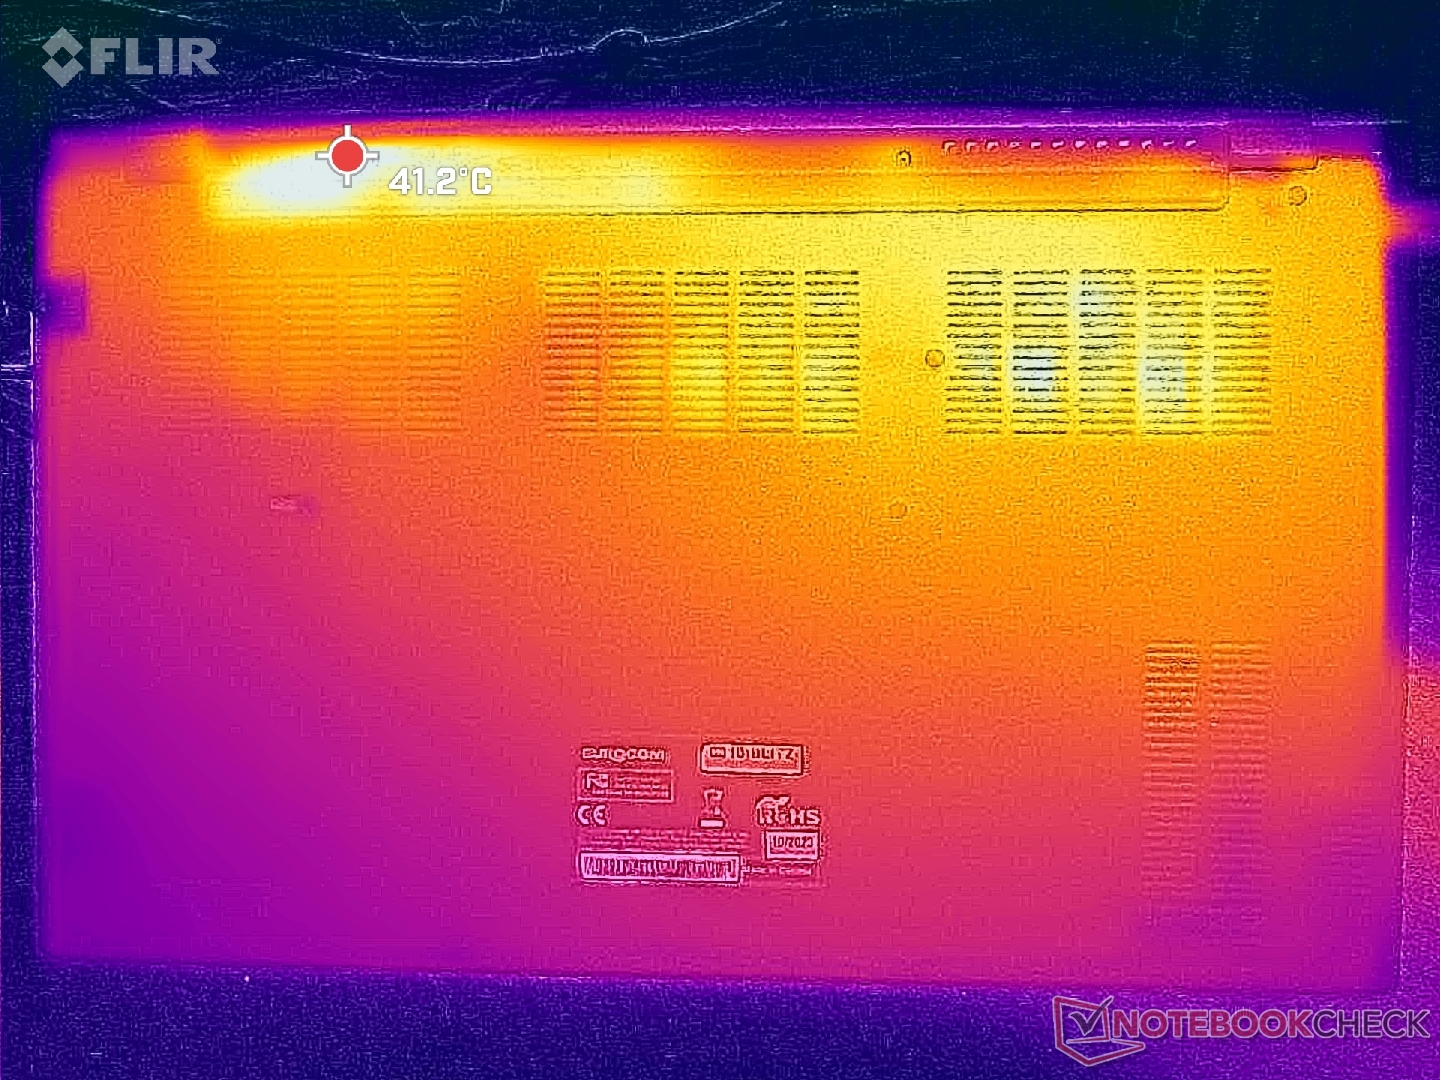
Temperatura
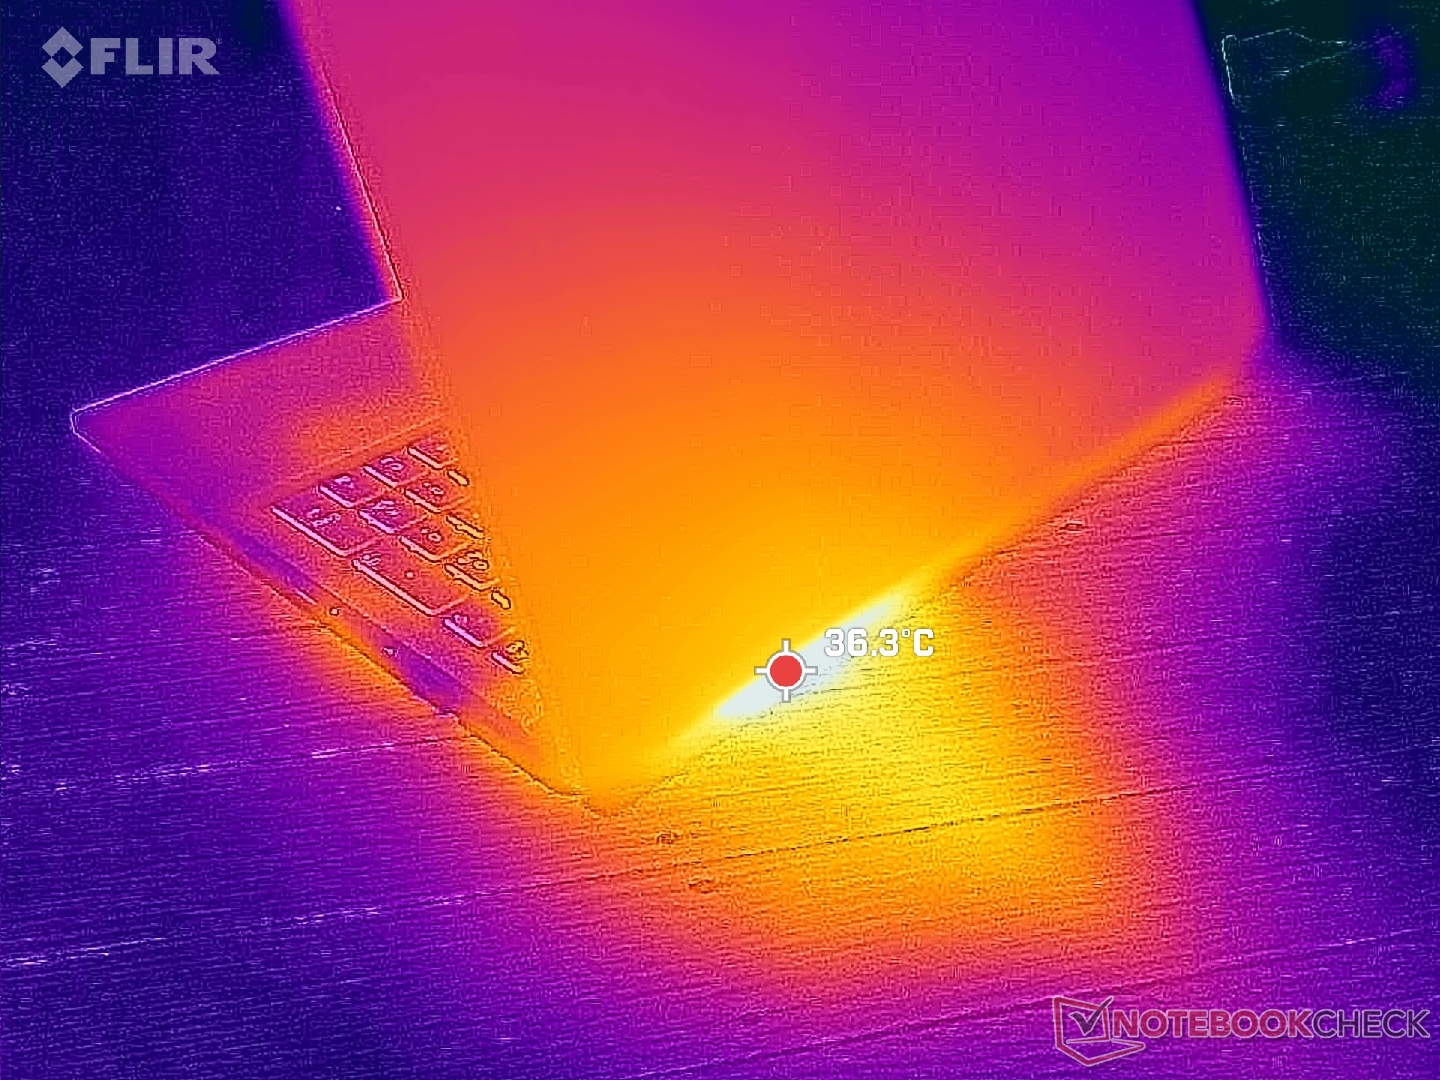
Las temperaturas superficiales son un poco más frías de media que las que observamos en la Schenker Work 15. Cuando se ejecutaban cargas exigentes, por ejemplo, los puntos calientes cerca de la parte trasera del chasis sólo alcanzaban de 35 C a 38 C en comparación con los 43 C de la Schenker.
(+) La temperatura máxima en la parte superior es de 35.6 °C / 96 F, frente a la media de 34.3 °C / 94 F, que oscila entre 21.2 y 62.5 °C para la clase Office.
(+) El fondo se calienta hasta un máximo de 37.8 °C / 100 F, frente a la media de 36.8 °C / 98 F
(+) En reposo, la temperatura media de la parte superior es de 22.8 °C / 73# F, frente a la media del dispositivo de 29.5 °C / 85 F.
(+) El reposamanos y el panel táctil están a una temperatura inferior a la de la piel, con un máximo de 26.6 °C / 79.9 F y, por tanto, son fríos al tacto.
(±) La temperatura media de la zona del reposamanos de dispositivos similares fue de 27.5 °C / 81.5 F (+0.9 °C / 1.6 F).
| Eurocom C315 Blitz Intel Core i7-1360P, Intel Iris Xe Graphics G7 96EUs | Schenker Work 15 Tiger Lake-H Intel Core i7-11370H, Intel Iris Xe Graphics G7 96EUs | Lenovo ThinkPad L15 Gen 4 21H70021GE AMD Ryzen 7 PRO 7730U, AMD Radeon RX Vega 8 (Ryzen 4000/5000) | Acer Aspire 5 A515-58GM-76S8 Intel Core i7-1355U, NVIDIA GeForce RTX 2050 Mobile | Asus VivoBook S15 M3502RA-L1029W AMD Ryzen 7 6800H, AMD Radeon 680M | Samsung Galaxy Book2 15 Intel Core i7-1260P, Intel Arc A350M | |
|---|---|---|---|---|---|---|
| Heat | -6% | 0% | -5% | -35% | -15% | |
| Maximum Upper Side * (°C) | 35.6 | 39.1 -10% | 39.1 -10% | 35.7 -0% | 50.2 -41% | 44.6 -25% |
| Maximum Bottom * (°C) | 37.8 | 43.4 -15% | 36.1 4% | 36.8 3% | 50.2 -33% | 47.5 -26% |
| Idle Upper Side * (°C) | 24.2 | 24.3 -0% | 23.1 5% | 27.9 -15% | 32.1 -33% | 25.8 -7% |
| Idle Bottom * (°C) | 26 | 25.1 3% | 25.7 1% | 27.9 -7% | 34.6 -33% | 26.1 -0% |
* ... más pequeño es mejor
Prueba de estrés
Al iniciar el estrés Prime95, la CPU se disparaba a 2,4 GHz, 47 W y 85 W durante sólo unos segundos antes de caer y estabilizarse en 800 MHz - 1,3 GHz, 15 W y 65 W. La pronunciada caída del rendimiento coincide con nuestros resultados del bucle CineBench R15 xT anteriores. Esperábamos una mejor sostenibilidad del rendimiento ya que se supone que la serie P de Core es un paso intermedio entre la serie U, más lenta, y la serie H, más potente, pero en cambio su comportamiento en nuestro Eurocom es el típico de la mayoría de las CPU de la serie U.
La temperatura del núcleo se estabilizaba en torno a los 65 C cuando se ejecutaban cargas exigentes, en comparación con los 78 C del Schenker Work 15 con el Core i7-11730H más antiguo.
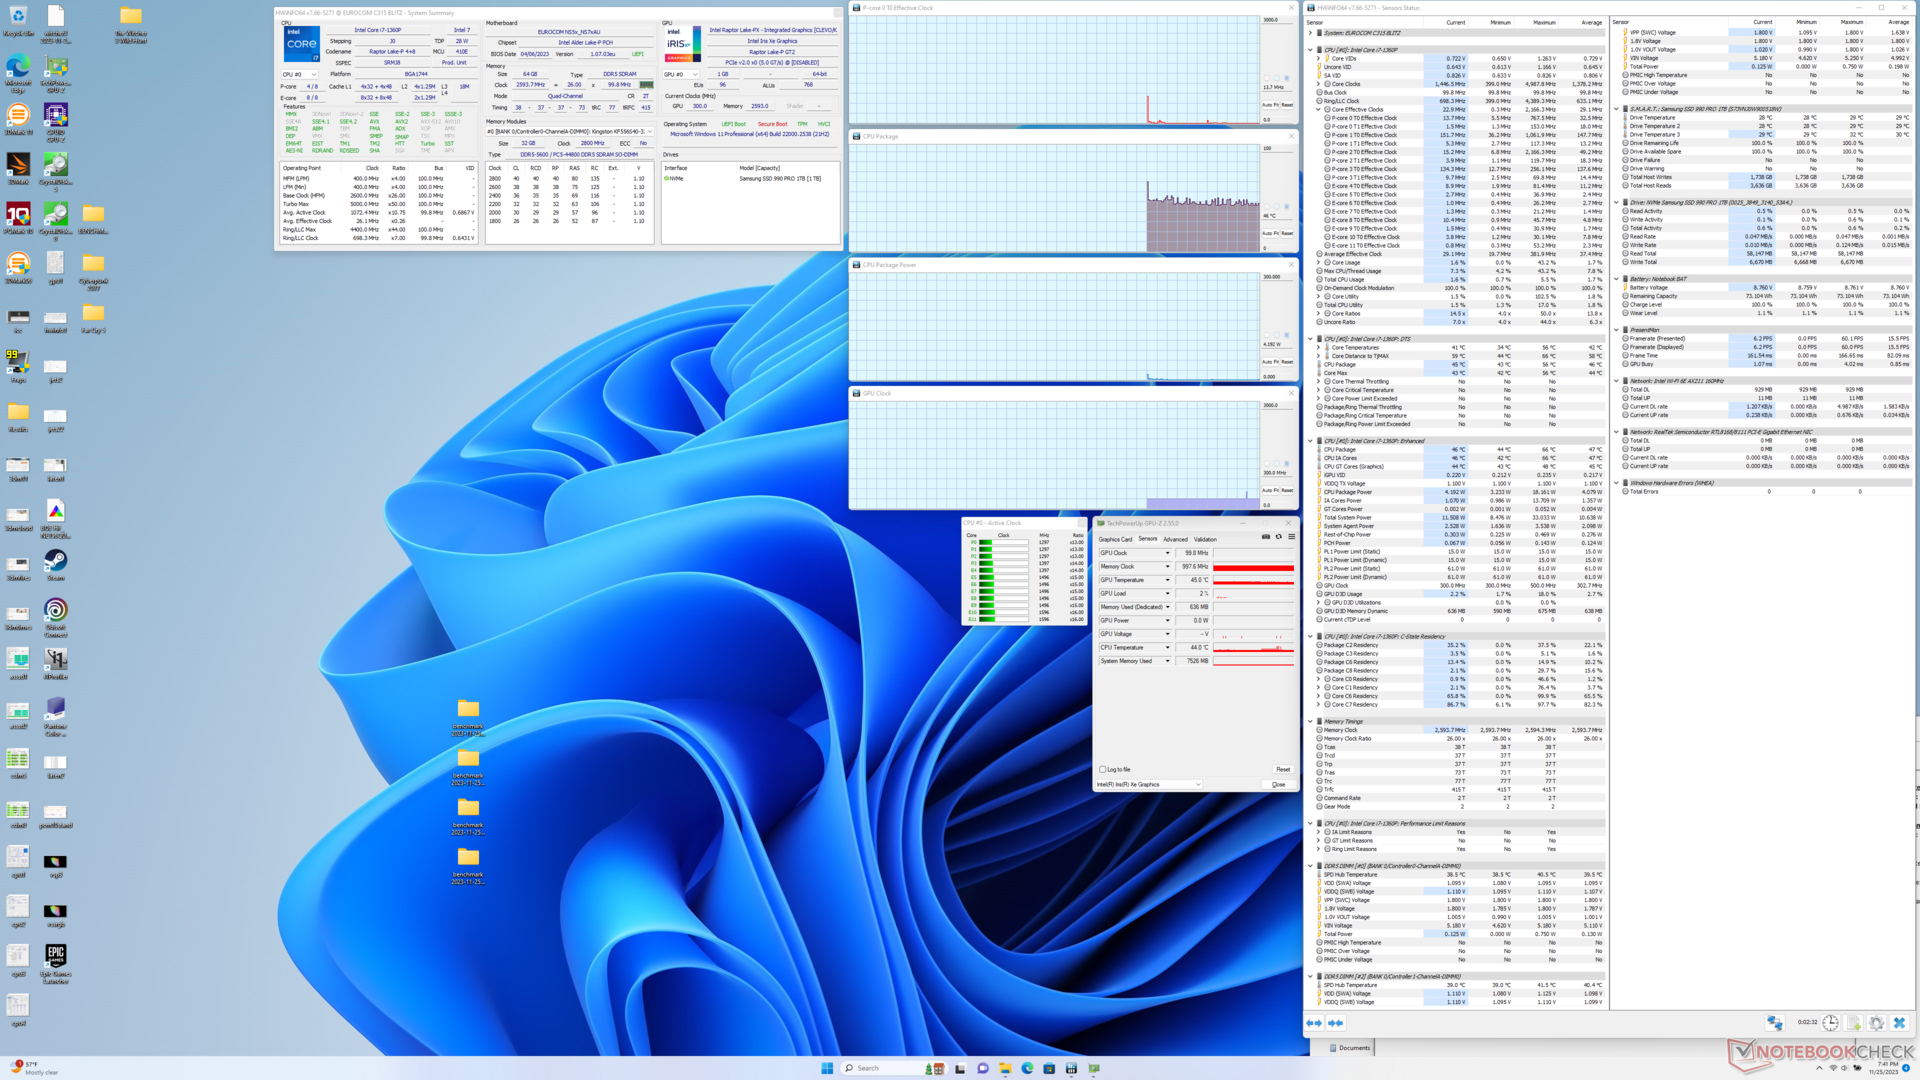
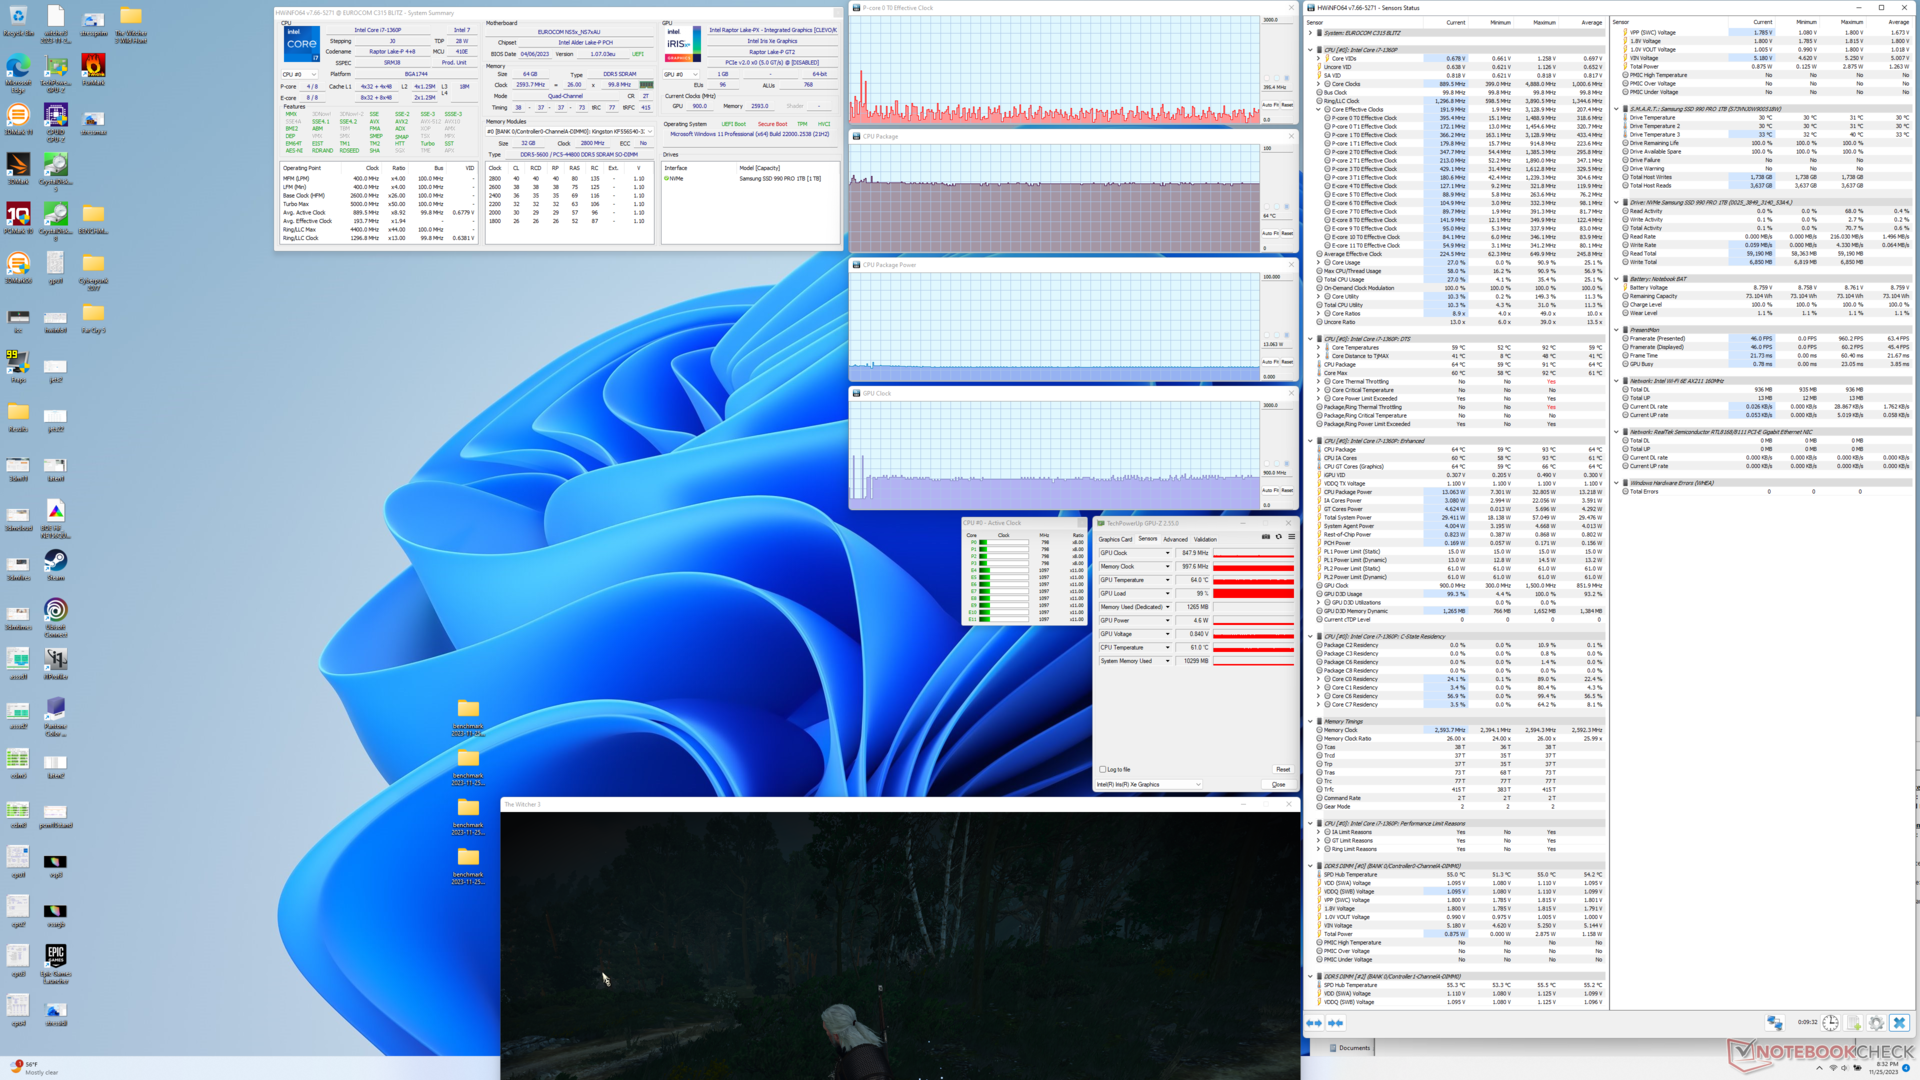
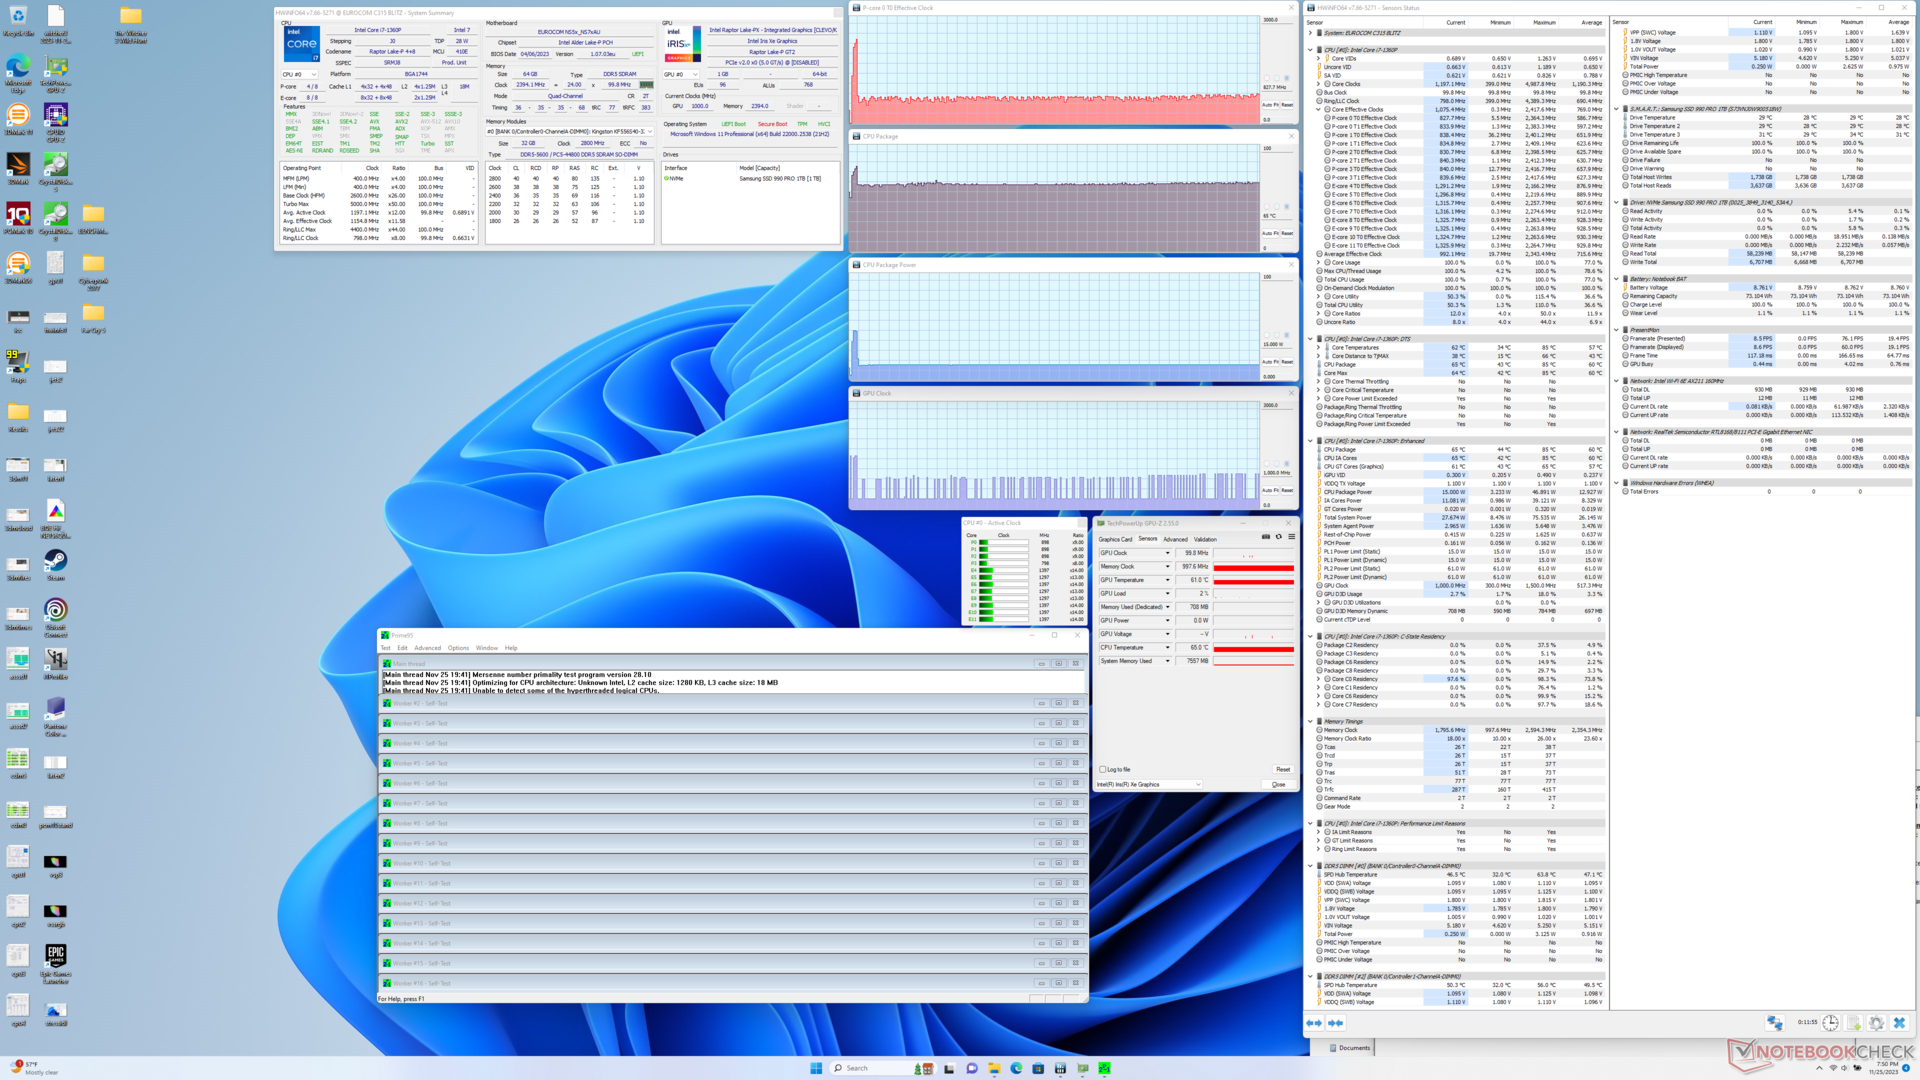
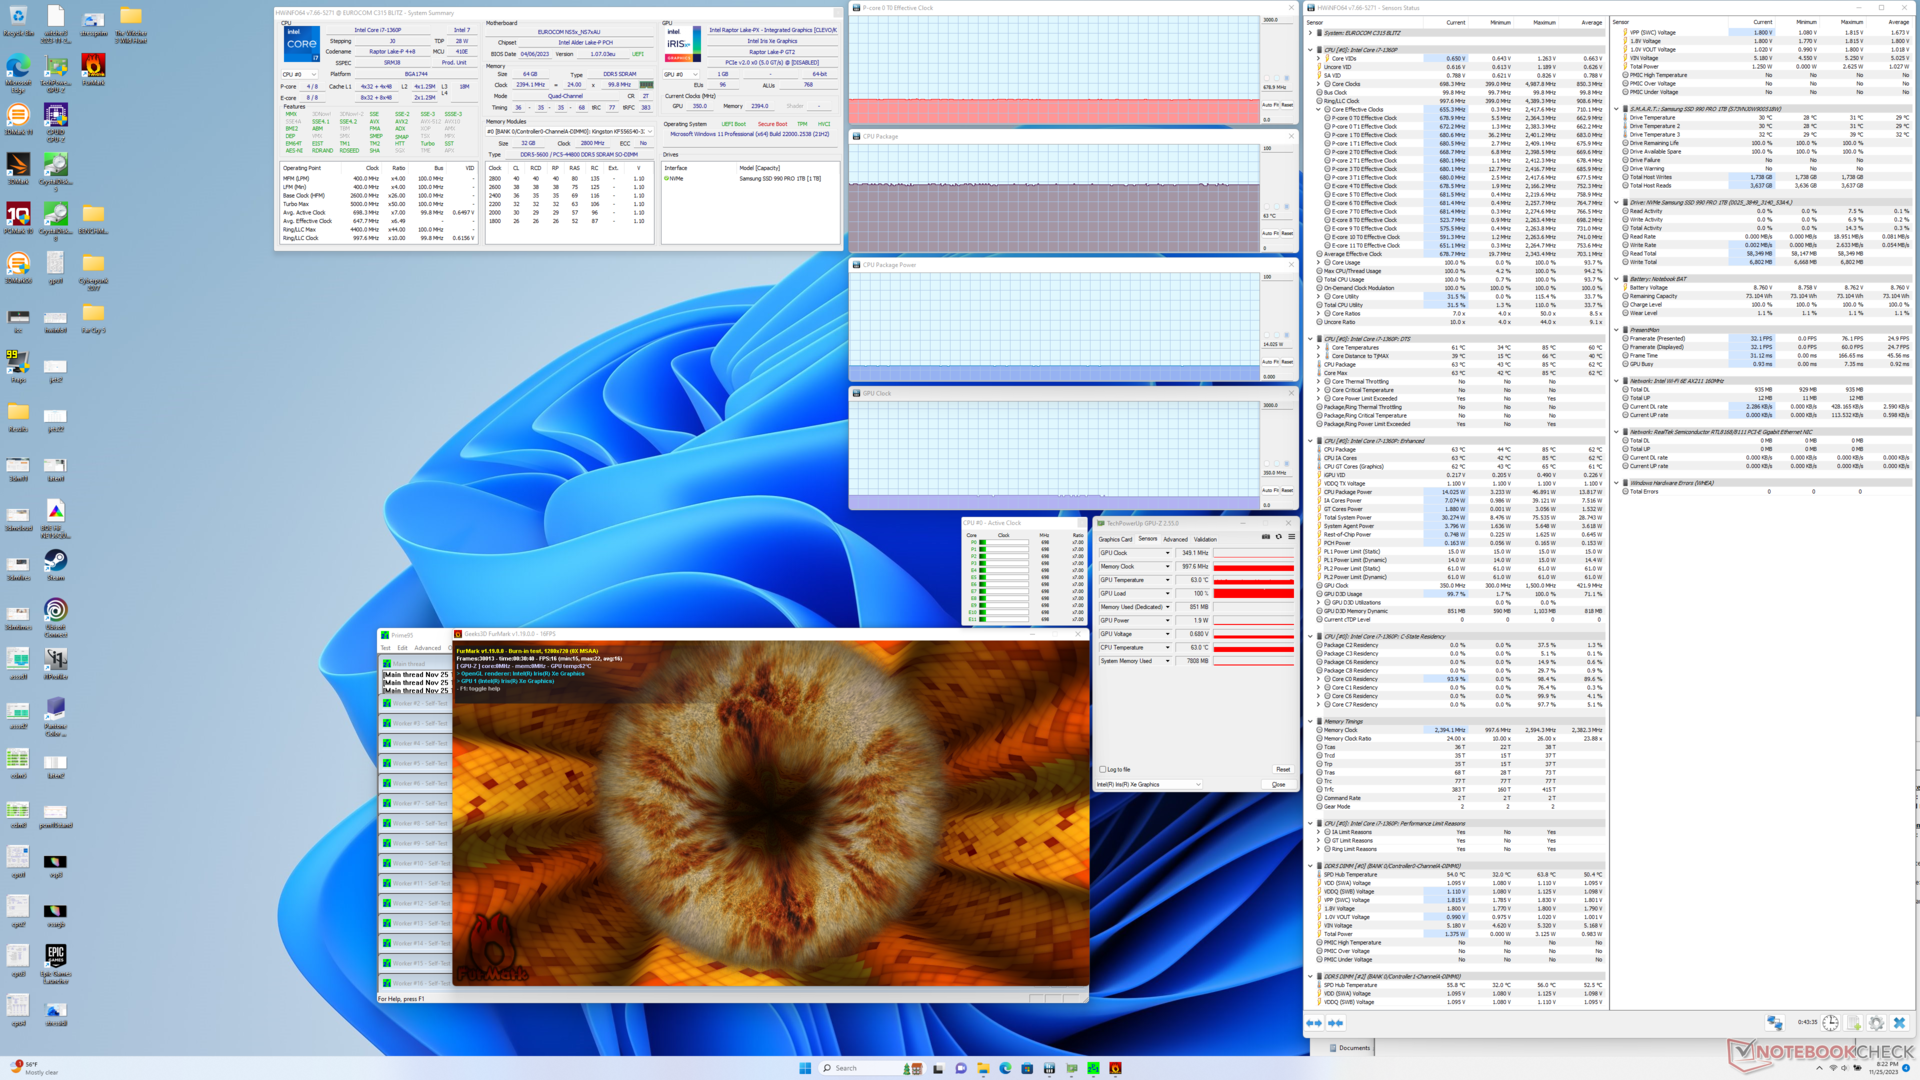
| Reloj dela CPU (GHz) | Reloj de la GPU (MHz) | Temperatura media de la CPU (°C) | |
| Sistema en reposo | -- | -- | 46 |
| Prime95 Estrés | 0,7 - 0,8 | -- | 65 |
| Estrés Prime95+ FurMark | 0,7 | 350 | 63 |
| Witcher 3 Tensión | ~0,4 | 900 | 64 |
Altavoces
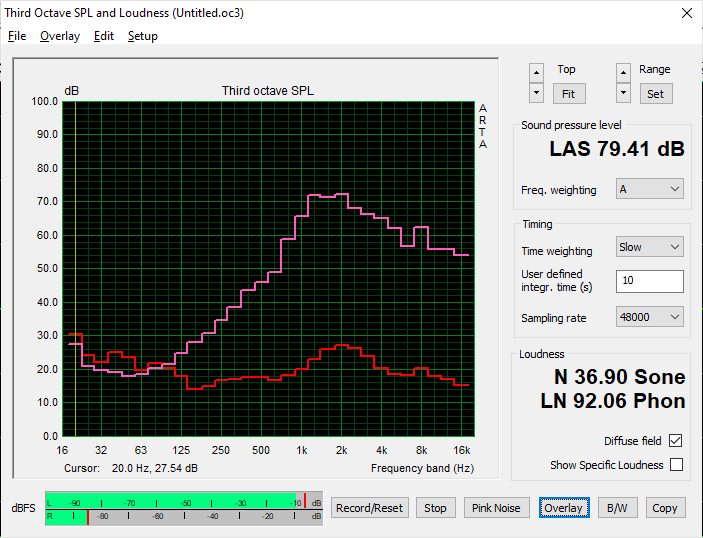
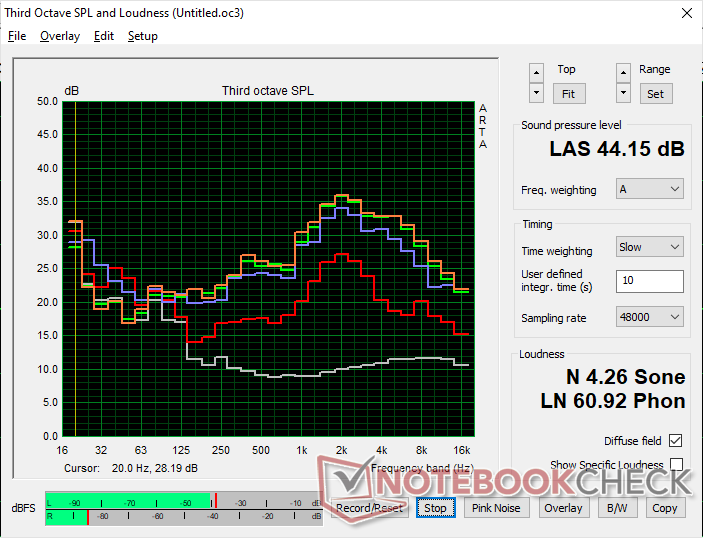
Eurocom C315 Blitz análisis de audio
(±) | la sonoridad del altavoz es media pero buena (79.4 dB)
Graves 100 - 315 Hz
(-) | casi sin bajos - de media 26.1% inferior a la mediana
(±) | la linealidad de los graves es media (8% delta a frecuencia anterior)
Medios 400 - 2000 Hz
(±) | medias más altas - de media 11.2% más altas que la mediana
(±) | la linealidad de los medios es media (11.5% delta respecto a la frecuencia anterior)
Altos 2 - 16 kHz
(±) | máximos más altos - de media 6.6% más altos que la mediana
(±) | la linealidad de los máximos es media (10.4% delta a frecuencia anterior)
Total 100 - 16.000 Hz
(-) | el sonido global no es lineal (35.6% de diferencia con la mediana)
En comparación con la misma clase
» 97% de todos los dispositivos probados de esta clase eran mejores, 1% similares, 2% peores
» El mejor tuvo un delta de 7%, la media fue 21%, el peor fue ###max##%
En comparación con todos los dispositivos probados
» 94% de todos los dispositivos probados eran mejores, 1% similares, 5% peores
» El mejor tuvo un delta de 4%, la media fue 23%, el peor fue ###max##%
Apple MacBook Pro 16 2021 M1 Pro análisis de audio
(+) | los altavoces pueden reproducir a un volumen relativamente alto (#84.7 dB)
Graves 100 - 315 Hz
(+) | buen bajo - sólo 3.8% lejos de la mediana
(+) | el bajo es lineal (5.2% delta a la frecuencia anterior)
Medios 400 - 2000 Hz
(+) | medios equilibrados - a sólo 1.3% de la mediana
(+) | los medios son lineales (2.1% delta a la frecuencia anterior)
Altos 2 - 16 kHz
(+) | máximos equilibrados - a sólo 1.9% de la mediana
(+) | los máximos son lineales (2.7% delta a la frecuencia anterior)
Total 100 - 16.000 Hz
(+) | el sonido global es lineal (4.6% de diferencia con la mediana)
En comparación con la misma clase
» 0% de todos los dispositivos probados de esta clase eran mejores, 0% similares, 100% peores
» El mejor tuvo un delta de 5%, la media fue 17%, el peor fue ###max##%
En comparación con todos los dispositivos probados
» 0% de todos los dispositivos probados eran mejores, 0% similares, 100% peores
» El mejor tuvo un delta de 4%, la media fue 23%, el peor fue ###max##%
Gestión de la energía
Consumo de energía
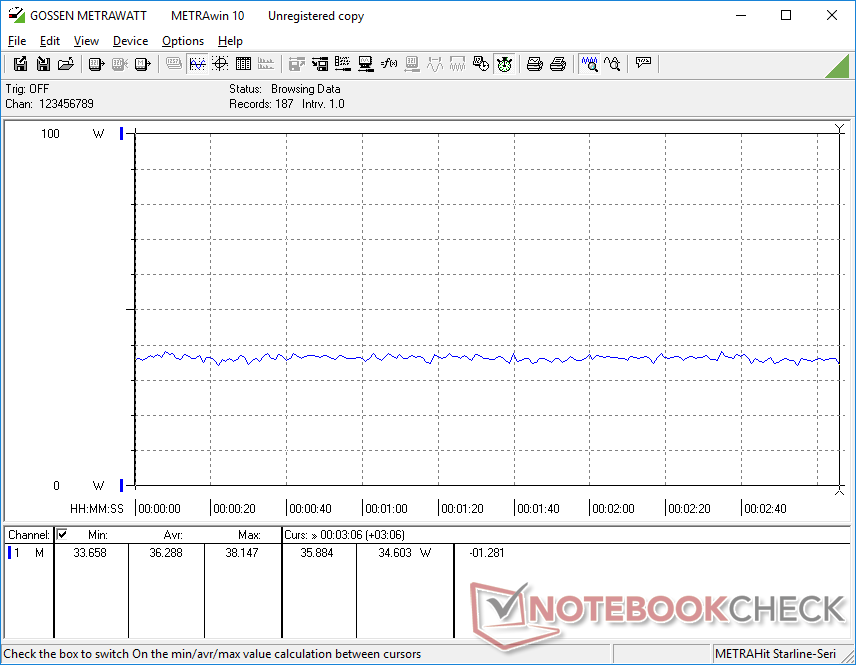
En ralentí sobre el escritorio consumiría unos pocos vatios más que en el Schenker Work 15, probablemente debido a nuestra pantalla 4K de mayor resolución. Sin embargo, el consumo sería aproximadamente el mismo de media al ejecutar cargas más altas a pesar de cualquier diferencia de rendimiento o temperatura entre el Core i7-1360P y el Core i7-11370H.
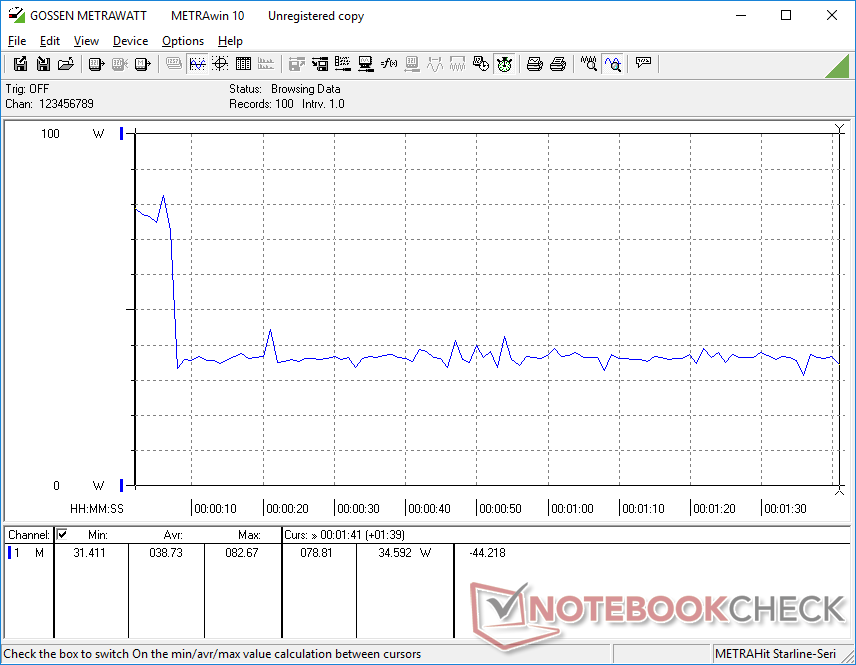
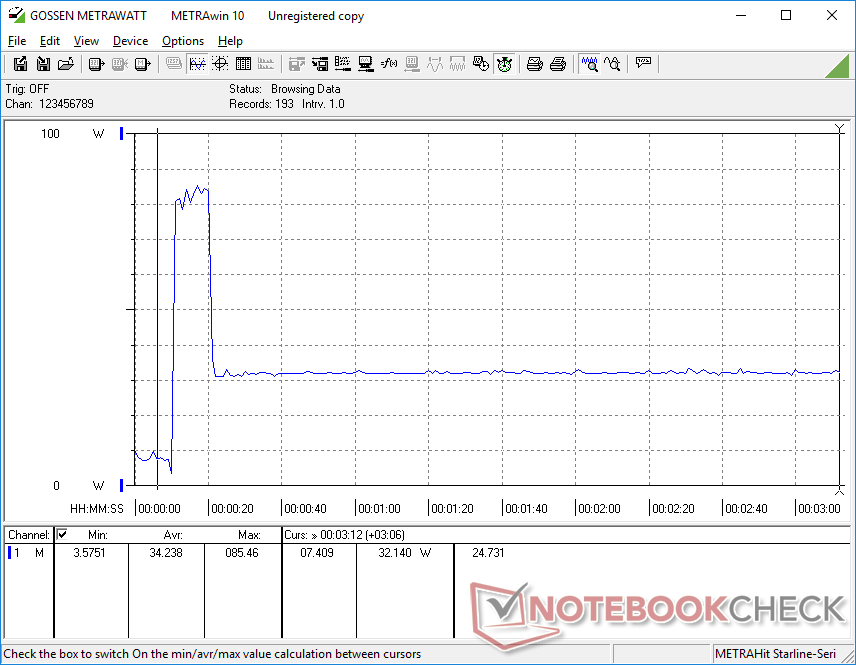
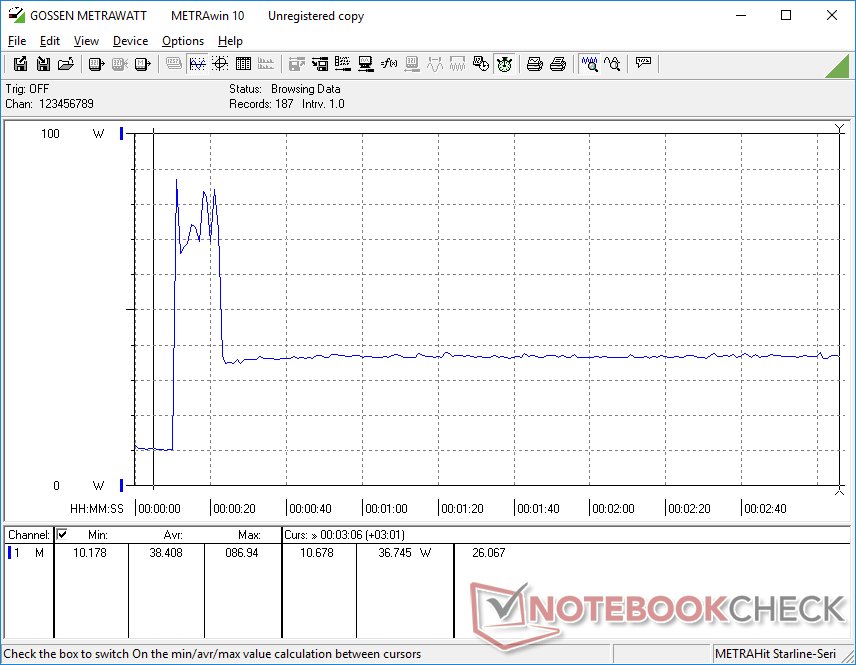
Somos capaces de registrar un consumo máximo de 87 W desde el pequeño (~12,5 x 4,8 x 3 cm) adaptador de CA de 90 W cuando la CPU está al 100 por ciento de utilización. Esta demanda es sólo temporal antes de que el estrangulamiento entre en acción como muestran nuestros gráficos de consumo de energía a continuación.
| Off / Standby | |
| Ocioso | |
| Carga |
|
Clave:
min: | |
| Eurocom C315 Blitz i7-1360P, Iris Xe G7 96EUs, Samsung 990 Pro 1 TB, IPS, 3840x2160, 15.6" | Schenker Work 15 Tiger Lake-H i7-11370H, Iris Xe G7 96EUs, Samsung SSD 980 Pro 1TB MZ-V8P1T0BW, IPS, 1920x1080, 15.6" | Lenovo ThinkPad L15 Gen 4 21H70021GE R7 PRO 7730U, Vega 8, SK hynix HFS512GEJ4X113N, IPS, 1920x1080, 15.6" | Acer Aspire 5 A515-58GM-76S8 i7-1355U, GeForce RTX 2050 Mobile, Micron 2450 1TB MTFDKBA1T0TFK, IPS, 1920x1080, 15.6" | Asus VivoBook S15 M3502RA-L1029W R7 6800H, Radeon 680M, WD PC SN735 SDBPNHH-512G, OLED, 1920x1080, 15.6" | Samsung Galaxy Book2 15 i7-1260P, A350M, Samsung PM991 MZVLQ512HBLU, IPS, 1920x1080, 15.6" | |
|---|---|---|---|---|---|---|
| Power Consumption | 18% | 22% | -6% | -5% | 6% | |
| Idle Minimum * (Watt) | 9.4 | 4.5 52% | 4.5 52% | 4.31 54% | 4.4 53% | 4 57% |
| Idle Average * (Watt) | 11.5 | 8.5 26% | 8.5 26% | 6.52 43% | 5.1 56% | 7.8 32% |
| Idle Maximum * (Watt) | 12.1 | 9.1 25% | 10.5 13% | 8.037 34% | 9.3 23% | 8.5 30% |
| Load Average * (Watt) | 38.7 | 43.5 -12% | 35.6 8% | 75.2 -94% | 67 -73% | 59.1 -53% |
| Witcher 3 ultra * (Watt) | 36.3 | 37.5 -3% | 37.4 -3% | 60.8 -67% | 66.4 -83% | 56.7 -56% |
| Load Maximum * (Watt) | 87 | 69.4 20% | 57.9 33% | 89.5 -3% | 93.5 -7% | 62.4 28% |
* ... más pequeño es mejor
Power Consumption Witcher 3 / Stresstest
Power Consumption external Monitor
Duración de las pilas
El tiempo de funcionamiento de la WLAN es notablemente más corto que en la antigua Schenker Work 15 en más de 2 horas. La discrepancia puede atribuirse a nuestra pantalla 4K de mayor resolución. Nuestra CPU Core-P también aumentaría a velocidades de reloj y niveles de consumo superiores a los del antiguo Core i7 de 11ª generación, lo que afectaría aún más a la duración de la batería.
La carga desde vacío a plena capacidad tarda poco más de 90 minutos.
| Eurocom C315 Blitz i7-1360P, Iris Xe G7 96EUs, 73 Wh | Schenker Work 15 Tiger Lake-H i7-11370H, Iris Xe G7 96EUs, 73 Wh | Lenovo ThinkPad L15 Gen 4 21H70021GE R7 PRO 7730U, Vega 8, 57 Wh | Acer Aspire 5 A515-58GM-76S8 i7-1355U, GeForce RTX 2050 Mobile, 48 Wh | Asus VivoBook S15 M3502RA-L1029W R7 6800H, Radeon 680M, 70 Wh | Samsung Galaxy Book2 15 i7-1260P, A350M, 54 Wh | |
|---|---|---|---|---|---|---|
| Duración de Batería | 27% | 49% | 9% | 44% | 2% | |
| WiFi v1.3 (h) | 8 | 10.2 27% | 11.9 49% | 8.7 9% | 11.5 44% | 8.2 2% |
| Reader / Idle (h) | 24.5 | 25.1 | ||||
| H.264 (h) | 9.6 | 9.5 | 6.6 | 12.8 | 10.6 | |
| Load (h) | 2.2 | 2.2 | 2 | 1 | 1.5 |
Pro
Contra
Veredicto - Al rendimiento de la CPU le vendría bien algo de trabajo
El Core i7-1360P ayuda a distinguir el Eurocom C315 Blitz de la mayoría de los demás portátiles, ya que esta opción de CPU es algo poco común. Por desgracia, el procesador se ralentiza demasiado en el Eurocom hasta el punto de que el rendimiento general puede ser idéntico al del Core i7-11370H o incluso más lento que el del Core i5-1340P, más económico. ElLG Gram 2 en 1 16que viene con la misma opción Core i7-1360P, es capaz de ejecutar la CPU hasta un 80 por ciento más rápido que nuestro Eurocom.
El Eurocom C315 Blitz se ve arrastrado por la CPU Core i7-1360P propensa al estrangulamiento y la falta de opciones de pantalla.
Otros aspectos importantes del modelo carecen de características. El panel 4K, por ejemplo, no ofrece colores DCI-P3, altas frecuencias de actualización ni compatibilidad con HDR que ciertos profesionales o usuarios multimedia podrían valorar. La duración de la batería y la calidad de la webcam también son meramente medias o decepcionantes.
Sin duda, al Clevo X170KM base le vendría bien un lavado de cara con un ajuste adicional del rendimiento, del ruido del ventilador y de las características de la pantalla, especialmente si se tiene en cuenta el precio de partida de 1300 USD. El rango de $1000 a $1500 ya es extremadamente competitivo en este espacio con opciones profesionales como el Lenovo ThinkPad L15, HP ProBook, o la serie Dell Latitude.
Precio y disponibilidad
Eurocom ya está enviando el C315 Blitz a partir de $1300 USD para la configuración base hasta más de $2500 si se configura con 64 GB de RAM y un SSD de 1 TB como el nuestro.
Eurocom C315 Blitz
- 11/29/2023 v7 (old)
Allen Ngo
Transparencia
La selección de los dispositivos que se van a reseñar corre a cargo de nuestro equipo editorial. La muestra de prueba fue proporcionada al autor en calidad de préstamo por el fabricante o el minorista a los efectos de esta reseña. El prestamista no tuvo ninguna influencia en esta reseña, ni el fabricante recibió una copia de la misma antes de su publicación. No había ninguna obligación de publicar esta reseña. Como empresa de medios independiente, Notebookcheck no está sujeta a la autoridad de fabricantes, minoristas o editores.
Así es como prueba Notebookcheck
Cada año, Notebookcheck revisa de forma independiente cientos de portátiles y smartphones utilizando procedimientos estandarizados para asegurar que todos los resultados son comparables. Hemos desarrollado continuamente nuestros métodos de prueba durante unos 20 años y hemos establecido los estándares de la industria en el proceso. En nuestros laboratorios de pruebas, técnicos y editores experimentados utilizan equipos de medición de alta calidad. Estas pruebas implican un proceso de validación en varias fases. Nuestro complejo sistema de clasificación se basa en cientos de mediciones y puntos de referencia bien fundamentados, lo que mantiene la objetividad.Price comparison

