Análisis del portátil Eurocom Raptor X17: La alternativa a los ROG de MSI y Asus

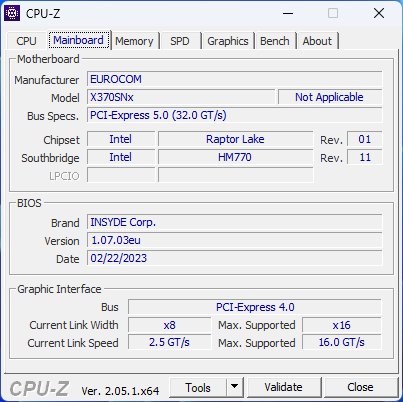
Después de haber probado recientemente el Raptor X15estamos listos para enfrentarnos a su hermano mayor, el Raptor X17 de 17,3 pulgadas. Su chasis es un nuevo diseño (X370) que todavía no hemos visto en otras marcas en el momento de la revisión. No obstante, esperamos que otros distribuidores como Schenker ofrezcan este mismo chasis con una marca diferente para los mercados extranjeros.
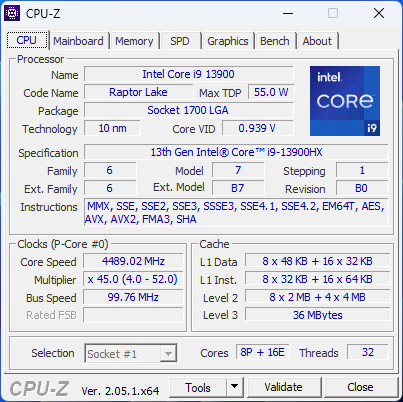
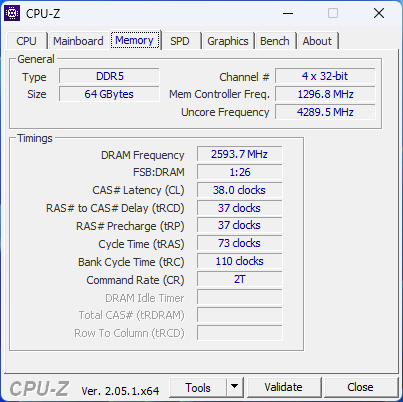
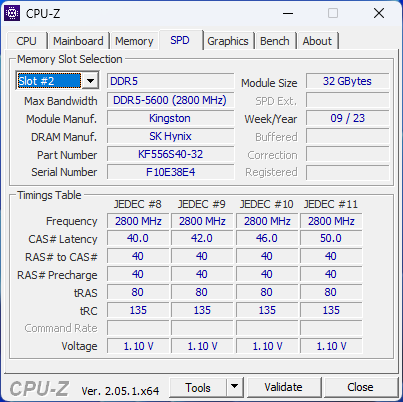
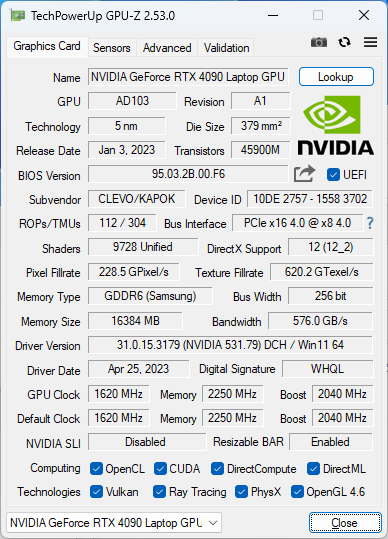
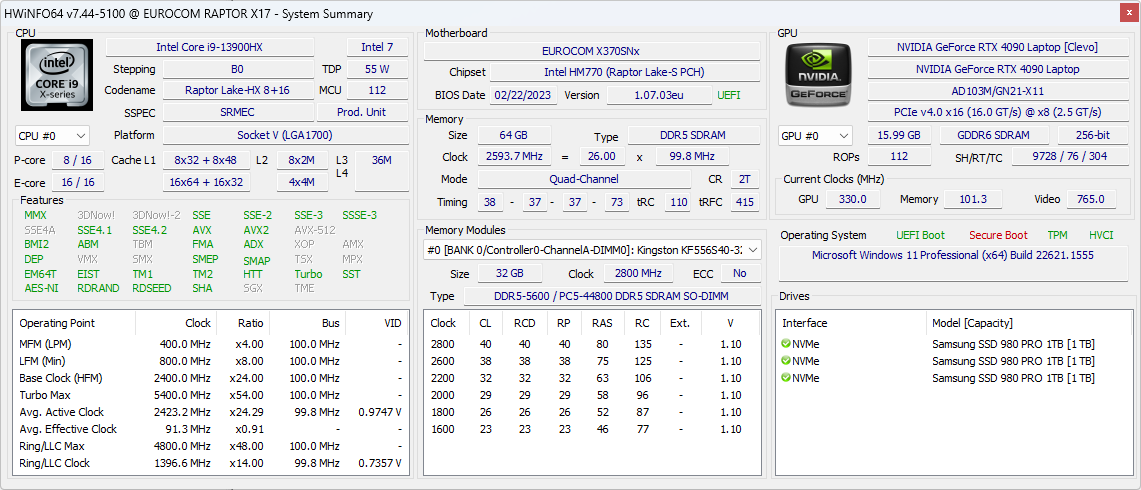
Nuestra configuración de análisis es una SKU de gama alta con la CPU Raptor Lake Core i9-13900HX de 13ª generación, GPU GeForce RTX 4090 de 175 W, 64 GB de RAM DDR5, 3 SSDs de 1 TB, y pantalla 1440p 240 Hz por unos 6.600 dólares. Por supuesto, los usuarios pueden configurarlo con menos RAM y almacenamiento y un i7-13700HX o una RTX 4080 por precios de partida más bajos.
Entre los competidores del Raptor X17 se incluyen otros portátiles para juegos de 17 pulgadas de tamaño delgado a mediano como el Razer Blade 17, Asus ROG Strix Scar 17, Gigabyte Aorus 17Xo el MSI GS77.
Más reseñas sobre Eurocom:
Posibles contendientes en la comparación
Valoración | Fecha | Modelo | Peso | Altura | Tamaño | Resolución | Precio |
|---|---|---|---|---|---|---|---|
| 82.8 % v7 (old) | 05/2023 | Eurocom Raptor X17 i9-13900HX, GeForce RTX 4090 Laptop GPU | 3.5 kg | 24.9 mm | 17.30" | 2560x1440 | |
| 88.3 % v7 (old) | 04/2023 | Asus ROG Strix Scar 17 G733PY-XS96 R9 7945HX, GeForce RTX 4090 Laptop GPU | 2.9 kg | 28.3 mm | 17.30" | 2560x1440 | |
| 86 % v7 (old) | 04/2023 | Aorus 17X AZF i9-13900HX, GeForce RTX 4090 Laptop GPU | 2.9 kg | 21.8 mm | 17.30" | 2560x1440 | |
| 88.3 % v7 (old) | 03/2023 | MSI GE78HX 13VH-070US i9-13950HX, GeForce RTX 4080 Laptop GPU | 3 kg | 23 mm | 17.00" | 2560x1600 | |
| 89.9 % v7 (old) | 03/2023 | Eluktronics Mech-17 GP2 i9-13900HX, GeForce RTX 4090 Laptop GPU | 2.9 kg | 27 mm | 17.00" | 2560x1600 | |
| 86.1 % v7 (old) | 01/2023 | Alienware m17 R5 (R9 6900HX, RX 6850M XT) R9 6900HX, Radeon RX 6850M XT | 3.4 kg | 26.7 mm | 17.00" | 3840x2160 |
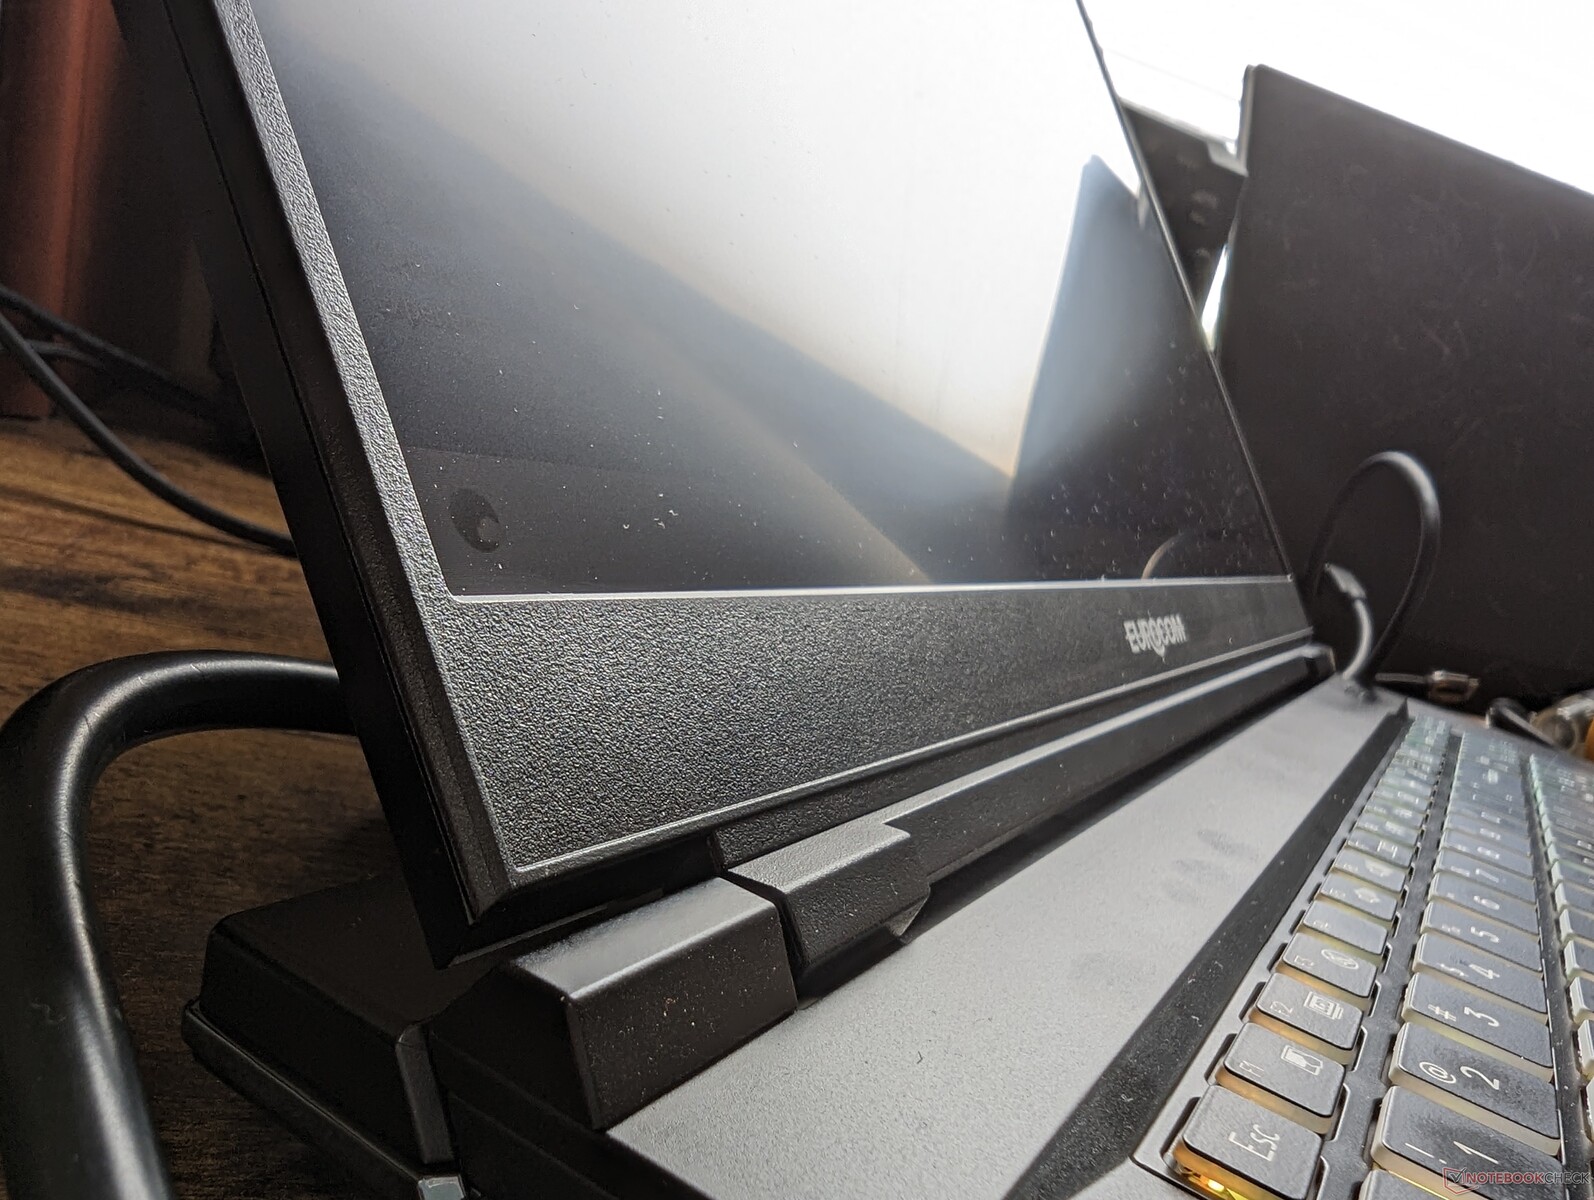
Caso - Un nuevo comienzo
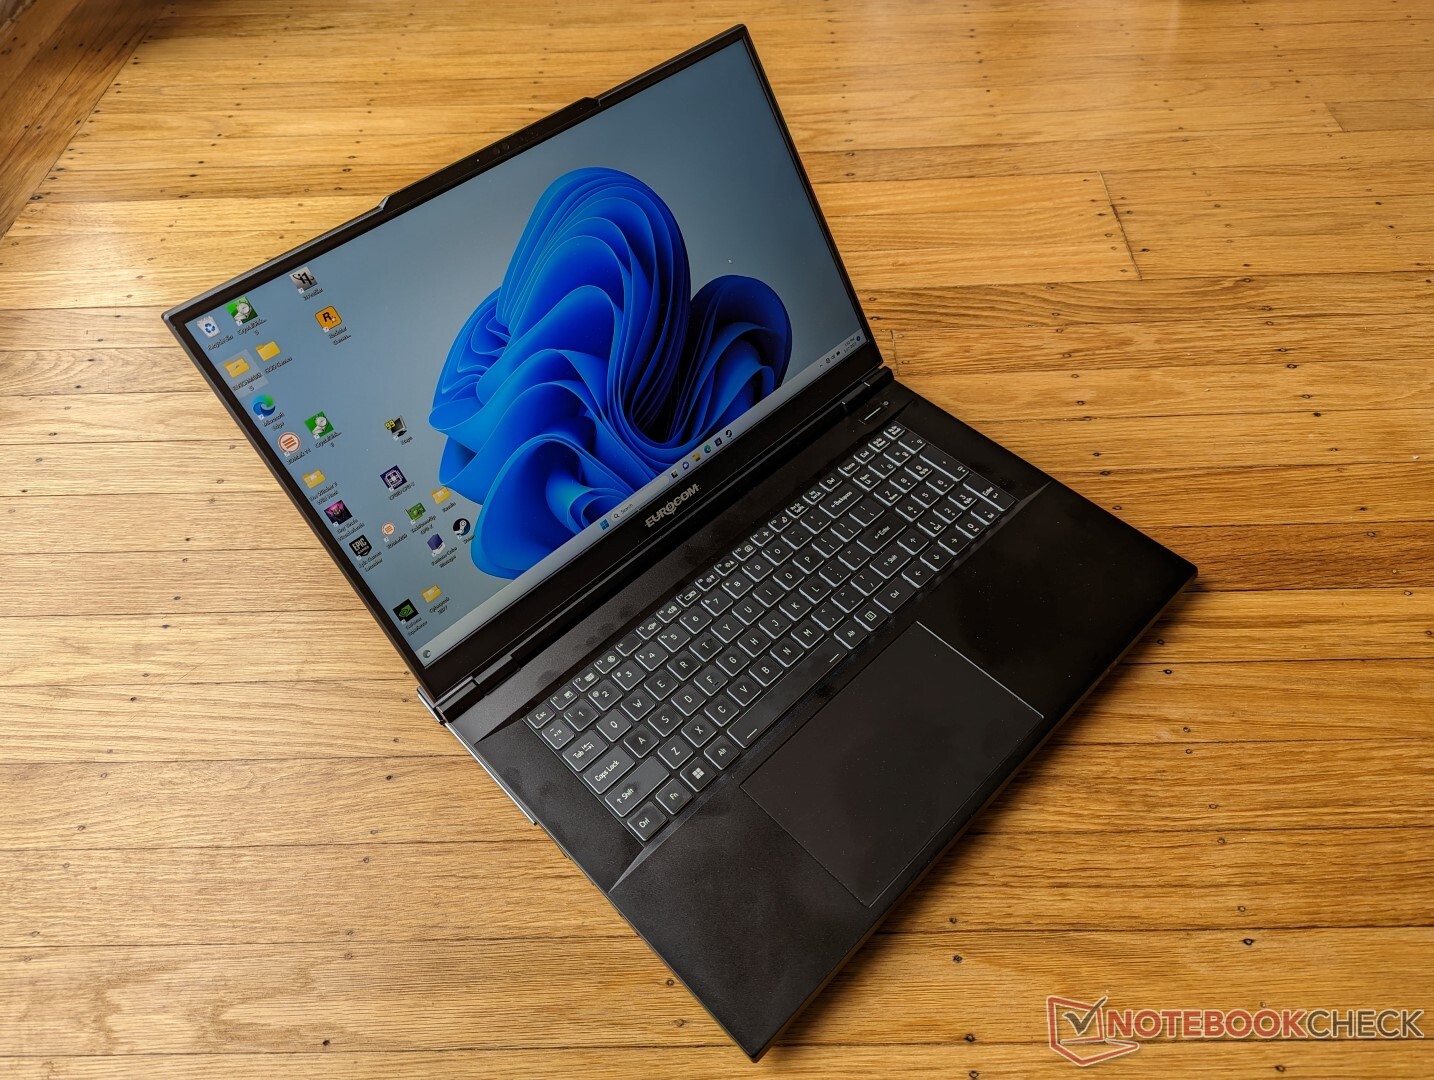
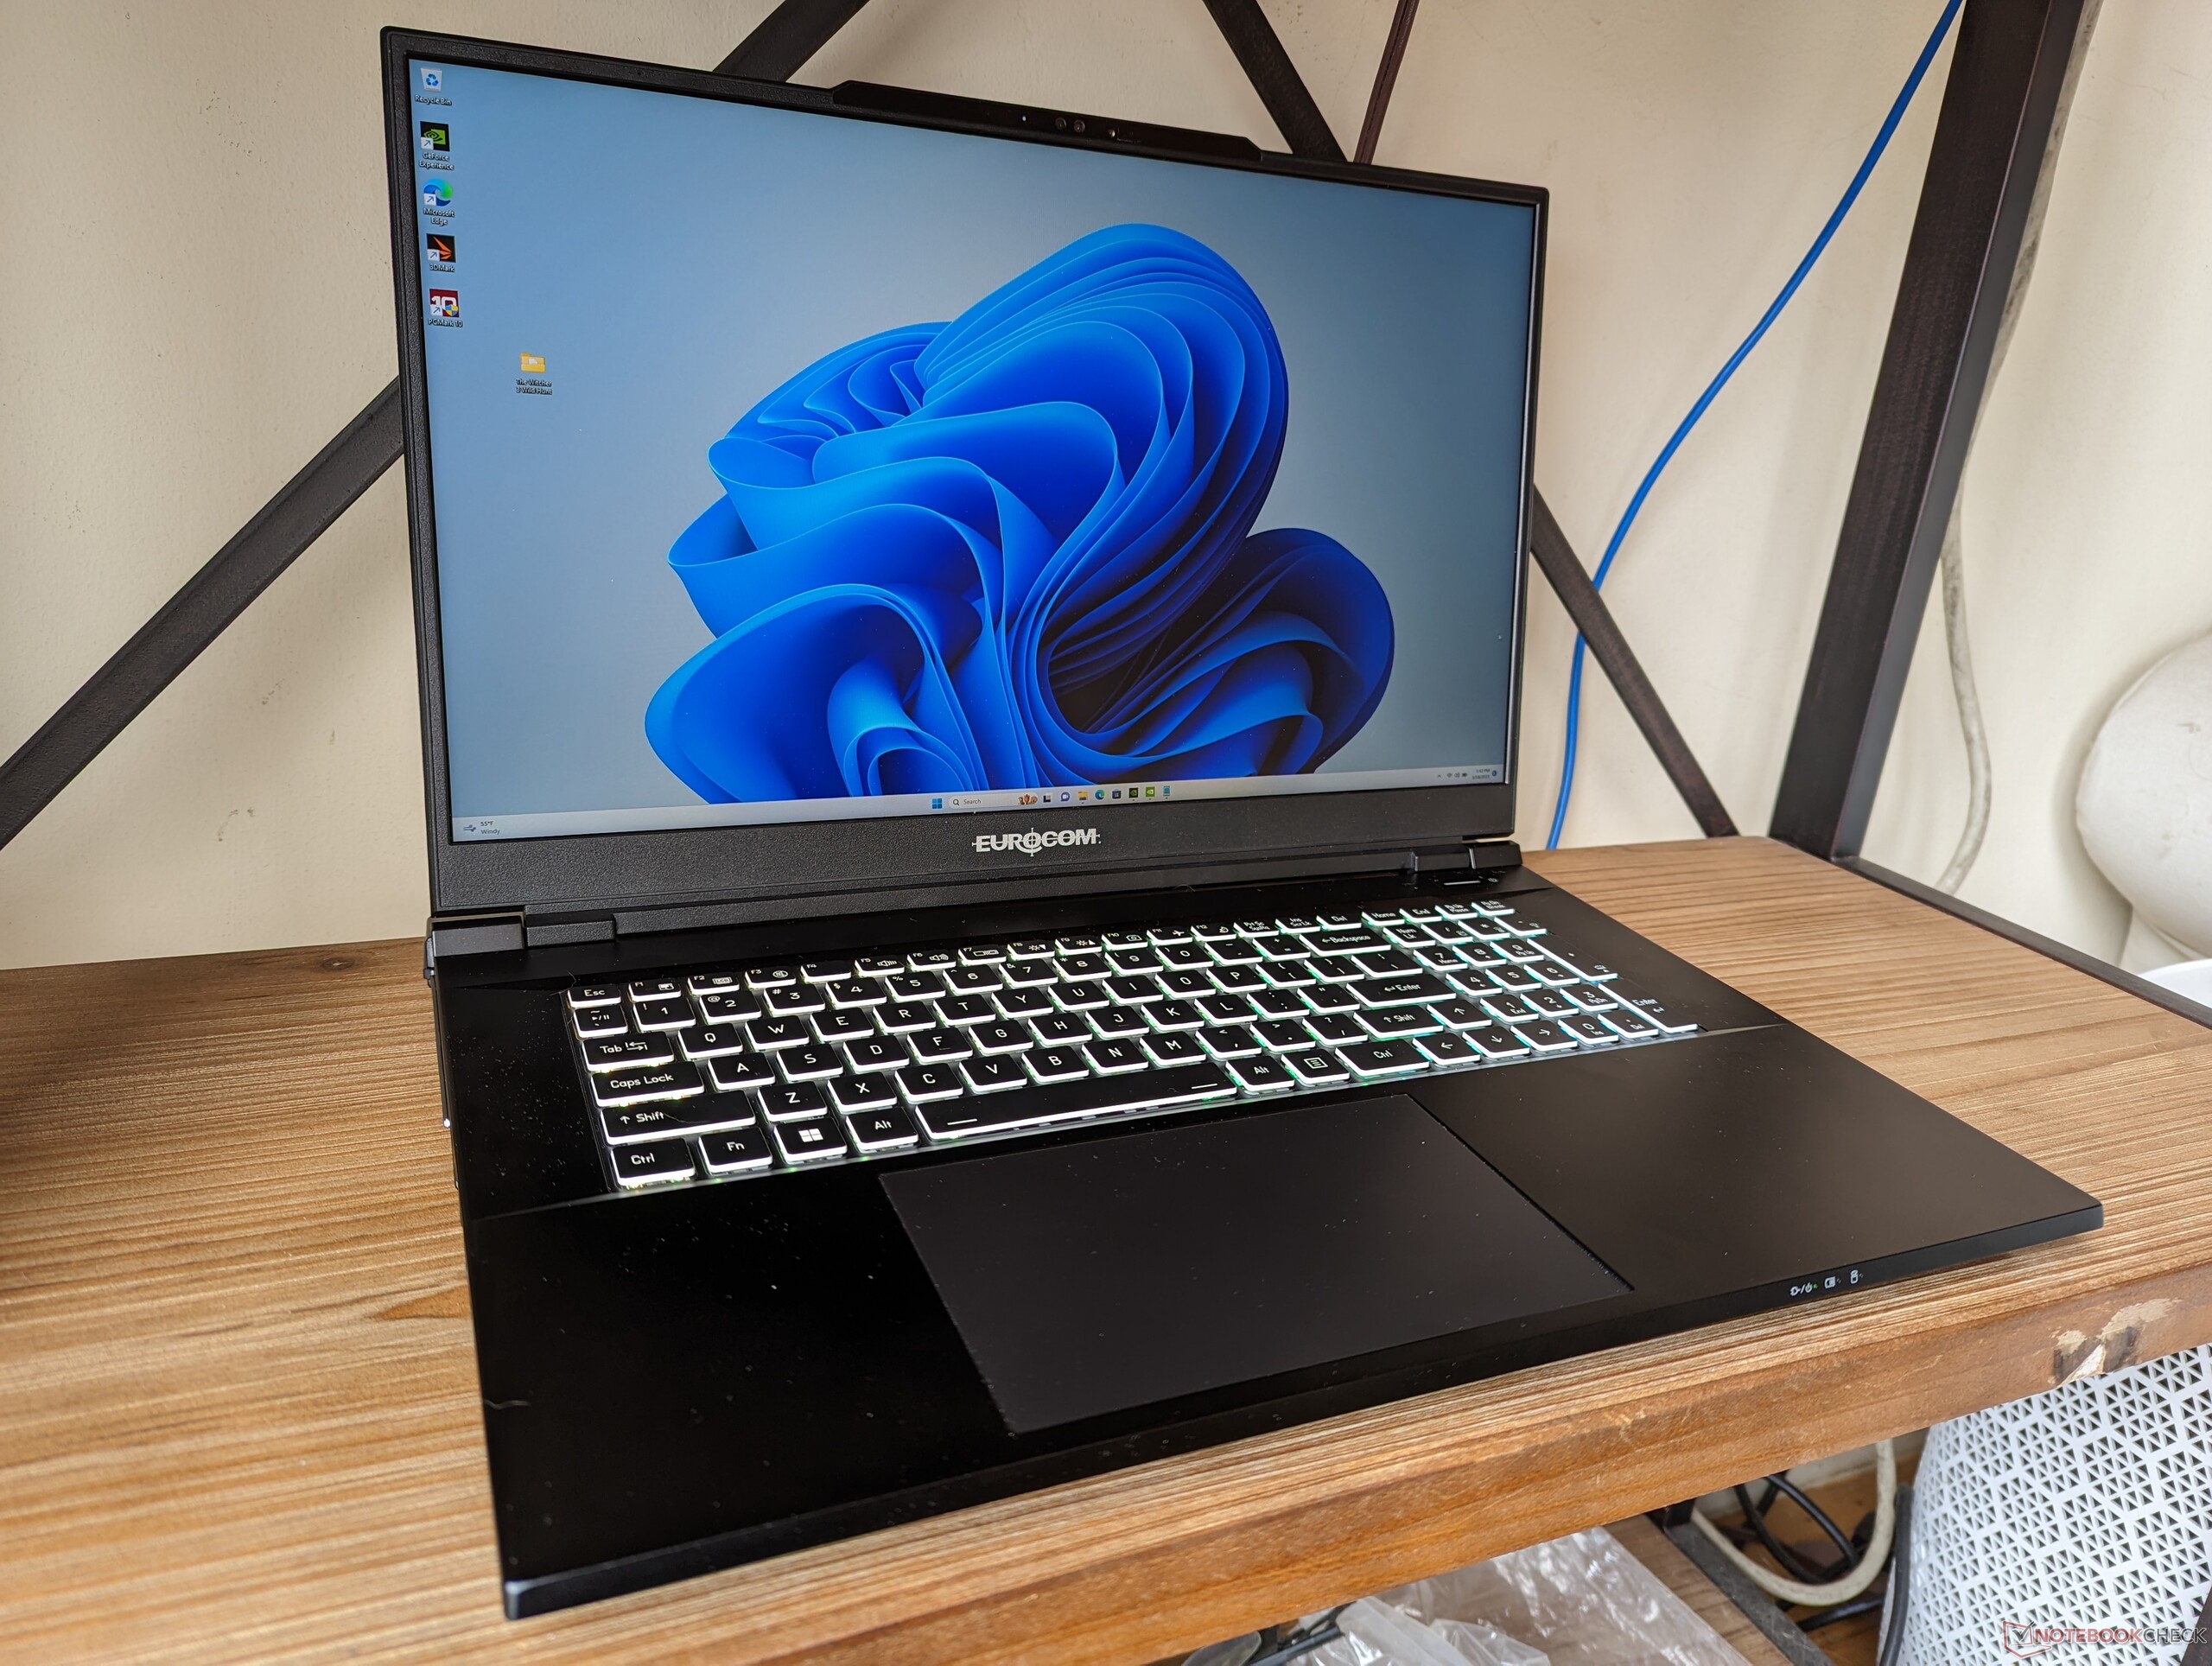
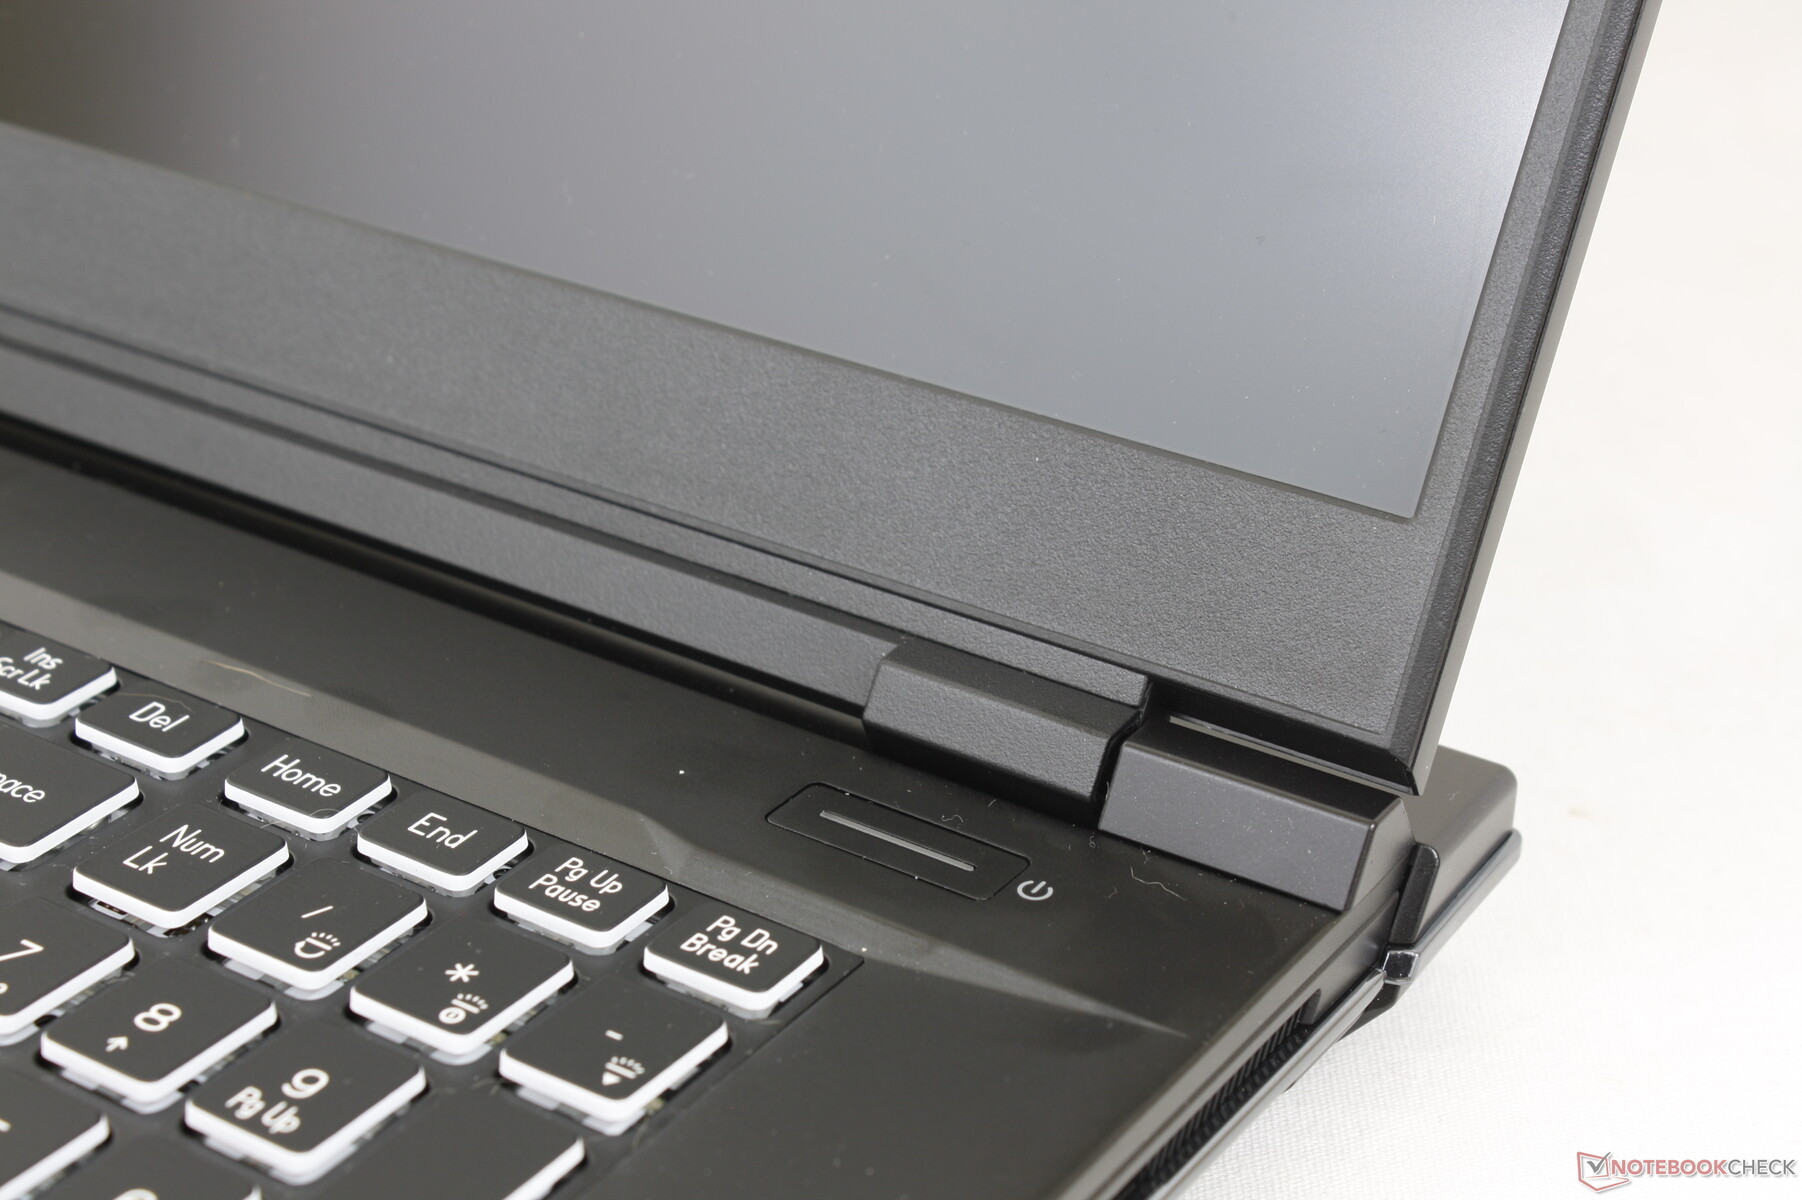
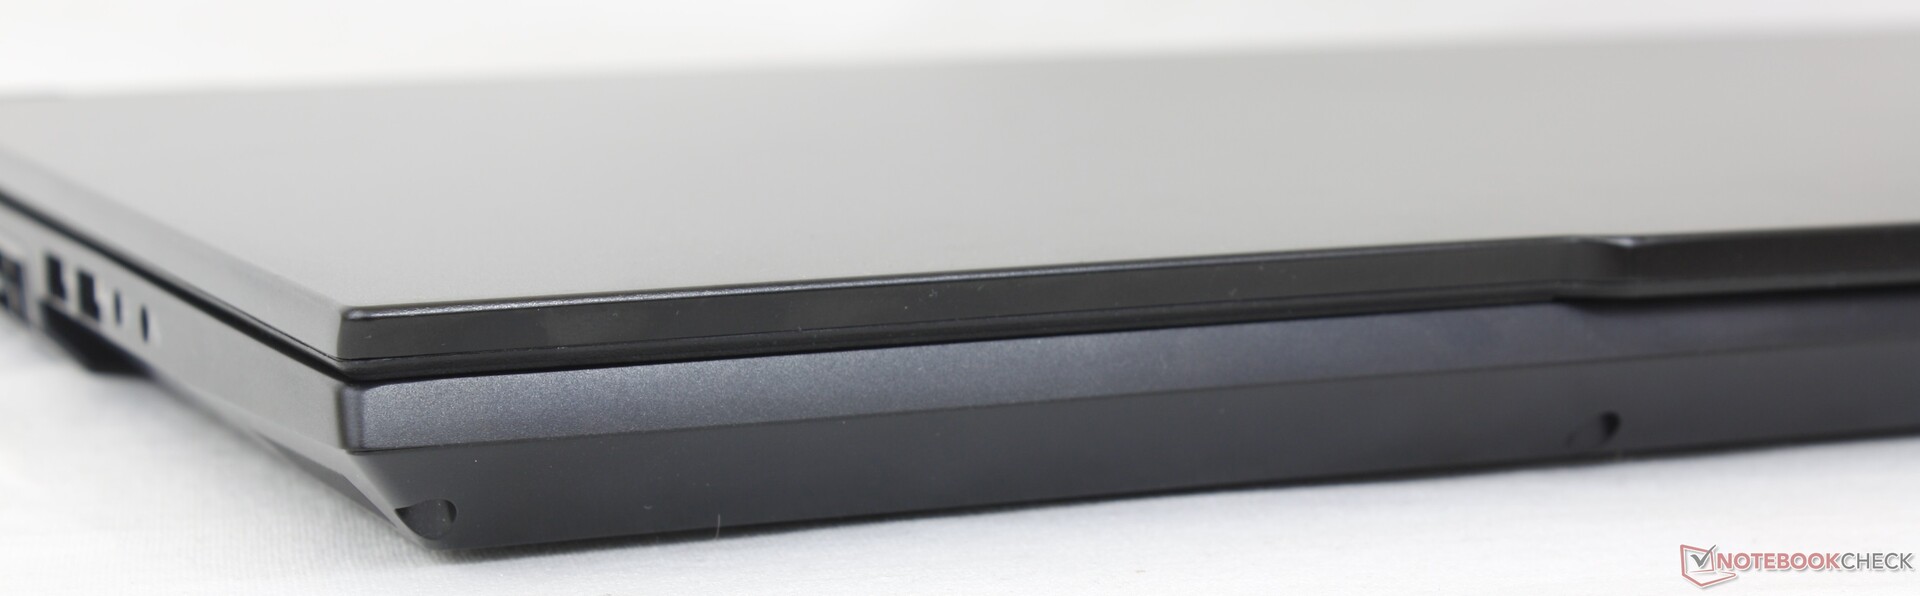
El Raptor X17 es probablemente el portátil más elegante que hemos visto de Eurocom. El esqueleto súper liso y mayoritariamente metálico contrasta fuertemente con los diseños más antiguos y gruesos de ABS de la misma compañía. La rigidez del chasis también es excelente, con una flexión mínima a lo largo de la base y la tapa exterior para una primera impresión sólida.
Quizás el aspecto más débil del chasis sea la bisagra, ya que la pantalla se tambalea un poco más agresivamente al ajustar los ángulos en comparación con las bisagras más rígidas y grandes de un Portátil Asus ROG. El centro del teclado también se flexiona ligeramente al aplicar presión con un dedo, lo que afecta negativamente a la respuesta de las teclas al escribir. Esperemos que cualquier rediseño futuro pueda abordar estas preocupaciones.
Con 3,5 kg, el Raptor X17 es uno de los portátiles para juegos más pesados de su categoría, superando incluso a los 3,4 kg del Alienware m17 R5. En particular, el sistema es ligeramente más pequeño que el ROG Strix Scar 17 G733 y, sin embargo, es un 20 por ciento más pesado para una sensación muy densa. Para algo significativamente más ligero y más pequeño, los usuarios pueden considerar el Razer Blade 17 en su lugar.
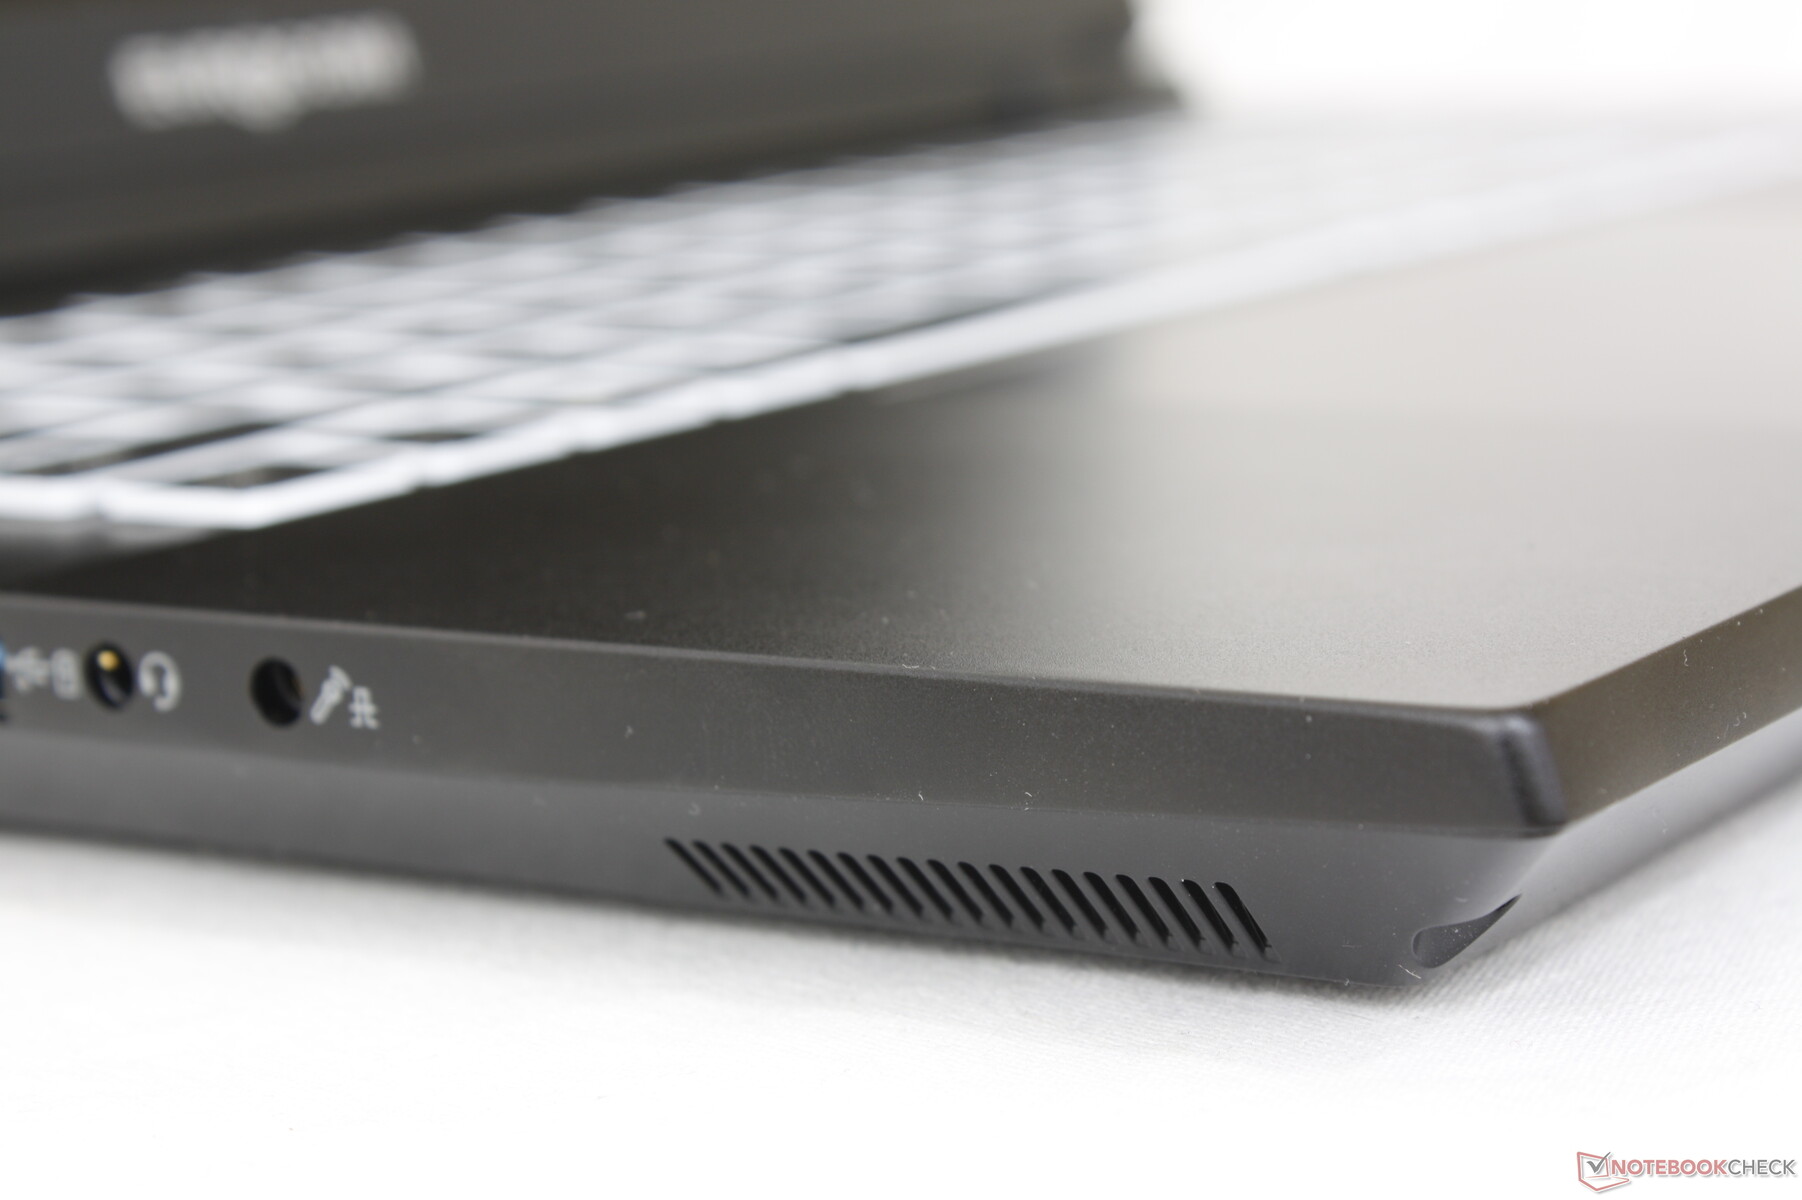
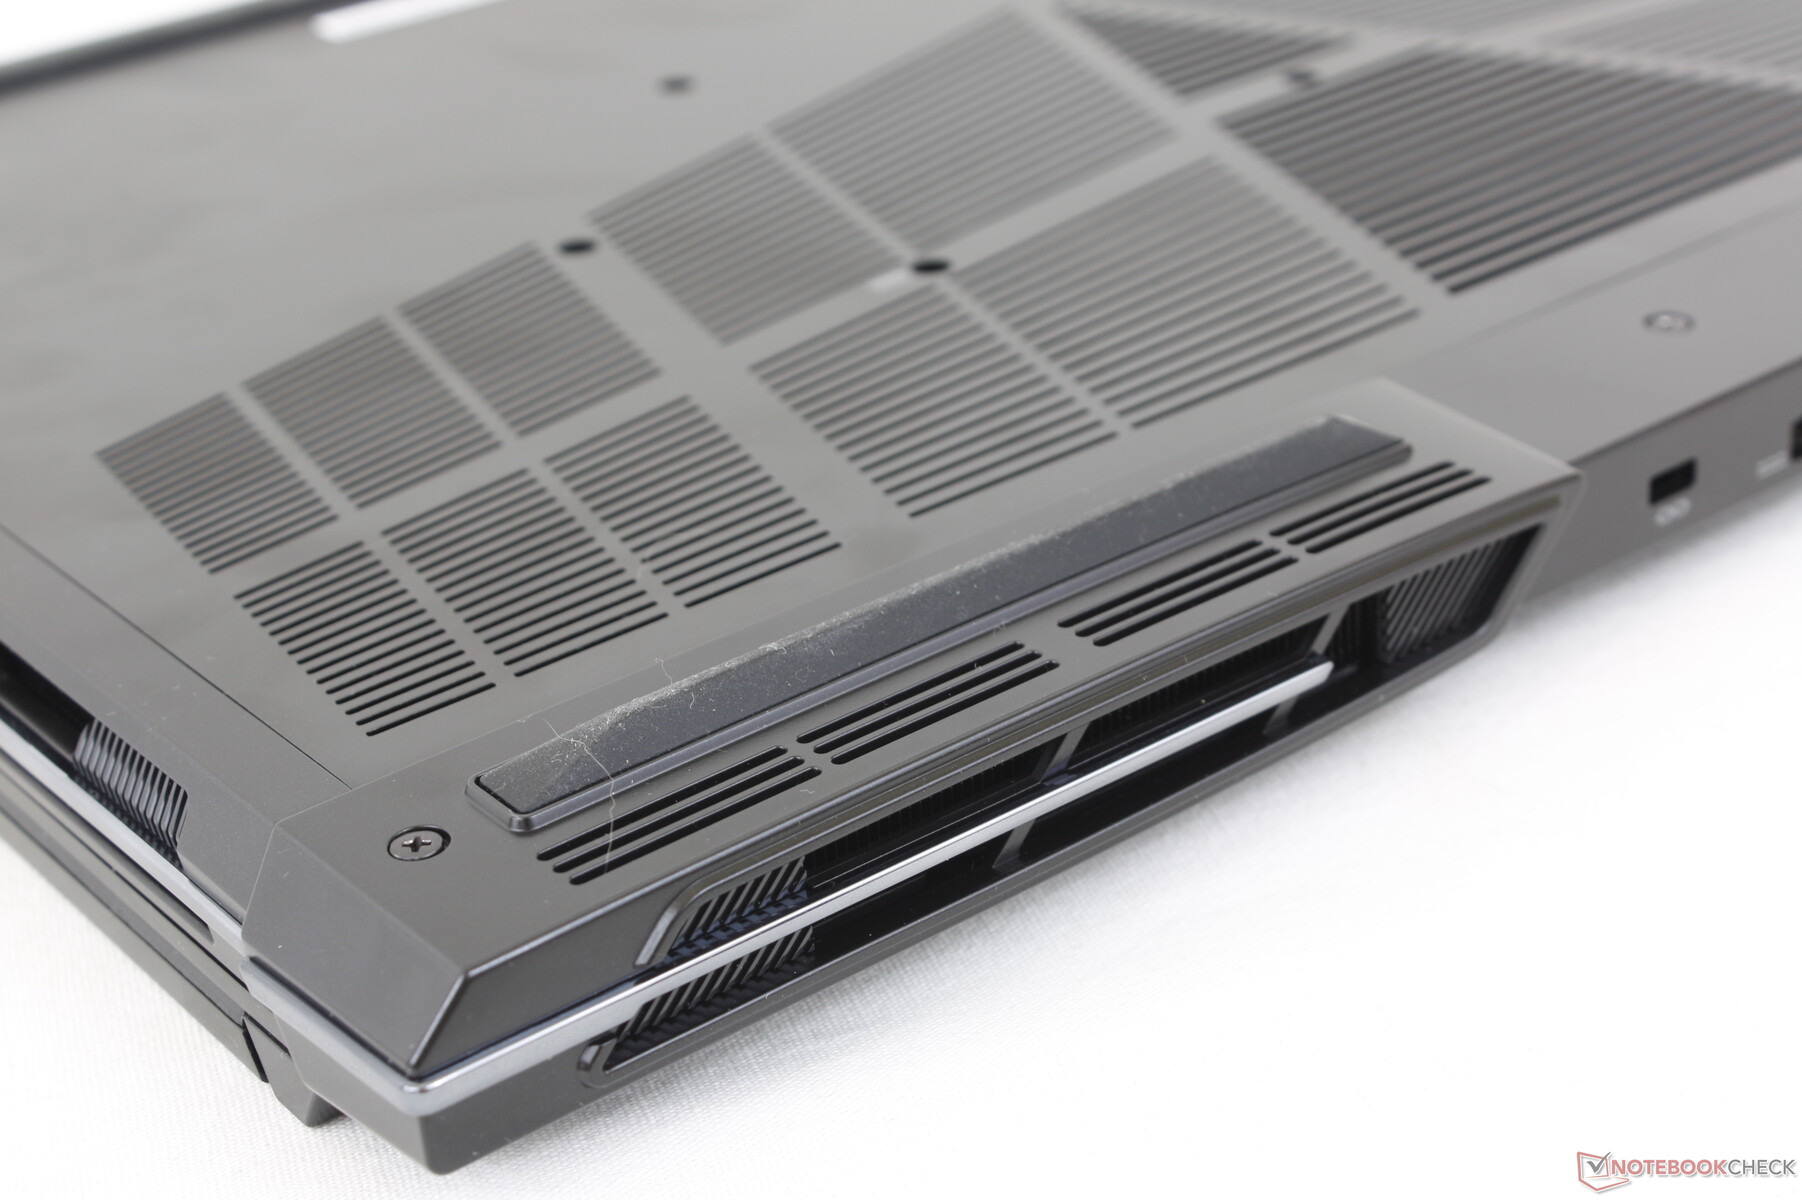
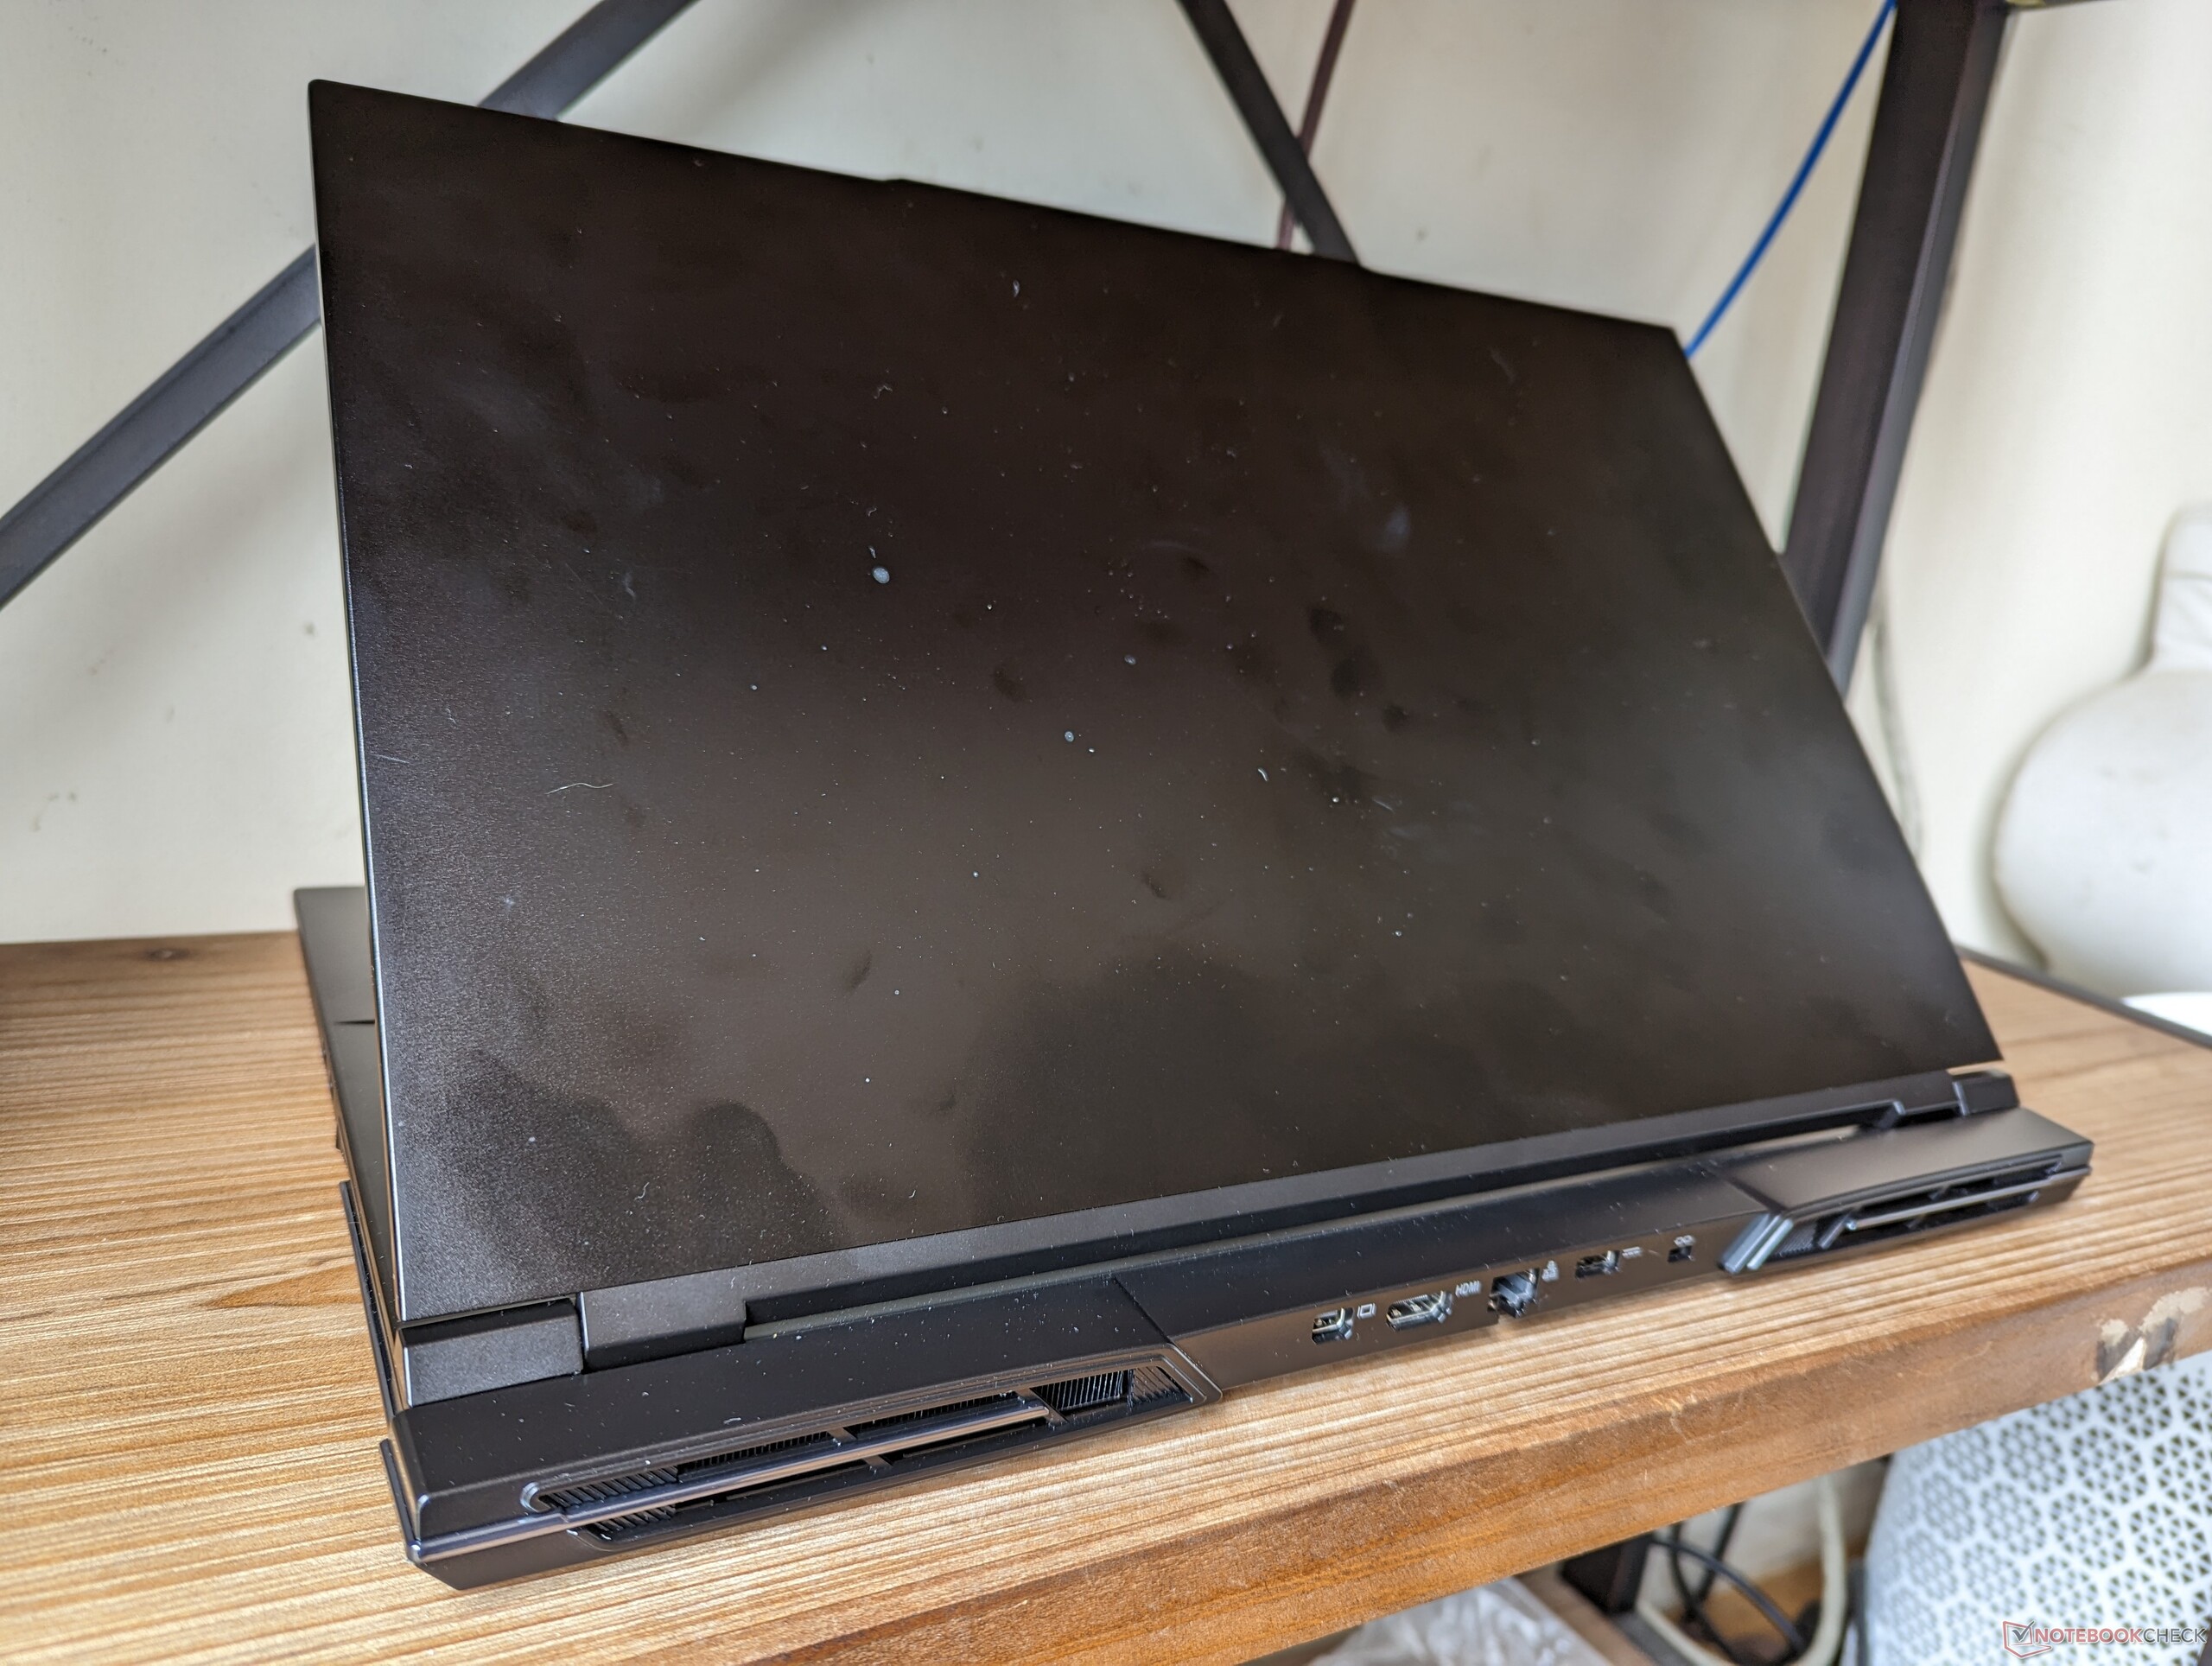
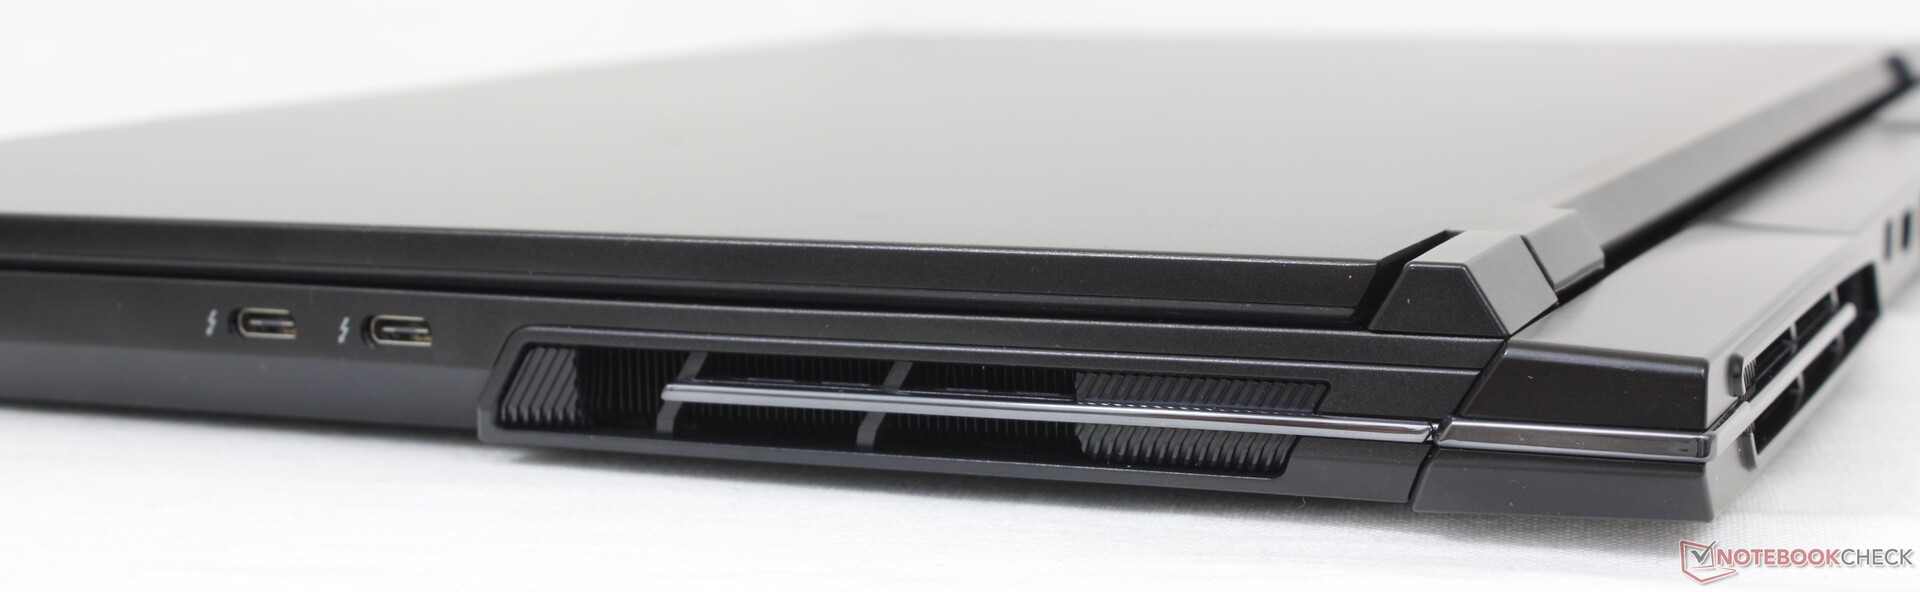
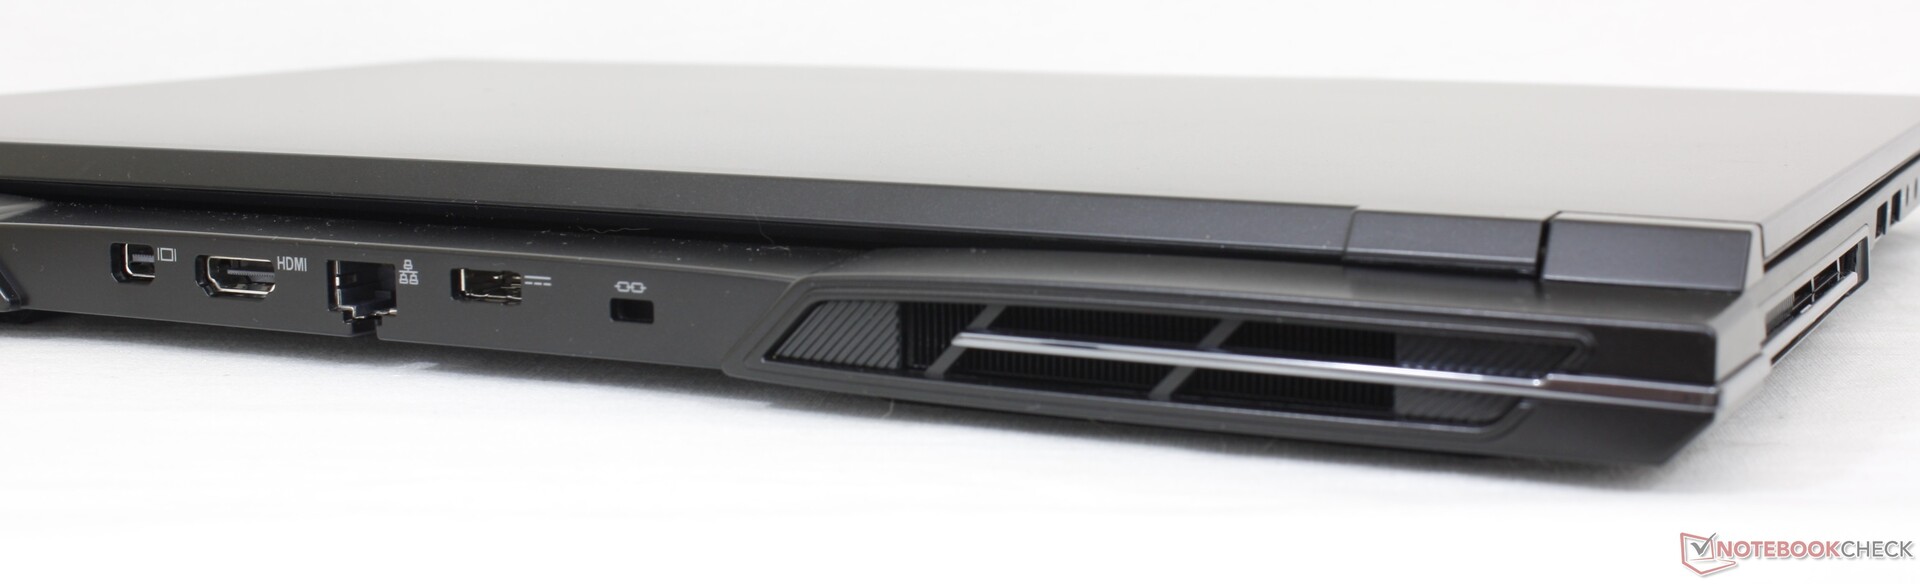
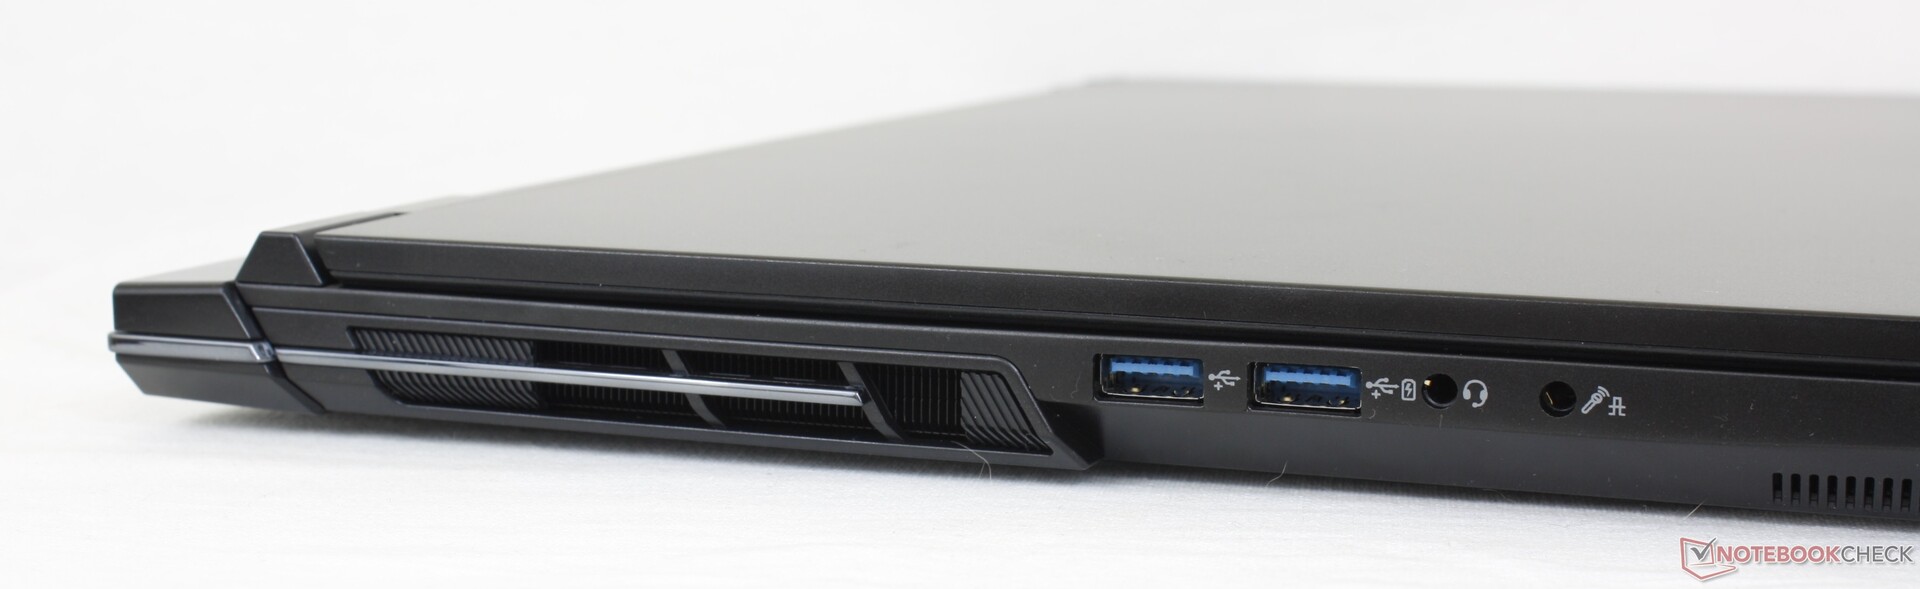
Conectividad: un poco de todo
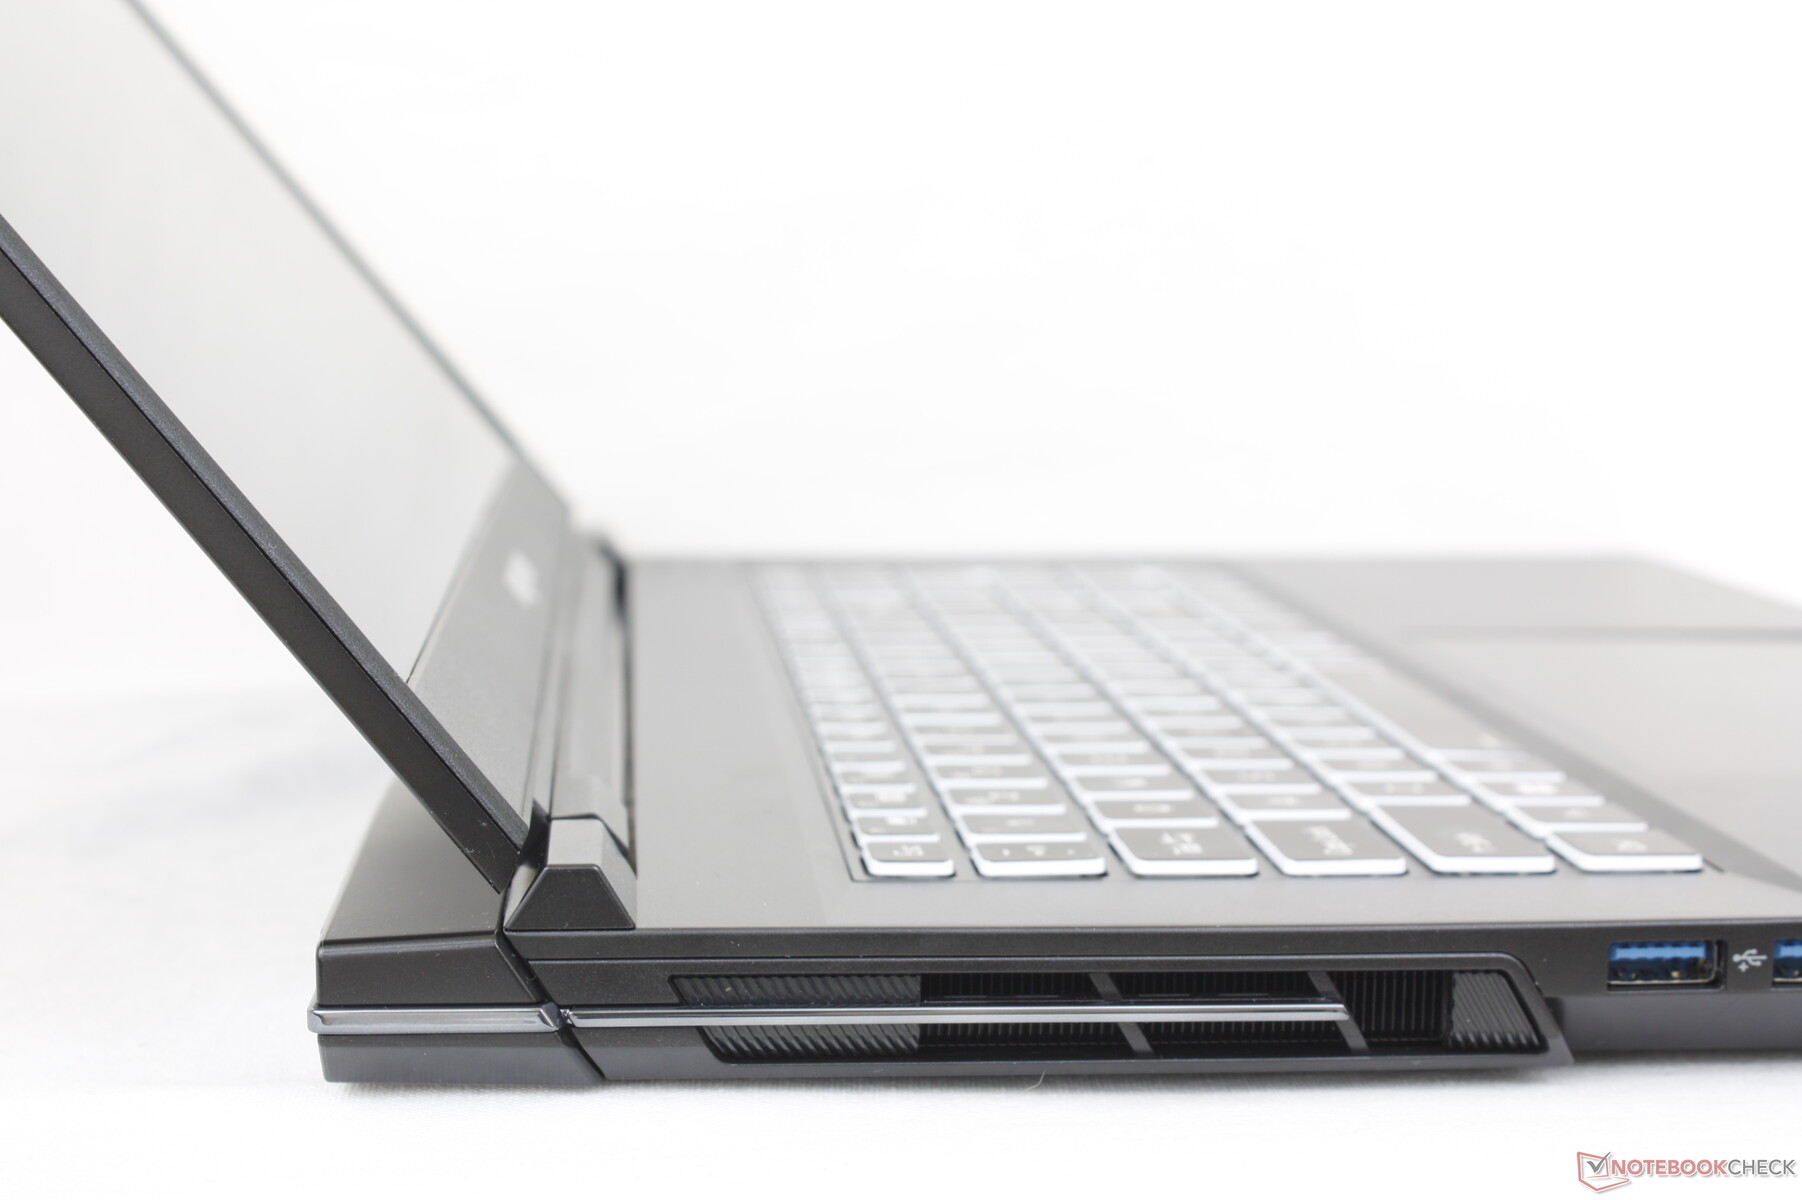
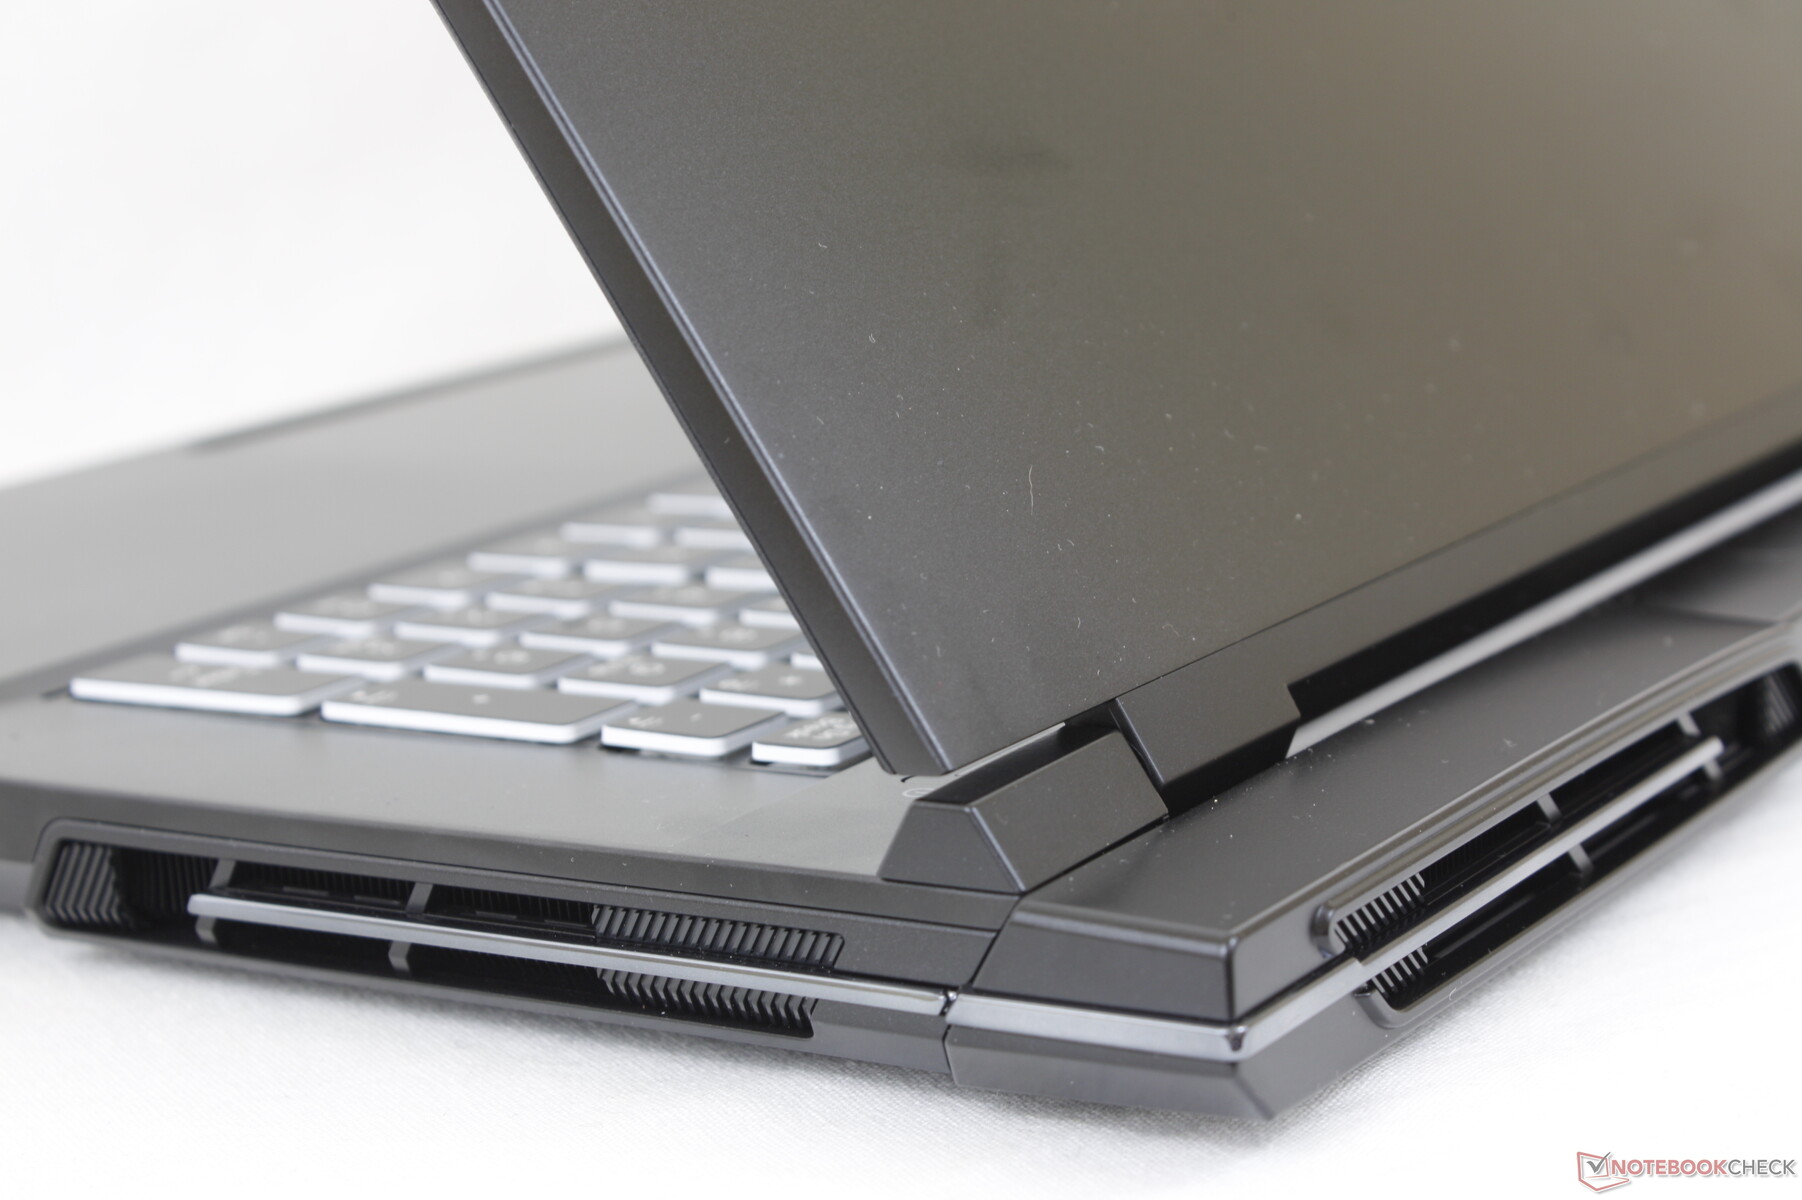
Las opciones de puertos son más variadas que en la mayoría de portátiles de 17 pulgadas para juegos. Por ejemplo, no es habitual encontrar un modelo que integre tanto mini DisplayPort como RJ-45. Todos los puertos USB están a lo largo de los laterales del chasis, mientras que la parte trasera alberga casi todo lo demás.
Comunicación
| Networking | |
| iperf3 transmit AXE11000 | |
| Aorus 17X AZF | |
| Eluktronics Mech-17 GP2 | |
| MSI GE78HX 13VH-070US | |
| Eurocom Raptor X17 | |
| Alienware m17 R5 (R9 6900HX, RX 6850M XT) | |
| Asus ROG Strix Scar 17 G733PY-XS96 | |
| iperf3 receive AXE11000 | |
| Aorus 17X AZF | |
| Eluktronics Mech-17 GP2 | |
| Asus ROG Strix Scar 17 G733PY-XS96 | |
| MSI GE78HX 13VH-070US | |
| Eurocom Raptor X17 | |
| Alienware m17 R5 (R9 6900HX, RX 6850M XT) | |
| iperf3 transmit AXE11000 6GHz | |
| Asus ROG Strix Scar 17 G733PY-XS96 | |
| MSI GE78HX 13VH-070US | |
| Eurocom Raptor X17 | |
| iperf3 receive AXE11000 6GHz | |
| MSI GE78HX 13VH-070US | |
| Asus ROG Strix Scar 17 G733PY-XS96 | |
| Eurocom Raptor X17 | |
Cámara web
La webcam de 2 MP es típica de la mayoría de portátiles de cualquier precio. Al menos incorpora infrarrojos y un obturador electrónico para mayor privacidad. Esperemos que los modelos de la próxima generación integren webcams de 5 MP como en el último Razer Blade 18.

")
")
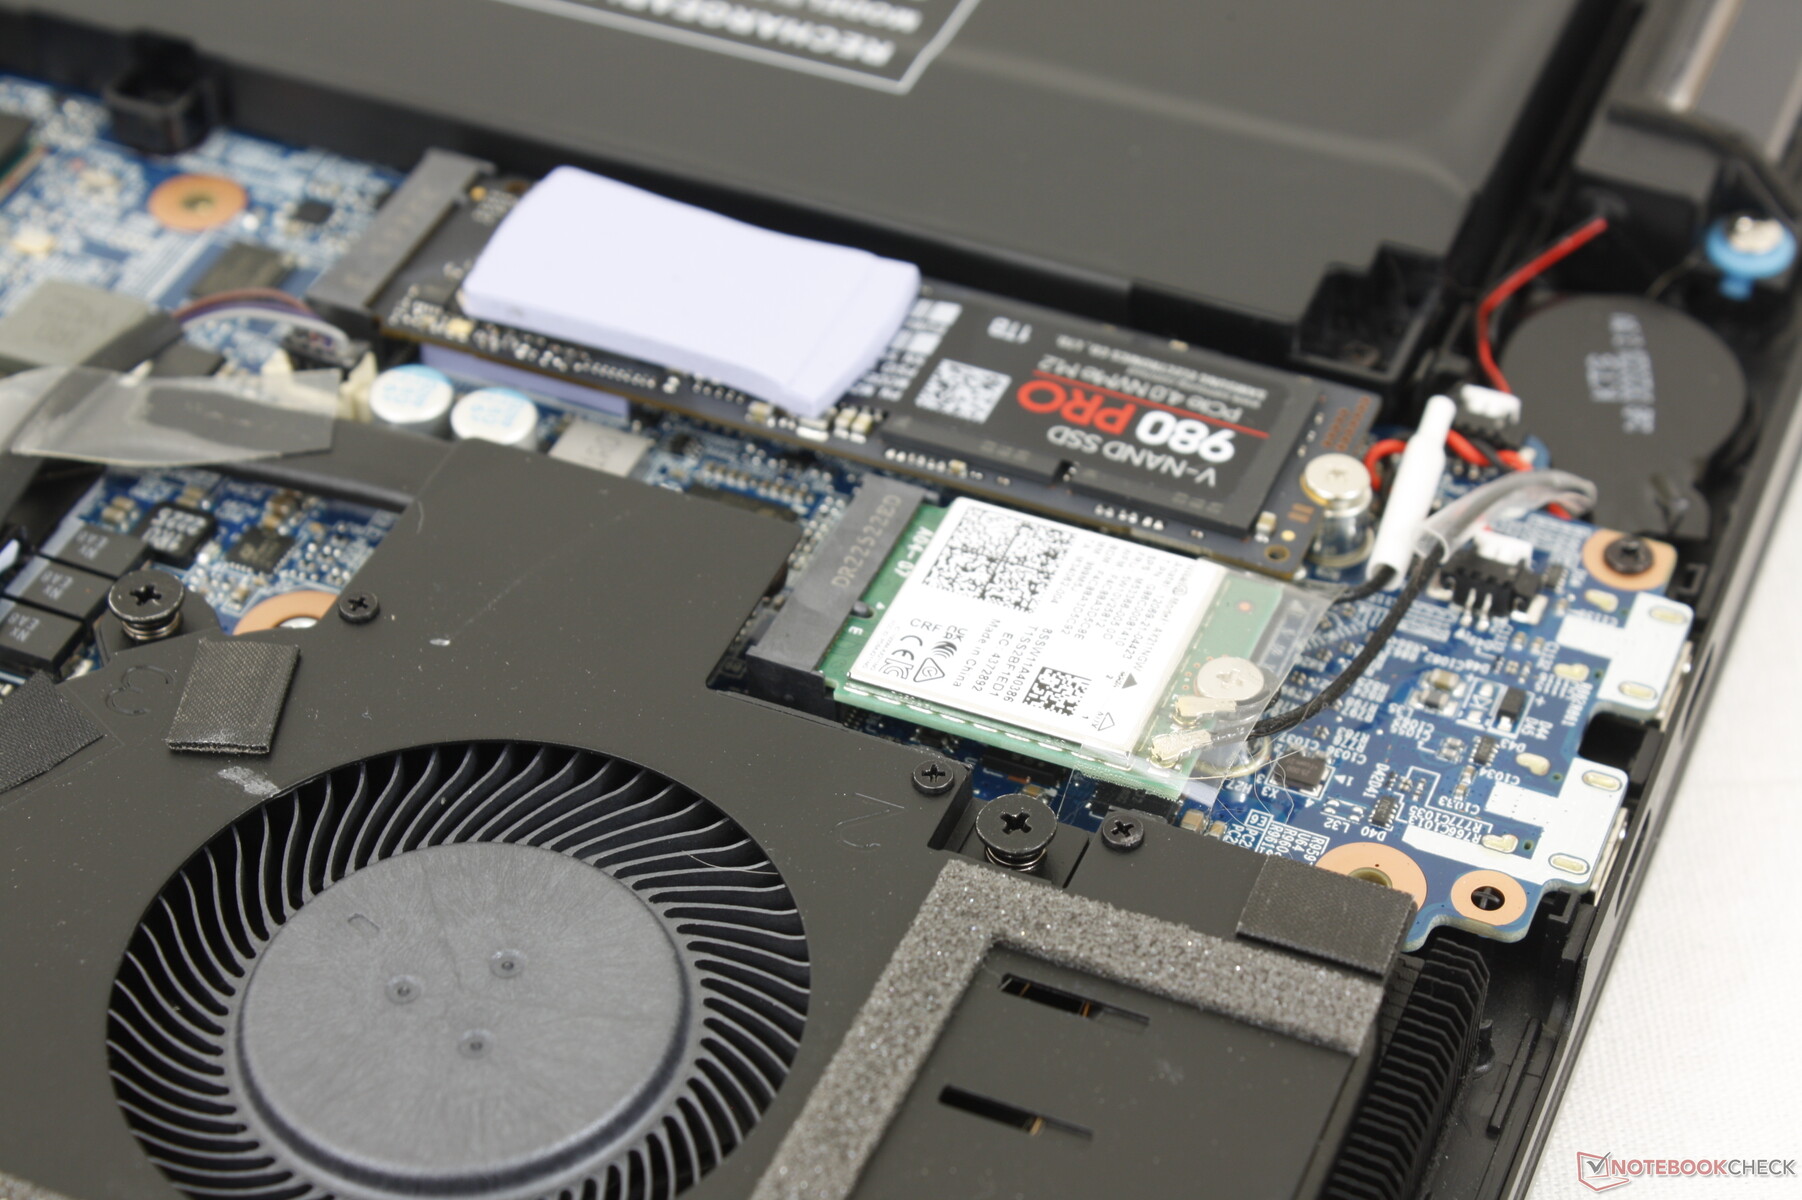
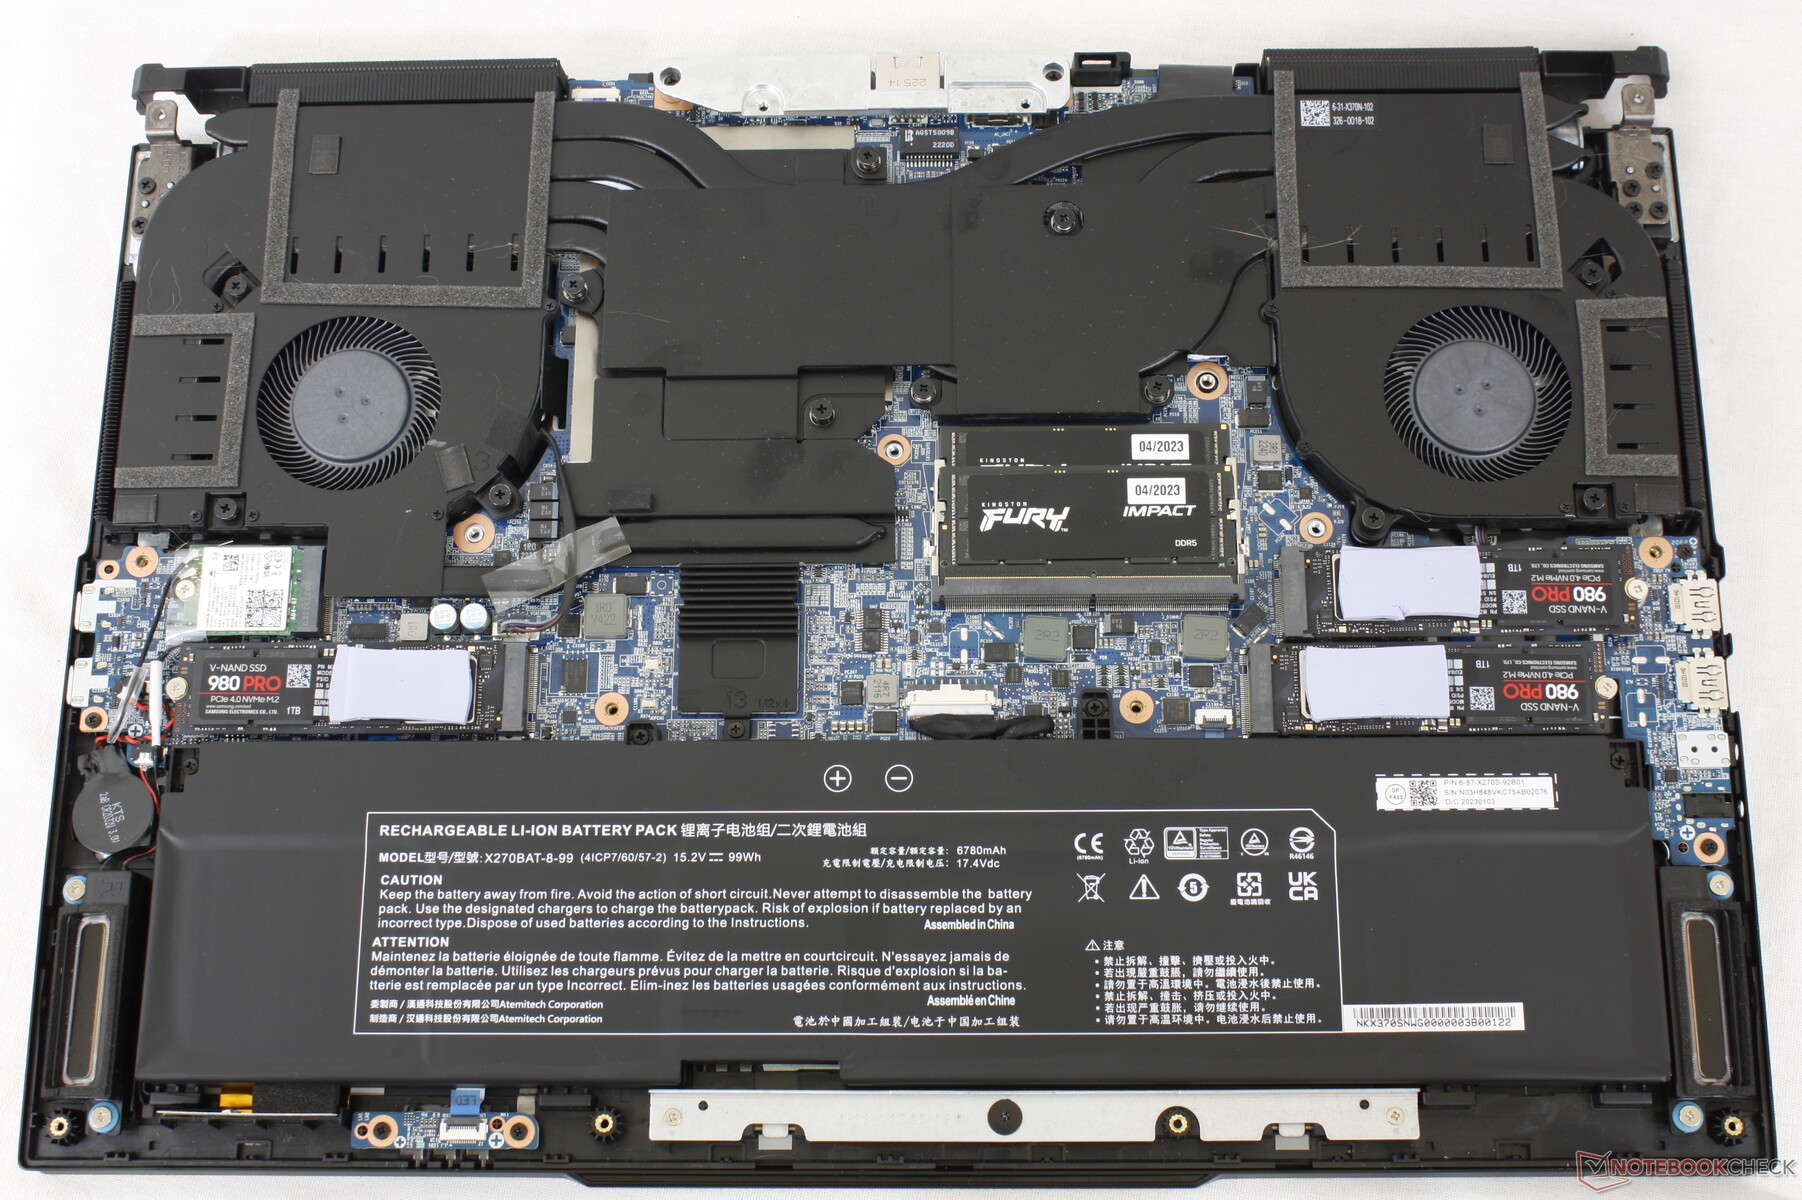
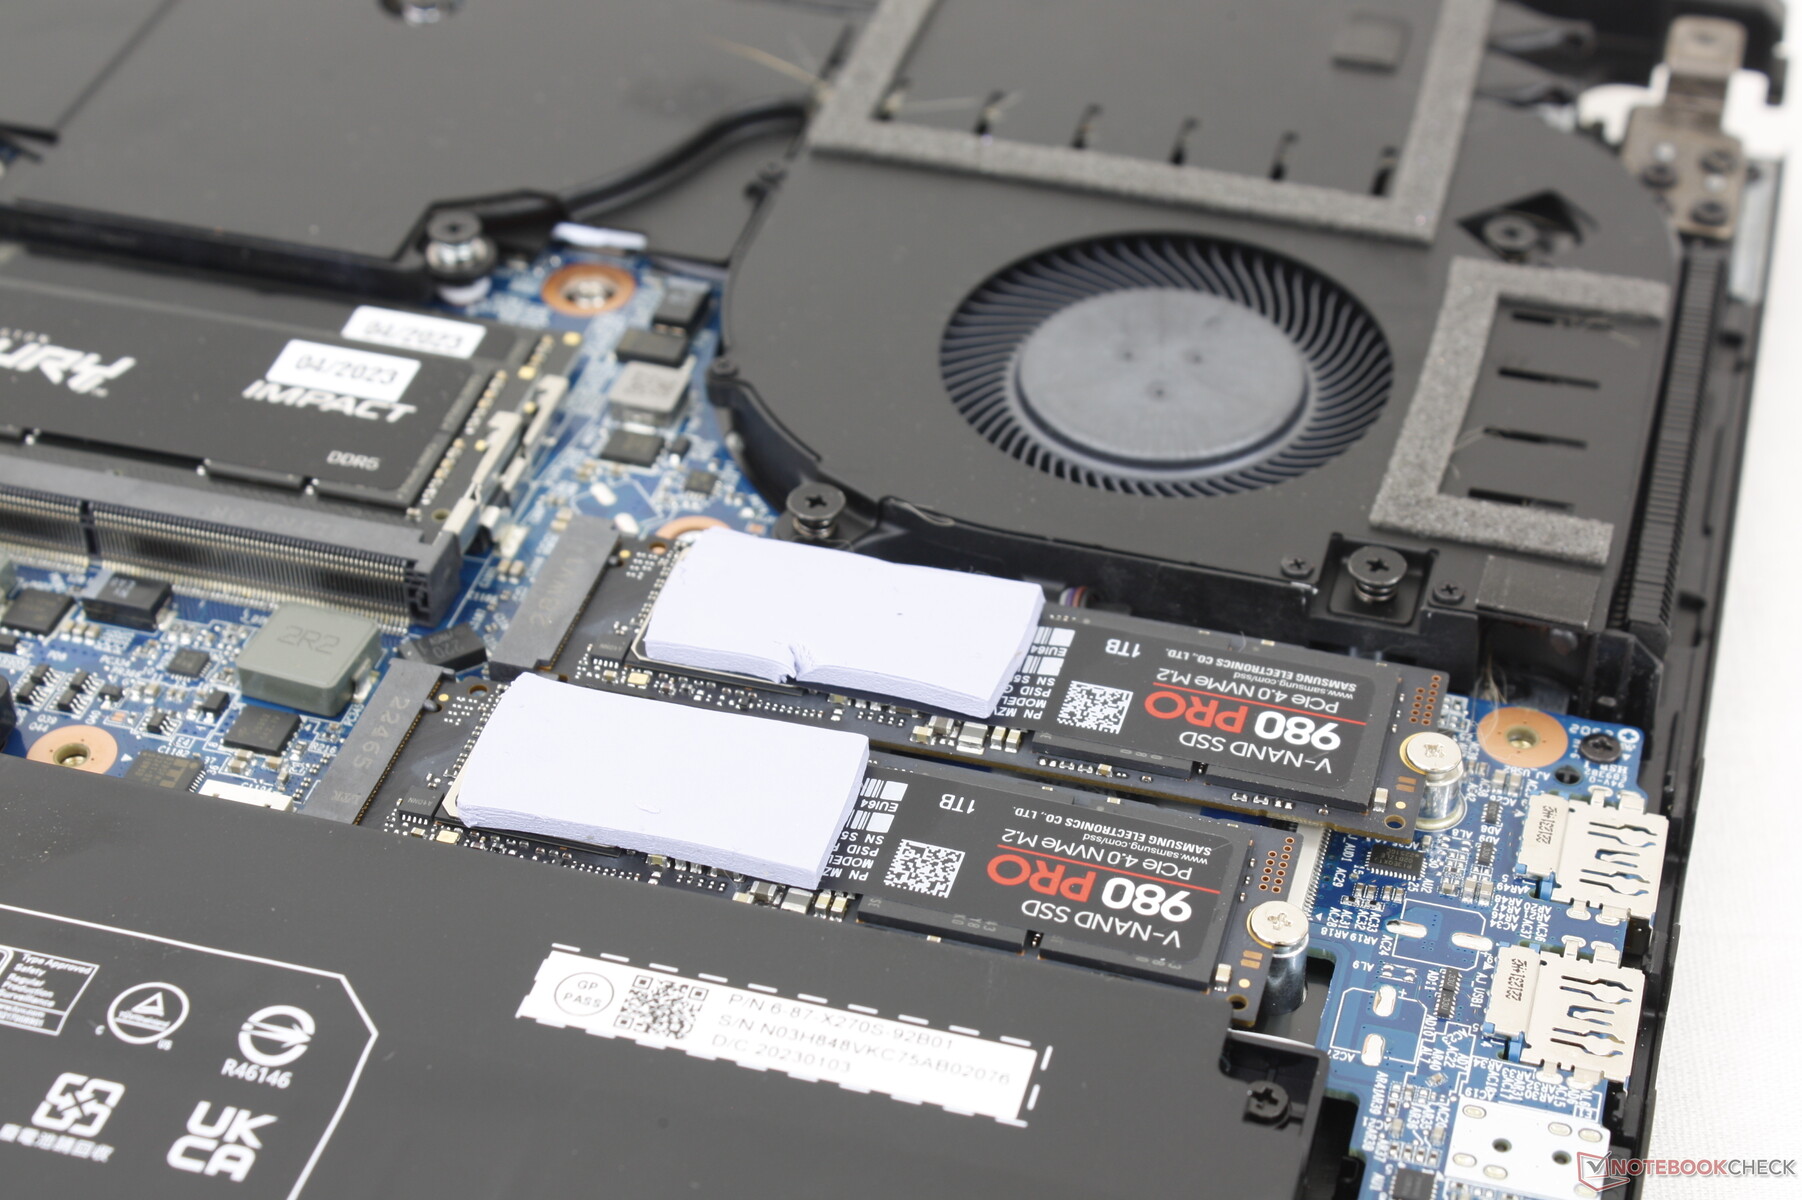
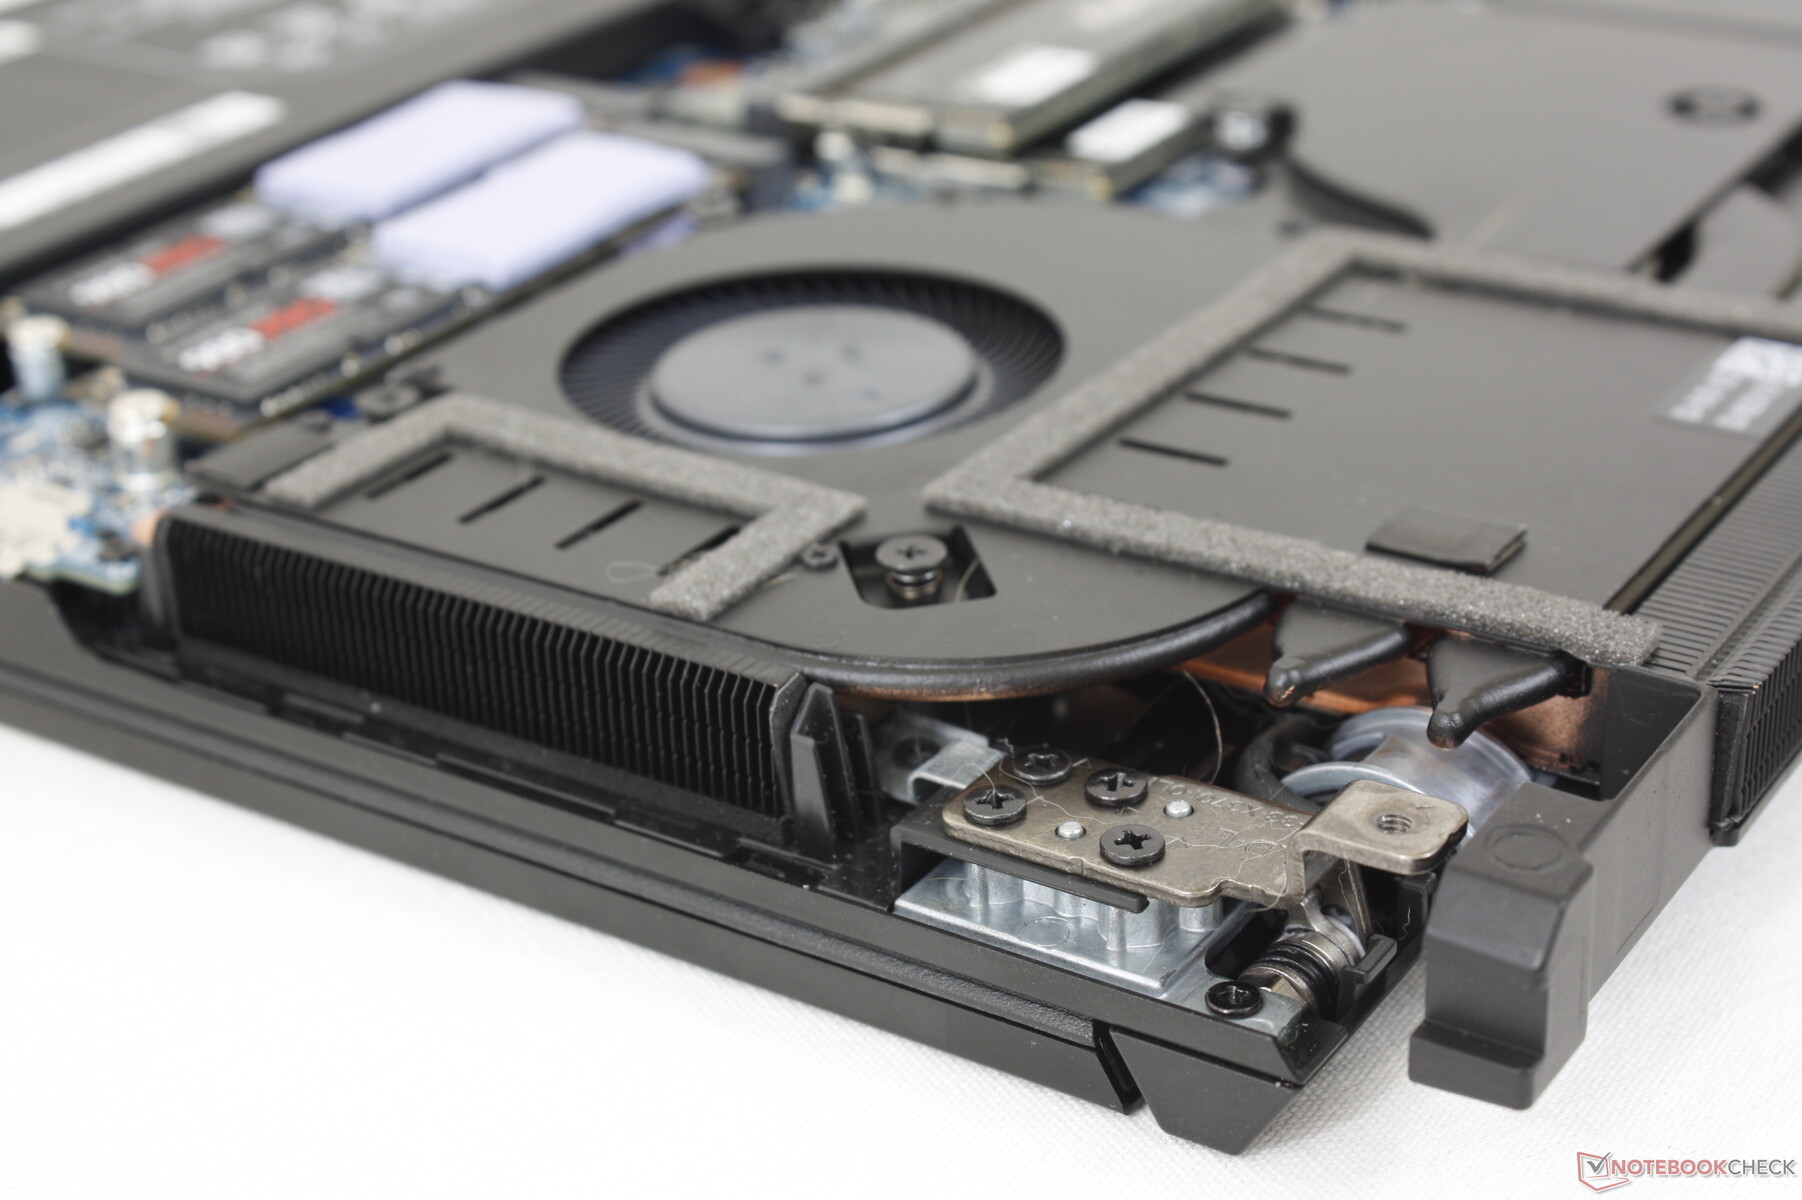
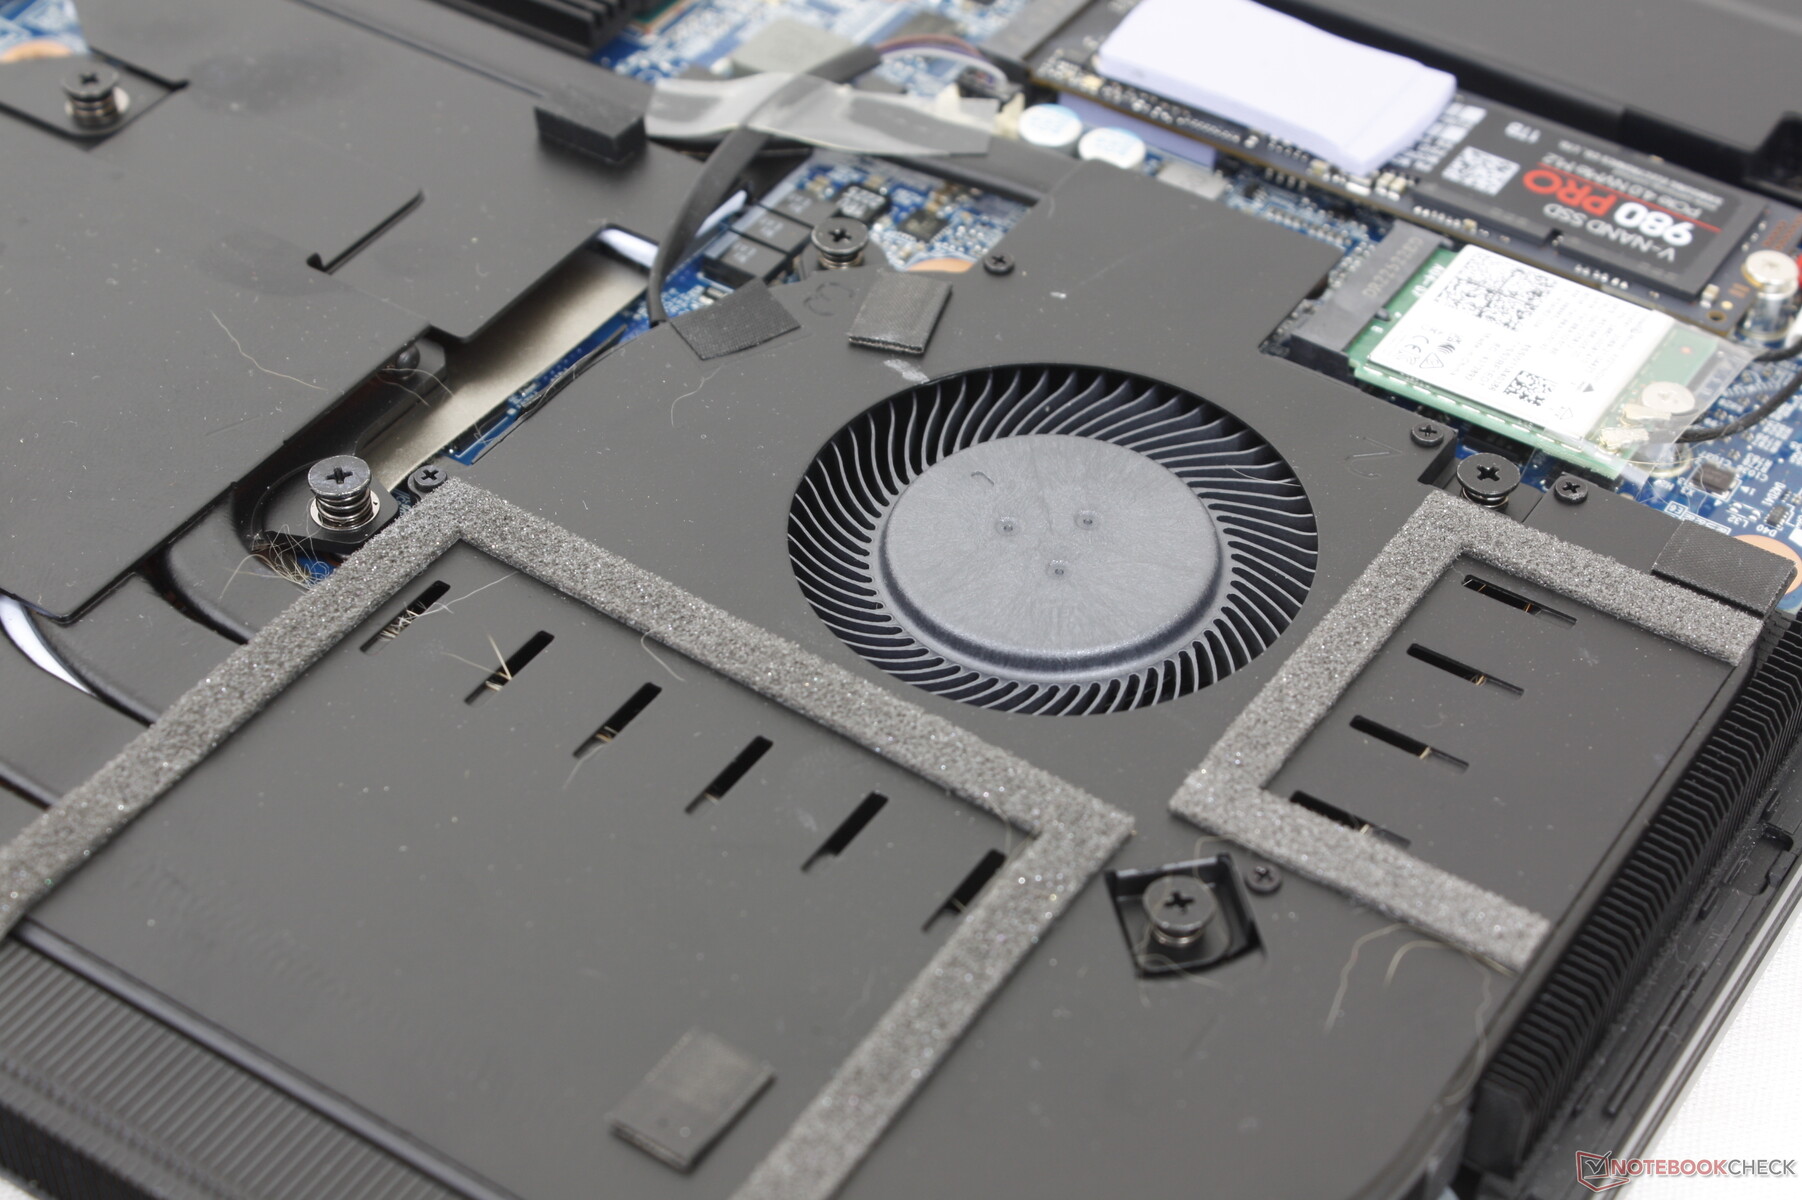
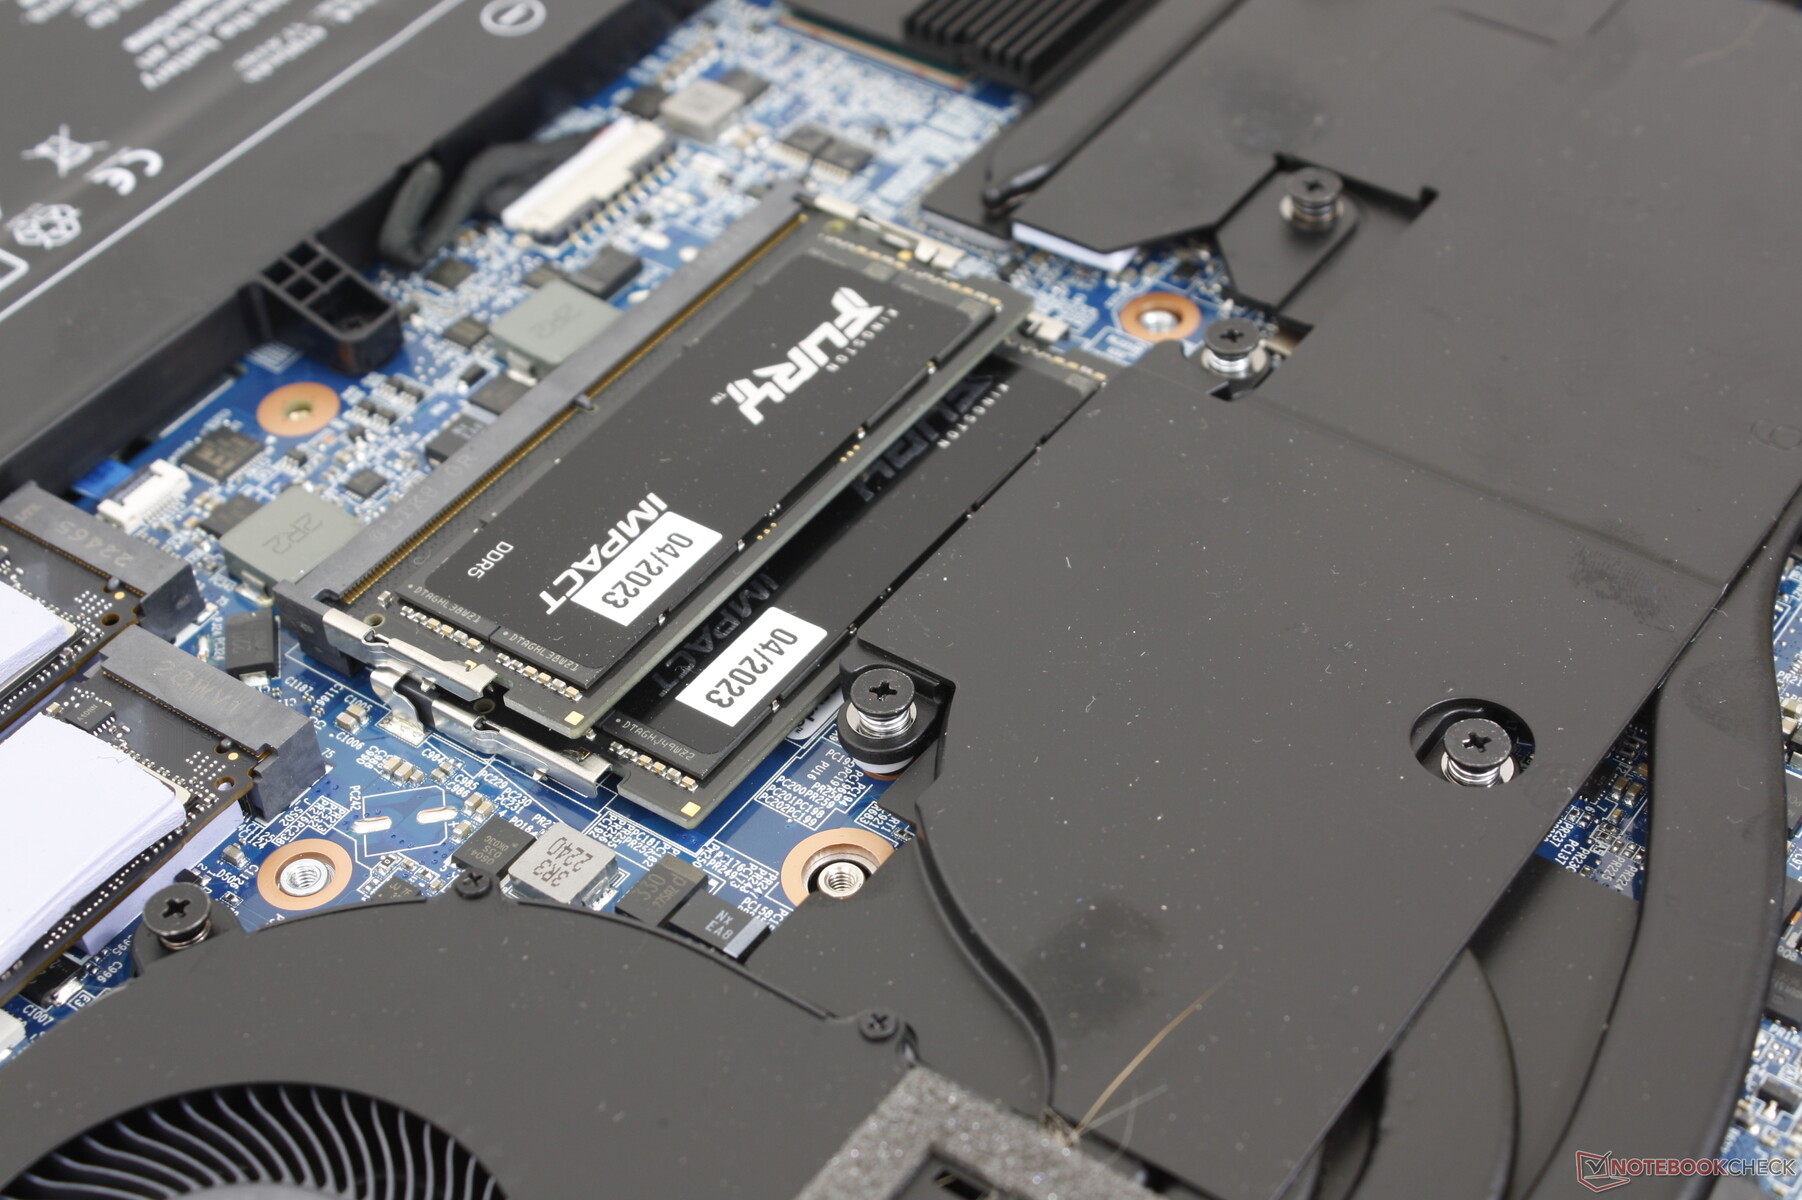
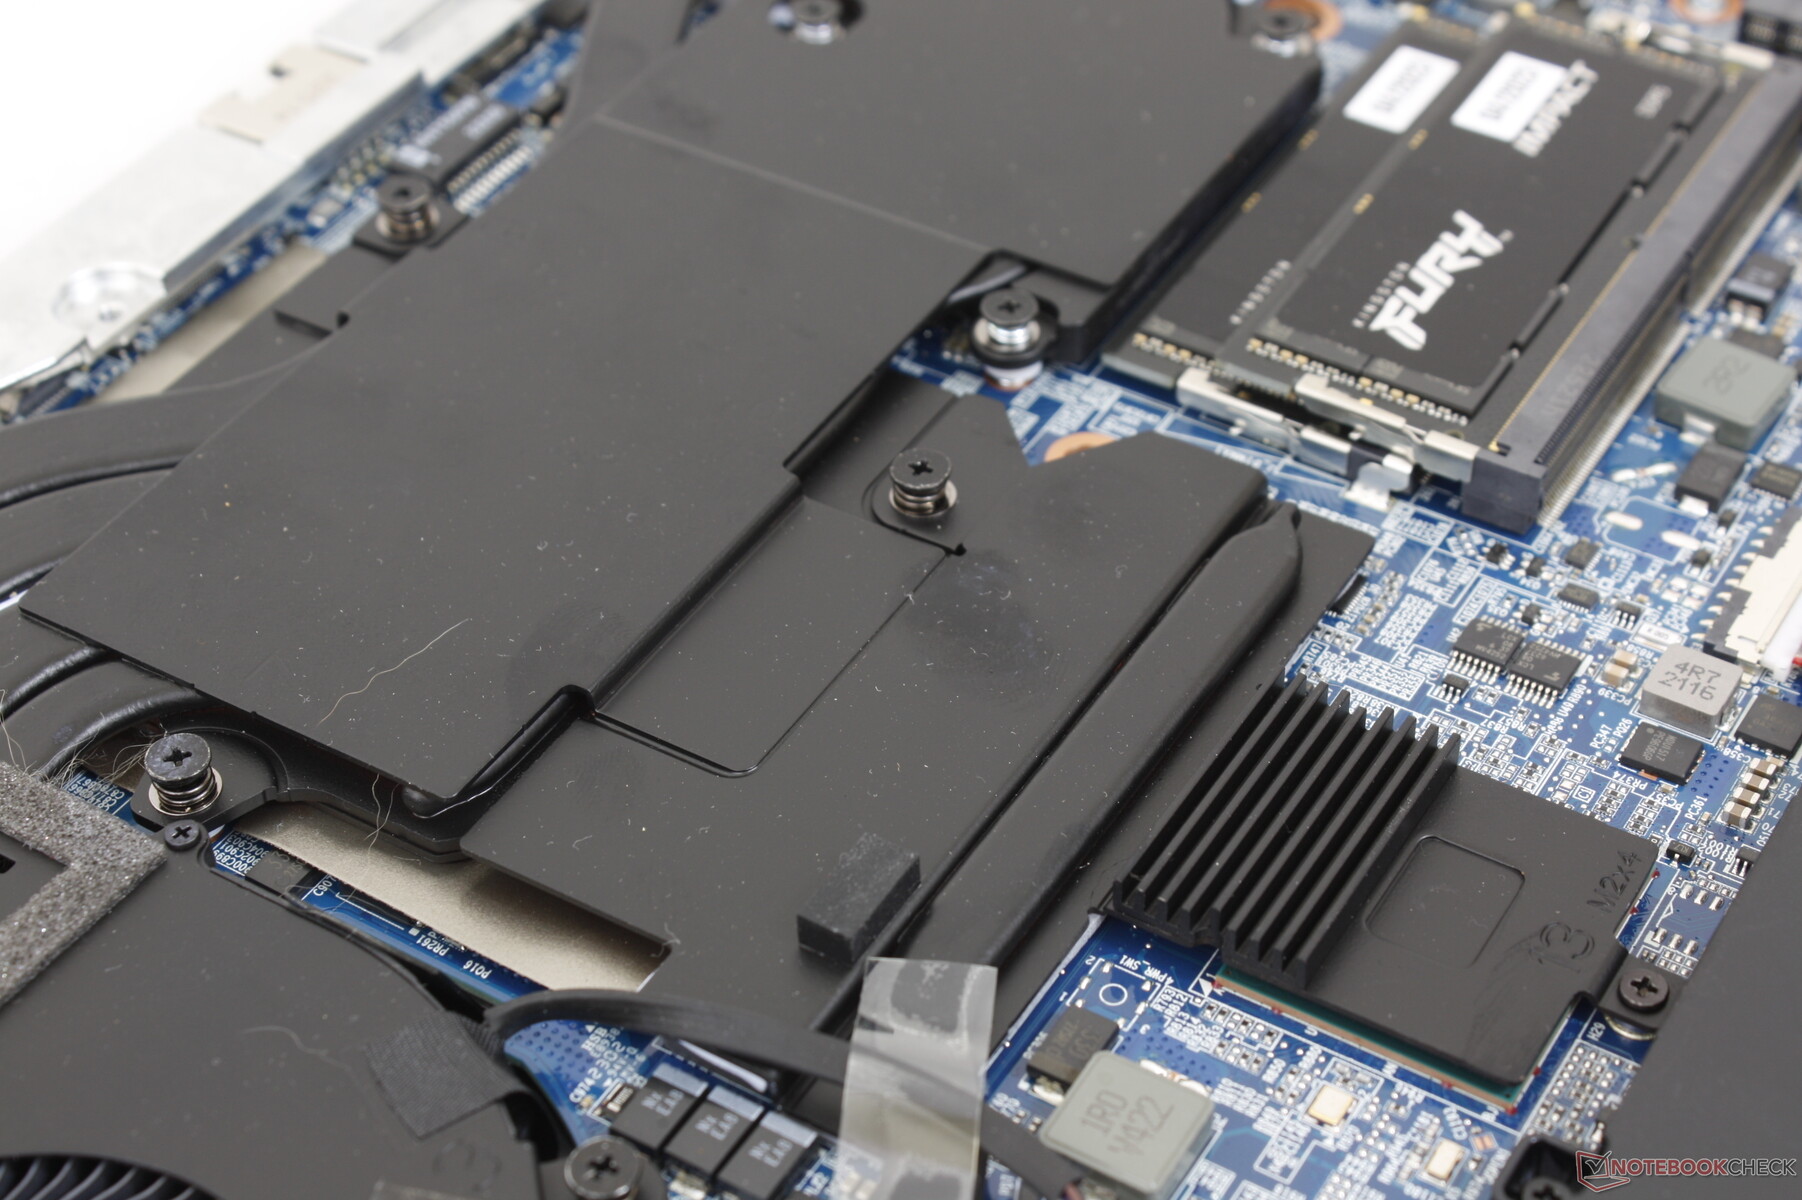
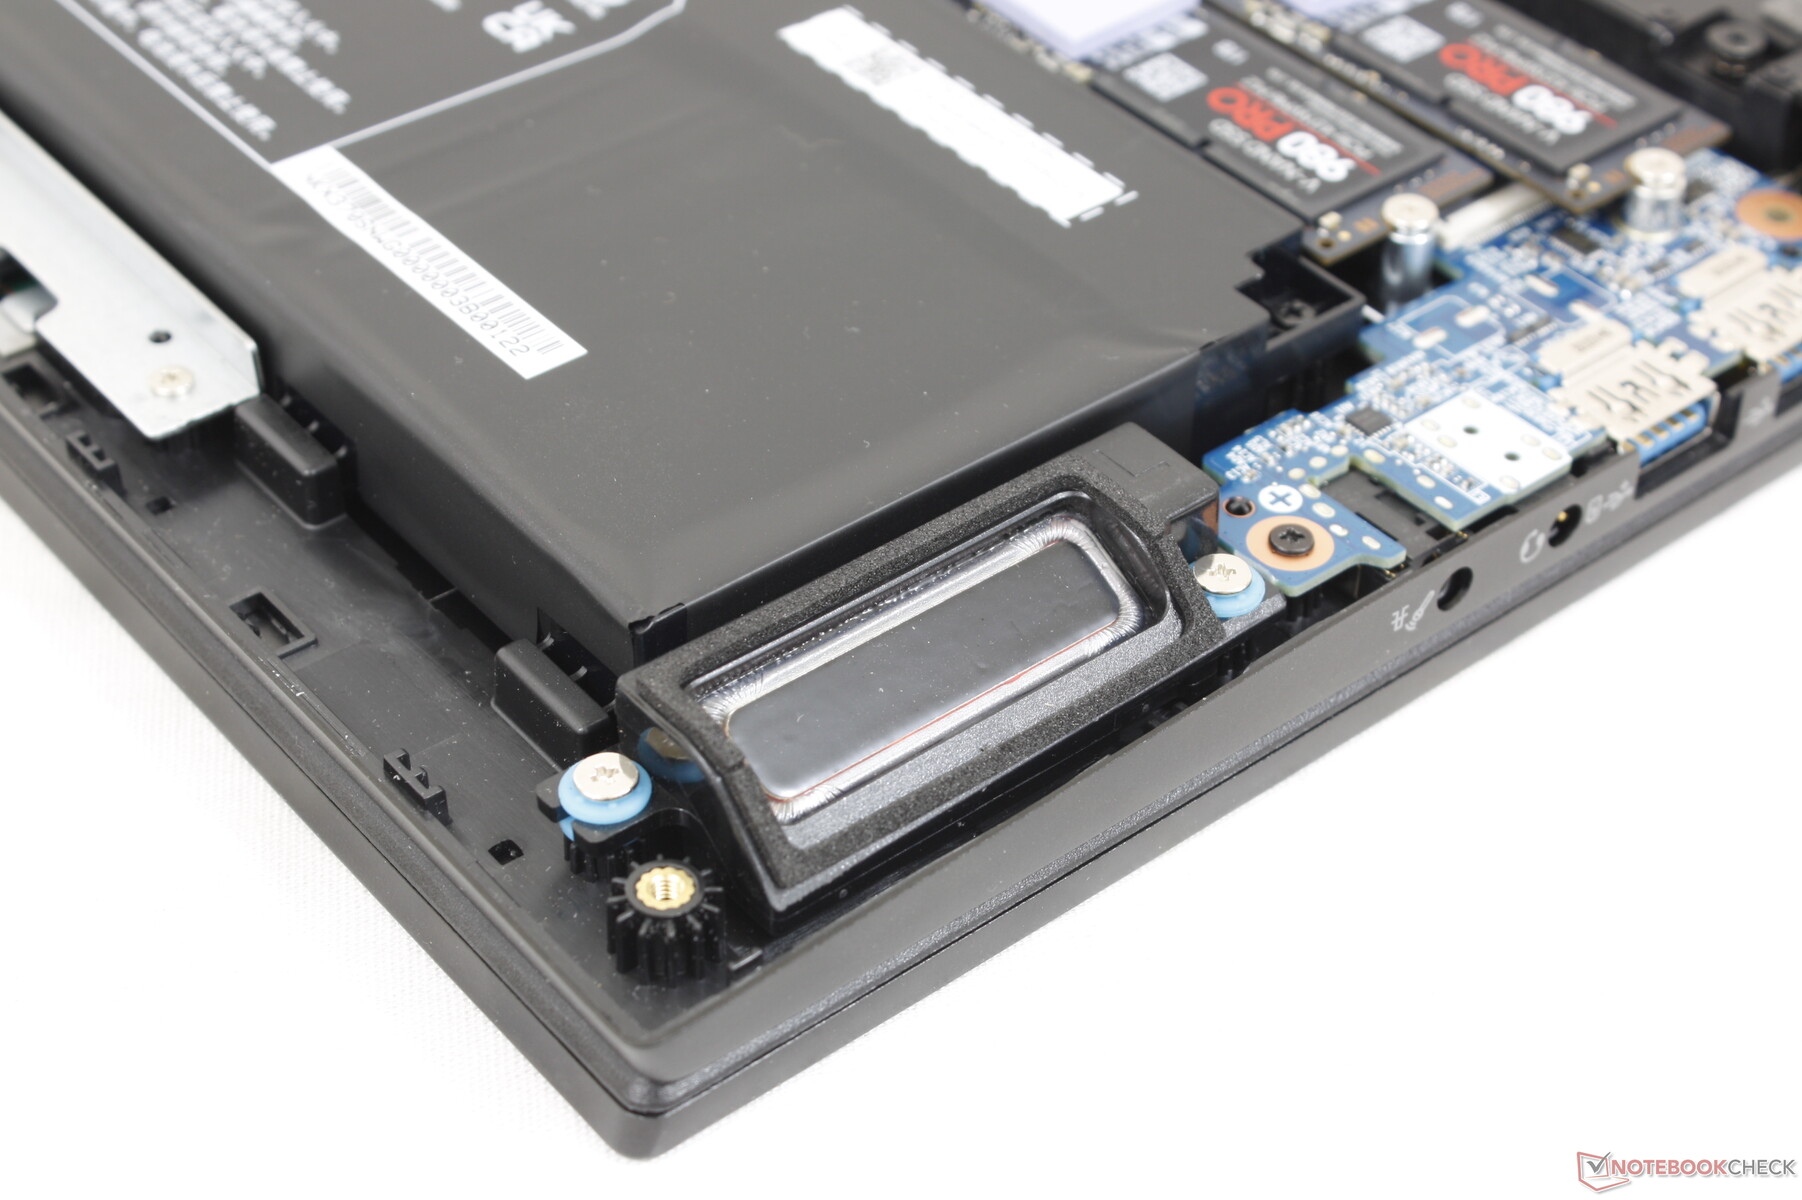
Mantenimiento
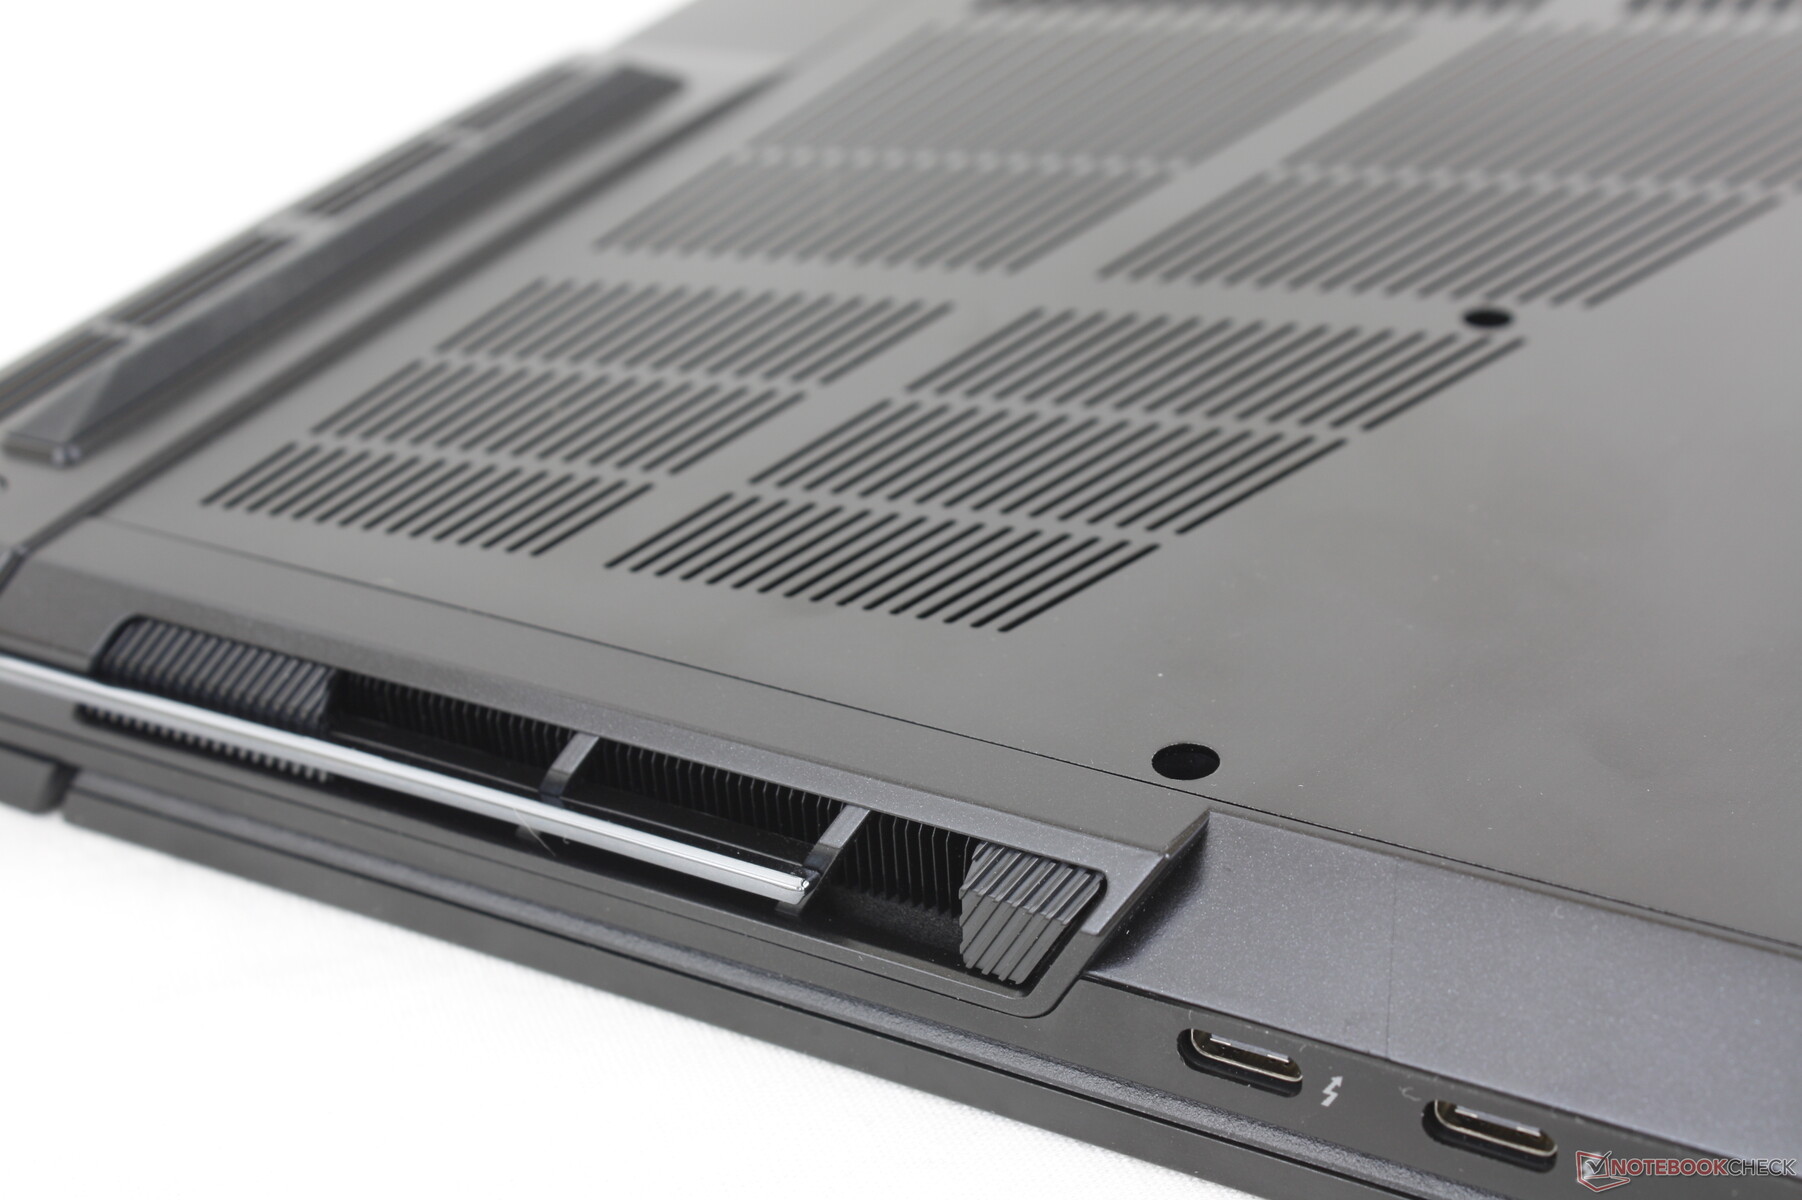
El panel inferior está asegurado por 16 tornillos Philips para una extracción relativamente fácil. Una vez dentro, los usuarios tienen acceso al módulo WLAN extraíble, 2x ranuras SODIMM, y 3x ranuras PCIe4 x4 M.2 2280. El sistema no soporta velocidades PCIe5 a diferencia de los recientes MSI GE y GT refresh.
Accesorios y garantía
La caja incluye un CD con los controladores del dispositivo, una memoria USB con los controladores de Windows 11 y una toallita de terciopelo, además de la documentación habitual y el adaptador de CA. Se aplica la garantía limitada estándar de un año, con opciones de ampliación de hasta tres años.
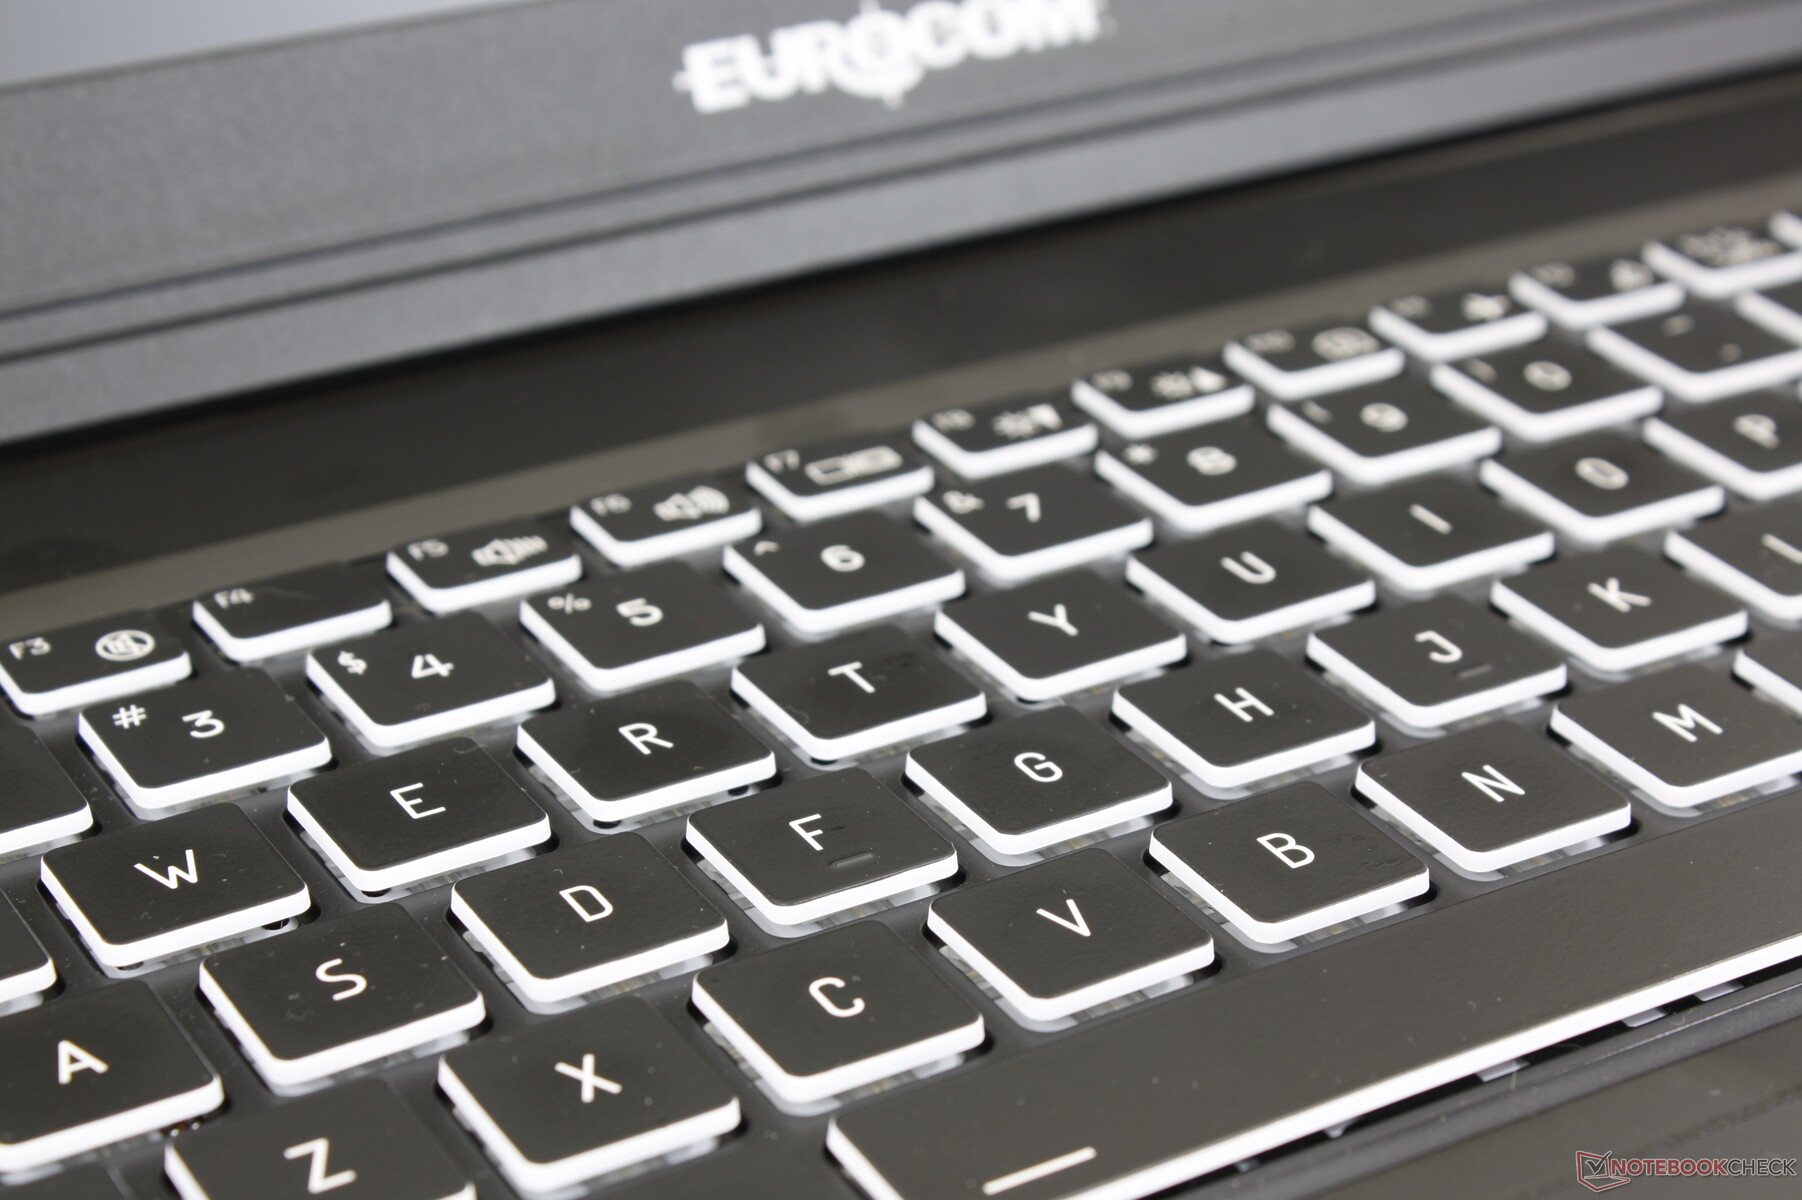
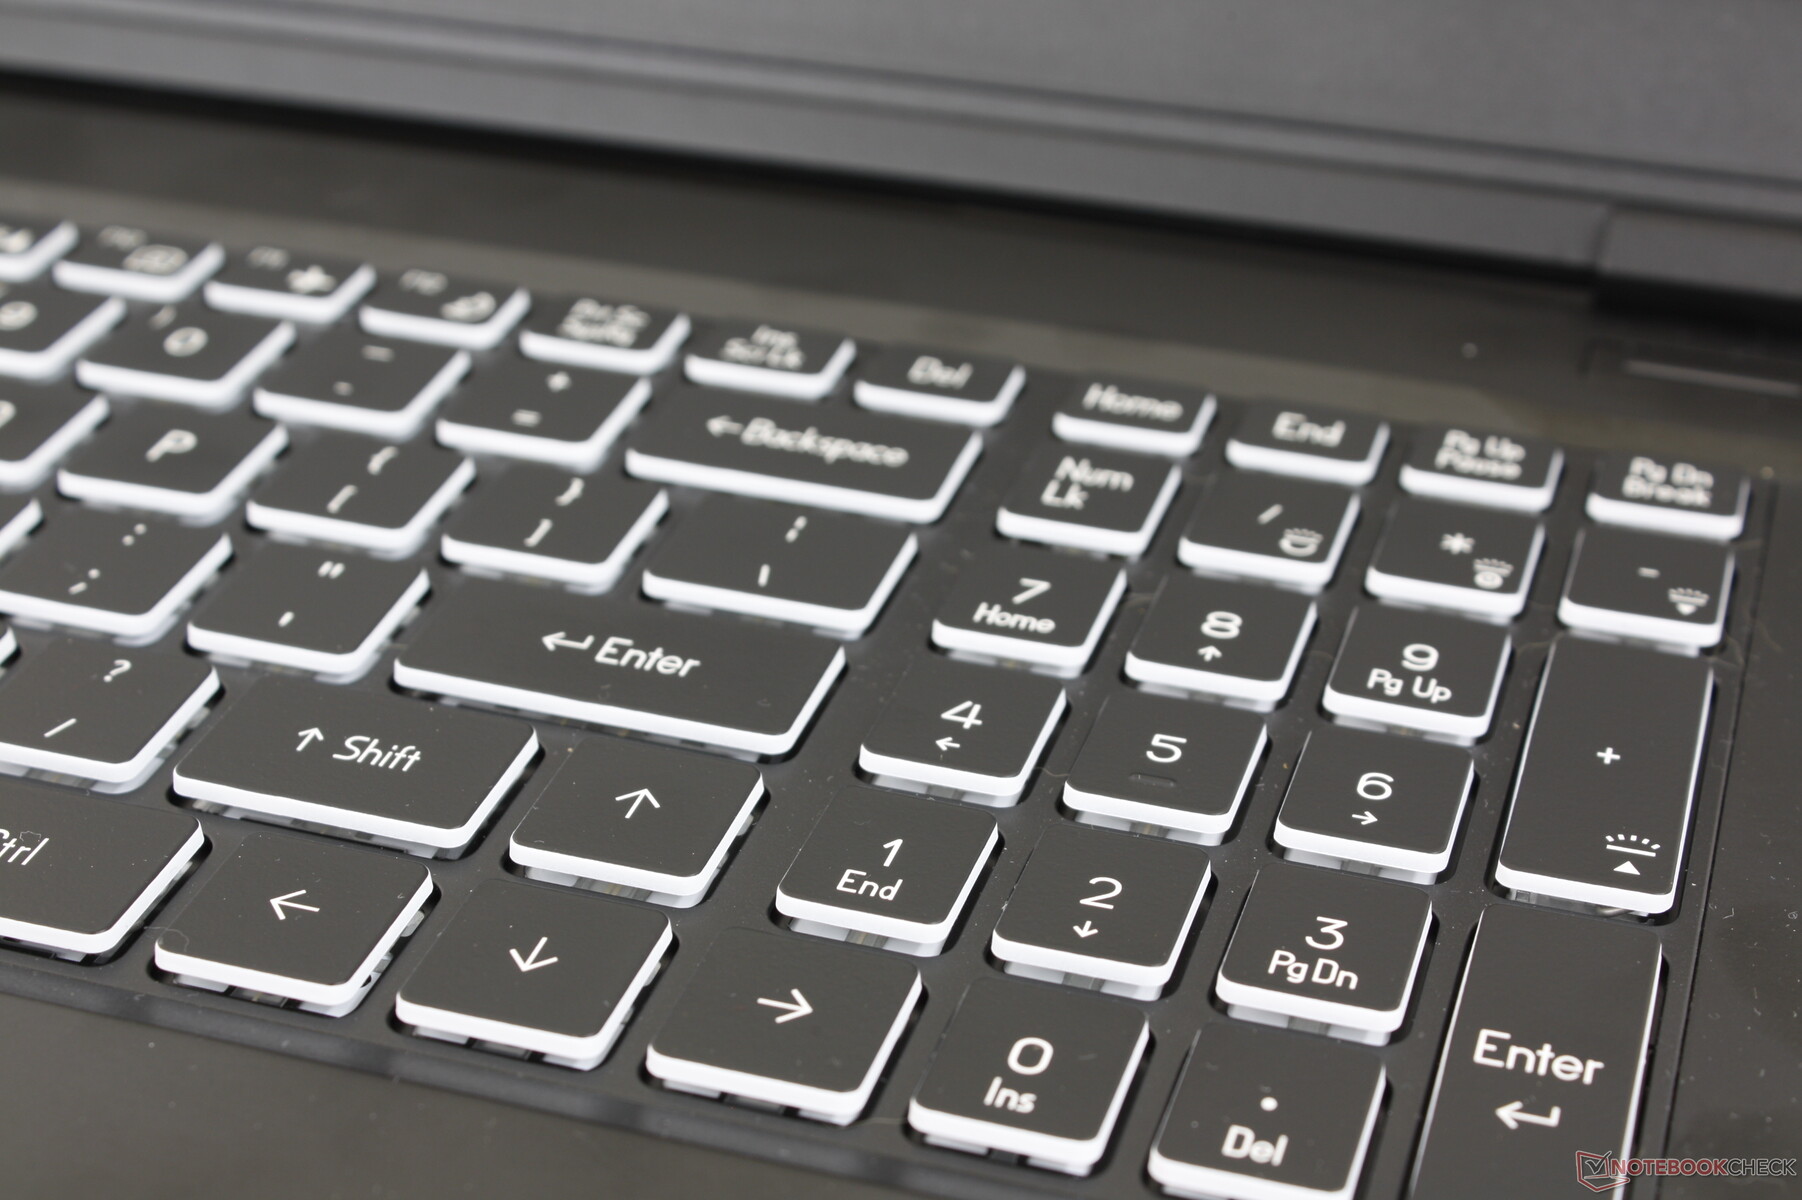
Dispositivos de entrada - Eurocom tradicional
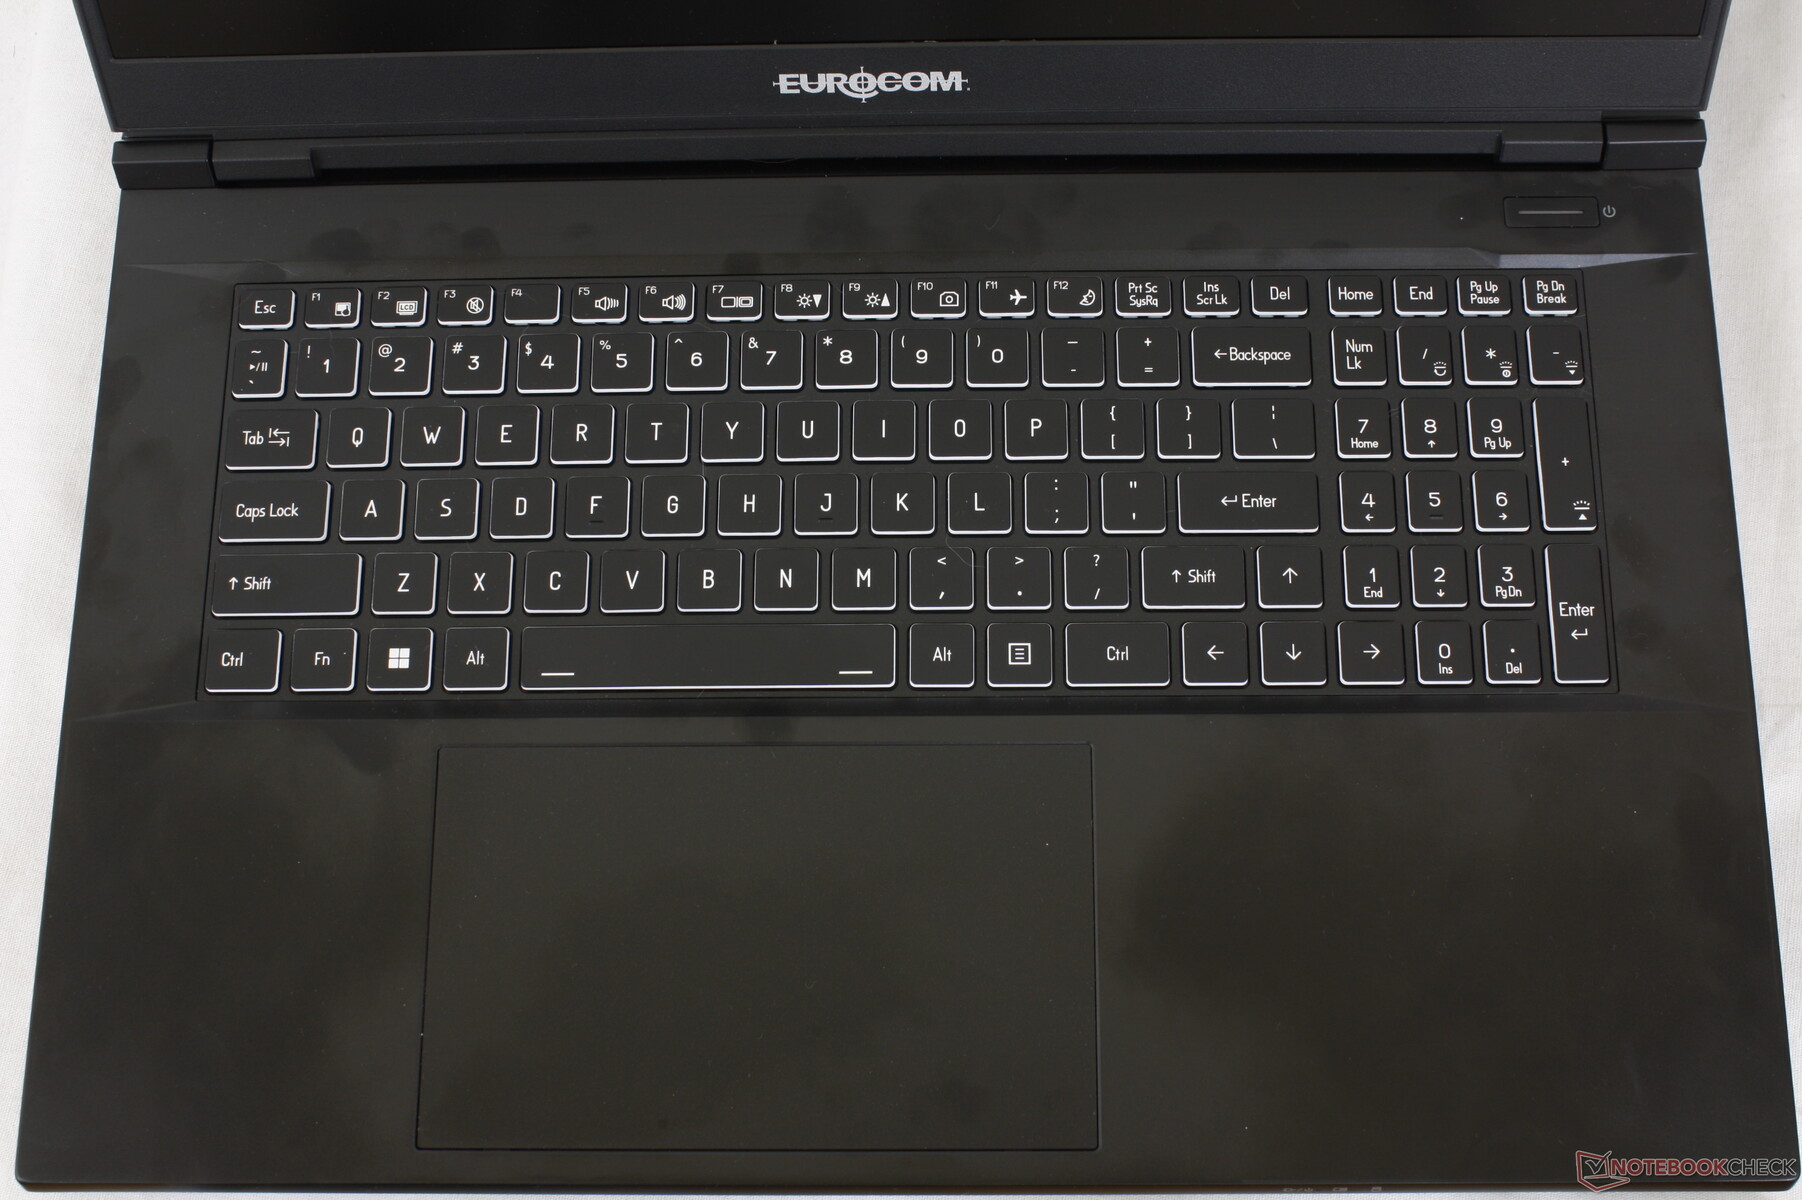
Teclado
La experiencia de tecleo es consistente en la mayoría de los modelos Eurocom ya que el ODM subyacente sigue siendo el mismo. El Raptor X17 tiene el mismo teclado de membrana que el Raptor X15 a pesar de las diferencias de tamaño de pantalla, lo que es una pena porque las teclas del teclado numérico siguen siendo más estrechas y apretadas que las teclas QWERTY principales.
La respuesta de las teclas es más suave que en el MSI GE78 o el Asus ROG Strix Scar 17. El ruido es relativamente silencioso, lo que algunos mecanógrafos preferirán, pero los jugadores hardcore pueden sentirse decepcionados por la falta de "clic".
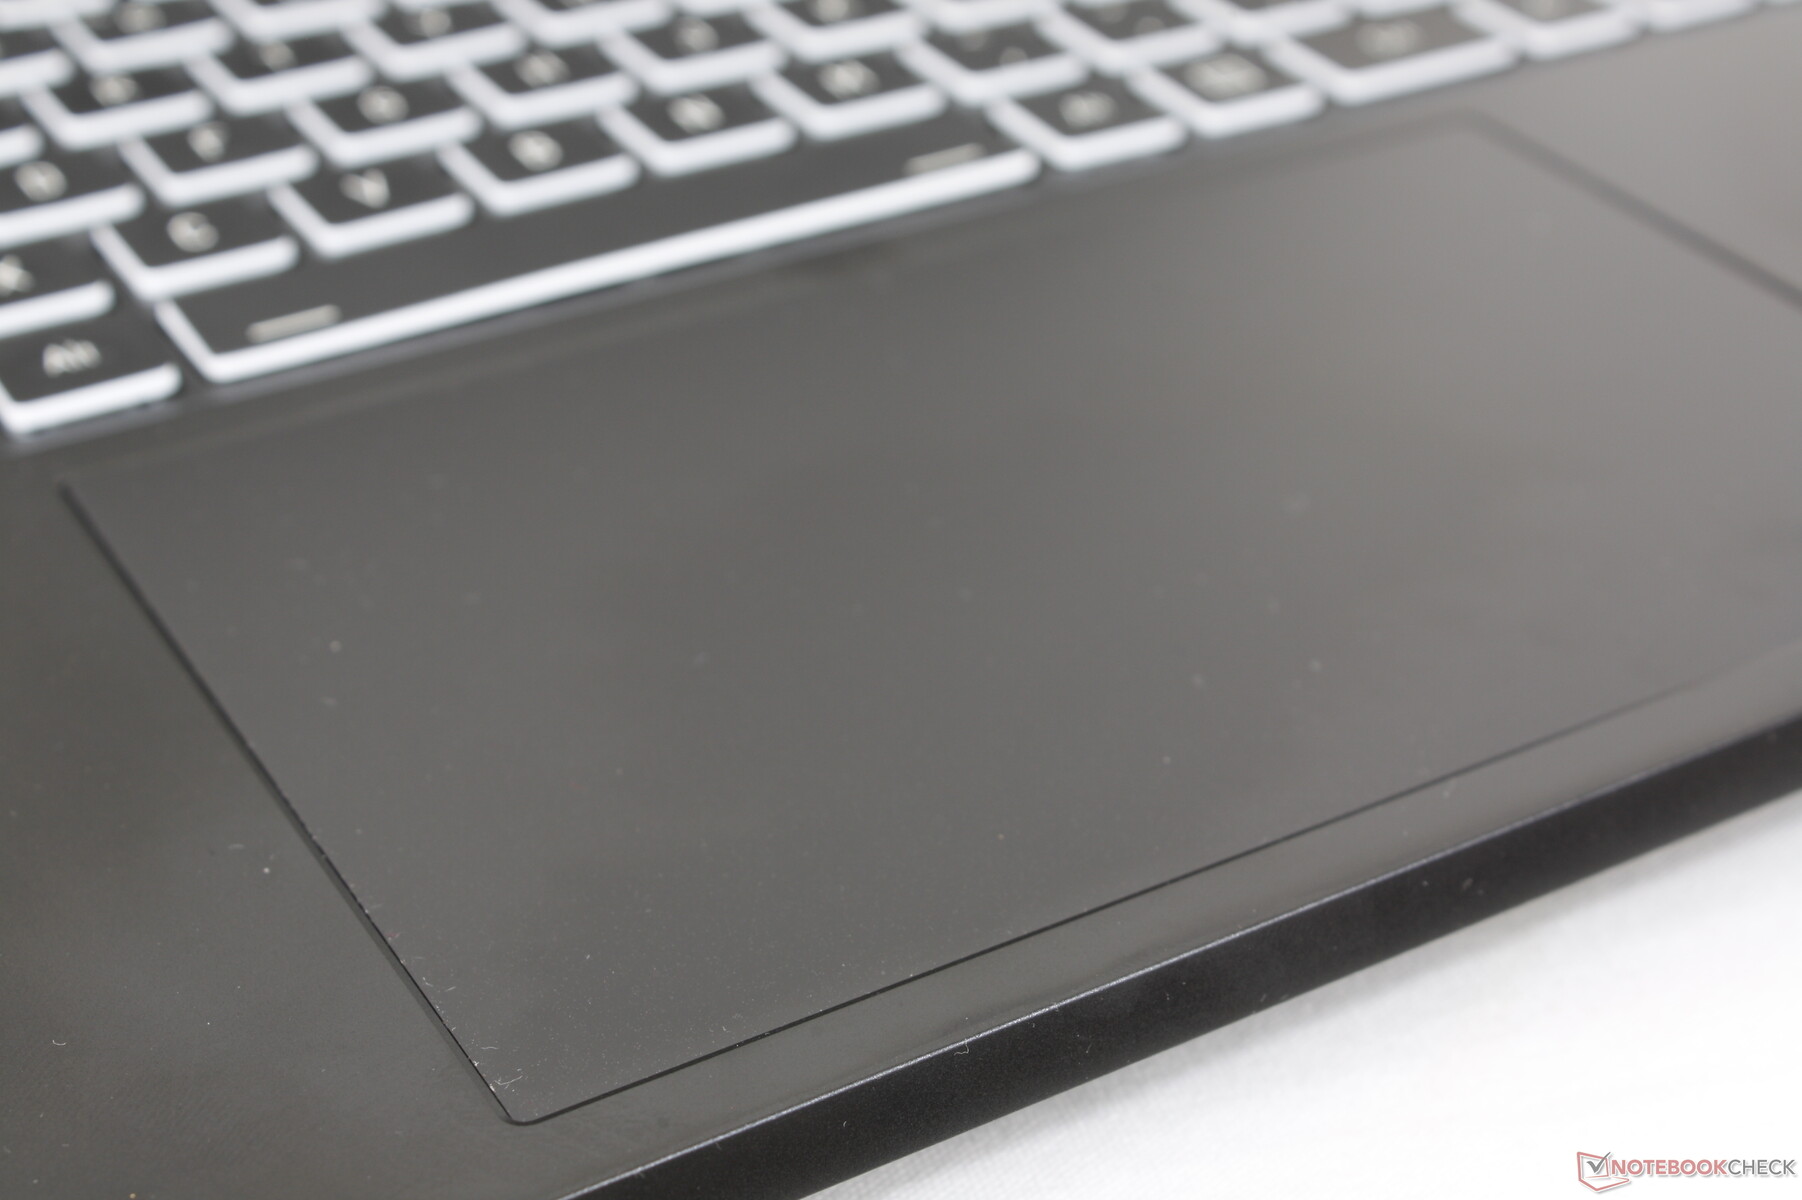
Panel táctil
El clickpad es grande con 15 x 9 cm comparado con el clickpad más pequeño de 13 x 8,2 cm del MSI GE78 HX. El deslizamiento es suave a velocidades medias y altas, mientras que se pega un poco a velocidades más lentas para ayudar a la precisión.
La respuesta al hacer clic en el clickpad es suave, con un recorrido poco profundo, como en el Razer Blade 17. Por lo tanto, las acciones de arrastrar y soltar son un poco incómodas de realizar a pesar de la gran superficie. Un ratón USB dedicado sigue siendo la mejor opción siempre que sea posible.
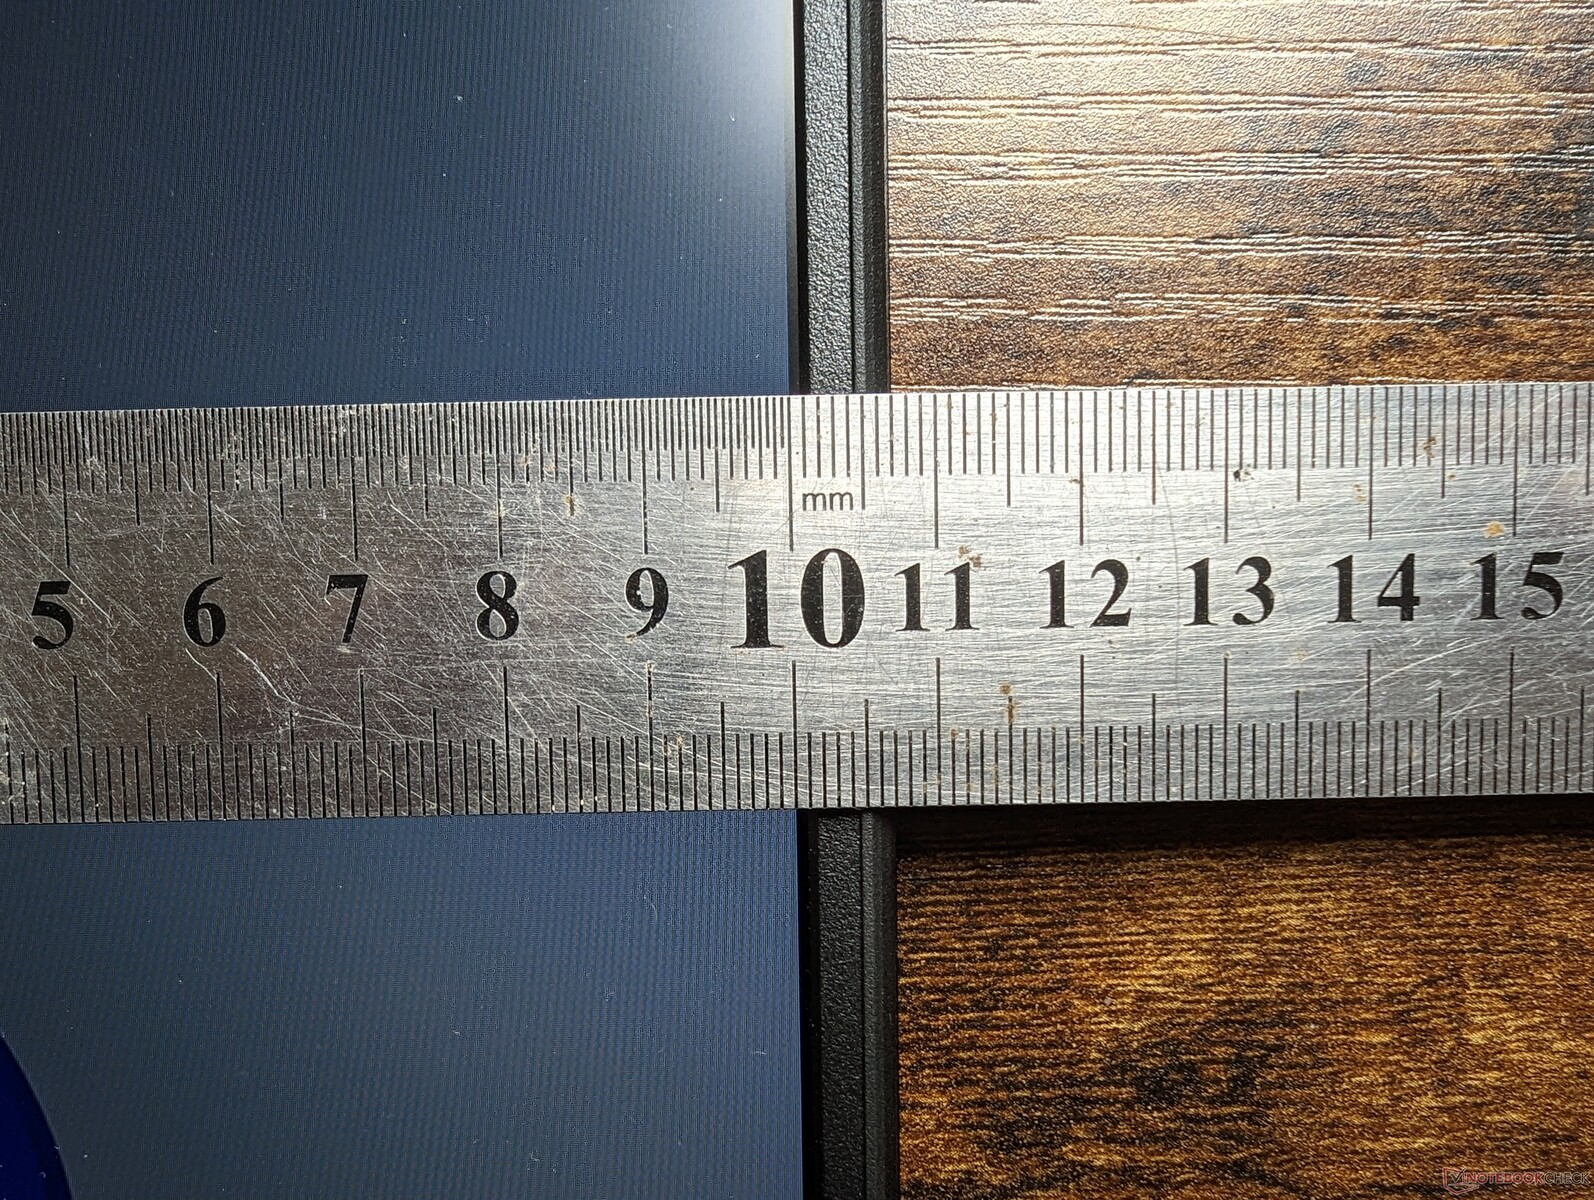
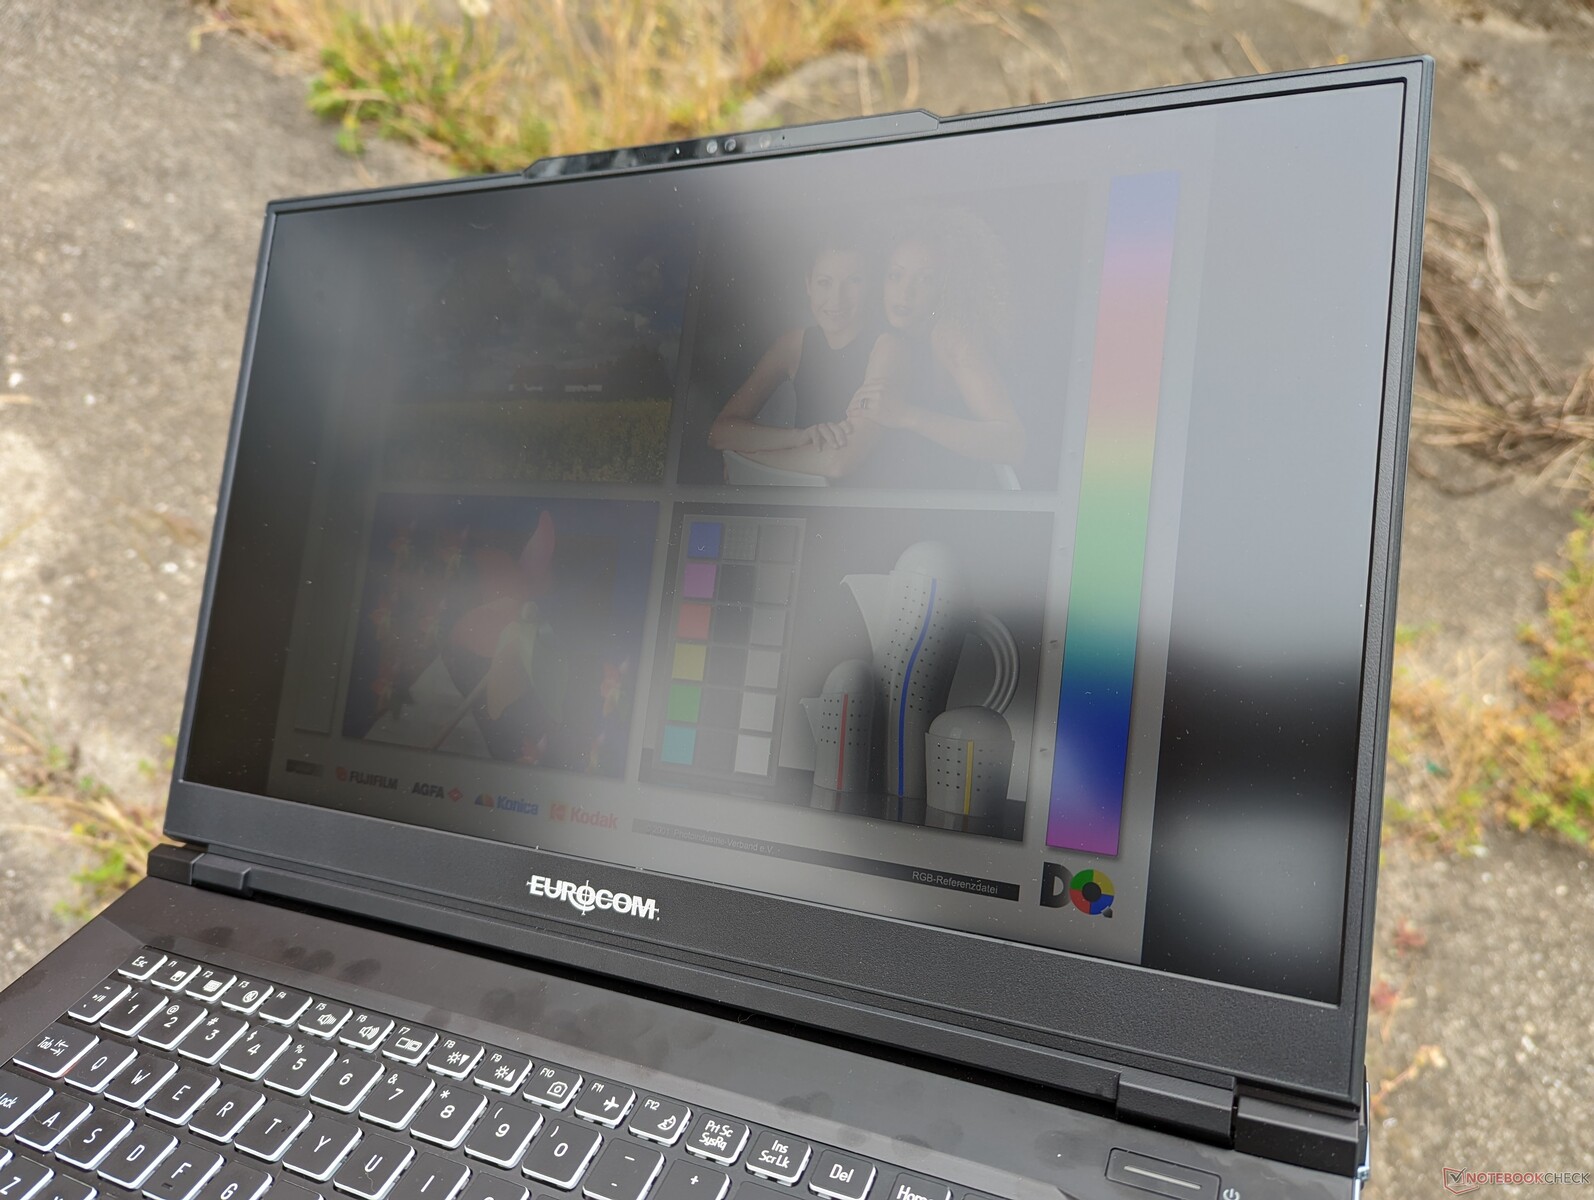
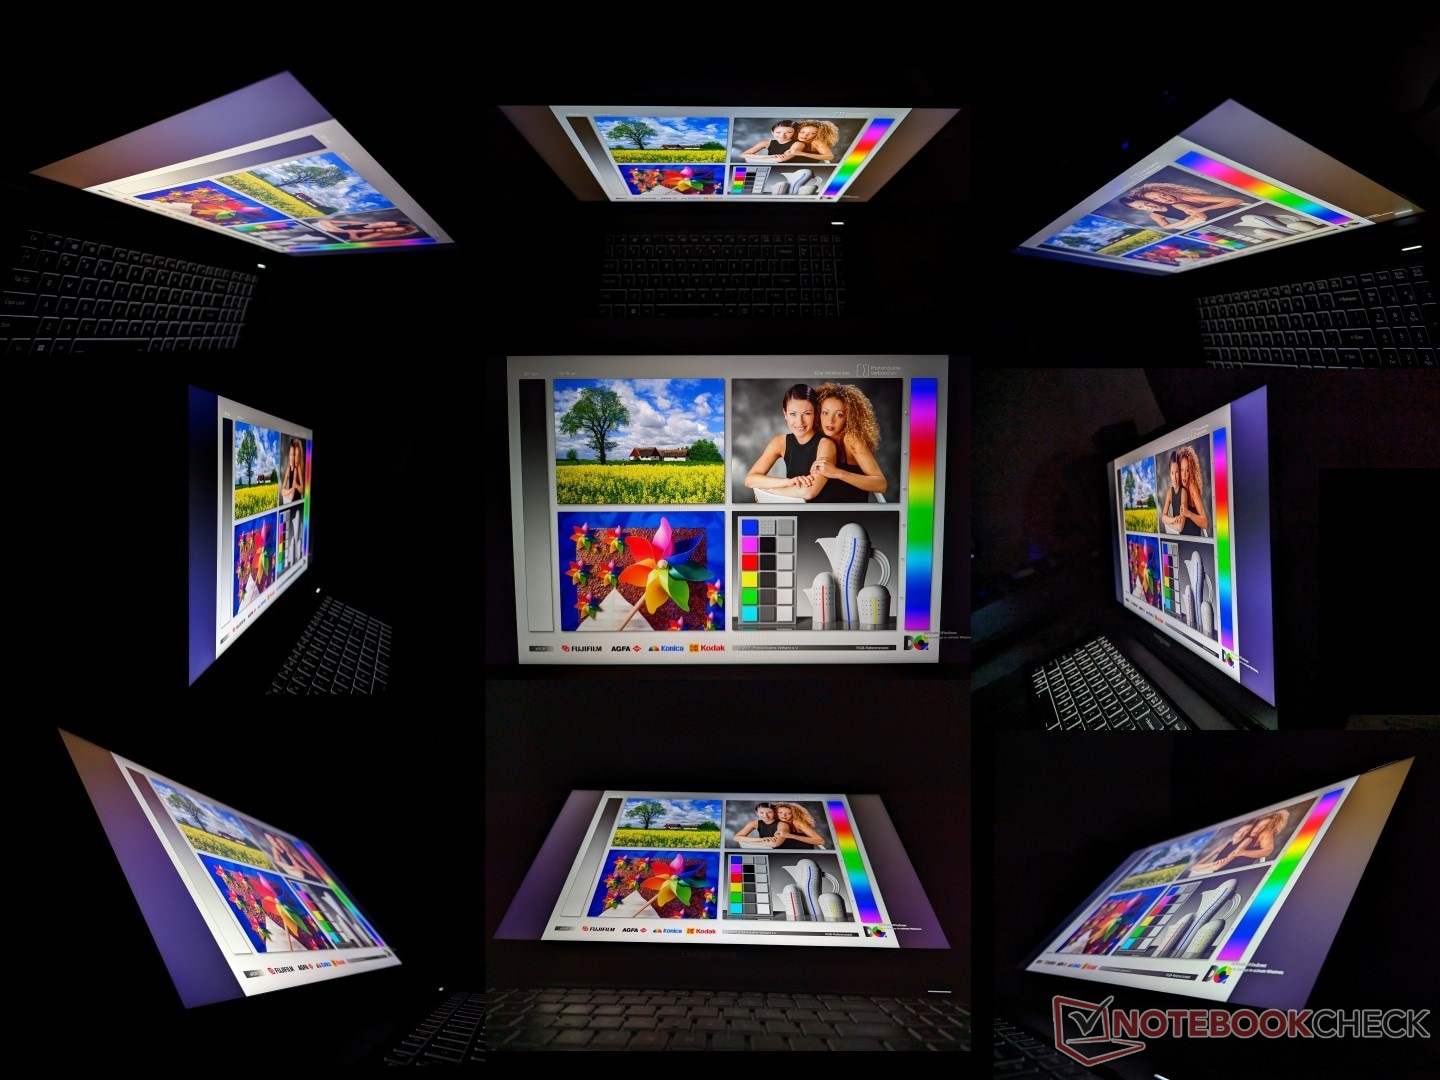
Pantalla - 240 Hz, QHD, G-Sync, Full DCI-P3 Colors
Hay dos opciones de pantalla disponibles: QHD a 240 Hz o 4K UHD a 144 Hz, cada una con 100% de colores DCI-P3 y compatibilidad con G-Sync. Nuestra unidad de pruebas específica viene con la primera.
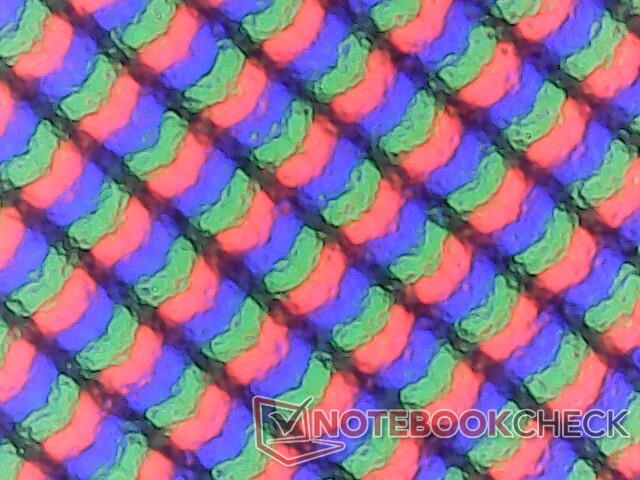
Nuestro sistema emplea un panel IPS de BOE muy similar al que se encuentra en elROG Strix Scar 17 (NE173QHM-NZ1 frente a NE173QHM-NZ2). No podemos notar grandes diferencias entre los dos paneles hasta sus rápidas tasas de refresco, rápidos tiempos de respuesta, amplias coberturas de color, objetivos de brillo y decentes ratios de contraste. Es un panel de gama alta apto tanto para juegos como para edición de contenidos.
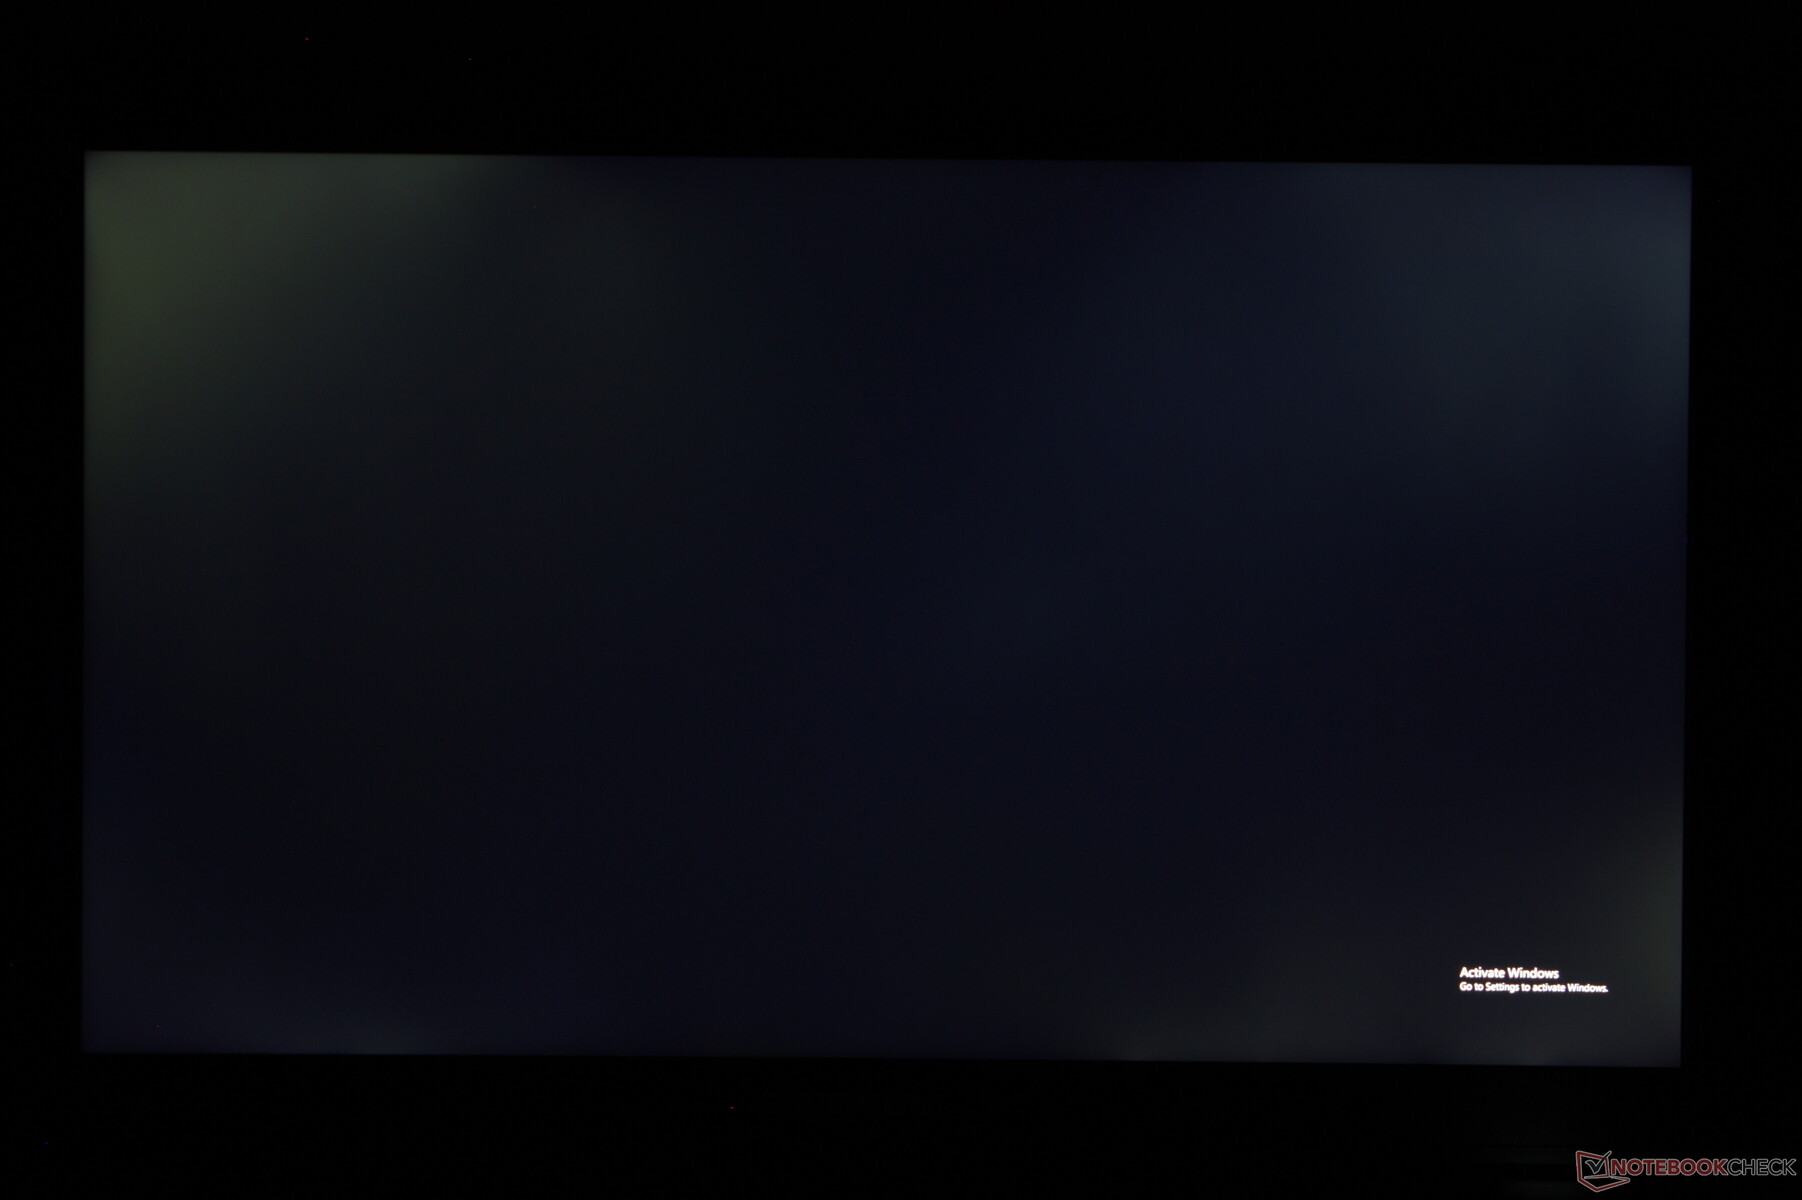
Una queja que tenemos se refiere a la sangría de luz de fondo notable en nuestra unidad de prueba. Aunque es de esperar algo de sangrado en la mayoría de paneles IPS, aquí es más severo que en otros portátiles que hemos probado que están por debajo de la mitad del precio.
| |||||||||||||||||||||||||
iluminación: 75 %
Brillo con batería: 312.6 cd/m²
Contraste: 1202:1 (Negro: 0.26 cd/m²)
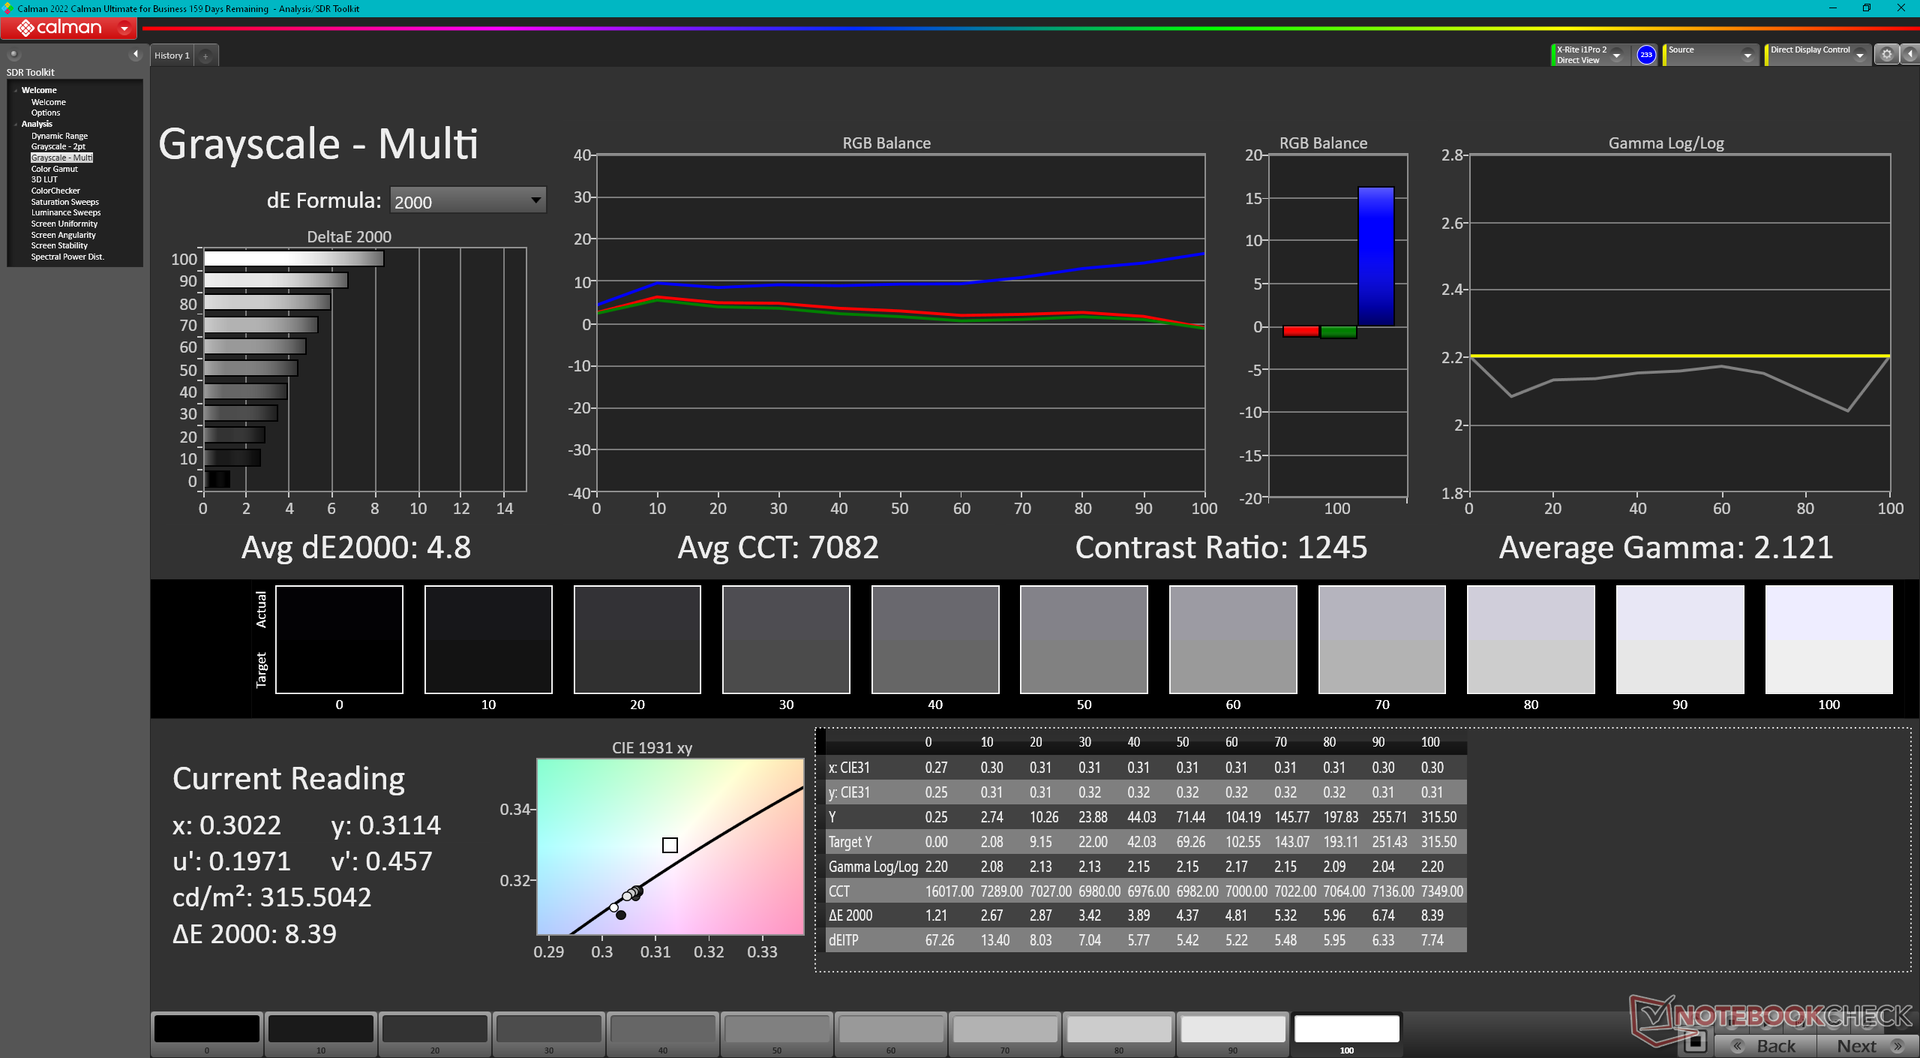
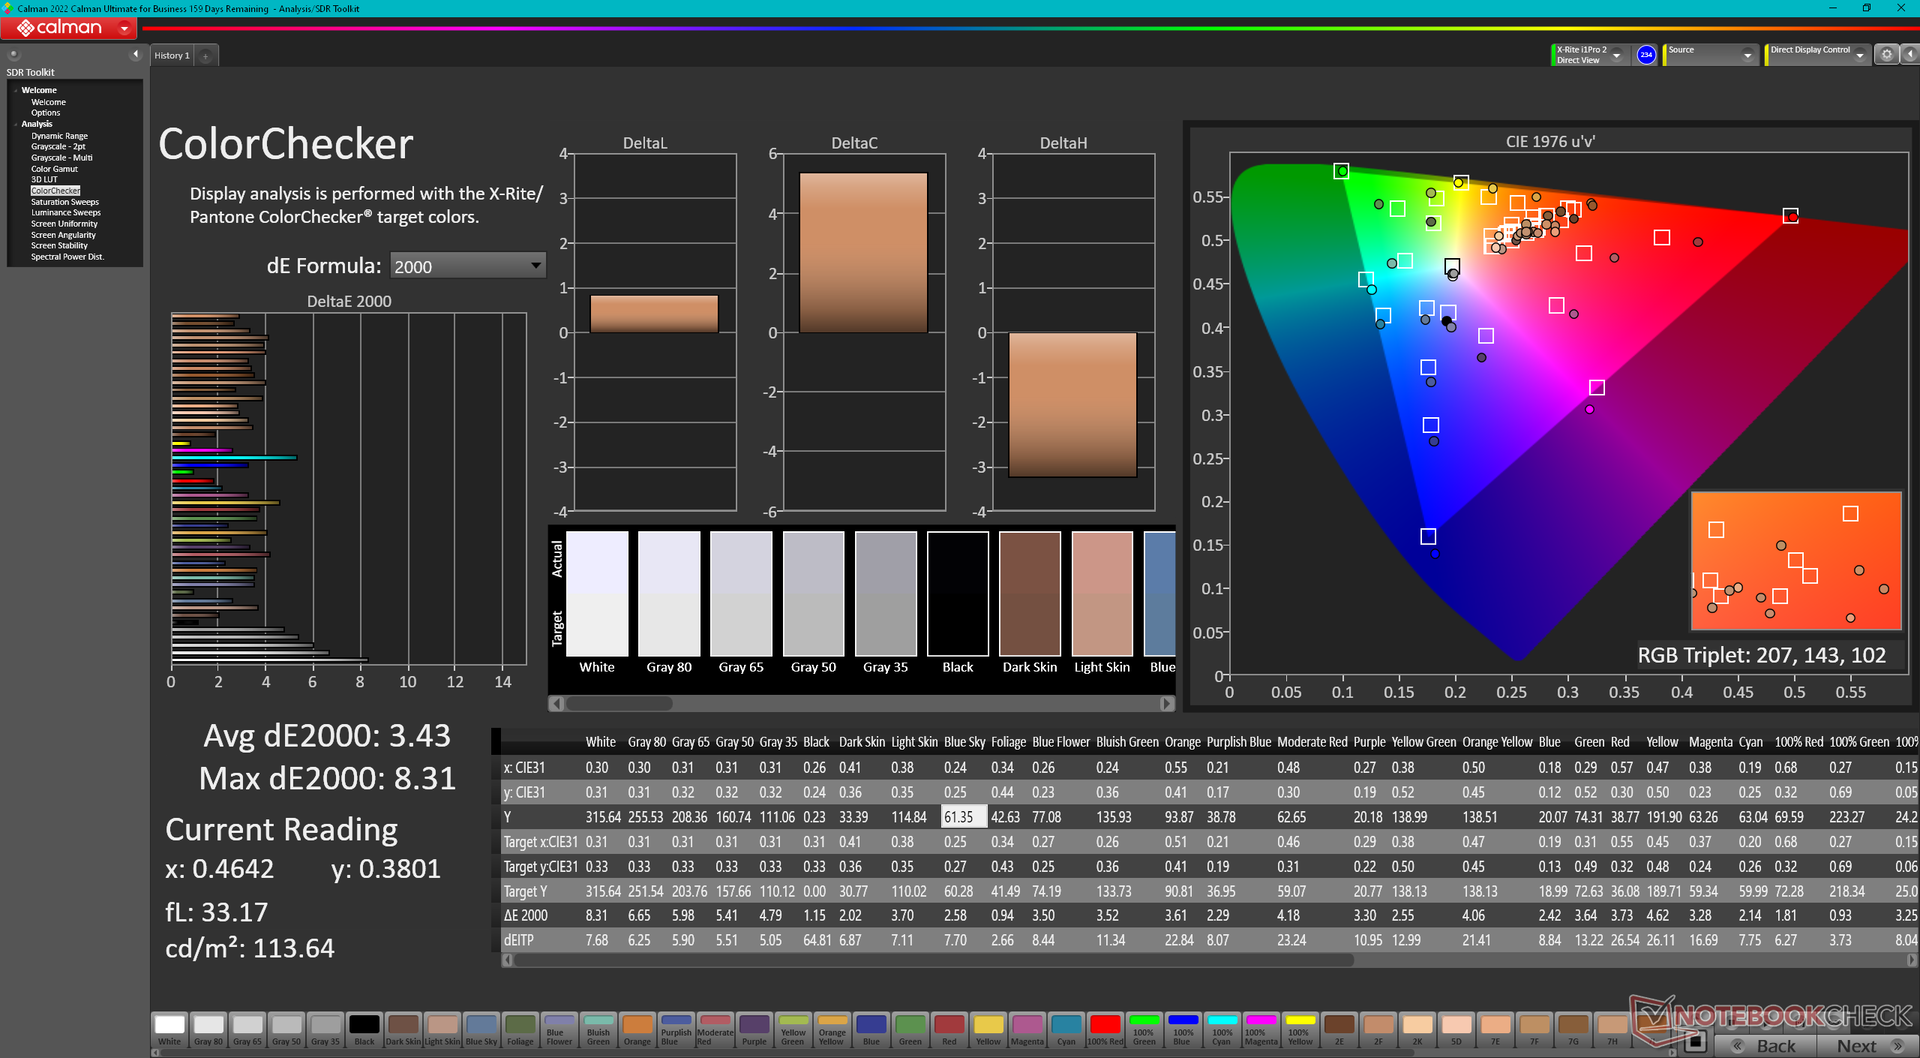
ΔE ColorChecker Calman: 3.43 | ∀{0.5-29.43 Ø4.71}
calibrated: 0.74
ΔE Greyscale Calman: 4.8 | ∀{0.09-98 Ø4.96}
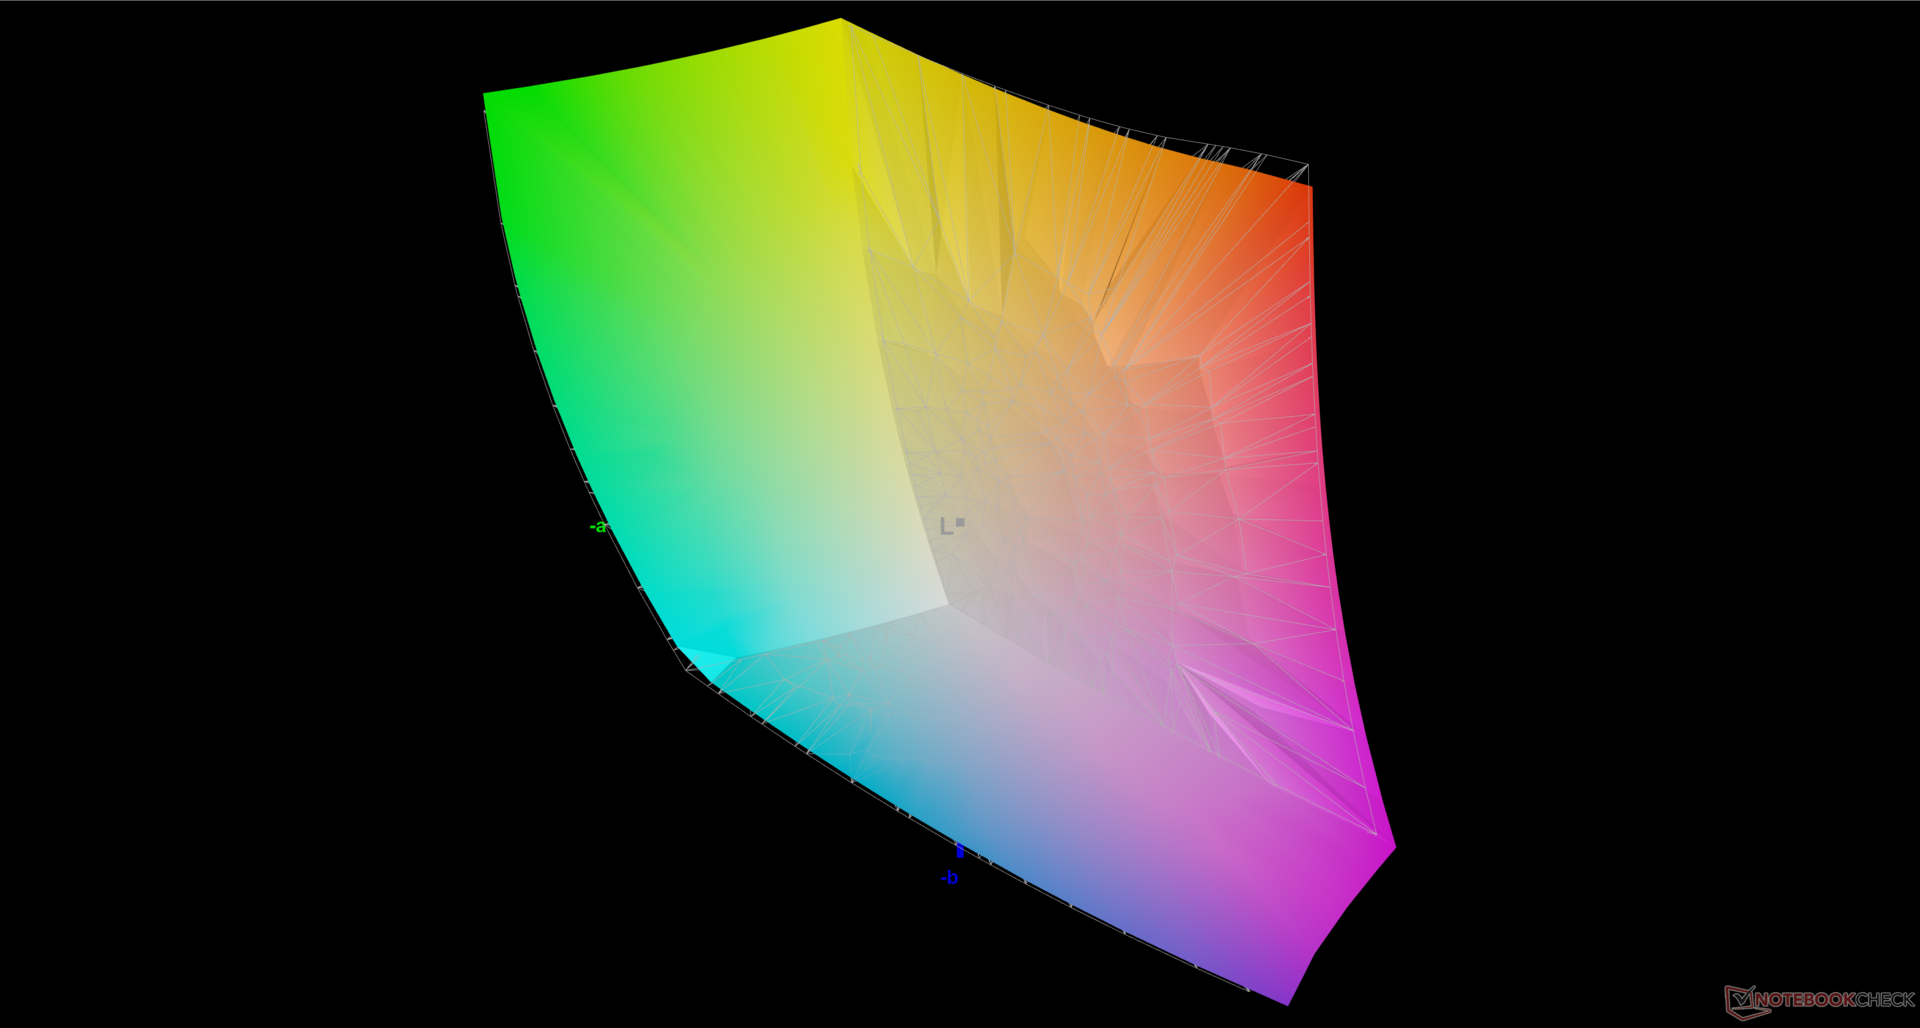
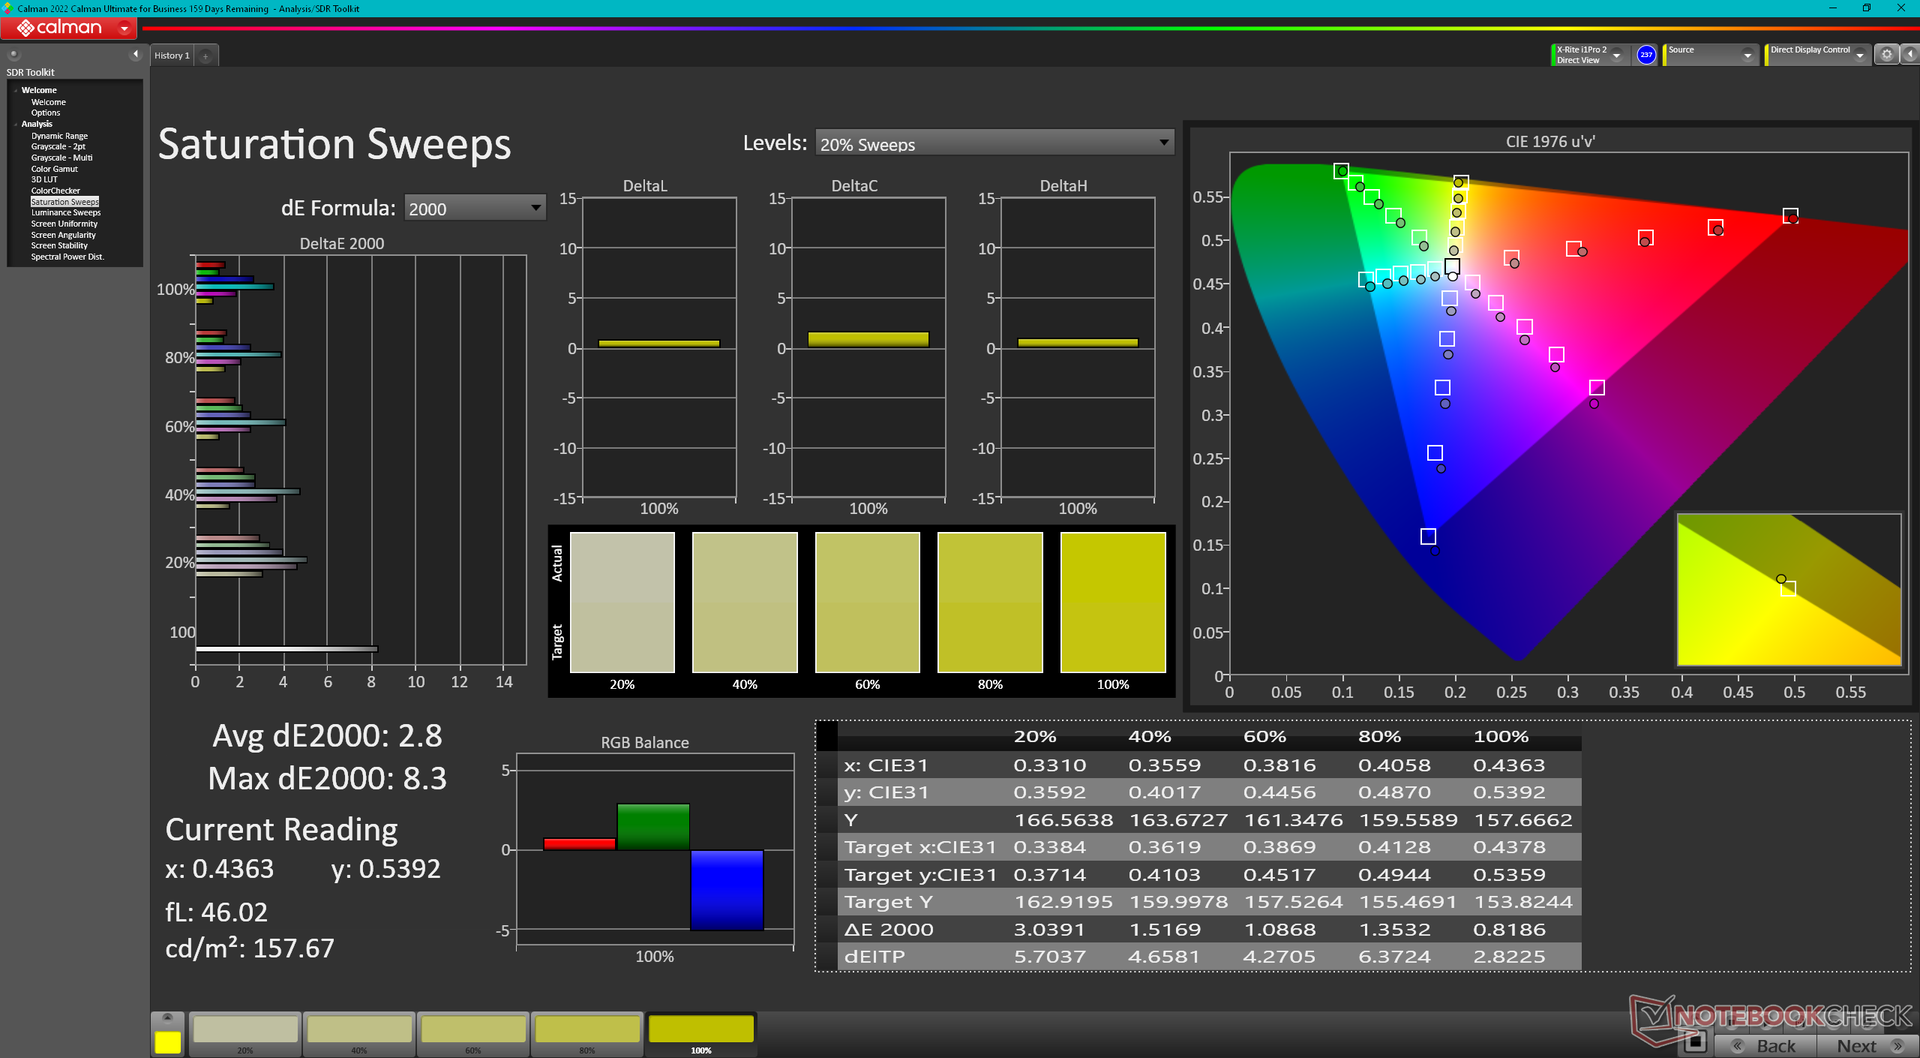
85.4% AdobeRGB 1998 (Argyll 3D)
99.9% sRGB (Argyll 3D)
97.8% Display P3 (Argyll 3D)
Gamma: 2.12
CCT: 7082 K
| Eurocom Raptor X17 BOE NE173QHM-NZ1, IPS, 2560x1440, 17.3" | Asus ROG Strix Scar 17 G733PY-XS96 NE173QHM-NZ2, IPS, 2560x1440, 17.3" | Aorus 17X AZF BOE09F9, IPS, 2560x1440, 17.3" | MSI GE78HX 13VH-070US AU Optronics B170QAN01.2, IPS, 2560x1600, 17" | Eluktronics Mech-17 GP2 BOE NE170QDM-NZ1, IPS, 2560x1600, 17" | Alienware m17 R5 (R9 6900HX, RX 6850M XT) AU Optronics AUODBA3, IPS, 3840x2160, 17" | |
|---|---|---|---|---|---|---|
| Display | 0% | -1% | 0% | -16% | 1% | |
| Display P3 Coverage (%) | 97.8 | 98 0% | 96.7 -1% | 97.6 0% | 69.1 -29% | 97.2 -1% |
| sRGB Coverage (%) | 99.9 | 100 0% | 99.9 0% | 99.9 0% | 99.7 0% | 99.6 0% |
| AdobeRGB 1998 Coverage (%) | 85.4 | 85.6 0% | 84.5 -1% | 86.5 1% | 69.8 -18% | 88.4 4% |
| Response Times | 20% | -3% | 52% | 8% | -20% | |
| Response Time Grey 50% / Grey 80% * (ms) | 13.3 ? | 6.2 ? 53% | 14 ? -5% | 4.2 ? 68% | 12 ? 10% | 16.4 ? -23% |
| Response Time Black / White * (ms) | 10 ? | 11.4 ? -14% | 10.1 ? -1% | 6.4 ? 36% | 9.4 ? 6% | 11.6 ? -16% |
| PWM Frequency (Hz) | ||||||
| Screen | 25% | 6% | -13% | 19% | -67% | |
| Brightness middle (cd/m²) | 312.6 | 322.5 3% | 294 -6% | 398.6 28% | 417.3 33% | 484 55% |
| Brightness (cd/m²) | 292 | 317 9% | 276 -5% | 384 32% | 387 33% | 449 54% |
| Brightness Distribution (%) | 75 | 86 15% | 90 20% | 89 19% | 87 16% | 87 16% |
| Black Level * (cd/m²) | 0.26 | 0.29 -12% | 0.28 -8% | 0.46 -77% | 0.42 -62% | 0.55 -112% |
| Contrast (:1) | 1202 | 1112 -7% | 1050 -13% | 867 -28% | 994 -17% | 880 -27% |
| Colorchecker dE 2000 * | 3.43 | 1.15 66% | 2.81 18% | 4.05 -18% | 2.14 38% | 4.8 -40% |
| Colorchecker dE 2000 max. * | 8.31 | 3.03 64% | 5.7 31% | 8.68 -4% | 4.09 51% | 7.48 10% |
| Colorchecker dE 2000 calibrated * | 0.74 | 0.56 24% | 0.86 -16% | 1.02 -38% | 0.42 43% | 4.74 -541% |
| Greyscale dE 2000 * | 4.8 | 1.7 65% | 3.4 29% | 6.5 -35% | 3.1 35% | 5.5 -15% |
| Gamma | 2.12 104% | 2.27 97% | 2.301 96% | 2.11 104% | 2.19 100% | 2.42 91% |
| CCT | 7082 92% | 6299 103% | 7389 88% | 7518 86% | 6040 108% | 6148 106% |
| Media total (Programa/Opciones) | 15% /
19% | 1% /
3% | 13% /
-1% | 4% /
10% | -29% /
-45% |
* ... más pequeño es mejor

La pantalla no viene precalibrada de fábrica. En su lugar, Eurocom cobra un extra por la calibración de fábrica, lo que nos parece absurdo dado el precio ya de por sí elevado. Otros fabricantes como MSI, Asus, Dell y otros ofrecen precalibrado de serie en muchos de sus respectivos modelos.
Tiempos de respuesta del display
| ↔ Tiempo de respuesta de Negro a Blanco | ||
|---|---|---|
| 10 ms ... subida ↗ y bajada ↘ combinada | ↗ 5 ms subida | 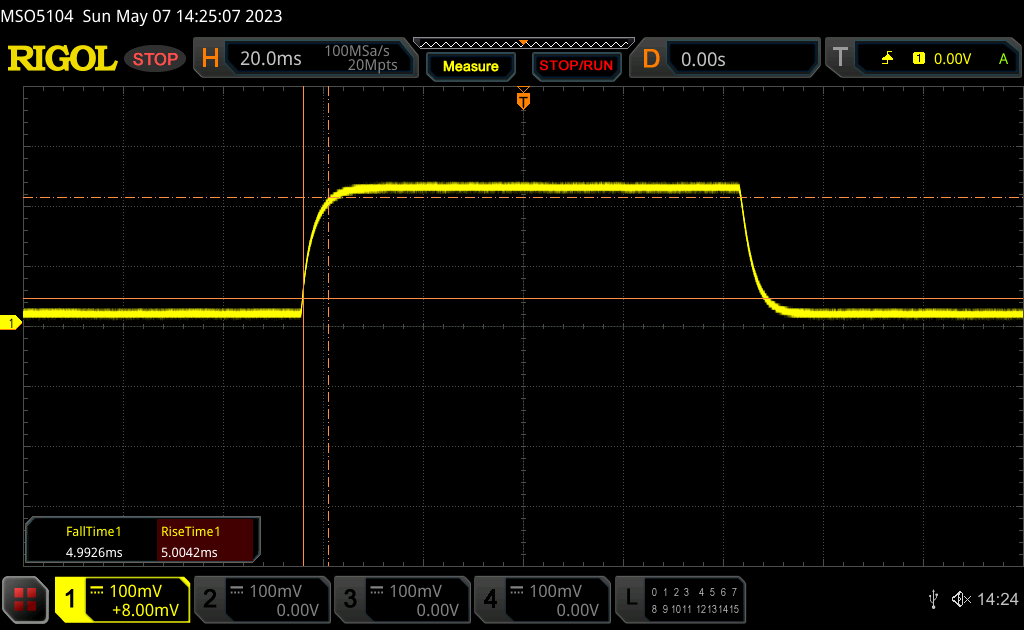 |
| ↘ 5 ms bajada | ||
| La pantalla mostró buenos tiempos de respuesta en nuestros tests pero podría ser demasiado lenta para los jugones competitivos. En comparación, todos los dispositivos de prueba van de ##min### (mínimo) a 240 (máximo) ms. » 27 % de todos los dispositivos son mejores. Esto quiere decir que el tiempo de respuesta medido es mejor que la media (19.8 ms) de todos los dispositivos testados. | ||
| ↔ Tiempo de respuesta 50% Gris a 80% Gris | ||
| 13.3 ms ... subida ↗ y bajada ↘ combinada | ↗ 6 ms subida | 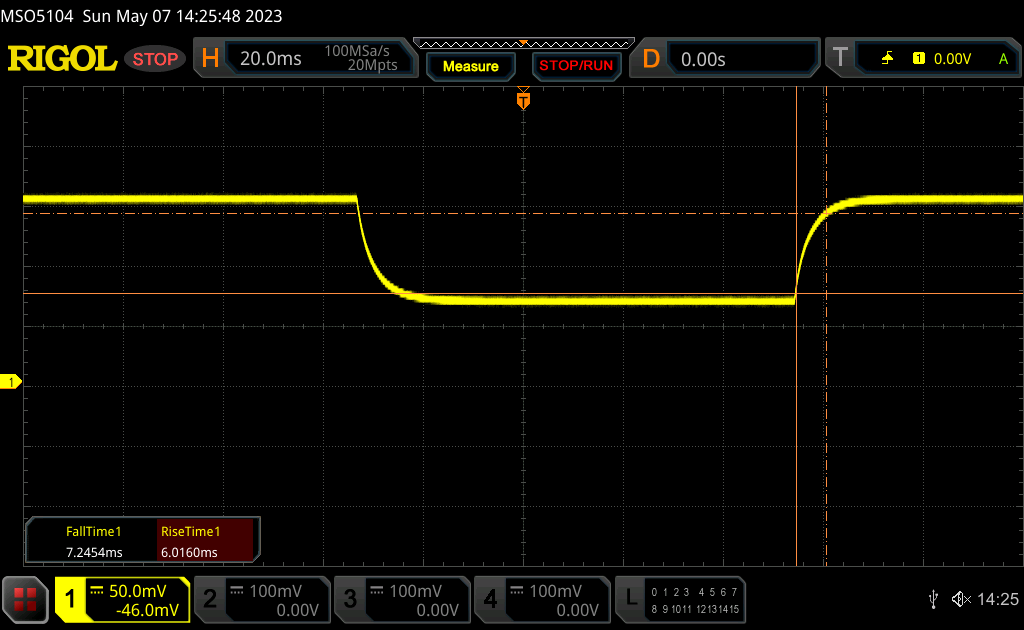 |
| ↘ 7.3 ms bajada | ||
| La pantalla mostró buenos tiempos de respuesta en nuestros tests pero podría ser demasiado lenta para los jugones competitivos. En comparación, todos los dispositivos de prueba van de ##min### (mínimo) a 636 (máximo) ms. » 27 % de todos los dispositivos son mejores. Esto quiere decir que el tiempo de respuesta medido es mejor que la media (31 ms) de todos los dispositivos testados. | ||
Parpadeo de Pantalla / PWM (Pulse-Width Modulation)
| Parpadeo de Pantalla / PWM no detectado | 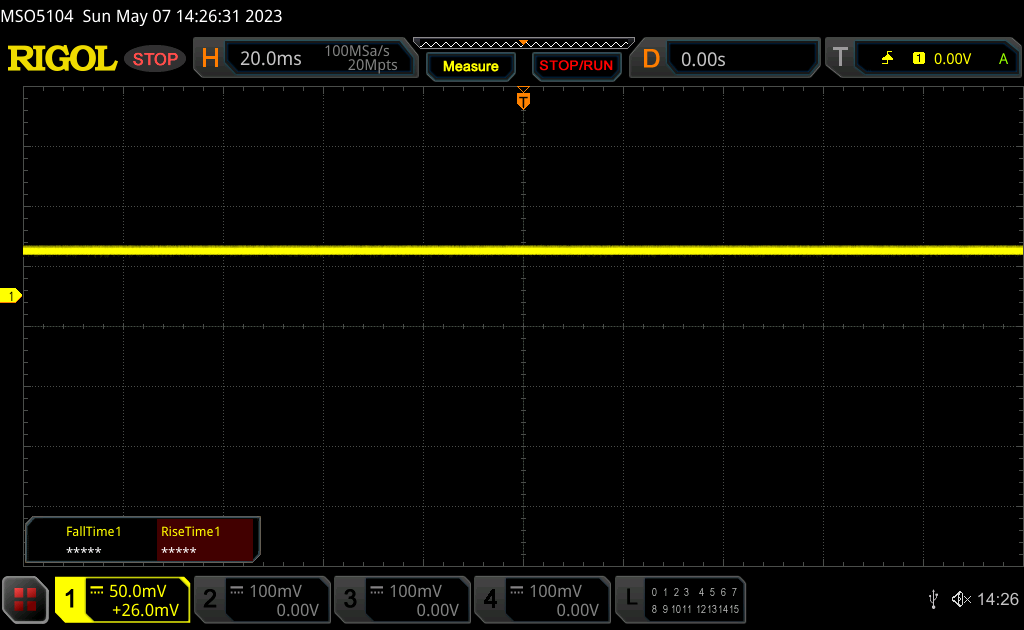 | ||
Comparación: 52 % de todos los dispositivos testados no usaron PWM para atenuar el display. Si se usó, medimos una media de 7754 (mínimo: 5 - máxmo: 343500) Hz. | |||
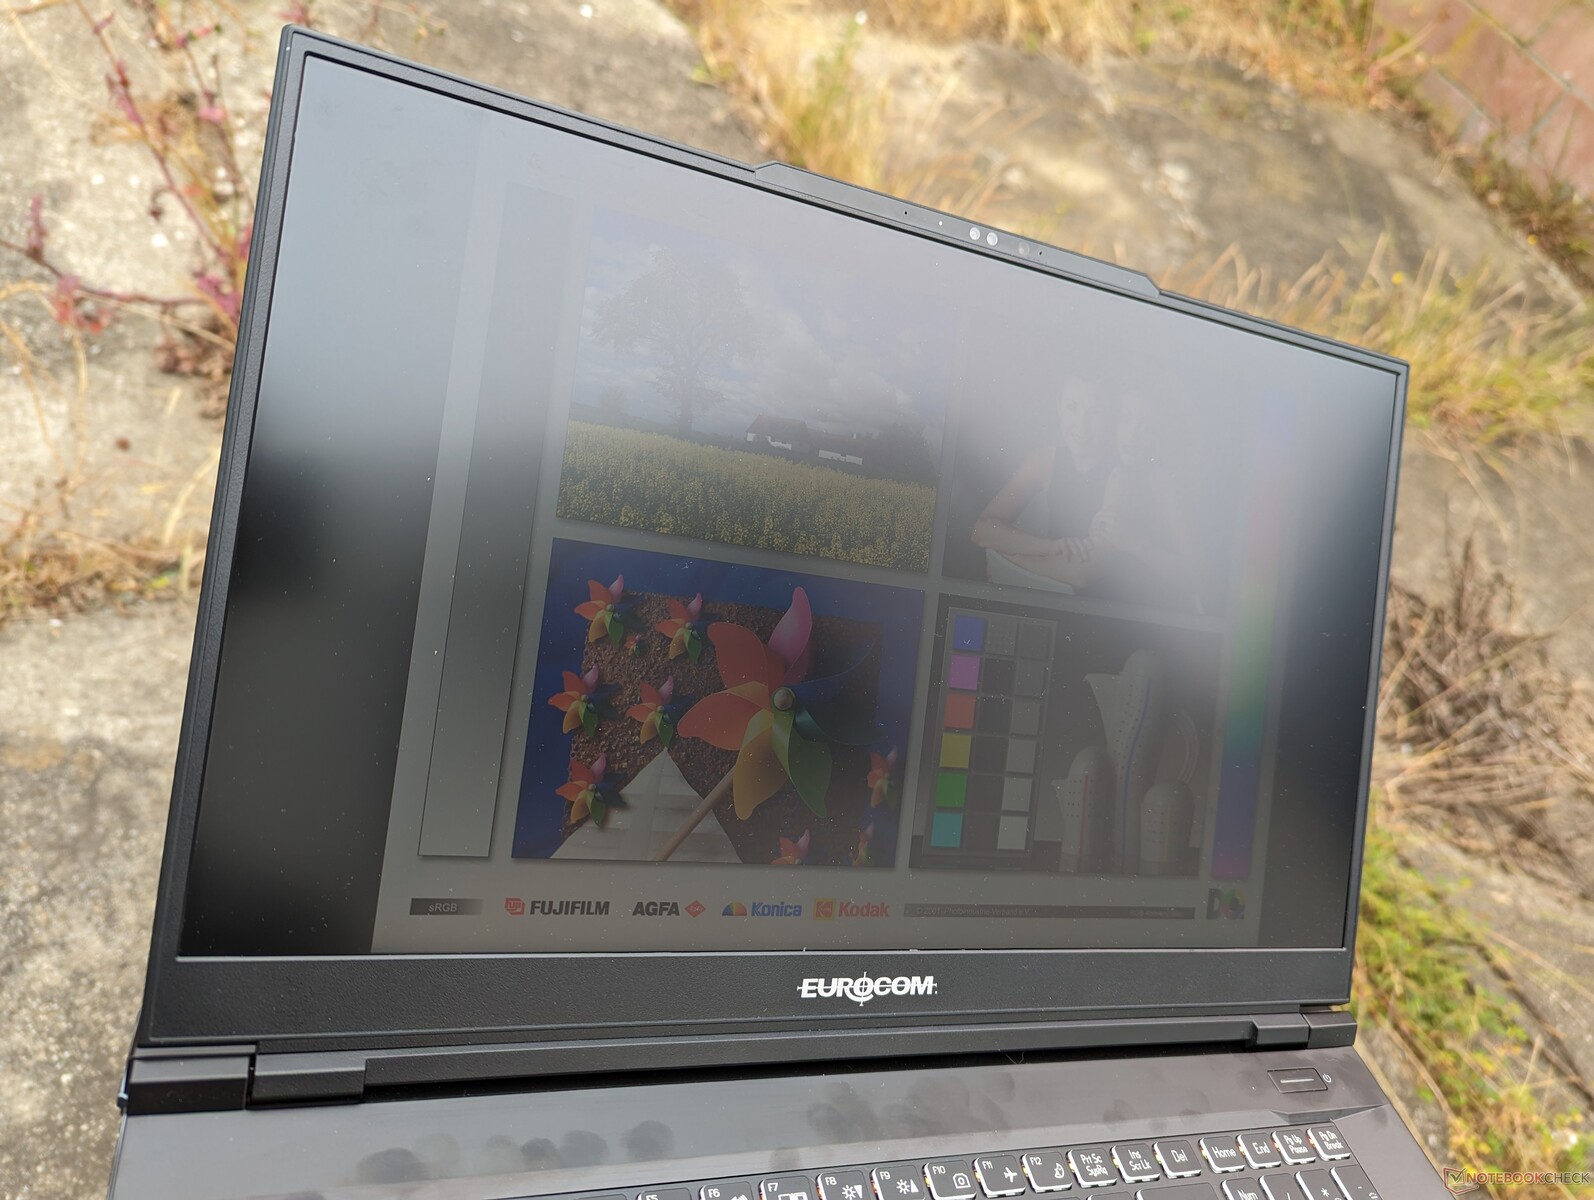
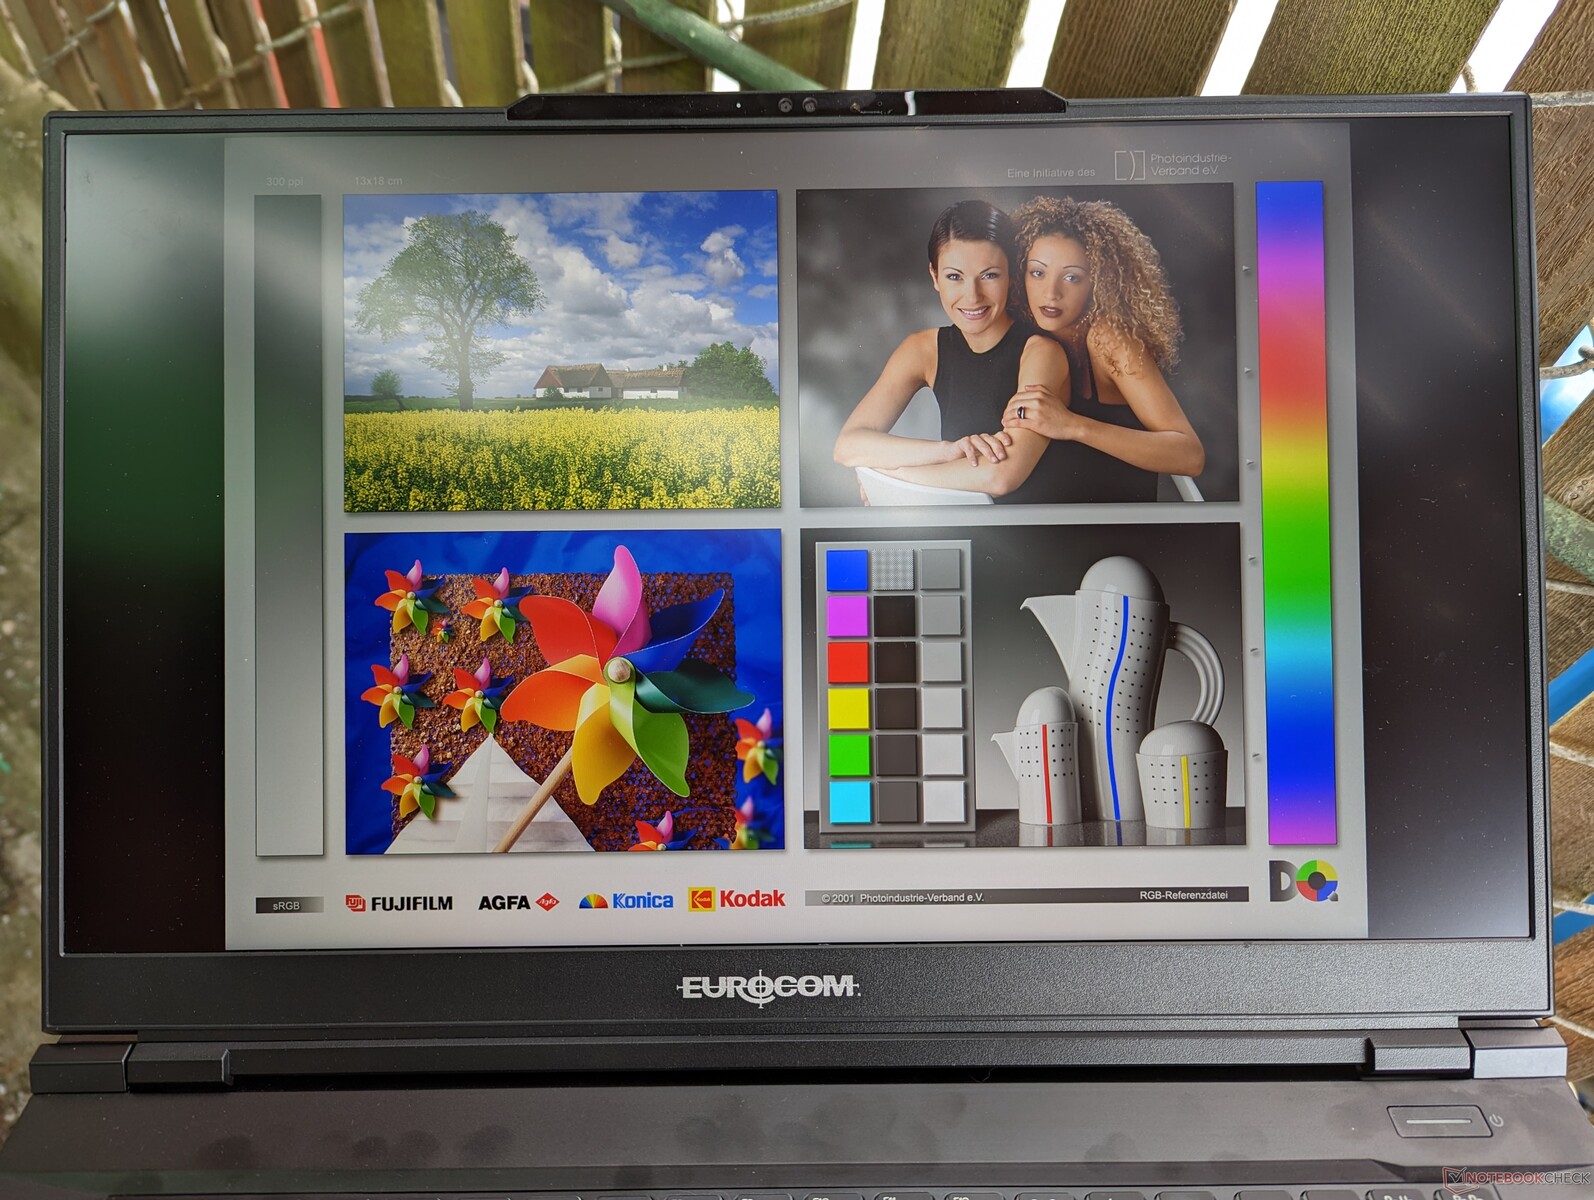
La visibilidad en exteriores es típica de la mayoría de portátiles para juegos, ya que 300 nits es la media de la categoría. Los paneles de algunos modelos de la competencia pueden alcanzar hasta 500 nits, como en el caso delAlienware m17 R5 o el Razer Blade 17 para facilitar la visión en exteriores, pero no lo vemos como una gran ventaja sobre el Eurocom teniendo en cuenta el tamaño y el peso de los portátiles de juego de 17 pulgadas.
Rendimiento - Raptor Lake Para El Raptor X17
Condiciones de ensayo
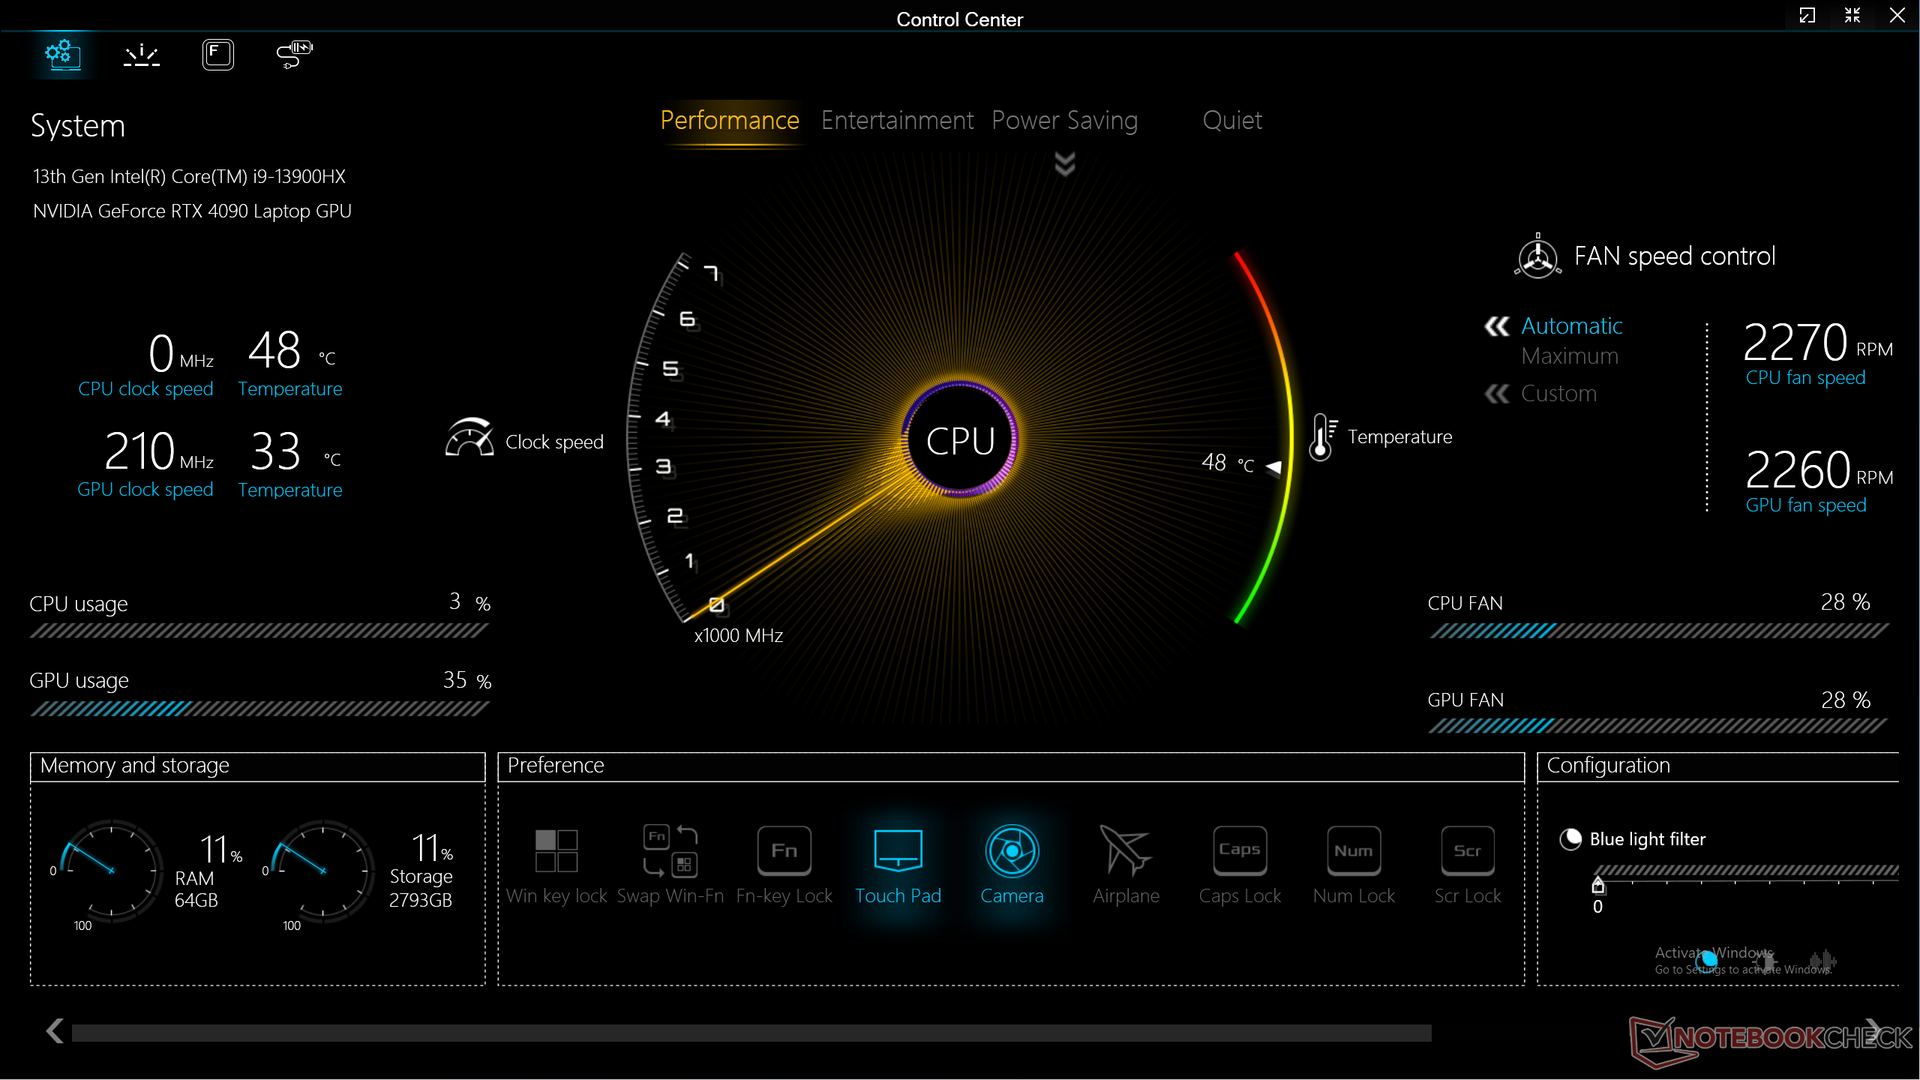
Pusimos nuestra unidad en modo Rendimiento tanto a través del Centro de Control como de Windows antes de ejecutar los benchmarks de abajo. Lamentablemente, la configuración de energía del Centro de Control no está vinculada a la configuración de energía de Windows, lo que significa que podría haber algún conflicto si ambas configuraciones no son idénticas. Por ejemplo, es posible configurar Windows en modo de ahorro de energía y el Centro de Control en modo de rendimiento simultáneamente. OEMs como Dell ya han abordado esta cuestión en su serie Alienware.
También pusimos nuestra unidad en modo dGPU antes de la prueba. El Raptor X17 soporta modo gráfico híbrido (Optimus), modo dGPU y modo Dinámico (también conocido como Optimus Avanzado). Aunque apreciamos las opciones, los ajustes están enterrados en varias capas de submenús en la BIOS. En comparación, competidores como MSI y Asus tienen ajustes similares en sus respectivas aplicaciones del Centro de Control para facilitar el acceso.
Procesador
ElCore i9-13900HX en nuestra unidad tiene un rendimiento ligeramente inferior al de otros portátiles con el mismo procesador, en torno a un 5 por ciento. A pesar de ello, sigue siendo una de las CPUs de la serie H más rápidas del mercado, rivalizando con el competidor Ryzen 9 7945HX. Actualizando desde el Core i9-12900HX aumentará el rendimiento multihilo en un 20%.
La sostenibilidad del rendimiento es excelente, especialmente si se compara con el Aorus 17X que viene con el mismo Core i9-13900HX. Las puntuaciones del bucle CineBench R15 xT serían más estables en nuestra unidad a lo largo de la prueba de estrés como se muestra en el gráfico de comparación a continuación.
Se espera que el cambio a la configuración Core i7-13700HX desde nuestro Core i9-13900HX reduzca el rendimiento multihilo entre un 20 y un 25 por ciento.
Cinebench R15 Multi Loop
Cinebench R23: Multi Core | Single Core
Cinebench R20: CPU (Multi Core) | CPU (Single Core)
Cinebench R15: CPU Multi 64Bit | CPU Single 64Bit
Blender: v2.79 BMW27 CPU
7-Zip 18.03: 7z b 4 | 7z b 4 -mmt1
Geekbench 5.5: Multi-Core | Single-Core
HWBOT x265 Benchmark v2.2: 4k Preset
LibreOffice : 20 Documents To PDF
R Benchmark 2.5: Overall mean
* ... más pequeño es mejor
AIDA64: FP32 Ray-Trace | FPU Julia | CPU SHA3 | CPU Queen | FPU SinJulia | FPU Mandel | CPU AES | CPU ZLib | FP64 Ray-Trace | CPU PhotoWorxx
| Performance rating | |
| Asus ROG Strix Scar 17 G733PY-XS96 | |
| Eluktronics Mech-17 GP2 | |
| MSI GE78HX 13VH-070US | |
| Medio Intel Core i9-13900HX | |
| Eurocom Raptor X17 | |
| Aorus 17X AZF | |
| Alienware m17 R5 (R9 6900HX, RX 6850M XT) | |
| AIDA64 / FP32 Ray-Trace | |
| Asus ROG Strix Scar 17 G733PY-XS96 | |
| MSI GE78HX 13VH-070US | |
| Eluktronics Mech-17 GP2 | |
| Medio Intel Core i9-13900HX (17589 - 27615, n=22) | |
| Eurocom Raptor X17 | |
| Aorus 17X AZF | |
| Alienware m17 R5 (R9 6900HX, RX 6850M XT) | |
| AIDA64 / FPU Julia | |
| Asus ROG Strix Scar 17 G733PY-XS96 | |
| MSI GE78HX 13VH-070US | |
| Eluktronics Mech-17 GP2 | |
| Eurocom Raptor X17 | |
| Medio Intel Core i9-13900HX (88686 - 137015, n=22) | |
| Alienware m17 R5 (R9 6900HX, RX 6850M XT) | |
| Aorus 17X AZF | |
| AIDA64 / CPU SHA3 | |
| Asus ROG Strix Scar 17 G733PY-XS96 | |
| Eluktronics Mech-17 GP2 | |
| MSI GE78HX 13VH-070US | |
| Eurocom Raptor X17 | |
| Medio Intel Core i9-13900HX (4362 - 7029, n=22) | |
| Aorus 17X AZF | |
| Alienware m17 R5 (R9 6900HX, RX 6850M XT) | |
| AIDA64 / CPU Queen | |
| Asus ROG Strix Scar 17 G733PY-XS96 | |
| Eluktronics Mech-17 GP2 | |
| MSI GE78HX 13VH-070US | |
| Eurocom Raptor X17 | |
| Medio Intel Core i9-13900HX (125644 - 141385, n=22) | |
| Aorus 17X AZF | |
| Alienware m17 R5 (R9 6900HX, RX 6850M XT) | |
| AIDA64 / FPU SinJulia | |
| Asus ROG Strix Scar 17 G733PY-XS96 | |
| Eluktronics Mech-17 GP2 | |
| MSI GE78HX 13VH-070US | |
| Medio Intel Core i9-13900HX (12334 - 17179, n=22) | |
| Eurocom Raptor X17 | |
| Aorus 17X AZF | |
| Alienware m17 R5 (R9 6900HX, RX 6850M XT) | |
| AIDA64 / FPU Mandel | |
| Asus ROG Strix Scar 17 G733PY-XS96 | |
| MSI GE78HX 13VH-070US | |
| Eluktronics Mech-17 GP2 | |
| Medio Intel Core i9-13900HX (43850 - 69202, n=22) | |
| Eurocom Raptor X17 | |
| Alienware m17 R5 (R9 6900HX, RX 6850M XT) | |
| Aorus 17X AZF | |
| AIDA64 / CPU AES | |
| Eluktronics Mech-17 GP2 | |
| Asus ROG Strix Scar 17 G733PY-XS96 | |
| Aorus 17X AZF | |
| Medio Intel Core i9-13900HX (89413 - 237881, n=22) | |
| MSI GE78HX 13VH-070US | |
| Eurocom Raptor X17 | |
| Alienware m17 R5 (R9 6900HX, RX 6850M XT) | |
| AIDA64 / CPU ZLib | |
| Asus ROG Strix Scar 17 G733PY-XS96 | |
| MSI GE78HX 13VH-070US | |
| Eluktronics Mech-17 GP2 | |
| Eurocom Raptor X17 | |
| Medio Intel Core i9-13900HX (1284 - 1958, n=22) | |
| Aorus 17X AZF | |
| Alienware m17 R5 (R9 6900HX, RX 6850M XT) | |
| AIDA64 / FP64 Ray-Trace | |
| Asus ROG Strix Scar 17 G733PY-XS96 | |
| MSI GE78HX 13VH-070US | |
| Eluktronics Mech-17 GP2 | |
| Medio Intel Core i9-13900HX (9481 - 15279, n=22) | |
| Eurocom Raptor X17 | |
| Aorus 17X AZF | |
| Alienware m17 R5 (R9 6900HX, RX 6850M XT) | |
| AIDA64 / CPU PhotoWorxx | |
| Eurocom Raptor X17 | |
| Aorus 17X AZF | |
| MSI GE78HX 13VH-070US | |
| Medio Intel Core i9-13900HX (42994 - 51994, n=22) | |
| Eluktronics Mech-17 GP2 | |
| Asus ROG Strix Scar 17 G733PY-XS96 | |
| Alienware m17 R5 (R9 6900HX, RX 6850M XT) | |
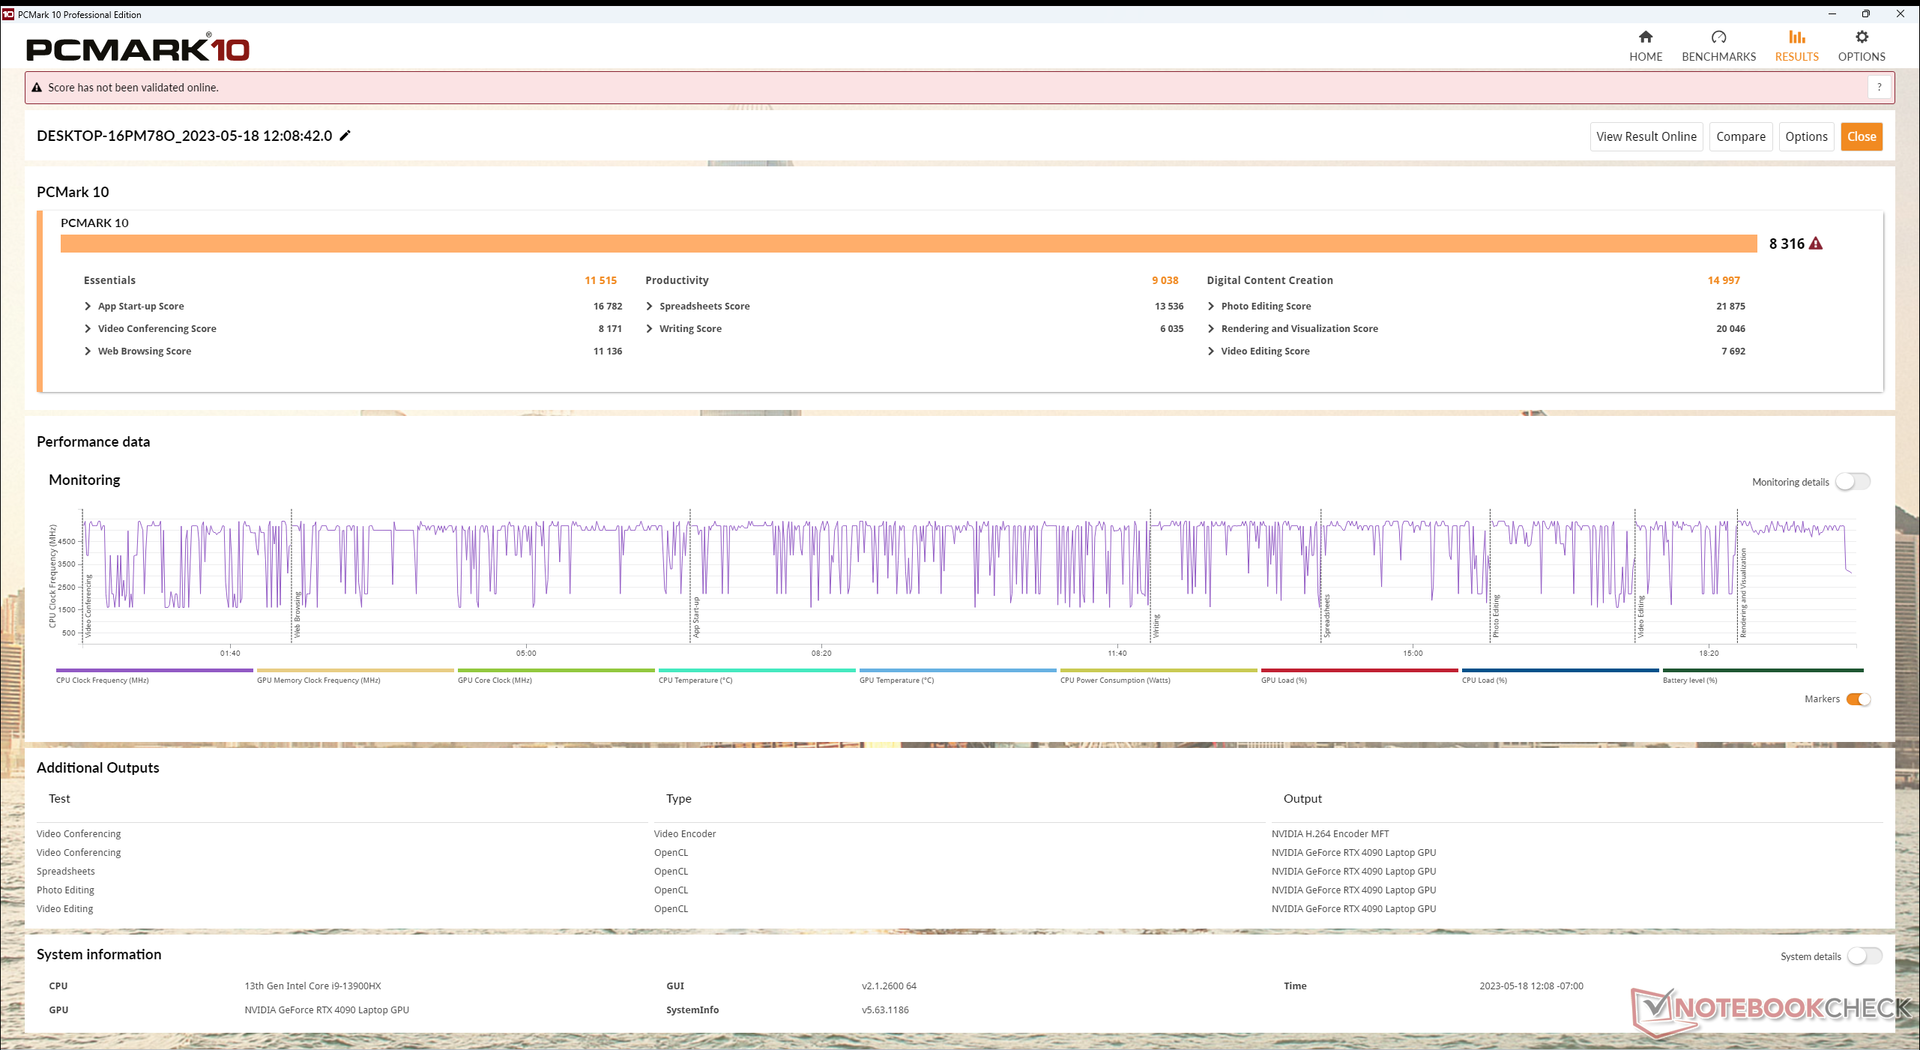
Rendimiento del sistema
CrossMark: Overall | Productivity | Creativity | Responsiveness
| PCMark 10 / Score | |
| Eluktronics Mech-17 GP2 | |
| MSI GE78HX 13VH-070US | |
| Asus ROG Strix Scar 17 G733PY-XS96 | |
| Medio Intel Core i9-13900HX, NVIDIA GeForce RTX 4090 Laptop GPU (7690 - 9331, n=8) | |
| Eurocom Raptor X17 | |
| Aorus 17X AZF | |
| Alienware m17 R5 (R9 6900HX, RX 6850M XT) | |
| PCMark 10 / Essentials | |
| Eluktronics Mech-17 GP2 | |
| Eurocom Raptor X17 | |
| MSI GE78HX 13VH-070US | |
| Medio Intel Core i9-13900HX, NVIDIA GeForce RTX 4090 Laptop GPU (10972 - 11983, n=8) | |
| Aorus 17X AZF | |
| Asus ROG Strix Scar 17 G733PY-XS96 | |
| Alienware m17 R5 (R9 6900HX, RX 6850M XT) | |
| PCMark 10 / Productivity | |
| Eluktronics Mech-17 GP2 | |
| MSI GE78HX 13VH-070US | |
| Medio Intel Core i9-13900HX, NVIDIA GeForce RTX 4090 Laptop GPU (9038 - 11680, n=8) | |
| Aorus 17X AZF | |
| Asus ROG Strix Scar 17 G733PY-XS96 | |
| Alienware m17 R5 (R9 6900HX, RX 6850M XT) | |
| Eurocom Raptor X17 | |
| PCMark 10 / Digital Content Creation | |
| Asus ROG Strix Scar 17 G733PY-XS96 | |
| Eluktronics Mech-17 GP2 | |
| MSI GE78HX 13VH-070US | |
| Eurocom Raptor X17 | |
| Medio Intel Core i9-13900HX, NVIDIA GeForce RTX 4090 Laptop GPU (10605 - 16395, n=8) | |
| Alienware m17 R5 (R9 6900HX, RX 6850M XT) | |
| Aorus 17X AZF | |
| CrossMark / Overall | |
| Eluktronics Mech-17 GP2 | |
| Aorus 17X AZF | |
| Medio Intel Core i9-13900HX, NVIDIA GeForce RTX 4090 Laptop GPU (1825 - 2295, n=8) | |
| Asus ROG Strix Scar 17 G733PY-XS96 | |
| MSI GE78HX 13VH-070US | |
| Eurocom Raptor X17 | |
| Alienware m17 R5 (R9 6900HX, RX 6850M XT) | |
| CrossMark / Productivity | |
| Aorus 17X AZF | |
| Eluktronics Mech-17 GP2 | |
| Medio Intel Core i9-13900HX, NVIDIA GeForce RTX 4090 Laptop GPU (1666 - 2166, n=8) | |
| MSI GE78HX 13VH-070US | |
| Asus ROG Strix Scar 17 G733PY-XS96 | |
| Eurocom Raptor X17 | |
| Alienware m17 R5 (R9 6900HX, RX 6850M XT) | |
| CrossMark / Creativity | |
| Eluktronics Mech-17 GP2 | |
| Medio Intel Core i9-13900HX, NVIDIA GeForce RTX 4090 Laptop GPU (2162 - 2514, n=8) | |
| Asus ROG Strix Scar 17 G733PY-XS96 | |
| Aorus 17X AZF | |
| Eurocom Raptor X17 | |
| MSI GE78HX 13VH-070US | |
| Alienware m17 R5 (R9 6900HX, RX 6850M XT) | |
| CrossMark / Responsiveness | |
| Aorus 17X AZF | |
| Eluktronics Mech-17 GP2 | |
| Medio Intel Core i9-13900HX, NVIDIA GeForce RTX 4090 Laptop GPU (1441 - 2275, n=8) | |
| MSI GE78HX 13VH-070US | |
| Asus ROG Strix Scar 17 G733PY-XS96 | |
| Eurocom Raptor X17 | |
| Alienware m17 R5 (R9 6900HX, RX 6850M XT) | |
| PCMark 10 Score | 8316 puntos | |
ayuda | ||
| AIDA64 / Memory Copy | |
| Aorus 17X AZF | |
| MSI GE78HX 13VH-070US | |
| Eurocom Raptor X17 | |
| Medio Intel Core i9-13900HX (67716 - 79193, n=22) | |
| Eluktronics Mech-17 GP2 | |
| Alienware m17 R5 (R9 6900HX, RX 6850M XT) | |
| Asus ROG Strix Scar 17 G733PY-XS96 | |
| AIDA64 / Memory Read | |
| Aorus 17X AZF | |
| MSI GE78HX 13VH-070US | |
| Medio Intel Core i9-13900HX (73998 - 88462, n=22) | |
| Eurocom Raptor X17 | |
| Eluktronics Mech-17 GP2 | |
| Asus ROG Strix Scar 17 G733PY-XS96 | |
| Alienware m17 R5 (R9 6900HX, RX 6850M XT) | |
| AIDA64 / Memory Write | |
| Aorus 17X AZF | |
| MSI GE78HX 13VH-070US | |
| Eurocom Raptor X17 | |
| Medio Intel Core i9-13900HX (65472 - 77045, n=22) | |
| Eluktronics Mech-17 GP2 | |
| Asus ROG Strix Scar 17 G733PY-XS96 | |
| Alienware m17 R5 (R9 6900HX, RX 6850M XT) | |
| AIDA64 / Memory Latency | |
| Alienware m17 R5 (R9 6900HX, RX 6850M XT) | |
| Eluktronics Mech-17 GP2 | |
| Medio Intel Core i9-13900HX (75.3 - 91.1, n=22) | |
| MSI GE78HX 13VH-070US | |
| Eurocom Raptor X17 | |
| Asus ROG Strix Scar 17 G733PY-XS96 | |
| Aorus 17X AZF | |
* ... más pequeño es mejor
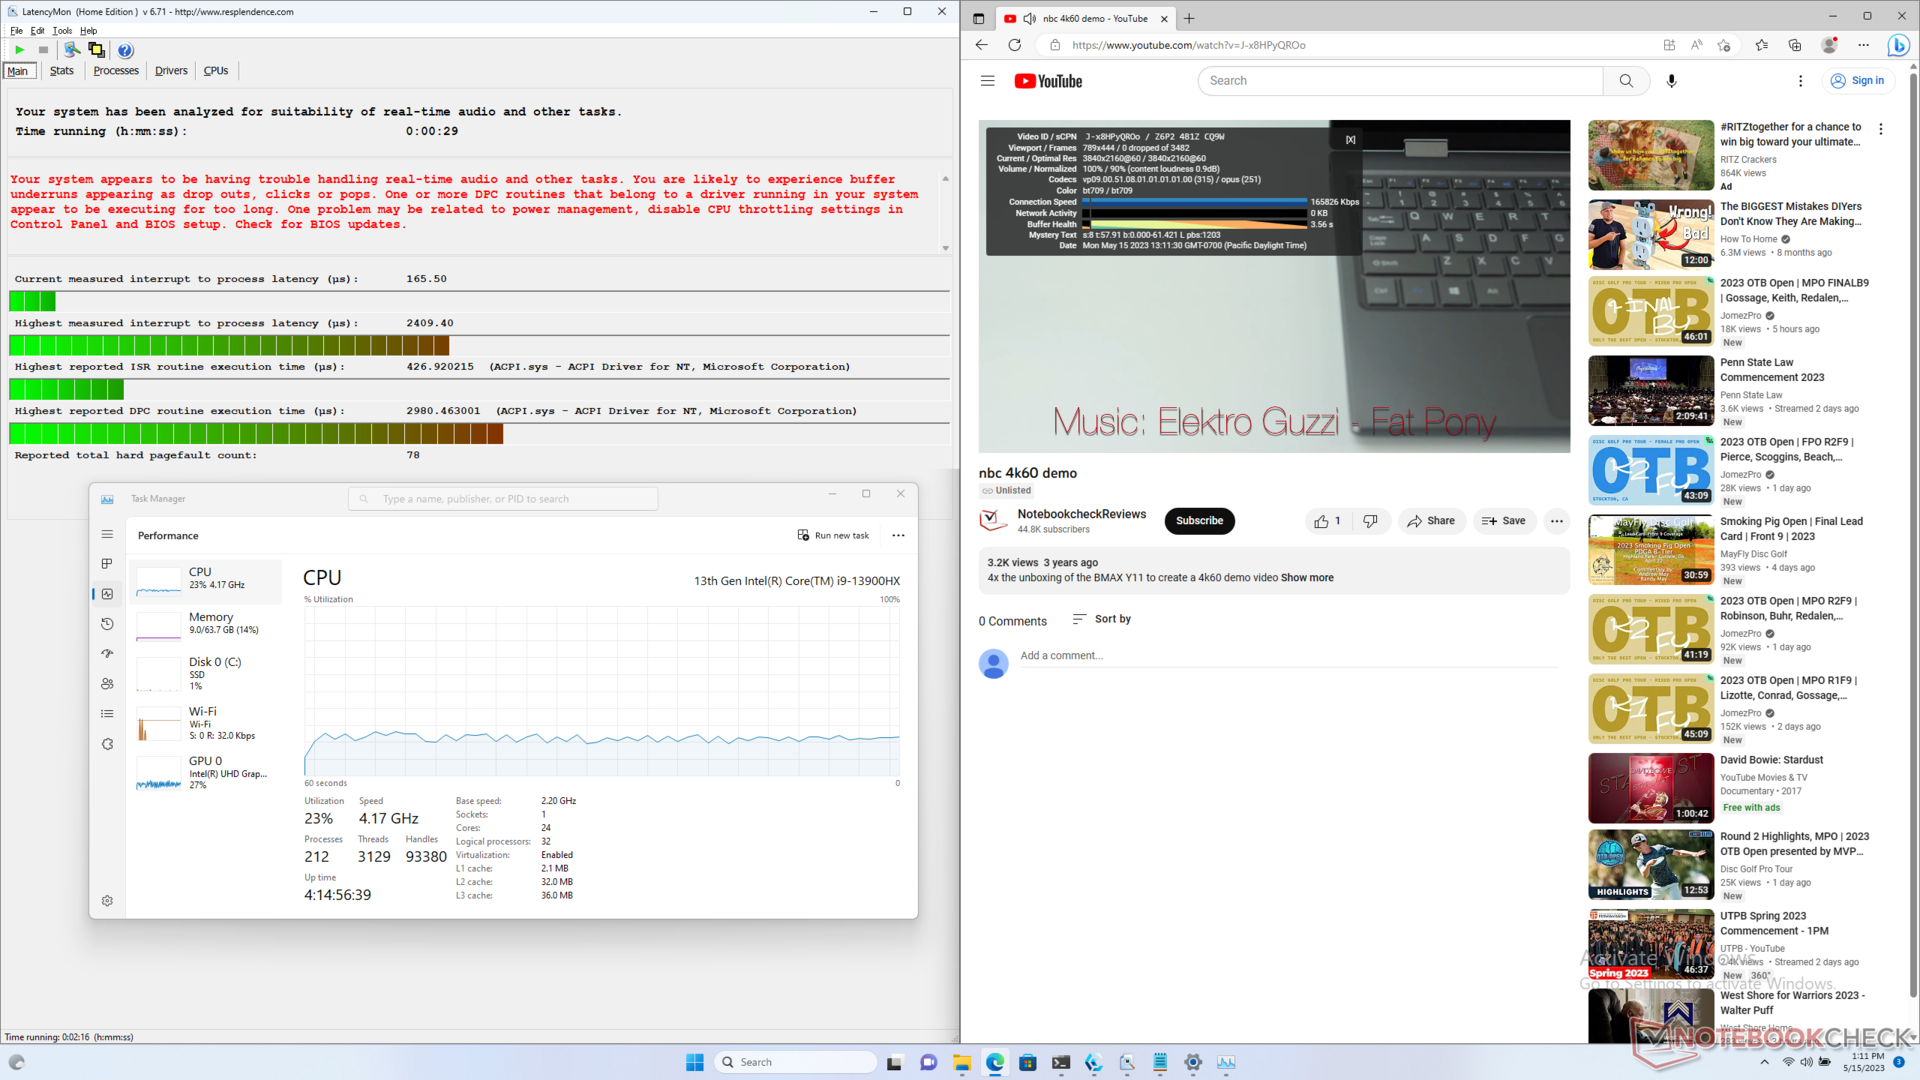
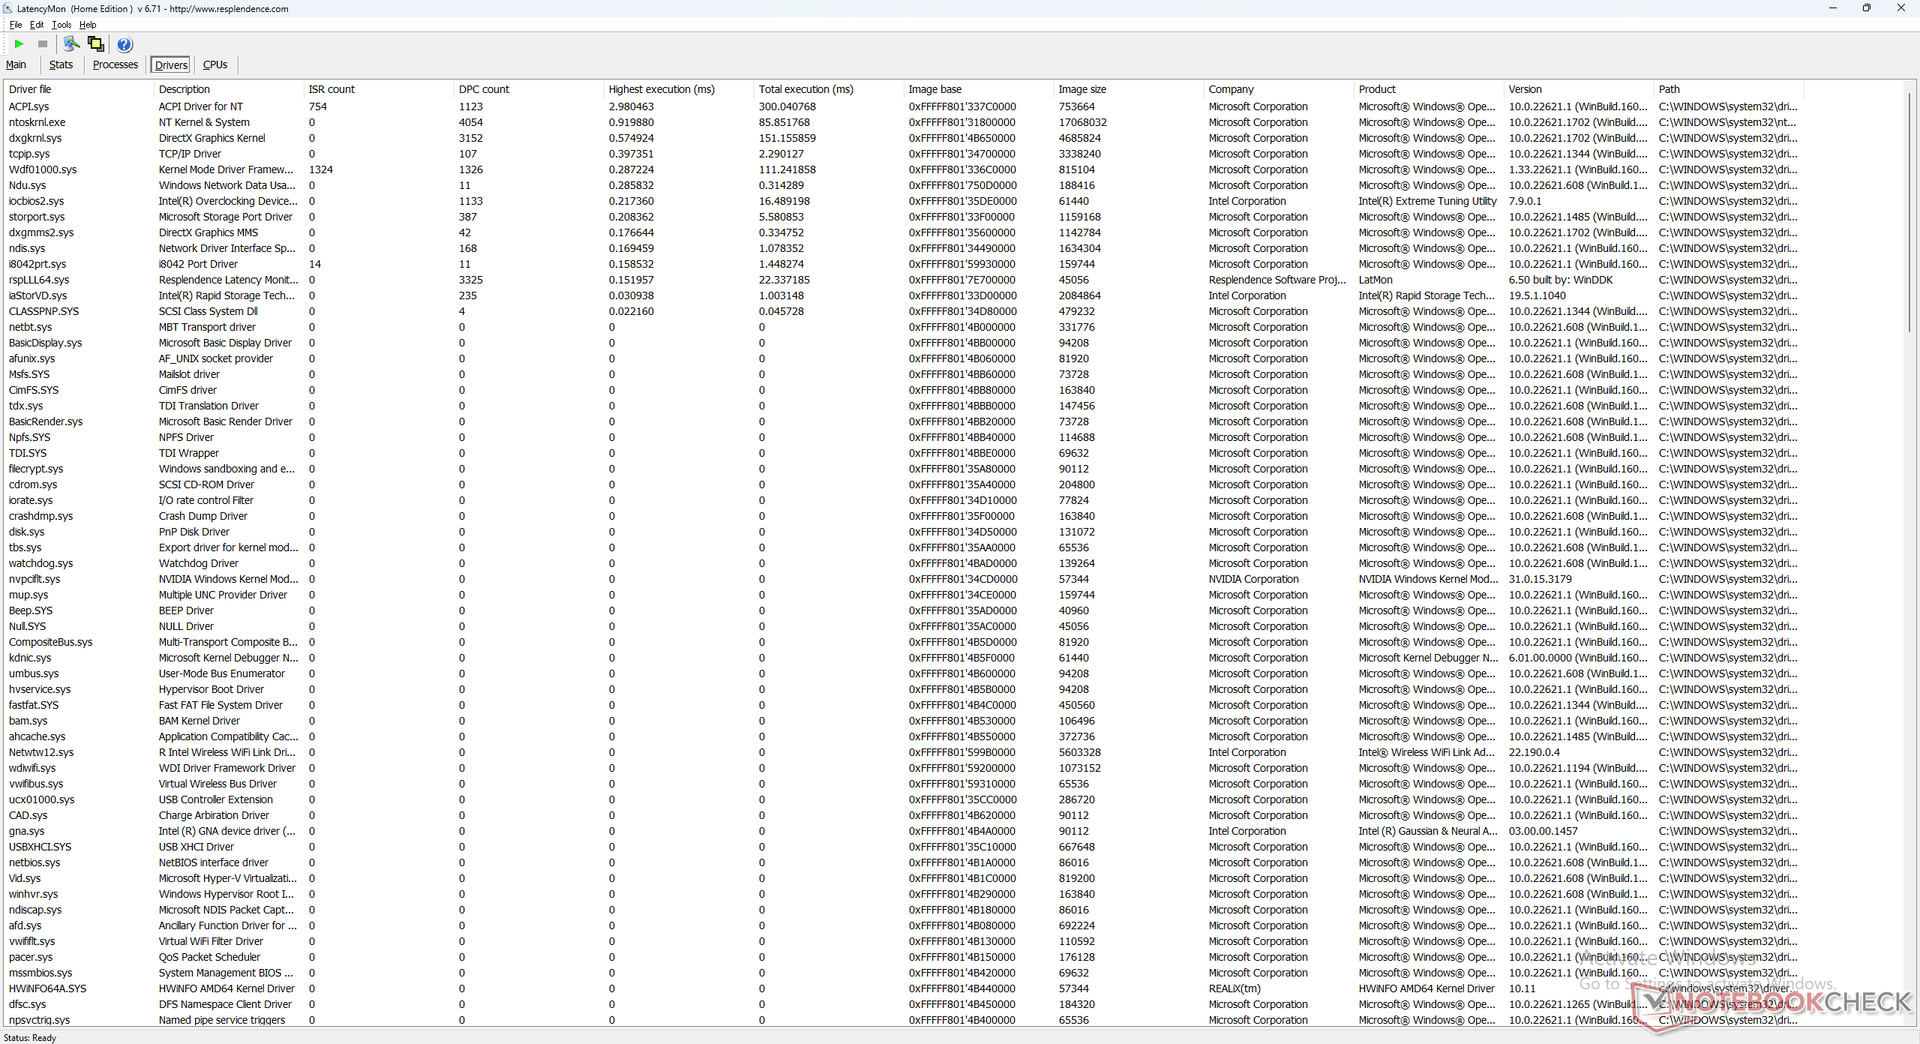
Latencia del CPD
LatencyMon revela problemas de CPD al abrir varias pestañas del navegador de nuestra página de inicio. por lo demás, la reproducción de vídeo 4K a 60 FPS es perfecta, con un bajo uso de la CPU y sin caídas de fotogramas.
| DPC Latencies / LatencyMon - interrupt to process latency (max), Web, Youtube, Prime95 | |
| Aorus 17X AZF | |
| MSI GE78HX 13VH-070US | |
| Eurocom Raptor X17 | |
| Asus ROG Strix Scar 17 G733PY-XS96 | |
| Alienware m17 R5 (R9 6900HX, RX 6850M XT) | |
| Eluktronics Mech-17 GP2 | |
* ... más pequeño es mejor
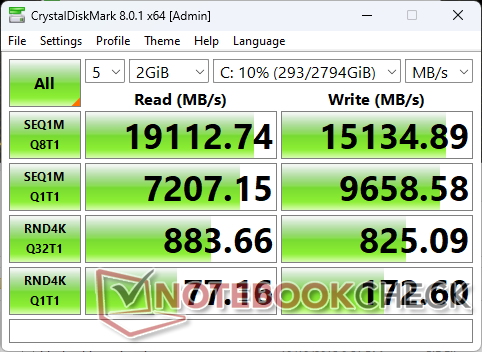
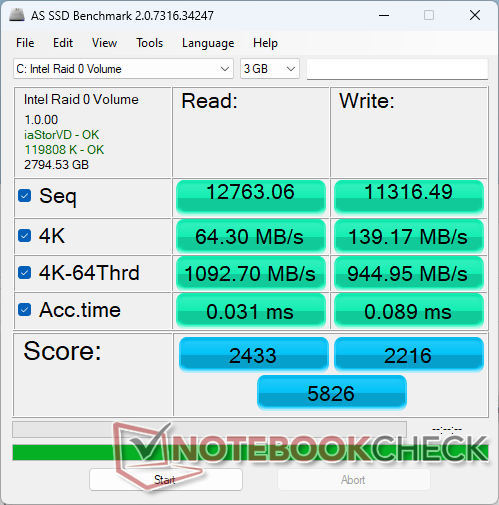
Dispositivos de almacenamiento: 3 unidades SSD PCIe4 x4 NVMe
Nuestra unidad viene configurada con tres Samsung 980 Pro PCIe4 x4 NVMe en RAID 0 para maximizar el rendimiento. De hecho, es uno de los pocos portátiles de juego que admite tantas unidades en configuración RAID. Las tasas de transferencia máximas rondan los 19000 MB/s, pero es de esperar que el rendimiento ronde entre los 15000 y los 18000 MB/s bajo estrés, lo que sigue siendo impresionante. No notamos problemas de ralentización importantes a este respecto.
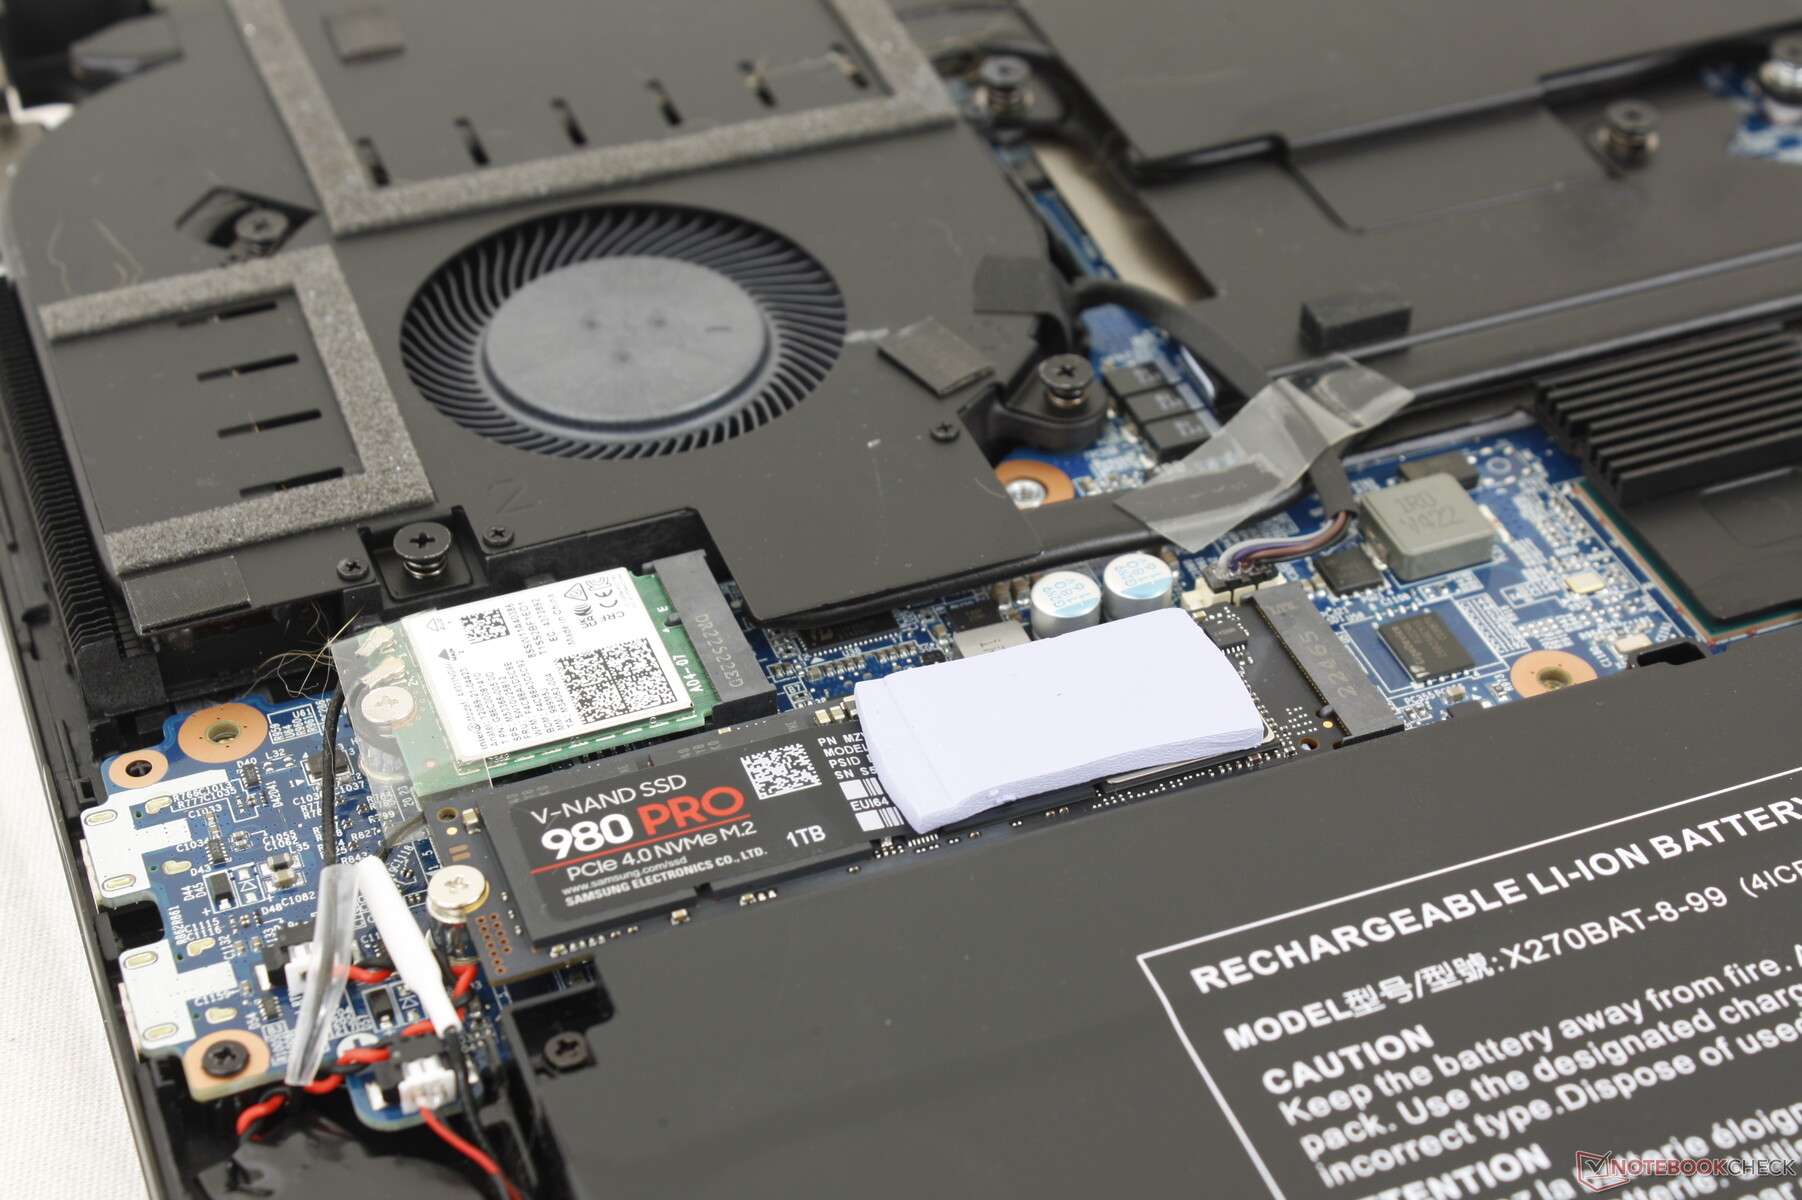

| Drive Performance rating - Percent | |
| Aorus 17X AZF | |
| MSI GE78HX 13VH-070US | |
| Eurocom Raptor X17 | |
| Asus ROG Strix Scar 17 G733PY-XS96 | |
| Eluktronics Mech-17 GP2 | |
| Alienware m17 R5 (R9 6900HX, RX 6850M XT) | |
* ... más pequeño es mejor
Disk Throttling: DiskSpd Read Loop, Queue Depth 8
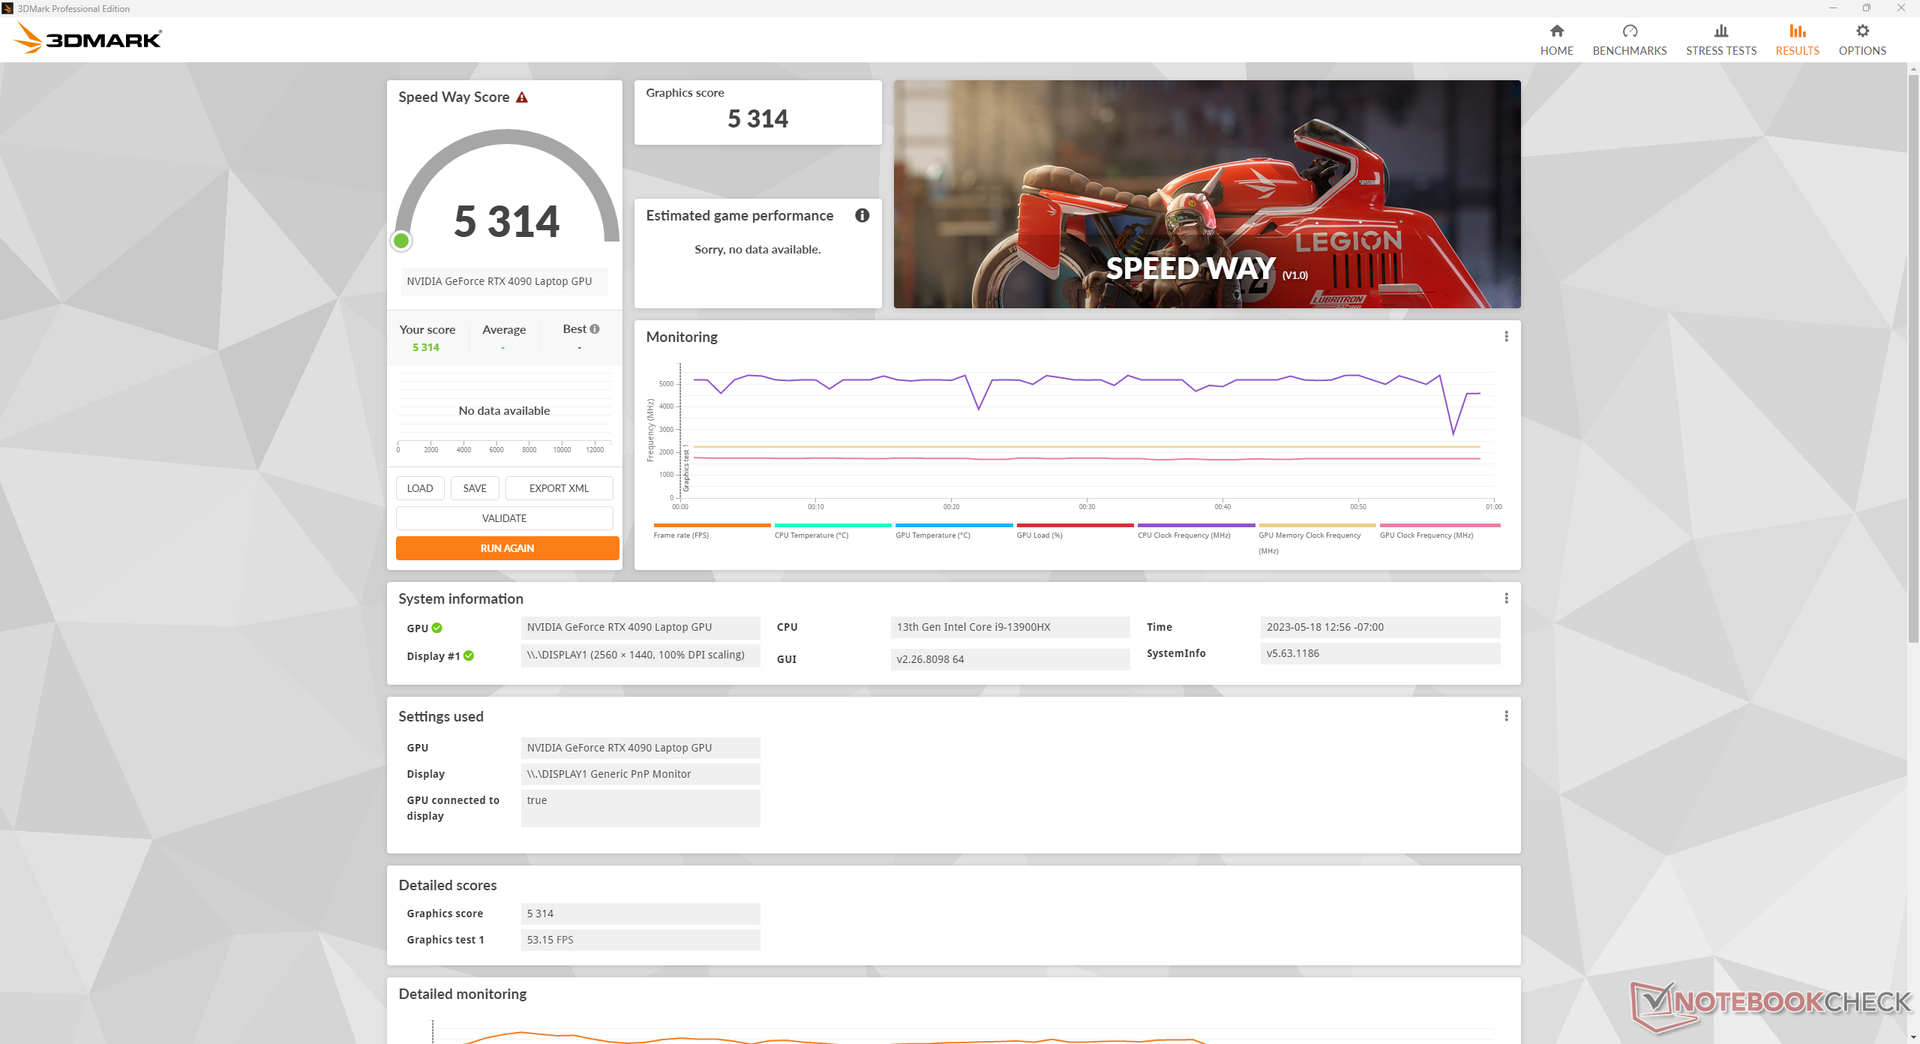
Rendimiento de la GPU - Gráficos TGP de 175 W
El rendimiento gráfico está dentro de unos pocos puntos porcentuales de la media de portátiles de nuestra base de datos con el misma GeForce RTX 4090 GPU. Ejecutar en modo Entretenimiento en vez de Rendimiento reduciría el rendimiento gráfico entre un 4 y un 5 por ciento. Un ordenador de rTX 4090 de sobremesa GeForce sigue siendo significativamente más rápida que nuestra RTX 4090 para portátiles, entre un 60 y un 80 por ciento, debido a las grandes limitaciones térmicas de las GPU para portátiles.
Hay que tener en cuenta que el cambio a la móvil GeForce RTX 4080 sólo reduciría el rendimiento gráfico entre un 5% y un 10%. Por tanto, puede que merezca la pena considerar la RTX 4080 para portátiles, ya que el rendimiento es muy similar entre las dos GPU.
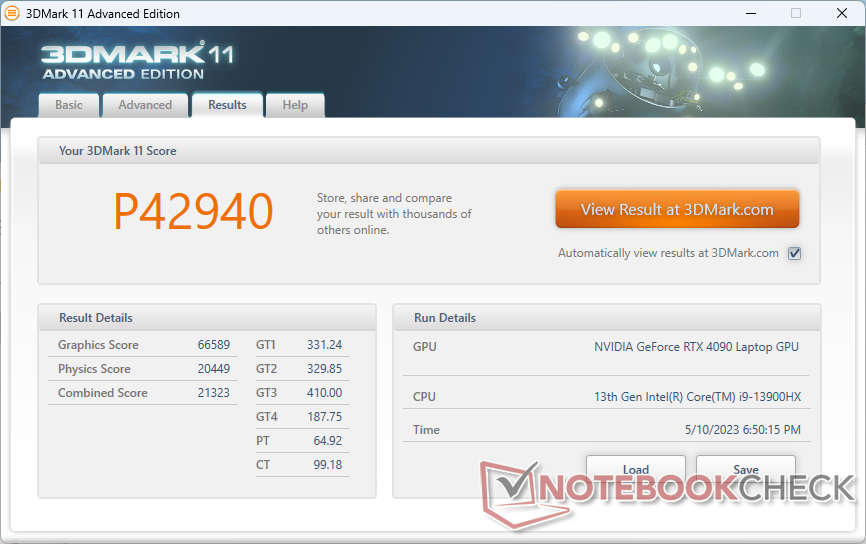
| 3DMark 11 Performance | 42940 puntos | |
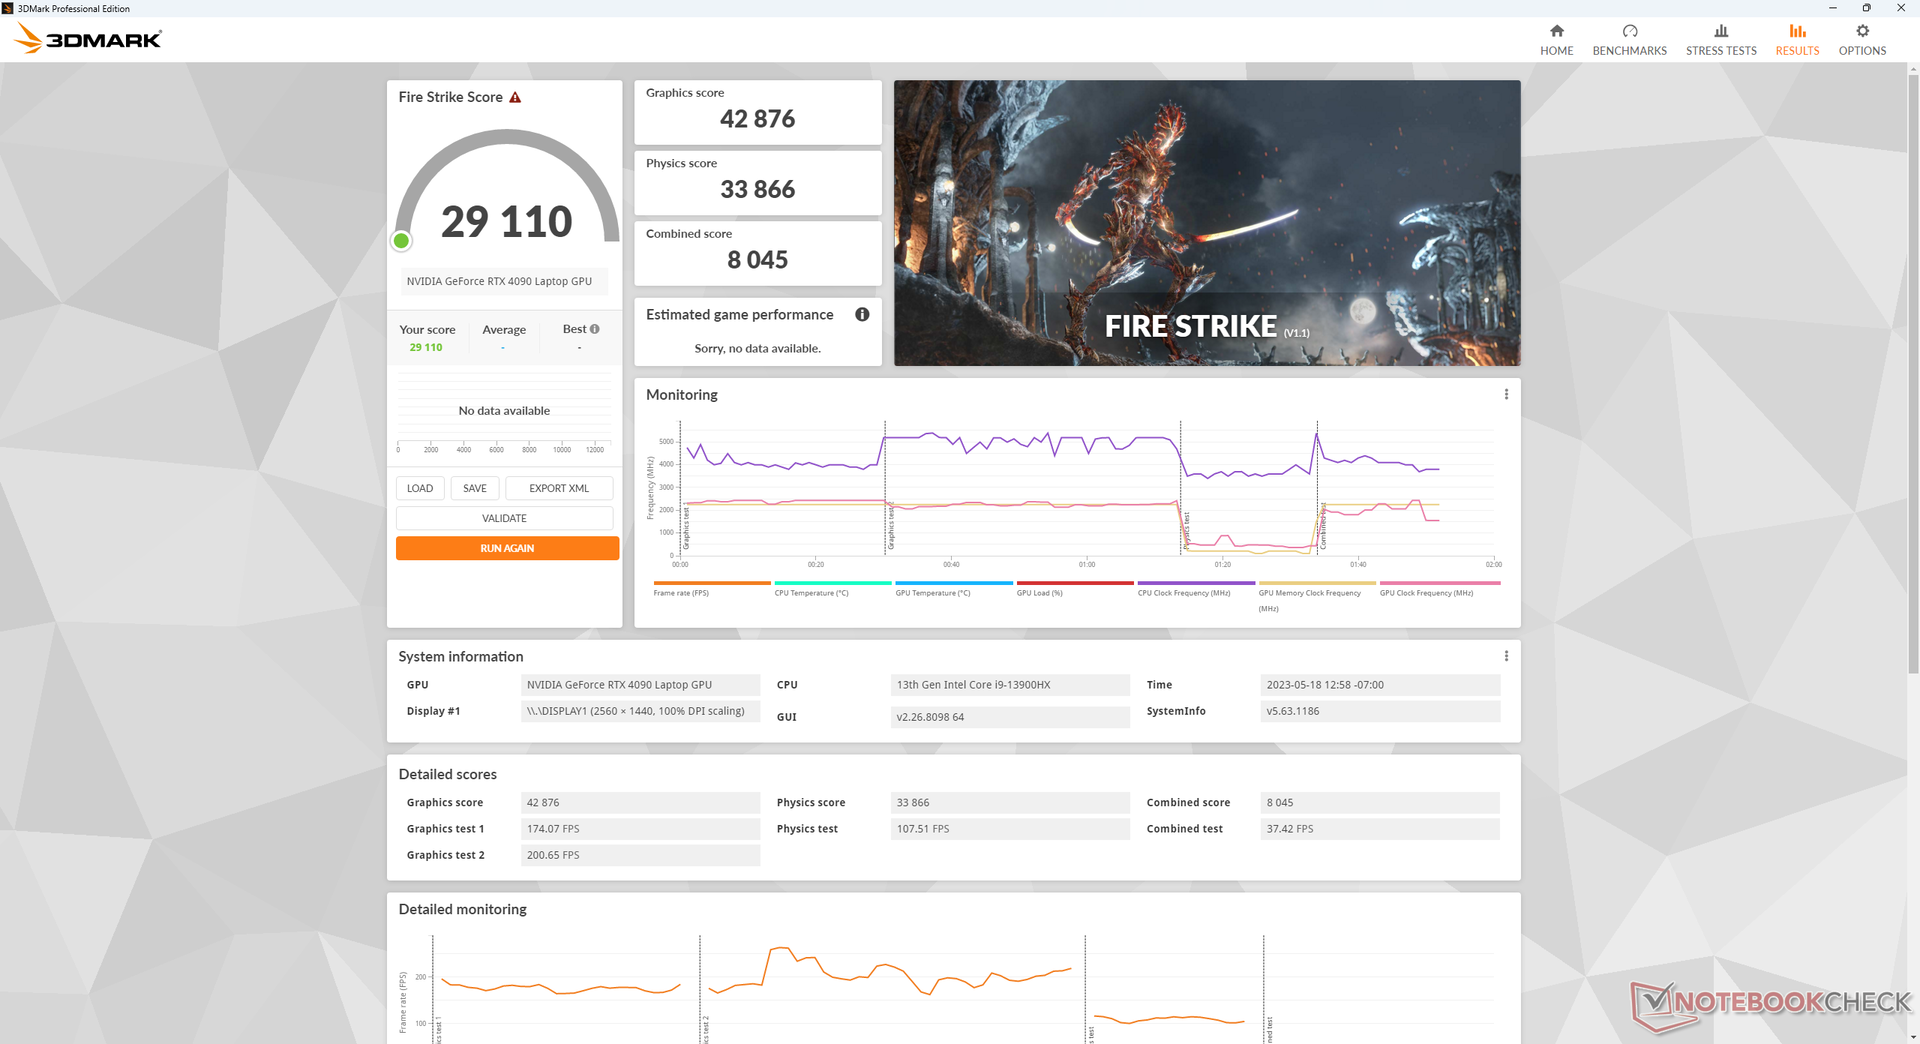
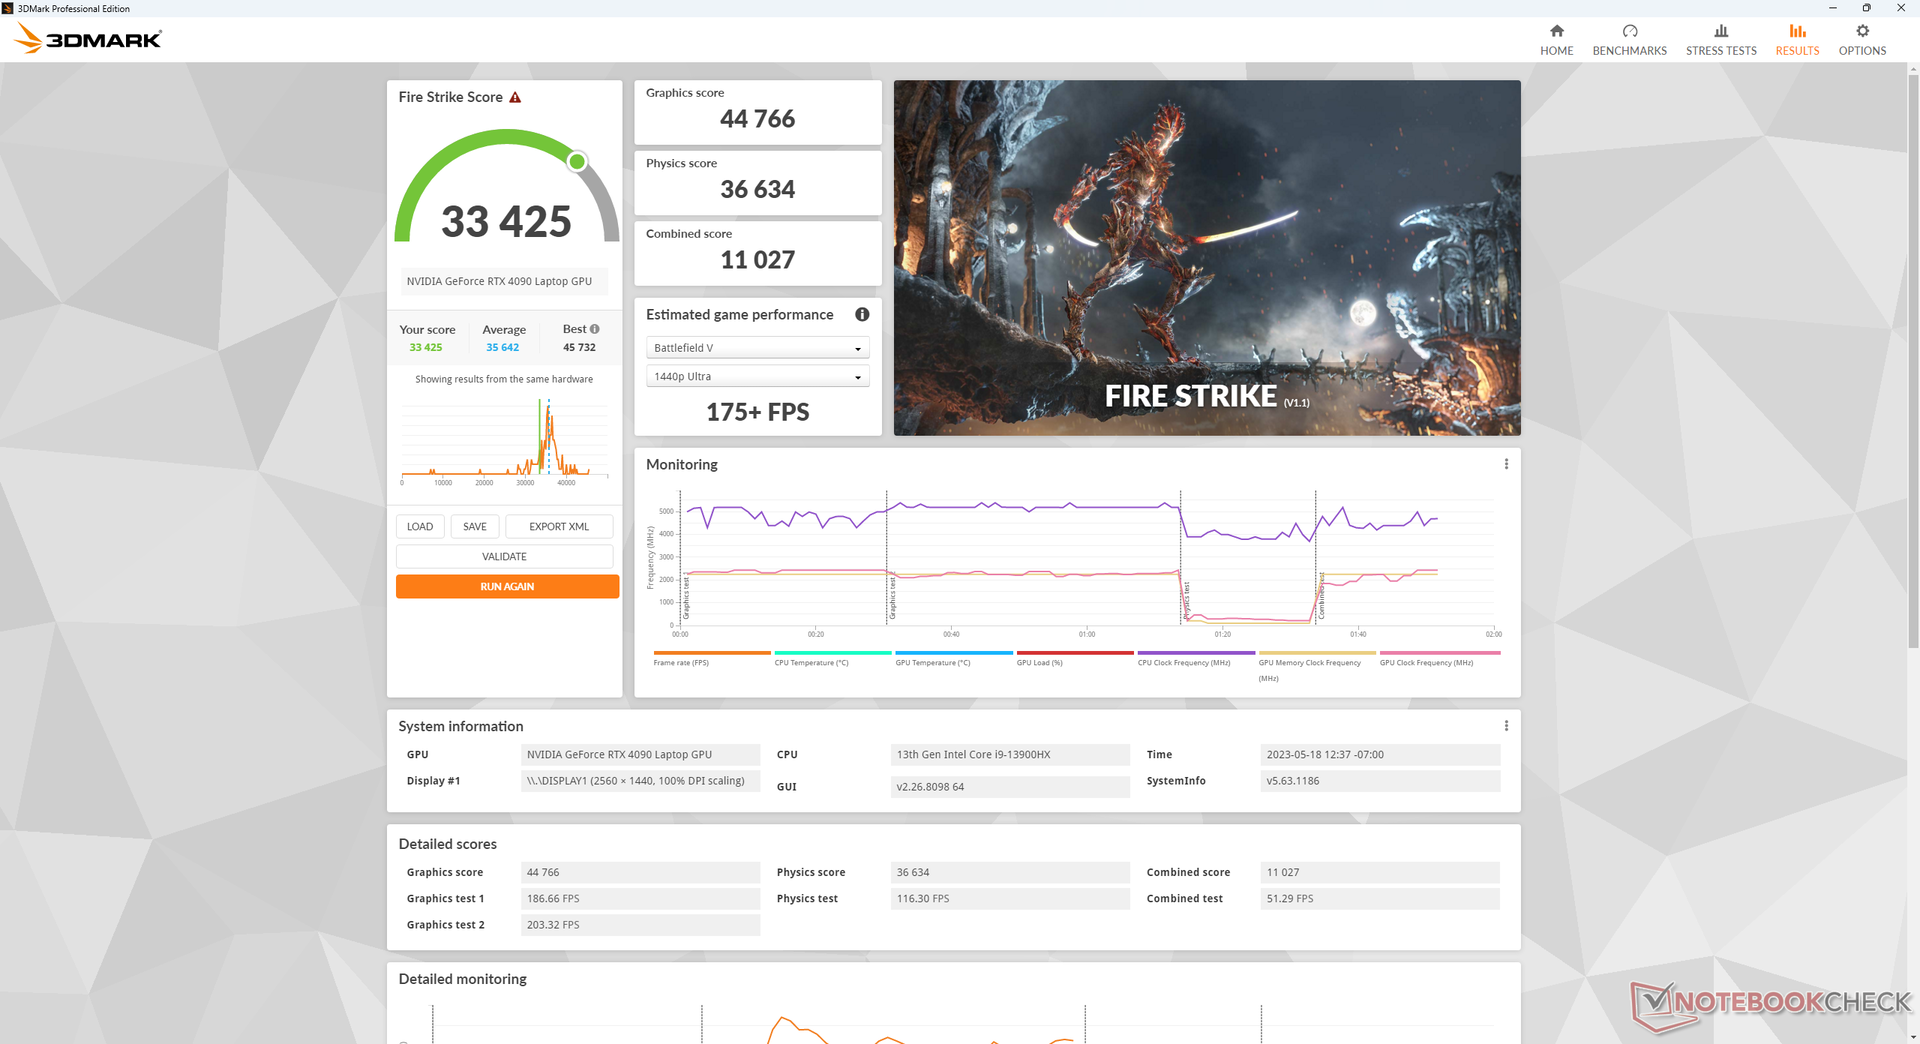
| 3DMark Fire Strike Score | 33425 puntos | |
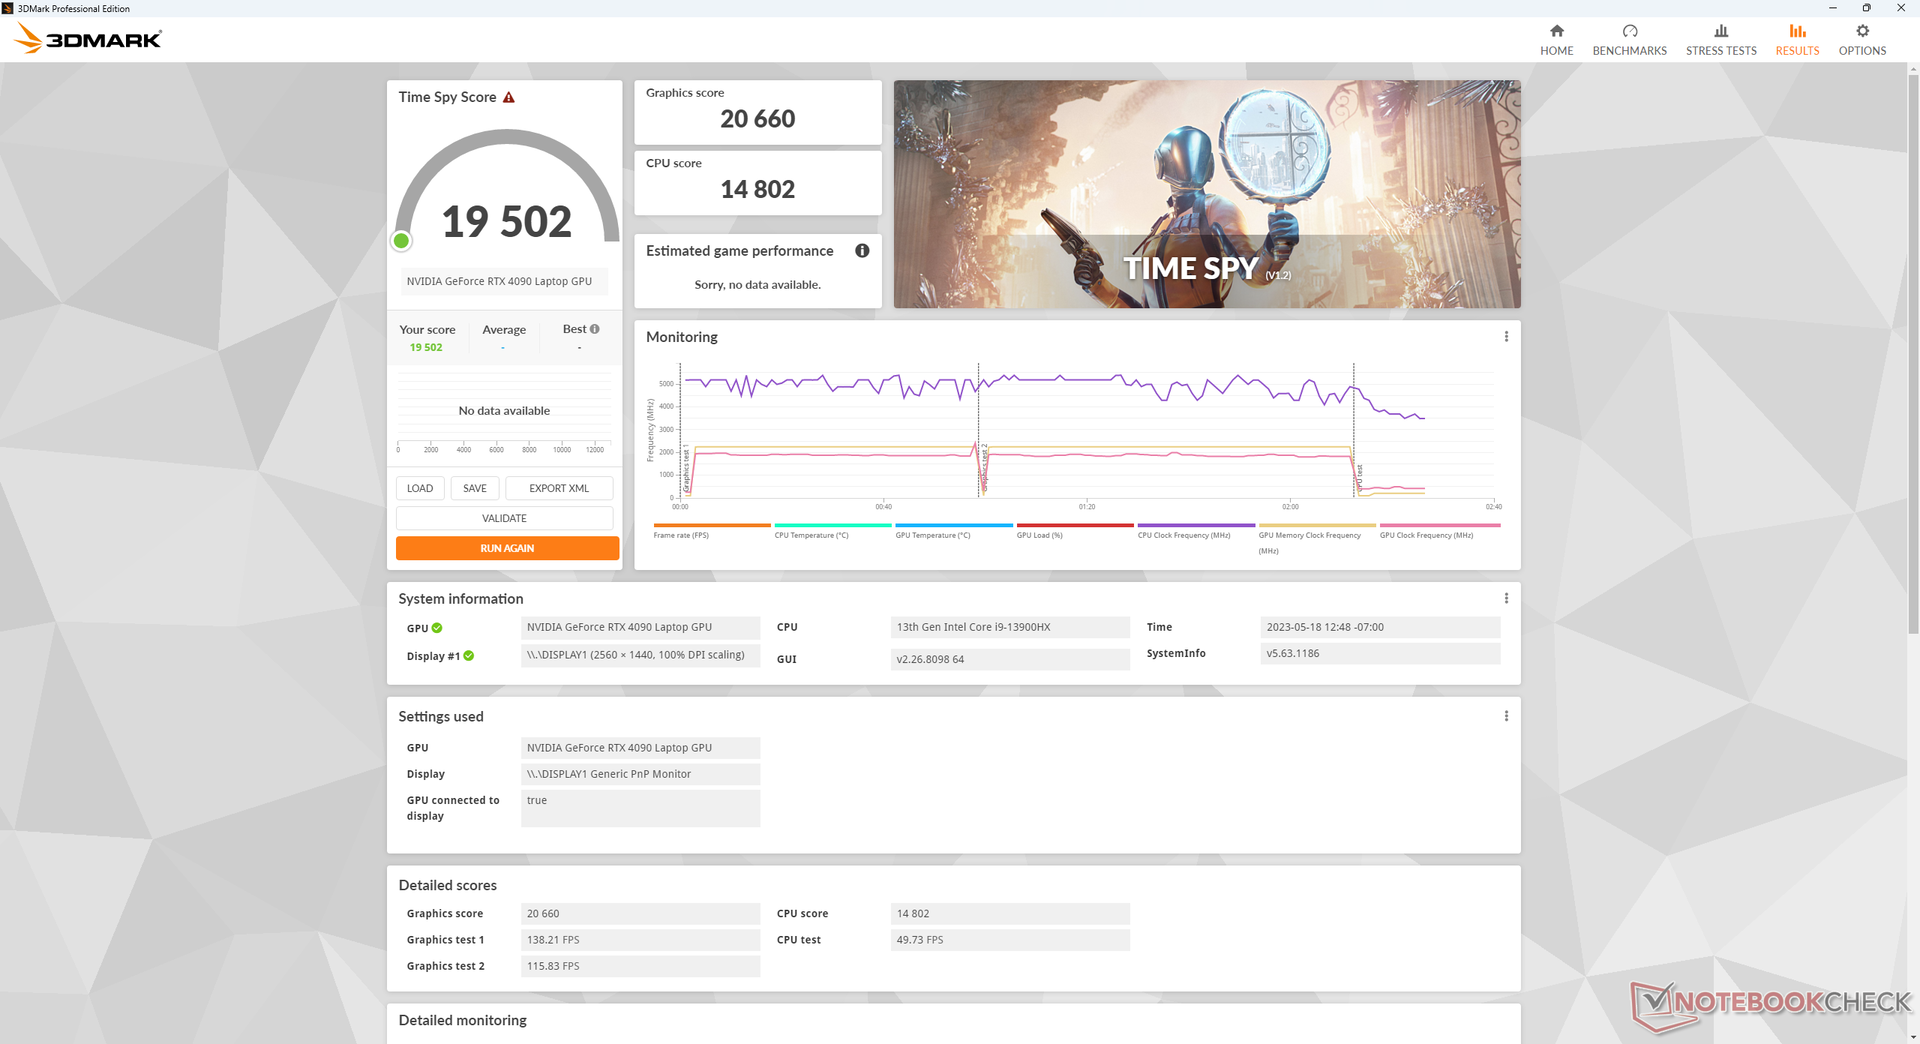
| 3DMark Time Spy Score | 19502 puntos | |
ayuda | ||
* ... más pequeño es mejor
Rendimiento en juegos
Aunque la RTX 4090 para móviles no es ni de lejos tan rápida como una RTX 4090 de sobremesa, sigue siendo potente incluso para los títulos más exigentes como F1 22, Returnal o Cyberpunk 2077. Más concretamente, la RTX 4090 para portátiles parece ideal para jugar a 1440p a 120 FPS o a 4K a 60 FPS con ajustes altos o ultra. Es recomendable usar el modo dGPU o el modo Advanced Optimus siempre que sea posible, sobre todo porque G-Sync no está disponible en el modo gráfico híbrido.
Witcher 3 FPS Chart
| bajo | medio | alto | ultra | QHD | 4K | |
|---|---|---|---|---|---|---|
| GTA V (2015) | 187.2 | 186.4 | 183.7 | 139.5 | 134.3 | 173.6 |
| The Witcher 3 (2015) | 512.8 | 448.8 | 388.1 | 207.2 | 163.8 | |
| Dota 2 Reborn (2015) | 234 | 207 | 199.4 | 184.9 | 178.5 | |
| Final Fantasy XV Benchmark (2018) | 219 | 204 | 172.2 | 149 | 88.8 | |
| X-Plane 11.11 (2018) | 192.9 | 172.1 | 136.2 | 117.3 | ||
| Strange Brigade (2018) | 439 | 351 | 341 | 328 | 300 | 155.2 |
| Cyberpunk 2077 1.6 (2022) | 114 | 109.4 | 103.7 | 91 | 87.3 | 47.3 |
| Tiny Tina's Wonderlands (2022) | 271.8 | 238.8 | 203.3 | 183.1 | 130.7 | 68.7 |
| F1 22 (2022) | 210 | 209 | 199 | 120.8 | 90.2 | 44.3 |
| Returnal (2023) | 145 | 153 | 159 | 141 | 115 | 69 |
Emisiones
Ruido del sistema: muy alto al jugar
Los ventiladores están siempre activos, independientemente del ajuste de potencia o de la carga en pantalla. Incluso en modo silencioso, por ejemplo, el ruido mínimo del ventilador es de 33 dB(A) sobre un fondo silencioso de 23 dB(A). Este nivel es más alto que en la mayoría de portátiles para juegos y es audible en entornos de oficina. Si se pone en modo Rendimiento o Entretenimiento, los ventiladores pulsarán con regularidad incluso si simplemente se navega o se hace streaming de vídeo. Definitivamente querrás estar en una configuración de potencia más baja siempre que sea posible cuando la potencia extra no sea necesaria.
Jugar en modo Rendimiento induciría un ruido de ventilador de casi 61 dB(A) para ser significativamente más ruidoso que los portátiles de juego de la competencia como el Alienware m17 R5 o elMSI GE78HX. El rango de más de 50 dB(A) es alto pero tolerable con un buen par de auriculares, pero más de 60 dB(A) hace que sea extremadamente difícil jugar a juegos sensibles al ruido como Fortnite u Overwatch , donde los pasos y otras colas de audio son vitales para el juego.
Al cambiar el ajuste de potencia del modo Rendimiento al modo Entretenimiento, el ruido del ventilador bajaría solo ligeramente de 60,7 dB(A) a 59,7 dB(A). La diferencia es tan pequeña que puedes usar el modo Rendimiento cuando juegues y saltarte el modo Entretenimiento.
Ruido
| Ocioso |
| 33.1 / 33.1 / 40.7 dB(A) |
| Carga |
| 59.9 / 61 dB(A) |
 | ||
30 dB silencioso 40 dB(A) audible 50 dB(A) ruidosamente alto |
||
min: | ||
| Eurocom Raptor X17 GeForce RTX 4090 Laptop GPU, i9-13900HX, 3x Samsung SSD 980 Pro 1TB (RAID 0) | Asus ROG Strix Scar 17 G733PY-XS96 GeForce RTX 4090 Laptop GPU, R9 7945HX, SK hynix PC801 HFS001TEJ9X101N | Aorus 17X AZF GeForce RTX 4090 Laptop GPU, i9-13900HX, Gigabyte AG470S1TB-SI B10 | MSI GE78HX 13VH-070US GeForce RTX 4080 Laptop GPU, i9-13950HX, Samsung PM9A1 MZVL22T0HBLB | Eluktronics Mech-17 GP2 GeForce RTX 4090 Laptop GPU, i9-13900HX, Samsung PM9A1 MZVL21T0HCLR | Alienware m17 R5 (R9 6900HX, RX 6850M XT) Radeon RX 6850M XT, R9 6900HX, SSSTC CA6-8D1024 | |
|---|---|---|---|---|---|---|
| Noise | 22% | 10% | 16% | 16% | 23% | |
| apagado / medio ambiente * (dB) | 23.3 | 22.7 3% | 25 -7% | 23.4 -0% | 25.2 -8% | 23 1% |
| Idle Minimum * (dB) | 33.1 | 23.5 29% | 28 15% | 24.2 27% | 28 15% | 23 31% |
| Idle Average * (dB) | 33.1 | 27.7 16% | 29 12% | 25.6 23% | 28 15% | 28.11 15% |
| Idle Maximum * (dB) | 40.7 | 27.7 32% | 34 16% | 31 24% | 30.4 25% | 28.11 31% |
| Load Average * (dB) | 59.9 | 30.5 49% | 51 15% | 43.3 28% | 41 32% | 30.62 49% |
| Witcher 3 ultra * (dB) | 60.8 | 51.4 15% | 57 6% | 56.3 7% | 50.7 17% | 49.75 18% |
| Load Maximum * (dB) | 61 | 54.1 11% | 54 11% | 59.1 3% | 52.6 14% | 50.17 18% |
* ... más pequeño es mejor
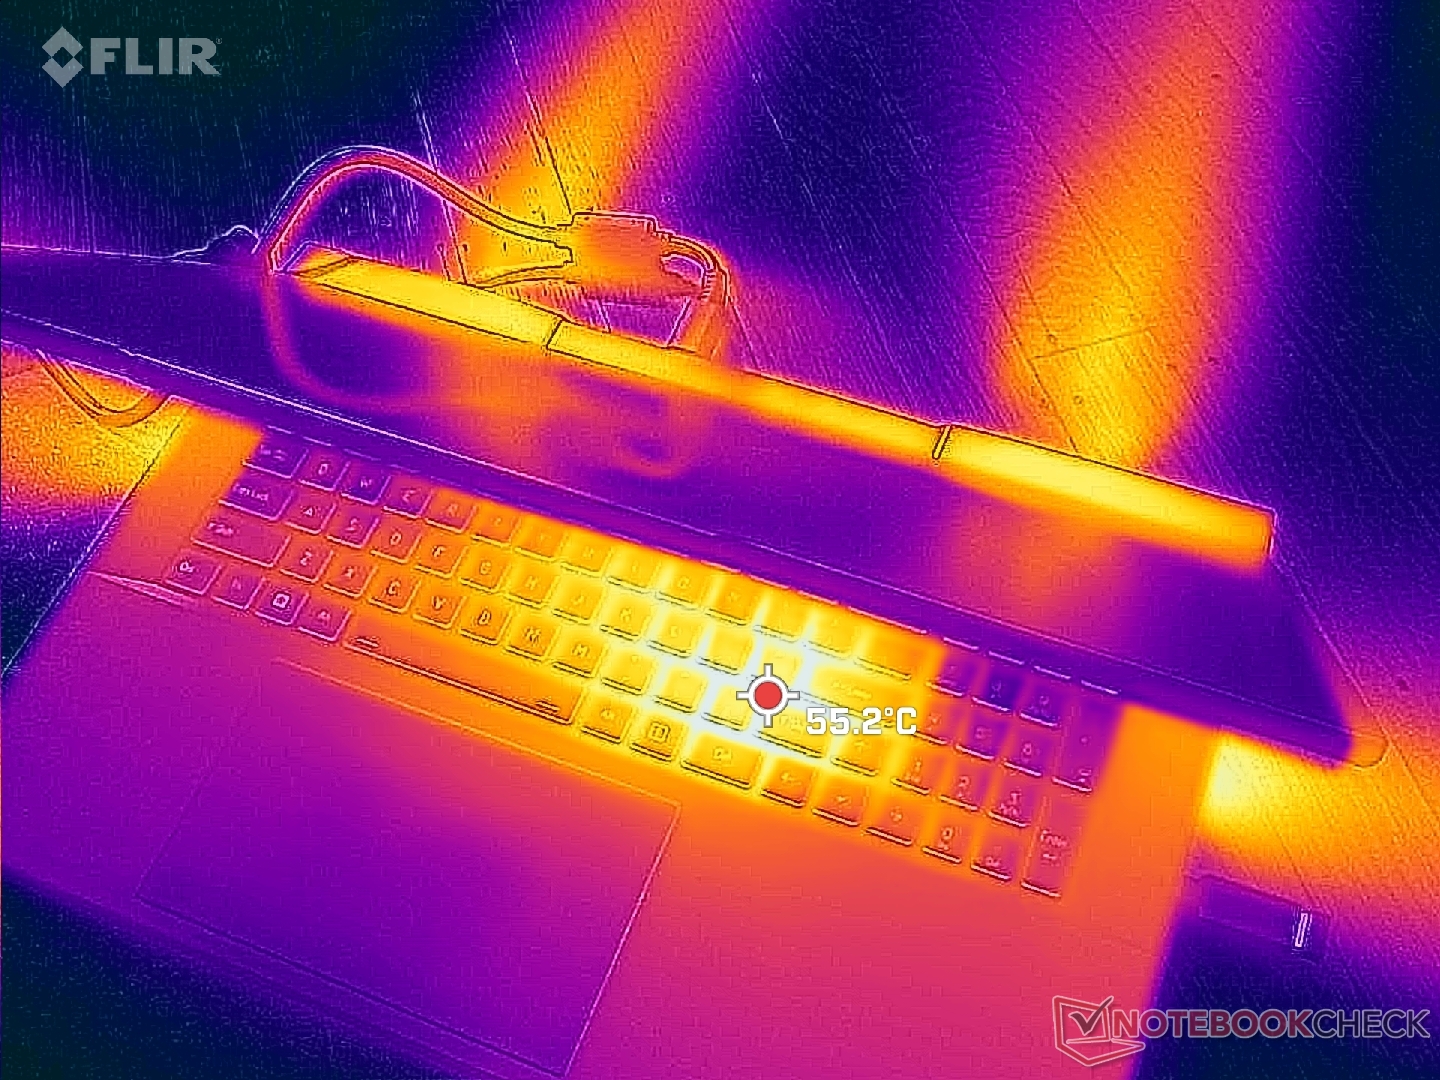
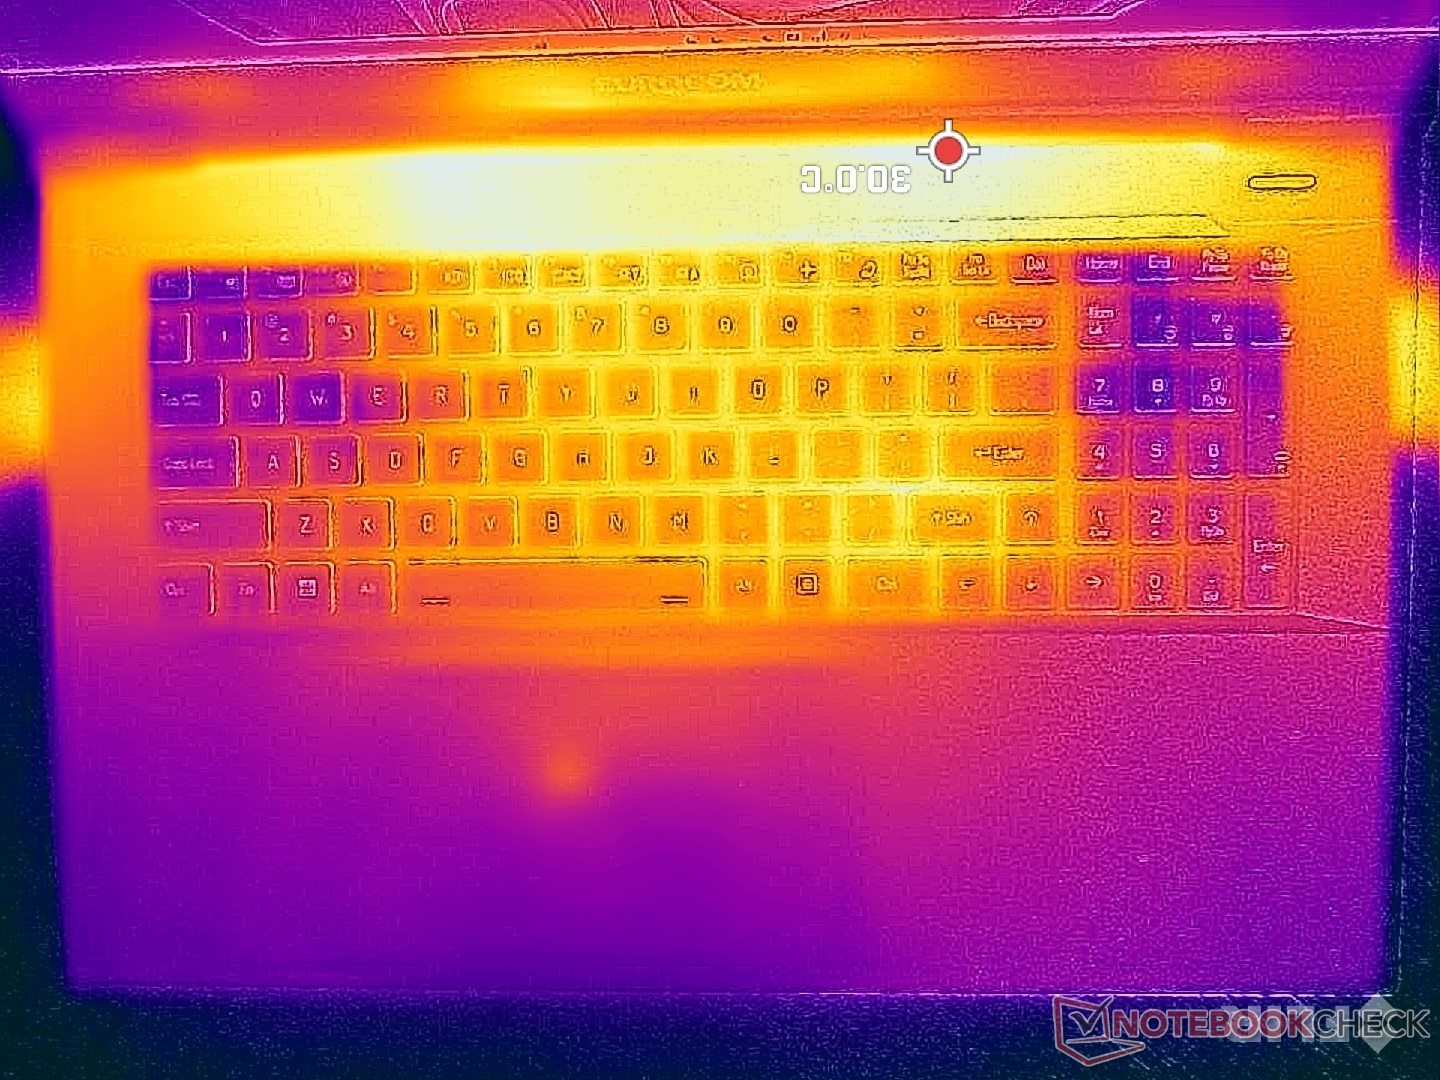
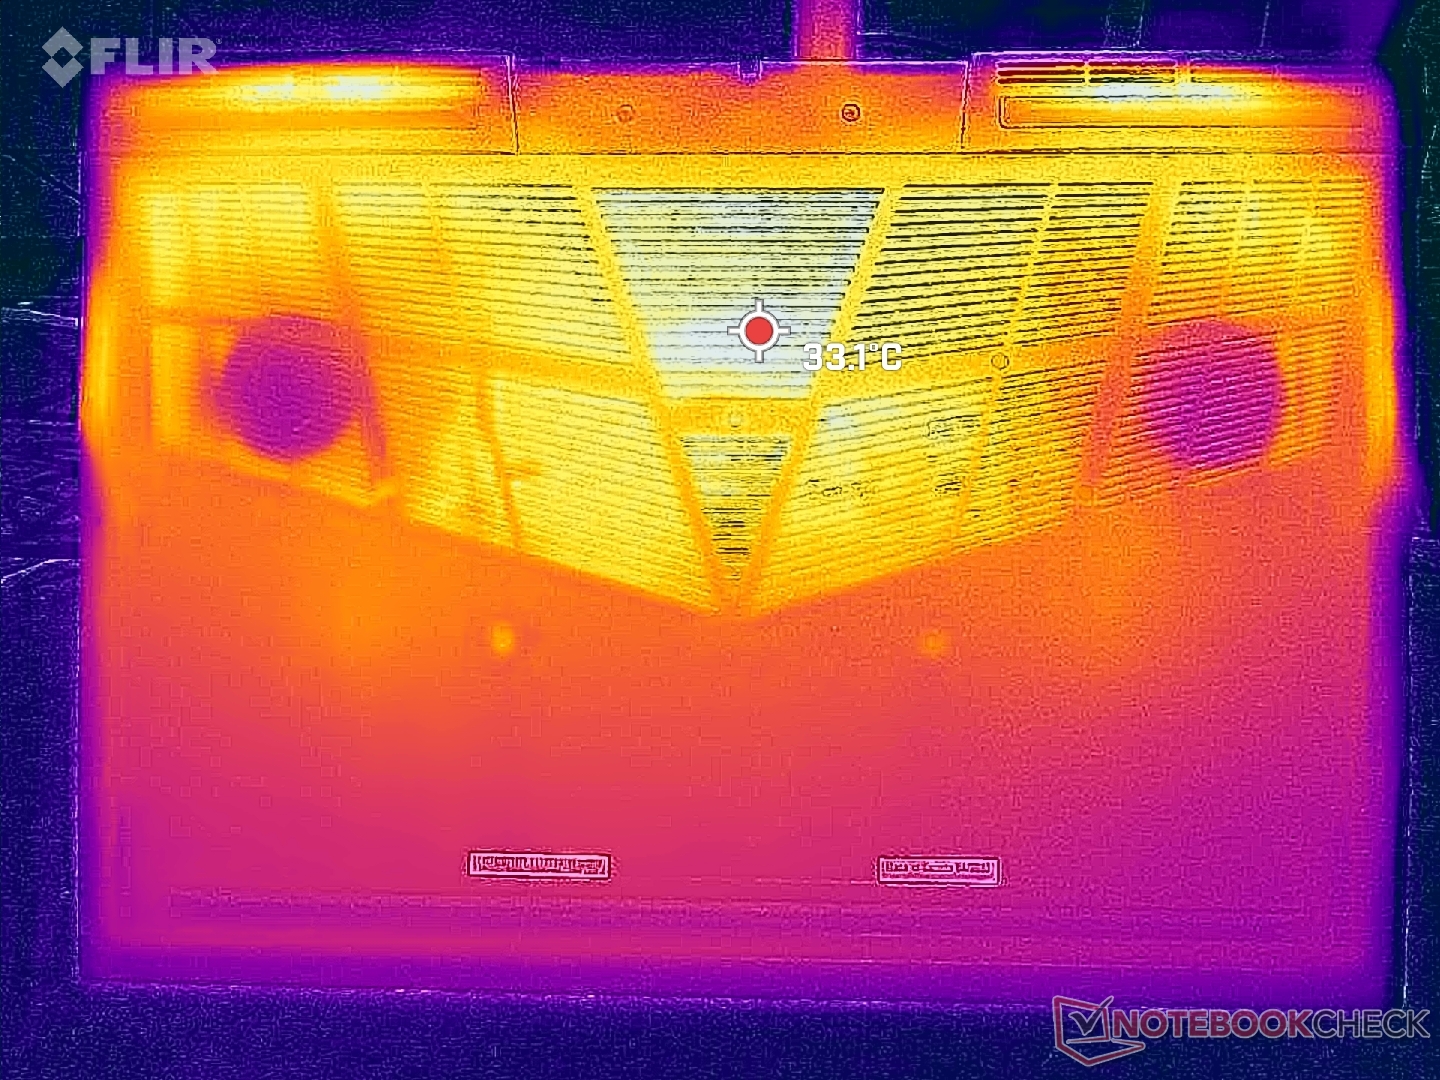
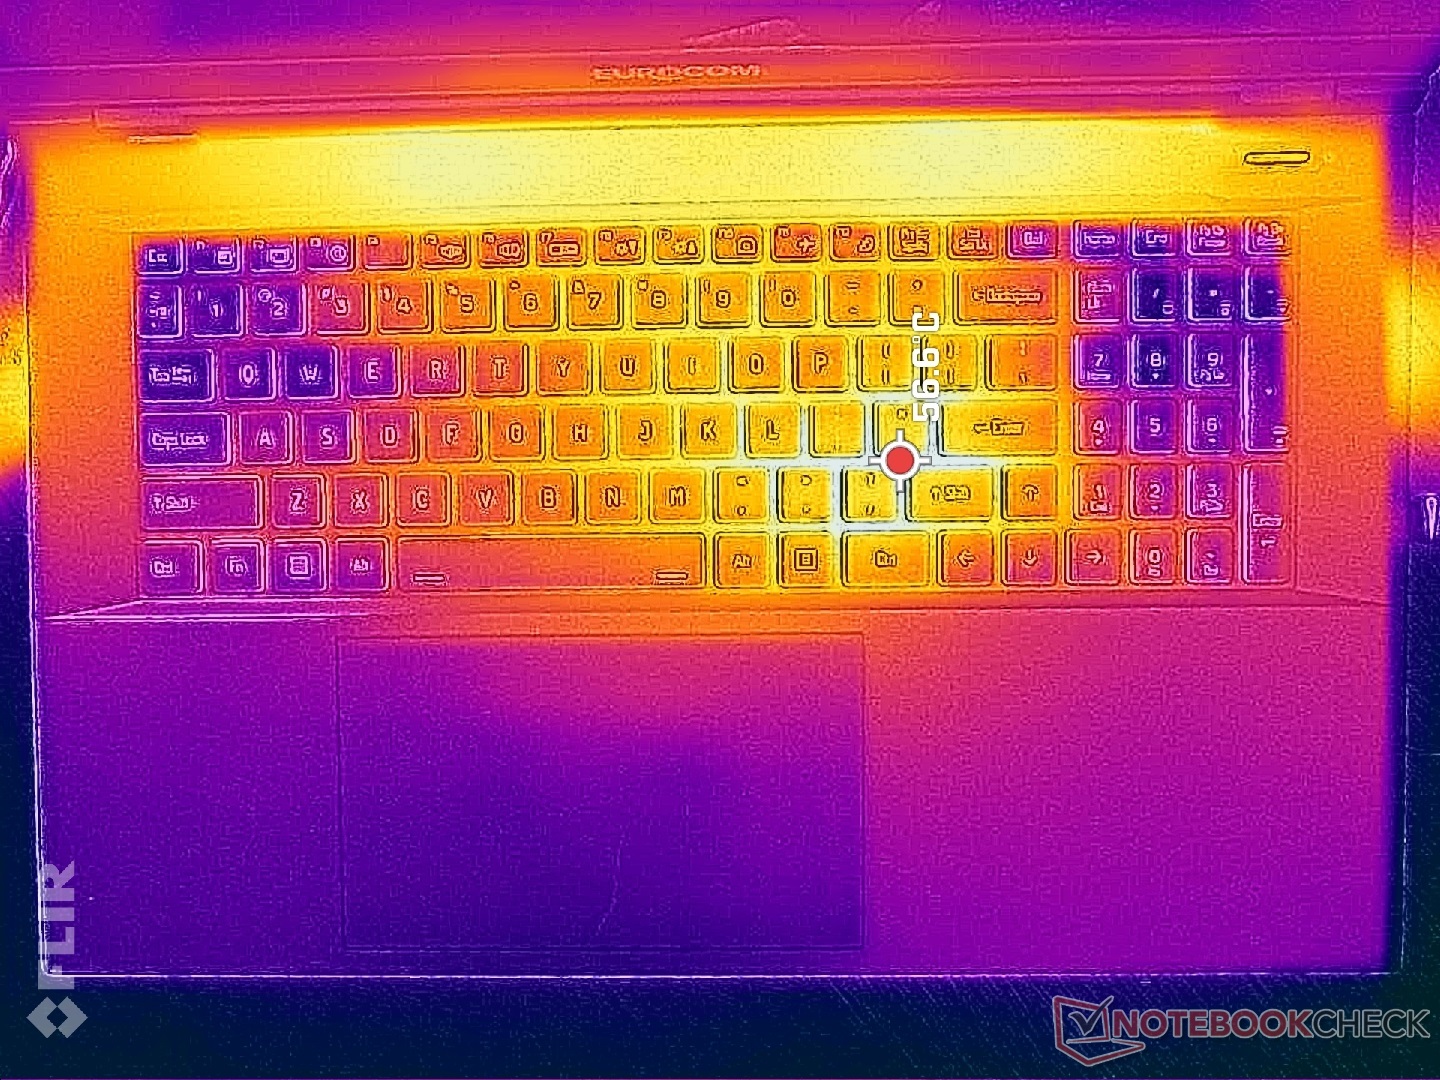
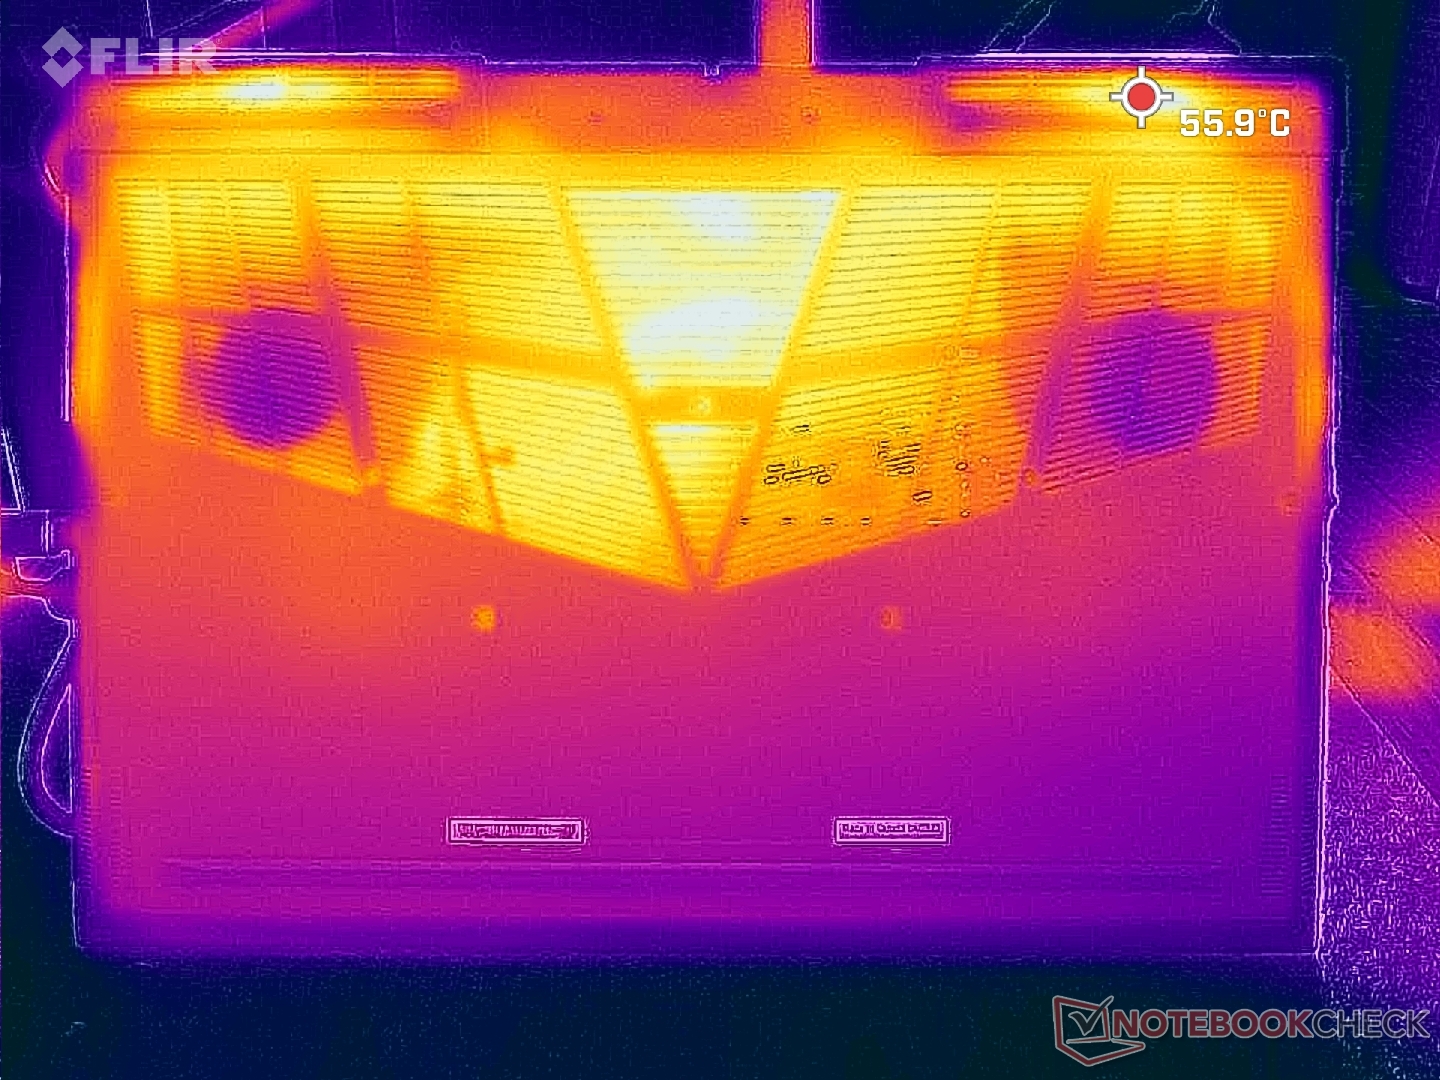
Temperatura
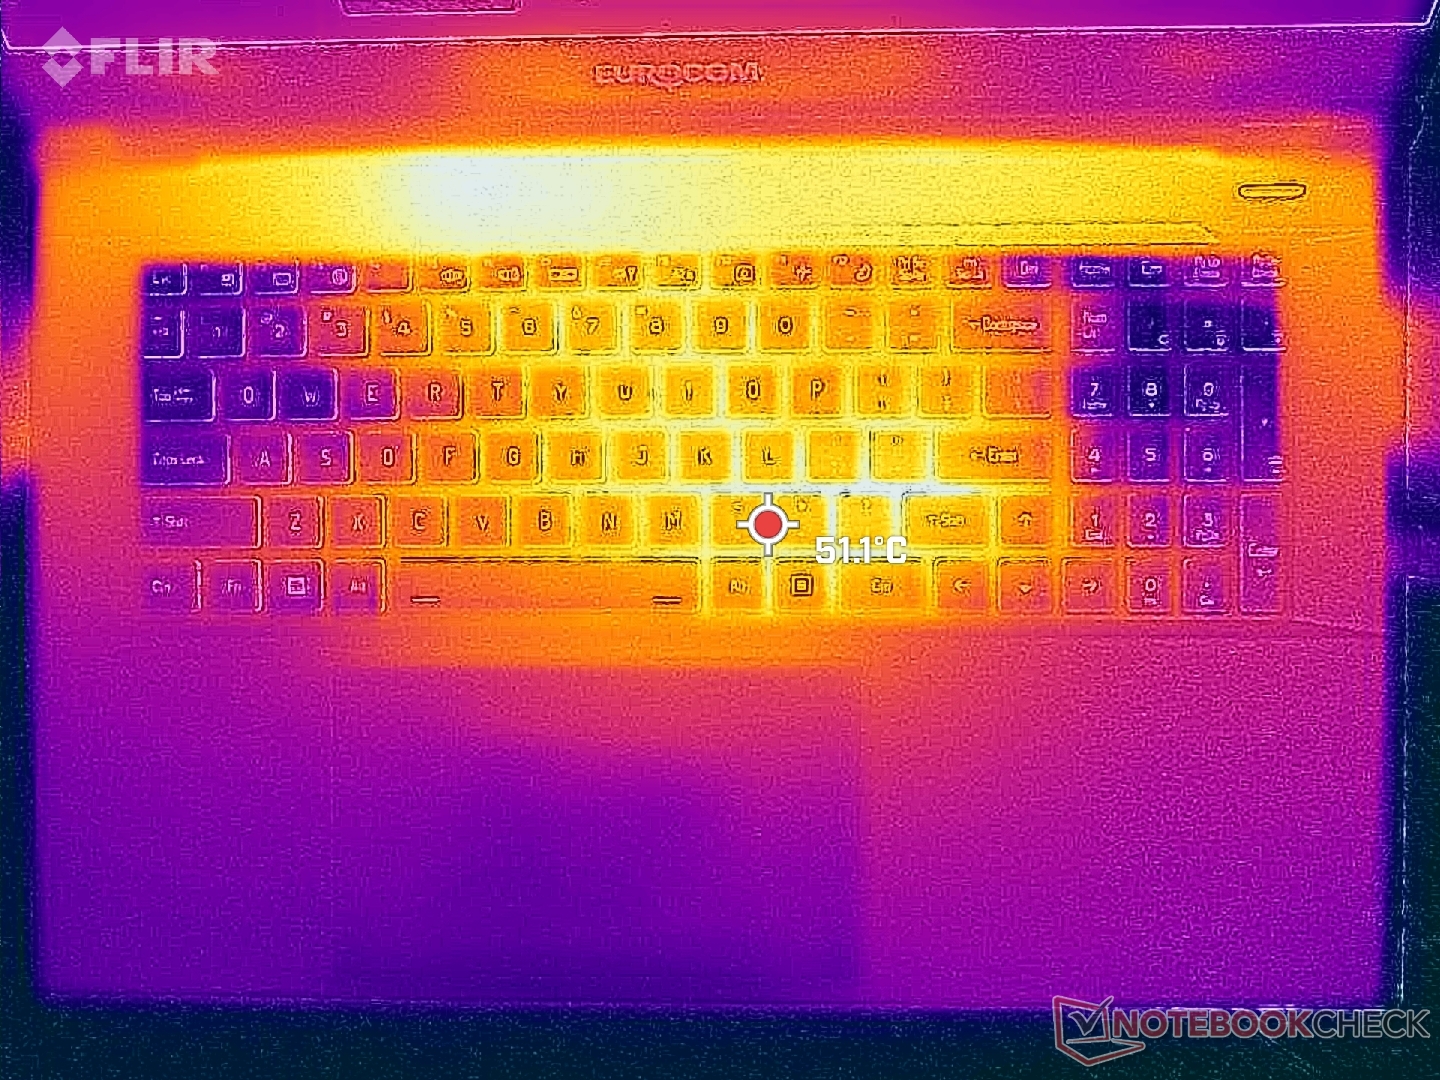
Las temperaturas superficiales son más cálidas hacia el centro del teclado, ya que tanto la CPU como la GPU están directamente debajo. Los puntos calientes pueden alcanzar más de 56 C en esta región comparado con los 46 C y 35 C delAorus 17X y el MSI Raider GE78 HX, respectivamente. Por suerte, los reposamanos, las teclas WASD y las áreas del numpad no están tan calientes como para mantener las manos cómodas cuando se juega.
(-) La temperatura máxima en la parte superior es de 49.4 °C / 121 F, frente a la media de 40.4 °C / 105 F, que oscila entre 21.2 y 68.8 °C para la clase Gaming.
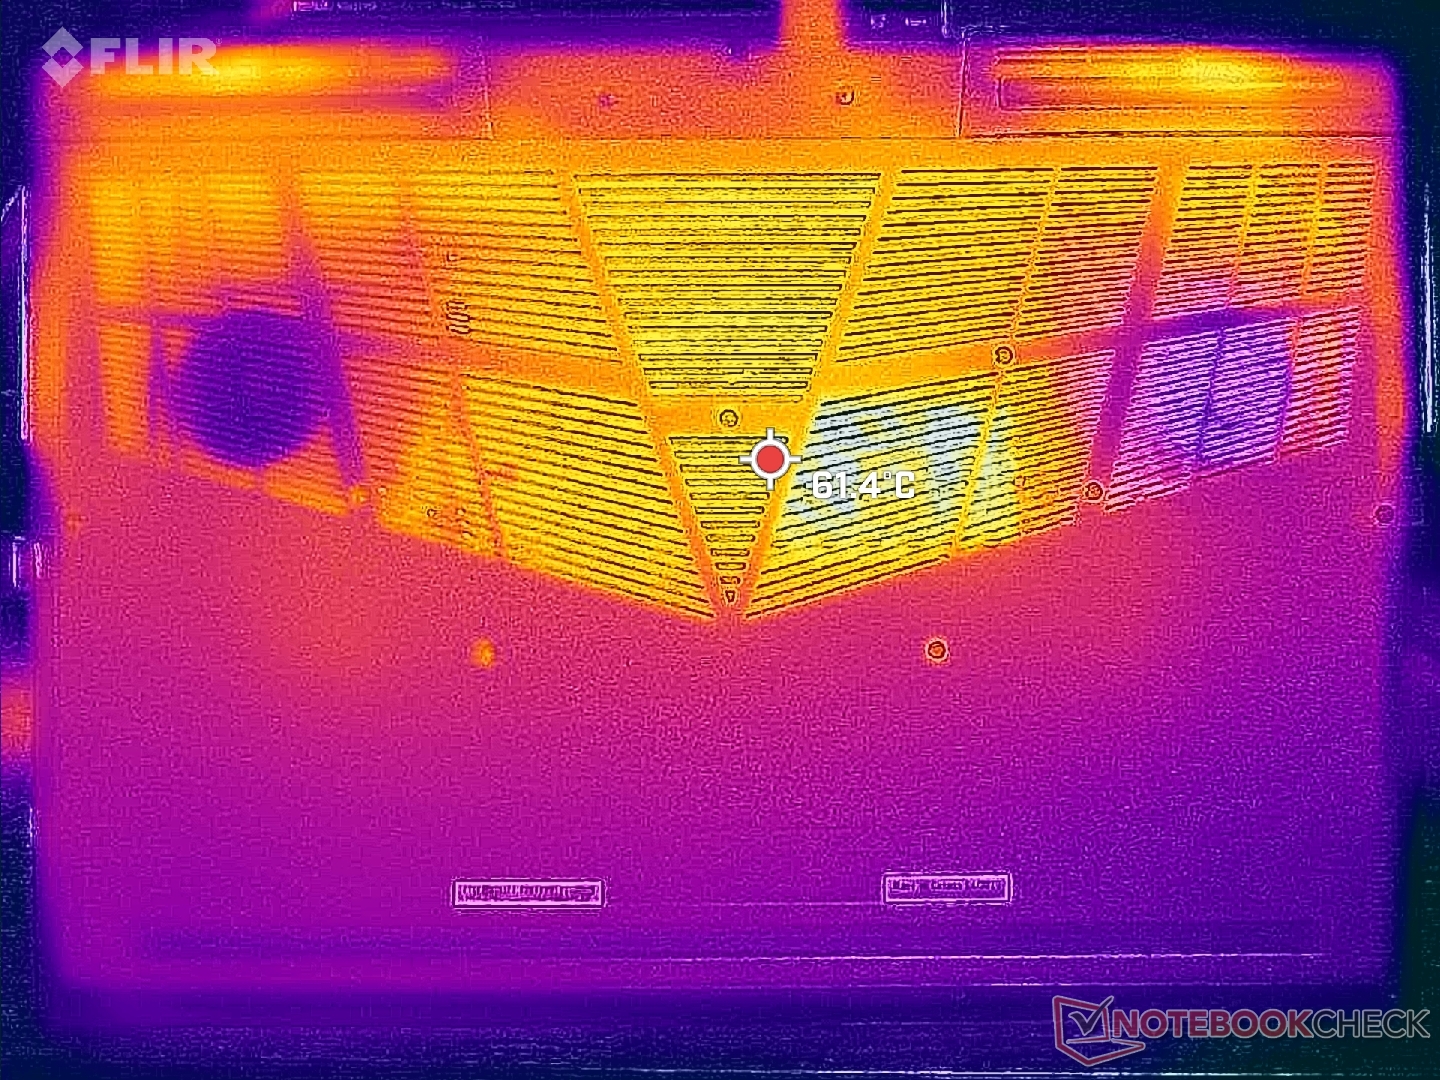
(-) El fondo se calienta hasta un máximo de 55.2 °C / 131 F, frente a la media de 43.2 °C / 110 F
(+) En reposo, la temperatura media de la parte superior es de 28.8 °C / 84# F, frente a la media del dispositivo de 33.9 °C / 93 F.
(-) Jugando a The Witcher 3, la temperatura media de la parte superior es de 40.4 °C / 105 F, frente a la media del dispositivo de 33.9 °C / 93 F.
(+) El reposamanos y el panel táctil están a una temperatura inferior a la de la piel, con un máximo de 31.2 °C / 88.2 F y, por tanto, son fríos al tacto.
(-) La temperatura media de la zona del reposamanos de dispositivos similares fue de 28.8 °C / 83.8 F (-2.4 °C / -4.4 F).
| Eurocom Raptor X17 Intel Core i9-13900HX, NVIDIA GeForce RTX 4090 Laptop GPU | Asus ROG Strix Scar 17 G733PY-XS96 AMD Ryzen 9 7945HX, NVIDIA GeForce RTX 4090 Laptop GPU | Aorus 17X AZF Intel Core i9-13900HX, NVIDIA GeForce RTX 4090 Laptop GPU | MSI GE78HX 13VH-070US Intel Core i9-13950HX, NVIDIA GeForce RTX 4080 Laptop GPU | Eluktronics Mech-17 GP2 Intel Core i9-13900HX, NVIDIA GeForce RTX 4090 Laptop GPU | Alienware m17 R5 (R9 6900HX, RX 6850M XT) AMD Ryzen 9 6900HX, AMD Radeon RX 6850M XT | |
|---|---|---|---|---|---|---|
| Heat | 24% | 8% | 14% | 15% | 4% | |
| Maximum Upper Side * (°C) | 49.4 | 34.6 30% | 47 5% | 37.4 24% | 39 21% | 53 -7% |
| Maximum Bottom * (°C) | 55.2 | 35.6 36% | 51 8% | 45 18% | 44 20% | 56 -1% |
| Idle Upper Side * (°C) | 33.4 | 27.2 19% | 30 10% | 29.8 11% | 31 7% | 30 10% |
| Idle Bottom * (°C) | 33.4 | 30 10% | 31 7% | 32.4 3% | 29.8 11% | 29 13% |
* ... más pequeño es mejor
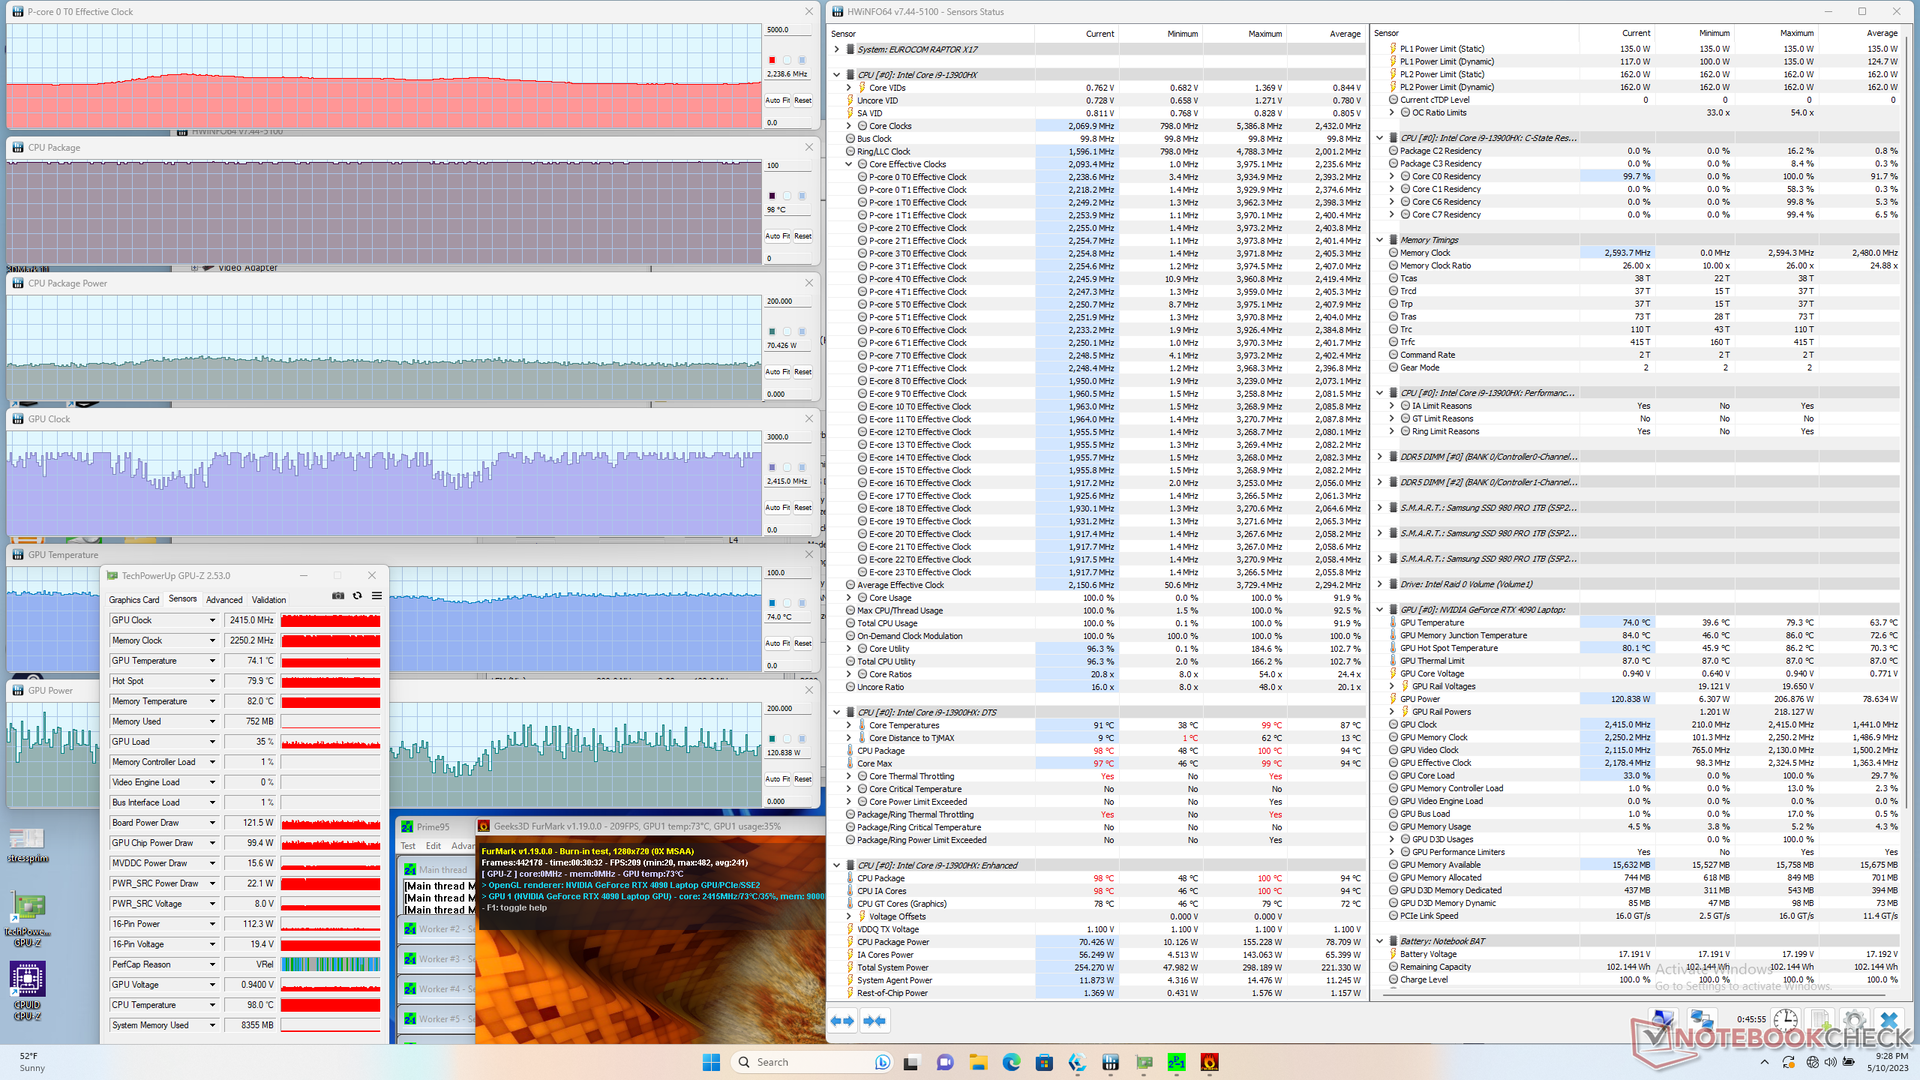
Prueba de resistencia
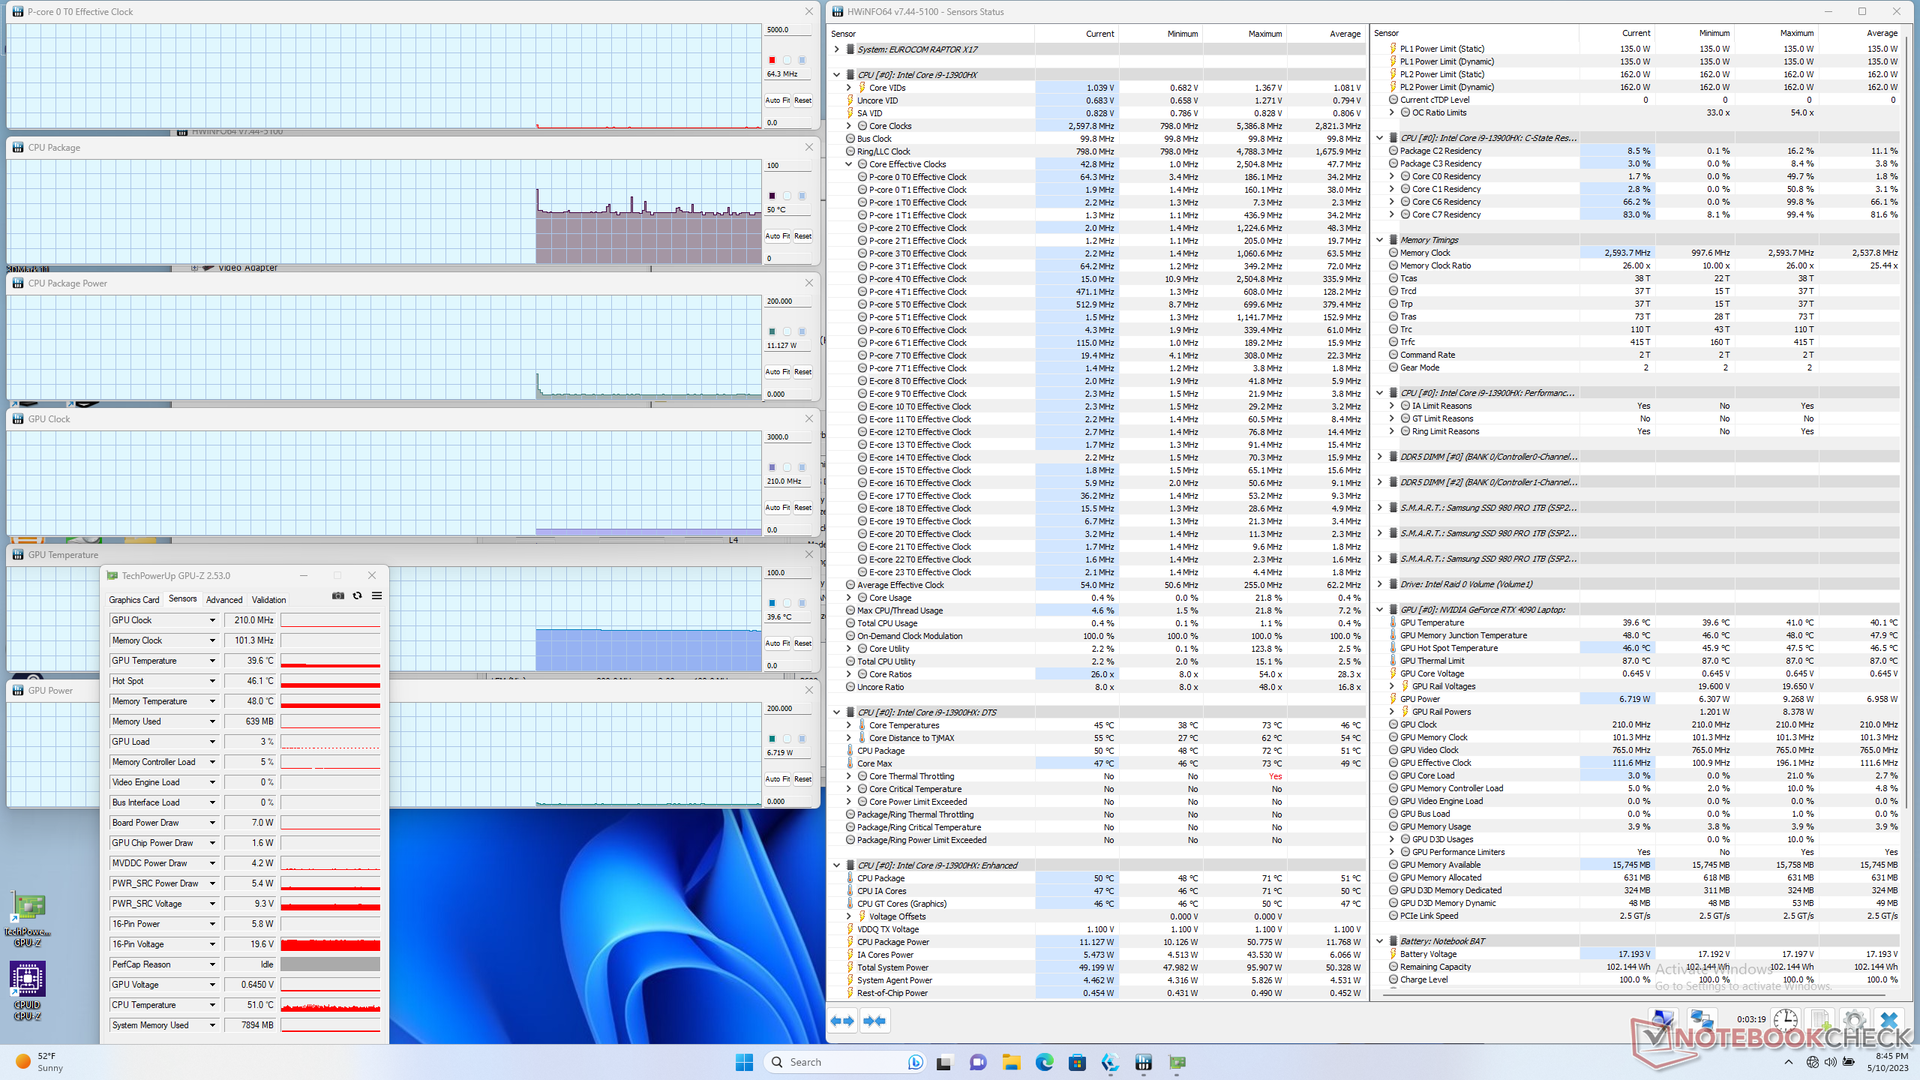
Al ejecutar Prime95 para estresar la CPU, las frecuencias de reloj y el consumo de la placa aumentaban a 4 GHz y 155 W, respectivamente, durante un instante antes de caer rápidamente al rango de 3,3 GHz y 110 W. La temperatura del núcleo se mantenía muy caliente a 97 C, lo que probablemente sea la razón del breve Turbo Boost máximo. La temperatura del núcleo se mantuvo muy caliente a 97 C, lo que probablemente explica la breve duración del Turbo Boost máximo. Repitiendo esta prueba en el MSI GE78HX o el Eluktronics Mech-17 GP2 resultaría en temperaturas de núcleo similares de más de 90 C para sugerir que la mayoría de las CPUs de la serie H de 13ª generación son generalmente más calientes que el promedio cuando están bajo carga.
Cuando se ejecuta Witcher 3 en el modo Rendimiento para representar las cargas típicas de los juegos, la GPU se estabilizaría en 2235 MHz de reloj del núcleo, 81 C y 170 W de consumo de energía de la placa frente a un objetivo TGP de 175 W. Ajustando el sistema al modo Equilibrado (o modo Entretenimiento), la GPU bajaría a 2055 MHz de reloj, 76 C y sólo 146 W. Por tanto, tendrás que activar el modo Rendimiento y soportar el ruido más fuerte del ventilador si quieres sacar el máximo partido de la GPU.
El funcionamiento con batería limita el rendimiento. Una prueba de Fire Strike con baterías arrojaría unas puntuaciones de Física y Gráficos de 12863 y 10075 puntos, respectivamente, frente a los 36634 y 44766 puntos de la red eléctrica.
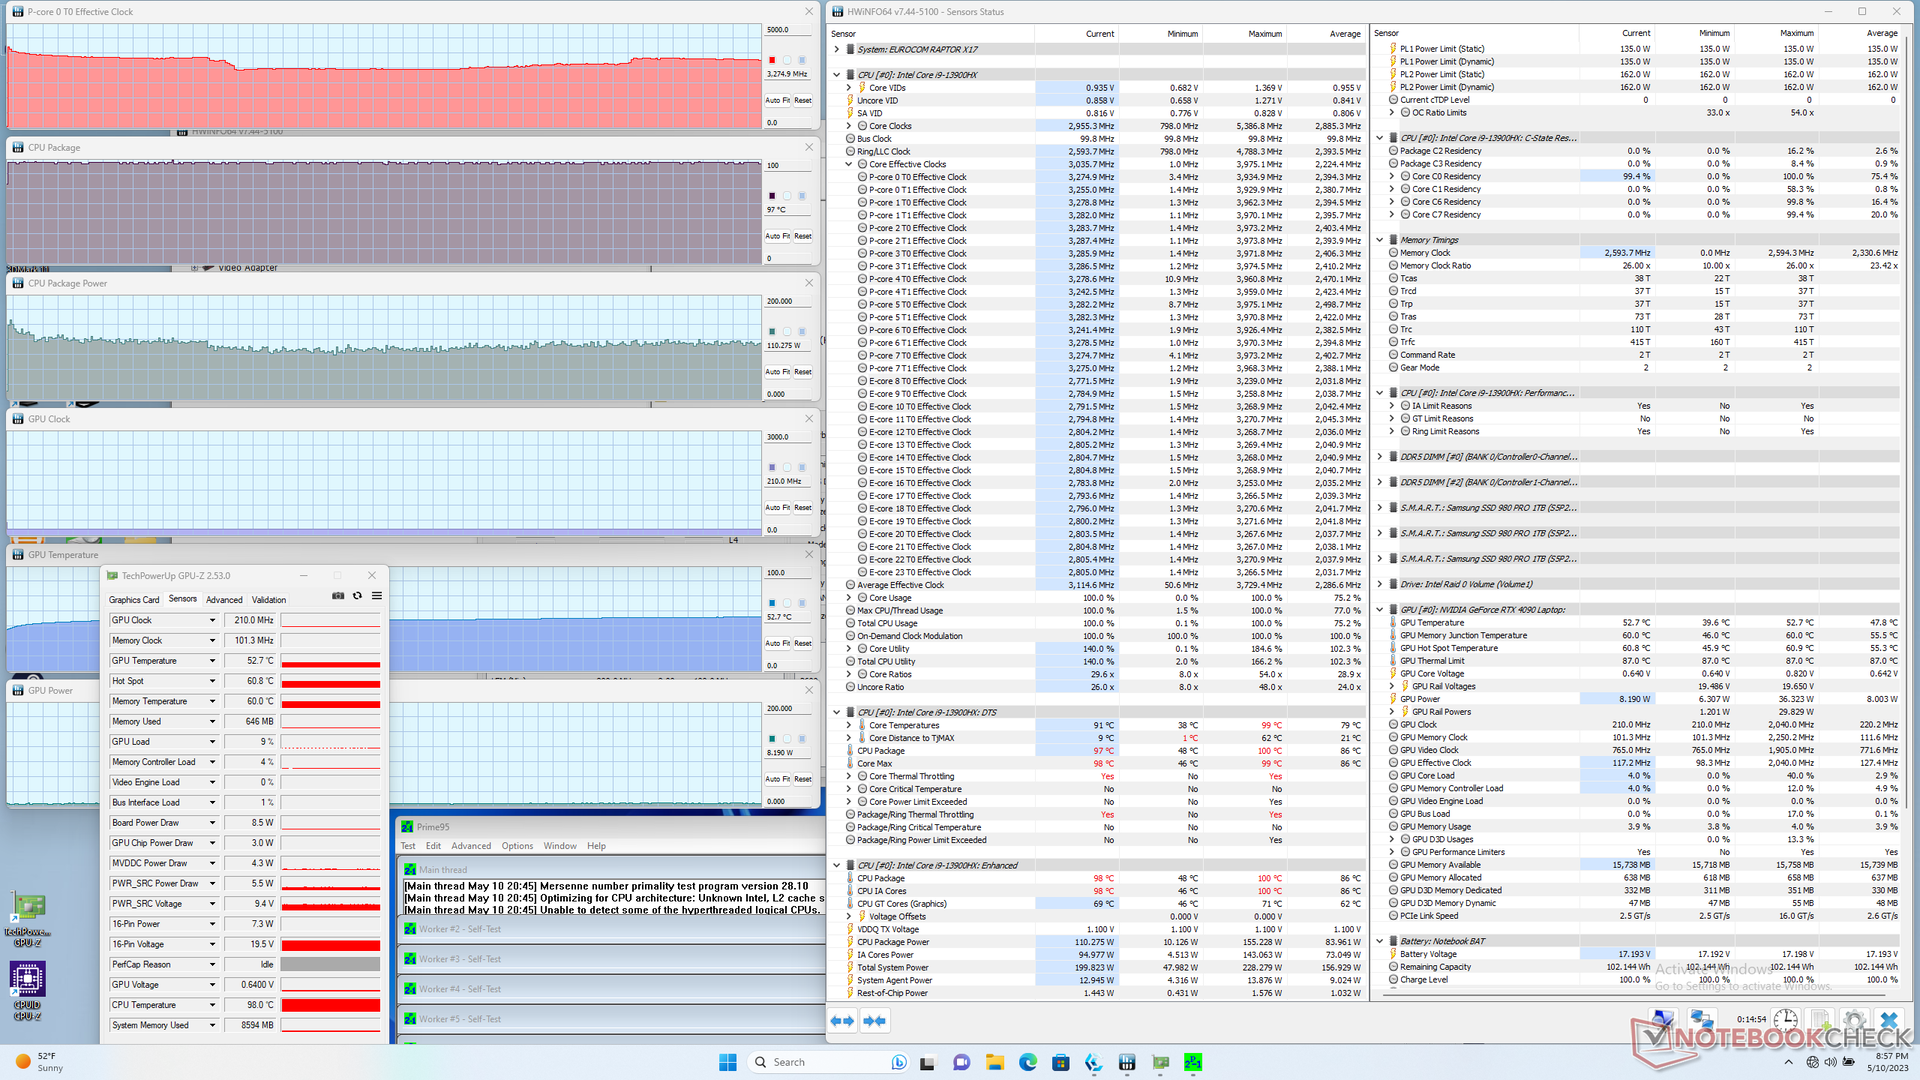
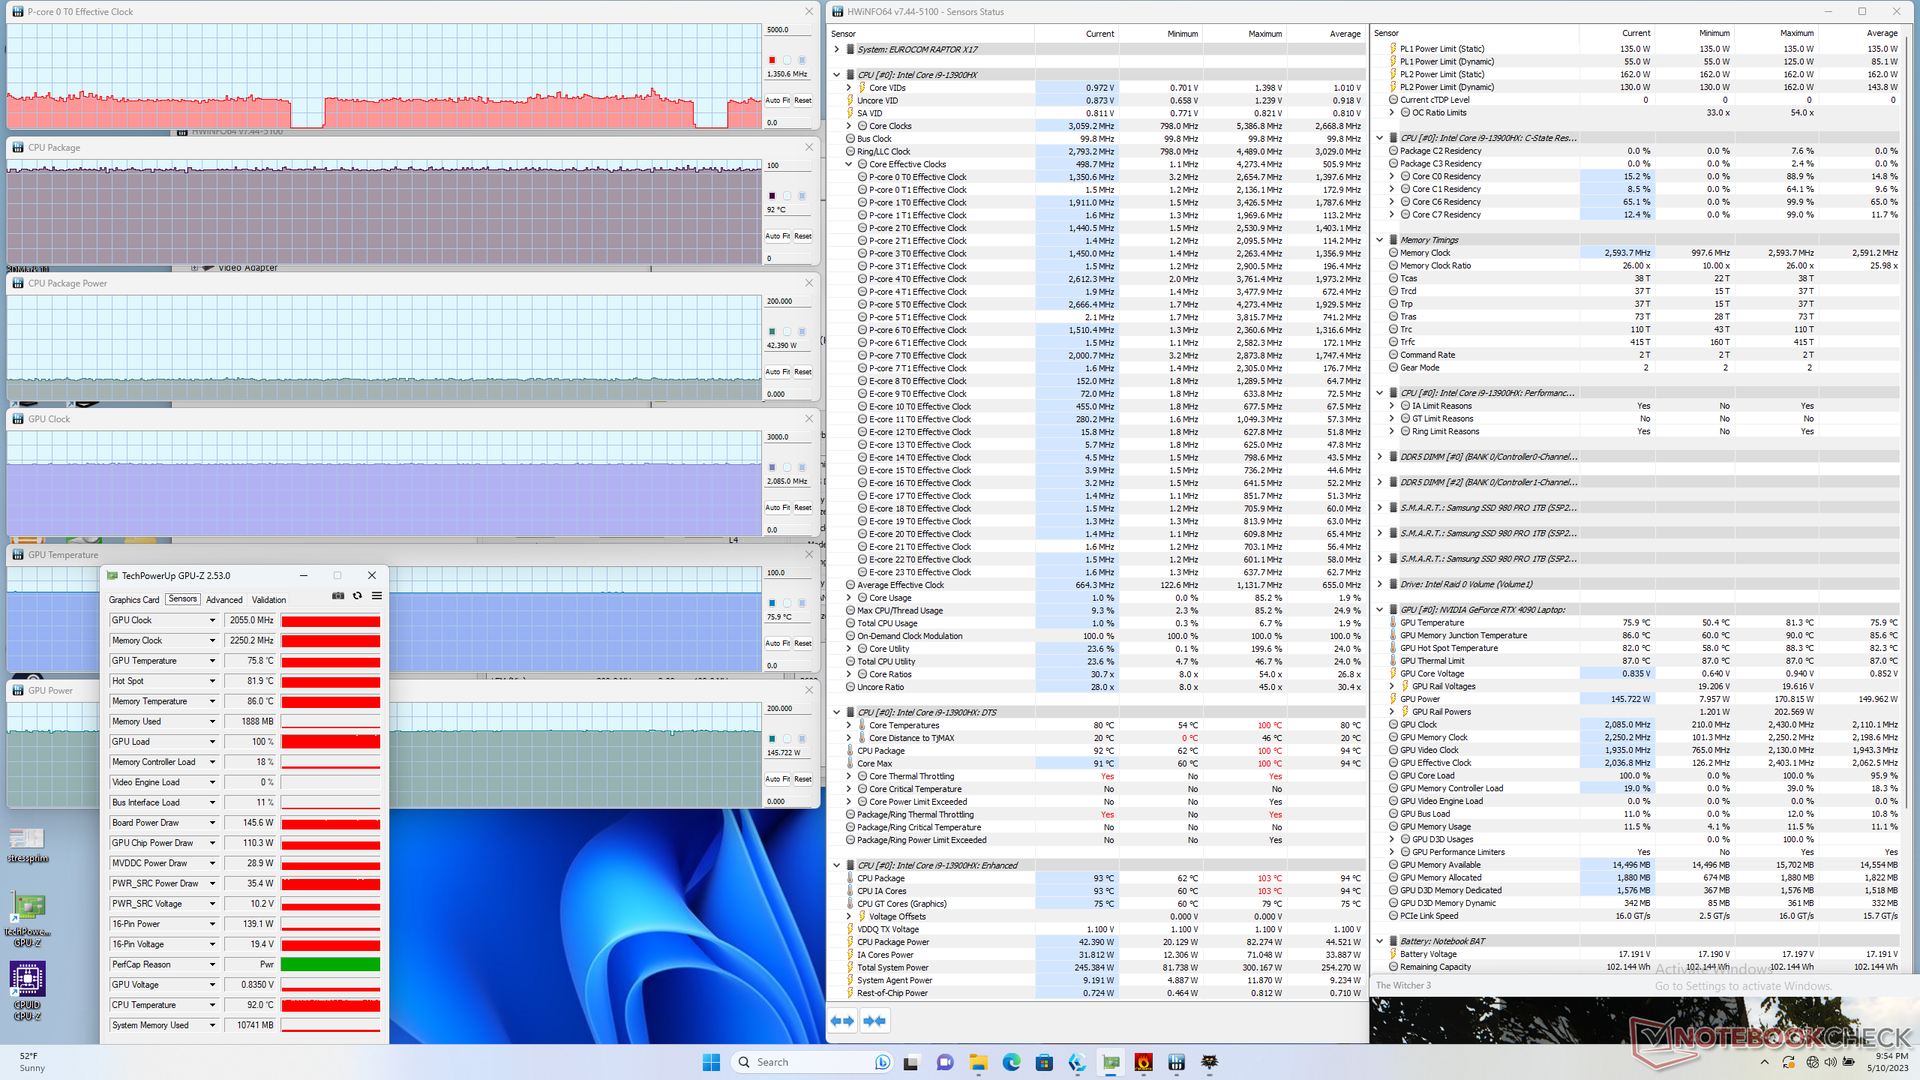
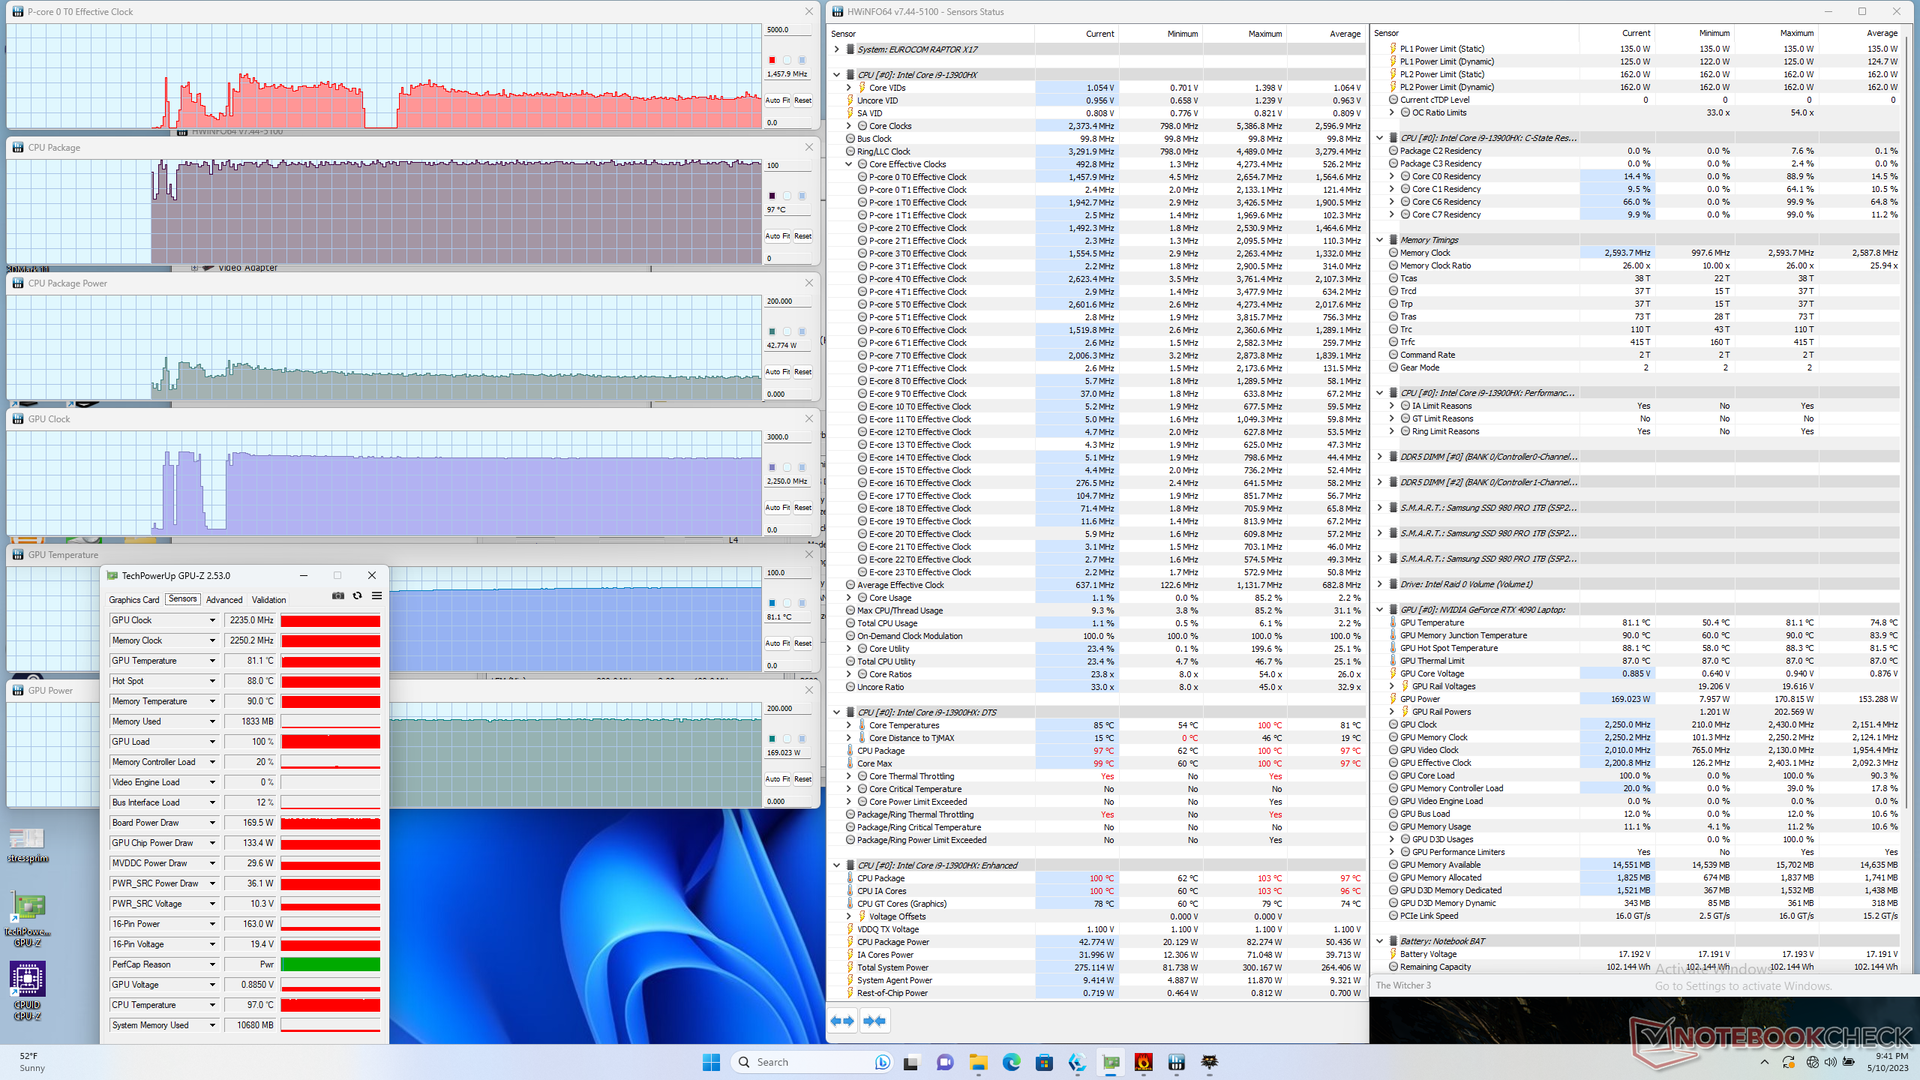
| RelojCPU (GHz) | Reloj GPU (MHz) | Temperatura mediaCPU (°C) | Temperatura media GPU (°C) | |
| Sistema en reposo | -- | -- | 50 | 40 |
| Prime95Stress | 3.3 | -- | 97 | 53 |
| Prime95+ FurMark Stress | 2.2 | 840 - 2400 | 98 | 74 |
| Witcher 3 Estrés (modoequilibrado) | 1,4 | 2055 | 92 | 76 |
| Witcher 3 Estrés (modoRendimiento) | 1,5 | 2250 | 97 | 81 |
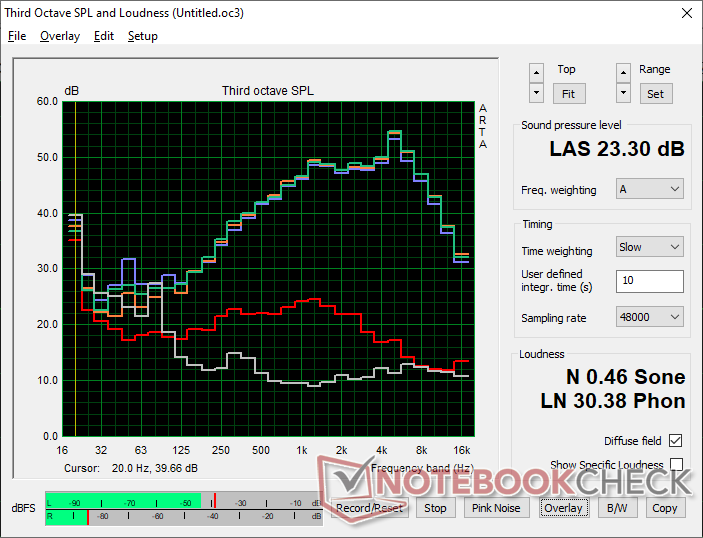
Altavoces
Los altavoces integrados son decepcionantes. No sólo la reproducción de graves es pobre, sino que el volumen máximo de 71 dB(A) es notablemente más silencioso que el de la mayoría de portátiles de juego en los que 80 dB(A) o más son habituales. Esto definitivamente parece un recorte para este nuevo diseño de chasis.
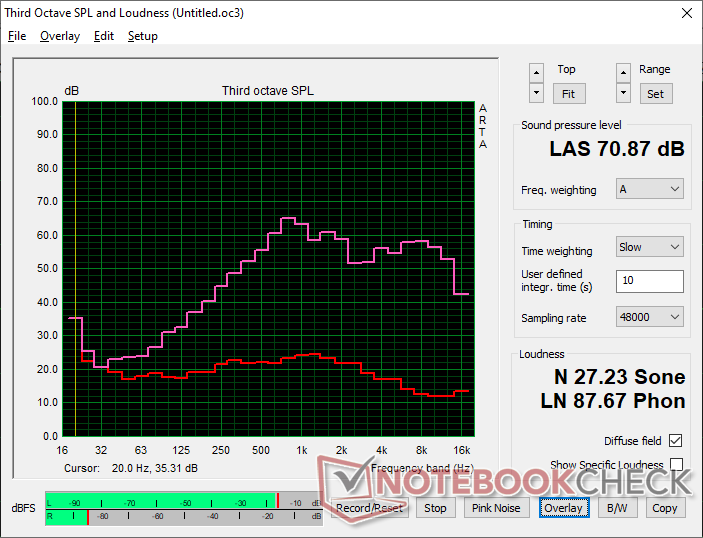
Eurocom Raptor X17 análisis de audio
(-) | altavoces no muy altos (#70.9 dB)
Graves 100 - 315 Hz
(-) | casi sin bajos - de media 15.5% inferior a la mediana
(±) | la linealidad de los graves es media (10.3% delta a frecuencia anterior)
Medios 400 - 2000 Hz
(±) | medias más altas - de media 5.4% más altas que la mediana
(±) | la linealidad de los medios es media (9.6% delta respecto a la frecuencia anterior)
Altos 2 - 16 kHz
(+) | máximos equilibrados - a sólo 2.3% de la mediana
(±) | la linealidad de los máximos es media (7.5% delta a frecuencia anterior)
Total 100 - 16.000 Hz
(±) | la linealidad del sonido global es media (23.7% de diferencia con la mediana)
En comparación con la misma clase
» 86% de todos los dispositivos probados de esta clase eran mejores, 5% similares, 10% peores
» El mejor tuvo un delta de 6%, la media fue 18%, el peor fue ###max##%
En comparación con todos los dispositivos probados
» 71% de todos los dispositivos probados eran mejores, 6% similares, 23% peores
» El mejor tuvo un delta de 4%, la media fue 23%, el peor fue ###max##%
Apple MacBook Pro 16 2021 M1 Pro análisis de audio
(+) | los altavoces pueden reproducir a un volumen relativamente alto (#84.7 dB)
Graves 100 - 315 Hz
(+) | buen bajo - sólo 3.8% lejos de la mediana
(+) | el bajo es lineal (5.2% delta a la frecuencia anterior)
Medios 400 - 2000 Hz
(+) | medios equilibrados - a sólo 1.3% de la mediana
(+) | los medios son lineales (2.1% delta a la frecuencia anterior)
Altos 2 - 16 kHz
(+) | máximos equilibrados - a sólo 1.9% de la mediana
(+) | los máximos son lineales (2.7% delta a la frecuencia anterior)
Total 100 - 16.000 Hz
(+) | el sonido global es lineal (4.6% de diferencia con la mediana)
En comparación con la misma clase
» 0% de todos los dispositivos probados de esta clase eran mejores, 0% similares, 100% peores
» El mejor tuvo un delta de 5%, la media fue 17%, el peor fue ###max##%
En comparación con todos los dispositivos probados
» 0% de todos los dispositivos probados eran mejores, 0% similares, 100% peores
» El mejor tuvo un delta de 4%, la media fue 23%, el peor fue ###max##%
Gestión de la energía
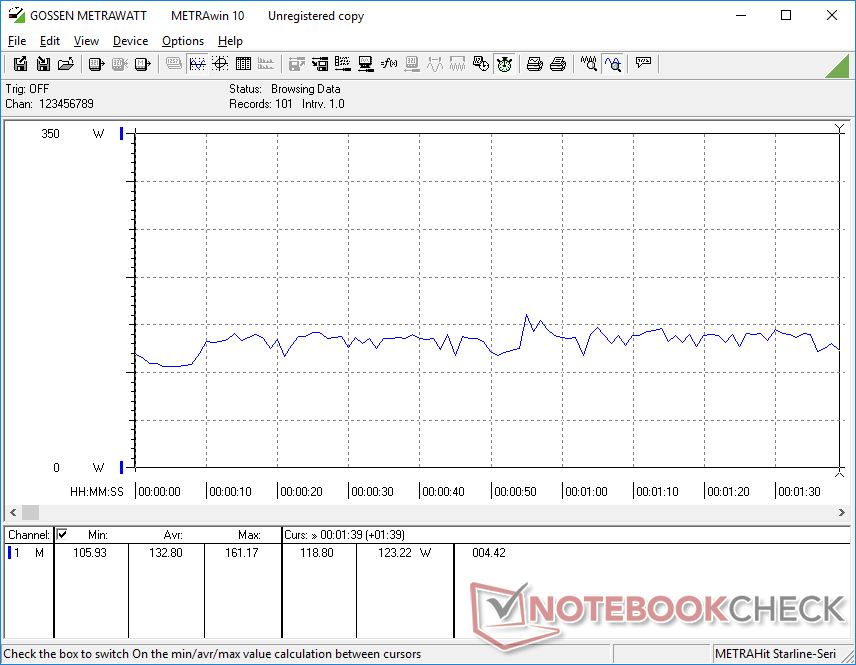
Consumo: más de 300 W en juegos
A ralentí en sobremesa consume entre 13 W y 43 W dependiendo del perfil de energía, la configuración de la GPU y el brillo de la pantalla. De hecho, 43 W es casi lo mismo que un Ultrabook con Core U como el Samsung Galaxy Book3 15 a carga máxima. El simple cambio del modo iGPU al modo dGPU aumentaría el consumo en unos 9 W en el Eurocom. Por tanto, el consumo de energía es muy sensible al perfil de energía activa.
El consumo medio en juegos es muy alto, 304 W frente a los 278 W de los modelos de la competencia.Asus ROG Strix Scar 17 o Aorus 17X con la misma GPU GeForce RTX 4090. Los SSD triples, la rápida tasa de refresco de 240 Hz, la gran capacidad RAM y el consumo ligeramente superior de la GPU contribuyen al mayor consumo del Eurocom.
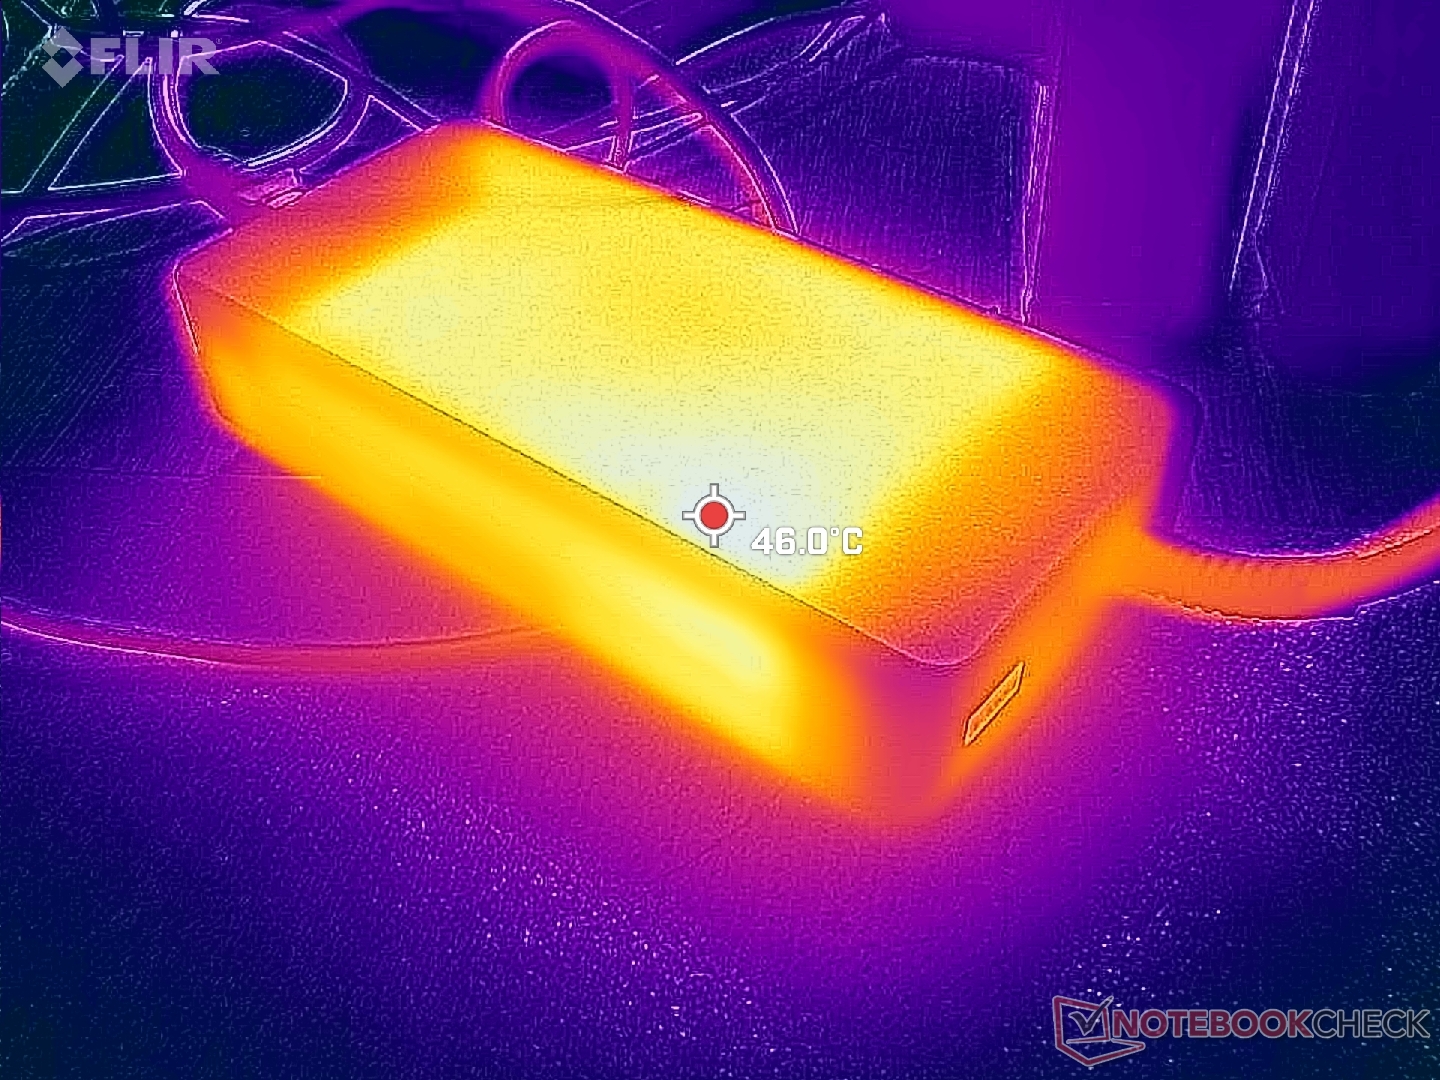
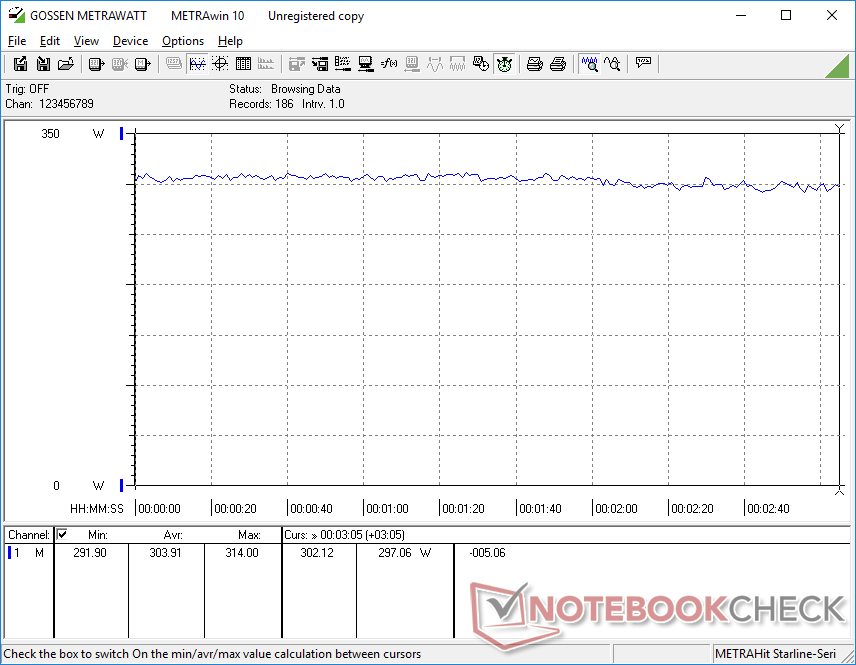
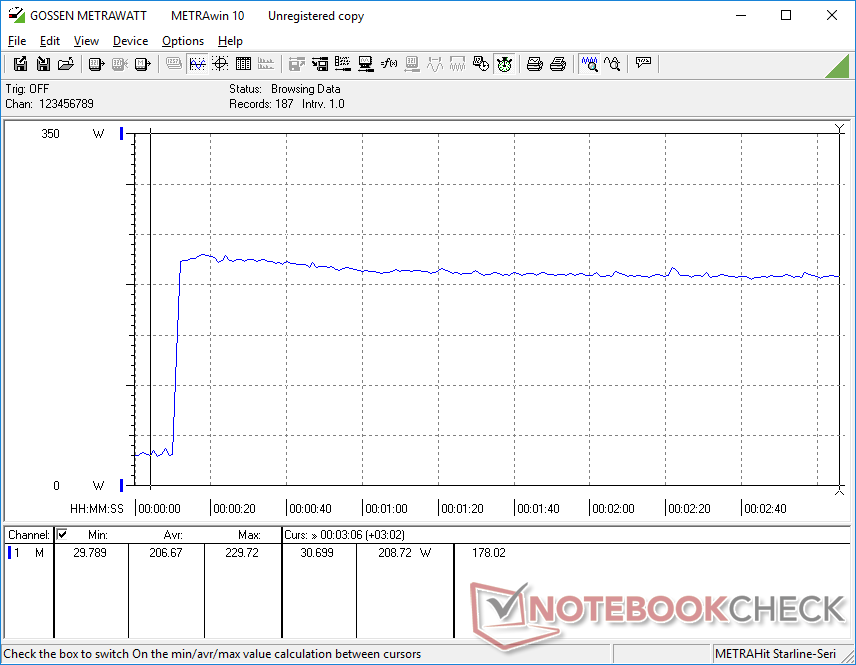
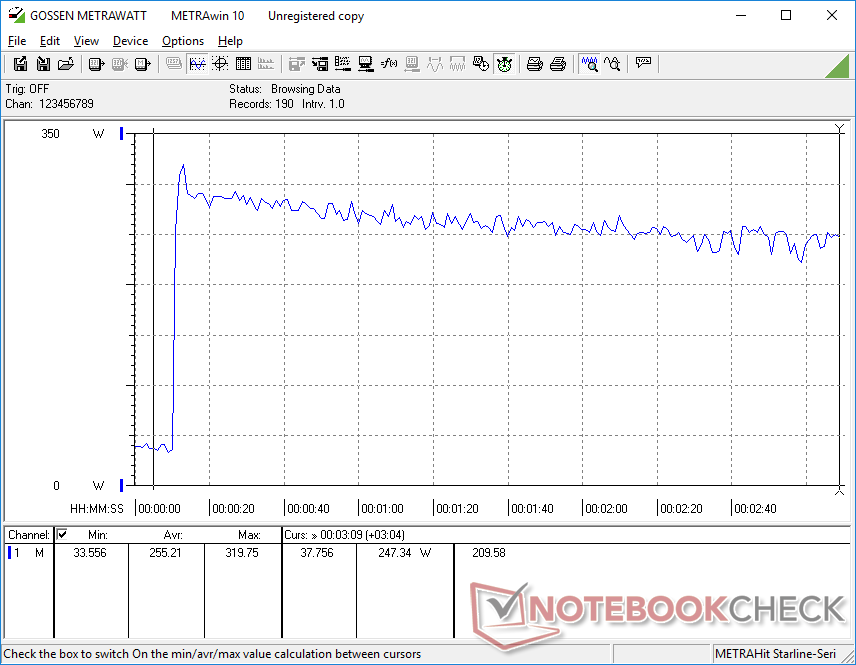
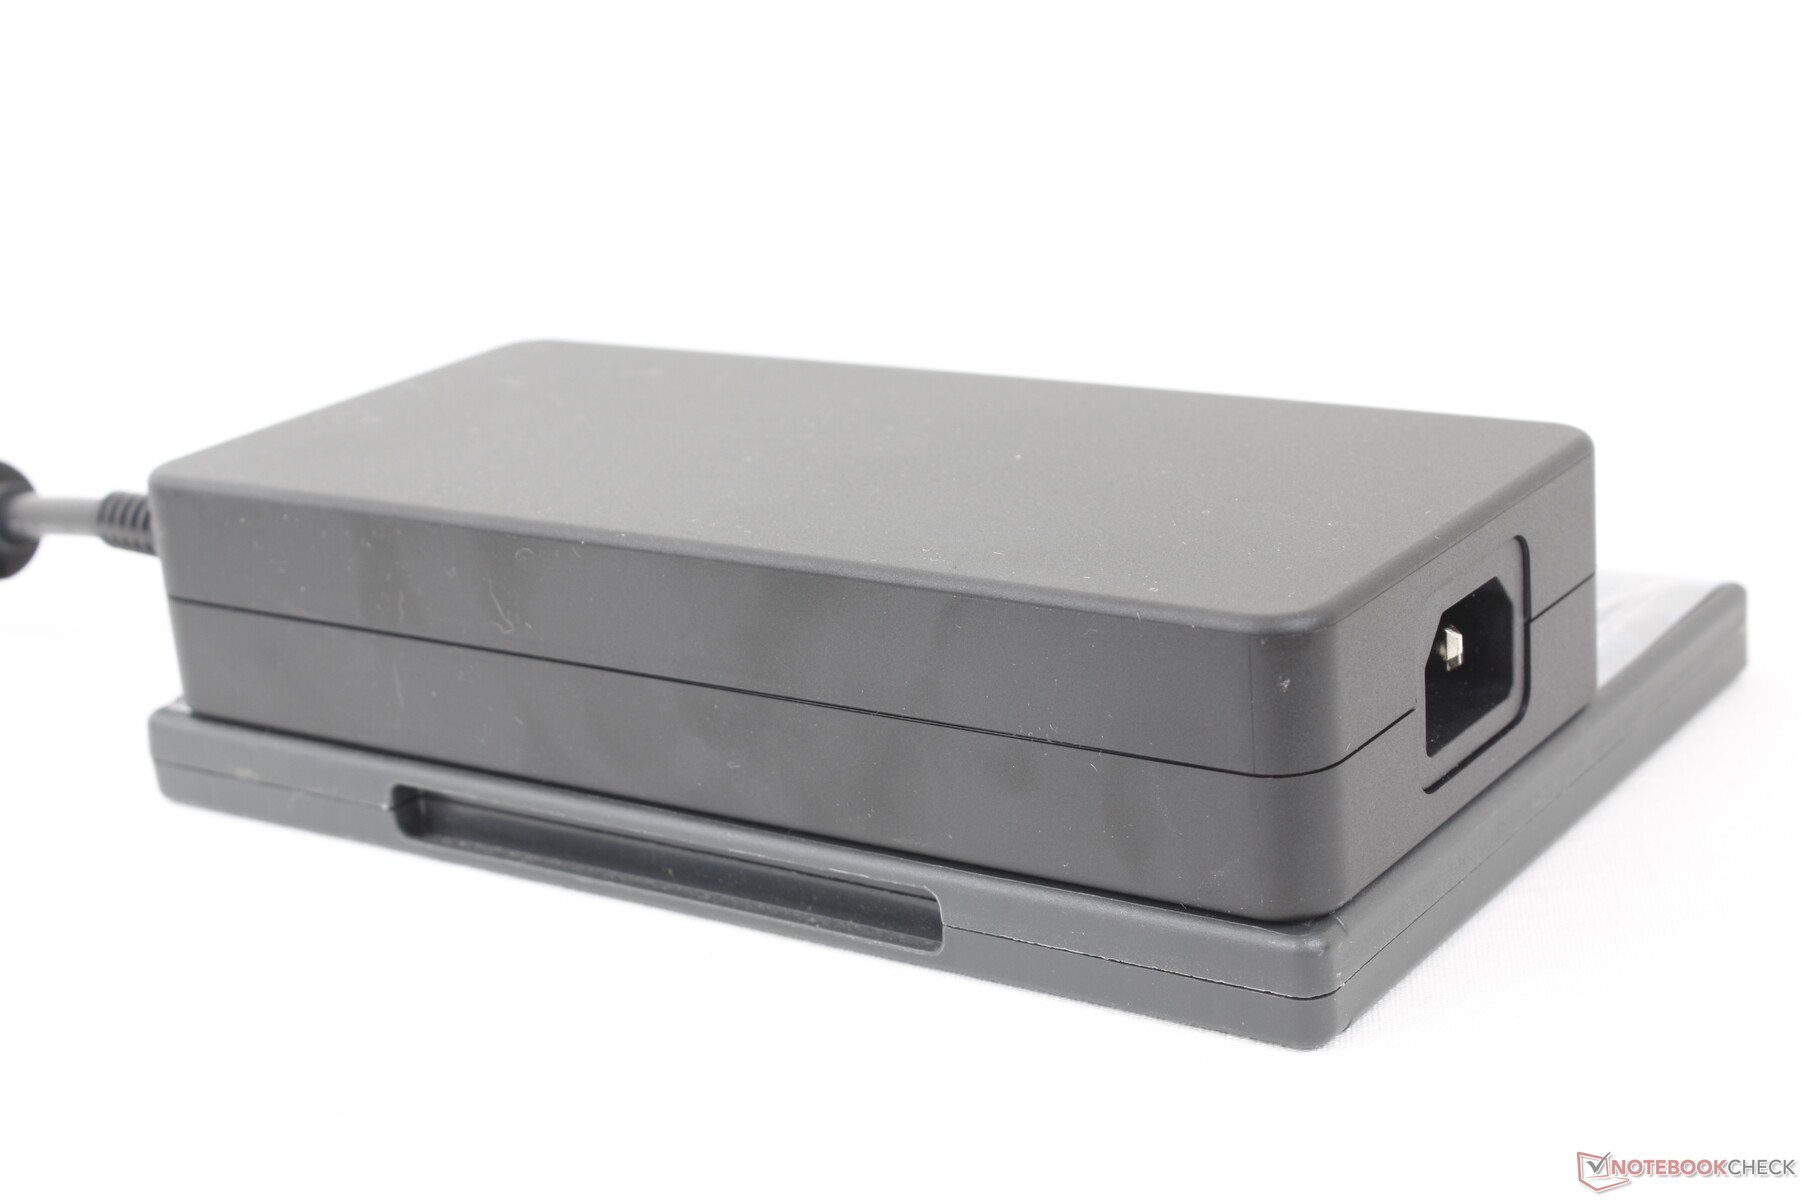
Registramos un consumo máximo de 320 W del gran adaptador de CA de 330 W (~18,5 x 8,5 x 3,5 cm) cuando tanto la CPU como la GPU están al 100% de utilización. Esta tasa disminuiría con el tiempo, como muestra el gráfico siguiente, debido a las limitaciones térmicas.
| Off / Standby | |
| Ocioso | |
| Carga |
|
Clave:
min: | |
| Eurocom Raptor X17 i9-13900HX, GeForce RTX 4090 Laptop GPU, 3x Samsung SSD 980 Pro 1TB (RAID 0), IPS, 2560x1440, 17.3" | Asus ROG Strix Scar 17 G733PY-XS96 R9 7945HX, GeForce RTX 4090 Laptop GPU, SK hynix PC801 HFS001TEJ9X101N, IPS, 2560x1440, 17.3" | Aorus 17X AZF i9-13900HX, GeForce RTX 4090 Laptop GPU, Gigabyte AG470S1TB-SI B10, IPS, 2560x1440, 17.3" | MSI GE78HX 13VH-070US i9-13950HX, GeForce RTX 4080 Laptop GPU, Samsung PM9A1 MZVL22T0HBLB, IPS, 2560x1600, 17" | Eluktronics Mech-17 GP2 i9-13900HX, GeForce RTX 4090 Laptop GPU, Samsung PM9A1 MZVL21T0HCLR, IPS, 2560x1600, 17" | Alienware m17 R5 (R9 6900HX, RX 6850M XT) R9 6900HX, Radeon RX 6850M XT, SSSTC CA6-8D1024, IPS, 3840x2160, 17" | |
|---|---|---|---|---|---|---|
| Power Consumption | 5% | 13% | 3% | 5% | 27% | |
| Idle Minimum * (Watt) | 13.4 | 14.5 -8% | 11 18% | 16.1 -20% | 14 -4% | 13 3% |
| Idle Average * (Watt) | 22.2 | 21.1 5% | 17 23% | 24 -8% | 19.3 13% | 16.5 26% |
| Idle Maximum * (Watt) | 42.4 | 42.8 -1% | 29 32% | 34 20% | 36.8 13% | 17 60% |
| Load Average * (Watt) | 132.8 | 116.7 12% | 134 -1% | 123.6 7% | 117.2 12% | 93 30% |
| Witcher 3 ultra * (Watt) | 304 | 278 9% | 278 9% | 286 6% | 304 -0% | 239 21% |
| Load Maximum * (Watt) | 319.8 | 279.6 13% | 334 -4% | 285.7 11% | 342.5 -7% | 251 22% |
* ... más pequeño es mejor
Power Consumption Witcher 3 / Stresstest
Power Consumption external Monitor
Duración de la batería
Los tiempos de ejecución son bastante buenos teniendo en cuenta la potencia interna. Pudimos registrar algo menos de 5 horas de navegación WLAN real con el perfil de energía equilibrado y la iGPU activa. Aún así, modelos de la competencia como el Aorus 17X o el MSI GE78HX son capaces de durar más de una hora que nuestro Eurocom.
La carga de vacío a pleno rendimiento con el adaptador de CA de 330 W incluido es relativamente lenta, de 2 a 2.5 horas. Se puede cargar con adaptadores USB-C de terceros, pero hay que tener en cuenta que sólo funciona en uno de los dos puertos USB-C (el más cercano a la trasera).
| Eurocom Raptor X17 i9-13900HX, GeForce RTX 4090 Laptop GPU, 99 Wh | Asus ROG Strix Scar 17 G733PY-XS96 R9 7945HX, GeForce RTX 4090 Laptop GPU, 90 Wh | Aorus 17X AZF i9-13900HX, GeForce RTX 4090 Laptop GPU, 99 Wh | MSI GE78HX 13VH-070US i9-13950HX, GeForce RTX 4080 Laptop GPU, 99 Wh | Eluktronics Mech-17 GP2 i9-13900HX, GeForce RTX 4090 Laptop GPU, 99 Wh | Alienware m17 R5 (R9 6900HX, RX 6850M XT) R9 6900HX, Radeon RX 6850M XT, 97 Wh | |
|---|---|---|---|---|---|---|
| Duración de Batería | -18% | 19% | -2% | 2% | 8% | |
| Reader / Idle (h) | 10.2 | 9 -12% | 7.3 -28% | |||
| WiFi v1.3 (h) | 5 | 4.1 -18% | 6.5 30% | 6.1 22% | 5.1 2% | 4.8 -4% |
| Load (h) | 1.5 | 2.1 40% | 1.5 0% | 1.8 20% | ||
| H.264 (h) | 6.7 | 4.9 |
Pro
Contra
Veredicto - Rendimiento excelente, pero podría necesitar más cariño

El mejor aspecto del Raptor X17 es su rapidísimo rendimiento en relación con su delgado perfil. Funcionará descaradamente muy caliente y muy alto para exprimir todo el rendimiento posible de CPU y GPU. Los cazadores de rendimiento en particular apreciarán este enfoque, así como la compatibilidad con hasta tres SSD PCIe4 x4 NVMe.
Por desgracia, hay un puñado de inconvenientes a tener en cuenta. Con más de 60 dB(A) al jugar, el sistema es notablemente más ruidoso que la mayoría de portátiles de juego del mercado. Cuando modelos de la competencia como elMSI GE78HX o Asus ROG Strix Scar 17 pueden ofrecer opciones de procesador similares a la vez que funcionan 10 dB(A) más silenciosos cuando se juega, se convierte en una venta más difícil preferir el Raptor X17 sobre muchas alternativas en el mercado. Su peso mucho mayor tampoco le hace ningún favor.
El hardware y el rendimiento son sólidos, pero otros aspectos como los débiles altavoces, los ventiladores muy ruidosos y el software del Centro de Control poco refinado no reflejan adecuadamente el elevado precio de venta.
Hay algunos detalles más que creemos que también podrían haber sido mejores. Los confusos perfiles de energía, el comportamiento pulsante del ventilador, los modos ocultos de la GPU, el sangrado moderado y desigual de la retroiluminación y la pantalla calibrada opcional son desafortunados en un portátil de gama alta que cuesta más de 3.000 dólares. Eurocom dice que está rediseñando el menú de la BIOS y el software del Centro de Control, lo que debería solucionar algunas de nuestras quejas.
Precio y disponibilidad
Eurocom ya está distribuyendo el Raptor X17 en Norteamérica a partir de $3550 USD para la configuración básica hasta más de $6000 según la configuración de nuestra unidad de prueba.
Eurocom Raptor X17
- 05/18/2023 v7 (old)
Allen Ngo
Transparencia
La selección de los dispositivos que se van a reseñar corre a cargo de nuestro equipo editorial. La muestra de prueba fue proporcionada al autor en calidad de préstamo por el fabricante o el minorista a los efectos de esta reseña. El prestamista no tuvo ninguna influencia en esta reseña, ni el fabricante recibió una copia de la misma antes de su publicación. No había ninguna obligación de publicar esta reseña. Como empresa de medios independiente, Notebookcheck no está sujeta a la autoridad de fabricantes, minoristas o editores.
Así es como prueba Notebookcheck
Cada año, Notebookcheck revisa de forma independiente cientos de portátiles y smartphones utilizando procedimientos estandarizados para asegurar que todos los resultados son comparables. Hemos desarrollado continuamente nuestros métodos de prueba durante unos 20 años y hemos establecido los estándares de la industria en el proceso. En nuestros laboratorios de pruebas, técnicos y editores experimentados utilizan equipos de medición de alta calidad. Estas pruebas implican un proceso de validación en varias fases. Nuestro complejo sistema de clasificación se basa en cientos de mediciones y puntos de referencia bien fundamentados, lo que mantiene la objetividad.Price comparison

