Corriendo un AMD Ryzen 9 5900X en un portátil: Análisis del Eurocom Nightsky ARX15
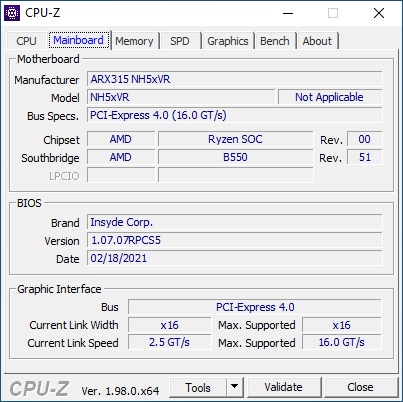
No hay que confundirlo con el Nightsky RX15, el Nightsky ARX15 utiliza CPUs AMD de sobremesa y un chasis diferente al de su homólogo Intel. Sus especificaciones sobre el papel deberían hacer del ARX15 uno de los portátiles de 15,6 pulgadas más rápidos que se pueden comprar en términos de rendimiento bruto de la CPU. La configuración que tenemos en la revisión se vende por alrededor de $3400 USD con precios mucho más bajos o más altos disponibles dependiendo del almacenamiento.
Se puede encontrar información adicional sobre el Nightsky ARX15 en su página oficial aquí. El chasis está basado en el Clevo NH57AF1, por lo que los usuarios encontrarán muchas similitudes entre el Eurocom Nightsky ARX15 y el Schenker XMG Apex 15.
Más reseñas de Eurocom
Potential Competitors in Comparison
Valoración | Fecha | Modelo | Peso | Altura | Tamaño | Resolución | Precio |
|---|---|---|---|---|---|---|---|
| 83 % v7 (old) | 01/2022 | Eurocom Nightsky ARX315 R9 5900X, GeForce RTX 3070 Laptop GPU | 2.6 kg | 32.5 mm | 15.60" | 1920x1080 | |
| 84.1 % v7 (old) | 01/2022 | Gigabyte A5 X1 R9 5900HX, GeForce RTX 3070 Laptop GPU | 2.2 kg | 25.3 mm | 15.60" | 1920x1080 | |
| 81.4 % v7 (old) | 12/2021 | Medion Erazer Deputy P25 R7 5800H, GeForce RTX 3060 Laptop GPU | 2.3 kg | 26 mm | 15.60" | 1920x1080 | |
| 82.9 % v7 (old) | 10/2021 | MSI Delta 15 A5EFK R9 5900HX, Radeon RX 6700M | 2 kg | 19 mm | 15.60" | 1920x1080 | |
| 84.4 % v7 (old) | 11/2021 | Schenker XMG Apex 15 NH57E PS R7 5800H, GeForce RTX 3060 Laptop GPU | 2.1 kg | 29 mm | 15.60" | 1920x1080 | |
| 84.6 % v7 (old) | 12/2020 | MSI GE66 Raider 10SFS i9-10980HK, GeForce RTX 2070 Super Mobile | 2.4 kg | 23 mm | 15.60" | 1920x1080 |
Caso
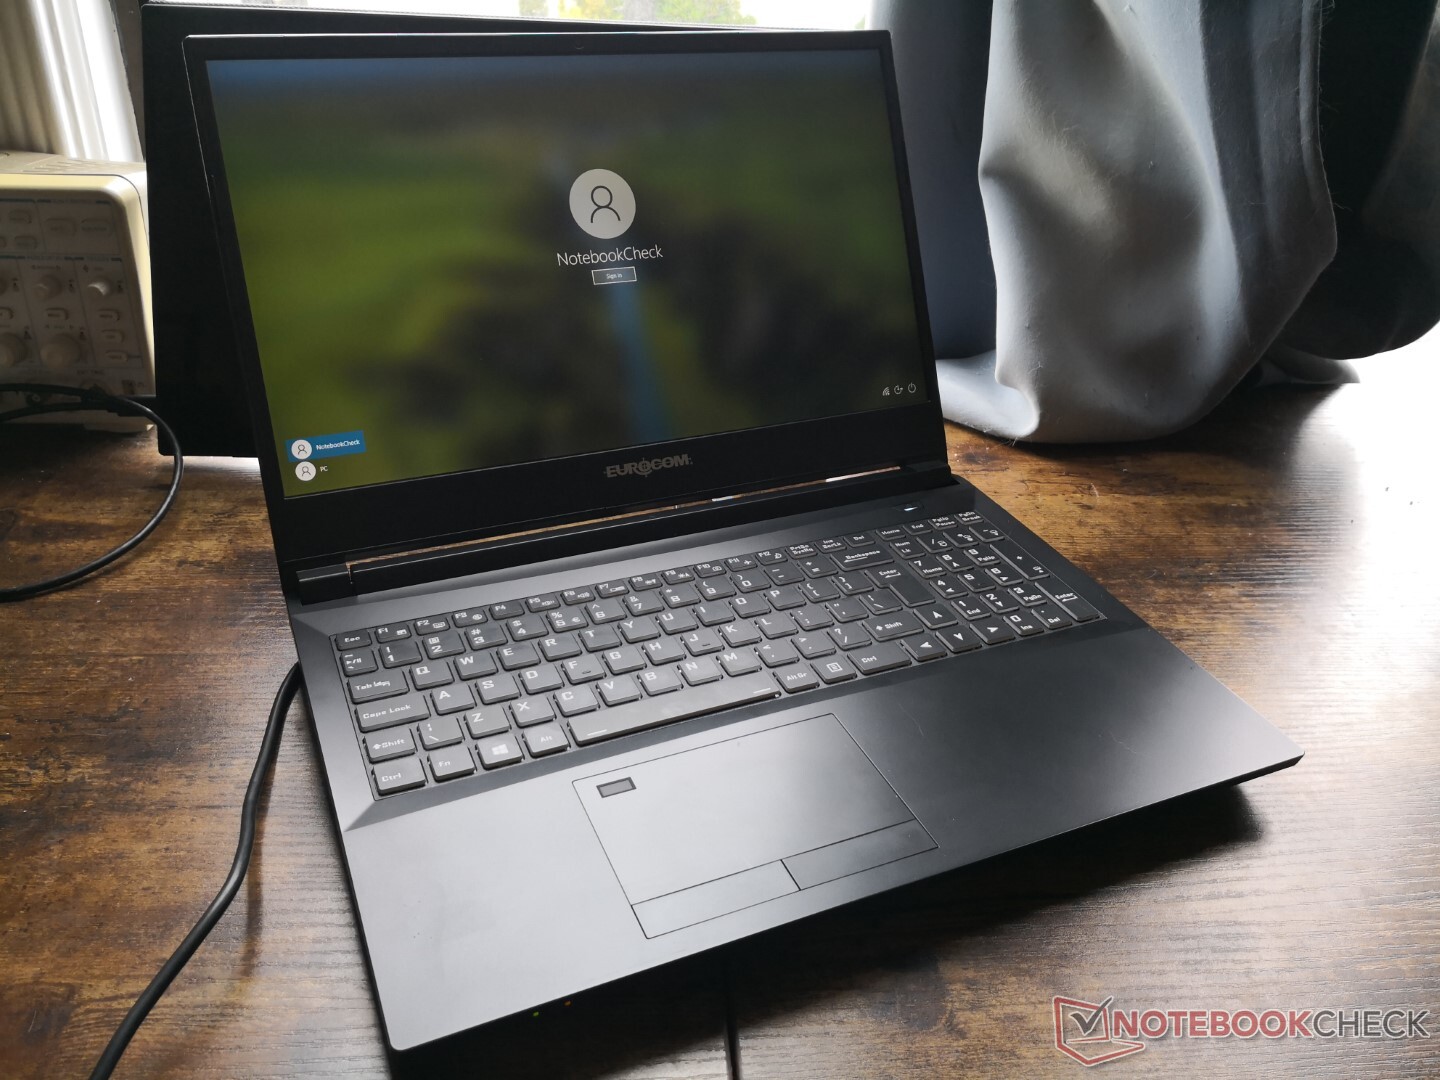
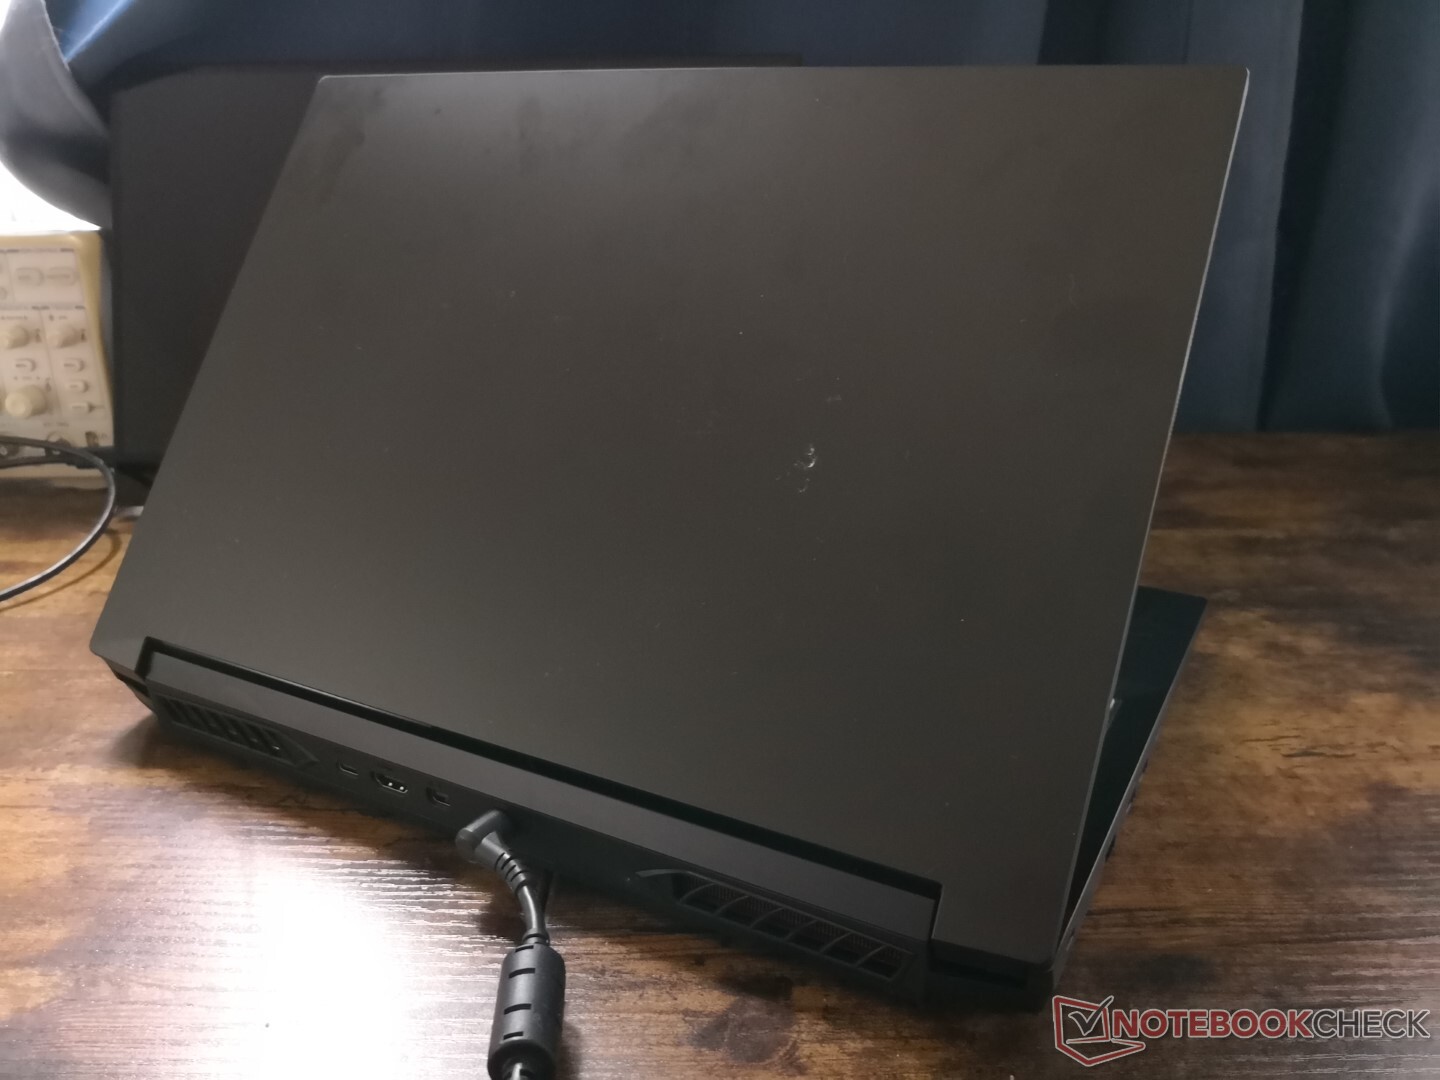
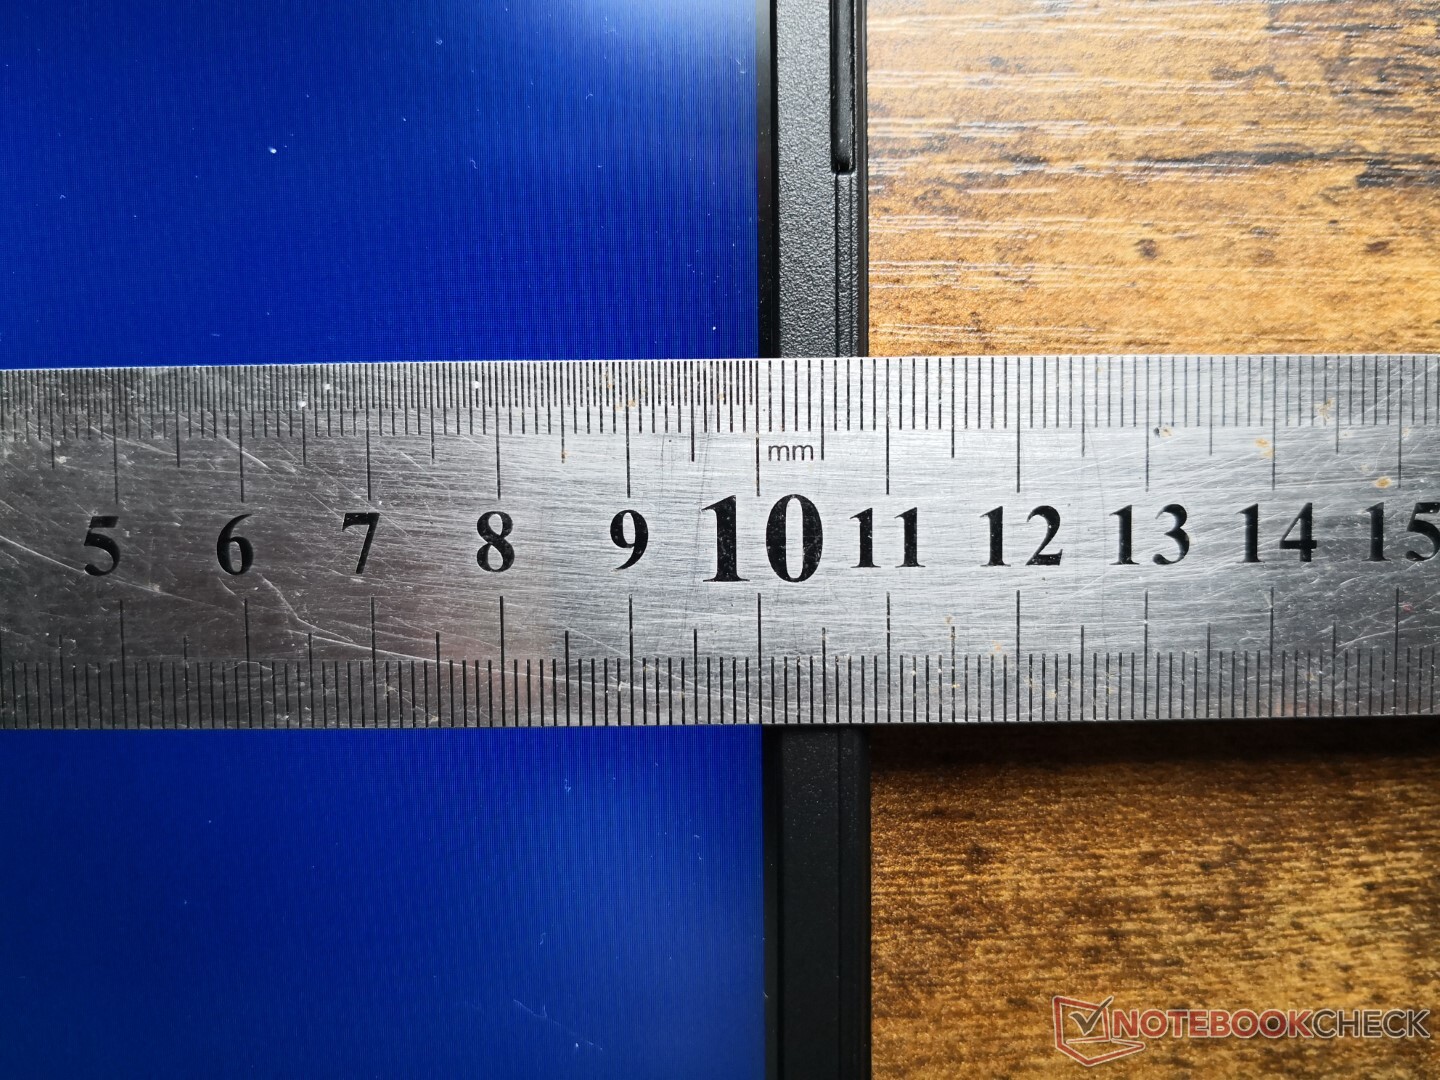
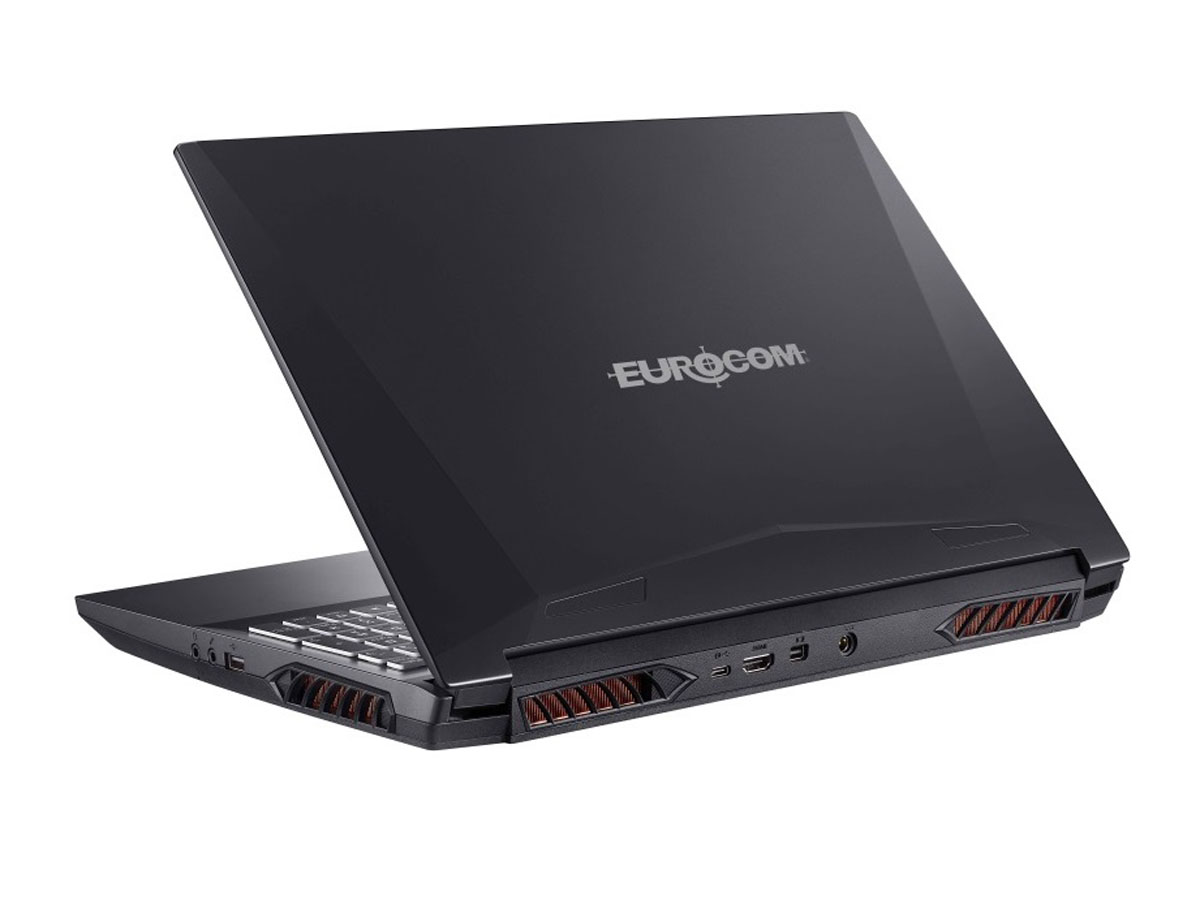
El chasis sigue siendo más grande y pesado en relación a otros portátiles de juego de 15,6 pulgadas con CPUs de la serie H más tradicionales como elMSI GE66 o elAsus ROG Strix G15. Nuestras impresiones sobre el chasis del Schenker Apex 15 se aplican aquí para el Nightsky ARX15.
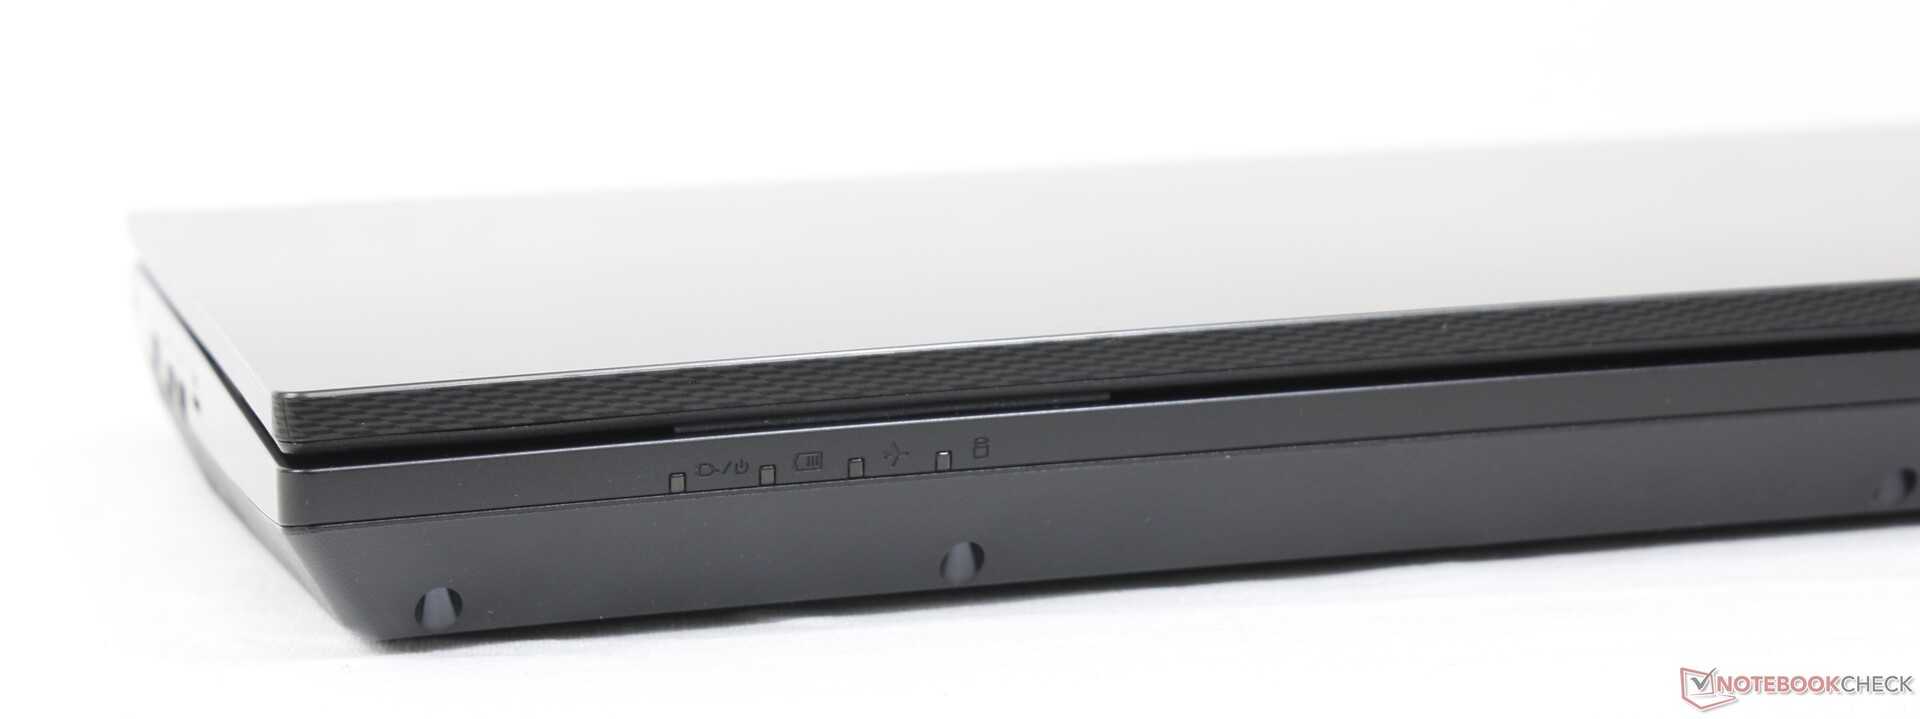
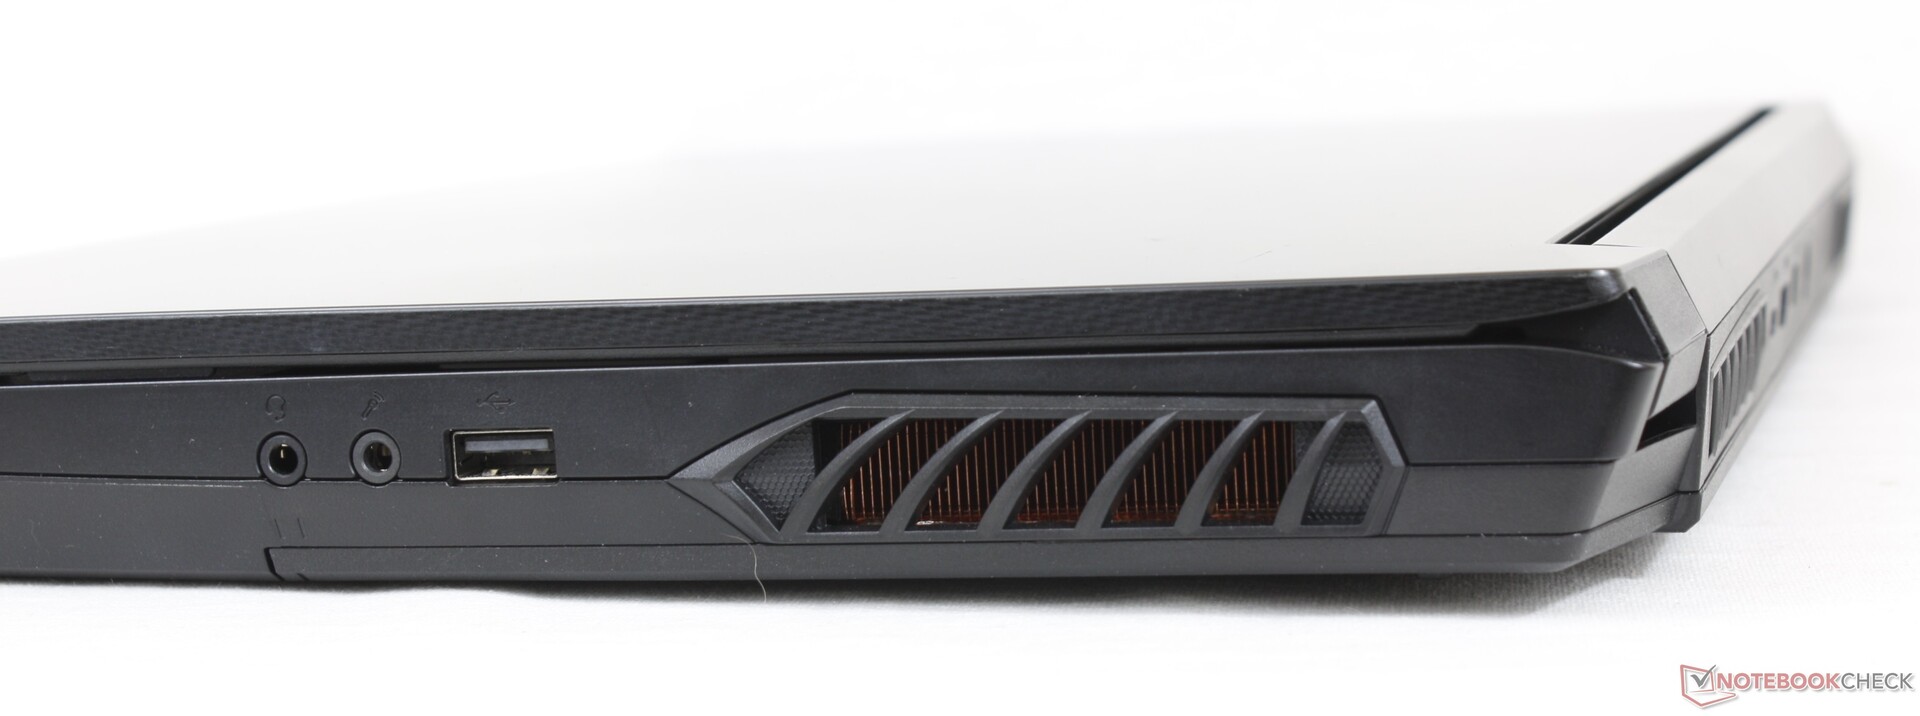
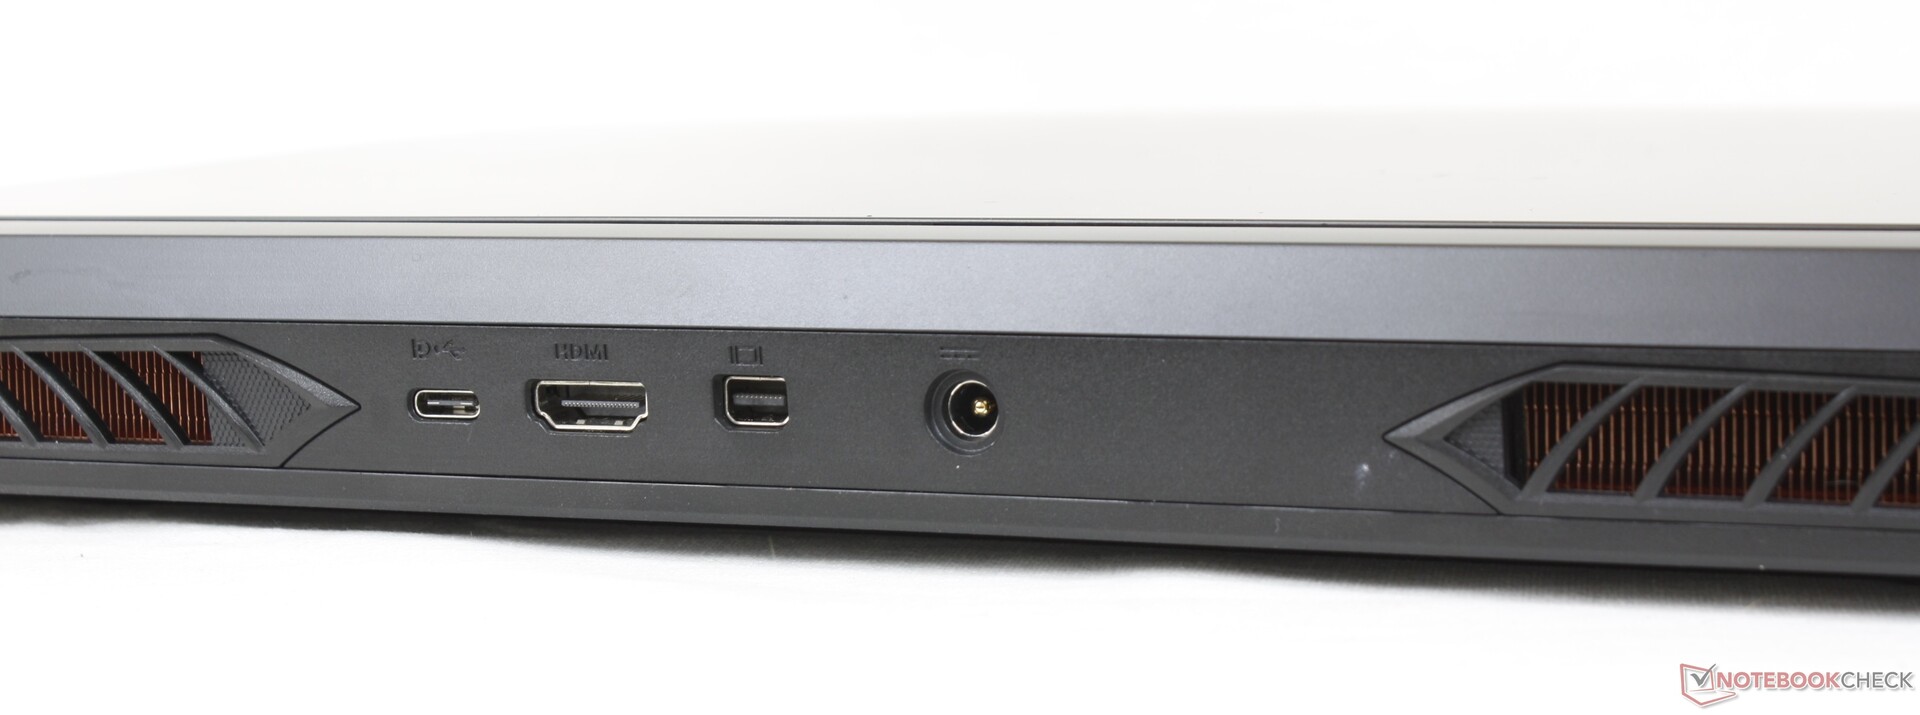
Conectividad
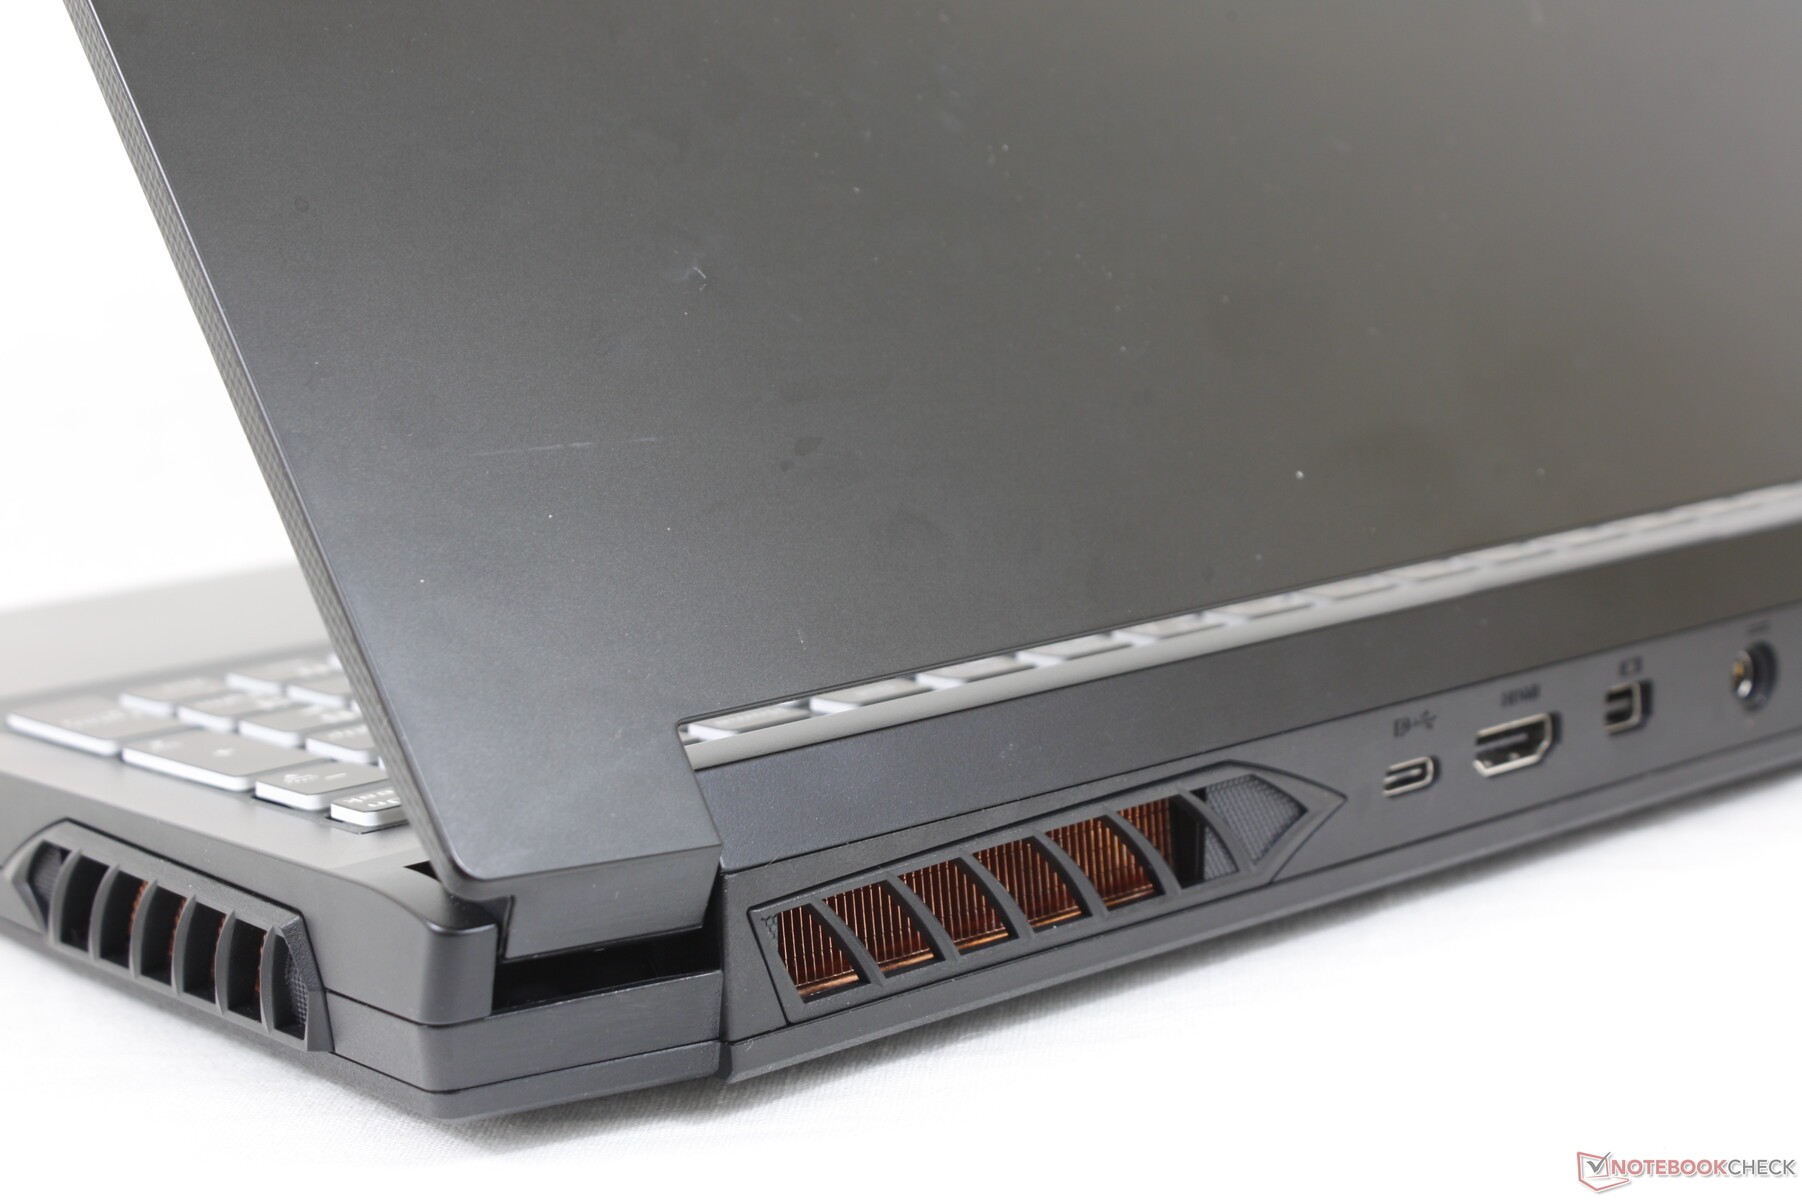
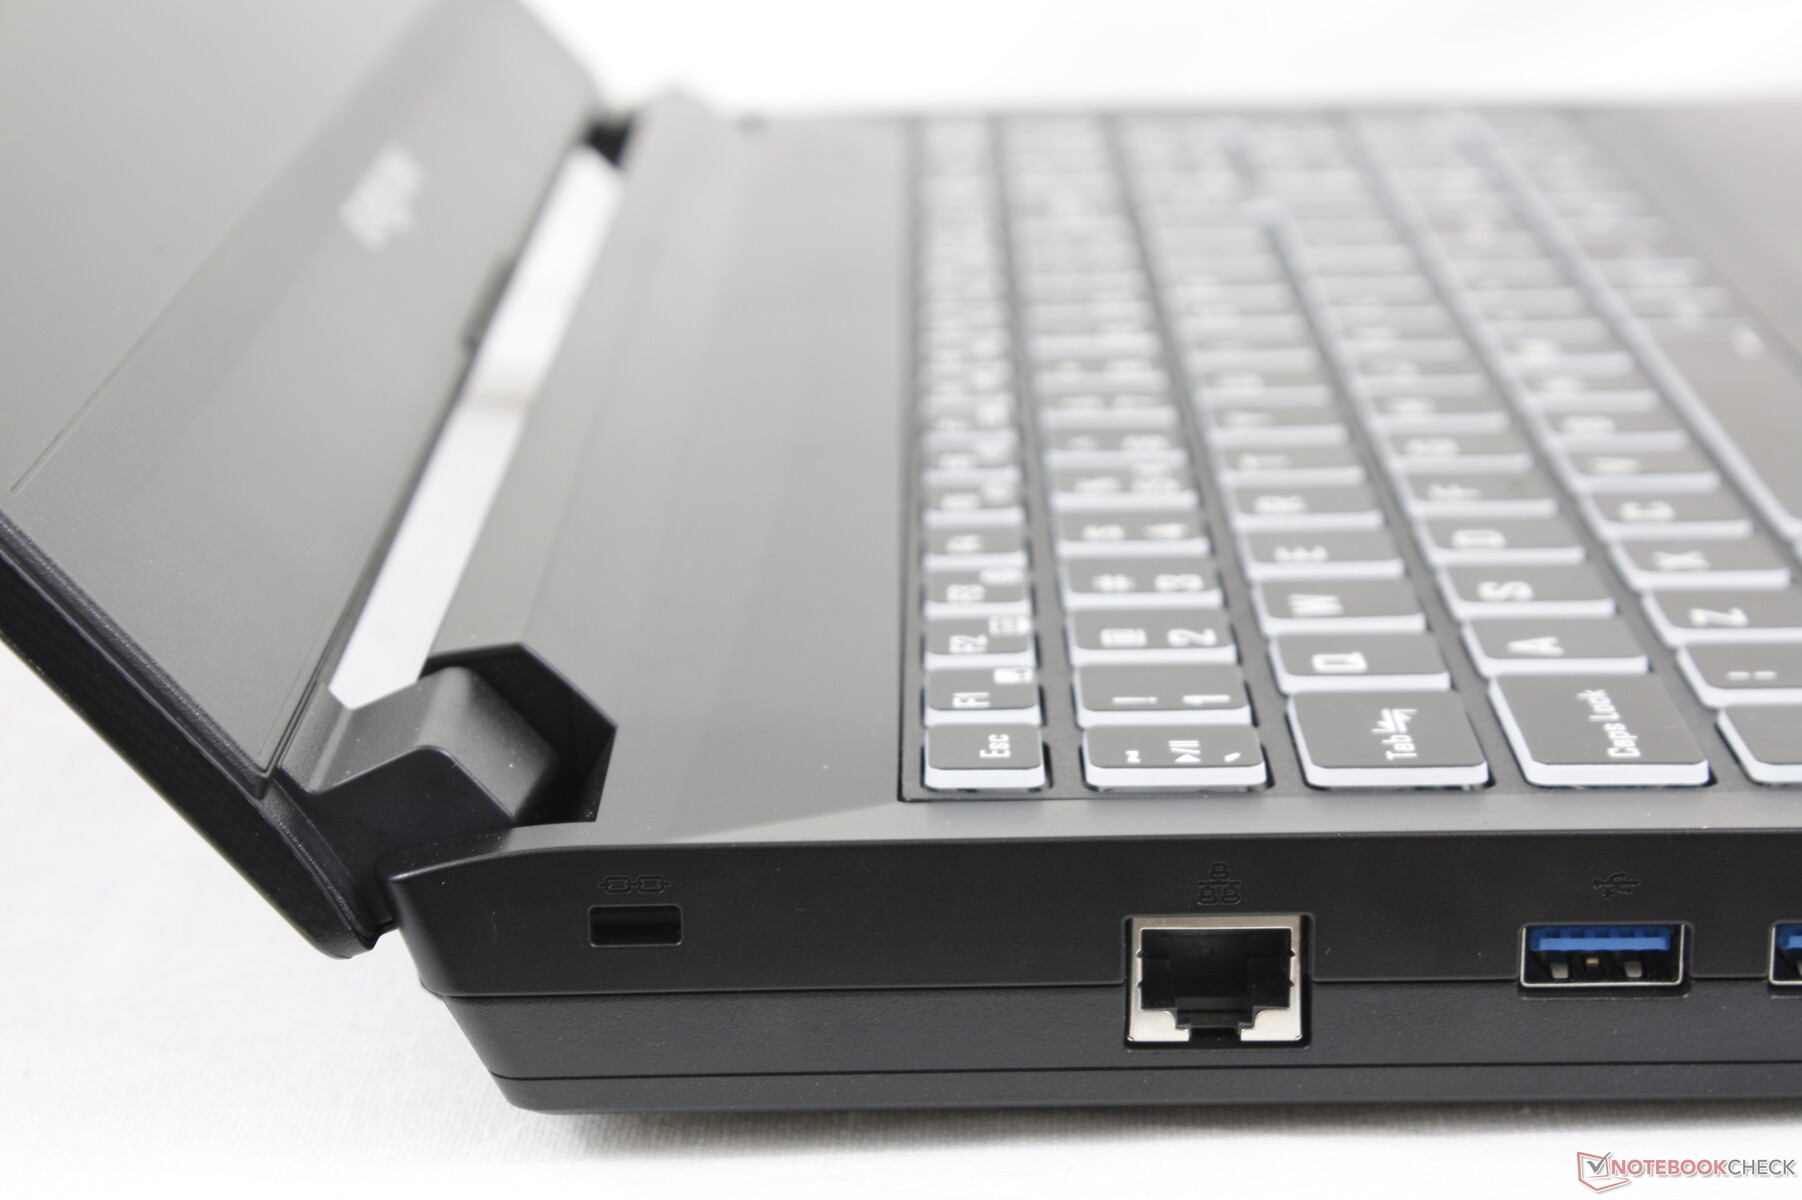
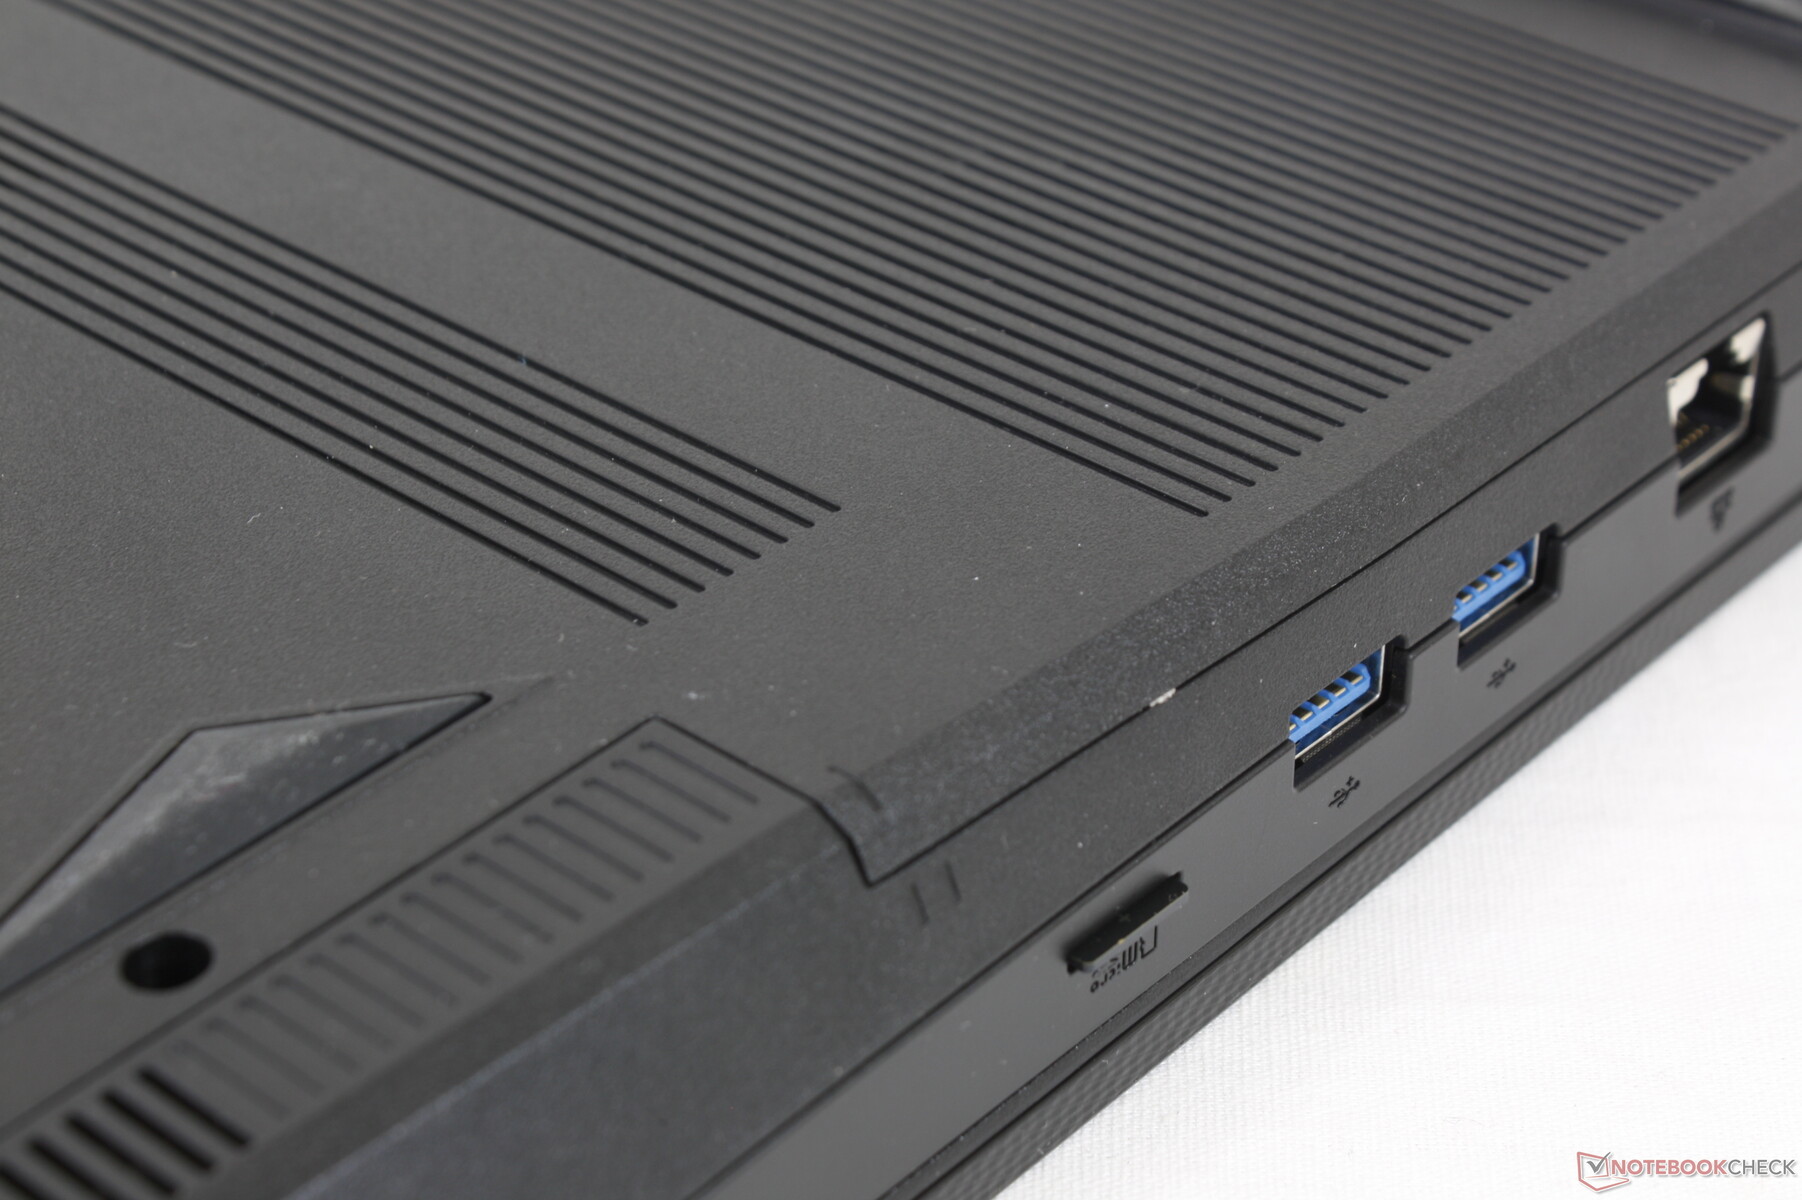
Hay menos opciones de puerto aquí en comparación con el RX15. Sólo hay un puerto USB-C en vez de dos, por ejemplo, y no soporta Thunderbolt o Power Delivery. En cambio, la mayoría de portátiles MSI, Asus, y Alienware tienen la opción de recargar por USB-C.
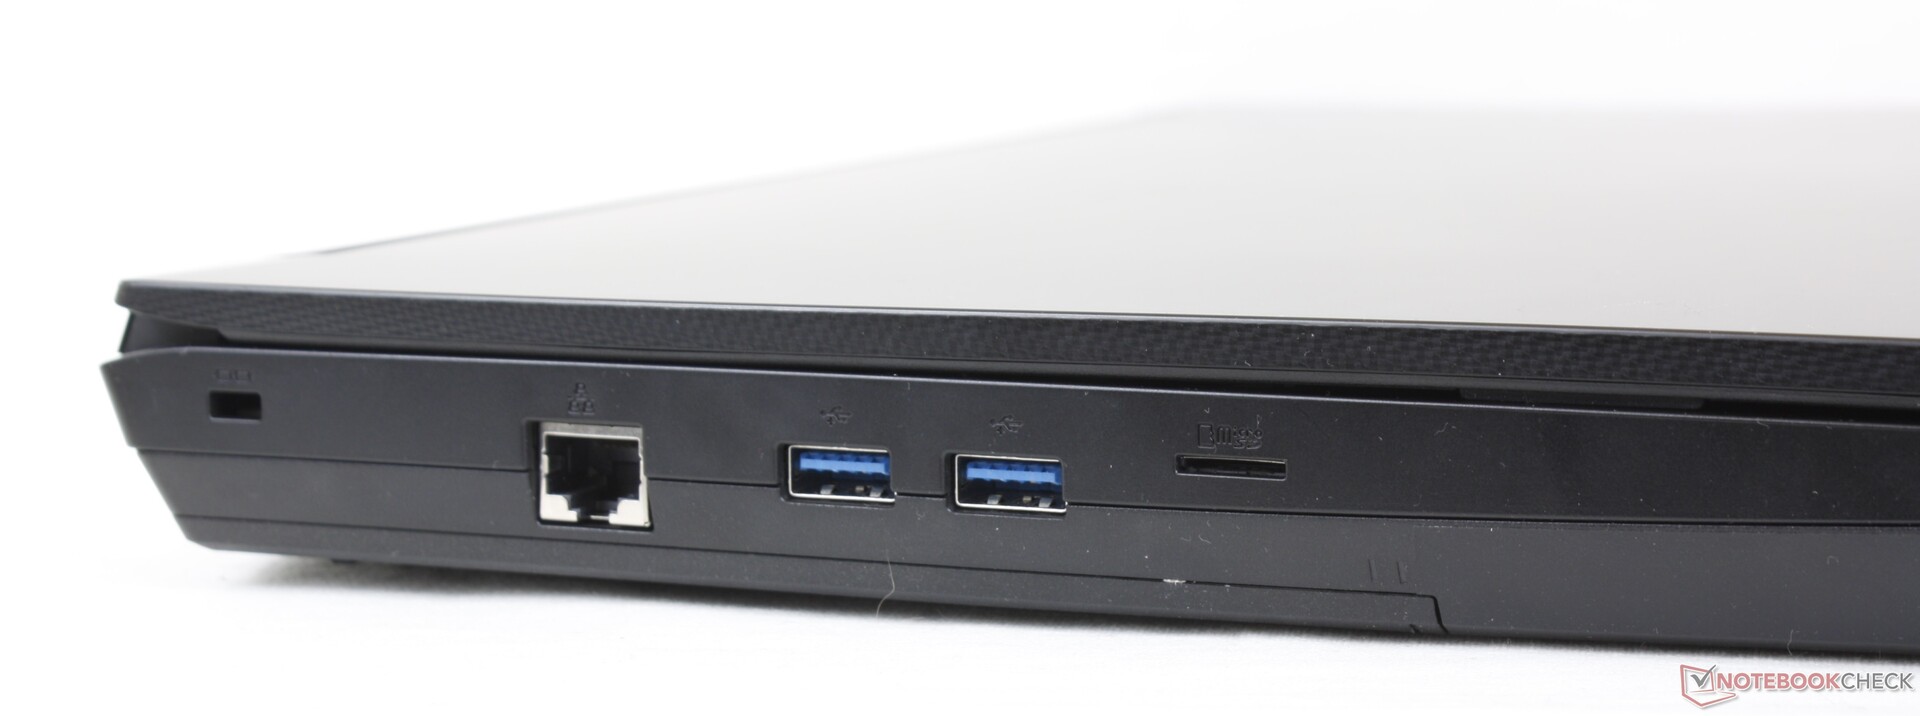
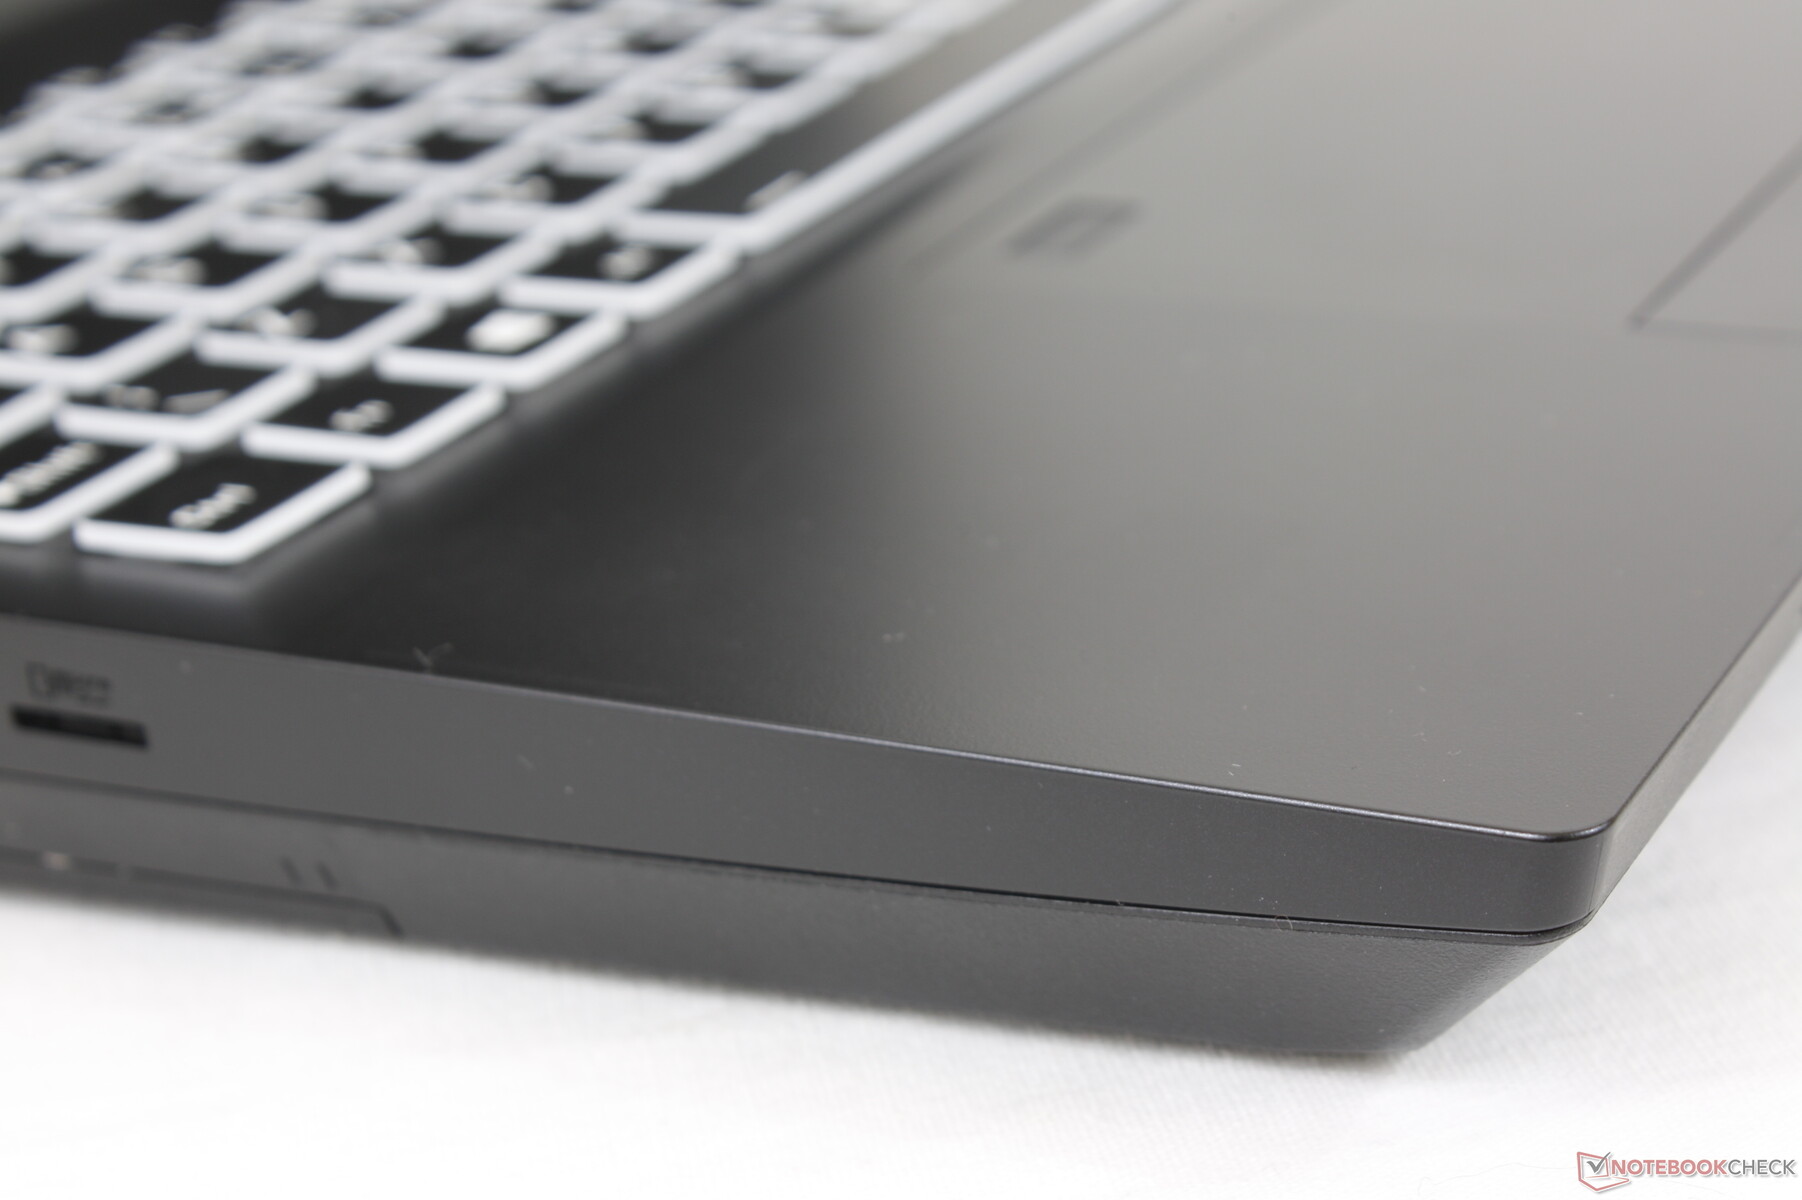
Lector de tarjetas SD
Las velocidades de transferencia del lector MicroSD integrado son decentes, pero siguen siendo decepcionantes en relación con el precio del sistema. Mover 1 GB de imágenes desde nuestra tarjeta de prueba UHS-II al escritorio lleva unos 15 segundos, comparado con menos de la mitad en elMSI GE66 Raider 10SFS.
| SD Card Reader | |
| average JPG Copy Test (av. of 3 runs) | |
| MSI GE66 Raider 10SFS (Toshiba Exceria Pro SDXC 64 GB UHS-II) | |
| Eurocom Nightsky ARX315 (AV Pro V60) | |
| maximum AS SSD Seq Read Test (1GB) | |
| MSI GE66 Raider 10SFS (Toshiba Exceria Pro SDXC 64 GB UHS-II) | |
| Eurocom Nightsky ARX315 (AV Pro V60) | |
Comunicación
Cámara web
El sistema viene equipado con una webcam de 720p mientras que el Eurocom Sky X4C viene con una webcam de mayor resolución de 1080p. No hay obturador de privacidad ni cámara IR. En cambio, hay una tecla Fn para desactivar la cámara electrónicamente.


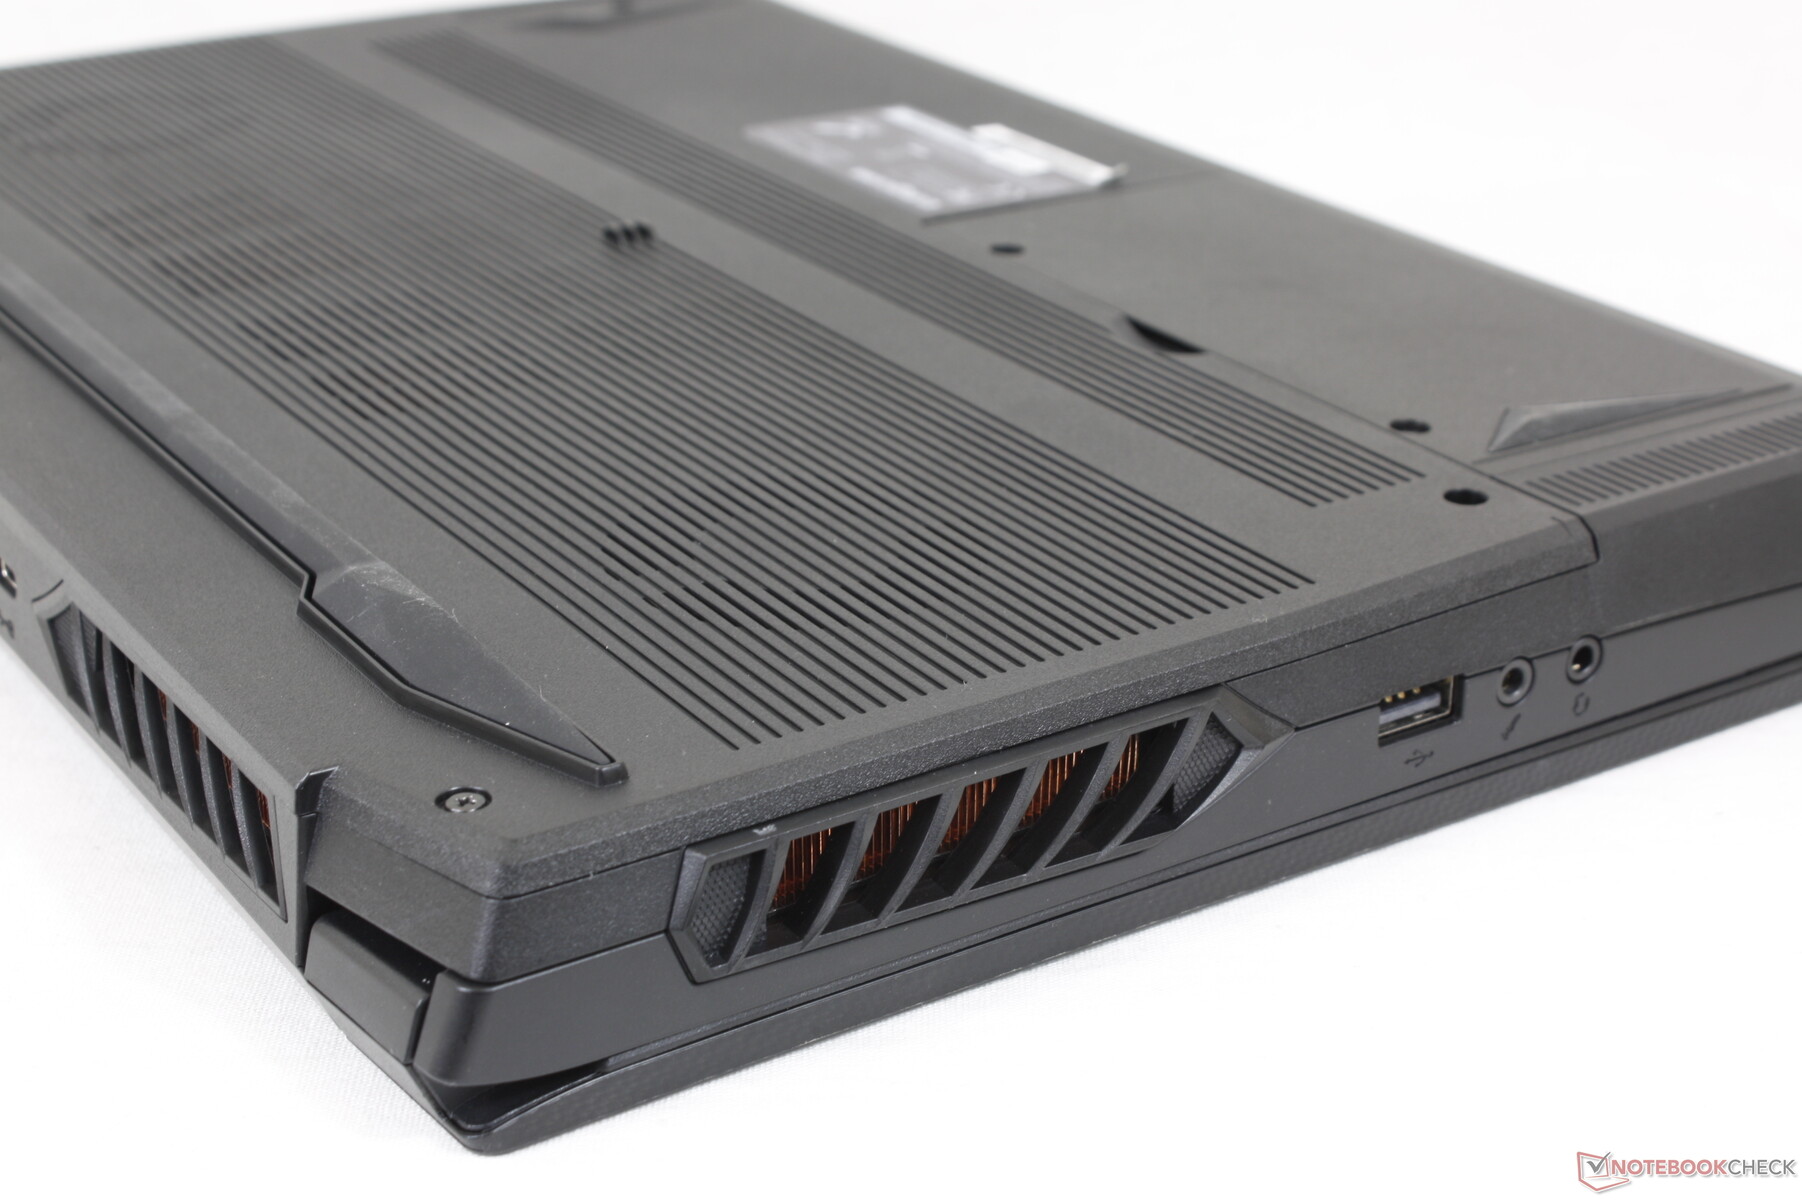
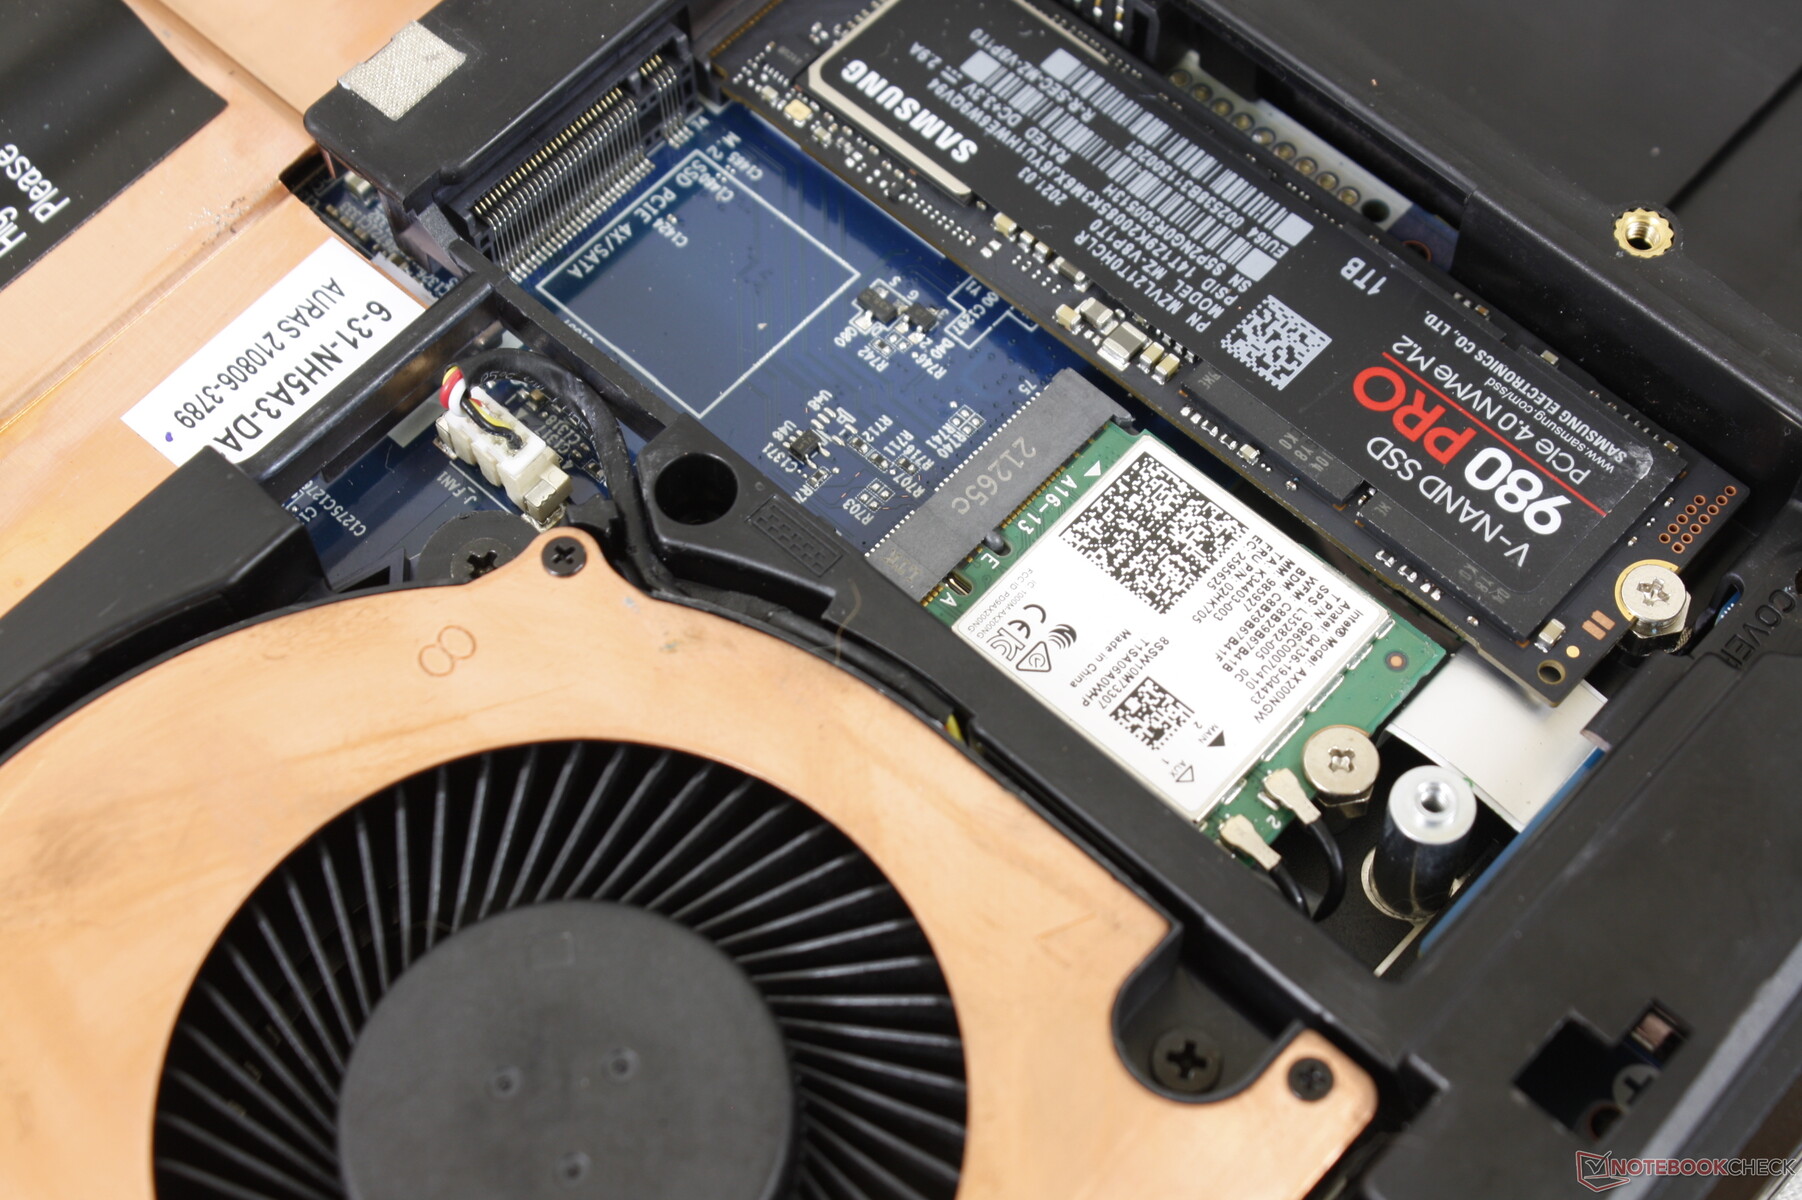
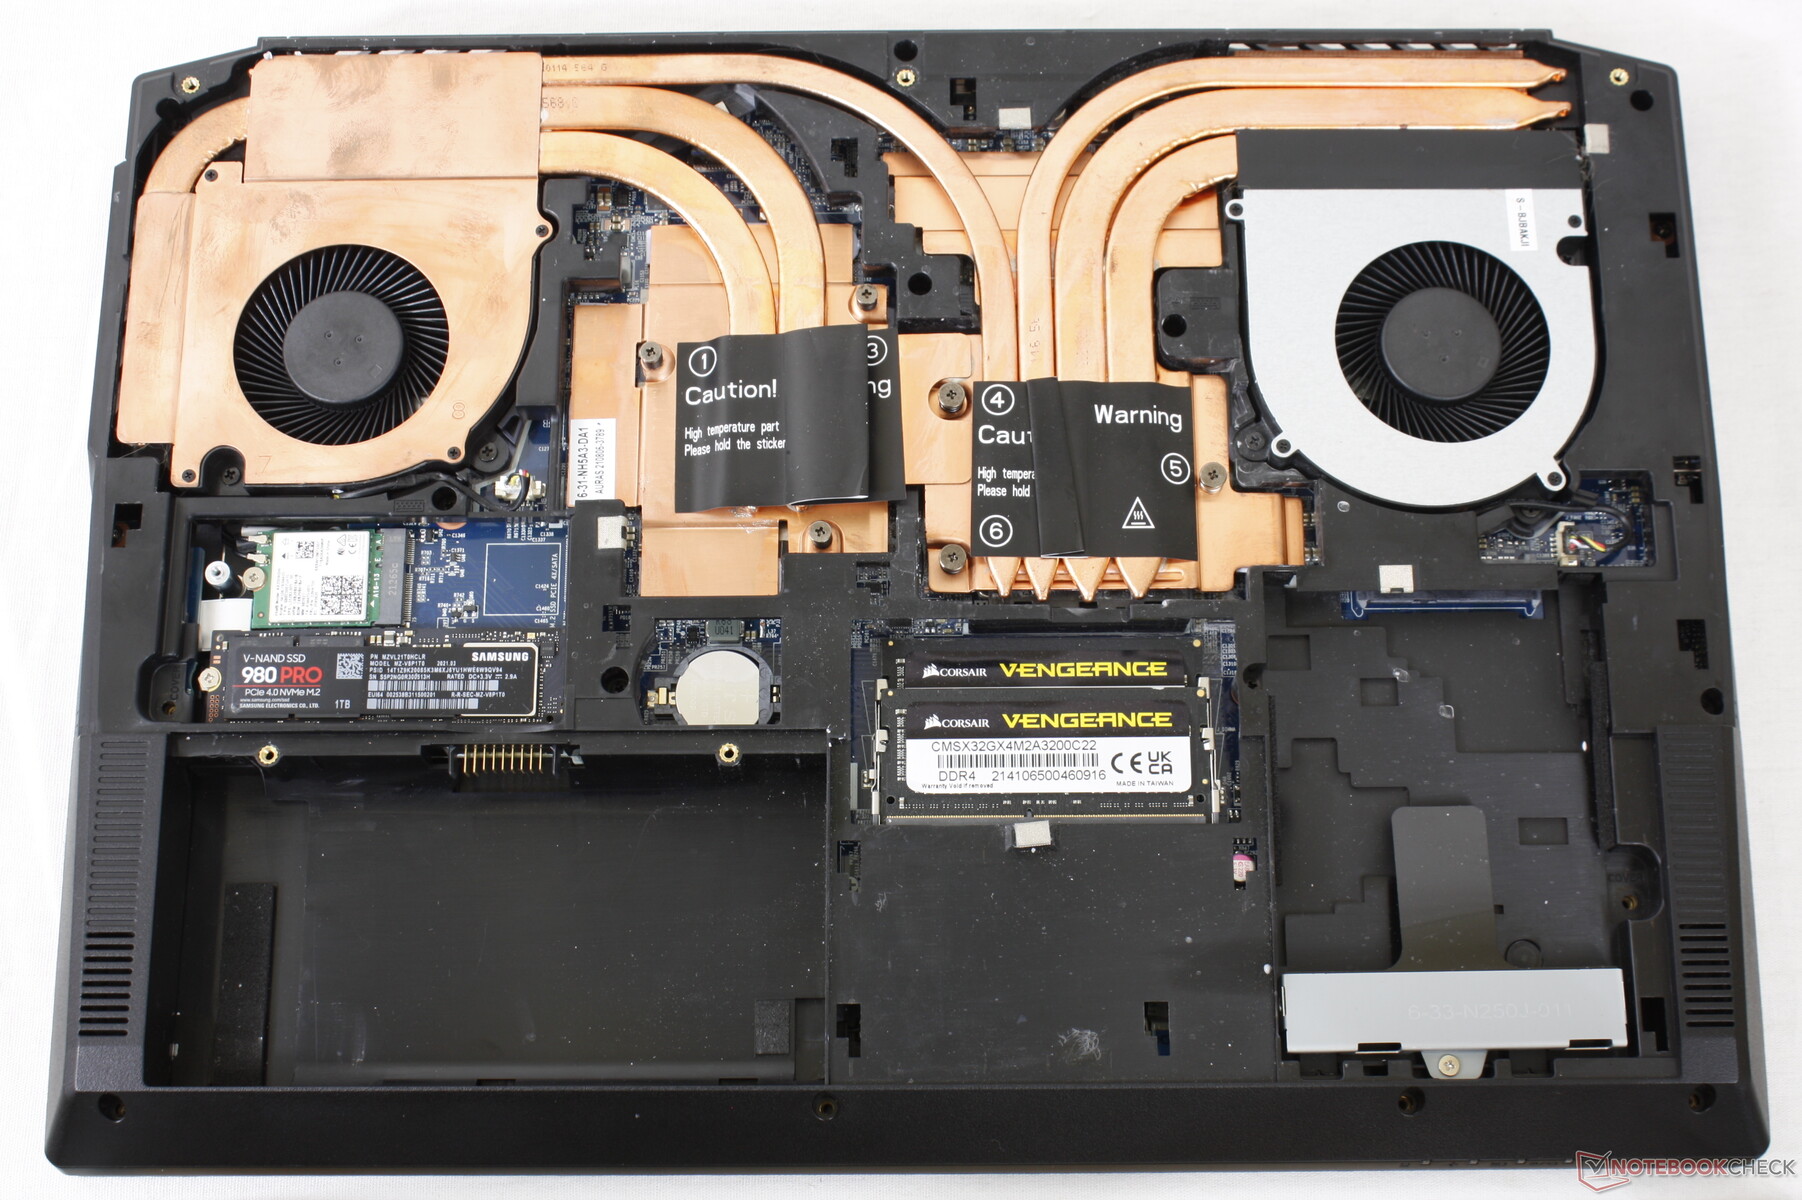
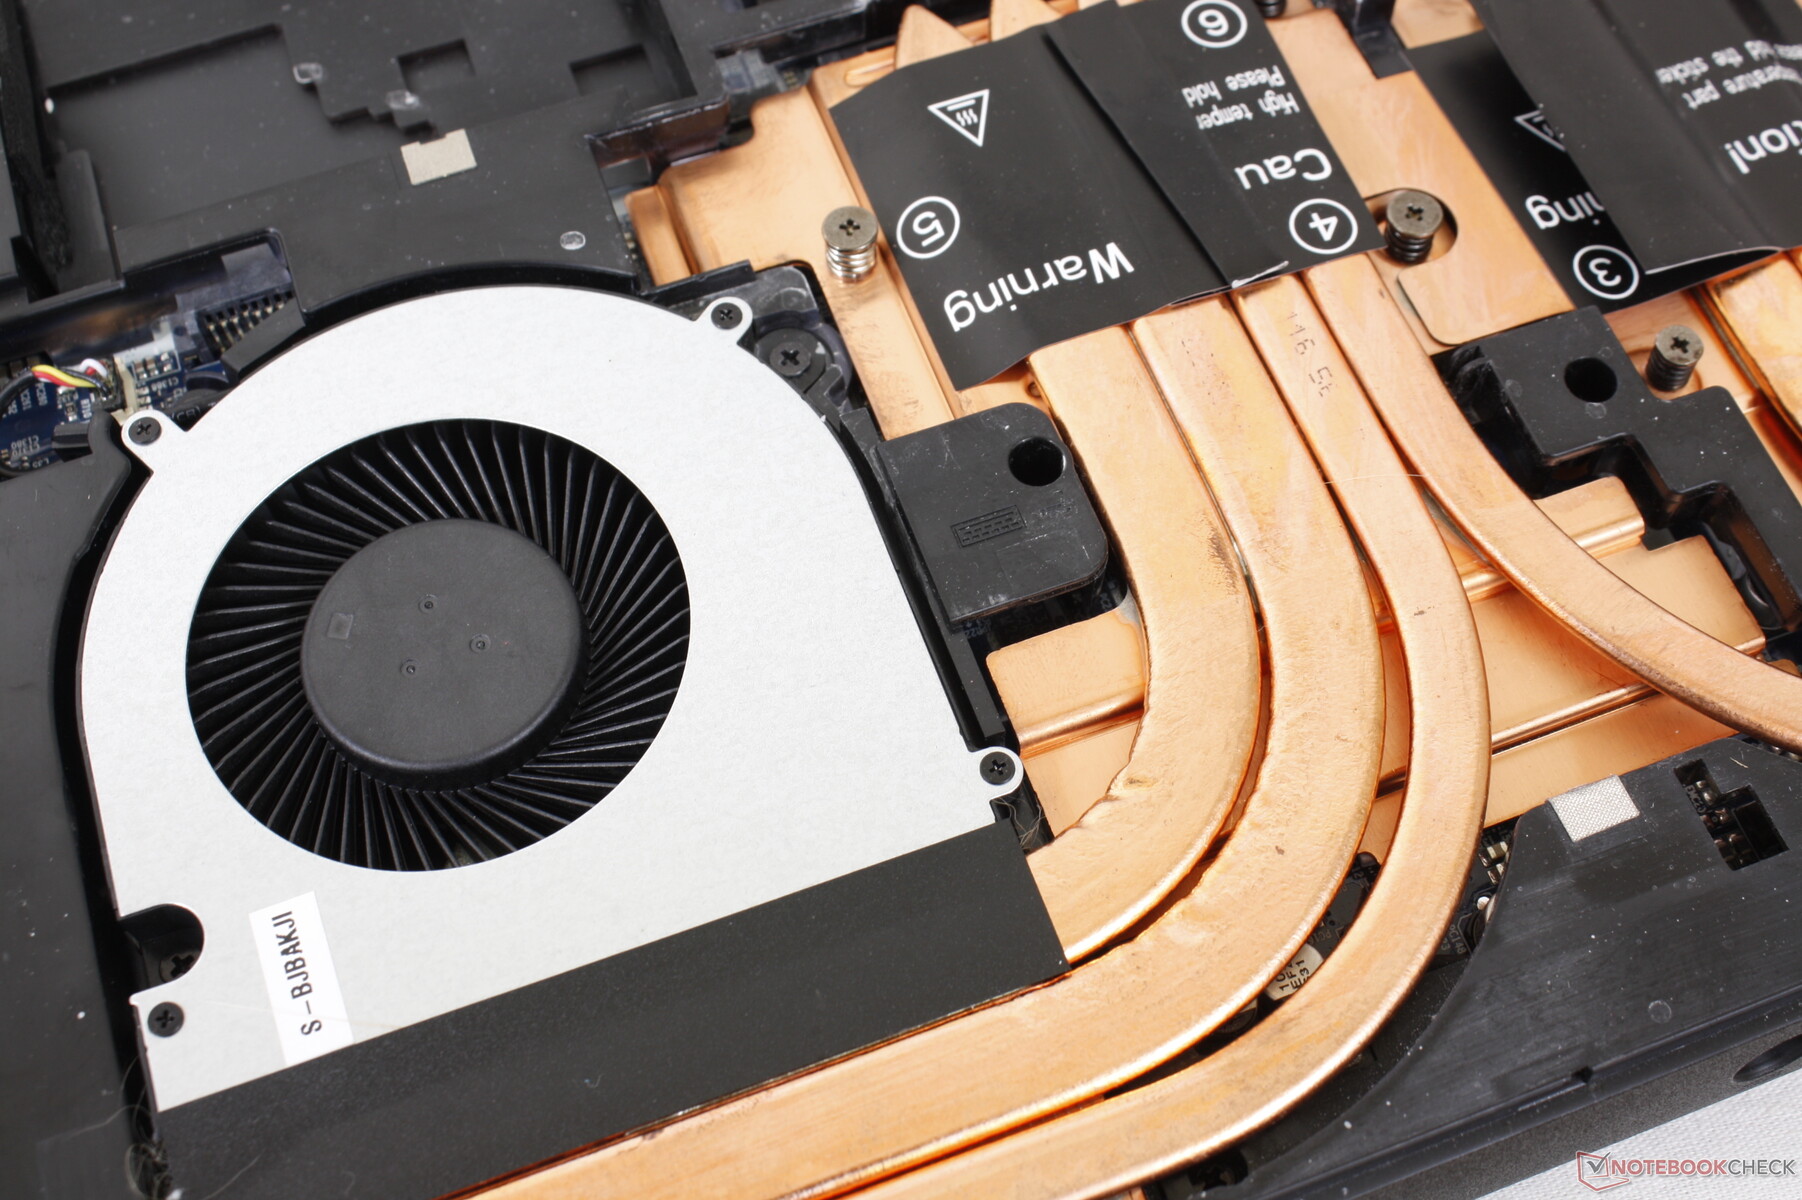
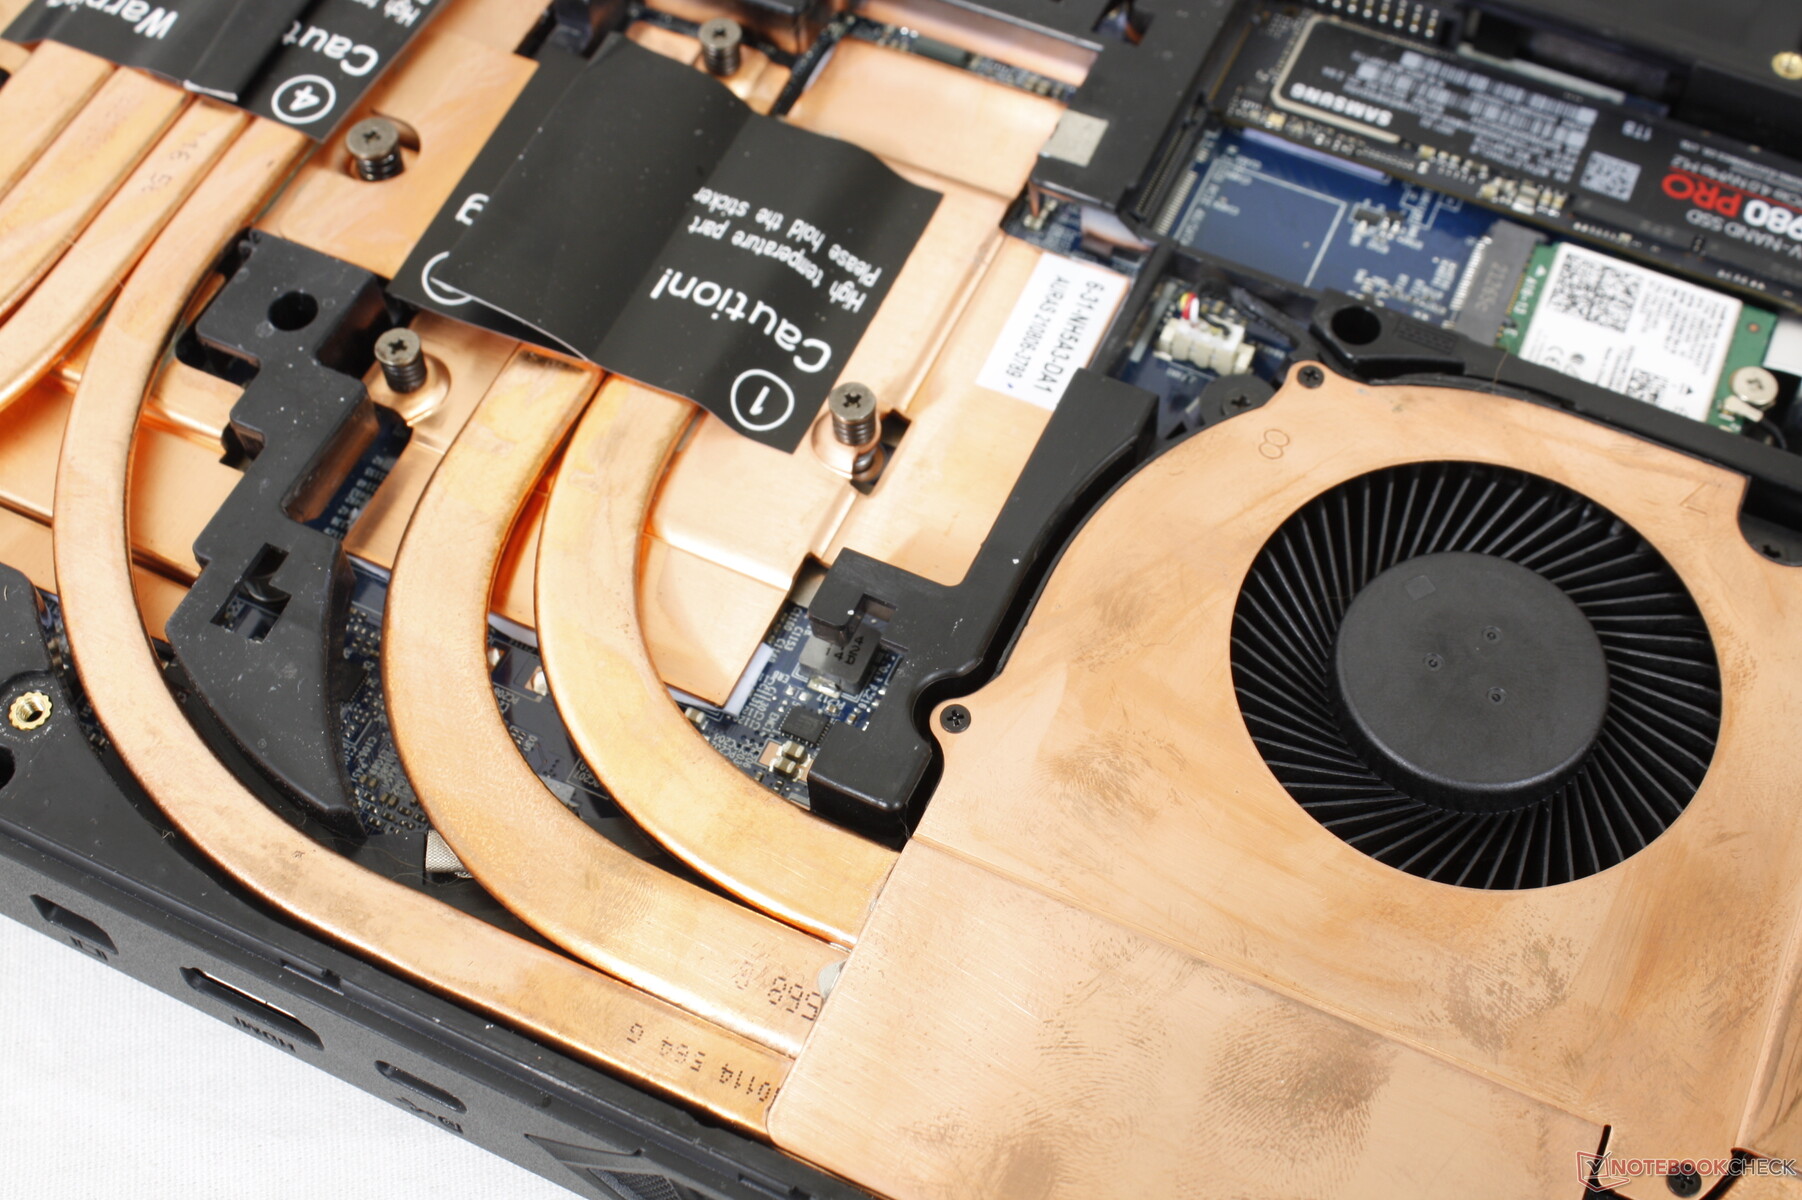
Mantenimiento
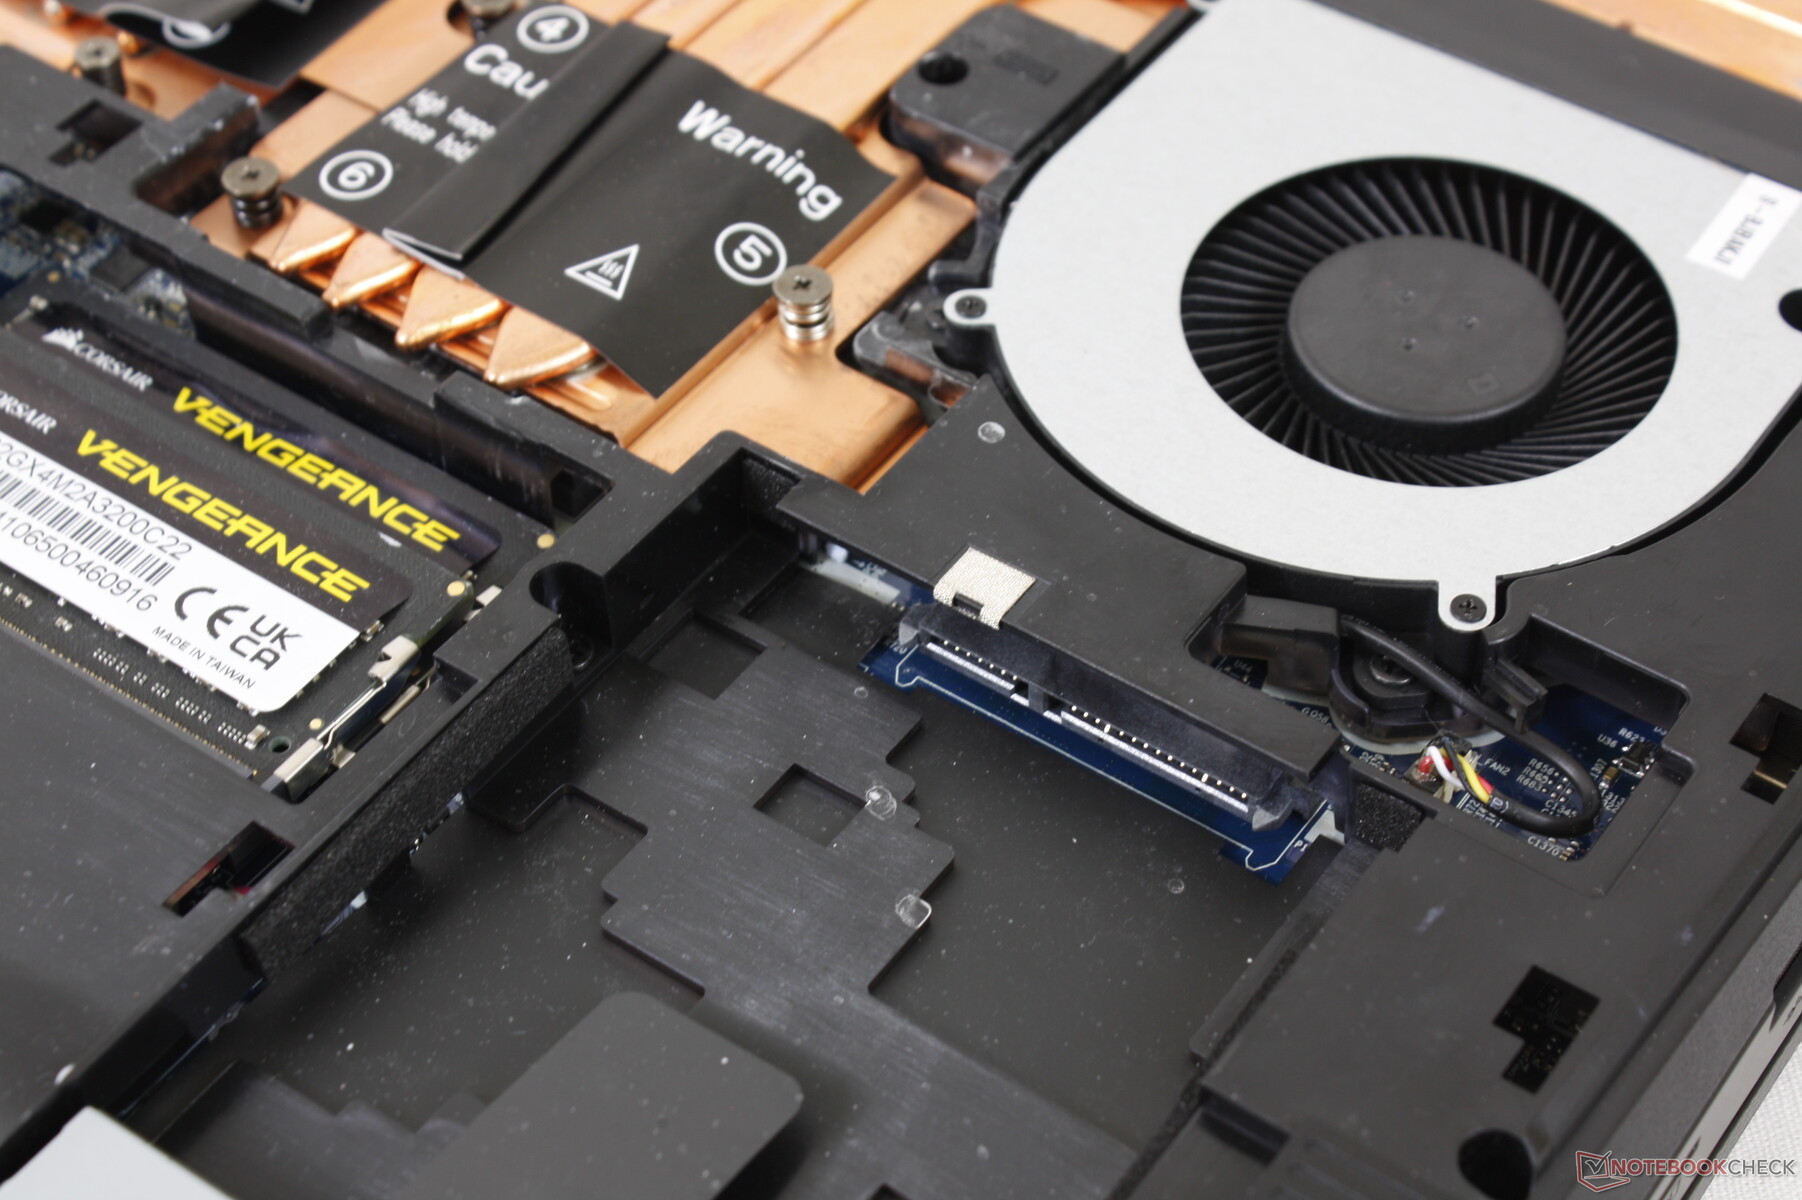
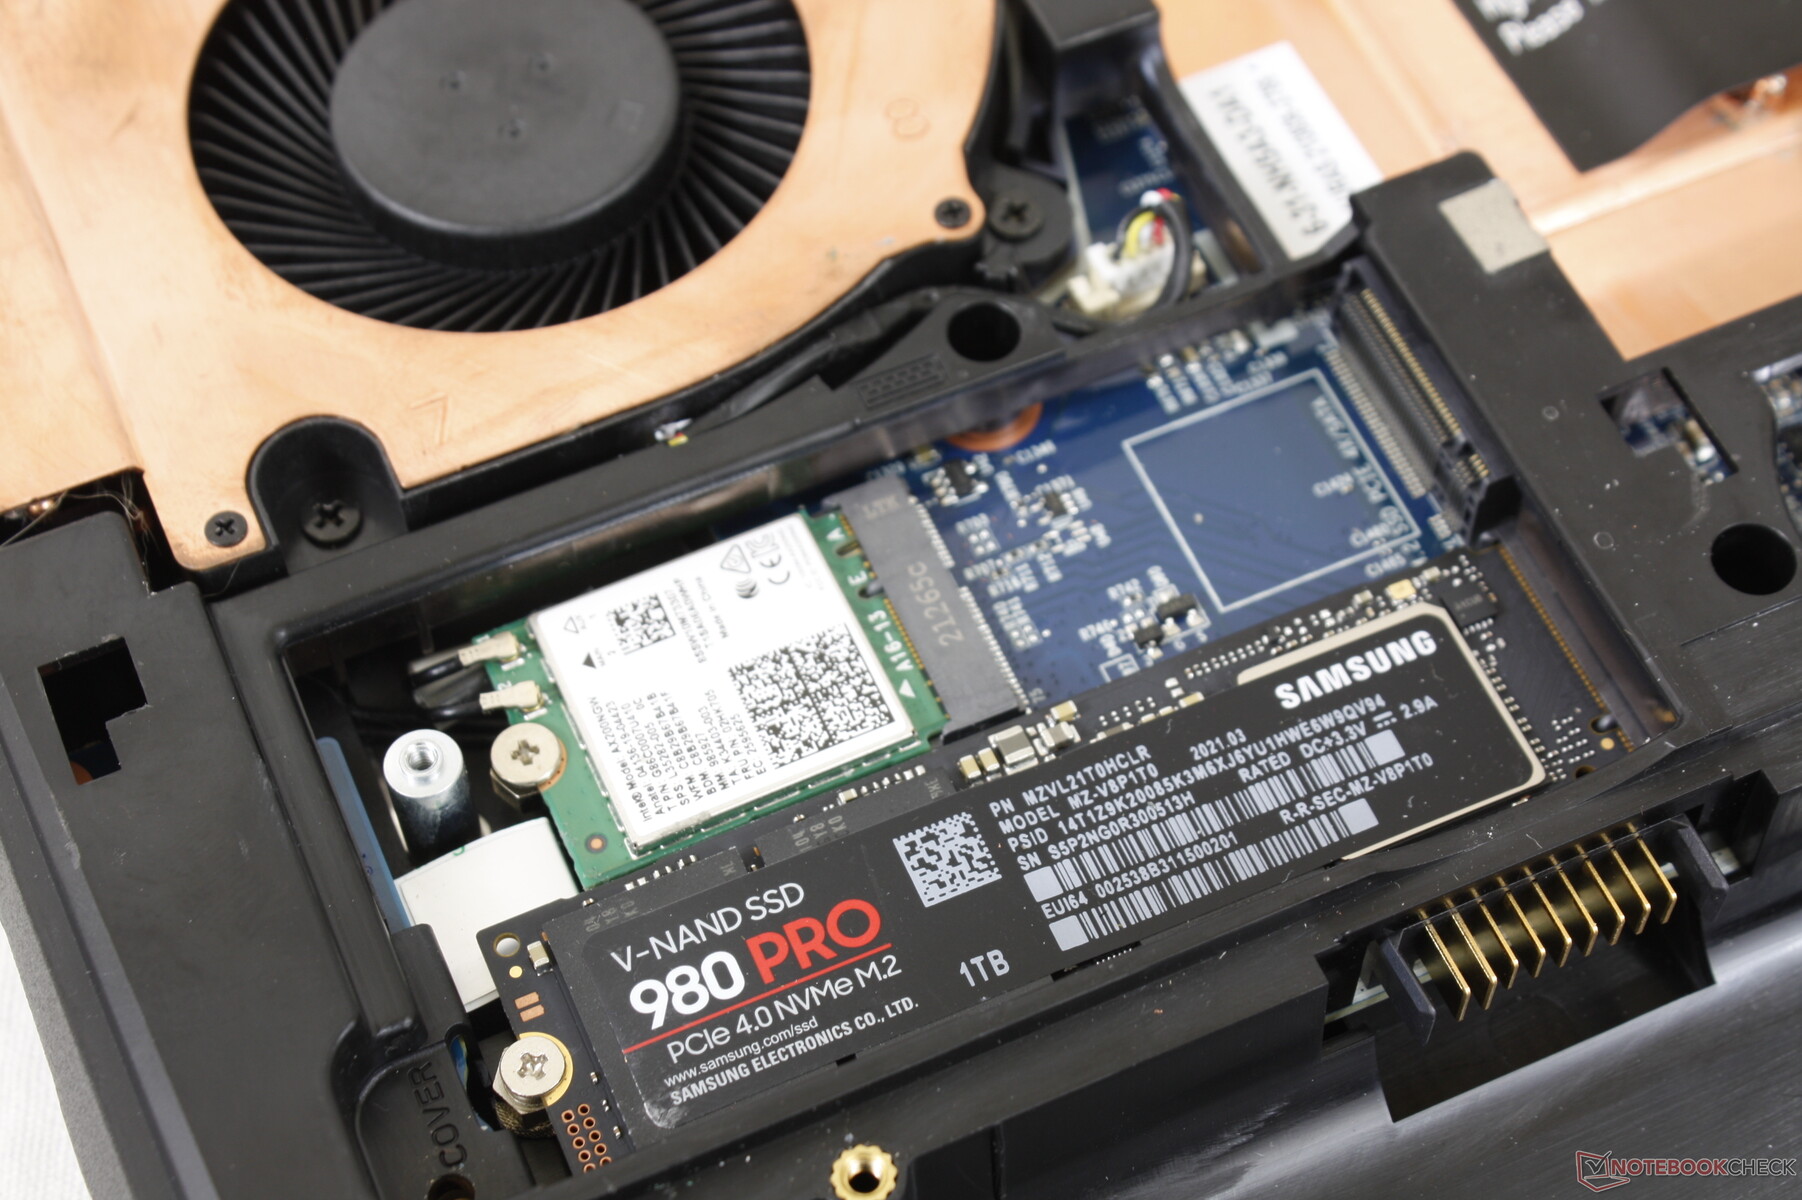
El panel inferior se desprende fácilmente tras retirar los cinco tornillos Philips. Los usuarios tienen acceso directo a todos los componentes comunes, incluidas las dos ranuras SODIMM DDR4 y las tres bahías de almacenamiento.
Accesorios y garantía
La caja de venta incluye un manual, un disco de controladores, una unidad USB de Windows 10, tornillos adicionales, una almohadilla térmica para SSD y dos jeringas de pasta térmica de 0,6 g. Se aplica la garantía limitada estándar de un año con la opción de ampliarla hasta 3 años
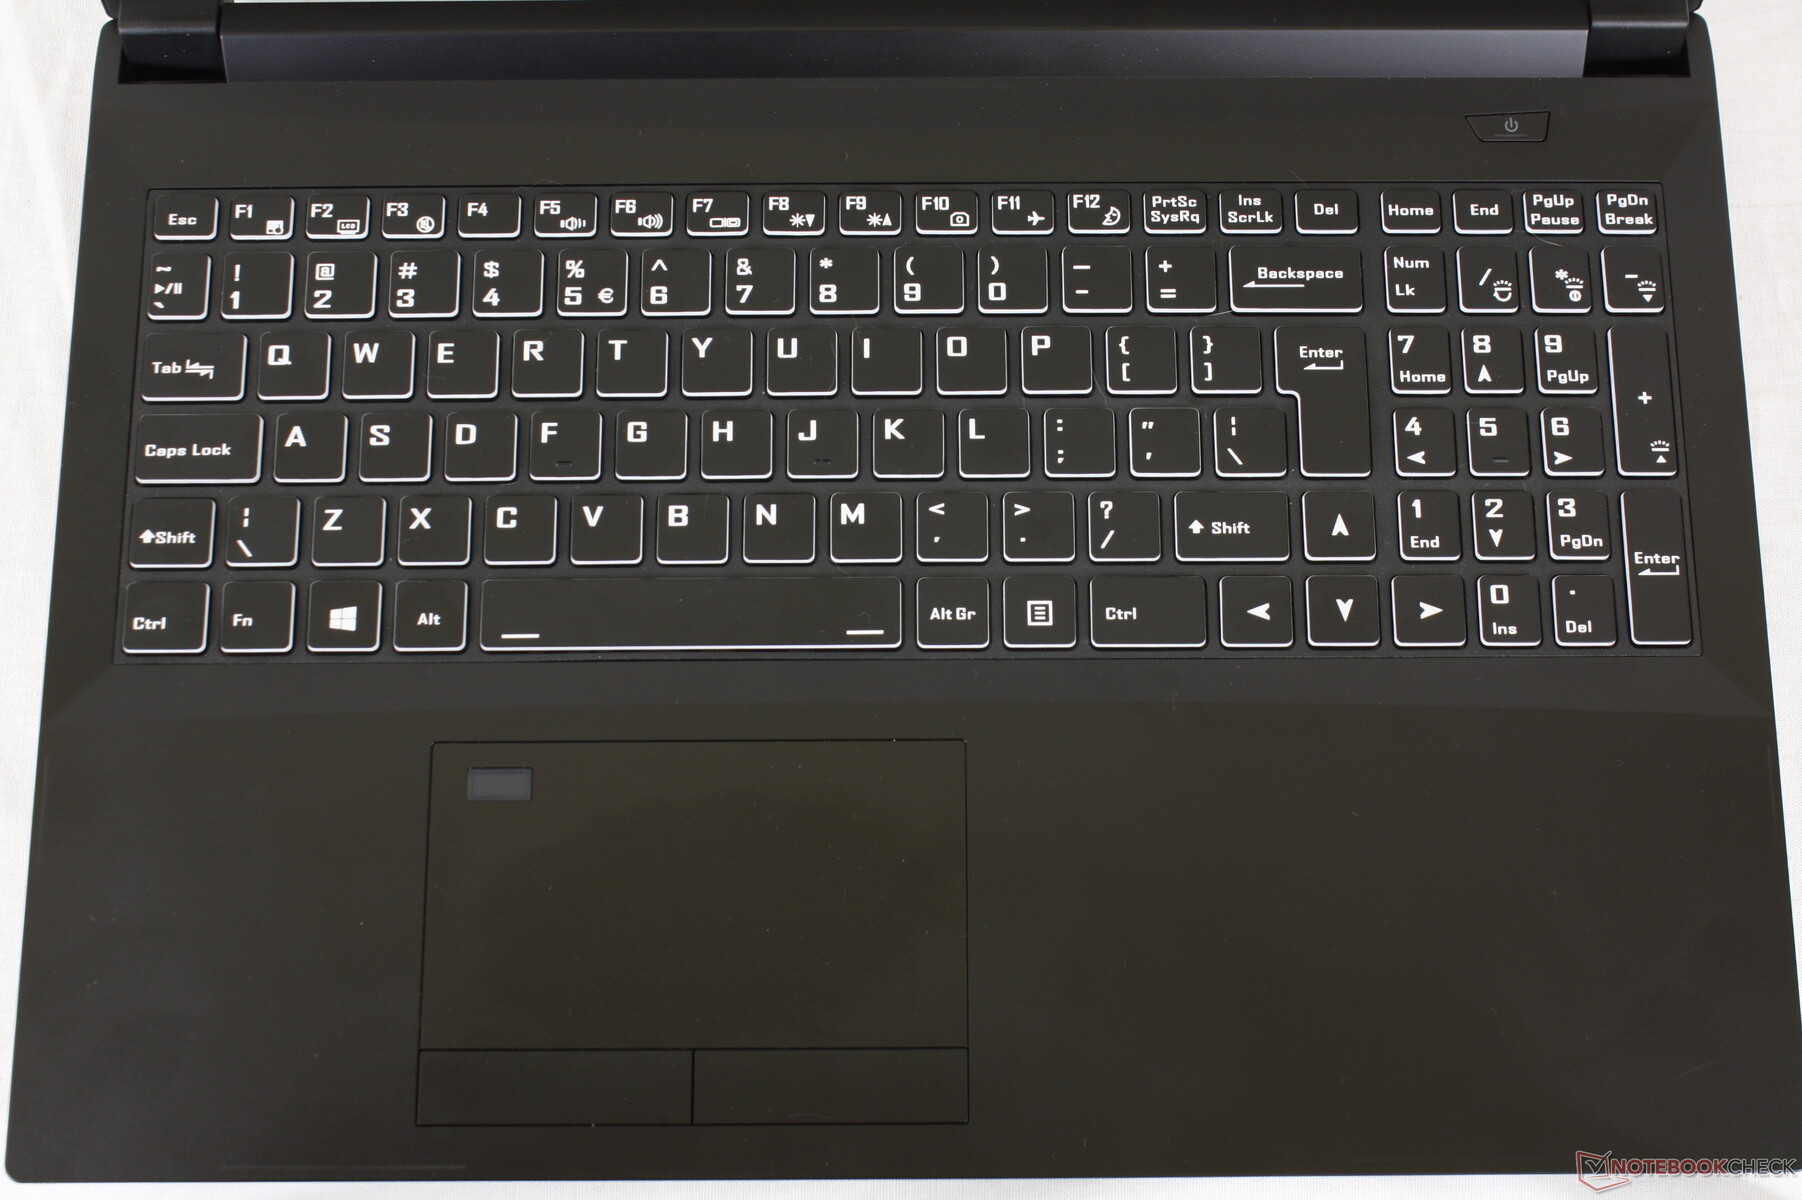
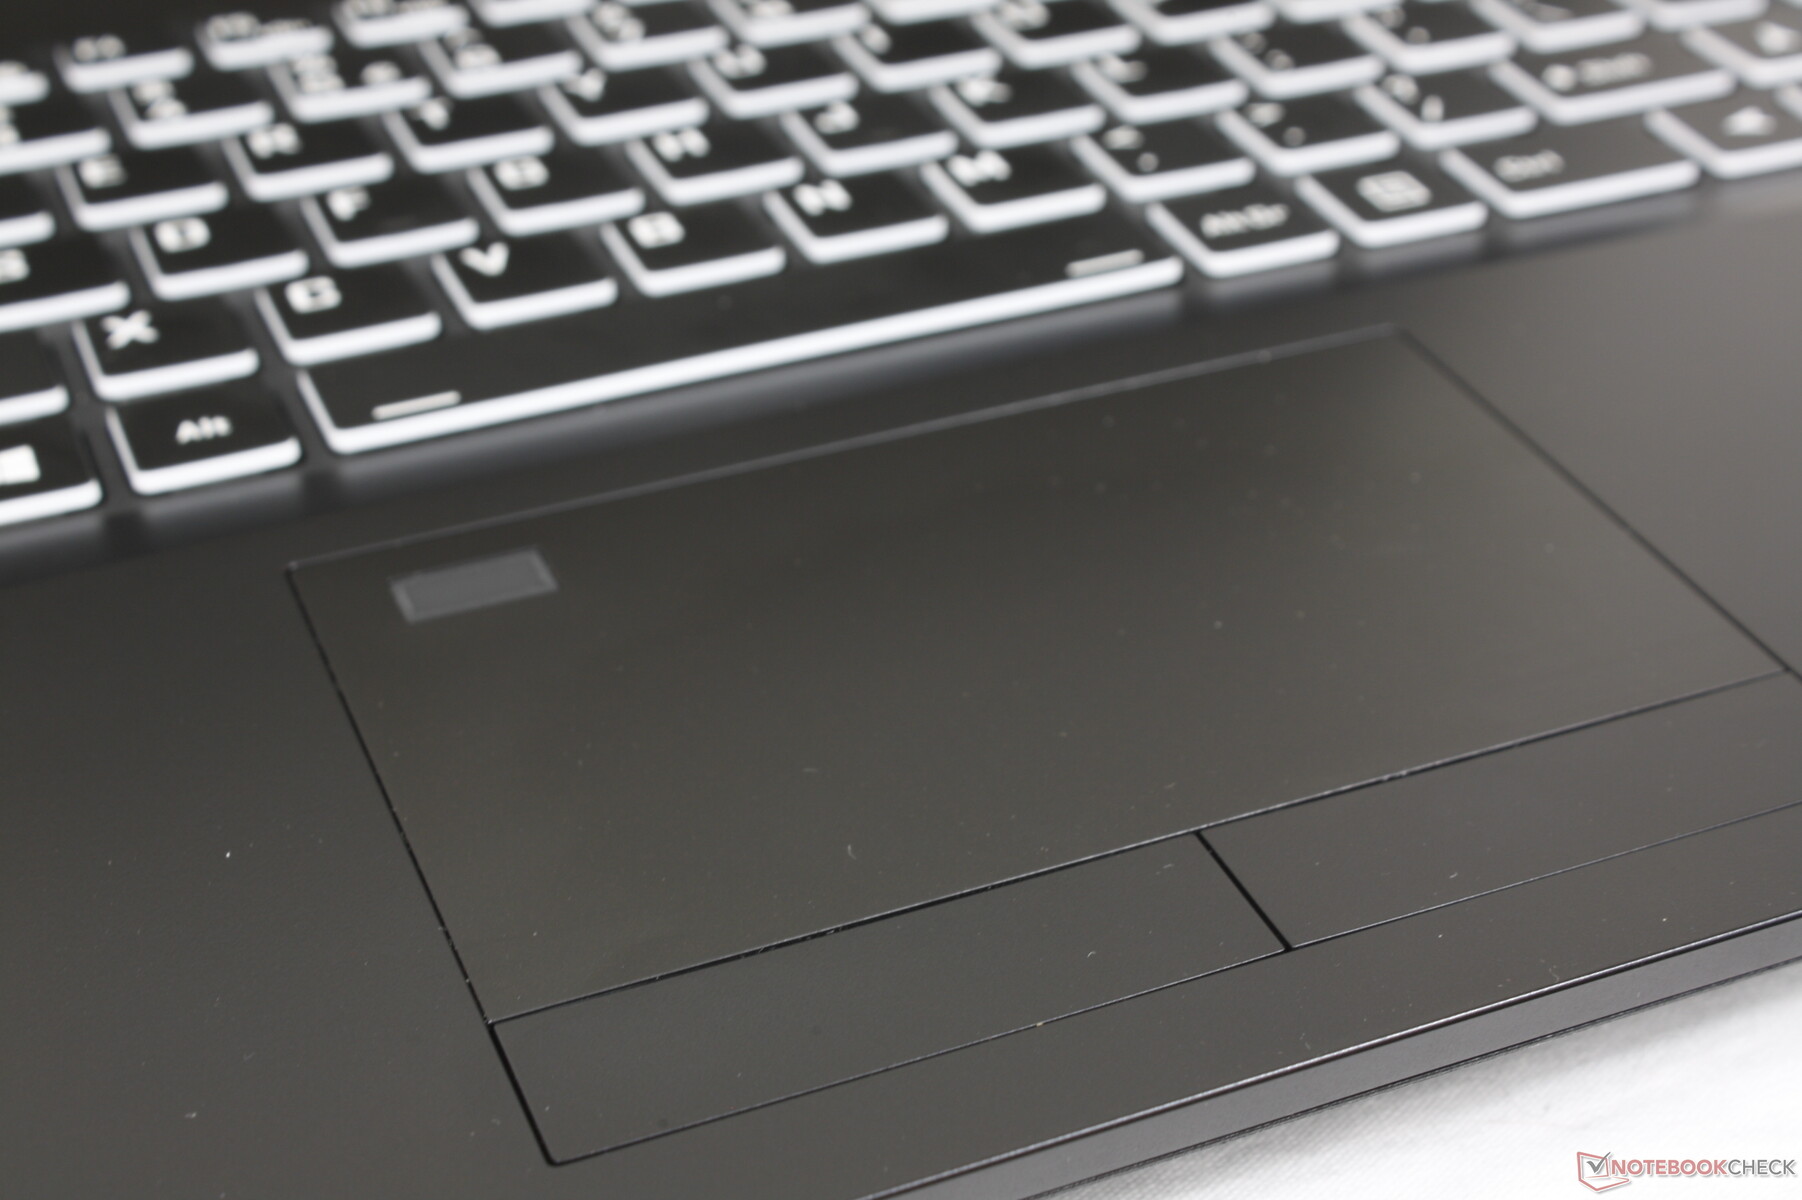
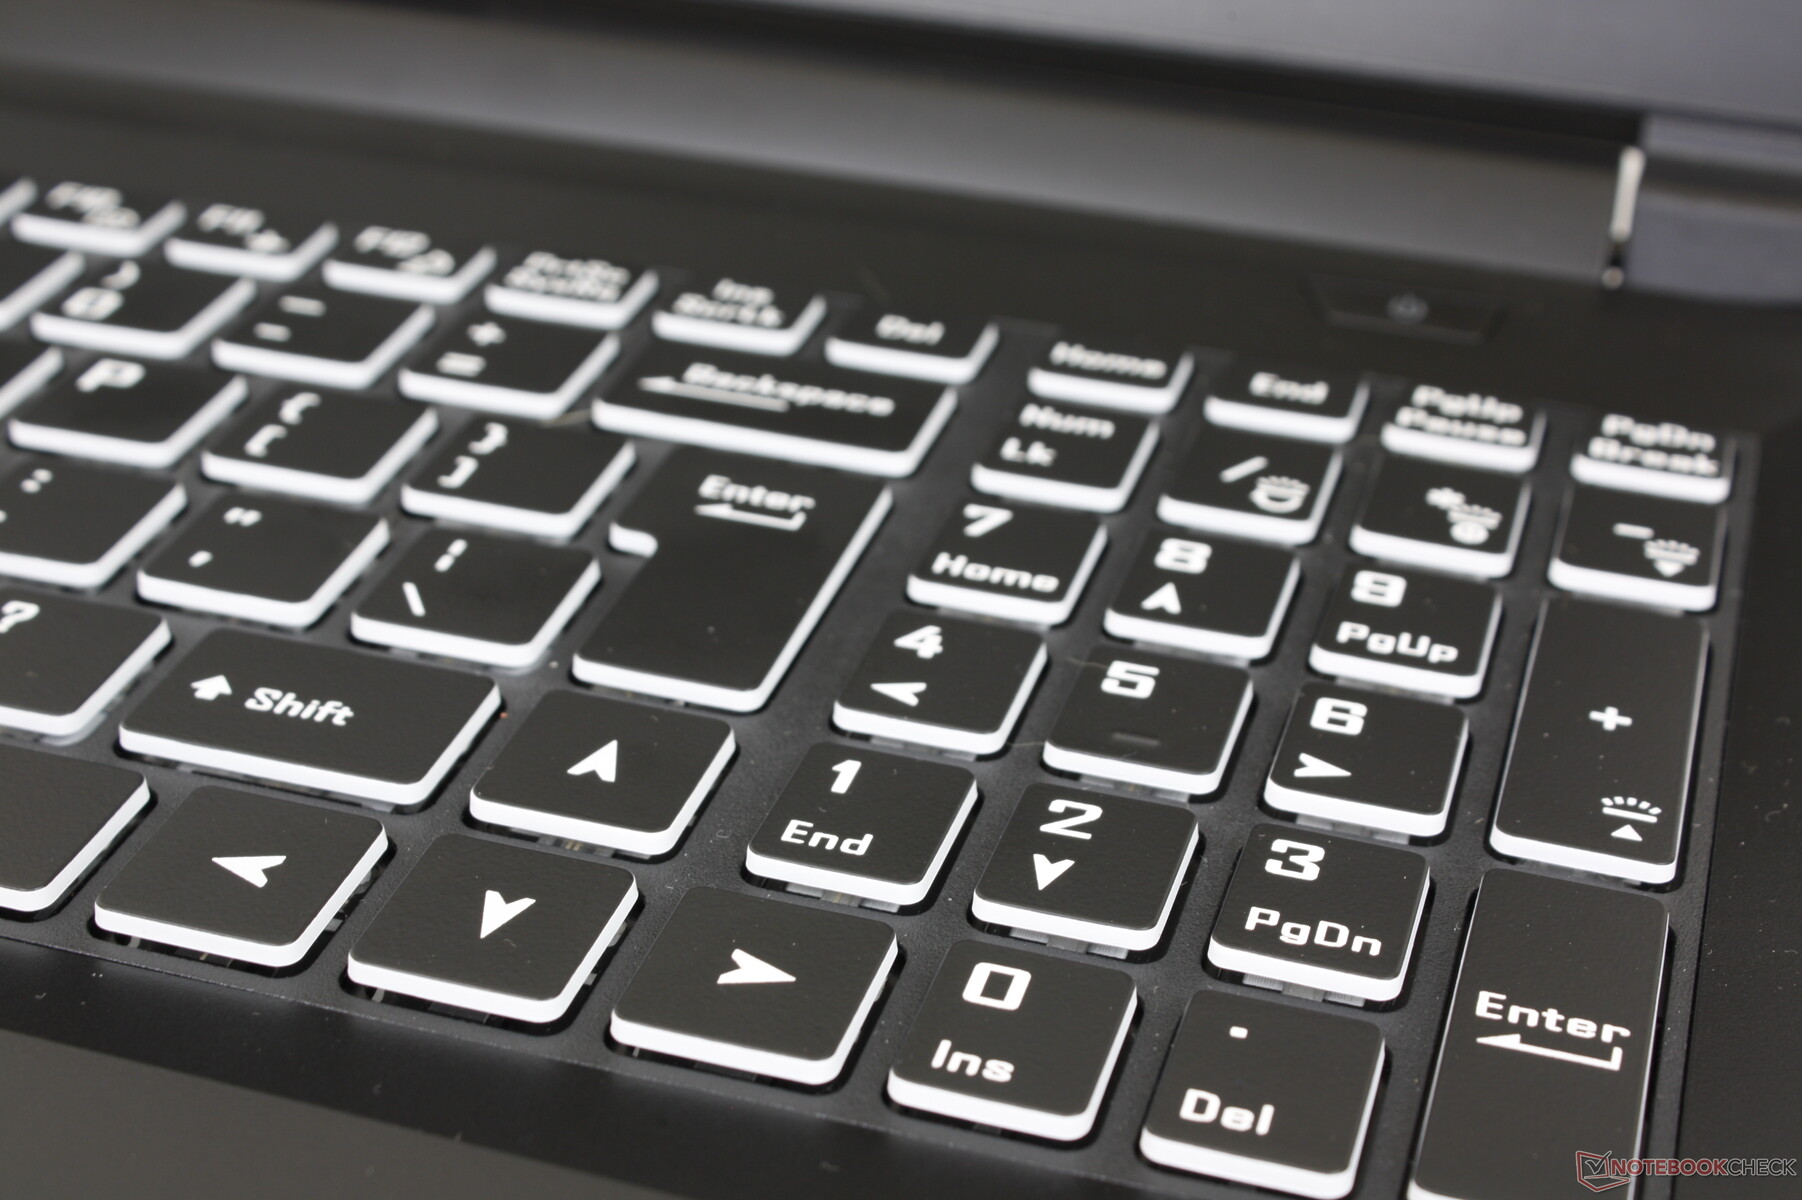
Dispositivos de entrada

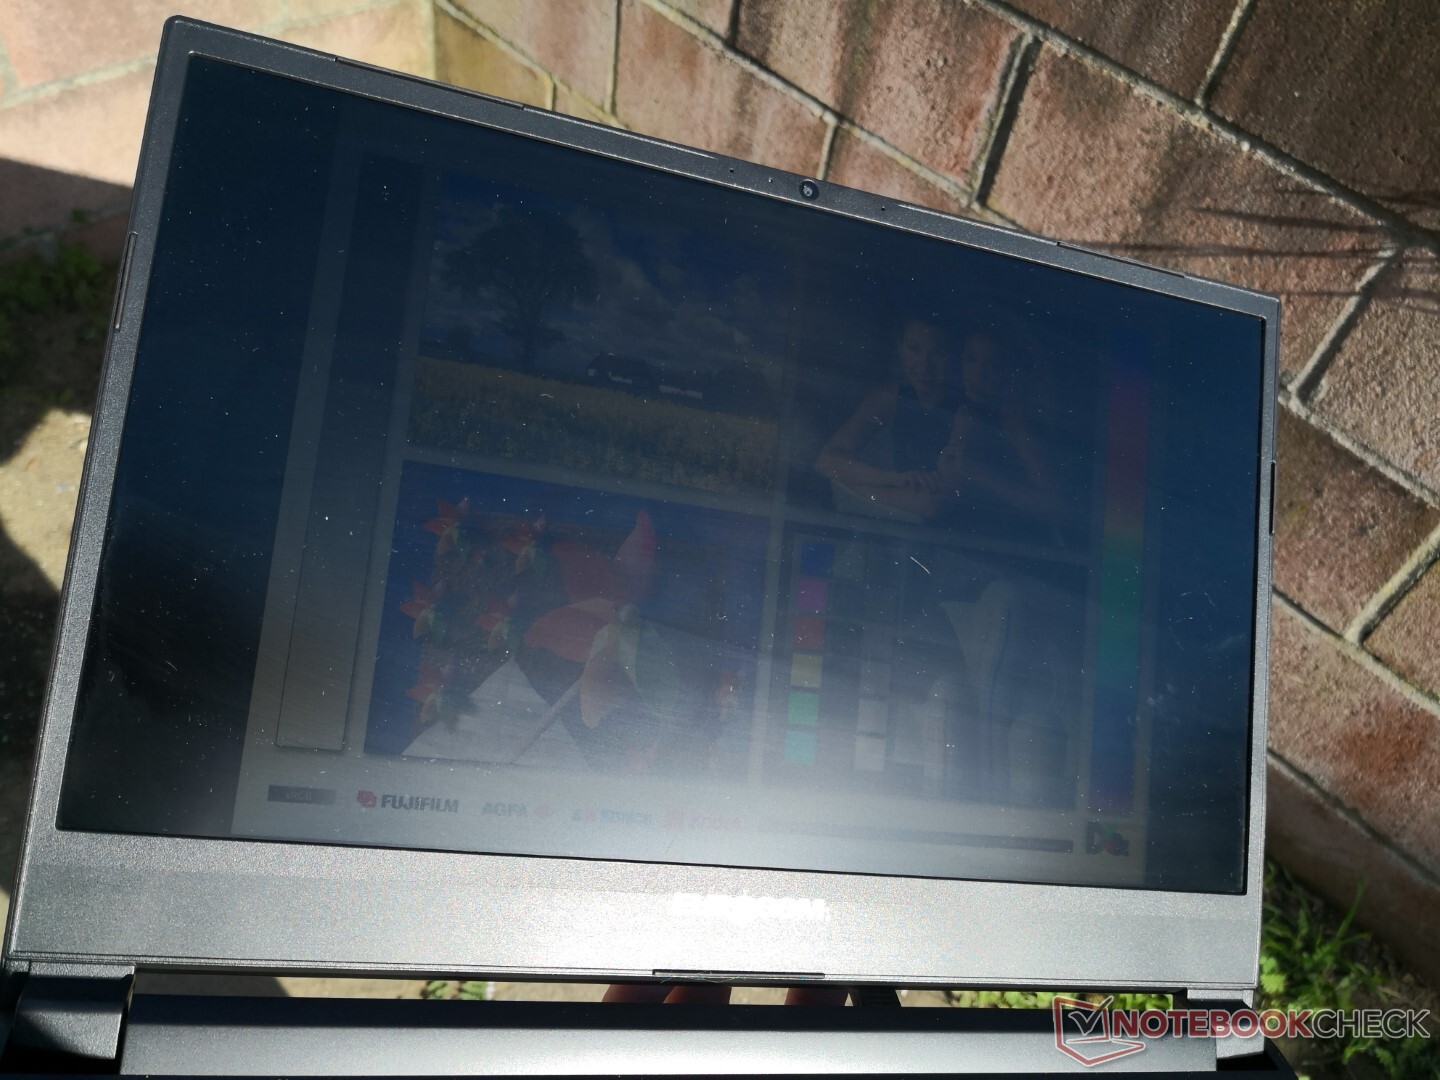
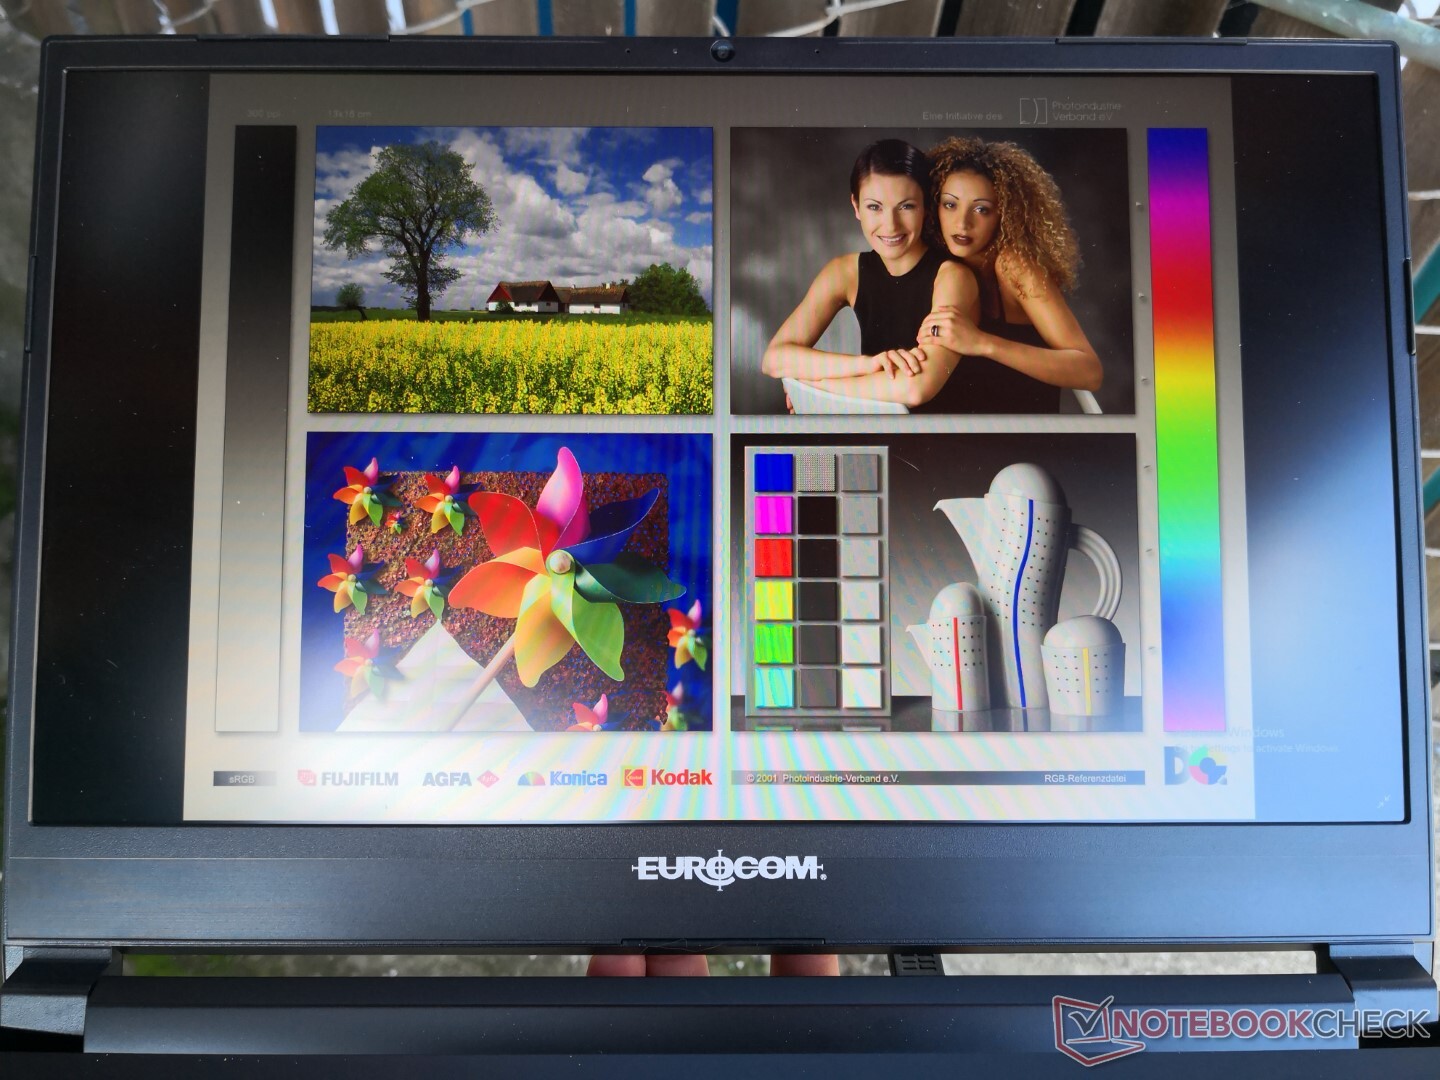
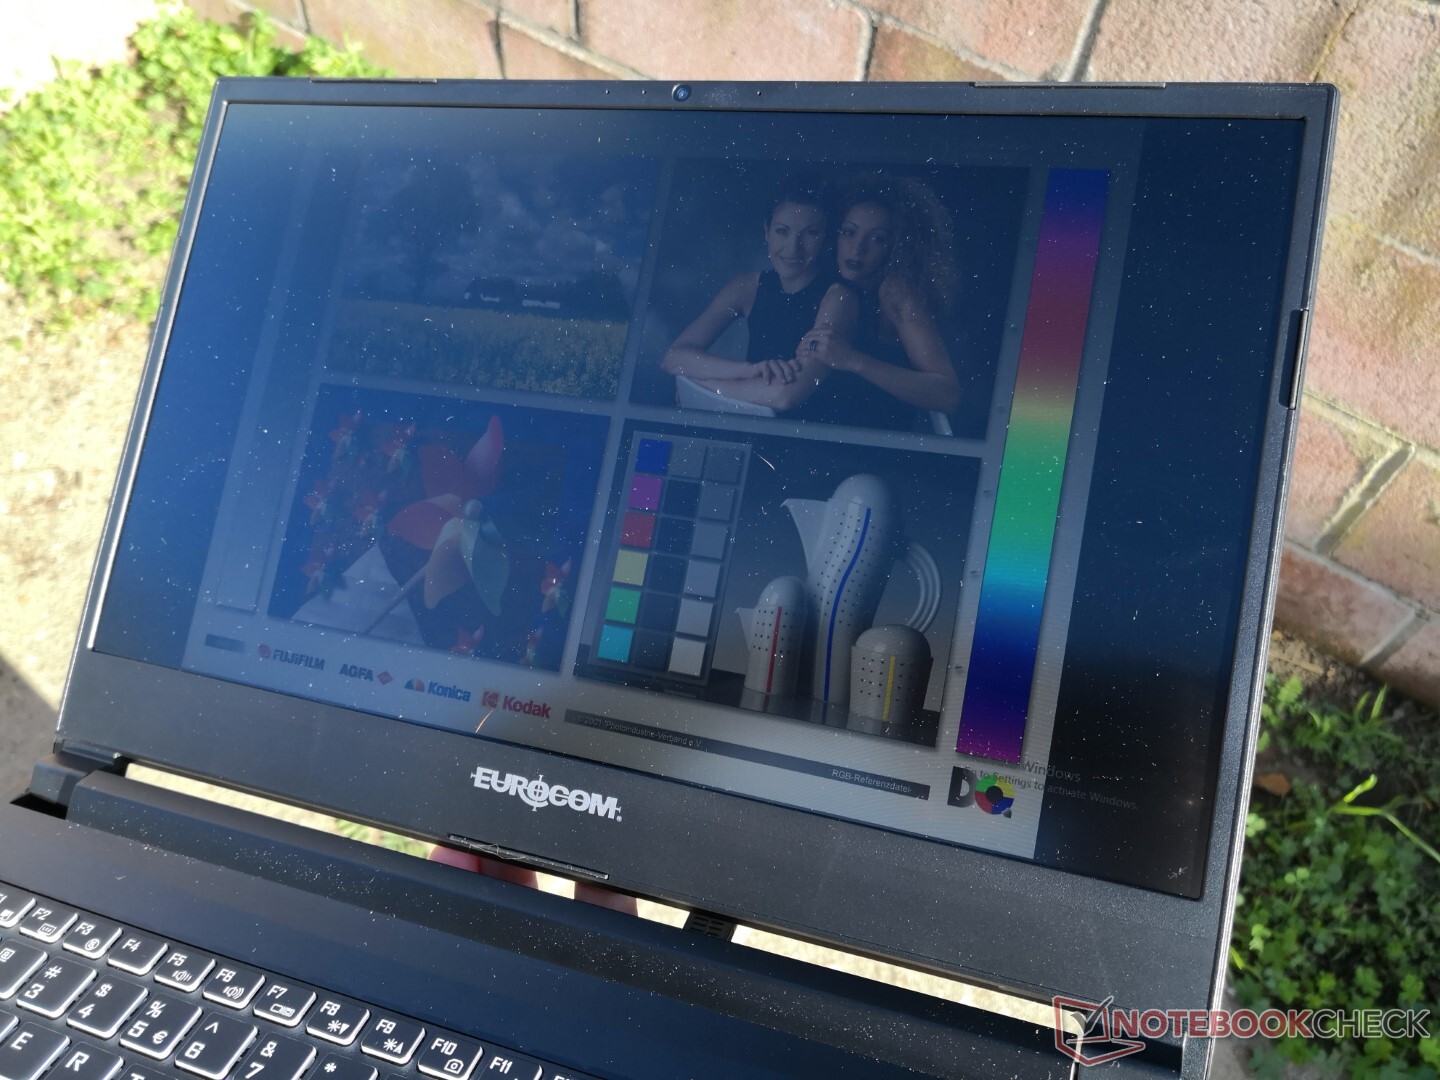
Mostrar
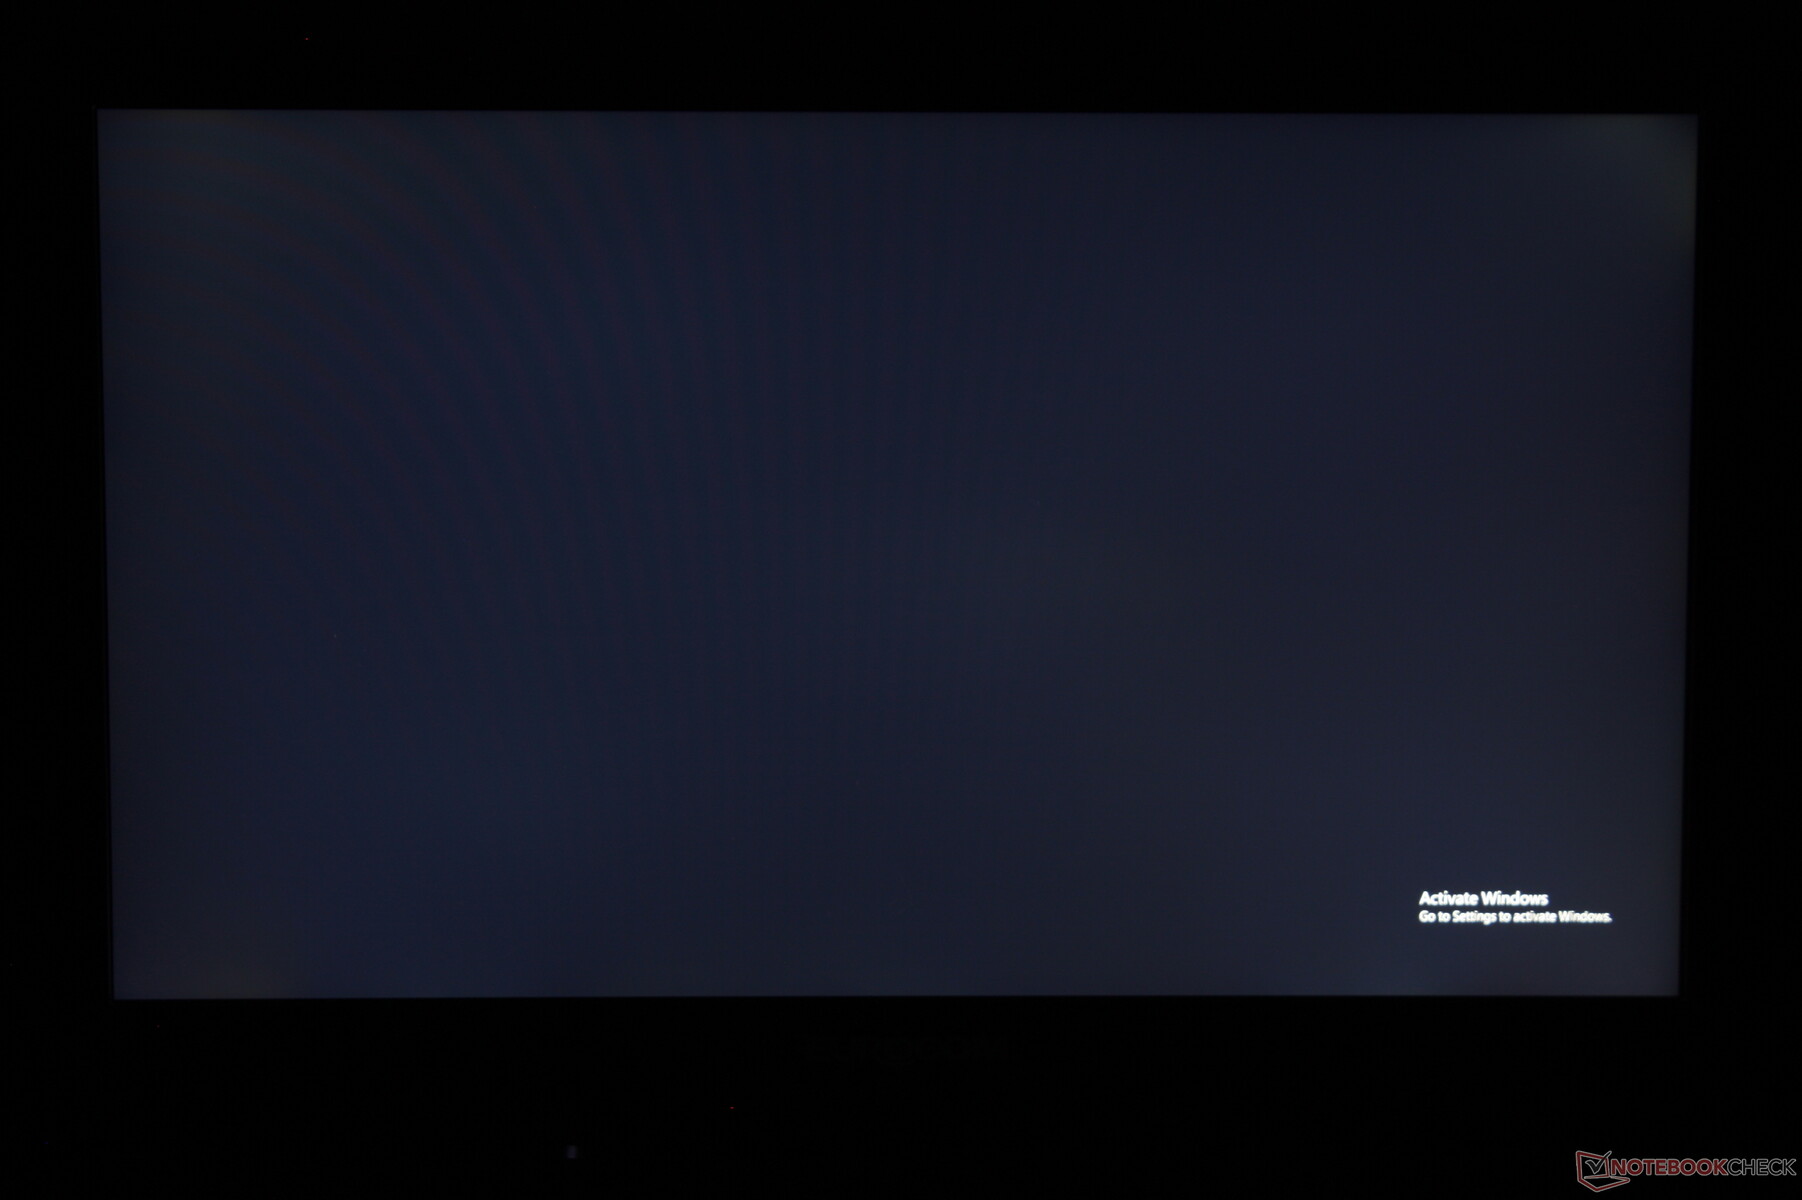
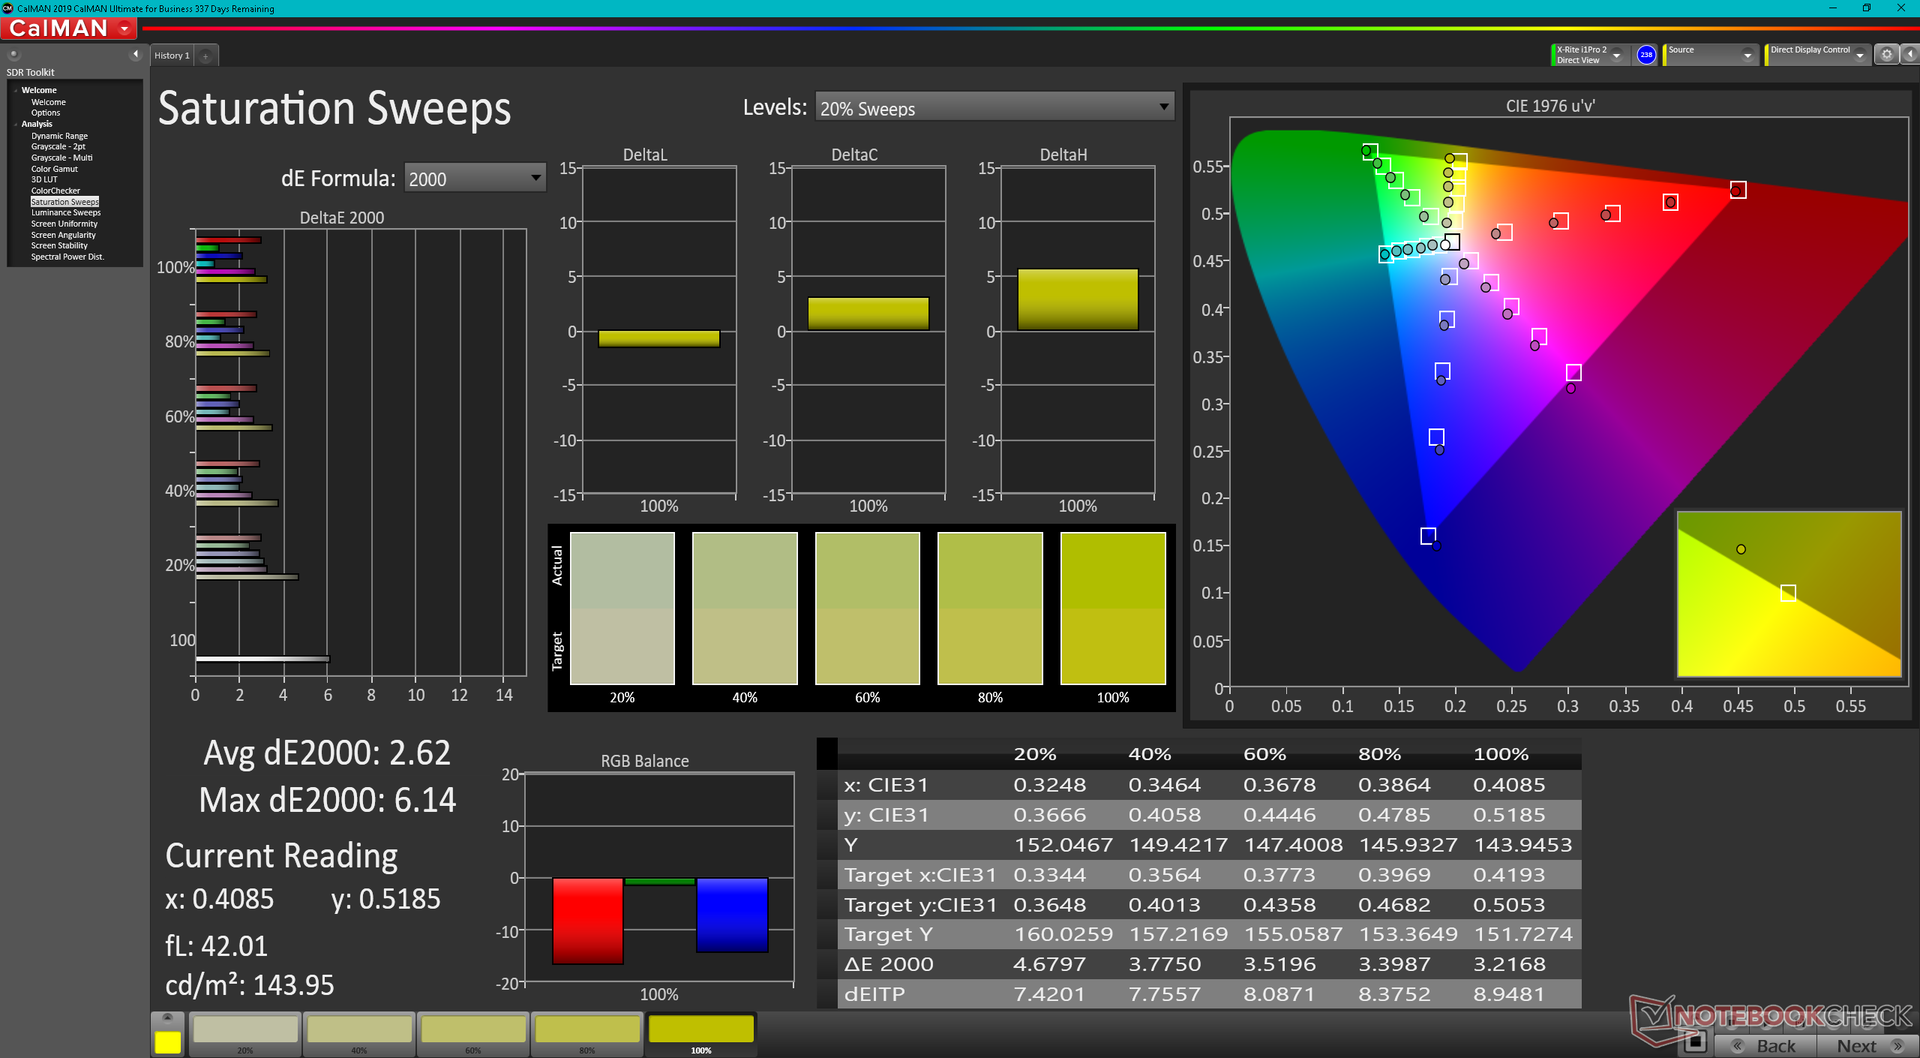
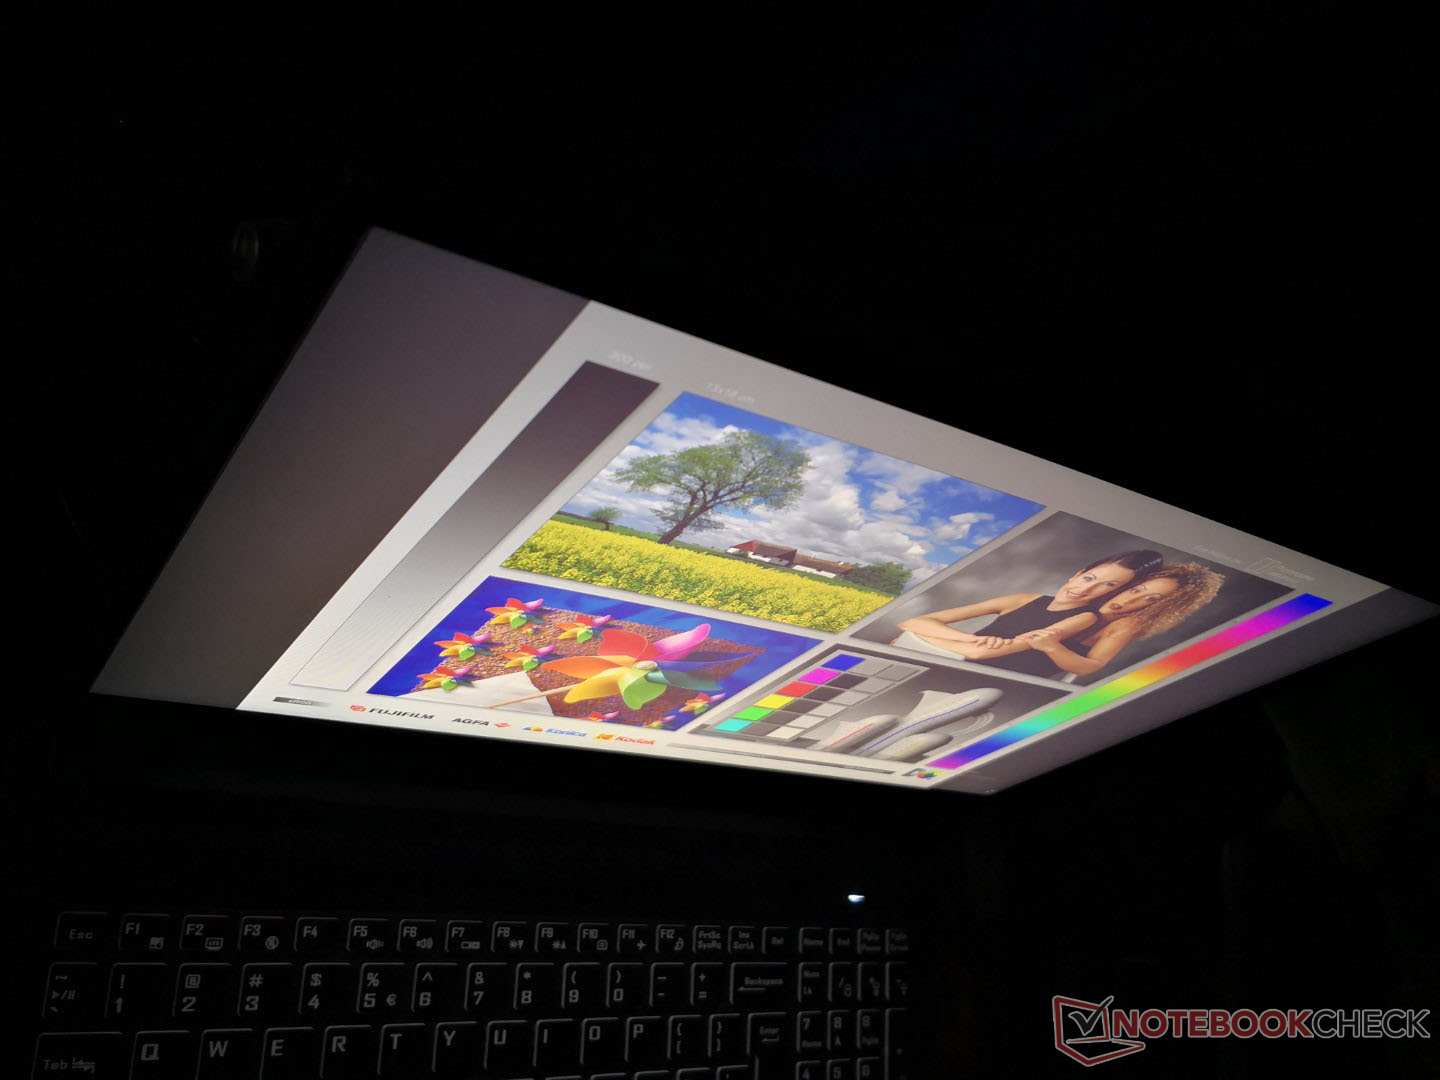
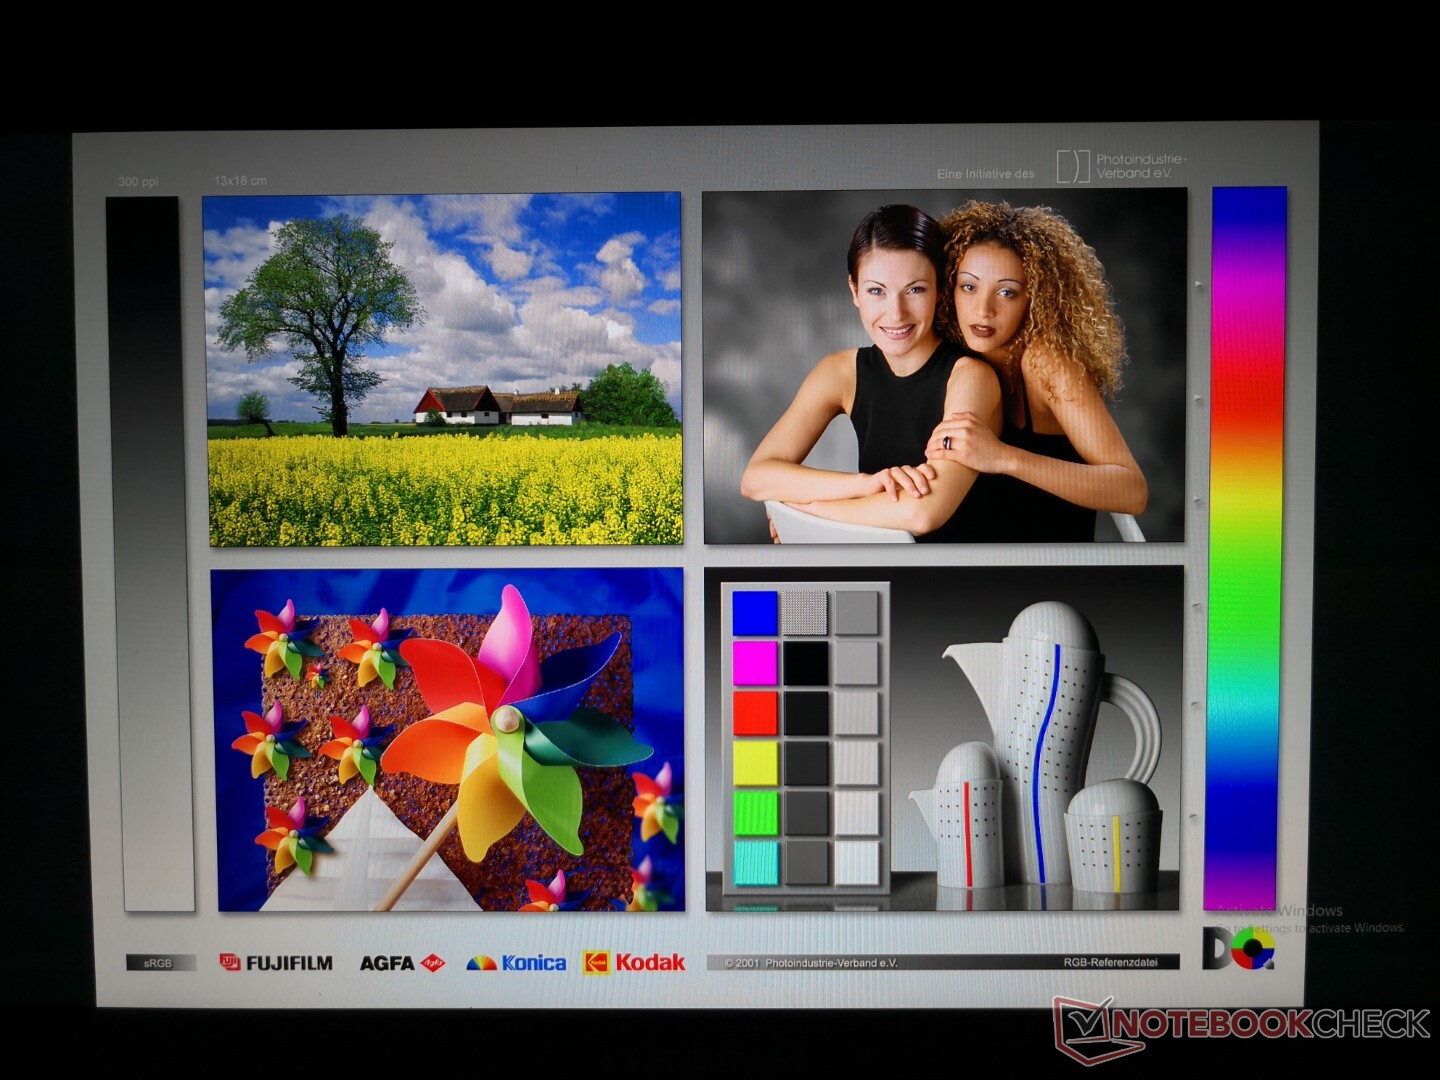
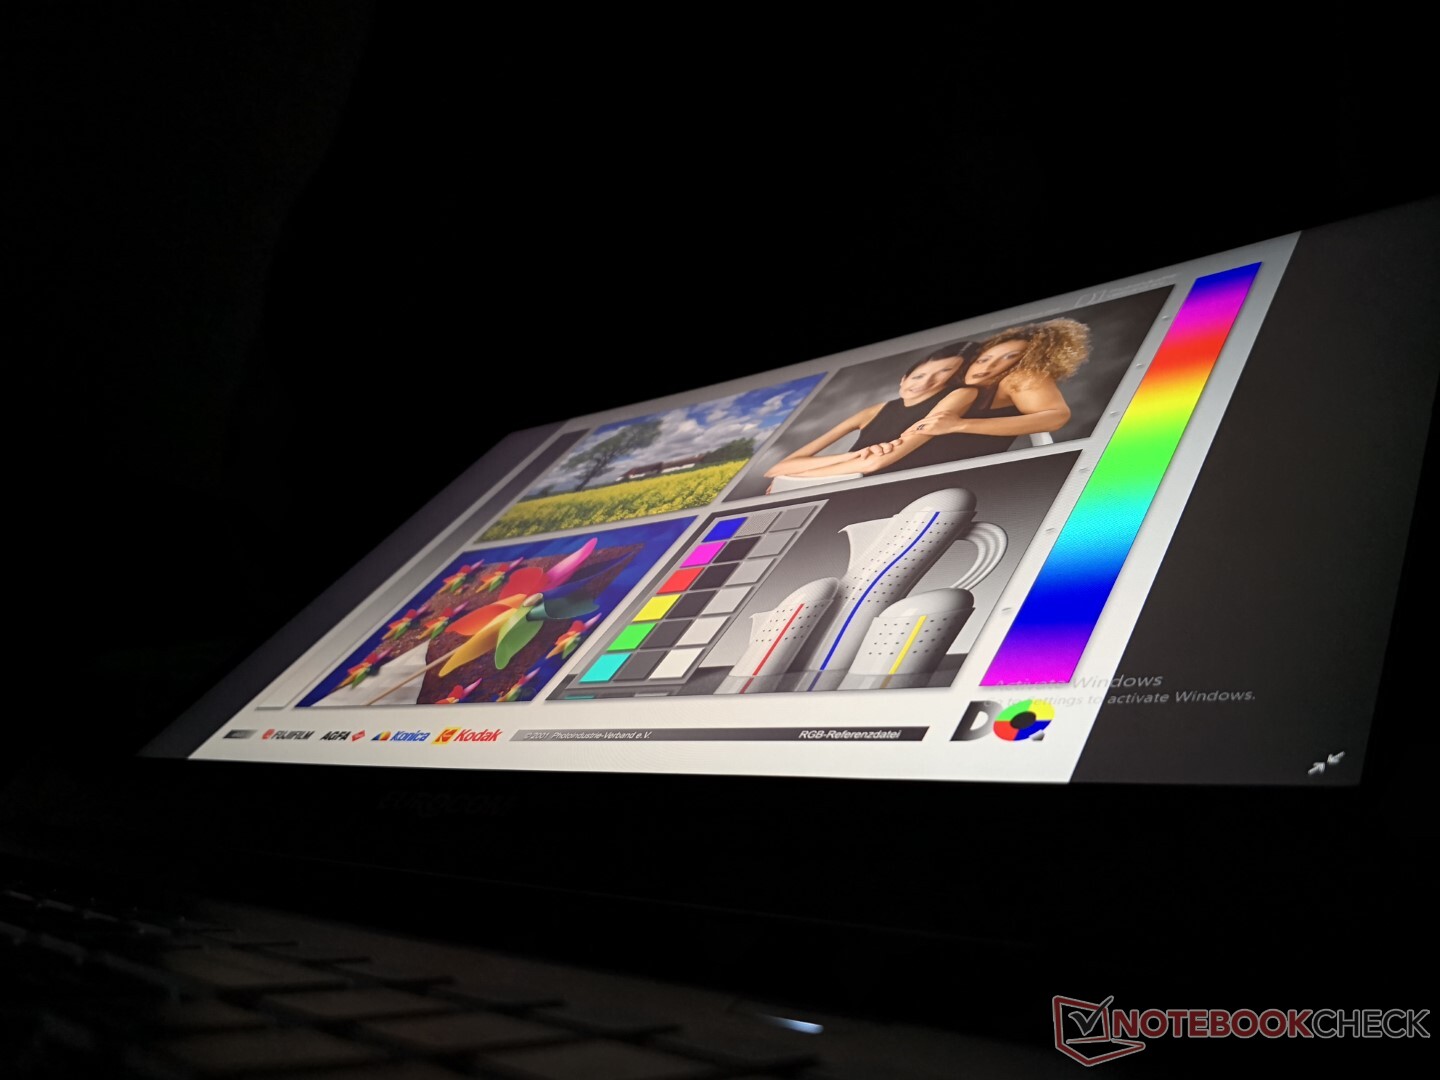
El Nightsky ARX15 utiliza un panel IPS Sharp LQ156M1JW03 muy similar al de los MSI GE66 o Delta 15. Por lo tanto, la experiencia de visualización es casi idéntica entre estos tres modelos con sus frecuencias de actualización nativas de 240 Hz, relaciones de contraste de ~1000:1, cobertura sRGB completa, tiempos de respuesta rápidos e incluso frecuencias de modulación de ancho de pulso similares. Es un panel de gama alta con excelentes atributos, aunque sus colores y su contraste no alcancen los mismos niveles que los paneles OLED.

| |||||||||||||||||||||||||
iluminación: 90 %
Brillo con batería: 312.8 cd/m²
Contraste: 1117:1 (Negro: 0.28 cd/m²)
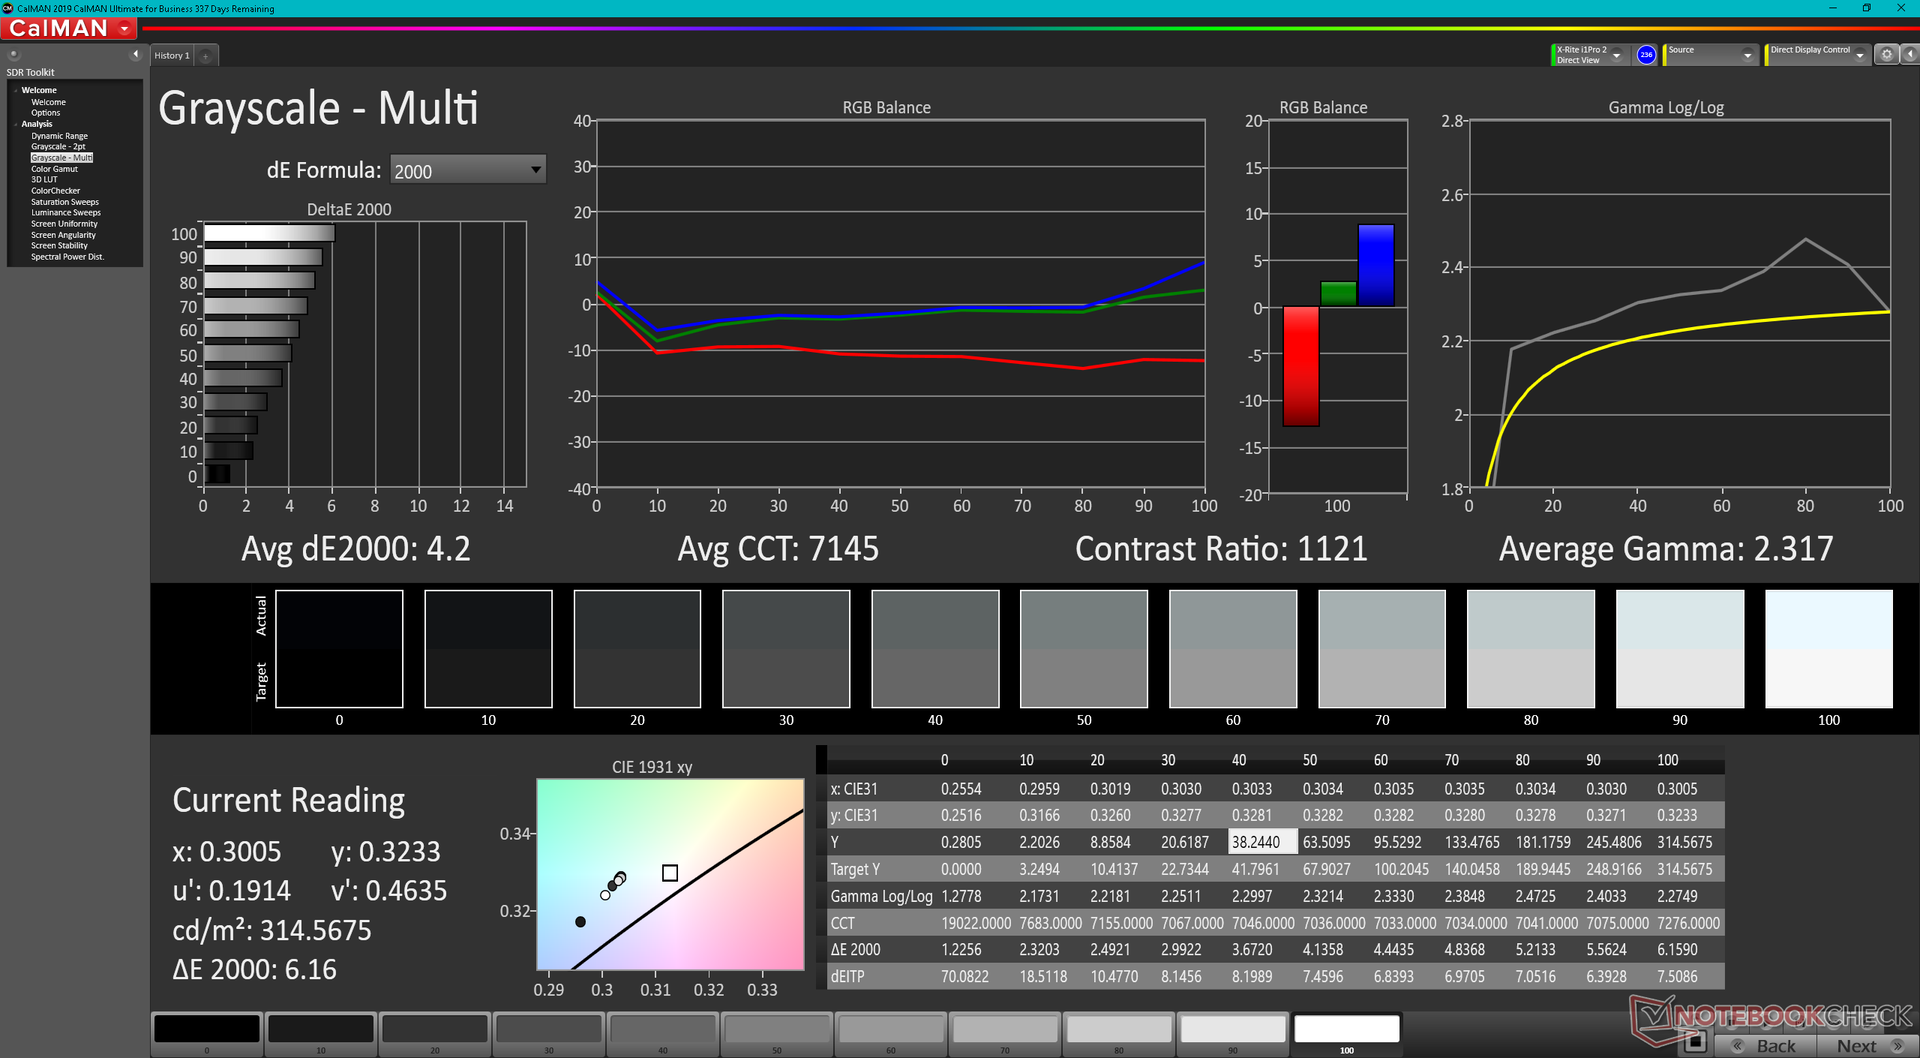
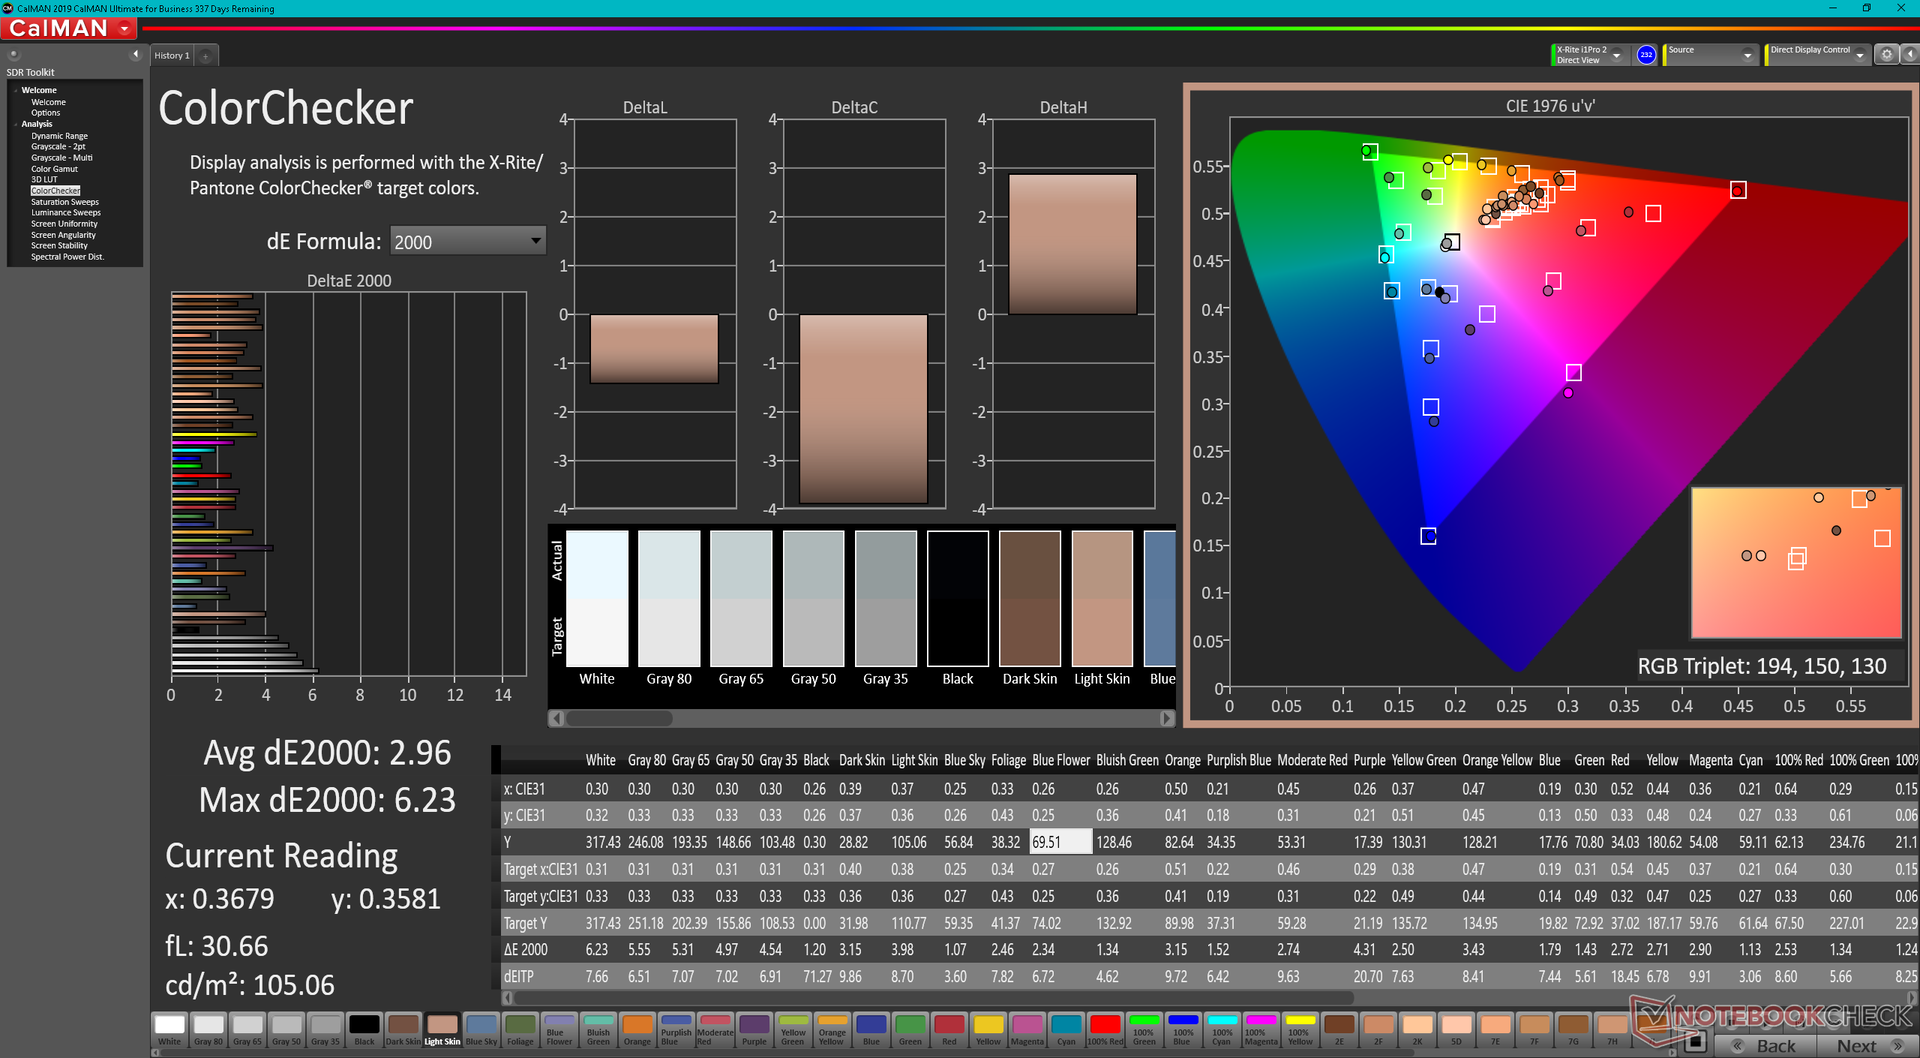
ΔE ColorChecker Calman: 2.96 | ∀{0.5-29.43 Ø4.72}
ΔE Greyscale Calman: 4.2 | ∀{0.09-98 Ø4.97}
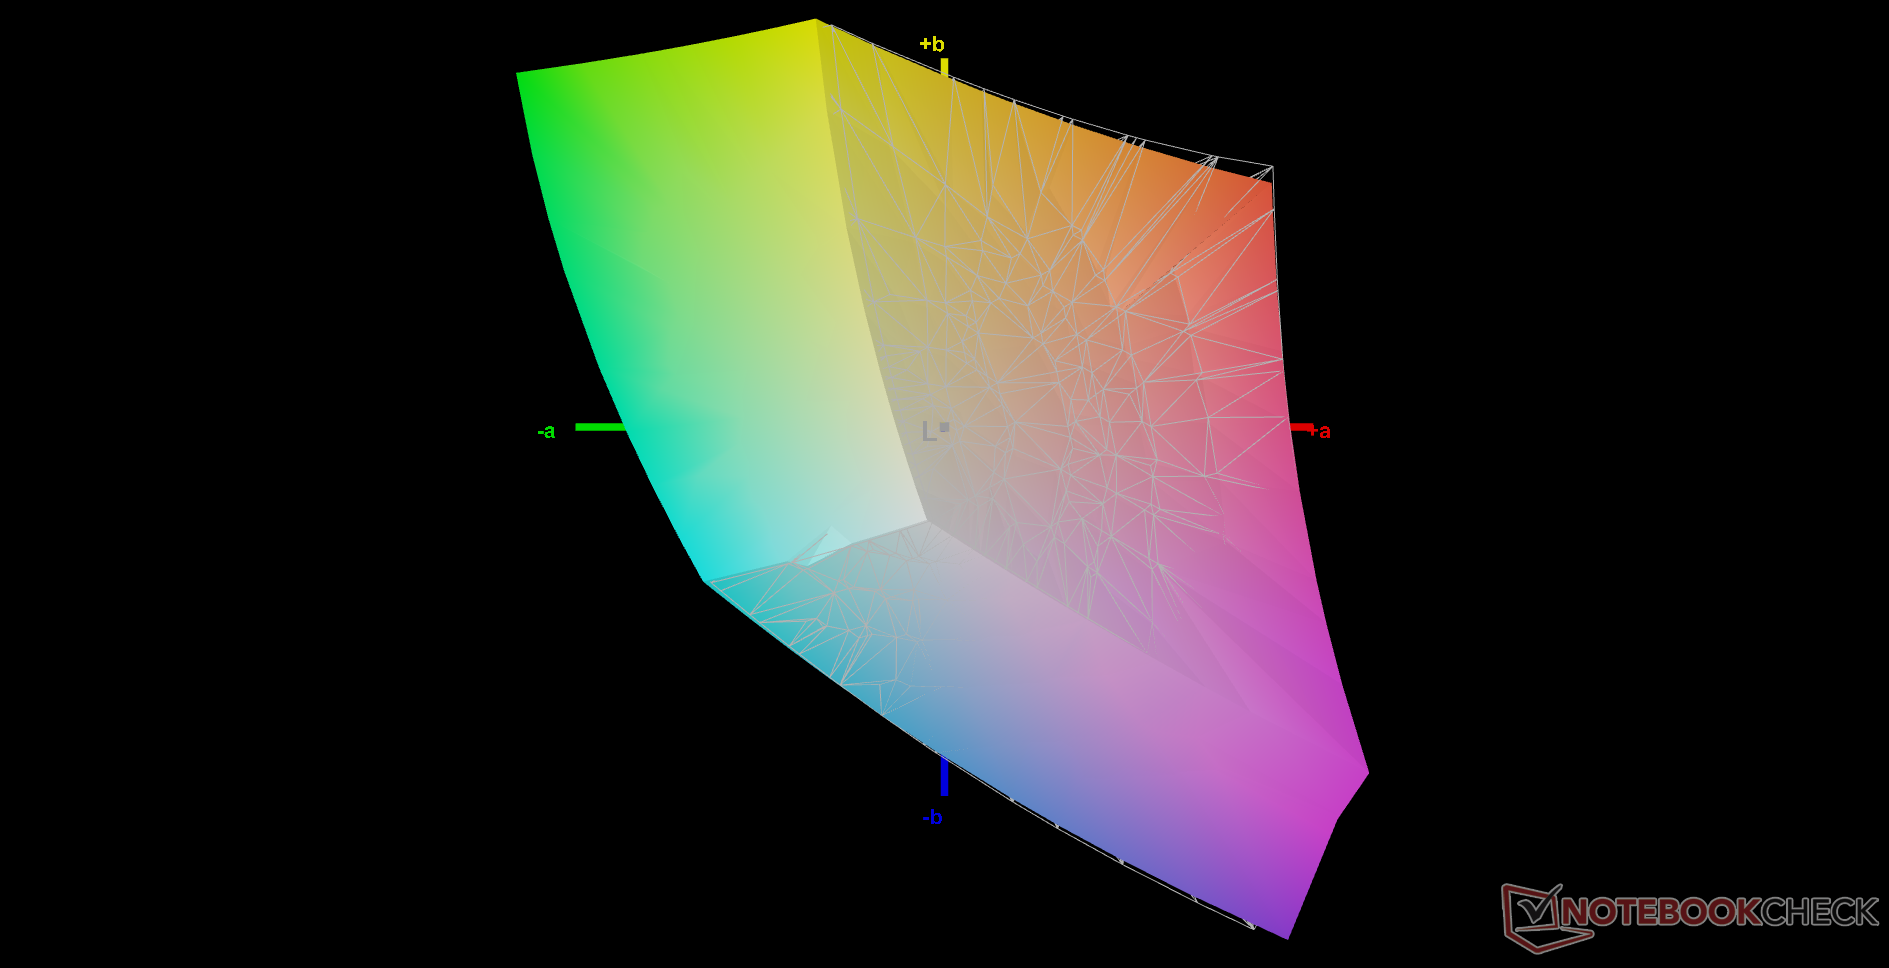
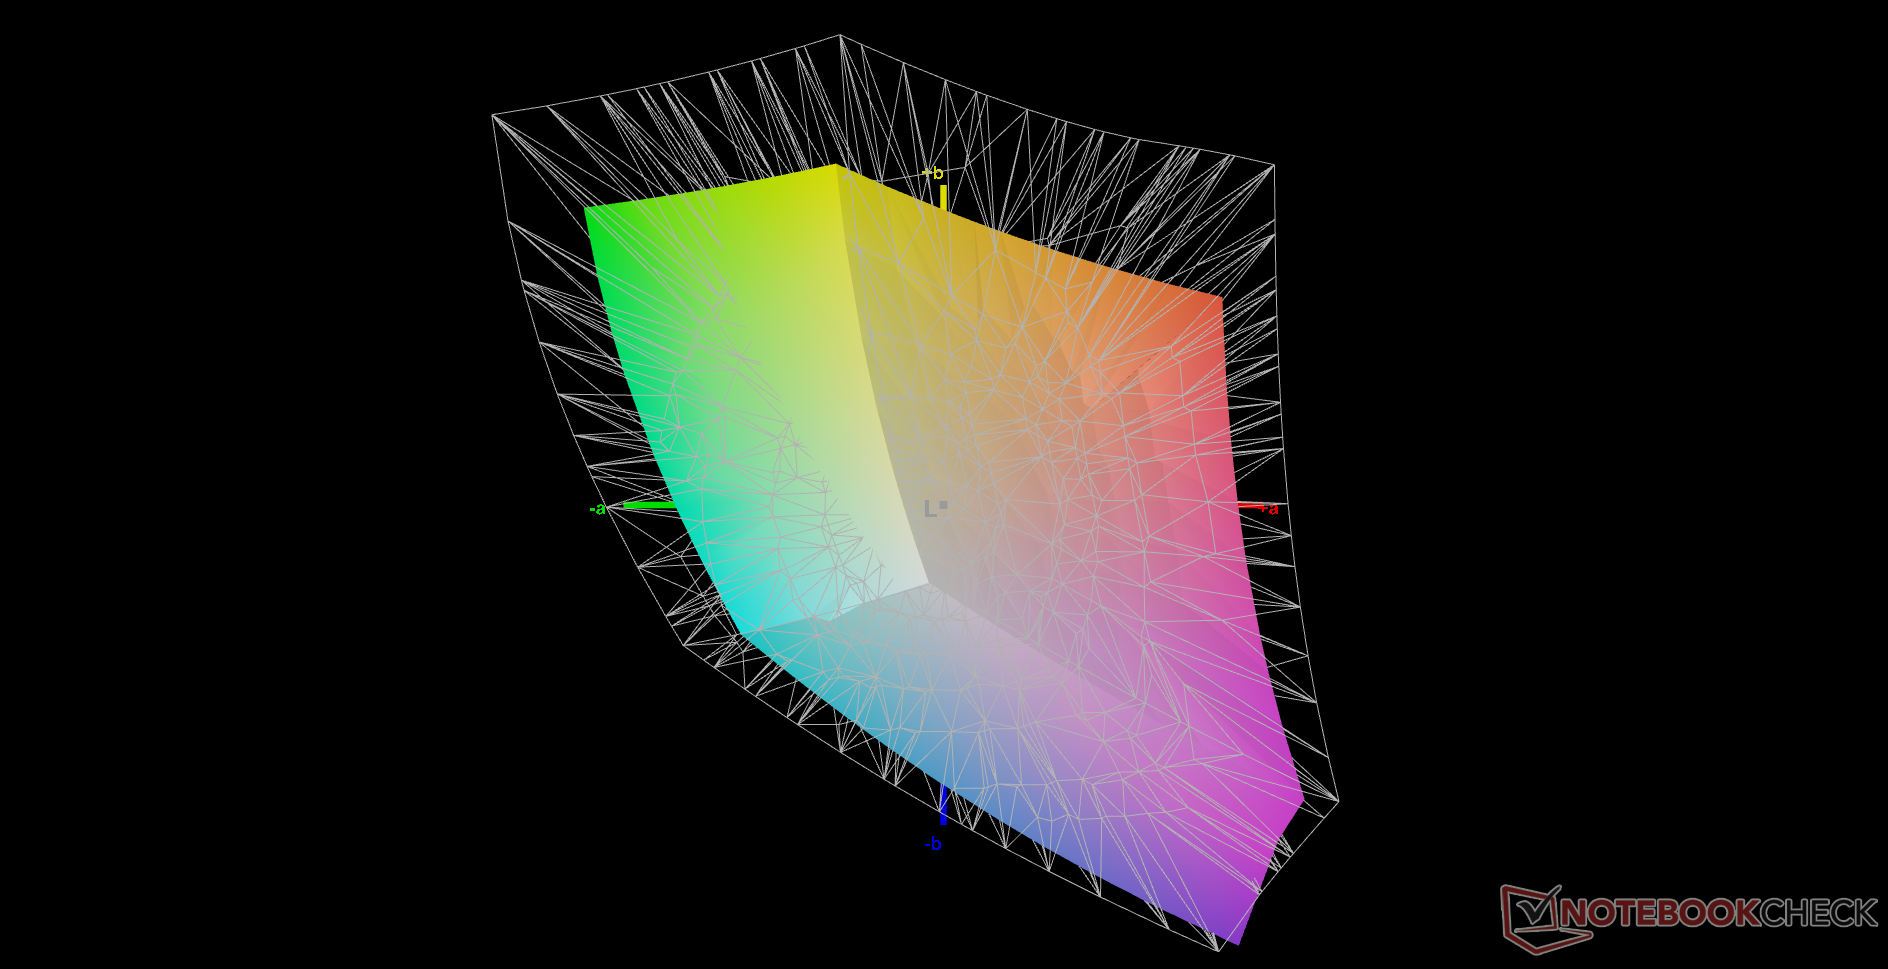
73.7% AdobeRGB 1998 (Argyll 3D)
99.7% sRGB (Argyll 3D)
67.9% Display P3 (Argyll 3D)
Gamma: 2.32
CCT: 7145 K
| Eurocom Nightsky ARX315 Sharp LQ156M1JW03, IPS, 1920x1080, 15.6" | Gigabyte A5 X1 AU Optronics B156HAN12.0, IPS, 1920x1080, 15.6" | Medion Erazer Deputy P25 Panda LM156LF-2F03, IPS, 1920x1080, 15.6" | MSI Delta 15 A5EFK LQ156M1JW03 (SHP155D), IPS-Level, 1920x1080, 15.6" | Schenker XMG Apex 15 NH57E PS LG Philips LGD0625 (LP156WFG-SPB3), IPS, 1920x1080, 15.6" | MSI GE66 Raider 10SFS Sharp LQ156M1JW03 (SHP14C5), IPS-Level, 1920x1080, 15.6" | |
|---|---|---|---|---|---|---|
| Display | -1% | -42% | -4% | -7% | -2% | |
| Display P3 Coverage (%) | 67.9 | 69.6 3% | 39.7 -42% | 66.5 -2% | 64.5 -5% | 68 0% |
| sRGB Coverage (%) | 99.7 | 98.6 -1% | 59.7 -40% | 97.8 -2% | 95.9 -4% | 99 -1% |
| AdobeRGB 1998 Coverage (%) | 73.7 | 70.8 -4% | 41.1 -44% | 67.6 -8% | 65.8 -11% | 69.8 -5% |
| Response Times | 34% | -169% | 12% | -2% | -1% | |
| Response Time Grey 50% / Grey 80% * (ms) | 15.2 ? | 4.8 ? 68% | 40.4 ? -166% | 12.8 ? 16% | 15 1% | 16.4 ? -8% |
| Response Time Black / White * (ms) | 11.2 ? | 11.2 ? -0% | 30.4 ? -171% | 10.4 ? 7% | 11.6 -4% | 10.4 ? 7% |
| PWM Frequency (Hz) | 23150 ? | 23580 ? | 23580 ? | |||
| Screen | -7% | -25% | -12% | -7% | 21% | |
| Brightness middle (cd/m²) | 312.8 | 335 7% | 283 -10% | 291 -7% | 393 26% | 291 -7% |
| Brightness (cd/m²) | 294 | 325 11% | 266 -10% | 266 -10% | 353 20% | 278 -5% |
| Brightness Distribution (%) | 90 | 90 0% | 85 -6% | 88 -2% | 83 -8% | 91 1% |
| Black Level * (cd/m²) | 0.28 | 0.4 -43% | 0.2 29% | 0.36 -29% | 0.47 -68% | 0.25 11% |
| Contrast (:1) | 1117 | 838 -25% | 1415 27% | 808 -28% | 836 -25% | 1164 4% |
| Colorchecker dE 2000 * | 2.96 | 2.63 11% | 5.32 -80% | 2.98 -1% | 2.84 4% | 1.19 60% |
| Colorchecker dE 2000 max. * | 6.23 | 7.71 -24% | 17.68 -184% | 7.59 -22% | 7.15 -15% | 3.04 51% |
| Greyscale dE 2000 * | 4.2 | 4 5% | 2.9 31% | 4.2 -0% | 3.73 11% | 1.9 55% |
| Gamma | 2.32 95% | 2.129 103% | 2.062 107% | 2.293 96% | 2.53 87% | 2.216 99% |
| CCT | 7145 91% | 7434 87% | 7167 91% | 7624 85% | 7312 89% | 7018 93% |
| Colorchecker dE 2000 calibrated * | 0.97 | 3.94 | 0.91 | 0.67 | ||
| Color Space (Percent of AdobeRGB 1998) (%) | 70 | |||||
| Color Space (Percent of sRGB) (%) | 92 | |||||
| Media total (Programa/Opciones) | 9% /
1% | -79% /
-51% | -1% /
-7% | -5% /
-6% | 6% /
13% |
* ... más pequeño es mejor
La temperatura del color es más fría de lo esperado, lo que afecta a la precisión del color y a los valores generales de Delta E. Eurocom calibrará personalmente la pantalla por un cargo adicional. Recomendamos calibrar la pantalla para aprovechar mejor la cobertura completa de sRGB del panel
Tiempos de respuesta del display
| ↔ Tiempo de respuesta de Negro a Blanco | ||
|---|---|---|
| 11.2 ms ... subida ↗ y bajada ↘ combinada | ↗ 6 ms subida | 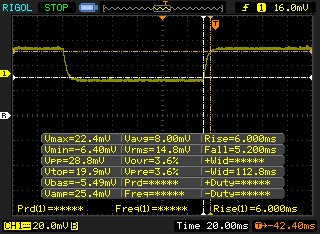 |
| ↘ 5.2 ms bajada | ||
| La pantalla mostró buenos tiempos de respuesta en nuestros tests pero podría ser demasiado lenta para los jugones competitivos. En comparación, todos los dispositivos de prueba van de ##min### (mínimo) a 240 (máximo) ms. » 30 % de todos los dispositivos son mejores. Esto quiere decir que el tiempo de respuesta medido es mejor que la media (19.8 ms) de todos los dispositivos testados. | ||
| ↔ Tiempo de respuesta 50% Gris a 80% Gris | ||
| 15.2 ms ... subida ↗ y bajada ↘ combinada | ↗ 7.6 ms subida | 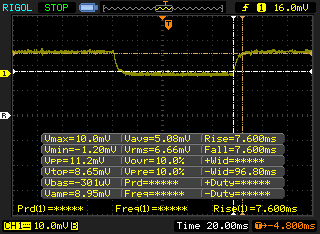 |
| ↘ 7.6 ms bajada | ||
| La pantalla mostró buenos tiempos de respuesta en nuestros tests pero podría ser demasiado lenta para los jugones competitivos. En comparación, todos los dispositivos de prueba van de ##min### (mínimo) a 636 (máximo) ms. » 29 % de todos los dispositivos son mejores. Esto quiere decir que el tiempo de respuesta medido es mejor que la media (31 ms) de todos los dispositivos testados. | ||
Parpadeo de Pantalla / PWM (Pulse-Width Modulation)
| Parpadeo de Pantalla / PWM detectado | 23150 Hz | ≤ 34 % de brillo | 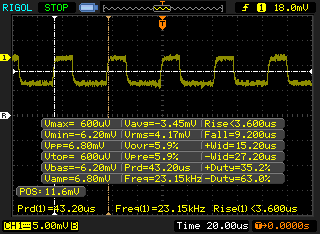 |
La retroiluminación del display parpadea a 23150 Hz (seguramente usa PWM - Pulse-Width Modulation) a un brillo del 34 % e inferior. Sobre este nivel de brillo no debería darse parpadeo / PWM. La frecuencia de 23150 Hz es bastante alta, por lo que la mayoría de gente sensible al parpadeo no debería ver parpadeo o tener fatiga visual. Comparación: 52 % de todos los dispositivos testados no usaron PWM para atenuar el display. Si se usó, medimos una media de 7769 (mínimo: 5 - máxmo: 343500) Hz. | |||
Rendimiento
Condiciones de la prueba
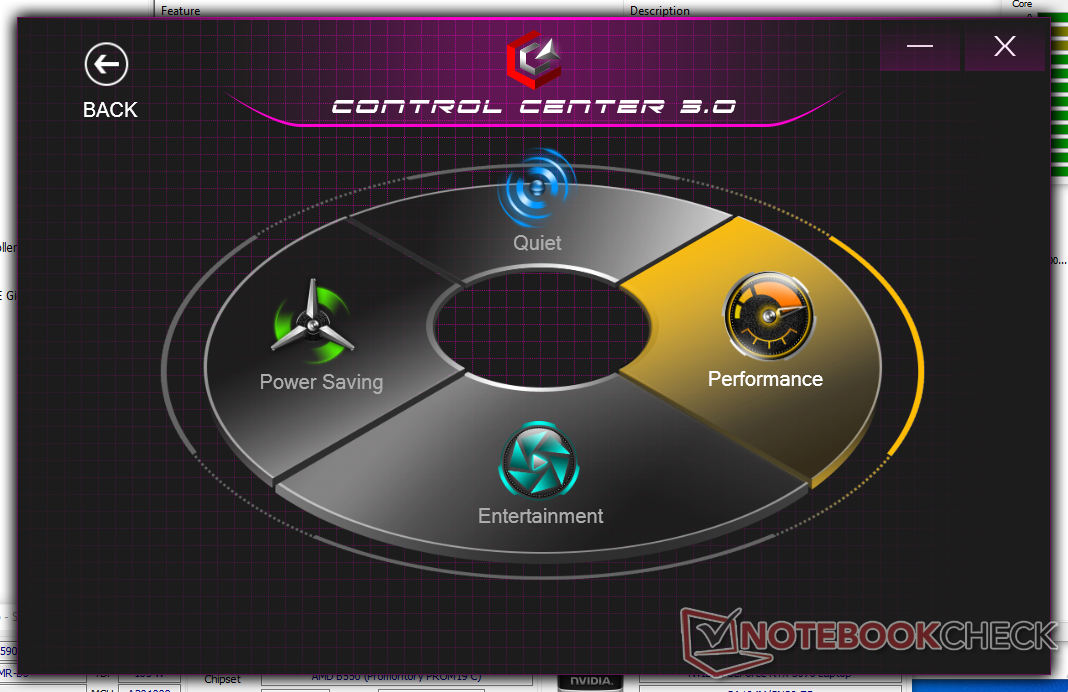
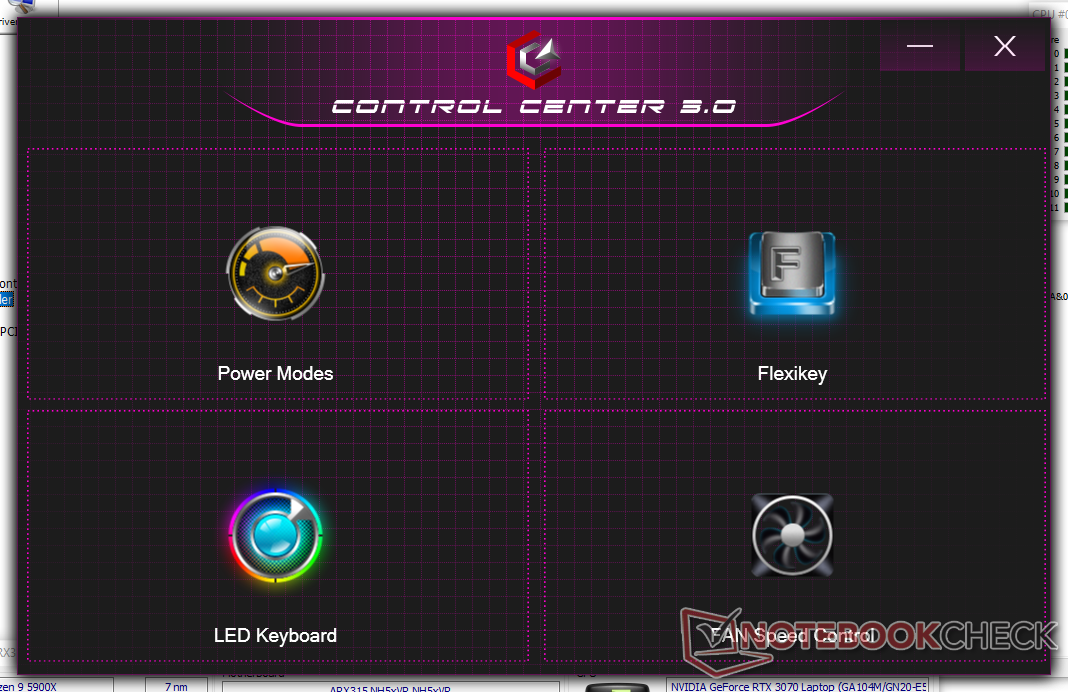
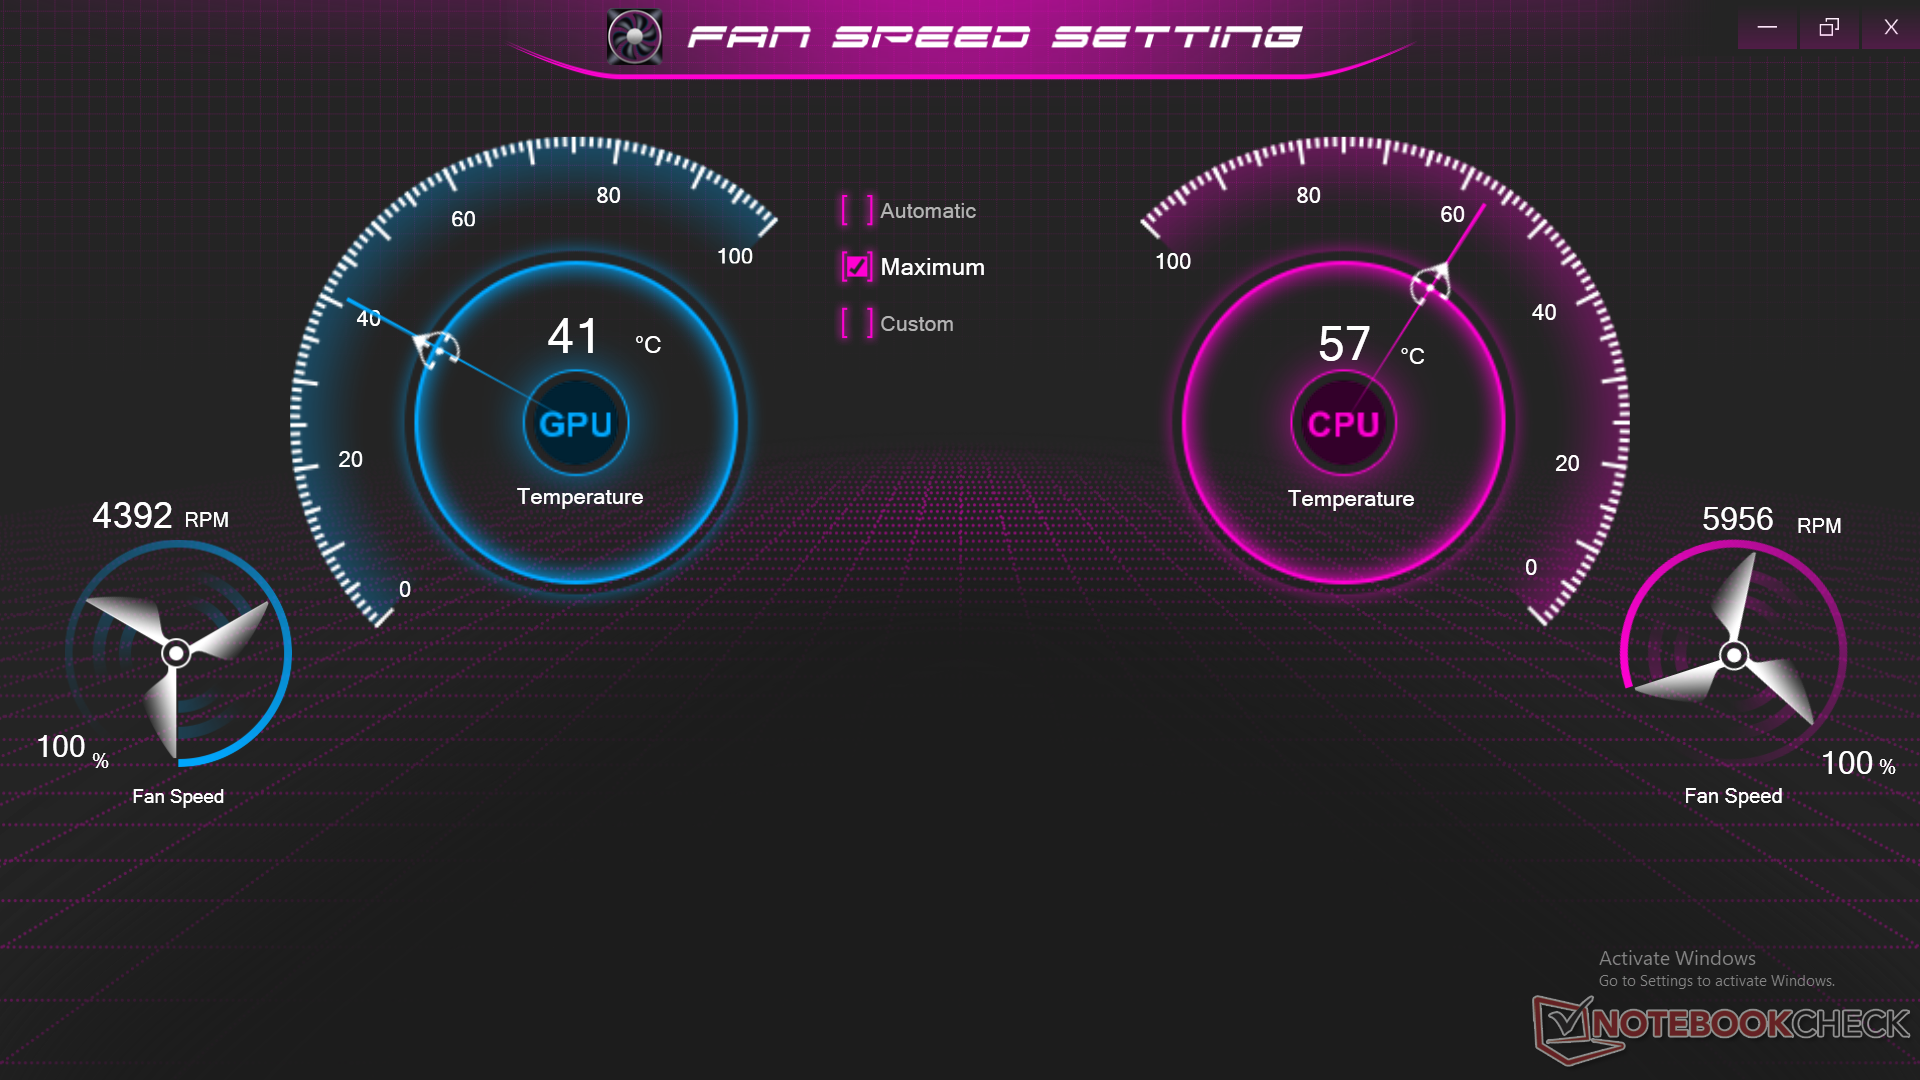
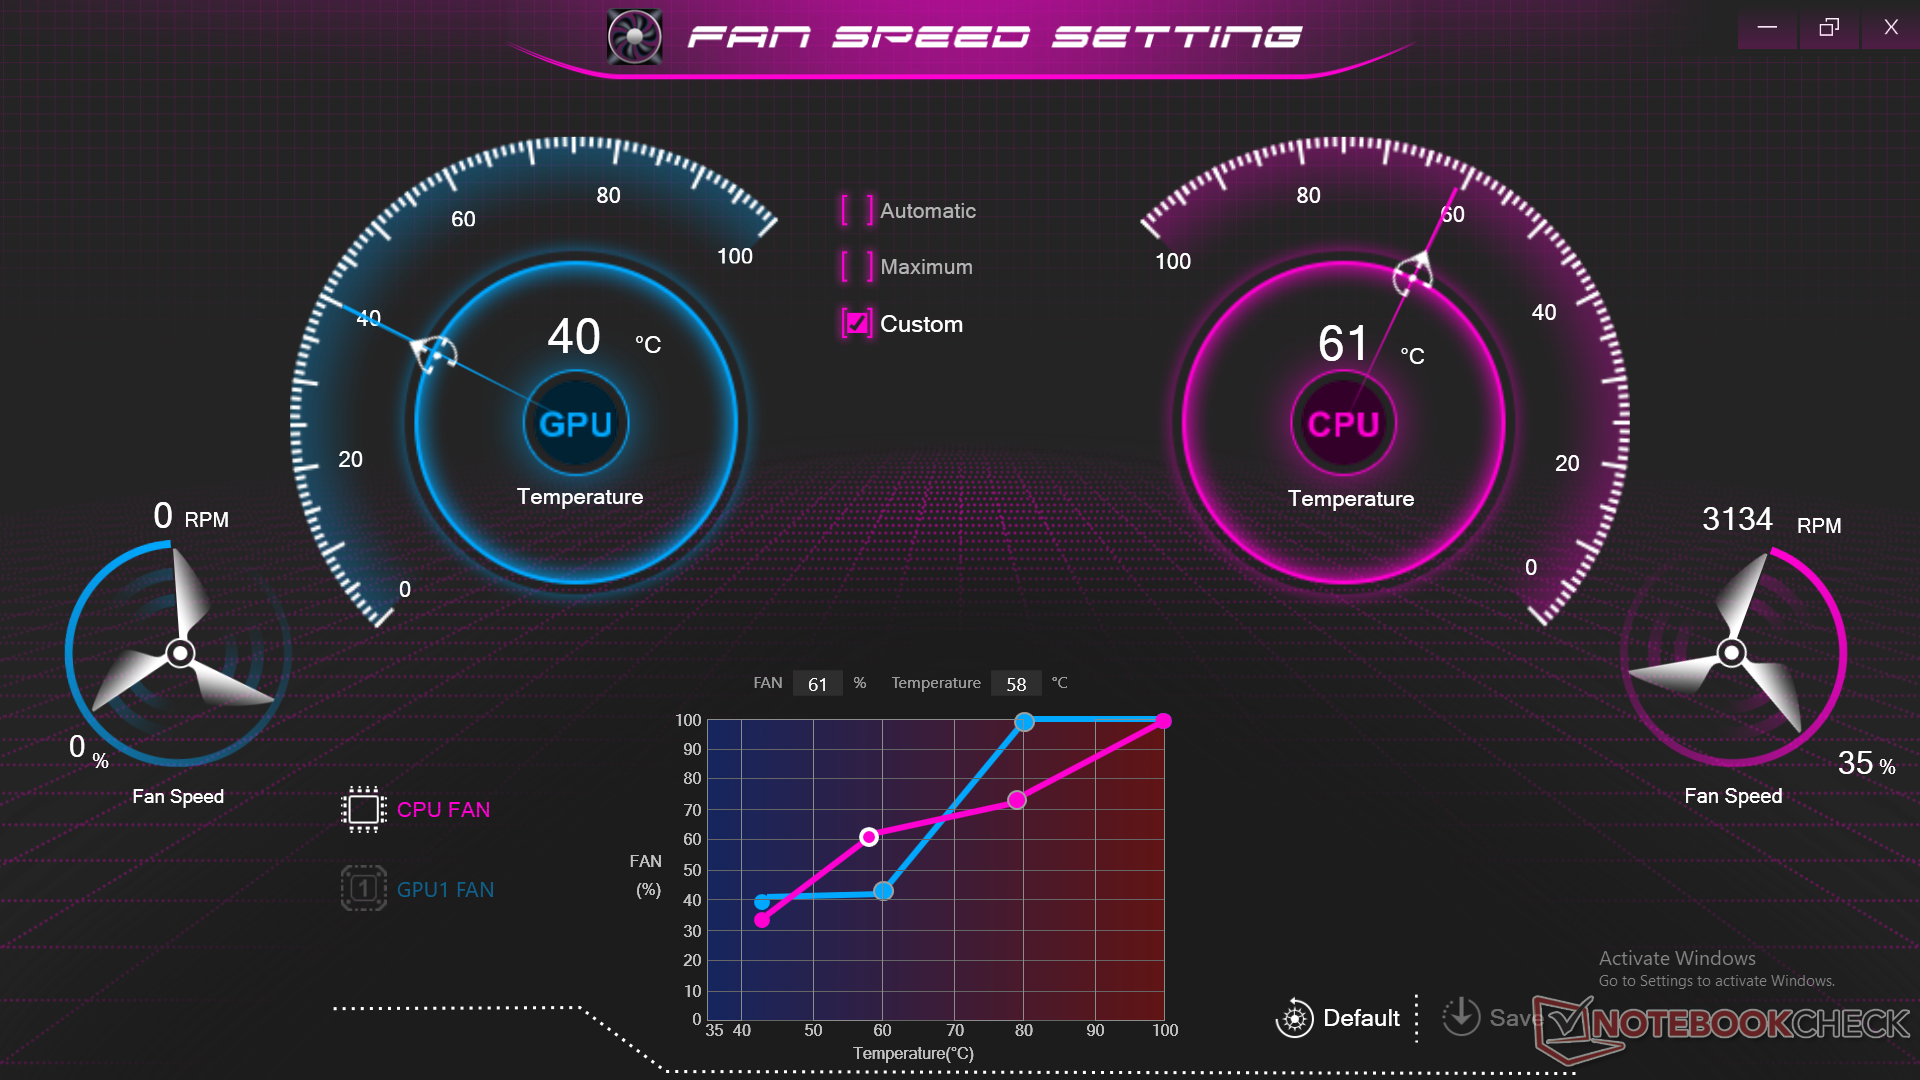
Nuestra unidad se configuró en el modo de alto rendimiento a través de Windows y en el modo de rendimiento con el modo de ventilador máximo activo a través del Centro de Control 3.0 para obtener las puntuaciones más altas posibles en la configuración original del OEM. Recomendamos a los usuarios que se familiaricen con el software del Centro de Control, ya que aquí se pueden activar muchas funciones auxiliares
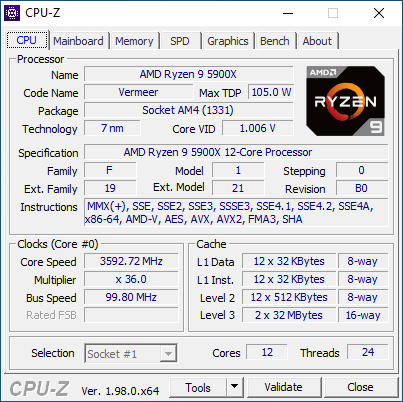
Procesador
El rendimiento multihilo es decepcionante cuando se compara con nuestro ryzen 9 5900X de escritorio de referencia. Nuestro Eurocom Ryzen 9 5900X es consistentemente más lento en alrededor de 30 a 40 por ciento para estar más en línea con el móvil Ryzen 9 5900HX móvil.
Cinebench R15 Multi Loop
Cinebench R23: Multi Core | Single Core
Cinebench R20: CPU (Multi Core) | CPU (Single Core)
Cinebench R15: CPU Multi 64Bit | CPU Single 64Bit
Blender: v2.79 BMW27 CPU
7-Zip 18.03: 7z b 4 | 7z b 4 -mmt1
Geekbench 5.5: Multi-Core | Single-Core
HWBOT x265 Benchmark v2.2: 4k Preset
LibreOffice : 20 Documents To PDF
R Benchmark 2.5: Overall mean
* ... más pequeño es mejor
AIDA64: FP32 Ray-Trace | FPU Julia | CPU SHA3 | CPU Queen | FPU SinJulia | FPU Mandel | CPU AES | CPU ZLib | FP64 Ray-Trace | CPU PhotoWorxx
| Performance rating | |
| Medio AMD Ryzen 9 5900X | |
| Eurocom Nightsky ARX315 | |
| Gigabyte A5 X1 | |
| MSI Delta 15 A5EFK | |
| Schenker XMG Apex 15 NH57E PS | |
| Medion Erazer Deputy P25 | |
| MSI GE66 Raider 10SFS | |
| AIDA64 / FP32 Ray-Trace | |
| Medio AMD Ryzen 9 5900X (3069 - 24659, n=15) | |
| Gigabyte A5 X1 | |
| MSI Delta 15 A5EFK | |
| Medion Erazer Deputy P25 | |
| Schenker XMG Apex 15 NH57E PS | |
| Eurocom Nightsky ARX315 | |
| MSI GE66 Raider 10SFS | |
| AIDA64 / FPU Julia | |
| Medio AMD Ryzen 9 5900X (18567 - 155529, n=15) | |
| Gigabyte A5 X1 | |
| Medion Erazer Deputy P25 | |
| MSI Delta 15 A5EFK | |
| Schenker XMG Apex 15 NH57E PS | |
| Eurocom Nightsky ARX315 | |
| MSI GE66 Raider 10SFS | |
| AIDA64 / CPU SHA3 | |
| Medio AMD Ryzen 9 5900X (629 - 5329, n=15) | |
| Gigabyte A5 X1 | |
| MSI Delta 15 A5EFK | |
| Schenker XMG Apex 15 NH57E PS | |
| Medion Erazer Deputy P25 | |
| Eurocom Nightsky ARX315 | |
| MSI GE66 Raider 10SFS | |
| AIDA64 / CPU Queen | |
| Eurocom Nightsky ARX315 | |
| Medio AMD Ryzen 9 5900X (15371 - 138889, n=15) | |
| MSI Delta 15 A5EFK | |
| Gigabyte A5 X1 | |
| Schenker XMG Apex 15 NH57E PS | |
| Medion Erazer Deputy P25 | |
| MSI GE66 Raider 10SFS | |
| AIDA64 / FPU SinJulia | |
| Eurocom Nightsky ARX315 | |
| Medio AMD Ryzen 9 5900X (2137 - 19465, n=15) | |
| Gigabyte A5 X1 | |
| MSI Delta 15 A5EFK | |
| Schenker XMG Apex 15 NH57E PS | |
| Medion Erazer Deputy P25 | |
| MSI GE66 Raider 10SFS | |
| AIDA64 / FPU Mandel | |
| Medio AMD Ryzen 9 5900X (10291 - 85469, n=15) | |
| Gigabyte A5 X1 | |
| MSI Delta 15 A5EFK | |
| Medion Erazer Deputy P25 | |
| Schenker XMG Apex 15 NH57E PS | |
| Eurocom Nightsky ARX315 | |
| MSI GE66 Raider 10SFS | |
| AIDA64 / CPU AES | |
| Medio AMD Ryzen 9 5900X (24327 - 212390, n=15) | |
| Eurocom Nightsky ARX315 | |
| Gigabyte A5 X1 | |
| MSI Delta 15 A5EFK | |
| Schenker XMG Apex 15 NH57E PS | |
| Medion Erazer Deputy P25 | |
| MSI GE66 Raider 10SFS | |
| AIDA64 / CPU ZLib | |
| Medio AMD Ryzen 9 5900X (150.9 - 1345, n=15) | |
| Eurocom Nightsky ARX315 | |
| Gigabyte A5 X1 | |
| MSI Delta 15 A5EFK | |
| Schenker XMG Apex 15 NH57E PS | |
| Medion Erazer Deputy P25 | |
| MSI GE66 Raider 10SFS | |
| AIDA64 / FP64 Ray-Trace | |
| Medio AMD Ryzen 9 5900X (1518 - 13196, n=15) | |
| Gigabyte A5 X1 | |
| MSI Delta 15 A5EFK | |
| Medion Erazer Deputy P25 | |
| Schenker XMG Apex 15 NH57E PS | |
| MSI GE66 Raider 10SFS | |
| Eurocom Nightsky ARX315 | |
| AIDA64 / CPU PhotoWorxx | |
| Medio AMD Ryzen 9 5900X (11451 - 32849, n=15) | |
| MSI GE66 Raider 10SFS | |
| Eurocom Nightsky ARX315 | |
| MSI Delta 15 A5EFK | |
| Schenker XMG Apex 15 NH57E PS | |
| Gigabyte A5 X1 | |
| Medion Erazer Deputy P25 | |
Rendimiento del sistema
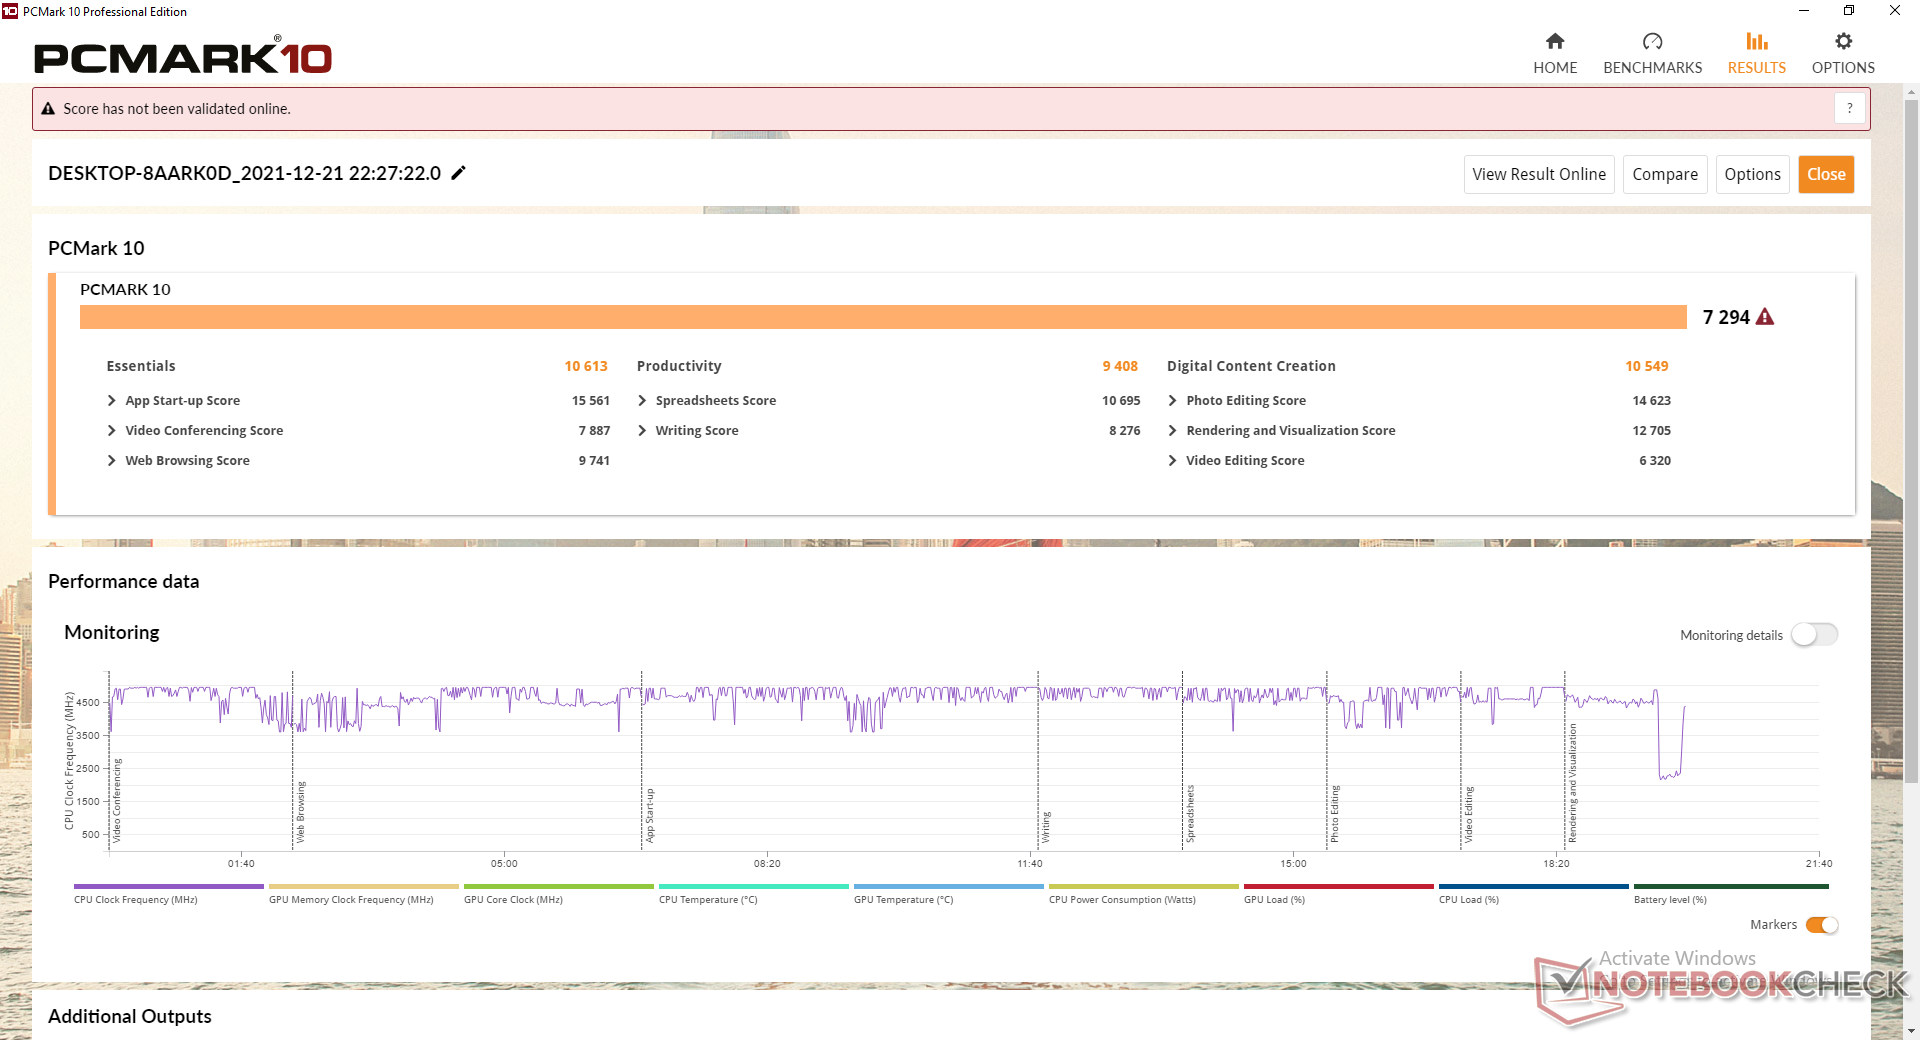
Las puntuaciones de PCMark 10 son excelentes y comparables a las del MSI Delta 15. Sin embargo, no recomendamos poner el Centro de Control en modo de ahorro de energía o en modo silencioso, ya que el rendimiento del sistema se ralentizará. La navegación simple o el sistema operativo se volverán muy lentos con constantes saltos del cursor del ratón y saltos de fotogramas. Los usuarios deben permanecer en el modo de entretenimiento o el modo de rendimiento para una experiencia más suave.
Además, el sistema tarda un tiempo inusualmente largo en despertarse de la suspensión. Los típicos portátiles o Ultrabooks tardan menos de un par de segundos, mientras que nuestro Eurocom siempre tarda más de 10 segundos.
| PCMark 10 / Score | |
| MSI Delta 15 A5EFK | |
| Eurocom Nightsky ARX315 | |
| Gigabyte A5 X1 | |
| Schenker XMG Apex 15 NH57E PS | |
| Medion Erazer Deputy P25 | |
| MSI GE66 Raider 10SFS | |
| PCMark 10 / Essentials | |
| Eurocom Nightsky ARX315 | |
| MSI Delta 15 A5EFK | |
| Gigabyte A5 X1 | |
| Schenker XMG Apex 15 NH57E PS | |
| Medion Erazer Deputy P25 | |
| MSI GE66 Raider 10SFS | |
| PCMark 10 / Productivity | |
| MSI Delta 15 A5EFK | |
| Eurocom Nightsky ARX315 | |
| Gigabyte A5 X1 | |
| Medion Erazer Deputy P25 | |
| Schenker XMG Apex 15 NH57E PS | |
| MSI GE66 Raider 10SFS | |
| PCMark 10 / Digital Content Creation | |
| MSI Delta 15 A5EFK | |
| Eurocom Nightsky ARX315 | |
| Gigabyte A5 X1 | |
| Schenker XMG Apex 15 NH57E PS | |
| Medion Erazer Deputy P25 | |
| MSI GE66 Raider 10SFS | |
| PCMark 10 Score | 7294 puntos | |
ayuda | ||
| AIDA64 / Memory Copy | |
| Medio AMD Ryzen 9 5900X (31315 - 72008, n=15) | |
| Schenker XMG Apex 15 NH57E PS | |
| MSI Delta 15 A5EFK | |
| Gigabyte A5 X1 | |
| Eurocom Nightsky ARX315 | |
| MSI GE66 Raider 10SFS | |
| Medion Erazer Deputy P25 | |
| AIDA64 / Memory Read | |
| Medio AMD Ryzen 9 5900X (32972 - 70692, n=15) | |
| Schenker XMG Apex 15 NH57E PS | |
| Gigabyte A5 X1 | |
| MSI Delta 15 A5EFK | |
| Eurocom Nightsky ARX315 | |
| MSI GE66 Raider 10SFS | |
| Medion Erazer Deputy P25 | |
| AIDA64 / Memory Write | |
| Medio AMD Ryzen 9 5900X (21619 - 57070, n=15) | |
| MSI GE66 Raider 10SFS | |
| Eurocom Nightsky ARX315 | |
| Schenker XMG Apex 15 NH57E PS | |
| MSI Delta 15 A5EFK | |
| Gigabyte A5 X1 | |
| Medion Erazer Deputy P25 | |
| AIDA64 / Memory Latency | |
| Medion Erazer Deputy P25 | |
| Schenker XMG Apex 15 NH57E PS | |
| MSI Delta 15 A5EFK | |
| Gigabyte A5 X1 | |
| Medio AMD Ryzen 9 5900X (58.4 - 107.6, n=15) | |
| Eurocom Nightsky ARX315 | |
| MSI GE66 Raider 10SFS | |
* ... más pequeño es mejor
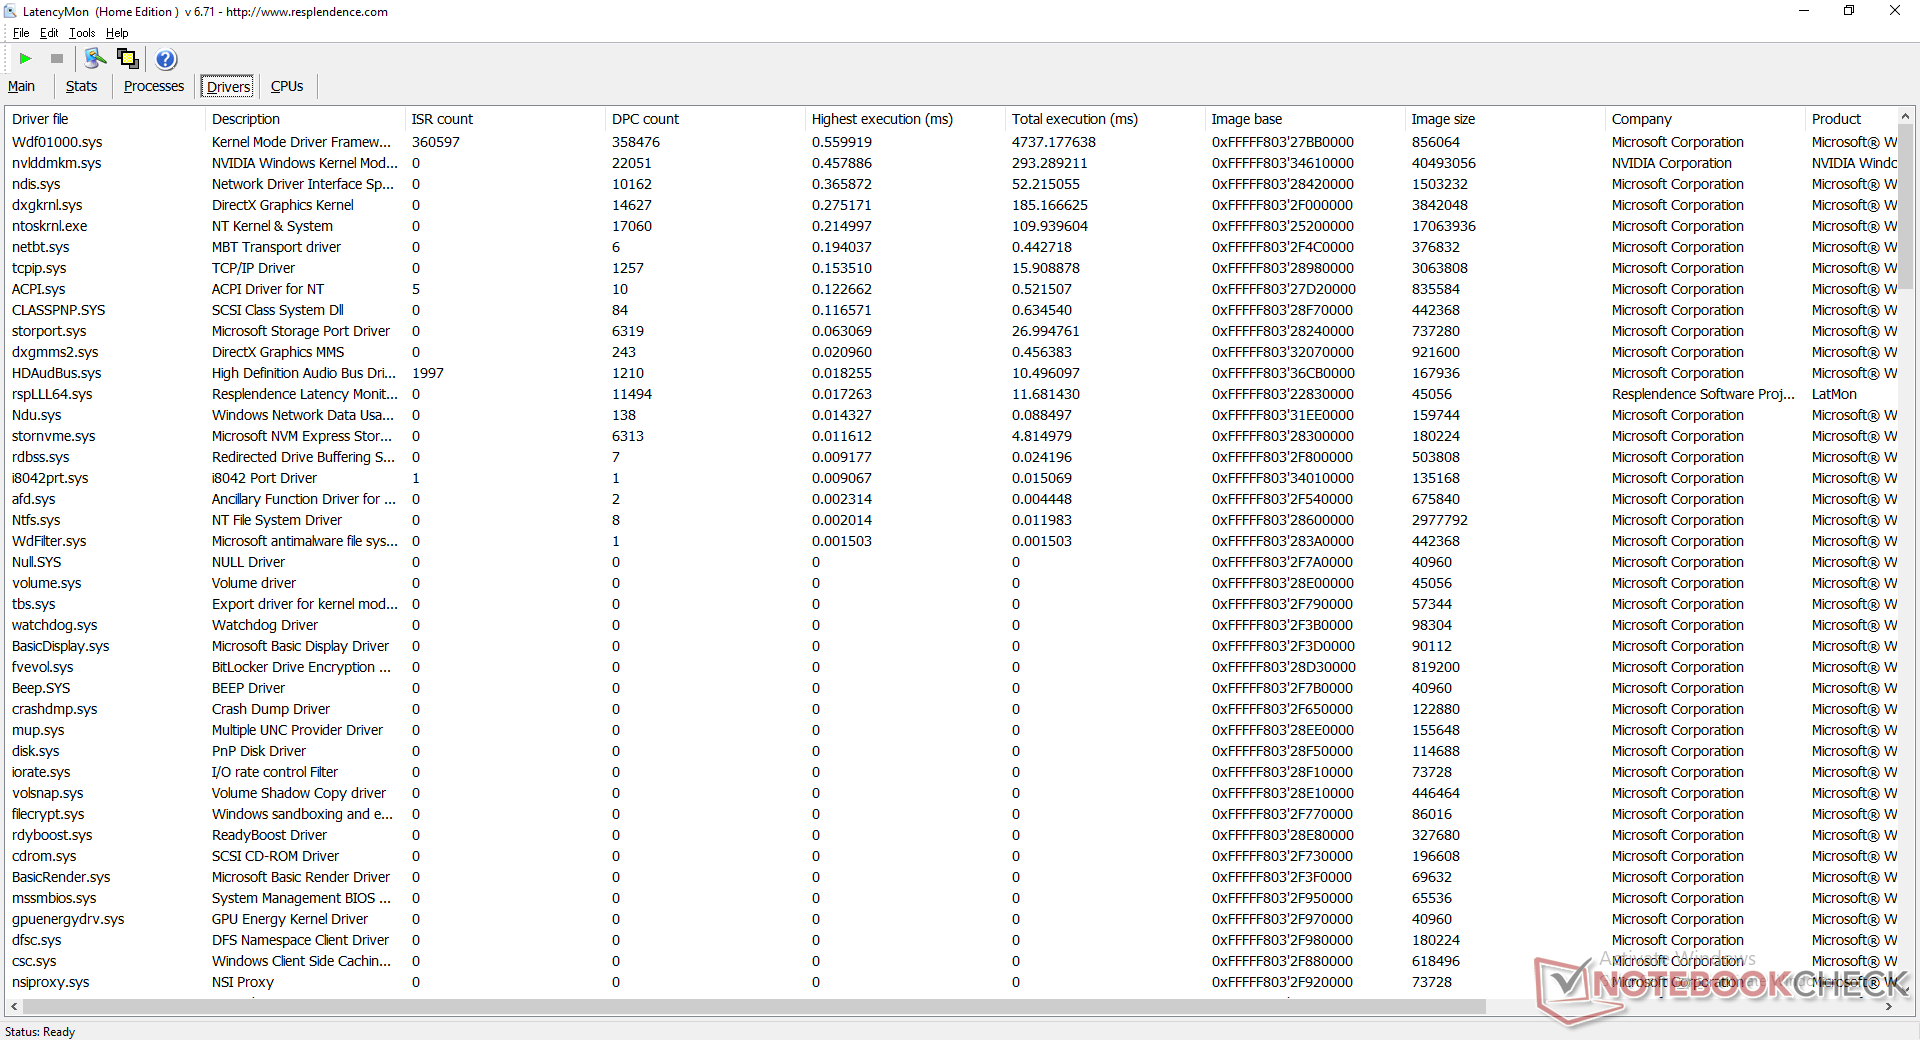
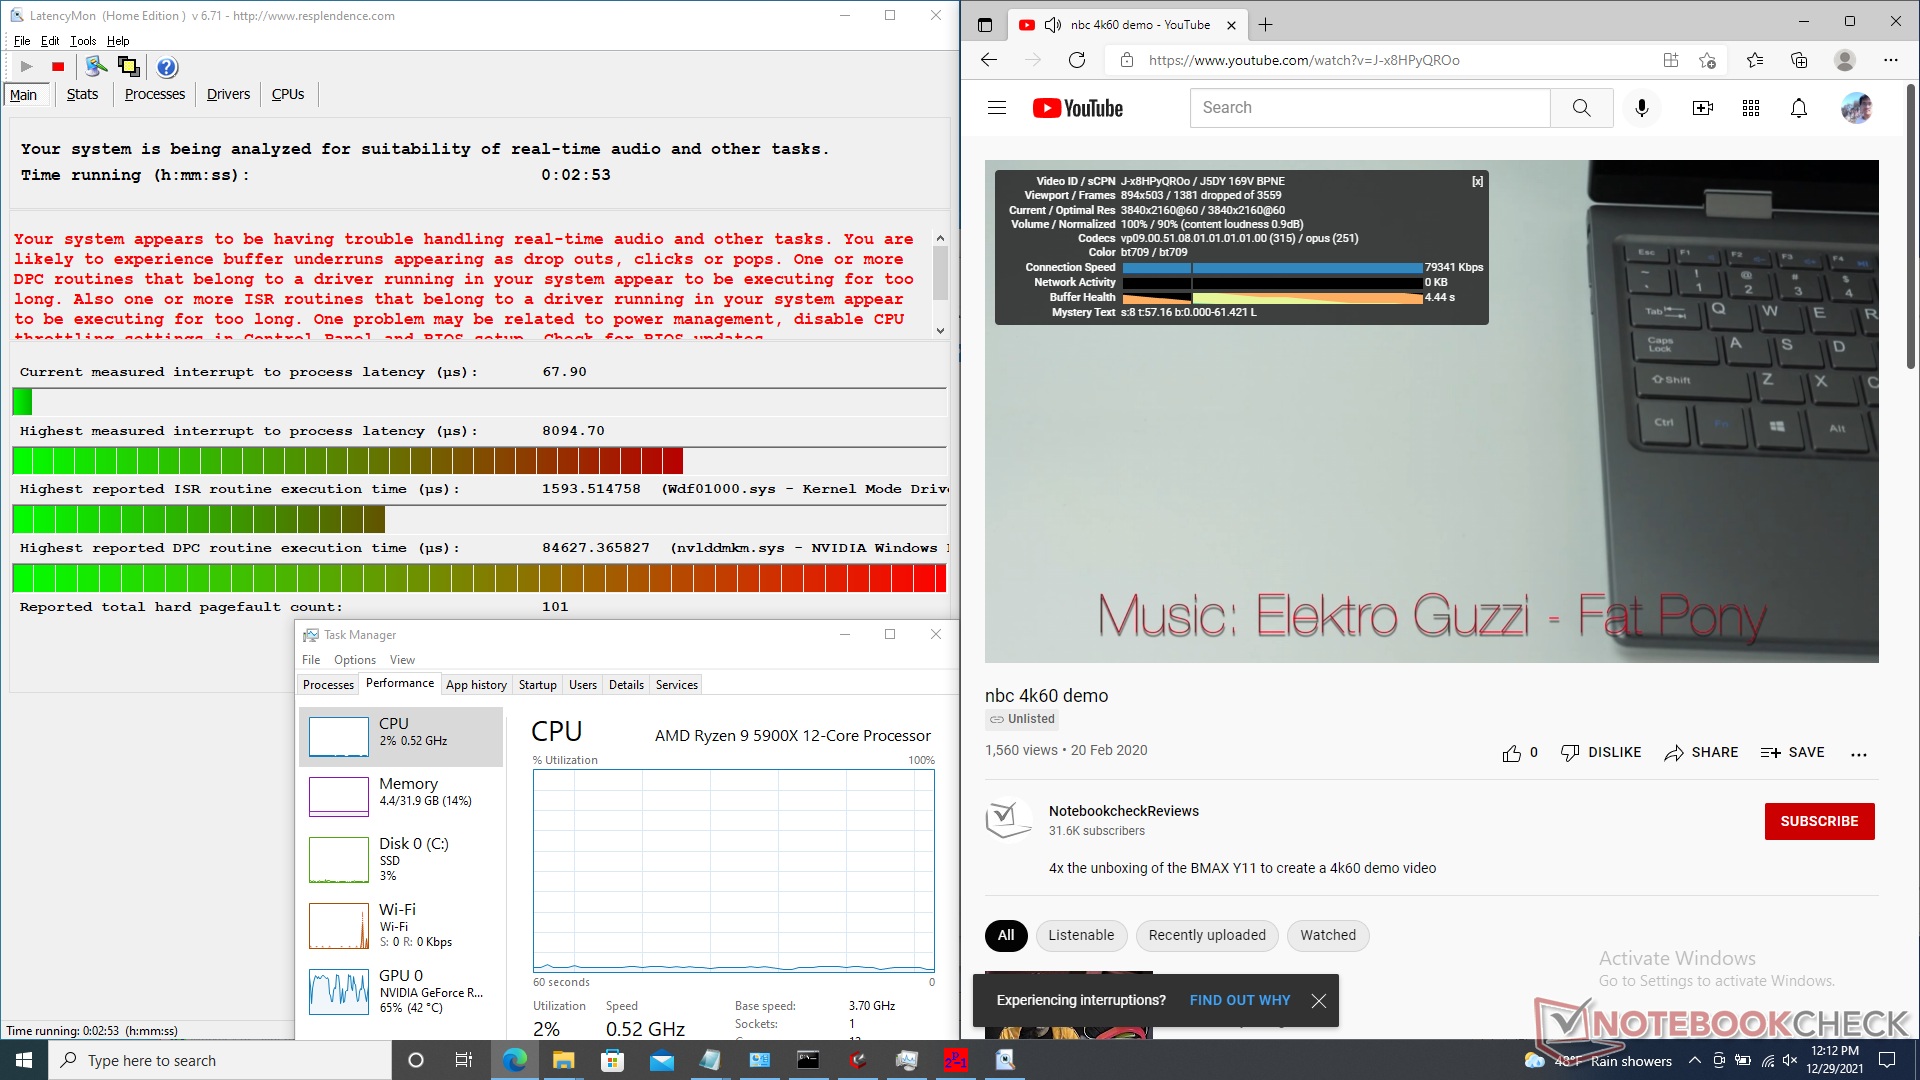
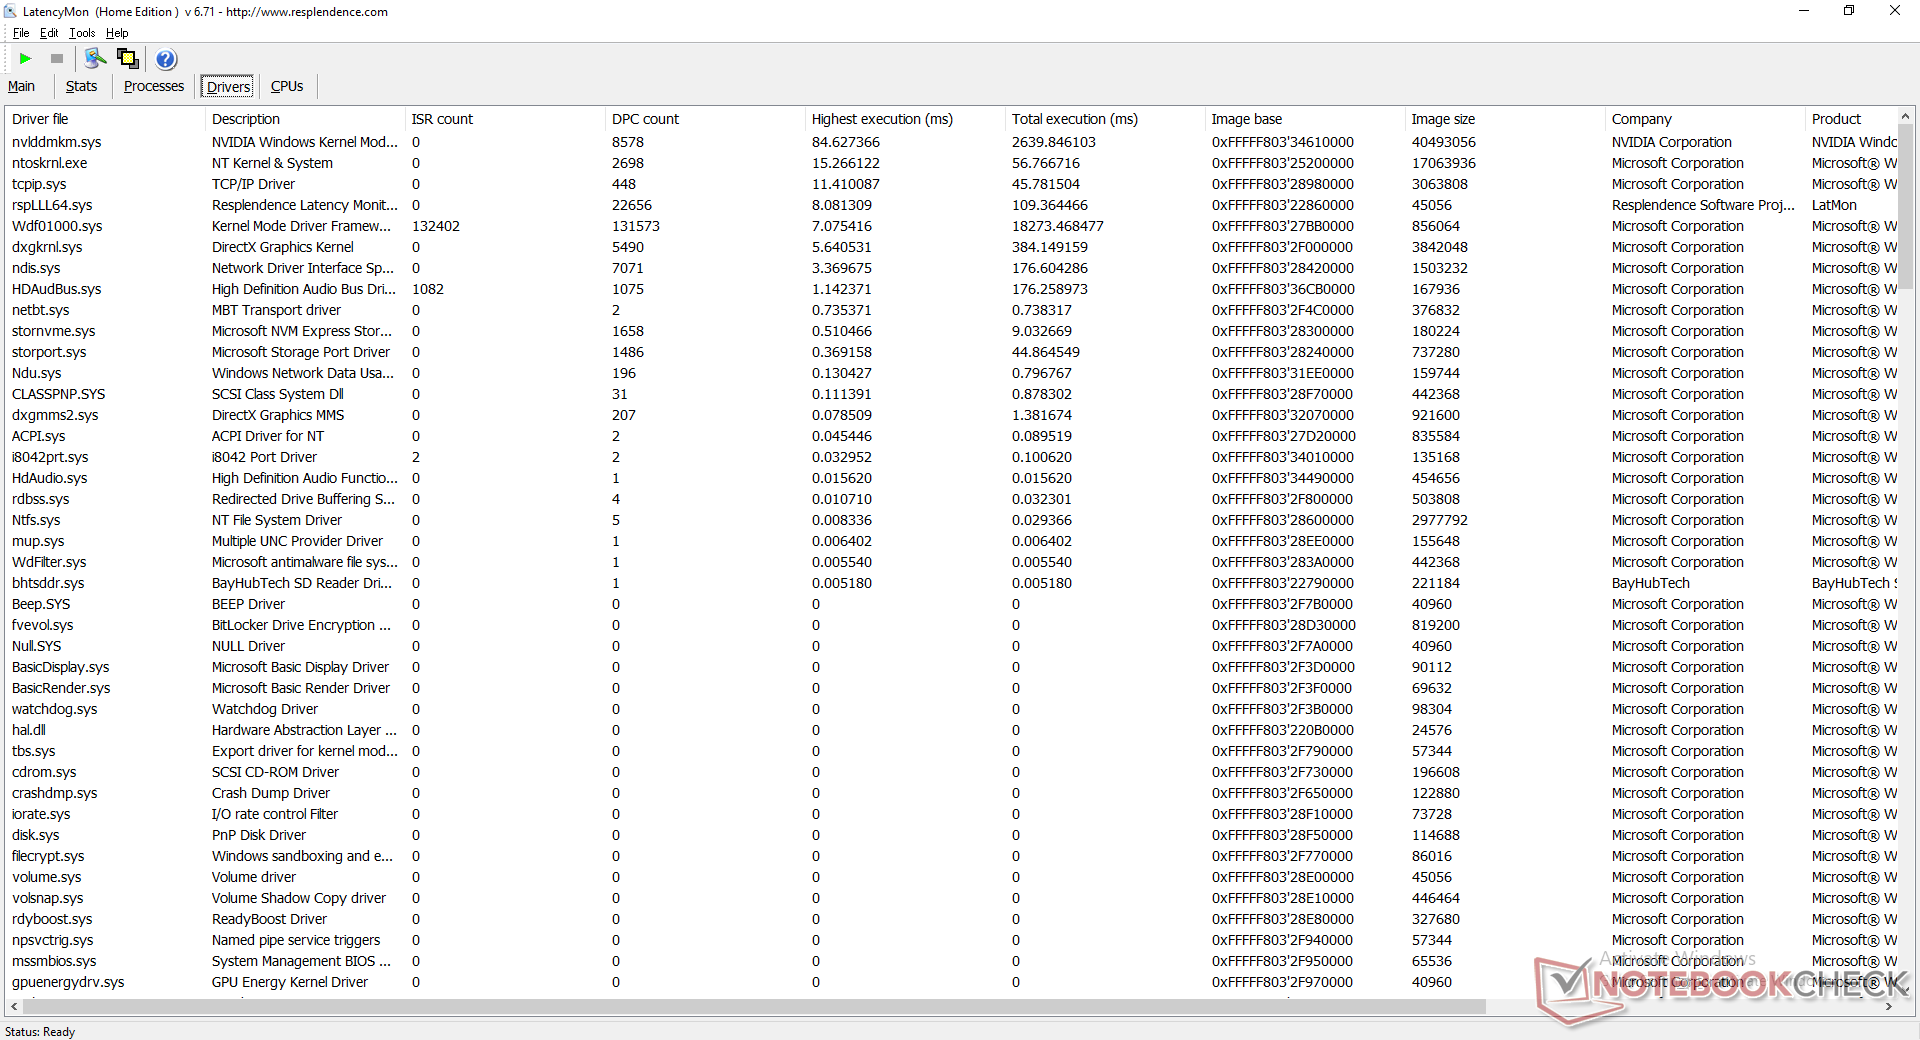
Latencia del CPD
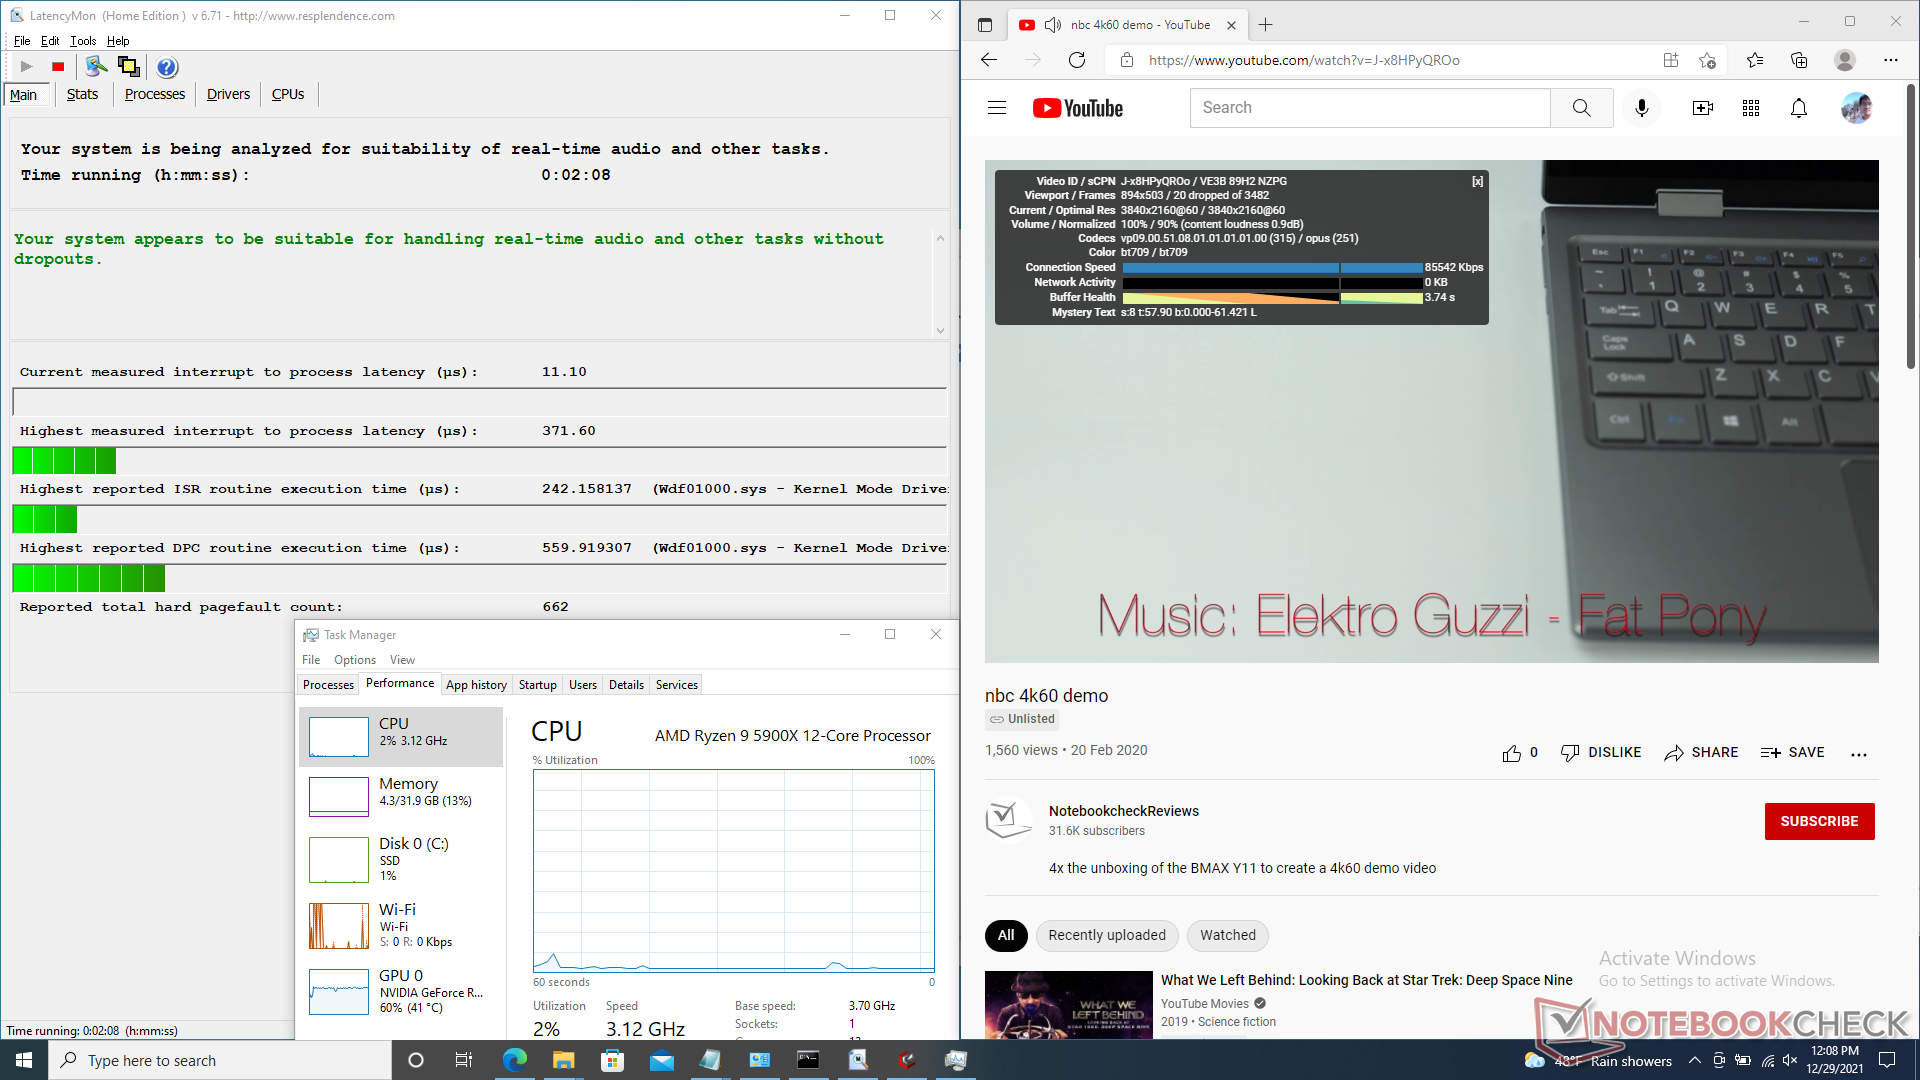
No hay problemas de latencia cuando se ejecuta en el modo de entretenimiento o en el modo de rendimiento. Por desgracia, la historia cambia si se ejecuta en el modo de ahorro de energía o en el modo silencioso. Nuestro vídeo de prueba 4K60, de un minuto de duración, tenía más de 1.500 fotogramas perdidos cuando estaba en modo de ahorro de energía o silencioso, en comparación con sólo 20 fotogramas perdidos si estaba en modo de entretenimiento o rendimiento.
| DPC Latencies / LatencyMon - interrupt to process latency (max), Web, Youtube, Prime95 | |
| MSI Delta 15 A5EFK | |
| Medion Erazer Deputy P25 | |
| Schenker XMG Apex 15 NH57E PS | |
| MSI GE66 Raider 10SFS | |
| Gigabyte A5 X1 | |
| Eurocom Nightsky ARX315 | |
* ... más pequeño es mejor
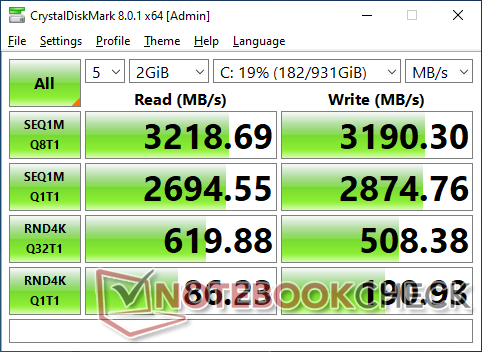
Dispositivos de almacenamiento
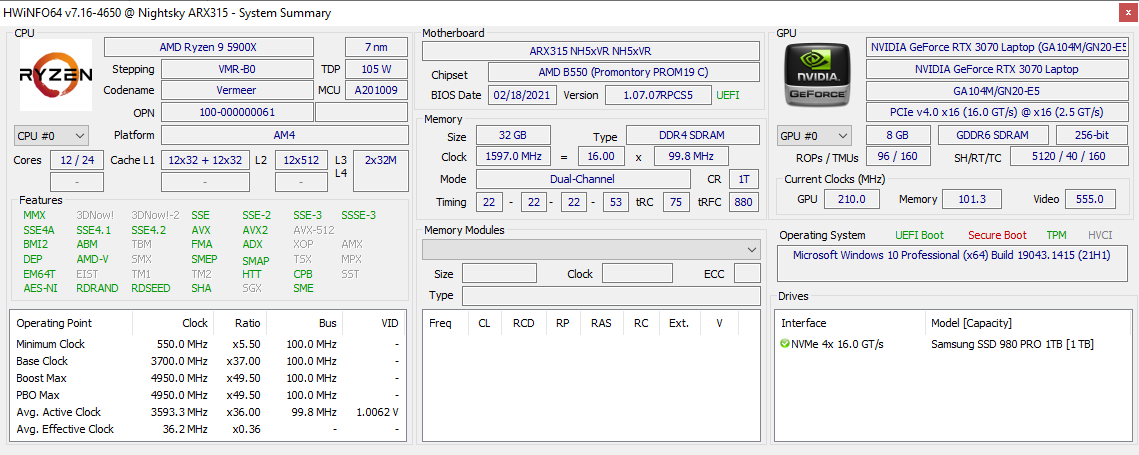
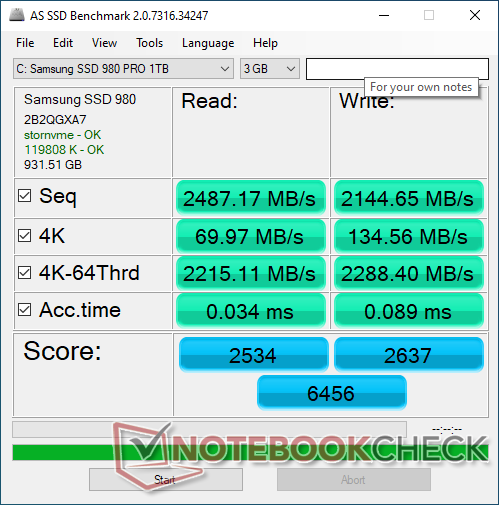
Eurocom ofrece una amplia selección de unidades SSD NVMe que van desde sólo 250 GB hasta 8 TB. Nuestra unidad ha sido configurada con elSamsung SSD 980 Pro que es un SSD PCIe4 x4 NVMe capaz de alcanzar tasas de transferencia de hasta 7000 MB/s. Por desgracia, las ranuras M.2 del Nightsky ARX15 son sólo PCIe3 x4, por lo que las tasas de transferencia serán mucho más lentas, hasta unos 3200 MB/s. Es posible que quieras ahorrarte algo de dinero y configurarlo sólo con unidades PCIe3 más baratas, ya que la placa base no puede aprovechar plenamente las ventajas de rendimiento de las unidades PCIe4 más caras.

* ... más pequeño es mejor
Disk Throttling: DiskSpd Read Loop, Queue Depth 8
Rendimiento de la GPU
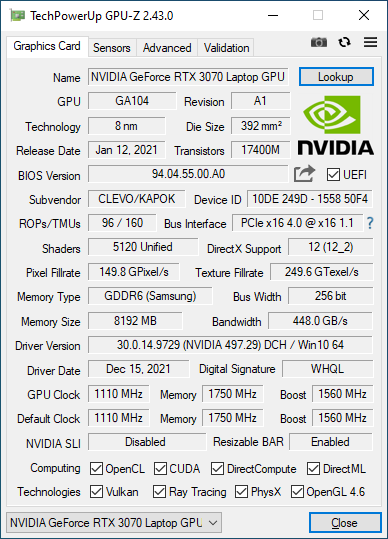
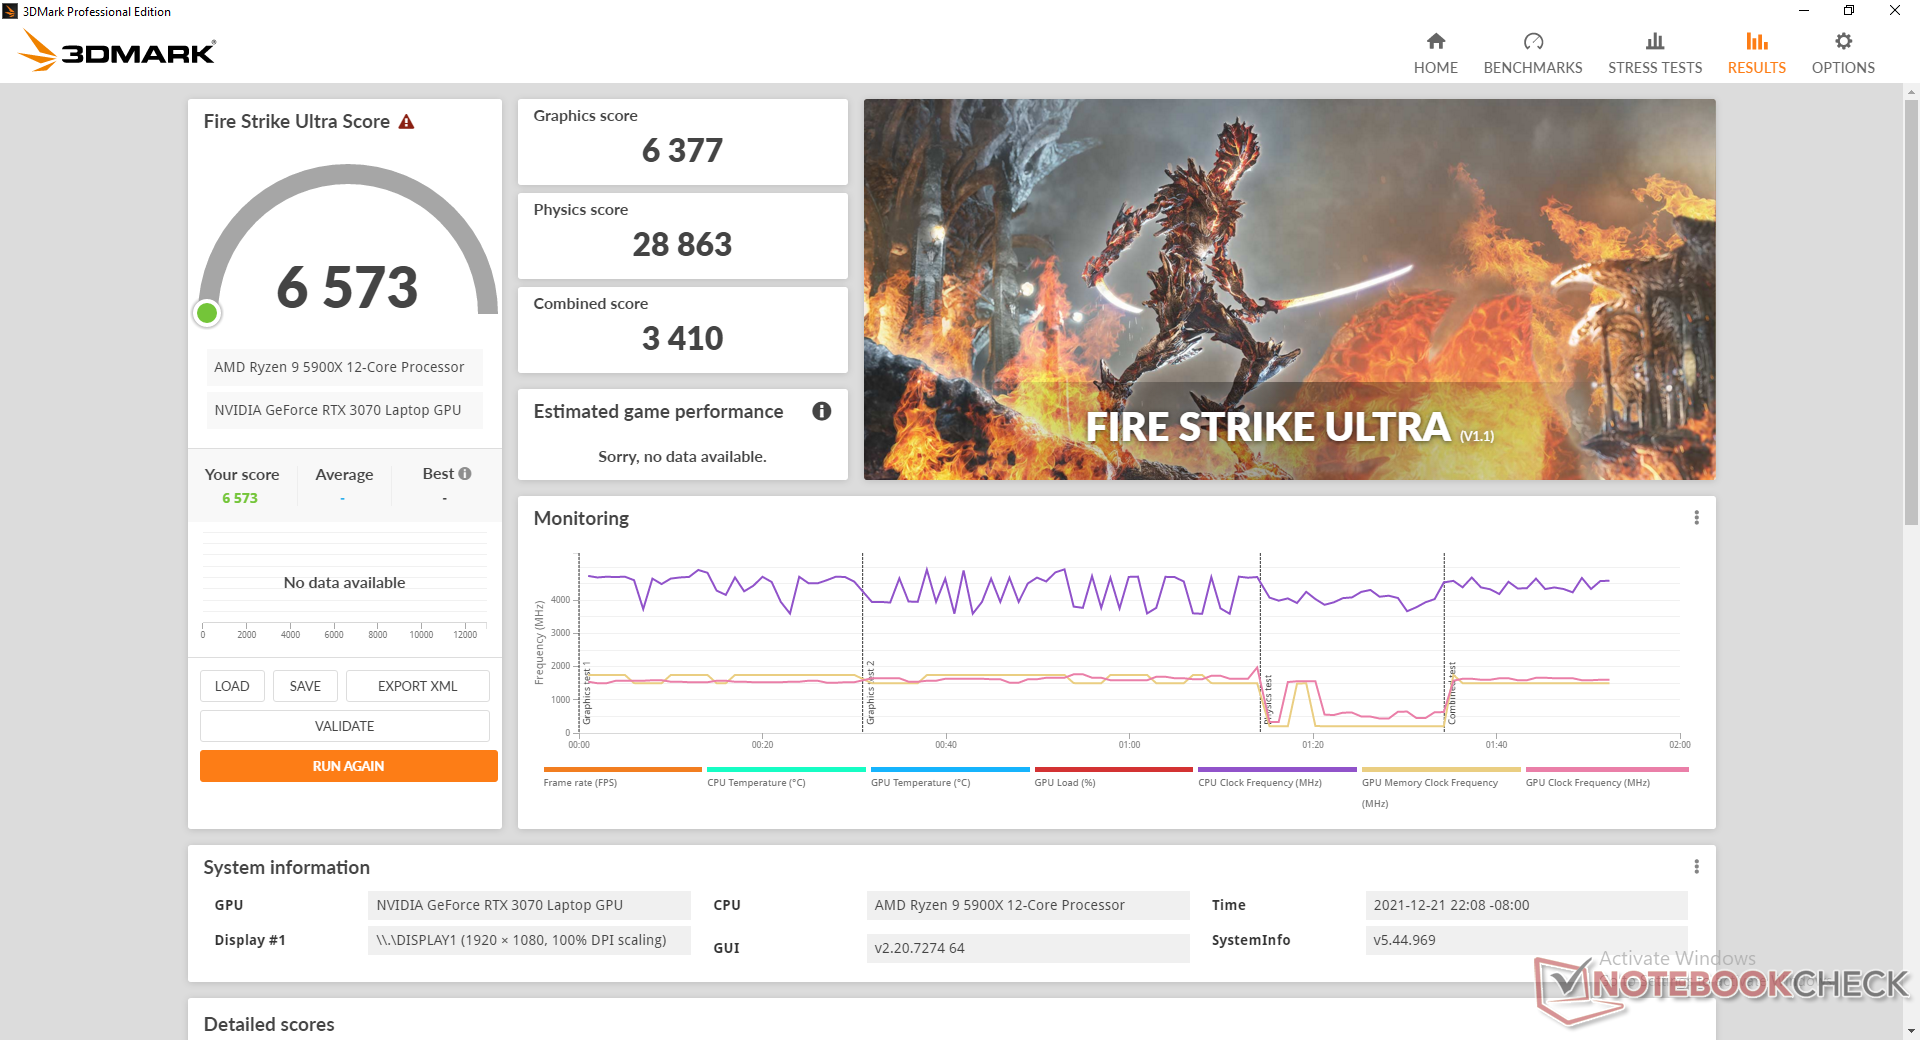
El TGP de 115 W móvil GeForce RTX 3070 rinde donde esperamos que lo haga en relación a otros portátiles con la misma GPU. No parece haber beneficios de rendimiento GPU si se ejecuta con el modo de Ventilador Máximo activado
G-Sync no es compatible con la pantalla principal y tampoco hay Advanced Optimus
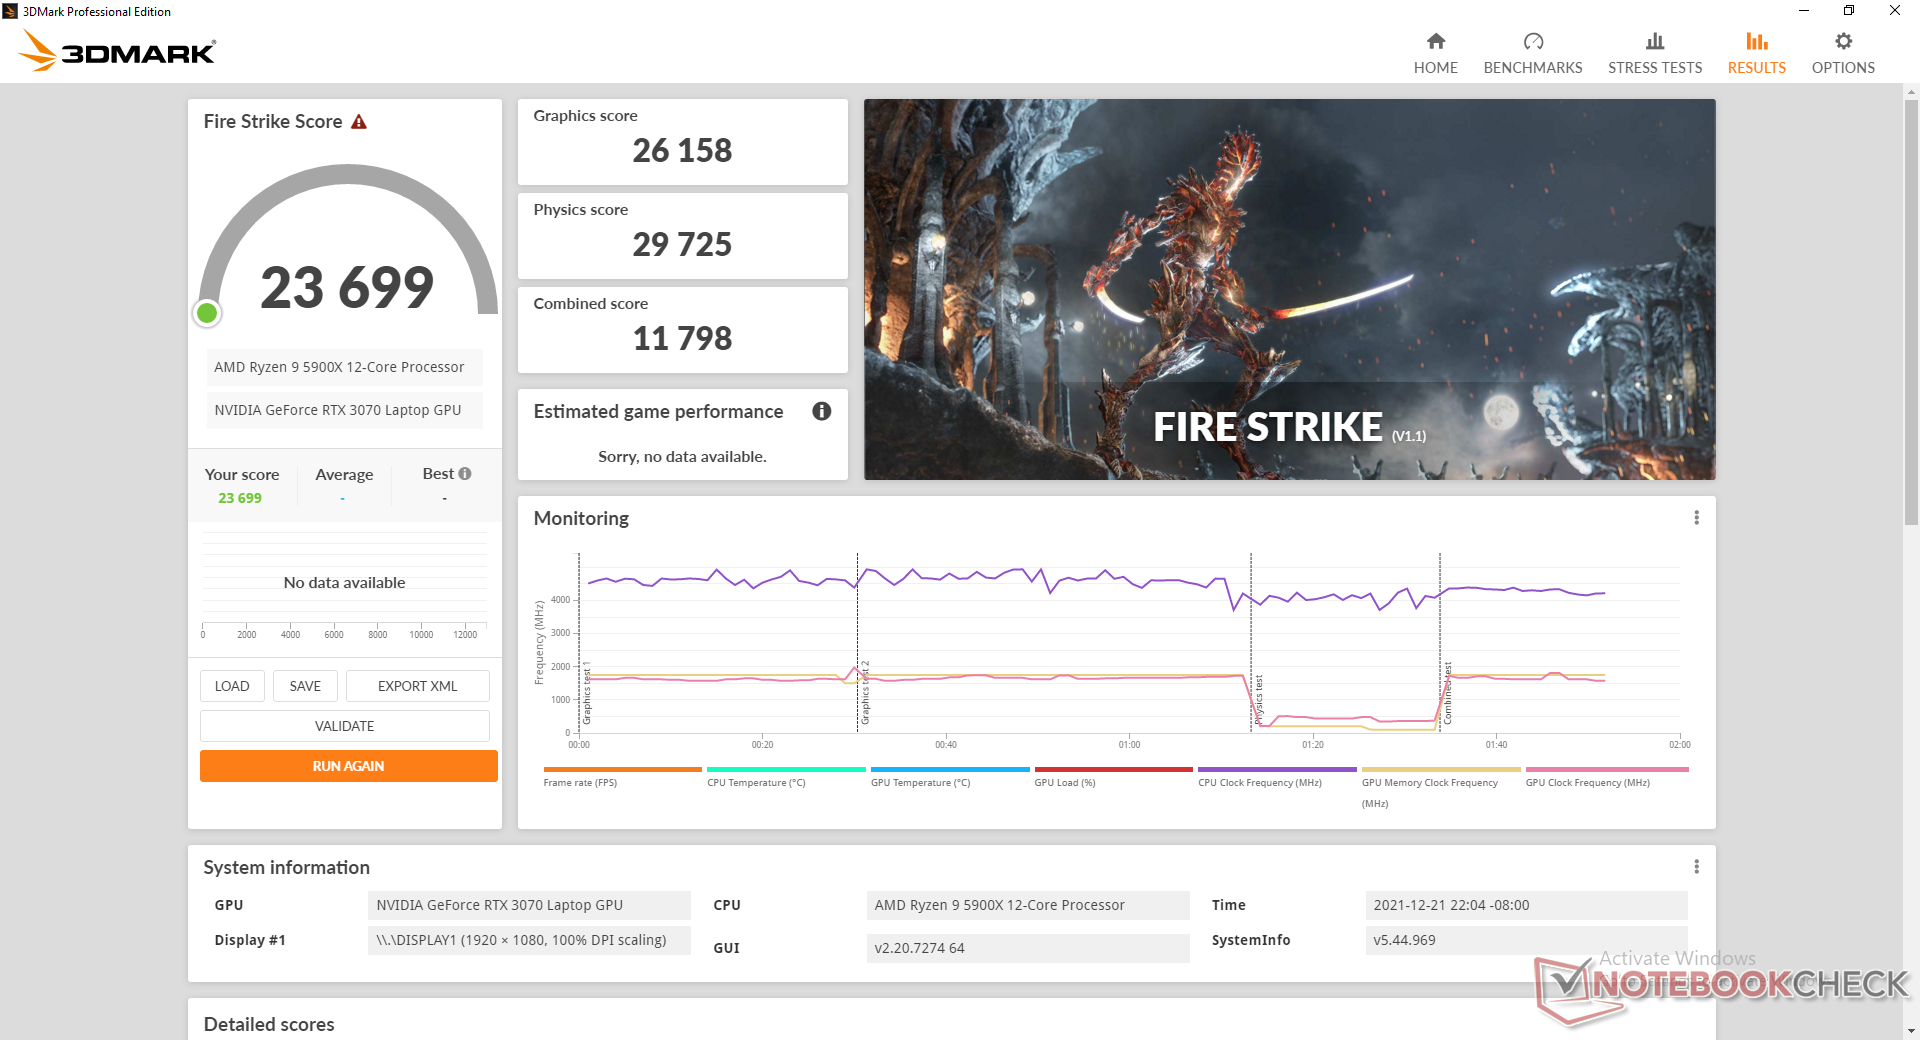
| 3DMark 11 Performance | 29688 puntos | |
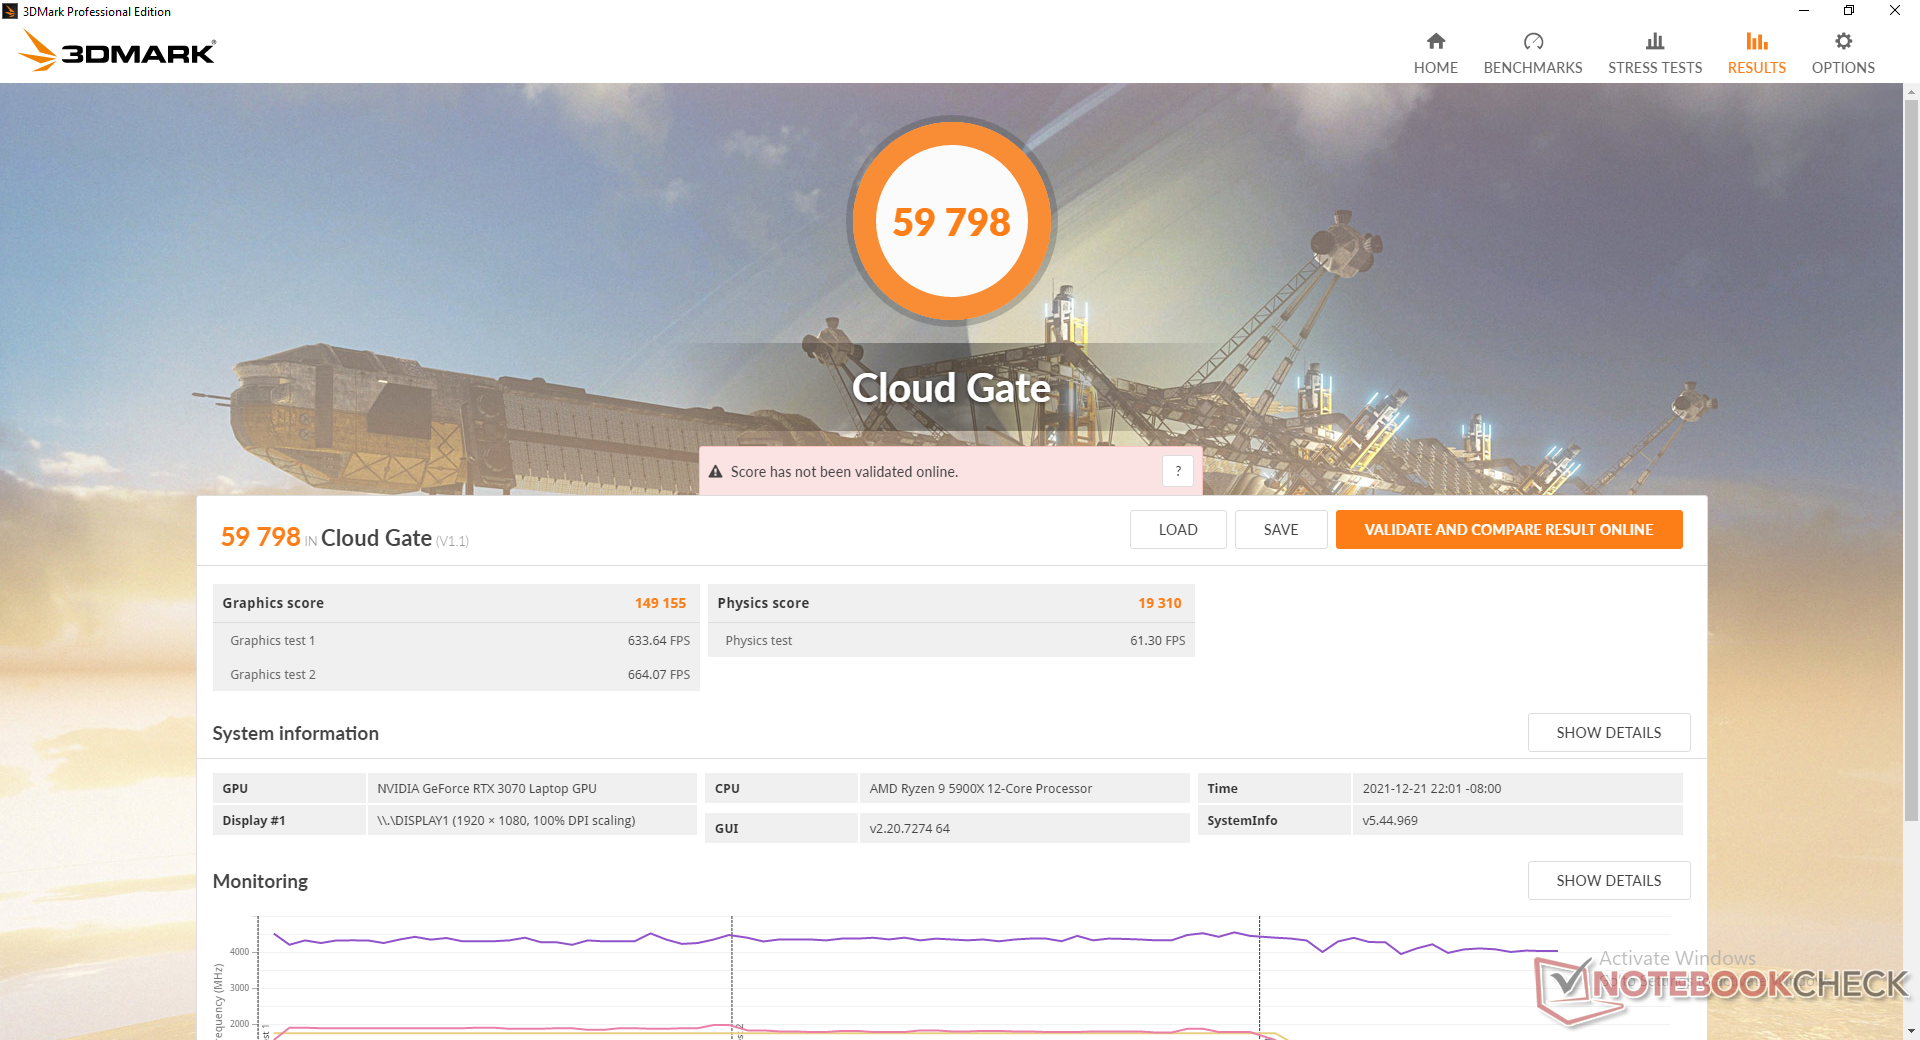
| 3DMark Cloud Gate Standard Score | 59798 puntos | |
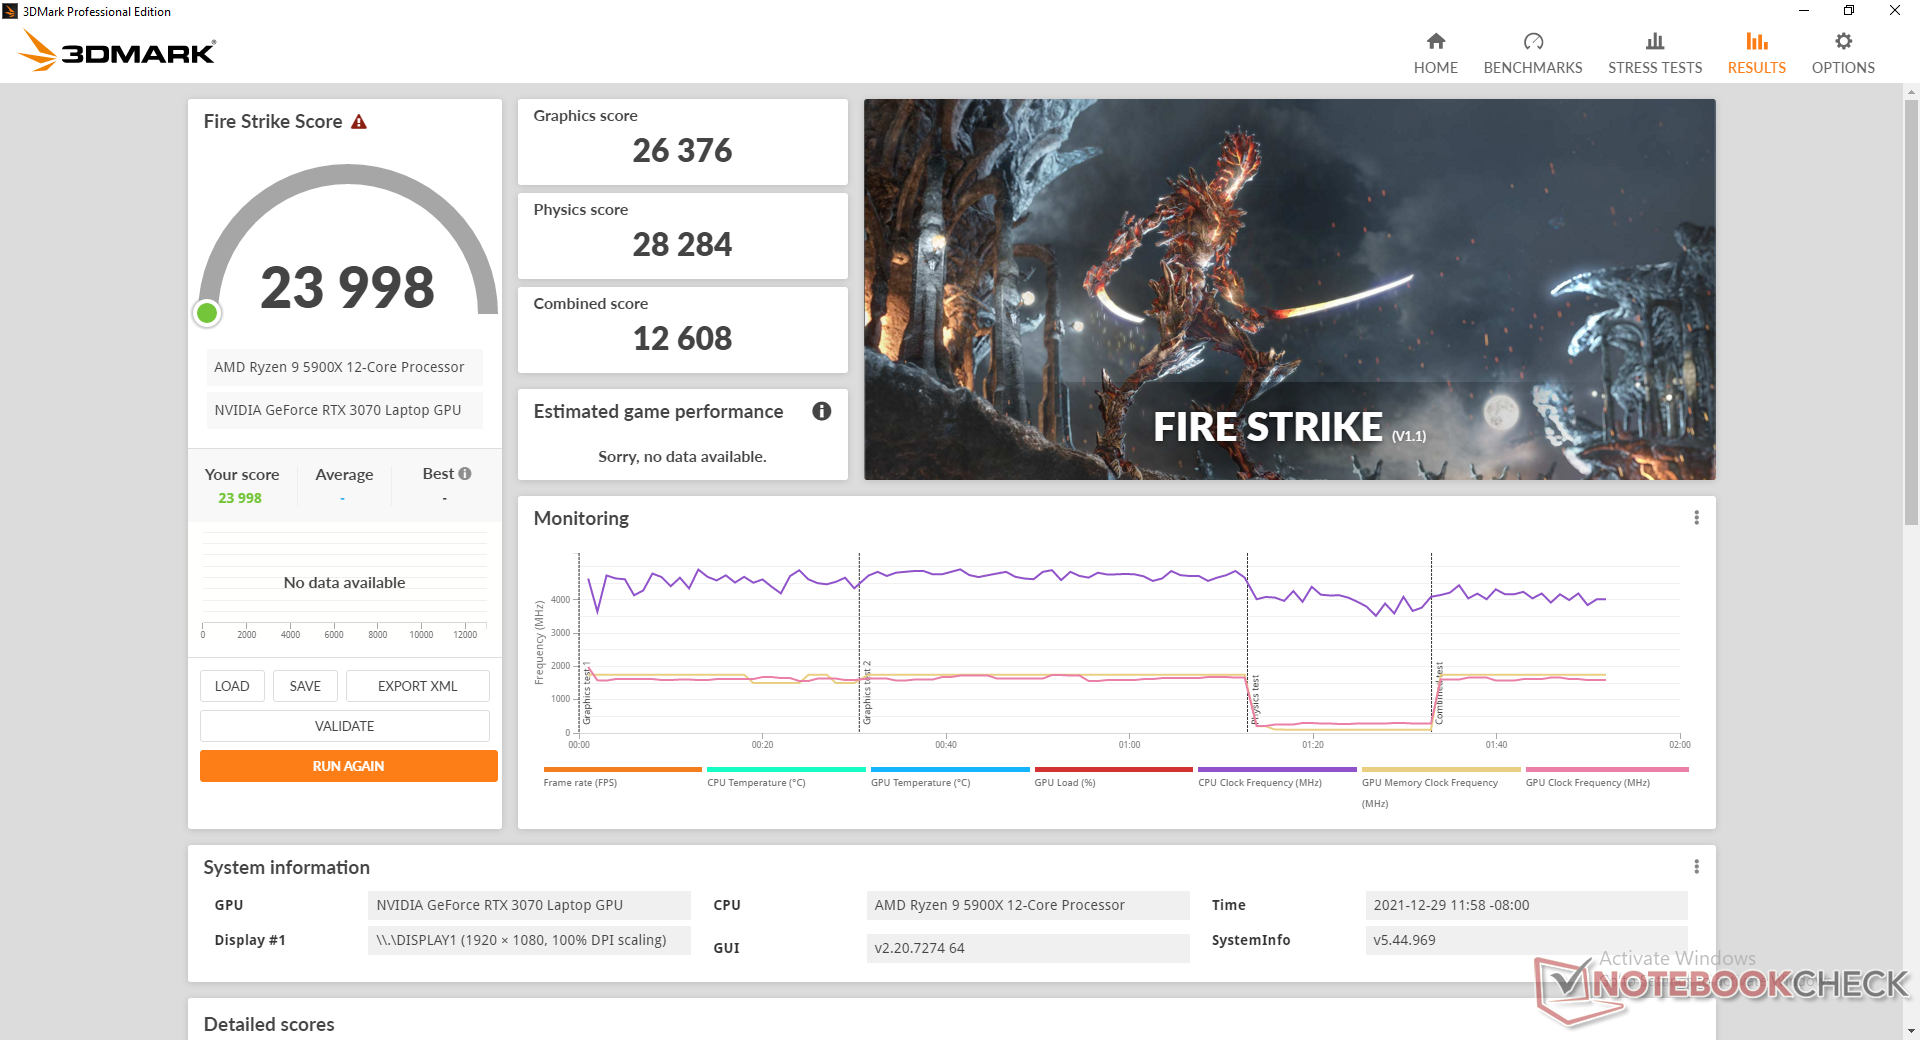
| 3DMark Fire Strike Score | 23699 puntos | |
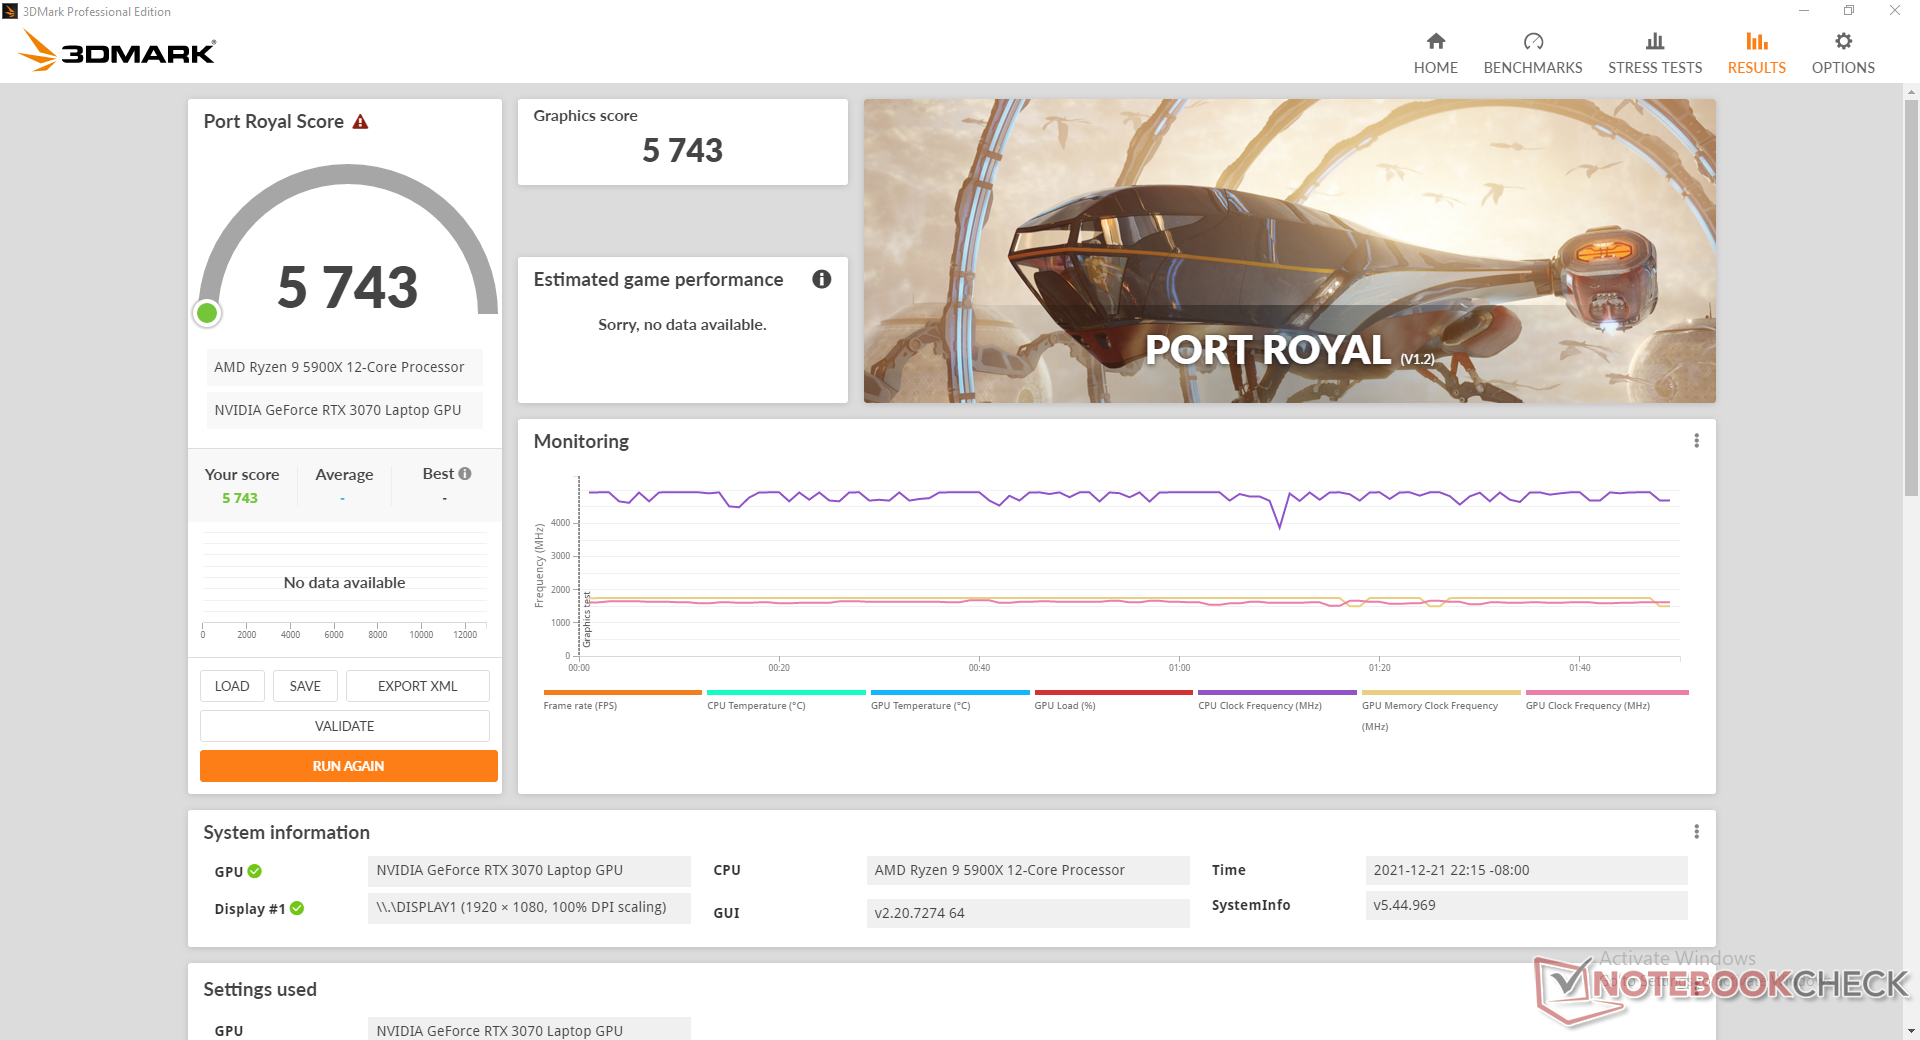
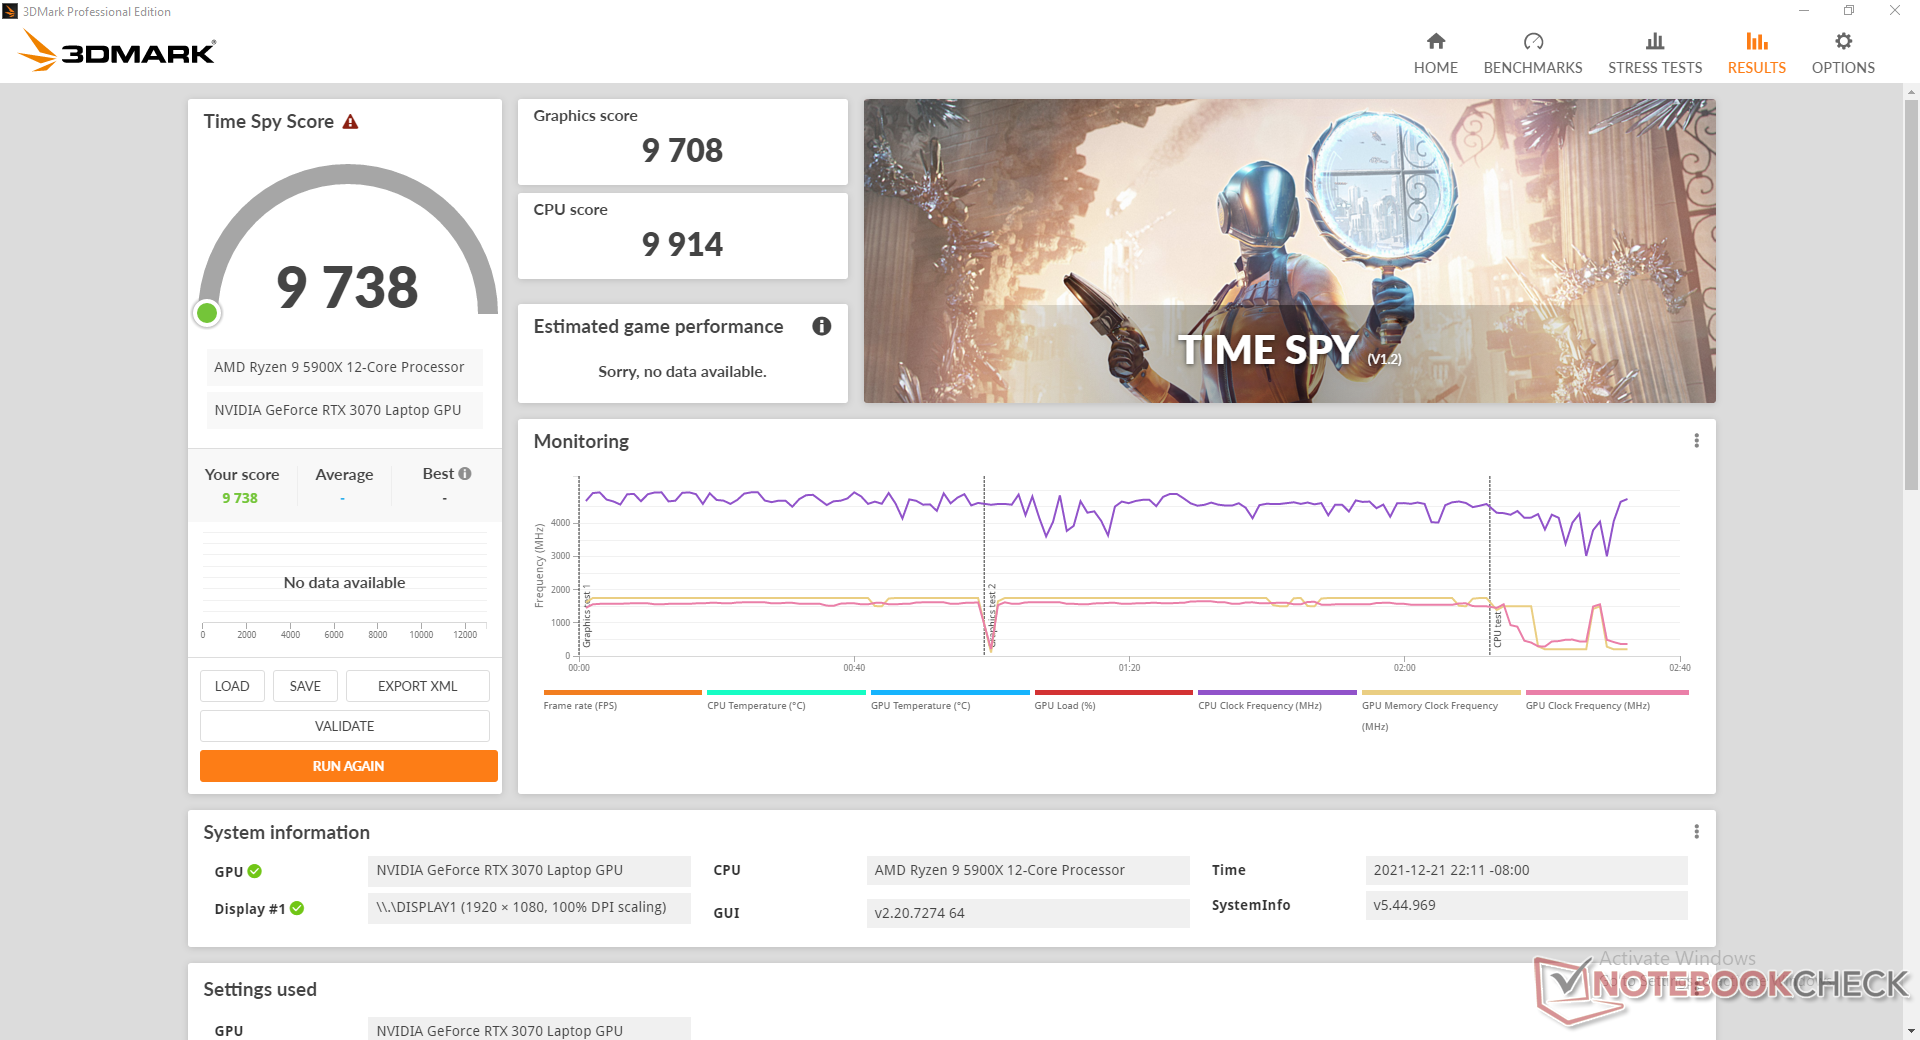
| 3DMark Time Spy Score | 9738 puntos | |
ayuda | ||
| Final Fantasy XV Benchmark | |
| 1280x720 Lite Quality | |
| Eurocom Nightsky ARX315 | |
| Gigabyte A5 X1 | |
| Medio NVIDIA GeForce RTX 3070 Laptop GPU (137 - 207, n=30) | |
| MSI GeForce RTX 3080 Gaming X Trio | |
| 1920x1080 Standard Quality | |
| Eurocom Nightsky ARX315 | |
| MSI GeForce RTX 3080 Gaming X Trio | |
| Gigabyte A5 X1 | |
| Medio NVIDIA GeForce RTX 3070 Laptop GPU (67 - 144, n=32) | |
| 1920x1080 High Quality | |
| MSI GeForce RTX 3080 Gaming X Trio | |
| Eurocom Nightsky ARX315 | |
| Gigabyte A5 X1 | |
| Medio NVIDIA GeForce RTX 3070 Laptop GPU (27.9 - 107, n=49) | |
| Strange Brigade | |
| 1280x720 lowest AF:1 | |
| Eurocom Nightsky ARX315 | |
| MSI GeForce RTX 3080 Gaming X Trio | |
| Medio NVIDIA GeForce RTX 3070 Laptop GPU (106.8 - 522, n=34) | |
| Gigabyte A5 X1 | |
| 1920x1080 medium AA:medium AF:4 | |
| MSI GeForce RTX 3080 Gaming X Trio | |
| Eurocom Nightsky ARX315 | |
| Medio NVIDIA GeForce RTX 3070 Laptop GPU (44.1 - 279, n=35) | |
| Gigabyte A5 X1 | |
| 1920x1080 high AA:high AF:8 | |
| MSI GeForce RTX 3080 Gaming X Trio | |
| Eurocom Nightsky ARX315 | |
| Medio NVIDIA GeForce RTX 3070 Laptop GPU (39.6 - 225, n=35) | |
| Gigabyte A5 X1 | |
| 1920x1080 ultra AA:ultra AF:16 | |
| MSI GeForce RTX 3080 Gaming X Trio | |
| Eurocom Nightsky ARX315 | |
| Gigabyte A5 X1 | |
| Medio NVIDIA GeForce RTX 3070 Laptop GPU (36.2 - 194, n=46) | |
Witcher 3 FPS Chart
| bajo | medio | alto | ultra | |
|---|---|---|---|---|
| GTA V (2015) | 185 | 182 | 175 | 114 |
| The Witcher 3 (2015) | 505 | 327.3 | 199 | 96.6 |
| Dota 2 Reborn (2015) | 211 | 180 | 178 | 158 |
| Final Fantasy XV Benchmark (2018) | 207 | 144 | 107 | |
| X-Plane 11.11 (2018) | 146 | 131 | 105 | |
| Far Cry 5 (2018) | 165 | 140 | 135 | 126 |
| Strange Brigade (2018) | 519 | 275 | 221 | 192 |
Emisiones
Ruido del sistema
El ruido del ventilador depende de los cuatro ajustes del perfil de energía del Centro de Control: Ahorro de energía, Silencio, Entretenimiento o Rendimiento. El sistema funciona de forma muy silenciosa (~27,9 dB(A)) en las dos primeras configuraciones, pero el rendimiento general se resiente tanto que el sistema puede parecer melaza. Mientras tanto, el ruido del ventilador a menudo se dispara hasta 40,8 dB(A) incluso si se ejecutan cargas poco exigentes en el modo Rendimiento. Recomendamos usar el modo Entretenimiento, ya que ofrece un mejor equilibrio entre el rendimiento del sistema y los ventiladores en constante movimiento.
El ruido de los ventiladores en el modo de juego oscila entre los 52 y los 56 dB(A), lo que no se diferencia de la mayoría de los portátiles de juego de 15,6 pulgadas de alto rendimiento. El ruido del ventilador puede alcanzar más de 60 dB(A) cuando el modo de ventilador máximo está activo.
Ruido
| Ocioso |
| 25.9 / 27.9 / 40.8 dB(A) |
| Carga |
| 55.2 / 60.3 dB(A) |
 | ||
30 dB silencioso 40 dB(A) audible 50 dB(A) ruidosamente alto |
||
min: | ||
| Eurocom Nightsky ARX315 GeForce RTX 3070 Laptop GPU, R9 5900X, Samsung SSD 980 Pro 1TB MZ-V8P1T0BW | Gigabyte A5 X1 GeForce RTX 3070 Laptop GPU, R9 5900HX, ADATA XPG SX8200 Pro (ASX8200PNP-512GT) | Medion Erazer Deputy P25 GeForce RTX 3060 Laptop GPU, R7 5800H, Phison E12S-512GB-Phison-SSD-BICS4 | MSI Delta 15 A5EFK Radeon RX 6700M, R9 5900HX, Micron 2210 MTFDHBA1T0QFD | Schenker XMG Apex 15 NH57E PS GeForce RTX 3060 Laptop GPU, R7 5800H, Samsung SSD 980 500GB (MZ-V8V500BW) | MSI GE66 Raider 10SFS GeForce RTX 2070 Super Mobile, i9-10980HK, WDC PC SN730 SDBPNTY-1T00 | |
|---|---|---|---|---|---|---|
| Noise | 1% | 2% | 5% | 15% | -8% | |
| apagado / medio ambiente * (dB) | 25.3 | 25 1% | 25 1% | 25 1% | 23 9% | 30 -19% |
| Idle Minimum * (dB) | 25.9 | 27 -4% | 27 -4% | 25 3% | 23 11% | 30 -16% |
| Idle Average * (dB) | 27.9 | 29 -4% | 29 -4% | 30 -8% | 23 18% | 35 -25% |
| Idle Maximum * (dB) | 40.8 | 32 22% | 31 24% | 40 2% | 26.4 35% | 44 -8% |
| Load Average * (dB) | 55.2 | 57 -3% | 57 -3% | 47 15% | 34.25 38% | 53 4% |
| Witcher 3 ultra * (dB) | 52.4 | 56 -7% | 56 -7% | 48 8% | 58.4 -11% | 53 -1% |
| Load Maximum * (dB) | 60.3 | 58 4% | 58 4% | 51 15% | 58.42 3% | 55 9% |
* ... más pequeño es mejor
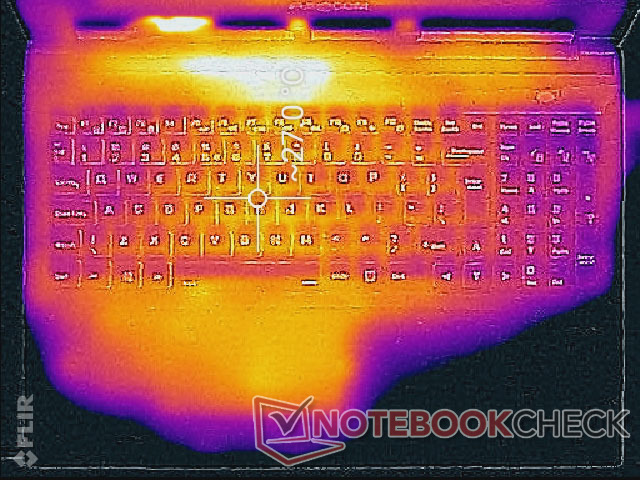
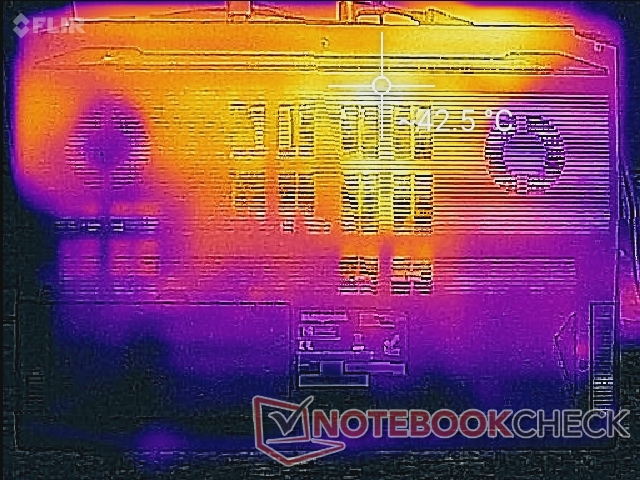
Temperatura
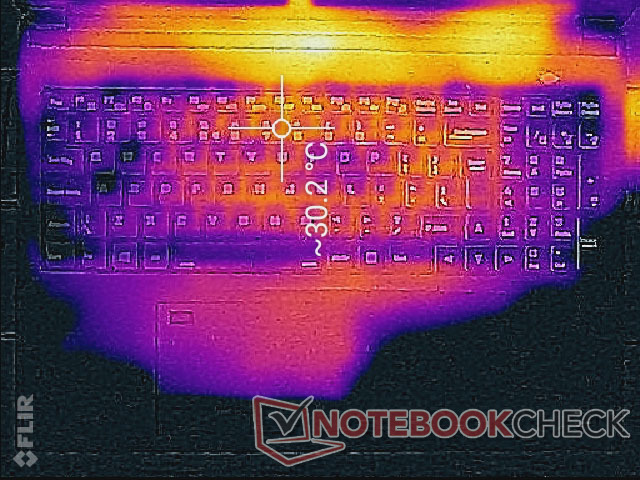
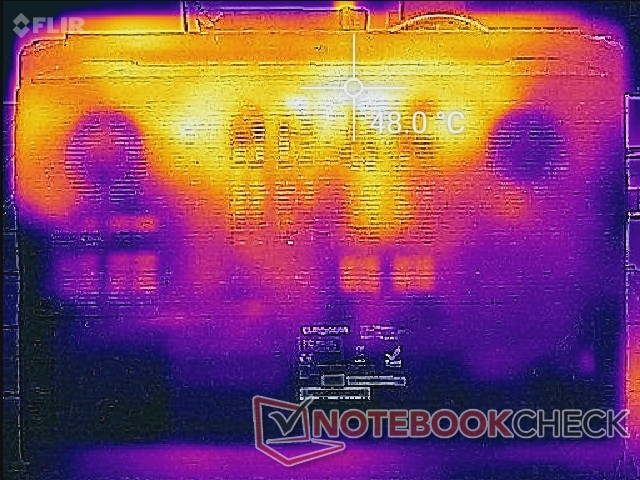
Las temperaturas de la superficie se calientan incluso cuando está en el modo de ahorro de energía o en el modo silencioso, ya que el ruido del ventilador está siendo llevado a límites mucho más silenciosos. Los puntos calientes pueden alcanzar los 27 C y 43 C en la parte superior e inferior, respectivamente. Las teclas del teclado están por tanto siempre calientes, pero afortunadamente nunca de forma incómoda cuando se ejecutan cargas altas, ya que los ruidosos ventiladores hacen un buen trabajo manteniendo las temperaturas de la superficie bajo control.
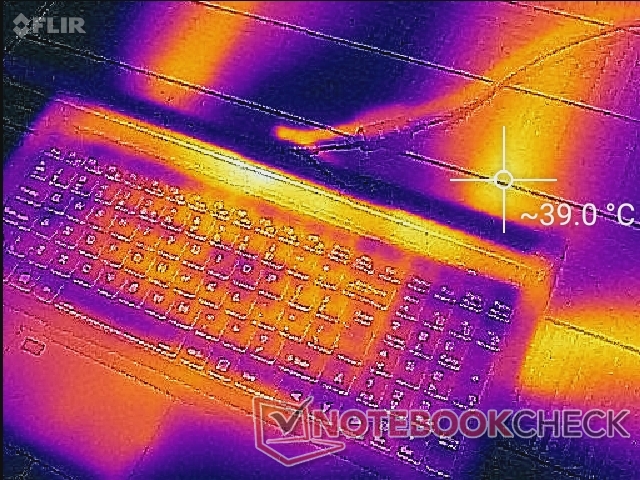
(+) La temperatura máxima en la parte superior es de 36.2 °C / 97 F, frente a la media de 40.4 °C / 105 F, que oscila entre 21.2 y 68.8 °C para la clase Gaming.
(-) El fondo se calienta hasta un máximo de 49.6 °C / 121 F, frente a la media de 43.2 °C / 110 F
(+) En reposo, la temperatura media de la parte superior es de 27 °C / 81# F, frente a la media del dispositivo de 33.9 °C / 93 F.
(+) El reposamanos y el panel táctil están a una temperatura inferior a la de la piel, con un máximo de 30 °C / 86 F y, por tanto, son fríos al tacto.
(±) La temperatura media de la zona del reposamanos de dispositivos similares fue de 28.8 °C / 83.8 F (-1.2 °C / -2.2 F).
| Eurocom Nightsky ARX315 AMD Ryzen 9 5900X, NVIDIA GeForce RTX 3070 Laptop GPU | Gigabyte A5 X1 AMD Ryzen 9 5900HX, NVIDIA GeForce RTX 3070 Laptop GPU | Medion Erazer Deputy P25 AMD Ryzen 7 5800H, NVIDIA GeForce RTX 3060 Laptop GPU | MSI Delta 15 A5EFK AMD Ryzen 9 5900HX, AMD Radeon RX 6700M | Schenker XMG Apex 15 NH57E PS AMD Ryzen 7 5800H, NVIDIA GeForce RTX 3060 Laptop GPU | MSI GE66 Raider 10SFS Intel Core i9-10980HK, NVIDIA GeForce RTX 2070 Super Mobile | |
|---|---|---|---|---|---|---|
| Heat | 4% | 17% | -3% | 13% | -3% | |
| Maximum Upper Side * (°C) | 36.2 | 47 -30% | 37 -2% | 50 -38% | 36 1% | 49 -35% |
| Maximum Bottom * (°C) | 49.6 | 51 -3% | 40 19% | 55 -11% | 38 23% | 52 -5% |
| Idle Upper Side * (°C) | 32.6 | 27 17% | 27 17% | 31 5% | 31 5% | 30 8% |
| Idle Bottom * (°C) | 43.2 | 30 31% | 29 33% | 30 31% | 33 24% | 34 21% |
* ... más pequeño es mejor
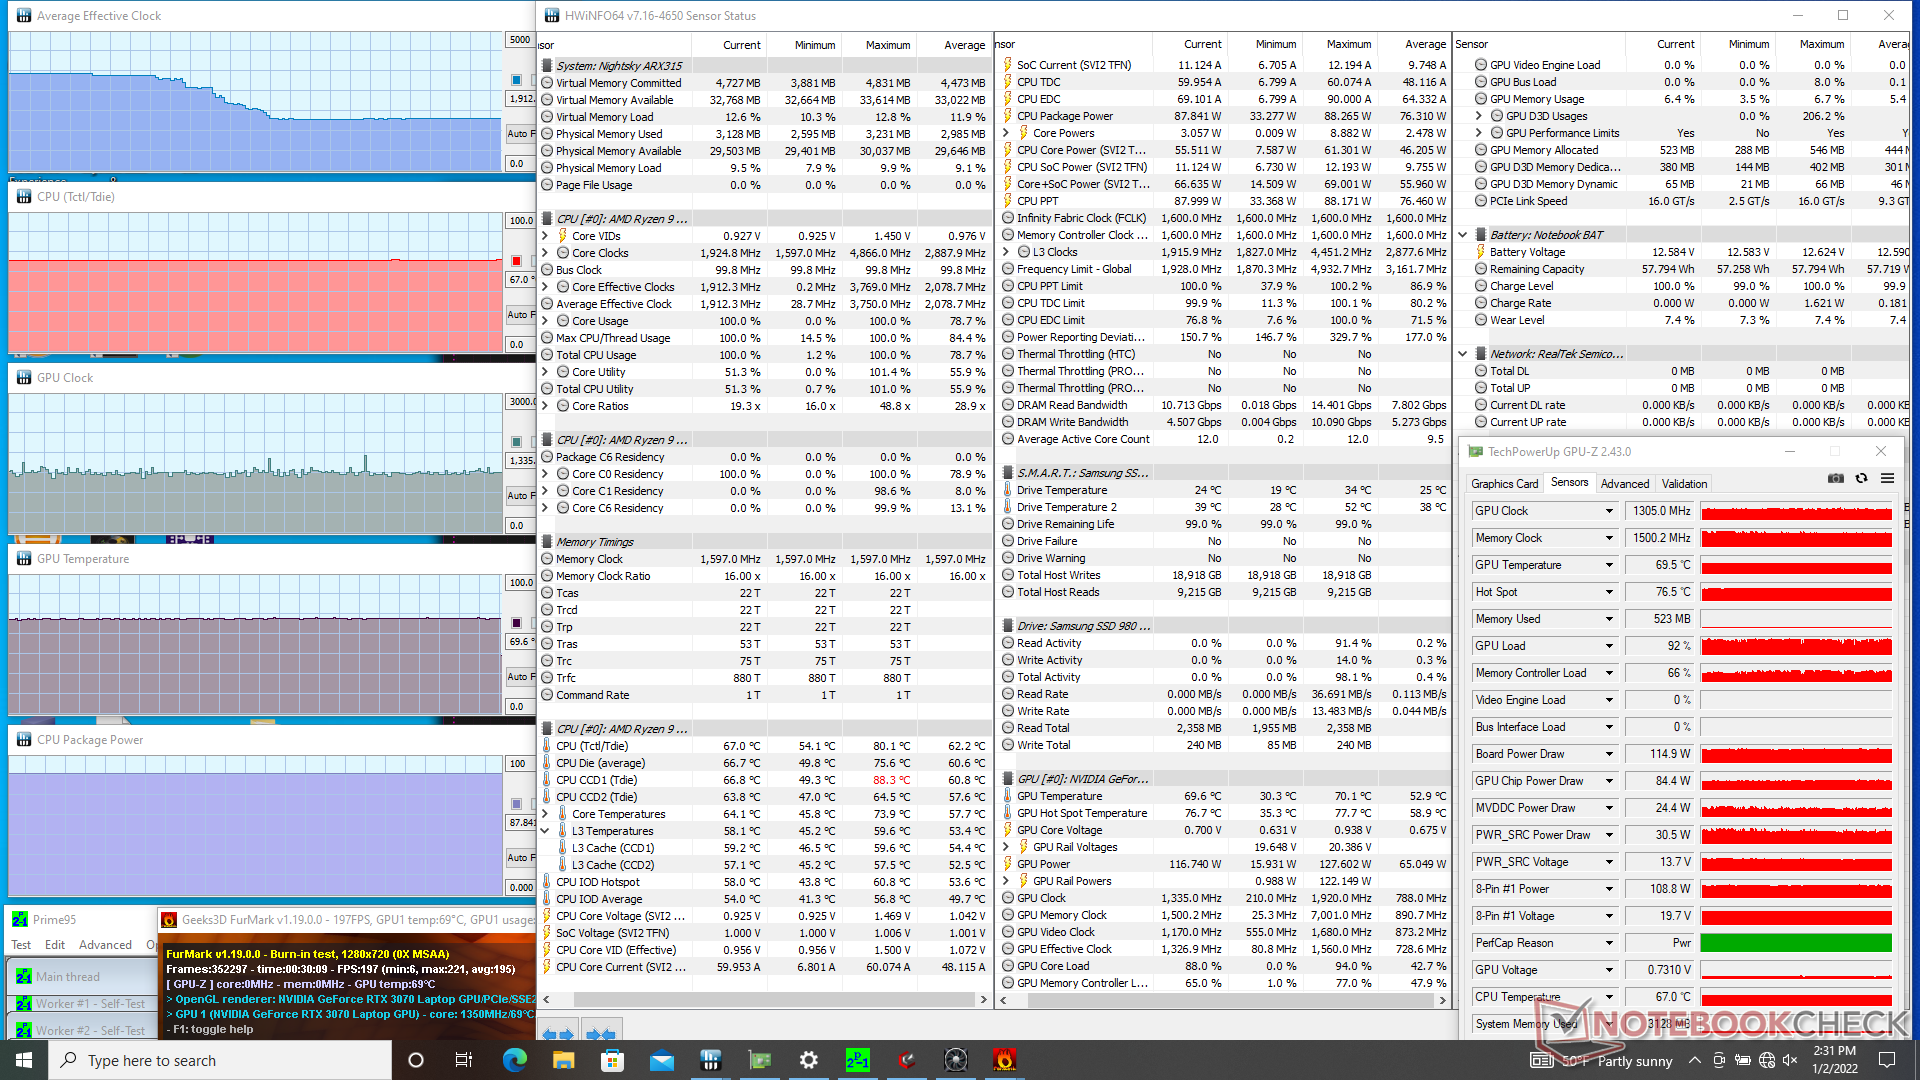
Prueba de esfuerzo
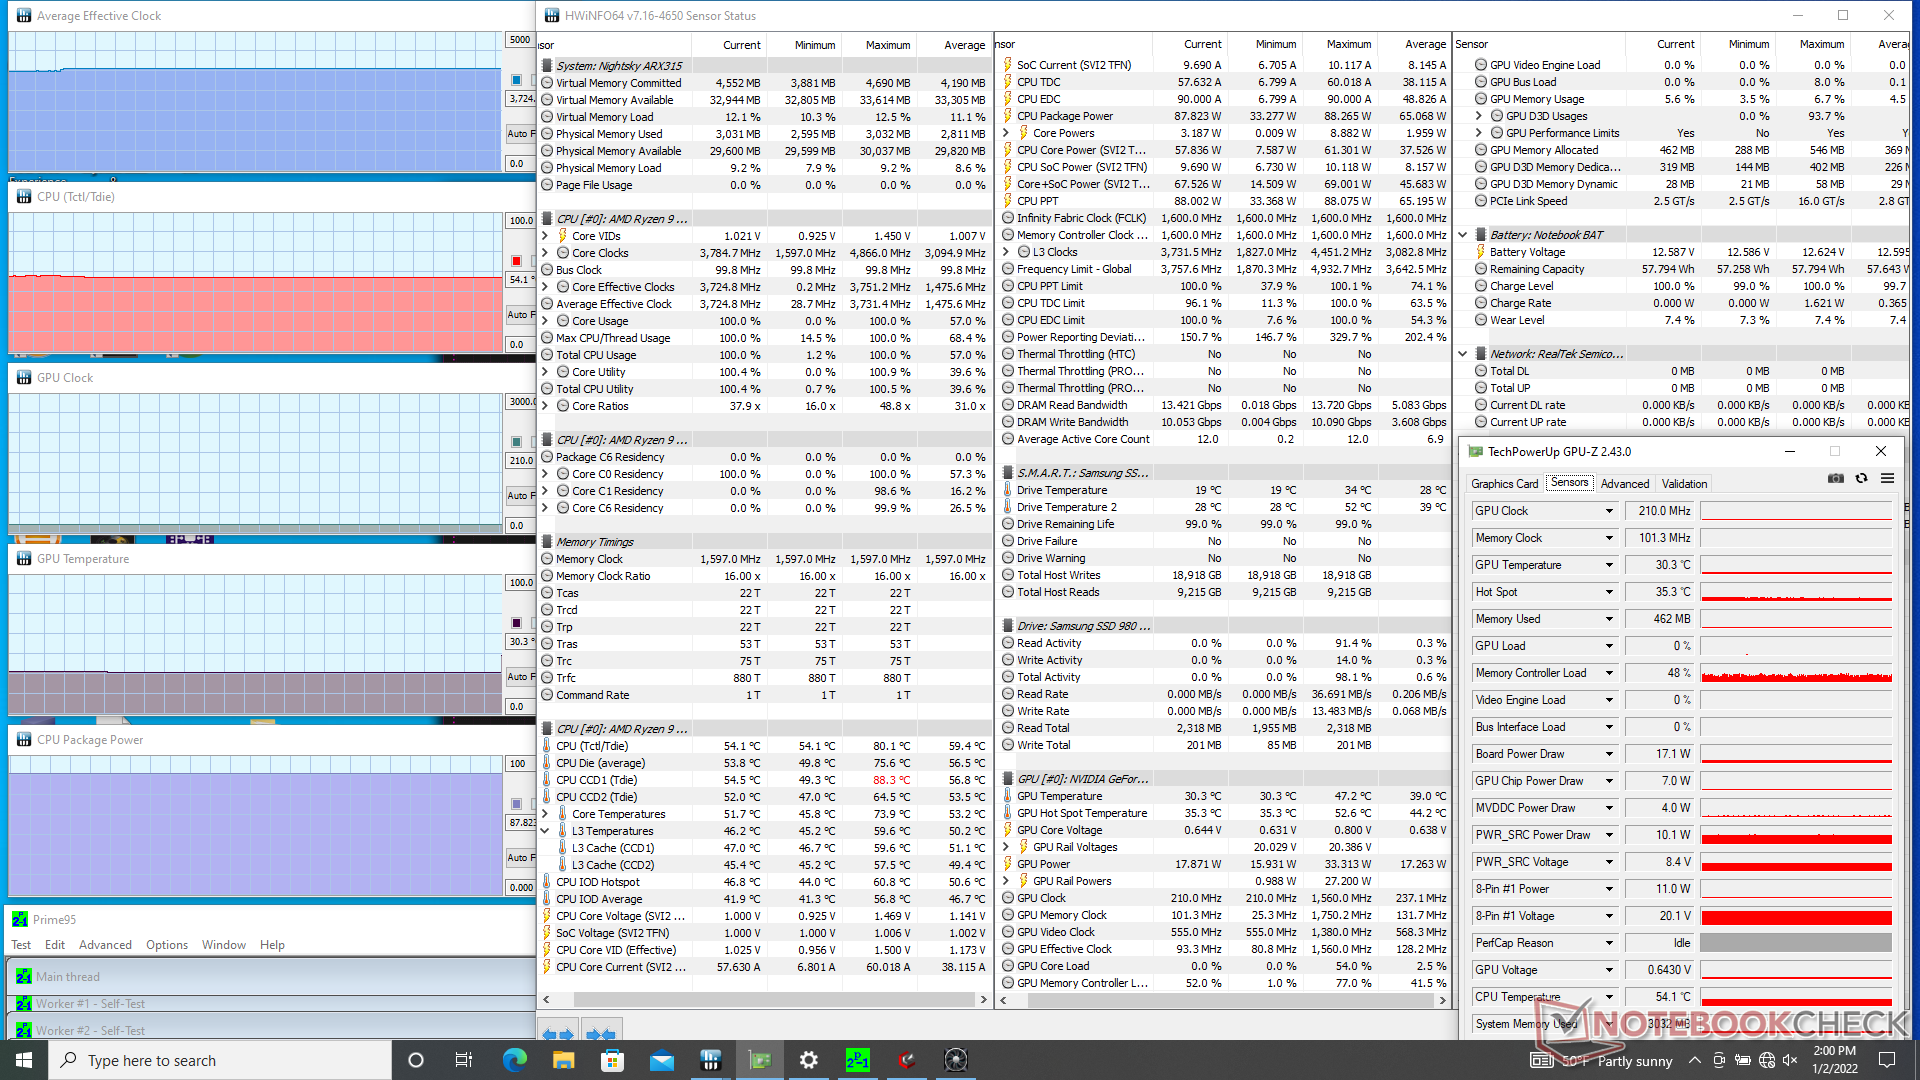
Cuando se ejecuta Prime95 con el modo de Ventilador Máximo desactivado, la CPU se estabilizaría en torno a 1,9 GHz y a una temperatura del núcleo de 67 C. Activando el modo de Ventilador Máximo se estabilizaría a 3,8 GHz y con una temperatura del núcleo más baja de 54 C. En comparación, nuestra referencia de sobremesa Ryzen 9 5900X se estabilizaría en cambio a una velocidad de reloj mucho más alta de 4,5 GHz cuando se somete a las mismas condiciones de Prime95, lo que explicaría los resultados del benchmark de CPU más lentos de lo esperado de nuestro Eurocom mencionados anteriormente. Afortunadamente, hay suficiente margen de temperatura para el overclocking del usuario final si lo desea, aunque a costa de un ruido de ventilador muy fuerte. La potencia del paquete de la CPU se estabilizaría en el rango de 82 W a 88 W con la configuración de fábrica.
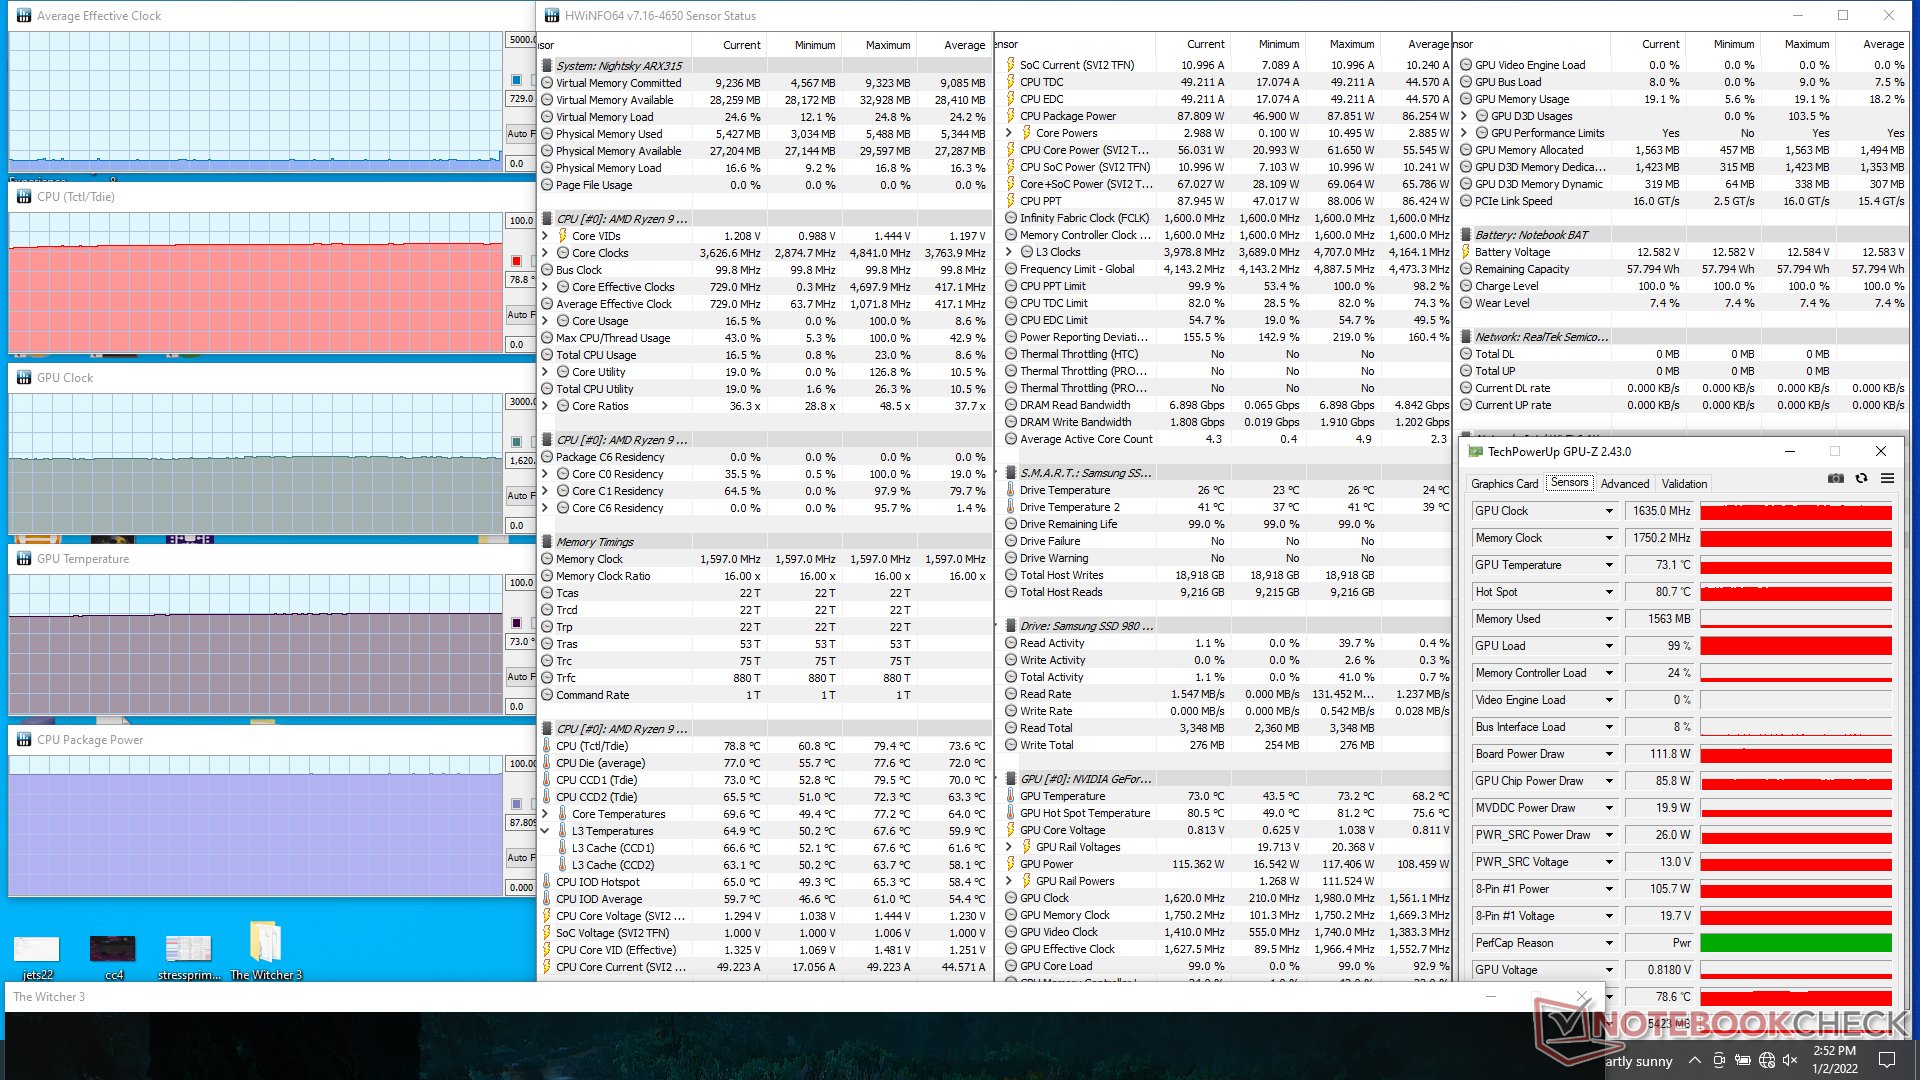
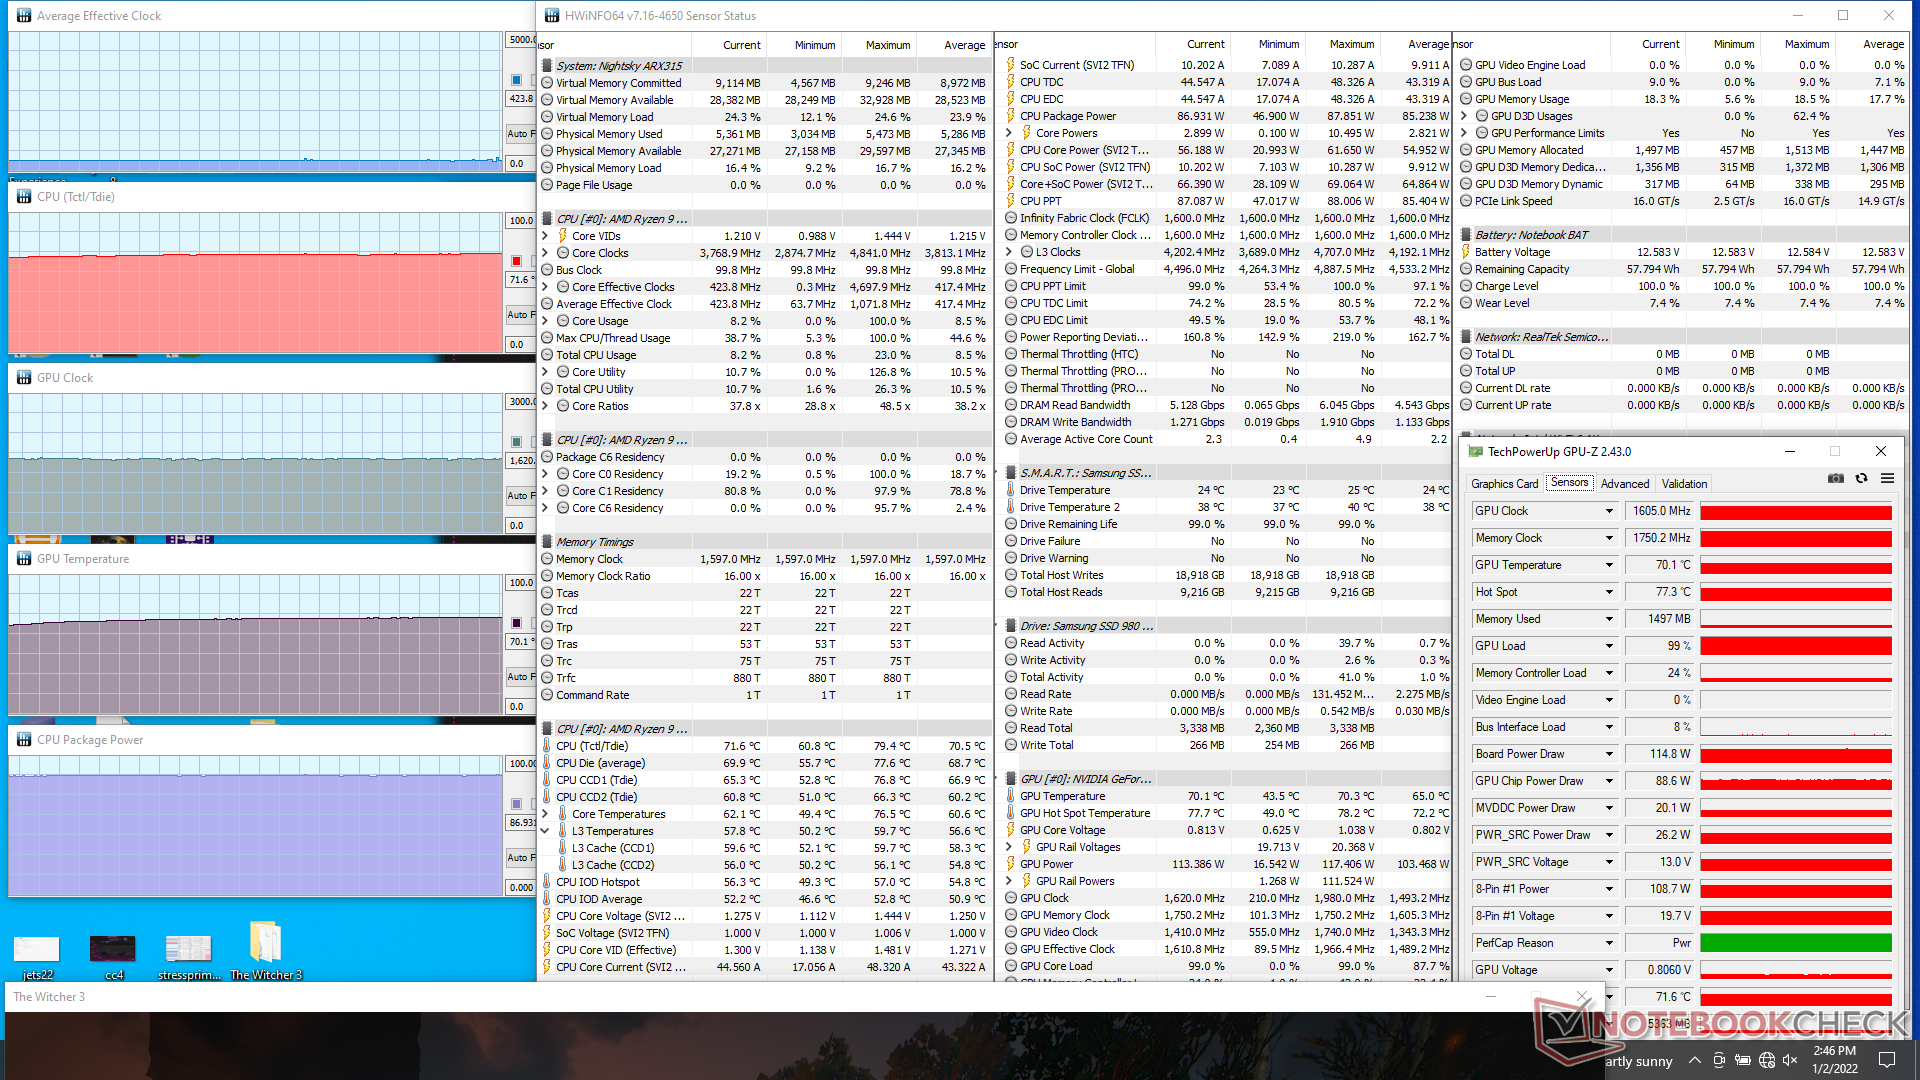
Si se ejecuta Witcher 3 en el modo de ventilador máximo resultaría en una velocidad de reloj de GPU estable y una temperatura de 1605 MHz y 70 C, respectivamente, comparado con 1365 MHz y 74 C en elAsus TUF Dash F15 equipado con la misma GPU GeForce RTX 3070.
El uso de la batería limita el rendimiento. Un test 3DMark 11 con baterías arrojaría unas puntuaciones de Física y Gráficos de 3398 y 7357 puntos, respectivamente, frente a los 19082 y 36118 puntos de la red eléctrica.
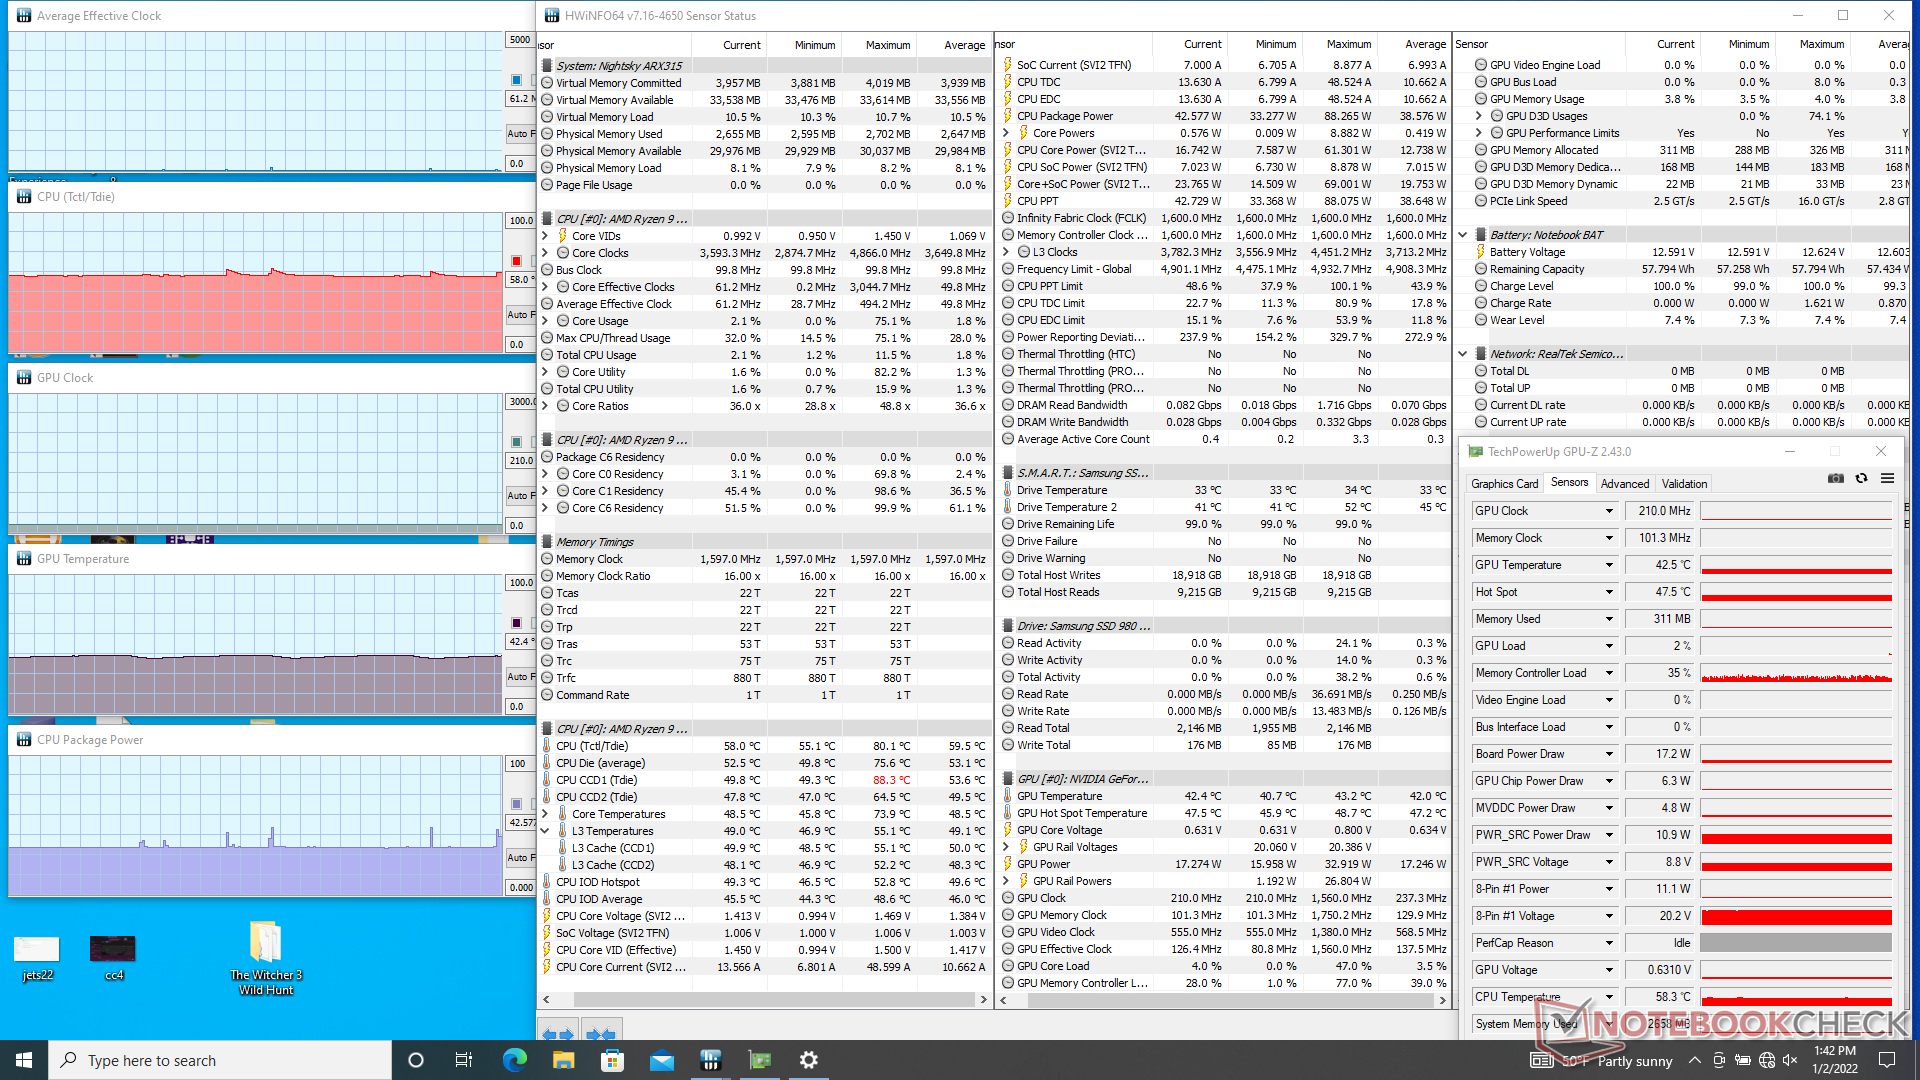
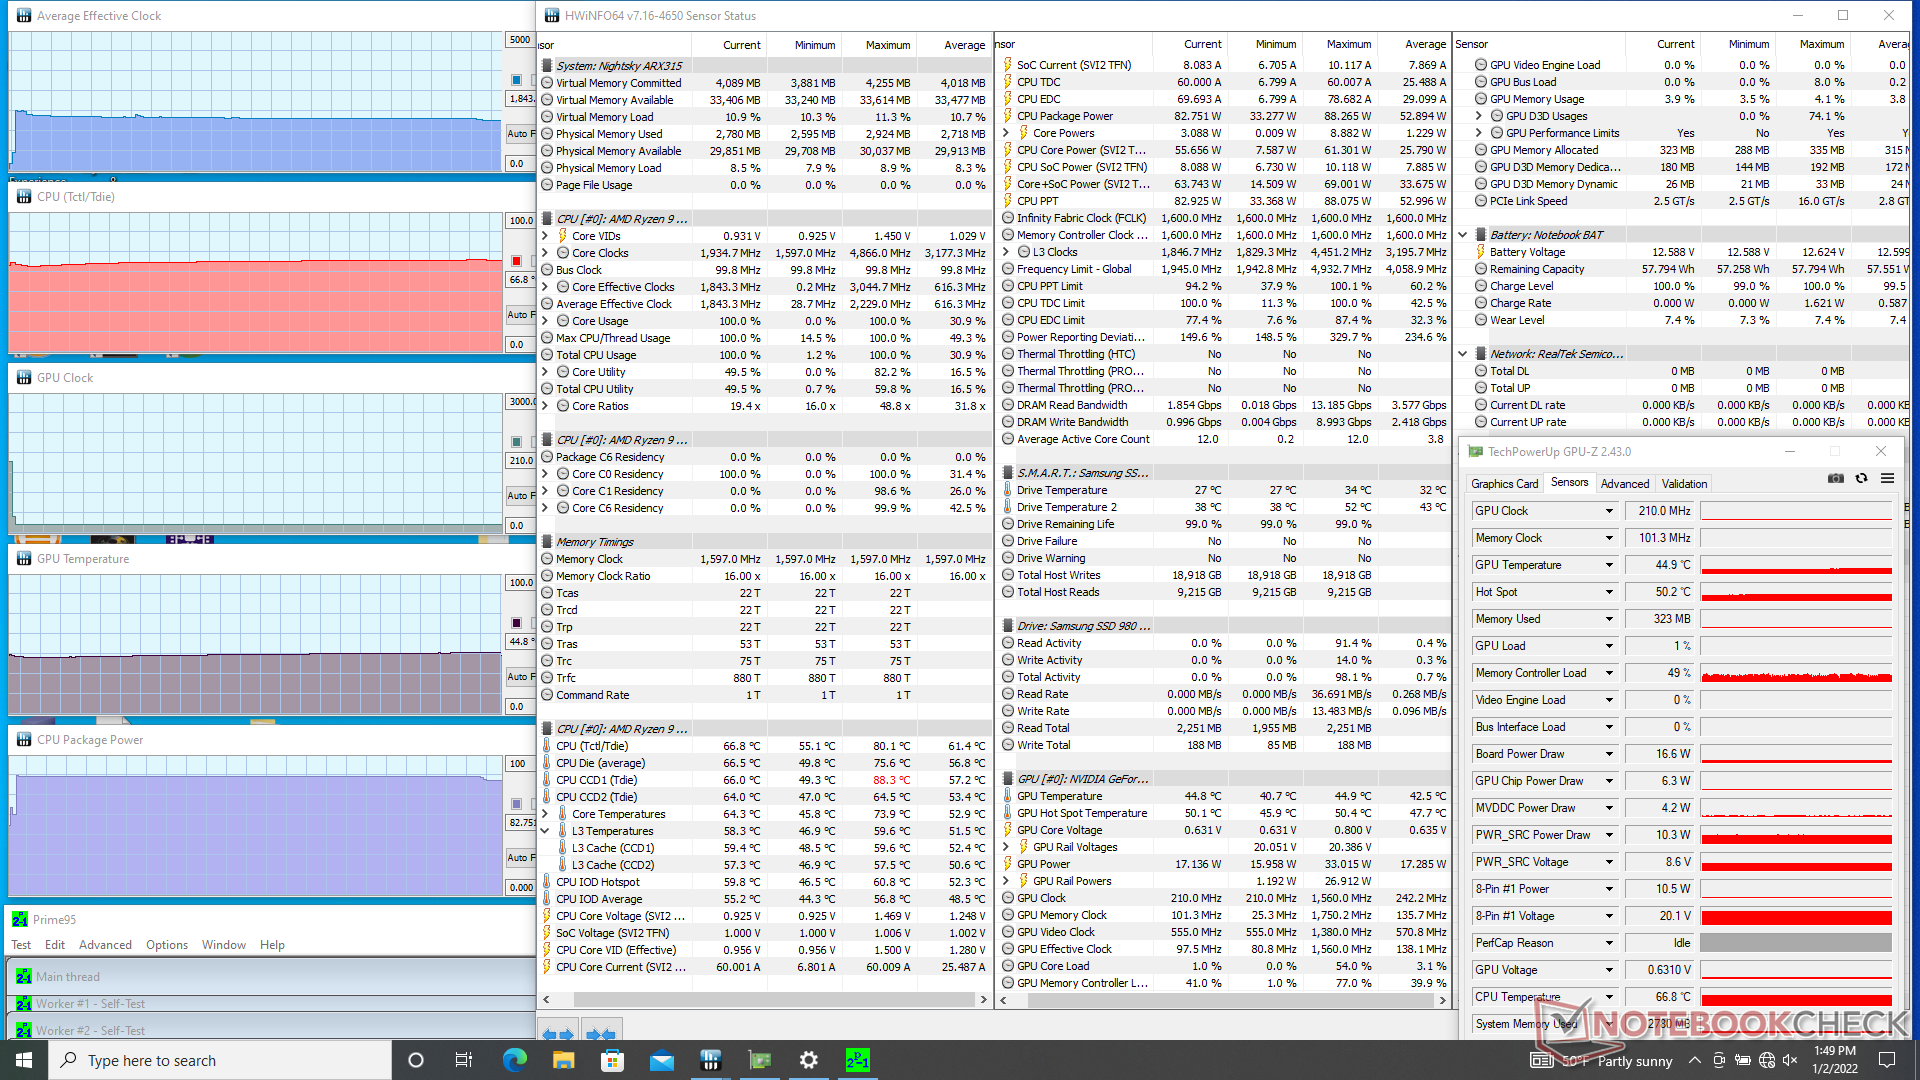
| Relojde la CPU(GHz) | Reloj dela GPU(MHz) | Temperatura media de la CPU (°C) | Temperaturamediade la GPU (°C) | |
| Sistema en reposo (modo de ventilador máximo desactivado) | -- | --58 | 42 | |
| Estrés de Prime95 (modo de ventilador máximo desactivado) | 1,8 | -- | 67 | 45 |
| Estrés de Prime95 (modo de ventilador máximo activado) | 3,8 | -- | 54 | 30 |
| Estrés de Prime95+ FurMark(modo ventilador máximo activado) | 1,9 - 3,6 | 1305 | 67 | 70 |
| Witcher 3 Tensión (modo ventilador máximo desactivado) | 0,8 | 1635 | 79 | 73 |
| Witcher 3 Tensión (modo ventilador máximo activado) | 0,4 | 1605 | 72 | 70 |
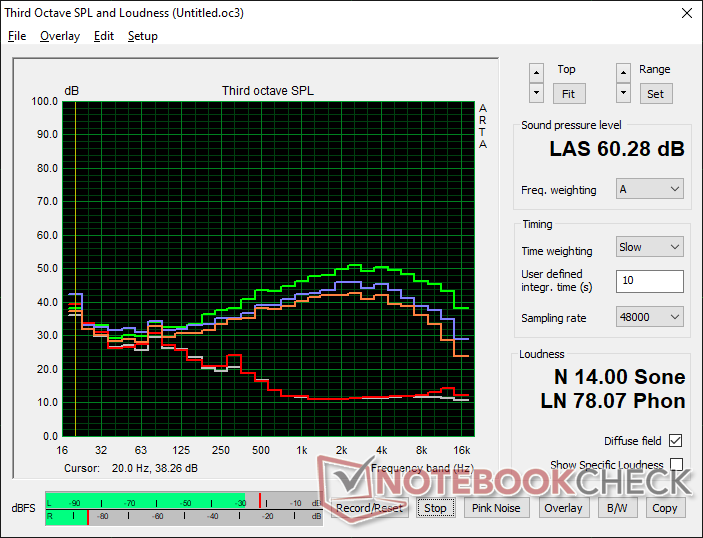
Altavoces
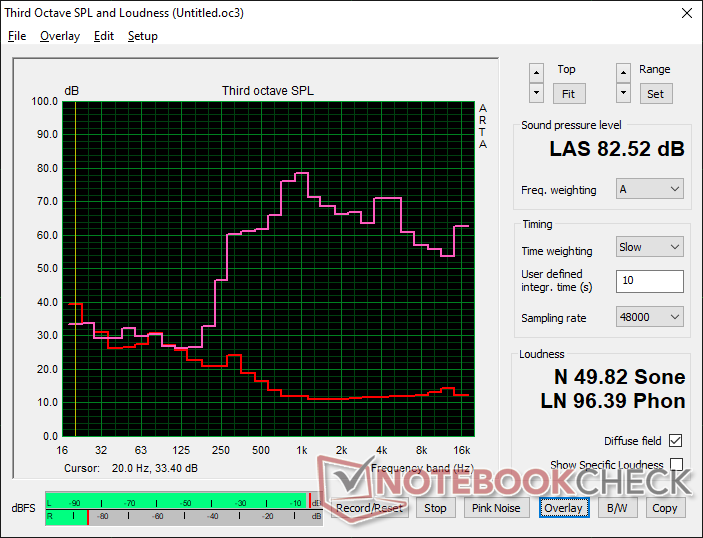
Eurocom Nightsky ARX315 análisis de audio
(+) | los altavoces pueden reproducir a un volumen relativamente alto (#82.5 dB)
Graves 100 - 315 Hz
(-) | casi sin bajos - de media 25.1% inferior a la mediana
(±) | la linealidad de los graves es media (12.8% delta a frecuencia anterior)
Medios 400 - 2000 Hz
(±) | medias más altas - de media 7.1% más altas que la mediana
(±) | la linealidad de los medios es media (7.7% delta respecto a la frecuencia anterior)
Altos 2 - 16 kHz
(±) | máximos más altos - de media 5.2% más altos que la mediana
(±) | la linealidad de los máximos es media (7.7% delta a frecuencia anterior)
Total 100 - 16.000 Hz
(±) | la linealidad del sonido global es media (23.2% de diferencia con la mediana)
En comparación con la misma clase
» 84% de todos los dispositivos probados de esta clase eran mejores, 4% similares, 11% peores
» El mejor tuvo un delta de 6%, la media fue 18%, el peor fue ###max##%
En comparación con todos los dispositivos probados
» 69% de todos los dispositivos probados eran mejores, 5% similares, 25% peores
» El mejor tuvo un delta de 4%, la media fue 24%, el peor fue ###max##%
Apple MacBook 12 (Early 2016) 1.1 GHz análisis de audio
(+) | los altavoces pueden reproducir a un volumen relativamente alto (#83.6 dB)
Graves 100 - 315 Hz
(±) | lubina reducida - en promedio 11.3% inferior a la mediana
(±) | la linealidad de los graves es media (14.2% delta a frecuencia anterior)
Medios 400 - 2000 Hz
(+) | medios equilibrados - a sólo 2.4% de la mediana
(+) | los medios son lineales (5.5% delta a la frecuencia anterior)
Altos 2 - 16 kHz
(+) | máximos equilibrados - a sólo 2% de la mediana
(+) | los máximos son lineales (4.5% delta a la frecuencia anterior)
Total 100 - 16.000 Hz
(+) | el sonido global es lineal (10.2% de diferencia con la mediana)
En comparación con la misma clase
» 7% de todos los dispositivos probados de esta clase eran mejores, 2% similares, 91% peores
» El mejor tuvo un delta de 5%, la media fue 18%, el peor fue ###max##%
En comparación con todos los dispositivos probados
» 5% de todos los dispositivos probados eran mejores, 1% similares, 94% peores
» El mejor tuvo un delta de 4%, la media fue 24%, el peor fue ###max##%
Gestión de la energía
Consumo de energía
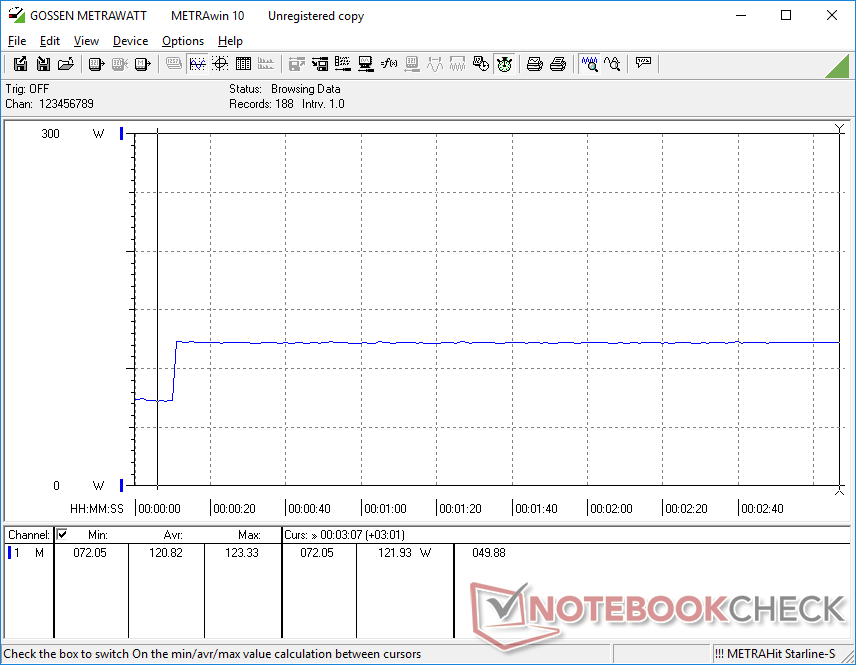
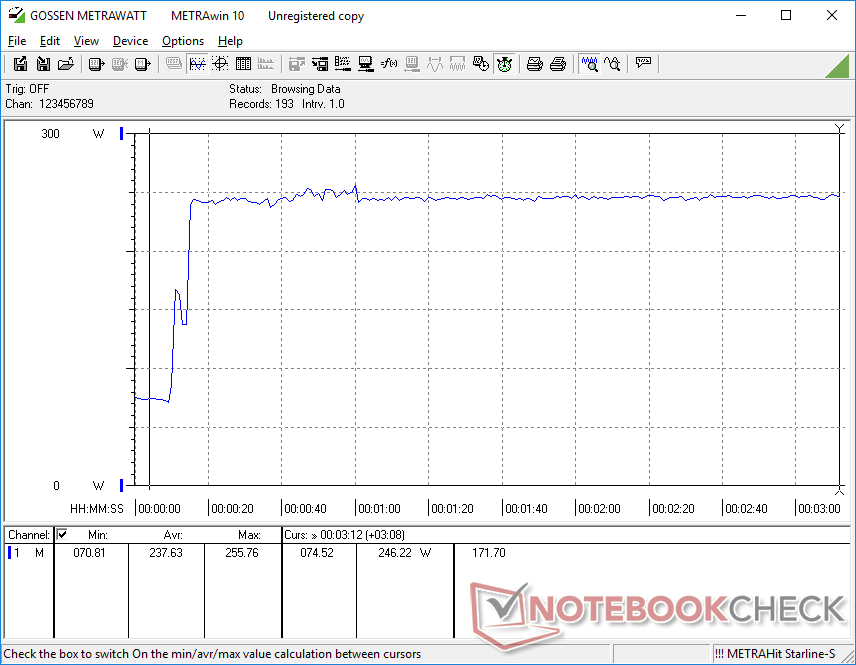
El consumo de energía es muy alto sin importar la actividad, lo que puede explicar la escasa duración de la batería en la siguiente sección. El simple hecho de estar en reposo en el escritorio consume entre 55 W y 73 W en comparación con los 12 W y 35 W del antiguo Nightsky RX15 con tecnología Intel. El amplio delta no se reduce cuando se ejecutan cargas más altas como los juegos. El Gigabyte A5 X1, que usa la misma GPU RTX 3070 pero la CPU móvil Ryzen 9 5900HX en su lugar, demandaría alrededor de 25 a 30 W menos que nuestro Eurocom cuando está bajo cargas más pesadas
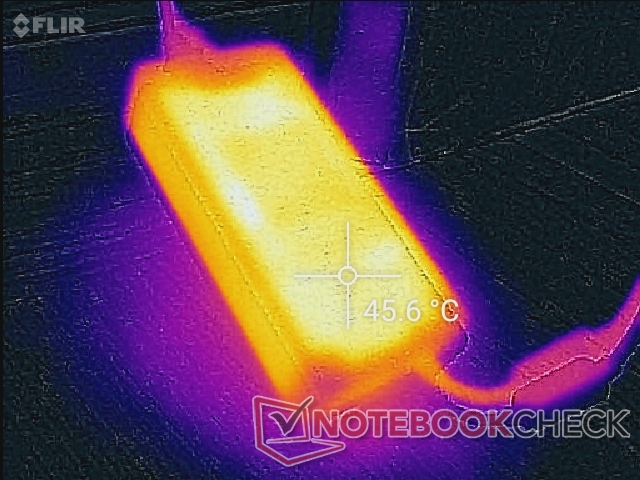
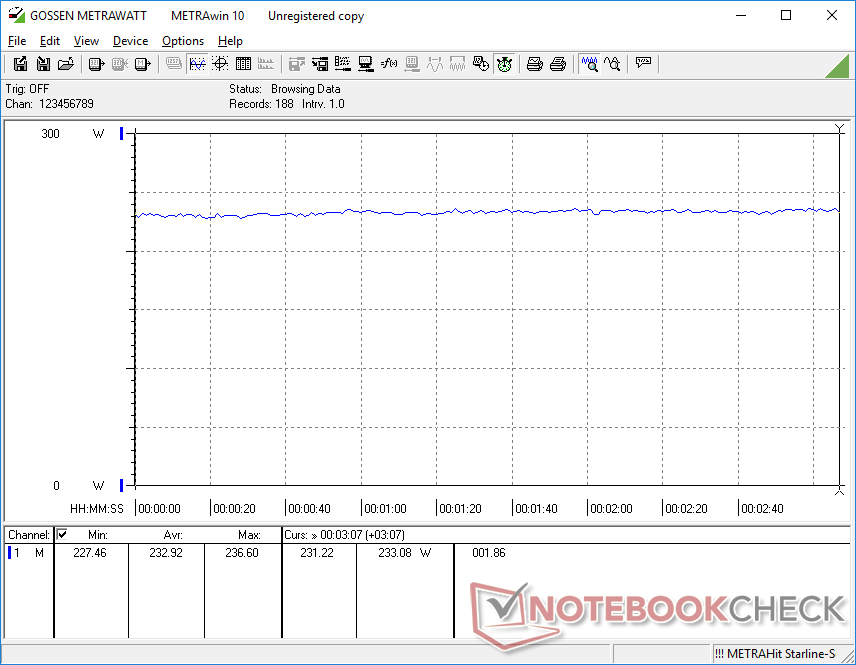
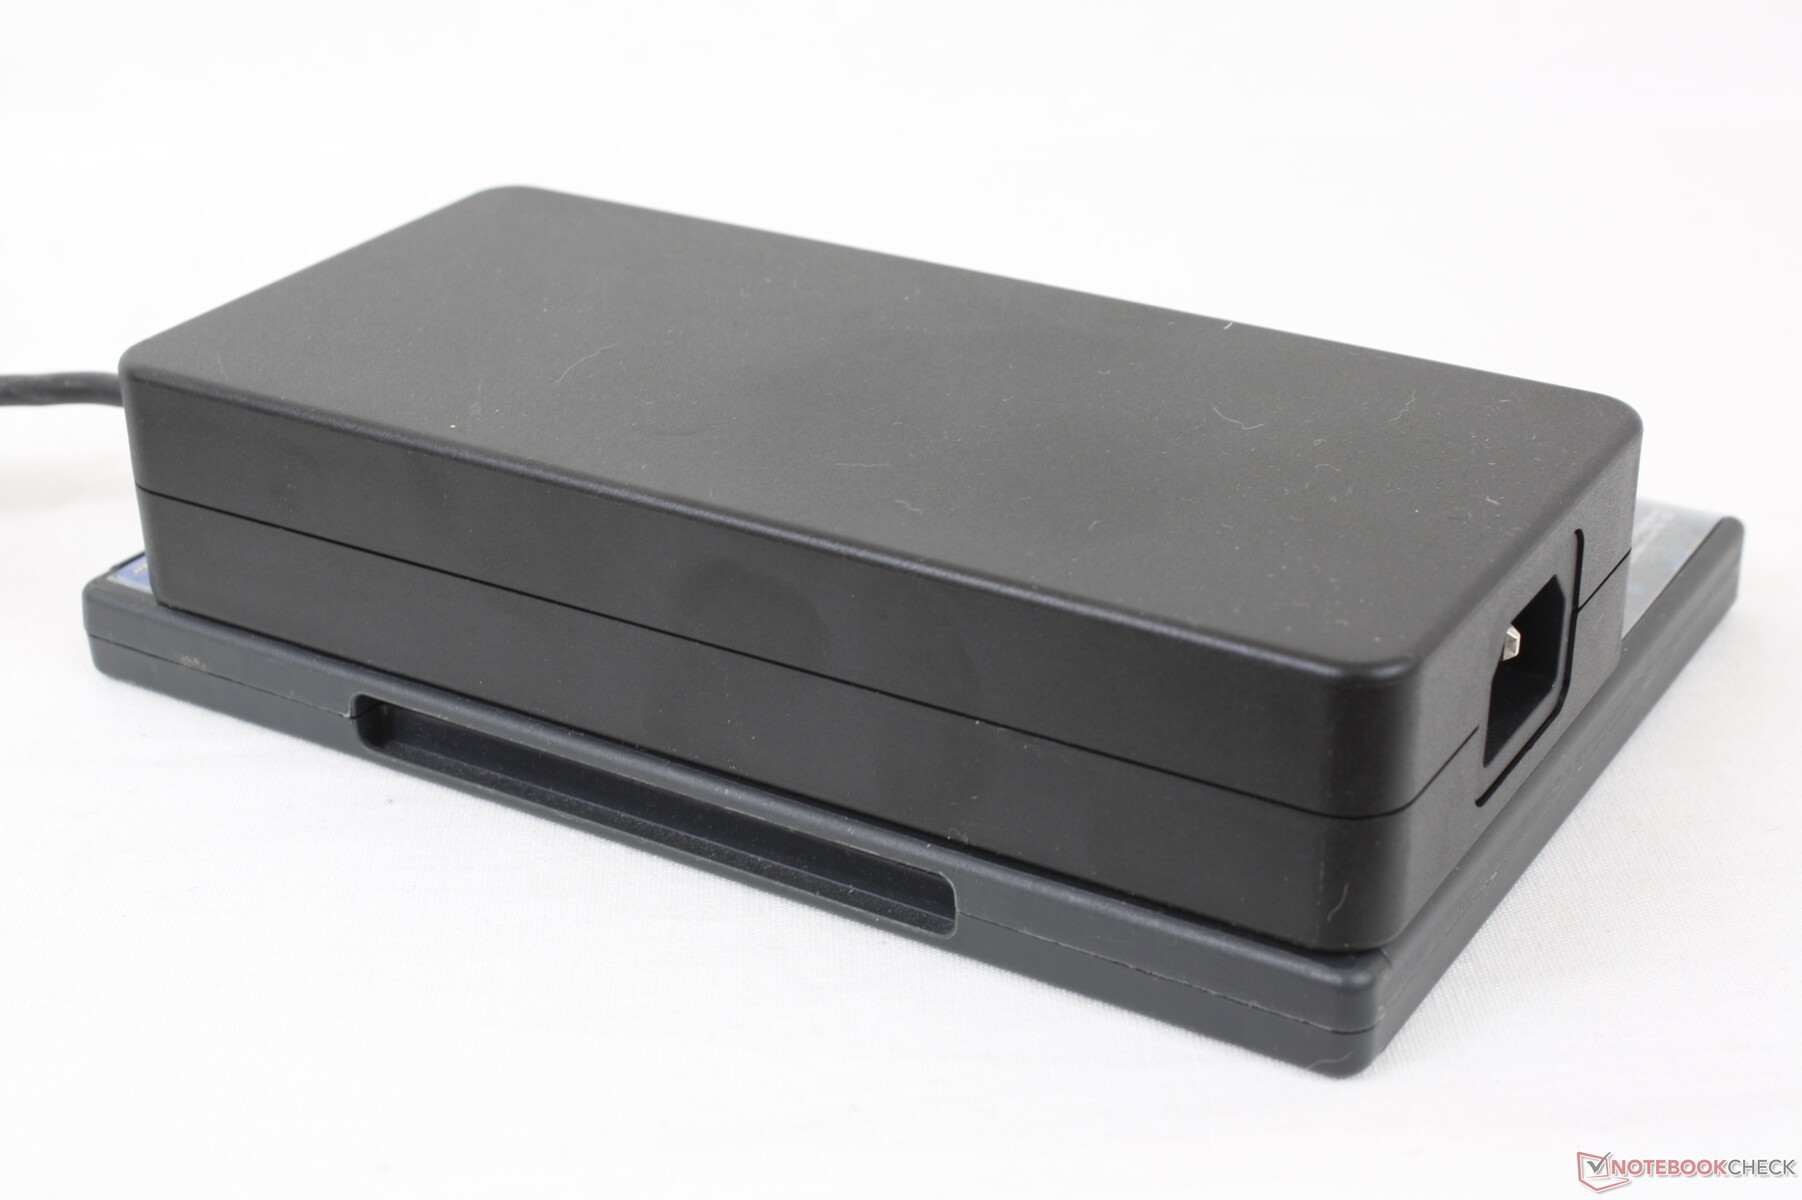
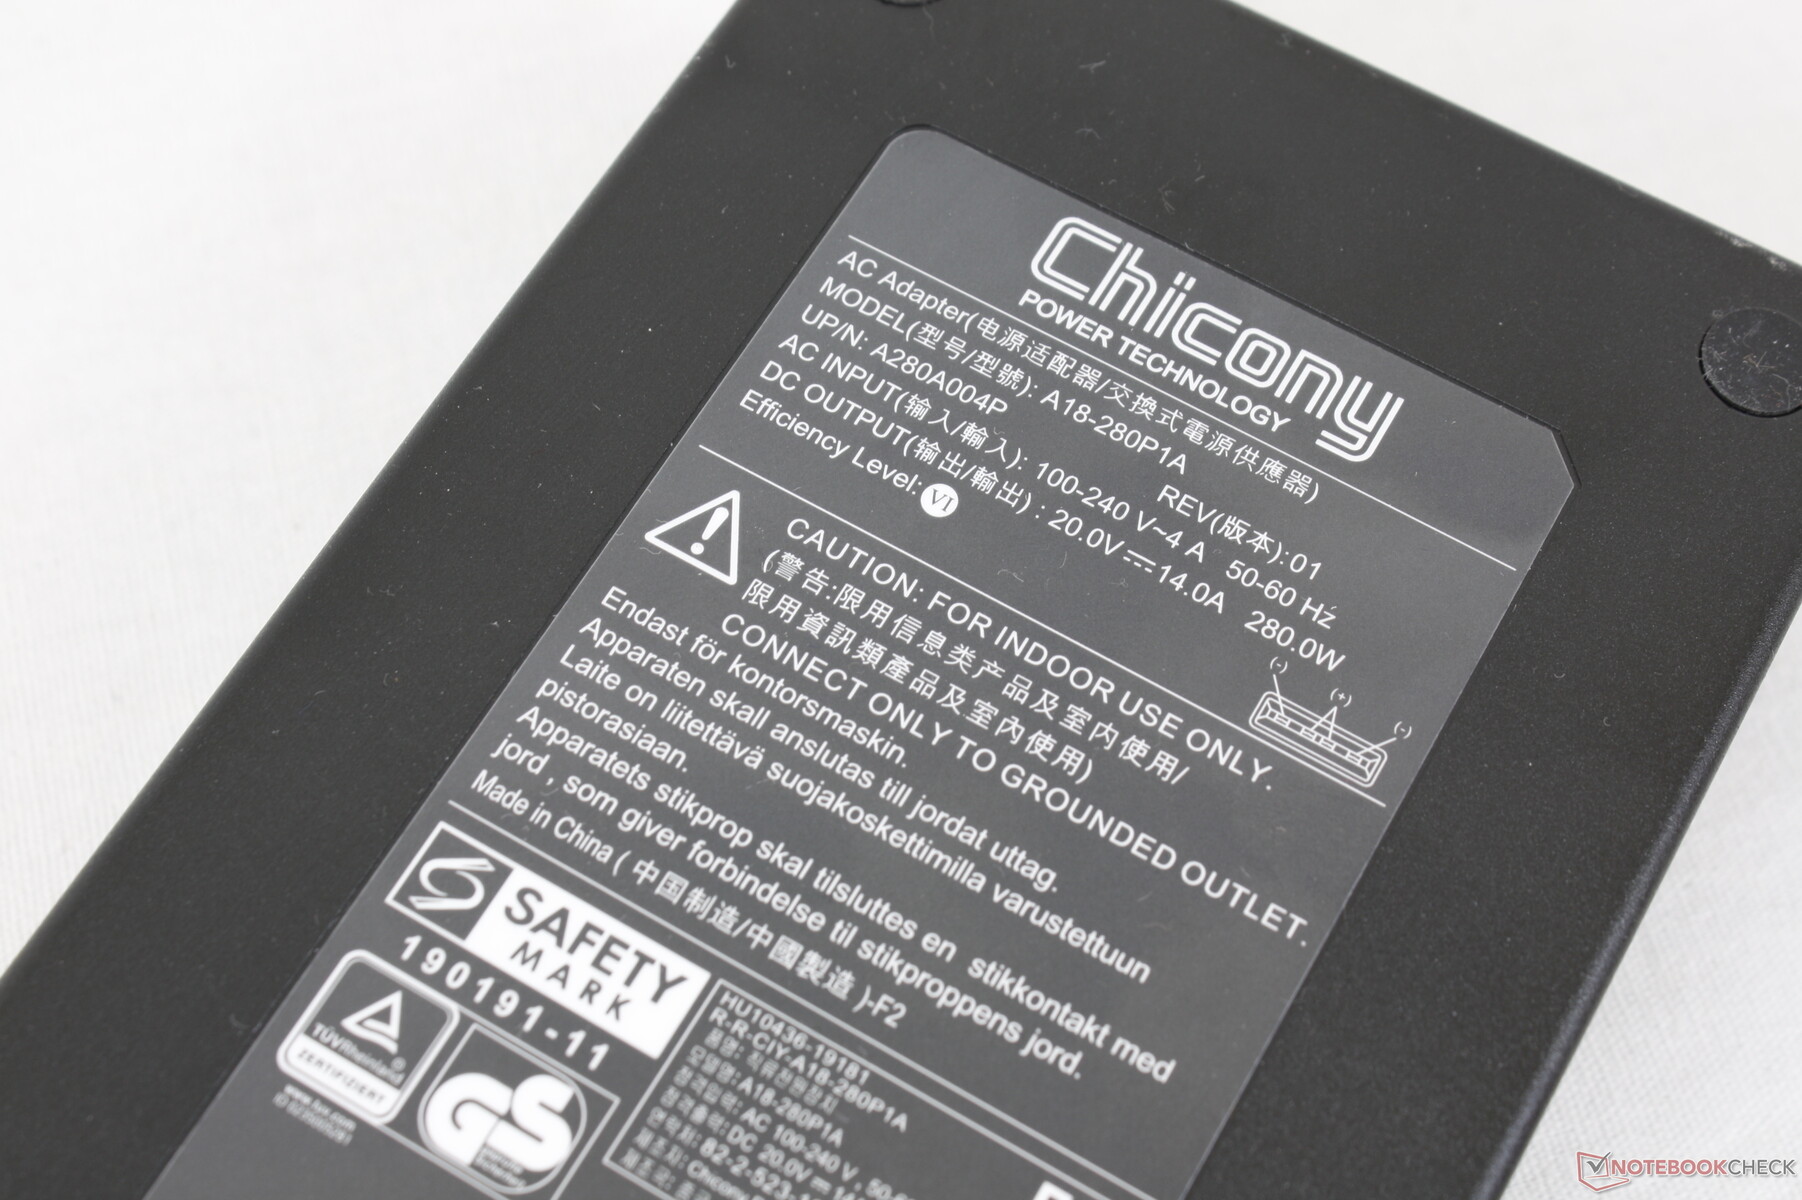
Registramos un consumo máximo de 256 W con el gran adaptador de CA (~18 x 8.5 x 3.5 cm) de 280 W al ejecutar Prime95 y FurMark simultáneamente.
| Off / Standby | |
| Ocioso | |
| Carga |
|
Clave:
min: | |
| Eurocom Nightsky ARX315 R9 5900X, GeForce RTX 3070 Laptop GPU, Samsung SSD 980 Pro 1TB MZ-V8P1T0BW, IPS, 1920x1080, 15.6" | Gigabyte A5 X1 R9 5900HX, GeForce RTX 3070 Laptop GPU, ADATA XPG SX8200 Pro (ASX8200PNP-512GT), IPS, 1920x1080, 15.6" | Medion Erazer Deputy P25 R7 5800H, GeForce RTX 3060 Laptop GPU, Phison E12S-512GB-Phison-SSD-BICS4, IPS, 1920x1080, 15.6" | MSI Delta 15 A5EFK R9 5900HX, Radeon RX 6700M, Micron 2210 MTFDHBA1T0QFD, IPS-Level, 1920x1080, 15.6" | Schenker XMG Apex 15 NH57E PS R7 5800H, GeForce RTX 3060 Laptop GPU, Samsung SSD 980 500GB (MZ-V8V500BW), IPS, 1920x1080, 15.6" | MSI GE66 Raider 10SFS i9-10980HK, GeForce RTX 2070 Super Mobile, WDC PC SN730 SDBPNTY-1T00, IPS-Level, 1920x1080, 15.6" | |
|---|---|---|---|---|---|---|
| Power Consumption | 44% | 52% | 48% | 52% | 45% | |
| Idle Minimum * (Watt) | 55 | 10 82% | 8 85% | 10 82% | 10.5 81% | 6 89% |
| Idle Average * (Watt) | 68.2 | 12 82% | 11 84% | 18 74% | 15 78% | 14 79% |
| Idle Maximum * (Watt) | 72.5 | 16 78% | 16 78% | 25 66% | 17 77% | 25 66% |
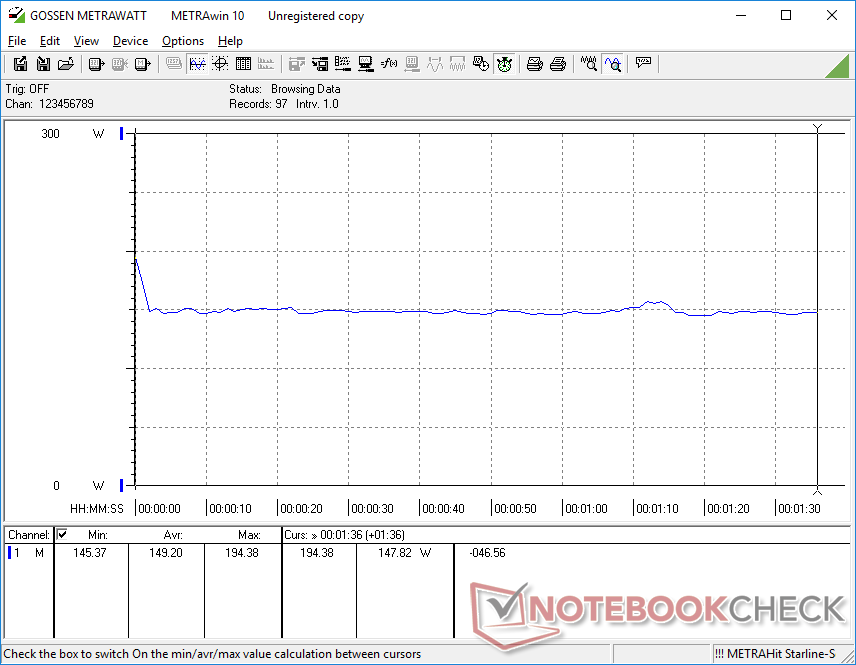
| Load Average * (Watt) | 149.2 | 124 17% | 109 27% | 101 32% | 109 27% | 108 28% |
| Witcher 3 ultra * (Watt) | 233 | 204 12% | 183 21% | 187 20% | 186 20% | 195 16% |
| Load Maximum * (Watt) | 255.8 | 272 -6% | 211 18% | 217 15% | 186 27% | 280 -9% |
* ... más pequeño es mejor
Power Consumption Witcher 3 / Stresstest
Power Consumption external Monitor
Duración de la batería
Los tiempos de funcionamiento en la configuración de perfil equilibrado (o silencioso) son tan pobres que se tarda mucho más en cargar la batería de vacío a lleno que lo que se tarda en descargar la batería cuando simplemente se navega por la web (120 minutos frente a 61 minutos). La batería es fácilmente extraíble, al contrario que en la mayoría de los otros portátiles, pero la capacidad es bastante pequeña, 62 Wh, cuando se compara con otros grandes portátiles de 15,6 pulgadas como el MSI GE66.
| Eurocom Nightsky ARX315 R9 5900X, GeForce RTX 3070 Laptop GPU, 62 Wh | Gigabyte A5 X1 R9 5900HX, GeForce RTX 3070 Laptop GPU, 48.96 Wh | Medion Erazer Deputy P25 R7 5800H, GeForce RTX 3060 Laptop GPU, 49 Wh | MSI Delta 15 A5EFK R9 5900HX, Radeon RX 6700M, 82 Wh | Schenker XMG Apex 15 NH57E PS R7 5800H, GeForce RTX 3060 Laptop GPU, 49 Wh | MSI GE66 Raider 10SFS i9-10980HK, GeForce RTX 2070 Super Mobile, 99.99 Wh | |
|---|---|---|---|---|---|---|
| Duración de Batería | 540% | 570% | 690% | 550% | 510% | |
| WiFi v1.3 (h) | 1 | 6.4 540% | 6.7 570% | 7.9 690% | 6.5 550% | 6.1 510% |
| Reader / Idle (h) | 10.1 | 10.5 | 11.1 | 7.6 | ||
| H.264 (h) | 7.3 | 4.6 | ||||
| Load (h) | 1.3 | 1.1 | 1.6 | 1.4 | 1.8 |
Pro
Contra
Veredicto
Hay un par de problemas que necesitan ser abordados: los tiempos de activación muy lentos y el rendimiento horriblemente lento cuando se establece en el modo de ahorro de energía o el modo silencioso. Estas dos características son significativamente más lentas aquí en el Nightsky ARX15 cuando se compara con un Ultrabook estándar que es una fracción del costo.
No se recomienda ejecutar este sistema en la configuración de stock para aquellos que deseen explotar el Ryzen 9 5900X a su máximo potencial. El rendimiento de la CPU será inferior al de un ordenador de sobremesa adecuado con el mismo Ryzen 9 5900X, lo que significa que los usuarios deben overclockear nuestro Ryzen 9 5900X móvil para ponerlo a la altura. Nuestras pruebas demuestran que hay algo de margen disponible, pero el ruido del ventilador resultante será muy fuerte y potencialmente molesto. No obstante, Eurocom sigue siendo una de las pocas empresas que ofrecen portátiles con CPUs de sobremesa, ya que muchos grandes fabricantes como MSI y Alienware se han centrado menos en este tipo de portátiles de "súper rendimiento".
Precio y disponibilidad
Los usuarios pueden configurar el Nightsky ARX15 directamente desde el fabricante aquí.
Eurocom Nightsky ARX315
- 01/06/2022 v7 (old)
Allen Ngo
Price comparison

