Análisis del portátil Eurocom RX315: La alternativa al MSI GS66 Stealth
")
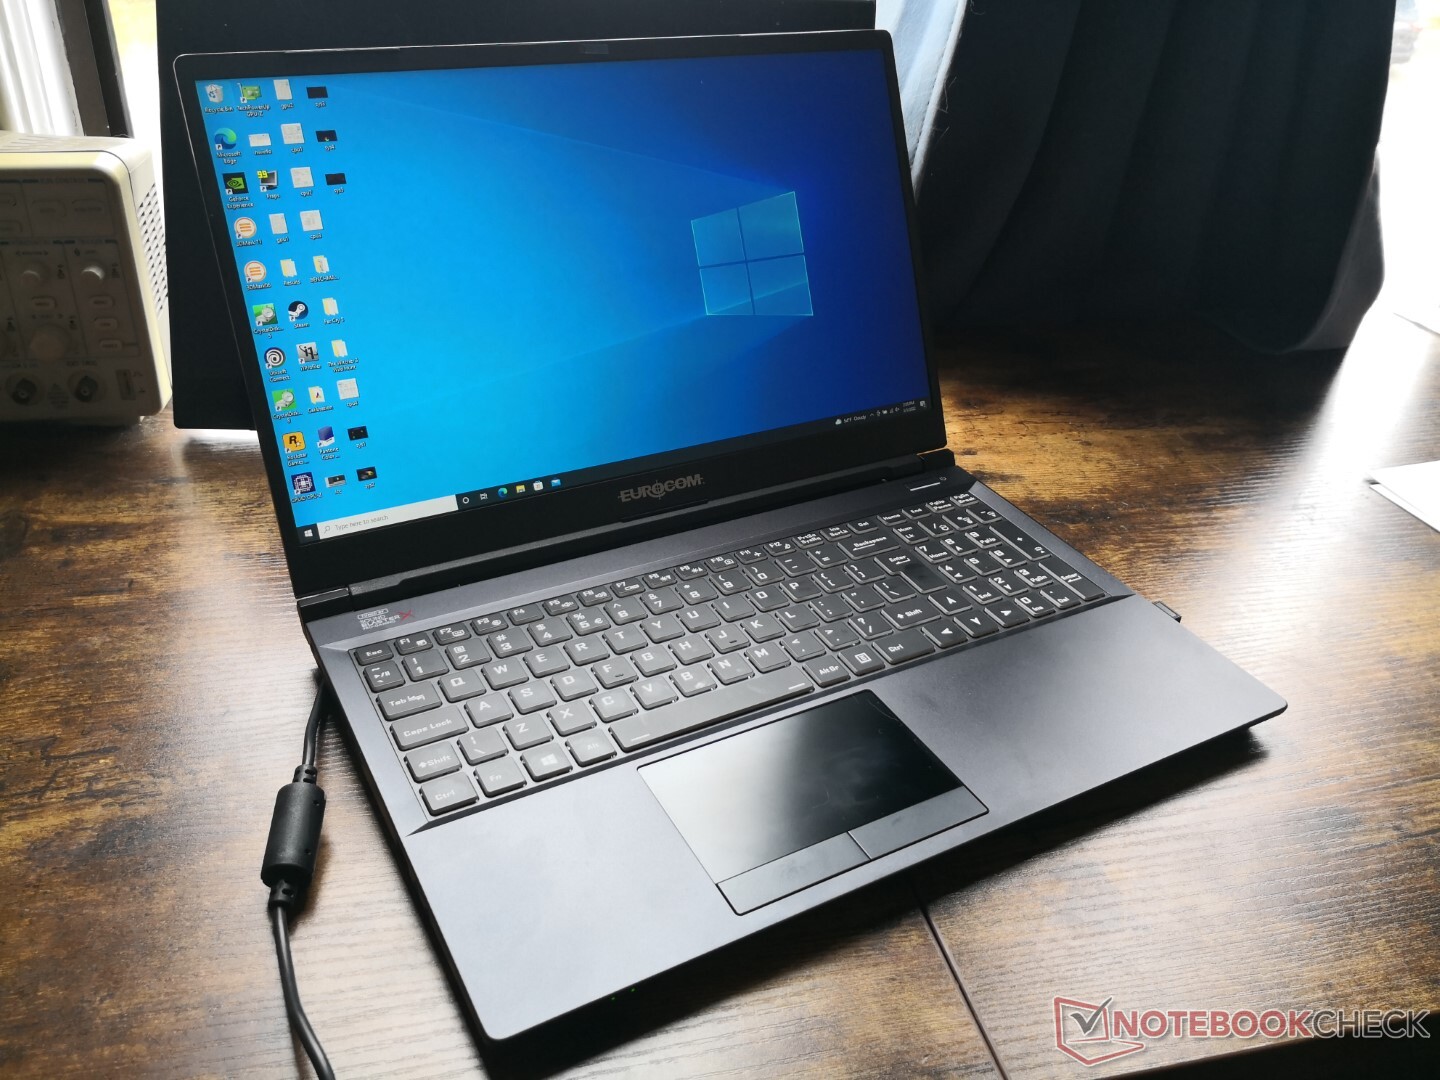
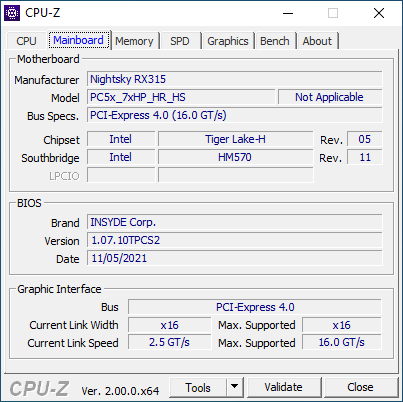
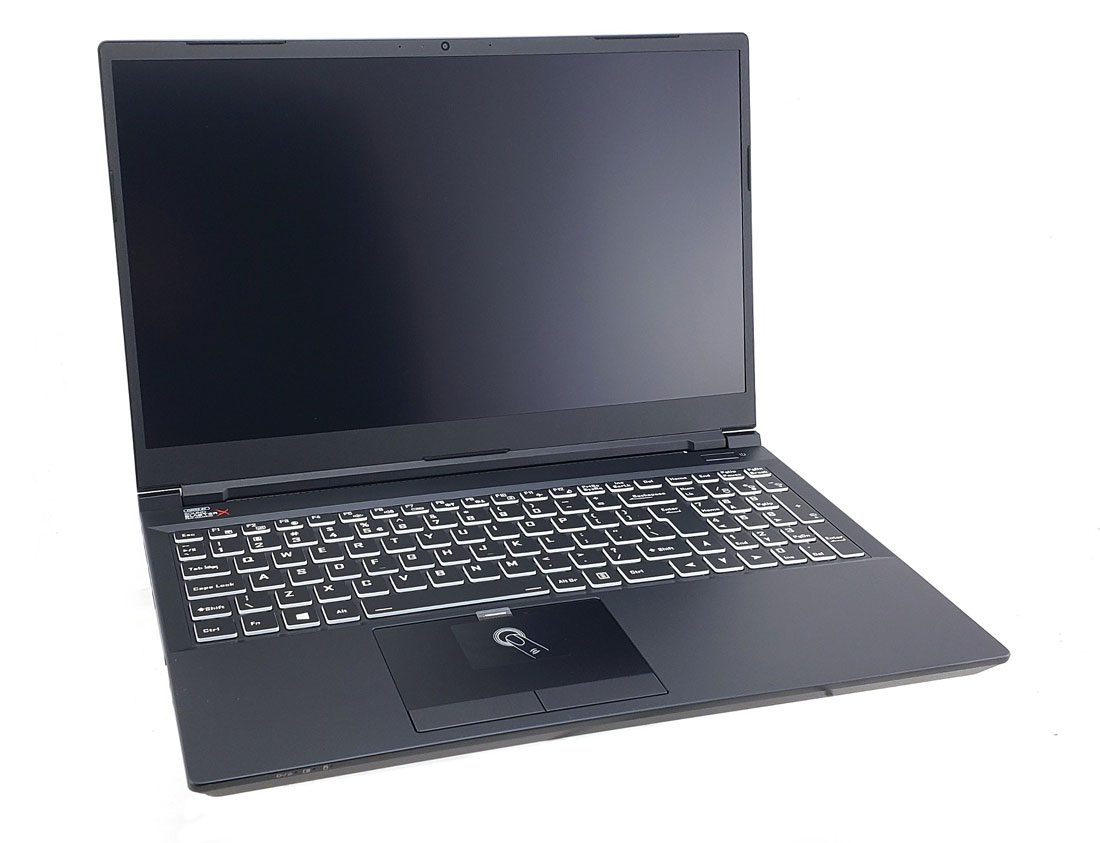
El Eurocom RX315 NH57AF1 es una configuración diferente del Schenker XMG Pro 15 que revisamos a principios de este año. Por lo tanto, recomendamos revisar nuestra revisión existente de Schenker para aprender más sobre el chasis y las características físicas, ya que ambos modelos son visualmente idénticos. En cambio, esta página se centrará en el rendimiento que los usuarios pueden esperar del RX315.
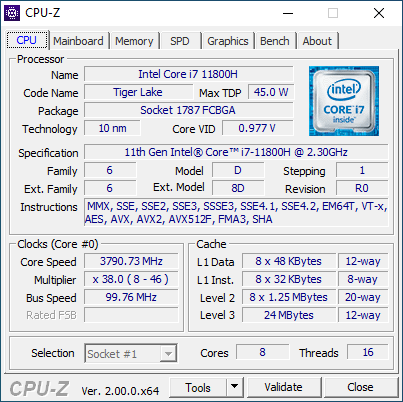
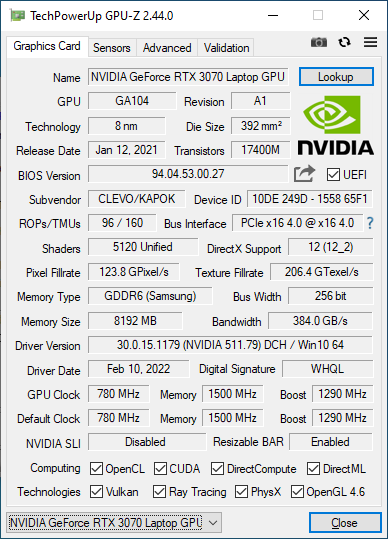
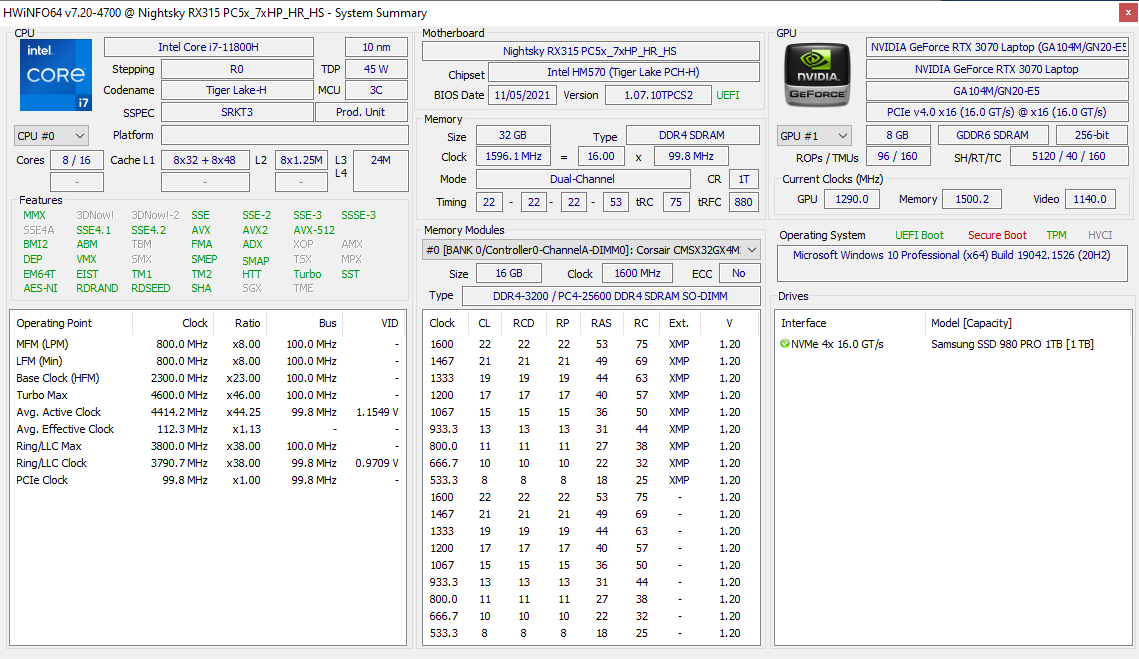
Nuestra unidad analizada viene con la CPU Core i7-11800H de 11ª generación, GPU TGP GeForce RTX 3070 de 105 W y pantalla IPS de 240 Hz. Las opciones de configuración adicionales se pueden encontrar en aquí. Eurocom dice que las CPU Intel de 12ª generación y la RTX 3080 Ti llegarán en un futuro próximo.
Entre las alternativas al RX315 se encuentran otros portátiles para juegos ultrafinos de 15,6 pulgadas como el MSI GS66, La serie Asus Zephyrus S15, Razer Blade 15o el Alienware X15. El Eurocom RX315 no debe confundirse con el más grueso ARX15 o ARX315.
Más reseñas de Eurocom:
Posibles contendientes en la comparación
Valoración | Fecha | Modelo | Peso | Altura | Tamaño | Resolución | Precio |
|---|---|---|---|---|---|---|---|
| 85.2 % v7 (old) | 03/2022 | Eurocom RX315 NH57AF1 i7-11800H, GeForce RTX 3070 Laptop GPU | 2 kg | 20 mm | 15.60" | 1920x1080 | |
| 84.5 % v7 (old) | 02/2022 | MSI Stealth GS66 12UGS i7-12700H, GeForce RTX 3070 Ti Laptop GPU | 2.2 kg | 19.8 mm | 15.60" | 2560x1440 | |
| 83 % v7 (old) | 01/2022 | Eurocom Nightsky ARX315 R9 5900X, GeForce RTX 3070 Laptop GPU | 2.6 kg | 32.5 mm | 15.60" | 1920x1080 | |
| 86.1 % v7 (old) | 11/2021 | Alienware m15 R6, i7-11800H RTX 3080 i7-11800H, GeForce RTX 3080 Laptop GPU | 2.5 kg | 22.85 mm | 15.60" | 1920x1080 | |
| 82.7 % v7 (old) | 10/2021 | Dell G15 5515 R7 5800H, GeForce RTX 3050 Ti Laptop GPU | 2.4 kg | 24.9 mm | 15.60" | 1920x1080 | |
| 88.9 % v7 (old) | 07/2021 | Razer Blade 15 Advanced (Mid 2021) i7-11800H, GeForce RTX 3080 Laptop GPU | 2 kg | 16.99 mm | 15.60" | 1920x1080 |
Caso
Comunicación
Cámara web


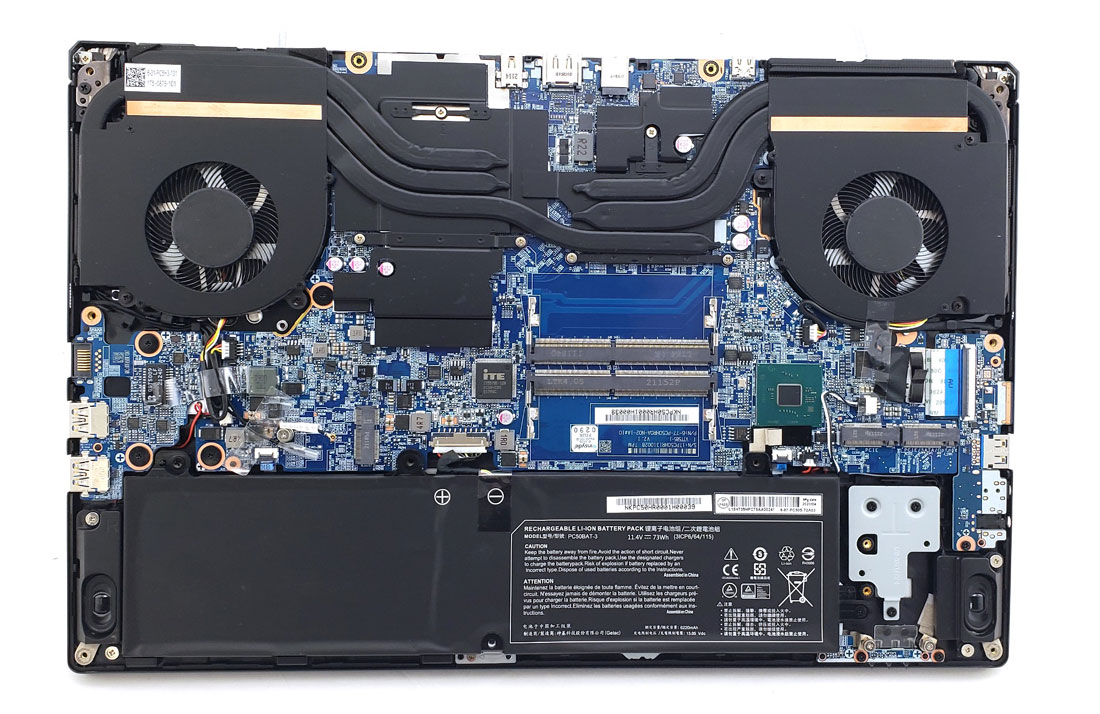
Mantenimiento
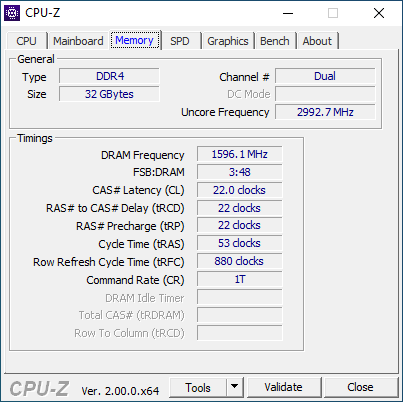
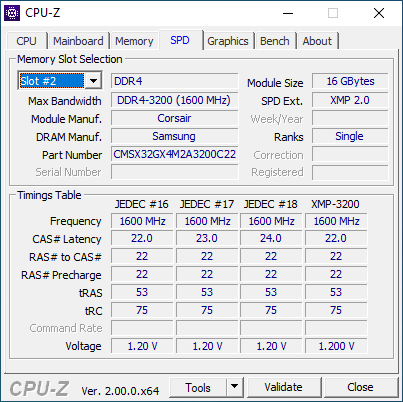
Los usuarios pueden instalar hasta dos módulos de RAM DDR4 SODIMM, dos SSD PCIe4 x4 M.2 2280 NVMe y un módulo WLAN.
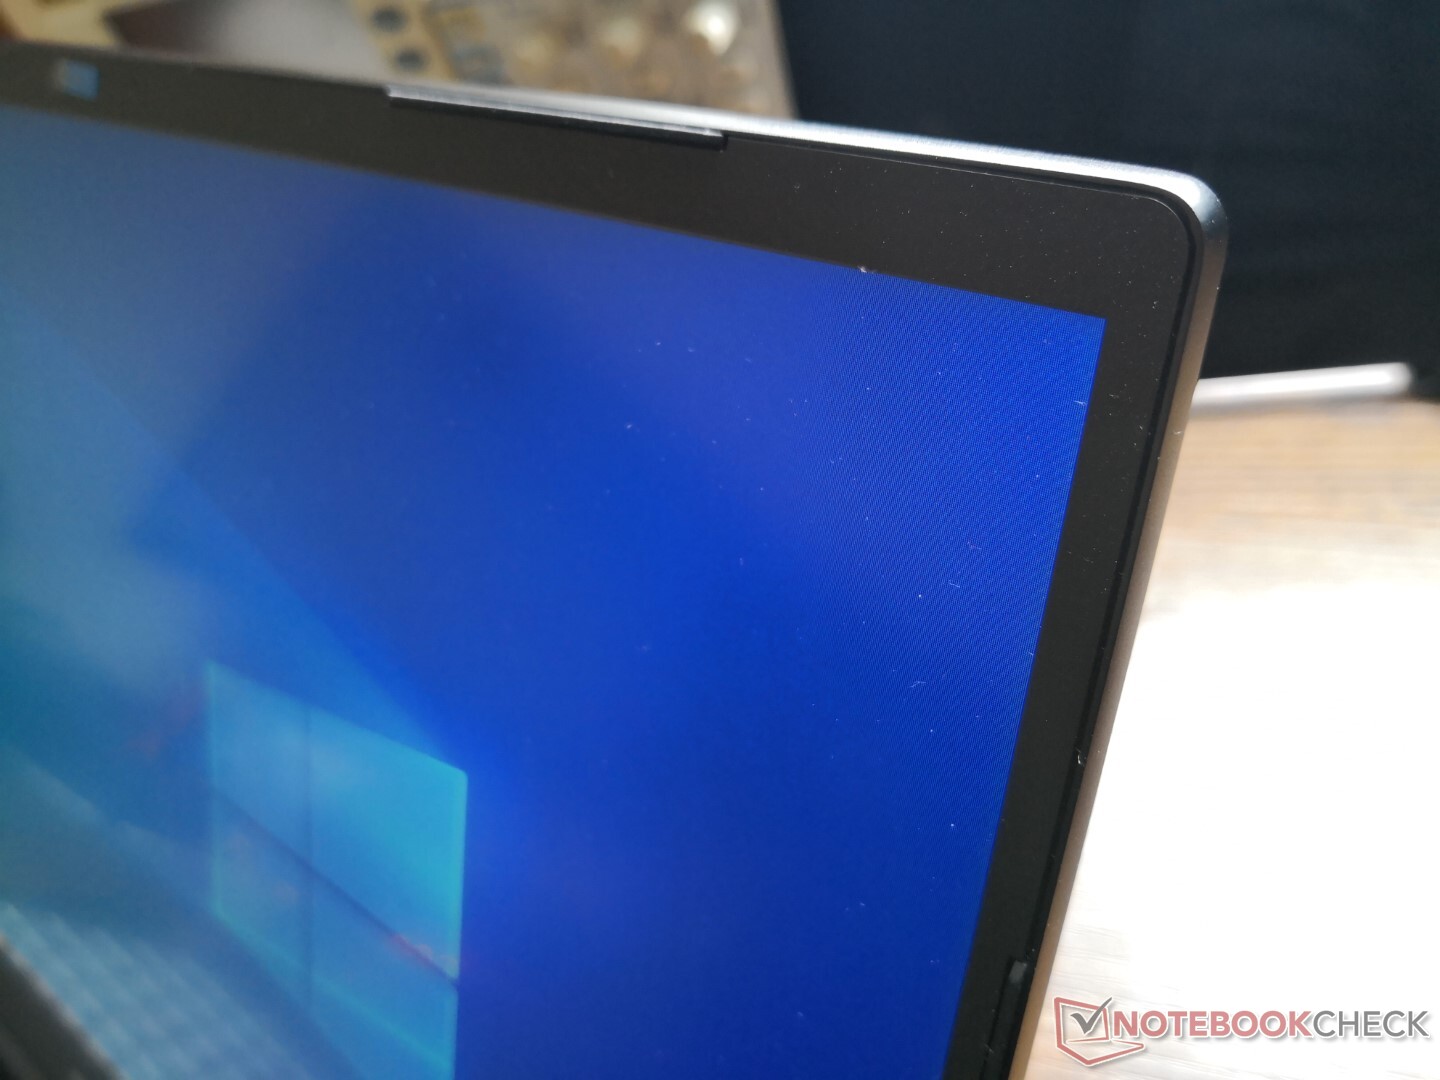
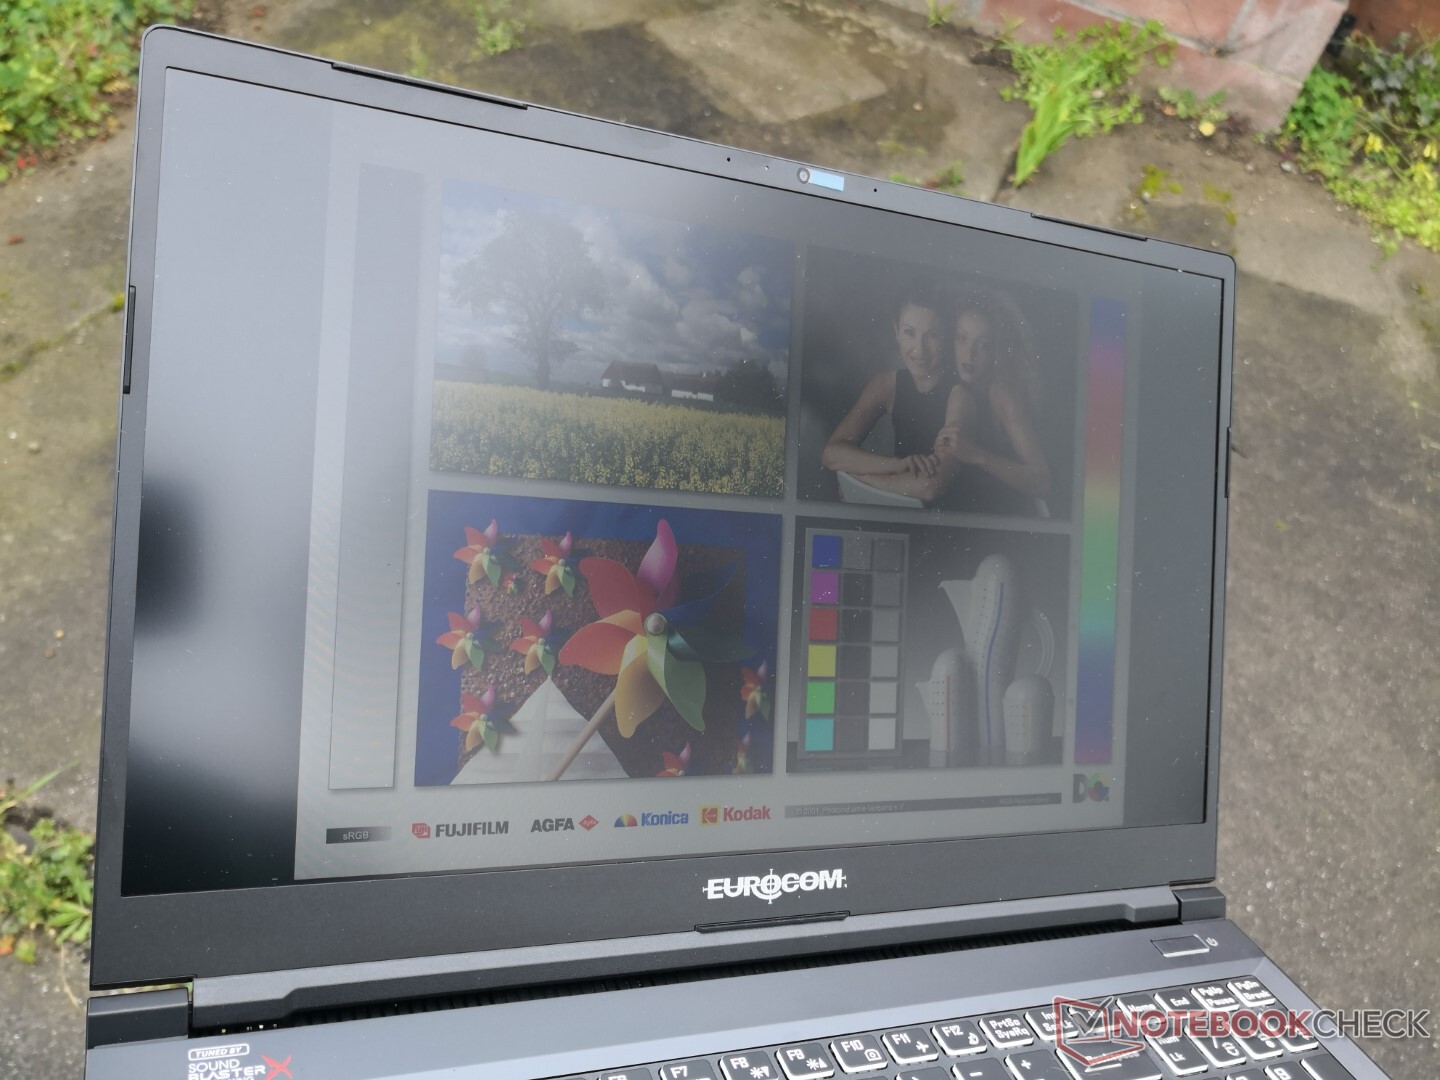
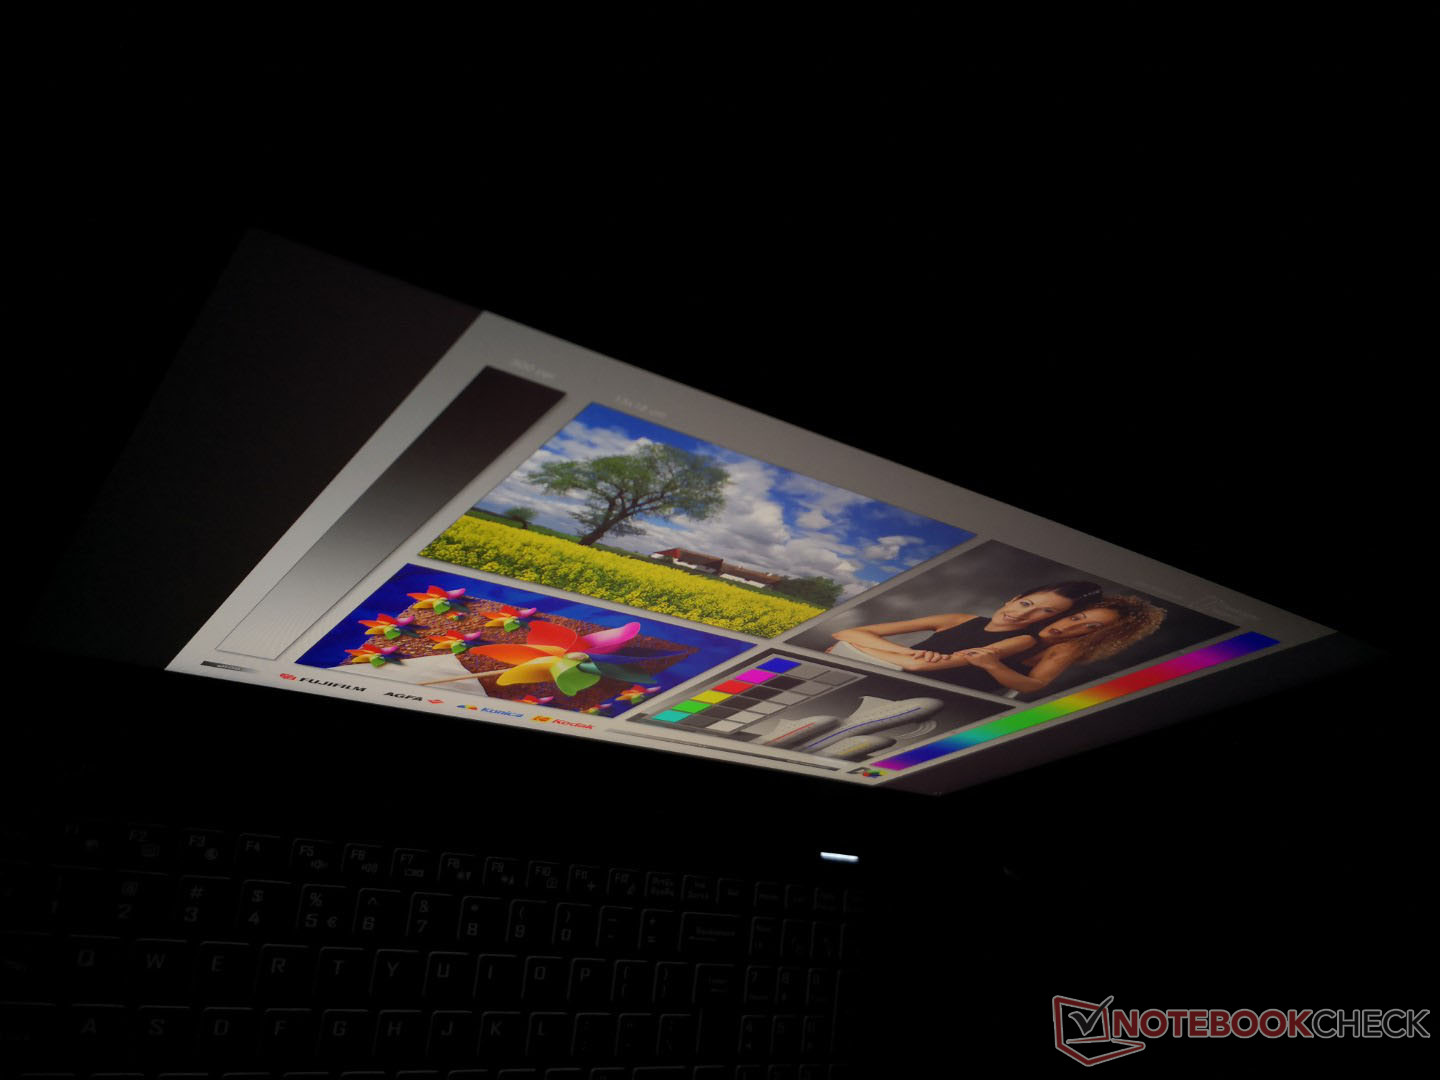
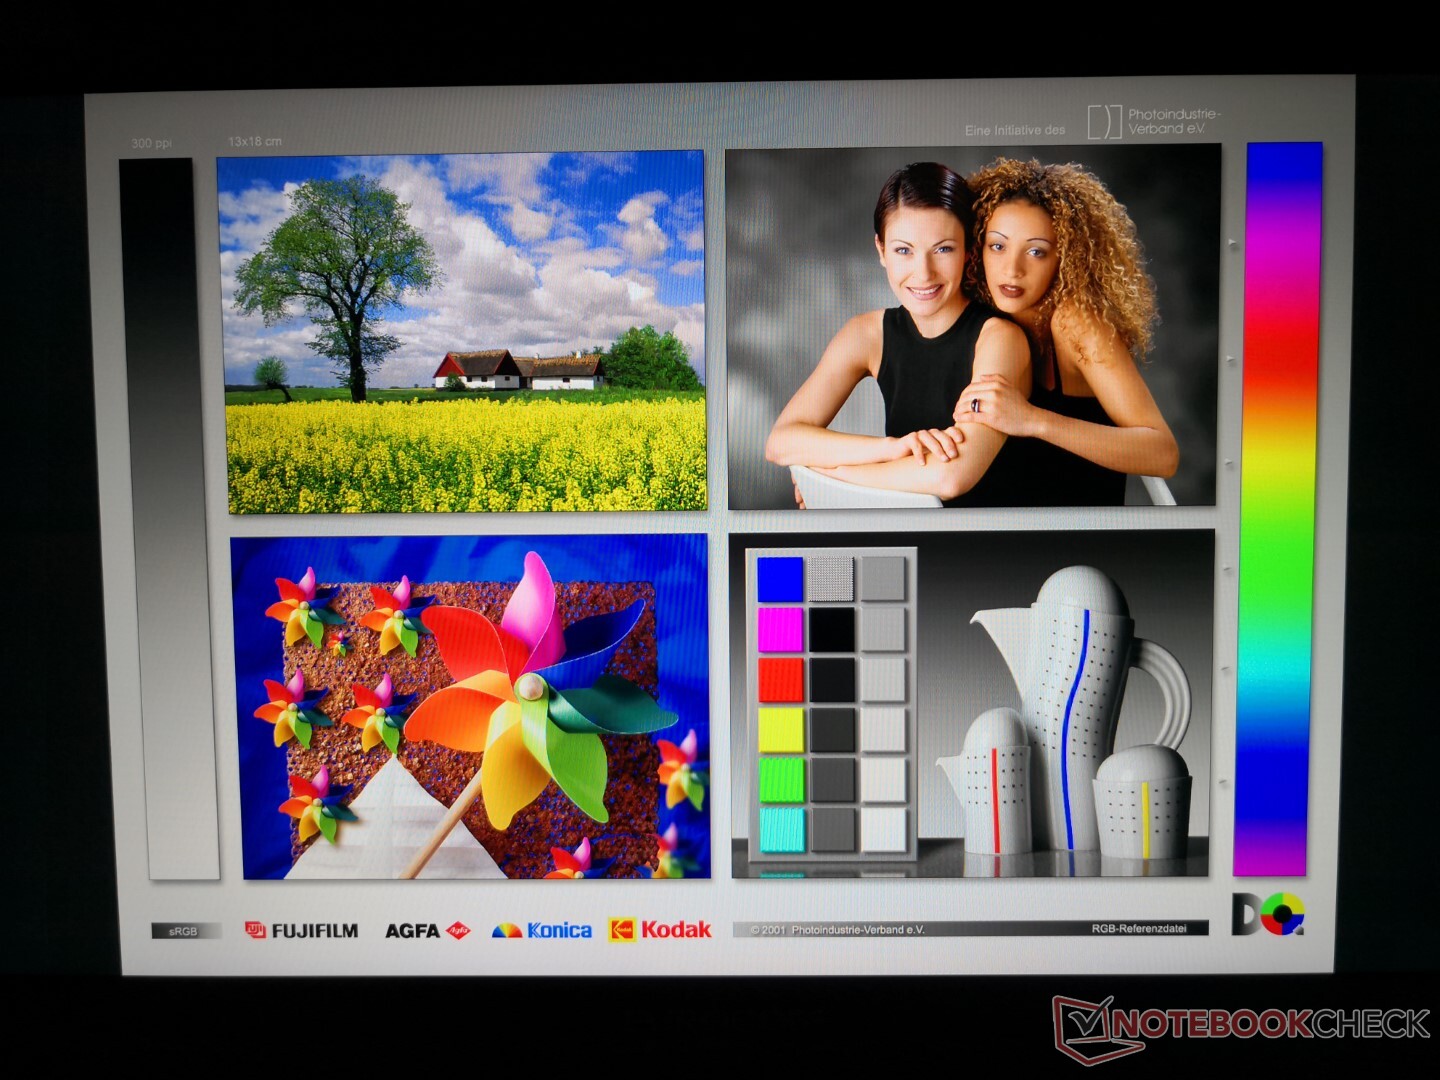
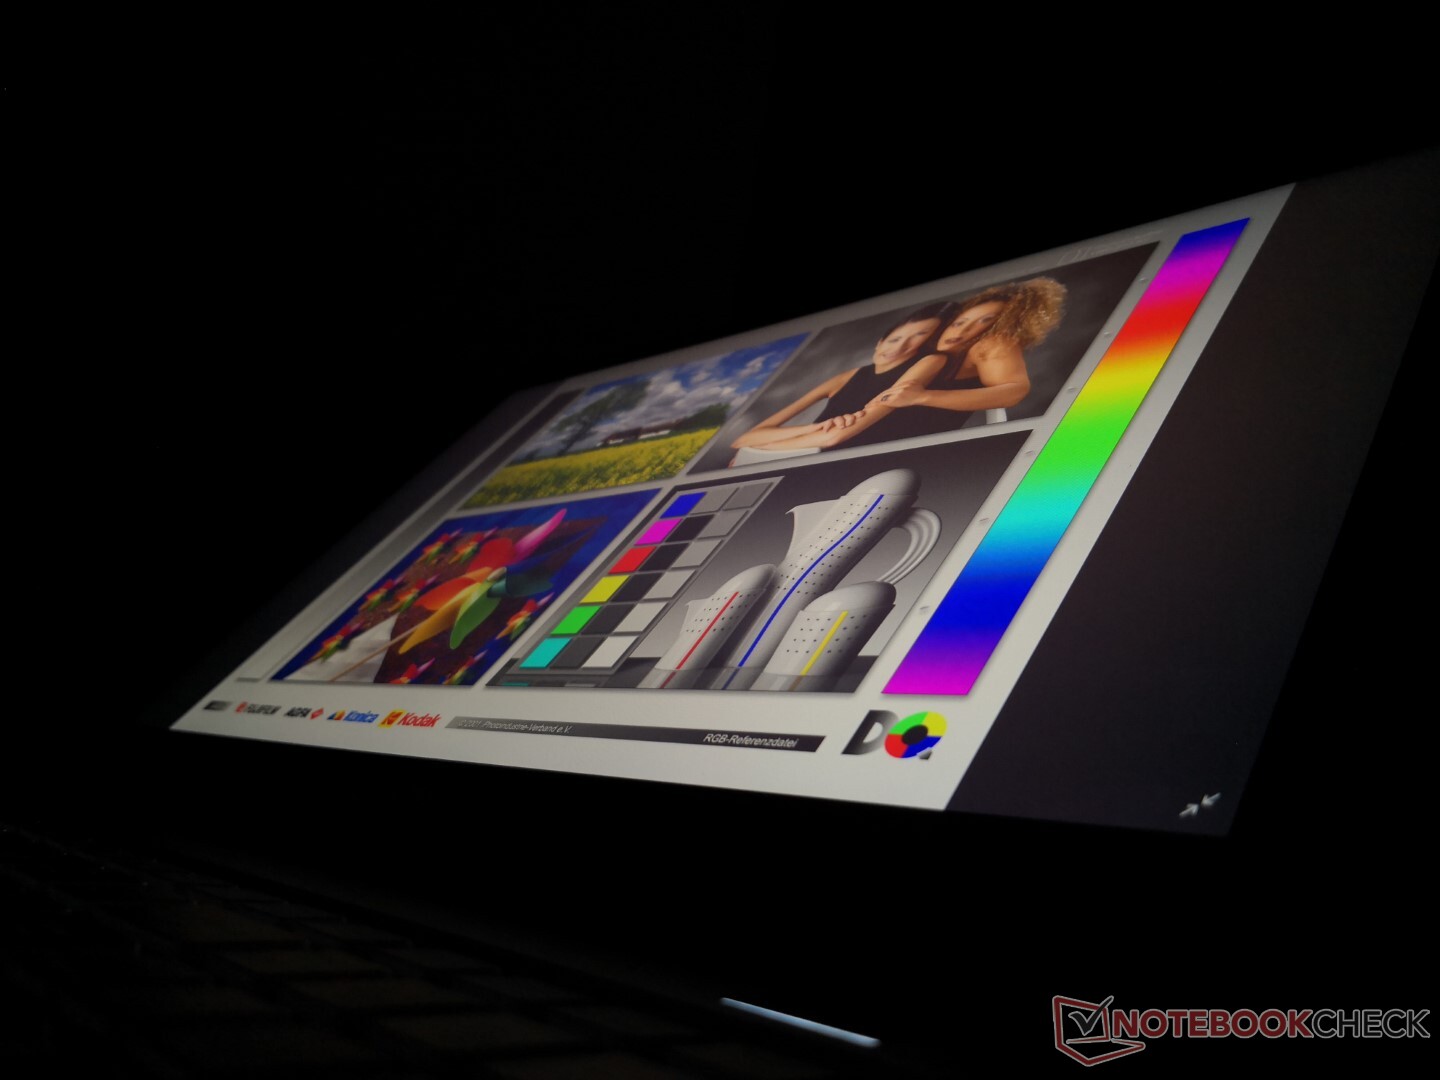
Mostrar
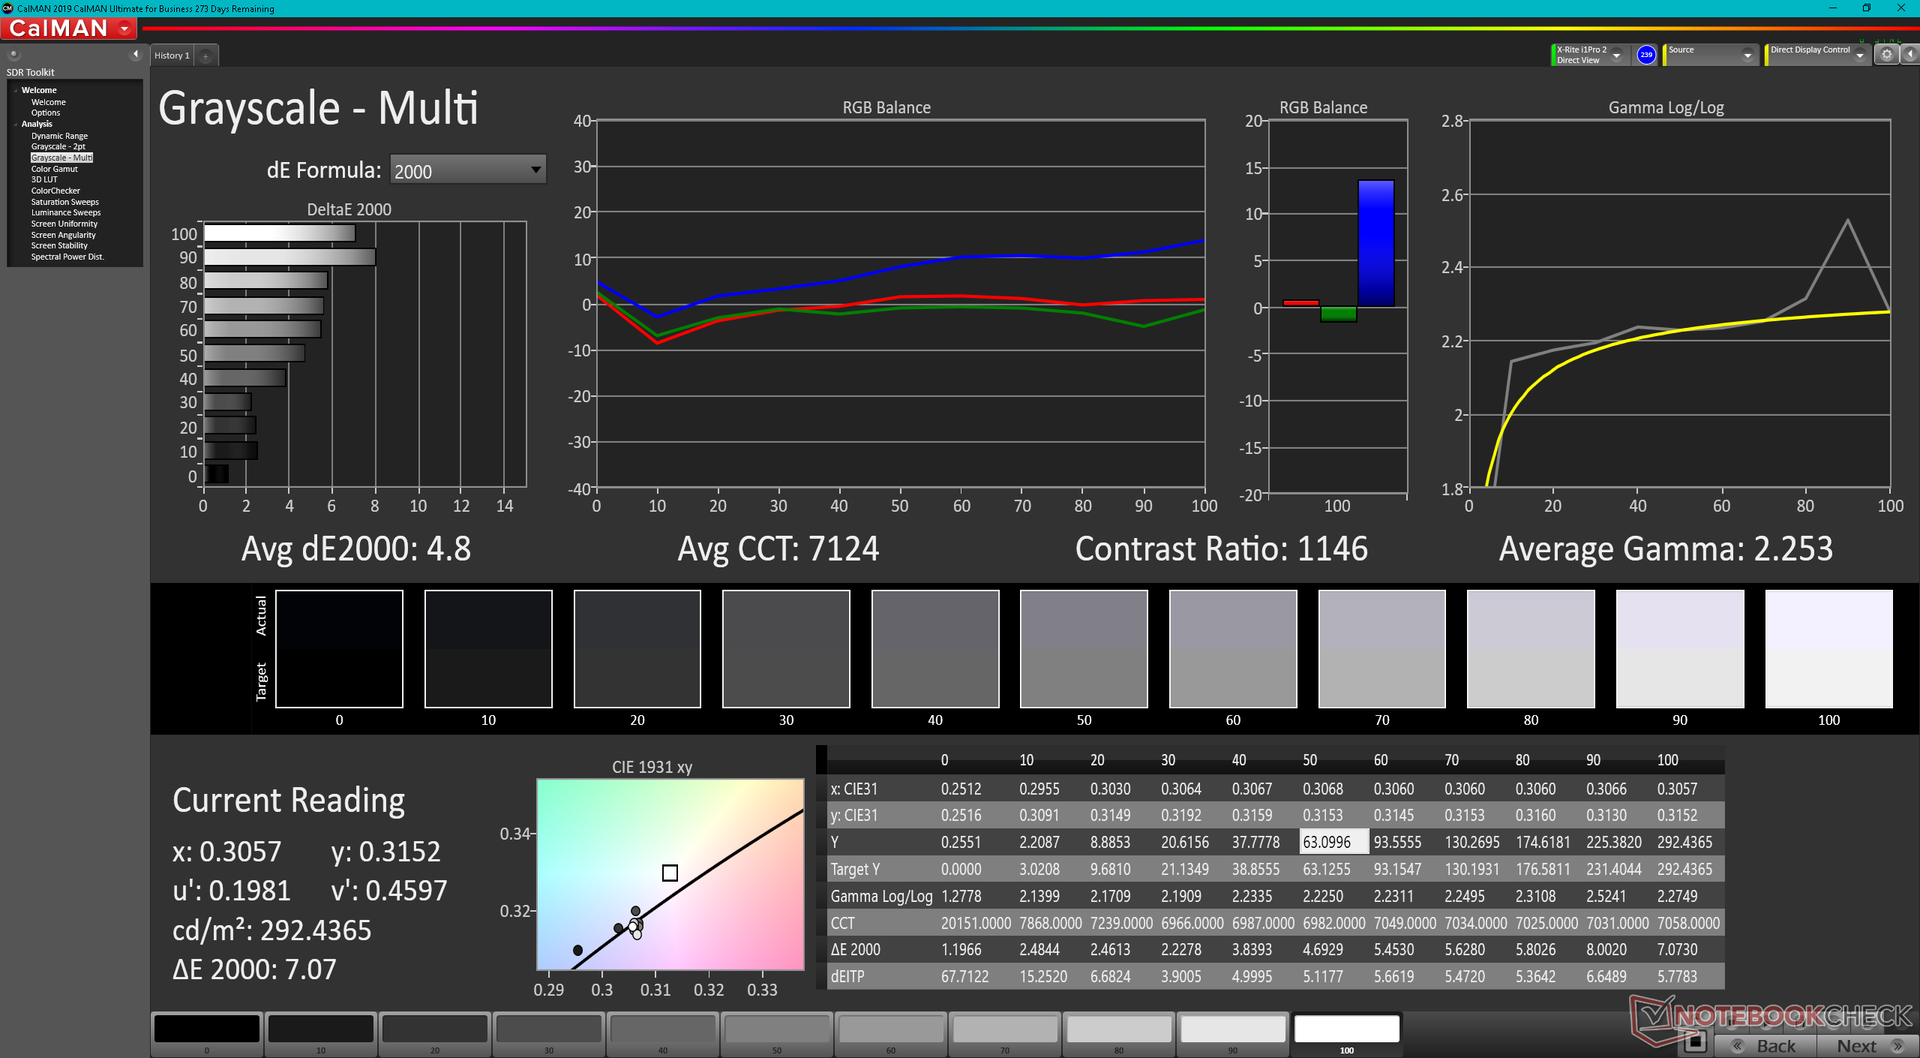
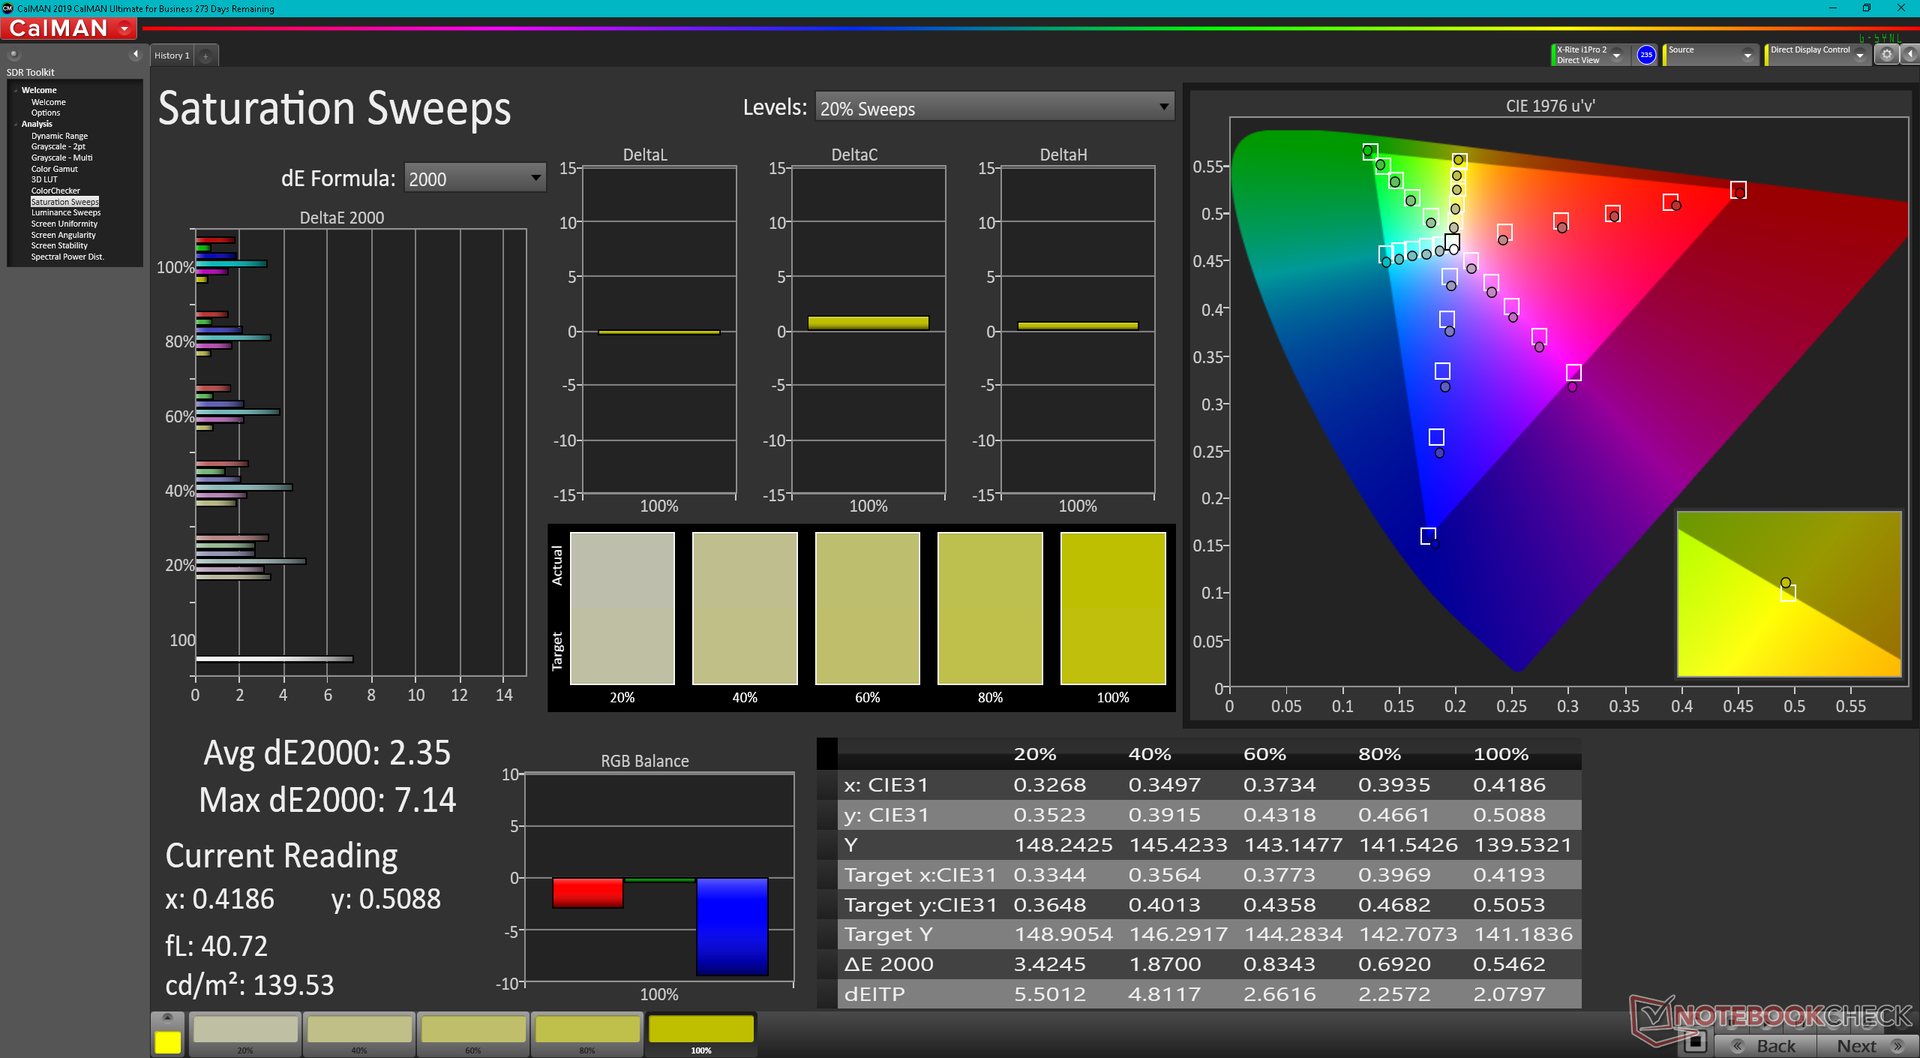
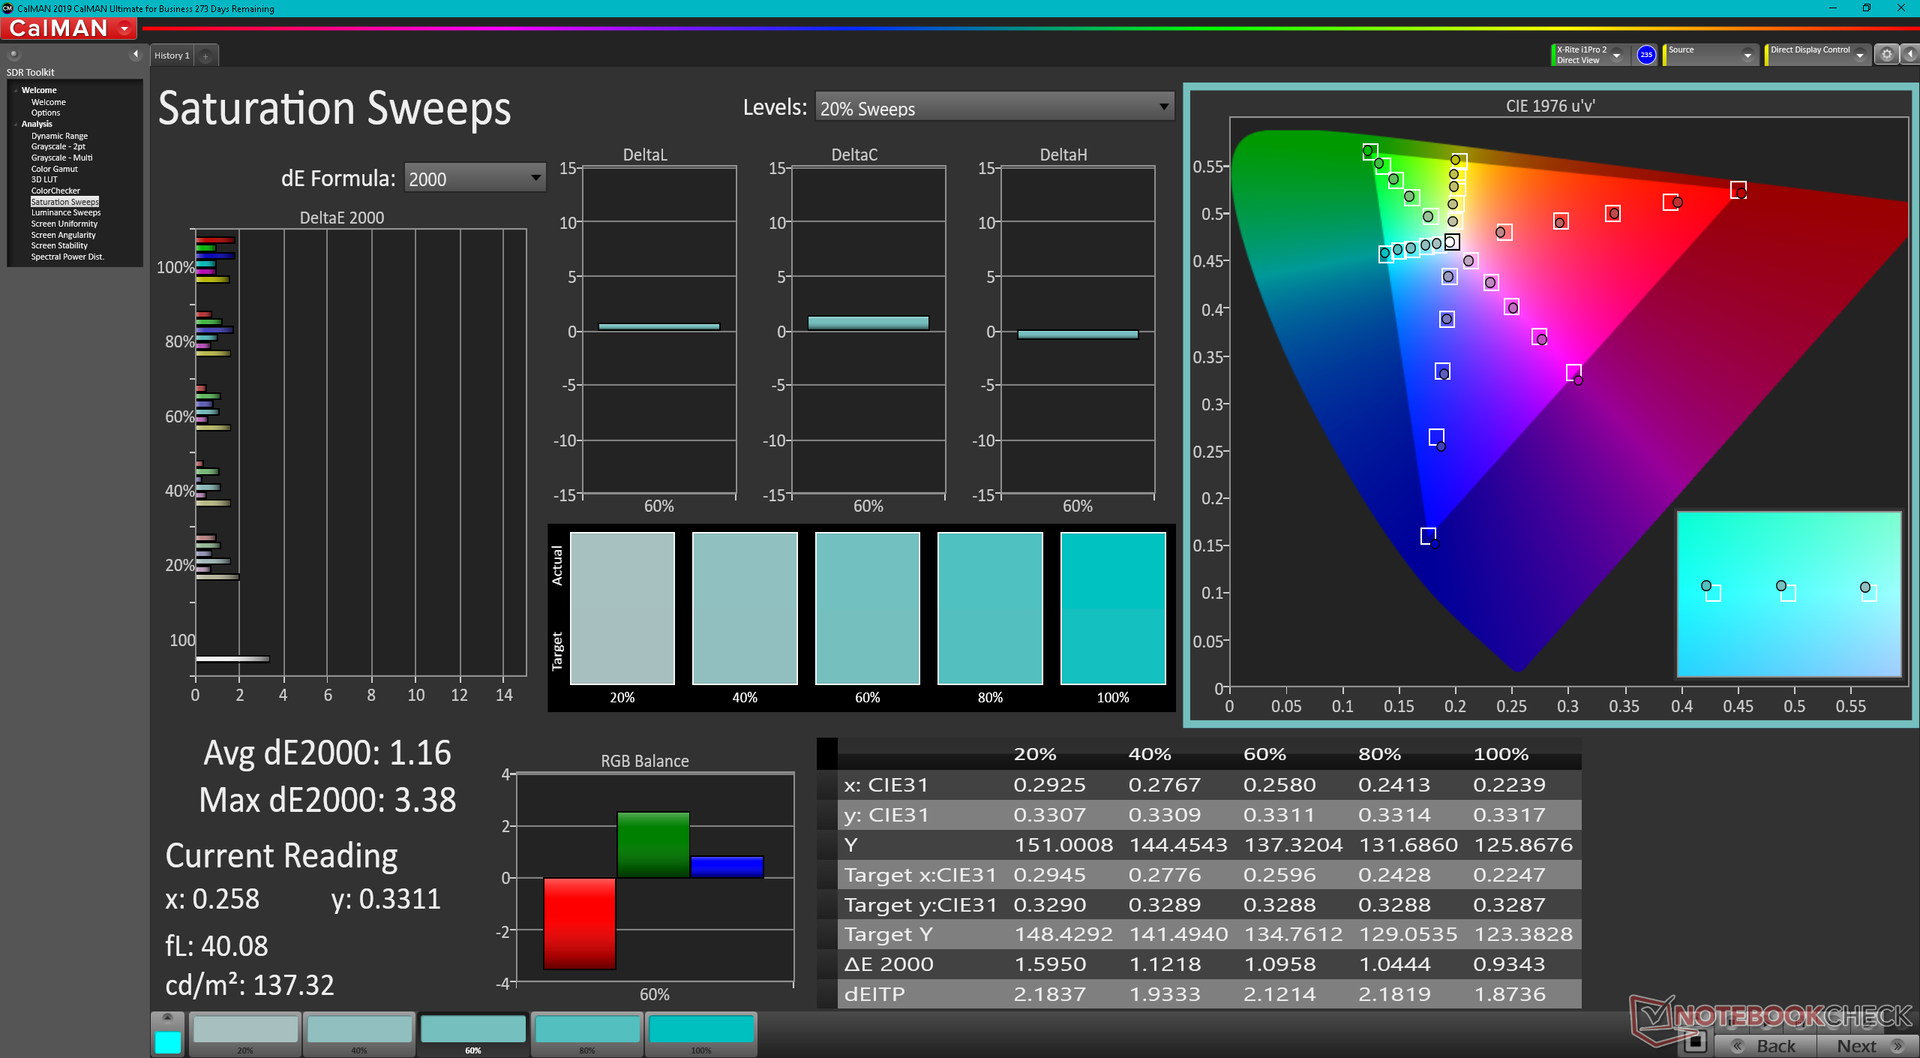
En comparación con la opción OLED 4K, nuestro panel IPS FHD tiene tiempos de respuesta más lentos en blanco y negro y gris, una retroiluminación más tenue, una relación de contraste más baja y una gama más estrecha para una calidad de imagen general inferior. A cambio, los usuarios obtienen una frecuencia de actualización nativa de 240 Hz mucho más rápida para reducir el desgarro de la pantalla y suavizar el juego. Sin embargo, G-Sync no es compatible con el monitor interno.

| |||||||||||||||||||||||||
iluminación: 91 %
Brillo con batería: 291.3 cd/m²
Contraste: 832:1 (Negro: 0.35 cd/m²)
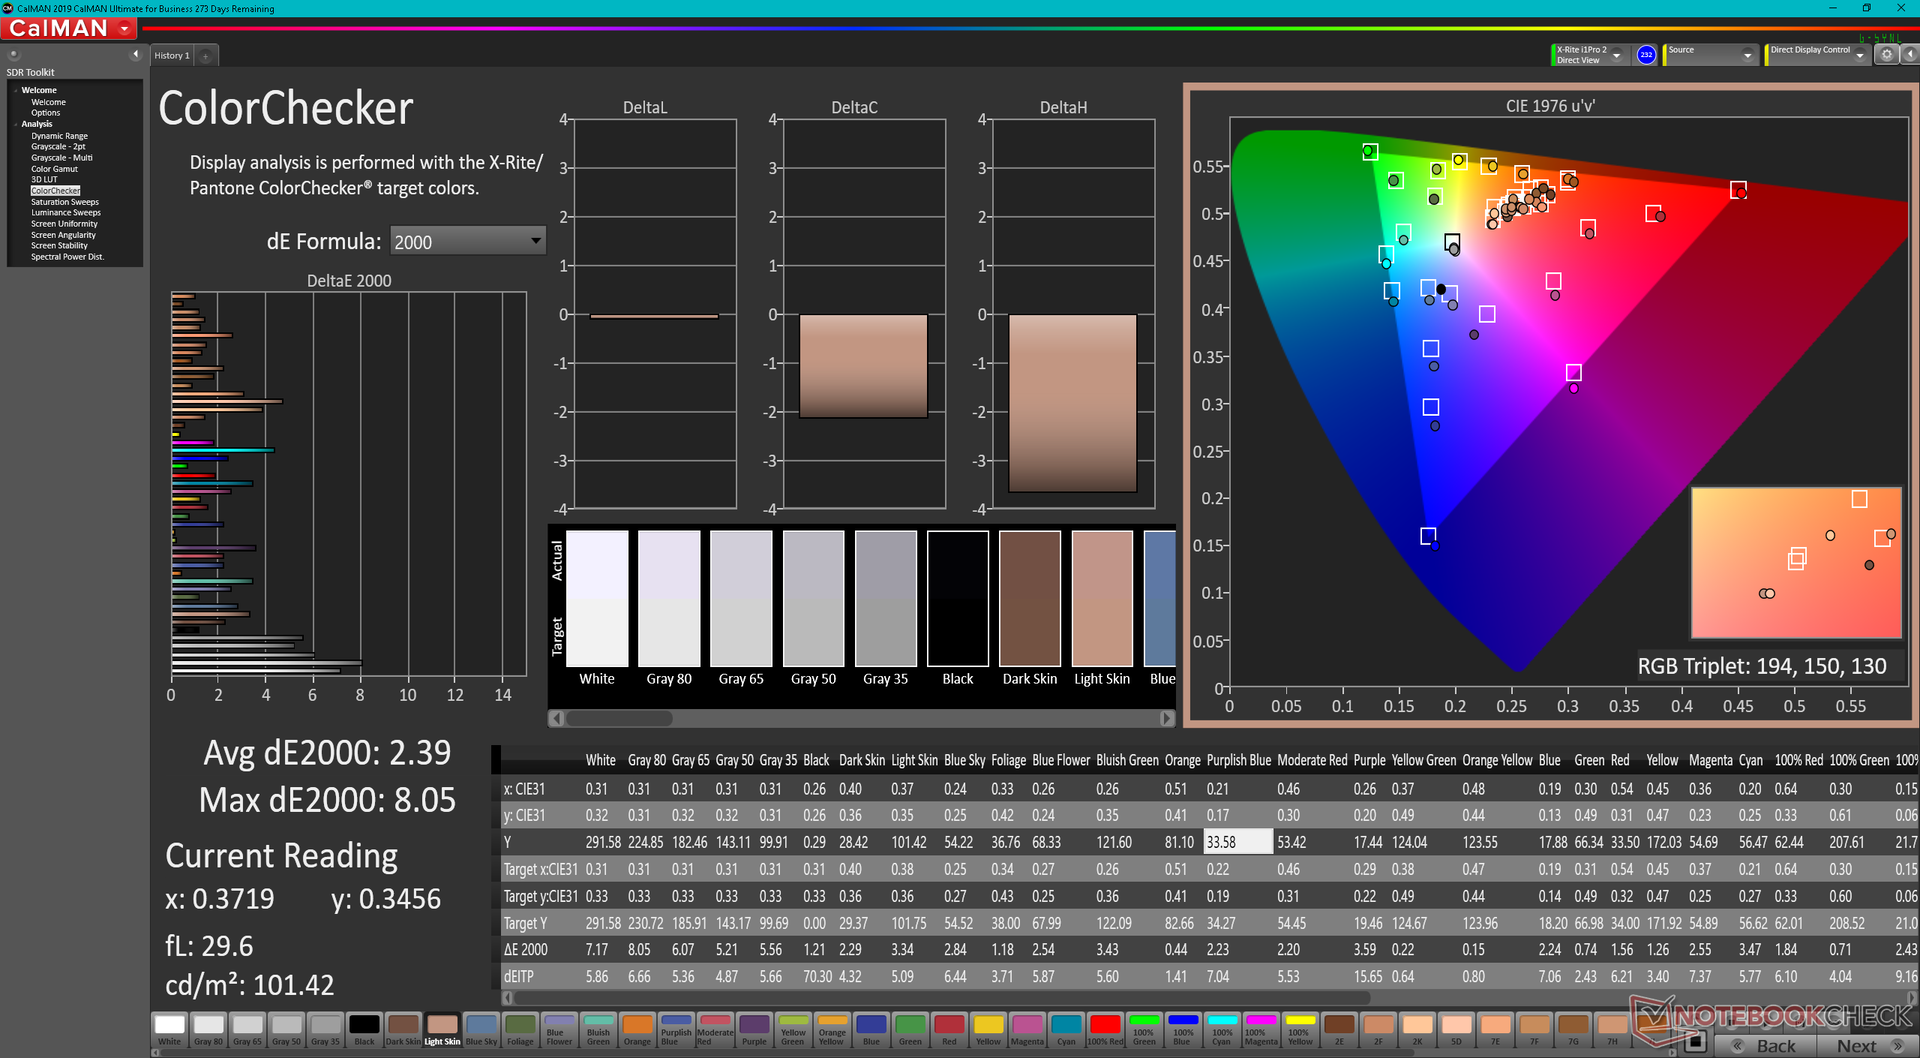
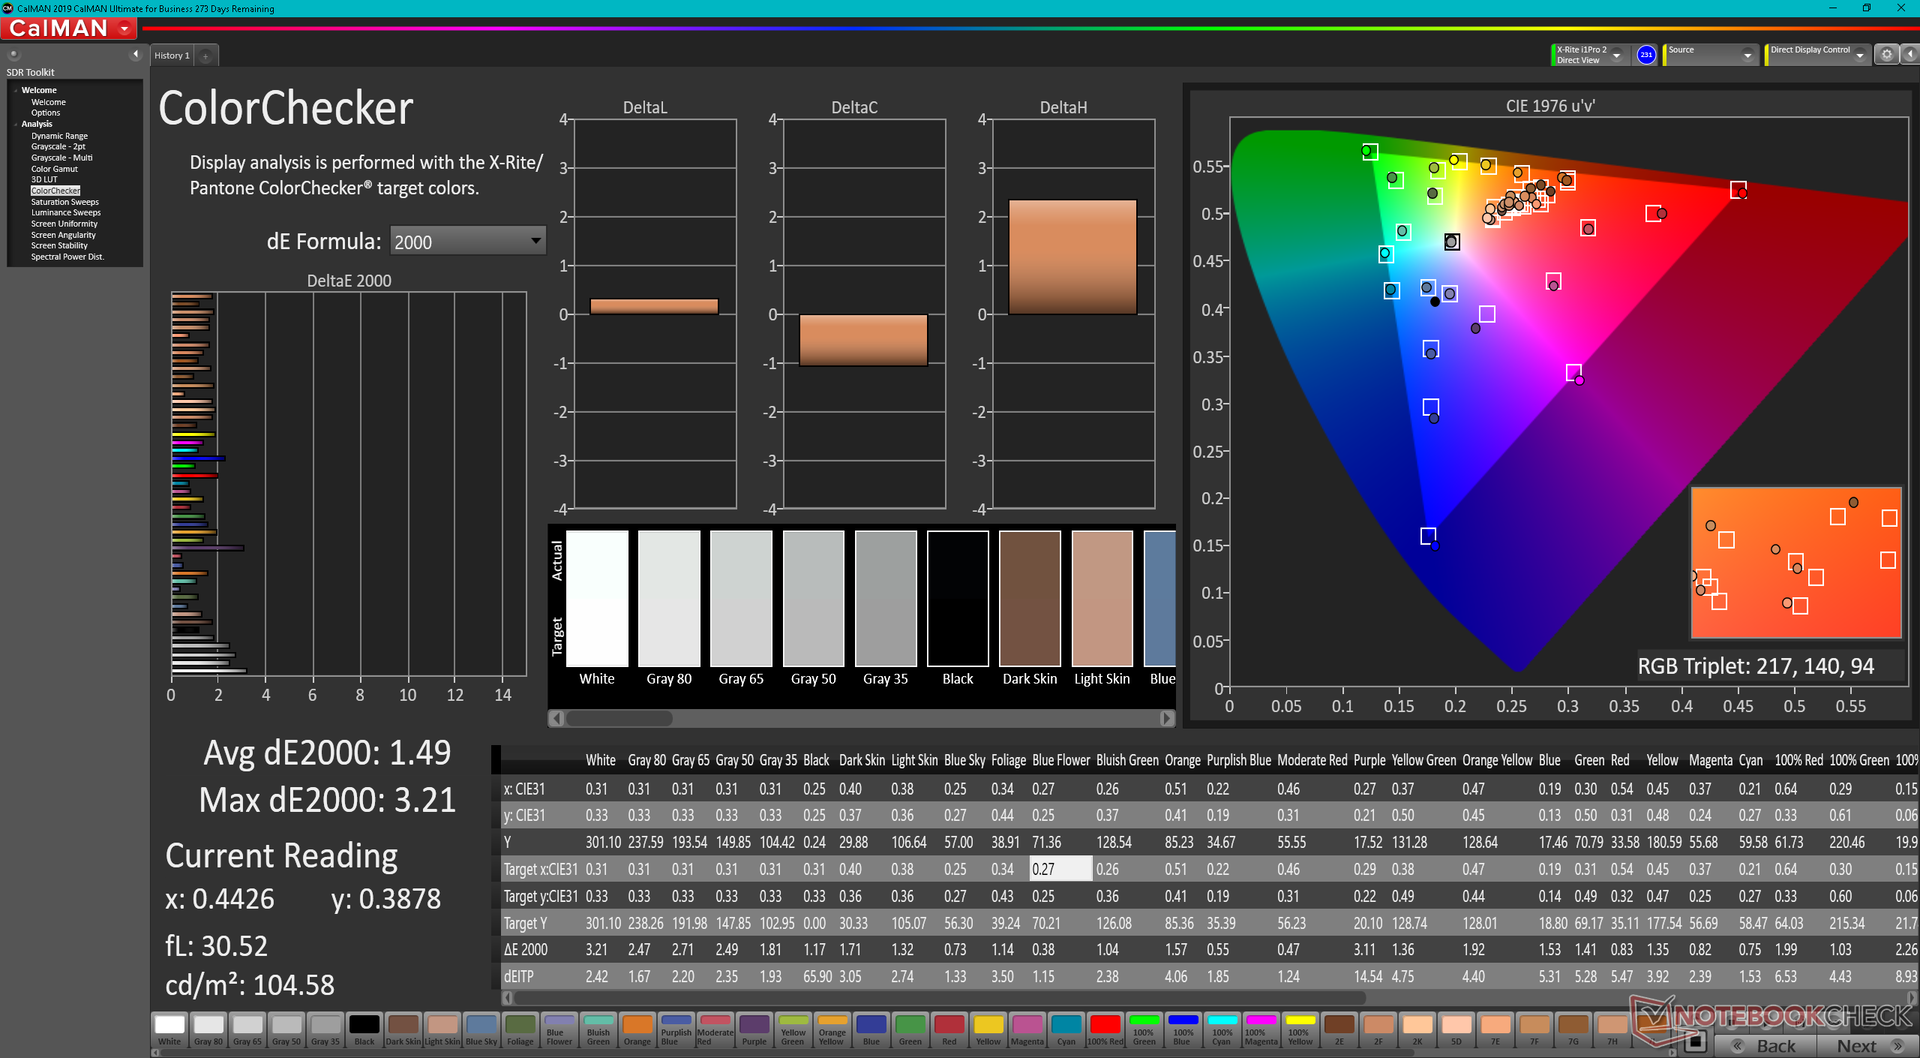
ΔE ColorChecker Calman: 2.39 | ∀{0.5-29.43 Ø4.72}
calibrated: 1.49
ΔE Greyscale Calman: 4.8 | ∀{0.09-98 Ø4.97}
68.5% AdobeRGB 1998 (Argyll 3D)
98% sRGB (Argyll 3D)
67.5% Display P3 (Argyll 3D)
Gamma: 2.25
CCT: 7124 K
| Eurocom RX315 NH57AF1 Sharp LQ156M1JW03, IPS, 1920x1080, 15.6" | MSI Stealth GS66 12UGS Sharp LQ156T1JW04 (SHP153C), IPS-Level, 2560x1440, 15.6" | Eurocom Nightsky ARX315 Sharp LQ156M1JW03, IPS, 1920x1080, 15.6" | Alienware m15 R6, i7-11800H RTX 3080 AU Optronics AUO9092 (B156HAN), IPS, 1920x1080, 15.6" | Dell G15 5515 BOE092A, IPS, 1920x1080, 15.6" | Razer Blade 15 Advanced (Mid 2021) TL156VDXP02-0, IPS, 1920x1080, 15.6" | |
|---|---|---|---|---|---|---|
| Display | 23% | 4% | 8% | -42% | -0% | |
| Display P3 Coverage (%) | 67.5 | 96.4 43% | 67.9 1% | 74.1 10% | 39.1 -42% | 66.9 -1% |
| sRGB Coverage (%) | 98 | 99.7 2% | 99.7 2% | 99.5 2% | 56.9 -42% | 97.1 -1% |
| AdobeRGB 1998 Coverage (%) | 68.5 | 85.6 25% | 73.7 8% | 75.7 11% | 40.4 -41% | 69 1% |
| Response Times | 35% | -22% | 63% | -94% | 37% | |
| Response Time Grey 50% / Grey 80% * (ms) | 10.4 ? | 6 ? 42% | 15.2 ? -46% | 2.8 73% | 25.2 ? -142% | 4.2 ? 60% |
| Response Time Black / White * (ms) | 11.6 ? | 8.4 ? 28% | 11.2 ? 3% | 5.6 52% | 16.8 ? -45% | 10 ? 14% |
| PWM Frequency (Hz) | 22730 ? | 23150 ? | 200 ? | |||
| Screen | -4% | 10% | -3% | -55% | 21% | |
| Brightness middle (cd/m²) | 291.3 | 272 -7% | 312.8 7% | 359 23% | 278 -5% | 353.4 21% |
| Brightness (cd/m²) | 273 | 253 -7% | 294 8% | 344 26% | 262 -4% | 340 25% |
| Brightness Distribution (%) | 91 | 87 -4% | 90 -1% | 85 -7% | 83 -9% | 92 1% |
| Black Level * (cd/m²) | 0.35 | 0.25 29% | 0.28 20% | 0.35 -0% | 0.36 -3% | 0.31 11% |
| Contrast (:1) | 832 | 1088 31% | 1117 34% | 1026 23% | 772 -7% | 1140 37% |
| Colorchecker dE 2000 * | 2.39 | 3.73 -56% | 2.96 -24% | 3.3 -38% | 5.74 -140% | 2.17 9% |
| Colorchecker dE 2000 max. * | 8.05 | 9.43 -17% | 6.23 23% | 4.84 40% | 19.63 -144% | 5.69 29% |
| Colorchecker dE 2000 calibrated * | 1.49 | 0.98 34% | 3.28 -120% | 4.7 -215% | 1.05 30% | |
| Greyscale dE 2000 * | 4.8 | 6.5 -35% | 4.2 12% | 3.66 24% | 3.1 35% | 3.4 29% |
| Gamma | 2.25 98% | 2.172 101% | 2.32 95% | 2.43 91% | 2.011 109% | 2.2 100% |
| CCT | 7124 91% | 6485 100% | 7145 91% | 5896 110% | 6207 105% | 6830 95% |
| Media total (Programa/Opciones) | 18% /
8% | -3% /
4% | 23% /
9% | -64% /
-57% | 19% /
19% |
* ... más pequeño es mejor
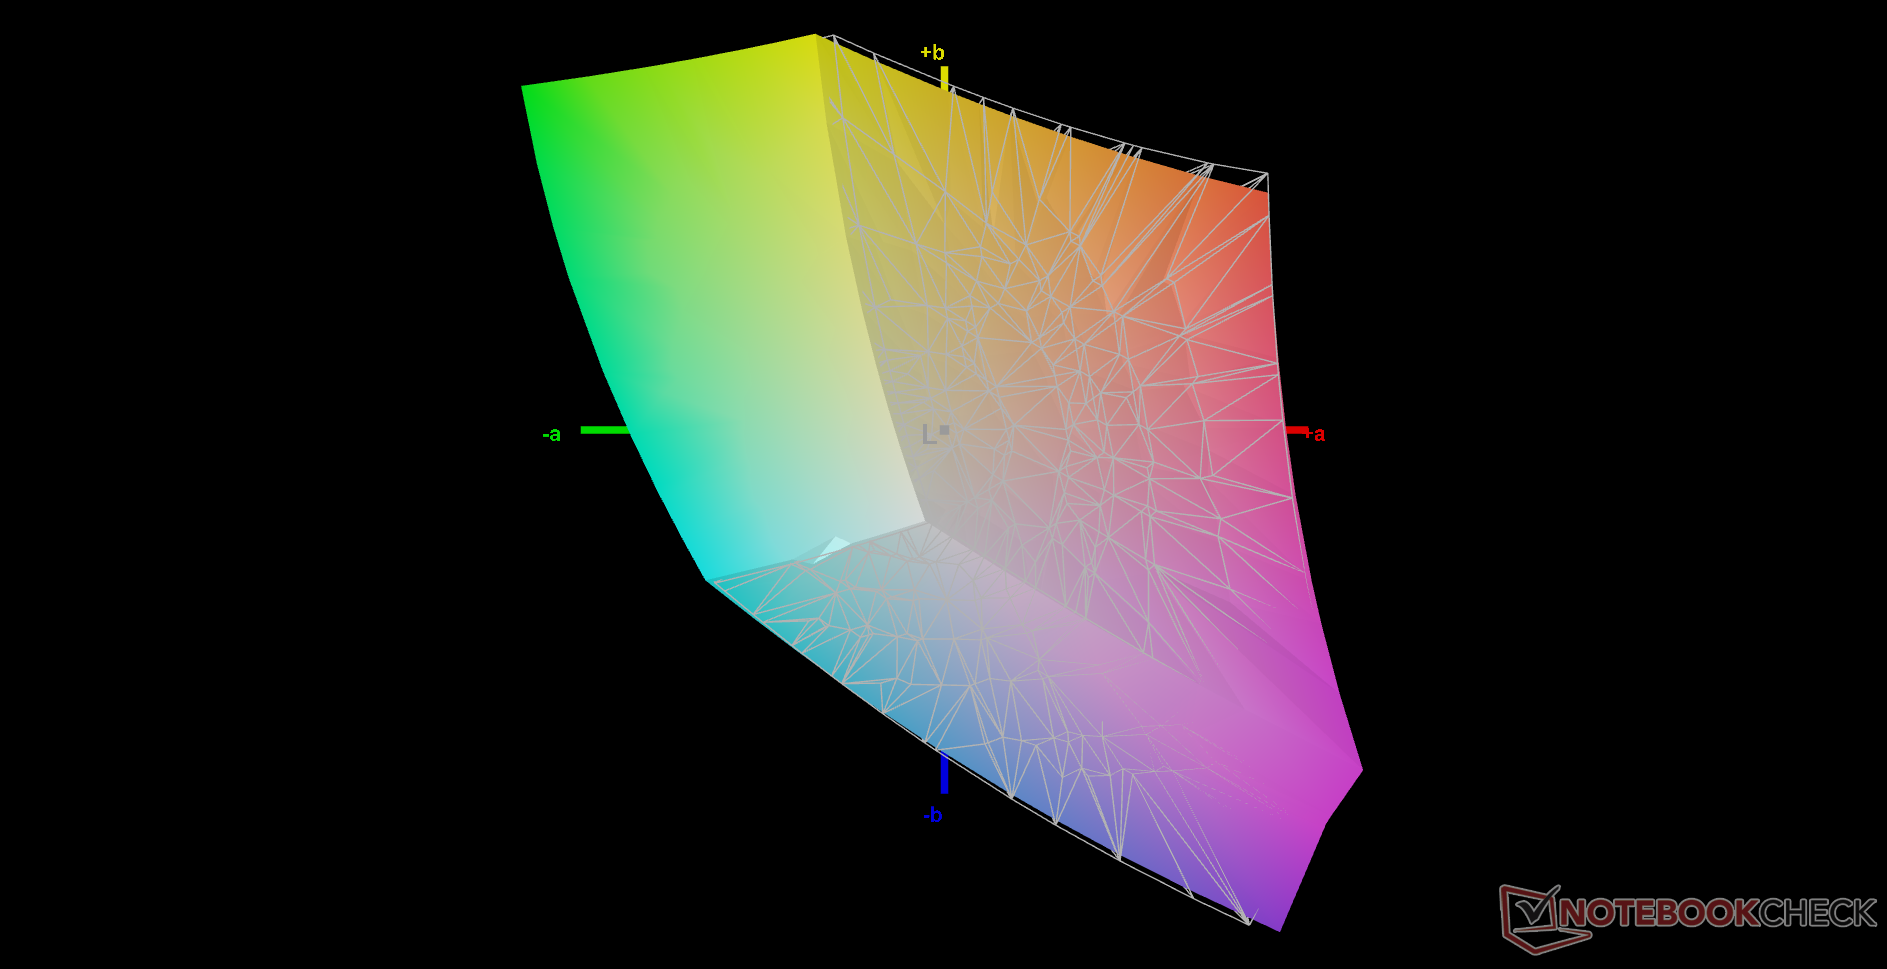
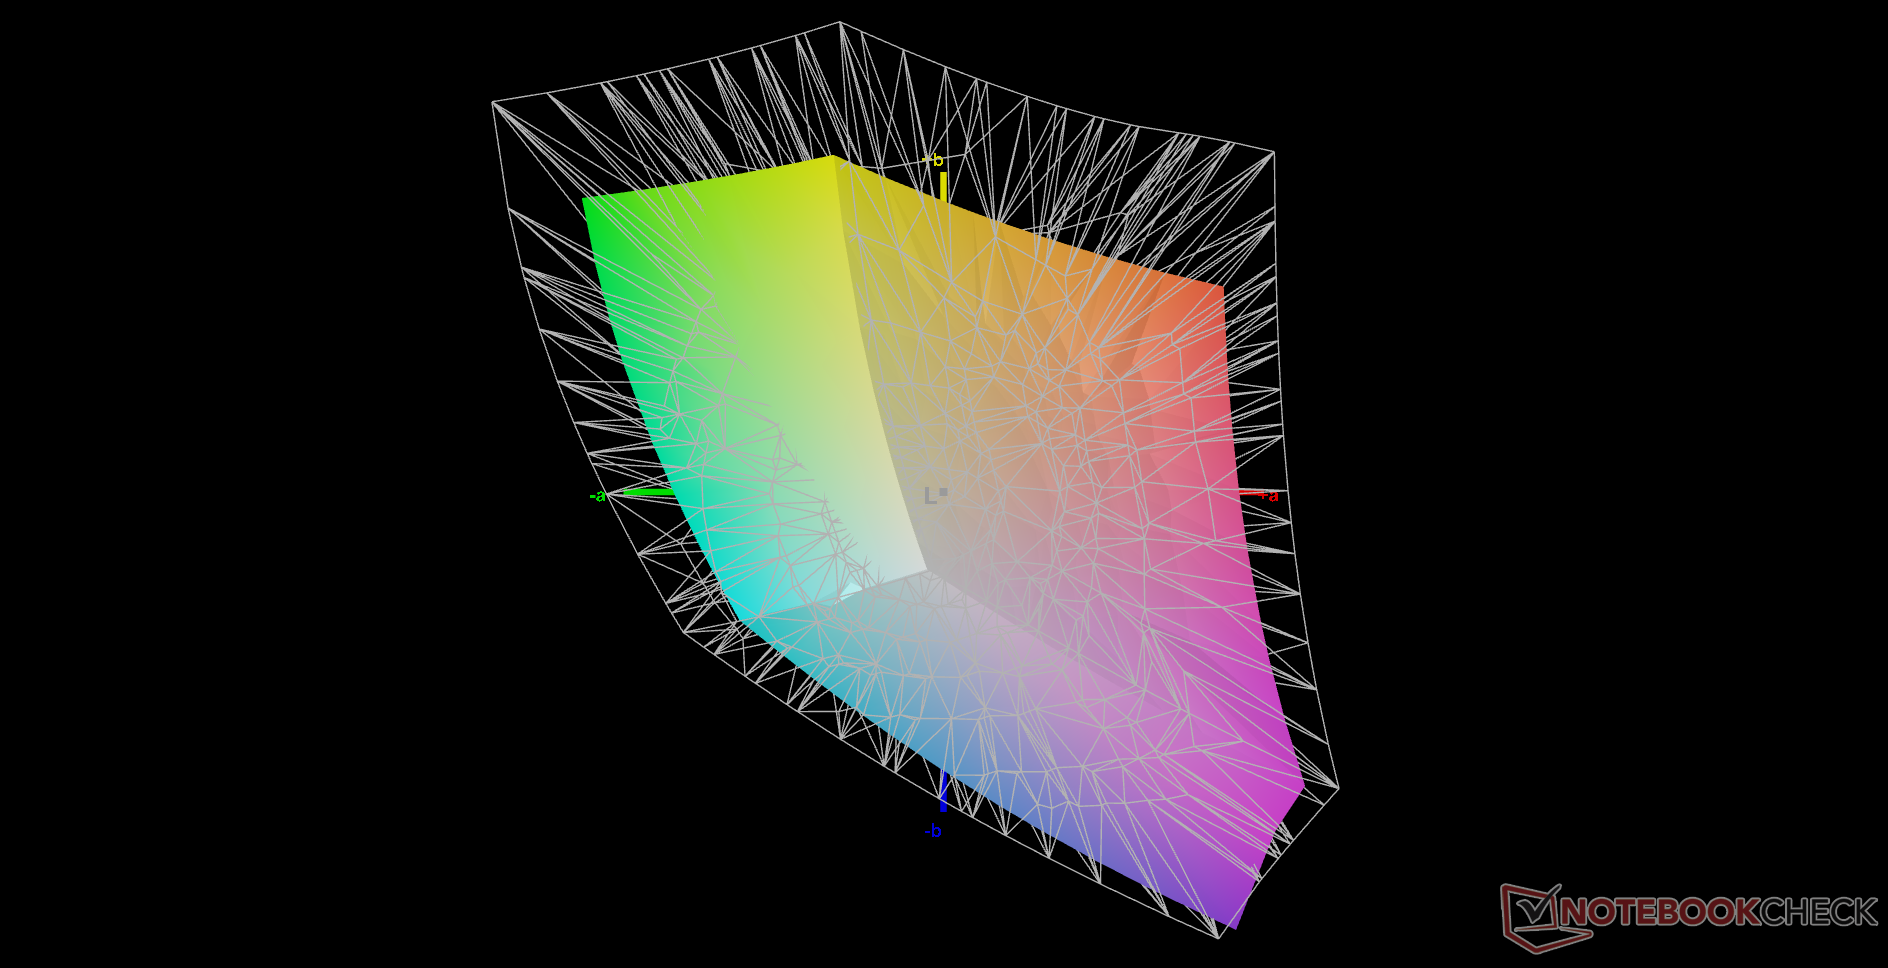
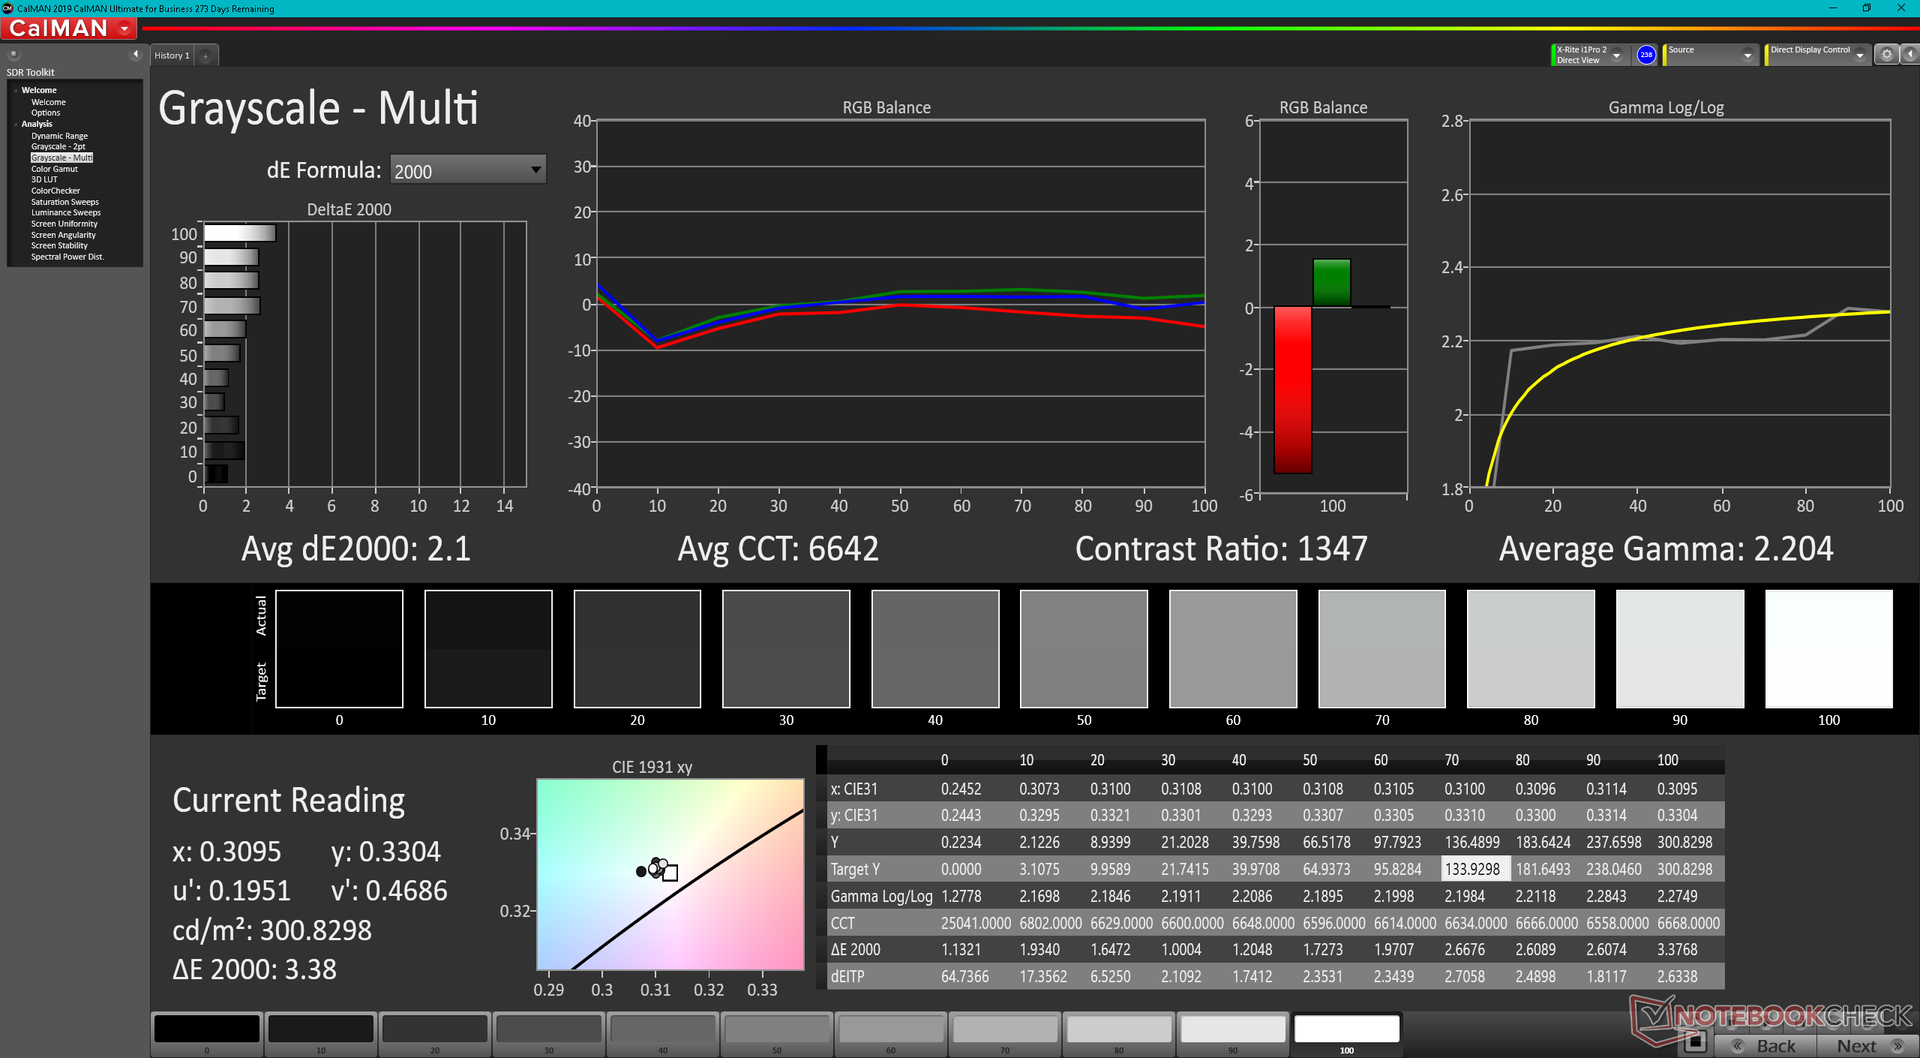
La temperatura del color es ligeramente demasiado fría al sacarla de la caja. Los valores medios de escala de grises y color deltaE mejorarían de 4,8 y 2,39 a 2,1 y 1,49, respectivamente, después de calibrarlos con nuestro colorímetro X-Rite.
Tiempos de respuesta del display
| ↔ Tiempo de respuesta de Negro a Blanco | ||
|---|---|---|
| 11.6 ms ... subida ↗ y bajada ↘ combinada | ↗ 5.6 ms subida | 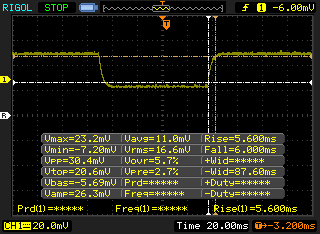 |
| ↘ 6 ms bajada | ||
| La pantalla mostró buenos tiempos de respuesta en nuestros tests pero podría ser demasiado lenta para los jugones competitivos. En comparación, todos los dispositivos de prueba van de ##min### (mínimo) a 240 (máximo) ms. » 31 % de todos los dispositivos son mejores. Esto quiere decir que el tiempo de respuesta medido es mejor que la media (19.8 ms) de todos los dispositivos testados. | ||
| ↔ Tiempo de respuesta 50% Gris a 80% Gris | ||
| 10.4 ms ... subida ↗ y bajada ↘ combinada | ↗ 5.2 ms subida | 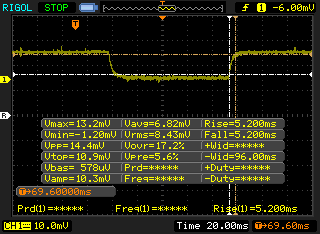 |
| ↘ 5.2 ms bajada | ||
| La pantalla mostró buenos tiempos de respuesta en nuestros tests pero podría ser demasiado lenta para los jugones competitivos. En comparación, todos los dispositivos de prueba van de ##min### (mínimo) a 636 (máximo) ms. » 24 % de todos los dispositivos son mejores. Esto quiere decir que el tiempo de respuesta medido es mejor que la media (31 ms) de todos los dispositivos testados. | ||
Parpadeo de Pantalla / PWM (Pulse-Width Modulation)
| Parpadeo de Pantalla / PWM detectado | 22730 Hz | ≤ 24 % de brillo | 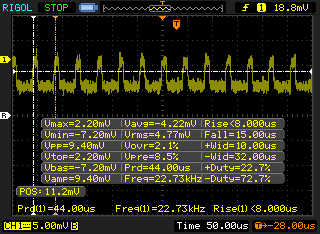 |
La retroiluminación del display parpadea a 22730 Hz (seguramente usa PWM - Pulse-Width Modulation) a un brillo del 24 % e inferior. Sobre este nivel de brillo no debería darse parpadeo / PWM. La frecuencia de 22730 Hz es bastante alta, por lo que la mayoría de gente sensible al parpadeo no debería ver parpadeo o tener fatiga visual. Comparación: 52 % de todos los dispositivos testados no usaron PWM para atenuar el display. Si se usó, medimos una media de 7763 (mínimo: 5 - máxmo: 343500) Hz. | |||
Rendimiento
Condiciones de la prueba
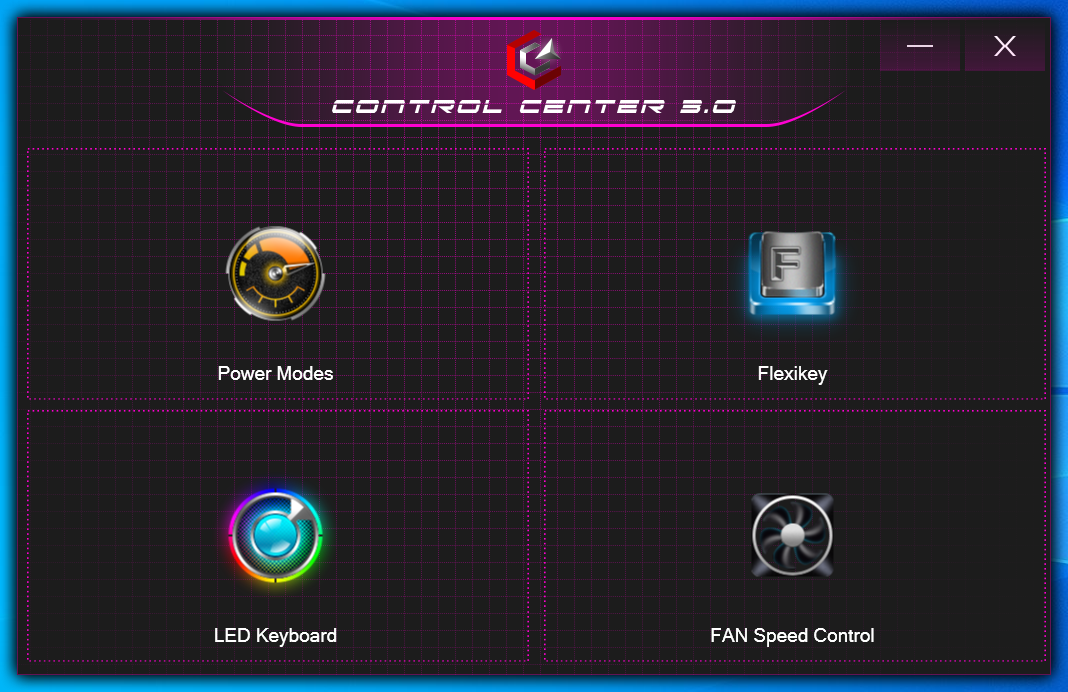
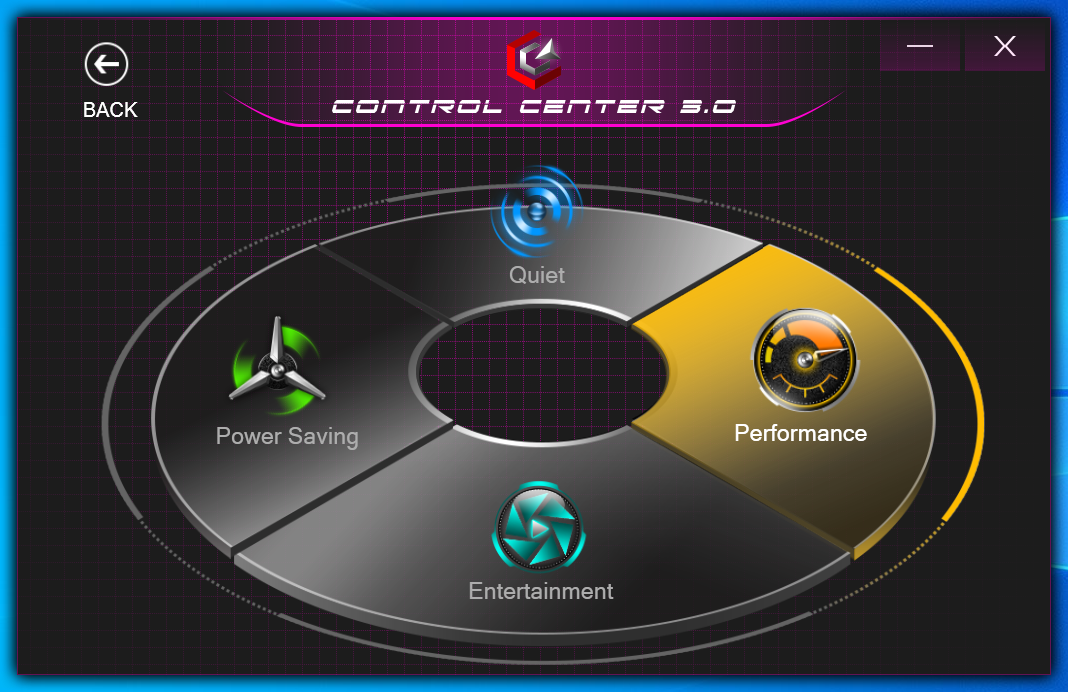
Nuestra unidad fue configurada en el modo de rendimiento a través del software Control Center 3.0 antes de ejecutar nuestros benchmarks de rendimiento a continuación para obtener las puntuaciones más altas posibles. Los usuarios deberían familiarizarse con este software, ya que aquí se activan funciones importantes como la iluminación del teclado, el control de los ventiladores, etc.
Ten en cuenta que no hay MUX en el RX315.
Procesador
El Core i7-11800H rinde donde esperamos que lo haga en relación a otros portátiles equipados con la misma CPU. No hay otras opciones de procesador disponibles actualmente.
Cinebench R15 Multi Loop
Cinebench R20: CPU (Multi Core) | CPU (Single Core)
Cinebench R15: CPU Multi 64Bit | CPU Single 64Bit
Blender: v2.79 BMW27 CPU
7-Zip 18.03: 7z b 4 | 7z b 4 -mmt1
Geekbench 5.5: Multi-Core | Single-Core
HWBOT x265 Benchmark v2.2: 4k Preset
LibreOffice : 20 Documents To PDF
R Benchmark 2.5: Overall mean
| HWBOT x265 Benchmark v2.2 / 4k Preset | |
| Corsair One i300 | |
| MSI Vector GP66 12UGS | |
| MSI Stealth GS66 12UGS | |
| Eurocom Nightsky ARX315 | |
| Schenker XMG Apex 15 NH57E PS | |
| Eurocom RX315 NH57AF1 | |
| Medio Intel Core i7-11800H (7.38 - 17.4, n=46) | |
| Schenker XMG Core 15 Ampere | |
| Alienware m15 R4 RTX 3080 | |
| Gigabyte G5 GD | |
| Razer Blade 15 Advanced Model Early 2021 | |
* ... más pequeño es mejor
AIDA64: FP32 Ray-Trace | FPU Julia | CPU SHA3 | CPU Queen | FPU SinJulia | FPU Mandel | CPU AES | CPU ZLib | FP64 Ray-Trace | CPU PhotoWorxx
| Performance rating | |
| Eurocom Nightsky ARX315 | |
| Alienware m15 R6, i7-11800H RTX 3080 | |
| Eurocom RX315 NH57AF1 | |
| Dell G15 5515 | |
| MSI Stealth GS66 12UGS | |
| Medio Intel Core i7-11800H | |
| Razer Blade 15 Advanced (Mid 2021) -9! | |
| AIDA64 / FP32 Ray-Trace | |
| Alienware m15 R6, i7-11800H RTX 3080 | |
| Eurocom RX315 NH57AF1 | |
| Dell G15 5515 | |
| Medio Intel Core i7-11800H (8772 - 15961, n=20) | |
| Eurocom Nightsky ARX315 | |
| MSI Stealth GS66 12UGS | |
| AIDA64 / FPU Julia | |
| Eurocom Nightsky ARX315 | |
| Dell G15 5515 | |
| Alienware m15 R6, i7-11800H RTX 3080 | |
| Eurocom RX315 NH57AF1 | |
| Medio Intel Core i7-11800H (39404 - 65636, n=20) | |
| MSI Stealth GS66 12UGS | |
| AIDA64 / CPU SHA3 | |
| Alienware m15 R6, i7-11800H RTX 3080 | |
| Eurocom RX315 NH57AF1 | |
| Medio Intel Core i7-11800H (2599 - 4439, n=20) | |
| MSI Stealth GS66 12UGS | |
| Eurocom Nightsky ARX315 | |
| Dell G15 5515 | |
| AIDA64 / CPU Queen | |
| Eurocom Nightsky ARX315 | |
| MSI Stealth GS66 12UGS | |
| Dell G15 5515 | |
| Alienware m15 R6, i7-11800H RTX 3080 | |
| Eurocom RX315 NH57AF1 | |
| Medio Intel Core i7-11800H (85233 - 91941, n=20) | |
| AIDA64 / FPU SinJulia | |
| Eurocom Nightsky ARX315 | |
| Dell G15 5515 | |
| MSI Stealth GS66 12UGS | |
| Alienware m15 R6, i7-11800H RTX 3080 | |
| Eurocom RX315 NH57AF1 | |
| Medio Intel Core i7-11800H (6420 - 9792, n=20) | |
| AIDA64 / FPU Mandel | |
| Eurocom Nightsky ARX315 | |
| Dell G15 5515 | |
| Alienware m15 R6, i7-11800H RTX 3080 | |
| Eurocom RX315 NH57AF1 | |
| Medio Intel Core i7-11800H (23365 - 39464, n=20) | |
| MSI Stealth GS66 12UGS | |
| AIDA64 / CPU AES | |
| Alienware m15 R6, i7-11800H RTX 3080 | |
| Eurocom RX315 NH57AF1 | |
| Eurocom Nightsky ARX315 | |
| Medio Intel Core i7-11800H (74617 - 149388, n=20) | |
| Dell G15 5515 | |
| MSI Stealth GS66 12UGS | |
| AIDA64 / CPU ZLib | |
| MSI Stealth GS66 12UGS | |
| Eurocom Nightsky ARX315 | |
| Alienware m15 R6, i7-11800H RTX 3080 | |
| Eurocom RX315 NH57AF1 | |
| Dell G15 5515 | |
| Medio Intel Core i7-11800H (461 - 830, n=43) | |
| Razer Blade 15 Advanced (Mid 2021) | |
| AIDA64 / FP64 Ray-Trace | |
| Alienware m15 R6, i7-11800H RTX 3080 | |
| Eurocom RX315 NH57AF1 | |
| Dell G15 5515 | |
| Medio Intel Core i7-11800H (4545 - 8717, n=21) | |
| Eurocom Nightsky ARX315 | |
| MSI Stealth GS66 12UGS | |
| AIDA64 / CPU PhotoWorxx | |
| MSI Stealth GS66 12UGS | |
| Alienware m15 R6, i7-11800H RTX 3080 | |
| Eurocom RX315 NH57AF1 | |
| Medio Intel Core i7-11800H (11898 - 26757, n=21) | |
| Eurocom Nightsky ARX315 | |
| Dell G15 5515 | |
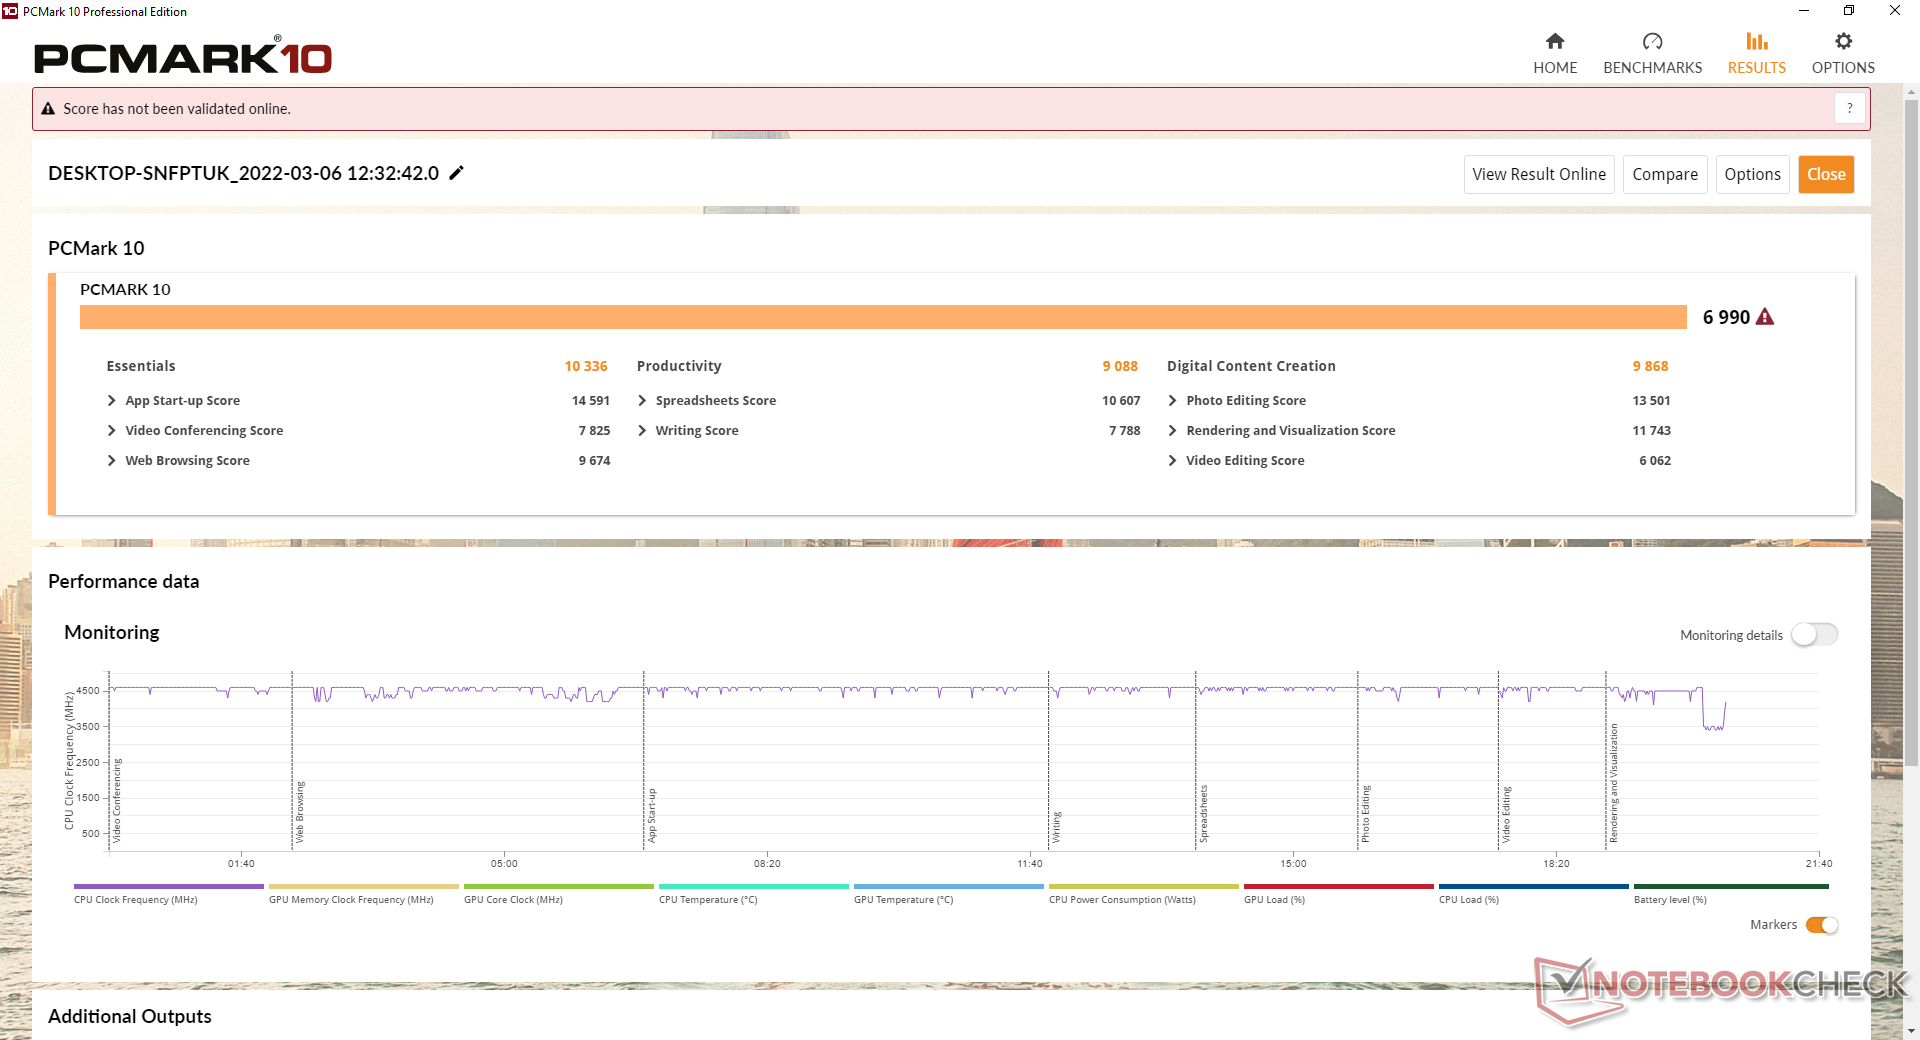
Rendimiento del sistema
| PCMark 10 / Score | |
| MSI Stealth GS66 12UGS | |
| Razer Blade 15 Advanced (Mid 2021) | |
| Eurocom Nightsky ARX315 | |
| Alienware m15 R6, i7-11800H RTX 3080 | |
| Eurocom RX315 NH57AF1 | |
| Medio Intel Core i7-11800H, NVIDIA GeForce RTX 3070 Laptop GPU (6126 - 7311, n=11) | |
| Dell G15 5515 | |
| PCMark 10 / Essentials | |
| Razer Blade 15 Advanced (Mid 2021) | |
| MSI Stealth GS66 12UGS | |
| Eurocom Nightsky ARX315 | |
| Eurocom RX315 NH57AF1 | |
| Medio Intel Core i7-11800H, NVIDIA GeForce RTX 3070 Laptop GPU (9248 - 10832, n=11) | |
| Alienware m15 R6, i7-11800H RTX 3080 | |
| Dell G15 5515 | |
| PCMark 10 / Productivity | |
| MSI Stealth GS66 12UGS | |
| Eurocom Nightsky ARX315 | |
| Alienware m15 R6, i7-11800H RTX 3080 | |
| Eurocom RX315 NH57AF1 | |
| Medio Intel Core i7-11800H, NVIDIA GeForce RTX 3070 Laptop GPU (8571 - 9669, n=11) | |
| Razer Blade 15 Advanced (Mid 2021) | |
| Dell G15 5515 | |
| PCMark 10 / Digital Content Creation | |
| MSI Stealth GS66 12UGS | |
| Razer Blade 15 Advanced (Mid 2021) | |
| Alienware m15 R6, i7-11800H RTX 3080 | |
| Eurocom Nightsky ARX315 | |
| Eurocom RX315 NH57AF1 | |
| Medio Intel Core i7-11800H, NVIDIA GeForce RTX 3070 Laptop GPU (7627 - 10851, n=11) | |
| Dell G15 5515 | |
| PCMark 10 Score | 6990 puntos | |
ayuda | ||
| AIDA64 / Memory Copy | |
| MSI Stealth GS66 12UGS | |
| Alienware m15 R6, i7-11800H RTX 3080 | |
| Eurocom RX315 NH57AF1 | |
| Medio Intel Core i7-11800H (24508 - 48144, n=21) | |
| Eurocom Nightsky ARX315 | |
| Dell G15 5515 | |
| AIDA64 / Memory Read | |
| MSI Stealth GS66 12UGS | |
| Alienware m15 R6, i7-11800H RTX 3080 | |
| Eurocom RX315 NH57AF1 | |
| Eurocom Nightsky ARX315 | |
| Medio Intel Core i7-11800H (25882 - 50365, n=20) | |
| Dell G15 5515 | |
| AIDA64 / Memory Write | |
| MSI Stealth GS66 12UGS | |
| Eurocom Nightsky ARX315 | |
| Alienware m15 R6, i7-11800H RTX 3080 | |
| Eurocom RX315 NH57AF1 | |
| Medio Intel Core i7-11800H (22240 - 46214, n=20) | |
| Dell G15 5515 | |
| AIDA64 / Memory Latency | |
| Alienware m15 R6, i7-11800H RTX 3080 | |
| MSI Stealth GS66 12UGS | |
| Eurocom RX315 NH57AF1 | |
| Dell G15 5515 | |
| Eurocom Nightsky ARX315 | |
| Medio Intel Core i7-11800H (71.9 - 104.1, n=44) | |
| Razer Blade 15 Advanced (Mid 2021) | |
* ... más pequeño es mejor
Latencia del CPD
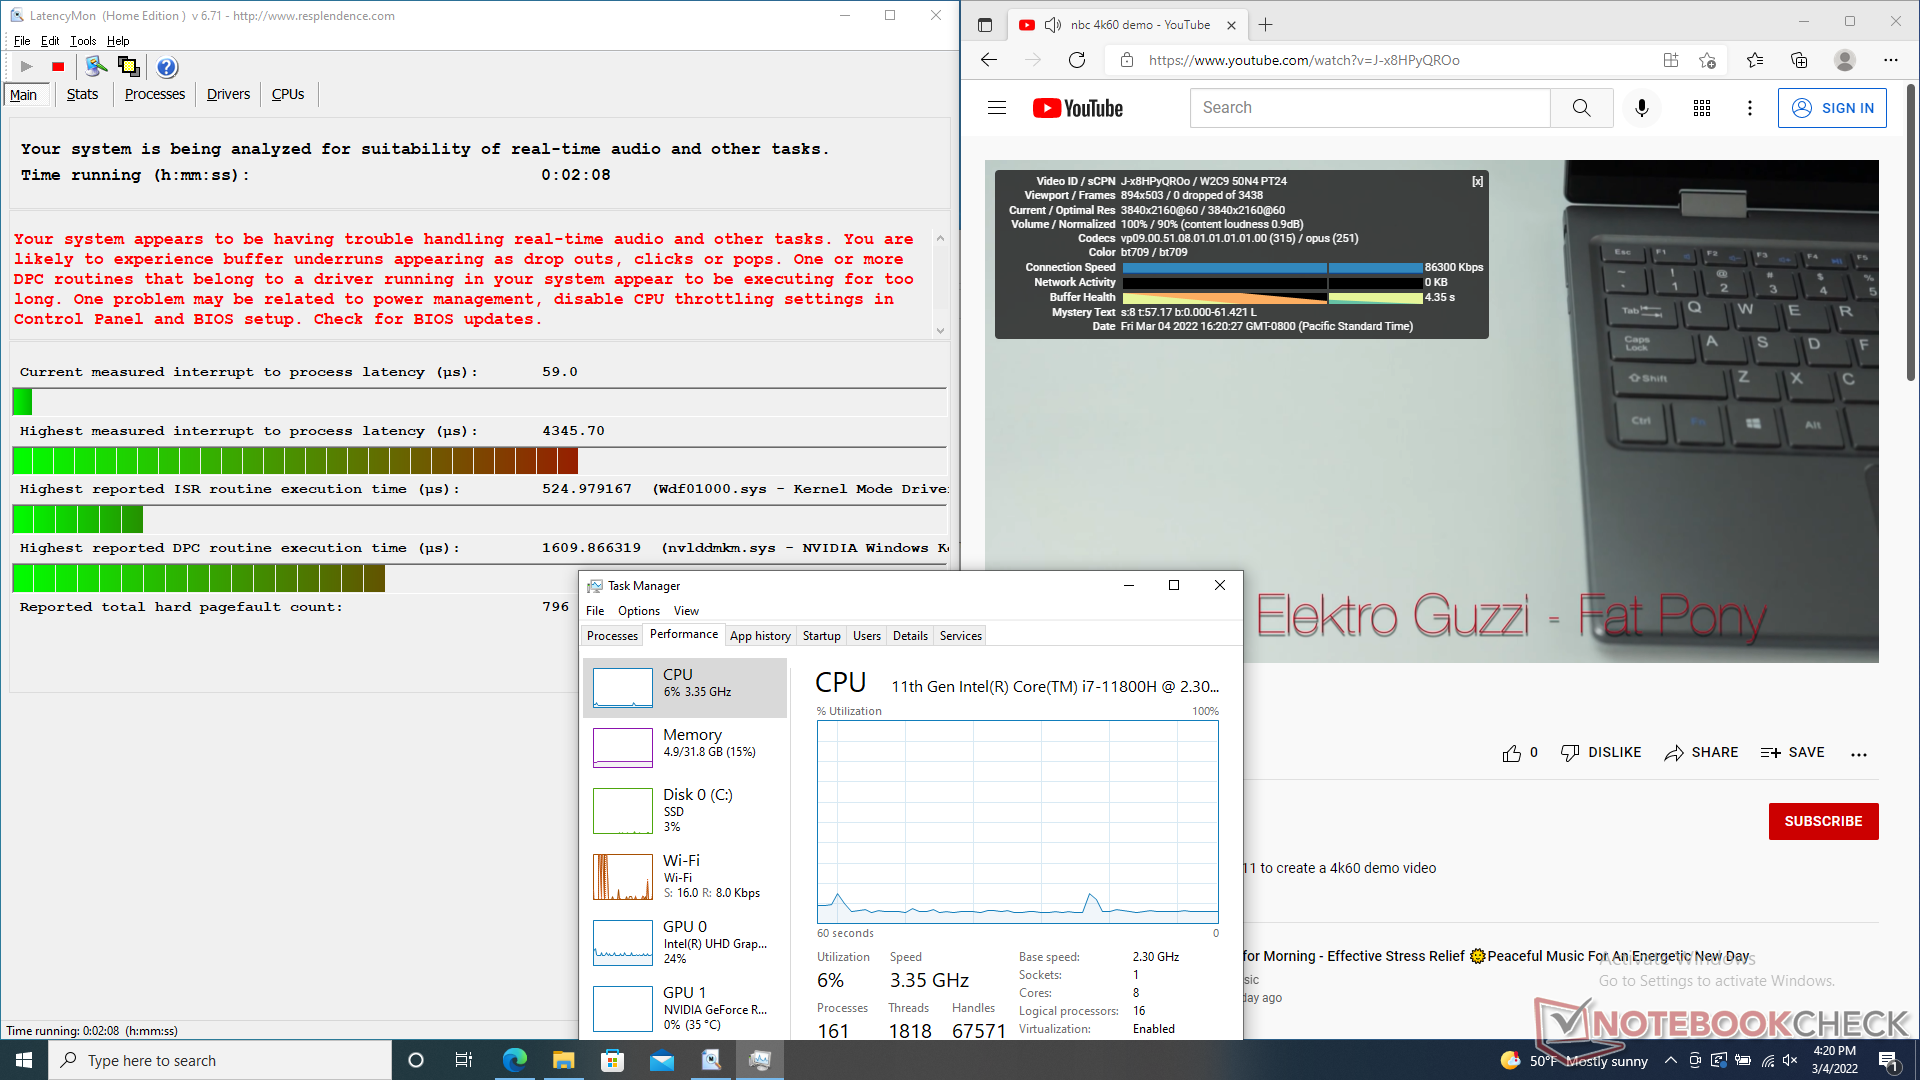
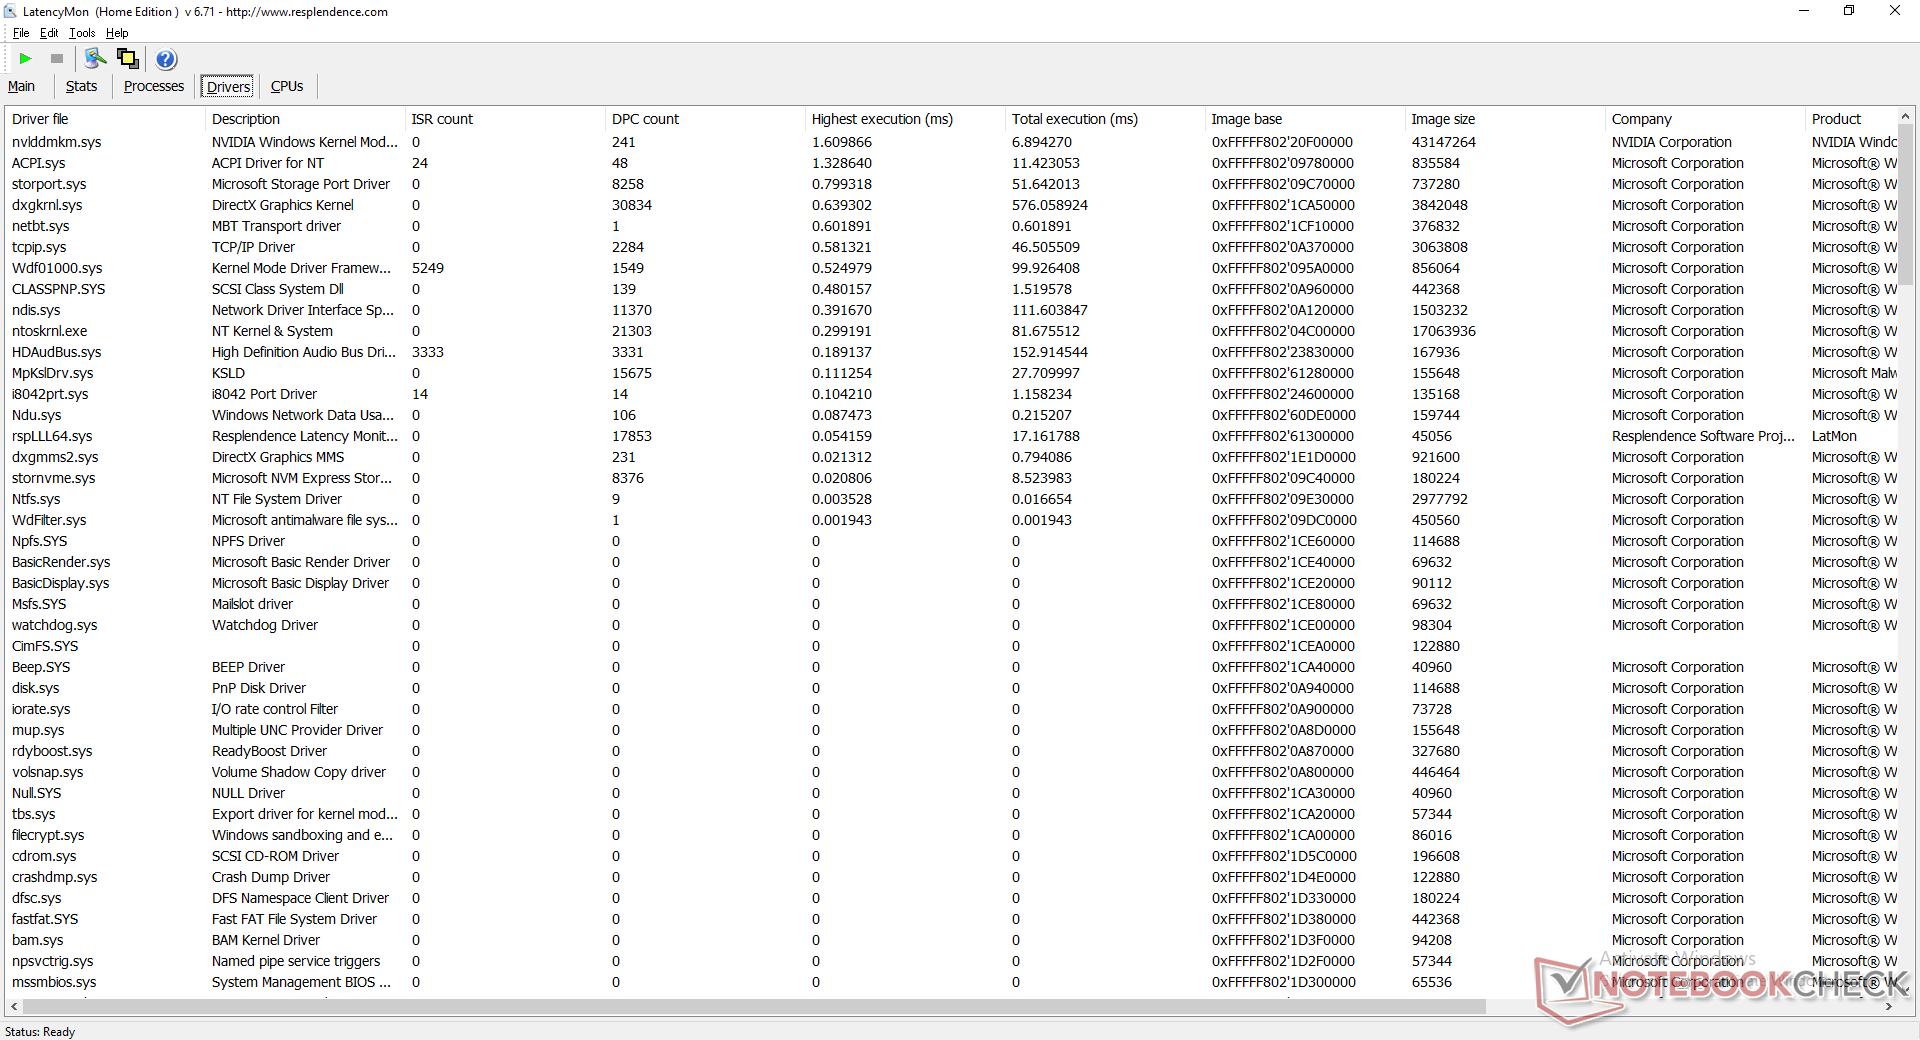
LatencyMon revela problemas de CPD al abrir varias pestañas del navegador de nuestra página web. la reproducción de vídeo 4K UHD a 60 FPS es, por lo demás, fluida y sin pérdida de fotogramas.
| DPC Latencies / LatencyMon - interrupt to process latency (max), Web, Youtube, Prime95 | |
| Razer Blade 15 Advanced (Mid 2021) | |
| Eurocom RX315 NH57AF1 | |
| MSI Stealth GS66 12UGS | |
| Alienware m15 R6, i7-11800H RTX 3080 | |
| Dell G15 5515 | |
| Eurocom Nightsky ARX315 | |
* ... más pequeño es mejor
Dispositivos de almacenamiento
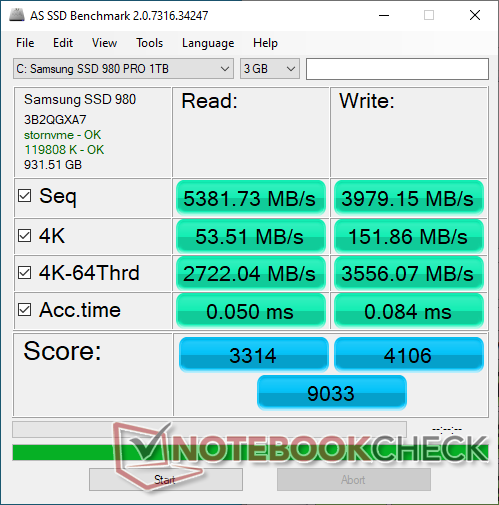
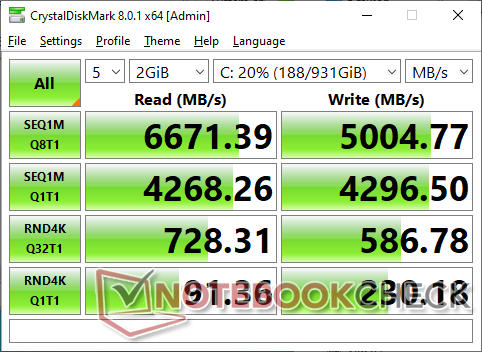
El SSD Samsung 980 Pro PCIe4 x4 de 1 TB de nuestra unidad puede alcanzar tasas de transferencia de hasta 6500 MB/s. La sostenibilidad del rendimiento también es bastante buena, ya que esta tasa máxima cae ligeramente hasta los 5900 MB/s durante el último tercio de nuestra prueba de estrés DiskSpd.

* ... más pequeño es mejor
Disk Throttling: DiskSpd Read Loop, Queue Depth 8
Rendimiento de la GPU
Los 105 W GeForce RTX 3070 es entre un 15 y un 20 por ciento más lenta que la nueva 150 W GeForce RTX 3070 Ti. El rendimiento general está donde esperamos que esté en relación con otros portátiles con la misma GPU RTX 3070 móvil.
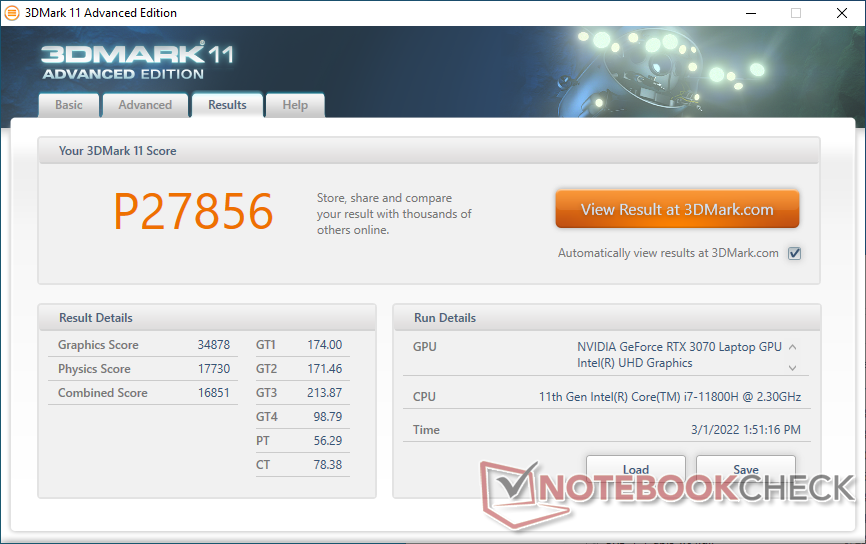
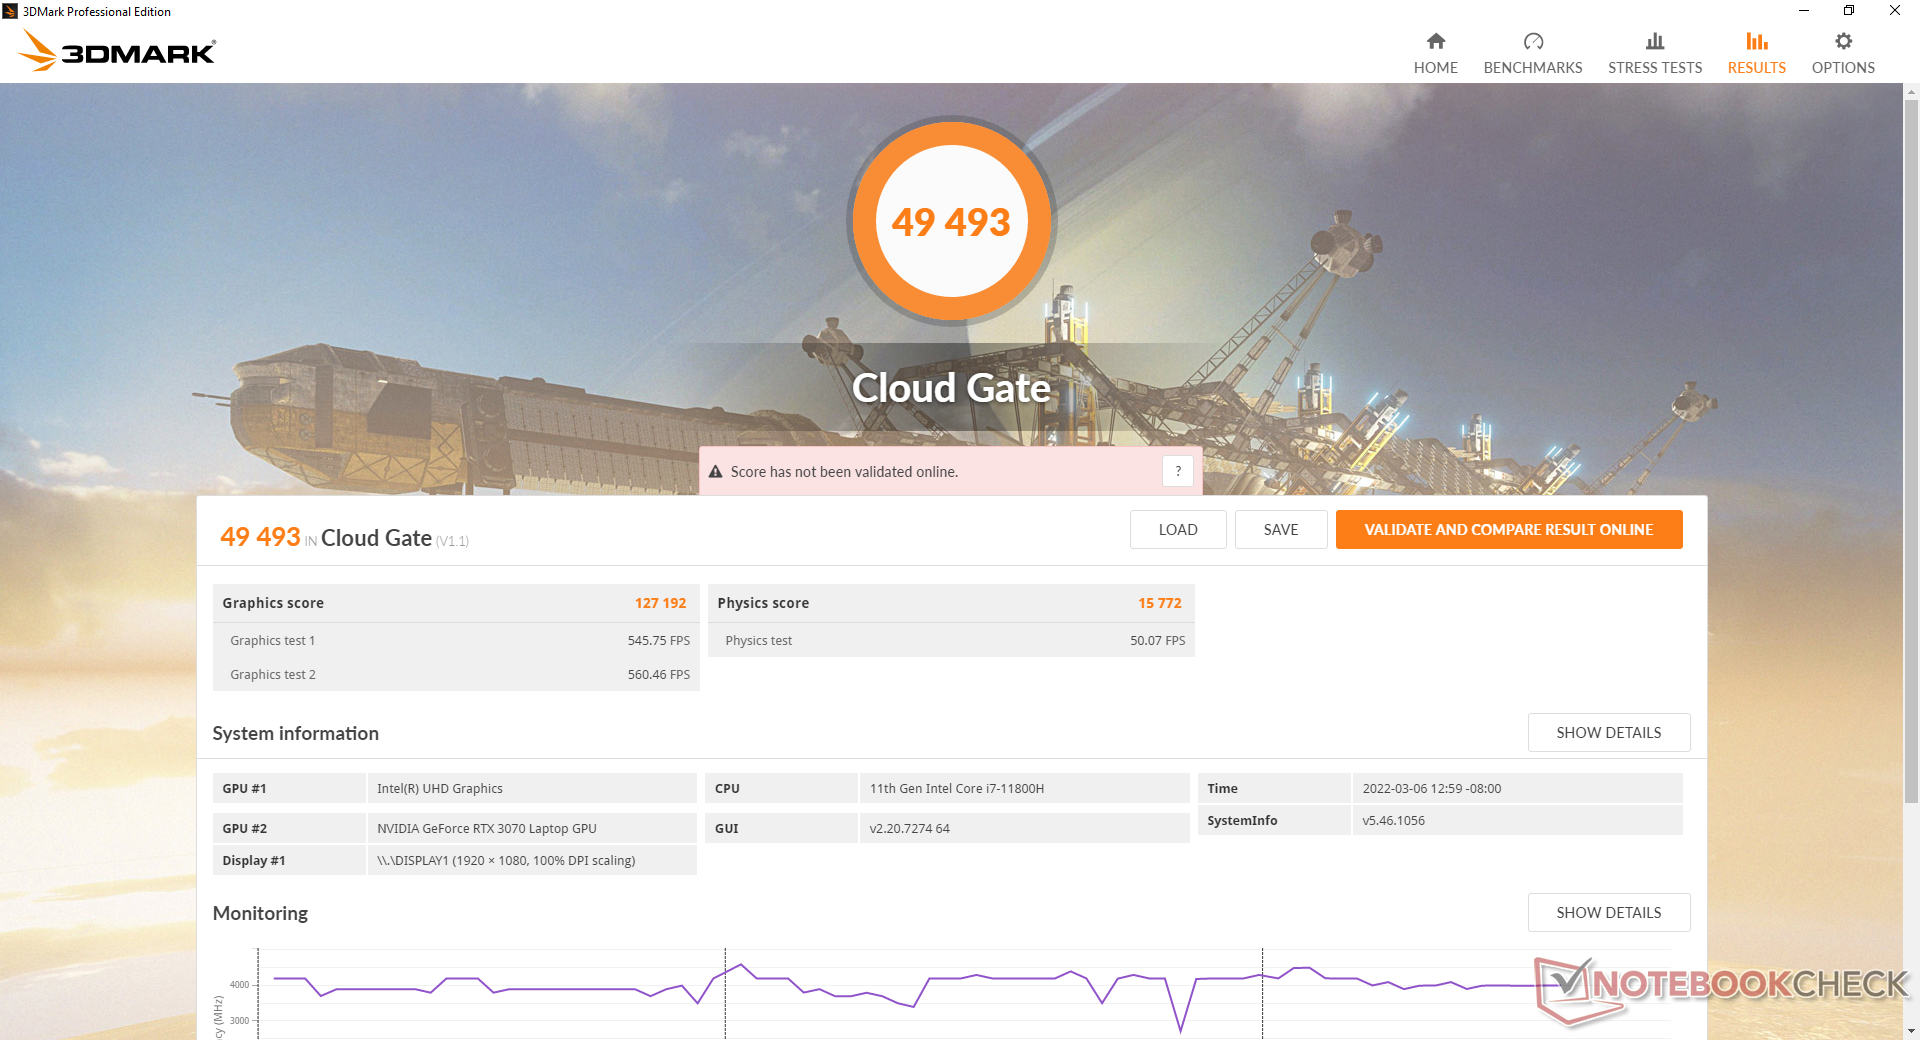
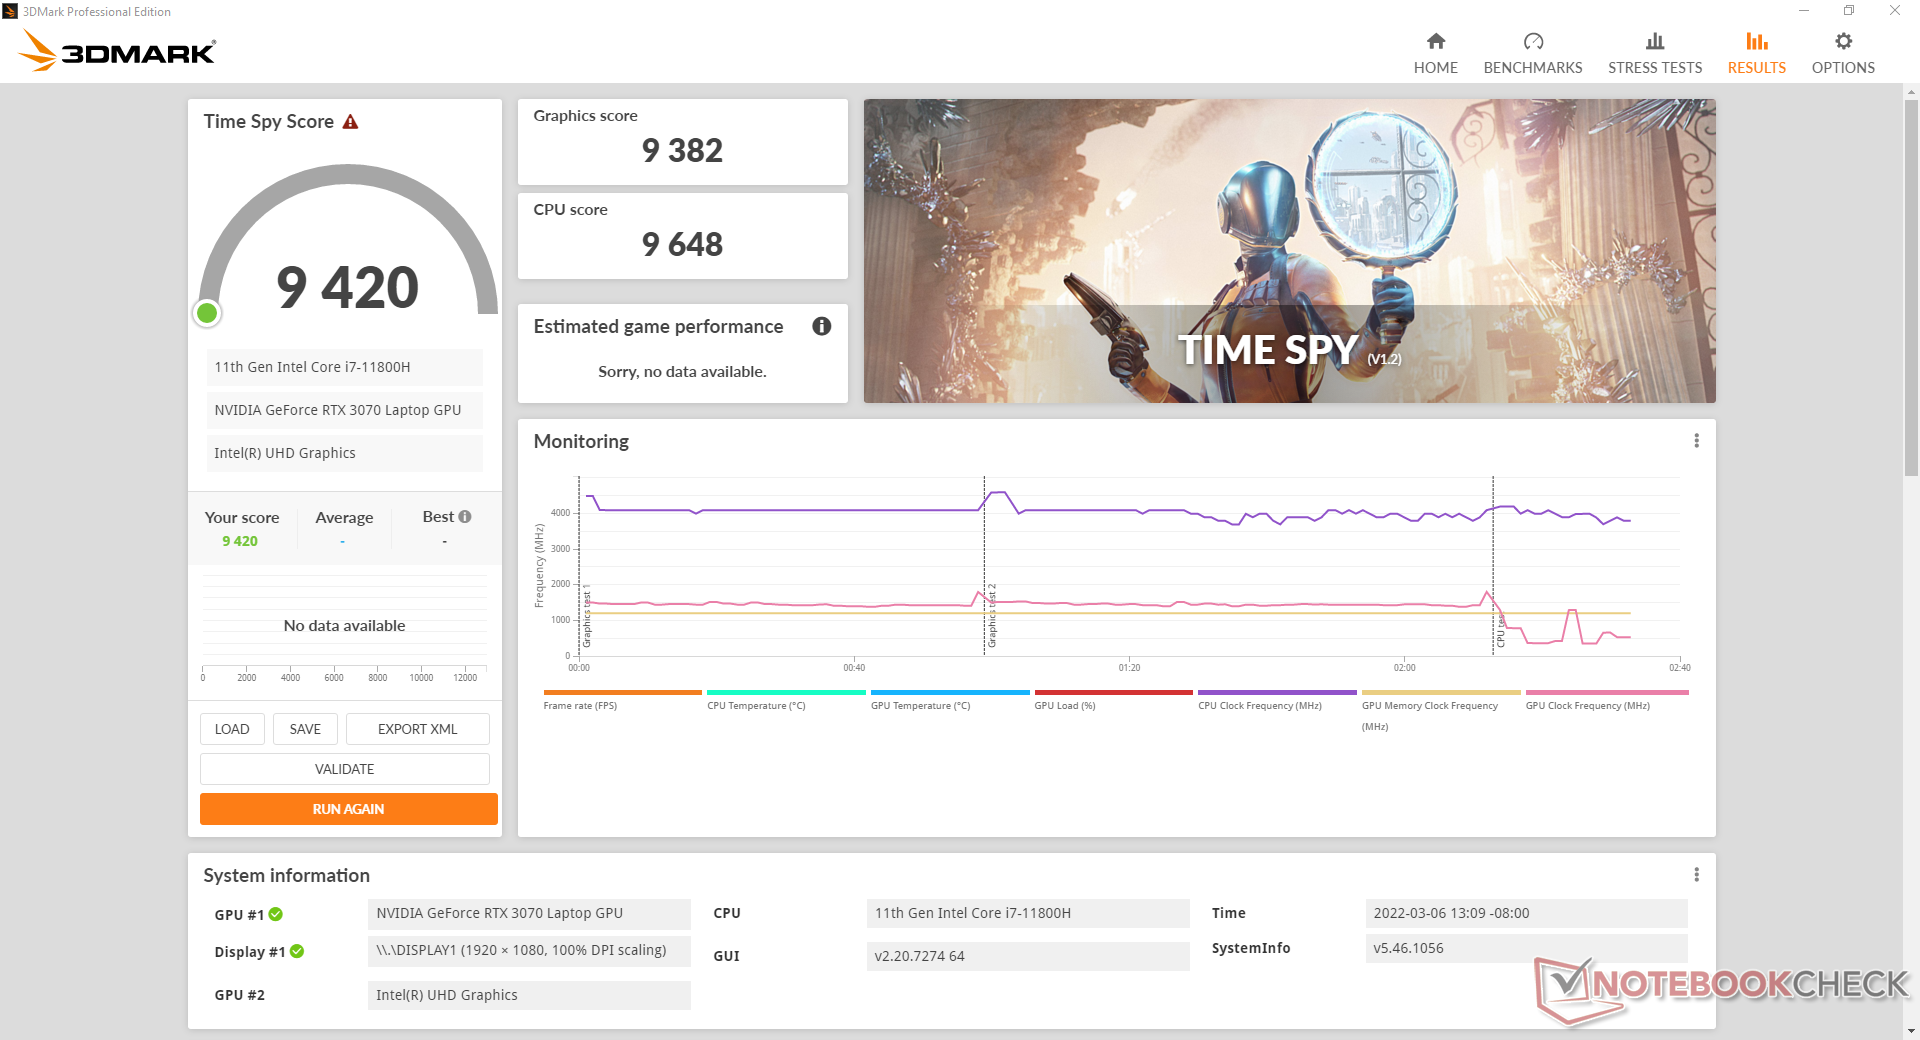
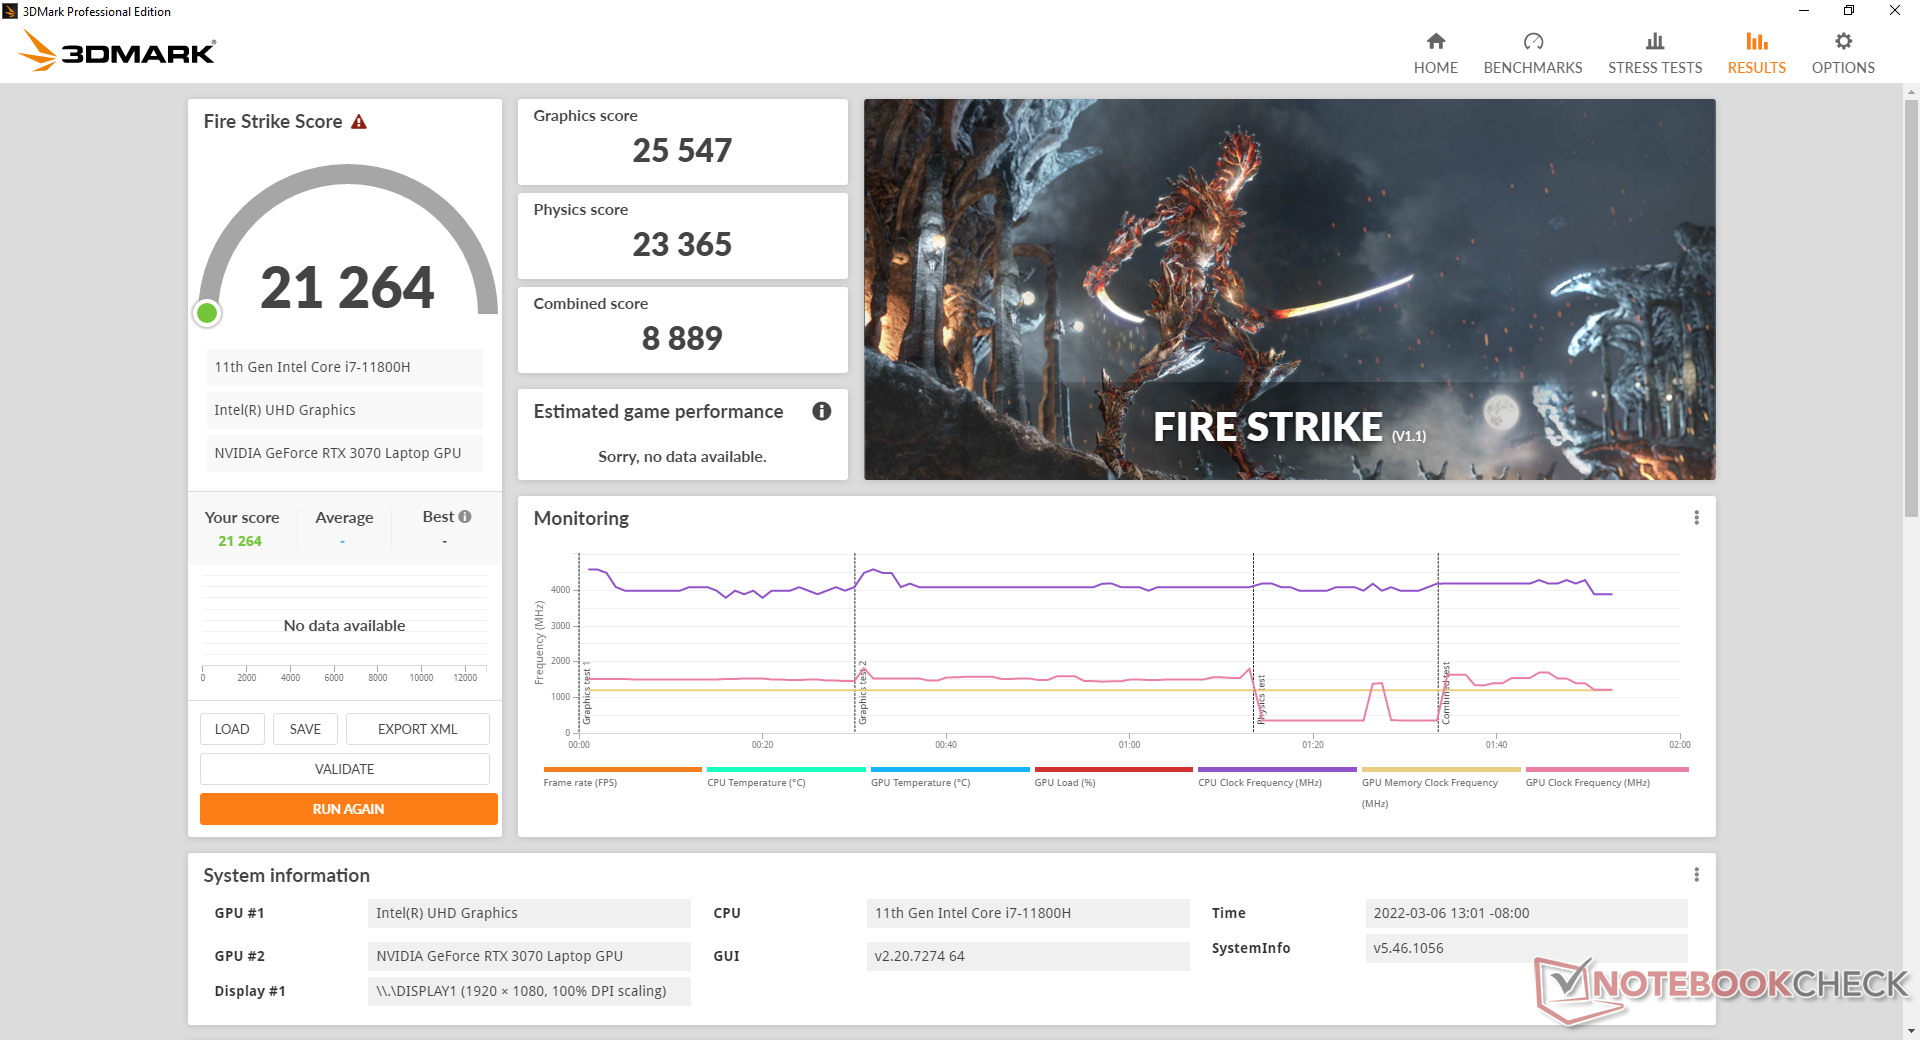
| 3DMark 11 Performance | 27856 puntos | |
| 3DMark Cloud Gate Standard Score | 49493 puntos | |
| 3DMark Fire Strike Score | 21264 puntos | |
| 3DMark Time Spy Score | 9420 puntos | |
ayuda | ||
Witcher 3 FPS Chart
| bajo | medio | alto | ultra | |
|---|---|---|---|---|
| GTA V (2015) | 182 | 176 | 159 | 95.5 |
| The Witcher 3 (2015) | 388.1 | 279.3 | 177.8 | 96.5 |
| Dota 2 Reborn (2015) | 163 | 146 | 137 | 129 |
| Final Fantasy XV Benchmark (2018) | 162 | 116 | 90.4 | |
| X-Plane 11.11 (2018) | 125 | 104 | 82.9 | |
| Far Cry 5 (2018) | 148 | 120 | 114 | 107 |
| Strange Brigade (2018) | 442 | 236 | 193 | 171 |
Emisiones
Ruido del sistema
El ruido del ventilador depende en gran medida de los cuatro ajustes del Centro de Control del perfil de energía: Silencio, Ahorro de energía, Entretenimiento y Rendimiento. Hay un quinto ajuste manual del modo de ventilador máximo que fija los ventiladores a su máximo ruido en 57 dB(A) sin importar la carga en pantalla.
Se recomienda ejecutar el sistema en el modo de ahorro de energía si simplemente navegar por la web o el procesamiento de textos, ya que los ventiladores tienden a pulsar con mucha frecuencia entre 26 y 34 dB (A) en el modo de rendimiento. Los juegos en modo Rendimiento son más ruidosos que los que registramos en elRazer Blade 15 Advanced o el MSI GS66.
Ruido
| Ocioso |
| 26.4 / 31 / 34 dB(A) |
| Carga |
| 47.8 / 57.1 dB(A) |
 | ||
30 dB silencioso 40 dB(A) audible 50 dB(A) ruidosamente alto |
||
min: | ||
| Eurocom RX315 NH57AF1 GeForce RTX 3070 Laptop GPU, i7-11800H, Samsung SSD 980 Pro 1TB MZ-V8P1T0BW | MSI Stealth GS66 12UGS GeForce RTX 3070 Ti Laptop GPU, i7-12700H, WDC PC SN810 1TB | Eurocom Nightsky ARX315 GeForce RTX 3070 Laptop GPU, R9 5900X, Samsung SSD 980 Pro 1TB MZ-V8P1T0BW | Alienware m15 R6, i7-11800H RTX 3080 GeForce RTX 3080 Laptop GPU, i7-11800H, Samsung PM9A1 MZVL21T0HCLR | Dell G15 5515 GeForce RTX 3050 Ti Laptop GPU, R7 5800H, Samsung PM991a MZ9LQ512HBLU-00BD1 | Razer Blade 15 Advanced (Mid 2021) GeForce RTX 3080 Laptop GPU, i7-11800H, SSSTC CA6-8D1024 | |
|---|---|---|---|---|---|---|
| Noise | 3% | -4% | 12% | 12% | 12% | |
| apagado / medio ambiente * (dB) | 26.3 | 24 9% | 25.3 4% | 23 13% | 24 9% | 25.1 5% |
| Idle Minimum * (dB) | 26.4 | 31 -17% | 25.9 2% | 23 13% | 25 5% | 25.3 4% |
| Idle Average * (dB) | 31 | 32 -3% | 27.9 10% | 23 26% | 26 16% | 25.3 18% |
| Idle Maximum * (dB) | 34 | 35 -3% | 40.8 -20% | 30 12% | 30 12% | 25.3 26% |
| Load Average * (dB) | 47.8 | 48 -0% | 55.2 -15% | 41.26 14% | 44 8% | 42 12% |
| Witcher 3 ultra * (dB) | 51.7 | 43 17% | 52.4 -1% | 53.4 -3% | 44 15% | 45.6 12% |
| Load Maximum * (dB) | 57.1 | 48 16% | 60.3 -6% | 53.37 7% | 48 16% | 51.6 10% |
* ... más pequeño es mejor
Temperatura
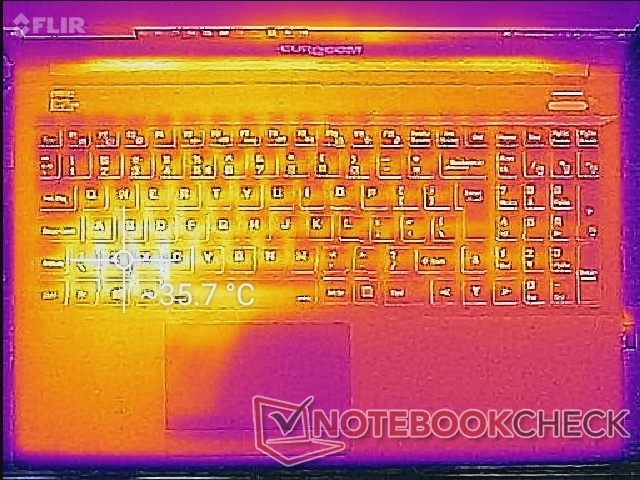
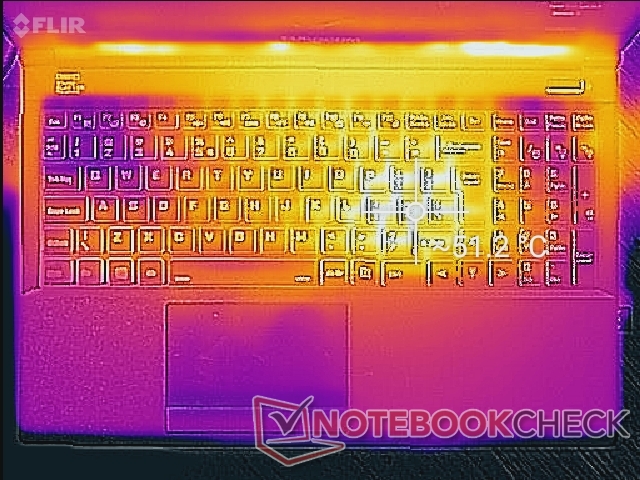
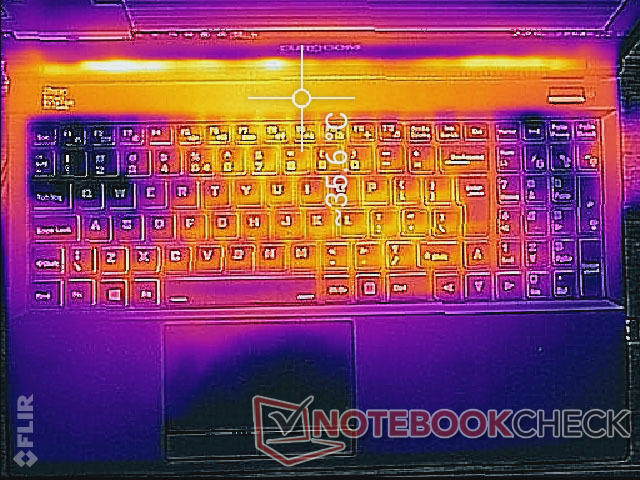
Las temperaturas de la superficie cuando se juega pueden llegar a los 51 C cerca del centro del teclado en comparación con los 44 C del Razer Blade 15. Como en la mayoría de portátiles de juego, los dos ventiladores están situados bajo las teclas WASD y el teclado numérico para mantener estas secciones del portátil relativamente frescas sin importar la carga.
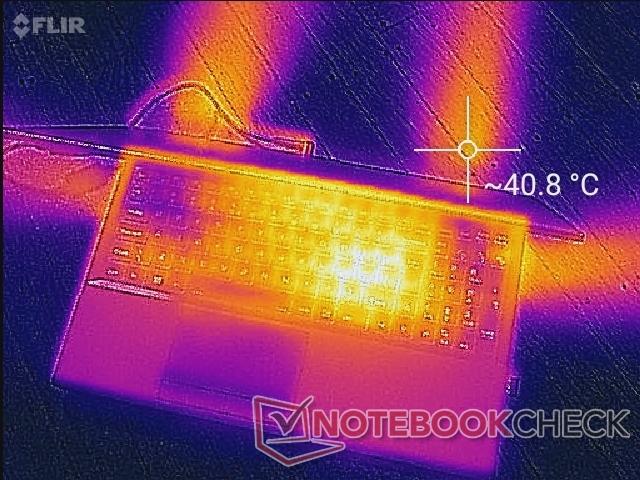
(+) La temperatura máxima en la parte superior es de 36 °C / 97 F, frente a la media de 40.4 °C / 105 F, que oscila entre 21.2 y 68.8 °C para la clase Gaming.
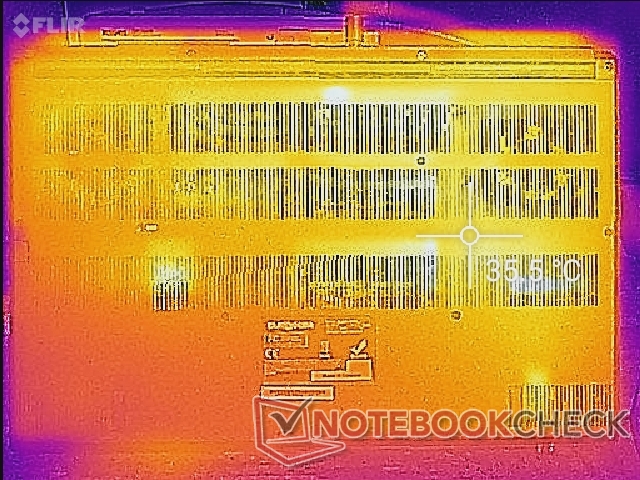
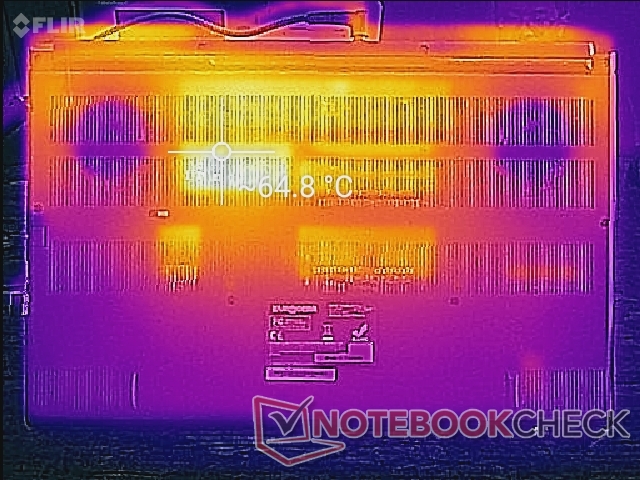
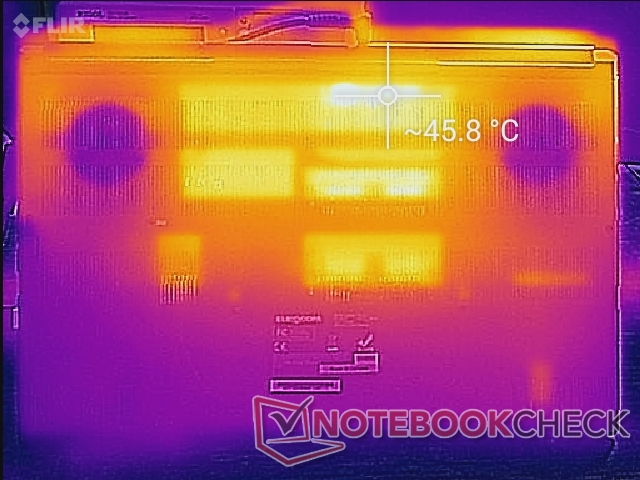
(-) El fondo se calienta hasta un máximo de 46 °C / 115 F, frente a la media de 43.2 °C / 110 F
(+) En reposo, la temperatura media de la parte superior es de 31.4 °C / 89# F, frente a la media del dispositivo de 33.9 °C / 93 F.
(±) Jugando a The Witcher 3, la temperatura media de la parte superior es de 37.1 °C / 99 F, frente a la media del dispositivo de 33.9 °C / 93 F.
(+) El reposamanos y el panel táctil están a una temperatura inferior a la de la piel, con un máximo de 31.2 °C / 88.2 F y, por tanto, son fríos al tacto.
(-) La temperatura media de la zona del reposamanos de dispositivos similares fue de 28.8 °C / 83.8 F (-2.4 °C / -4.4 F).
| Eurocom RX315 NH57AF1 Intel Core i7-11800H, NVIDIA GeForce RTX 3070 Laptop GPU | MSI Stealth GS66 12UGS Intel Core i7-12700H, NVIDIA GeForce RTX 3070 Ti Laptop GPU | Eurocom Nightsky ARX315 AMD Ryzen 9 5900X, NVIDIA GeForce RTX 3070 Laptop GPU | Alienware m15 R6, i7-11800H RTX 3080 Intel Core i7-11800H, NVIDIA GeForce RTX 3080 Laptop GPU | Dell G15 5515 AMD Ryzen 7 5800H, NVIDIA GeForce RTX 3050 Ti Laptop GPU | Razer Blade 15 Advanced (Mid 2021) Intel Core i7-11800H, NVIDIA GeForce RTX 3080 Laptop GPU | |
|---|---|---|---|---|---|---|
| Heat | -6% | -5% | -25% | 3% | -14% | |
| Maximum Upper Side * (°C) | 36 | 54 -50% | 36.2 -1% | 61 -69% | 50 -39% | 51 -42% |
| Maximum Bottom * (°C) | 46 | 59 -28% | 49.6 -8% | 58 -26% | 49 -7% | 52 -13% |
| Idle Upper Side * (°C) | 35.6 | 26 27% | 32.6 8% | 38 -7% | 26 27% | 35.2 1% |
| Idle Bottom * (°C) | 36.8 | 27 27% | 43.2 -17% | 36 2% | 26 29% | 37.8 -3% |
* ... más pequeño es mejor
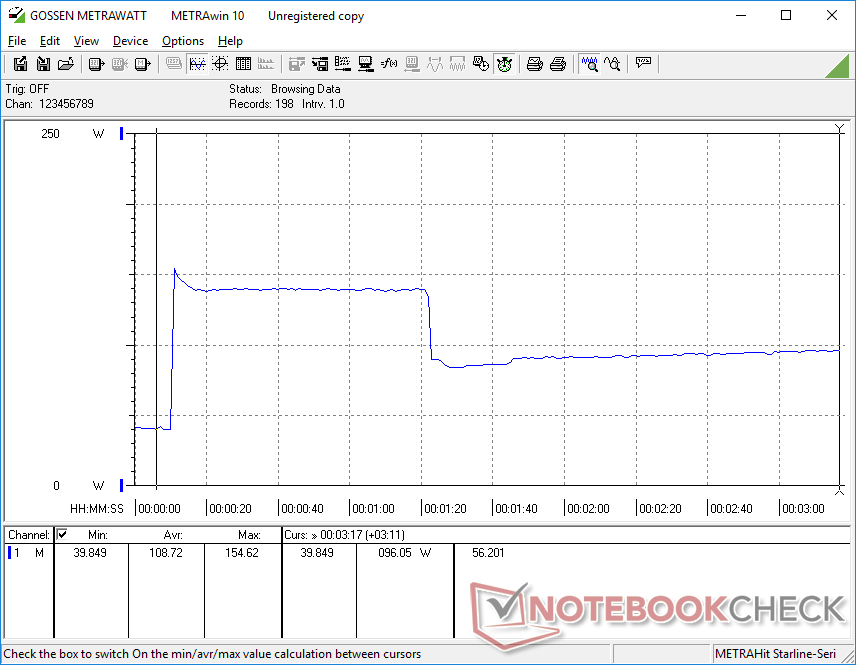
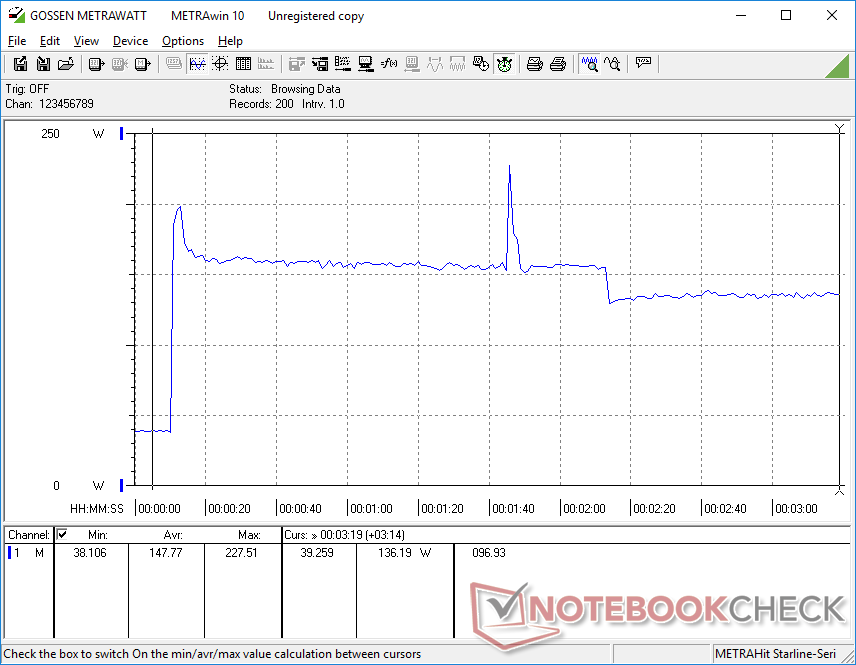
Prueba de esfuerzo
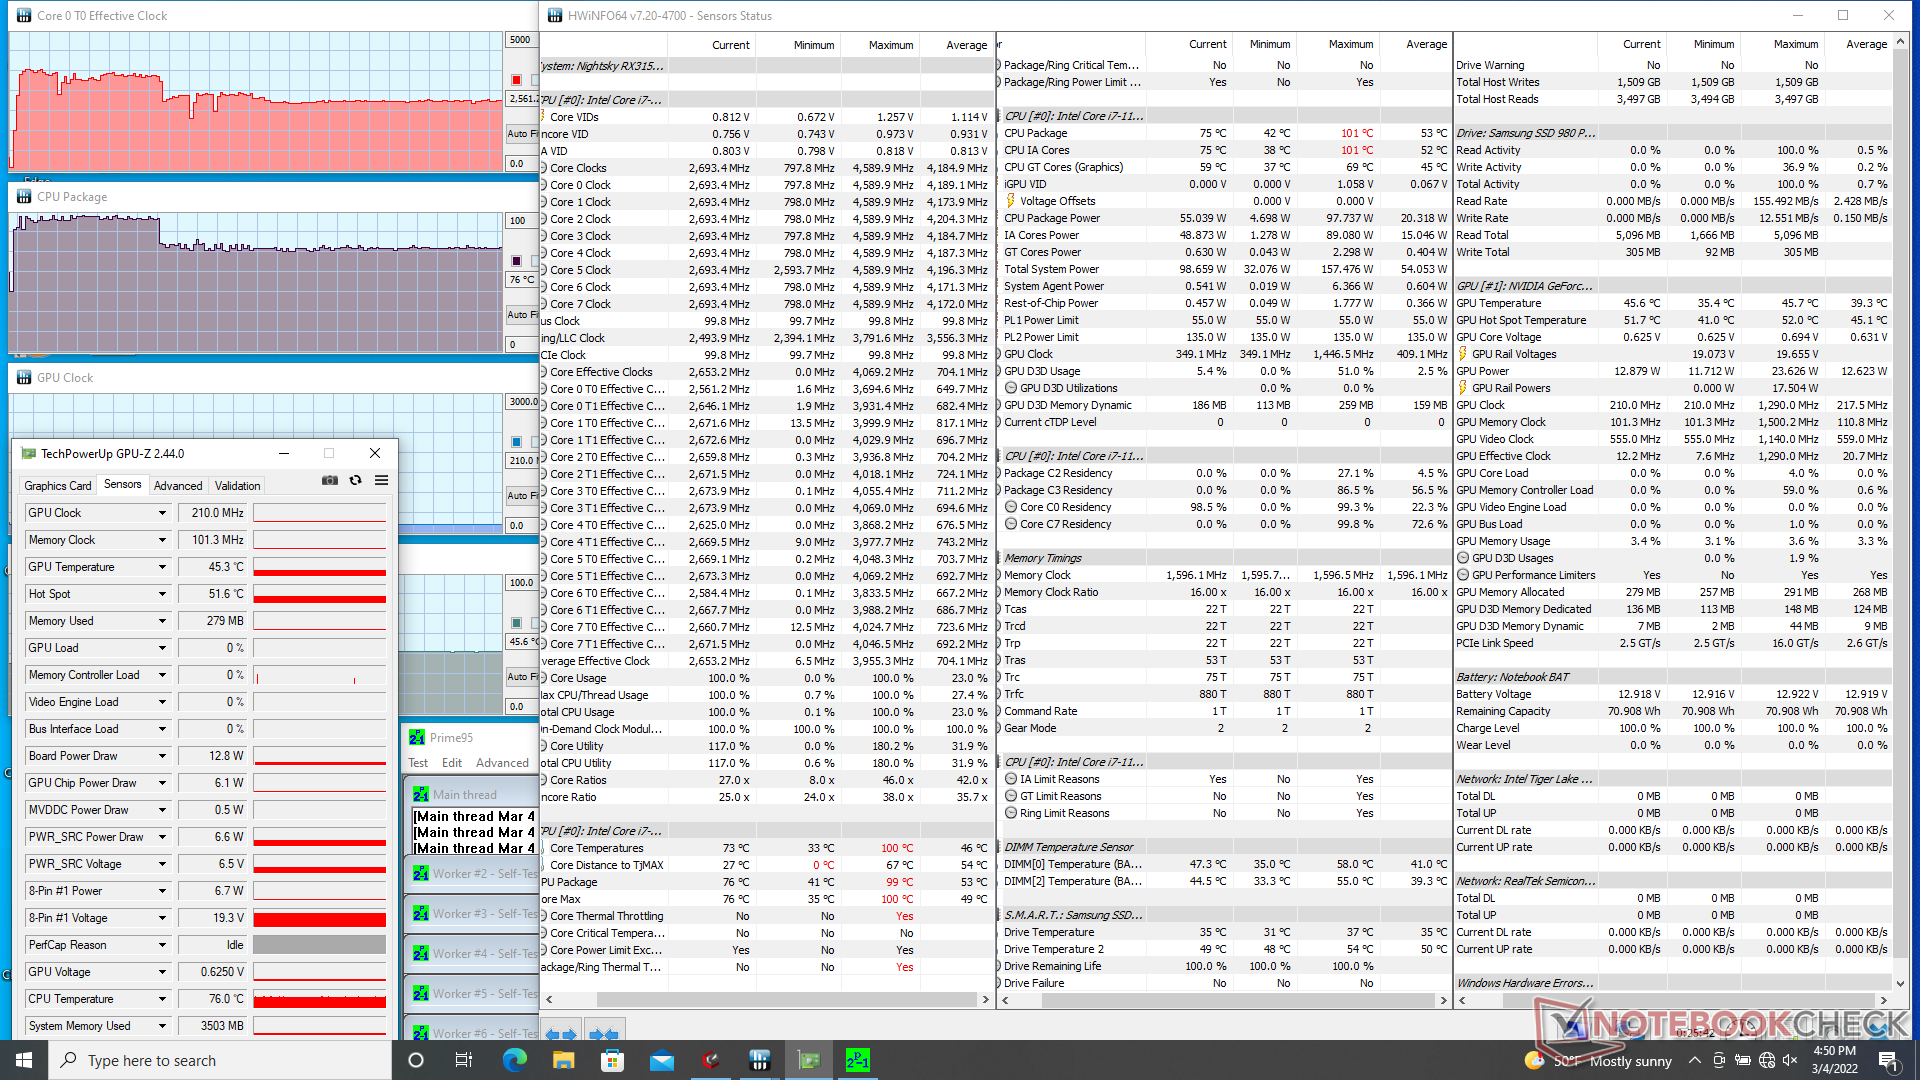
Cuando se ejecutaba Prime95, la CPU subía a 3,5 o 3,7 GHz durante los primeros 70 segundos con un consumo de 95 W y una temperatura del núcleo de 99 C. Después, la CPU se estabilizaba a una temperatura más cómoda de 76 C y 54 W, aunque a una velocidad de reloj inferior de 2,8 GHz.
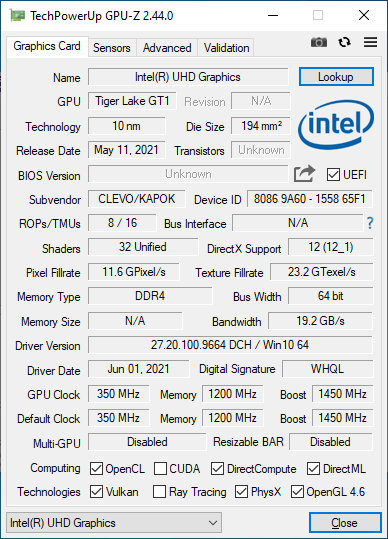
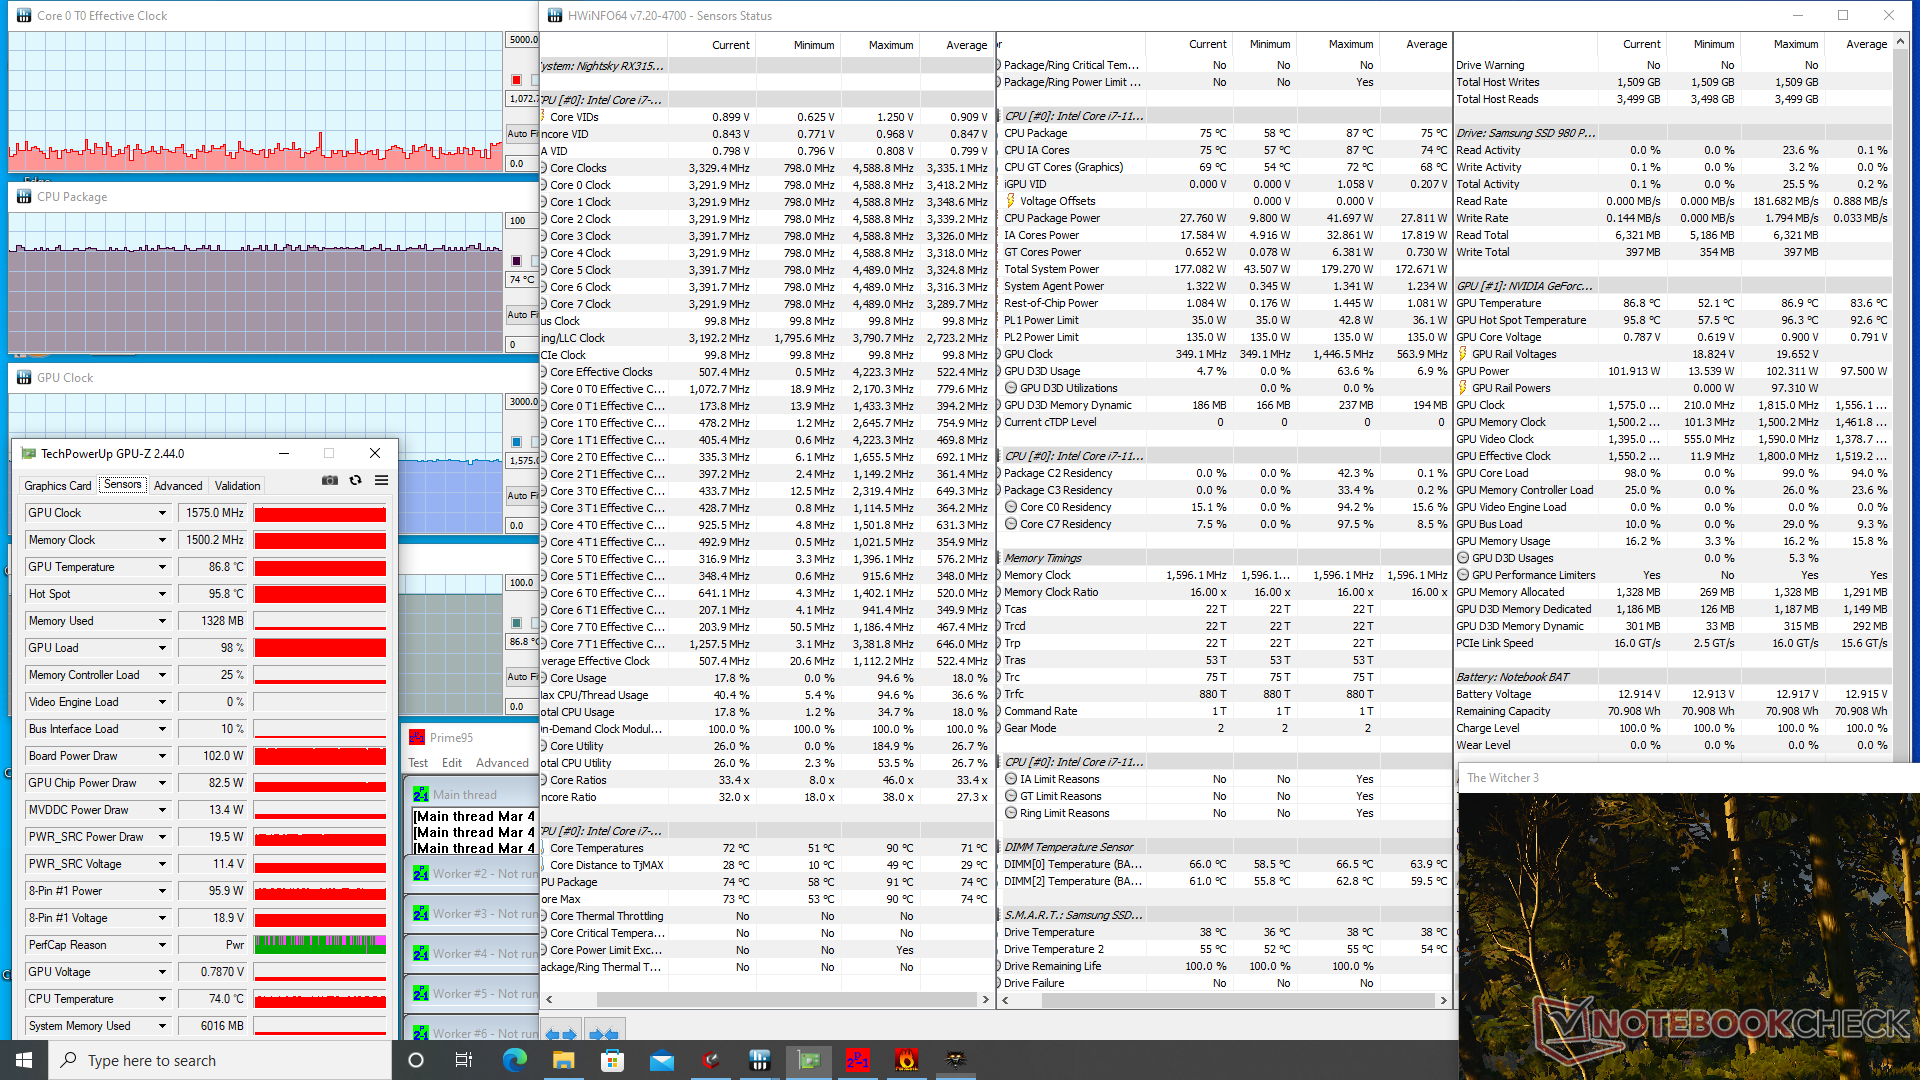
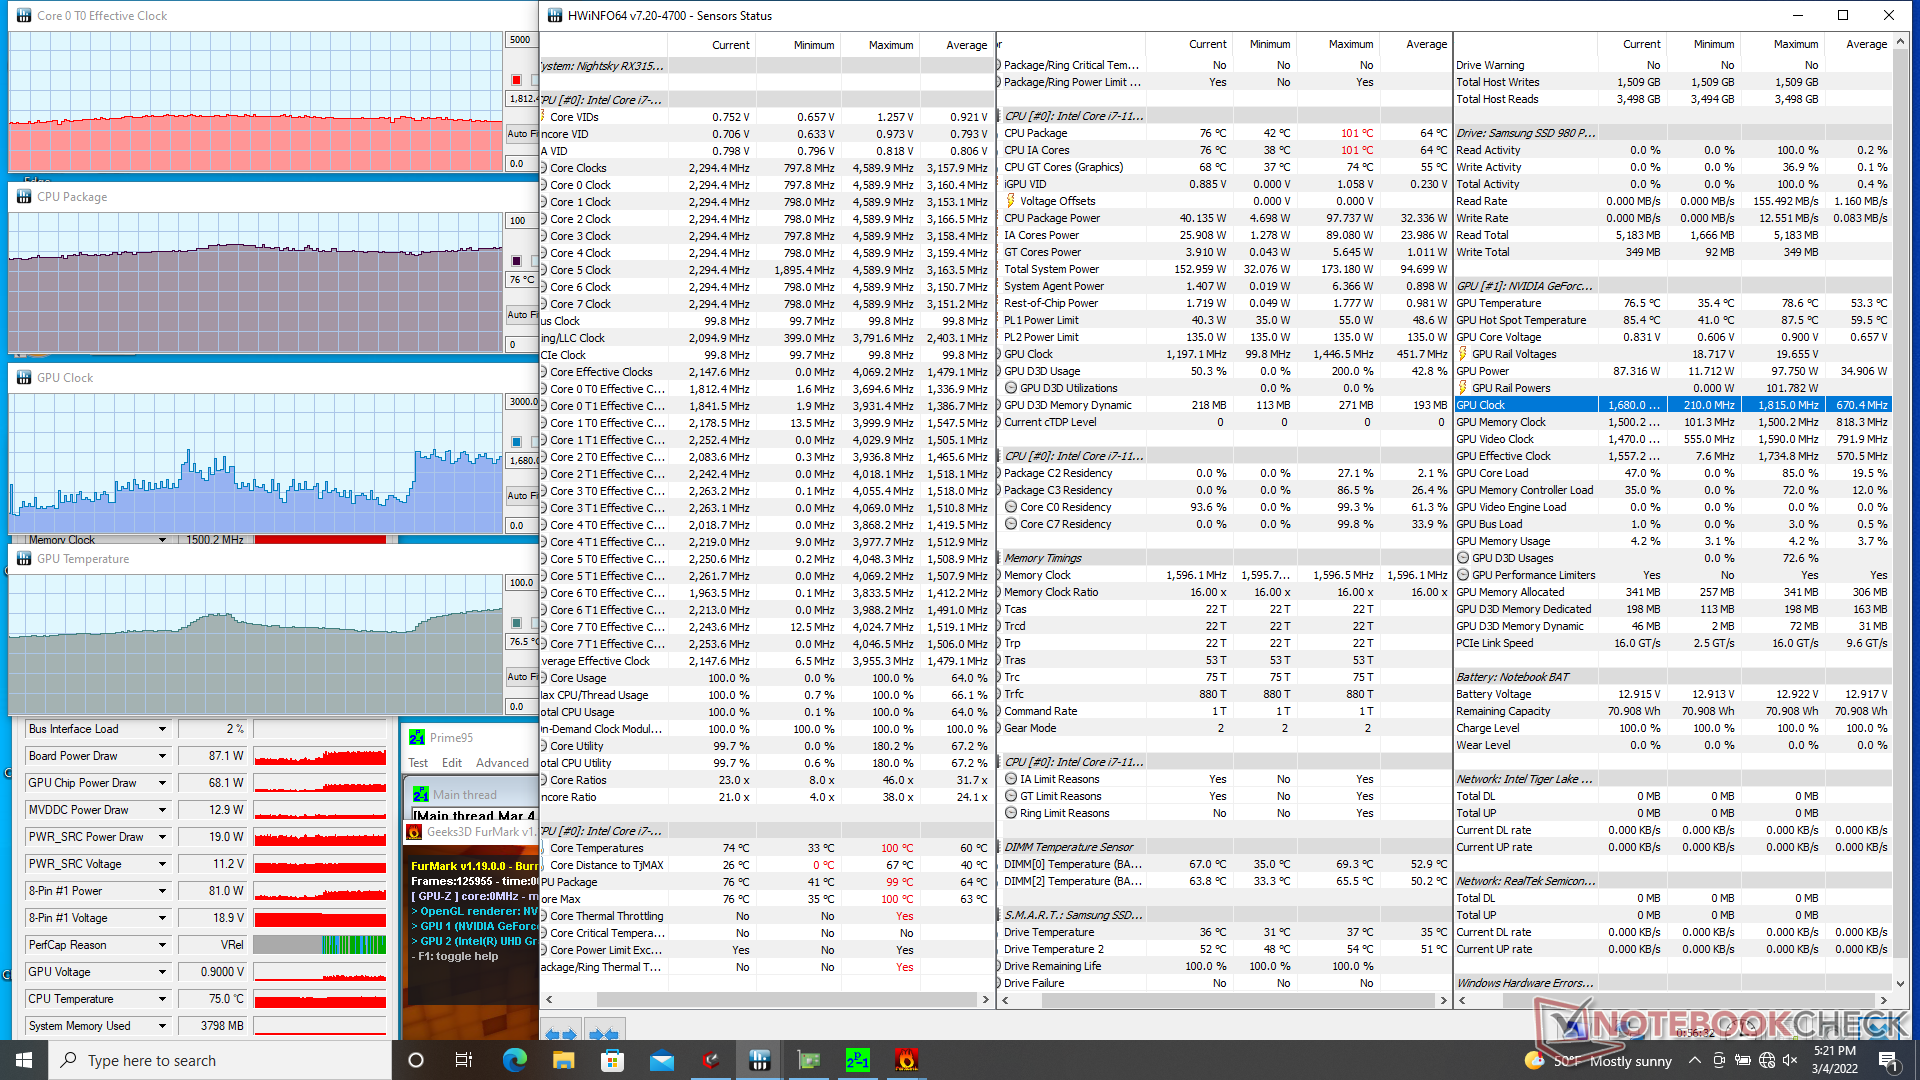
Cuando se ejecuta Witcher 3la GPU se estabiliza a 1.575 MHz y 87 C. GPU-Z indica un consumo de energía de la placa de 102 W, lo que está muy cerca del objetivo anunciado de 105 W de TGP.
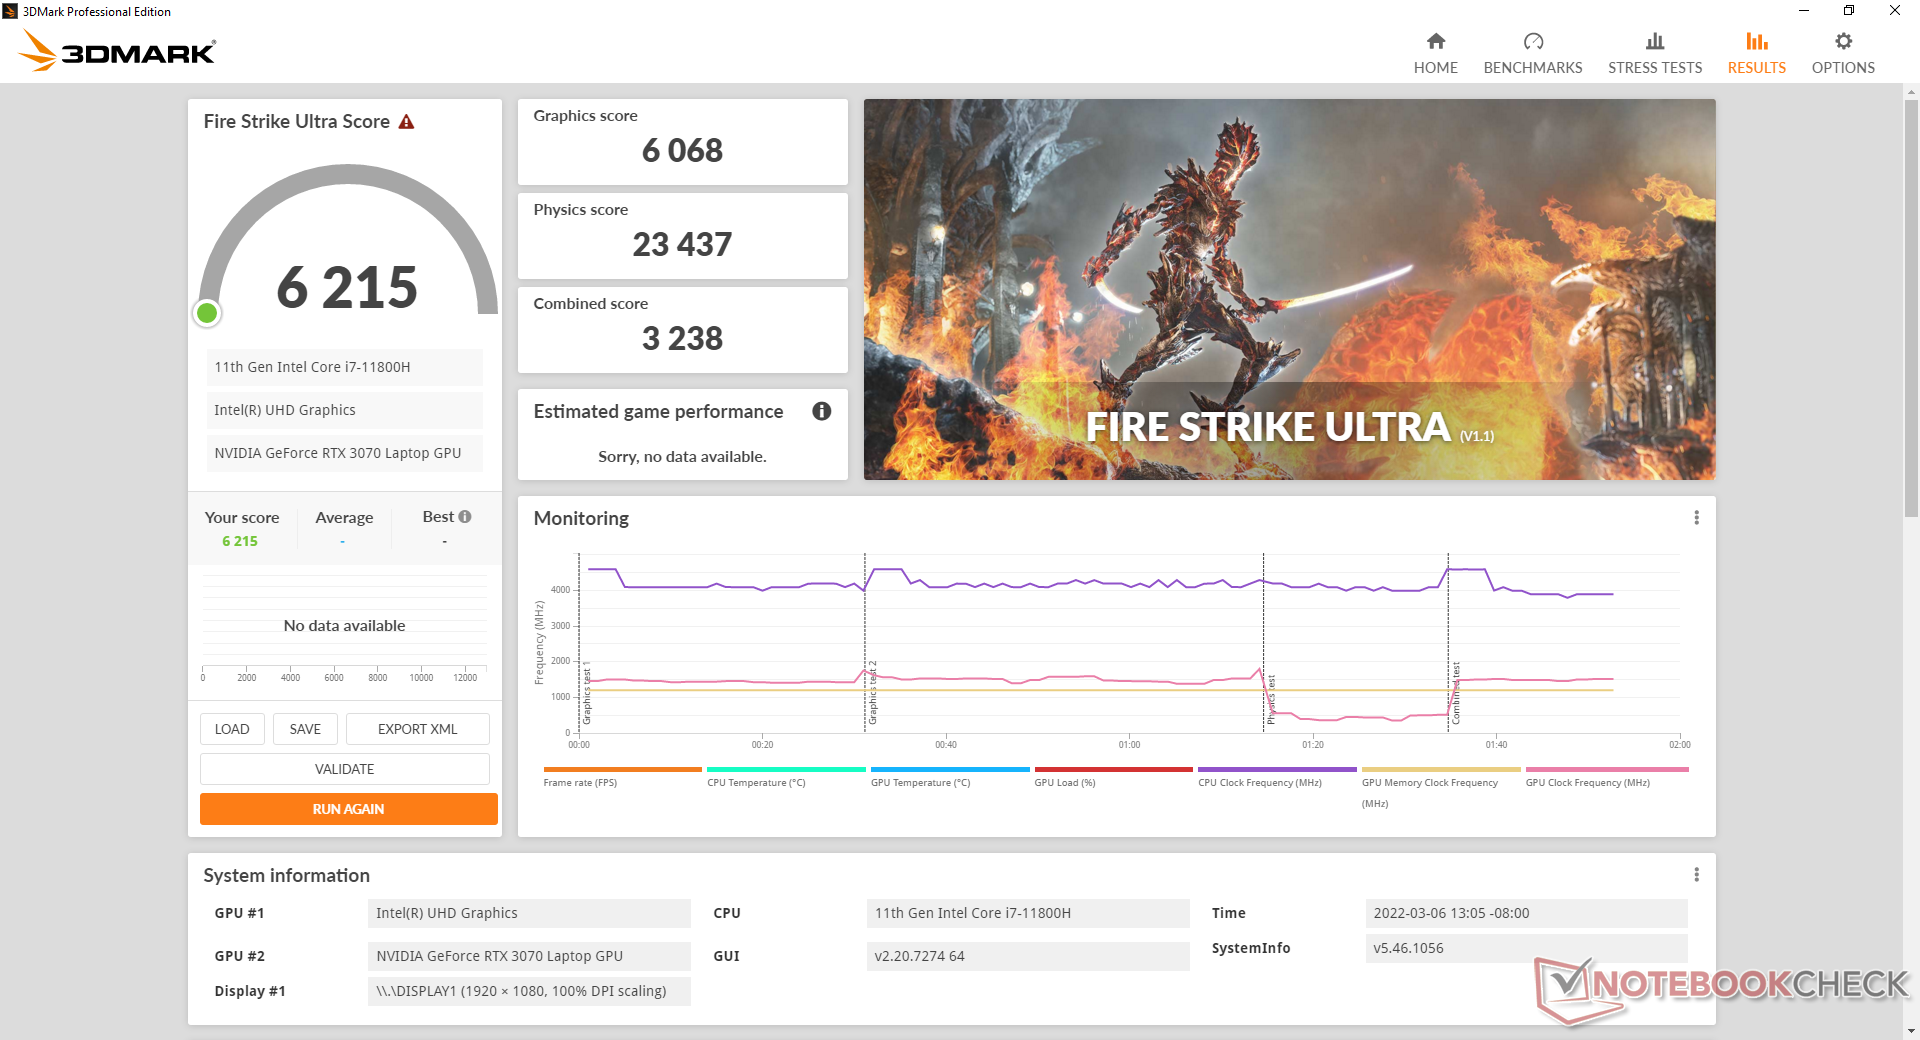
El uso de la batería limita el rendimiento. Una prueba de Fire Strike con baterías arrojaría unas puntuaciones de Física y Gráficos de 15083 y 2154 puntos, respectivamente, en comparación con los 23365 y 25547 puntos con la red eléctrica.
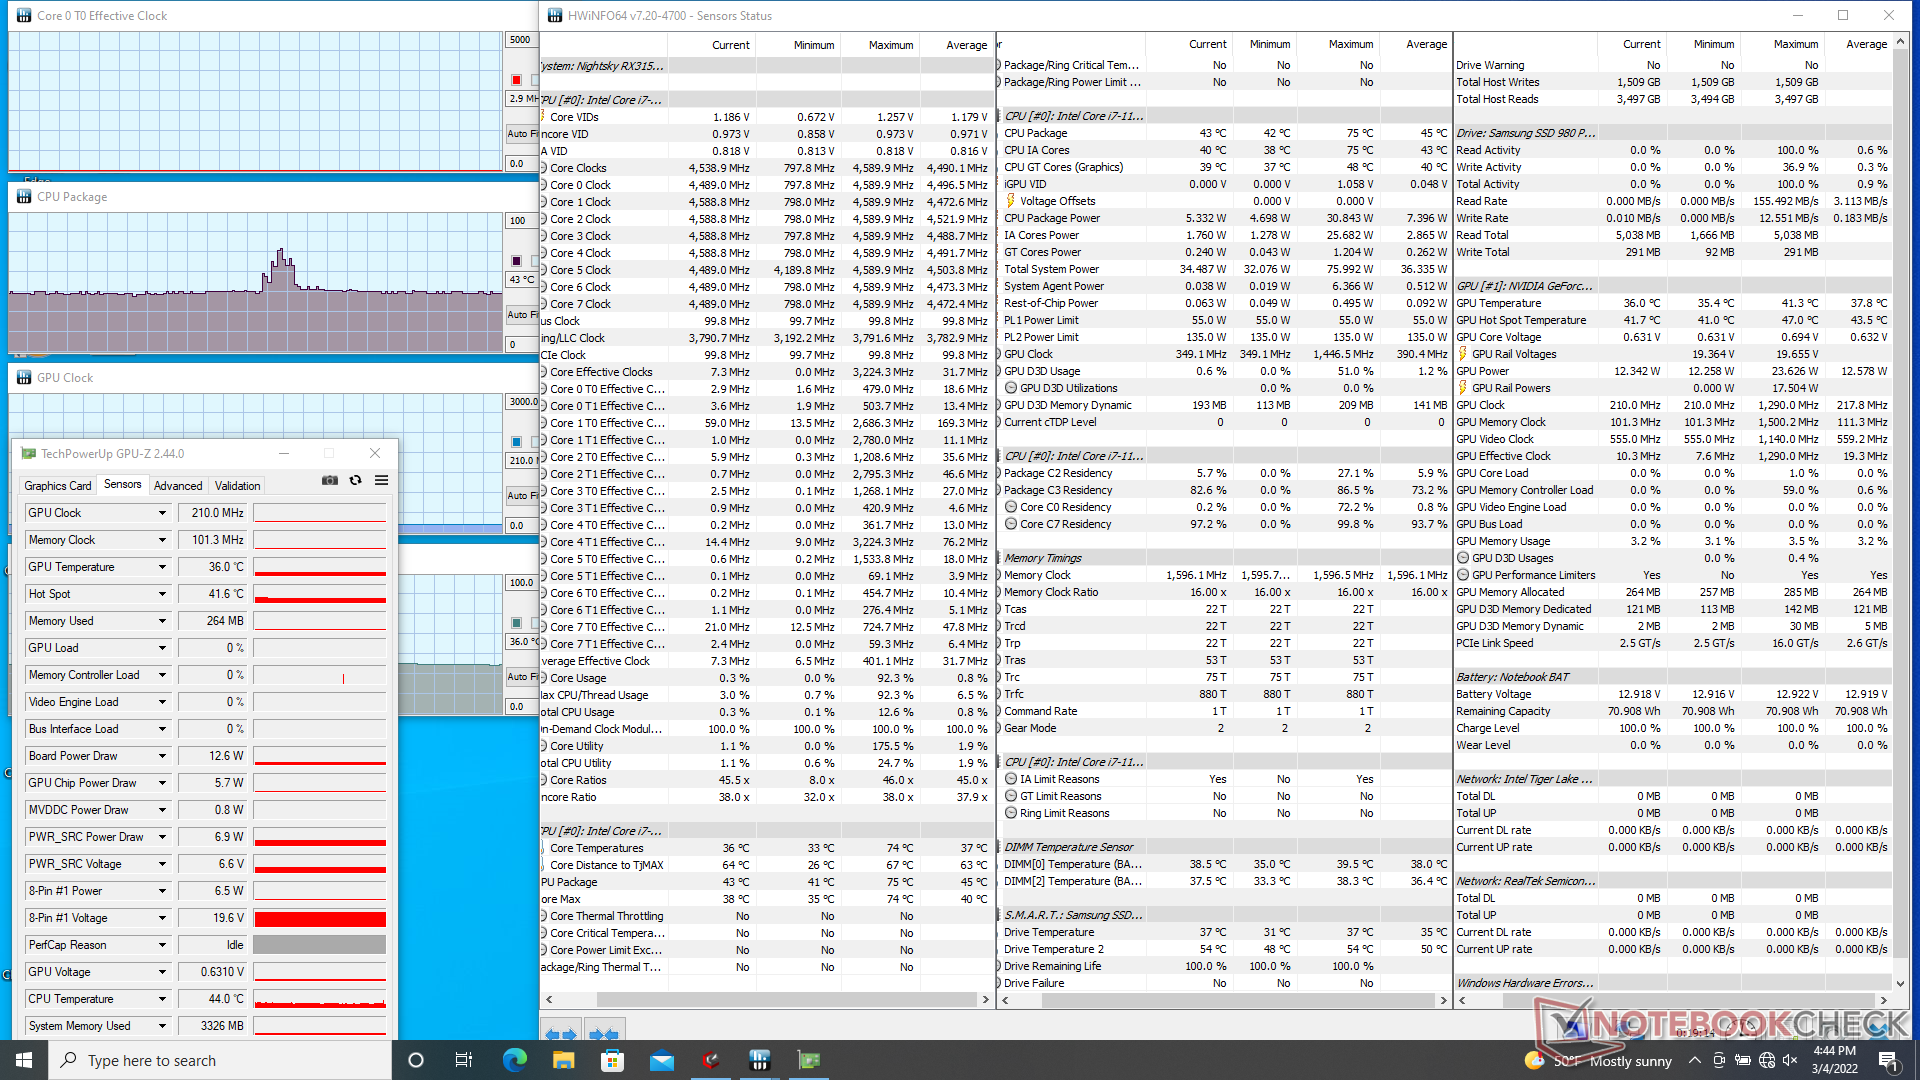
| Reloj dela CPU (GHz) | Reloj de la GPU (MHz) | Temperatura media dela CPU (°C) | Temperatura media de la GPU (°C) | |
| Sistema en reposo | -- | -- | 43 | 36 |
| Prime95 Stress | 2.6 | -- | 76 | 46 |
| Prime95+ FurMarkStress | 1,6 - 2,1 | 700 - 1800 | 70 - 78 | 60 - 77 |
| Witcher 3 Stress | ~1.0 | 1575 | 74 | 87 |
Altavoces
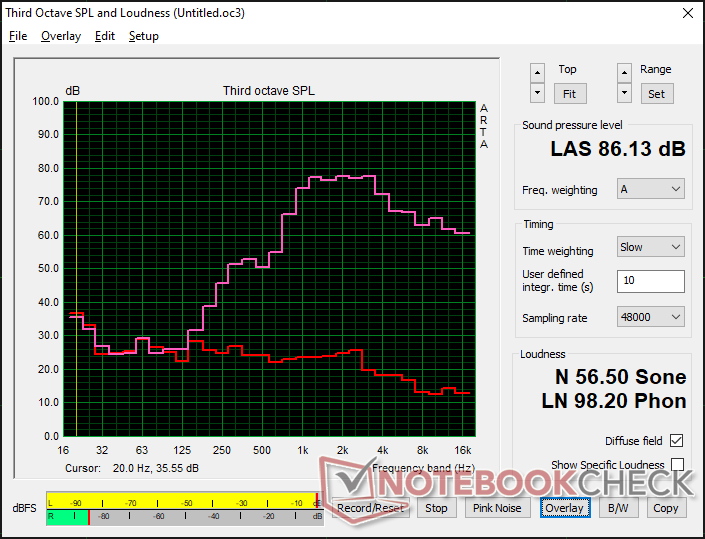
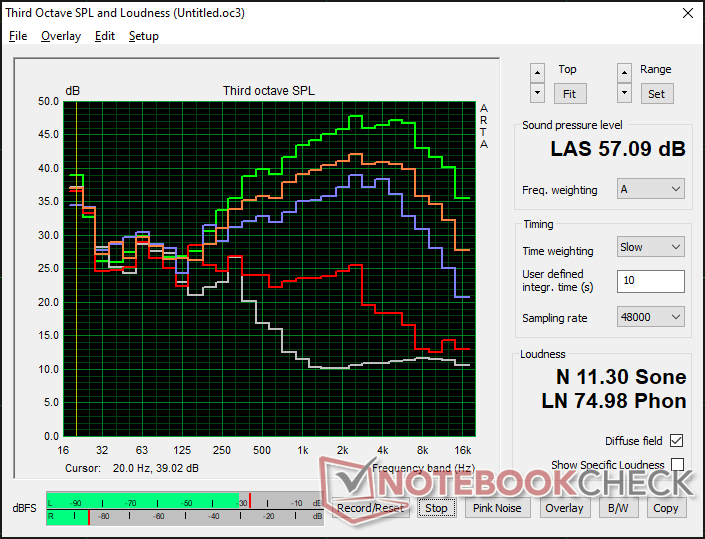
Eurocom RX315 NH57AF1 análisis de audio
(+) | los altavoces pueden reproducir a un volumen relativamente alto (#86.1 dB)
Graves 100 - 315 Hz
(-) | casi sin bajos - de media 26.3% inferior a la mediana
(±) | la linealidad de los graves es media (11.2% delta a frecuencia anterior)
Medios 400 - 2000 Hz
(±) | medias más altas - de media 11% más altas que la mediana
(±) | la linealidad de los medios es media (10.3% delta respecto a la frecuencia anterior)
Altos 2 - 16 kHz
(±) | máximos más altos - de media 6.9% más altos que la mediana
(+) | los máximos son lineales (6.7% delta a la frecuencia anterior)
Total 100 - 16.000 Hz
(-) | el sonido global no es lineal (33.3% de diferencia con la mediana)
En comparación con la misma clase
» 98% de todos los dispositivos probados de esta clase eran mejores, 1% similares, 1% peores
» El mejor tuvo un delta de 6%, la media fue 18%, el peor fue ###max##%
En comparación con todos los dispositivos probados
» 92% de todos los dispositivos probados eran mejores, 1% similares, 6% peores
» El mejor tuvo un delta de 4%, la media fue 24%, el peor fue ###max##%
Apple MacBook Pro 16 2021 M1 Pro análisis de audio
(+) | los altavoces pueden reproducir a un volumen relativamente alto (#84.7 dB)
Graves 100 - 315 Hz
(+) | buen bajo - sólo 3.8% lejos de la mediana
(+) | el bajo es lineal (5.2% delta a la frecuencia anterior)
Medios 400 - 2000 Hz
(+) | medios equilibrados - a sólo 1.3% de la mediana
(+) | los medios son lineales (2.1% delta a la frecuencia anterior)
Altos 2 - 16 kHz
(+) | máximos equilibrados - a sólo 1.9% de la mediana
(+) | los máximos son lineales (2.7% delta a la frecuencia anterior)
Total 100 - 16.000 Hz
(+) | el sonido global es lineal (4.6% de diferencia con la mediana)
En comparación con la misma clase
» 0% de todos los dispositivos probados de esta clase eran mejores, 0% similares, 100% peores
» El mejor tuvo un delta de 5%, la media fue 17%, el peor fue ###max##%
En comparación con todos los dispositivos probados
» 0% de todos los dispositivos probados eran mejores, 0% similares, 100% peores
» El mejor tuvo un delta de 4%, la media fue 24%, el peor fue ###max##%
Gestión de la energía
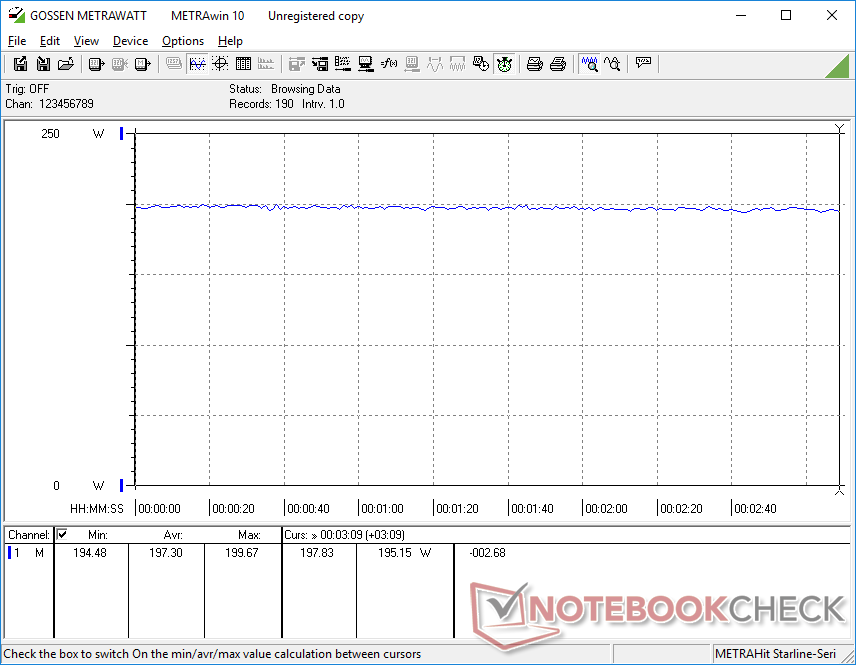
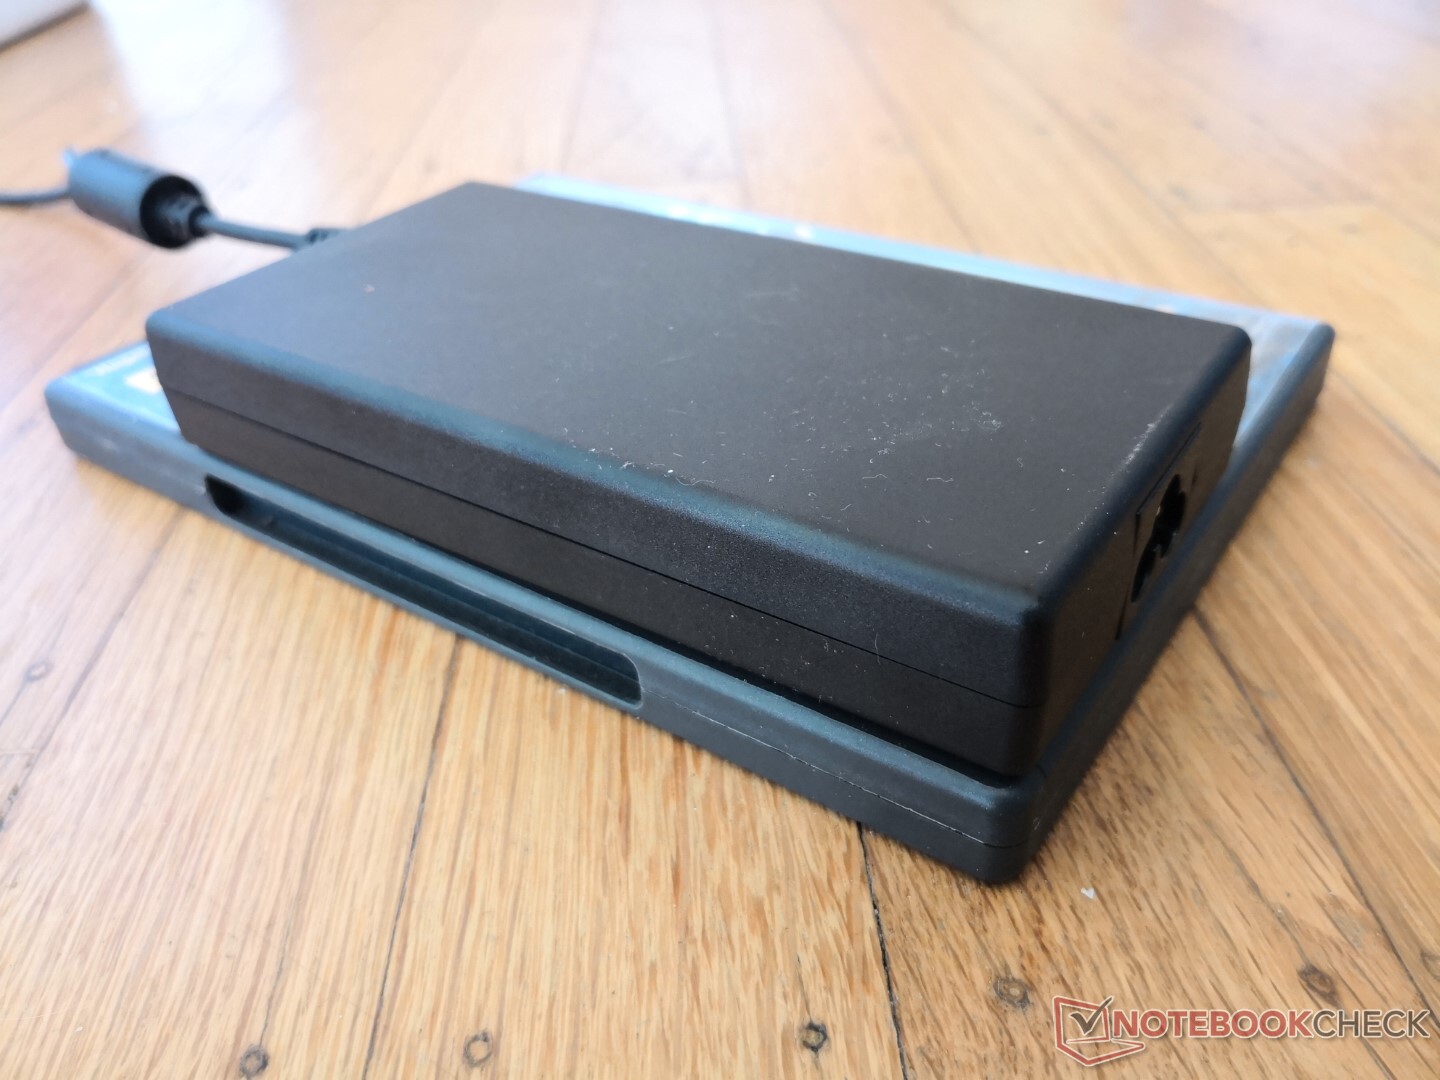
Consumo de energía
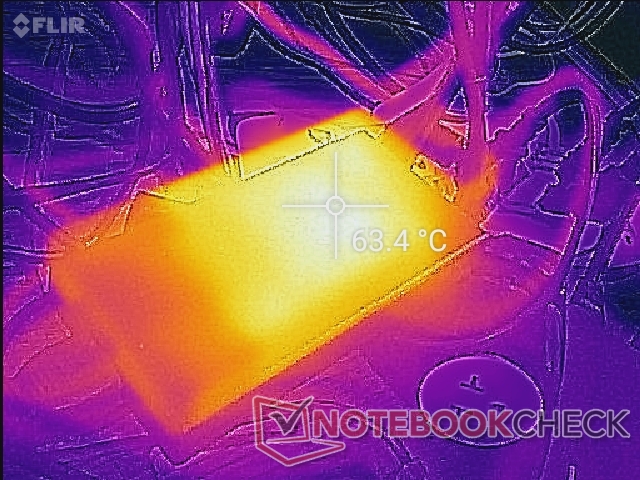
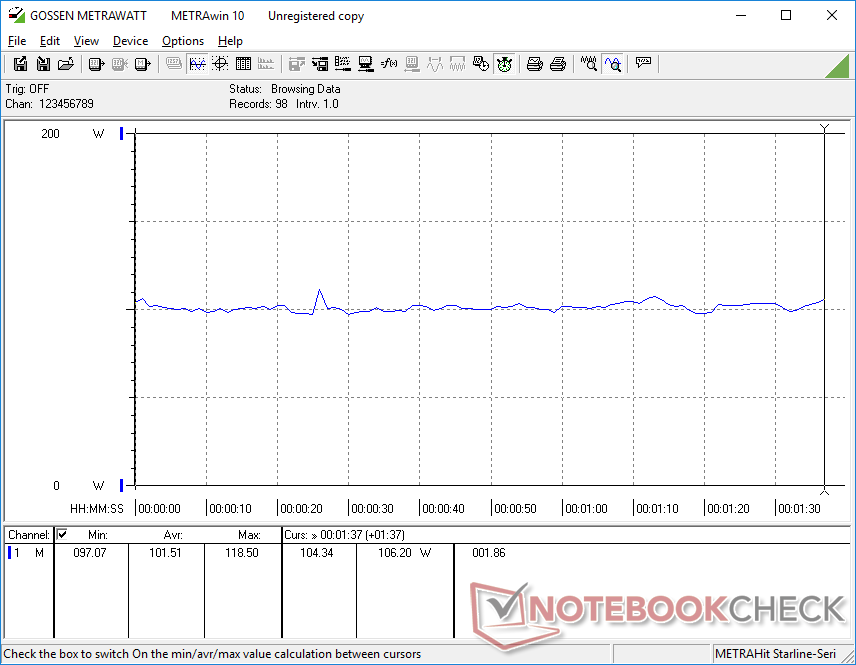
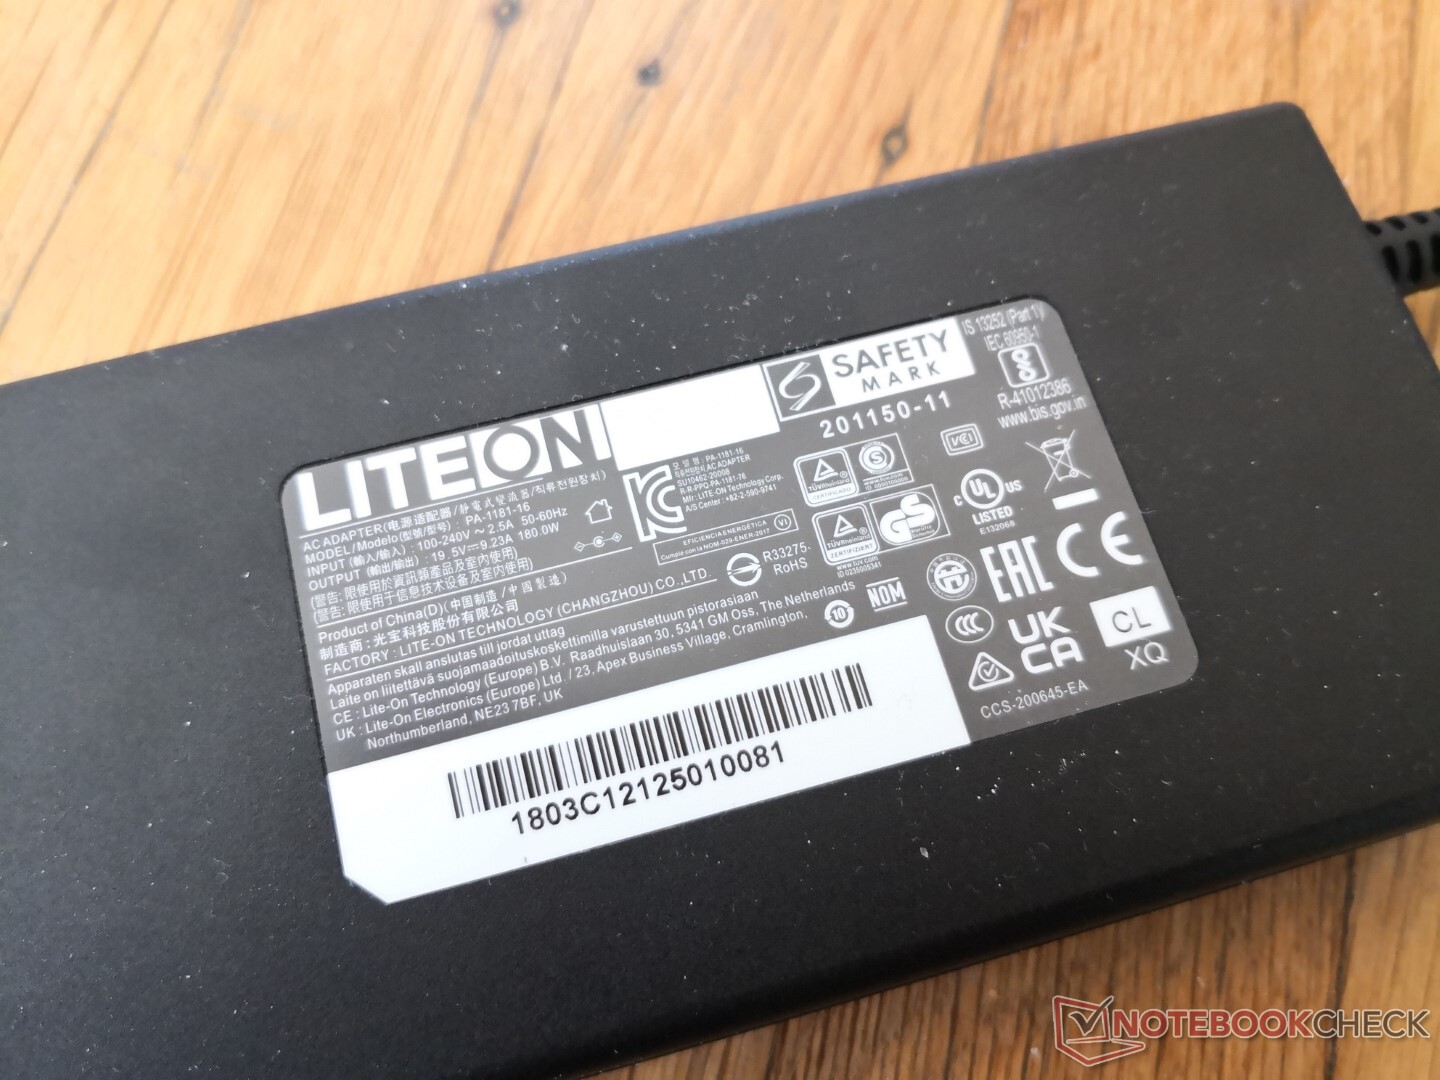
El sistema exige más energía de la que puede proporcionar el limitado adaptador de CA de 180 W. Cuando funciona Witcher 3el pequeño adaptador de 180 W (~14,5 x 7,4 x 2,5 cm) es sin duda más portátil que la mayoría de los adaptadores de CA para portátiles de juegos, pero un adaptador más grande y capaz podría haber permitido un mayor rendimiento sostenido y tasas de carga más rápidas al jugar.
| Off / Standby | |
| Ocioso | |
| Carga |
|
Clave:
min: | |
| Eurocom RX315 NH57AF1 i7-11800H, GeForce RTX 3070 Laptop GPU, Samsung SSD 980 Pro 1TB MZ-V8P1T0BW, IPS, 1920x1080, 15.6" | MSI Stealth GS66 12UGS i7-12700H, GeForce RTX 3070 Ti Laptop GPU, WDC PC SN810 1TB, IPS-Level, 2560x1440, 15.6" | Eurocom Nightsky ARX315 R9 5900X, GeForce RTX 3070 Laptop GPU, Samsung SSD 980 Pro 1TB MZ-V8P1T0BW, IPS, 1920x1080, 15.6" | Alienware m15 R6, i7-11800H RTX 3080 i7-11800H, GeForce RTX 3080 Laptop GPU, Samsung PM9A1 MZVL21T0HCLR, IPS, 1920x1080, 15.6" | Dell G15 5515 R7 5800H, GeForce RTX 3050 Ti Laptop GPU, Samsung PM991a MZ9LQ512HBLU-00BD1, IPS, 1920x1080, 15.6" | Razer Blade 15 Advanced (Mid 2021) i7-11800H, GeForce RTX 3080 Laptop GPU, SSSTC CA6-8D1024, IPS, 1920x1080, 15.6" | |
|---|---|---|---|---|---|---|
| Power Consumption | 8% | -141% | 1% | 35% | -17% | |
| Idle Minimum * (Watt) | 12.7 | 11 13% | 55 -333% | 14 -10% | 5 61% | 19.5 -54% |
| Idle Average * (Watt) | 16.4 | 16 2% | 68.2 -316% | 18 -10% | 9 45% | 23.3 -42% |
| Idle Maximum * (Watt) | 36.1 | 23 36% | 72.5 -101% | 29 20% | 20 45% | 40.1 -11% |
| Load Average * (Watt) | 101.5 | 110 -8% | 149.2 -47% | 93 8% | 94 7% | 98.9 3% |
| Witcher 3 ultra * (Watt) | 197 | 151 23% | 233 -18% | 190 4% | 123 38% | 174 12% |
| Load Maximum * (Watt) | 196.1 | 230 -17% | 255.8 -30% | 203 -4% | 172 12% | 214 -9% |
* ... más pequeño es mejor
Power Consumption Witcher 3 / Stresstest
Power Consumption external Monitor
Duración de la batería
Se esperan algo menos de 5 horas de uso real de la WLAN en el perfil equilibrado con la GPU integrada activa. La carga con el adaptador de corriente incluido tarda unas 2.5 horas, pero se ralentizará al ejecutar juegos debido a la baja potencia de 180 W. No se puede cargar con adaptadores USB-C.
| Eurocom RX315 NH57AF1 i7-11800H, GeForce RTX 3070 Laptop GPU, 71 Wh | MSI Stealth GS66 12UGS i7-12700H, GeForce RTX 3070 Ti Laptop GPU, 99.9 Wh | Eurocom Nightsky ARX315 R9 5900X, GeForce RTX 3070 Laptop GPU, 62 Wh | Alienware m15 R6, i7-11800H RTX 3080 i7-11800H, GeForce RTX 3080 Laptop GPU, 84 Wh | Dell G15 5515 R7 5800H, GeForce RTX 3050 Ti Laptop GPU, 56 Wh | Razer Blade 15 Advanced (Mid 2021) i7-11800H, GeForce RTX 3080 Laptop GPU, 80 Wh | |
|---|---|---|---|---|---|---|
| Duración de Batería | 13% | -79% | 4% | 67% | 23% | |
| WiFi v1.3 (h) | 4.8 | 5.4 13% | 1 -79% | 5 4% | 8 67% | 5.9 23% |
| Reader / Idle (h) | 7.8 | 13.5 | ||||
| Load (h) | 1.6 | 1.6 | 1.5 | |||
| H.264 (h) | 5.6 | 8.8 |
Pro
Contra
Veredicto
Las principales ventajas del Eurocom RX315 sobre los portátiles de juego ultradelgados de la competencia, como el Razer Blade 15 o el MSI GS66 son su menor peso y su mayor facilidad de mantenimiento. Los propietarios pueden instalar fácilmente hasta dos SSD M.2 frente a una sola en el Blade 15, mientras que el GS66 es un modelo más grande y pesado en general. Estos atributos pueden ser deseables para los usuarios que viajan mucho y tienen un segundo SSD M.2 que desean instalar.
Un sólido rendimiento ultradelgado con fácil mantenimiento y cómodas teclas de teclado.
La solución de refrigeración y la batería del RX315 no son tan efectivas o grandes, respectivamente, como las de las mencionadas alternativas de Razer o MSI. El ruido del ventilador es, por tanto, más fuerte en el Eurocom para compensar, mientras que la duración de la batería es, en general, más corta. La rigidez del chasis también está un paso o dos por debajo del Blade 15 o el GS66, lo que hace que las primeras impresiones sean ligeramente más débiles.
Precio y disponibilidad
El Eurocom Nightsky RX315 es actualmente se envía a partir de 2750 dólares con la CPU Core i7-11800H y la GPU GeForce RTX 3070.
Eurocom RX315 NH57AF1
- 03/08/2022 v7 (old)
Allen Ngo
Price comparison

