Notebookcheck Logo

Intel Core Ultra 5 338H y Arc B370 Benchmarks - Casi tan rápido como el Arc B390

Intel Core Ultra 5 338H con Arc B370
ⓘ Intel
Intel Core Ultra 5 338H con Arc B370
Hemos tenido la oportunidad de probar el rendimiento del nuevo Intel Core Ultra 5 338H incluyendo la GPU Arc B370 con 10 núcleos Xe en algunos benchmarks. Los resultados son muy prometedores y la diferencia de rendimiento con el Arc B390 es pequeña.

Ya hemos echado un vistazo de cerca a la nueva arquitectura Panther Lake de Intel y hemos analizado tanto el rendimiento como la eficiencia de las nuevas CPU y la rápida iGPU Arc B390. El resultado fue un enorme aumento del rendimiento de la GPU en comparación con anteriores GPU integradas como la Intel Arc Graphics 140V/140T o la Radeon 890M de AMD. En todas las pruebas comparativas combinadas, se aprecia una ventaja de alrededor del 70 %.

Nuestras pruebas se limitaron a los modelos de CPU con la GPU Arc B390 más rápida en el momento del lanzamiento, pero ahora también hemos tenido la oportunidad de realizar algunas pruebas con la Arc B370. Nuestra unidad de pruebas era una muestra de ingeniería, en la que el procesador funcionaba a un límite de potencia constante de 35 vatios.

Visión general de Intel Panther Lake
ⓘ Intel
Visión general de Intel Panther Lake

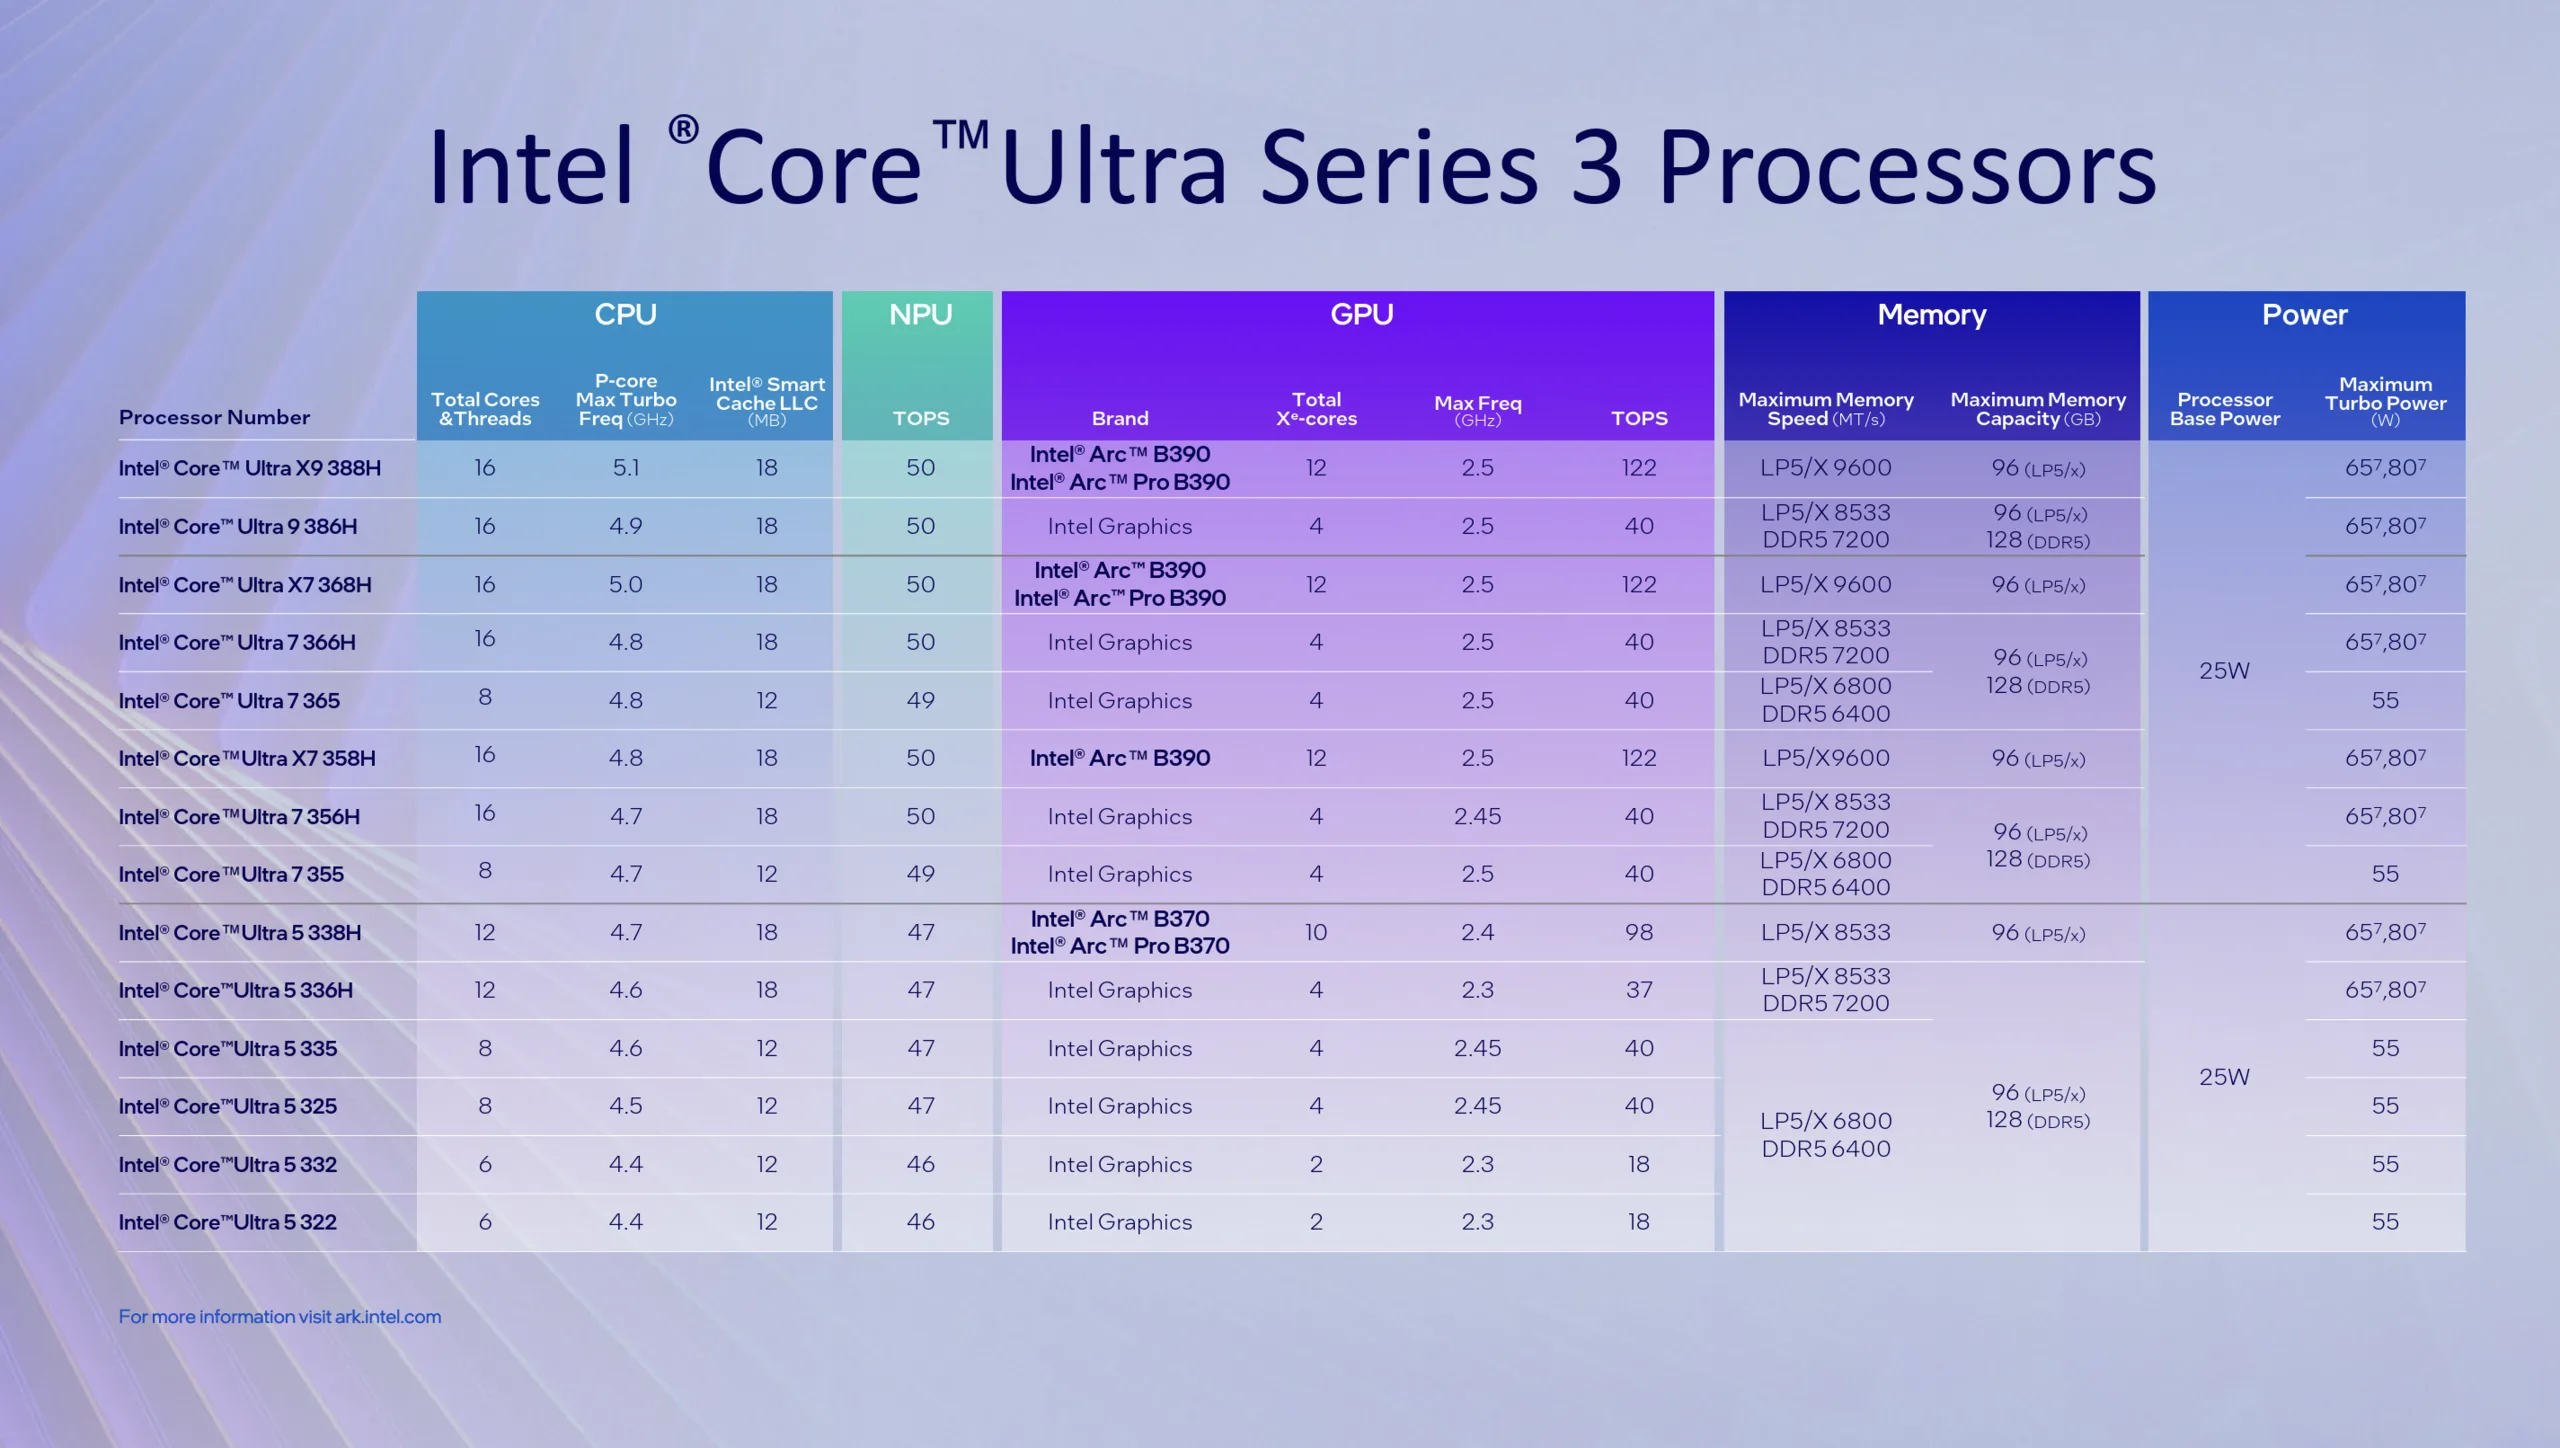
El Core Ultra 5 338H ofrece 12 núcleos, incluidos cuatro de alto rendimiento con una frecuencia de reloj de hasta 4,7 GHz. La GPU integrada es la Arc B370, que cuenta con 10 núcleos Xe y, por tanto, dos menos en comparación con la Arc B390. El reloj máximo de la GPU también es ligeramente inferior, de 2,4 frente a 2,5 GHz. Al igual que los modelos con la GPU Arc B390, el Core Ultra 5 338H sólo está disponible con RAM sodlerizada (hasta 8533 MHz).

Rendimiento de la CPU

Si nos fijamos en el rendimiento de la CPU, el nuevo Core Ultra 5 338H rinde bien y está más o menos a la par con el nuevo AMD Ryzen AI 9 465 en valores de TDP comparables (45/35W), que analizamos en el Asus Zenbook S16. Intel está ligeramente por delante en las pruebas mononúcleo, mientras que el chip AMD ofrece un mejor rendimiento multinúcleo.

Performance rating: Percent
Cinebench 2024: CPU Single Core | CPU Multi Core
Geekbench 6.5: Single-Core | Multi-Core
Performance rating
Apple M4 Pro (12 cores)
MacBook Pro 14 2024 M4 Pro Entry, 0, 0
93.9 pt
Apple M5 (10 Cores)
MacBook Pro 14 2025 M5, 30.5, 27.5
92.5 pt
Apple M4 (10 cores)
MacBook Pro 14 2024 M4, 24, 24
78.6 pt
Intel Core Ultra X9 388H
ZenBook Duo UX8407AA, 64, 46
75.7 pt
Intel Core Ultra 7 255H
RedmiBook Pro 14 2025, 115, 45
72.6 pt
Intel Core Ultra X7 358H
ExpertBook Ultra B9406CAA, 63, 41
71.9 pt
AMD Ryzen AI 9 HX 370
ProArt P16 H7606WI, 0, 0
70.7 pt
Qualcomm Snapdragon X Elite X1E-84-100
Galaxy Book4 Edge 16 X1E-84-100, 0, 0
66.5 pt
Qualcomm Snapdragon X Elite X1E-80-100
MagicBook Art 14 Snapdragon, 50, 35
66.1 pt
AMD Ryzen AI 7 350
IdeaPad Pro 5 14AKP G10, 65, 65
65.3 pt
AMD Ryzen AI 9 465
ZenBook S16 UM5606GA, 45, 35
65.2 pt
AMD Ryzen AI 9 365
Yoga Pro 7 14ASP G9, 60, 54
65.1 pt
AMD Ryzen AI 7 350
Yoga Pro 7 14AKP G10, 85, 70
65 pt
Intel Core Ultra 9 285H
ZenBook Duo OLED UX8406CA, 60, 35
63.8 pt
Intel Core Ultra 5 338H
Core Ultra 5 338H Engineering Sample, 35, 35
63.1 pt
AMD Ryzen AI 9 HX 370
Zenbook S 16 UM5606-RK333W, 33, 28
63 pt
Intel Core Ultra 7 255H
MagicBook Art 14 2025, 40, 26
62.8 pt
Qualcomm Snapdragon X Elite X1E-78-100
OmniBook X 14, 0, 0
58.2 pt
Intel Core Ultra 7 268V
Surface Pro OLED Lunar Lake, 37, 30
56.8 pt
Intel Core Ultra 7 268V
Surface Laptop 7 15 Lunar Lake, 37, 30
56.2 pt
Intel Core Ultra 7 258V
Yoga 7 14 2in1 G10, 37, 25
54.8 pt
Intel Core Ultra 7 258V
ThinkPad X9-15 Aura Edition, 37, 25
54.6 pt
Qualcomm Snapdragon X Plus X1P-42-100
Surface Laptop 13, 45, 35
53 pt
Intel Core Ultra 5 228V
ThinkPad T14s Gen 6 Intel, 35, 20
49.9 pt
Qualcomm Snapdragon X X1-26-100
ZenBook A14 UX3407QA, 0, 0
48.4 pt
Cinebench 2024 / CPU Single Core
Apple M5 (10 Cores)
MacBook Pro 14 2025 M5, 30.5, 27.5
200 Points +63%
Apple M4 Pro (12 cores)
MacBook Pro 14 2024 M4 Pro Entry, 0, 0
176 Points +44%
Apple M4 (10 cores)
MacBook Pro 14 2024 M4, 24, 24
174 Points +42%
Intel Core Ultra X9 388H
ZenBook Duo UX8407AA, 64, 46
129.8 Points +6%
Intel Core Ultra 7 255H
RedmiBook Pro 14 2025, 115, 45
127.6 Points +4%
Qualcomm Snapdragon X Elite X1E-84-100
Galaxy Book4 Edge 16 X1E-84-100, 0, 0
127 Points +4%
Intel Core Ultra 9 285H
ZenBook Duo OLED UX8406CA, 60, 35
127 Points +4%
Intel Core Ultra 7 268V
Surface Pro OLED Lunar Lake, 37, 30
124.9 Points +2%
Intel Core Ultra X7 358H
ExpertBook Ultra B9406CAA, 63, 41
124.2 Points +1%
Intel Core Ultra 7 268V
Surface Laptop 7 15 Lunar Lake, 37, 30
123.3 Points +1%
Qualcomm Snapdragon X Elite X1E-80-100
MagicBook Art 14 Snapdragon, 50, 35
123 Points 0%
Intel Core Ultra 5 338H
Core Ultra 5 338H Engineering Sample, 35, 35
122.4 Points
Intel Core Ultra 7 258V
Yoga 7 14 2in1 G10, 37, 25
121 Points -1%
Intel Core Ultra 7 258V
ThinkPad X9-15 Aura Edition, 37, 25
119.7 Points -2%
Intel Core Ultra 7 255H
MagicBook Art 14 2025, 40, 26
119 Points -3%
AMD Ryzen AI 7 350
IdeaPad Pro 5 14AKP G10, 65, 65
116.5 Points -5%
AMD Ryzen AI 9 HX 370
ProArt P16 H7606WI, 0, 0
116 Points -5%
AMD Ryzen AI 7 350
Yoga Pro 7 14AKP G10, 85, 70
115.2 Points -6%
AMD Ryzen AI 9 465
ZenBook S16 UM5606GA, 45, 35
115 Points -6%
AMD Ryzen AI 9 HX 370
Zenbook S 16 UM5606-RK333W, 33, 28
113.6 Points -7%
AMD Ryzen AI 9 365
Yoga Pro 7 14ASP G9, 60, 54
113.5 Points -7%
Intel Core Ultra 5 228V
ThinkPad T14s Gen 6 Intel, 35, 20
112.5 Points -8%
Qualcomm Snapdragon X Plus X1P-42-100
Surface Laptop 13, 45, 35
109 Points -11%
Qualcomm Snapdragon X Elite X1E-78-100
OmniBook X 14, 0, 0
108 Points -12%
Qualcomm Snapdragon X X1-26-100
ZenBook A14 UX3407QA, 0, 0
96 Points -22%
Cinebench 2024 / CPU Multi Core
Apple M4 Pro (12 cores)
MacBook Pro 14 2024 M4 Pro Entry, 0, 0
1435 Points +66%
Apple M4 Pro (12 cores)
MacBook Pro 14 2024 M4 Pro Entry, 0, 0
1403 Points +63%
AMD Ryzen AI 9 HX 370
ProArt P16 H7606WI, 0, 0
1213 Points +41%
Apple M5 (10 Cores)
MacBook Pro 14 2025 M5, 30.5, 27.5
1172 Points +36%
Intel Core Ultra X9 388H
ZenBook Duo UX8407AA, 64, 46
1172 Points +36%
Intel Core Ultra X7 358H
ExpertBook Ultra B9406CAA, 63, 41
1125 Points +30%
Intel Core Ultra 7 255H
RedmiBook Pro 14 2025, 115, 45
1053 Points +22%
AMD Ryzen AI 9 365
Yoga Pro 7 14ASP G9, 60, 54
996 Points +15%
Apple M4 (10 cores)
MacBook Pro 14 2024 M4, 24, 24
986 Points +14%
AMD Ryzen AI 7 350
IdeaPad Pro 5 14AKP G10, 65, 65
977 Points +13%
AMD Ryzen AI 7 350
Yoga Pro 7 14AKP G10, 85, 70
973 Points +13%
AMD Ryzen AI 9 465
ZenBook S16 UM5606GA, 45, 35
953 Points +10%
Qualcomm Snapdragon X Elite X1E-80-100
MagicBook Art 14 Snapdragon, 50, 35
926 Points +7%
AMD Ryzen AI 9 HX 370
Zenbook S 16 UM5606-RK333W, 33, 28
921 Points +7%
Qualcomm Snapdragon X Elite X1E-84-100
Galaxy Book4 Edge 16 X1E-84-100, 0, 0
866 Points 0%
Intel Core Ultra 5 338H
Core Ultra 5 338H Engineering Sample, 35, 35
863 Points
Qualcomm Snapdragon X Elite X1E-78-100
OmniBook X 14, 0, 0
840 Points -3%
Intel Core Ultra 7 255H
MagicBook Art 14 2025, 40, 26
810 Points -6%
Intel Core Ultra 9 285H
ZenBook Duo OLED UX8406CA, 60, 35
740 Points -14%
Qualcomm Snapdragon X Plus X1P-42-100
Surface Laptop 13, 45, 35
723 Points -16%
Qualcomm Snapdragon X X1-26-100
ZenBook A14 UX3407QA, 0, 0
646 Points -25%
Intel Core Ultra 7 268V
Surface Pro OLED Lunar Lake, 37, 30
619 Points -28%
Intel Core Ultra 7 268V
Surface Laptop 7 15 Lunar Lake, 37, 30
600 Points -30%
Intel Core Ultra 7 258V
Yoga 7 14 2in1 G10, 37, 25
580 Points -33%
Intel Core Ultra 7 258V
ThinkPad X9-15 Aura Edition, 37, 25
574 Points -33%
Intel Core Ultra 5 228V
ThinkPad T14s Gen 6 Intel, 35, 20
506 Points -41%
Geekbench 6.5 / Single-Core
Apple M5 (10 Cores)
MacBook Pro 14 2025 M5, 30.5, 27.5
4326 Points +52%
Apple M4 Pro (12 cores)
MacBook Pro 14 2024 M4 Pro Entry, 0, 0
3844 Points +35%
Apple M4 Pro (12 cores)
MacBook Pro 14 2024 M4 Pro Entry, 0, 0
3837 Points +35%
Apple M4 (10 cores)
MacBook Pro 14 2024 M4, 24, 24
3673 Points +29%
Intel Core Ultra X9 388H
ZenBook Duo UX8407AA, 64, 46
3020 Points +6%
Intel Core Ultra 7 255H
RedmiBook Pro 14 2025, 115, 45
2923 Points +3%
AMD Ryzen AI 7 350
IdeaPad Pro 5 14AKP G10, 65, 65
2874 Points +1%
Intel Core Ultra 7 268V
Surface Laptop 7 15 Lunar Lake, 37, 30
2871 Points +1%
AMD Ryzen AI 9 HX 370
ProArt P16 H7606WI, 0, 0
2857 Points +1%
Intel Core Ultra 7 268V
Surface Pro OLED Lunar Lake, 37, 30
2855 Points 0%
AMD Ryzen AI 7 350
Yoga Pro 7 14AKP G10, 85, 70
2854 Points 0%
Intel Core Ultra 5 338H
Core Ultra 5 338H Engineering Sample, 35, 35
2841 Points
Intel Core Ultra X7 358H
ExpertBook Ultra B9406CAA, 63, 41
2836 Points 0%
Qualcomm Snapdragon X Elite X1E-84-100
Galaxy Book4 Edge 16 X1E-84-100, 0, 0
2834 Points 0%
AMD Ryzen AI 9 465
ZenBook S16 UM5606GA, 45, 35
2834 Points 0%
AMD Ryzen AI 9 365
Yoga Pro 7 14ASP G9, 60, 54
2815 Points -1%
Qualcomm Snapdragon X Elite X1E-80-100
MagicBook Art 14 Snapdragon, 50, 35
2813 Points -1%
Intel Core Ultra 7 255H
MagicBook Art 14 2025, 40, 26
2797 Points -2%
Intel Core Ultra 7 258V
ThinkPad X9-15 Aura Edition, 37, 25
2795 Points -2%
Intel Core Ultra 7 258V
Yoga 7 14 2in1 G10, 37, 25
2789 Points -2%
AMD Ryzen AI 9 HX 370
Zenbook S 16 UM5606-RK333W, 33, 28
2785 Points -2%
Intel Core Ultra 9 285H
ZenBook Duo OLED UX8406CA, 60, 35
2781 Points -2%
Intel Core Ultra 5 228V
ThinkPad T14s Gen 6 Intel, 35, 20
2562 Points -10%
Qualcomm Snapdragon X Elite X1E-78-100
OmniBook X 14, 0, 0
2454 Points -14%
Qualcomm Snapdragon X Plus X1P-42-100
Surface Laptop 13, 45, 35
2287 Points -20%
Qualcomm Snapdragon X X1-26-100
ZenBook A14 UX3407QA, 0, 0
2126 Points -25%
Geekbench 6.5 / Multi-Core
Apple M4 Pro (12 cores)
MacBook Pro 14 2024 M4 Pro Entry, 0, 0
20458 Points +53%
Apple M4 Pro (12 cores)
MacBook Pro 14 2024 M4 Pro Entry, 0, 0
20385 Points +52%
Apple M5 (10 Cores)
MacBook Pro 14 2025 M5, 30.5, 27.5
18054 Points +35%
Intel Core Ultra X9 388H
ZenBook Duo UX8407AA, 64, 46
17694 Points +32%
Intel Core Ultra 7 255H
RedmiBook Pro 14 2025, 115, 45
17489 Points +31%
Intel Core Ultra X7 358H
ExpertBook Ultra B9406CAA, 63, 41
16674 Points +25%
Qualcomm Snapdragon X Elite X1E-84-100
Galaxy Book4 Edge 16 X1E-84-100, 0, 0
15665 Points +17%
Intel Core Ultra 9 285H
ZenBook Duo OLED UX8406CA, 60, 35
15476 Points +16%
AMD Ryzen AI 9 HX 370
ProArt P16 H7606WI, 0, 0
15221 Points +14%
Apple M4 (10 cores)
MacBook Pro 14 2024 M4, 24, 24
15128 Points +13%
Qualcomm Snapdragon X Elite X1E-80-100
MagicBook Art 14 Snapdragon, 50, 35
14998 Points +12%
AMD Ryzen AI 9 465
ZenBook S16 UM5606GA, 45, 35
14562 Points +9%
Intel Core Ultra 7 255H
MagicBook Art 14 2025, 40, 26
14454 Points +8%
AMD Ryzen AI 9 365
Yoga Pro 7 14ASP G9, 60, 54
14118 Points +6%
AMD Ryzen AI 7 350
Yoga Pro 7 14AKP G10, 85, 70
14028 Points +5%
AMD Ryzen AI 7 350
IdeaPad Pro 5 14AKP G10, 65, 65
13988 Points +5%
AMD Ryzen AI 9 HX 370
Zenbook S 16 UM5606-RK333W, 33, 28
13648 Points +2%
Intel Core Ultra 5 338H
Core Ultra 5 338H Engineering Sample, 35, 35
13368 Points
Qualcomm Snapdragon X Elite X1E-78-100
OmniBook X 14, 0, 0
12971 Points -3%
Intel Core Ultra 7 268V
Surface Pro OLED Lunar Lake, 37, 30
11388 Points -15%
Intel Core Ultra 7 268V
Surface Laptop 7 15 Lunar Lake, 37, 30
11279 Points -16%
Qualcomm Snapdragon X Plus X1P-42-100
Surface Laptop 13, 45, 35
11125 Points -17%
Intel Core Ultra 7 258V
ThinkPad X9-15 Aura Edition, 37, 25
11037 Points -17%
Intel Core Ultra 7 258V
Yoga 7 14 2in1 G10, 37, 25
11027 Points -18%
Qualcomm Snapdragon X X1-26-100
ZenBook A14 UX3407QA, 0, 0
10550 Points -21%
Intel Core Ultra 5 228V
ThinkPad T14s Gen 6 Intel, 35, 20
10036 Points -25%
Performance rating: Percent
Cinebench 2024: CPU Single Core | CPU Multi Core
Geekbench 6.5: Single-Core | Multi-Core

Rendimiento de la GPU

Como era de esperar, la Arc B370 es superada por la Arc B390 en las pruebas comparativas sintéticas, pero los límites de potencia también juegan un papel aquí y los analizaremos más detenidamente en la siguiente sección. Los resultados de la Arc B370 son muy prometedores en general y existe una gran ventaja sobre las anteriores iGPU de Intel (Arc Graphics 140V/140T) así como de AMD (Radeon 890M).

3DMark / Time Spy Graphics
AMD Radeon 8060S
Asus ROG Flow Z13 GZ302EA-RU073W, 80
10224 Points +72%
NVIDIA GeForce RTX 4060 Laptop GPU
Schenker Key 14 (M24), 100
10144 Points +71%
NVIDIA GeForce RTX 4060 Laptop GPU
Asus ROG Zephyrus G16 GA605WV, 80
9286 Points +57%
NVIDIA GeForce RTX 5050 Laptop
Lenovo Yoga Pro 9 16IAH10 RTX 5050, 100
9122 Points +54%
AMD Radeon 8050S
HP ZBook Ultra G1a A3ZQ0ET,
8898 Points +50%
NVIDIA GeForce RTX 4050 Laptop GPU
Lenovo IdeaPad Pro 5 16IMH G9 RTX 4050, 90
8574 Points +45%
NVIDIA GeForce RTX 4050 Laptop GPU
Lenovo Yoga Pro 7 14IMH9, RTX 4050, 60
7342 Points +24%
Intel Arc B390 12 Xe3 Panther Lake iGPU
Asus ZenBook Duo UX8407AA, 0
7190 Points +21%
Intel Arc B390 12 Xe3 Panther Lake iGPU
Asus ExpertBook Ultra B9406CAA, 0
6679 Points +13%
Intel Arc B370 10 Xe3 Panther Lake iGPU
Intel Core Ultra 5 338H Engineering Sample, 0
5933 Points
NVIDIA GeForce RTX 4050 Laptop GPU
Dell XPS 14 2024 OLED, 30
5107 Points -14%
NVIDIA GeForce RTX 3050 Ti Laptop GPU
Schenker Vision 14 2022 RTX 3050 Ti, 45
4773 Points -20%
NVIDIA GeForce RTX 3050 6GB Laptop GPU
Asus V16 V3607V, 65
4571 Points -23%
Intel Arc Graphics 140V
Microsoft Surface Laptop 7 15 Lunar Lake, 0
4415 Points -26%
Intel Arc Graphics 140T
MSI Prestige 16 AI Evo B2HMG, 0
4194 Points -29%
Intel Arc Graphics 140V
MSI Claw 8 AI+, 0
4118 Points -31%
Intel Arc Graphics 130V
Lenovo ThinkPad E14 Gen 7 21U2002QGE, 0
3538 Points -40%
AMD Radeon 890M
Asus Zenbook S 16 UM5606-RK333W, 0
3421 Points -42%
AMD Radeon 890M
MSI Claw A8 BZ2EM, 0
3331 Points -44%
AMD Radeon 860M
Lenovo ThinkPad X13 G6 AMD, 0
2804 Points -53%
AMD Radeon 780M
Lenovo IdeaPad Slim 3 14 AHP G10, 0
2569 Points -57%
Qualcomm SD X Adreno X1-85 4.6 TFLOPS
Samsung Galaxy Book4 Edge 16 X1E-84-100, 0
1989 Points -66%
Qualcomm SD X Adreno X1-45 1.7 TFLOPS
Microsoft Surface Pro 12, 0
936 Points -84%
Qualcomm SD X Adreno X1-85 3.8 TFLOPS
HP OmniBook X 14, 0
804 Points -86%
3DMark / Fire Strike Graphics
NVIDIA GeForce RTX 4060 Laptop GPU
Schenker Key 14 (M24), 100
26499 Points +80%
AMD Radeon 8060S
Asus ROG Flow Z13 GZ302EA-RU073W, 80
25992 Points +77%
NVIDIA GeForce RTX 5050 Laptop
Lenovo Yoga Pro 9 16IAH10 RTX 5050, 100
25400 Points +73%
NVIDIA GeForce RTX 4060 Laptop GPU
Asus ROG Zephyrus G16 GA605WV, 80
23753 Points +62%
AMD Radeon 8050S
HP ZBook Ultra G1a A3ZQ0ET,
23521 Points +60%
NVIDIA GeForce RTX 4050 Laptop GPU
Lenovo IdeaPad Pro 5 16IMH G9 RTX 4050, 90
23210 Points +58%
NVIDIA GeForce RTX 4050 Laptop GPU
Lenovo Yoga Pro 7 14IMH9, RTX 4050, 60
19853 Points +35%
Intel Arc B390 12 Xe3 Panther Lake iGPU
Asus ZenBook Duo UX8407AA, 0
17498 Points +19%
Intel Arc B390 12 Xe3 Panther Lake iGPU
Asus ExpertBook Ultra B9406CAA, 0
17054 Points +16%
Intel Arc B370 10 Xe3 Panther Lake iGPU
Intel Core Ultra 5 338H Engineering Sample, 0
14699 Points
NVIDIA GeForce RTX 4050 Laptop GPU
Dell XPS 14 2024 OLED, 30
13591 Points -8%
NVIDIA GeForce RTX 3050 Ti Laptop GPU
Schenker Vision 14 2022 RTX 3050 Ti, 45
12349 Points -16%
NVIDIA GeForce RTX 3050 6GB Laptop GPU
Asus V16 V3607V, 65
11986 Points -18%
Intel Arc Graphics 140V
Microsoft Surface Laptop 7 15 Lunar Lake, 0
10476 Points -29%
Intel Arc Graphics 140V
MSI Claw 8 AI+, 0
9971 Points -32%
AMD Radeon 890M
MSI Claw A8 BZ2EM, 0
9472 Points -36%
Intel Arc Graphics 140T
MSI Prestige 16 AI Evo B2HMG, 0
9173 Points -38%
Intel Arc Graphics 130V
Lenovo ThinkPad E14 Gen 7 21U2002QGE, 0
8755 Points -40%
AMD Radeon 890M
Asus Zenbook S 16 UM5606-RK333W, 0
8188 Points -44%
AMD Radeon 860M
Lenovo ThinkPad X13 G6 AMD, 0
7391 Points -50%
AMD Radeon 780M
Lenovo IdeaPad Slim 3 14 AHP G10, 0
7317 Points -50%
Qualcomm SD X Adreno X1-85 4.6 TFLOPS
Samsung Galaxy Book4 Edge 16 X1E-84-100, 0
6982 Points -53%
Qualcomm SD X Adreno X1-85 3.8 TFLOPS
Honor MagicBook Art 14 Snapdragon, 0
6043 Points -59%
Qualcomm SD X Adreno X1-45 1.7 TFLOPS
Microsoft Surface Pro 12, 0
3736 Points -75%
Qualcomm SD X Adreno X1-85 3.8 TFLOPS
HP OmniBook X 14, 0
3239 Points -78%
3DMark / Steel Nomad Score
NVIDIA GeForce RTX 4060 Laptop GPU
Schenker Key 14 (M24), 100
2236 Points +63%
NVIDIA GeForce RTX 5050 Laptop
Lenovo Yoga Pro 9 16IAH10 RTX 5050, 100
2046 Points +49%
NVIDIA GeForce RTX 4060 Laptop GPU
Asus ROG Zephyrus G16 GA605WV, 80
2025 Points +47%
AMD Radeon 8060S
Asus ROG Flow Z13 GZ302EA-RU073W, 80
1874 Points +36%
NVIDIA GeForce RTX 4050 Laptop GPU
Lenovo IdeaPad Pro 5 16IMH G9 RTX 4050, 90
1873 Points +36%
Intel Arc B390 12 Xe3 Panther Lake iGPU
Asus ZenBook Duo UX8407AA, 0
1667 Points +21%
Apple M4 Pro 16-Core GPU
Apple MacBook Pro 14 2024 M4 Pro Entry, 0
1619 Points +18%
NVIDIA GeForce RTX 4050 Laptop GPU
Lenovo Yoga Pro 7 14IMH9, RTX 4050, 60
1561 Points +13%
Intel Arc B370 10 Xe3 Panther Lake iGPU
Intel Core Ultra 5 338H Engineering Sample, 0
1376 Points
Apple M5 GPU
Apple MacBook Pro 14 2025 M5, 19
1125 Points -18%
Intel Arc Graphics 140T
MSI Prestige 16 AI Evo B2HMG, 0
919 Points -33%
Intel Arc Graphics 140V
Microsoft Surface Laptop 7 15 Lunar Lake, 0
910 Points -34%
Intel Arc Graphics 140V
MSI Claw 8 AI+, 0
812 Points -41%
AMD Radeon 890M
MSI Claw A8 BZ2EM, 0
597 Points -57%
Qualcomm SD X Adreno X1-85 4.6 TFLOPS
Samsung Galaxy Book4 Edge 16 X1E-84-100, 0
590 Points -57%
AMD Radeon 890M
Asus Zenbook S 16 UM5606-RK333W, 0
557 Points -60%
Qualcomm SD X Adreno X1-85 3.8 TFLOPS
Honor MagicBook Art 14 Snapdragon, 0
512 Points -63%
AMD Radeon 860M
Lenovo ThinkPad X13 G6 AMD, 0
462 Points -66%
AMD Radeon 780M
Lenovo IdeaPad Slim 3 14 AHP G10, 0
407 Points -70%
Qualcomm SD X Adreno X1-85 3.8 TFLOPS
HP OmniBook X 14, 0
253 Points -82%
Qualcomm SD X Adreno X1-45 1.7 TFLOPS
Microsoft Surface Pro 12, 0
228 Points -83%
3DMark / Steel Nomad Light Score
NVIDIA GeForce RTX 4060 Laptop GPU
Schenker Key 14 (M24), 100
9967 Points +86%
AMD Radeon 8060S
Asus ROG Flow Z13 GZ302EA-RU073W, 80
9653 Points +80%
NVIDIA GeForce RTX 4060 Laptop GPU
Asus ROG Zephyrus G16 GA605WV, 80
9201 Points +72%
Apple M4 Pro 20-Core GPU
Apple MacBook Pro 16 2024 M4 Pro, 32
7781 Points +45%
NVIDIA GeForce RTX 4050 Laptop GPU
Lenovo Yoga Pro 7 14IMH9, RTX 4050, 60
7254 Points +35%
Apple M4 Pro 16-Core GPU
Apple MacBook Pro 14 2024 M4 Pro Entry, 0
6739 Points +26%
Intel Arc B390 12 Xe3 Panther Lake iGPU
Asus ZenBook Duo UX8407AA, 0
6338 Points +18%
Intel Arc B370 10 Xe3 Panther Lake iGPU
Intel Core Ultra 5 338H Engineering Sample, 0
5354 Points
Apple M5 GPU
Apple MacBook Pro 14 2025 M5, 19
5221 Points -2%
Intel Arc Graphics 140T
MSI Prestige 16 AI Evo B2HMG, 0
3692 Points -31%
Intel Arc Graphics 140V
Microsoft Surface Laptop 7 15 Lunar Lake, 0
3555 Points -34%
Intel Arc Graphics 140V
MSI Claw 8 AI+, 0
3289 Points -39%
AMD Radeon 890M
MSI Claw A8 BZ2EM, 0
3228 Points -40%
AMD Radeon 890M
Asus Zenbook S 16 UM5606-RK333W, 0
3198 Points -40%
Intel Arc Graphics 130V
Lenovo ThinkPad E14 Gen 7 21U2002QGE, 0
2670 Points -50%
Qualcomm SD X Adreno X1-85 4.6 TFLOPS
Samsung Galaxy Book4 Edge 16 X1E-84-100, 0
2467 Points -54%
AMD Radeon 860M
Lenovo ThinkPad X13 G6 AMD, 0
2454 Points -54%
AMD Radeon 780M
Lenovo IdeaPad Slim 3 14 AHP G10, 0
2447 Points -54%
Qualcomm SD X Adreno X1-85 3.8 TFLOPS
Honor MagicBook Art 14 Snapdragon, 0
2231 Points -58%
Qualcomm SD X Adreno X1-45 1.7 TFLOPS
Microsoft Surface Pro 12, 0
1097 Points -80%
Qualcomm SD X Adreno X1-85 3.8 TFLOPS
HP OmniBook X 14, 0
1034 Points -81%

También examinamos el rendimiento a valores de TDP inferiores. El rendimiento del Arc B370 es prácticamente idéntico al del Arc B390 a 20 vatios, mientras que el déficit es de sólo el 6 % a 35 vatios.

Time Spy Graphics
20 vatios 28 vatios 35 vatios
Core Ultra X9 388H c/ Arco B390 4.567 puntos 5.600 puntos 6.321 puntos
Core Ultra X7 358H c/ Arco B390 4.334 puntos 5.330 puntos 6.296 puntos
Core Ultra 5 338H c/ Arco B370 4.476 puntos 5.474 puntos 5.933 puntos

Impresiones iniciales

La primera impresión del nuevo Core Ultra 5 338H con la GPU Arc B370 es positiva. El rendimiento general de la CPU (un solo núcleo y varios combinados) está a la par con el nuevo AMD Ryzen AI 9 465 en configuraciones de TDP similares. El Arc B370 continúa la buena impresión del Arc B390 y la diferencia general no es tan grande en el rango de TDP de hasta 35 vatios que hemos podido probar hasta ahora. El delta de rendimiento será probablemente un poco mayor en los límites de potencia superiores.

Tendremos que esperar un poco más para realizar pruebas más exhaustivas y esperamos las primeras unidades de venta al público con el nuevo Core Ultra 5 338H y el Arc B370 en las próximas semanas.

Please share our article, every link counts!
Mail Logo
> Análisis y pruebas de ordenadores portátiles y móviles teléfonos > Noticias > Archivo de noticias > Archivo de noticias 2026 02 > Intel Core Ultra 5 338H y Arc B370 Benchmarks - Casi tan rápido como el Arc B390
Andreas Osthoff, 2026-02-13 (Update: 2026-02-13)