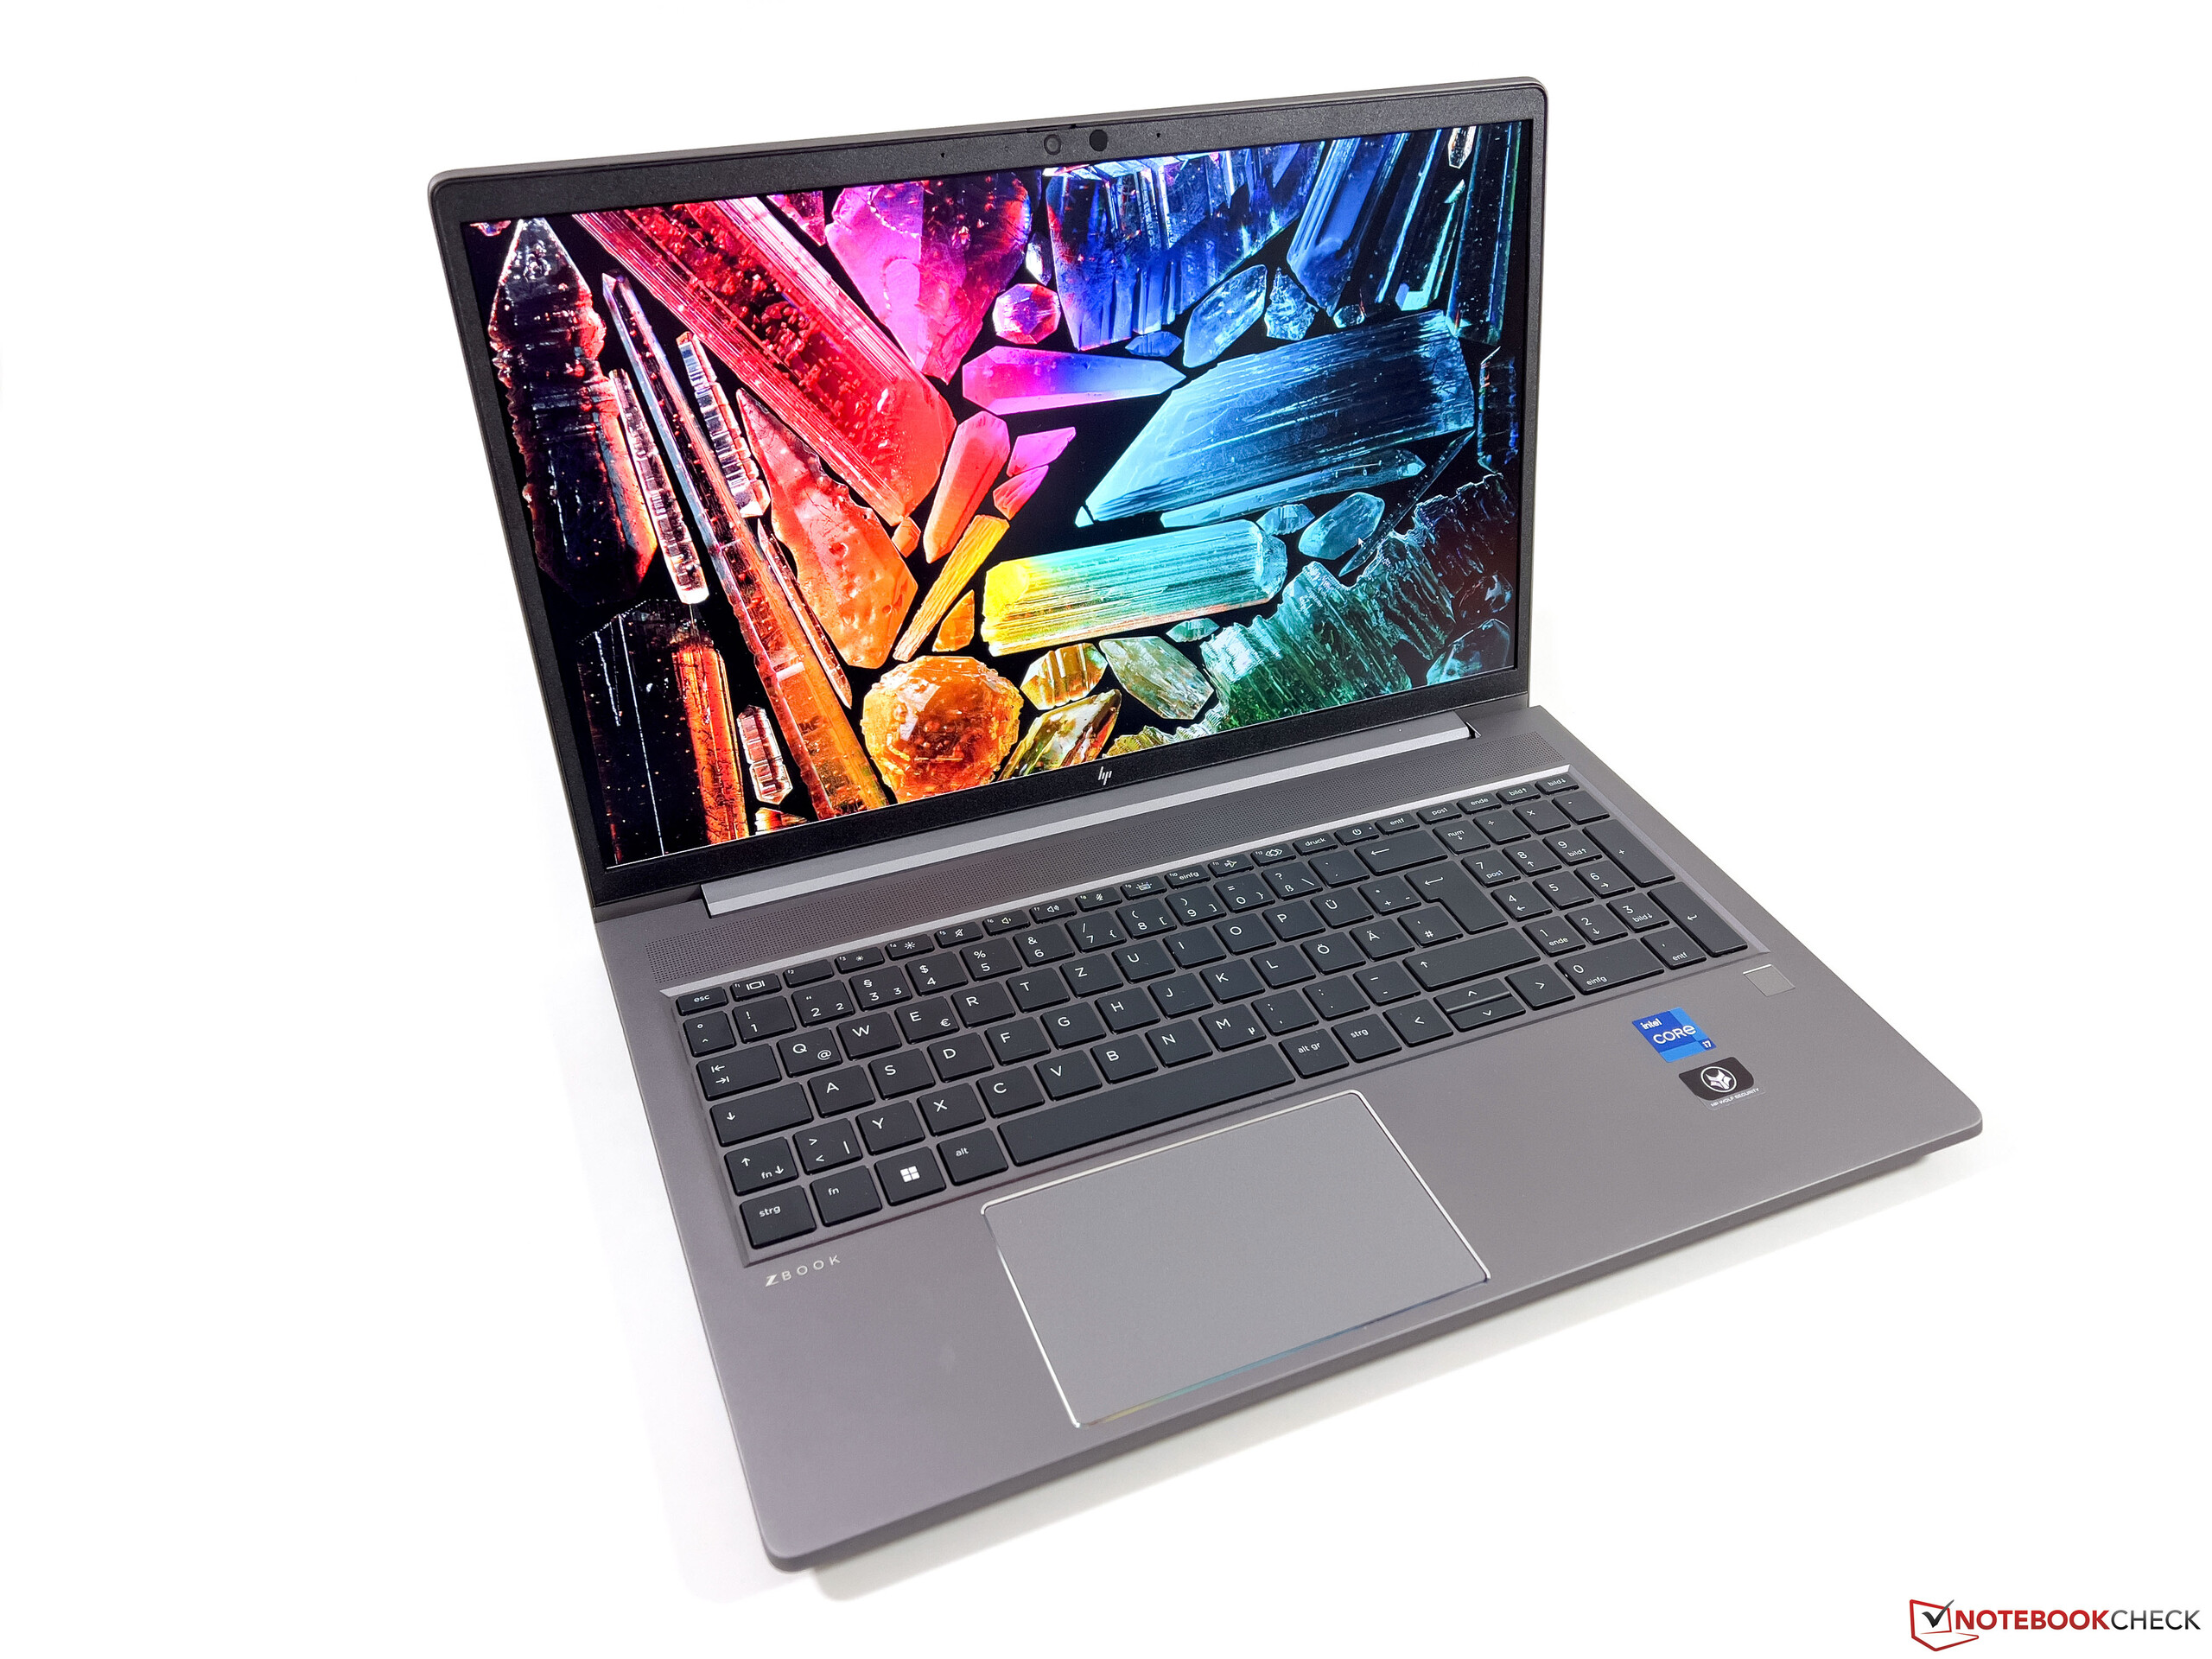
Análisis de la estación de trabajo HP ZBook Power 15 G10: Excelente alternativa al ThinkPad P15v

El HP ZBook Power 15 G10 sustituye al ZBook Power 15 G9 del año pasado cambiando las CPU Intel Alder Lake de 12ª generación por las nuevas Raptor Lake de 13ª generación y las opciones AMD Ryzen Zen 4. Por lo demás, el chasis es idéntico al del ZBook Power 15 G9 o ZBook Power 15 G8 por lo que recomendamos consultar nuestros anteriores análisis para conocer mejor las características físicas del modelo.
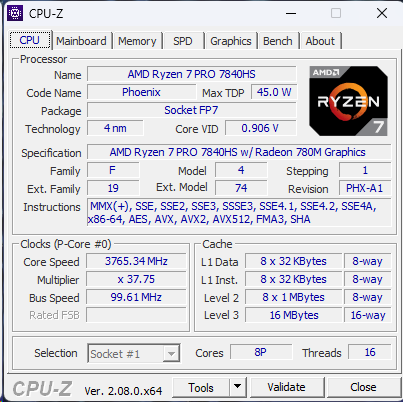
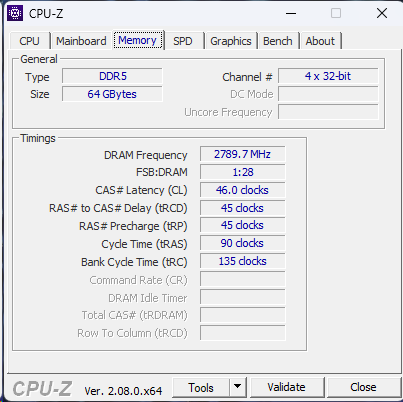
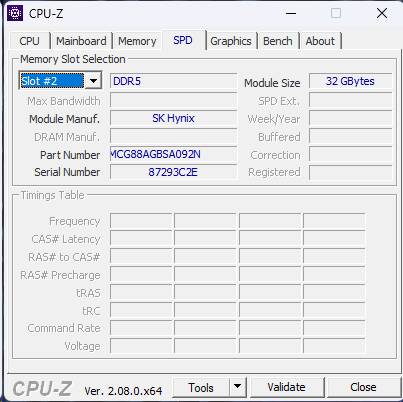
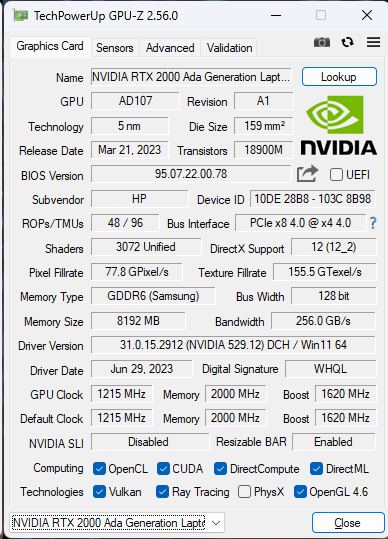
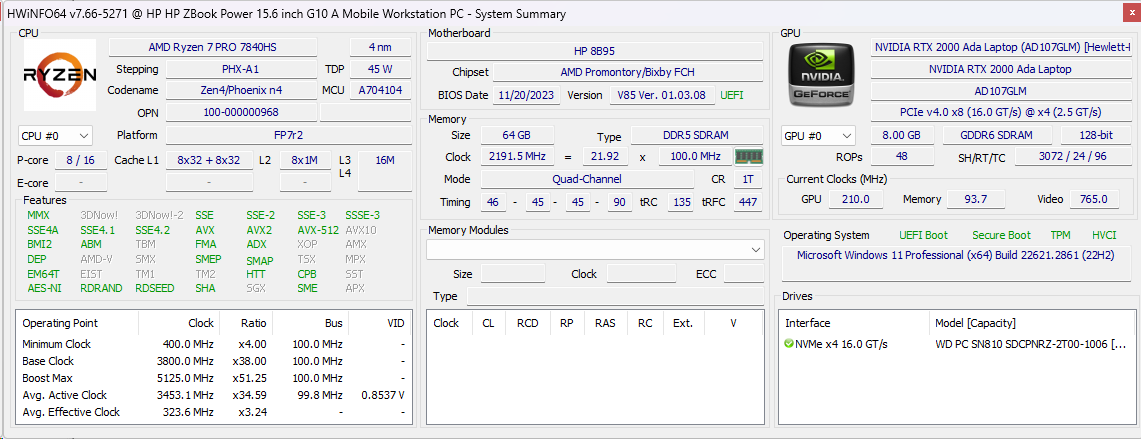
Nuestra unidad de revisión específica es la configuración AMD de gama más alta con la CPU Ryzen 7 Pro 7940HS, GPU Nvidia RTX 2000 Ada, pantalla IPS de 1440p y 64 GB de RAM DDR5-5600 por aproximadamente 2600 USD. SKUs menores que comienzan con el Ryzen 5 7640HS, pantalla 1080p, y sólo gráficos integrados también están disponibles por tan sólo $1600. Tenga en cuenta que las configuraciones con CPU Intel se denominan ZBook Power 15 G10 mientras que las que tienen CPU AMD se venden como ZBook Power 15 G10 A.
Entre las alternativas al ZBook Power 15 G10 se incluyen otras estaciones de trabajo ultradelgadas como el Dell Precision 5560, Lenovo ThinkPad P15v G3, o Asus ExpertBook B6 Flip.
Más opiniones sobre HP:
Posibles contendientes en la comparación
Valoración | Fecha | Modelo | Peso | Altura | Tamaño | Resolución | Precio |
|---|---|---|---|---|---|---|---|
| 88.9 % v7 (old) | 12/2023 | HP ZBook Power 15 G10 R7 PRO 7840HS, RTX 2000 Ada Generation Laptop | 2 kg | 22.9 mm | 15.60" | 2560x1440 | |
| 87.4 % v7 (old) | 01/2023 | HP ZBook Power 15 G9 6B8C4EA i7-12700H, RTX A2000 Laptop GPU | 2 kg | 22.8 mm | 15.60" | 3840x2160 | |
| 87.8 % v7 (old) | 04/2023 | Lenovo ThinkPad P15v G3 21EM001AGE R7 PRO 6850H, RTX A2000 Laptop GPU | 2.2 kg | 22.7 mm | 15.60" | 3840x2160 | |
| 88.3 % v7 (old) | 10/2021 | Dell Precision 5000 5560 i7-11850H, RTX A2000 Laptop GPU | 2 kg | 18 mm | 15.60" | 3840x2400 | |
| 91.7 % v7 (old) | 10/2023 | Lenovo ThinkPad P1 G6-21FV000DGE i9-13900H, RTX 2000 Ada Generation Laptop | 1.9 kg | 17.5 mm | 16.00" | 2560x1600 | |
| 89.6 % v7 (old) | 01/2023 | Asus ExpertBook B6 Flip B6602FC2 i9-12950HX, RTX A2000 Laptop GPU | 2.8 kg | 27.2 mm | 16.00" | 2560x1600 |
Caso

Comunicación
| Networking | |
| iperf3 transmit AX12 | |
| Dell Precision 5000 5560 | |
| iperf3 receive AX12 | |
| Dell Precision 5000 5560 | |
| iperf3 transmit AXE11000 | |
| HP ZBook Power 15 G10 | |
| Lenovo ThinkPad P1 G6-21FV000DGE | |
| Asus ExpertBook B6 Flip B6602FC2 | |
| Lenovo ThinkPad P15v G3 21EM001AGE | |
| iperf3 receive AXE11000 | |
| Lenovo ThinkPad P1 G6-21FV000DGE | |
| Lenovo ThinkPad P15v G3 21EM001AGE | |
| Asus ExpertBook B6 Flip B6602FC2 | |
| HP ZBook Power 15 G10 | |
| iperf3 transmit AXE11000 6GHz | |
| HP ZBook Power 15 G9 6B8C4EA | |
| HP ZBook Power 15 G10 | |
| Asus ExpertBook B6 Flip B6602FC2 | |
| Lenovo ThinkPad P15v G3 21EM001AGE | |
| iperf3 receive AXE11000 6GHz | |
| HP ZBook Power 15 G9 6B8C4EA | |
| Asus ExpertBook B6 Flip B6602FC2 | |
| Lenovo ThinkPad P15v G3 21EM001AGE | |
| HP ZBook Power 15 G10 | |
Cámara web
Mientras que nuestro ZBook Power G9 estaba configurado con una webcam de 1 MP, nuestro Power G10 viene con una webcam de 5 MP en su lugar para obtener una imagen mucho más nítida. Las funciones IR y de obturador físico permanecen inalteradas.


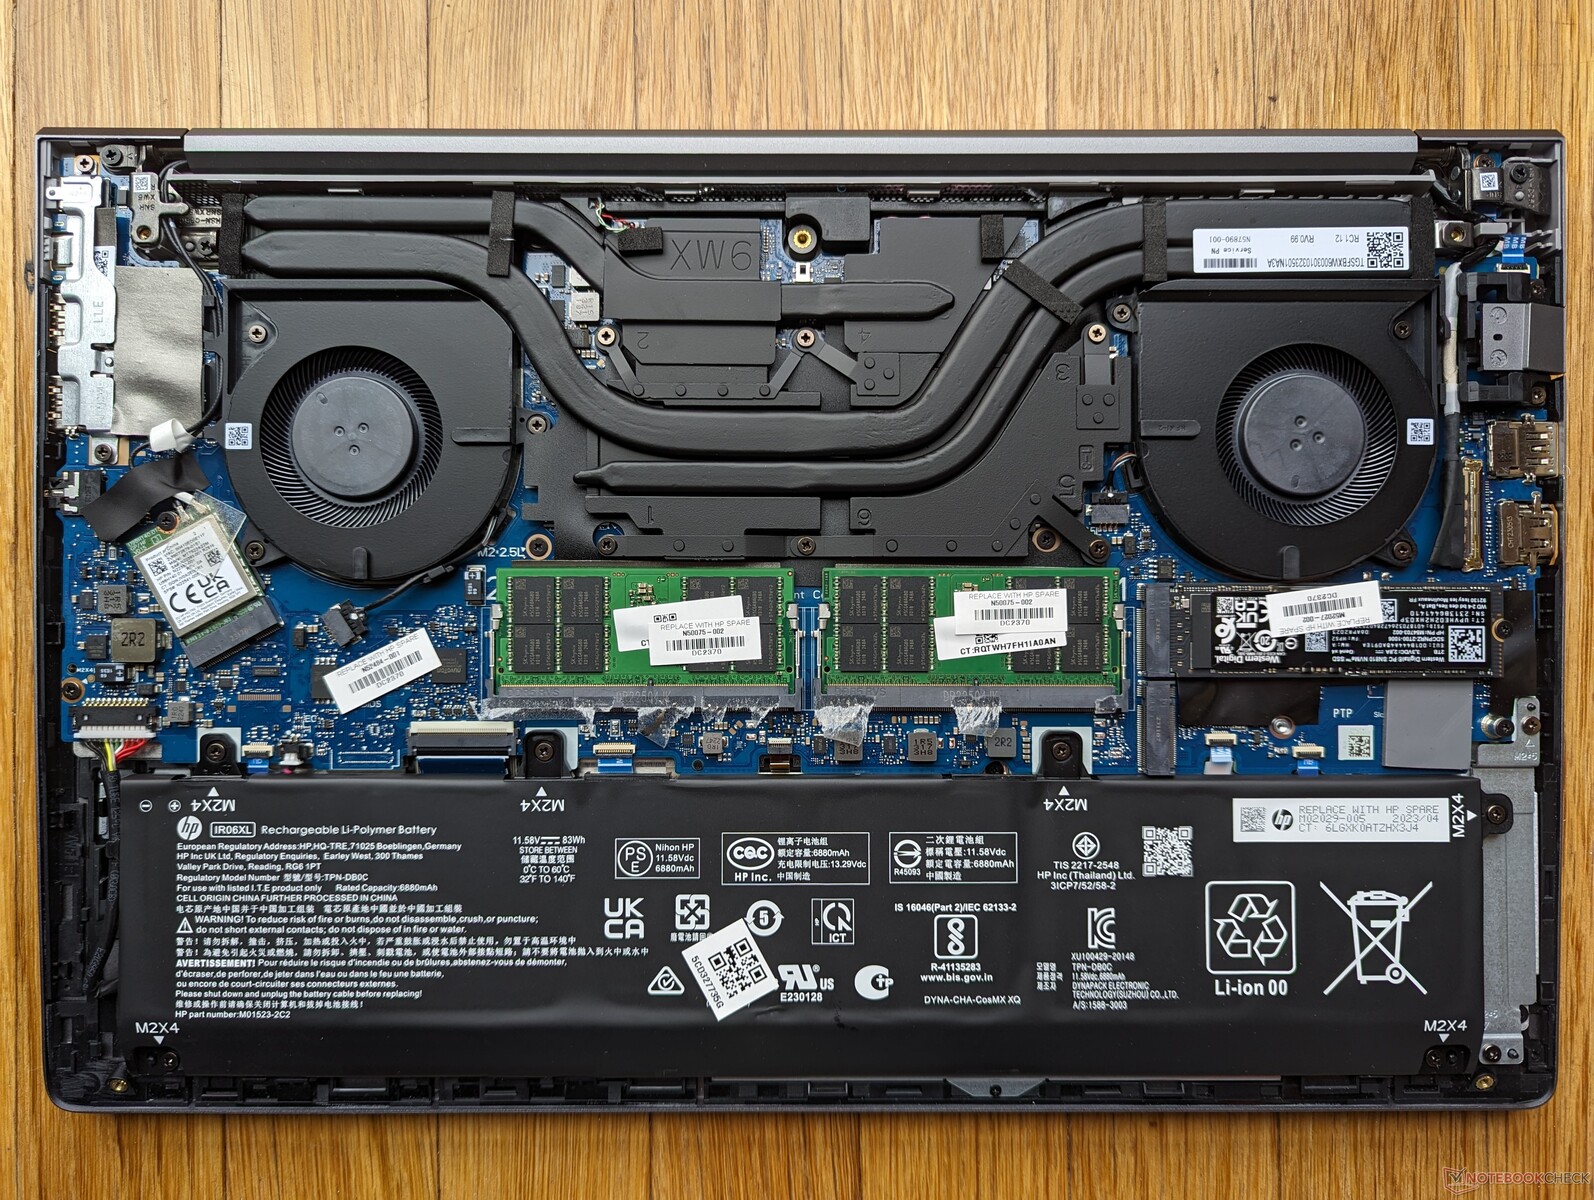
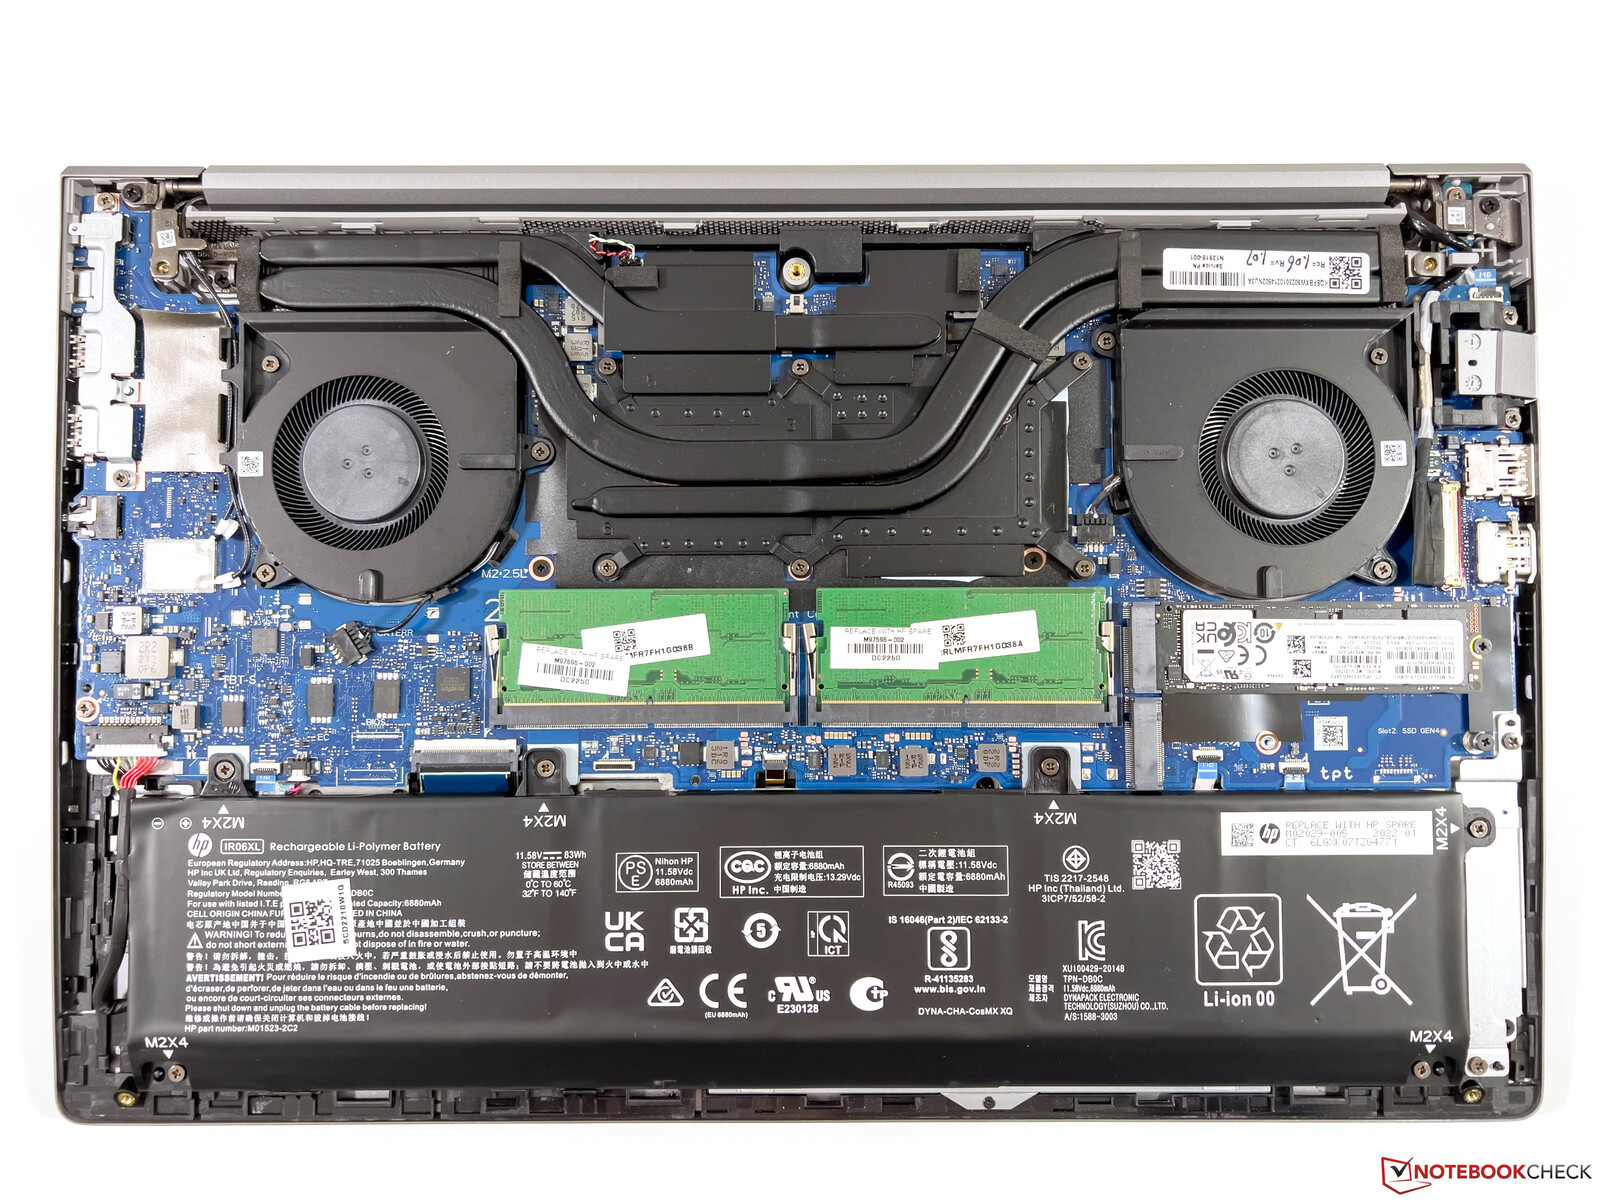
Mantenimiento
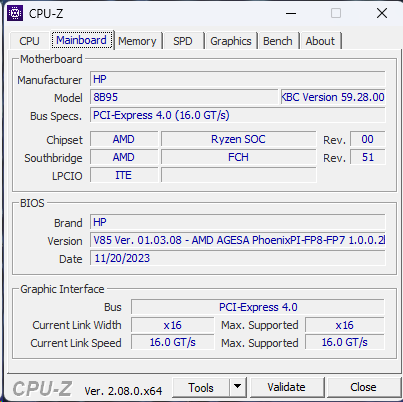
HP ha realizado un pequeño pero notable cambio: el módulo WLAN M.2 es ahora reemplazable mientras que estaba soldado en el ZBook Power 15 G9 del año pasado. Casi todo lo demás permanece intacto, incluidas las dos ranuras DDR5 SODIMM y las dos ranuras M.2 PCIe4 x4.
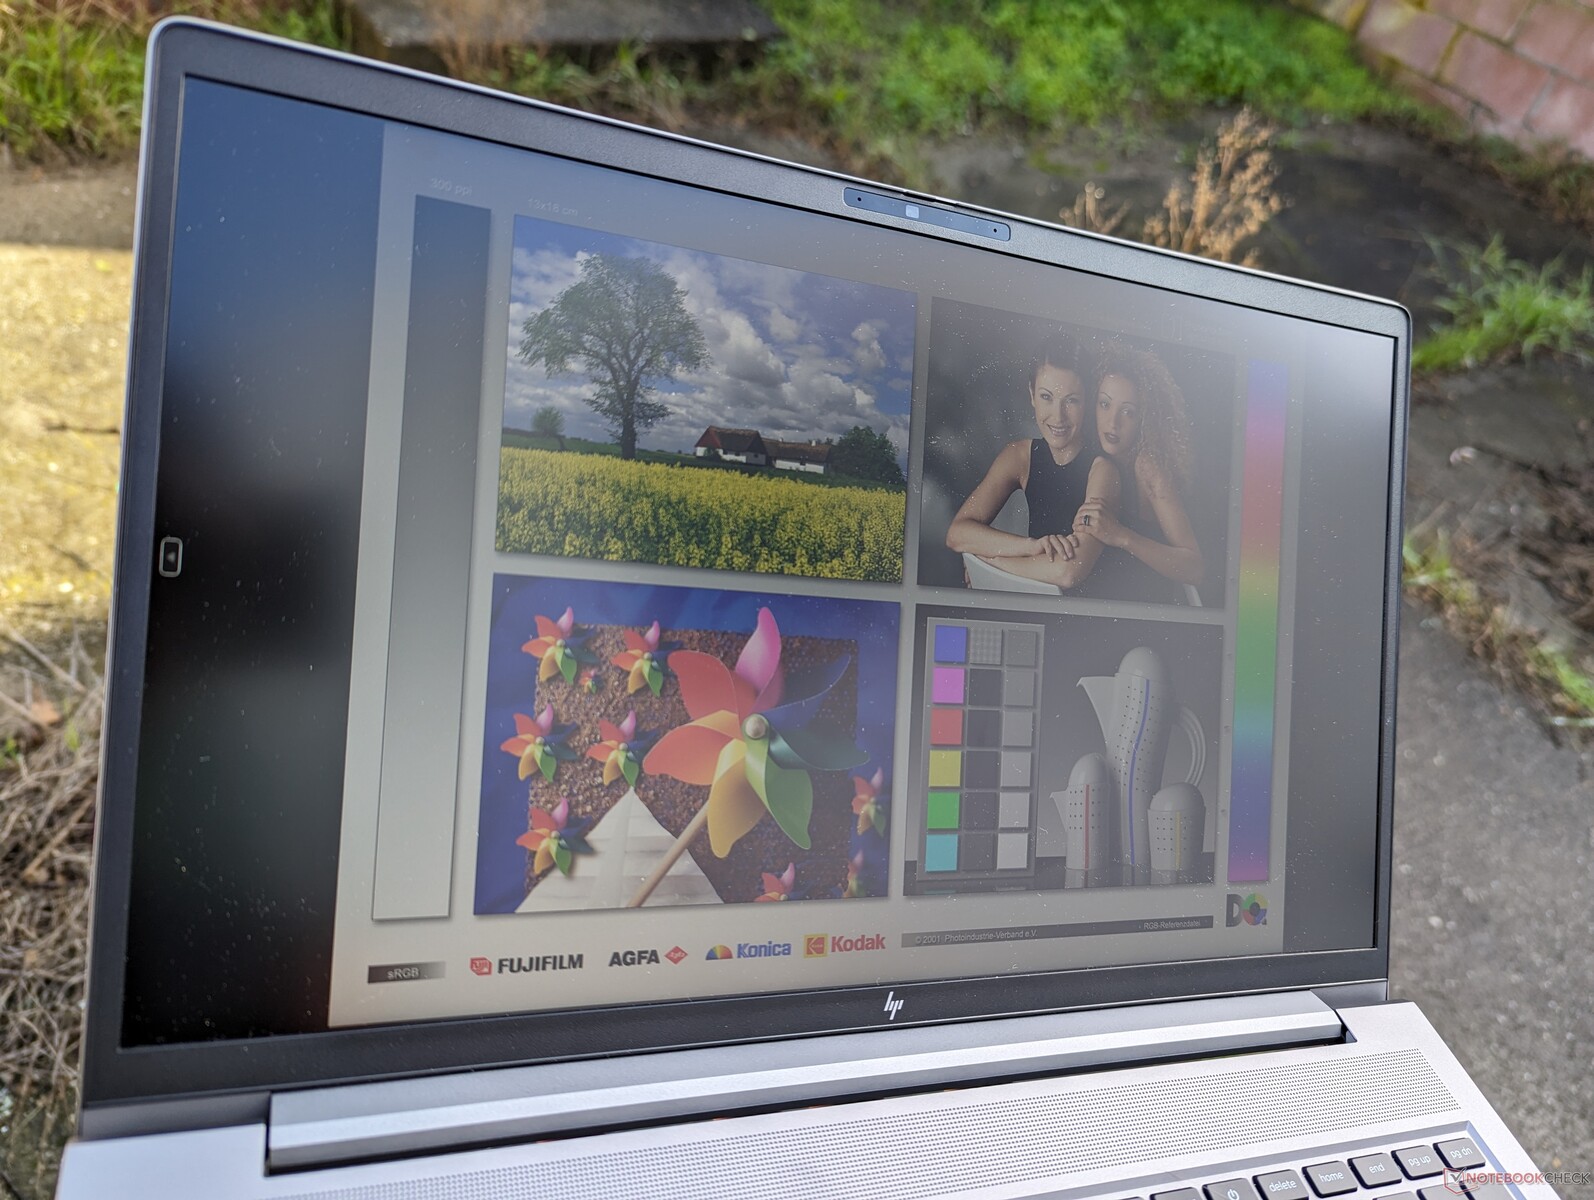
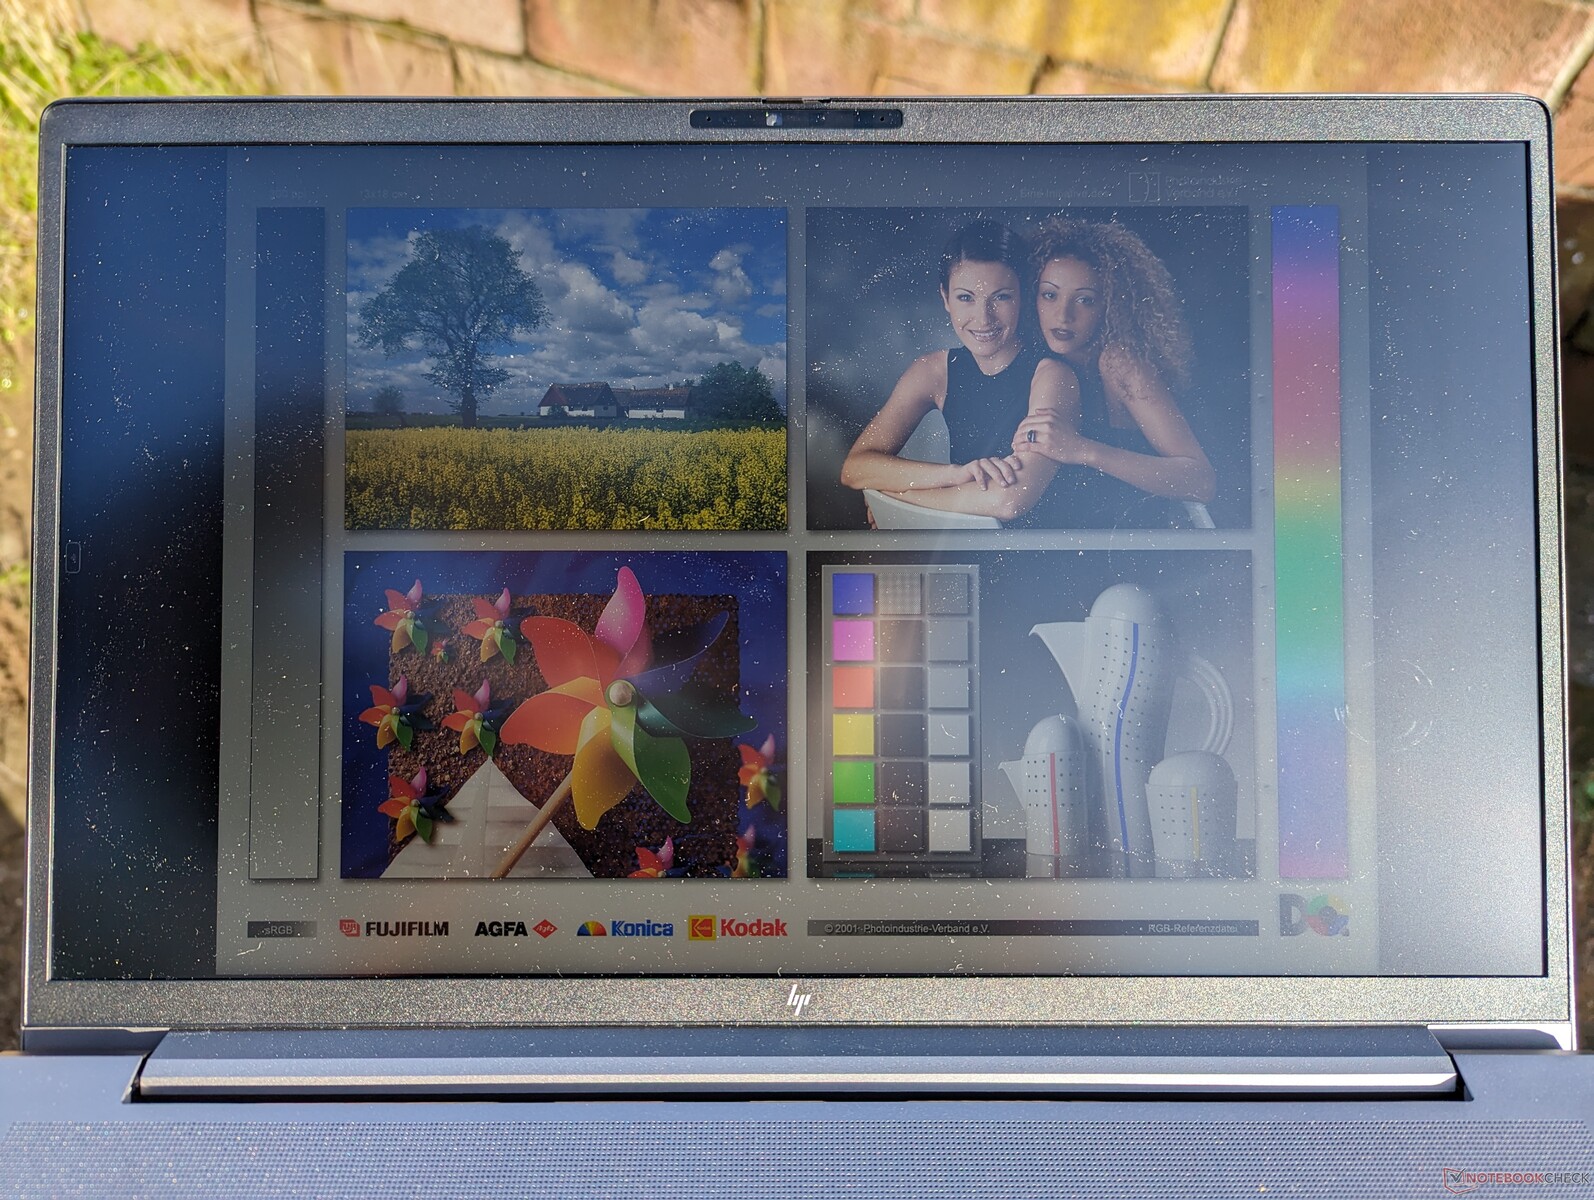
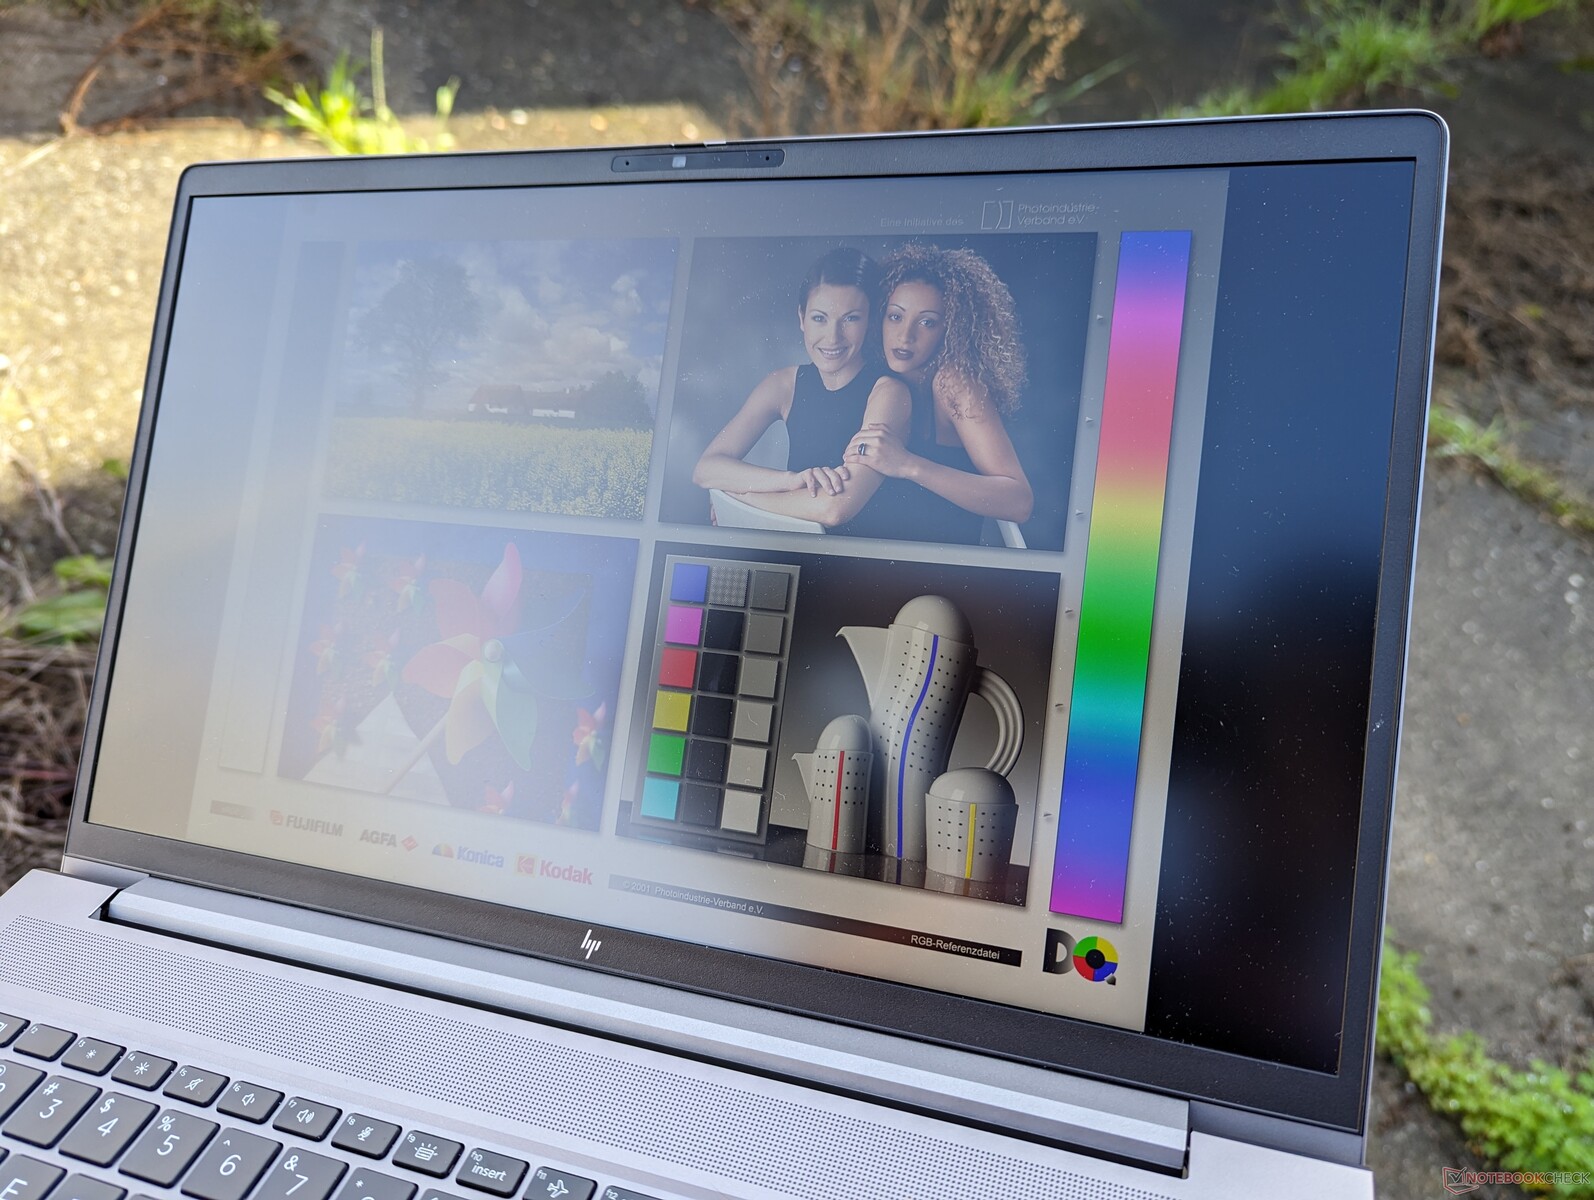
Mostrar
El modelo ofrece las siguientes cuatro opciones de pantalla mate:
- 1080p, 250 nits, 60% sRGB, pantalla táctil
- 1080p, 250 nits, 60% sRGB, no táctil
- 1080p, 400 nits, 100% sRGB, no táctil
- 1440p, 300 nits, 100% sRGB, no táctil, 120 Hz
A menos que la pantalla táctil sea una necesidad, recomendamos evitar las dos opciones de 250 nits, ya que cada una de ellas cubre sólo el 45% de NTSC para unos colores notablemente menos profundos.
Por razones que desconocemos, HP no ofrece opciones 4K para ninguna configuración del ZBook Power G10 a pesar de que antes estaban disponibles en el ZBook Power G9. Sospechamos que esto podría deberse a problemas de suministro, ya que los fabricantes están abandonando actualmente los paneles 16:9 de 15,6 pulgadas en favor de los paneles 16:10 de 16 pulgadas.
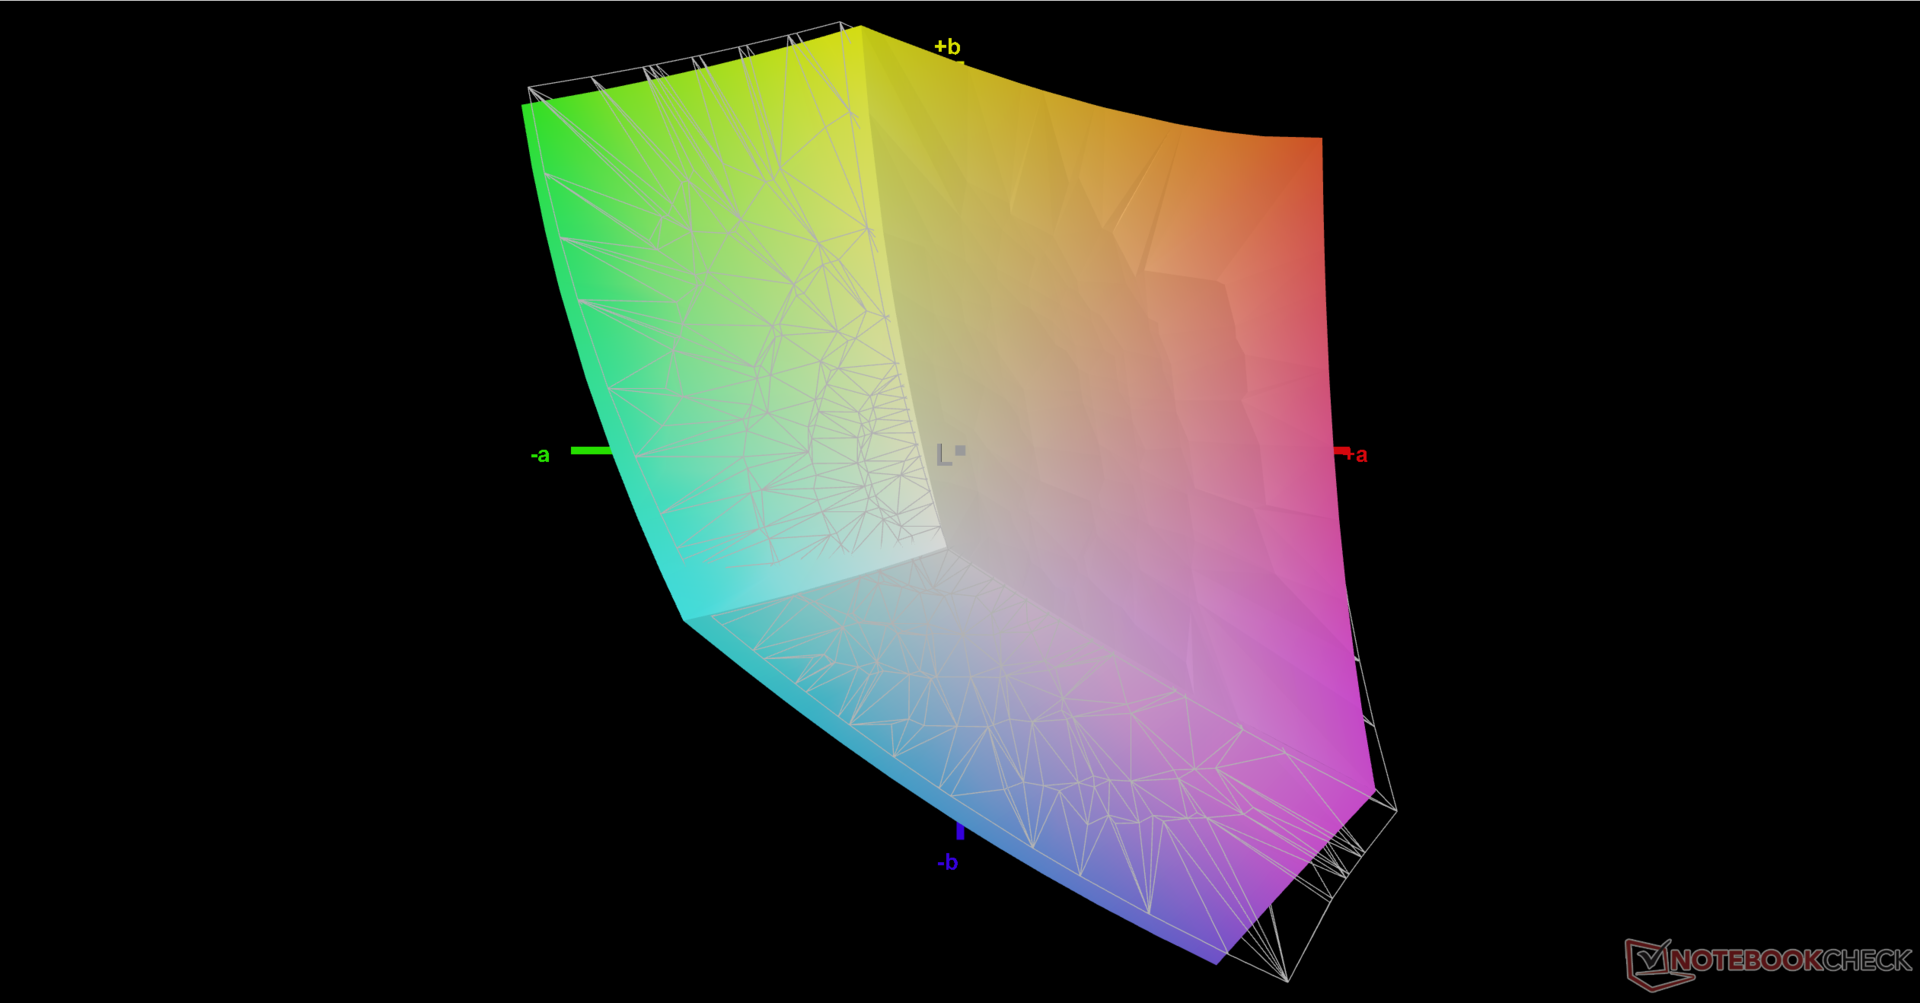
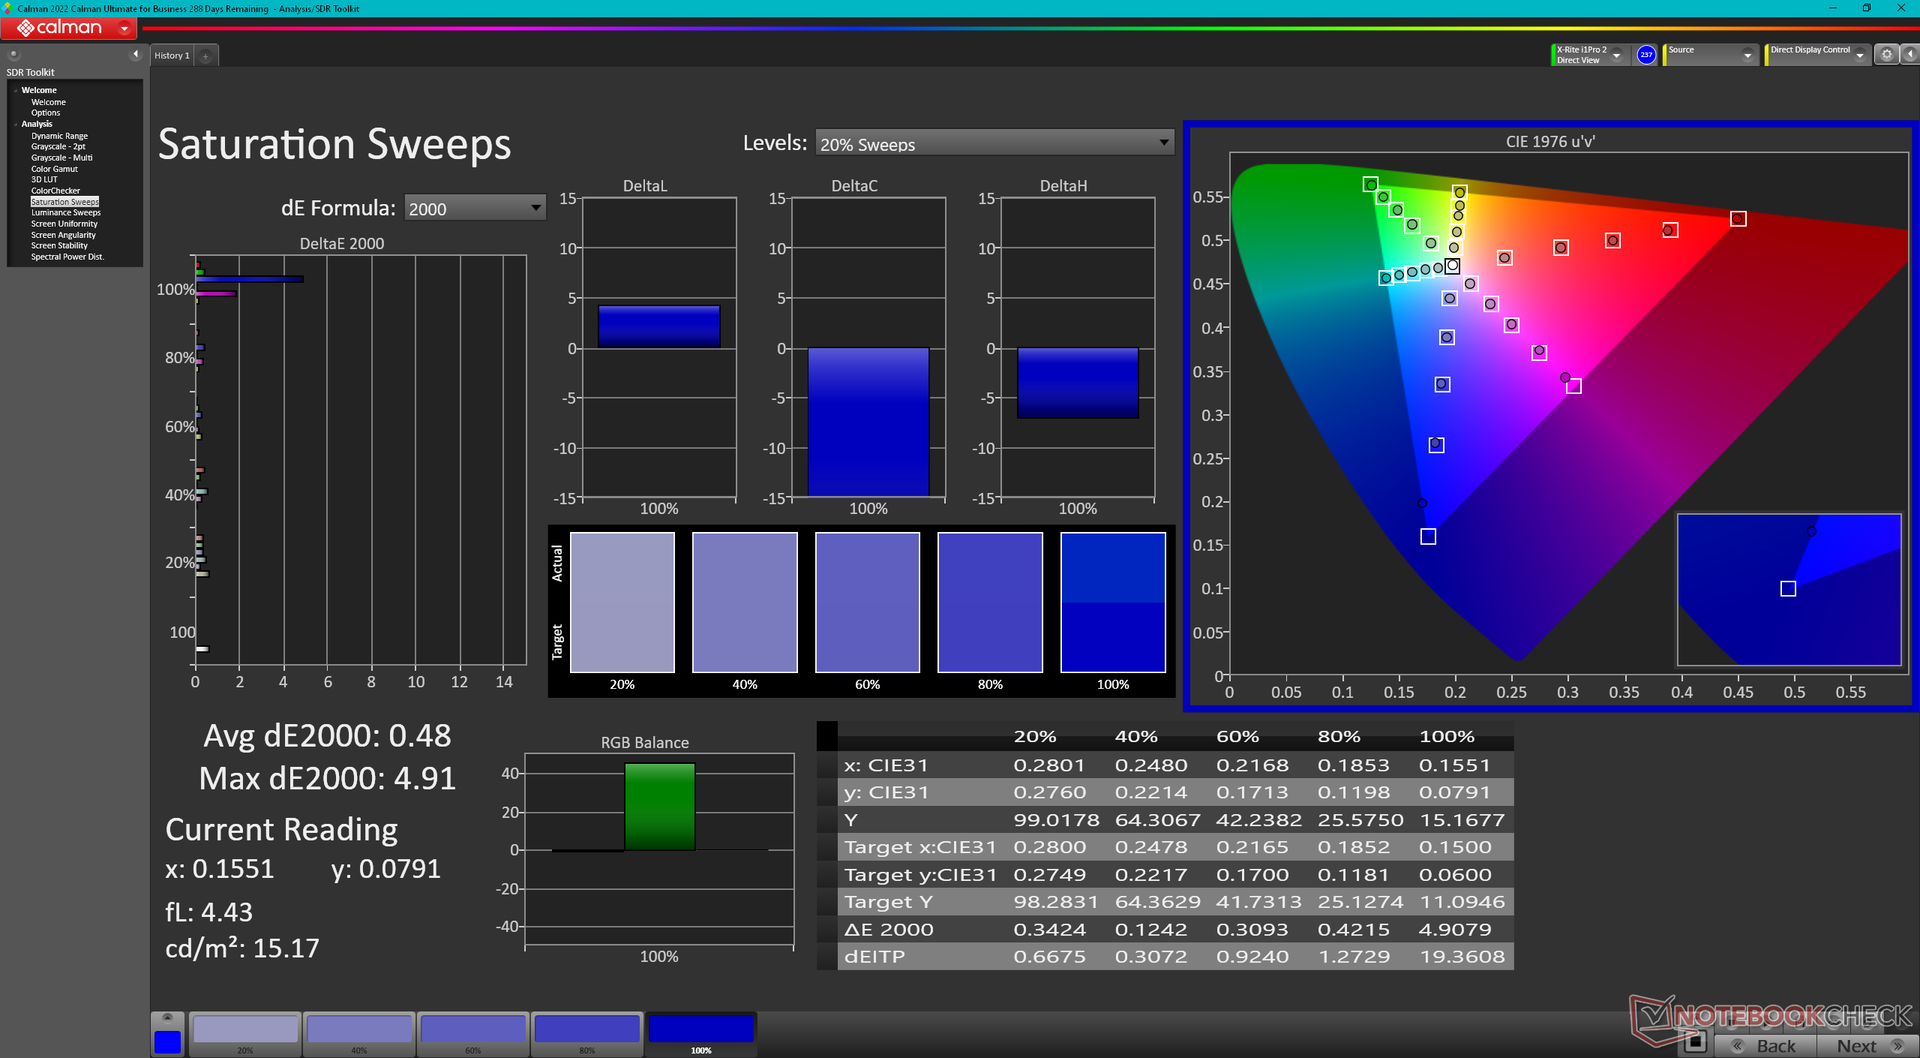
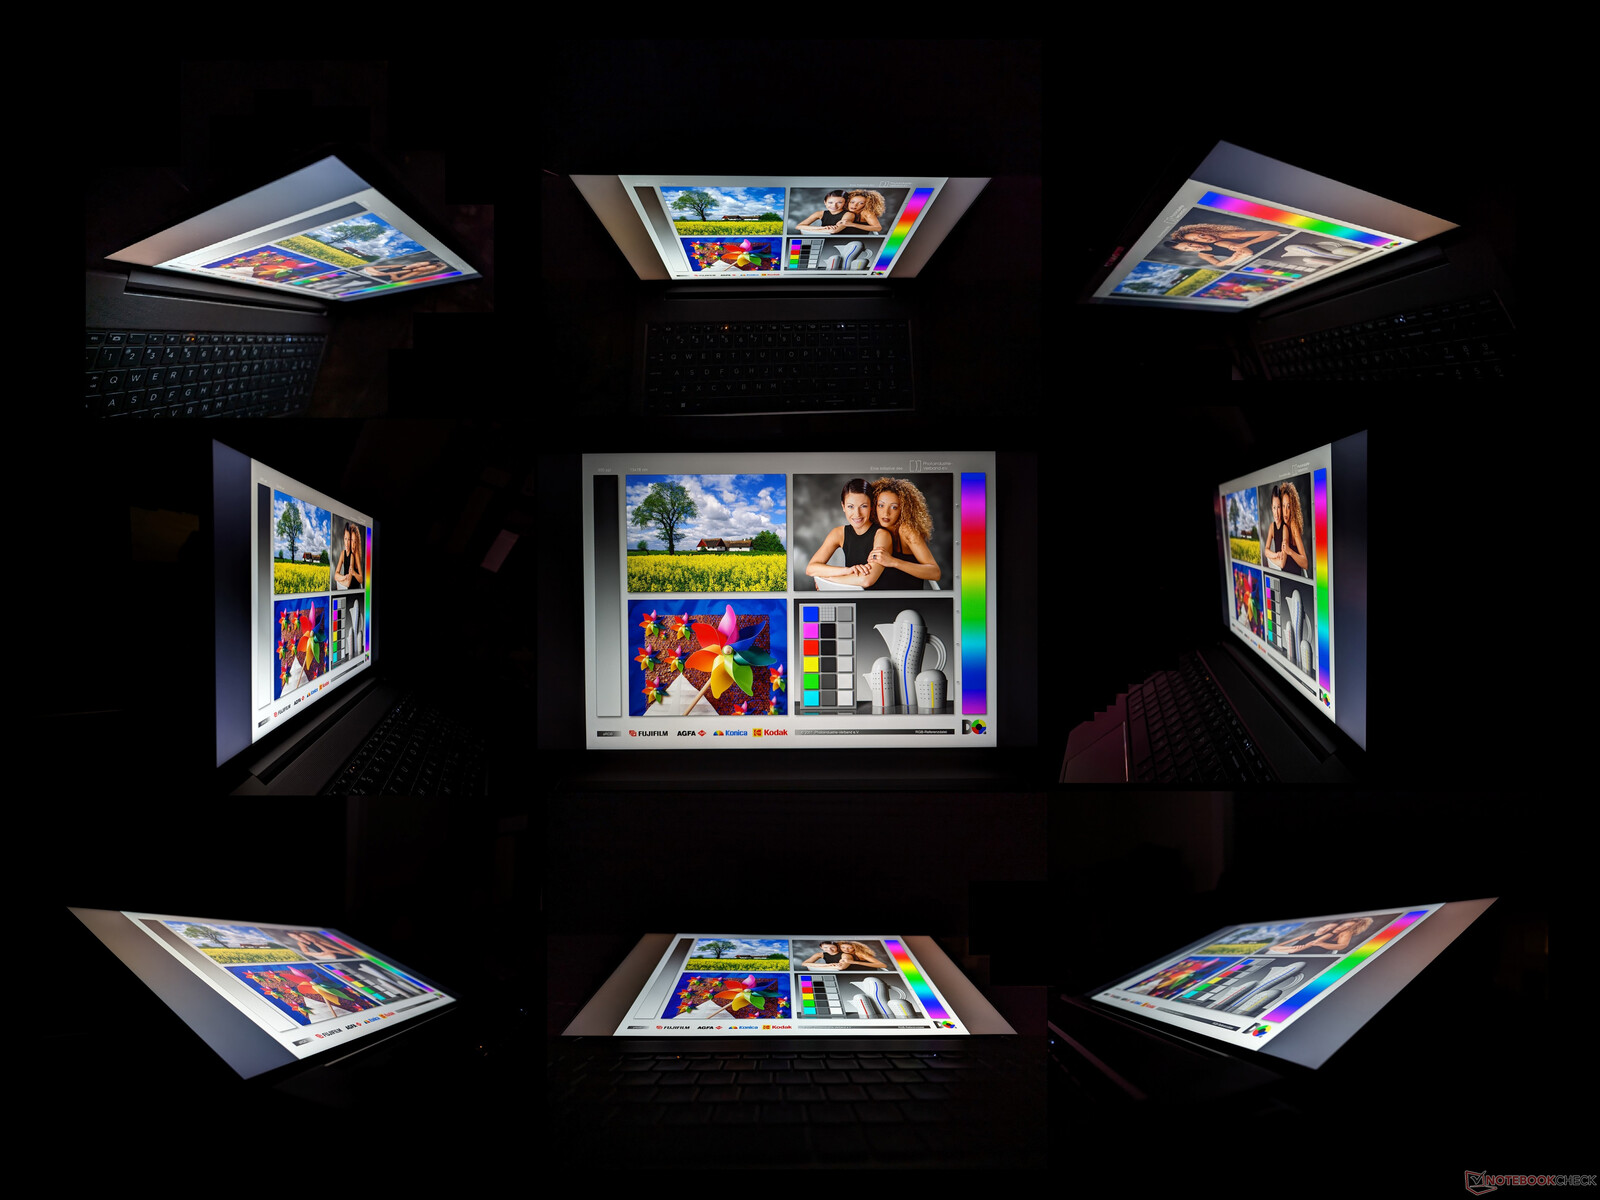
No obstante, nuestro panel de 1440p es excelente gracias a su rápida frecuencia de actualización, sus rápidos tiempos de respuesta y sus precisos colores sRGB, aptos para la creación de contenidos e incluso para los juegos. Puede que no sea OLED o 4K, pero sigue siendo una de las mejores pantallas IPS de 15,6 pulgadas que existen.

| |||||||||||||||||||||||||
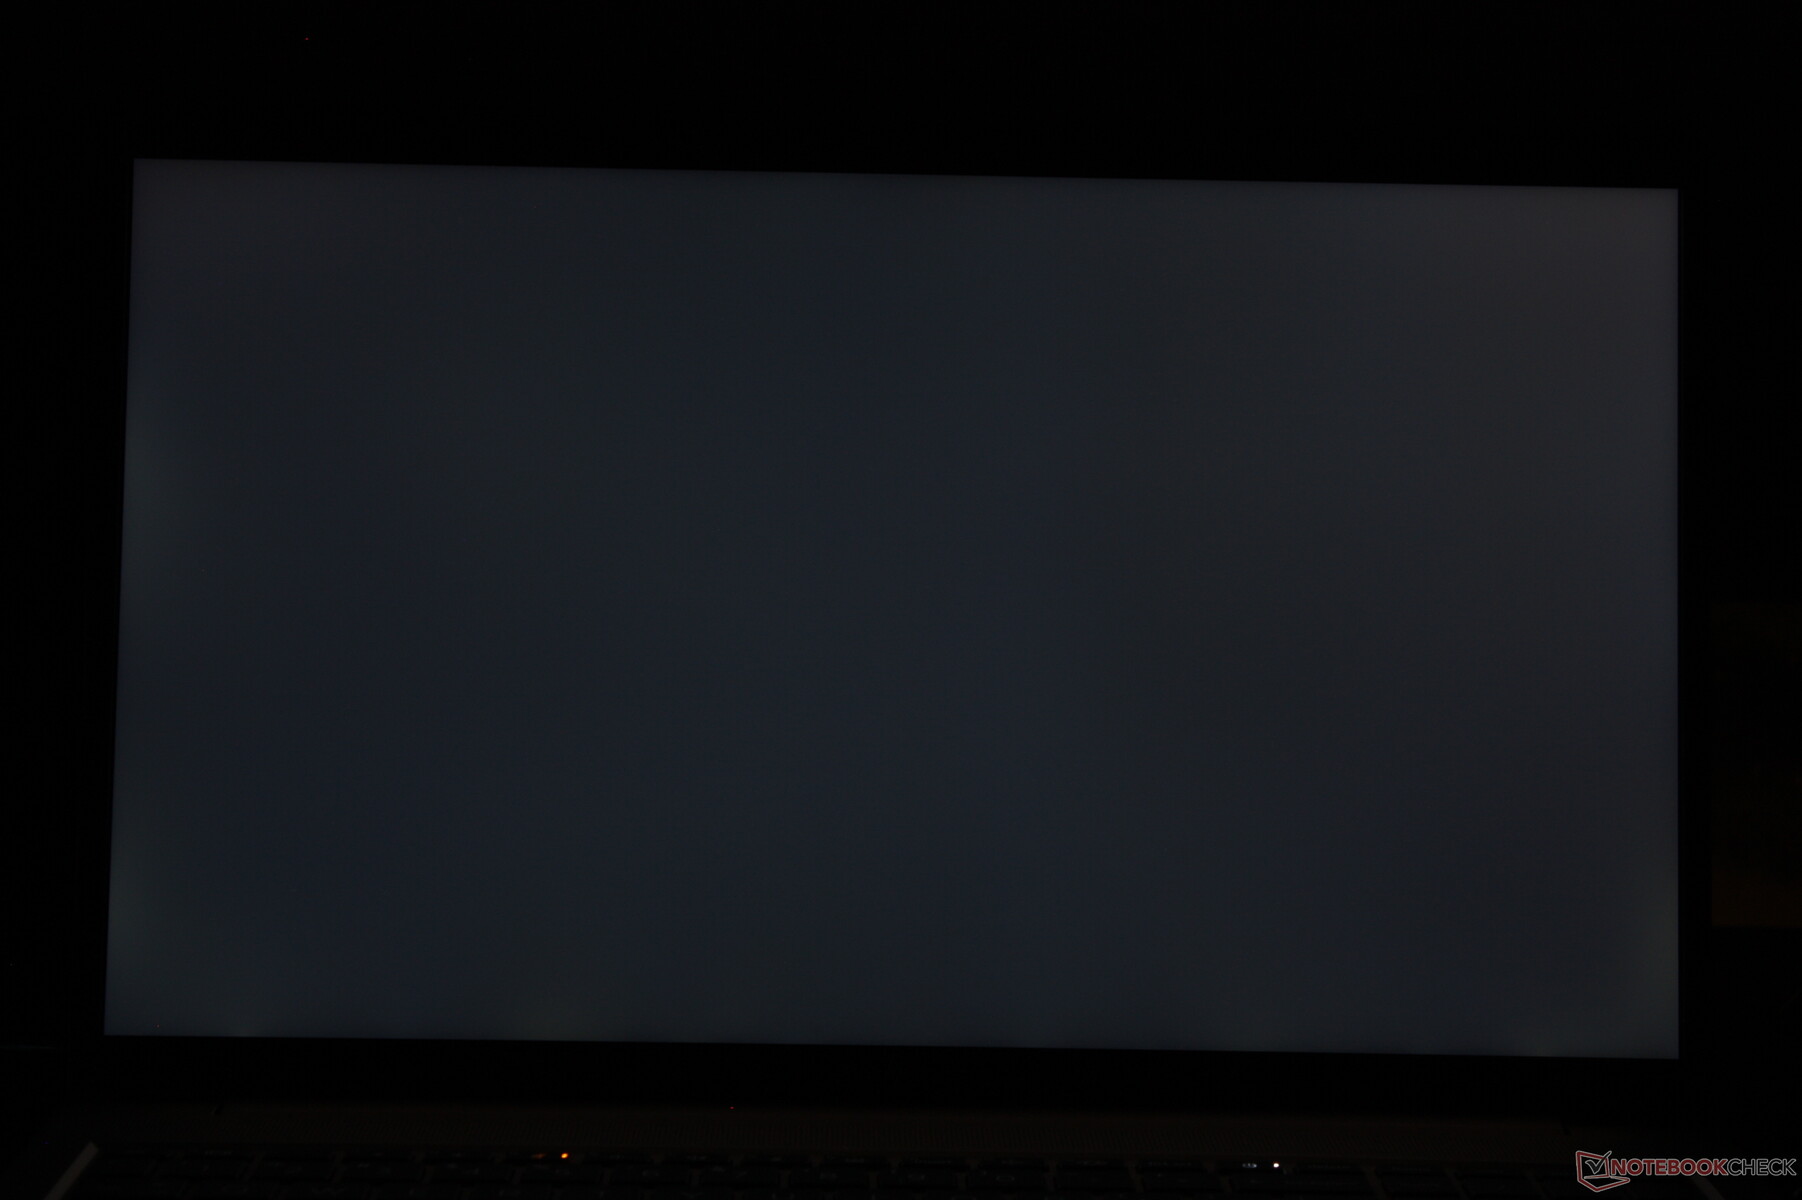
iluminación: 83 %
Brillo con batería: 313.8 cd/m²
Contraste: 1082:1 (Negro: 0.29 cd/m²)
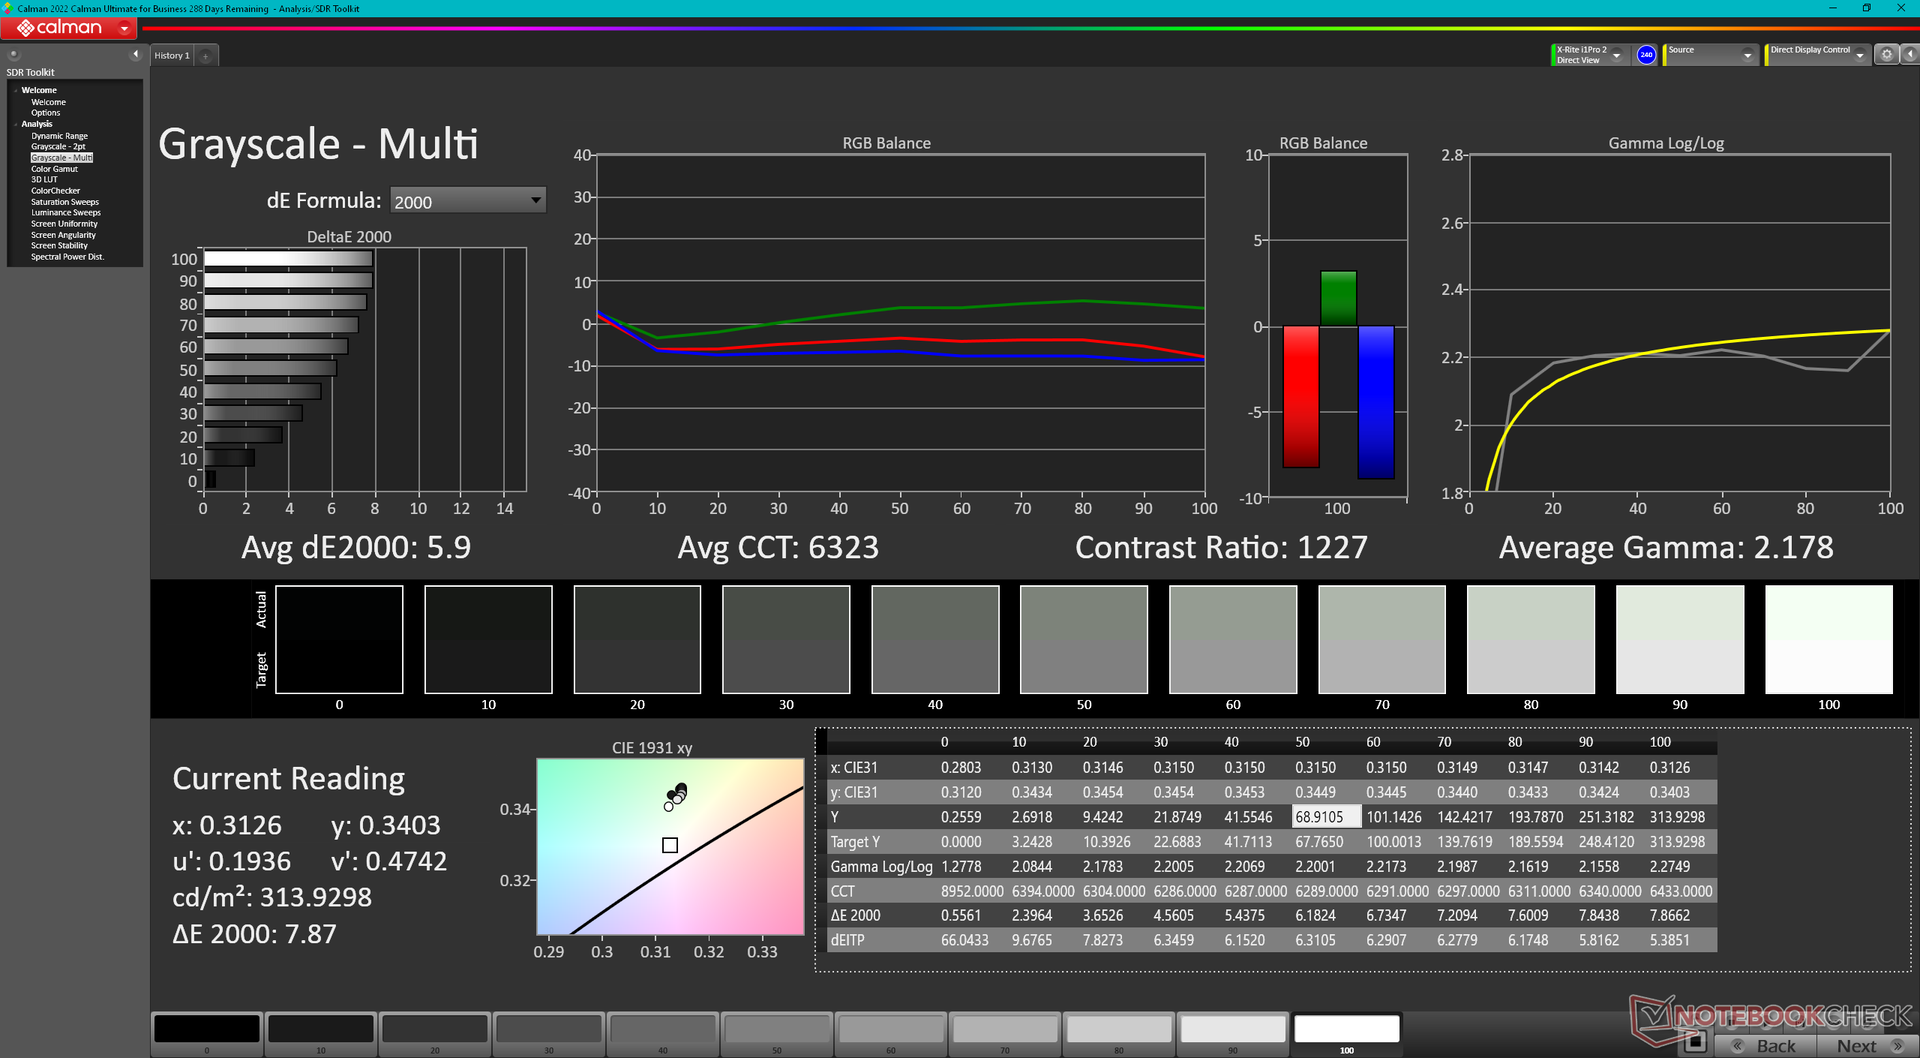
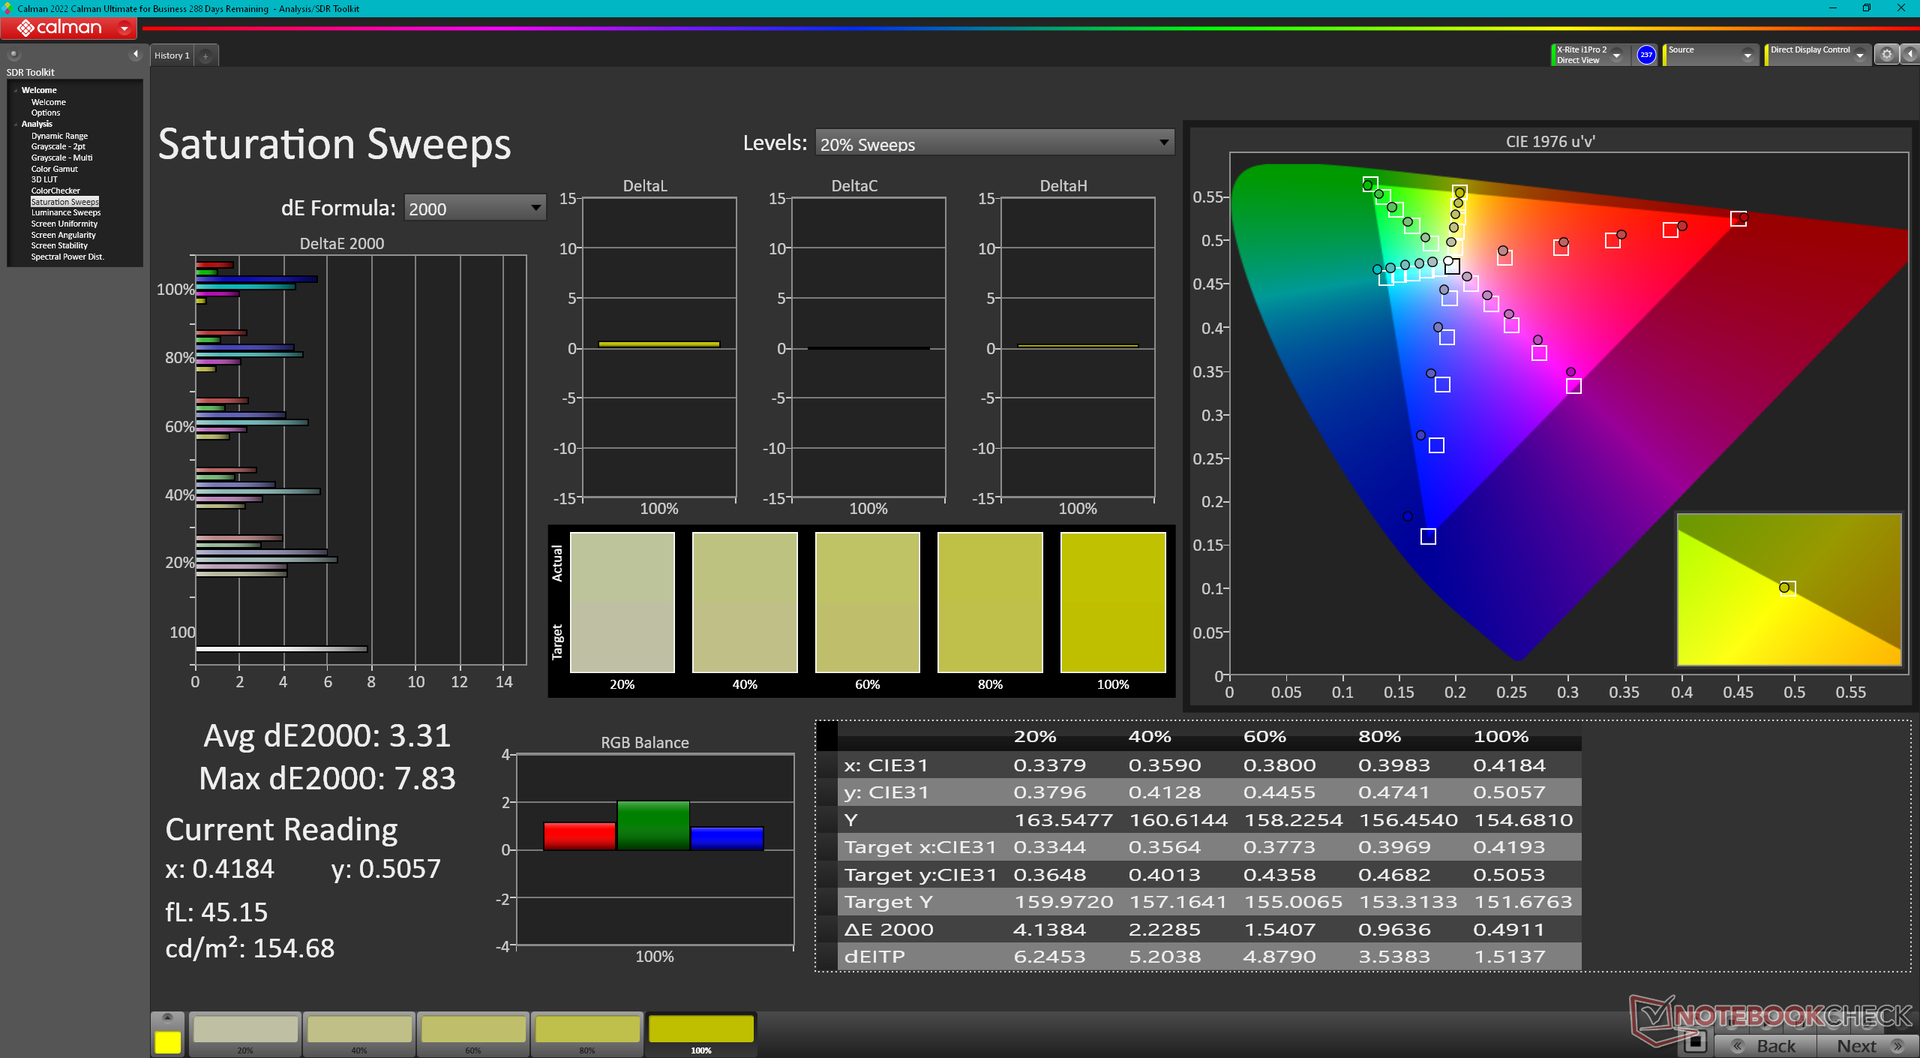
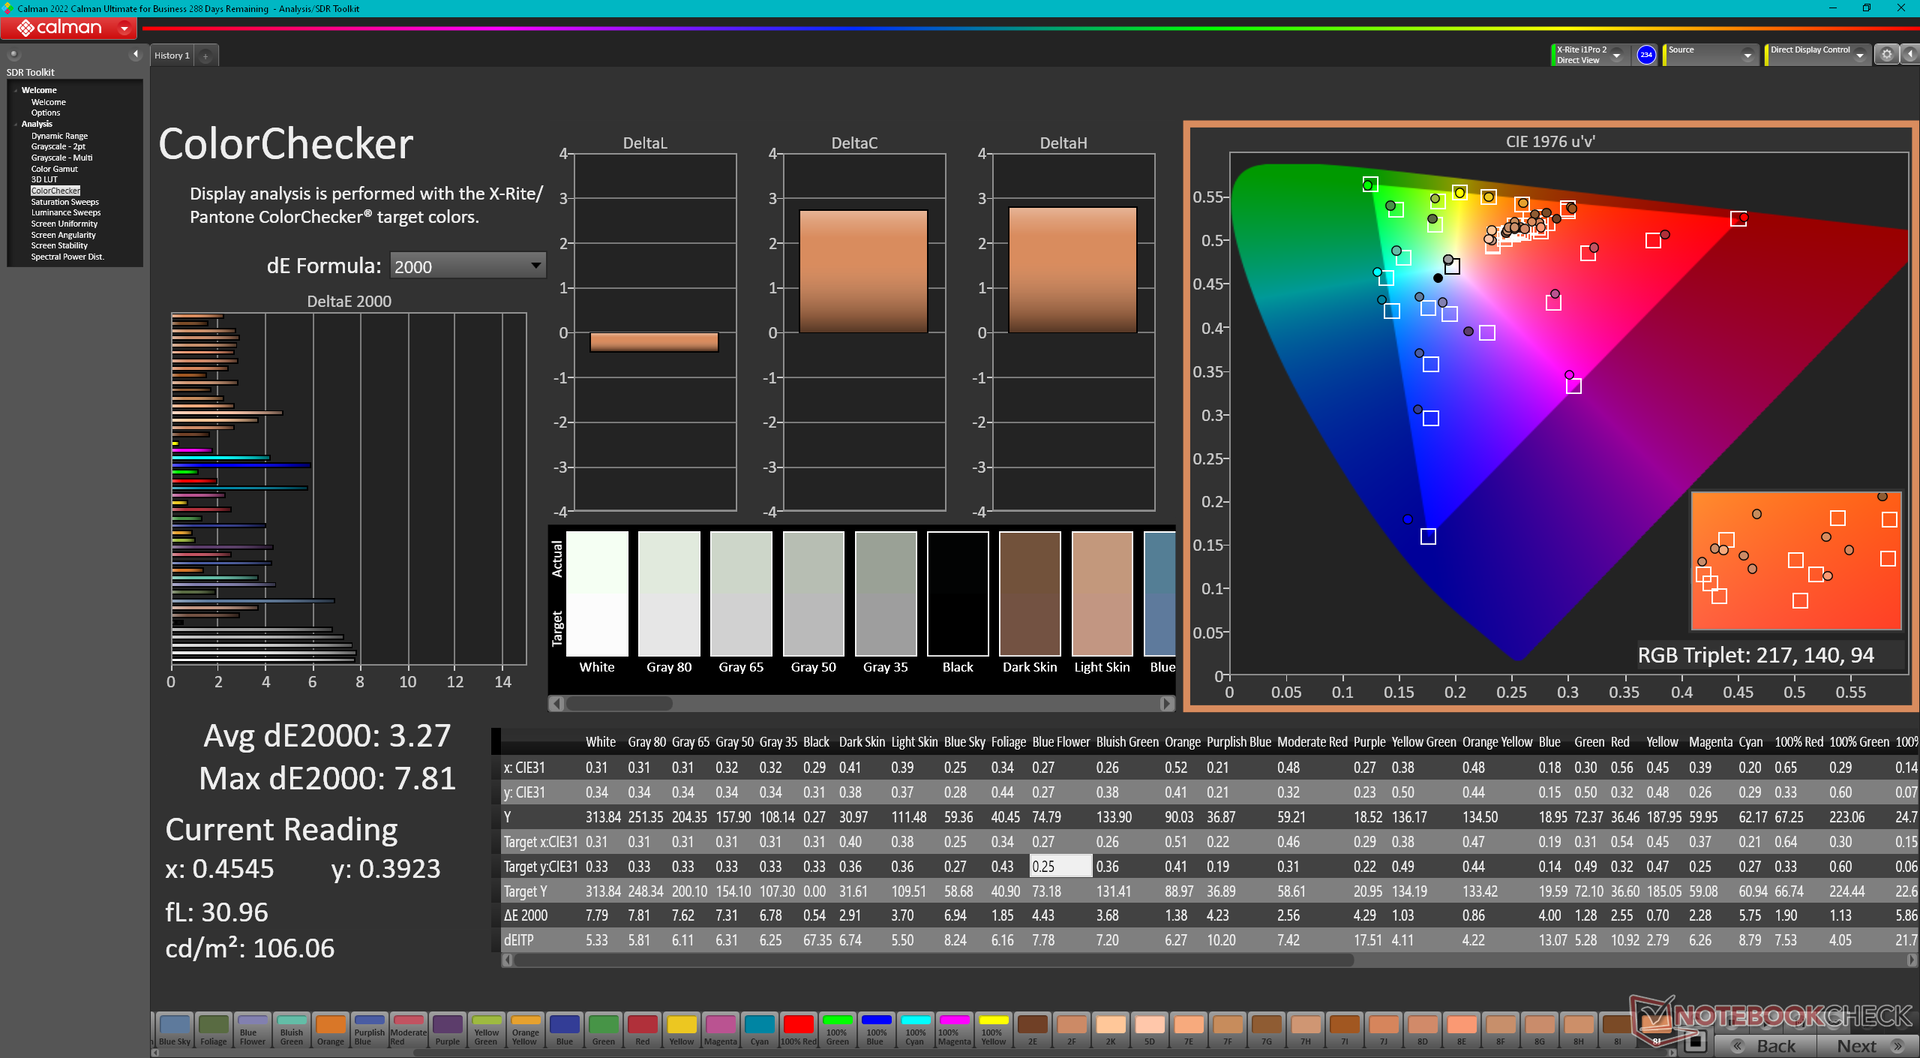
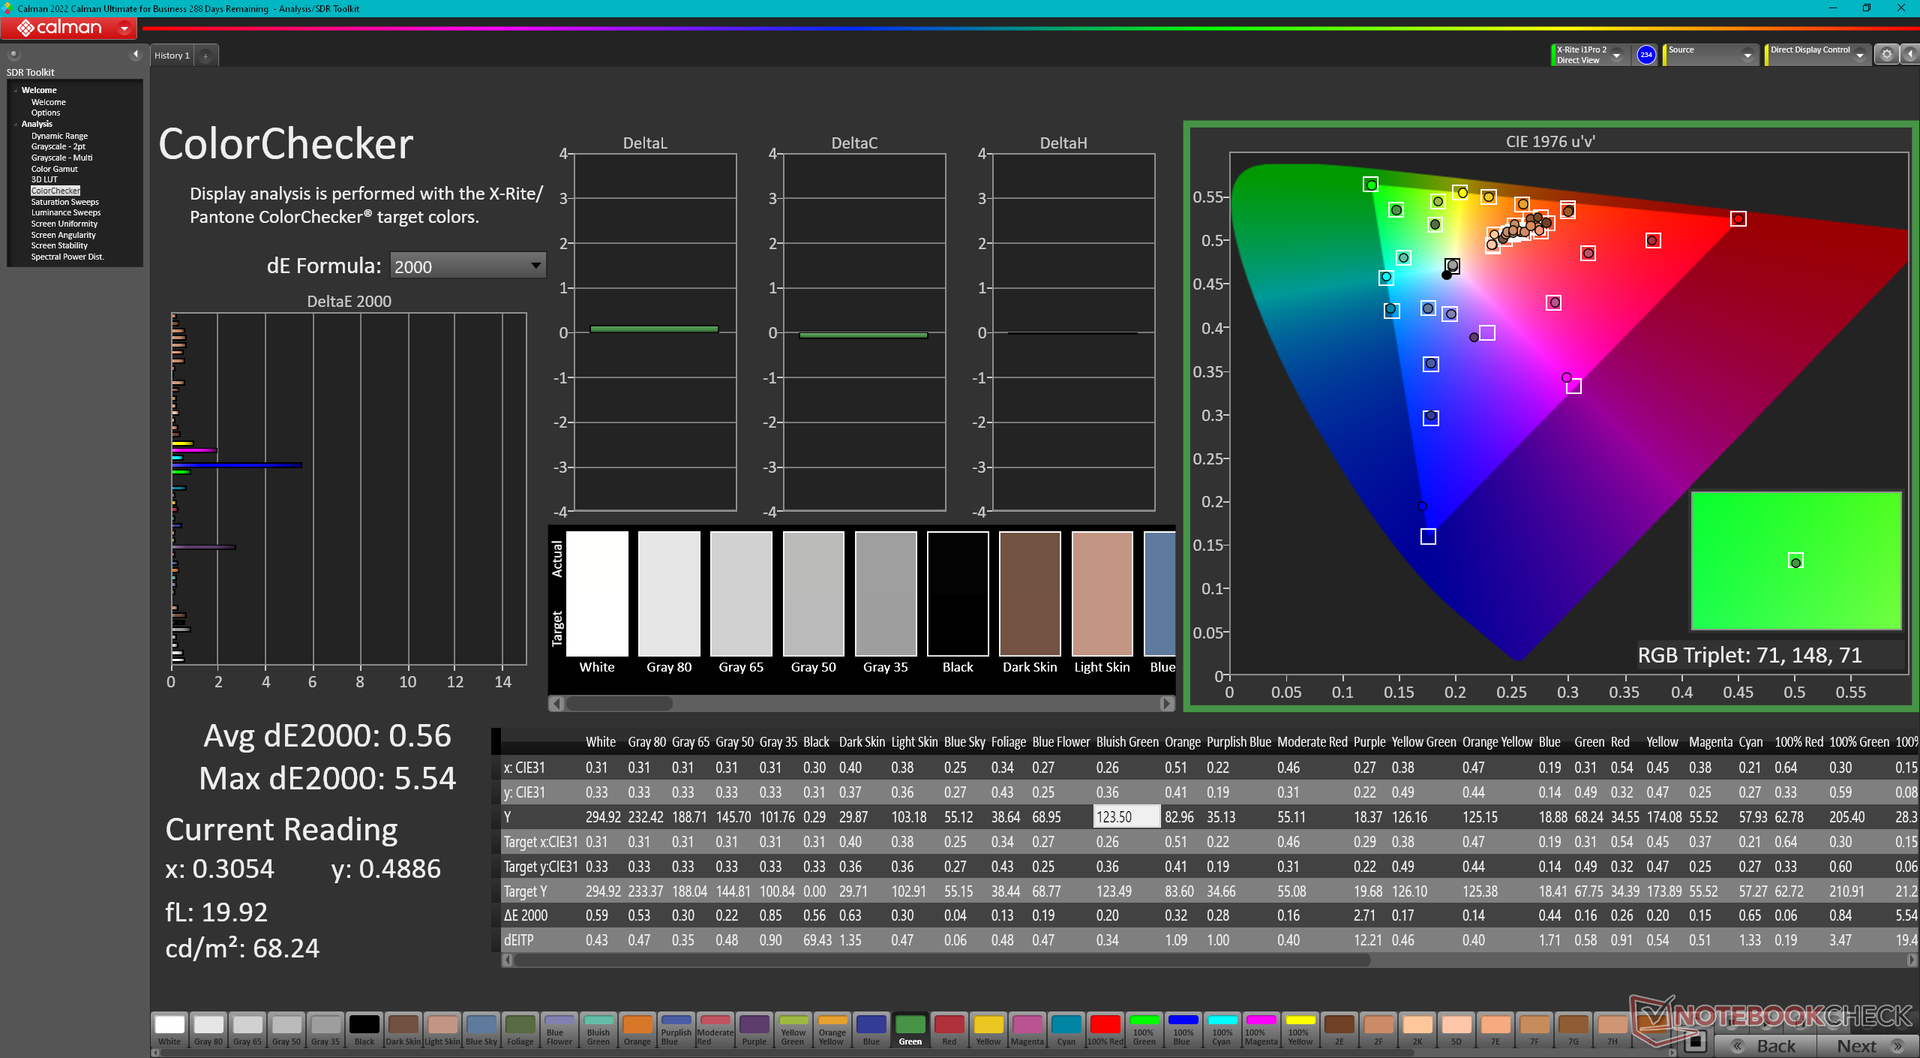
ΔE ColorChecker Calman: 3.27 | ∀{0.5-29.43 Ø4.72}
calibrated: 0.56
ΔE Greyscale Calman: 5.9 | ∀{0.09-98 Ø4.97}
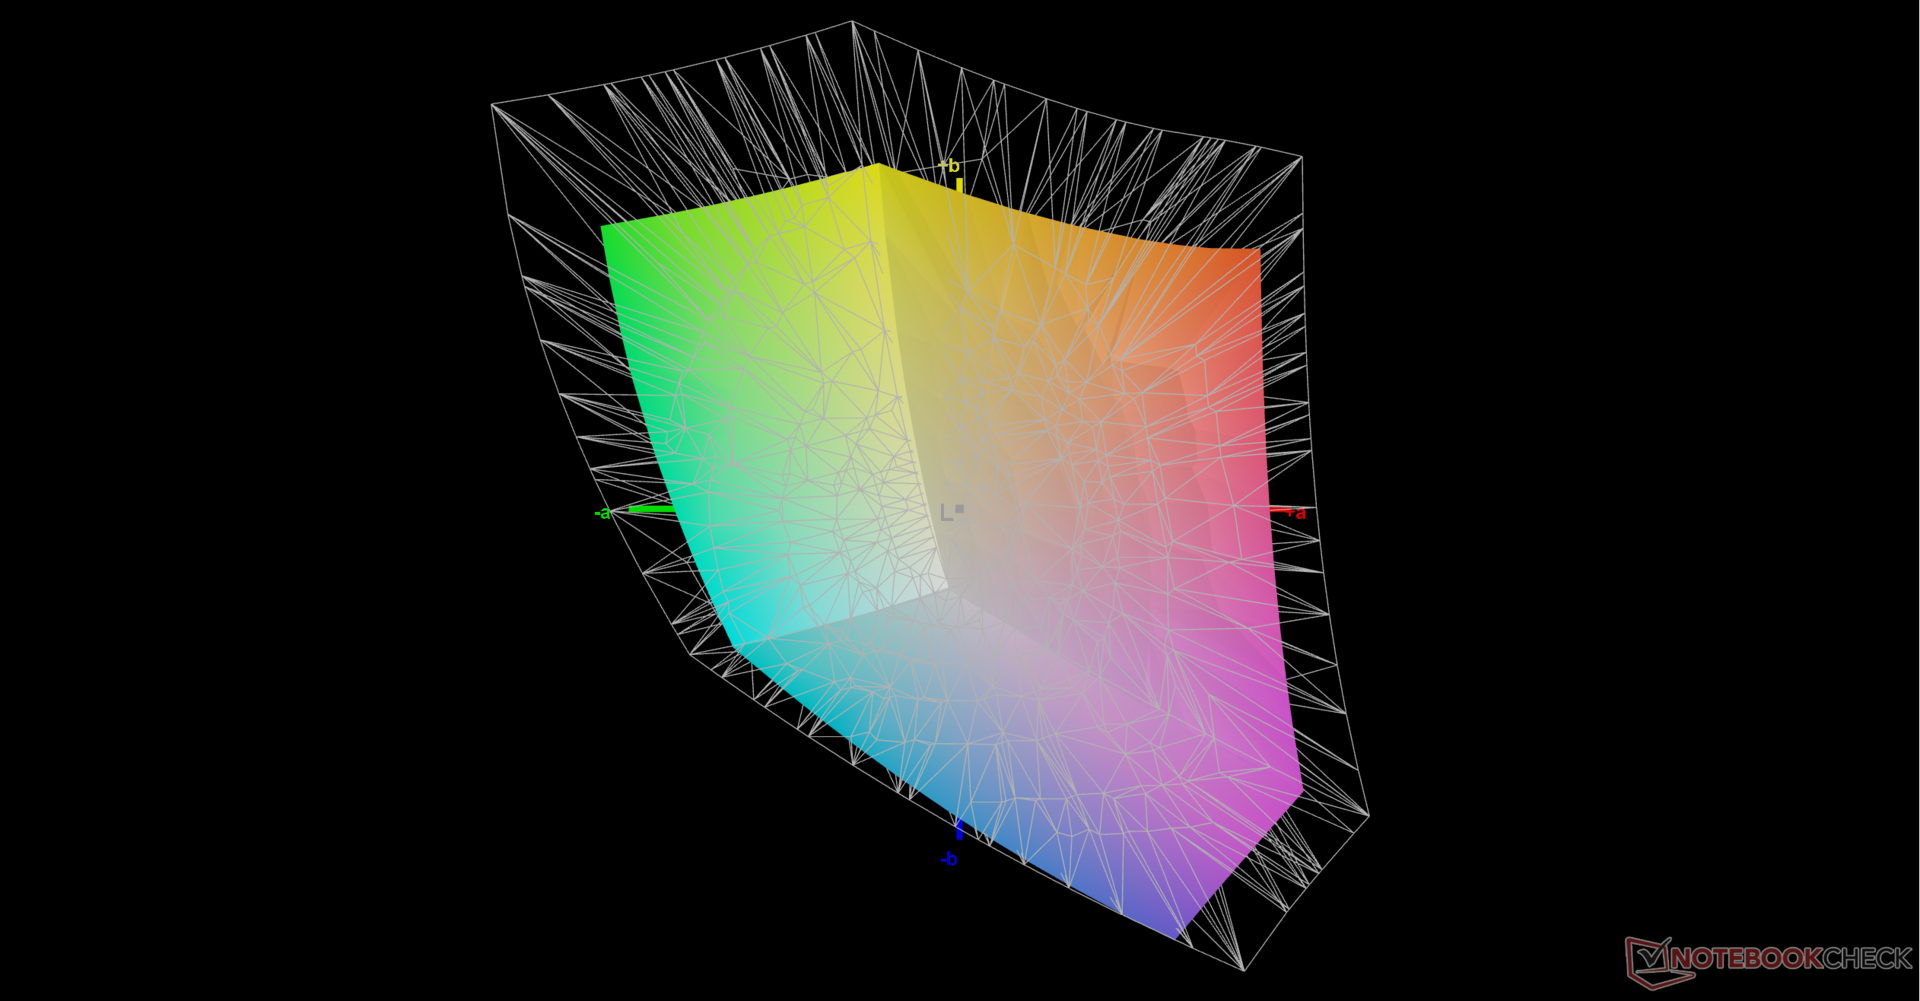
70.5% AdobeRGB 1998 (Argyll 3D)
95.6% sRGB (Argyll 3D)
68.2% Display P3 (Argyll 3D)
Gamma: 2.18
CCT: 6323 K
| HP ZBook Power 15 G10 BOE0B6A, IPS, 2560x1440, 15.6" | HP ZBook Power 15 G9 6B8C4EA LGD073F, IPS, 3840x2160, 15.6" | Lenovo ThinkPad P15v G3 21EM001AGE NE156QUM-N6C, IPS LED, 3840x2160, 15.6" | Dell Precision 5000 5560 Sharp LQ156R1, IPS, 3840x2400, 15.6" | Lenovo ThinkPad P1 G6-21FV000DGE NE160QDM-NY1, IPS, 2560x1600, 16" | Asus ExpertBook B6 Flip B6602FC2 AU Optronics Model: AUOE495, IPS, 2560x1600, 16" | |
|---|---|---|---|---|---|---|
| Display | 1% | 26% | 29% | 1% | 23% | |
| Display P3 Coverage (%) | 68.2 | 69.1 1% | 89.9 32% | 94.9 39% | 68.1 0% | 97.9 44% |
| sRGB Coverage (%) | 95.6 | 97.7 2% | 100 5% | 100 5% | 97.5 2% | 99.89 4% |
| AdobeRGB 1998 Coverage (%) | 70.5 | 69.6 -1% | 99.9 42% | 100 42% | 70.2 0% | 85.52 21% |
| Response Times | -214% | -211% | -228% | 2% | -120% | |
| Response Time Grey 50% / Grey 80% * (ms) | 13 ? | 45.8 ? -252% | 46.7 ? -259% | 47.2 ? -263% | 13.7 ? -5% | 36 ? -177% |
| Response Time Black / White * (ms) | 10.4 ? | 28.6 ? -175% | 27.3 ? -163% | 30.4 ? -192% | 9.6 ? 8% | 17 ? -63% |
| PWM Frequency (Hz) | ||||||
| Screen | 18% | 5% | 7% | 30% | -20% | |
| Brightness middle (cd/m²) | 313.8 | 392 25% | 588 87% | 501.5 60% | 521 66% | 440 40% |
| Brightness (cd/m²) | 302 | 388 28% | 536 77% | 467 55% | 484 60% | 418 38% |
| Brightness Distribution (%) | 83 | 88 6% | 83 0% | 83 0% | 89 7% | 82 -1% |
| Black Level * (cd/m²) | 0.29 | 0.15 48% | 0.38 -31% | 0.44 -52% | 0.36 -24% | 0.3 -3% |
| Contrast (:1) | 1082 | 2613 141% | 1547 43% | 1140 5% | 1447 34% | 1467 36% |
| Colorchecker dE 2000 * | 3.27 | 3.2 2% | 3.9 -19% | 4.73 -45% | 1.2 63% | 2.81 14% |
| Colorchecker dE 2000 max. * | 7.81 | 7 10% | 8.8 -13% | 8.45 -8% | 2.5 68% | 4.62 41% |
| Colorchecker dE 2000 calibrated * | 0.56 | 1.2 -114% | 1 -79% | 0.51 9% | 1 -79% | 2.99 -434% |
| Greyscale dE 2000 * | 5.9 | 4.9 17% | 7.1 -20% | 3.6 39% | 1.4 76% | 0.91 85% |
| Gamma | 2.18 101% | 2.13 103% | 2.12 104% | 2.08 106% | 2.25 98% | 2.2 100% |
| CCT | 6323 103% | 5982 109% | 7268 89% | 6447 101% | 6682 97% | 6600 98% |
| Media total (Programa/Opciones) | -65% /
-19% | -60% /
-21% | -64% /
-22% | 11% /
20% | -39% /
-25% |
* ... más pequeño es mejor
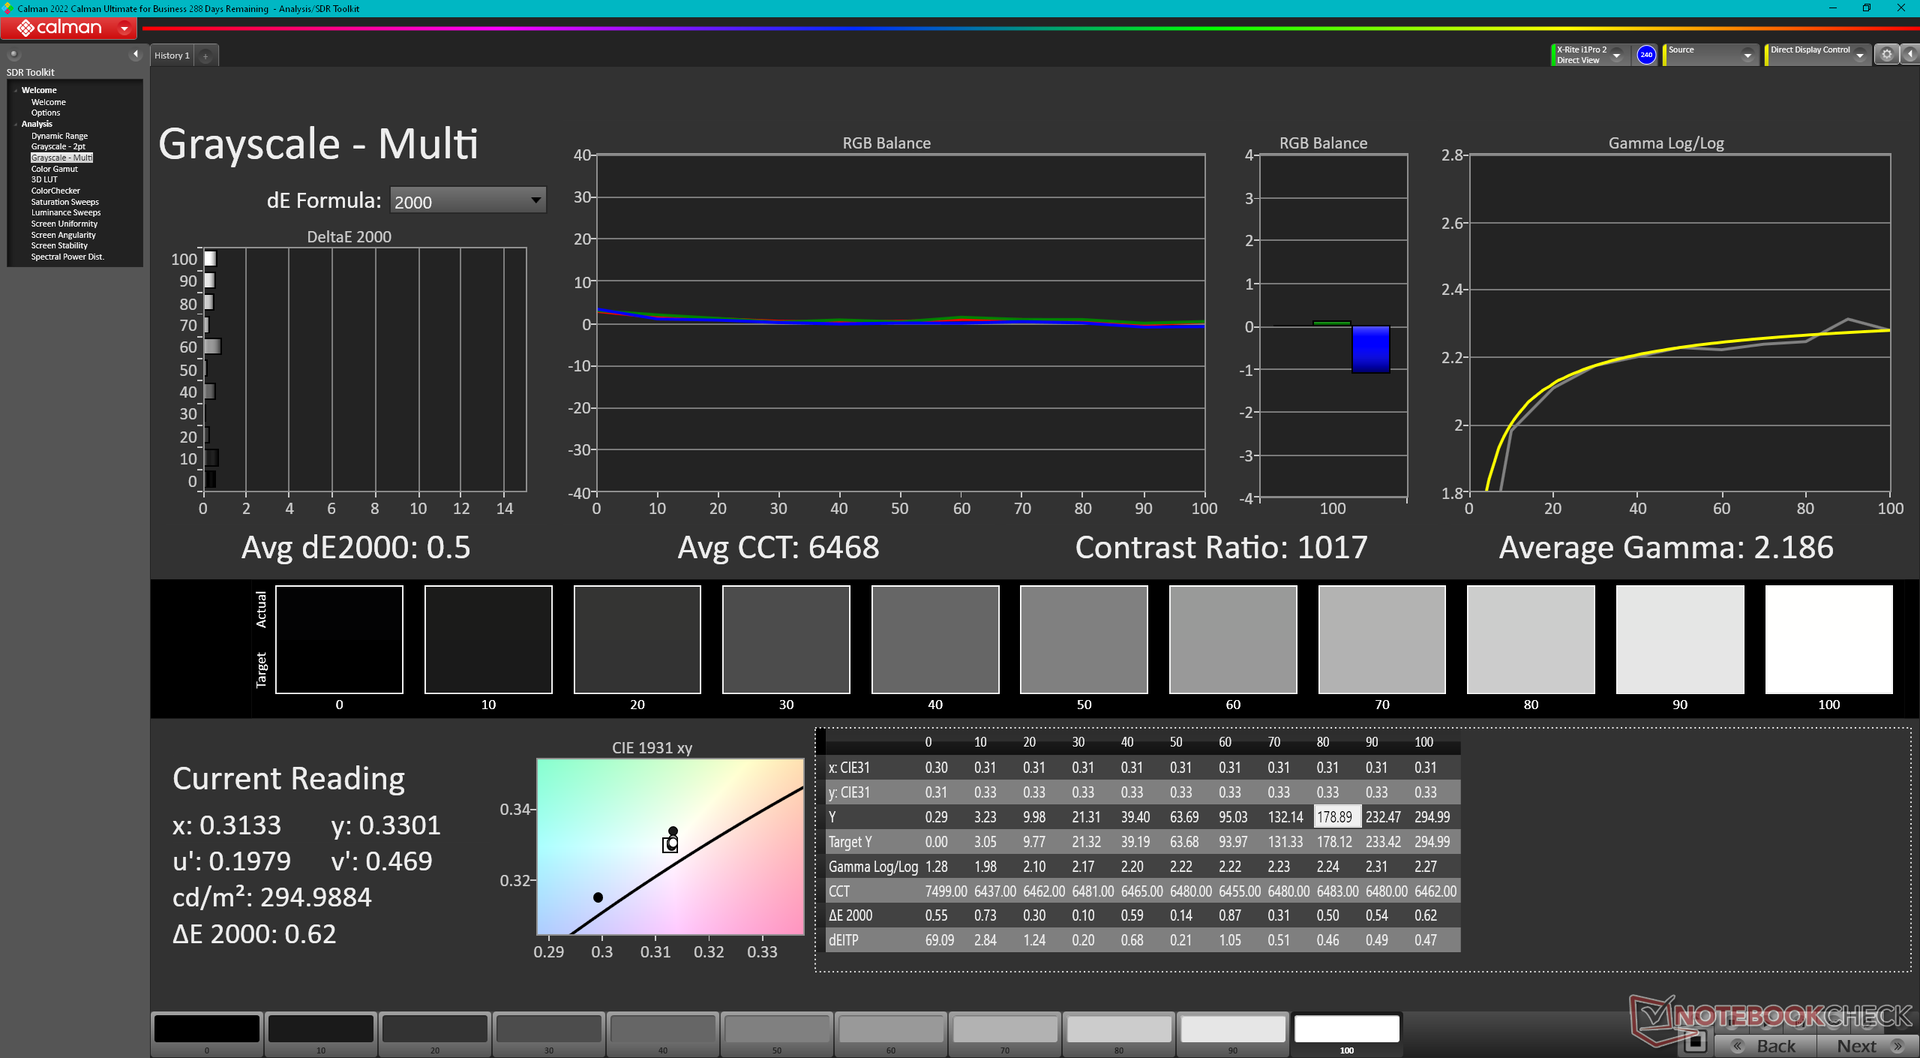
HP no envía el modelo precalibrado, lo que es una pena para un portátil de la clase ZBook. Los valores DeltaE medios en escala de grises y color al sacarlo de la caja estarían en 5,9 y 3,27, respectivamente, y la temperatura de color sería ligeramente demasiado cálida. Calibrar nosotros mismos la pantalla mejoraría los valores deltaE medios a sólo 0,5 y 0,56. Puede descargar gratuitamente nuestro archivo ICM calibrado.
Tiempos de respuesta del display
| ↔ Tiempo de respuesta de Negro a Blanco | ||
|---|---|---|
| 10.4 ms ... subida ↗ y bajada ↘ combinada | ↗ 5.5 ms subida | 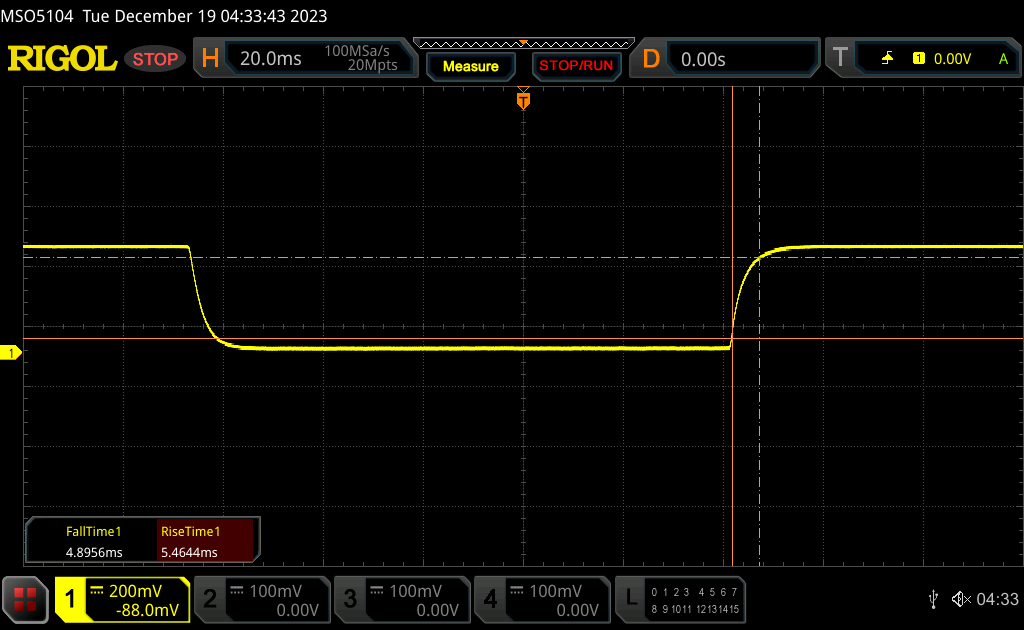 |
| ↘ 4.9 ms bajada | ||
| La pantalla mostró buenos tiempos de respuesta en nuestros tests pero podría ser demasiado lenta para los jugones competitivos. En comparación, todos los dispositivos de prueba van de ##min### (mínimo) a 240 (máximo) ms. » 28 % de todos los dispositivos son mejores. Esto quiere decir que el tiempo de respuesta medido es mejor que la media (19.8 ms) de todos los dispositivos testados. | ||
| ↔ Tiempo de respuesta 50% Gris a 80% Gris | ||
| 13 ms ... subida ↗ y bajada ↘ combinada | ↗ 6.4 ms subida | 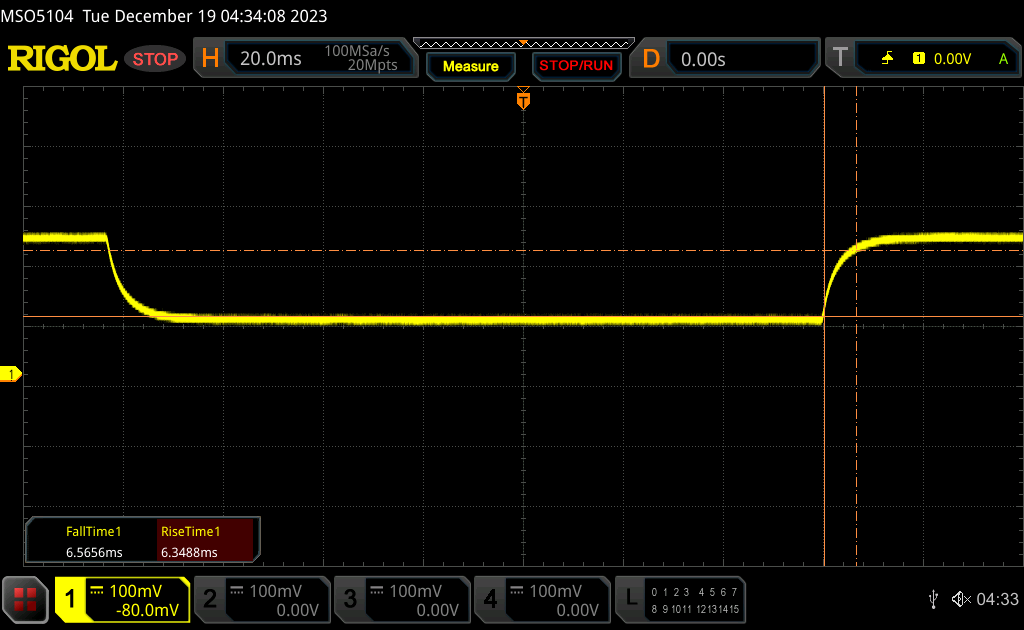 |
| ↘ 6.6 ms bajada | ||
| La pantalla mostró buenos tiempos de respuesta en nuestros tests pero podría ser demasiado lenta para los jugones competitivos. En comparación, todos los dispositivos de prueba van de ##min### (mínimo) a 636 (máximo) ms. » 27 % de todos los dispositivos son mejores. Esto quiere decir que el tiempo de respuesta medido es mejor que la media (31 ms) de todos los dispositivos testados. | ||
Parpadeo de Pantalla / PWM (Pulse-Width Modulation)
| Parpadeo de Pantalla / PWM no detectado |  | ||
Comparación: 52 % de todos los dispositivos testados no usaron PWM para atenuar el display. Si se usó, medimos una media de 7772 (mínimo: 5 - máxmo: 343500) Hz. | |||
Rendimiento
Condiciones de prueba
Pusimos tanto Windows como el panel de control de Nvidia en modo Rendimiento antes de ejecutar los puntos de referencia que se muestran a continuación. El sistema no parece tener ningún perfil de energía adicional de HP.
Optimus es compatible como era de esperar, pero no hay modo ECC VRAM a diferencia de en el más grueso ZBook Fury 16 G10 con la RTX 5000 Ada más rápida.
Procesador
El Ryzen 7 Pro 7840HS ofrece un rendimiento multihilo hasta un 20 por ciento más rápido que el Core i7-12700H en el ZBook Power 15 G9 del año pasado. Para un rendimiento aún más rápido, sin embargo, los usuarios deben configurar con el Intel Core i9-13900H en su lugar, que puede funcionar hasta un 30 por ciento más rápido que nuestro Ryzen 7.
Bajar de categoría al Ryzen 5 Pro 7640HS desde nuestra configuración Ryzen 7 Pro 7840HS se espera que afecte al rendimiento hasta en un 25 a 30 por ciento. Por otro lado, la actualización a la configuración Ryzen 9 Pro 7940HS se espera que aumente el rendimiento sólo marginalmente en alrededor de 5 a 10 por ciento basado en nuestro tiempo con el Lenovo ThinkPad Z16 Gen 2. Por lo tanto, el rendimiento por dólar disminuye significativamente si se configura con Ryzen 9 en lugar de Ryzen 7.
Cinebench R15 Multi Loop
Cinebench R23: Multi Core | Single Core
Cinebench R20: CPU (Multi Core) | CPU (Single Core)
Cinebench R15: CPU Multi 64Bit | CPU Single 64Bit
Blender: v2.79 BMW27 CPU
7-Zip 18.03: 7z b 4 | 7z b 4 -mmt1
Geekbench 5.5: Multi-Core | Single-Core
HWBOT x265 Benchmark v2.2: 4k Preset
LibreOffice : 20 Documents To PDF
R Benchmark 2.5: Overall mean
* ... más pequeño es mejor
AIDA64: FP32 Ray-Trace | FPU Julia | CPU SHA3 | CPU Queen | FPU SinJulia | FPU Mandel | CPU AES | CPU ZLib | FP64 Ray-Trace | CPU PhotoWorxx
| Performance rating | |
| HP ZBook Power 15 G10 | |
| Medio AMD Ryzen 7 PRO 7840HS | |
| Lenovo ThinkPad P1 G6-21FV000DGE | |
| Lenovo ThinkPad P15v G3 21EM001AGE | |
| Asus ExpertBook B6 Flip B6602FC2 | |
| HP ZBook Power 15 G9 6B8C4EA | |
| Dell Precision 5000 5560 -9! | |
| AIDA64 / FP32 Ray-Trace | |
| HP ZBook Power 15 G10 | |
| Medio AMD Ryzen 7 PRO 7840HS (25606 - 25776, n=2) | |
| Lenovo ThinkPad P1 G6-21FV000DGE | |
| Asus ExpertBook B6 Flip B6602FC2 | |
| Lenovo ThinkPad P15v G3 21EM001AGE | |
| HP ZBook Power 15 G9 6B8C4EA | |
| AIDA64 / FPU Julia | |
| HP ZBook Power 15 G10 | |
| Medio AMD Ryzen 7 PRO 7840HS (107907 - 109059, n=2) | |
| Lenovo ThinkPad P15v G3 21EM001AGE | |
| Lenovo ThinkPad P1 G6-21FV000DGE | |
| Asus ExpertBook B6 Flip B6602FC2 | |
| HP ZBook Power 15 G9 6B8C4EA | |
| AIDA64 / CPU SHA3 | |
| HP ZBook Power 15 G10 | |
| Medio AMD Ryzen 7 PRO 7840HS (4631 - 4656, n=2) | |
| Lenovo ThinkPad P1 G6-21FV000DGE | |
| Asus ExpertBook B6 Flip B6602FC2 | |
| HP ZBook Power 15 G9 6B8C4EA | |
| Lenovo ThinkPad P15v G3 21EM001AGE | |
| AIDA64 / CPU Queen | |
| Lenovo ThinkPad P1 G6-21FV000DGE | |
| HP ZBook Power 15 G10 | |
| Medio AMD Ryzen 7 PRO 7840HS (97729 - 115640, n=2) | |
| Asus ExpertBook B6 Flip B6602FC2 | |
| Lenovo ThinkPad P15v G3 21EM001AGE | |
| HP ZBook Power 15 G9 6B8C4EA | |
| AIDA64 / FPU SinJulia | |
| HP ZBook Power 15 G10 | |
| Medio AMD Ryzen 7 PRO 7840HS (14693 - 14742, n=2) | |
| Lenovo ThinkPad P15v G3 21EM001AGE | |
| Asus ExpertBook B6 Flip B6602FC2 | |
| Lenovo ThinkPad P1 G6-21FV000DGE | |
| HP ZBook Power 15 G9 6B8C4EA | |
| AIDA64 / FPU Mandel | |
| HP ZBook Power 15 G10 | |
| Medio AMD Ryzen 7 PRO 7840HS (57502 - 58181, n=2) | |
| Lenovo ThinkPad P15v G3 21EM001AGE | |
| Lenovo ThinkPad P1 G6-21FV000DGE | |
| Asus ExpertBook B6 Flip B6602FC2 | |
| HP ZBook Power 15 G9 6B8C4EA | |
| AIDA64 / CPU AES | |
| Lenovo ThinkPad P15v G3 21EM001AGE | |
| HP ZBook Power 15 G10 | |
| Medio AMD Ryzen 7 PRO 7840HS (84454 - 85341, n=2) | |
| Lenovo ThinkPad P1 G6-21FV000DGE | |
| Asus ExpertBook B6 Flip B6602FC2 | |
| HP ZBook Power 15 G9 6B8C4EA | |
| AIDA64 / CPU ZLib | |
| Lenovo ThinkPad P1 G6-21FV000DGE | |
| HP ZBook Power 15 G10 | |
| Medio AMD Ryzen 7 PRO 7840HS (1032 - 1043, n=2) | |
| Asus ExpertBook B6 Flip B6602FC2 | |
| HP ZBook Power 15 G9 6B8C4EA | |
| Lenovo ThinkPad P15v G3 21EM001AGE | |
| Dell Precision 5000 5560 | |
| AIDA64 / FP64 Ray-Trace | |
| HP ZBook Power 15 G10 | |
| Medio AMD Ryzen 7 PRO 7840HS (13545 - 13800, n=2) | |
| Lenovo ThinkPad P1 G6-21FV000DGE | |
| Asus ExpertBook B6 Flip B6602FC2 | |
| Lenovo ThinkPad P15v G3 21EM001AGE | |
| HP ZBook Power 15 G9 6B8C4EA | |
| AIDA64 / CPU PhotoWorxx | |
| HP ZBook Power 15 G10 | |
| HP ZBook Power 15 G9 6B8C4EA | |
| Asus ExpertBook B6 Flip B6602FC2 | |
| Medio AMD Ryzen 7 PRO 7840HS (24325 - 42810, n=2) | |
| Lenovo ThinkPad P1 G6-21FV000DGE | |
| Lenovo ThinkPad P15v G3 21EM001AGE | |
Rendimiento del sistema
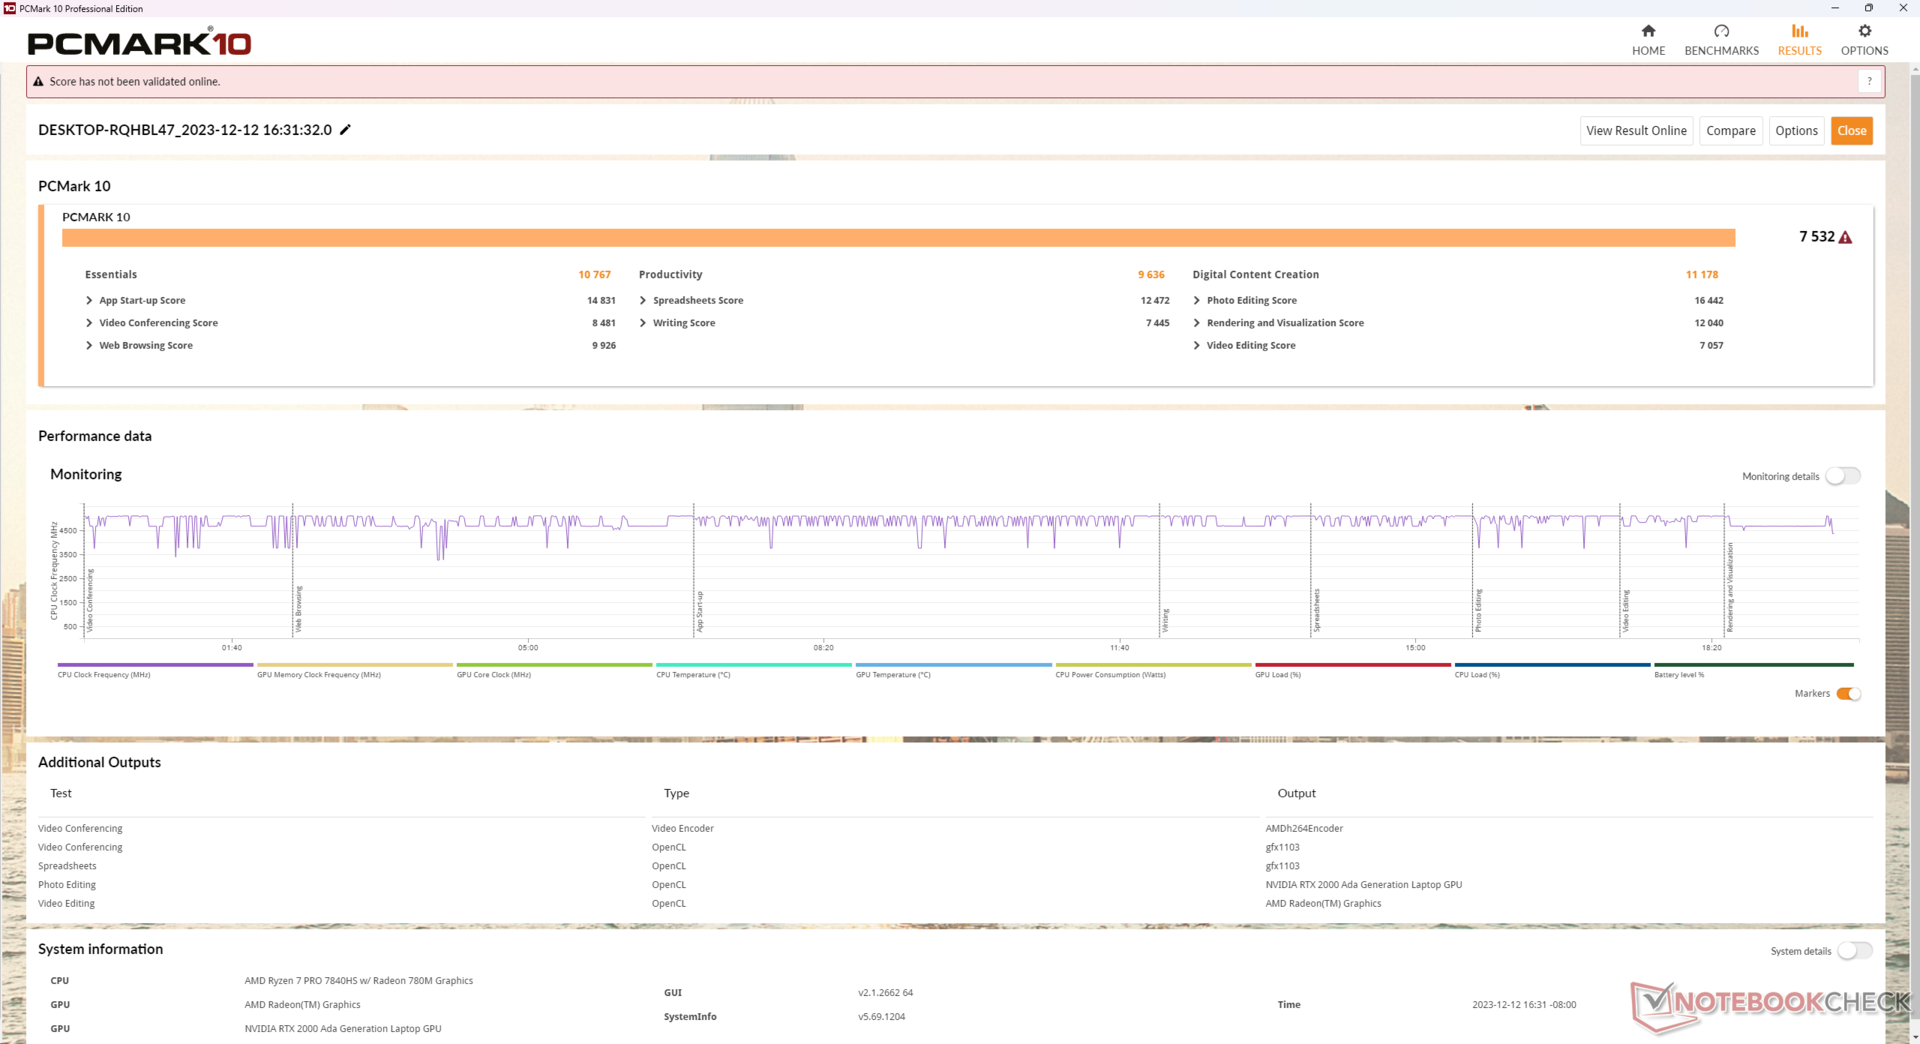
Los resultados de PCMark son excelentes, con puntuaciones sistemáticamente superiores a las de otras estaciones de trabajo que funcionan con la antigua Nvidia RTX A2000, incluida la ZBook Power 15 G9. La rápida memoria RAM de 5600 MHz también es un punto a destacar como evidencian las altas puntuaciones de memoria AIDA64.
CrossMark: Overall | Productivity | Creativity | Responsiveness
WebXPRT 3: Overall
WebXPRT 4: Overall
Mozilla Kraken 1.1: Total
| PCMark 10 / Score | |
| HP ZBook Power 15 G10 | |
| Medio AMD Ryzen 7 PRO 7840HS, NVIDIA RTX 2000 Ada Generation Laptop (n=1) | |
| Lenovo ThinkPad P1 G6-21FV000DGE | |
| Asus ExpertBook B6 Flip B6602FC2 | |
| Dell Precision 5000 5560 | |
| Lenovo ThinkPad P15v G3 21EM001AGE | |
| HP ZBook Power 15 G9 6B8C4EA | |
| PCMark 10 / Essentials | |
| Lenovo ThinkPad P1 G6-21FV000DGE | |
| Asus ExpertBook B6 Flip B6602FC2 | |
| HP ZBook Power 15 G10 | |
| Medio AMD Ryzen 7 PRO 7840HS, NVIDIA RTX 2000 Ada Generation Laptop (n=1) | |
| Dell Precision 5000 5560 | |
| Lenovo ThinkPad P15v G3 21EM001AGE | |
| HP ZBook Power 15 G9 6B8C4EA | |
| PCMark 10 / Productivity | |
| Asus ExpertBook B6 Flip B6602FC2 | |
| Lenovo ThinkPad P1 G6-21FV000DGE | |
| HP ZBook Power 15 G10 | |
| Medio AMD Ryzen 7 PRO 7840HS, NVIDIA RTX 2000 Ada Generation Laptop (n=1) | |
| Dell Precision 5000 5560 | |
| Lenovo ThinkPad P15v G3 21EM001AGE | |
| HP ZBook Power 15 G9 6B8C4EA | |
| PCMark 10 / Digital Content Creation | |
| HP ZBook Power 15 G10 | |
| Medio AMD Ryzen 7 PRO 7840HS, NVIDIA RTX 2000 Ada Generation Laptop (n=1) | |
| Lenovo ThinkPad P1 G6-21FV000DGE | |
| Asus ExpertBook B6 Flip B6602FC2 | |
| Lenovo ThinkPad P15v G3 21EM001AGE | |
| HP ZBook Power 15 G9 6B8C4EA | |
| Dell Precision 5000 5560 | |
| CrossMark / Overall | |
| Asus ExpertBook B6 Flip B6602FC2 | |
| Lenovo ThinkPad P1 G6-21FV000DGE | |
| HP ZBook Power 15 G9 6B8C4EA | |
| HP ZBook Power 15 G10 | |
| Medio AMD Ryzen 7 PRO 7840HS, NVIDIA RTX 2000 Ada Generation Laptop (n=1) | |
| Lenovo ThinkPad P15v G3 21EM001AGE | |
| CrossMark / Productivity | |
| Asus ExpertBook B6 Flip B6602FC2 | |
| Lenovo ThinkPad P1 G6-21FV000DGE | |
| HP ZBook Power 15 G10 | |
| Medio AMD Ryzen 7 PRO 7840HS, NVIDIA RTX 2000 Ada Generation Laptop (n=1) | |
| HP ZBook Power 15 G9 6B8C4EA | |
| Lenovo ThinkPad P15v G3 21EM001AGE | |
| CrossMark / Creativity | |
| Asus ExpertBook B6 Flip B6602FC2 | |
| Lenovo ThinkPad P1 G6-21FV000DGE | |
| HP ZBook Power 15 G9 6B8C4EA | |
| HP ZBook Power 15 G10 | |
| Medio AMD Ryzen 7 PRO 7840HS, NVIDIA RTX 2000 Ada Generation Laptop (n=1) | |
| Lenovo ThinkPad P15v G3 21EM001AGE | |
| CrossMark / Responsiveness | |
| Asus ExpertBook B6 Flip B6602FC2 | |
| Lenovo ThinkPad P1 G6-21FV000DGE | |
| HP ZBook Power 15 G9 6B8C4EA | |
| HP ZBook Power 15 G10 | |
| Medio AMD Ryzen 7 PRO 7840HS, NVIDIA RTX 2000 Ada Generation Laptop (n=1) | |
| Lenovo ThinkPad P15v G3 21EM001AGE | |
| WebXPRT 3 / Overall | |
| Lenovo ThinkPad P1 G6-21FV000DGE | |
| HP ZBook Power 15 G10 | |
| Medio AMD Ryzen 7 PRO 7840HS, NVIDIA RTX 2000 Ada Generation Laptop (n=1) | |
| Asus ExpertBook B6 Flip B6602FC2 | |
| HP ZBook Power 15 G9 6B8C4EA | |
| Dell Precision 5000 5560 | |
| Lenovo ThinkPad P15v G3 21EM001AGE | |
| WebXPRT 4 / Overall | |
| Lenovo ThinkPad P1 G6-21FV000DGE | |
| Asus ExpertBook B6 Flip B6602FC2 | |
| HP ZBook Power 15 G9 6B8C4EA | |
| HP ZBook Power 15 G10 | |
| Medio AMD Ryzen 7 PRO 7840HS, NVIDIA RTX 2000 Ada Generation Laptop (n=1) | |
| Lenovo ThinkPad P15v G3 21EM001AGE | |
| Mozilla Kraken 1.1 / Total | |
| Lenovo ThinkPad P15v G3 21EM001AGE | |
| Dell Precision 5000 5560 | |
| HP ZBook Power 15 G10 | |
| Medio AMD Ryzen 7 PRO 7840HS, NVIDIA RTX 2000 Ada Generation Laptop (n=1) | |
| HP ZBook Power 15 G9 6B8C4EA | |
| Asus ExpertBook B6 Flip B6602FC2 | |
| Lenovo ThinkPad P1 G6-21FV000DGE | |
* ... más pequeño es mejor
| PCMark 10 Score | 7532 puntos | |
ayuda | ||
| AIDA64 / Memory Copy | |
| HP ZBook Power 15 G10 | |
| HP ZBook Power 15 G9 6B8C4EA | |
| Asus ExpertBook B6 Flip B6602FC2 | |
| Medio AMD Ryzen 7 PRO 7840HS (34323 - 67943, n=2) | |
| Lenovo ThinkPad P1 G6-21FV000DGE | |
| Lenovo ThinkPad P15v G3 21EM001AGE | |
| AIDA64 / Memory Read | |
| HP ZBook Power 15 G9 6B8C4EA | |
| HP ZBook Power 15 G10 | |
| Asus ExpertBook B6 Flip B6602FC2 | |
| Medio AMD Ryzen 7 PRO 7840HS (30787 - 61660, n=2) | |
| Lenovo ThinkPad P1 G6-21FV000DGE | |
| Lenovo ThinkPad P15v G3 21EM001AGE | |
| AIDA64 / Memory Write | |
| HP ZBook Power 15 G10 | |
| HP ZBook Power 15 G9 6B8C4EA | |
| Medio AMD Ryzen 7 PRO 7840HS (39362 - 83167, n=2) | |
| Asus ExpertBook B6 Flip B6602FC2 | |
| Lenovo ThinkPad P1 G6-21FV000DGE | |
| Lenovo ThinkPad P15v G3 21EM001AGE | |
| AIDA64 / Memory Latency | |
| Medio AMD Ryzen 7 PRO 7840HS (99.6 - 101.2, n=2) | |
| HP ZBook Power 15 G10 | |
| Lenovo ThinkPad P15v G3 21EM001AGE | |
| Asus ExpertBook B6 Flip B6602FC2 | |
| HP ZBook Power 15 G9 6B8C4EA | |
| Lenovo ThinkPad P1 G6-21FV000DGE | |
* ... más pequeño es mejor
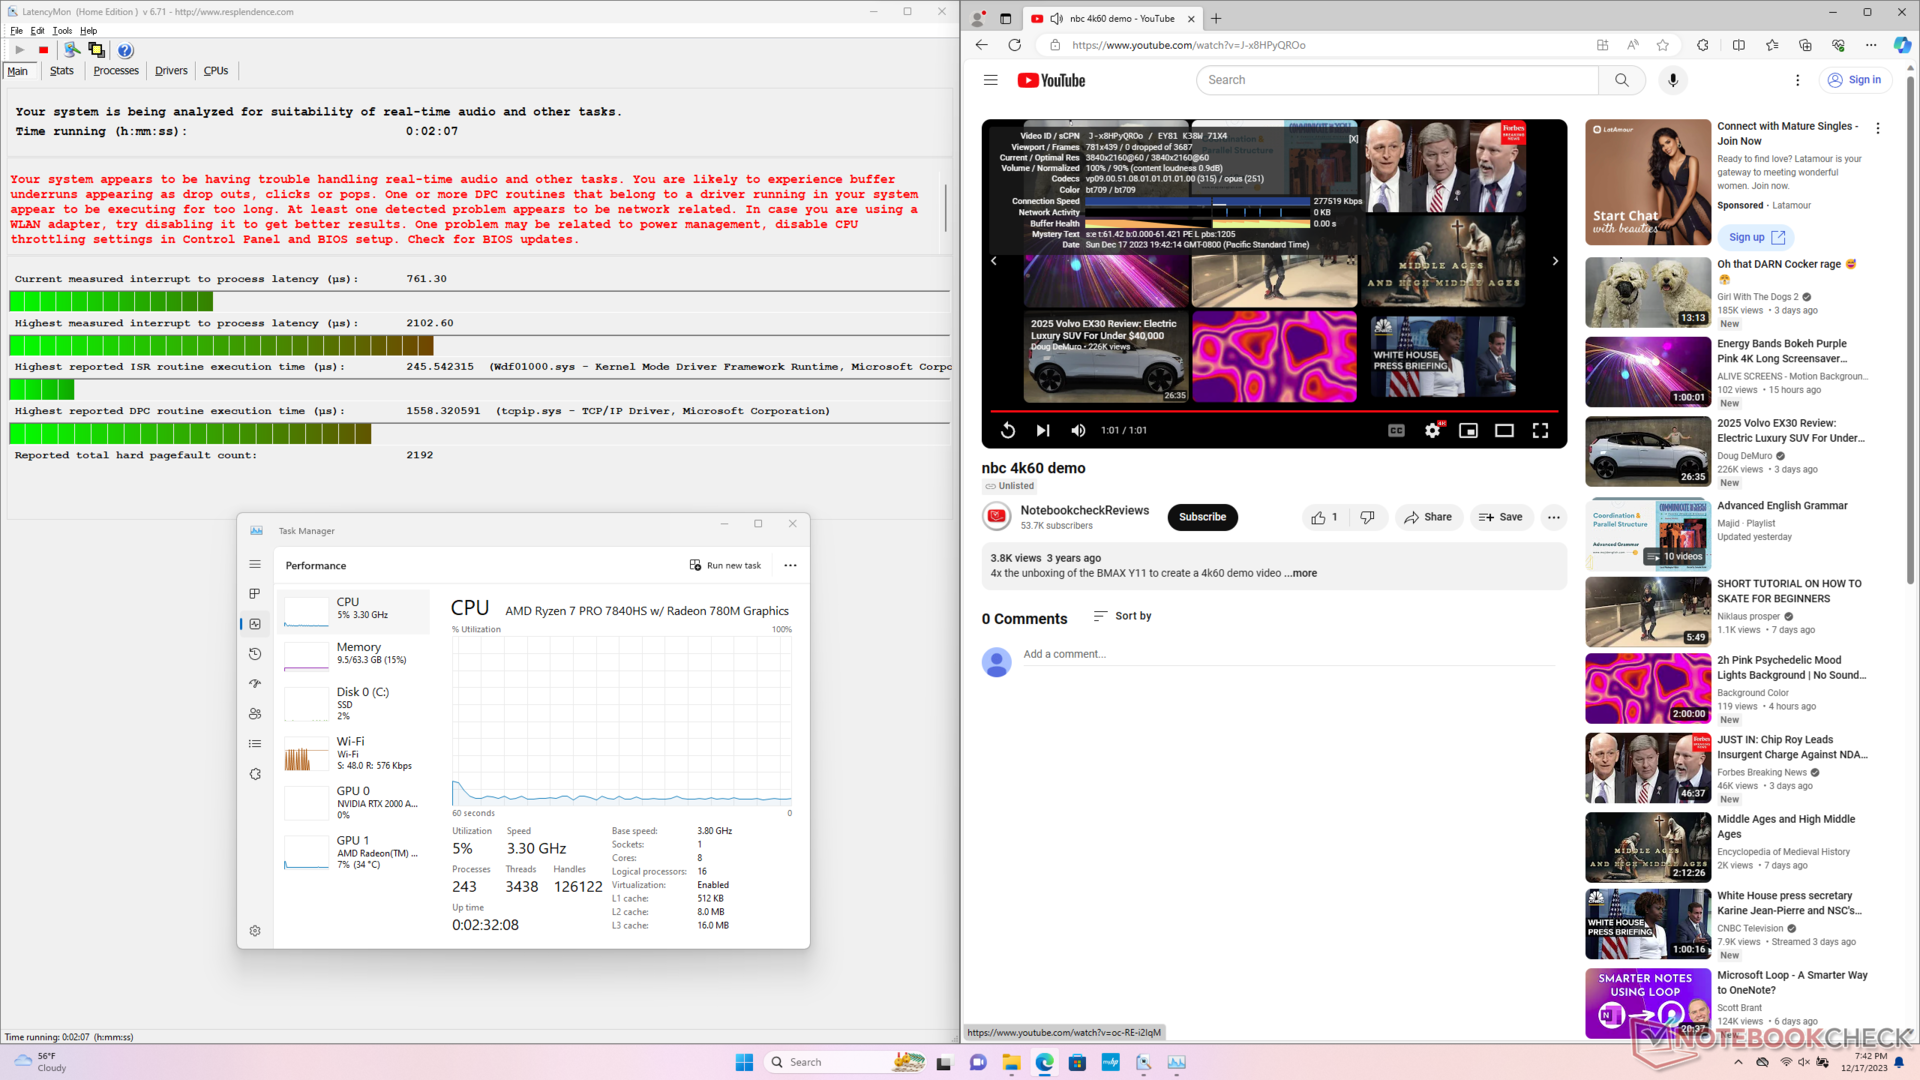
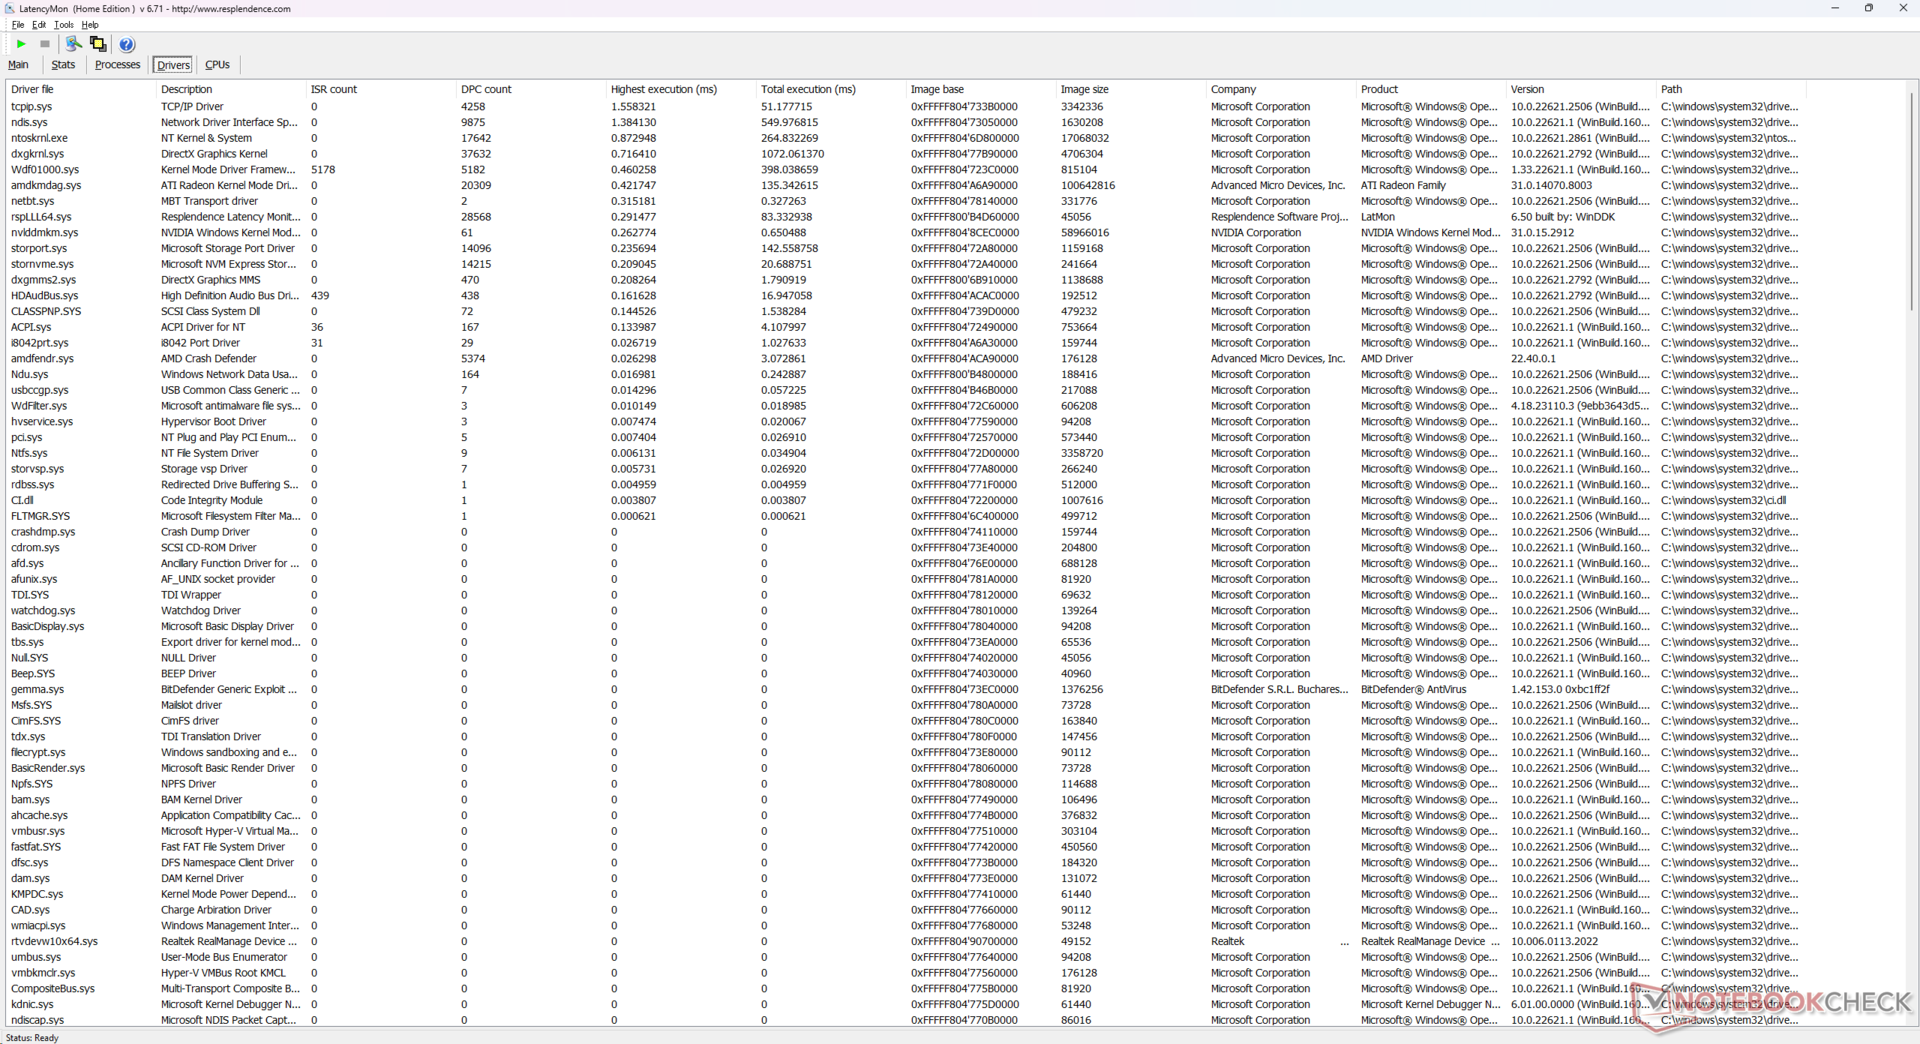
Latencia del CPD
LatencyMon revela problemas de CPD al abrir varias pestañas del navegador de nuestra página principal. por lo demás, la reproducción de vídeo 4K a 60 FPS es perfecta, sin que se registren caídas de fotogramas.
| DPC Latencies / LatencyMon - interrupt to process latency (max), Web, Youtube, Prime95 | |
| Lenovo ThinkPad P1 G6-21FV000DGE | |
| Asus ExpertBook B6 Flip B6602FC2 | |
| HP ZBook Power 15 G10 | |
| HP ZBook Power 15 G9 6B8C4EA | |
| Dell Precision 5000 5560 | |
| Lenovo ThinkPad P15v G3 21EM001AGE | |
* ... más pequeño es mejor
Dispositivos de almacenamiento
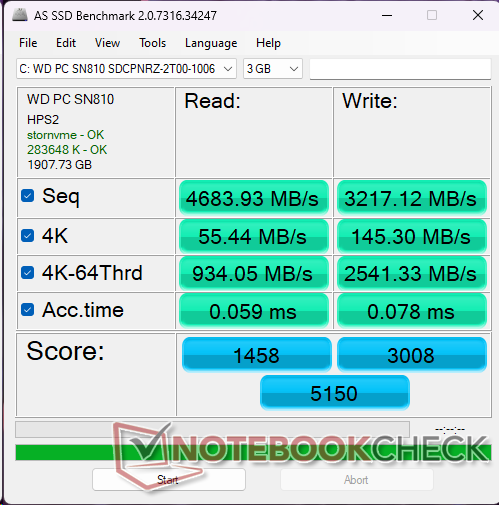
Nuestra unidad viene configurada con el WDC PC SN810 en lugar de la Samsung PM9A1 del modelo del año pasado. En general, la unidad WDC es más lenta que la Samsung cuando se trata de leer y escribir pequeños bloques 4K a profundidades de cola elevadas. HP permite a los compradores configurarlo con unidades SED o no SED, pero HP no enumera explícitamente las marcas de SSD en cuestión.


* ... más pequeño es mejor
Disk Throttling: DiskSpd Read Loop, Queue Depth 8
Rendimiento de la GPU
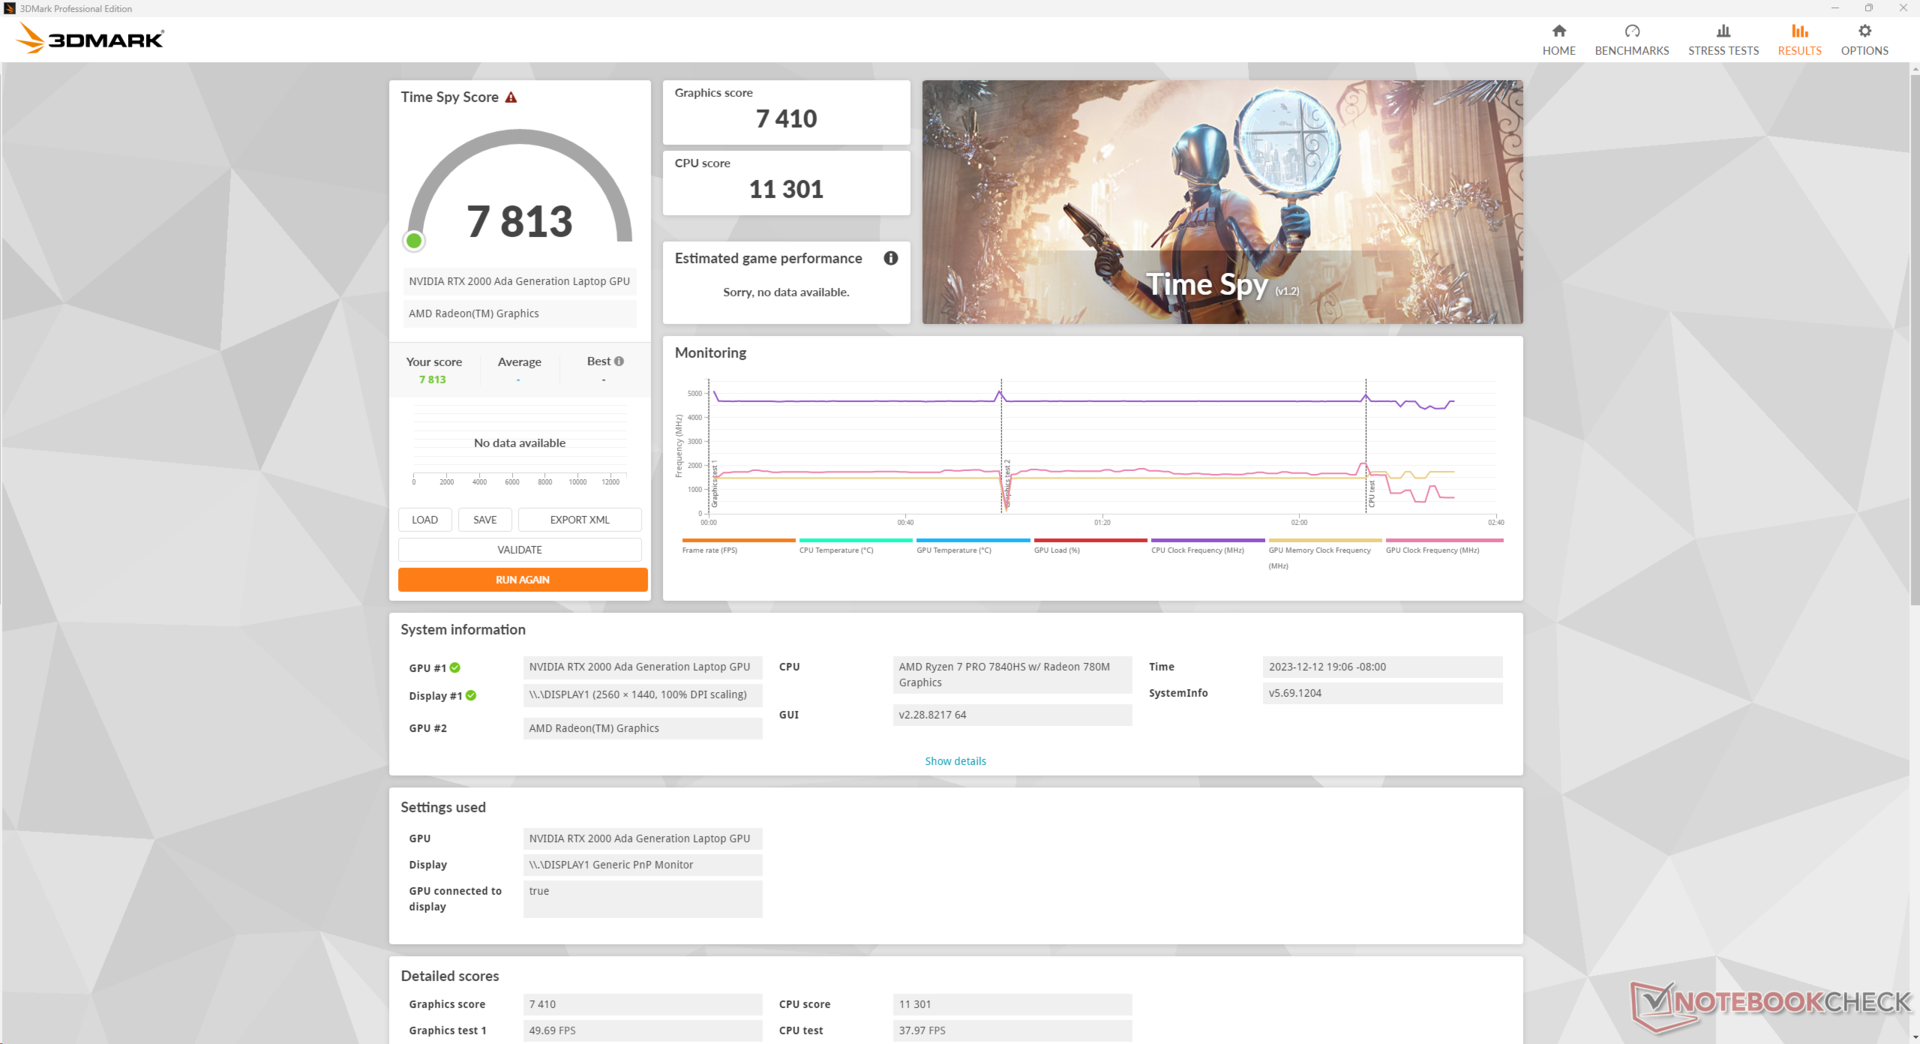
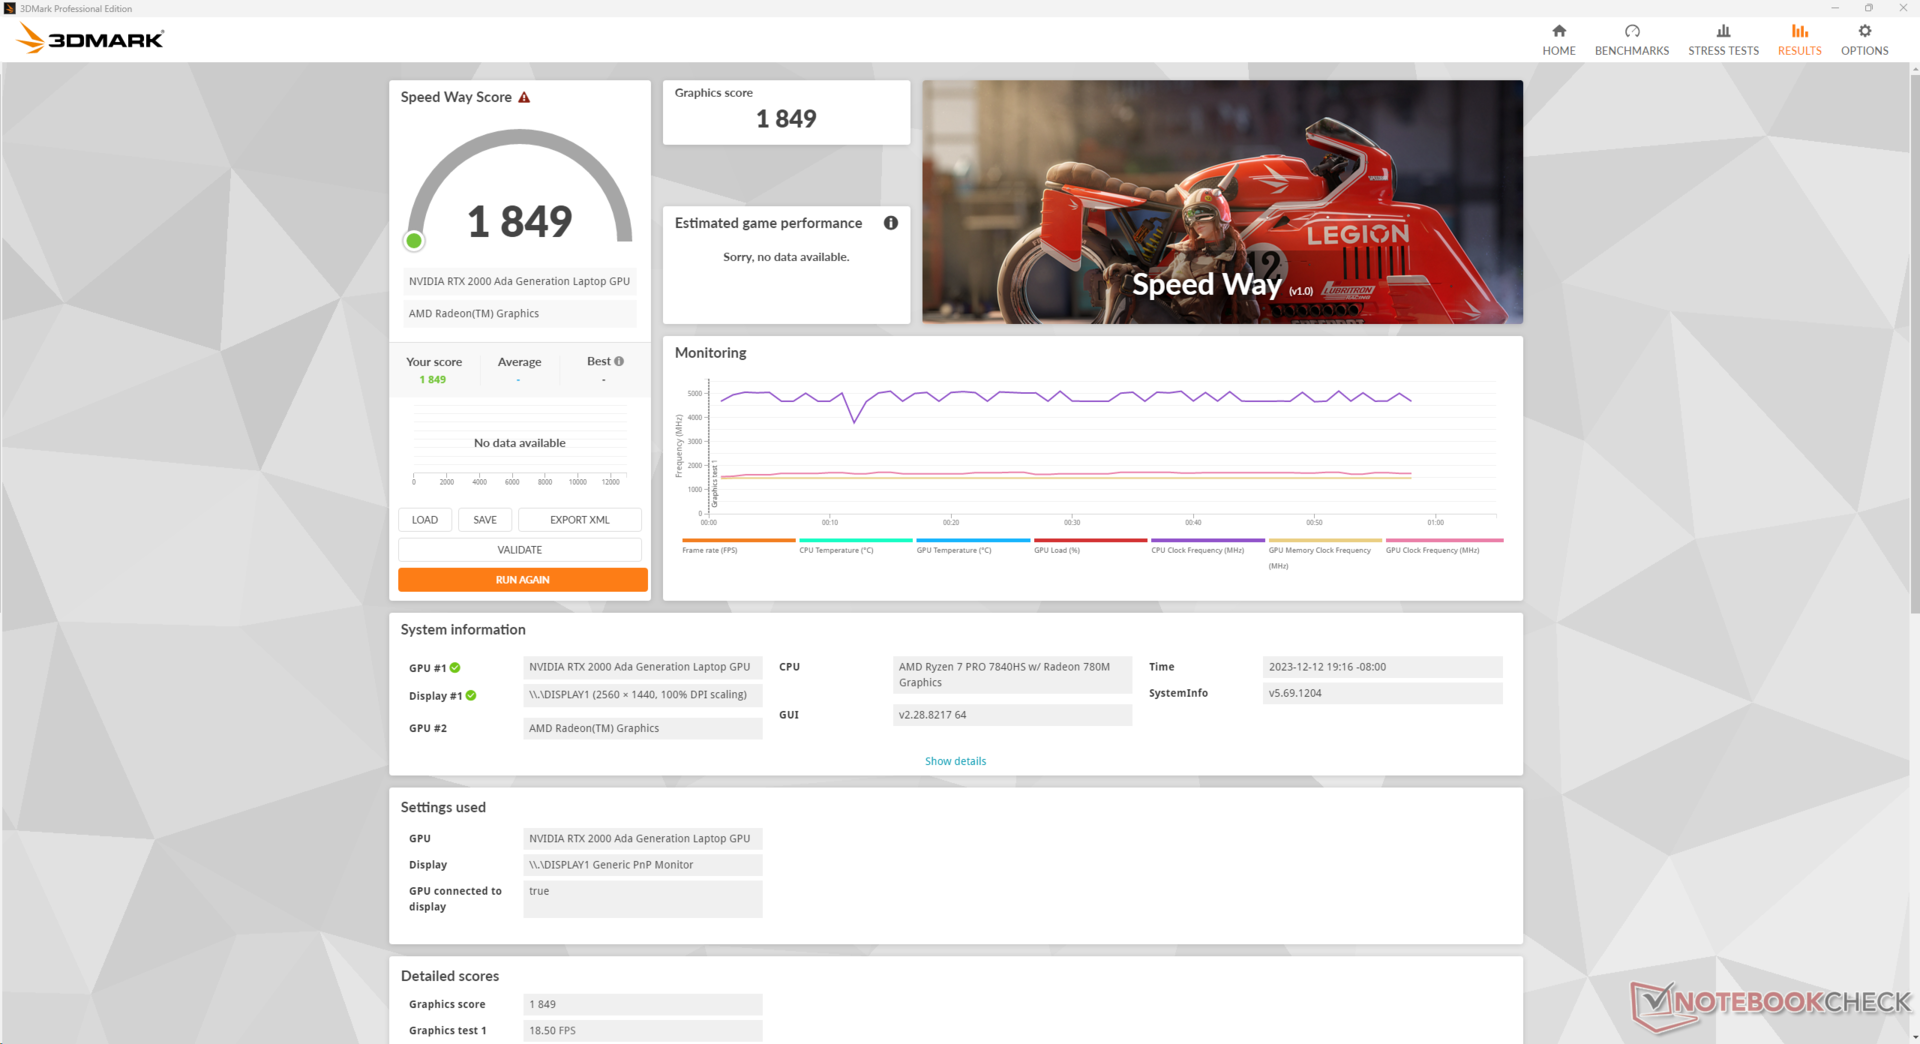
El Nvidia RTX 2000 Ada es una mejora notable con respecto a la RTX A2000 en el ZBook Power 15 G9 del año pasado y una de las principales razones para elegir el nuevo modelo G10 en lugar de la versión anterior. La potencia gráfica bruta es aproximadamente entre un 55 y un 65 por ciento más rápida y los resultados de SpecViewPerf también son sistemáticamente superiores.
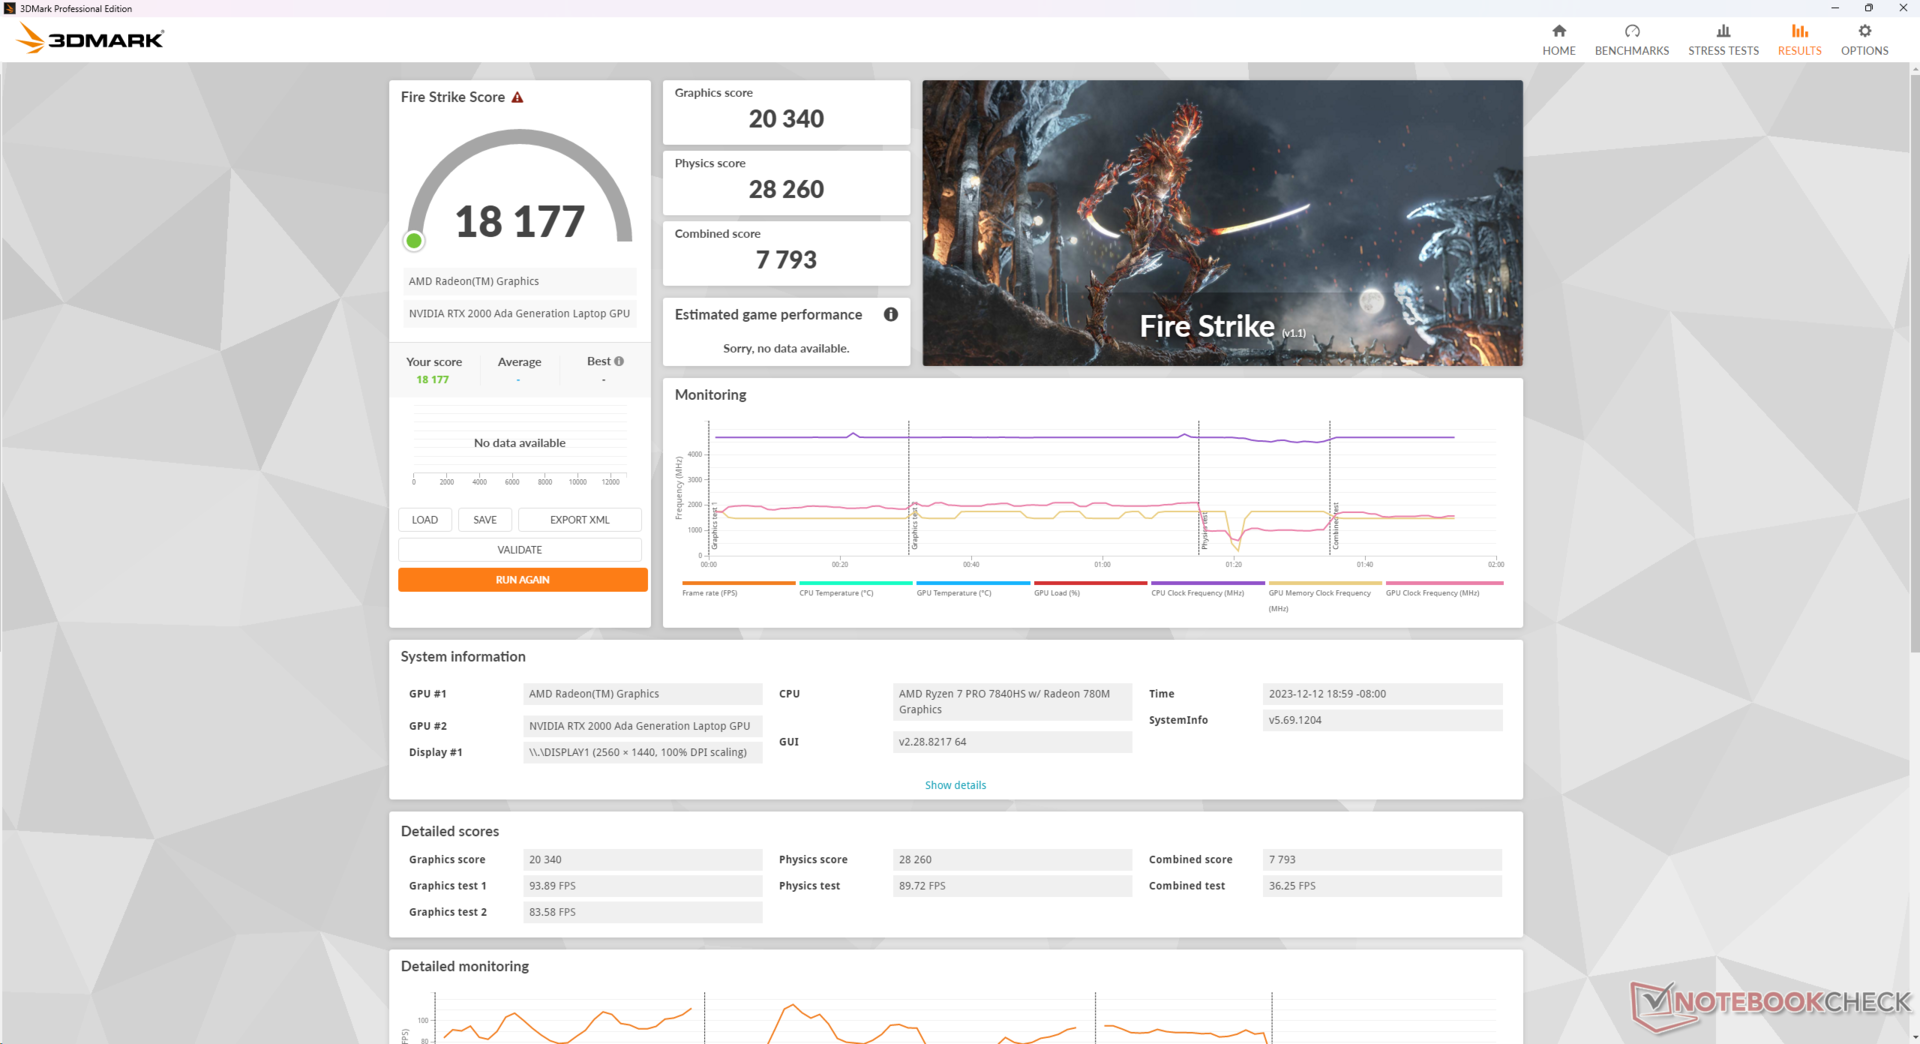
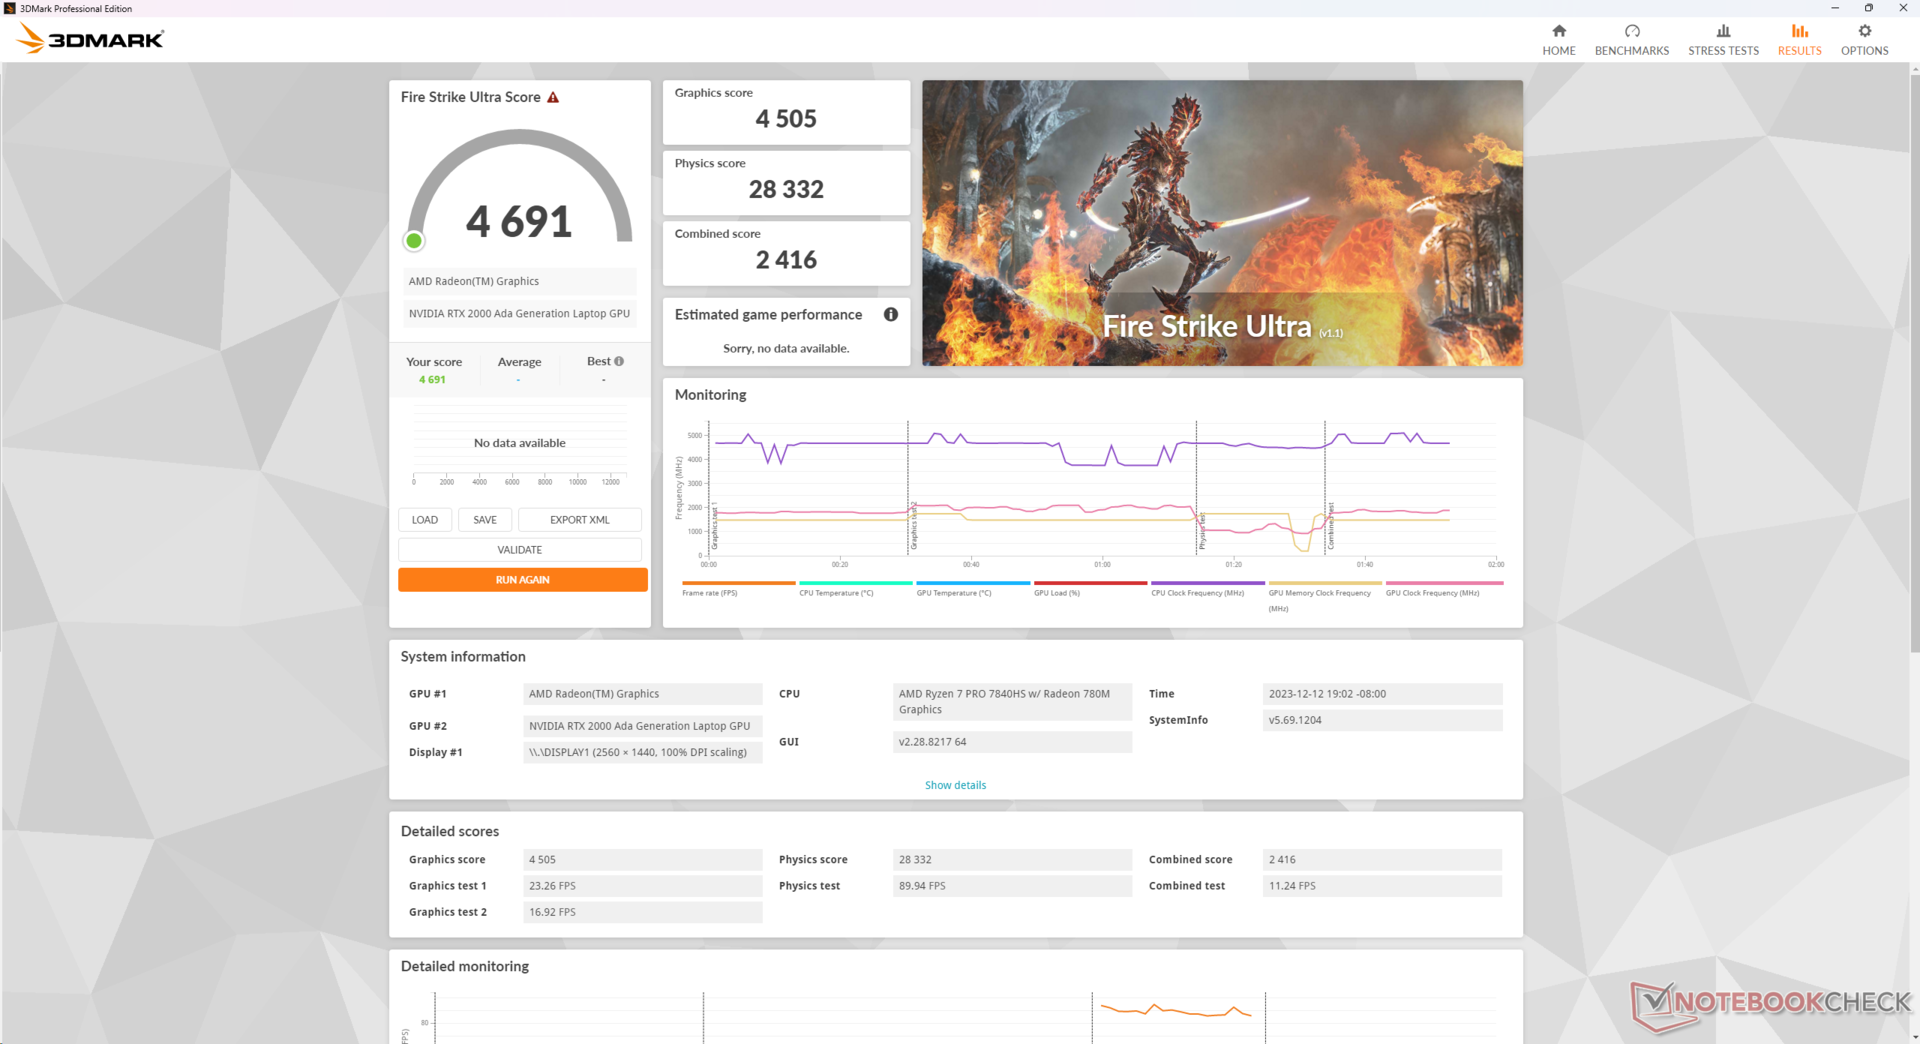
Funcionar en modo Equilibrado en lugar de en modo Rendimiento no parece afectar al rendimiento de la CPU ni de la GPU, como muestran nuestros resultados en Fire Strike que aparecen a continuación. Sin embargo, el funcionamiento con batería reduce significativamente el rendimiento incluso si se configura en modo Rendimiento.
| Perfil de potencia | Puntuación física | Puntuación de gráficos | Puntuación combinada |
| Modo de rendimiento (en la prueba principal) | 28260 | 20340 | 7793 |
| Modo equilibrado (en red) | 27579 (-0%) | 20812 (-0%) | 7877 (-0%) |
| Modo Rendimiento (con batería) | 6105 (-78%) | 12744 (-37%) | 2392 (-69%) |
Lamentablemente, HP ofrece la RTX 3000 Ada Sólo para configuraciones Intel del ZBook Power 15 G10, mientras que las configuraciones AMD se limitan a la RTX 2000 Ada. La GPU 3000 Ada ofrece aproximadamente entre un 5 y un 15 por ciento más de rendimiento que la 2000 Ada basándonos en nuestro tiempo con la más pequeña Dell Precision 5480.
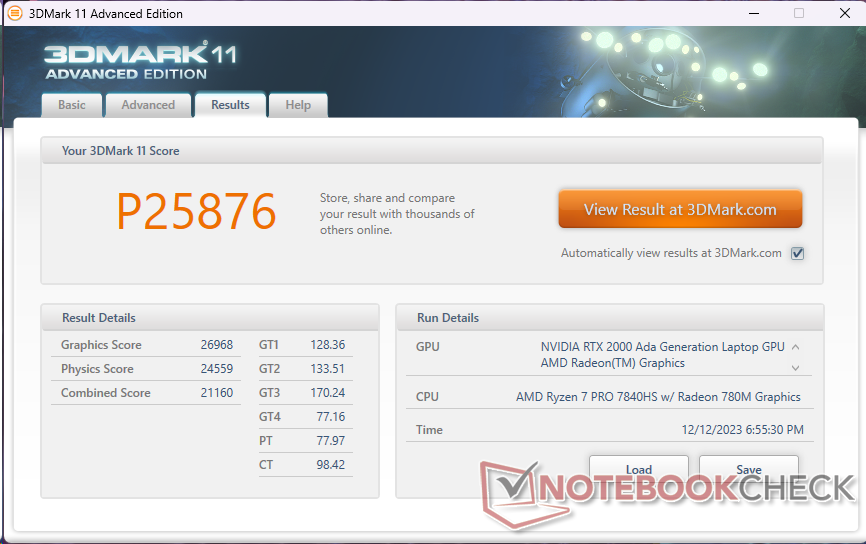
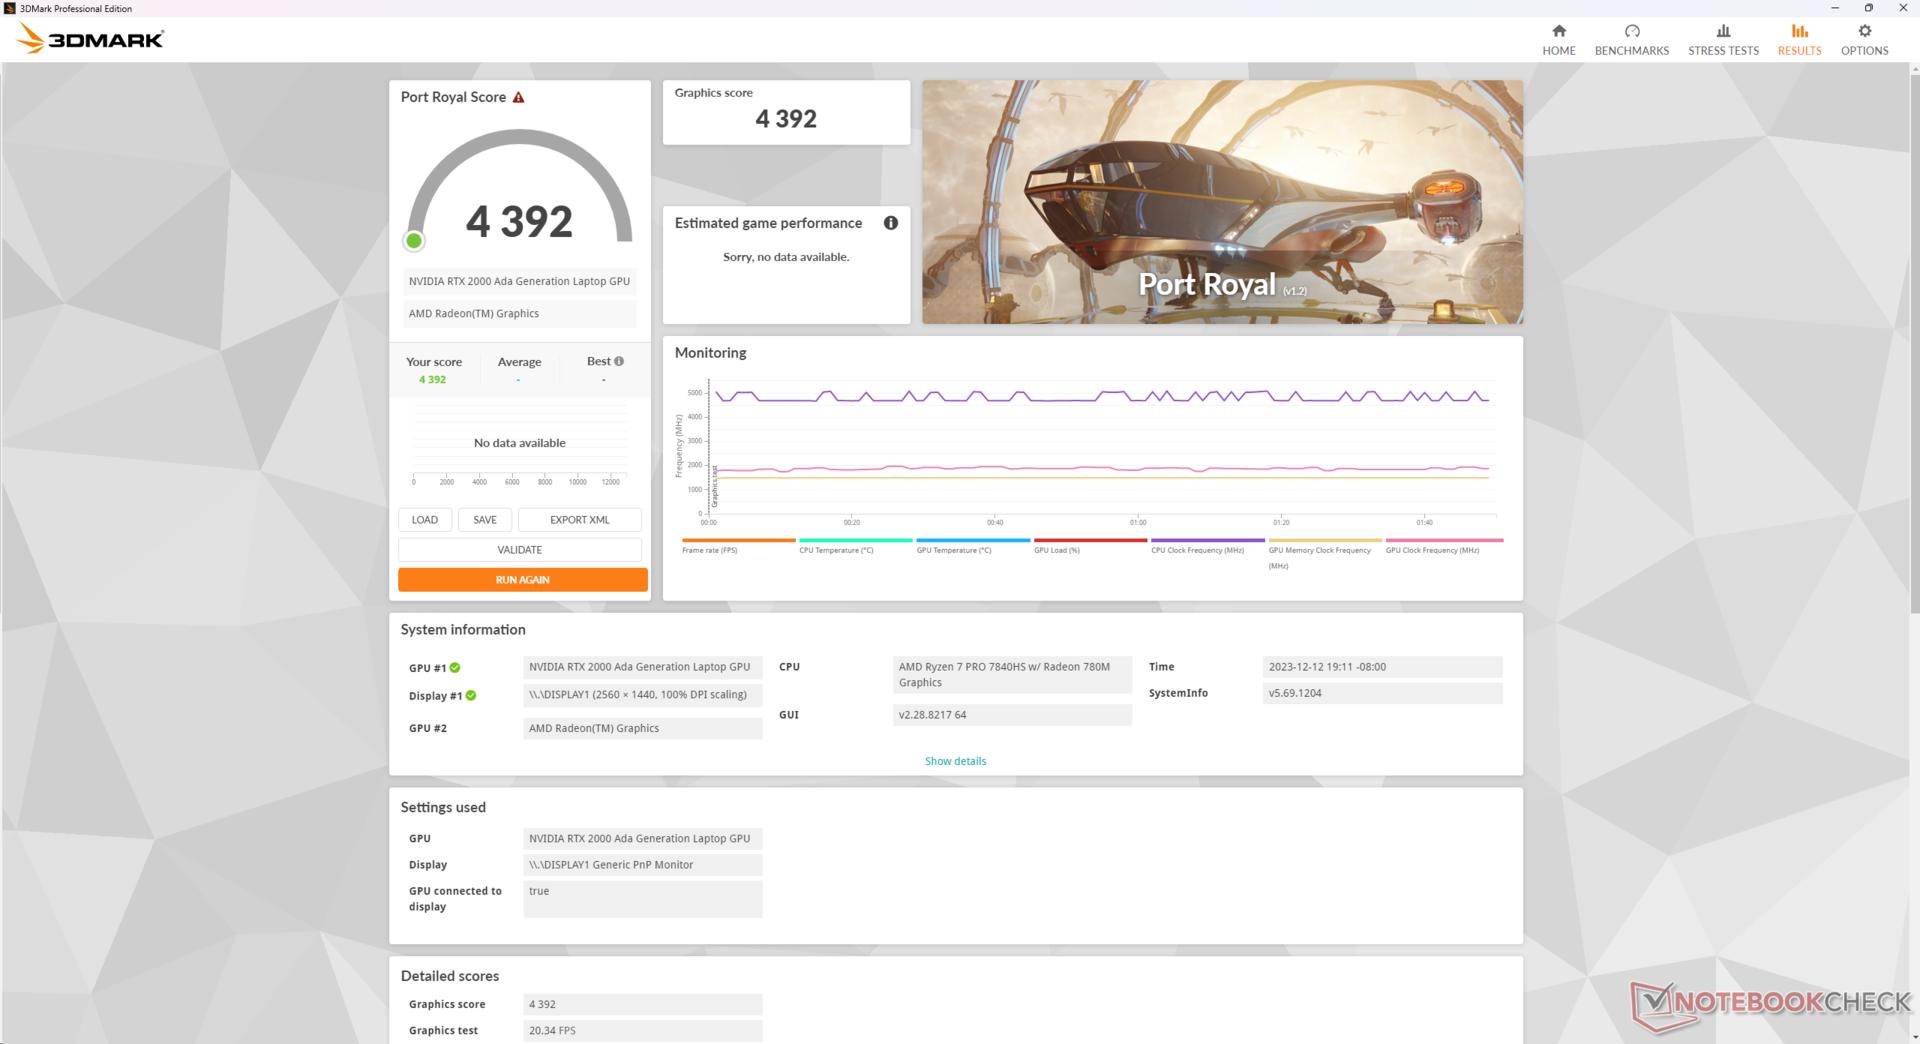
| 3DMark 11 Performance | 25876 puntos | |
| 3DMark Fire Strike Score | 18177 puntos | |
| 3DMark Time Spy Score | 7813 puntos | |
ayuda | ||
* ... más pequeño es mejor
Rendimiento en juegos
El rendimiento general en juegos es muy similar al de la GeForce RTX 4050 aunque la Ada 2000 integra más pipelines unificados, TMUs, VRAM y un mayor ancho de banda de memoria. Juegos exigentes como Cyberpunk 2077 son jugables a 1080p y ajustes extremos, pero se requieren ajustes más bajos si se juega a la resolución nativa de 1440p.
| Cyberpunk 2077 | |
| 1920x1080 Low Preset (FSR off) | |
| HP ZBook Power 15 G10 | |
| Medio NVIDIA RTX 2000 Ada Generation Laptop (81.1 - 85.4, n=2) | |
| Lenovo ThinkPad Z16 Gen 2 | |
| 1920x1080 Medium Preset (FSR off) | |
| HP ZBook Power 15 G10 | |
| Medio NVIDIA RTX 2000 Ada Generation Laptop (61.4 - 64.5, n=2) | |
| Lenovo ThinkPad Z16 Gen 2 | |
| 1920x1080 High Preset (FSR off) | |
| HP ZBook Power 15 G10 | |
| Medio NVIDIA RTX 2000 Ada Generation Laptop (51.7 - 55.2, n=2) | |
| Lenovo ThinkPad Z16 Gen 2 | |
| 1920x1080 Ultra Preset (FSR off) | |
| HP ZBook Power 15 G10 | |
| Medio NVIDIA RTX 2000 Ada Generation Laptop (44.8 - 48.3, n=2) | |
| Lenovo ThinkPad Z16 Gen 2 | |
| 2560x1440 Ultra Preset (FSR off) | |
| HP ZBook Power 15 G10 | |
| Medio NVIDIA RTX 2000 Ada Generation Laptop (29.7 - 29.9, n=2) | |
| Lenovo ThinkPad Z16 Gen 2 | |
| 1920x1080 Ray Tracing Ultra Preset (DLSS off) | |
| HP ZBook Power 15 G10 | |
| Medio NVIDIA RTX 2000 Ada Generation Laptop (19.2 - 21.6, n=2) | |
| Lenovo ThinkPad Z16 Gen 2 | |
Witcher 3 FPS Chart
| bajo | medio | alto | ultra | QHD | |
|---|---|---|---|---|---|
| GTA V (2015) | 178.1 | 170.6 | 157.7 | 86.2 | 60.6 |
| The Witcher 3 (2015) | 336.4 | 219 | 127.9 | 65.5 | |
| Dota 2 Reborn (2015) | 155 | 140.8 | 136.9 | 132 | |
| Final Fantasy XV Benchmark (2018) | 173.3 | 93.5 | 67.7 | 50.3 | |
| X-Plane 11.11 (2018) | 80.6 | 73 | 52.5 | ||
| Far Cry 5 (2018) | 151 | 110 | 102 | 95 | 63 |
| Strange Brigade (2018) | 332 | 183 | 148.4 | 132.5 | 94.1 |
| Tiny Tina's Wonderlands (2022) | 119.8 | 110.5 | 77.3 | 62.3 | 43.5 |
| F1 22 (2022) | 166.7 | 151.8 | 119.9 | 44.2 | 28.9 |
| Cyberpunk 2077 (2023) | 85.4 | 64.5 | 55.2 | 48.3 | 29.9 |
Emisiones
Ruido del sistema
El ruido de los ventiladores es esencialmente idéntico al del modelo del año pasado, con mínimos y máximos similares a pesar de sus diferencias de rendimiento. Por si sirve de algo, los ventiladores internos de nuestra unidad G10 son capaces de permanecer más silenciosos durante algo más de tiempo que en nuestra unidad G9 al ejecutar 3DMark 06, pero esto depende, por supuesto, de las condiciones iniciales de temperatura.
El ruido de los ventiladores en funcionamiento Witcher 3 permanece igual entre los modos Equilibrado y Rendimiento, lo que se correlaciona con los resultados de nuestras pruebas, que muestran diferencias mínimas entre los dos perfiles de potencia.
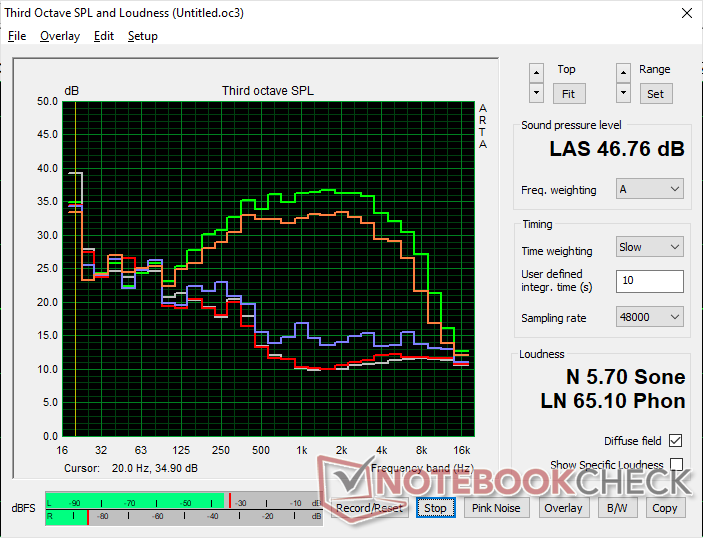
Ruido
| Ocioso |
| 24.4 / 24.4 / 24.4 dB(A) |
| Carga |
| 27.4 / 46.8 dB(A) |
 | ||
30 dB silencioso 40 dB(A) audible 50 dB(A) ruidosamente alto |
||
min: | ||
| HP ZBook Power 15 G10 RTX 2000 Ada Generation Laptop, R7 PRO 7840HS, WDC PC SN810 2TB | HP ZBook Power 15 G9 6B8C4EA RTX A2000 Laptop GPU, i7-12700H, Samsung PM9A1 MZVL21T0HCLR | Lenovo ThinkPad P15v G3 21EM001AGE RTX A2000 Laptop GPU, R7 PRO 6850H, SK Hynix PC711 1TB HFS001TDE9X081N | Dell Precision 5000 5560 RTX A2000 Laptop GPU, i7-11850H, Samsung PM9A1 MZVL22T0HBLB | Lenovo ThinkPad P1 G6-21FV000DGE RTX 2000 Ada Generation Laptop, i9-13900H, SK Hynix PC711 1TB HFS001TDE9X084N | Asus ExpertBook B6 Flip B6602FC2 RTX A2000 Laptop GPU, i9-12950HX, Samsung PM9A1 MZVL21T0HCLR | |
|---|---|---|---|---|---|---|
| Noise | -8% | 3% | 5% | -10% | -34% | |
| apagado / medio ambiente * (dB) | 24.2 | 23.8 2% | 23.2 4% | 23.4 3% | 24.5 -1% | 26 -7% |
| Idle Minimum * (dB) | 24.4 | 23.8 2% | 23.2 5% | 23.6 3% | 24.5 -0% | 32.4 -33% |
| Idle Average * (dB) | 24.4 | 23.8 2% | 23.2 5% | 23.6 3% | 24.5 -0% | 32.4 -33% |
| Idle Maximum * (dB) | 24.4 | 23.8 2% | 23.2 5% | 23.6 3% | 24.5 -0% | 32.4 -33% |
| Load Average * (dB) | 27.4 | 42.9 -57% | 35 -28% | 25.8 6% | 48 -75% | 51.9 -89% |
| Witcher 3 ultra * (dB) | 43.3 | 44.5 -3% | 37.9 12% | 40.1 7% | 40.7 6% | |
| Load Maximum * (dB) | 46.8 | 47.9 -2% | 37.5 20% | 41.4 12% | 48 -3% | 52.1 -11% |
* ... más pequeño es mejor
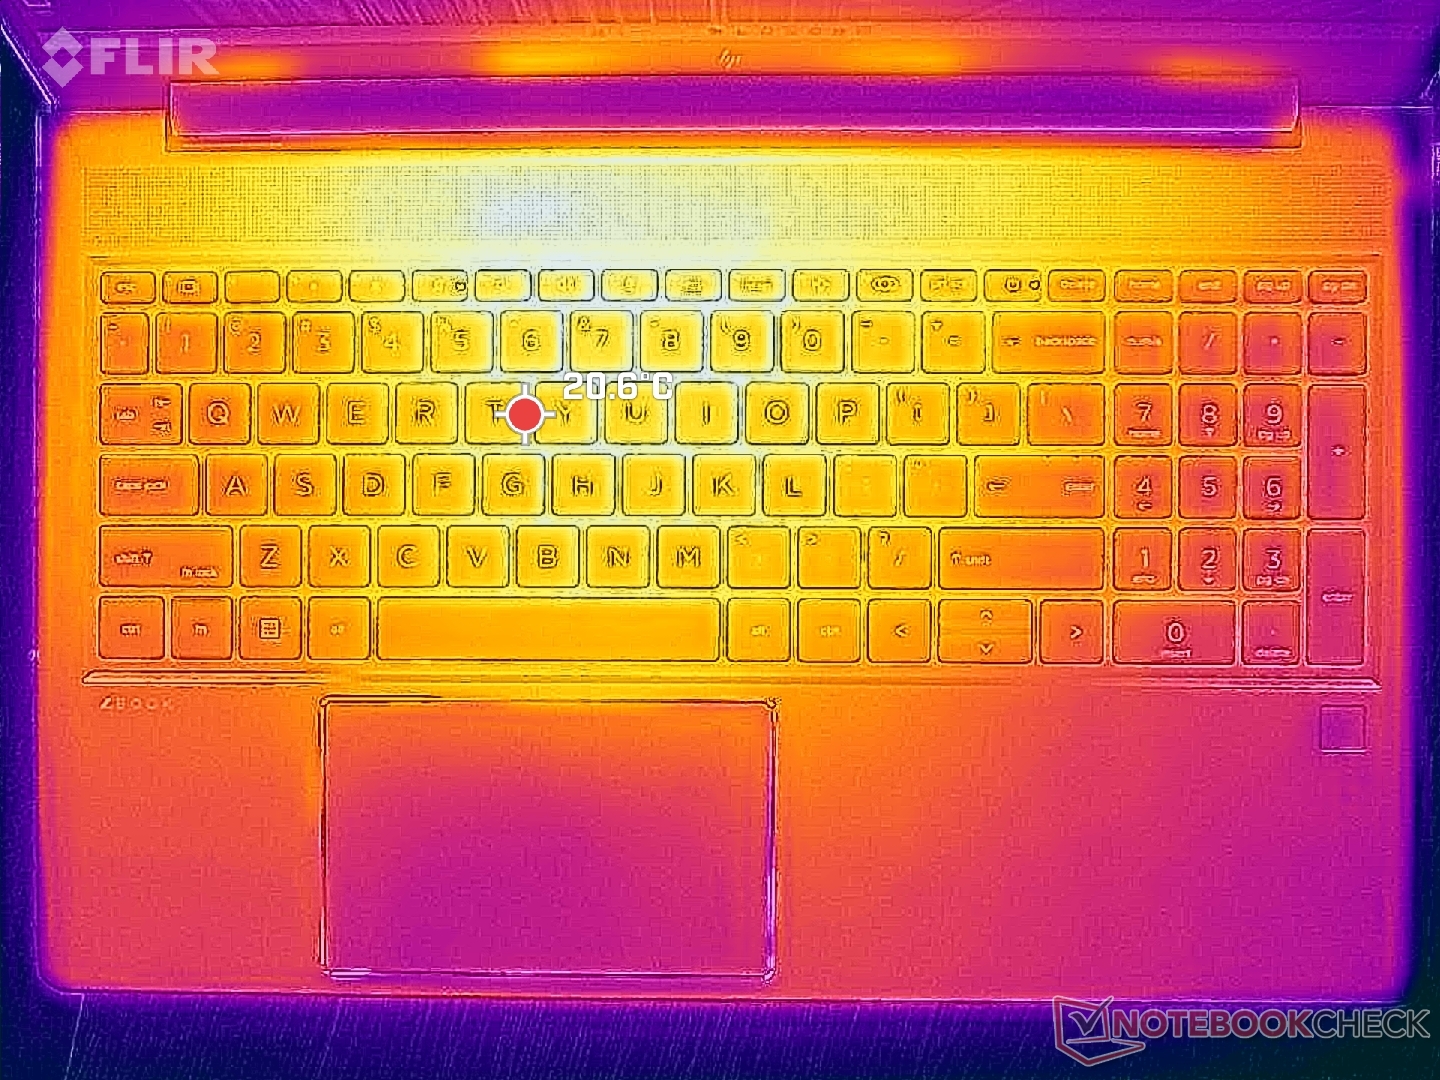
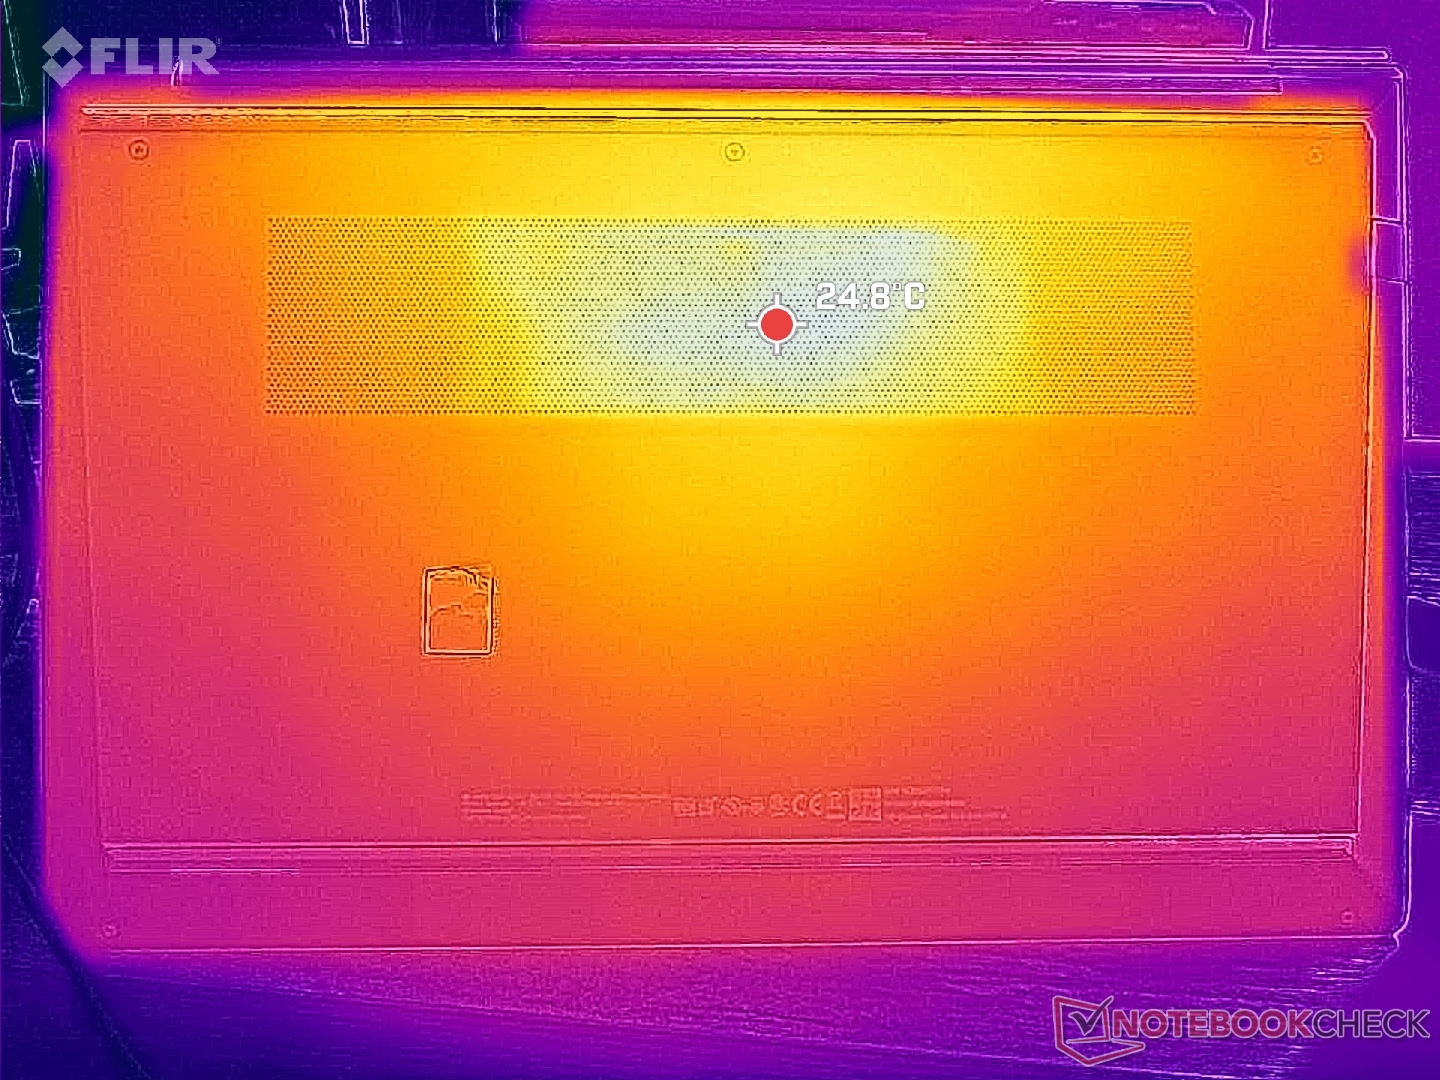
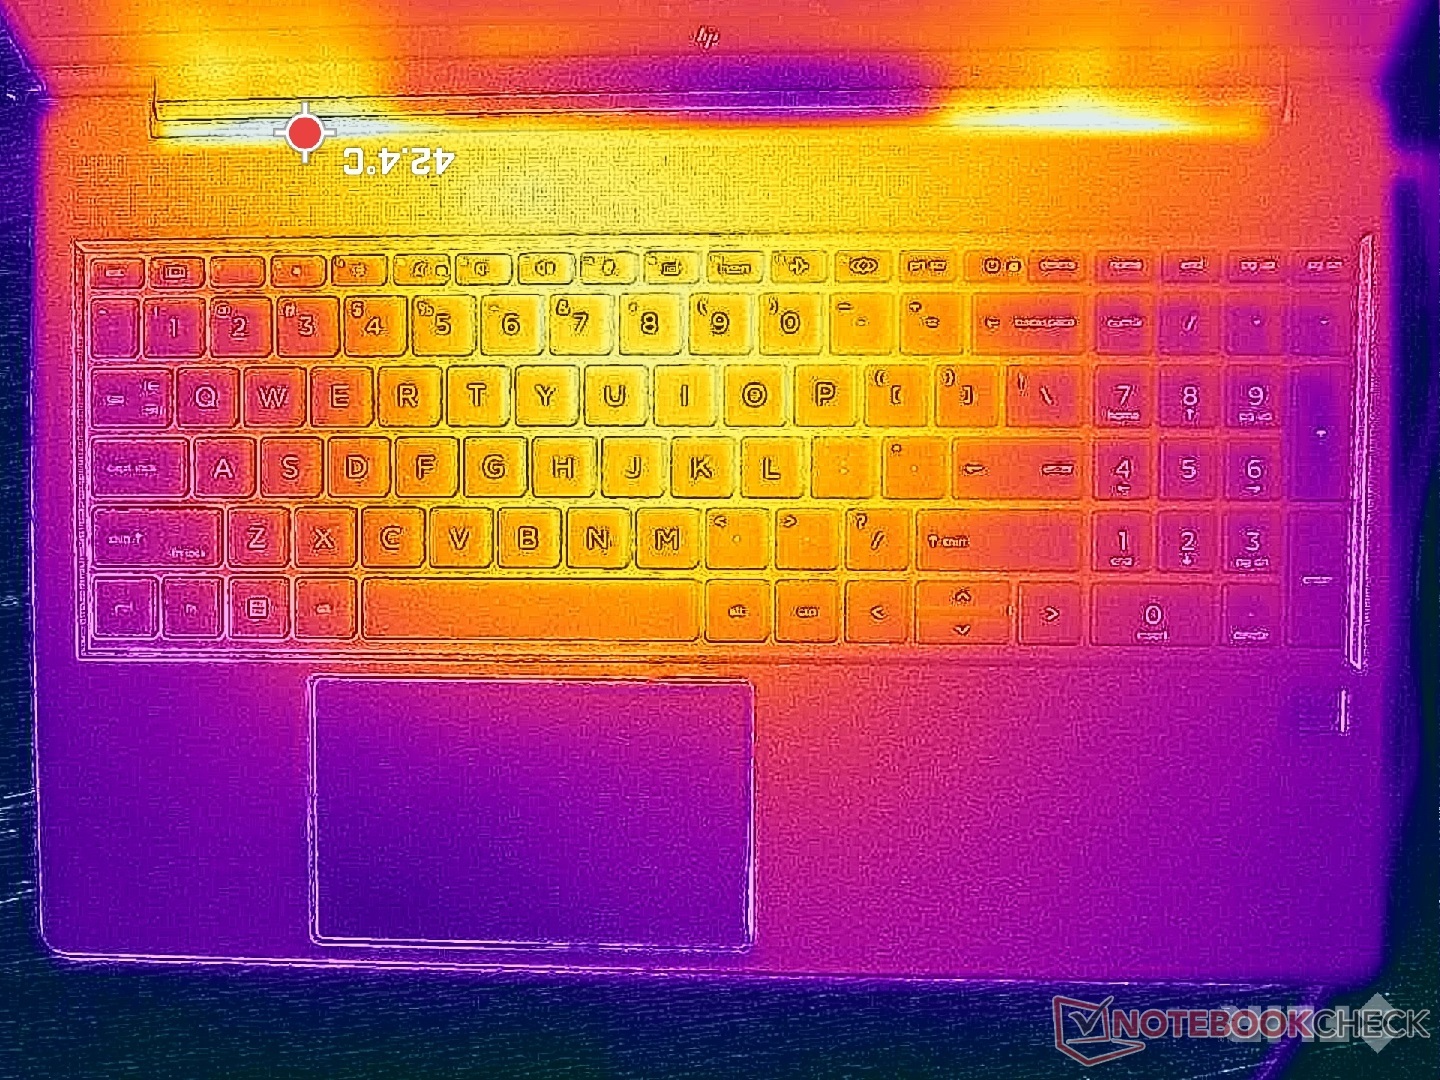
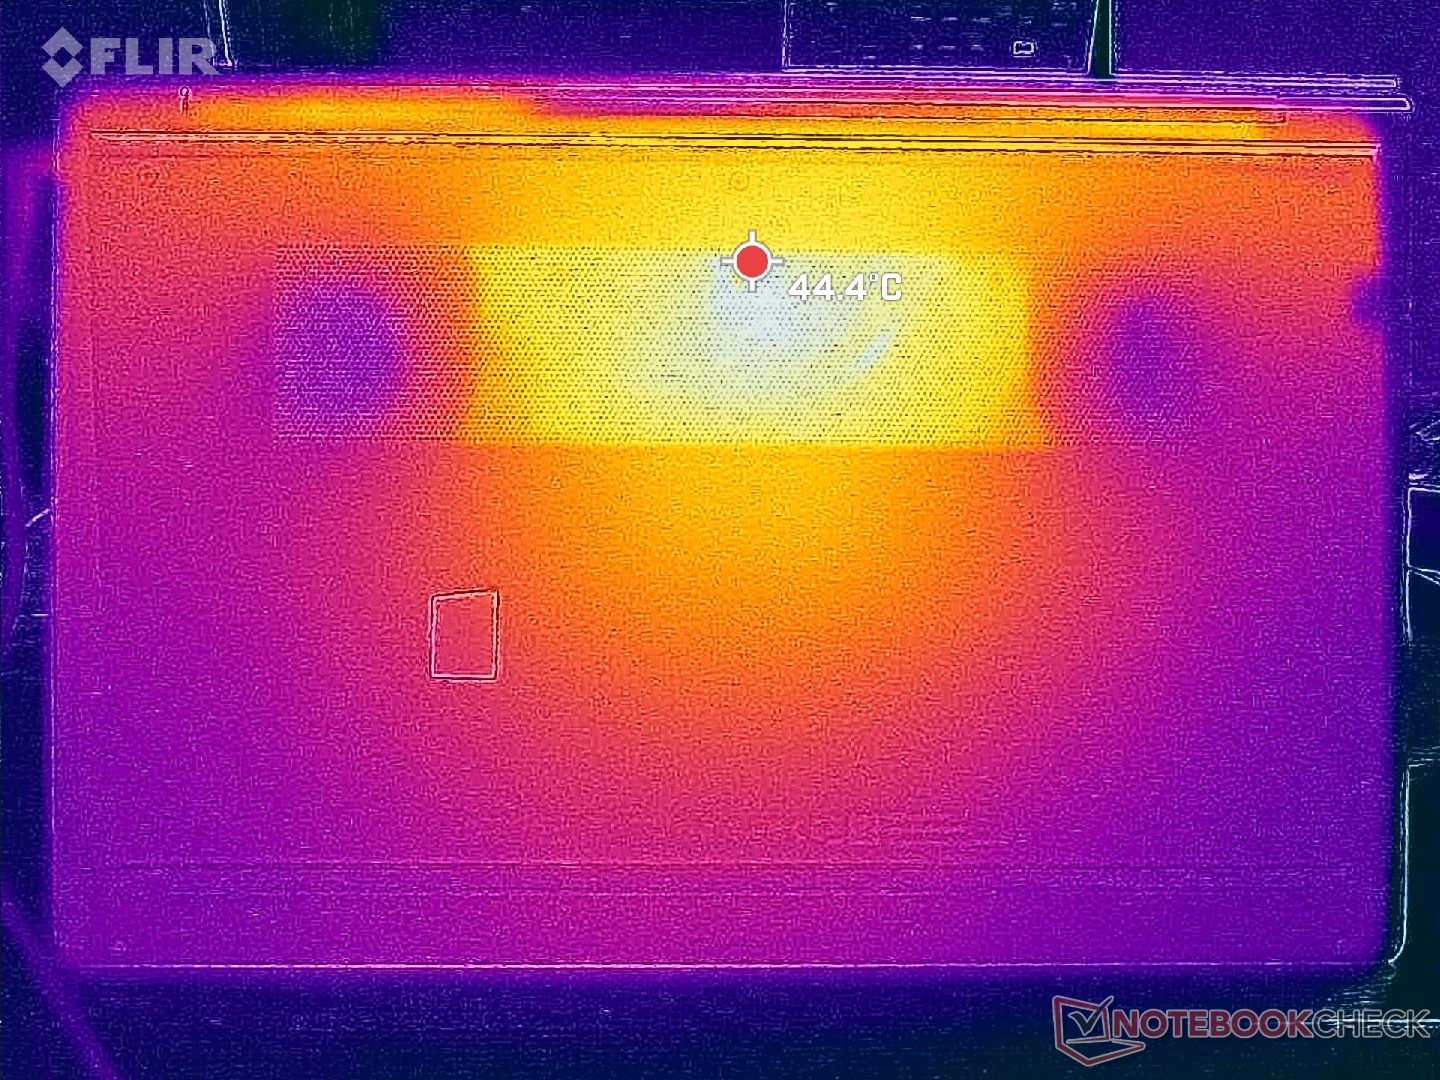
Temperatura
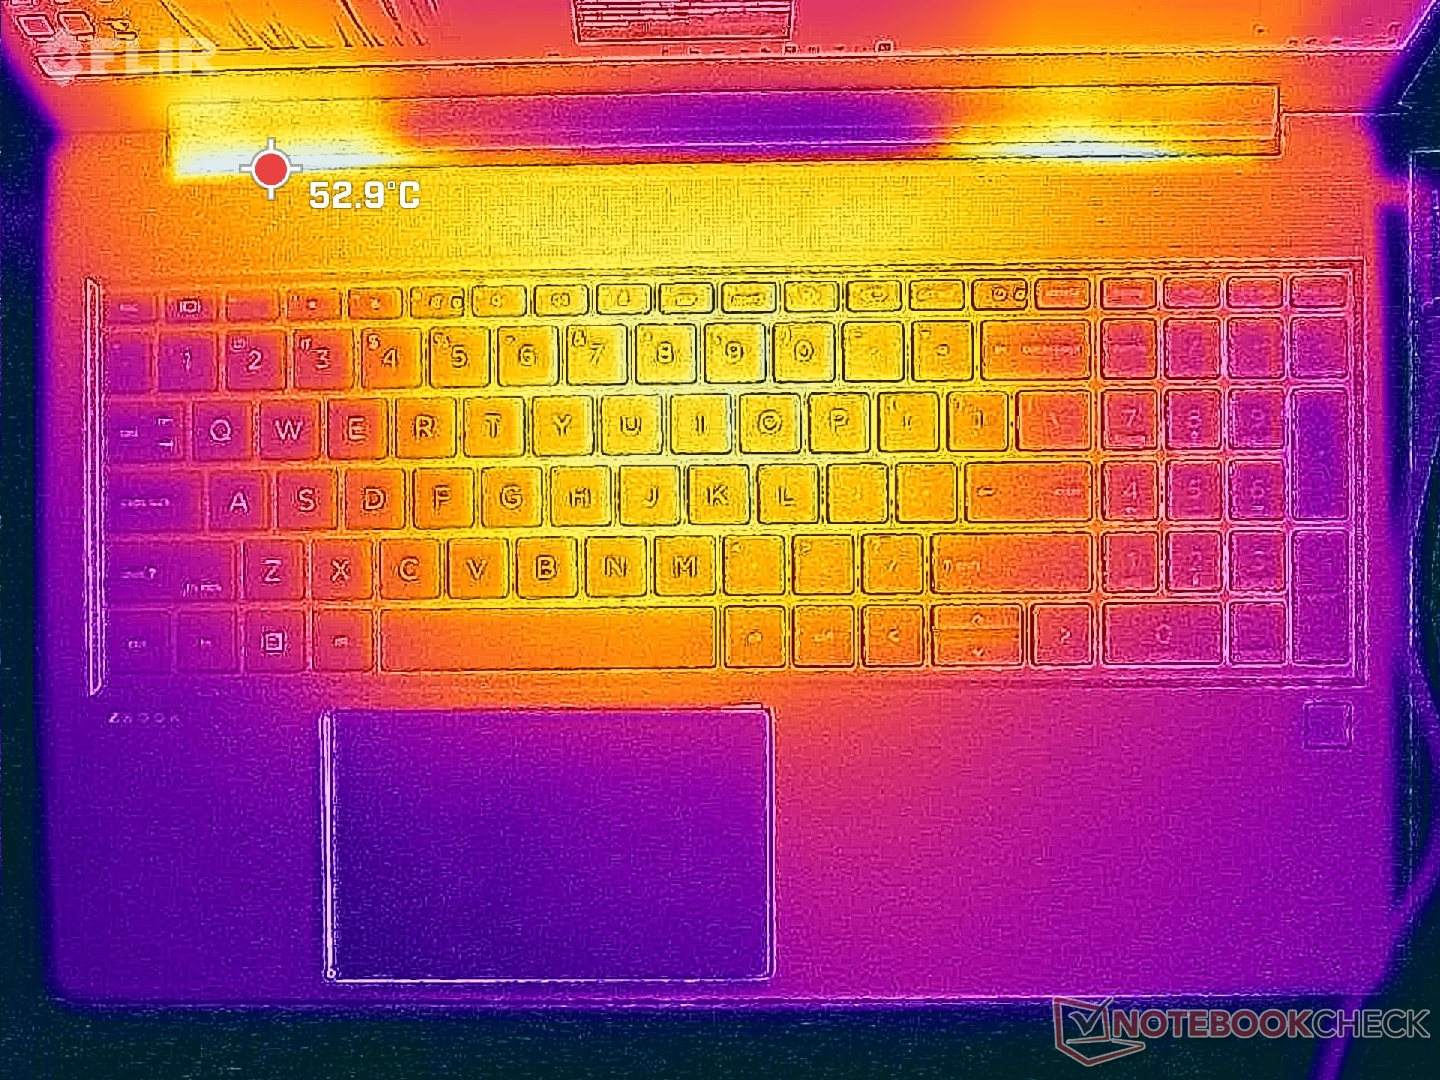
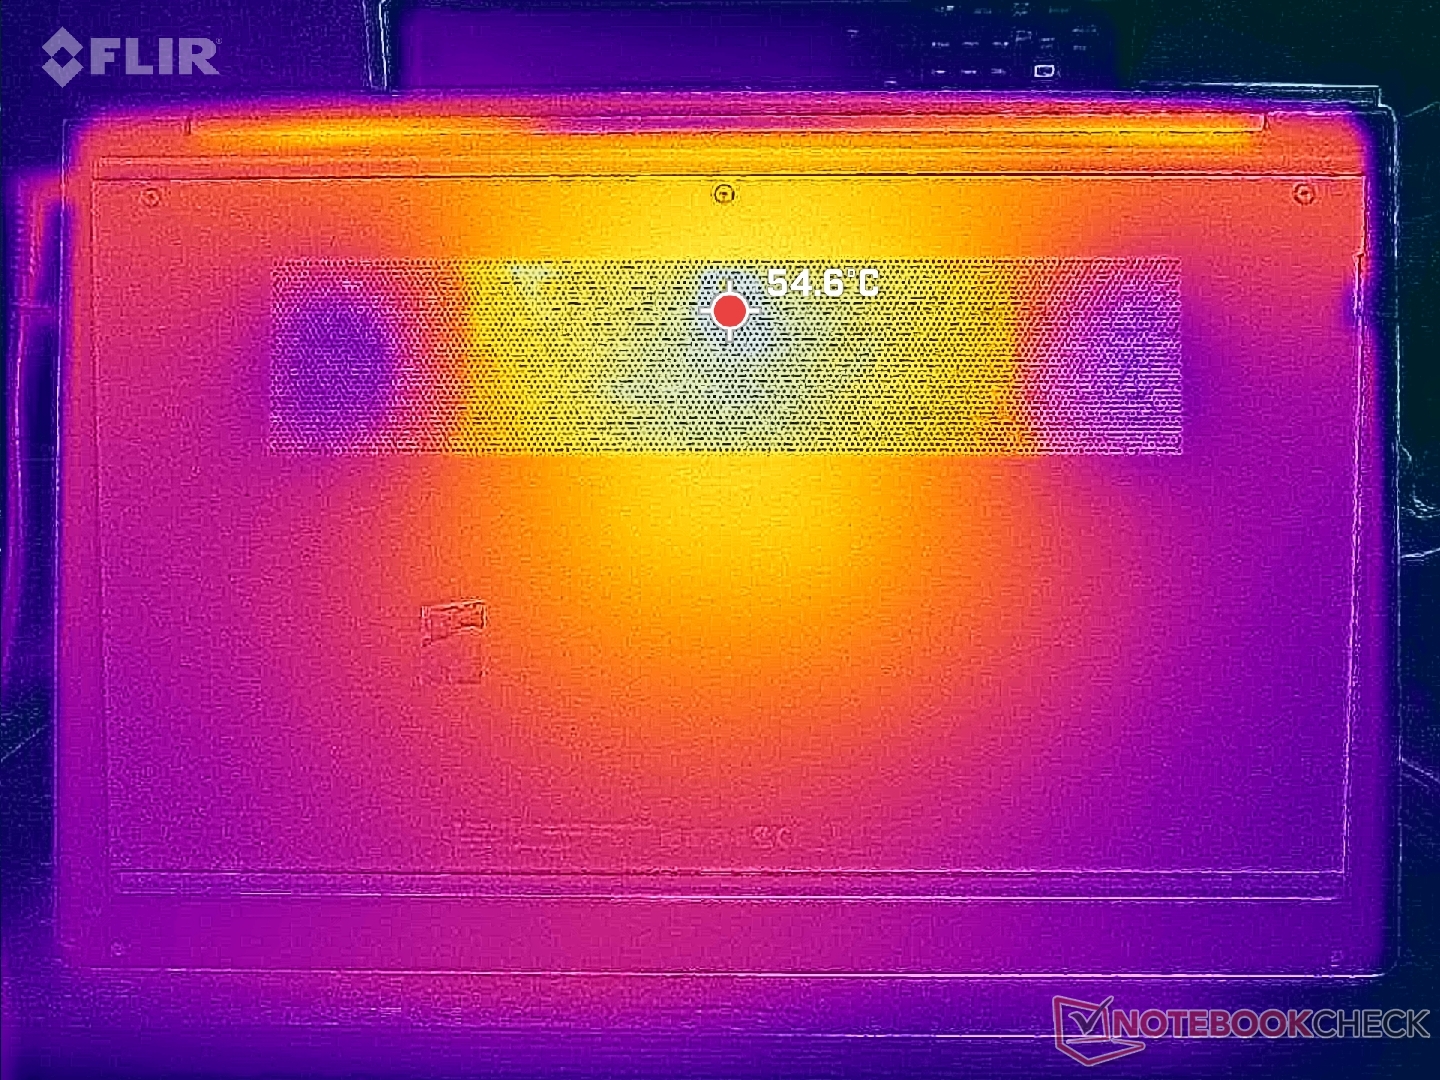
Las temperaturas superficiales son más cálidas hacia el centro y más frías a lo largo de los laterales del teclado o los bordes del chasis. Los puntos calientes en el centro y la parte inferior del teclado pueden alcanzar más de 42 C, lo que supone varios grados menos que en el modelo de la competencia ThinkPad P1 G6 con la misma GPU RTX 2000.
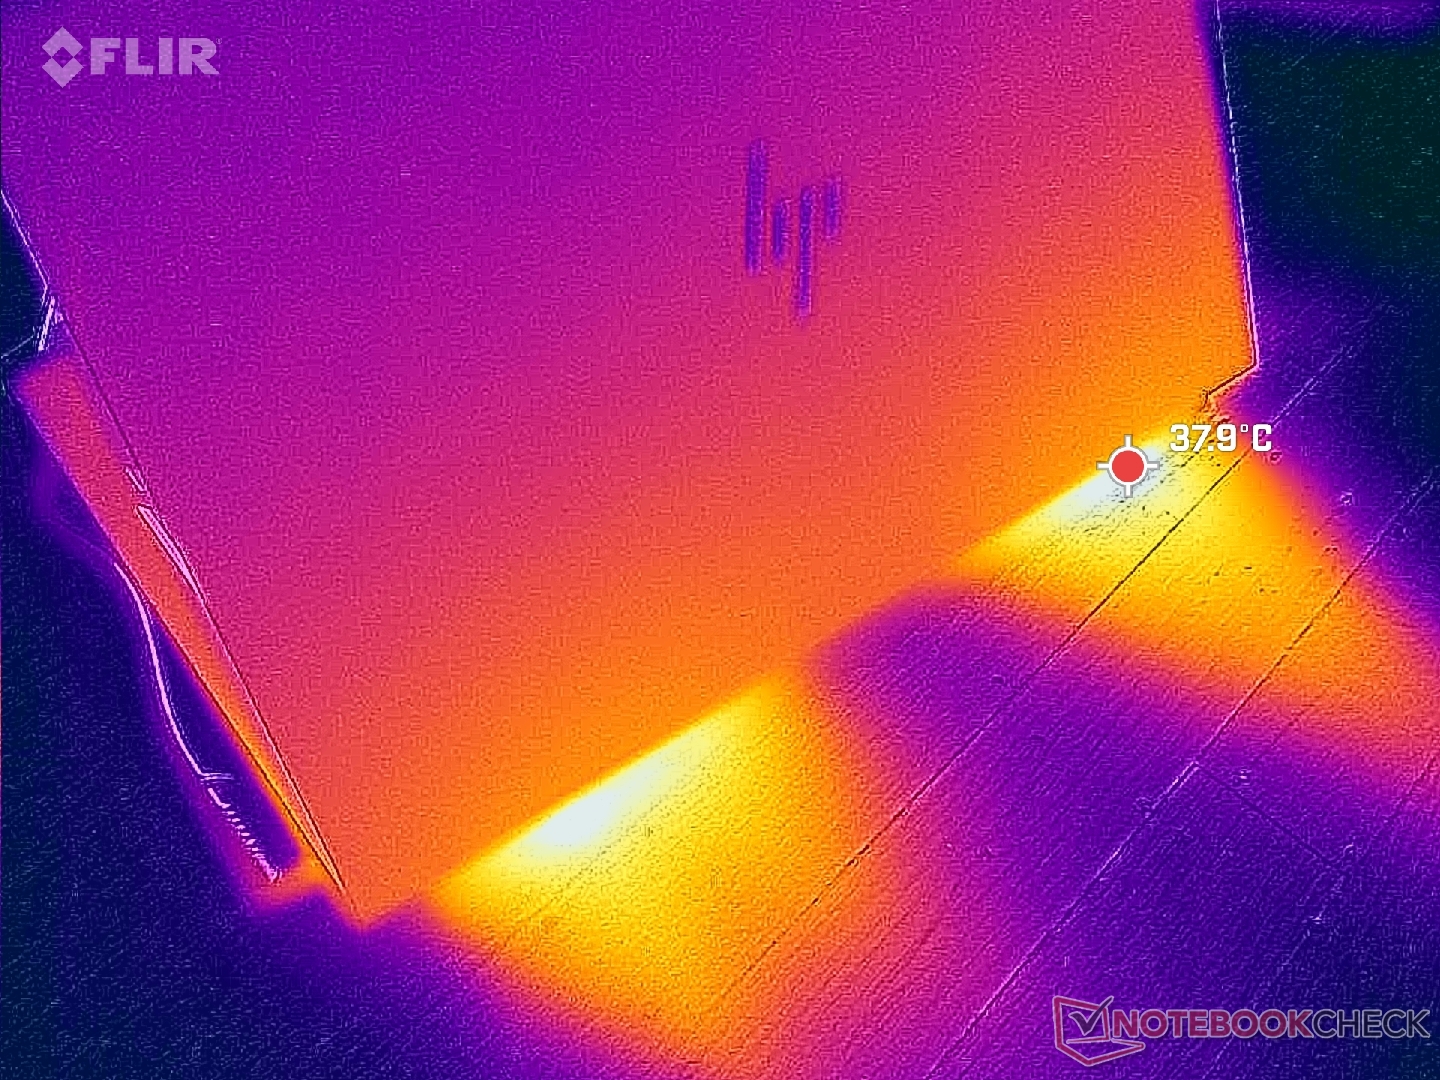
(±) La temperatura máxima en la parte superior es de 42.4 °C / 108 F, frente a la media de 38.2 °C / 101 F, que oscila entre 22.2 y 69.8 °C para la clase Workstation.
(-) El fondo se calienta hasta un máximo de 47.8 °C / 118 F, frente a la media de 41.1 °C / 106 F
(+) En reposo, la temperatura media de la parte superior es de 24.4 °C / 76# F, frente a la media del dispositivo de 32 °C / 90 F.
(+) Jugando a The Witcher 3, la temperatura media de la parte superior es de 31.2 °C / 88 F, frente a la media del dispositivo de 32 °C / 90 F.
(+) El reposamanos y el panel táctil están a una temperatura inferior a la de la piel, con un máximo de 27.6 °C / 81.7 F y, por tanto, son fríos al tacto.
(±) La temperatura media de la zona del reposamanos de dispositivos similares fue de 27.8 °C / 82 F (+0.2 °C / 0.3 F).
| HP ZBook Power 15 G10 AMD Ryzen 7 PRO 7840HS, NVIDIA RTX 2000 Ada Generation Laptop | HP ZBook Power 15 G9 6B8C4EA Intel Core i7-12700H, NVIDIA RTX A2000 Laptop GPU | Lenovo ThinkPad P15v G3 21EM001AGE AMD Ryzen 7 PRO 6850H, NVIDIA RTX A2000 Laptop GPU | Dell Precision 5000 5560 Intel Core i7-11850H, NVIDIA RTX A2000 Laptop GPU | Lenovo ThinkPad P1 G6-21FV000DGE Intel Core i9-13900H, NVIDIA RTX 2000 Ada Generation Laptop | Asus ExpertBook B6 Flip B6602FC2 Intel Core i9-12950HX, NVIDIA RTX A2000 Laptop GPU | |
|---|---|---|---|---|---|---|
| Heat | 7% | -2% | -16% | -9% | -10% | |
| Maximum Upper Side * (°C) | 42.4 | 40.3 5% | 48.7 -15% | 48.2 -14% | 47.1 -11% | 48.4 -14% |
| Maximum Bottom * (°C) | 47.8 | 48.3 -1% | 50.5 -6% | 42.6 11% | 56.5 -18% | 52.3 -9% |
| Idle Upper Side * (°C) | 26.8 | 23.7 12% | 25 7% | 34.8 -30% | 28.1 -5% | 27.8 -4% |
| Idle Bottom * (°C) | 27.2 | 23.8 12% | 25.4 7% | 35.2 -29% | 27.6 -1% | 30.3 -11% |
* ... más pequeño es mejor
Prueba de estrés
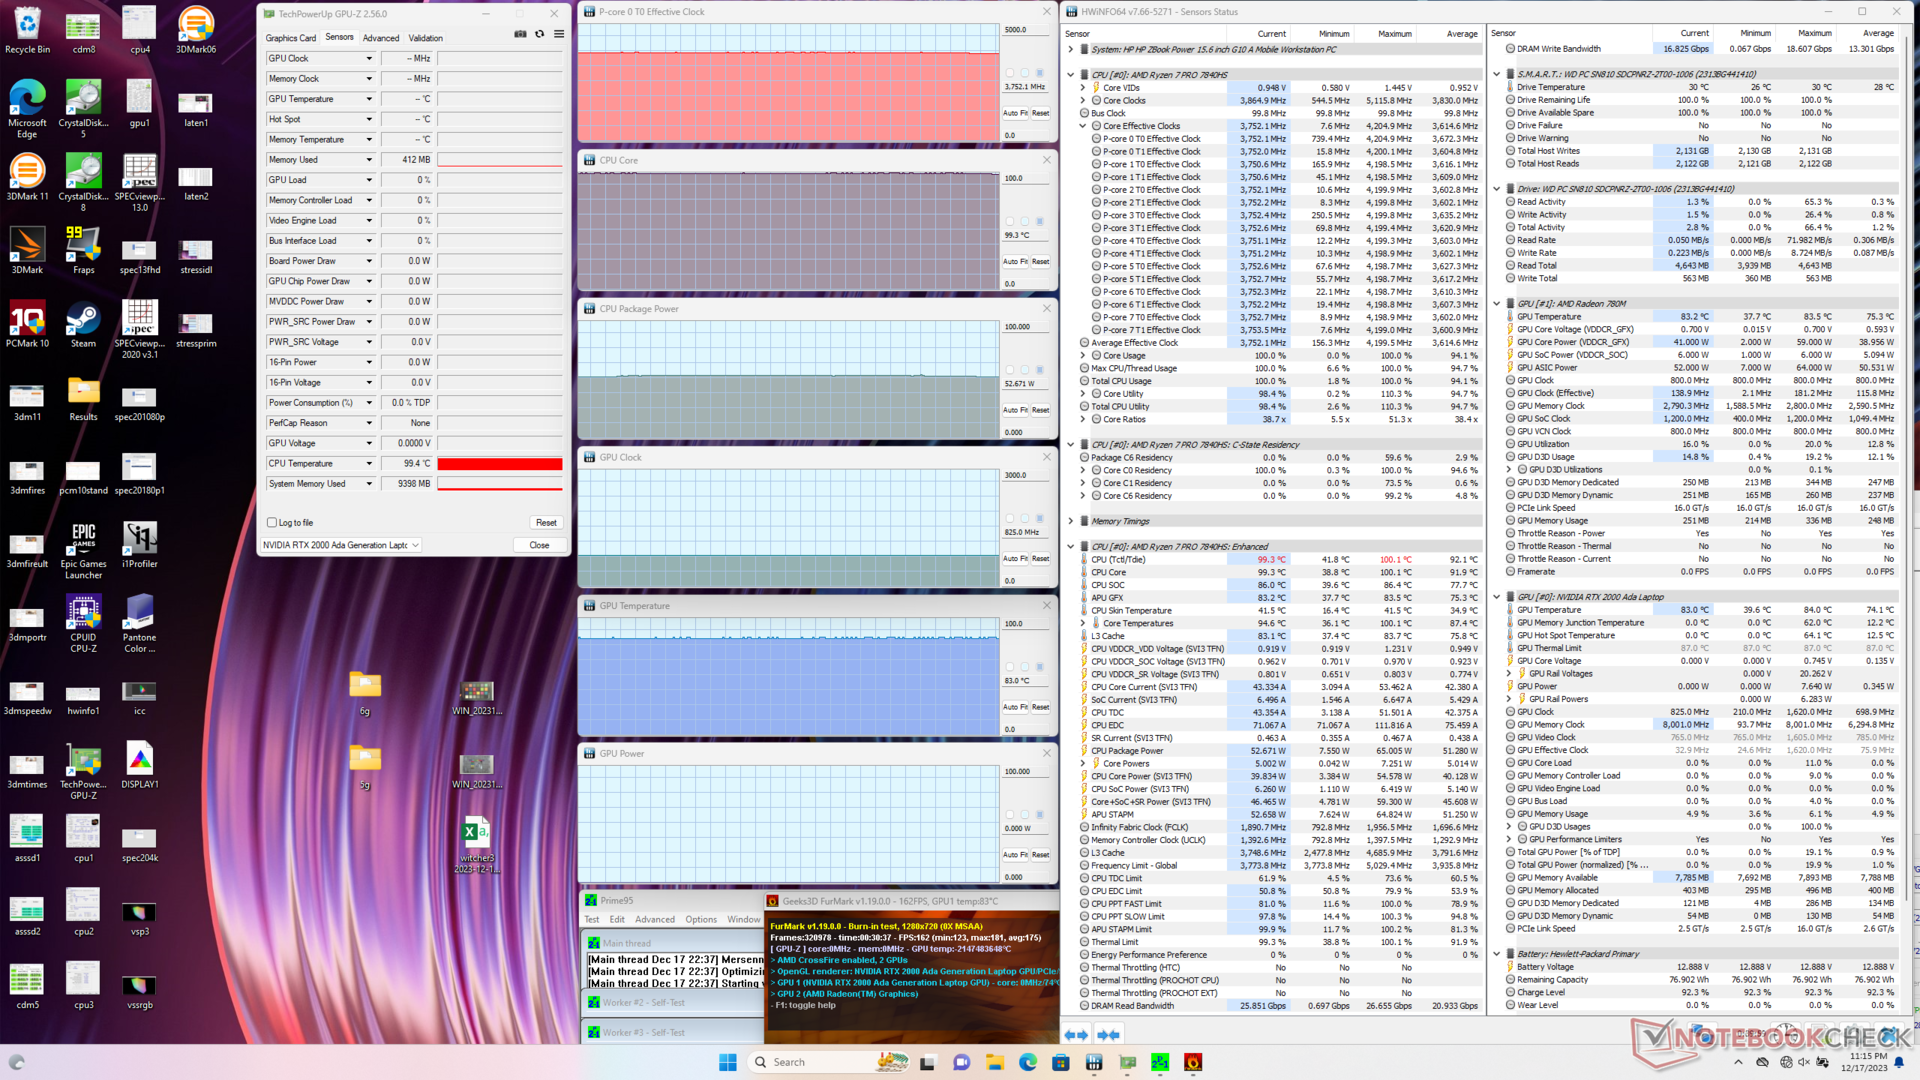
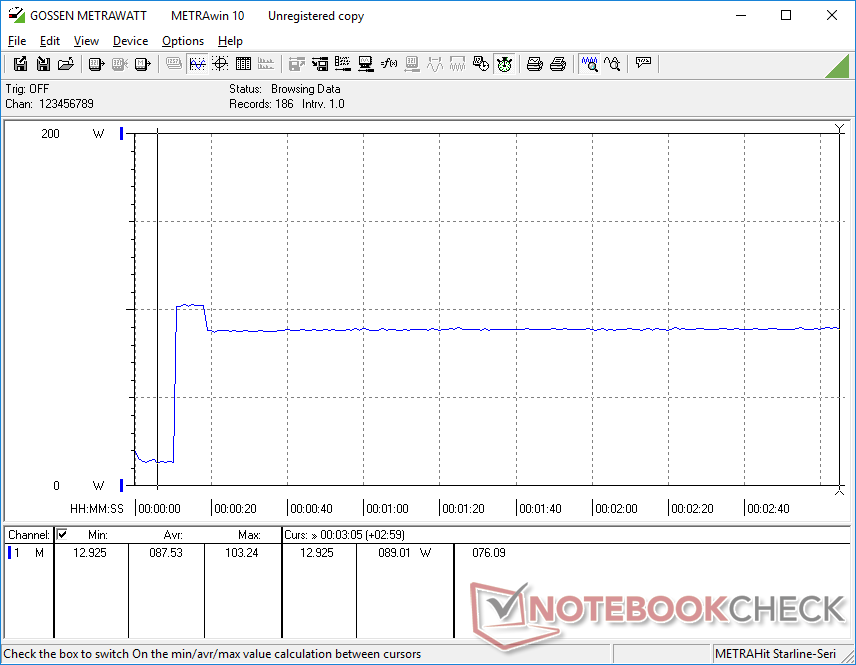
Cuando se estresó con Prime95, la CPU se disparó a 4,2 GHz y 65 W sólo durante los primeros segundos antes de caer ligeramente y estabilizarse en 4,0 GHz y 54 W. La temperatura del núcleo se calentó bastante, a 87 C, pero esto puede ser normal en muchos portátiles con Zen 4. Repitiendo esta prueba en el ThinkPad Z16 G2por ejemplo, haría que su CPU Ryzen 9 se estabilizara en unos aún más cálidos 100 C.
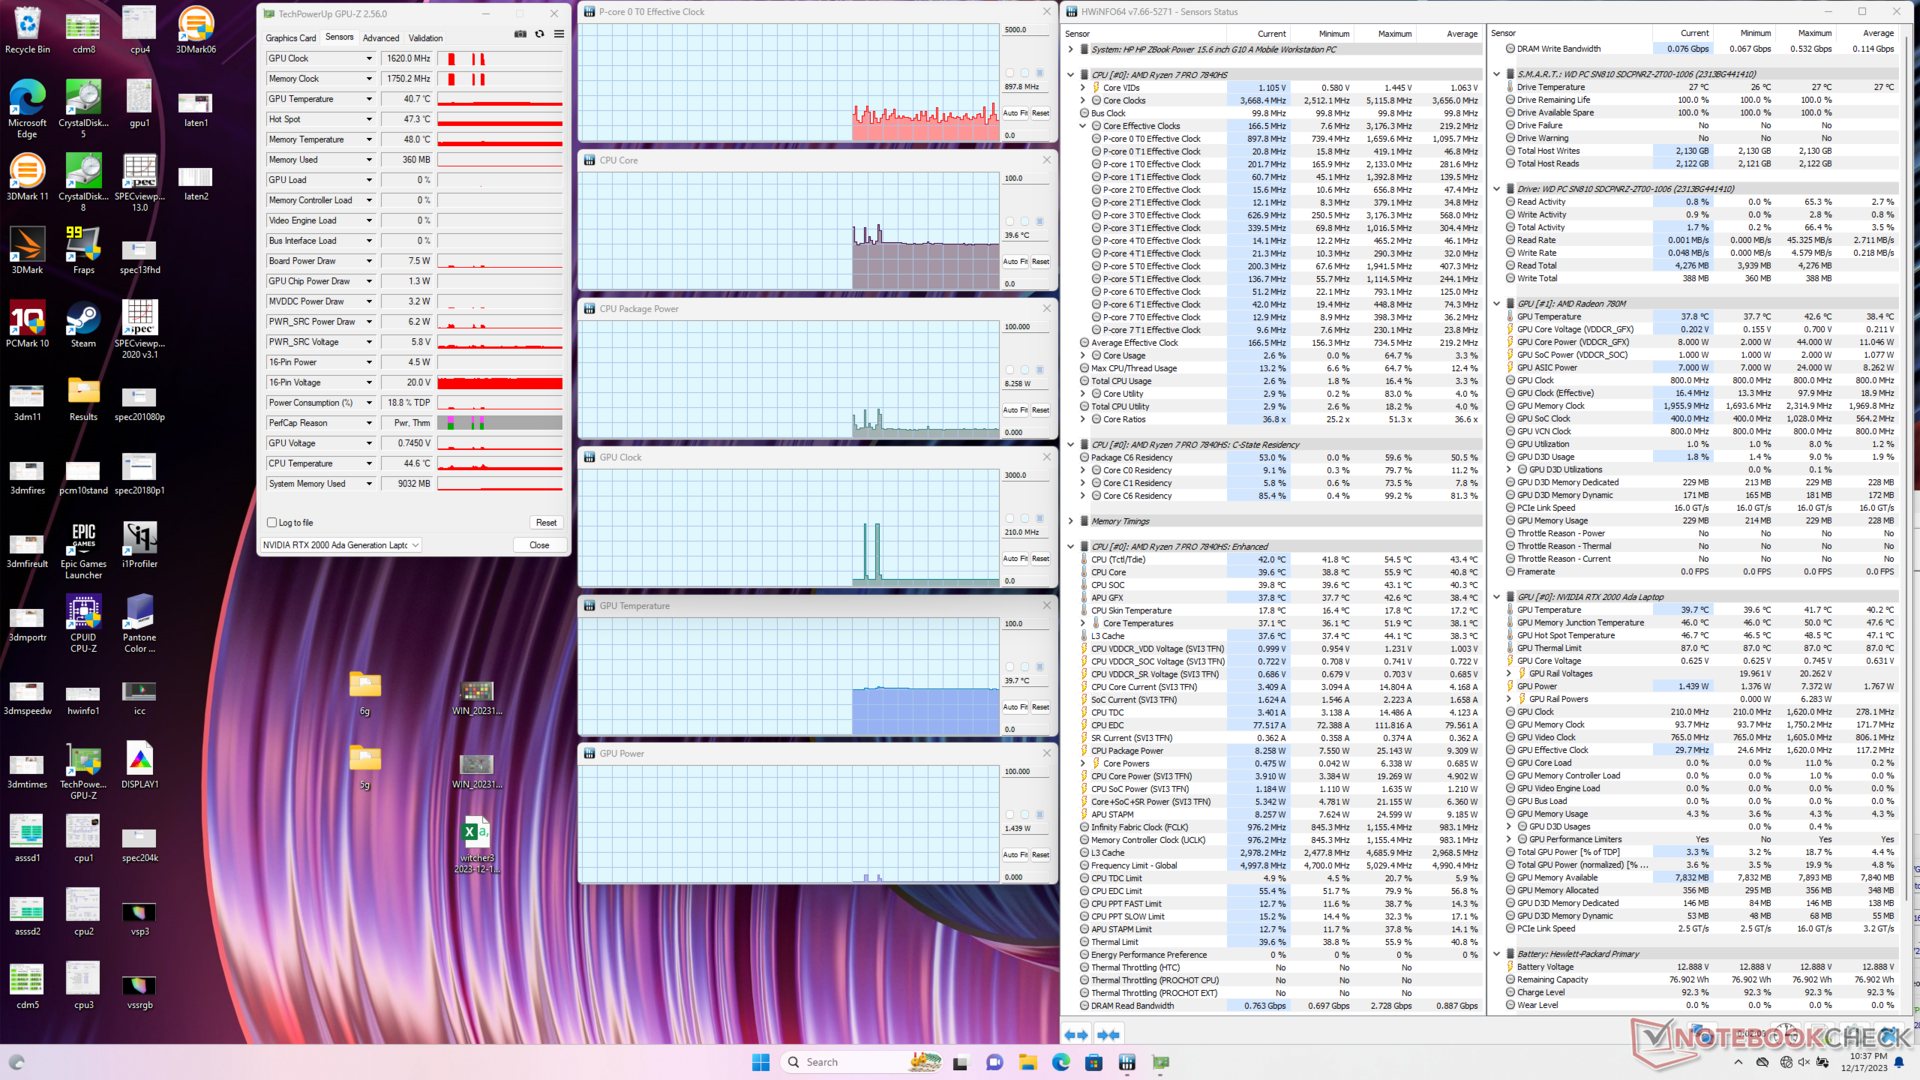
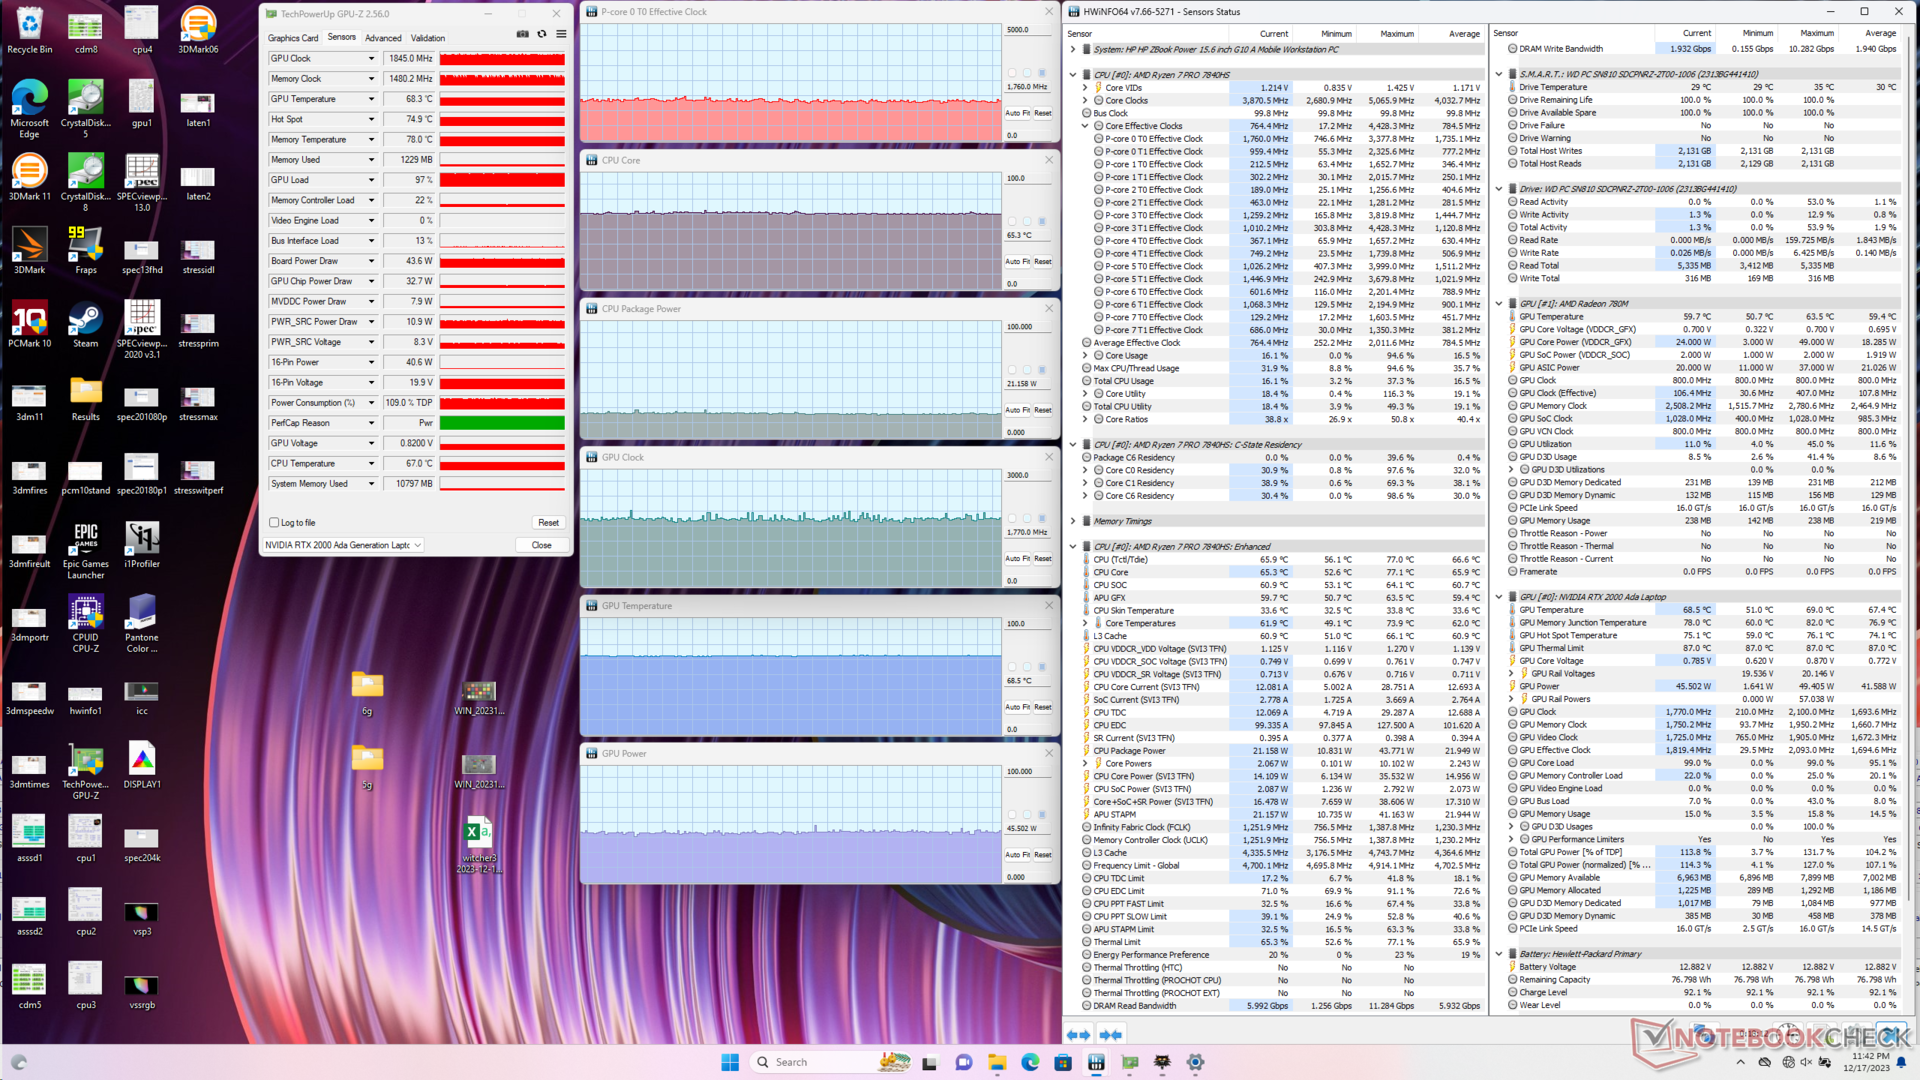
Ejecutando Witcher 3 en modo Equilibrado no mostraría diferencias significativas en temperaturas o velocidades de reloj en comparación con el modo Rendimiento, lo que concuerda con nuestras observaciones de Fire Strike en la sección anterior. El consumo de energía de la placa GPU rondaría los 44 W frente al objetivo de 50 W.
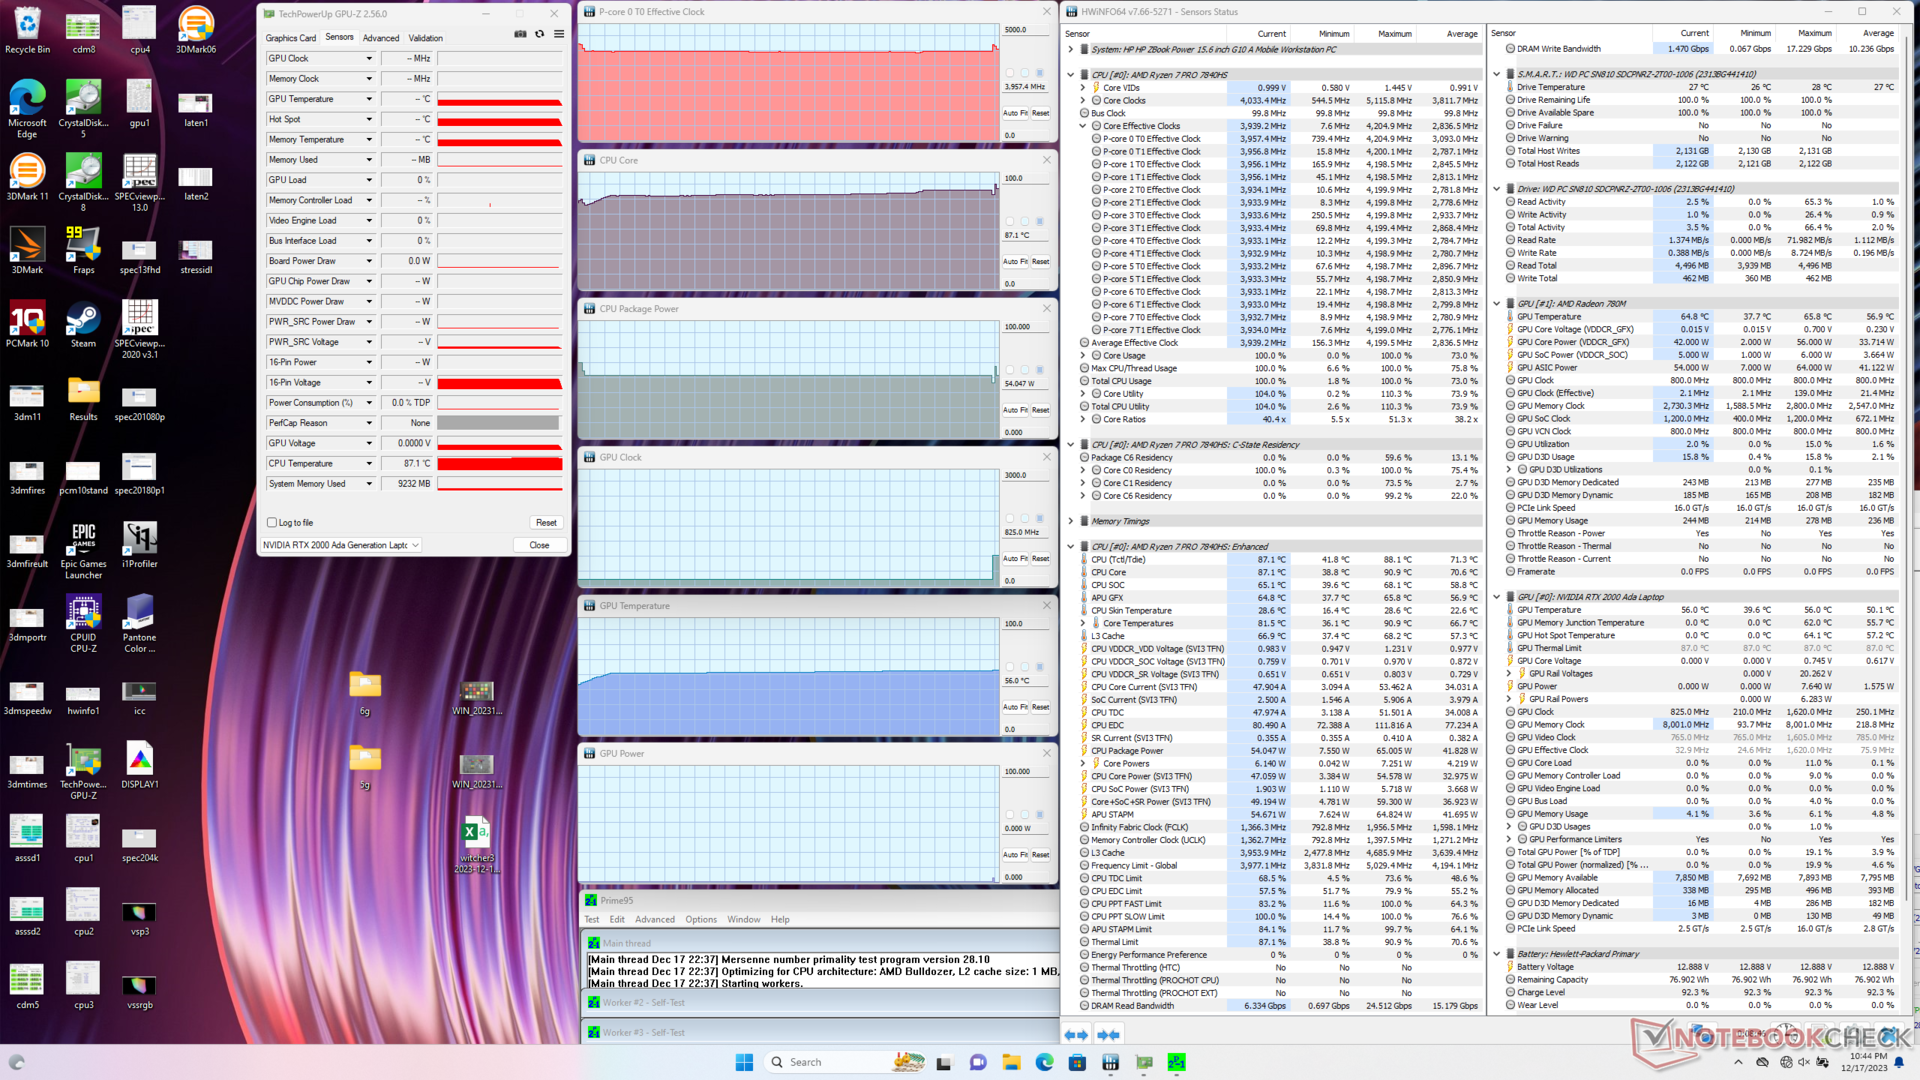

| Reloj dela CPU (GHz) | Reloj de la GPU (MHz) | Temperatura media dela CPU (°C) | Temperatura media de la GPU (°C) | |
| Sistema en reposo | -- | -- | 40 | 40 |
| Prime95 Stress | 4.0 | -- | 87 | 56 |
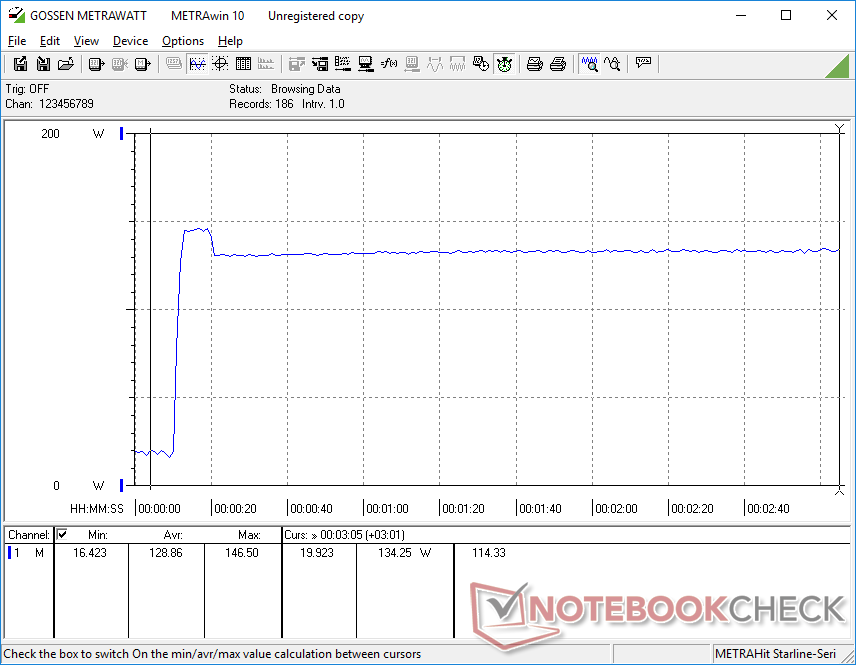
| Estrés Prime95+ FurMark | 3,8 | 825 | 99 | 83 |
| Witcher 3 Estrés (modoequilibrado) | 1,8 | 1770 | 65 | 69 |
| Witcher 3 Estrés (modo Rendimiento) | 1,8 | 1710 | 67 | 68 |
Gestión de la energía
Consumo de energía
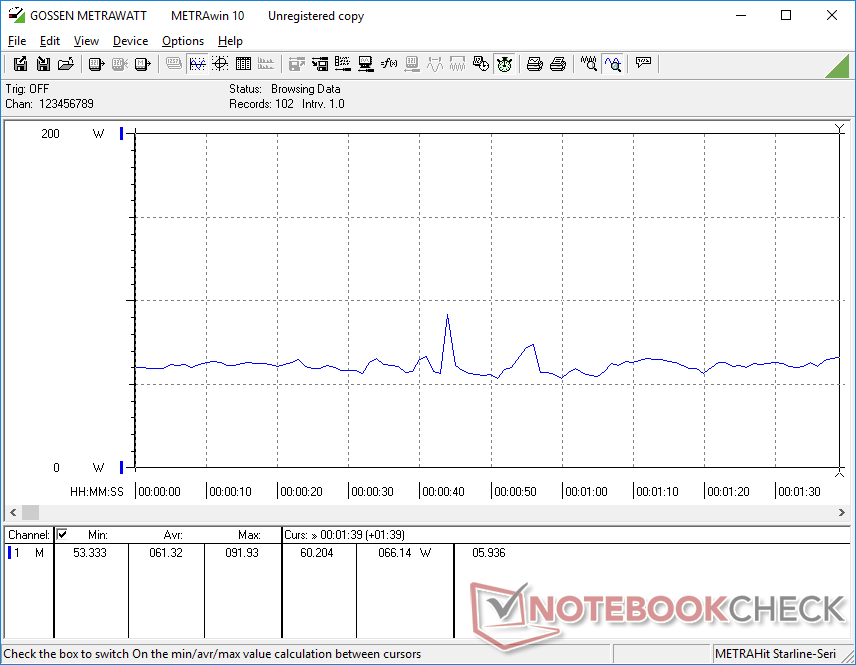
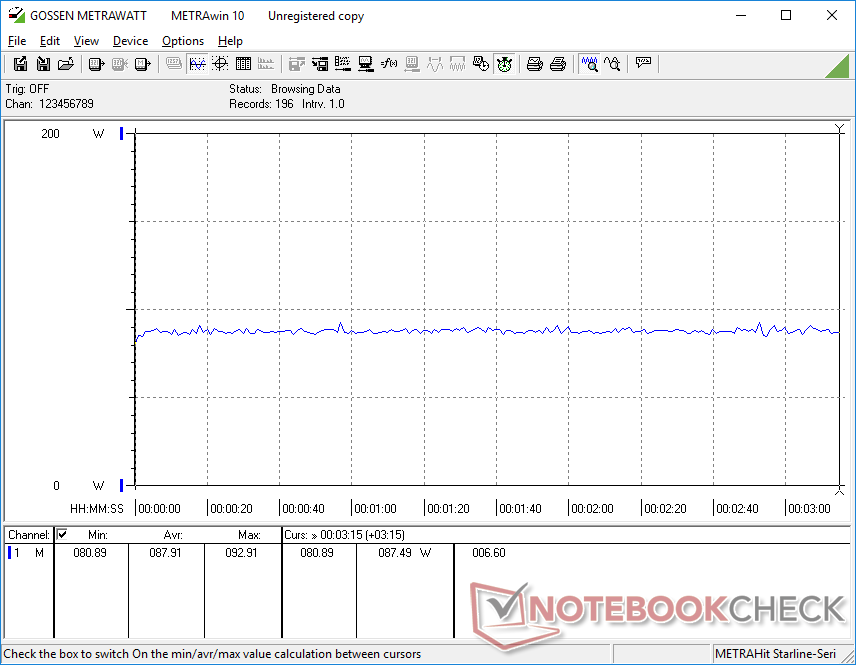
El consumo energético global es superior al del modelo del año pasado, lo que se correlaciona con el mayor rendimiento de nuestra configuración. Sin embargo, el rendimiento por vatio sigue favoreciendo a nuestro modelo más reciente, especialmente en lo que se refiere al rendimiento gráfico. Por ejemplo, la ejecución de Prime95 exige un 16 por ciento más de potencia para un rendimiento multihilo un 20 por ciento más rápido que el Core i7-12700H del ZBook Power 15 G9, mientras que la ejecución de FurMark exigiría sólo un 14 por ciento más de potencia para un rendimiento gráfico hasta un 65 por ciento superior.
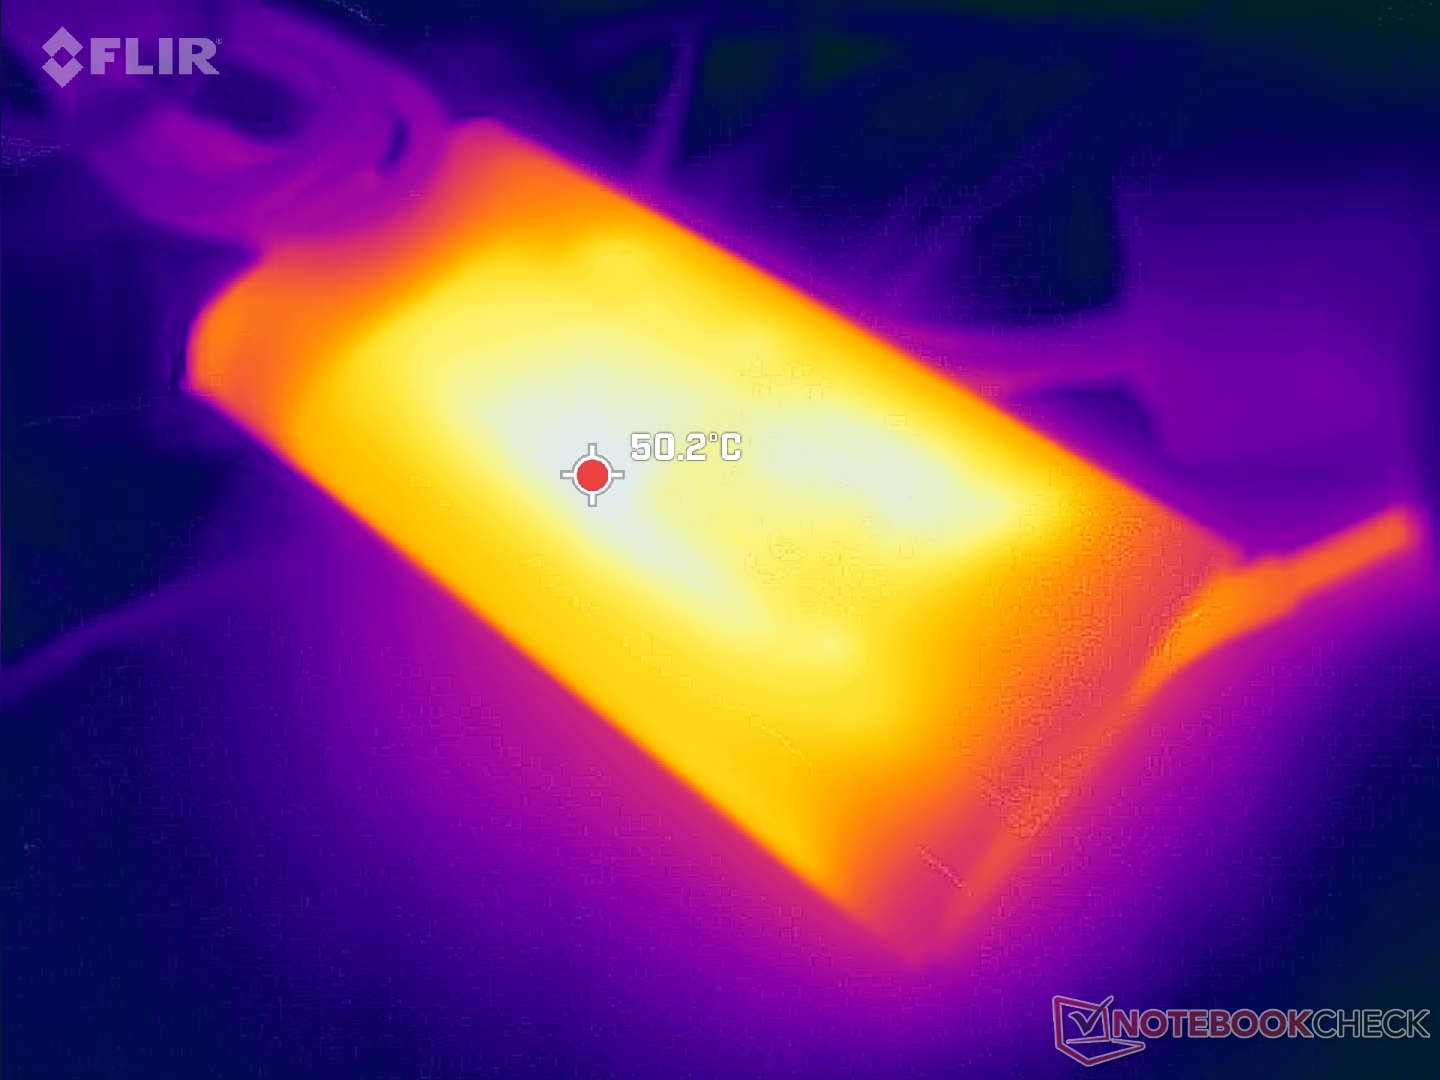
El adaptador de CA de 150 W de tamaño medio (~13,8 x 6,5 x 2,3 cm) no ha cambiado, ya que el ZBook Power 15 G10 funciona con la misma potencia que el ZBook Power 15 G9. No obstante, la carga USB-C es compatible; nuestro cargador USB-C de 135 W de Lenovo, por ejemplo, es compatible con nuestra unidad de prueba HP.
| Off / Standby | |
| Ocioso | |
| Carga |
|
Clave:
min: | |
| HP ZBook Power 15 G10 R7 PRO 7840HS, RTX 2000 Ada Generation Laptop, WDC PC SN810 2TB, IPS, 2560x1440, 15.6" | HP ZBook Power 15 G9 6B8C4EA i7-12700H, RTX A2000 Laptop GPU, Samsung PM9A1 MZVL21T0HCLR, IPS, 3840x2160, 15.6" | Lenovo ThinkPad P15v G3 21EM001AGE R7 PRO 6850H, RTX A2000 Laptop GPU, SK Hynix PC711 1TB HFS001TDE9X081N, IPS LED, 3840x2160, 15.6" | Dell Precision 5000 5560 i7-11850H, RTX A2000 Laptop GPU, Samsung PM9A1 MZVL22T0HBLB, IPS, 3840x2400, 15.6" | Lenovo ThinkPad P1 G6-21FV000DGE i9-13900H, RTX 2000 Ada Generation Laptop, SK Hynix PC711 1TB HFS001TDE9X084N, IPS, 2560x1600, 16" | Asus ExpertBook B6 Flip B6602FC2 i9-12950HX, RTX A2000 Laptop GPU, Samsung PM9A1 MZVL21T0HCLR, IPS, 2560x1600, 16" | |
|---|---|---|---|---|---|---|
| Power Consumption | 11% | -11% | -24% | -30% | -81% | |
| Idle Minimum * (Watt) | 5.3 | 3.9 26% | 6.3 -19% | 6.2 -17% | 8.3 -57% | 10.5 -98% |
| Idle Average * (Watt) | 9.9 | 7.2 27% | 13.9 -40% | 13.9 -40% | 14.5 -46% | 11.9 -20% |
| Idle Maximum * (Watt) | 16.7 | 8.5 49% | 14.5 13% | 23.8 -43% | 15.3 8% | 18 -8% |
| Load Average * (Watt) | 61.3 | 87.2 -42% | 82.8 -35% | 95.7 -56% | 91.8 -50% | 182 -197% |
| Witcher 3 ultra * (Watt) | 87.9 | 86.8 1% | 88.8 -1% | 87 1% | 104.7 -19% | 177.5 -102% |
| Load Maximum * (Watt) | 145.3 | 139 4% | 124.8 14% | 132.6 9% | 164.5 -13% | 229 -58% |
* ... más pequeño es mejor
Power Consumption Witcher 3 / Stresstest
Power Consumption external Monitor
Duración de las pilas
Los tiempos de ejecución son casi exactamente iguales a los que registramos en el modelo del año pasado a pesar de las diferencias en CPU, GPU y pantalla. Diez horas de navegación en el mundo real es similar a muchos Ultrabooks de nivel de consumidor.
| HP ZBook Power 15 G10 R7 PRO 7840HS, RTX 2000 Ada Generation Laptop, 83 Wh | HP ZBook Power 15 G9 6B8C4EA i7-12700H, RTX A2000 Laptop GPU, 83 Wh | Lenovo ThinkPad P15v G3 21EM001AGE R7 PRO 6850H, RTX A2000 Laptop GPU, 68 Wh | Dell Precision 5000 5560 i7-11850H, RTX A2000 Laptop GPU, 86 Wh | Lenovo ThinkPad P1 G6-21FV000DGE i9-13900H, RTX 2000 Ada Generation Laptop, 90 Wh | Asus ExpertBook B6 Flip B6602FC2 i9-12950HX, RTX A2000 Laptop GPU, 90 Wh | |
|---|---|---|---|---|---|---|
| Duración de Batería | 0% | -31% | -37% | -5% | -13% | |
| WiFi v1.3 (h) | 10 | 10 0% | 6.9 -31% | 6.3 -37% | 9.5 -5% | 8.7 -13% |
| H.264 (h) | 10.7 | 11.2 | 5.8 | |||
| Load (h) | 1.8 | 1.8 | 1.1 | 1.7 | ||
| Reader / Idle (h) | 12 | 12.5 |
Pro
Contra
Veredicto - Si no está roto, no lo arregles
El diseño del ZBook Power 15 G10 se acerca a los tres años. Es una de las pocas estaciones de trabajo 16:19 de 15,6 pulgadas que quedan con CPU AMD Zen 4 Pro y GPU Nvidia RTX Ada, mientras que la mayoría de las demás en esta categoría han pasado a factores de forma 16:10 de 16 pulgadas con opciones de pantalla adicionales, incluyendo OLED y 4K. Si el factor de forma más alto y las pantallas más nuevas son importantes para sus cargas de trabajo, entonces es posible que desee esperar hasta que HP actualice el diseño del ZBook Power o buscar alternativas como el Lenovo ThinkPad P1 G6 en su lugar. Si no es así, el ZBook Power 15 G10 sigue siendo una opción clásica y fiable.
Para las posibles revisiones 16:10 en el futuro, nos gustaría ver a HP ir más allá incluyendo soporte para ECC RAM y ECC VRAM y carga completa solo por USB-C. El cargador de barril de CA propietario es cada vez más difícil de justificar ahora que la próxima generación Thunderbolt puede soportar la carga USB-C de hasta 240 W.
El ZBook Power 15 G10 será probablemente una de las últimas estaciones de trabajo de 15,6 pulgadas de HP antes de que la serie se renueve con un diseño 16:10 más moderno.
El principal factor diferenciador entre la ZBook Power 15 G9 y la G10 es que esta última viene con GPU Ada Lovelace para un rendimiento por vatio mucho mayor que las antiguas GPU Ampere. Si las CPU y GPU más recientes son de valor, entonces se recomienda el G10 sobre el G9. Por lo demás, la experiencia de usuario entre los modelos es esencialmente idéntica, incluida incluso la duración de la batería.
Precio y disponibilidad
HP ya está distribuyendo el ZBook Power 15 G10 desde $1600 USD para la configuración Ryzen 5 hasta $2100 para nuestra configuración Ryzen 7 y Nvidia 2000 Ada o superior.
HP ZBook Power 15 G10
- 12/20/2023 v7 (old)
Allen Ngo
Transparencia
La selección de los dispositivos que se van a reseñar corre a cargo de nuestro equipo editorial. La muestra de prueba fue proporcionada al autor en calidad de préstamo por el fabricante o el minorista a los efectos de esta reseña. El prestamista no tuvo ninguna influencia en esta reseña, ni el fabricante recibió una copia de la misma antes de su publicación. No había ninguna obligación de publicar esta reseña. Como empresa de medios independiente, Notebookcheck no está sujeta a la autoridad de fabricantes, minoristas o editores.
Así es como prueba Notebookcheck
Cada año, Notebookcheck revisa de forma independiente cientos de portátiles y smartphones utilizando procedimientos estandarizados para asegurar que todos los resultados son comparables. Hemos desarrollado continuamente nuestros métodos de prueba durante unos 20 años y hemos establecido los estándares de la industria en el proceso. En nuestros laboratorios de pruebas, técnicos y editores experimentados utilizan equipos de medición de alta calidad. Estas pruebas implican un proceso de validación en varias fases. Nuestro complejo sistema de clasificación se basa en cientos de mediciones y puntos de referencia bien fundamentados, lo que mantiene la objetividad.Price comparison

