Veredicto - Rápido, pero podría ser más rápido
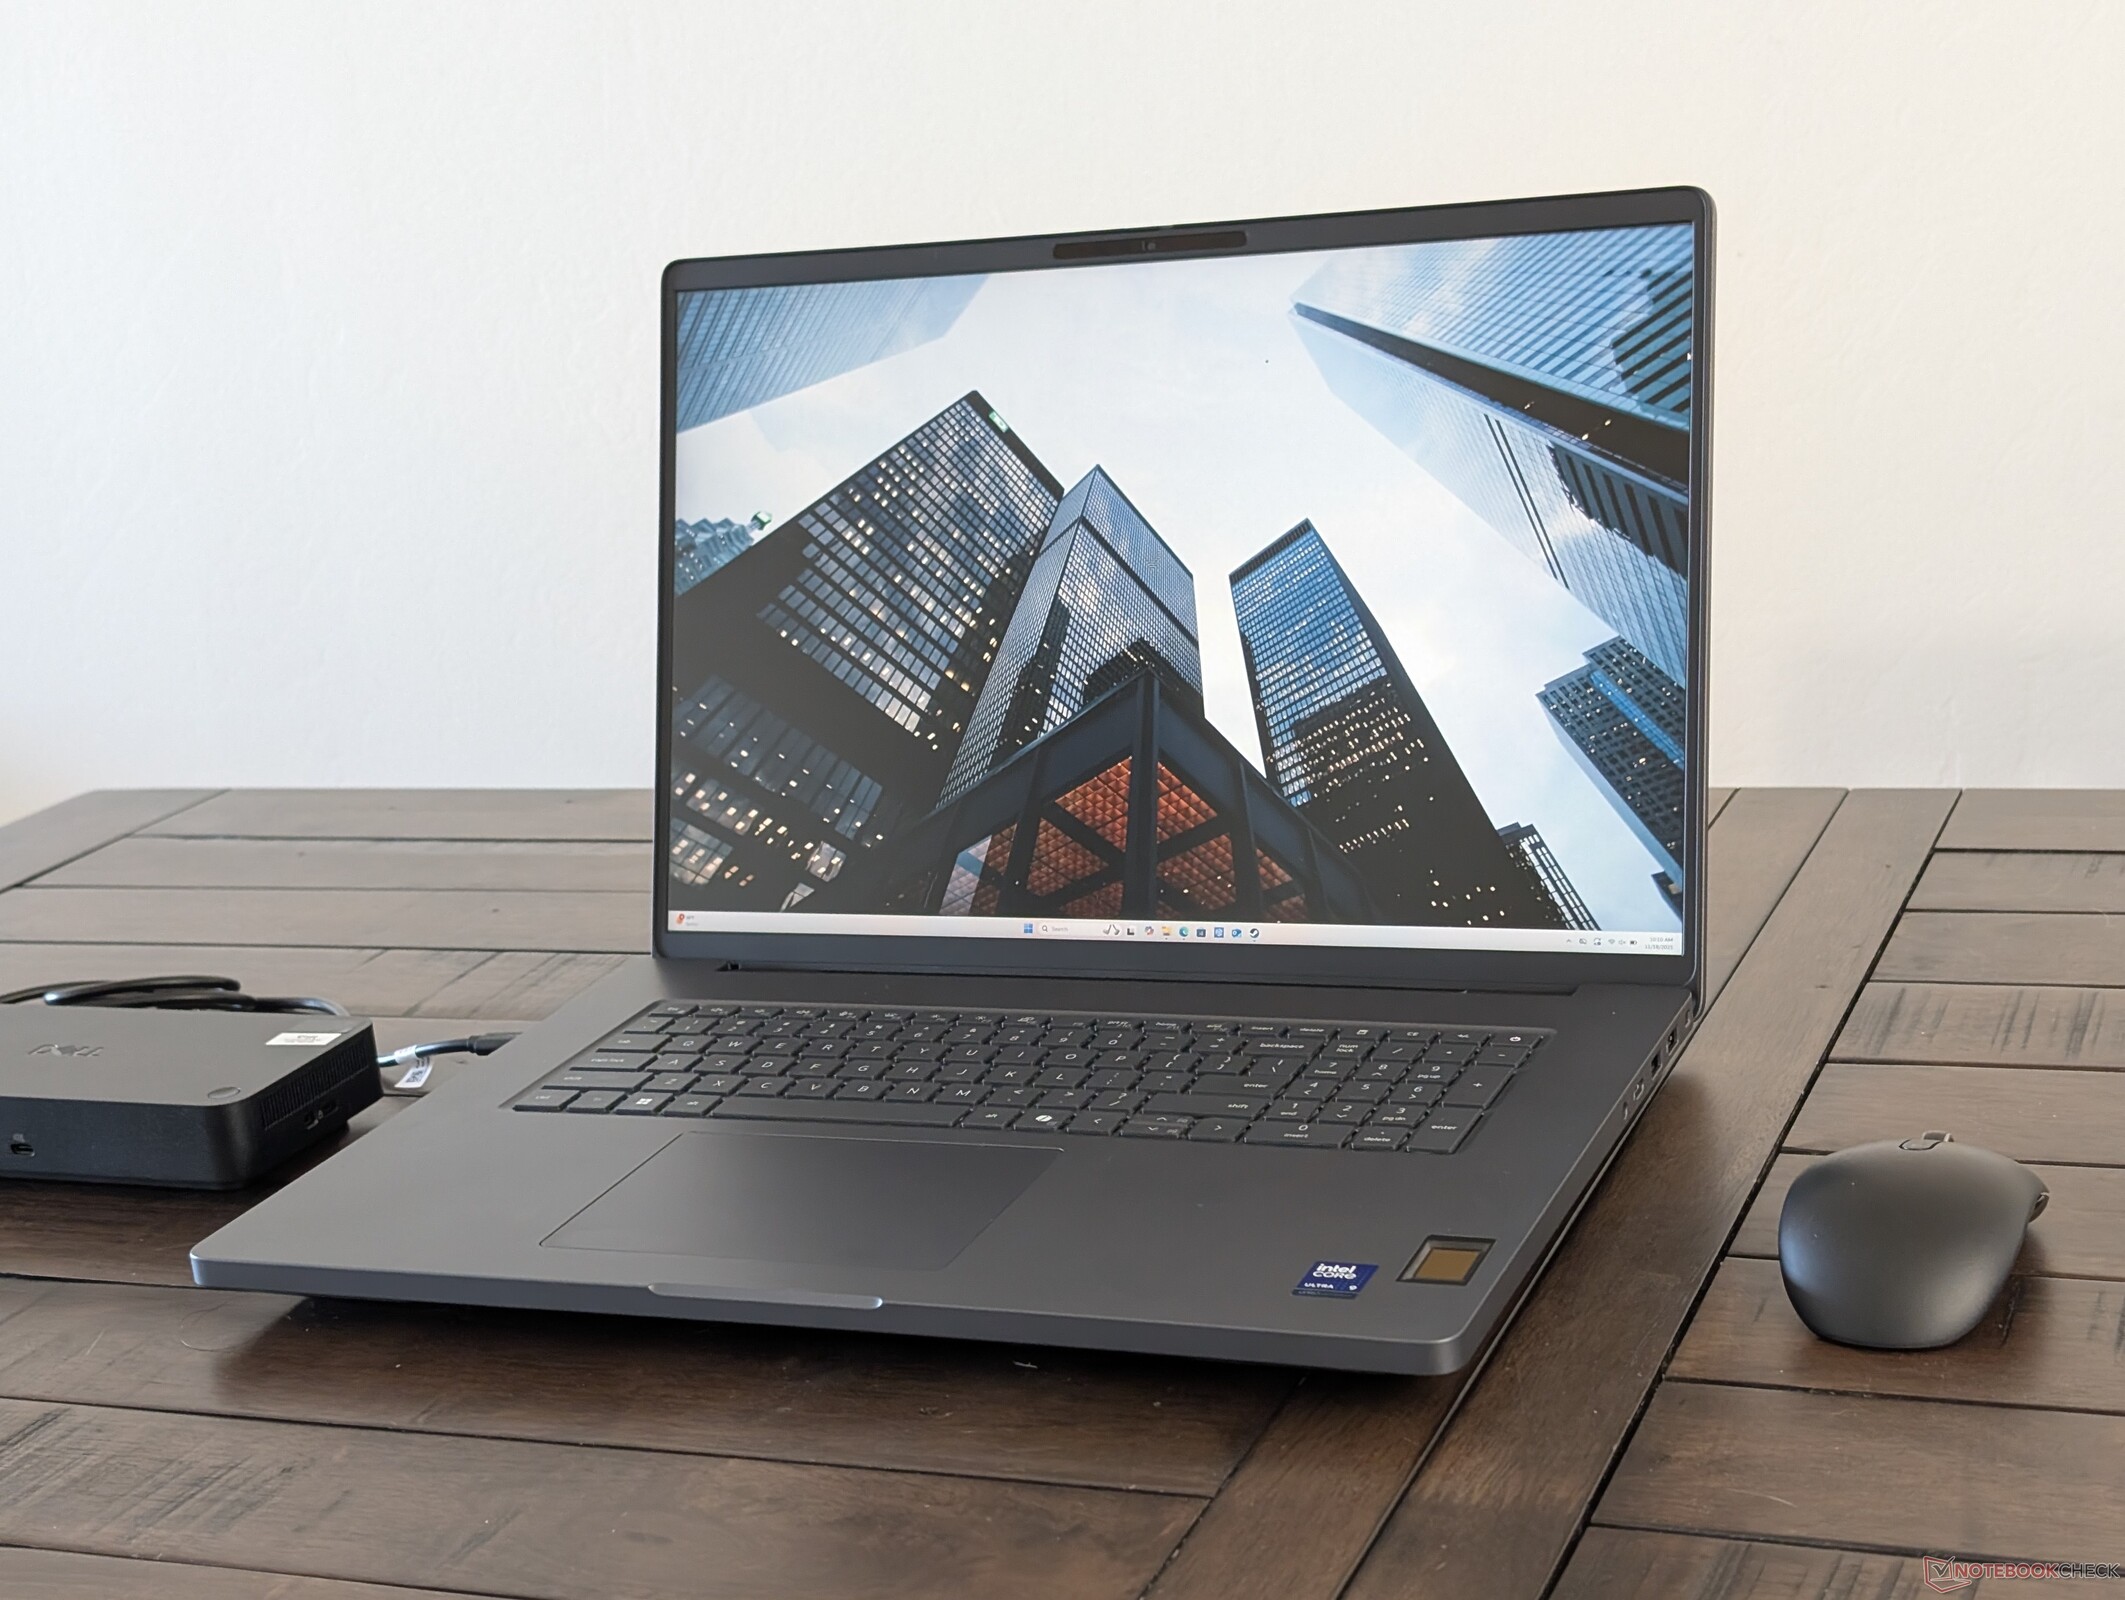
La Dell Pro Max 18 Plus es una pieza de hardware impresionante y bien construida que refleja sus precios de partida de cuatro dígitos. Sus componentes exclusivos como CAMM2, DGFF y puertos USB-C modulares para una mayor reparabilidad ayudan a distinguir el modelo de la competencia. No se trata de un portátil para juegos convertido en estación de trabajo, sino de un portátil optimizado desde cero específicamente para cargas de trabajo profesionales. En cuanto al rendimiento, la Dell es fácilmente una de las estaciones de trabajo portátiles más rápidas con su CPU Arrow Lake-HX, su GPU Nvidia Pro RTX 5000 Blackwell de 175 W y una amplia memoria RAM de 128 a 256 GB que pueden utilizar las aplicaciones de IA. Todo el sistema está alimentado por un adaptador de CA universal 280 USB-C, que es otra característica digna de mención que aún no hemos visto en los principales competidores.
A pesar de lo sorprendentes que son la calidad de construcción y el hardware, el rendimiento aún podría ser un poco mejor. La CPU se calienta demasiado, en torno a los 100 C cuando está sometida a estrés, lo que repercute en el rendimiento Turbo Boost. Características como la solución de refrigeración, el teclado y las opciones de puerto siguen siendo esencialmente las mismas que en el pequeño Dell Pro Max 16 Plus a pesar de sus diferencias de tamaño. La falta de opciones de pantalla en particular puede decepcionar a los usuarios, especialmente porque el modelo de 16 pulgadas viene con al menos tres paneles para elegir, incluyendo OLED 4K.
Otros inconvenientes incluyen la falta de iluminación RGB por tecla o de botones de ratón dedicados, ambos disponibles en el HP ZBook Fury G1i 18, pero se trata de abolladuras relativamente menores en una estación de trabajo DTR por lo demás sólida.
Pro
Contra
Precio y disponibilidad
La Dell Pro Max 18 Plus ya se envía directamente desde el fabricante a partir de 3790 dólares para la configuración base hasta más de 6000 dólares.
- $1,799.95Dell Pro 16 Plus PB16250 (Replaces Latitude 5550) AI Business Notebook 16" FHD+ Intel Ultra 7-265U, 32GB DDR5 RAM, 512GB SSD PCIe, Wi-Fi 6E, BT, Backlit Keyboard, HD Webcam, RJ-45, Win 11 Pro - Silver
- $1,599.95Dell Pro 16 Plus PB16250 Business Laptop 16" FHD+ Intel Ultra 7-265U, Oemgenuine Customized Laptop, 16GB / 32GB / 64GB RAM, 512GB / 1TB / 2TB SSD, Wi-Fi 6E, Backlit Keyboard, Webcam, RJ-45, Win 11 Pro
- $54.99165W USB-C Gan Laptop Charger Compatible with Dell Pro Max 16 18 Plus MB16250 MB18250, Pro Max 16 Premium MA16250, Precision 5680 5690 Laptop Type C AC Adapter Power Cord
La Dell Pro Max 18 Plus sucede a la antigua generación de estaciones de trabajo portátiles de la serie Precision. Aunque es uno de los modelos más rápidos y grandes de la gama de Dell, está construido sobre la misma plataforma que el más pequeño de 16 pulgadas Dell Pro Max 16 Plus por lo que ambos modelos comparten muchas características físicas. La mayoría de nuestros comentarios sobre el Dell Pro Max 16 Plus se aplican posteriormente aquí para el modelo de 18 pulgadas.
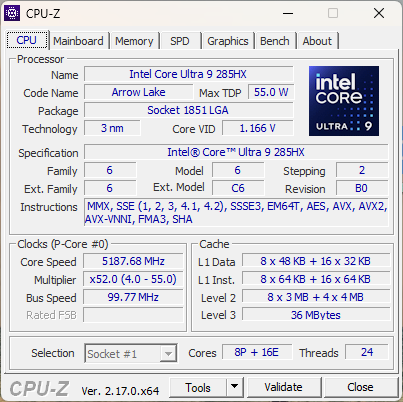
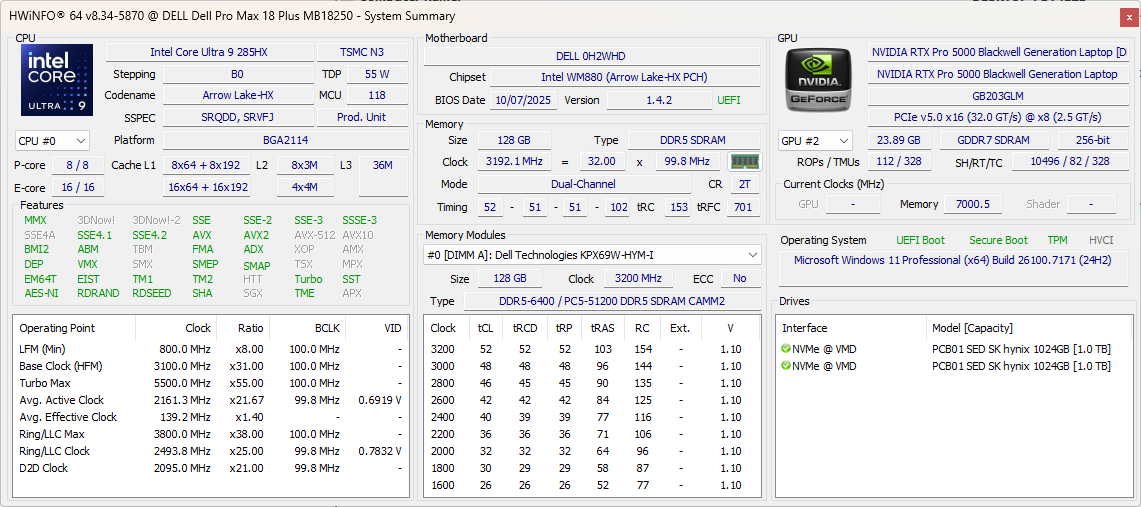
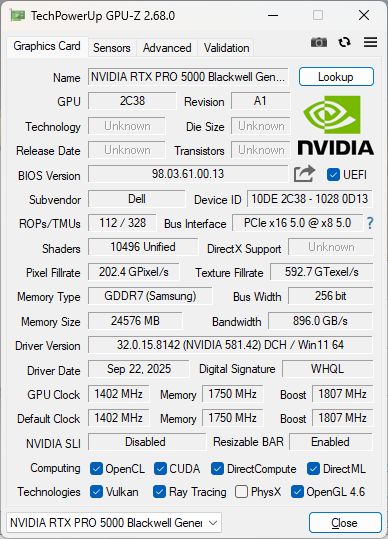
Nuestra unidad de prueba es una configuración de gama alta con la CPU Arrow Lake-HX Core Ultra 9 285HX vPro, la GPU Nvidia RTX Pro 5000 Blackwell de 175 W y dos unidades SSD PCIe5 en RAID 0 por bastante más de 6.000 dólares. Por lo demás, todas las opciones se entregan con la misma pantalla QHD+ 1600p no táctil.
Las alternativas son escasas ya que las estaciones de trabajo DTR de 18 pulgadas son poco comunes. El HP ZBook Fury G1i 18 es un competidor importante.
Más opiniones sobre Dell:
Especificaciones
Maletín - Aprobado por MIL-STD
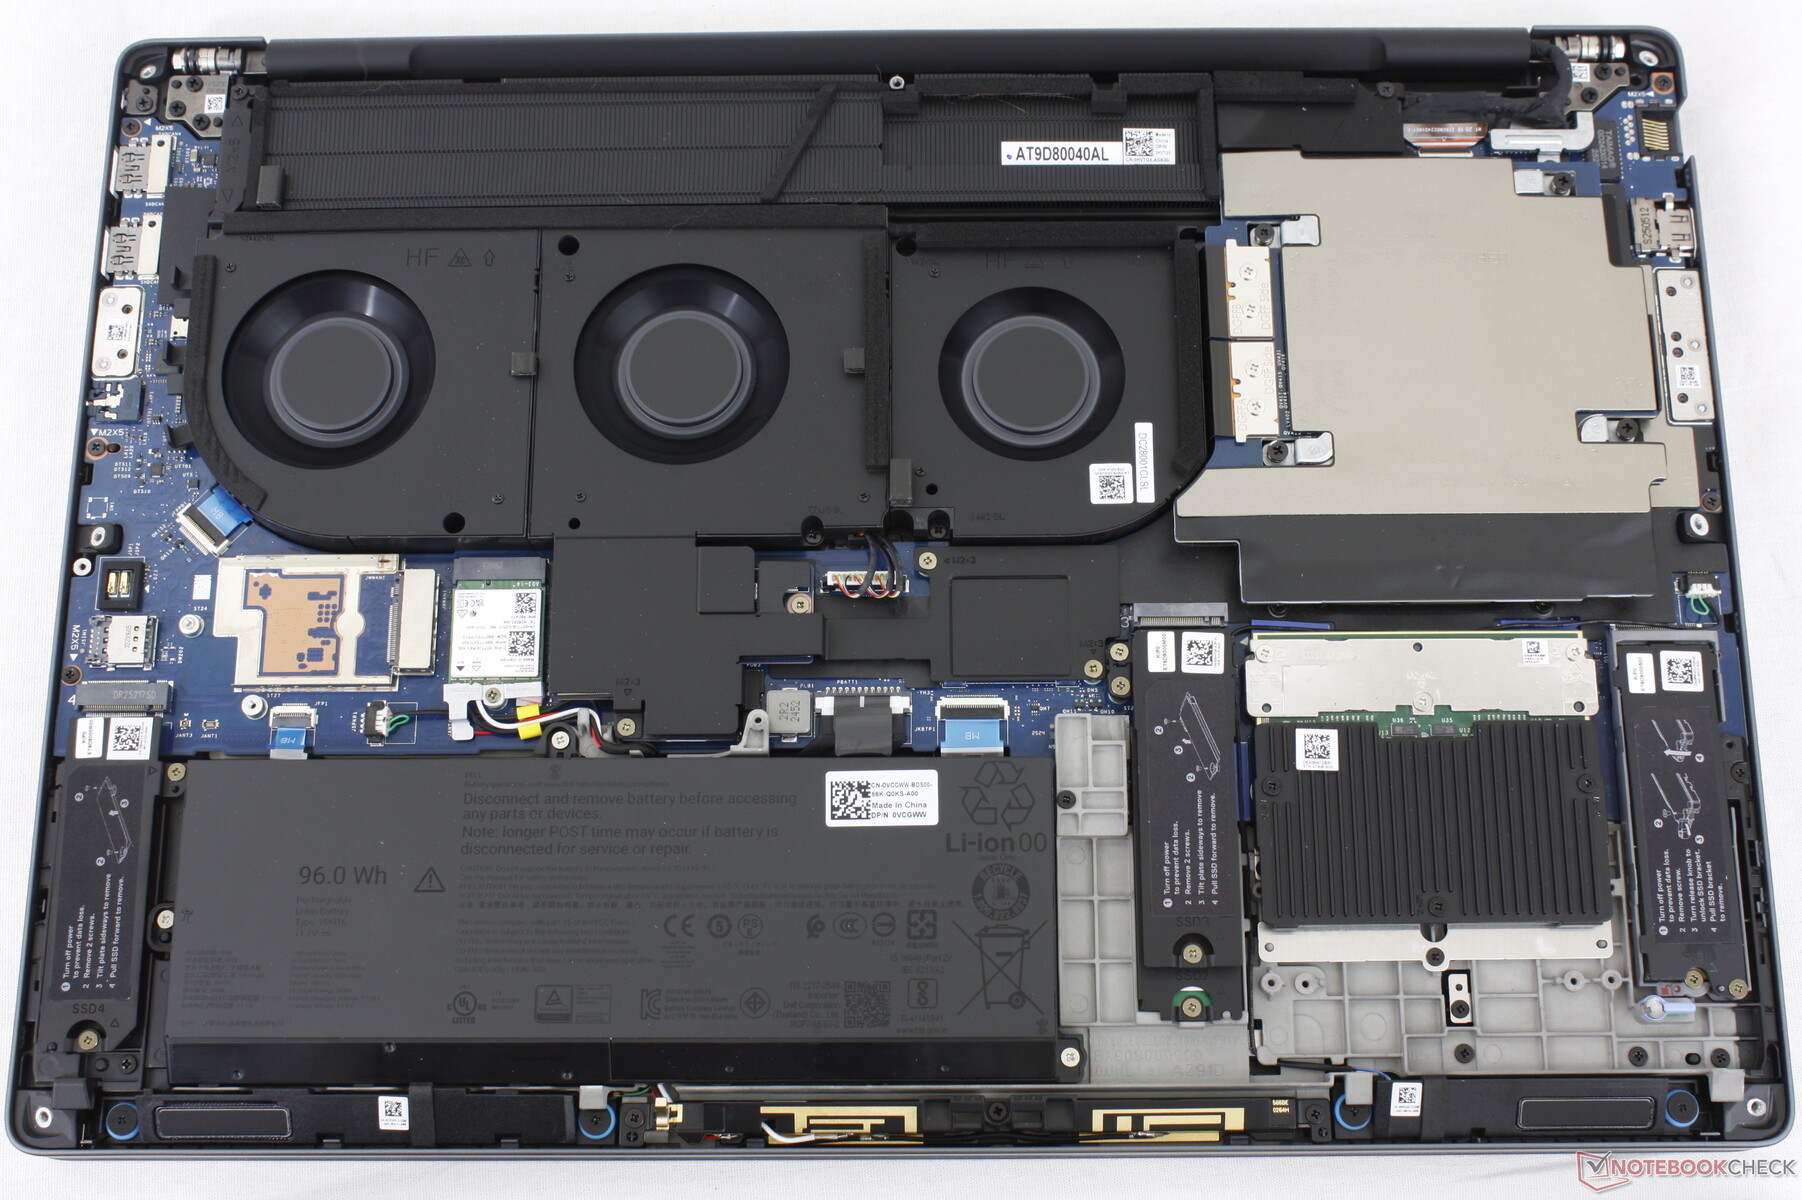
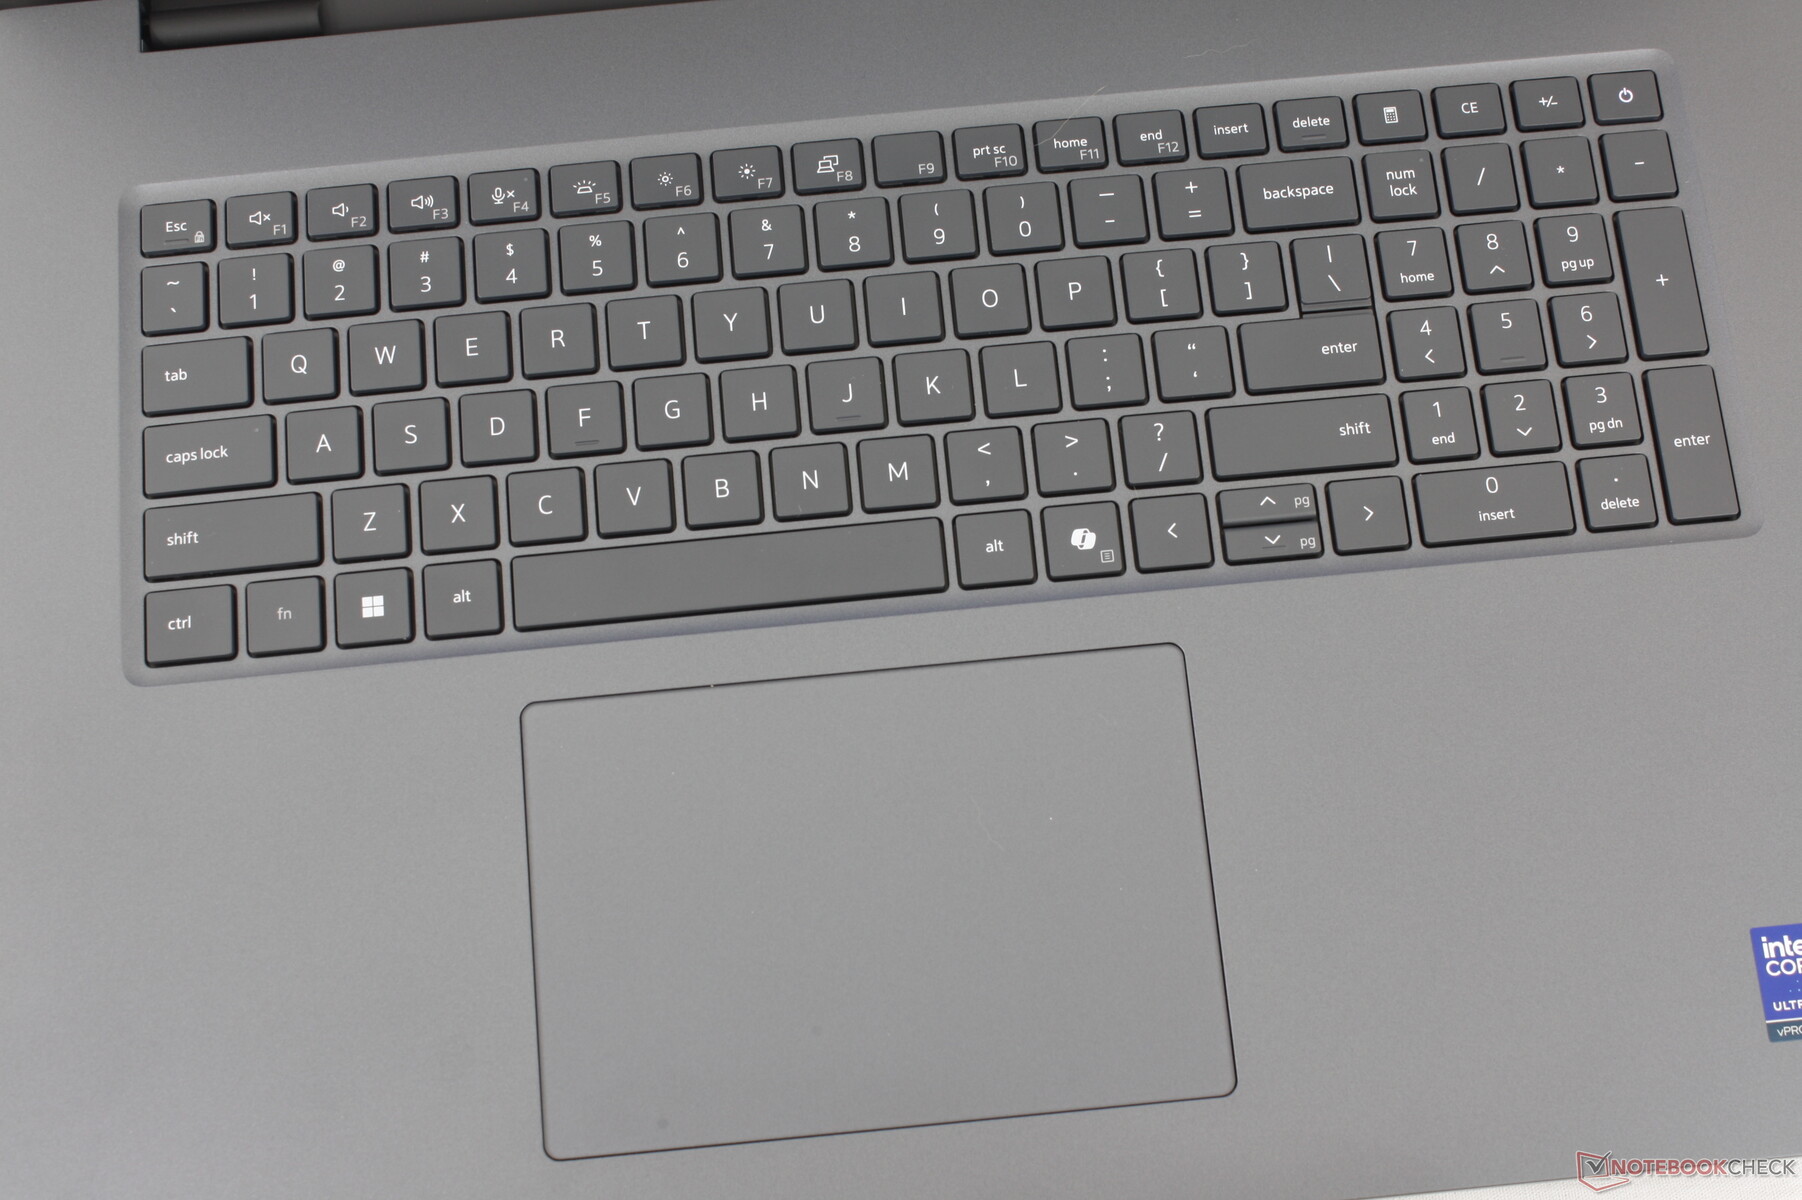
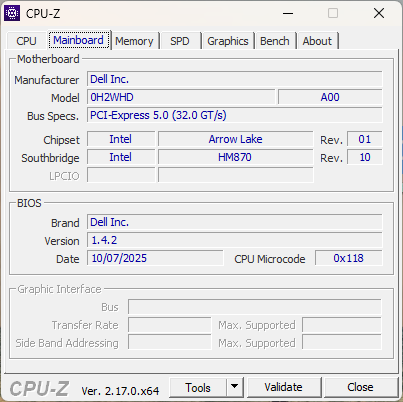
El chasis es esencialmente una versión ampliada del Dell Pro Max 16 Plus de 16 pulgadas con un aumento de peso de casi el 30%. La mayoría de las características físicas como el teclado, el clickpad e incluso los puertos siguen siendo idénticos con sólo pequeñas diferencias en la placa base.

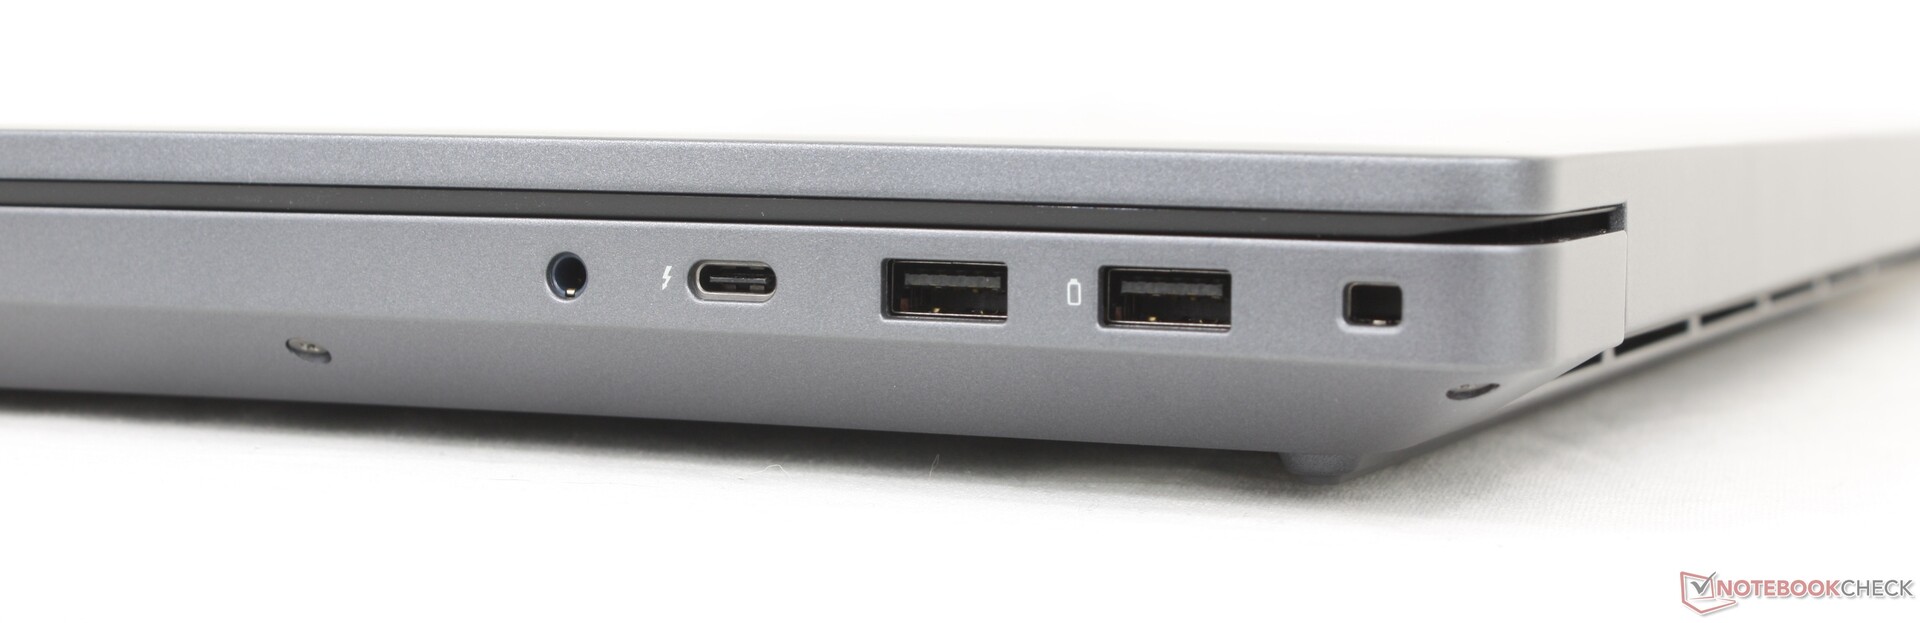
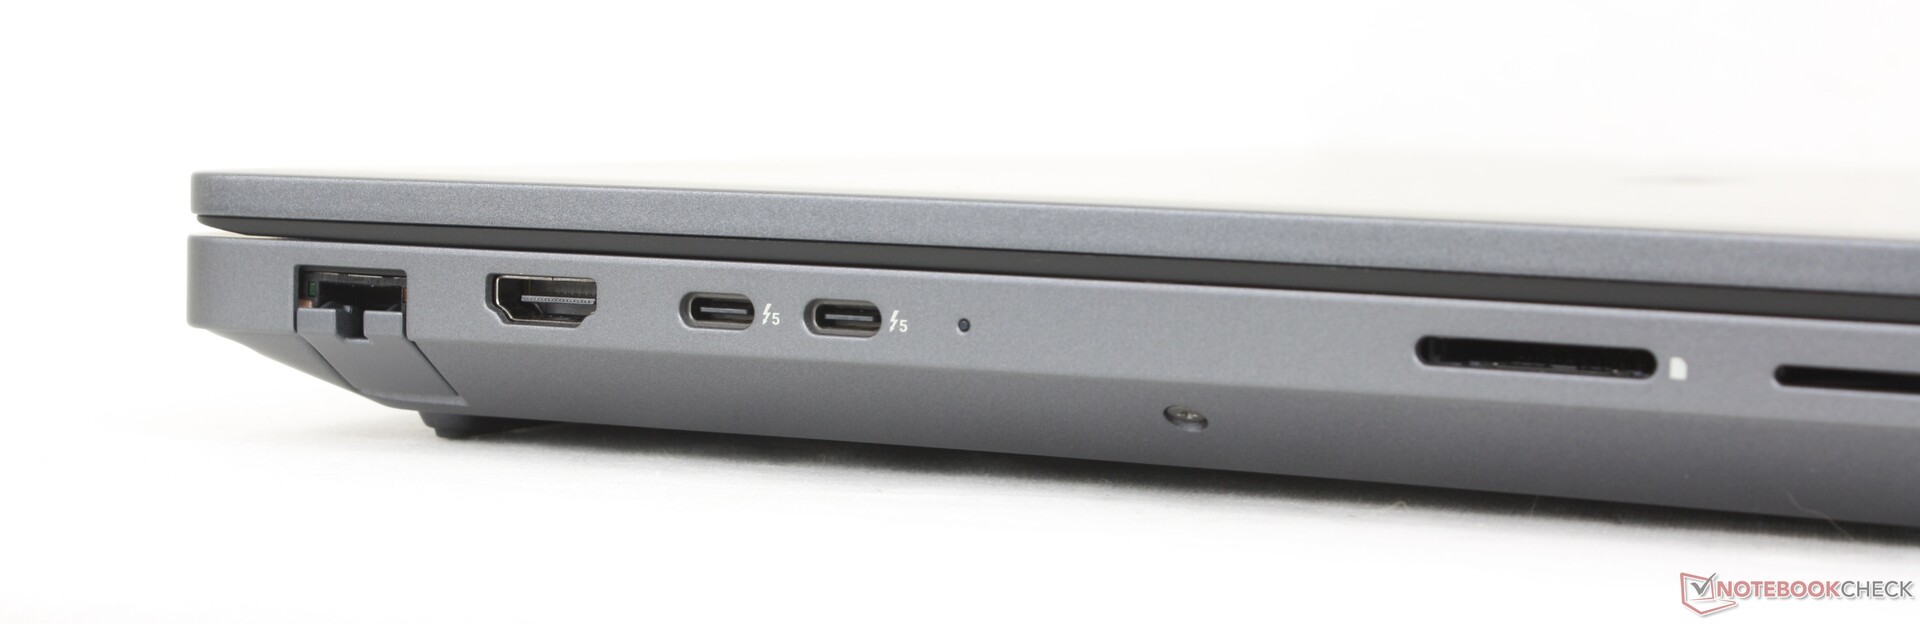
Conectividad
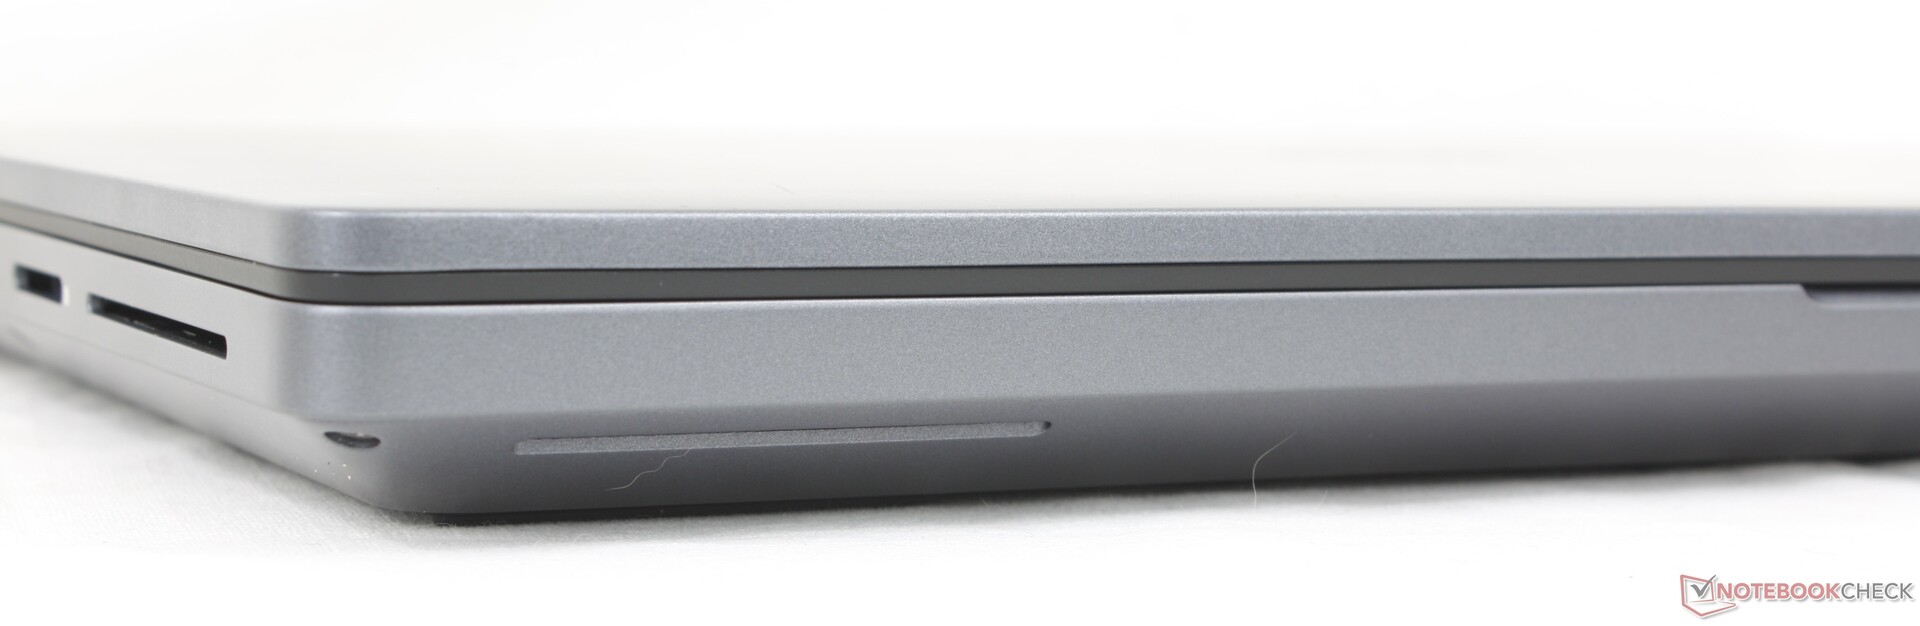
Lector de tarjetas SD
| SD Card Reader | |
| average JPG Copy Test (av. of 3 runs) | |
| HP ZBook X G1i 16 (Toshiba Exceria Pro SDXC 64 GB UHS-II) | |
| Dell Pro Max 18 Plus MB18250 (Toshiba Exceria Pro SDXC 64 GB UHS-II) | |
| Schenker Key 18 Pro M25 RTX 5090 (Angelbird AV Pro V60) | |
| Dell Pro Max 16 Plus (Toshiba Exceria Pro SDXC 64 GB UHS-II) | |
| maximum AS SSD Seq Read Test (1GB) | |
| HP ZBook X G1i 16 (Toshiba Exceria Pro SDXC 64 GB UHS-II) | |
| Dell Pro Max 18 Plus MB18250 (Toshiba Exceria Pro SDXC 64 GB UHS-II) | |
| Dell Pro Max 16 Plus (Toshiba Exceria Pro SDXC 64 GB UHS-II) | |
| Schenker Key 18 Pro M25 RTX 5090 (Angelbird AV Pro V60) | |
Comunicación
Cámara web
La webcam IR de 8 MP es una mejora opcional respecto a la webcam básica de 2 MP.


Mantenimiento
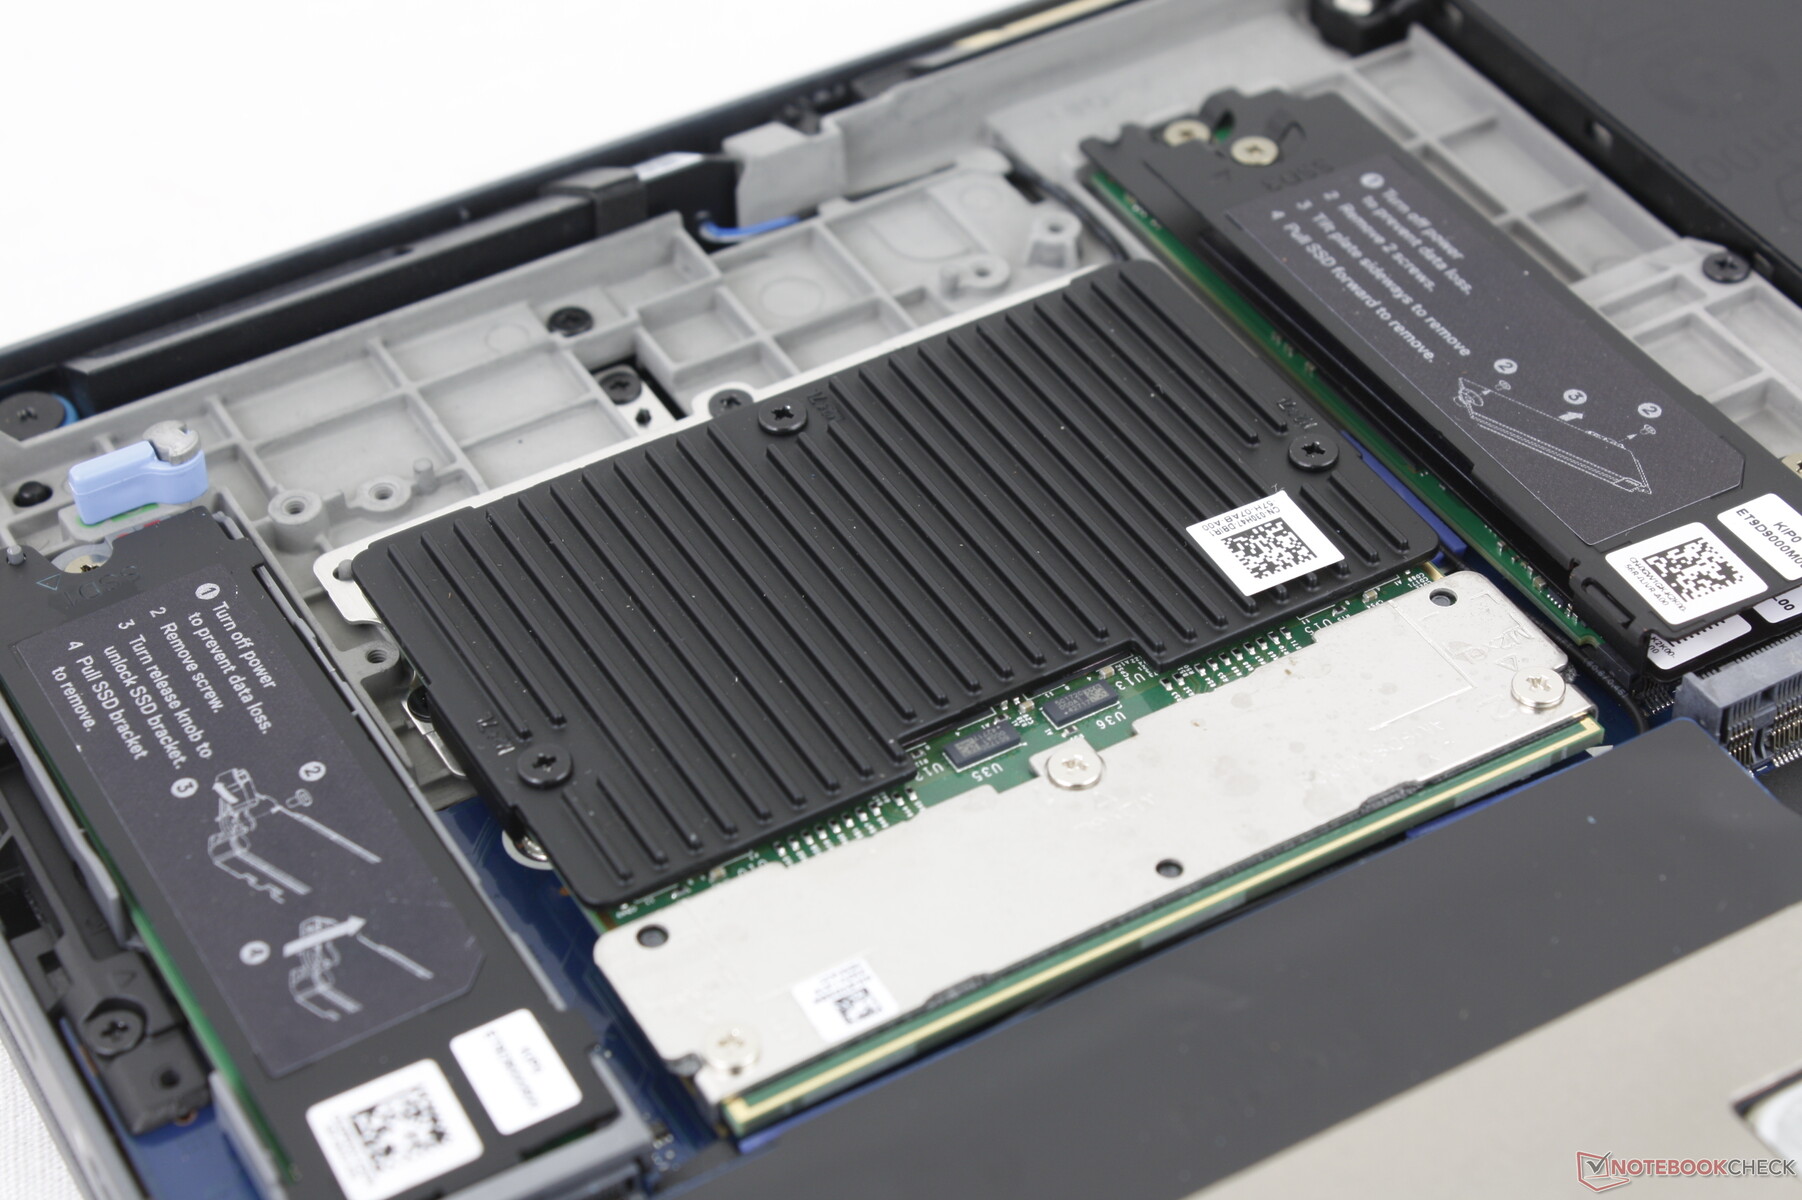
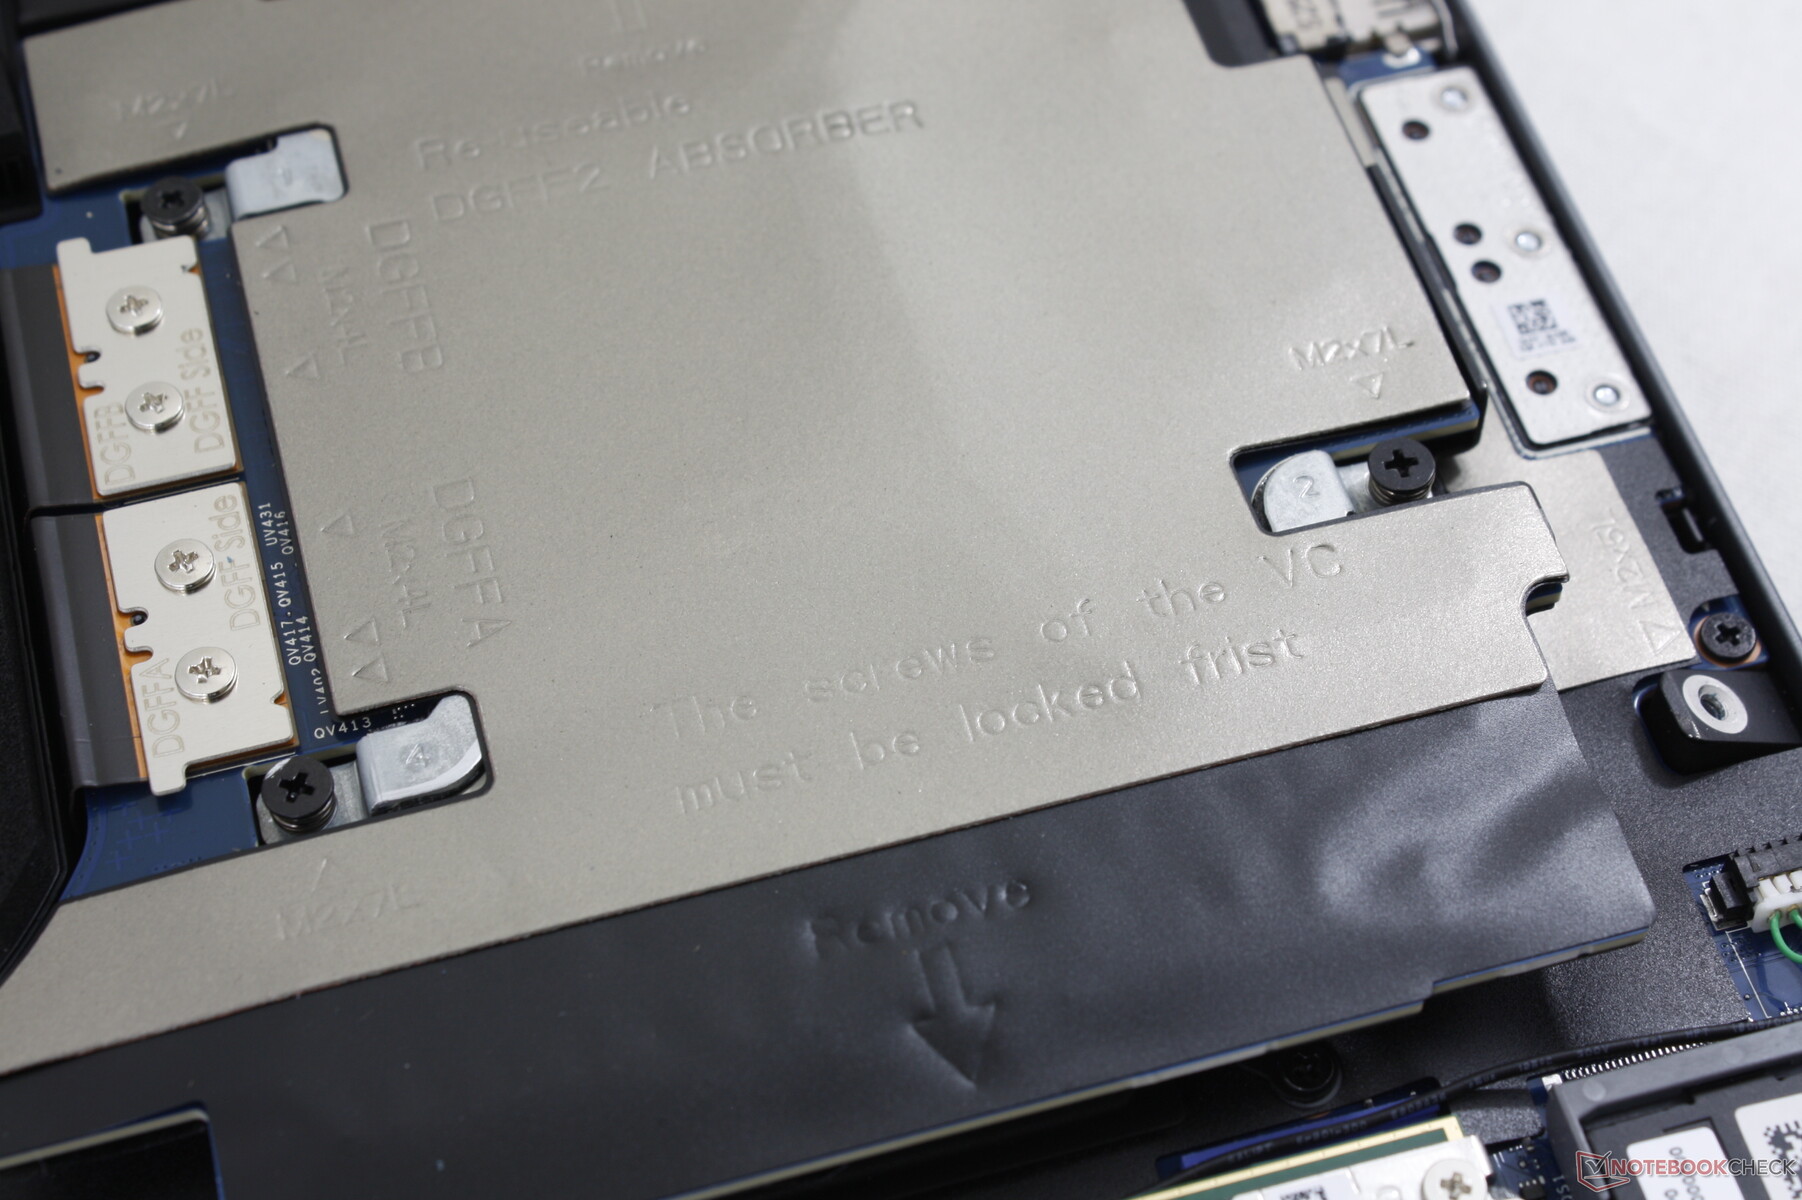
Al retirar el panel inferior se descubren dos ranuras para SSD M.2 2280 PCIe5 x4, la ranura para RAM CAMM2, el módulo WLAN extraíble, la GPU DGFF y la ranura WAN. Hay disponible un adaptador de CAMM2 a SODIMM por si los usuarios prefieren el estándar más antiguo.
Sostenibilidad
Se utilizó aproximadamente un 90% de magnesio reciclado para las cubiertas superior e inferior, entre un 30% y un 50% de plásticos reciclados para los reposamanos y los parachoques inferiores, y un 50% de cobalto reciclado para la batería. El embalaje es todo de papel y reciclable.
Accesorios y garantía
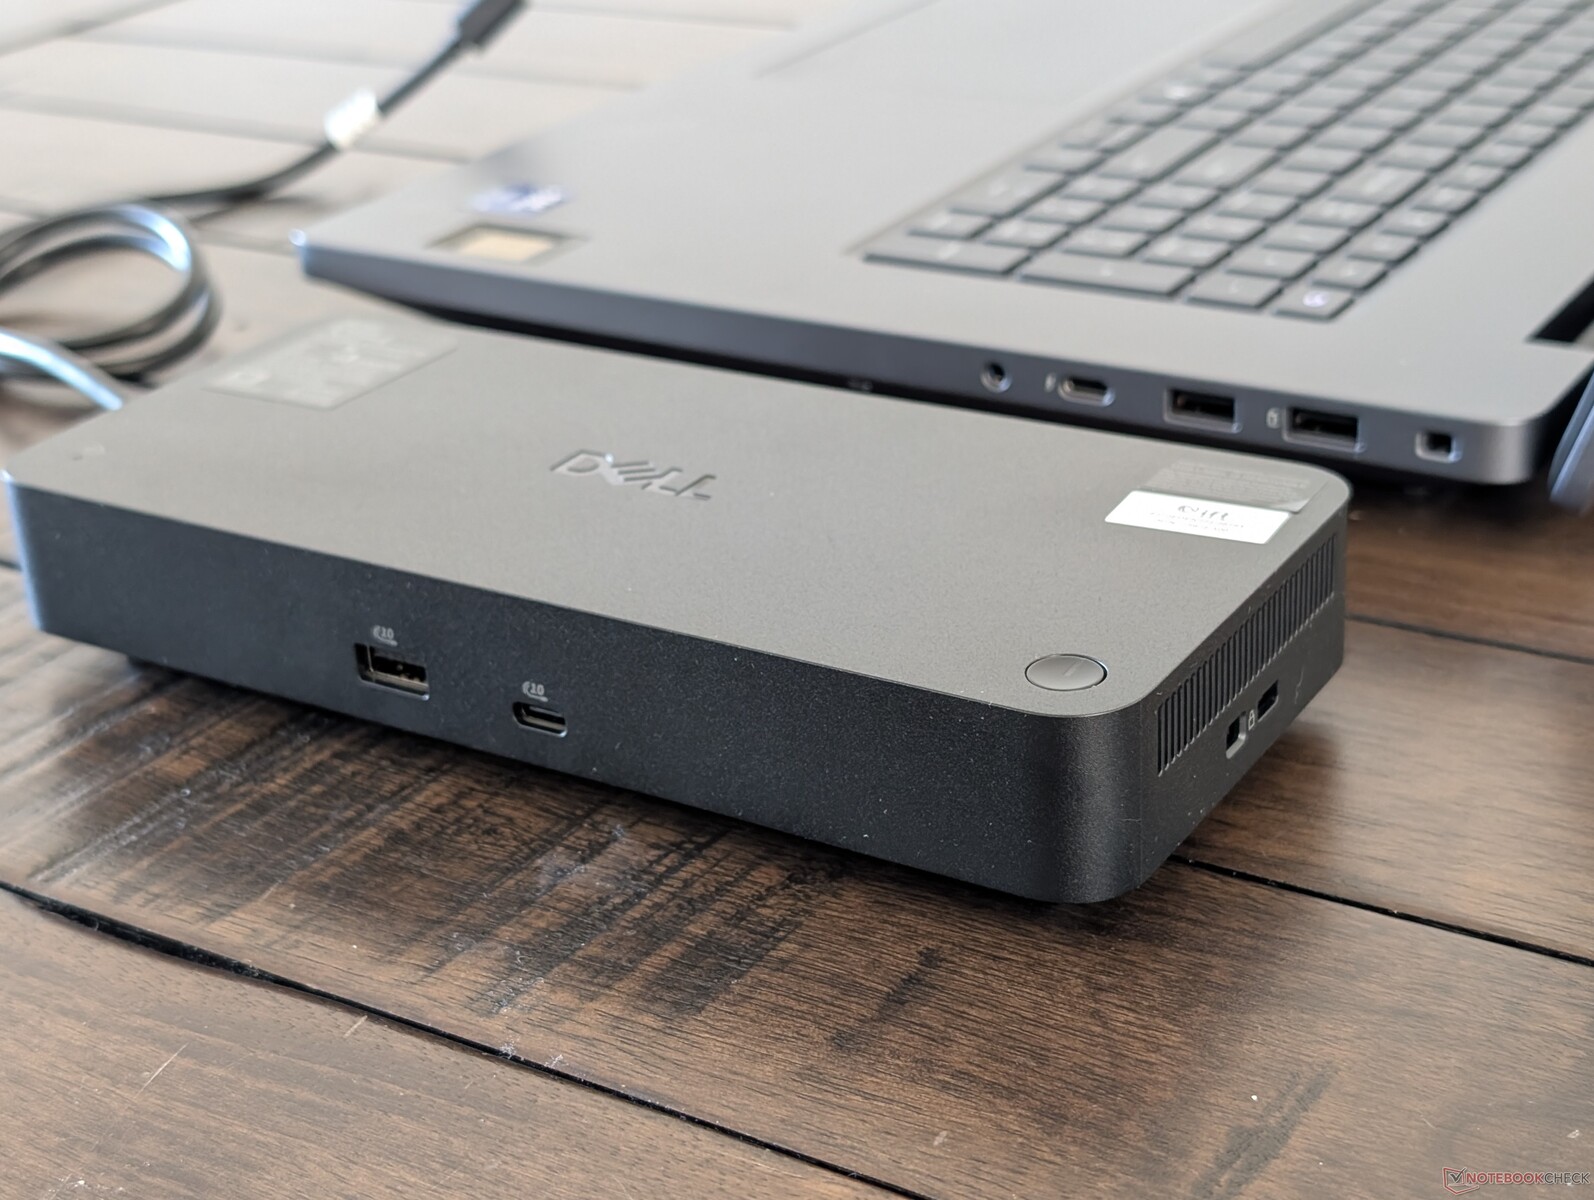
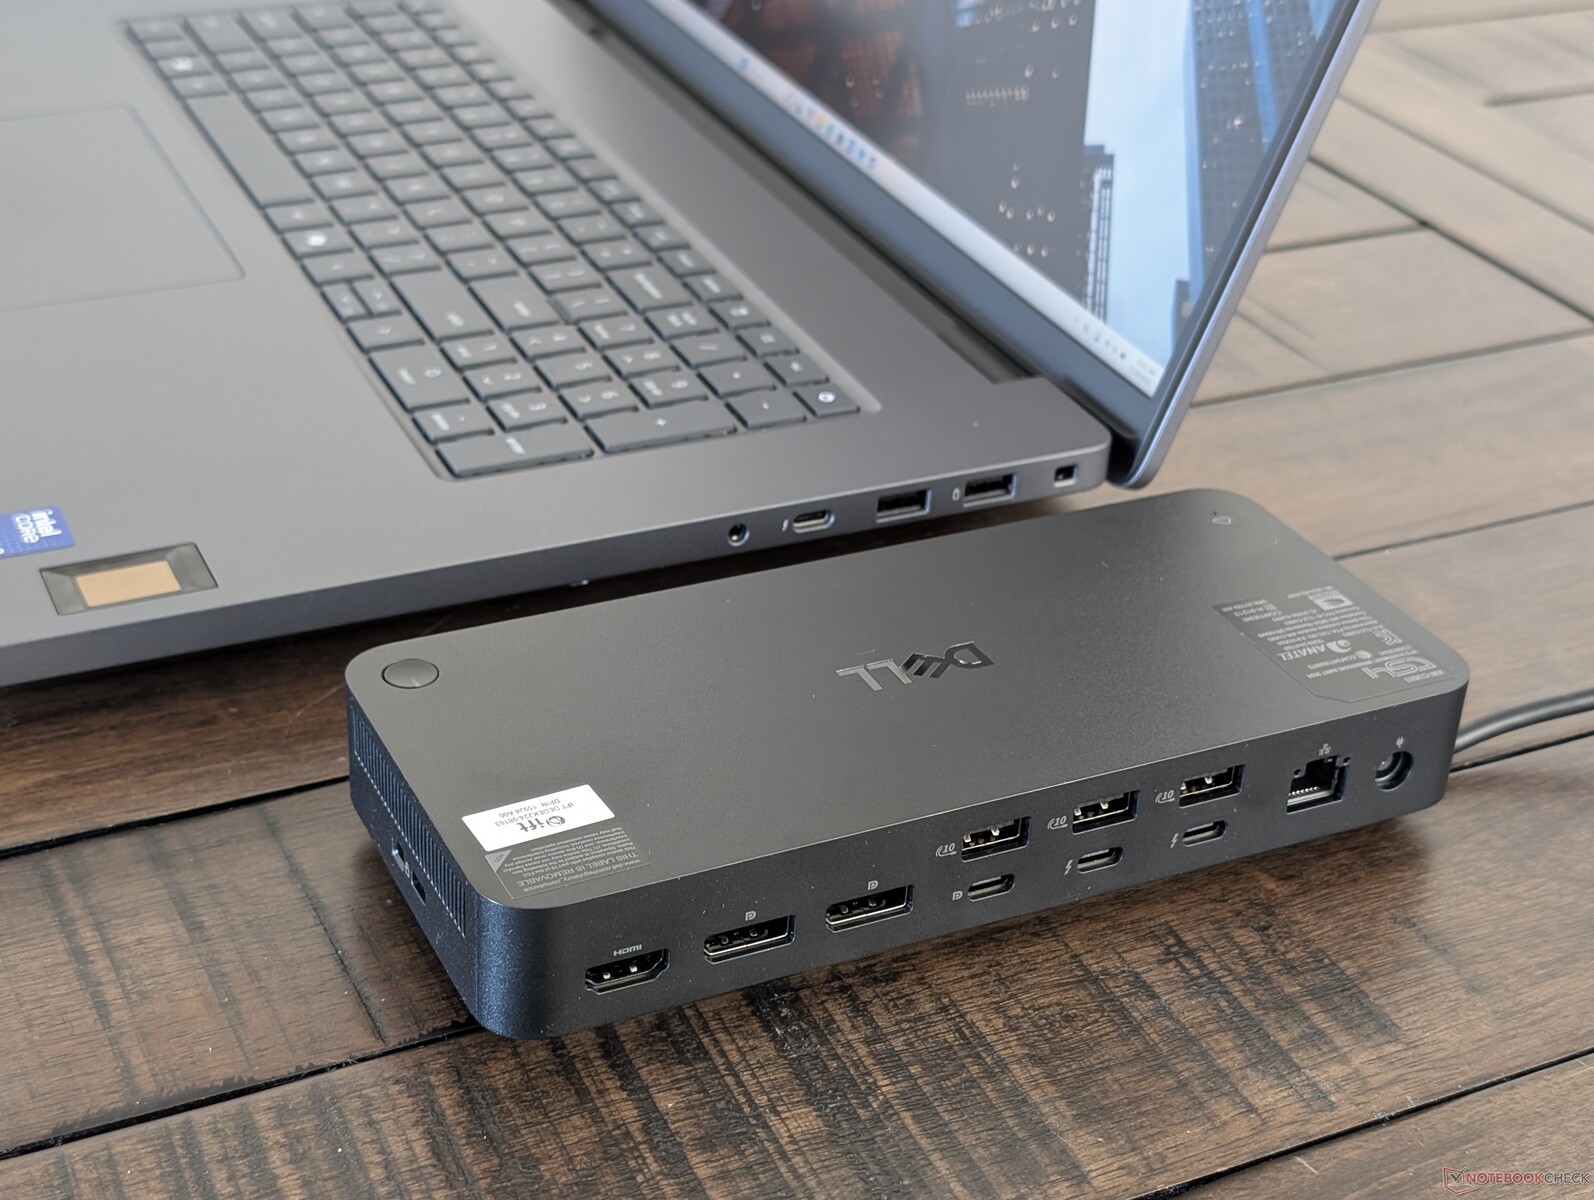
Entre los extras opcionales se incluye el Dell Pro Thunderbolt 5 Smart Dock como se muestra a continuación. La estación de acoplamiento es una solución de un solo cable que proporciona tanto paso de energía (hasta 300 W) como puertos adicionales para el portátil. Sin embargo, viene con su propio adaptador de CA, que es tan grande como la propia estación de acoplamiento.
Una garantía limitada del fabricante de tres años viene de serie para el portátil y la estación de acoplamiento opcional.
Dispositivos de entrada
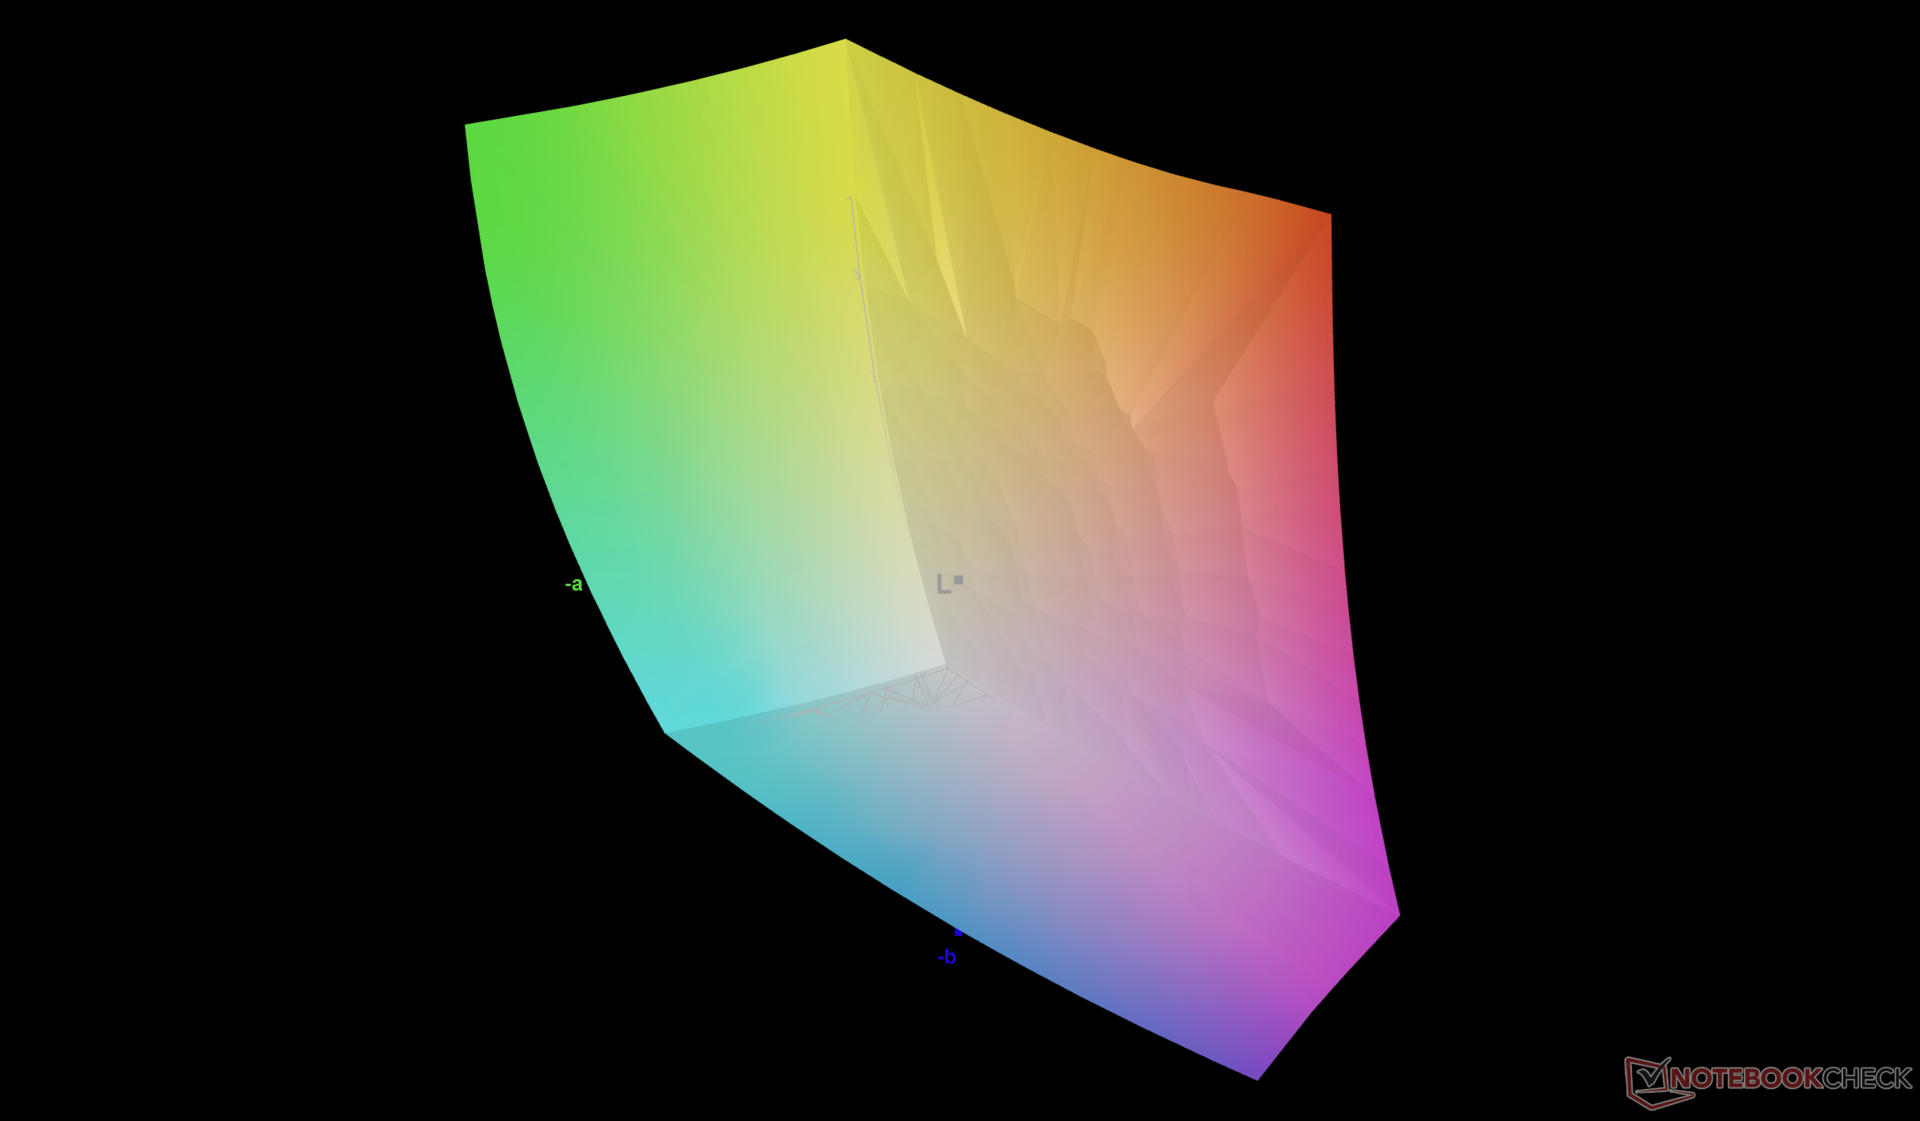
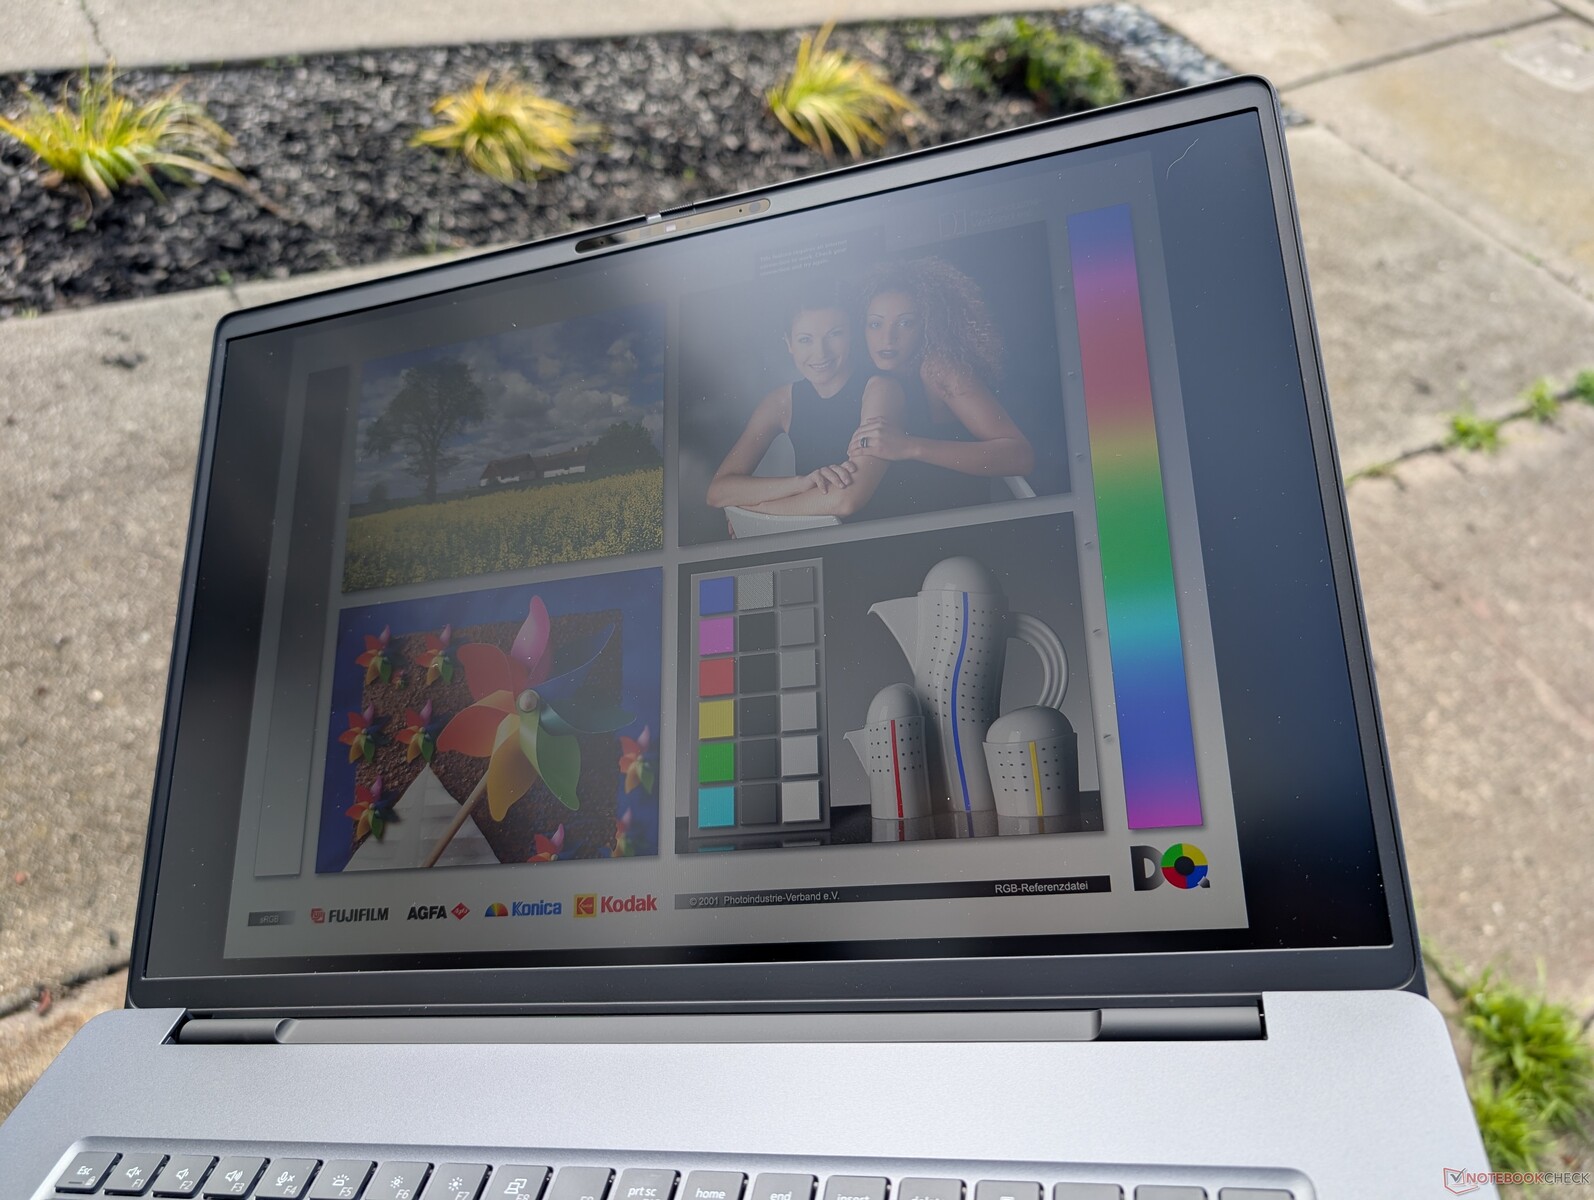
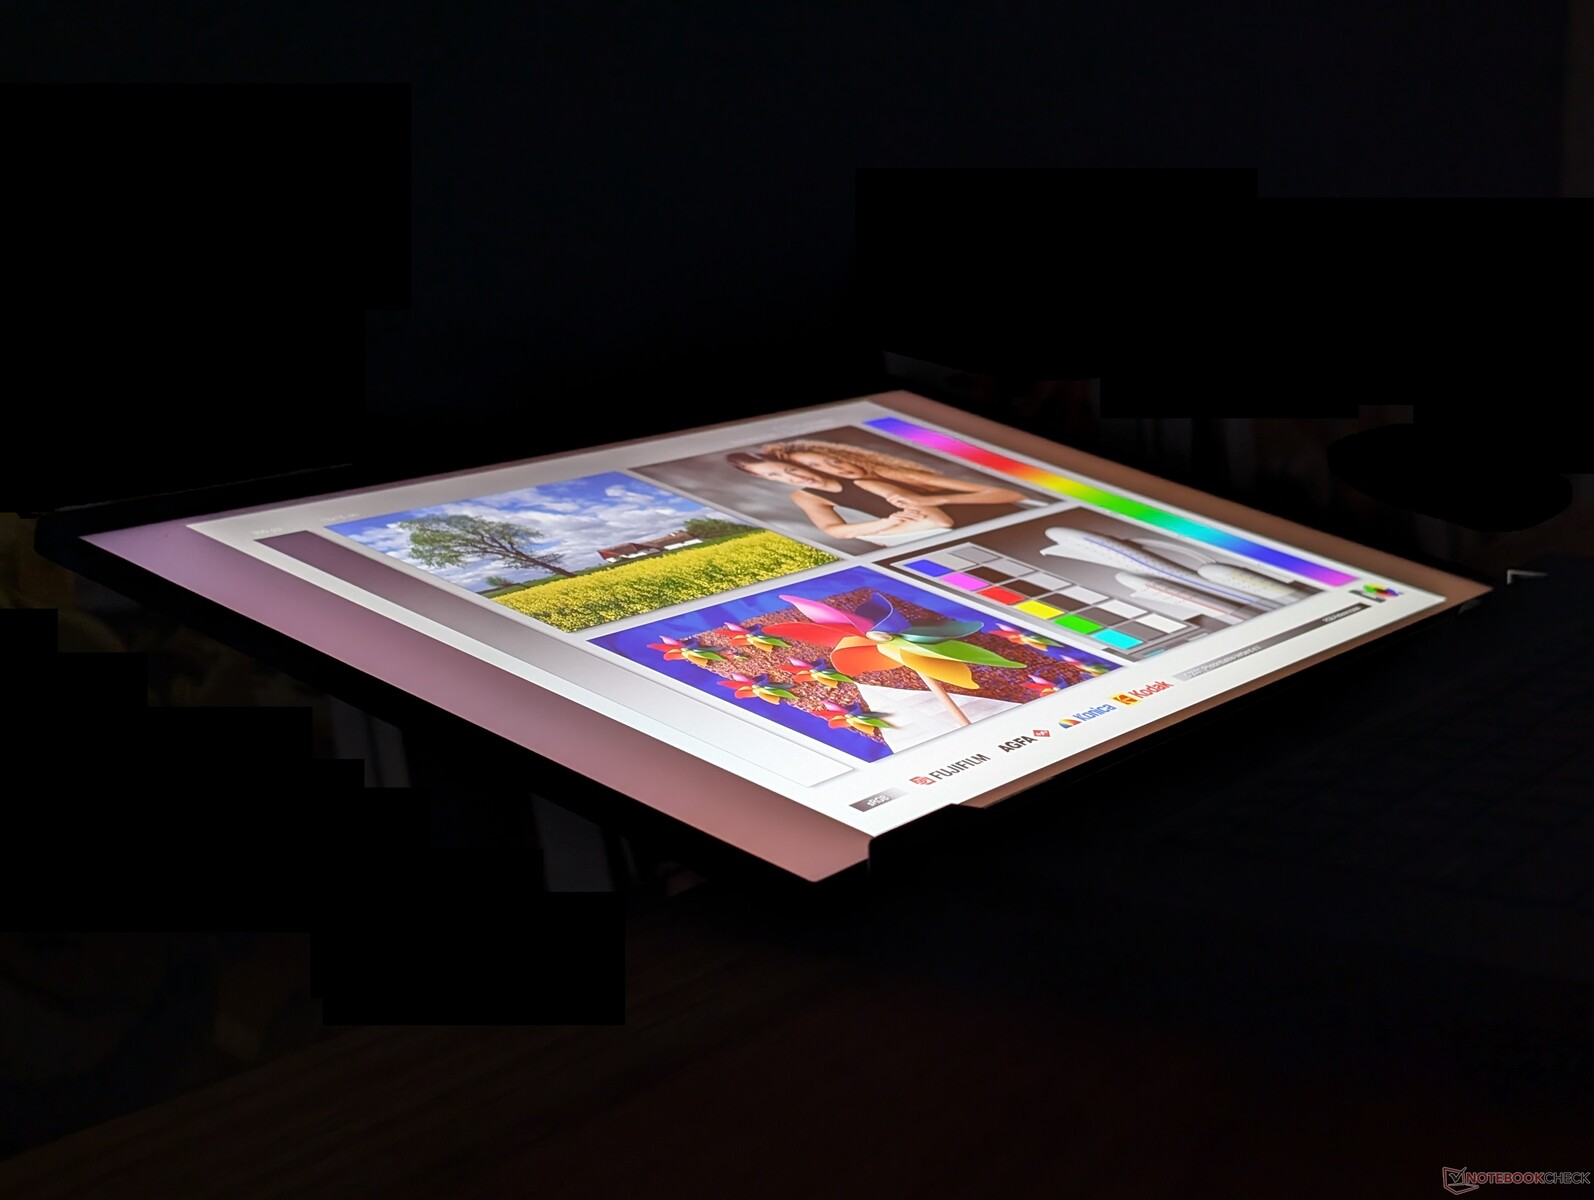
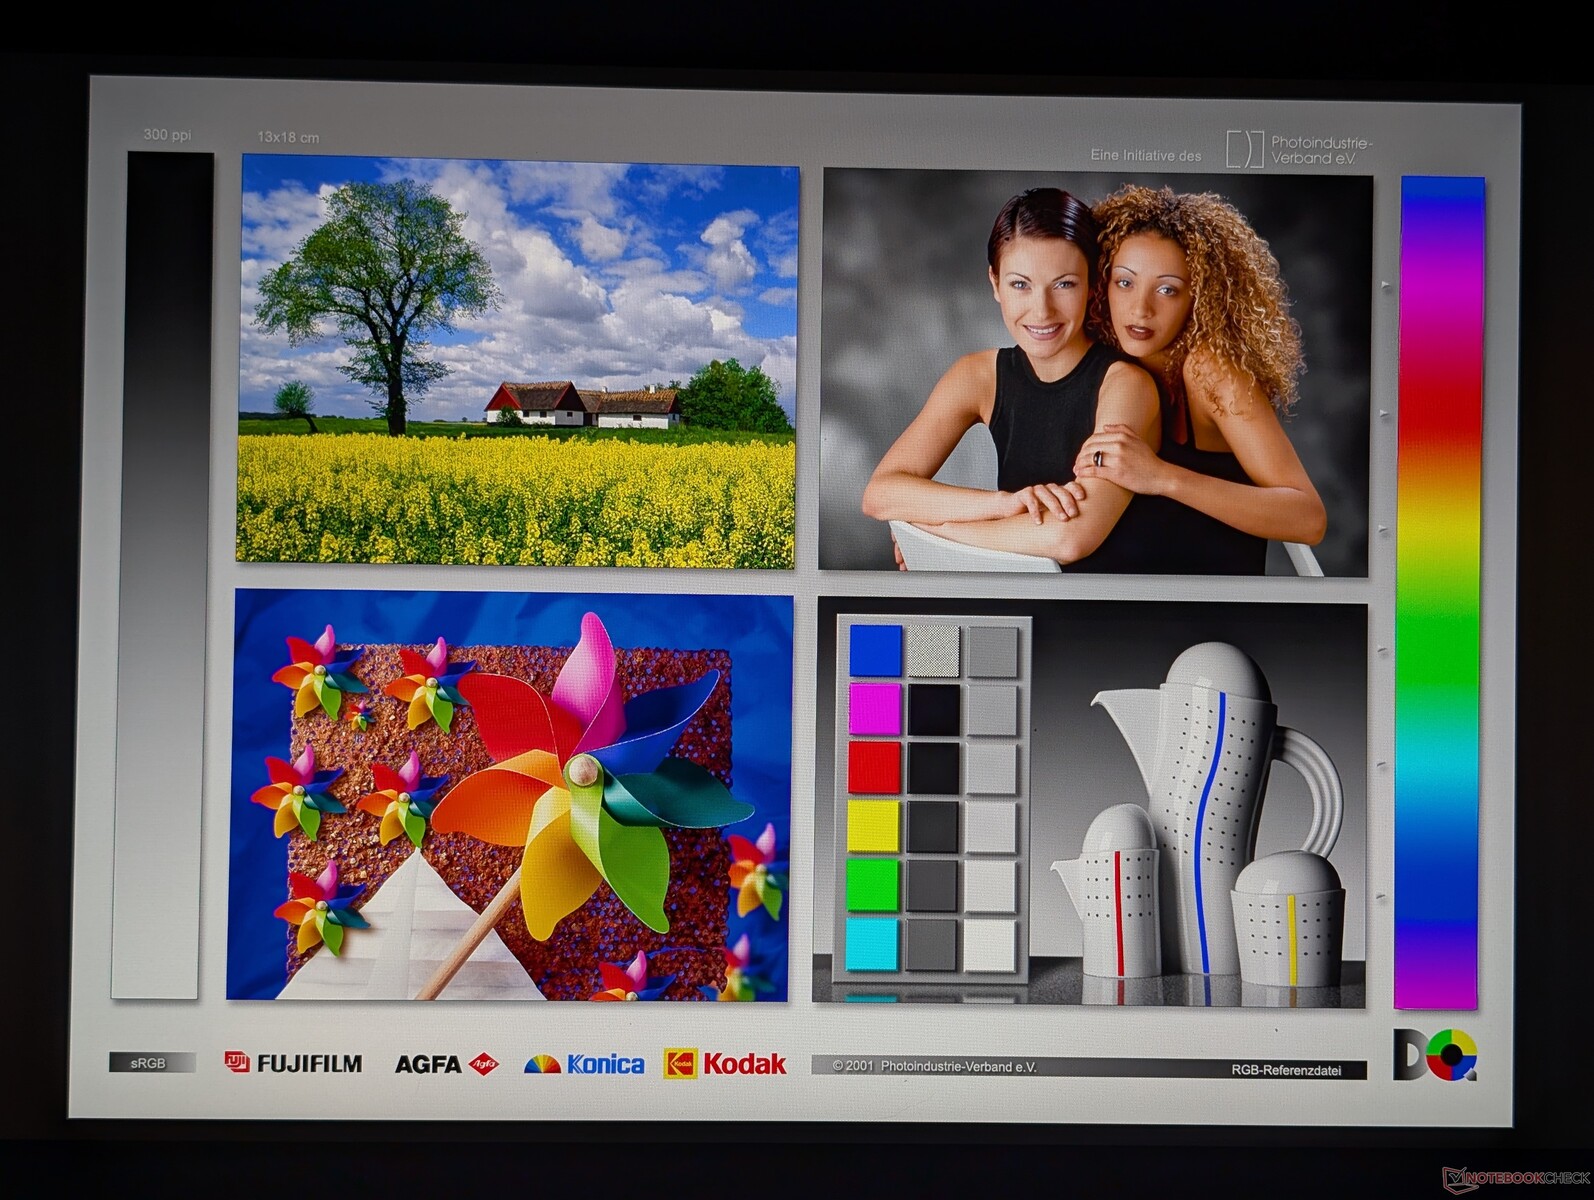
Pantalla - P3 Colores Y 120 Hz Con IPS
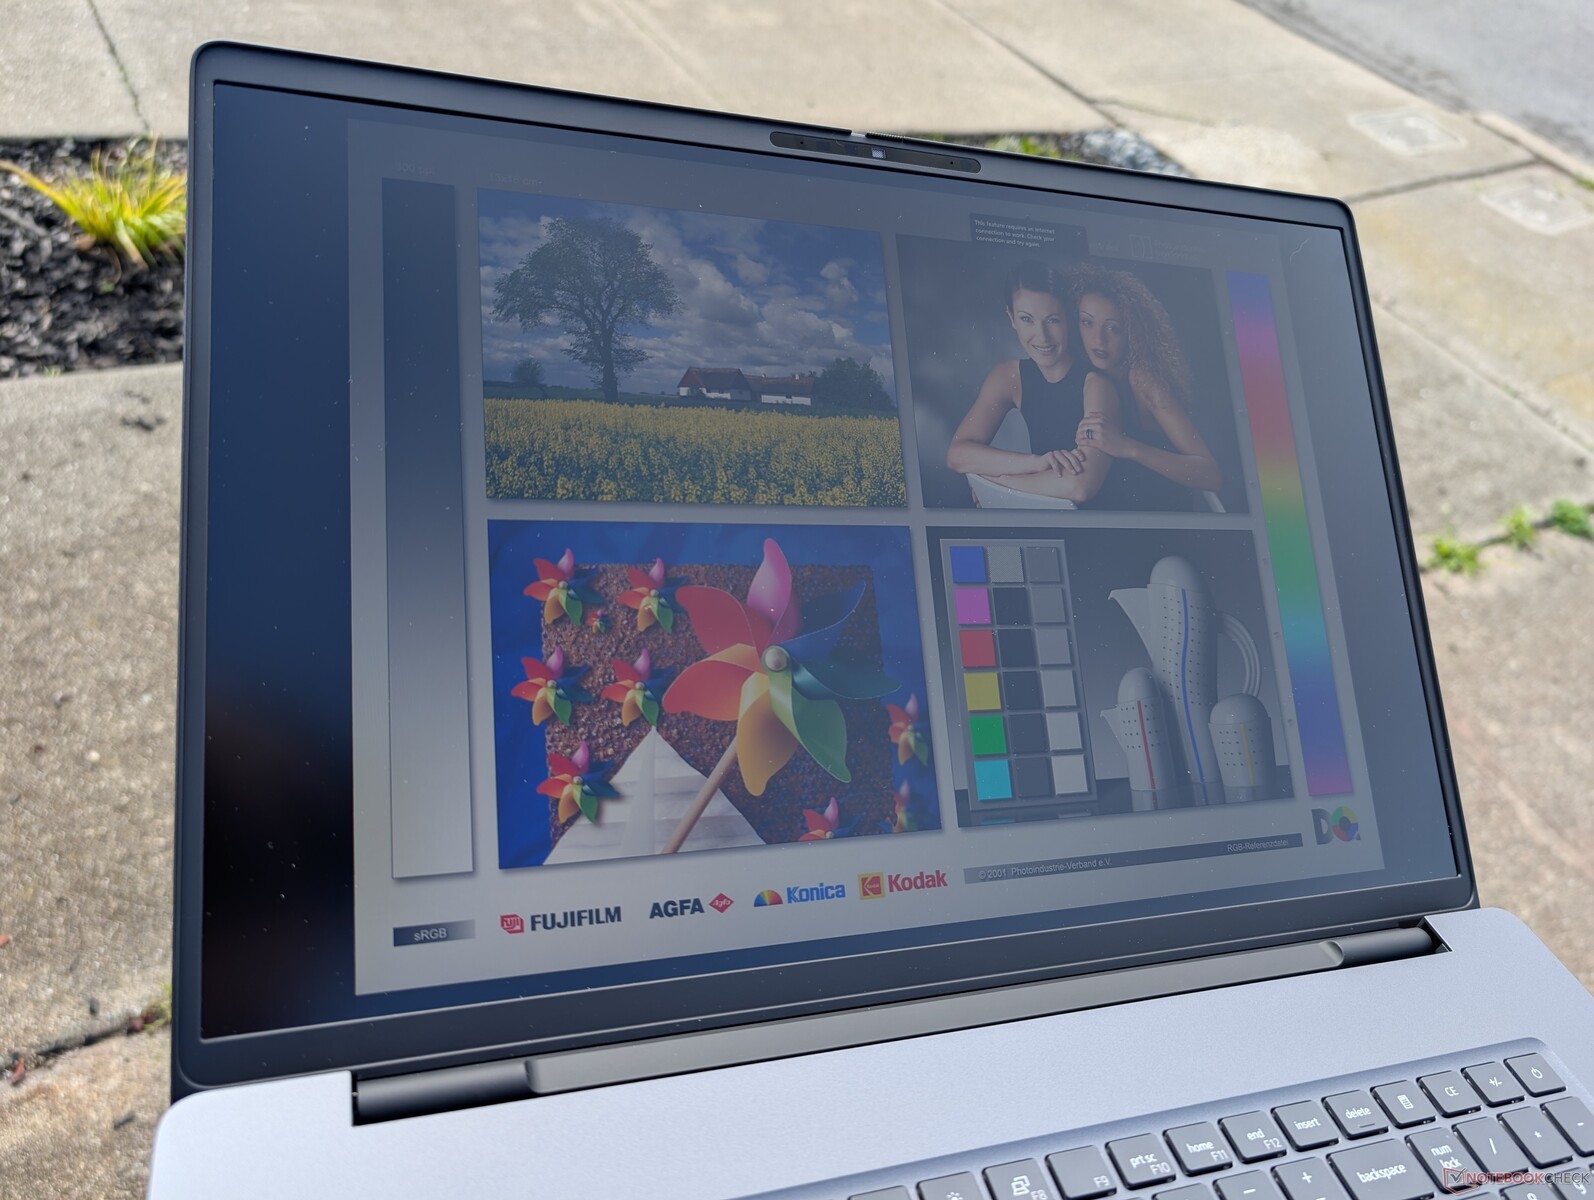
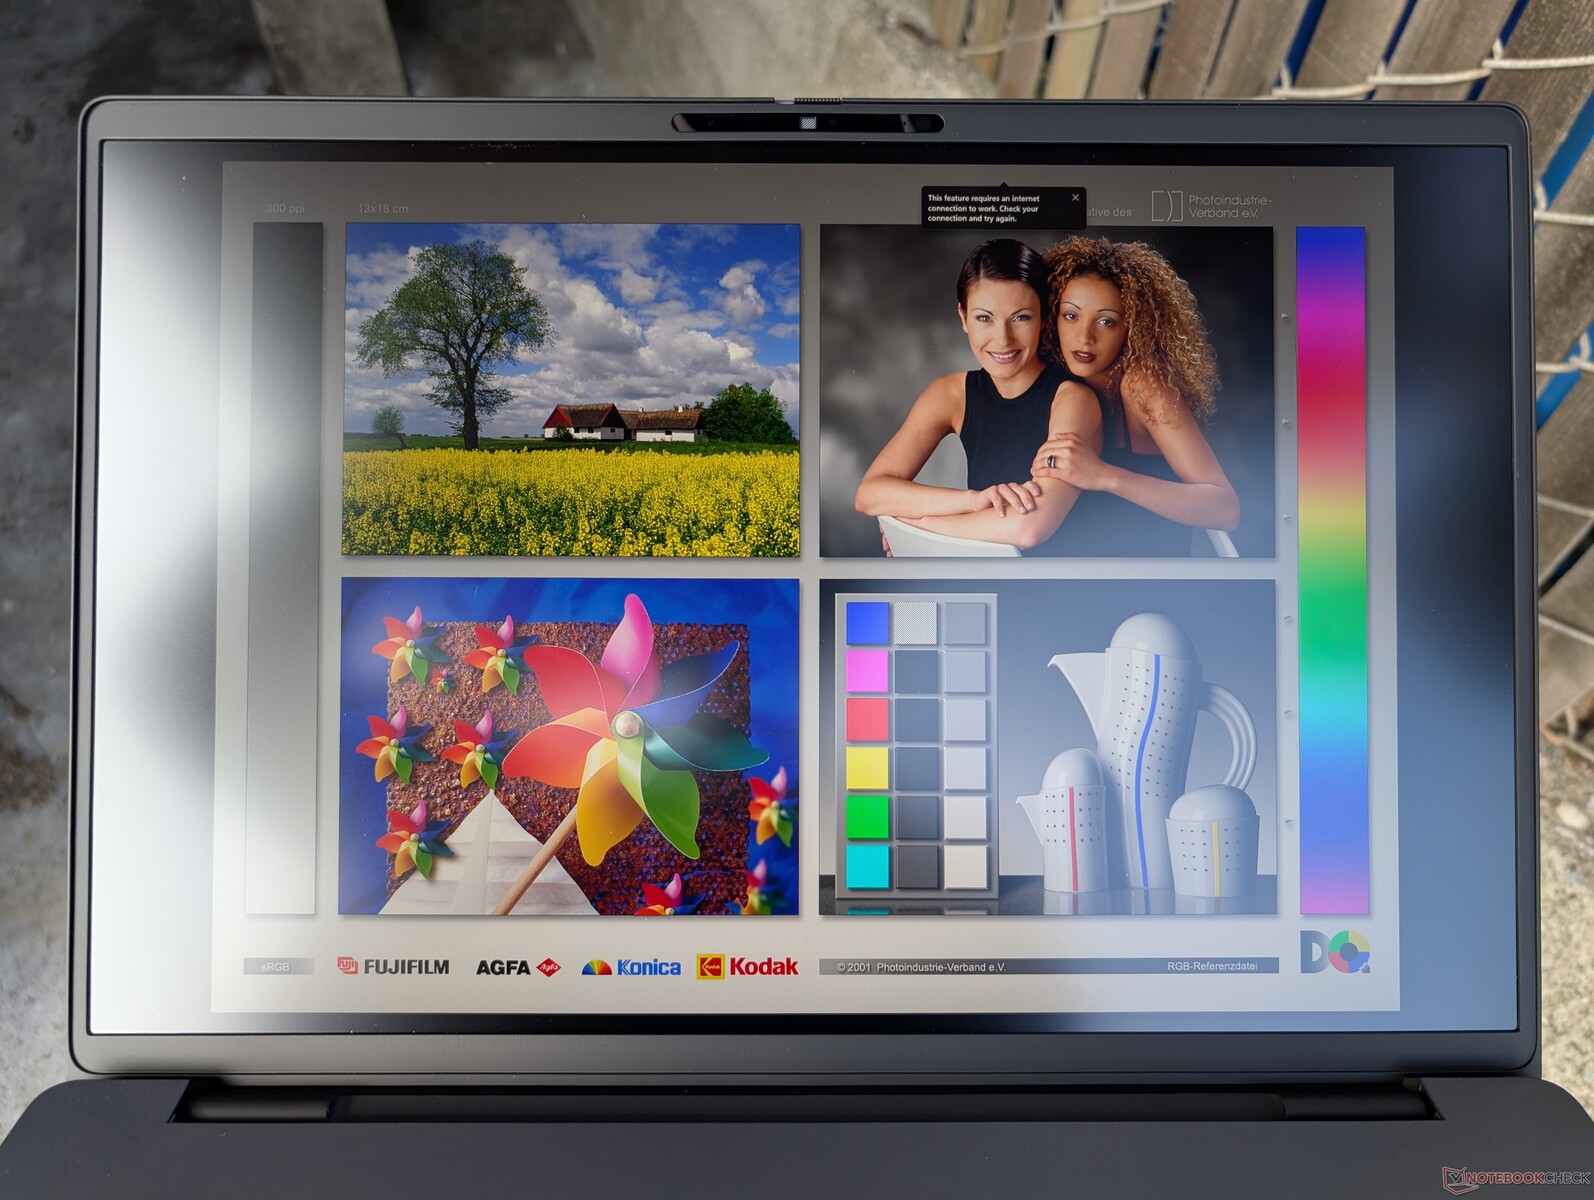
Por el momento, Dell sólo ofrece la opción de un único panel en todas las configuraciones, mientras que otros portátiles de 18 pulgadas como el Schenker Key 18 Pro pueden ofrecer opciones 4K de mayor resolución. La pantalla aquí es por lo demás excelente y una de las mejores pantallas IPS que hemos visto en cualquier portátil de 18 pulgadas en términos de cobertura de color, relación de contraste y brillo. No obstante, características como la compatibilidad con HDR y los tiempos de respuesta no pueden competir con las ofertas OLED actuales.
| |||||||||||||||||||||||||
iluminación: 91 %
Brillo con batería: 528.8 cd/m²
Contraste: 2404:1 (Negro: 0.22 cd/m²)
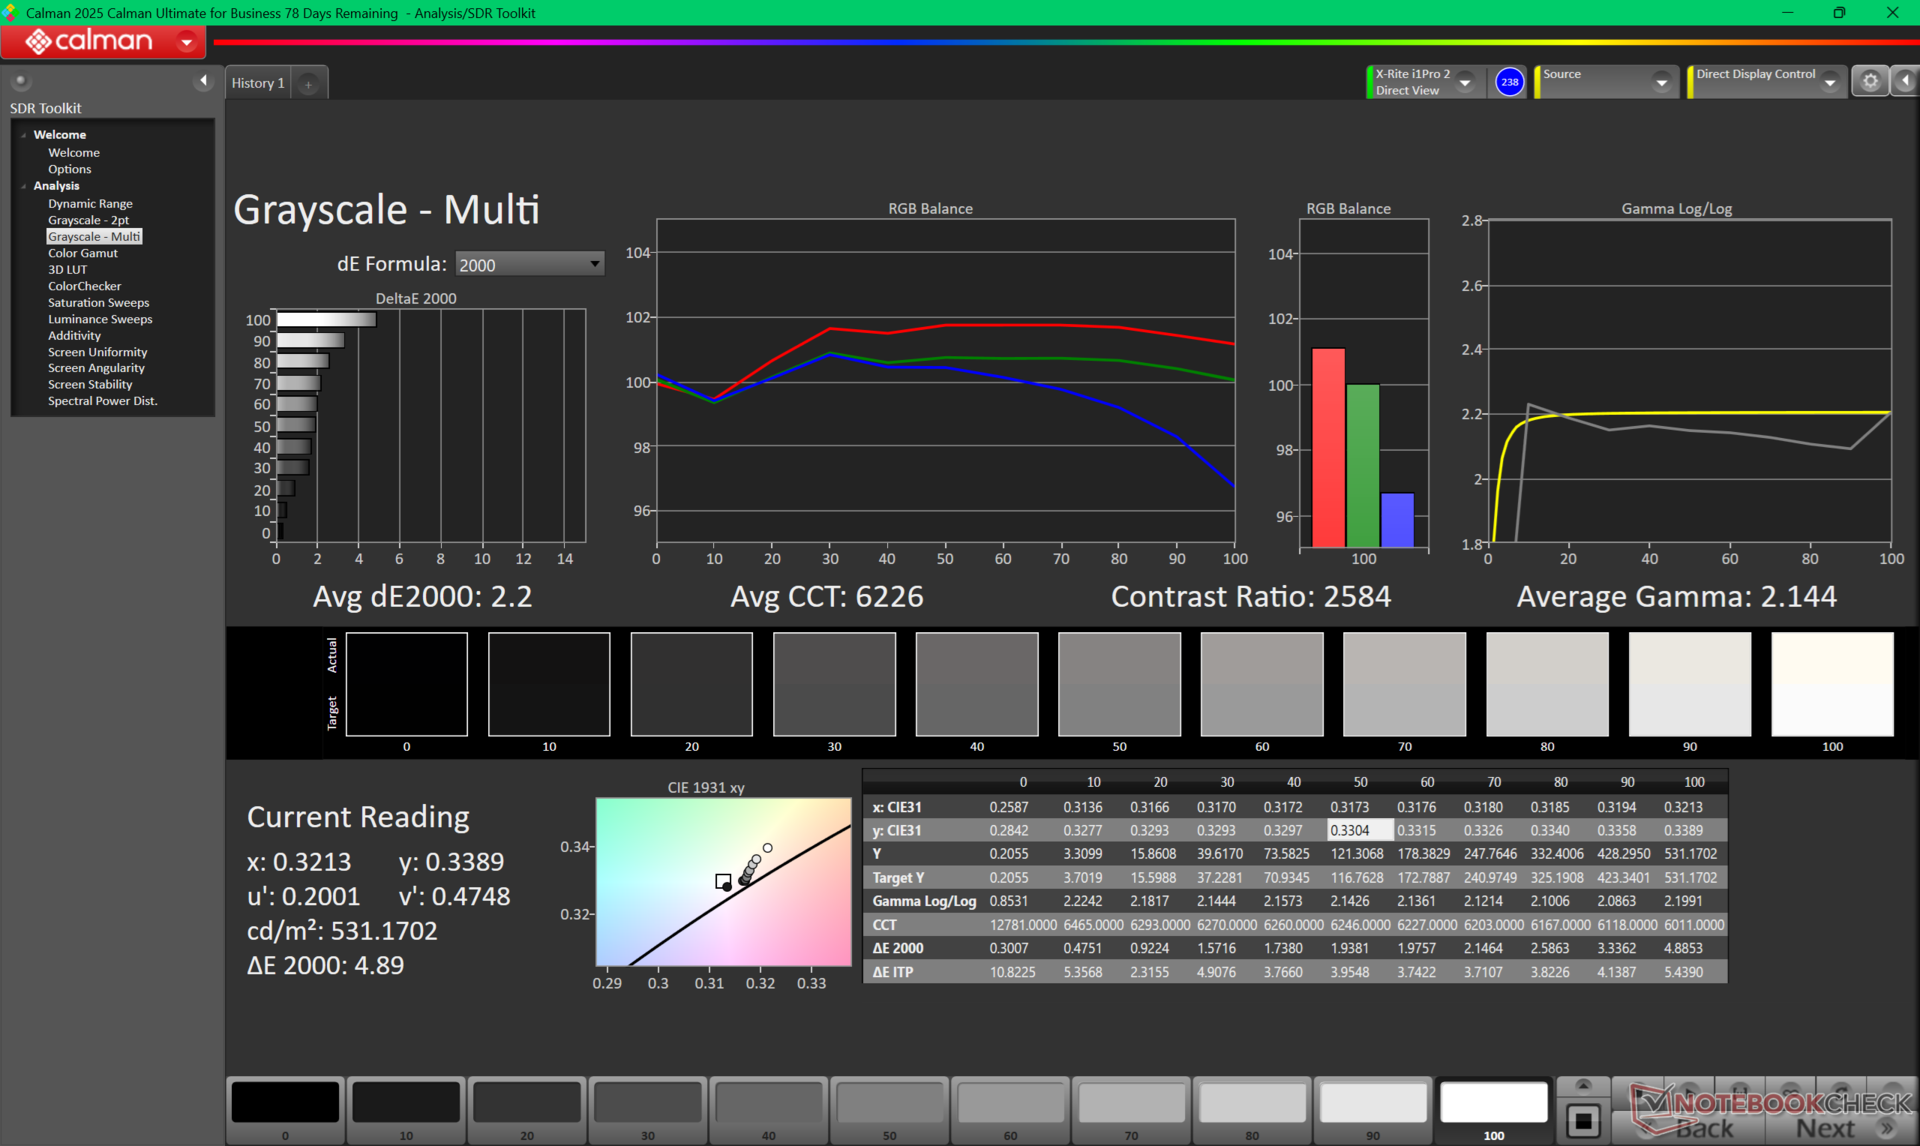
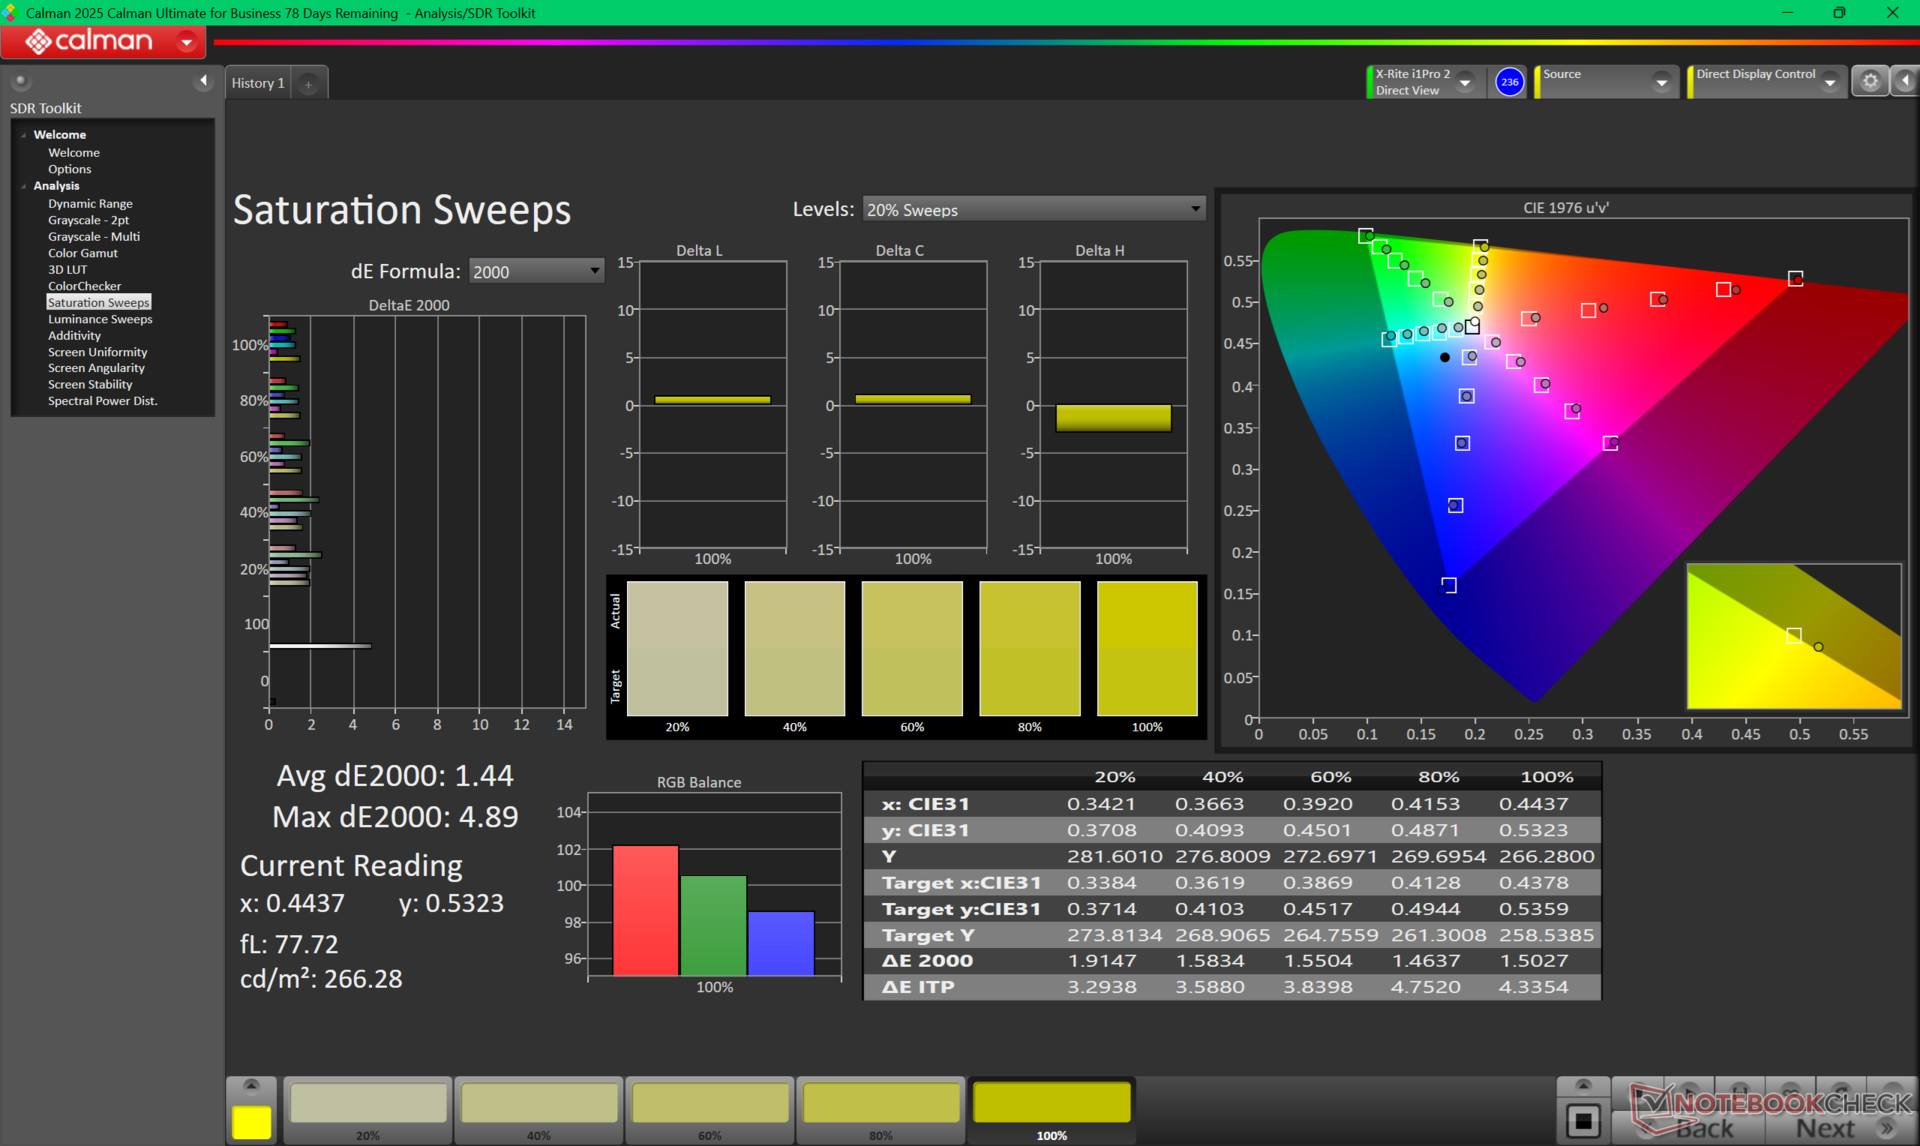
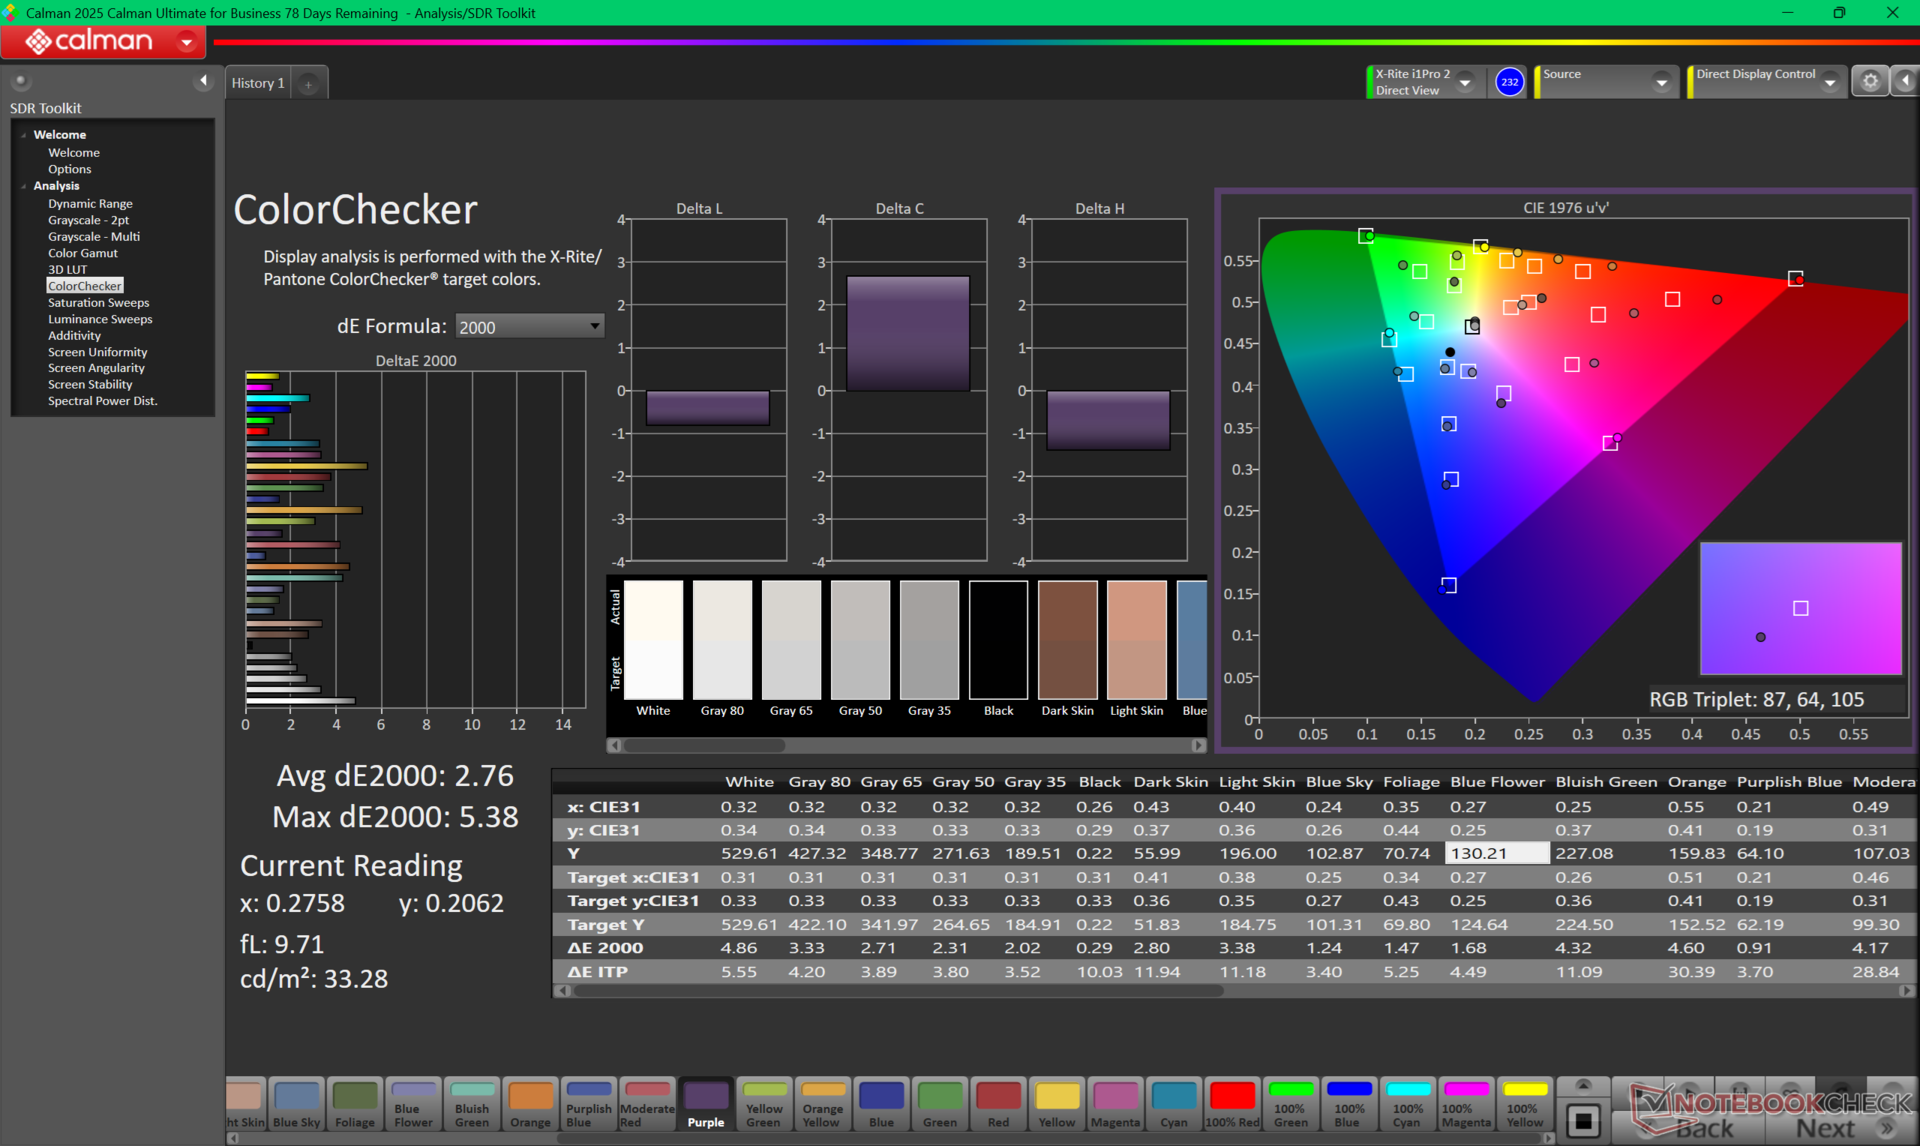
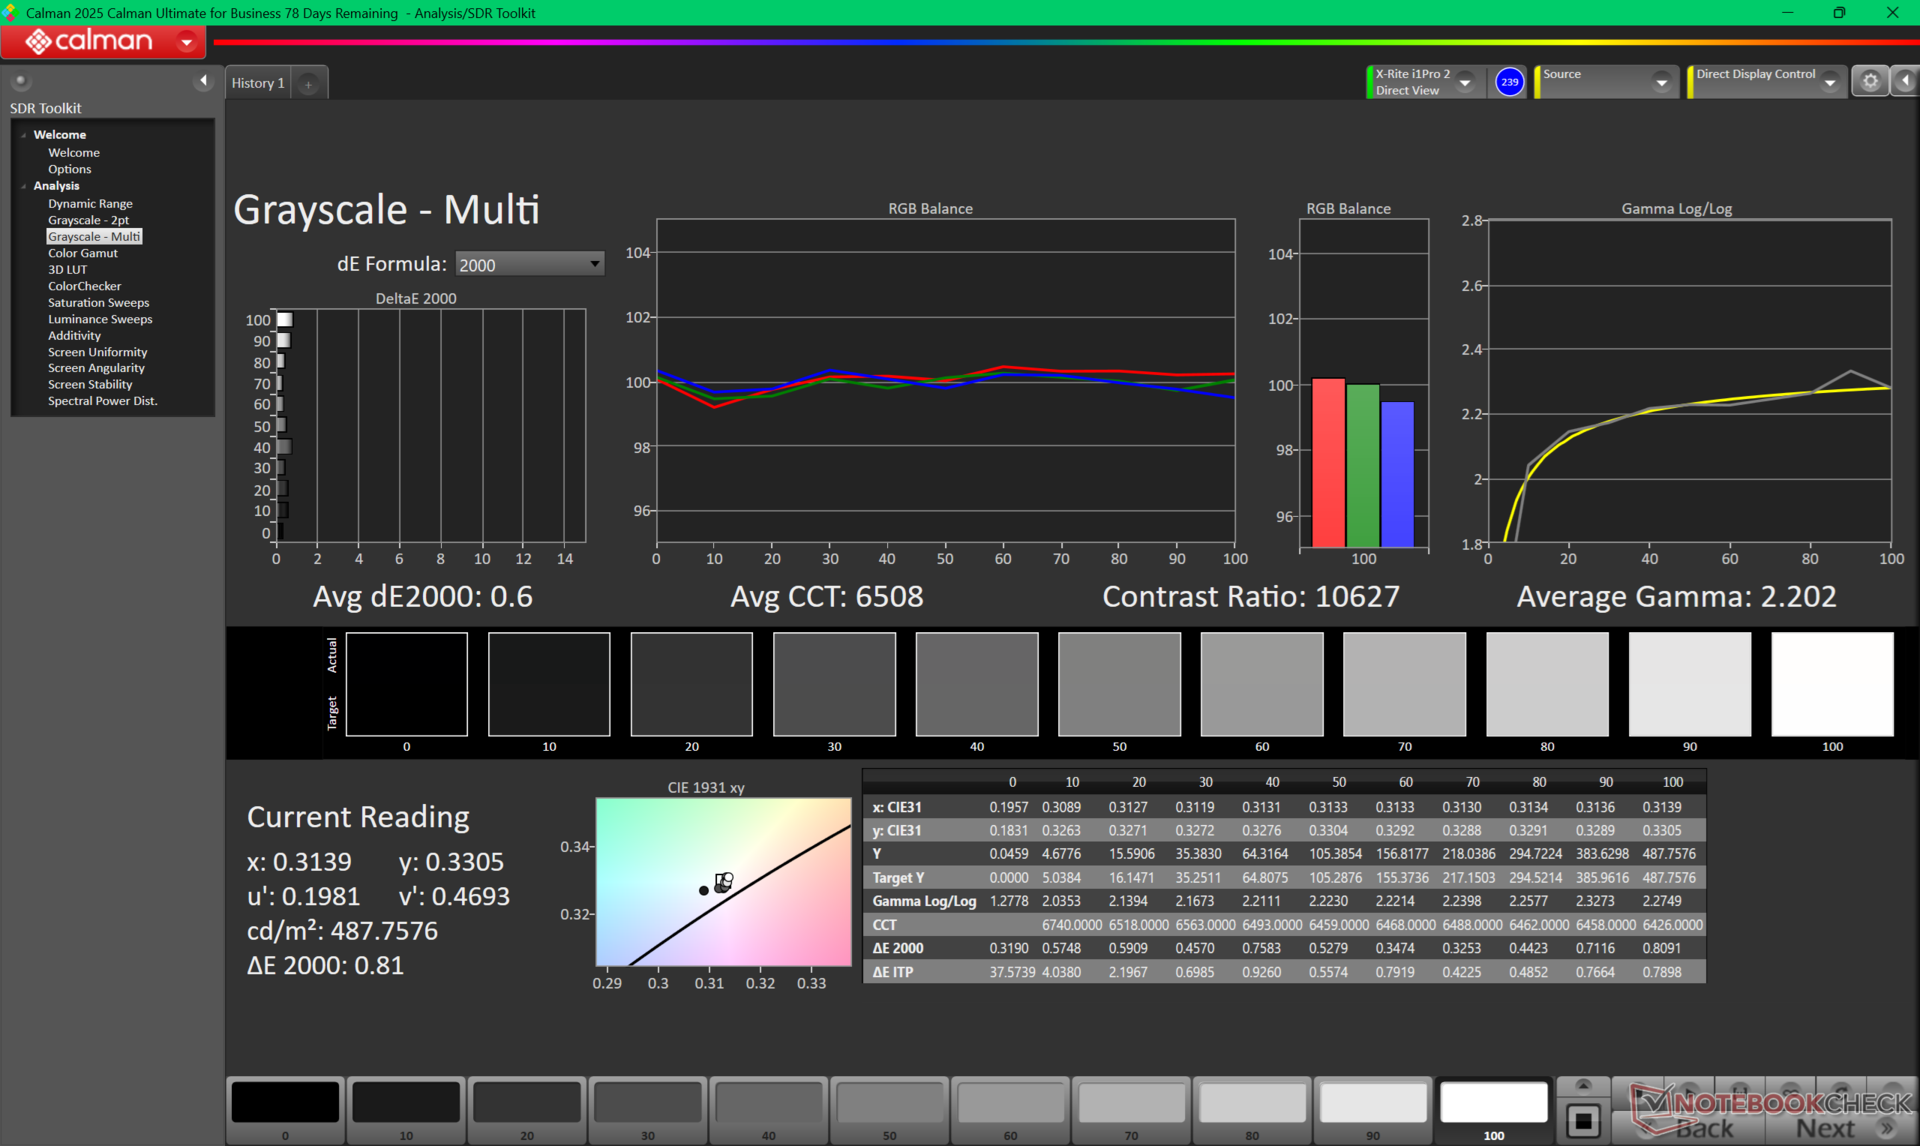
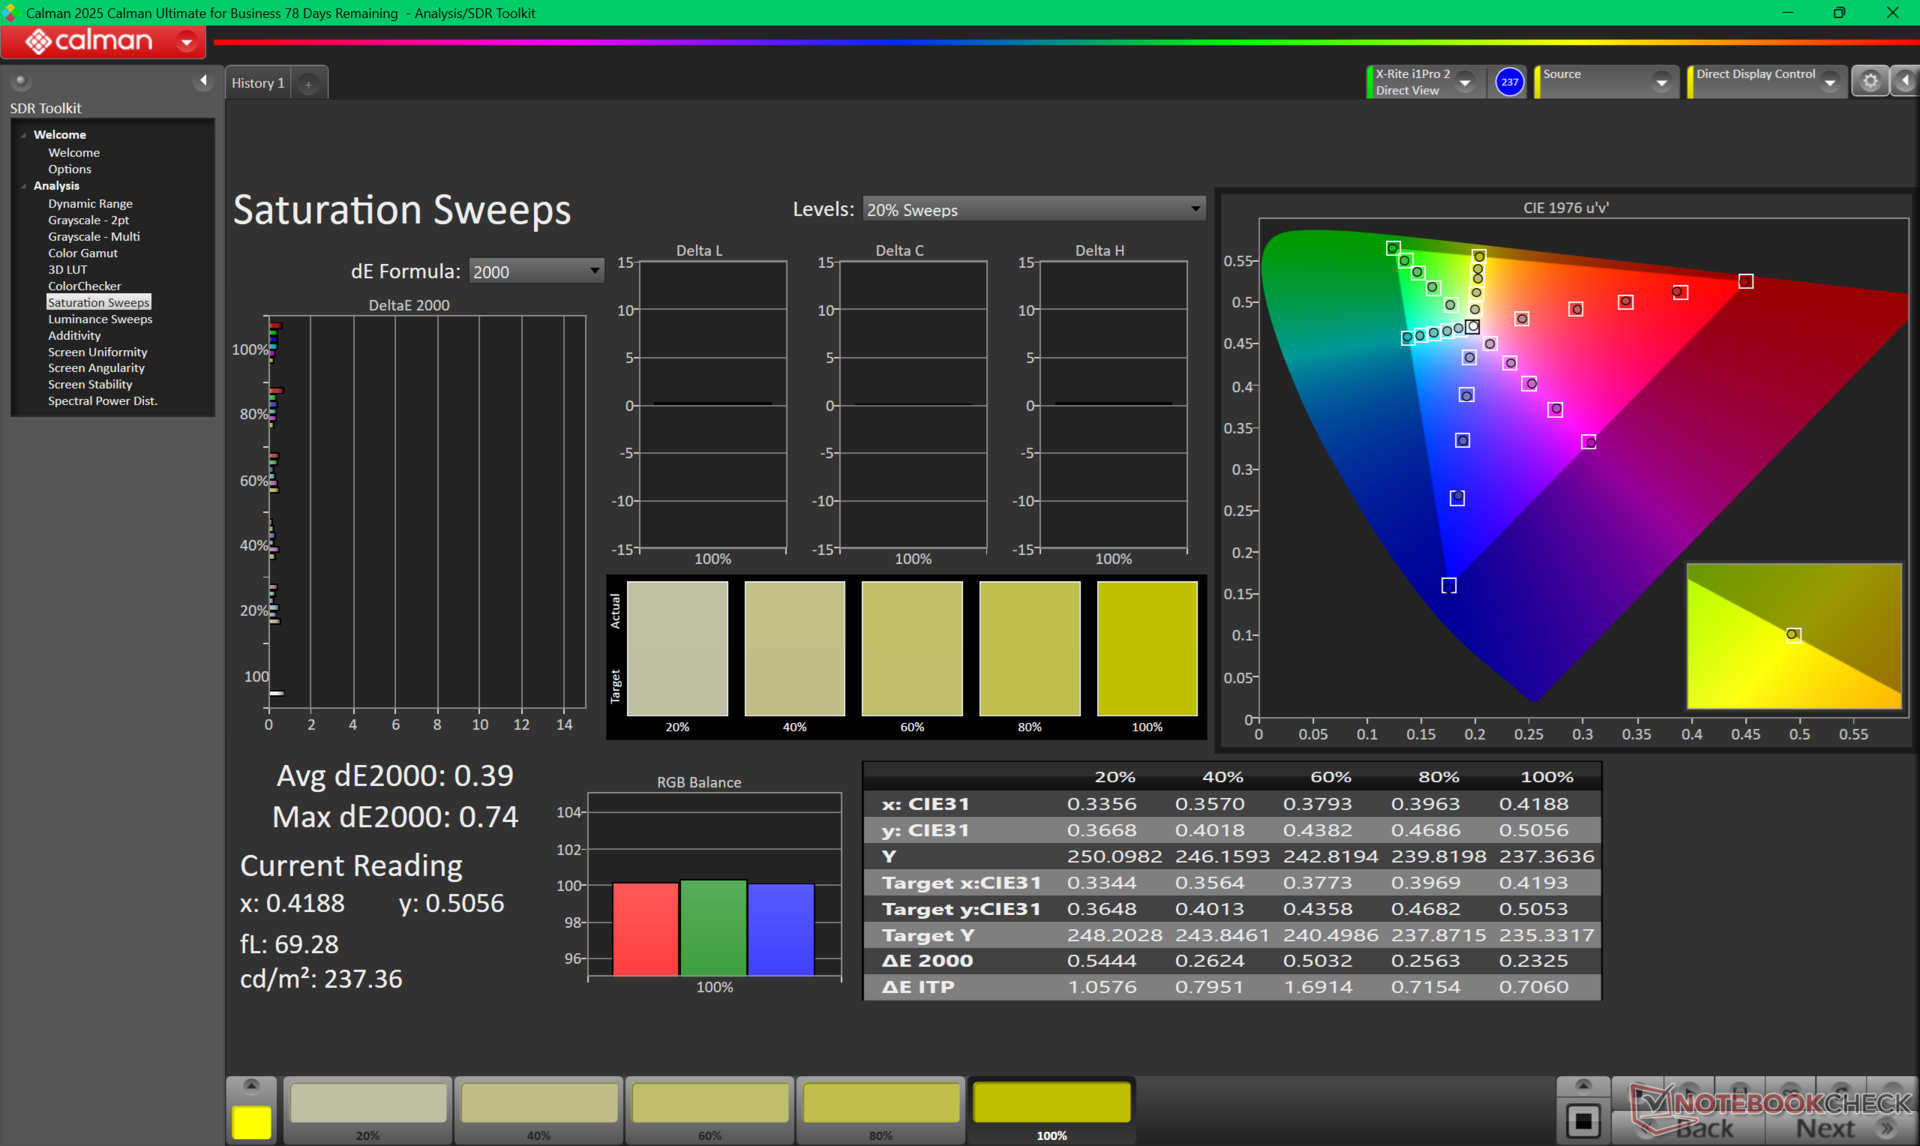
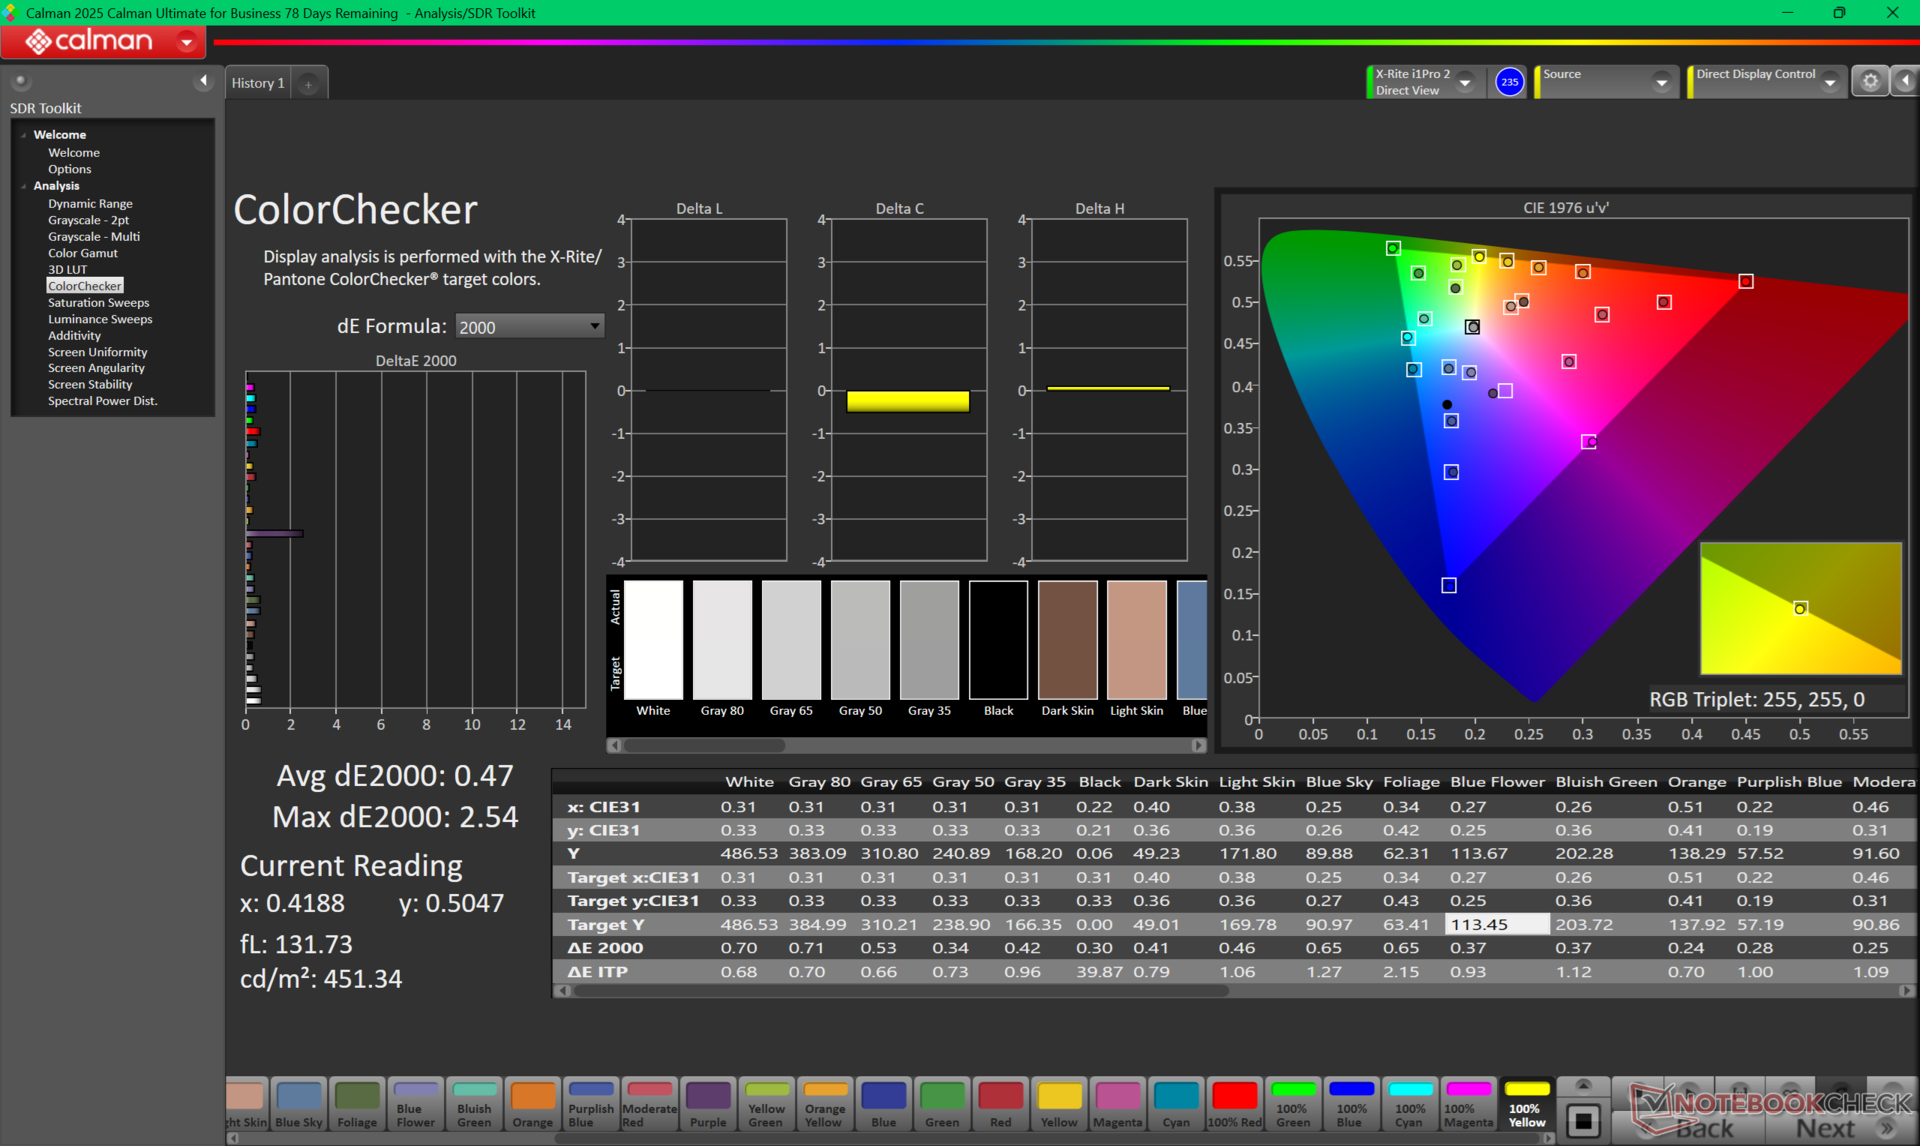
ΔE ColorChecker Calman: 2.76 | ∀{0.5-29.43 Ø4.72}
calibrated: 0.47
ΔE Greyscale Calman: 2.2 | ∀{0.09-98 Ø4.97}
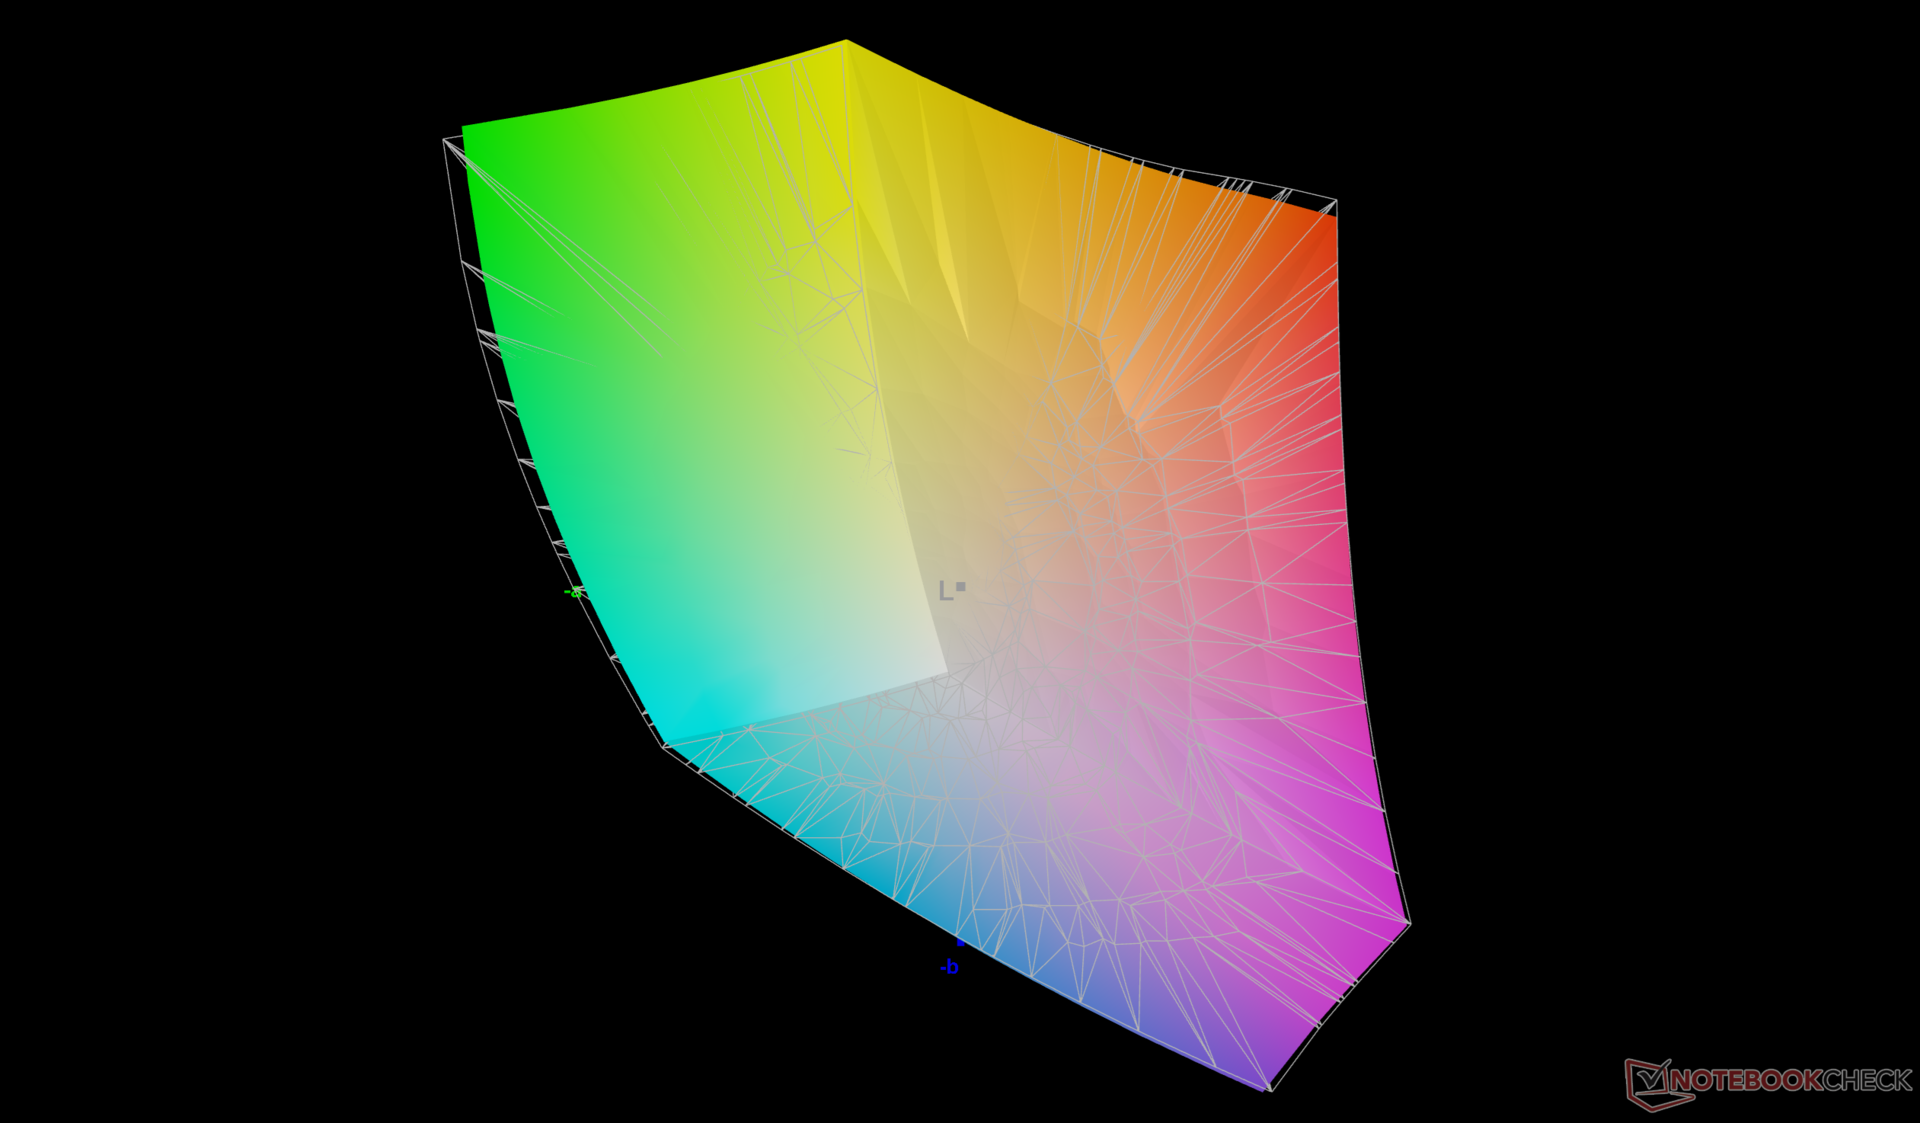
85.9% AdobeRGB 1998 (Argyll 3D)
99.9% sRGB (Argyll 3D)
97.7% Display P3 (Argyll 3D)
Gamma: 2.14
CCT: 2584 K
| Dell Pro Max 18 Plus MB18250 BOE NE18NZ7, IPS, 2560x1600, 18", 120 Hz | Schenker Key 18 Pro M25 RTX 5090 LQ180D1JW01, IPS, 3840x2400, 18", 200 Hz | HP ZBook X G1i 16 LG Philips LGD07B3, IPS, 2560x1600, 16", 120 Hz | HP ZBook Studio 16 G11 AUO87A8, IPS, 3840x2400, 16", 120 Hz | Lenovo ThinkPad P16s Gen 4 21RX000YGE N160JCA-GT1, IPS LED, 1920x1200, 16", 60 Hz | Dell Pro Max 16 Plus Samsung 160HC01, OLED, 3840x2400, 16", 120 Hz | |
|---|---|---|---|---|---|---|
| Display | -2% | 5% | 0% | -19% | 1% | |
| Display P3 Coverage (%) | 97.7 | 90.5 -7% | 97.2 -1% | 97.7 0% | 65.8 -33% | 97.3 0% |
| sRGB Coverage (%) | 99.9 | 100 0% | 100 0% | 99.9 0% | 96.8 -3% | 100 0% |
| AdobeRGB 1998 Coverage (%) | 85.9 | 87.4 2% | 99.9 16% | 85.7 0% | 67.8 -21% | 88.8 3% |
| Response Times | 86% | -2% | 64% | 25% | 98% | |
| Response Time Grey 50% / Grey 80% * (ms) | 39.9 ? | 5.2 ? 87% | 45.5 ? -14% | 14.2 ? 64% | 29.4 ? 26% | 0.63 ? 98% |
| Response Time Black / White * (ms) | 29.4 ? | 4.3 ? 85% | 26.1 ? 11% | 10.6 ? 64% | 22.4 ? 24% | 0.89 ? 97% |
| PWM Frequency (Hz) | 26536 ? | 479.9 ? | ||||
| PWM Amplitude * (%) | 47 | 28 | ||||
| Screen | -34% | -46% | -33% | -36% | 4% | |
| Brightness middle (cd/m²) | 528.8 | 529 0% | 461.8 -13% | 404.3 -24% | 540 2% | 530.9 0% |
| Brightness (cd/m²) | 515 | 513 0% | 427 -17% | 405 -21% | 516 0% | 540 5% |
| Brightness Distribution (%) | 91 | 95 4% | 88 -3% | 92 1% | 93 2% | 95 4% |
| Black Level * (cd/m²) | 0.22 | 0.31 -41% | 0.46 -109% | 0.28 -27% | 0.37 -68% | |
| Contrast (:1) | 2404 | 1706 -29% | 1004 -58% | 1444 -40% | 1459 -39% | |
| Colorchecker dE 2000 * | 2.76 | 2.7 2% | 4.08 -48% | 2.63 5% | 3.4 -23% | 2.42 12% |
| Colorchecker dE 2000 max. * | 5.38 | 7.8 -45% | 8.1 -51% | 4.48 17% | 5.6 -4% | 5.76 -7% |
| Colorchecker dE 2000 calibrated * | 0.47 | 0.8 -70% | 0.75 -60% | 1.46 -211% | 0.9 -91% | 0.7 -49% |
| Greyscale dE 2000 * | 2.2 | 4.9 -123% | 3.5 -59% | 2.1 5% | 4.5 -105% | 0.8 64% |
| Gamma | 2.14 103% | 2.23 99% | 2.15 102% | 2.3 96% | 2.51 88% | 2.23 99% |
| CCT | 2584 252% | 6997 93% | 6715 97% | 6810 95% | 6294 103% | 6488 100% |
| Media total (Programa/Opciones) | 17% /
-10% | -14% /
-29% | 10% /
-12% | -10% /
-24% | 34% /
19% |
* ... más pequeño es mejor
Tiempos de respuesta del display
| ↔ Tiempo de respuesta de Negro a Blanco | ||
|---|---|---|
| 29.4 ms ... subida ↗ y bajada ↘ combinada | ↗ 13.9 ms subida | 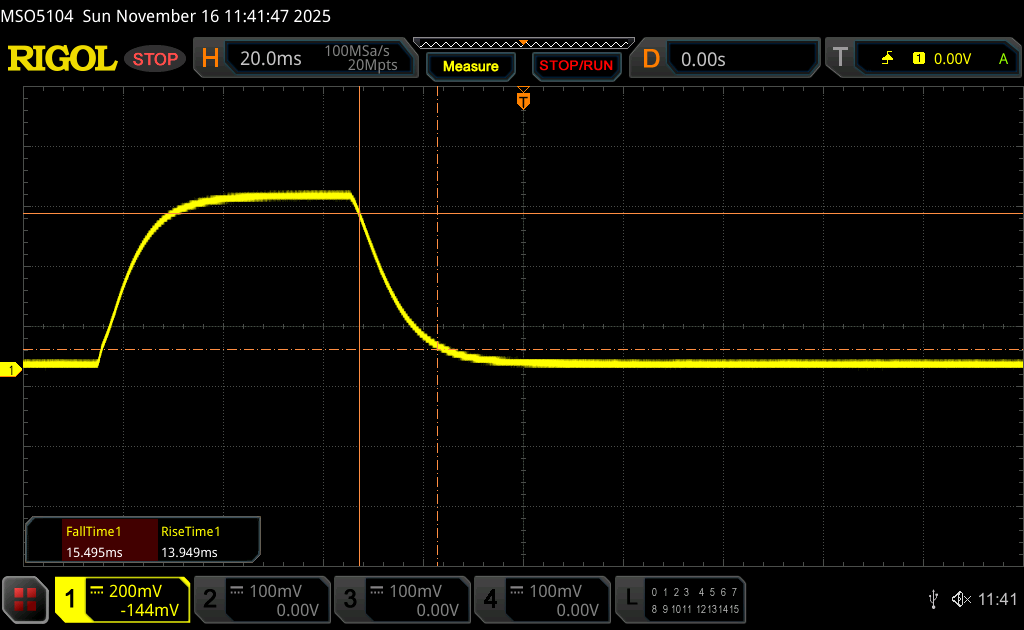 |
| ↘ 15.5 ms bajada | ||
| La pantalla mostró tiempos de respuesta relativamente lentos en nuestros tests pero podría ser demasiado lenta para los jugones. En comparación, todos los dispositivos de prueba van de ##min### (mínimo) a 240 (máximo) ms. » 79 % de todos los dispositivos son mejores. Eso quiere decir que el tiempo de respuesta es peor que la media (19.8 ms) de todos los dispositivos testados. | ||
| ↔ Tiempo de respuesta 50% Gris a 80% Gris | ||
| 39.9 ms ... subida ↗ y bajada ↘ combinada | ↗ 17.7 ms subida | 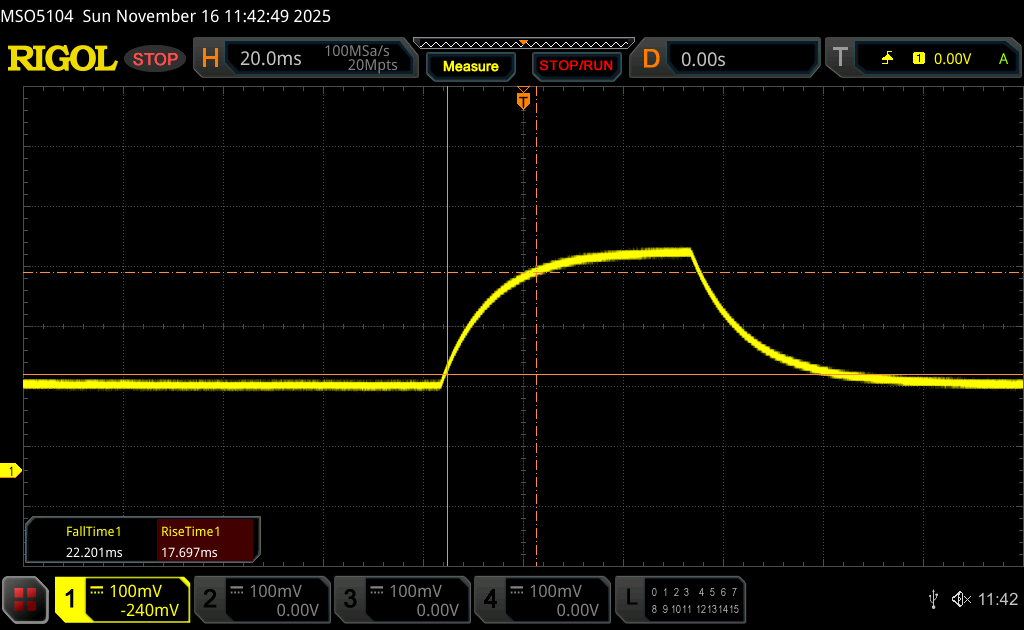 |
| ↘ 22.2 ms bajada | ||
| La pantalla mostró tiempos de respuesta lentos en nuestros tests y podría ser demasiado lenta para los jugones. En comparación, todos los dispositivos de prueba van de ##min### (mínimo) a 636 (máximo) ms. » 61 % de todos los dispositivos son mejores. Eso quiere decir que el tiempo de respuesta es peor que la media (31 ms) de todos los dispositivos testados. | ||
Parpadeo de Pantalla / PWM (Pulse-Width Modulation)
| Parpadeo de Pantalla / PWM no detectado | 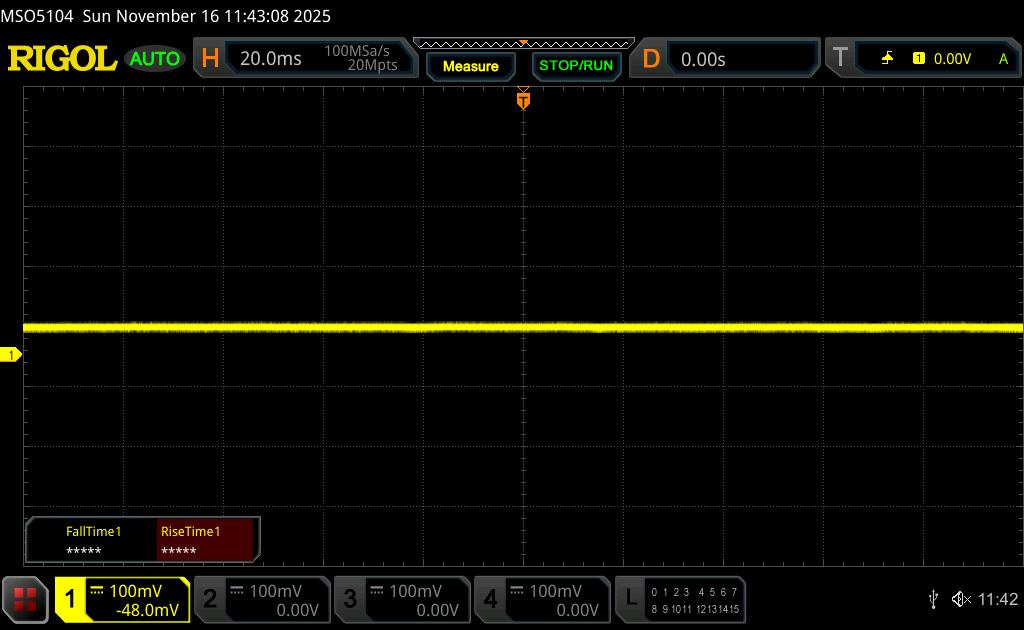 | ||
Comparación: 52 % de todos los dispositivos testados no usaron PWM para atenuar el display. Si se usó, medimos una media de 7781 (mínimo: 5 - máxmo: 343500) Hz. | |||

Rendimiento
Condiciones de prueba
Configuramos Dell Optimizer y el panel de control de Nvidia en modo Rendimiento y modo de gráficos discretos, respectivamente, antes de ejecutar los puntos de referencia que se indican a continuación. Advanced Optimus es compatible para cambiar entre los modos iGPU y dGPU sin reiniciar.
Procesador
El rendimiento de la CPU es excelente pero imperfecto. Al ejecutar CineBench R15 xT en bucle, por ejemplo, nuestro Core Ultra 9 285HX la puntuación inicial caería alrededor de un 15 por ciento con el tiempo, como muestra el gráfico siguiente, debido a la sostenibilidad limitada de Turbo Boost.
Bucle múltiple Cinebench R15
Cinebench R23: Multi Core | Single Core
Cinebench R20: CPU (Multi Core) | CPU (Single Core)
Cinebench R15: CPU Multi 64Bit | CPU Single 64Bit
Blender: v2.79 BMW27 CPU
7-Zip 18.03: 7z b 4 | 7z b 4 -mmt1
Geekbench 6.7: Multi-Core | Single-Core
Geekbench 5.5: Multi-Core | Single-Core
HWBOT x265 Benchmark v2.2: 4k Preset
LibreOffice : 20 Documents To PDF
R Benchmark 2.5: Overall mean
| Cinebench R20 / CPU (Multi Core) | |
| Dell Pro Max 18 Plus MB18250 | |
| Medio Intel Core Ultra 9 285HX (13152 - 15751, n=6) | |
| Schenker Key 18 Pro M25 RTX 5090 | |
| Dell Pro Max 16 Plus | |
| Lenovo ThinkPad P16 Gen 2 | |
| HP ZBook Fury 16 G10 | |
| HP ZBook X G1i 16 | |
| Lenovo ThinkPad P16s Gen 4 21RX000YGE | |
| HP ZBook Studio 16 G11 | |
| Dell Precision 7000 7670 Performance | |
| Cinebench R20 / CPU (Single Core) | |
| Schenker Key 18 Pro M25 RTX 5090 | |
| Medio Intel Core Ultra 9 285HX (799 - 884, n=6) | |
| Dell Pro Max 18 Plus MB18250 | |
| HP ZBook Fury 16 G10 | |
| Dell Pro Max 16 Plus | |
| Lenovo ThinkPad P16s Gen 4 21RX000YGE | |
| Lenovo ThinkPad P16 Gen 2 | |
| HP ZBook X G1i 16 | |
| Dell Precision 7000 7670 Performance | |
| HP ZBook Studio 16 G11 | |
| Cinebench R15 / CPU Multi 64Bit | |
| Dell Pro Max 18 Plus MB18250 | |
| Medio Intel Core Ultra 9 285HX (5427 - 6232, n=6) | |
| Schenker Key 18 Pro M25 RTX 5090 | |
| Dell Pro Max 16 Plus | |
| Lenovo ThinkPad P16 Gen 2 | |
| HP ZBook Fury 16 G10 | |
| HP ZBook X G1i 16 | |
| Lenovo ThinkPad P16s Gen 4 21RX000YGE | |
| HP ZBook Studio 16 G11 | |
| Dell Precision 7000 7670 Performance | |
| Cinebench R15 / CPU Single 64Bit | |
| Schenker Key 18 Pro M25 RTX 5090 | |
| Medio Intel Core Ultra 9 285HX (307 - 340, n=6) | |
| Dell Pro Max 18 Plus MB18250 | |
| Lenovo ThinkPad P16s Gen 4 21RX000YGE | |
| Dell Pro Max 16 Plus | |
| HP ZBook X G1i 16 | |
| HP ZBook Fury 16 G10 | |
| Lenovo ThinkPad P16 Gen 2 | |
| Dell Precision 7000 7670 Performance | |
| HP ZBook Studio 16 G11 | |
| Geekbench 6.7 / Multi-Core | |
| Dell Pro Max 18 Plus MB18250 | |
| Dell Pro Max 16 Plus | |
| Medio Intel Core Ultra 9 285HX (18212 - 22104, n=6) | |
| HP ZBook X G1i 16 | |
| Schenker Key 18 Pro M25 RTX 5090 | |
| Lenovo ThinkPad P16 Gen 2 | |
| HP ZBook Fury 16 G10 | |
| Lenovo ThinkPad P16s Gen 4 21RX000YGE | |
| HP ZBook Studio 16 G11 | |
| Geekbench 6.7 / Single-Core | |
| Dell Pro Max 18 Plus MB18250 | |
| Medio Intel Core Ultra 9 285HX (2907 - 3088, n=6) | |
| HP ZBook Fury 16 G10 | |
| Lenovo ThinkPad P16s Gen 4 21RX000YGE | |
| HP ZBook X G1i 16 | |
| Dell Pro Max 16 Plus | |
| Lenovo ThinkPad P16 Gen 2 | |
| Schenker Key 18 Pro M25 RTX 5090 | |
| HP ZBook Studio 16 G11 | |
| HWBOT x265 Benchmark v2.2 / 4k Preset | |
| Dell Pro Max 18 Plus MB18250 | |
| Medio Intel Core Ultra 9 285HX (35.3 - 44.3, n=6) | |
| Schenker Key 18 Pro M25 RTX 5090 | |
| Dell Pro Max 16 Plus | |
| HP ZBook Fury 16 G10 | |
| HP ZBook X G1i 16 | |
| Lenovo ThinkPad P16 Gen 2 | |
| Lenovo ThinkPad P16s Gen 4 21RX000YGE | |
| HP ZBook Studio 16 G11 | |
| Dell Precision 7000 7670 Performance | |
| LibreOffice / 20 Documents To PDF | |
| Lenovo ThinkPad P16s Gen 4 21RX000YGE | |
| Lenovo ThinkPad P16 Gen 2 | |
| HP ZBook Studio 16 G11 | |
| Dell Precision 7000 7670 Performance | |
| HP ZBook Fury 16 G10 | |
| Medio Intel Core Ultra 9 285HX (38 - 49.1, n=6) | |
| Dell Pro Max 16 Plus | |
| HP ZBook X G1i 16 | |
| Dell Pro Max 18 Plus MB18250 | |
| Schenker Key 18 Pro M25 RTX 5090 | |
* ... más pequeño es mejor
AIDA64: FP32 Ray-Trace | FPU Julia | CPU SHA3 | CPU Queen | FPU SinJulia | FPU Mandel | CPU AES | CPU ZLib | FP64 Ray-Trace | CPU PhotoWorxx
| Performance rating | |
| Dell Pro Max 18 Plus MB18250 | |
| Schenker Key 18 Pro M25 RTX 5090 | |
| Medio Intel Core Ultra 9 285HX | |
| Dell Pro Max 16 Plus | |
| Lenovo ThinkPad P16s Gen 4 21RX000YGE | |
| HP ZBook Studio 16 G11 | |
| AIDA64 / FP32 Ray-Trace | |
| Schenker Key 18 Pro M25 RTX 5090 | |
| Dell Pro Max 18 Plus MB18250 | |
| Medio Intel Core Ultra 9 285HX (29076 - 42341, n=6) | |
| Dell Pro Max 16 Plus | |
| Lenovo ThinkPad P16s Gen 4 21RX000YGE | |
| HP ZBook Studio 16 G11 | |
| AIDA64 / FPU Julia | |
| Schenker Key 18 Pro M25 RTX 5090 | |
| Medio Intel Core Ultra 9 285HX (161276 - 210885, n=6) | |
| Dell Pro Max 18 Plus MB18250 | |
| Dell Pro Max 16 Plus | |
| Lenovo ThinkPad P16s Gen 4 21RX000YGE | |
| HP ZBook Studio 16 G11 | |
| AIDA64 / CPU SHA3 | |
| Schenker Key 18 Pro M25 RTX 5090 | |
| Dell Pro Max 18 Plus MB18250 | |
| Medio Intel Core Ultra 9 285HX (7757 - 9815, n=6) | |
| Dell Pro Max 16 Plus | |
| Lenovo ThinkPad P16s Gen 4 21RX000YGE | |
| HP ZBook Studio 16 G11 | |
| AIDA64 / CPU Queen | |
| Medio Intel Core Ultra 9 285HX (134345 - 141681, n=6) | |
| Dell Pro Max 18 Plus MB18250 | |
| Dell Pro Max 16 Plus | |
| Schenker Key 18 Pro M25 RTX 5090 | |
| Lenovo ThinkPad P16s Gen 4 21RX000YGE | |
| HP ZBook Studio 16 G11 | |
| AIDA64 / FPU SinJulia | |
| Lenovo ThinkPad P16s Gen 4 21RX000YGE | |
| Schenker Key 18 Pro M25 RTX 5090 | |
| Dell Pro Max 18 Plus MB18250 | |
| Medio Intel Core Ultra 9 285HX (12559 - 14431, n=6) | |
| Dell Pro Max 16 Plus | |
| HP ZBook Studio 16 G11 | |
| AIDA64 / FPU Mandel | |
| Schenker Key 18 Pro M25 RTX 5090 | |
| Medio Intel Core Ultra 9 285HX (84053 - 108922, n=6) | |
| Dell Pro Max 18 Plus MB18250 | |
| Dell Pro Max 16 Plus | |
| Lenovo ThinkPad P16s Gen 4 21RX000YGE | |
| HP ZBook Studio 16 G11 | |
| AIDA64 / CPU AES | |
| Schenker Key 18 Pro M25 RTX 5090 | |
| Dell Pro Max 18 Plus MB18250 | |
| Medio Intel Core Ultra 9 285HX (119553 - 134195, n=6) | |
| Dell Pro Max 16 Plus | |
| Lenovo ThinkPad P16s Gen 4 21RX000YGE | |
| HP ZBook Studio 16 G11 | |
| AIDA64 / CPU ZLib | |
| Dell Pro Max 18 Plus MB18250 | |
| Schenker Key 18 Pro M25 RTX 5090 | |
| Medio Intel Core Ultra 9 285HX (1886 - 2267, n=6) | |
| Dell Pro Max 16 Plus | |
| Lenovo ThinkPad P16s Gen 4 21RX000YGE | |
| HP ZBook Studio 16 G11 | |
| AIDA64 / FP64 Ray-Trace | |
| Schenker Key 18 Pro M25 RTX 5090 | |
| Medio Intel Core Ultra 9 285HX (15059 - 22312, n=6) | |
| Dell Pro Max 18 Plus MB18250 | |
| Dell Pro Max 16 Plus | |
| Lenovo ThinkPad P16s Gen 4 21RX000YGE | |
| HP ZBook Studio 16 G11 | |
| AIDA64 / CPU PhotoWorxx | |
| Dell Pro Max 16 Plus | |
| Dell Pro Max 18 Plus MB18250 | |
| HP ZBook Studio 16 G11 | |
| Medio Intel Core Ultra 9 285HX (39232 - 62611, n=6) | |
| Lenovo ThinkPad P16s Gen 4 21RX000YGE | |
| Schenker Key 18 Pro M25 RTX 5090 | |
Prueba de estrés
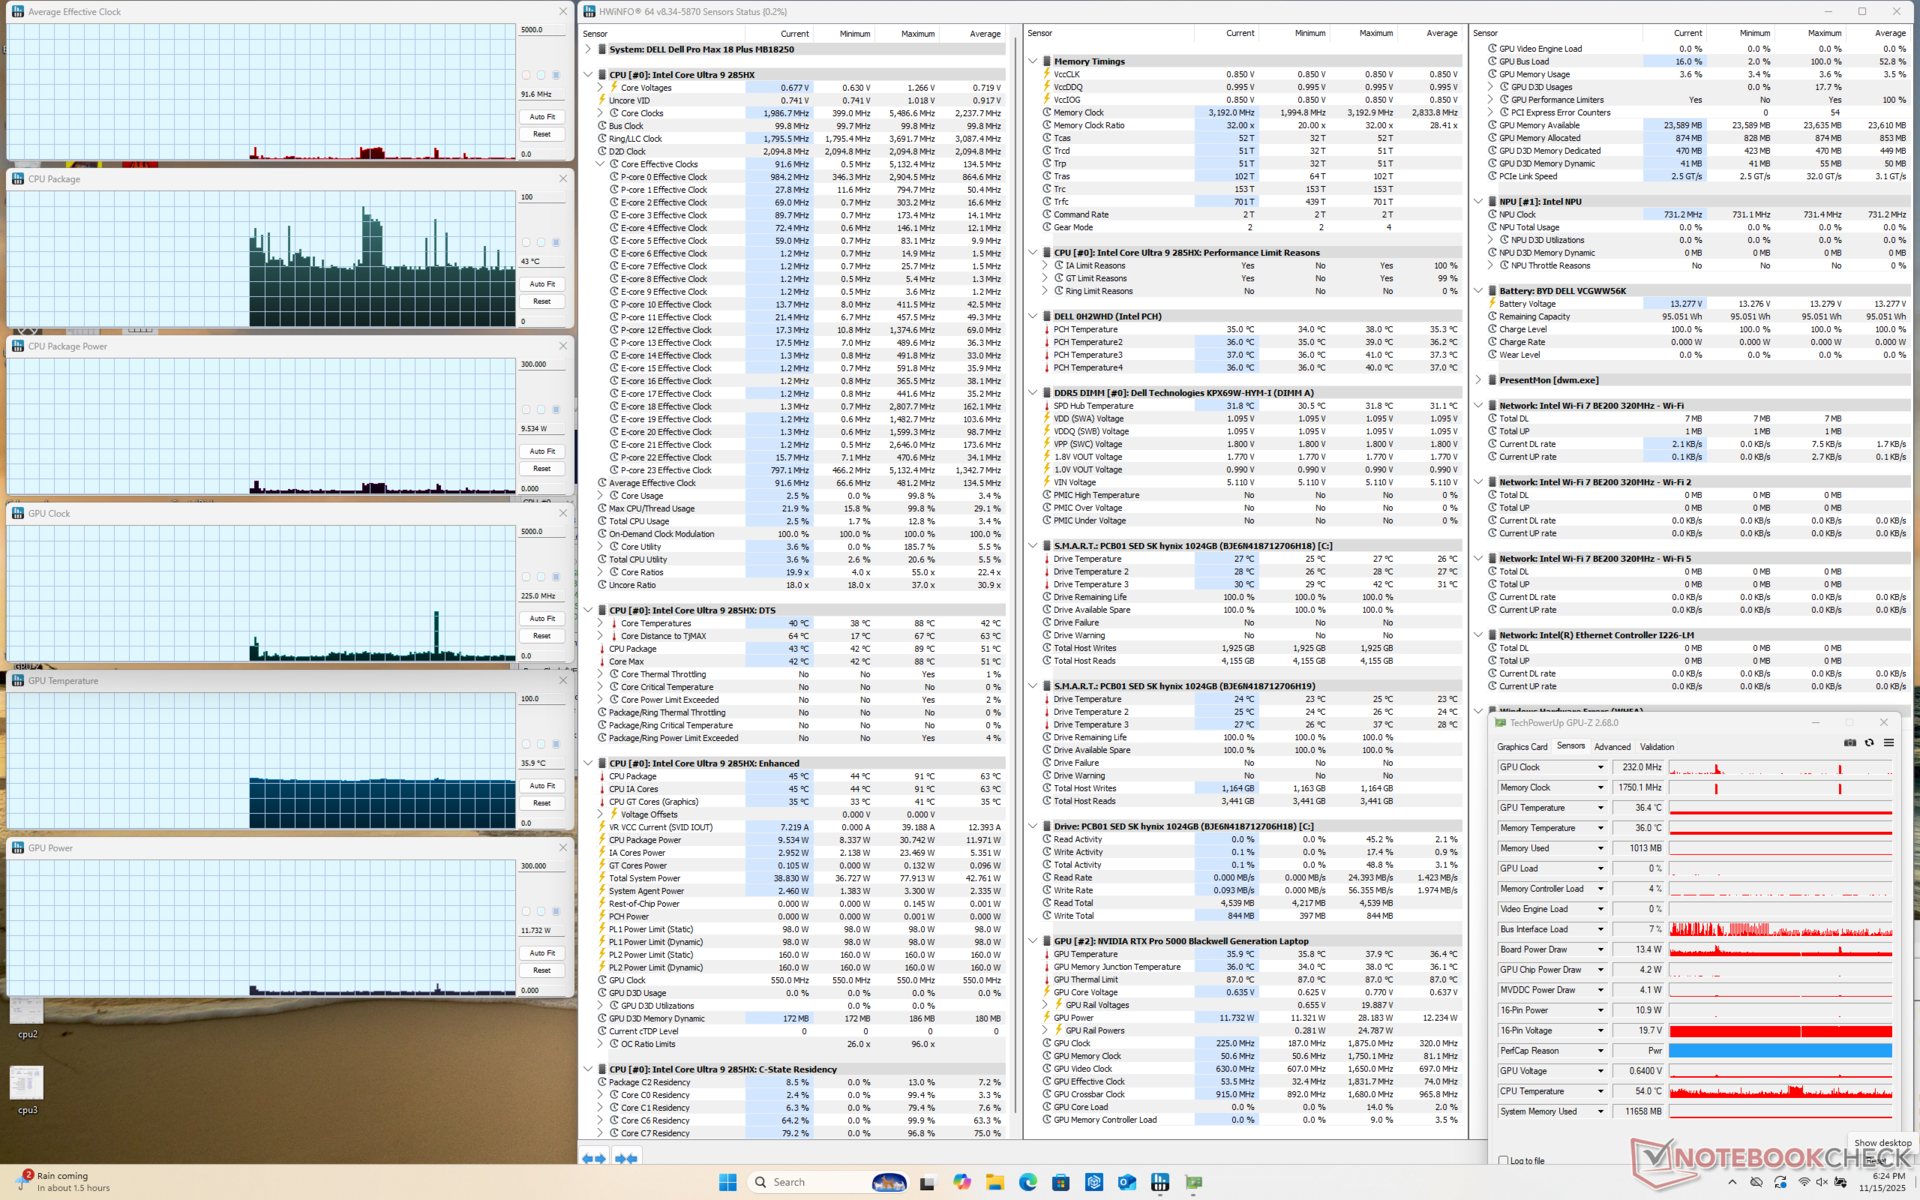
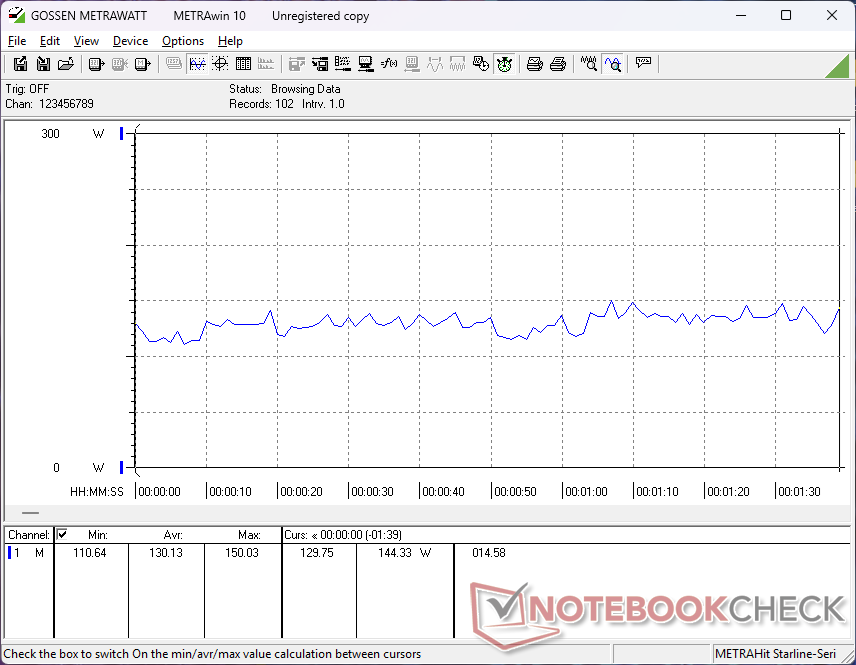
Al ejecutar el estrés de Prime95, la CPU aumentaría a 4 GHz, 160 W y algo más de 100 C (¡!) antes de caer y estabilizarse en 3,2 GHz, 99 W y 98 C. El Turbo Boost de corta duración complementa nuestras observaciones del bucle CineBench R15 xT mencionadas anteriormente.
Las temperaturas de la CPU se mantenían muy calientes a ~100 C cuando se ejecutaban otras cargas exigentes como juegos en comparación con sólo 77 C en el antiguo Rendimiento del Dell Precision 7670.
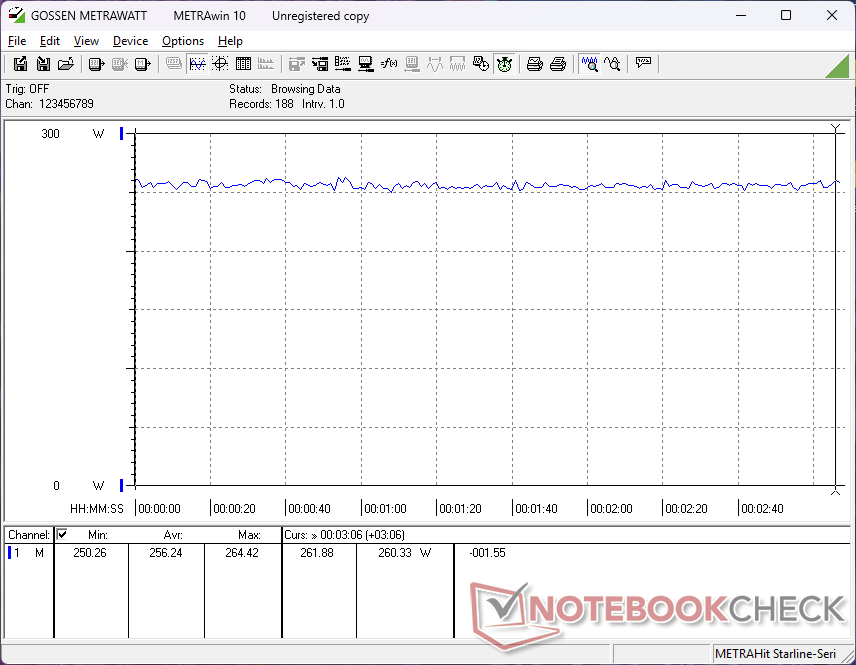
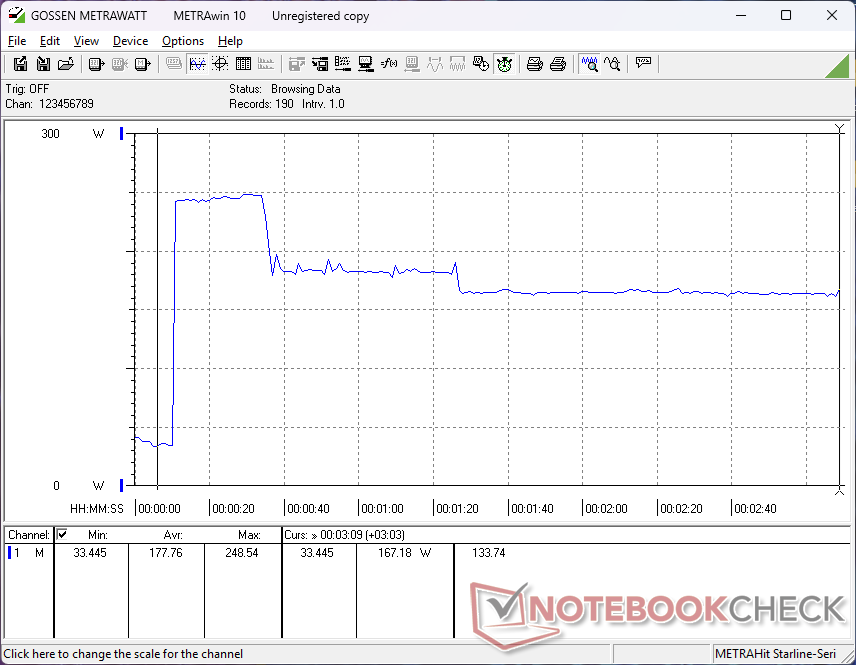
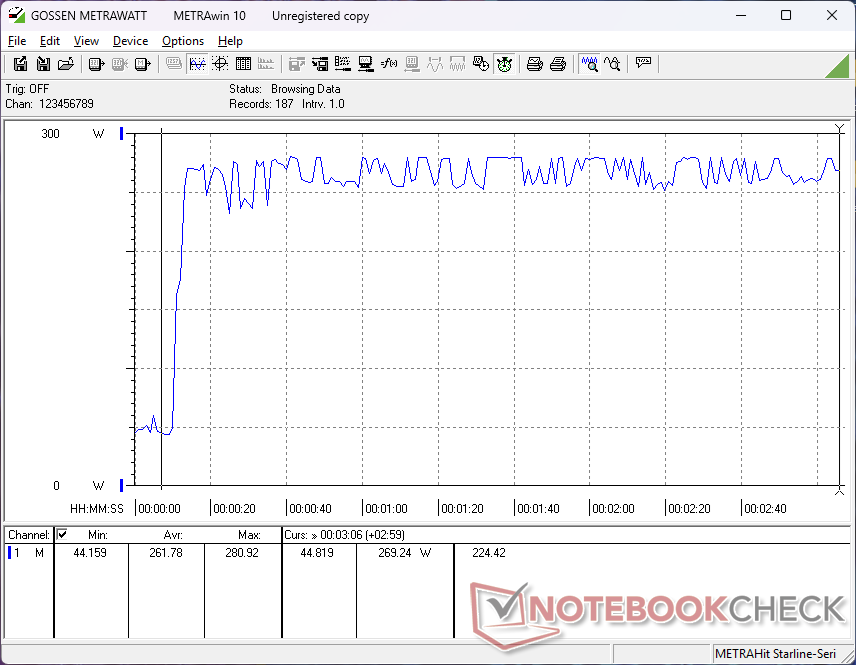
Tenga en cuenta que el consumo de energía de la placa GPU y las velocidades de reloj disminuirían ligeramente cuando se ejecuta en el modo Equilibrado en lugar del modo Rendimiento, como se muestra en las capturas de pantalla a continuación.
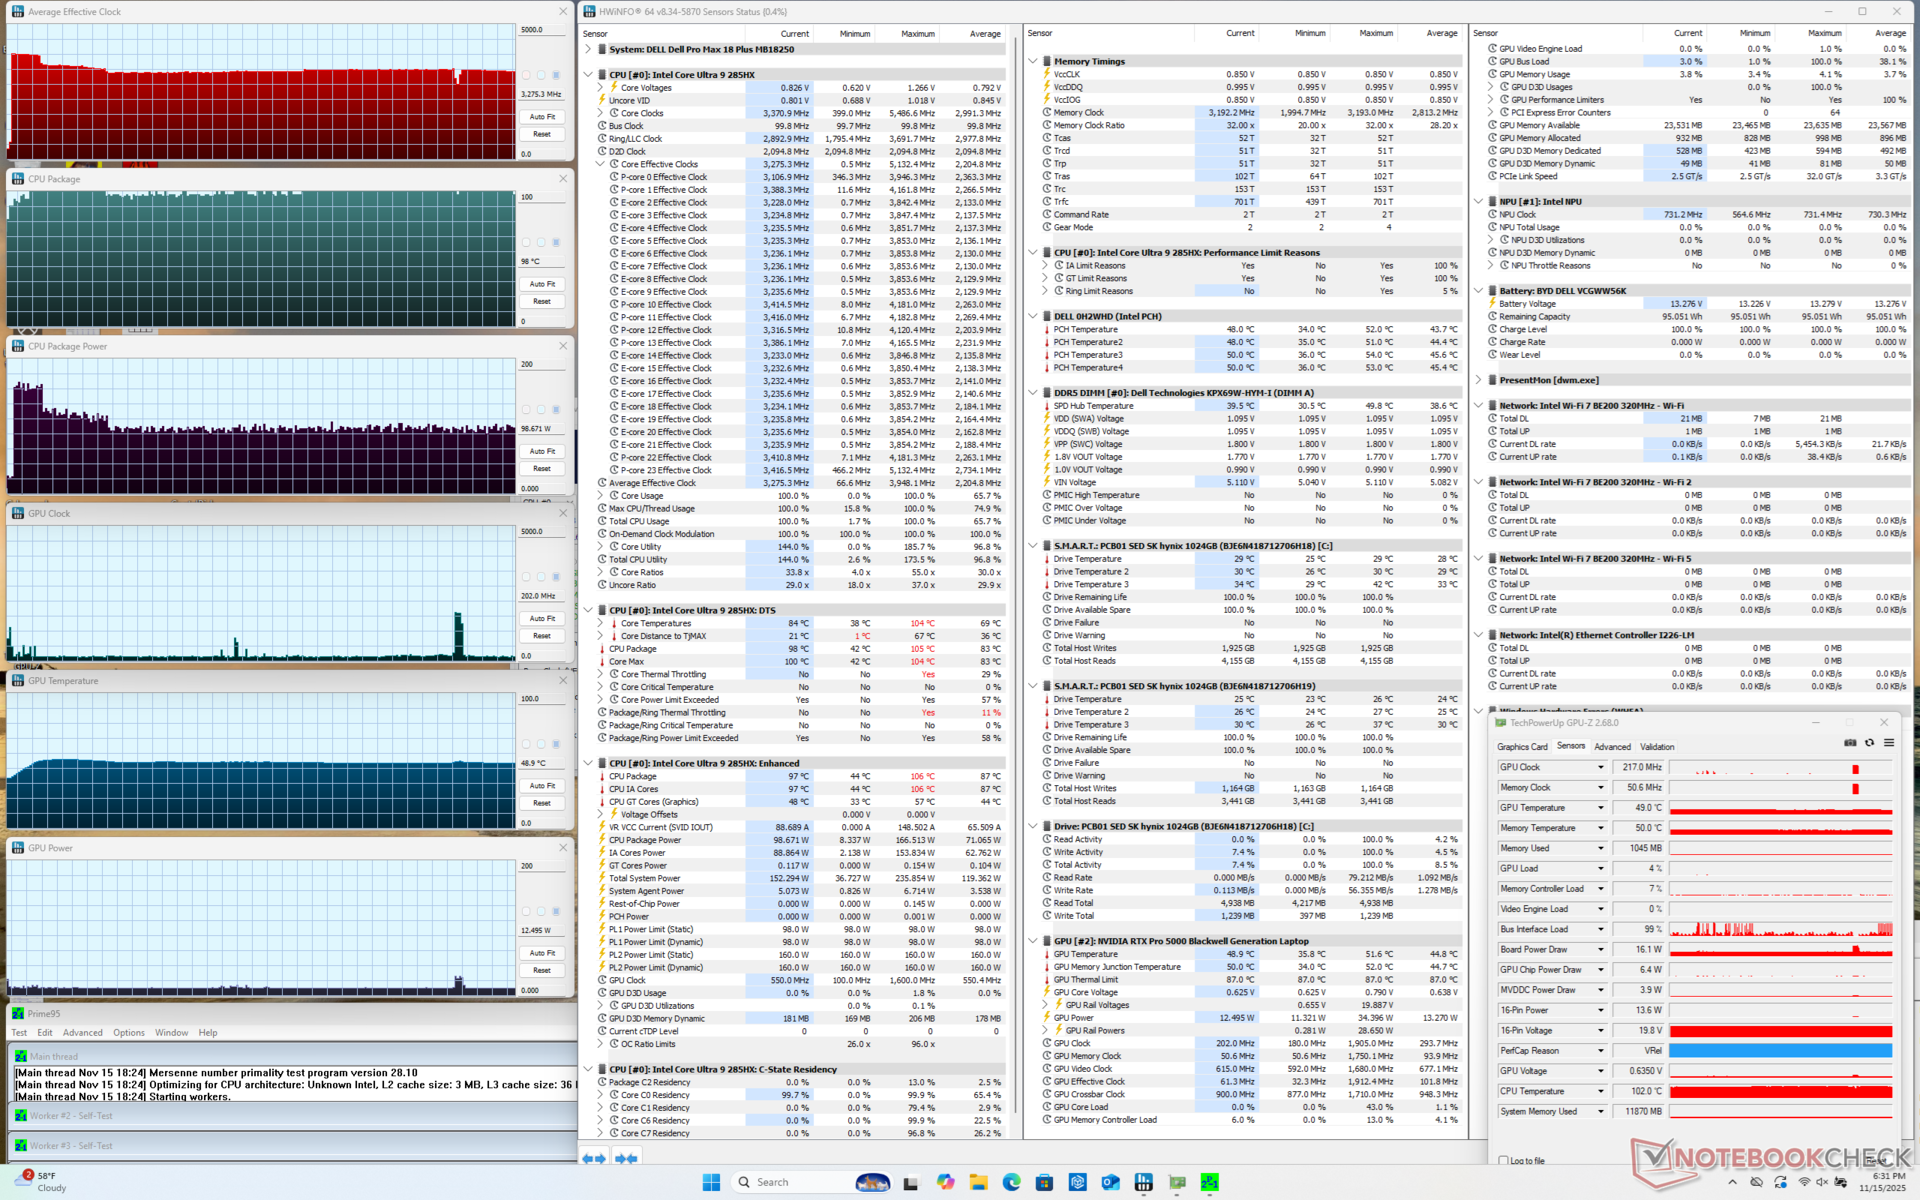
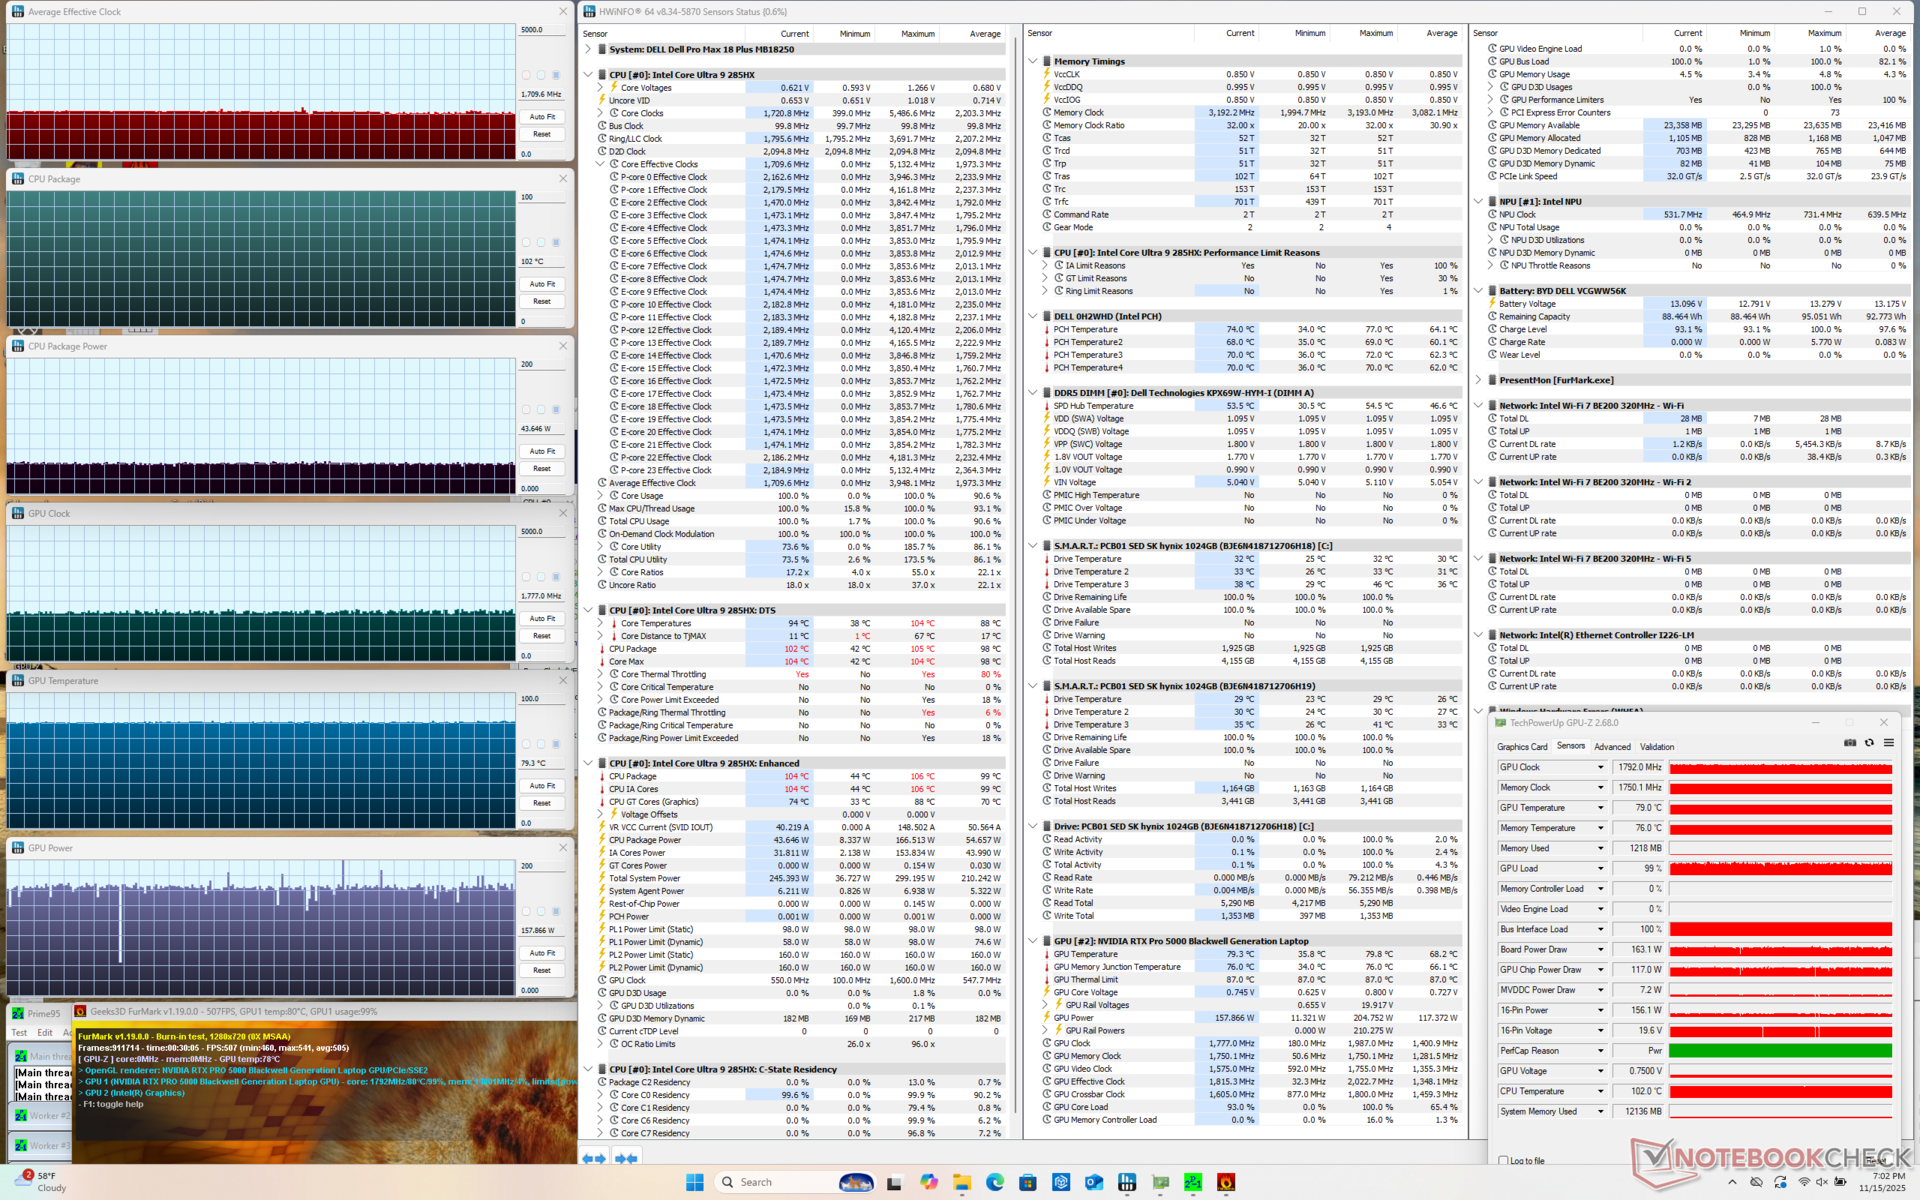
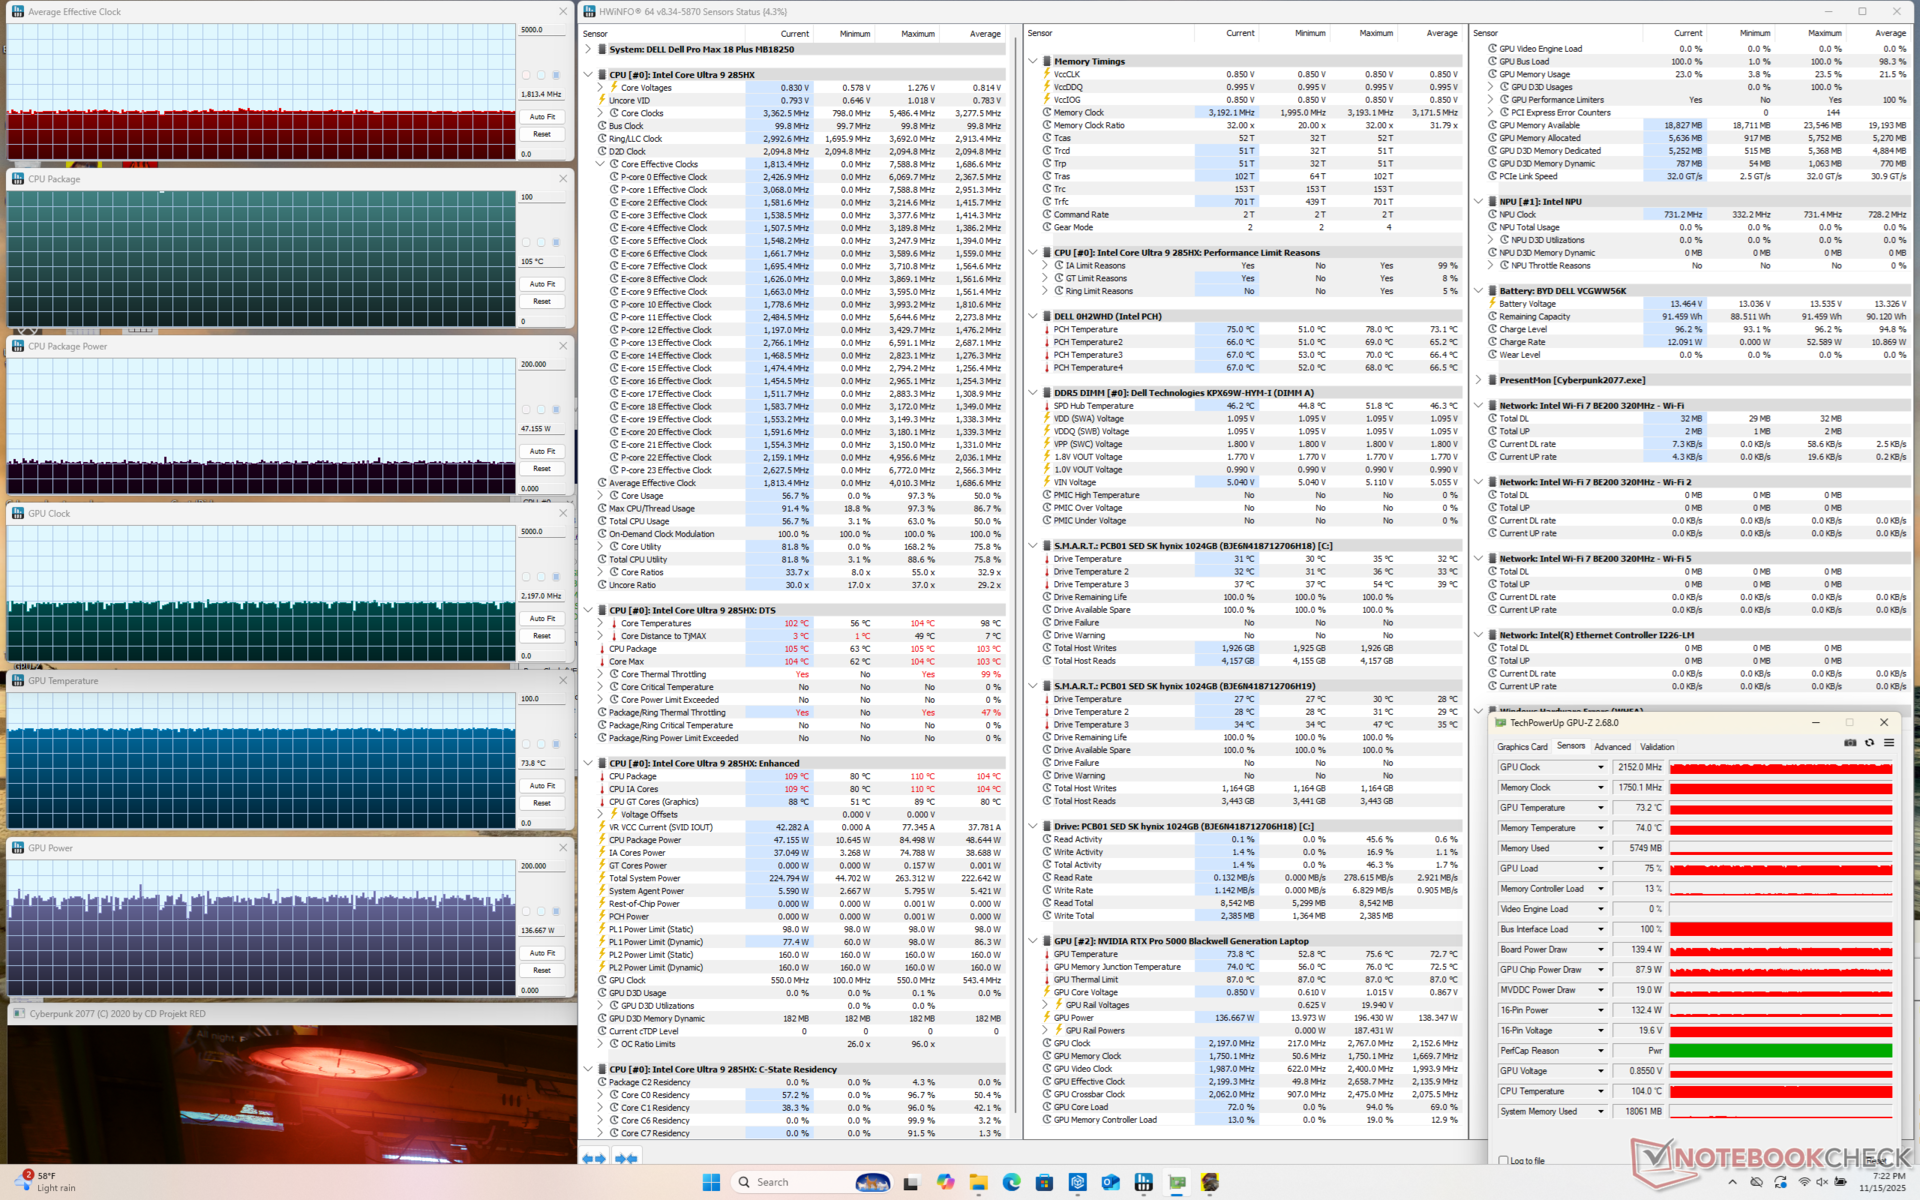
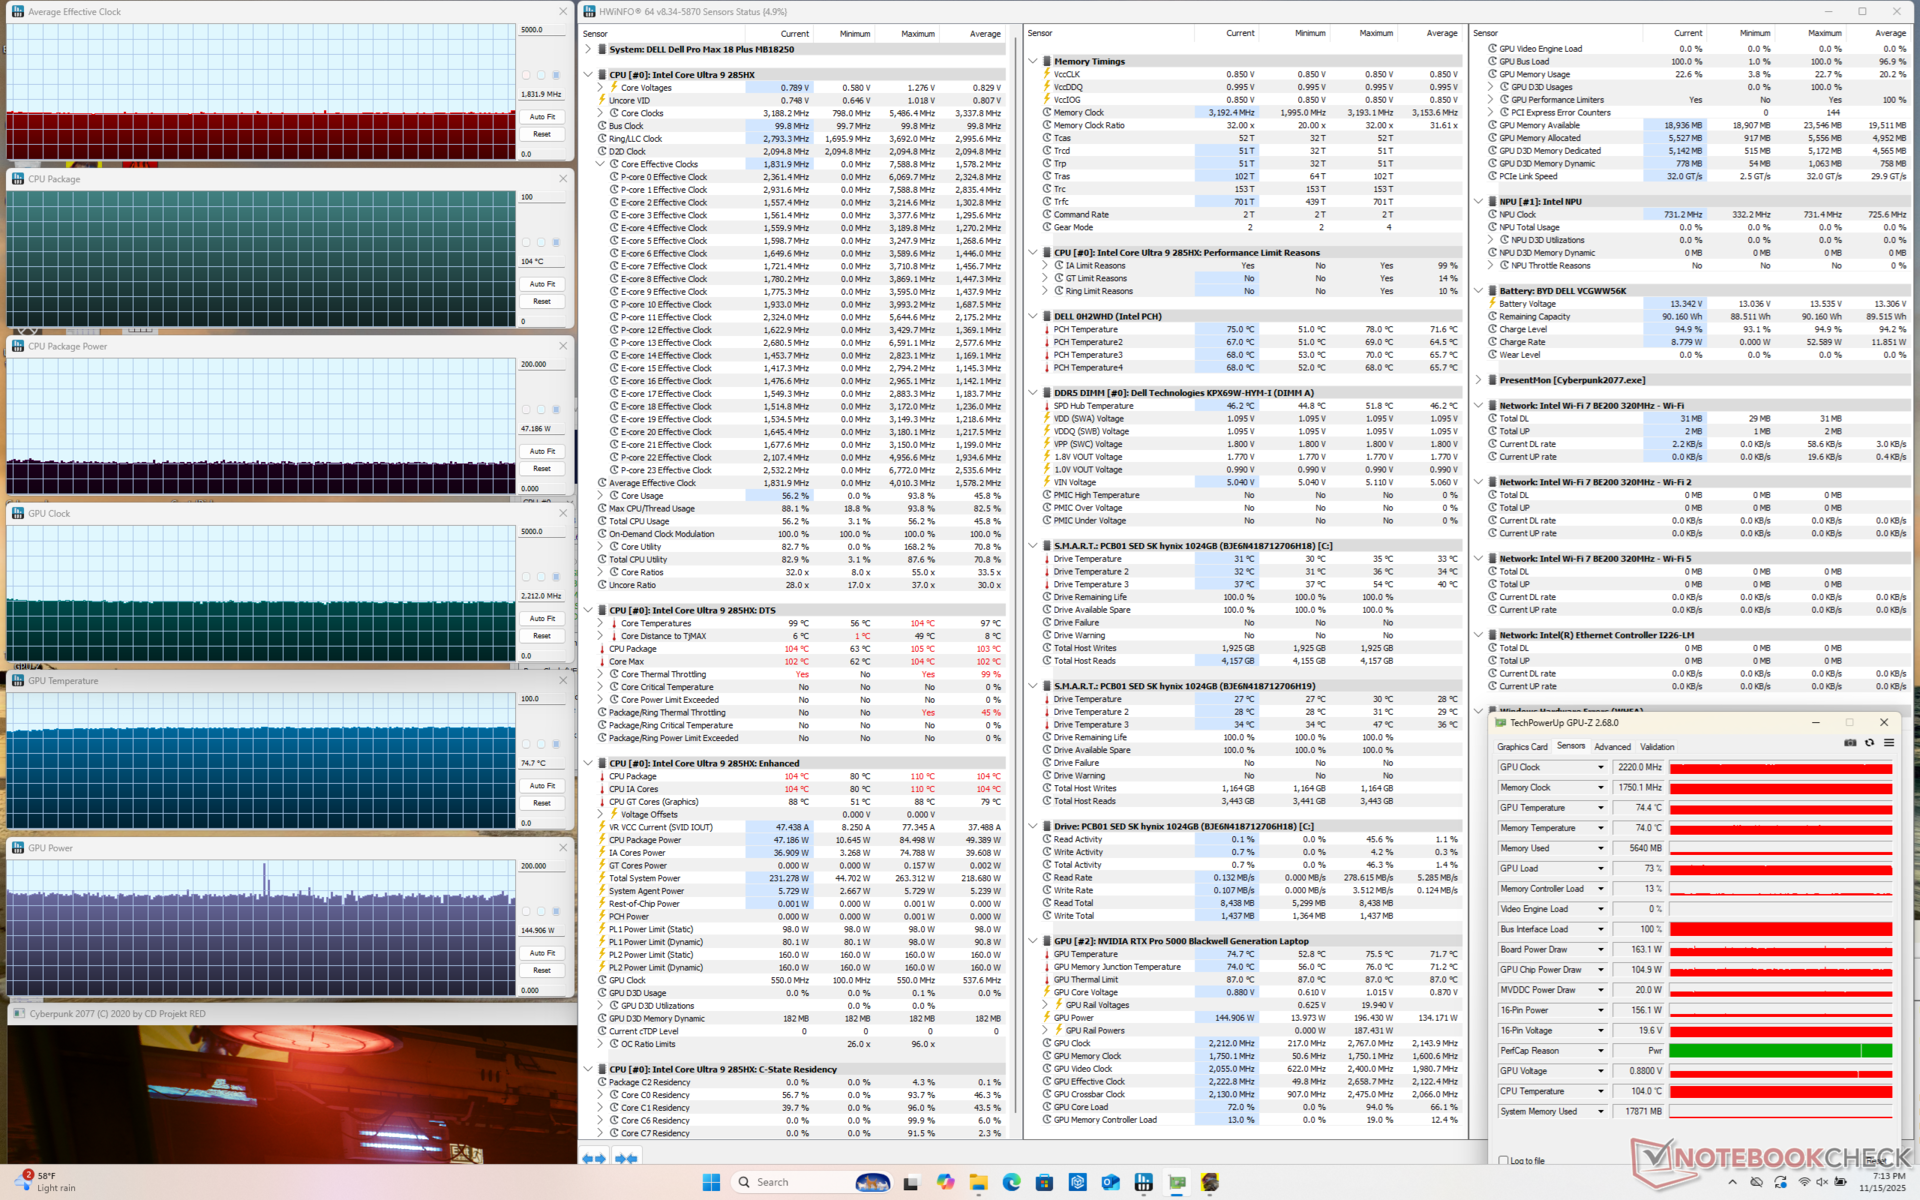
| Reloj medio de la CPU (GHz) | Reloj medio de la GPU (MHz) | Temperatura media dela CPU (°C) | Temperatura media de la GPU (°C) | |
| Sistema en reposo | -- | 225 | 43 | 36 |
| Prime95 Stress | 3.3 | -- | 99 | 49 |
| Estrés de Prime95 + FurMark | 1,7 | 1777 | 102 | 79 |
| Estrés de Cyberpunk 2077 (modo equilibrado) | 1.8 | 2197 | 105 | 74 |
| Cyberpunk 2077 Estrés (modo Rendimiento) | 1.8 | 2212 | 104 | 75 |
Rendimiento del sistema
PCMark 10 no se completaba con independencia de la configuración de la GPU, por lo que sus puntuaciones no se indican a continuación.
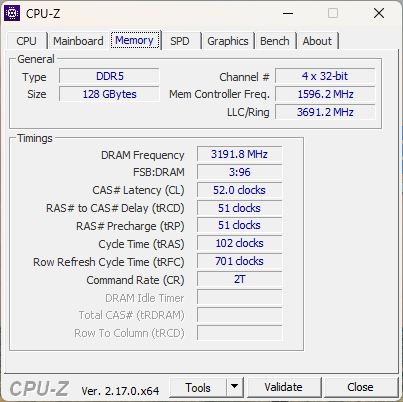
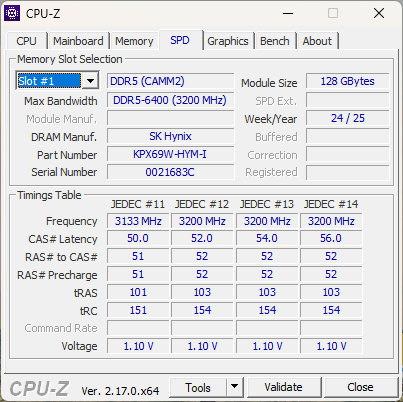
Las puntuaciones de memoria de AIDA64 son muy altas, especialmente para un portátil con 128 GB de RAM, debido al factor de forma CAMM2. El nuevo estándar se diseñó para superar muchas de las limitaciones del anticuado conector SODIMM.
CrossMark: Overall | Productivity | Creativity | Responsiveness
WebXPRT 3: Overall
WebXPRT 4: Overall
Mozilla Kraken 1.1: Total
| Performance rating | |
| Dell Pro Max 18 Plus MB18250 | |
| Medio Intel Core Ultra 9 285HX, NVIDIA RTX PRO 5000 Blackwell Generation Laptop | |
| Dell Pro Max 16 Plus | |
| Schenker Key 18 Pro M25 RTX 5090 | |
| HP ZBook X G1i 16 | |
| HP ZBook Studio 16 G11 | |
| Lenovo ThinkPad P16s Gen 4 21RX000YGE | |
| CrossMark / Overall | |
| Dell Pro Max 18 Plus MB18250 | |
| Dell Pro Max 16 Plus | |
| Medio Intel Core Ultra 9 285HX, NVIDIA RTX PRO 5000 Blackwell Generation Laptop (2142 - 2267, n=3) | |
| Schenker Key 18 Pro M25 RTX 5090 | |
| HP ZBook X G1i 16 | |
| HP ZBook Studio 16 G11 | |
| Lenovo ThinkPad P16s Gen 4 21RX000YGE | |
| CrossMark / Productivity | |
| Medio Intel Core Ultra 9 285HX, NVIDIA RTX PRO 5000 Blackwell Generation Laptop (2016 - 2028, n=3) | |
| Dell Pro Max 16 Plus | |
| Dell Pro Max 18 Plus MB18250 | |
| Schenker Key 18 Pro M25 RTX 5090 | |
| HP ZBook X G1i 16 | |
| HP ZBook Studio 16 G11 | |
| Lenovo ThinkPad P16s Gen 4 21RX000YGE | |
| CrossMark / Creativity | |
| Dell Pro Max 18 Plus MB18250 | |
| Dell Pro Max 16 Plus | |
| Medio Intel Core Ultra 9 285HX, NVIDIA RTX PRO 5000 Blackwell Generation Laptop (2395 - 2725, n=3) | |
| HP ZBook X G1i 16 | |
| Schenker Key 18 Pro M25 RTX 5090 | |
| HP ZBook Studio 16 G11 | |
| Lenovo ThinkPad P16s Gen 4 21RX000YGE | |
| CrossMark / Responsiveness | |
| Schenker Key 18 Pro M25 RTX 5090 | |
| Dell Pro Max 18 Plus MB18250 | |
| Medio Intel Core Ultra 9 285HX, NVIDIA RTX PRO 5000 Blackwell Generation Laptop (1806 - 1858, n=3) | |
| Dell Pro Max 16 Plus | |
| HP ZBook X G1i 16 | |
| HP ZBook Studio 16 G11 | |
| Lenovo ThinkPad P16s Gen 4 21RX000YGE | |
| WebXPRT 3 / Overall | |
| Dell Pro Max 18 Plus MB18250 | |
| Medio Intel Core Ultra 9 285HX, NVIDIA RTX PRO 5000 Blackwell Generation Laptop (327 - 360, n=3) | |
| Schenker Key 18 Pro M25 RTX 5090 | |
| Dell Pro Max 16 Plus | |
| HP ZBook X G1i 16 | |
| Lenovo ThinkPad P16s Gen 4 21RX000YGE | |
| HP ZBook Studio 16 G11 | |
| WebXPRT 4 / Overall | |
| Schenker Key 18 Pro M25 RTX 5090 | |
| Medio Intel Core Ultra 9 285HX, NVIDIA RTX PRO 5000 Blackwell Generation Laptop (306 - 323, n=3) | |
| Dell Pro Max 16 Plus | |
| Dell Pro Max 18 Plus MB18250 | |
| HP ZBook X G1i 16 | |
| HP ZBook Studio 16 G11 | |
| Lenovo ThinkPad P16s Gen 4 21RX000YGE | |
| Mozilla Kraken 1.1 / Total | |
| HP ZBook Studio 16 G11 | |
| Lenovo ThinkPad P16s Gen 4 21RX000YGE | |
| HP ZBook X G1i 16 | |
| Dell Pro Max 18 Plus MB18250 | |
| Dell Pro Max 16 Plus | |
| Medio Intel Core Ultra 9 285HX, NVIDIA RTX PRO 5000 Blackwell Generation Laptop (411 - 439, n=3) | |
| Schenker Key 18 Pro M25 RTX 5090 | |
* ... más pequeño es mejor
| AIDA64 / Memory Copy | |
| Dell Pro Max 16 Plus | |
| Dell Pro Max 18 Plus MB18250 | |
| Medio Intel Core Ultra 9 285HX (63431 - 93933, n=6) | |
| HP ZBook Studio 16 G11 | |
| Lenovo ThinkPad P16s Gen 4 21RX000YGE | |
| Schenker Key 18 Pro M25 RTX 5090 | |
| AIDA64 / Memory Read | |
| Dell Pro Max 16 Plus | |
| Dell Pro Max 18 Plus MB18250 | |
| Lenovo ThinkPad P16s Gen 4 21RX000YGE | |
| Medio Intel Core Ultra 9 285HX (67084 - 97565, n=6) | |
| HP ZBook Studio 16 G11 | |
| Schenker Key 18 Pro M25 RTX 5090 | |
| AIDA64 / Memory Write | |
| Dell Pro Max 18 Plus MB18250 | |
| Dell Pro Max 16 Plus | |
| Lenovo ThinkPad P16s Gen 4 21RX000YGE | |
| Medio Intel Core Ultra 9 285HX (64112 - 89691, n=6) | |
| HP ZBook Studio 16 G11 | |
| Schenker Key 18 Pro M25 RTX 5090 | |
| AIDA64 / Memory Latency | |
| Schenker Key 18 Pro M25 RTX 5090 | |
| Medio Intel Core Ultra 9 285HX (104.8 - 151.7, n=6) | |
| HP ZBook Studio 16 G11 | |
| Dell Pro Max 16 Plus | |
| Dell Pro Max 18 Plus MB18250 | |
| Lenovo ThinkPad P16s Gen 4 21RX000YGE | |
* ... más pequeño es mejor
Latencia del CPD
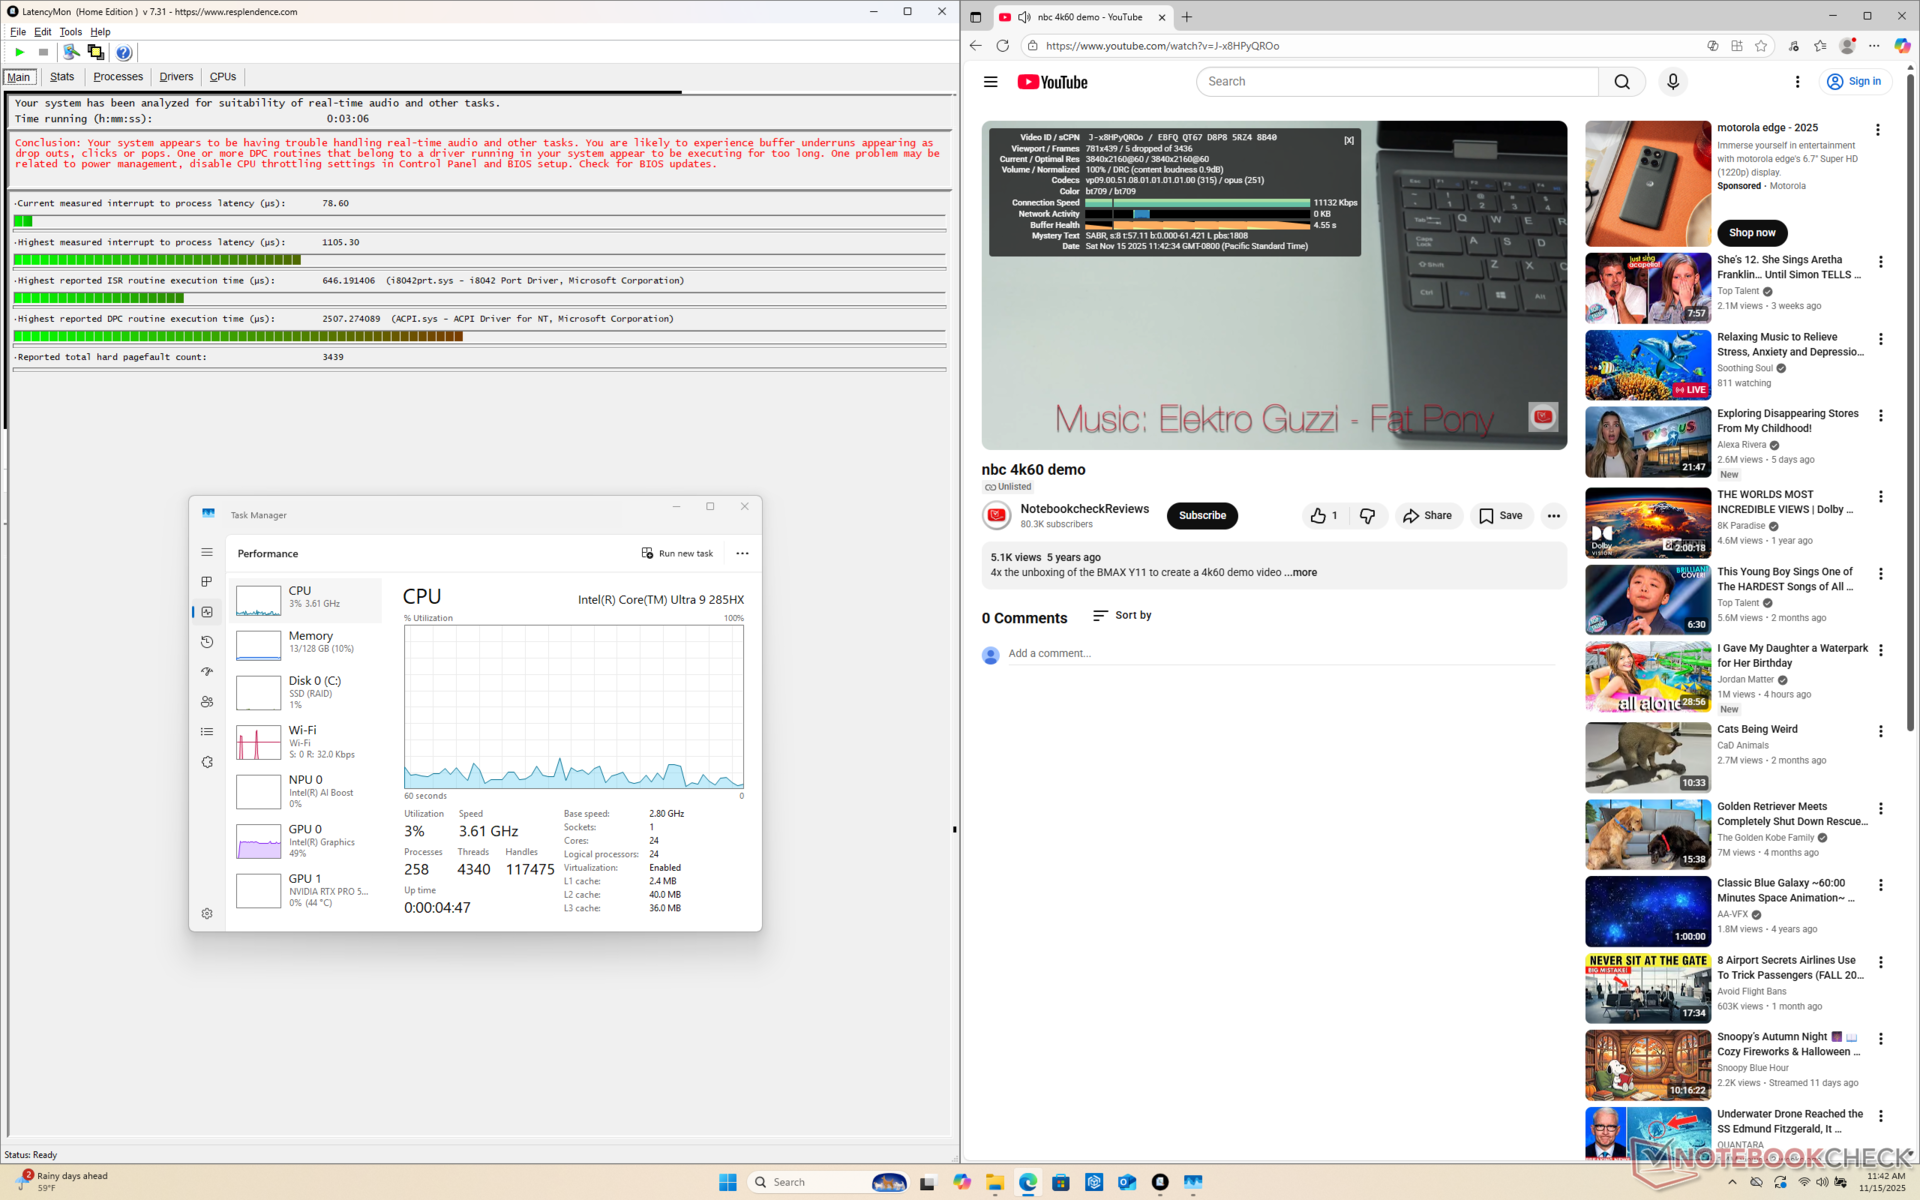
| DPC Latencies / LatencyMon - interrupt to process latency (max), Web, Youtube, Prime95 | |
| Schenker Key 18 Pro M25 RTX 5090 | |
| Dell Pro Max 16 Plus | |
| HP ZBook Studio 16 G11 | |
| Dell Pro Max 18 Plus MB18250 | |
| Lenovo ThinkPad P16s Gen 4 21RX000YGE | |
| HP ZBook X G1i 16 | |
* ... más pequeño es mejor
Dispositivos de almacenamiento
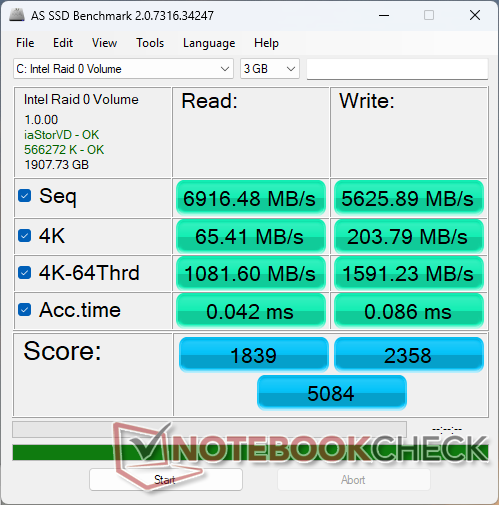
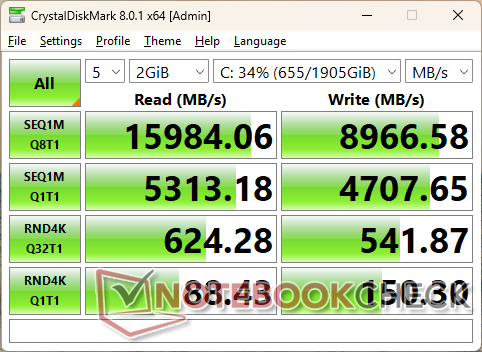
Nuestra unidad de prueba funciona con dos SK hynix PCB01 SSD PCIe5 en configuración RAID 0. Una sola unidad puede alcanzar velocidades de transferencia de ~16000 MB/s aunque sólo durante unos minutos seguidos, según los resultados de nuestra prueba en bucle DiskSpd que se muestran a continuación.

| Drive Performance rating - Percent | |
| Schenker Key 18 Pro M25 RTX 5090 | |
| HP ZBook X G1i 16 | |
| Dell Pro Max 16 Plus | |
| Dell Pro Max 18 Plus MB18250 | |
| Lenovo ThinkPad P16s Gen 4 21RX000YGE | |
| HP ZBook Studio 16 G11 | |
* ... más pequeño es mejor
Estrangulamiento de disco: Bucle de lectura DiskSpd, profundidad de cola 8
Rendimiento de la GPU
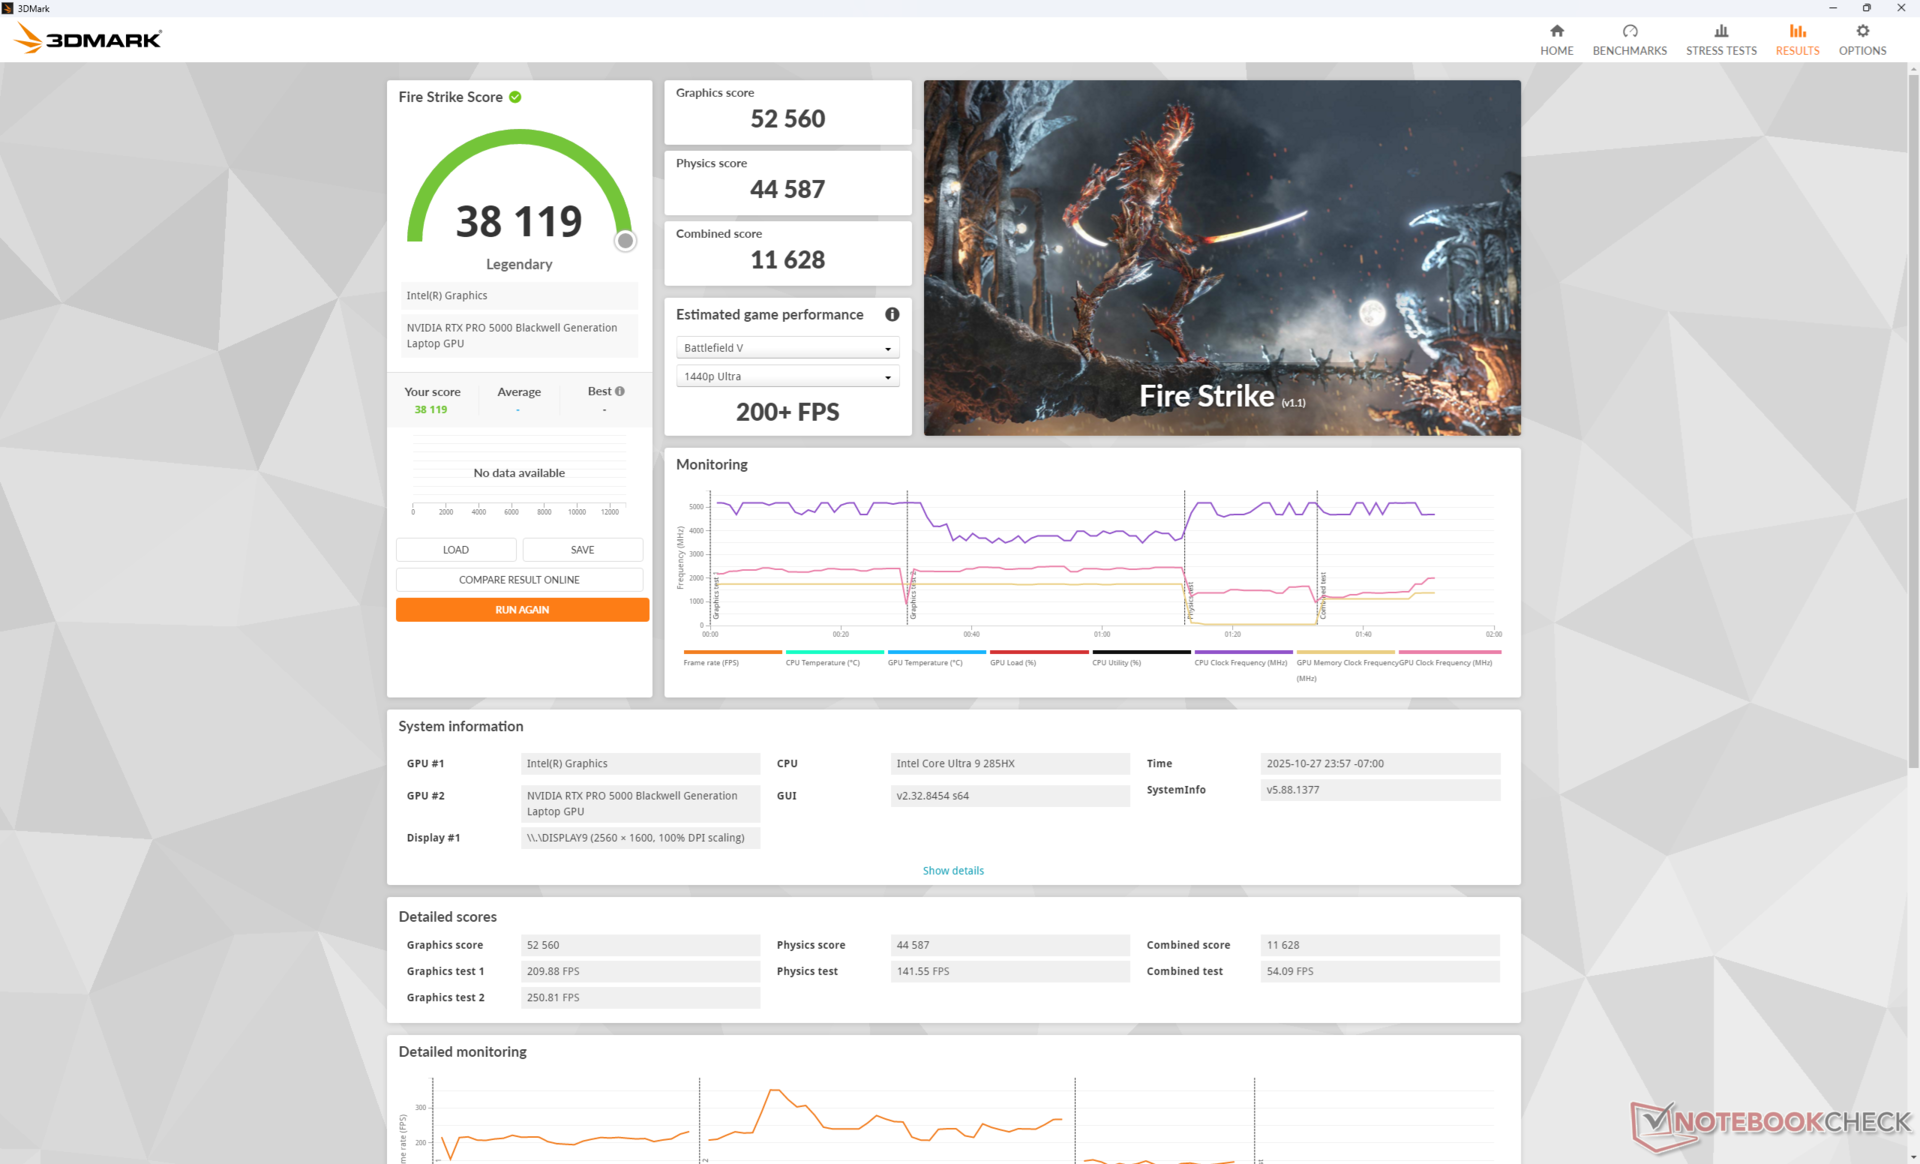
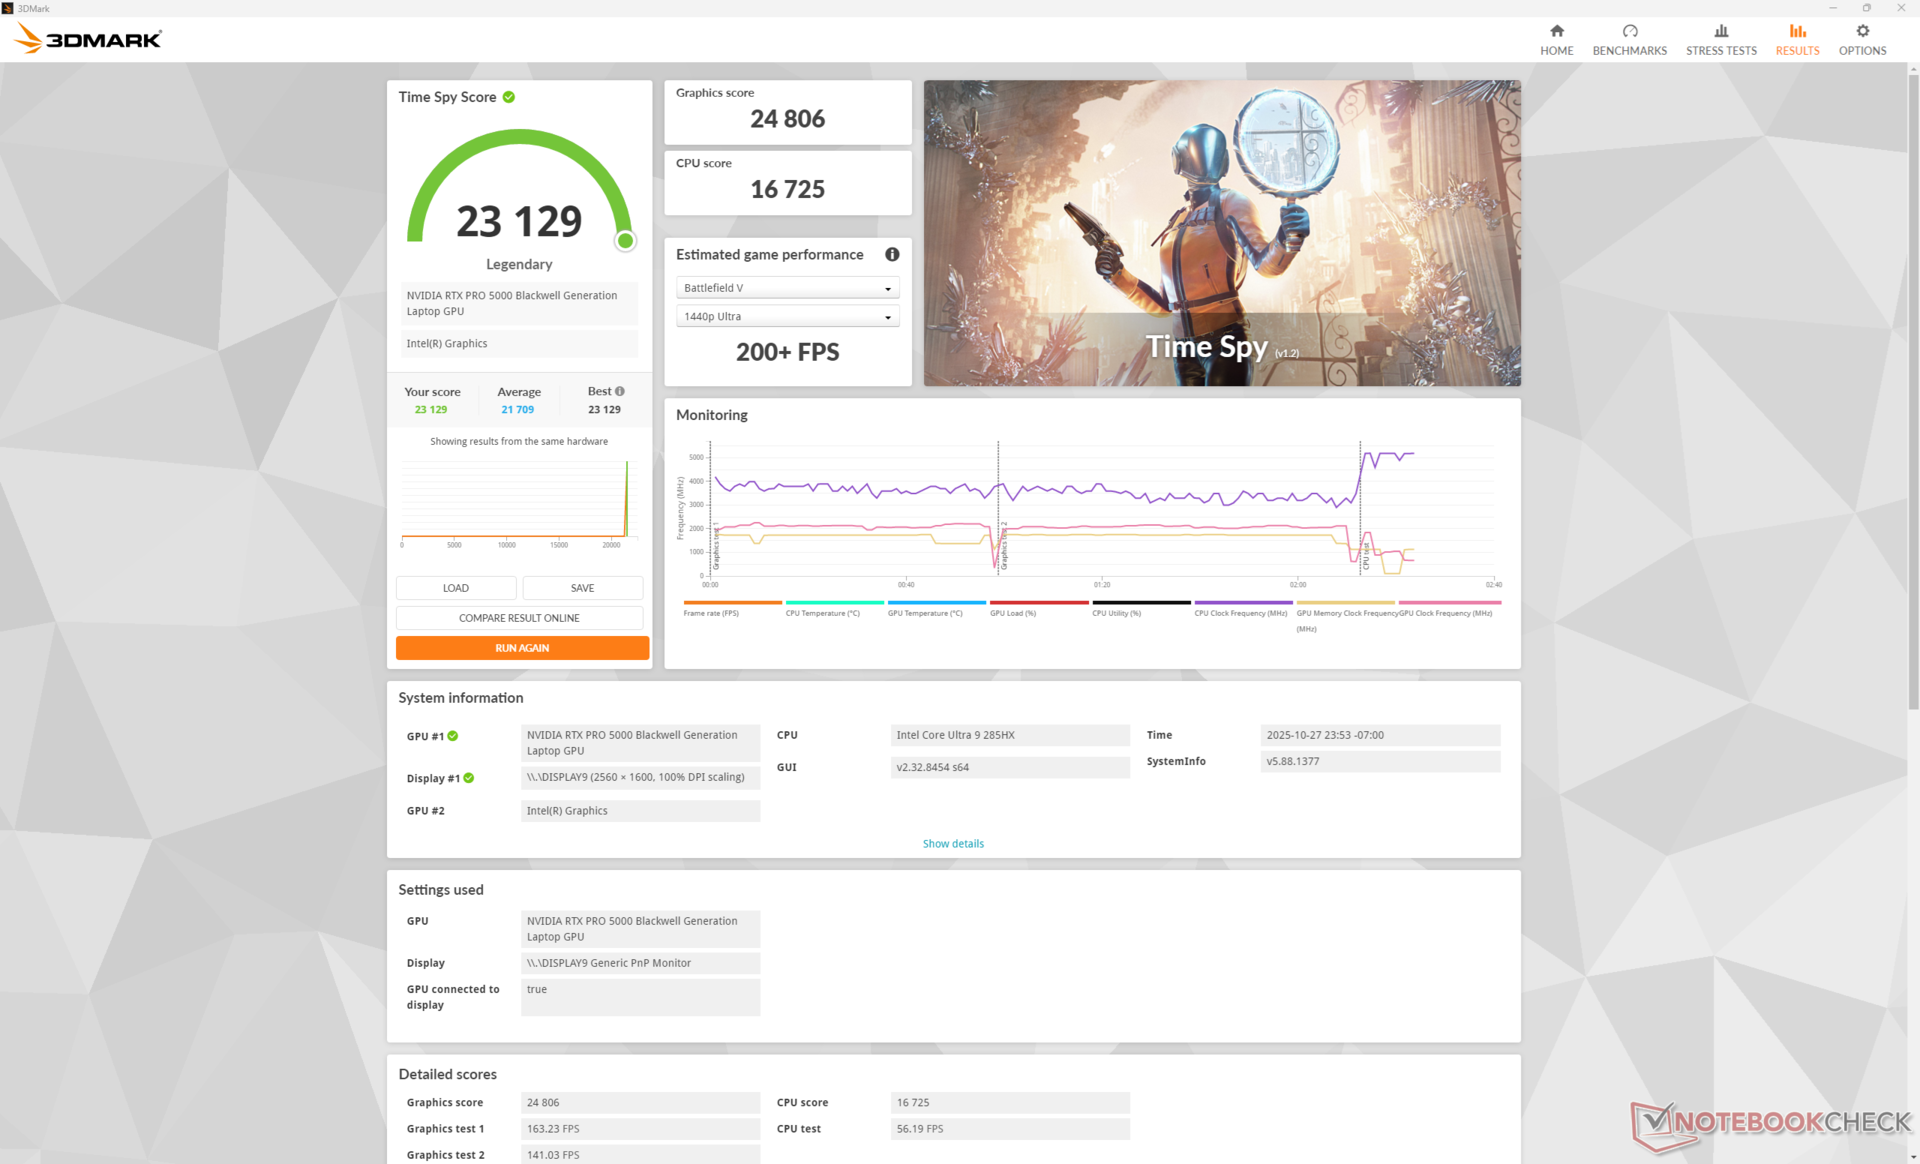
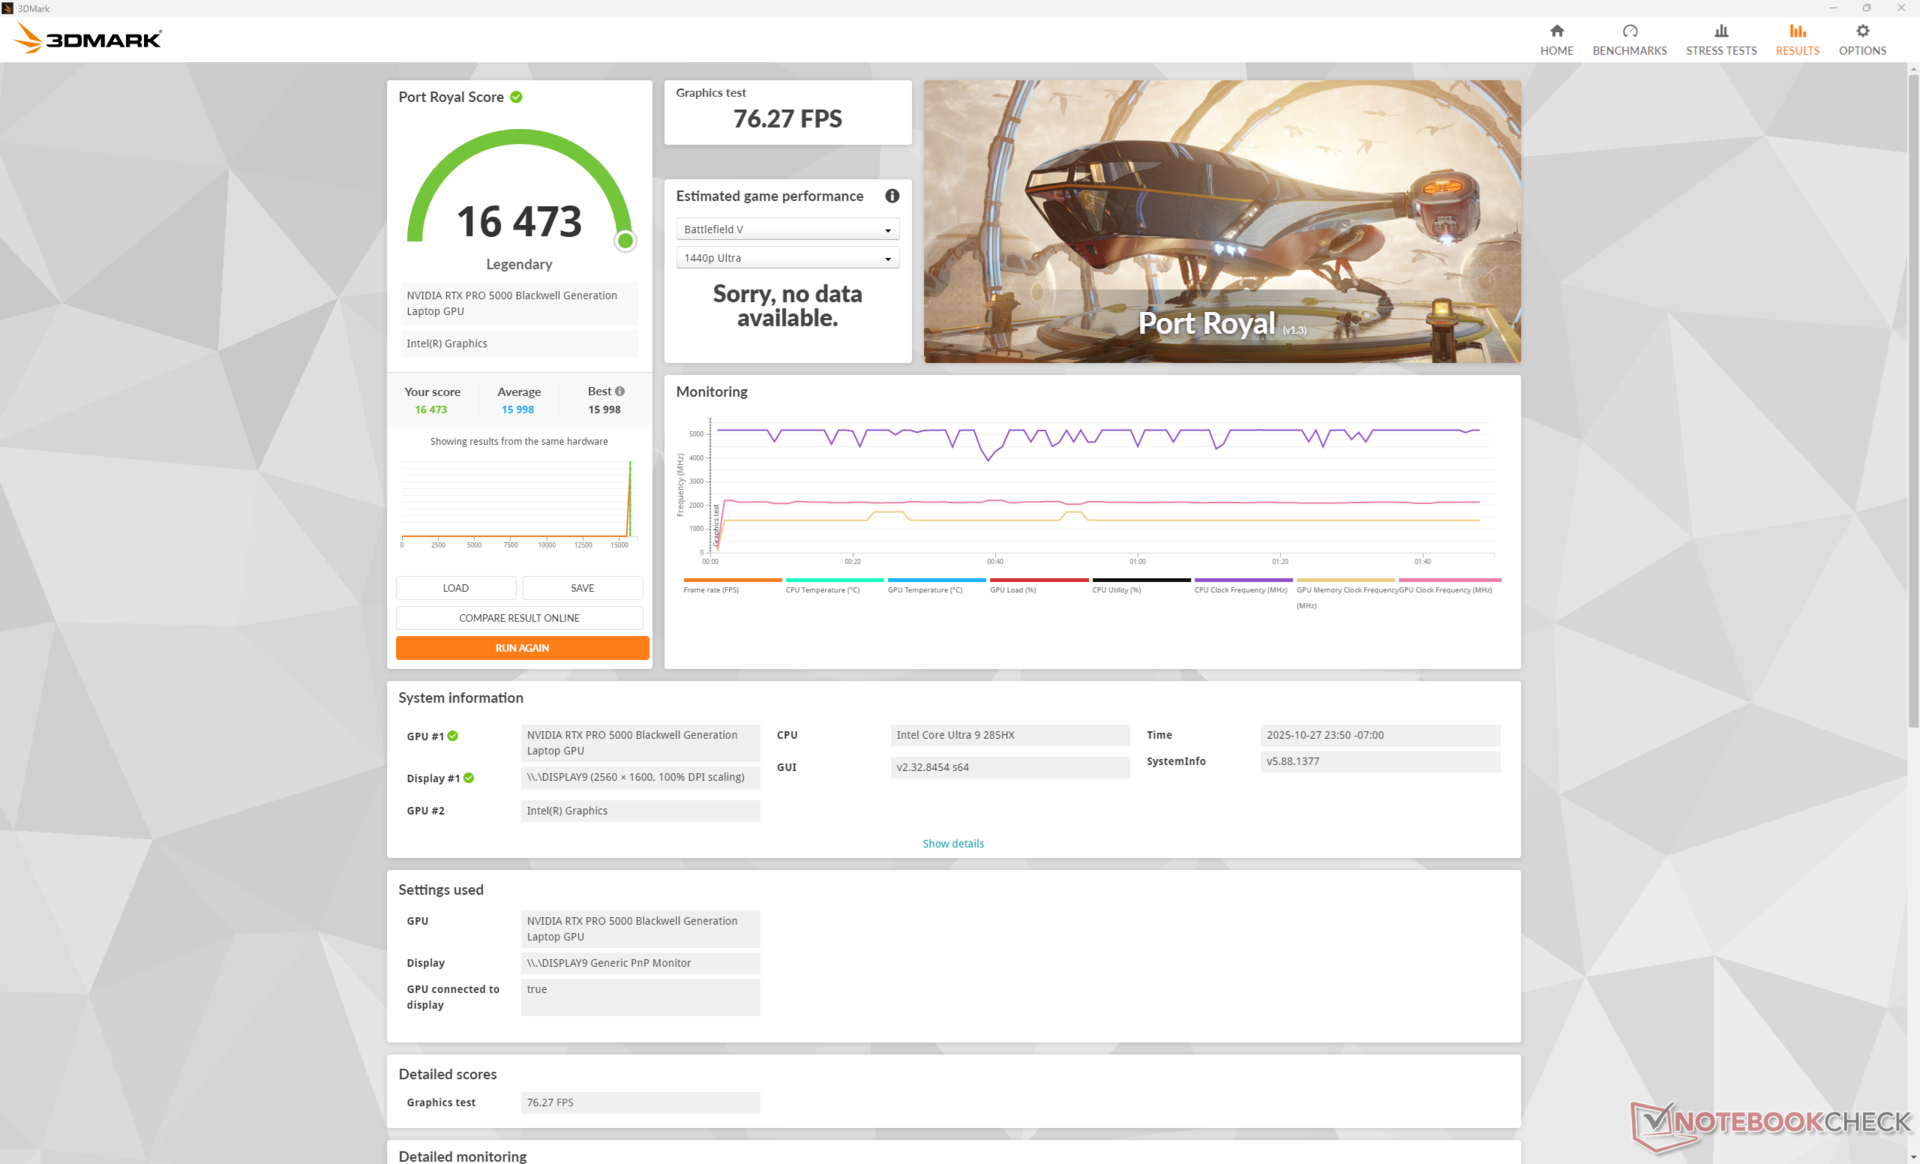
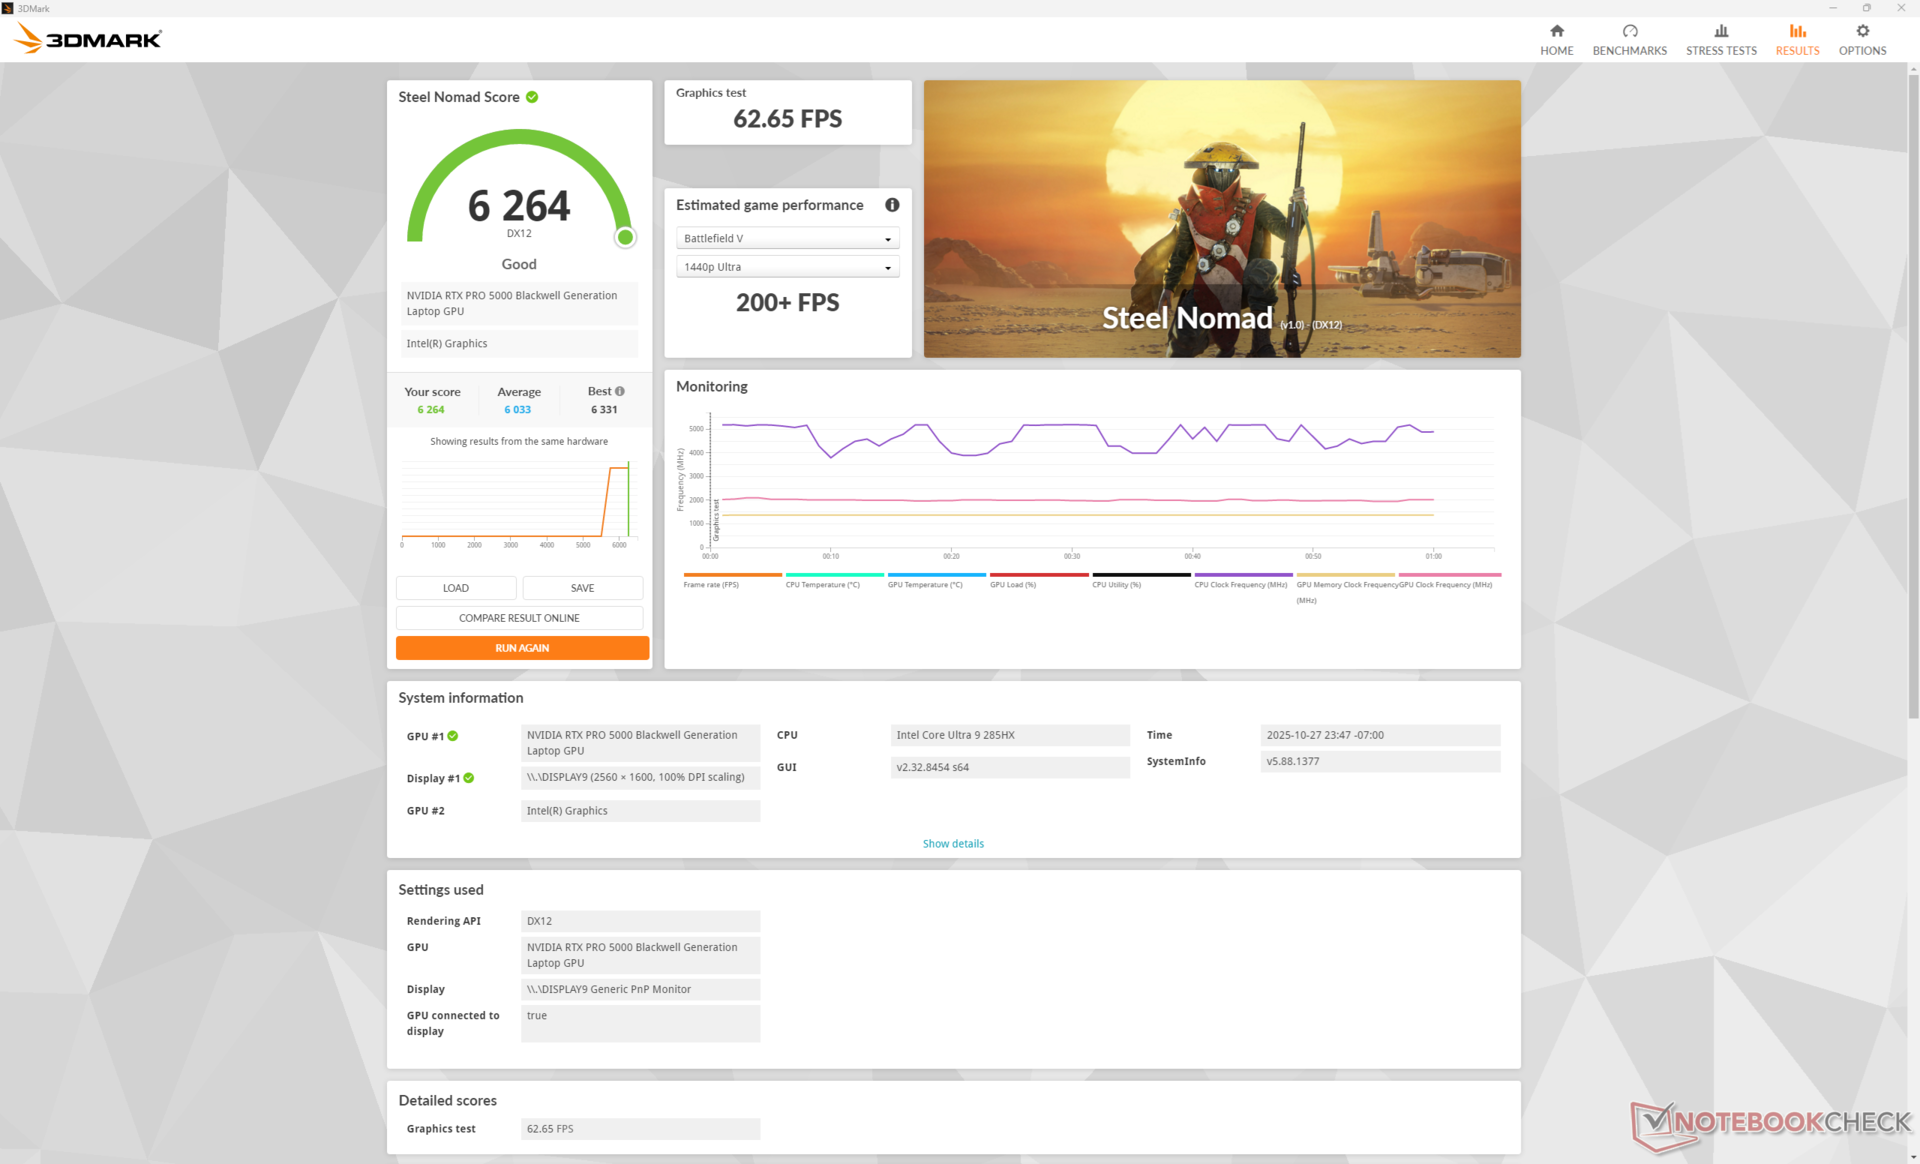
El rendimiento gráfico es ligeramente más rápido por sólo unos puntos porcentuales que en el Dell Pro Max 16 Plus equipado con la misma GPU. El consumo medio de la tarjeta GPU es de unos 163 W en el modo Rendimiento, lo que se acerca al máximo de 175 W.
| Perfil de potencia | Puntuación gráfica | Puntuación física | Puntuación combinada |
| Modo Rendimiento | 52560 | 44587 | 11628 |
| Modo equilibrado | 47593 (-10%) | 47039 (+6%) | 11029 (-5%) |
| Batería | 22941 (-56%) | 32131 (-28%) | 6944 (-40%) |
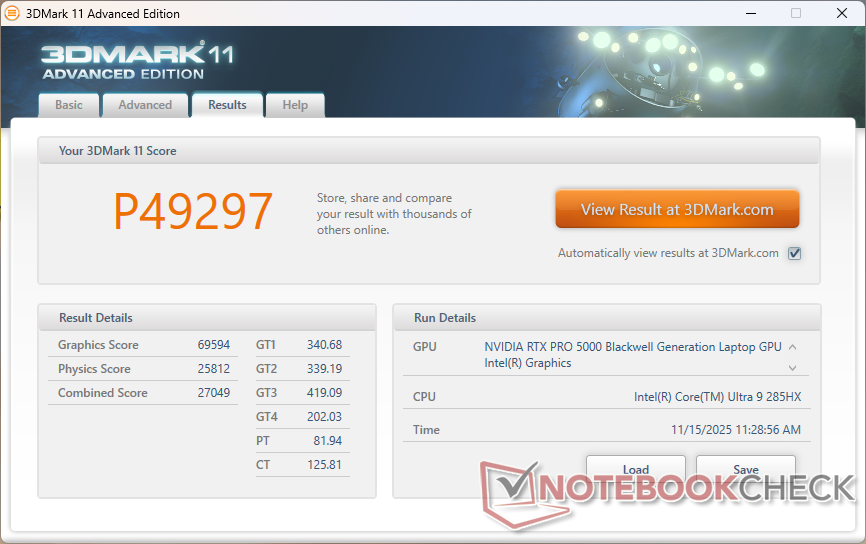
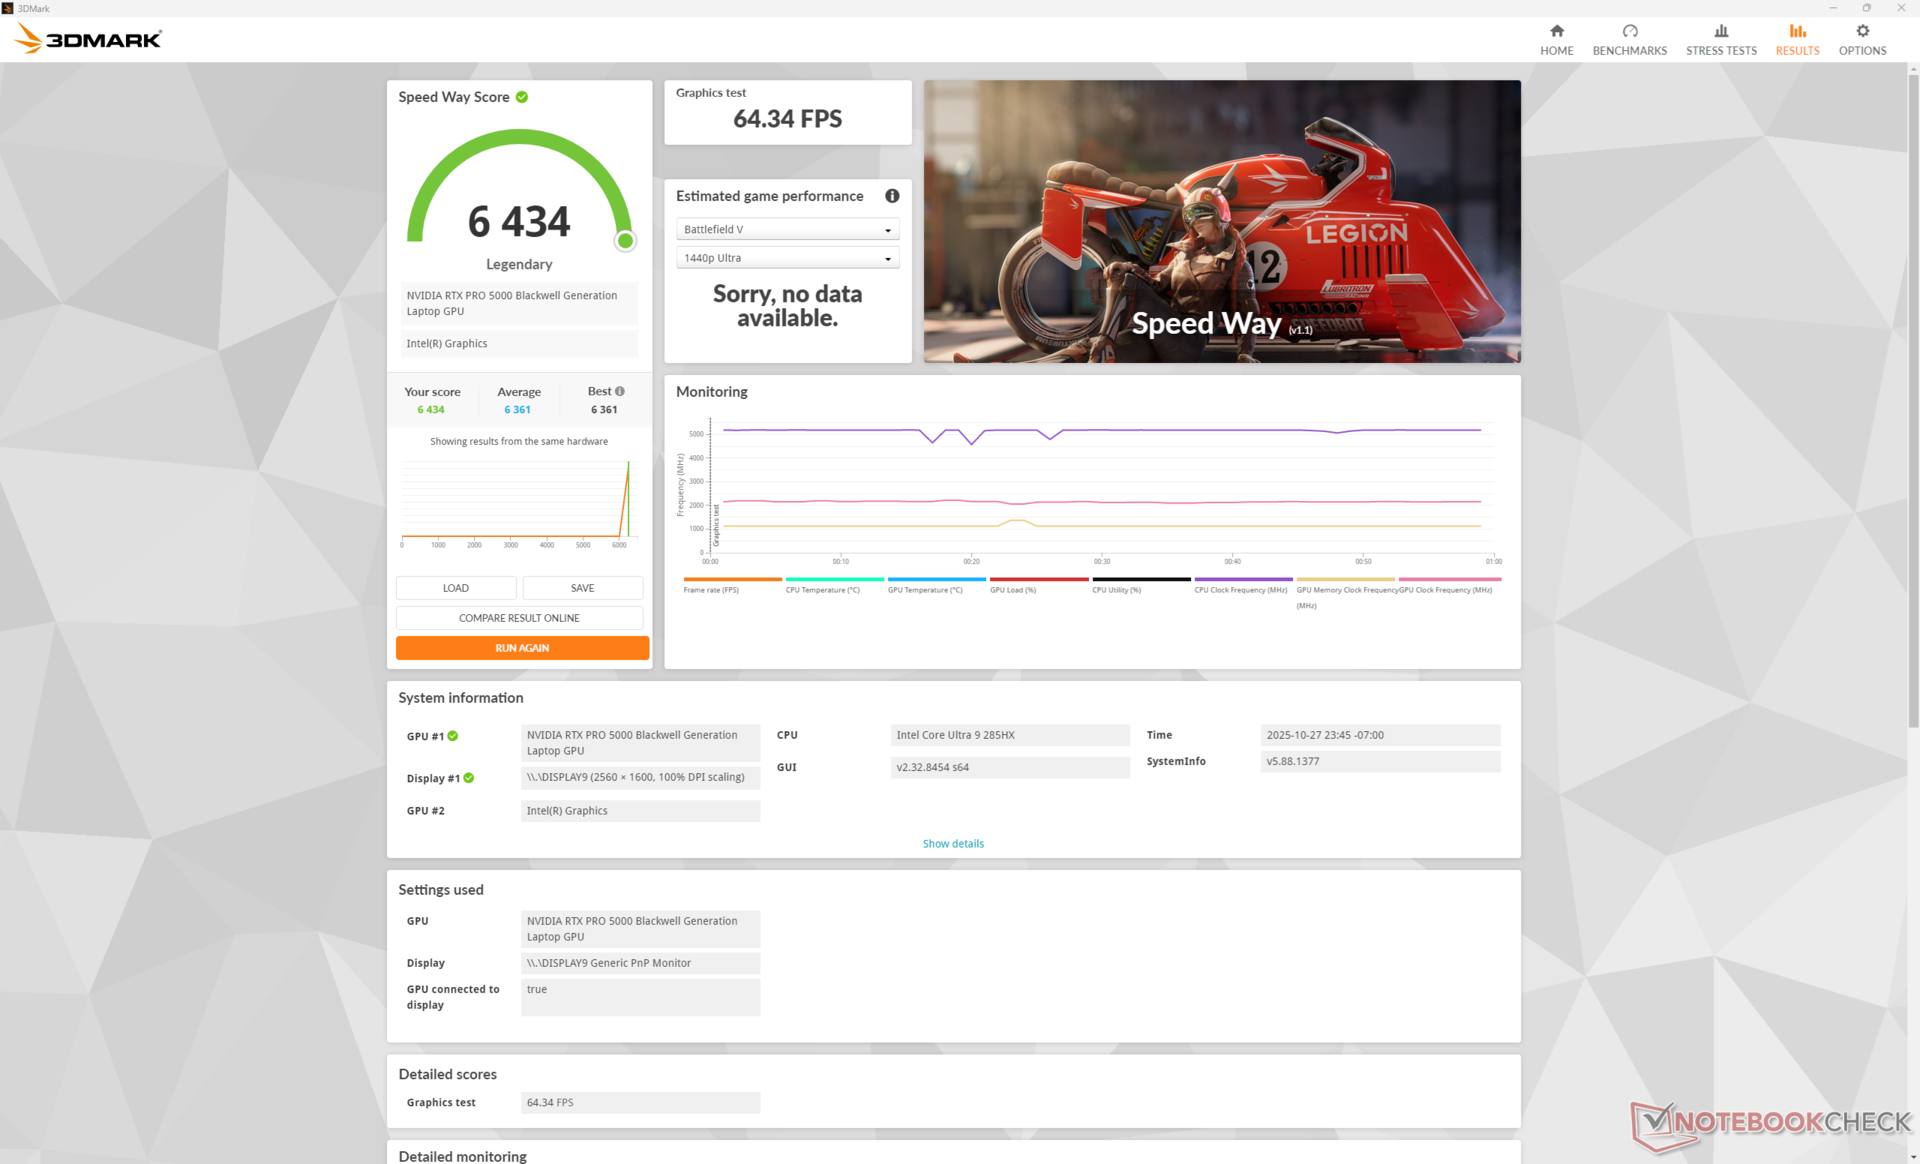
| 3DMark 11 Performance | 49297 puntos | |
| 3DMark Cloud Gate Standard Score | 67936 puntos | |
| 3DMark Fire Strike Score | 38119 puntos | |
| 3DMark Time Spy Score | 23129 puntos | |
| 3DMark Steel Nomad Score | 6264 puntos | |
ayuda | ||
* ... más pequeño es mejor
| Performance rating - Percent | |
| Dell Pro Max 18 Plus MB18250 | |
| Schenker Key 18 Pro M25 RTX 5090 | |
| Dell Pro Max 16 Plus | |
| HP ZBook X G1i 16 | |
| HP ZBook Studio 16 G11 | |
| Lenovo ThinkPad P16s Gen 4 21RX000YGE -1! | |
| Cyberpunk 2077 - 1920x1080 Ultra Preset (FSR off) | |
| Dell Pro Max 18 Plus MB18250 | |
| Schenker Key 18 Pro M25 RTX 5090 | |
| Dell Pro Max 16 Plus | |
| HP ZBook X G1i 16 | |
| HP ZBook Studio 16 G11 | |
| Lenovo ThinkPad P16s Gen 4 21RX000YGE | |
| Baldur's Gate 3 - 1920x1080 Ultra Preset AA:T | |
| Dell Pro Max 18 Plus MB18250 | |
| Dell Pro Max 16 Plus | |
| Schenker Key 18 Pro M25 RTX 5090 | |
| HP ZBook Studio 16 G11 | |
| HP ZBook X G1i 16 | |
| Lenovo ThinkPad P16s Gen 4 21RX000YGE | |
| GTA V - 1920x1080 Highest AA:4xMSAA + FX AF:16x | |
| Dell Pro Max 18 Plus MB18250 | |
| Schenker Key 18 Pro M25 RTX 5090 | |
| Dell Pro Max 16 Plus | |
| HP ZBook X G1i 16 | |
| HP ZBook Studio 16 G11 | |
| Lenovo ThinkPad P16s Gen 4 21RX000YGE | |
| Final Fantasy XV Benchmark - 1920x1080 High Quality | |
| Dell Pro Max 18 Plus MB18250 | |
| Dell Pro Max 16 Plus | |
| Schenker Key 18 Pro M25 RTX 5090 | |
| HP ZBook X G1i 16 | |
| HP ZBook Studio 16 G11 | |
| Lenovo ThinkPad P16s Gen 4 21RX000YGE | |
| Strange Brigade - 1920x1080 ultra AA:ultra AF:16 | |
| Dell Pro Max 18 Plus MB18250 | |
| Schenker Key 18 Pro M25 RTX 5090 | |
| Dell Pro Max 16 Plus | |
| HP ZBook Studio 16 G11 | |
| HP ZBook X G1i 16 | |
| Dota 2 Reborn - 1920x1080 ultra (3/3) best looking | |
| Dell Pro Max 16 Plus | |
| Dell Pro Max 18 Plus MB18250 | |
| Schenker Key 18 Pro M25 RTX 5090 | |
| HP ZBook Studio 16 G11 | |
| HP ZBook X G1i 16 | |
| Lenovo ThinkPad P16s Gen 4 21RX000YGE | |
| X-Plane 11.11 - 1920x1080 high (fps_test=3) | |
| Dell Pro Max 18 Plus MB18250 | |
| Dell Pro Max 16 Plus | |
| Schenker Key 18 Pro M25 RTX 5090 | |
| HP ZBook Studio 16 G11 | |
| HP ZBook X G1i 16 | |
| Lenovo ThinkPad P16s Gen 4 21RX000YGE | |
| Dota 2 Reborn - 3840x2160 ultra (3/3) best looking | |
| HP ZBook Fury 16 G10 | |
| Schenker Key 18 Pro M25 RTX 5090 | |
| Dell Pro Max 18 Plus MB18250 | |
| Medio NVIDIA RTX PRO 5000 Blackwell Generation Laptop (143.9 - 149.4, n=3) | |
| Dell Pro Max 16 Plus | |
| Dell Precision 7000 7670 Performance | |
Cyberpunk 2077 ultra FPS Gráfico
| bajo | medio | alto | ultra | QHD DLSS | QHD | 4K DLSS | 4K FSR | 4K | |
|---|---|---|---|---|---|---|---|---|---|
| GTA V (2015) | 186.7 | 185.8 | 178.3 | 156.1 | 152.6 | ||||
| Dota 2 Reborn (2015) | 219 | 179.8 | 182 | 163.9 | 149.4 | ||||
| Final Fantasy XV Benchmark (2018) | 233 | 232 | 197.6 | 156.9 | 101.5 | ||||
| X-Plane 11.11 (2018) | 154.4 | 133.2 | 104.2 | 94.4 | |||||
| Strange Brigade (2018) | 548 | 442 | 426 | 418 | 351 | 188.7 | |||
| Baldur's Gate 3 (2023) | 253 | 238 | 212 | 205 | 198.2 | 150.3 | 126.3 | 85.9 | |
| Cyberpunk 2077 (2023) | 176 | 174.3 | 161.4 | 152.4 | 130.3 | 116.7 | |||
| F1 24 (2024) | 338 | 322 | 322 | 147.7 | 148.6 | 101.8 | 85.7 | 83.6 | 50.2 |
Emisiones
Ruido del sistema
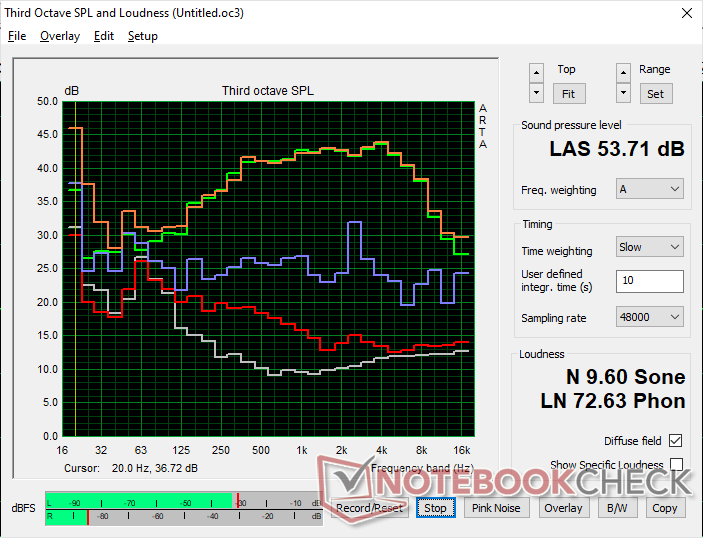
Los tres ventiladores internos están casi siempre activos, por lo que el sistema nunca es verdaderamente silencioso en la mayoría de los casos. Aun así, son casi inaudibles en una oficina típica durante la mayoría de las cargas de trabajo bajas a medias y no se hacen perceptibles hasta que se introducen cargas mucho más altas. Somos capaces de alcanzar casi 54 dB(A) cuando ejecutamos juegos o cargas similares en modo Equilibrado o en modo Rendimiento.
Quizás por casualidad, el comportamiento del ventilador y las mediciones son muy similares a las que registramos en el Dell Pro Max 16 Plus.
Ruido
| Ocioso |
| 27.1 / 27.1 / 27.1 dB(A) |
| Carga |
| 38 / 53.8 dB(A) |
 | ||
30 dB silencioso 40 dB(A) audible 50 dB(A) ruidosamente alto |
||
min: | ||
| Dell Pro Max 18 Plus MB18250 Ultra 9 285HX, RTX PRO 5000 Blackwell Generation Laptop | Schenker Key 18 Pro M25 RTX 5090 Ultra 9 275HX, GeForce RTX 5090 Laptop | HP ZBook X G1i 16 Ultra 7 265H, RTX PRO 2000 Blackwell Generation Laptop | HP ZBook Studio 16 G11 Ultra 9 185H, RTX 3000 Ada Generation Laptop | Lenovo ThinkPad P16s Gen 4 21RX000YGE Ryzen AI 9 HX PRO 370, Radeon 890M | Dell Pro Max 16 Plus Ultra 9 285HX, RTX PRO 5000 Blackwell Generation Laptop | |
|---|---|---|---|---|---|---|
| Noise | -3% | 9% | 6% | -0% | -6% | |
| apagado / medio ambiente * (dB) | 23.1 | 23.9 -3% | 23.7 -3% | 23.8 -3% | 25.9 -12% | 23.2 -0% |
| Idle Minimum * (dB) | 27.1 | 25.2 7% | 23.7 13% | 23.8 12% | 25.9 4% | 26.7 1% |
| Idle Average * (dB) | 27.1 | 25.2 7% | 23.7 13% | 26.4 3% | 25.9 4% | 30.5 -13% |
| Idle Maximum * (dB) | 27.1 | 25.2 7% | 23.7 13% | 26.4 3% | 28.5 -5% | 34 -25% |
| Load Average * (dB) | 38 | 47.8 -26% | 32.7 14% | 33.7 11% | 42.9 -13% | 39.8 -5% |
| Cyberpunk 2077 ultra * (dB) | 53.8 | 54.4 -1% | 50.9 5% | 46.1 14% | 48.7 9% | 54.3 -1% |
| Load Maximum * (dB) | 53.8 | 58.6 -9% | 48 11% | 53.2 1% | 48.5 10% | 54.3 -1% |
* ... más pequeño es mejor
Temperatura
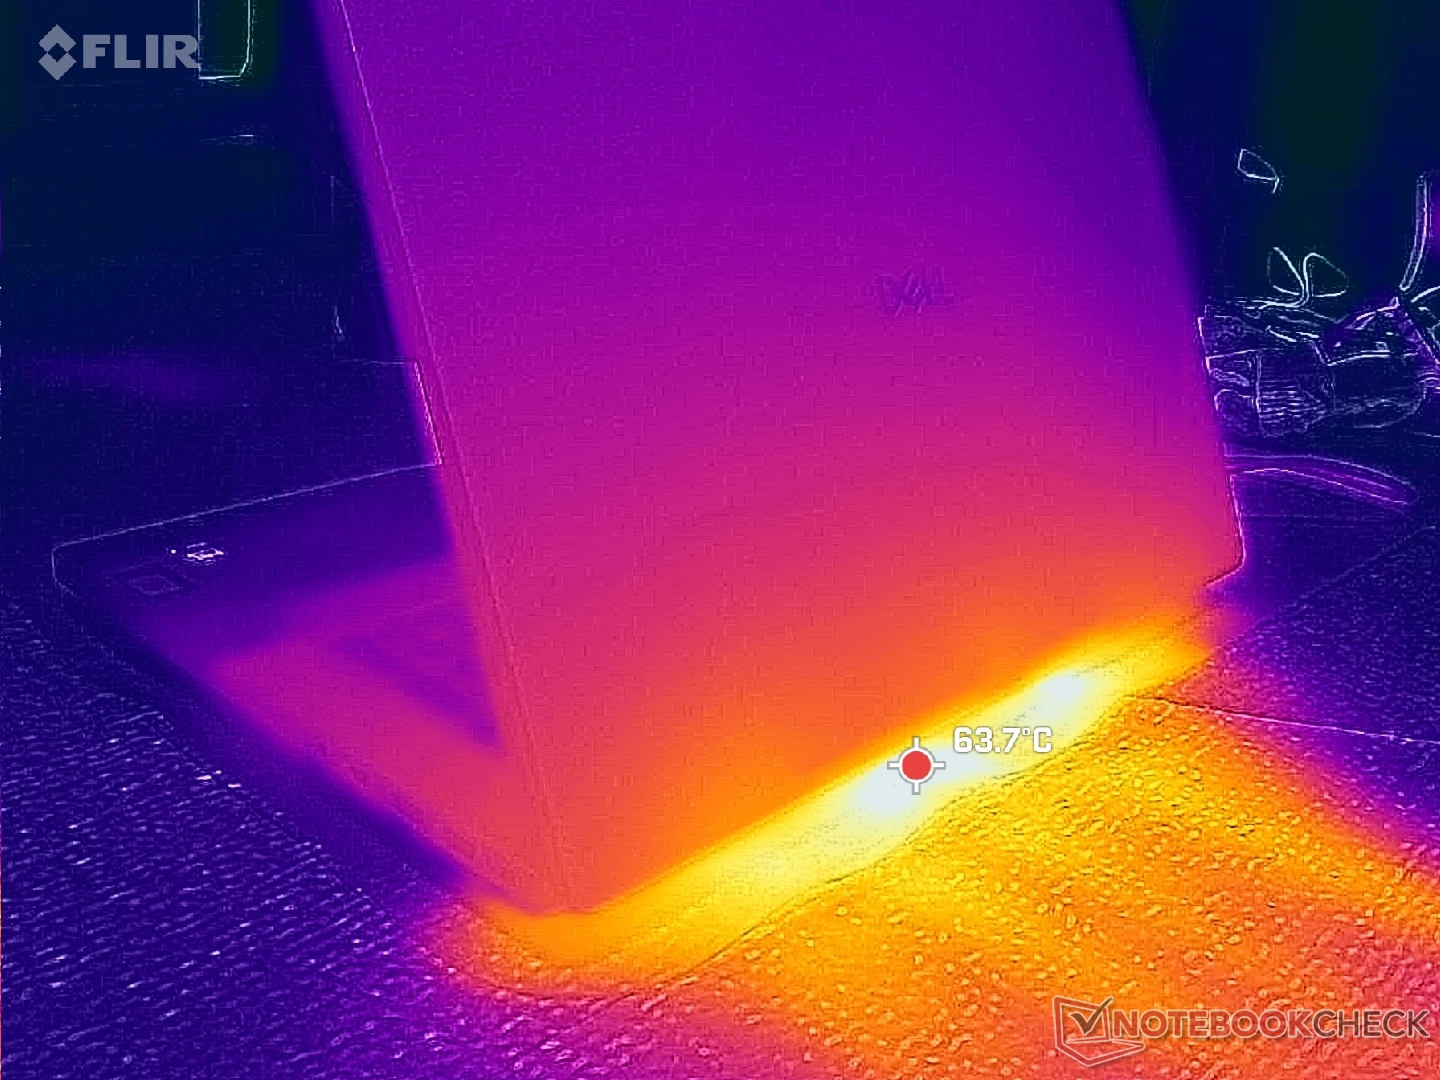
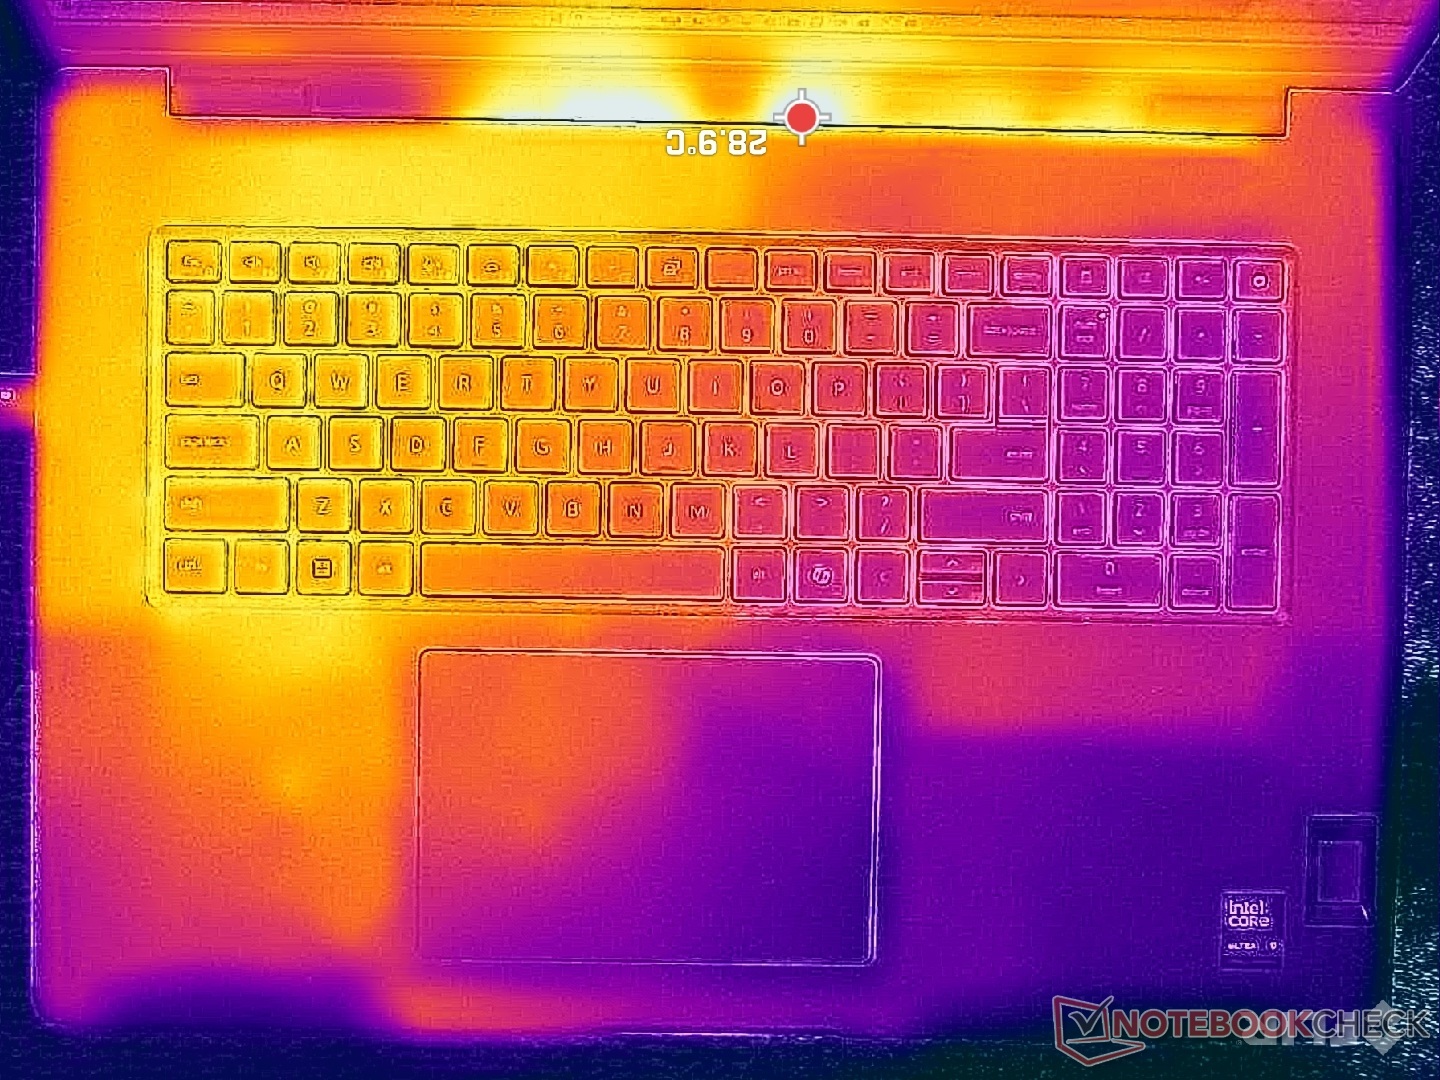
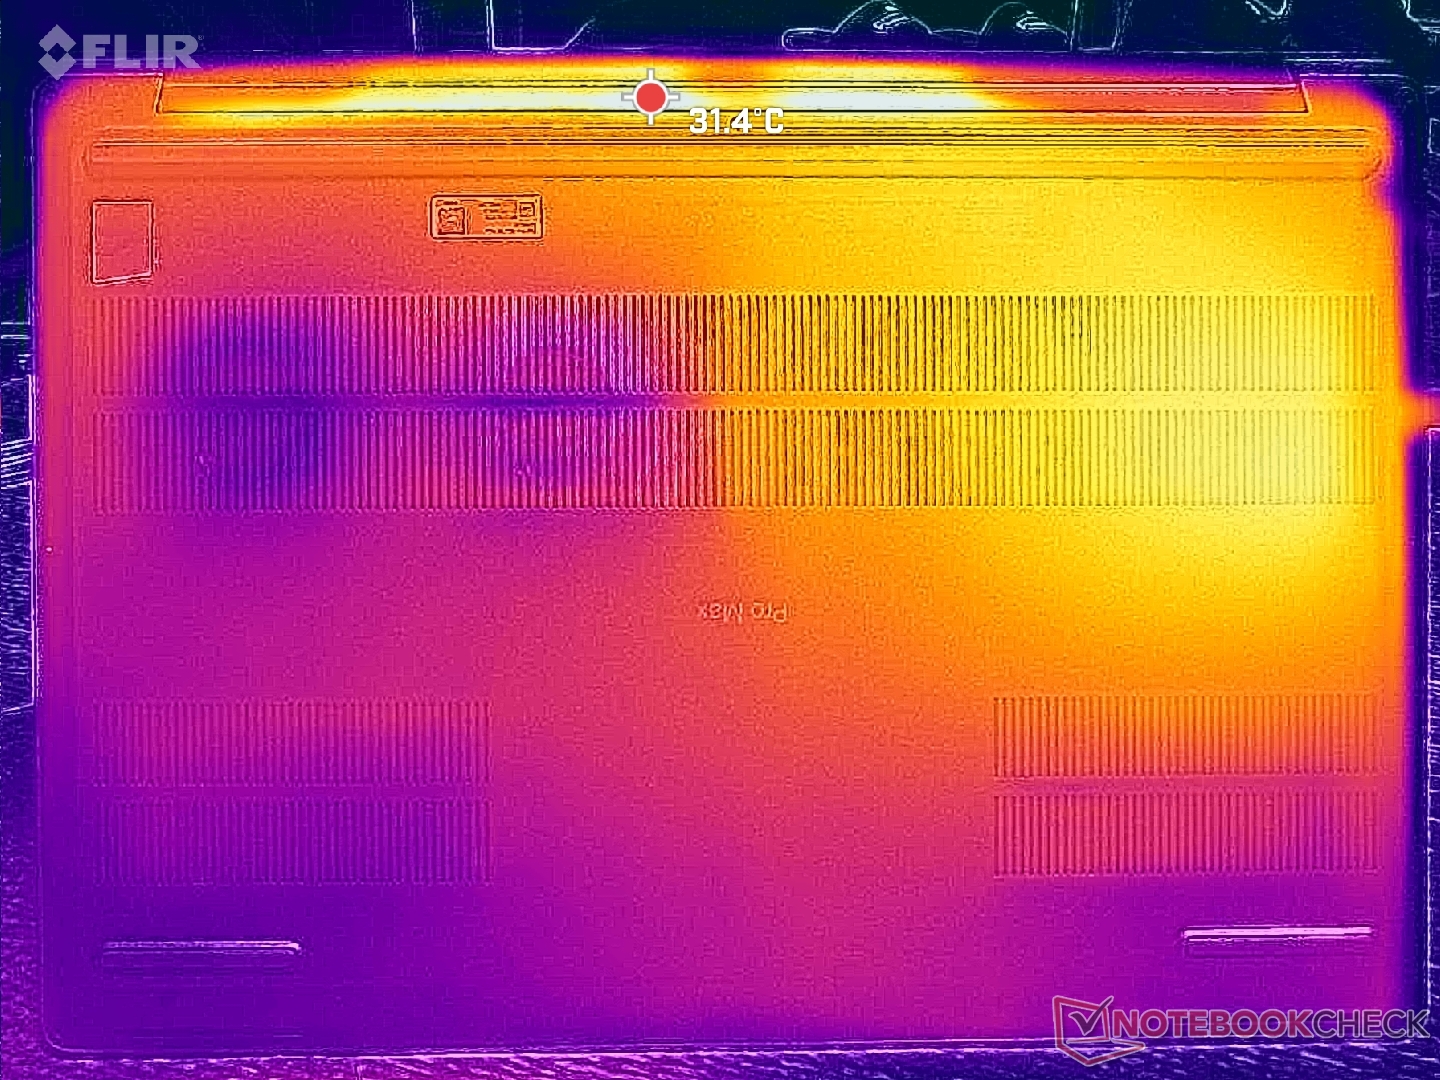
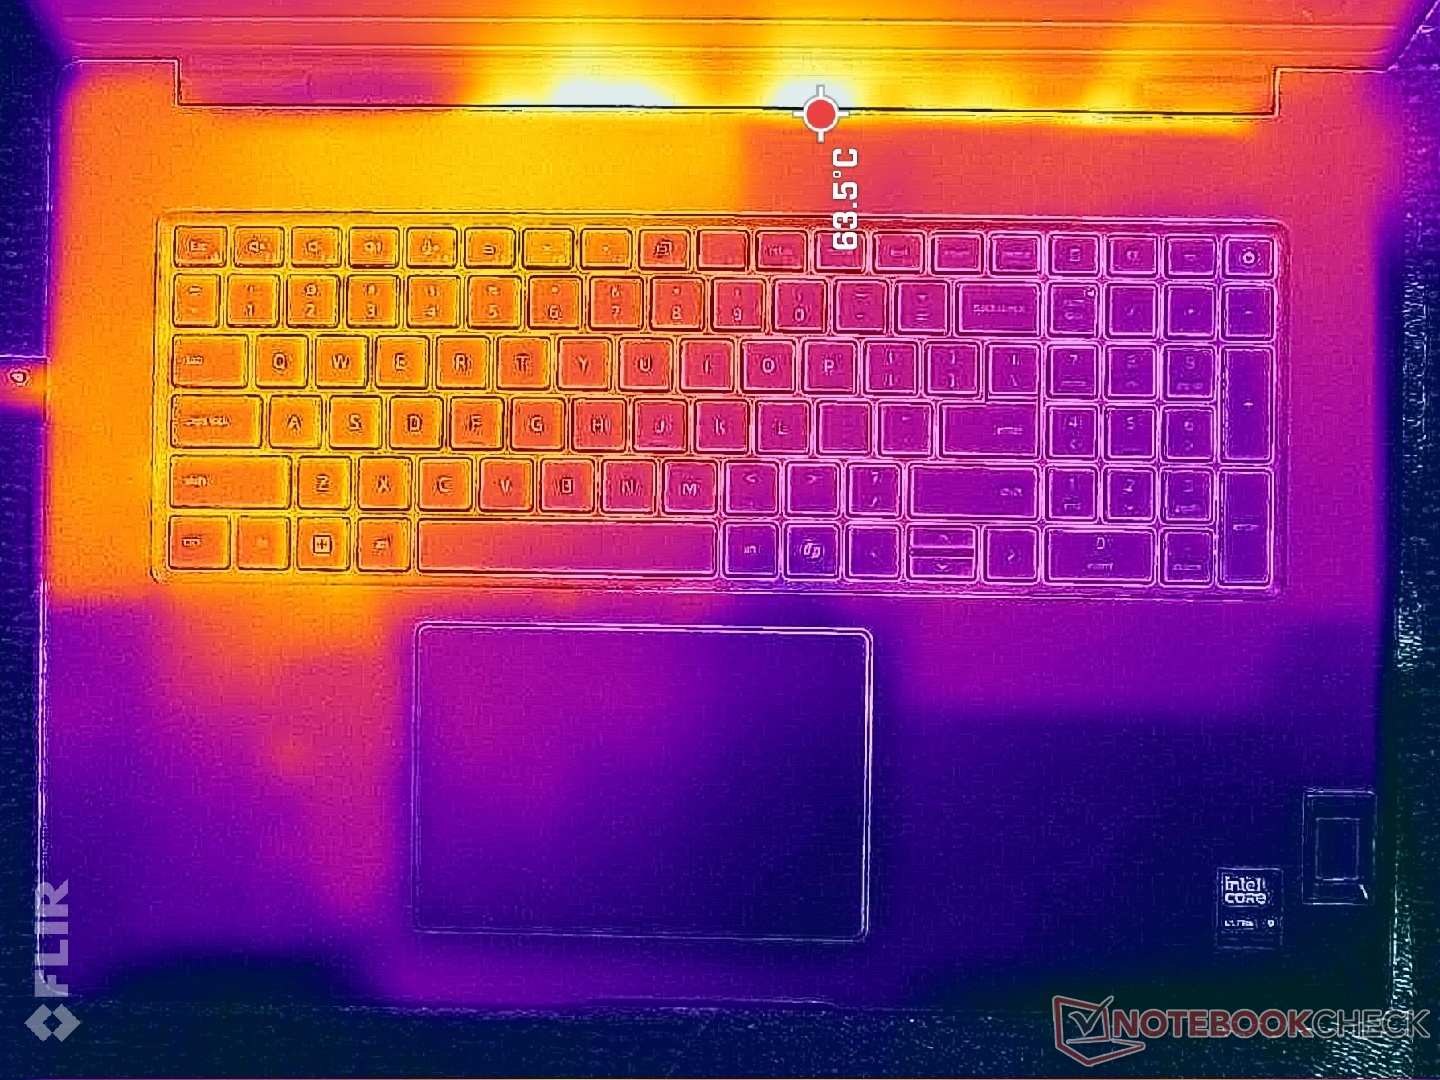
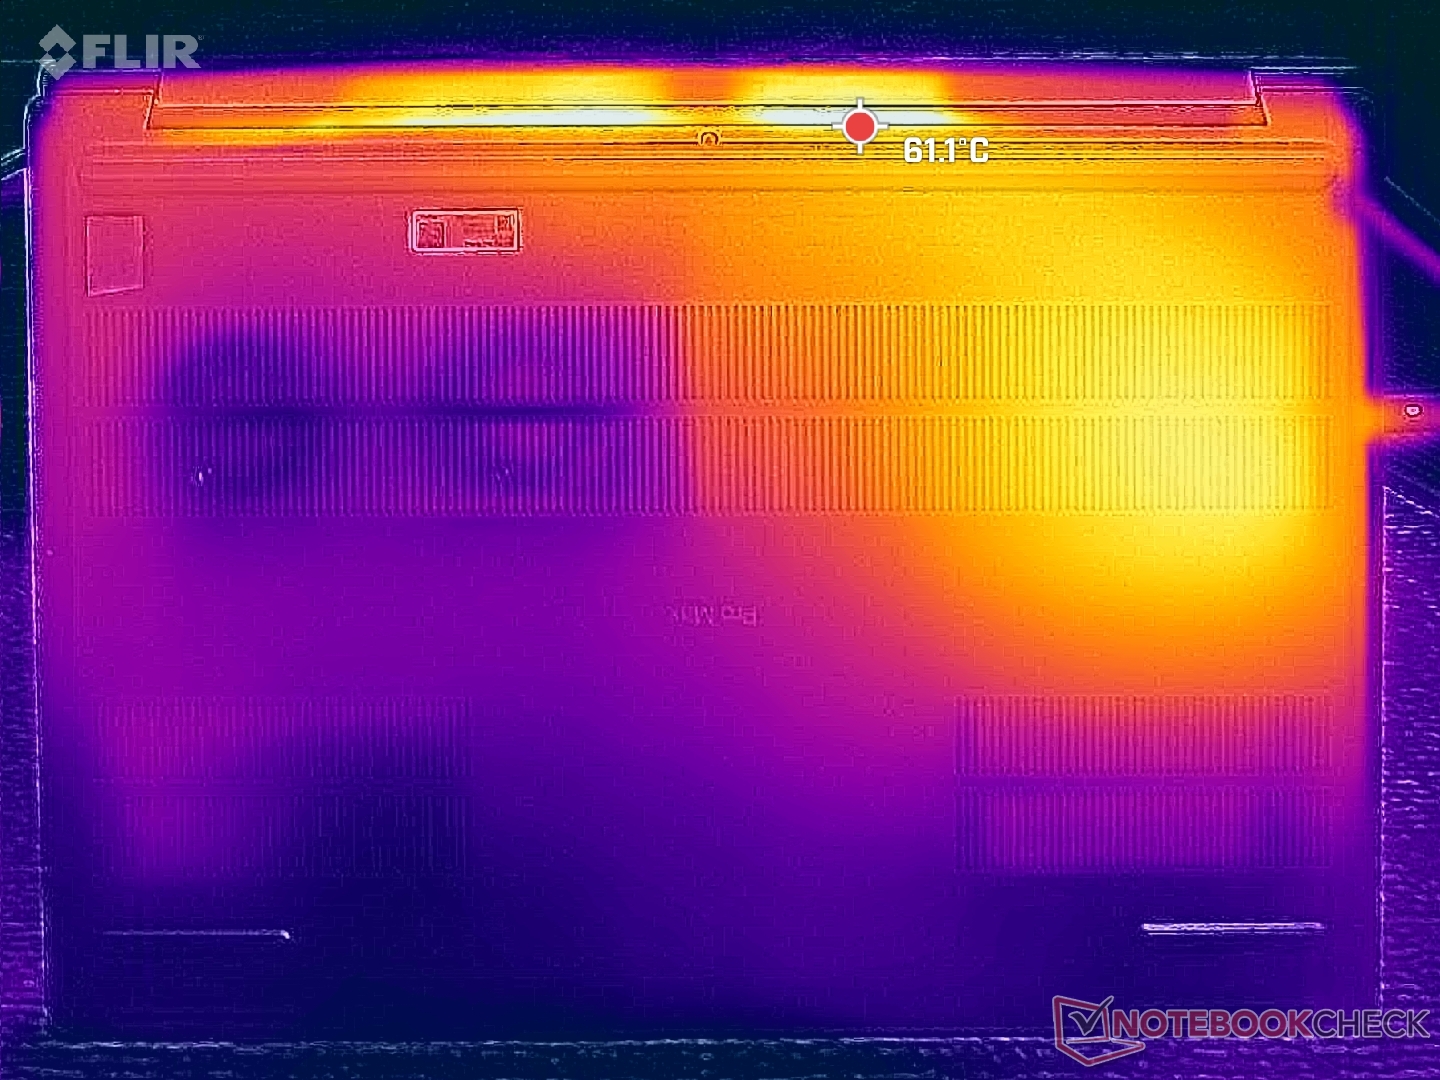
Las temperaturas superficiales son más cálidas en la mitad izquierda del sistema que en la derecha, donde los puntos calientes pueden alcanzar de 43 C a 47 C cuando está bajo carga.
(±) La temperatura máxima en la parte superior es de 44.8 °C / 113 F, frente a la media de 38.2 °C / 101 F, que oscila entre 22.2 y 69.8 °C para la clase Workstation.
(-) El fondo se calienta hasta un máximo de 47 °C / 117 F, frente a la media de 41.1 °C / 106 F
(+) En reposo, la temperatura media de la parte superior es de 29.3 °C / 85# F, frente a la media del dispositivo de 32 °C / 90 F.
(+) Los reposamanos y el panel táctil alcanzan como máximo la temperatura de la piel (32.8 °C / 91 F) y, por tanto, no están calientes.
(-) La temperatura media de la zona del reposamanos de dispositivos similares fue de 27.8 °C / 82 F (-5 °C / -9 F).
| Dell Pro Max 18 Plus MB18250 Ultra 9 285HX, RTX PRO 5000 Blackwell Generation Laptop | Schenker Key 18 Pro M25 RTX 5090 Ultra 9 275HX, GeForce RTX 5090 Laptop | HP ZBook X G1i 16 Ultra 7 265H, RTX PRO 2000 Blackwell Generation Laptop | HP ZBook Studio 16 G11 Ultra 9 185H, RTX 3000 Ada Generation Laptop | Lenovo ThinkPad P16s Gen 4 21RX000YGE Ryzen AI 9 HX PRO 370, Radeon 890M | Dell Pro Max 16 Plus Ultra 9 285HX, RTX PRO 5000 Blackwell Generation Laptop | |
|---|---|---|---|---|---|---|
| Heat | -1% | 10% | 1% | -16% | 1% | |
| Maximum Upper Side * (°C) | 44.8 | 47.5 -6% | 36 20% | 36.6 18% | 50.6 -13% | 40.4 10% |
| Maximum Bottom * (°C) | 47 | 52.8 -12% | 39.4 16% | 47.8 -2% | 54.3 -16% | 45.6 3% |
| Idle Upper Side * (°C) | 31.8 | 28.5 10% | 30.4 4% | 31.4 1% | 35.3 -11% | 32.8 -3% |
| Idle Bottom * (°C) | 31.4 | 30.1 4% | 31.8 -1% | 35.6 -13% | 38.5 -23% | 33 -5% |
* ... más pequeño es mejor
Altavoces
Dell Pro Max 18 Plus MB18250 análisis de audio
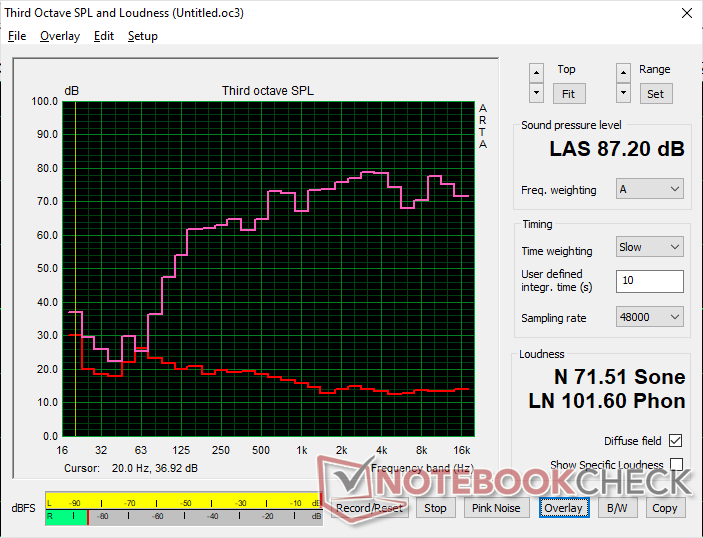
(+) | los altavoces pueden reproducir a un volumen relativamente alto (#87.2 dB)
Graves 100 - 315 Hz
(±) | lubina reducida - en promedio 12.8% inferior a la mediana
(±) | la linealidad de los graves es media (8.4% delta a frecuencia anterior)
Medios 400 - 2000 Hz
(+) | medios equilibrados - a sólo 4% de la mediana
(+) | los medios son lineales (6.6% delta a la frecuencia anterior)
Altos 2 - 16 kHz
(+) | máximos equilibrados - a sólo 4.7% de la mediana
(+) | los máximos son lineales (5.9% delta a la frecuencia anterior)
Total 100 - 16.000 Hz
(+) | el sonido global es lineal (11.4% de diferencia con la mediana)
En comparación con la misma clase
» 13% de todos los dispositivos probados de esta clase eran mejores, 4% similares, 83% peores
» El mejor tuvo un delta de 7%, la media fue 17%, el peor fue ###max##%
En comparación con todos los dispositivos probados
» 7% de todos los dispositivos probados eran mejores, 2% similares, 91% peores
» El mejor tuvo un delta de 4%, la media fue 24%, el peor fue ###max##%
Apple MacBook Pro 16 2021 M1 Pro análisis de audio
(+) | los altavoces pueden reproducir a un volumen relativamente alto (#84.7 dB)
Graves 100 - 315 Hz
(+) | buen bajo - sólo 3.8% lejos de la mediana
(+) | el bajo es lineal (5.2% delta a la frecuencia anterior)
Medios 400 - 2000 Hz
(+) | medios equilibrados - a sólo 1.3% de la mediana
(+) | los medios son lineales (2.1% delta a la frecuencia anterior)
Altos 2 - 16 kHz
(+) | máximos equilibrados - a sólo 1.9% de la mediana
(+) | los máximos son lineales (2.7% delta a la frecuencia anterior)
Total 100 - 16.000 Hz
(+) | el sonido global es lineal (4.6% de diferencia con la mediana)
En comparación con la misma clase
» 0% de todos los dispositivos probados de esta clase eran mejores, 0% similares, 100% peores
» El mejor tuvo un delta de 5%, la media fue 17%, el peor fue ###max##%
En comparación con todos los dispositivos probados
» 0% de todos los dispositivos probados eran mejores, 0% similares, 100% peores
» El mejor tuvo un delta de 4%, la media fue 24%, el peor fue ###max##%
Gestión de la energía
Consumo de energía
En ralentí puede consumir tan sólo 6 W hasta 32 W si está en el ajuste de brillo máximo con la GPU discreta activa. Este mínimo es inferior al de la mayoría de portátiles de 18 pulgadas, lo que explica la duración relativamente larga de la batería en la siguiente sección.
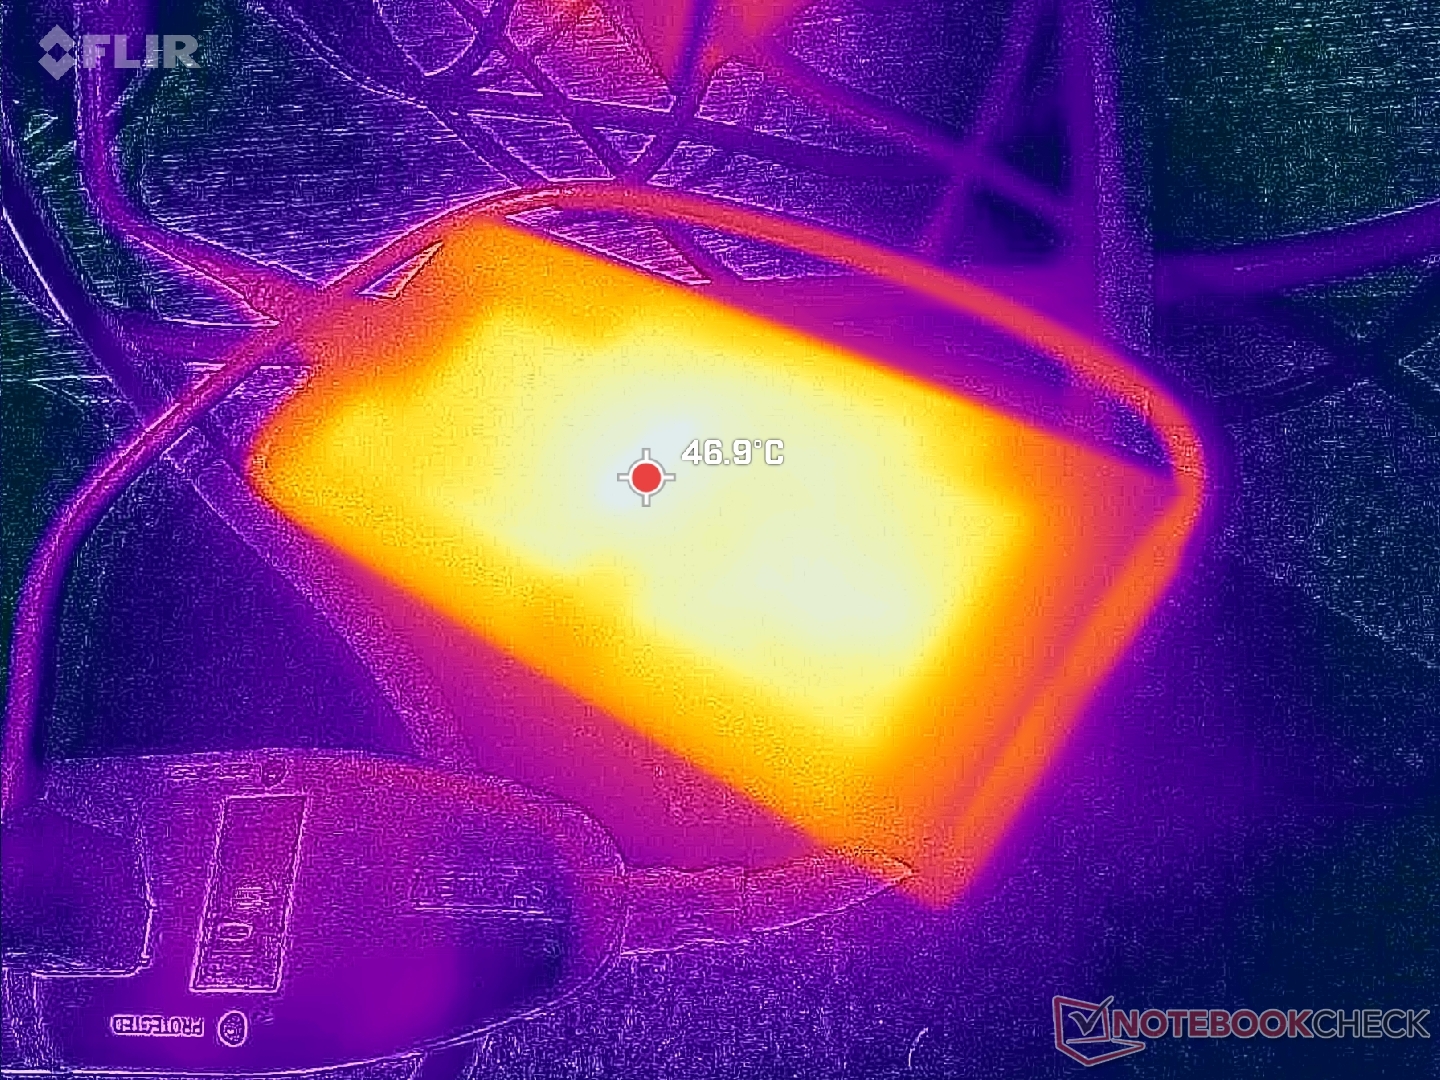
Ejecutar cargas exigentes como Cyberpunk 2077 demanda casi 260 W del adaptador de CA USB-C de 280 W (~16,2 x 7,8 x 2,3 cm). Espere que las tasas de carga sean muy lentas si ejecuta cargas exigentes simultáneamente. En comparación, el HP ZBook Fury G1i 18 se entrega con un adaptador de CA más voluminoso de 330 W para unos máximos de rendimiento potencialmente superiores y unas velocidades de carga más rápidas.
| Off / Standby | |
| Ocioso | |
| Carga |
|
Clave:
min: | |
| Dell Pro Max 18 Plus MB18250 Ultra 9 285HX, RTX PRO 5000 Blackwell Generation Laptop, , IPS, 2560x1600, 18" | Schenker Key 18 Pro M25 RTX 5090 Ultra 9 275HX, GeForce RTX 5090 Laptop, Samsung 9100 Pro 4 TB, IPS, 3840x2400, 18" | HP ZBook X G1i 16 Ultra 7 265H, RTX PRO 2000 Blackwell Generation Laptop, Samsung PM9A1 MZVL22T0HBLB, IPS, 2560x1600, 16" | HP ZBook Studio 16 G11 Ultra 9 185H, RTX 3000 Ada Generation Laptop, Kioxia XG8 KXG80ZNV1T02, IPS, 3840x2400, 16" | Lenovo ThinkPad P16 Gen 2 i7-14700HX, RTX 4000 Ada Generation Laptop, SK hynix PC801 HFS001TEJ9X162N, IPS, 2560x1600, 16" | Dell Pro Max 16 Plus Ultra 9 285HX, RTX PRO 5000 Blackwell Generation Laptop, SK hynix PCB01 HFS001TFM9X186N, OLED, 3840x2400, 16" | |
|---|---|---|---|---|---|---|
| Power Consumption | -38% | 49% | 4% | 7% | -97% | |
| Idle Minimum * (Watt) | 6.1 | 14 -130% | 4.1 33% | 14 -130% | 7.9 -30% | 35.1 -475% |
| Idle Average * (Watt) | 15.2 | 21.9 -44% | 9 41% | 22.4 -47% | 13.1 14% | 39.2 -158% |
| Idle Maximum * (Watt) | 32.4 | 22.3 31% | 9.4 71% | 25.7 21% | 24.2 25% | 56 -73% |
| Load Average * (Watt) | 130.1 | 149.5 -15% | 86.7 33% | 90.2 31% | 127.4 2% | 130.2 -0% |
| Cyberpunk 2077 ultra external monitor * (Watt) | 252 | 336 -33% | 102 60% | 120.3 52% | 219 13% | 213 15% |
| Cyberpunk 2077 ultra * (Watt) | 256 | 333 -30% | 106.1 59% | 125.4 51% | 225 12% | 229 11% |
| Load Maximum * (Watt) | 280.9 | 415.4 -48% | 152.9 46% | 142 49% | 248.5 12% | 285.2 -2% |
* ... más pequeño es mejor
Consumo de energía Cyberpunk / Prueba de estrés
Consumo de energía Monitor externo
Duración de las pilas
Los tiempos de ejecución son sorprendentemente largos cuando se navega por Internet en el modo de gráficos integrados y el perfil de energía equilibrado. Somos capaces de exprimir más de 9 horas de uso en el mundo real, que es horas más de lo que registramos en el Lenovo ThinkPad P16 o HP ZBook Studio 16 G11.
| Dell Pro Max 18 Plus MB18250 Ultra 9 285HX, RTX PRO 5000 Blackwell Generation Laptop, 96 Wh | Schenker Key 18 Pro M25 RTX 5090 Ultra 9 275HX, GeForce RTX 5090 Laptop, 98 Wh | HP ZBook X G1i 16 Ultra 7 265H, RTX PRO 2000 Blackwell Generation Laptop, 83 Wh | HP ZBook Studio 16 G11 Ultra 9 185H, RTX 3000 Ada Generation Laptop, 86 Wh | Lenovo ThinkPad P16 Gen 2 i7-14700HX, RTX 4000 Ada Generation Laptop, 94 Wh | Dell Pro Max 16 Plus Ultra 9 285HX, RTX PRO 5000 Blackwell Generation Laptop, 96 Wh | |
|---|---|---|---|---|---|---|
| Duración de Batería | ||||||
| WiFi v1.3 (h) | 9.3 | 5.8 -38% | 12.5 34% | 4.8 -48% | 2.5 -73% | 3.6 -61% |
Valoración de Notebookcheck
La mayor estación de trabajo móvil de Dell hasta la fecha es también una de sus mejores y más rápidas, pero curiosamente tiene menos opciones de pantalla que en su homóloga más pequeña de 16 pulgadas.
Dell Pro Max 18 Plus MB18250
- 11/19/2025 v8
Allen Ngo
 Total Sustainability Score:
 Competidores potenciales en comparación
Imagen | Modelo | Precio | Peso | Altura | Pantalla |
|---|---|---|---|---|---|
1. 88.9%  | Dell Pro Max 18 Plus MB18250 Intel Core Ultra 9 285HX ⎘ NVIDIA RTX PRO 5000 Blackwell Generation Laptop ⎘ 128 GB Memoría | Amazon: Precio de catálogo: 6000 USD | 3.6 kg | 30.2 mm | 18.00" 2560x1600 168 PPI IPS |
2. 84.6%  | Schenker Key 18 Pro M25 RTX 5090 Intel Core Ultra 9 275HX ⎘ NVIDIA GeForce RTX 5090 Laptop ⎘ 256 GB Memoría, 4096 GB SSD | Amazon: Precio de catálogo: 6400€ | 4.1 kg | 29.5 mm | 18.00" 3840x2400 252 PPI IPS |
3. 87.4%  | HP ZBook X G1i 16 Intel Core Ultra 7 265H ⎘ NVIDIA RTX PRO 2000 Blackwell Generation Laptop ⎘ 64 GB Memoría, 2048 GB SSD | Amazon: Precio de catálogo: 2700 USD | 2.2 kg | 23 mm | 16.00" 2560x1600 189 PPI IPS |
4. 84.2%  | HP ZBook Studio 16 G11 Intel Core Ultra 9 185H ⎘ NVIDIA RTX 3000 Ada Generation Laptop ⎘ 64 GB Memoría, 1024 GB SSD | Amazon: Precio de catálogo: 4300 USD | 1.8 kg | 19 mm | 16.00" 3840x2400 283 PPI IPS |
5. 82% 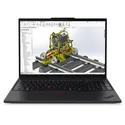 | Lenovo ThinkPad P16s Gen 4 21RX000YGE AMD Ryzen AI 9 HX PRO 370 ⎘ AMD Radeon 890M ⎘ 64 GB Memoría, 1024 GB SSD | Amazon: Precio de catálogo: 2440 Euro | 2 kg | 23 mm | 16.00" 1920x1200 142 PPI IPS LED |
6. 88.4%  | Dell Pro Max 16 Plus Intel Core Ultra 9 285HX ⎘ NVIDIA RTX PRO 5000 Blackwell Generation Laptop ⎘ 128 GB Memoría, SSD | Amazon: Precio de catálogo: 5000 USD | 2.8 kg | 30.9 mm | 16.00" 3840x2400 283 PPI OLED |
Transparencia
La selección de los dispositivos que se van a reseñar corre a cargo de nuestro equipo editorial. La muestra de prueba fue proporcionada al autor en calidad de préstamo por el fabricante o el minorista a los efectos de esta reseña. El prestamista no tuvo ninguna influencia en esta reseña, ni el fabricante recibió una copia de la misma antes de su publicación. No había ninguna obligación de publicar esta reseña. Como empresa de medios independiente, Notebookcheck no está sujeta a la autoridad de fabricantes, minoristas o editores.
Así es como prueba Notebookcheck
Cada año, Notebookcheck revisa de forma independiente cientos de portátiles y smartphones utilizando procedimientos estandarizados para asegurar que todos los resultados son comparables. Hemos desarrollado continuamente nuestros métodos de prueba durante unos 20 años y hemos establecido los estándares de la industria en el proceso. En nuestros laboratorios de pruebas, técnicos y editores experimentados utilizan equipos de medición de alta calidad. Estas pruebas implican un proceso de validación en varias fases. Nuestro complejo sistema de clasificación se basa en cientos de mediciones y puntos de referencia bien fundamentados, lo que mantiene la objetividad.
