Veredicto - Más verde y más esbelto que nunca
La CPU Core Ultra X7 y la GPU Arc B390 son hasta un 70% y un 150% más rápidas que las opciones Core Ultra 5 o Ultra 7, ciertamente decepcionantes, respectivamente, sin necesidad de calentarlas. Esta configuración de gama más alta puede costar 400 dólares más en el momento de escribir estas líneas, pero también duplica tanto la RAM (de 16 GB a 32 GB) como la capacidad de almacenamiento (de 512 GB a 1 TB) para ser una consideración que merece la pena especialmente para editores gráficos o creadores de contenidos.
Para aún más potencia pero menor eficiencia, los usuarios pueden considerar el Arrow Lake-powered del año pasado Dell 16 Premium que puede ofrecer un rendimiento multihilo un 20 por ciento más rápido y un rendimiento gráfico un 60 por ciento más rápido que incluso la configuración XPS 16 de gama alta 2026. Sólo hay que tener en cuenta que el diseño más antiguo del Dell 16 Premium implica una construcción más gruesa y pesada para acomodar la GPU Nvidia.
El comportamiento de ralentización observado sugiere que la CPU probablemente podría haberse beneficiado de una solución de refrigeración más potente. La temperatura del núcleo alcanzaba los 100 C cuando se estresaba antes de reducir la velocidad de reloj para mantener las temperaturas bajo control. El competidor Asus ExpertBook Ultra es capaz de mantener velocidades de reloj más altas con el mismo procesador Panther Lake X7 para un rendimiento más rápido que nuestro Dell.
Mientras tanto, el lujoso panel OLED supone 150 dólares adicionales a los 400 dólares mencionados anteriormente. La actualización de la pantalla es menos recomendable que la de la CPU Core Ultra X7, ya que el panel IPS de base ya es bastante potente en términos de colores, relación de contraste y frecuencia de actualización. Para el nivel de edición y multimedia al que apuntan la CPU y la GPU, el panel IPS debería ser suficiente para la mayoría de los usuarios con un presupuesto más ajustado.
Pro
Contra
Precio y disponibilidad
La configuración analizada con el Core Ultra X7 y la pantalla táctil OLED de 3,2K se vende al por menor por 2.350 dólares directamente en Dell.
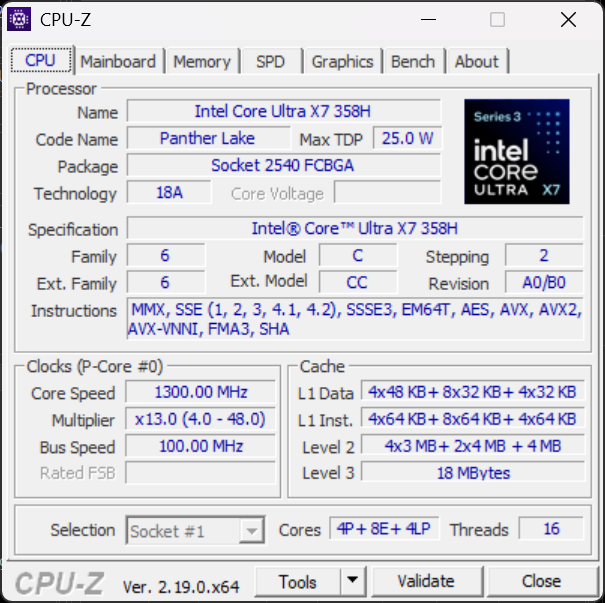
Después de haber probado recientemente la configuración básica Core Ultra 5 325 IPS del último XPS 16, ahora estamos listos para abordar la configuración Core Ultra X7 358H OLED para ver qué tipo de mejoras y beneficios aporta la opción más costosa. ¿Merece la pena pagar entre 500 y 600 dólares más por el modelo de gama alta?
Todos nuestros comentarios sobre las características físicas del nuevo diseño 2026 XPS 16 se pueden encontrar aquí. En cambio, esta página se centra en las diferencias que los usuarios pueden esperar al elegir entre las configuraciones Core Ultra 5 o Core Ultra X7 del modelo.
Más comentarios sobre Dell:
Especificaciones
Caso
La configuración OLED es ligeramente más delgada y ligera que la configuración IPS en casi 1 mm y 100 g, respectivamente. Por lo demás, ambas opciones son idénticas.
Conectividad


Comunicación
Cámara web


Mantenimiento

Sostenibilidad
La nueva XPS 16 utiliza más materiales reciclados que la mayoría de los modelos de la cartera actual de Dell. El chasis se compone de entre un 25 y un 75 por ciento de aluminio reciclado junto a un 10 por ciento de vidrio reciclado para la pantalla táctil OLED, un 50 por ciento de cobalto para la batería, un 90 por ciento de acero reciclado para las teclas y un 100 por cien de materiales reciclados para el embalaje.
Mostrar
Hay dos opciones de visualización disponibles:
- 1920 x 1200, 100% sRGB, IPS, no táctil, 1 - 120 Hz, mate
- 3200 x 2000, 100% DCI-P3, OLED, táctil, 20 - 120 Hz, DisplayHDR 500, brillante
La opción OLED ofrece múltiples mejoras con respecto al panel IPS básico, como una resolución nativa más alta, colores P3 más profundos, funcionalidad de pantalla táctil, compatibilidad con HDR500 y niveles de contraste en negro intenso. También resuelve de forma nativa los tiempos de respuesta blanco-negro relativamente lentos del panel IPS base para una experiencia de usuario más limpia.
La selección de OLED introduce, no obstante, algunos contratiempos menores, como un mayor consumo de energía, modulación por ancho de pulsos y una pantalla brillante con muchos reflejos. Su resolución nativa de 3,2K también es notablemente inferior a la del panel OLED 4K del diseño anterior del XPS 16 (3200 x 2000 frente a 3840 x 2400).
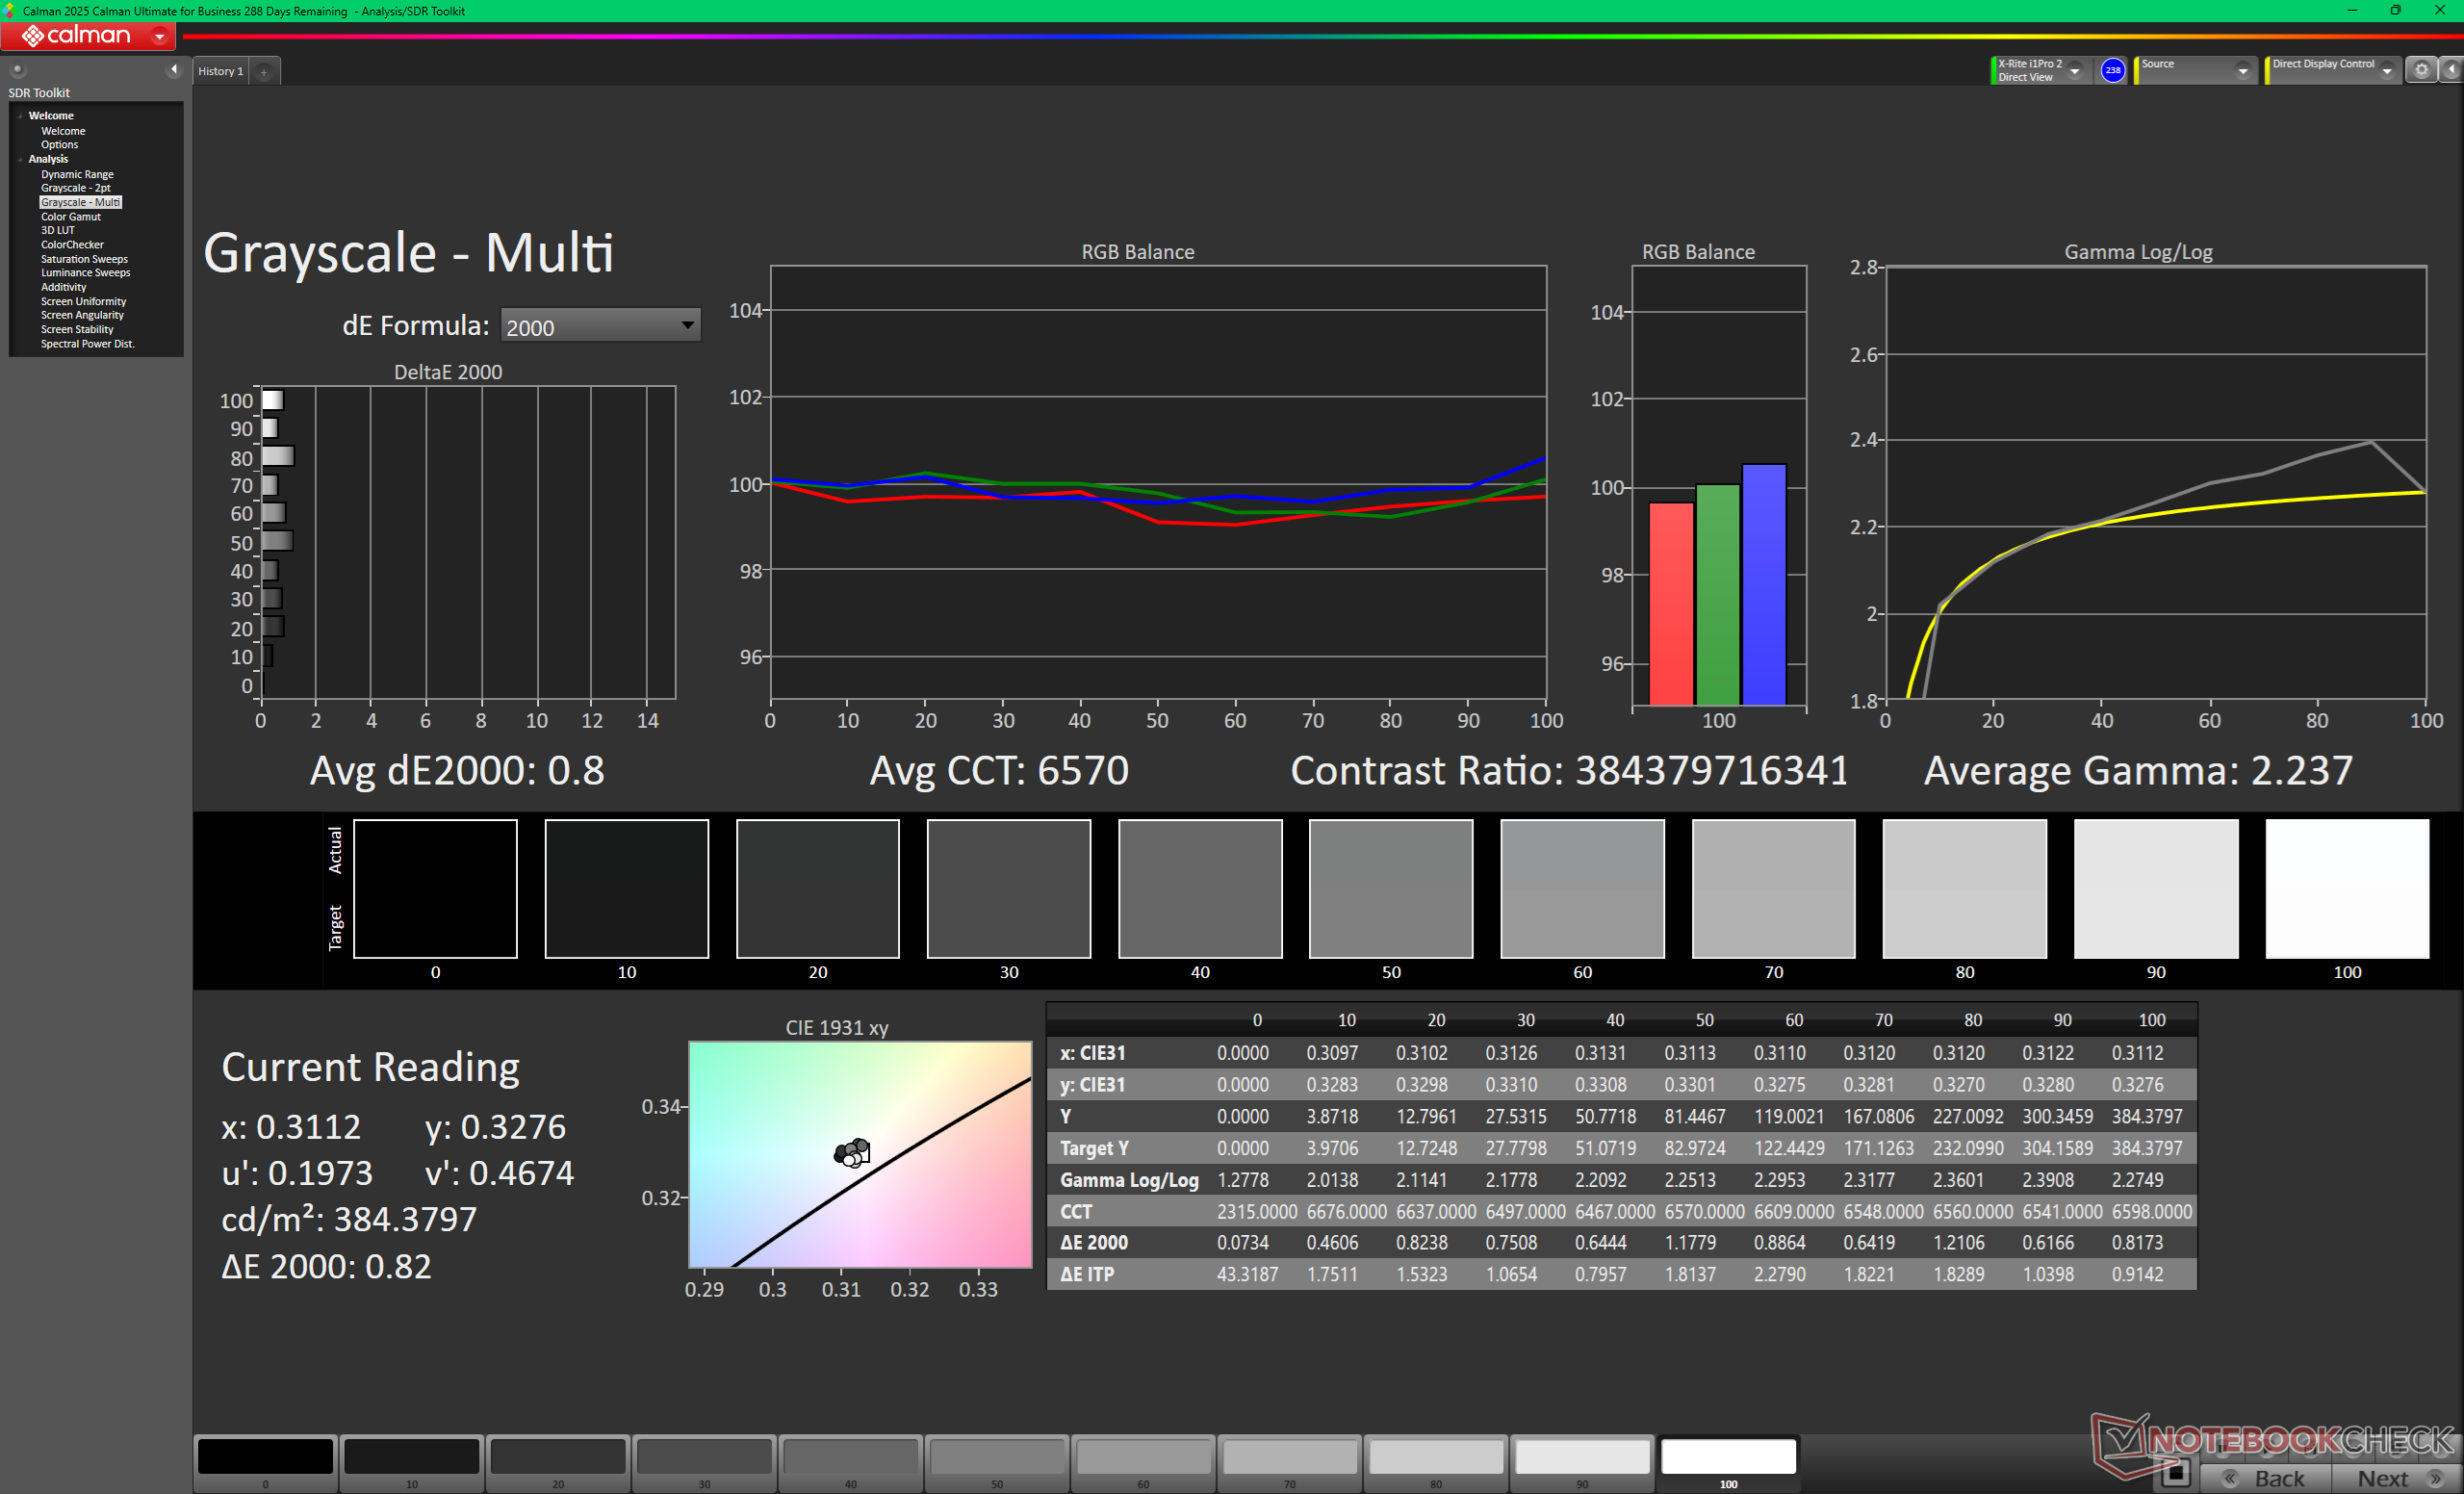
El brillo máximo del panel OLED alcanza los 400 nits en modo SDR o los 500 nits si está en modo HDR, según nuestras propias mediciones internas. Así pues, la configuración IPS, más barata, es en realidad ligeramente más brillante que la OLED al mostrar contenidos SDR. Por tanto, la visibilidad en exteriores no es necesariamente mejor con la opción OLED más brillante.
| |||||||||||||||||||||||||
iluminación: 95 %
Brillo con batería: 395.4 cd/m²
Contraste: ∞:1 (Negro: 0 cd/m²)
ΔE ColorChecker Calman: 3.69 | ∀{0.5-29.43 Ø4.72}
calibrated: 0.68
ΔE Greyscale Calman: 1.9 | ∀{0.09-98 Ø4.97}
96.5% AdobeRGB 1998 (Argyll 3D)
100% sRGB (Argyll 3D)
99.5% Display P3 (Argyll 3D)
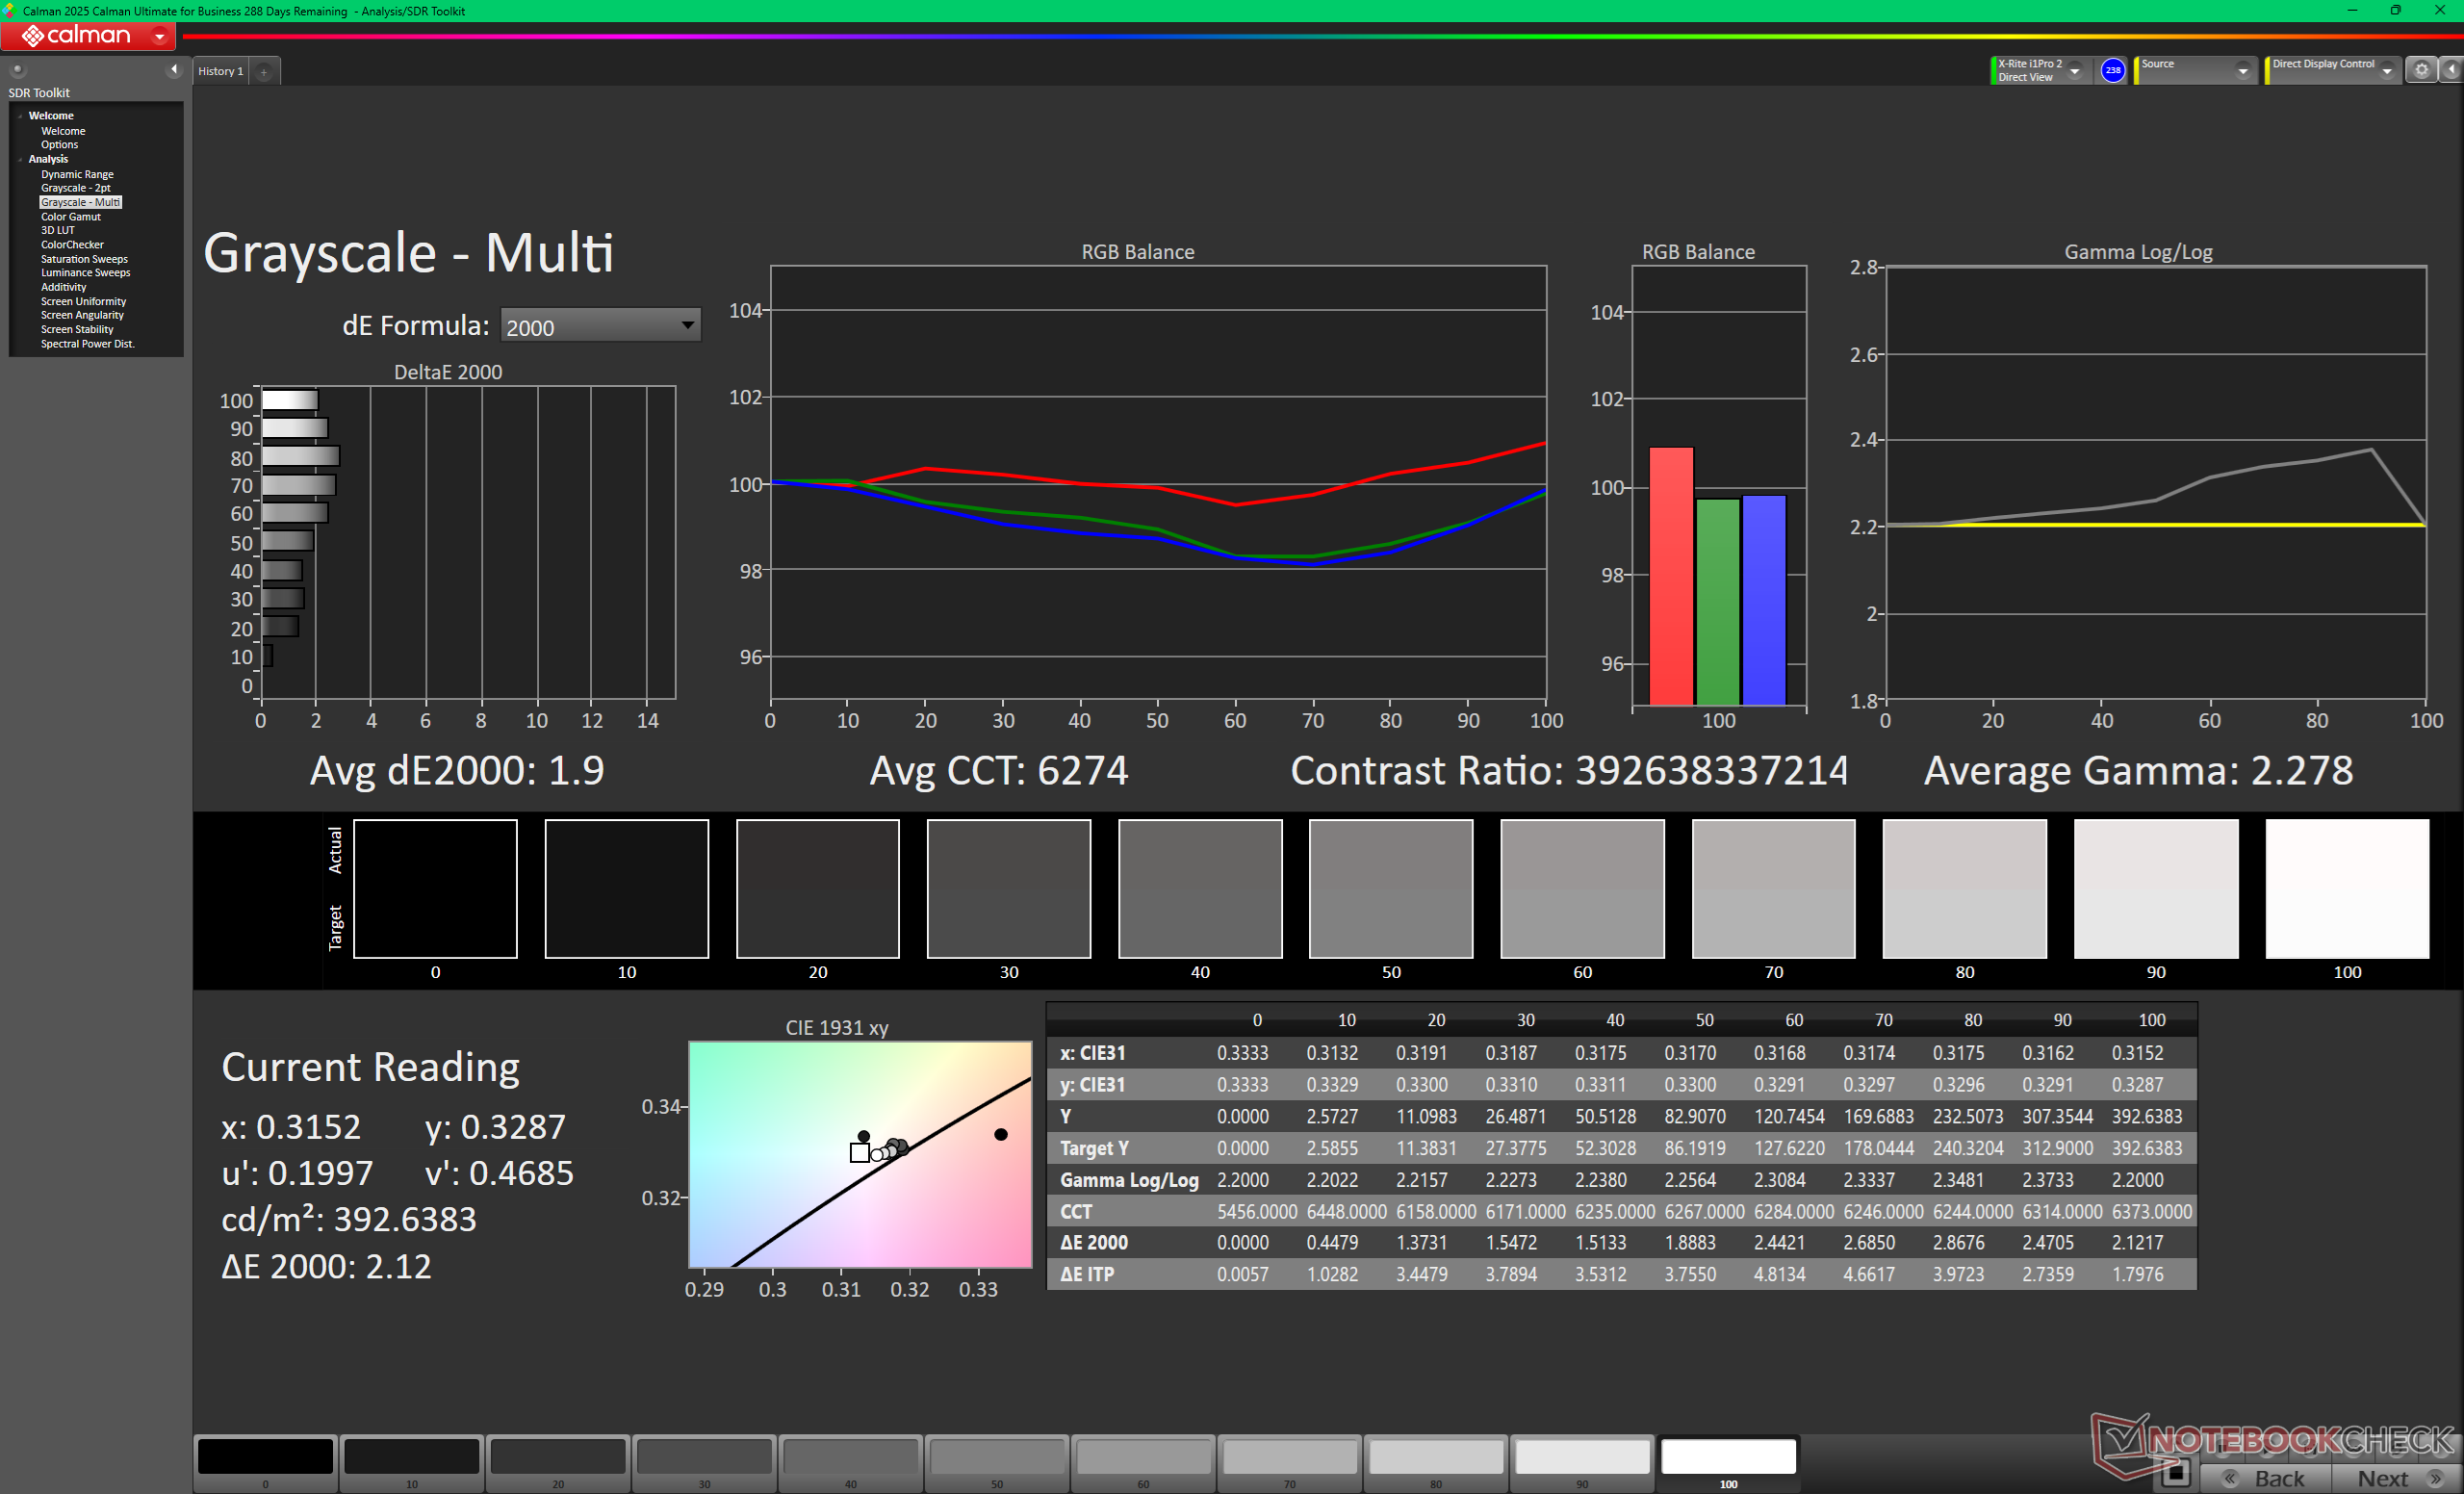
Gamma: 2.28
CCT: 6274 K
| Dell XPS 16 Core Ultra X7 358H LG Philips 160WV1, OLED, 3200x2000, 16", 120 Hz | Dell XPS 16 Core Ultra 5 325 LG Philips 160WUX, IPS, 1920x1200, 16", 120 Hz | Dell XPS 16 9640 SDC4196, OLED, 3840x2400, 16.3", 90 Hz | Samsung Galaxy Book6 Pro ATNA60HR05-0, OLED, 2880x1800, 16", 120 Hz | Lenovo Yoga Pro 9 16IAH10 RTX 5050 ATNA60HR04-0, OLED, 2880x1800, 16", 120 Hz | HP Omnibook 5 16-af1037nr BOE0C46, IPS, 1920x1200, 16", 60 Hz | |
|---|---|---|---|---|---|---|
| Display | -22% | -3% | -4% | -54% | ||
| Display P3 Coverage (%) | 99.5 | 66.2 -33% | 98.3 -1% | 98.3 -1% | 39.2 -61% | |
| sRGB Coverage (%) | 100 | 97.4 -3% | 100 0% | 99.9 0% | 57.7 -42% | |
| AdobeRGB 1998 Coverage (%) | 96.5 | 67.7 -30% | 87.8 -9% | 85.9 -11% | 40.5 -58% | |
| Response Times | -4418% | -12% | -49% | -19% | -3791% | |
| Response Time Grey 50% / Grey 80% * (ms) | 0.65 ? | 39.3 ? -5946% | 0.82 ? -26% | 0.51 ? 22% | 32.5 ? -4900% | |
| Response Time Black / White * (ms) | 0.87 ? | 26 ? -2889% | 0.85 ? 2% | 0.41 ? 53% | 24.2 ? -2682% | |
| PWM Frequency (Hz) | 240.2 ? | 360 ? | 240 ? | 1200 | ||
| PWM Amplitude * (%) | 31 | 100 -223% | 37 -19% | |||
| Screen | 1% | 6% | 34% | 5% | -91% | |
| Brightness middle (cd/m²) | 395.4 | 534.6 35% | 366 -7% | 502 27% | 471.7 19% | 349.2 -12% |
| Brightness (cd/m²) | 392 | 515 31% | 367 -6% | 507 29% | 474 21% | 326 -17% |
| Brightness Distribution (%) | 95 | 92 -3% | 96 1% | 97 2% | 98 3% | 86 -9% |
| Black Level * (cd/m²) | 0.26 | 0.33 | ||||
| Colorchecker dE 2000 * | 3.69 | 2.53 31% | 1.3 65% | 1 73% | 3.53 4% | 5.87 -59% |
| Colorchecker dE 2000 max. * | 7.94 | 4.57 42% | 3.6 55% | 2.4 70% | 6.31 21% | 20.58 -159% |
| Colorchecker dE 2000 calibrated * | 0.68 | 1.26 -85% | 1 -47% | 3.04 -347% | ||
| Greyscale dE 2000 * | 1.9 | 2.7 -42% | 2.2 -16% | 1.8 5% | 2.6 -37% | 2.6 -37% |
| Gamma | 2.28 96% | 2.32 95% | 2.14 103% | 2.24 98% | 2.24 98% | 2.14 103% |
| CCT | 6274 104% | 6860 95% | 6680 97% | 6435 101% | 6292 103% | 6411 101% |
| Contrast (:1) | 2056 | 1058 | ||||
| Media total (Programa/Opciones) | -1480% /
-741% | -3% /
1% | -6% /
4% | -7% /
2% | -1312% /
-699% |
* ... más pequeño es mejor


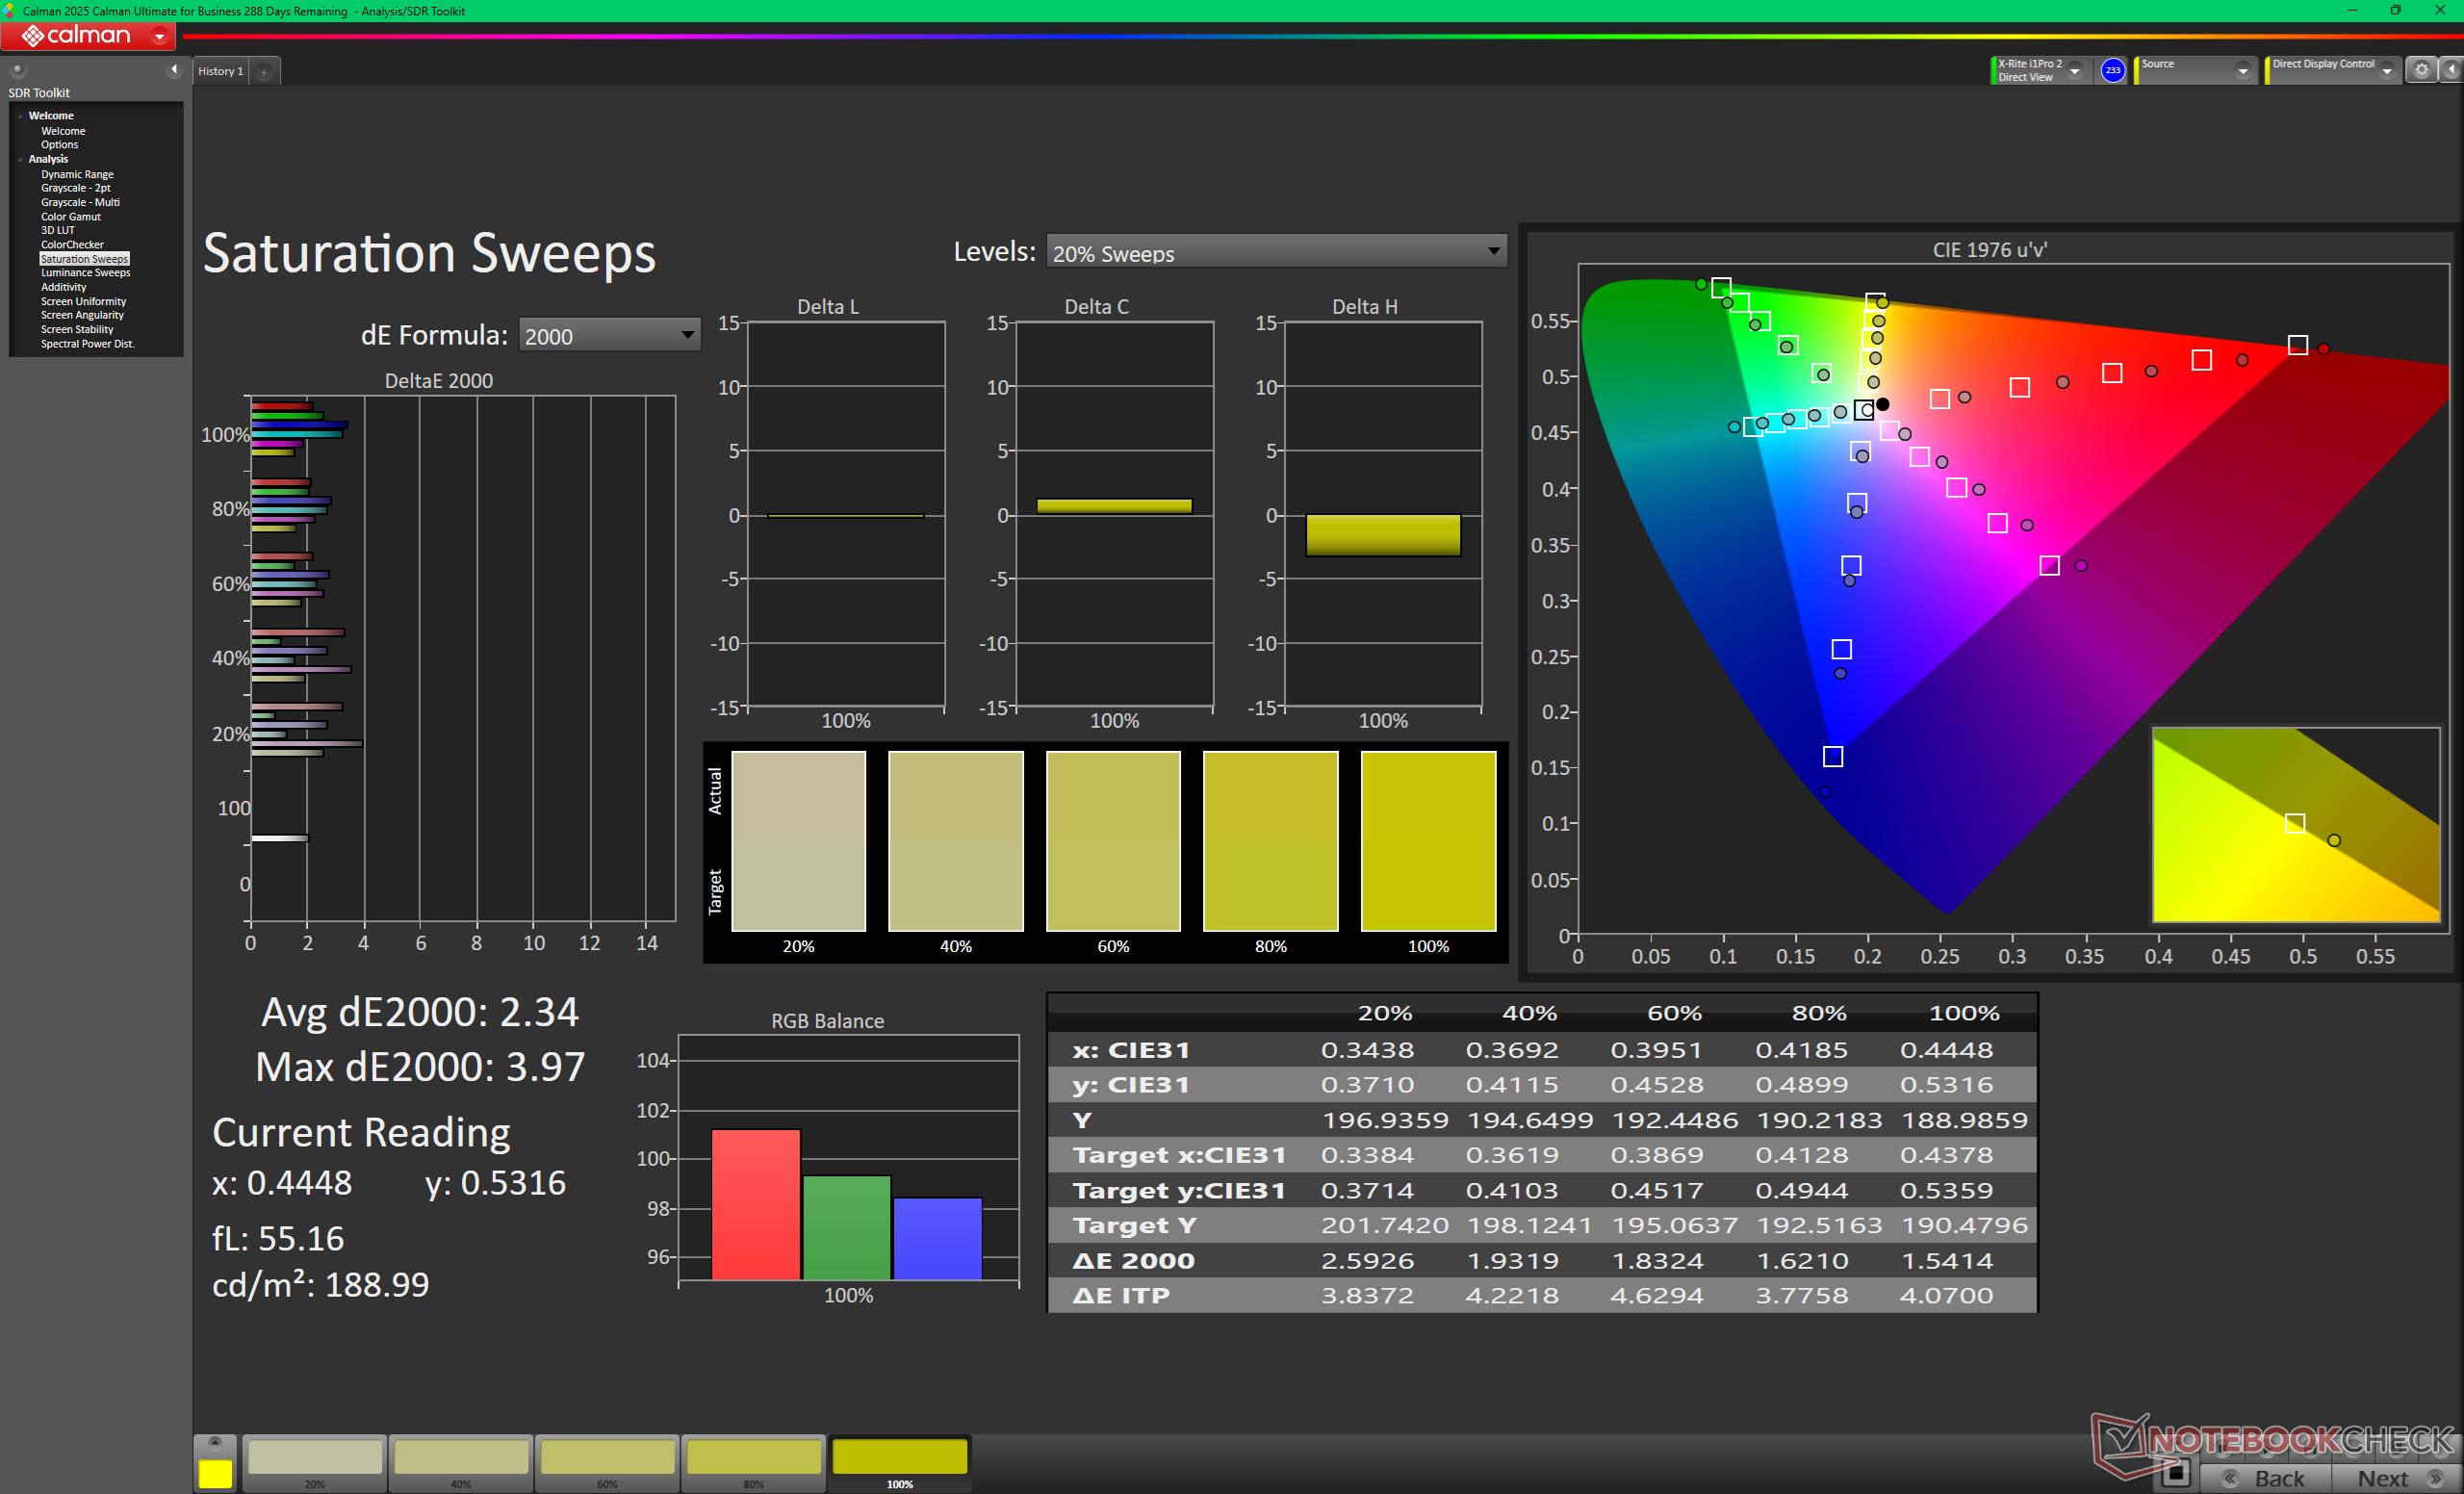
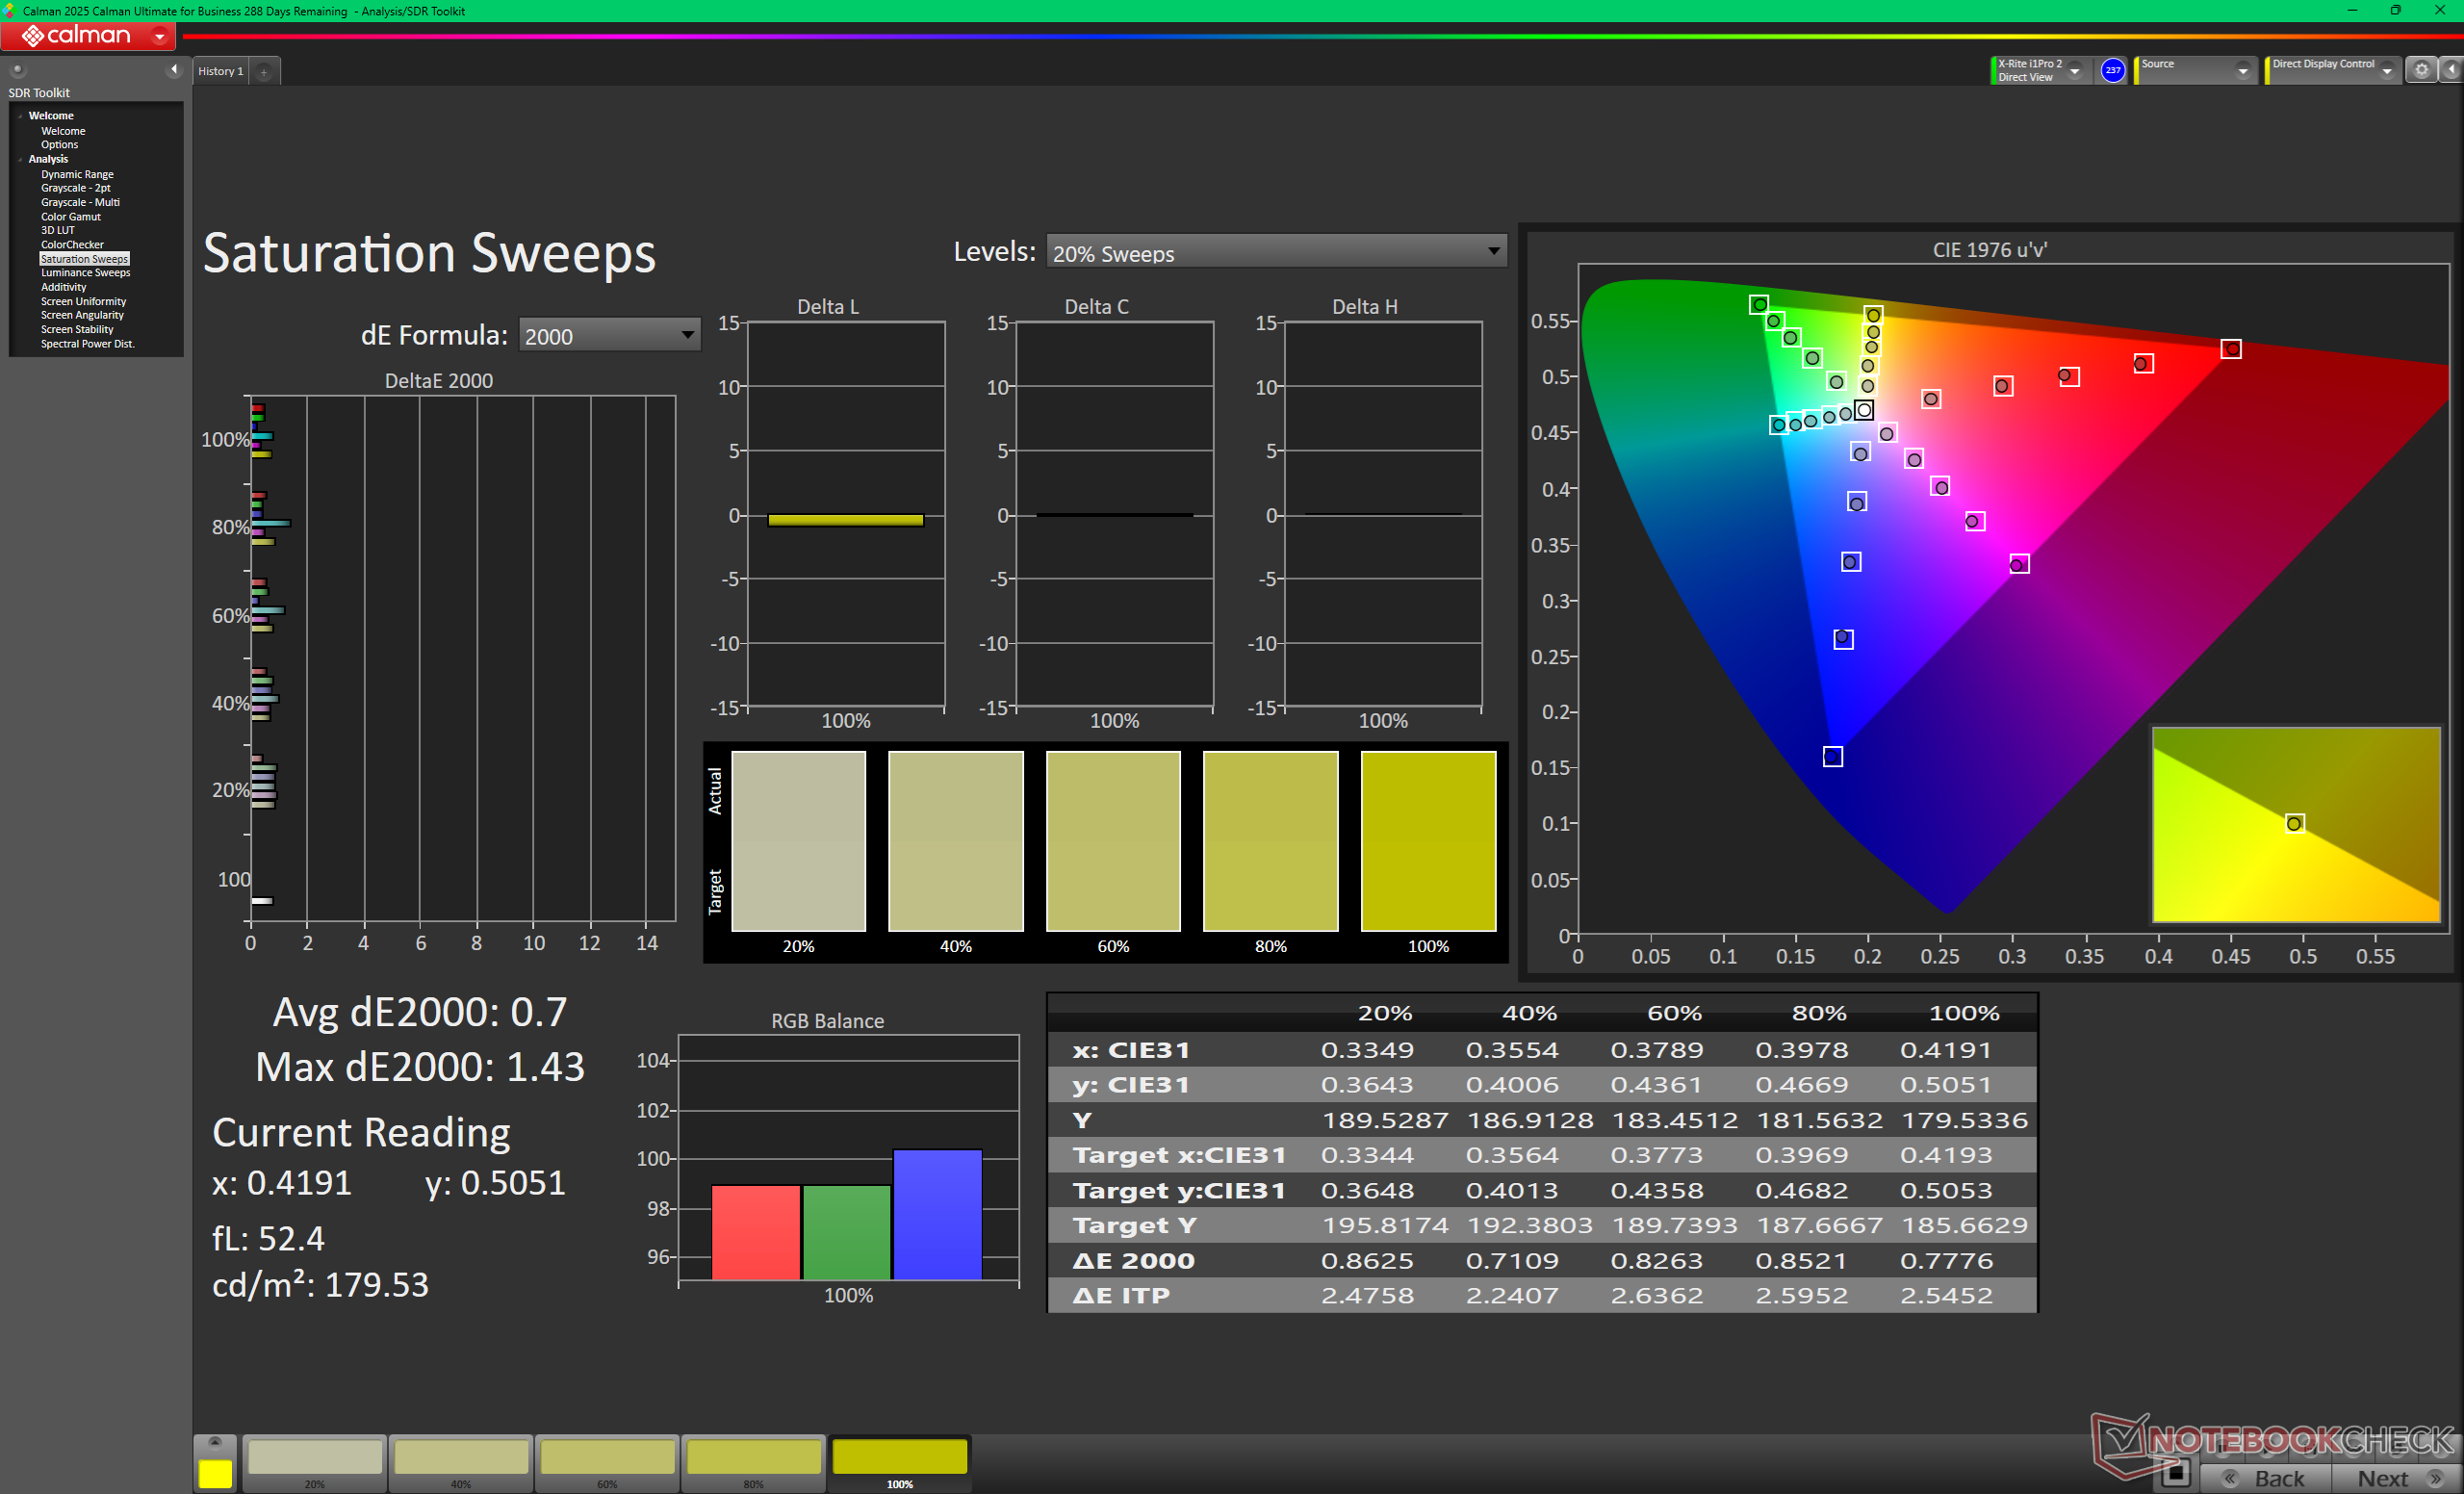
El panel viene decentemente calibrado con respecto a la norma P3, con valores DeltaE medios en escala de grises y color que alcanzan 1,9 y 3,69, respectivamente. Por tanto, la calibración adicional no es necesaria para la mayoría de los usuarios finales.


Tiempos de respuesta del display
| ↔ Tiempo de respuesta de Negro a Blanco | ||
|---|---|---|
| 0.87 ms ... subida ↗ y bajada ↘ combinada | ↗ 0.43 ms subida | 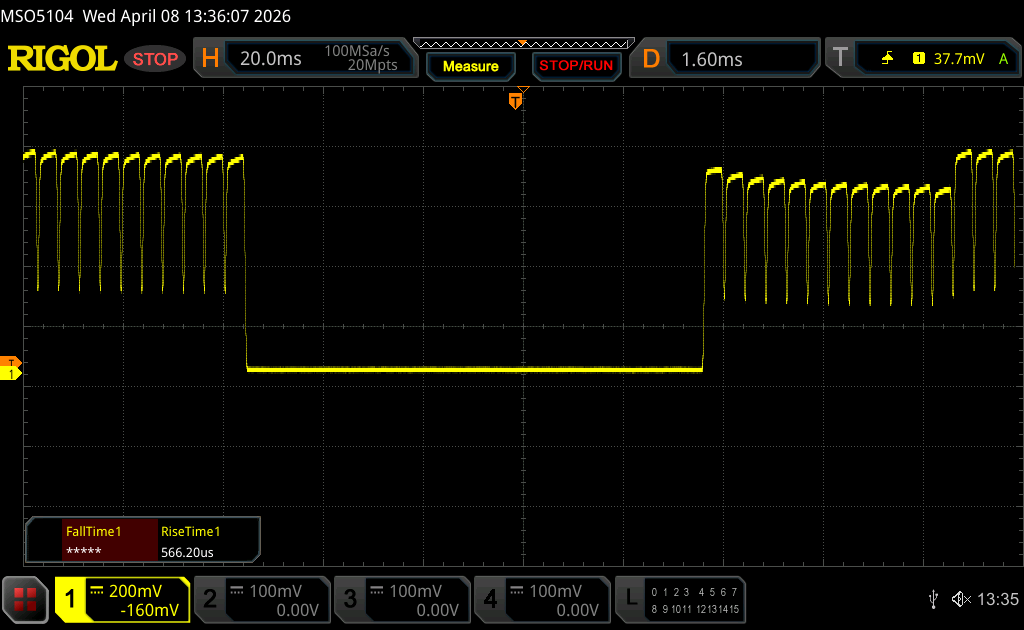 |
| ↘ 0.44 ms bajada | ||
| La pantalla mostró tiempos de respuesta muy rápidos en nuestros tests y debería ser adecuada para juegos frenéticos. En comparación, todos los dispositivos de prueba van de ##min### (mínimo) a 240 (máximo) ms. » 3 % de todos los dispositivos son mejores. Esto quiere decir que el tiempo de respuesta medido es mejor que la media (19.8 ms) de todos los dispositivos testados. | ||
| ↔ Tiempo de respuesta 50% Gris a 80% Gris | ||
| 0.65 ms ... subida ↗ y bajada ↘ combinada | ↗ 0.36 ms subida | 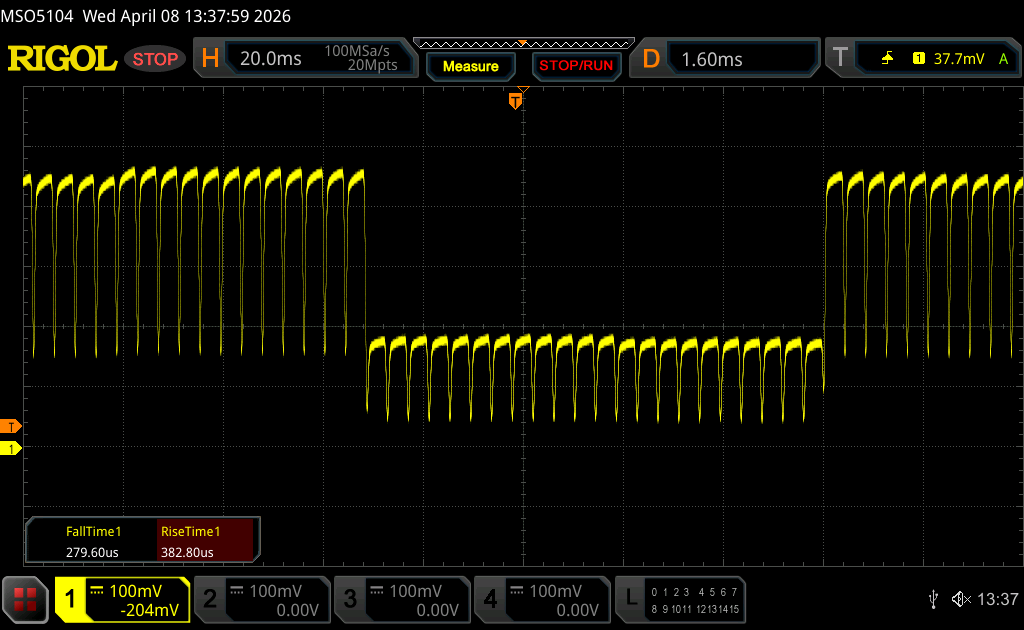 |
| ↘ 0.29 ms bajada | ||
| La pantalla mostró tiempos de respuesta muy rápidos en nuestros tests y debería ser adecuada para juegos frenéticos. En comparación, todos los dispositivos de prueba van de ##min### (mínimo) a 636 (máximo) ms. » 2 % de todos los dispositivos son mejores. Esto quiere decir que el tiempo de respuesta medido es mejor que la media (31 ms) de todos los dispositivos testados. | ||
Parpadeo de Pantalla / PWM (Pulse-Width Modulation)
| Parpadeo de Pantalla / PWM detectado | 240.2 Hz Amplitude: 31 % | ≤ 100 % de brillo | 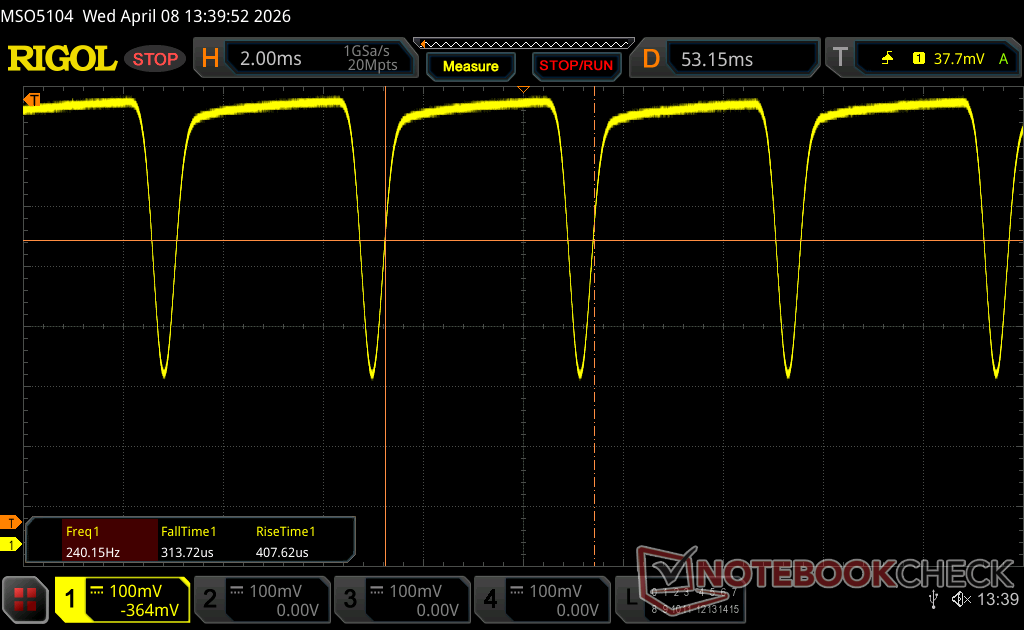 |
La retroiluminación del display parpadea a 240.2 Hz (seguramente usa PWM - Pulse-Width Modulation) a un brillo del 100 % e inferior. Sobre este nivel de brillo no debería darse parpadeo / PWM. La frecuencia de 240.2 Hz es relativamente baja, por lo que la gente sensible debería ver parpadeos y padecer fatiga visual por la pantalla (usado al brillo indicado a continuación). Comparación: 52 % de todos los dispositivos testados no usaron PWM para atenuar el display. Si se usó, medimos una media de 7763 (mínimo: 5 - máxmo: 343500) Hz. | |||


Rendimiento
Condiciones de prueba
Pusimos Windows y Dell Optimizer en modo Rendimiento antes de ejecutar las pruebas comparativas que se indican a continuación.
Procesador
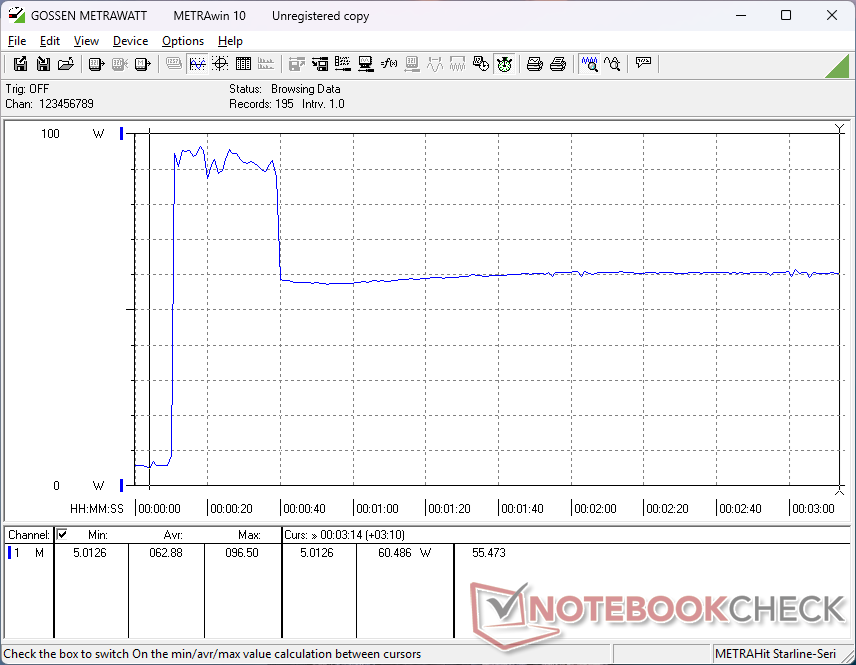
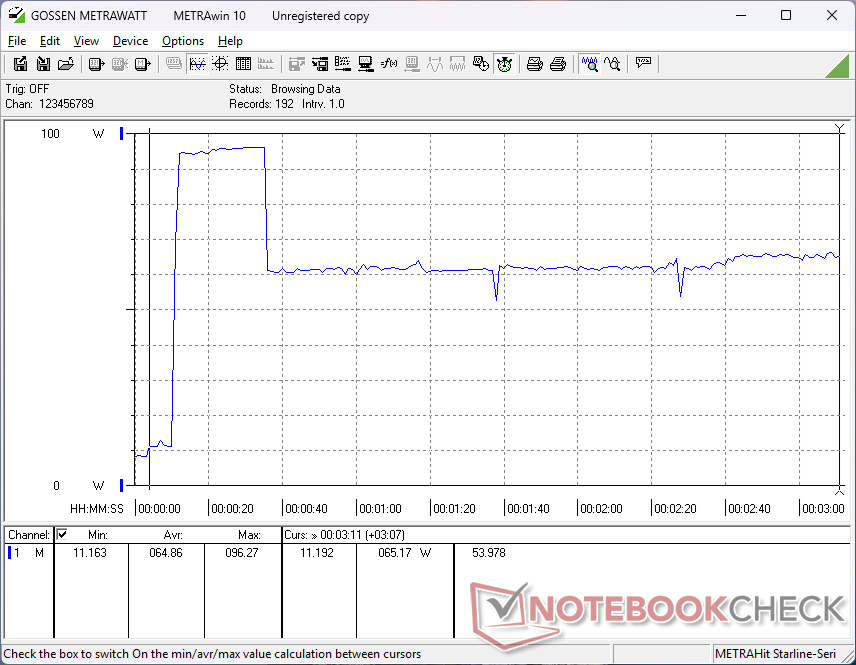
El Core Ultra X7 358H ofrece un aumento del 60 al 70 por ciento en el rendimiento multihilo con respecto a la base Core Ultra 5 325 o Core Ultra 7 355 configuraciones. Lamentablemente, la sostenibilidad de Turbo Boost es imperfecta, como muestra nuestro gráfico de estrés de CineBench R15 xT que aparece a continuación, donde el rendimiento caería alrededor de un 15 por ciento después de los primeros bucles. El competidor Asus ExpertBook Ultra puede sostener velocidades de reloj y rendimiento más rápidos con la misma CPU Core Ultra X7 en comparación.
El Core Ultra 7 255H en el Dell 16 Premium más antiguo es notablemente más rápido que el Core Ultra X7 358H en el XPS 16 más reciente cuando se trata de cargas multihilo.
Bucle múltiple Cinebench R15
Cinebench R23: Multi Core | Single Core
Cinebench R20: CPU (Multi Core) | CPU (Single Core)
Cinebench R15: CPU Multi 64Bit | CPU Single 64Bit
Blender: v2.79 BMW27 CPU
7-Zip 18.03: 7z b 4 | 7z b 4 -mmt1
Geekbench 6.7: Multi-Core | Single-Core
Geekbench 5.5: Multi-Core | Single-Core
HWBOT x265 Benchmark v2.2: 4k Preset
LibreOffice : 20 Documents To PDF
R Benchmark 2.5: Overall mean
* ... más pequeño es mejor
AIDA64: FP32 Ray-Trace | FPU Julia | CPU SHA3 | CPU Queen | FPU SinJulia | FPU Mandel | CPU AES | CPU ZLib | FP64 Ray-Trace | CPU PhotoWorxx | CPU CheckMate
| Performance rating | |
| Lenovo Yoga Pro 9 16IAH10 RTX 5050 -1! | |
| Dell XPS 16 9640 -1! | |
| Samsung Galaxy Book6 Pro -1! | |
| Dell XPS 16 Core Ultra X7 358H -1! | |
| Medio Intel Core Ultra X7 358H | |
| Dell XPS 16 Core Ultra 5 325 -1! | |
| HP Omnibook 5 16-af1037nr -1! | |
| AIDA64 / FP32 Ray-Trace | |
| Lenovo Yoga Pro 9 16IAH10 RTX 5050 (v6.92.6600) | |
| Dell XPS 16 9640 (v6.92.6600) | |
| Samsung Galaxy Book6 Pro (v8.20.8100) | |
| Dell XPS 16 Core Ultra X7 358H (v8.20.8100) | |
| Medio Intel Core Ultra X7 358H (12221 - 17932, n=8) | |
| Dell XPS 16 Core Ultra 5 325 (v8.20.8100) | |
| HP Omnibook 5 16-af1037nr (v6.92.6600) | |
| AIDA64 / FPU Julia | |
| Lenovo Yoga Pro 9 16IAH10 RTX 5050 (v6.92.6600) | |
| Dell XPS 16 9640 (v6.92.6600) | |
| Dell XPS 16 Core Ultra X7 358H (v8.20.8100) | |
| Samsung Galaxy Book6 Pro (v8.20.8100) | |
| Medio Intel Core Ultra X7 358H (29930 - 95525, n=8) | |
| Dell XPS 16 Core Ultra 5 325 (v8.20.8100) | |
| HP Omnibook 5 16-af1037nr (v6.92.6600) | |
| AIDA64 / CPU SHA3 | |
| Lenovo Yoga Pro 9 16IAH10 RTX 5050 (v6.92.6600) | |
| Medio Intel Core Ultra X7 358H (3910 - 4911, n=8) | |
| Dell XPS 16 Core Ultra X7 358H (v8.20.8100) | |
| Samsung Galaxy Book6 Pro (v8.20.8100) | |
| Dell XPS 16 9640 (v6.92.6600) | |
| Dell XPS 16 Core Ultra 5 325 (v8.20.8100) | |
| HP Omnibook 5 16-af1037nr (v6.92.6600) | |
| AIDA64 / CPU Queen | |
| Dell XPS 16 9640 (v6.92.6600) | |
| Lenovo Yoga Pro 9 16IAH10 RTX 5050 (v6.92.6600) | |
| Medio Intel Core Ultra X7 358H (63425 - 63827, n=2) | |
| HP Omnibook 5 16-af1037nr (v6.92.6600) | |
| AIDA64 / FPU SinJulia | |
| Dell XPS 16 9640 (v6.92.6600) | |
| Lenovo Yoga Pro 9 16IAH10 RTX 5050 (v6.92.6600) | |
| Samsung Galaxy Book6 Pro (v8.20.8100) | |
| Dell XPS 16 Core Ultra X7 358H (v8.20.8100) | |
| Medio Intel Core Ultra X7 358H (4735 - 7038, n=8) | |
| Dell XPS 16 Core Ultra 5 325 (v8.20.8100) | |
| HP Omnibook 5 16-af1037nr (v6.92.6600) | |
| AIDA64 / FPU Mandel | |
| Lenovo Yoga Pro 9 16IAH10 RTX 5050 (v6.92.6600) | |
| Dell XPS 16 Core Ultra X7 358H (v8.20.8100) | |
| Samsung Galaxy Book6 Pro (v8.20.8100) | |
| Dell XPS 16 9640 (v6.92.6600) | |
| Medio Intel Core Ultra X7 358H (14716 - 50734, n=8) | |
| Dell XPS 16 Core Ultra 5 325 (v8.20.8100) | |
| HP Omnibook 5 16-af1037nr (v6.92.6600) | |
| AIDA64 / CPU AES | |
| Dell XPS 16 9640 (v6.92.6600) | |
| Lenovo Yoga Pro 9 16IAH10 RTX 5050 (v6.92.6600) | |
| Samsung Galaxy Book6 Pro (v8.20.8100) | |
| Dell XPS 16 Core Ultra X7 358H (v8.20.8100) | |
| Medio Intel Core Ultra X7 358H (5127 - 67510, n=8) | |
| Dell XPS 16 Core Ultra 5 325 (v8.20.8100) | |
| HP Omnibook 5 16-af1037nr (v6.92.6600) | |
| AIDA64 / CPU ZLib | |
| Lenovo Yoga Pro 9 16IAH10 RTX 5050 (v6.92.6600) | |
| Dell XPS 16 9640 (v6.92.6600) | |
| Samsung Galaxy Book6 Pro (v8.20.8100) | |
| Medio Intel Core Ultra X7 358H (932 - 1179, n=8) | |
| Dell XPS 16 Core Ultra X7 358H (v8.20.8100) | |
| Dell XPS 16 Core Ultra 5 325 (v8.20.8100) | |
| HP Omnibook 5 16-af1037nr (v6.92.6600) | |
| AIDA64 / FP64 Ray-Trace | |
| Lenovo Yoga Pro 9 16IAH10 RTX 5050 (v6.92.6600) | |
| Dell XPS 16 9640 (v6.92.6600) | |
| Dell XPS 16 Core Ultra X7 358H (v8.20.8100) | |
| Samsung Galaxy Book6 Pro (v8.20.8100) | |
| Medio Intel Core Ultra X7 358H (6506 - 9447, n=8) | |
| Dell XPS 16 Core Ultra 5 325 (v8.20.8100) | |
| HP Omnibook 5 16-af1037nr (v6.92.6600) | |
| AIDA64 / CPU PhotoWorxx | |
| Dell XPS 16 Core Ultra X7 358H (v8.20.8100) | |
| Samsung Galaxy Book6 Pro (v8.20.8100) | |
| Medio Intel Core Ultra X7 358H (30538 - 88154, n=8) | |
| Lenovo Yoga Pro 9 16IAH10 RTX 5050 (v6.92.6600) | |
| Dell XPS 16 Core Ultra 5 325 (v8.20.8100) | |
| Dell XPS 16 9640 (v6.92.6600) | |
| HP Omnibook 5 16-af1037nr (v6.92.6600) | |
| AIDA64 / CPU CheckMate | |
| Medio Intel Core Ultra X7 358H (4187 - 4475, n=7) | |
| Dell XPS 16 Core Ultra X7 358H (v8.20.8100) | |
| Samsung Galaxy Book6 Pro (v8.20.8100) | |
| Dell XPS 16 Core Ultra 5 325 (v8.20.8100) | |
Rendimiento del sistema
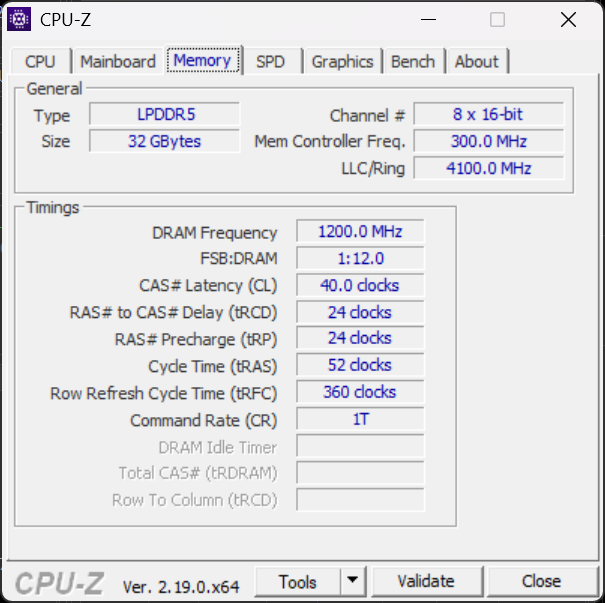
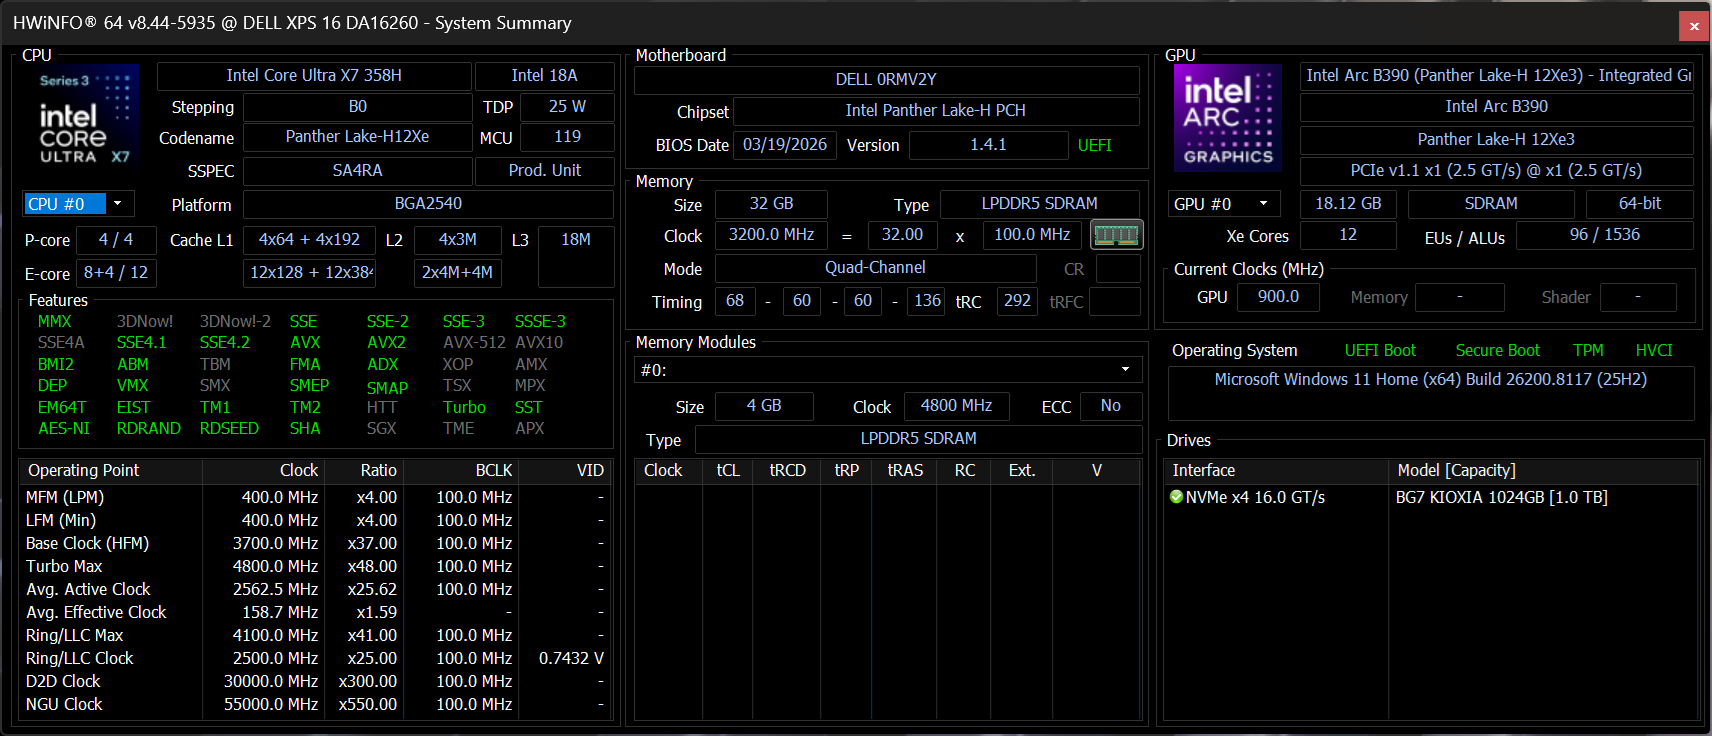
Los resultados de PCMark son notablemente superiores a los de la configuración básica Core Ultra 5, especialmente en lo que se refiere a la subprueba de creación de contenidos digitales con gran carga de GPU, debido a los gráficos integrados mucho más rápidos de la configuración Core Ultra X7. El rendimiento de la RAM también es entre un 25 y un 40 por ciento más rápido cuando se configura con 32 GB en lugar de 16 GB según AIDA64.

PCMark 10: Score | Essentials | Productivity | Digital Content Creation
CrossMark: Overall | Productivity | Creativity | Responsiveness
WebXPRT 3: Overall
WebXPRT 4: Overall
Mozilla Kraken 1.1: Total
| Performance rating | |
| Dell XPS 16 Core Ultra X7 358H | |
| Lenovo Yoga Pro 9 16IAH10 RTX 5050 | |
| Medio Intel Core Ultra X7 358H, Intel Arc B390 12 Xe3 Panther Lake iGPU | |
| Samsung Galaxy Book6 Pro | |
| Dell XPS 16 9640 -1! | |
| Dell XPS 16 Core Ultra 5 325 | |
| HP Omnibook 5 16-af1037nr | |
| PCMark 10 / Score | |
| Dell XPS 16 Core Ultra X7 358H | |
| Lenovo Yoga Pro 9 16IAH10 RTX 5050 | |
| Medio Intel Core Ultra X7 358H, Intel Arc B390 12 Xe3 Panther Lake iGPU (8834 - 9880, n=8) | |
| Samsung Galaxy Book6 Pro | |
| Dell XPS 16 Core Ultra 5 325 | |
| HP Omnibook 5 16-af1037nr | |
| Dell XPS 16 9640 | |
| PCMark 10 / Essentials | |
| Dell XPS 16 Core Ultra X7 358H | |
| Medio Intel Core Ultra X7 358H, Intel Arc B390 12 Xe3 Panther Lake iGPU (10282 - 11263, n=7) | |
| Lenovo Yoga Pro 9 16IAH10 RTX 5050 | |
| Dell XPS 16 9640 | |
| Samsung Galaxy Book6 Pro | |
| Dell XPS 16 Core Ultra 5 325 | |
| HP Omnibook 5 16-af1037nr | |
| PCMark 10 / Productivity | |
| Lenovo Yoga Pro 9 16IAH10 RTX 5050 | |
| Dell XPS 16 Core Ultra X7 358H | |
| Samsung Galaxy Book6 Pro | |
| Medio Intel Core Ultra X7 358H, Intel Arc B390 12 Xe3 Panther Lake iGPU (13908 - 16780, n=7) | |
| HP Omnibook 5 16-af1037nr | |
| Dell XPS 16 Core Ultra 5 325 | |
| Dell XPS 16 9640 | |
| PCMark 10 / Digital Content Creation | |
| Dell XPS 16 Core Ultra X7 358H | |
| Medio Intel Core Ultra X7 358H, Intel Arc B390 12 Xe3 Panther Lake iGPU (13082 - 13893, n=7) | |
| Lenovo Yoga Pro 9 16IAH10 RTX 5050 | |
| Samsung Galaxy Book6 Pro | |
| Dell XPS 16 9640 | |
| Dell XPS 16 Core Ultra 5 325 | |
| HP Omnibook 5 16-af1037nr | |
| CrossMark / Overall | |
| Dell XPS 16 Core Ultra X7 358H | |
| Medio Intel Core Ultra X7 358H, Intel Arc B390 12 Xe3 Panther Lake iGPU (1884 - 2119, n=8) | |
| Lenovo Yoga Pro 9 16IAH10 RTX 5050 | |
| Samsung Galaxy Book6 Pro | |
| Dell XPS 16 9640 | |
| Dell XPS 16 Core Ultra 5 325 | |
| HP Omnibook 5 16-af1037nr | |
| CrossMark / Productivity | |
| Dell XPS 16 Core Ultra X7 358H | |
| Lenovo Yoga Pro 9 16IAH10 RTX 5050 | |
| Medio Intel Core Ultra X7 358H, Intel Arc B390 12 Xe3 Panther Lake iGPU (1678 - 1928, n=8) | |
| Samsung Galaxy Book6 Pro | |
| Dell XPS 16 9640 | |
| Dell XPS 16 Core Ultra 5 325 | |
| HP Omnibook 5 16-af1037nr | |
| CrossMark / Creativity | |
| Dell XPS 16 Core Ultra X7 358H | |
| Medio Intel Core Ultra X7 358H, Intel Arc B390 12 Xe3 Panther Lake iGPU (2241 - 2529, n=8) | |
| Samsung Galaxy Book6 Pro | |
| Lenovo Yoga Pro 9 16IAH10 RTX 5050 | |
| Dell XPS 16 9640 | |
| Dell XPS 16 Core Ultra 5 325 | |
| HP Omnibook 5 16-af1037nr | |
| CrossMark / Responsiveness | |
| Dell XPS 16 Core Ultra X7 358H | |
| Dell XPS 16 9640 | |
| Medio Intel Core Ultra X7 358H, Intel Arc B390 12 Xe3 Panther Lake iGPU (1560 - 1837, n=8) | |
| Lenovo Yoga Pro 9 16IAH10 RTX 5050 | |
| Samsung Galaxy Book6 Pro | |
| Dell XPS 16 Core Ultra 5 325 | |
| HP Omnibook 5 16-af1037nr | |
| WebXPRT 3 / Overall | |
| Lenovo Yoga Pro 9 16IAH10 RTX 5050 | |
| Medio Intel Core Ultra X7 358H, Intel Arc B390 12 Xe3 Panther Lake iGPU (293 - 338, n=8) | |
| Dell XPS 16 Core Ultra X7 358H | |
| HP Omnibook 5 16-af1037nr | |
| Samsung Galaxy Book6 Pro | |
| Dell XPS 16 9640 | |
| Dell XPS 16 Core Ultra 5 325 | |
| WebXPRT 4 / Overall | |
| Lenovo Yoga Pro 9 16IAH10 RTX 5050 | |
| Dell XPS 16 Core Ultra X7 358H | |
| Medio Intel Core Ultra X7 358H, Intel Arc B390 12 Xe3 Panther Lake iGPU (278 - 305, n=7) | |
| HP Omnibook 5 16-af1037nr | |
| Samsung Galaxy Book6 Pro | |
| Dell XPS 16 Core Ultra 5 325 | |
| Dell XPS 16 9640 | |
| Mozilla Kraken 1.1 / Total | |
| HP Omnibook 5 16-af1037nr | |
| Dell XPS 16 Core Ultra 5 325 | |
| Samsung Galaxy Book6 Pro | |
| Medio Intel Core Ultra X7 358H, Intel Arc B390 12 Xe3 Panther Lake iGPU (445 - 460, n=8) | |
| Dell XPS 16 Core Ultra X7 358H | |
| Lenovo Yoga Pro 9 16IAH10 RTX 5050 | |
* ... más pequeño es mejor
| PCMark 10 Score | 9717 puntos | |
ayuda | ||
| AIDA64 / Memory Copy | |
| Dell XPS 16 Core Ultra X7 358H | |
| Samsung Galaxy Book6 Pro | |
| Medio Intel Core Ultra X7 358H (102745 - 132135, n=7) | |
| Dell XPS 16 Core Ultra 5 325 | |
| Lenovo Yoga Pro 9 16IAH10 RTX 5050 | |
| Dell XPS 16 9640 | |
| HP Omnibook 5 16-af1037nr | |
| AIDA64 / Memory Read | |
| Dell XPS 16 Core Ultra X7 358H | |
| Samsung Galaxy Book6 Pro | |
| Medio Intel Core Ultra X7 358H (97755 - 118888, n=8) | |
| Lenovo Yoga Pro 9 16IAH10 RTX 5050 | |
| Dell XPS 16 Core Ultra 5 325 | |
| Dell XPS 16 9640 | |
| HP Omnibook 5 16-af1037nr | |
| AIDA64 / Memory Write | |
| Dell XPS 16 Core Ultra X7 358H | |
| Medio Intel Core Ultra X7 358H (105984 - 134998, n=8) | |
| Samsung Galaxy Book6 Pro | |
| Dell XPS 16 Core Ultra 5 325 | |
| Lenovo Yoga Pro 9 16IAH10 RTX 5050 | |
| Dell XPS 16 9640 | |
| HP Omnibook 5 16-af1037nr | |
| AIDA64 / Memory Latency | |
| HP Omnibook 5 16-af1037nr | |
| Dell XPS 16 9640 | |
| Lenovo Yoga Pro 9 16IAH10 RTX 5050 | |
| Dell XPS 16 Core Ultra 5 325 | |
| Samsung Galaxy Book6 Pro | |
| Dell XPS 16 Core Ultra X7 358H | |
| Medio Intel Core Ultra X7 358H (84.6 - 101.9, n=8) | |
* ... más pequeño es mejor
Latencia del CPD


| DPC Latencies / LatencyMon - interrupt to process latency (max), Web, Youtube, Prime95 | |
| Lenovo Yoga Pro 9 16IAH10 RTX 5050 | |
| Dell XPS 16 Core Ultra 5 325 | |
| HP Omnibook 5 16-af1037nr | |
| Dell XPS 16 9640 | |
| Dell XPS 16 Core Ultra X7 358H | |
| Samsung Galaxy Book6 Pro | |
* ... más pequeño es mejor
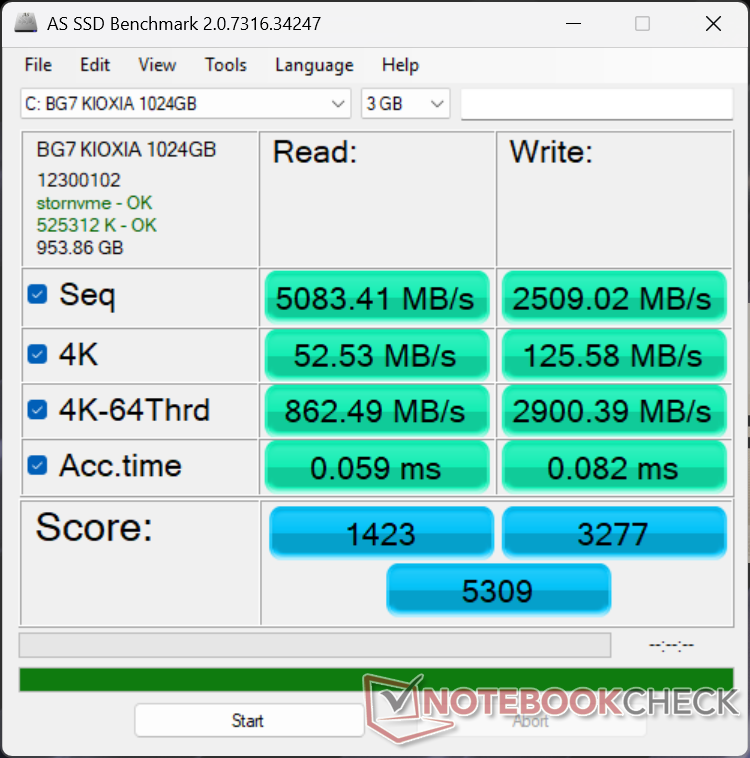
Dispositivos de almacenamiento
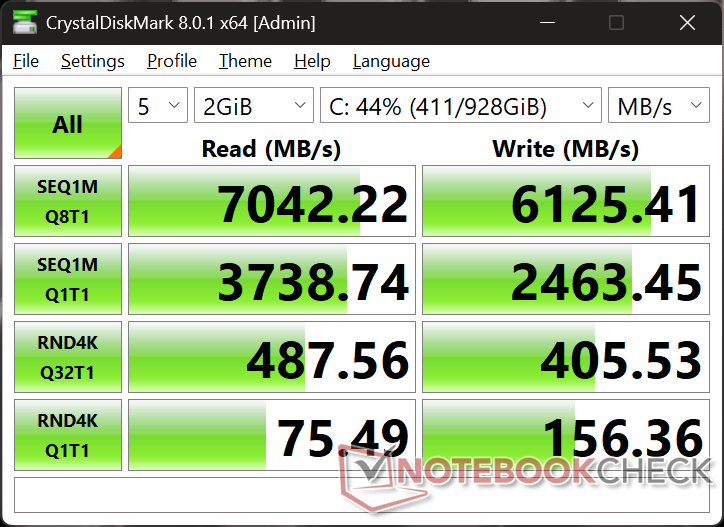
Nuestra unidad de prueba se entrega con un Kioxia BG7 en lugar del BG8 o BG6 que se encuentra en nuestra configuración Core Ultra 5 o 2025 Dell 16 Premiumrespectivamente. Por lo demás, el rendimiento es prácticamente el mismo entre ambos, con tasas de transferencia máximas sostenibles de unos 7000 MB/s.


| Drive Performance rating - Percent | |
| Dell XPS 16 9640 | |
| Lenovo Yoga Pro 9 16IAH10 RTX 5050 | |
| Dell XPS 16 Core Ultra X7 358H | |
| Samsung Galaxy Book6 Pro | |
| Dell XPS 16 Core Ultra 5 325 | |
| HP Omnibook 5 16-af1037nr | |
* ... más pequeño es mejor
Estrangulamiento de disco: Bucle de lectura DiskSpd, profundidad de cola 8
Rendimiento de la GPU
El integrado Arco B390 es significativamente más rápido que la base Gráficos 4 Xe3 en la configuración Core Ultra 5. Es la GPU más rápida disponible para el XPS 16 2026 ya que las opciones discretas de Nvidia ya no son configurables. Los usuarios pueden esperar un aumento de 2,5 veces en el rendimiento bruto sobre la Graphics 4 Xe3 o un déficit de rendimiento bruto del 30 por ciento en comparación con la antigua XPS 16 con RTX 4070 gráficos. No obstante, es lo suficientemente potente como para ejecutar la mayoría de los títulos modernos a 1080p en ajustes medios, incluido Black Myth: Wukong.
Ejecutar en modo Equilibrado en lugar de en modo Rendimiento no afecta significativamente al rendimiento. Mientras tanto, el funcionamiento con batería reduce el rendimiento sólo ligeramente hasta un 10 por ciento, como se muestra en nuestra tabla de resultados Fire Strike a continuación.
| Perfil de energía | Puntuación de gráficos | Puntuación física | Puntuación combinada |
| Modo Rendimiento | 17018 | 22086 | 4859 |
| Modo Equilibrado | 16785 (-1%) | 22887 (+4%) | 4467 (-8%) |
| Batería | 15685 (-8%) | 20760 (-6%) | 4269 (-12%) |
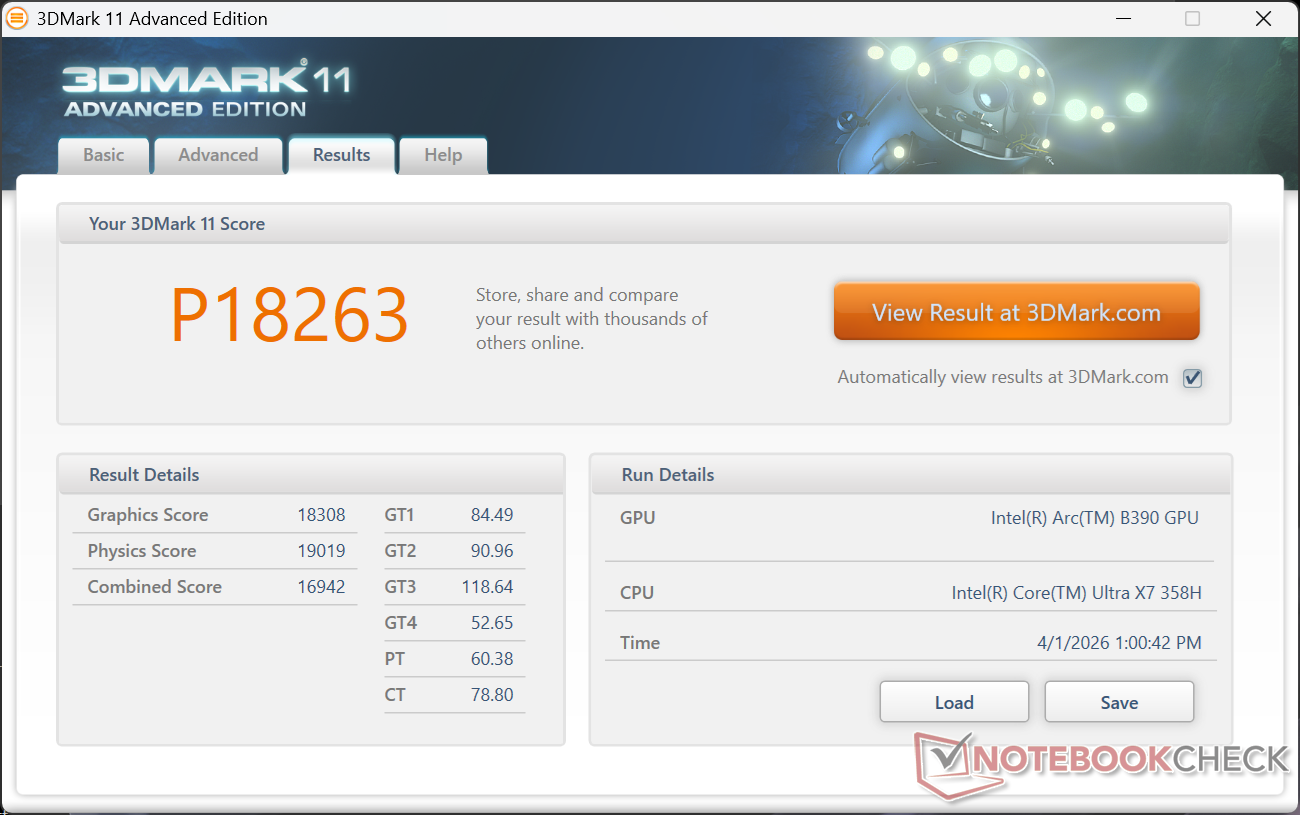


| 3DMark 11 Performance | 18263 puntos | |
| 3DMark Cloud Gate Standard Score | 39015 puntos | |
| 3DMark Fire Strike Score | 13997 puntos | |
| 3DMark Time Spy Score | 7436 puntos | |
ayuda | ||
* ... más pequeño es mejor
| Performance rating - Percent | |
| Lenovo Yoga Pro 9 16IAH10 RTX 5050 | |
| Dell XPS 16 9640 | |
| Dell XPS 16 Core Ultra X7 358H | |
| Samsung Galaxy Book6 Pro | |
| Dell XPS 16 Core Ultra 5 325 | |
| HP Omnibook 5 16-af1037nr | |
| Cyberpunk 2077 - 1920x1080 Ultra Preset (FSR off) | |
| Lenovo Yoga Pro 9 16IAH10 RTX 5050 | |
| Dell XPS 16 9640 | |
| Dell XPS 16 Core Ultra X7 358H | |
| Samsung Galaxy Book6 Pro | |
| Dell XPS 16 Core Ultra 5 325 | |
| HP Omnibook 5 16-af1037nr | |
| Baldur's Gate 3 - 1920x1080 Ultra Preset AA:T | |
| Lenovo Yoga Pro 9 16IAH10 RTX 5050 | |
| Dell XPS 16 9640 | |
| Dell XPS 16 Core Ultra X7 358H | |
| Samsung Galaxy Book6 Pro | |
| Dell XPS 16 Core Ultra 5 325 | |
| HP Omnibook 5 16-af1037nr | |
| GTA V - 1920x1080 Highest AA:4xMSAA + FX AF:16x | |
| Lenovo Yoga Pro 9 16IAH10 RTX 5050 | |
| Dell XPS 16 9640 | |
| Dell XPS 16 Core Ultra X7 358H | |
| Samsung Galaxy Book6 Pro | |
| Dell XPS 16 Core Ultra 5 325 | |
| HP Omnibook 5 16-af1037nr | |
| Final Fantasy XV Benchmark - 1920x1080 High Quality | |
| Lenovo Yoga Pro 9 16IAH10 RTX 5050 | |
| Dell XPS 16 9640 | |
| Dell XPS 16 Core Ultra X7 358H | |
| Samsung Galaxy Book6 Pro | |
| Dell XPS 16 Core Ultra 5 325 | |
| HP Omnibook 5 16-af1037nr | |
| Strange Brigade - 1920x1080 ultra AA:ultra AF:16 | |
| Lenovo Yoga Pro 9 16IAH10 RTX 5050 | |
| Dell XPS 16 9640 | |
| Dell XPS 16 Core Ultra X7 358H | |
| Samsung Galaxy Book6 Pro | |
| Dell XPS 16 Core Ultra 5 325 | |
| HP Omnibook 5 16-af1037nr | |
| Dota 2 Reborn - 1920x1080 ultra (3/3) best looking | |
| Lenovo Yoga Pro 9 16IAH10 RTX 5050 | |
| Dell XPS 16 Core Ultra X7 358H | |
| Dell XPS 16 9640 | |
| Samsung Galaxy Book6 Pro | |
| Dell XPS 16 Core Ultra 5 325 | |
| HP Omnibook 5 16-af1037nr | |
| X-Plane 11.11 - 1920x1080 high (fps_test=3) | |
| Lenovo Yoga Pro 9 16IAH10 RTX 5050 | |
| Dell XPS 16 9640 | |
| Dell XPS 16 9640 | |
| Dell XPS 16 Core Ultra X7 358H | |
| Samsung Galaxy Book6 Pro | |
| HP Omnibook 5 16-af1037nr | |
| Dell XPS 16 Core Ultra 5 325 | |
Cyberpunk 2077 ultra FPS Gráfico
| bajo | medio | alto | ultra | |
|---|---|---|---|---|
| GTA V (2015) | 182 | 176.1 | 103.3 | 45.2 |
| Dota 2 Reborn (2015) | 112.9 | 91.6 | 100.2 | 96.9 |
| Final Fantasy XV Benchmark (2018) | 131.1 | 79.7 | 56.2 | |
| X-Plane 11.11 (2018) | 55.9 | 47.6 | 38.8 | |
| Strange Brigade (2018) | 359 | 130.5 | 104 | 90.6 |
| Baldur's Gate 3 (2023) | 72.3 | 62.3 | 55.6 | 54.3 |
| Cyberpunk 2077 (2023) | 80.4 | 65.4 | 56 | 48.7 |
| F1 24 (2024) | 142.7 | 135.3 | 103.4 | 36.8 |
| Black Myth: Wukong (2024) | 47 | 37 | 29 | 16 |
Emisiones
Ruido del sistema
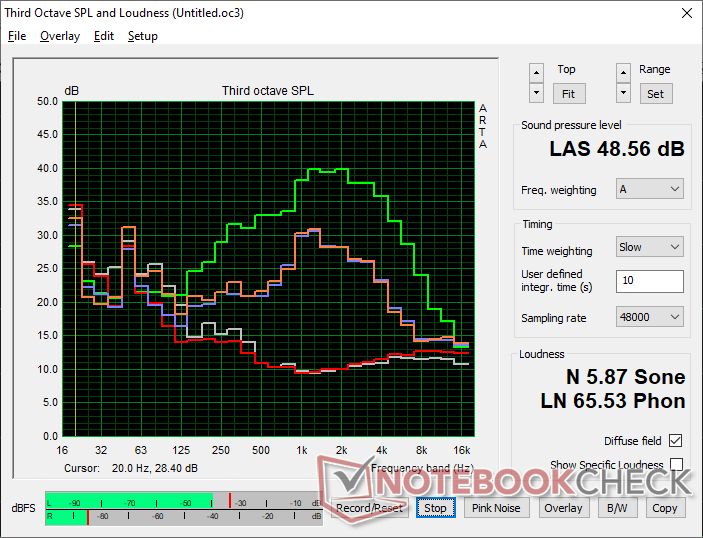
Las RPM del ventilador aumentarían más fácilmente en comparación con la configuración base Core Ultra 5, lo que concuerda con el consumo de energía generalmente más elevado del sistema Core Ultra X7. Al ejecutar 3DMark 06, por ejemplo, el ruido del ventilador alcanzaría un máximo de 38 dB(A) en comparación con los 34 dB(A) de la SKU Core Ultra 5.
Ruido
| Ocioso |
| 23.4 / 23.4 / 25.8 dB(A) |
| Carga |
| 38 / 48.6 dB(A) |
 | ||
30 dB silencioso 40 dB(A) audible 50 dB(A) ruidosamente alto |
||
min: | ||
| Dell XPS 16 Core Ultra X7 358H Ultra X7 358H, Arc B390 Panther Lake iGPU | Dell XPS 16 Core Ultra 5 325 Ultra 5 325, Intel Graphics 4 Xe3 PTL | Dell XPS 16 9640 Ultra 7 155H, GeForce RTX 4070 Laptop GPU | Samsung Galaxy Book6 Pro Ultra 7 356H, Intel Graphics 4 Xe3 PTL | Lenovo Yoga Pro 9 16IAH10 RTX 5050 Ultra 9 285H, GeForce RTX 5050 Laptop | HP Omnibook 5 16-af1037nr Ultra 7 255U, Graphics 4-Core iGPU (Arrow Lake) | |
|---|---|---|---|---|---|---|
| Noise | 5% | -5% | 2% | -7% | 13% | |
| apagado / medio ambiente * (dB) | 23.3 | 22.8 2% | 24.5 -5% | 25.3 -9% | 24.6 -6% | 23.3 -0% |
| Idle Minimum * (dB) | 23.4 | 22.9 2% | 24.5 -5% | 25.3 -8% | 24.6 -5% | 23.5 -0% |
| Idle Average * (dB) | 23.4 | 22.9 2% | 24.5 -5% | 25.3 -8% | 24.6 -5% | 23.5 -0% |
| Idle Maximum * (dB) | 25.8 | 23.9 7% | 27.5 -7% | 25.3 2% | 26.8 -4% | 24.4 5% |
| Load Average * (dB) | 38 | 34.8 8% | 39.6 -4% | 31.8 16% | 32.8 14% | 25.8 32% |
| Cyberpunk 2077 ultra * (dB) | 38.1 | 38 -0% | 38.4 -1% | 51.8 -36% | 26.2 31% | |
| Load Maximum * (dB) | 48.6 | 43.3 11% | 49.7 -2% | 38.4 21% | 51.8 -7% | 39 20% |
| Witcher 3 ultra * (dB) | 49.7 |
* ... más pequeño es mejor
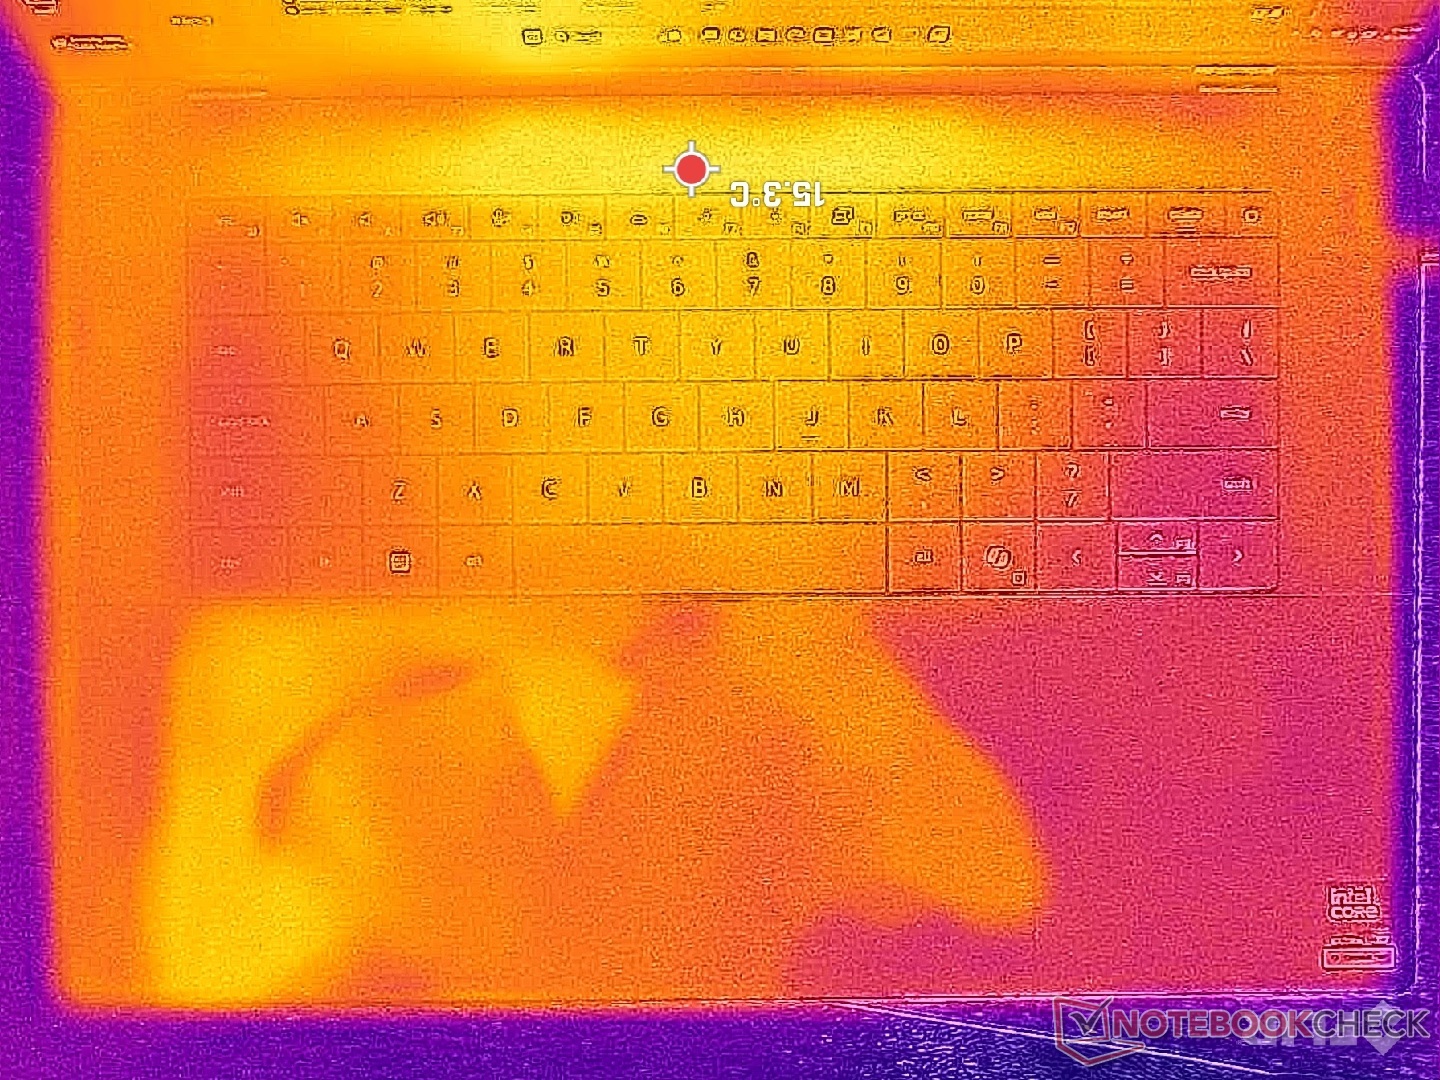
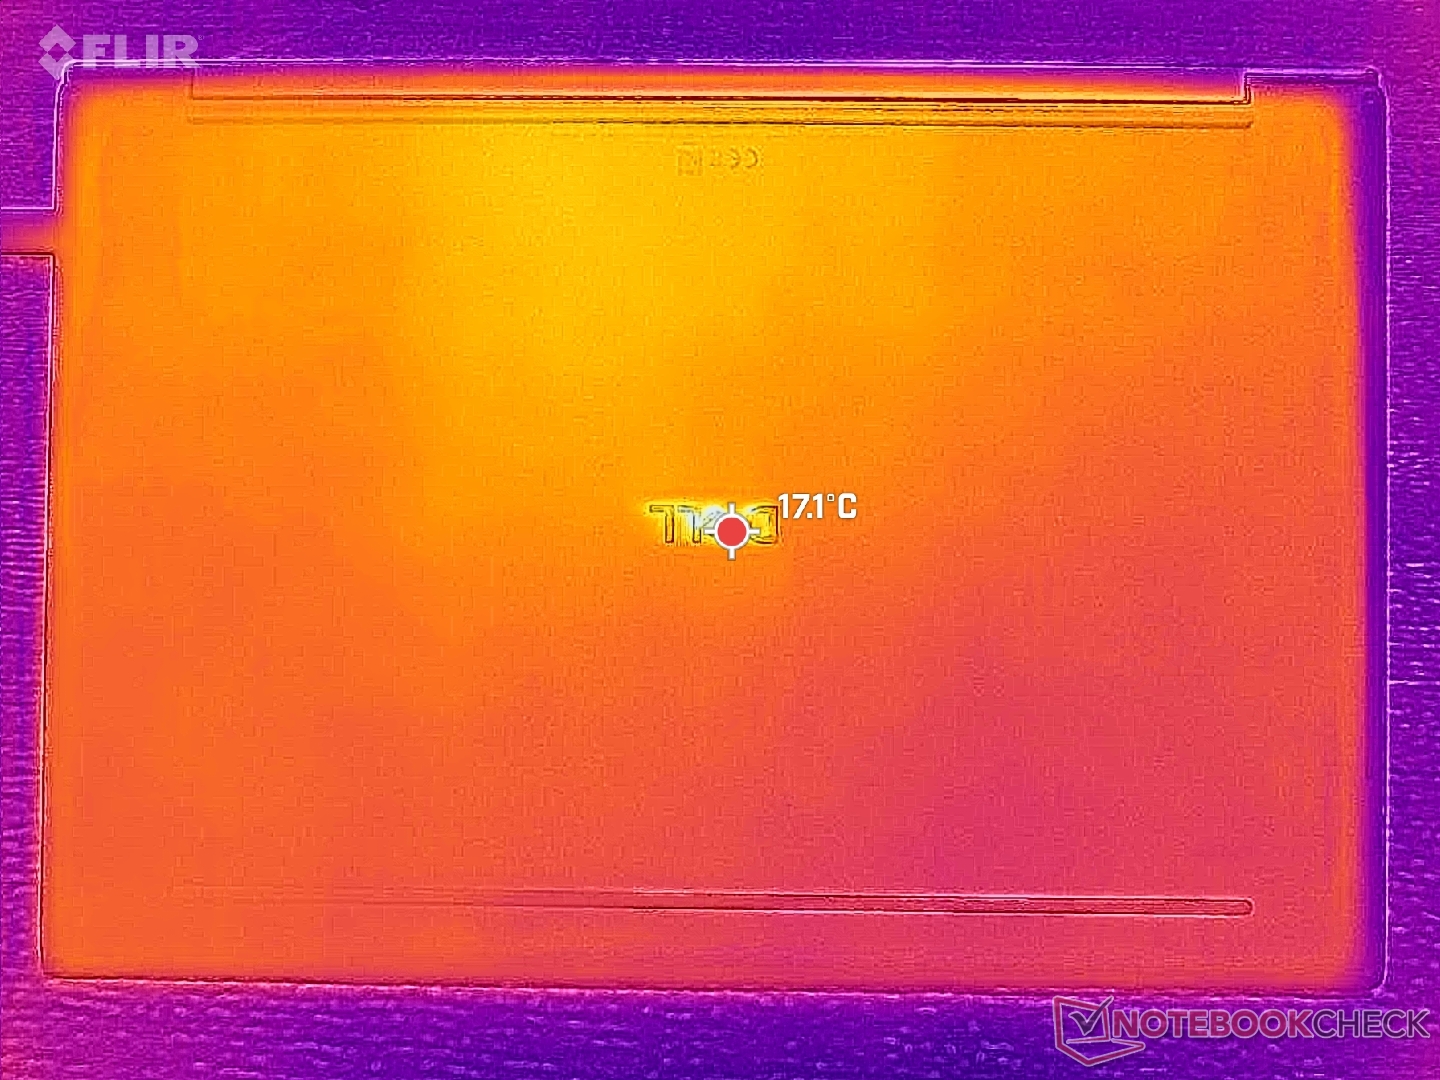
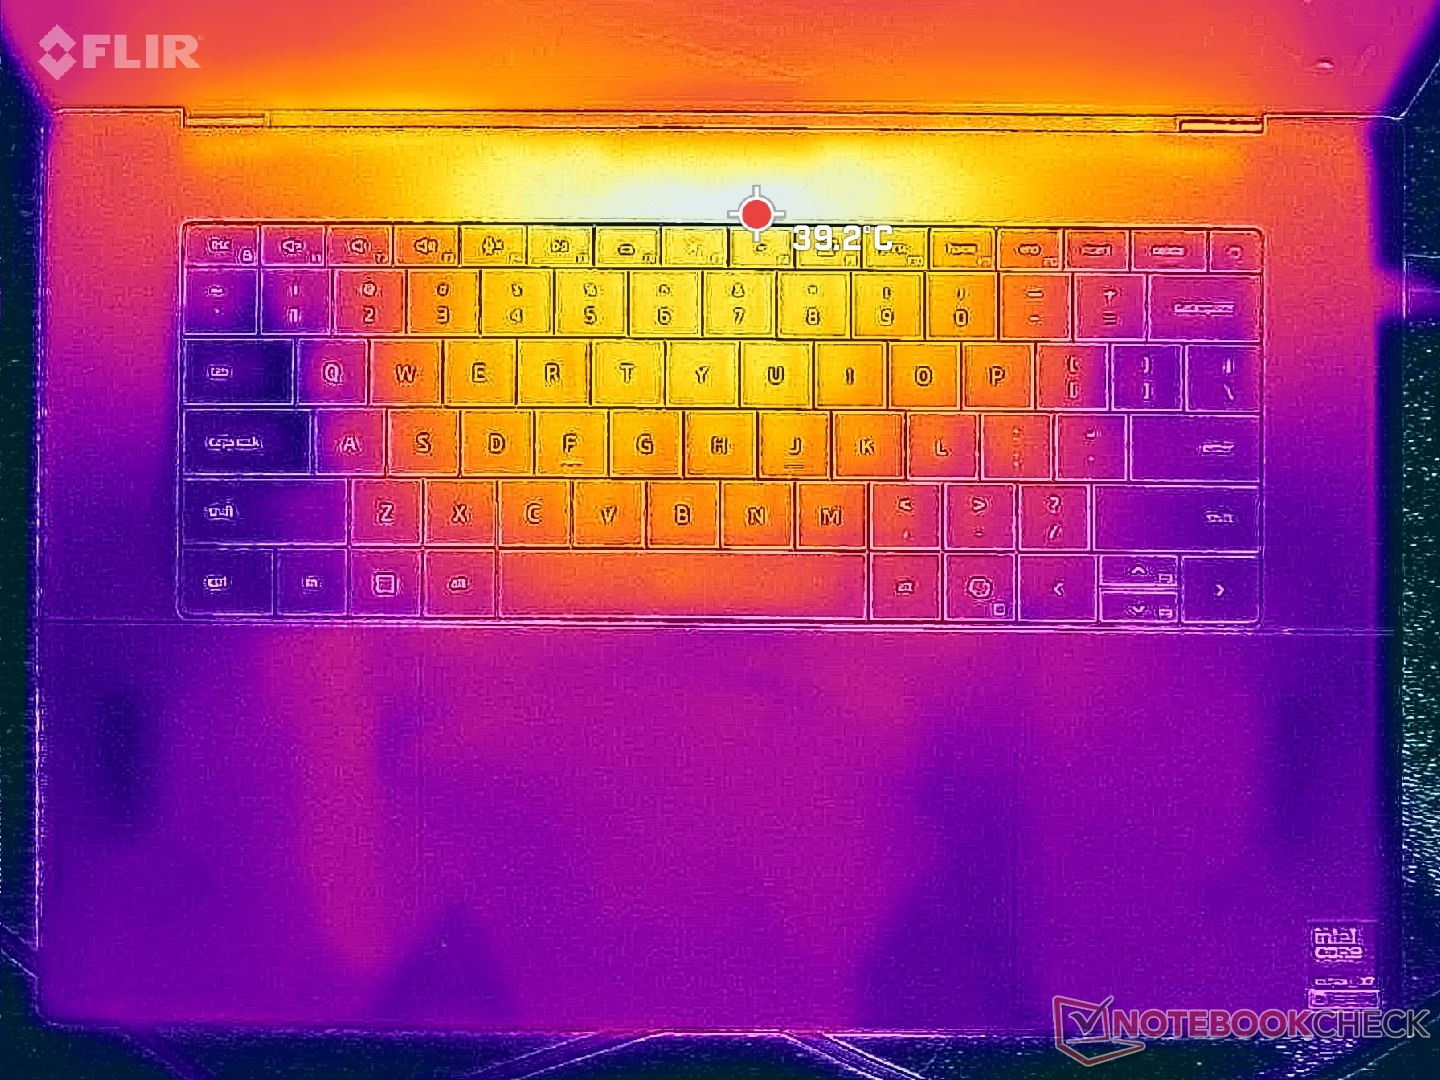
Temperatura
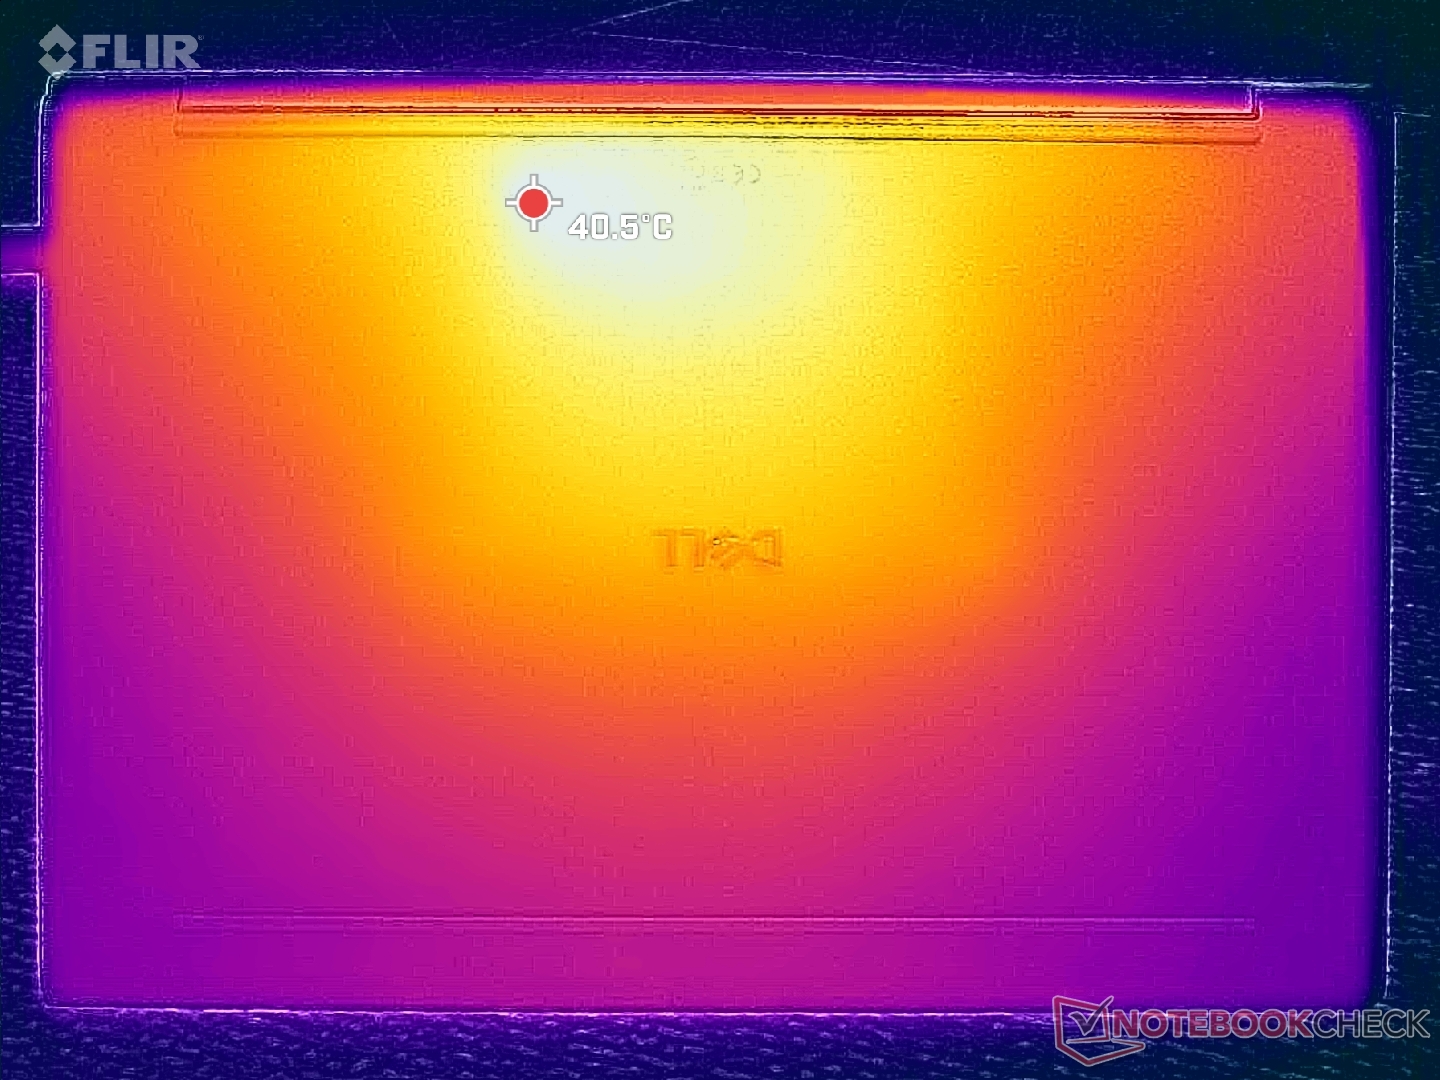
Las temperaturas de la superficie son más frías en promedio en comparación con el XPS 16 9640 más antiguo pero más grueso con gráficos RTX 4070 más rápidos. No obstante, los puntos calientes alcanzan un máximo similar de 40 C cerca del centro del teclado.
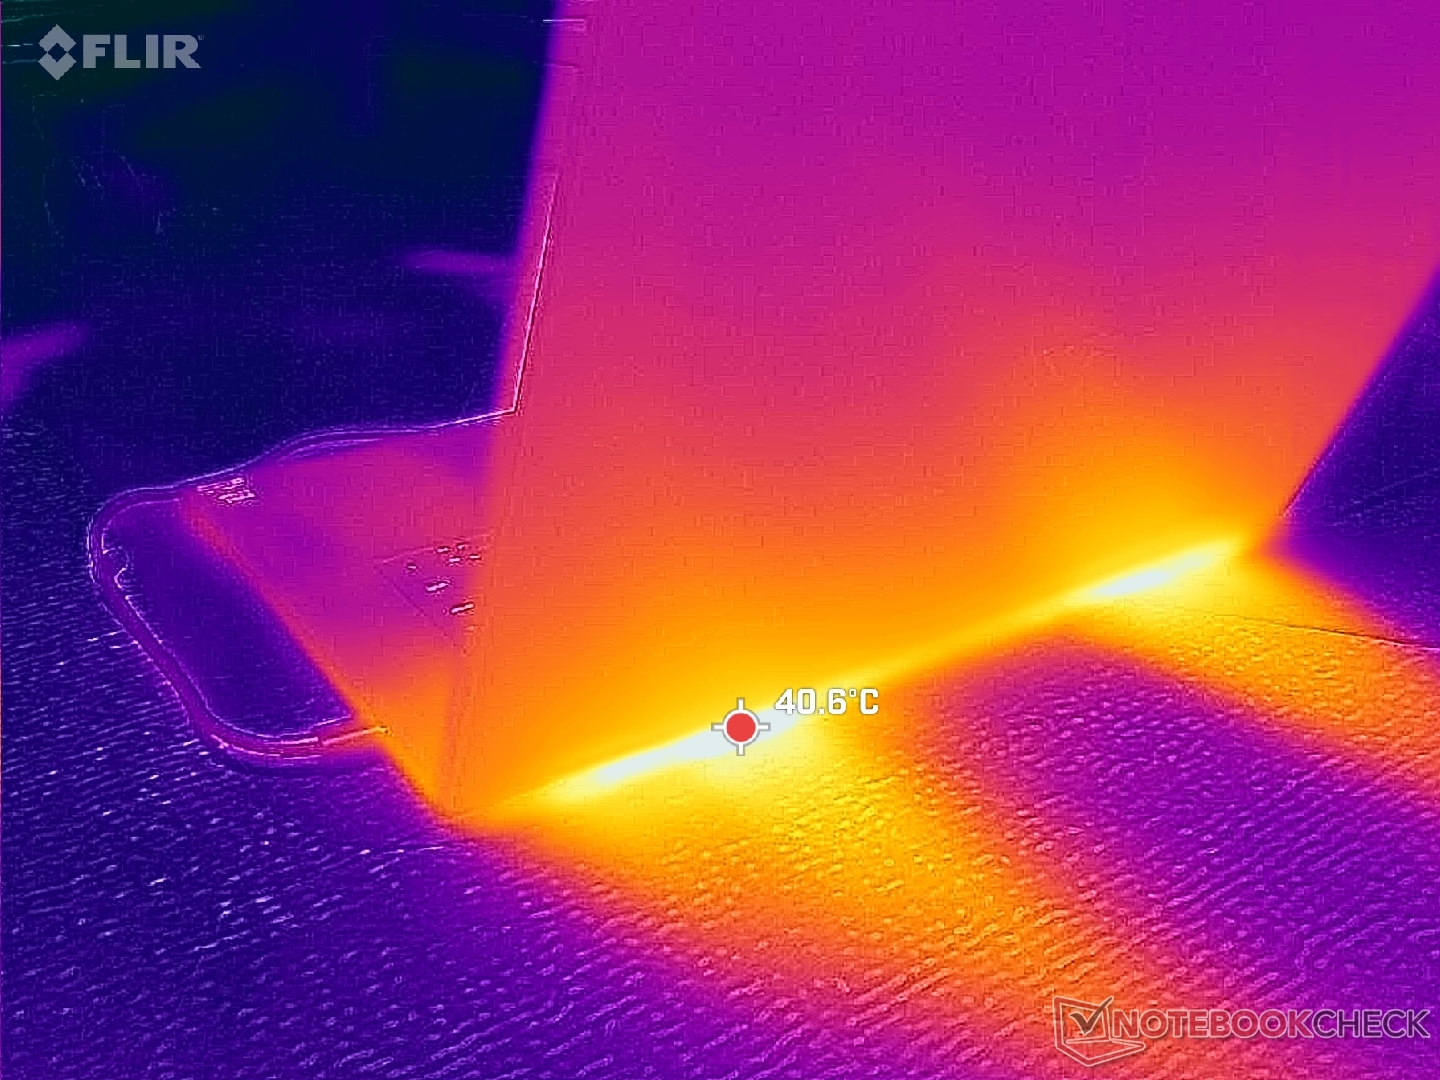
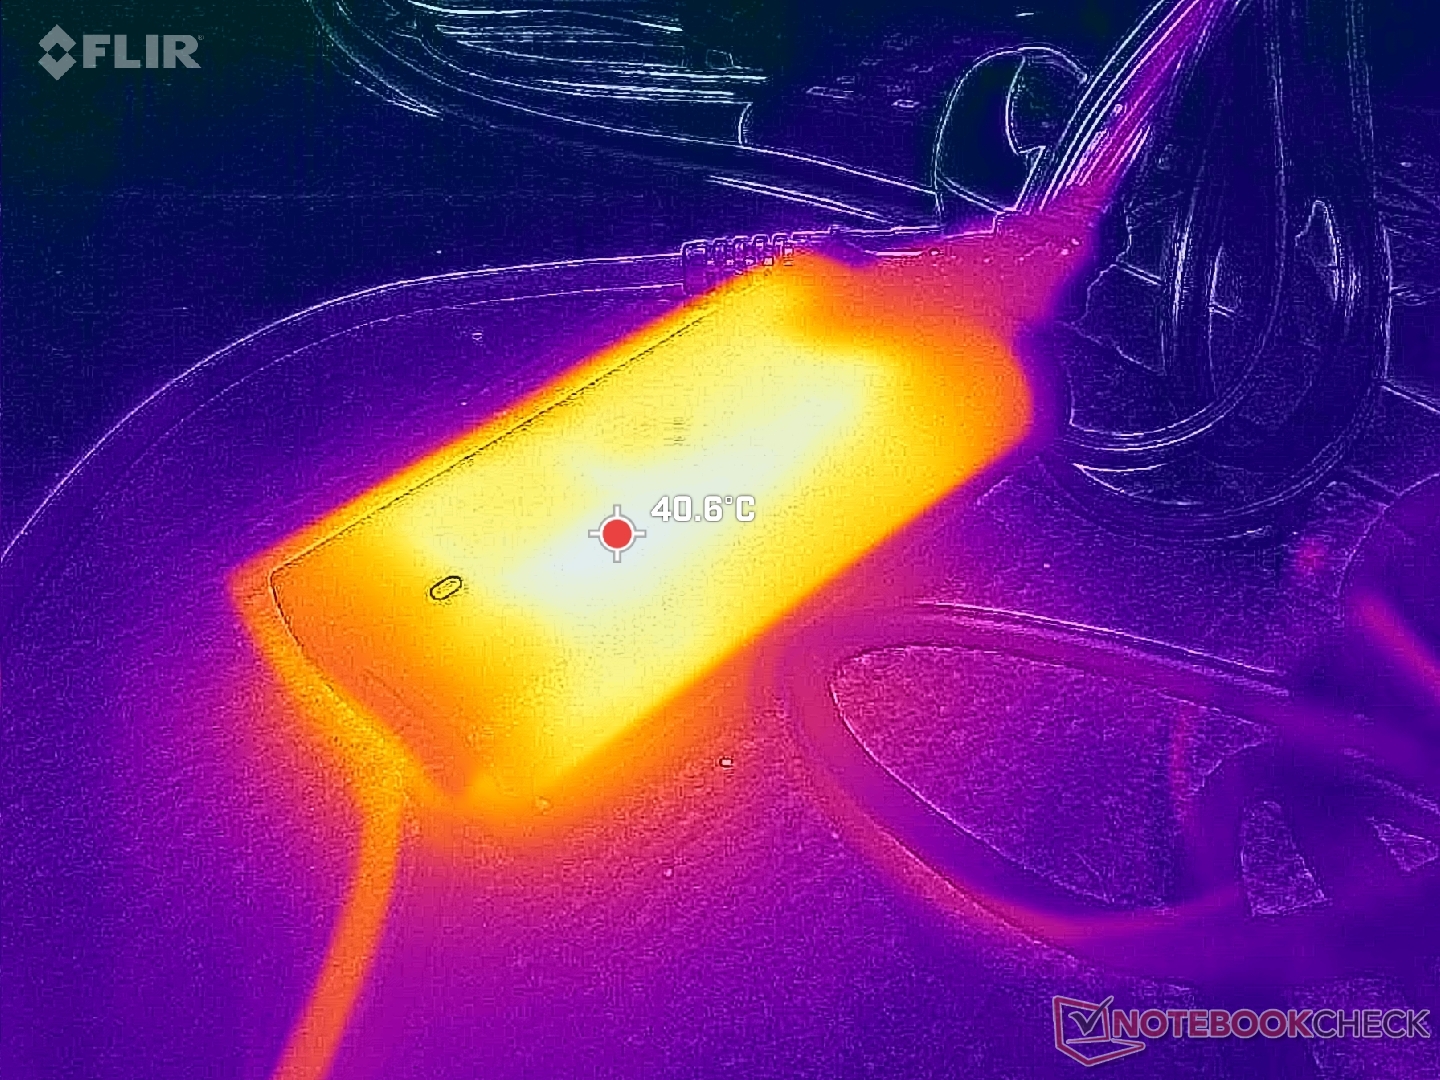
(±) La temperatura máxima en la parte superior es de 40.6 °C / 105 F, frente a la media de 36.8 °C / 98 F, que oscila entre 21 y 71 °C para la clase Multimedia.
(+) El fondo se calienta hasta un máximo de 39.8 °C / 104 F, frente a la media de 39.1 °C / 102 F
(+) En reposo, la temperatura media de la parte superior es de 22.3 °C / 72# F, frente a la media del dispositivo de 31.3 °C / 88 F.
(+) El reposamanos y el panel táctil están a una temperatura inferior a la de la piel, con un máximo de 25.6 °C / 78.1 F y, por tanto, son fríos al tacto.
(+) La temperatura media de la zona del reposamanos de dispositivos similares fue de 28.7 °C / 83.7 F (+3.1 °C / 5.6 F).
| Dell XPS 16 Core Ultra X7 358H Ultra X7 358H, Arc B390 Panther Lake iGPU | Dell XPS 16 Core Ultra 5 325 Ultra 5 325, Intel Graphics 4 Xe3 PTL | Dell XPS 16 9640 Ultra 7 155H, GeForce RTX 4070 Laptop GPU | Samsung Galaxy Book6 Pro Ultra 7 356H, Intel Graphics 4 Xe3 PTL | Lenovo Yoga Pro 9 16IAH10 RTX 5050 Ultra 9 285H, GeForce RTX 5050 Laptop | HP Omnibook 5 16-af1037nr Ultra 7 255U, Graphics 4-Core iGPU (Arrow Lake) | |
|---|---|---|---|---|---|---|
| Heat | -3% | -7% | 3% | -12% | 6% | |
| Maximum Upper Side * (°C) | 40.6 | 43.8 -8% | 39.4 3% | 37.8 7% | 34.4 15% | 28 31% |
| Maximum Bottom * (°C) | 39.8 | 42 -6% | 36.9 7% | 40.1 -1% | 41.4 -4% | 33.2 17% |
| Idle Upper Side * (°C) | 23.2 | 23.2 -0% | 28.2 -22% | 22.6 3% | 28.6 -23% | 24.6 -6% |
| Idle Bottom * (°C) | 23.8 | 23.6 1% | 27.4 -15% | 22.8 4% | 31.8 -34% | 27.8 -17% |
* ... más pequeño es mejor
Prueba de estrés
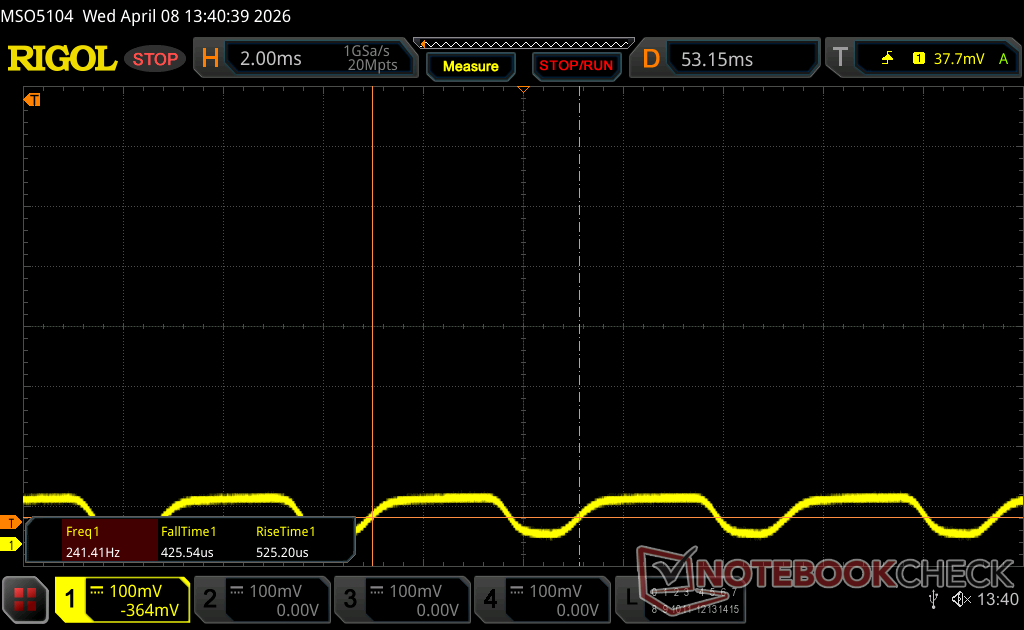
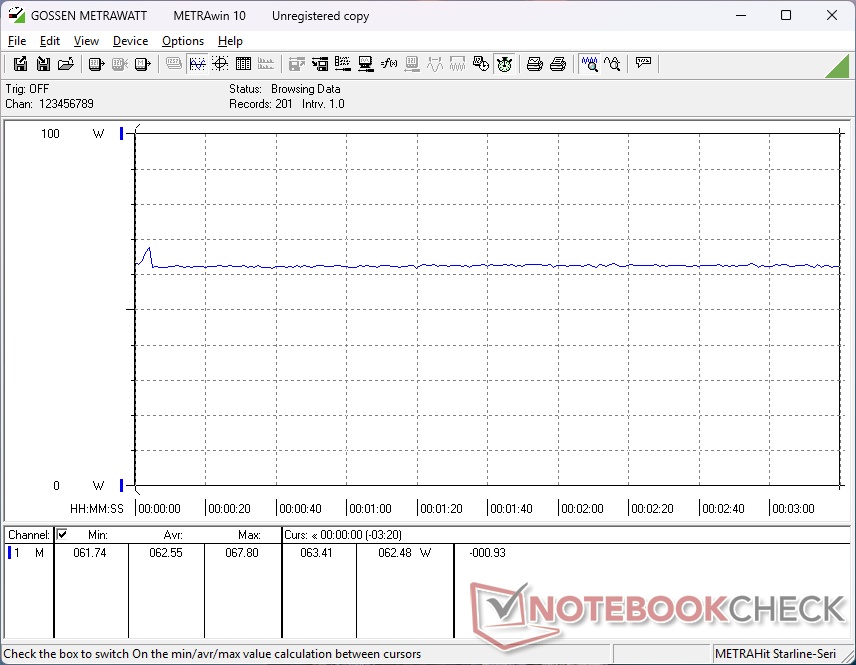
La CPU se aceleraba a 2,9 GHz, 69 W y 100 C cuando se ejecutaba el estrés Prime95 antes de caer a 2,2 GHz, 40 W y 78 C unos segundos más tarde para representar la sostenibilidad limitada de Turbo Boost. La ralentización complementa nuestros resultados del bucle CineBench R15 xT más arriba y el comportamiento del consumo de energía más abajo.
Quizás más notablemente, la temperatura del núcleo bajo carga es más fría que la configuración Core Ultra 5 más lenta del XPS 16. La CPU se estabilizaría en 78 C y 68 C al ejecutar Prime95 y Cyberpunk 2077, respectivamente, en comparación con los 86 C y 89 C del Core Ultra 5 del XPS 16.


| Reloj de la CPU (GHz) | Reloj de la GPU (MHz) | Temperatura media de la CPU (°C) | |
| Sistema en reposo | -- | -- | 44 |
| Prime95 Stress | 2.1 | 900 | 78 |
| Prime95 + FurMark Stress | 1.7 | 1350 | 71 |
| Cyberpunk 2077 Estrés | 0,87 | 2150 | 68 |
Altavoces
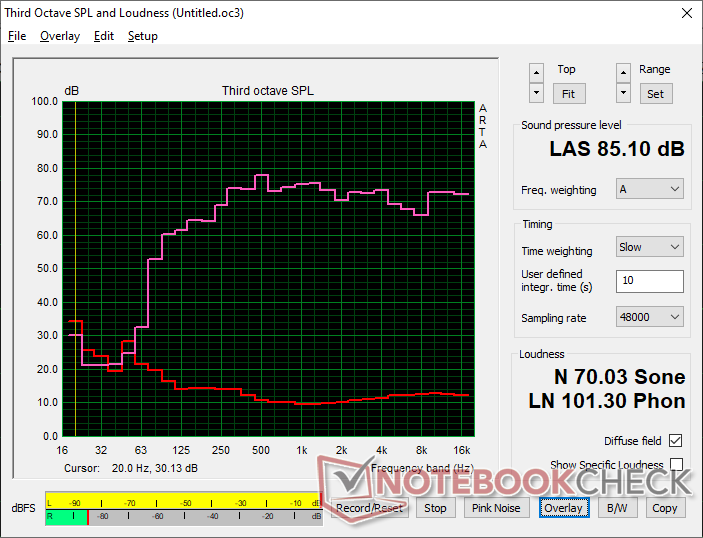
Dell XPS 16 Core Ultra X7 358H análisis de audio
(+) | los altavoces pueden reproducir a un volumen relativamente alto (#85.1 dB)
Graves 100 - 315 Hz
(±) | lubina reducida - en promedio 7.6% inferior a la mediana
(+) | el bajo es lineal (6.1% delta a la frecuencia anterior)
Medios 400 - 2000 Hz
(+) | medios equilibrados - a sólo 2.1% de la mediana
(+) | los medios son lineales (3.4% delta a la frecuencia anterior)
Altos 2 - 16 kHz
(+) | máximos equilibrados - a sólo 2.3% de la mediana
(+) | los máximos son lineales (4.1% delta a la frecuencia anterior)
Total 100 - 16.000 Hz
(+) | el sonido global es lineal (6.2% de diferencia con la mediana)
En comparación con la misma clase
» 3% de todos los dispositivos probados de esta clase eran mejores, 0% similares, 96% peores
» El mejor tuvo un delta de 5%, la media fue 17%, el peor fue ###max##%
En comparación con todos los dispositivos probados
» 0% de todos los dispositivos probados eran mejores, 0% similares, 99% peores
» El mejor tuvo un delta de 4%, la media fue 23%, el peor fue ###max##%
Apple MacBook Pro 16 2021 M1 Pro análisis de audio
(+) | los altavoces pueden reproducir a un volumen relativamente alto (#84.7 dB)
Graves 100 - 315 Hz
(+) | buen bajo - sólo 3.8% lejos de la mediana
(+) | el bajo es lineal (5.2% delta a la frecuencia anterior)
Medios 400 - 2000 Hz
(+) | medios equilibrados - a sólo 1.3% de la mediana
(+) | los medios son lineales (2.1% delta a la frecuencia anterior)
Altos 2 - 16 kHz
(+) | máximos equilibrados - a sólo 1.9% de la mediana
(+) | los máximos son lineales (2.7% delta a la frecuencia anterior)
Total 100 - 16.000 Hz
(+) | el sonido global es lineal (4.6% de diferencia con la mediana)
En comparación con la misma clase
» 0% de todos los dispositivos probados de esta clase eran mejores, 0% similares, 100% peores
» El mejor tuvo un delta de 5%, la media fue 17%, el peor fue ###max##%
En comparación con todos los dispositivos probados
» 0% de todos los dispositivos probados eran mejores, 0% similares, 100% peores
» El mejor tuvo un delta de 4%, la media fue 23%, el peor fue ###max##%
Gestión de la energía
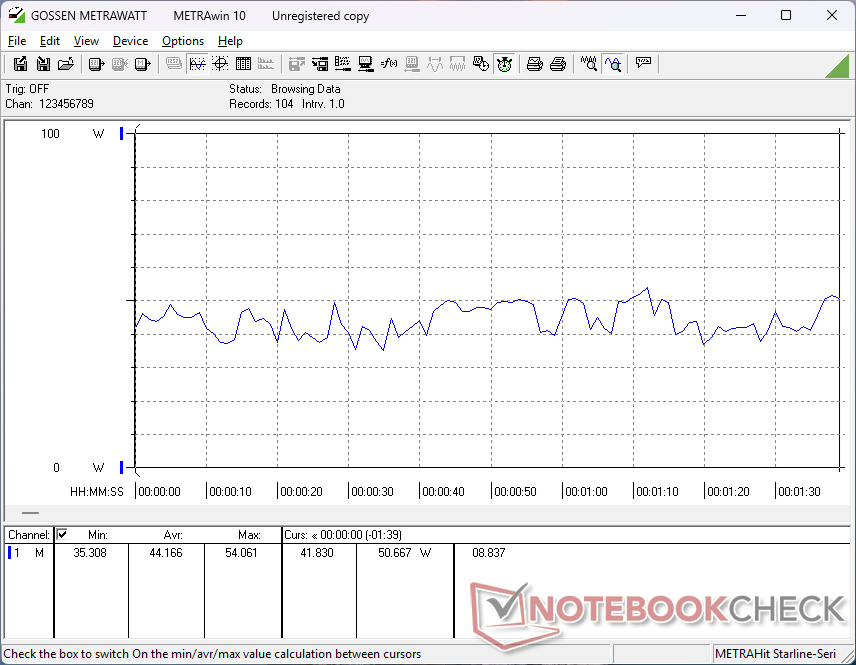
Consumo de energía
La configuración Core Ultra X7 OLED es en general más exigente que la configuración básica Core Ultra 5 IPS incluso en reposo debido al panel OLED. Ejecutar Cyberpunk 2077 y Prime95 consume alrededor de un 38 y un 35 por ciento más de energía, respectivamente. Sin embargo, el aumento del rendimiento compensa con creces la mayor demanda de energía, por lo que el rendimiento por vatio sigue siendo superior con la opción Core Ultra X7.
| Off / Standby | |
| Ocioso | |
| Carga |
|
Clave:
min: | |
| Dell XPS 16 Core Ultra X7 358H Ultra X7 358H, Arc B390 Panther Lake iGPU, , OLED, 3200x2000, 16" | Dell XPS 16 Core Ultra 5 325 Ultra 5 325, Intel Graphics 4 Xe3 PTL, SK hynix PVC10 HFS512GEM4X182N, IPS, 1920x1200, 16" | Dell XPS 16 9640 Ultra 7 155H, GeForce RTX 4070 Laptop GPU, Kioxia XG8 KXG80ZNV1T02, OLED, 3840x2400, 16.3" | Samsung Galaxy Book6 Pro Ultra 7 356H, Intel Graphics 4 Xe3 PTL, Samsung PM9C1b MZVL8512HFLU-00BLL, OLED, 2880x1800, 16" | Lenovo Yoga Pro 9 16IAH10 RTX 5050 Ultra 9 285H, GeForce RTX 5050 Laptop, WD PC SN7100S SDFPMSL-1T00-1101, OLED, 2880x1800, 16" | HP Omnibook 5 16-af1037nr Ultra 7 255U, Graphics 4-Core iGPU (Arrow Lake), , IPS, 1920x1200, 16" | |
|---|---|---|---|---|---|---|
| Power Consumption | 28% | -70% | 25% | -142% | -2% | |
| Idle Minimum * (Watt) | 4 | 1.3 67% | 7.7 -93% | 2.5 37% | 6.8 -70% | 4.8 -20% |
| Idle Average * (Watt) | 4.4 | 4.5 -2% | 10.3 -134% | 4.2 5% | 20.1 -357% | 9.4 -114% |
| Idle Maximum * (Watt) | 10.2 | 4.6 55% | 10.6 -4% | 4.6 55% | 21.6 -112% | 9.7 5% |
| Load Average * (Watt) | 44.2 | 36.5 17% | 76.5 -73% | 42.2 5% | 87.6 -98% | 41.8 5% |
| Cyberpunk 2077 ultra * (Watt) | 62.6 | 47.9 23% | 52.7 16% | 148.2 -137% | 39.5 37% | |
| Cyberpunk 2077 ultra external monitor * (Watt) | 62.4 | 45.4 27% | 40.6 35% | 147.9 -137% | 35.9 42% | |
| Load Maximum * (Watt) | 94.6 | 82.8 12% | 138.5 -46% | 70.8 25% | 173.5 -83% | 66.1 30% |
| Witcher 3 ultra * (Watt) | 126.4 |
* ... más pequeño es mejor
Consumo de energía Cyberpunk / Prueba de estrés
Consumo de energía Monitor externo
Duración de las pilas
Los tiempos de ejecución son significativamente más cortos con nuestra Core Ultra X7 3.2K OLED SKU frente a la Core Ultra 5 FHD IPS SKU por más de la mitad, incluso con Windows VRR activado. Aunque más de 10 horas sigue siendo más que suficiente para la mayoría, la diferencia es notable.
| Dell XPS 16 Core Ultra X7 358H Ultra X7 358H, Arc B390 Panther Lake iGPU, 70 Wh | Dell XPS 16 Core Ultra 5 325 Ultra 5 325, Intel Graphics 4 Xe3 PTL, 70 Wh | Dell XPS 16 9640 Ultra 7 155H, GeForce RTX 4070 Laptop GPU, 99.5 Wh | Samsung Galaxy Book6 Pro Ultra 7 356H, Intel Graphics 4 Xe3 PTL, 78 Wh | Lenovo Yoga Pro 9 16IAH10 RTX 5050 Ultra 9 285H, GeForce RTX 5050 Laptop, 84 Wh | HP Omnibook 5 16-af1037nr Ultra 7 255U, Graphics 4-Core iGPU (Arrow Lake), 59 Wh | |
|---|---|---|---|---|---|---|
| Duración de Batería | 158% | 2% | 58% | 4% | -8% | |
| WiFi v1.3 (h) | 10.3 | 26.6 158% | 10.5 2% | 16.3 58% | 10.7 4% | 9.5 -8% |
| H.264 (h) | 16.5 | |||||
| Load (h) | 1.5 |
Valoración de Notebookcheck
La configuración Core Ultra X7 XPS 16 es significativamente más convincente que las opciones inferiores Core Ultra 5 o Ultra 7. El modelo renuncia al rendimiento en comparación con el Dell 16 Premium del año pasado a cambio de un aspecto mucho más delgado, esbelto y eficiente.
Dell XPS 16 Core Ultra X7 358H
- 04/11/2026 v8
Allen Ngo
 Total Sustainability Score:
 Competidores potenciales en comparación
Imagen | Modelo | Precio | Peso | Altura | Pantalla |
|---|---|---|---|---|---|
1. 87.2%  | Dell XPS 16 Core Ultra X7 358H Intel Core Ultra X7 358H ⎘ Intel Arc B390 12 Xe3 Panther Lake iGPU ⎘ 32 GB Memoría | Amazon: 1. $2,199.00 Dell Premium 16 (XPS 16 2025... 2. $2,599.00 Dell Premium 16 (XPS 16 2025... 3. $1,977.99 Dell Premium 16 (Previously ... Precio de catálogo: 2350 USD | 1.7 kg | 14.62 mm | 16.00" 3200x2000 236 PPI OLED |
2. 84.2%  | Dell XPS 16 Core Ultra 5 325 Intel Core Ultra 5 325 ⎘ Intel Graphics 4 Xe3 Panther Lake iGPU ⎘ 16 GB Memoría, 512 GB SSD | Amazon: 1. $2,599.00 Dell Premium 16 (XPS 16 2025... 2. $2,199.00 Dell Premium 16 (XPS 16 2025... 3. $1,977.99 Dell Premium 16 (Previously ... Precio de catálogo: 1600 USD | 1.7 kg | 15.4 mm | 16.00" 1920x1200 142 PPI IPS |
3. 88.6% v7 (old)  | Dell XPS 16 9640 Intel Core Ultra 7 155H ⎘ NVIDIA GeForce RTX 4070 Laptop GPU ⎘ 32 GB Memoría, 1024 GB SSD | Amazon: 1. $2,199.00 New XPS 16 9640 Business Lap... 2. $2,499.00 Dell XPS 16 9640 16.3" Touch... 3. $2,799.99 Dell XPS 16 9640 Laptop | In... | 2.3 kg | 18.7 mm | 16.30" 3840x2400 139 PPI OLED |
4. 86.3%  | Samsung Galaxy Book6 Pro Intel Core Ultra 7 356H ⎘ Intel Graphics 4 Xe3 Panther Lake iGPU ⎘ 32 GB Memoría, 512 GB SSD | Amazon: Precio de catálogo: 2199€ | 1.6 kg | 11.9 mm | 16.00" 2880x1800 212 PPI OLED |
5. 88.8%  | Lenovo Yoga Pro 9 16IAH10 RTX 5050 Intel Core Ultra 9 285H ⎘ NVIDIA GeForce RTX 5050 Laptop ⎘ 32 GB Memoría, 1024 GB SSD | Amazon: Precio de catálogo: 1800 USD | 2 kg | 17.9 mm | 16.00" 2880x1800 212 PPI OLED |
6. 77.8%  | HP Omnibook 5 16-af1037nr Intel Core Ultra 7 255U ⎘ Intel Graphics 4-Core iGPU (Meteor / Arrow Lake) ⎘ 16 GB Memoría | Amazon: Precio de catálogo: 660 USD | 1.7 kg | 18.6 mm | 16.00" 1920x1200 142 PPI IPS |
Transparencia
La selección de los dispositivos que se van a reseñar corre a cargo de nuestro equipo editorial. La muestra de prueba fue proporcionada al autor en calidad de préstamo por el fabricante o el minorista a los efectos de esta reseña. El prestamista no tuvo ninguna influencia en esta reseña, ni el fabricante recibió una copia de la misma antes de su publicación. No había ninguna obligación de publicar esta reseña. Como empresa de medios independiente, Notebookcheck no está sujeta a la autoridad de fabricantes, minoristas o editores.
Así es como prueba Notebookcheck
Cada año, Notebookcheck revisa de forma independiente cientos de portátiles y smartphones utilizando procedimientos estandarizados para asegurar que todos los resultados son comparables. Hemos desarrollado continuamente nuestros métodos de prueba durante unos 20 años y hemos establecido los estándares de la industria en el proceso. En nuestros laboratorios de pruebas, técnicos y editores experimentados utilizan equipos de medición de alta calidad. Estas pruebas implican un proceso de validación en varias fases. Nuestro complejo sistema de clasificación se basa en cientos de mediciones y puntos de referencia bien fundamentados, lo que mantiene la objetividad.
