Veredicto - Superando los límites del rendimiento
Sin nuevas GPU GeForce este año, el Arrow Lake Core Ultra 9 290HX Plus y la pantalla OLED de 1600p son las dos únicas novedades hasta ahora para el Alienware 16 Area-51 de 2026. La nueva CPU es, en efecto, hasta un 25 por ciento más rápida que la anterior opción de gama alta Core Ultra 9 275HX, pero el consumo de energía es igualmente hasta un 25 por ciento más exigente como resultado].
En cuanto a la pantalla, la actualización de IPS a OLED es posiblemente mucho más notable que la actualización del Core Ultra 9 al Core Ultra 9 Plus. El panel OLED ofrece un contraste significativamente mayor, tiempos de respuesta más rápidos y HDR superior, todo ello manteniendo la compatibilidad con Advanced Optimus, la resolución nativa QHD+ y una rápida frecuencia de actualización de 240 Hz. Los juegos y los multimedia se beneficiarán especialmente de estas ventajas. Desgraciadamente, las nuevas opciones OLED y CPU Core Ultra 9 Plus van unidas y no se pueden separar, lo que conlleva unos precios muy elevados para esta configuración.
Dado que el chasis no ha cambiado, la mayoría de nuestras quejas sobre el modelo 2025 siguen siendo las mismas para el modelo 2026. Las ya de por sí cálidas temperaturas del núcleo son aún peores esta vez, de hasta 100 C si se configura con el Core Ultra 9 Plus. Mientras tanto, la duración de la batería sigue siendo bastante corta incluso para un portátil de juegos. La mentalidad de "rendimiento a toda costa" es tan fuerte como siempre para estar en línea con lo que la marca Alienware es conocida.
Pro
Contra
Precio y disponibilidad
Dell ya está distribuyendo la Alienware 16 Area-51 2026 a partir de 1950 dólares para la configuración básica Core Ultra 7 y RTX 5060 hasta 3900 dólares o más para nuestra configuración Core Ultra 9 Plus y RTX 5080.
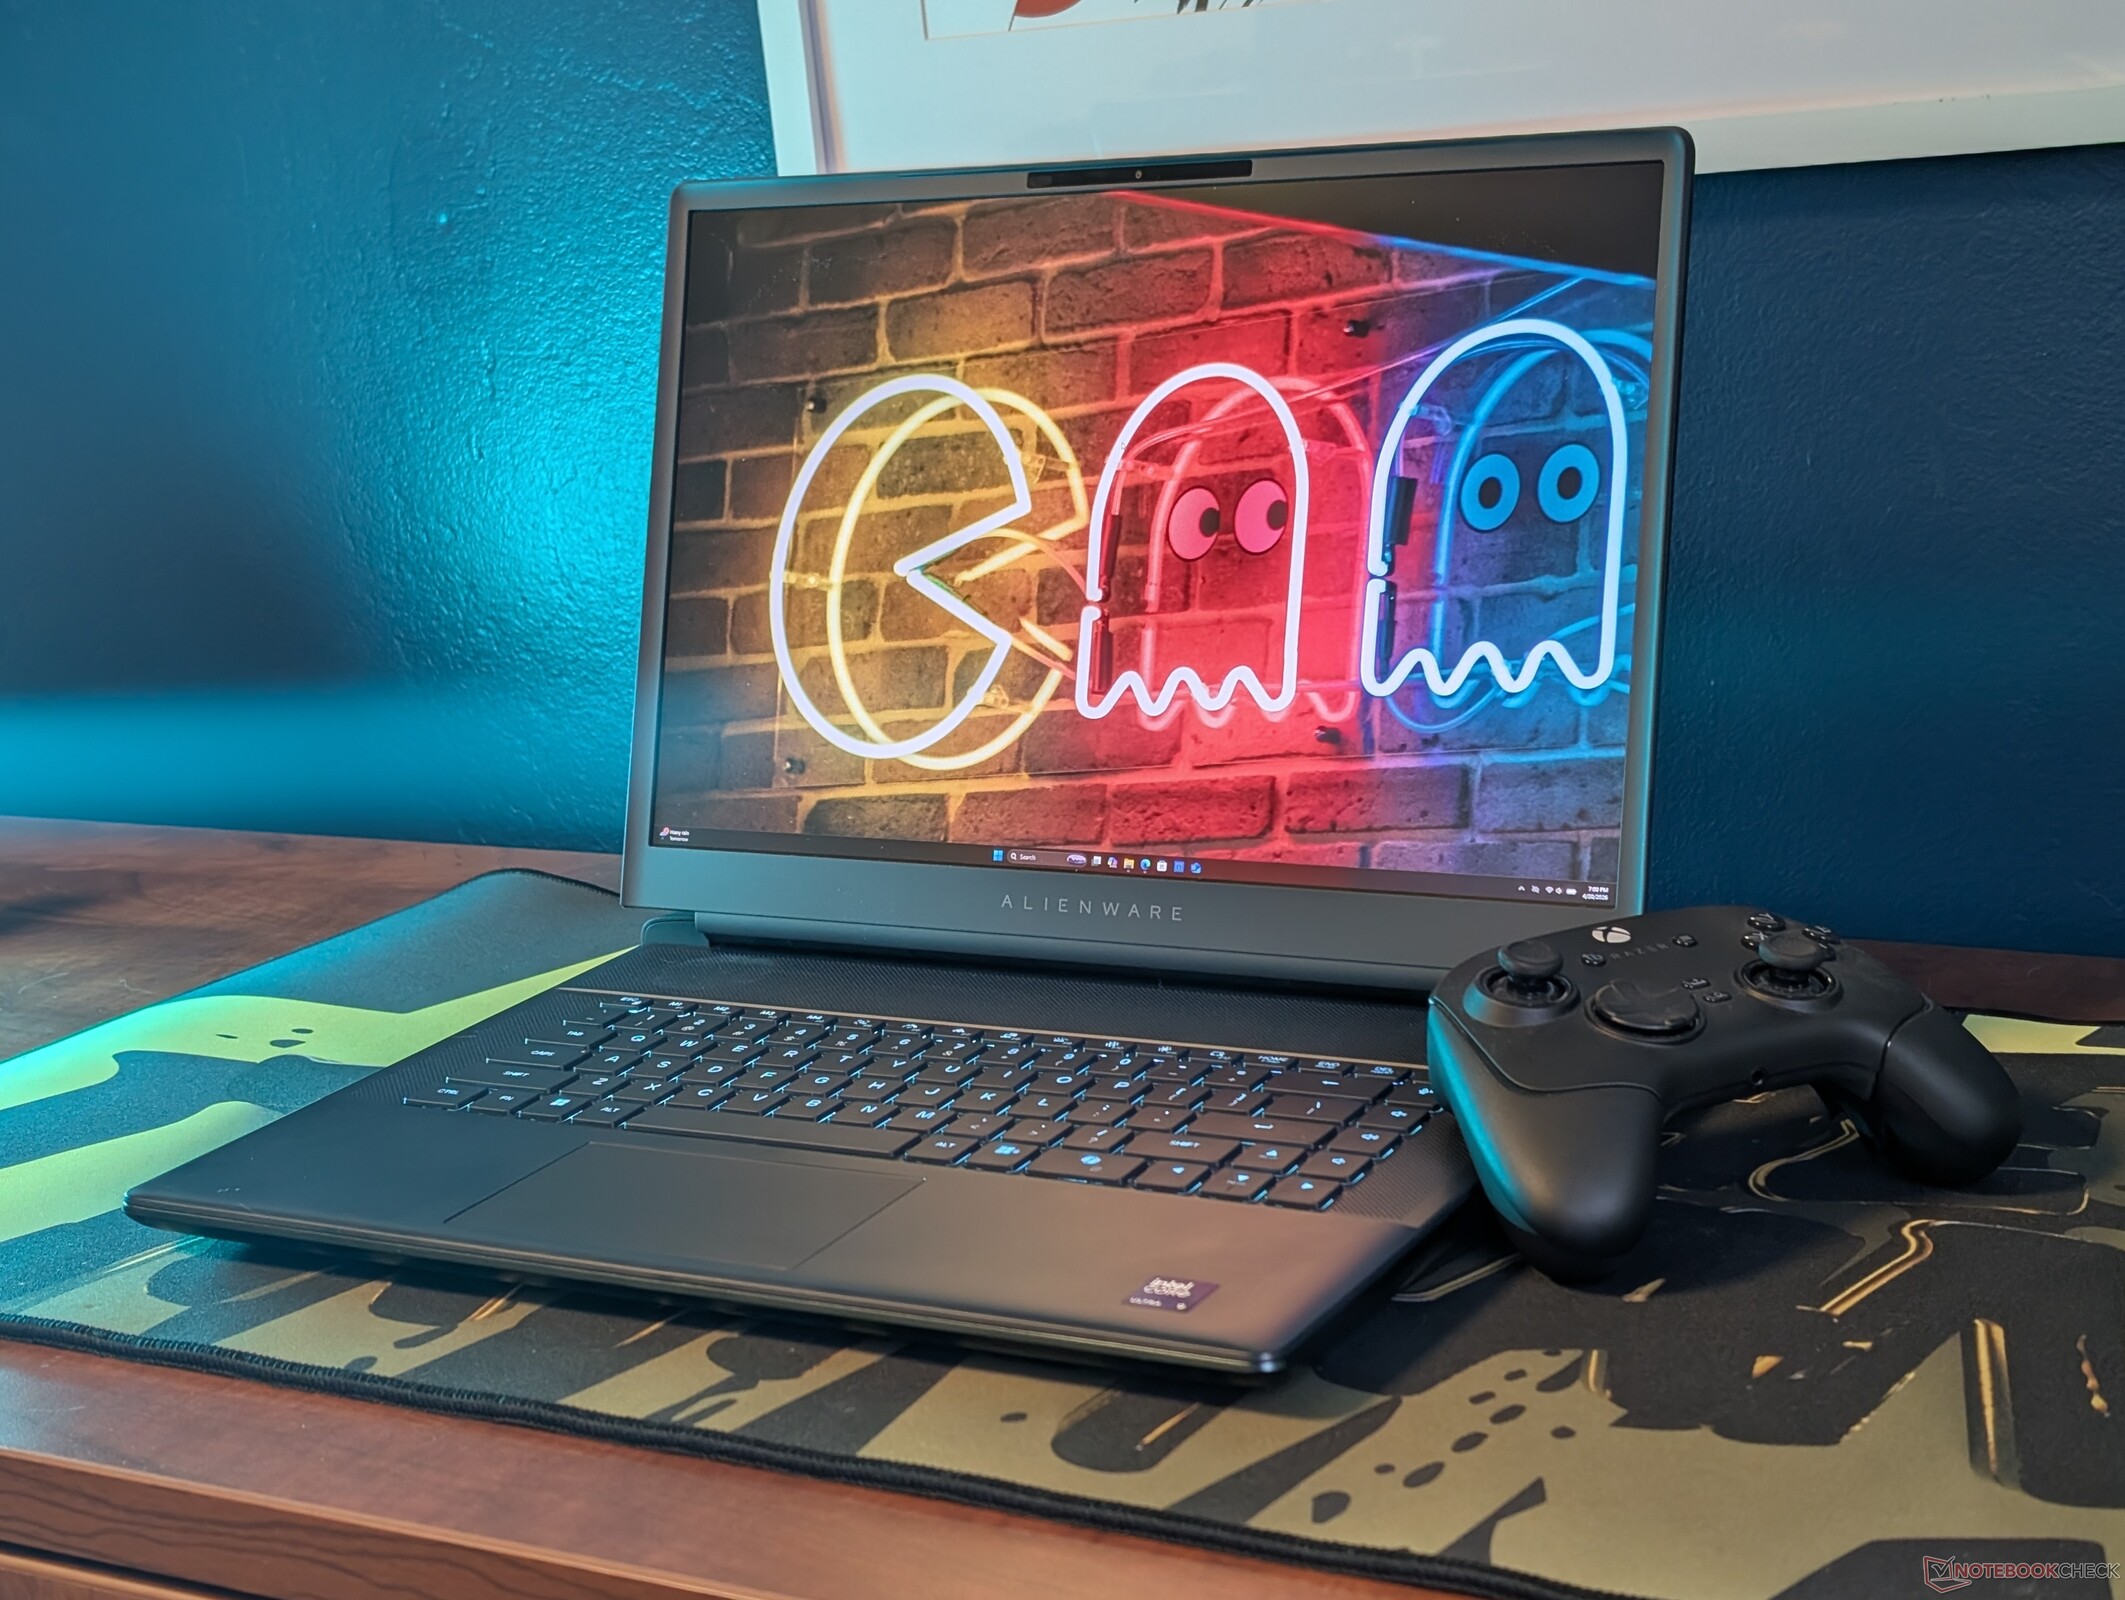
El Alienware 16 Area-51 hizo su debut el año pasado y podría decirse que se convirtió en uno de los mejores portátiles de Alienware con diferencia. Para 2026, el modelo sólo recibe renovaciones menores relacionadas con su CPU y pantalla, ya que la serie GeForce RTX 50 aún no ha tenido éxito.
Nuestra unidad de prueba viene equipada con nuevas opciones no disponibles en la versión 2025, incluyendo la CPU Core Ultra 9 290HX Plus y el panel OLED mate de 240 Hz 1600p con G-Sync por algo menos de 4000 dólares. ¿Mejoran estos cambios la experiencia del usuario o justifican el nuevo precio?
Le recomendamos que eche un vistazo a nuestro análisis del Alienware 16 Area-51 de 2025 para saber más sobre las características físicas del portátil. Entre las alternativas al modelo de Dell se incluyen otros portátiles para juegos de 16 pulgadas de gama alta como el Asus ROG Zephyrus G16 o Lenovo Legion Pro 7i 16 Gen 10.
Más opiniones sobre Alienware:
Especificaciones
Caso

Conectividad


Lector de tarjetas SD
| SD Card Reader | |
| average JPG Copy Test (av. of 3 runs) | |
| Alienware 16 Area-51 Core Ultra 9 290HX Plus (Toshiba Exceria Pro SDXC 64 GB UHS-II) | |
| Alienware 16 Area-51 (Toshiba Exceria Pro SDXC 64 GB UHS-II) | |
| Asus ROG Zephyrus G16 GU605CW (AV Pro SD microSD 128 GB V60) | |
| MSI Vector 16 HX AI A2XWHG (AV PRO microSD 128 GB V60) | |
| maximum AS SSD Seq Read Test (1GB) | |
| Alienware 16 Area-51 Core Ultra 9 290HX Plus (Toshiba Exceria Pro SDXC 64 GB UHS-II) | |
| Alienware 16 Area-51 (Toshiba Exceria Pro SDXC 64 GB UHS-II) | |
| MSI Vector 16 HX AI A2XWHG (AV PRO microSD 128 GB V60) | |
| Asus ROG Zephyrus G16 GU605CW (AV Pro SD microSD 128 GB V60) | |
Comunicación
Cámara web


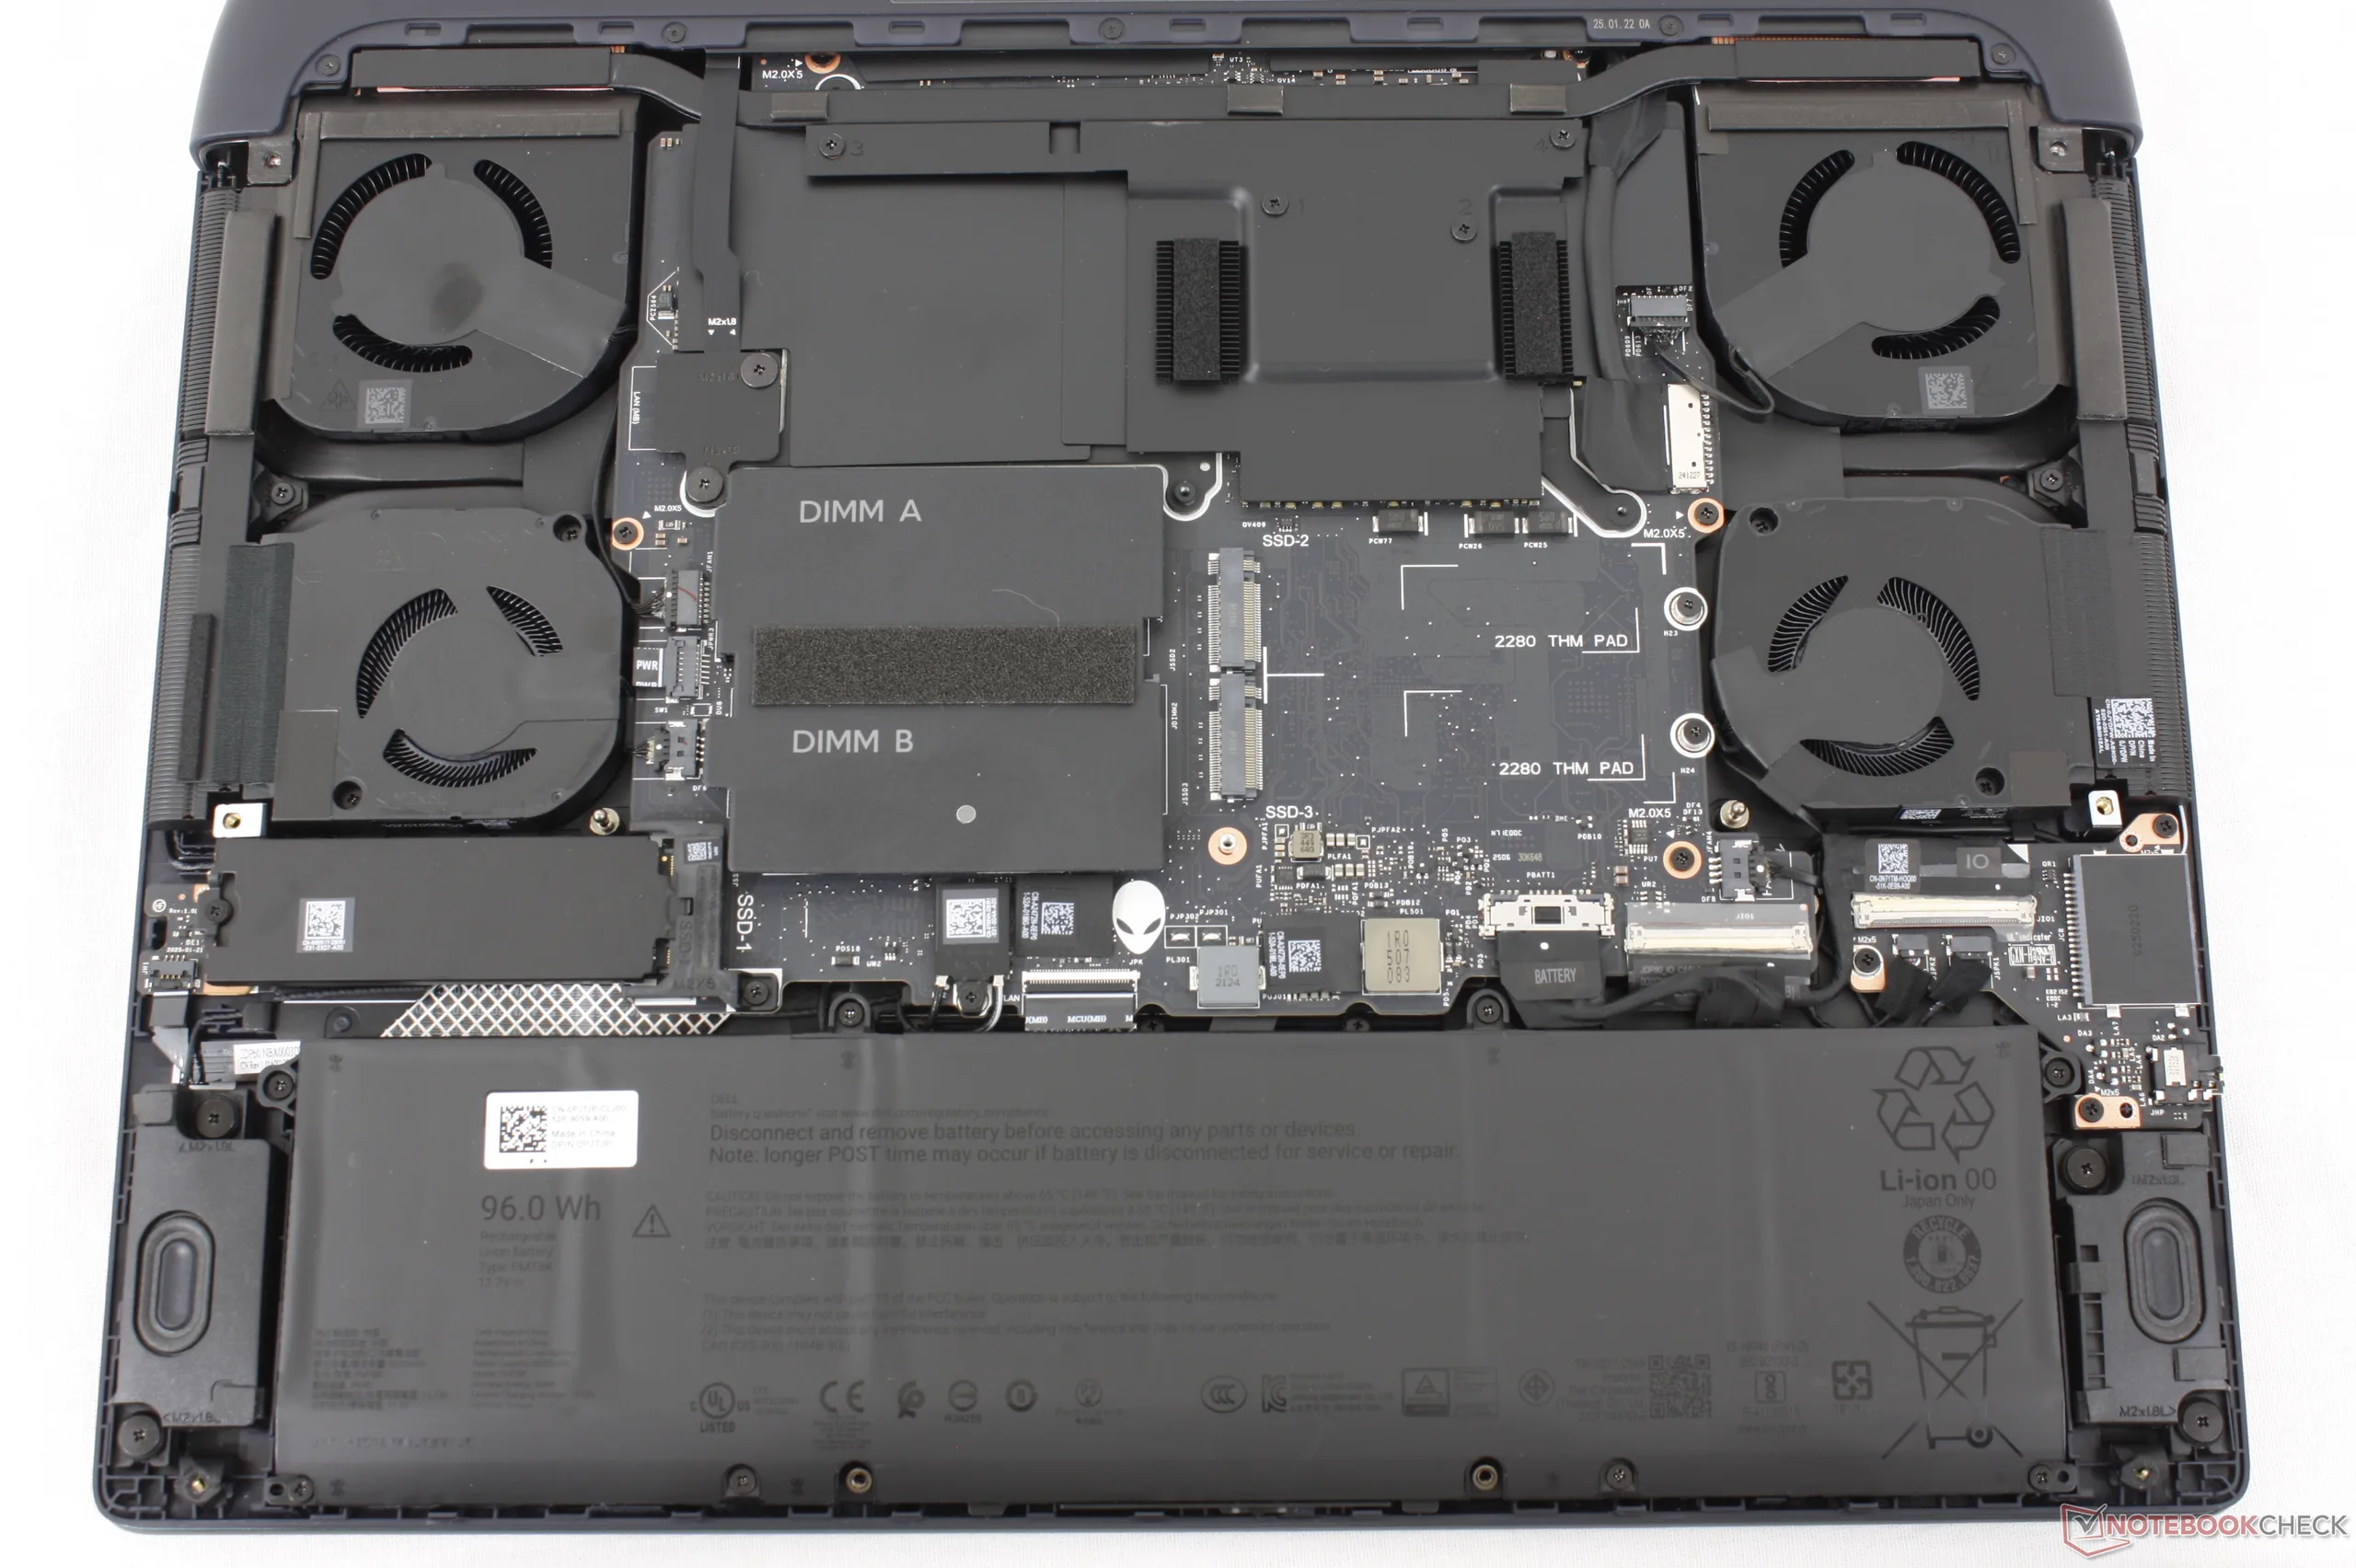
Mantenimiento

Dispositivos de entrada

Mostrar
Ahora hay dos opciones de pantalla disponibles, cada una con G-sync y soporte nativo de frecuencia de refresco de 240 Hz:
- 2560 x 1600, 100% DCI-P3, IPS, 500 nits, mate
- 2560 x 1600, 120% DCI-P3, OLED, 620 nits (en HDR), mate
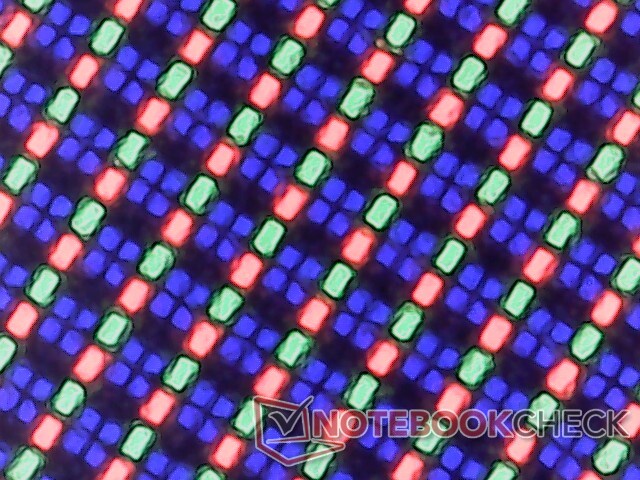
El panel IPS de base es el mismo que en el modelo 2025, mientras que el OLED es una nueva opción. A diferencia de la mayoría de portátiles OLED, el panel OLED del Alienware es mate con soporte G-Sync en lugar de brillante. Sin embargo, la superposición mate implica textos e imágenes ligeramente más granulados como resultado.
| |||||||||||||||||||||||||
iluminación: 97 %
Brillo con batería: 383.3 cd/m²
Contraste: ∞:1 (Negro: 0 cd/m²)
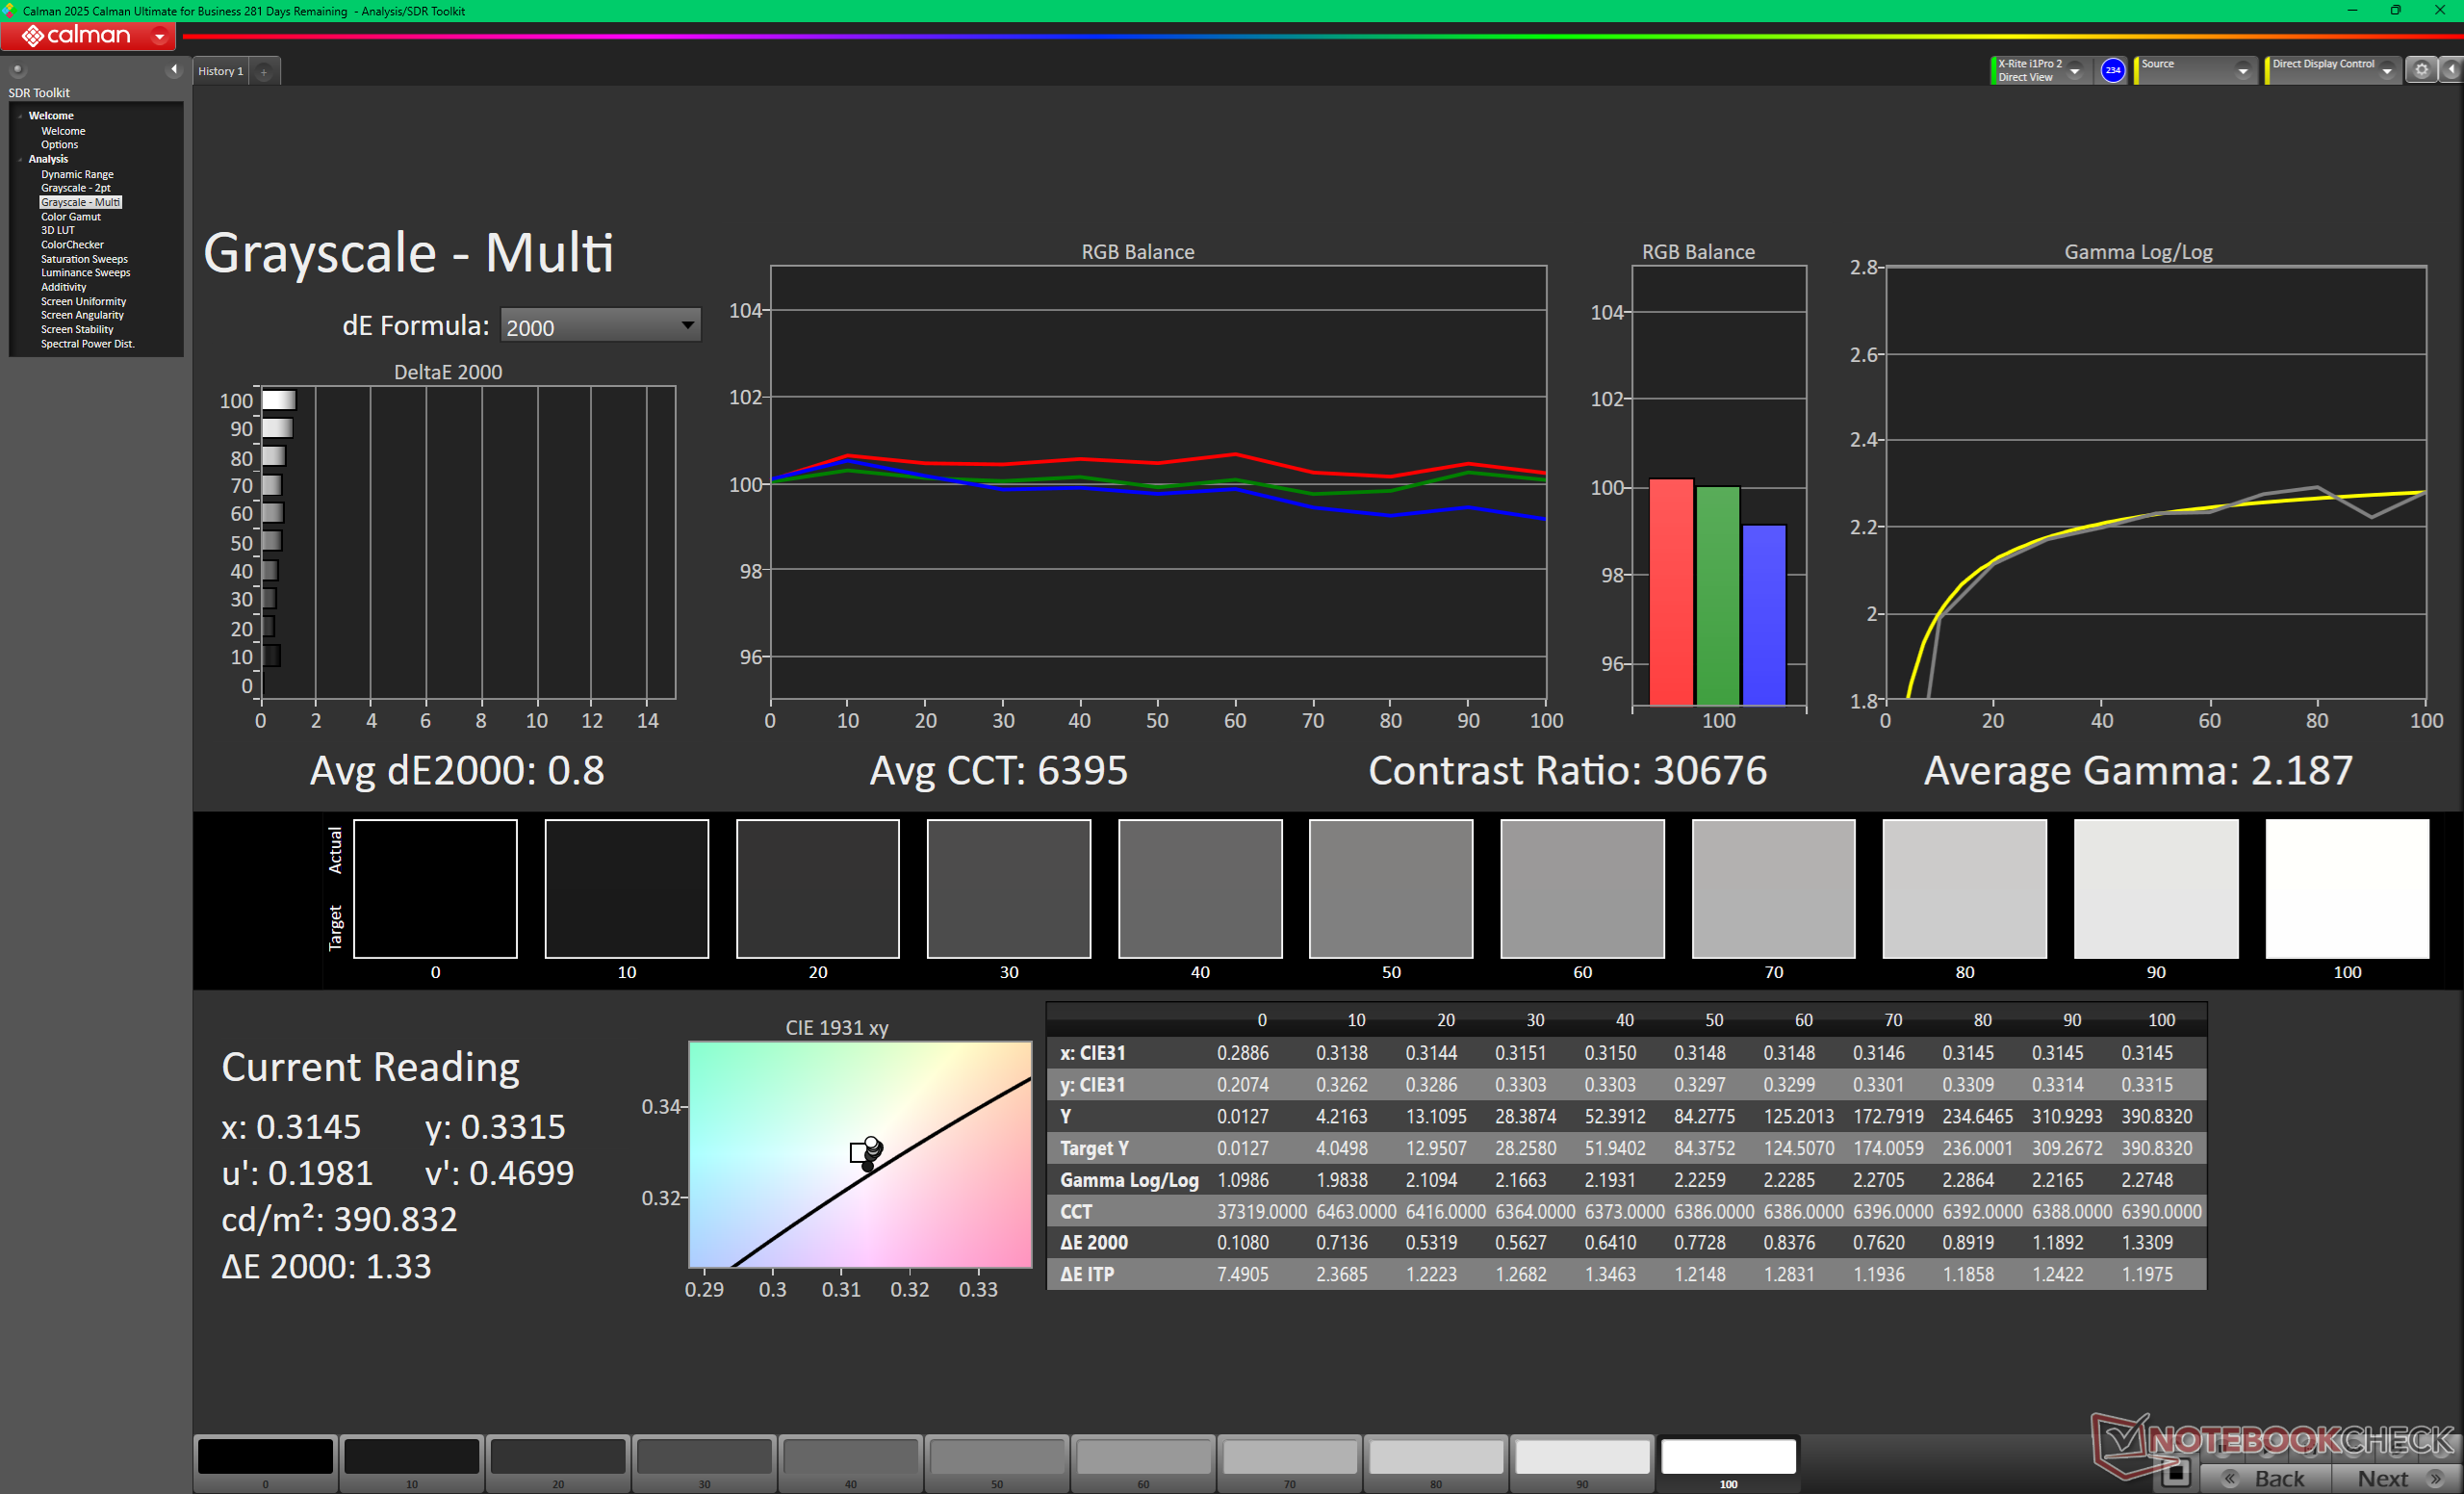
ΔE ColorChecker Calman: 0.87 | ∀{0.5-29.43 Ø4.72}
calibrated: 0.61
ΔE Greyscale Calman: 0.8 | ∀{0.09-98 Ø4.97}
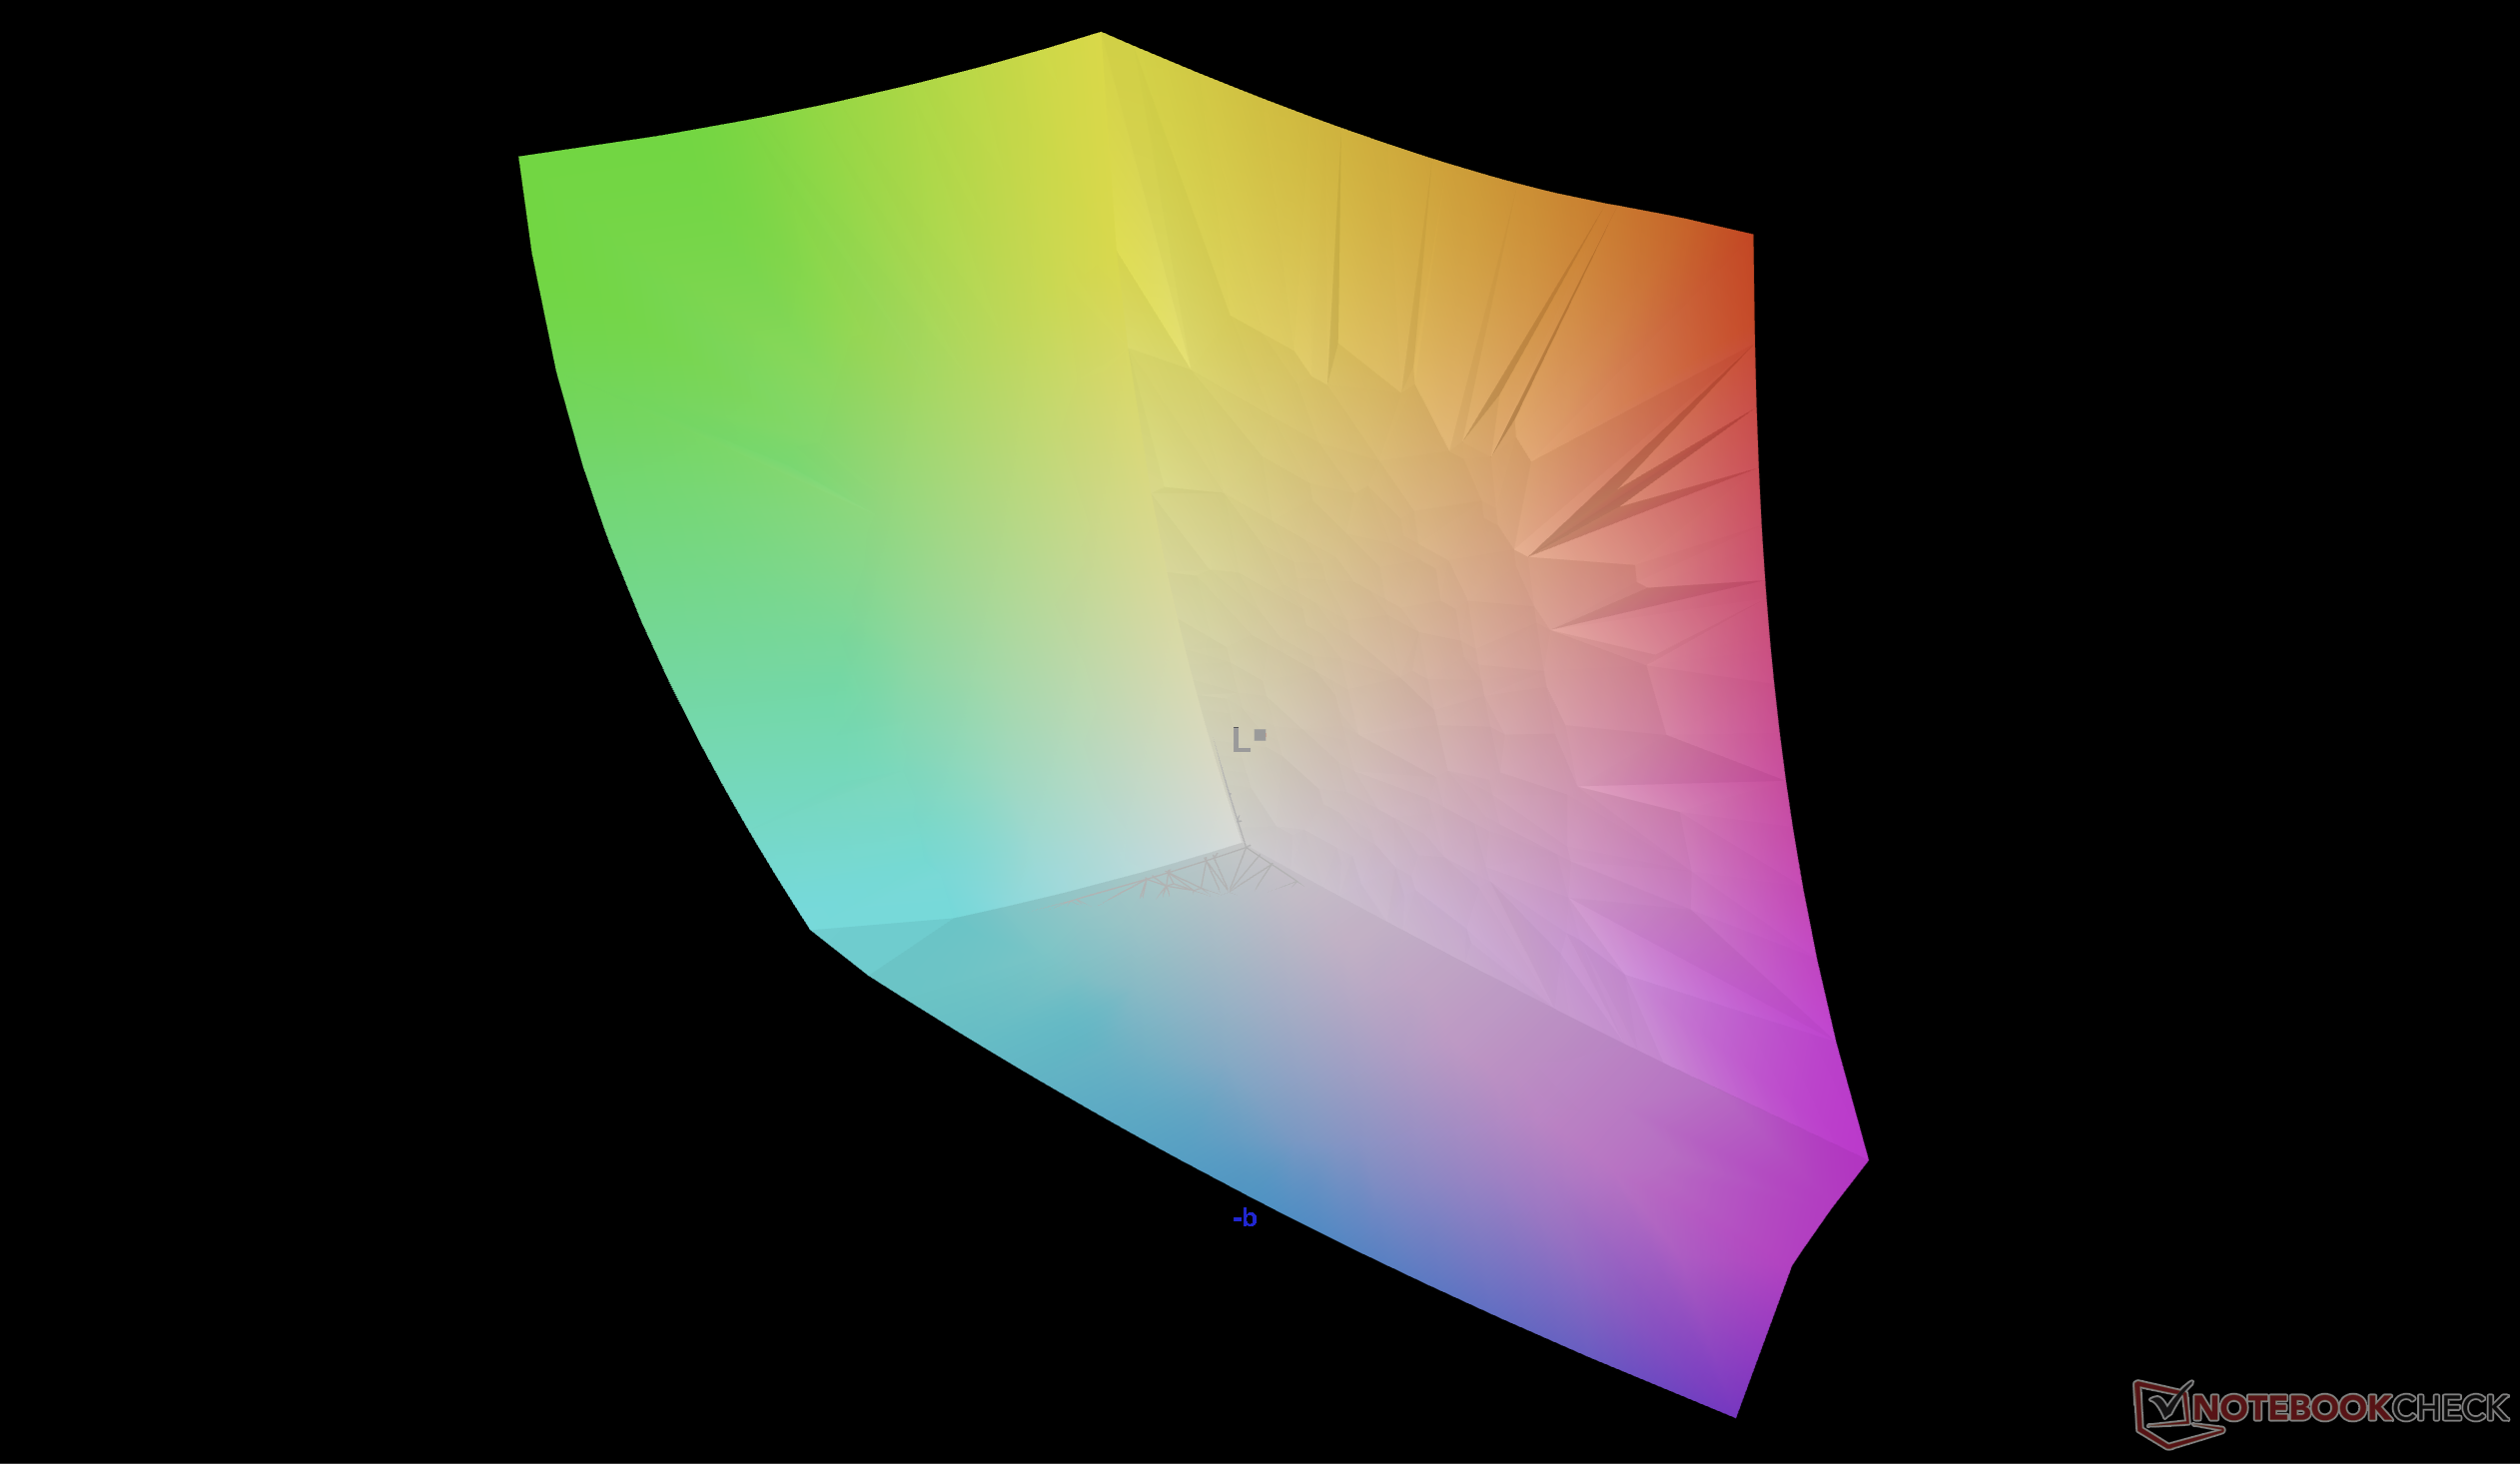
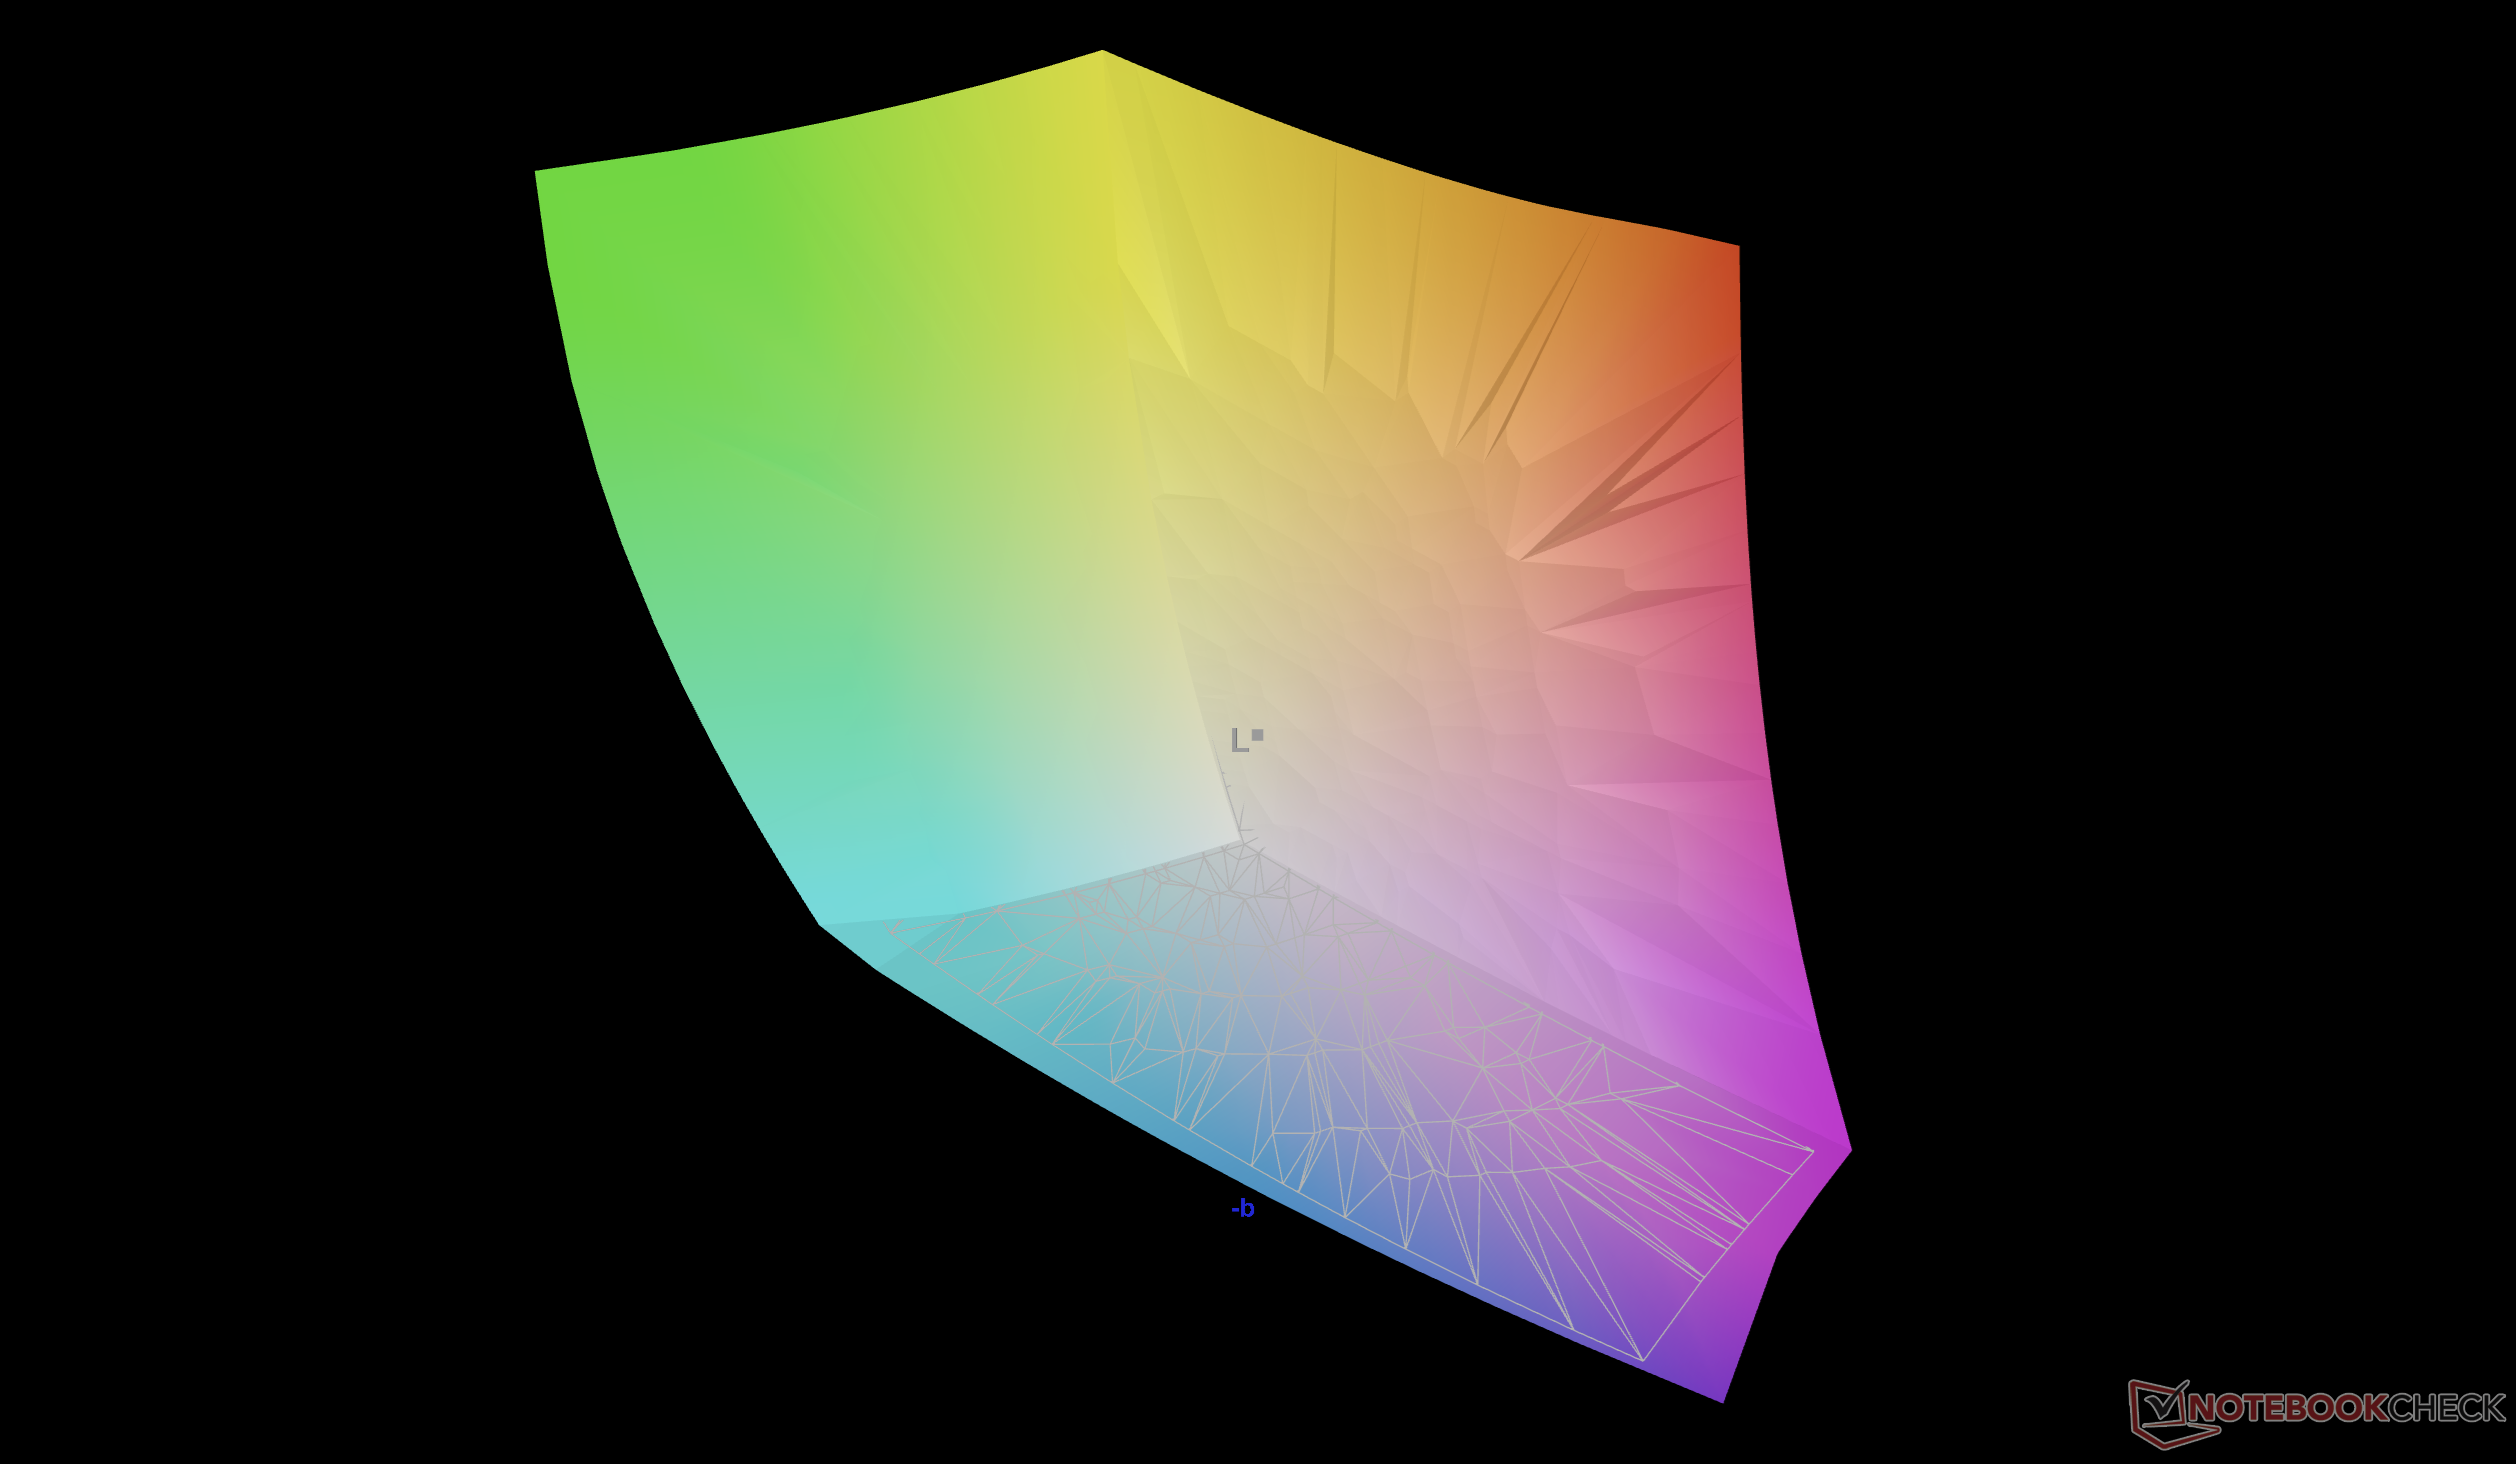
95.6% AdobeRGB 1998 (Argyll 3D)
100% sRGB (Argyll 3D)
99.6% Display P3 (Argyll 3D)
Gamma: 2.19
CCT: 6395 K
| Alienware 16 Area-51 Core Ultra 9 290HX Plus Samsung 160HU05, OLED, 2560x1600, 16", 240 Hz | Alienware 16 Area-51 AU Optronics B160QAN, IPS, 2560x1600, 16", 240 Hz | Lenovo Legion Pro 7i 16 Gen 10 Samsung ATNA60HU01-0, OLED, 2560x1600, 16", 240 Hz | HP Omen Max 16 ah000 Samsung ATNA60DL02-0, OLED, 2560x1600, 16", 240 Hz | MSI Vector 16 HX AI A2XWHG B160QAN02.3 (AUO7DB2), IPS, 2560x1600, 16", 240 Hz | Asus ROG Zephyrus G16 GU605CW Samsung ATNA60DL01-0, OLED, 2560x1600, 16", 240 Hz | |
|---|---|---|---|---|---|---|
| Display | -4% | -0% | 1% | -5% | -2% | |
| APL18 Peak Brightness (cd/m²) | 609 | |||||
| HDR Peak Brightness (cd/m²) | 609 | |||||
| Display P3 Coverage (%) | 99.6 | 96 -4% | 99.5 0% | 99.7 0% | 96.6 -3% | 96.5 -3% |
| sRGB Coverage (%) | 100 | 100 0% | 100 0% | 100 0% | 99.8 0% | 99.2 -1% |
| AdobeRGB 1998 Coverage (%) | 95.6 | 89.2 -7% | 94.4 -1% | 98.2 3% | 84.4 -12% | 94.5 -1% |
| Response Times | -1606% | 0% | -6% | -1373% | -447% | |
| Response Time Grey 50% / Grey 80% * (ms) | 0.29 ? | 4.8 ? -1555% | 0.28 ? 3% | 0.29 ? -0% | 4.3 ? -1383% | 0.32 ? -10% |
| Response Time Black / White * (ms) | 0.41 ? | 7.2 ? -1656% | 0.43 ? -5% | 0.47 ? -15% | 6 ? -1363% | 6 ? -1363% |
| PWM Frequency (Hz) | 1440 ? | 1438 ? | 960 ? | 960 | ||
| PWM Amplitude * (%) | 30 | 29 3% | 31 -3% | 20 33% | ||
| Screen | -131% | -64% | -92% | -131% | -82% | |
| Brightness middle (cd/m²) | 383.3 | 554 45% | 490.4 28% | 376.5 -2% | 473 23% | 394 3% |
| Brightness (cd/m²) | 387 | 532 37% | 498 29% | 382 -1% | 426 10% | 398 3% |
| Brightness Distribution (%) | 97 | 88 -9% | 97 0% | 96 -1% | 85 -12% | 98 1% |
| Black Level * (cd/m²) | 0.52 | 0.42 | 0.0084 | |||
| Colorchecker dE 2000 * | 0.87 | 2.81 -223% | 3.2 -268% | 3.67 -322% | 3.47 -299% | 2.41 -177% |
| Colorchecker dE 2000 max. * | 2.23 | 8.32 -273% | 6.04 -171% | 7.24 -225% | 7.24 -225% | 3.82 -71% |
| Colorchecker dE 2000 calibrated * | 0.61 | 0.65 -7% | 0.84 -38% | 0.94 -54% | 1.36 -123% | 1.41 -131% |
| Greyscale dE 2000 * | 0.8 | 4.7 -488% | 1 -25% | 1.1 -38% | 3.1 -288% | 2.4 -200% |
| Gamma | 2.19 100% | 2.3 96% | 2.24 98% | 2.25 98% | 2.486 88% | 2.16 102% |
| CCT | 6395 102% | 6476 100% | 6373 102% | 6319 103% | 6832 95% | 6544 99% |
| Contrast (:1) | 1065 | 1126 | 46905 | |||
| Media total (Programa/Opciones) | -580% /
-345% | -21% /
-34% | -32% /
-51% | -503% /
-306% | -177% /
-147% |
* ... más pequeño es mejor
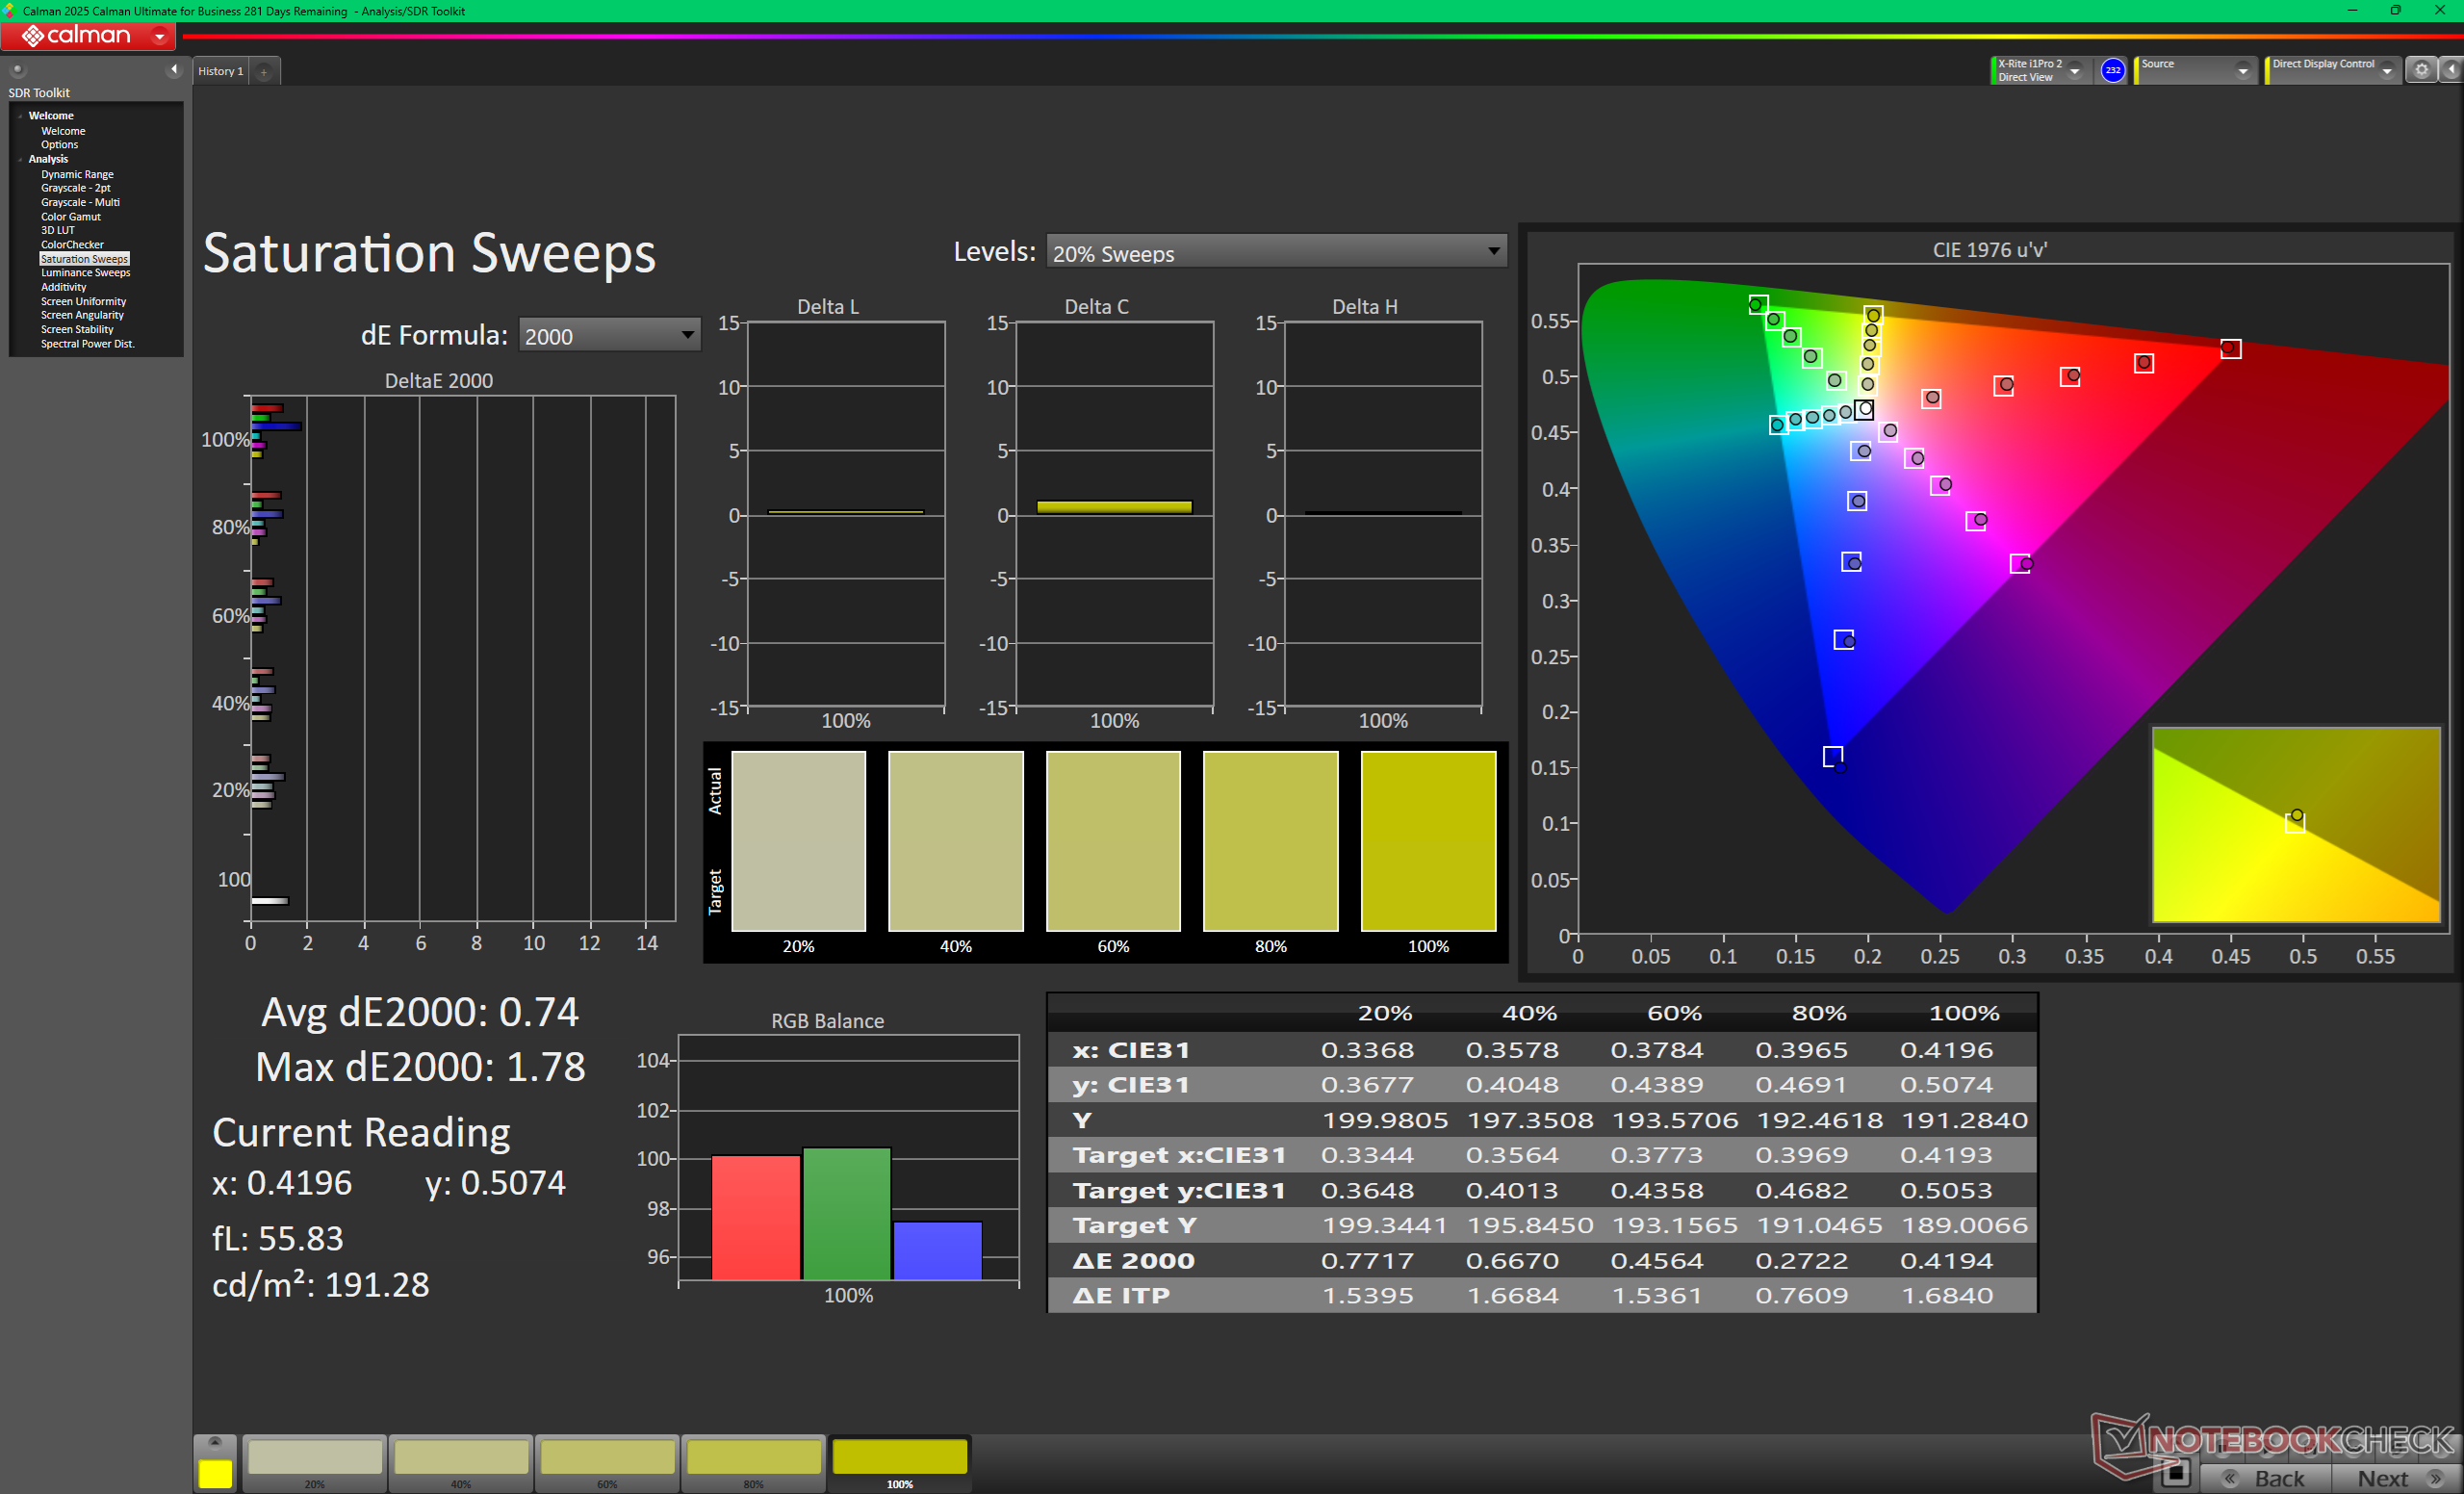
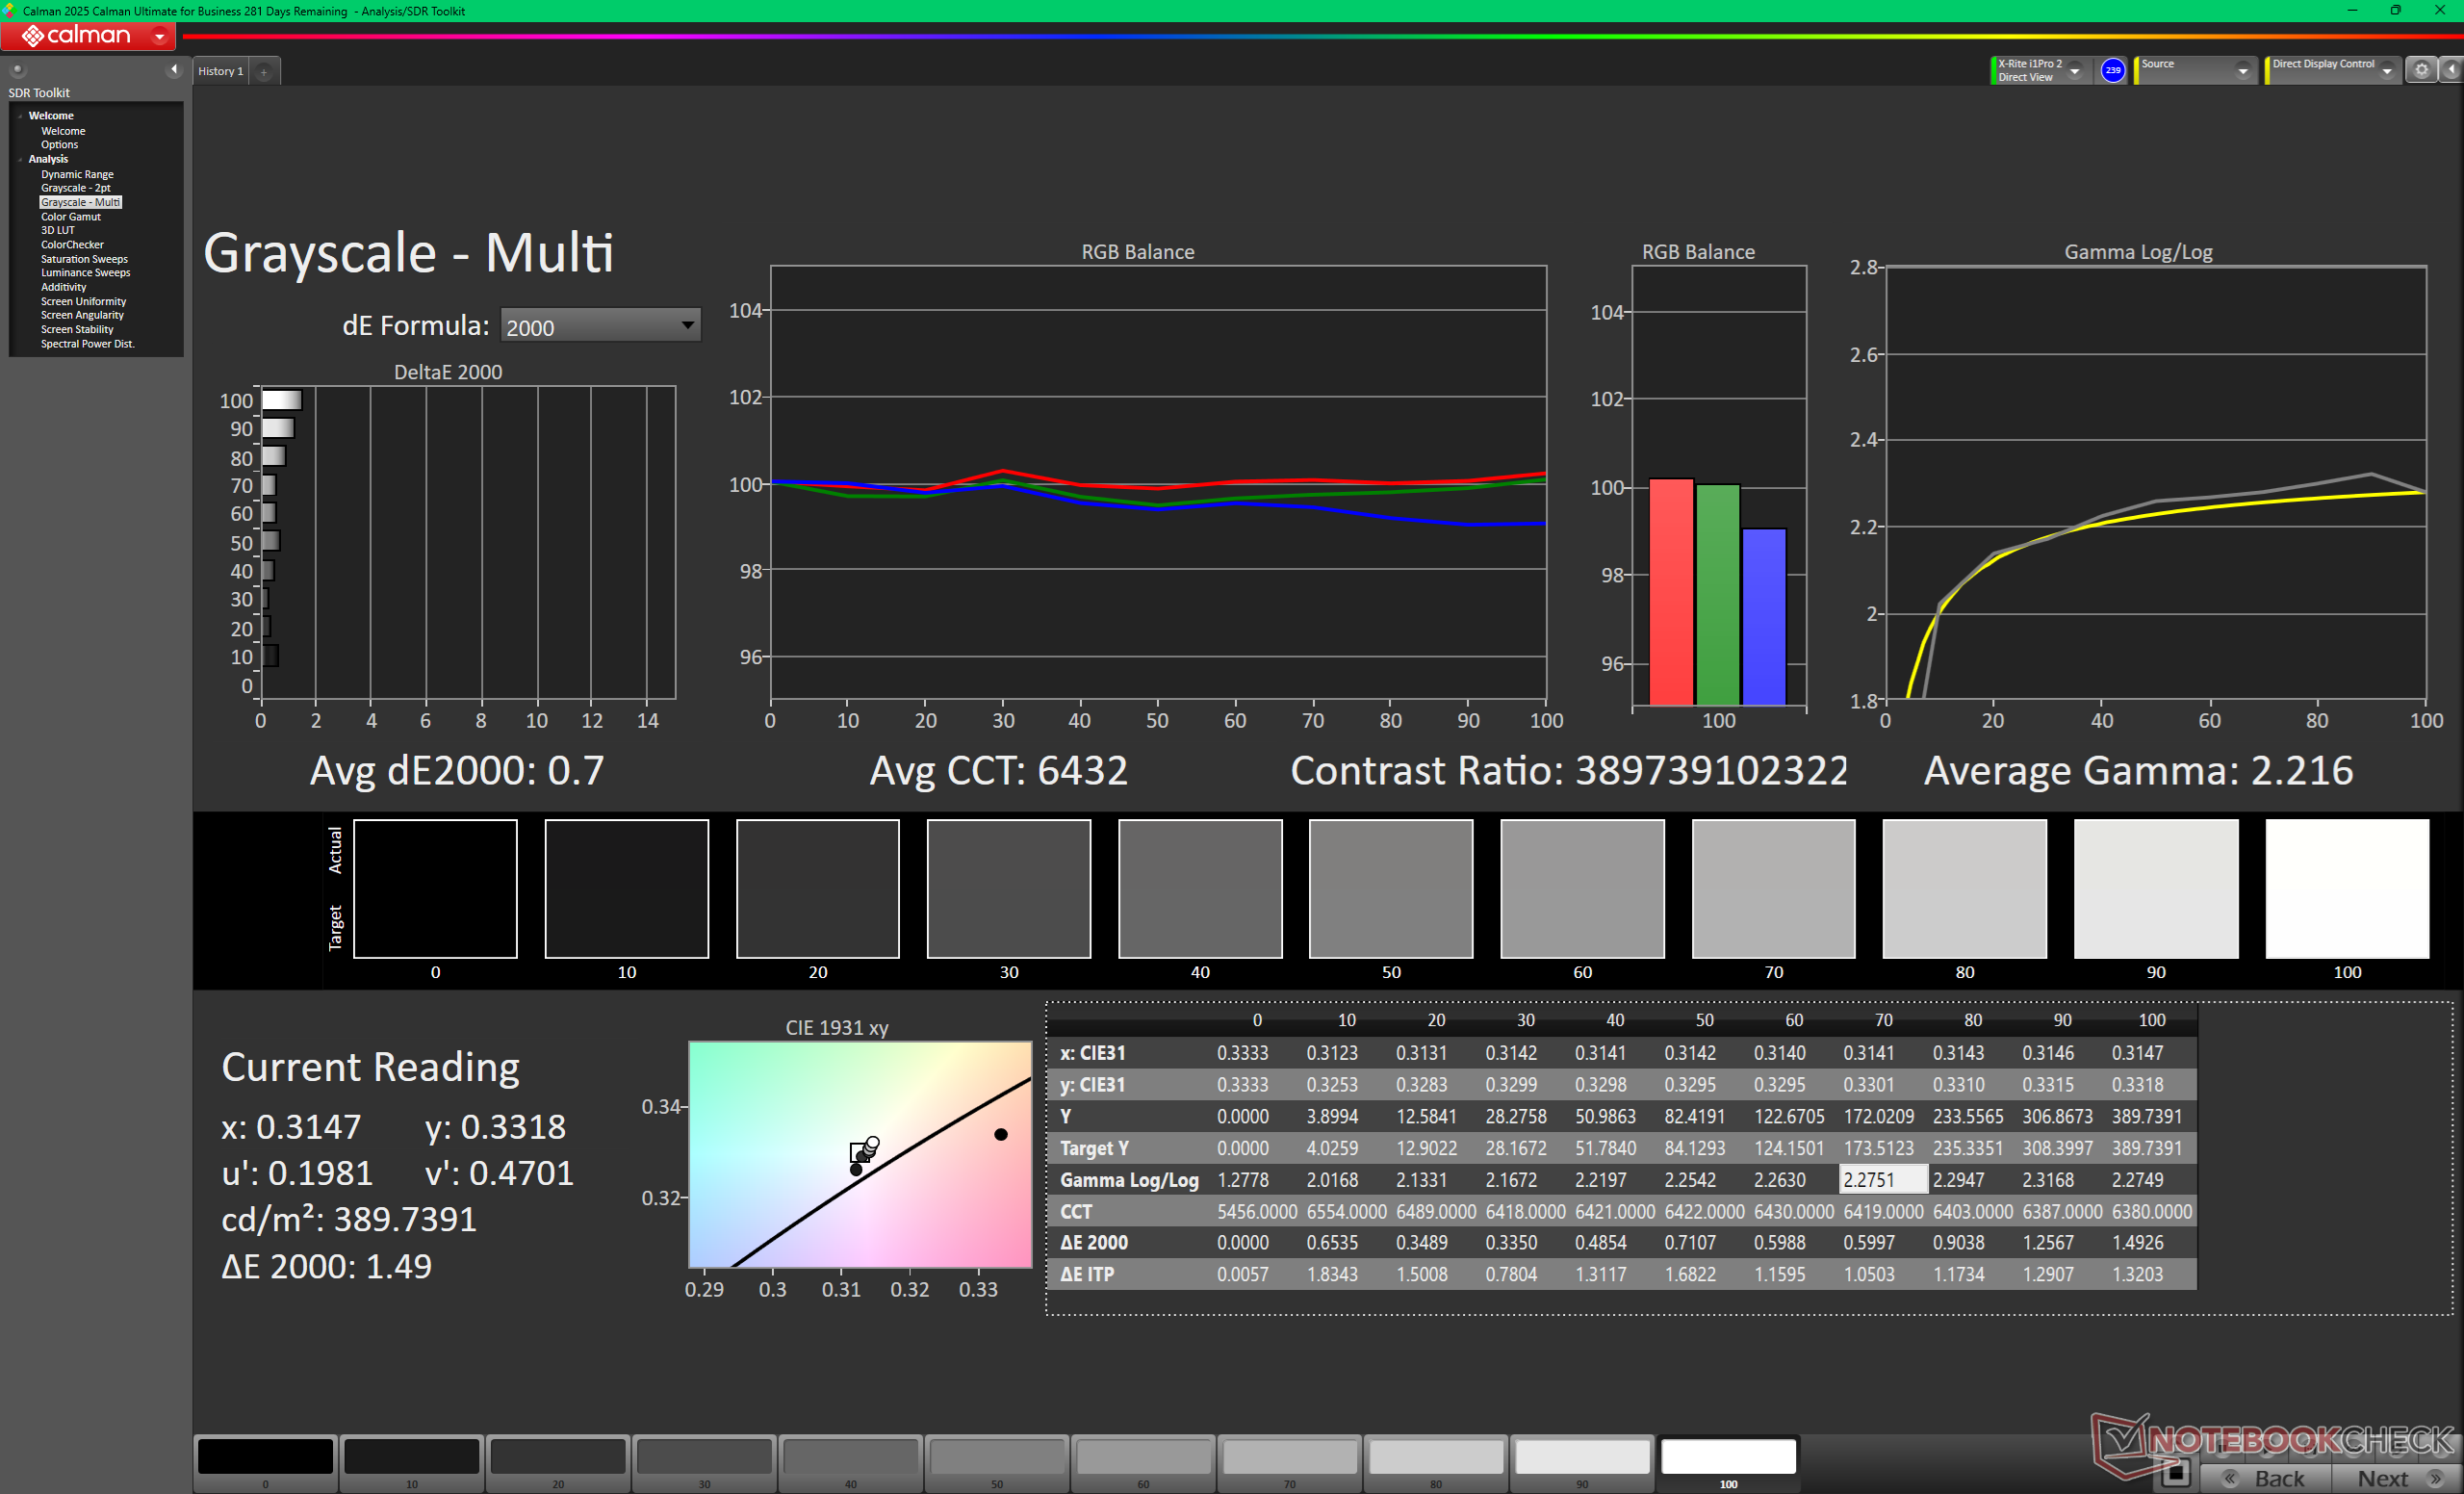
La pantalla viene bien calibrada de fábrica con valores deltaE medios muy por debajo de 2. Una calibración por parte del usuario final no debería ser necesaria para la mayoría.


Tiempos de respuesta del display
| ↔ Tiempo de respuesta de Negro a Blanco | ||
|---|---|---|
| 0.41 ms ... subida ↗ y bajada ↘ combinada | ↗ 0.2 ms subida | 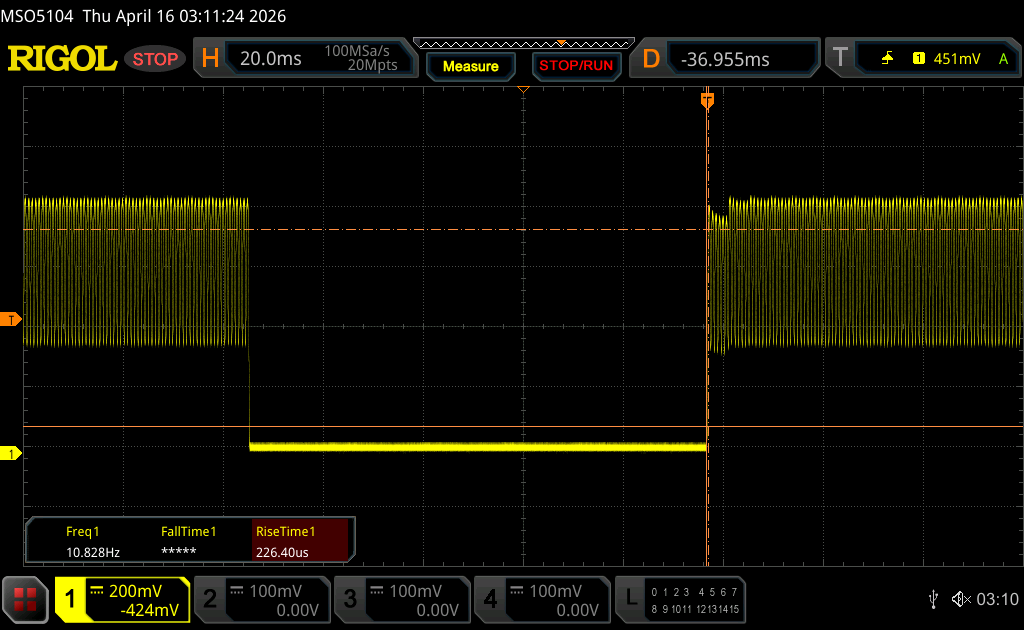 |
| ↘ 0.21 ms bajada | ||
| La pantalla mostró tiempos de respuesta muy rápidos en nuestros tests y debería ser adecuada para juegos frenéticos. En comparación, todos los dispositivos de prueba van de ##min### (mínimo) a 240 (máximo) ms. » 0 % de todos los dispositivos son mejores. Esto quiere decir que el tiempo de respuesta medido es mejor que la media (19.8 ms) de todos los dispositivos testados. | ||
| ↔ Tiempo de respuesta 50% Gris a 80% Gris | ||
| 0.29 ms ... subida ↗ y bajada ↘ combinada | ↗ 0.15 ms subida | 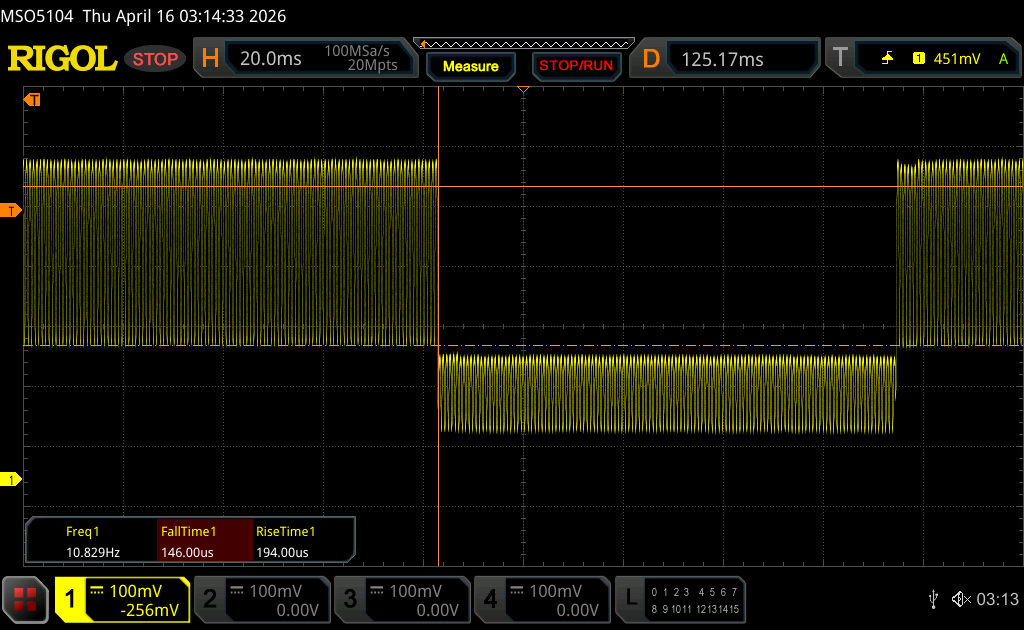 |
| ↘ 0.14 ms bajada | ||
| La pantalla mostró tiempos de respuesta muy rápidos en nuestros tests y debería ser adecuada para juegos frenéticos. En comparación, todos los dispositivos de prueba van de ##min### (mínimo) a 636 (máximo) ms. » 0 % de todos los dispositivos son mejores. Esto quiere decir que el tiempo de respuesta medido es mejor que la media (31 ms) de todos los dispositivos testados. | ||
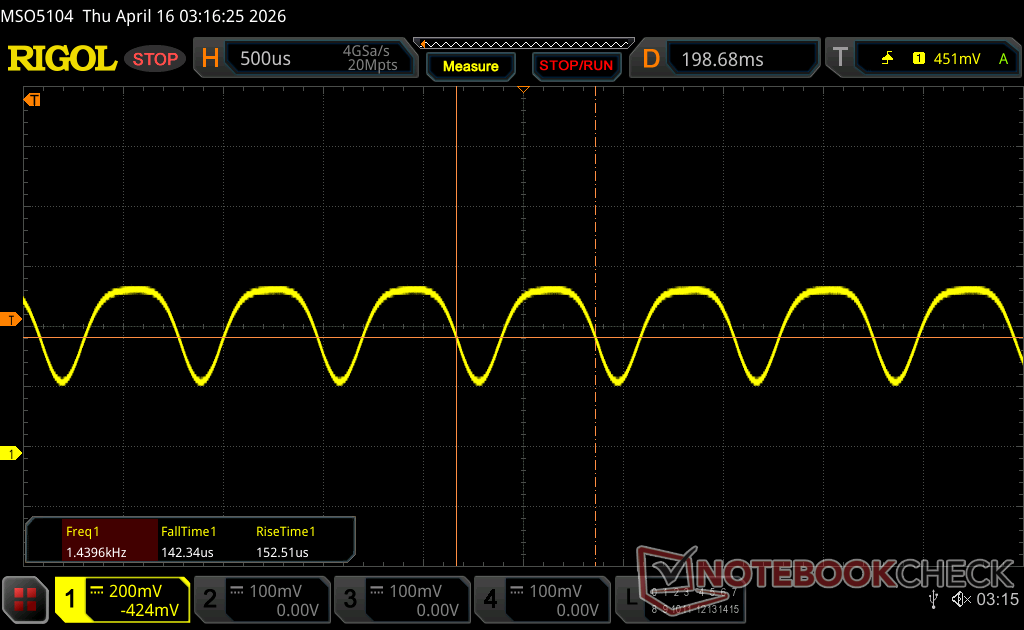
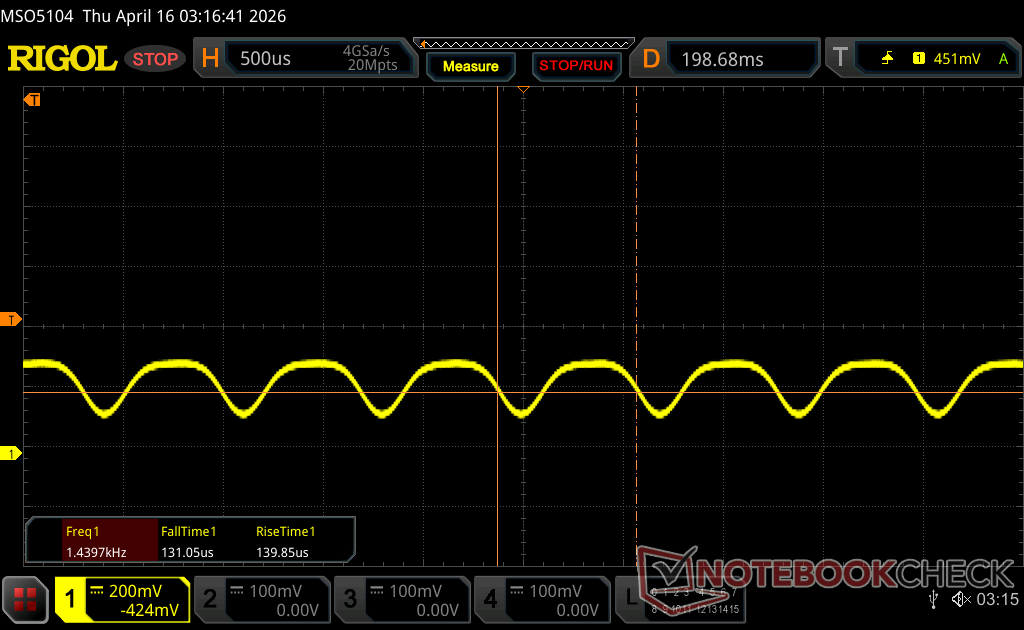
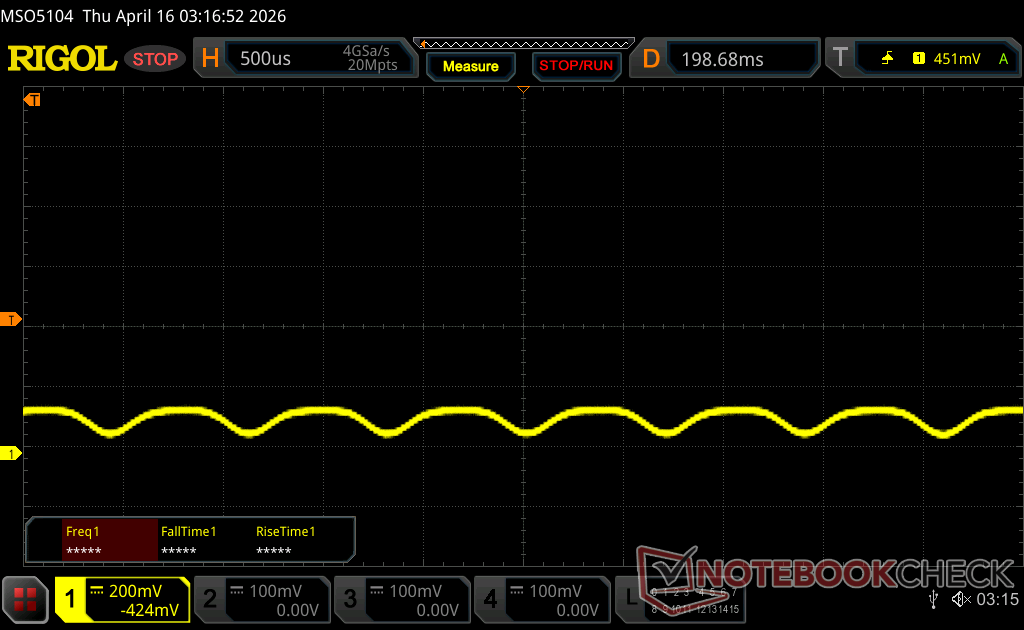
Parpadeo de Pantalla / PWM (Pulse-Width Modulation)
| Parpadeo de Pantalla / PWM detectado | 1440 Hz Amplitude: 30 % | ≤ 100 % de brillo | 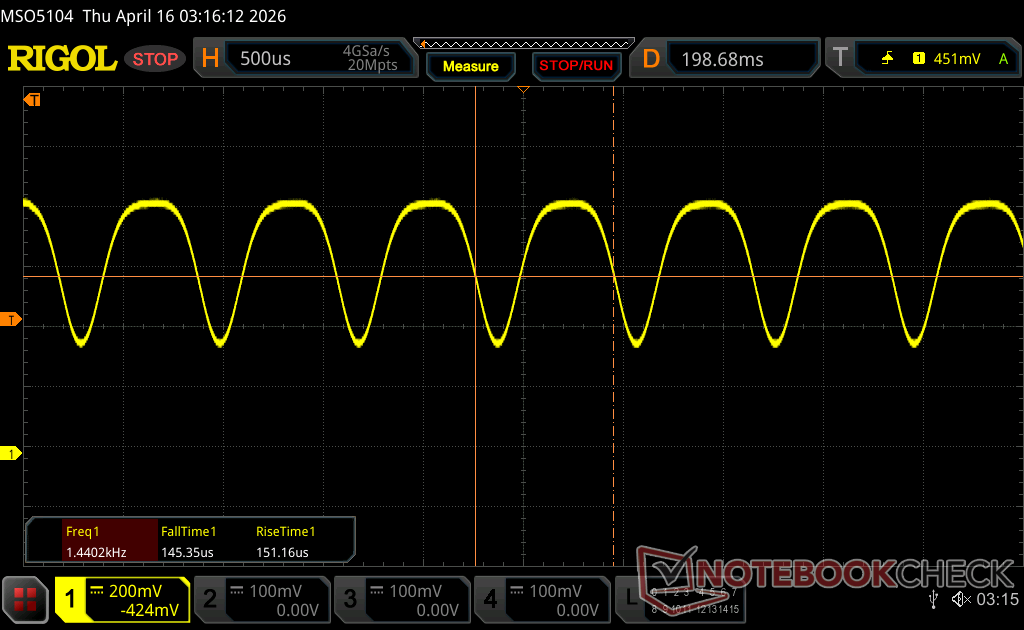 |
La retroiluminación del display parpadea a 1440 Hz (seguramente usa PWM - Pulse-Width Modulation) a un brillo del 100 % e inferior. Sobre este nivel de brillo no debería darse parpadeo / PWM. La frecuencia de 1440 Hz es bastante alta, por lo que la mayoría de gente sensible al parpadeo no debería ver parpadeo o tener fatiga visual. Comparación: 52 % de todos los dispositivos testados no usaron PWM para atenuar el display. Si se usó, medimos una media de 7747 (mínimo: 5 - máxmo: 343500) Hz. | |||


Rendimiento
Condiciones de prueba
Pusimos Windows en modo Rendimiento y el Centro de Comandos Alienware en modo Overdrive antes de ejecutar los benchmarks que se muestran a continuación. El modo Overdrive es necesario para obtener el máximo rendimiento gráfico.
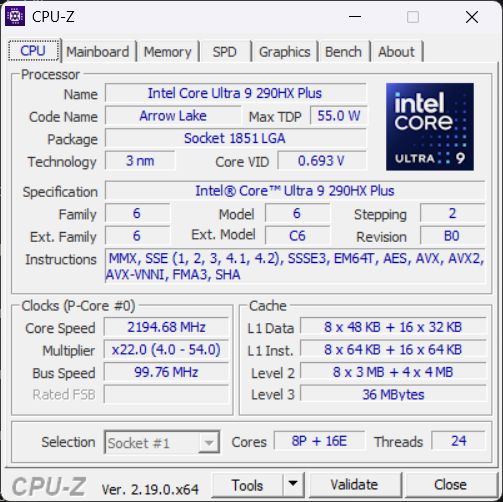
Procesador
El Core Ultra 9 290HX Plus ofrece hasta un 15 por ciento y un 25 por ciento más de rendimiento en monohilo y multihilo, respectivamente, que el Core Ultra 9 275HX en el Alienware 16 Area-51 del año pasado. El impulso pone a la CPU Arrow Lake codo con codo con el competidor Ryzen 9 9955HX3D.
Bucle múltiple Cinebench R15
Cinebench R23: Multi Core | Single Core
Cinebench R20: CPU (Multi Core) | CPU (Single Core)
Cinebench R15: CPU Multi 64Bit | CPU Single 64Bit
Blender: v2.79 BMW27 CPU
7-Zip 18.03: 7z b 4 | 7z b 4 -mmt1
Geekbench 6.7: Multi-Core | Single-Core
Geekbench 5.5: Multi-Core | Single-Core
HWBOT x265 Benchmark v2.2: 4k Preset
LibreOffice : 20 Documents To PDF
R Benchmark 2.5: Overall mean
* ... más pequeño es mejor
AIDA64: FP32 Ray-Trace | FPU Julia | CPU SHA3 | CPU Queen | FPU SinJulia | FPU Mandel | CPU AES | CPU ZLib | FP64 Ray-Trace | CPU PhotoWorxx | CPU CheckMate
| Performance rating | |
| Alienware 16 Area-51 Core Ultra 9 290HX Plus -1! | |
| Medio Intel Core Ultra 9 290HX Plus -1! | |
| Lenovo Legion Pro 7i 16 Gen 10 -1! | |
| Alienware 16 Area-51 -1! | |
| HP Omen Max 16 ah000 -1! | |
| MSI Vector 16 HX AI A2XWHG -1! | |
| Asus ROG Zephyrus G16 GU605CW -1! | |
| AIDA64 / FP32 Ray-Trace | |
| Alienware 16 Area-51 Core Ultra 9 290HX Plus (v8.20.8100) | |
| Medio Intel Core Ultra 9 290HX Plus (34761 - 40761, n=4) | |
| Lenovo Legion Pro 7i 16 Gen 10 (v6.92.6600) | |
| Alienware 16 Area-51 (v6.92.6600) | |
| HP Omen Max 16 ah000 (v6.92.6600) | |
| MSI Vector 16 HX AI A2XWHG (v6.92.6600) | |
| Asus ROG Zephyrus G16 GU605CW (v6.92.6600) | |
| AIDA64 / FPU Julia | |
| Alienware 16 Area-51 Core Ultra 9 290HX Plus (v8.20.8100) | |
| Medio Intel Core Ultra 9 290HX Plus (174665 - 208083, n=4) | |
| Lenovo Legion Pro 7i 16 Gen 10 (v6.92.6600) | |
| HP Omen Max 16 ah000 (v6.92.6600) | |
| Alienware 16 Area-51 (v6.92.6600) | |
| MSI Vector 16 HX AI A2XWHG (v6.92.6600) | |
| Asus ROG Zephyrus G16 GU605CW (v6.92.6600) | |
| AIDA64 / CPU SHA3 | |
| Alienware 16 Area-51 Core Ultra 9 290HX Plus (v8.20.8100) | |
| Medio Intel Core Ultra 9 290HX Plus (8352 - 9784, n=4) | |
| Lenovo Legion Pro 7i 16 Gen 10 (v6.92.6600) | |
| Alienware 16 Area-51 (v6.92.6600) | |
| HP Omen Max 16 ah000 (v6.92.6600) | |
| MSI Vector 16 HX AI A2XWHG (v6.92.6600) | |
| Asus ROG Zephyrus G16 GU605CW (v6.92.6600) | |
| AIDA64 / CPU Queen | |
| Lenovo Legion Pro 7i 16 Gen 10 (v6.92.6600) | |
| Alienware 16 Area-51 (v6.92.6600) | |
| HP Omen Max 16 ah000 (v6.92.6600) | |
| MSI Vector 16 HX AI A2XWHG (v6.92.6600) | |
| Asus ROG Zephyrus G16 GU605CW (v6.92.6600) | |
| AIDA64 / FPU SinJulia | |
| Lenovo Legion Pro 7i 16 Gen 10 (v6.92.6600) | |
| Medio Intel Core Ultra 9 290HX Plus (13612 - 14461, n=4) | |
| Alienware 16 Area-51 Core Ultra 9 290HX Plus (v8.20.8100) | |
| Alienware 16 Area-51 (v6.92.6600) | |
| HP Omen Max 16 ah000 (v6.92.6600) | |
| MSI Vector 16 HX AI A2XWHG (v6.92.6600) | |
| Asus ROG Zephyrus G16 GU605CW (v6.92.6600) | |
| AIDA64 / FPU Mandel | |
| Alienware 16 Area-51 Core Ultra 9 290HX Plus (v8.20.8100) | |
| Medio Intel Core Ultra 9 290HX Plus (91215 - 108275, n=4) | |
| Lenovo Legion Pro 7i 16 Gen 10 (v6.92.6600) | |
| HP Omen Max 16 ah000 (v6.92.6600) | |
| Alienware 16 Area-51 (v6.92.6600) | |
| MSI Vector 16 HX AI A2XWHG (v6.92.6600) | |
| Asus ROG Zephyrus G16 GU605CW (v6.92.6600) | |
| AIDA64 / CPU AES | |
| Lenovo Legion Pro 7i 16 Gen 10 (v6.92.6600) | |
| Medio Intel Core Ultra 9 290HX Plus (127585 - 136781, n=4) | |
| Alienware 16 Area-51 Core Ultra 9 290HX Plus (v8.20.8100) | |
| Alienware 16 Area-51 (v6.92.6600) | |
| HP Omen Max 16 ah000 (v6.92.6600) | |
| MSI Vector 16 HX AI A2XWHG (v6.92.6600) | |
| Asus ROG Zephyrus G16 GU605CW (v6.92.6600) | |
| AIDA64 / CPU ZLib | |
| Alienware 16 Area-51 Core Ultra 9 290HX Plus (v8.20.8100) | |
| Medio Intel Core Ultra 9 290HX Plus (1967 - 2206, n=4) | |
| Lenovo Legion Pro 7i 16 Gen 10 (v6.92.6600) | |
| Alienware 16 Area-51 (v6.92.6600) | |
| HP Omen Max 16 ah000 (v6.92.6600) | |
| MSI Vector 16 HX AI A2XWHG (v6.92.6600) | |
| Asus ROG Zephyrus G16 GU605CW (v6.92.6600) | |
| AIDA64 / FP64 Ray-Trace | |
| Alienware 16 Area-51 Core Ultra 9 290HX Plus (v8.20.8100) | |
| Medio Intel Core Ultra 9 290HX Plus (18611 - 21949, n=4) | |
| Lenovo Legion Pro 7i 16 Gen 10 (v6.92.6600) | |
| Alienware 16 Area-51 (v6.92.6600) | |
| HP Omen Max 16 ah000 (v6.92.6600) | |
| MSI Vector 16 HX AI A2XWHG (v6.92.6600) | |
| Asus ROG Zephyrus G16 GU605CW (v6.92.6600) | |
| AIDA64 / CPU PhotoWorxx | |
| Asus ROG Zephyrus G16 GU605CW (v6.92.6600) | |
| Alienware 16 Area-51 Core Ultra 9 290HX Plus (v8.20.8100) | |
| Lenovo Legion Pro 7i 16 Gen 10 (v6.92.6600) | |
| Alienware 16 Area-51 (v6.92.6600) | |
| Medio Intel Core Ultra 9 290HX Plus (51134 - 55731, n=4) | |
| HP Omen Max 16 ah000 (v6.92.6600) | |
| MSI Vector 16 HX AI A2XWHG (v6.92.6600) | |
| AIDA64 / CPU CheckMate | |
| Alienware 16 Area-51 Core Ultra 9 290HX Plus (v8.20.8100) | |
| Medio Intel Core Ultra 9 290HX Plus (7624 - 8322, n=4) | |
Rendimiento del sistema
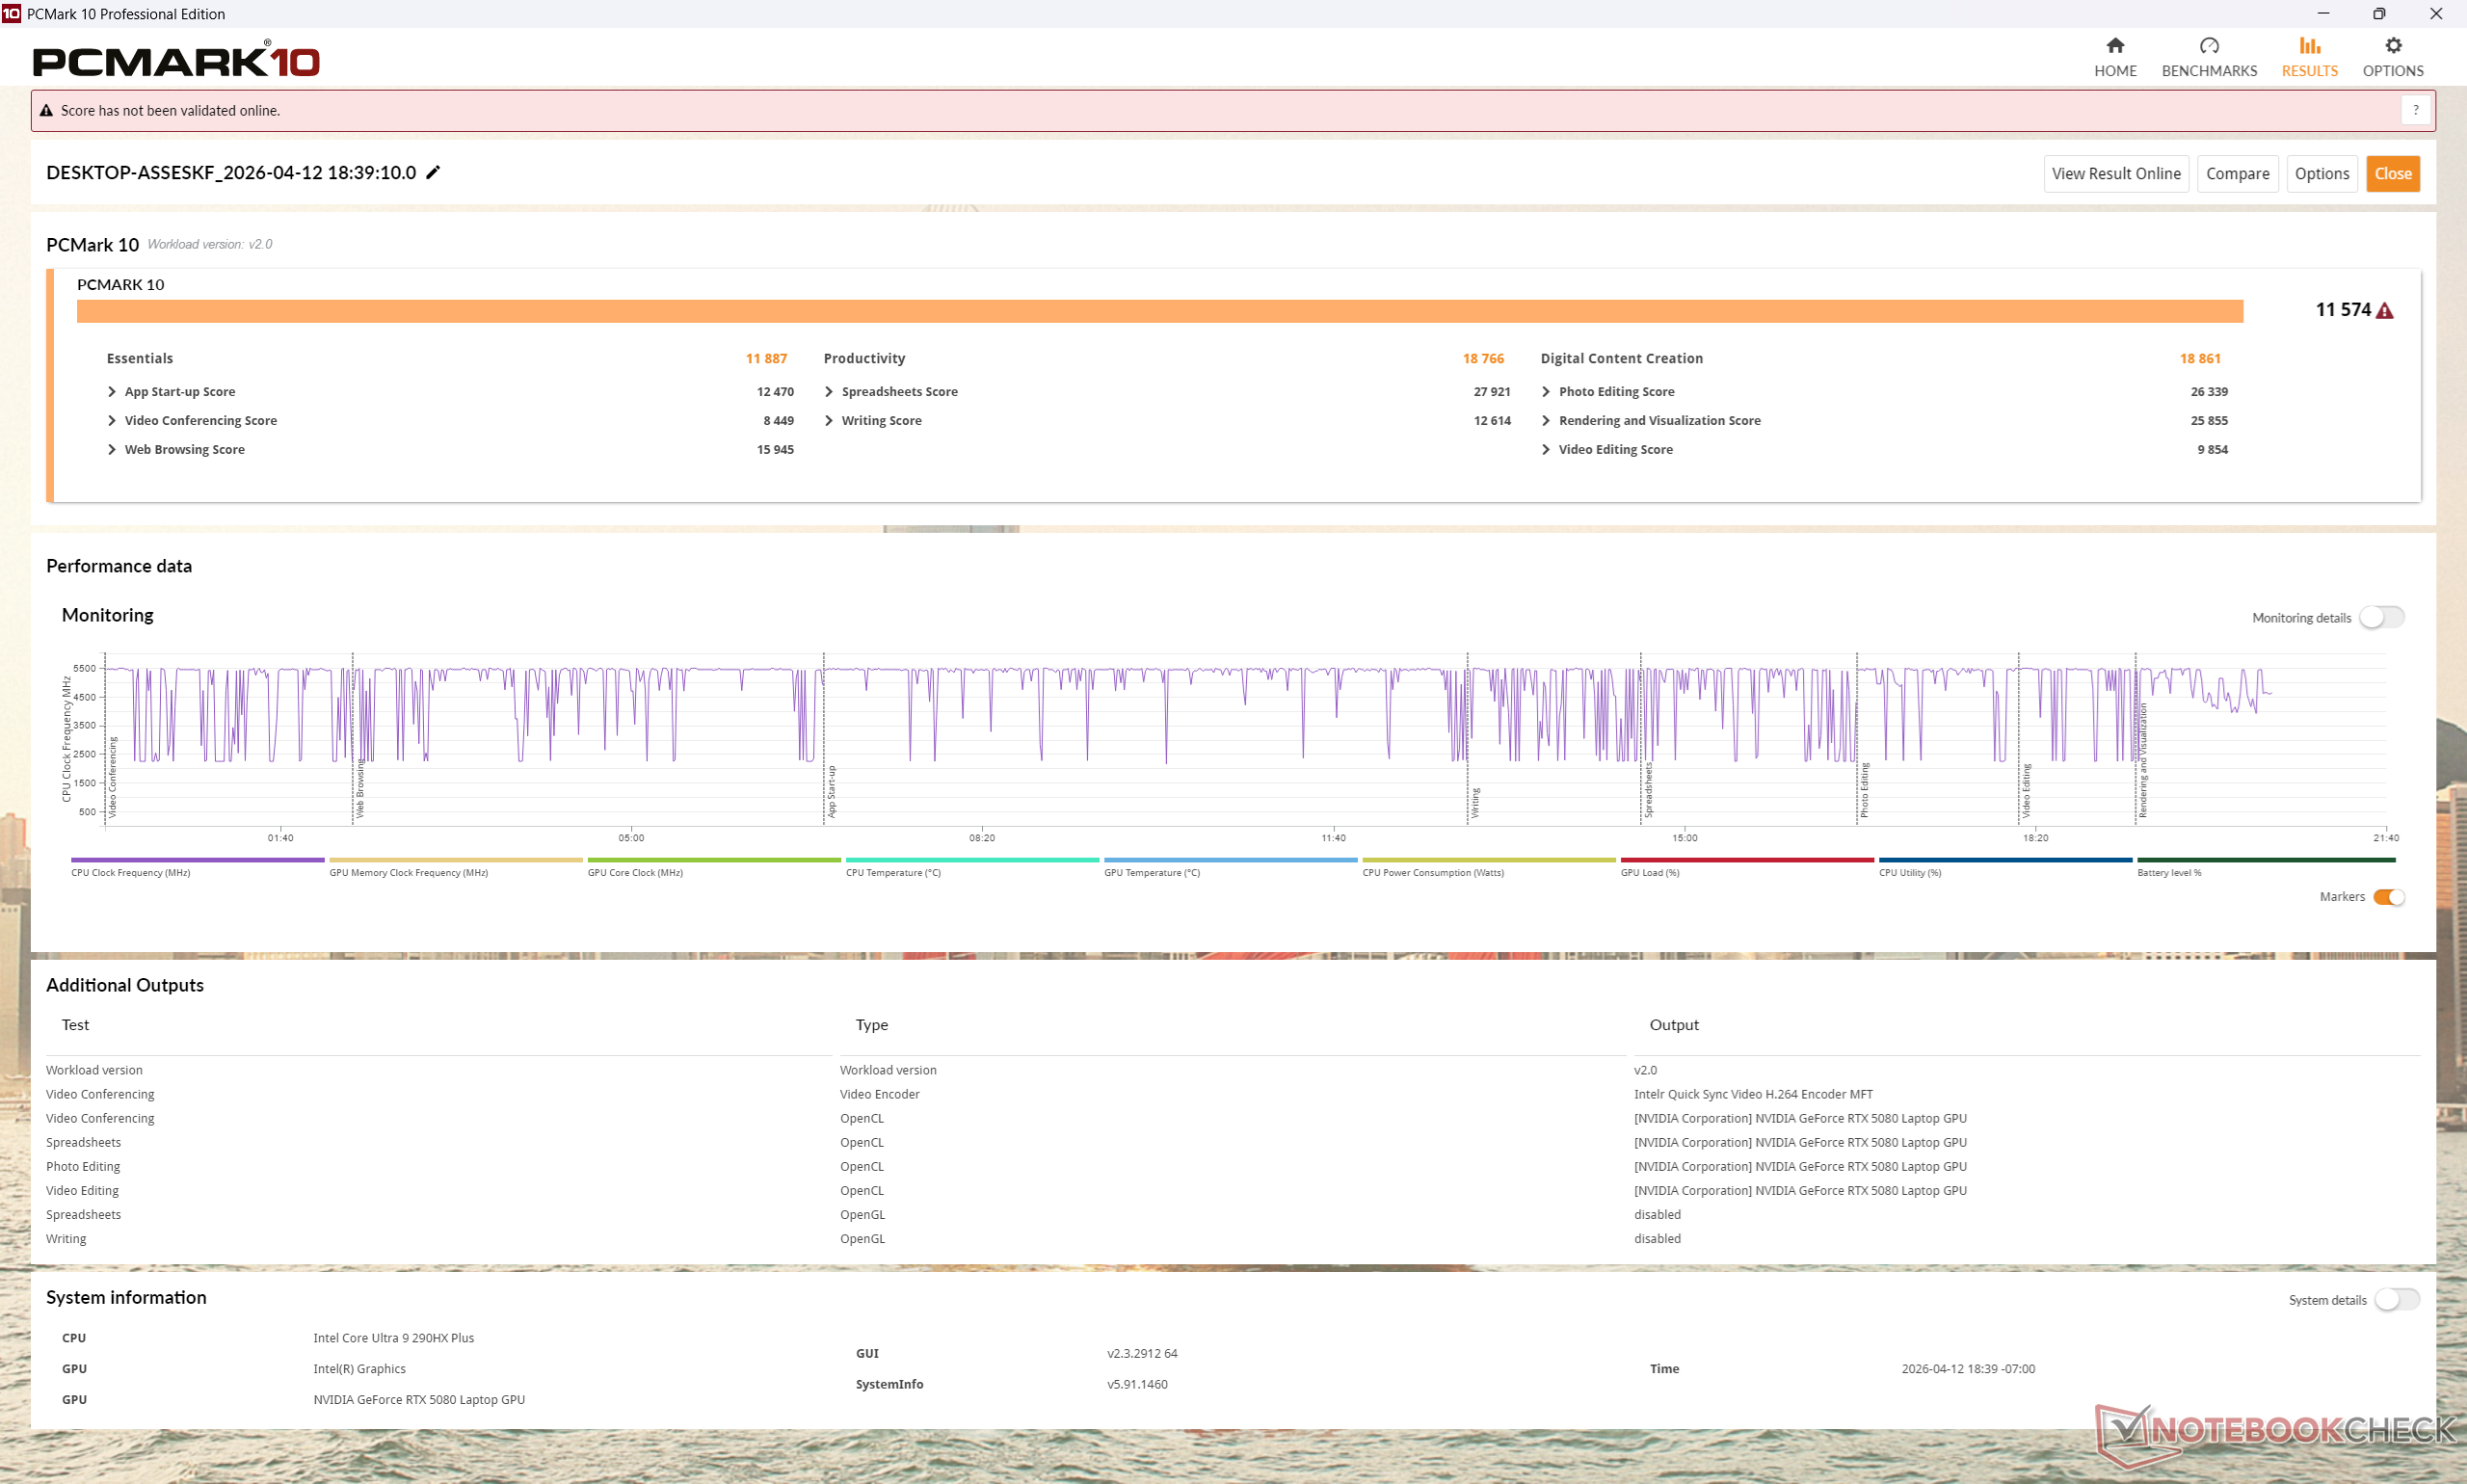
PCMark 10: Score | Essentials | Productivity | Digital Content Creation
CrossMark: Overall | Productivity | Creativity | Responsiveness
WebXPRT 3: Overall
WebXPRT 4: Overall
Mozilla Kraken 1.1: Total
| Performance rating | |
| Alienware 16 Area-51 Core Ultra 9 290HX Plus | |
| Medio Intel Core Ultra 9 290HX Plus, NVIDIA GeForce RTX 5080 Laptop | |
| Alienware 16 Area-51 | |
| Lenovo Legion Pro 7i 16 Gen 10 | |
| HP Omen Max 16 ah000 -1! | |
| MSI Vector 16 HX AI A2XWHG | |
| Asus ROG Zephyrus G16 GU605CW | |
| PCMark 10 / Score | |
| Alienware 16 Area-51 Core Ultra 9 290HX Plus | |
| Medio Intel Core Ultra 9 290HX Plus, NVIDIA GeForce RTX 5080 Laptop (n=1) | |
| Lenovo Legion Pro 7i 16 Gen 10 | |
| HP Omen Max 16 ah000 | |
| Alienware 16 Area-51 | |
| MSI Vector 16 HX AI A2XWHG | |
| Asus ROG Zephyrus G16 GU605CW | |
| PCMark 10 / Essentials | |
| Alienware 16 Area-51 Core Ultra 9 290HX Plus | |
| Medio Intel Core Ultra 9 290HX Plus, NVIDIA GeForce RTX 5080 Laptop (n=1) | |
| Lenovo Legion Pro 7i 16 Gen 10 | |
| Alienware 16 Area-51 | |
| HP Omen Max 16 ah000 | |
| MSI Vector 16 HX AI A2XWHG | |
| Asus ROG Zephyrus G16 GU605CW | |
| PCMark 10 / Productivity | |
| Alienware 16 Area-51 Core Ultra 9 290HX Plus | |
| Medio Intel Core Ultra 9 290HX Plus, NVIDIA GeForce RTX 5080 Laptop (n=1) | |
| Lenovo Legion Pro 7i 16 Gen 10 | |
| MSI Vector 16 HX AI A2XWHG | |
| Alienware 16 Area-51 | |
| HP Omen Max 16 ah000 | |
| Asus ROG Zephyrus G16 GU605CW | |
| PCMark 10 / Digital Content Creation | |
| Lenovo Legion Pro 7i 16 Gen 10 | |
| Alienware 16 Area-51 Core Ultra 9 290HX Plus | |
| Medio Intel Core Ultra 9 290HX Plus, NVIDIA GeForce RTX 5080 Laptop (n=1) | |
| HP Omen Max 16 ah000 | |
| Alienware 16 Area-51 | |
| Asus ROG Zephyrus G16 GU605CW | |
| MSI Vector 16 HX AI A2XWHG | |
| CrossMark / Overall | |
| Alienware 16 Area-51 Core Ultra 9 290HX Plus | |
| Medio Intel Core Ultra 9 290HX Plus, NVIDIA GeForce RTX 5080 Laptop (n=1) | |
| Alienware 16 Area-51 | |
| Lenovo Legion Pro 7i 16 Gen 10 | |
| HP Omen Max 16 ah000 | |
| MSI Vector 16 HX AI A2XWHG | |
| Asus ROG Zephyrus G16 GU605CW | |
| CrossMark / Productivity | |
| Alienware 16 Area-51 Core Ultra 9 290HX Plus | |
| Medio Intel Core Ultra 9 290HX Plus, NVIDIA GeForce RTX 5080 Laptop (n=1) | |
| Alienware 16 Area-51 | |
| Lenovo Legion Pro 7i 16 Gen 10 | |
| HP Omen Max 16 ah000 | |
| MSI Vector 16 HX AI A2XWHG | |
| Asus ROG Zephyrus G16 GU605CW | |
| CrossMark / Creativity | |
| Alienware 16 Area-51 Core Ultra 9 290HX Plus | |
| Medio Intel Core Ultra 9 290HX Plus, NVIDIA GeForce RTX 5080 Laptop (n=1) | |
| Alienware 16 Area-51 | |
| Lenovo Legion Pro 7i 16 Gen 10 | |
| HP Omen Max 16 ah000 | |
| MSI Vector 16 HX AI A2XWHG | |
| Asus ROG Zephyrus G16 GU605CW | |
| CrossMark / Responsiveness | |
| Alienware 16 Area-51 Core Ultra 9 290HX Plus | |
| Medio Intel Core Ultra 9 290HX Plus, NVIDIA GeForce RTX 5080 Laptop (n=1) | |
| Alienware 16 Area-51 | |
| HP Omen Max 16 ah000 | |
| Lenovo Legion Pro 7i 16 Gen 10 | |
| MSI Vector 16 HX AI A2XWHG | |
| Asus ROG Zephyrus G16 GU605CW | |
| WebXPRT 3 / Overall | |
| Alienware 16 Area-51 Core Ultra 9 290HX Plus | |
| Medio Intel Core Ultra 9 290HX Plus, NVIDIA GeForce RTX 5080 Laptop (n=1) | |
| HP Omen Max 16 ah000 | |
| Lenovo Legion Pro 7i 16 Gen 10 | |
| Alienware 16 Area-51 | |
| MSI Vector 16 HX AI A2XWHG | |
| Asus ROG Zephyrus G16 GU605CW | |
| WebXPRT 4 / Overall | |
| Alienware 16 Area-51 Core Ultra 9 290HX Plus | |
| Medio Intel Core Ultra 9 290HX Plus, NVIDIA GeForce RTX 5080 Laptop (n=1) | |
| Lenovo Legion Pro 7i 16 Gen 10 | |
| Alienware 16 Area-51 | |
| MSI Vector 16 HX AI A2XWHG | |
| Asus ROG Zephyrus G16 GU605CW | |
| Mozilla Kraken 1.1 / Total | |
| Asus ROG Zephyrus G16 GU605CW | |
| MSI Vector 16 HX AI A2XWHG | |
| HP Omen Max 16 ah000 | |
| Alienware 16 Area-51 | |
| Lenovo Legion Pro 7i 16 Gen 10 | |
| Alienware 16 Area-51 Core Ultra 9 290HX Plus | |
| Medio Intel Core Ultra 9 290HX Plus, NVIDIA GeForce RTX 5080 Laptop (n=1) | |
* ... más pequeño es mejor
| PCMark 10 Score | 11574 puntos | |
ayuda | ||
| AIDA64 / Memory Copy | |
| Asus ROG Zephyrus G16 GU605CW | |
| Alienware 16 Area-51 Core Ultra 9 290HX Plus | |
| Alienware 16 Area-51 | |
| Lenovo Legion Pro 7i 16 Gen 10 | |
| Medio Intel Core Ultra 9 290HX Plus (76912 - 86055, n=4) | |
| HP Omen Max 16 ah000 | |
| MSI Vector 16 HX AI A2XWHG | |
| AIDA64 / Memory Read | |
| Lenovo Legion Pro 7i 16 Gen 10 | |
| Alienware 16 Area-51 Core Ultra 9 290HX Plus | |
| Alienware 16 Area-51 | |
| Medio Intel Core Ultra 9 290HX Plus (84638 - 96309, n=4) | |
| HP Omen Max 16 ah000 | |
| MSI Vector 16 HX AI A2XWHG | |
| Asus ROG Zephyrus G16 GU605CW | |
| AIDA64 / Memory Write | |
| Lenovo Legion Pro 7i 16 Gen 10 | |
| Alienware 16 Area-51 | |
| Alienware 16 Area-51 Core Ultra 9 290HX Plus | |
| Medio Intel Core Ultra 9 290HX Plus (76094 - 85001, n=4) | |
| HP Omen Max 16 ah000 | |
| Asus ROG Zephyrus G16 GU605CW | |
| MSI Vector 16 HX AI A2XWHG | |
| AIDA64 / Memory Latency | |
| Asus ROG Zephyrus G16 GU605CW | |
| Alienware 16 Area-51 | |
| HP Omen Max 16 ah000 | |
| Lenovo Legion Pro 7i 16 Gen 10 | |
| MSI Vector 16 HX AI A2XWHG | |
| Alienware 16 Area-51 Core Ultra 9 290HX Plus | |
| Medio Intel Core Ultra 9 290HX Plus (100.7 - 108.4, n=4) | |
* ... más pequeño es mejor
Latencia del CPD
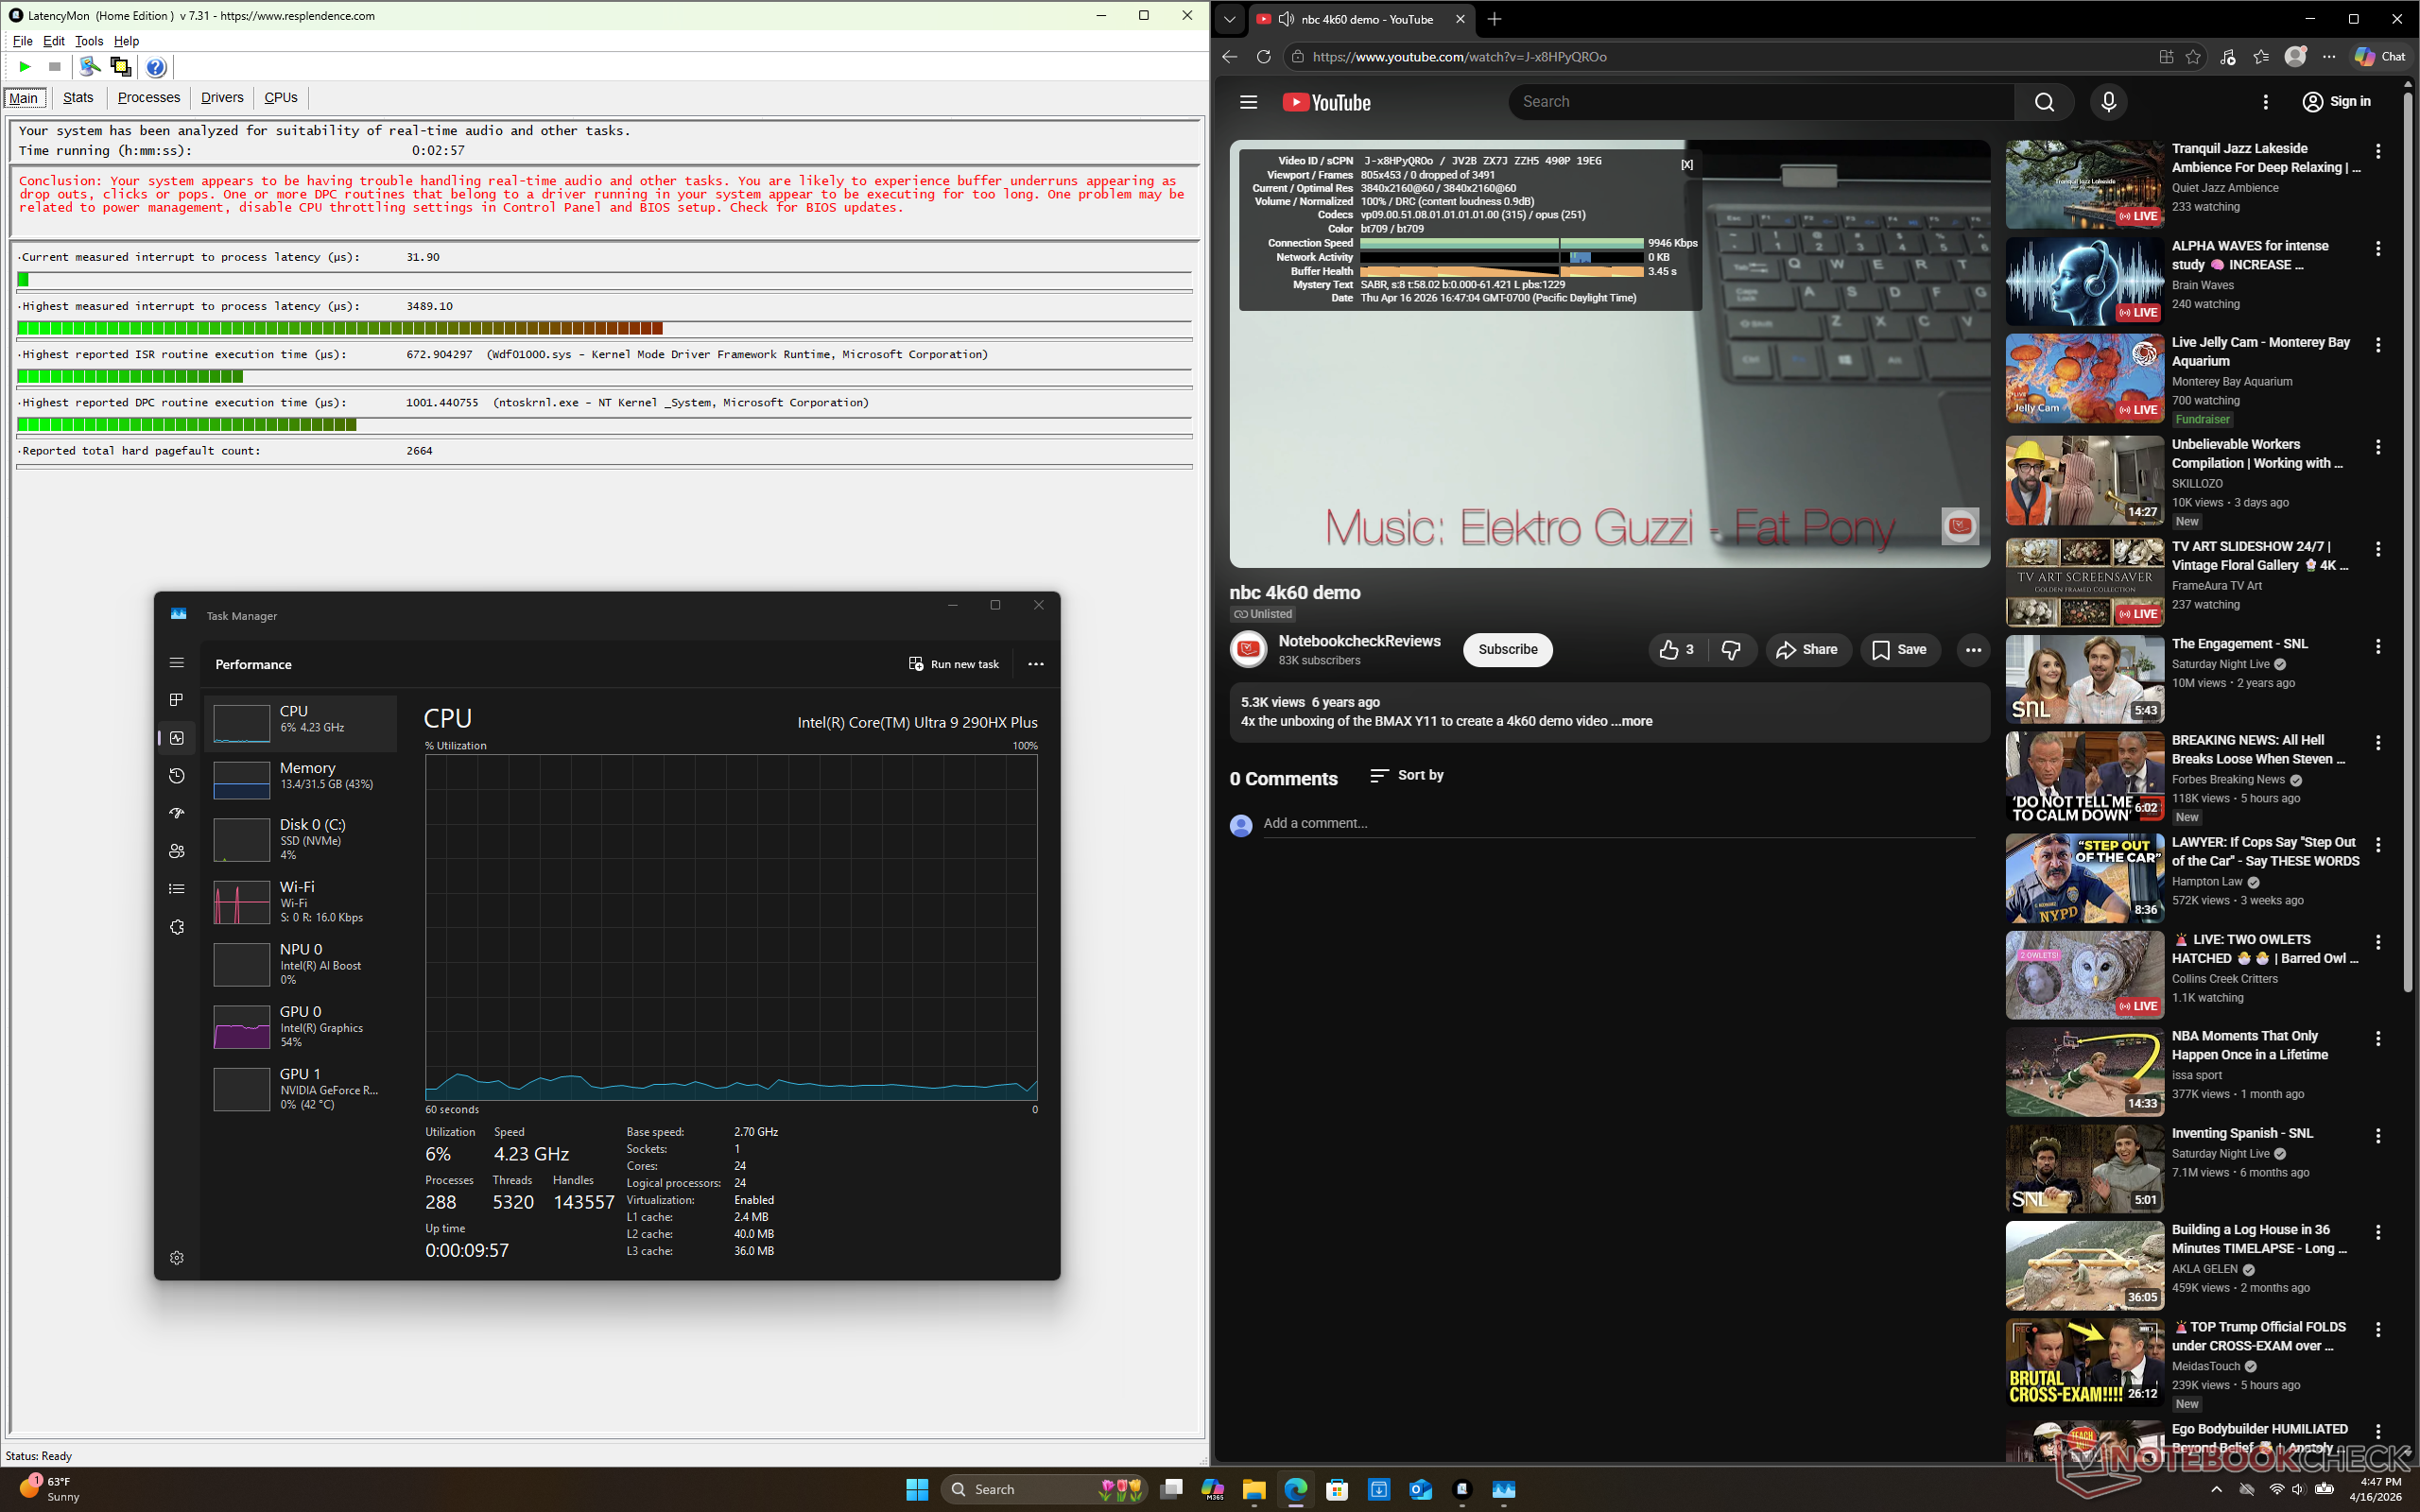
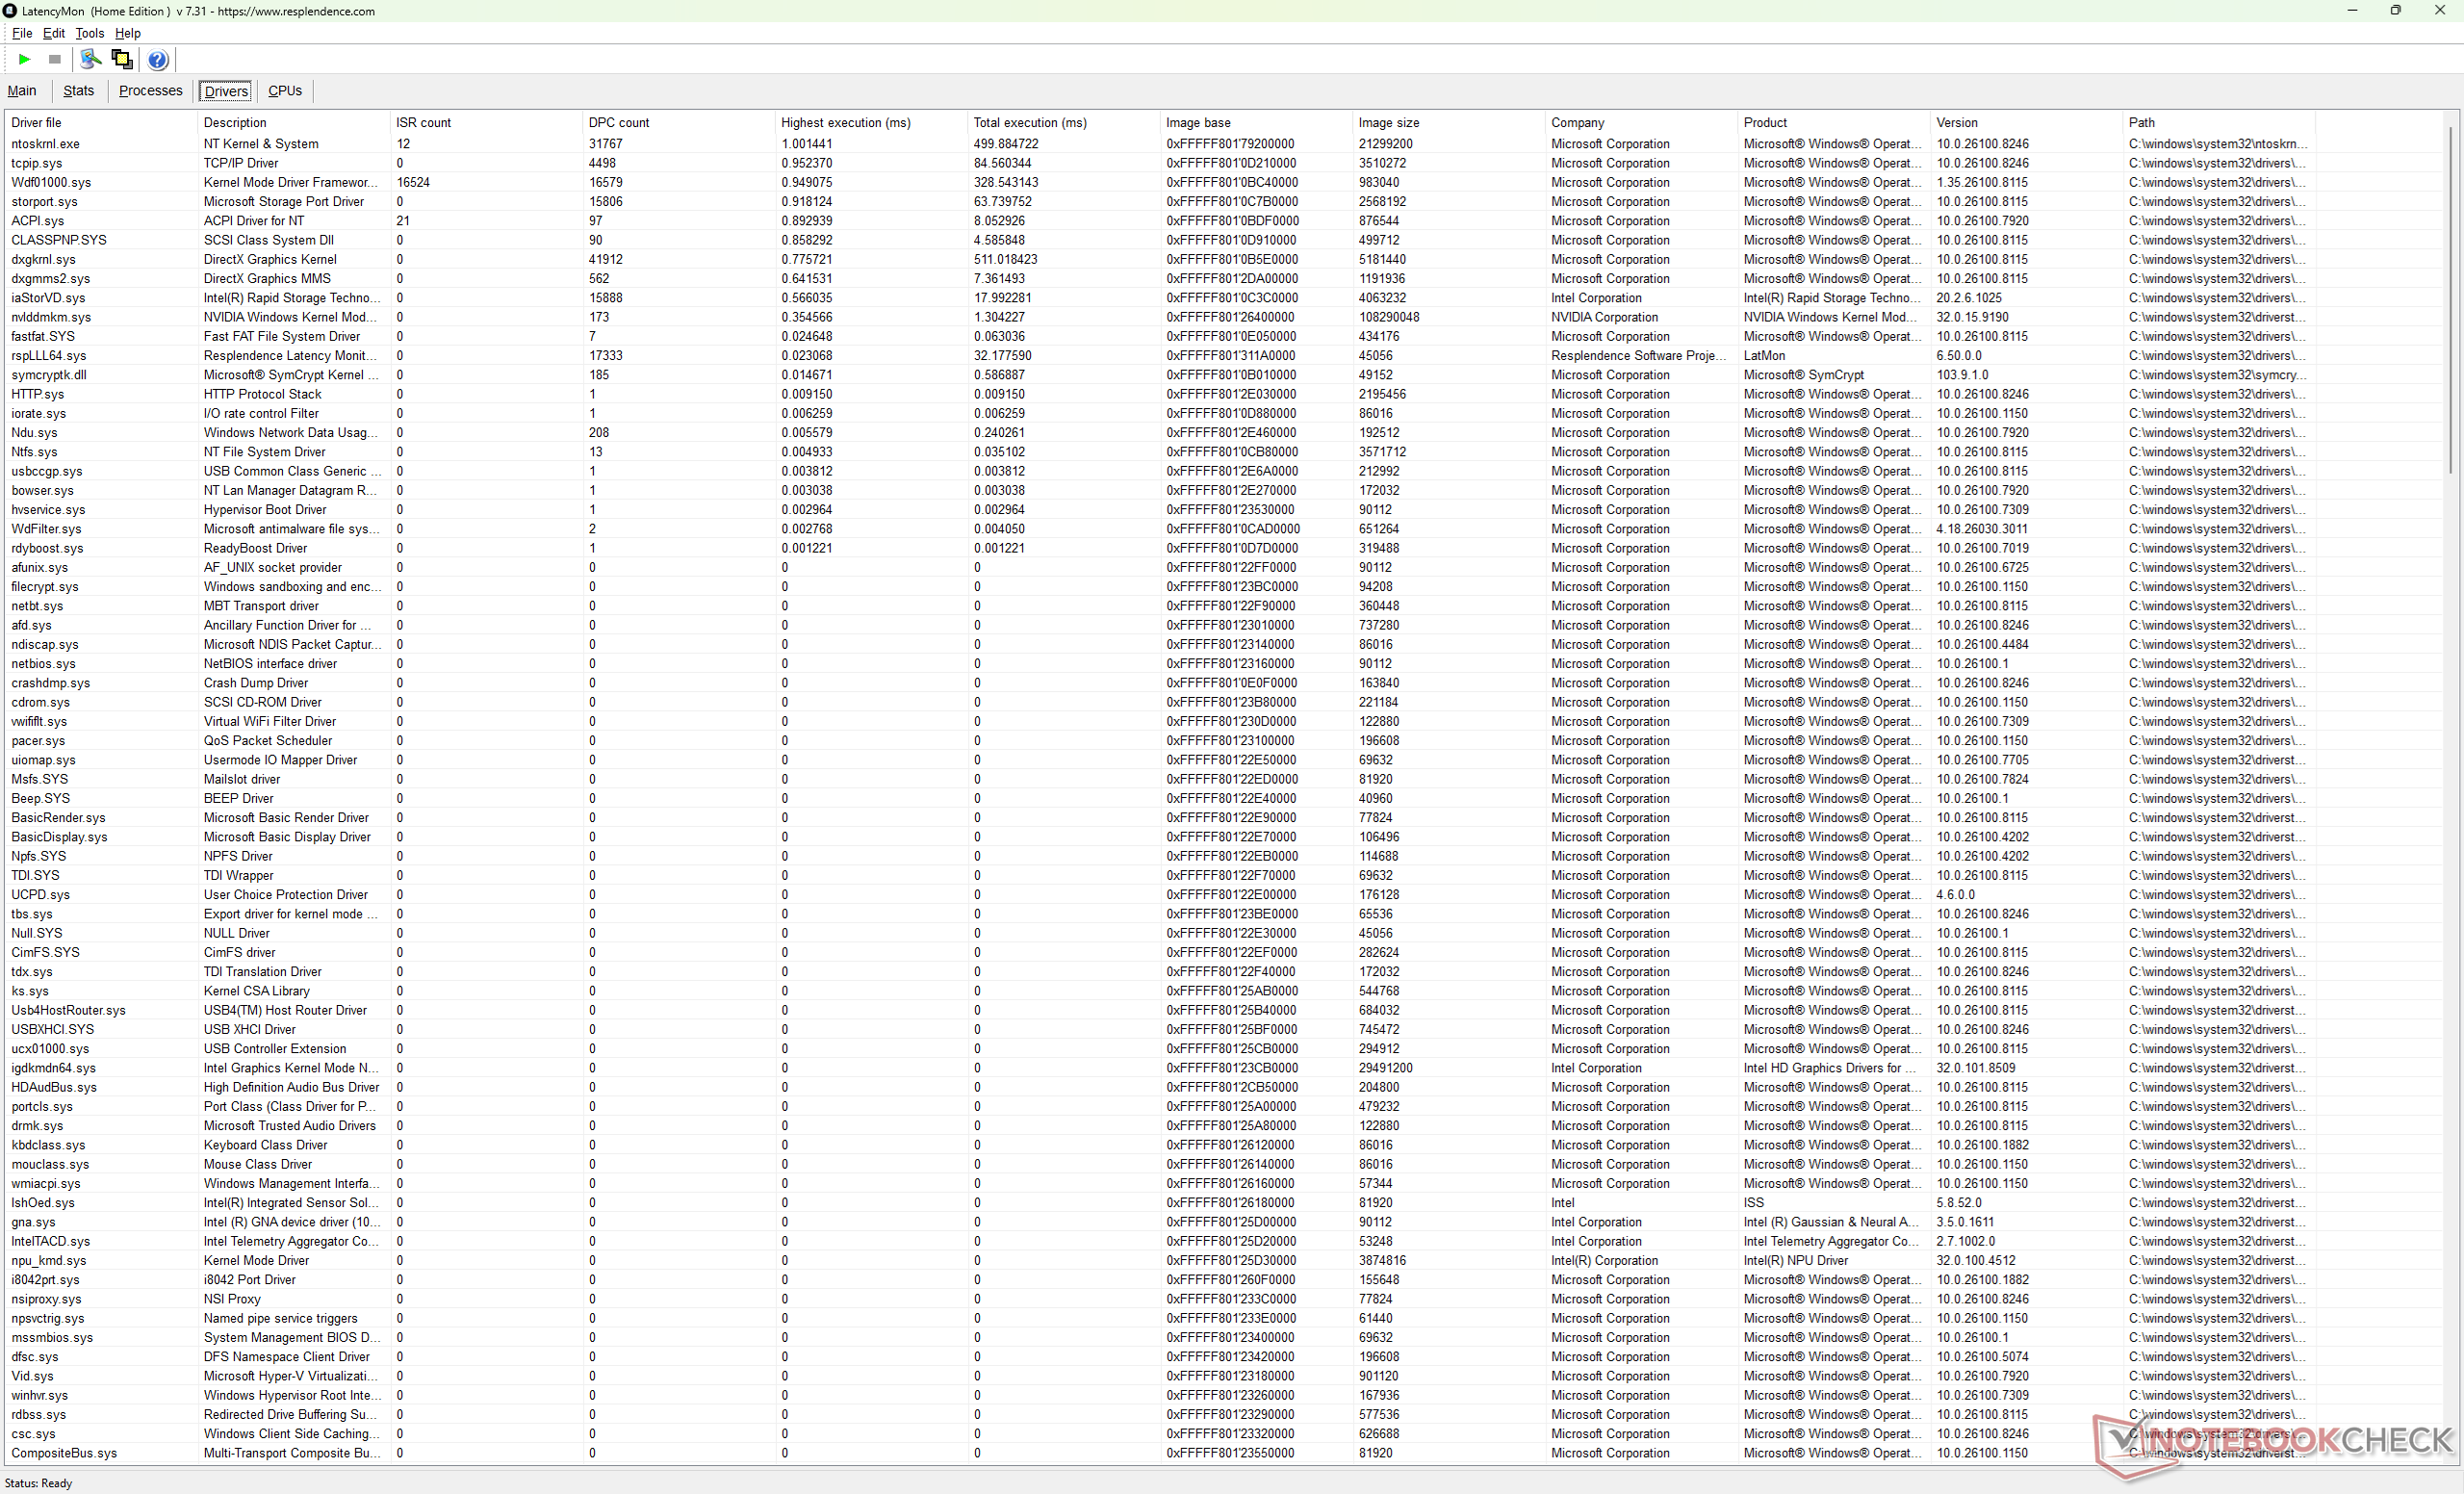
| DPC Latencies / LatencyMon - interrupt to process latency (max), Web, Youtube, Prime95 | |
| MSI Vector 16 HX AI A2XWHG | |
| Alienware 16 Area-51 Core Ultra 9 290HX Plus | |
| Alienware 16 Area-51 | |
| HP Omen Max 16 ah000 | |
| Asus ROG Zephyrus G16 GU605CW | |
| Lenovo Legion Pro 7i 16 Gen 10 | |
* ... más pequeño es mejor
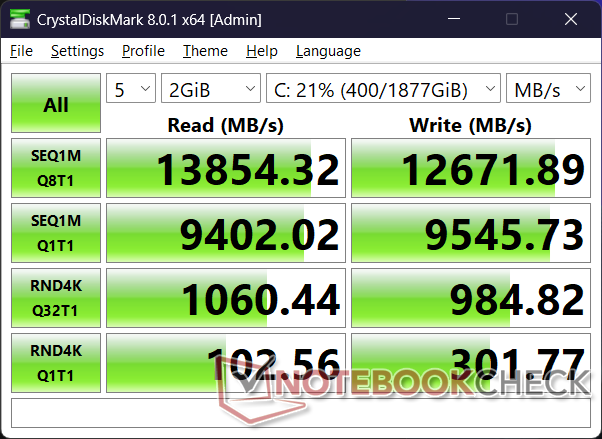
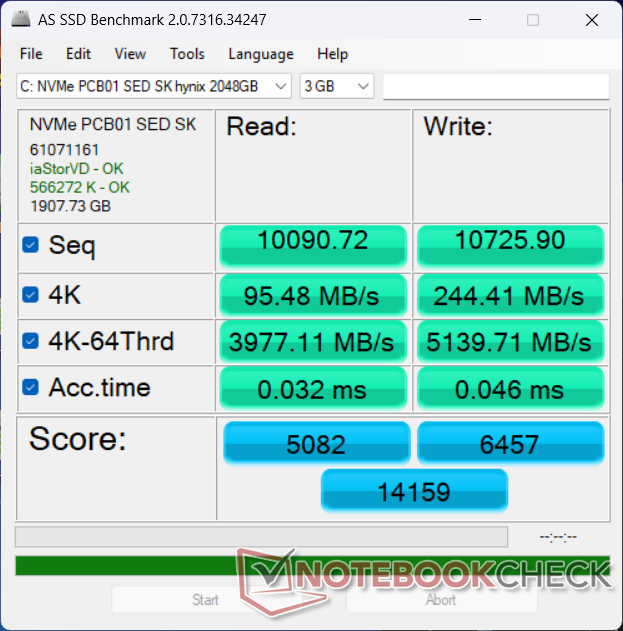
Dispositivos de almacenamiento
Impresionantemente, el SK Hynix PCB01 PCIe5 x4 NVMe SSD es capaz de sostener tasas de transferencia de casi 14000 MB/s sin ninguna ralentización.

* ... más pequeño es mejor
Estrangulamiento de disco: Bucle de lectura DiskSpd, profundidad de cola 8
Rendimiento de la GPU
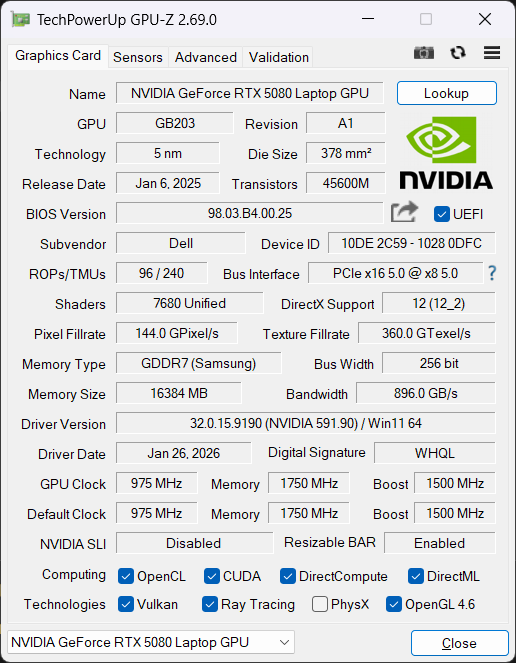
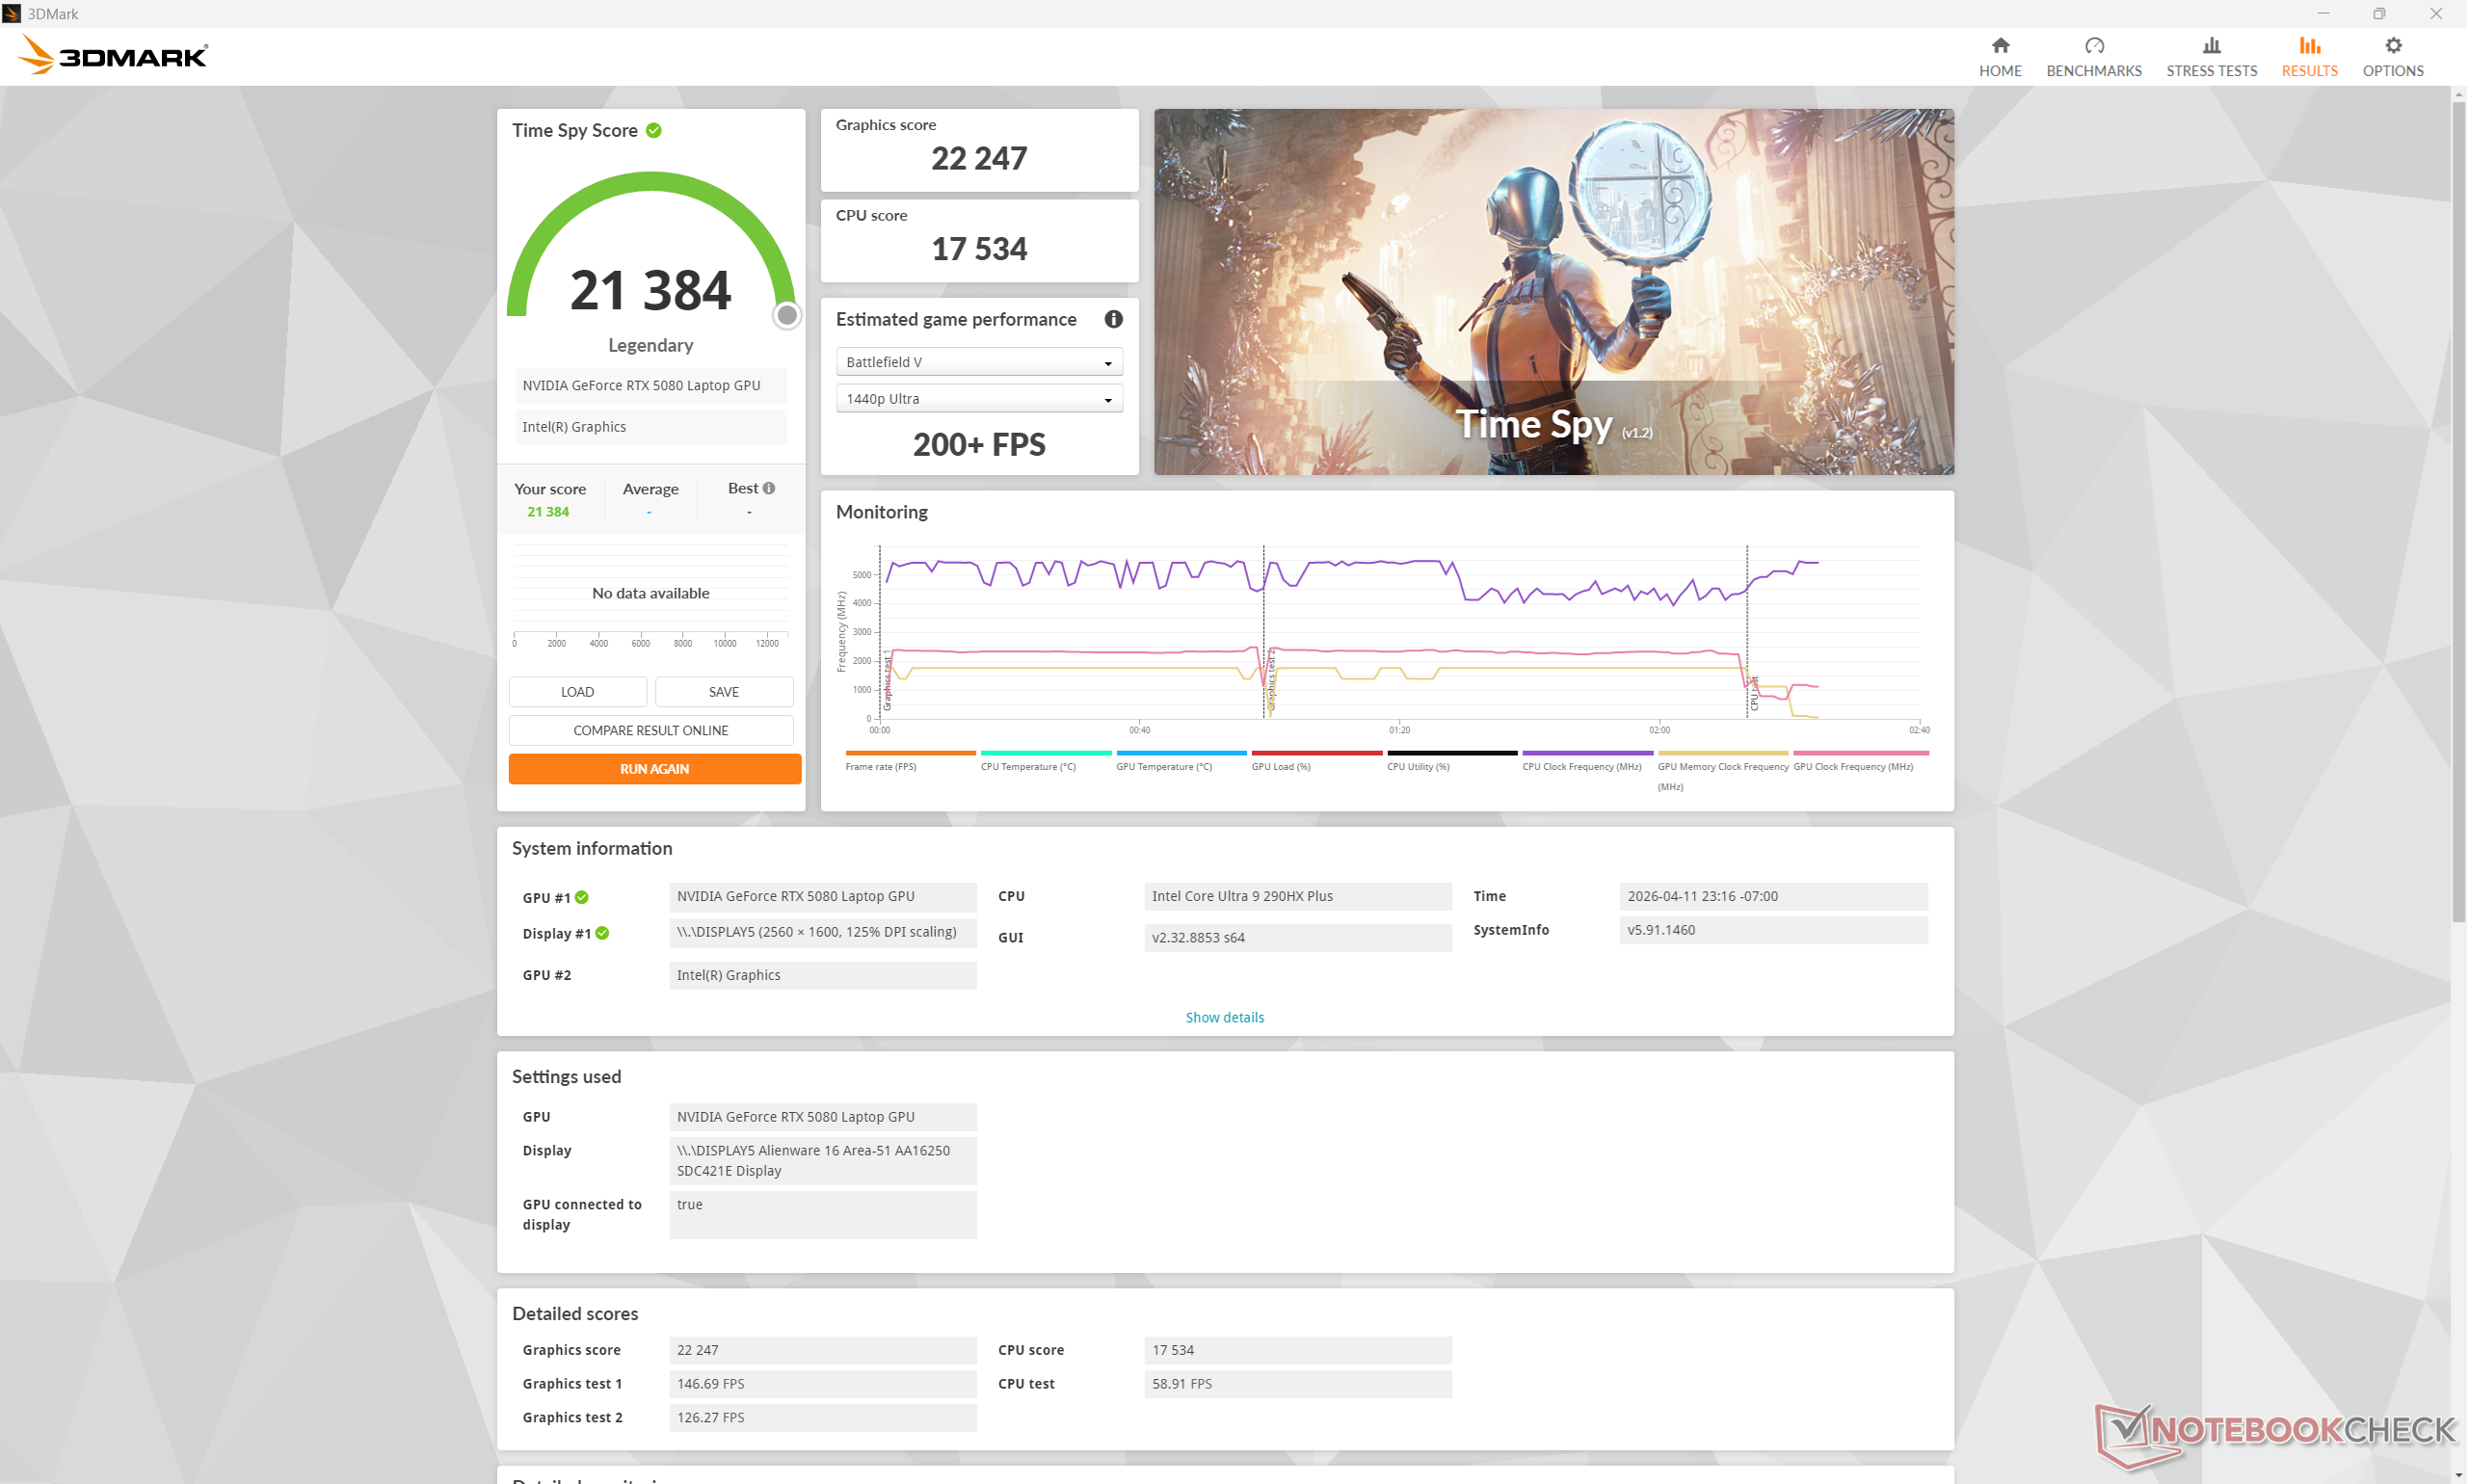
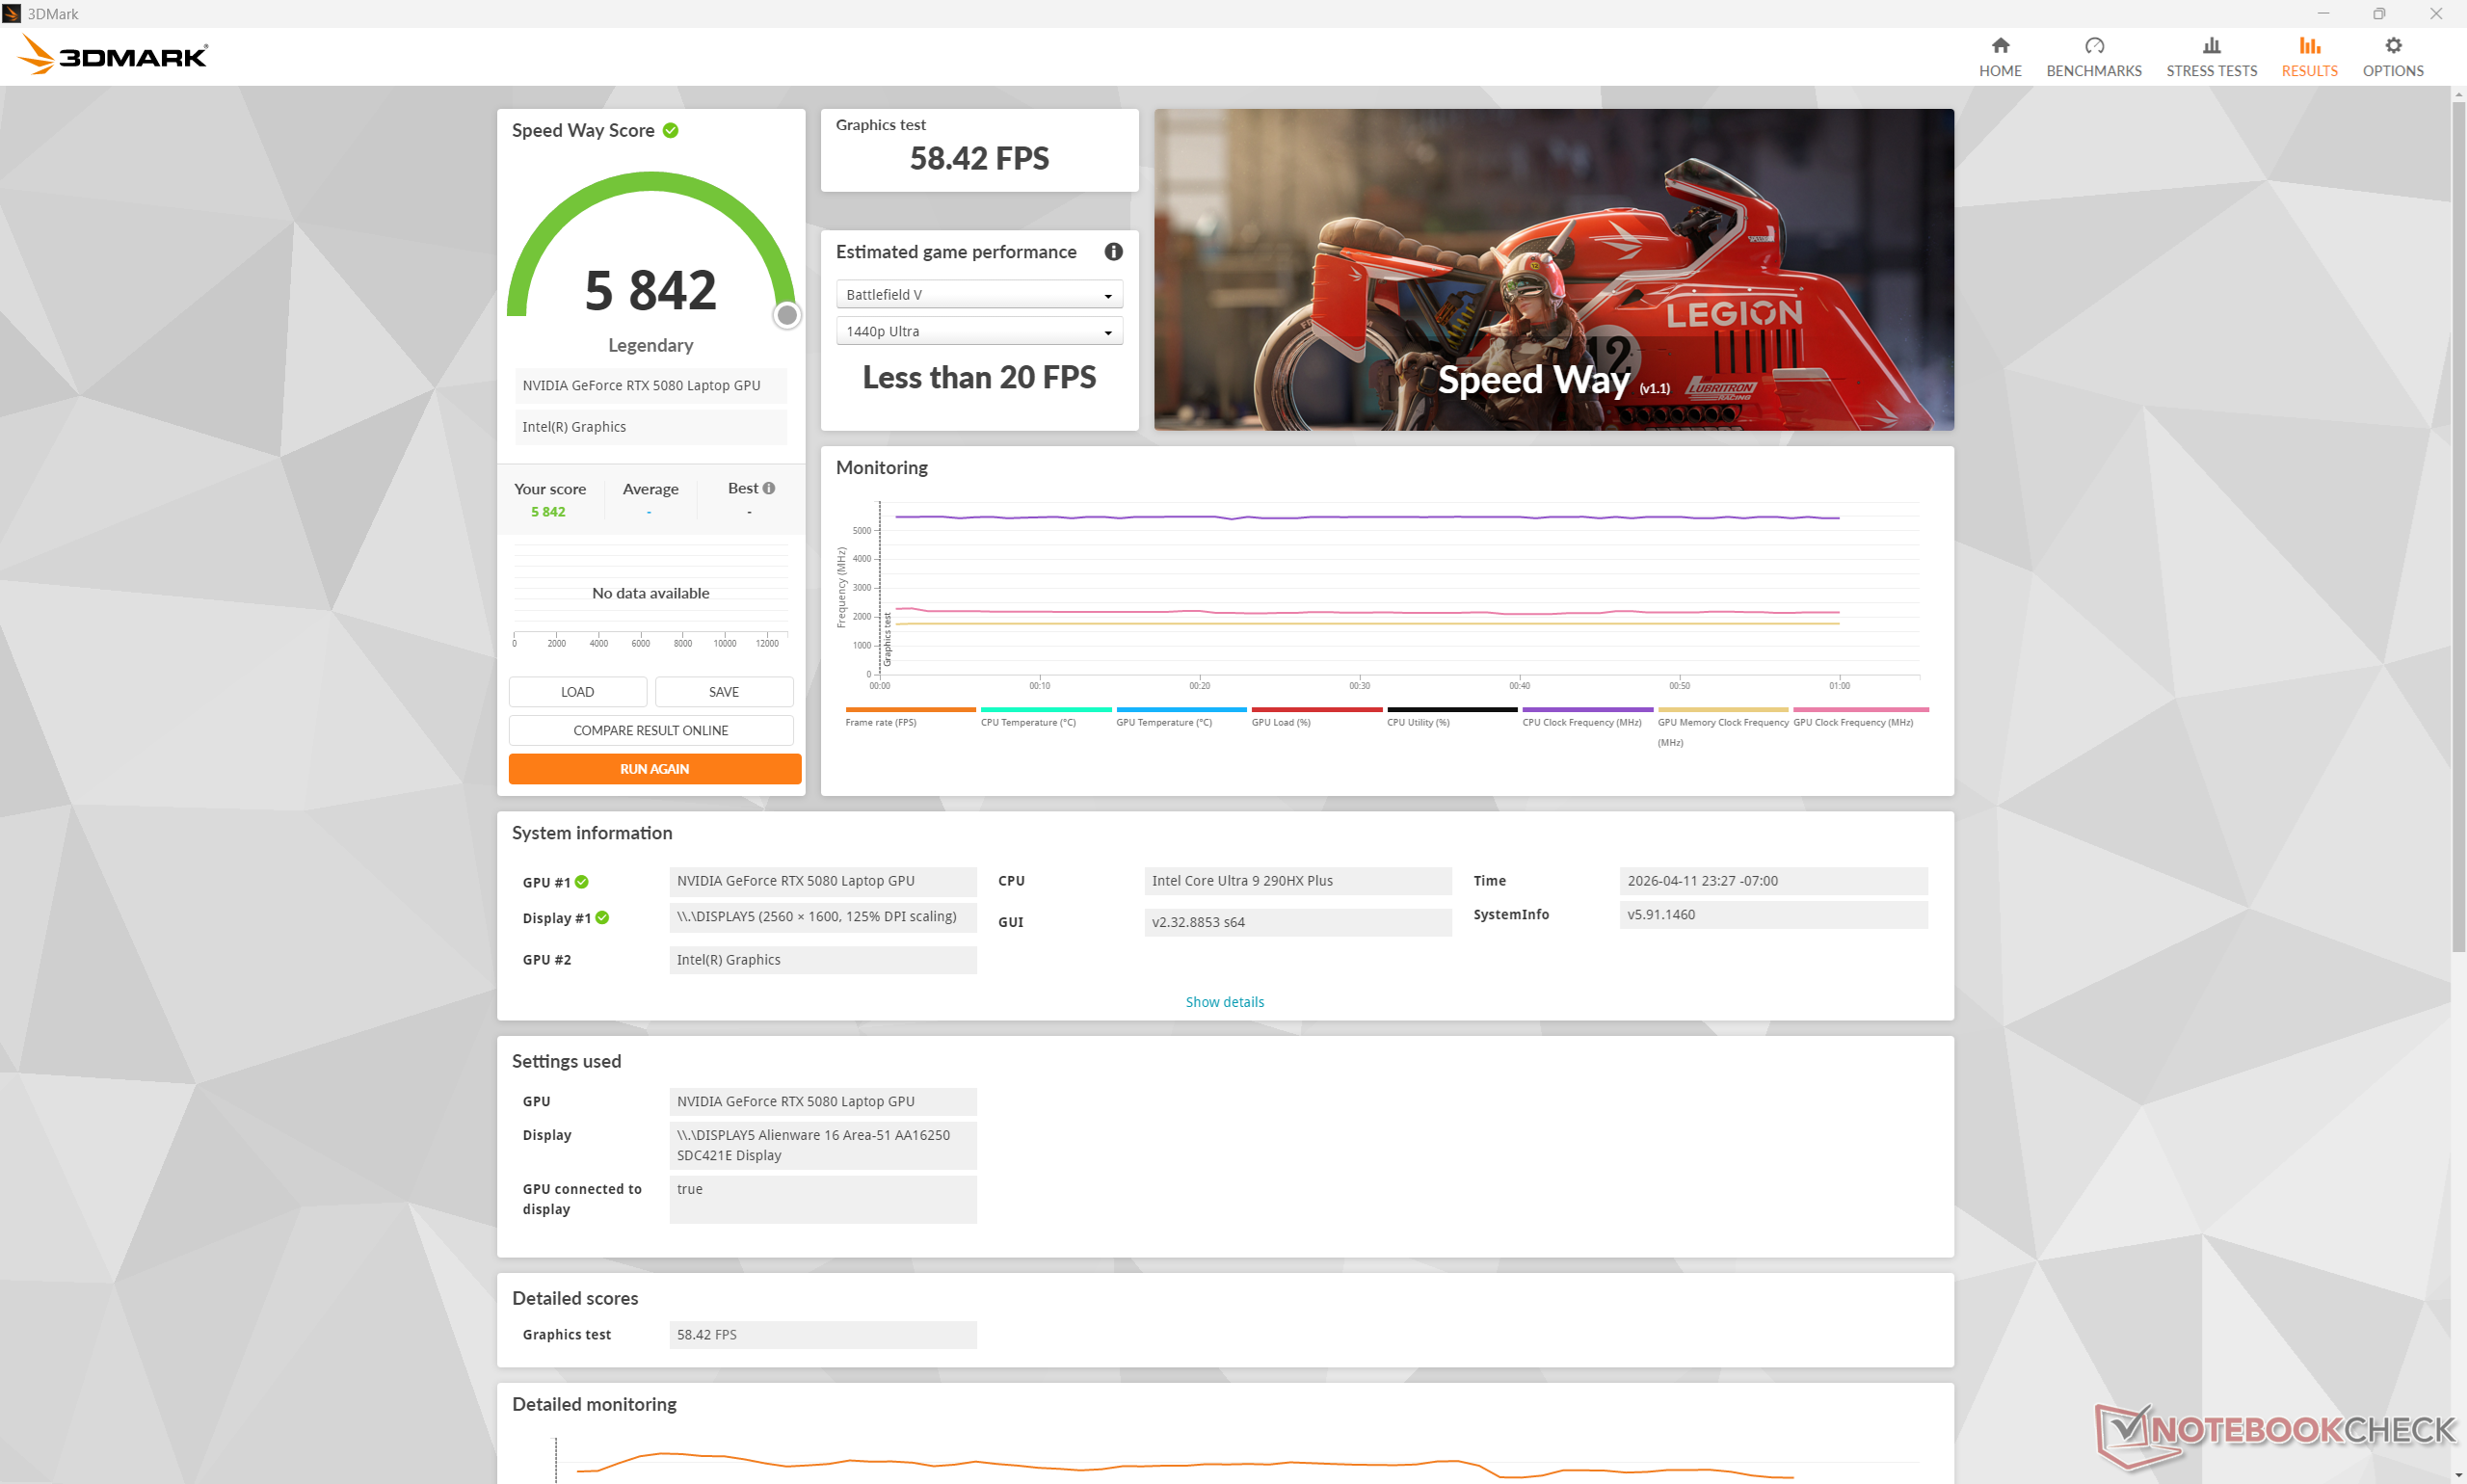
GeForce RTX 5080 y 5090 Las opciones de GPU siguen siendo las mismas que antes, sin cambios en el objetivo TGP de 175 W. No obstante, los resultados de 3DMark son algunos puntos porcentuales superiores en nuestro modelo 2026 más reciente. Se espera que la actualización de la RTX 5080 a la RTX 5090 sólo aumente el rendimiento en juegos entre un 10 y un 15 por ciento.
Lo más notable es que si se ejecuta en modo Rendimiento o en modo Equilibrado en lugar de en modo Overdrive, el rendimiento gráfico solo disminuiría en un 3 y un 6 por ciento, respectivamente, según nuestra tabla de resultados Time Spy que aparece a continuación. Los déficits de rendimiento son menores de lo esperado si se comparan con la mayoría de portátiles para juegos.
| Perfil de potencia | Puntuación de gráficos | Puntuación física | Puntuación combinada |
| Modo Overdrive | 22247 | 17534 | 21384 |
| Modo Rendimiento | 21478 (-3%) | 17530 (-0%) | 20776 (-3%) |
| Modo equilibrado | 20815 (-6%) | 17251 (-2%) | 20189 (-6%) |
| Batería | 13861 (-38%) | 13580 (-23%) | 13818 (-35%) |
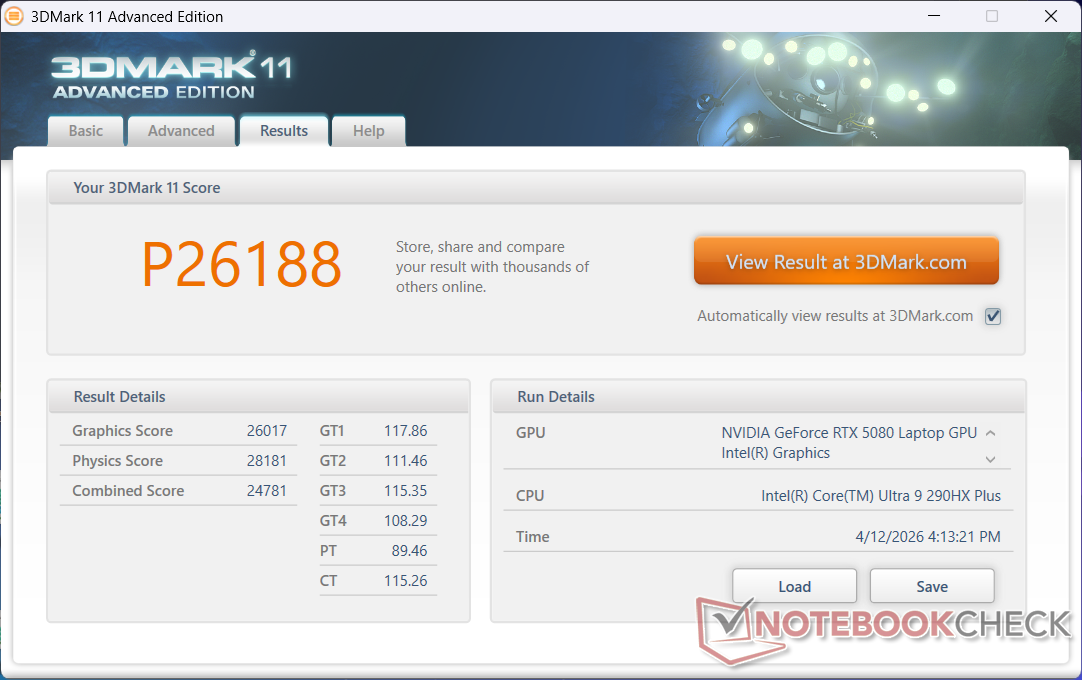

| 3DMark 11 Performance | 26188 puntos | |
| 3DMark Cloud Gate Standard Score | 74132 puntos | |
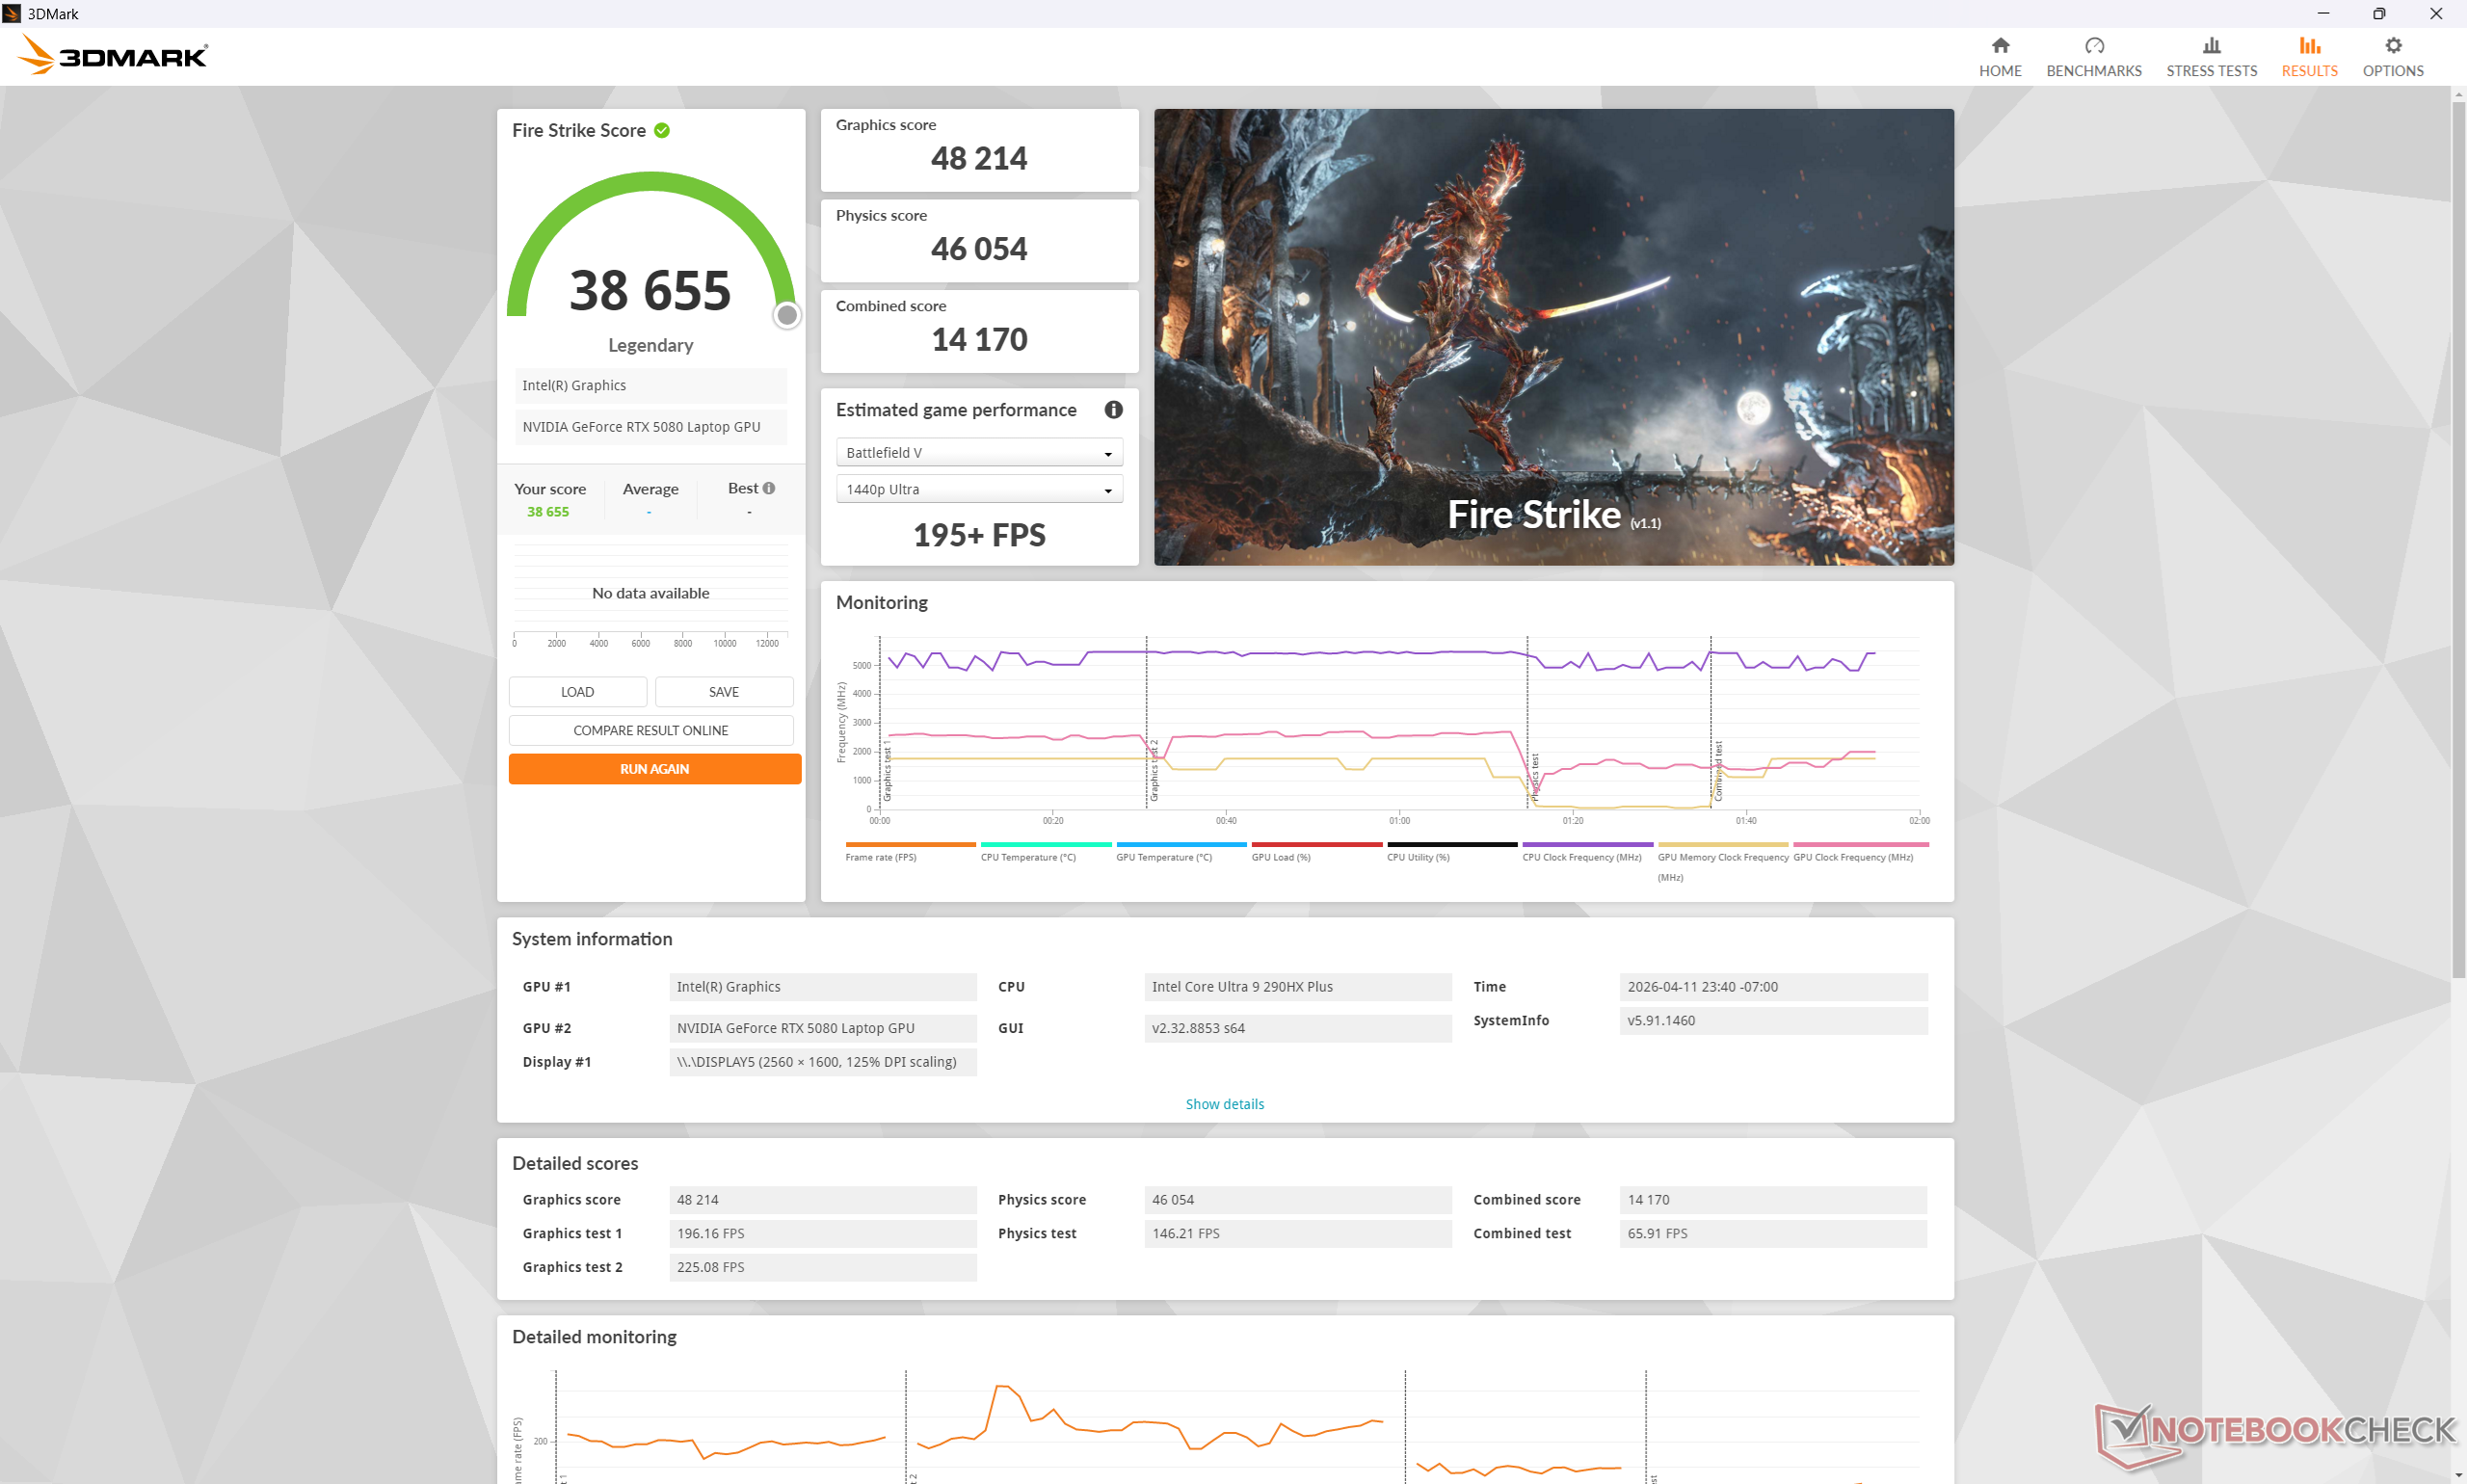
| 3DMark Fire Strike Score | 38655 puntos | |
| 3DMark Time Spy Score | 21384 puntos | |
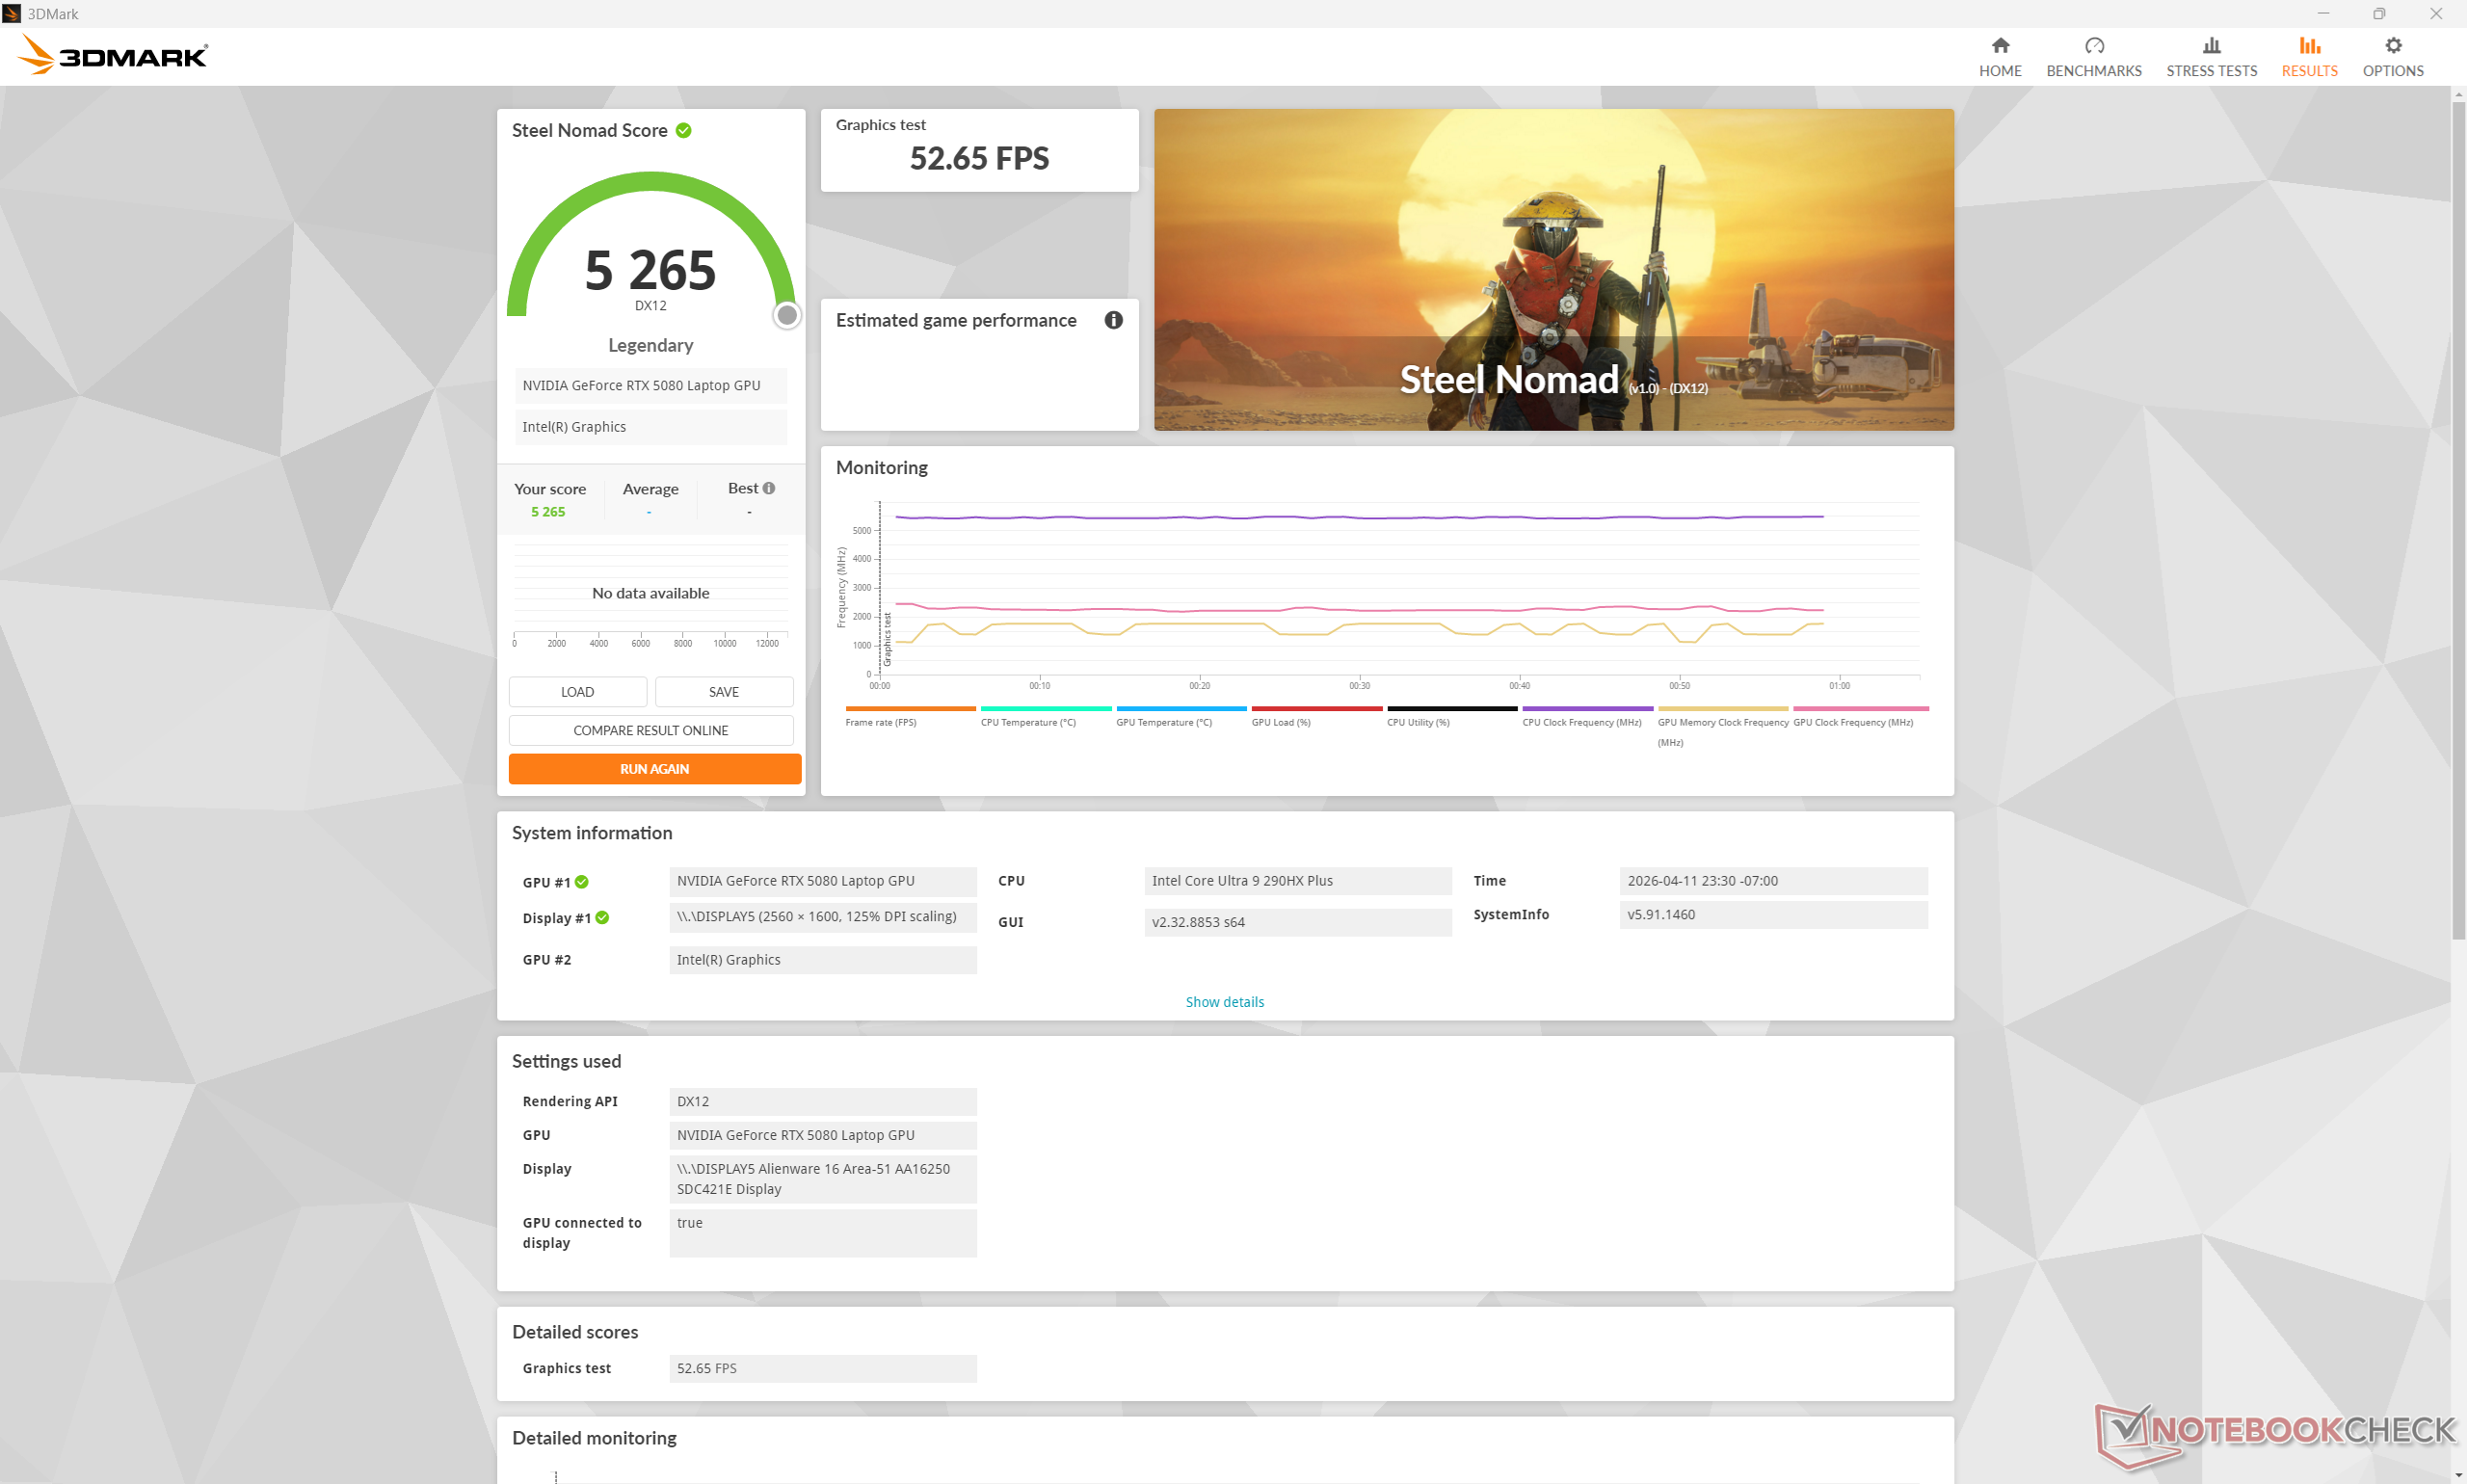
| 3DMark Steel Nomad Score | 5265 puntos | |
ayuda | ||
* ... más pequeño es mejor
| Performance rating - Percent | |
| Lenovo Legion Pro 7i 16 Gen 10 -1! | |
| Alienware 16 Area-51 Core Ultra 9 290HX Plus -1! | |
| HP Omen Max 16 ah000 -2! | |
| Alienware 16 Area-51 -1! | |
| MSI Vector 16 HX AI A2XWHG -1! | |
| Asus ROG Zephyrus G16 GU605CW | |
| Cyberpunk 2077 - 1920x1080 Ultra Preset (FSR off) | |
| Lenovo Legion Pro 7i 16 Gen 10 | |
| Alienware 16 Area-51 Core Ultra 9 290HX Plus | |
| HP Omen Max 16 ah000 | |
| Alienware 16 Area-51 | |
| MSI Vector 16 HX AI A2XWHG | |
| Asus ROG Zephyrus G16 GU605CW | |
| Baldur's Gate 3 - 1920x1080 Ultra Preset AA:T | |
| Lenovo Legion Pro 7i 16 Gen 10 | |
| Alienware 16 Area-51 | |
| MSI Vector 16 HX AI A2XWHG | |
| Asus ROG Zephyrus G16 GU605CW | |
| GTA V - 1920x1080 Highest AA:4xMSAA + FX AF:16x | |
| Alienware 16 Area-51 Core Ultra 9 290HX Plus | |
| MSI Vector 16 HX AI A2XWHG | |
| Asus ROG Zephyrus G16 GU605CW | |
| Final Fantasy XV Benchmark - 1920x1080 High Quality | |
| Lenovo Legion Pro 7i 16 Gen 10 | |
| HP Omen Max 16 ah000 | |
| Alienware 16 Area-51 Core Ultra 9 290HX Plus | |
| Alienware 16 Area-51 | |
| MSI Vector 16 HX AI A2XWHG | |
| Asus ROG Zephyrus G16 GU605CW | |
| Strange Brigade - 1920x1080 ultra AA:ultra AF:16 | |
| Lenovo Legion Pro 7i 16 Gen 10 | |
| Alienware 16 Area-51 Core Ultra 9 290HX Plus | |
| Alienware 16 Area-51 | |
| HP Omen Max 16 ah000 | |
| Asus ROG Zephyrus G16 GU605CW | |
| Dota 2 Reborn - 1920x1080 ultra (3/3) best looking | |
| Lenovo Legion Pro 7i 16 Gen 10 | |
| Alienware 16 Area-51 Core Ultra 9 290HX Plus | |
| MSI Vector 16 HX AI A2XWHG | |
| HP Omen Max 16 ah000 | |
| Alienware 16 Area-51 | |
| Asus ROG Zephyrus G16 GU605CW | |
Cyberpunk 2077 ultra FPS Gráfico
| bajo | medio | alto | ultra | QHD DLSS | QHD FSR | QHD | 4K DLSS | 4K | |
|---|---|---|---|---|---|---|---|---|---|
| GTA V (2015) | 187.9 | 187.6 | 186.2 | 168.1 | 167.2 | 183.9 | |||
| Dota 2 Reborn (2015) | 216 | 191 | 184.3 | 170.9 | 165.9 | ||||
| Final Fantasy XV Benchmark (2018) | 234 | 232 | 201 | 157.5 | 93.6 | ||||
| X-Plane 11.11 (2018) | 171.5 | 154.6 | 129.5 | 101.3 | |||||
| Strange Brigade (2018) | 624 | 489 | 448 | 413 | 300 | 161.1 | |||
| Cyberpunk 2077 (2023) | 195.9 | 191.5 | 171.9 | 153.3 | 119.1 | 101.7 | 57.8 | 46.4 | |
| F1 24 (2024) | 341 | 375 | 351 | 136.9 | 141.2 | 136.2 | 89.2 | 76.5 | 44.8 |
| Black Myth: Wukong (2024) | 55 | 61 | 42 | 42 | 24 | ||||
| Monster Hunter Wilds (2025) | 85.5 | 82.5 | 69 | 58.7 | 43 | ||||
| Assassin's Creed Shadows (2025) | 59 | 59 | 51 | 49 | 37 |
Emisiones
Ruido del sistema
Los niveles de ruido del ventilador y el comportamiento son casi idénticos a los que registramos en el Alienware 16 2025 a pesar del aumento de rendimiento en esta última iteración. Observe que el ruido del ventilador se estabilizaba en 48 dB(A), 49 dB(A) y 57 dB(A) al ejecutar Cyberpunk 2077 en modo Equilibrado, modo Rendimiento y modo Overdrive, respectivamente. El ruido se reduce significativamente al pasar de Overdrive a Performance por sólo una pérdida <5% en los gráficos.
Ruido
| Ocioso |
| 23.2 / 28.2 / 28.3 dB(A) |
| Carga |
| 28.8 / 57.1 dB(A) |
 | ||
30 dB silencioso 40 dB(A) audible 50 dB(A) ruidosamente alto |
||
min: | ||
| Alienware 16 Area-51 Core Ultra 9 290HX Plus Ultra 9 290HX Plus, GeForce RTX 5080 Laptop | Alienware 16 Area-51 Ultra 9 275HX, GeForce RTX 5080 Laptop | Lenovo Legion Pro 7i 16 Gen 10 Ultra 9 275HX, GeForce RTX 5080 Laptop | HP Omen Max 16 ah000 Ultra 9 275HX, GeForce RTX 5090 Laptop | MSI Vector 16 HX AI A2XWHG Ultra 7 255HX, GeForce RTX 5070 Ti Laptop | Asus ROG Zephyrus G16 GU605CW Ultra 9 285H, GeForce RTX 5080 Laptop | |
|---|---|---|---|---|---|---|
| Noise | -2% | 4% | -16% | -21% | -20% | |
| apagado / medio ambiente * (dB) | 23.1 | 23.6 -2% | 22.9 1% | 22.8 1% | 25 -8% | 25.56 -11% |
| Idle Minimum * (dB) | 23.2 | 25.4 -9% | 22.9 1% | 29 -25% | 33 -42% | 30 -29% |
| Idle Average * (dB) | 28.2 | 27.8 1% | 22.9 19% | 29 -3% | 34 -21% | 30 -6% |
| Idle Maximum * (dB) | 28.3 | 28.1 1% | 26.3 7% | 29 -2% | 38 -34% | 30 -6% |
| Load Average * (dB) | 28.8 | 28.8 -0% | 27.8 3% | 47.7 -66% | 46 -60% | 53.55 -86% |
| Cyberpunk 2077 ultra * (dB) | 49 | 50.4 -3% | 54.2 -11% | 54.8 -12% | 47 4% | 53.5 -9% |
| Load Maximum * (dB) | 57.1 | 56.4 1% | 53.9 6% | 61.1 -7% | 49 14% | 54.02 5% |
* ... más pequeño es mejor
Temperatura
Los puntos calientes al jugar alcanzarían el rango bajo de 40 C, que es similar a lo que observamos en el Alienware 16 Area-51 de 2025. La temperatura media es ligeramente más cálida que en el competidor Lenovo Legion Pro 7i 16 Gen 10 ya que los reposamanos del Alienware no permanecen tan fríos.


(-) La temperatura máxima en la parte superior es de 45.2 °C / 113 F, frente a la media de 40.4 °C / 105 F, que oscila entre 21.2 y 68.8 °C para la clase Gaming.
(+) El fondo se calienta hasta un máximo de 37.4 °C / 99 F, frente a la media de 43.2 °C / 110 F
(+) En reposo, la temperatura media de la parte superior es de 27.6 °C / 82# F, frente a la media del dispositivo de 33.9 °C / 93 F.
(±) 3: The average temperature for the upper side is 36.4 °C / 98 F, compared to the average of 33.9 °C / 93 F for the class Gaming.
(+) El reposamanos y el panel táctil están a una temperatura inferior a la de la piel, con un máximo de 29.8 °C / 85.6 F y, por tanto, son fríos al tacto.
(±) La temperatura media de la zona del reposamanos de dispositivos similares fue de 28.8 °C / 83.8 F (-1 °C / -1.8 F).


| Alienware 16 Area-51 Core Ultra 9 290HX Plus Ultra 9 290HX Plus, GeForce RTX 5080 Laptop | Alienware 16 Area-51 Ultra 9 275HX, GeForce RTX 5080 Laptop | Lenovo Legion Pro 7i 16 Gen 10 Ultra 9 275HX, GeForce RTX 5080 Laptop | HP Omen Max 16 ah000 Ultra 9 275HX, GeForce RTX 5090 Laptop | MSI Vector 16 HX AI A2XWHG Ultra 7 255HX, GeForce RTX 5070 Ti Laptop | Asus ROG Zephyrus G16 GU605CW Ultra 9 285H, GeForce RTX 5080 Laptop | |
|---|---|---|---|---|---|---|
| Heat | -9% | -4% | -1% | -14% | -21% | |
| Maximum Upper Side * (°C) | 45.2 | 43.8 3% | 42.6 6% | 42.8 5% | 53 -17% | 49.2 -9% |
| Maximum Bottom * (°C) | 37.4 | 40 -7% | 41.2 -10% | 50.2 -34% | 52 -39% | 50.2 -34% |
| Idle Upper Side * (°C) | 31.6 | 35.8 -13% | 32.6 -3% | 27.6 13% | 33 -4% | 37.2 -18% |
| Idle Bottom * (°C) | 30.2 | 35.2 -17% | 32.4 -7% | 26.2 13% | 29 4% | 37.4 -24% |
* ... más pequeño es mejor
Prueba de estrés
Al ejecutar el estrés Prime95 en el modo Overdrive (es decir, el modo de ventilador máximo), la CPU aumentaría a 4,3 GHz, 182 W y 105 C (¡!) antes de caer ligeramente al rango de 3,9 a 4,1 GHz para mantener una temperatura del núcleo ligeramente más fría de 95 C a 100 C. En comparación, la ejecución de esta misma prueba en la Alienware 16 de 2025 daría como resultado una velocidad de reloj de la CPU y una temperatura media más bajas de 3,6 GHz y 92 C, respectivamente. Está claro que la Core Ultra 9 290HX Plus está llevando la solución de refrigeración existente de la Alienware 16 a sus límites absolutos.
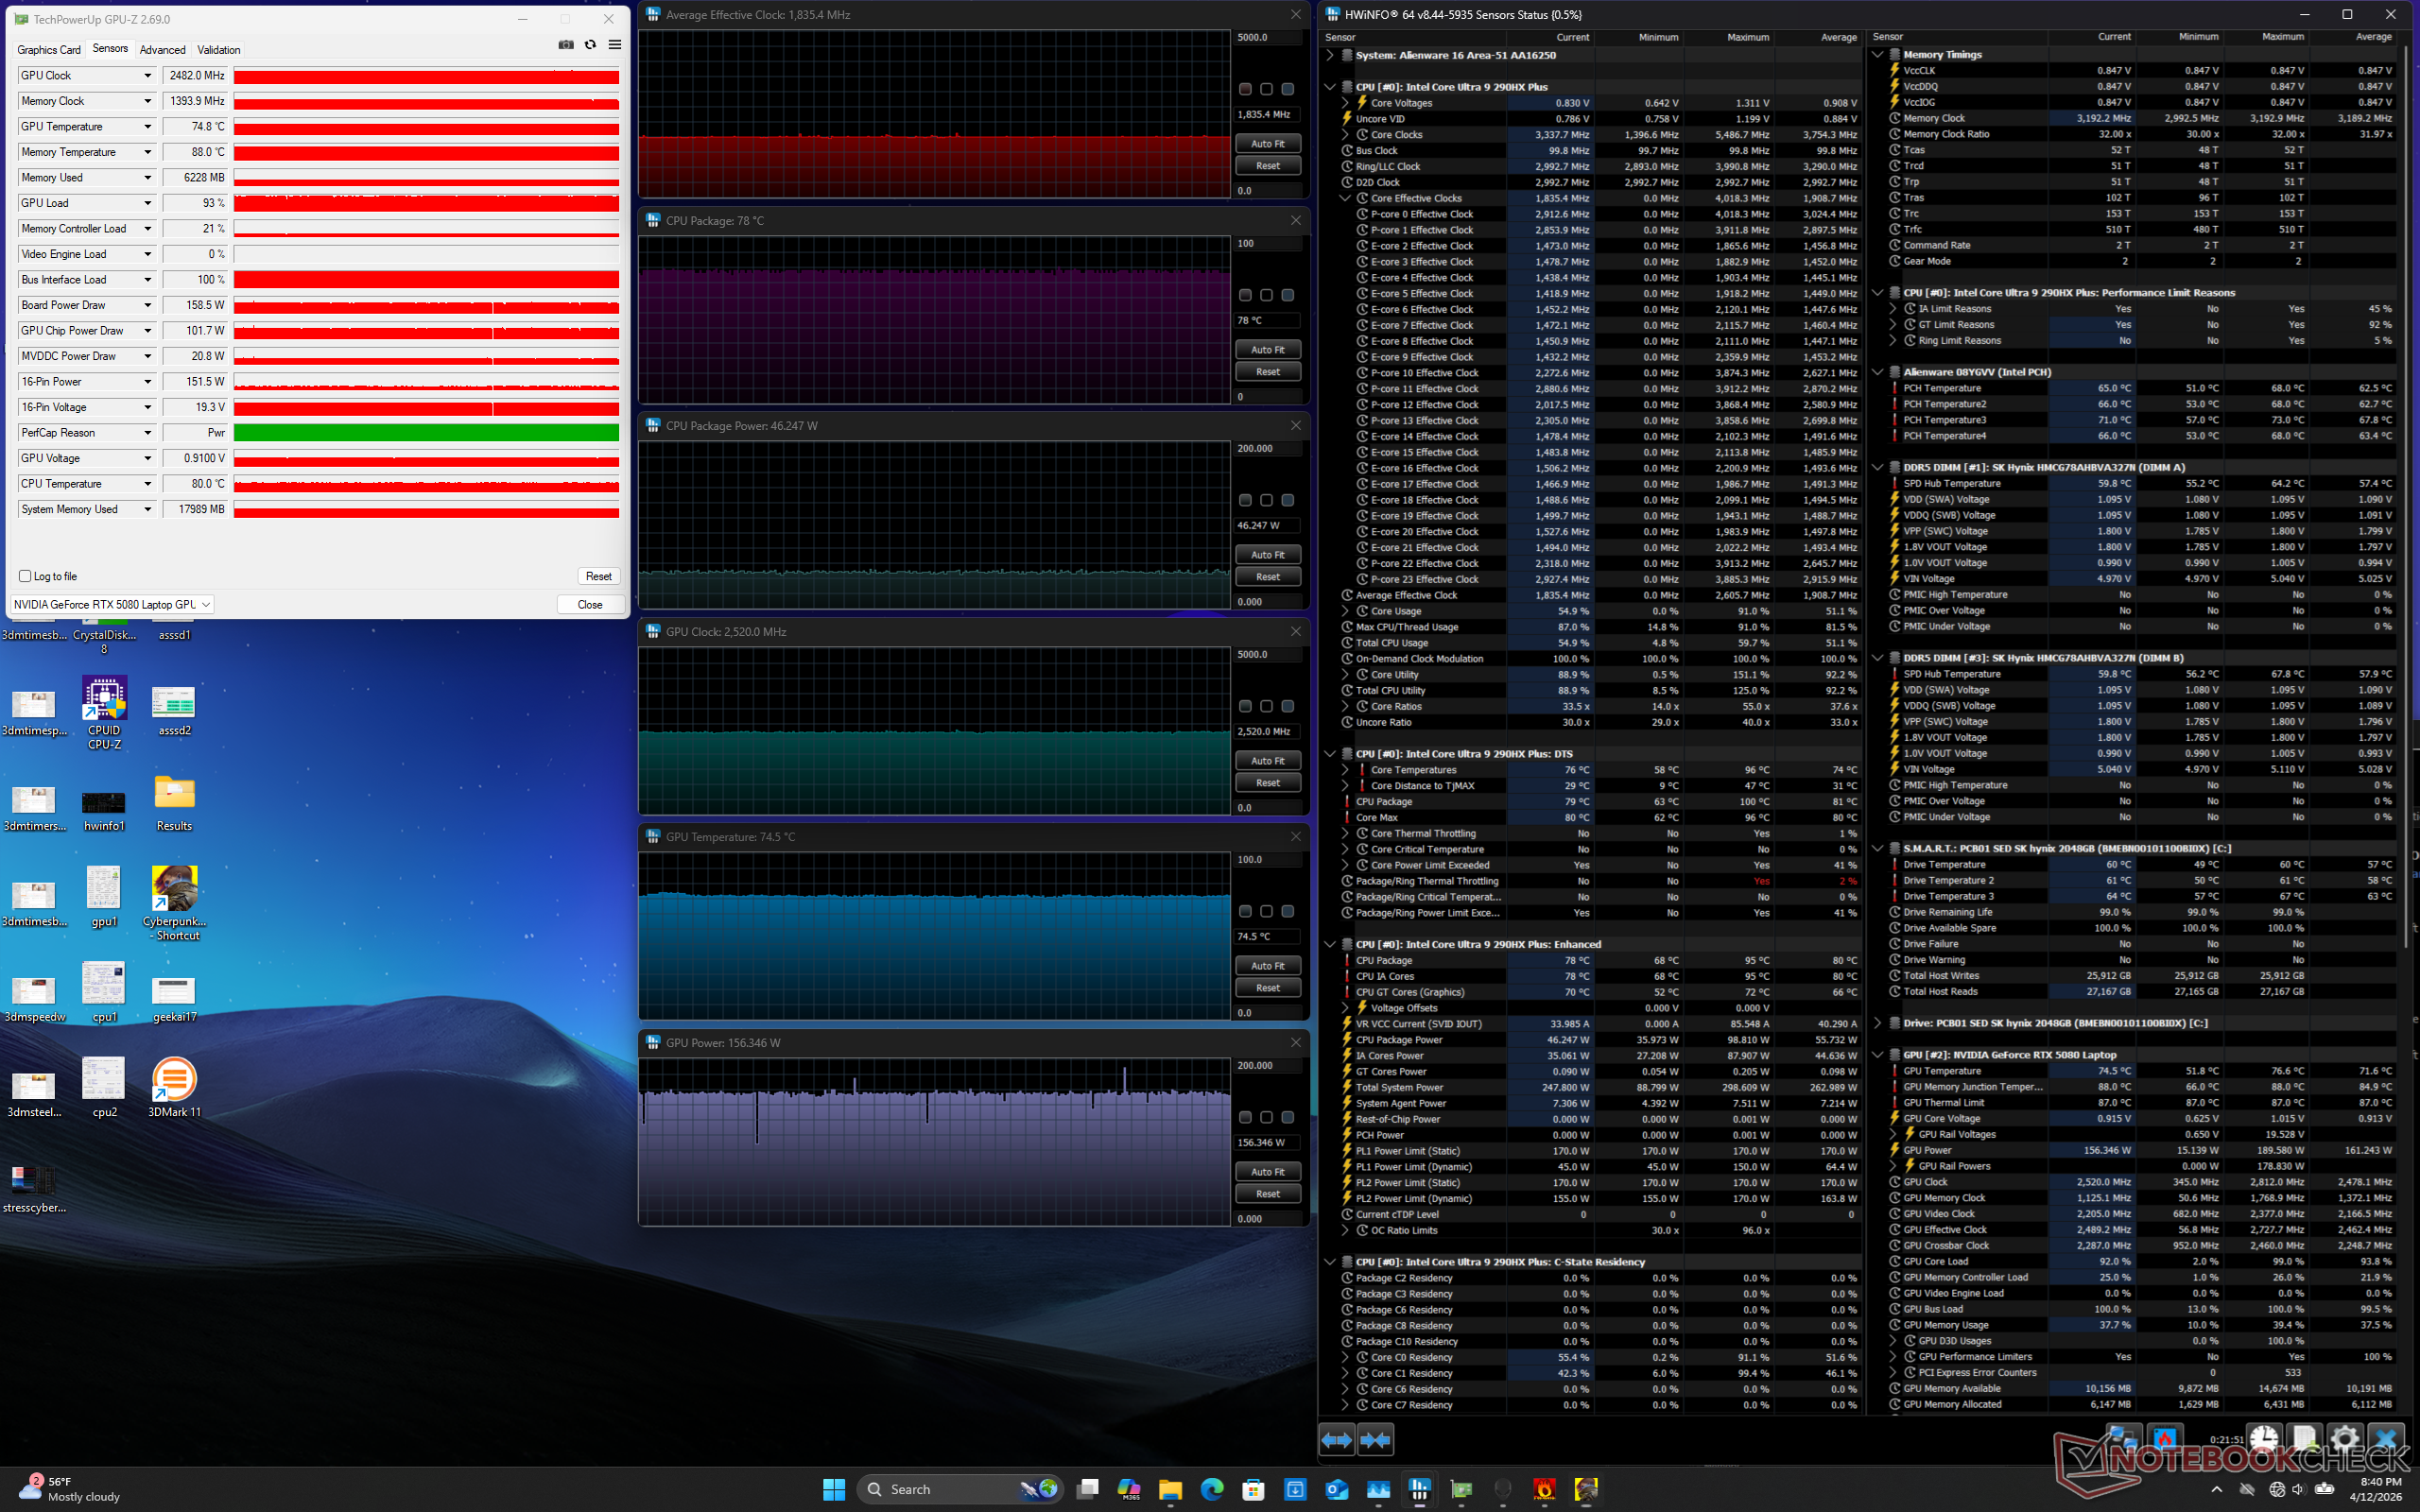
La temperatura de la GPU se mantendría más o menos igual que en el modelo 2025 al ejecutar Cyberpunk 2077. La temperatura de la CPU, sin embargo, sería más cálida en unos pocos grados C hasta los 82 C.
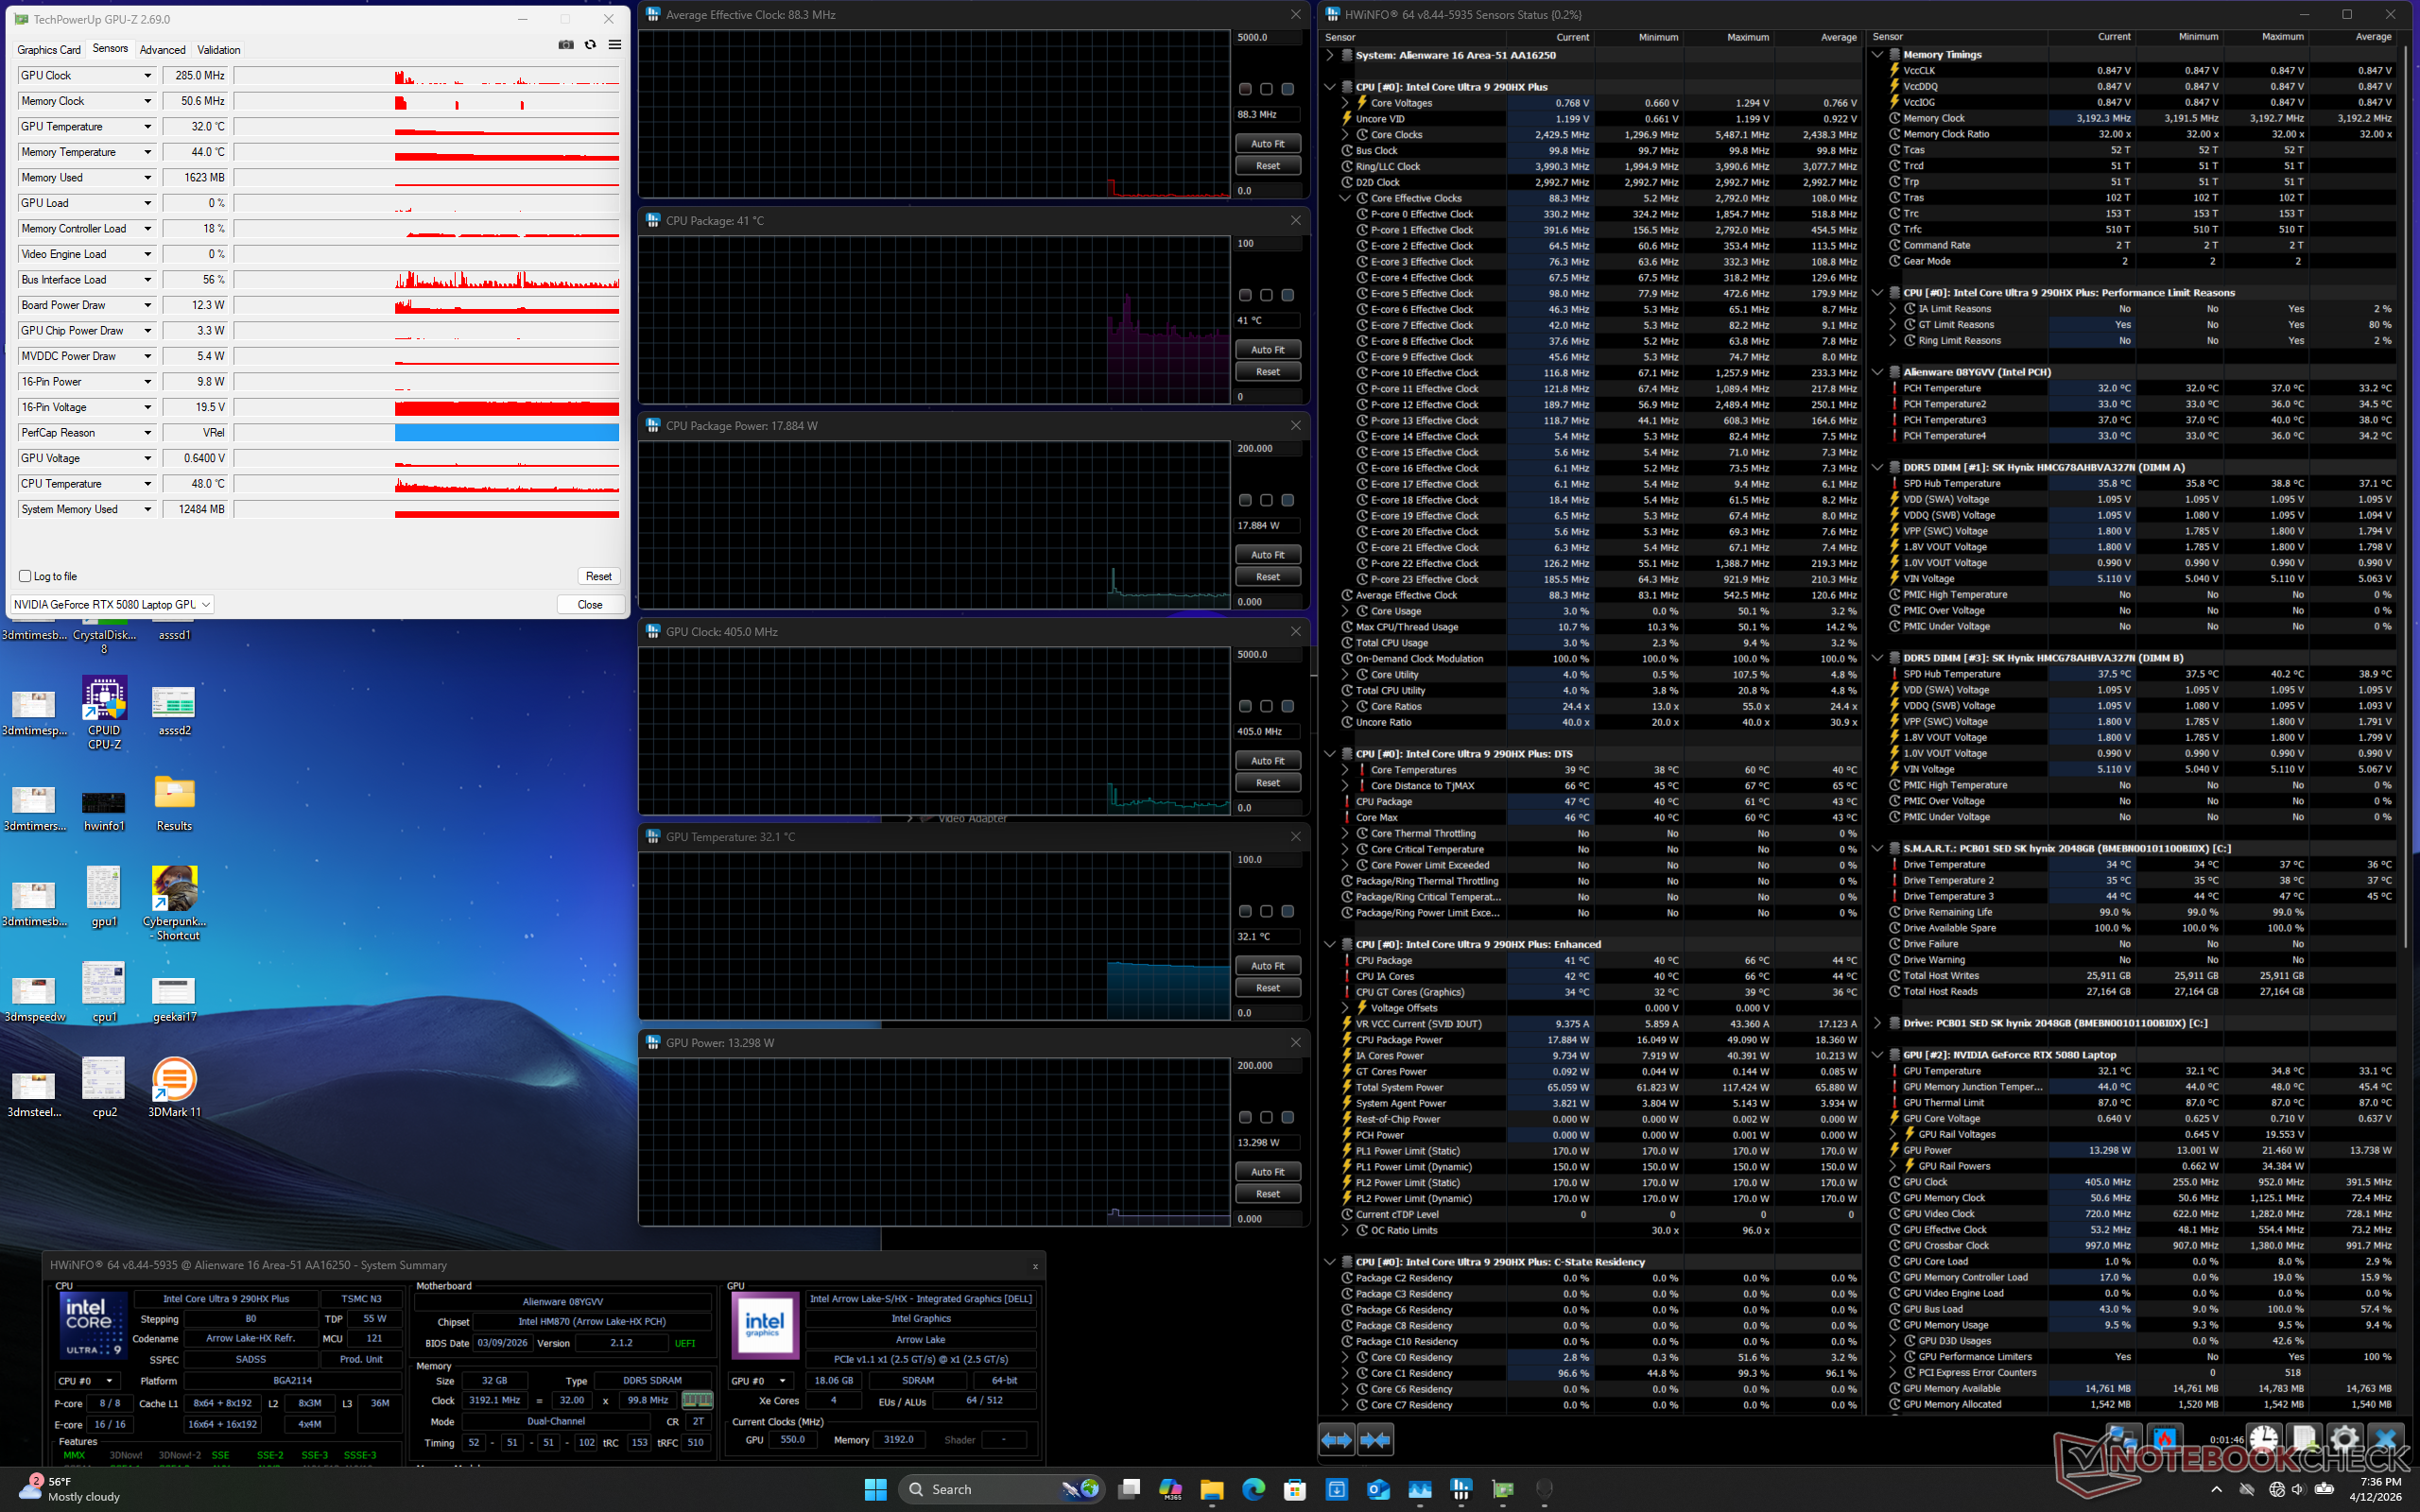
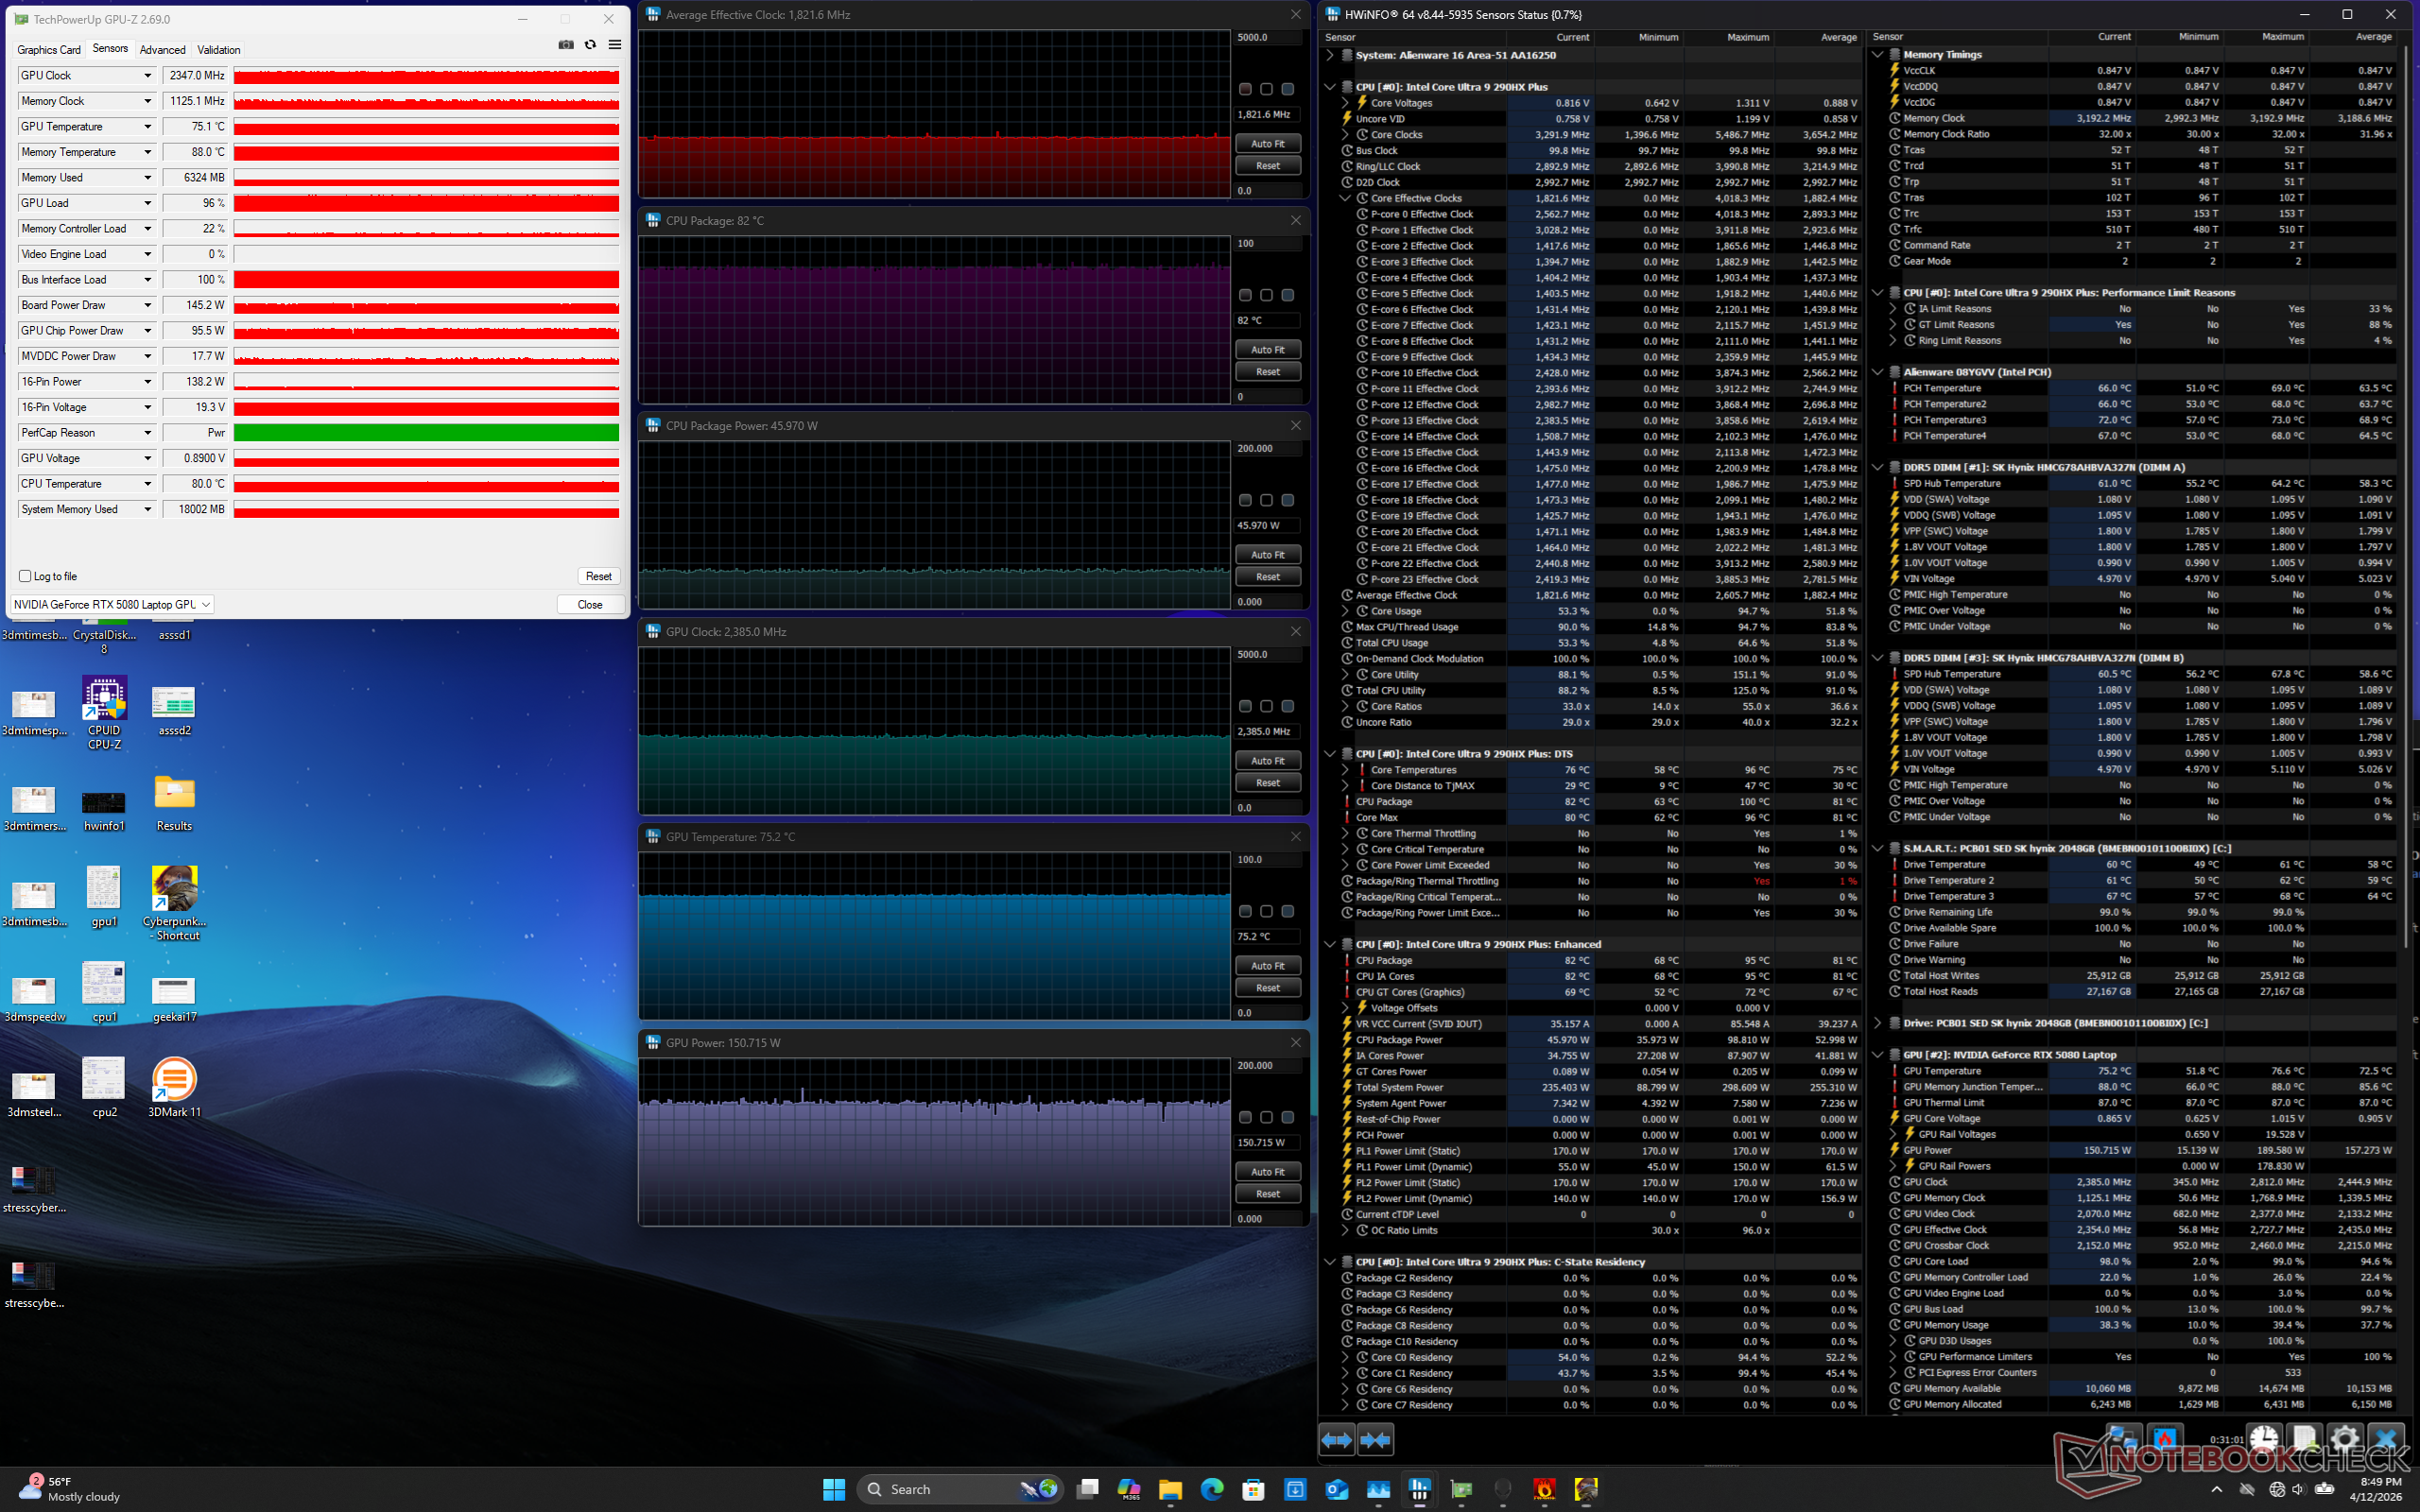
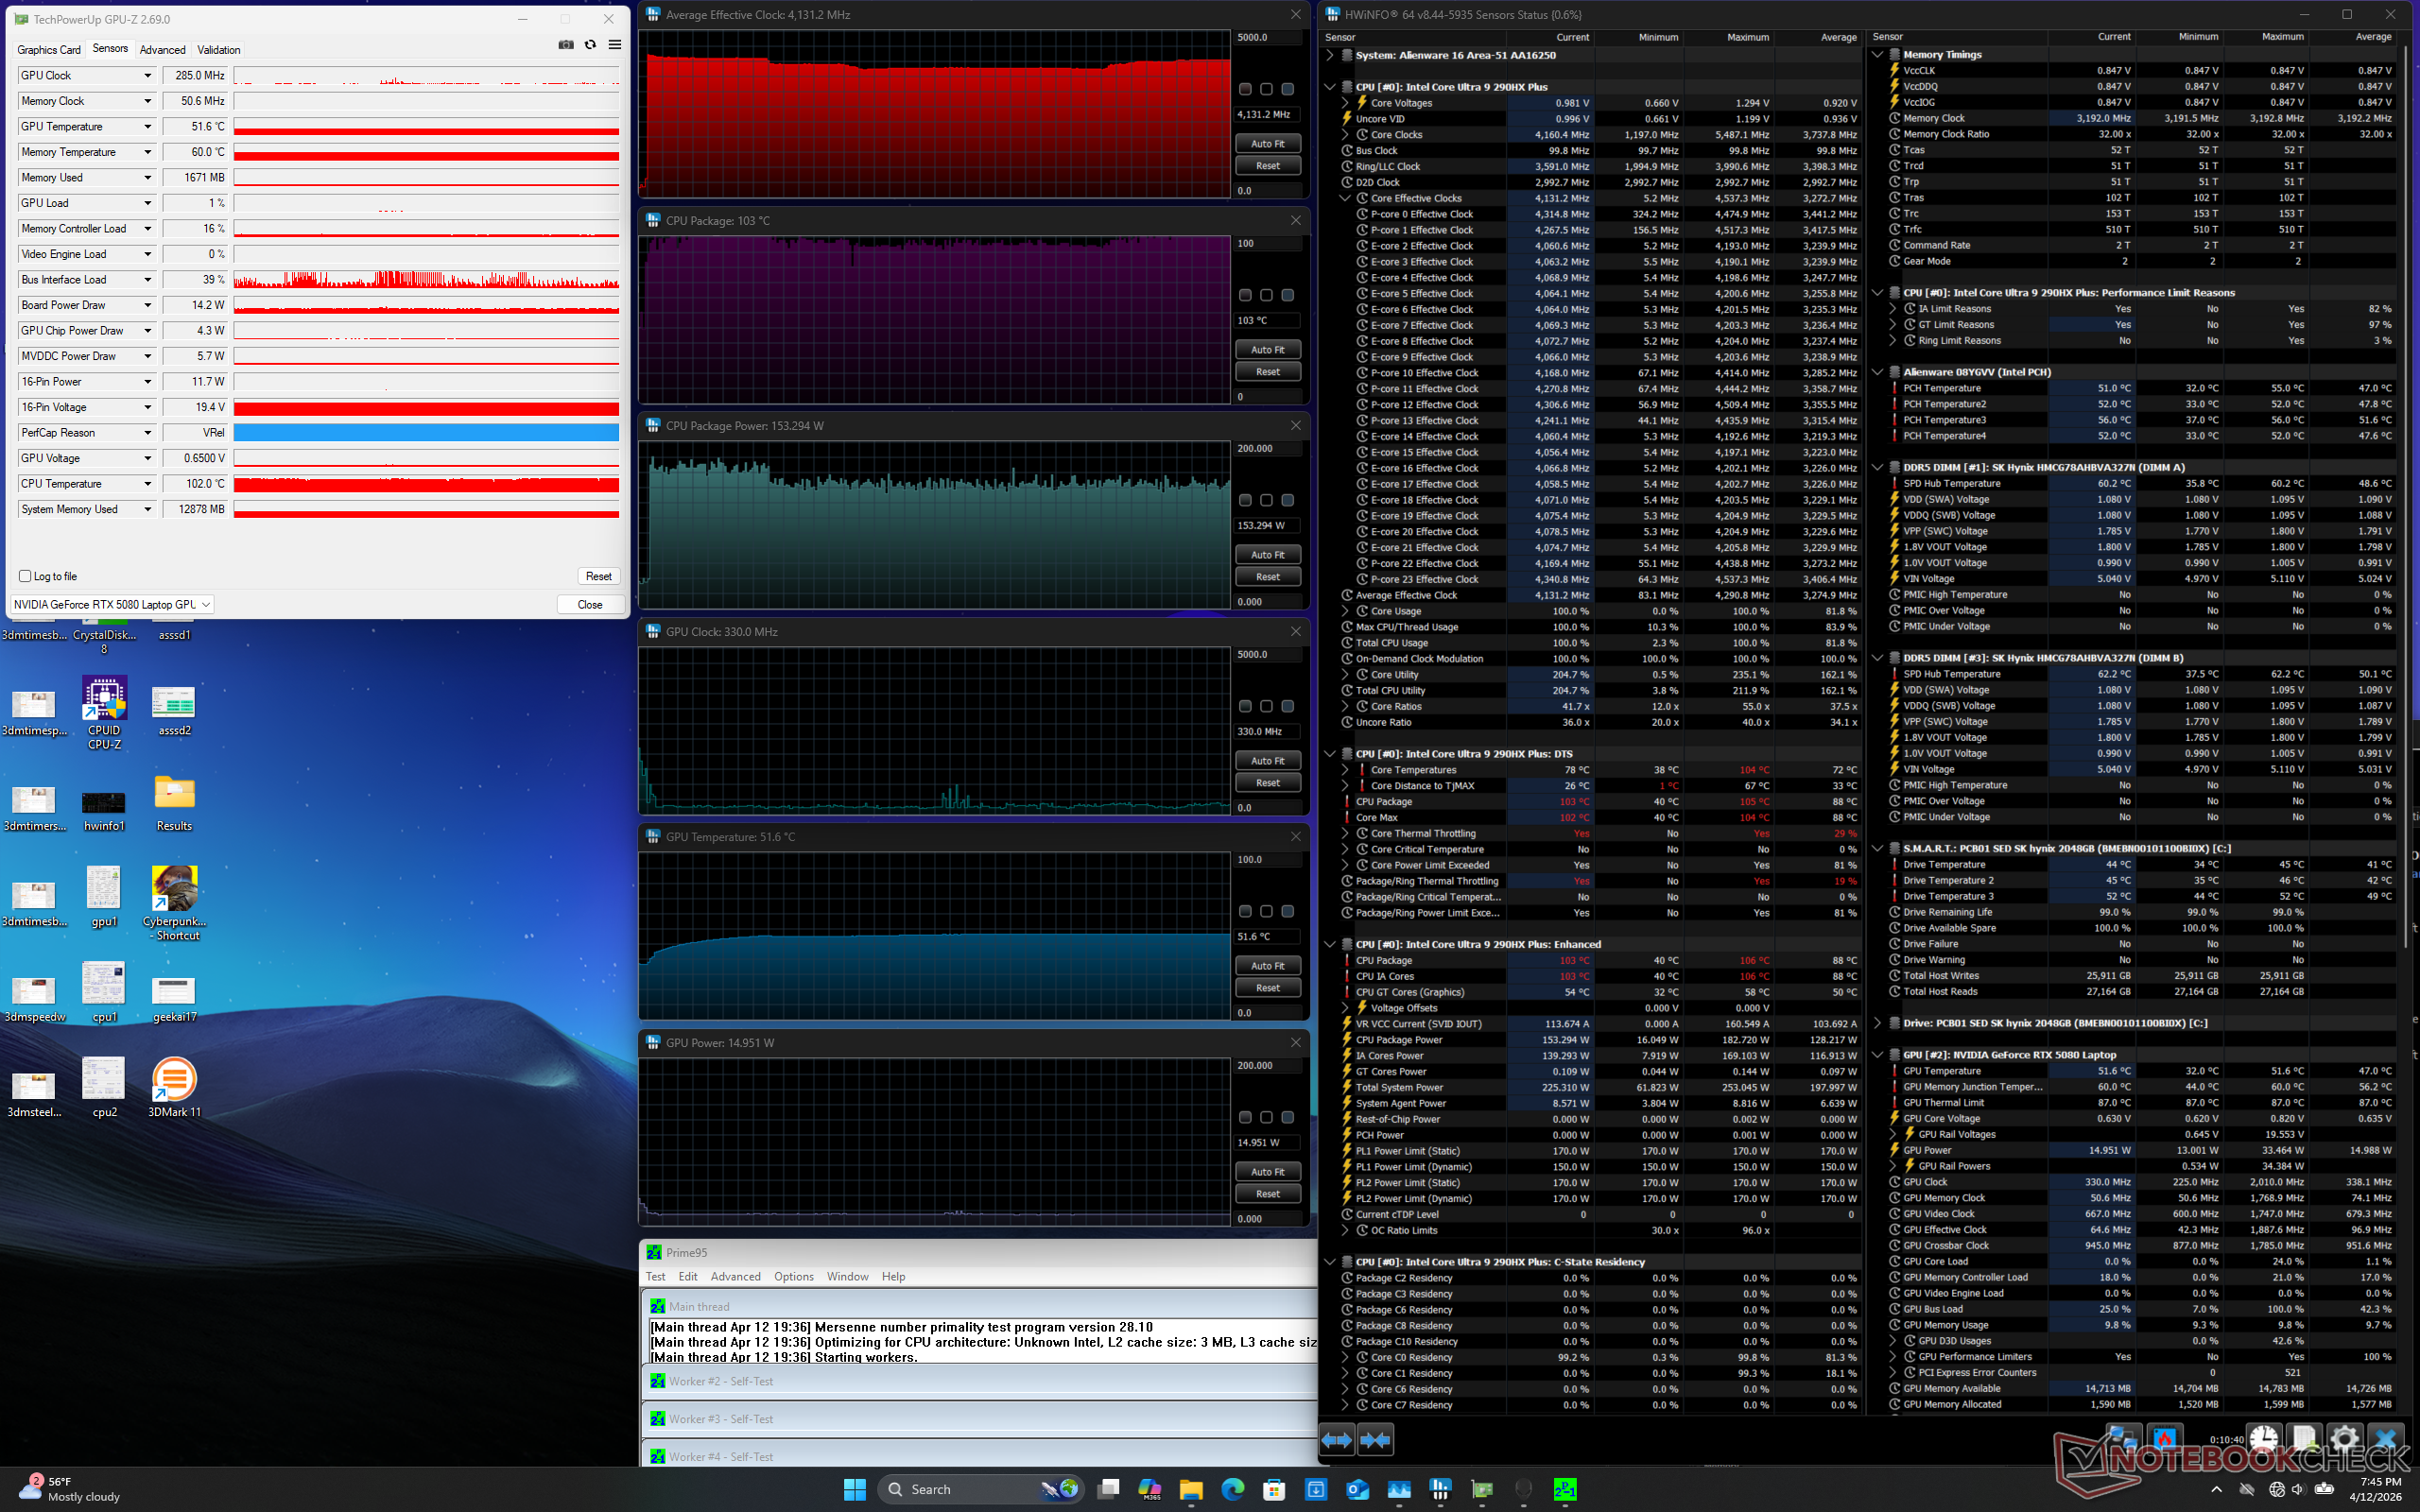
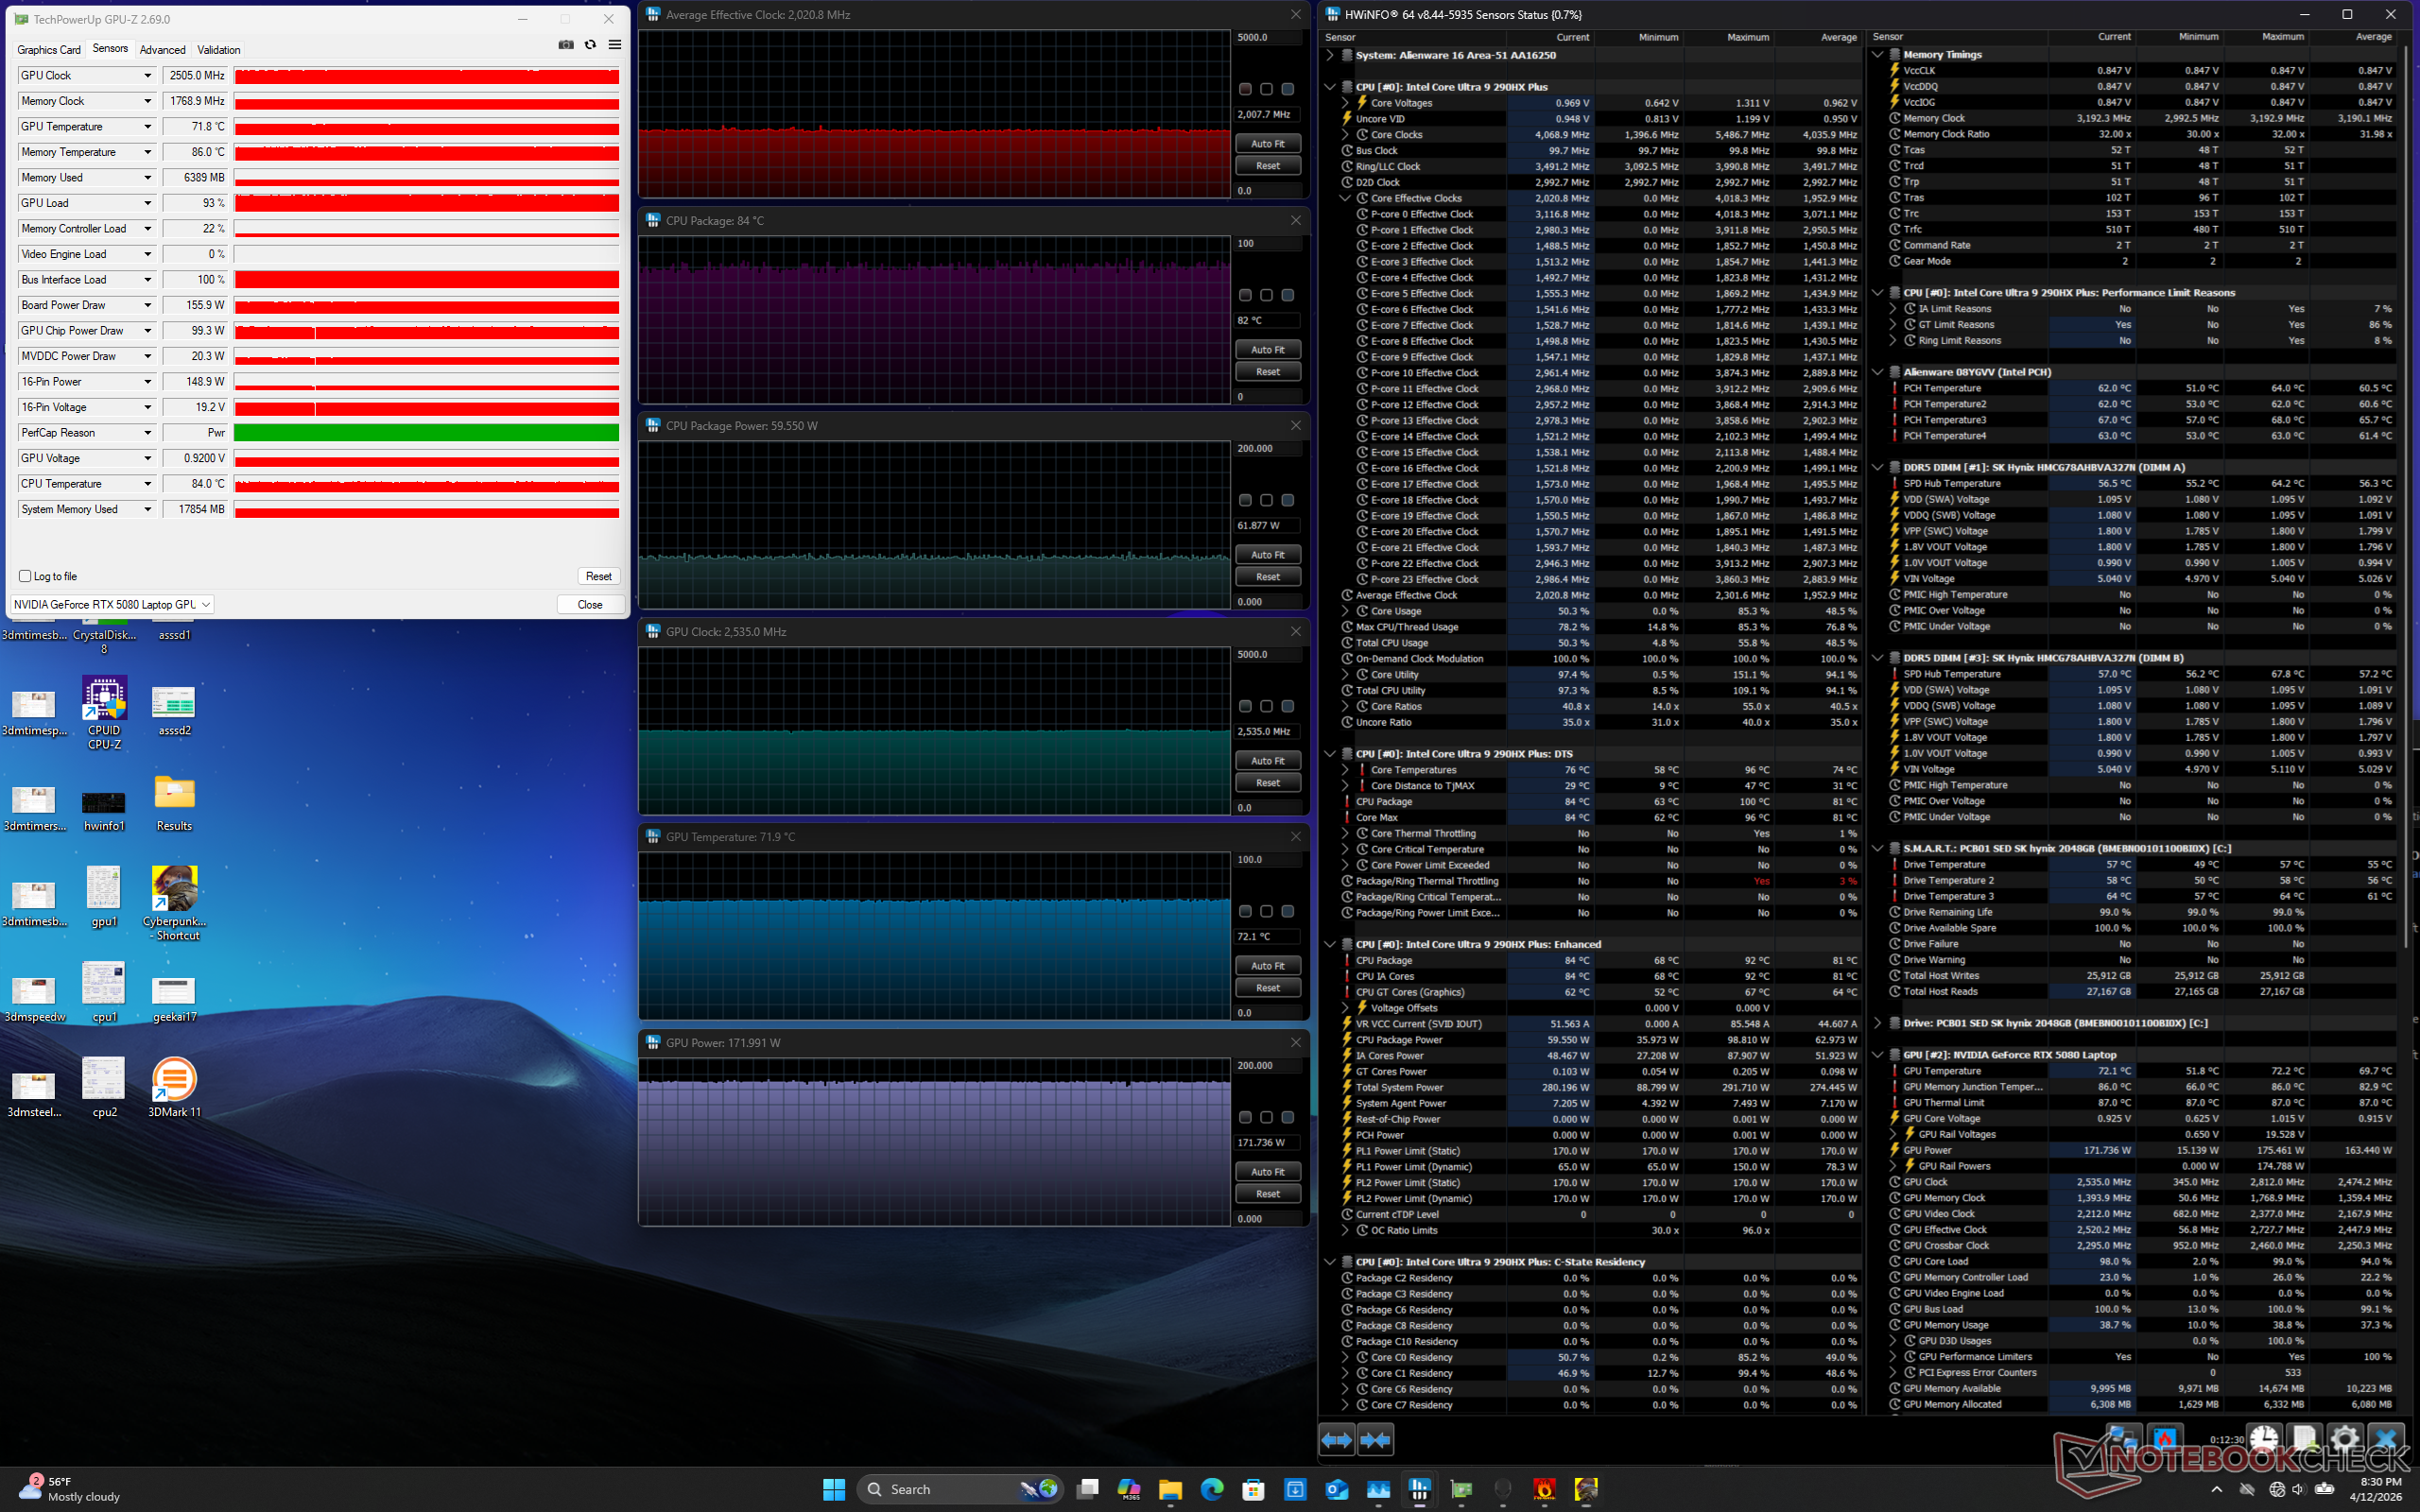
| Reloj medio de la CPU (GHz) | Reloj medio de la GPU (MHz) | Temperatura media dela CPU (°C) | Temperatura media de la GPU (°C) | |
| Sistema en reposo | -- | -- | 41 | 32 |
| Prime95 Stress | 4.1 | -- | 103 | 52 |
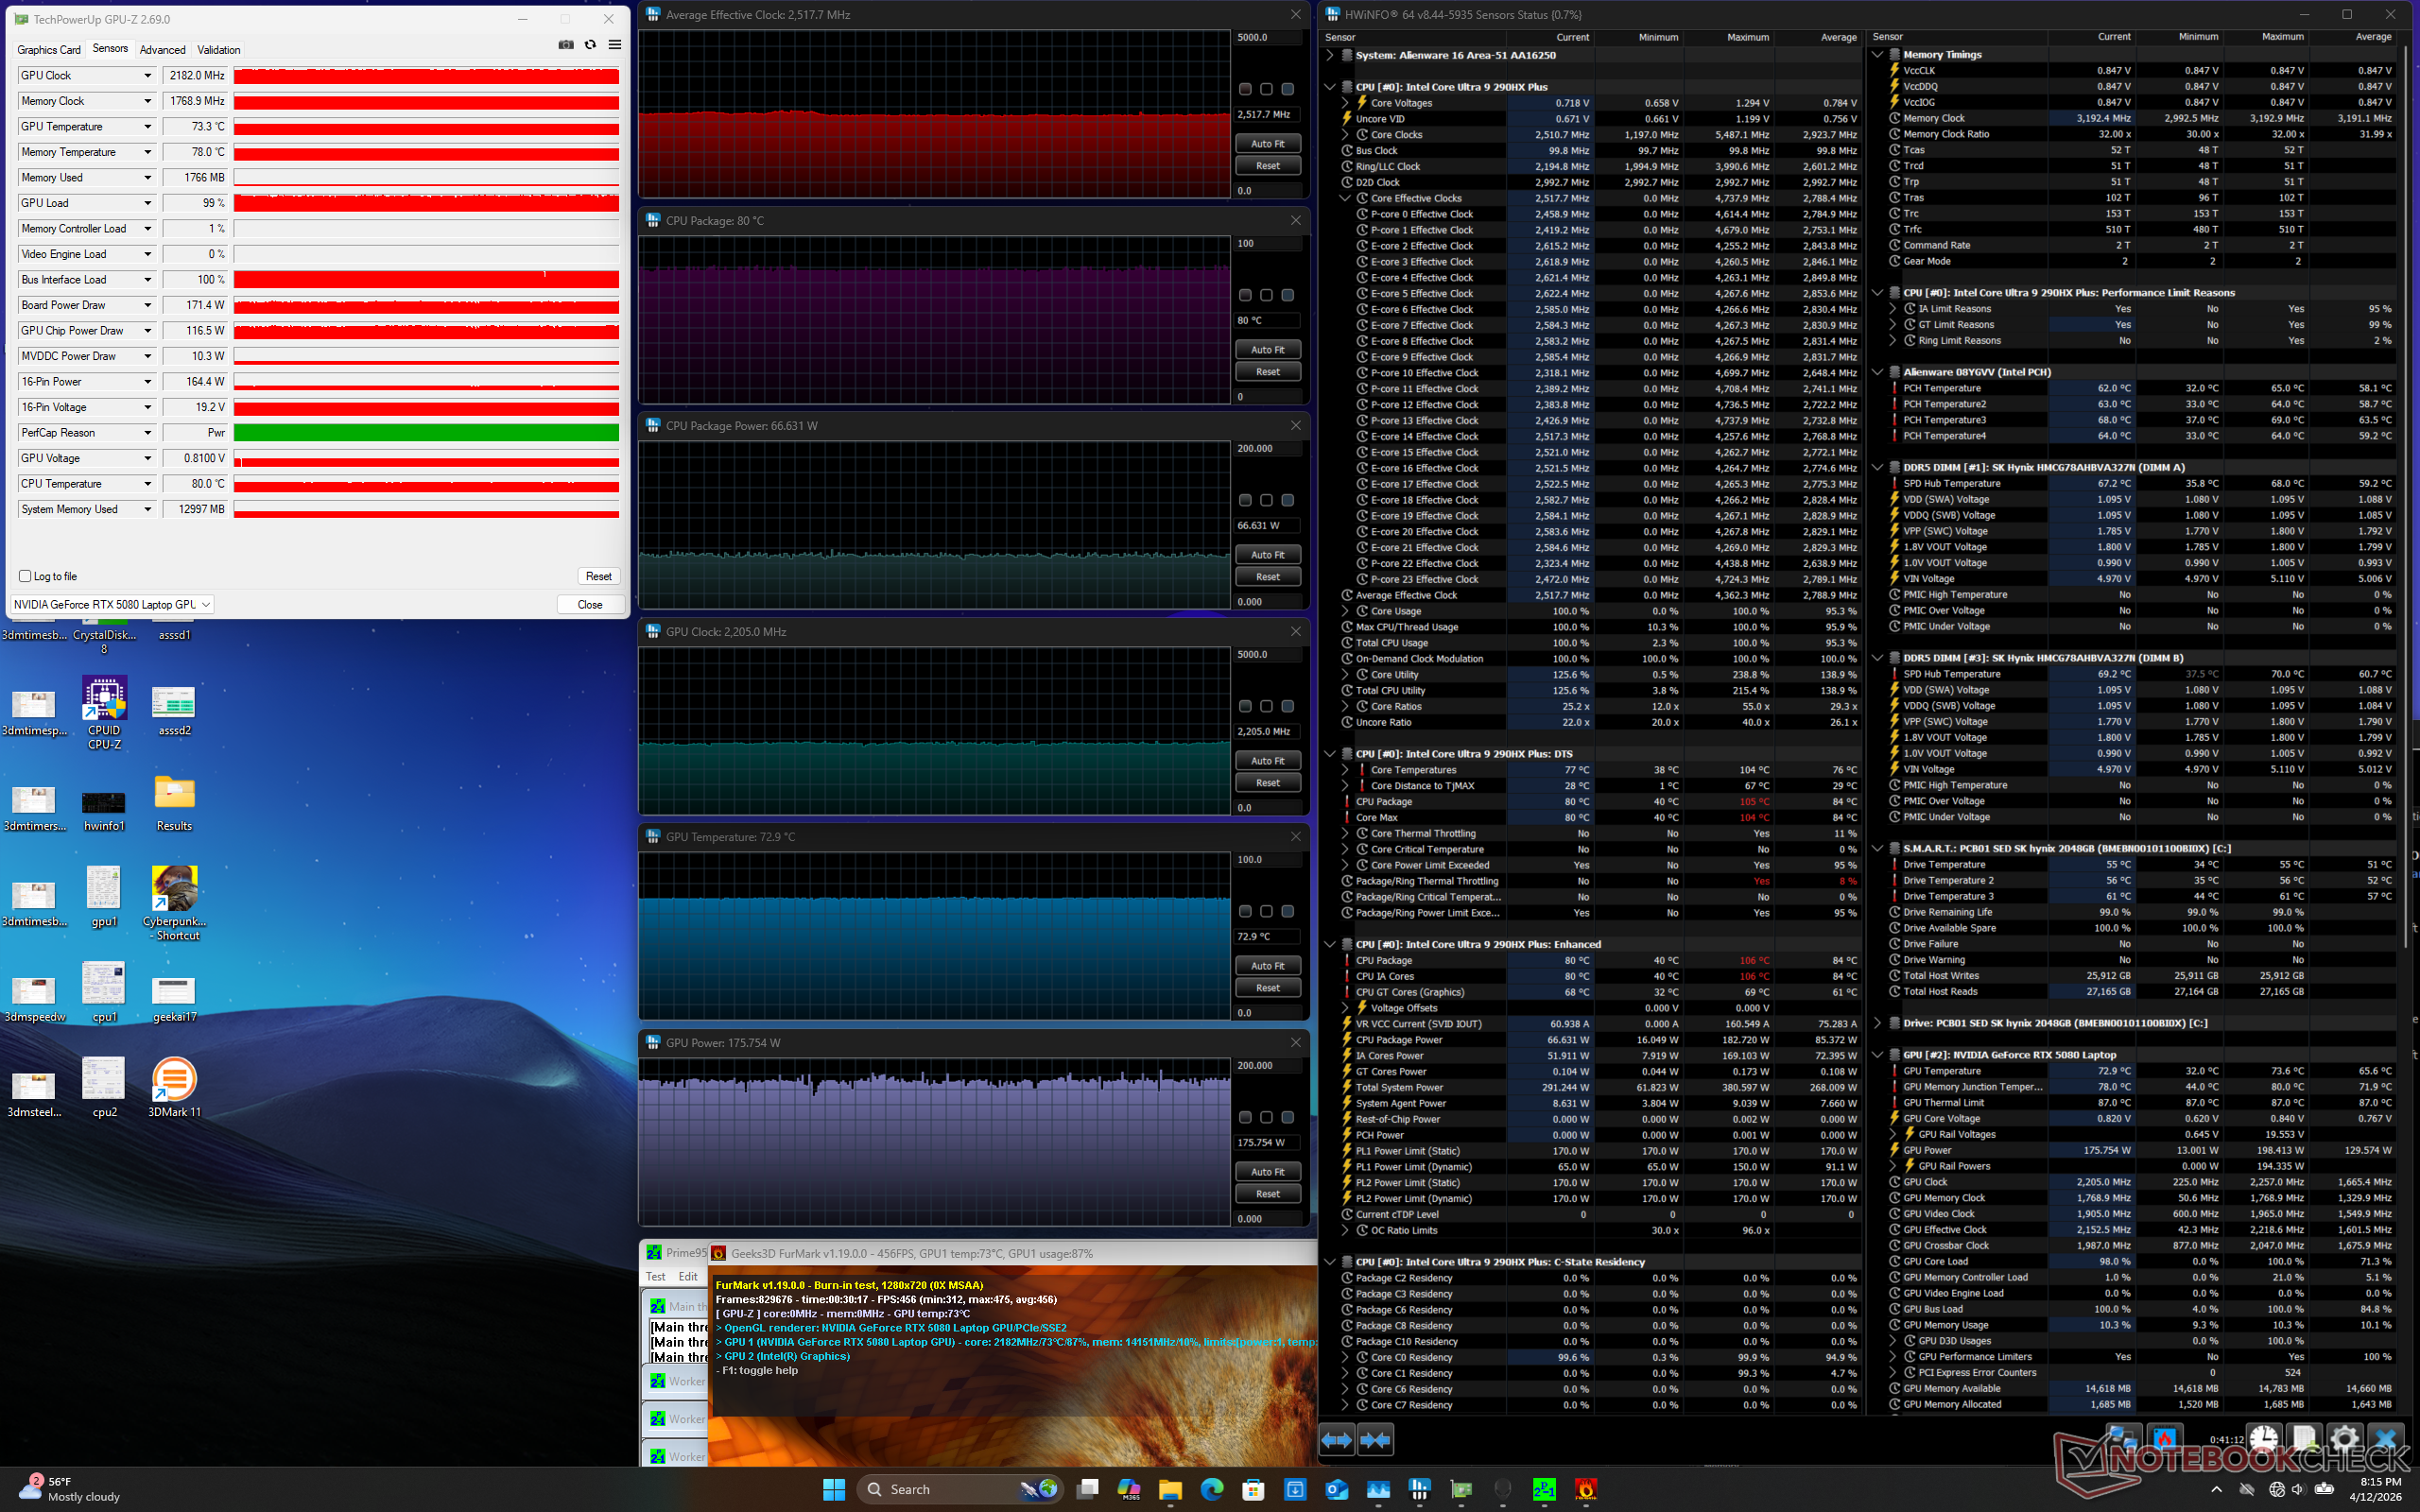
| Estrés de Prime95 + FurMark | 2,5 | 182 | 80 | 73 |
| Estrésde Cyberpunk 2077 (modo equilibrado) | 1,8 | 2347 | 82 | 75 |
| Cyberpunk 2077 Estrés (modo Rendimiento) | 1,8 | 2482 | 78 | 75 |
| Cyberpunk 2077 Stress (modo Overdrive) | 2.1 | 2505 | 82 | 72 |
Altavoces
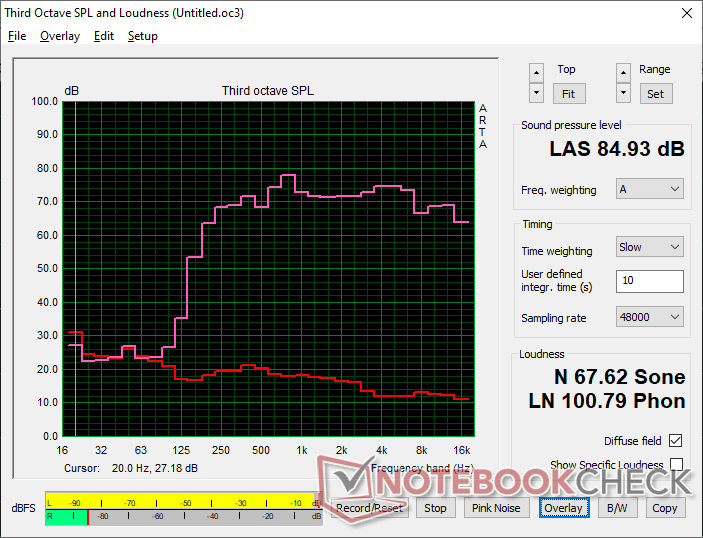
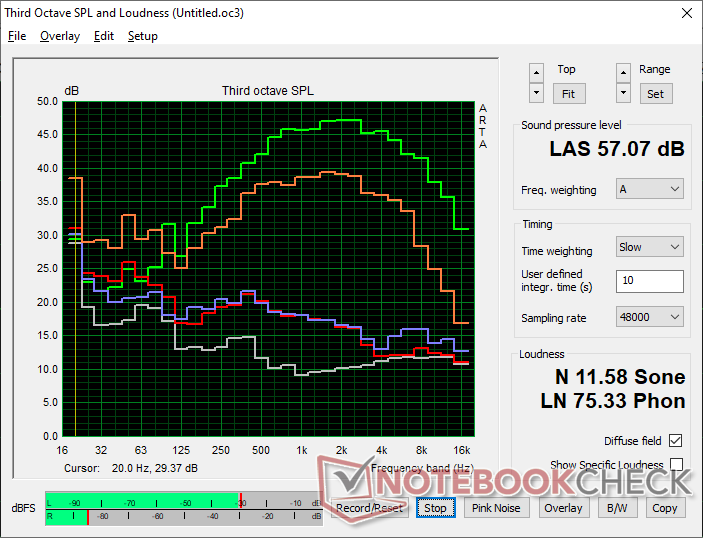
Alienware 16 Area-51 Core Ultra 9 290HX Plus análisis de audio
(+) | los altavoces pueden reproducir a un volumen relativamente alto (#84.9 dB)
Graves 100 - 315 Hz
(-) | casi sin bajos - de media 18.7% inferior a la mediana
(±) | la linealidad de los graves es media (13.9% delta a frecuencia anterior)
Medios 400 - 2000 Hz
(+) | medios equilibrados - a sólo 1.8% de la mediana
(+) | los medios son lineales (5.1% delta a la frecuencia anterior)
Altos 2 - 16 kHz
(+) | máximos equilibrados - a sólo 2.5% de la mediana
(+) | los máximos son lineales (3.4% delta a la frecuencia anterior)
Total 100 - 16.000 Hz
(+) | el sonido global es lineal (12.6% de diferencia con la mediana)
En comparación con la misma clase
» 16% de todos los dispositivos probados de esta clase eran mejores, 4% similares, 81% peores
» El mejor tuvo un delta de 6%, la media fue 18%, el peor fue ###max##%
En comparación con todos los dispositivos probados
» 11% de todos los dispositivos probados eran mejores, 3% similares, 86% peores
» El mejor tuvo un delta de 4%, la media fue 23%, el peor fue ###max##%
Apple MacBook Pro 16 2021 M1 Pro análisis de audio
(+) | los altavoces pueden reproducir a un volumen relativamente alto (#84.7 dB)
Graves 100 - 315 Hz
(+) | buen bajo - sólo 3.8% lejos de la mediana
(+) | el bajo es lineal (5.2% delta a la frecuencia anterior)
Medios 400 - 2000 Hz
(+) | medios equilibrados - a sólo 1.3% de la mediana
(+) | los medios son lineales (2.1% delta a la frecuencia anterior)
Altos 2 - 16 kHz
(+) | máximos equilibrados - a sólo 1.9% de la mediana
(+) | los máximos son lineales (2.7% delta a la frecuencia anterior)
Total 100 - 16.000 Hz
(+) | el sonido global es lineal (4.6% de diferencia con la mediana)
En comparación con la misma clase
» 0% de todos los dispositivos probados de esta clase eran mejores, 0% similares, 100% peores
» El mejor tuvo un delta de 5%, la media fue 17%, el peor fue ###max##%
En comparación con todos los dispositivos probados
» 0% de todos los dispositivos probados eran mejores, 0% similares, 100% peores
» El mejor tuvo un delta de 4%, la media fue 23%, el peor fue ###max##%
Gestión de la energía
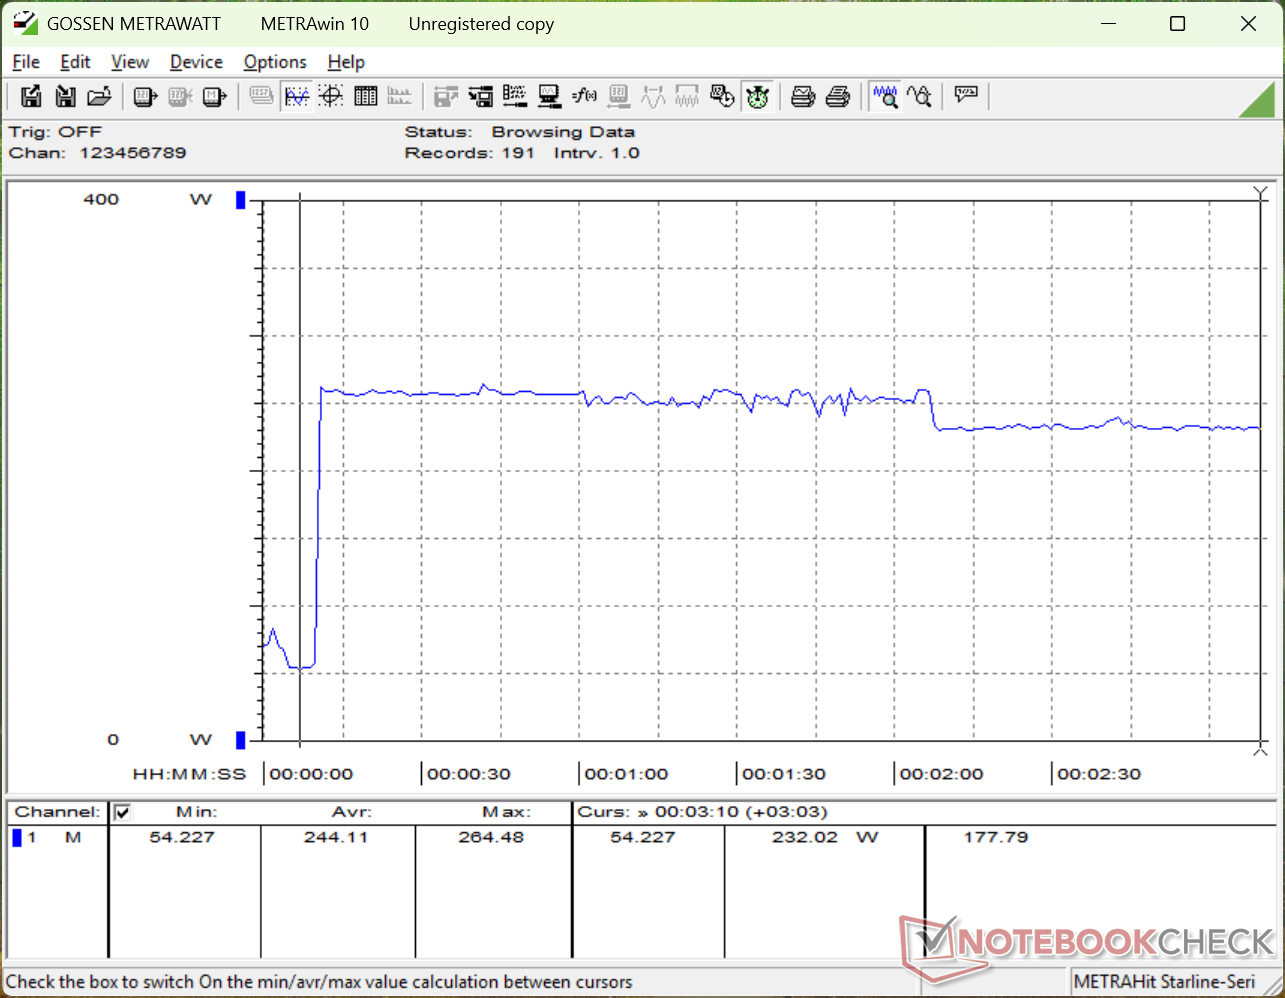
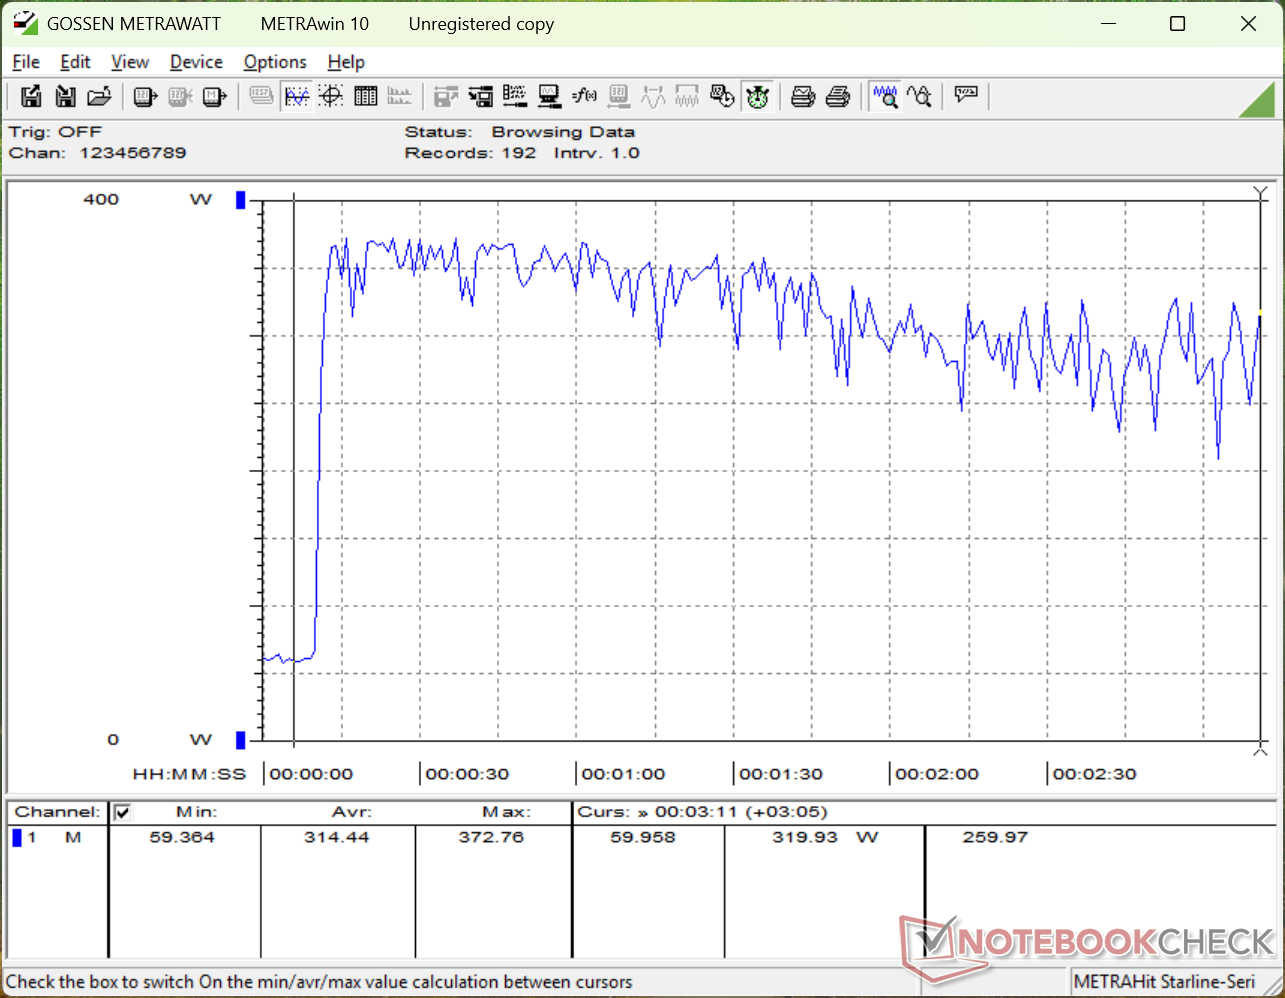
Consumo de energía
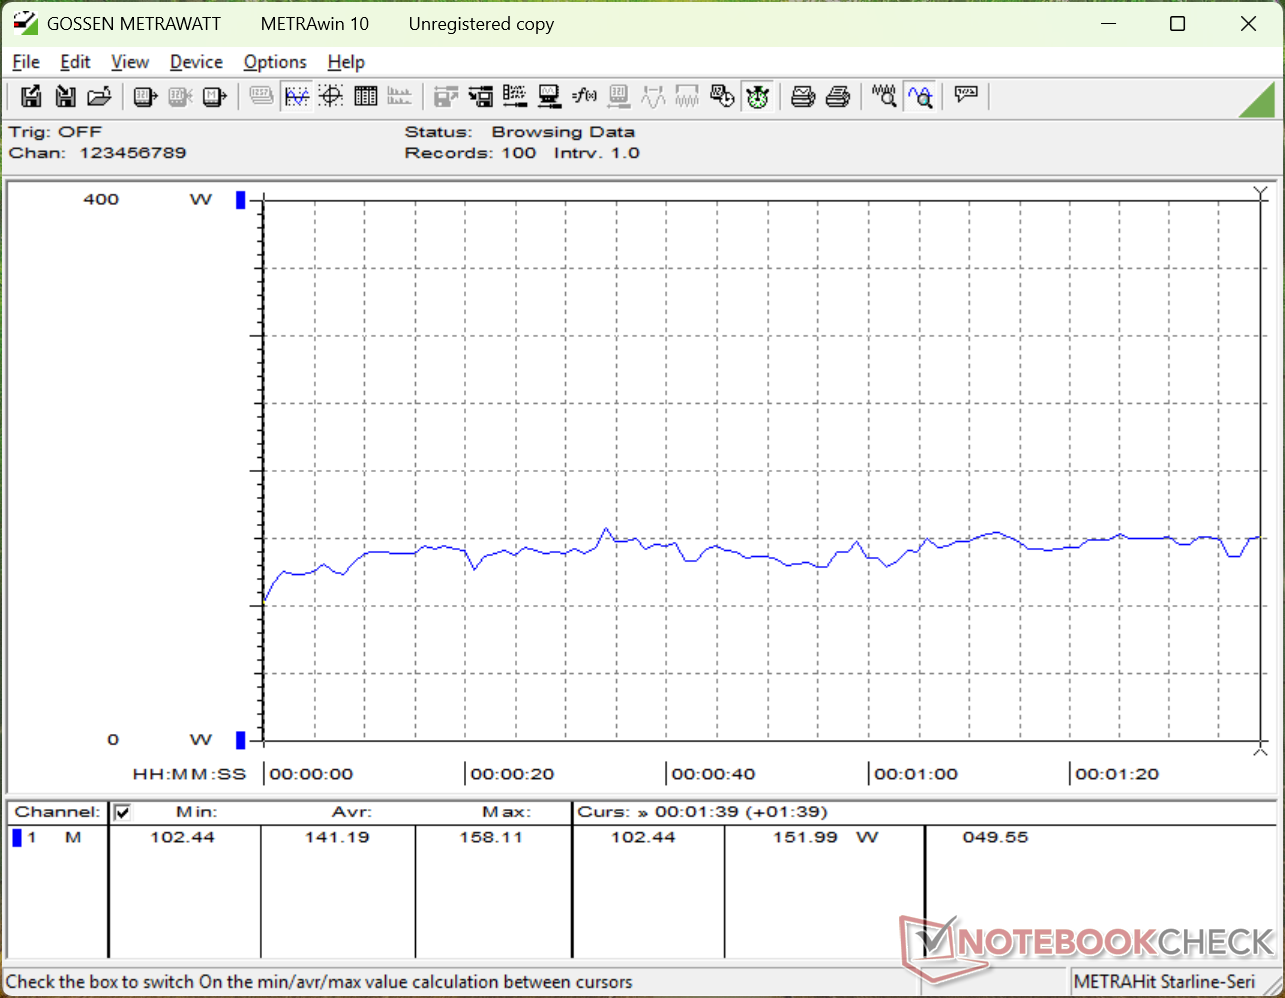
La Core Ultra 9 290HX Plus es entre un 15 y un 25 por ciento más rápida que la Core Ultra 9 275HX precedente, como ya hemos mencionado. Casualmente, nuestro Alienware 16 de 2026 es entre un 15 y un 25 por ciento más exigente que el Alienware 16 de 2025 cuando se estresa la CPU. Ejecutar Prime95 en el último modelo de Alienware consume alrededor de 255 W cuando Turbo Boost es más eficaz o 230 W cuando Turbo Boost se ha estabilizado en comparación con sólo 200 W en el modelo del año pasado. Incluso cuando no se está jugando, el modelo más nuevo es generalmente más exigente en al menos unos pocos vatios más.
Por lo demás, el delgado adaptador de CA GaN de 360 W no ha cambiado con respecto al modelo de 2025.
| Off / Standby | |
| Ocioso | |
| Carga |
|
Clave:
min: | |
| Alienware 16 Area-51 Core Ultra 9 290HX Plus Ultra 9 290HX Plus, GeForce RTX 5080 Laptop, SK hynix PCB01 HFS001TFM9X186N, OLED, 2560x1600, 16" | Alienware 16 Area-51 Ultra 9 275HX, GeForce RTX 5080 Laptop, Samsung PM9C1a MZ9L81T0HDLB, IPS, 2560x1600, 16" | Lenovo Legion Pro 7i 16 Gen 10 Ultra 9 275HX, GeForce RTX 5080 Laptop, SK Hynix HFS001TEJ9X115N, OLED, 2560x1600, 16" | HP Omen Max 16 ah000 Ultra 9 275HX, GeForce RTX 5090 Laptop, WDC PC SN810 2TB, OLED, 2560x1600, 16" | MSI Vector 16 HX AI A2XWHG Ultra 7 255HX, GeForce RTX 5070 Ti Laptop, Micron 2400 MTFDKBA512QFM, IPS, 2560x1600, 16" | Asus ROG Zephyrus G16 GU605CW Ultra 9 285H, GeForce RTX 5080 Laptop, Micron 2500 2TB MTFDKBA2T0QGN-1BN1AABGA, OLED, 2560x1600, 16" | |
|---|---|---|---|---|---|---|
| Power Consumption | 2% | -11% | 18% | 32% | 46% | |
| Idle Minimum * (Watt) | 23.9 | 27 -13% | 28.5 -19% | 9.9 59% | 7.1 70% | 12.6 47% |
| Idle Average * (Watt) | 25.2 | 33.5 -33% | 38.8 -54% | 28.6 -13% | 15.9 37% | 13.4 47% |
| Idle Maximum * (Watt) | 49.6 | 41.4 17% | 45.6 8% | 47.1 5% | 29.5 41% | 15.1 70% |
| Load Average * (Watt) | 141.2 | 124.7 12% | 132.2 6% | 141.8 -0% | 124 12% | 116.3 18% |
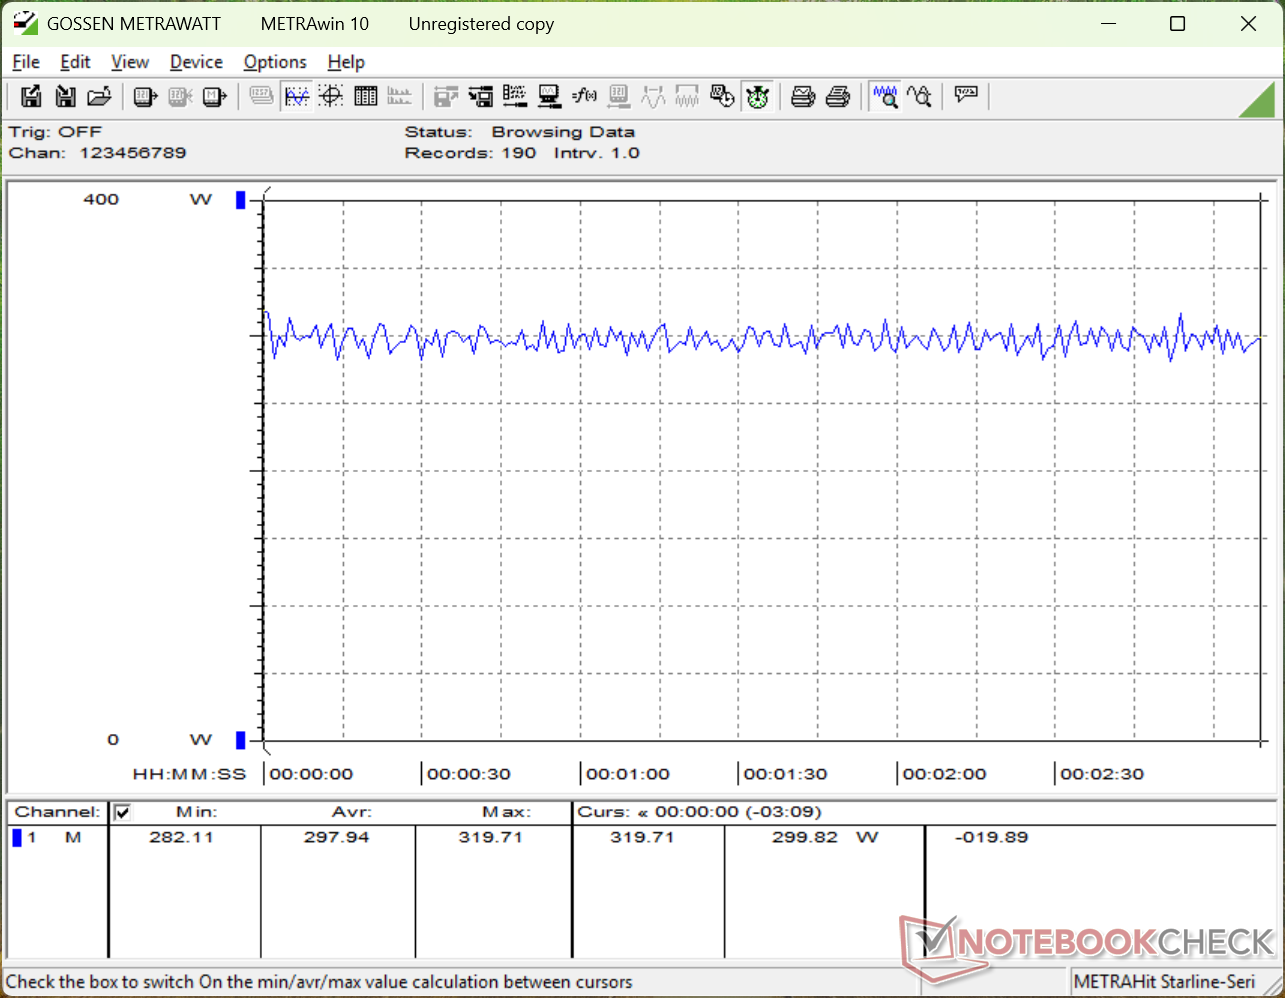
| Cyberpunk 2077 ultra external monitor * (Watt) | 297 | 249 16% | 319 -7% | 230 23% | 217 27% | 157.9 47% |
| Cyberpunk 2077 ultra * (Watt) | 298 | 256 14% | 318 -7% | 253 15% | 222 26% | 156.4 48% |
| Load Maximum * (Watt) | 372.8 | 367.2 2% | 384 -3% | 233 37% | 336 10% | 199 47% |
* ... más pequeño es mejor
Consumo de energía Cyberpunk / Prueba de estrés
Consumo de energía Monitor externo
Duración de las pilas
El tiempo de funcionamiento de la WLAN es más o menos el mismo que antes, si no ligeramente superior en apenas media hora, incluso con VRR y Optimus activados y los LED desactivados. Aún así, 3 horas no es mucho tiempo se mire como se mire.
| Alienware 16 Area-51 Core Ultra 9 290HX Plus Ultra 9 290HX Plus, GeForce RTX 5080 Laptop, 96 Wh | Alienware 16 Area-51 Ultra 9 275HX, GeForce RTX 5080 Laptop, 96 Wh | Lenovo Legion Pro 7i 16 Gen 10 Ultra 9 275HX, GeForce RTX 5080 Laptop, 99 Wh | HP Omen Max 16 ah000 Ultra 9 275HX, GeForce RTX 5090 Laptop, 83 Wh | MSI Vector 16 HX AI A2XWHG Ultra 7 255HX, GeForce RTX 5070 Ti Laptop, 90 Wh | Asus ROG Zephyrus G16 GU605CW Ultra 9 285H, GeForce RTX 5080 Laptop, 90 Wh | |
|---|---|---|---|---|---|---|
| Duración de Batería | -13% | 69% | 81% | 119% | ||
| WiFi v1.3 (h) | 3.2 | 2.8 -13% | 5.4 69% | 5.8 81% | 7 119% | |
| Reader / Idle (h) | 3.1 | 8.7 | ||||
| Load (h) | 0.8 | 1.2 |
Valoración de Notebookcheck
El Alienware 16 Area-51 con Core Ultra 9 290HX Plus es la versión más rápida del modelo disponible. Para la gran mayoría de los jugadores, sin embargo, los caballos de fuerza adicionales de la CPU sólo supondrán una diferencia menor en el mejor de los casos.
Alienware 16 Area-51 Core Ultra 9 290HX Plus
- 04/22/2026 v8
Allen Ngo
 Total Sustainability Score:
 Competidores potenciales en comparación
Imagen | Modelo | Precio | Peso | Altura | Pantalla |
|---|---|---|---|---|---|
1. 88.1%  | Alienware 16 Area-51 Core Ultra 9 290HX Plus Intel Core Ultra 9 290HX Plus ⎘ NVIDIA GeForce RTX 5080 Laptop ⎘ 32 GB Memoría, SSD | Amazon: Precio de catálogo: 4000 USD | 3.3 kg | 28.5 mm | 16.00" 2560x1600 189 PPI OLED |
2. 85.7%  | Alienware 16 Area-51 Intel Core Ultra 9 275HX ⎘ NVIDIA GeForce RTX 5080 Laptop ⎘ 32 GB Memoría, 1024 GB SSD | Amazon: 1. $2,463.19 Alienware 16 Area-51 Gaming ... 2. $3,899.99 Alienware 16 Area-51 Gaming ... 3. $3,799.99 Alienware 16 Area-51 Gaming ... Precio de catálogo: 3500 USD | 3.3 kg | 28.5 mm | 16.00" 2560x1600 189 PPI IPS |
3. 87.5%  | Lenovo Legion Pro 7i 16 Gen 10 Intel Core Ultra 9 275HX ⎘ NVIDIA GeForce RTX 5080 Laptop ⎘ 32 GB Memoría, 1024 GB SSD | Amazon: Precio de catálogo: 4200 USD | 2.6 kg | 26.65 mm | 16.00" 2560x1600 189 PPI OLED |
4. 81.9%  | HP Omen Max 16 ah000 Intel Core Ultra 9 275HX ⎘ NVIDIA GeForce RTX 5090 Laptop ⎘ 32 GB Memoría, 2048 GB SSD | Amazon: Precio de catálogo: 3800 USD | 2.8 kg | 24.9 mm | 16.00" 2560x1600 189 PPI OLED |
5. 84%  | MSI Vector 16 HX AI A2XWHG Intel Core Ultra 7 255HX ⎘ NVIDIA GeForce RTX 5070 Ti Laptop ⎘ 16 GB Memoría, 512 GB SSD | Amazon: Precio de catálogo: 2000 EUR | 2.6 kg | 28.6 mm | 16.00" 2560x1600 189 PPI IPS |
6.  | Asus ROG Zephyrus G16 GU605CW Intel Core Ultra 9 285H ⎘ NVIDIA GeForce RTX 5080 Laptop ⎘ 32 GB Memoría, 2048 GB SSD | Amazon: Precio de catálogo: 3800€ | 2 kg | 14.9 mm | 16.00" 2560x1600 189 PPI OLED |
Transparencia
La selección de los dispositivos que se van a reseñar corre a cargo de nuestro equipo editorial. La muestra de prueba fue proporcionada al autor en calidad de préstamo por el fabricante o el minorista a los efectos de esta reseña. El prestamista no tuvo ninguna influencia en esta reseña, ni el fabricante recibió una copia de la misma antes de su publicación. No había ninguna obligación de publicar esta reseña. Como empresa de medios independiente, Notebookcheck no está sujeta a la autoridad de fabricantes, minoristas o editores.
Así es como prueba Notebookcheck
Cada año, Notebookcheck revisa de forma independiente cientos de portátiles y smartphones utilizando procedimientos estandarizados para asegurar que todos los resultados son comparables. Hemos desarrollado continuamente nuestros métodos de prueba durante unos 20 años y hemos establecido los estándares de la industria en el proceso. En nuestros laboratorios de pruebas, técnicos y editores experimentados utilizan equipos de medición de alta calidad. Estas pruebas implican un proceso de validación en varias fases. Nuestro complejo sistema de clasificación se basa en cientos de mediciones y puntos de referencia bien fundamentados, lo que mantiene la objetividad.
