Veredicto: ¿está justificada la diferencia de precio de 500 euros?
La Versión RTX 5070 Ti era uno de los portátiles más rápidos con esa GPU, y lo mismo puede decirse en gran medida del modelo RTX 5070 estándar, aunque la ventaja sobre sus rivales no es tan grande. El Aurora 16X de Alienware de Alienware consigue incluso superarla ligeramente.
La diferencia entre las dos variantes de Legion es de aproximadamente 500-700 euros, y a cambio se obtiene hasta un 25 por ciento más de rendimiento de la GPU. Eso suena significativo sobre el papel, pero el impacto en el mundo real varía mucho en función del juego. El modelo Ti también se beneficia de memoria de vídeo adicional, lo que ayuda a prepararse para el futuro. Por otro lado, la versión "más pequeña" funciona de forma más silenciosa, más fría y consume menos energía.
Incluso sin la GPU más potente, sigue siendo un portátil para juegos muy capaz y de gran calidad a un precio relativamente moderado.
Pro
Contra
- $1,849.00Lenovo Legion Pro 5 16IAX10 Gaming Laptop 2025 16” WQXGA 2560 x 1600 Display IPS Intel Core Ultra 7 255HX NVIDIA GeForce RTX 5070 8GB GDDR7 16GB DDR5 1TB SSD Backlit KB Wi-Fi 7 Windows 11 Home
- $2,129.00Lenovo 2025 Gaming Laptop | Legion Pro 5 | Intel 20-Core Ultra 7 255HX | NVIDIA GeForce RTX 5070 | 32GB DDR5 | 1TB SSD | 16" 2560x1600 165Hz | Win11 Pro - Wi-Fi 7 - BT 5.4 - RGB Backlit KB - Grey
- $1,899.00Lenovo Legion Pro 5 16IAX10 Gaming Laptop 2025 16” WQXGA 2560 x 1600 Display IPS Intel Core Ultra 7 255HX NVIDIA GeForce RTX 5070 8GB GDDR7 16GB DDR5 1TB SSD Backlit KB Wi-Fi 7 Windows 11 Pro
Índice
- Veredicto: ¿está justificada la diferencia de precio de 500 euros?
- Especificaciones
- Chasis y características: elegante, pero un imán para las huellas dactilares
- Dispositivos de entrada - sólidos, para un portátil de juegos
- Pantalla - OLED brillante
- Rendimiento - RTX 5070 mantiene el Legion rápido
- Emisiones y energía: más silencioso, más frío, más eficiente
- Impresiones generales de Notebookcheck
- Posibles alternativas en comparación
Junto al Modelo RTX 5070 Ti, Lenovo también ofrece el Legion Pro 5 16 con una RTX 5070. Pero, ¿pueden los usuarios realmente sentir la diferencia - aparte de en sus billeteras? ¿Qué tan cerca están las versiones RTX 5070 Ti y RTX 5070 en la práctica? Dado que el resto del sistema es casi idéntico, nos centraremos en el rendimiento, el ruido y la térmica y nos remitiremos a nuestro análisis original para las secciones de chasis, dispositivos de entrada y similares.
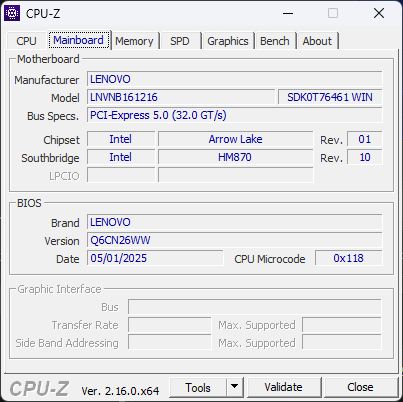
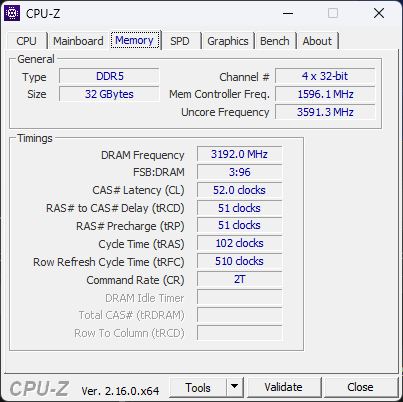
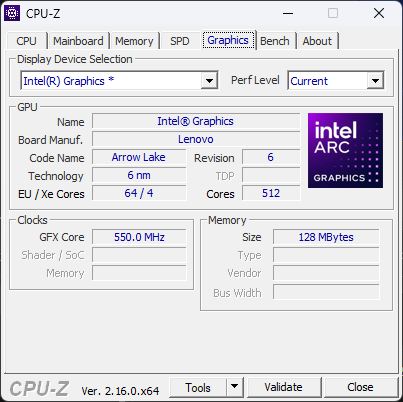
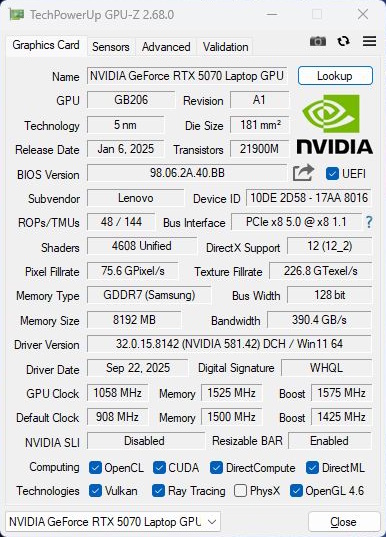
Especificaciones
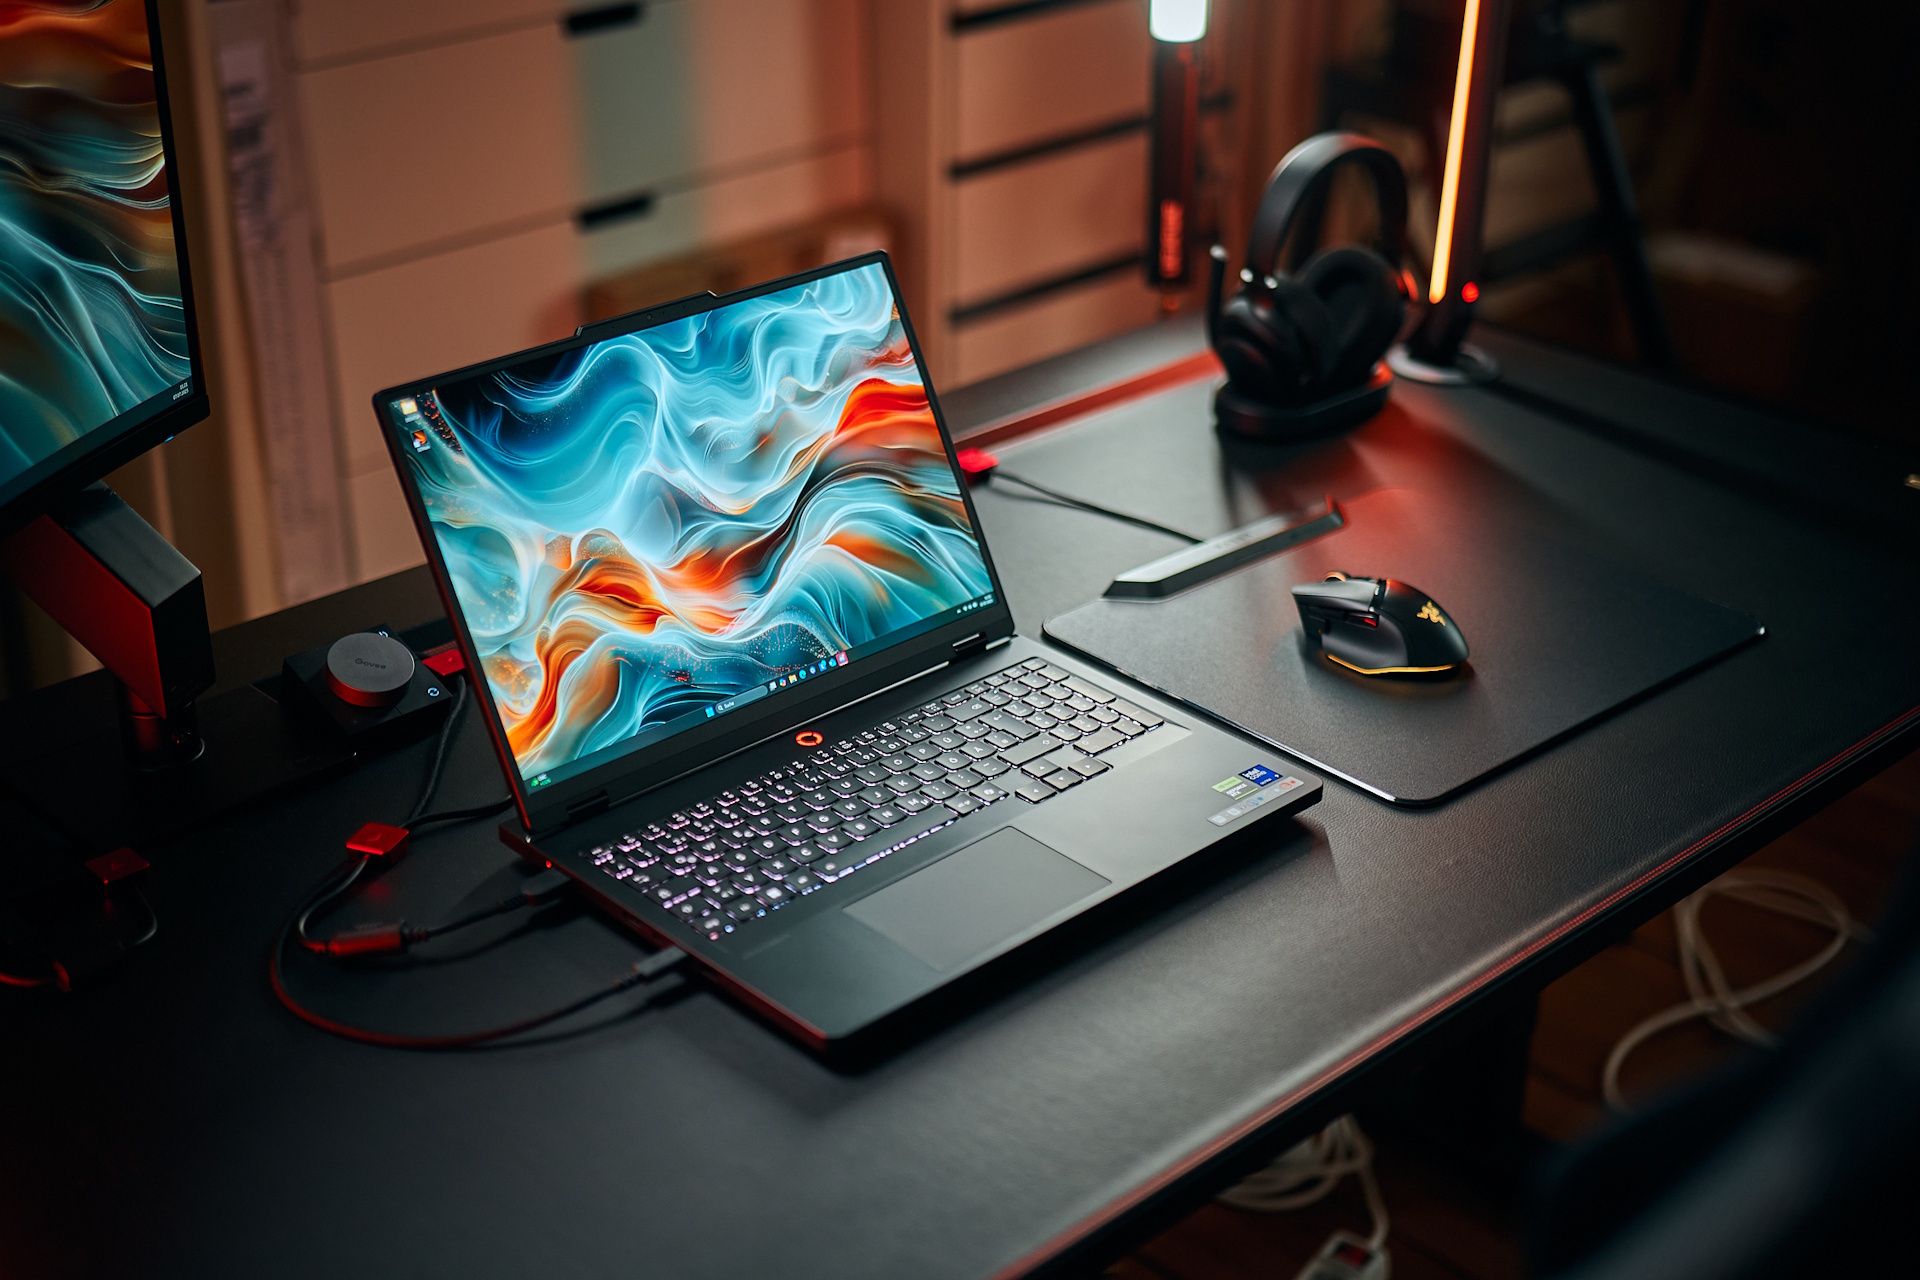
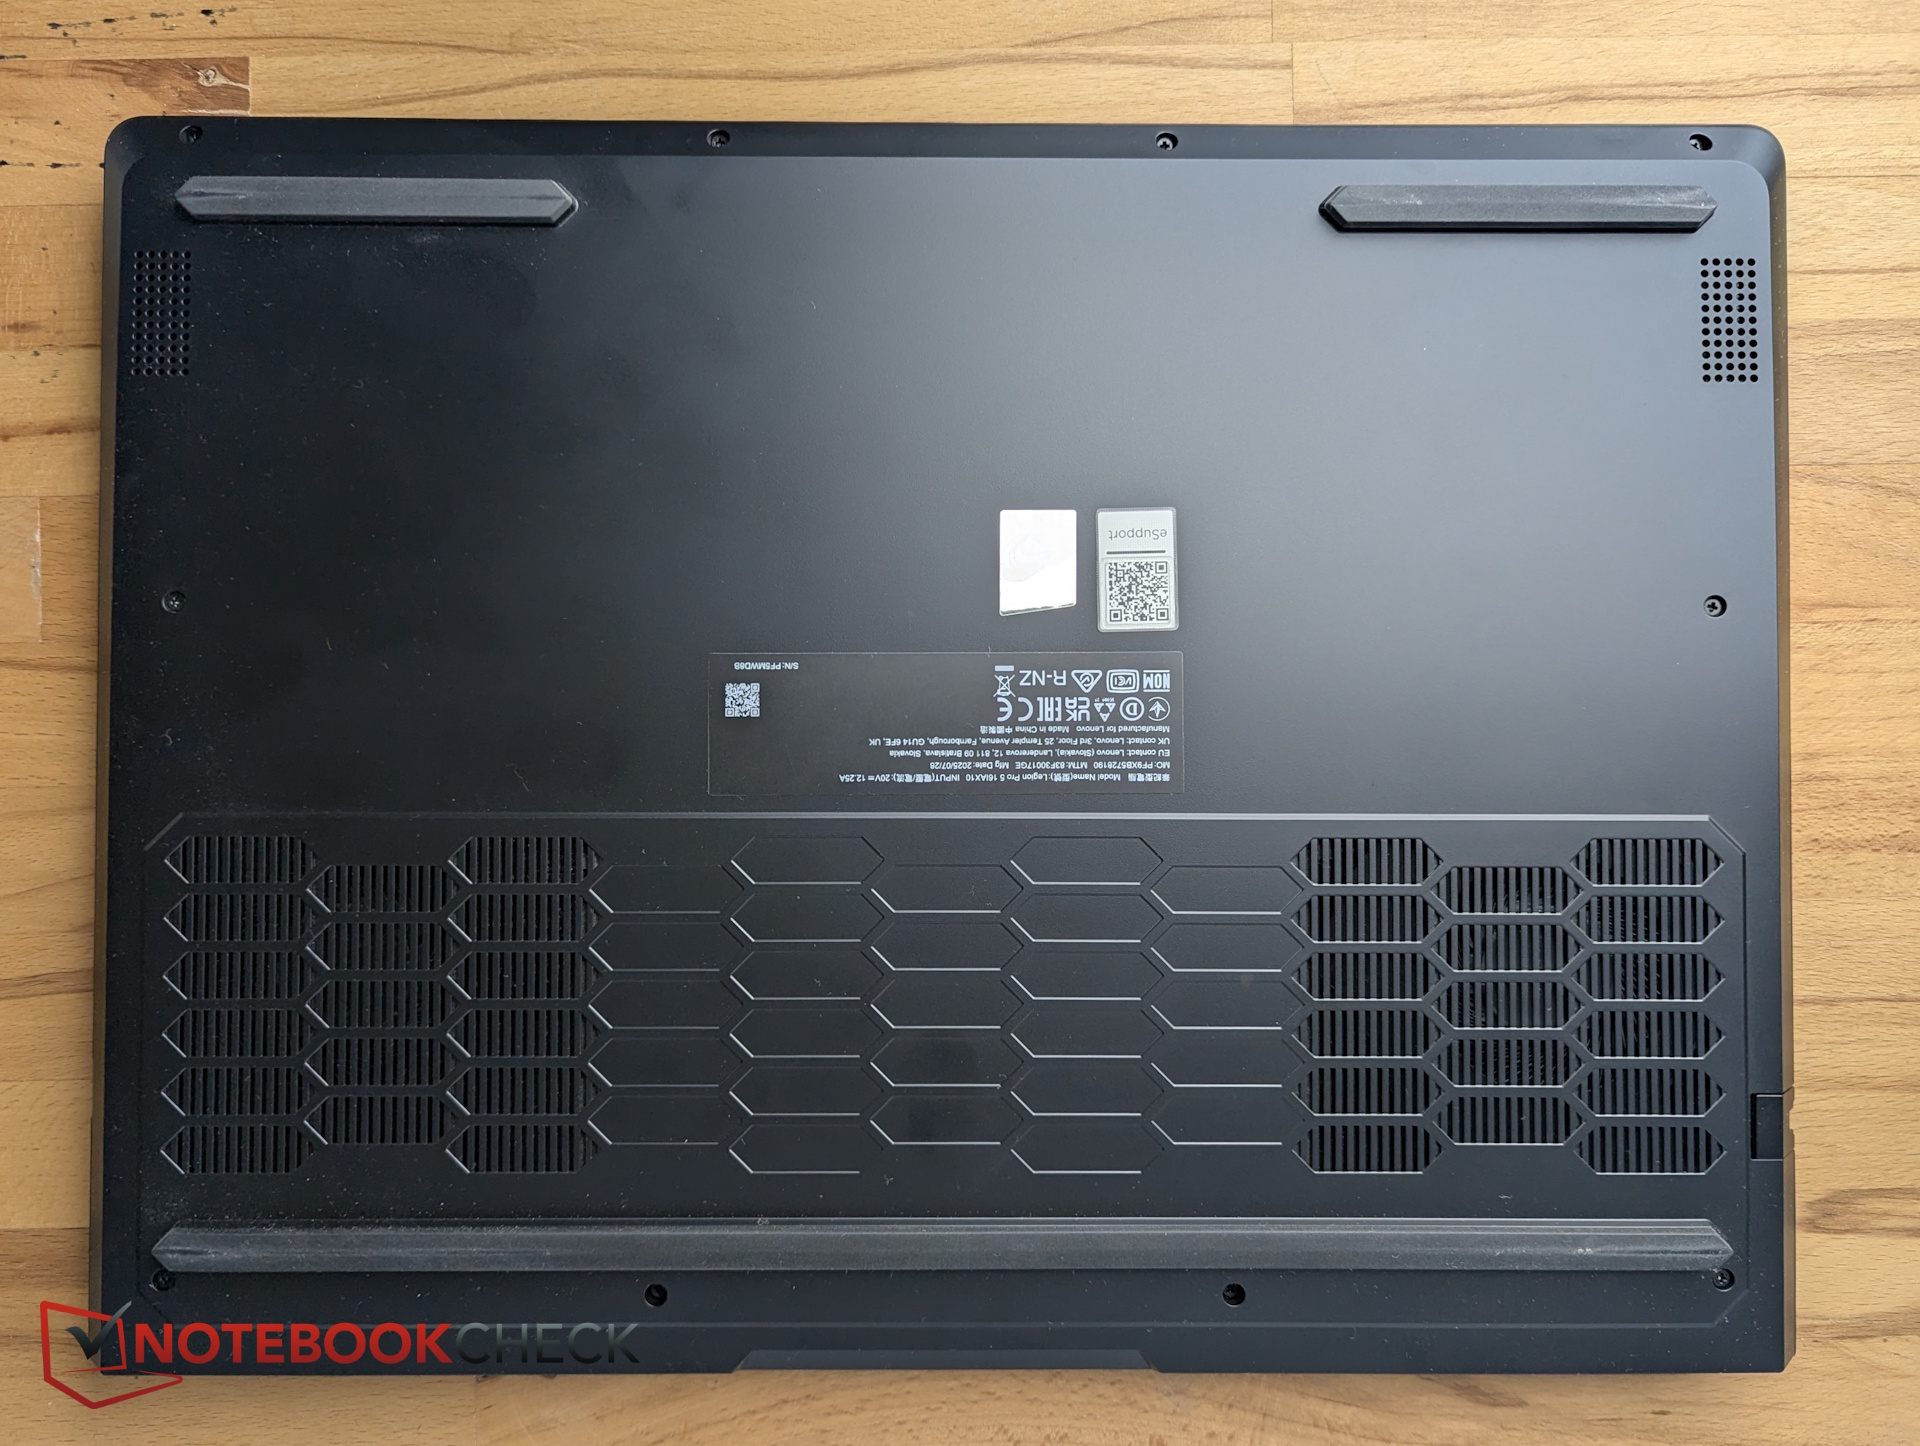
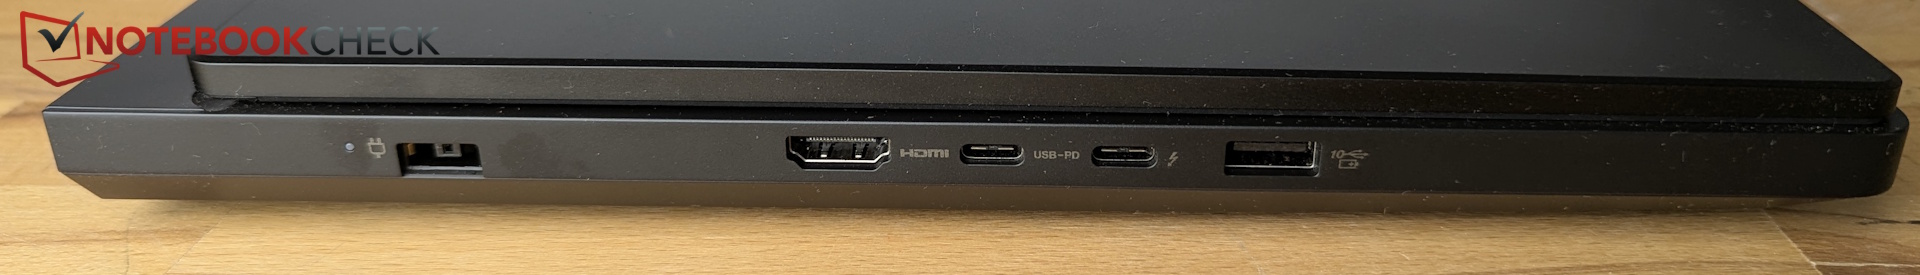
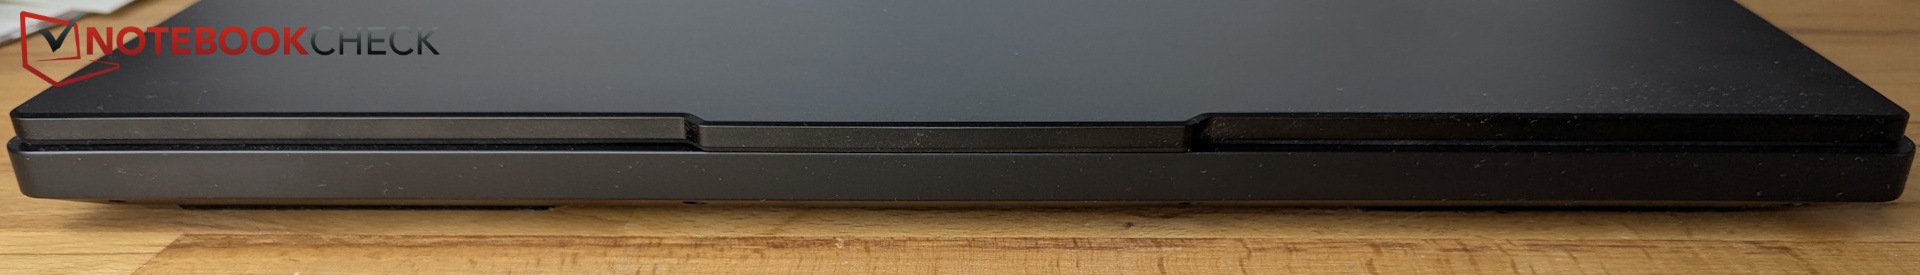
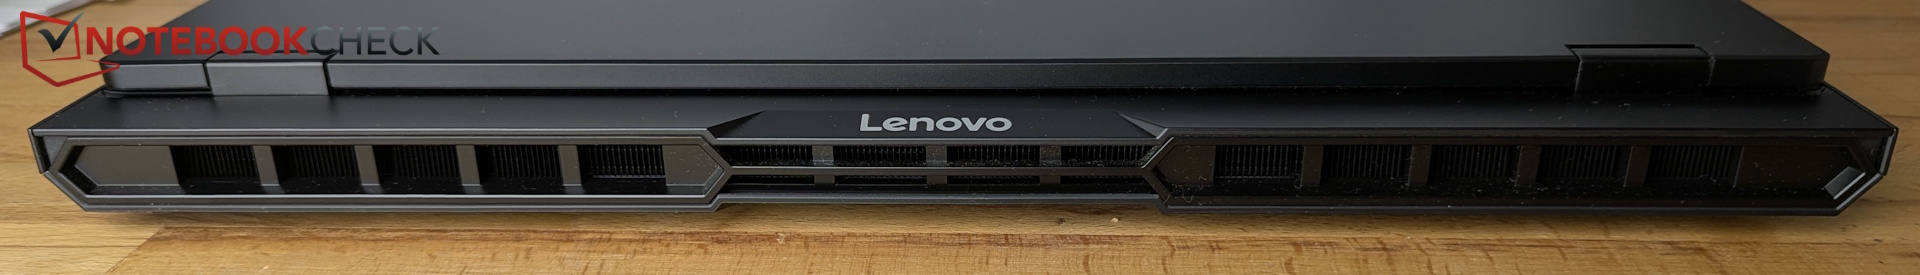
Chasis y características: elegante, pero un imán para las huellas dactilares

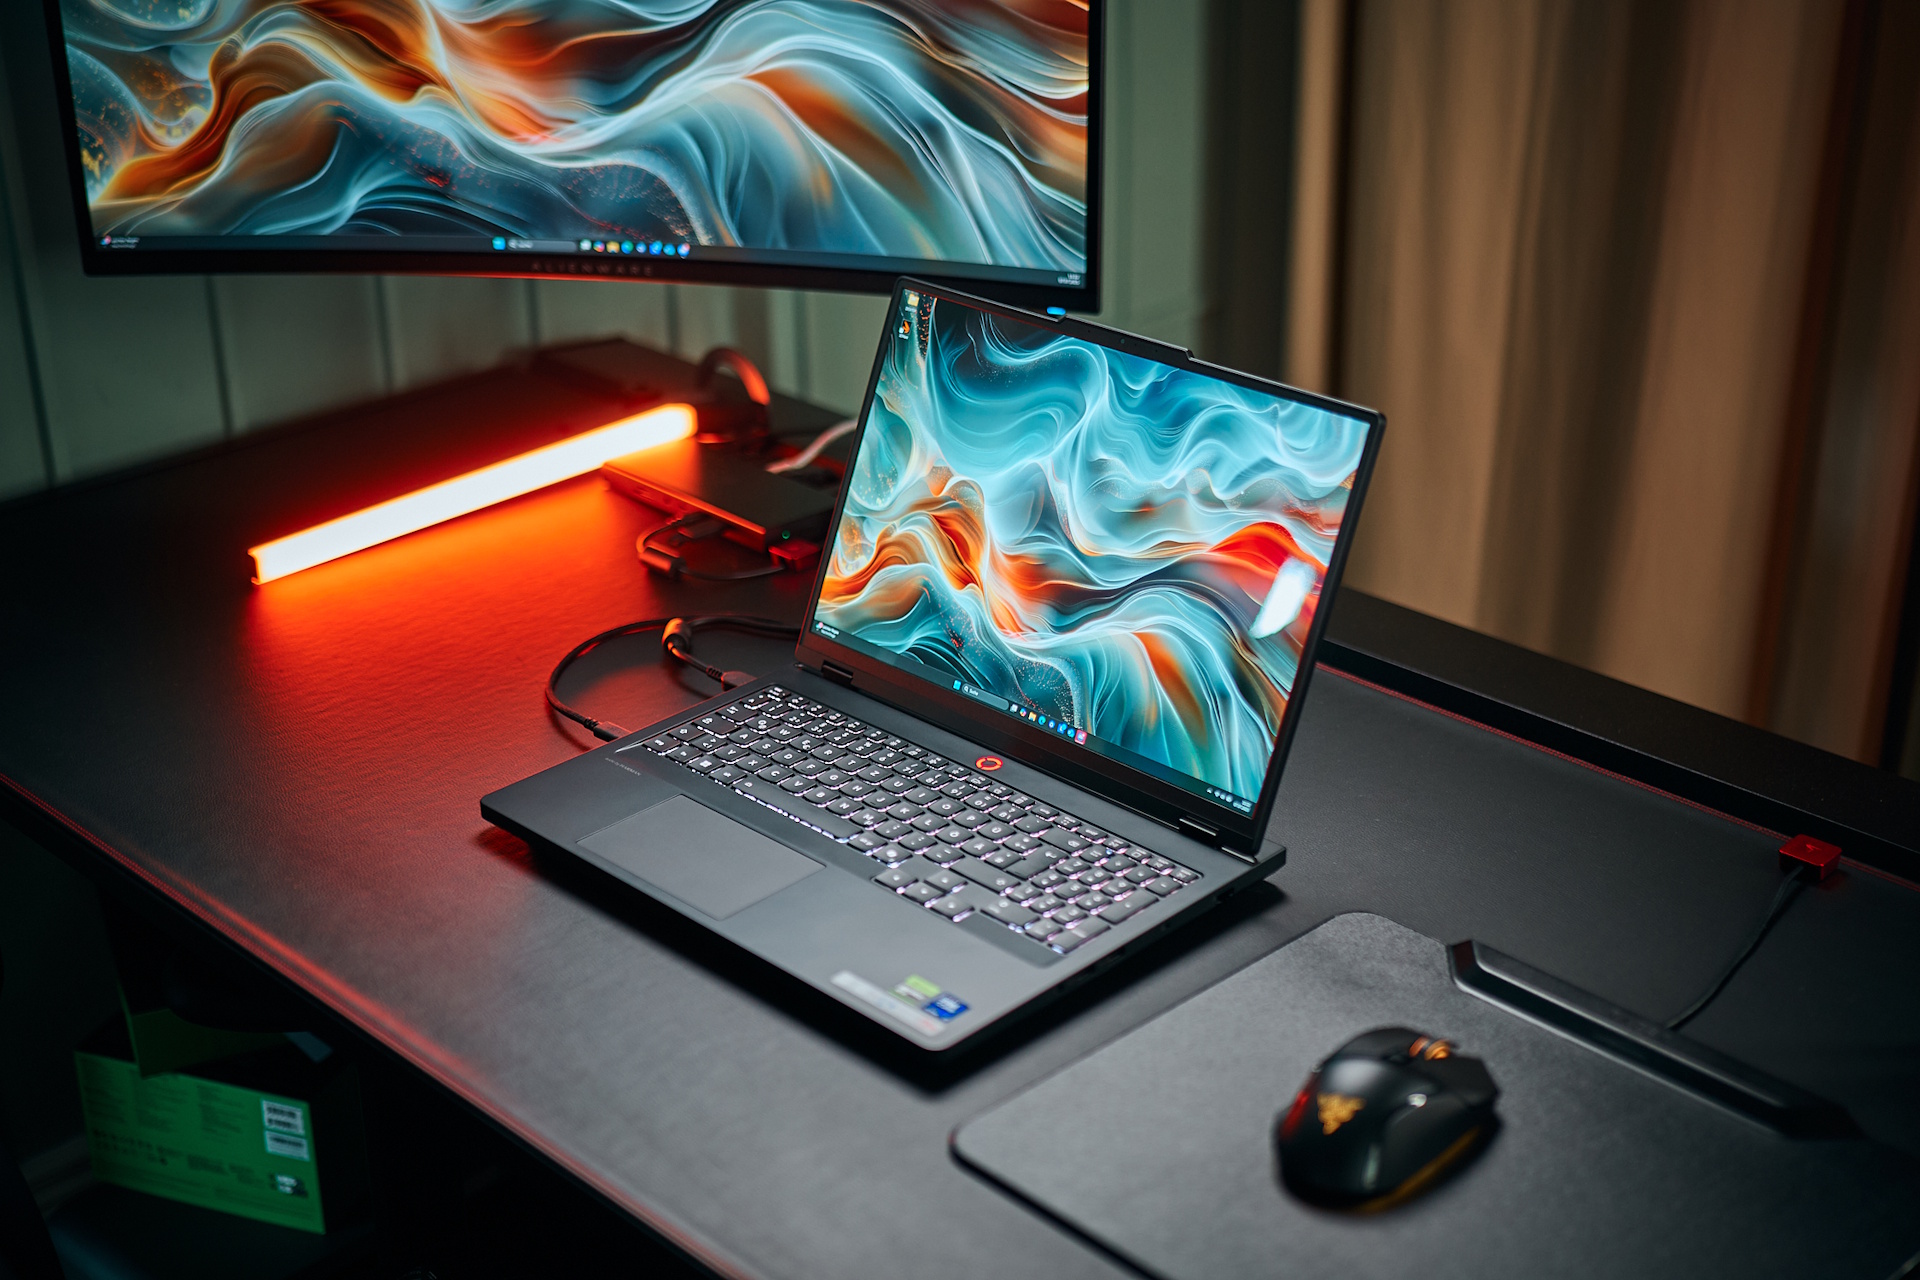


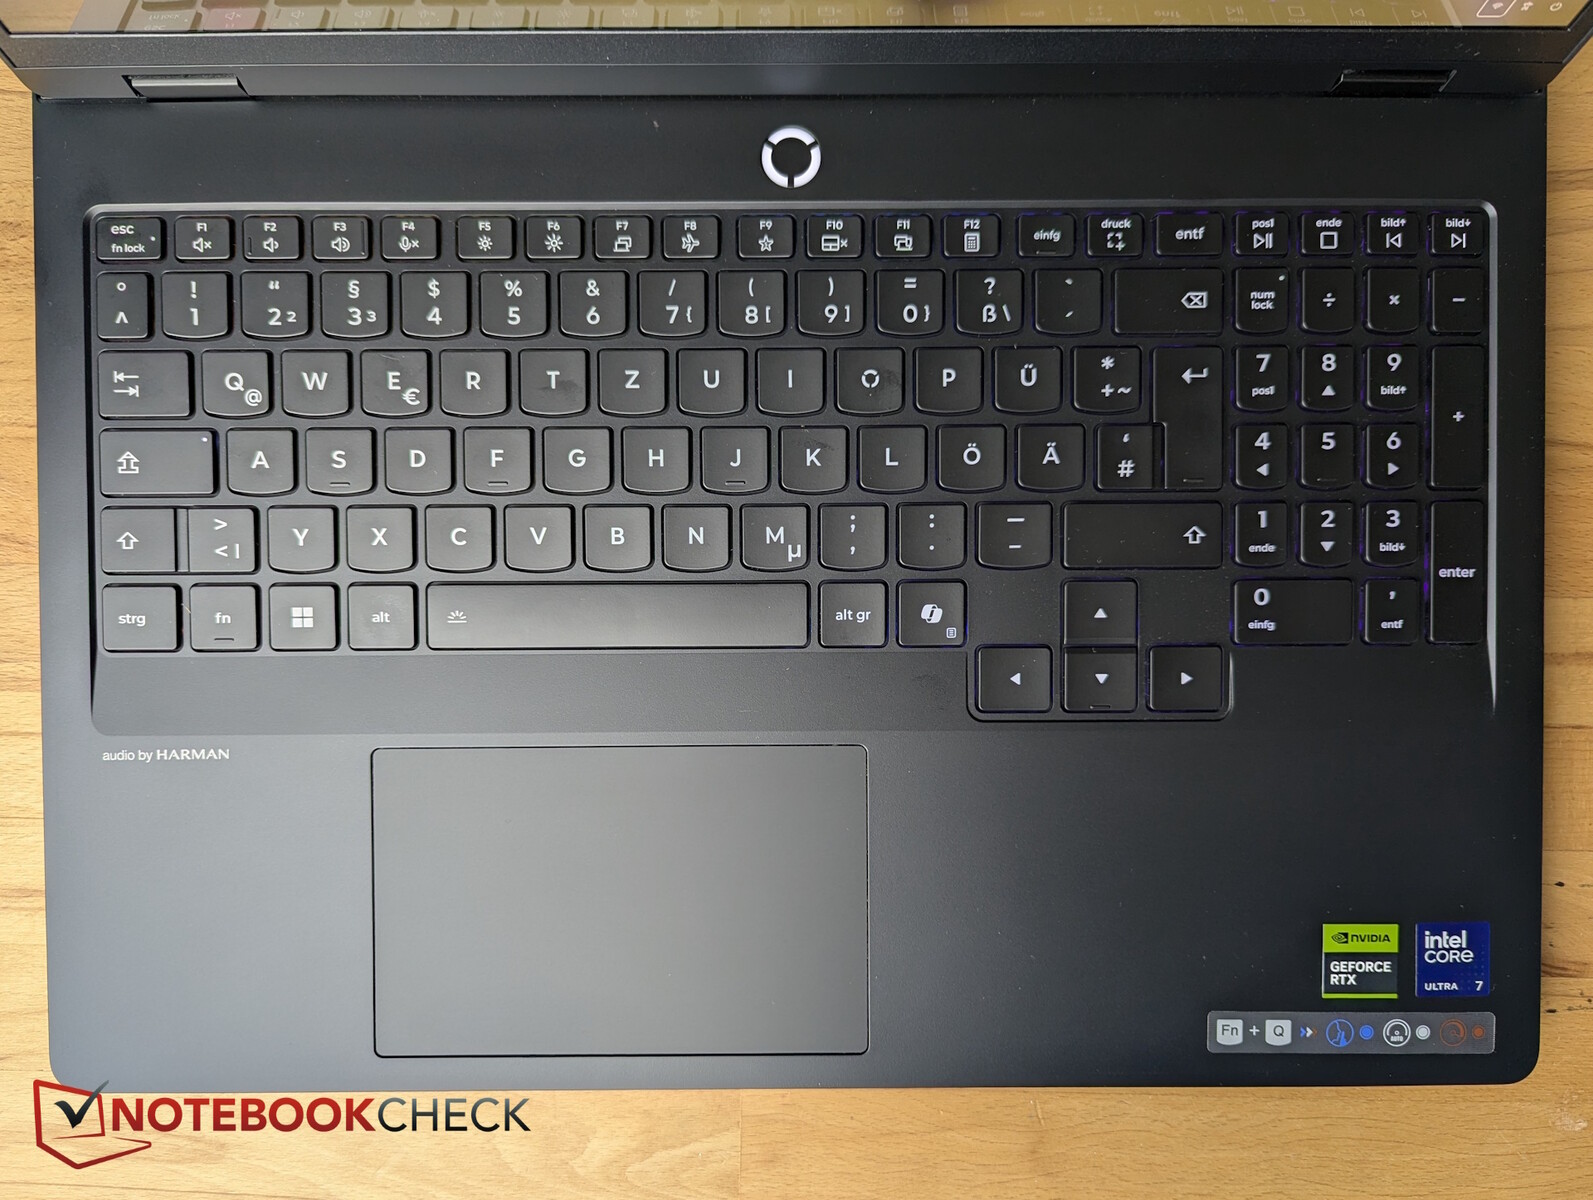
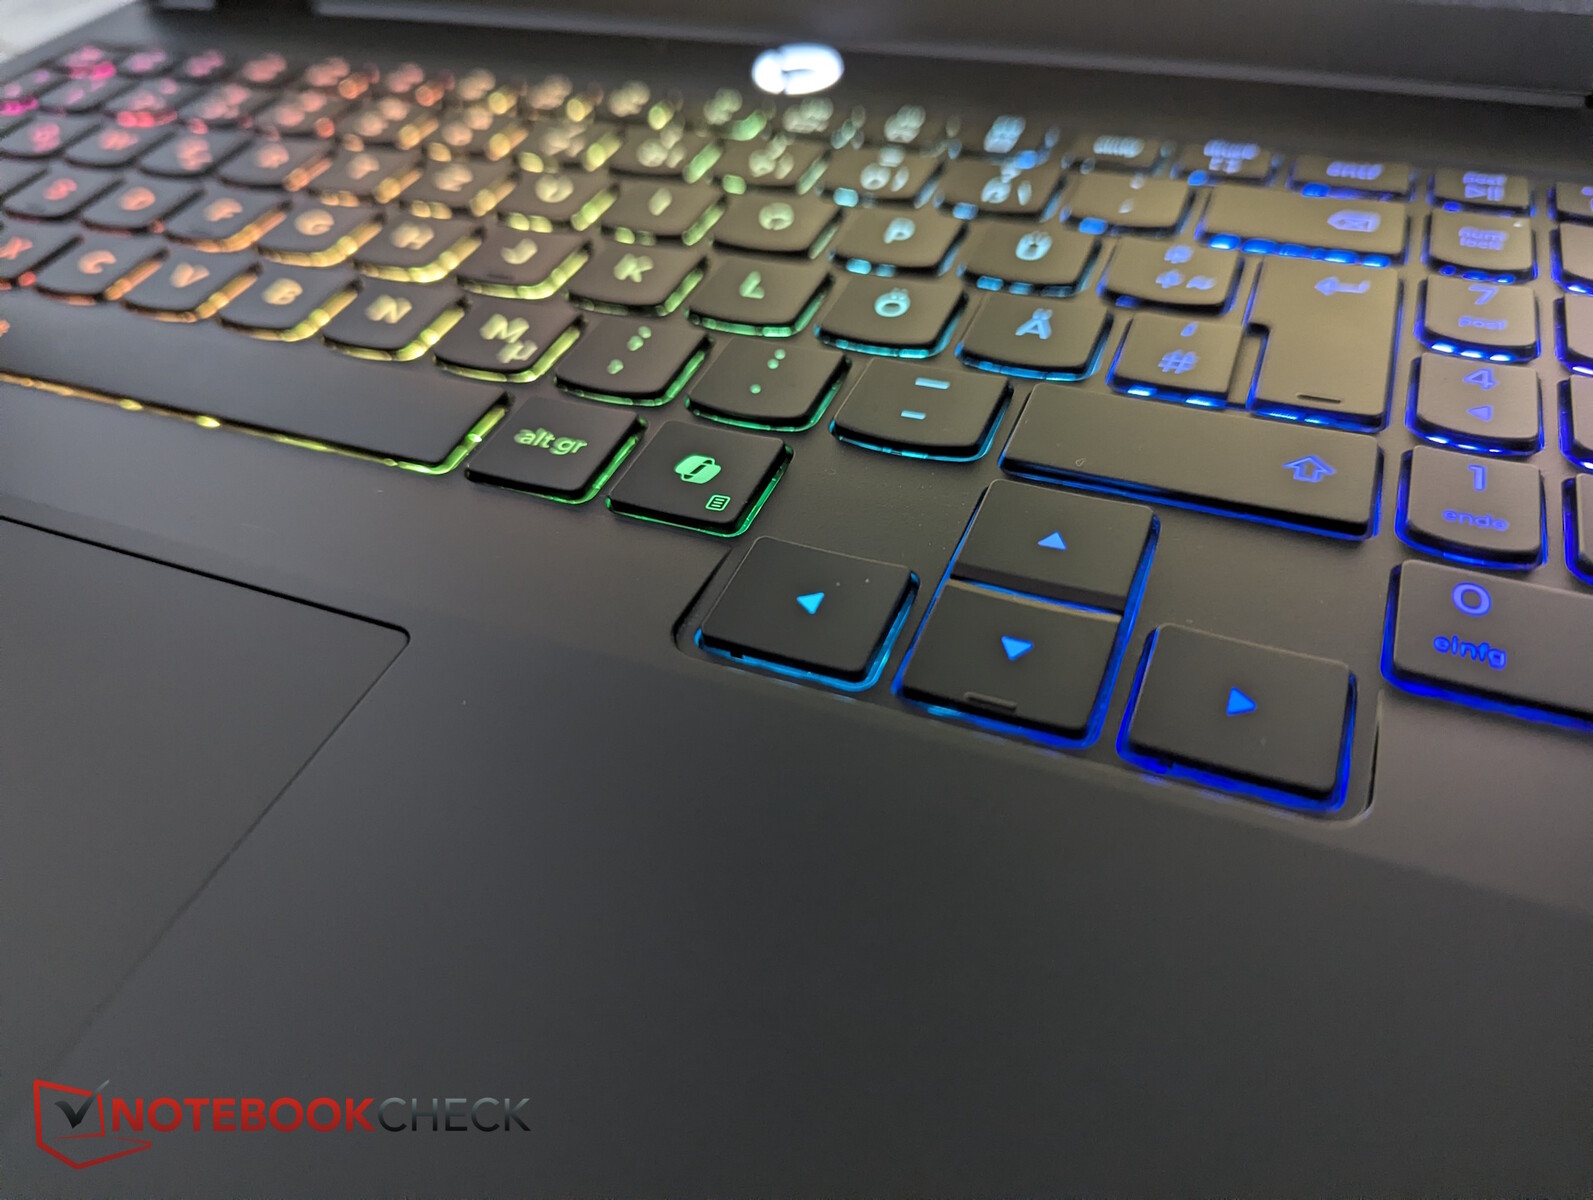
Dispositivos de entrada - sólidos, para un portátil de juegos
Pantalla - OLED brillante

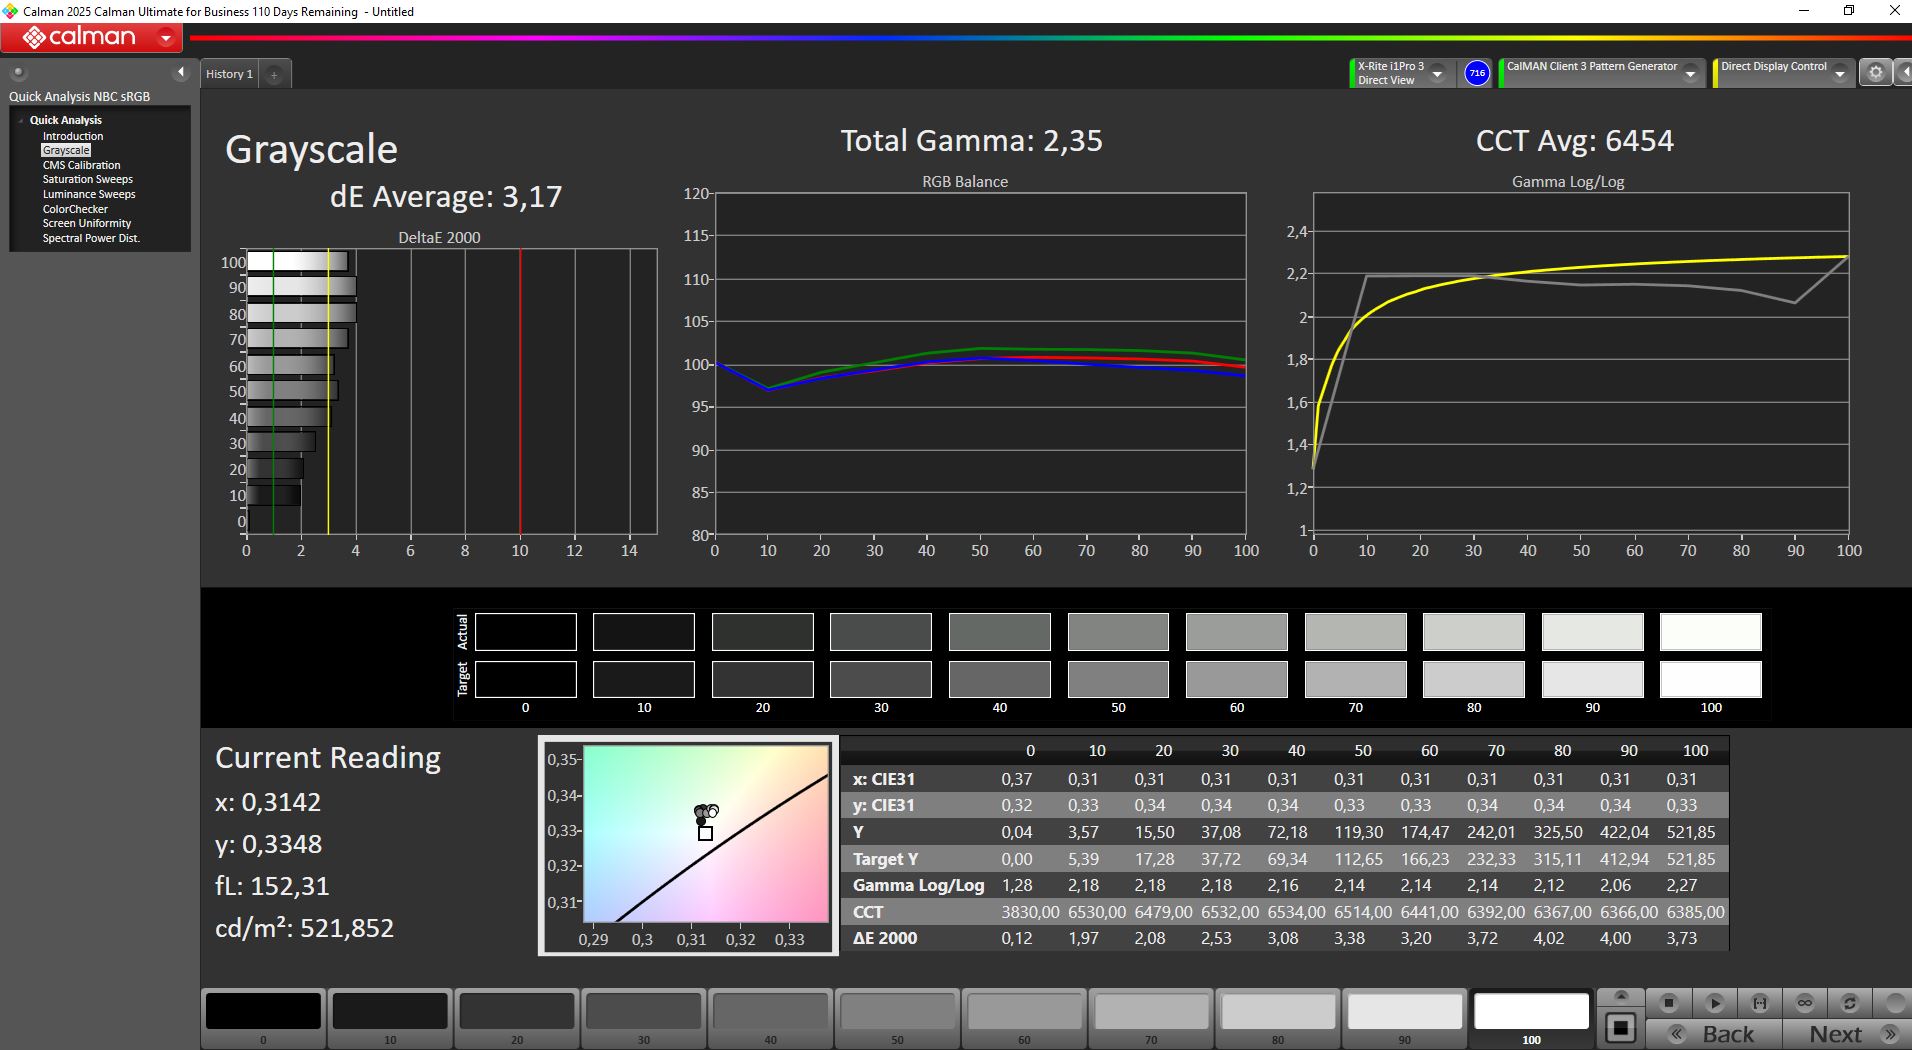
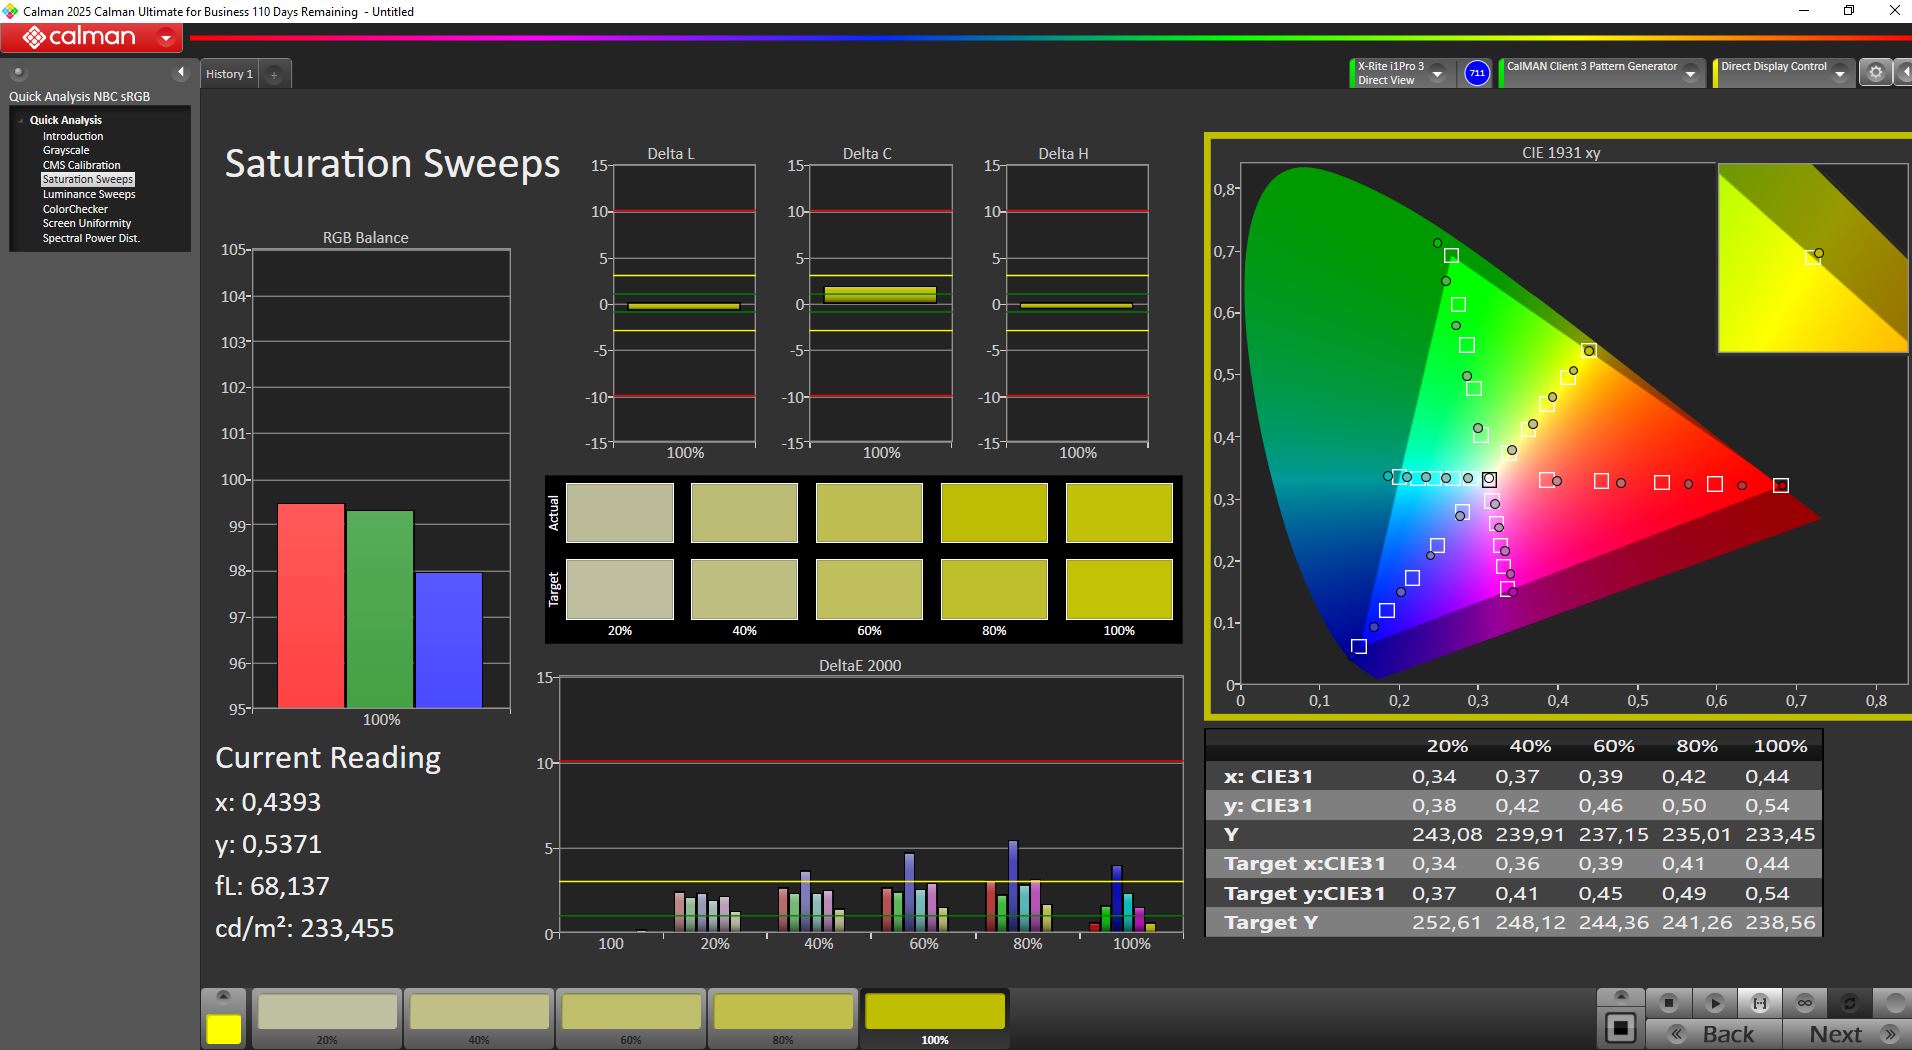
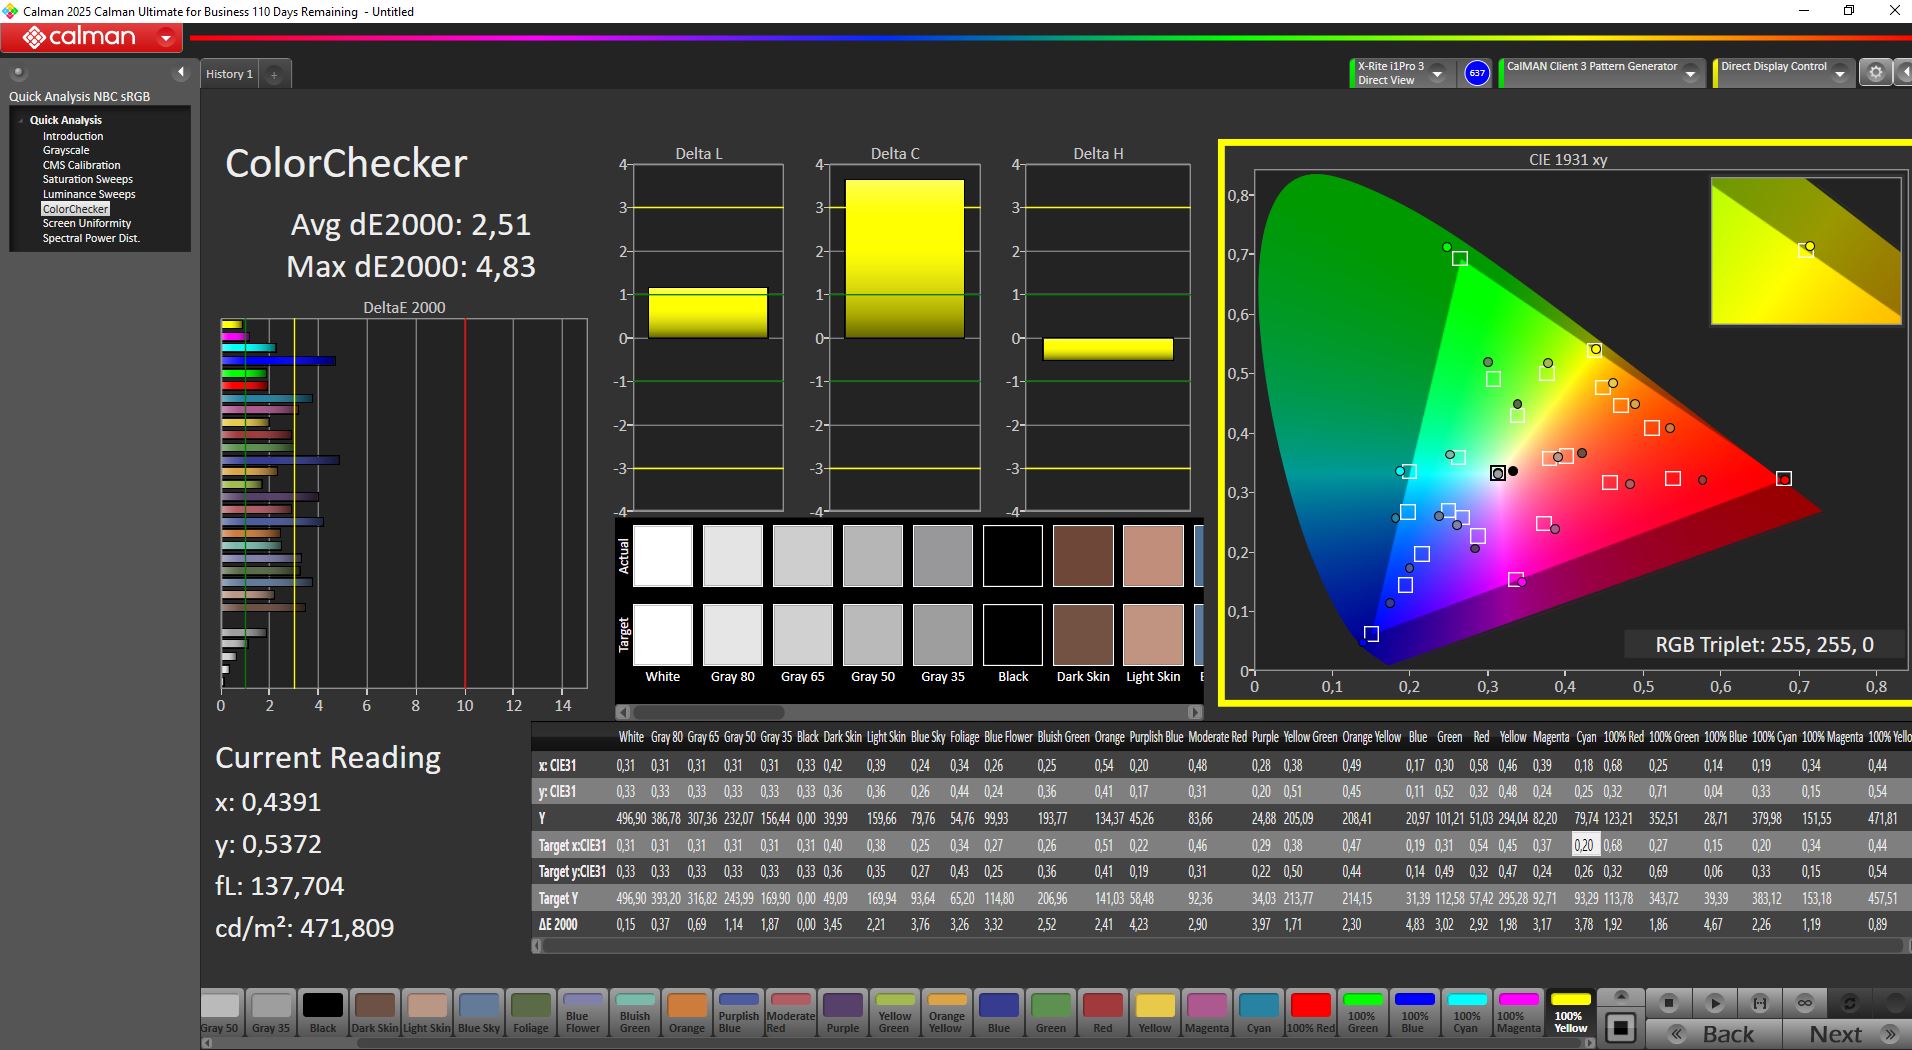
El panel OLED de 16 pulgadas (2560 × 1600 px, DisplayHDR True Black 1000, Dolby Vision, G-SYNC) es una de las características más destacadas del Legion Pro 5.
Entre los competidores, el OLED Legion ofrece una de las mejores pantallas de esta clase: más de 500 nits de brillo, tiempos de respuesta rápidos, amplia cobertura de color y contraste profundo, algo que pocos portátiles para juegos ofrecen a este precio.
| |||||||||||||||||||||||||
iluminación: 98 %
Brillo con batería: 521 cd/m²
Contraste: 6947:1 (Negro: 0.075 cd/m²)
ΔE ColorChecker Calman: 2.5 | ∀{0.5-29.43 Ø4.71}
calibrated: 2.5
ΔE Greyscale Calman: 3.17 | ∀{0.09-98 Ø4.96}
93.9% AdobeRGB 1998 (Argyll 3D)
100% sRGB (Argyll 3D)
99.3% Display P3 (Argyll 3D)
Gamma: 2.35
CCT: 6454 K
| Lenovo Legion Pro 5 16IAX10, RTX 5070 ATNA60HS01-0 (Samsung SDC420A), OLED, 2650x1600, 16", 165 Hz | Lenovo Legion 5 Pro 16IAX10H ATNA60HS01-0 (Samsung SDC420A), OLED, 2560x1600, 16", 165 Hz | Alienware 16X Aurora, RTX 5070 LG Philips 160WQG, IPS, 2560x1600, 16", 240 Hz | Gigabyte Aero X16 1WH MNG007DA5-1, IPS, 2560x1600, 16", 165 Hz | Asus TUF Gaming A16 FA608UP MNG007DA5-3, IPS, 2560x1600, 16", 165 Hz | Schenker XMG Core 16 M25 MNG007DA6-4, IPS, 2560x1600, 16", 300 Hz | Gigabyte Gaming A16 GA6H NE160QDM-NYJ (BOE0C80), IPS, 2560x1600, 16", 165 Hz | |
|---|---|---|---|---|---|---|---|
| Display | 0% | -2% | -20% | -19% | -2% | -18% | |
| Display P3 Coverage (%) | 99.3 | 99.9 1% | 96.9 -2% | 68.7 -31% | 69.4 -30% | 98.8 -1% | 69.4 -30% |
| sRGB Coverage (%) | 100 | 100 0% | 99.8 0% | 96.1 -4% | 97.2 -3% | 100 0% | 99.5 0% |
| AdobeRGB 1998 Coverage (%) | 93.9 | 94.1 0% | 89.7 -4% | 71.2 -24% | 71.9 -23% | 88.4 -6% | 71.6 -24% |
| Response Times | 0% | -318% | -400% | -229% | -343% | -508% | |
| Response Time Grey 50% / Grey 80% * (ms) | 2 ? | 2 ? -0% | 4.3 ? -115% | 12 ? -500% | 6.3 ? -215% | 10.7 ? -435% | 14.3 ? -615% |
| Response Time Black / White * (ms) | 1.4 ? | 1.4 ? -0% | 8.7 ? -521% | 5.6 ? -300% | 4.8 ? -243% | 4.9 ? -250% | 7 ? -400% |
| PWM Frequency (Hz) | 1300 | 1300 | |||||
| PWM Amplitude * (%) | 16.7 | 16.7 -0% | |||||
| Screen | 1% | -78% | -31% | -26% | -53% | -81% | |
| Brightness middle (cd/m²) | 521 | 518 -1% | 493.2 -5% | 395 -24% | 480 -8% | 512 -2% | 432 -17% |
| Brightness (cd/m²) | 519 | 522 1% | 477 -8% | 398 -23% | 456 -12% | 483 -7% | 425 -18% |
| Brightness Distribution (%) | 98 | 97 -1% | 93 -5% | 97 -1% | 91 -7% | 91 -7% | 91 -7% |
| Black Level * (cd/m²) | 0.075 | 0.5 -567% | 0.32 -327% | 0.32 -327% | 0.43 -473% | 0.37 -393% | |
| Contrast (:1) | 6947 | 986 -86% | 1234 -82% | 1500 -78% | 1191 -83% | 1168 -83% | |
| Colorchecker dE 2000 * | 2.5 | 2.49 -0% | 3.57 -43% | 1.3 48% | 1.4 44% | 2.4 4% | 4.76 -90% |
| Colorchecker dE 2000 max. * | 4.85 | 5.25 -8% | 7.03 -45% | 2.8 42% | 2.5 48% | 3.8 22% | 8.59 -77% |
| Colorchecker dE 2000 calibrated * | 2.5 | 2.15 14% | 0.68 73% | 1.4 44% | 1.3 48% | 0.9 64% | 1.18 53% |
| Greyscale dE 2000 * | 3.17 | 3.02 5% | 3.7 -17% | 1.8 43% | 1.2 62% | 3.1 2% | 6.2 -96% |
| Gamma | 2.35 94% | 2.37 93% | 2.16 102% | 2.2 100% | 2.16 102% | 2.41 91% | 2.079 106% |
| CCT | 6454 101% | 6426 101% | 5876 111% | 6842 95% | 6620 98% | 6534 99% | 6690 97% |
| Media total (Programa/Opciones) | 0% /
1% | -133% /
-96% | -150% /
-81% | -91% /
-53% | -133% /
-84% | -202% /
-128% |
* ... más pequeño es mejor
La calibración de fábrica ya es excelente; nuestro ajuste manual mejoró ligeramente la escala de grises, y las desviaciones de color se mantuvieron entre bajas y moderadas.
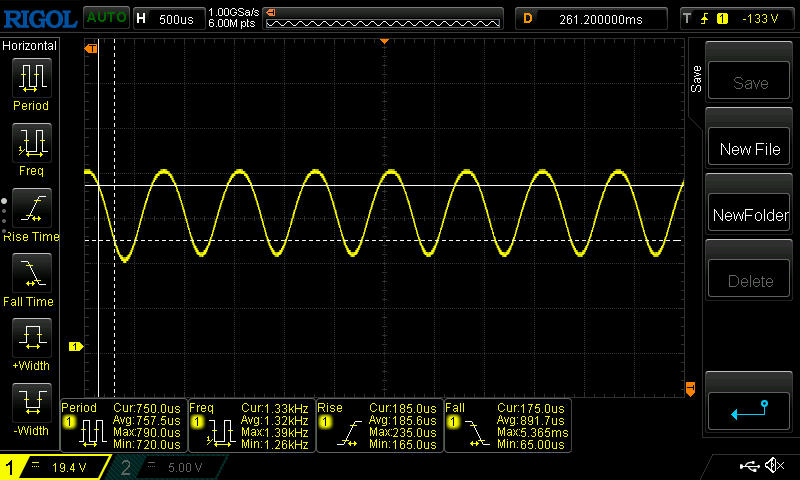
Tiempos de respuesta del display
| ↔ Tiempo de respuesta de Negro a Blanco | ||
|---|---|---|
| 1.4 ms ... subida ↗ y bajada ↘ combinada | ↗ 0.8 ms subida | 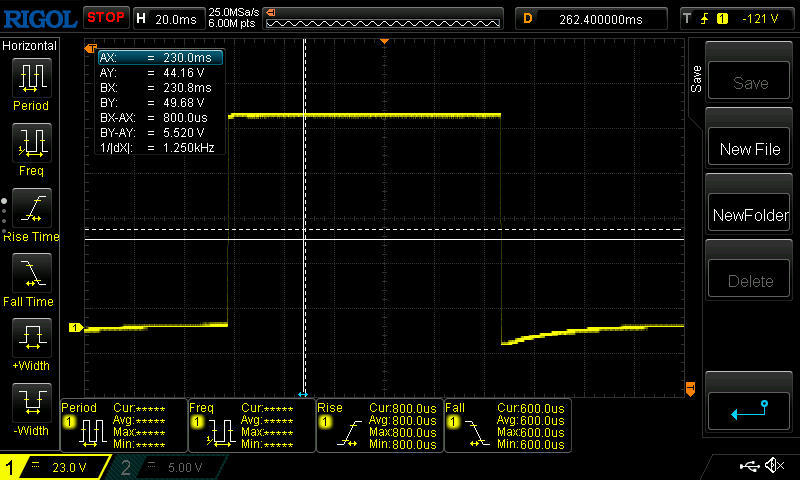 |
| ↘ 0.6 ms bajada | ||
| La pantalla mostró tiempos de respuesta muy rápidos en nuestros tests y debería ser adecuada para juegos frenéticos. En comparación, todos los dispositivos de prueba van de ##min### (mínimo) a 240 (máximo) ms. » 8 % de todos los dispositivos son mejores. Esto quiere decir que el tiempo de respuesta medido es mejor que la media (19.8 ms) de todos los dispositivos testados. | ||
| ↔ Tiempo de respuesta 50% Gris a 80% Gris | ||
| 2 ms ... subida ↗ y bajada ↘ combinada | ↗ 1 ms subida | 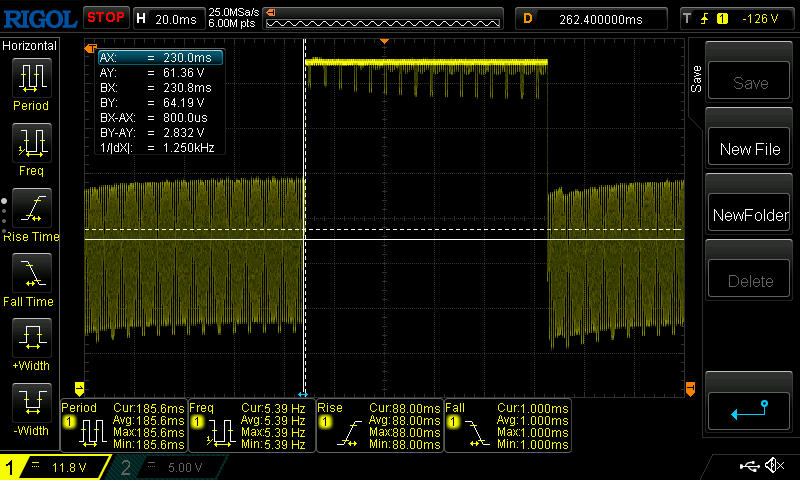 |
| ↘ 1 ms bajada | ||
| La pantalla mostró tiempos de respuesta muy rápidos en nuestros tests y debería ser adecuada para juegos frenéticos. En comparación, todos los dispositivos de prueba van de ##min### (mínimo) a 636 (máximo) ms. » 10 % de todos los dispositivos son mejores. Esto quiere decir que el tiempo de respuesta medido es mejor que la media (31 ms) de todos los dispositivos testados. | ||
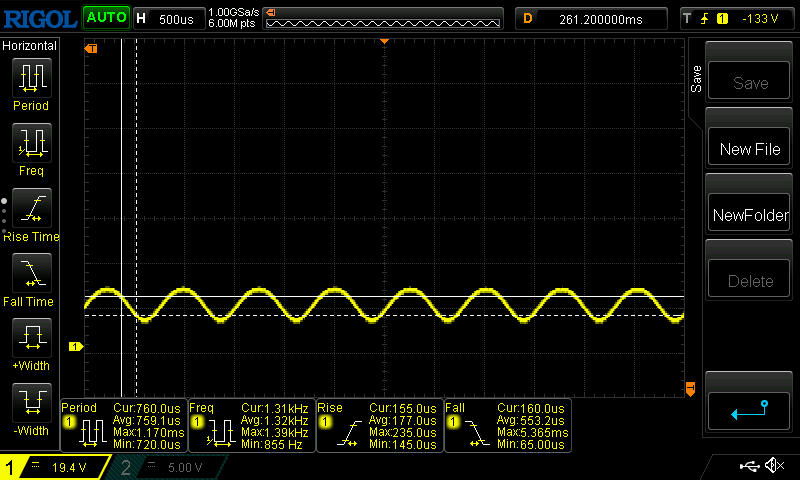
Parpadeo de Pantalla / PWM (Pulse-Width Modulation)
| Parpadeo de Pantalla / PWM detectado | 1300 Hz Amplitude: 16.7 % | 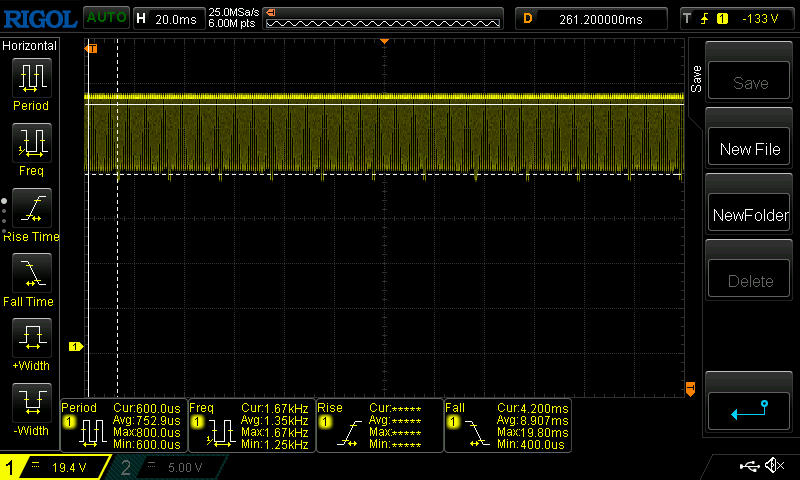 | |
La retroiluminación del display parpadea a 1300 Hz (seguramente usa PWM - Pulse-Width Modulation) . La frecuencia de 1300 Hz es bastante alta, por lo que la mayoría de gente sensible al parpadeo no debería ver parpadeo o tener fatiga visual. Comparación: 52 % de todos los dispositivos testados no usaron PWM para atenuar el display. Si se usó, medimos una media de 7747 (mínimo: 5 - máxmo: 343500) Hz. | |||
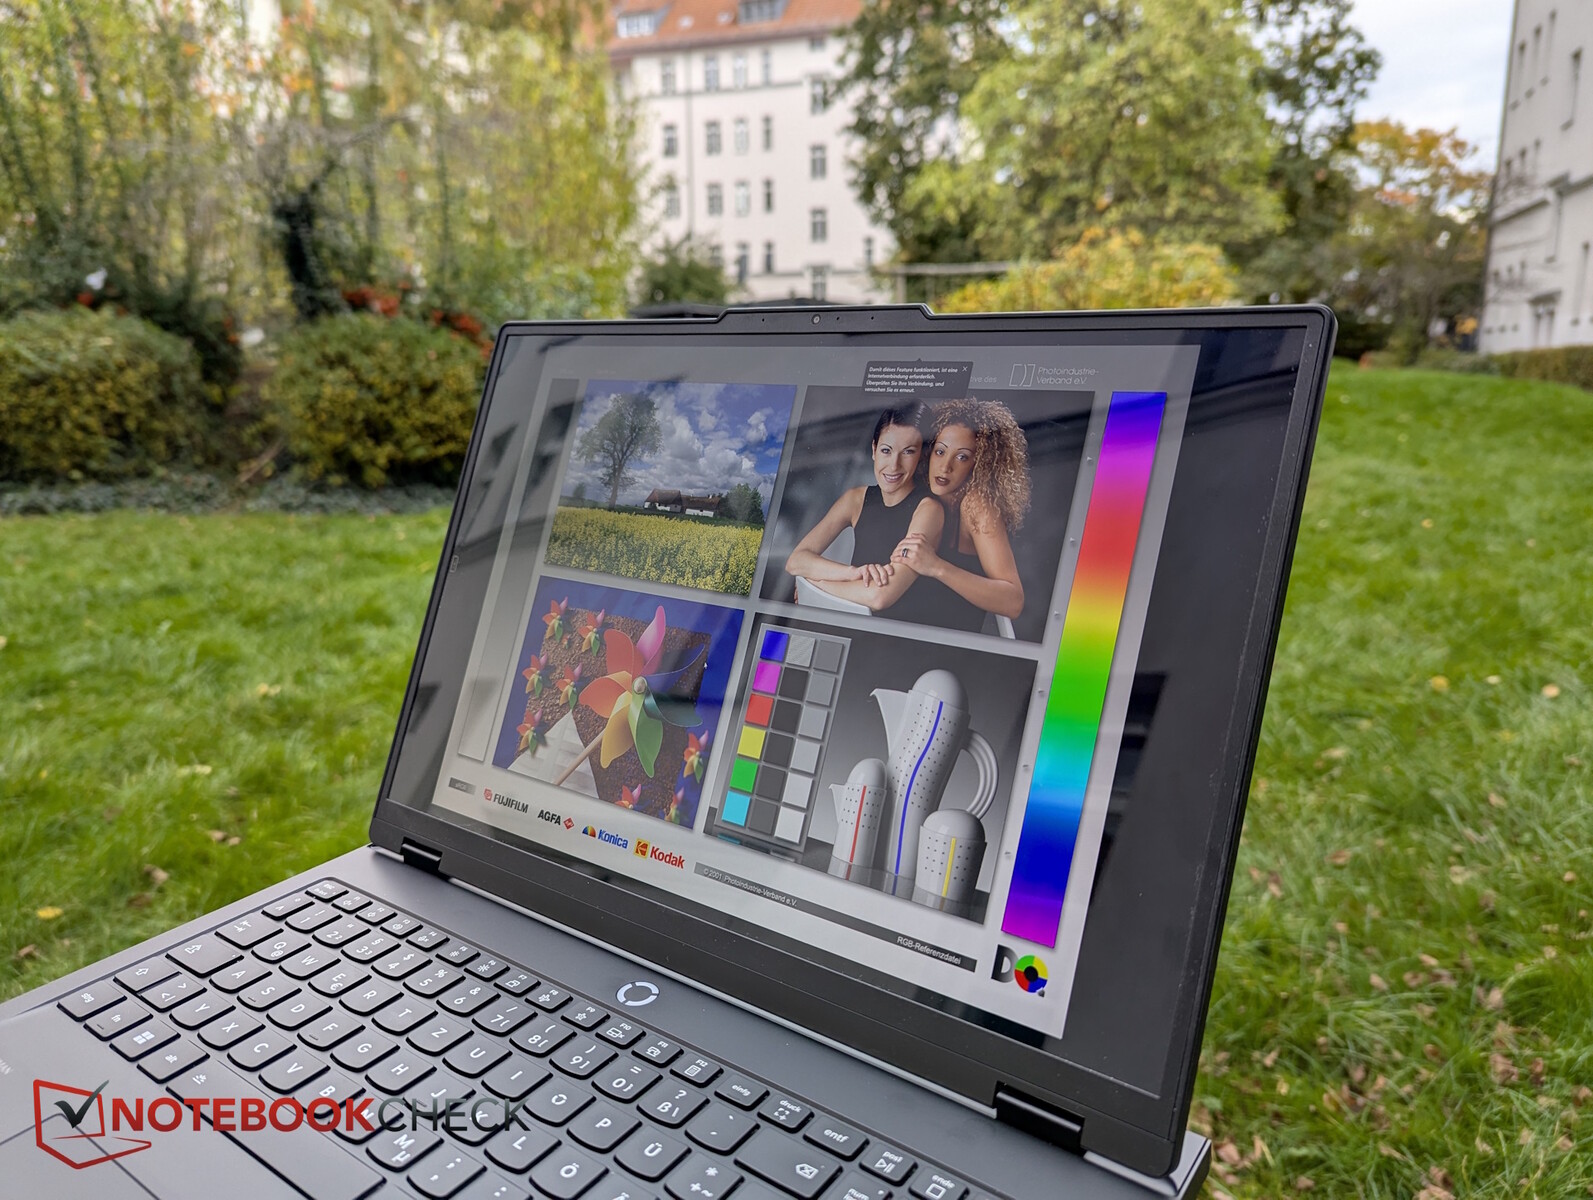
El brillo de 500 nits ayuda en exteriores, aunque la superficie brillante no. Manténgase a la sombra y reduzca al mínimo los reflejos directos, y el uso en exteriores funcionará bien.


Rendimiento - RTX 5070 mantiene el Legion rápido
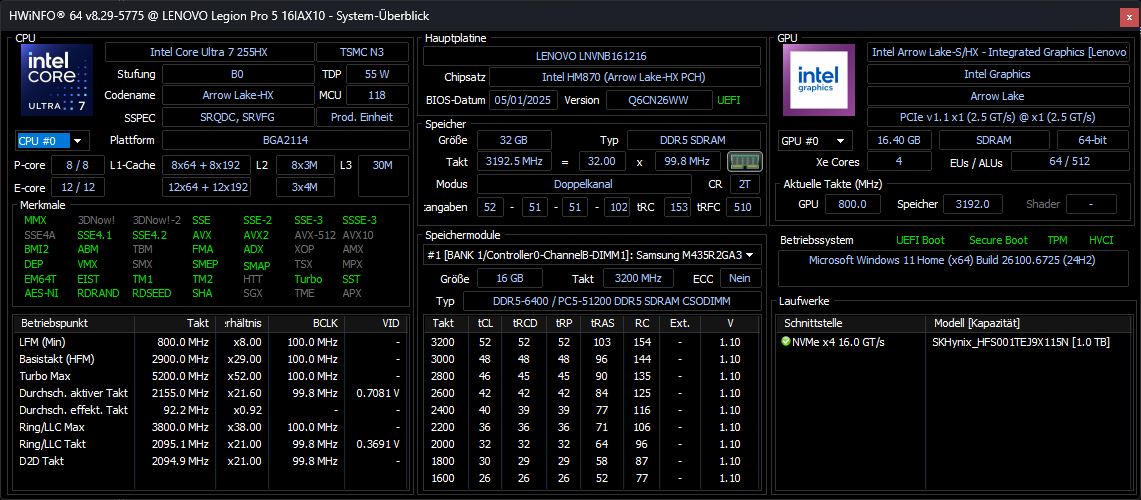
Con una RTX 5070, Core Ultra 7 255HXy 32 GB de RAM, el Legion Pro 5 16 se posiciona como un potente gamer de gama media que, gracias a su gran pantalla, rendimiento y diseño discreto, también podría atraer a los creadores de contenidos.
Condiciones de la prueba
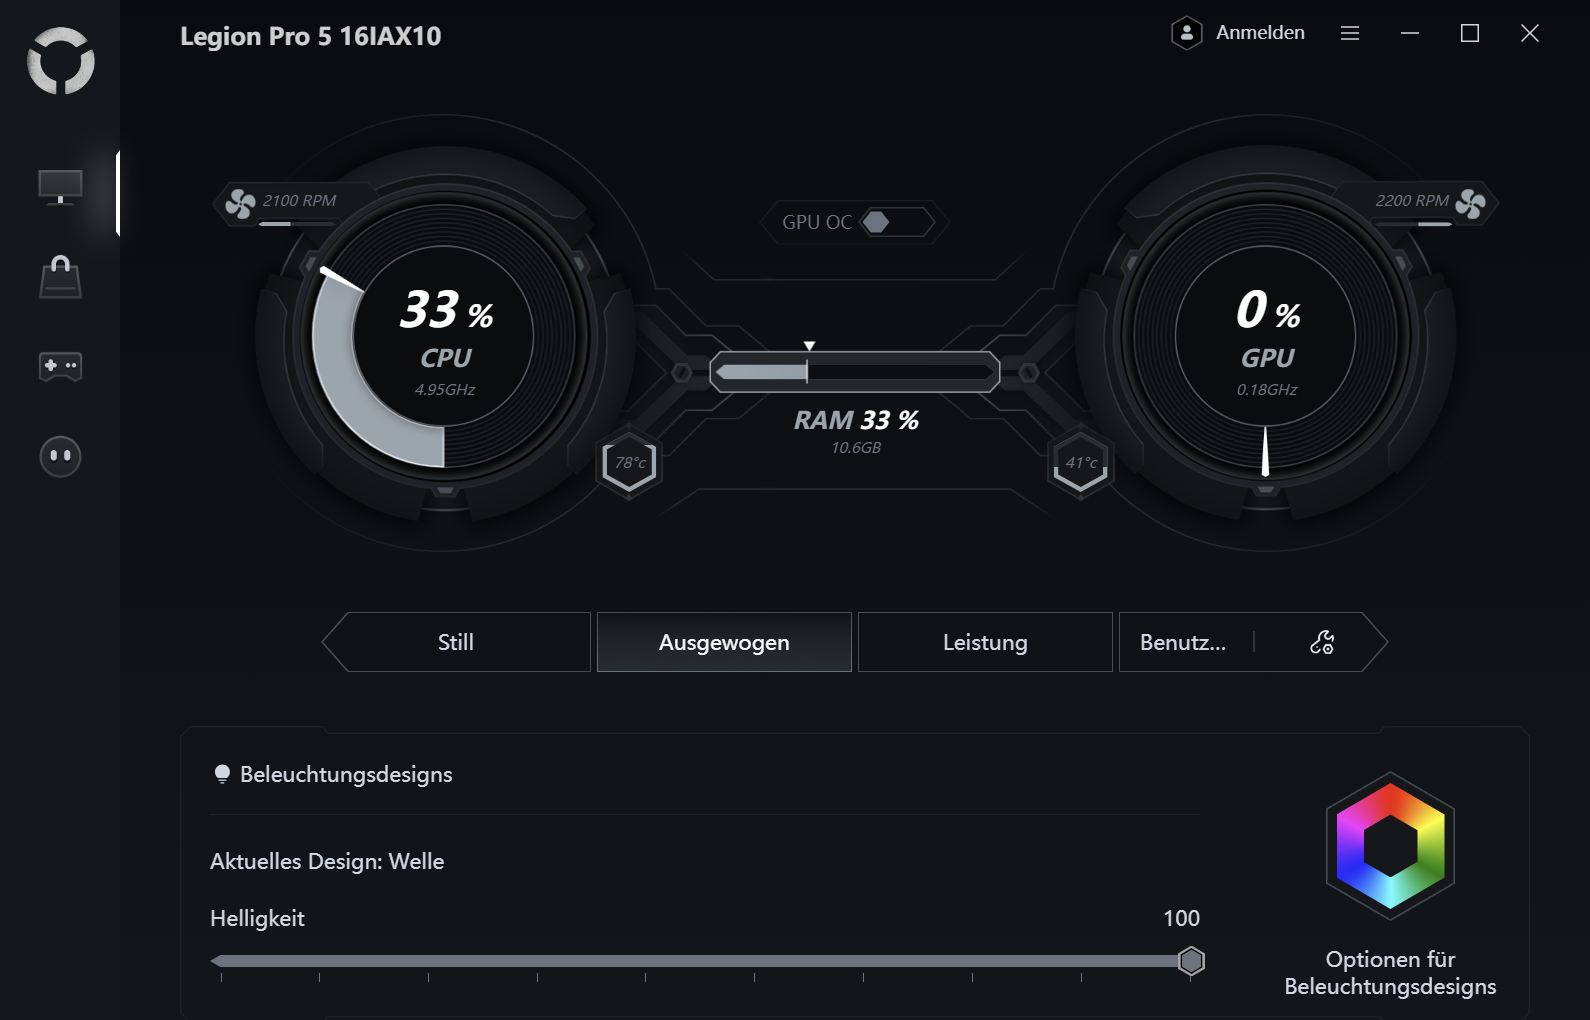
Lenovo preinstala dos utilidades clave: Vantage para la gestión del sistema, escaneos de hardware y ajustes generales, y Legion Space, el centro de juegos con modos de rendimiento y control MUX. Ambas aplicaciones incluyen anuncios, y Vantage puede resultar intrusiva con frecuentes ventanas emergentes. Lenovo Now, otra aplicación, es casi totalmente promocional; lo mejor es desinstalarla.
Todos los puntos de referencia se ejecutaron en modo Rendimiento.

| Modo | Cinebench R15 | Potencia de la CPU | Cyberpunk 2077 Ultra | Potencia de la GPU | Nivel de ruido (Cyberpunk) |
|---|---|---|---|---|---|
| Rendimiento | 5190 | 194 → 183 W | 107 fps | 103 W | 50,27 dB |
| Equilibrado | 4463 | 135 → 75 W | 94,2 fps | 93 W | 47,34 dB |
| Eco | 3731 | 65 W | 72 fps | 55 W | 38,44 dB |
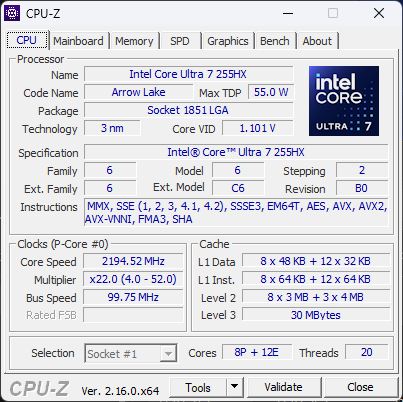
Procesador
El Intel Core Ultra 7 255HX tiene cuatro núcleos E menos que el Ultra 9 275HX y velocidades de reloj ligeramente inferiores.
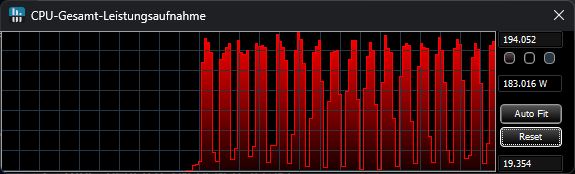
En nuestras pruebas comparativas de CPU, el rendimiento está por encima de la media, sólo unos pocos puntos porcentuales por detrás de la Ultra 9 275HX. En el bucle Cinebench, mantiene un rendimiento estable con sólo una caída menor (~7 %) con el tiempo.
Funcionar con batería reduce el rendimiento de la CPU en un 43 % aproximadamente.
Cinebench R15 Prueba de estrés múltiple
Cinebench R23: Multi Core | Single Core
Cinebench R20: CPU (Multi Core) | CPU (Single Core)
Cinebench R15: CPU Multi 64Bit | CPU Single 64Bit
Blender: v2.79 BMW27 CPU
7-Zip 18.03: 7z b 4 | 7z b 4 -mmt1
Geekbench 6.7: Multi-Core | Single-Core
Geekbench 5.5: Multi-Core | Single-Core
HWBOT x265 Benchmark v2.2: 4k Preset
LibreOffice : 20 Documents To PDF
R Benchmark 2.5: Overall mean
| CPU Performance rating | |
| Lenovo Legion 5 Pro 16IAX10H | |
| Alienware 16X Aurora, RTX 5070 | |
| Lenovo Legion Pro 5 16IAX10, RTX 5070 | |
| Medio Intel Core Ultra 7 255HX | |
| Media de la clase Gaming | |
| Schenker XMG Core 16 M25 | |
| Gigabyte Aero X16 1WH | |
| Asus TUF Gaming A16 FA608UP | |
| Gigabyte Gaming A16 GA6H | |
| Cinebench R23 / Multi Core | |
| Lenovo Legion 5 Pro 16IAX10H | |
| Alienware 16X Aurora, RTX 5070 | |
| Lenovo Legion Pro 5 16IAX10, RTX 5070 | |
| Medio Intel Core Ultra 7 255HX (27129 - 34005, n=5) | |
| Media de la clase Gaming (10488 - 42661, n=107, últimos 2 años) | |
| Schenker XMG Core 16 M25 | |
| Gigabyte Aero X16 1WH | |
| Asus TUF Gaming A16 FA608UP | |
| Gigabyte Gaming A16 GA6H | |
| Cinebench R23 / Single Core | |
| Lenovo Legion 5 Pro 16IAX10H | |
| Alienware 16X Aurora, RTX 5070 | |
| Lenovo Legion Pro 5 16IAX10, RTX 5070 | |
| Medio Intel Core Ultra 7 255HX (2111 - 2171, n=5) | |
| Schenker XMG Core 16 M25 | |
| Media de la clase Gaming (1166 - 2415, n=107, últimos 2 años) | |
| Gigabyte Aero X16 1WH | |
| Gigabyte Gaming A16 GA6H | |
| Asus TUF Gaming A16 FA608UP | |
| Cinebench R20 / CPU (Multi Core) | |
| Lenovo Legion 5 Pro 16IAX10H | |
| Alienware 16X Aurora, RTX 5070 | |
| Lenovo Legion Pro 5 16IAX10, RTX 5070 | |
| Medio Intel Core Ultra 7 255HX (10626 - 13056, n=5) | |
| Media de la clase Gaming (4029 - 16433, n=106, últimos 2 años) | |
| Schenker XMG Core 16 M25 | |
| Asus TUF Gaming A16 FA608UP | |
| Gigabyte Aero X16 1WH | |
| Gigabyte Gaming A16 GA6H | |
| Cinebench R20 / CPU (Single Core) | |
| Lenovo Legion 5 Pro 16IAX10H | |
| Alienware 16X Aurora, RTX 5070 | |
| Lenovo Legion Pro 5 16IAX10, RTX 5070 | |
| Medio Intel Core Ultra 7 255HX (822 - 835, n=5) | |
| Schenker XMG Core 16 M25 | |
| Media de la clase Gaming (442 - 913, n=106, últimos 2 años) | |
| Gigabyte Aero X16 1WH | |
| Gigabyte Gaming A16 GA6H | |
| Asus TUF Gaming A16 FA608UP | |
| Cinebench R15 / CPU Multi 64Bit | |
| Lenovo Legion 5 Pro 16IAX10H | |
| Alienware 16X Aurora, RTX 5070 | |
| Lenovo Legion Pro 5 16IAX10, RTX 5070 | |
| Medio Intel Core Ultra 7 255HX (4114 - 5190, n=5) | |
| Media de la clase Gaming (1578 - 6330, n=105, últimos 2 años) | |
| Schenker XMG Core 16 M25 | |
| Asus TUF Gaming A16 FA608UP | |
| Gigabyte Aero X16 1WH | |
| Gigabyte Gaming A16 GA6H | |
| Cinebench R15 / CPU Single 64Bit | |
| Lenovo Legion 5 Pro 16IAX10H | |
| Alienware 16X Aurora, RTX 5070 | |
| Lenovo Legion Pro 5 16IAX10, RTX 5070 | |
| Medio Intel Core Ultra 7 255HX (322 - 328, n=5) | |
| Media de la clase Gaming (188.8 - 350, n=106, últimos 2 años) | |
| Asus TUF Gaming A16 FA608UP | |
| Gigabyte Gaming A16 GA6H | |
| Gigabyte Aero X16 1WH | |
| Schenker XMG Core 16 M25 | |
| Blender / v2.79 BMW27 CPU | |
| Gigabyte Gaming A16 GA6H | |
| Gigabyte Aero X16 1WH | |
| Asus TUF Gaming A16 FA608UP | |
| Media de la clase Gaming (79 - 330, n=104, últimos 2 años) | |
| Schenker XMG Core 16 M25 | |
| Medio Intel Core Ultra 7 255HX (104 - 122, n=5) | |
| Lenovo Legion Pro 5 16IAX10, RTX 5070 | |
| Alienware 16X Aurora, RTX 5070 | |
| Lenovo Legion 5 Pro 16IAX10H | |
| 7-Zip 18.03 / 7z b 4 | |
| Lenovo Legion 5 Pro 16IAX10H | |
| Alienware 16X Aurora, RTX 5070 | |
| Lenovo Legion Pro 5 16IAX10, RTX 5070 | |
| Medio Intel Core Ultra 7 255HX (87806 - 104055, n=5) | |
| Media de la clase Gaming (33491 - 148086, n=105, últimos 2 años) | |
| Schenker XMG Core 16 M25 | |
| Asus TUF Gaming A16 FA608UP | |
| Gigabyte Aero X16 1WH | |
| Gigabyte Gaming A16 GA6H | |
| 7-Zip 18.03 / 7z b 4 -mmt1 | |
| Lenovo Legion 5 Pro 16IAX10H | |
| Alienware 16X Aurora, RTX 5070 | |
| Lenovo Legion Pro 5 16IAX10, RTX 5070 | |
| Medio Intel Core Ultra 7 255HX (6407 - 6576, n=5) | |
| Schenker XMG Core 16 M25 | |
| Media de la clase Gaming (4199 - 7436, n=105, últimos 2 años) | |
| Asus TUF Gaming A16 FA608UP | |
| Gigabyte Aero X16 1WH | |
| Gigabyte Gaming A16 GA6H | |
| Geekbench 6.7 / Multi-Core | |
| Lenovo Legion 5 Pro 16IAX10H | |
| Lenovo Legion Pro 5 16IAX10, RTX 5070 | |
| Alienware 16X Aurora, RTX 5070 | |
| Medio Intel Core Ultra 7 255HX (16396 - 19623, n=6) | |
| Schenker XMG Core 16 M25 | |
| Media de la clase Gaming (6625 - 22850, n=106, últimos 2 años) | |
| Gigabyte Aero X16 1WH | |
| Asus TUF Gaming A16 FA608UP | |
| Gigabyte Gaming A16 GA6H | |
| Geekbench 6.7 / Single-Core | |
| Lenovo Legion 5 Pro 16IAX10H | |
| Alienware 16X Aurora, RTX 5070 | |
| Lenovo Legion Pro 5 16IAX10, RTX 5070 | |
| Medio Intel Core Ultra 7 255HX (2917 - 3028, n=6) | |
| Schenker XMG Core 16 M25 | |
| Gigabyte Aero X16 1WH | |
| Media de la clase Gaming (1490 - 3259, n=106, últimos 2 años) | |
| Asus TUF Gaming A16 FA608UP | |
| Gigabyte Gaming A16 GA6H | |
| Geekbench 5.5 / Multi-Core | |
| Lenovo Legion 5 Pro 16IAX10H | |
| Alienware 16X Aurora, RTX 5070 | |
| Lenovo Legion Pro 5 16IAX10, RTX 5070 | |
| Medio Intel Core Ultra 7 255HX (18263 - 21014, n=5) | |
| Media de la clase Gaming (6460 - 28263, n=105, últimos 2 años) | |
| Schenker XMG Core 16 M25 | |
| Gigabyte Aero X16 1WH | |
| Asus TUF Gaming A16 FA608UP | |
| Gigabyte Gaming A16 GA6H | |
| Geekbench 5.5 / Single-Core | |
| Lenovo Legion 5 Pro 16IAX10H | |
| Alienware 16X Aurora, RTX 5070 | |
| Lenovo Legion Pro 5 16IAX10, RTX 5070 | |
| Medio Intel Core Ultra 7 255HX (2112 - 2211, n=5) | |
| Gigabyte Aero X16 1WH | |
| Schenker XMG Core 16 M25 | |
| Media de la clase Gaming (986 - 2474, n=105, últimos 2 años) | |
| Asus TUF Gaming A16 FA608UP | |
| Gigabyte Gaming A16 GA6H | |
| HWBOT x265 Benchmark v2.2 / 4k Preset | |
| Lenovo Legion 5 Pro 16IAX10H | |
| Alienware 16X Aurora, RTX 5070 | |
| Lenovo Legion Pro 5 16IAX10, RTX 5070 | |
| Medio Intel Core Ultra 7 255HX (30.4 - 36.9, n=5) | |
| Media de la clase Gaming (11.5 - 44.4, n=105, últimos 2 años) | |
| Schenker XMG Core 16 M25 | |
| Gigabyte Aero X16 1WH | |
| Asus TUF Gaming A16 FA608UP | |
| Gigabyte Gaming A16 GA6H | |
| LibreOffice / 20 Documents To PDF | |
| Asus TUF Gaming A16 FA608UP | |
| Gigabyte Gaming A16 GA6H | |
| Gigabyte Aero X16 1WH | |
| Schenker XMG Core 16 M25 | |
| Media de la clase Gaming (33.2 - 88.8, n=105, últimos 2 años) | |
| Lenovo Legion Pro 5 16IAX10, RTX 5070 | |
| Medio Intel Core Ultra 7 255HX (35.4 - 45.9, n=5) | |
| Alienware 16X Aurora, RTX 5070 | |
| Lenovo Legion 5 Pro 16IAX10H | |
| R Benchmark 2.5 / Overall mean | |
| Gigabyte Gaming A16 GA6H | |
| Asus TUF Gaming A16 FA608UP | |
| Media de la clase Gaming (0.3439 - 0.759, n=106, últimos 2 años) | |
| Lenovo Legion Pro 5 16IAX10, RTX 5070 | |
| Medio Intel Core Ultra 7 255HX (0.4209 - 0.4287, n=5) | |
| Alienware 16X Aurora, RTX 5070 | |
| Lenovo Legion 5 Pro 16IAX10H | |
| Gigabyte Aero X16 1WH | |
| Schenker XMG Core 16 M25 | |
* ... más pequeño es mejor
AIDA64: FP32 Ray-Trace | FPU Julia | CPU SHA3 | CPU Queen | FPU SinJulia | FPU Mandel | CPU AES | CPU ZLib | FP64 Ray-Trace | CPU PhotoWorxx
| Performance rating | |
| Lenovo Legion 5 Pro 16IAX10H | |
| Lenovo Legion Pro 5 16IAX10, RTX 5070 | |
| Alienware 16X Aurora, RTX 5070 | |
| Schenker XMG Core 16 M25 | |
| Medio Intel Core Ultra 7 255HX | |
| Media de la clase Gaming | |
| Asus TUF Gaming A16 FA608UP | |
| Gigabyte Aero X16 1WH | |
| Gigabyte Gaming A16 GA6H | |
| AIDA64 / FP32 Ray-Trace | |
| Schenker XMG Core 16 M25 | |
| Lenovo Legion 5 Pro 16IAX10H | |
| Lenovo Legion Pro 5 16IAX10, RTX 5070 | |
| Alienware 16X Aurora, RTX 5070 | |
| Media de la clase Gaming (10227 - 85542, n=105, últimos 2 años) | |
| Medio Intel Core Ultra 7 255HX (27732 - 34250, n=5) | |
| Asus TUF Gaming A16 FA608UP | |
| Gigabyte Aero X16 1WH | |
| Gigabyte Gaming A16 GA6H | |
| AIDA64 / FPU Julia | |
| Lenovo Legion 5 Pro 16IAX10H | |
| Lenovo Legion Pro 5 16IAX10, RTX 5070 | |
| Alienware 16X Aurora, RTX 5070 | |
| Medio Intel Core Ultra 7 255HX (140290 - 167758, n=5) | |
| Schenker XMG Core 16 M25 | |
| Media de la clase Gaming (51376 - 238426, n=105, últimos 2 años) | |
| Asus TUF Gaming A16 FA608UP | |
| Gigabyte Aero X16 1WH | |
| Gigabyte Gaming A16 GA6H | |
| AIDA64 / CPU SHA3 | |
| Lenovo Legion 5 Pro 16IAX10H | |
| Alienware 16X Aurora, RTX 5070 | |
| Lenovo Legion Pro 5 16IAX10, RTX 5070 | |
| Medio Intel Core Ultra 7 255HX (6445 - 7694, n=5) | |
| Media de la clase Gaming (2180 - 10115, n=105, últimos 2 años) | |
| Schenker XMG Core 16 M25 | |
| Asus TUF Gaming A16 FA608UP | |
| Gigabyte Aero X16 1WH | |
| Gigabyte Gaming A16 GA6H | |
| AIDA64 / CPU Queen | |
| Lenovo Legion 5 Pro 16IAX10H | |
| Lenovo Legion Pro 5 16IAX10, RTX 5070 | |
| Alienware 16X Aurora, RTX 5070 | |
| Medio Intel Core Ultra 7 255HX (115802 - 135237, n=5) | |
| Asus TUF Gaming A16 FA608UP | |
| Media de la clase Gaming (49785 - 173351, n=90, últimos 2 años) | |
| Schenker XMG Core 16 M25 | |
| Gigabyte Aero X16 1WH | |
| Gigabyte Gaming A16 GA6H | |
| AIDA64 / FPU SinJulia | |
| Schenker XMG Core 16 M25 | |
| Asus TUF Gaming A16 FA608UP | |
| Media de la clase Gaming (4424 - 33636, n=105, últimos 2 años) | |
| Lenovo Legion 5 Pro 16IAX10H | |
| Gigabyte Aero X16 1WH | |
| Alienware 16X Aurora, RTX 5070 | |
| Lenovo Legion Pro 5 16IAX10, RTX 5070 | |
| Medio Intel Core Ultra 7 255HX (11066 - 12286, n=5) | |
| Gigabyte Gaming A16 GA6H | |
| AIDA64 / FPU Mandel | |
| Lenovo Legion 5 Pro 16IAX10H | |
| Lenovo Legion Pro 5 16IAX10, RTX 5070 | |
| Alienware 16X Aurora, RTX 5070 | |
| Medio Intel Core Ultra 7 255HX (72938 - 87947, n=5) | |
| Schenker XMG Core 16 M25 | |
| Media de la clase Gaming (25115 - 128721, n=105, últimos 2 años) | |
| Asus TUF Gaming A16 FA608UP | |
| Gigabyte Aero X16 1WH | |
| Gigabyte Gaming A16 GA6H | |
| AIDA64 / CPU AES | |
| Lenovo Legion 5 Pro 16IAX10H | |
| Alienware 16X Aurora, RTX 5070 | |
| Schenker XMG Core 16 M25 | |
| Lenovo Legion Pro 5 16IAX10, RTX 5070 | |
| Medio Intel Core Ultra 7 255HX (96832 - 116158, n=5) | |
| Media de la clase Gaming (39258 - 247074, n=105, últimos 2 años) | |
| Asus TUF Gaming A16 FA608UP | |
| Gigabyte Aero X16 1WH | |
| Gigabyte Gaming A16 GA6H | |
| AIDA64 / CPU ZLib | |
| Lenovo Legion 5 Pro 16IAX10H | |
| Alienware 16X Aurora, RTX 5070 | |
| Lenovo Legion Pro 5 16IAX10, RTX 5070 | |
| Medio Intel Core Ultra 7 255HX (1510 - 1850, n=5) | |
| Media de la clase Gaming (574 - 2531, n=105, últimos 2 años) | |
| Schenker XMG Core 16 M25 | |
| Gigabyte Aero X16 1WH | |
| Asus TUF Gaming A16 FA608UP | |
| Gigabyte Gaming A16 GA6H | |
| AIDA64 / FP64 Ray-Trace | |
| Schenker XMG Core 16 M25 | |
| Lenovo Legion 5 Pro 16IAX10H | |
| Lenovo Legion Pro 5 16IAX10, RTX 5070 | |
| Alienware 16X Aurora, RTX 5070 | |
| Media de la clase Gaming (5509 - 45446, n=105, últimos 2 años) | |
| Medio Intel Core Ultra 7 255HX (15137 - 18315, n=5) | |
| Asus TUF Gaming A16 FA608UP | |
| Gigabyte Aero X16 1WH | |
| Gigabyte Gaming A16 GA6H | |
| AIDA64 / CPU PhotoWorxx | |
| Lenovo Legion Pro 5 16IAX10, RTX 5070 | |
| Schenker XMG Core 16 M25 | |
| Lenovo Legion 5 Pro 16IAX10H | |
| Alienware 16X Aurora, RTX 5070 | |
| Medio Intel Core Ultra 7 255HX (39697 - 54070, n=5) | |
| Media de la clase Gaming (12271 - 89891, n=105, últimos 2 años) | |
| Gigabyte Aero X16 1WH | |
| Asus TUF Gaming A16 FA608UP | |
| Gigabyte Gaming A16 GA6H | |
Rendimiento del sistema
La Legion Pro 5 16 ofrece un excelente rendimiento general del sistema, aventajando a la mayoría de los competidores y quedando por detrás de su hermana Ti sólo por un pequeño margen.
PCMark 10: Score | Essentials | Productivity | Digital Content Creation
CrossMark: Overall | Productivity | Creativity | Responsiveness
WebXPRT 3: Overall
WebXPRT 4: Overall
Mozilla Kraken 1.1: Total
| Performance rating | |
| Lenovo Legion 5 Pro 16IAX10H | |
| Alienware 16X Aurora, RTX 5070 -4! | |
| Lenovo Legion Pro 5 16IAX10, RTX 5070 | |
| Medio Intel Core Ultra 7 255HX, NVIDIA GeForce RTX 5070 Laptop | |
| Media de la clase Gaming | |
| Schenker XMG Core 16 M25 -4! | |
| Gigabyte Aero X16 1WH | |
| Gigabyte Gaming A16 GA6H | |
| Asus TUF Gaming A16 FA608UP -4! | |
| PCMark 10 / Score | |
| Lenovo Legion Pro 5 16IAX10, RTX 5070 | |
| Medio Intel Core Ultra 7 255HX, NVIDIA GeForce RTX 5070 Laptop (n=1) | |
| Media de la clase Gaming (5828 - 12414, n=93, últimos 2 años) | |
| Lenovo Legion 5 Pro 16IAX10H | |
| Gigabyte Aero X16 1WH | |
| Gigabyte Gaming A16 GA6H | |
| PCMark 10 / Essentials | |
| Lenovo Legion Pro 5 16IAX10, RTX 5070 | |
| Medio Intel Core Ultra 7 255HX, NVIDIA GeForce RTX 5070 Laptop (n=1) | |
| Lenovo Legion 5 Pro 16IAX10H | |
| Media de la clase Gaming (8810 - 11935, n=97, últimos 2 años) | |
| Gigabyte Aero X16 1WH | |
| Gigabyte Gaming A16 GA6H | |
| PCMark 10 / Productivity | |
| Media de la clase Gaming (6845 - 25323, n=95, últimos 2 años) | |
| Gigabyte Aero X16 1WH | |
| Lenovo Legion Pro 5 16IAX10, RTX 5070 | |
| Medio Intel Core Ultra 7 255HX, NVIDIA GeForce RTX 5070 Laptop (n=1) | |
| Lenovo Legion 5 Pro 16IAX10H | |
| Gigabyte Gaming A16 GA6H | |
| PCMark 10 / Digital Content Creation | |
| Lenovo Legion Pro 5 16IAX10, RTX 5070 | |
| Medio Intel Core Ultra 7 255HX, NVIDIA GeForce RTX 5070 Laptop (n=1) | |
| Lenovo Legion 5 Pro 16IAX10H | |
| Media de la clase Gaming (7602 - 19954, n=95, últimos 2 años) | |
| Gigabyte Aero X16 1WH | |
| Gigabyte Gaming A16 GA6H | |
| CrossMark / Overall | |
| Alienware 16X Aurora, RTX 5070 | |
| Lenovo Legion 5 Pro 16IAX10H | |
| Lenovo Legion Pro 5 16IAX10, RTX 5070 | |
| Medio Intel Core Ultra 7 255HX, NVIDIA GeForce RTX 5070 Laptop (n=1) | |
| Schenker XMG Core 16 M25 | |
| Media de la clase Gaming (1366 - 2409, n=94, últimos 2 años) | |
| Gigabyte Gaming A16 GA6H | |
| Gigabyte Aero X16 1WH | |
| Asus TUF Gaming A16 FA608UP | |
| CrossMark / Productivity | |
| Alienware 16X Aurora, RTX 5070 | |
| Lenovo Legion 5 Pro 16IAX10H | |
| Lenovo Legion Pro 5 16IAX10, RTX 5070 | |
| Medio Intel Core Ultra 7 255HX, NVIDIA GeForce RTX 5070 Laptop (n=1) | |
| Media de la clase Gaming (1386 - 2254, n=94, últimos 2 años) | |
| Schenker XMG Core 16 M25 | |
| Gigabyte Gaming A16 GA6H | |
| Gigabyte Aero X16 1WH | |
| Asus TUF Gaming A16 FA608UP | |
| CrossMark / Creativity | |
| Lenovo Legion 5 Pro 16IAX10H | |
| Schenker XMG Core 16 M25 | |
| Alienware 16X Aurora, RTX 5070 | |
| Lenovo Legion Pro 5 16IAX10, RTX 5070 | |
| Medio Intel Core Ultra 7 255HX, NVIDIA GeForce RTX 5070 Laptop (n=1) | |
| Media de la clase Gaming (1343 - 2786, n=94, últimos 2 años) | |
| Gigabyte Aero X16 1WH | |
| Asus TUF Gaming A16 FA608UP | |
| Gigabyte Gaming A16 GA6H | |
| CrossMark / Responsiveness | |
| Alienware 16X Aurora, RTX 5070 | |
| Lenovo Legion 5 Pro 16IAX10H | |
| Gigabyte Gaming A16 GA6H | |
| Lenovo Legion Pro 5 16IAX10, RTX 5070 | |
| Medio Intel Core Ultra 7 255HX, NVIDIA GeForce RTX 5070 Laptop (n=1) | |
| Media de la clase Gaming (1226 - 2334, n=94, últimos 2 años) | |
| Schenker XMG Core 16 M25 | |
| Gigabyte Aero X16 1WH | |
| Asus TUF Gaming A16 FA608UP | |
| WebXPRT 3 / Overall | |
| Lenovo Legion 5 Pro 16IAX10H | |
| Alienware 16X Aurora, RTX 5070 | |
| Schenker XMG Core 16 M25 | |
| Gigabyte Aero X16 1WH | |
| Lenovo Legion Pro 5 16IAX10, RTX 5070 | |
| Medio Intel Core Ultra 7 255HX, NVIDIA GeForce RTX 5070 Laptop (n=1) | |
| Media de la clase Gaming (220 - 532, n=98, últimos 2 años) | |
| Asus TUF Gaming A16 FA608UP | |
| Gigabyte Gaming A16 GA6H | |
| WebXPRT 4 / Overall | |
| Schenker XMG Core 16 M25 | |
| Alienware 16X Aurora, RTX 5070 | |
| Lenovo Legion Pro 5 16IAX10, RTX 5070 | |
| Medio Intel Core Ultra 7 255HX, NVIDIA GeForce RTX 5070 Laptop (n=1) | |
| Lenovo Legion 5 Pro 16IAX10H | |
| Media de la clase Gaming (165 - 354, n=98, últimos 2 años) | |
| Gigabyte Aero X16 1WH | |
| Gigabyte Gaming A16 GA6H | |
| Asus TUF Gaming A16 FA608UP | |
| Mozilla Kraken 1.1 / Total | |
| Asus TUF Gaming A16 FA608UP | |
| Gigabyte Gaming A16 GA6H | |
| Media de la clase Gaming (391 - 590, n=100, últimos 2 años) | |
| Gigabyte Aero X16 1WH | |
| Lenovo Legion Pro 5 16IAX10, RTX 5070 | |
| Medio Intel Core Ultra 7 255HX, NVIDIA GeForce RTX 5070 Laptop (n=1) | |
| Schenker XMG Core 16 M25 | |
| Lenovo Legion 5 Pro 16IAX10H | |
| Alienware 16X Aurora, RTX 5070 | |
* ... más pequeño es mejor
| PCMark 10 Score | 8910 puntos | |
ayuda | ||
| AIDA64 / Memory Copy | |
| Lenovo Legion Pro 5 16IAX10, RTX 5070 | |
| Medio Intel Core Ultra 7 255HX (68939 - 104987, n=5) | |
| Lenovo Legion 5 Pro 16IAX10H | |
| Alienware 16X Aurora, RTX 5070 | |
| Schenker XMG Core 16 M25 | |
| Gigabyte Aero X16 1WH | |
| Media de la clase Gaming (21750 - 129946, n=105, últimos 2 años) | |
| Asus TUF Gaming A16 FA608UP | |
| Gigabyte Gaming A16 GA6H | |
| AIDA64 / Memory Read | |
| Lenovo Legion Pro 5 16IAX10, RTX 5070 | |
| Medio Intel Core Ultra 7 255HX (82336 - 95821, n=5) | |
| Lenovo Legion 5 Pro 16IAX10H | |
| Alienware 16X Aurora, RTX 5070 | |
| Schenker XMG Core 16 M25 | |
| Media de la clase Gaming (22956 - 118858, n=105, últimos 2 años) | |
| Gigabyte Aero X16 1WH | |
| Asus TUF Gaming A16 FA608UP | |
| Gigabyte Gaming A16 GA6H | |
| AIDA64 / Memory Write | |
| Medio Intel Core Ultra 7 255HX (66479 - 133486, n=5) | |
| Asus TUF Gaming A16 FA608UP | |
| Gigabyte Aero X16 1WH | |
| Lenovo Legion Pro 5 16IAX10, RTX 5070 | |
| Schenker XMG Core 16 M25 | |
| Alienware 16X Aurora, RTX 5070 | |
| Lenovo Legion 5 Pro 16IAX10H | |
| Media de la clase Gaming (22297 - 135096, n=105, últimos 2 años) | |
| Gigabyte Gaming A16 GA6H | |
| AIDA64 / Memory Latency | |
| Alienware 16X Aurora, RTX 5070 | |
| Lenovo Legion 5 Pro 16IAX10H | |
| Media de la clase Gaming (75.3 - 259, n=105, últimos 2 años) | |
| Medio Intel Core Ultra 7 255HX (104.2 - 110, n=5) | |
| Lenovo Legion Pro 5 16IAX10, RTX 5070 | |
| Gigabyte Gaming A16 GA6H | |
| Gigabyte Aero X16 1WH | |
| Asus TUF Gaming A16 FA608UP | |
| Schenker XMG Core 16 M25 | |
* ... más pequeño es mejor
Latencia del CPD
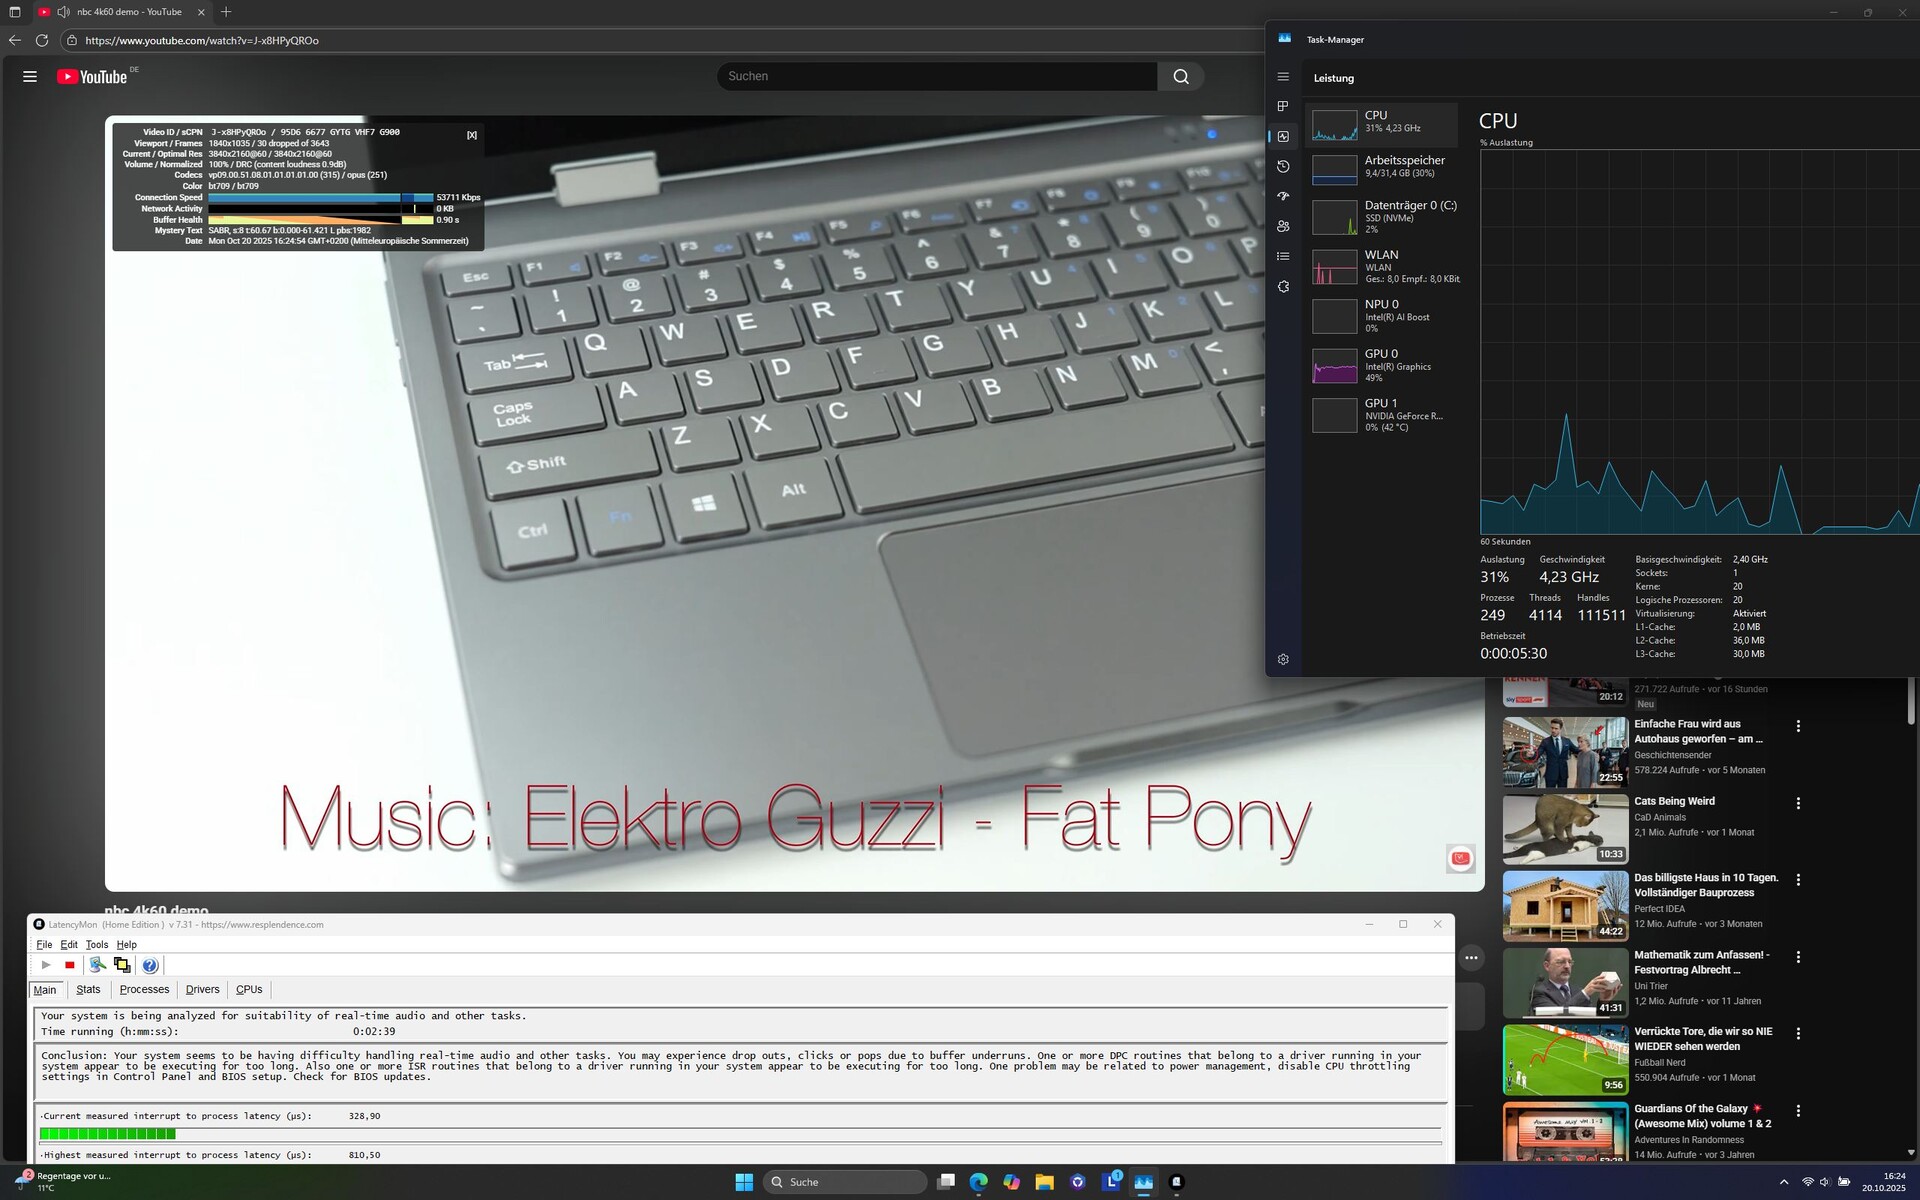
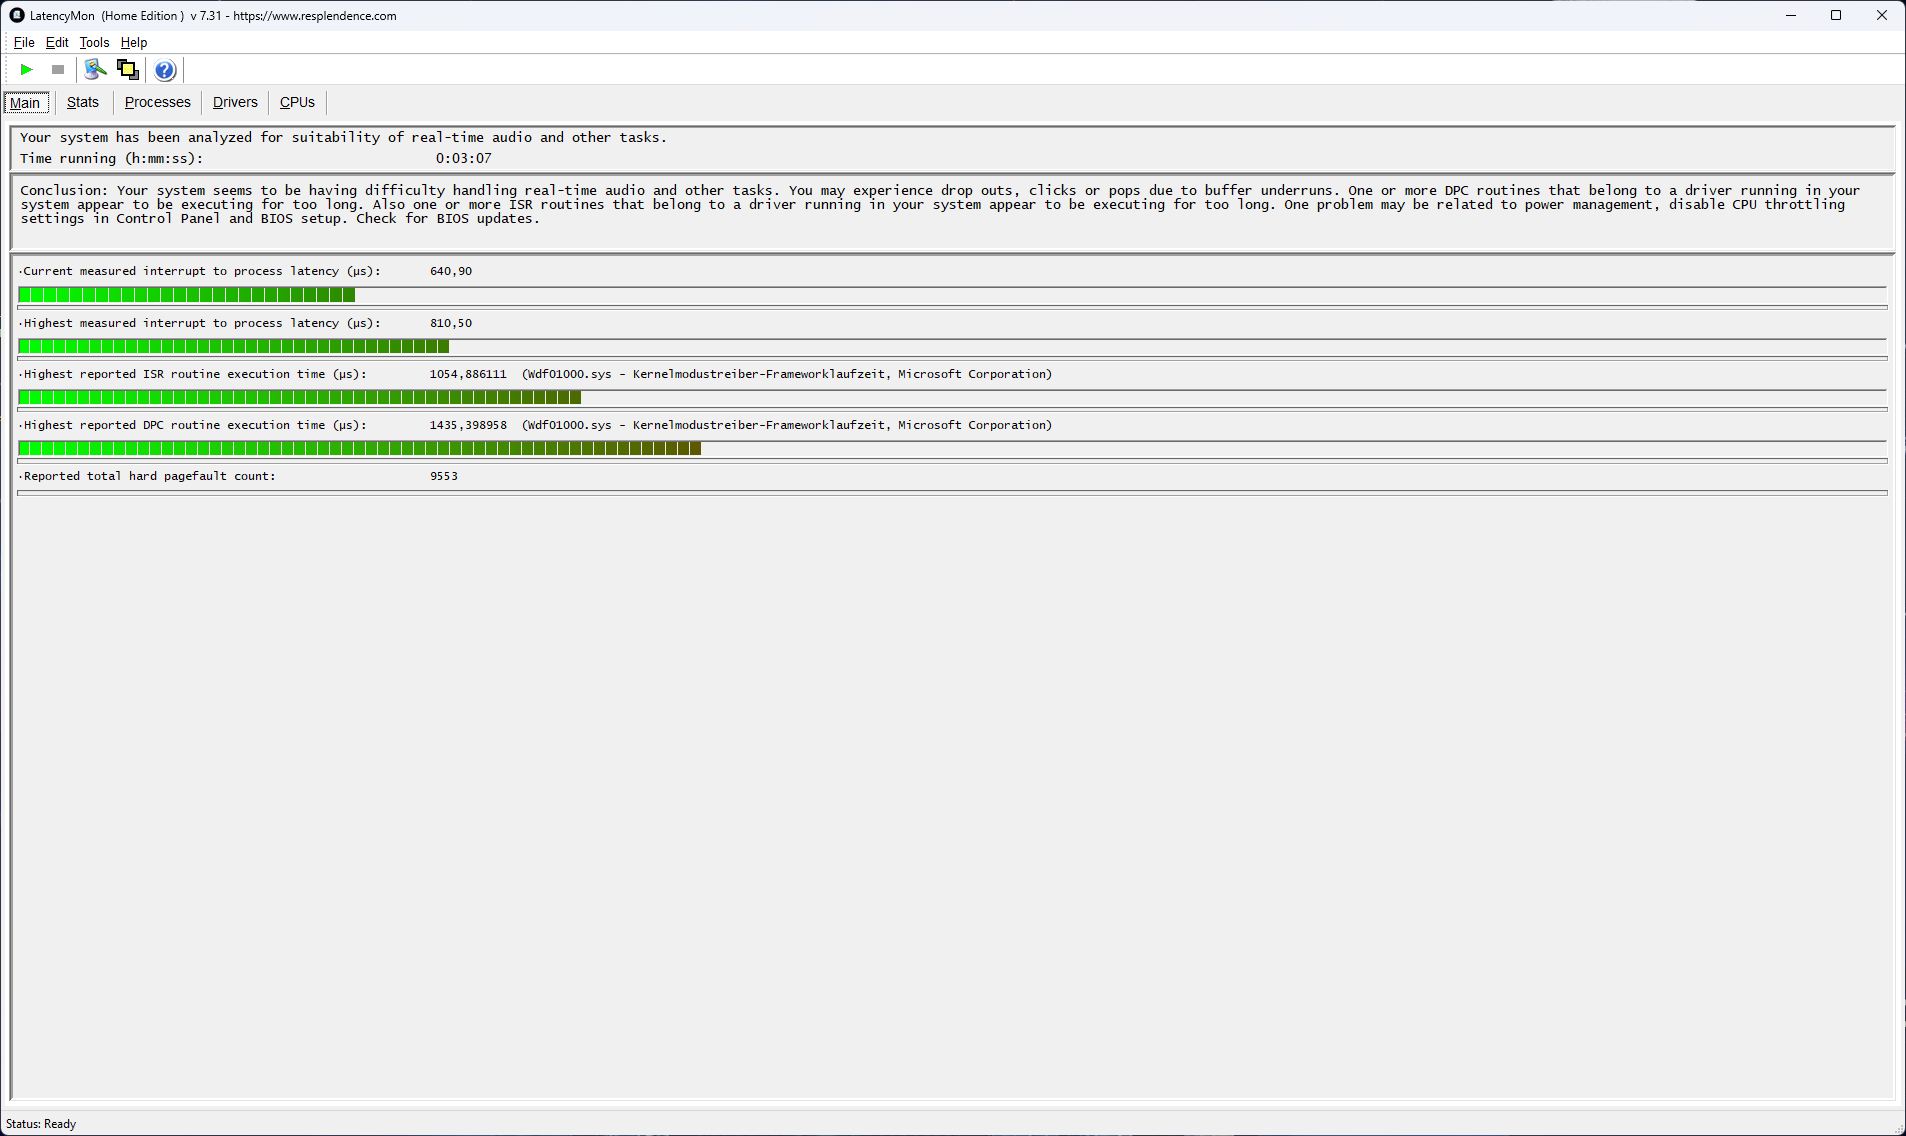
Aparecen pequeños picos de latencia al iniciar el navegador, pero la apertura de varias pestañas no los empeora. La reproducción de un vídeo de prueba de YouTube provoca unas 30 caídas de fotogramas, aunque la latencia general sigue siendo baja en comparación con otros sistemas.

| DPC Latencies / LatencyMon - interrupt to process latency (max), Web, Youtube, Prime95 | |
| Gigabyte Gaming A16 GA6H | |
| Gigabyte Aero X16 1WH | |
| Alienware 16X Aurora, RTX 5070 | |
| Lenovo Legion 5 Pro 16IAX10H | |
| Lenovo Legion Pro 5 16IAX10, RTX 5070 | |
| Schenker XMG Core 16 M25 | |
| Asus TUF Gaming A16 FA608UP | |
* ... más pequeño es mejor
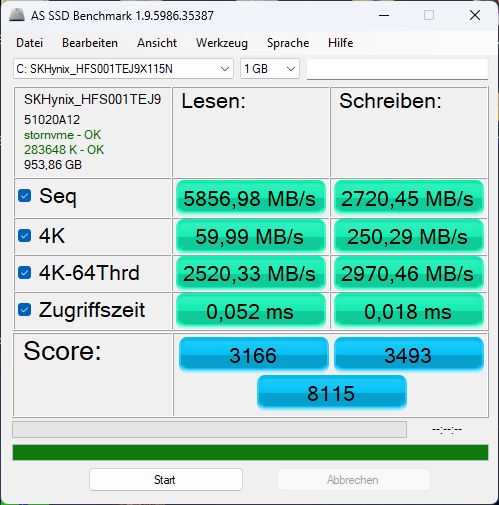
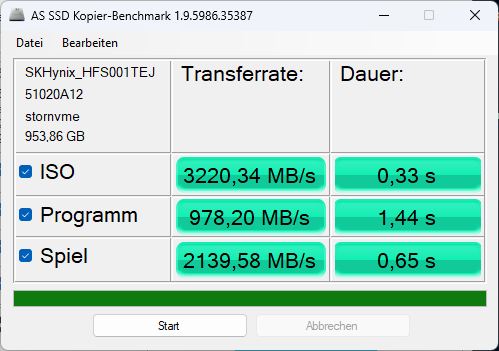
Almacenamiento masivo
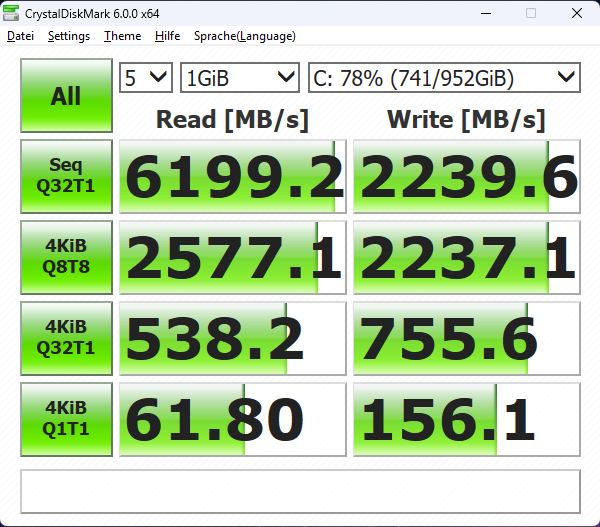
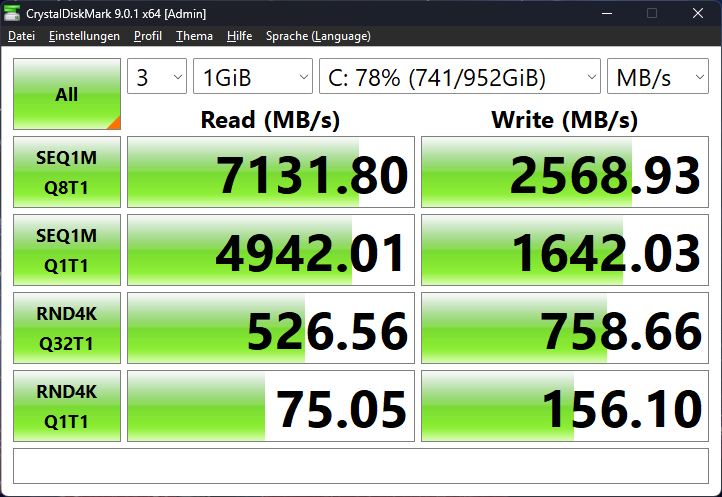
Nuestra unidad utiliza una SSD SK Hynix PCIe 4.0; el Modelo Ti utiliza una unidad Western Digital. El Hynix es ligeramente más rápido en general, pero comienza a estrangularse térmicamente hacia el final de nuestra larga prueba de estrés.

* ... más pequeño es mejor
Rendimiento continuo de lectura: Bucle de lectura DiskSpd, profundidad de cola 8
Rendimiento de la GPU
La RTX 5070 viene con 8 GB de VRAM frente a los 12 GB de la RTX 5070 Ti. En ciertos juegos a resoluciones o ajustes más altos, eso puede convertirse en una limitación (véase la captura de pantalla a continuación), aunque en nuestras pruebas no causó tartamudeos -los tiempos de fotogramas fueron en su mayoría consistentes.
En Indiana Jones y el Gran Círculo, el juego ya muestra un desbordamiento de VRAM en Full HD con ajustes bajos; la jugabilidad sigue siendo fluida hasta detalles medios, pero con ajustes altos o ultra se bloquea repetidamente en el lanzamiento.
Las pruebas 3DMark sintéticas muestran unas puntuaciones un 25 por ciento superiores para la variante Ti.
Las comparaciones entre juegos varían: Títulos basados en la CPU como Dota 2 Reborn apenas se benefician, mientras que títulos basados en la GPU como Cyberpunk 2077 o Strange Brigade reflejan toda la ventaja de la Ti vista en 3DMark.
Aun así, la RTX 5070 maneja sin problemas la mayoría de los juegos modernos con ajustes altos: la resolución QHD apenas supone un problema, e incluso 4K es jugable en muchos casos. La versión Ti sólo exprime unos pocos fotogramas extra en títulos ultra exigentes (Cyberpunk 2077 sin DLSS, F1 25). Por debajo de 30 fps, no medimos más, por ejemplo, F1 25 en QHD ya no era jugable con fluidez.
Desenchufado, el rendimiento 3D cae bruscamente: un 82 por ciento (Fire Strike).
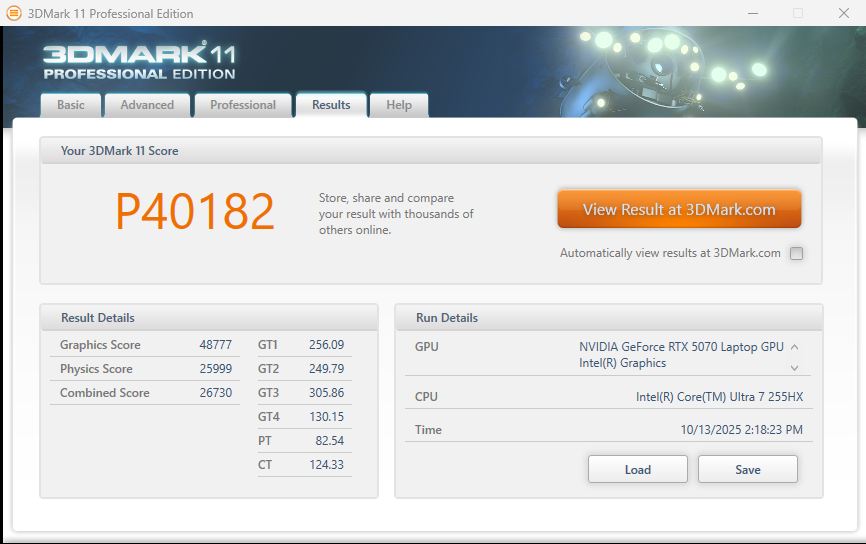
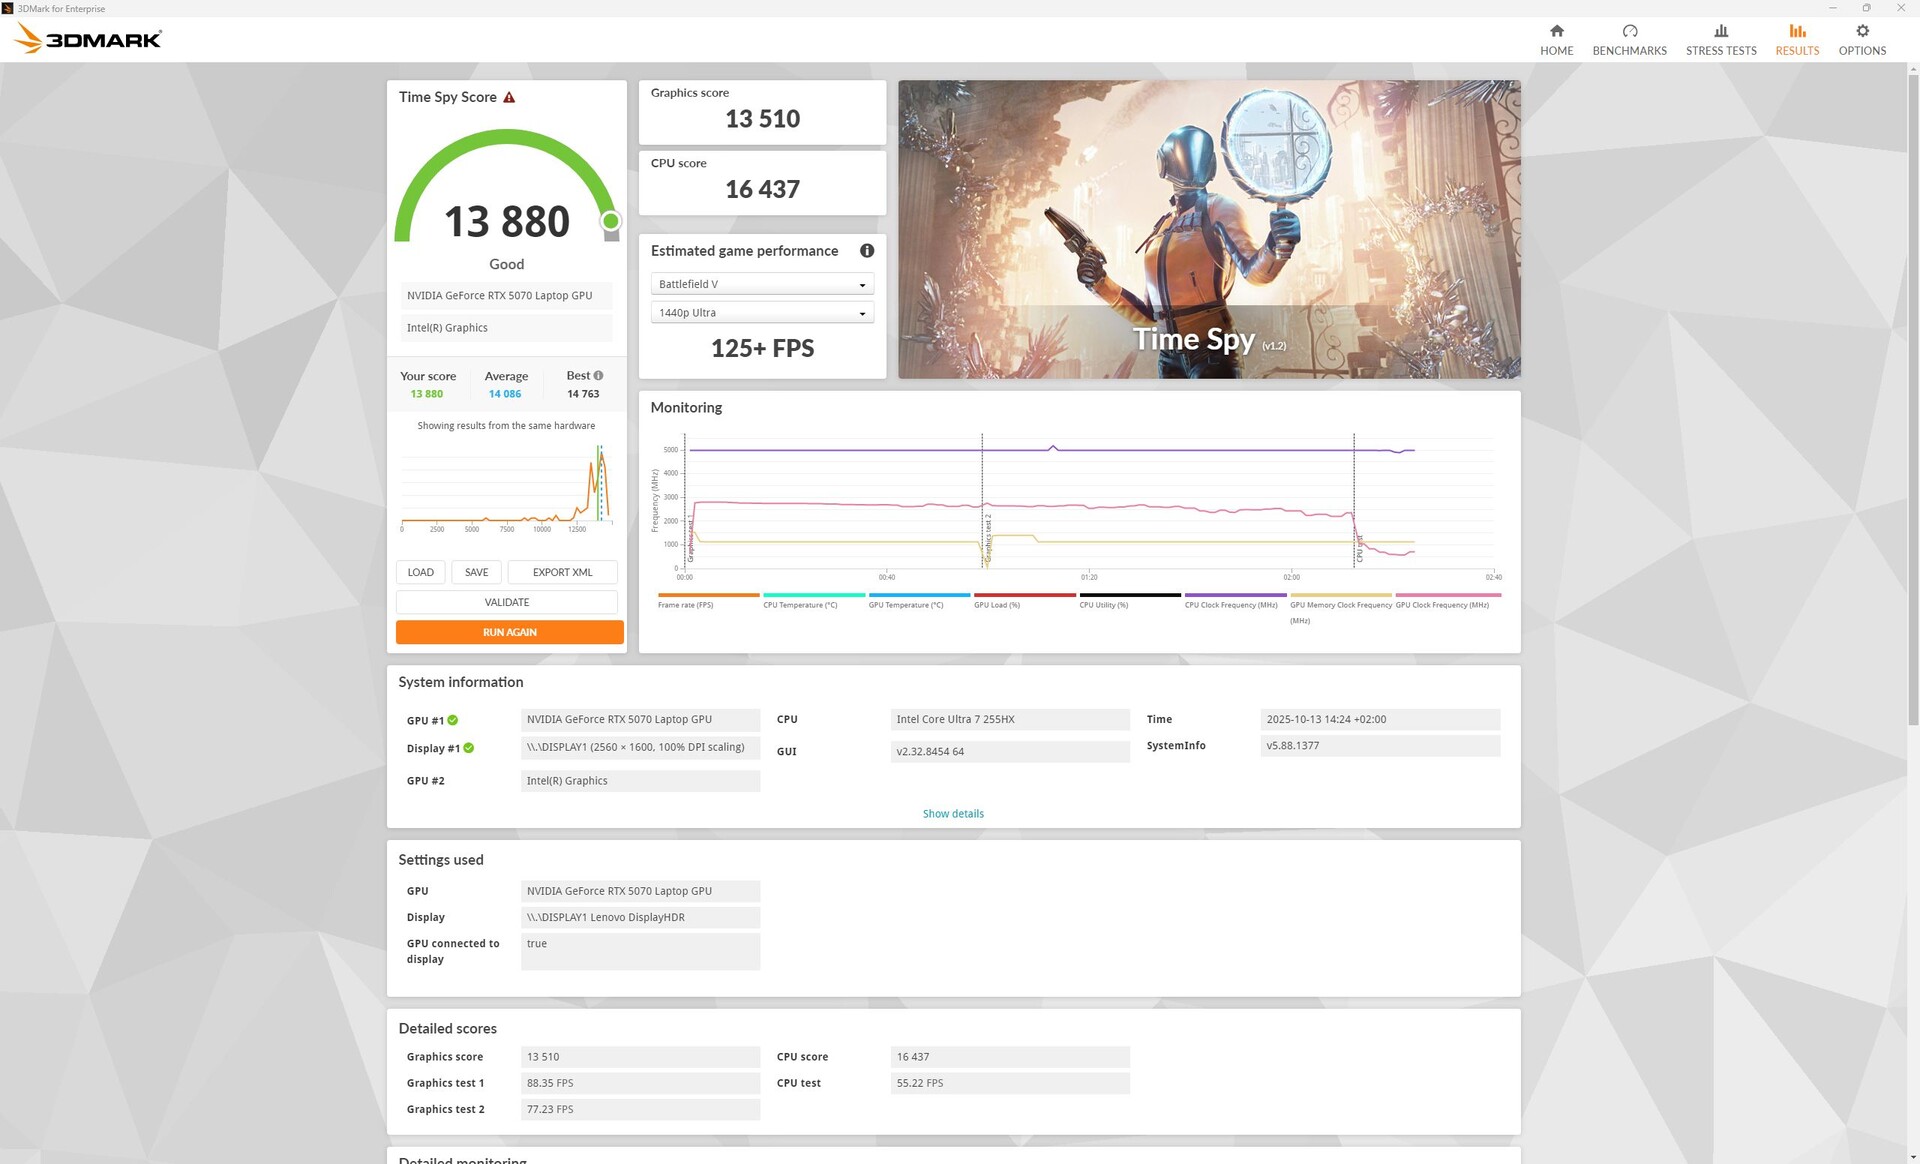
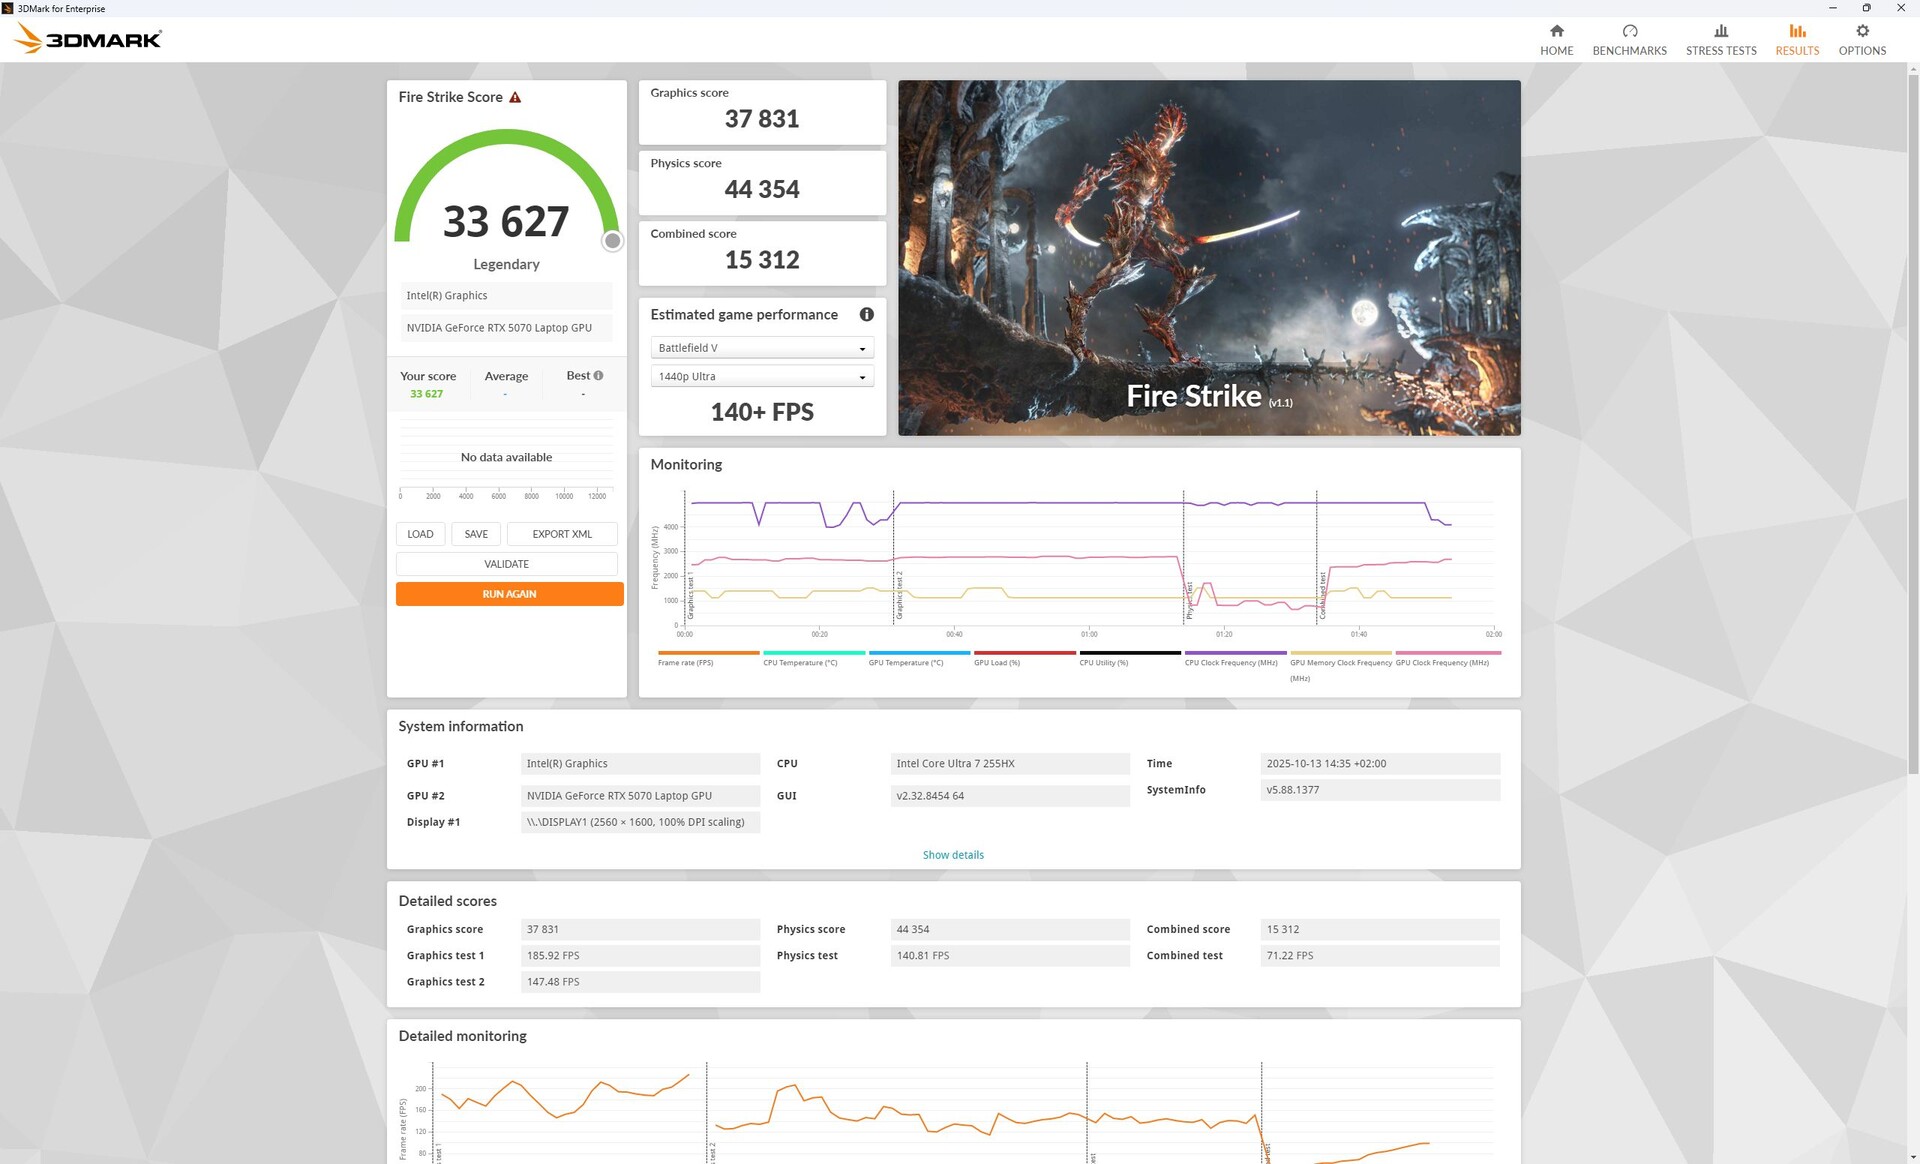
| 3DMark 11 Performance | 40182 puntos | |
| 3DMark Fire Strike Score | 33627 puntos | |
| 3DMark Time Spy Score | 13880 puntos | |
ayuda | ||
* ... más pequeño es mejor
| F1 25 | |
| 1920x1080 Ultra High Preset AA:T AF:16x | |
| Media de la clase Gaming (46.3 - 120.6, n=26, últimos 2 años) | |
| Lenovo Legion Pro 5 16IAX10, RTX 5070 | |
| Lenovo Legion 5 Pro 16IAX10H | |
| Medio NVIDIA GeForce RTX 5070 Laptop (48.5 - 64.5, n=10) | |
| 1920x1080 Ultra Max Preset AA:T AF:16x | |
| Lenovo Legion 5 Pro 16IAX10H | |
| Media de la clase Gaming (12.5 - 62.3, n=33, últimos 2 años) | |
| Lenovo Legion Pro 5 16IAX10, RTX 5070 | |
| Medio NVIDIA GeForce RTX 5070 Laptop (25.8 - 31.6, n=11) | |
Cyberpunk 2077 tabla de ultra fps
| bajo | medio | alto | ultra | QHD DLSS | QHD | 4K DLSS | 4K | |
|---|---|---|---|---|---|---|---|---|
| GTA V (2015) | 187.6 | 186.4 | 184.1 | 153.2 | 126 | 119 | ||
| Dota 2 Reborn (2015) | 203 | 184.2 | 178.1 | 162.4 | 131 | |||
| Final Fantasy XV Benchmark (2018) | 232 | 191.3 | 144.5 | 106.8 | 59.1 | |||
| X-Plane 11.11 (2018) | 135.5 | 117.6 | 101.6 | 80 | ||||
| Strange Brigade (2018) | 560 | 349 | 295 | 246 | 177.4 | 95.8 | ||
| Baldur's Gate 3 (2023) | 192.4 | 153.1 | 134.6 | 130.6 | 135.8 | 90 | 77.6 | 46 |
| Cyberpunk 2077 (2023) | 171.8 | 146.4 | 122 | 107 | 80.7 | 68.3 | 30.2 | |
| Indiana Jones and the Great Circle (2024) | 131.6 | |||||||
| Assassin's Creed Shadows (2025) | 75 | 70 | 60 | 46 | 45 | 38 | ||
| Doom: The Dark Ages (2025) | 96.2 | 88.4 | 74.2 | 72.2 | 70 | 49.4 | 33.2 | |
| F1 25 (2025) | 242 | 227 | 191.9 | 31.6 |
Emisiones y energía: más silencioso, más frío, más eficiente
Ruido
En ralentí, los ventiladores suelen permanecer apagados, aunque girarán en silencio incluso bajo cargas ligeras como la navegación web.
Bajo carga sostenida, son algo más silenciosos que en el Modelo Timientras que sus rivales muestran cifras similares. A cambio de un 12% menos de potencia de la GPU en modo equilibrado, el ruido de los ventiladores en Cyberpunk 2077 es aproximadamente la mitad (recuerde: +3 dB ≈ el doble de sonoridad percibida).
Ruido
| Ocioso |
| 23 / 23 / 23 dB(A) |
| Carga |
| 43.85 / 52.9 dB(A) |
 | ||
30 dB silencioso 40 dB(A) audible 50 dB(A) ruidosamente alto |
||
min: | ||
| Lenovo Legion Pro 5 16IAX10, RTX 5070 Ultra 7 255HX, GeForce RTX 5070 Laptop | Lenovo Legion 5 Pro 16IAX10H Ultra 9 275HX, GeForce RTX 5070 Ti Laptop | Alienware 16X Aurora, RTX 5070 Ultra 9 275HX, GeForce RTX 5070 Laptop | Gigabyte Aero X16 1WH Ryzen AI 7 350, GeForce RTX 5070 Laptop | Asus TUF Gaming A16 FA608UP R7 260, GeForce RTX 5070 Laptop | Schenker XMG Core 16 M25 Ryzen AI 9 HX 370, GeForce RTX 5070 Laptop | Gigabyte Gaming A16 GA6H i7-13620H, GeForce RTX 5070 Laptop | |
|---|---|---|---|---|---|---|---|
| Noise | -13% | 0% | 2% | -19% | -4% | -11% | |
| apagado / medio ambiente * (dB) | 23 | 24 -4% | 23.7 -3% | 23.9 -4% | 25.1 -9% | 24.8 -8% | 24 -4% |
| Idle Minimum * (dB) | 23 | 24 -4% | 23.9 -4% | 23.9 -4% | 32.2 -40% | 24.8 -8% | 25 -9% |
| Idle Average * (dB) | 23 | 24 -4% | 23.9 -4% | 23.9 -4% | 32.2 -40% | 24.8 -8% | 26 -13% |
| Idle Maximum * (dB) | 23 | 30.9 -34% | 26.1 -13% | 23.9 -4% | 32.2 -40% | 27.1 -18% | 27 -17% |
| Load Average * (dB) | 43.85 | 55.9 -27% | 26.8 39% | 33.2 24% | 38.1 13% | 40.2 8% | 54 -23% |
| Cyberpunk 2077 ultra * (dB) | 50.27 | 56.72 -13% | 51.8 -3% | 50.2 -0% | 53.9 -7% | 49.2 2% | 54 -7% |
| Load Maximum * (dB) | 52.9 | 56.72 -7% | 58 -10% | 50.2 5% | 57.1 -8% | 49.2 7% | 55 -4% |
* ... más pequeño es mejor
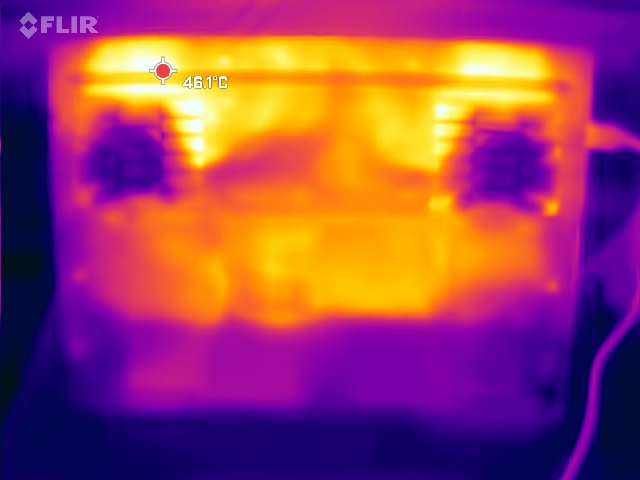
Temperatura
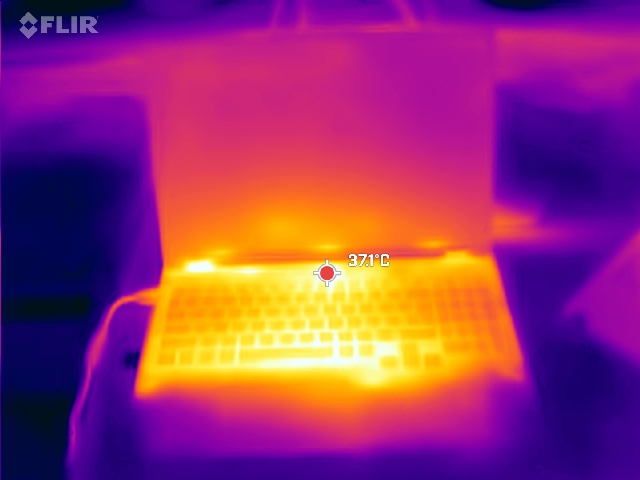
Bajo carga, este modelo funciona más frío que el Variante Ti. Medimos puntos calientes de 44 °C en la parte inferior trasera (frente a los 50 °C de la Ti). Las teclas WASD se mantienen a 37 °C, y los reposamanos siguen siendo cómodos.
(±) La temperatura máxima en la parte superior es de 42 °C / 108 F, frente a la media de 40.4 °C / 105 F, que oscila entre 21.2 y 68.8 °C para la clase Gaming.
(±) El fondo se calienta hasta un máximo de 44 °C / 111 F, frente a la media de 43.2 °C / 110 F
(+) En reposo, la temperatura media de la parte superior es de 29.8 °C / 86# F, frente a la media del dispositivo de 33.9 °C / 93 F.
(±) 3: The average temperature for the upper side is 34.3 °C / 94 F, compared to the average of 33.9 °C / 93 F for the class Gaming.
(+) El reposamanos y el panel táctil están a una temperatura inferior a la de la piel, con un máximo de 31 °C / 87.8 F y, por tanto, son fríos al tacto.
(-) La temperatura media de la zona del reposamanos de dispositivos similares fue de 28.8 °C / 83.8 F (-2.2 °C / -4 F).
| Lenovo Legion Pro 5 16IAX10, RTX 5070 Ultra 7 255HX, GeForce RTX 5070 Laptop | Lenovo Legion 5 Pro 16IAX10H Ultra 9 275HX, GeForce RTX 5070 Ti Laptop | Alienware 16X Aurora, RTX 5070 Ultra 9 275HX, GeForce RTX 5070 Laptop | Gigabyte Aero X16 1WH Ryzen AI 7 350, GeForce RTX 5070 Laptop | Asus TUF Gaming A16 FA608UP R7 260, GeForce RTX 5070 Laptop | Schenker XMG Core 16 M25 Ryzen AI 9 HX 370, GeForce RTX 5070 Laptop | Gigabyte Gaming A16 GA6H i7-13620H, GeForce RTX 5070 Laptop | |
|---|---|---|---|---|---|---|---|
| Heat | -17% | 1% | 5% | 13% | -5% | -9% | |
| Maximum Upper Side * (°C) | 42 | 48 -14% | 51 -21% | 43.3 -3% | 39.5 6% | 46.7 -11% | 50 -19% |
| Maximum Bottom * (°C) | 44 | 50 -14% | 45.6 -4% | 50.3 -14% | 45.1 -3% | 58.5 -33% | 49 -11% |
| Idle Upper Side * (°C) | 33 | 38 -15% | 29.8 10% | 27 18% | 25.7 22% | 28.3 14% | 35 -6% |
| Idle Bottom * (°C) | 34 | 42 -24% | 27.4 19% | 28.3 17% | 25.5 25% | 29.9 12% | 34 -0% |
* ... más pequeño es mejor
Altavoces
Como señalamos en nuestra reseña originallos altavoces son algo silenciosos y carecen de graves, aunque los agudos están equilibrados. Hay una toma de 3,5 mm para dispositivos de audio externos.
Lenovo Legion Pro 5 16IAX10, RTX 5070 análisis de audio
(±) | la sonoridad del altavoz es media pero buena (75.73 dB)
Graves 100 - 315 Hz
(-) | casi sin bajos - de media 20% inferior a la mediana
(±) | la linealidad de los graves es media (9.3% delta a frecuencia anterior)
Medios 400 - 2000 Hz
(±) | medias más altas - de media 6.1% más altas que la mediana
(±) | la linealidad de los medios es media (7.9% delta respecto a la frecuencia anterior)
Altos 2 - 16 kHz
(+) | máximos equilibrados - a sólo 2.2% de la mediana
(+) | los máximos son lineales (6.3% delta a la frecuencia anterior)
Total 100 - 16.000 Hz
(±) | la linealidad del sonido global es media (19.4% de diferencia con la mediana)
En comparación con la misma clase
» 67% de todos los dispositivos probados de esta clase eran mejores, 7% similares, 26% peores
» El mejor tuvo un delta de 6%, la media fue 18%, el peor fue ###max##%
En comparación con todos los dispositivos probados
» 48% de todos los dispositivos probados eran mejores, 7% similares, 45% peores
» El mejor tuvo un delta de 4%, la media fue 23%, el peor fue ###max##%
Apple MacBook Pro 16 2021 M1 Pro análisis de audio
(+) | los altavoces pueden reproducir a un volumen relativamente alto (#84.7 dB)
Graves 100 - 315 Hz
(+) | buen bajo - sólo 3.8% lejos de la mediana
(+) | el bajo es lineal (5.2% delta a la frecuencia anterior)
Medios 400 - 2000 Hz
(+) | medios equilibrados - a sólo 1.3% de la mediana
(+) | los medios son lineales (2.1% delta a la frecuencia anterior)
Altos 2 - 16 kHz
(+) | máximos equilibrados - a sólo 1.9% de la mediana
(+) | los máximos son lineales (2.7% delta a la frecuencia anterior)
Total 100 - 16.000 Hz
(+) | el sonido global es lineal (4.6% de diferencia con la mediana)
En comparación con la misma clase
» 0% de todos los dispositivos probados de esta clase eran mejores, 0% similares, 100% peores
» El mejor tuvo un delta de 5%, la media fue 17%, el peor fue ###max##%
En comparación con todos los dispositivos probados
» 0% de todos los dispositivos probados eran mejores, 0% similares, 100% peores
» El mejor tuvo un delta de 4%, la media fue 23%, el peor fue ###max##%
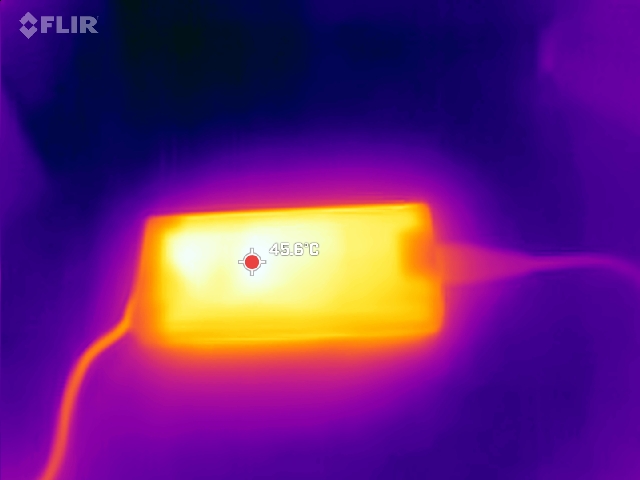
Consumo de energía
Como era de esperar, el consumo de energía es inferior al de la De la versión Ti. Entre los competidores, la Legion Pro 5 sigue consumiendo bastante durante los juegos, pero también se encuentra entre las de mayor rendimiento.
La conexión de un monitor externo a través de DisplayPort/Thunderbolt mantiene la RTX 5070 activa, elevando el uso de energía en reposo.
| Off / Standby | |
| Ocioso | |
| Carga |
|
Clave:
min: | |
| Lenovo Legion Pro 5 16IAX10, RTX 5070 Ultra 7 255HX, GeForce RTX 5070 Laptop, SK Hynix HFS001TEJ9X115N, OLED, 2650x1600, 16" | Lenovo Legion 5 Pro 16IAX10H Ultra 9 275HX, GeForce RTX 5070 Ti Laptop, Western Digital PC SN8000S SDEPNRK-1T00, OLED, 2560x1600, 16" | Alienware 16X Aurora, RTX 5070 Ultra 9 275HX, GeForce RTX 5070 Laptop, , IPS, 2560x1600, 16" | Gigabyte Aero X16 1WH Ryzen AI 7 350, GeForce RTX 5070 Laptop, Kingston OM8PGP41024Q-A0, IPS, 2560x1600, 16" | Asus TUF Gaming A16 FA608UP R7 260, GeForce RTX 5070 Laptop, Western Digital PC SN5000S SDEQNSJ-1T00, IPS, 2560x1600, 16" | Schenker XMG Core 16 M25 Ryzen AI 9 HX 370, GeForce RTX 5070 Laptop, Samsung 990 Pro 2 TB MZVL72T0HDLB, IPS, 2560x1600, 16" | Gigabyte Gaming A16 GA6H i7-13620H, GeForce RTX 5070 Laptop, Kingston OM8PGP41024Q-A0, IPS, 2560x1600, 16" | Medio NVIDIA GeForce RTX 5070 Laptop | Media de la clase Gaming | |
|---|---|---|---|---|---|---|---|---|---|
| Power Consumption | -24% | -40% | 34% | 26% | 10% | 20% | -5% | -23% | |
| Idle Minimum * (Watt) | 10.6 | 14 -32% | 20.1 -90% | 5.8 45% | 4.6 57% | 7.4 30% | 9 15% | 10.8 ? -2% | 13 ? -23% |
| Idle Average * (Watt) | 12.3 | 14.3 -16% | 27.6 -124% | 10.9 11% | 9.8 20% | 14.9 -21% | 11 11% | 15.4 ? -25% | 18.7 ? -52% |
| Idle Maximum * (Watt) | 18.6 | 20.1 -8% | 31.8 -71% | 11.2 40% | 10.2 45% | 15.2 18% | 23 -24% | 21 ? -13% | 24.3 ? -31% |
| Load Average * (Watt) | 104 | 177 -70% | 102.7 1% | 91.3 12% | 76.1 27% | 100.8 3% | 91 12% | 98.7 ? 5% | 110.2 ? -6% |
| Cyberpunk 2077 ultra * (Watt) | 231 | 255 -10% | 217 6% | 123.8 46% | 198.9 14% | 184.8 20% | 132.5 43% | ||
| Cyberpunk 2077 ultra external monitor * (Watt) | 227 | 255 -12% | 192.3 15% | 117.9 48% | 198.1 13% | 181.4 20% | 130 43% | ||
| Load Maximum * (Watt) | 248 | 294 -19% | 292 -18% | 155.3 37% | 235.2 5% | 251.1 -1% | 155 37% | 218 ? 12% | 258 ? -4% |
* ... más pequeño es mejor
Consumo de energía Cyberpunk / prueba de estrés
Consumo de energía con monitor externo
Duración de las pilas
La batería de 80 Wh permanece inalterada. El portátil dura unas 6 horas en nuestras pruebas de Wi-Fi y reproducción de vídeo, aproximadamente una hora más que el modelo Modelo Ti.
| Lenovo Legion Pro 5 16IAX10, RTX 5070 Ultra 7 255HX, GeForce RTX 5070 Laptop, 80 Wh | Lenovo Legion 5 Pro 16IAX10H Ultra 9 275HX, GeForce RTX 5070 Ti Laptop, 80 Wh | Alienware 16X Aurora, RTX 5070 Ultra 9 275HX, GeForce RTX 5070 Laptop, 96 Wh | Gigabyte Aero X16 1WH Ryzen AI 7 350, GeForce RTX 5070 Laptop, 76 Wh | Asus TUF Gaming A16 FA608UP R7 260, GeForce RTX 5070 Laptop, 90 Wh | Schenker XMG Core 16 M25 Ryzen AI 9 HX 370, GeForce RTX 5070 Laptop, 99.8 Wh | Gigabyte Gaming A16 GA6H i7-13620H, GeForce RTX 5070 Laptop, 76 Wh | Media de la clase Gaming | |
|---|---|---|---|---|---|---|---|---|
| Duración de Batería | -16% | -31% | 39% | 110% | 76% | 24% | 13% | |
| H.264 (h) | 6.1 | 4.8 -21% | 8.64 ? 42% | |||||
| WiFi v1.3 (h) | 6.2 | 4.9 -21% | 4.3 -31% | 8.6 39% | 13 110% | 10.9 76% | 7.7 24% | 7.11 ? 15% |
| Load (h) | 1.8 | 1.7 -6% | 1.502 ? -17% |
Impresiones generales de Notebookcheck
Incluso con la RTX 5070 no Ti, el Lenovo Legion Pro 5 16 es un potente portátil para juegos, y a 500-700 euros menos que la variante Ti, es una oferta muy atractiva.
Lenovo Legion Pro 5 16IAX10, RTX 5070
- 10/22/2025 v8
Christian Hintze
 Total Sustainability Score:
 Posibles alternativas en comparación
Imagen | Modelo | Precio | Peso | Altura | Pantalla |
|---|---|---|---|---|---|
1. 86.2%  | Lenovo Legion Pro 5 16IAX10, RTX 5070 Intel Core Ultra 7 255HX ⎘ NVIDIA GeForce RTX 5070 Laptop ⎘ 32 GB Memoría, 1024 GB SSD | Amazon: Precio de catálogo: 1800 Euro | 2.3 kg | 25.95 mm | 16.00" 2650x1600 189 PPI OLED |
2. 84.5%  | Lenovo Legion 5 Pro 16IAX10H Intel Core Ultra 9 275HX ⎘ NVIDIA GeForce RTX 5070 Ti Laptop ⎘ 32 GB Memoría, 1024 GB SSD | Amazon: 1. $2,999.00 Lenovo Legion Pro 5i Gen 10 ... 2. $3,369.00 Lenovo Legion Pro 7 16IAX10H... 3. $1,749.00 Lenovo Legion 5 16" WQXGA 24... Precio de catálogo: 2500 Euro | 2.4 kg | 25.95 mm | 16.00" 2560x1600 189 PPI OLED |
3. 84.9%  | Alienware 16X Aurora, RTX 5070 Intel Core Ultra 9 275HX ⎘ NVIDIA GeForce RTX 5070 Laptop ⎘ 32 GB Memoría | Amazon: Precio de catálogo: 1800 USD | 2.5 kg | 23.4 mm | 16.00" 2560x1600 189 PPI IPS |
4. 83.7%  | Gigabyte Aero X16 1WH AMD Ryzen AI 7 350 ⎘ NVIDIA GeForce RTX 5070 Laptop ⎘ 32 GB Memoría, 1024 GB SSD | Amazon: Precio de catálogo: 1799€ | 2 kg | 19.9 mm | 16.00" 2560x1600 189 PPI IPS |
5. 83.8%  | Asus TUF Gaming A16 FA608UP AMD Ryzen 7 260 ⎘ NVIDIA GeForce RTX 5070 Laptop ⎘ 32 GB Memoría, 1024 GB SSD | Amazon: Precio de catálogo: 2199€ | 2.2 kg | 25.7 mm | 16.00" 2560x1600 189 PPI IPS |
6. 86.2%  | Schenker XMG Core 16 M25 AMD Ryzen AI 9 HX 370 ⎘ NVIDIA GeForce RTX 5070 Laptop ⎘ 64 GB Memoría, 2048 GB SSD | Amazon: Precio de catálogo: 2100€ | 2.1 kg | 23 mm | 16.00" 2560x1600 189 PPI IPS |
7. 80.1%  | Gigabyte Gaming A16 GA6H Intel Core i7-13620H ⎘ NVIDIA GeForce RTX 5070 Laptop ⎘ 16 GB Memoría, 1024 GB SSD | Amazon: 1. $1,091.55 GIGABYTE - Gaming A16 Gaming... 2. $1,225.98 GIGABYTE - Gaming A16 Gaming... 3. $1,067.59 GIGABYTE - Gaming A16 Gaming... Precio de catálogo: 1700 EUR | 2.3 kg | 23 mm | 16.00" 2560x1600 189 PPI IPS |
Transparencia
La selección de los dispositivos que se van a reseñar corre a cargo de nuestro equipo editorial. La muestra de prueba fue proporcionada al autor en calidad de préstamo por el fabricante o el minorista a los efectos de esta reseña. El prestamista no tuvo ninguna influencia en esta reseña, ni el fabricante recibió una copia de la misma antes de su publicación. No había ninguna obligación de publicar esta reseña. Como empresa de medios independiente, Notebookcheck no está sujeta a la autoridad de fabricantes, minoristas o editores.
Así es como prueba Notebookcheck
Cada año, Notebookcheck revisa de forma independiente cientos de portátiles y smartphones utilizando procedimientos estandarizados para asegurar que todos los resultados son comparables. Hemos desarrollado continuamente nuestros métodos de prueba durante unos 20 años y hemos establecido los estándares de la industria en el proceso. En nuestros laboratorios de pruebas, técnicos y editores experimentados utilizan equipos de medición de alta calidad. Estas pruebas implican un proceso de validación en varias fases. Nuestro complejo sistema de clasificación se basa en cientos de mediciones y puntos de referencia bien fundamentados, lo que mantiene la objetividad.
