Notebookcheck Logo

Análisis del PC de sobremesa NUCXi7 de Minisforum: PC de juegos ultra delgado con GeForce RTX 3070 y Core i7-11800H

¿Un portátil sin pantalla? Con la serie NUCX, el fabricante de sistemas Minisforum ofrece un PC para juegos con todas las funciones, utilizando casi exclusivamente componentes de portátil. Pudimos tener en nuestras manos un NUCXi7 y echamos un vistazo más detallado al modelo, haciéndolo pasar por nuestro curso de pruebas. Puedes encontrar toda la información importante sobre este interesante dispositivo en nuestro extenso análisis aquí.
Minisforo NUCXi7
Minisforo NUCXi7

Minisforum es conocido como fabricante de sistemas para mini PC en este país (Alemania). Sin embargo, con la serie NUCX, el fabricante se dirige a un grupo de usuarios ligeramente diferente, ofreciendo un PC para juegos con todas las funciones con este modelo. No se trata de un ordenador de sobremesa al uso, sino de un PC ultrafino con una potencia decente. Se basa en una placa base para portátiles Intel NUC-XI5, que también se utiliza en los portátiles.

El NUCX está disponible actualmente en dos configuraciones básicas que difieren tanto en sus CPU como en sus GPU. Por un lado, está el Minisforum NUCXi5, que se basa en el Intel Core i5-11400Hen combinación con unaGPU Nvidia GeForce RTX 3060 para portátilesy, por otro lado, el MinisForum NUCXi7 con elIntel Core i7-11800Hen combinación con una Nvidia GeForce RTX 3070 GPU para portátiles. En cuanto a su precio, los modelos comienzan como sistemas barebones desde 1.199 euros (~1.195 dólares) y 1.449 euros (~1.444 dólares) respectivamente. Nuestra unidad de prueba, un NUCXi7 con 16 GB de RAM y un SSD de 512 GB, cuesta 1.629 euros (~1.623 dólares) con la versión Pro de Windows 11 ya preinstalada.

En este análisis, otros PCs de sobremesa compactos sirven como dispositivos de comparación. Para reflejar la comparación directa del rendimiento de la GPU, también incluimos un portátil de juego de equipamiento similar en el campo de nuestros competidores de prueba.

Minisforum NUCXi7
Procesador
Intel Core i7-11800H 8 x 2.3 - 4.6 GHz, 110 W PL2 / Short Burst, 68 W PL1 / Sustained, Tiger Lake-H
Adaptador gráfico
NVIDIA GeForce RTX 3070 Laptop GPU - 8 GB VRAM, Núcleo: 1290 MHz, Memoría: 1500 MHz, 125 W TDP ( including 25 W Dynamic Boost), Nvidia 516.94
Memoría
16 GB 
, DDR4-3200, 2 of 2 installed, max. 64 GB
Placa base
Intel HM570
Disco duro
M.2 2280 NVMe, 450 GB libre
Tarjeta de sonido
Intel Tiger Lake PCH-H - cAVS (Audio, Voice, Speech)
Conexiones
3 USB 3.1 Gen2, 1 USB 3.2 Gen 2x2 20Gbps, 1 Thunderbolt, 1 HDMI, Card Reader: SDXC
Equipamento de red
Intel Ethernet Controller I225-V (10/100/1000/2500MBit/s), Intel Wi-Fi 6E AX210 (a/b/g/h/n = Wi-Fi 4/ac = Wi-Fi 5/ax = Wi-Fi 6/), Bluetooth 5.2
Tamaño
Alto x ancho x profundidad (en mm): 393 x 80.1 x 260
Sistema Operativo
Microsoft Windows 11 Pro
Características adicionales
230-Watt power supply, HDMI cable, stand, 24 Meses Garantía
Peso
2.444 kg, Suministro de Electricidad: 496 g
Precio
1629 EUR
Note: The manufacturer may use components from different suppliers including display panels, drives or memory sticks with similar specifications.


Posibles contendientes en la comparación

Valoración
Fecha
Modelo
Peso
Altura
Best Price
09/2022
Minisforum NUCX i7
i7-11800H, GeForce RTX 3070 Laptop GPU
2.4 kg393 mm
12/2021
Intel Beast Canyon NUC
i9-11900KB, NVIDIA GeForce RTX 3060
189 mm
06/2021
Zotac Magnus One (ECM73070C)
i7-10700, NVIDIA GeForce RTX 3070
05/2022
Zotac ZBOX Magnus EN173070C
i7-11800H, GeForce RTX 3070 Laptop GPU
1.8 kg62.2 mm
04/2022
Intel Dragon Canyon NUC - RTX 3060
i9-12900, NVIDIA GeForce RTX 3060
189 mm
06/2020
Zotac MEK Mini (RTX 2070 Super)
i7-9700, GeForce RTX 2070 Super (Desktop)
83.2 %
10/2021
Gigabyte A7 X1
R9 5900HX, GeForce RTX 3070 Laptop GPU
2.5 kg34 mm

Minisforum NUCXi7 en detalle

Minisforo NUCXi7
Minisforo NUCXi7
Minisforo NUCXi7
Minisforo NUCXi7
Minisforo NUCXi7
Minisforo NUCXi7
Minisforo NUCXi7
Minisforo NUCXi7
Minisforo NUCXi7
Minisforo NUCXi7
Minisforo NUCXi7
Minisforum NUCXi7 (Fuente: Minisforum)

Caso

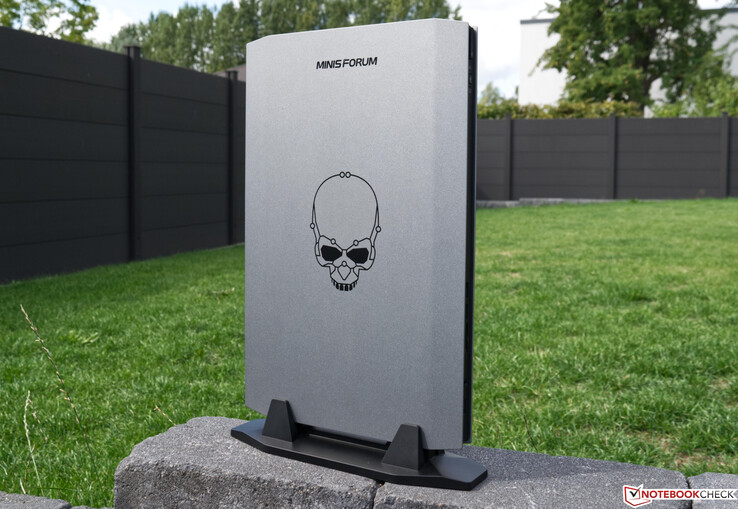
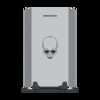
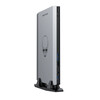
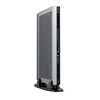
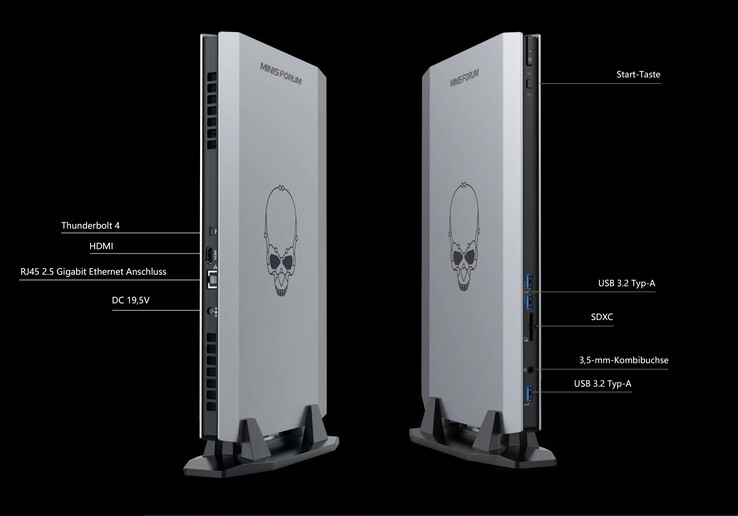
El Minisforum NUCXi7 no es pequeño y, en nuestra opinión, no es un mini PC clásico. Sin embargo, el dispositivo sigue siendo muy delgado, recordando a un portátil sin pantalla ni dispositivos de entrada. La mayor parte de la carcasa está hecha de plástico, aunque sigue dando una impresión háptica de alta calidad. Aunque una base de aluminio sería probablemente más pesada, el dispositivo ganaría significativamente en términos de impresión de calidad. Visualmente, el lado izquierdo está adornado por una calavera, que anima el lado plateado, que de otro modo sería liso. La parte trasera está cubierta por un gran diseño en forma de panal para garantizar una buena refrigeración. El dispositivo está atornillado a un soporte estable y sólo puede funcionar en posición vertical. El Minisforum NUCXi7 no está diseñado para funcionar en horizontal, ya que esto probablemente también iría en claro detrimento de las características de refrigeración.

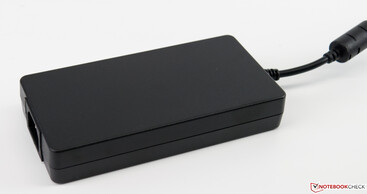
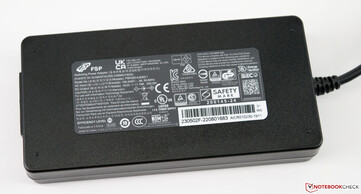
Incluyendo el soporte, el Minisforum NUCXi7 sólo pesa 2,4 kg (~5,3 lb), lo que es muy ligero. Por otro lado, el peso del soporte evita que se caiga fácilmente. Para la fuente de alimentación externa, también hay que añadir aproximadamente otros 0,5 kg (~1,1 lb) al peso.

Equipo

A primera vista, todas las conexiones importantes están disponibles. Hay incluso un moderno puerto Thunderbolt. Al mismo tiempo, podría tener diferentes opiniones sobre el número de puertos USB 3.2 Tipo-A disponibles. El dispositivo sólo ofrece tres de ellos, y todos están colocados en la parte delantera. Nos hubiera gustado tener al menos un puerto USB más en la parte trasera. Pero, por desgracia, el fabricante está atado a la disposición de la placa base, lo que lo haría más difícil. Puedes conectar pantallas por HDMI o Thunderbolt, y ambas opciones funcionaron sin problemas en nuestra prueba. Tampoco tienes que vivir sin un lector de tarjetas SD aquí.

Conexiones externas del Minisforum NUCXi7

Lector de tarjetas SD

El Minisforum NUCXi7 está equipado con un lector de tarjetas SD que funciona a velocidades USB 3. Los 76 MB/s que medimos en nuestra prueba utilizando nuestra tarjeta de referencia (Angelbird AV Pro V60) con conexión UHS-II también confirman la velocidad USB 3. Sin embargo, este rendimiento sigue siendo peor que la media de la clase.

SD Card Reader - average JPG Copy Test (av. of 3 runs)
Asus ROG Zephyrus Duo 16 GX650RX
AMD Ryzen 9 6900HX (AV PRO microSD 128 GB V60)
155 MB/s +104%
Razer Blade 17 Early 2022
Intel Core i9-12900H (AV PRO microSD 128 GB V60)
152 MB/s +100%
Average of class Desktop
  (19.9 - 187, n=6, last 2 years)
82.2 MB/s +8%
Minisforum NUCX i7
Intel Core i7-11800H (AV Pro SD microSD 128 GB V60)
76.07 MB/s
MSI Titan GT77 12UHS
Intel Core i9-12900HX (AV PRO microSD 128 GB V60)
69.1 (68.5min - 72.99max) MB/s -9%
Acer Predator Triton 500 SE PT516-52s-70KX
Intel Core i7-12700H (AV PRO microSD 128 GB V60)
68 MB/s -11%
MSI Raider GE77 HX 12UHS
Intel Core i9-12900HX (AV PRO microSD 128 GB V60)
60 MB/s -21%

Comunicación

Minisforum utiliza un módulo Intel Wi-Fi 6E-AX210 en el NUCXi7. En nuestra prueba con nuestro router ASUS ROG Rapture GT-AXE11000, no pudimos alcanzar el buen rendimiento de los dispositivos de la comparación. El Minisforum NUCXi7 se sitúa al final del campo de la comparación, quedando claramente atrás. El puerto LAN integrado ofrece una buena alternativa a la conexión inalámbrica, soportando hasta 2,5 Gbit/s.

Networking
iperf3 receive AXE11000 6GHz
Intel Dragon Canyon NUC - RTX 3060
Intel Wi-Fi 6E AX211
1848 (1731min - 1888max) MBit/s +109%
Average Intel Wi-Fi 6E AX210
  (885 - 1827, n=17)
1490 MBit/s +68%
Zotac ZBOX Magnus EN173070C
Killer Wi-Fi 6 AX1650x Wireless Network Adapter (200NGW)
1480 (1212min - 1519max) MBit/s +67%
Average of class Desktop
  (430 - 1827, n=9, last 2 years)
1265 MBit/s +43%
Minipc Union Ace Magician AMR5
MediaTek RZ608
903 (450min - 913max) MBit/s +2%
Minisforum NUCX i7
Intel Wi-Fi 6E AX210
885 (820min - 897max) MBit/s
iperf3 transmit AXE11000 6GHz
Intel Dragon Canyon NUC - RTX 3060
Intel Wi-Fi 6E AX211
1851 (1799min - 1897max) MBit/s +55%
Zotac ZBOX Magnus EN173070C
Killer Wi-Fi 6 AX1650x Wireless Network Adapter (200NGW)
1669 (1609min - 1719max) MBit/s +39%
Average of class Desktop
  (572 - 1745, n=10, last 2 years)
1409 MBit/s +18%
Average Intel Wi-Fi 6E AX210
  (712 - 1615, n=16)
1337 MBit/s +12%
Minisforum NUCX i7
Intel Wi-Fi 6E AX210
1198 (975min - 1352max) MBit/s
Minipc Union Ace Magician AMR5
MediaTek RZ608
967 (486min - 993max) MBit/s -19%
05010015020025030035040045050055060065070075080085090095010001050110011501200125013001350Tooltip
Minisforum NUCX i7; iperf3 transmit AXE11000 6GHz; iperf 3.1.3: Ø1198 (975-1352)
Minisforum NUCX i7; iperf3 receive AXE11000 6GHz; iperf 3.1.3: Ø885 (820-897)

Accesorios

Además del propio ordenador, la caja también incluye la fuente de alimentación de 230 vatios y el soporte, que permite colocar el dispositivo en posición horizontal.

Mantenimiento

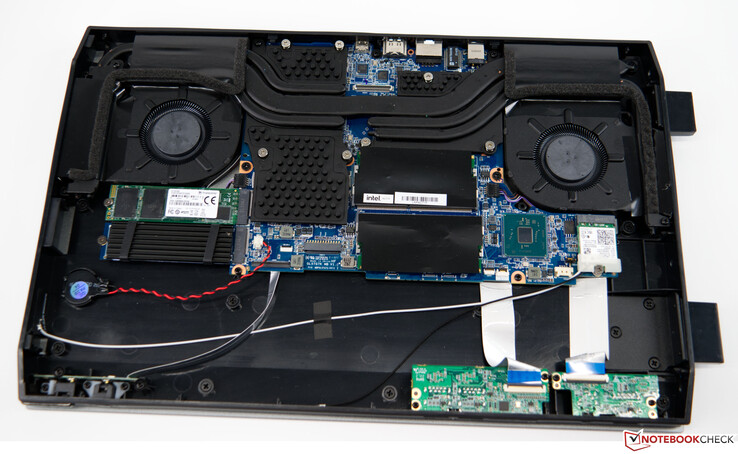
Minisforum abierto NUCXi7 con tapa lateral

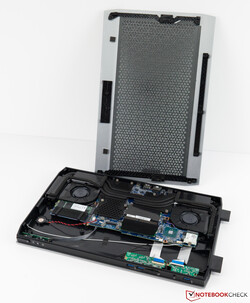
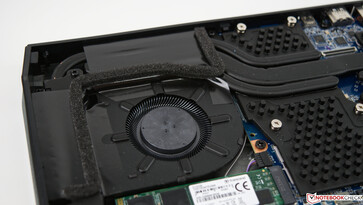
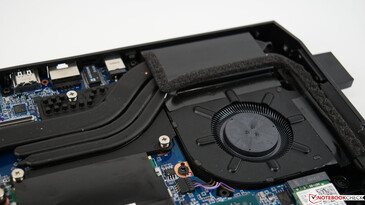
Para las tareas de ampliación o mantenimiento, se puede retirar la tapa lateral del aparato. Ésta se fija en la parte inferior con tres tornillos y, una vez retirados, se puede quitar la tapa sin mucho problema. Un folleto incluido también explica cómo hacerlo. Después de quitar la tapa, se puede pensar erróneamente que se está ante un portátil. Pero todavía hay mucho espacio sin utilizar, que normalmente estaría reservado para una batería. También puedes ver por qué no podrías añadir fácilmente algunos puertos USB en la parte trasera. El único espacio para algunas conexiones adicionales estaría en la parte delantera.

Puedes meter un total de dos SSDs M.2 en el dispositivo, lo que también hicimos para esta prueba. Para ampliar la memoria de trabajo, sólo tienes la opción de reemplazar los módulos, ya que ambas ranuras SO-Dimm ya están ocupadas con módulos de 8-GB.

Un vistazo al interior del Minisforum NUCXi7

Rendimiento - Un rápido Core i7-11800H

Con el Intel Core i7-11800Hnuestra unidad de pruebas ofrece una buena base para manejar aplicaciones exigentes. En combinación con la GPU Nvidia GeForce RTX 3070 para portátilesel Minisforum NUCXi7 parece un portátil para juegos bien equipado. Los 16 GB de RAM suelen ser suficientes para todos los juegos actuales, aunque el espacio puede quedar un poco justo con los 512 GB del SSD. Con este equipo, también puedes disfrutar de los juegos actuales a 1.440p. Aquellos que sólo quieran jugar a juegos a 1.080p deberían echar un vistazo al Minisforum NUCXi5.

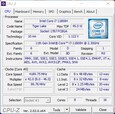
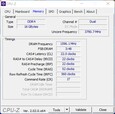
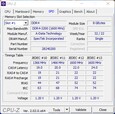
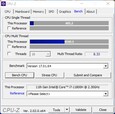
CPU-Z
CPU-Z
CPU-Z
CPU-Z
CPU-Z
CPU-Z
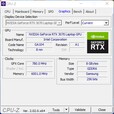
GPU-Z
GPU-Z
GPU-Z
HWiNFO
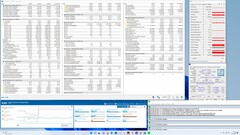
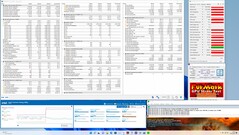
Utilidad extrema de Inte
Inte Extreme Utility - Prueba de fuego

Condiciones de la prueba

Realizamos todas las pruebas de rendimiento en modo Gaming. Éste puede activarse pulsando un botón en la parte frontal, lo que otorga a la GPU un mayor consumo de energía bajo carga. Para ser exactos, esto corresponde a un aumento del consumo de energía de la GPU a 125 vatios.

Procesador

ElIntel Core i7-11800Hofrece ocho núcleos de computación nativos y se basa en la arquitectura Tiger Lake de Intel. En cuanto al consumo de energía, Minisforum da un poco de ventaja de hasta 110 vatios (PL2), aunque con 68 vatios, el PL1 sigue siendo un valor muy bueno para lograr un alto rendimiento. Y así es, ya que nuestra unidad de prueba es capaz de asegurar un buen lugar en el medio del campo con su rendimiento alcanzado en nuestra prueba. La desventaja respecto a los aparatos más rápidos de la comparación es pequeña y subjetivamente no se nota.

Puede encontrar más pruebas de rendimiento de los procesadores aquí.

Performance Rating - Percent
Intel Dragon Canyon NUC - RTX 3060
Intel Core i9-12900, 2400 MHz
54.3 pt
Gigabyte A7 X1 -17!
AMD Ryzen 9 5900HX, 3300 MHz
54.2 pt
Intel Beast Canyon NUC
Intel Core i9-11900KB, 3300 MHz
48.1 pt
Minisforum NUCX i7
Intel Core i7-11800H, 2300 MHz
47 pt
Average Intel Core i7-11800H
 
45.6 pt
Zotac ZBOX Magnus EN173070C
Intel Core i7-11800H, 2300 MHz
45.5 pt
Zotac Magnus One (ECM73070C) -2!
Intel Core i7-10700, 2900 MHz
43.4 pt
Zotac MEK Mini (RTX 2070 Super)
Intel Core i7-9700, 3000 MHz
40.9 pt
Cinebench R15
CPU Single 64Bit
Intel Dragon Canyon NUC - RTX 3060
Intel Core i9-12900, 2400 MHz
262 Points +15%
Intel Beast Canyon NUC
Intel Core i9-11900KB, 3300 MHz
247 Points +9%
Gigabyte A7 X1
AMD Ryzen 9 5900HX, 3300 MHz
241 Points +6%
Minisforum NUCX i7
Intel Core i7-11800H, 2300 MHz
227 Points
Average Intel Core i7-11800H
  (201 - 231, n=46)
225 Points -1%
Zotac ZBOX Magnus EN173070C
Intel Core i7-11800H, 2300 MHz
224 Points -1%
Zotac MEK Mini (RTX 2070 Super)
Intel Core i7-9700, 3000 MHz
199 Points -12%
Zotac Magnus One (ECM73070C)
Intel Core i7-10700, 2900 MHz
196 Points -14%
CPU Multi 64Bit
Intel Dragon Canyon NUC - RTX 3060
Intel Core i9-12900, 2400 MHz
3299 Points +61%
Gigabyte A7 X1
AMD Ryzen 9 5900HX, 3300 MHz
2087 (2046.66min - 2087.25max) Points +2%
Minisforum NUCX i7
Intel Core i7-11800H, 2300 MHz
2045 Points
Intel Beast Canyon NUC
Intel Core i9-11900KB, 3300 MHz
2027 Points -1%
Average Intel Core i7-11800H
  (1342 - 2173, n=50)
1894 Points -7%
Zotac ZBOX Magnus EN173070C
Intel Core i7-11800H, 2300 MHz
1666 Points -19%
Zotac Magnus One (ECM73070C)
Intel Core i7-10700, 2900 MHz
1455 Points -29%
Zotac MEK Mini (RTX 2070 Super)
Intel Core i7-9700, 3000 MHz
1254 Points -39%
Cinebench R20
CPU (Single Core)
Intel Dragon Canyon NUC - RTX 3060
Intel Core i9-12900, 2400 MHz
703 Points +21%
Intel Beast Canyon NUC
Intel Core i9-11900KB, 3300 MHz
629 Points +9%
Gigabyte A7 X1
AMD Ryzen 9 5900HX, 3300 MHz
580 Points 0%
Minisforum NUCX i7
Intel Core i7-11800H, 2300 MHz
579 Points
Average Intel Core i7-11800H
  (520 - 586, n=47)
576 Points -1%
Zotac ZBOX Magnus EN173070C
Intel Core i7-11800H, 2300 MHz
564 Points -3%
Zotac MEK Mini (RTX 2070 Super)
Intel Core i7-9700, 3000 MHz
474 Points -18%
CPU (Multi Core)
Intel Dragon Canyon NUC - RTX 3060
Intel Core i9-12900, 2400 MHz
7179 Points +51%
Gigabyte A7 X1
AMD Ryzen 9 5900HX, 3300 MHz
4850 Points +2%
Minisforum NUCX i7
Intel Core i7-11800H, 2300 MHz
4760 Points
Intel Beast Canyon NUC
Intel Core i9-11900KB, 3300 MHz
4644 Points -2%
Average Intel Core i7-11800H
  (2498 - 5408, n=50)
4459 Points -6%
Zotac ZBOX Magnus EN173070C
Intel Core i7-11800H, 2300 MHz
3954 Points -17%
Zotac MEK Mini (RTX 2070 Super)
Intel Core i7-9700, 3000 MHz
2892 Points -39%
Cinebench R11.5
CPU Single 64Bit
Intel Dragon Canyon NUC - RTX 3060
Intel Core i9-12900, 2400 MHz
3.16 Points +21%
Intel Beast Canyon NUC
Intel Core i9-11900KB, 3300 MHz
2.84 Points +9%
Minisforum NUCX i7
Intel Core i7-11800H, 2300 MHz
2.61 Points
Zotac ZBOX Magnus EN173070C
Intel Core i7-11800H, 2300 MHz
2.59 Points -1%
Average Intel Core i7-11800H
  (2.45 - 2.62, n=4)
2.57 Points -2%
Zotac Magnus One (ECM73070C)
Intel Core i7-10700, 2900 MHz
2.26 Points -13%
Zotac MEK Mini (RTX 2070 Super)
Intel Core i7-9700, 3000 MHz
2.25 Points -14%
CPU Multi 64Bit
Intel Dragon Canyon NUC - RTX 3060
Intel Core i9-12900, 2400 MHz
38.96 Points +78%
Intel Beast Canyon NUC
Intel Core i9-11900KB, 3300 MHz
22.07 Points +1%
Minisforum NUCX i7
Intel Core i7-11800H, 2300 MHz
21.87 Points
Zotac ZBOX Magnus EN173070C
Intel Core i7-11800H, 2300 MHz
19.18 Points -12%
Average Intel Core i7-11800H
  (16 - 21.9, n=4)
18.7 Points -14%
Zotac Magnus One (ECM73070C)
Intel Core i7-10700, 2900 MHz
16.7 Points -24%
Zotac MEK Mini (RTX 2070 Super)
Intel Core i7-9700, 3000 MHz
14.44 Points -34%
Cinebench R10
Rendering Single CPUs 64Bit
Intel Dragon Canyon NUC - RTX 3060
Intel Core i9-12900, 2400 MHz
14610 Points +22%
Intel Beast Canyon NUC
Intel Core i9-11900KB, 3300 MHz
12508 Points +5%
Minisforum NUCX i7
Intel Core i7-11800H, 2300 MHz
11957 Points
Zotac ZBOX Magnus EN173070C
Intel Core i7-11800H, 2300 MHz
11608 Points -3%
Average Intel Core i7-11800H
  (10903 - 11957, n=4)
11582 Points -3%
Zotac Magnus One (ECM73070C)
Intel Core i7-10700, 2900 MHz
9898 Points -17%
Zotac MEK Mini (RTX 2070 Super)
Intel Core i7-9700, 3000 MHz
9840 Points -18%
Rendering Multiple CPUs 64Bit
Intel Dragon Canyon NUC - RTX 3060
Intel Core i9-12900, 2400 MHz
107565 Points +59%
Minisforum NUCX i7
Intel Core i7-11800H, 2300 MHz
67486 Points
Intel Beast Canyon NUC
Intel Core i9-11900KB, 3300 MHz
67183 Points 0%
Zotac ZBOX Magnus EN173070C
Intel Core i7-11800H, 2300 MHz
58426 Points -13%
Average Intel Core i7-11800H
  (49232 - 67486, n=4)
58329 Points -14%
Zotac Magnus One (ECM73070C)
Intel Core i7-10700, 2900 MHz
52577 Points -22%
Zotac MEK Mini (RTX 2070 Super)
Intel Core i7-9700, 3000 MHz
49666 Points -26%
Blender - v2.79 BMW27 CPU
Zotac MEK Mini (RTX 2070 Super)
Intel Core i7-9700, 3000 MHz
388.7 Seconds * -49%
Zotac Magnus One (ECM73070C)
Intel Core i7-10700, 2900 MHz
315.4 Seconds * -21%
Zotac ZBOX Magnus EN173070C
Intel Core i7-11800H, 2300 MHz
286.1 Seconds * -10%
Average Intel Core i7-11800H
  (217 - 454, n=46)
277 Seconds * -6%
Intel Beast Canyon NUC
Intel Core i9-11900KB, 3300 MHz
262.7 Seconds * -1%
Intel Dragon Canyon NUC - RTX 3060
Intel Core i9-12900, 2400 MHz
262.7 Seconds * -1%
Minisforum NUCX i7
Intel Core i7-11800H, 2300 MHz
261 Seconds *
Gigabyte A7 X1
AMD Ryzen 9 5900HX, 3300 MHz
246 Seconds * +6%
wPrime 2.10
32m
Zotac MEK Mini (RTX 2070 Super)
Intel Core i7-9700, 3000 MHz
4.785 s * -41%
Zotac ZBOX Magnus EN173070C
Intel Core i7-11800H, 2300 MHz
4.186 s * -23%
Average Intel Core i7-11800H
  (3.41 - 4.19, n=3)
3.85 s * -13%
Intel Beast Canyon NUC
Intel Core i9-11900KB, 3300 MHz
3.416 s * -0%
Minisforum NUCX i7
Intel Core i7-11800H, 2300 MHz
3.405 s *
Zotac Magnus One (ECM73070C)
Intel Core i7-10700, 2900 MHz
3.257 s * +4%
Intel Dragon Canyon NUC - RTX 3060
Intel Core i9-12900, 2400 MHz
2.67 s * +22%
1024m
Intel Dragon Canyon NUC - RTX 3060
Intel Core i9-12900, 2400 MHz
211.8 s * -115%
Zotac MEK Mini (RTX 2070 Super)
Intel Core i7-9700, 3000 MHz
155.8 s * -58%
Zotac ZBOX Magnus EN173070C
Intel Core i7-11800H, 2300 MHz
120.839 s * -23%
Zotac Magnus One (ECM73070C)
Intel Core i7-10700, 2900 MHz
119.5 s * -22%
Average Intel Core i7-11800H
  (98.3 - 121.1, n=3)
113.4 s * -15%
Intel Beast Canyon NUC
Intel Core i9-11900KB, 3300 MHz
102.2 s * -4%
Minisforum NUCX i7
Intel Core i7-11800H, 2300 MHz
98.307 s *
X264 HD Benchmark 4.0
Pass 1
Intel Dragon Canyon NUC - RTX 3060
Intel Core i9-12900, 2400 MHz
310 (303min - 324max) fps +20%
Intel Beast Canyon NUC
Intel Core i9-11900KB, 3300 MHz
272.5 (271min - 279max) fps +6%
Minisforum NUCX i7
Intel Core i7-11800H, 2300 MHz
258 (256min - 259max) fps
Average Intel Core i7-11800H
  (242 - 258, n=3)
249 fps -3%
Zotac MEK Mini (RTX 2070 Super)
Intel Core i7-9700, 3000 MHz
247.5 (247min - 252max) fps -4%
Zotac ZBOX Magnus EN173070C
Intel Core i7-11800H, 2300 MHz
247.5 (245min - 250max) fps -4%
Zotac Magnus One (ECM73070C)
Intel Core i7-10700, 2900 MHz
236 (235min - 257max) fps -9%
Pass 2
Intel Dragon Canyon NUC - RTX 3060
Intel Core i9-12900, 2400 MHz
147.5 (134min - 173max) fps +35%
Minisforum NUCX i7
Intel Core i7-11800H, 2300 MHz
109.3 (108.1min - 111.7max) fps
Intel Beast Canyon NUC
Intel Core i9-11900KB, 3300 MHz
106 (101min - 108max) fps -3%
Average Intel Core i7-11800H
  (86.3 - 109.3, n=3)
96.4 fps -12%
Zotac ZBOX Magnus EN173070C
Intel Core i7-11800H, 2300 MHz
93.75 (91.3min - 98.8max) fps -14%
Zotac Magnus One (ECM73070C)
Intel Core i7-10700, 2900 MHz
84.8 (84.6min - 105max) fps -22%
Zotac MEK Mini (RTX 2070 Super)
Intel Core i7-9700, 3000 MHz
77.6 (77.3min - 79.4max) fps -29%
WinRAR - Result
Intel Dragon Canyon NUC - RTX 3060
Intel Core i9-12900, 2400 MHz
10739 KB/s +35%
Intel Beast Canyon NUC
Intel Core i9-11900KB, 3300 MHz
9584 KB/s +21%
Average Intel Core i7-11800H
  (7925 - 8569, n=3)
8146 KB/s +3%
Minisforum NUCX i7
Intel Core i7-11800H, 2300 MHz
7944 KB/s
Zotac ZBOX Magnus EN173070C
Intel Core i7-11800H, 2300 MHz
7925 KB/s 0%
Zotac MEK Mini (RTX 2070 Super)
Intel Core i7-9700, 3000 MHz
6945 KB/s -13%
Zotac Magnus One (ECM73070C)
Intel Core i7-10700, 2900 MHz
6555 KB/s -17%
TrueCrypt
AES Mean 100MB
Intel Dragon Canyon NUC - RTX 3060
Intel Core i9-12900, 2400 MHz
17.2 GB/s +48%
Intel Beast Canyon NUC
Intel Core i9-11900KB, 3300 MHz
11.6 GB/s 0%
Minisforum NUCX i7
Intel Core i7-11800H, 2300 MHz
11.6 GB/s
Zotac Magnus One (ECM73070C)
Intel Core i7-10700, 2900 MHz
10.3 GB/s -11%
Zotac ZBOX Magnus EN173070C
Intel Core i7-11800H, 2300 MHz
9.9 GB/s -15%
Average Intel Core i7-11800H
  (6.5 - 11.6, n=4)
9.43 GB/s -19%
Zotac MEK Mini (RTX 2070 Super)
Intel Core i7-9700, 3000 MHz
7.6 GB/s -34%
Twofish Mean 100MB
Intel Dragon Canyon NUC - RTX 3060
Intel Core i9-12900, 2400 MHz
3.4 GB/s +100%
Zotac Magnus One (ECM73070C)
Intel Core i7-10700, 2900 MHz
1.8 GB/s +6%
Intel Beast Canyon NUC
Intel Core i9-11900KB, 3300 MHz
1.7 GB/s 0%
Minisforum NUCX i7
Intel Core i7-11800H, 2300 MHz
1.7 GB/s
Average Intel Core i7-11800H
  (1.5 - 1.7, n=4)
1.55 GB/s -9%
Zotac ZBOX Magnus EN173070C
Intel Core i7-11800H, 2300 MHz
1.5 GB/s -12%
Zotac MEK Mini (RTX 2070 Super)
Intel Core i7-9700, 3000 MHz
1.3 GB/s -24%
Serpent Mean 100MB
Intel Dragon Canyon NUC - RTX 3060
Intel Core i9-12900, 2400 MHz
1.9 GB/s +73%
Zotac Magnus One (ECM73070C)
Intel Core i7-10700, 2900 MHz
1.1 GB/s 0%
Intel Beast Canyon NUC
Intel Core i9-11900KB, 3300 MHz
1.1 GB/s 0%
Minisforum NUCX i7
Intel Core i7-11800H, 2300 MHz
1.1 GB/s
Average Intel Core i7-11800H
  (0.9 - 1.1, n=4)
1 GB/s -9%
Zotac ZBOX Magnus EN173070C
Intel Core i7-11800H, 2300 MHz
0.9 GB/s -18%
Zotac MEK Mini (RTX 2070 Super)
Intel Core i7-9700, 3000 MHz
0.775 GB/s -30%
Geekbench 5.5
Multi-Core
Minisforum NUCX i7
Intel Core i7-11800H, 2300 MHz
9186 Points
Intel Beast Canyon NUC
Intel Core i9-11900KB, 3300 MHz
8924 Points -3%
Intel Dragon Canyon NUC - RTX 3060
Intel Core i9-12900, 2400 MHz
8924 Points -3%
Average Intel Core i7-11800H
  (4655 - 9851, n=40)
8551 Points -7%
Zotac ZBOX Magnus EN173070C
Intel Core i7-11800H, 2300 MHz
8207 Points -11%
Zotac Magnus One (ECM73070C)
Intel Core i7-10700, 2900 MHz
8173 Points -11%
Gigabyte A7 X1
AMD Ryzen 9 5900HX, 3300 MHz
7599 Points -17%
Zotac MEK Mini (RTX 2070 Super)
Intel Core i7-9700, 3000 MHz
7060 Points -23%
Single-Core
Intel Beast Canyon NUC
Intel Core i9-11900KB, 3300 MHz
1656 Points +5%
Intel Dragon Canyon NUC - RTX 3060
Intel Core i9-12900, 2400 MHz
1656 Points +5%
Zotac ZBOX Magnus EN173070C
Intel Core i7-11800H, 2300 MHz
1579 Points +1%
Minisforum NUCX i7
Intel Core i7-11800H, 2300 MHz
1570 Points
Average Intel Core i7-11800H
  (1429 - 1625, n=40)
1561 Points -1%
Gigabyte A7 X1
AMD Ryzen 9 5900HX, 3300 MHz
1538 Points -2%
Zotac MEK Mini (RTX 2070 Super)
Intel Core i7-9700, 3000 MHz
1312 Points -16%
Zotac Magnus One (ECM73070C)
Intel Core i7-10700, 2900 MHz
1299 Points -17%
Geekbench 5.0
5.0 Multi-Core
Minisforum NUCX i7
Intel Core i7-11800H, 2300 MHz
9074 Points
Intel Beast Canyon NUC
Intel Core i9-11900KB, 3300 MHz
8845 Points -3%
Intel Dragon Canyon NUC - RTX 3060
Intel Core i9-12900, 2400 MHz
8845 Points -3%
Zotac Magnus One (ECM73070C)
Intel Core i7-10700, 2900 MHz
8196 Points -10%
Zotac ZBOX Magnus EN173070C
Intel Core i7-11800H, 2300 MHz
8109 Points -11%
Average Intel Core i7-11800H
  (6340 - 9103, n=8)
7831 Points -14%
Zotac MEK Mini (RTX 2070 Super)
Intel Core i7-9700, 3000 MHz
7060 Points -22%
5.0 Single-Core
Intel Beast Canyon NUC
Intel Core i9-11900KB, 3300 MHz
1638 Points +5%
Intel Dragon Canyon NUC - RTX 3060
Intel Core i9-12900, 2400 MHz
1638 Points +5%
Zotac ZBOX Magnus EN173070C
Intel Core i7-11800H, 2300 MHz
1571 Points +1%
Minisforum NUCX i7
Intel Core i7-11800H, 2300 MHz
1563 Points
Average Intel Core i7-11800H
  (1436 - 1571, n=8)
1533 Points -2%
Zotac Magnus One (ECM73070C)
Intel Core i7-10700, 2900 MHz
1304 Points -17%
Zotac MEK Mini (RTX 2070 Super)
Intel Core i7-9700, 3000 MHz
1300 Points -17%
Geekbench 4.4
64 Bit Single-Core Score
Intel Beast Canyon NUC
Intel Core i9-11900KB, 3300 MHz
6991 Points +4%
Intel Dragon Canyon NUC - RTX 3060
Intel Core i9-12900, 2400 MHz
6991 Points +4%
Zotac ZBOX Magnus EN173070C
Intel Core i7-11800H, 2300 MHz
6698 Points 0%
Minisforum NUCX i7
Intel Core i7-11800H, 2300 MHz
6693 Points
Average Intel Core i7-11800H
  (6104 - 6747, n=7)
6593 Points -1%
Zotac MEK Mini (RTX 2070 Super)
Intel Core i7-9700, 3000 MHz
5777 Points -14%
Zotac Magnus One (ECM73070C)
Intel Core i7-10700, 2900 MHz
5726 Points -14%
64 Bit Multi-Core Score
Minisforum NUCX i7
Intel Core i7-11800H, 2300 MHz
36347 Points
Intel Beast Canyon NUC
Intel Core i9-11900KB, 3300 MHz
36310 Points 0%
Intel Dragon Canyon NUC - RTX 3060
Intel Core i9-12900, 2400 MHz
36310 Points 0%
Average Intel Core i7-11800H
  (27454 - 36706, n=7)
33439 Points -8%
Zotac ZBOX Magnus EN173070C
Intel Core i7-11800H, 2300 MHz
33034 Points -9%
Zotac Magnus One (ECM73070C)
Intel Core i7-10700, 2900 MHz
32174 Points -11%
Zotac MEK Mini (RTX 2070 Super)
Intel Core i7-9700, 3000 MHz
27040 Points -26%
3DMark 11 - 1280x720 Performance Physics
Intel Dragon Canyon NUC - RTX 3060
Intel Core i9-12900, 2400 MHz
24314 Points +45%
Intel Beast Canyon NUC
Intel Core i9-11900KB, 3300 MHz
17803 Points +6%
Minisforum NUCX i7
Intel Core i7-11800H, 2300 MHz
16736 Points
Average Intel Core i7-11800H
  (10590 - 19167, n=46)
16408 Points -2%
Zotac ZBOX Magnus EN173070C
Intel Core i7-11800H, 2300 MHz
15739 Points -6%
Zotac Magnus One (ECM73070C)
Intel Core i7-10700, 2900 MHz
15497 Points -7%
Gigabyte A7 X1
AMD Ryzen 9 5900HX, 3300 MHz
15483 Points -7%
Zotac MEK Mini (RTX 2070 Super)
Intel Core i7-9700, 3000 MHz
13939 Points -17%
7-Zip 18.03
7z b 4
Gigabyte A7 X1
AMD Ryzen 9 5900HX, 3300 MHz
55231 MIPS +7%
Minisforum NUCX i7
Intel Core i7-11800H, 2300 MHz
51773 MIPS
Intel Beast Canyon NUC
Intel Core i9-11900KB, 3300 MHz
50152 MIPS -3%
Intel Dragon Canyon NUC - RTX 3060
Intel Core i9-12900, 2400 MHz
50152 MIPS -3%
Average Intel Core i7-11800H
  (33718 - 56758, n=46)
48384 MIPS -7%
Zotac ZBOX Magnus EN173070C
Intel Core i7-11800H, 2300 MHz
45999 MIPS -11%
Zotac Magnus One (ECM73070C)
Intel Core i7-10700, 2900 MHz
43007 MIPS -17%
Zotac MEK Mini (RTX 2070 Super)
Intel Core i7-9700, 3000 MHz
33539 MIPS -35%
7z b 4 -mmt1
Intel Beast Canyon NUC
Intel Core i9-11900KB, 3300 MHz
5979 MIPS +10%
Intel Dragon Canyon NUC - RTX 3060
Intel Core i9-12900, 2400 MHz
5979 MIPS +10%
Gigabyte A7 X1
AMD Ryzen 9 5900HX, 3300 MHz
5681 MIPS +4%
Zotac ZBOX Magnus EN173070C
Intel Core i7-11800H, 2300 MHz
5619 MIPS +3%
Average Intel Core i7-11800H
  (5138 - 5732, n=46)
5492 MIPS +1%
Minisforum NUCX i7
Intel Core i7-11800H, 2300 MHz
5446 MIPS
Zotac Magnus One (ECM73070C)
Intel Core i7-10700, 2900 MHz
5293 MIPS -3%
Zotac MEK Mini (RTX 2070 Super)
Intel Core i7-9700, 3000 MHz
5186 MIPS -5%
HWBOT x265 Benchmark v2.2 - 4k Preset
Gigabyte A7 X1
AMD Ryzen 9 5900HX, 3300 MHz
14.8 fps 0%
Minisforum NUCX i7
Intel Core i7-11800H, 2300 MHz
14.8 fps
Intel Beast Canyon NUC
Intel Core i9-11900KB, 3300 MHz
14.4 fps -3%
Intel Dragon Canyon NUC - RTX 3060
Intel Core i9-12900, 2400 MHz
14.4 fps -3%
Average Intel Core i7-11800H
  (7.38 - 17.4, n=46)
13.8 fps -7%
Zotac ZBOX Magnus EN173070C
Intel Core i7-11800H, 2300 MHz
13.2 fps -11%
Zotac Magnus One (ECM73070C)
Intel Core i7-10700, 2900 MHz
11.6 fps -22%
Zotac MEK Mini (RTX 2070 Super)
Intel Core i7-9700, 3000 MHz
10.5 fps -29%
R Benchmark 2.5 - Overall mean
Zotac MEK Mini (RTX 2070 Super)
Intel Core i7-9700, 3000 MHz
0.603 sec * -7%
Zotac Magnus One (ECM73070C)
Intel Core i7-10700, 2900 MHz
0.588 sec * -5%
Average Intel Core i7-11800H
  (0.548 - 0.615, n=46)
0.566 sec * -1%
Minisforum NUCX i7
Intel Core i7-11800H, 2300 MHz
0.562 sec *
Zotac ZBOX Magnus EN173070C
Intel Core i7-11800H, 2300 MHz
0.56 sec * -0%
Intel Beast Canyon NUC
Intel Core i9-11900KB, 3300 MHz
0.535 sec * +5%
Intel Dragon Canyon NUC - RTX 3060
Intel Core i9-12900, 2400 MHz
0.535 sec * +5%
Gigabyte A7 X1
AMD Ryzen 9 5900HX, 3300 MHz
0.502 sec * +11%
LibreOffice - 20 Documents To PDF
Zotac Magnus One (ECM73070C)
Intel Core i7-10700, 2900 MHz
59.5 s * -19%
Gigabyte A7 X1
AMD Ryzen 9 5900HX, 3300 MHz
56.5 s * -13%
Minisforum NUCX i7
Intel Core i7-11800H, 2300 MHz
50.1 s *
Zotac MEK Mini (RTX 2070 Super)
Intel Core i7-9700, 3000 MHz
48.73 s * +3%
Zotac ZBOX Magnus EN173070C
Intel Core i7-11800H, 2300 MHz
48 s * +4%
Average Intel Core i7-11800H
  (38.6 - 59.9, n=45)
46.5 s * +7%
Intel Beast Canyon NUC
Intel Core i9-11900KB, 3300 MHz
44.9 s * +10%
Intel Dragon Canyon NUC - RTX 3060
Intel Core i9-12900, 2400 MHz
44.9 s * +10%
WebXPRT 3 - Overall
Gigabyte A7 X1
AMD Ryzen 9 5900HX, 3300 MHz
279 Points +6%
Intel Beast Canyon NUC
Intel Core i9-11900KB, 3300 MHz
269 Points +3%
Intel Dragon Canyon NUC - RTX 3060
Intel Core i9-12900, 2400 MHz
269 Points +3%
Zotac ZBOX Magnus EN173070C
Intel Core i7-11800H, 2300 MHz
267 Points +2%
Average Intel Core i7-11800H
  (251 - 280, n=40)
264 Points +1%
Minisforum NUCX i7
Intel Core i7-11800H, 2300 MHz
262 Points
Zotac Magnus One (ECM73070C)
Intel Core i7-10700, 2900 MHz
244 Points -7%
Zotac MEK Mini (RTX 2070 Super)
Intel Core i7-9700, 3000 MHz
232 Points -11%
Mozilla Kraken 1.1 - Total
Zotac MEK Mini (RTX 2070 Super)
Intel Core i7-9700, 3000 MHz
790 ms * -23%
Zotac Magnus One (ECM73070C)
Intel Core i7-10700, 2900 MHz
752 ms * -18%
Average Intel Core i7-11800H
  (600 - 690, n=45)
642 ms * -0%
Zotac ZBOX Magnus EN173070C
Intel Core i7-11800H, 2300 MHz
641 ms * -0%
Minisforum NUCX i7
Intel Core i7-11800H, 2300 MHz
640 ms *
Gigabyte A7 X1
AMD Ryzen 9 5900HX, 3300 MHz
611 ms * +5%
Intel Beast Canyon NUC
Intel Core i9-11900KB, 3300 MHz
602 ms * +6%
Intel Dragon Canyon NUC - RTX 3060
Intel Core i9-12900, 2400 MHz
602 ms * +6%
3DMark
3840x2160 Fire Strike Ultra Physics
Intel Dragon Canyon NUC - RTX 3060
Intel Core i9-12900, 2400 MHz
37967 Points +60%
Intel Beast Canyon NUC
Intel Core i9-11900KB, 3300 MHz
23921 Points +1%
Average Intel Core i7-11800H
  (21176 - 25203, n=16)
23839 Points 0%
Minisforum NUCX i7
Intel Core i7-11800H, 2300 MHz
23774 Points
Zotac ZBOX Magnus EN173070C
Intel Core i7-11800H, 2300 MHz
22873 Points -4%
Zotac Magnus One (ECM73070C)
Intel Core i7-10700, 2900 MHz
21542 Points -9%
Zotac MEK Mini (RTX 2070 Super)
Intel Core i7-9700, 3000 MHz
16553 Points -30%
1920x1080 Fire Strike Physics
Intel Dragon Canyon NUC - RTX 3060
Intel Core i9-12900, 2400 MHz
35153 Points +43%
Gigabyte A7 X1
AMD Ryzen 9 5900HX, 3300 MHz
25271 Points +3%
Minisforum NUCX i7
Intel Core i7-11800H, 2300 MHz
24508 Points
Intel Beast Canyon NUC
Intel Core i9-11900KB, 3300 MHz
24327 Points -1%
Zotac ZBOX Magnus EN173070C
Intel Core i7-11800H, 2300 MHz
23641 Points -4%
Average Intel Core i7-11800H
  (12843 - 25145, n=47)
22367 Points -9%
Zotac Magnus One (ECM73070C)
Intel Core i7-10700, 2900 MHz
20080 Points -18%
Zotac MEK Mini (RTX 2070 Super)
Intel Core i7-9700, 3000 MHz
16387 Points -33%
2560x1440 Time Spy CPU
Intel Dragon Canyon NUC - RTX 3060
Intel Core i9-12900, 2400 MHz
15095 Points +48%
Minisforum NUCX i7
Intel Core i7-11800H, 2300 MHz
10169 Points
Intel Beast Canyon NUC
Intel Core i9-11900KB, 3300 MHz
10035 Points -1%
Zotac ZBOX Magnus EN173070C
Intel Core i7-11800H, 2300 MHz
9282 Points -9%
Average Intel Core i7-11800H
  (5086 - 11076, n=47)
9108 Points -10%
Gigabyte A7 X1
AMD Ryzen 9 5900HX, 3300 MHz
9077 Points -11%
Zotac Magnus One (ECM73070C)
Intel Core i7-10700, 2900 MHz
8580 Points -16%
Zotac MEK Mini (RTX 2070 Super)
Intel Core i7-9700, 3000 MHz
6867 Points -32%

* ... más pequeño es mejor

Performance Rating
Average of class Desktop
 
92.2 pt
Gigabyte A7 X1
AMD Ryzen 9 5900HX, GeForce RTX 3070 Laptop GPU
87.6 pt
Intel Beast Canyon NUC
Intel Core i9-11900KB, NVIDIA GeForce RTX 3060
84.4 pt
Intel Dragon Canyon NUC - RTX 3060
Intel Core i9-12900, NVIDIA GeForce RTX 3060
84.4 pt
Zotac ZBOX Magnus EN173070C
Intel Core i7-11800H, GeForce RTX 3070 Laptop GPU
78.9 pt
Minisforum NUCX i7
Intel Core i7-11800H, GeForce RTX 3070 Laptop GPU
78.7 pt
Zotac MEK Mini (RTX 2070 Super)
Intel Core i7-9700, GeForce RTX 2070 Super (Desktop)
57.5 pt
AIDA64 / FP32 Ray-Trace
Average of class Desktop
  (490 - 62786, n=25, last 2 years)
17460 KRay/s +37%
Gigabyte A7 X1
AMD Ryzen 9 5900HX, GeForce RTX 3070 Laptop GPU
14782 KRay/s +16%
Intel Beast Canyon NUC
Intel Core i9-11900KB, NVIDIA GeForce RTX 3060
14342 KRay/s +12%
Intel Dragon Canyon NUC - RTX 3060
Intel Core i9-12900, NVIDIA GeForce RTX 3060
14342 KRay/s +12%
Zotac ZBOX Magnus EN173070C
Intel Core i7-11800H, GeForce RTX 3070 Laptop GPU
13002 KRay/s +2%
Minisforum NUCX i7
Intel Core i7-11800H, GeForce RTX 3070 Laptop GPU
12788 KRay/s
Zotac MEK Mini (RTX 2070 Super)
Intel Core i7-9700, GeForce RTX 2070 Super (Desktop)
10014 KRay/s -22%
AIDA64 / FPU Julia
Gigabyte A7 X1
AMD Ryzen 9 5900HX, GeForce RTX 3070 Laptop GPU
92642 Points +70%
Average of class Desktop
  (2932 - 264044, n=25, last 2 years)
81505 Points +50%
Intel Beast Canyon NUC
Intel Core i9-11900KB, NVIDIA GeForce RTX 3060
60136 Points +11%
Intel Dragon Canyon NUC - RTX 3060
Intel Core i9-12900, NVIDIA GeForce RTX 3060
60136 Points +11%
Zotac ZBOX Magnus EN173070C
Intel Core i7-11800H, GeForce RTX 3070 Laptop GPU
56368 Points +4%
Minisforum NUCX i7
Intel Core i7-11800H, GeForce RTX 3070 Laptop GPU
54342 Points
Zotac MEK Mini (RTX 2070 Super)
Intel Core i7-9700, GeForce RTX 2070 Super (Desktop)
51809 Points -5%
AIDA64 / CPU SHA3
Intel Beast Canyon NUC
Intel Core i9-11900KB, NVIDIA GeForce RTX 3060
4043 MB/s +11%
Intel Dragon Canyon NUC - RTX 3060
Intel Core i9-12900, NVIDIA GeForce RTX 3060
4043 MB/s +11%
Zotac ZBOX Magnus EN173070C
Intel Core i7-11800H, GeForce RTX 3070 Laptop GPU
3829 MB/s +5%
Average of class Desktop
  (202 - 10362, n=25, last 2 years)
3734 MB/s +2%
Minisforum NUCX i7
Intel Core i7-11800H, GeForce RTX 3070 Laptop GPU
3655 MB/s
Gigabyte A7 X1
AMD Ryzen 9 5900HX, GeForce RTX 3070 Laptop GPU
3179 MB/s -13%
Zotac MEK Mini (RTX 2070 Super)
Intel Core i7-9700, GeForce RTX 2070 Super (Desktop)
2091 MB/s -43%
AIDA64 / CPU Queen
Gigabyte A7 X1
AMD Ryzen 9 5900HX, GeForce RTX 3070 Laptop GPU
101317 Points +13%
Intel Beast Canyon NUC
Intel Core i9-11900KB, NVIDIA GeForce RTX 3060
98219 Points +10%
Intel Dragon Canyon NUC - RTX 3060
Intel Core i9-12900, NVIDIA GeForce RTX 3060
98219 Points +10%
Average of class Desktop
  (8820 - 205588, n=25, last 2 years)
94006 Points +5%
Minisforum NUCX i7
Intel Core i7-11800H, GeForce RTX 3070 Laptop GPU
89290 Points
Zotac ZBOX Magnus EN173070C
Intel Core i7-11800H, GeForce RTX 3070 Laptop GPU
88481 Points -1%
Zotac MEK Mini (RTX 2070 Super)
Intel Core i7-9700, GeForce RTX 2070 Super (Desktop)
72659 Points -19%
AIDA64 / FPU SinJulia
Gigabyte A7 X1
AMD Ryzen 9 5900HX, GeForce RTX 3070 Laptop GPU
12519 Points +29%
Average of class Desktop
  (396 - 32855, n=25, last 2 years)
10987 Points +13%
Intel Beast Canyon NUC
Intel Core i9-11900KB, NVIDIA GeForce RTX 3060
9861 Points +1%
Intel Dragon Canyon NUC - RTX 3060
Intel Core i9-12900, NVIDIA GeForce RTX 3060
9861 Points +1%
Minisforum NUCX i7
Intel Core i7-11800H, GeForce RTX 3070 Laptop GPU
9734 Points
Zotac ZBOX Magnus EN173070C
Intel Core i7-11800H, GeForce RTX 3070 Laptop GPU
9457 Points -3%
Zotac MEK Mini (RTX 2070 Super)
Intel Core i7-9700, GeForce RTX 2070 Super (Desktop)
6927 Points -29%
AIDA64 / FPU Mandel
Gigabyte A7 X1
AMD Ryzen 9 5900HX, GeForce RTX 3070 Laptop GPU
51120 Points +58%
Average of class Desktop
  (1558 - 138291, n=25, last 2 years)
43317 Points +34%
Intel Beast Canyon NUC
Intel Core i9-11900KB, NVIDIA GeForce RTX 3060
36161 Points +12%
Intel Dragon Canyon NUC - RTX 3060
Intel Core i9-12900, NVIDIA GeForce RTX 3060
36161 Points +12%
Zotac ZBOX Magnus EN173070C
Intel Core i7-11800H, GeForce RTX 3070 Laptop GPU
33223 Points +3%
Minisforum NUCX i7
Intel Core i7-11800H, GeForce RTX 3070 Laptop GPU
32372 Points
Zotac MEK Mini (RTX 2070 Super)
Intel Core i7-9700, GeForce RTX 2070 Super (Desktop)
28306 Points -13%
AIDA64 / CPU AES
Intel Beast Canyon NUC
Intel Core i9-11900KB, NVIDIA GeForce RTX 3060
141926 MB/s +11%
Intel Dragon Canyon NUC - RTX 3060
Intel Core i9-12900, NVIDIA GeForce RTX 3060
141926 MB/s +11%
Minisforum NUCX i7
Intel Core i7-11800H, GeForce RTX 3070 Laptop GPU
128262 MB/s
Zotac ZBOX Magnus EN173070C
Intel Core i7-11800H, GeForce RTX 3070 Laptop GPU
124539 MB/s -3%
Gigabyte A7 X1
AMD Ryzen 9 5900HX, GeForce RTX 3070 Laptop GPU
123970 MB/s -3%
Average of class Desktop
  (3778 - 379659, n=25, last 2 years)
108385 MB/s -15%
Zotac MEK Mini (RTX 2070 Super)
Intel Core i7-9700, GeForce RTX 2070 Super (Desktop)
36217 MB/s -72%
AIDA64 / CPU ZLib
Average of class Desktop
  (75.2 - 2441, n=25, last 2 years)
936 MB/s +24%
Gigabyte A7 X1
AMD Ryzen 9 5900HX, GeForce RTX 3070 Laptop GPU
807 MB/s +7%
Minisforum NUCX i7
Intel Core i7-11800H, GeForce RTX 3070 Laptop GPU
756 MB/s
Intel Beast Canyon NUC
Intel Core i9-11900KB, NVIDIA GeForce RTX 3060
755 MB/s 0%
Intel Dragon Canyon NUC - RTX 3060
Intel Core i9-12900, NVIDIA GeForce RTX 3060
755 MB/s 0%
Zotac ZBOX Magnus EN173070C
Intel Core i7-11800H, GeForce RTX 3070 Laptop GPU
735 MB/s -3%
Zotac MEK Mini (RTX 2070 Super)
Intel Core i7-9700, GeForce RTX 2070 Super (Desktop)
550 MB/s -27%
AIDA64 / FP64 Ray-Trace
Average of class Desktop
  (273 - 33821, n=25, last 2 years)
9478 KRay/s +33%
Gigabyte A7 X1
AMD Ryzen 9 5900HX, GeForce RTX 3070 Laptop GPU
7794 KRay/s +10%
Intel Beast Canyon NUC
Intel Core i9-11900KB, NVIDIA GeForce RTX 3060
7780 KRay/s +9%
Intel Dragon Canyon NUC - RTX 3060
Intel Core i9-12900, NVIDIA GeForce RTX 3060
7780 KRay/s +9%
Zotac ZBOX Magnus EN173070C
Intel Core i7-11800H, GeForce RTX 3070 Laptop GPU
7119 KRay/s 0%
Minisforum NUCX i7
Intel Core i7-11800H, GeForce RTX 3070 Laptop GPU
7109 KRay/s
Zotac MEK Mini (RTX 2070 Super)
Intel Core i7-9700, GeForce RTX 2070 Super (Desktop)
5449 KRay/s -23%
AIDA64 / CPU PhotoWorxx
Average of class Desktop
  (5125 - 54037, n=25, last 2 years)
26592 MPixel/s +12%
Zotac ZBOX Magnus EN173070C
Intel Core i7-11800H, GeForce RTX 3070 Laptop GPU
23774 MPixel/s 0%
Minisforum NUCX i7
Intel Core i7-11800H, GeForce RTX 3070 Laptop GPU
23758 MPixel/s
Intel Beast Canyon NUC
Intel Core i9-11900KB, NVIDIA GeForce RTX 3060
23422 MPixel/s -1%
Intel Dragon Canyon NUC - RTX 3060
Intel Core i9-12900, NVIDIA GeForce RTX 3060
23422 MPixel/s -1%
Zotac MEK Mini (RTX 2070 Super)
Intel Core i7-9700, GeForce RTX 2070 Super (Desktop)
22866 MPixel/s -4%
Gigabyte A7 X1
AMD Ryzen 9 5900HX, GeForce RTX 3070 Laptop GPU
15048 MPixel/s -37%

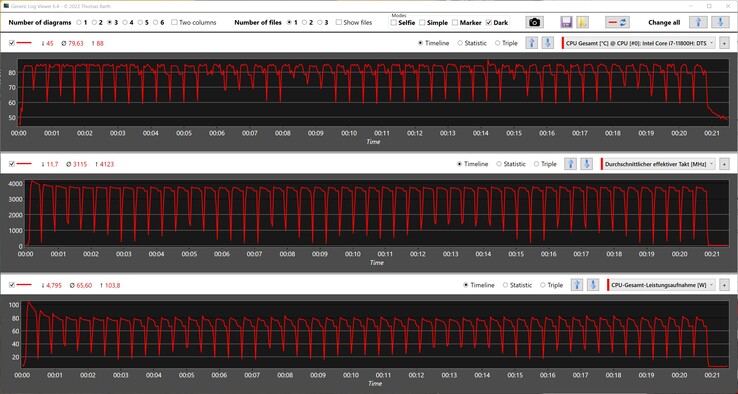
Minisforum NUCXi7 en el bucle múltiple de Cinebench R15

El bucle de la prueba de carga constante de Cinebench R15 da una buena impresión de la eficiencia del sistema de refrigeración incorporado. Tras las primeras ejecuciones, el rendimiento sólo cae mínimamente, antes de seguir nivelándose a una media de 1.828 puntos.

Métricas de la CPU durante el bucle de Cinebench R15
017034051068085010201190136015301700187020402210238025502720289030603230Tooltip
Minisforum NUCX i7 Intel Core i7-11800H, Intel Core i7-11800H: Ø1825 (1783.96-2050.55)
Intel Beast Canyon NUC Intel Core i9-11900KB, Intel Core i9-11900KB: Ø1800 (1776.75-1859.25)
Zotac Magnus One (ECM73070C) Intel Core i7-10700, Intel Core i7-10700: Ø1338 (1184.66-1454.54)
Zotac ZBOX Magnus EN173070C Intel Core i7-11800H, Intel Core i7-11800H: Ø1562 (1536.63-1683.86)
Intel Dragon Canyon NUC - RTX 3060 Intel Core i9-12900, Intel Core i9-12900: Ø2592 (2433.39-3346.44)
Zotac MEK Mini (RTX 2070 Super) Intel Core i7-9700, Intel Core i7-9700: Ø1226 (1219.7-1254.78)

Rendimiento del sistema

El Minisforum NUCXi7 deja una buena impresión en los benchmarks del sistema. La desventaja detrás del NUC Intel Dragon Canyon con un Intel Core i9-12900 es del 17%. Al mismo tiempo, el Intel Core i7-11800Hque a estas alturas ya tiene más de un año, también demuestra que no pertenecerá al montón de chatarra durante bastante tiempo. No obstante, el Minisforum también podría obtener algunas mejoras significativas con una actualización a los SoC Alder Lake de Intel. Pero en la configuración actual del equipo, el Minisforum NUCXi7 ofrece un rendimiento sólido que también convence en el funcionamiento diario.

Performance Rating - Percent
Intel Dragon Canyon NUC - RTX 3060, Intel Core i9-12900
NVIDIA GeForce RTX 3060, Transcend M.2 SSD 2200S TS512GMTE220S
100 pt
Intel Beast Canyon NUC, Intel Core i9-11900KB
NVIDIA GeForce RTX 3060, Sabrent Rocket 4.0 500GB
92.4 pt
Gigabyte A7 X1, AMD Ryzen 9 5900HX
NVIDIA GeForce RTX 3070 Laptop GPU, ESR512GTLCG-EAC-4
88.7 pt
Zotac ZBOX Magnus EN173070C, Intel Core i7-11800H
NVIDIA GeForce RTX 3070 Laptop GPU, Transcend M.2 SSD 2200S TS512GMTE220S
87.9 pt
Minisforum NUCX i7, Intel Core i7-11800H
NVIDIA GeForce RTX 3070 Laptop GPU,
85.8 pt
Zotac Magnus One (ECM73070C), Intel Core i7-10700
NVIDIA GeForce RTX 3070, Phison 512GB PA6620060U
80.5 pt
Zotac MEK Mini (RTX 2070 Super), Intel Core i7-9700
NVIDIA GeForce RTX 2070 Super (Desktop),
79.8 pt
PCMark 10
Score
Intel Dragon Canyon NUC - RTX 3060, Intel Core i9-12900
NVIDIA GeForce RTX 3060, Transcend M.2 SSD 2200S TS512GMTE220S
8083 Points +18%
Intel Beast Canyon NUC, Intel Core i9-11900KB
NVIDIA GeForce RTX 3060, Sabrent Rocket 4.0 500GB
7281 Points +6%
Zotac ZBOX Magnus EN173070C, Intel Core i7-11800H
NVIDIA GeForce RTX 3070 Laptop GPU, Transcend M.2 SSD 2200S TS512GMTE220S
6952 Points +1%
Gigabyte A7 X1, AMD Ryzen 9 5900HX
NVIDIA GeForce RTX 3070 Laptop GPU, ESR512GTLCG-EAC-4
6898 Points +1%
Minisforum NUCX i7, Intel Core i7-11800H
NVIDIA GeForce RTX 3070 Laptop GPU,
6863 Points
Zotac Magnus One (ECM73070C), Intel Core i7-10700
NVIDIA GeForce RTX 3070, Phison 512GB PA6620060U
6499 Points -5%
Zotac MEK Mini (RTX 2070 Super), Intel Core i7-9700
NVIDIA GeForce RTX 2070 Super (Desktop),
6351 Points -7%
Essentials
Intel Dragon Canyon NUC - RTX 3060, Intel Core i9-12900
NVIDIA GeForce RTX 3060, Transcend M.2 SSD 2200S TS512GMTE220S
11171 Points +13%
Intel Beast Canyon NUC, Intel Core i9-11900KB
NVIDIA GeForce RTX 3060, Sabrent Rocket 4.0 500GB
10422 Points +6%
Zotac ZBOX Magnus EN173070C, Intel Core i7-11800H
NVIDIA GeForce RTX 3070 Laptop GPU, Transcend M.2 SSD 2200S TS512GMTE220S
10014 Points +2%
Gigabyte A7 X1, AMD Ryzen 9 5900HX
NVIDIA GeForce RTX 3070 Laptop GPU, ESR512GTLCG-EAC-4
9991 Points +1%
Minisforum NUCX i7, Intel Core i7-11800H
NVIDIA GeForce RTX 3070 Laptop GPU,
9865 Points
Zotac Magnus One (ECM73070C), Intel Core i7-10700
NVIDIA GeForce RTX 3070, Phison 512GB PA6620060U
9846 Points 0%
Zotac MEK Mini (RTX 2070 Super), Intel Core i7-9700
NVIDIA GeForce RTX 2070 Super (Desktop),
9060 Points -8%
Productivity
Intel Dragon Canyon NUC - RTX 3060, Intel Core i9-12900
NVIDIA GeForce RTX 3060, Transcend M.2 SSD 2200S TS512GMTE220S
10205 Points +19%
Intel Beast Canyon NUC, Intel Core i9-11900KB
NVIDIA GeForce RTX 3060, Sabrent Rocket 4.0 500GB
9582 Points +12%
Gigabyte A7 X1, AMD Ryzen 9 5900HX
NVIDIA GeForce RTX 3070 Laptop GPU, ESR512GTLCG-EAC-4
9324 Points +9%
Zotac ZBOX Magnus EN173070C, Intel Core i7-11800H
NVIDIA GeForce RTX 3070 Laptop GPU, Transcend M.2 SSD 2200S TS512GMTE220S
8985 Points +5%
Minisforum NUCX i7, Intel Core i7-11800H
NVIDIA GeForce RTX 3070 Laptop GPU,
8579 Points
Zotac MEK Mini (RTX 2070 Super), Intel Core i7-9700
NVIDIA GeForce RTX 2070 Super (Desktop),
8148 Points -5%
Zotac Magnus One (ECM73070C), Intel Core i7-10700
NVIDIA GeForce RTX 3070, Phison 512GB PA6620060U
7447 Points -13%
CrossMark / Responsiveness
Intel Beast Canyon NUC, Intel Core i9-11900KB
NVIDIA GeForce RTX 3060, Sabrent Rocket 4.0 500GB
1885 Points +26%
Intel Dragon Canyon NUC - RTX 3060, Intel Core i9-12900
NVIDIA GeForce RTX 3060, Transcend M.2 SSD 2200S TS512GMTE220S
1885 Points +26%
Minisforum NUCX i7, Intel Core i7-11800H
NVIDIA GeForce RTX 3070 Laptop GPU,
1496 Points
Zotac ZBOX Magnus EN173070C, Intel Core i7-11800H
NVIDIA GeForce RTX 3070 Laptop GPU, Transcend M.2 SSD 2200S TS512GMTE220S
1435 Points -4%
CrossMark / Creativity
Intel Beast Canyon NUC, Intel Core i9-11900KB
NVIDIA GeForce RTX 3060, Sabrent Rocket 4.0 500GB
1724 Points +5%
Intel Dragon Canyon NUC - RTX 3060, Intel Core i9-12900
NVIDIA GeForce RTX 3060, Transcend M.2 SSD 2200S TS512GMTE220S
1724 Points +5%
Minisforum NUCX i7, Intel Core i7-11800H
NVIDIA GeForce RTX 3070 Laptop GPU,
1644 Points
Zotac ZBOX Magnus EN173070C, Intel Core i7-11800H
NVIDIA GeForce RTX 3070 Laptop GPU, Transcend M.2 SSD 2200S TS512GMTE220S
1613 Points -2%
CrossMark / Productivity
Intel Beast Canyon NUC, Intel Core i9-11900KB
NVIDIA GeForce RTX 3060, Sabrent Rocket 4.0 500GB
1816 Points +14%
Intel Dragon Canyon NUC - RTX 3060, Intel Core i9-12900
NVIDIA GeForce RTX 3060, Transcend M.2 SSD 2200S TS512GMTE220S
1816 Points +14%
Minisforum NUCX i7, Intel Core i7-11800H
NVIDIA GeForce RTX 3070 Laptop GPU,
1592 Points
Zotac ZBOX Magnus EN173070C, Intel Core i7-11800H
NVIDIA GeForce RTX 3070 Laptop GPU, Transcend M.2 SSD 2200S TS512GMTE220S
1573 Points -1%
CrossMark / Overall
Intel Beast Canyon NUC, Intel Core i9-11900KB
NVIDIA GeForce RTX 3060, Sabrent Rocket 4.0 500GB
1785 Points +12%
Intel Dragon Canyon NUC - RTX 3060, Intel Core i9-12900
NVIDIA GeForce RTX 3060, Transcend M.2 SSD 2200S TS512GMTE220S
1785 Points +12%
Minisforum NUCX i7, Intel Core i7-11800H
NVIDIA GeForce RTX 3070 Laptop GPU,
1600 Points
Zotac ZBOX Magnus EN173070C, Intel Core i7-11800H
NVIDIA GeForce RTX 3070 Laptop GPU, Transcend M.2 SSD 2200S TS512GMTE220S
1569 Points -2%
AIDA64 / Memory Copy
Average of class Desktop
  (15737 - 85092, n=25, last 2 years)
45847 MB/s +3%
Intel Beast Canyon NUC
Intel Core i9-11900KB, NVIDIA GeForce RTX 3060
44474 MB/s 0%
Intel Dragon Canyon NUC - RTX 3060
Intel Core i9-12900, NVIDIA GeForce RTX 3060
44474 MB/s 0%
Minisforum NUCX i7
Intel Core i7-11800H, GeForce RTX 3070 Laptop GPU
44370 MB/s
Zotac ZBOX Magnus EN173070C
Intel Core i7-11800H, GeForce RTX 3070 Laptop GPU
44240 MB/s 0%
Average Intel Core i7-11800H
  (24508 - 48144, n=21)
42778 MB/s -4%
Gigabyte A7 X1
AMD Ryzen 9 5900HX, GeForce RTX 3070 Laptop GPU
38633 MB/s -13%
Zotac MEK Mini (RTX 2070 Super)
Intel Core i7-9700, GeForce RTX 2070 Super (Desktop)
33103 MB/s -25%
AIDA64 / Memory Read
Zotac ZBOX Magnus EN173070C
Intel Core i7-11800H, GeForce RTX 3070 Laptop GPU
50365 MB/s +2%
Intel Beast Canyon NUC
Intel Core i9-11900KB, NVIDIA GeForce RTX 3060
49616 MB/s +1%
Intel Dragon Canyon NUC - RTX 3060
Intel Core i9-12900, NVIDIA GeForce RTX 3060
49616 MB/s +1%
Minisforum NUCX i7
Intel Core i7-11800H, GeForce RTX 3070 Laptop GPU
49326 MB/s
Average of class Desktop
  (10311 - 94830, n=25, last 2 years)
48236 MB/s -2%
Average Intel Core i7-11800H
  (25882 - 50365, n=20)
45259 MB/s -8%
Gigabyte A7 X1
AMD Ryzen 9 5900HX, GeForce RTX 3070 Laptop GPU
43730 MB/s -11%
Zotac MEK Mini (RTX 2070 Super)
Intel Core i7-9700, GeForce RTX 2070 Super (Desktop)
38236 MB/s -22%
AIDA64 / Memory Write
Average of class Desktop
  (17031 - 82856, n=25, last 2 years)
49736 MB/s +8%
Zotac ZBOX Magnus EN173070C
Intel Core i7-11800H, GeForce RTX 3070 Laptop GPU
46213 MB/s 0%
Minisforum NUCX i7
Intel Core i7-11800H, GeForce RTX 3070 Laptop GPU
46018 MB/s
Intel Beast Canyon NUC
Intel Core i9-11900KB, NVIDIA GeForce RTX 3060
45577 MB/s -1%
Intel Dragon Canyon NUC - RTX 3060
Intel Core i9-12900, NVIDIA GeForce RTX 3060
45577 MB/s -1%
Average Intel Core i7-11800H
  (22240 - 46214, n=20)
42489 MB/s -8%
Zotac MEK Mini (RTX 2070 Super)
Intel Core i7-9700, GeForce RTX 2070 Super (Desktop)
37723 MB/s -18%
Gigabyte A7 X1
AMD Ryzen 9 5900HX, GeForce RTX 3070 Laptop GPU
34324 MB/s -25%
AIDA64 / Memory Latency
Minisforum NUCX i7
Intel Core i7-11800H, GeForce RTX 3070 Laptop GPU
97.7 ns *
Intel Beast Canyon NUC
Intel Core i9-11900KB, NVIDIA GeForce RTX 3060
87.4 ns * +11%
Intel Dragon Canyon NUC - RTX 3060
Intel Core i9-12900, NVIDIA GeForce RTX 3060
87.4 ns * +11%
Zotac ZBOX Magnus EN173070C
Intel Core i7-11800H, GeForce RTX 3070 Laptop GPU
77.3 ns * +21%
Gigabyte A7 X1
AMD Ryzen 9 5900HX, GeForce RTX 3070 Laptop GPU
75.8 ns * +22%
Average of class Desktop
  (58 - 97.7, n=25, last 2 years)
74.9 ns * +23%
Zotac MEK Mini (RTX 2070 Super)
Intel Core i7-9700, GeForce RTX 2070 Super (Desktop)
57.1 ns * +42%
Average Intel Core i7-11800H
  (71.9 - 104.1, n=44)
43.3 (71.9min - 104.1max) ns * +56%

* ... más pequeño es mejor

Latencias del CPD

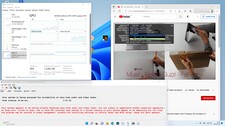
El Minisforum NUCXi7 lucha con el aumento de las latencias ya al abrir varias pestañas en el navegador Edge. Al reproducir nuestro vídeo de prueba 4K, la GPU Nvidia GeForce RTX 3070 para portátilesse carga al 36% aproximadamente.

Latencia máxima al abrir varias pestañas del navegador y reproducir material de vídeo 4K
Latencia máxima tras 10 segundos de Prime95
Conductores ordenados por el mayor tiempo de ejecución
DPC Latencies / LatencyMon - interrupt to process latency (max), Web, Youtube, Prime95
Minisforum NUCX i7, Intel Core i7-11800H
NVIDIA GeForce RTX 3070 Laptop GPU,
2373 μs *
Zotac ZBOX Magnus EN173070C, Intel Core i7-11800H
NVIDIA GeForce RTX 3070 Laptop GPU, Transcend M.2 SSD 2200S TS512GMTE220S
1214.8 μs * +49%
Gigabyte A7 X1, AMD Ryzen 9 5900HX
NVIDIA GeForce RTX 3070 Laptop GPU, ESR512GTLCG-EAC-4
792 μs * +67%

* ... más pequeño es mejor

Solución de almacenamiento

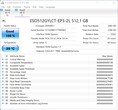
sSD NVMe de 512 GB
sSD NVMe de 512 GB

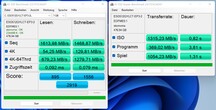
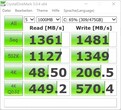
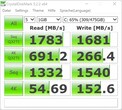
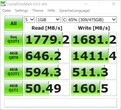
En nuestra configuración, la solución de almacenamiento es un SSD NVMe con 512 GB de espacio de almacenamiento. Aunque el modelo usado es rápido, no es capaz de seguir el ritmo del rendimiento de nuestros dispositivos de comparación. Sin embargo, el rendimiento sigue siendo suficiente para todas las aplicaciones habituales. Además, no pudimos ver ninguna latencia innecesaria debido al rendimiento del SSD. Por otro lado, teniendo en cuenta el grupo de usuarios al que va dirigido, el espacio de almacenamiento resulta muy escaso con sólo 512 GB. Para un dispositivo de juego, esperamos al menos 1 TB de almacenamiento. Al mismo tiempo, también puedes ampliar el almacenamiento más adelante usando la segunda ranura M.2.

Puedes encontrar más comparaciones y pruebas en nuestra tabla de comparación.

AS SSD
AS SSD
MDL 3
MDL 3
CDM 5
CDM 5
CDM 6
CDM 6
CDI
CDI
Sequential Read: 1361 MB/s
Sequential Write: 1481 MB/s
512K Read: 1127 MB/s
512K Write: 1349 MB/s
4K Read: 48.5 MB/s
4K Write: 206.5 MB/s
4K QD32 Read: 449.2 MB/s
4K QD32 Write: 570.4 MB/s
Drive Performance Rating - Percent
Intel Beast Canyon NUC
Sabrent Rocket 4.0 500GB
92.8 pt
Intel Dragon Canyon NUC - RTX 3060 -11!
Transcend M.2 SSD 2200S TS512GMTE220S
84.5 pt
Gigabyte A7 X1
ESR512GTLCG-EAC-4
71.6 pt
Average of class Desktop
 
67.4 pt
Zotac Magnus One (ECM73070C)
Phison 512GB PA6620060U
64.6 pt
Zotac ZBOX Magnus EN173070C
Transcend M.2 SSD 2200S TS512GMTE220S
62.2 pt
Global Average -3
 
57.8 pt
Minisforum NUCX i7
 
57.3 pt
Zotac MEK Mini (RTX 2070 Super)
 
30.4 pt
DiskSpd
seq read
Global Average -3
  (113.3 - 7045, n=1546)
2276 MB/s +40%
Zotac ZBOX Magnus EN173070C
Transcend M.2 SSD 2200S TS512GMTE220S
2008 (1998.8min - 2008.02max) MB/s +24%
Gigabyte A7 X1
ESR512GTLCG-EAC-4
1959 (1933.36min - 1959.16max) MB/s +21%
Intel Beast Canyon NUC
Sabrent Rocket 4.0 500GB
1936 (1755.26min - 1936.41max) MB/s +20%
Intel Dragon Canyon NUC - RTX 3060
Transcend M.2 SSD 2200S TS512GMTE220S
1936 (1755.26min - 1936.41max) MB/s +20%
Average of class Desktop
  (229 - 4276, n=20, last 2 years)
1935 MB/s +19%
Minisforum NUCX i7
 
1620 (1579.16min - 1620.17max) MB/s
Zotac Magnus One (ECM73070C)
Phison 512GB PA6620060U
824 (549.82min - 823.58max) MB/s -49%
Zotac MEK Mini (RTX 2070 Super)
 
226.5 (226.07min - 226.49max) MB/s -86%
seq write
Global Average -3
  (43 - 9307, n=1546)
2302 MB/s +35%
Gigabyte A7 X1
ESR512GTLCG-EAC-4
2124 (2090.44min - 2123.58max) MB/s +24%
Average of class Desktop
  (105.7 - 6288, n=20, last 2 years)
2108 MB/s +23%
Intel Beast Canyon NUC
Sabrent Rocket 4.0 500GB
1744 (525.75min - 1743.78max) MB/s +2%
Intel Dragon Canyon NUC - RTX 3060
Transcend M.2 SSD 2200S TS512GMTE220S
1744 (525.75min - 1743.78max) MB/s +2%
Minisforum NUCX i7
 
1707 (1684.21min - 1706.66max) MB/s
Zotac ZBOX Magnus EN173070C
Transcend M.2 SSD 2200S TS512GMTE220S
1701 (653.68min - 1701.42max) MB/s 0%
Zotac Magnus One (ECM73070C)
Phison 512GB PA6620060U
665 (240.27min - 665.08max) MB/s -61%
Zotac MEK Mini (RTX 2070 Super)
 
186.2 (148.9min - 186.23max) MB/s -89%
seq q8 t1 read
Intel Beast Canyon NUC
Sabrent Rocket 4.0 500GB
4996 (4330.97min - 4996.25max) MB/s +116%
Intel Dragon Canyon NUC - RTX 3060
Transcend M.2 SSD 2200S TS512GMTE220S
4996 (4330.97min - 4996.25max) MB/s +116%
Global Average -3
  (114.5 - 16089, n=1546)
3814 MB/s +65%
Gigabyte A7 X1
ESR512GTLCG-EAC-4
3463 (3045.7min - 3462.82max) MB/s +50%
Average of class Desktop
  (254 - 7219, n=20, last 2 years)
3190 MB/s +38%
Zotac Magnus One (ECM73070C)
Phison 512GB PA6620060U
2635 (2212.29min - 2635.07max) MB/s +14%
Zotac ZBOX Magnus EN173070C
Transcend M.2 SSD 2200S TS512GMTE220S
2599 (2228.8min - 2599.21max) MB/s +13%
Minisforum NUCX i7
 
2308 (2036.12min - 2307.5max) MB/s
Zotac MEK Mini (RTX 2070 Super)
 
237.8 (232.15min - 237.82max) MB/s -90%
seq q8 t1 write
Global Average -3
  (46.7 - 14571, n=1546)
2853 MB/s +55%
Average of class Desktop
  (100.9 - 6920, n=20, last 2 years)
2620 MB/s +42%
Intel Beast Canyon NUC
Sabrent Rocket 4.0 500GB
2524 (535.17min - 2524.36max) MB/s +37%
Intel Dragon Canyon NUC - RTX 3060
Transcend M.2 SSD 2200S TS512GMTE220S
2524 (535.17min - 2524.36max) MB/s +37%
Gigabyte A7 X1
ESR512GTLCG-EAC-4
2497 (2486.17min - 2496.87max) MB/s +35%
Zotac Magnus One (ECM73070C)
Phison 512GB PA6620060U
2002 (577.14min - 2001.94max) MB/s +9%
Zotac ZBOX Magnus EN173070C
Transcend M.2 SSD 2200S TS512GMTE220S
1988 (530.16min - 1987.88max) MB/s +8%
Minisforum NUCX i7
 
1843 (1731.1min - 1843.4max) MB/s
Zotac MEK Mini (RTX 2070 Super)
 
159.6 (120.8min - 159.59max) MB/s -91%
4k q1 t1 read
Zotac ZBOX Magnus EN173070C
Transcend M.2 SSD 2200S TS512GMTE220S
68.2 (66.68min - 68.15max) MB/s +75%
Global Average -3
  (0.67 - 361, n=1546)
58.1 MB/s +49%
Average of class Desktop
  (13.7 - 91.9, n=20, last 2 years)
51.9 MB/s +33%
Intel Beast Canyon NUC
Sabrent Rocket 4.0 500GB
45.7 (45.38min - 45.71max) MB/s +17%
Intel Dragon Canyon NUC - RTX 3060
Transcend M.2 SSD 2200S TS512GMTE220S
45.7 (45.38min - 45.71max) MB/s +17%
Gigabyte A7 X1
ESR512GTLCG-EAC-4
44.5 (44.06min - 44.46max) MB/s +14%
Zotac Magnus One (ECM73070C)
Phison 512GB PA6620060U
42.2 (41.94min - 42.15max) MB/s +8%
Minisforum NUCX i7
 
38.9 (38.65min - 38.87max) MB/s
Zotac MEK Mini (RTX 2070 Super)
 
7.23 (7.13min - 7.23max) MB/s -81%
4k q1 t1 write
Intel Beast Canyon NUC
Sabrent Rocket 4.0 500GB
320 (298.75min - 319.53max) MB/s +71%
Intel Dragon Canyon NUC - RTX 3060
Transcend M.2 SSD 2200S TS512GMTE220S
320 (298.75min - 319.53max) MB/s +71%
Zotac ZBOX Magnus EN173070C
Transcend M.2 SSD 2200S TS512GMTE220S
251 (152.06min - 251.09max) MB/s +34%
Minisforum NUCX i7
 
187.4 (170.03min - 187.4max) MB/s
Average of class Desktop
  (13.8 - 364, n=20, last 2 years)
181 MB/s -3%
Global Average -3
  (1.23 - 429, n=1545)
164.9 MB/s -12%
Gigabyte A7 X1
ESR512GTLCG-EAC-4
130 (127.46min - 129.84max) MB/s -31%
Zotac Magnus One (ECM73070C)
Phison 512GB PA6620060U
120 (119.43min - 119.96max) MB/s -36%
Zotac MEK Mini (RTX 2070 Super)
 
10.22 (9.1min - 10.22max) MB/s -95%
4k q32 t16 read
Global Average -3
  (1.03 - 6172, n=1545)
1391 MB/s +77%
Gigabyte A7 X1
ESR512GTLCG-EAC-4
1331 (1303.48min - 1331.29max) MB/s +69%
Zotac Magnus One (ECM73070C)
Phison 512GB PA6620060U
1311 (1269.74min - 1311.13max) MB/s +67%
Average of class Desktop
  (26 - 4319, n=20, last 2 years)
1201 MB/s +53%
Intel Beast Canyon NUC
Sabrent Rocket 4.0 500GB
970 (966.45min - 970.29max) MB/s +23%
Intel Dragon Canyon NUC - RTX 3060
Transcend M.2 SSD 2200S TS512GMTE220S
970 (966.45min - 970.29max) MB/s +23%
Minisforum NUCX i7
 
786 (734.36min - 786.34max) MB/s
Zotac ZBOX Magnus EN173070C
Transcend M.2 SSD 2200S TS512GMTE220S
656 (654.58min - 656.18max) MB/s -17%
Zotac MEK Mini (RTX 2070 Super)
 
11.1 (11.09min - 11.1max) MB/s -99%
4k q32 t16 write
Average of class Desktop
  (13.1 - 5015, n=20, last 2 years)
1241 MB/s +20%
Global Average -3
  (1.5 - 5015, n=1545)
1206 MB/s +17%
Intel Beast Canyon NUC
Sabrent Rocket 4.0 500GB
1119 (483.18min - 1119.3max) MB/s +8%
Intel Dragon Canyon NUC - RTX 3060
Transcend M.2 SSD 2200S TS512GMTE220S
1119 (483.18min - 1119.3max) MB/s +8%
Minisforum NUCX i7
 
1032 (266.97min - 1032.05max) MB/s
Zotac Magnus One (ECM73070C)
Phison 512GB PA6620060U
937 (473.07min - 936.52max) MB/s -9%
Zotac ZBOX Magnus EN173070C
Transcend M.2 SSD 2200S TS512GMTE220S
933 (584.14min - 933.42max) MB/s -10%
Gigabyte A7 X1
ESR512GTLCG-EAC-4
549 (541.16min - 549.03max) MB/s -47%
Zotac MEK Mini (RTX 2070 Super)
 
11.62 (11.16min - 11.62max) MB/s -99%
AS SSD
Score Total
Intel Beast Canyon NUC
Sabrent Rocket 4.0 500GB
6467 Points +513%
Zotac Magnus One (ECM73070C)
Phison 512GB PA6620060U
4893 Points +364%
Gigabyte A7 X1
ESR512GTLCG-EAC-4
4666 Points +343%
Average of class Desktop
  (136 - 8347, n=16, last 2 years)
3122 Points +196%
Zotac MEK Mini (RTX 2070 Super)
 
2907 Points +176%
Global Average -3
  (19 - 13854, n=3220)
2773 Points +163%
Zotac ZBOX Magnus EN173070C
Transcend M.2 SSD 2200S TS512GMTE220S
2237 Points +112%
Minisforum NUCX i7
 
1054.23 Points
Score Read
Intel Beast Canyon NUC
Sabrent Rocket 4.0 500GB
2462 Points +175%
Zotac Magnus One (ECM73070C)
Phison 512GB PA6620060U
1911 Points +114%
Gigabyte A7 X1
ESR512GTLCG-EAC-4
1545 Points +73%
Zotac MEK Mini (RTX 2070 Super)
 
1282 Points +43%
Average of class Desktop
  (65 - 3253, n=16, last 2 years)
1112 Points +24%
Global Average -3
  (6 - 26650, n=3221)
1086 Points +21%
Minisforum NUCX i7
 
895 Points
Zotac ZBOX Magnus EN173070C
Transcend M.2 SSD 2200S TS512GMTE220S
824 Points -8%
Score Write
Intel Beast Canyon NUC
Sabrent Rocket 4.0 500GB
2827 Points +82%
Gigabyte A7 X1
ESR512GTLCG-EAC-4
2395 Points +54%
Zotac Magnus One (ECM73070C)
Phison 512GB PA6620060U
2041 Points +31%
Average of class Desktop
  (39 - 5665, n=16, last 2 years)
1582 Points +2%
Minisforum NUCX i7
 
1556 Points
Global Average -3
  (4 - 7208, n=3221)
1172 Points -25%
Zotac MEK Mini (RTX 2070 Super)
 
1039 Points -33%
Zotac ZBOX Magnus EN173070C
Transcend M.2 SSD 2200S TS512GMTE220S
1022 Points -34%
Seq Read
Intel Beast Canyon NUC
Sabrent Rocket 4.0 500GB
4274 MB/s +165%
Gigabyte A7 X1
ESR512GTLCG-EAC-4
2859 MB/s +77%
Zotac ZBOX Magnus EN173070C
Transcend M.2 SSD 2200S TS512GMTE220S
2822 MB/s +75%
Zotac Magnus One (ECM73070C)
Phison 512GB PA6620060U
2361 MB/s +46%
Average of class Desktop
  (265 - 6331, n=16, last 2 years)
2332 MB/s +45%
Zotac MEK Mini (RTX 2070 Super)
 
2257 MB/s +40%
Global Average -3
  (226 - 12763, n=3437)
1847 MB/s +15%
Minisforum NUCX i7
 
1613 MB/s
Seq Write
Intel Beast Canyon NUC
Sabrent Rocket 4.0 500GB
2382 MB/s +62%
Zotac ZBOX Magnus EN173070C
Transcend M.2 SSD 2200S TS512GMTE220S
2044 MB/s +39%
Zotac Magnus One (ECM73070C)
Phison 512GB PA6620060U
1690 MB/s +15%
Average of class Desktop
  (117 - 5326, n=16, last 2 years)
1630 MB/s +11%
Gigabyte A7 X1
ESR512GTLCG-EAC-4
1530 MB/s +4%
Minisforum NUCX i7
 
1468 MB/s
Global Average -3
  (52.2 - 11316, n=3440)
1239 MB/s -16%
Zotac MEK Mini (RTX 2070 Super)
 
965 MB/s -34%
4K Read
Intel Beast Canyon NUC
Sabrent Rocket 4.0 500GB
83.9 MB/s +55%
Minisforum NUCX i7
 
54.25 MB/s
Average of class Desktop
  (13.2 - 83.7, n=16, last 2 years)
48.2 MB/s -11%
Gigabyte A7 X1
ESR512GTLCG-EAC-4
41.47 MB/s -24%
Global Average -3
  (6.08 - 314, n=3430)
41.2 MB/s -24%
Zotac Magnus One (ECM73070C)
Phison 512GB PA6620060U
38.25 MB/s -29%
Zotac ZBOX Magnus EN173070C
Transcend M.2 SSD 2200S TS512GMTE220S
37.9 MB/s -30%
Zotac MEK Mini (RTX 2070 Super)
 
17.46 MB/s -68%
4K Write
Intel Beast Canyon NUC
Sabrent Rocket 4.0 500GB
308.4 MB/s +138%
Zotac ZBOX Magnus EN173070C
Transcend M.2 SSD 2200S TS512GMTE220S
173.69 MB/s +34%
Average of class Desktop
  (13.5 - 272, n=16, last 2 years)
141.9 MB/s +9%
Gigabyte A7 X1
ESR512GTLCG-EAC-4
133.9 MB/s +3%
Minisforum NUCX i7
 
129.81 MB/s
Global Average -3
  (13.5 - 512, n=3430)
108.7 MB/s -16%
Zotac Magnus One (ECM73070C)
Phison 512GB PA6620060U
100.2 MB/s -23%
Zotac MEK Mini (RTX 2070 Super)
 
99.7 MB/s -23%
4K-64 Read
Intel Beast Canyon NUC
Sabrent Rocket 4.0 500GB
1950 MB/s +187%
Zotac Magnus One (ECM73070C)
Phison 512GB PA6620060U
1637 MB/s +141%
Gigabyte A7 X1
ESR512GTLCG-EAC-4
1218 MB/s +79%
Zotac MEK Mini (RTX 2070 Super)
 
1039 MB/s +53%
Average of class Desktop
  (25.7 - 2536, n=16, last 2 years)
830 MB/s +22%
Global Average -3
  (13.1 - 3475, n=3429)
798 MB/s +17%
Minisforum NUCX i7
 
679.23 MB/s
Zotac ZBOX Magnus EN173070C
Transcend M.2 SSD 2200S TS512GMTE220S
503.52 MB/s -26%
4K-64 Write
Intel Beast Canyon NUC
Sabrent Rocket 4.0 500GB
2281 MB/s +78%
Gigabyte A7 X1
ESR512GTLCG-EAC-4
2108 MB/s +65%
Zotac Magnus One (ECM73070C)
Phison 512GB PA6620060U
1772 MB/s +38%
Minisforum NUCX i7
 
1279.71 MB/s
Average of class Desktop
  (13.7 - 5085, n=16, last 2 years)
1277 MB/s 0%
Global Average -3
  (13.7 - 5909, n=3427)
878 MB/s -31%
Zotac MEK Mini (RTX 2070 Super)
 
843 MB/s -34%
Zotac ZBOX Magnus EN173070C
Transcend M.2 SSD 2200S TS512GMTE220S
643.35 MB/s -50%
Access Time Read
Global Average -3
  (0.012 - 33, n=3361)
0.656 ms * -613%
Zotac MEK Mini (RTX 2070 Super)
 
0.178 ms * -93%
Average of class Desktop
  (0.031 - 0.311, n=16, last 2 years)
0.123 ms * -34%
Zotac Magnus One (ECM73070C)
Phison 512GB PA6620060U
0.099 ms * -8%
Gigabyte A7 X1
ESR512GTLCG-EAC-4
0.098 ms * -7%
Minisforum NUCX i7
 
0.092 ms *
Intel Beast Canyon NUC
Sabrent Rocket 4.0 500GB
0.071 ms * +23%
Zotac ZBOX Magnus EN173070C
Transcend M.2 SSD 2200S TS512GMTE220S
0.063 ms * +32%
Access Time Write
Global Average -3
  (0.011 - 60.7, n=3403)
0.559 ms * -608%
Average of class Desktop
  (0.013 - 0.942, n=16, last 2 years)
0.1468 ms * -86%
Minisforum NUCX i7
 
0.079 ms *
Zotac MEK Mini (RTX 2070 Super)
 
0.055 ms * +30%
Zotac Magnus One (ECM73070C)
Phison 512GB PA6620060U
0.035 ms * +56%
Gigabyte A7 X1
ESR512GTLCG-EAC-4
0.028 ms * +65%
Zotac ZBOX Magnus EN173070C
Transcend M.2 SSD 2200S TS512GMTE220S
0.027 ms * +66%
Intel Beast Canyon NUC
Sabrent Rocket 4.0 500GB
0.012 ms * +85%

* ... más pequeño es mejor

Constant Performance Reading: DiskSpd Read Loop, Queue Depth 8

02555107651020127515301785204022952550280530603315357038254080433545904845Tooltip
Minisforum NUCX i7  : Ø2309 (2137.76-2318.4)
Intel Beast Canyon NUC Sabrent Rocket 4.0 500GB: Ø3896 (225.06-5002.7)
Zotac ZBOX Magnus EN173070C Transcend M.2 SSD 2200S TS512GMTE220S: Ø2440 (1786.98-2501.9)
Intel Dragon Canyon NUC - RTX 3060 Transcend M.2 SSD 2200S TS512GMTE220S: Ø3896 (225.06-5002.7)

Tarjeta gráfica

ElGPU Nvidia GeForce RTX 3070 para portátilesque se ejecuta en el Minisforum NUCXi7 es capaz de utilizar todo su rendimiento de 125 vatios en el modo Gaming. Sin embargo, hay que tener en cuenta que se trata de la versión móvil de la GeForce RTX 3070 cuyo rendimiento no se acerca al de la versión de sobremesa. La GPU Nvidia GeForce RTX 3070 para portátiles es entre un 25 y un 30% más lenta que laNvidia GeForce RTX 3070 de sobremesa. Sin embargo, nuestra unidad de pruebas mantiene a los competidores que se basan en una GPU Nvidia GeForce RTX 3060 de sobremesa fácilmente. Para calibrar el rendimiento aproximado del Minisforum NUCXi5, también incluimos los valores de rendimiento medio de la GPU Nvidia GeForce RTX 3060 para portátilesen nuestro gráfico.

Puedes encontrar más benchmarks de la Nvidia GeForce RTX 3070 aquí.

3DMark Performance Rating - Percent
MSI GeForce RTX 3070 Ventus 3X
NVIDIA GeForce RTX 3070, AMD Ryzen 9 5900X
98.8 pt
Zotac Magnus One (ECM73070C)
NVIDIA GeForce RTX 3070, Intel Core i7-10700
97.6 pt
Zotac ZBOX Magnus EN173070C
NVIDIA GeForce RTX 3070 Laptop GPU, Intel Core i7-11800H
83.8 pt
Minisforum NUCX i7
NVIDIA GeForce RTX 3070 Laptop GPU, Intel Core i7-11800H
78.4 pt
Average NVIDIA GeForce RTX 3070 Laptop GPU
 
76 pt
Zotac MEK Mini (RTX 2070 Super)
NVIDIA GeForce RTX 2070 Super (Desktop), Intel Core i7-9700
74.5 pt
Intel Dragon Canyon NUC - RTX 3060
NVIDIA GeForce RTX 3060, Intel Core i9-12900
68.5 pt
Intel Beast Canyon NUC
NVIDIA GeForce RTX 3060, Intel Core i9-11900KB
68.4 pt
Average NVIDIA GeForce RTX 3060 Laptop GPU
 
63.6 pt
3DMark 11 - 1280x720 Performance GPU
MSI GeForce RTX 3070 Ventus 3X
NVIDIA GeForce RTX 3070, AMD Ryzen 9 5900X
43005 Points +23%
Zotac Magnus One (ECM73070C)
NVIDIA GeForce RTX 3070, Intel Core i7-10700
40950 Points +17%
Minisforum NUCX i7
NVIDIA GeForce RTX 3070 Laptop GPU, Intel Core i7-11800H
34986 Points
Zotac ZBOX Magnus EN173070C
NVIDIA GeForce RTX 3070 Laptop GPU, Intel Core i7-11800H
34957 Points 0%
Zotac MEK Mini (RTX 2070 Super)
NVIDIA GeForce RTX 2070 Super (Desktop), Intel Core i7-9700
33626 Points -4%
Average NVIDIA GeForce RTX 3070 Laptop GPU
  (12535 - 38275, n=54)
32331 Points -8%
Intel Dragon Canyon NUC - RTX 3060
NVIDIA GeForce RTX 3060, Intel Core i9-12900
29172 Points -17%
Intel Beast Canyon NUC
NVIDIA GeForce RTX 3060, Intel Core i9-11900KB
28939 Points -17%
Average NVIDIA GeForce RTX 3060 Laptop GPU
  (13799 - 30772, n=43)
26816 Points -23%
3DMark
1280x720 Cloud Gate Standard Graphics
Zotac Magnus One (ECM73070C)
NVIDIA GeForce RTX 3070, Intel Core i7-10700
164443 Points +15%
Zotac ZBOX Magnus EN173070C
NVIDIA GeForce RTX 3070 Laptop GPU, Intel Core i7-11800H
159036 Points +11%
MSI GeForce RTX 3070 Ventus 3X
NVIDIA GeForce RTX 3070, AMD Ryzen 9 5900X
154637 Points +8%
Minisforum NUCX i7
NVIDIA GeForce RTX 3070 Laptop GPU, Intel Core i7-11800H
143126 Points
Intel Beast Canyon NUC
NVIDIA GeForce RTX 3060, Intel Core i9-11900KB
124830 Points -13%
Zotac MEK Mini (RTX 2070 Super)
NVIDIA GeForce RTX 2070 Super (Desktop), Intel Core i7-9700
124048 Points -13%
Average NVIDIA GeForce RTX 3070 Laptop GPU
  (45531 - 179716, n=33)
121367 Points -15%
Intel Dragon Canyon NUC - RTX 3060
NVIDIA GeForce RTX 3060, Intel Core i9-12900
120756 Points -16%
Average NVIDIA GeForce RTX 3060 Laptop GPU
  (33126 - 136826, n=38)
101628 Points -29%
1920x1080 Fire Strike Graphics
MSI GeForce RTX 3070 Ventus 3X
NVIDIA GeForce RTX 3070, AMD Ryzen 9 5900X
31020 Points +27%
Zotac Magnus One (ECM73070C)
NVIDIA GeForce RTX 3070, Intel Core i7-10700
30090 Points +23%
Zotac ZBOX Magnus EN173070C
NVIDIA GeForce RTX 3070 Laptop GPU, Intel Core i7-11800H
26284 Points +7%
Minisforum NUCX i7
NVIDIA GeForce RTX 3070 Laptop GPU, Intel Core i7-11800H
24451 Points
Average NVIDIA GeForce RTX 3070 Laptop GPU
  (7178 - 29128, n=52)
24302 Points -1%
Zotac MEK Mini (RTX 2070 Super)
NVIDIA GeForce RTX 2070 Super (Desktop), Intel Core i7-9700
22819 Points -7%
Intel Dragon Canyon NUC - RTX 3060
NVIDIA GeForce RTX 3060, Intel Core i9-12900
21984 Points -10%
Intel Beast Canyon NUC
NVIDIA GeForce RTX 3060, Intel Core i9-11900KB
21379 Points -13%
Average NVIDIA GeForce RTX 3060 Laptop GPU
  (16354 - 23109, n=49)
20436 Points -16%
2560x1440 Time Spy Graphics
MSI GeForce RTX 3070 Ventus 3X
NVIDIA GeForce RTX 3070, AMD Ryzen 9 5900X
13111 Points +42%
Zotac Magnus One (ECM73070C)
NVIDIA GeForce RTX 3070, Intel Core i7-10700
12668 Points +38%
Zotac ZBOX Magnus EN173070C
NVIDIA GeForce RTX 3070 Laptop GPU, Intel Core i7-11800H
9929 Points +8%
Zotac MEK Mini (RTX 2070 Super)
NVIDIA GeForce RTX 2070 Super (Desktop), Intel Core i7-9700
9564 Points +4%
Average NVIDIA GeForce RTX 3070 Laptop GPU
  (2644 - 11019, n=53)
9300 Points +1%
Minisforum NUCX i7
NVIDIA GeForce RTX 3070 Laptop GPU, Intel Core i7-11800H
9205 Points
Intel Dragon Canyon NUC - RTX 3060
NVIDIA GeForce RTX 3060, Intel Core i9-12900
8578 Points -7%
Intel Beast Canyon NUC
NVIDIA GeForce RTX 3060, Intel Core i9-11900KB
8525 Points -7%
Average NVIDIA GeForce RTX 3060 Laptop GPU
  (6285 - 9235, n=49)
8057 Points -12%
Fire Strike Extreme Graphics
MSI GeForce RTX 3070 Ventus 3X
NVIDIA GeForce RTX 3070, AMD Ryzen 9 5900X
15722 Points +34%
Zotac Magnus One (ECM73070C)
NVIDIA GeForce RTX 3070, Intel Core i7-10700
15597 Points +33%
Average NVIDIA GeForce RTX 3070 Laptop GPU
  (11757 - 13506, n=4)
12817 Points +9%
Zotac ZBOX Magnus EN173070C
NVIDIA GeForce RTX 3070 Laptop GPU, Intel Core i7-11800H
12636 Points +7%
Minisforum NUCX i7
NVIDIA GeForce RTX 3070 Laptop GPU, Intel Core i7-11800H
11757 Points
Zotac MEK Mini (RTX 2070 Super)
NVIDIA GeForce RTX 2070 Super (Desktop), Intel Core i7-9700
11382 Points -3%
Average NVIDIA GeForce RTX 3060 Laptop GPU
  (10110 - 10623, n=4)
10438 Points -11%
Intel Dragon Canyon NUC - RTX 3060
NVIDIA GeForce RTX 3060, Intel Core i9-12900
10244 Points -13%
Intel Beast Canyon NUC
NVIDIA GeForce RTX 3060, Intel Core i9-11900KB
10181 Points -13%
Performance Rating - Percent
Zotac Magnus One (ECM73070C)
NVIDIA GeForce RTX 3070, i7-10700, Phison 512GB PA6620060U
100 pt
Zotac ZBOX Magnus EN173070C
GeForce RTX 3070 Laptop GPU, i7-11800H, Transcend M.2 SSD 2200S TS512GMTE220S
80.3 pt
Average NVIDIA GeForce RTX 3070 Laptop GPU
 
77.3 pt
Minisforum NUCX i7
GeForce RTX 3070 Laptop GPU, i7-11800H
74.4 pt
Intel Dragon Canyon NUC - RTX 3060
NVIDIA GeForce RTX 3060, i9-12900, Transcend M.2 SSD 2200S TS512GMTE220S
66 pt
Intel Beast Canyon NUC
NVIDIA GeForce RTX 3060, i9-11900KB, Sabrent Rocket 4.0 500GB
65.1 pt
Average NVIDIA GeForce RTX 3060 Laptop GPU
 
63.3 pt
Unigine Heaven 4.0
Extreme Preset OpenGL
Zotac Magnus One (ECM73070C)
NVIDIA GeForce RTX 3070, i7-10700, Phison 512GB PA6620060U
187.5 fps +35%
Zotac ZBOX Magnus EN173070C
GeForce RTX 3070 Laptop GPU, i7-11800H, Transcend M.2 SSD 2200S TS512GMTE220S
152.9 fps +10%
Average NVIDIA GeForce RTX 3070 Laptop GPU
  (139.4 - 152.9, n=2)
146.2 fps +5%
Minisforum NUCX i7
GeForce RTX 3070 Laptop GPU, i7-11800H
139.4 fps
Intel Dragon Canyon NUC - RTX 3060
NVIDIA GeForce RTX 3060, i9-12900, Transcend M.2 SSD 2200S TS512GMTE220S
124.9 fps -10%
Intel Beast Canyon NUC
NVIDIA GeForce RTX 3060, i9-11900KB, Sabrent Rocket 4.0 500GB
121 fps -13%
Average NVIDIA GeForce RTX 3060 Laptop GPU
  ()
119.4 fps -14%
Extreme Preset DX11
Zotac Magnus One (ECM73070C)
NVIDIA GeForce RTX 3070, i7-10700, Phison 512GB PA6620060U
196.4 fps +28%
Zotac ZBOX Magnus EN173070C
GeForce RTX 3070 Laptop GPU, i7-11800H, Transcend M.2 SSD 2200S TS512GMTE220S
165.1 fps +8%
Average NVIDIA GeForce RTX 3070 Laptop GPU
  (152.9 - 165.1, n=2)
159 fps +4%
Minisforum NUCX i7
GeForce RTX 3070 Laptop GPU, i7-11800H
152.9 fps
Intel Dragon Canyon NUC - RTX 3060
NVIDIA GeForce RTX 3060, i9-12900, Transcend M.2 SSD 2200S TS512GMTE220S
134.8 fps -12%
Intel Beast Canyon NUC
NVIDIA GeForce RTX 3060, i9-11900KB, Sabrent Rocket 4.0 500GB
130.8 fps -14%
Average NVIDIA GeForce RTX 3060 Laptop GPU
  ()
121.6 fps -20%
Unigine Valley 1.0
1920x1080 Extreme HD DirectX AA:x8
Zotac Magnus One (ECM73070C)
NVIDIA GeForce RTX 3070, i7-10700, Phison 512GB PA6620060U
157.5 fps +30%
Zotac ZBOX Magnus EN173070C
GeForce RTX 3070 Laptop GPU, i7-11800H, Transcend M.2 SSD 2200S TS512GMTE220S
131.6 fps +9%
Average NVIDIA GeForce RTX 3070 Laptop GPU
  (120.9 - 131.6, n=2)
126.3 fps +4%
Minisforum NUCX i7
GeForce RTX 3070 Laptop GPU, i7-11800H
120.9 fps
Intel Dragon Canyon NUC - RTX 3060
NVIDIA GeForce RTX 3060, i9-12900, Transcend M.2 SSD 2200S TS512GMTE220S
108.3 fps -10%
Intel Beast Canyon NUC
NVIDIA GeForce RTX 3060, i9-11900KB, Sabrent Rocket 4.0 500GB
106.7 fps -12%
Average NVIDIA GeForce RTX 3060 Laptop GPU
  ()
97.4 fps -19%
1920x1080 Extreme HD Preset OpenGL AA:x8
Zotac Magnus One (ECM73070C)
NVIDIA GeForce RTX 3070, i7-10700, Phison 512GB PA6620060U
140.2 fps +34%
Zotac ZBOX Magnus EN173070C
GeForce RTX 3070 Laptop GPU, i7-11800H, Transcend M.2 SSD 2200S TS512GMTE220S
115.3 fps +10%
Average NVIDIA GeForce RTX 3070 Laptop GPU
  (104.8 - 115.3, n=2)
110.1 fps +5%
Minisforum NUCX i7
GeForce RTX 3070 Laptop GPU, i7-11800H
104.8 fps
Intel Dragon Canyon NUC - RTX 3060
NVIDIA GeForce RTX 3060, i9-12900, Transcend M.2 SSD 2200S TS512GMTE220S
96.1 fps -8%
Intel Beast Canyon NUC
NVIDIA GeForce RTX 3060, i9-11900KB, Sabrent Rocket 4.0 500GB
93.9 fps -10%
Average NVIDIA GeForce RTX 3060 Laptop GPU
  ()
92.6 fps -12%
Unigine Superposition
1920x1080 1080p High
Zotac Magnus One (ECM73070C)
NVIDIA GeForce RTX 3070, i7-10700, Phison 512GB PA6620060U
17054 Points +35%
Zotac ZBOX Magnus EN173070C
GeForce RTX 3070 Laptop GPU, i7-11800H, Transcend M.2 SSD 2200S TS512GMTE220S
13502 Points +7%
Average NVIDIA GeForce RTX 3070 Laptop GPU
  (12667 - 13502, n=2)
13085 Points +3%
Minisforum NUCX i7
GeForce RTX 3070 Laptop GPU, i7-11800H
12667 Points
Average NVIDIA GeForce RTX 3060 Laptop GPU
  ()
11258 Points -11%
Intel Beast Canyon NUC
NVIDIA GeForce RTX 3060, i9-11900KB, Sabrent Rocket 4.0 500GB
11177 Points -12%
Intel Dragon Canyon NUC - RTX 3060
NVIDIA GeForce RTX 3060, i9-12900, Transcend M.2 SSD 2200S TS512GMTE220S
11130 Points -12%
1920x1080 1080p Extreme
Zotac Magnus One (ECM73070C)
NVIDIA GeForce RTX 3070, i7-10700, Phison 512GB PA6620060U
8276 Points +42%
Zotac ZBOX Magnus EN173070C
GeForce RTX 3070 Laptop GPU, i7-11800H, Transcend M.2 SSD 2200S TS512GMTE220S
6259 Points +7%
Average NVIDIA GeForce RTX 3070 Laptop GPU
  (5847 - 6259, n=2)
6053 Points +4%
Minisforum NUCX i7
GeForce RTX 3070 Laptop GPU, i7-11800H
5847 Points
Intel Dragon Canyon NUC - RTX 3060
NVIDIA GeForce RTX 3060, i9-12900, Transcend M.2 SSD 2200S TS512GMTE220S
5008 Points -14%
Intel Beast Canyon NUC
NVIDIA GeForce RTX 3060, i9-11900KB, Sabrent Rocket 4.0 500GB
5006 Points -14%
Average NVIDIA GeForce RTX 3060 Laptop GPU
  ()
4990 Points -15%
3840x2160 4k Optimized
Zotac Magnus One (ECM73070C)
NVIDIA GeForce RTX 3070, i7-10700, Phison 512GB PA6620060U
10544 Points +39%
Zotac ZBOX Magnus EN173070C
GeForce RTX 3070 Laptop GPU, i7-11800H, Transcend M.2 SSD 2200S TS512GMTE220S
7997 Points +6%
Average NVIDIA GeForce RTX 3070 Laptop GPU
  (7574 - 7997, n=2)
7786 Points +3%
Minisforum NUCX i7
GeForce RTX 3070 Laptop GPU, i7-11800H
7574 Points
Intel Beast Canyon NUC
NVIDIA GeForce RTX 3060, i9-11900KB, Sabrent Rocket 4.0 500GB
6733 Points -11%
Average NVIDIA GeForce RTX 3060 Laptop GPU
  ()
6699 Points -12%
Intel Dragon Canyon NUC - RTX 3060
NVIDIA GeForce RTX 3060, i9-12900, Transcend M.2 SSD 2200S TS512GMTE220S
6694 Points -12%
3DMark 05 Standard
46264 puntos
3DMark 06 Standard Score
47138 puntos
3DMark Vantage P Result
76594 puntos
3DMark 11 Performance
27592 puntos
3DMark Ice Storm Standard Score
218821 puntos
3DMark Cloud Gate Standard Score
53894 puntos
3DMark Fire Strike Score
21258 puntos
3DMark Fire Strike Extreme Score
11291 puntos
3DMark Time Spy Score
9337 puntos
ayuda

Rendimiento de los juegos

El Minisforum NUCXi7 es sorprendentemente adecuado como PC para juegos. El rendimiento del sistema es suficiente para jugar a 1.440p en la mayoría de los casos. De vez en cuando, también puede obtener 2.160p de la GPU Nvidia GeForce RTX 3070 para portátilessiempre que el juego no exija demasiado al hardware. Sin embargo, el rendimiento de juego documentado aquí es sorprendente en comparación. A menudo, nuestra unidad de pruebas es capaz de mantener el ritmo de los dispositivos de comparación basados en las GPUs de sobremesa más rápidas, o incluso superarlas.

Puedes encontrar un resumen del rendimiento de todos nuestros juegos probados en comparación con otros modelos en nuestra Lista de juegos para GPU.

GTA V
1920x1080 Highest Settings possible AA:4xMSAA + FX AF:16x
Minisforum NUCX i7
Intel Core i7-11800H, NVIDIA GeForce RTX 3070 Laptop GPU
106 (6.46min, 76.9P1) fps
Zotac ZBOX Magnus EN173070C
Intel Core i7-11800H, NVIDIA GeForce RTX 3070 Laptop GPU
104.9 (4.3min, 71.4P1) fps -1%
Intel Beast Canyon NUC
Intel Core i9-11900KB, NVIDIA GeForce RTX 3060
104 (4.33min, 71.4P1) fps -2%
Intel Dragon Canyon NUC - RTX 3060
Intel Core i9-12900, NVIDIA GeForce RTX 3060
104 (4.33min, 71.4P1) fps -2%
Zotac Magnus One (ECM73070C)
Intel Core i7-10700, NVIDIA GeForce RTX 3070
95.6 (6.11min, 66.7P1) fps -10%
Average NVIDIA GeForce RTX 3070 Laptop GPU
  (21.7 - 125.8, n=50)
91 fps -14%
Gigabyte A7 X1
AMD Ryzen 9 5900HX, NVIDIA GeForce RTX 3070 Laptop GPU
83.6 (9.74min, 58.8P1) fps -21%
1920x1080 High/On (Advanced Graphics Off) AA:2xMSAA + FX AF:8x
Intel Beast Canyon NUC
Intel Core i9-11900KB, NVIDIA GeForce RTX 3060
177 (2.71min, 125P1) fps +3%
Intel Dragon Canyon NUC - RTX 3060
Intel Core i9-12900, NVIDIA GeForce RTX 3060
177 (2.71min, 125P1) fps +3%
Minisforum NUCX i7
Intel Core i7-11800H, NVIDIA GeForce RTX 3070 Laptop GPU
171.5 (2.79min, 111.1P1) fps
Zotac ZBOX Magnus EN173070C
Intel Core i7-11800H, NVIDIA GeForce RTX 3070 Laptop GPU
167.5 (3.4min, 100P1) fps -2%
Zotac Magnus One (ECM73070C)
Intel Core i7-10700, NVIDIA GeForce RTX 3070
161 (6.66min, 100P1) fps -6%
Average NVIDIA GeForce RTX 3070 Laptop GPU
  (58.2 - 181.4, n=38)
153.2 fps -11%
Gigabyte A7 X1
AMD Ryzen 9 5900HX, NVIDIA GeForce RTX 3070 Laptop GPU
139 (7.99min, 90.9P1) fps -19%
The Witcher 3
1920x1080 High Graphics & Postprocessing (Nvidia HairWorks Off)
Zotac Magnus One (ECM73070C)
Intel Core i7-10700, NVIDIA GeForce RTX 3070
235 fps +15%
Minisforum NUCX i7
Intel Core i7-11800H, NVIDIA GeForce RTX 3070 Laptop GPU
204 (41.8min, 71.5P0.1, 144.3P1) fps
Zotac ZBOX Magnus EN173070C
Intel Core i7-11800H, NVIDIA GeForce RTX 3070 Laptop GPU
190.1 (27.7min, 84.1P0.1, 144.8P1) fps -7%
Intel Dragon Canyon NUC - RTX 3060
Intel Core i9-12900, NVIDIA GeForce RTX 3060
178 (48.9min, 122P0.1, 146P1) fps -13%
Zotac MEK Mini (RTX 2070 Super)
Intel Core i7-9700, NVIDIA GeForce RTX 2070 Super (Desktop)
169 (157min) fps -17%
Average NVIDIA GeForce RTX 3070 Laptop GPU
  (122.1 - 207, n=34)
168 fps -18%
1920x1080 Ultra Graphics & Postprocessing (HBAO+)
Zotac Magnus One (ECM73070C)
Intel Core i7-10700, NVIDIA GeForce RTX 3070
121 fps +16%
Zotac ZBOX Magnus EN173070C
Intel Core i7-11800H, NVIDIA GeForce RTX 3070 Laptop GPU
105.5 (40.2min, 65.7P0.1, 83.1P1) fps +1%
Minisforum NUCX i7
Intel Core i7-11800H, NVIDIA GeForce RTX 3070 Laptop GPU
104.1 (24.9min, 51.1P0.1, 81.2P1) fps
Gigabyte A7 X1
AMD Ryzen 9 5900HX, NVIDIA GeForce RTX 3070 Laptop GPU
95.9 (80min) fps -8%
Zotac MEK Mini (RTX 2070 Super)
Intel Core i7-9700, NVIDIA GeForce RTX 2070 Super (Desktop)
95.6 (87min) fps -8%
Average NVIDIA GeForce RTX 3070 Laptop GPU
  (34.9 - 109, n=52)
91.8 fps -12%
Intel Dragon Canyon NUC - RTX 3060
Intel Core i9-12900, NVIDIA GeForce RTX 3060
91.3 (52.3min, 64.5P0.1, 77.1P1) fps -12%
Far Cry 5
1920x1080 Ultra Preset AA:T
Intel Dragon Canyon NUC - RTX 3060
Intel Core i9-12900, NVIDIA GeForce RTX 3060
132 (114min) fps +11%
Intel Beast Canyon NUC
Intel Core i9-11900KB, NVIDIA GeForce RTX 3060
122 (93min) fps +3%
Zotac ZBOX Magnus EN173070C
Intel Core i7-11800H, NVIDIA GeForce RTX 3070 Laptop GPU
120 (91min) fps +1%
Minisforum NUCX i7
Intel Core i7-11800H, NVIDIA GeForce RTX 3070 Laptop GPU
119 (90min) fps
Zotac Magnus One (ECM73070C)
Intel Core i7-10700, NVIDIA GeForce RTX 3070
117 (89min) fps -2%
Zotac MEK Mini (RTX 2070 Super)
Intel Core i7-9700, NVIDIA GeForce RTX 2070 Super (Desktop)
109 (85min) fps -8%
Average NVIDIA GeForce RTX 3070 Laptop GPU
  (89 - 140, n=36)
108.6 fps -9%
2560x1440 Ultra Preset AA:T
Zotac Magnus One (ECM73070C)
Intel Core i7-10700, NVIDIA GeForce RTX 3070
112 (86min) fps +13%
Zotac ZBOX Magnus EN173070C
Intel Core i7-11800H, NVIDIA GeForce RTX 3070 Laptop GPU
101 (79min) fps +2%
Minisforum NUCX i7
Intel Core i7-11800H, NVIDIA GeForce RTX 3070 Laptop GPU
99 (83min) fps
Intel Beast Canyon NUC
Intel Core i9-11900KB, NVIDIA GeForce RTX 3060
94 (84min) fps -5%
Intel Dragon Canyon NUC - RTX 3060
Intel Core i9-12900, NVIDIA GeForce RTX 3060
94 (85min) fps -5%
Zotac MEK Mini (RTX 2070 Super)
Intel Core i7-9700, NVIDIA GeForce RTX 2070 Super (Desktop)
93 (78min) fps -6%
Average NVIDIA GeForce RTX 3070 Laptop GPU
  (81 - 101, n=18)
91.2 fps -8%
Far Cry New Dawn
2560x1440 Ultra Preset
Zotac Magnus One (ECM73070C)
Intel Core i7-10700, NVIDIA GeForce RTX 3070
92 (67min) fps +1%
Intel Dragon Canyon NUC - RTX 3060
Intel Core i9-12900, NVIDIA GeForce RTX 3060
92 (74min) fps +1%
Zotac ZBOX Magnus EN173070C
Intel Core i7-11800H, NVIDIA GeForce RTX 3070 Laptop GPU
91 (70min) fps 0%
Minisforum NUCX i7
Intel Core i7-11800H, NVIDIA GeForce RTX 3070 Laptop GPU
91 (70min) fps
Intel Beast Canyon NUC
Intel Core i9-11900KB, NVIDIA GeForce RTX 3060
88 (70min) fps -3%
Average NVIDIA GeForce RTX 3070 Laptop GPU
  (62 - 91, n=5)
83.8 fps -8%
Zotac MEK Mini (RTX 2070 Super)
Intel Core i7-9700, NVIDIA GeForce RTX 2070 Super (Desktop)
83 (61min) fps -9%
1920x1080 Ultra Preset
Intel Dragon Canyon NUC - RTX 3060
Intel Core i9-12900, NVIDIA GeForce RTX 3060
113 (86min) fps +13%
Intel Beast Canyon NUC
Intel Core i9-11900KB, NVIDIA GeForce RTX 3060
102 (72min) fps +2%
Zotac ZBOX Magnus EN173070C
Intel Core i7-11800H, NVIDIA GeForce RTX 3070 Laptop GPU
100 (67min) fps 0%
Minisforum NUCX i7
Intel Core i7-11800H, NVIDIA GeForce RTX 3070 Laptop GPU
100 (71min) fps
Zotac Magnus One (ECM73070C)
Intel Core i7-10700, NVIDIA GeForce RTX 3070
95 (66min) fps -5%
Average NVIDIA GeForce RTX 3070 Laptop GPU
  (70 - 101, n=6)
91.3 fps -9%
Zotac MEK Mini (RTX 2070 Super)
Intel Core i7-9700, NVIDIA GeForce RTX 2070 Super (Desktop)
80 (59min) fps -20%
F1 2020
2560x1440 Ultra High Preset AA:T AF:16x
Minisforum NUCX i7
Intel Core i7-11800H, NVIDIA GeForce RTX 3070 Laptop GPU
123.7 (103min) fps
Zotac ZBOX Magnus EN173070C
Intel Core i7-11800H, NVIDIA GeForce RTX 3070 Laptop GPU
123.6 (102min) fps 0%
Intel Beast Canyon NUC
Intel Core i9-11900KB, NVIDIA GeForce RTX 3060
106 (88min) fps -14%
Intel Dragon Canyon NUC - RTX 3060
Intel Core i9-12900, NVIDIA GeForce RTX 3060
106 (88min) fps -14%
Average NVIDIA GeForce RTX 3070 Laptop GPU
  (74 - 123.7, n=4)
105.3 fps -15%
1920x1080 Ultra High Preset AA:T AF:16x
Minisforum NUCX i7
Intel Core i7-11800H, NVIDIA GeForce RTX 3070 Laptop GPU
166.2 (136min) fps
Zotac ZBOX Magnus EN173070C
Intel Core i7-11800H, NVIDIA GeForce RTX 3070 Laptop GPU
165.8 (134min) fps 0%
Intel Beast Canyon NUC
Intel Core i9-11900KB, NVIDIA GeForce RTX 3060
142 (114min) fps -15%
Intel Dragon Canyon NUC - RTX 3060
Intel Core i9-12900, NVIDIA GeForce RTX 3060
142 (114min) fps -15%
Average NVIDIA GeForce RTX 3070 Laptop GPU
  (97 - 173, n=7)
141.3 fps -15%
Strange Brigade
2560x1440 ultra AA:ultra AF:16
Zotac Magnus One (ECM73070C)
Intel Core i7-10700, NVIDIA GeForce RTX 3070
165 (53.6min, 133P1) fps +20%
Zotac ZBOX Magnus EN173070C
Intel Core i7-11800H, NVIDIA GeForce RTX 3070 Laptop GPU
137.3 (106.4min, 110P1) fps 0%
Minisforum NUCX i7
Intel Core i7-11800H, NVIDIA GeForce RTX 3070 Laptop GPU
137.3 (44.8min, 111P1) fps
Average NVIDIA GeForce RTX 3070 Laptop GPU
  (82.3 - 140.5, n=18)
121.8 fps -11%
Intel Beast Canyon NUC
Intel Core i9-11900KB, NVIDIA GeForce RTX 3060
116 (76.6min, 92.1P1) fps -16%
Intel Dragon Canyon NUC - RTX 3060
Intel Core i9-12900, NVIDIA GeForce RTX 3060
116 (76.6min, 92.1P1) fps -16%
1920x1080 ultra AA:ultra AF:16
Zotac Magnus One (ECM73070C)
Intel Core i7-10700, NVIDIA GeForce RTX 3070
222 (155min, 168P1) fps +20%
Zotac ZBOX Magnus EN173070C
Intel Core i7-11800H, NVIDIA GeForce RTX 3070 Laptop GPU
186.7 (103.5min, 141.7P1) fps +1%
Gigabyte A7 X1
AMD Ryzen 9 5900HX, NVIDIA GeForce RTX 3070 Laptop GPU
185 (39.2min, 139P1) fps 0%
Minisforum NUCX i7
Intel Core i7-11800H, NVIDIA GeForce RTX 3070 Laptop GPU
184.7 (56.8min, 140.7P1) fps
Average NVIDIA GeForce RTX 3070 Laptop GPU
  (36.2 - 194, n=46)
159 fps -14%
Intel Beast Canyon NUC
Intel Core i9-11900KB, NVIDIA GeForce RTX 3060
154 (58.1min, 116P1) fps -17%
Intel Dragon Canyon NUC - RTX 3060
Intel Core i9-12900, NVIDIA GeForce RTX 3060
154 (58.1min, 116P1) fps -17%
Borderlands 3
2560x1440 Badass Overall Quality (DX11)
Zotac Magnus One (ECM73070C)
Intel Core i7-10700, NVIDIA GeForce RTX 3070
75.5 fps +21%
Intel Beast Canyon NUC
Intel Core i9-11900KB, NVIDIA GeForce RTX 3060
70.2 fps +12%
Minisforum NUCX i7
Intel Core i7-11800H, NVIDIA GeForce RTX 3070 Laptop GPU
62.6 fps
Zotac ZBOX Magnus EN173070C
Intel Core i7-11800H, NVIDIA GeForce RTX 3070 Laptop GPU
62.2 fps -1%
Intel Dragon Canyon NUC - RTX 3060
Intel Core i9-12900, NVIDIA GeForce RTX 3060
60.3 fps -4%
Average NVIDIA GeForce RTX 3070 Laptop GPU
  (47.2 - 64.3, n=4)
59.1 fps -6%
Zotac MEK Mini (RTX 2070 Super)
Intel Core i7-9700, NVIDIA GeForce RTX 2070 Super (Desktop)
53.7 fps -14%
1920x1080 Badass Overall Quality (DX11)
Intel Beast Canyon NUC
Intel Core i9-11900KB, NVIDIA GeForce RTX 3060
100 fps +18%
Zotac Magnus One (ECM73070C)
Intel Core i7-10700, NVIDIA GeForce RTX 3070
98.8 fps +17%
Intel Dragon Canyon NUC - RTX 3060
Intel Core i9-12900, NVIDIA GeForce RTX 3060
84.7 fps 0%
Minisforum NUCX i7
Intel Core i7-11800H, NVIDIA GeForce RTX 3070 Laptop GPU
84.7 fps
Zotac ZBOX Magnus EN173070C
Intel Core i7-11800H, NVIDIA GeForce RTX 3070 Laptop GPU
84.6 fps 0%
Average NVIDIA GeForce RTX 3070 Laptop GPU
  (65.4 - 88.3, n=4)
80.8 fps -5%
Zotac MEK Mini (RTX 2070 Super)
Intel Core i7-9700, NVIDIA GeForce RTX 2070 Super (Desktop)
74.3 fps -12%
Metro Exodus
1920x1080 Ultra Quality AF:16x
Zotac Magnus One (ECM73070C)
Intel Core i7-10700, NVIDIA GeForce RTX 3070
93.1 (45.73min) fps +25%
Zotac ZBOX Magnus EN173070C
Intel Core i7-11800H, NVIDIA GeForce RTX 3070 Laptop GPU
74.6 (38.33min) fps 0%
Minisforum NUCX i7
Intel Core i7-11800H, NVIDIA GeForce RTX 3070 Laptop GPU
74.6 (38.07min) fps
Average NVIDIA GeForce RTX 3070 Laptop GPU
  (57.1 - 77.2, n=4)
70.9 fps -5%
Zotac MEK Mini (RTX 2070 Super)
Intel Core i7-9700, NVIDIA GeForce RTX 2070 Super (Desktop)
68.4 (35.76min) fps -8%
Intel Dragon Canyon NUC - RTX 3060
Intel Core i9-12900, NVIDIA GeForce RTX 3060
65.3 (34.71min) fps -12%
Intel Beast Canyon NUC
Intel Core i9-11900KB, NVIDIA GeForce RTX 3060
59.8 (30.99min) fps -20%
2560x1440 Ultra Quality AF:16x
Zotac Magnus One (ECM73070C)
Intel Core i7-10700, NVIDIA GeForce RTX 3070
76.1 (40.35min) fps +27%
Minisforum NUCX i7
Intel Core i7-11800H, NVIDIA GeForce RTX 3070 Laptop GPU
59.9 (32.93min) fps
Zotac ZBOX Magnus EN173070C
Intel Core i7-11800H, NVIDIA GeForce RTX 3070 Laptop GPU
58.7 (32.87min) fps -2%
Average NVIDIA GeForce RTX 3070 Laptop GPU
  (45.3 - 61.6, n=4)
56.4 fps -6%
Zotac MEK Mini (RTX 2070 Super)
Intel Core i7-9700, NVIDIA GeForce RTX 2070 Super (Desktop)
54.9 (31.8min) fps -8%
Intel Dragon Canyon NUC - RTX 3060
Intel Core i9-12900, NVIDIA GeForce RTX 3060
51.7 (29.47min) fps -14%
Intel Beast Canyon NUC
Intel Core i9-11900KB, NVIDIA GeForce RTX 3060
48.6 (28.29min) fps -19%
bajo medio alto ultraQHD4K DLSS4K FSR4K
GTA V (2015) 184.7 179.4 171.5 106 90.6 85.6
The Witcher 3 (2015) 417 315 204 104.1 71.6
Dota 2 Reborn (2015) 169.9 151.2 145.8 135.6 124.3
Rise of the Tomb Raider (2016) 293 206 138.7 122 56.9
Final Fantasy XV Benchmark (2018) 187.3 135.9 103.3 76.7 45.6
X-Plane 11.11 (2018) 143.2 125.9 94.8 81.5
Far Cry 5 (2018) 157 134 127 119 99 55
Strange Brigade (2018) 501 265 213 184.7 137.3 78.6
Shadow of the Tomb Raider (2018) 167.7 143.5 134.3 123.1 88.6 48
Forza Horizon 4 (2018) 211 189 188 167 140 93
Far Cry New Dawn (2019) 133 115 112 100 91 58
Metro Exodus (2019) 185 120.8 93.1 74.6 59.9 37.6
Anno 1800 (2019) 143.6 132.6 109.8 56.7 48.2 32.1
Control (2019) 240 131.7 96.1 61 30.3
Borderlands 3 (2019) 141.9 124.9 101 84.7 62.6 34.8
F1 2020 (2020) 333 273 230 166.2 123.7 69.7
Watch Dogs Legion (2020) 114 106 96 73 64 27
Dirt 5 (2020) 210 147 114 91 73 49
F1 2021 (2021) 381 303 244 123.1 90.2 51.1
New World (2021) 115.7 95.2 89.1 84.2 67.5 35.7
Forza Horizon 5 (2021) 206 145 132 81 70 50
God of War (2022) 128.1 111 91.5 67.7 57.4 37
GRID Legends (2022) 147 163 153 122 81 56
Cyberpunk 2077 1.6 (2022) 145.6 129.2 113.9 72.3 47.3 22.3
Tiny Tina's Wonderlands (2022) 194.1 158.8 111.6 88.3 62.1 33.6
F1 22 (2022) 239 208 172.1 61.9 39.7 19.1
A Plague Tale Requiem (2022) 107.9 84.8 66.2 50.1 36.3 20.4
Uncharted Legacy of Thieves Collection (2022) 83.4 80.6 76.8 73.7 56.4 21.9
Call of Duty Modern Warfare 2 2022 (2022) 129 117 90 87 62 58 37
Spider-Man Miles Morales (2022) 124.8 114.7 111.3 100.4 66.6 44.6
The Callisto Protocol (2022) 124.9 105.2 100.2 72.5 53.2 30.8
Need for Speed Unbound (2022) 116.8 108.2 92.7 89.7 78.1 44.8
High On Life (2023) 216 157 124.3 103 65.5 27.6
The Witcher 3 v4.00 (2023) 161.1 151.2 128.4 112.6 81.9 46.5
Dead Space Remake (2023) 87.7 83.9 73.3 73.6 53.8 27.5
Hogwarts Legacy (2023) 97.1 88.4 72.4 59.1 47 26.7
Returnal (2023) 104 101 93 79 59 34
Atomic Heart (2023) 186.7 143.9 88.5 69.8 53.8 32.5
Company of Heroes 3 (2023) 193.5 167.4 134.3 133.9 100.8 58.4
Sons of the Forest (2023) 80.4 75.8 72.8 72.5 57.7 37.8
Resident Evil 4 Remake (2023) 140 103.1 96.7 67.6 52.6 30.5
The Last of Us (2023) 96.6 82.2 71.6 56.9 36.6 31 16.5
Dead Island 2 (2023) 209 205 164.3 126.1 89.9 45.1
Star Wars Jedi Survivor (2023) 81.1 72.3 67.4 64.2 40.5 19.8
Diablo 4 (2023) 250 197.9 164.1 155.6 111.2 57.3
Ratchet & Clank Rift Apart (2023) 87.6 75.7 66.8 63.5 61.7 51.3
Baldur's Gate 3 (2023) 163.1 121.6 102 86.7 84.7 30.3
Atlas Fallen (2023) 144.5 135 127 106.8 42.6 75.9
Immortals of Aveum (2023) 62.4 51.2 41.7 28.2 15.9
Armored Core 6 (2023) 104.3 102.4 101.1 96.3 76.6 44.6
Starfield (2023) 73.5 64 51.6 47.1 32.5 23.1
Lies of P (2023) 160.7 152 130.2 117.1 80.2 65 41.6
Cyberpunk 2077 2.0 Phantom Liberty (2023) 122.9 99.3 84.8 75 46.9 20.9
Counter-Strike 2 (2023) 241 230 193.8 149.5 105.9 63.3
EA Sports FC 24 (2023) 249 199.3 161.7 151.4 129 79.5
Assassin's Creed Mirage (2023) 114 106 101 79 64 52 41
Total War Pharaoh (2023) 329.3 205.4 127.1 99.1 78.3 42.5
Lords of the Fallen (2023) 68 68.1 65.2 53.9 54.6 26.1 34
Alan Wake 2 (2023) 67 61.2 53.2 33.6 14.1
EA Sports WRC (2023) 130.8 98.1 90.7 83.4 63.2 52.5 35.5
Call of Duty Modern Warfare 3 2023 (2023) 146 129 101 83 67 46 43
Avatar Frontiers of Pandora (2023) 76 72 61 46 31 28 16
The Finals (2023) 222 181.7 160.6 127.2 80.2 37.6
Ready or Not (2023) 210 189.1 174.8 131.3 82 75.1 37.2
Prince of Persia The Lost Crown (2024) 356 356 356 340 178
Palworld (2024) 116.7 106.1 103 102.1 72.9 54.9 38.7
Enshrouded (2024) 80.3 68.8 58.8 49.2 38 34 32.8 22.8
Helldivers 2 (2024) 130 101 91.3 89.5 65.6 35.3
Skull & Bones (2024) 112 103 84 63 50 46 43 31
Last Epoch (2024) 192.2 184.2 167.2 127.3 83.6 40.7
Alone in the Dark (2024) 172.9 156.8 149.9 102.4 51.5 36.7 53.1 16.1
Horizon Forbidden West (2024) 104.2 96.2 62.7 60.5 47 42.2 38.8 29.3
Dragon's Dogma 2 (2024) 54.2 52.7 49.3 38.7 37.5 33.9

Emisiones - Buena refrigeración y silencio bajo carga

Emisiones acústicas

El sistema de refrigeración del Minisforum NUCXi7 consta de cinco tubos de calor y dos ventiladores, que son apenas audibles o incluso completamente silenciosos durante el funcionamiento en vacío. Pero incluso bajo carga, el dispositivo nunca se vuelve realmente ruidoso, y medimos un nivel de ruido máximo de 40.8 dB(A).

Un vistazo a la unidad de refrigeración del Minisforum NUCXi7
 

Ruido

Ocioso
29.5 / 29.5 / 29.5 dB(A)
Carga
32.8 / 40.8 dB(A)
  red to green bar
 
 
30 dB
silencioso
40 dB(A)
audible
50 dB(A)
ruidosamente alto
 
min: dark, med: mid, max: light   Earthworks M23R, Arta (15 cm de distancia)   environment noise: 29.5 dB(A)
dB(A) 0102030405060708090Deep BassMiddle BassHigh BassLower RangeMidsHigher MidsLower HighsMid HighsUpper HighsSuper Highs2033.331.232.53233.931.533.32532.433.631.130.729.631.732.4313131.731.329.63030.6314029.329.429.328.530.730.329.35028.934.234.233.533.432.928.96328.327.727.827.927.927.728.38028.326.126.428.829.126.928.310027.72625.625.324.526.827.712525.425.224.924.523.724.425.416025.125.123.823.323.62425.120025.724.222.822.822.522.425.725025.524.521.422.821.121.225.531524.822.620.221.320.821.324.840024.721.519.82020.520.124.750023.620.619.219.719.21923.663023.820.318.618.919.118.923.880025.52118.418.31818.225.5100026.422.117.917.317.817.226.4125028.920.817.416.917.216.928.91600312116.816.817.316.931200032.623.816.616.517.316.532.6250031.520.516.816.616.916.331.5315030.221.116.316.51816.130.240002919.716.416.417.416.629500028.517.316.716.717.116.528.563002417.116.716.81716.624800019.917.116.916.917.116.819.91000018.217.417.217.217.117.118.21250017.817.717.517.617.417.417.81600018.118.3181817.917.918.1SPL40.832.729.629.629.929.540.8N3.31.81.31.31.31.33.3median 25.5median 21median 17.9median 17.6median 17.9median 17.4median 25.5Delta3.52.82.32.31.82.33.5hearing rangehide median Fan NoiseMinisforum NUCX i7
Minisforum NUCX i7
i7-11800H, GeForce RTX 3070 Laptop GPU
Zotac Magnus One (ECM73070C)
i7-10700, NVIDIA GeForce RTX 3070
Zotac ZBOX Magnus EN173070C
i7-11800H, GeForce RTX 3070 Laptop GPU
Intel Dragon Canyon NUC - RTX 3060
i9-12900, NVIDIA GeForce RTX 3060
Noise
-18%
-13%
-4%
off / environment *
29.5
30
-2%
30.7
-4%
30.2
-2%
Idle Minimum *
29.5
33.58
-14%
32.7
-11%
30.2
-2%
Idle Average *
29.5
32.8
-11%
30.4
-3%
Idle Maximum *
29.5
32.8
-11%
30.8
-4%
Load Average *
32.8
44.25
-35%
41.7
-27%
Load Maximum *
40.8
48.72
-19%
45.4
-11%
45.1
-11%

* ... más pequeño es mejor

Temperaturas

Debido a la construcción, las temperaturas de la carcasa son muy similares a las de un portátil para juegos. Durante la prueba de estrés, medimos 45,9 °C en el punto más caliente del lado visible que también muestra el logotipo y la etiqueta. Las temperaturas de la carcasa que medimos durante el juego son ligeramente inferiores.

Las cosas parecen igualmente buenas con los componentes: El Intel Core i7-11800H alcanza los 86 °C bajo carga, aunque la GPU Nvidia GeForce RTX 3070 Laptop se mantiene ligeramente más fría durante la prueba de estrés con 77 °C. Tanto Intel XTU como HWiNFO informan de un estrangulamiento térmico bajo carga, lo que confirma que el fabricante definió un límite térmico de 85 °C (185 °F) para el procesador. Se puede aumentar este límite del procesador a 94 °C (201 °F) en el BIOS. Por otro lado, el límite de 87 °C (189 °F) permanece siempre fijo para la tarjeta gráfica.

Prueba de esfuerzo en solitario FurMark
Prueba de esfuerzo en solitario Prime95
Prueba de esfuerzo Prime95 + FurMark
Tapa de la caja durante el funcionamiento en vacío
Tapa del maletín bajo carga
Funda superior mientras se juega
Fondo de la caja durante el funcionamiento en vacío
Fondo de la caja bajo carga
Fondo de la caja mientras se juega
 45.9 °C44.4 °C44.4 °C 
 42.2 °C41.2 °C41.1 °C 
 38.3 °C37.5 °C36.6 °C 
Máximo: 45.9 °C
Médio: 41.3 °C
38.4 °C39.3 °C38.3 °C
33 °C32.6 °C36 °C
31.1 °C31 °C32.2 °C
Máximo: 39.3 °C
Médio: 34.7 °C
Conector de corriente  58 °C | Temperatura del cuarto 25.8 °C | FIRT 550-Pocket
(-) The average temperature for the upper side under maximal load is 41.3 °C / 106 F, compared to the average of 29.7 °C / 85 F for the devices in the class Desktop.
(-) The maximum temperature on the upper side is 45.9 °C / 115 F, compared to the average of 34.4 °C / 94 F, ranging from 25 to 47 °C for the class Desktop.
(+) The bottom heats up to a maximum of 39.3 °C / 103 F, compared to the average of 34 °C / 93 F
(±) In idle usage, the average temperature for the upper side is 35.7 °C / 96 F, compared to the device average of 29.7 °C / 85 F.
(-) Playing The Witcher 3, the average temperature for the upper side is 40.2 °C / 104 F, compared to the device average of 29.7 °C / 85 F.

Consumo de energía

En comparación con un PC de sobremesa normal, el Minisforum NUCXi7 tiene una clara ventaja gracias a sus eficientes componentes. Incluso comparado con el Zotac ZBOX Magnus EN1730Cnuestra unidad de prueba está claramente por delante, siendo significativamente más eficiente a pesar del hardware casi idéntico, sin perder nada de rendimiento. Con 28 a 36 vatios, el consumo de energía es bajo sin carga, pero sigue siendo significativamente mayor en comparación con el Gigabyte A7 X1. Bajo carga, el Minisforum NUCXi7 consume una media de 83 vatios, aunque medimos 167 vatios mientras jugamos. También observamos breves picos de hasta 215 vatios, que no alcanzan los límites de la fuente de alimentación de 230 vatios.

fuente de alimentación de 230 W
Consumo de corriente
Off / Standbydarklight 2.3 / 15.2 Watt
Ociosodarkmidlight 28.2 / 29.9 / 36.2 Watt
Carga midlight 83.2 / 215.7 Watt
 color bar
Clave: min: dark, med: mid, max: light        Metrahit Energy
Currently we use the Metrahit Energy, a professional single phase power quality and energy measurement digital multimeter, for our measurements. Find out more about it here. All of our test methods can be found here.
Minisforum NUCX i7
i7-11800H, GeForce RTX 3070 Laptop GPU
Zotac ZBOX Magnus EN173070C
i7-11800H, GeForce RTX 3070 Laptop GPU
Gigabyte A7 X1
R9 5900HX, GeForce RTX 3070 Laptop GPU
Average NVIDIA GeForce RTX 3070 Laptop GPU
 
Average of class Desktop
 
Power Consumption
-37%
15%
13%
17%
Idle Minimum *
28.2
31.3
-11%
12
57%
15.6 ?(4 - 64, n=39)
45%
Idle Average *
29.9
35.1
-17%
14
53%
20.1 ?(9 - 68.2, n=39)
33%
Idle Maximum *
36.2
41.6
-15%
19
48%
29.4 ?(14.6 - 76, n=39)
19%
Load Average *
83.2
214
-157%
118
-42%
110.8 ?(76.8 - 214, n=39)
-33%
Witcher 3 ultra *
167
193.5
-16%
205
-23%
Load Maximum *
215.7
231
-7%
229
-6%

* ... más pequeño es mejor

Power Consumption With External Monitor

0153045607590105120135150165180195210Tooltip
Minisforum NUCX i7; Prime95 V2810 Stress (external Monitor): Ø109.2 (100.1-122.5)
Minisforum NUCX i7; Cinebench R15 Multi (external Monitor): Ø127.7 (68.2-149.7)
Minisforum NUCX i7; 1280x720 FurMark 1.19 GPU Stress Test (external Monitor): Ø178.5 (143.7-216)
Minisforum NUCX i7; 1280x720 FurMark 1.19 GPU Stress Test (external Monitor): Ø167.5 (160.7-181.3)
Minisforum NUCX i7; 1920x1080 The Witcher 3 ultra (external Monitor): Ø167 (159.9-187.6)
Minisforum NUCX i7; Idle 1min (external Monitor): Ø29.9 (28.3-36.1)

Pro

+ diseño atractivo
+ caja muy delgada
+ bajo peso
+ rendimiento estable del sistema
+ lo suficientemente rápido para jugar a 1440p
+ relativamente silencioso bajo carga
+ bajo consumo de energía
+ 2.ethernet de 5 Gbit
+ Thunderbolt 4
+ Lector de tarjetas SD
+ fácil de abrir
+ rendimiento estable de la SSD

Contra

- Problemas de latencia del CPD
- Sólo hay USB tipo A en la parte delantera
- sólo 512 GB de almacenamiento

Veredicto - Un PC para juegos ultra delgado

Probando el Minisforum NUCXi7, unidad de prueba proporcionada por Minisforum

Con el Minisforum NUCXi7, el fabricante ofrece un PC para juegos muy emocionante, que utiliza la tecnología probada de los portátiles. La combinación del Intel Core i7-11800Hy GPU Nvidia GeForce RTX 3070 para portátilesfunciona muy bien y garantiza un sistema de funcionamiento rápido. La carcasa, muy delgada, parece ser de alta calidad y moderna al mismo tiempo. Debido a la refrigeración, el Minisforum NUCXi7 sólo debe funcionar en posición vertical. Esto es algo que tienes que aceptar cuando te decides por el dispositivo. También tienes que vivir con algunos pequeños compromisos en cuanto a la variedad de conexiones, ya que los puertos USB-A que se suelen utilizar para el ratón y el teclado están colocados en la parte delantera del dispositivo. Con el SSD de 512 GB, está bastante bien equipado para empezar. Sin embargo, teniendo en cuenta los usuarios a los que va dirigido, los jugadores podrían llegar rápidamente a sus límites, y recomendamos al menos 1 TB como estándar.

El Minisforum NUCXi7 es un PC de juego silencioso en una carcasa ultrafina que está diseñado para jugar a 1.440p.

Nos han gustado mucho los bajos valores de emisión del Minisforum NUCXi7: no sólo es silencioso, sino que también es eficiente, manteniendo siempre las temperaturas bajo control. Al mismo tiempo, no tienes que vivir con un rendimiento reducido de la CPU y la GPU. Además, nuestra muestra de prueba no cometió ningún error garrafal en ningún momento. El rendimiento del sistema es bueno mientras se trabaja o se juega. En algunas partes, el Minisforum NUCXi7 es incluso capaz de seguir el ritmo de los PCs de sobremesa normales.

Como posible alternativa al Minisforum NUCXi7, también podrías mirar un portátil para juegos. Definitivamente hay un valor adicional, aunque también hay una pequeña prima adicional con un equipo similar: El Gigabyte A7 X1 cuesta alrededor de $1800.

Precio y disponibilidad

El Minisforum NUCXi7está en la lista de la tienda de Minisforum con pedidos que se enviarán a mediados de octubre. Actualmente todavía hay algunos atractivos descuentos de "preventa". Por ejemplo, nuestra unidad de prueba cuesta actualmente 1.169 dólares. El precio normal sería de 1.339 dólares sin la rebaja. El más asequible NUCXi5 actualmente cuesta $979 con el mismo equipo de RAM y SSD (regularmente 1129 dólares).

Minisforum NUCX i7 - 09/14/2022 v7
Sebastian Bade
Acabado
79 / 98 → 81%
Conectividad
54 / 81 → 67%
Peso
60%
Rendimiento de juegos
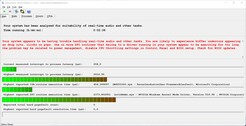
98%
Rendimiento de la Aplicación
94%
Temperatura
87%
Ruido
95%
Médio
81%
0%
Desktop - media ponderada
Please share our article, every link counts!
> Análisis y pruebas de ordenadores portátiles y móviles teléfonos > Análisis > Análisis del PC de sobremesa NUCXi7 de Minisforum: PC de juegos ultra delgado con GeForce RTX 3070 y Core i7-11800H
Sebastian Bade, 2022-09-18 (Update: 2022-09-18)