Análisis de la Zotac ZBOX Magnus: GeForce RTX 3070 Mobile y Tiger Lake SoC en una caja de 2,65 litros
Bajo la etiqueta Zotac ZBOX, el fabricante ofrece una serie de PCs compactos destinados a diversos escenarios de uso individual. En combinación con el añadido de la etiqueta Magnus, la dirección es la de un PC para juegos, lo que también se refleja en los componentes incorporados. La versión actual del Magnus EN173070C contiene un Intel Core i7-11800Hque se supone que garantiza un funcionamiento rápido para juegos en combinación con la Nvidia GeForce RTX 3070 portátilgráficos. Esta combinación no es nueva para nosotros como plataforma de análisis de portátiles, y ya podemos dar una estimación aproximada de qué rendimiento esperar
En nuestra configuración de equipo, el Magnus EN173070C cuesta casi 1650 Euros (~$1743). Sin embargo, como siempre se trata de un sistema barebone, también hay que calcular el SSD, la RAM y la licencia de Windows. Dependiendo de los componentes que elijas, la factura total puede superar fácilmente los 2000 euros. Aquellos para los que el rendimiento de la Nvidia GeForce RTX 3070 para portátilesno es suficiente, también pueden conseguir la versión EN173080C del Magnus, que contiene una GPU más rápida con la Nvidia GeForce RTX 3080 para portátilesgráficos. La CPU sigue siendo la misma con el Intel Core i7-11800H. También puedes conseguir el Magnus EN153060C, que ofrece un rendimiento ligeramente inferior e incluye elIntel Core i5-11400HcPU y Nvidia GeForce RTX 3060 PortátilgPU.
Zotac ZBOX Magnus EN173070C en detalle
Caso
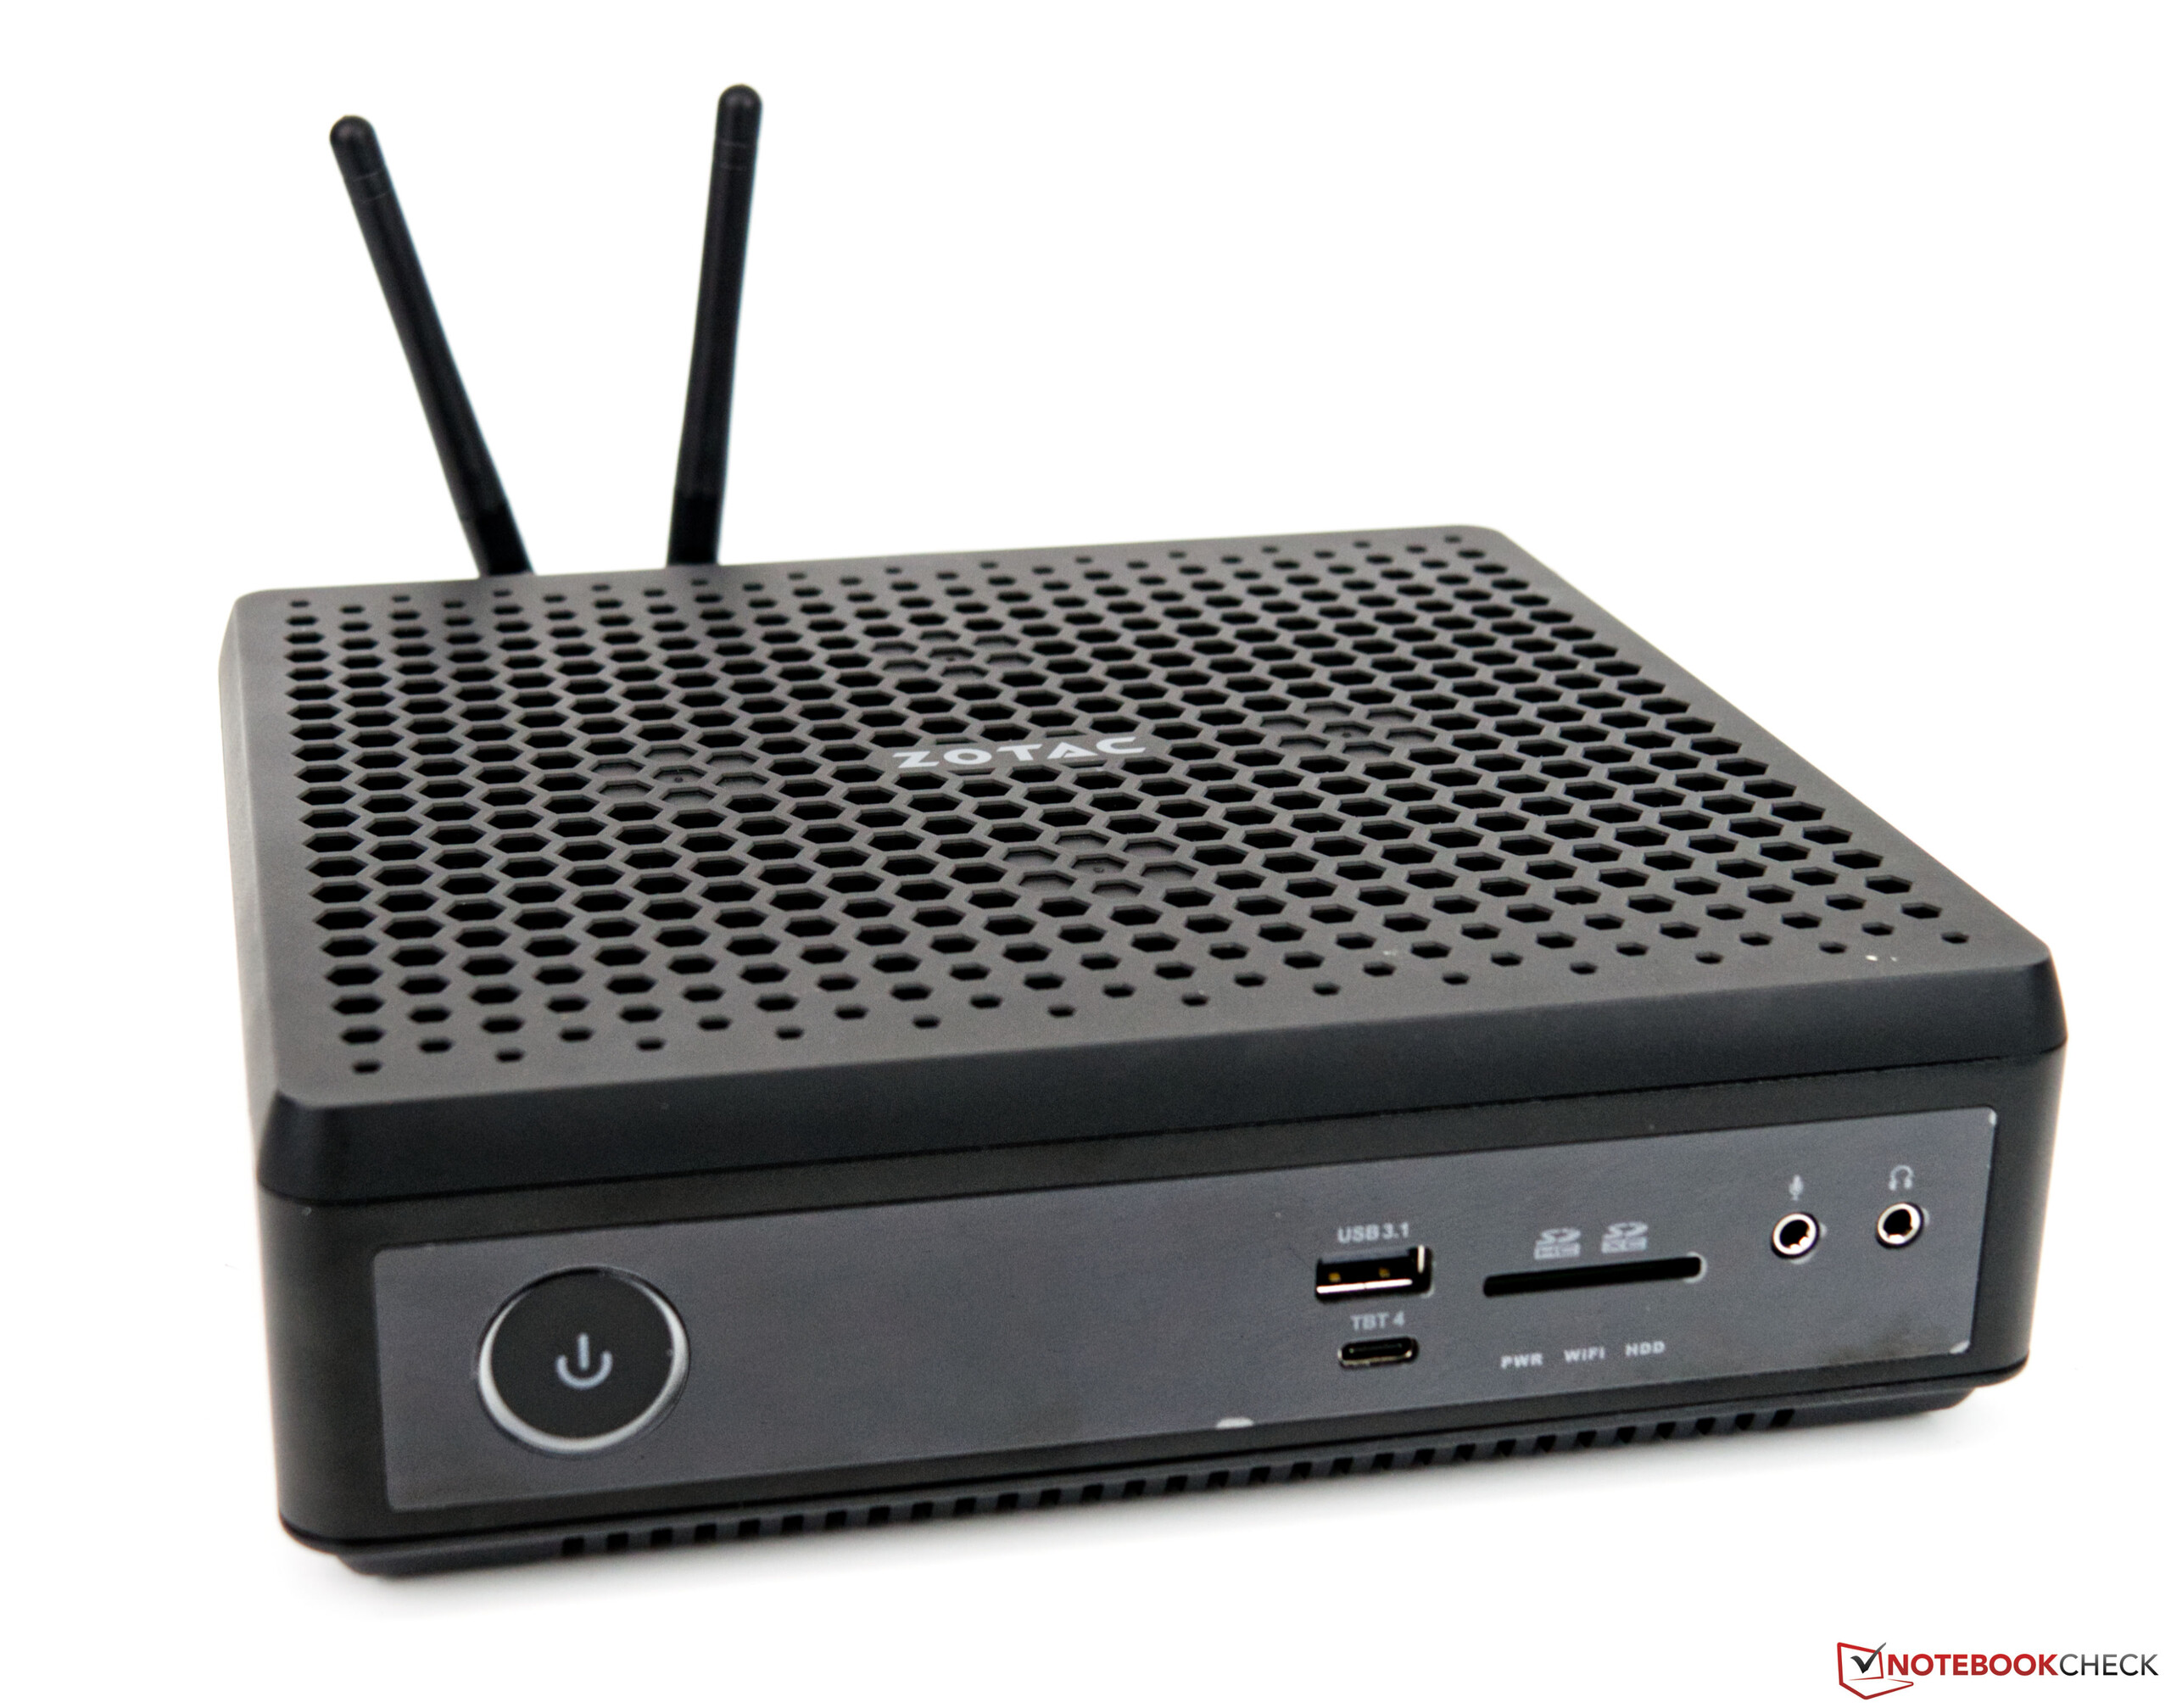
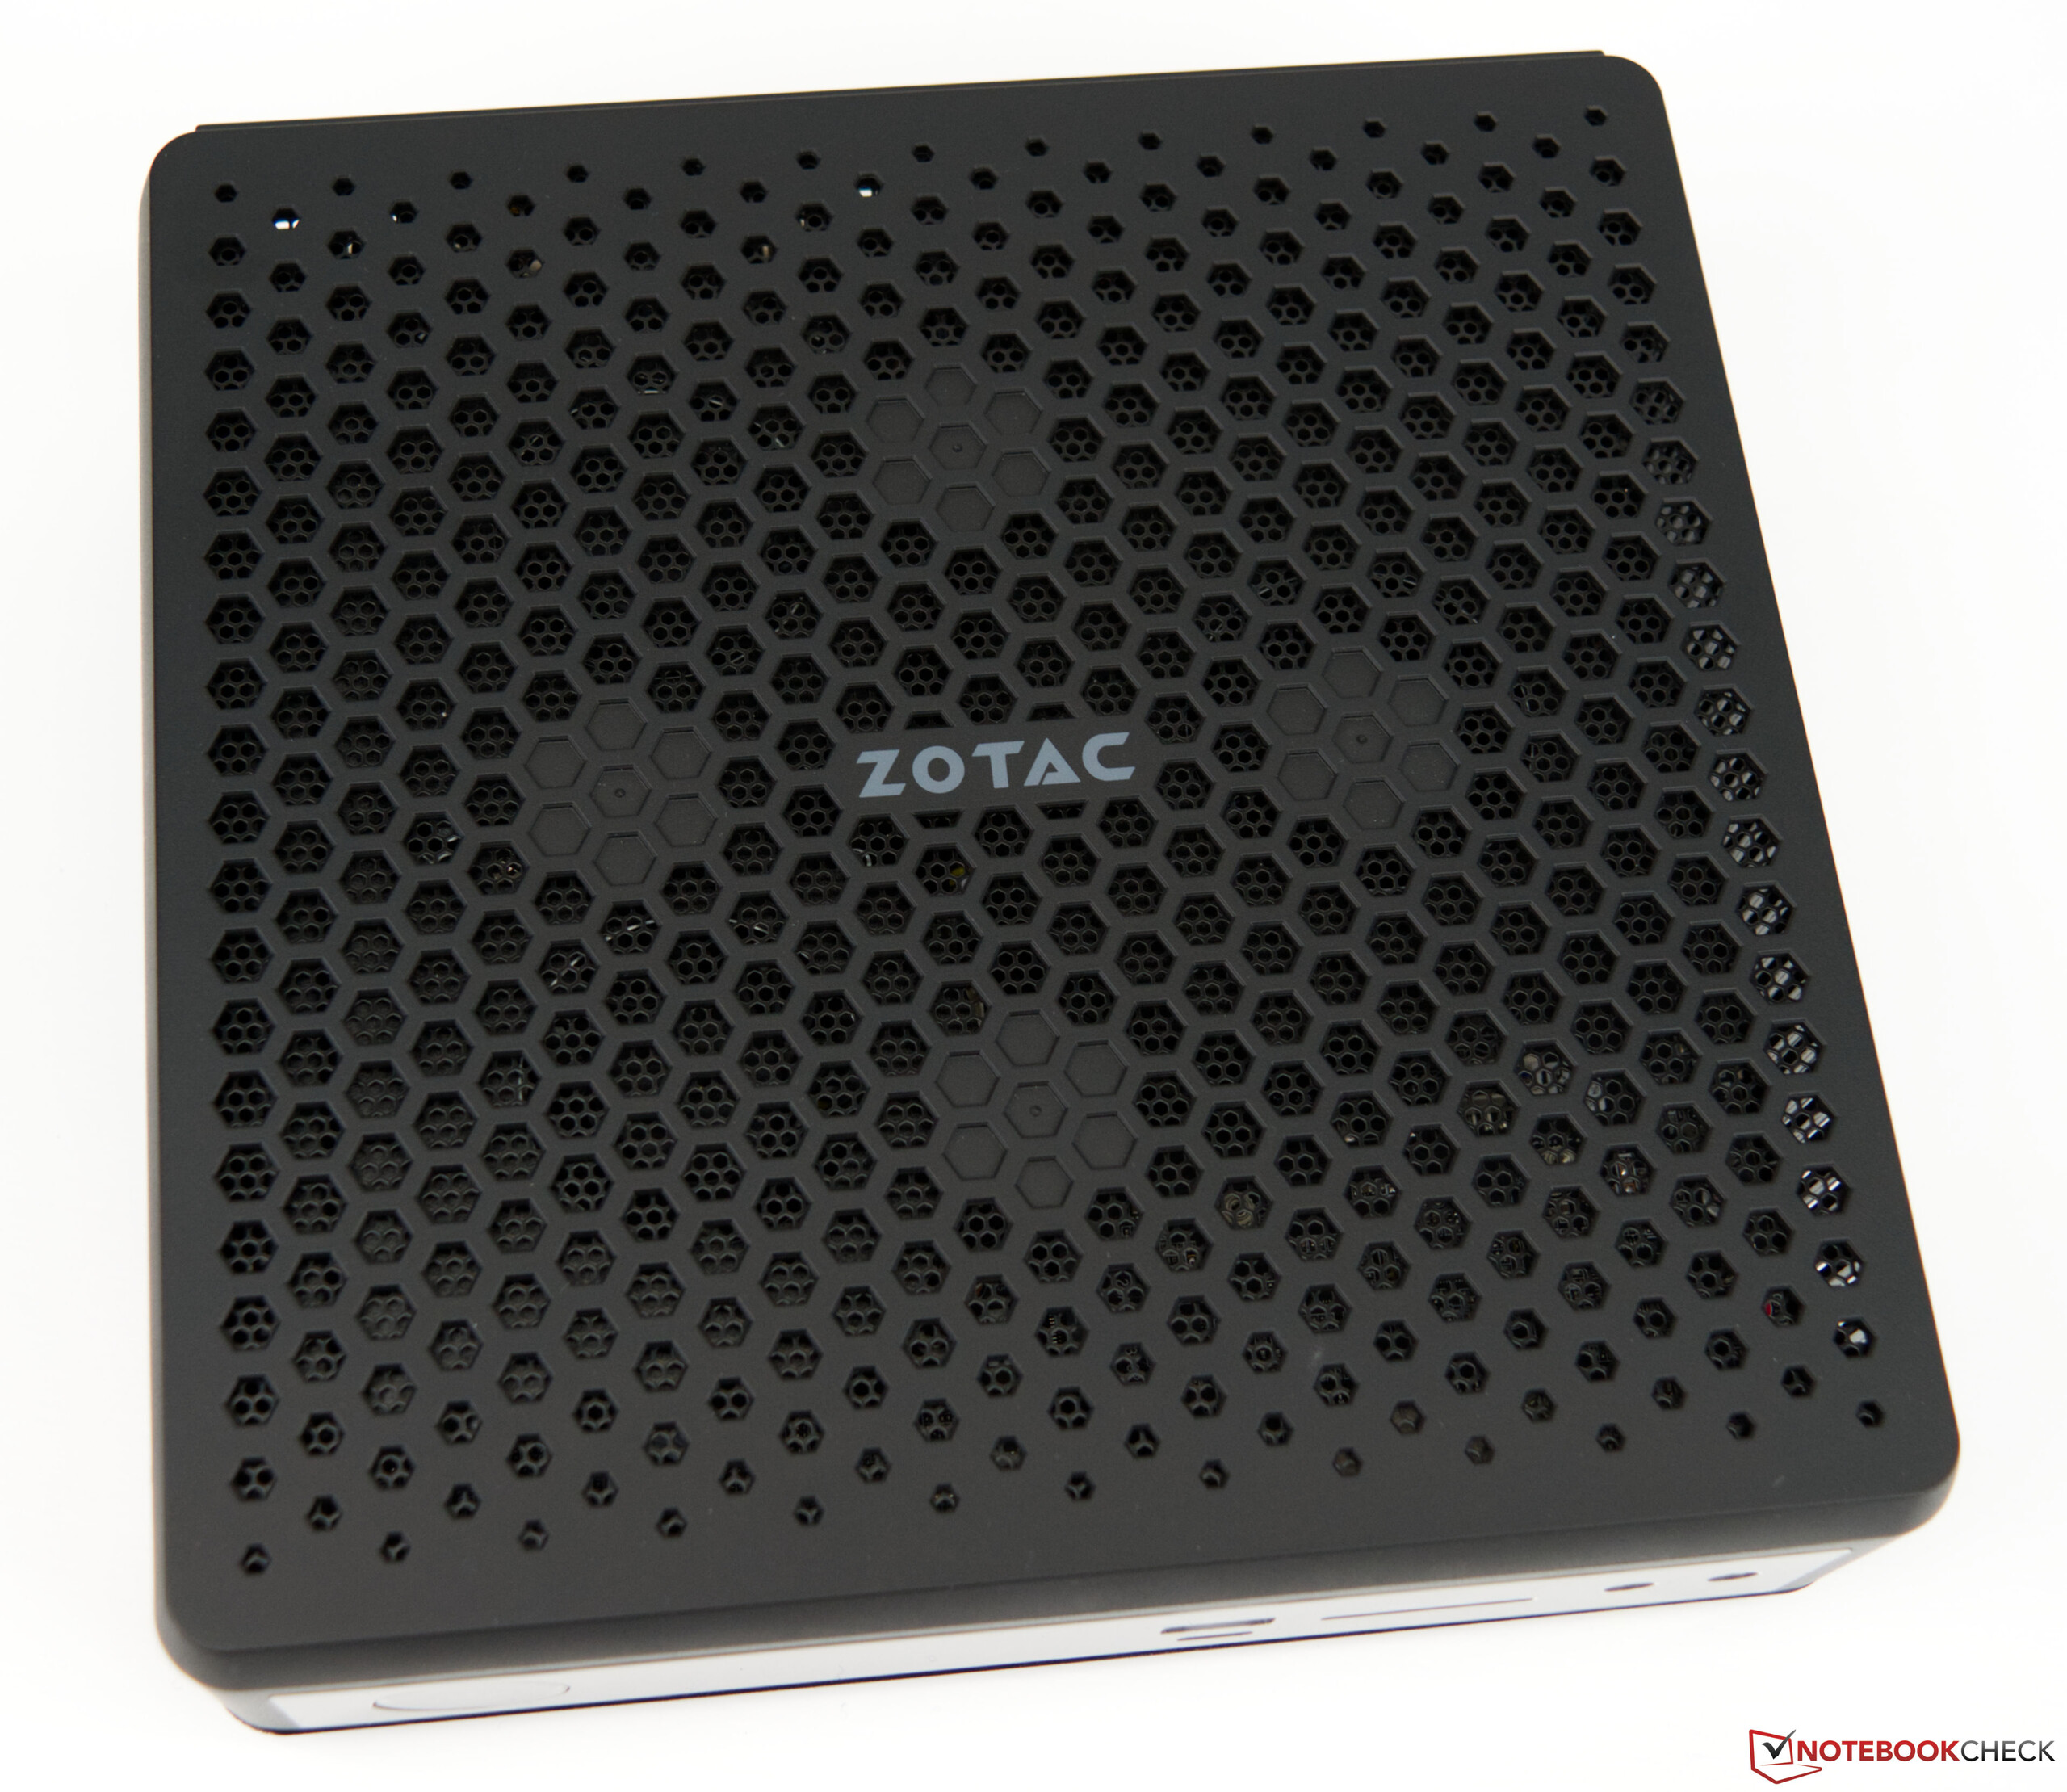
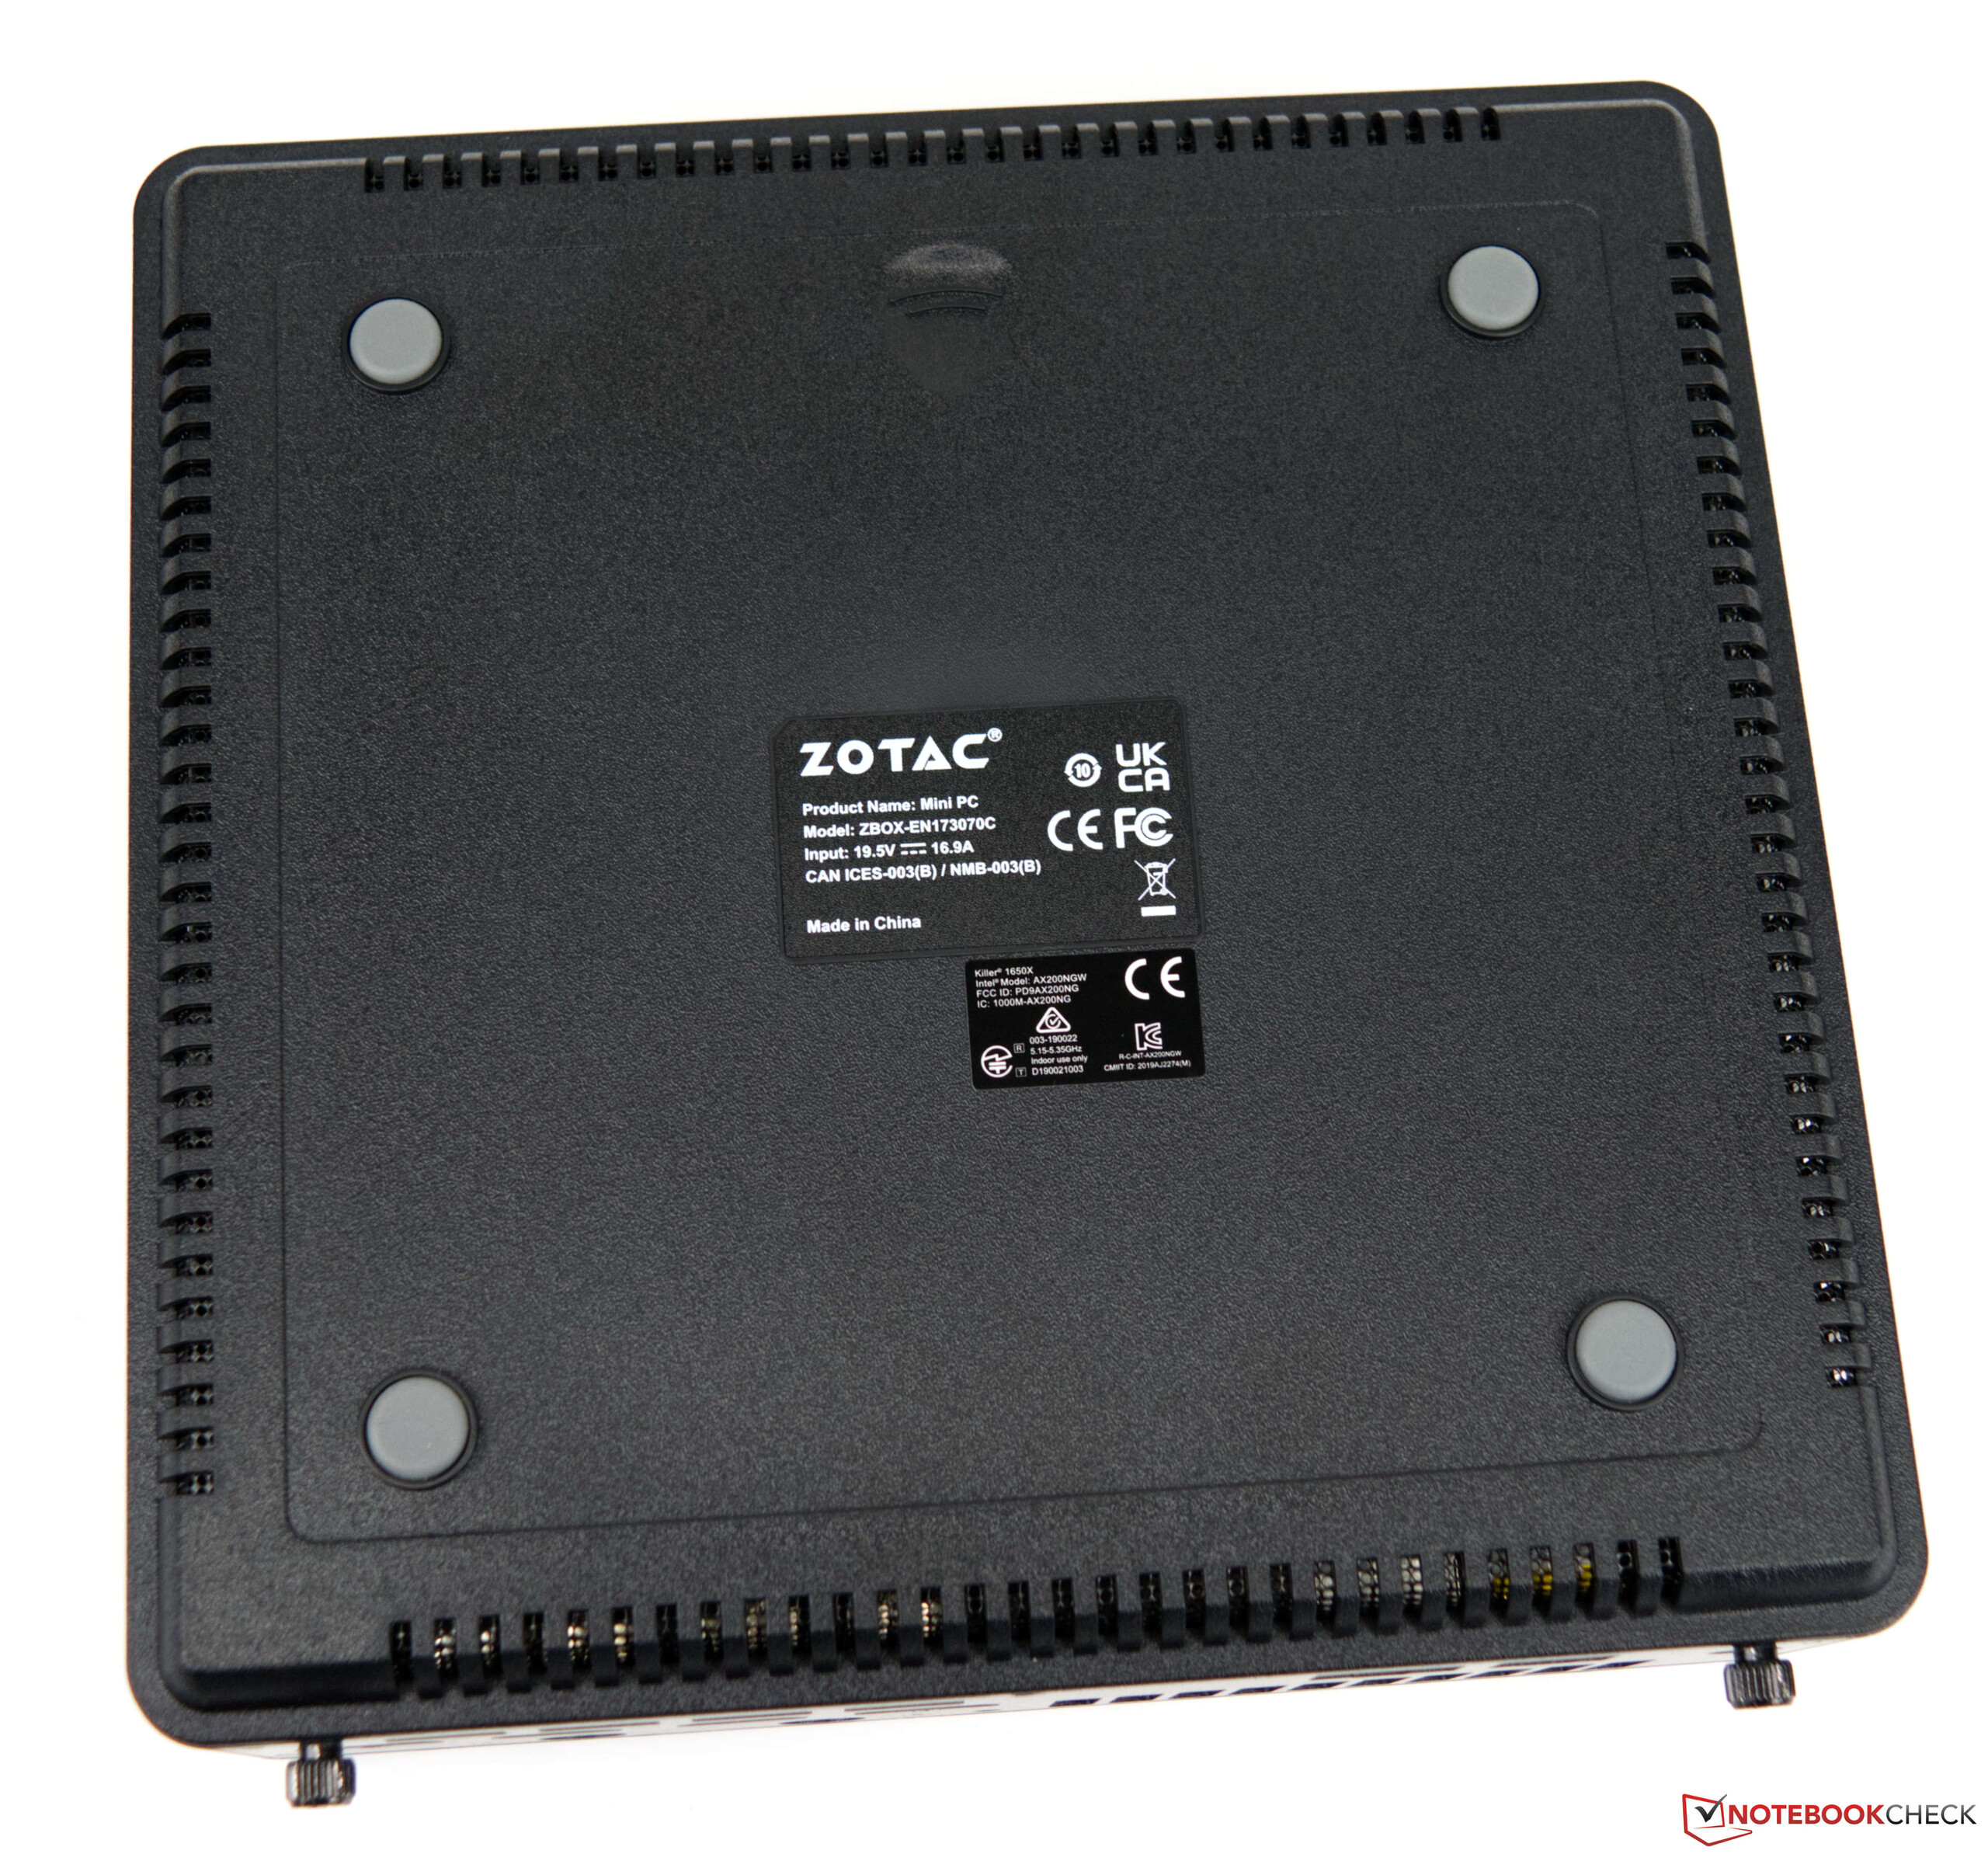
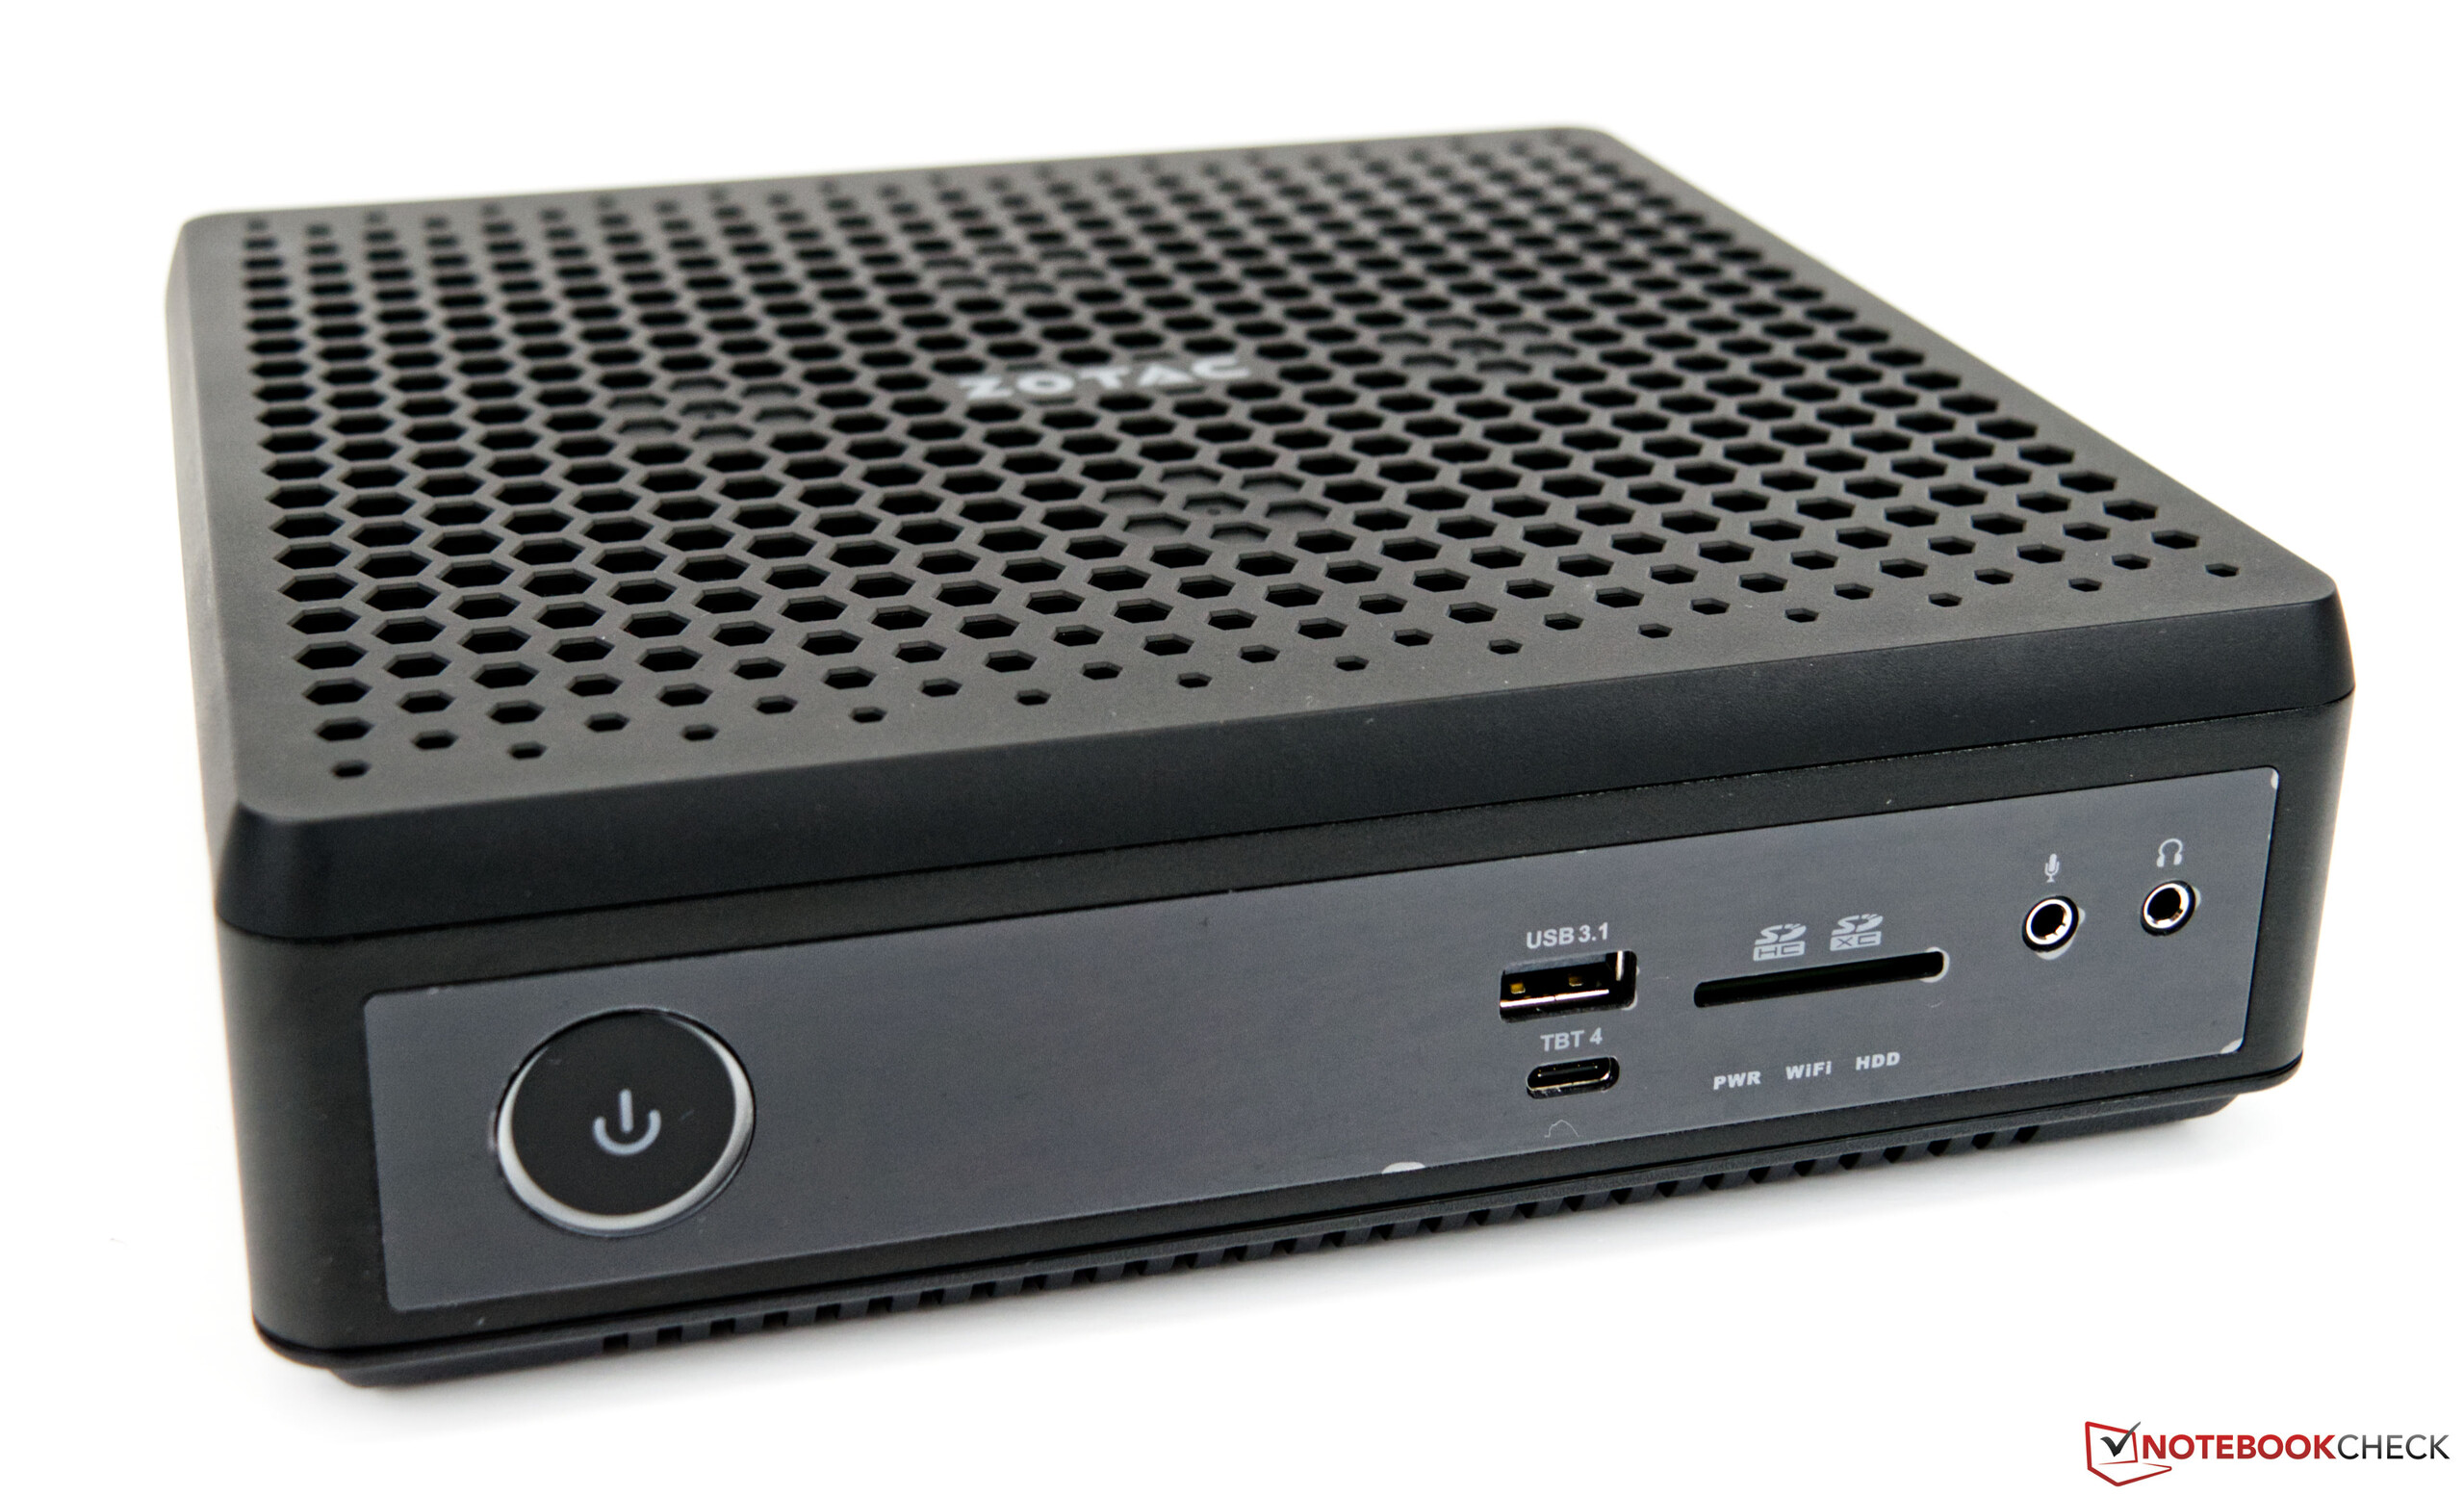
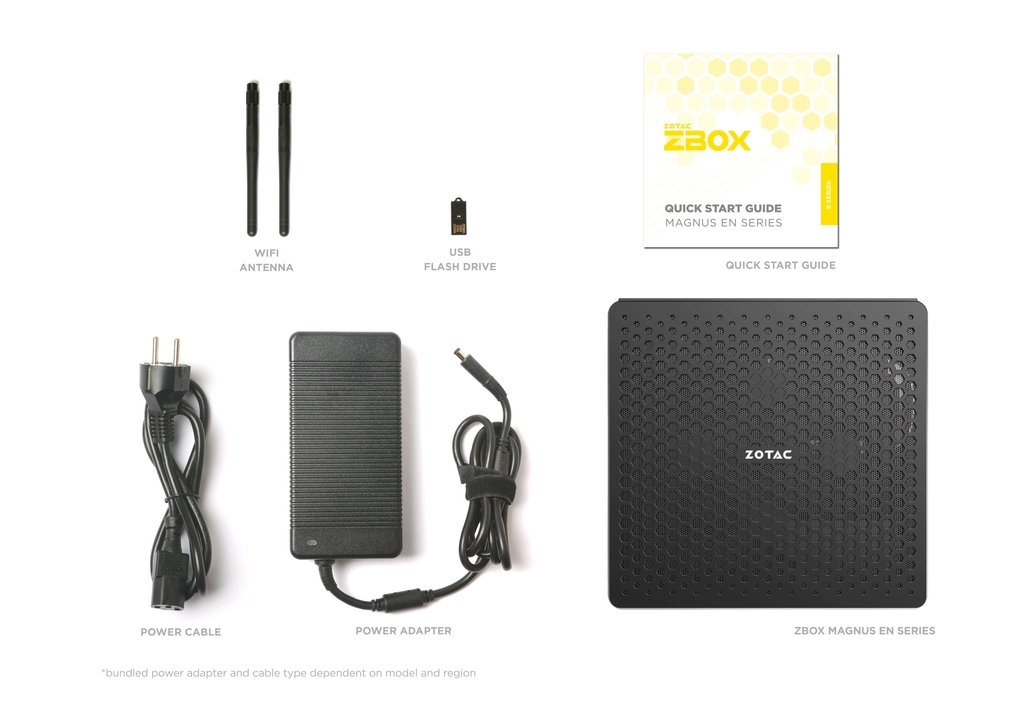
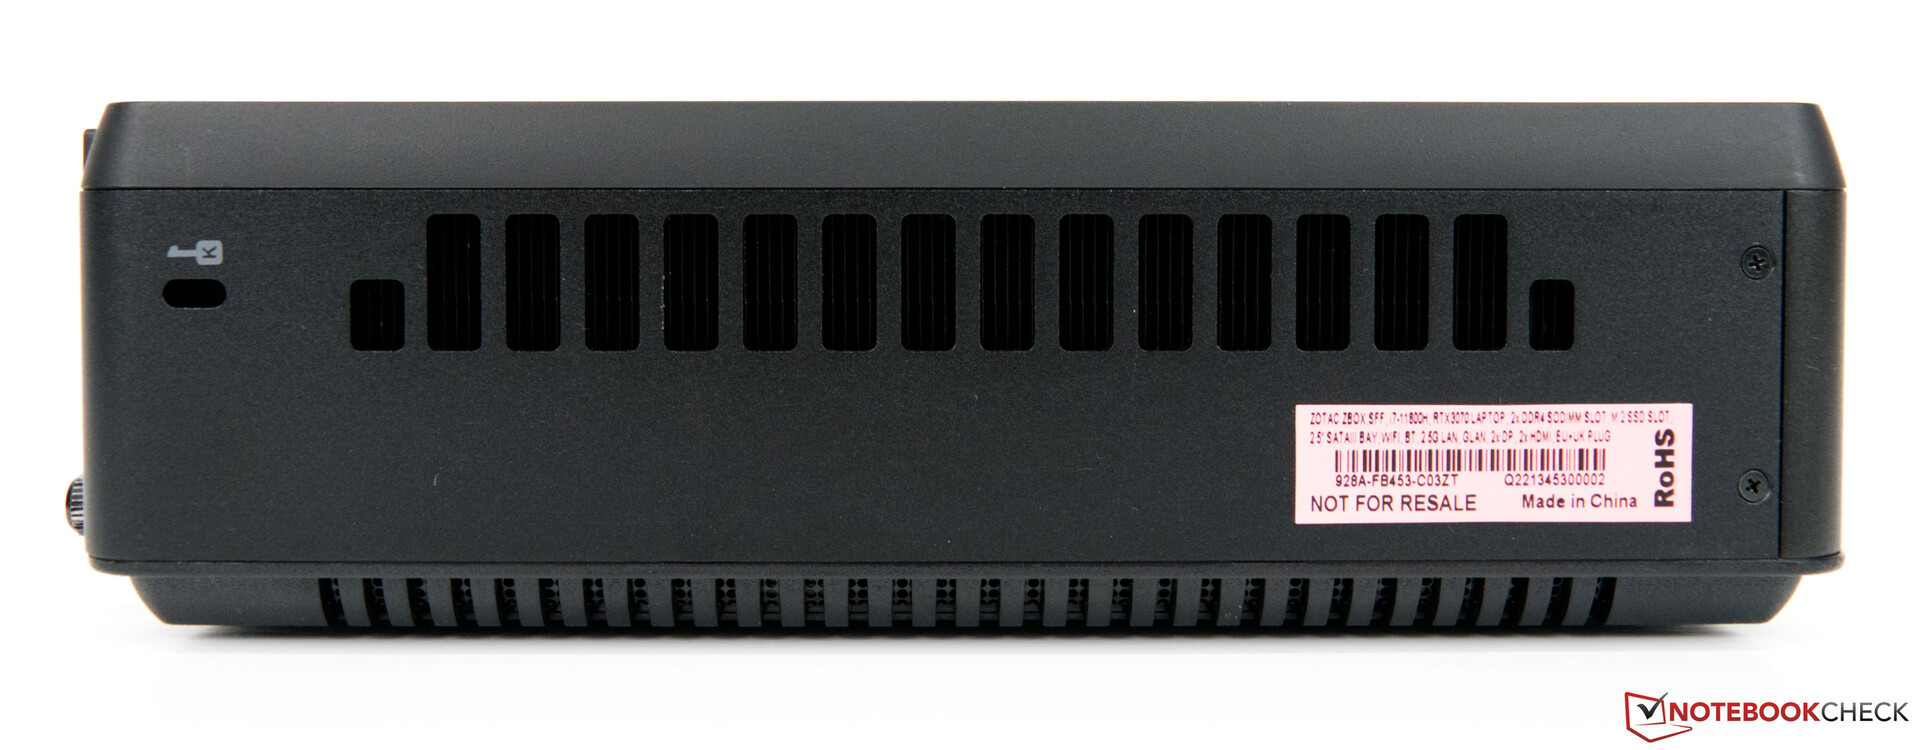
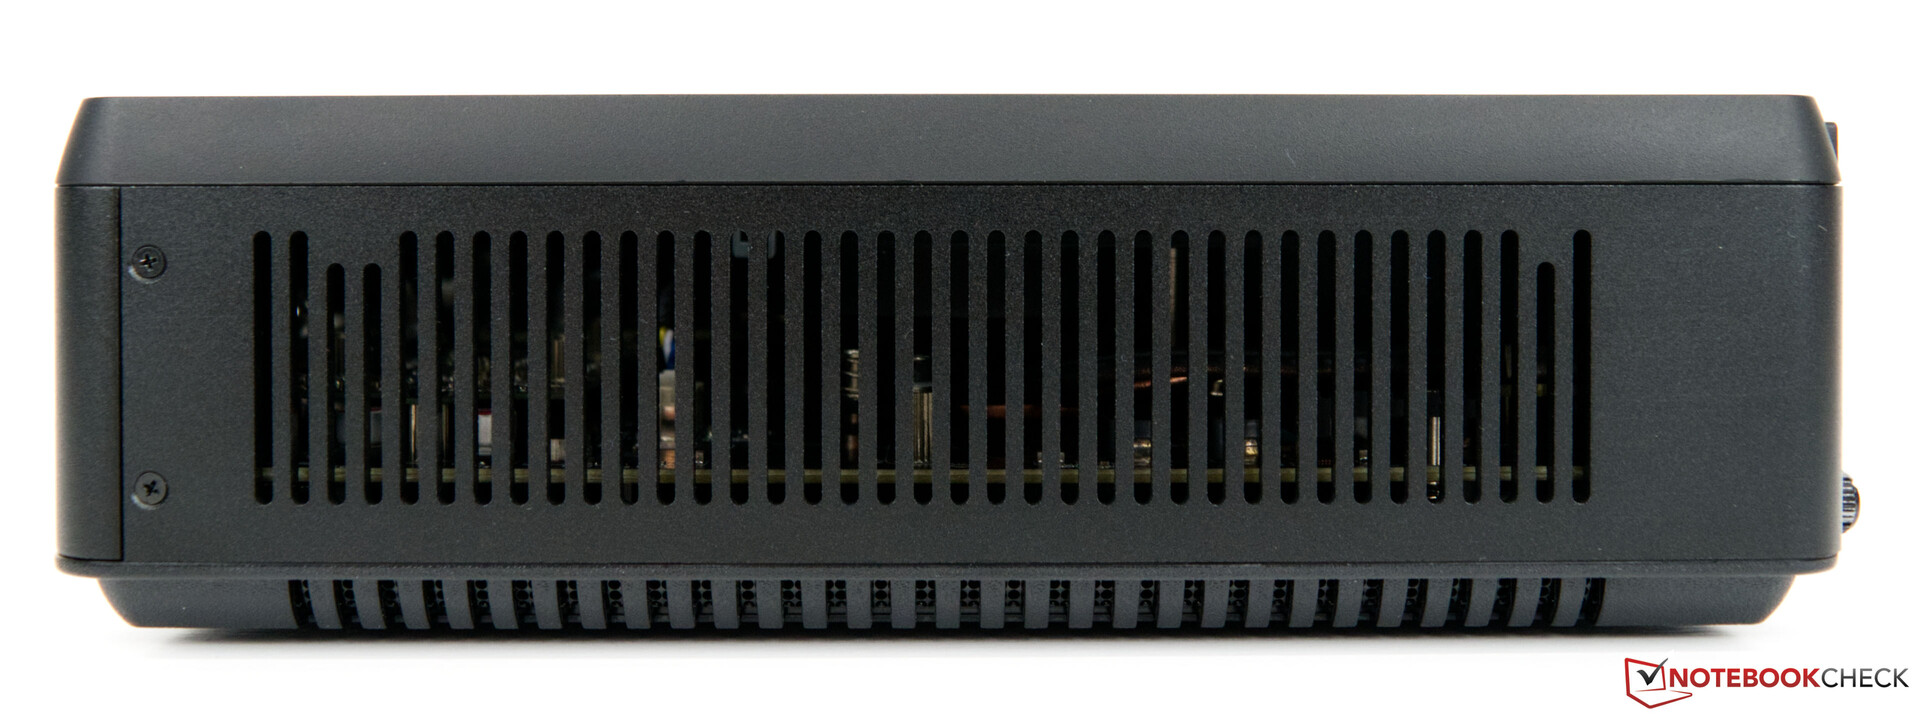
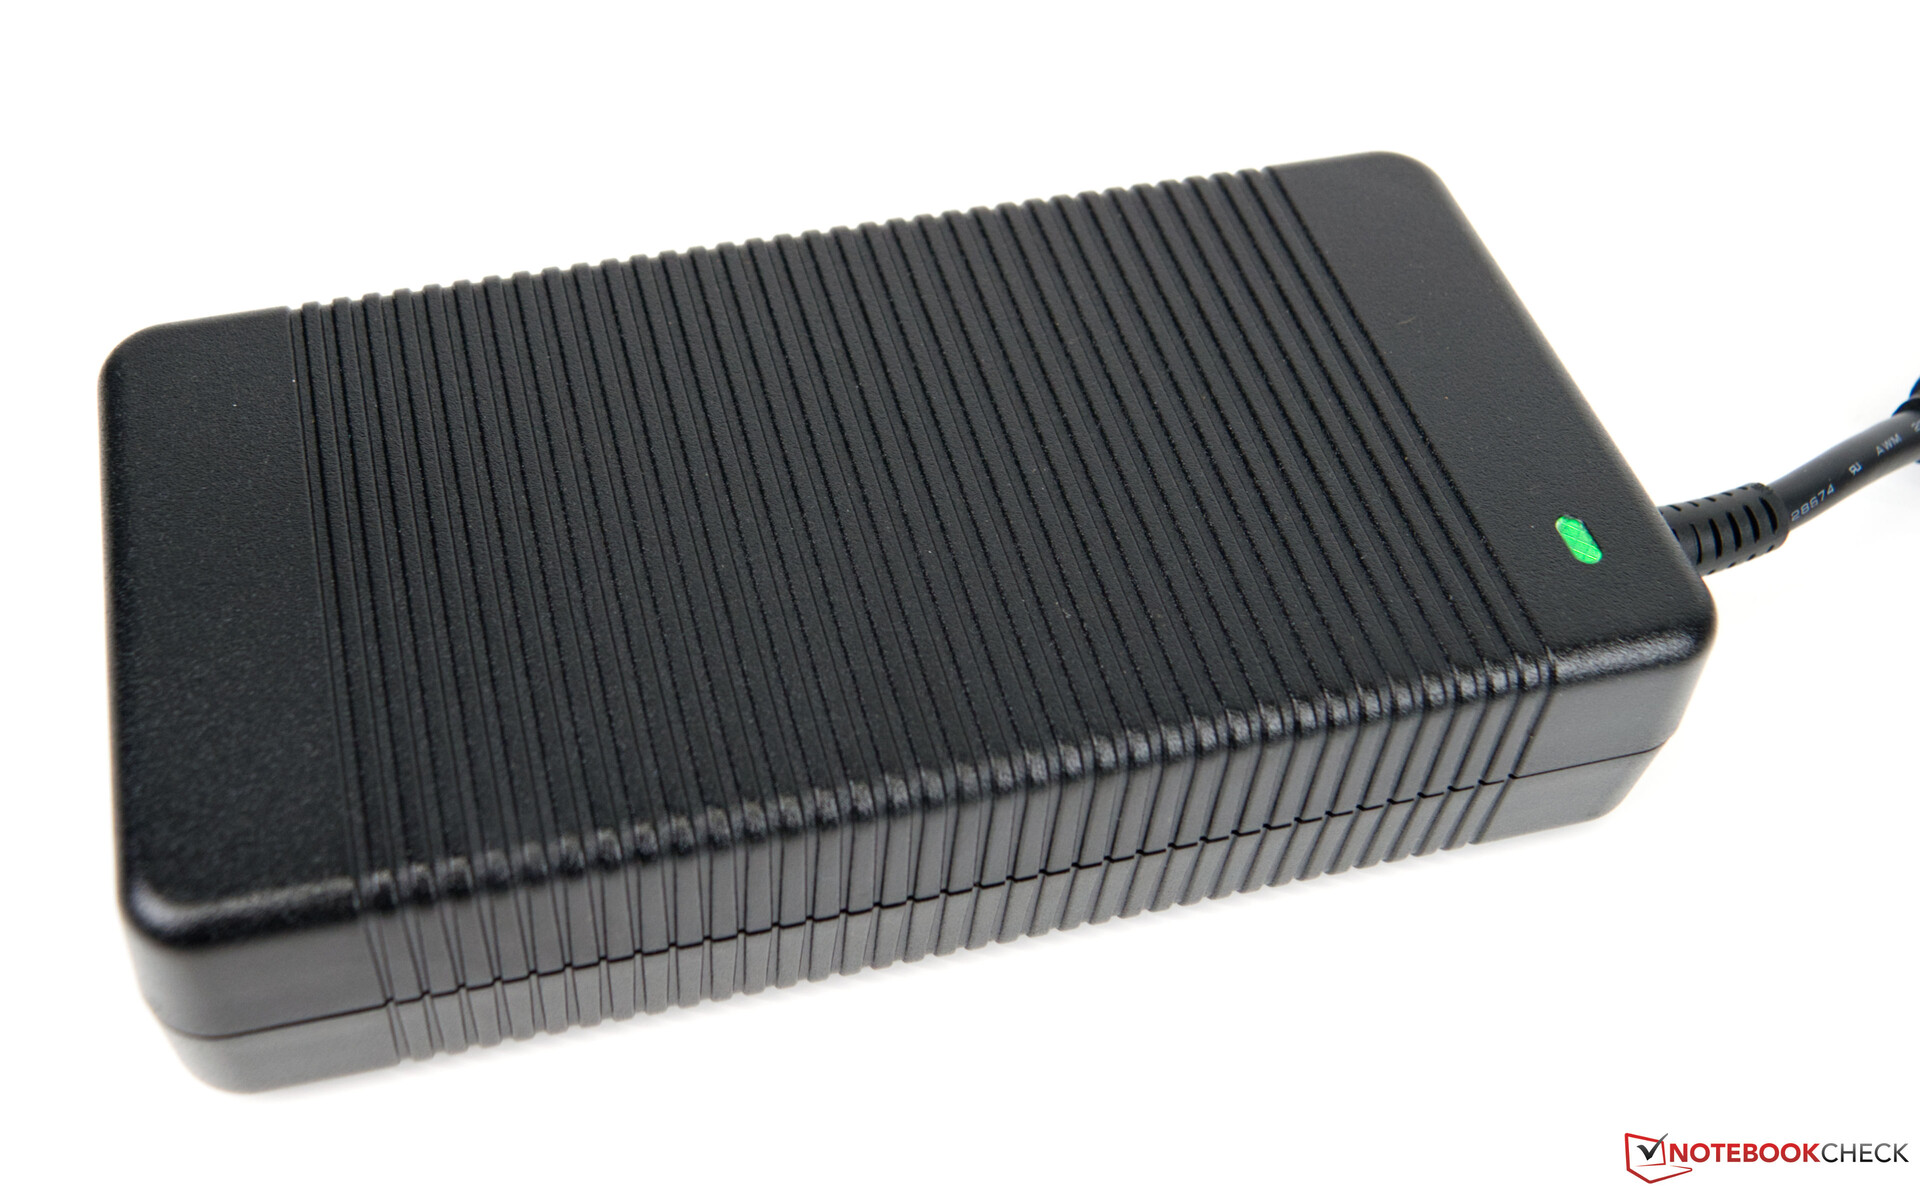
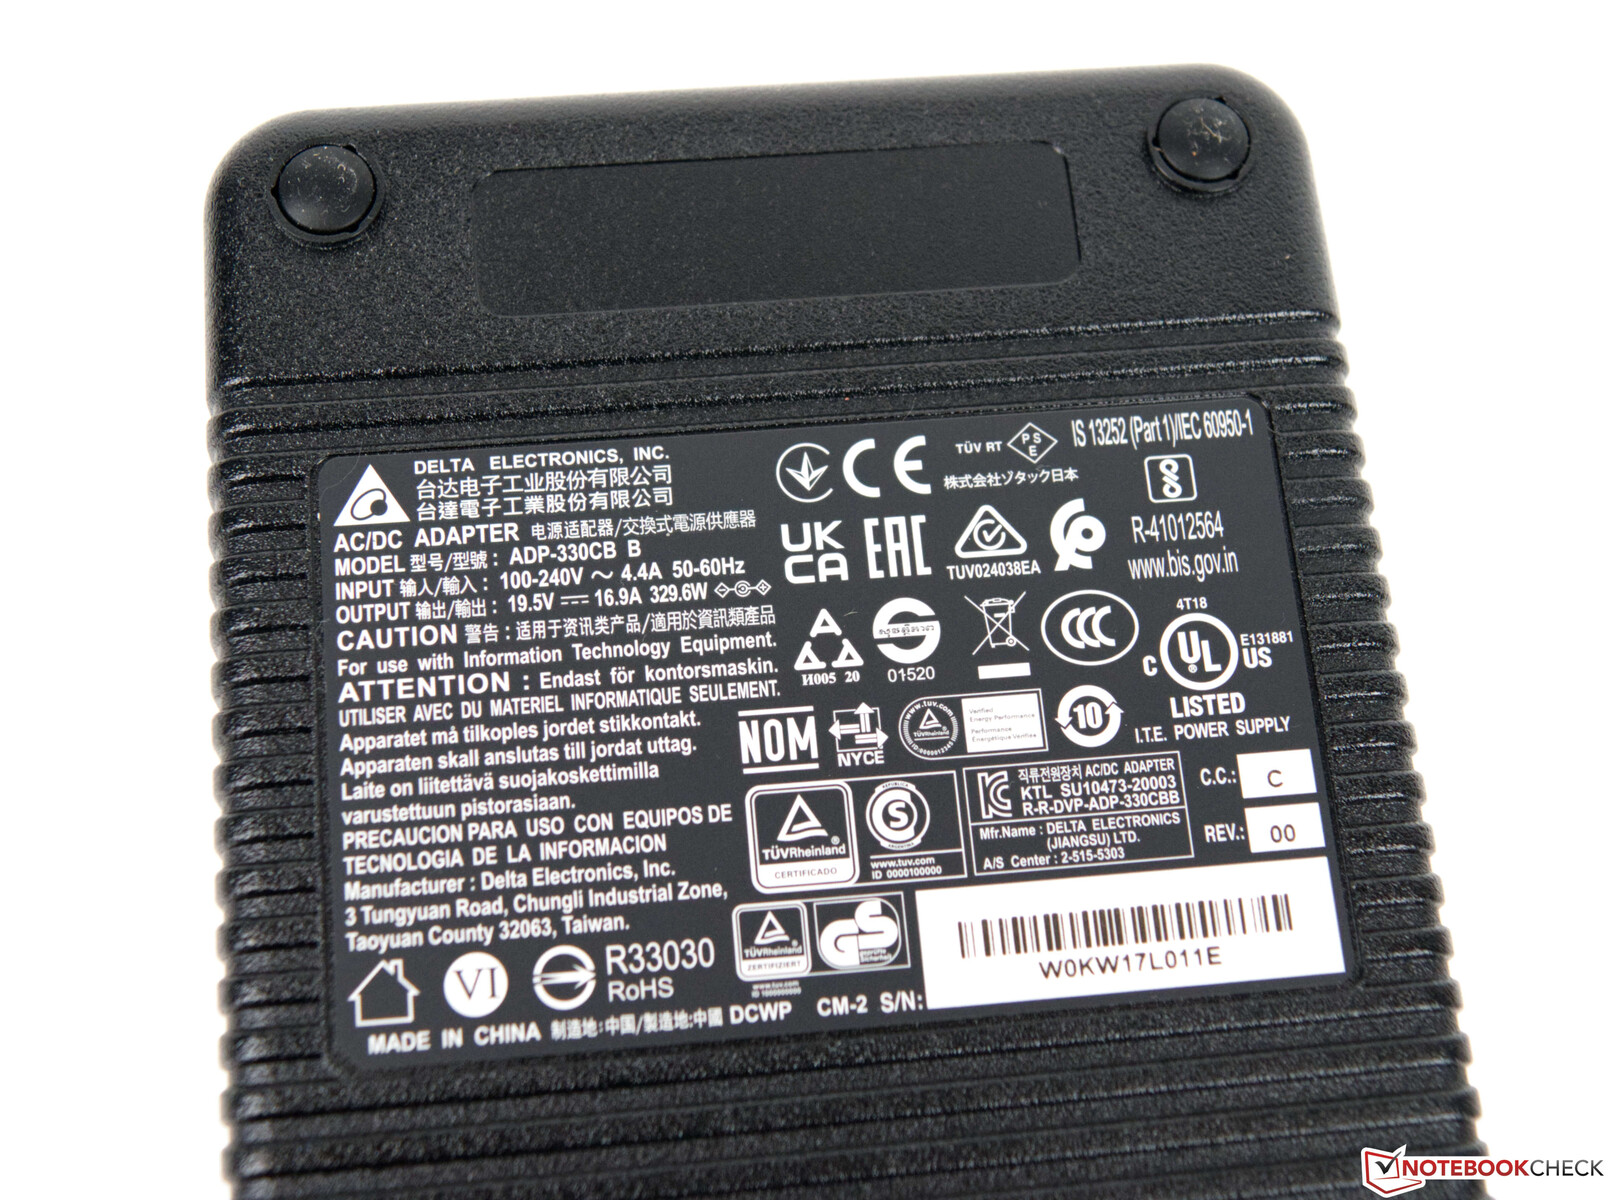
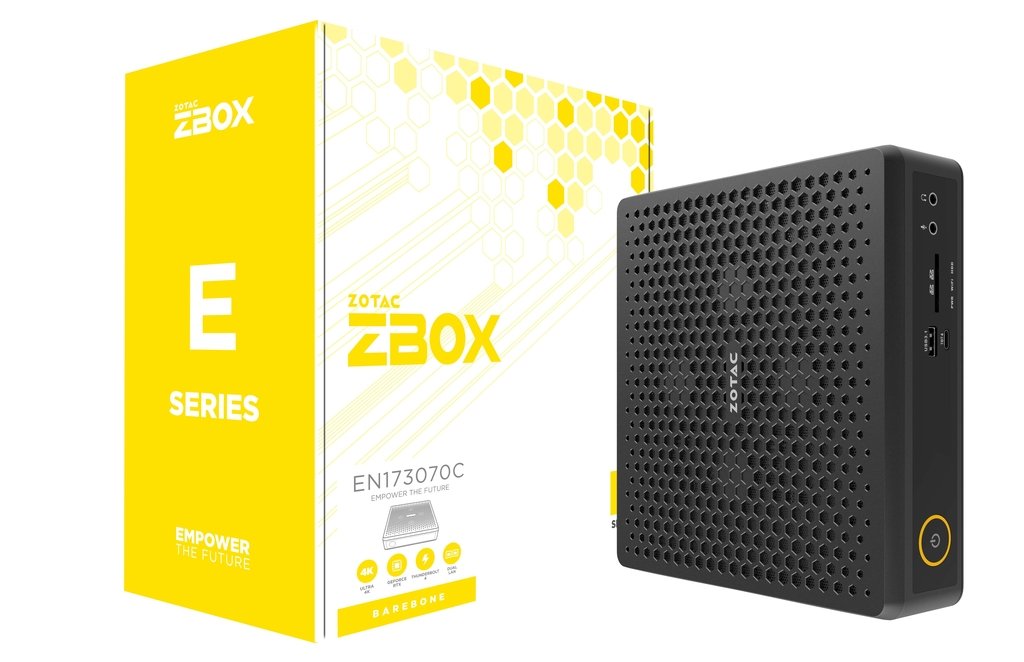
Visualmente, el Zotac ZBOX Magnus EN173070C se puede distinguir claramente. El Zotac ZBOX Magnus EN72080V ya se basaba en la carcasa compacta, que sólo cambió mínimamente en la parte frontal. También se puede prescindir completamente del RGB, como muestra Zotac aquí. Aquellos que gustan de un diseño simple y compacto estarán encantados. La caja está hecha de plástico y dejó una muy buena impresión háptica en nuestras mentes. Junto con la RAM añadida y los dos SSDs M.2, el sistema pesa algo menos de 1,8 kilogramos. Hay que añadir la potente fuente de alimentación de 330 vatios, que pesa 1,3 kilogramos. En términos de tamaño, la fuente de alimentación es aproximadamente la mitad de grande que el propio Magnus EN173070C, que no necesita mucho espacio con unas dimensiones de 21 x 20,3 cm. Con una altura de sólo 6,22 cm, el dispositivo también es relativamente delgado.
Equipo de conexión
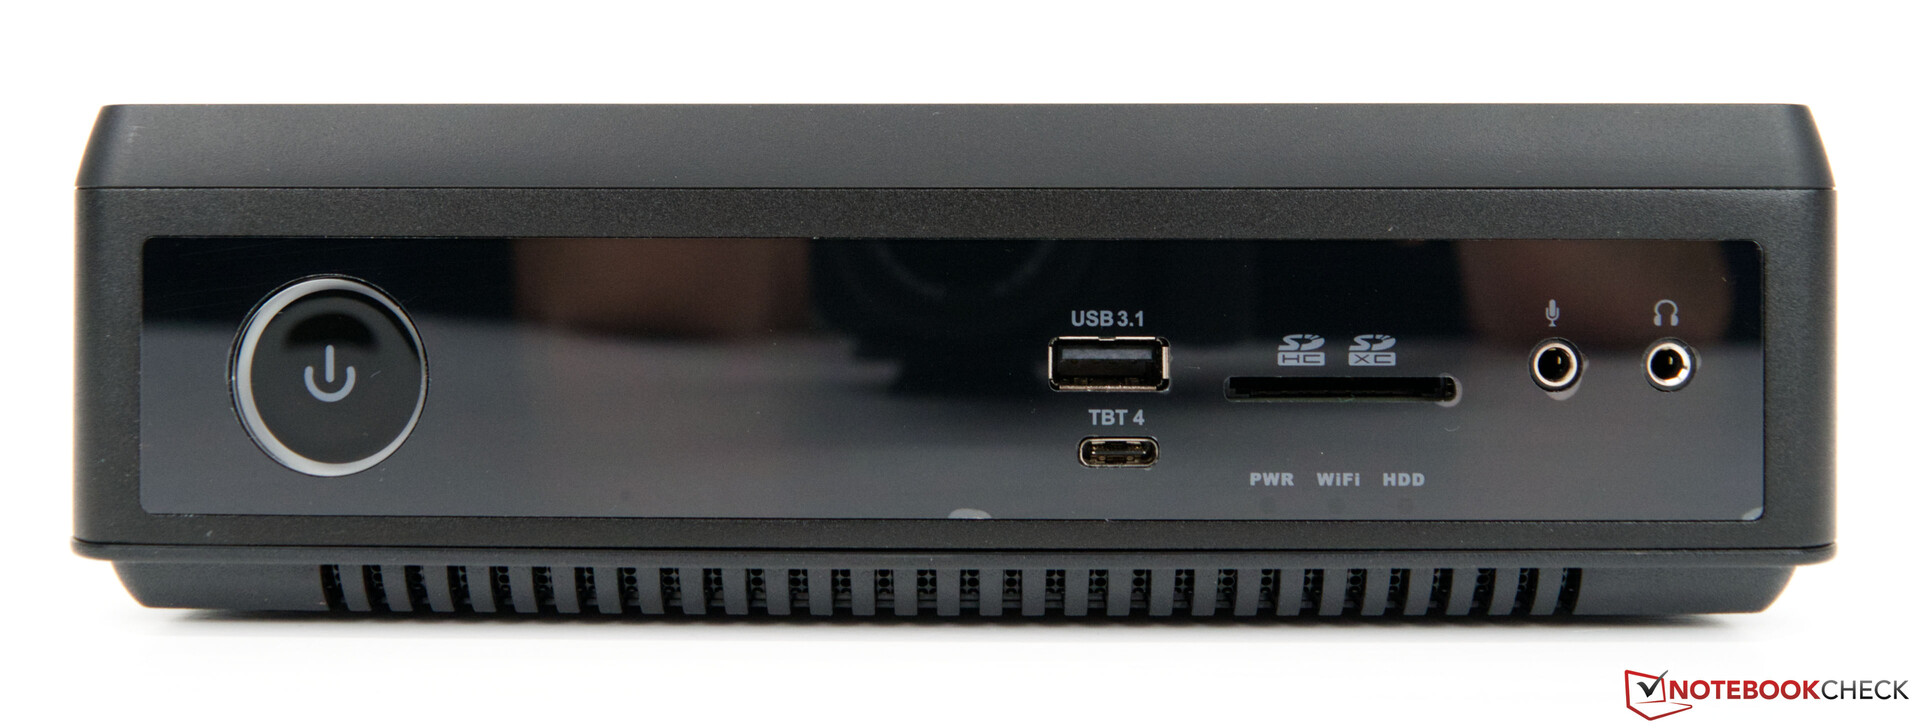
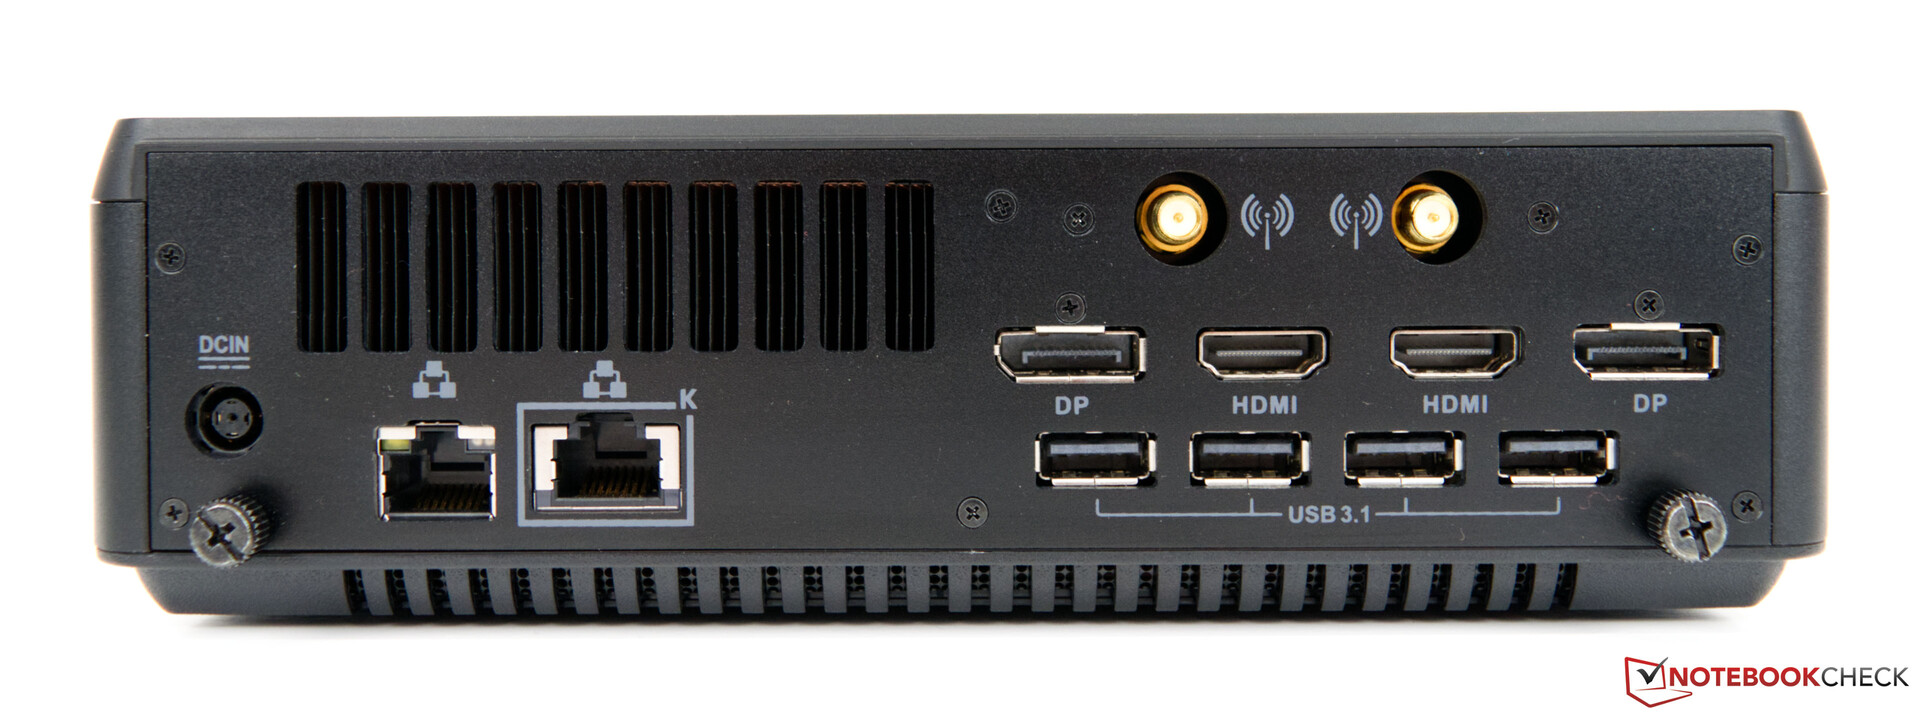
El Zotac ZBOX Magnus EN173070C ofrece una amplia variedad de conexiones externas, pero esto también debería esperarse de un PC de sobremesa. Hay un total de cinco puertos USB Type-A y una única conexión Type-C, que soporta Thunderbolt 4. Sin embargo, esta última tiene una limitación, ya que sólo está pensada para datos. Además, puede ejecutar hasta cuatro pantallas externas simultáneamente. Para conectarlas, hay dos puertos DisplayPort y dos HDMI. Además, los usuarios tampoco tienen que vivir sin un lector de tarjetas SD.
Lector de tarjetas SD
El lector de tarjetas SD que hay en su interior ofrece velocidades USB-3 y es incapaz de utilizar todo el rendimiento de nuestra tarjeta de prueba (AV Pro SD microSD 128 GB V60). En cambio, el NUC Intel Dragon Canyonmuestra lo que es posible con el soporte UHS II.
| SD Card Reader | |
| average JPG Copy Test (av. of 3 runs) | |
| Intel Dragon Canyon NUC | |
| Zotac ZBOX Magnus EN173070C (AV Pro SD microSD 128 GB V60) | |
| maximum AS SSD Seq Read Test (1GB) | |
| Intel Dragon Canyon NUC | |
| Zotac ZBOX Magnus EN173070C (AV Pro SD microSD 128 GB V60) | |
Comunicación
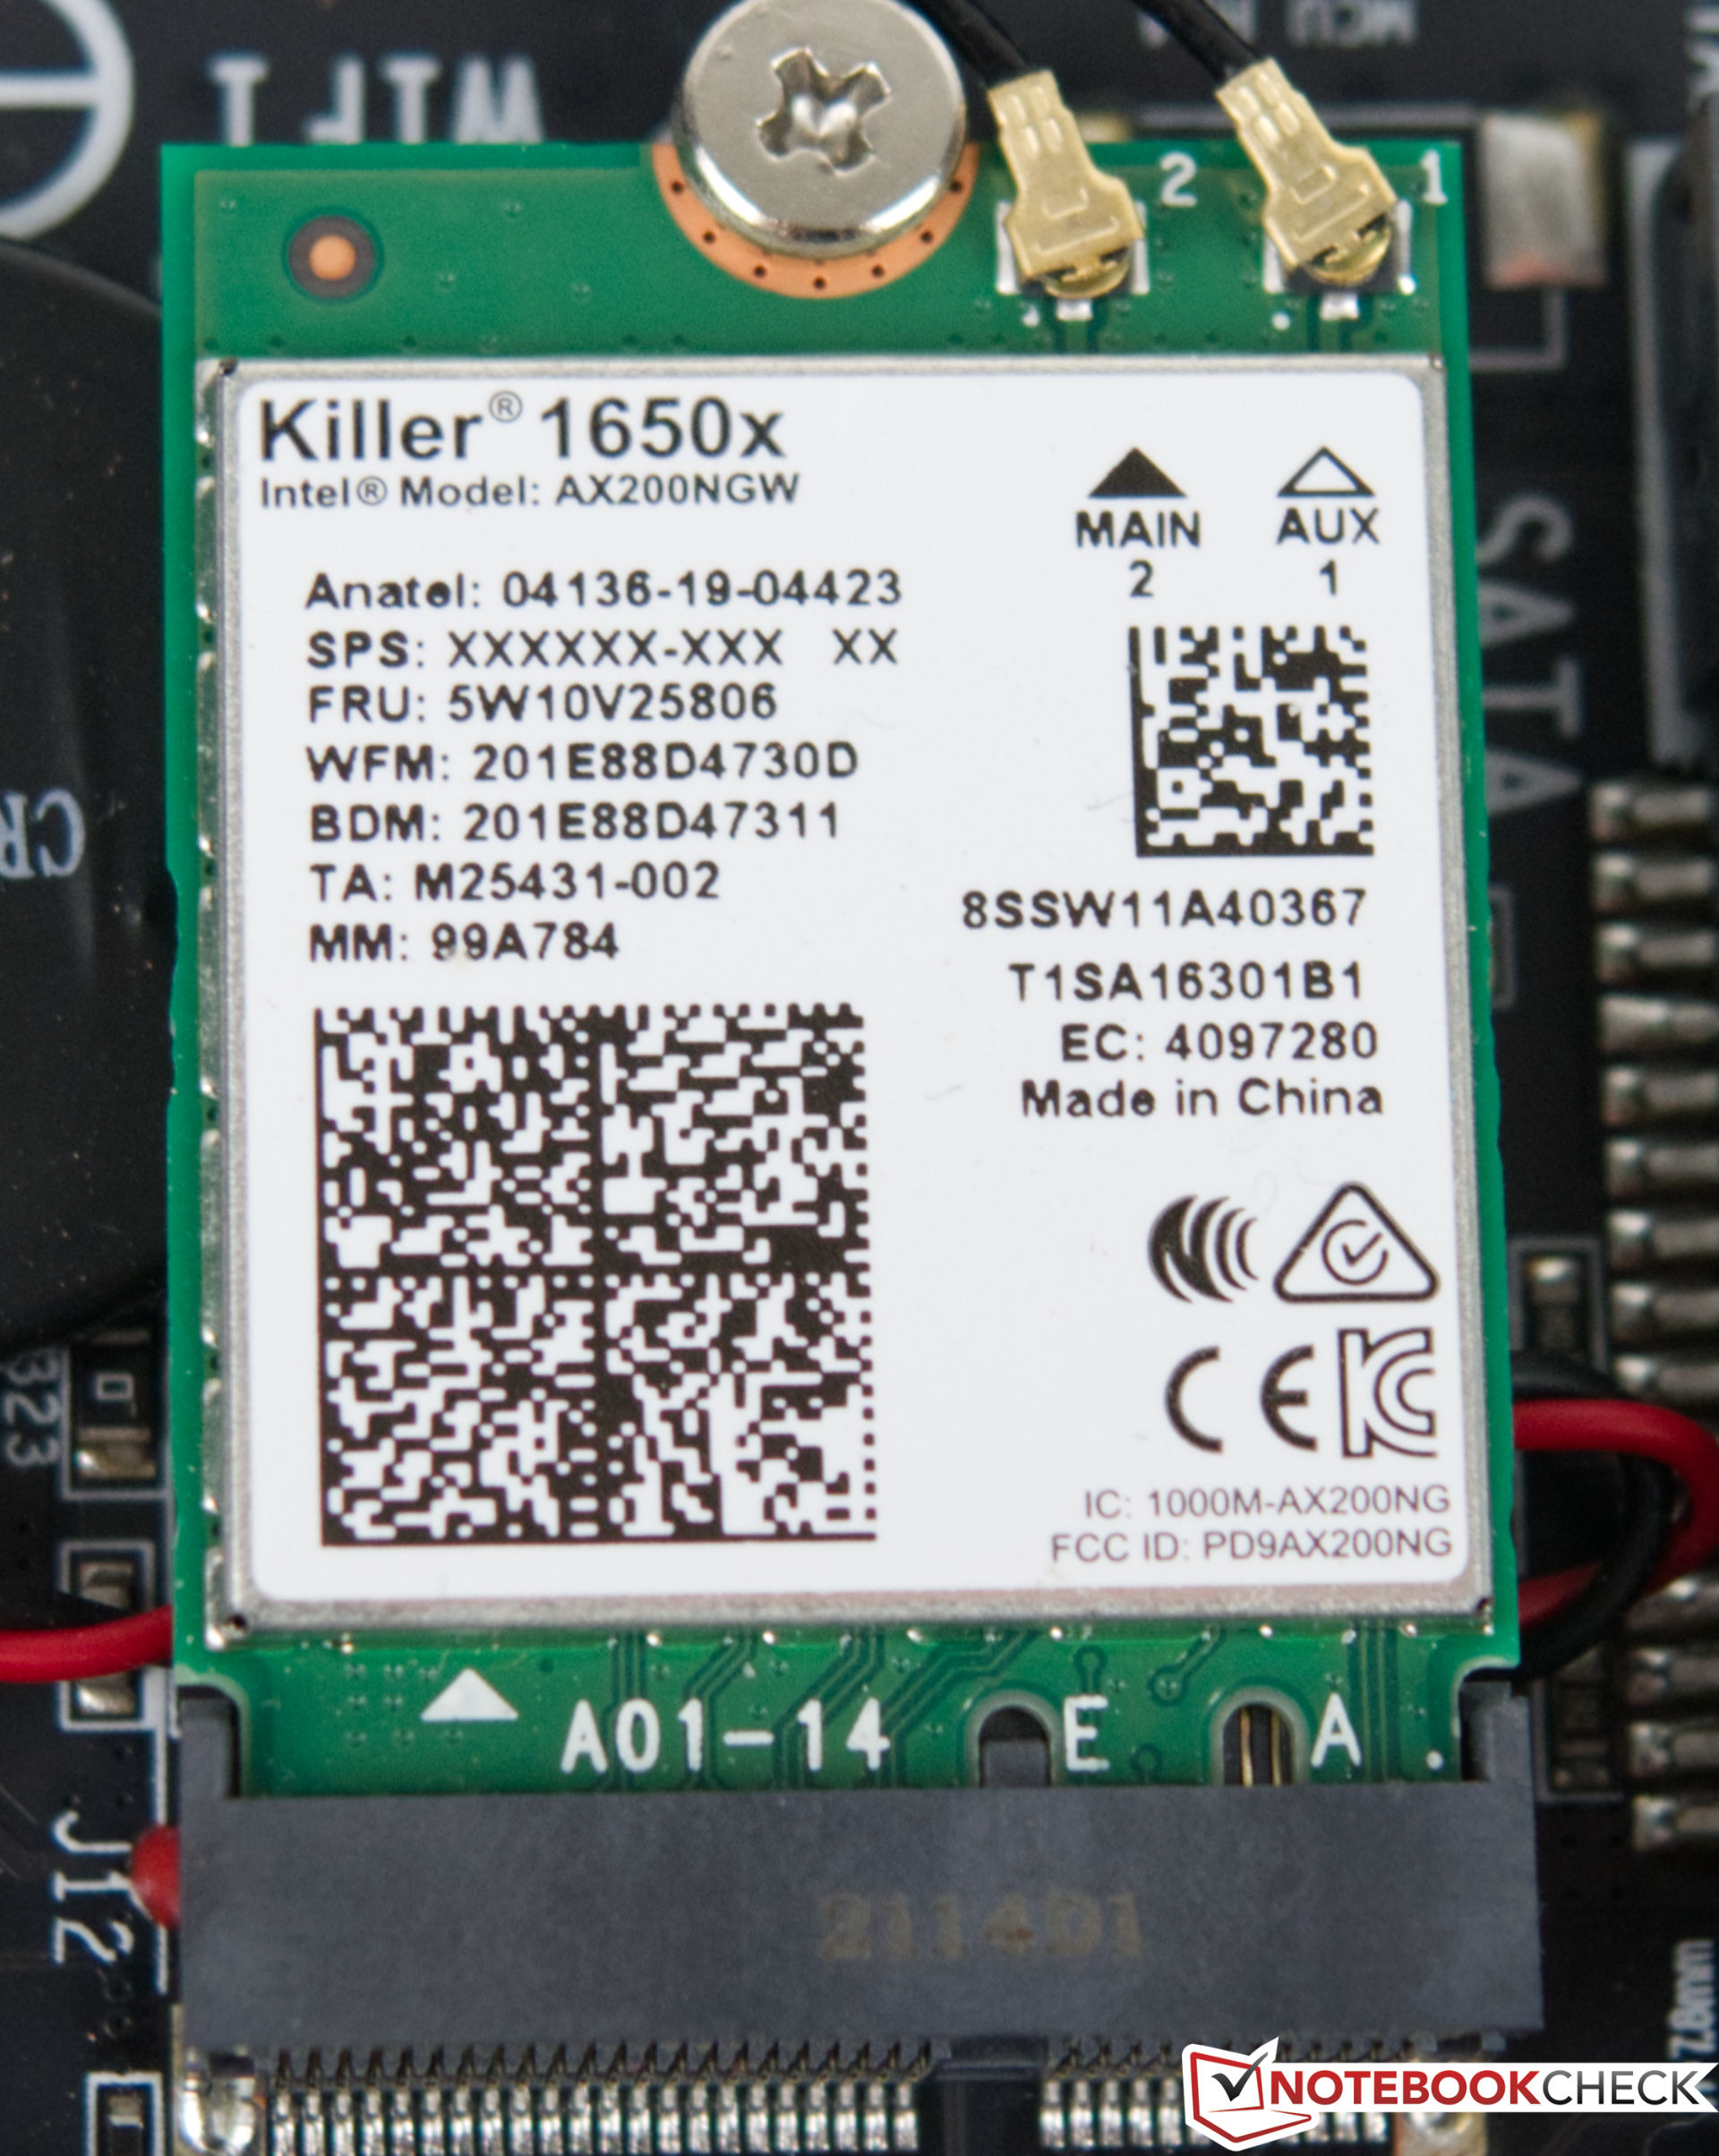
Zotac usa un módulo WLAN de Killer en el Magnus EN173070C. El AX1650x ofrece Wi-Fi 6 y hace un muy buen trabajo en nuestro test. El rendimiento se mantiene estable incluso durante un largo periodo de tiempo y no hay variaciones significativas. Sin embargo, en la comparación directa, el NUC Intel Dragon Canyoncon el Intel Wi-Fi 6E AX211 es capaz de ofrecer mejores valores. Realizamos la prueba en condiciones óptimas usando el router WLAN para juegos Asus GT-AXE1000WiFi-6E.
Rendimiento
Procesador
El Zotac ZBOX Magnus EN173070C utiliza unIntel Core i7-11800HcPU. Este procesador está realmente pensado para portátiles y ofrece 8 núcleos y 16 hilos a una velocidad de reloj máxima de hasta 4,6 GHz. El SoC, que pertenece a la serie Tiger Lake, hace un buen trabajo en el sistema compacto. Zotac define el valor PL1 en 55 vatios, y el sistema es capaz de consumir hasta 69 vatios durante un corto periodo de tiempo. Aunque el rendimiento no se refleja realmente en los resultados, el SoC de nuestra unidad de pruebas funciona al nivel de un Intel Core i9-10900Kdurante la carga de un solo núcleo, y a veces incluso es capaz de superarlo. Por otro lado, el Intel Core i7-11800H es superado por elAMD Ryzen 9 5900HXen muchas pruebas. Sólo esperamos un salto de rendimiento notable con los SoCs Alder Lake P de Intel. Quizá Zotac ya esté planeando una pequeña actualización en un futuro próximo aquí, que debería mejorar el rendimiento en todas las áreas.
* ... más pequeño es mejor
AIDA64: FP32 Ray-Trace | FPU Julia | CPU SHA3 | CPU Queen | FPU SinJulia | FPU Mandel | CPU AES | CPU ZLib | FP64 Ray-Trace | CPU PhotoWorxx
| Performance rating | |
| Media de la clase Desktop | |
| Minisforum EliteMini HX90 | |
| AMD Ryzen 7 5800X | |
| Zotac ZBOX Magnus EN173070C | |
| Medio Intel Core i7-11800H | |
| Intel Core i5-12600K | |
| Intel Ghost Canyon NUC (RTX 2070) -1! | |
| AIDA64 / FP32 Ray-Trace | |
| Media de la clase Desktop (12248 - 84577, n=21, últimos 2 años) | |
| AMD Ryzen 7 5800X | |
| Minisforum EliteMini HX90 | |
| Medio Intel Core i7-11800H (8772 - 15961, n=20) | |
| Zotac ZBOX Magnus EN173070C | |
| Intel Ghost Canyon NUC (RTX 2070) | |
| Intel Core i5-12600K | |
| AIDA64 / FPU Julia | |
| Media de la clase Desktop (65152 - 246125, n=21, últimos 2 años) | |
| Minisforum EliteMini HX90 | |
| AMD Ryzen 7 5800X | |
| Medio Intel Core i7-11800H (39404 - 65636, n=20) | |
| Zotac ZBOX Magnus EN173070C | |
| Intel Ghost Canyon NUC (RTX 2070) | |
| Intel Core i5-12600K | |
| AIDA64 / CPU SHA3 | |
| Media de la clase Desktop (2982 - 10804, n=21, últimos 2 años) | |
| Medio Intel Core i7-11800H (2599 - 4439, n=20) | |
| Zotac ZBOX Magnus EN173070C | |
| Minisforum EliteMini HX90 | |
| Intel Core i5-12600K | |
| Intel Ghost Canyon NUC (RTX 2070) | |
| AMD Ryzen 7 5800X | |
| AIDA64 / CPU Queen | |
| Media de la clase Desktop (76512 - 187912, n=18, últimos 2 años) | |
| AMD Ryzen 7 5800X | |
| Minisforum EliteMini HX90 | |
| Medio Intel Core i7-11800H (85233 - 91941, n=20) | |
| Zotac ZBOX Magnus EN173070C | |
| Intel Core i5-12600K | |
| AIDA64 / FPU SinJulia | |
| Media de la clase Desktop (6443 - 35251, n=21, últimos 2 años) | |
| AMD Ryzen 7 5800X | |
| Minisforum EliteMini HX90 | |
| Intel Core i5-12600K | |
| Zotac ZBOX Magnus EN173070C | |
| Intel Ghost Canyon NUC (RTX 2070) | |
| Medio Intel Core i7-11800H (6420 - 9792, n=20) | |
| AIDA64 / FPU Mandel | |
| Media de la clase Desktop (31697 - 129745, n=21, últimos 2 años) | |
| Minisforum EliteMini HX90 | |
| AMD Ryzen 7 5800X | |
| Medio Intel Core i7-11800H (23365 - 39464, n=20) | |
| Zotac ZBOX Magnus EN173070C | |
| Intel Ghost Canyon NUC (RTX 2070) | |
| Intel Core i5-12600K | |
| AIDA64 / CPU AES | |
| Media de la clase Desktop (57777 - 513073, n=21, últimos 2 años) | |
| Minisforum EliteMini HX90 | |
| Zotac ZBOX Magnus EN173070C | |
| Medio Intel Core i7-11800H (74617 - 149388, n=20) | |
| AMD Ryzen 7 5800X | |
| Intel Core i5-12600K | |
| Intel Ghost Canyon NUC (RTX 2070) | |
| AIDA64 / CPU ZLib | |
| Media de la clase Desktop (887 - 2674, n=21, últimos 2 años) | |
| Intel Core i5-12600K | |
| AMD Ryzen 7 5800X | |
| Minisforum EliteMini HX90 | |
| Zotac ZBOX Magnus EN173070C | |
| Intel Ghost Canyon NUC (RTX 2070) | |
| Medio Intel Core i7-11800H (461 - 830, n=43) | |
| AIDA64 / FP64 Ray-Trace | |
| Media de la clase Desktop (6471 - 44013, n=21, últimos 2 años) | |
| AMD Ryzen 7 5800X | |
| Minisforum EliteMini HX90 | |
| Medio Intel Core i7-11800H (4545 - 8717, n=21) | |
| Zotac ZBOX Magnus EN173070C | |
| Intel Ghost Canyon NUC (RTX 2070) | |
| Intel Core i5-12600K | |
| AIDA64 / CPU PhotoWorxx | |
| Intel Core i5-12600K | |
| Media de la clase Desktop (38071 - 63949, n=21, últimos 2 años) | |
| AMD Ryzen 7 5800X | |
| Zotac ZBOX Magnus EN173070C | |
| Intel Ghost Canyon NUC (RTX 2070) | |
| Medio Intel Core i7-11800H (11898 - 26757, n=21) | |
| Minisforum EliteMini HX90 | |
Zotac ZBOX Magnus durante el bucle múltiple de Cinebench R15
La construcción compacta requiere un sistema de refrigeración bien diseñado y eficaz. Zotac ofrece exactamente eso aquí, ya que no medimos ninguna fuerte pérdida de rendimiento bajo carga constante durante el repetido bucle de carga de Cinebench R15.
Rendimiento de las aplicaciones y solución de almacenamiento
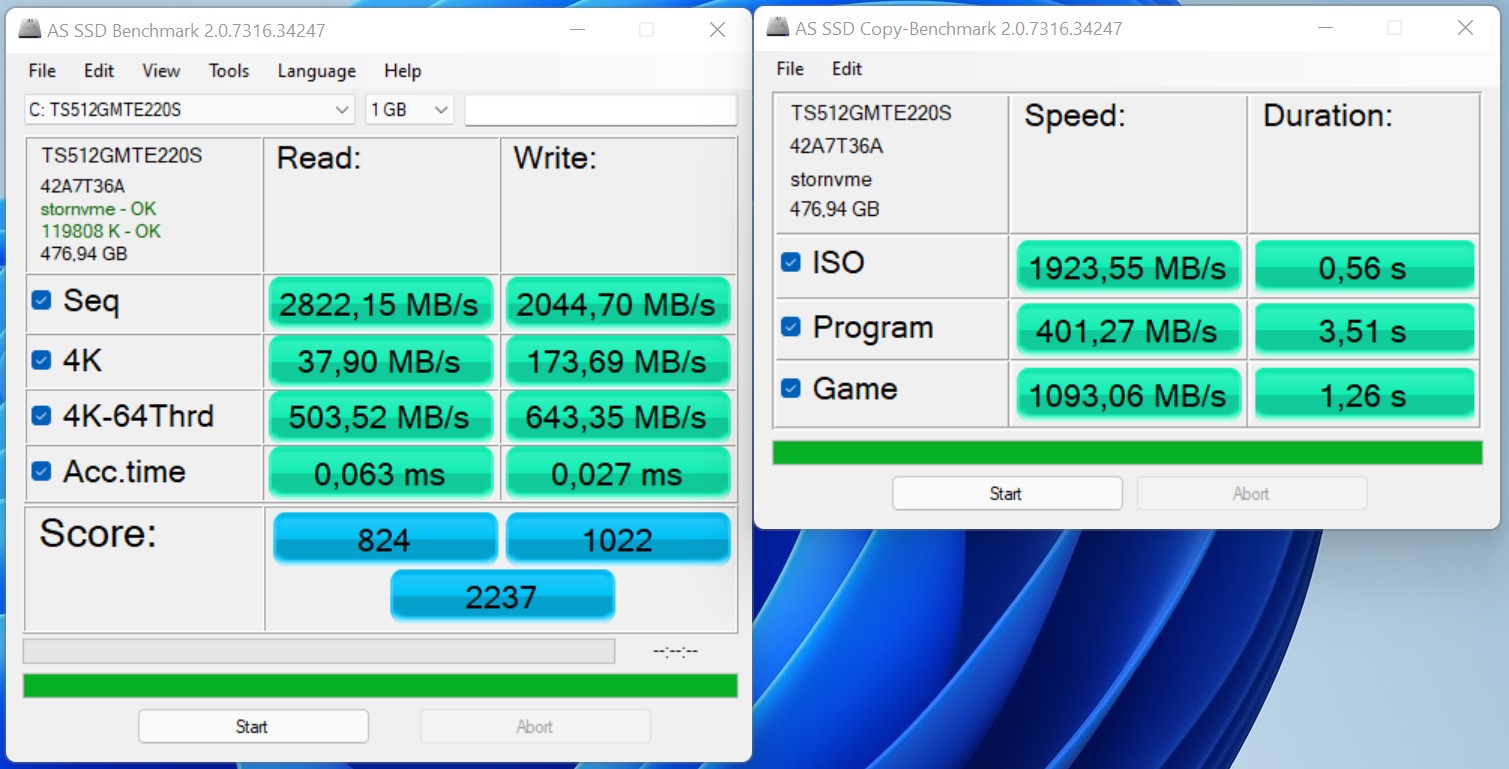
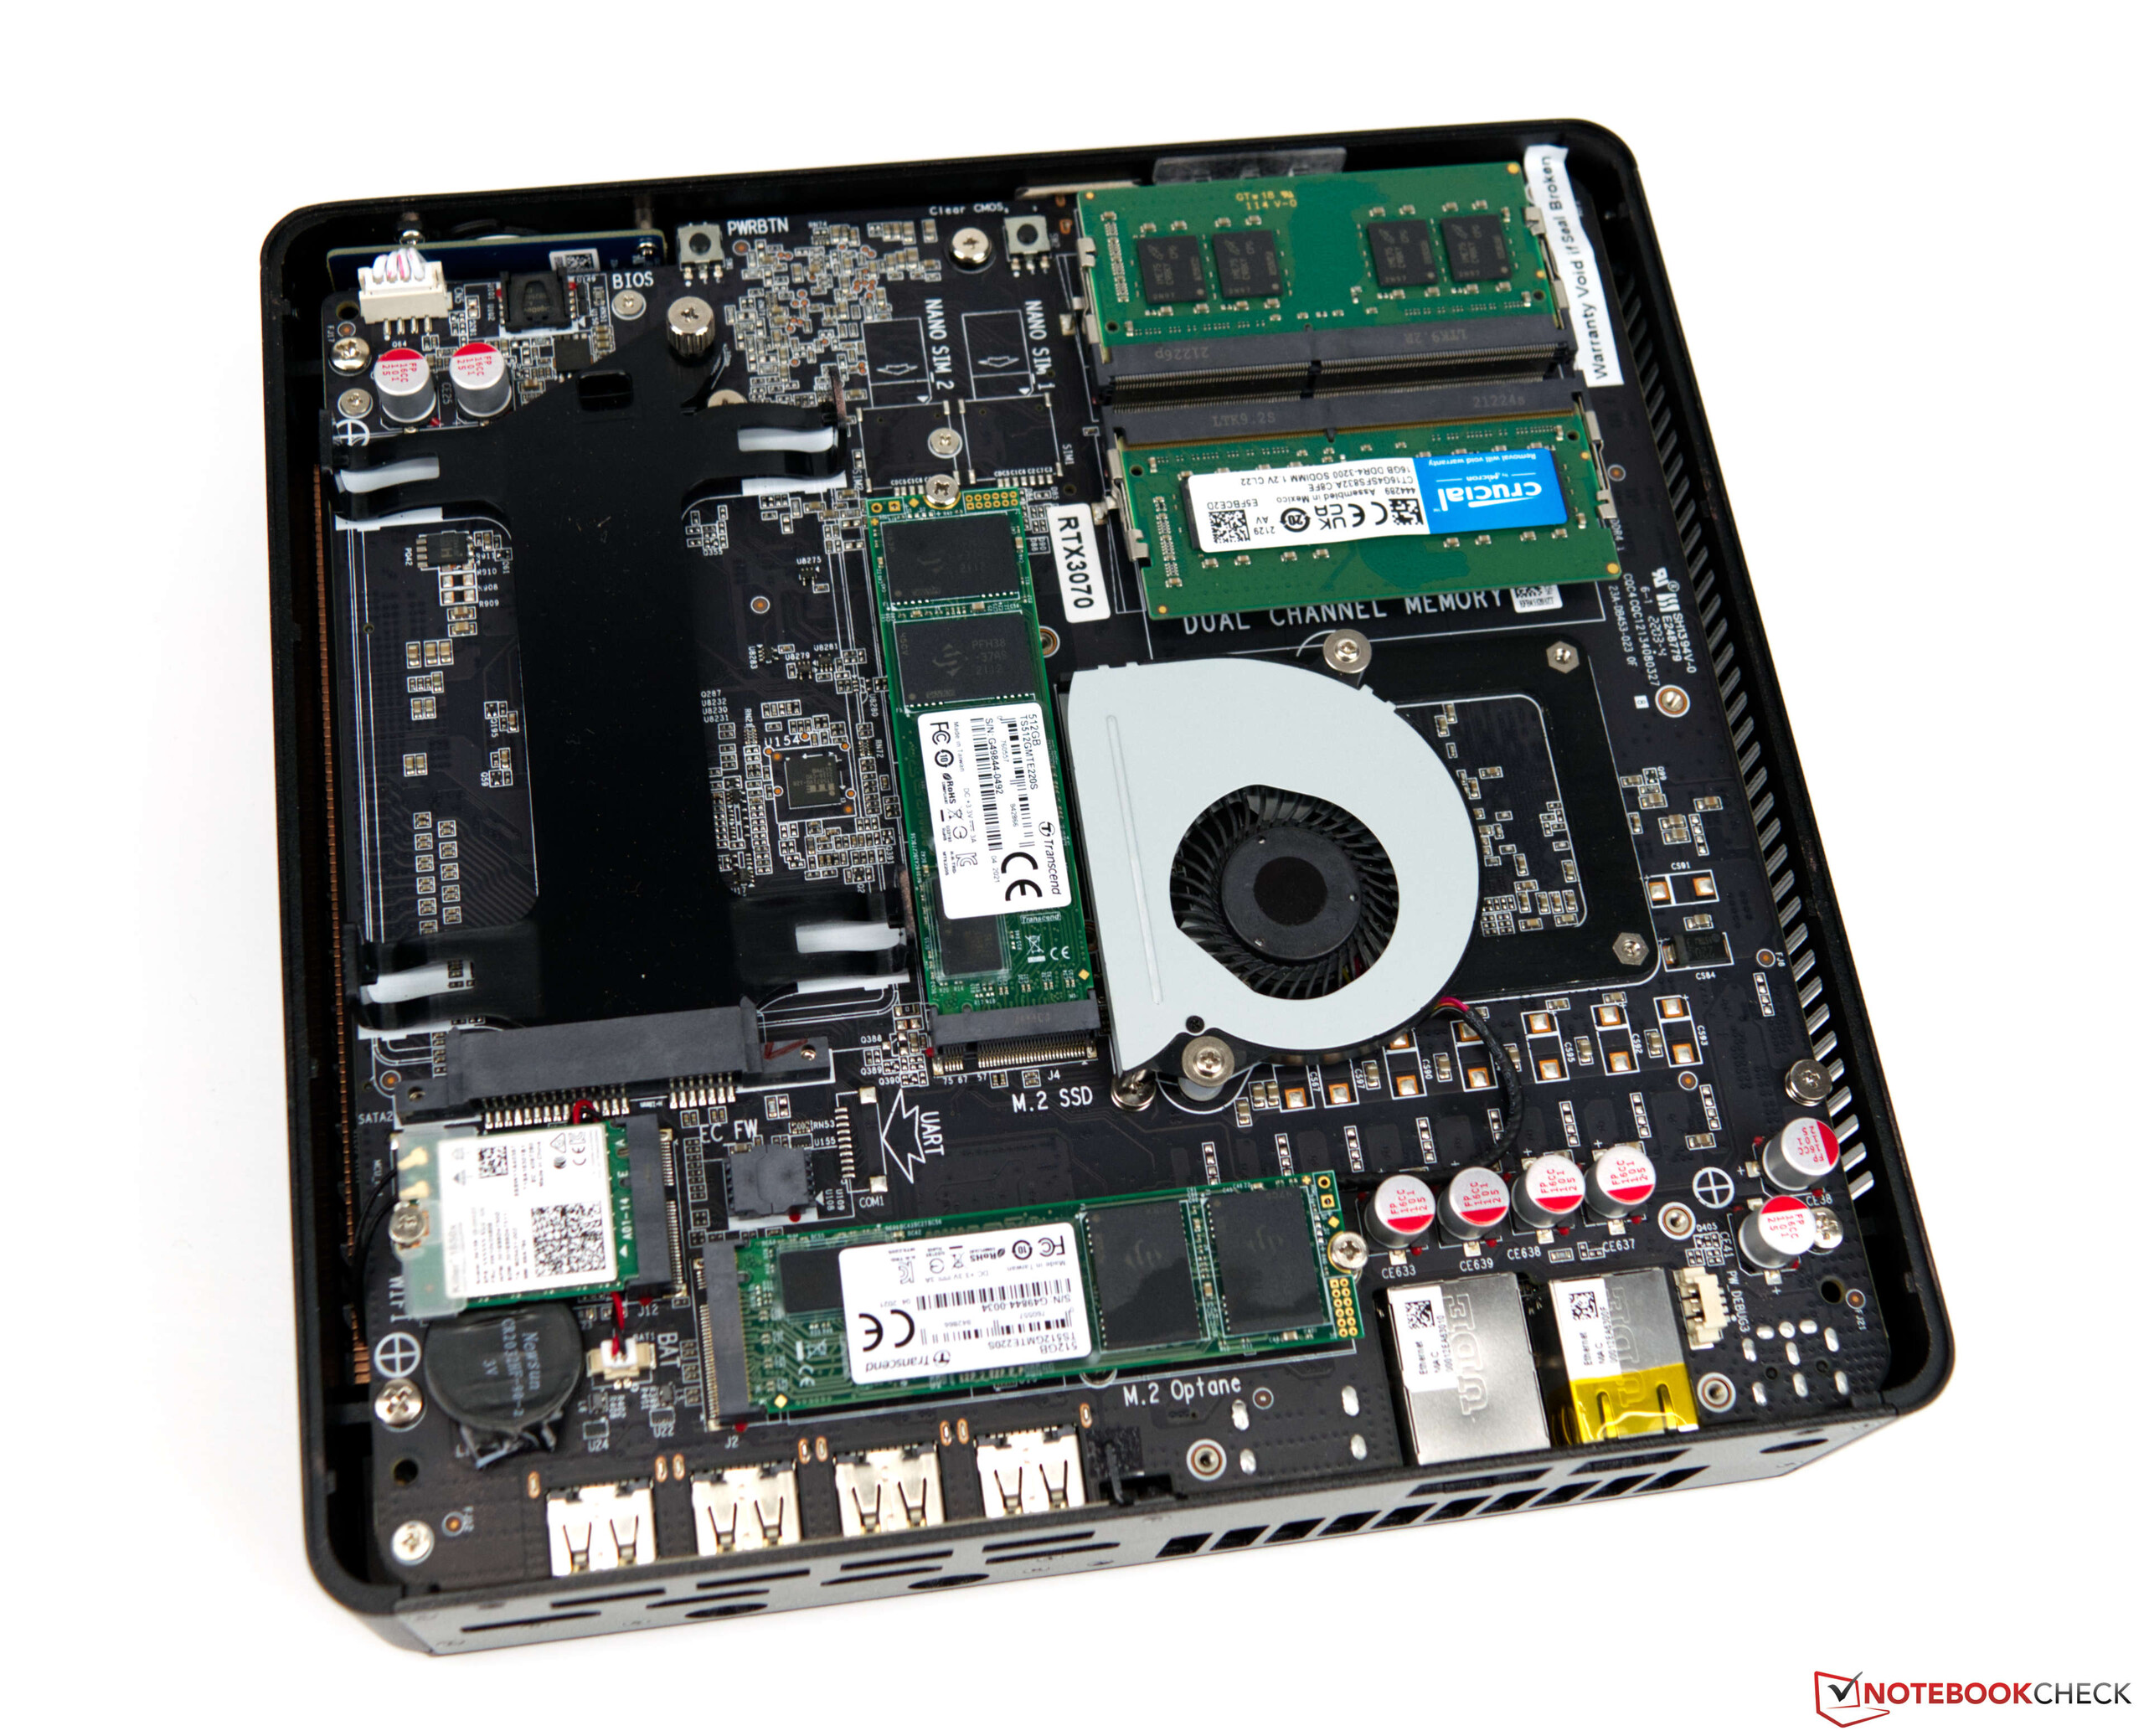
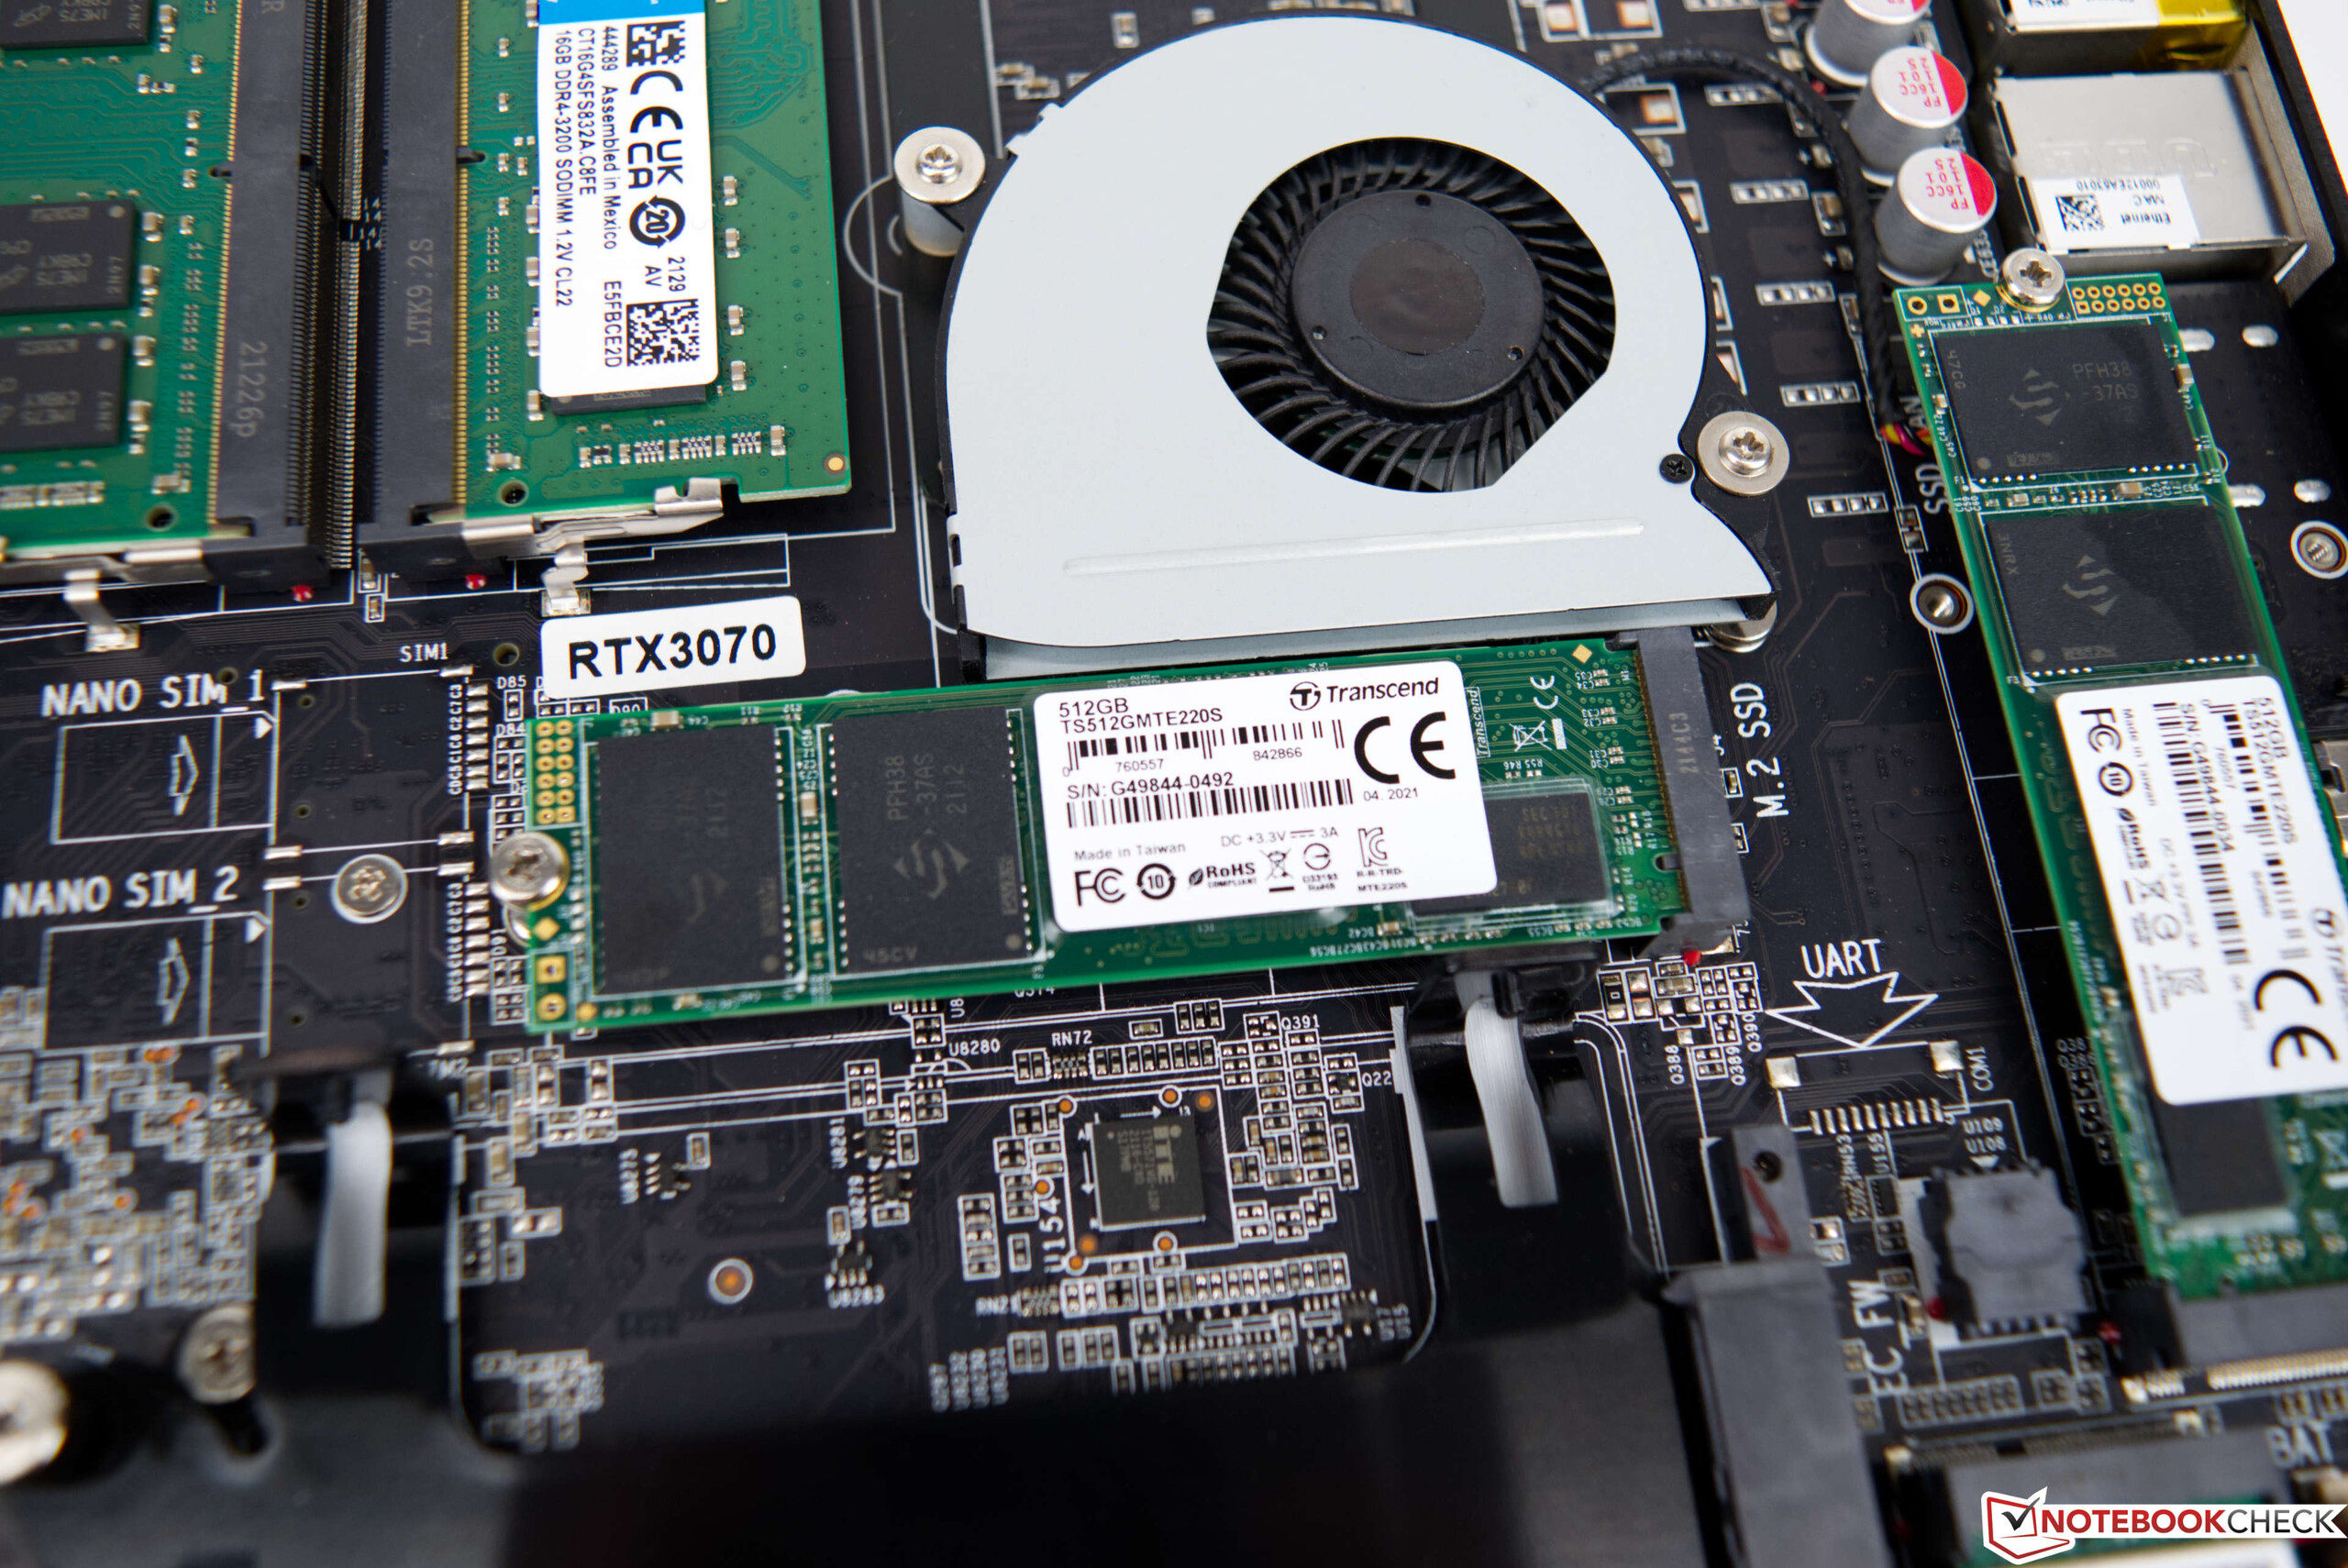
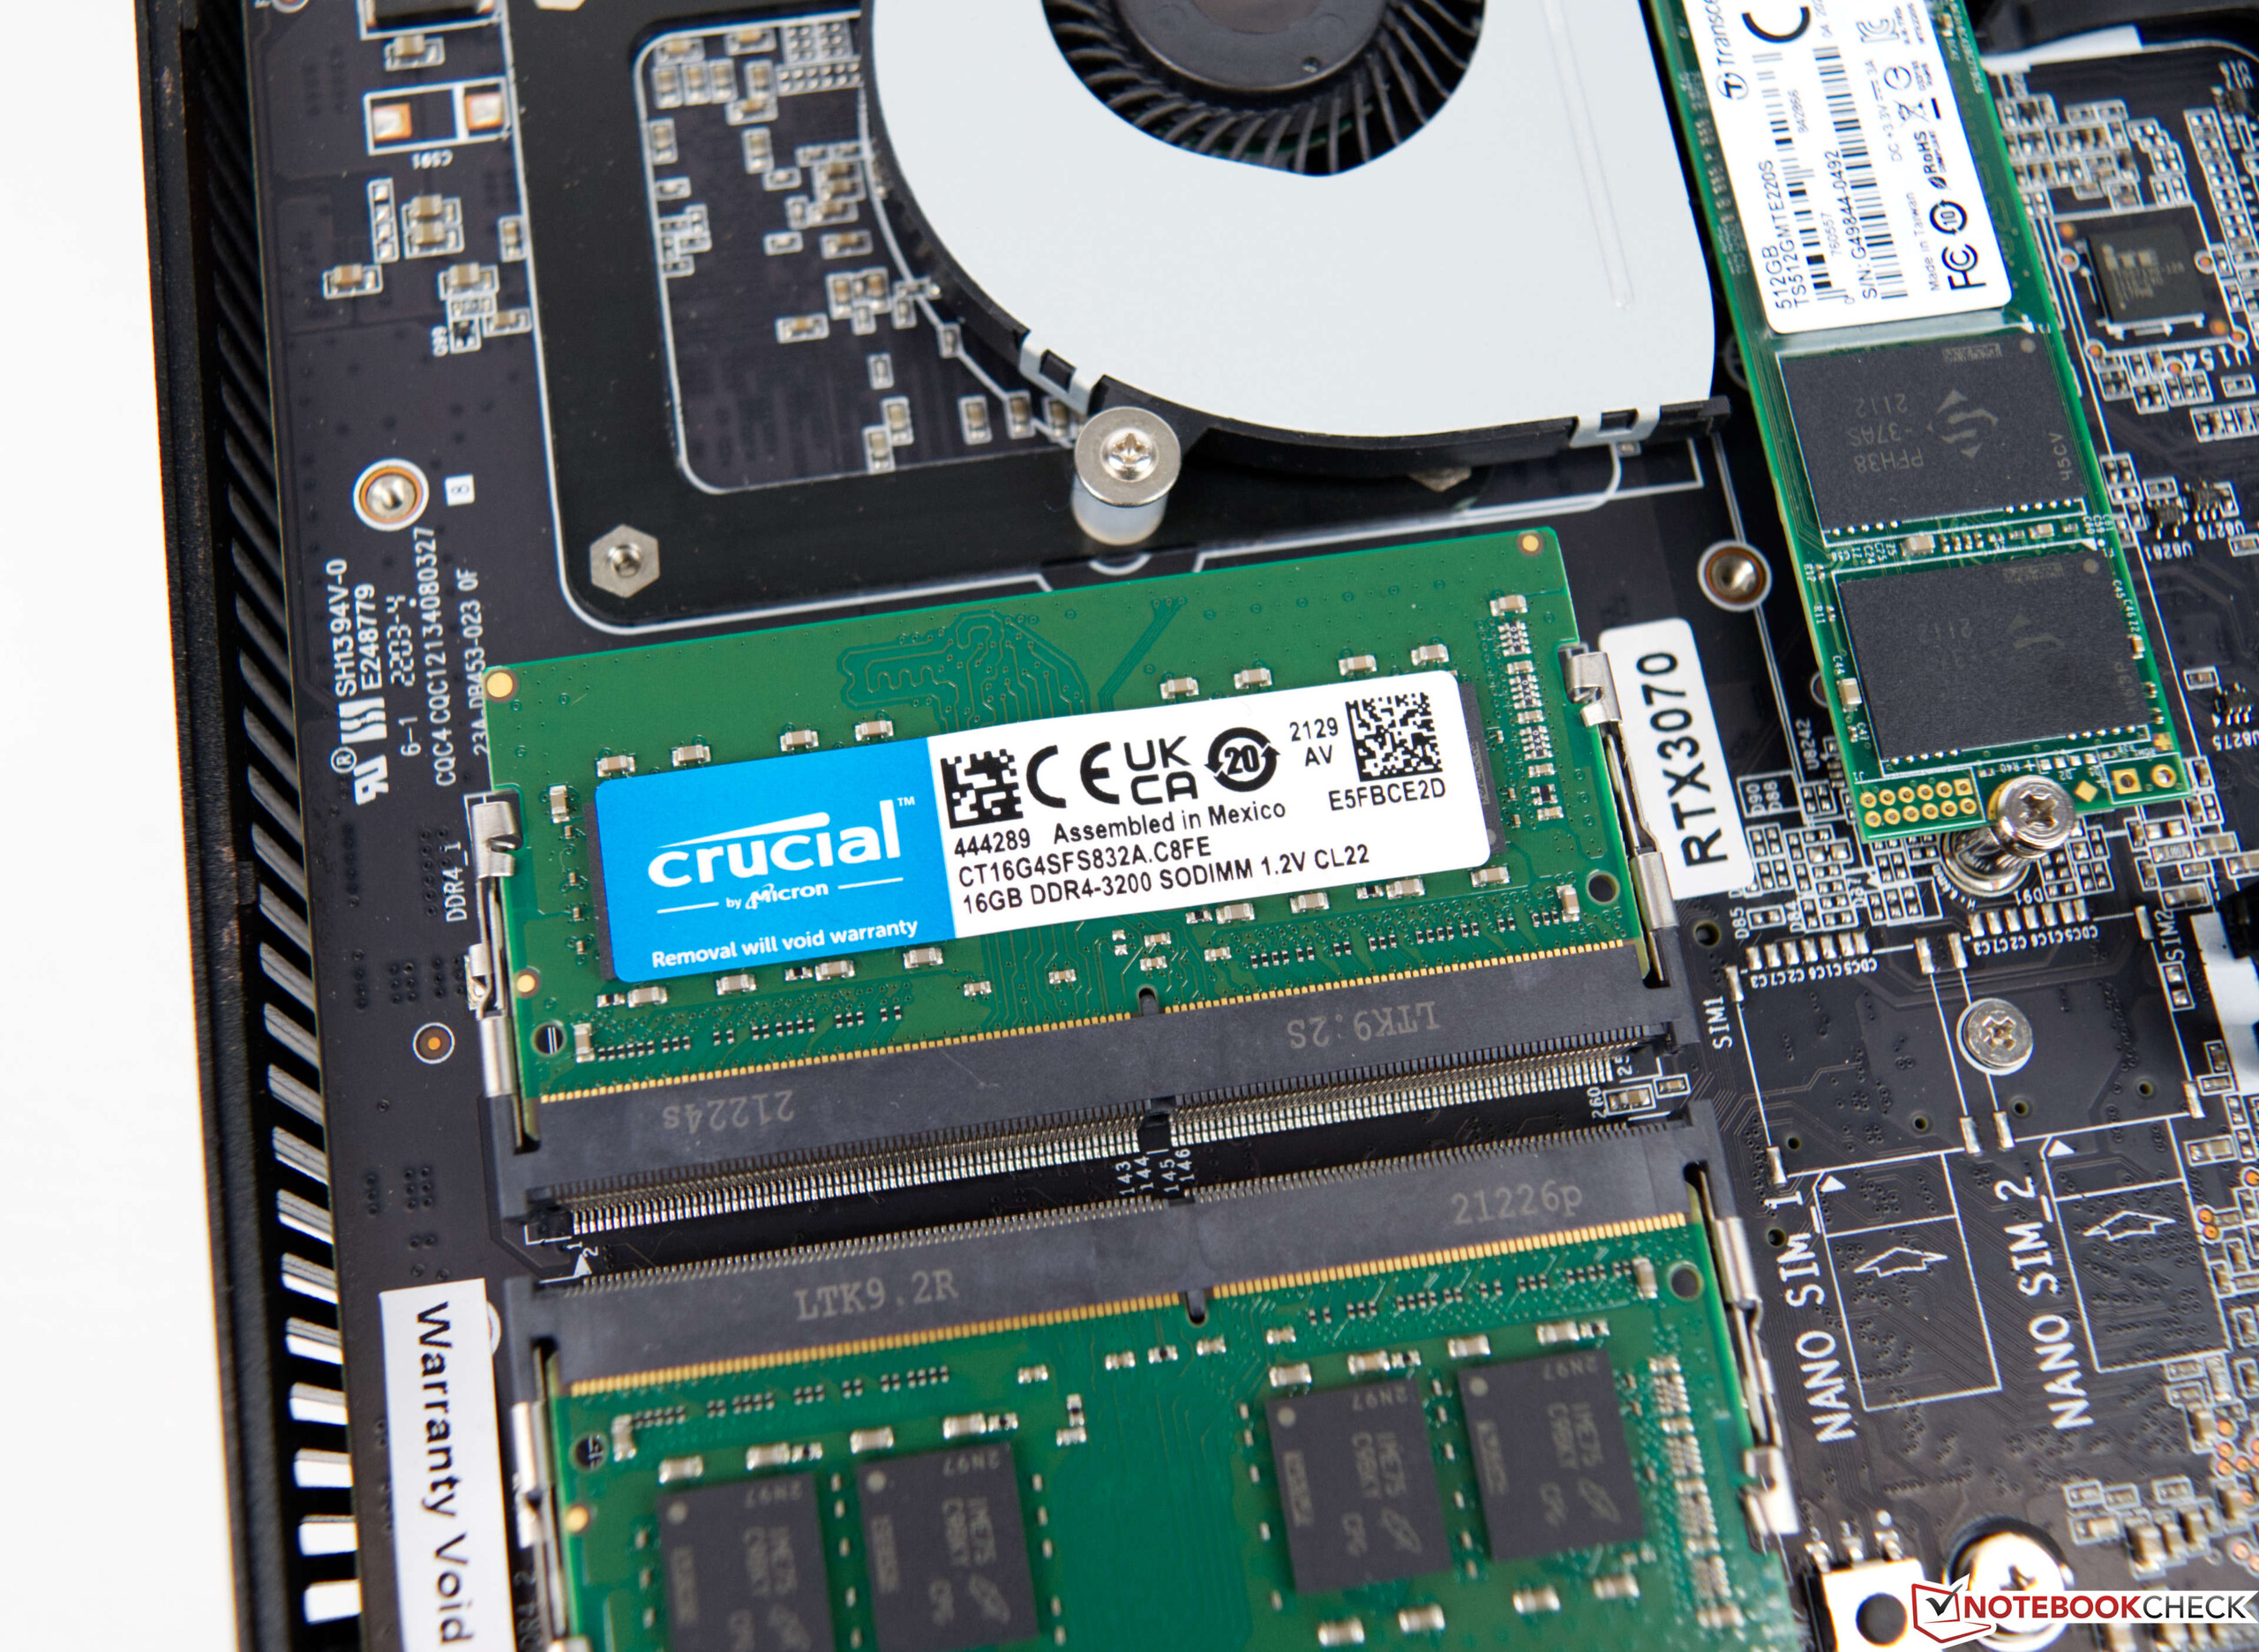
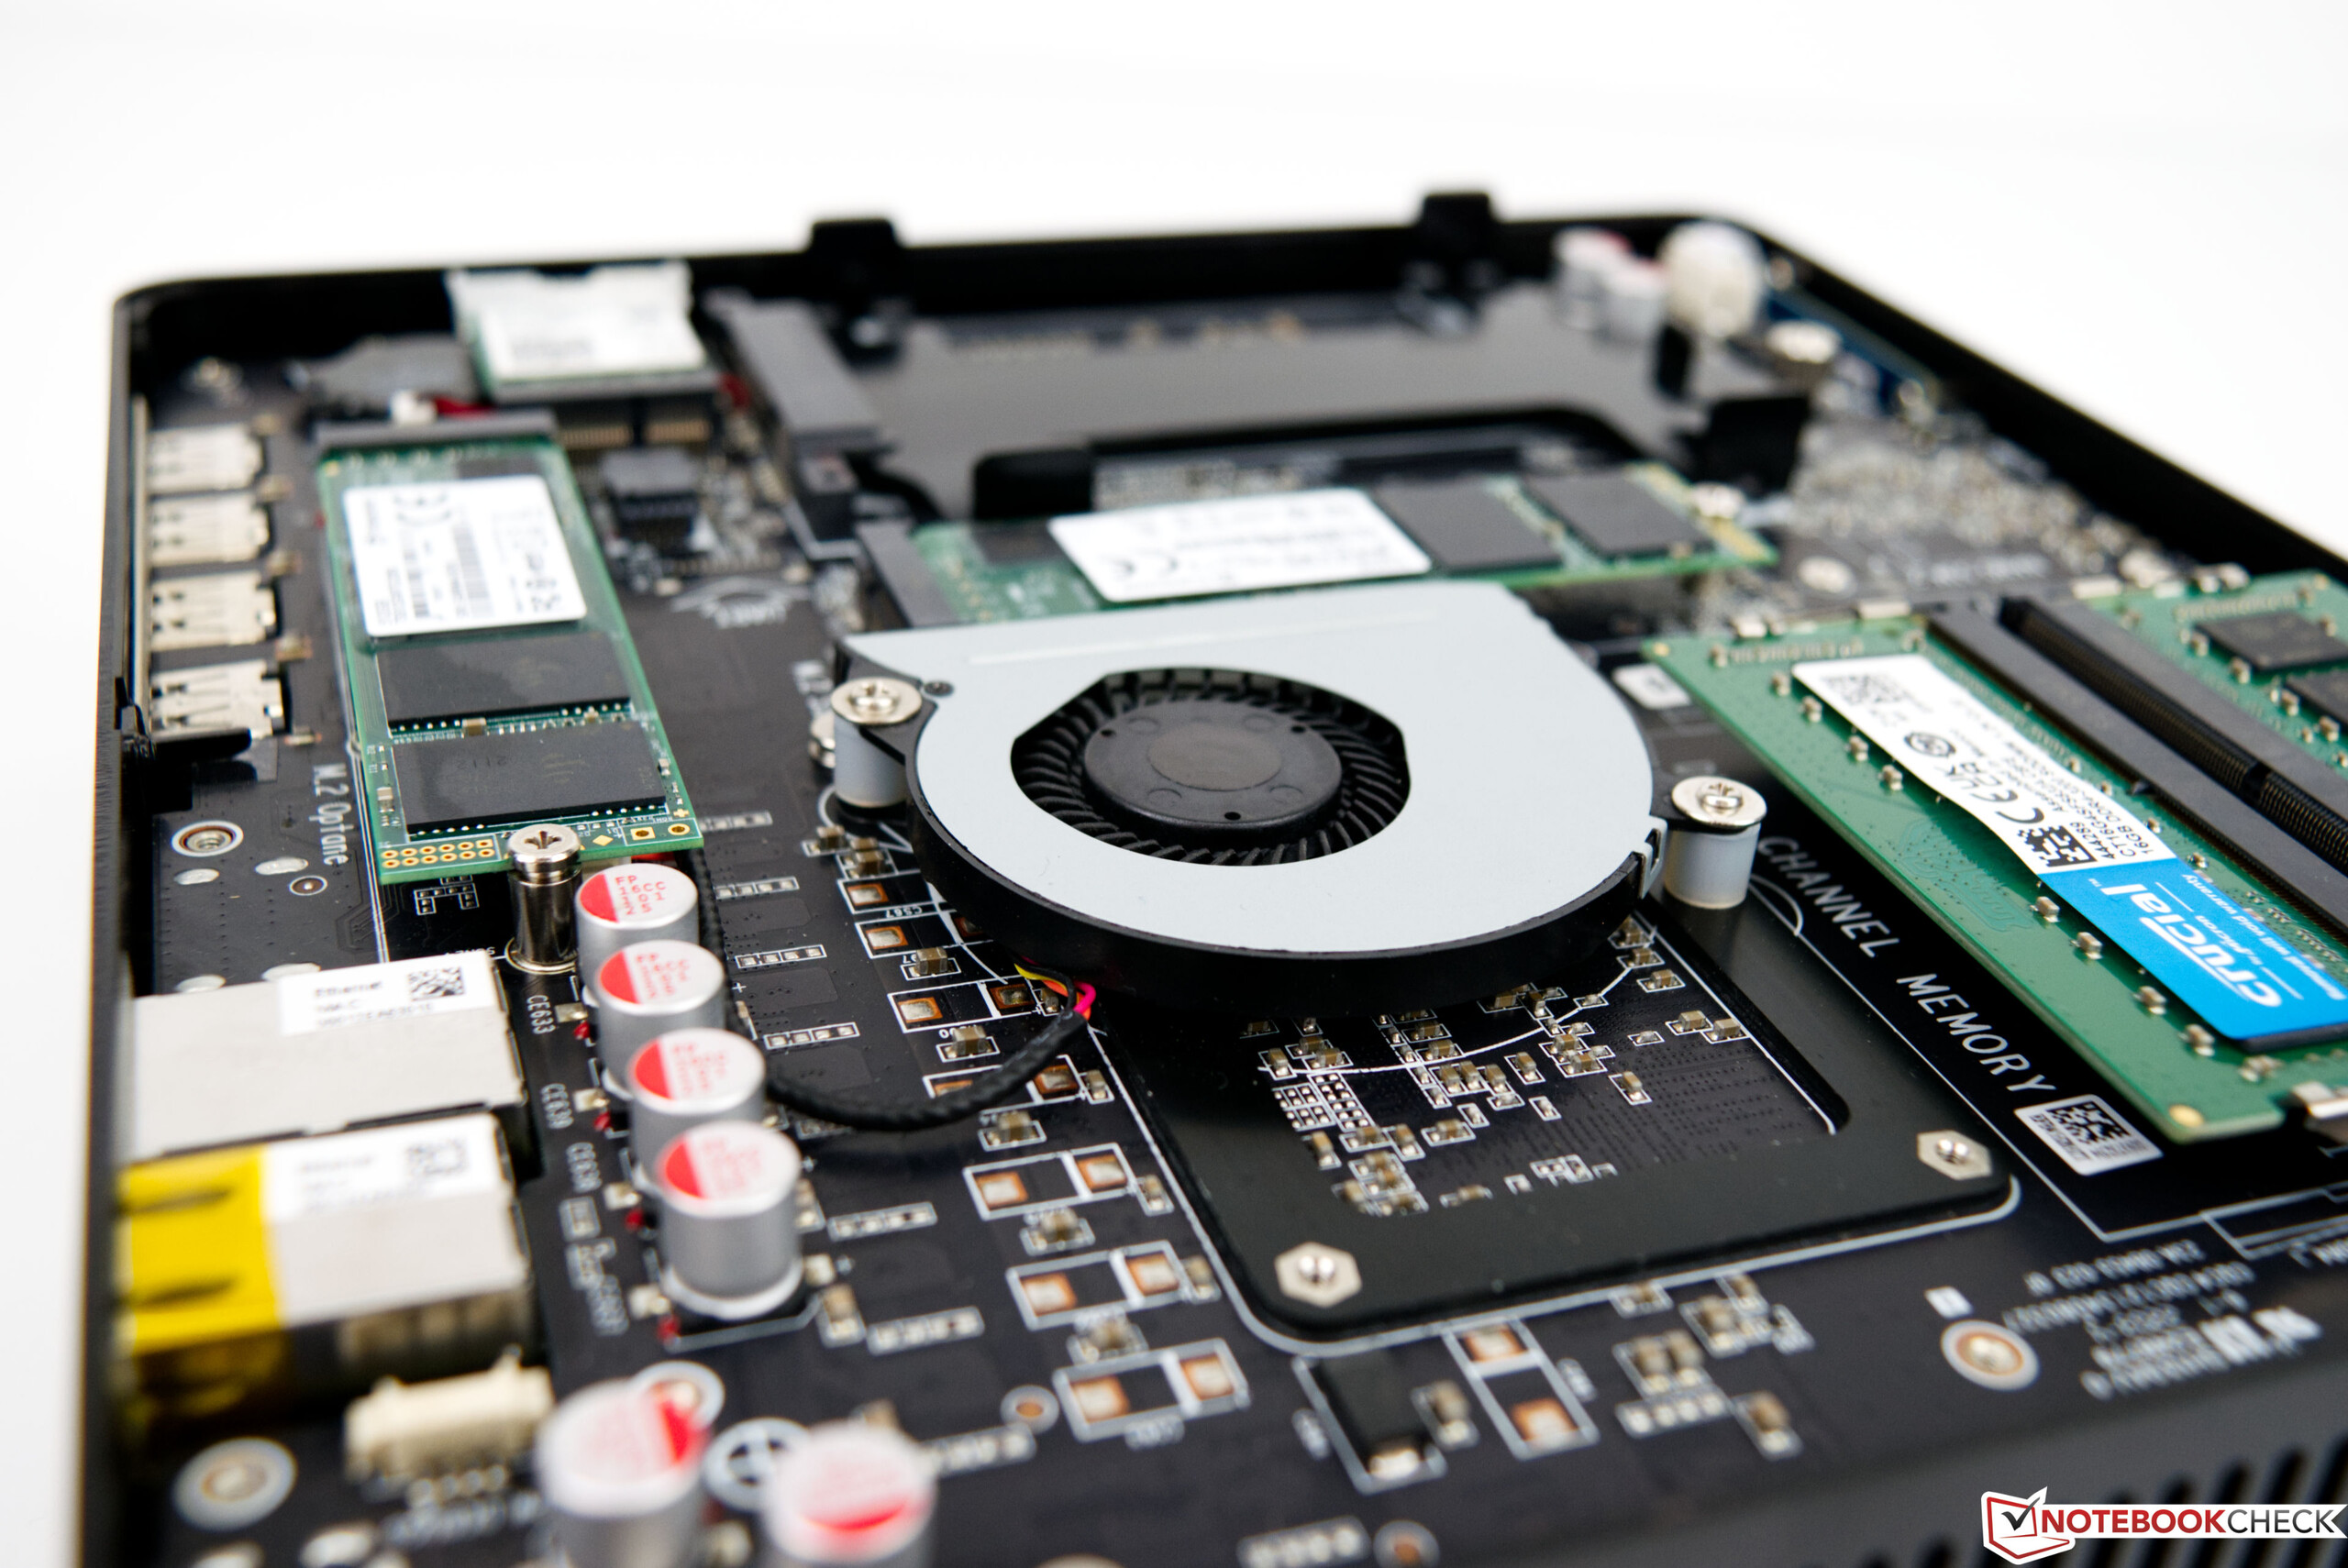
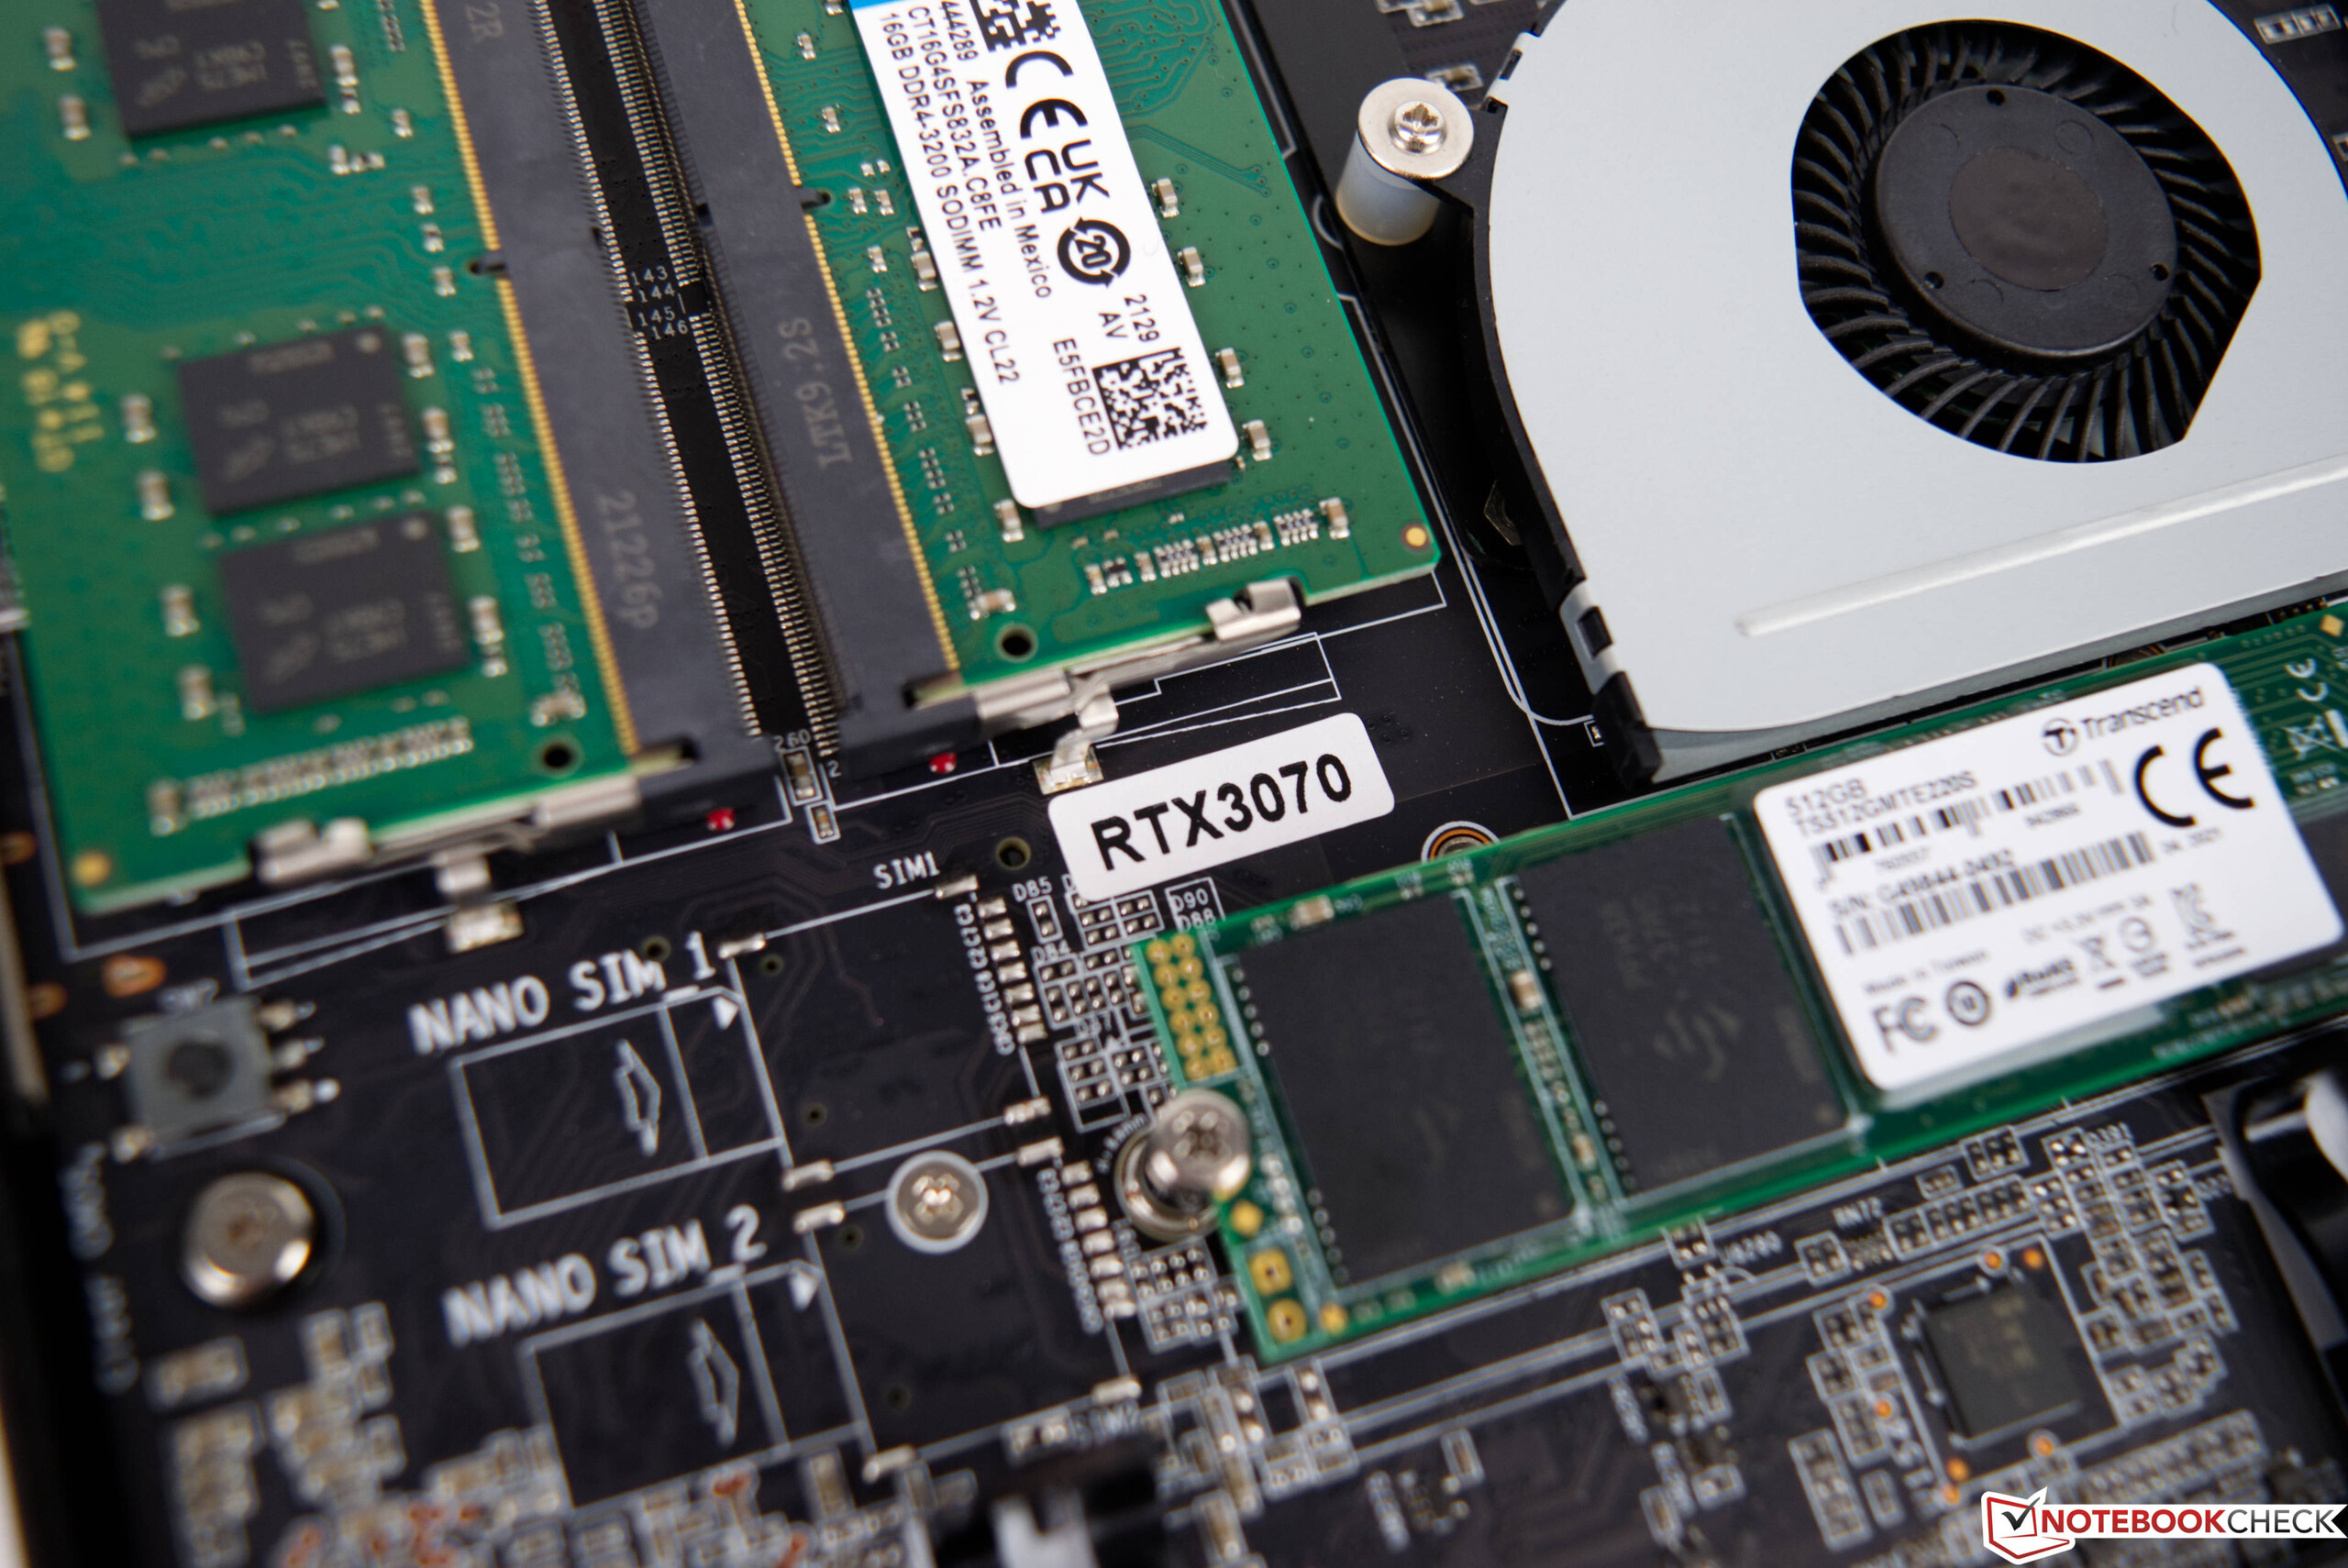
En los benchmarks de aplicaciones, vemos un claro aumento del rendimiento en comparación con el Zotac ZBOX Magus EN72080V. Juntos, el nuevo SoC y la tarjeta gráfica significativamente más rápida aseguran el buen resultado. En general, el Zotac ZBOX Magnus EN173070C es incluso ligeramente más rápido que el Intel Dragon Canyon NUC con su GPU de sobremesa de tamaño completo y su CPU Alder Lake más actual. En las pruebas de renderizado, la GeForce RTX 3070 Mobile es capaz de ganar los puntos decisivos en comparación con la GeForce RTX 3060. Mirándolo de forma subjetiva, las velocidades en el funcionamiento diario son muy buenas. Ya sea navegando por Internet, viendo vídeos o jugando, el Zotac ZBOX Magnus EN173070C domina todas estas tareas sin problemas. Para este análisis, hemos equipado el mini PC con 32 GB de RAM DDR4 y dos SSD de 512 GB. Los modelos de Transcend ofrecen un rendimiento sólido. Sin embargo, todavía se pueden exprimir algunos puntos porcentuales más en términos de rendimiento utilizando SSDs aún más rápidos. En la carcasa caben hasta tres soluciones de almacenamiento. Además de las dos conexiones M.2 que no sólo están limitadas a 80 mm de longitud, también puedes instalar una unidad de 2,5 pulgadas.
| DPC Latencies / LatencyMon - interrupt to process latency (max), Web, Youtube, Prime95 | |
| Zotac ZBOX Magnus EN173070C, Intel Core i7-11800H | |
| Minisforum EliteMini HX90, AMD Ryzen 9 5900HX | |
* ... más pequeño es mejor
3D y rendimiento de los juegos
Para un PC de juegos, una tarjeta gráfica rápida es indispensable para conseguir una velocidad de fotogramas fluida. En nuestro caso, hay una tarjeta gráfica rápida con 8 GB de VRAM con la Nvidia GeForce RTX 3070 Mobile. Al mismo tiempo, no se puede comparar realmente con las versiones de escritorio de la misma nomenclatura. En cambio, la versión móvil de la GeForce RTX 3070alcanza un rendimiento similar al de Nvidia GeForce RTX 3060. La comparación directa con el NUC Intel Beast Canyon lo ilustra muy bien.
En la clasificación del TDP, Zotac va a toda velocidad, permitiendo hasta 125 vatios bajo carga. Con esto, el rendimiento de la tarjeta gráfica dedicada no está limitado artificialmente, como suele ocurrir en los portátiles compactos. Esto también lleva a un resultado a veces bueno comparado con el rendimiento medio del adaptador gráfico. Los juegos que probamos pueden ser reproducidos a niveles máximos de detalle en resolución FHD y QHD sin ningún problema. Sin embargo, cuando la resolución se mueve hacia 4K, las cosas pueden volverse apretadas a veces. Pero todavía hay muchos juegos que también se pueden reproducir sin problemas en esa alta resolución
Puedes encontrar más comparaciones y pruebas de rendimiento en nuestro GTabla de comparación de la PU.
| bajo | medio | alto | ultra | QHD | 4K | |
|---|---|---|---|---|---|---|
| GTA V (2015) | 182.7 | 177.1 | 167.5 | 104.9 | 94.4 | 100.8 |
| The Witcher 3 (2015) | 435 | 331 | 190.1 | 105.5 | 70.7 | |
| Dota 2 Reborn (2015) | 164.4 | 148.3 | 142.9 | 133.9 | 127.7 | |
| Rise of the Tomb Raider (2016) | 302 | 216 | 141.9 | 116.2 | 55.4 | |
| Final Fantasy XV Benchmark (2018) | 190.1 | 139 | 101 | 75.3 | 43.5 | |
| X-Plane 11.11 (2018) | 136.6 | 121.2 | 95.7 | 82.3 | ||
| Far Cry 5 (2018) | 159 | 136 | 129 | 120 | 101 | 55 |
| Strange Brigade (2018) | 437 | 267 | 216 | 186.7 | 137.3 | 78.1 |
| Shadow of the Tomb Raider (2018) | 169.6 | 146.4 | 142.5 | 133.7 | 95.1 | 50.8 |
| Far Cry New Dawn (2019) | 134 | 116 | 112 | 100 | 91 | 57 |
| Metro Exodus (2019) | 177.1 | 123 | 94 | 74.6 | 58.7 | 36.6 |
| Control (2019) | 240 | 128 | 93.7 | 60.9 | 30.3 | |
| Borderlands 3 (2019) | 135.5 | 117.3 | 101 | 84.6 | 62.2 | 34.2 |
| F1 2020 (2020) | 315 | 267 | 238 | 165.8 | 123.6 | 68.3 |
| Dirt 5 (2020) | 227 | 153 | 123 | 96 | 75 | 49 |
| F1 2021 (2021) | 367 | 309 | 246 | 122.7 | 88.3 | 49.8 |
| Alan Wake Remastered (2021) | 119.2 | 118.2 | 118.2 | 113.1 | ||
| Far Cry 6 (2021) | 127.5 | 109.5 | 99 | 99.8 | 79.2 | 41 |
| Guardians of the Galaxy (2021) | 123 | 124 | 122 | 120 | 102 | 55 |
| Riders Republic (2021) | 174 | 144 | 118 | 107 | 77 | 40 |
| Forza Horizon 5 (2021) | 213 | 141 | 129 | 82 | 70 | 48 |
| Farming Simulator 22 (2021) | 205 | 161.1 | 138.8 | 132.8 | 124.8 | 79.2 |
| God of War (2022) | 122.2 | 109.4 | 88.1 | 61.7 | 50.7 | 33.8 |
| Rainbow Six Extraction (2022) | 241 | 182 | 181 | 149 | 97 | 49 |
| GRID Legends (2022) | 194 | 189 | 158 | 123 | 95 | 62 |
| Cyberpunk 2077 1.6 (2022) | 139 | 116 | 92 | 76 | 47 | 22 |
| Elex 2 (2022) | 98.4 | 95.1 | 87.3 | 79.5 | 61.8 | 34.5 |
Emisiones
Emisiones acústicas
Cuando se adquiere un portátil para juegos, se suele ser consciente del aumento del nivel de ruido que esto conlleva. Sin embargo, las cosas suelen ser diferentes para un PC de sobremesa, ya que los sistemas de refrigeración más grandes son capaces de disipar el calor de forma más eficaz y silenciosa. Pero como Zotac utiliza aquí una carcasa muy compacta, los ventiladores integrados tienen que trabajar bastante bajo carga. Los niveles de ruido bajo carga nos recuerdan a los de un portátil de juegos medio. Con 45 dB(A), el dispositivo es claramente audible. Bajo carga baja, aún medimos 41 dB(A). En funcionamiento 2D, los ventiladores zumban silenciosamente y apenas se notan.
Ruido
| Ocioso |
| 32.7 / 32.8 / 32.8 dB(A) |
| Carga |
| 41.7 / 45.4 dB(A) |
 | ||
30 dB silencioso 40 dB(A) audible 50 dB(A) ruidosamente alto |
||
min: | ||
| Zotac ZBOX Magnus EN173070C GeForce RTX 3070 Laptop GPU, i7-11800H, Transcend M.2 SSD 2200S TS512GMTE220S | Zotac Magnus One (ECM73070C) GeForce RTX 3070, i7-10700, Phison 512GB PA6620060U | Minisforum EliteMini HX90 Vega 8, R9 5900HX, Kingston OM8PCP3512F-AB | |
|---|---|---|---|
| Noise | -4% | 10% | |
| apagado / medio ambiente * (dB) | 30.7 | 30 2% | 30.8 -0% |
| Idle Minimum * (dB) | 32.7 | 33.58 -3% | |
| Idle Average * (dB) | 32.8 | 31.6 4% | |
| Idle Maximum * (dB) | 32.8 | ||
| Load Average * (dB) | 41.7 | 44.25 -6% | |
| Load Maximum * (dB) | 45.4 | 48.72 -7% | 33.4 26% |
* ... más pequeño es mejor
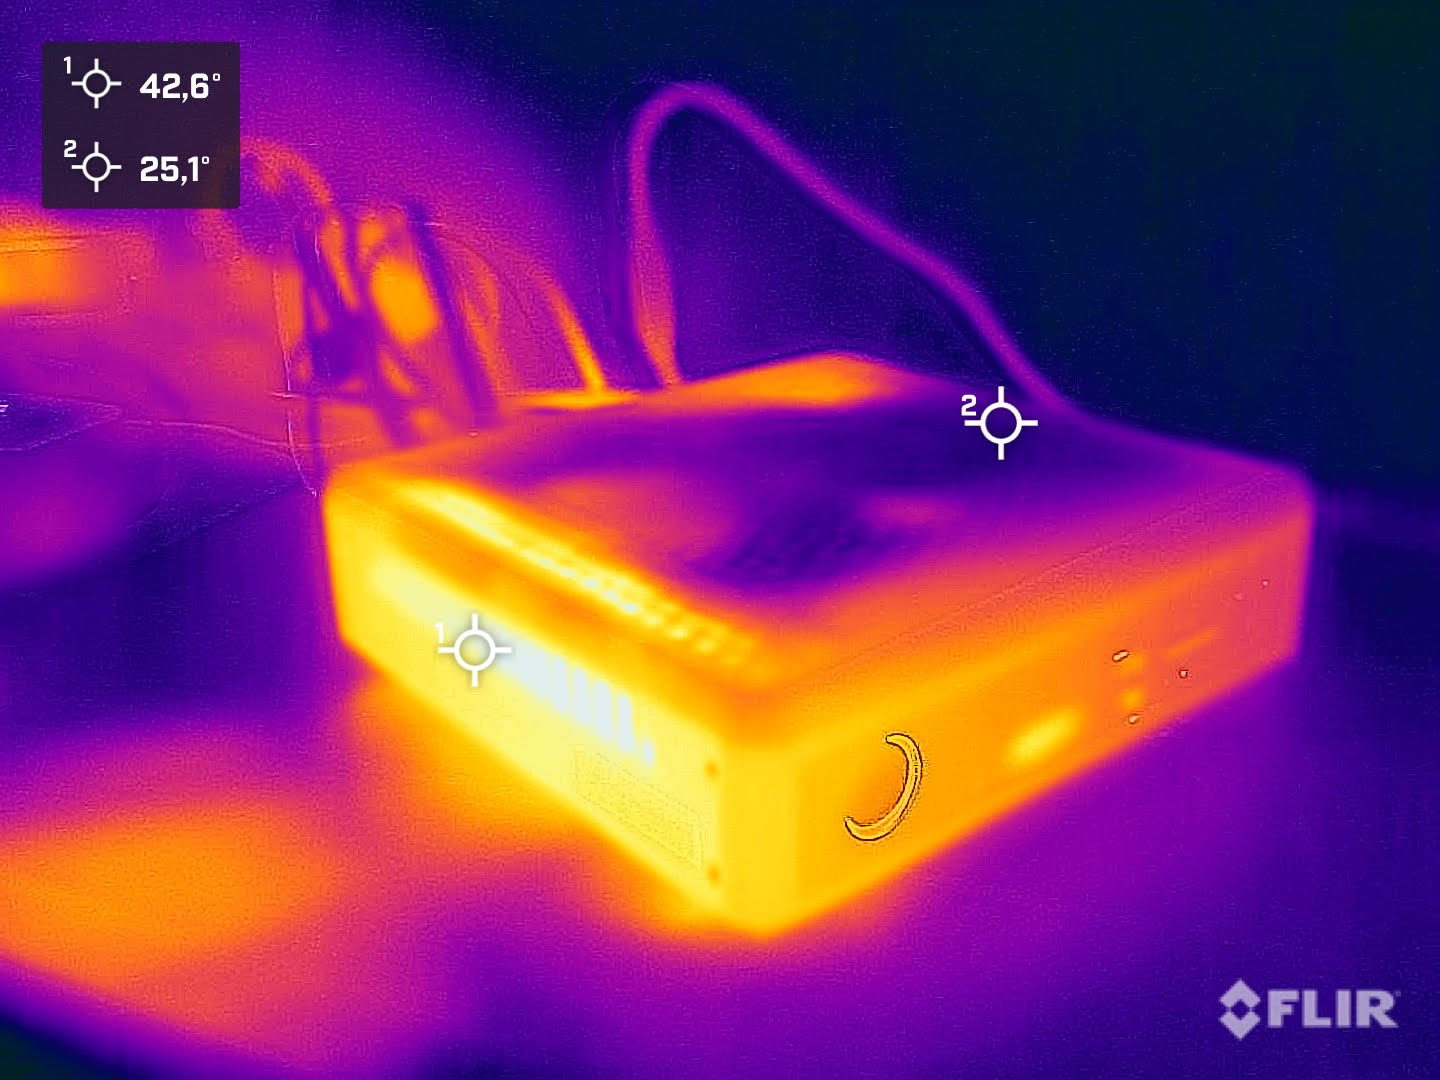
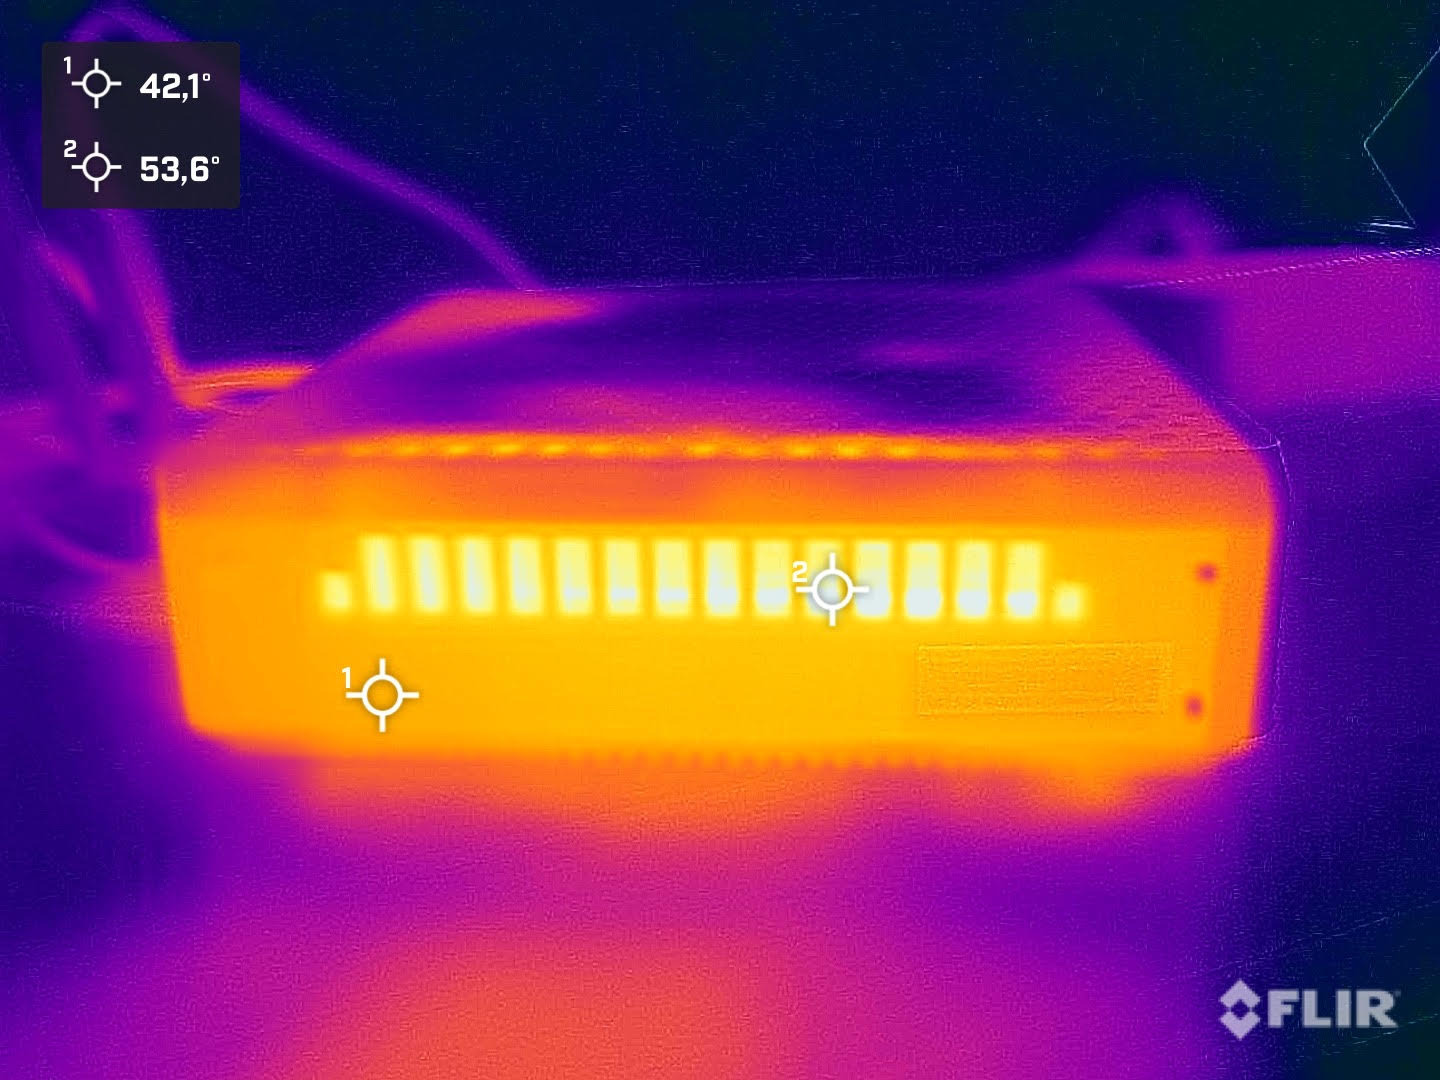
Temperaturas
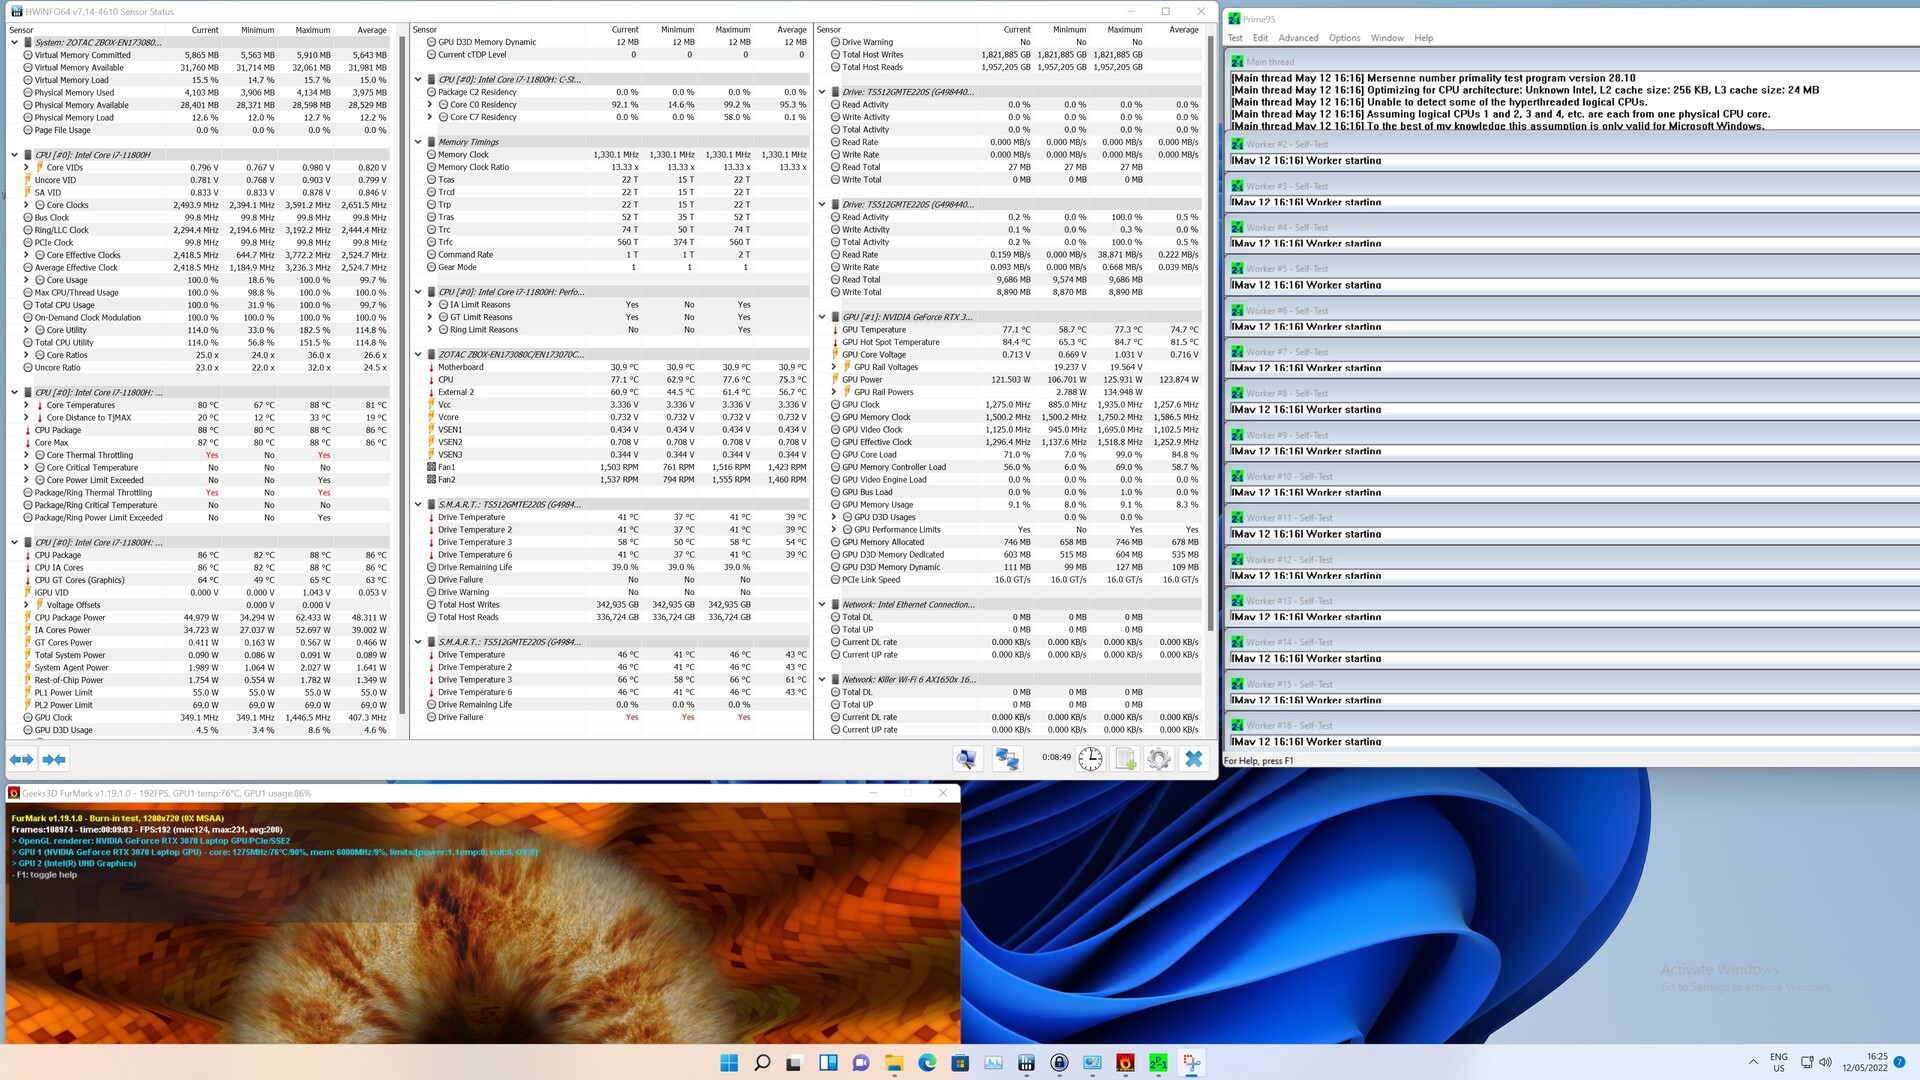
Durante la prueba de estrés, pusimos los niveles de carga más altos en el sistema con Prime95 y FurMark. En el peor de los casos, el Intel Core i7-11800Halcanza una temperatura máxima de 88 °C (190 °F). En la tarjeta gráfica, medimos un valor ligeramente inferior de 77 °C (171 °F). La velocidad de reloj de la CPU es de 2,6 GHz, que es superior a la velocidad de reloj básica de 2,3 GHz. La carga constante en todos los componentes no tiene un efecto negativo, y un benchmark 3D justo después produce un resultado idéntico comparado con el arranque en frío.
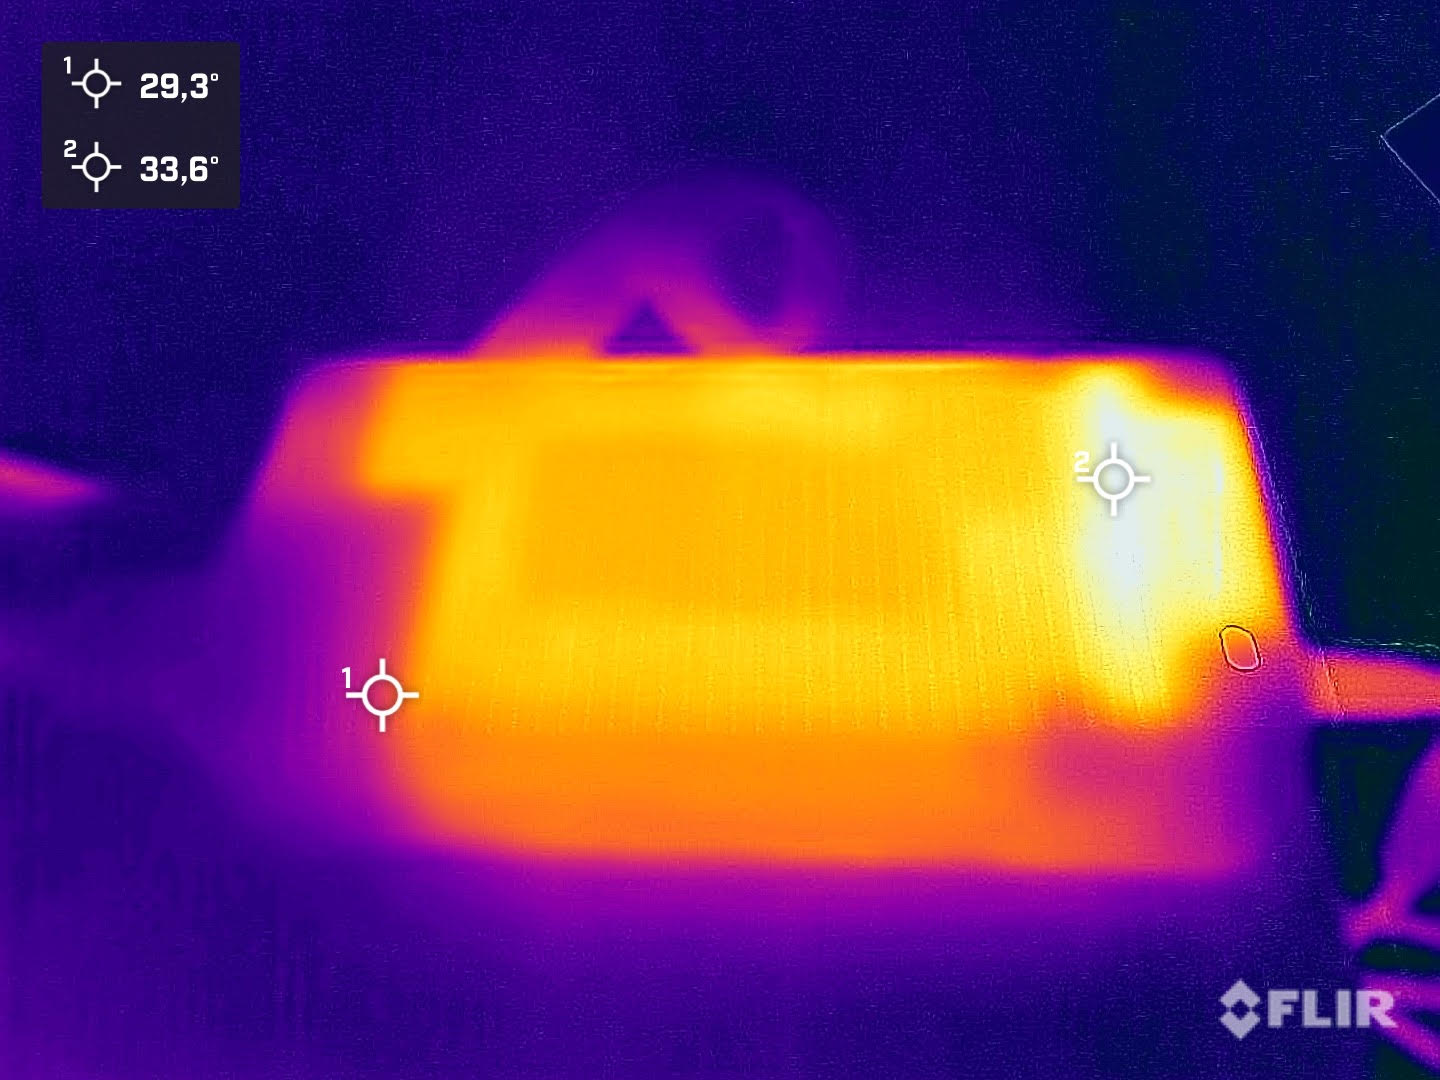
Consumo de energía
Durante el funcionamiento en reposo, el consumo de energía del Zotac ZBOX Magnus EN173070C es de entre 31 y 41 vatios. Para un sistema de sobremesa, son valores muy buenos. Por otro lado, en comparación con los portátiles equipados de forma similar, estos valores son demasiado altos. Bajo carga, medimos 214 vatios de media. Al mismo tiempo, la robusta fuente de alimentación es capaz de manejar fácilmente el consumo máximo de sólo 231 vatios que medimos.
| Ocioso | |
| Carga |
|
Clave:
min: | |
Power Consumption With External Monitor
Pro
Contra
Veredicto - Un PC de juegos ultracompacto

Con el ZBOX Magnus EN173070C, Zotac ofrece una buena actualización del producto. El rápidoIntel Core i7-11800Hofrece una muy buena velocidad de funcionamiento, y la Nvidia GeForce RTX 3070 Mobilees igualmente capaz de producir un buen rendimiento sin ser estrangulado artificialmente. Los 125 vatios completos están disponibles aquí, lo que significa que incluso la Nvidia GeForce RTX 3080 Mobile es a menudo superada. Sin embargo, aún tenemos que considerar que los niveles de rendimiento están en el rango de unaNvidia GeForce RTX 3060 DesktopgPU. Pero teniendo en cuenta la compacidad de la caja de sólo 2,65 litros, es sorprendente lo que Zotac puede ofrecer con sus ZBOX aquí.
Todo eso, por supuesto, también tiene su precio. Comparado con portátiles de juego asequibles como el Acer Nitro5 AN515el precio está en un nivel similar. A veces incluso tienes que pagar más, ya que un SSD y la RAM no están incluidos en el equipamiento base. Con 1650 euros, Zotac pide un precio elevado. Por otro lado, también obtienes un PC de juegos ultracompacto que puedes guardar o llevar contigo tan fácilmente como un portátil.
El rendimiento de juego pudo convencernos, y la variedad de conexiones también es suficiente. Al mismo tiempo, también tienes que tener en cuenta que sólo puedes transferir datos por Thunderbolt 4, pero no puedes usarlo para ejecutar una tarjeta gráfica externa. Esto es desafortunado en nuestra opinión, ya que de otro modo te permitiría aumentar el rendimiento 3D sin tener que comprar un dispositivo completamente nuevo.
El Zotac ZBOX Magnus EN173070C es un PC para juegos muy rápido basado en componentes móviles. Sin embargo, antes de comprarlo, deberías estar familiarizado con las características de un sistema barebone.
En cuanto al nivel de ruido, el Zotac ZBOX Magnus EN173070C pierde en comparación con los PC de sobremesa convencionales. Bajo carga, los ventiladores tienen que acelerar considerablemente, pero el ruido del ventilador sigue siendo relativamente cómodo y no demasiado agudo. Una alternativa la ofrece Intel con el Dragon Canyon NUCque es otro sistema barebone, como el ZBOX Magnus EN173070C. Aunque el dispositivo no es tan compacto, también puede equiparse con tarjetas gráficas convencionales de sobremesa. Como siempre, el cliente tiene la posibilidad de elegir y debe decidir qué parámetros son los más importantes en su compra.
Precio y disponibilidad
Mientras que el Zotac ZBOX Magnus EN173070C aparece en el sitio Zotac USy en muchos otros de sus sitios específicos de cada país, parece ser difícil de encontrar para su compra en los Estados Unidos. El modelo más frecuente en los Estados Unidos parece ser elZOTAC Magnus ONE ECM7307LH Mini PC, que utiliza una carcasa diferente y ya incluye la memoria RAM, el SSD y el HDD por $2130 en Amazon.

