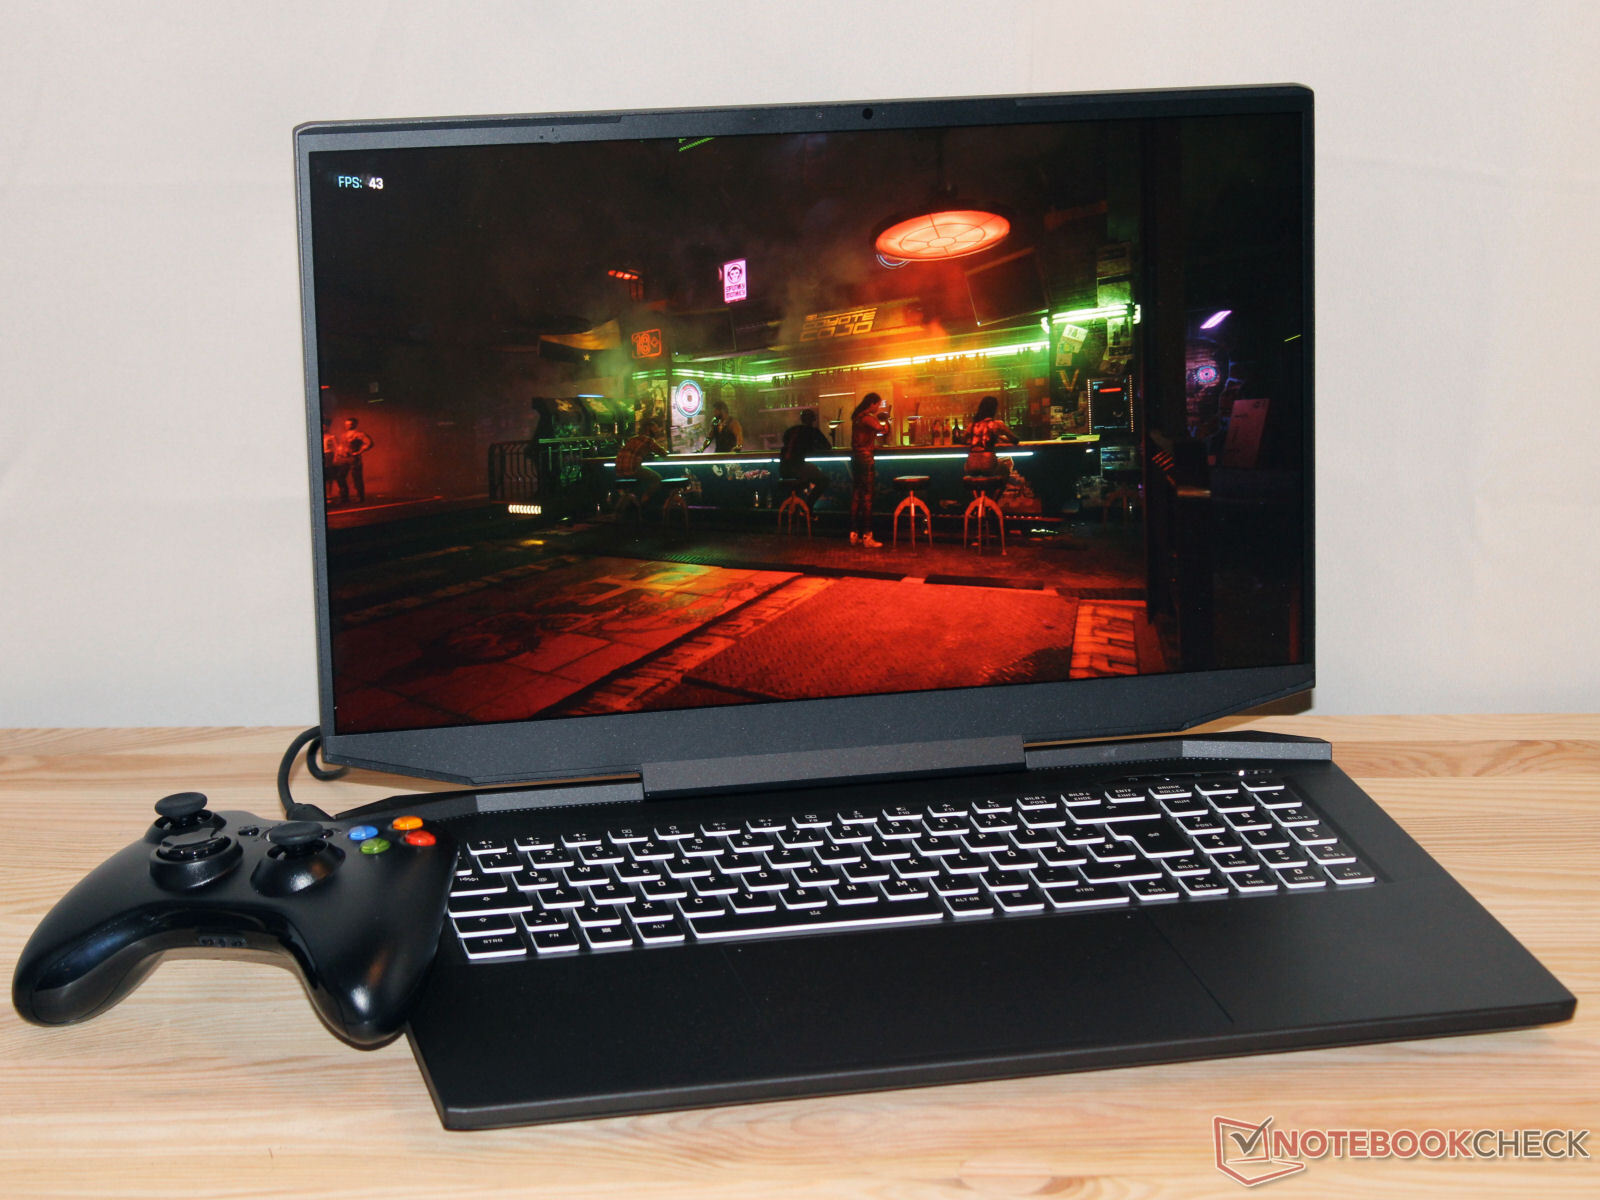
Análisis del XMG Apex 17 (finales del 23): un portátil gaming QHD con una RTX 4060
El XMG Apex 17 (finales del 23) es un portátil gaming QHD de gama media basado en un barebone de TongFang (GM7XG0) y está disponible en esta variante por algo menos de 1.800 euros. El paquete consta de un Ryzen 7 7840HS, GeForce RTX 4060 (alternativamente: RTX 4050), 32 GB de RAM y un SSD de 1 TB. La competencia la encontramos en elAcer Nitro 17 AN17-51elAlienware m16 R1y elLenovo Legion Pro 5 16IRX8elMSI Katana 17 B13VFKy elMedion Erazer Defender P40.
Posibles contendientes en la comparación
Valoración | Fecha | Modelo | Peso | Altura | Tamaño | Resolución | Precio |
|---|---|---|---|---|---|---|---|
| 87.1 % v7 (old) | 10/2023 | Schenker XMG Apex 17 (Late 23) R7 7840HS, GeForce RTX 4060 Laptop GPU | 2.5 kg | 24.9 mm | 17.30" | 2560x1440 | |
| 88.3 % v7 (old) | 09/2023 | Alienware m16 R1 Intel i7-13700HX, GeForce RTX 4060 Laptop GPU | 3 kg | 25.4 mm | 16.00" | 2560x1600 | |
| 87.9 % v7 (old) | 05/2023 | Lenovo Legion Pro 5 16IRX8 i7-13700HX, GeForce RTX 4060 Laptop GPU | 2.5 kg | 26.8 mm | 16.00" | 2560x1600 | |
| 87.2 % v7 (old) | 07/2023 | Acer Nitro 17 AN17-51-71ER i7-13700H, GeForce RTX 4060 Laptop GPU | 3 kg | 30.3 mm | 17.30" | 2560x1440 | |
| 84.6 % v7 (old) | 05/2023 | Medion Erazer Defender P40 i7-13700HX, GeForce RTX 4060 Laptop GPU | 2.9 kg | 33 mm | 17.30" | 2560x1440 | |
| 82.1 % v7 (old) | 02/2023 | MSI Katana 17 B13VFK i7-13620H, GeForce RTX 4060 Laptop GPU | 2.8 kg | 25.2 mm | 17.30" | 1920x1080 |
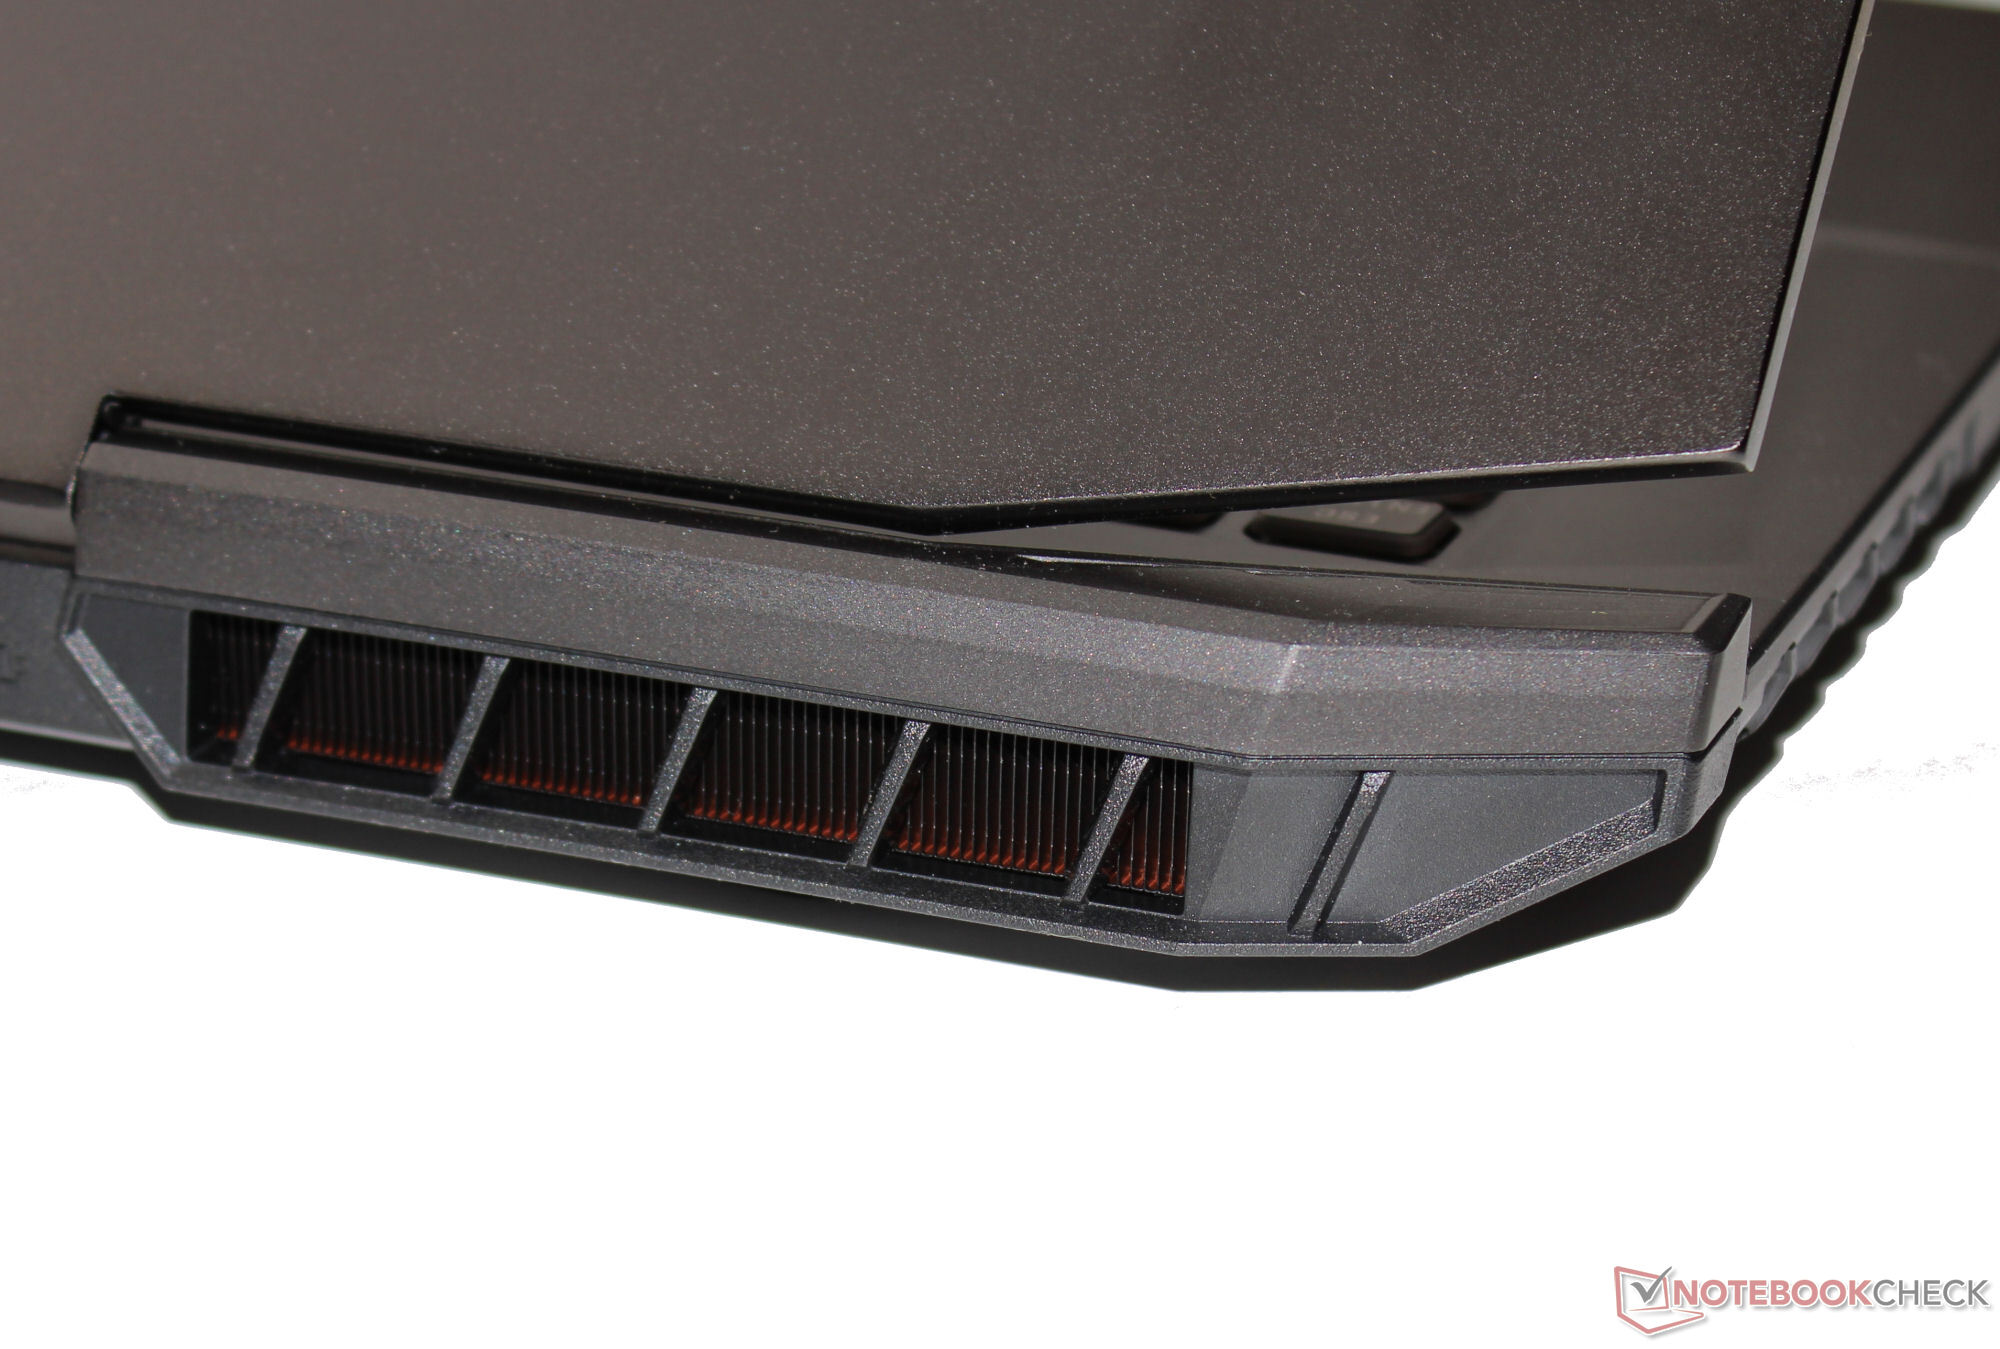
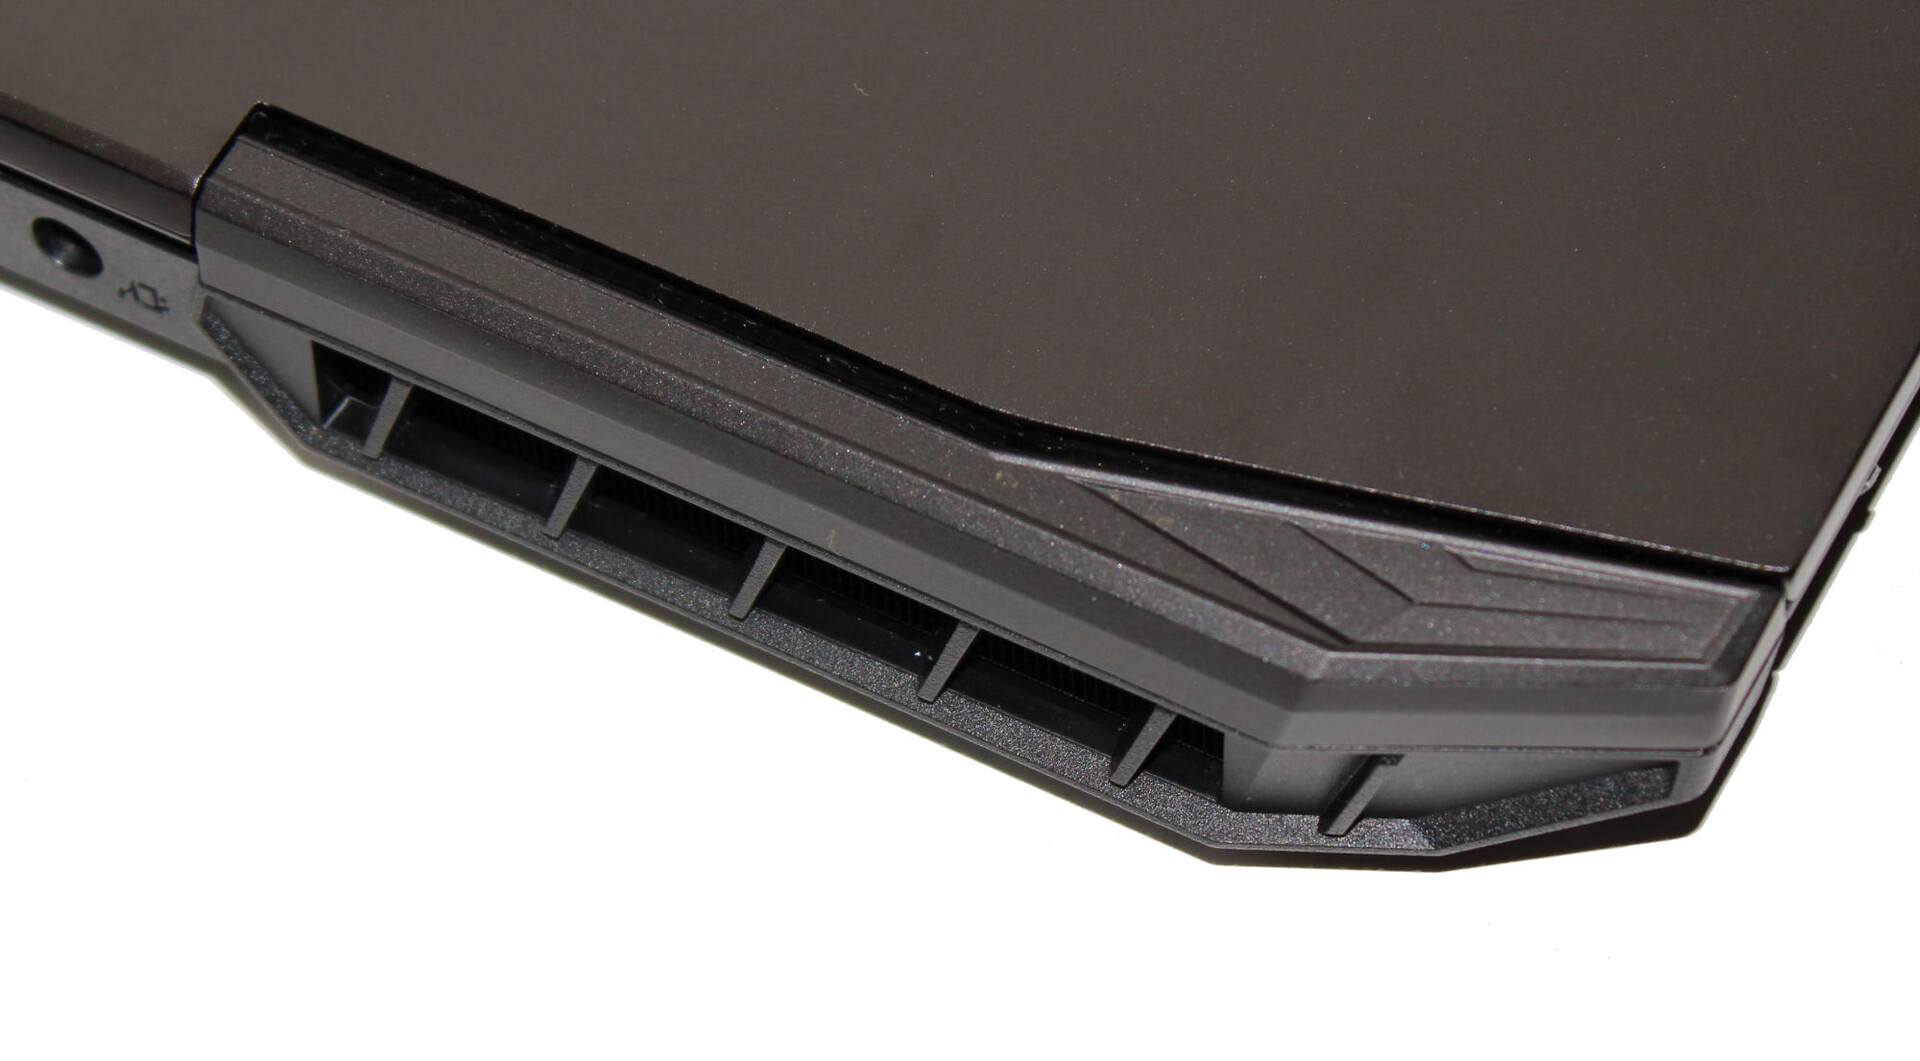
Carcasa - La parte trasera de la carcasa es de aluminio
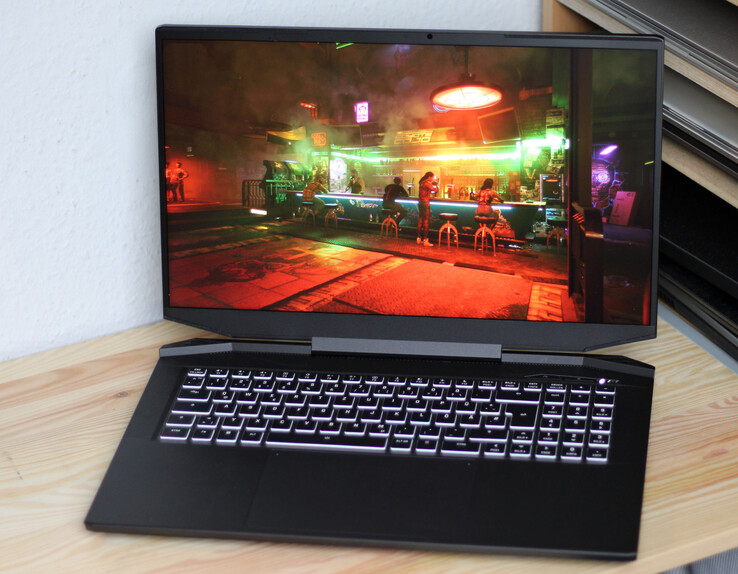
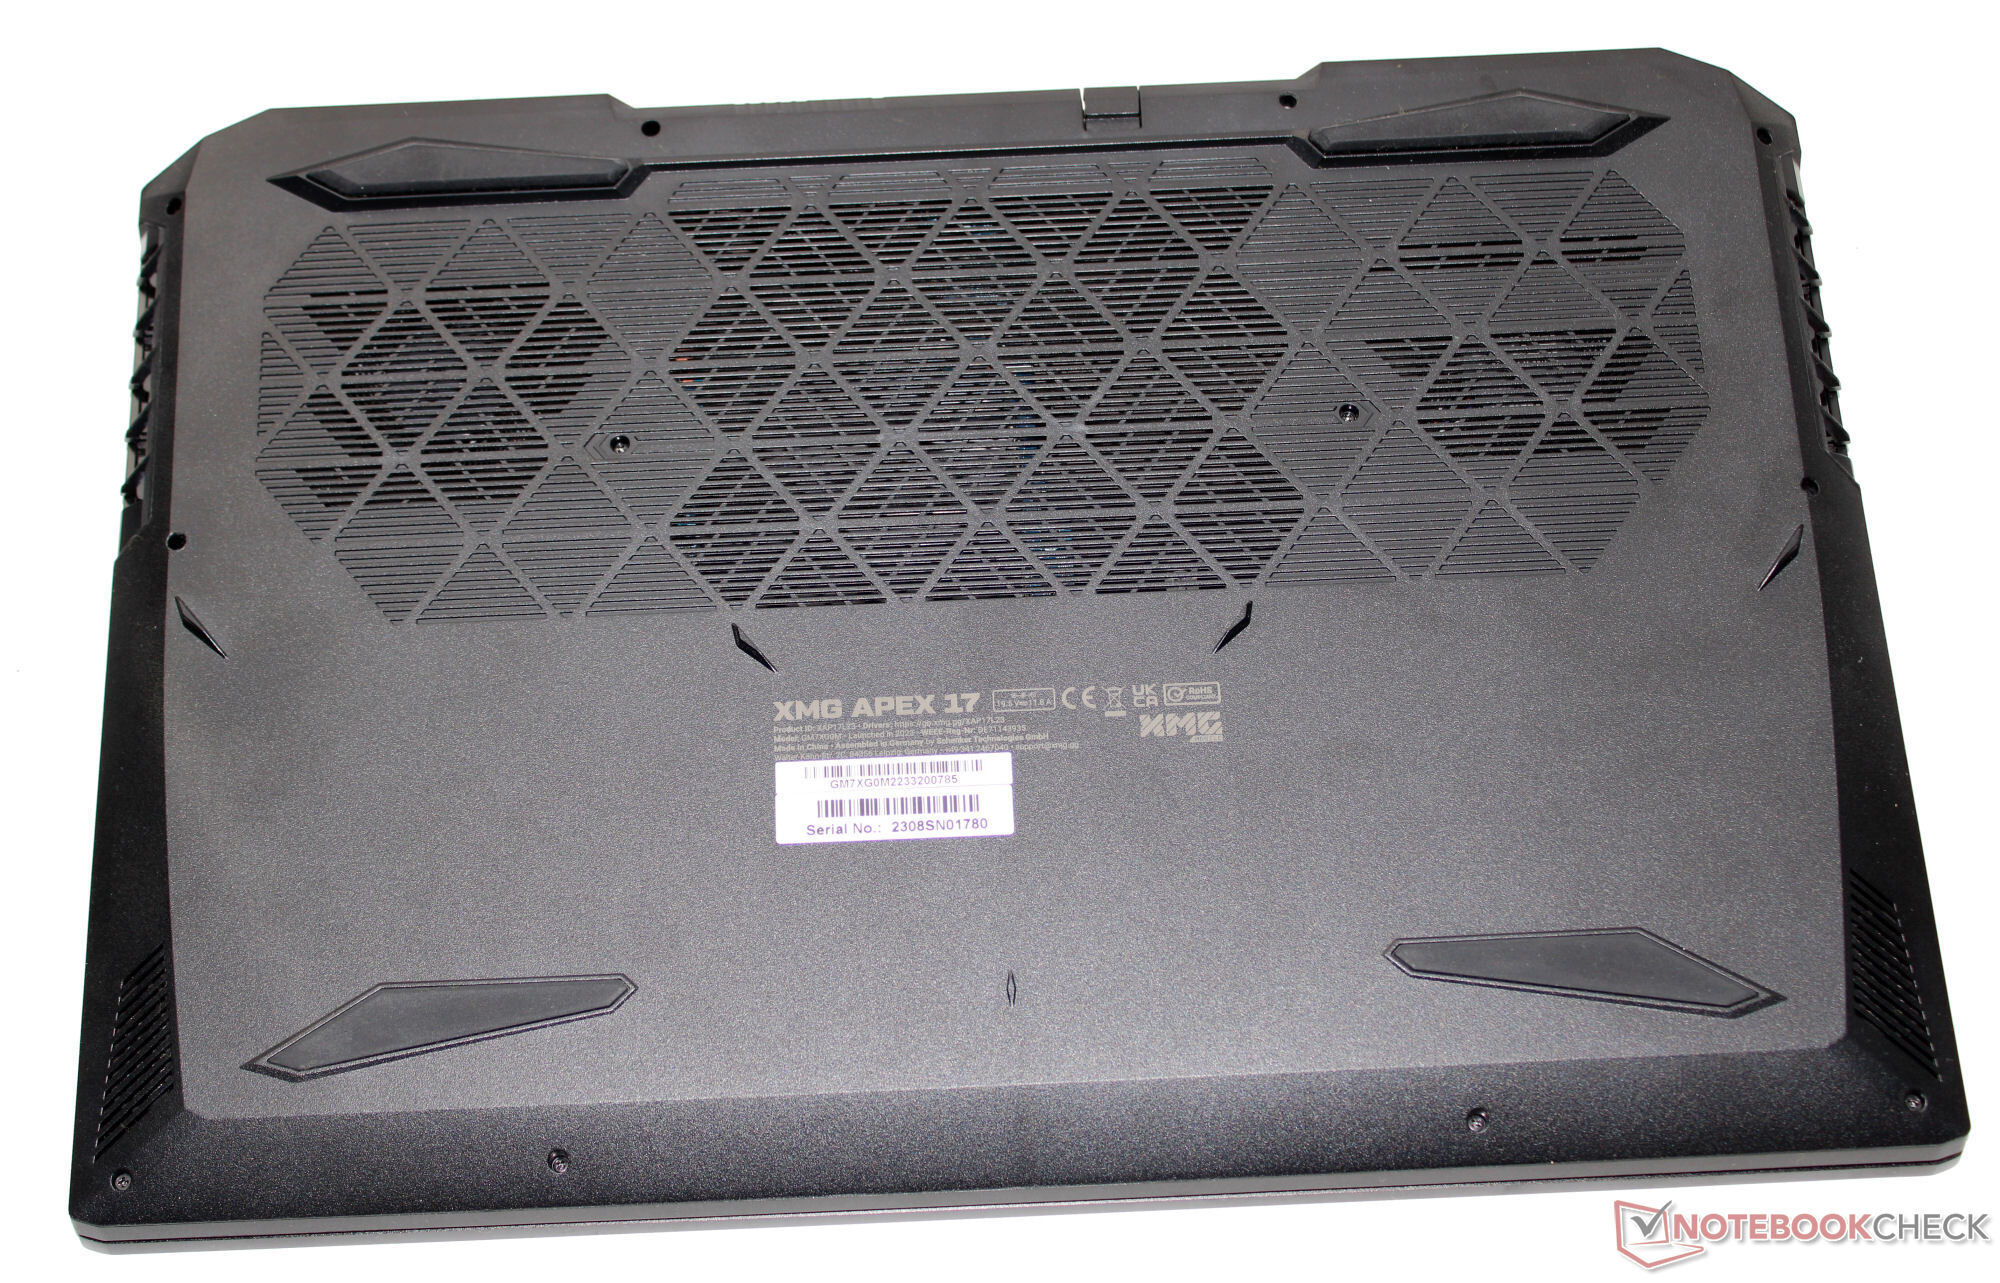
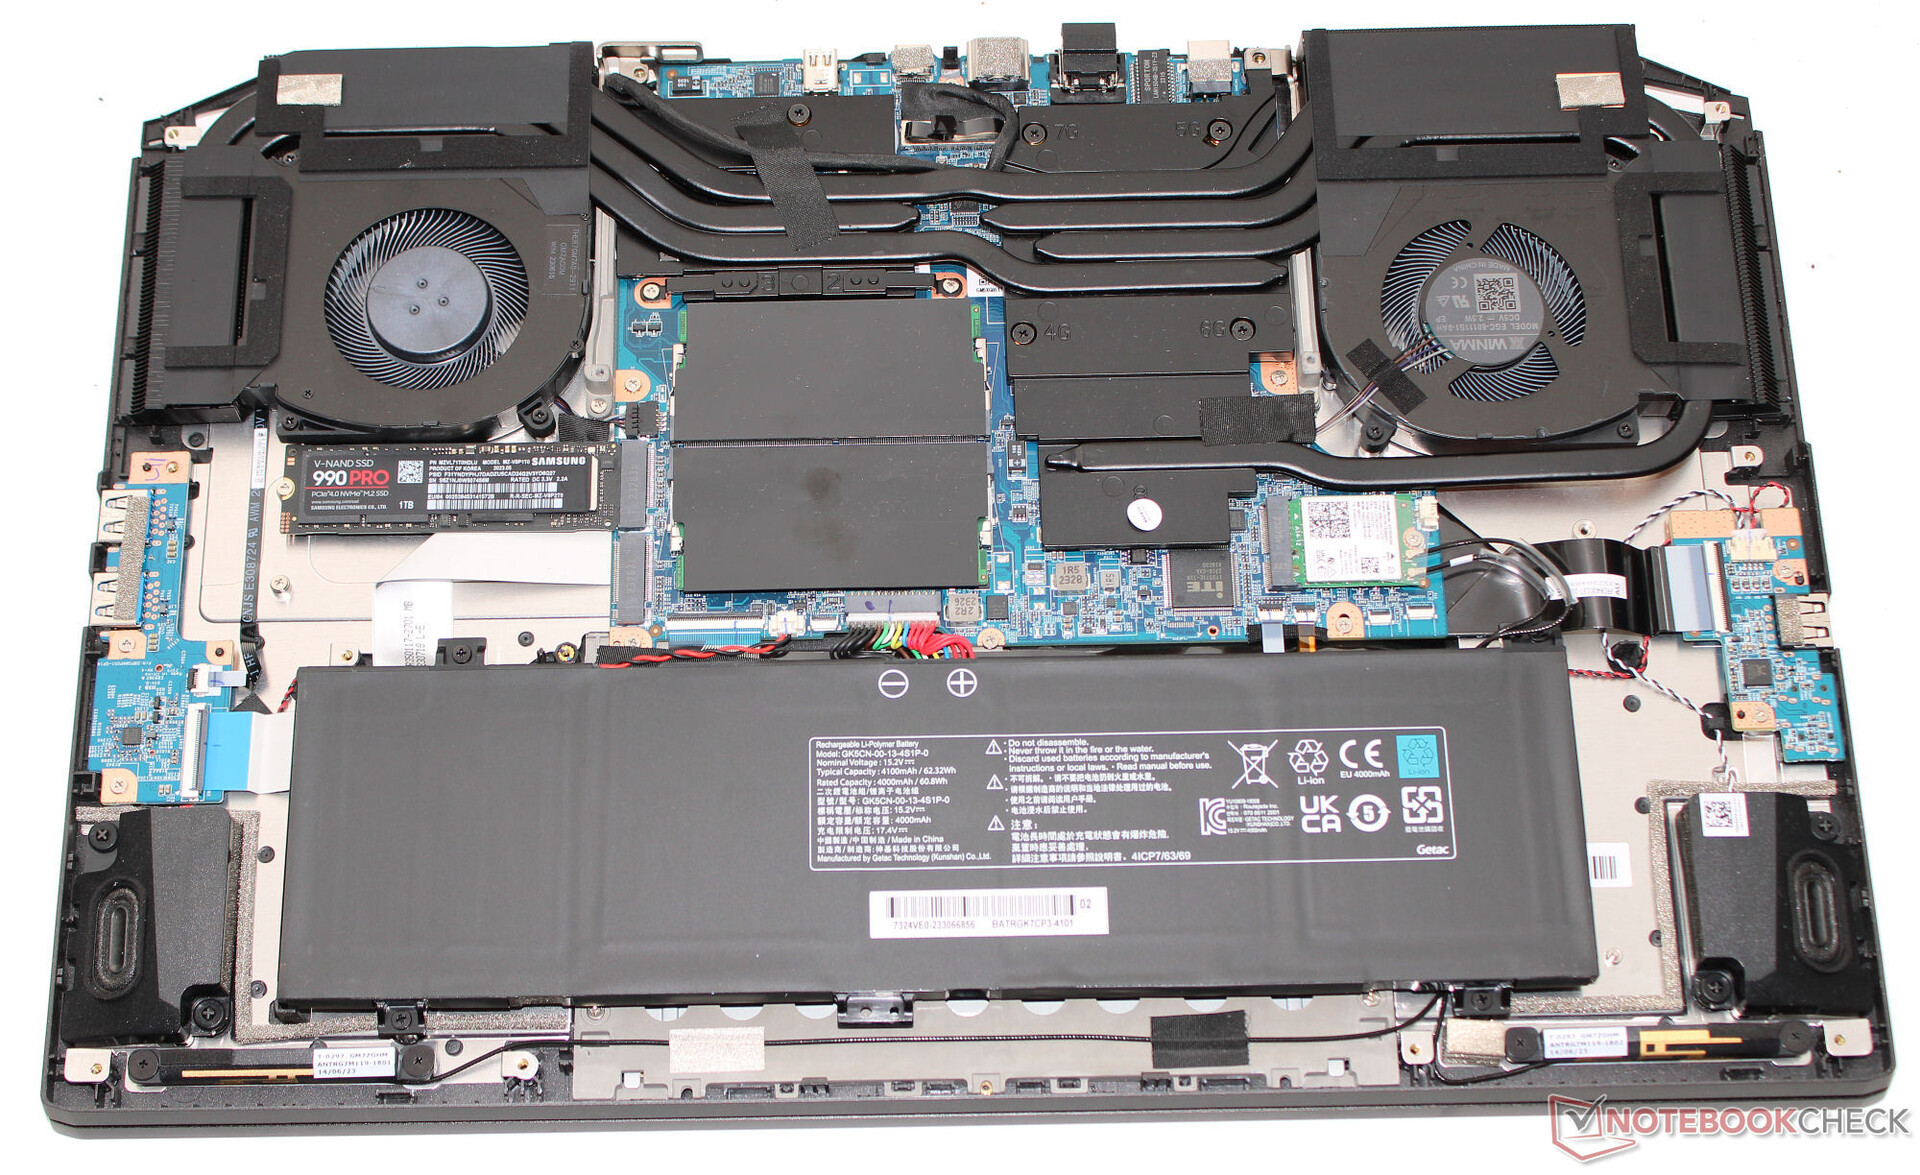
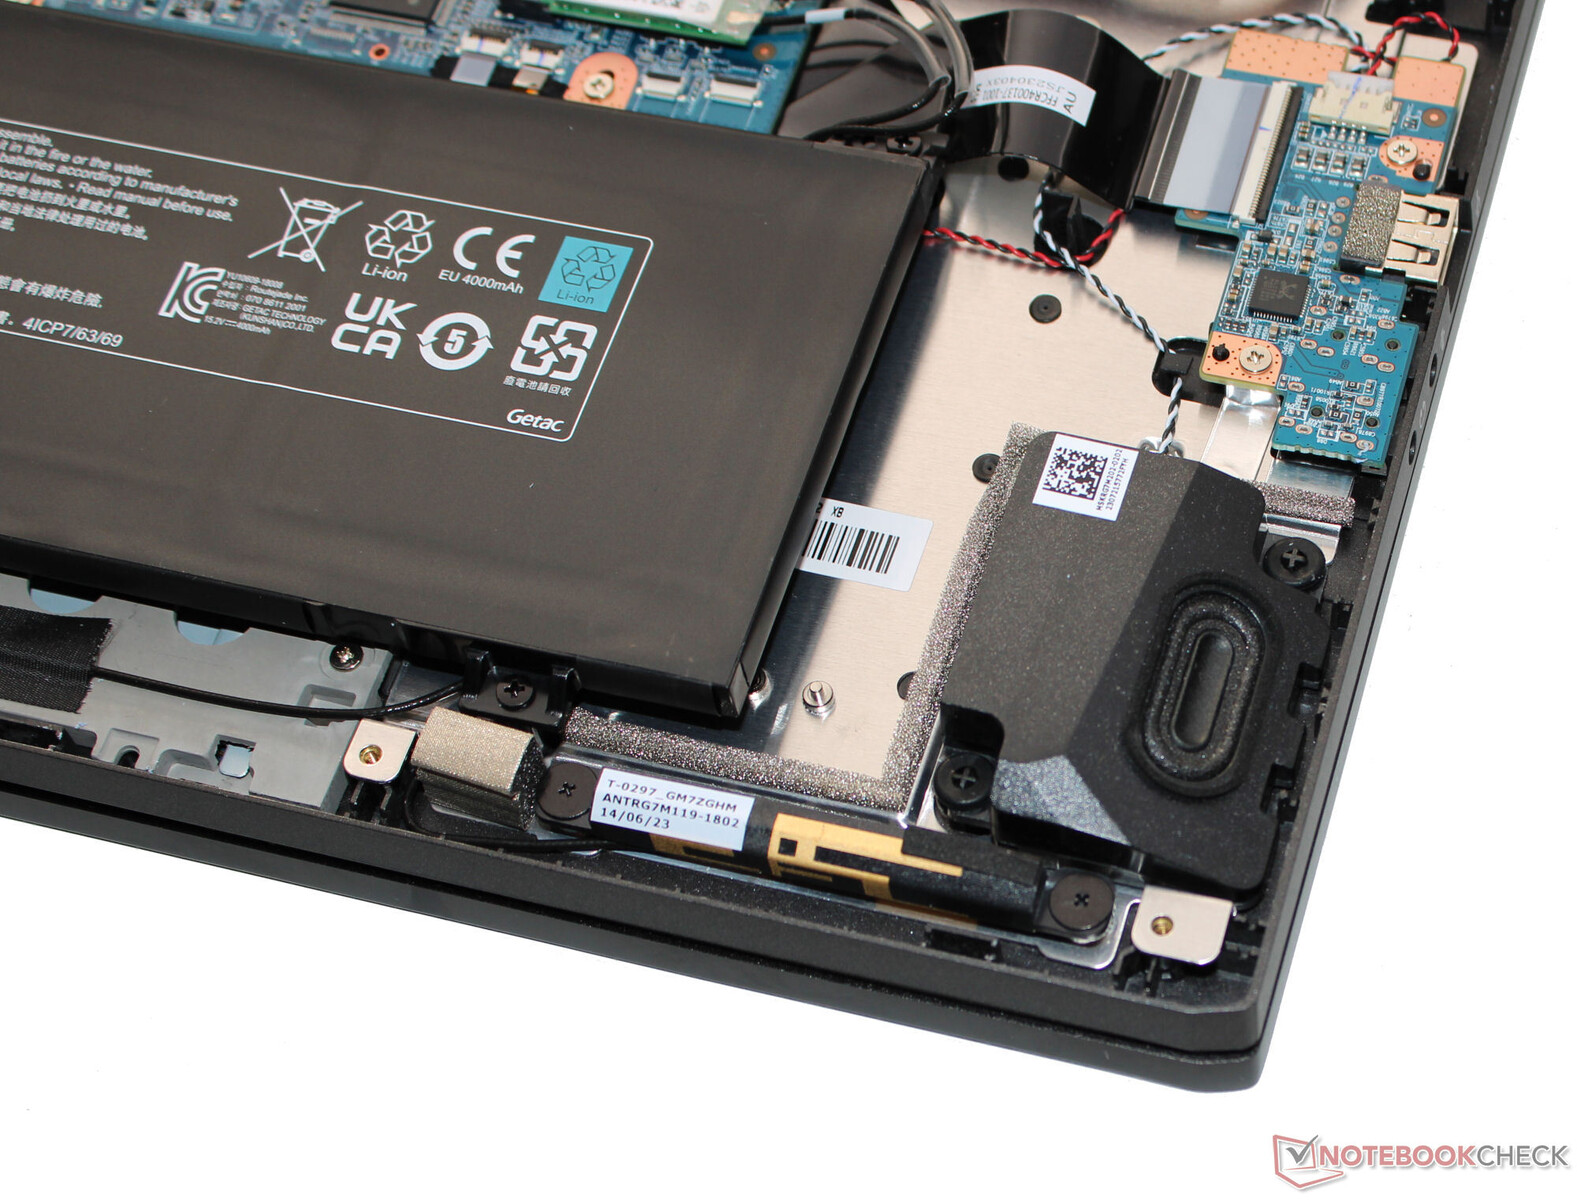
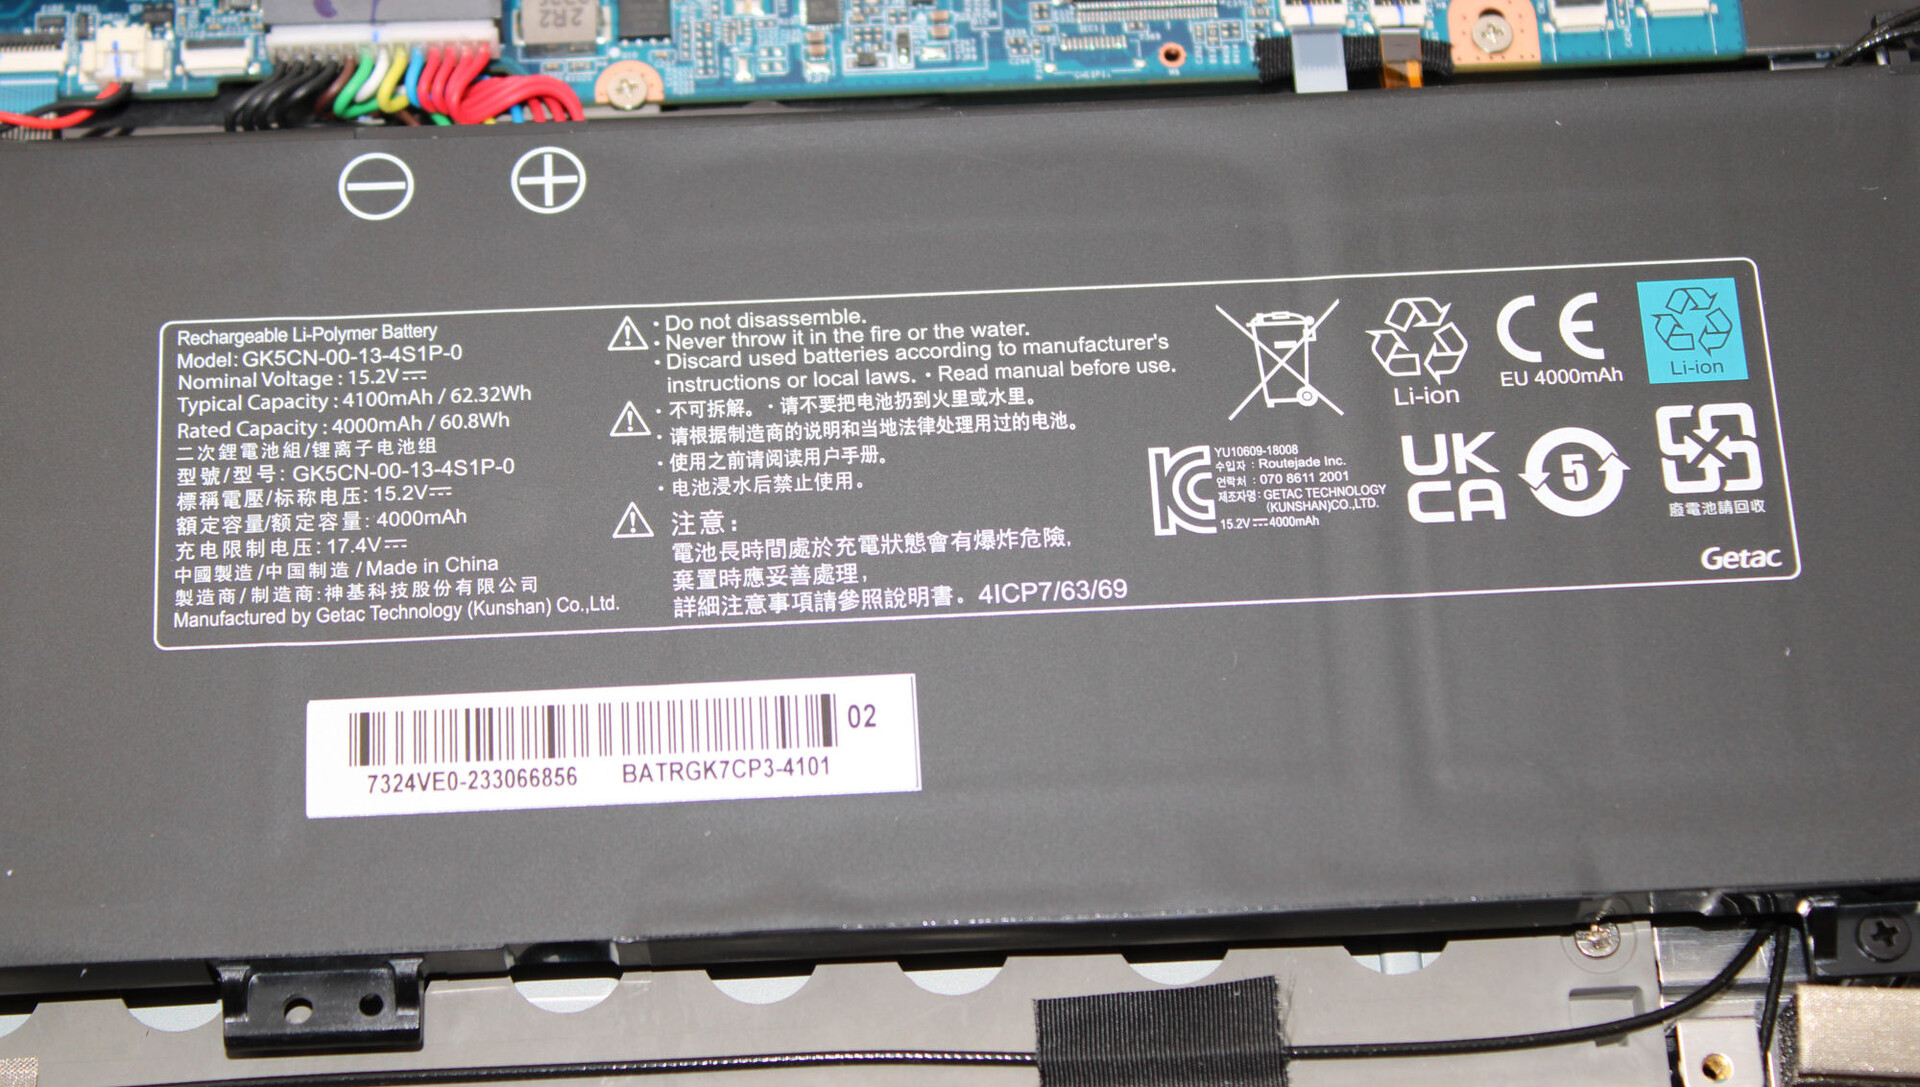
La carcasa de color negro mate tiene superficies lisas (excepto la unidad base) y carece de elementos de diseño llamativos. Los elementos luminosos LED no están presentes, a excepción de la iluminación de las teclas. Schenker ha optado por una mezcla de materiales: La parte trasera de la tapa de aluminio también se complementa con componentes de plástico. Tras desmontar la unidad base, la batería (atornillada, no pegada), así como la tornillería habitual, quedan al descubierto.
No se aprecian defectos de fabricación y las dimensiones de los huecos son buenas. La tapa y la unidad base se pueden torcer ligeramente, pero todo dentro de un rango aceptable. Cualquier presión ejercida sobre la tapa no provoca distorsiones de la imagen. Las bisagras mantienen la tapa en su sitio, pero se tambalean un poco. El ángulo máximo de apertura es de 140 grados. Es posible abrir el portátil con una mano.
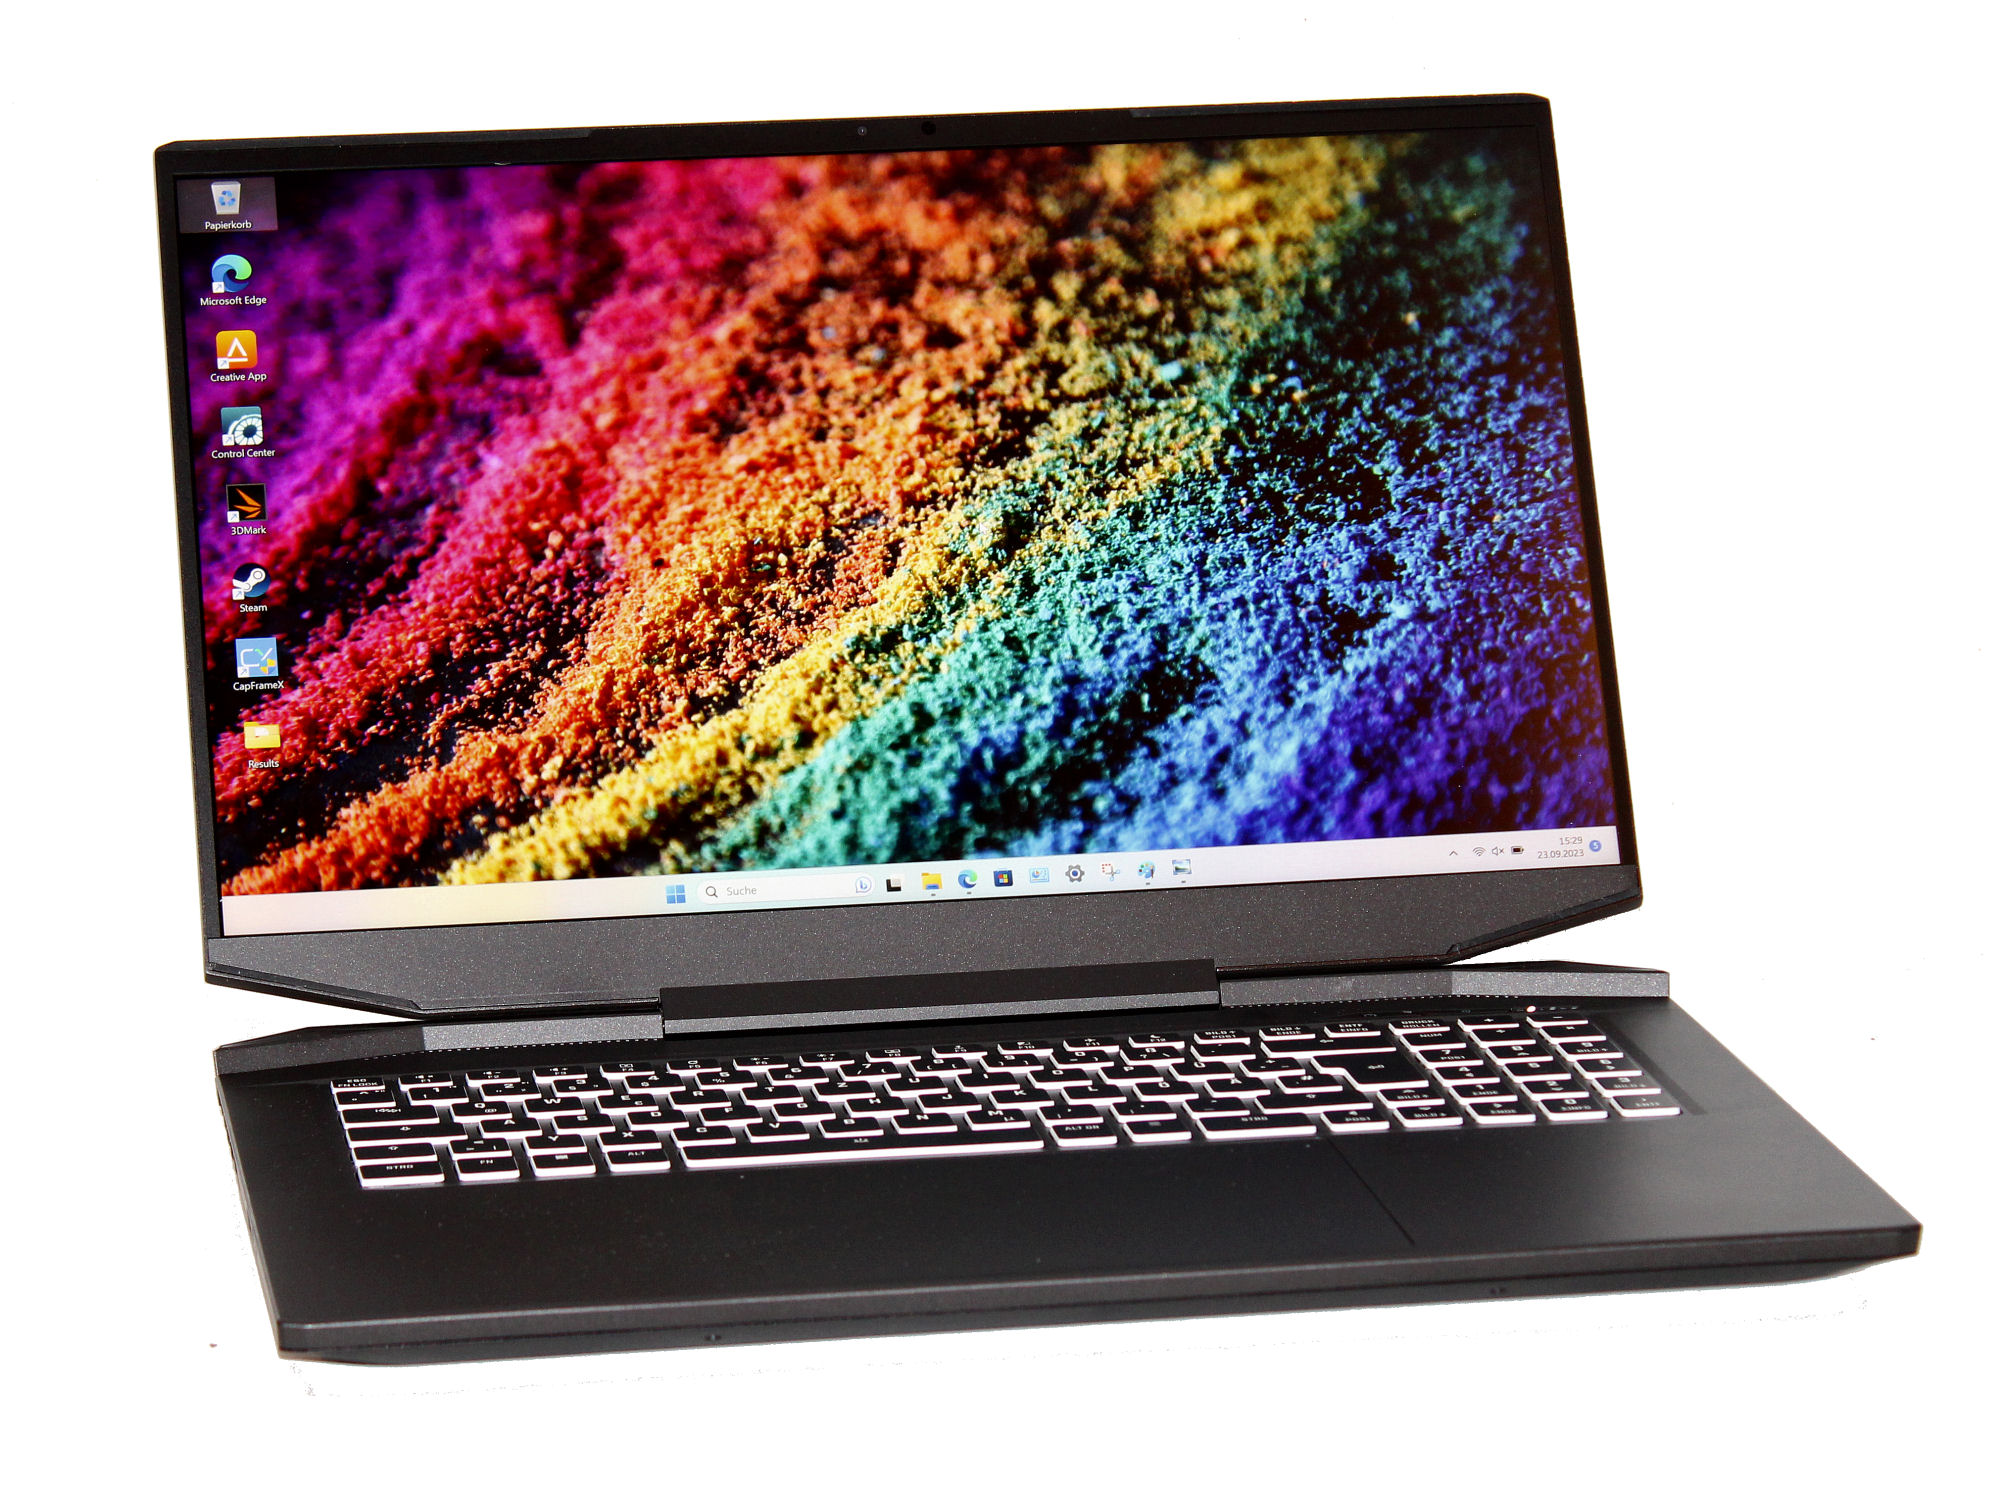
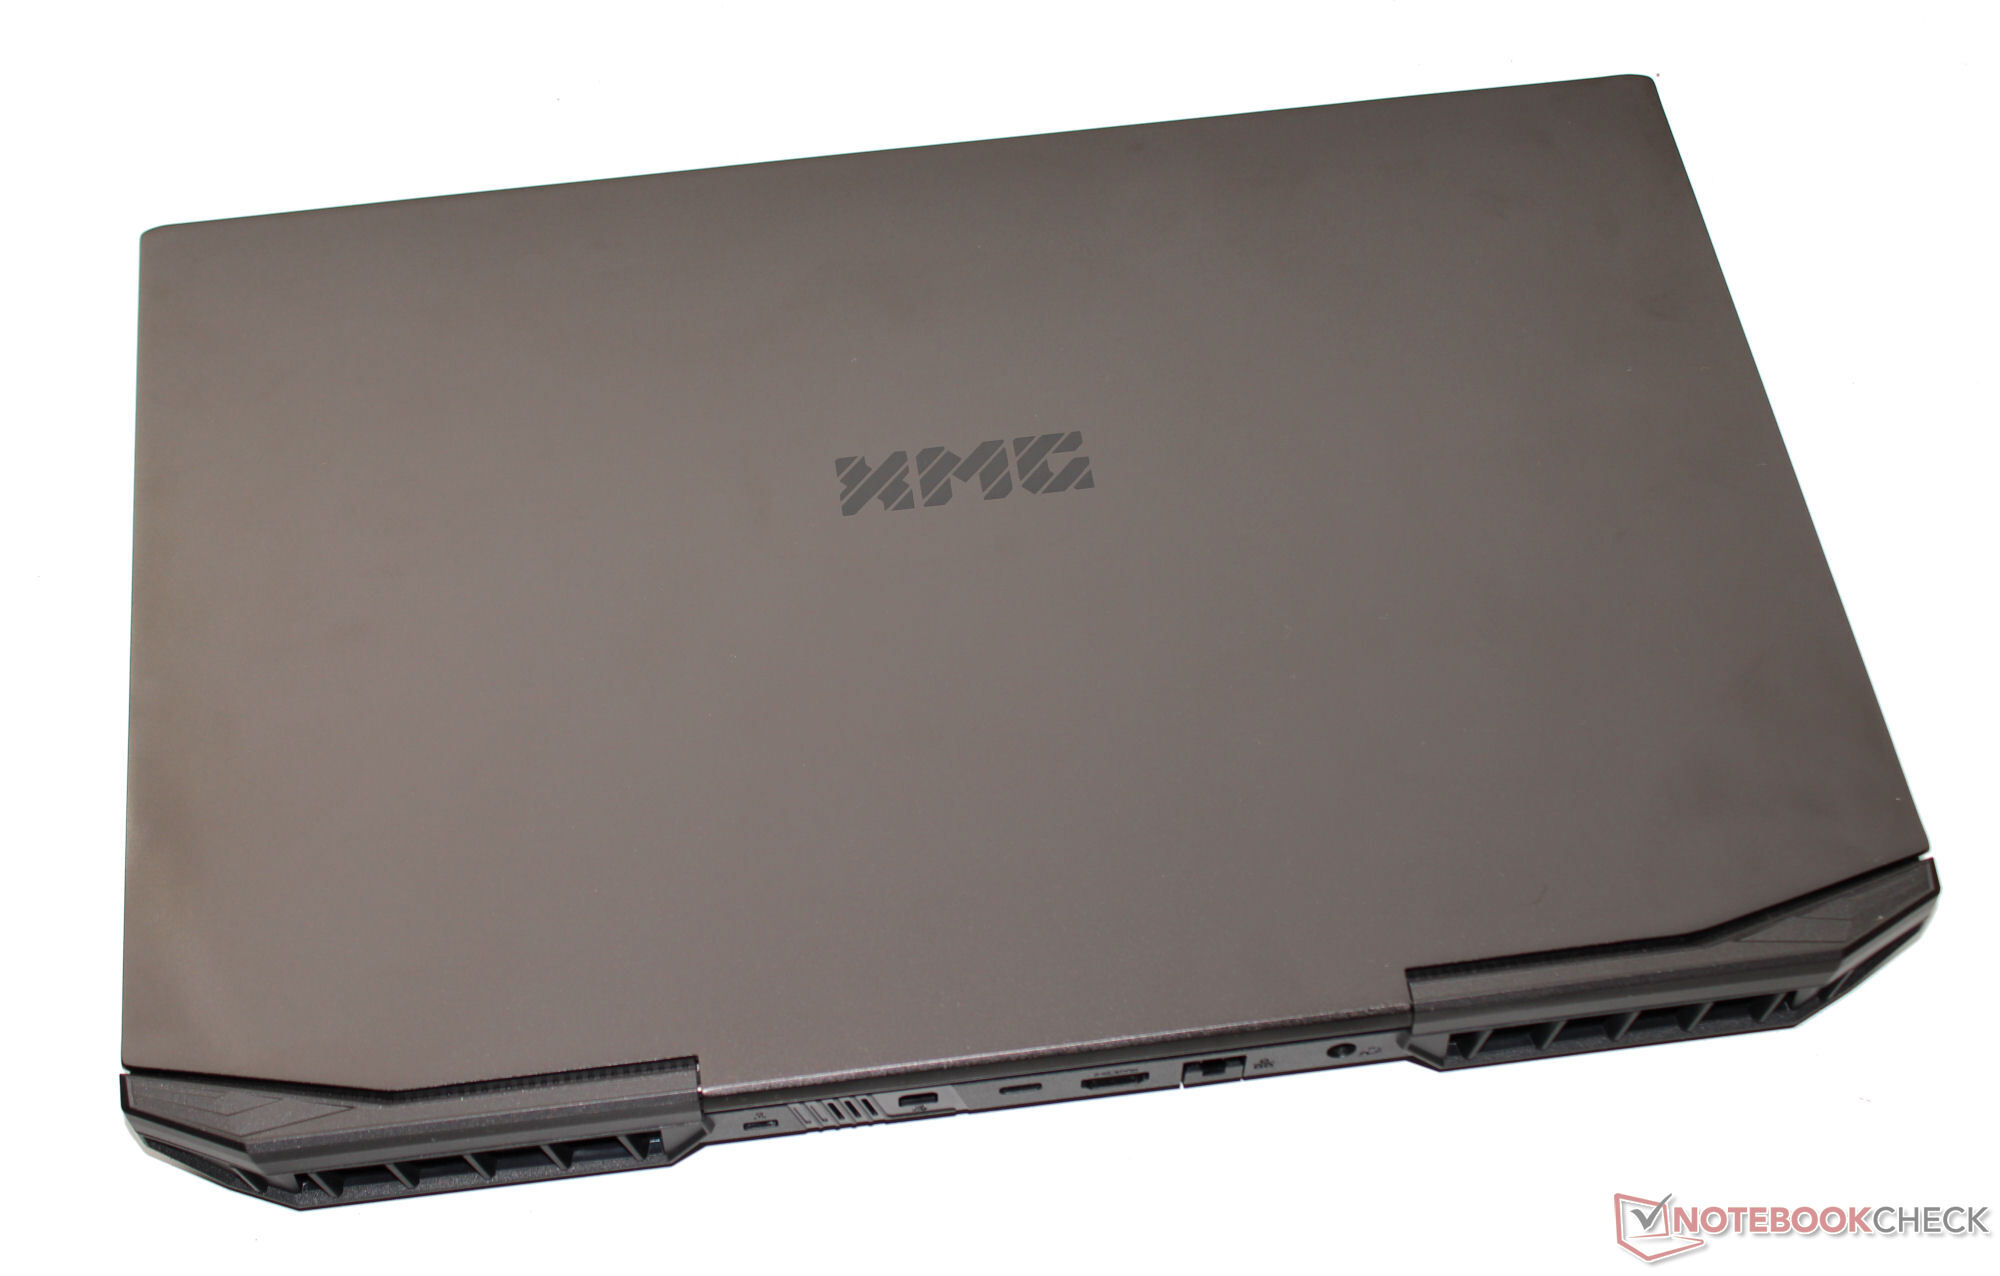
El ordenador XMG es el más ligero y compacto entre los portátiles de 17,3 pulgadas de la competencia. Con un peso que ronda los 2,5 kg, suele estar entre los representantes más ligeros de su categoría.
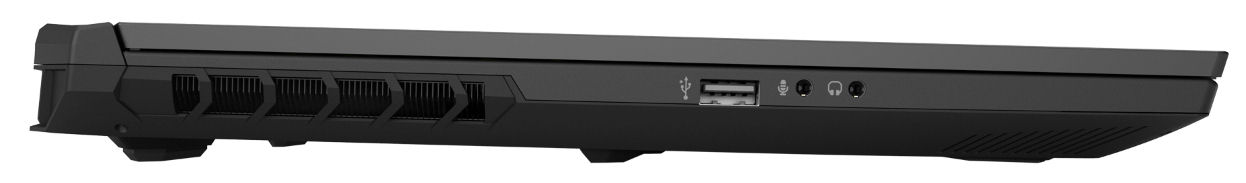
Características - El portátil XMG viene sin Thunderbolt
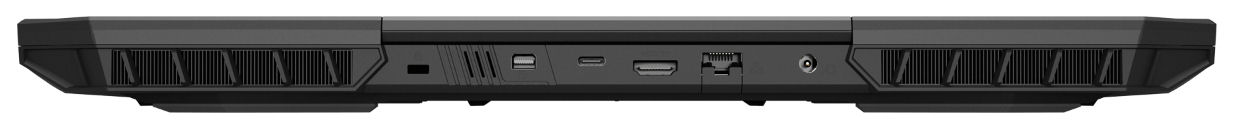
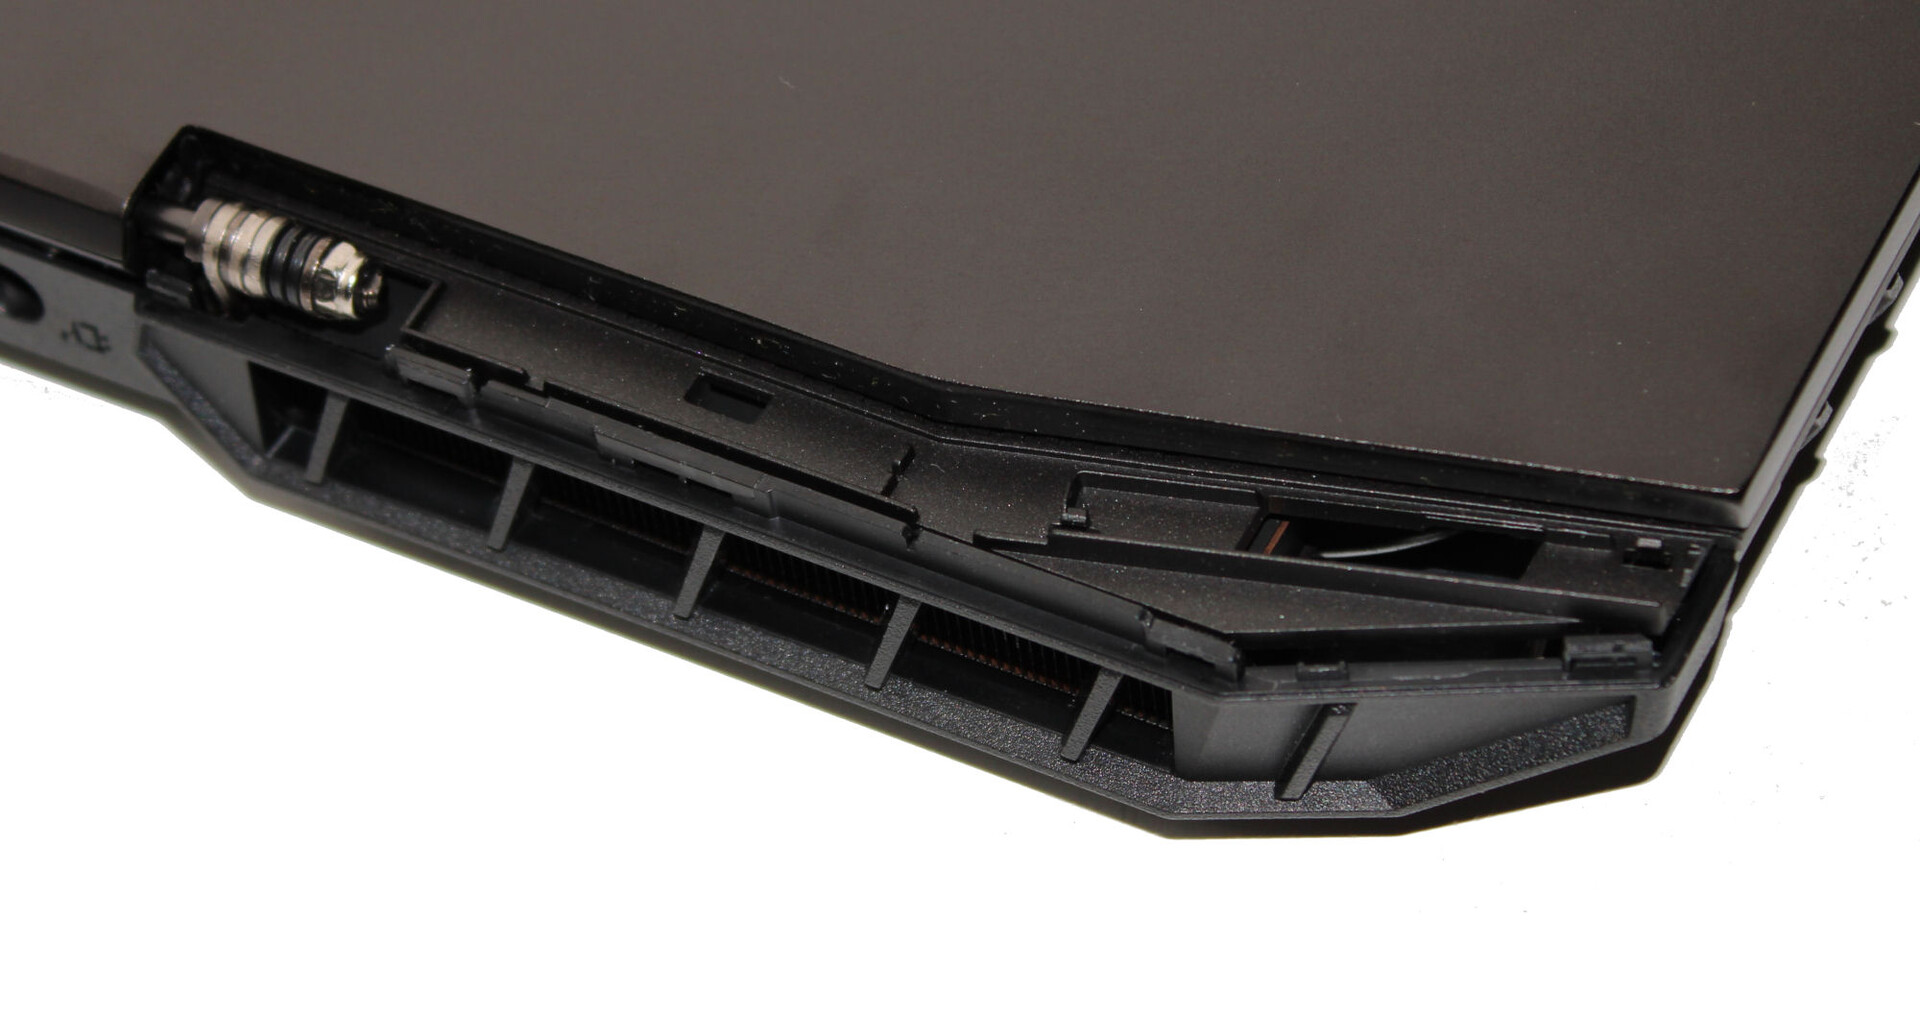
El Apex dispone de tres puertos USB-A (1x USB 2.0, 2x USB 3.2 Gen 1) y un puerto USB-C (USB 3.2 Gen 2). Este último no puede emitir señal Displayport ni ofrece soporte Power Delivery. Dos salidas de vídeo (HDMI 2.1, DP 1.4a), tomas de audio y un puerto Gigabit Ethernet completan el paquete.
Las salidas de vídeo, el conector de alimentación y el puerto LAN se encuentran en la parte trasera del dispositivo. Sus cables correspondientes irán hacia la parte trasera y, por tanto, no estorbarán.
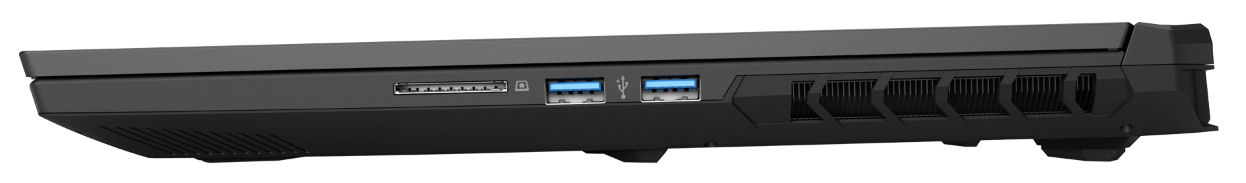
Lector de tarjetas SD
Con una velocidad máxima de transferencia de 35 MB/s (transferencia de 250 archivos de imagen jpg, de unos 5 MB cada uno) y 36 MB/s (copia de grandes bloques de datos), el lector de tarjetas de memoria (tarjeta de referencia: AV PRO microSD 128 GB V60) pertenece a los modelos lentos. En este sentido, la competencia ofrece más.
| SD Card Reader | |
| average JPG Copy Test (av. of 3 runs) | |
| Alienware m16 R1 Intel (AV PRO microSD 128 GB V60) | |
| Media de la clase Gaming (20.9 - 210, n=54, últimos 2 años) | |
| Medion Erazer Defender P40 (AV PRO microSD 128 GB V60) | |
| Acer Nitro 17 AN17-51-71ER | |
| Schenker XMG Apex 17 (Late 23) (AV PRO microSD 128 GB V60) | |
| maximum AS SSD Seq Read Test (1GB) | |
| Alienware m16 R1 Intel (AV PRO microSD 128 GB V60) | |
| Media de la clase Gaming (25.5 - 261, n=51, últimos 2 años) | |
| Medion Erazer Defender P40 (AV PRO microSD 128 GB V60) | |
| Acer Nitro 17 AN17-51-71ER | |
| Schenker XMG Apex 17 (Late 23) (AV PRO microSD 128 GB V60) | |
Comunicación
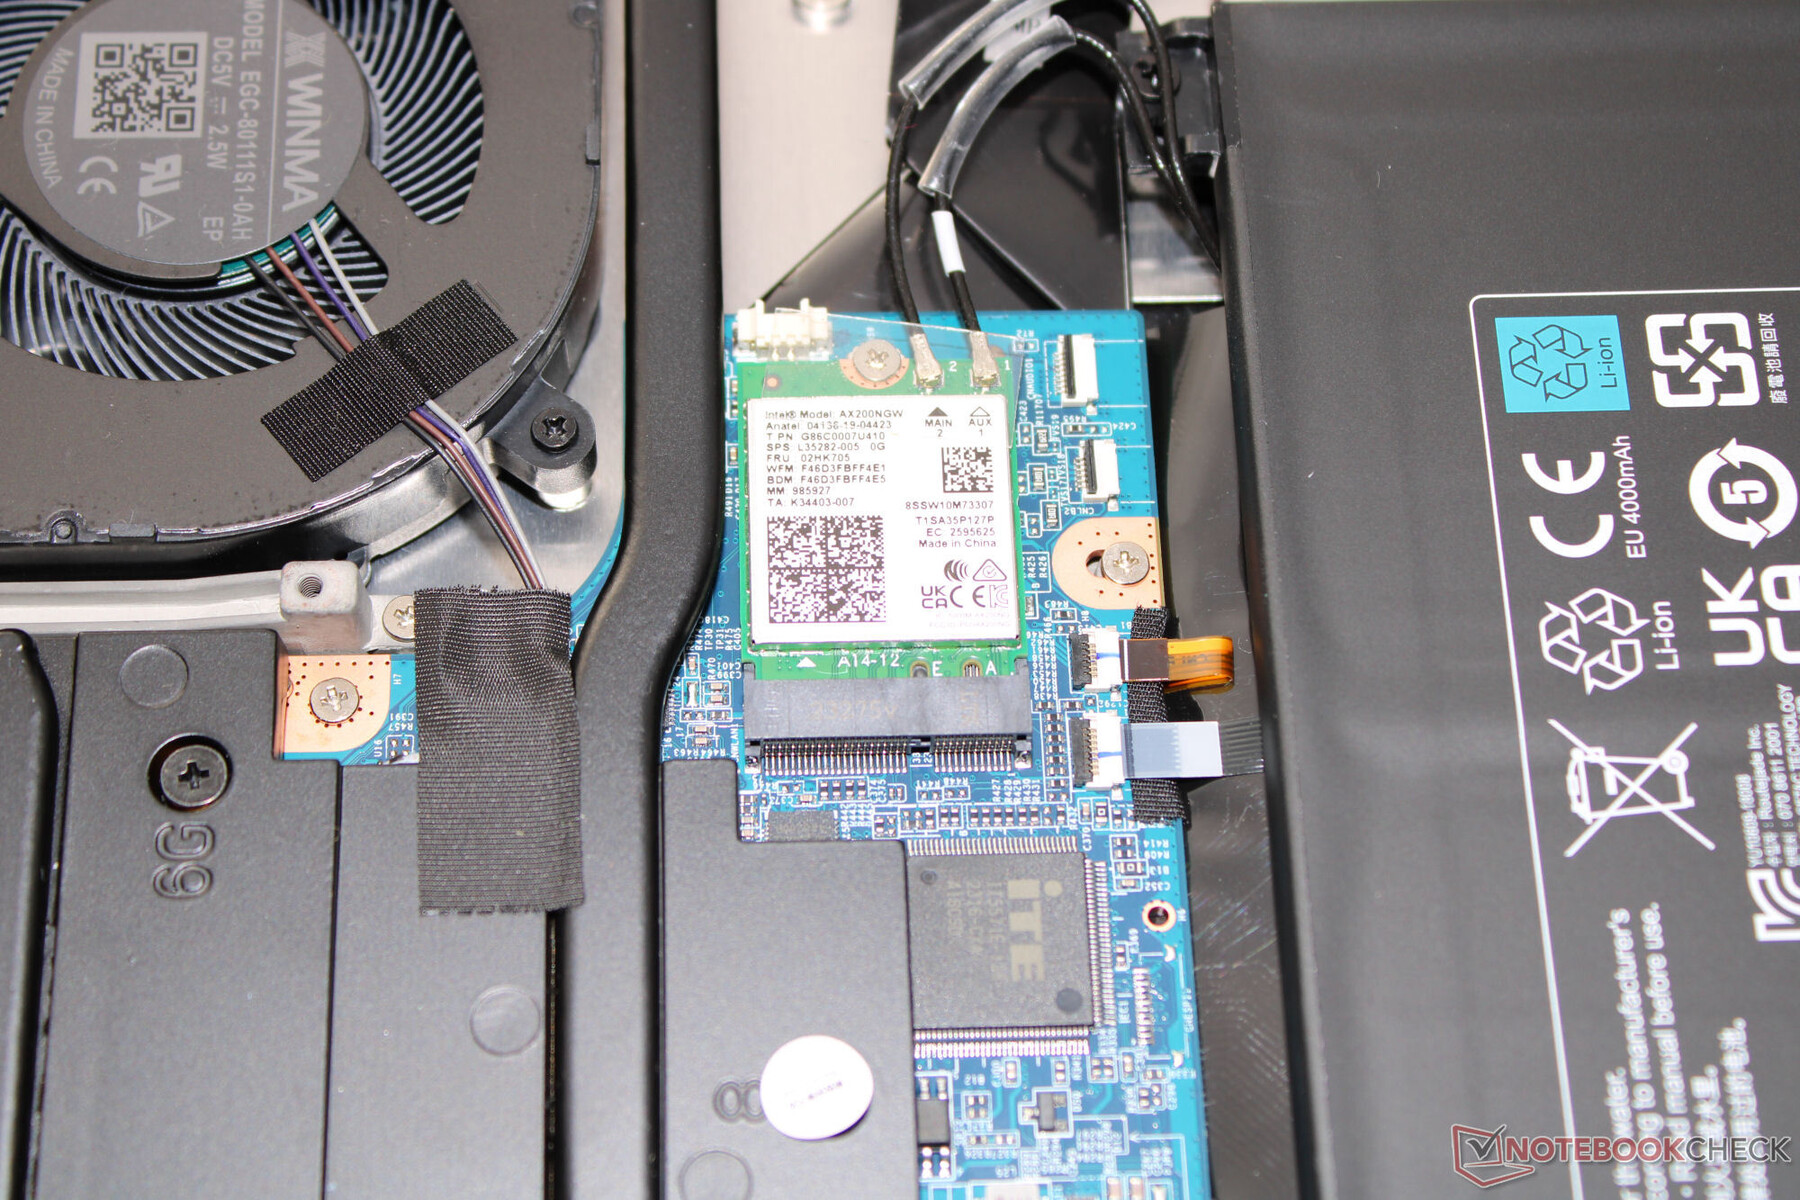
En condiciones óptimas (sin dispositivos Wi-Fi cerca, una distancia corta entre el portátil y el PC servidor) es posible alcanzar velocidades de datos Wi-Fi de buenas a muy buenas. El portátil de Schenker utiliza un chip Wi-Fi 6E (Intel AX200). Un controlador Realtek (RTL8168/8111; 1 GBit/s) se encarga de las conexiones por cable.
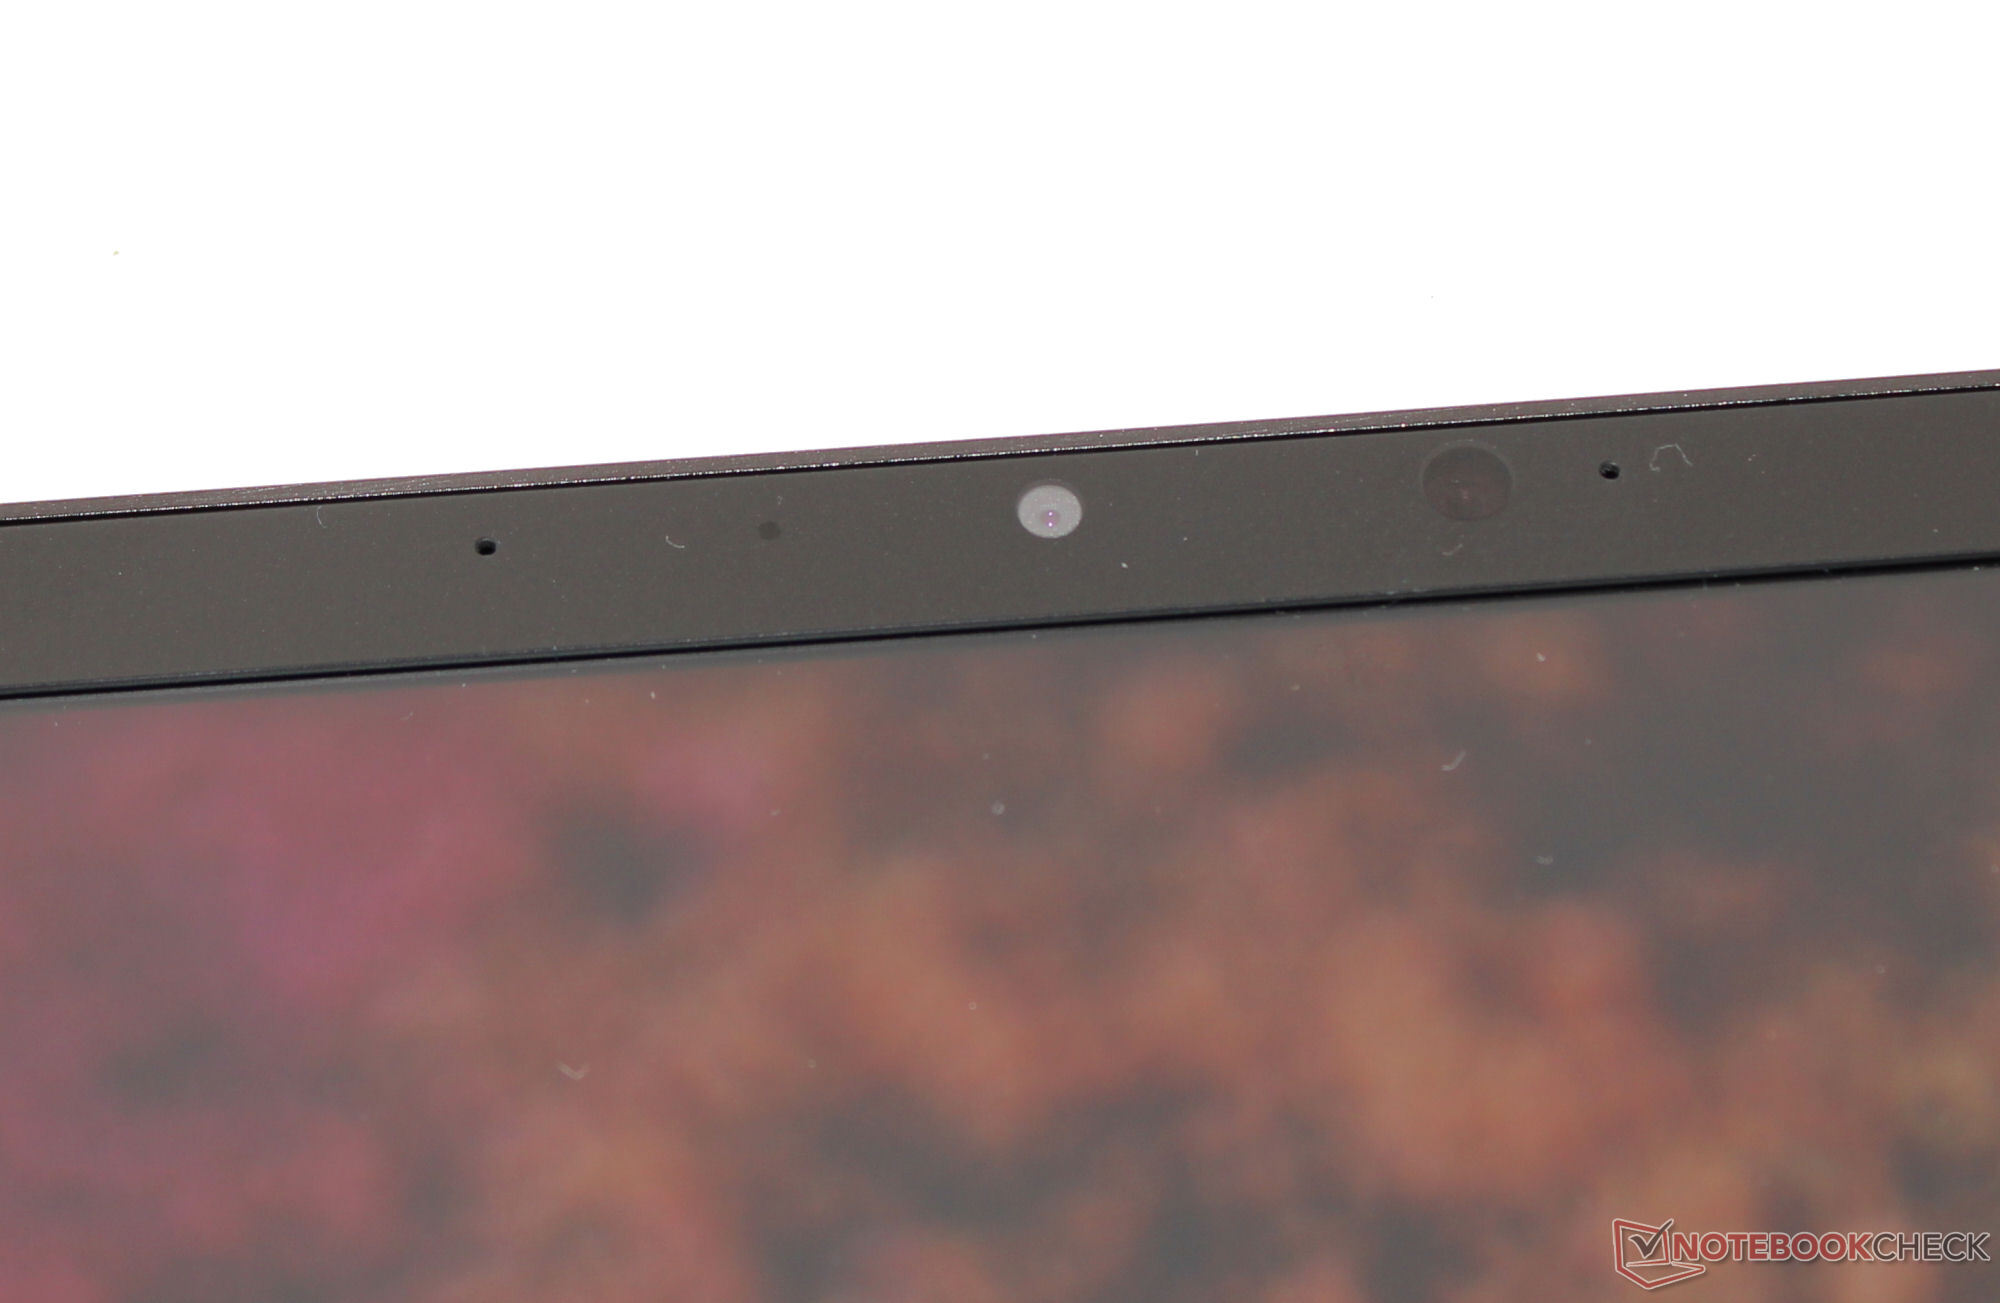
Cámara web
En cuanto a la calidad, la webcam (2,1 MP, máx. 1.920 x 1.080 píxeles) es estándar. Una desviación de color de alrededor de 8,7 (objetivo: DeltaE < 3) es bastante decente. La cámara no ofrece obturador mecánico.

 GeForce RTX 4060 Laptop GPU, R7 7840HS, Samsung 990 Pro 1 TB")
 GeForce RTX 4060 Laptop GPU, R7 7840HS, Samsung 990 Pro 1 TB")
Accesorios
Además de los documentos habituales, el portátil viene con una memoria USB (controladores, software), un llavero que incluye un abridor de botellas y una gran alfombrilla para el ratón.
Mantenimiento
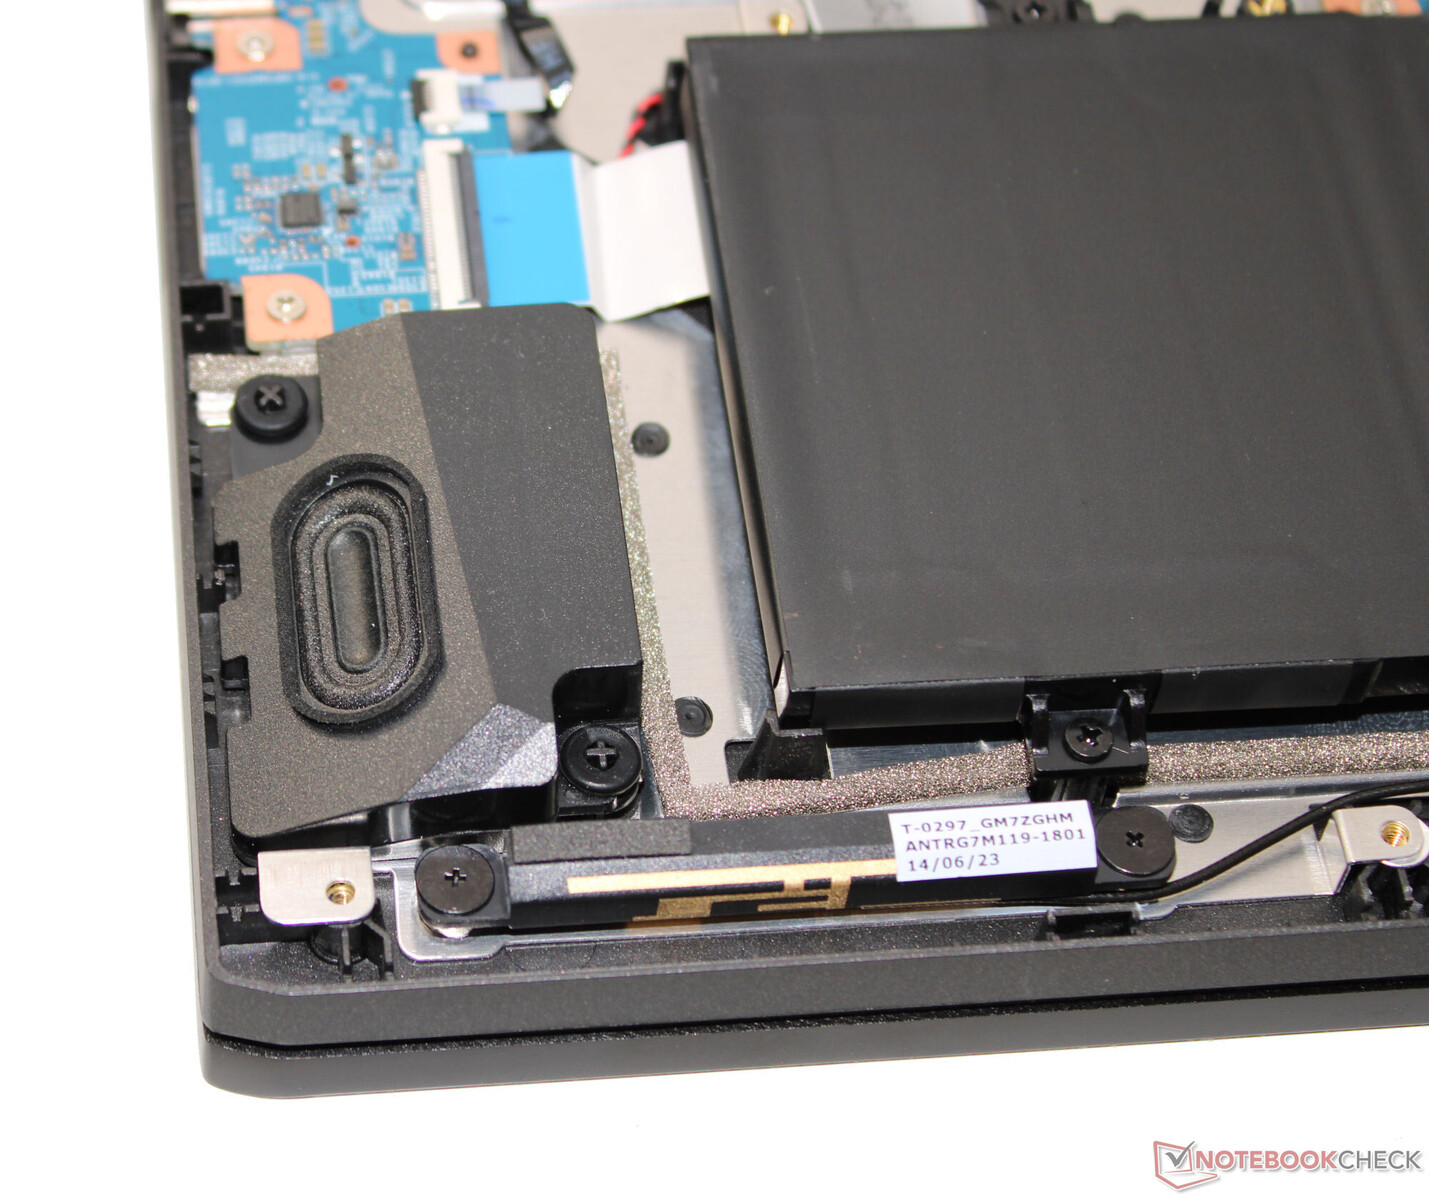
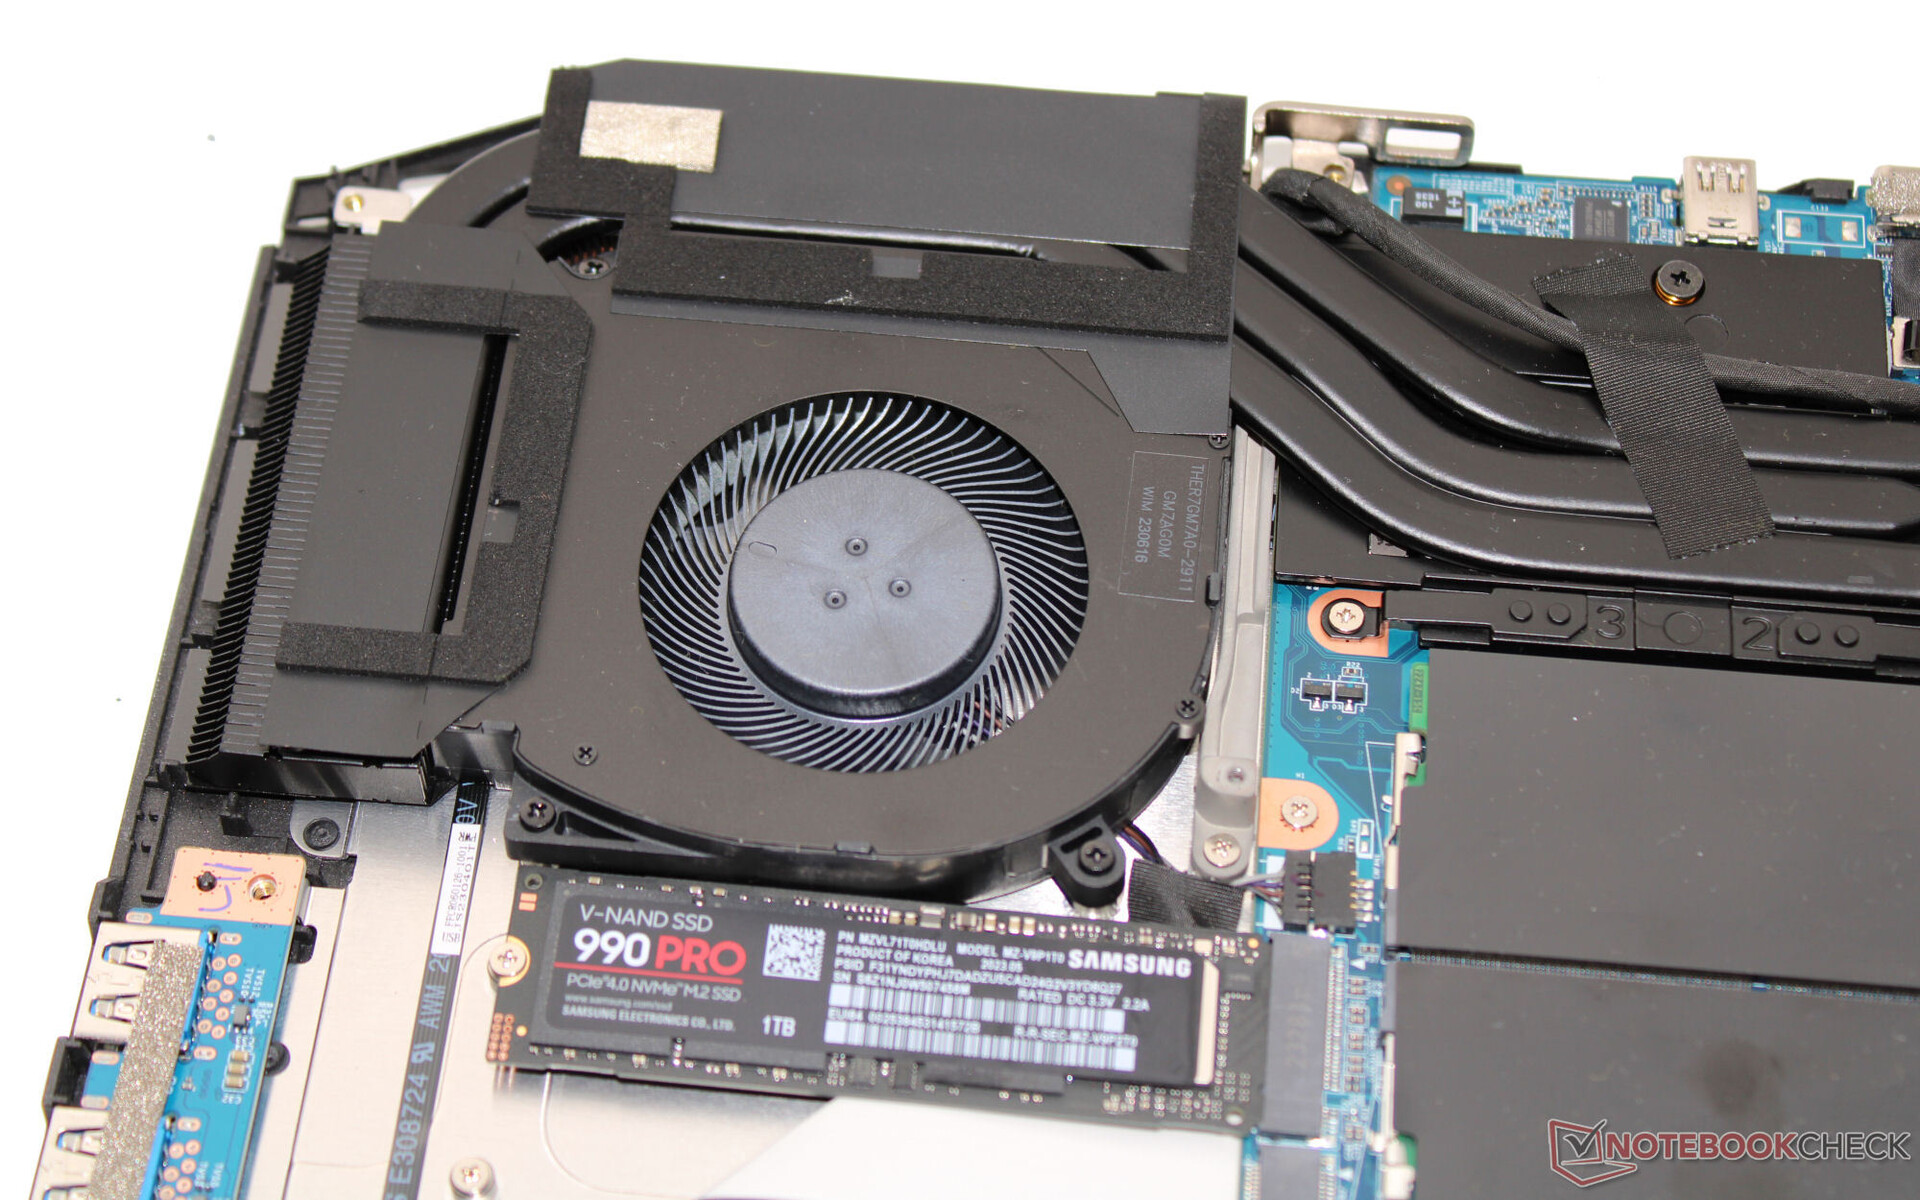
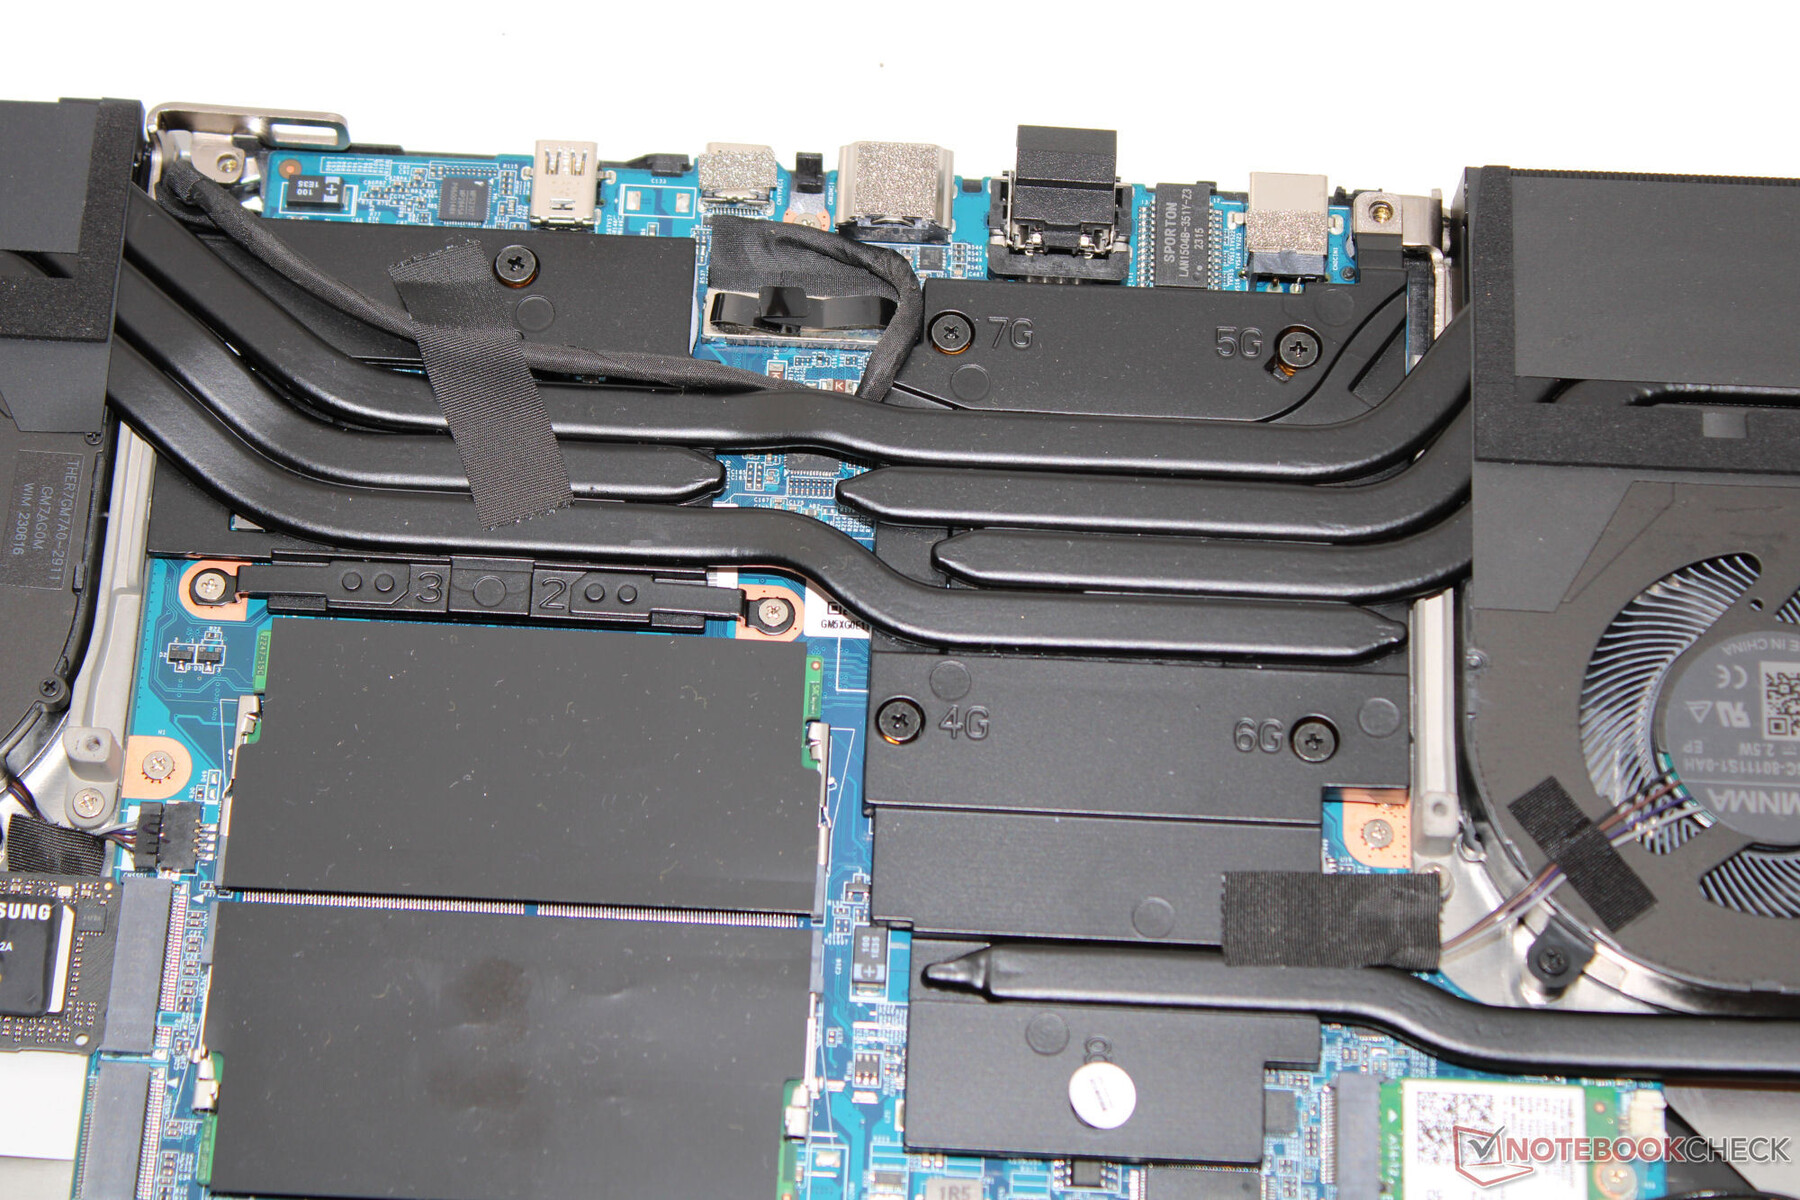
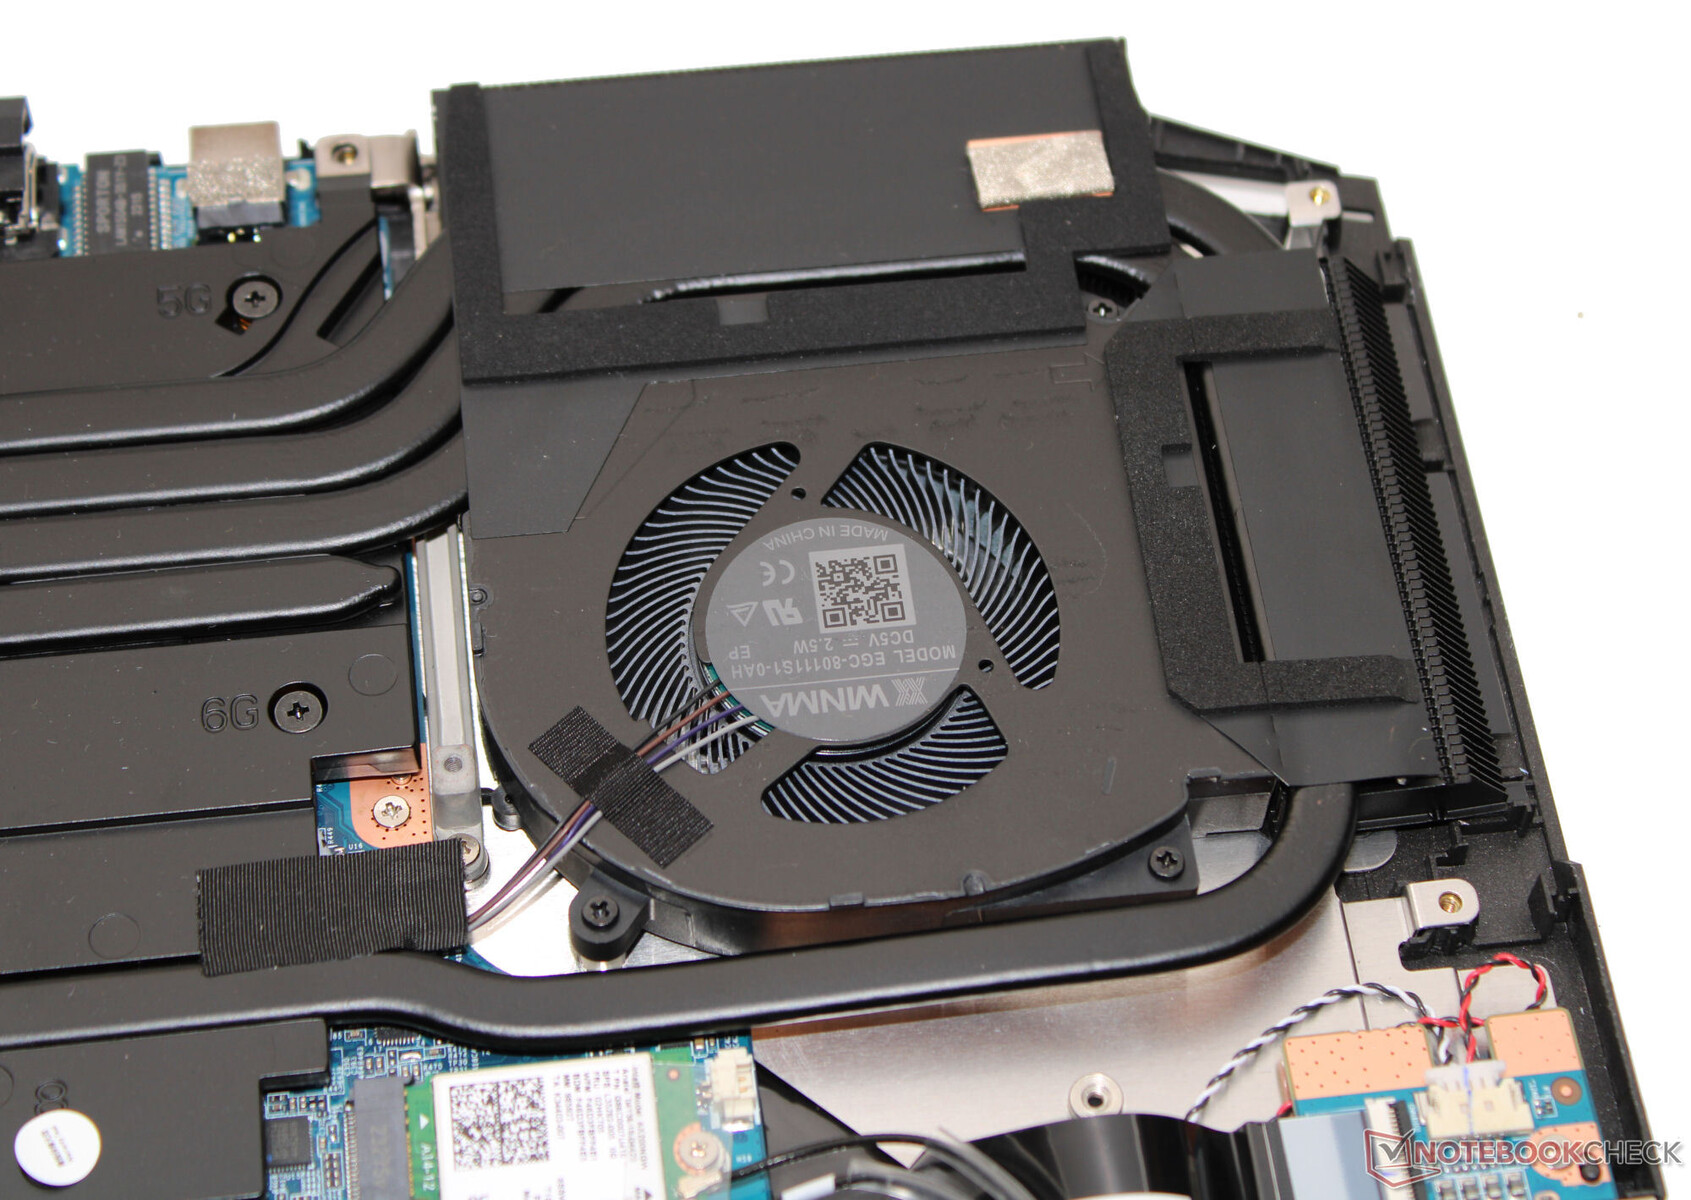
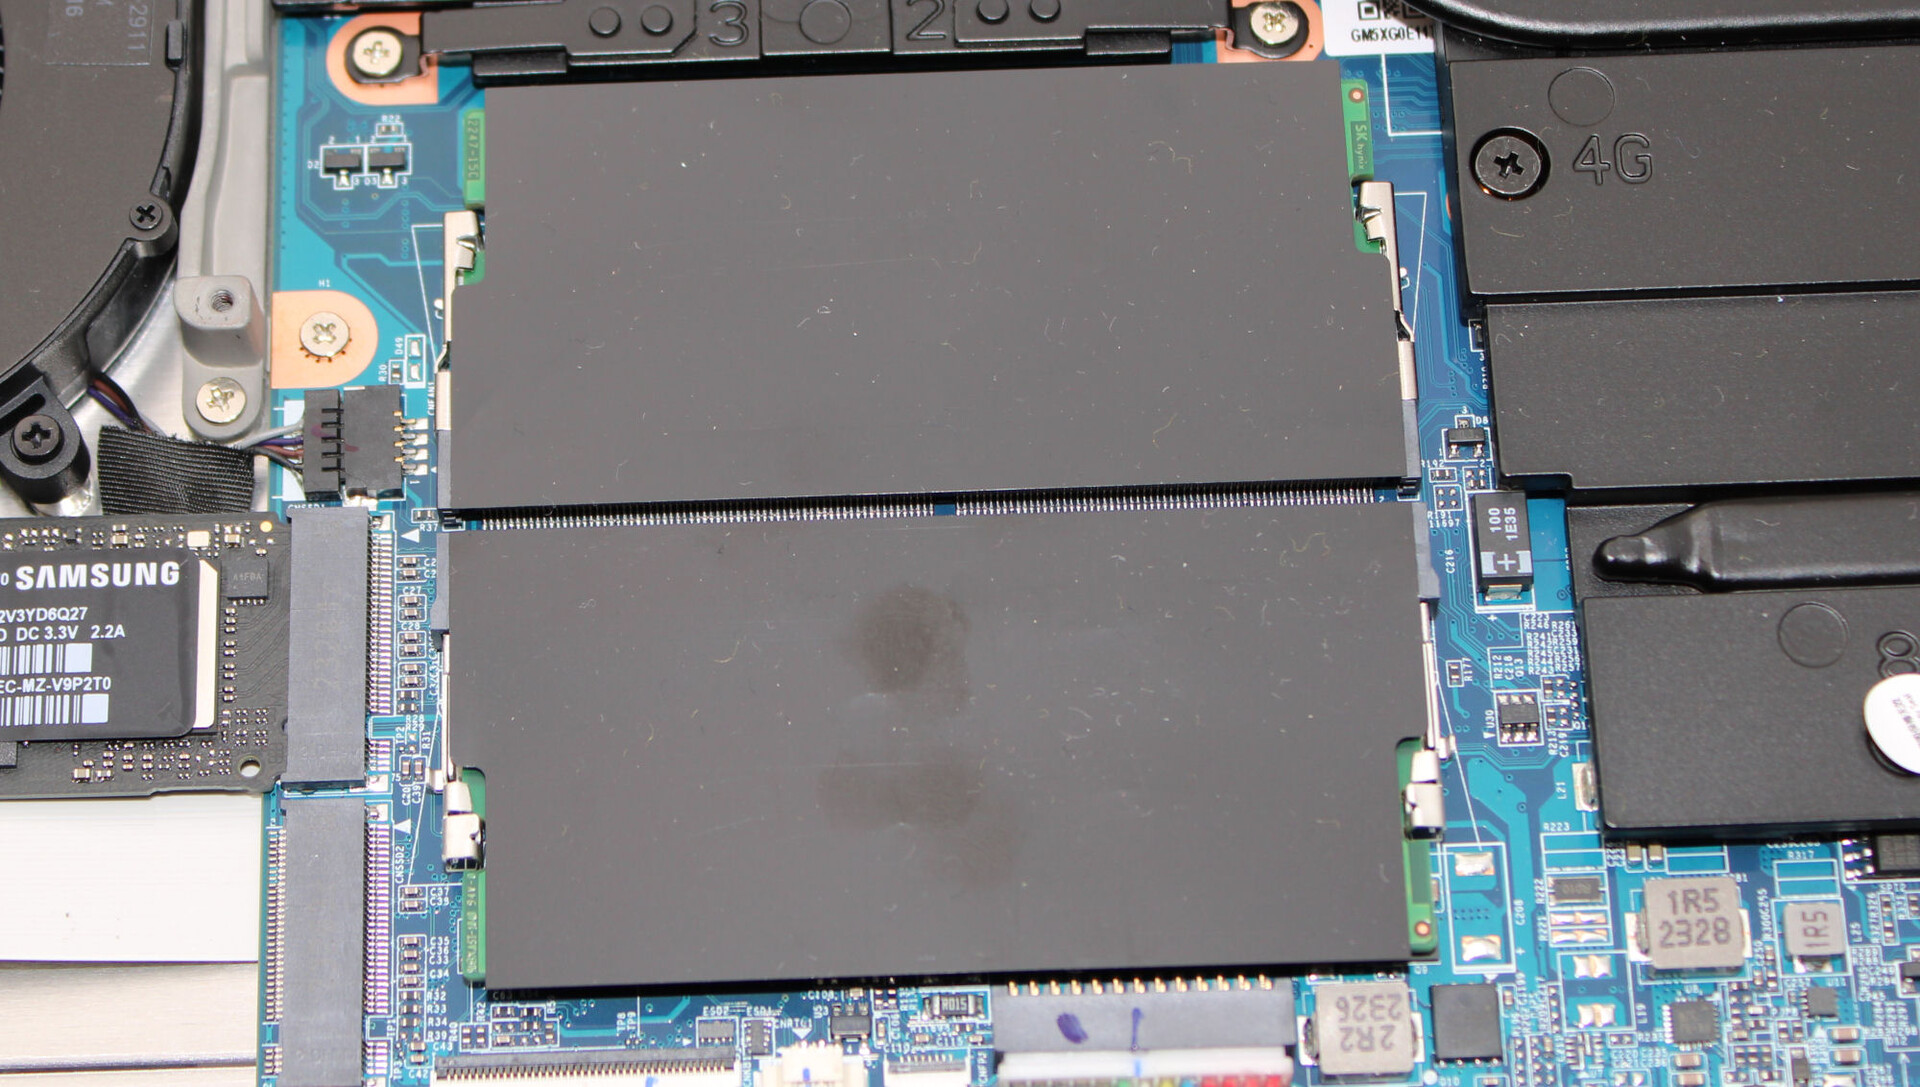
Tras desmontar la placa base, se puede acceder a la tornillería. El primer paso en este viaje se presenta por la eliminación de las tapas de las bisagras (por encima de las rejillas de ventilación). Éstas sólo están ranuradas y no atornilladas. A continuación, la retirada de todos los tornillos de la parte inferior del dispositivo permite separar la carcasa base del resto del dispositivo utilizando una espátula fina o una púa. Esto permite acceder a los bancos de memoria (ambos ocupados), el SSD (PCIe 4, M.2 2280), la segunda ranura SSD (PCIe 4, M.2 2280), el módulo Wi-Fi, la batería de la BIOS, los ventiladores y la batería.
Garantía
La garantía básica es de dos años e incluye un servicio de recogida y seis meses de reparación rápida (reparación en 48 horas). En Alemania, el precio de una garantía de 36 meses oscila entre 80 y 119 euros, en función del periodo de reparación rápida seleccionado.
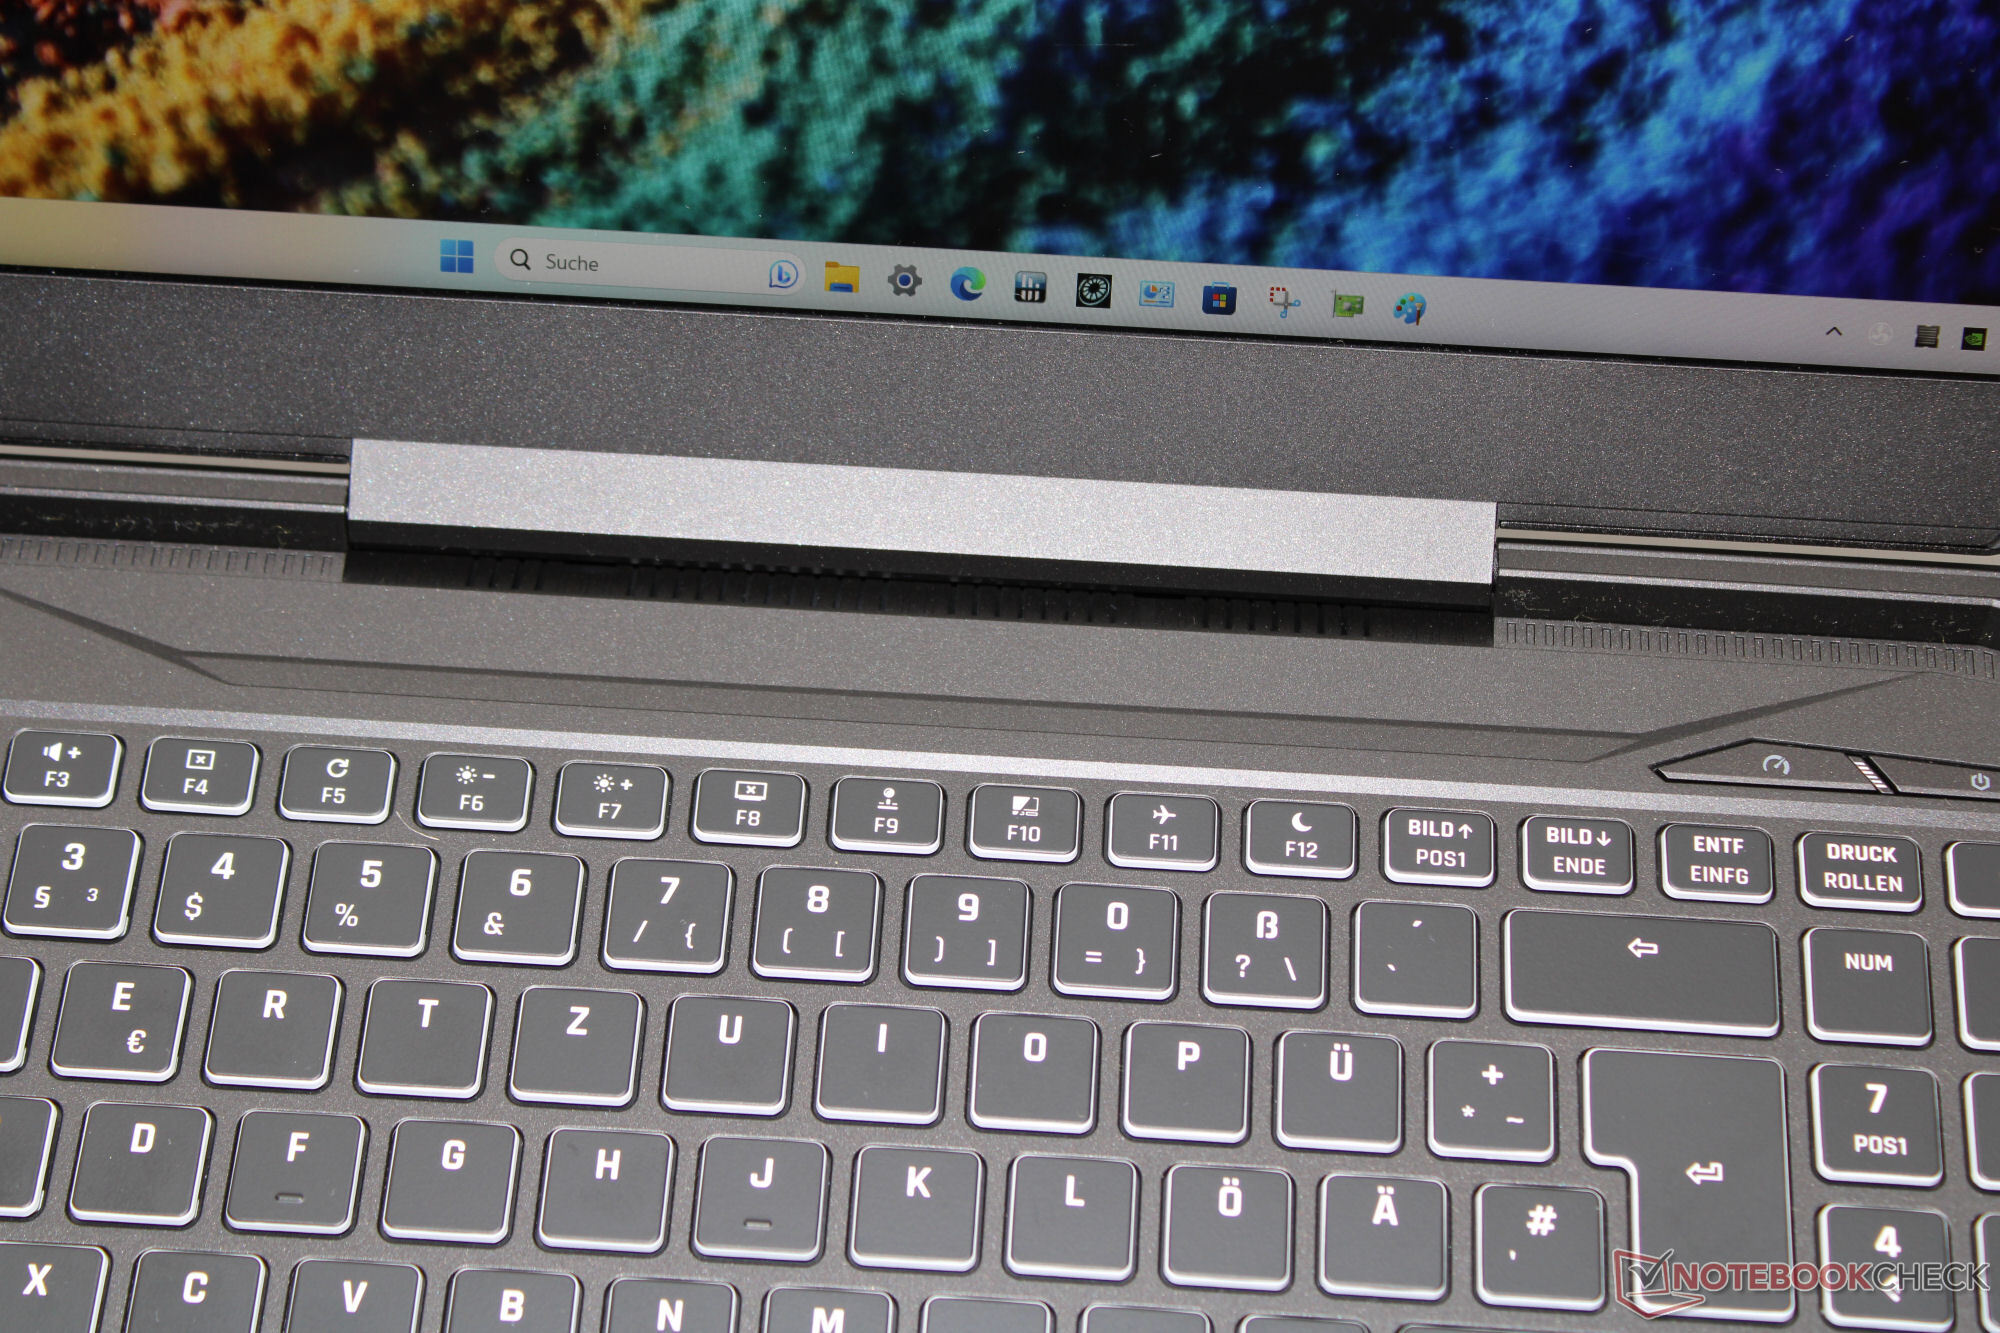
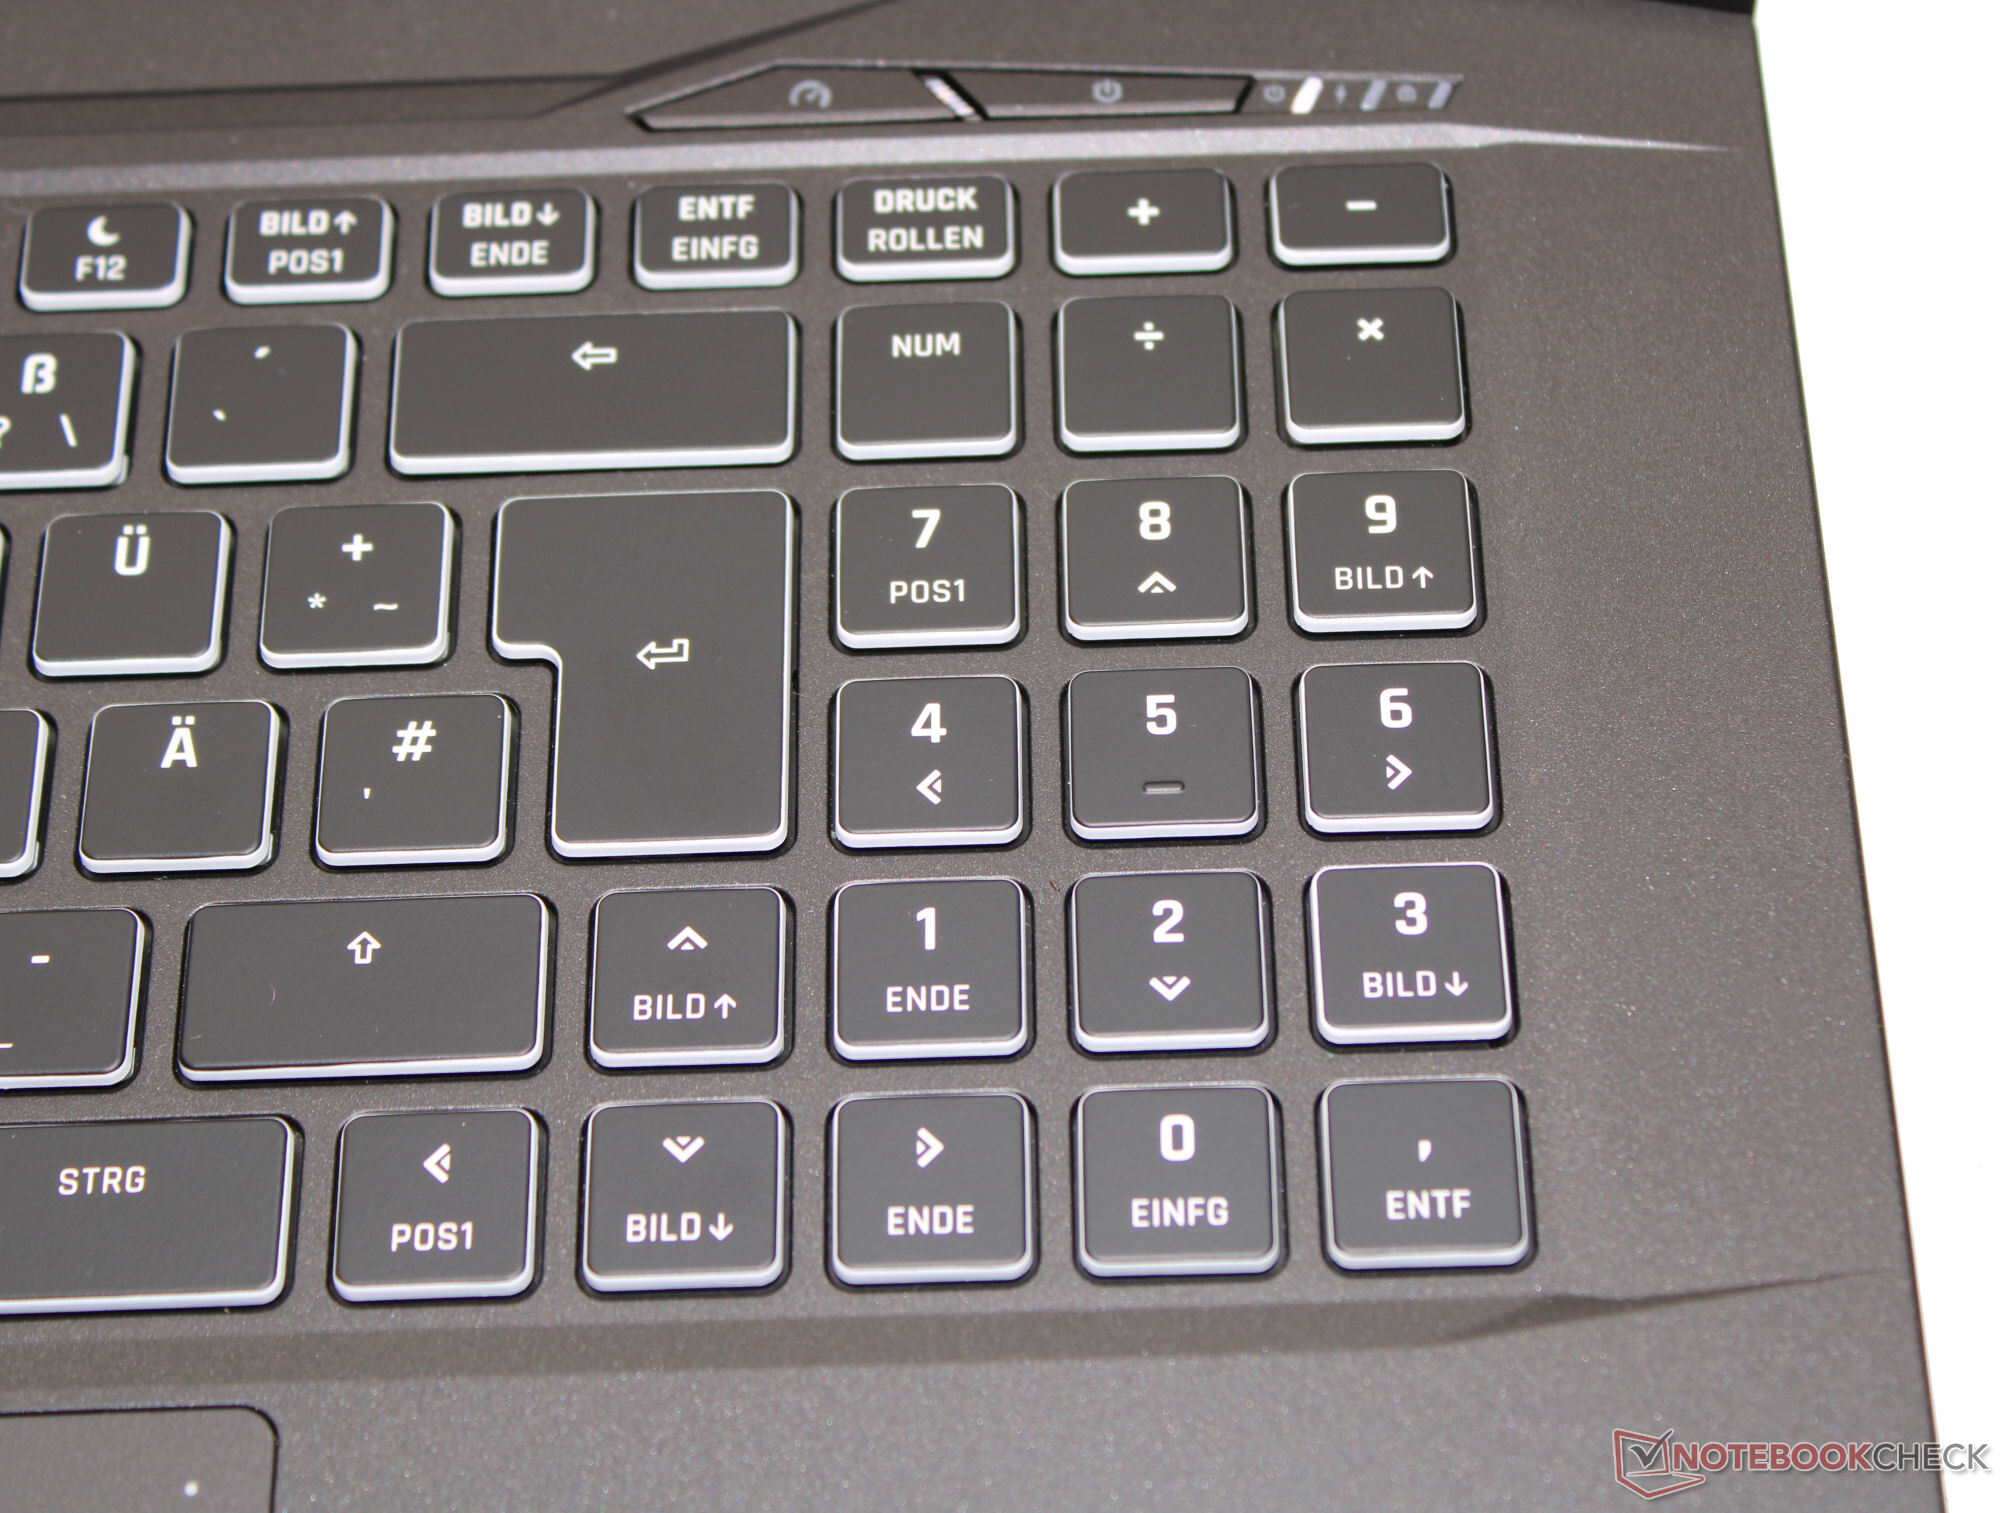
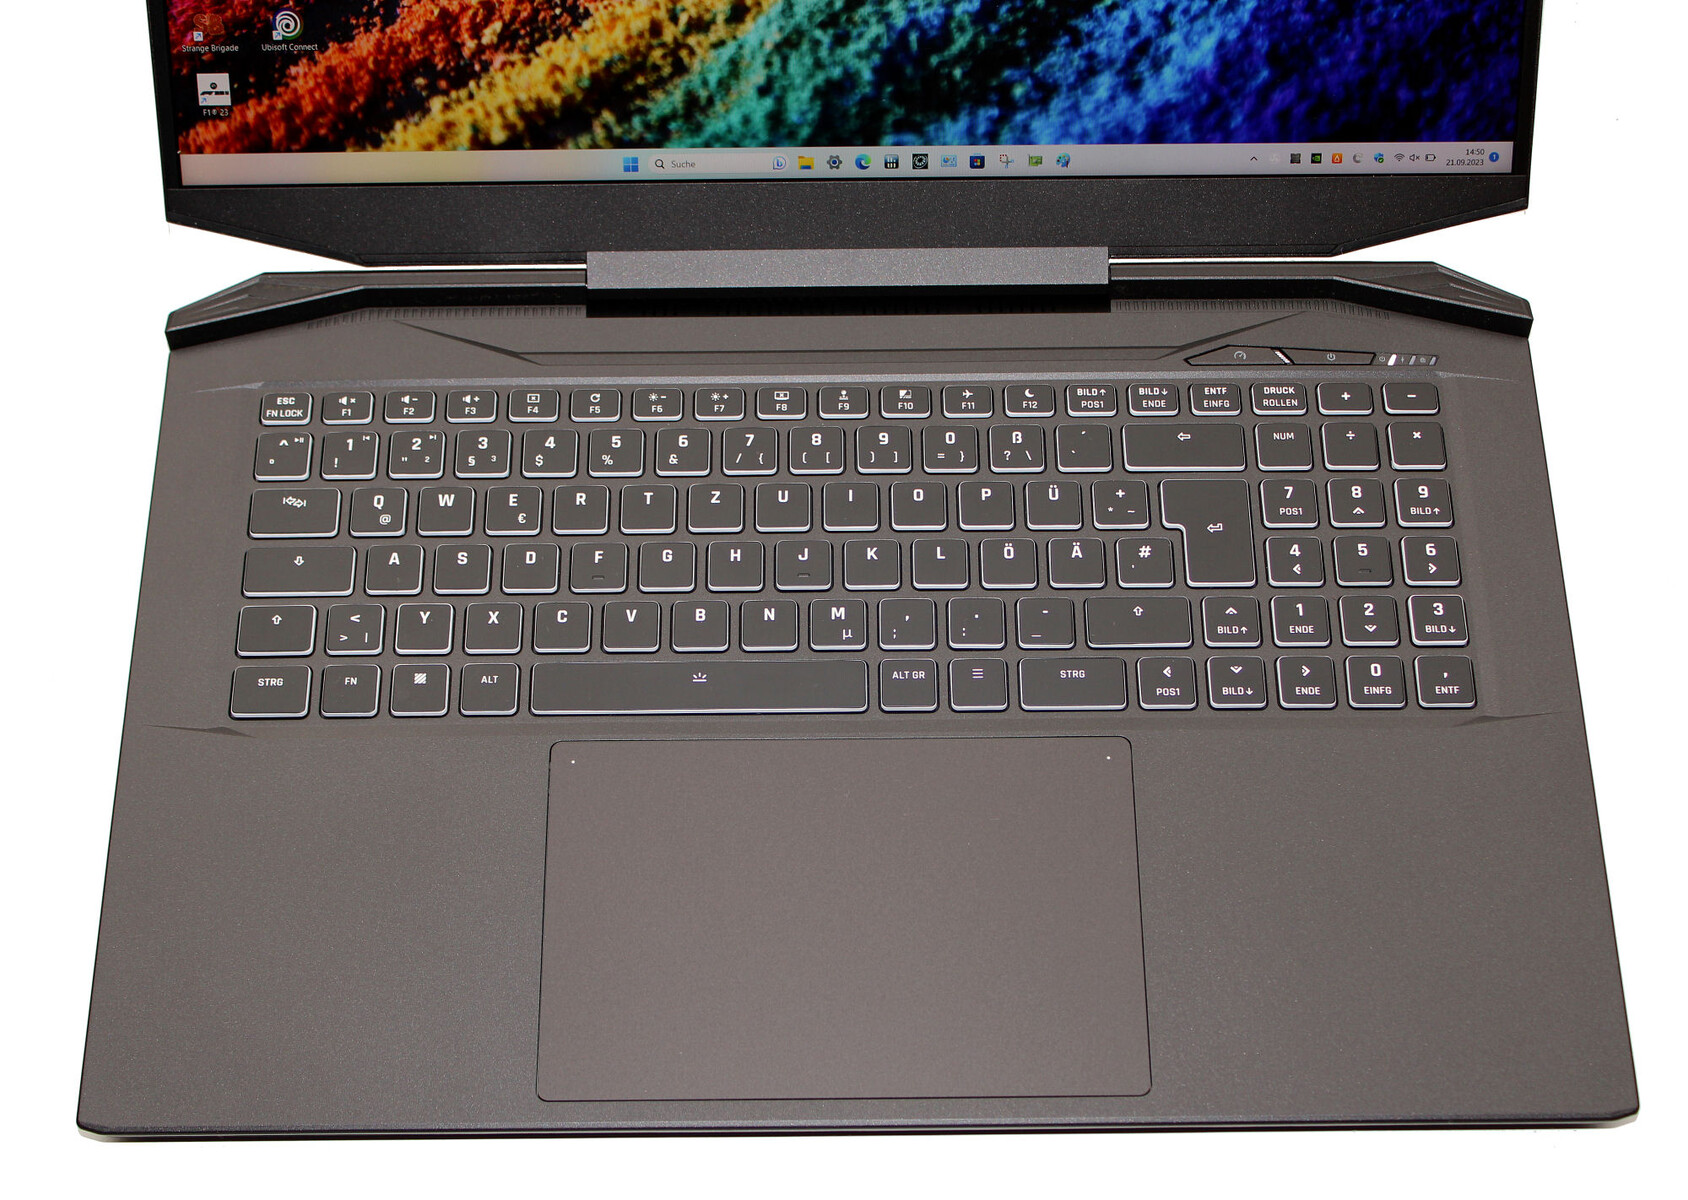
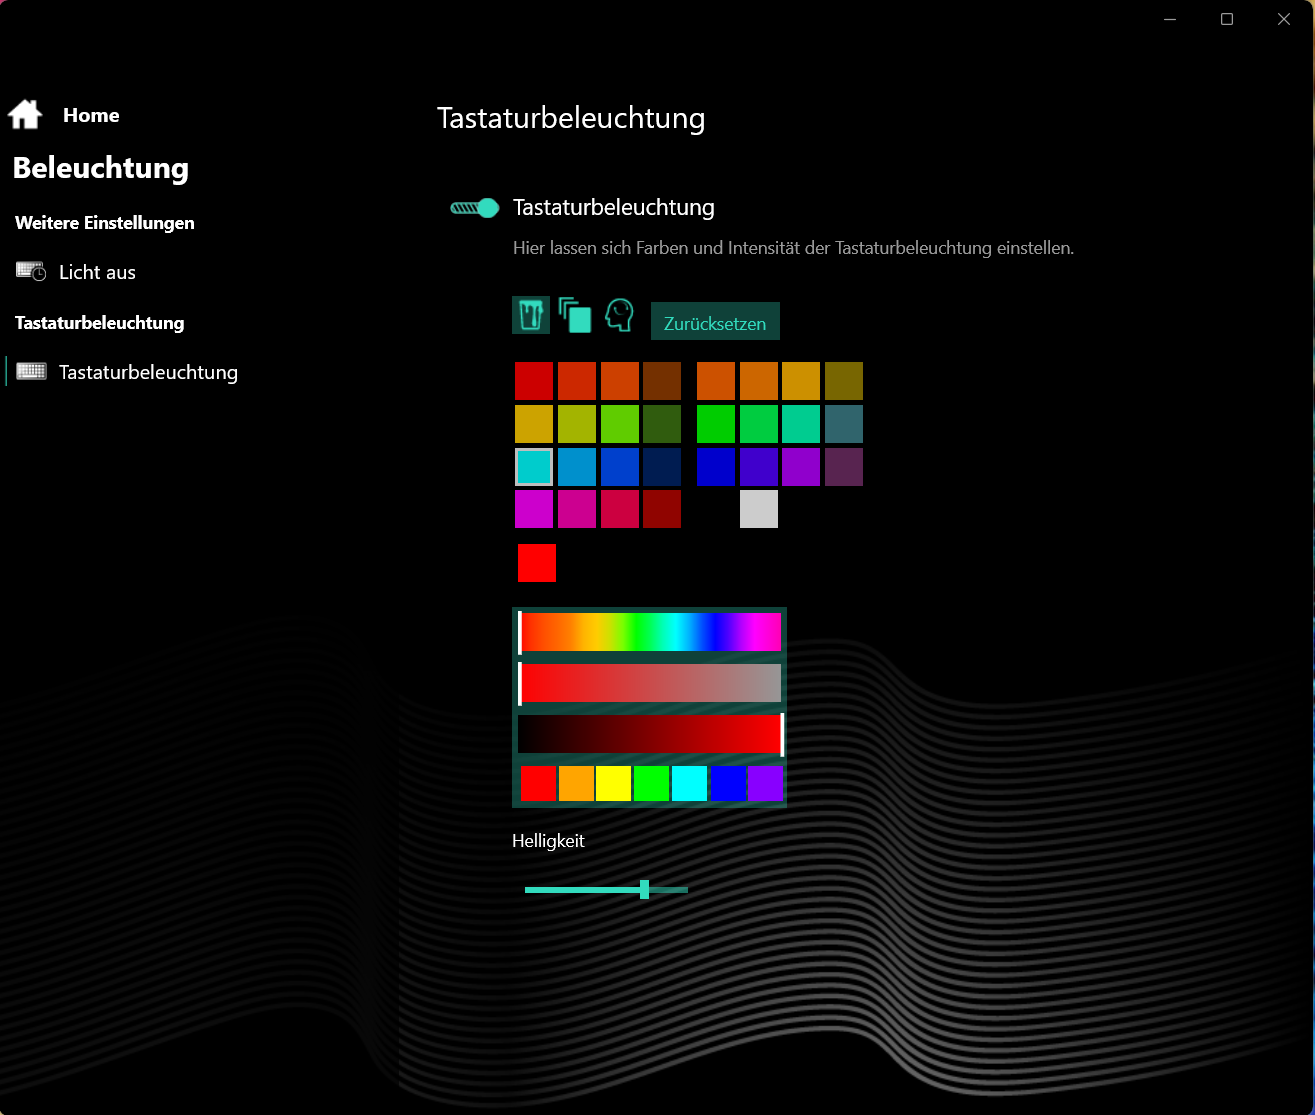
Dispositivos de entrada - El Apex 17 tiene iluminación de teclas RGB
Teclado
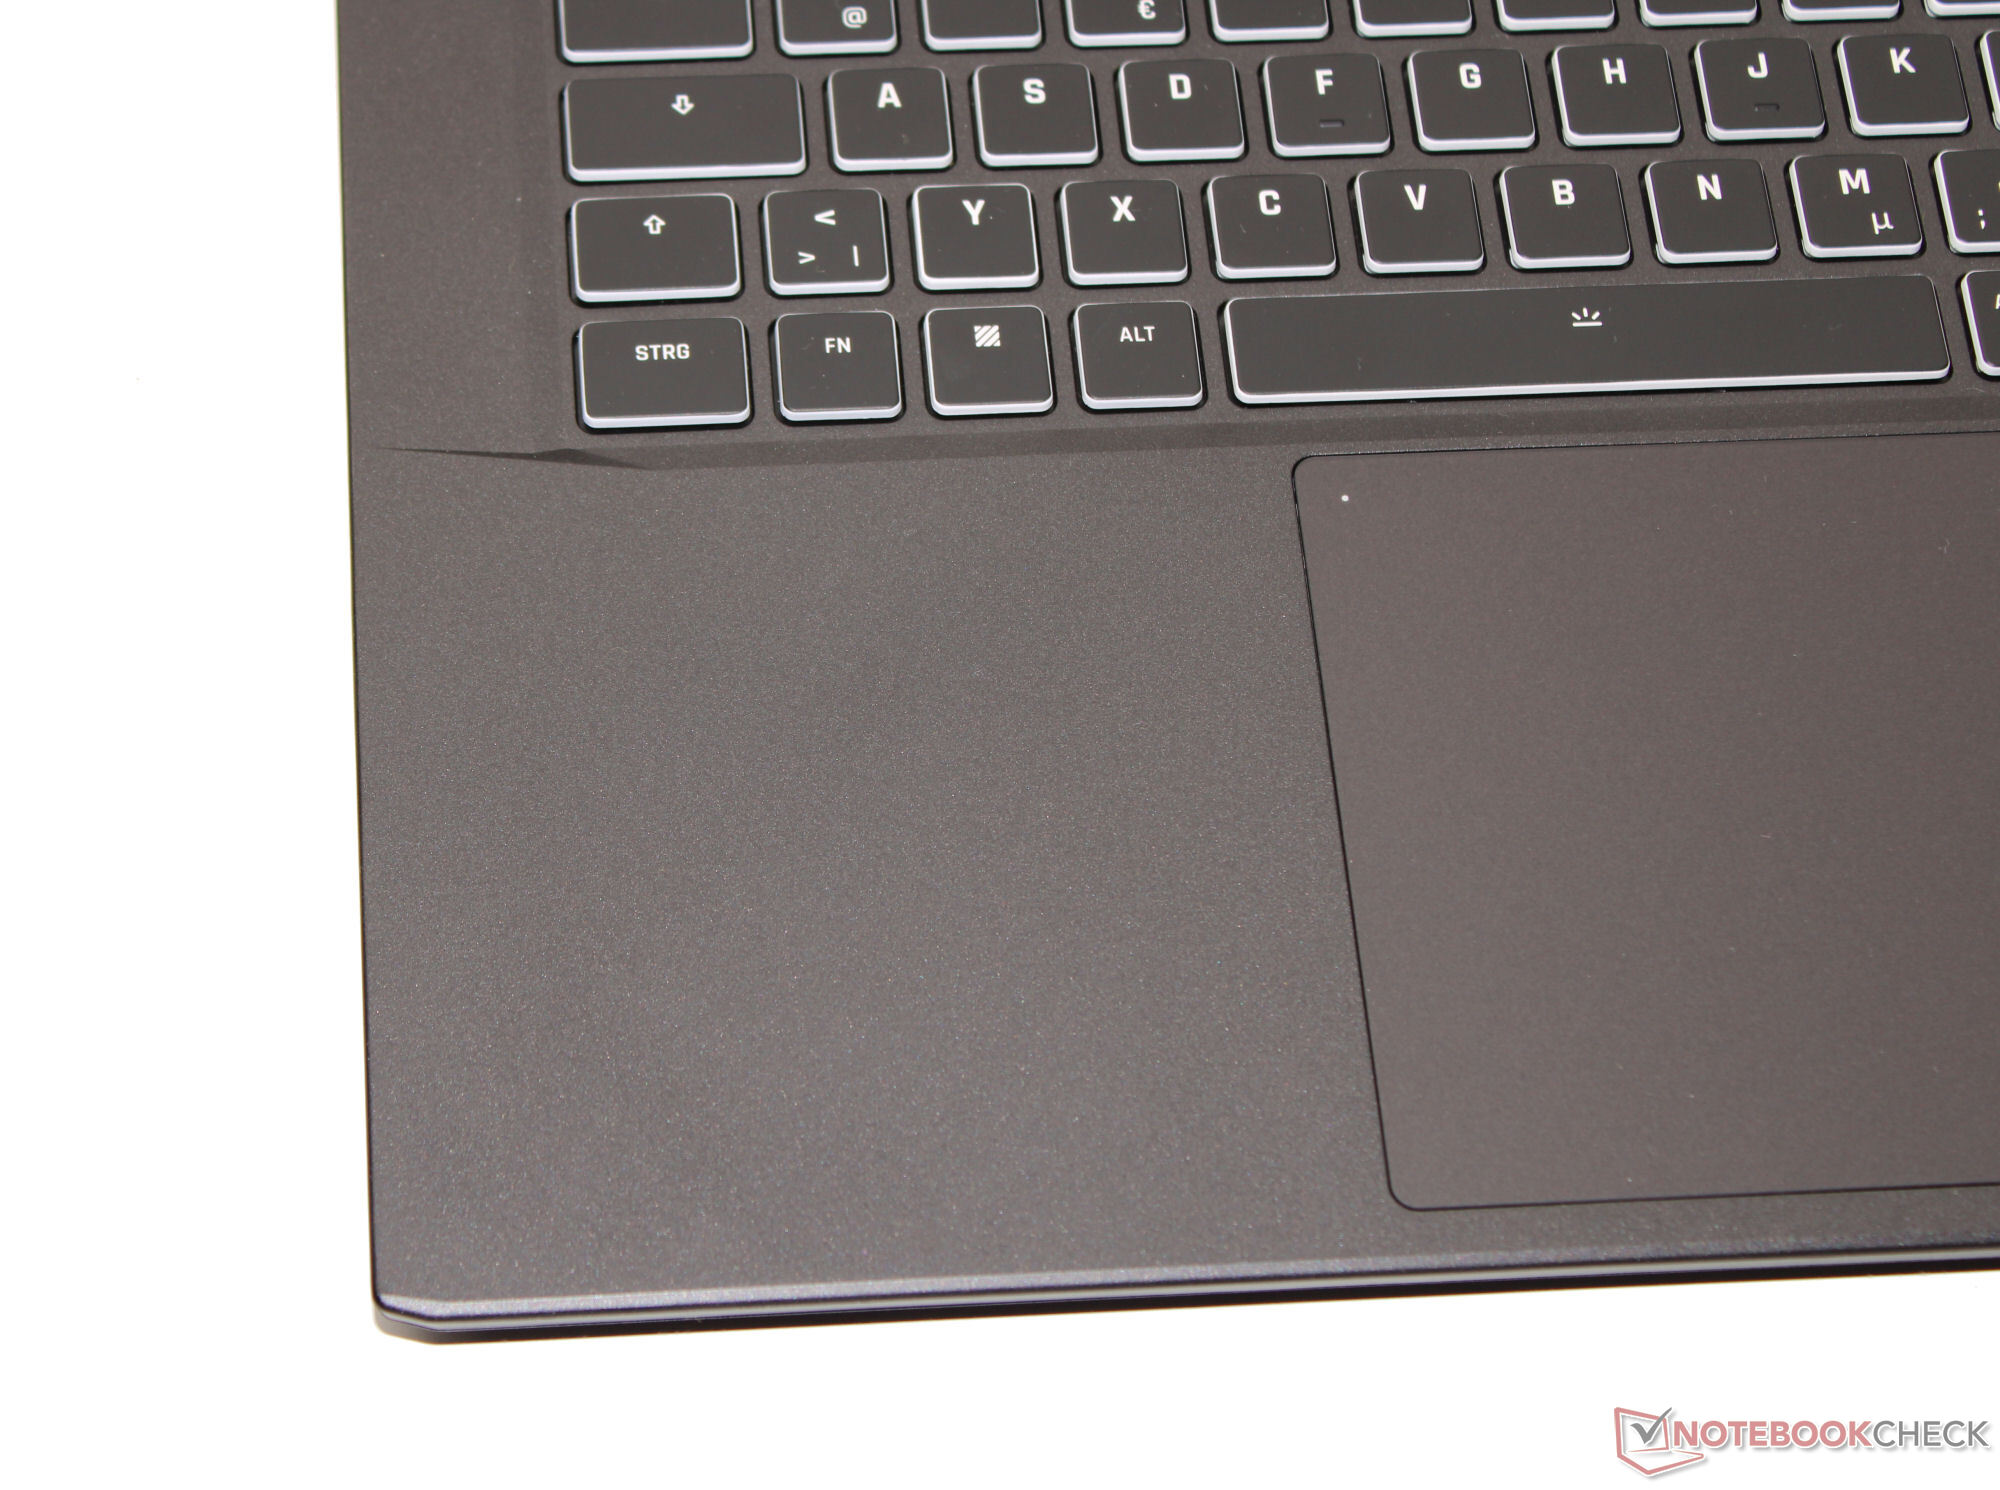
Las teclas planas y suaves (RGB) del teclado chiclet retroiluminado tienen un recorrido medio, un punto de presión definido y una resistencia agradable. Al escribir, el teclado no cede. En definitiva, un teclado apto para el uso diario.
Panel táctil
Un sustituto del ratón es el Clickpad (de unos 15,4 x 10 cm), que tiene un recorrido corto y un punto de presión claro. Al tocar el LED de la esquina superior izquierda, se apaga o enciende todo el pad. Un toque en el LED de la esquina superior derecha apaga o enciende la parte derecha del pad.
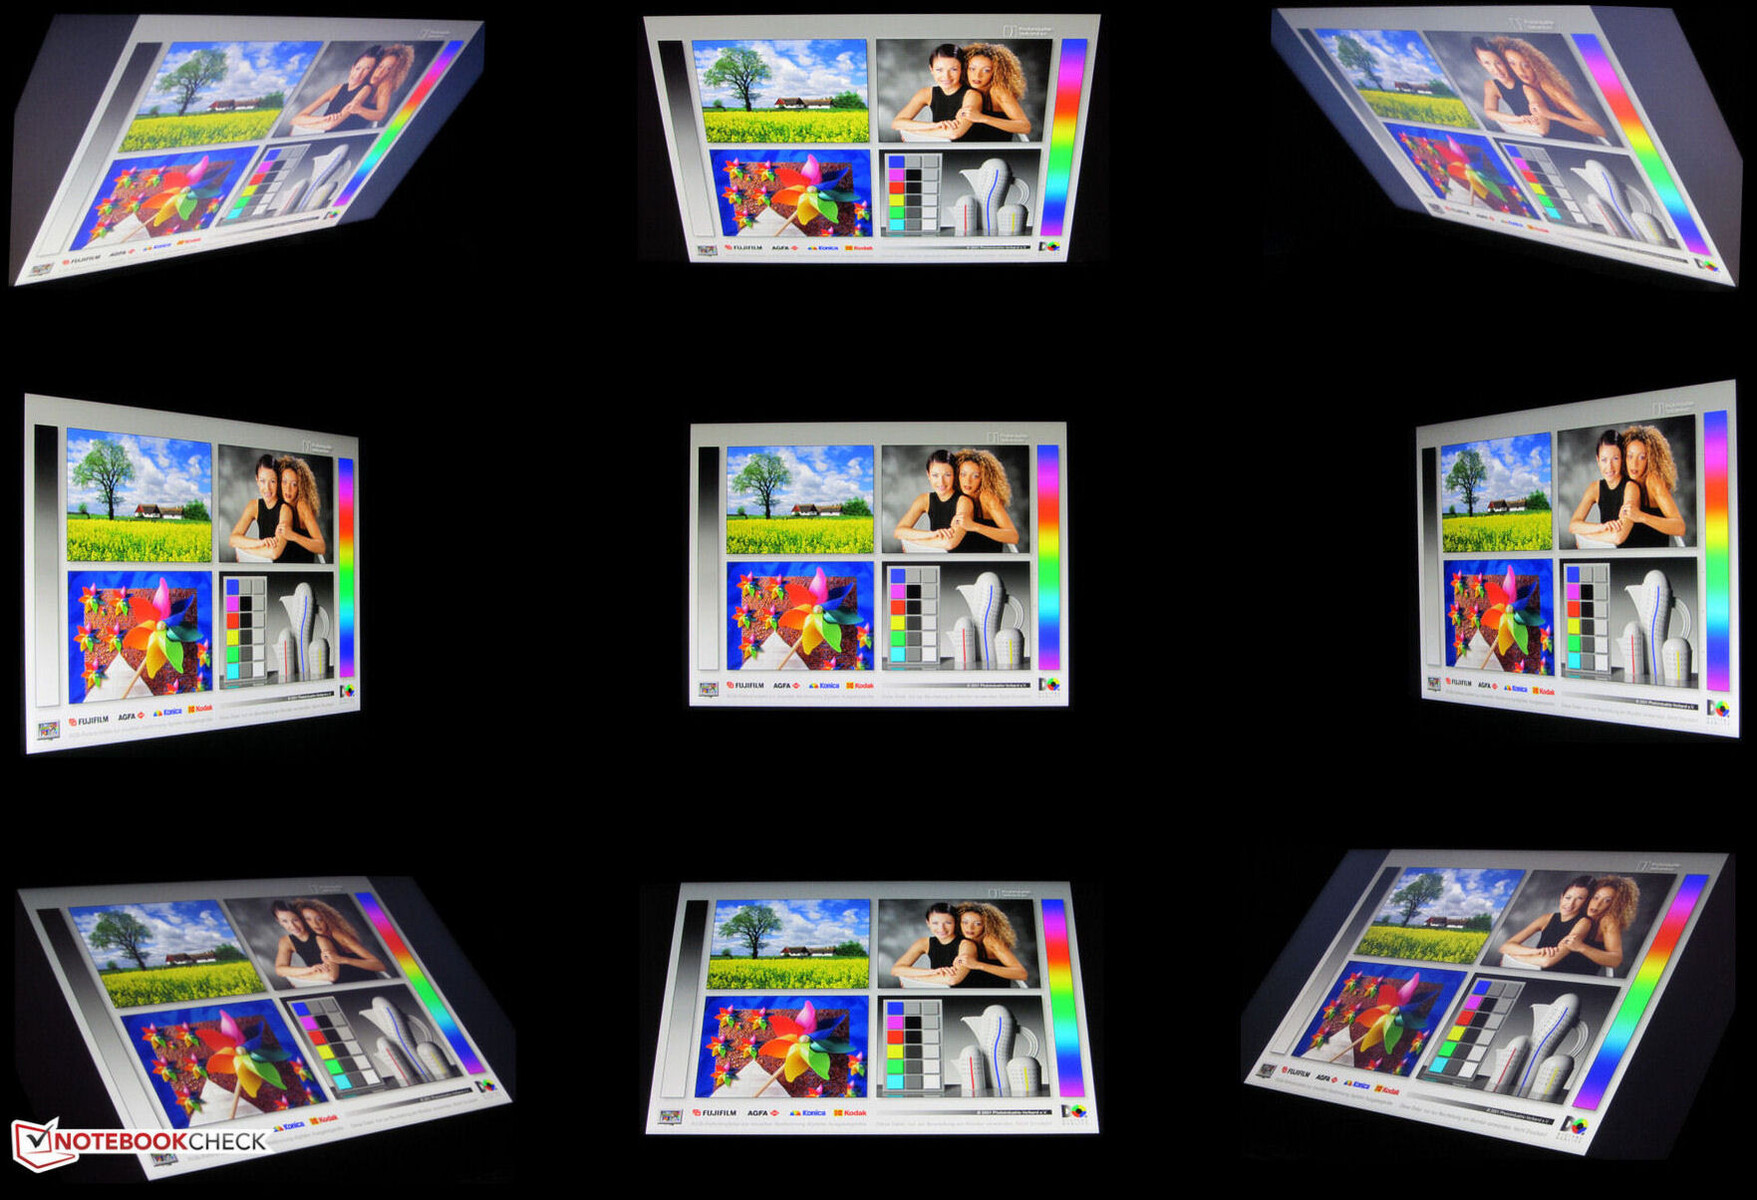
Pantalla - Un panel QHD con cobertura sRGB
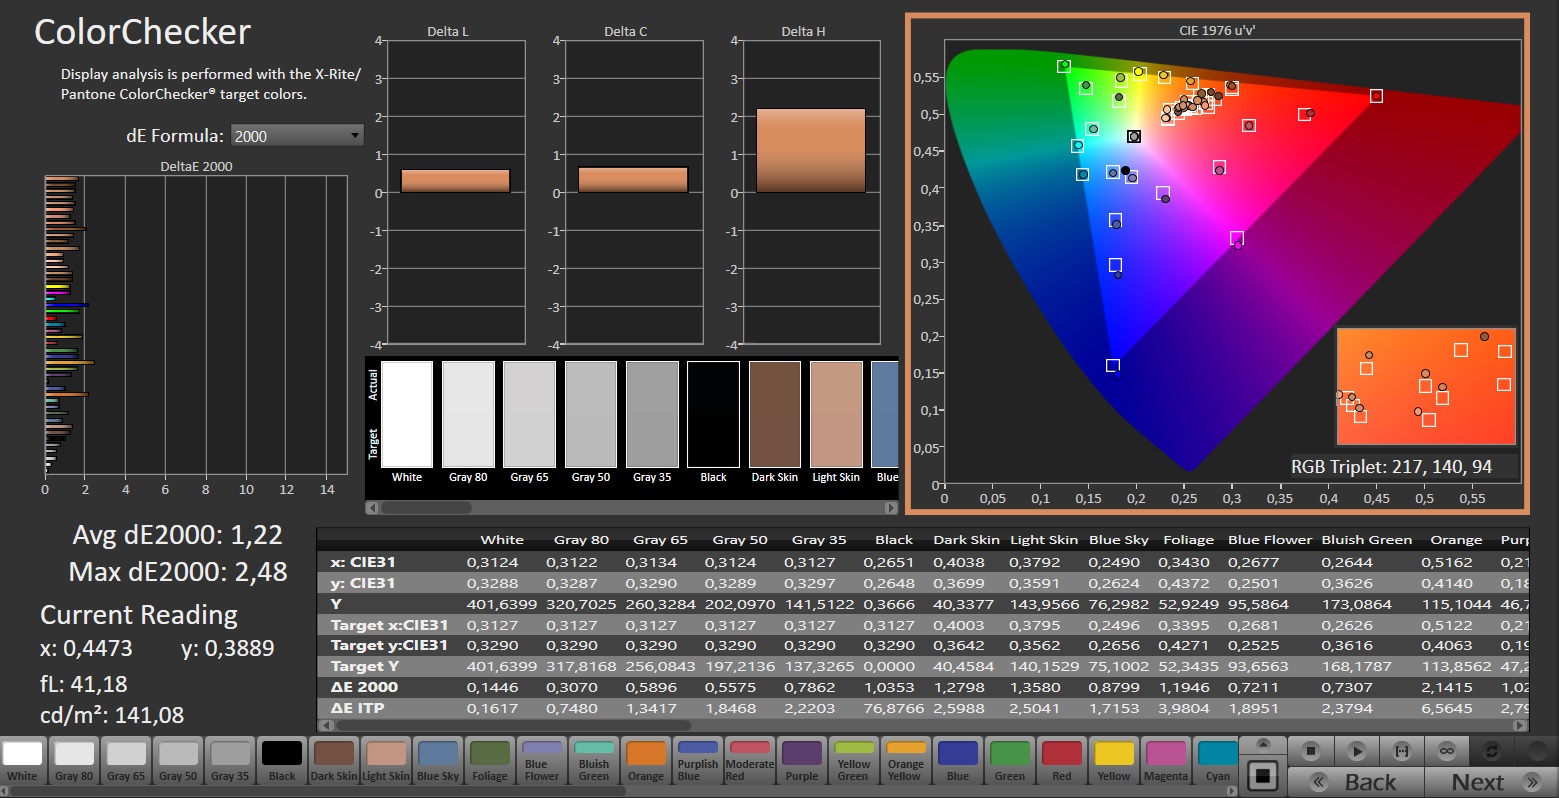
El panel de 240 Hz, con relación de aspecto 16:9 y gran capacidad de respuesta, no muestra parpadeo PWM, independientemente del ajuste de brillo. El brillo y el contraste de la pantalla mate de 17,3 pulgadas (2.560 x 1.440 píxeles) cumplen sus respectivos objetivos (> 300 cd/m² y 1.000:1).
Además de la pantalla QHD del dispositivo de pruebas, Schenker ofrece el Apex 17 con un panel alternativo FHD (1.920 x 1.080 pixels, 144 Hz, IPS).
| |||||||||||||||||||||||||
iluminación: 90 %
Brillo con batería: 403 cd/m²
Contraste: 1089:1 (Negro: 0.37 cd/m²)
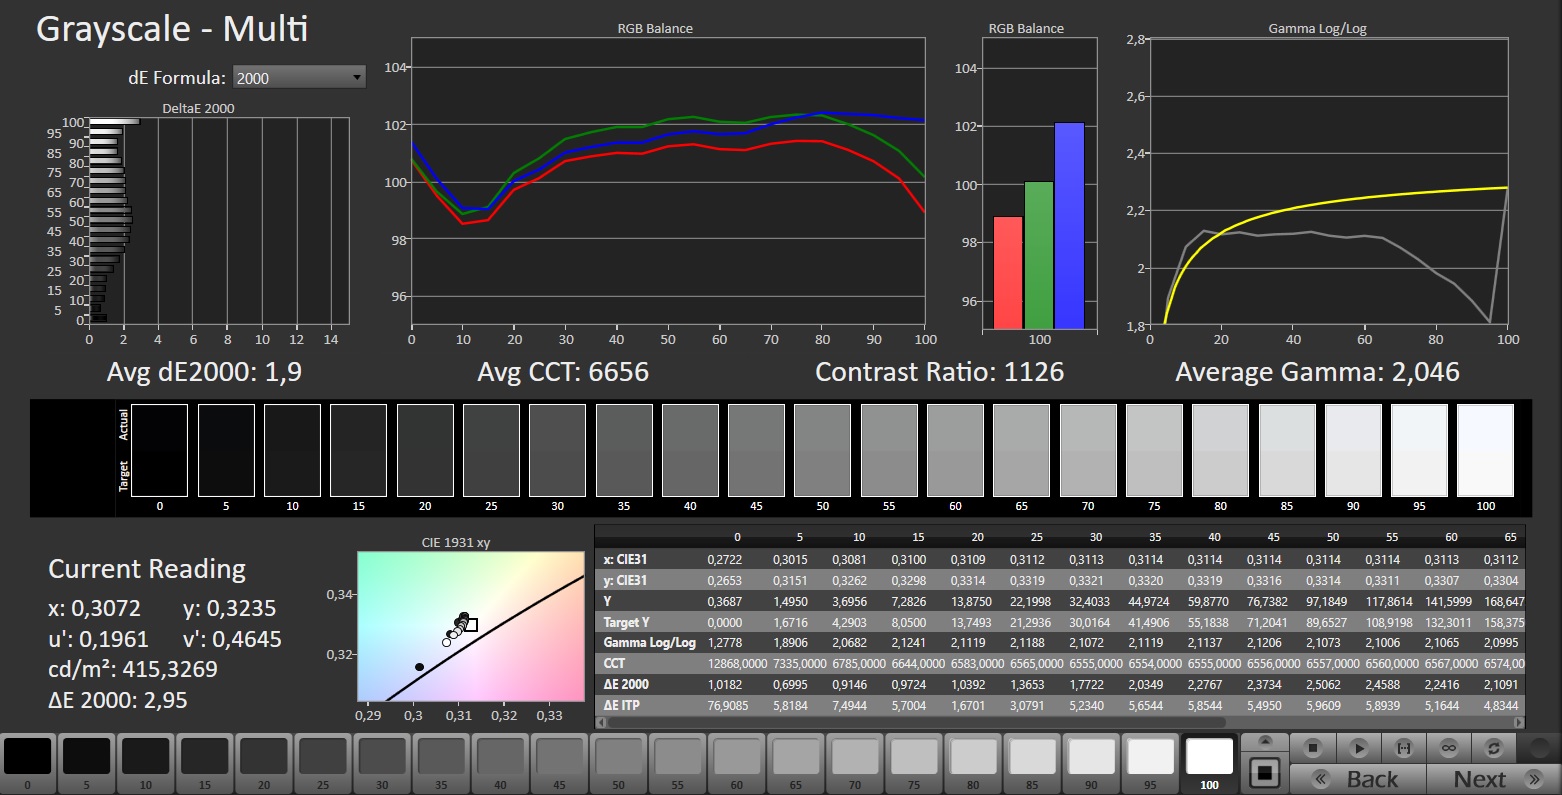
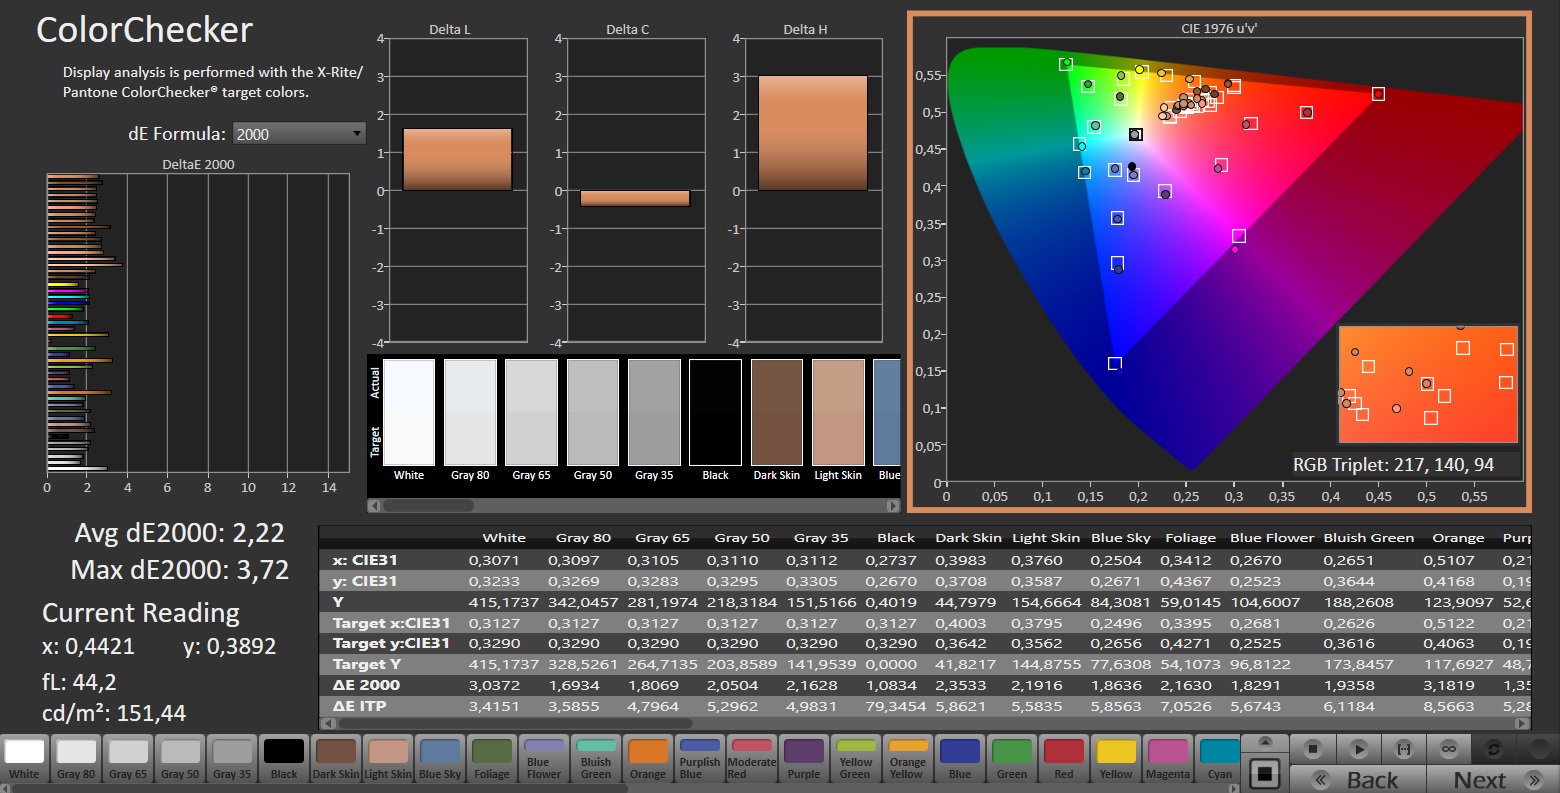
ΔE ColorChecker Calman: 2.22 | ∀{0.5-29.43 Ø4.71}
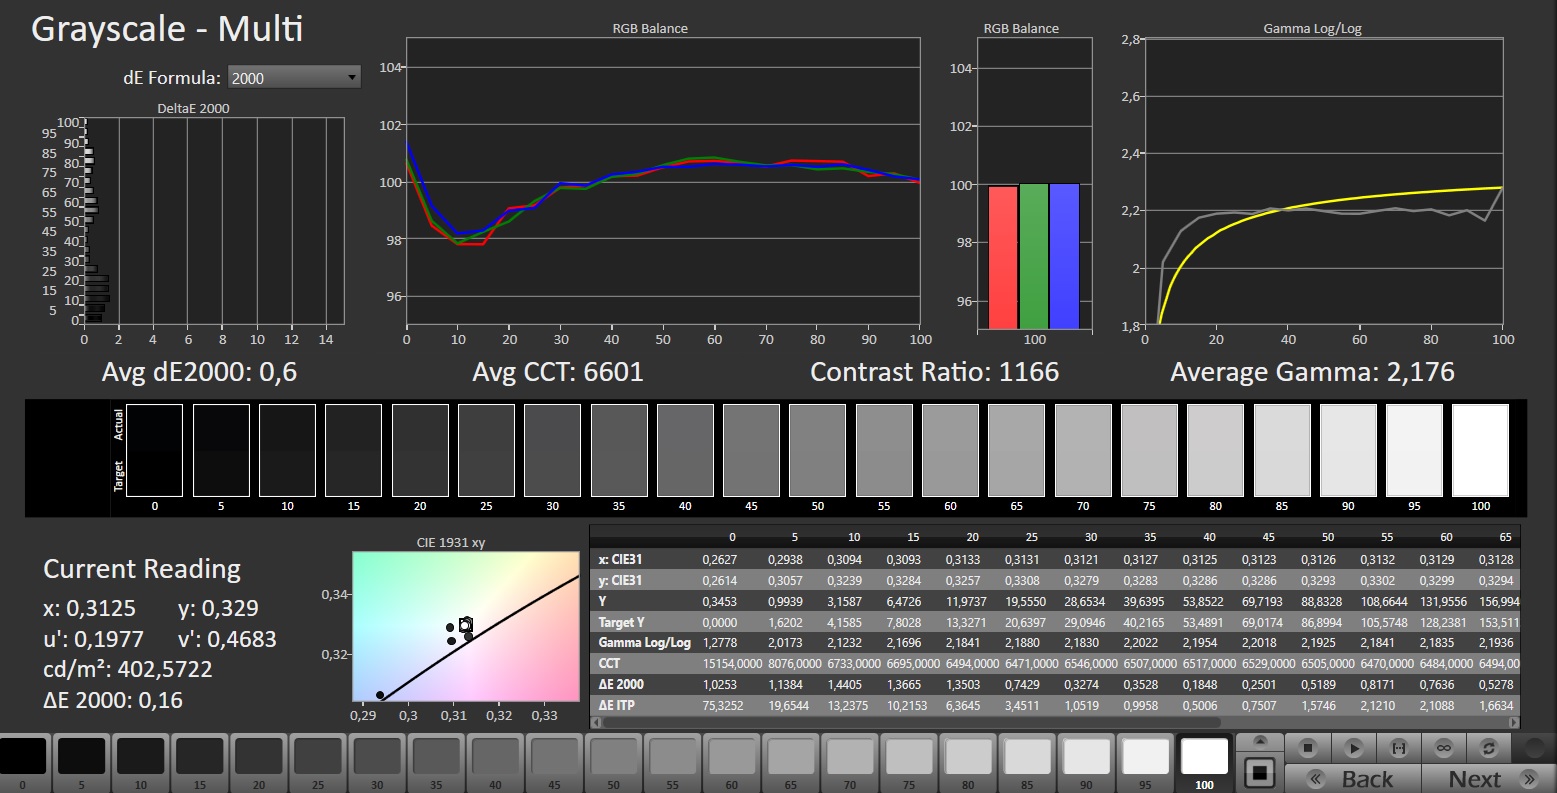
calibrated: 1.22
ΔE Greyscale Calman: 1.9 | ∀{0.09-98 Ø4.96}
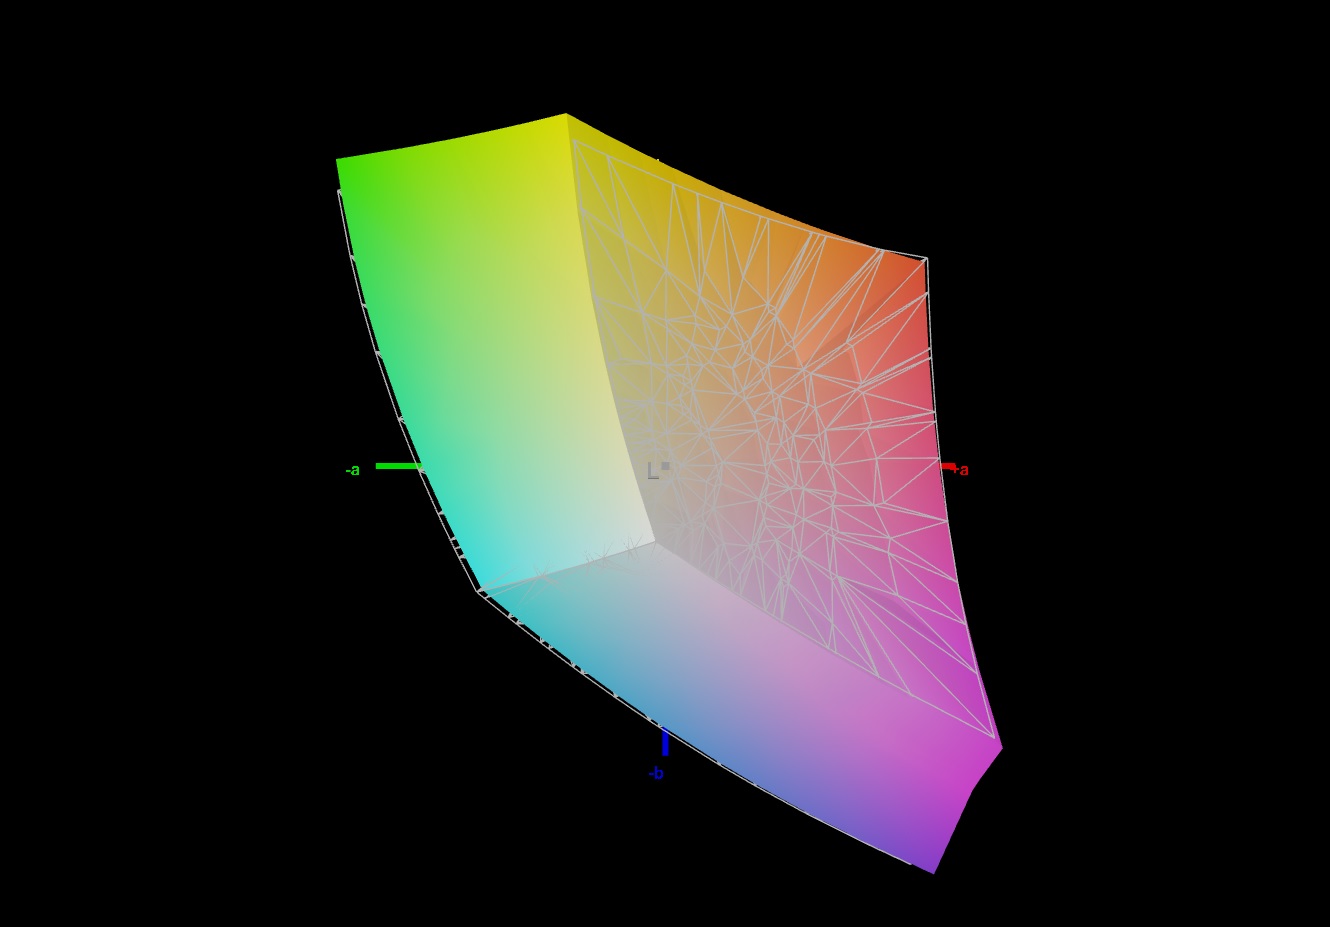
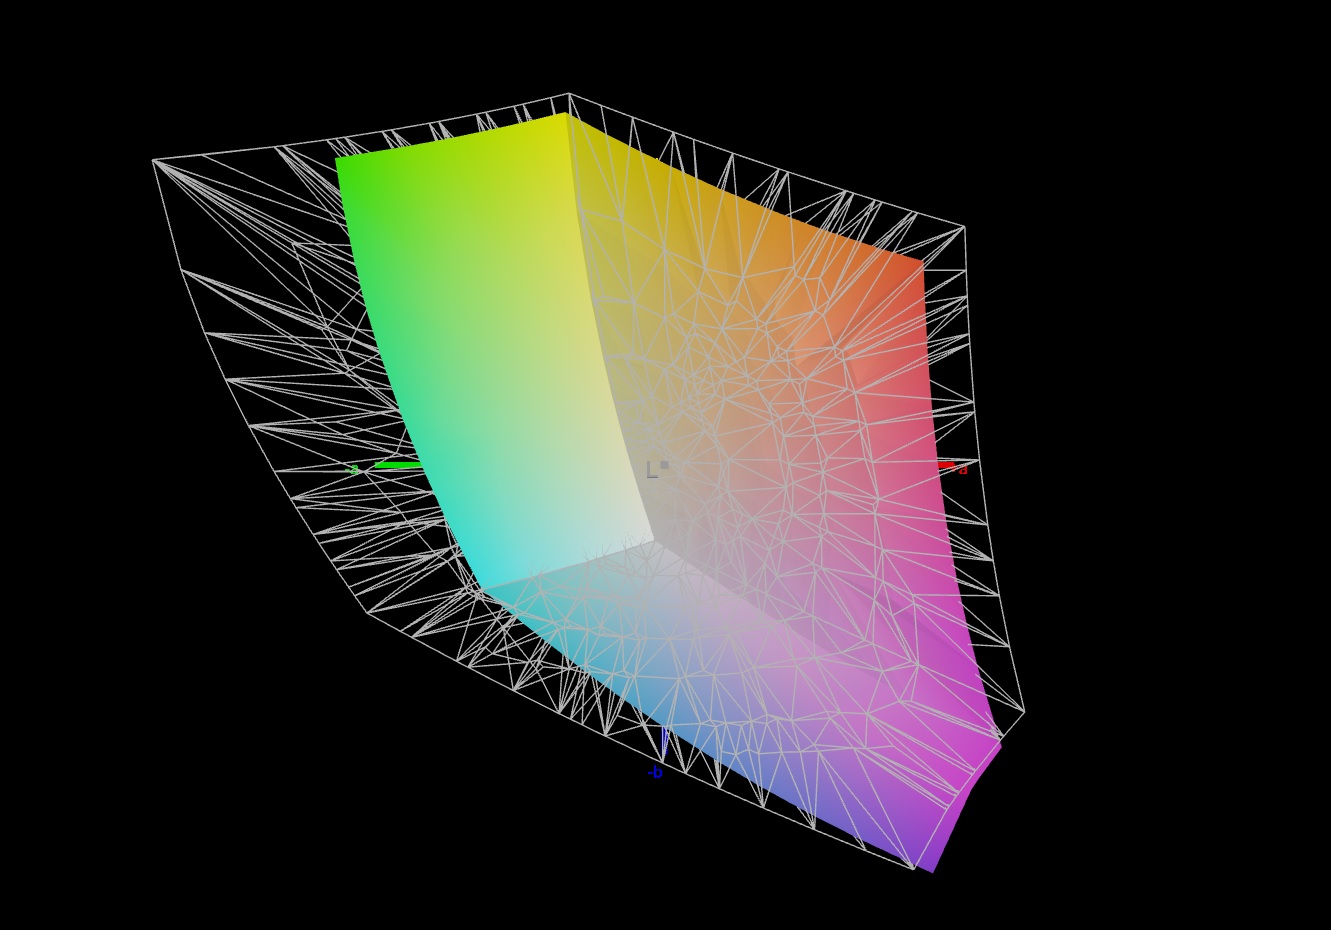
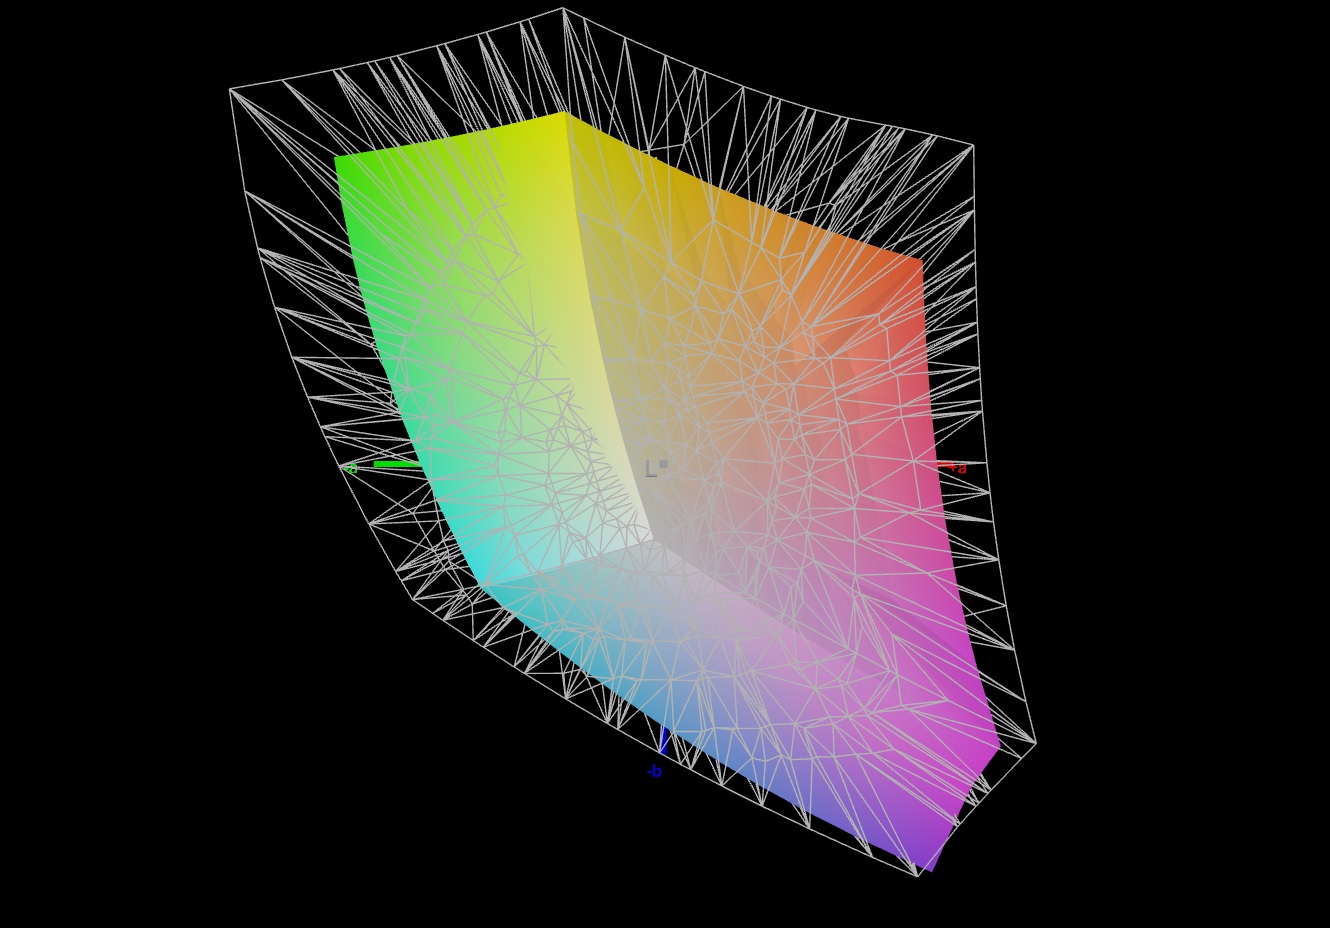
69.5% AdobeRGB 1998 (Argyll 3D)
97.7% sRGB (Argyll 3D)
68.1% Display P3 (Argyll 3D)
Gamma: 2.046
CCT: 6656 K
| Schenker XMG Apex 17 (Late 23) BOE CQ NE173QHM-NZ3, IPS, 2560x1440, 17.3" | Alienware m16 R1 Intel BOE NE16NYB, IPS, 2560x1600, 16" | Lenovo Legion Pro 5 16IRX8 AU Optronics B160QAN03.1, IPS, 2560x1600, 16" | Acer Nitro 17 AN17-51-71ER BOE0B7C NE173QHM-NY6, , 2560x1440, 17.3" | Medion Erazer Defender P40 BOE CQ NE173QHM-NZ3, IPS, 2560x1440, 17.3" | MSI Katana 17 B13VFK B173HAN04.9, IPS LED, 1920x1080, 17.3" | |
|---|---|---|---|---|---|---|
| Display | -0% | 4% | 23% | 0% | -39% | |
| Display P3 Coverage (%) | 68.1 | 67.7 -1% | 71.2 5% | 98.3 44% | 68.3 0% | 40.8 -40% |
| sRGB Coverage (%) | 97.7 | 97.2 -1% | 98.8 1% | 100 2% | 98.1 0% | 61 -38% |
| AdobeRGB 1998 Coverage (%) | 69.5 | 70 1% | 73.3 5% | 85.7 23% | 69.8 0% | 42.2 -39% |
| Response Times | 39% | -20% | -6% | -9% | -187% | |
| Response Time Grey 50% / Grey 80% * (ms) | 13.5 ? | 4 ? 70% | 14.5 ? -7% | 14.8 ? -10% | 14.6 ? -8% | 33 ? -144% |
| Response Time Black / White * (ms) | 7.9 ? | 7.3 ? 8% | 10.4 ? -32% | 8 ? -1% | 8.7 ? -10% | 26 ? -229% |
| PWM Frequency (Hz) | ||||||
| Screen | -12% | 11% | -57% | 11% | -90% | |
| Brightness middle (cd/m²) | 403 | 306 -24% | 405.7 1% | 361 -10% | 364 -10% | 267 -34% |
| Brightness (cd/m²) | 381 | 302 -21% | 368 -3% | 326 -14% | 343 -10% | 256 -33% |
| Brightness Distribution (%) | 90 | 89 -1% | 87 -3% | 87 -3% | 86 -4% | 93 3% |
| Black Level * (cd/m²) | 0.37 | 0.3 19% | 0.38 -3% | 0.6 -62% | 0.28 24% | 0.21 43% |
| Contrast (:1) | 1089 | 1020 -6% | 1068 -2% | 602 -45% | 1300 19% | 1271 17% |
| Colorchecker dE 2000 * | 2.22 | 2.57 -16% | 1.65 26% | 3.83 -73% | 1.67 25% | 4.7 -112% |
| Colorchecker dE 2000 max. * | 3.76 | 4.26 -13% | 4.2 -12% | 5.71 -52% | 2.78 26% | 20.4 -443% |
| Colorchecker dE 2000 calibrated * | 1.22 | 0.85 30% | 0.53 57% | 3.48 -185% | 1.14 7% | 4.5 -269% |
| Greyscale dE 2000 * | 1.9 | 3.3 -74% | 1.2 37% | 3.29 -73% | 1.4 26% | 1.5 21% |
| Gamma | 2.046 108% | 1.997 110% | 2.3 96% | 2.29 96% | 2.091 105% | 2.12 104% |
| CCT | 6656 98% | 6895 94% | 6453 101% | 6679 97% | 6568 99% | 6552 99% |
| Media total (Programa/Opciones) | 9% /
-2% | -2% /
5% | -13% /
-33% | 1% /
6% | -105% /
-93% |
* ... más pequeño es mejor
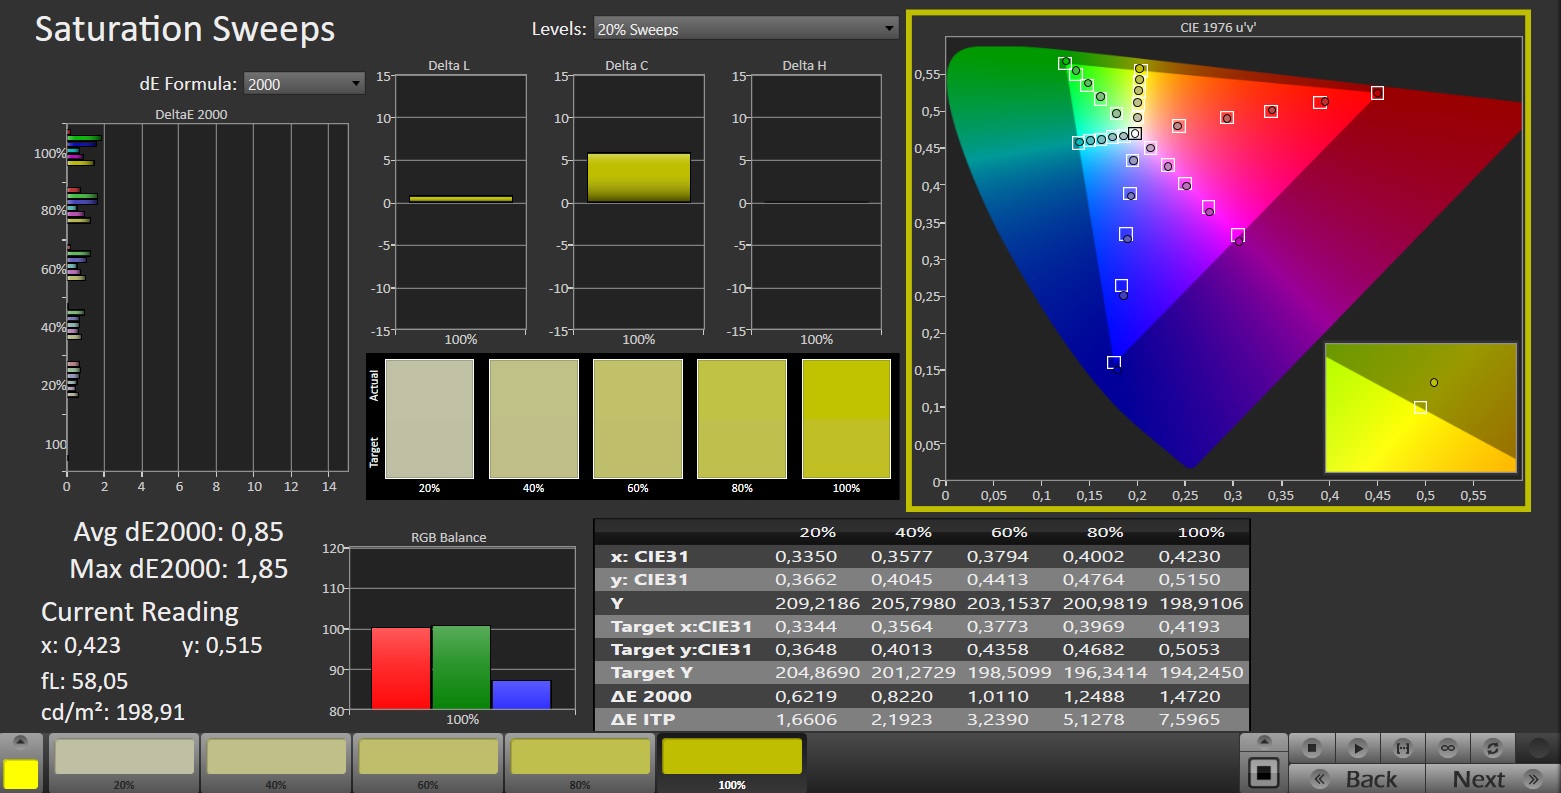
Desde el primer momento, la pantalla muestra una buena reproducción del color. Con una desviación de alrededor de 2,2, se alcanza el valor objetivo (DeltaE < 3). Una calibración reduce la desviación a 1,2 y garantiza escalas de grises equilibradas. El panel cubre el espacio de color sRGB casi por completo, pero no los espacios de color AdobeRGB y DCI P3. La mayoría de las pantallas de la competencia ofrecen una imagen similar. Sólo elNitro 17cubre el espacio de color P3.

Tiempos de respuesta del display
| ↔ Tiempo de respuesta de Negro a Blanco | ||
|---|---|---|
| 7.9 ms ... subida ↗ y bajada ↘ combinada | ↗ 3 ms subida | 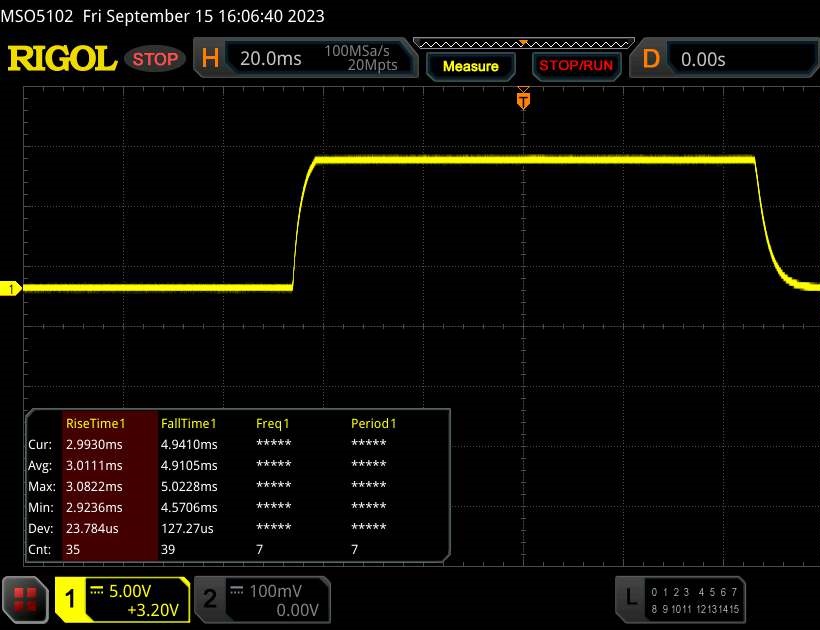 |
| ↘ 4.9 ms bajada | ||
| La pantalla mostró tiempos de respuesta muy rápidos en nuestros tests y debería ser adecuada para juegos frenéticos. En comparación, todos los dispositivos de prueba van de ##min### (mínimo) a 240 (máximo) ms. » 22 % de todos los dispositivos son mejores. Esto quiere decir que el tiempo de respuesta medido es mejor que la media (19.8 ms) de todos los dispositivos testados. | ||
| ↔ Tiempo de respuesta 50% Gris a 80% Gris | ||
| 13.5 ms ... subida ↗ y bajada ↘ combinada | ↗ 6.4 ms subida | 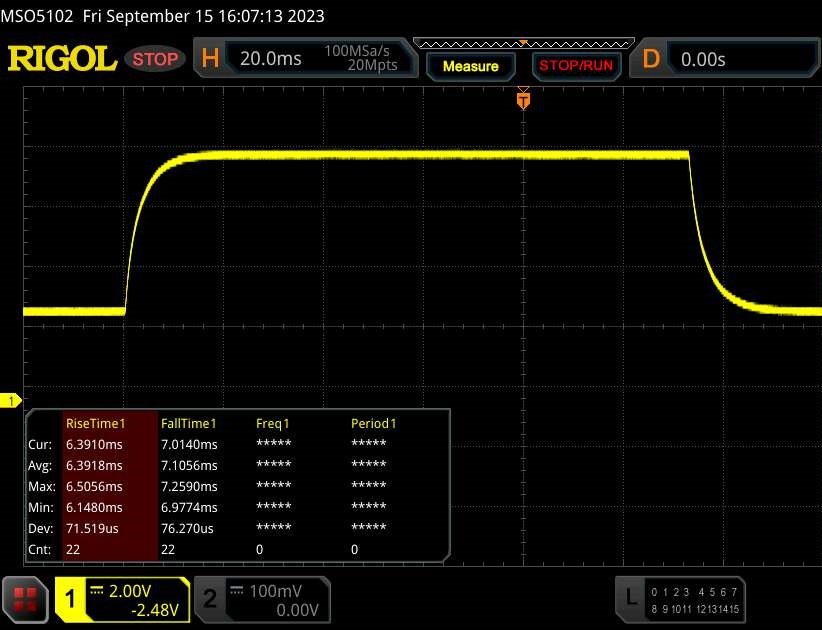 |
| ↘ 7.1 ms bajada | ||
| La pantalla mostró buenos tiempos de respuesta en nuestros tests pero podría ser demasiado lenta para los jugones competitivos. En comparación, todos los dispositivos de prueba van de ##min### (mínimo) a 636 (máximo) ms. » 27 % de todos los dispositivos son mejores. Esto quiere decir que el tiempo de respuesta medido es mejor que la media (31 ms) de todos los dispositivos testados. | ||
Parpadeo de Pantalla / PWM (Pulse-Width Modulation)
| Parpadeo de Pantalla / PWM no detectado | 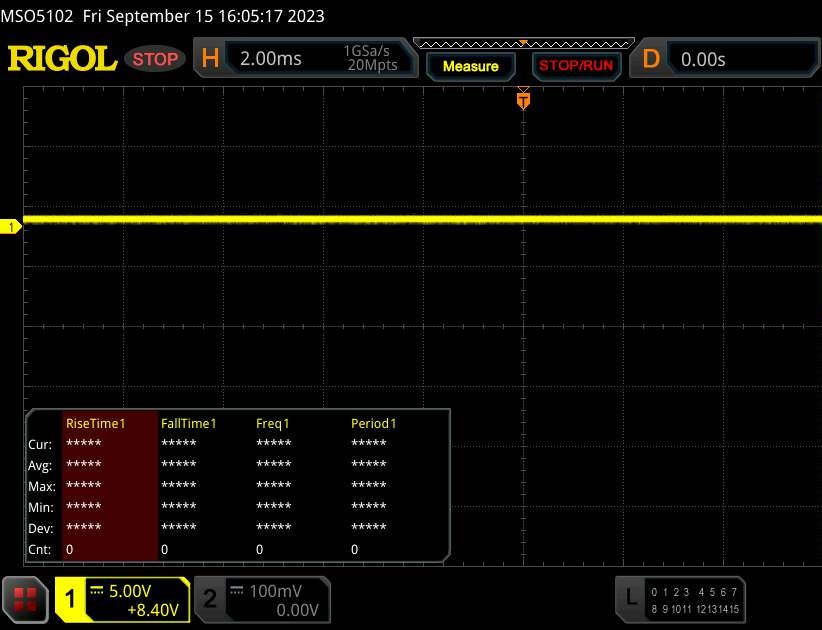 | ||
Comparación: 52 % de todos los dispositivos testados no usaron PWM para atenuar el display. Si se usó, medimos una media de 7754 (mínimo: 5 - máxmo: 343500) Hz. | |||
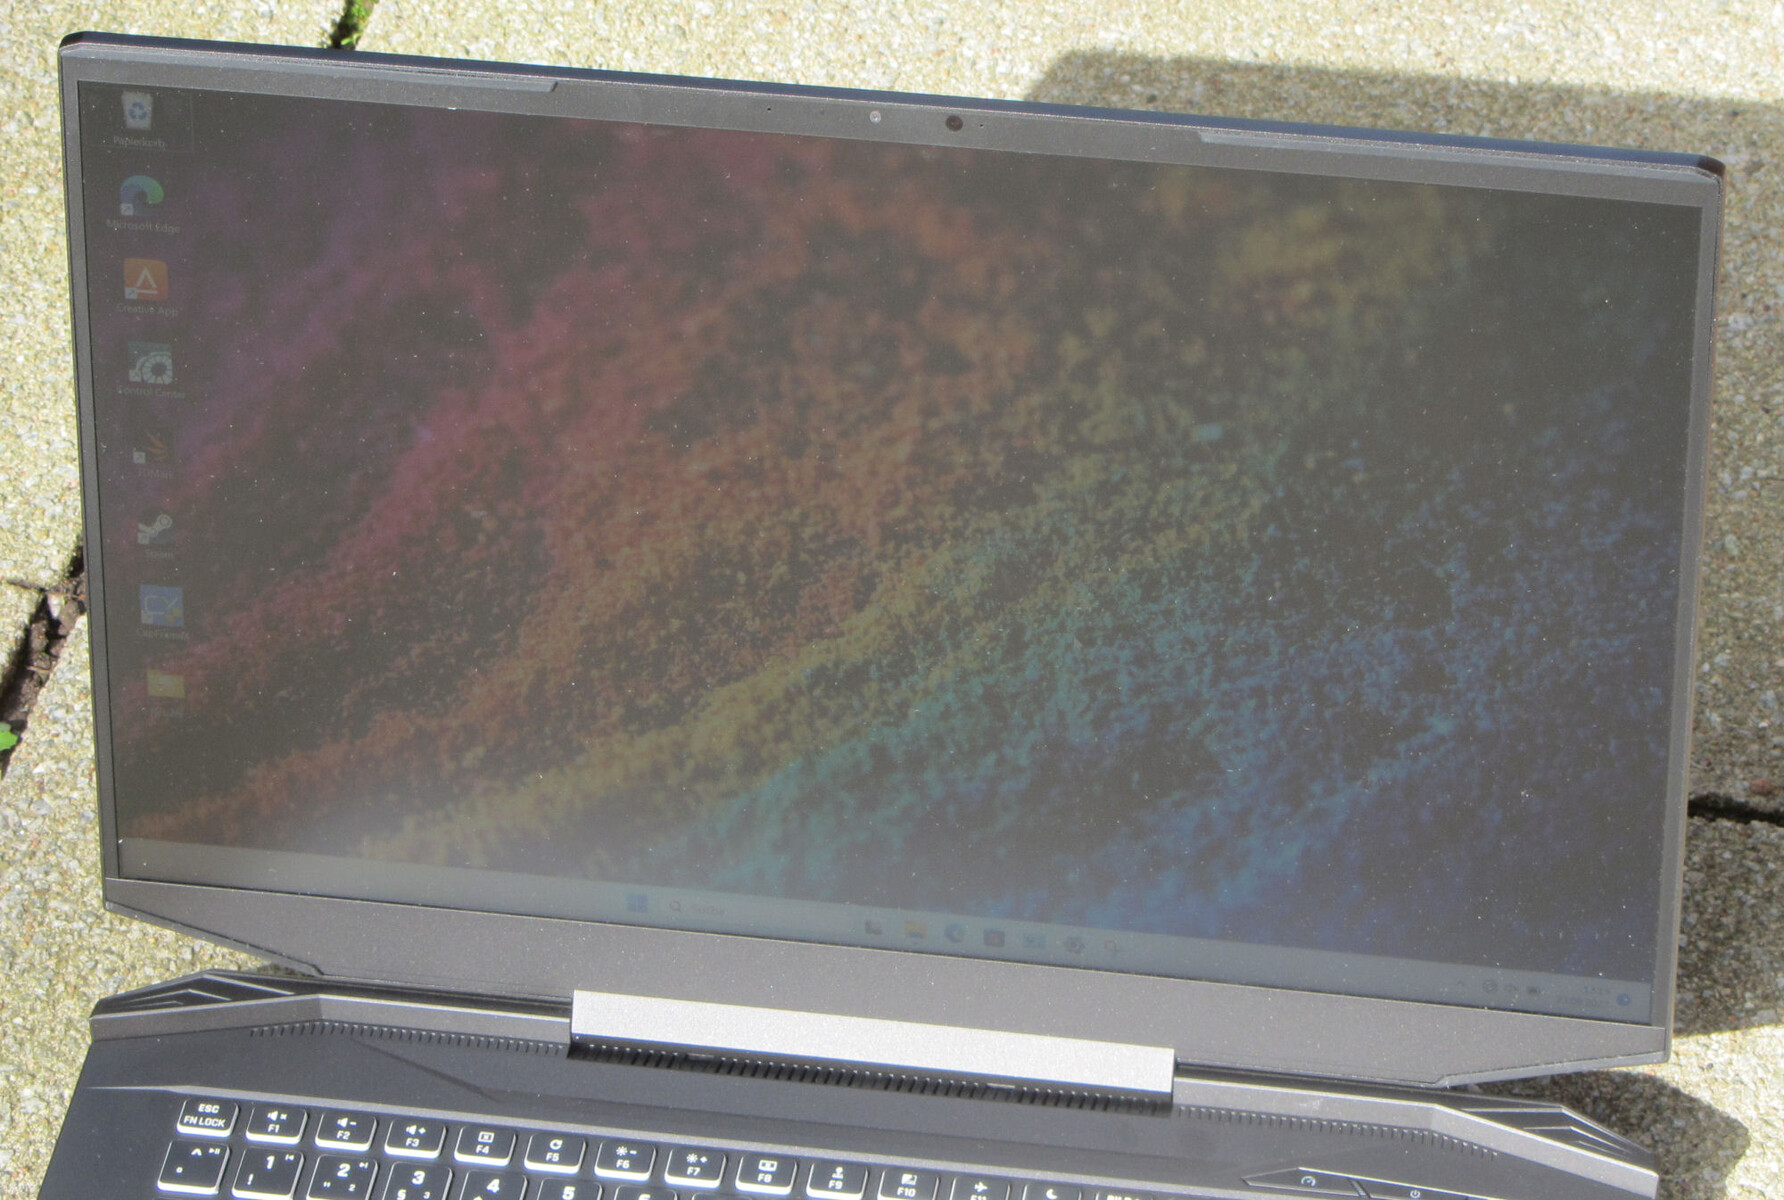
El panel IPS tiene una buena estabilidad del ángulo de visión y es legible desde cualquier posición. En exteriores, la pantalla es legible siempre que la luz solar no sea demasiado intensa.
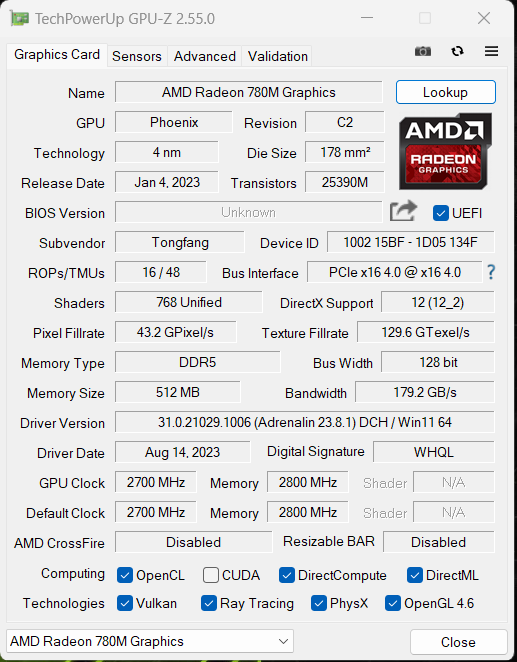
Actuación - Phoenix y Ada Lovelace impulsan el portátil Schenker
El Schenker Apex 17 es un portátil de juegos QHD de gama media cuya potencia de cálculo la proporcionan Phoenix y Ada Lovelace. El portátil puede configurarse a medida y comprarse en Bestware.com. Nuestro dispositivo de análisis puede adquirirse por 1.750 euros, con precios que empiezan en torno a los 1.200 euros.
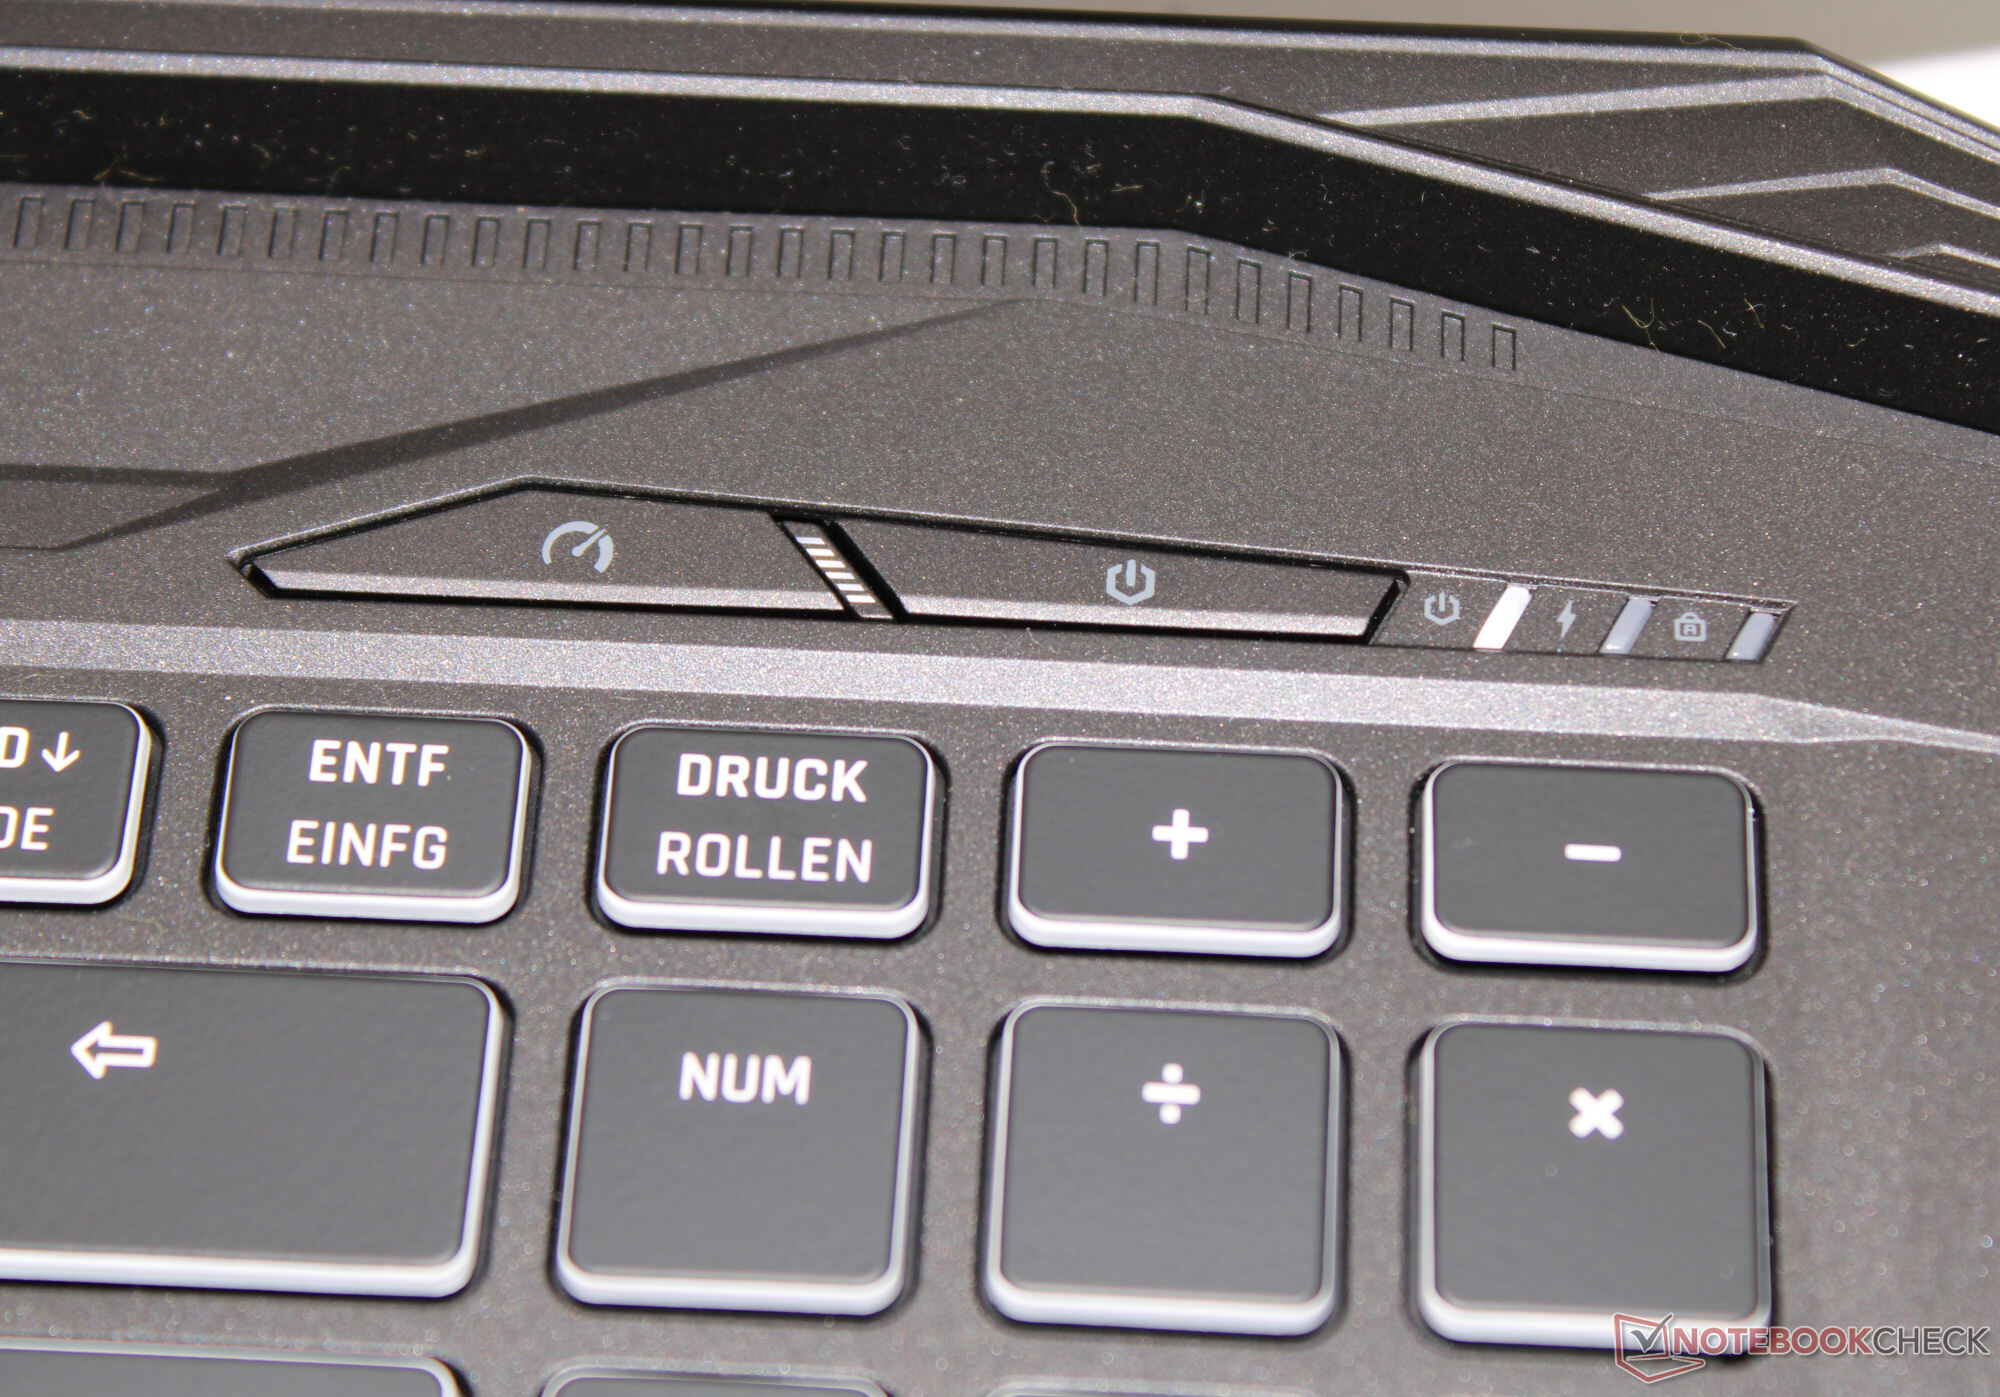
Condiciones de la prueba
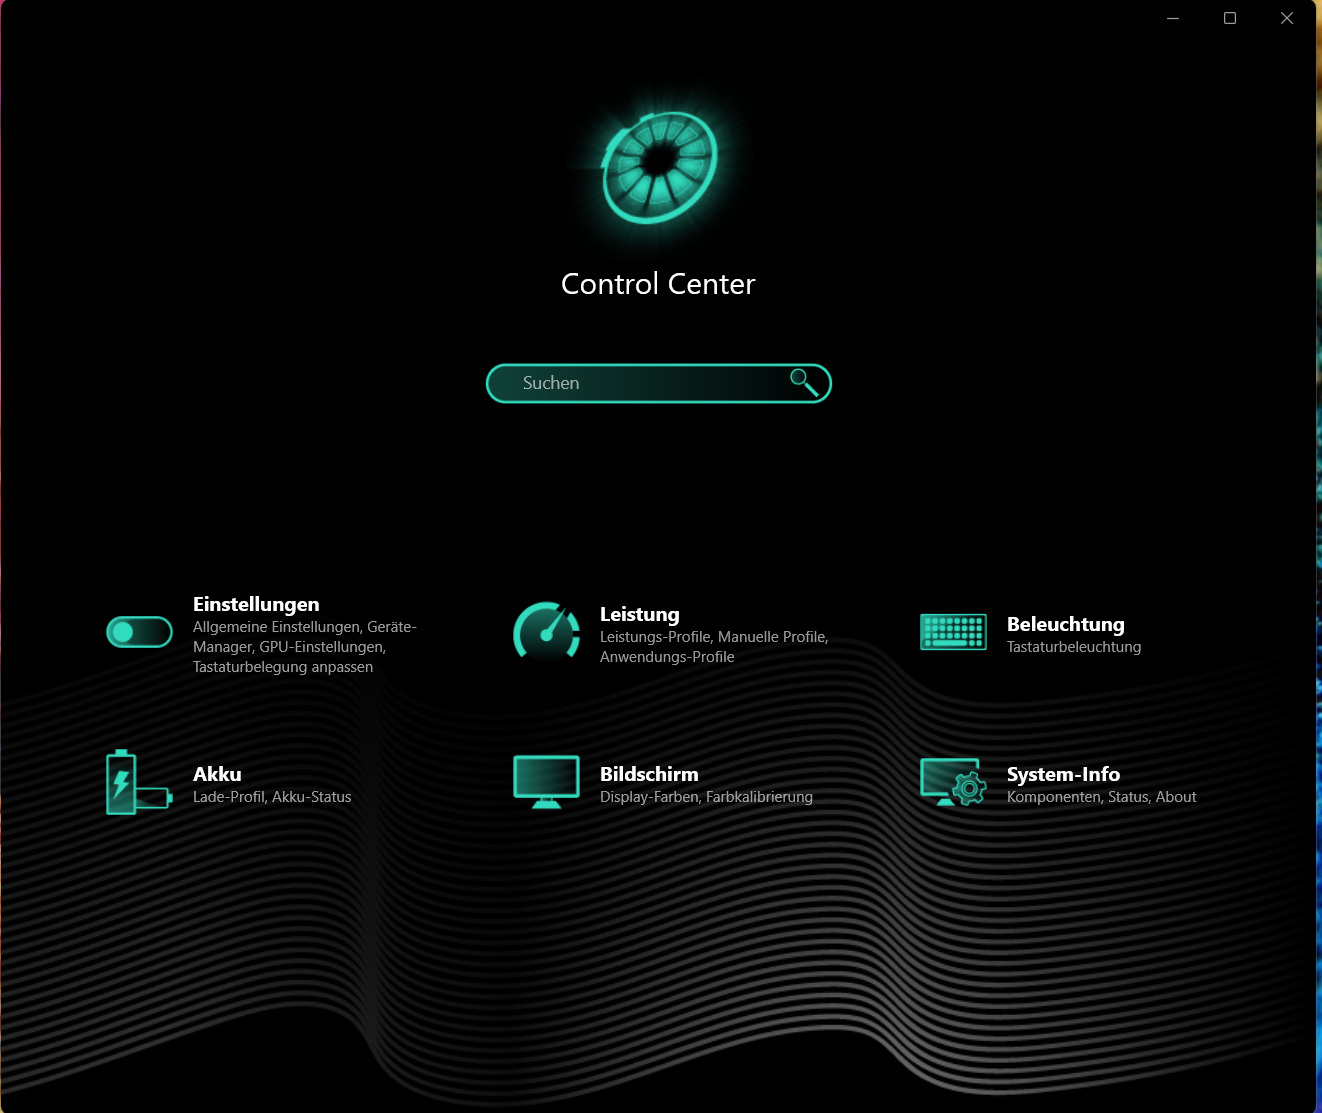
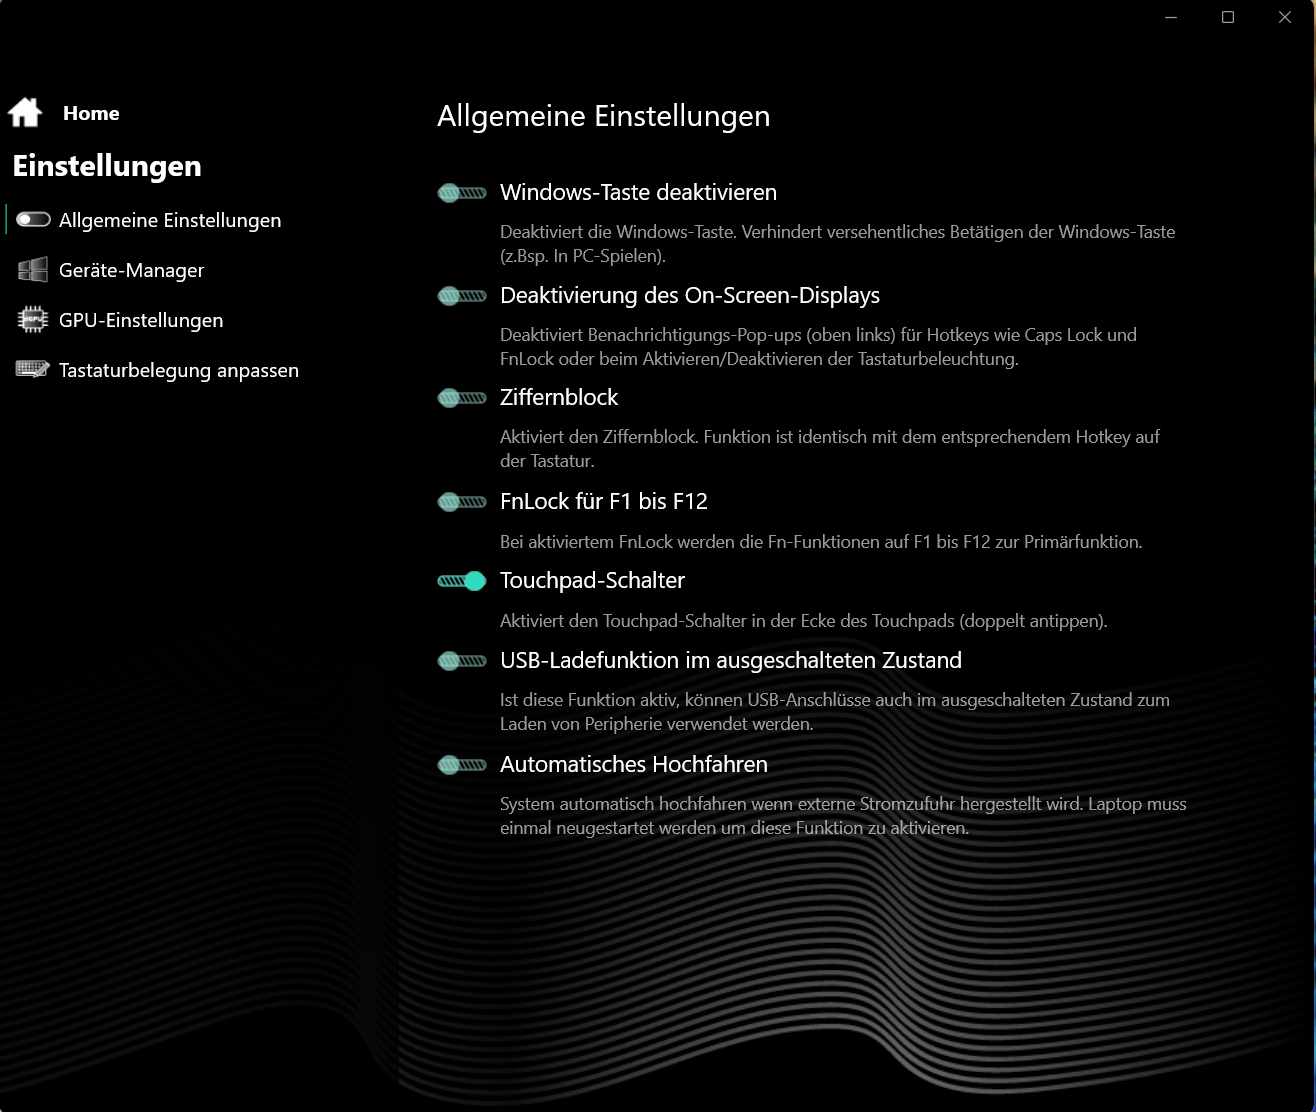
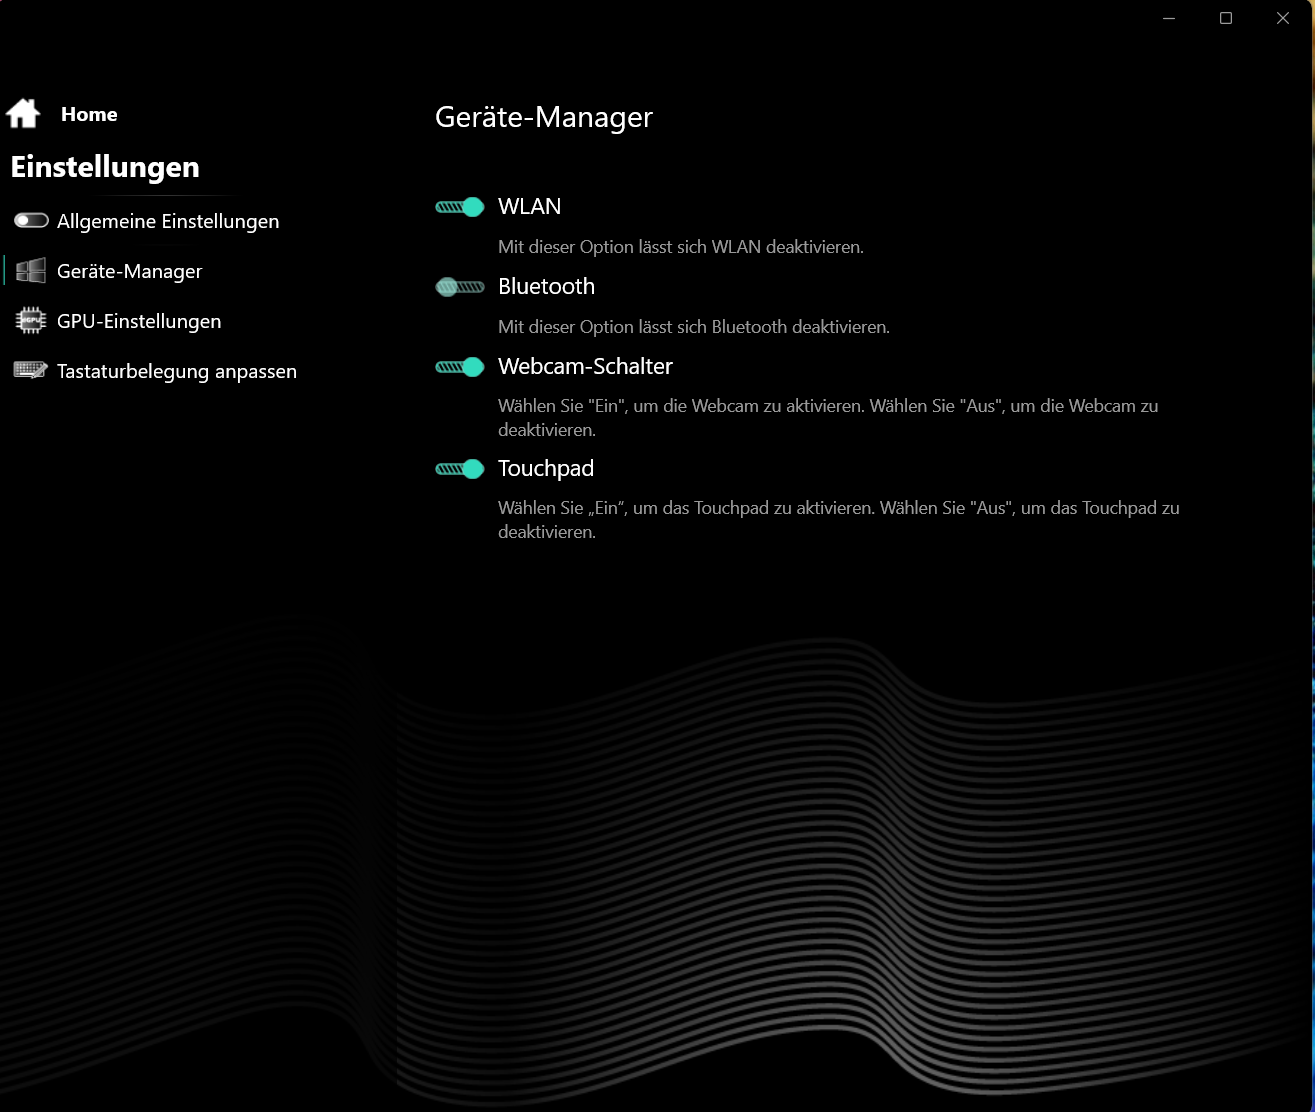
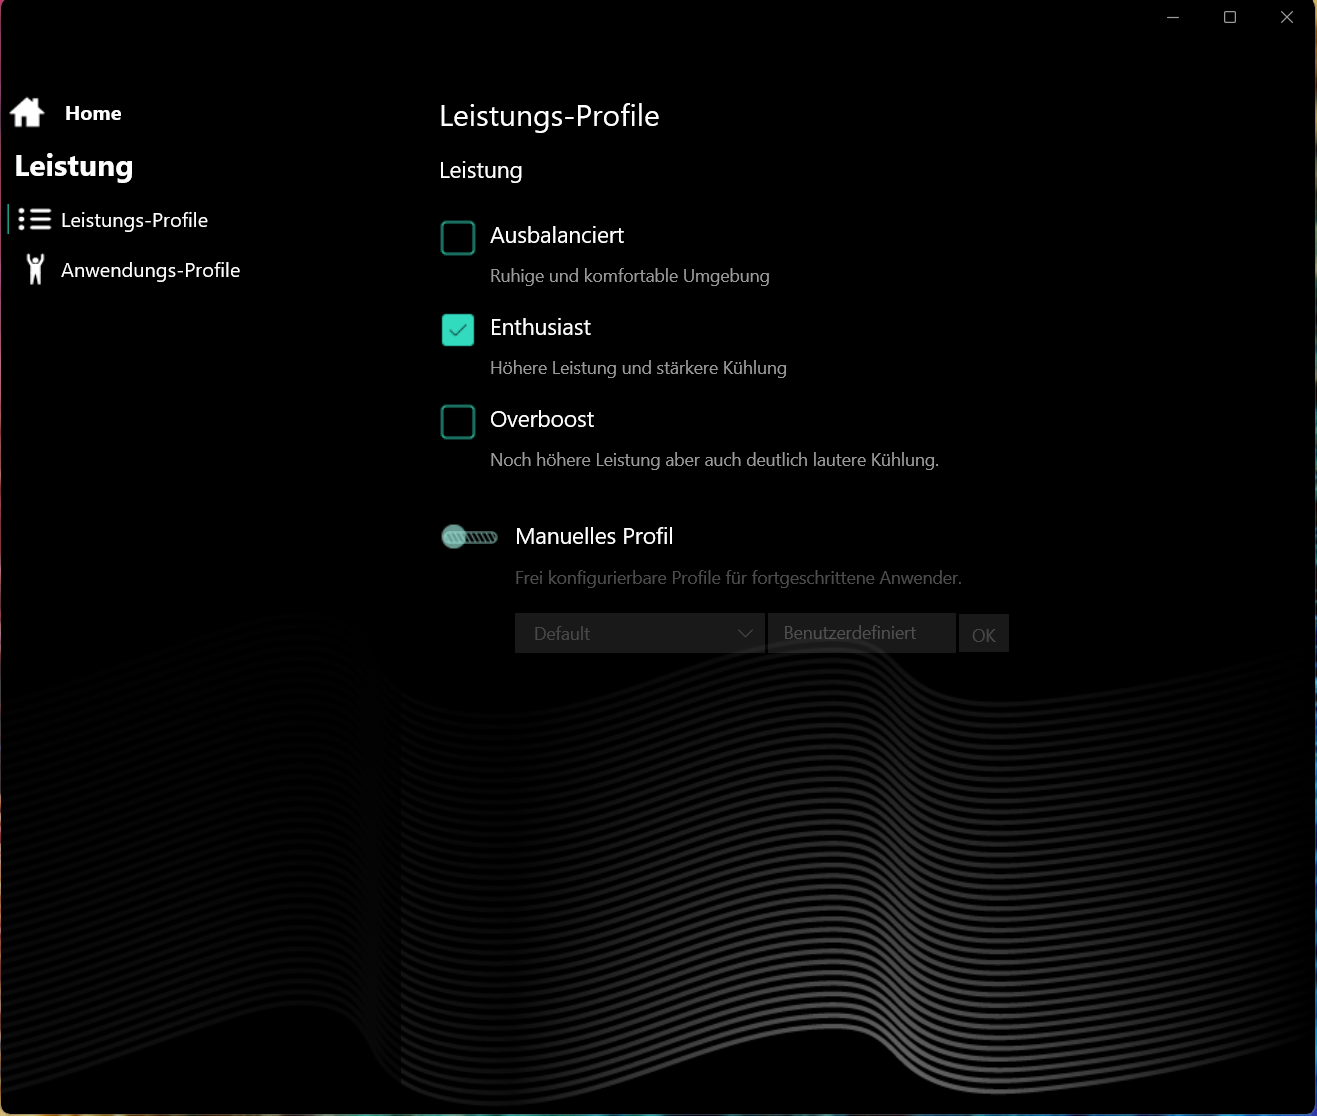
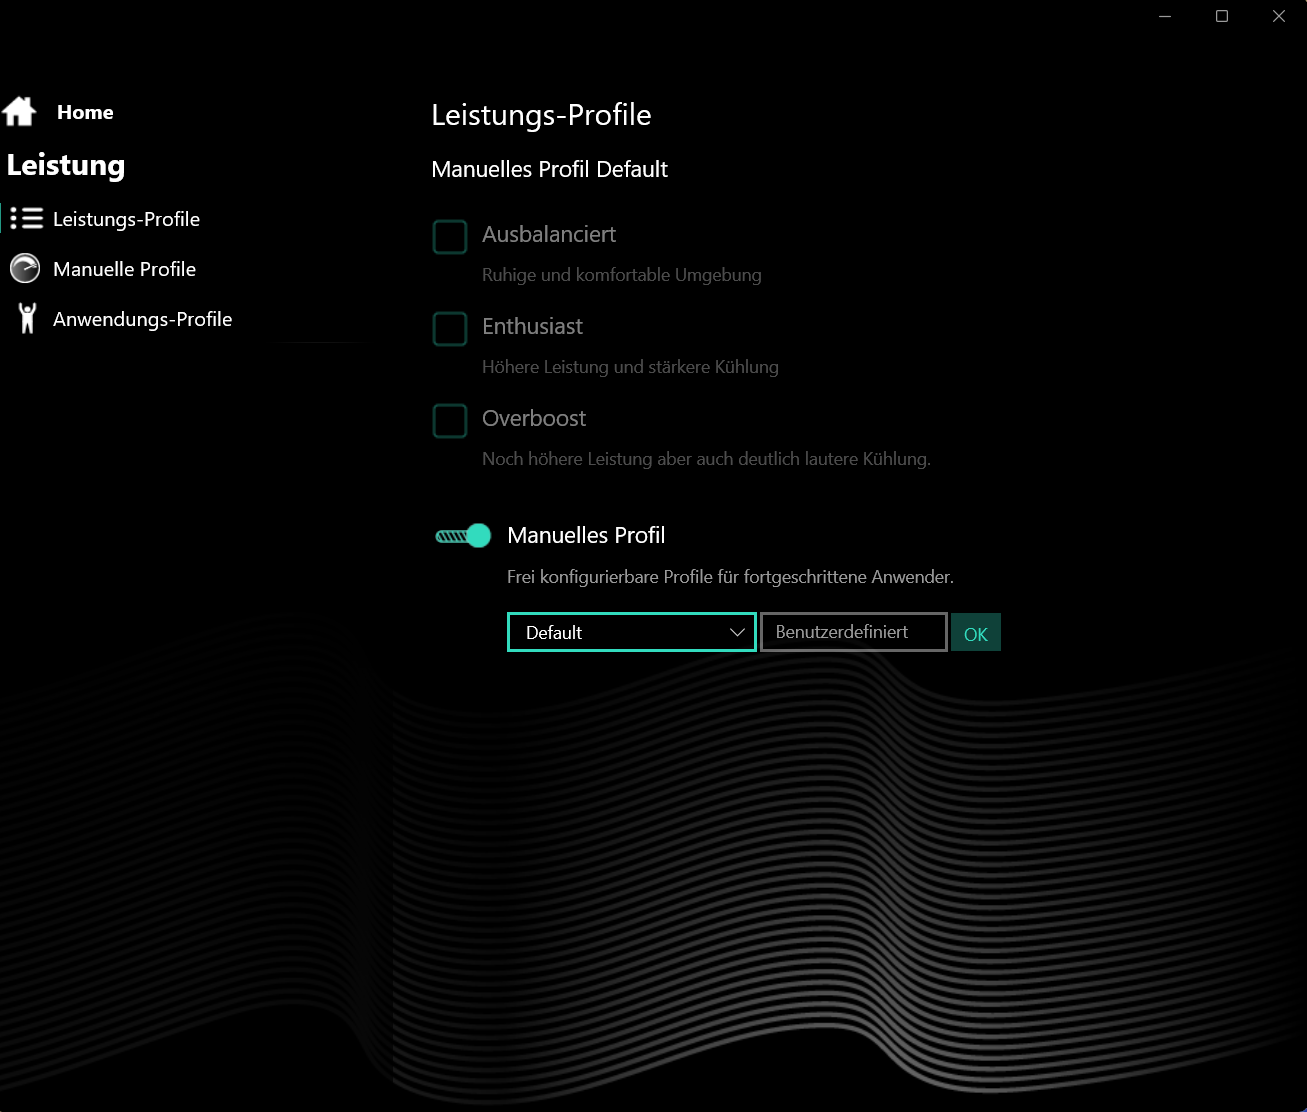
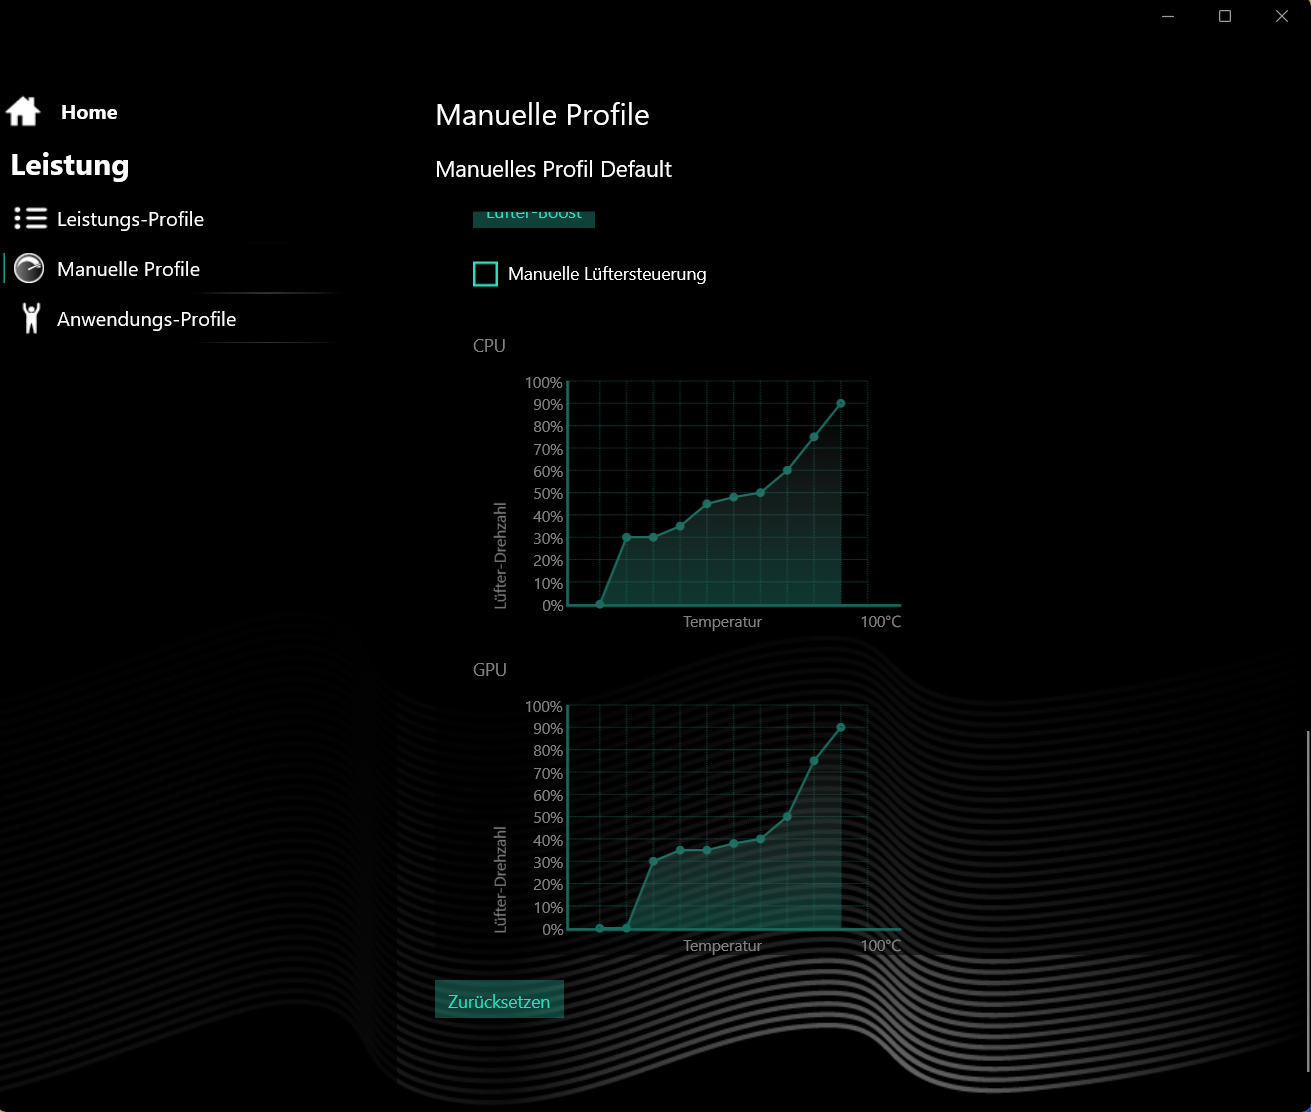
El Apex ofrece tres modos de rendimiento específicos del fabricante (ver tabla) entre los que puedes cambiar mediante una tecla independiente (junto al botón de encendido). Un LED de estado indica qué modo está activo. Utilizamos los modos "entusiasta" (pruebas de rendimiento) y "equilibrado" (pruebas de batería). Optimus estaba activo.
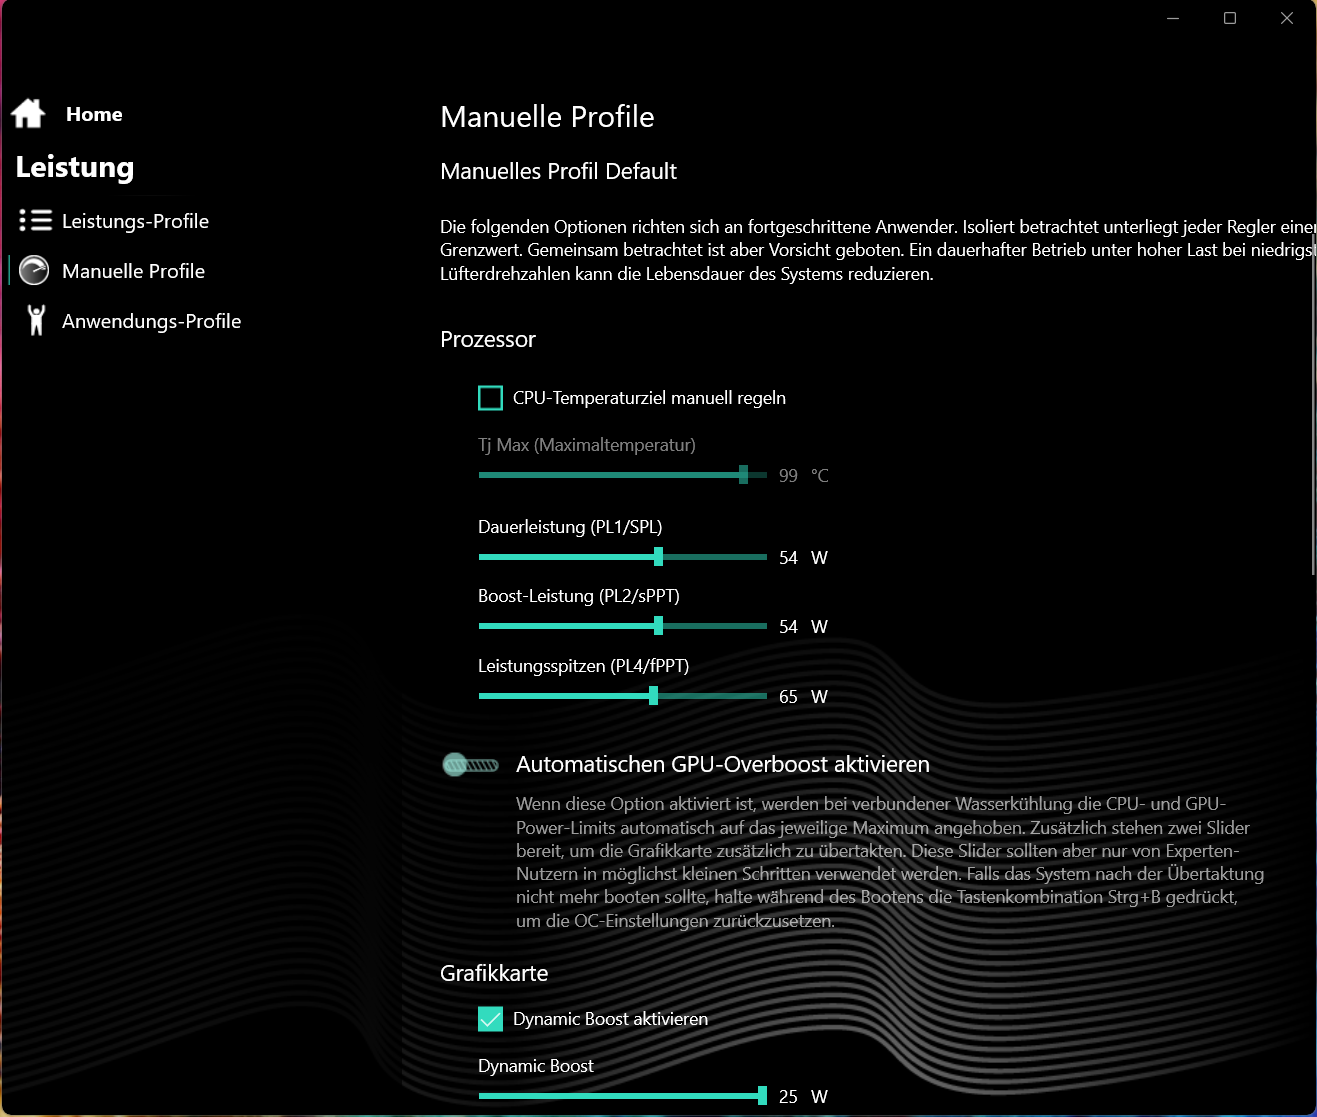
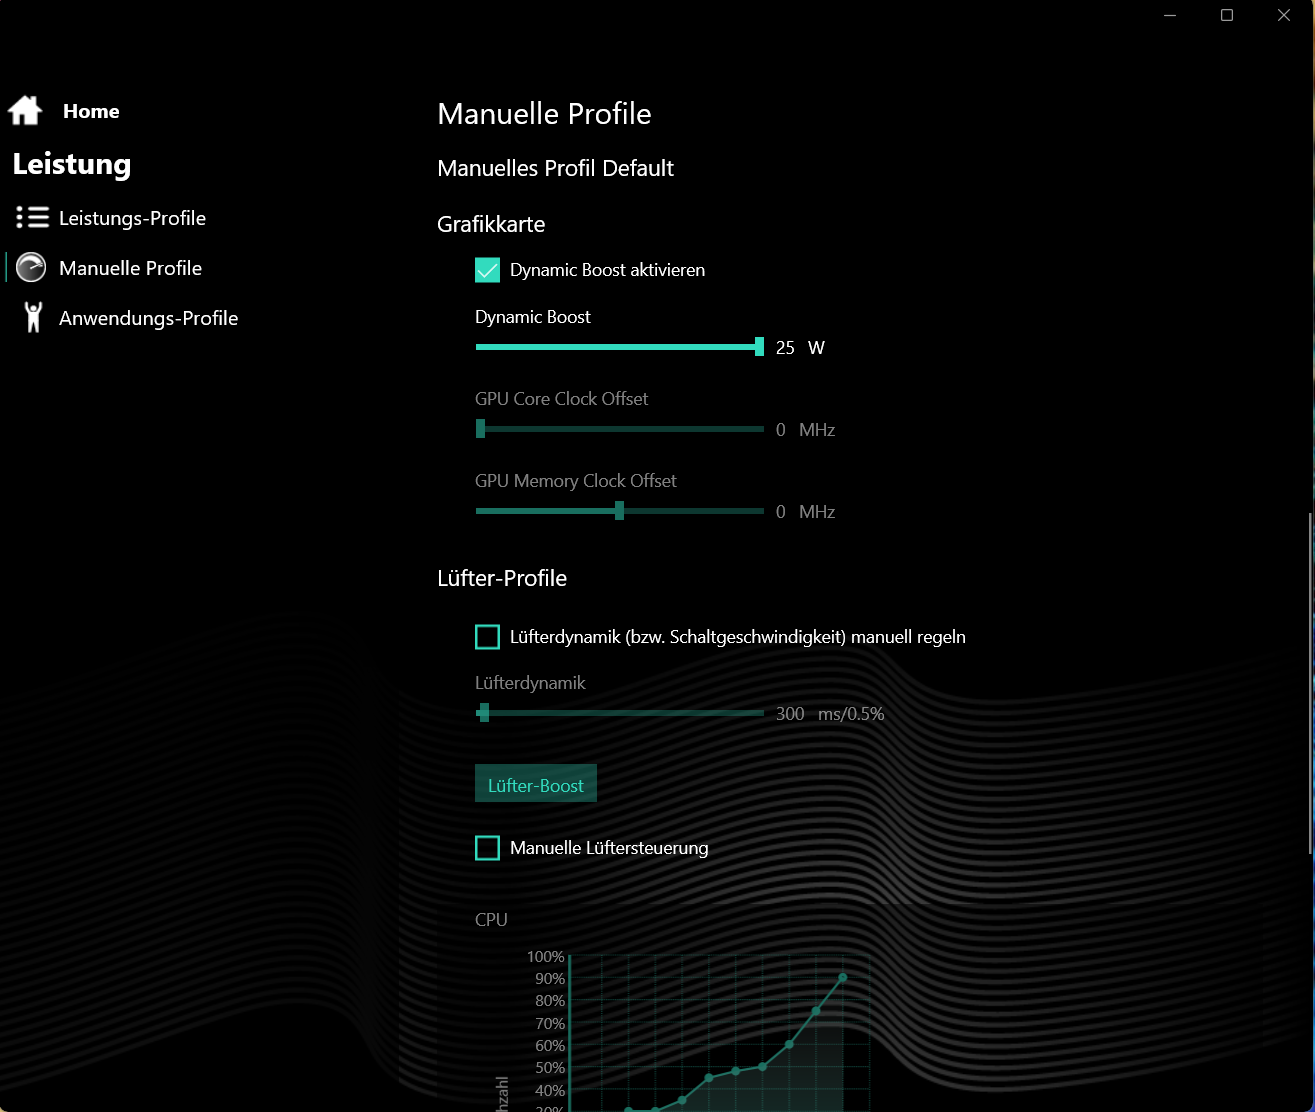
El Centro de Control preinstalado permite perfiles individuales: Esto permite ajustar, por ejemplo, los límites de potencia de la CPU, el TGP de la GPU y/o el control del ventilador.
| Entusiasta | Sobrealimentación | Equilibrada | |
|---|---|---|---|
| Límite de potencia 1 (HWInfo) | 54 vatios | 80 vatios | 35 vatios |
| Límite de potencia 2 (HWInfo) | 65 vatios | 80 vatios | 65 vatios |
| Ruido (Witcher 3) | ~50 dB(A) | ~54 dB(A) | ~34 dB(A) |
| Rendimiento (Witcher 3) | ~102 fps | ~105 fps | ~60 fps |
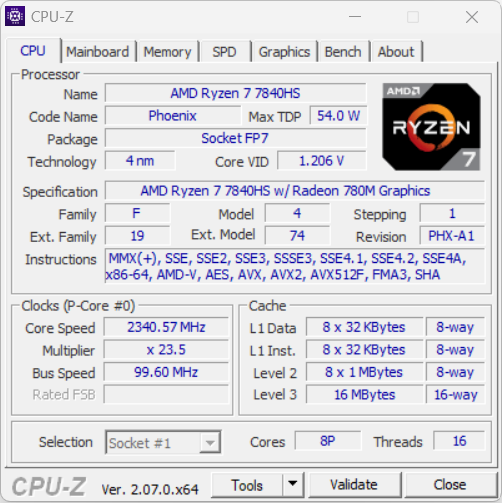
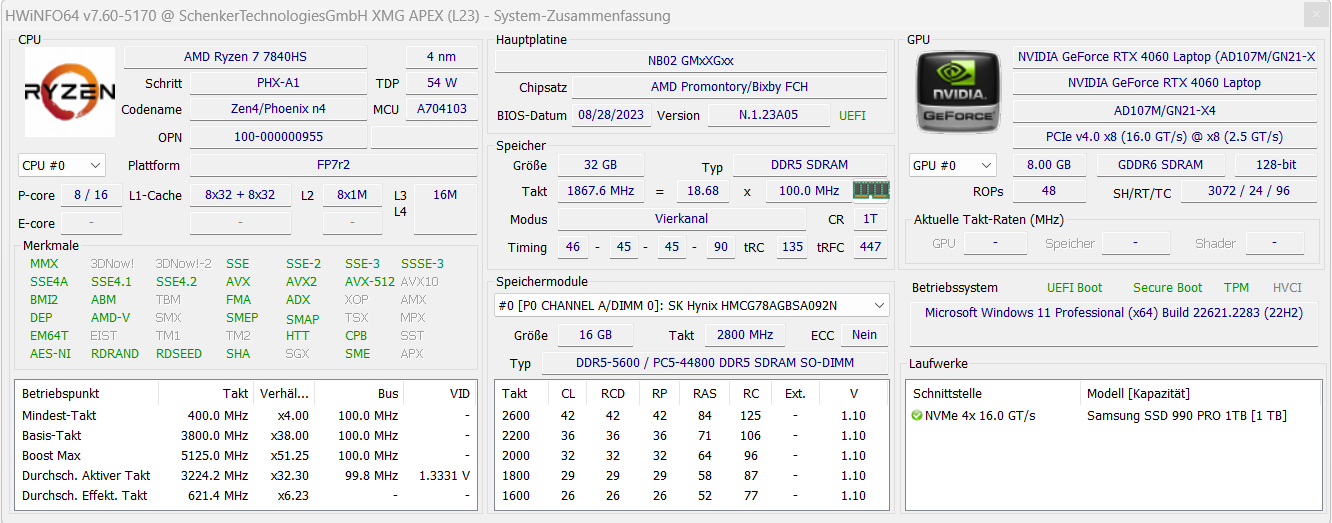
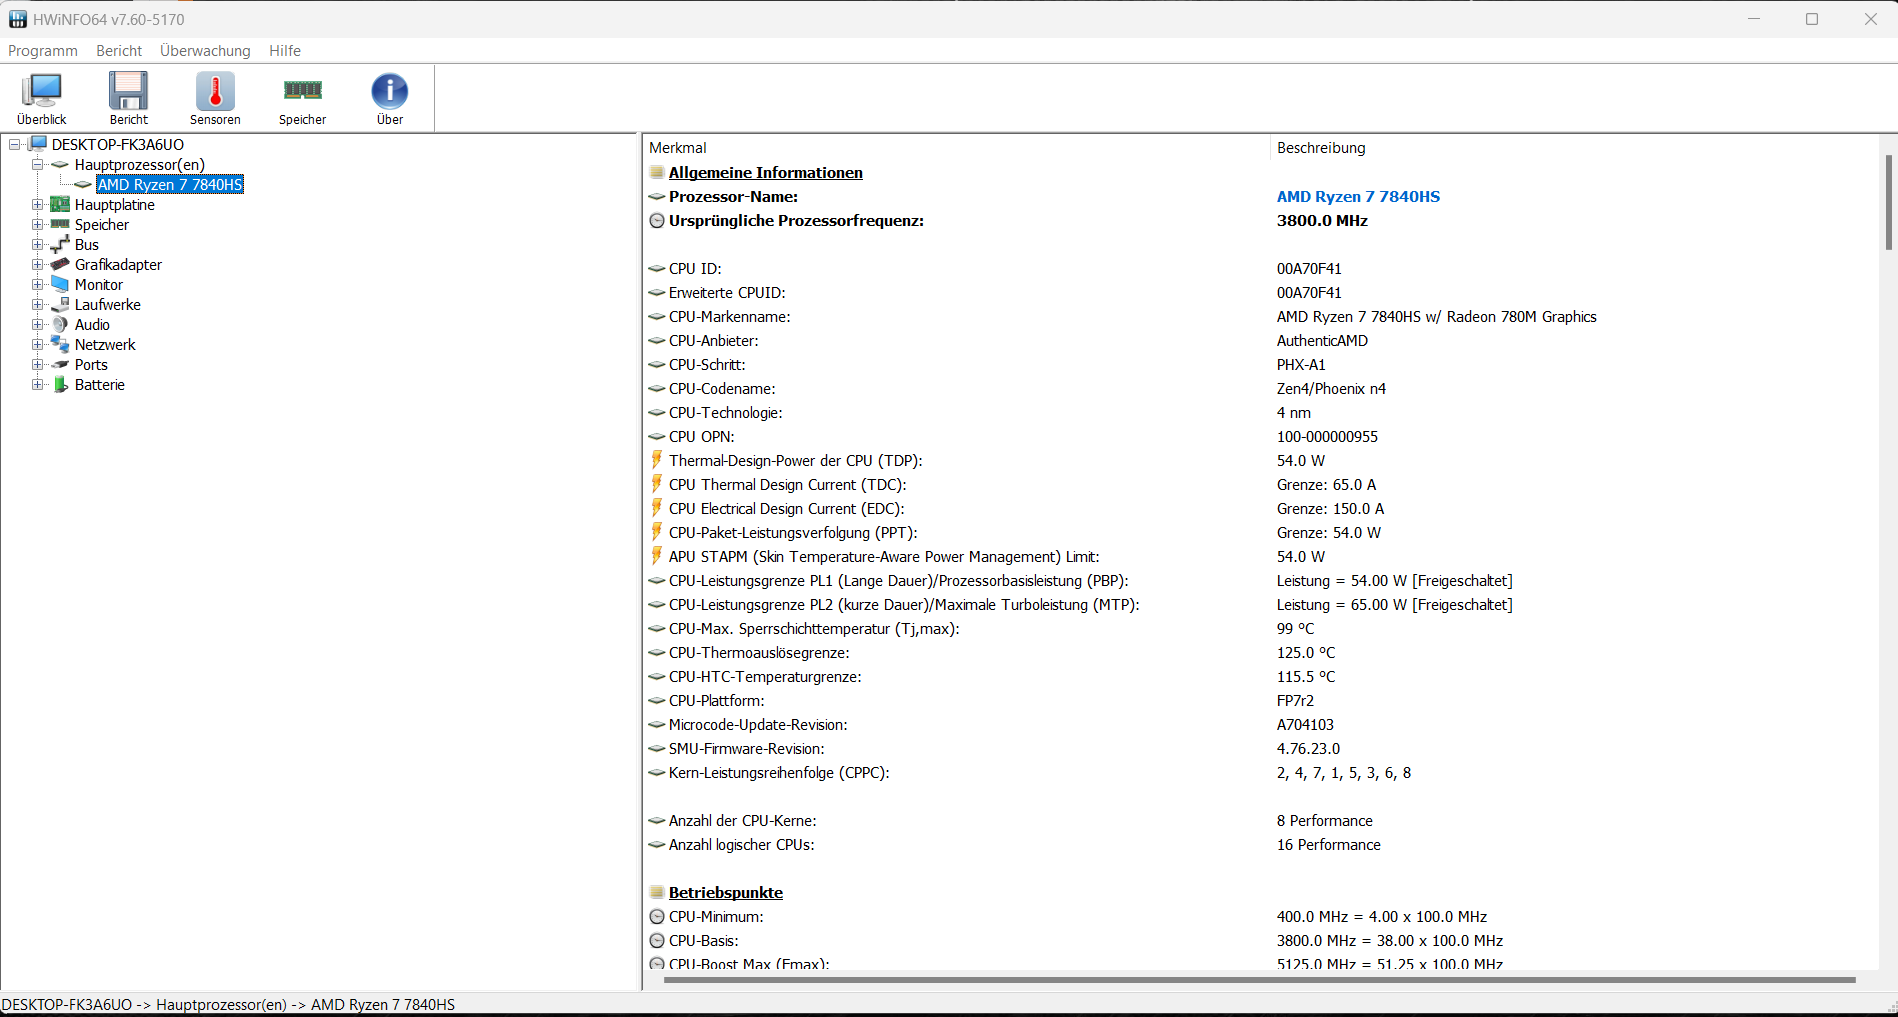
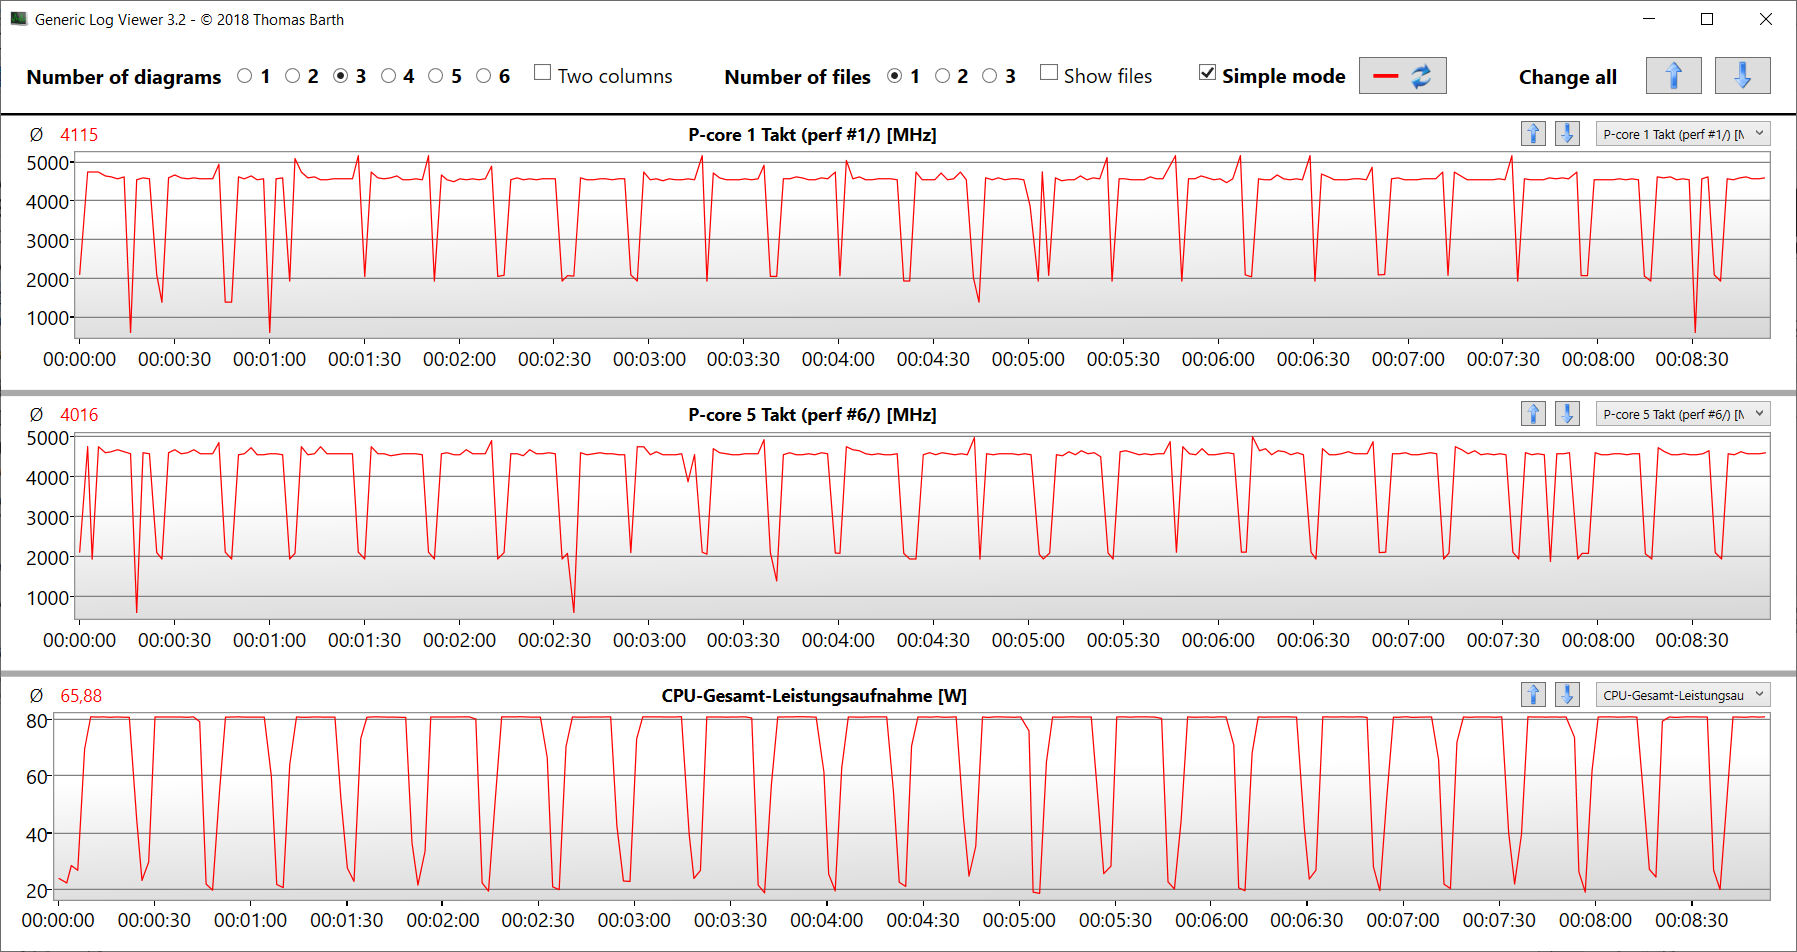
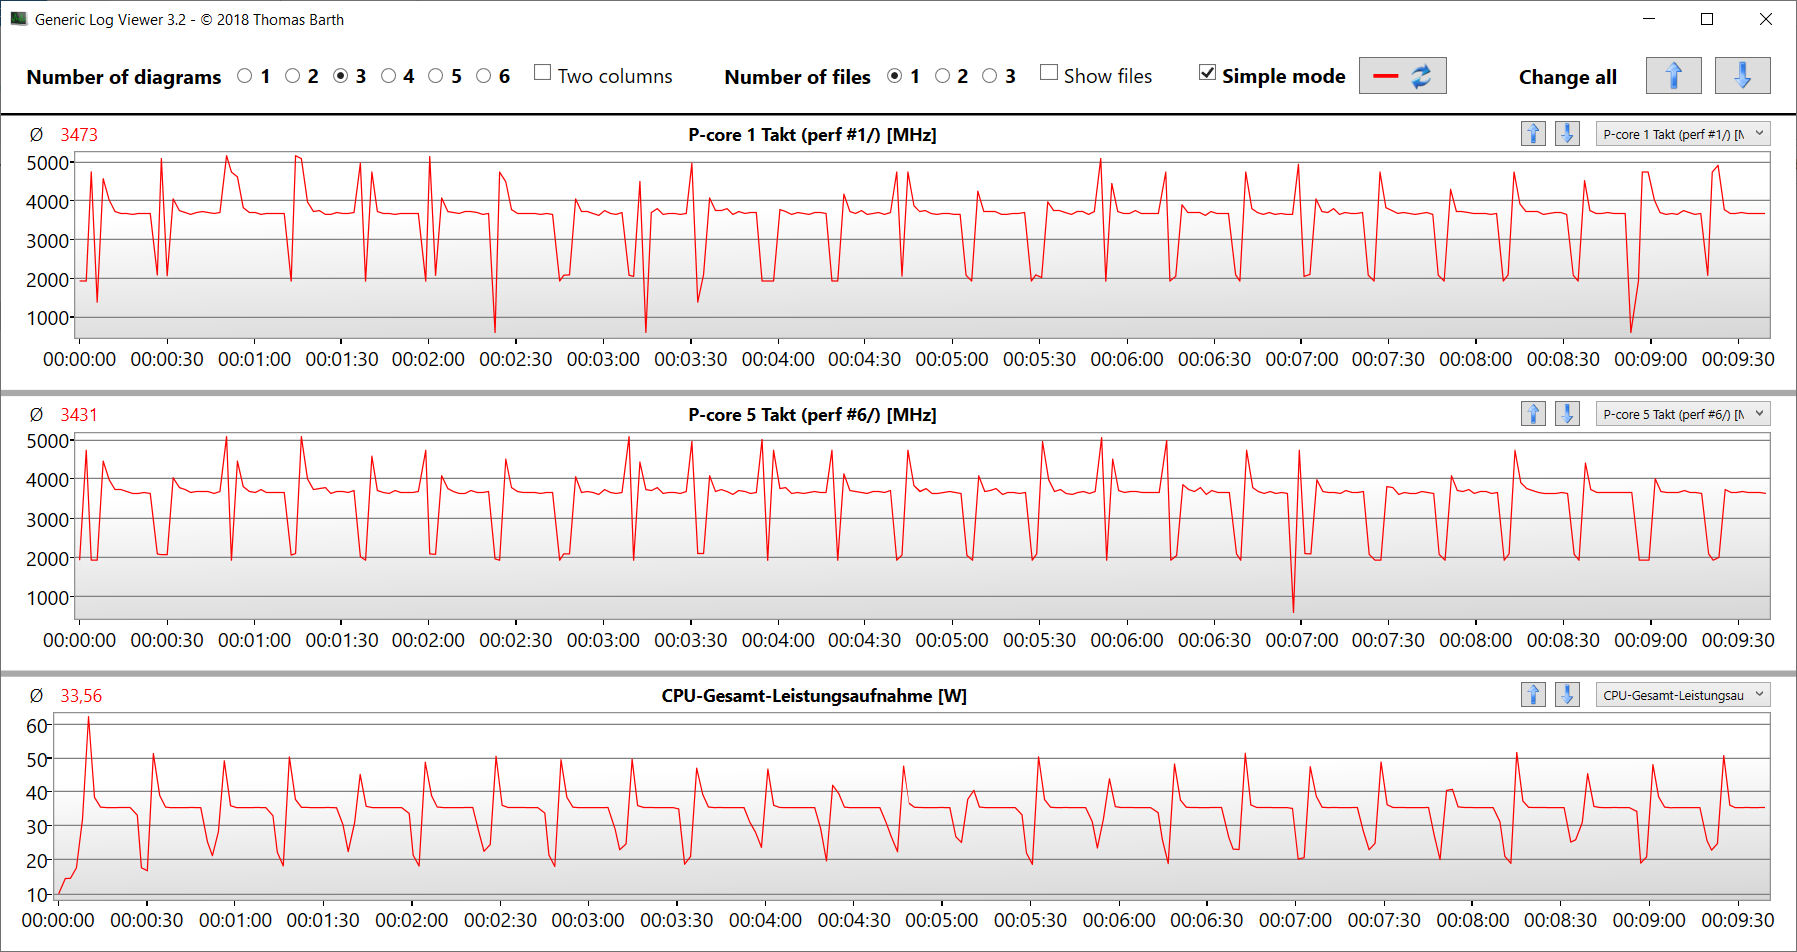
Procesador
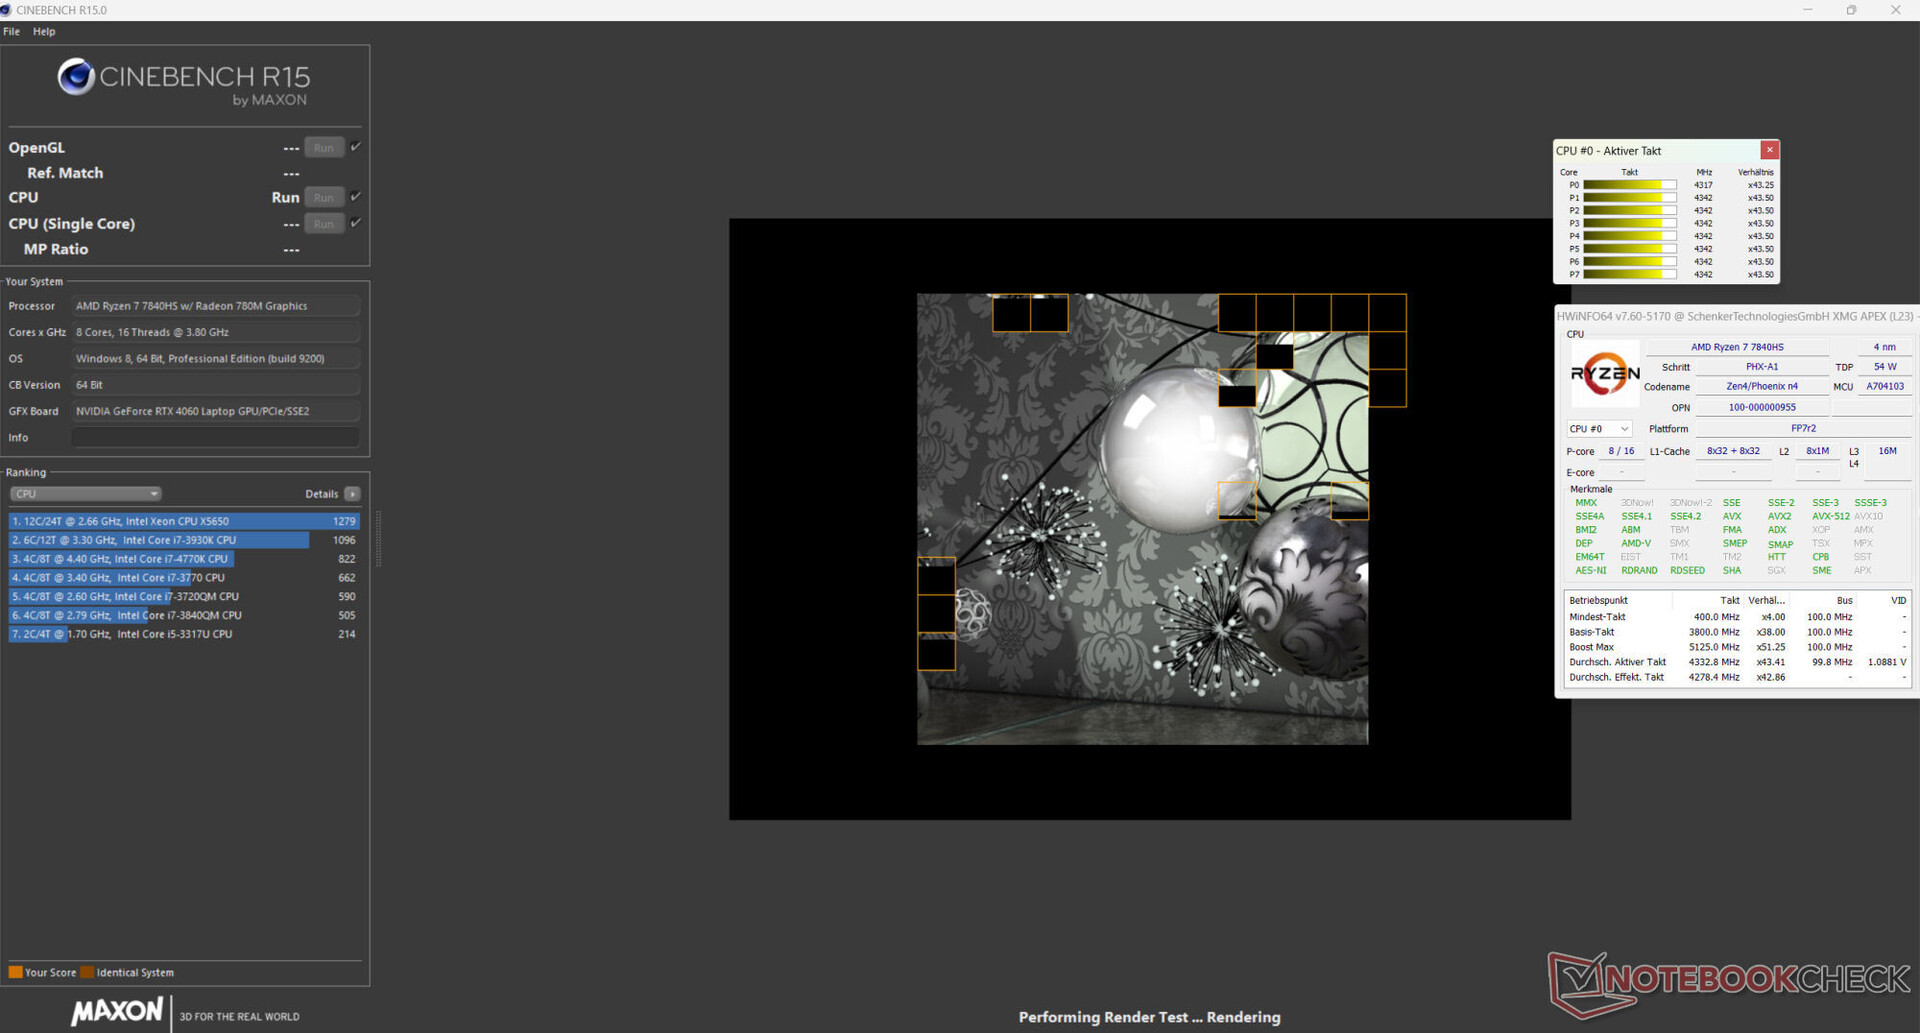
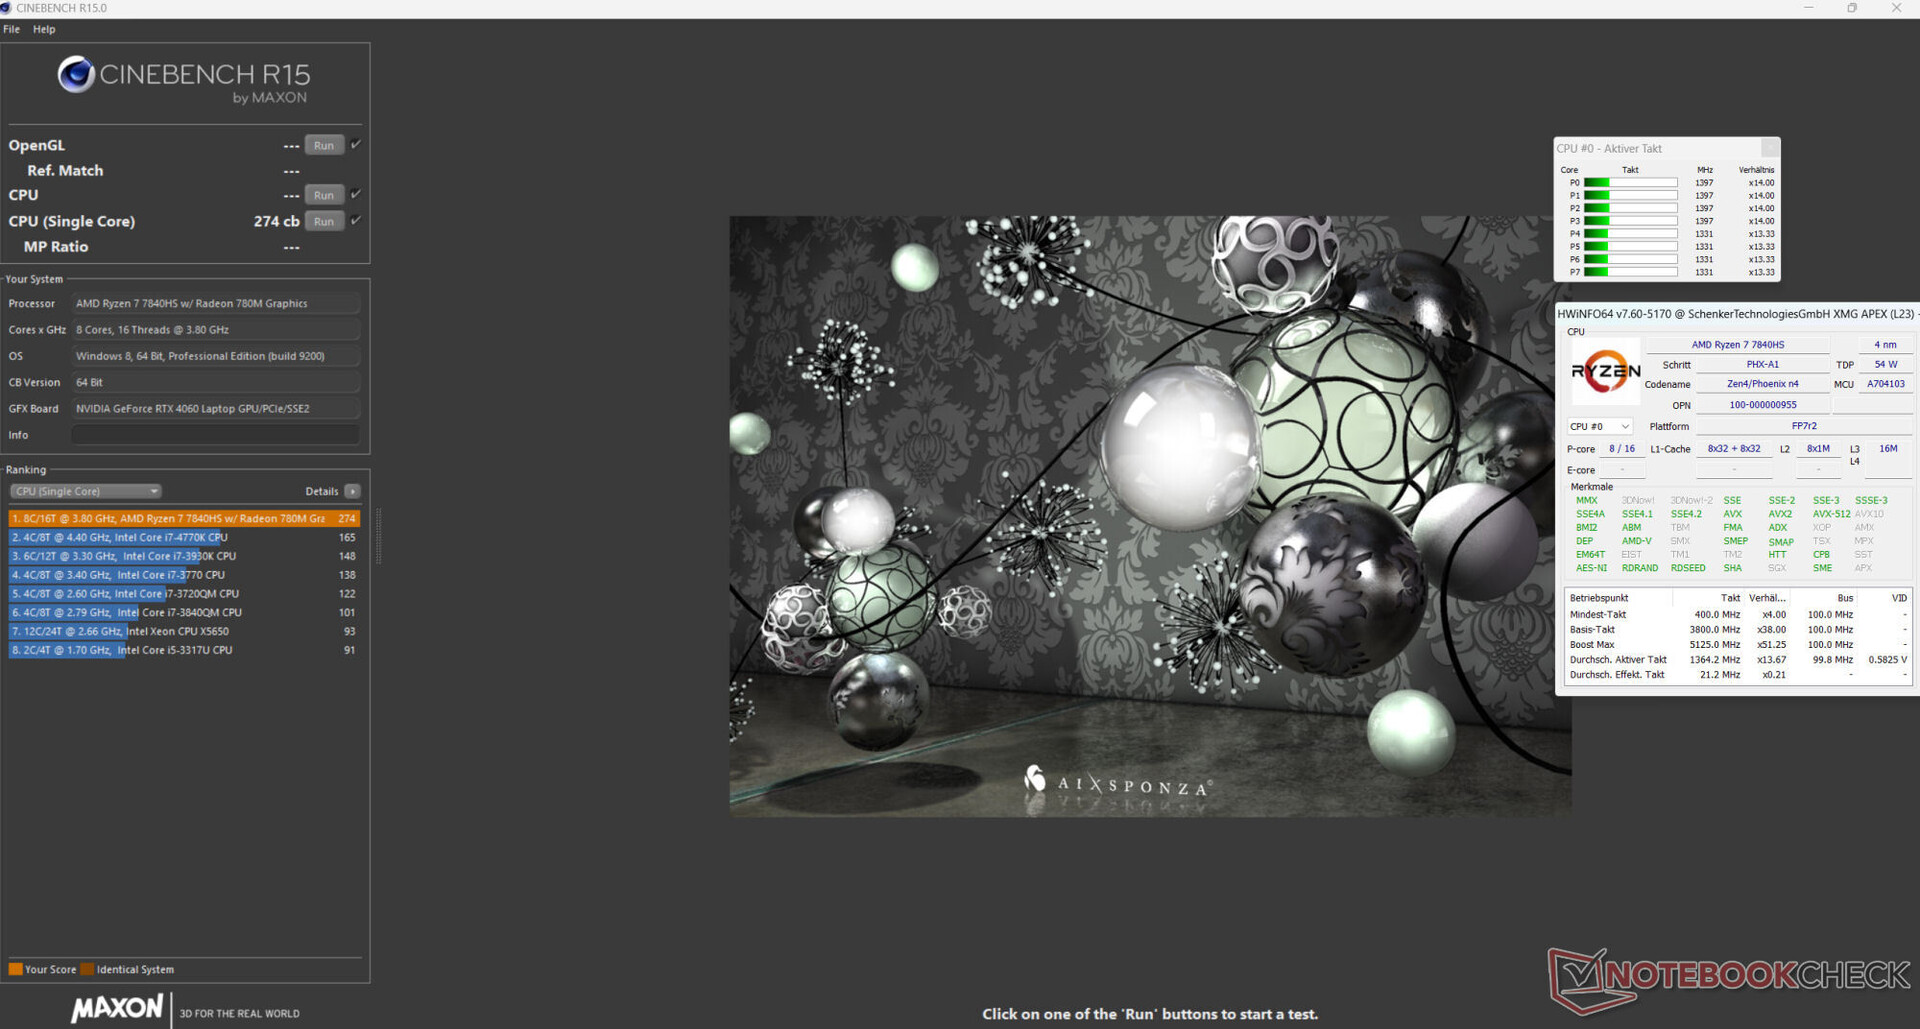
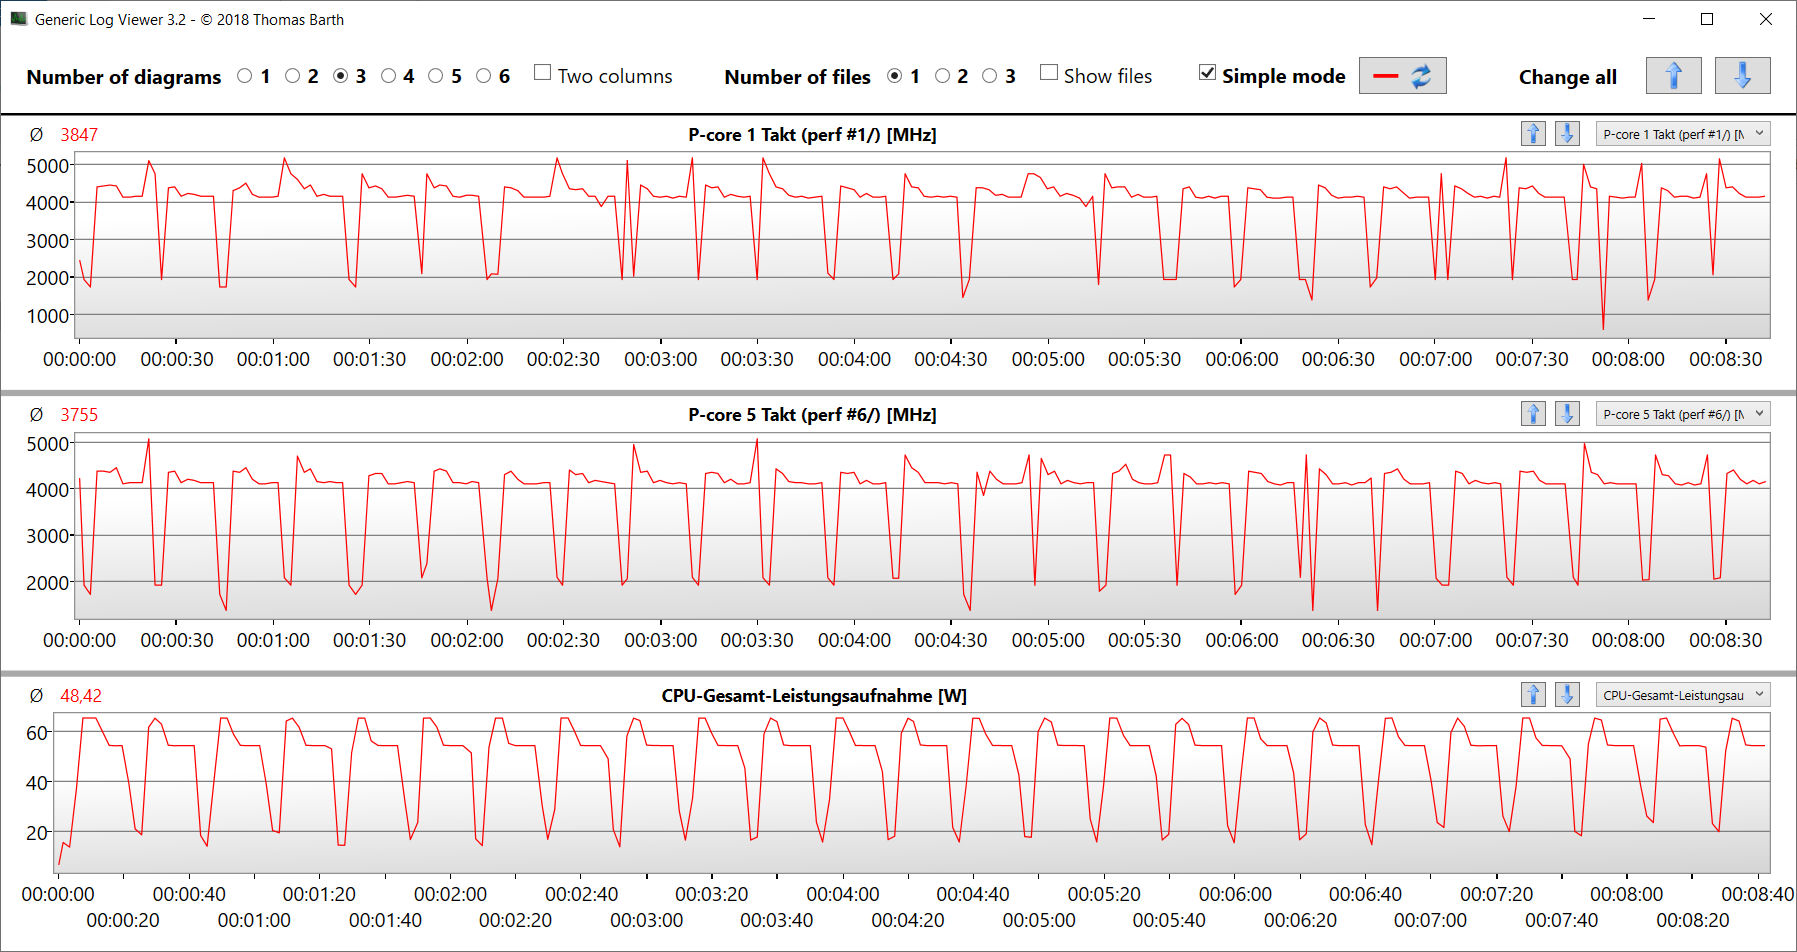
ElRyzen 7 7840HS(Phoenix, Zen 4) ofrece 8 núcleos de CPU con un total de 16 hilos a una velocidad de reloj máxima de 5,1 GHz (un núcleo). La CPU reconoce la carga multihilo continua (bucle CB15) con una velocidad turbo elevada y constante, independientemente del modo de rendimiento seleccionado.
En funcionamiento con red eléctrica, los resultados de los benchmarks se sitúan en torno a la media de la CPU. En modo batería, el rendimiento más relevante de un solo hilo (216 puntos) cae en menor medida que el rendimiento multihilo (1.715 puntos).
Nota: Puede encontrarse información más detallada sobre la arquitectura Zen 4 en este artículo de análisis de Análisis de AMD Ryzen 9 7940HS - Zen4 Phoenix es idealmente tan eficiente como Apple .
Cinebench R15 Multi Continuous Test
* ... más pequeño es mejor
AIDA64: FP32 Ray-Trace | FPU Julia | CPU SHA3 | CPU Queen | FPU SinJulia | FPU Mandel | CPU AES | CPU ZLib | FP64 Ray-Trace | CPU PhotoWorxx
| Performance rating | |
| Media de la clase Gaming | |
| Schenker XMG Apex 17 (Late 23) | |
| Medio AMD Ryzen 7 7840HS | |
| Alienware m16 R1 Intel | |
| Lenovo Legion Pro 5 16IRX8 | |
| Acer Nitro 17 AN17-51-71ER | |
| Medion Erazer Defender P40 | |
| MSI Katana 17 B13VFK | |
| AIDA64 / FP32 Ray-Trace | |
| Media de la clase Gaming (10227 - 85542, n=105, últimos 2 años) | |
| Medio AMD Ryzen 7 7840HS (22845 - 28921, n=21) | |
| Schenker XMG Apex 17 (Late 23) | |
| Lenovo Legion Pro 5 16IRX8 | |
| Alienware m16 R1 Intel | |
| Acer Nitro 17 AN17-51-71ER | |
| Medion Erazer Defender P40 | |
| MSI Katana 17 B13VFK | |
| AIDA64 / FPU Julia | |
| Media de la clase Gaming (51376 - 238426, n=105, últimos 2 años) | |
| Medio AMD Ryzen 7 7840HS (97164 - 123167, n=21) | |
| Schenker XMG Apex 17 (Late 23) | |
| Lenovo Legion Pro 5 16IRX8 | |
| Alienware m16 R1 Intel | |
| Acer Nitro 17 AN17-51-71ER | |
| Medion Erazer Defender P40 | |
| MSI Katana 17 B13VFK | |
| AIDA64 / CPU SHA3 | |
| Media de la clase Gaming (2180 - 10115, n=105, últimos 2 años) | |
| Alienware m16 R1 Intel | |
| Medio AMD Ryzen 7 7840HS (4293 - 5155, n=21) | |
| Lenovo Legion Pro 5 16IRX8 | |
| Schenker XMG Apex 17 (Late 23) | |
| Acer Nitro 17 AN17-51-71ER | |
| Medion Erazer Defender P40 | |
| MSI Katana 17 B13VFK | |
| AIDA64 / CPU Queen | |
| Media de la clase Gaming (49785 - 173351, n=90, últimos 2 años) | |
| Medio AMD Ryzen 7 7840HS (102271 - 125820, n=21) | |
| Schenker XMG Apex 17 (Late 23) | |
| Alienware m16 R1 Intel | |
| Lenovo Legion Pro 5 16IRX8 | |
| Medion Erazer Defender P40 | |
| Acer Nitro 17 AN17-51-71ER | |
| MSI Katana 17 B13VFK | |
| AIDA64 / FPU SinJulia | |
| Medio AMD Ryzen 7 7840HS (13767 - 15525, n=21) | |
| Schenker XMG Apex 17 (Late 23) | |
| Media de la clase Gaming (4424 - 33636, n=105, últimos 2 años) | |
| Alienware m16 R1 Intel | |
| Lenovo Legion Pro 5 16IRX8 | |
| Acer Nitro 17 AN17-51-71ER | |
| Medion Erazer Defender P40 | |
| MSI Katana 17 B13VFK | |
| AIDA64 / FPU Mandel | |
| Media de la clase Gaming (25115 - 128721, n=105, últimos 2 años) | |
| Medio AMD Ryzen 7 7840HS (52084 - 65812, n=21) | |
| Schenker XMG Apex 17 (Late 23) | |
| Lenovo Legion Pro 5 16IRX8 | |
| Alienware m16 R1 Intel | |
| Acer Nitro 17 AN17-51-71ER | |
| Medion Erazer Defender P40 | |
| MSI Katana 17 B13VFK | |
| AIDA64 / CPU AES | |
| Alienware m16 R1 Intel | |
| Schenker XMG Apex 17 (Late 23) | |
| Acer Nitro 17 AN17-51-71ER | |
| Medio AMD Ryzen 7 7840HS (67389 - 177158, n=21) | |
| Media de la clase Gaming (39258 - 247074, n=105, últimos 2 años) | |
| Lenovo Legion Pro 5 16IRX8 | |
| Medion Erazer Defender P40 | |
| MSI Katana 17 B13VFK | |
| AIDA64 / CPU ZLib | |
| Media de la clase Gaming (574 - 2531, n=105, últimos 2 años) | |
| Alienware m16 R1 Intel | |
| Lenovo Legion Pro 5 16IRX8 | |
| Acer Nitro 17 AN17-51-71ER | |
| Medio AMD Ryzen 7 7840HS (944 - 1123, n=21) | |
| Schenker XMG Apex 17 (Late 23) | |
| Medion Erazer Defender P40 | |
| MSI Katana 17 B13VFK | |
| AIDA64 / FP64 Ray-Trace | |
| Media de la clase Gaming (5509 - 45446, n=105, últimos 2 años) | |
| Medio AMD Ryzen 7 7840HS (12248 - 15599, n=21) | |
| Schenker XMG Apex 17 (Late 23) | |
| Lenovo Legion Pro 5 16IRX8 | |
| Alienware m16 R1 Intel | |
| Acer Nitro 17 AN17-51-71ER | |
| Medion Erazer Defender P40 | |
| MSI Katana 17 B13VFK | |
| AIDA64 / CPU PhotoWorxx | |
| Media de la clase Gaming (12271 - 89891, n=105, últimos 2 años) | |
| Acer Nitro 17 AN17-51-71ER | |
| Medio AMD Ryzen 7 7840HS (17615 - 41516, n=21) | |
| Lenovo Legion Pro 5 16IRX8 | |
| Schenker XMG Apex 17 (Late 23) | |
| Medion Erazer Defender P40 | |
| Alienware m16 R1 Intel | |
| MSI Katana 17 B13VFK | |
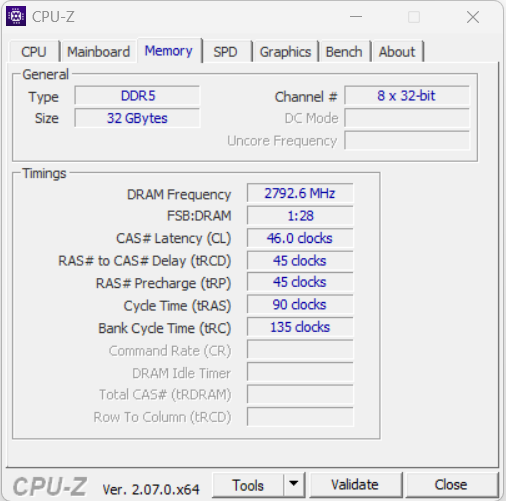
Rendimiento del sistema
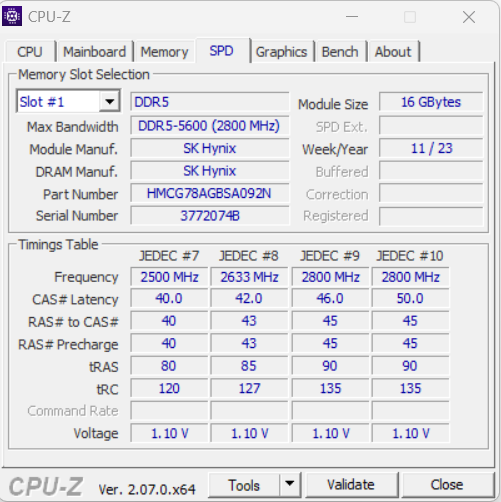
El buen funcionamiento del sistema está diseñado para manejar escenarios de uso exigentes en rendimiento, como el renderizado y los juegos; los buenos resultados de PC Mark lo confirman. Las tasas de transferencia de la RAM están en un nivel normal para una RAM DDR5 5600.
CrossMark: Overall | Productivity | Creativity | Responsiveness
| PCMark 10 / Score | |
| Media de la clase Gaming (5828 - 12414, n=93, últimos 2 años) | |
| Schenker XMG Apex 17 (Late 23) | |
| Medio AMD Ryzen 7 7840HS, NVIDIA GeForce RTX 4060 Laptop GPU (7502 - 7946, n=4) | |
| Lenovo Legion Pro 5 16IRX8 | |
| Alienware m16 R1 Intel | |
| MSI Katana 17 B13VFK | |
| Acer Nitro 17 AN17-51-71ER | |
| Medion Erazer Defender P40 | |
| PCMark 10 / Essentials | |
| Lenovo Legion Pro 5 16IRX8 | |
| Medio AMD Ryzen 7 7840HS, NVIDIA GeForce RTX 4060 Laptop GPU (10441 - 11169, n=4) | |
| MSI Katana 17 B13VFK | |
| Alienware m16 R1 Intel | |
| Schenker XMG Apex 17 (Late 23) | |
| Media de la clase Gaming (8810 - 11935, n=97, últimos 2 años) | |
| Acer Nitro 17 AN17-51-71ER | |
| Medion Erazer Defender P40 | |
| PCMark 10 / Productivity | |
| Media de la clase Gaming (6845 - 25323, n=95, últimos 2 años) | |
| Schenker XMG Apex 17 (Late 23) | |
| Medio AMD Ryzen 7 7840HS, NVIDIA GeForce RTX 4060 Laptop GPU (9575 - 10273, n=4) | |
| Medion Erazer Defender P40 | |
| Alienware m16 R1 Intel | |
| MSI Katana 17 B13VFK | |
| Lenovo Legion Pro 5 16IRX8 | |
| Acer Nitro 17 AN17-51-71ER | |
| PCMark 10 / Digital Content Creation | |
| Media de la clase Gaming (7602 - 19954, n=95, últimos 2 años) | |
| Lenovo Legion Pro 5 16IRX8 | |
| Schenker XMG Apex 17 (Late 23) | |
| Medio AMD Ryzen 7 7840HS, NVIDIA GeForce RTX 4060 Laptop GPU (11464 - 12418, n=4) | |
| Acer Nitro 17 AN17-51-71ER | |
| Alienware m16 R1 Intel | |
| MSI Katana 17 B13VFK | |
| Medion Erazer Defender P40 | |
| CrossMark / Overall | |
| Alienware m16 R1 Intel | |
| Media de la clase Gaming (1366 - 2409, n=94, últimos 2 años) | |
| MSI Katana 17 B13VFK | |
| Medio AMD Ryzen 7 7840HS, NVIDIA GeForce RTX 4060 Laptop GPU (1800 - 1866, n=3) | |
| Schenker XMG Apex 17 (Late 23) | |
| Medion Erazer Defender P40 | |
| Lenovo Legion Pro 5 16IRX8 | |
| Acer Nitro 17 AN17-51-71ER | |
| CrossMark / Productivity | |
| Alienware m16 R1 Intel | |
| Media de la clase Gaming (1386 - 2254, n=94, últimos 2 años) | |
| Medio AMD Ryzen 7 7840HS, NVIDIA GeForce RTX 4060 Laptop GPU (1743 - 1821, n=3) | |
| MSI Katana 17 B13VFK | |
| Schenker XMG Apex 17 (Late 23) | |
| Medion Erazer Defender P40 | |
| Lenovo Legion Pro 5 16IRX8 | |
| Acer Nitro 17 AN17-51-71ER | |
| CrossMark / Creativity | |
| Media de la clase Gaming (1343 - 2786, n=94, últimos 2 años) | |
| Alienware m16 R1 Intel | |
| MSI Katana 17 B13VFK | |
| Medion Erazer Defender P40 | |
| Medio AMD Ryzen 7 7840HS, NVIDIA GeForce RTX 4060 Laptop GPU (1908 - 1966, n=3) | |
| Schenker XMG Apex 17 (Late 23) | |
| Lenovo Legion Pro 5 16IRX8 | |
| Acer Nitro 17 AN17-51-71ER | |
| CrossMark / Responsiveness | |
| Alienware m16 R1 Intel | |
| MSI Katana 17 B13VFK | |
| Media de la clase Gaming (1226 - 2334, n=94, últimos 2 años) | |
| Schenker XMG Apex 17 (Late 23) | |
| Lenovo Legion Pro 5 16IRX8 | |
| Medio AMD Ryzen 7 7840HS, NVIDIA GeForce RTX 4060 Laptop GPU (1522 - 1776, n=3) | |
| Acer Nitro 17 AN17-51-71ER | |
| Medion Erazer Defender P40 | |
| PCMark 10 Score | 7854 puntos | |
ayuda | ||
| AIDA64 / Memory Copy | |
| Media de la clase Gaming (21750 - 129946, n=105, últimos 2 años) | |
| Schenker XMG Apex 17 (Late 23) | |
| Medio AMD Ryzen 7 7840HS (30937 - 72158, n=21) | |
| Lenovo Legion Pro 5 16IRX8 | |
| Acer Nitro 17 AN17-51-71ER | |
| Medion Erazer Defender P40 | |
| Alienware m16 R1 Intel | |
| MSI Katana 17 B13VFK | |
| AIDA64 / Memory Read | |
| Media de la clase Gaming (22956 - 118858, n=105, últimos 2 años) | |
| Lenovo Legion Pro 5 16IRX8 | |
| Medion Erazer Defender P40 | |
| Alienware m16 R1 Intel | |
| Acer Nitro 17 AN17-51-71ER | |
| Schenker XMG Apex 17 (Late 23) | |
| MSI Katana 17 B13VFK | |
| Medio AMD Ryzen 7 7840HS (30497 - 62147, n=21) | |
| AIDA64 / Memory Write | |
| Schenker XMG Apex 17 (Late 23) | |
| Medio AMD Ryzen 7 7840HS (34590 - 93323, n=21) | |
| Media de la clase Gaming (22297 - 135096, n=105, últimos 2 años) | |
| Lenovo Legion Pro 5 16IRX8 | |
| Acer Nitro 17 AN17-51-71ER | |
| Alienware m16 R1 Intel | |
| Medion Erazer Defender P40 | |
| MSI Katana 17 B13VFK | |
| AIDA64 / Memory Latency | |
| Acer Nitro 17 AN17-51-71ER | |
| Media de la clase Gaming (75.3 - 259, n=105, últimos 2 años) | |
| MSI Katana 17 B13VFK | |
| Medion Erazer Defender P40 | |
| Medio AMD Ryzen 7 7840HS (85.1 - 112, n=21) | |
| Alienware m16 R1 Intel | |
| Schenker XMG Apex 17 (Late 23) | |
| Lenovo Legion Pro 5 16IRX8 | |
* ... más pequeño es mejor
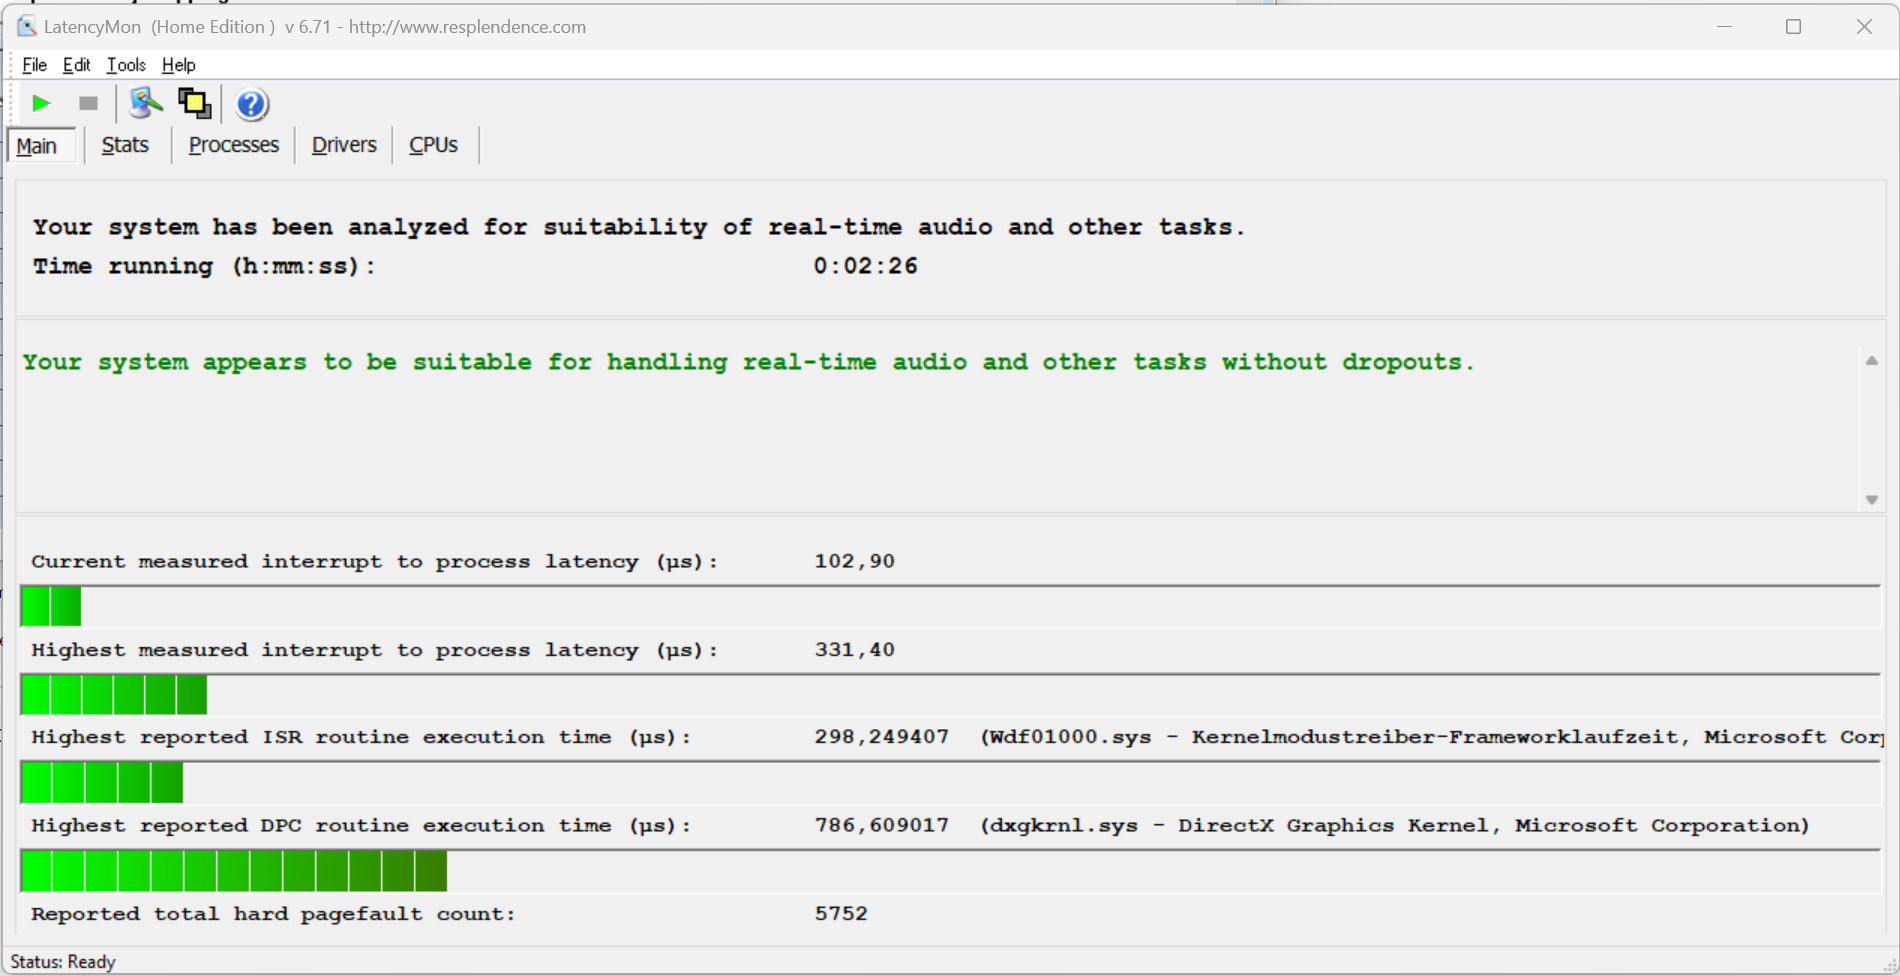
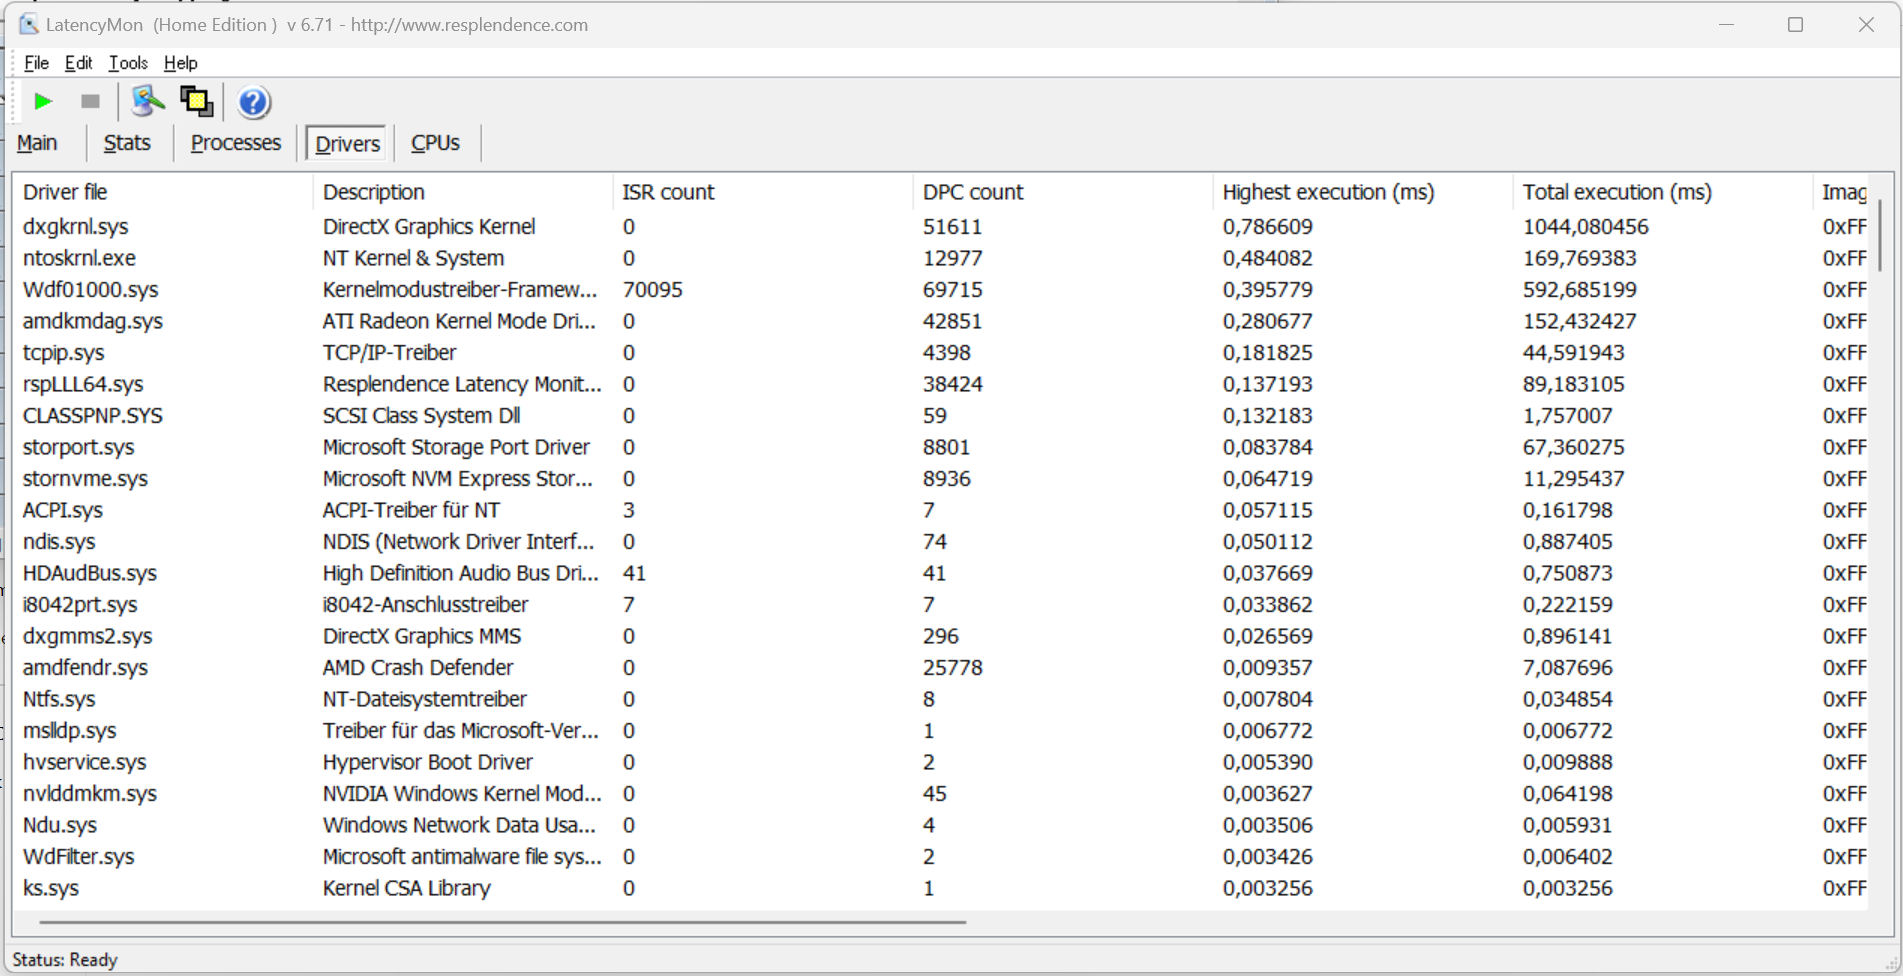
Latencias del CPD
La prueba estandarizada Latency Monitor (navegación por internet, reproducción de vídeo 4k, Prime95 a alta carga) no reveló ninguna anomalía. El sistema parece adecuado para la edición de vídeo y audio en tiempo real. Futuras actualizaciones de software podrían mejorar o empeorar esta área de rendimiento.
| DPC Latencies / LatencyMon - interrupt to process latency (max), Web, Youtube, Prime95 | |
| Medion Erazer Defender P40 | |
| Alienware m16 R1 Intel | |
| MSI Katana 17 B13VFK | |
| Acer Nitro 17 AN17-51-71ER | |
| Lenovo Legion Pro 5 16IRX8 | |
| Schenker XMG Apex 17 (Late 23) | |
* ... más pequeño es mejor
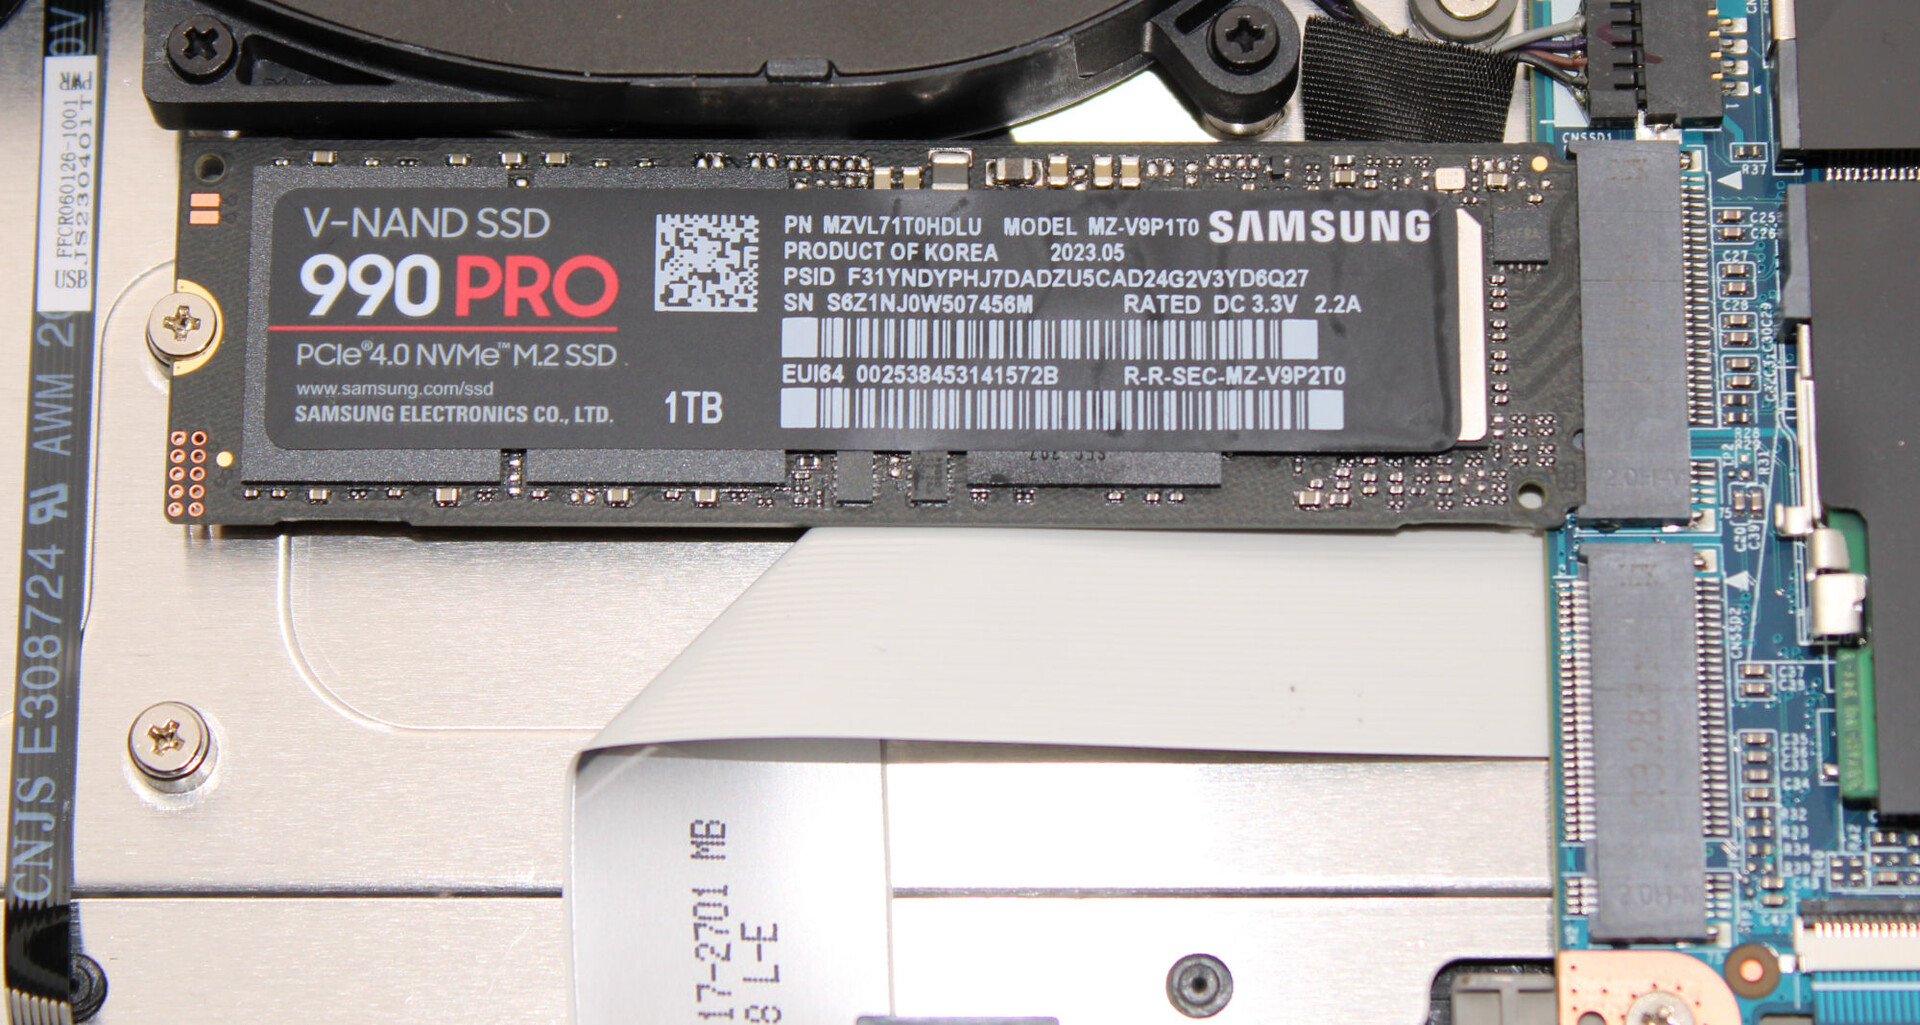
Almacenamiento masivo
El Apex puede alojar un total de dos SSD PCIe 4 en formato M.2 2280. Soporta RAID-0/1. El dispositivo de prueba que nos han proporcionado tiene un SSD Samsung de 1 TB (PCIe 4, M.2 2280) a bordo que ofrece excelentes velocidades de transferencia. Positivo: No se produjo ralentización térmica.

* ... más pequeño es mejor
Continuous Performance Read: DiskSpd Read Loop, Queue Depth 8
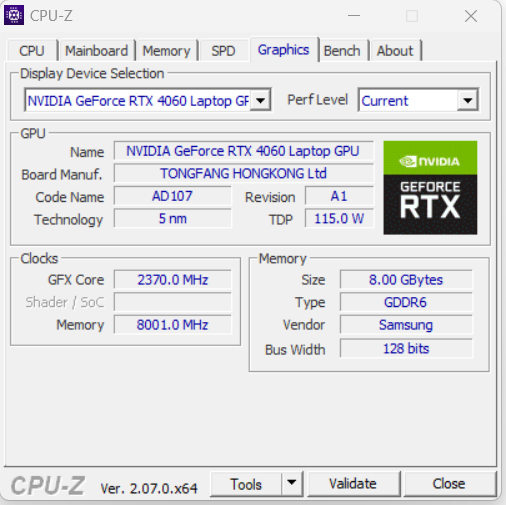
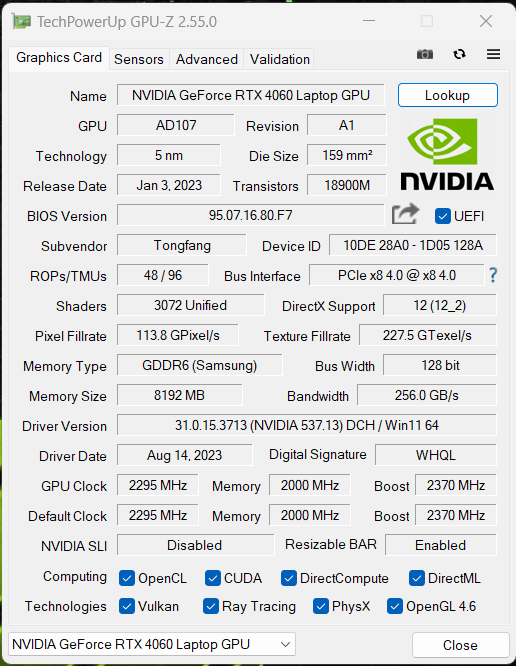
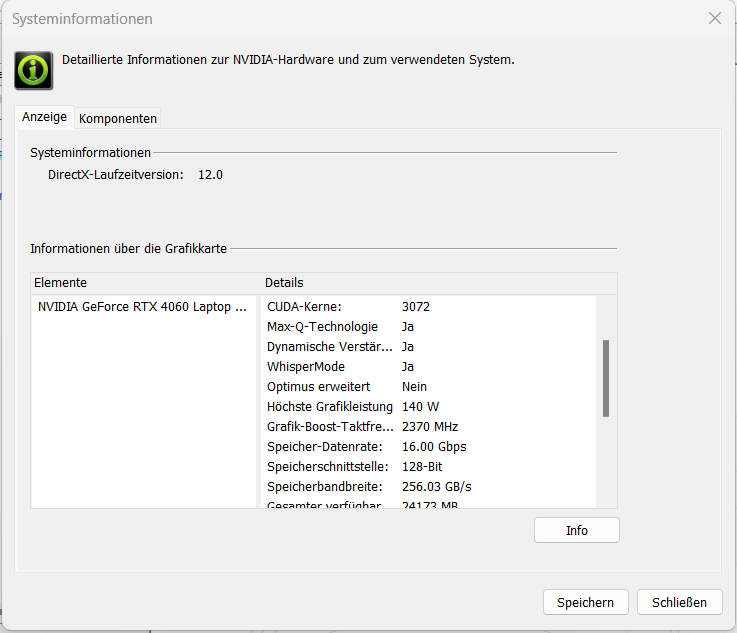
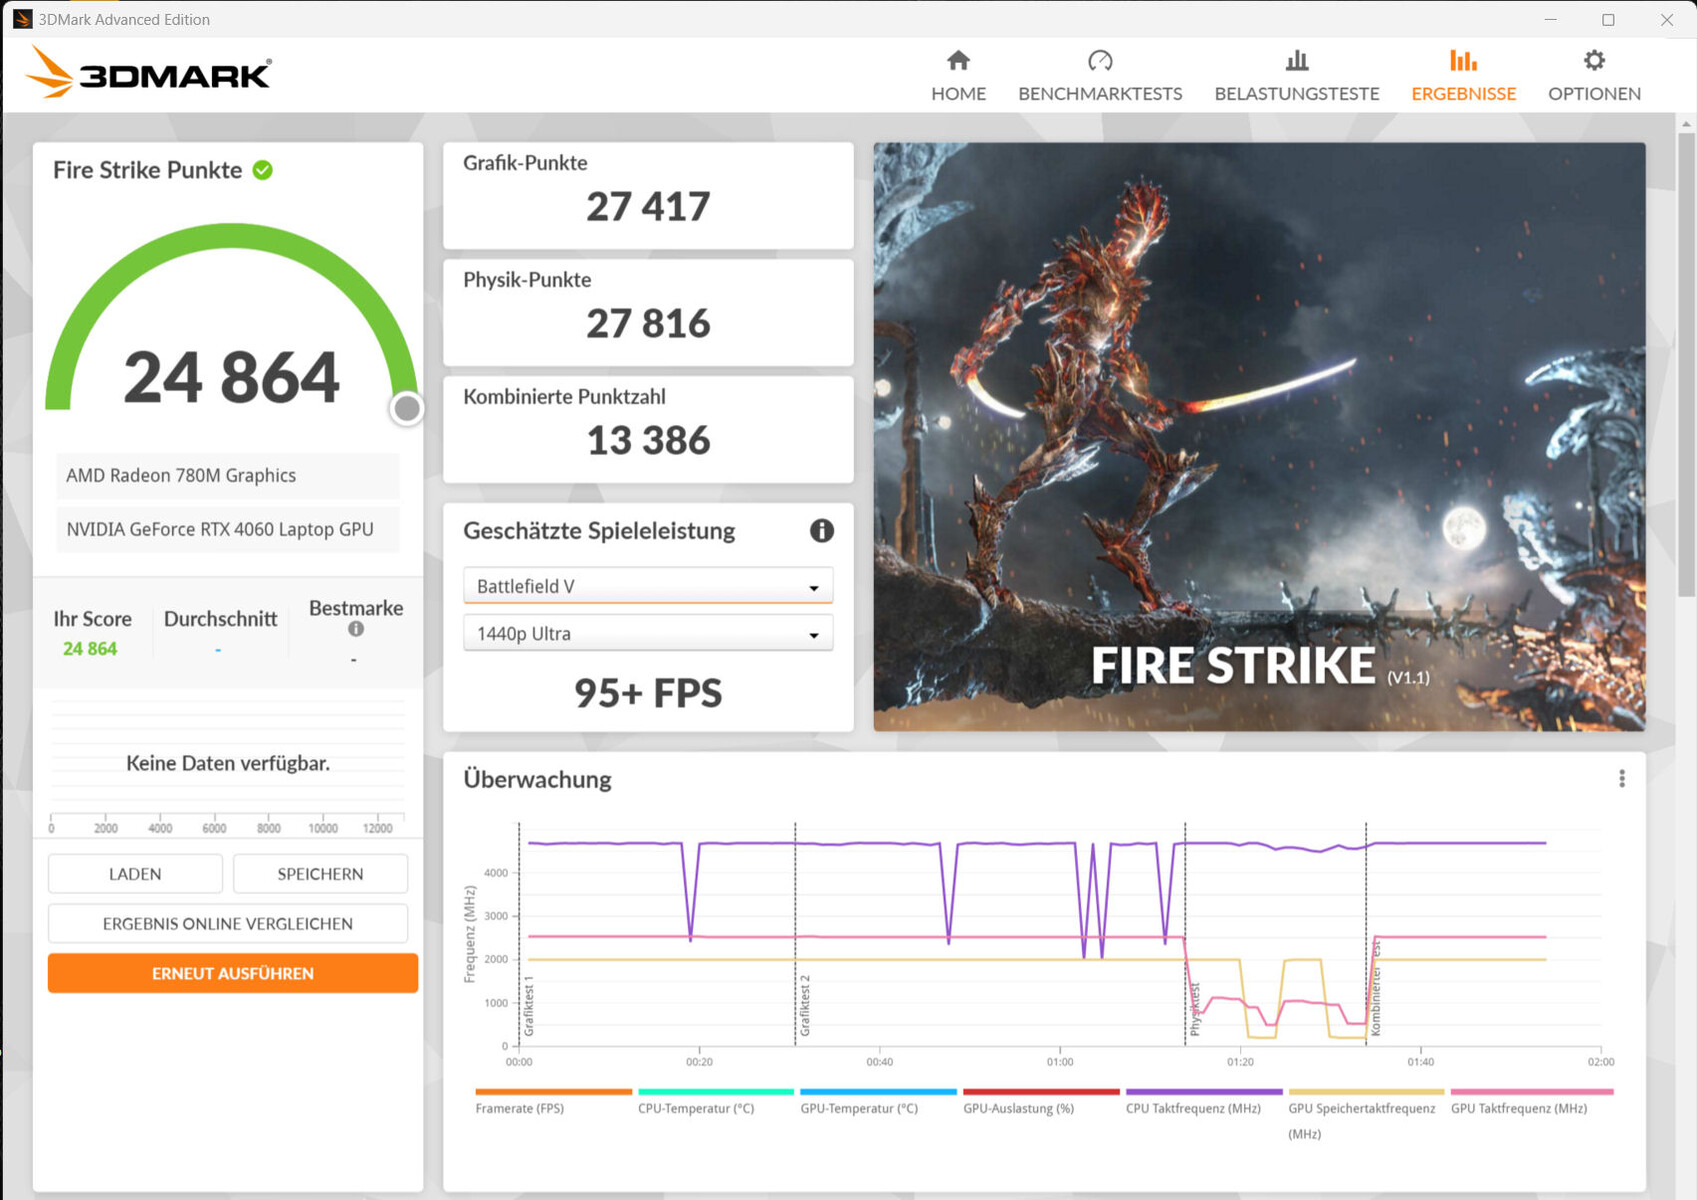
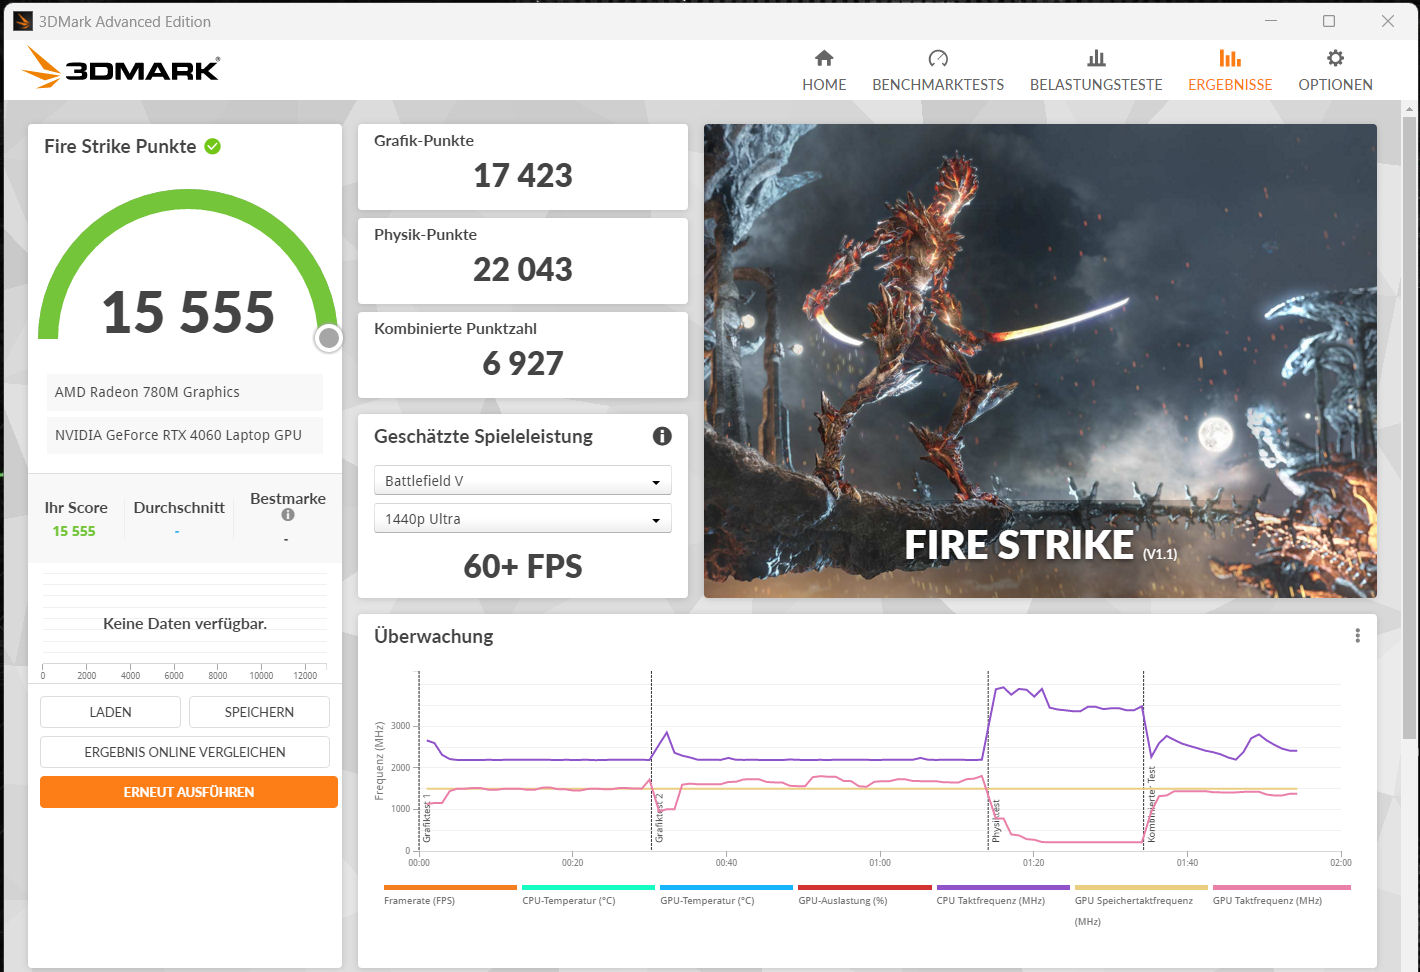
Tarjeta gráfica
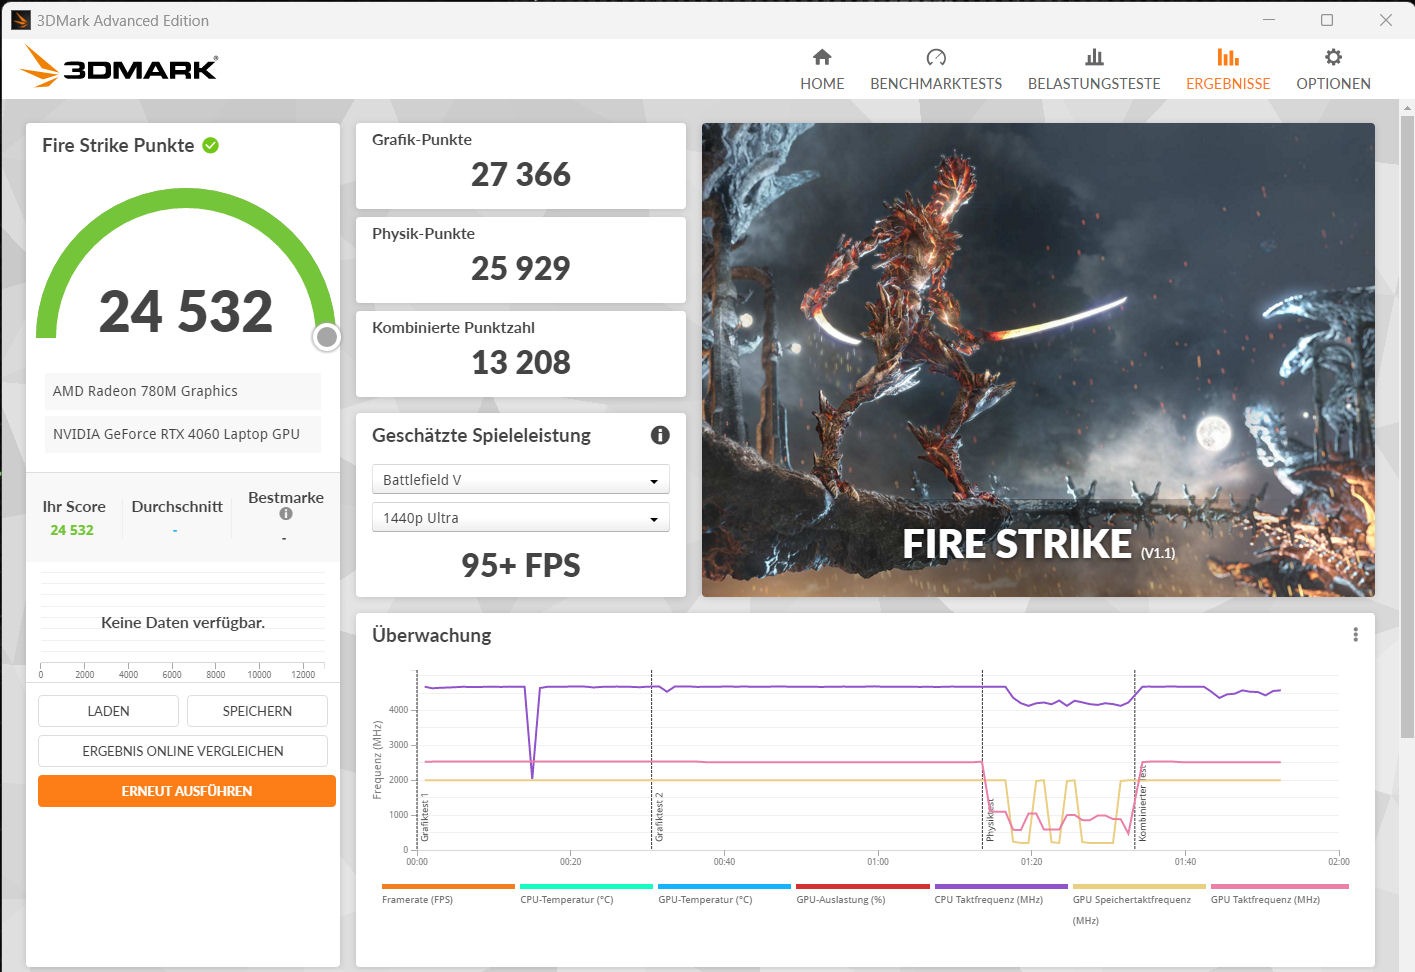
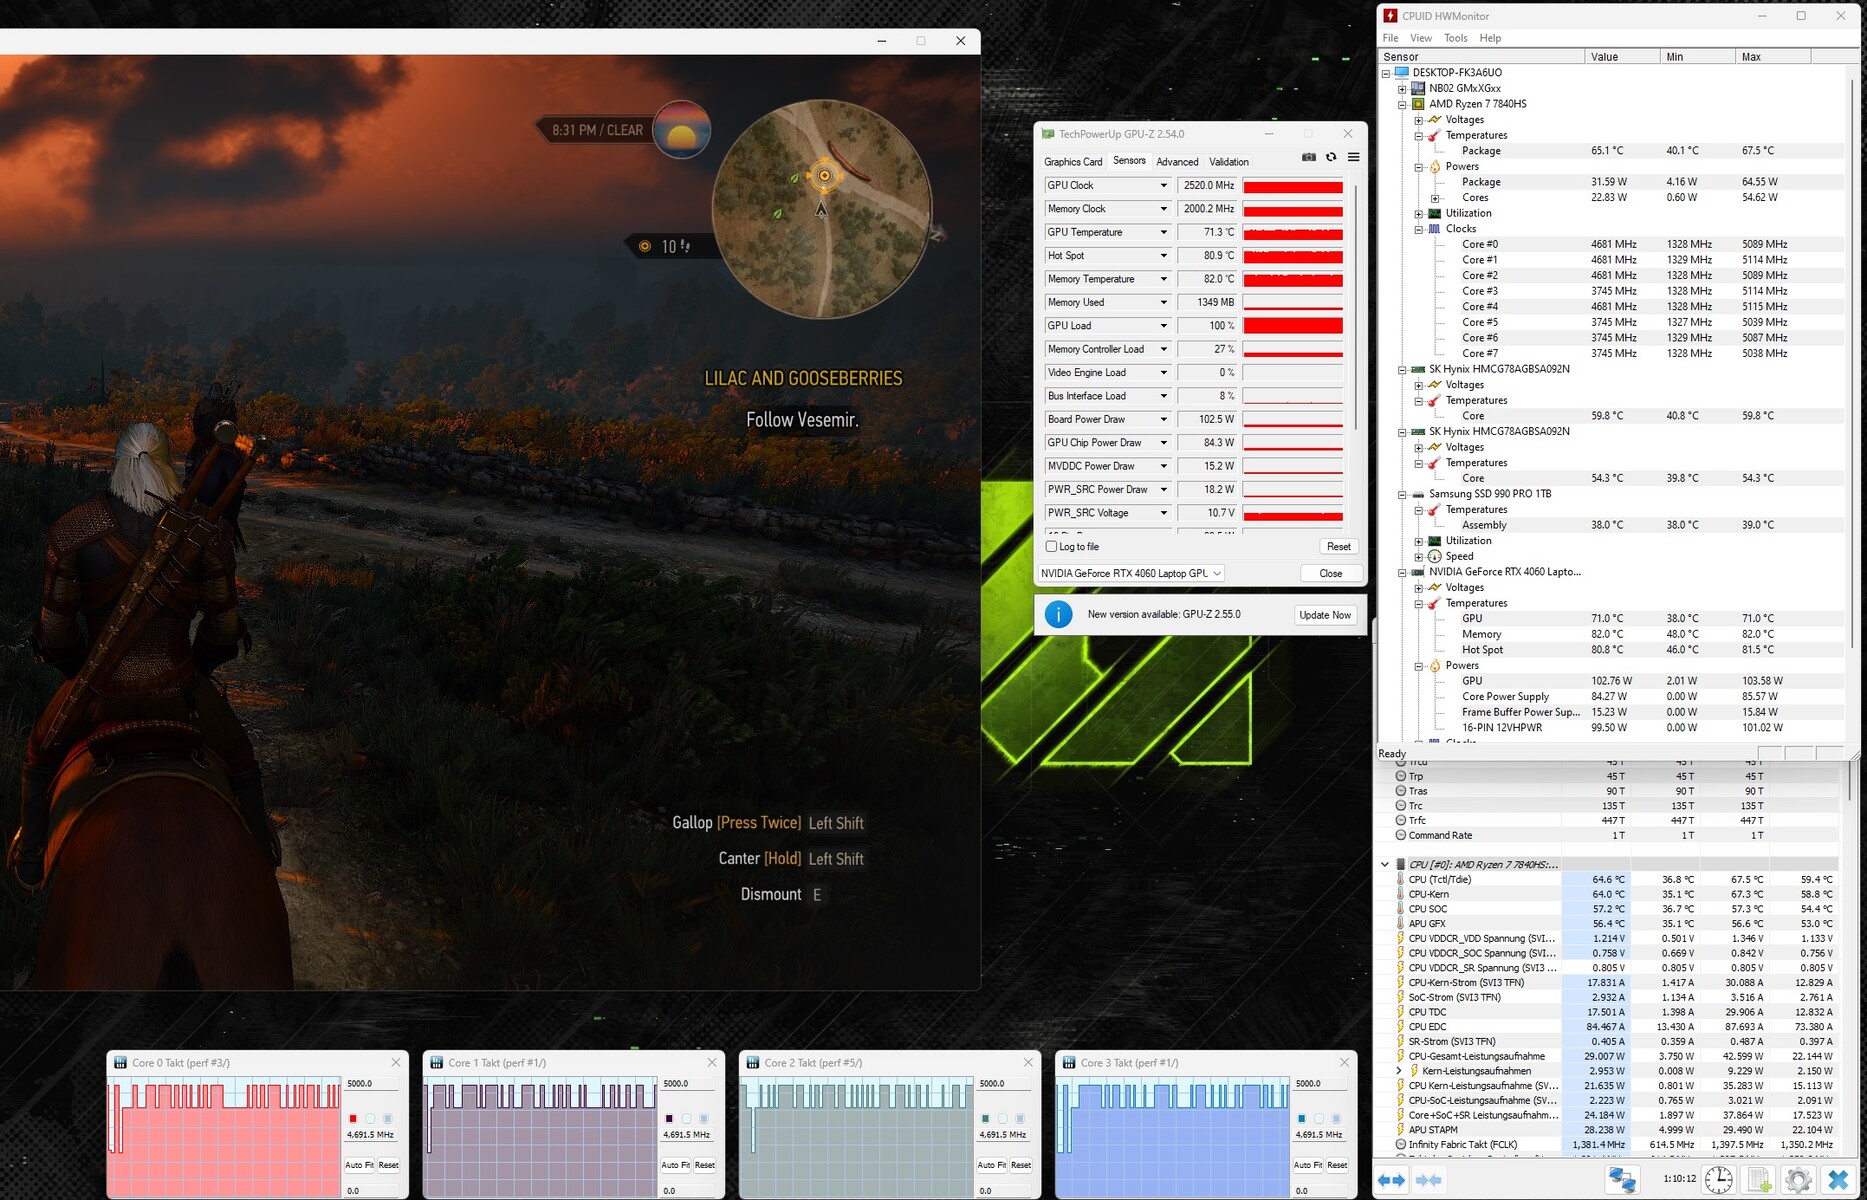
LaGeForce RTX 4060 ofrece 3.072 sombreadores, un bus de 128 bits de ancho y una rápida RAM GDDR6 (8.192 MB). Schenker ha fijado el TGP máximo en un valor de 140 vatios (115 vatios + 25 vatios de boost dinámico) - más no es posible. Según la prueba Witcher 3, el TGP no está al máximo.
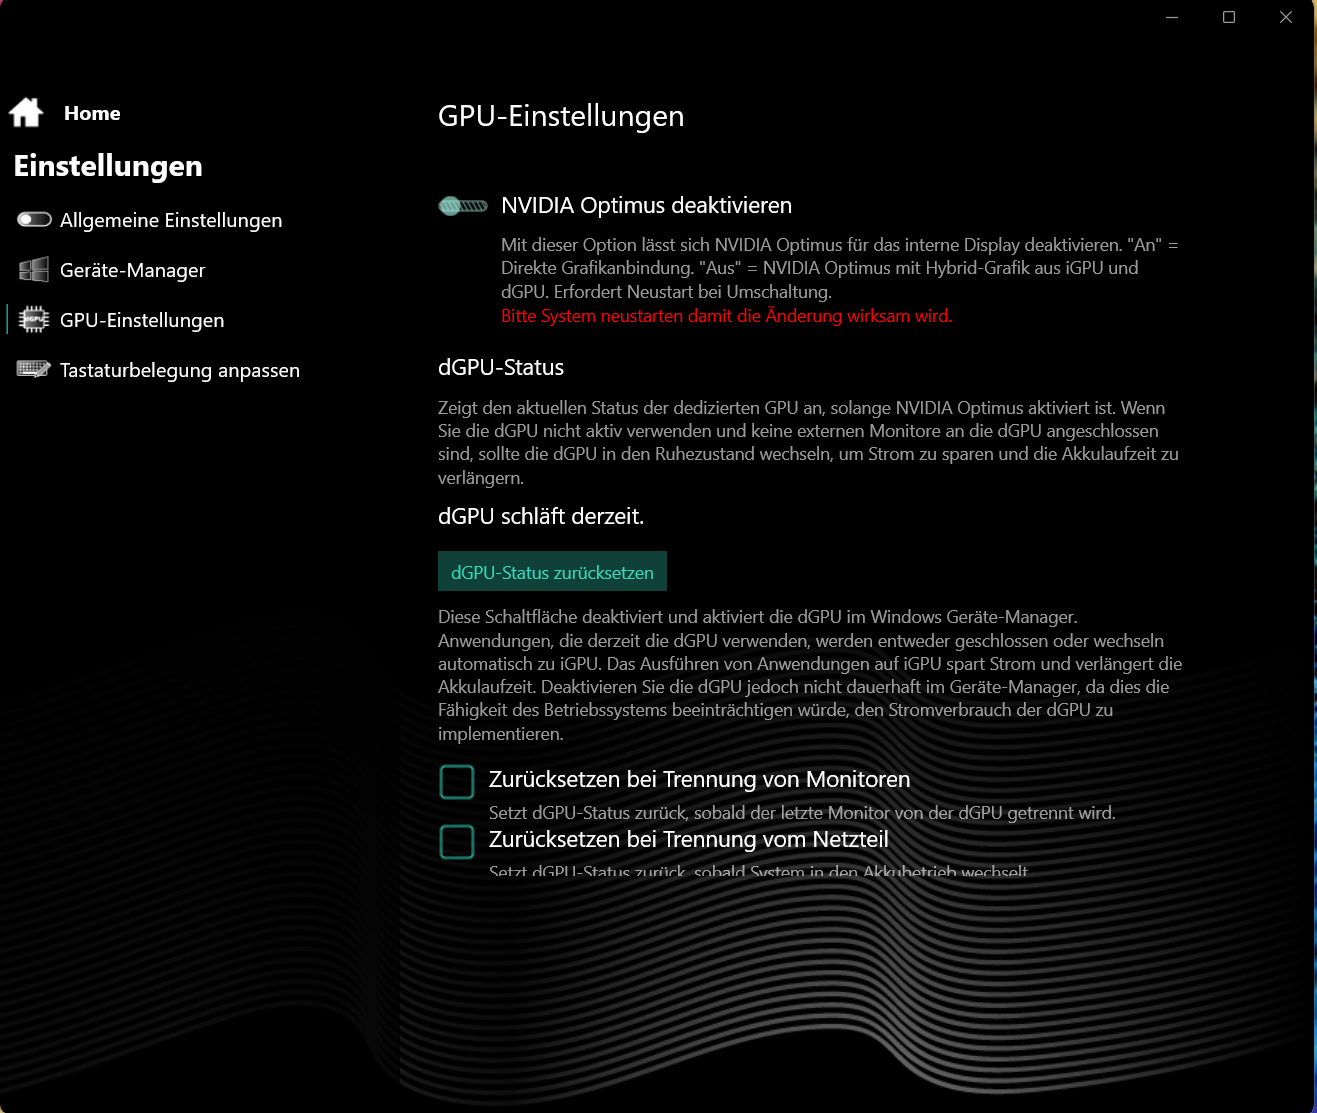
Los resultados del benchmark son superiores a la media de la anterior RTX 4060. El modo dGPU no aumenta el rendimiento. El cambio entre dGPU y Optimus requiere un reinicio - Advanced Optimus no es compatible.
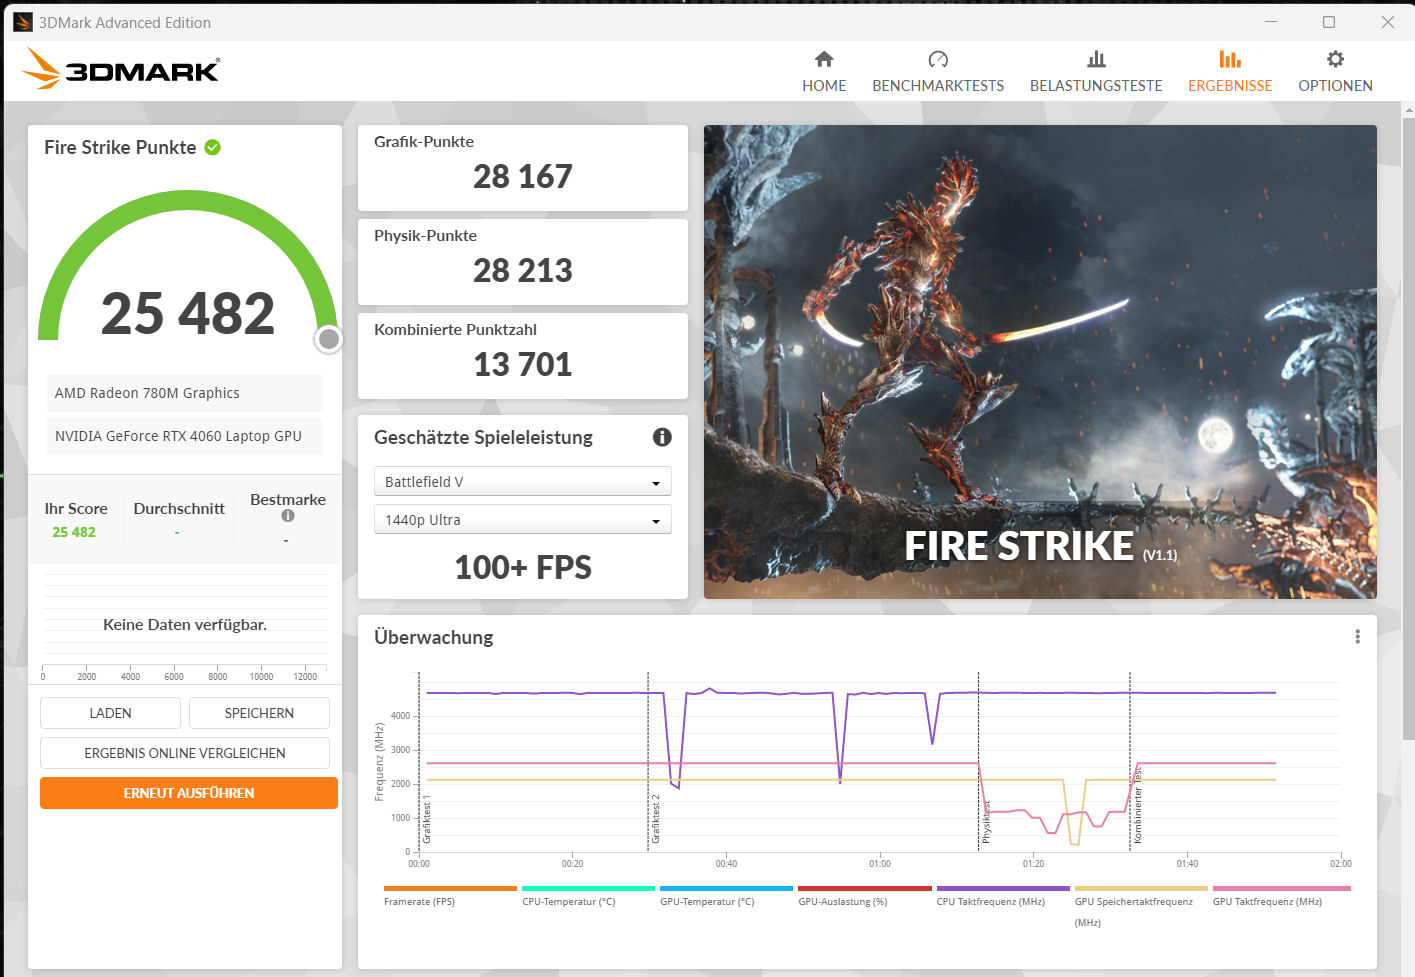
| 3DMark 06 Standard Score | 49011 puntos | |
| 3DMark 11 Performance | 32639 puntos | |
| 3DMark Cloud Gate Standard Score | 64881 puntos | |
| 3DMark Fire Strike Score | 24864 puntos | |
| 3DMark Time Spy Score | 10640 puntos | |
ayuda | ||
* ... más pequeño es mejor
Rendimiento de juego
El ordenador Schenker está diseñado para juegos QHD con ajustes de altos a máximos. Las resoluciones más altas serían utilizables con ajustes a veces reducidos si se conectan a un monitor adecuado. Se pueden alcanzar velocidades de fotogramas típicas de la media RTX 4060. En general, el modo dGP no se traduce en un aumento del rendimiento. Sólo en el juego "X Plane 11" se registró un aumento de la tasa de imágenes por segundo del 10 al 20 por ciento.
| The Witcher 3 - 1920x1080 Ultra Graphics & Postprocessing (HBAO+) | |
| Media de la clase Gaming (104.7 - 240, n=7, últimos 2 años) | |
| Lenovo Legion Pro 5 16IRX8 | |
| Alienware m16 R1 Intel | |
| Acer Nitro 17 AN17-51-71ER | |
| MSI Katana 17 B13VFK | |
| Schenker XMG Apex 17 (Late 23) | |
| Medion Erazer Defender P40 | |
| Medio NVIDIA GeForce RTX 4060 Laptop GPU (77 - 159.7, n=42) | |
| Cyberpunk 2077 1.6 - 1920x1080 Ultra Preset | |
| Lenovo Legion Pro 5 16IRX8 | |
| Alienware m16 R1 Intel | |
| Schenker XMG Apex 17 (Late 23) | |
| Acer Nitro 17 AN17-51-71ER | |
| Medio NVIDIA GeForce RTX 4060 Laptop GPU (57.9 - 93.2, n=18) | |
| MSI Katana 17 B13VFK | |
| Ratchet & Clank Rift Apart | |
| 1920x1080 Very High Preset AA:T | |
| Alienware m16 R1 Intel | |
| Schenker XMG Apex 17 (Late 23) | |
| Medio NVIDIA GeForce RTX 4060 Laptop GPU (51.6 - 54.8, n=4) | |
| 2560x1440 Very High Preset AA:T | |
| Alienware m16 R1 Intel | |
| Medio NVIDIA GeForce RTX 4060 Laptop GPU (45.6 - 46.6, n=3) | |
| Schenker XMG Apex 17 (Late 23) | |
| 1920x1080 Very High Preset + Very High Raytracing AA:T | |
| Alienware m16 R1 Intel | |
| Medio NVIDIA GeForce RTX 4060 Laptop GPU (39.1 - 44.5, n=3) | |
| Schenker XMG Apex 17 (Late 23) | |
| Atlas Fallen | |
| 1920x1080 High Preset | |
| Schenker XMG Apex 17 (Late 23) | |
| Alienware m16 R1 Intel | |
| Medio NVIDIA GeForce RTX 4060 Laptop GPU (88.8 - 133.3, n=3) | |
| 2560x1440 Very High Preset | |
| Alienware m16 R1 Intel | |
| Schenker XMG Apex 17 (Late 23) | |
| Medio NVIDIA GeForce RTX 4060 Laptop GPU (75 - 79.2, n=3) | |
| Immortals of Aveum | |
| 1920x1080 Ultra AF:16x | |
| Alienware m16 R1 Intel | |
| Schenker XMG Apex 17 (Late 23) | |
| Medio NVIDIA GeForce RTX 4060 Laptop GPU (33 - 48.9, n=4) | |
| 2560x1440 Ultra AF:16x | |
| Alienware m16 R1 Intel | |
| Schenker XMG Apex 17 (Late 23) | |
| Medio NVIDIA GeForce RTX 4060 Laptop GPU (20.5 - 32.8, n=4) | |
| Armored Core 6 | |
| 1920x1080 Maximum Preset | |
| Schenker XMG Apex 17 (Late 23) | |
| Medio NVIDIA GeForce RTX 4060 Laptop GPU (95.6 - 100.8, n=3) | |
| Media de la clase Gaming (n=1últimos 2 años) | |
| 2560x1440 Maximum Preset | |
| Schenker XMG Apex 17 (Late 23) | |
| Medio NVIDIA GeForce RTX 4060 Laptop GPU (73.2 - 74.6, n=3) | |
| Media de la clase Gaming (n=1últimos 2 años) | |
| Starfield | |
| 1920x1080 Ultra Preset | |
| Media de la clase Gaming (n=1últimos 2 años) | |
| Medio NVIDIA GeForce RTX 4060 Laptop GPU (39.7 - 41, n=3) | |
| Schenker XMG Apex 17 (Late 23) | |
| 2560x1440 Ultra Preset | |
| Media de la clase Gaming (n=1últimos 2 años) | |
| Schenker XMG Apex 17 (Late 23) | |
| Medio NVIDIA GeForce RTX 4060 Laptop GPU (32.5 - 32.6, n=2) | |
| Lies of P | |
| 1920x1080 Best Preset | |
| Schenker XMG Apex 17 (Late 23) | |
| Medio NVIDIA GeForce RTX 4060 Laptop GPU (106.2 - 126.6, n=3) | |
| 2560x1440 Best Preset | |
| Schenker XMG Apex 17 (Late 23) | |
| Medio NVIDIA GeForce RTX 4060 Laptop GPU (83.6 - 85.6, n=2) | |
Para comprobar si las frecuencias de cuadro se mantenían constantes durante un periodo de tiempo más largo, ejecutamos el juego "The Witcher 3" durante unos 60 minutos a resolución Full HD y ajustes de máxima calidad. El personaje del juego no se movió. No notamos ninguna caída en la velocidad de fotogramas.
Witcher 3 FPS diagram
| bajo | medio | alto | ultra | QHD | |
|---|---|---|---|---|---|
| The Witcher 3 (2015) | 401.8 | 316.1 | 198.2 | 103.4 | 76.3 |
| Dota 2 Reborn (2015) | 169.4 | 154.1 | 147.6 | 139.8 | |
| Final Fantasy XV Benchmark (2018) | 223 | 148.4 | 103.4 | 76.8 | |
| X-Plane 11.11 (2018) | 127.3 | 110.9 | 88.2 | ||
| Far Cry 5 (2018) | 163 | 145 | 139 | 130 | 106 |
| Strange Brigade (2018) | 399 | 279 | 221 | 190.1 | 126.9 |
| Gears Tactics (2020) | 320.2 | 255 | 180.5 | 125.9 | 85.8 |
| GRID Legends (2022) | 152.8 | 141.6 | 132.4 | 120.6 | 103.2 |
| Cyberpunk 2077 1.6 (2022) | 129.9 | 101 | 87.5 | 79.8 | 49.1 |
| Spider-Man Miles Morales (2022) | 123.7 | 115.9 | 110.3 | 103.8 | 77.8 |
| F1 23 (2023) | 249 | 244 | 186.2 | 60.1 | 37.8 |
| Ratchet & Clank Rift Apart (2023) | 85.4 | 74.7 | 60.6 | 54.6 | 45.6 |
| Atlas Fallen (2023) | 146 | 143.2 | 133.3 | 112.6 | 79.1 |
| Immortals of Aveum (2023) | 65.7 | 53.1 | 44 | 30.2 | |
| Armored Core 6 (2023) | 111.1 | 108.7 | 109.4 | 100.8 | 74.6 |
| Starfield (2023) | 70.3 | 62.5 | 47.1 | 39.7 | 32.6 |
| The Crew Motorfest (2023) | 60 | 60 | 60 | 60 | 54 |
| Lies of P (2023) | 186.6 | 163.8 | 141.9 | 126.6 | 85.6 |
Emisiones - El portátil para juegos puede funcionar en silencio
Emisiones sonoras
En general, calificamos el Apex de bajo a moderadamente ruidoso. En el uso cotidiano (oficina, internet, bancos...) los ventiladores suelen girar lentamente o incluso quedarse quietos. También son bajos bajo carga media. Esto es diferente en el ámbito de los juegos: Los niveles de presión sonora pueden llegar a 54 dB(A) ("overboost"). En el modo "entusiasta", con 50 dB(A), los niveles de ruido pueden calificarse de bastante bajos. El modo "equilibrado" es bastante más silencioso: sin embargo, un nivel de 34 dB(A) supone una pérdida significativa de rendimiento de la GPU.
Los ventiladores emiten principalmente un ruido sonoro. Los molestos ruidos de fondo son imperceptibles.
Ruido
| Ocioso |
| 25 / 29 / 33 dB(A) |
| Carga |
| 37 / 54 dB(A) |
 | ||
30 dB silencioso 40 dB(A) audible 50 dB(A) ruidosamente alto |
||
min: | ||
| Schenker XMG Apex 17 (Late 23) R7 7840HS, GeForce RTX 4060 Laptop GPU | Alienware m16 R1 Intel i7-13700HX, GeForce RTX 4060 Laptop GPU | Lenovo Legion Pro 5 16IRX8 i7-13700HX, GeForce RTX 4060 Laptop GPU | Acer Nitro 17 AN17-51-71ER i7-13700H, GeForce RTX 4060 Laptop GPU | Medion Erazer Defender P40 i7-13700HX, GeForce RTX 4060 Laptop GPU | MSI Katana 17 B13VFK i7-13620H, GeForce RTX 4060 Laptop GPU | |
|---|---|---|---|---|---|---|
| Noise | -2% | 9% | 2% | -10% | -8% | |
| apagado / medio ambiente * (dB) | 24 | 25 -4% | 23 4% | 24 -0% | 25 -4% | 24.5 -2% |
| Idle Minimum * (dB) | 25 | 25 -0% | 23.1 8% | 24 4% | 26 -4% | 24.5 2% |
| Idle Average * (dB) | 29 | 26 10% | 23.1 20% | 24 17% | 27 7% | 24.5 16% |
| Idle Maximum * (dB) | 33 | 27 18% | 26.6 19% | 32.32 2% | 32 3% | 40 -21% |
| Load Average * (dB) | 37 | 52 -41% | 34.7 6% | 35.18 5% | 53 -43% | 48.3 -31% |
| Witcher 3 ultra * (dB) | 50 | 51 -2% | 47.6 5% | 54.78 -10% | 56 -12% | 56 -12% |
| Load Maximum * (dB) | 54 | 53 2% | 54.8 -1% | 54.78 -1% | 64 -19% | 59.1 -9% |
* ... más pequeño es mejor
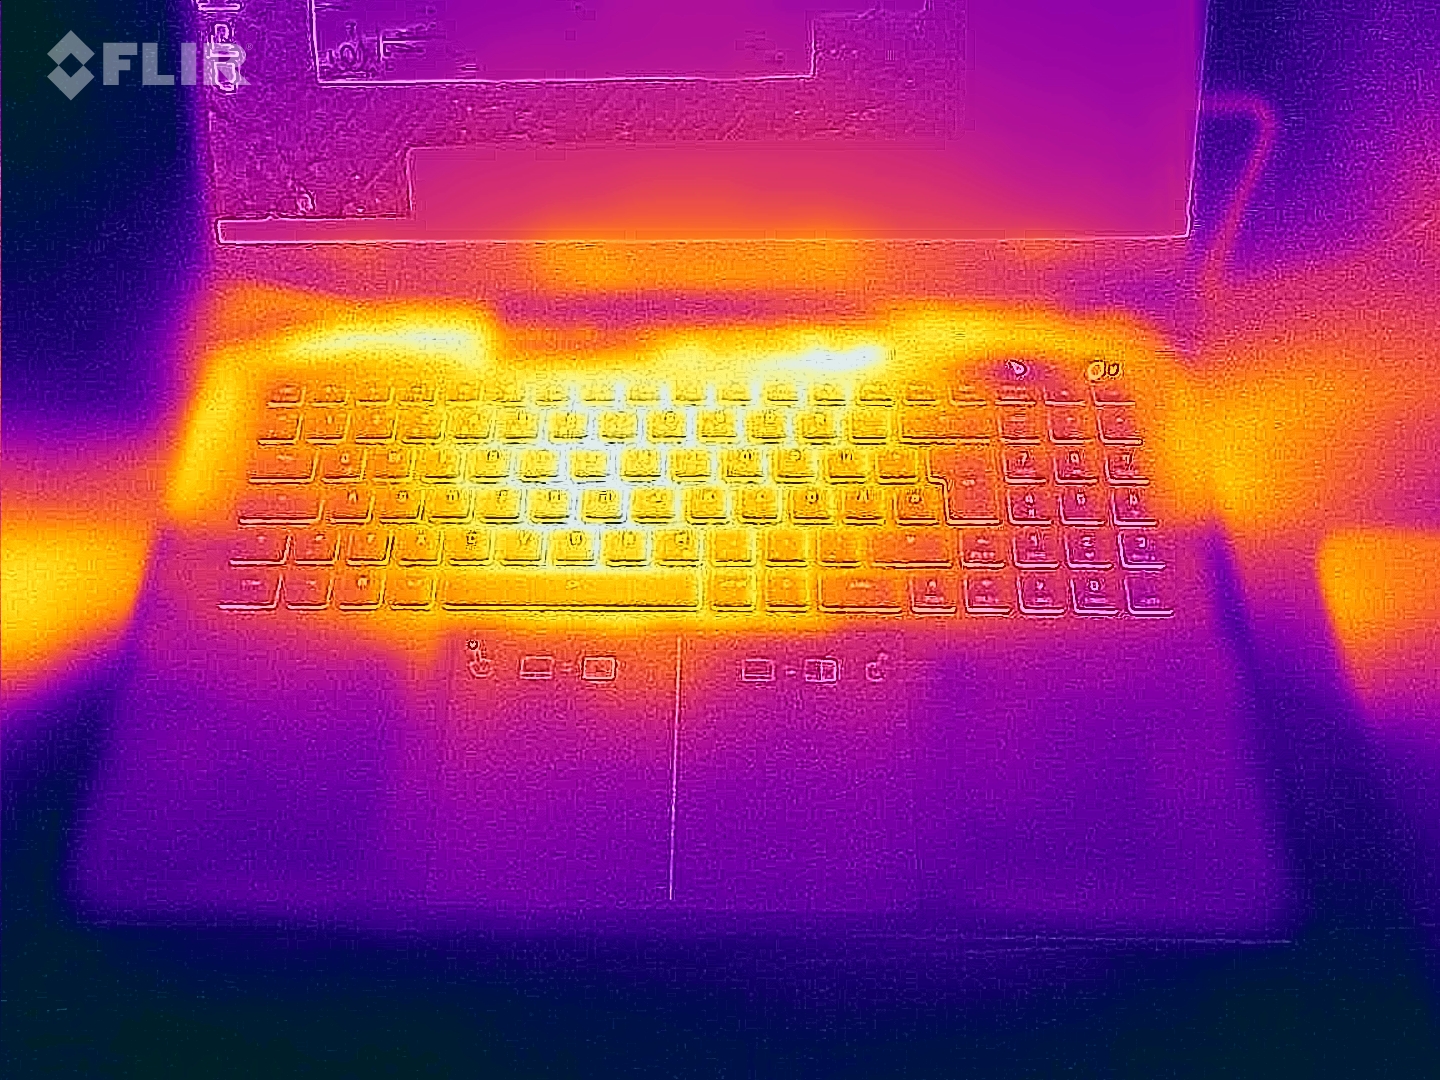
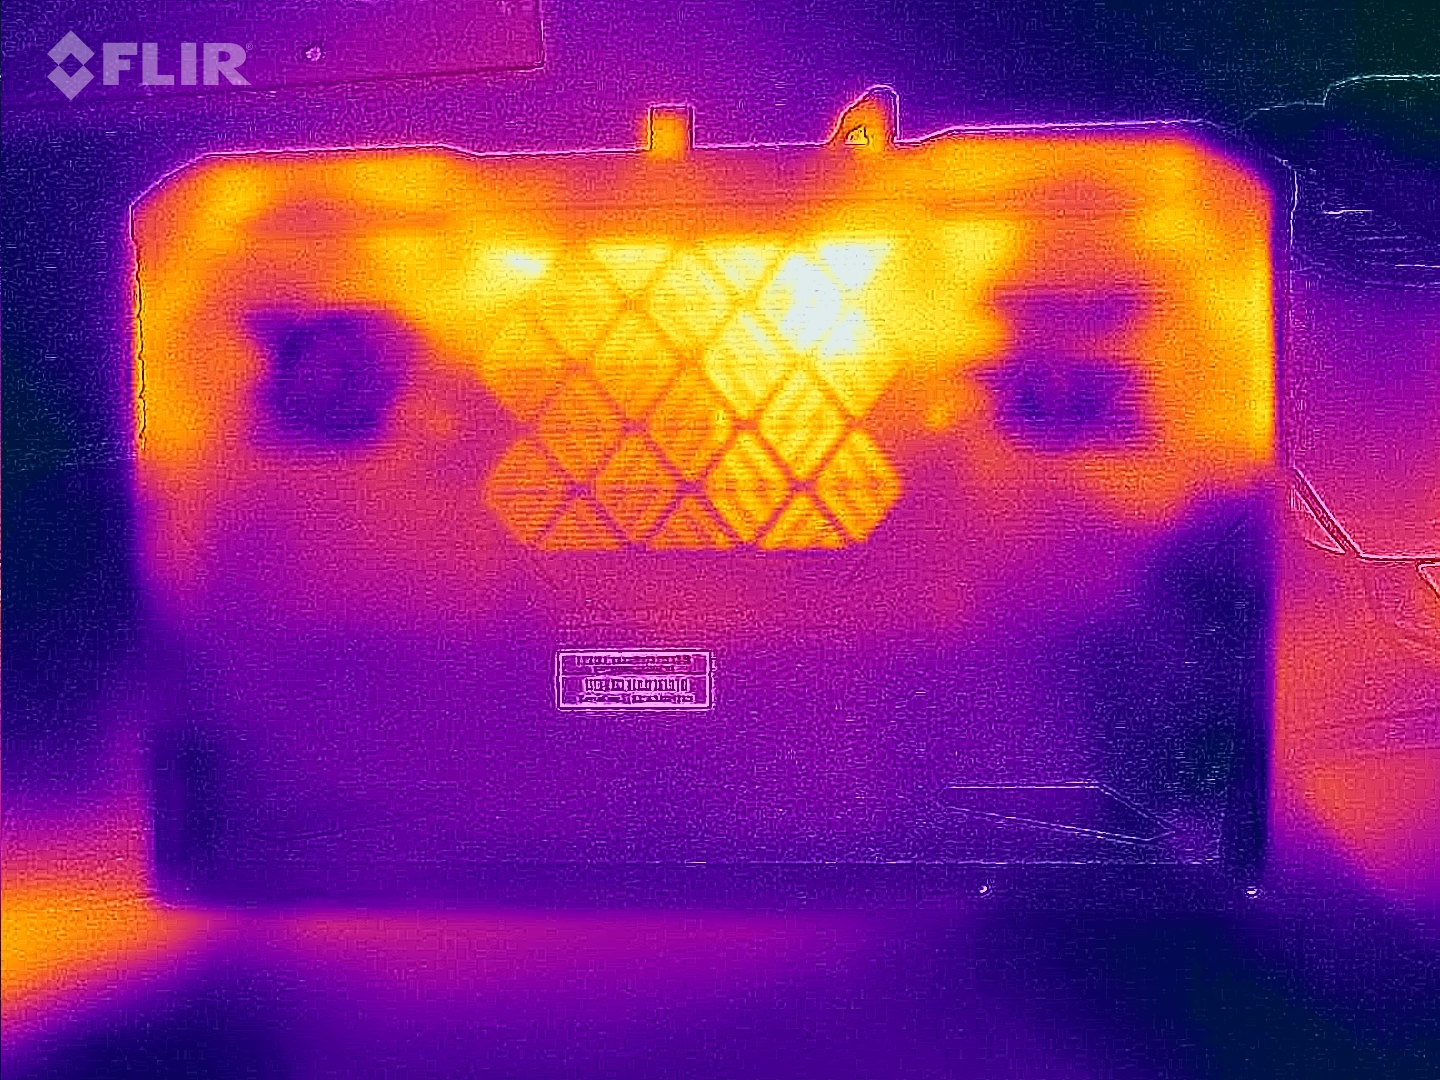
Temperatura
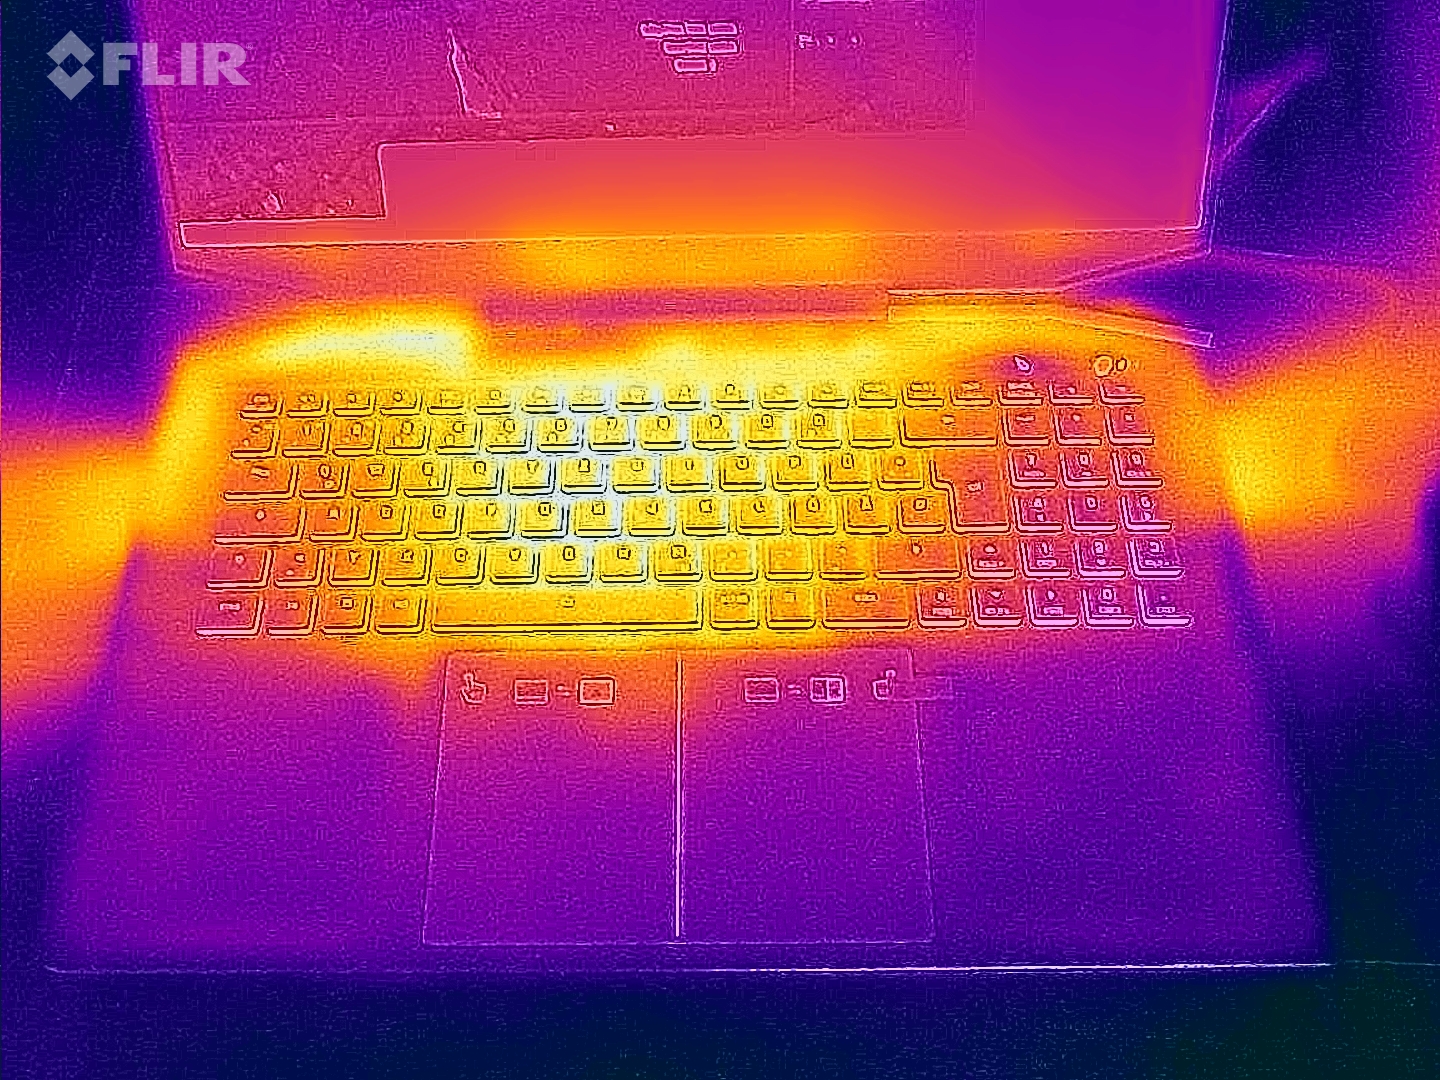
La prueba de estrés y la prueba Witcher 3 hicieron que el portátil se calentara notablemente en ciertos lugares. Sin embargo, todo sigue con unas dimensiones aceptables. En el uso diario (oficina, internet) las temperaturas de la carcasa se mantienen en la zona verde.
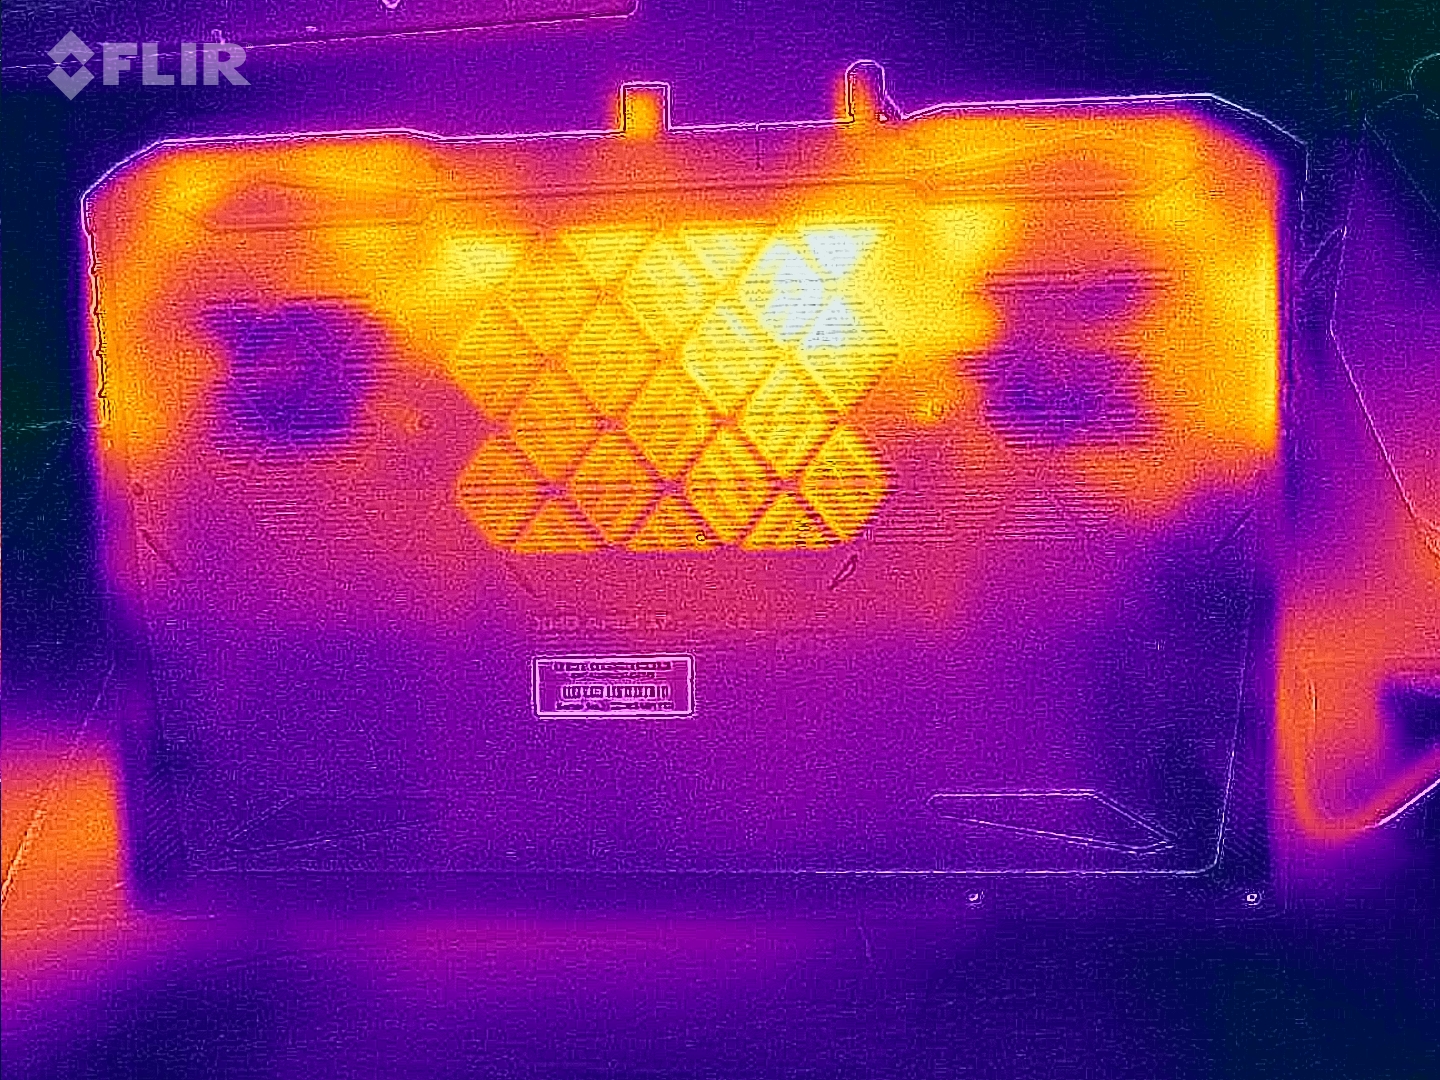
(-) La temperatura máxima en la parte superior es de 51 °C / 124 F, frente a la media de 40.4 °C / 105 F, que oscila entre 21.2 y 68.8 °C para la clase Gaming.
(-) El fondo se calienta hasta un máximo de 54 °C / 129 F, frente a la media de 43.2 °C / 110 F
(+) En reposo, la temperatura media de la parte superior es de 30.3 °C / 87# F, frente a la media del dispositivo de 33.9 °C / 93 F.
(-) Jugando a The Witcher 3, la temperatura media de la parte superior es de 38.2 °C / 101 F, frente a la media del dispositivo de 33.9 °C / 93 F.
(+) El reposamanos y el panel táctil están a una temperatura inferior a la de la piel, con un máximo de 31 °C / 87.8 F y, por tanto, son fríos al tacto.
(-) La temperatura media de la zona del reposamanos de dispositivos similares fue de 28.8 °C / 83.8 F (-2.2 °C / -4 F).
| Schenker XMG Apex 17 (Late 23) AMD Ryzen 7 7840HS, NVIDIA GeForce RTX 4060 Laptop GPU | Alienware m16 R1 Intel Intel Core i7-13700HX, NVIDIA GeForce RTX 4060 Laptop GPU | Lenovo Legion Pro 5 16IRX8 Intel Core i7-13700HX, NVIDIA GeForce RTX 4060 Laptop GPU | Acer Nitro 17 AN17-51-71ER Intel Core i7-13700H, NVIDIA GeForce RTX 4060 Laptop GPU | Medion Erazer Defender P40 Intel Core i7-13700HX, NVIDIA GeForce RTX 4060 Laptop GPU | MSI Katana 17 B13VFK Intel Core i7-13620H, NVIDIA GeForce RTX 4060 Laptop GPU | |
|---|---|---|---|---|---|---|
| Heat | -5% | 8% | 4% | 16% | 9% | |
| Maximum Upper Side * (°C) | 51 | 49 4% | 42.8 16% | 46 10% | 42 18% | 41.6 18% |
| Maximum Bottom * (°C) | 54 | 48 11% | 50 7% | 51 6% | 45 17% | 43.1 20% |
| Idle Upper Side * (°C) | 33 | 40 -21% | 29.6 10% | 34 -3% | 28 15% | 32 3% |
| Idle Bottom * (°C) | 34 | 39 -15% | 34 -0% | 33 3% | 30 12% | 35.8 -5% |
* ... más pequeño es mejor
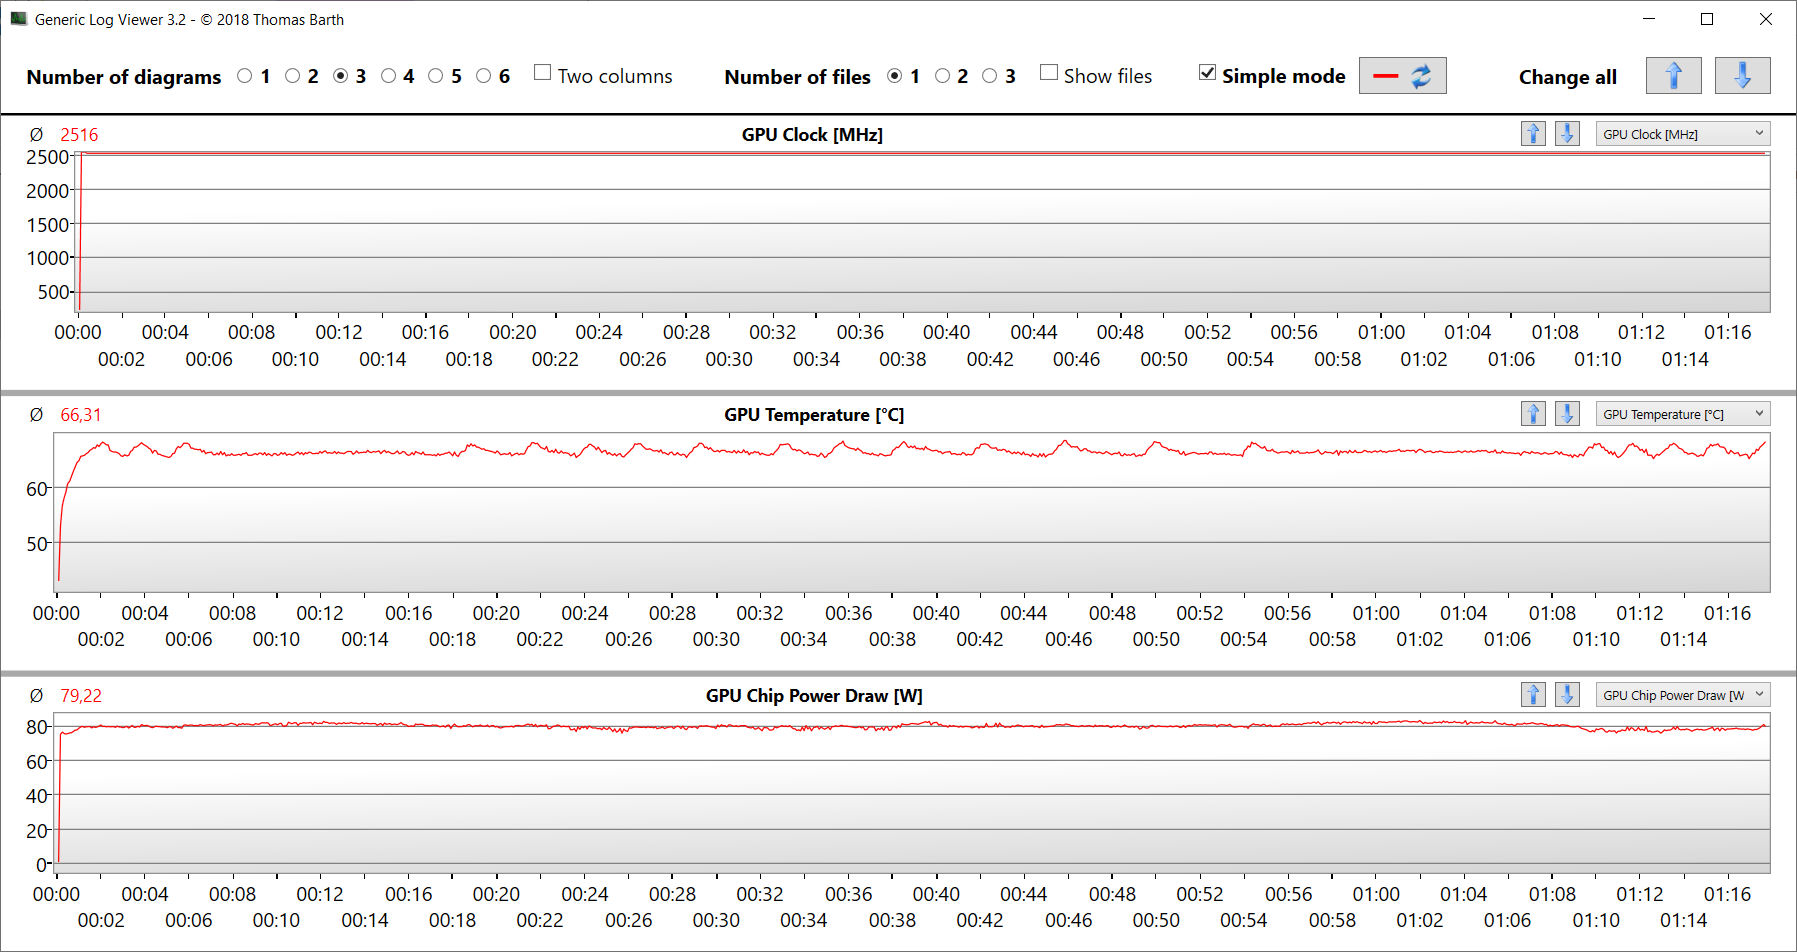
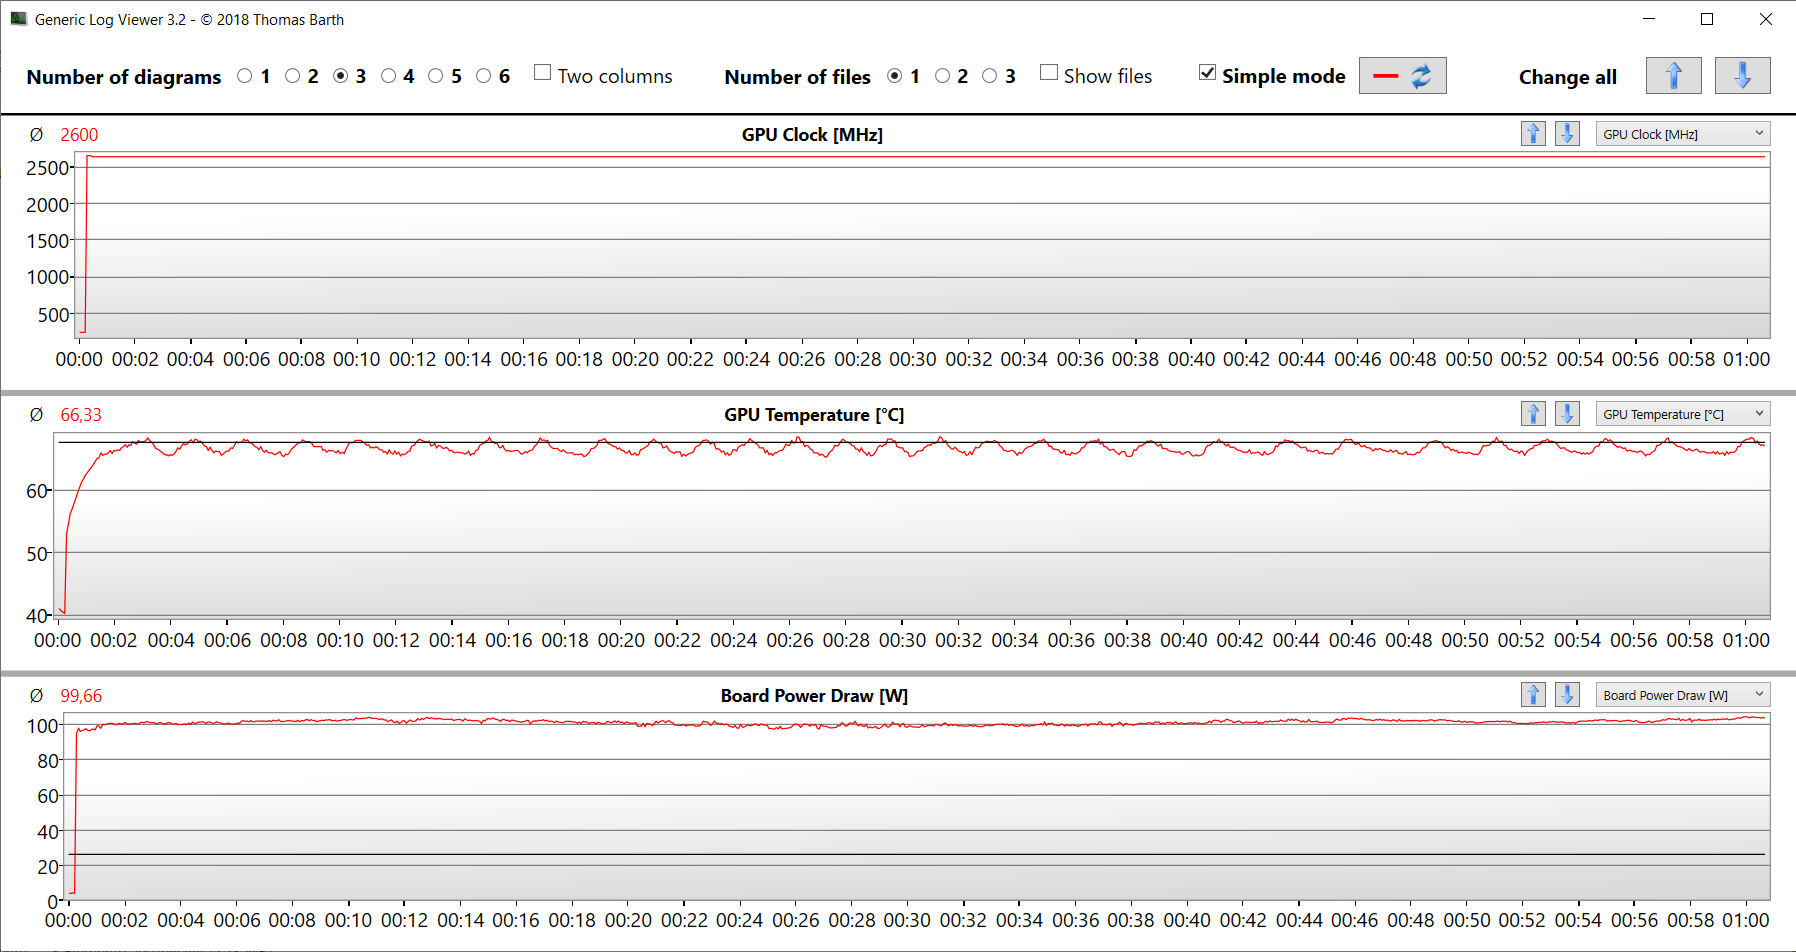
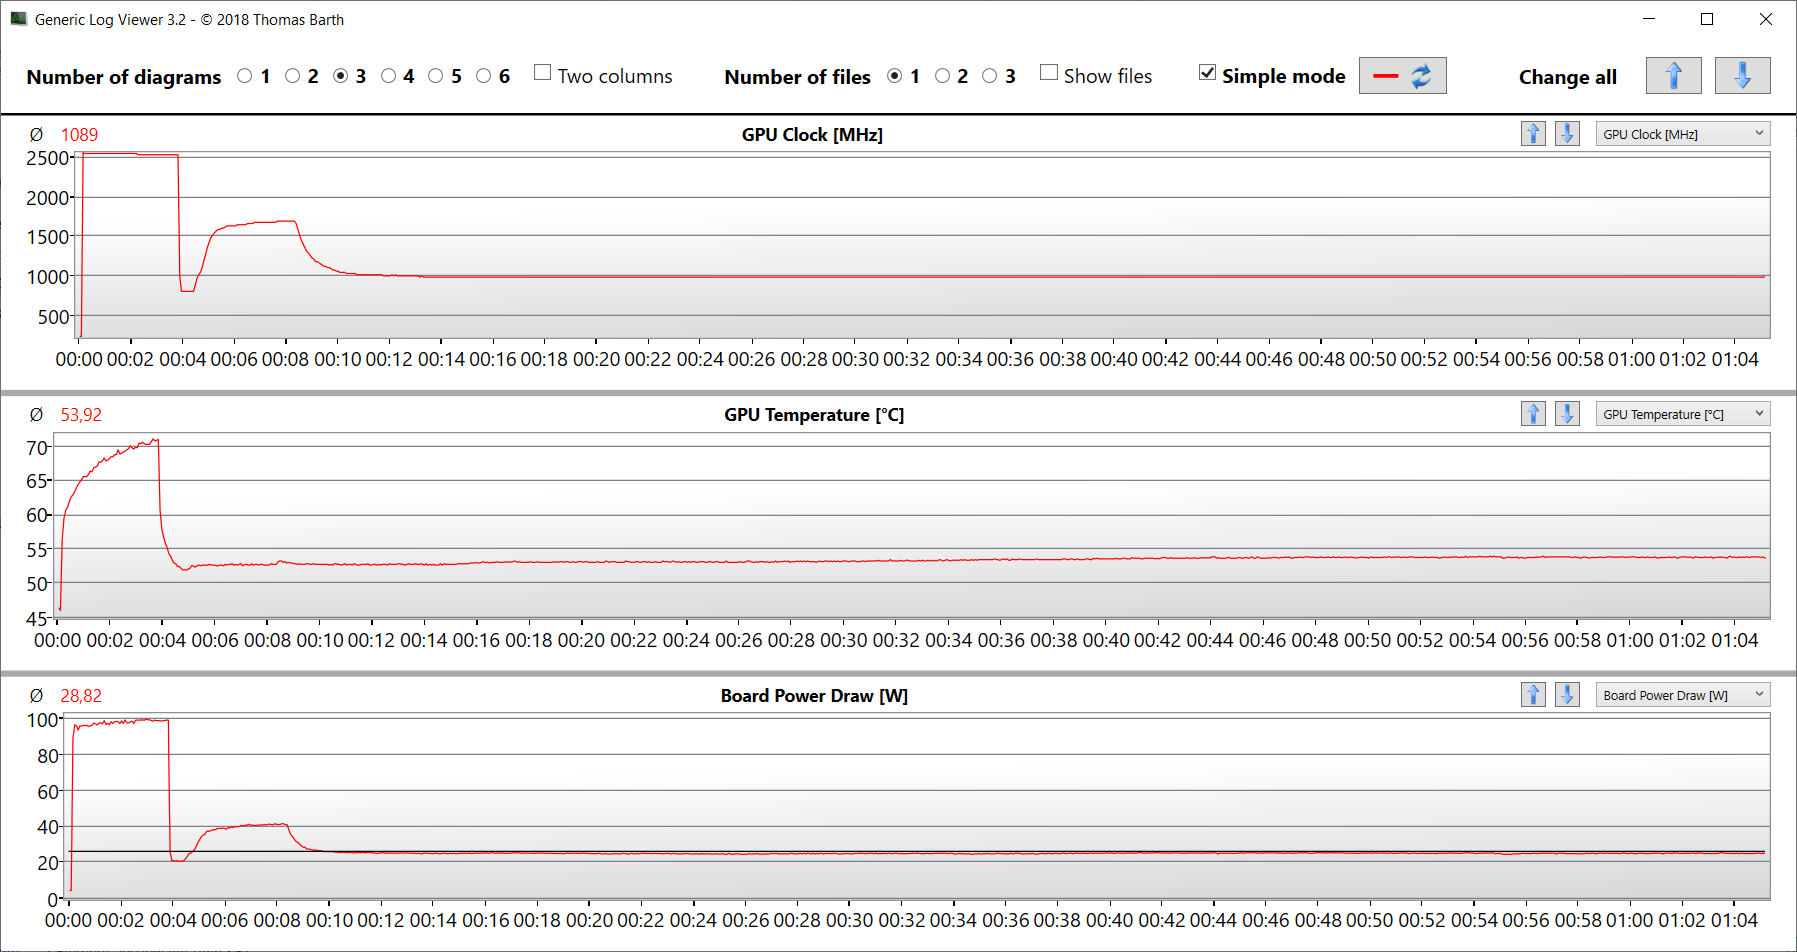
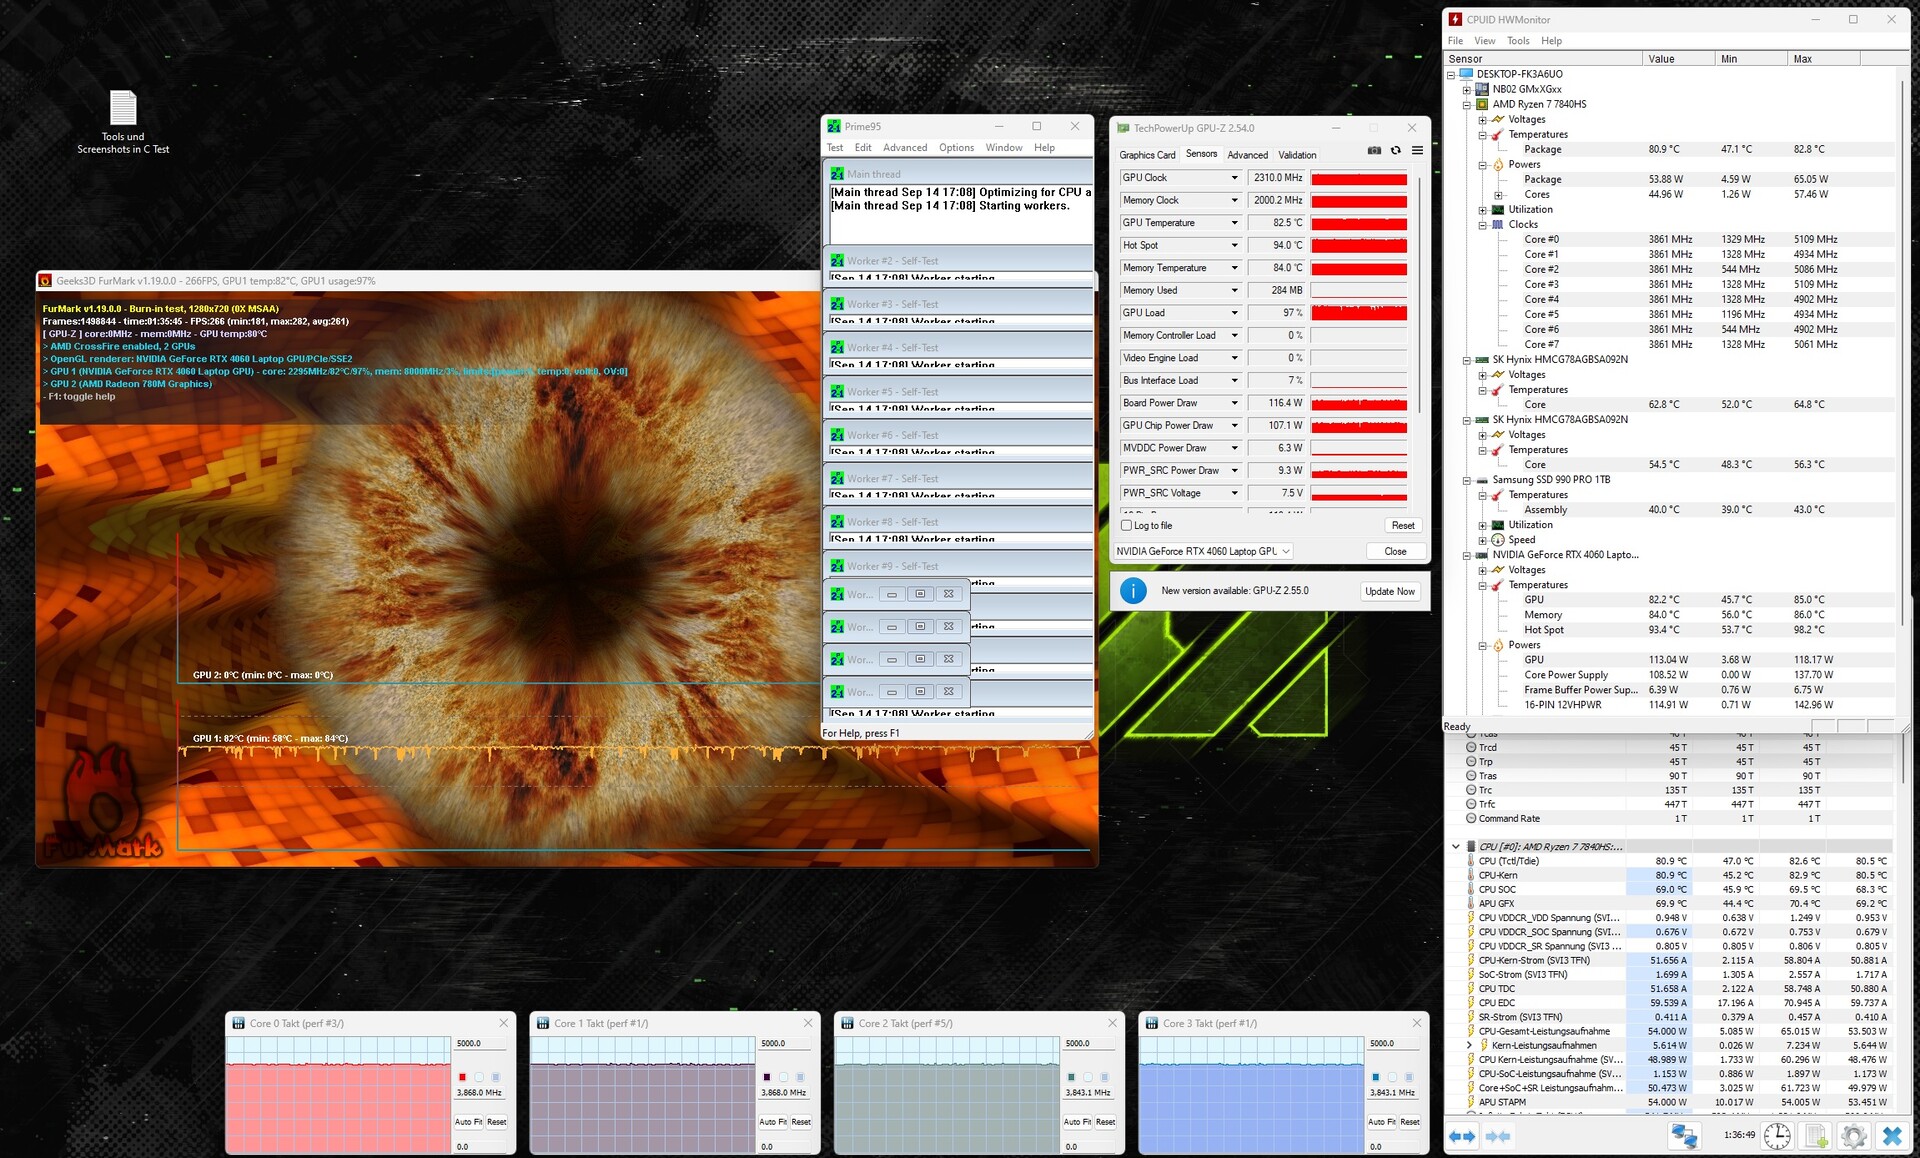
Prueba de esfuerzo
La prueba de estrés (Prime95 y Furmark en funcionamiento continuo) representa un escenario extremo que nos permite comprobar la estabilidad del sistema a plena carga. La CPU funcionó durante toda la prueba con velocidades de reloj de 3,8 a 3,9 GHz y los núcleos gráficos funcionaron de 2,2 a 2,4 GHz.
Altavoces
Los altavoces estéreo producen un sonido decente pero carecen de graves. Para una mejor experiencia de sonido, recomendamos el uso de auriculares o altavoces externos.
Schenker XMG Apex 17 (Late 23) análisis de audio
(±) | la sonoridad del altavoz es media pero buena (80 dB)
Graves 100 - 315 Hz
(-) | casi sin bajos - de media 29% inferior a la mediana
(±) | la linealidad de los graves es media (10.4% delta a frecuencia anterior)
Medios 400 - 2000 Hz
(+) | medios equilibrados - a sólo 2.7% de la mediana
(+) | los medios son lineales (4.7% delta a la frecuencia anterior)
Altos 2 - 16 kHz
(+) | máximos equilibrados - a sólo 2.1% de la mediana
(+) | los máximos son lineales (4.9% delta a la frecuencia anterior)
Total 100 - 16.000 Hz
(±) | la linealidad del sonido global es media (18.3% de diferencia con la mediana)
En comparación con la misma clase
» 58% de todos los dispositivos probados de esta clase eran mejores, 9% similares, 33% peores
» El mejor tuvo un delta de 6%, la media fue 18%, el peor fue ###max##%
En comparación con todos los dispositivos probados
» 40% de todos los dispositivos probados eran mejores, 8% similares, 52% peores
» El mejor tuvo un delta de 4%, la media fue 23%, el peor fue ###max##%
Alienware m16 R1 Intel análisis de audio
(+) | los altavoces pueden reproducir a un volumen relativamente alto (#87 dB)
Graves 100 - 315 Hz
(-) | casi sin bajos - de media 24% inferior a la mediana
(±) | la linealidad de los graves es media (13.5% delta a frecuencia anterior)
Medios 400 - 2000 Hz
(+) | medios equilibrados - a sólo 1.4% de la mediana
(+) | los medios son lineales (3.3% delta a la frecuencia anterior)
Altos 2 - 16 kHz
(+) | máximos equilibrados - a sólo 3.5% de la mediana
(+) | los máximos son lineales (4.6% delta a la frecuencia anterior)
Total 100 - 16.000 Hz
(+) | el sonido global es lineal (13.4% de diferencia con la mediana)
En comparación con la misma clase
» 19% de todos los dispositivos probados de esta clase eran mejores, 7% similares, 74% peores
» El mejor tuvo un delta de 6%, la media fue 18%, el peor fue ###max##%
En comparación con todos los dispositivos probados
» 14% de todos los dispositivos probados eran mejores, 4% similares, 82% peores
» El mejor tuvo un delta de 4%, la media fue 23%, el peor fue ###max##%
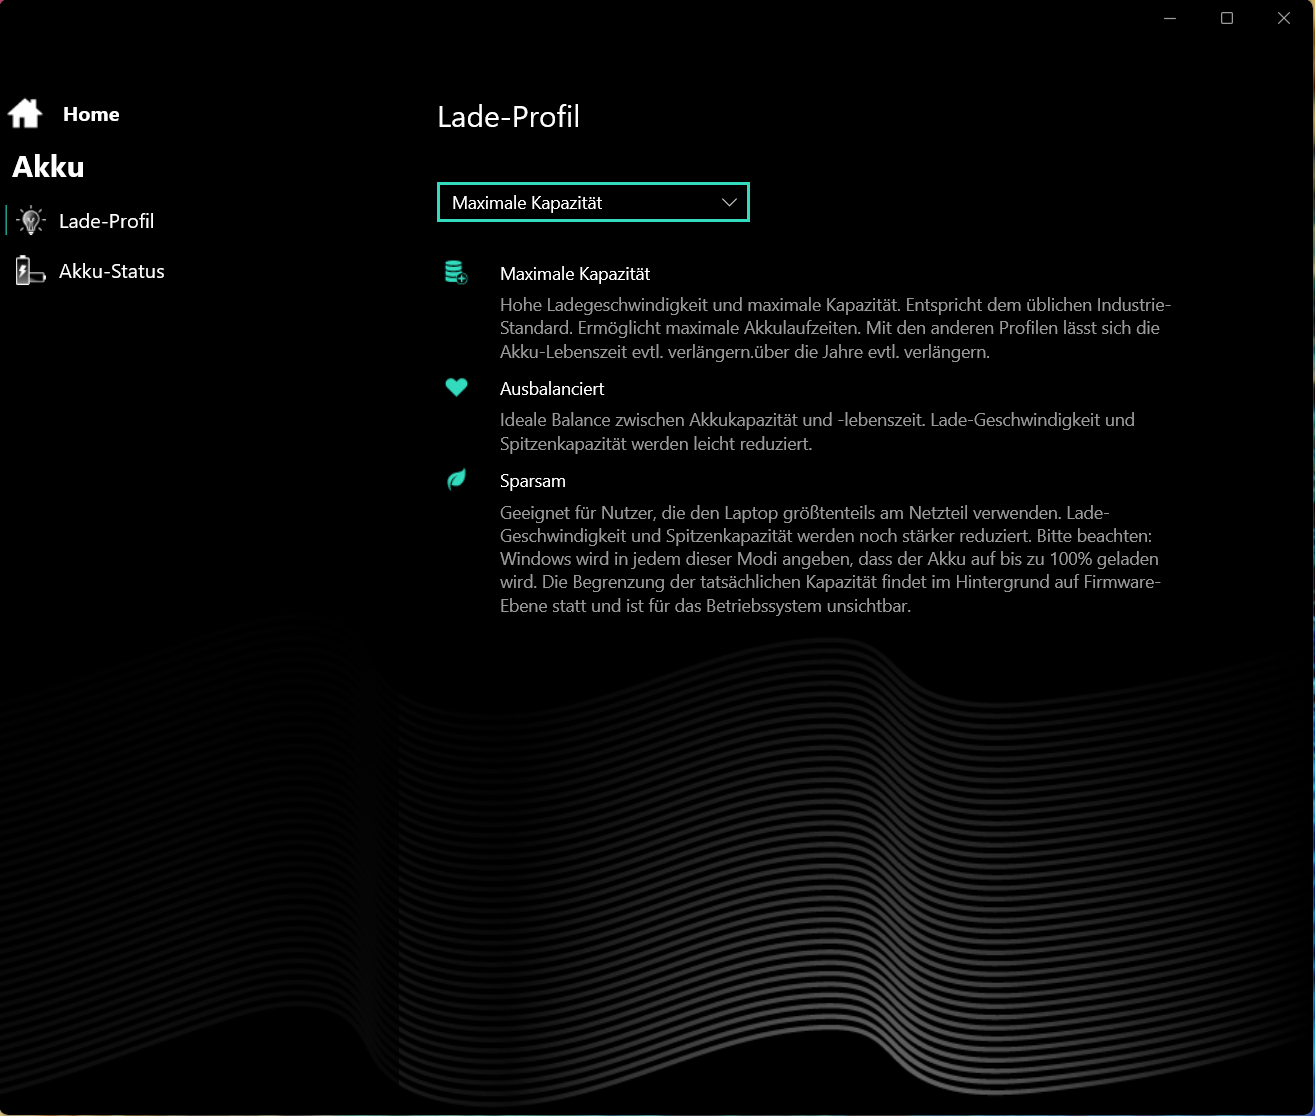
Gestión de la energía - El Schenker XMG ofrece una duración decente de la batería
Consumo de energía
Digno de elogio: Entre los dispositivos de su comparación, el Apex 17 es el portátil más económico. En general, los competidores tienen unos requisitos energéticos mucho mayores. El test de estrés y Witcher 3 funcionaron con un consumo de energía consistente. La fuente de alimentación (230 vatios) es de tamaño adecuado.
| Off / Standby | |
| Ocioso | |
| Carga |
|
Clave:
min: | |
| Schenker XMG Apex 17 (Late 23) R7 7840HS, GeForce RTX 4060 Laptop GPU | Alienware m16 R1 Intel i7-13700HX, GeForce RTX 4060 Laptop GPU | Lenovo Legion Pro 5 16IRX8 i7-13700HX, GeForce RTX 4060 Laptop GPU | Acer Nitro 17 AN17-51-71ER i7-13700H, GeForce RTX 4060 Laptop GPU | Medion Erazer Defender P40 i7-13700HX, GeForce RTX 4060 Laptop GPU | MSI Katana 17 B13VFK i7-13620H, GeForce RTX 4060 Laptop GPU | Medio NVIDIA GeForce RTX 4060 Laptop GPU | Media de la clase Gaming | |
|---|---|---|---|---|---|---|---|---|
| Power Consumption | -38% | -90% | -8% | -20% | -16% | -28% | -52% | |
| Idle Minimum * (Watt) | 9 | 10 -11% | 24.5 -172% | 8.3 8% | 8 11% | 12.2 -36% | 11.5 ? -28% | 13 ? -44% |
| Idle Average * (Watt) | 12 | 14 -17% | 29.2 -143% | 13.5 -13% | 12 -0% | 14.9 -24% | 16 ? -33% | 19 ? -58% |
| Idle Maximum * (Watt) | 14 | 21 -50% | 34.3 -145% | 14.8 -6% | 18 -29% | 15.8 -13% | 20.3 ? -45% | 24.6 ? -76% |
| Load Average * (Watt) | 67 | 119 -78% | 98.7 -47% | 77 -15% | 101 -51% | 85.22 -27% | 92.9 ? -39% | 110.7 ? -65% |
| Witcher 3 ultra * (Watt) | 147.6 | 186.7 -26% | 178.6 -21% | 154 -4% | 180.8 -22% | 151.1 -2% | ||
| Load Maximum * (Watt) | 223 | 323 -45% | 249.6 -12% | 263 -18% | 284 -27% | 212.8 5% | 210 ? 6% | 259 ? -16% |
* ... más pequeño es mejor
Power consumption Witcher 3 / stress test
Power consumption with an external monitor
Duración de la batería
En la prueba Wi-Fi (usando un script para cargar webs) y la prueba de vídeo (corto de Big Buck Bunny (codificación H.264, FHD), el dispositivo de 17,3 pulgadas logró duraciones de 5,06 y 6,51 horas, respectivamente. Durante las pruebas, se desactivaron las funciones de ahorro de energía del portátil y se ajustó el brillo de la pantalla a unos 150 cd/m². Además, la prueba de vídeo se realizó con los módulos de radio apagados.
Aunque el Apex posee una capacidad de batería relativamente baja, logra tiempos de ejecución muy respetables. El ordenador deja atrás a algunos de los competidores con baterías más grandes.
| Schenker XMG Apex 17 (Late 23) R7 7840HS, GeForce RTX 4060 Laptop GPU, 62.32 Wh | Alienware m16 R1 Intel i7-13700HX, GeForce RTX 4060 Laptop GPU, 86 Wh | Lenovo Legion Pro 5 16IRX8 i7-13700HX, GeForce RTX 4060 Laptop GPU, 80 Wh | Acer Nitro 17 AN17-51-71ER i7-13700H, GeForce RTX 4060 Laptop GPU, 90 Wh | Medion Erazer Defender P40 i7-13700HX, GeForce RTX 4060 Laptop GPU, 73 Wh | MSI Katana 17 B13VFK i7-13620H, GeForce RTX 4060 Laptop GPU, 53.5 Wh | Media de la clase Gaming | |
|---|---|---|---|---|---|---|---|
| Duración de Batería | -20% | -34% | 31% | -0% | -40% | 15% | |
| Reader / Idle (h) | 7.8 | 6.4 -18% | 6.7 -14% | 8.8 13% | 8.27 ? 6% | ||
| H.264 (h) | 6.9 | 5.6 -19% | 6.9 0% | 5.7 -17% | 8.32 ? 21% | ||
| WiFi v1.3 (h) | 5.1 | 4.8 -6% | 3.4 -33% | 8.2 61% | 6.2 22% | 2.9 -43% | 7.11 ? 39% |
| Load (h) | 1.6 | 1 -37% | 0.7 -56% | 1.3 -19% | 1 -37% | 1.502 ? -6% | |
| Witcher 3 ultra (h) | 2.5 |
Pro
Contra
Veredicto - Una modesta máquina de juegos de gama media
Das Apex 17 cumple las tareas previstas (juegos QHD, renderizado, edición de vídeo) sin dificultad - ElRyzen 7 7840HSy GeForce RTX 4060 lo hacen posible. Ambos chips pueden funcionar a velocidades de reloj consistentemente altas.
Con el XMG Apex 17 (finales del 23), Schenker ha ofrecido un portátil QHD de gama media muy completo.
El ordenador no produce mucho ruido en el uso diario, pero, cuando se juega, es posible llegar a un compromiso entre rendimiento y ruido seleccionando el perfil adecuado. La autonomía real de la batería, de entre 5 y 7 horas, es perfectamente aceptable. La batería no se puede cargar a través del puerto USB-C (USB 3.2 Gen 2).
El portátil ofrece espacio para dos SSDs PCIe 4 (M.2 2280). Soporta RAID 0/1. La tienda online de Schenker te permite elegir tu SSD o SSDs preferidos. El dispositivo de pruebas está equipado con un veloz SSD PCIe 4 (1 TB). En general, la pantalla QHD instalada (17.3 pulgadas, 2,560 x 1,440 pixeles, sRGB, IPS, 240 Hz) causó una buena impresión. Como alternativa, hay disponible un panel FHD más barato.
ElMedion Erazer Defender P40 sería una alternativa con rendimiento y especificaciones comparables. A diferencia del Apex, el P40 tiene un puerto Thunderbolt 4 a bordo.
Notebookcheck.com publicará pronto un análisis del modelo hermano de 15,6 pulgadas, el XMG Apex 15 (finales del 23) en una variante con un Ryzen 7 7840HS y una GeForce RTX 4050.
Precio y disponibilidad
Una variante similar a nuestro dispositivo de pruebas (16 en vez de 32 GB RAM) está disponible por 1.739 euros en Notebooksbilliger.de. También ofrecen un modelo básico más barato con una GeForce RTX 4050 por 1,399 euros. Alternativamente, es posible configurar tu propio dispositivo a medida en la tienda online de Schenker.
Schenker XMG Apex 17 (Late 23)
- 10/04/2023 v7 (old)
Sascha Mölck
Transparencia
La selección de los dispositivos que se van a reseñar corre a cargo de nuestro equipo editorial. La muestra de prueba fue proporcionada al autor en calidad de préstamo por el fabricante o el minorista a los efectos de esta reseña. El prestamista no tuvo ninguna influencia en esta reseña, ni el fabricante recibió una copia de la misma antes de su publicación. No había ninguna obligación de publicar esta reseña. Como empresa de medios independiente, Notebookcheck no está sujeta a la autoridad de fabricantes, minoristas o editores.
Así es como prueba Notebookcheck
Cada año, Notebookcheck revisa de forma independiente cientos de portátiles y smartphones utilizando procedimientos estandarizados para asegurar que todos los resultados son comparables. Hemos desarrollado continuamente nuestros métodos de prueba durante unos 20 años y hemos establecido los estándares de la industria en el proceso. En nuestros laboratorios de pruebas, técnicos y editores experimentados utilizan equipos de medición de alta calidad. Estas pruebas implican un proceso de validación en varias fases. Nuestro complejo sistema de clasificación se basa en cientos de mediciones y puntos de referencia bien fundamentados, lo que mantiene la objetividad.Price comparison

