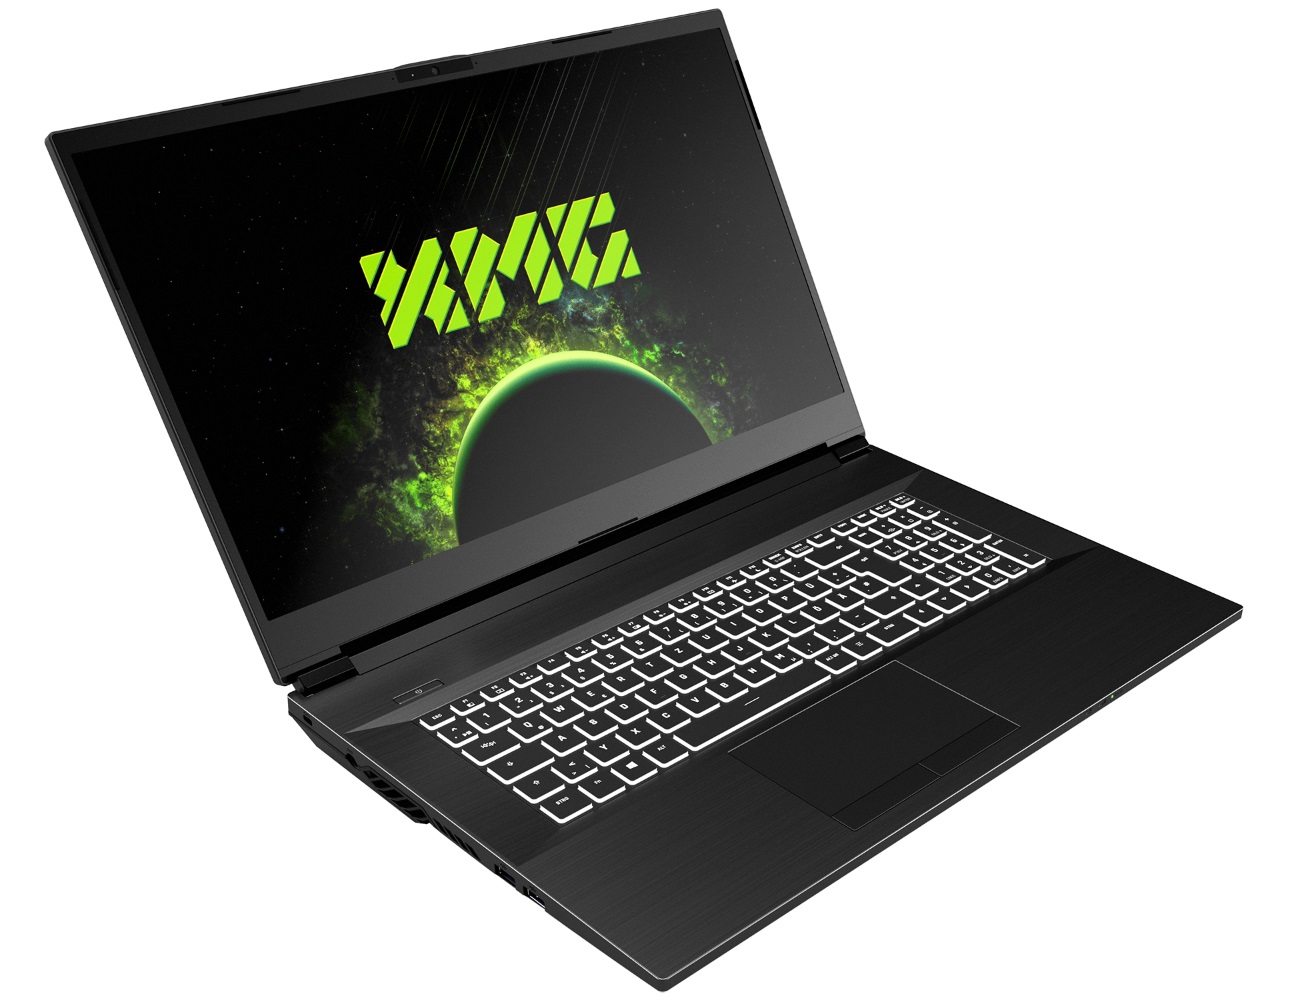
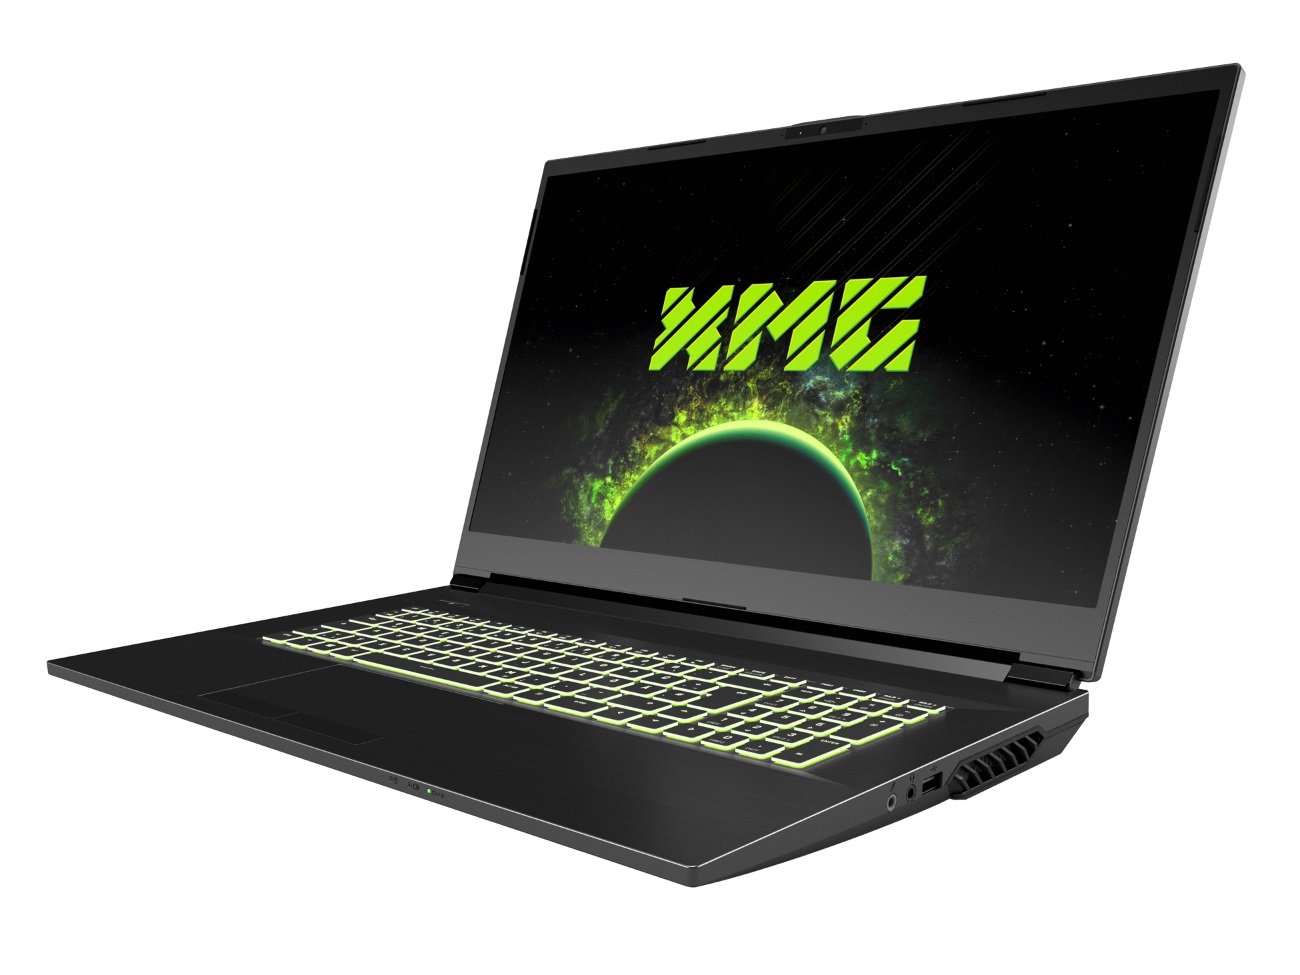
Análisis del portátil XMG Apex 17 (Clevo NH77ERQ): Para jugadores resistentes al ruido

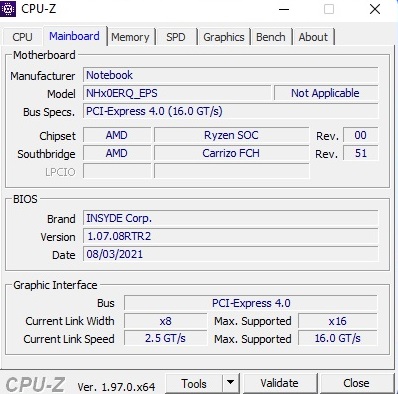
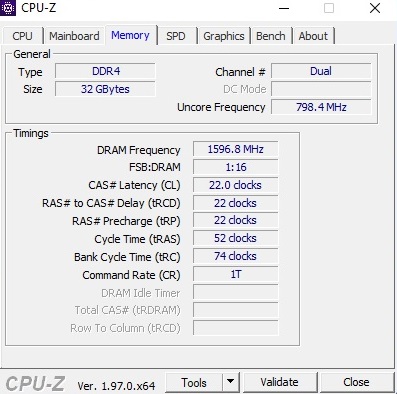
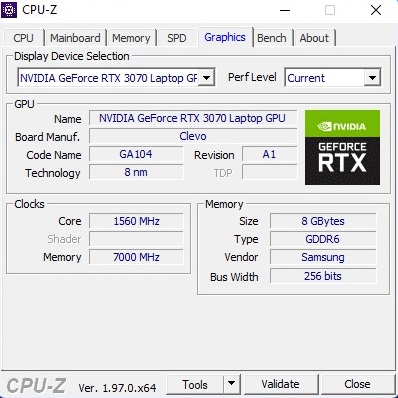
Como es sabido por Schenker Technologies, el dispositivo puede configurarse ampliamente en la tienda web propia bestware.com. Mientras que el procesador es un Ryzen 7 5800H o un Ryzen 9 5900HXla tarjeta gráfica es una GeForce RTX 3060 con 6 GB de VRAM o una GeForce RTX 3070 con 8 GB de VRAM. En cualquiera de los dos casos, una pantalla IPS mate de 144 Hz se encarga de la reproducción de imágenes. La memoria de trabajo DDR4 va de 8 a un máximo de 64 GB (2x SO-DIMM). Por lo demás, la carcasa de 17 pulgadas admite hasta dos SSD M.2 (PCIe 3.0 x4). Los compradores también pueden influir en el módulo WLAN, el idioma del teclado y el sistema operativo.
El precio del Apex 17 empieza en 1.479 Euros. Nuestra configuración de prueba con Ryzen 7 5800H, GeForce RTX 3070, 32 GB de RAM dual-channel y 1 TB SSD costaría actualmente más de 2,000 Euros.
Entre los competidores del Apex 17 se encuentran otros portátiles para juegos de 17 pulgadas con la RTX 3070, como el Razer Blade 17y el MSI GP76y el Acer Nitro 5 AN517 y el propio XMG Neo 17. Todos estos portátiles aparecen en las tablas como dispositivos de comparación
Possible competitors in comparison
Valoración | Fecha | Modelo | Peso | Altura | Tamaño | Resolución | Precio |
|---|---|---|---|---|---|---|---|
| 83.4 % v7 (old) | 11/2021 | Schenker XMG Apex 17 M21 R7 5800H, GeForce RTX 3070 Laptop GPU | 2.6 kg | 32.4 mm | 17.30" | 1920x1080 | |
| 85.1 % v7 (old) | 01/2021 | Schenker XMG Neo 17 (Early 2021, RTX 3070, 5800H) R7 5800H, GeForce RTX 3070 Laptop GPU | 2.5 kg | 27 mm | 17.30" | 2560x1440 | |
| 89.4 % v7 (old) | 09/2021 | Razer Blade 17 RTX 3070 i7-11800H, GeForce RTX 3070 Laptop GPU | 2.8 kg | 19.9 mm | 17.30" | 1920x1080 | |
| 85.1 % v7 (old) | 03/2021 | MSI GP76 Leopard 10UG i7-10750H, GeForce RTX 3070 Laptop GPU | 2.9 kg | 26 mm | 17.30" | 1920x1080 | |
| 81.3 % v7 (old) | 08/2021 | Acer Nitro 5 AN517-41-R5Z7 R7 5800H, GeForce RTX 3070 Laptop GPU | 2.7 kg | 24.9 mm | 17.30" | 1920x1080 |
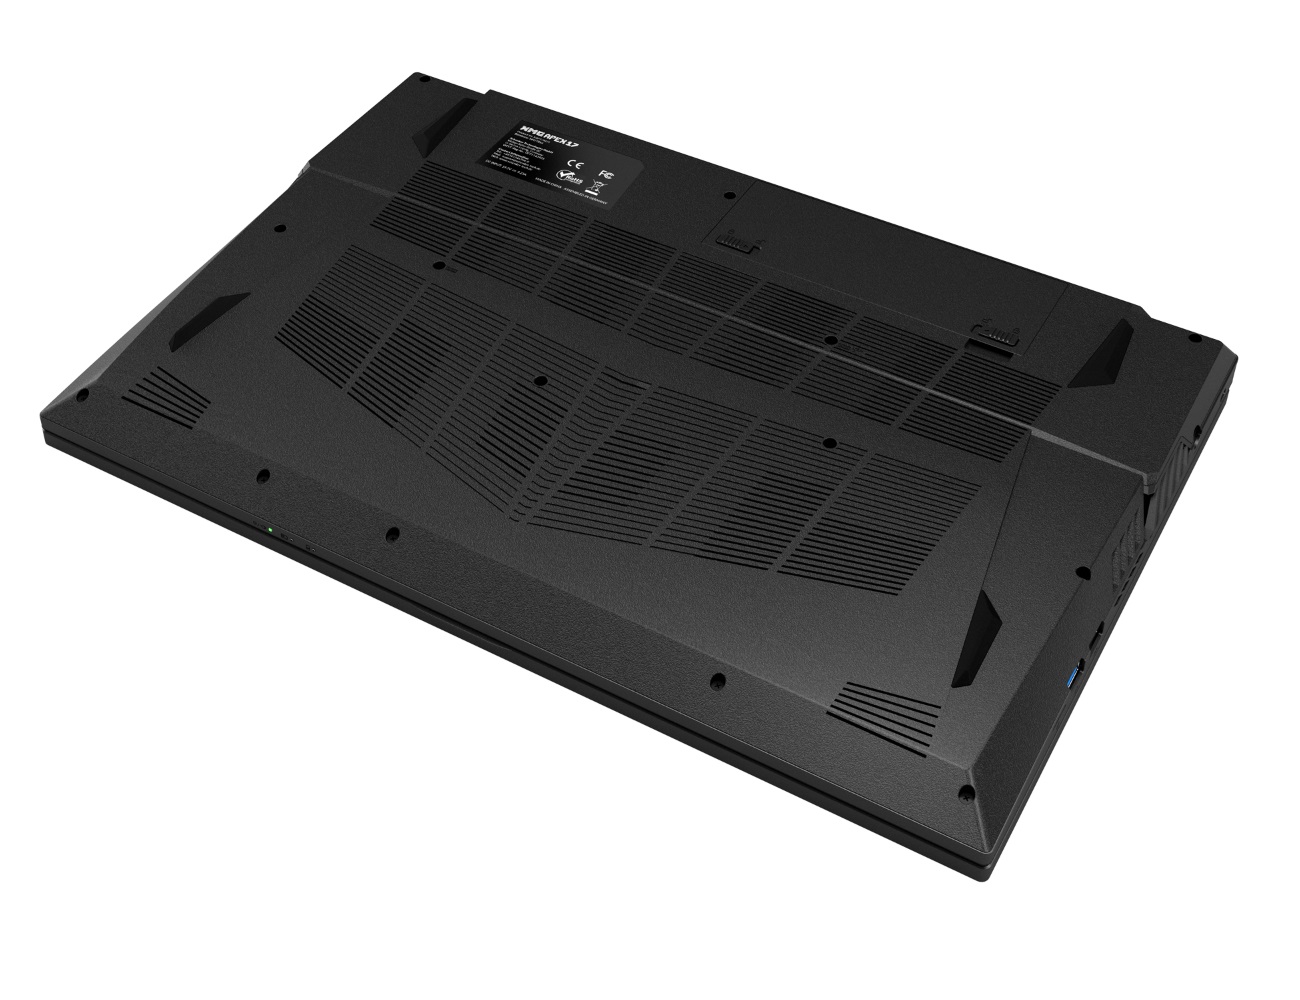
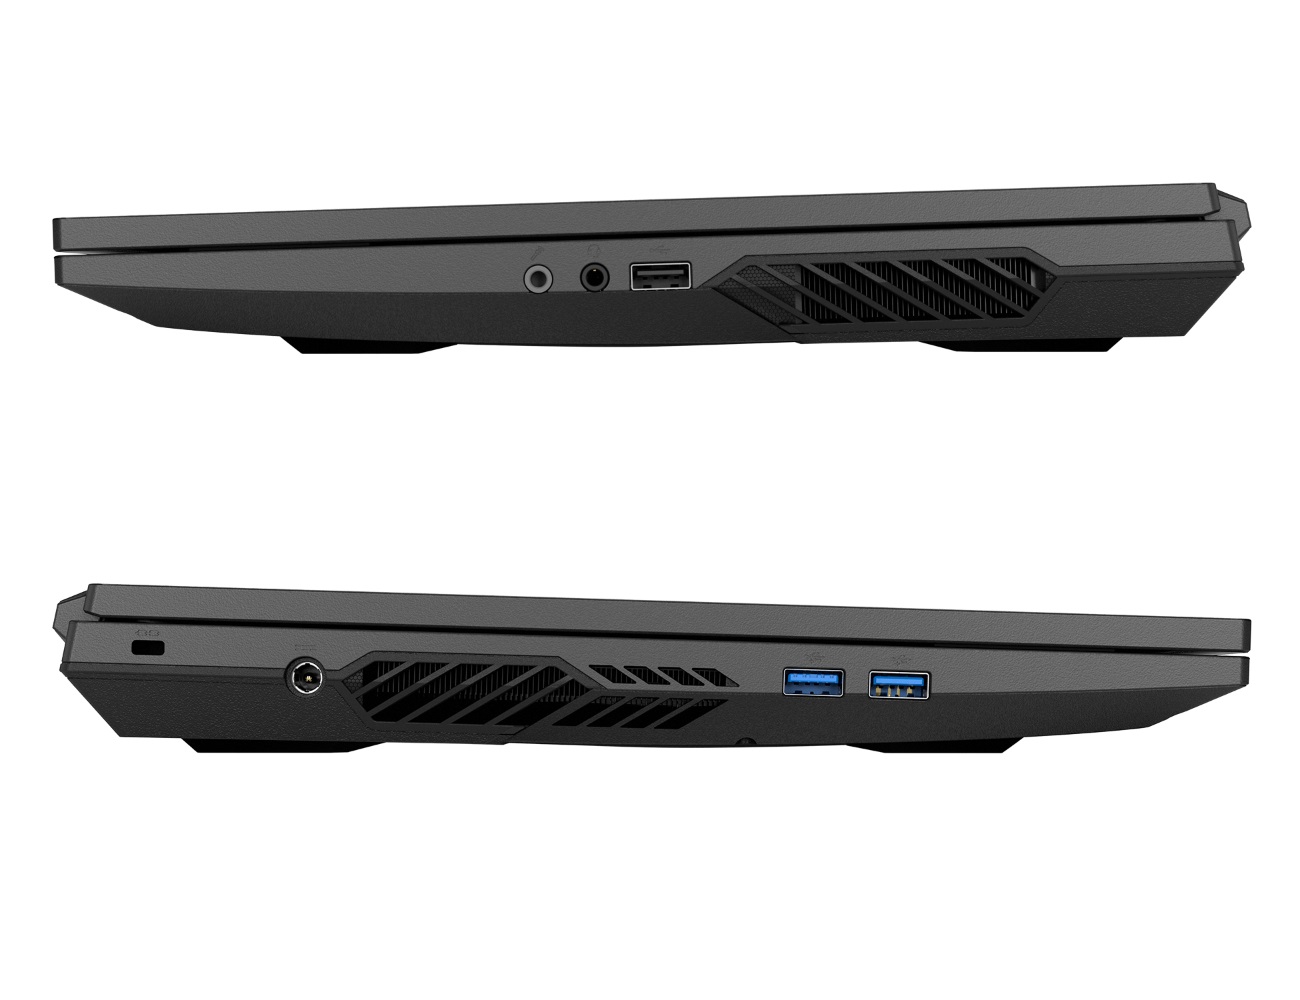
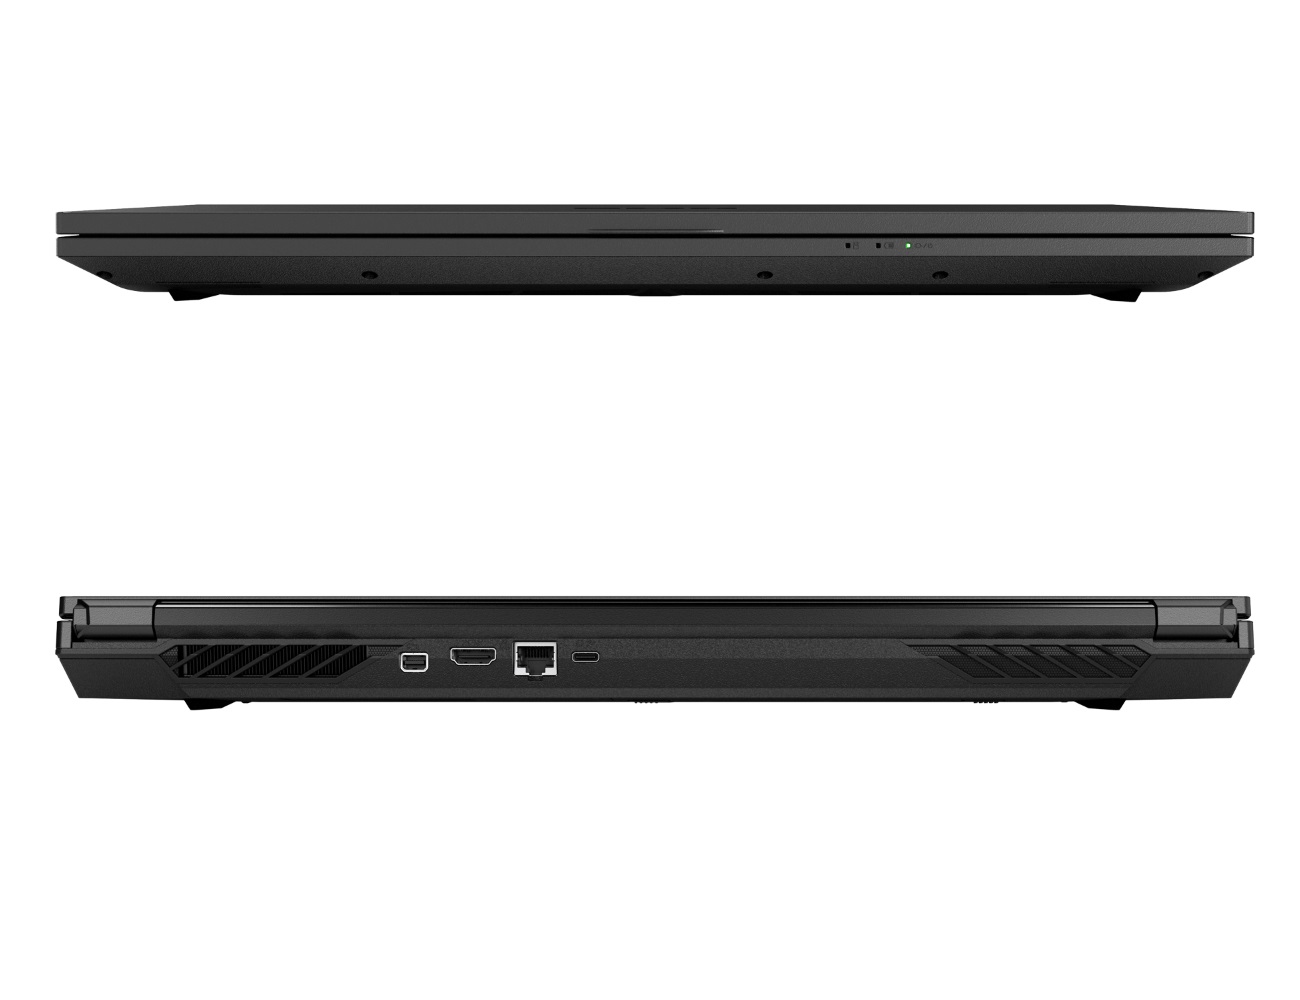
Dado que el Apex 17 es casi idéntico en construcción al recientemente probado Gigabyte A7 X1 (Clevo barebone), no profundizaremos en la carcasa, el equipo y los dispositivos de entrada en este artículo. Puedes encontrar la información correspondiente en el análisis enlazado.

Comunicación
Cámara web


Mostrar
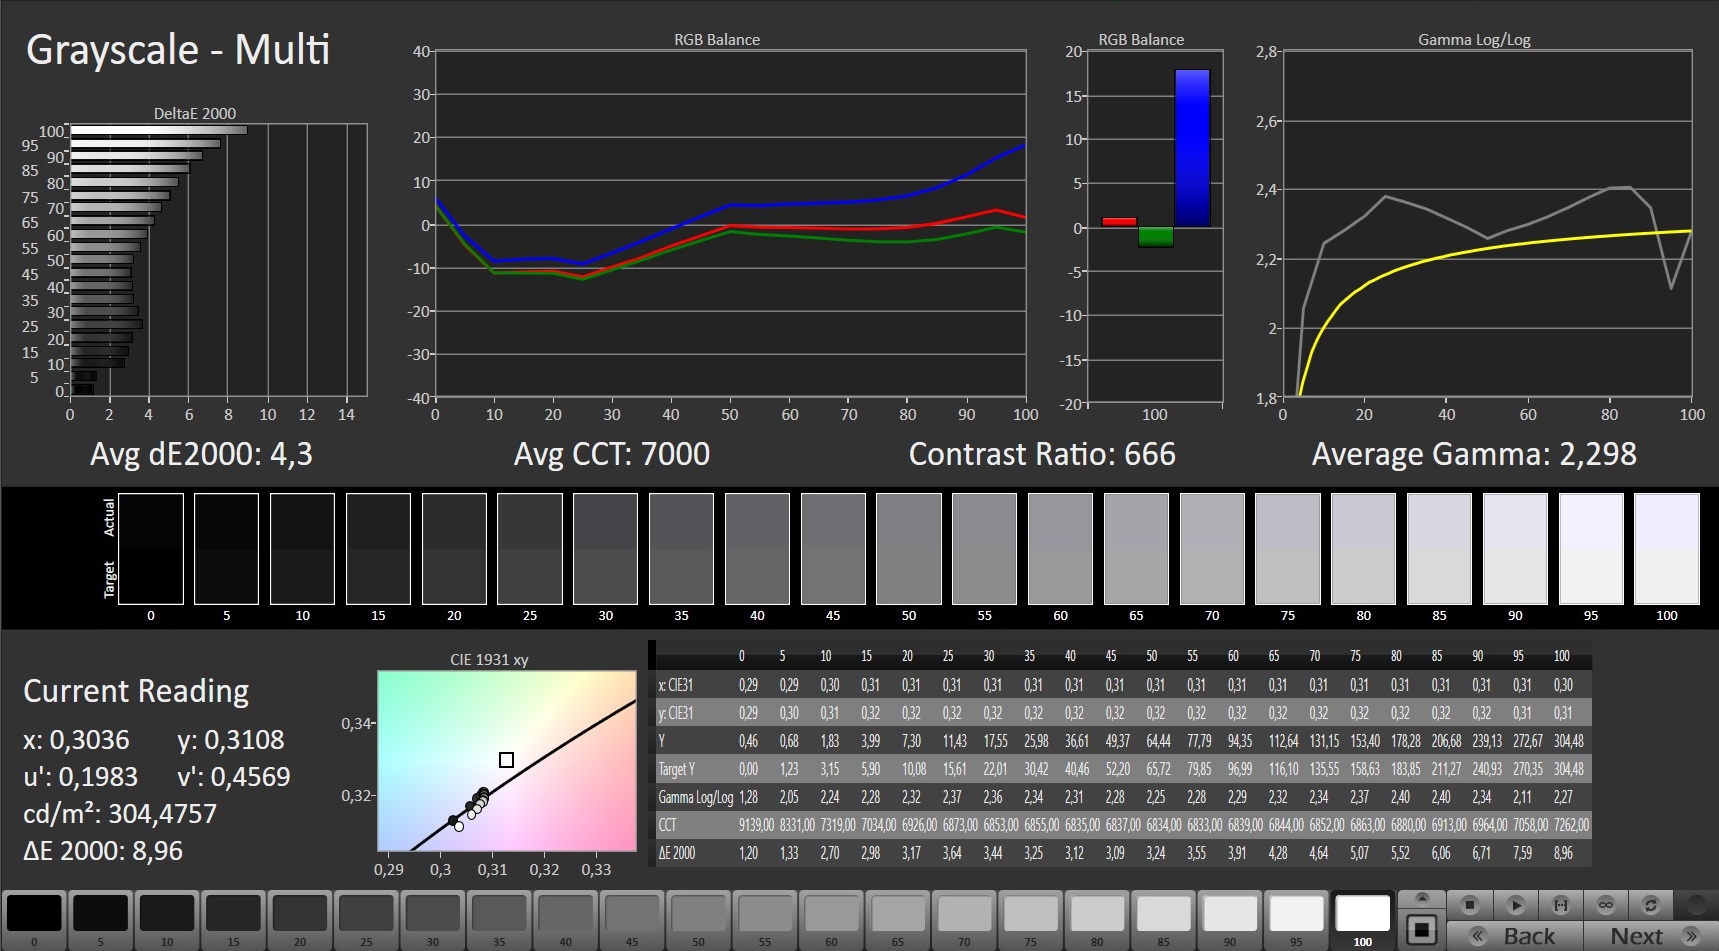
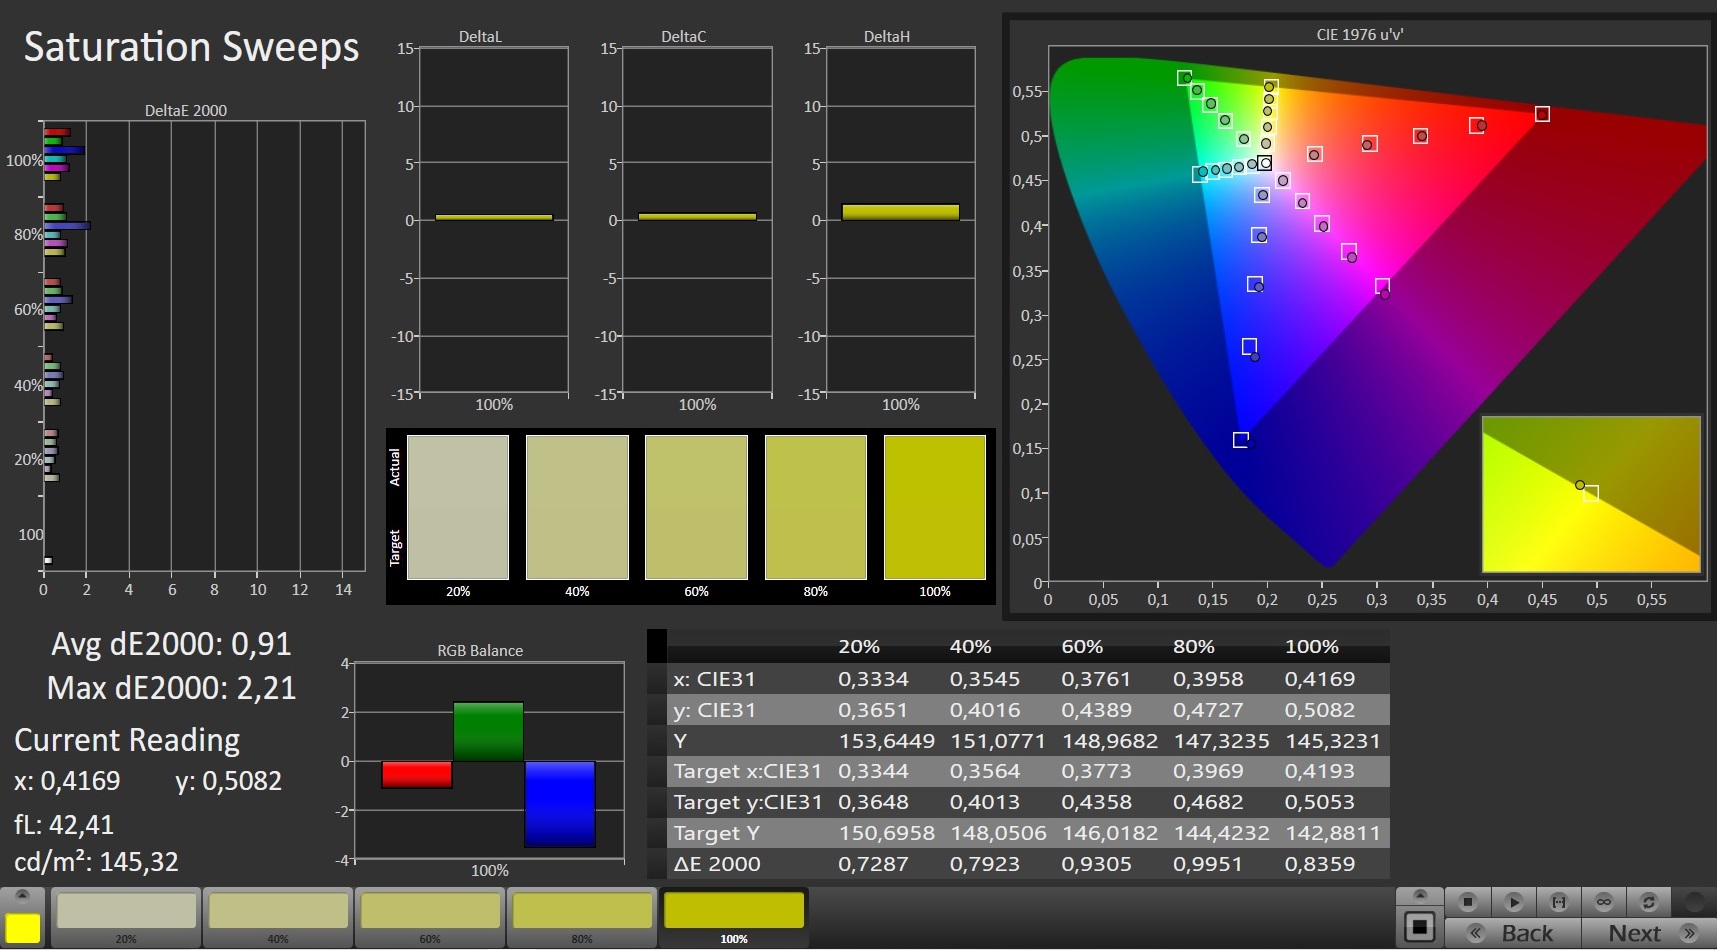
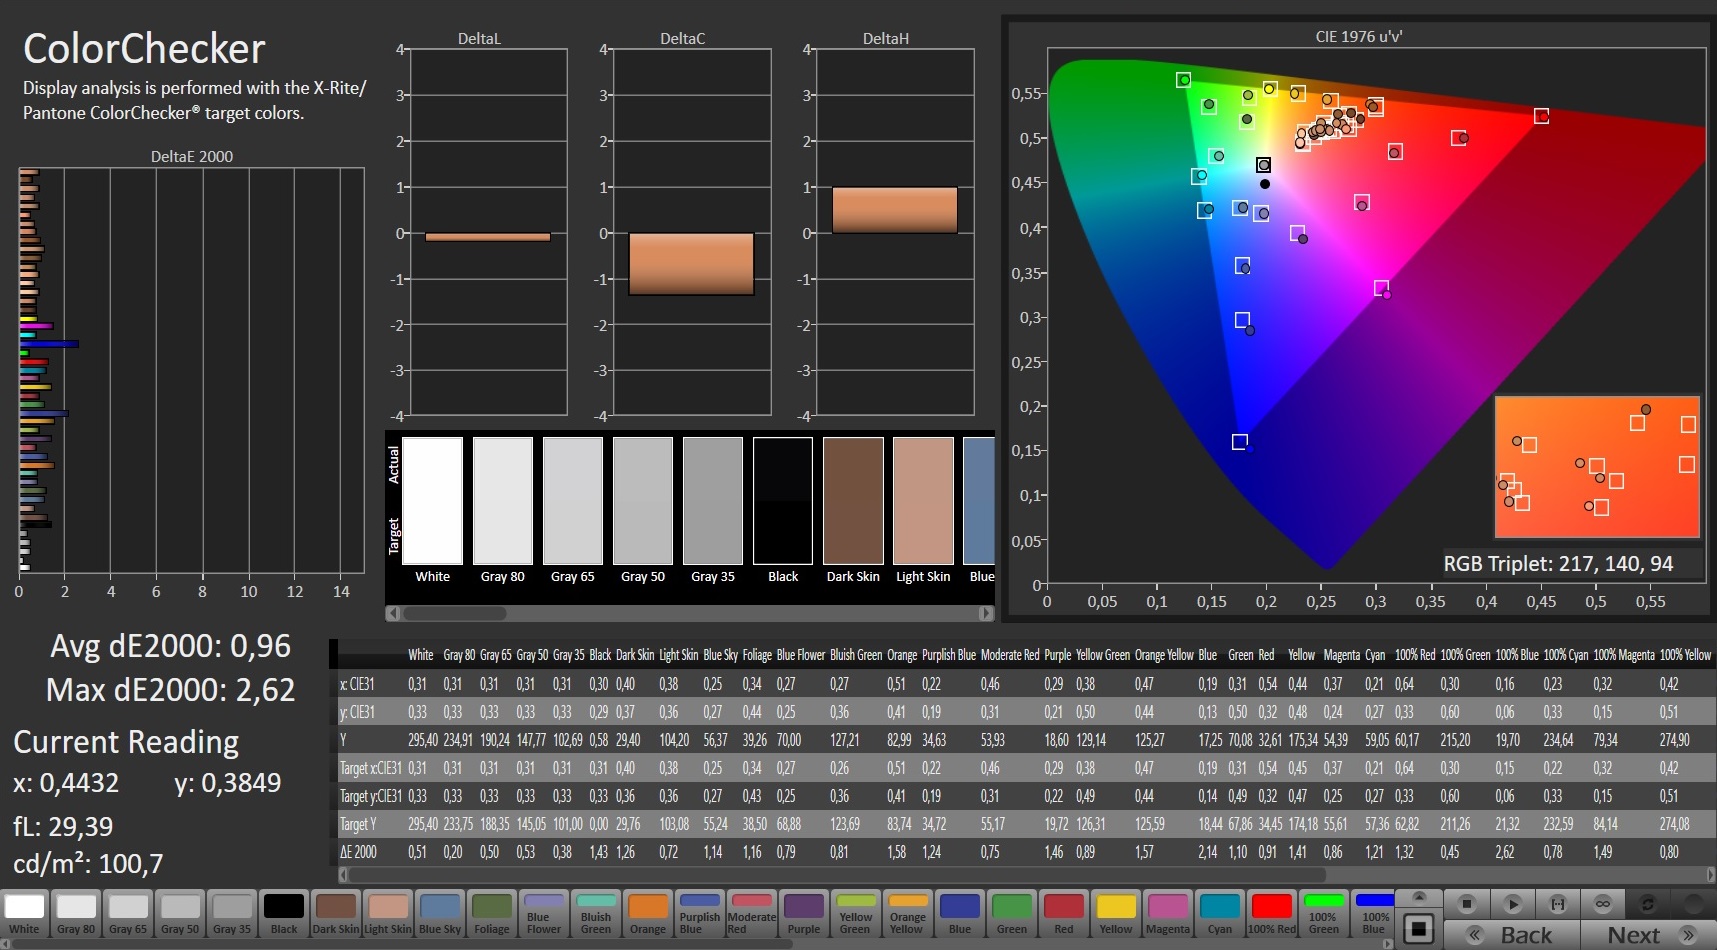
La pantalla utilizada difiere de la del A7 X1 a pesar de las idénticas especificaciones básicas (Full HD, 144 Hz, IPS). En vez de un panel de AU Optronics, el portátil Schenker usa un panel de LG Philips, que por desgracia no está a la altura del homólogo Gigabyte. Además del brillo, el contraste también es más débil. Una media de 285 cd/m² y 823:1 son bastante bajos en el rango de precios de unos 2000 Euros (~$2,289). El panel QHD del XMG Neo 17 con 381 cd/m² y 1108:1 muestra que puede ser mejor.
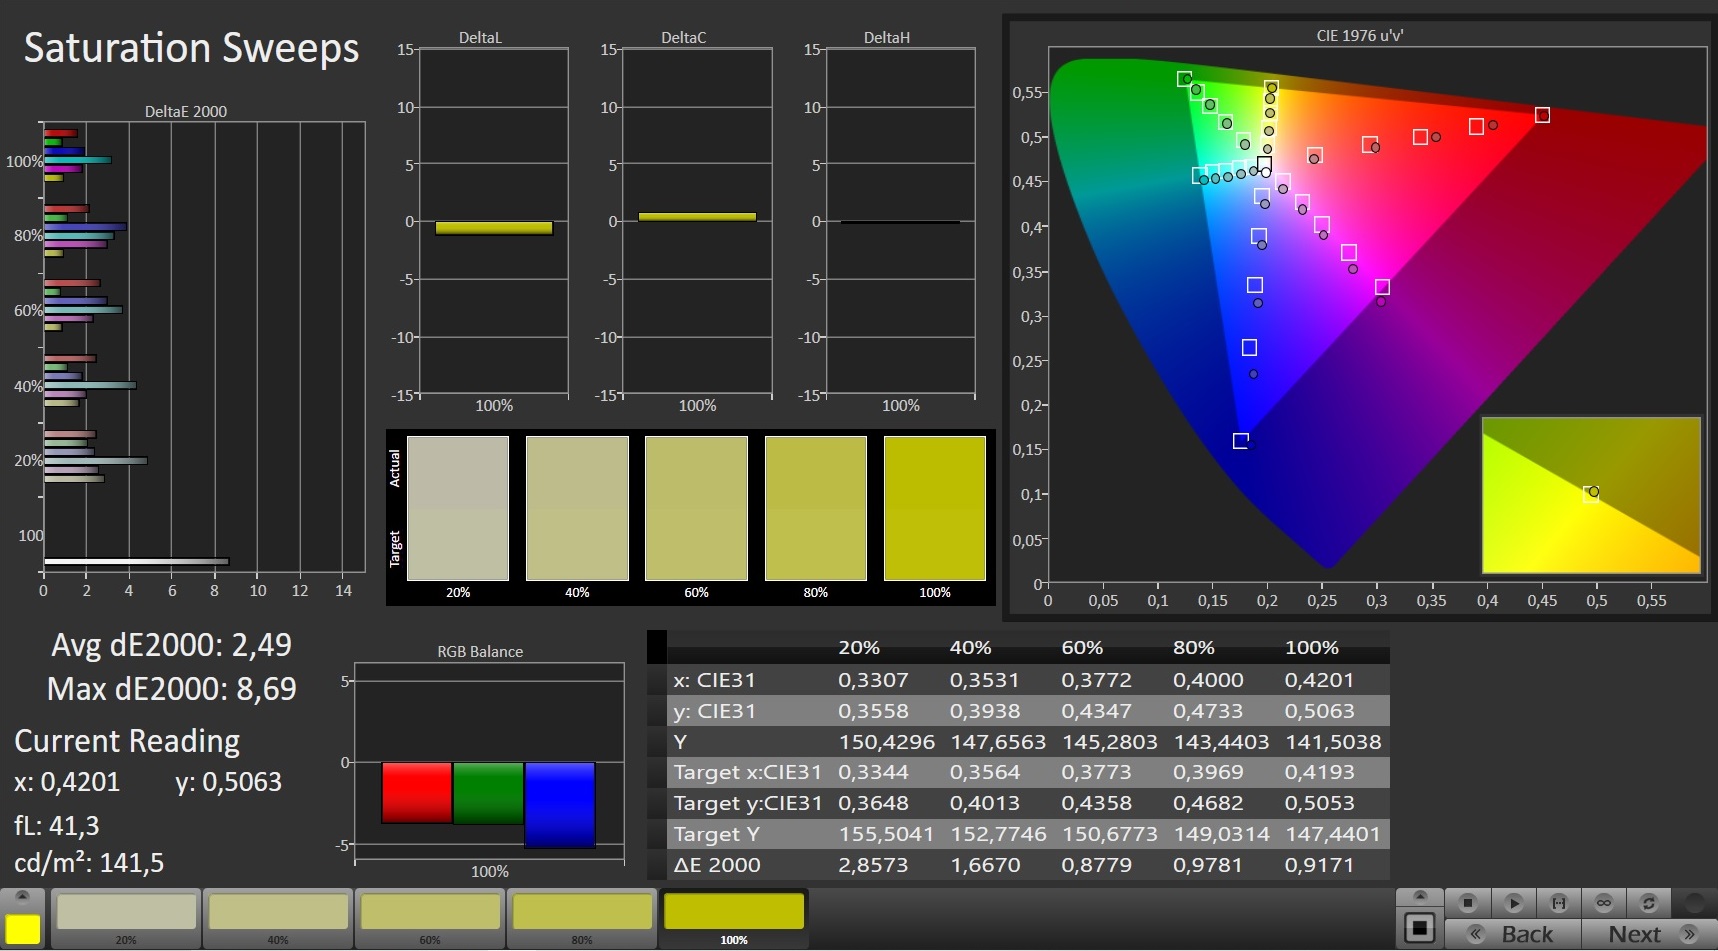
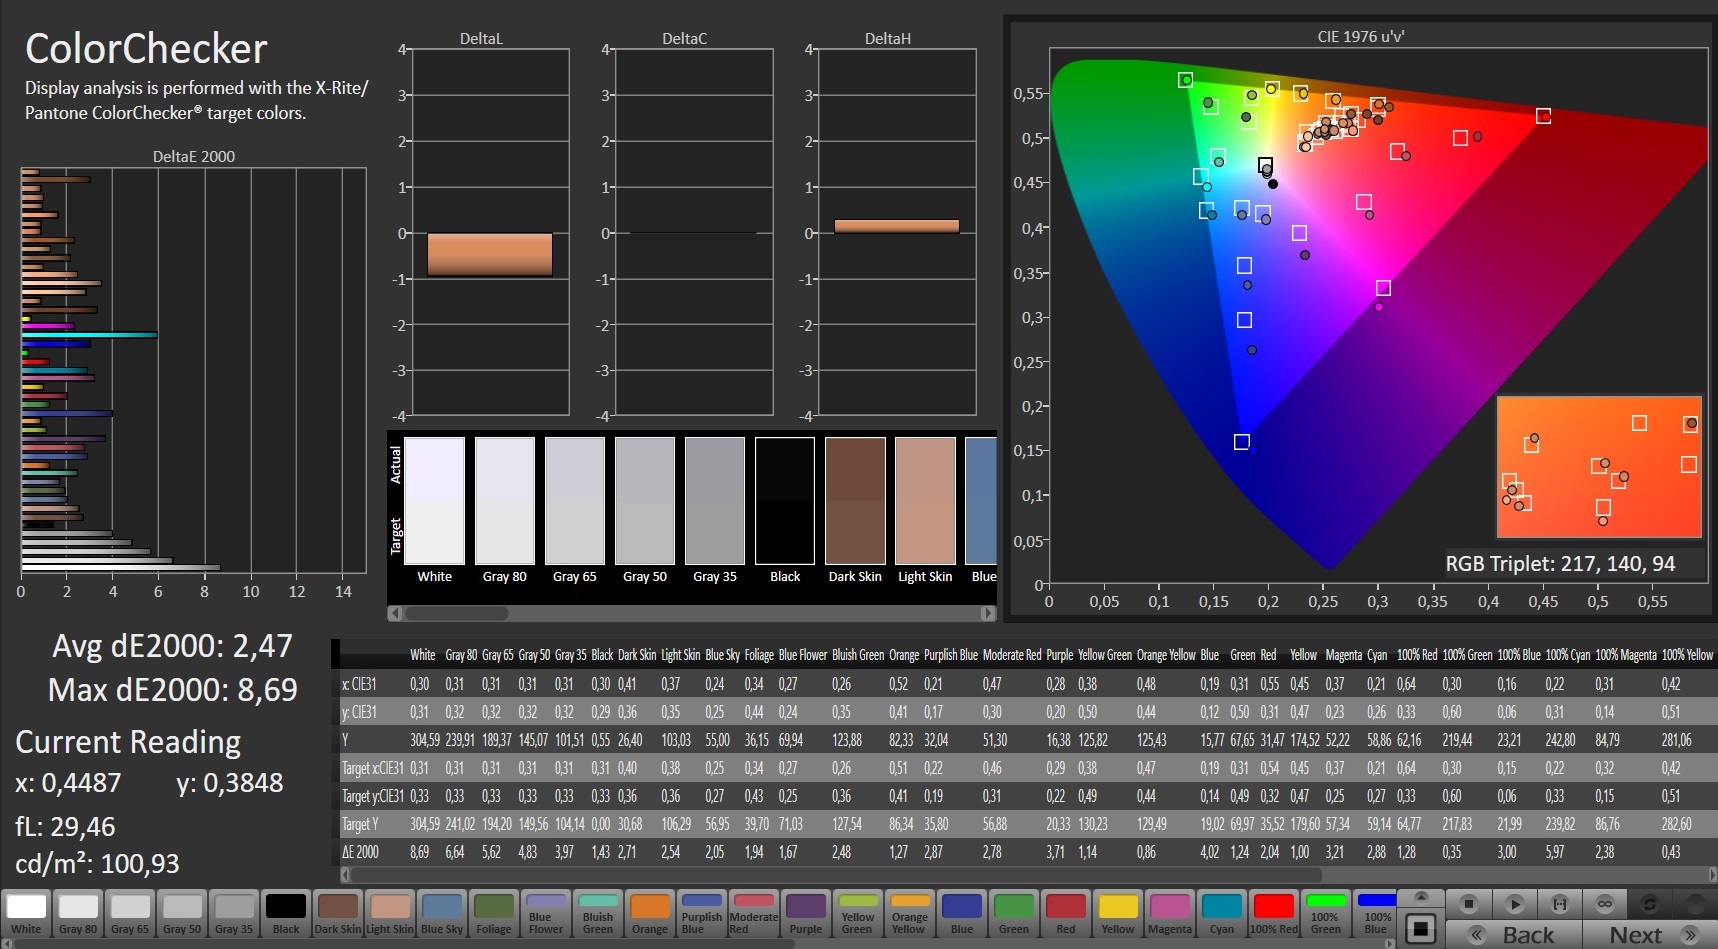
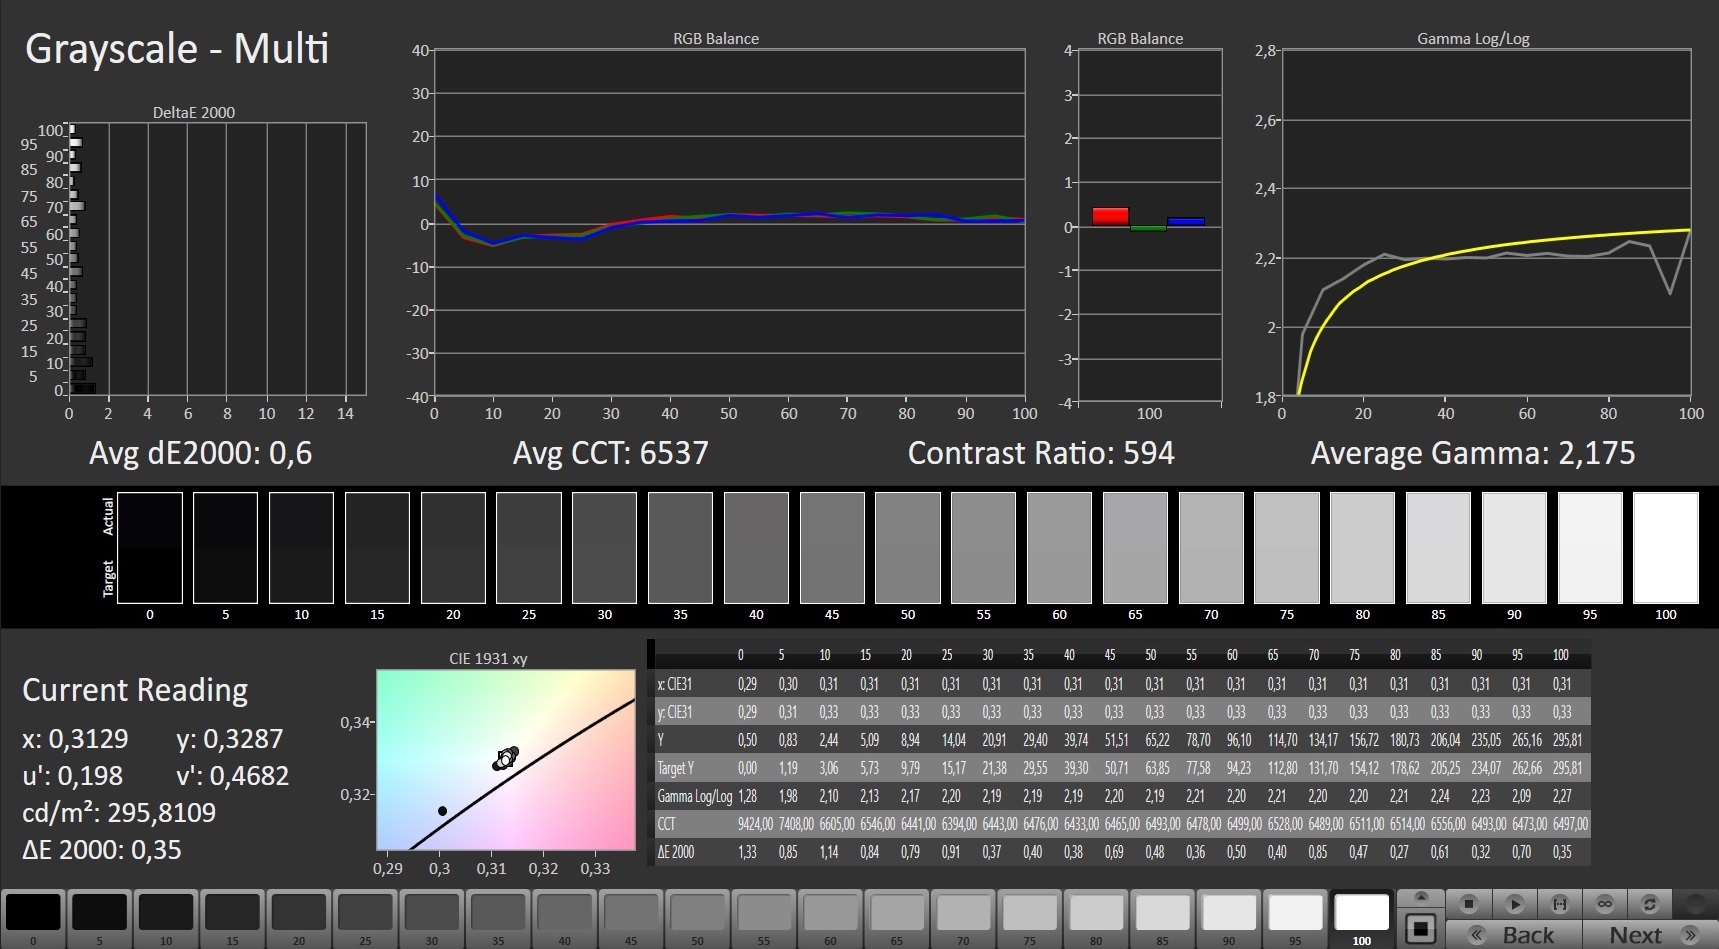
Por otro lado, hay puntos positivos para el corto tiempo de respuesta y el decente espacio de color. El 96% de sRGB es completamente suficiente para un portátil de juegos. La reproducción del color tampoco puede criticarse, aunque aún pueden lograrse mejoras a través de la calibración (nuestro archivo ICC está enlazado más abajo). La estabilidad de los ángulos de visión está al típico nivel IPS, por lo que es buena
| |||||||||||||||||||||||||
iluminación: 94 %
Brillo con batería: 292 cd/m²
Contraste: 823:1 (Negro: 0.355 cd/m²)
ΔE ColorChecker Calman: 2.47 | ∀{0.5-29.43 Ø4.73}
calibrated: 0.96
ΔE Greyscale Calman: 4.3 | ∀{0.09-98 Ø4.97}
65.8% AdobeRGB 1998 (Argyll 3D)
95.9% sRGB (Argyll 3D)
65% Display P3 (Argyll 3D)
Gamma: 2.298
CCT: 7000 K
| Schenker XMG Apex 17 M21 LG Philips LP173WFG-SPB3, IPS, 1920x1080, 17.3" | Schenker XMG Neo 17 (Early 2021, RTX 3070, 5800H) BOE NE173QHM-NY2 (BOE0977), IPS, 2560x1440, 17.3" | Razer Blade 17 RTX 3070 AU Optronics B173HAN05.4, IPS, 1920x1080, 17.3" | MSI GP76 Leopard 10UG Chi Mei CMN176E, IPS, 1920x1080, 17.3" | Acer Nitro 5 AN517-41-R5Z7 BOE NV173FHM-NX4, IPS, 1920x1080, 17.3" | |
|---|---|---|---|---|---|
| Display | 7% | 8% | 1% | -43% | |
| Display P3 Coverage (%) | 65 | 70.5 8% | 71.7 10% | 64.7 0% | 36.7 -44% |
| sRGB Coverage (%) | 95.9 | 99.5 4% | 98.8 3% | 96.4 1% | 55.3 -42% |
| AdobeRGB 1998 Coverage (%) | 65.8 | 71.8 9% | 73.6 12% | 66.9 2% | 37.9 -42% |
| Response Times | -4% | 44% | 24% | -27% | |
| Response Time Grey 50% / Grey 80% * (ms) | 15.2 ? | 16.8 ? -11% | 4.2 ? 72% | 7.4 ? 51% | 18 ? -18% |
| Response Time Black / White * (ms) | 10.4 ? | 10 ? 4% | 8.8 ? 15% | 10.8 ? -4% | 14 ? -35% |
| PWM Frequency (Hz) | 24510 ? | ||||
| Screen | 15% | -22% | 22% | -19% | |
| Brightness middle (cd/m²) | 292 | 410 40% | 323.3 11% | 328 12% | 282 -3% |
| Brightness (cd/m²) | 285 | 381 34% | 315 11% | 314 10% | 255 -11% |
| Brightness Distribution (%) | 94 | 88 -6% | 91 -3% | 87 -7% | 85 -10% |
| Black Level * (cd/m²) | 0.355 | 0.37 -4% | 0.33 7% | 0.29 18% | 0.24 32% |
| Contrast (:1) | 823 | 1108 35% | 980 19% | 1131 37% | 1175 43% |
| Colorchecker dE 2000 * | 2.47 | 2.55 -3% | 4.59 -86% | 1.93 22% | 5.91 -139% |
| Colorchecker dE 2000 max. * | 8.69 | 4.33 50% | 10.82 -25% | 4.94 43% | 10.98 -26% |
| Colorchecker dE 2000 calibrated * | 0.96 | 1.28 -33% | 1.4 -46% | 0.68 29% | |
| Greyscale dE 2000 * | 4.3 | 3.4 21% | 7.9 -84% | 2.8 35% | 5.85 -36% |
| Gamma | 2.298 96% | 2.275 97% | 2.28 96% | 2.18 101% | 2.32 95% |
| CCT | 7000 93% | 6637 98% | 5941 109% | 7023 93% | 7372 88% |
| Color Space (Percent of AdobeRGB 1998) (%) | 72 | 67 | 35 | ||
| Color Space (Percent of sRGB) (%) | 95 | 89 | 55 | ||
| Media total (Programa/Opciones) | 6% /
11% | 10% /
-6% | 16% /
18% | -30% /
-25% |
* ... más pequeño es mejor
Tiempos de respuesta del display
| ↔ Tiempo de respuesta de Negro a Blanco | ||
|---|---|---|
| 10.4 ms ... subida ↗ y bajada ↘ combinada | ↗ 6 ms subida | 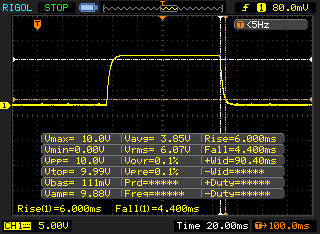 |
| ↘ 4.4 ms bajada | ||
| La pantalla mostró buenos tiempos de respuesta en nuestros tests pero podría ser demasiado lenta para los jugones competitivos. En comparación, todos los dispositivos de prueba van de ##min### (mínimo) a 240 (máximo) ms. » 28 % de todos los dispositivos son mejores. Esto quiere decir que el tiempo de respuesta medido es mejor que la media (19.9 ms) de todos los dispositivos testados. | ||
| ↔ Tiempo de respuesta 50% Gris a 80% Gris | ||
| 15.2 ms ... subida ↗ y bajada ↘ combinada | ↗ 7.6 ms subida | 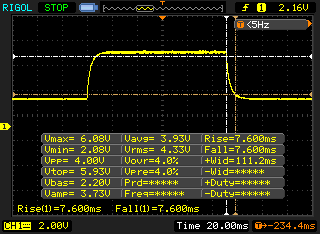 |
| ↘ 7.6 ms bajada | ||
| La pantalla mostró buenos tiempos de respuesta en nuestros tests pero podría ser demasiado lenta para los jugones competitivos. En comparación, todos los dispositivos de prueba van de ##min### (mínimo) a 636 (máximo) ms. » 29 % de todos los dispositivos son mejores. Esto quiere decir que el tiempo de respuesta medido es mejor que la media (31.1 ms) de todos los dispositivos testados. | ||
Parpadeo de Pantalla / PWM (Pulse-Width Modulation)
| Parpadeo de Pantalla / PWM no detectado |  | ||
Comparación: 52 % de todos los dispositivos testados no usaron PWM para atenuar el display. Si se usó, medimos una media de 7798 (mínimo: 5 - máxmo: 343500) Hz. | |||
Condiciones de la prueba
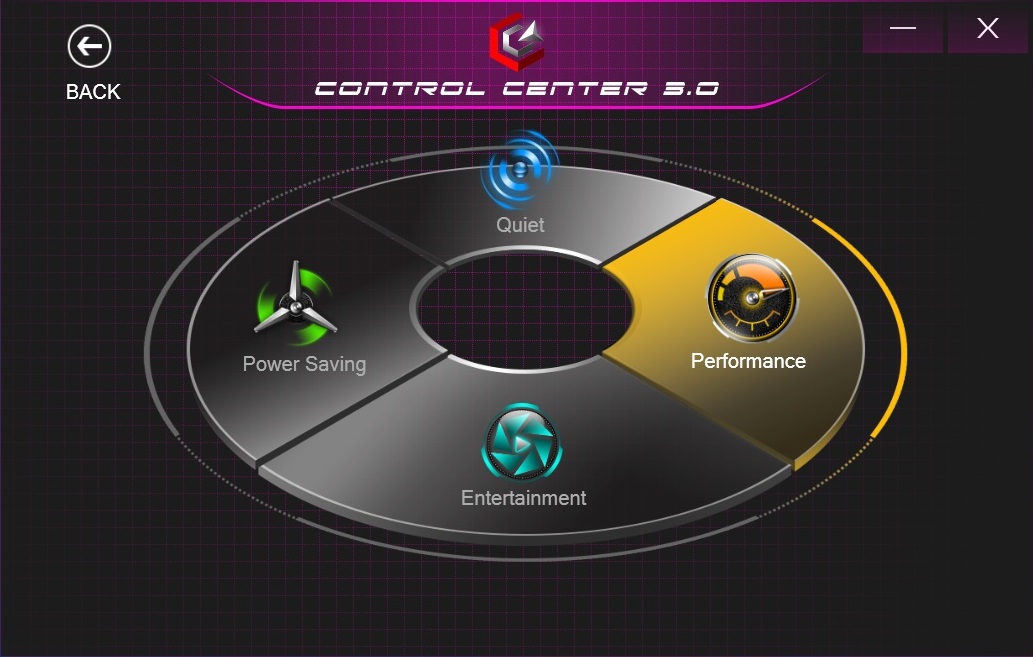
En el Centro de Control precargado, que proviene del fabricante de barebones Clevo, se pueden realizar varios ajustes del sistema. Estos incluyen el control del ventilador y el perfil de rendimiento. Para obtener la máxima potencia del Apex 17, utilizamos el modo Rendimiento para nuestras pruebas (sólo las mediciones de la batería se realizaron en el modo Entretenimiento). Dejamos el ajuste de la velocidad del ventilador en la opción por defecto Automático.
Nota: Para evitar que Windows 11, que estaba instalado en el dispositivo de pruebas, influyera negativamente en los resultados del benchmark, esperamos al último controlador de AMD para la placa base y a cierta actualización de Microsoft (error de la palabra clave L3 cache).
Potencia
No importa qué CPU o GPU elijas para la configuración: El Apex 17 tiende hacia el segmento de gama alta. Para estar adecuadamente preparado para el futuro, recomendaríamos 16 GB de RAM y un mínimo de 500 GB de SSD. La configuración básica es extremadamente escasa en este sentido (8 GB y 250 GB).
Procesador
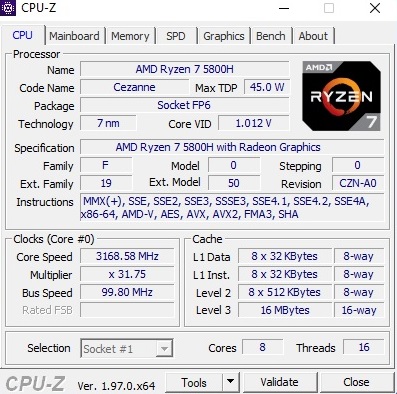
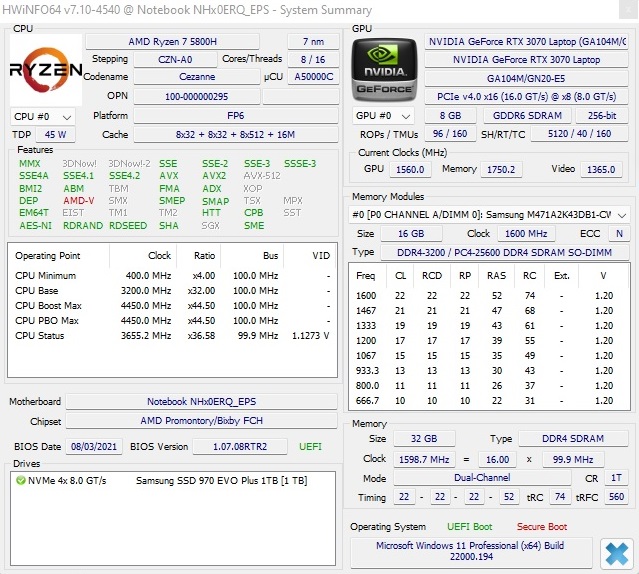
El Ryzen 7 5800H instalado en el modelo de pruebas es un procesador de ocho núcleos extremadamente rápido que puede procesar hasta 16 hilos en paralelo mediante SMT. No hubo sorpresas desagradables en nuestro curso de pruebas. Las puntuaciones de Cinebench son todas de alto nivel y pueden mantenerse frente a la competencia. El rendimiento también se mantuvo bastante estable en la prueba Loop (comparar gráfico)
Cinebench R15 Multi Endurance Test
* ... más pequeño es mejor
AIDA64: FP32 Ray-Trace | FPU Julia | CPU SHA3 | CPU Queen | FPU SinJulia | FPU Mandel | CPU AES | CPU ZLib | FP64 Ray-Trace | CPU PhotoWorxx
| Performance rating | |
| Media de la clase Gaming | |
| Schenker XMG Apex 17 M21 | |
| Schenker XMG Neo 17 (Early 2021, RTX 3070, 5800H) | |
| Acer Nitro 5 AN517-41-R5Z7 | |
| Medio AMD Ryzen 7 5800H | |
| MSI GP76 Leopard 10UG | |
| Razer Blade 17 RTX 3070 -9! | |
| AIDA64 / FP32 Ray-Trace | |
| Media de la clase Gaming (10227 - 85542, n=109, últimos 2 años) | |
| Schenker XMG Apex 17 M21 | |
| Schenker XMG Neo 17 (Early 2021, RTX 3070, 5800H) | |
| Acer Nitro 5 AN517-41-R5Z7 | |
| Medio AMD Ryzen 7 5800H (10349 - 15169, n=29) | |
| MSI GP76 Leopard 10UG | |
| AIDA64 / FPU Julia | |
| Media de la clase Gaming (51376 - 238426, n=109, últimos 2 años) | |
| Schenker XMG Apex 17 M21 | |
| Schenker XMG Neo 17 (Early 2021, RTX 3070, 5800H) | |
| Acer Nitro 5 AN517-41-R5Z7 | |
| Medio AMD Ryzen 7 5800H (63663 - 95954, n=29) | |
| MSI GP76 Leopard 10UG | |
| AIDA64 / CPU SHA3 | |
| Media de la clase Gaming (2180 - 9817, n=109, últimos 2 años) | |
| Schenker XMG Apex 17 M21 | |
| Schenker XMG Neo 17 (Early 2021, RTX 3070, 5800H) | |
| Acer Nitro 5 AN517-41-R5Z7 | |
| Medio AMD Ryzen 7 5800H (2096 - 3287, n=29) | |
| MSI GP76 Leopard 10UG | |
| AIDA64 / CPU Queen | |
| Media de la clase Gaming (49785 - 173351, n=100, últimos 2 años) | |
| Acer Nitro 5 AN517-41-R5Z7 | |
| Schenker XMG Apex 17 M21 | |
| Medio AMD Ryzen 7 5800H (91846 - 99215, n=29) | |
| Schenker XMG Neo 17 (Early 2021, RTX 3070, 5800H) | |
| MSI GP76 Leopard 10UG | |
| AIDA64 / FPU SinJulia | |
| Media de la clase Gaming (4424 - 33636, n=109, últimos 2 años) | |
| Acer Nitro 5 AN517-41-R5Z7 | |
| Schenker XMG Apex 17 M21 | |
| Schenker XMG Neo 17 (Early 2021, RTX 3070, 5800H) | |
| Medio AMD Ryzen 7 5800H (9962 - 11871, n=29) | |
| MSI GP76 Leopard 10UG | |
| AIDA64 / FPU Mandel | |
| Media de la clase Gaming (25115 - 128721, n=109, últimos 2 años) | |
| Schenker XMG Apex 17 M21 | |
| Schenker XMG Neo 17 (Early 2021, RTX 3070, 5800H) | |
| Acer Nitro 5 AN517-41-R5Z7 | |
| Medio AMD Ryzen 7 5800H (36083 - 52732, n=29) | |
| MSI GP76 Leopard 10UG | |
| AIDA64 / CPU AES | |
| Schenker XMG Apex 17 M21 | |
| Schenker XMG Neo 17 (Early 2021, RTX 3070, 5800H) | |
| Acer Nitro 5 AN517-41-R5Z7 | |
| Medio AMD Ryzen 7 5800H (50226 - 127832, n=29) | |
| Media de la clase Gaming (39258 - 247074, n=109, últimos 2 años) | |
| MSI GP76 Leopard 10UG | |
| AIDA64 / CPU ZLib | |
| Media de la clase Gaming (574 - 2531, n=109, últimos 2 años) | |
| Schenker XMG Neo 17 (Early 2021, RTX 3070, 5800H) | |
| Schenker XMG Apex 17 M21 | |
| Acer Nitro 5 AN517-41-R5Z7 | |
| Medio AMD Ryzen 7 5800H (591 - 828, n=29) | |
| MSI GP76 Leopard 10UG | |
| Razer Blade 17 RTX 3070 | |
| AIDA64 / FP64 Ray-Trace | |
| Media de la clase Gaming (5509 - 45446, n=109, últimos 2 años) | |
| Schenker XMG Apex 17 M21 | |
| Schenker XMG Neo 17 (Early 2021, RTX 3070, 5800H) | |
| Acer Nitro 5 AN517-41-R5Z7 | |
| Medio AMD Ryzen 7 5800H (5457 - 7884, n=29) | |
| MSI GP76 Leopard 10UG | |
| AIDA64 / CPU PhotoWorxx | |
| Media de la clase Gaming (12271 - 89891, n=109, últimos 2 años) | |
| Schenker XMG Apex 17 M21 | |
| MSI GP76 Leopard 10UG | |
| Schenker XMG Neo 17 (Early 2021, RTX 3070, 5800H) | |
| Medio AMD Ryzen 7 5800H (14445 - 25421, n=29) | |
| Acer Nitro 5 AN517-41-R5Z7 | |
Rendimiento del sistema
El rendimiento del sistema parece igualmente bueno. El Apex 17 también se lleva uno de los primeros puestos aquí, aunque los dispositivos de la competencia aún se probaron con Windows 10, lo que puede significar ciertas desviaciones.
| PCMark 10 / Score | |
| Media de la clase Gaming (5828 - 11574, n=95, últimos 2 años) | |
| Razer Blade 17 RTX 3070 | |
| Schenker XMG Neo 17 (Early 2021, RTX 3070, 5800H) | |
| Schenker XMG Apex 17 M21 | |
| Medio AMD Ryzen 7 5800H, NVIDIA GeForce RTX 3070 Laptop GPU (6717 - 6983, n=6) | |
| Acer Nitro 5 AN517-41-R5Z7 | |
| MSI GP76 Leopard 10UG | |
| PCMark 10 / Essentials | |
| Razer Blade 17 RTX 3070 | |
| Media de la clase Gaming (8810 - 12600, n=99, últimos 2 años) | |
| Schenker XMG Apex 17 M21 | |
| Acer Nitro 5 AN517-41-R5Z7 | |
| Schenker XMG Neo 17 (Early 2021, RTX 3070, 5800H) | |
| Medio AMD Ryzen 7 5800H, NVIDIA GeForce RTX 3070 Laptop GPU (9548 - 10226, n=6) | |
| MSI GP76 Leopard 10UG | |
| PCMark 10 / Productivity | |
| Media de la clase Gaming (6845 - 18766, n=97, últimos 2 años) | |
| Acer Nitro 5 AN517-41-R5Z7 | |
| Razer Blade 17 RTX 3070 | |
| Schenker XMG Apex 17 M21 | |
| Medio AMD Ryzen 7 5800H, NVIDIA GeForce RTX 3070 Laptop GPU (8849 - 9514, n=6) | |
| Schenker XMG Neo 17 (Early 2021, RTX 3070, 5800H) | |
| MSI GP76 Leopard 10UG | |
| PCMark 10 / Digital Content Creation | |
| Media de la clase Gaming (7602 - 19657, n=97, últimos 2 años) | |
| Razer Blade 17 RTX 3070 | |
| Schenker XMG Neo 17 (Early 2021, RTX 3070, 5800H) | |
| Schenker XMG Apex 17 M21 | |
| Medio AMD Ryzen 7 5800H, NVIDIA GeForce RTX 3070 Laptop GPU (8948 - 10389, n=6) | |
| Acer Nitro 5 AN517-41-R5Z7 | |
| MSI GP76 Leopard 10UG | |
| PCMark 10 Score | 6972 puntos | |
ayuda | ||
| AIDA64 / Memory Copy | |
| Media de la clase Gaming (21750 - 129946, n=109, últimos 2 años) | |
| Schenker XMG Apex 17 M21 | |
| Schenker XMG Neo 17 (Early 2021, RTX 3070, 5800H) | |
| Medio AMD Ryzen 7 5800H (34964 - 44180, n=29) | |
| MSI GP76 Leopard 10UG | |
| AIDA64 / Memory Read | |
| Media de la clase Gaming (22956 - 118858, n=109, últimos 2 años) | |
| Schenker XMG Apex 17 M21 | |
| Schenker XMG Neo 17 (Early 2021, RTX 3070, 5800H) | |
| Medio AMD Ryzen 7 5800H (39548 - 47260, n=29) | |
| MSI GP76 Leopard 10UG | |
| AIDA64 / Memory Write | |
| Media de la clase Gaming (22297 - 135096, n=109, últimos 2 años) | |
| Schenker XMG Apex 17 M21 | |
| MSI GP76 Leopard 10UG | |
| Medio AMD Ryzen 7 5800H (28456 - 47022, n=29) | |
| Schenker XMG Neo 17 (Early 2021, RTX 3070, 5800H) | |
| AIDA64 / Memory Latency | |
| Media de la clase Gaming (75.3 - 259, n=109, últimos 2 años) | |
| Schenker XMG Neo 17 (Early 2021, RTX 3070, 5800H) | |
| Medio AMD Ryzen 7 5800H (76.3 - 105.1, n=29) | |
| Schenker XMG Apex 17 M21 | |
| MSI GP76 Leopard 10UG | |
| Razer Blade 17 RTX 3070 | |
* ... más pequeño es mejor
Latencias del CPD
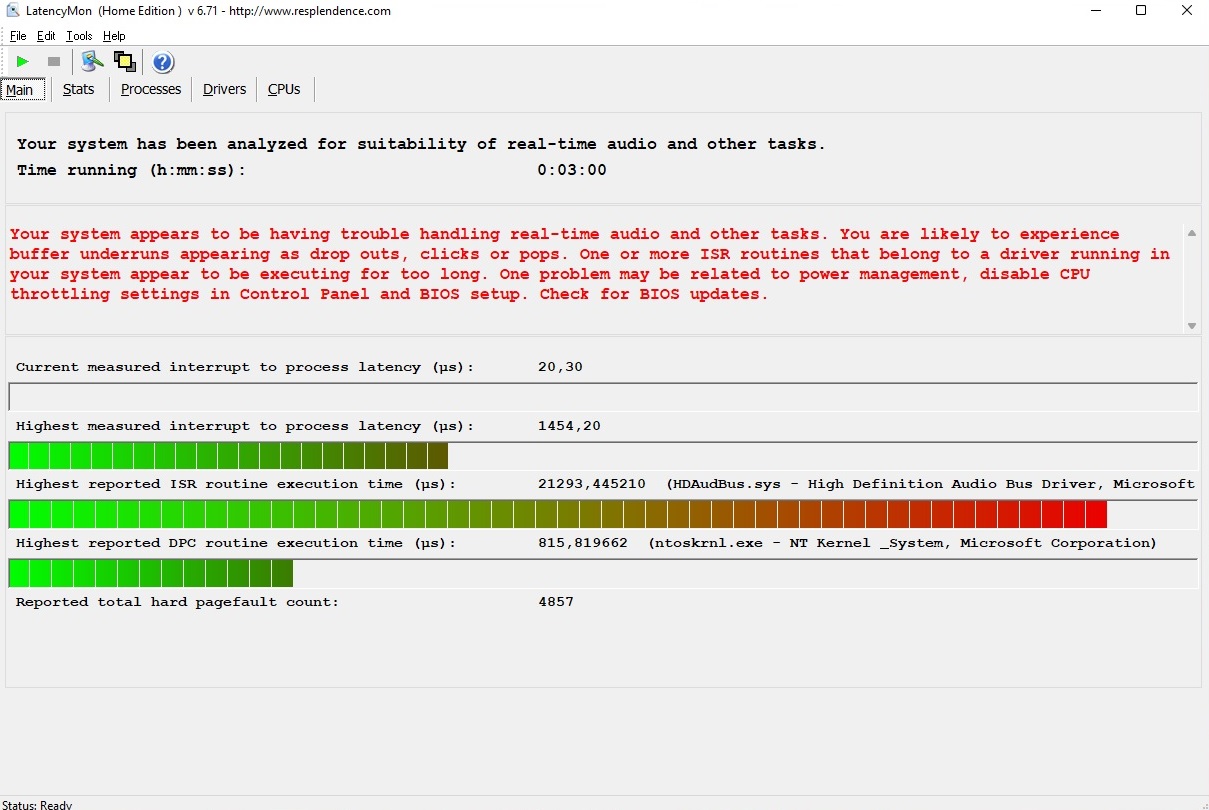
Hay margen de mejora en términos de latencias. Según la herramienta LatencyMon, el Apex 17 no es realmente adecuado para la edición de audio y/o vídeo en tiempo real en su estado de entrega, si se planifican tales escenarios de aplicación (sólo debería aplicarse a muy pocos compradores)
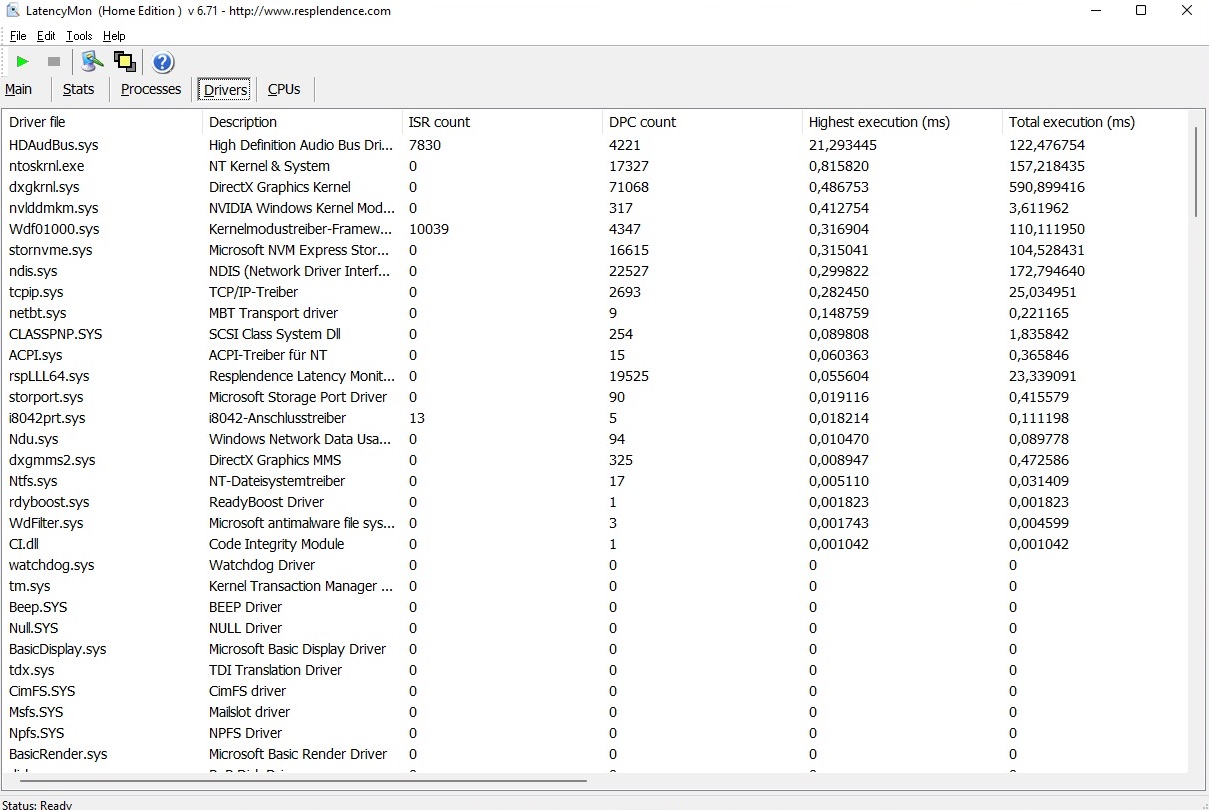
| DPC Latencies / LatencyMon - interrupt to process latency (max), Web, Youtube, Prime95 | |
| Schenker XMG Neo 17 (Early 2021, RTX 3070, 5800H) | |
| Schenker XMG Apex 17 M21 | |
| Acer Nitro 5 AN517-41-R5Z7 | |
| MSI GP76 Leopard 10UG | |
| Razer Blade 17 RTX 3070 | |
* ... más pequeño es mejor
Almacenamiento masivo
Nuestro dispositivo de pruebas tenía un SSD de 1 TB de Samsung como almacenamiento masivo. Como es habitual, el 970 Evo Plus ofrece un rendimiento completo y satisfactorio, ya sea en lectura o en escritura. Si quieres ampliar el almacenamiento más tarde, hay una ranura M.2 libre bajo el capó

Continuous load read: DiskSpd Read Loop, Queue Depth 8
Tarjeta gráfica
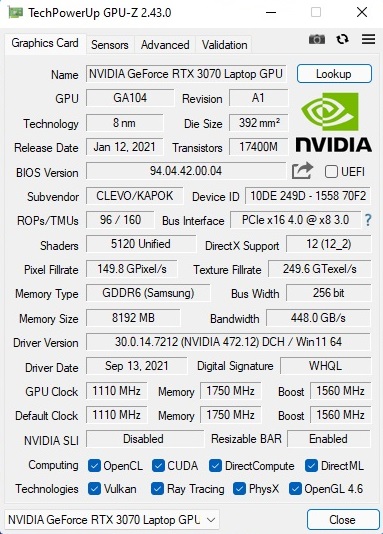
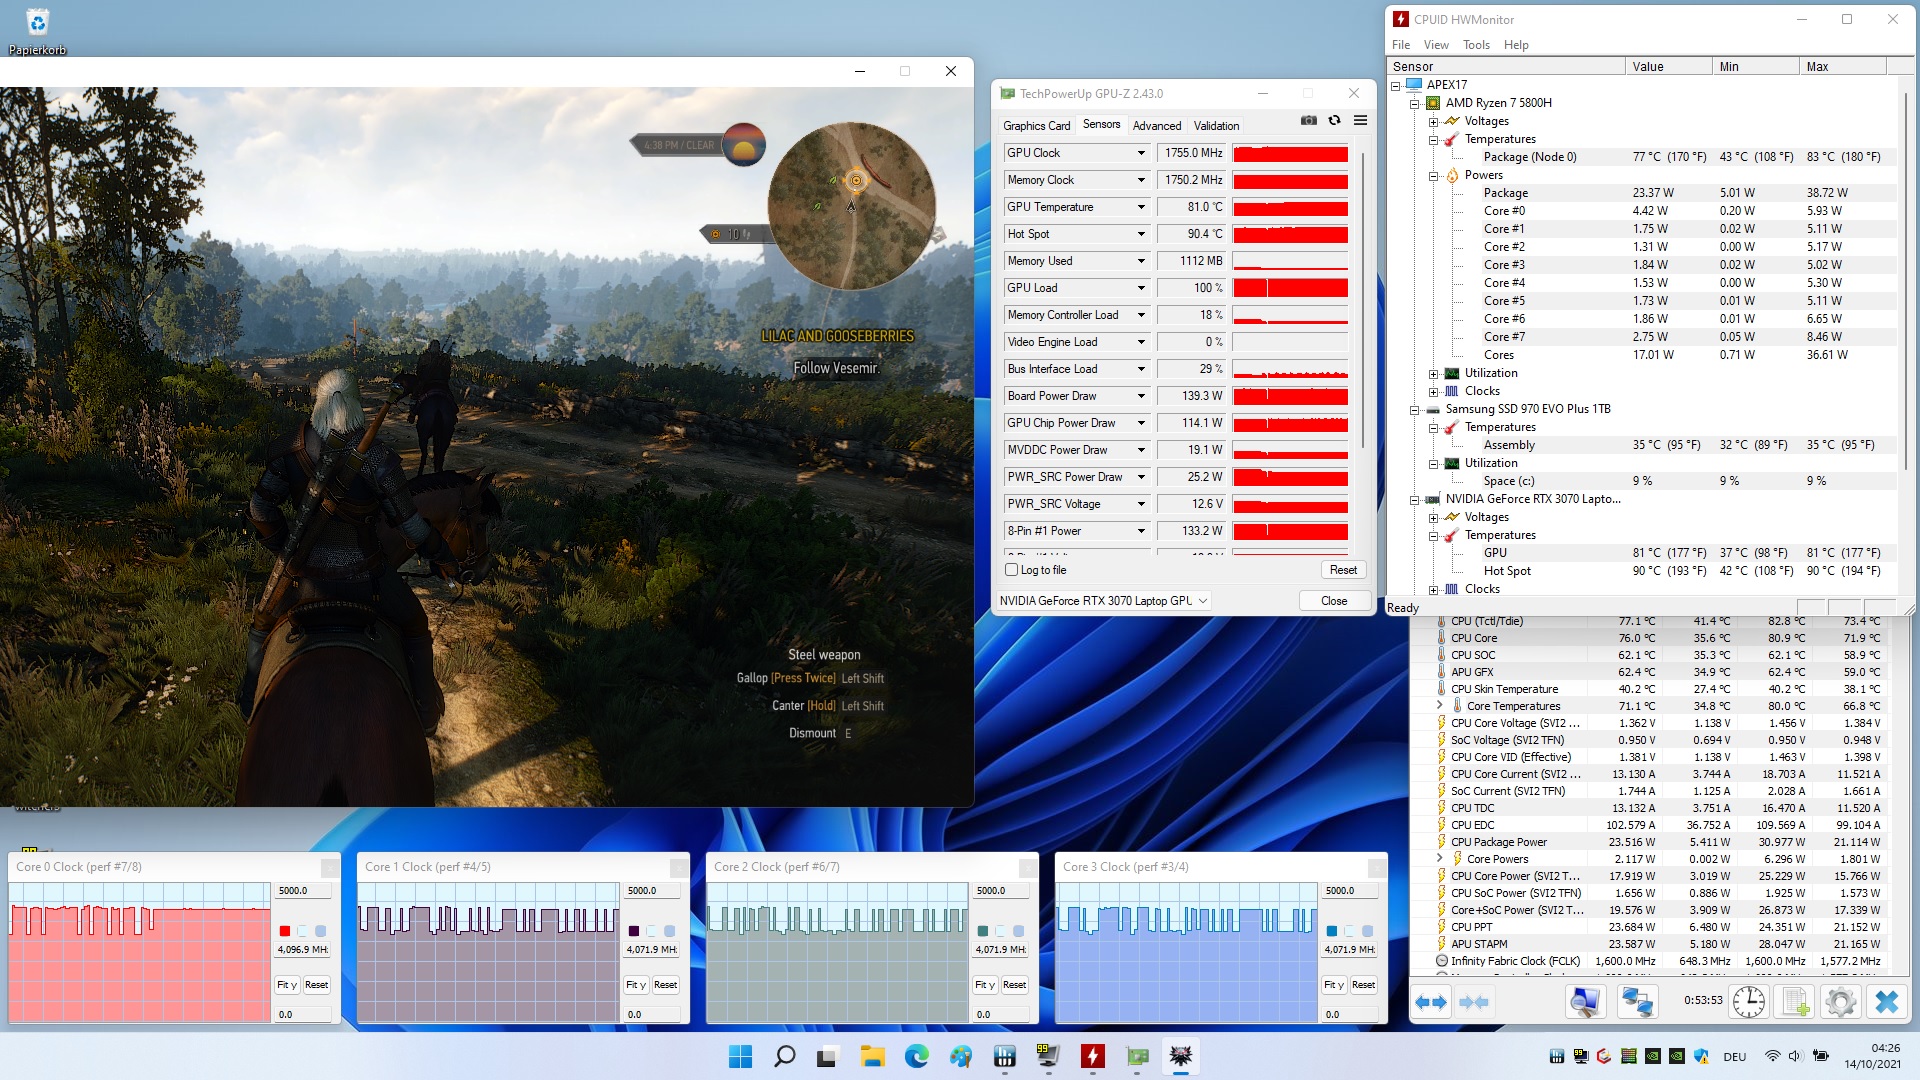
El rendimiento de la generación de amplificadores de Nvidia depende en gran medida del TGP ajustado. Schenker le da a la RTX 3070 un total de 140 vatios en modo de rendimiento (incluyendo 15 vatios de Dynamic Boost), que es el valor máximo para esta GPU. Por tanto, no es sorprendente que el Apex 17 obtenga una puntuación bastante buena en los benchmarks gráficos. De forma análoga al rendimiento de la CPU y del sistema, el 17 también se siente cómodo en el tercio superior del campo de pruebas
| 3DMark 11 Performance | 28685 puntos | |
| 3DMark Cloud Gate Standard Score | 47429 puntos | |
| 3DMark Fire Strike Score | 24012 puntos | |
| 3DMark Time Spy Score | 10640 puntos | |
ayuda | ||
Rendimiento de los juegos
En la resolución nativa Full HD de 1.920 x 1.080, la RTX 3070 puede mostrar sin problemas todos los juegos actuales con el máximo detalle. Incluso los juegos particularmente exigentes suelen alcanzar más de 60 FPS. El Apex 17 también se las arreglaría bien con una pantalla QHD externa
| The Witcher 3 | |
| 1920x1080 High Graphics & Postprocessing (Nvidia HairWorks Off) | |
| Media de la clase Gaming (181 - 341, n=3, últimos 2 años) | |
| Razer Blade 17 RTX 3070 | |
| Schenker XMG Neo 17 (Early 2021, RTX 3070, 5800H) | |
| Schenker XMG Apex 17 M21 | |
| Medio NVIDIA GeForce RTX 3070 Laptop GPU (122.1 - 207, n=34) | |
| Acer Nitro 5 AN517-41-R5Z7 | |
| 1920x1080 Ultra Graphics & Postprocessing (HBAO+) | |
| Media de la clase Gaming (95 - 240, n=8, últimos 2 años) | |
| MSI GP76 Leopard 10UG | |
| Schenker XMG Neo 17 (Early 2021, RTX 3070, 5800H) | |
| Razer Blade 17 RTX 3070 | |
| Schenker XMG Apex 17 M21 | |
| Medio NVIDIA GeForce RTX 3070 Laptop GPU (34.9 - 109, n=52) | |
| Acer Nitro 5 AN517-41-R5Z7 | |
Durante la prueba de resistencia con El Witcher 3 (1 hora @FHD/Ultra) no hubo anomalías. La tasa de fotogramas se mantuvo bastante estable durante todo el periodo, como debería.
Witcher 3 FPS-Diagram
| bajo | medio | alto | ultra | |
|---|---|---|---|---|
| GTA V (2015) | 172 | 158 | 92.9 | |
| The Witcher 3 (2015) | 262 | 174 | 100 | |
| Dota 2 Reborn (2015) | 148 | 135 | 127 | 122 |
| Final Fantasy XV Benchmark (2018) | 132 | 100 | ||
| X-Plane 11.11 (2018) | 104 | 91.9 | 75 | |
| Far Cry 5 (2018) | 124 | 119 | 110 | |
| Strange Brigade (2018) | 203 | 183 | 173 | |
| Hitman 3 (2021) | 176 | 170 | 162 | |
| Outriders (2021) | 118 | 117 | 117 | |
| Resident Evil Village (2021) | 178 | 176 | 156 | |
| Mass Effect Legendary Edition (2021) | 105 | |||
| Days Gone (2021) | 154 | 140 | 106 | |
| Monster Hunter Stories 2 (2021) | 144 | 143 | ||
| Deathloop (2021) | 117 | 106 | 90.1 | |
| New World (2021) | 96.8 | 92.7 | 86.8 | |
| Alan Wake Remastered (2021) | 82.7 | 79.2 | ||
| Far Cry 6 (2021) | 103 | 91 | 87 | |
| Back 4 Blood (2021) | 220 | 205 | 193 | |
| Guardians of the Galaxy (2021) | 112 | 111 | 110 | |
| Riders Republic (2021) | 136 | 114 | 105 |
Emisiones
Emisiones acústicas
Uno de los puntos débiles cruciales de los Clevo barebones ha sido siempre el escaso control de los ventiladores. Aunque el Apex 17 sigue siendo relativamente silencioso con 25 a 31 dB(A) en modo inactivo, los ventiladores suben hasta 57 a 59 dB(A) bajo carga cuando se usa el modo de rendimiento - un nivel de ruido molesto que acaba obligando a usar auriculares. Si quieres que sea más silencioso, debes cambiar al modo de entretenimiento o al modo silencioso cuando juegues y especialmente durante tareas menos exigentes como la reproducción de vídeos
Ruido
| Ocioso |
| 25 / 28 / 31 dB(A) |
| Carga |
| 57 / 59 dB(A) |
 | ||
30 dB silencioso 40 dB(A) audible 50 dB(A) ruidosamente alto |
||
min: | ||
| Schenker XMG Apex 17 M21 R7 5800H, GeForce RTX 3070 Laptop GPU | Schenker XMG Neo 17 (Early 2021, RTX 3070, 5800H) R7 5800H, GeForce RTX 3070 Laptop GPU | Razer Blade 17 RTX 3070 i7-11800H, GeForce RTX 3070 Laptop GPU | MSI GP76 Leopard 10UG i7-10750H, GeForce RTX 3070 Laptop GPU | Acer Nitro 5 AN517-41-R5Z7 R7 5800H, GeForce RTX 3070 Laptop GPU | Media de la clase Gaming | |
|---|---|---|---|---|---|---|
| Noise | -3% | 11% | 1% | 0% | 7% | |
| apagado / medio ambiente * (dB) | 25 | 24 4% | 24.2 3% | 24 4% | 26 -4% | 24.1 ? 4% |
| Idle Minimum * (dB) | 25 | 29 -16% | 24.7 1% | 25 -0% | 26 -4% | 25.8 ? -3% |
| Idle Average * (dB) | 28 | 32 -14% | 24.7 12% | 32 -14% | 33.1 -18% | 27.4 ? 2% |
| Idle Maximum * (dB) | 31 | 38 -23% | 24.7 20% | 34 -10% | 31.3 -1% | 30 ? 3% |
| Load Average * (dB) | 57 | 49 14% | 44.3 22% | 54 5% | 49.8 13% | 43 ? 25% |
| Witcher 3 ultra * (dB) | 57 | 53 7% | 56.3 1% | 51 11% | ||
| Load Maximum * (dB) | 59 | 55 7% | 47.7 19% | 54 8% | 49.6 16% | 54 ? 8% |
* ... más pequeño es mejor
Temperatura
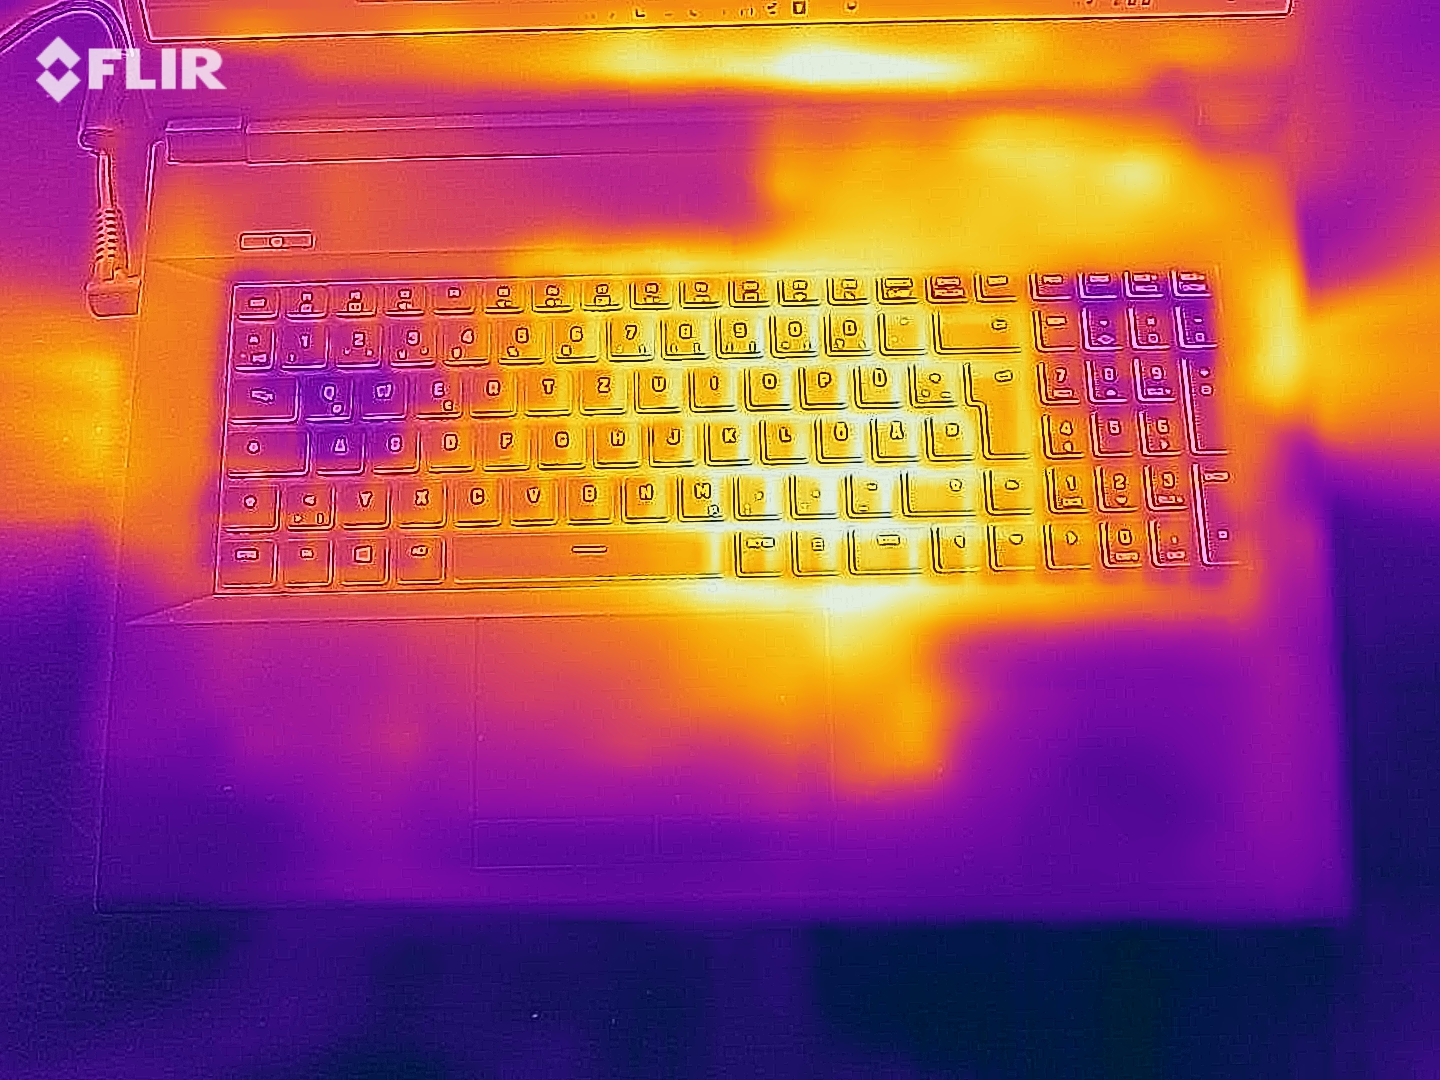
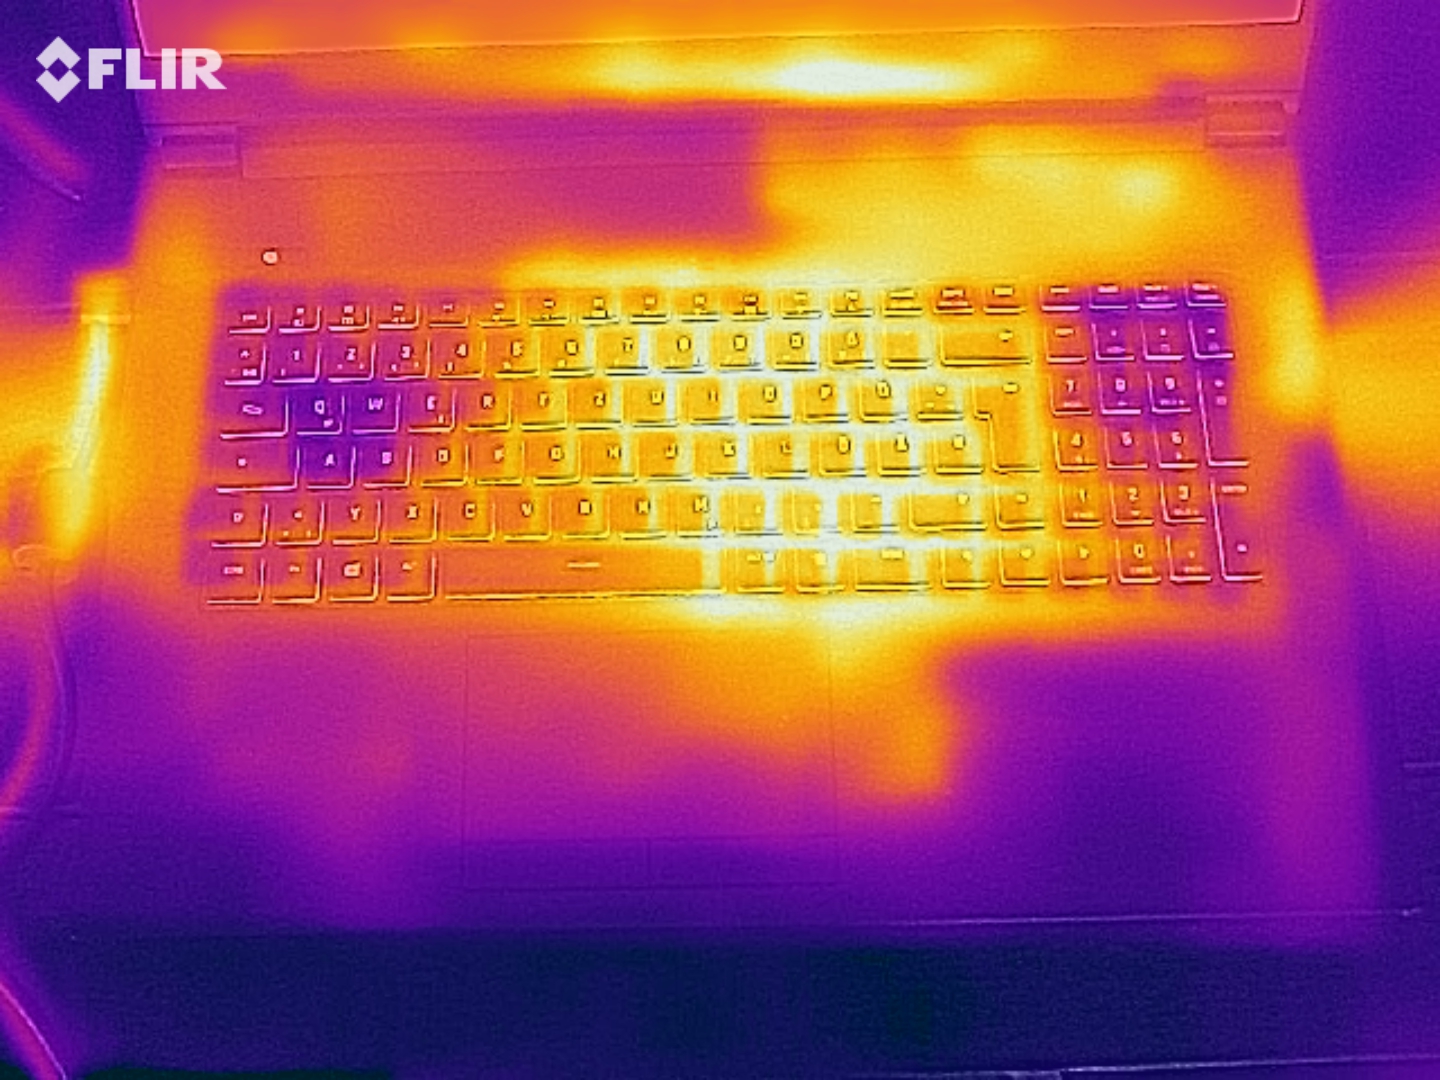
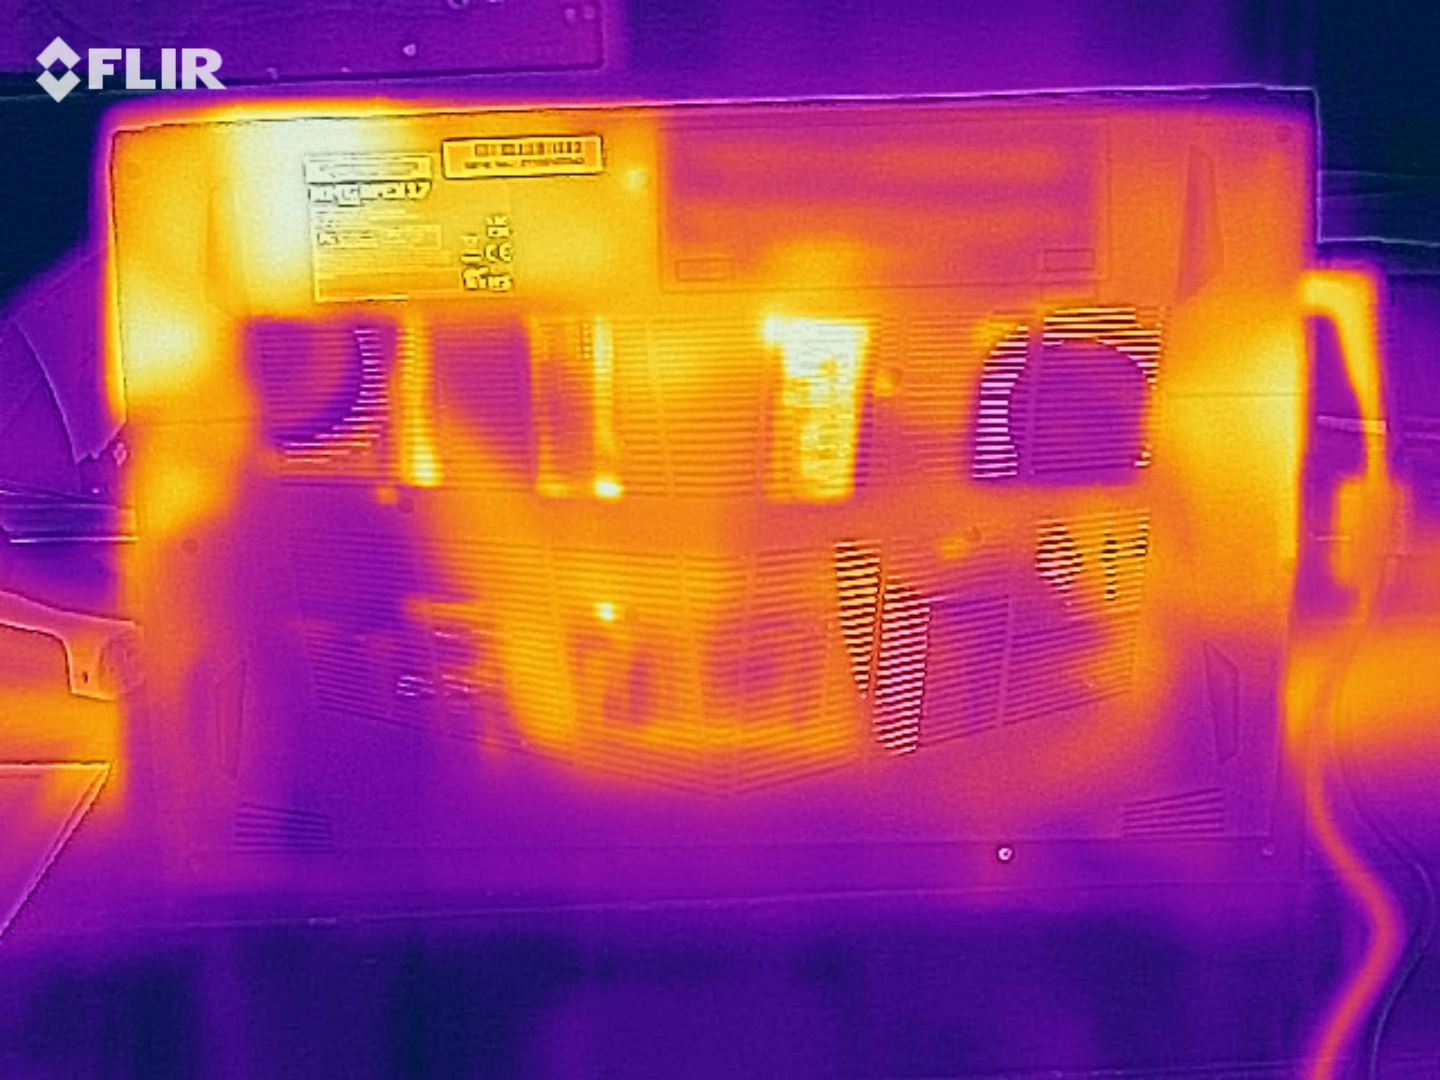
La evolución de la temperatura del Apex 17 está en línea con la competencia a pesar del mayor nivel de ruido. Tras una hora de carga completa con las herramientas FurMark y Prime95, pudimos sacar del chasis hasta 45 °C en la parte superior y hasta 49°C en la inferior. El procesador, en particular, se calienta dentro de la carcasa. Mientras que la RTX 3070 alcanzó unos 83 °C durante la prueba de estrés, el Ryzen 7 5800H casi superó la marca de los100 °C según la herramienta HWMonitor
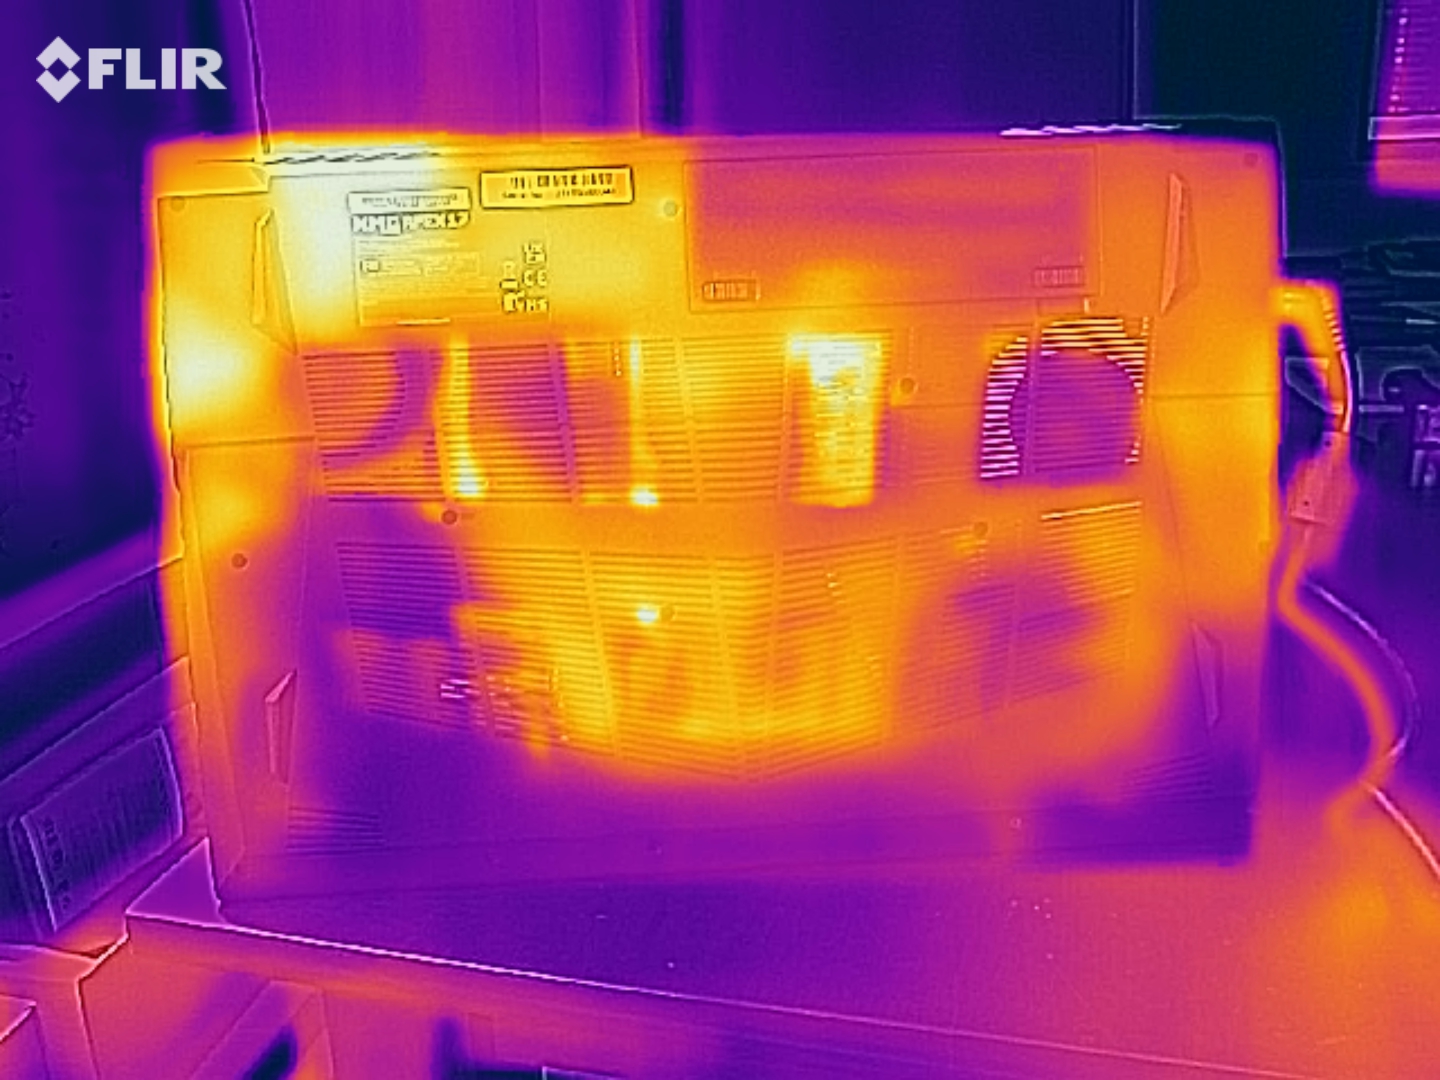
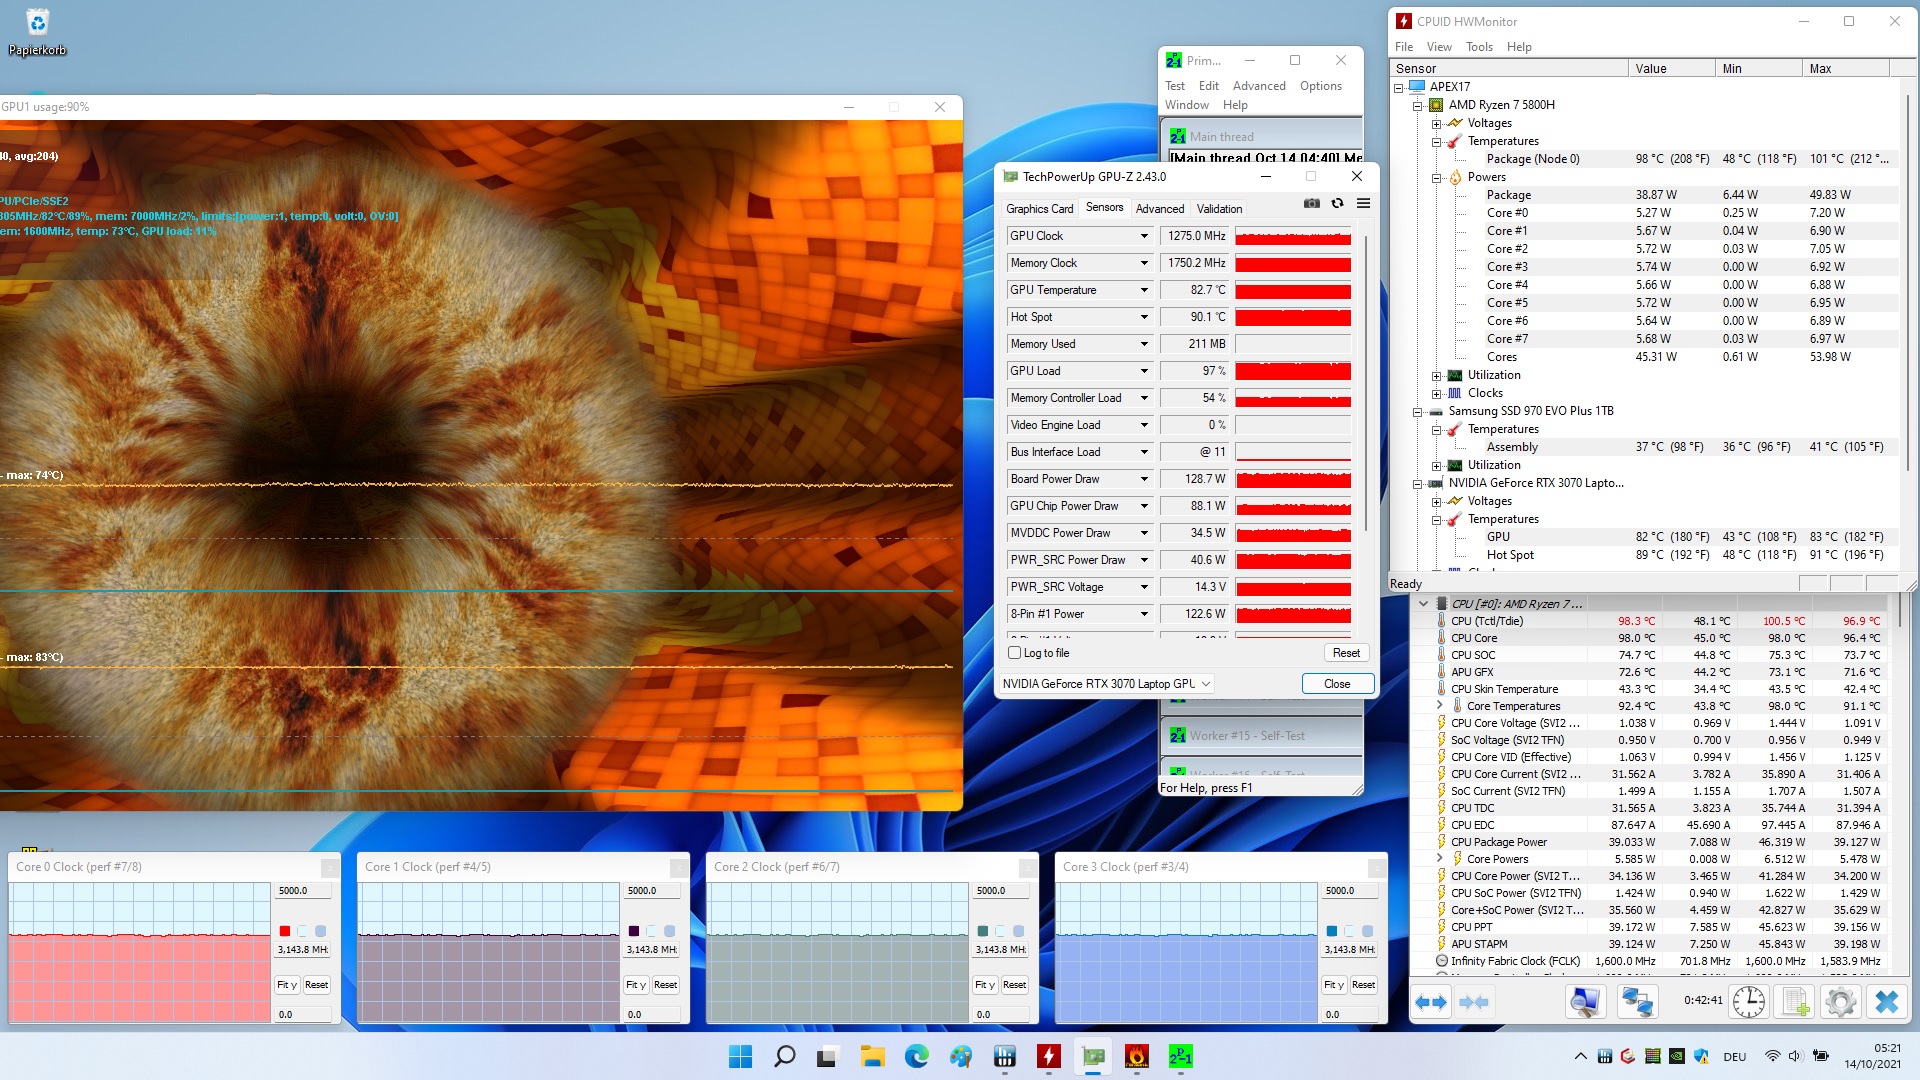
(±) La temperatura máxima en la parte superior es de 45 °C / 113 F, frente a la media de 40.4 °C / 105 F, que oscila entre 21.2 y 68.8 °C para la clase Gaming.
(-) El fondo se calienta hasta un máximo de 49 °C / 120 F, frente a la media de 43.2 °C / 110 F
(+) En reposo, la temperatura media de la parte superior es de 25.9 °C / 79# F, frente a la media del dispositivo de 33.9 °C / 93 F.
(±) Jugando a The Witcher 3, la temperatura media de la parte superior es de 37.6 °C / 100 F, frente a la media del dispositivo de 33.9 °C / 93 F.
(±) El reposamanos y el touchpad pueden calentarse mucho al tacto con un máximo de 37 °C / 98.6 F.
(-) La temperatura media de la zona del reposamanos de dispositivos similares fue de 28.8 °C / 83.8 F (-8.2 °C / -14.8 F).
| Schenker XMG Apex 17 M21 R7 5800H, GeForce RTX 3070 Laptop GPU | Schenker XMG Neo 17 (Early 2021, RTX 3070, 5800H) R7 5800H, GeForce RTX 3070 Laptop GPU | Razer Blade 17 RTX 3070 i7-11800H, GeForce RTX 3070 Laptop GPU | MSI GP76 Leopard 10UG i7-10750H, GeForce RTX 3070 Laptop GPU | Acer Nitro 5 AN517-41-R5Z7 R7 5800H, GeForce RTX 3070 Laptop GPU | Media de la clase Gaming | |
|---|---|---|---|---|---|---|
| Heat | -13% | -10% | -3% | -9% | -7% | |
| Maximum Upper Side * (°C) | 45 | 47 -4% | 41 9% | 43 4% | 44 2% | 45.2 ? -0% |
| Maximum Bottom * (°C) | 49 | 51 -4% | 47.2 4% | 47 4% | 52.7 -8% | 48 ? 2% |
| Idle Upper Side * (°C) | 27 | 32 -19% | 33.2 -23% | 30 -11% | 32.6 -21% | 31.1 ? -15% |
| Idle Bottom * (°C) | 30 | 37 -23% | 39 -30% | 33 -10% | 32.1 -7% | 34.2 ? -14% |
* ... más pequeño es mejor
Altavoz
Schenker XMG Apex 17 M21 análisis de audio
(+) | los altavoces pueden reproducir a un volumen relativamente alto (#84 dB)
Graves 100 - 315 Hz
(-) | casi sin bajos - de media 22.5% inferior a la mediana
(±) | la linealidad de los graves es media (12.9% delta a frecuencia anterior)
Medios 400 - 2000 Hz
(±) | medias más altas - de media 5.5% más altas que la mediana
(±) | la linealidad de los medios es media (8.8% delta respecto a la frecuencia anterior)
Altos 2 - 16 kHz
(+) | máximos equilibrados - a sólo 3.8% de la mediana
(+) | los máximos son lineales (5.4% delta a la frecuencia anterior)
Total 100 - 16.000 Hz
(±) | la linealidad del sonido global es media (18.3% de diferencia con la mediana)
En comparación con la misma clase
» 58% de todos los dispositivos probados de esta clase eran mejores, 9% similares, 33% peores
» El mejor tuvo un delta de 6%, la media fue 18%, el peor fue ###max##%
En comparación con todos los dispositivos probados
» 40% de todos los dispositivos probados eran mejores, 8% similares, 52% peores
» El mejor tuvo un delta de 4%, la media fue 24%, el peor fue ###max##%
Schenker XMG Neo 17 (Early 2021, RTX 3070, 5800H) análisis de audio
(+) | los altavoces pueden reproducir a un volumen relativamente alto (#84 dB)
Graves 100 - 315 Hz
(-) | casi sin bajos - de media 20.8% inferior a la mediana
(±) | la linealidad de los graves es media (12.3% delta a frecuencia anterior)
Medios 400 - 2000 Hz
(+) | medios equilibrados - a sólo 2.9% de la mediana
(+) | los medios son lineales (5.1% delta a la frecuencia anterior)
Altos 2 - 16 kHz
(+) | máximos equilibrados - a sólo 2.7% de la mediana
(±) | la linealidad de los máximos es media (7.6% delta a frecuencia anterior)
Total 100 - 16.000 Hz
(+) | el sonido global es lineal (14.5% de diferencia con la mediana)
En comparación con la misma clase
» 27% de todos los dispositivos probados de esta clase eran mejores, 7% similares, 66% peores
» El mejor tuvo un delta de 6%, la media fue 18%, el peor fue ###max##%
En comparación con todos los dispositivos probados
» 18% de todos los dispositivos probados eran mejores, 4% similares, 78% peores
» El mejor tuvo un delta de 4%, la media fue 24%, el peor fue ###max##%
Gestión de la energía
Consumo de energía
Gracias a la conmutación de gráficos (Nvidia Optimus), el Apex 17 no consume demasiada energía durante las tareas poco exigentes. El consumo en reposo de 10 a 20 vatios es menor que el de la competencia. Las diferencias son limitadas bajo carga
| Off / Standby | |
| Ocioso | |
| Carga |
|
Clave:
min: | |
| Schenker XMG Apex 17 M21 R7 5800H, GeForce RTX 3070 Laptop GPU | Schenker XMG Neo 17 (Early 2021, RTX 3070, 5800H) R7 5800H, GeForce RTX 3070 Laptop GPU | Razer Blade 17 RTX 3070 i7-11800H, GeForce RTX 3070 Laptop GPU | MSI GP76 Leopard 10UG i7-10750H, GeForce RTX 3070 Laptop GPU | Acer Nitro 5 AN517-41-R5Z7 R7 5800H, GeForce RTX 3070 Laptop GPU | Media de la clase Gaming | |
|---|---|---|---|---|---|---|
| Power Consumption | -15% | -50% | -8% | -21% | -19% | |
| Idle Minimum * (Watt) | 10 | 13 -30% | 20.9 -109% | 12 -20% | 18.7 -87% | 13.2 ? -32% |
| Idle Average * (Watt) | 14 | 16 -14% | 25.1 -79% | 16 -14% | 22 -57% | 18.9 ? -35% |
| Idle Maximum * (Watt) | 20 | 26 -30% | 45 -125% | 28 -40% | 25.2 -26% | 24.3 ? -22% |
| Load Average * (Watt) | 112 | 125 -12% | 102 9% | 92 18% | 134.7 -20% | 108 ? 4% |
| Witcher 3 ultra * (Watt) | 202 | 187 7% | 189 6% | 198 2% | 135 33% | |
| Load Maximum * (Watt) | 231 | 259 -12% | 234.8 -2% | 210 9% | 157 32% | 254 ? -10% |
* ... más pequeño es mejor
Energy consumption Witcher 3
Duración de la batería
La capacidad de la batería es modesta. Los 49 Wh ya no son actuales en 2021, sobre todo teniendo en cuenta el precio. Para comparar: La competencia ofrece de 62 a 70 Wh. Afortunadamente, la duración no cae por completo debido al moderado consumo de energía. El Apex 17 duró alrededor de 5 horas en nuestra prueba Wi-Fi con brillo medio - una tasa decente.
| Schenker XMG Apex 17 M21 R7 5800H, GeForce RTX 3070 Laptop GPU, 49 Wh | Schenker XMG Neo 17 (Early 2021, RTX 3070, 5800H) R7 5800H, GeForce RTX 3070 Laptop GPU, 62 Wh | Razer Blade 17 RTX 3070 i7-11800H, GeForce RTX 3070 Laptop GPU, 70 Wh | MSI GP76 Leopard 10UG i7-10750H, GeForce RTX 3070 Laptop GPU, 65 Wh | Acer Nitro 5 AN517-41-R5Z7 R7 5800H, GeForce RTX 3070 Laptop GPU, 57.5 Wh | Media de la clase Gaming | |
|---|---|---|---|---|---|---|
| Duración de Batería | -31% | 17% | -18% | 33% | 38% | |
| Reader / Idle (h) | 7 | 4.7 -33% | 6.7 -4% | 5.6 -20% | 10.1 44% | 8.71 ? 24% |
| WiFi v1.3 (h) | 4.9 | 3.5 -29% | 5.2 6% | 4.2 -14% | 5.6 14% | 7.02 ? 43% |
| Load (h) | 1 | 0.7 -30% | 1.5 50% | 0.8 -20% | 1.4 40% | 1.47 ? 47% |
| H.264 (h) | 7 | 8.26 ? |
Pro
Contra
Veredicto
Si buscas un portátil para juegos con buenas opciones de mantenimiento, el Apex 17 es la elección correcta.
Una batería accesible externamente y extraíble es algo que rara vez se encuentra hoy en día (aunque la capacidad de la batería deja mucho que desear).
Aparte del elevadísimo desarrollo de ruido en el modo de rendimiento - hay diferentes perfiles de rendimiento - el 17 pulgadas tiene por lo demás un aspecto poco espectacular. La carcasa, los dispositivos de entrada y las interfaces son sólidos. Por otro lado, es un poco desafortunado que el fabricante no haya instalado una mejor pantalla. El brillo y el contraste sólo satisfacen las altas exigencias hasta cierto punto.
A cambio, el Apex 17 puntúa en la categoría de rendimiento. El procesador y la tarjeta gráfica ofrecen índices de referencia por encima de la media (sobre todo gracias al generoso TDP).
Los aficionados a la economía que quieran tener una RTX 3070 deberían optar por el Acer Nitro 5 AN517que cuesta unos 100 euros menos con un equipamiento similar (pero también tiene un TGP inferior).
Precio y disponibilidad
El XMG Apex 17 está disponible en la tienda del fabricante bestware.com a partir de 1.479 euros (~1.692 dólares)
Schenker XMG Apex 17 M21
- 11/02/2021 v7 (old)
Florian Glaser
Price comparison
