Veredicto - Apex 16 Max con pleno rendimiento para juegos y pocos compromisos
Con sus rápidos componentes, el Apex 16 Max se centra por completo en el rendimiento de los juegos y ofrece unos resultados convincentes. Combinado con el panel Mini-LED, los juegos HDR en particular son muy divertidos. Sin embargo, la brillante pantalla también consume mucha energía y perjudica la duración de la batería. Si necesita una mayor autonomía, debería optar en su lugar por el panel IPS.
Para mantener bajo el precio de entrada, XMG hace algunas concesiones (sin USB-C 4.0, sin Wi-Fi 7, sin Advanced Optimus y con una base de plástico). Honestamente, sin embargo, nada de esto es un problema real en el juego diario, y con mucho gusto aceptaríamos estas concesiones a cambio de una RTX 5070 Ti con 12 GB de VRAM. En general, se trata de un muy buen portátil para juegos a un precio justo.
Pro
Contra
Precio y disponibilidad
El XMG Apex 16 Max puede configurarse en Bestware a partir de 2.099 euros (unos 2.461 dólares).
Nota del traductor: Los portátiles XMG no están disponibles oficialmente en Norteamérica.
Índice
- Veredicto - Apex 16 Max con pleno rendimiento para juegos y pocos compromisos
- Especificaciones
- Maletín y equipamiento
- Dispositivos de entrada - Teclado con iluminación de una sola tecla
- Pantalla - Mini LED con 1.000 cd/m²
- Rendimiento
- Emisiones y energía
- Valoración general de Notebookcheck
- Posibles alternativas en comparación
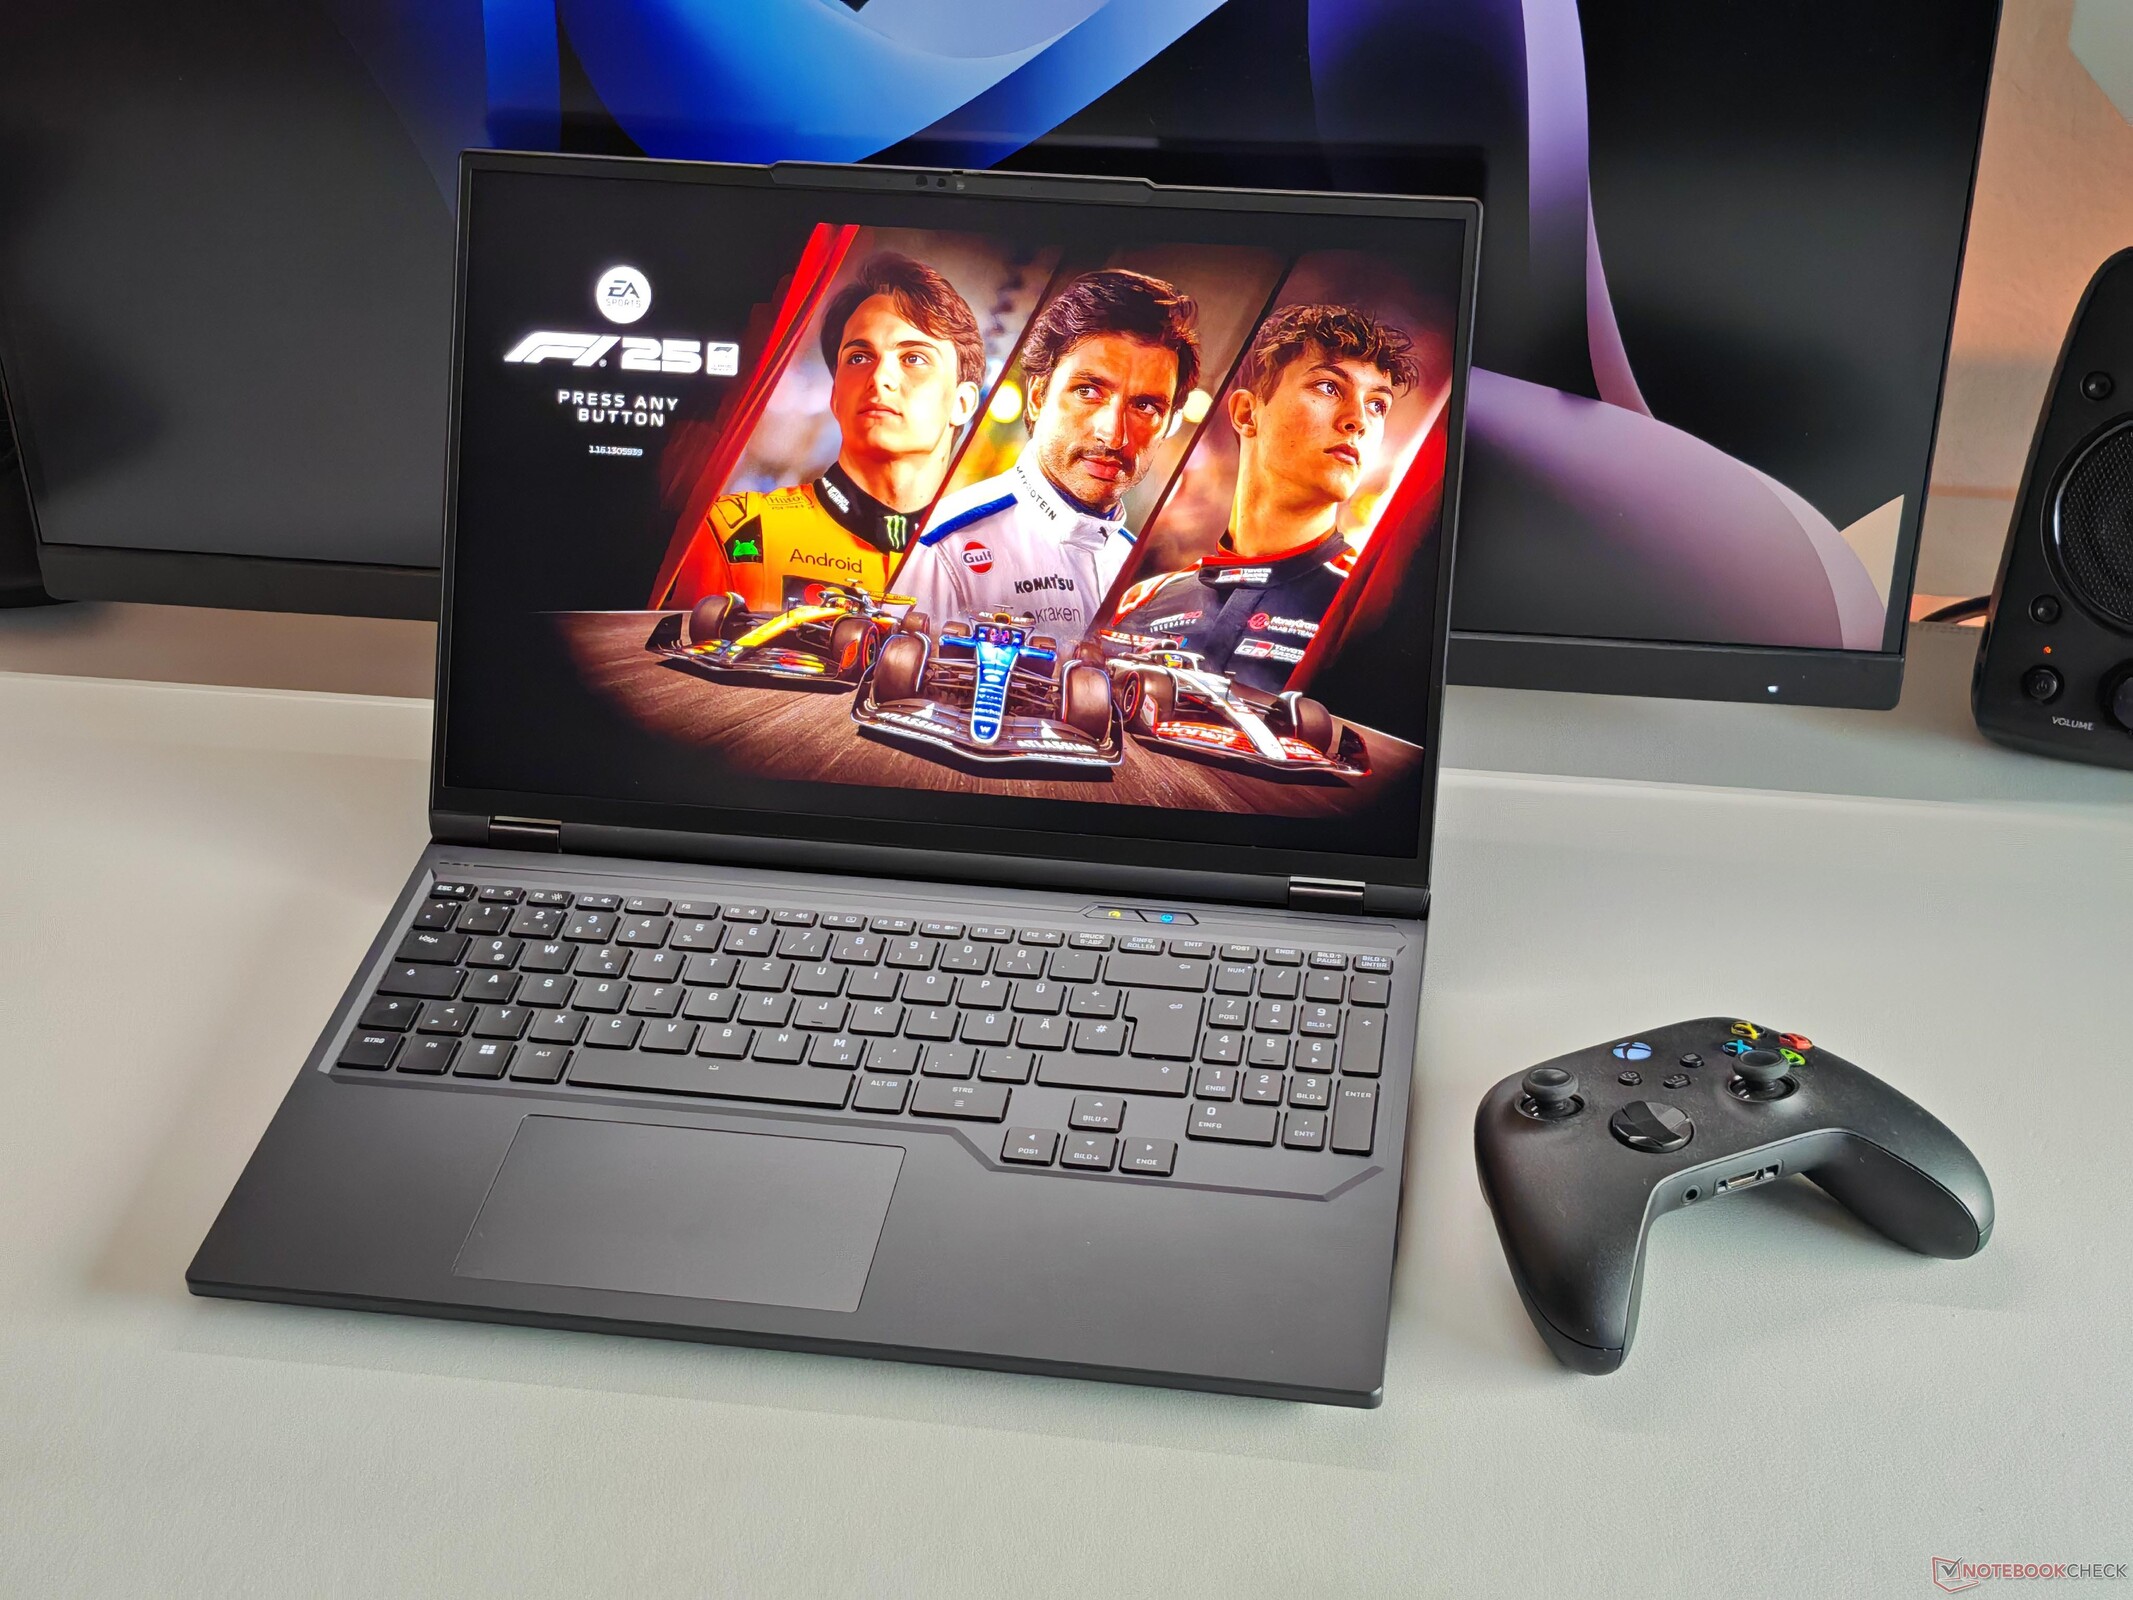
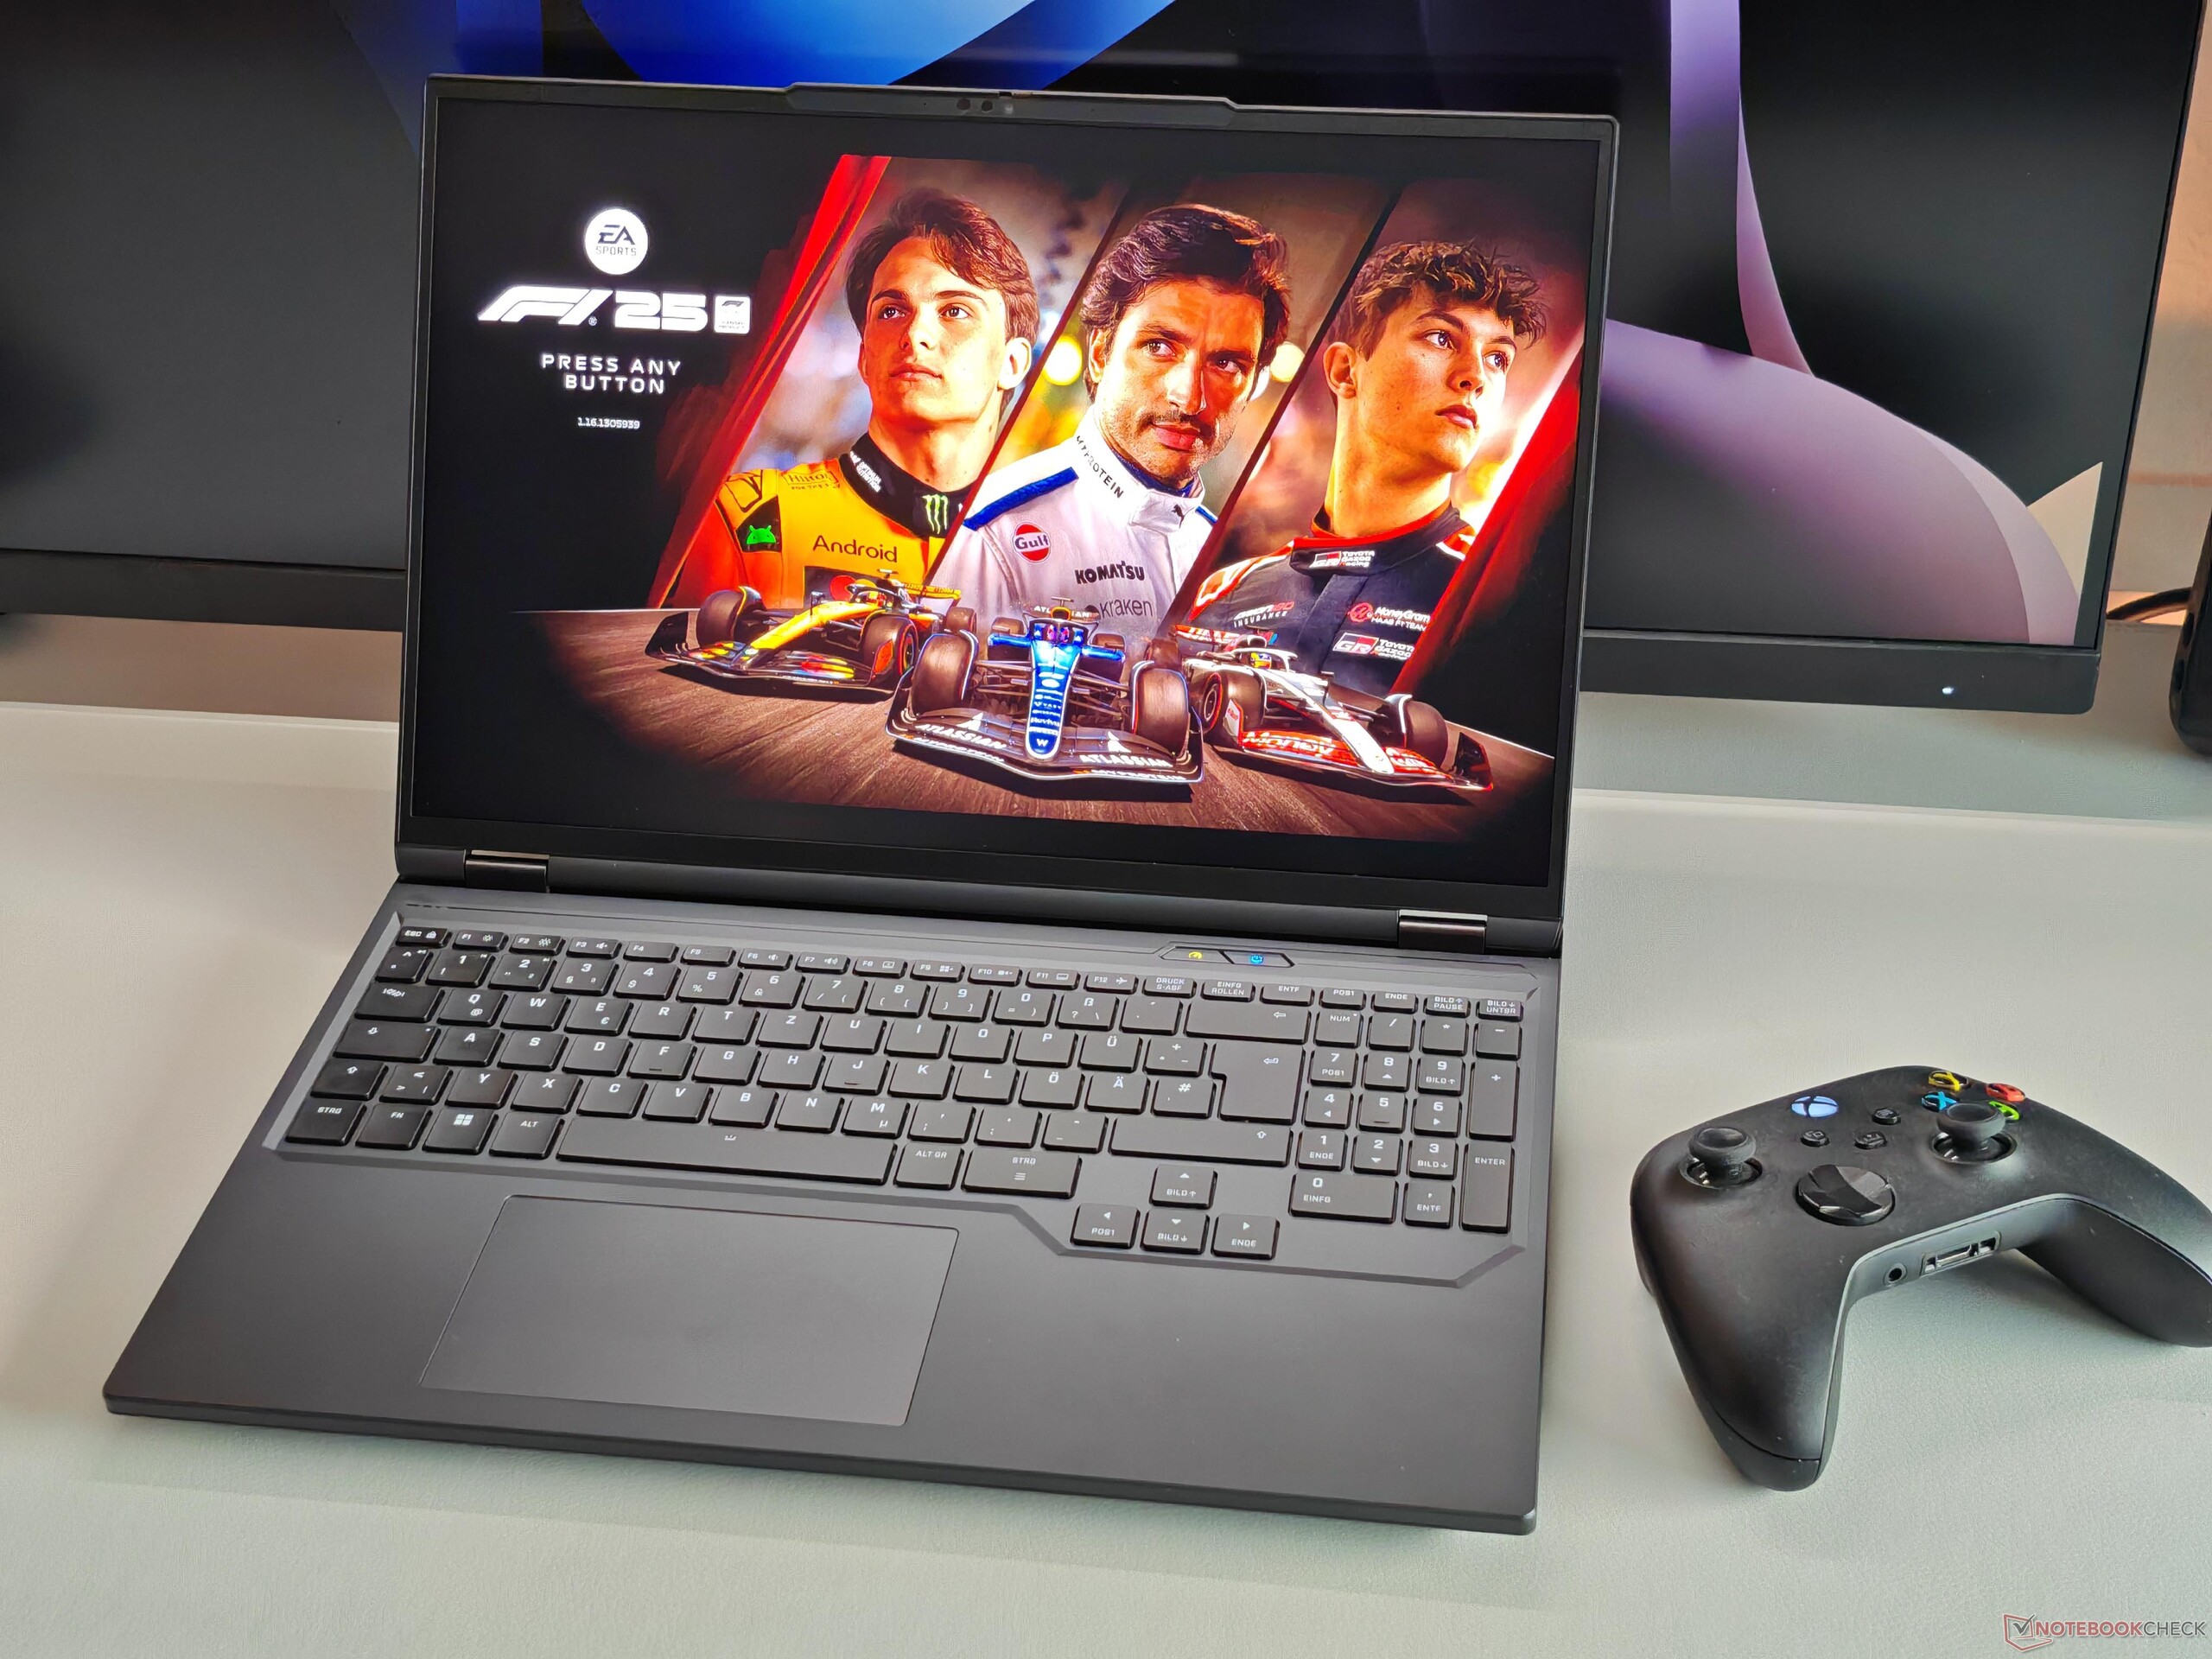
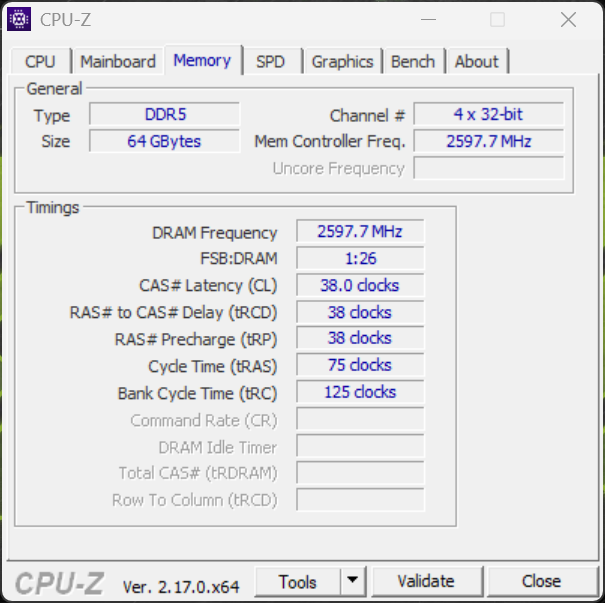
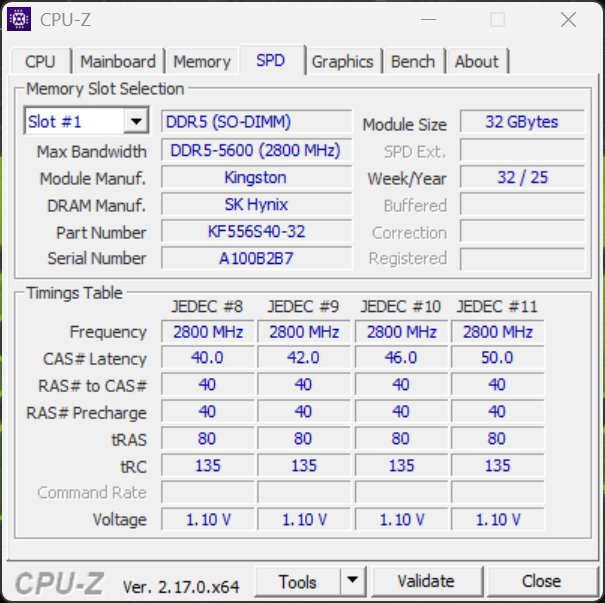
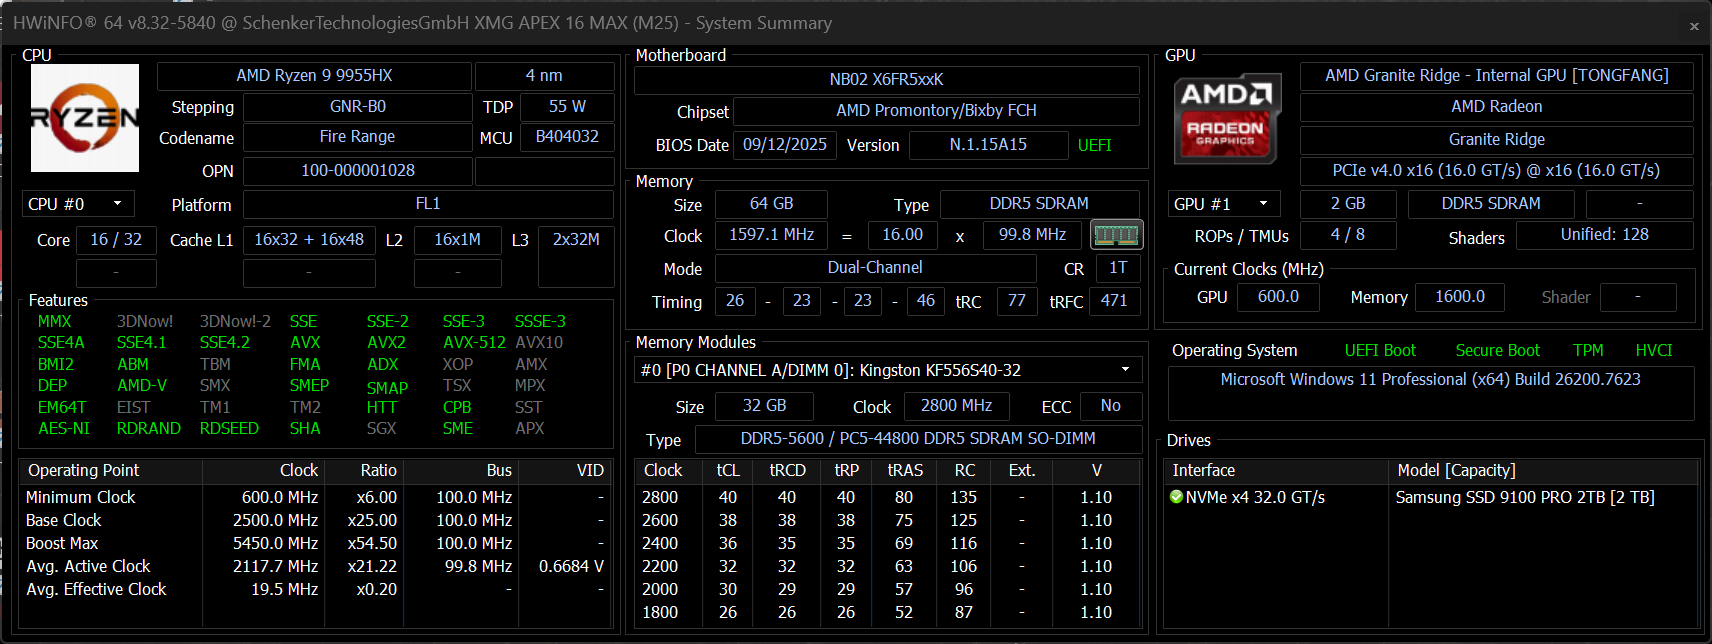
Con el Apex 16 Max, XMG ofrece un potente portátil para juegos que debería atraer a los compradores más preocupados por el precio. El precio de partida con pantalla IPS y RTX 5070 Ti ronda actualmente los 2.090 euros, mientras que nuestro dispositivo de prueba cuesta unos 2.800 euros, debido principalmente a la generosa configuración de memoria (64 GB de RAM, 2 TB de SSD) y al panel mini LED.
Con el Apex 16 Max, XMG ofrece un potente portátil para juegos dirigido a los compradores más conscientes del precio. El precio de partida con la pantalla IPS y la RTX 5070 Ti ronda actualmente los 2.090 euros, mientras que nuestra unidad de análisis cuesta unos 2.800 euros (aprox. 3 x 283 dólares), debido principalmente a la generosa configuración de memoria (64 GB de RAM, 2 TB de SSD) y al panel Mini-LED.
Especificaciones
Maletín y equipamiento
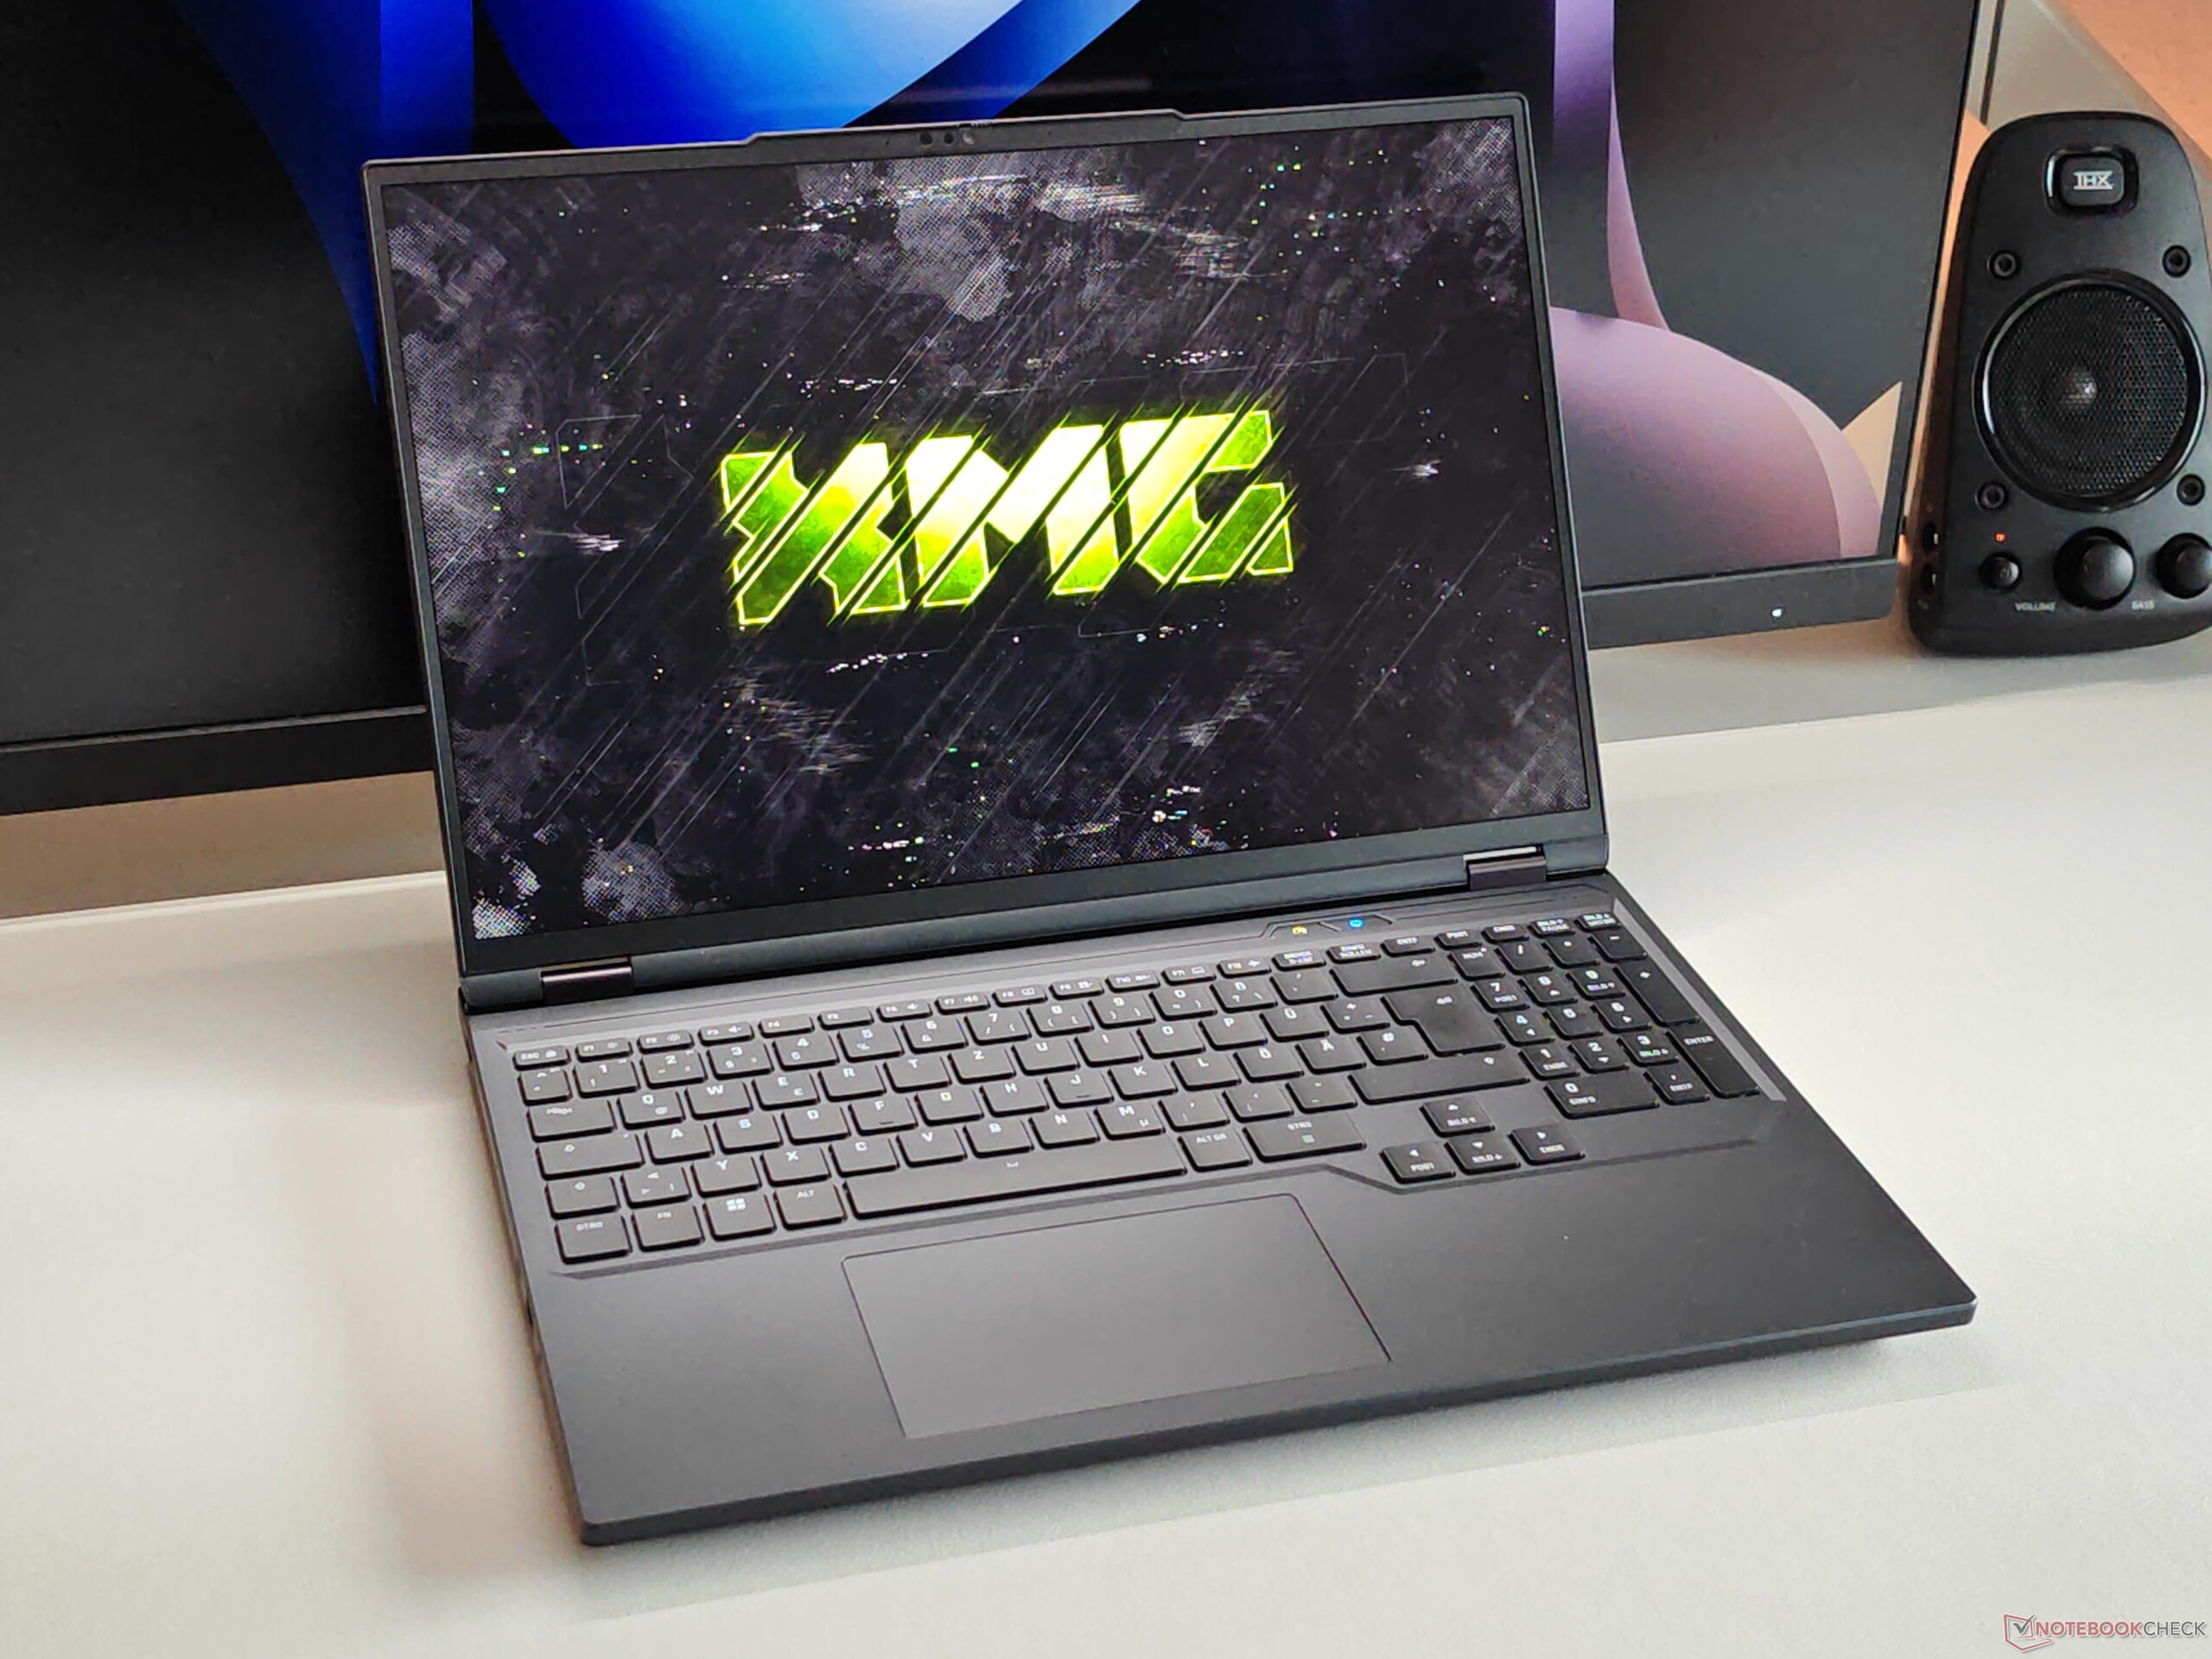
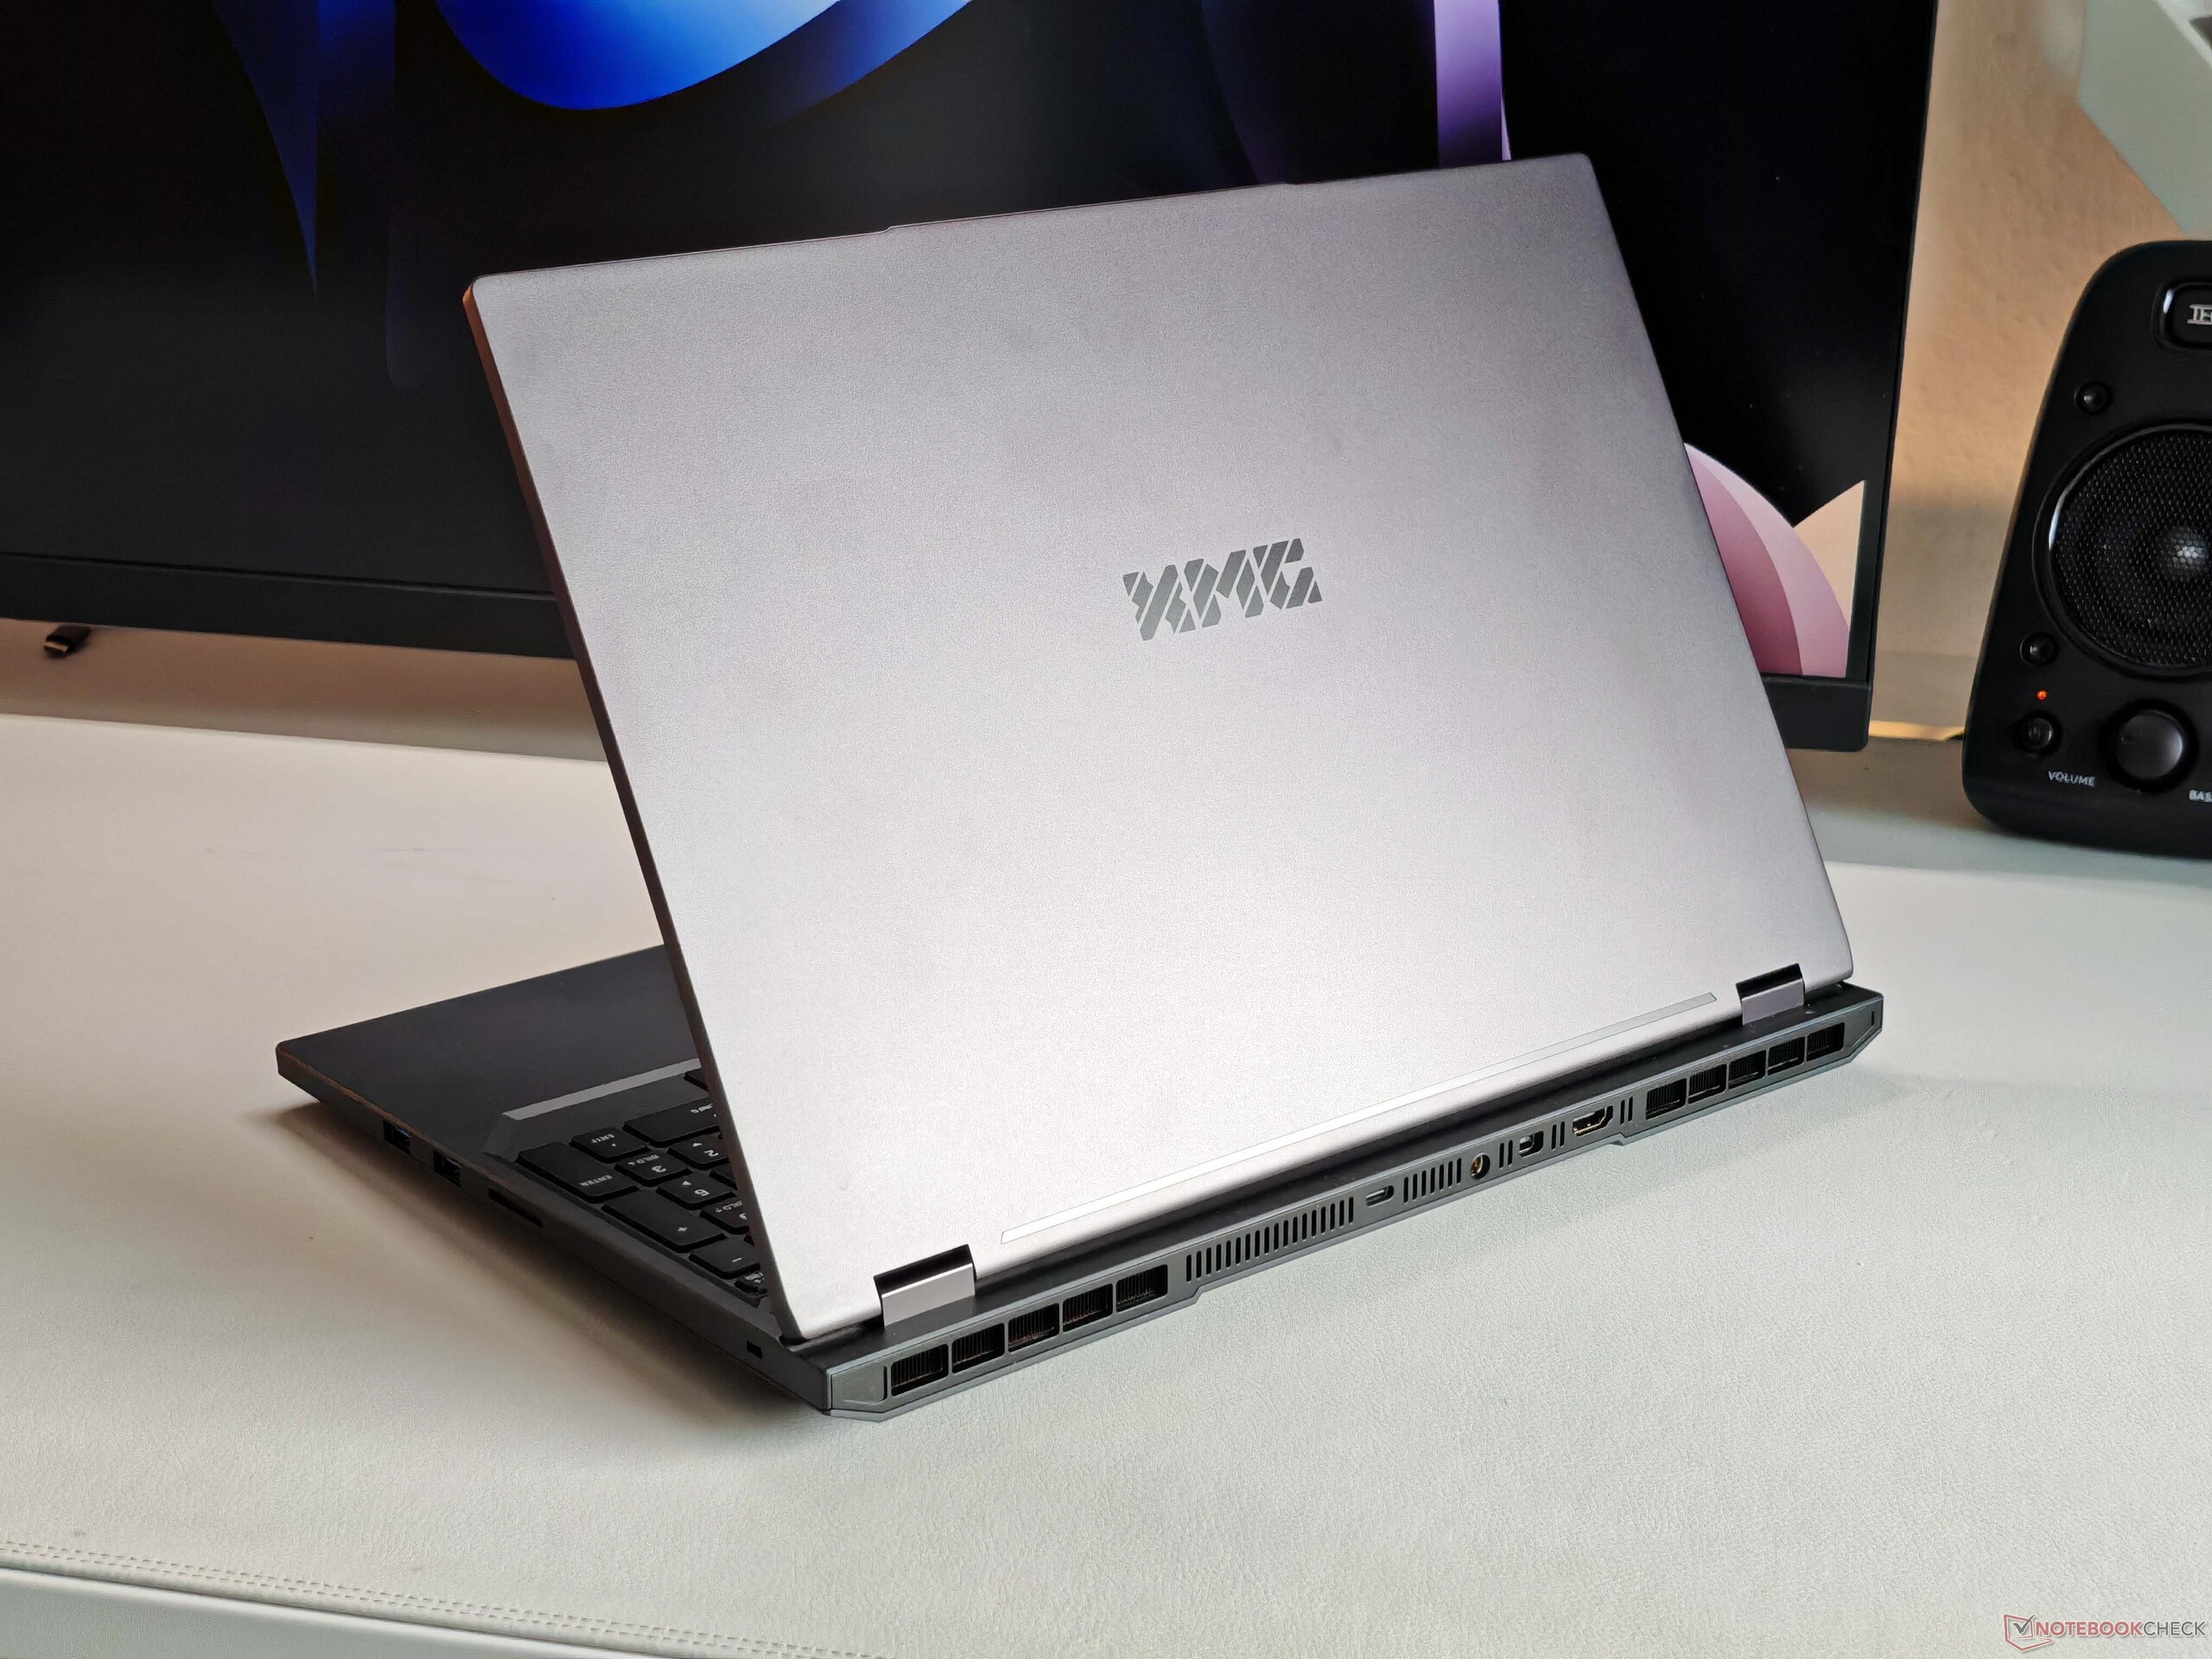
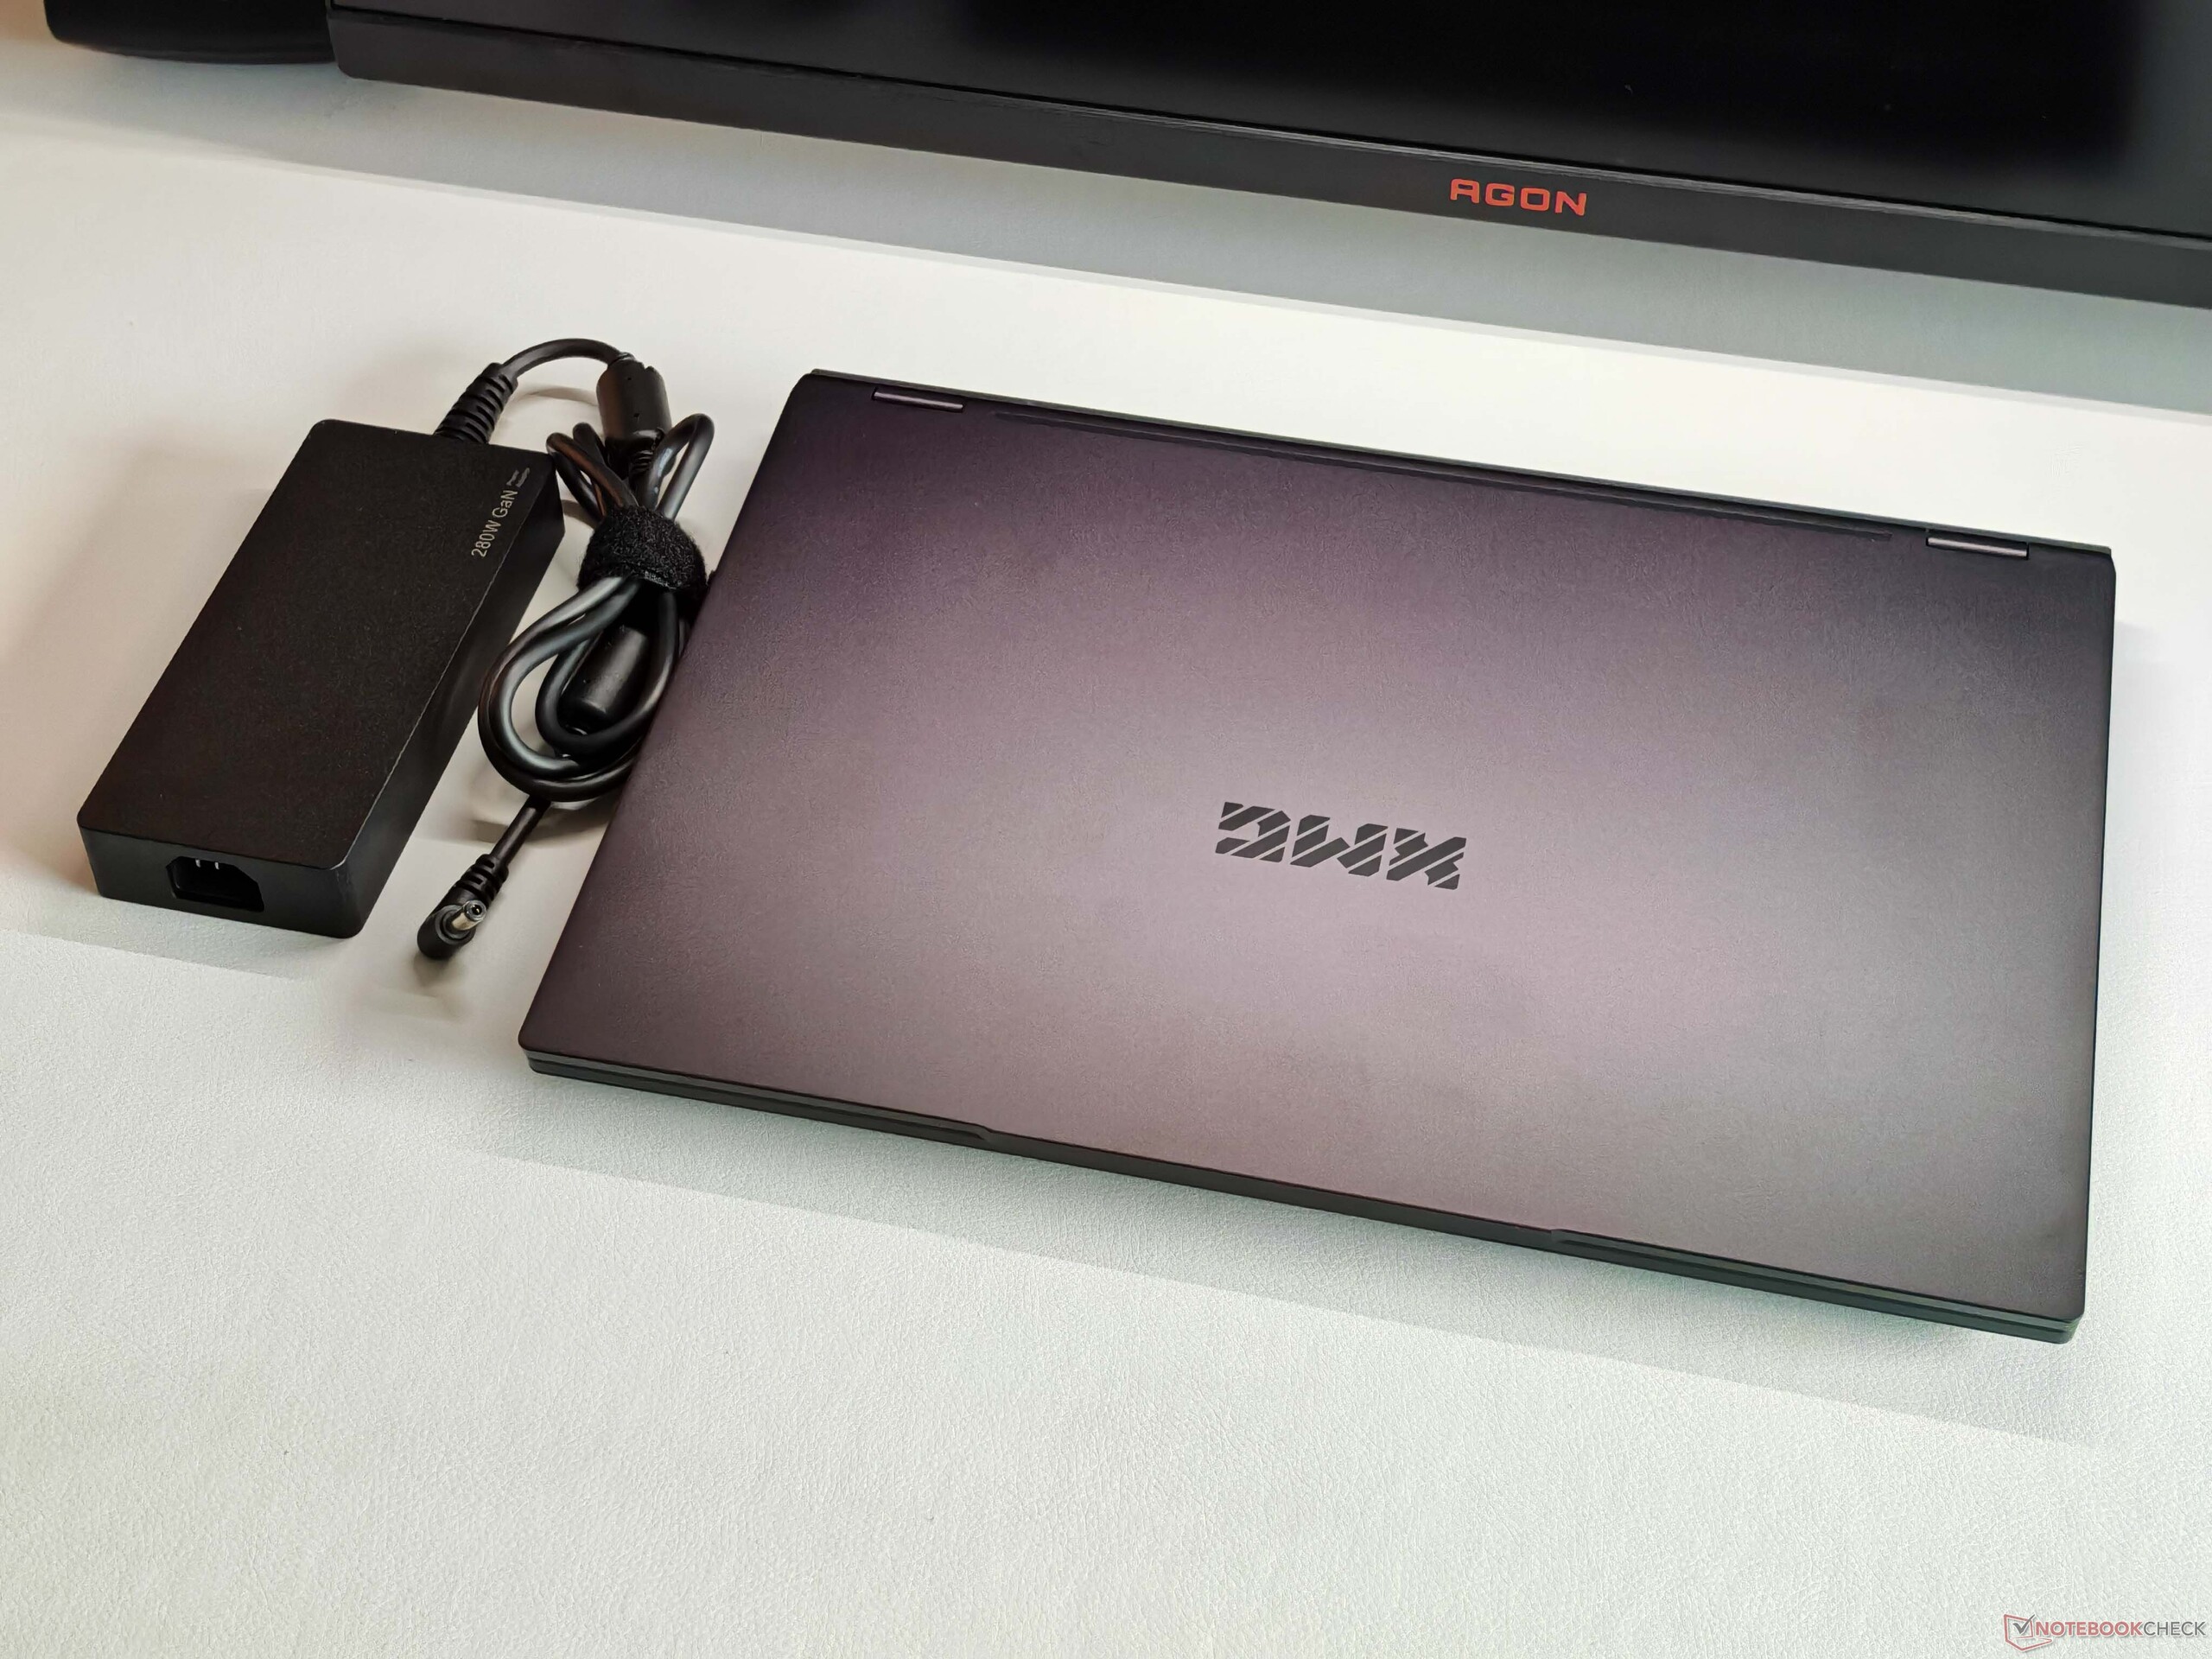
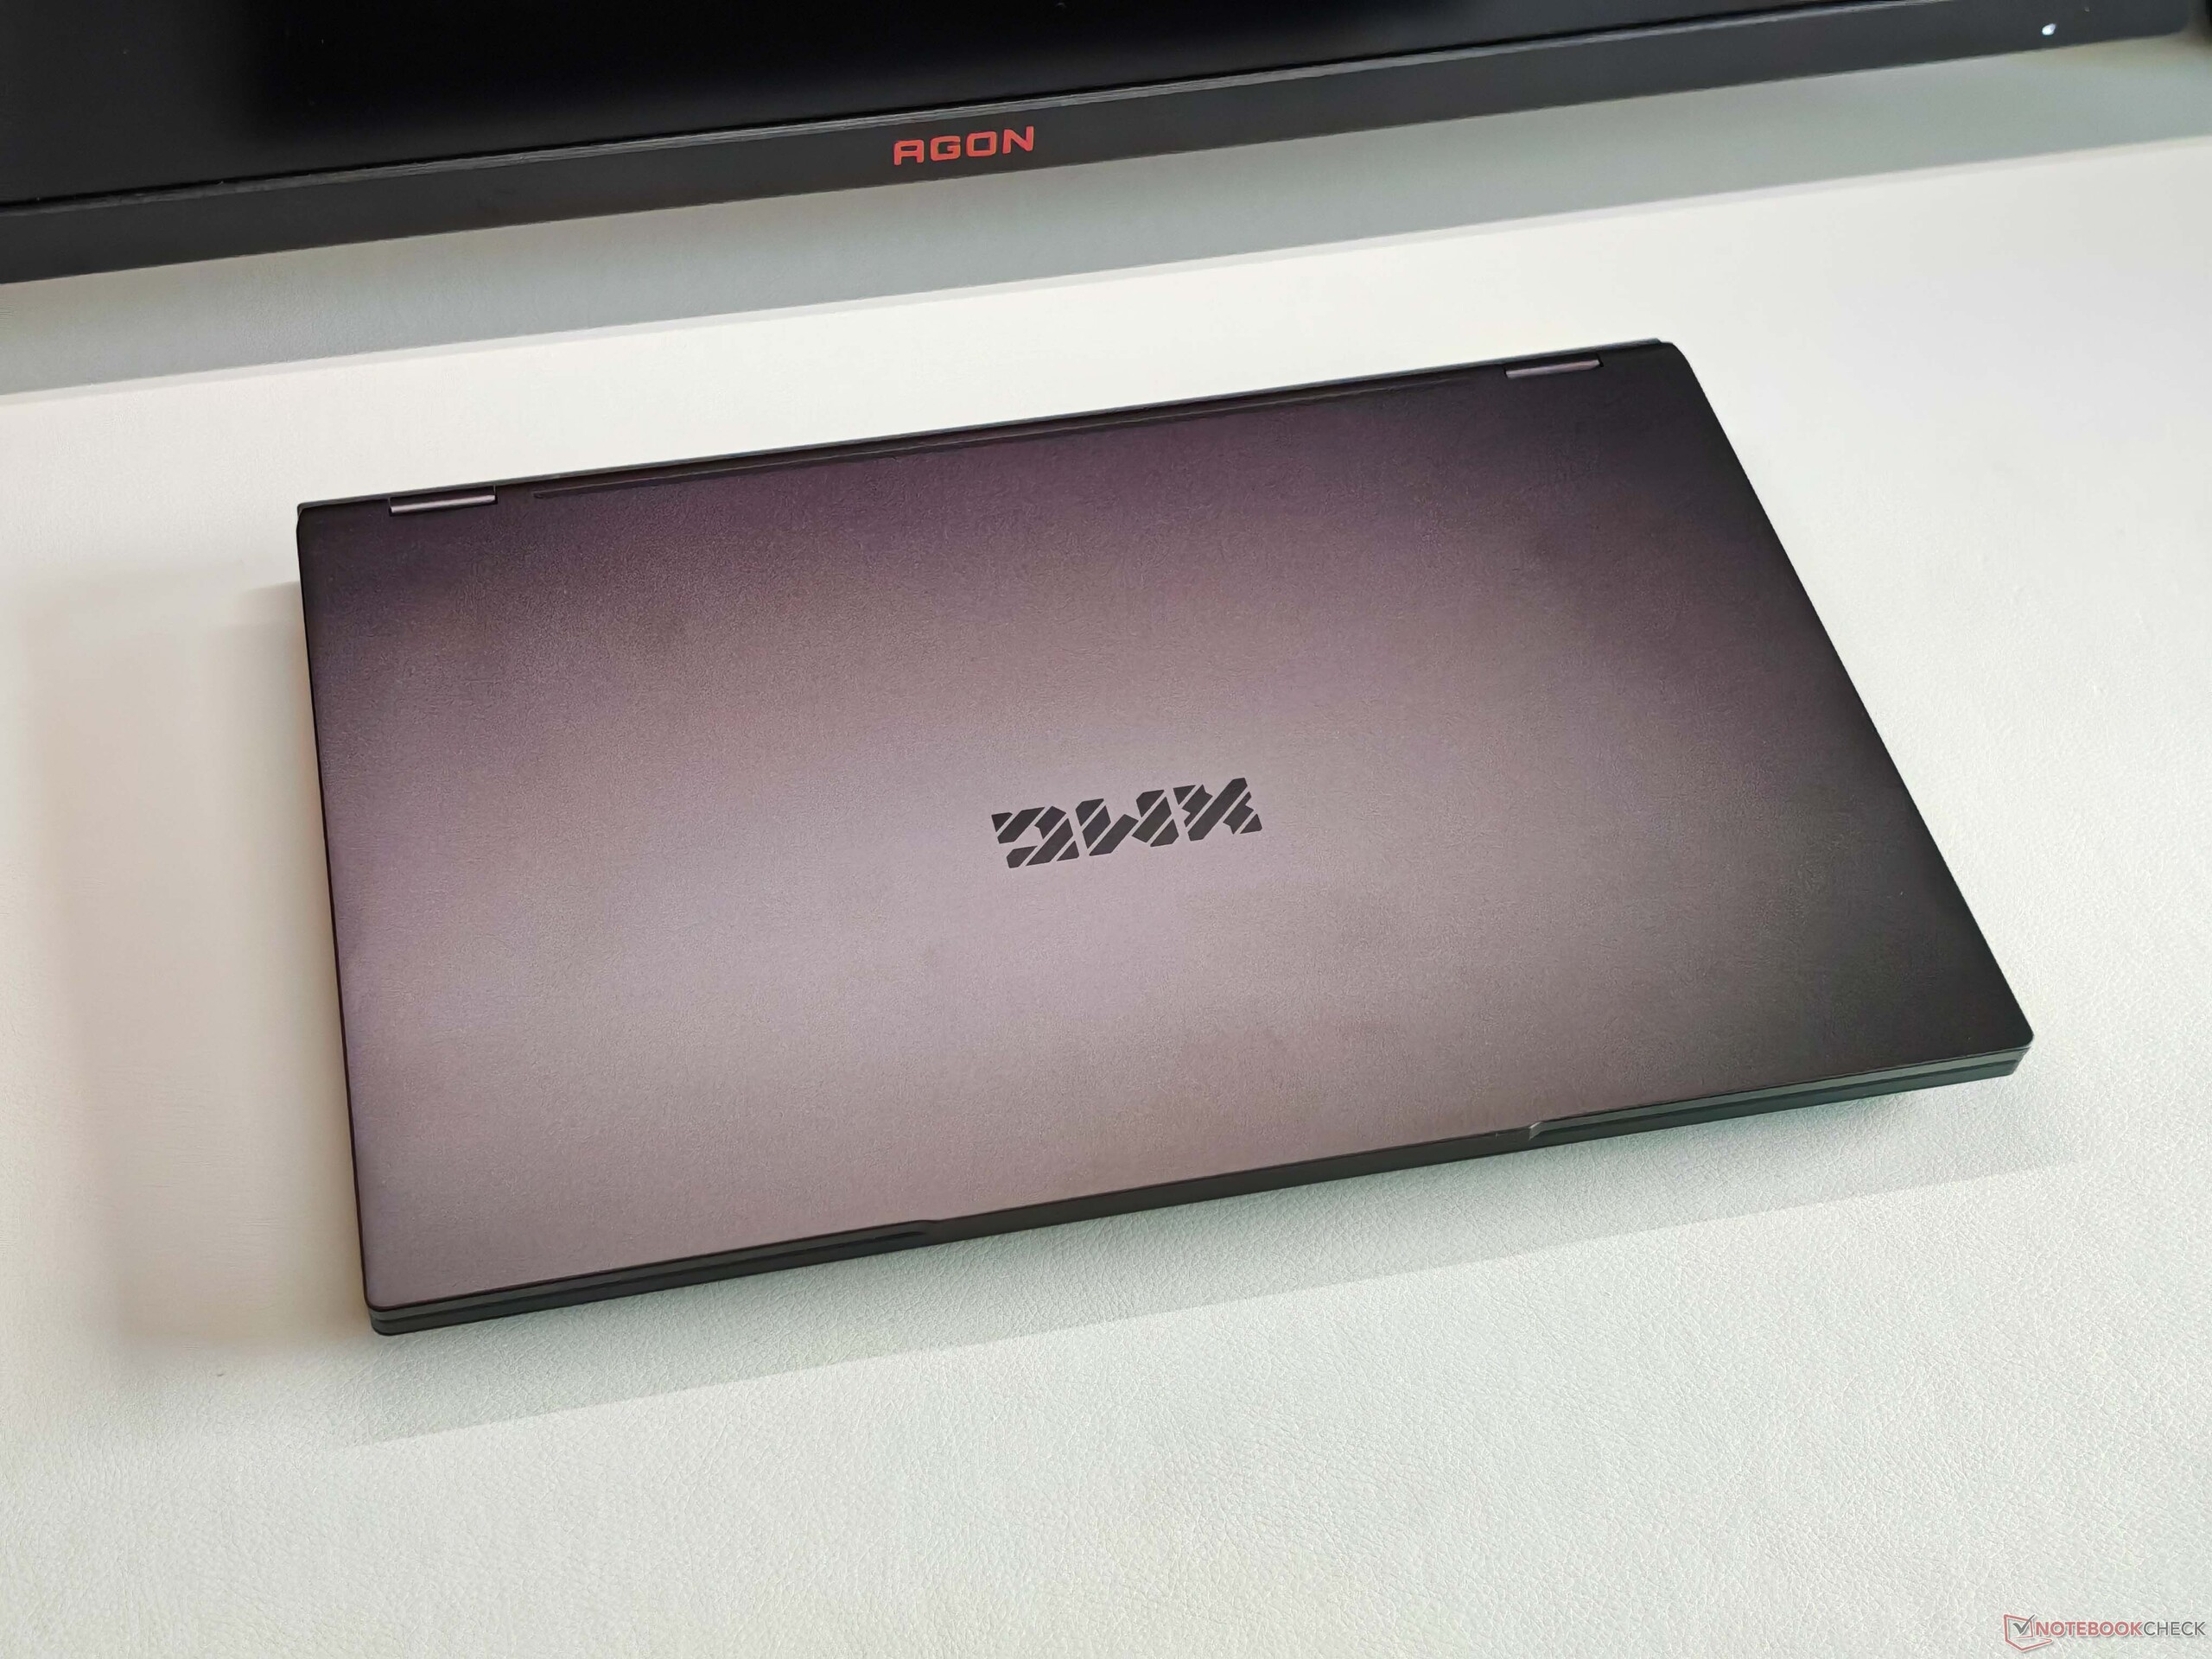
Ya conocemos este chasis en una forma muy similar del actual XMG Pro 16. En general, el diseño es discreto, y no hay elementos de iluminación en el chasis. Para mantener el precio lo más bajo posible, sólo la tapa de la pantalla es de aluminio, mientras que la carcasa inferior es de plástico. Aun así, la estabilidad general sigue siendo muy buena, y las bisagras (de hasta 180 grados) sólo permiten un ligero tambaleo.
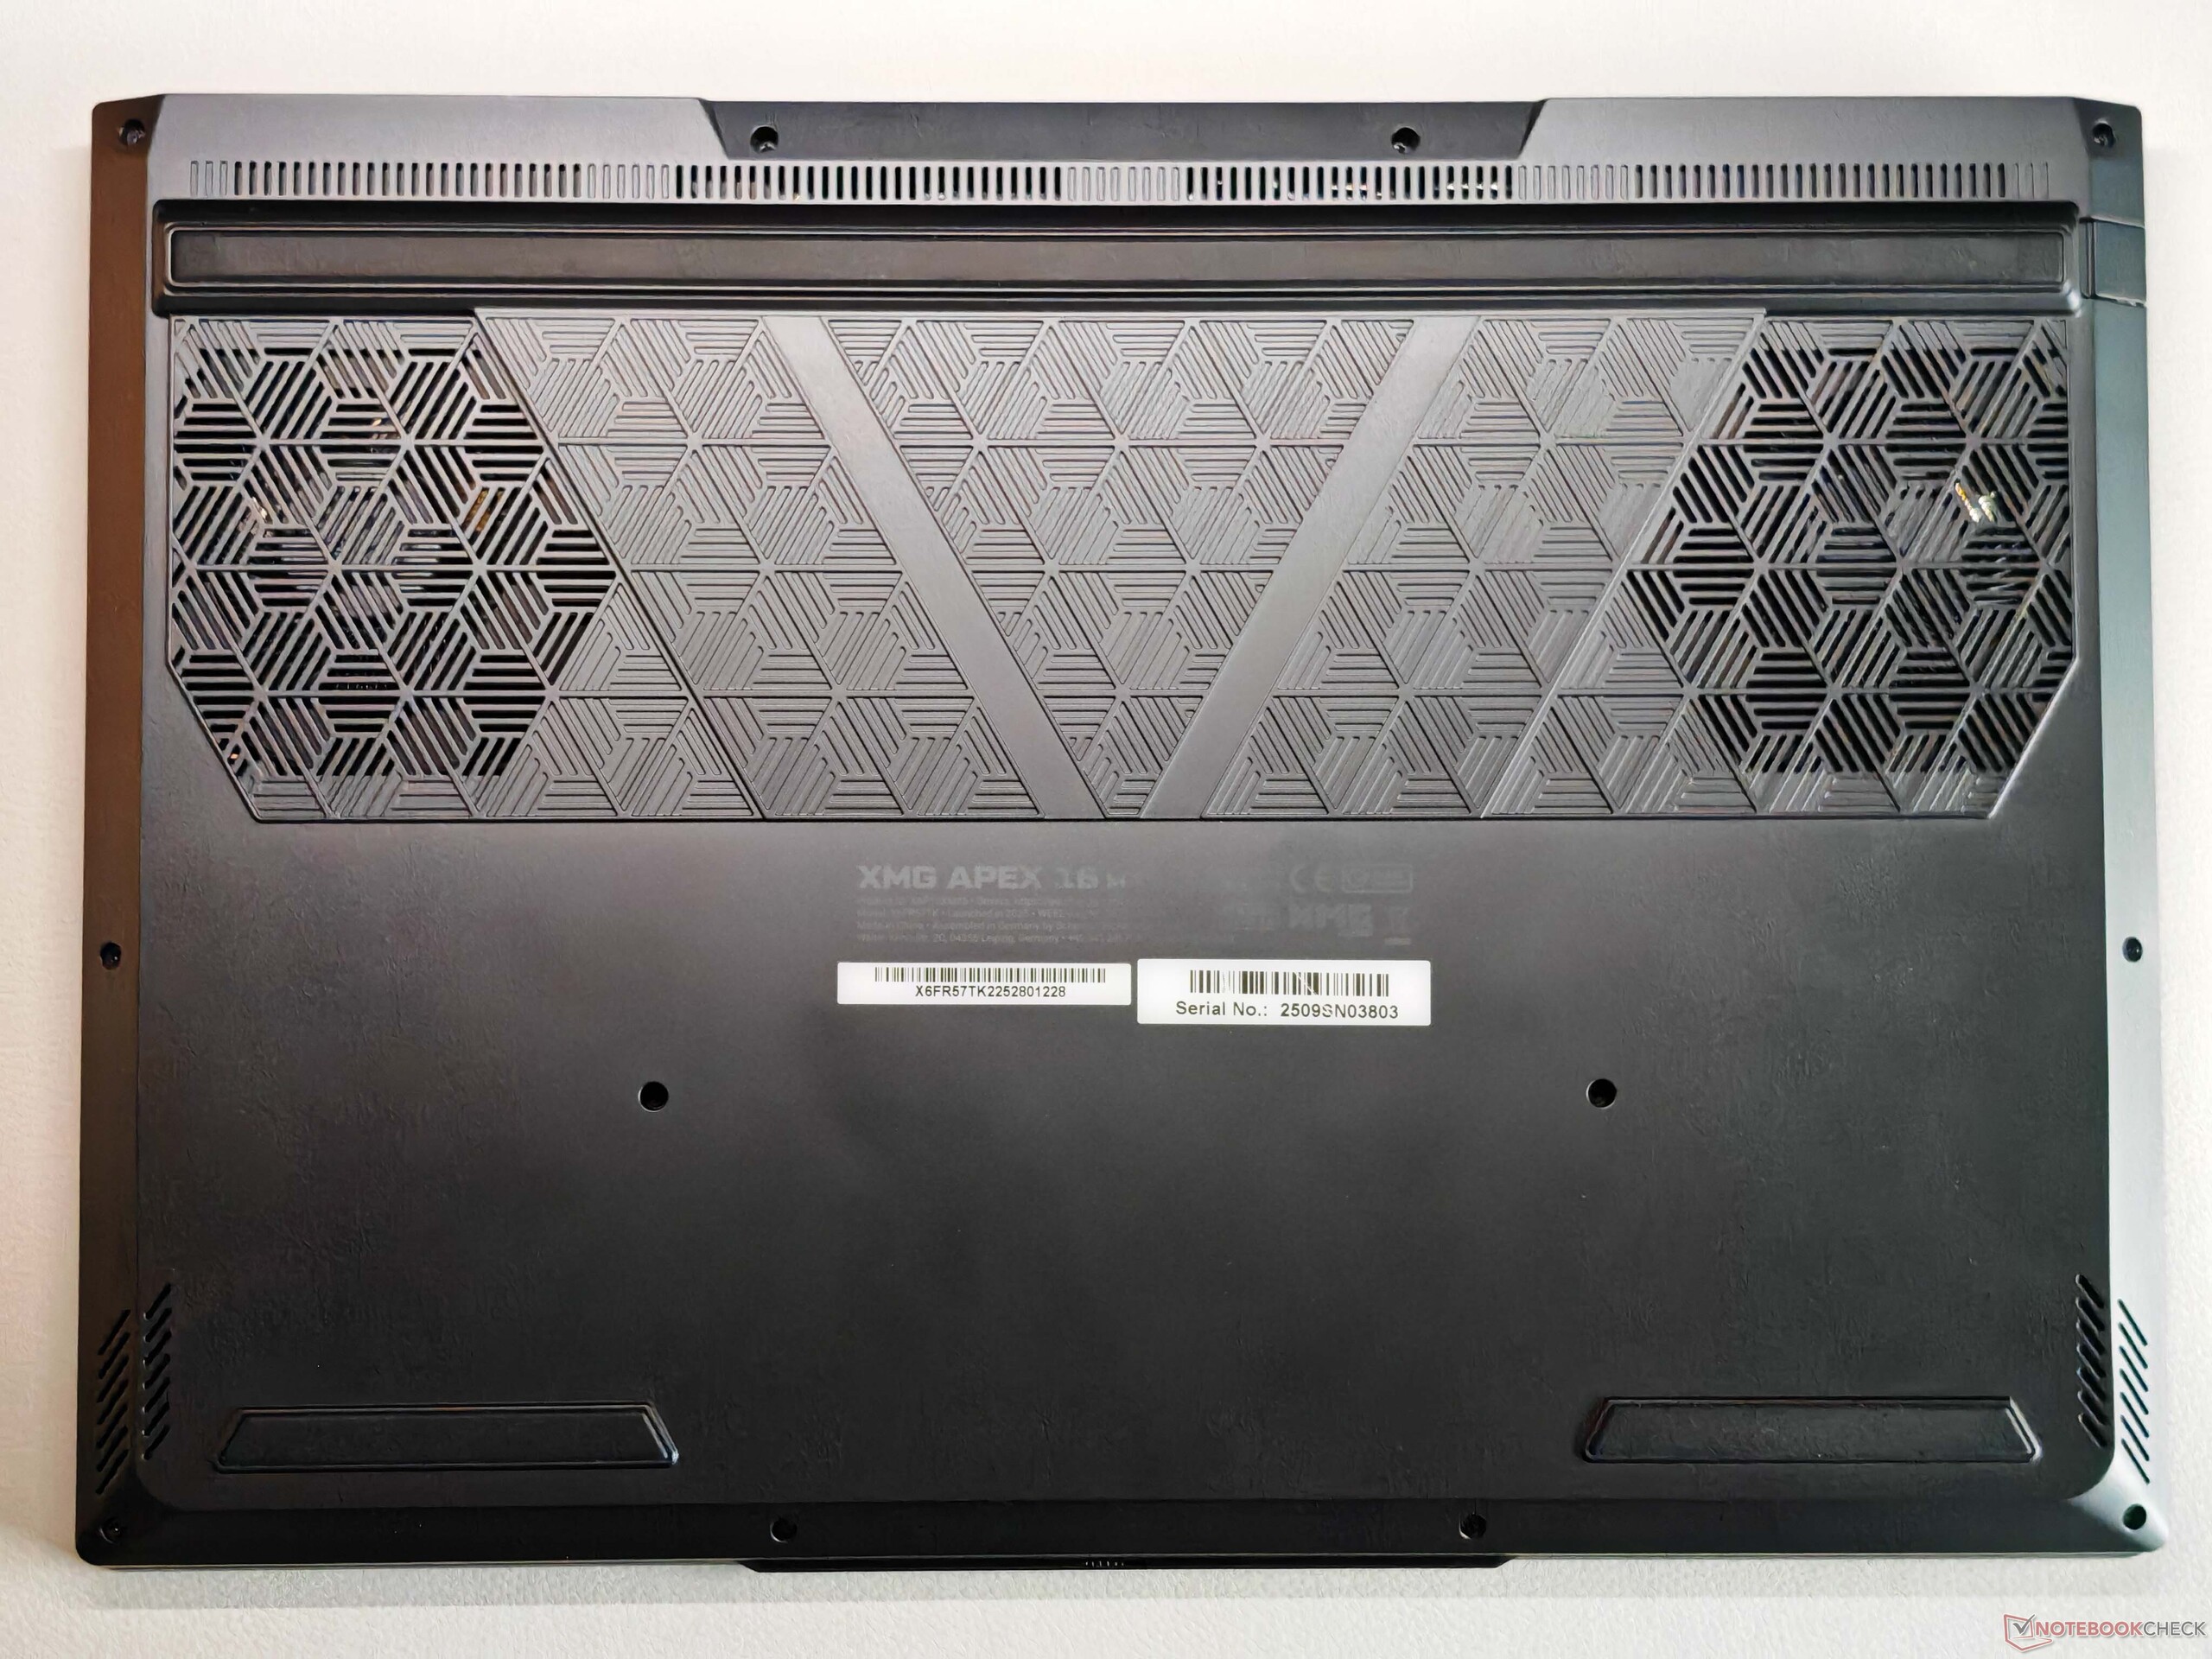
Las opciones de mantenimiento son amplias (2× RAM, 2× SSD), y hay un montón de puertos disponibles - aunque no hay USB 4.0. Además de Wi-Fi 6E, el portátil también ofrece Gigabit Ethernet y un lector de tarjetas de tamaño completo. La webcam 1080p (con obturador de privacidad e IR) cumple su cometido.


| SD Card Reader | |
| average JPG Copy Test (av. of 3 runs) | |
| Medion Erazer Major 16 X1 MD62736 (AV PRO microSD 128 GB V60) | |
| Schenker XMG Pro 16 (E25) (Angelbird AV Pro V60) | |
| Media de la clase Gaming (20.9 - 210, n=54, últimos 2 años) | |
| MSI Vector 16 HX AI A2XWHG (AV PRO microSD 128 GB V60) | |
| Acer Predator Helios Neo 16S AI PHN16S-71-94L9 (AV PRO microSD 128 GB V60) | |
| Schenker XMG APEX 16 MAX (Angelbird AV Pro V60) | |
| maximum AS SSD Seq Read Test (1GB) | |
| Schenker XMG Pro 16 (E25) (Angelbird AV Pro V60) | |
| Medion Erazer Major 16 X1 MD62736 (AV PRO microSD 128 GB V60) | |
| Media de la clase Gaming (25.5 - 261, n=51, últimos 2 años) | |
| MSI Vector 16 HX AI A2XWHG (AV PRO microSD 128 GB V60) | |
| Schenker XMG APEX 16 MAX (Angelbird AV Pro V60) | |
| Acer Predator Helios Neo 16S AI PHN16S-71-94L9 (AV PRO microSD 128 GB V60) | |
| Networking | |
| Schenker XMG APEX 16 MAX | |
| iperf3 transmit AXE11000 | |
| iperf3 receive AXE11000 | |
| Acer Predator Helios Neo 16S AI PHN16S-71-94L9 | |
| iperf3 transmit AXE11000 | |
| iperf3 receive AXE11000 | |
| Chuwi Gamebook, R9 9955HX | |
| iperf3 transmit AXE11000 | |
| iperf3 receive AXE11000 | |
| iperf3 transmit AXE11000 6GHz | |
| iperf3 receive AXE11000 6GHz | |
| Medion Erazer Major 16 X1 MD62736 | |
| iperf3 transmit AXE11000 | |
| iperf3 receive AXE11000 | |
| Lenovo Legion 5 Pro 16IAX10H | |
| iperf3 transmit AXE11000 | |
| iperf3 receive AXE11000 | |
| MSI Vector 16 HX AI A2XWHG | |
| iperf3 transmit AXE11000 | |
| iperf3 receive AXE11000 | |
| Schenker XMG Pro 16 (E25) | |
| iperf3 transmit AXE11000 | |
| iperf3 receive AXE11000 | |


Dispositivos de entrada - Teclado con iluminación de una sola tecla
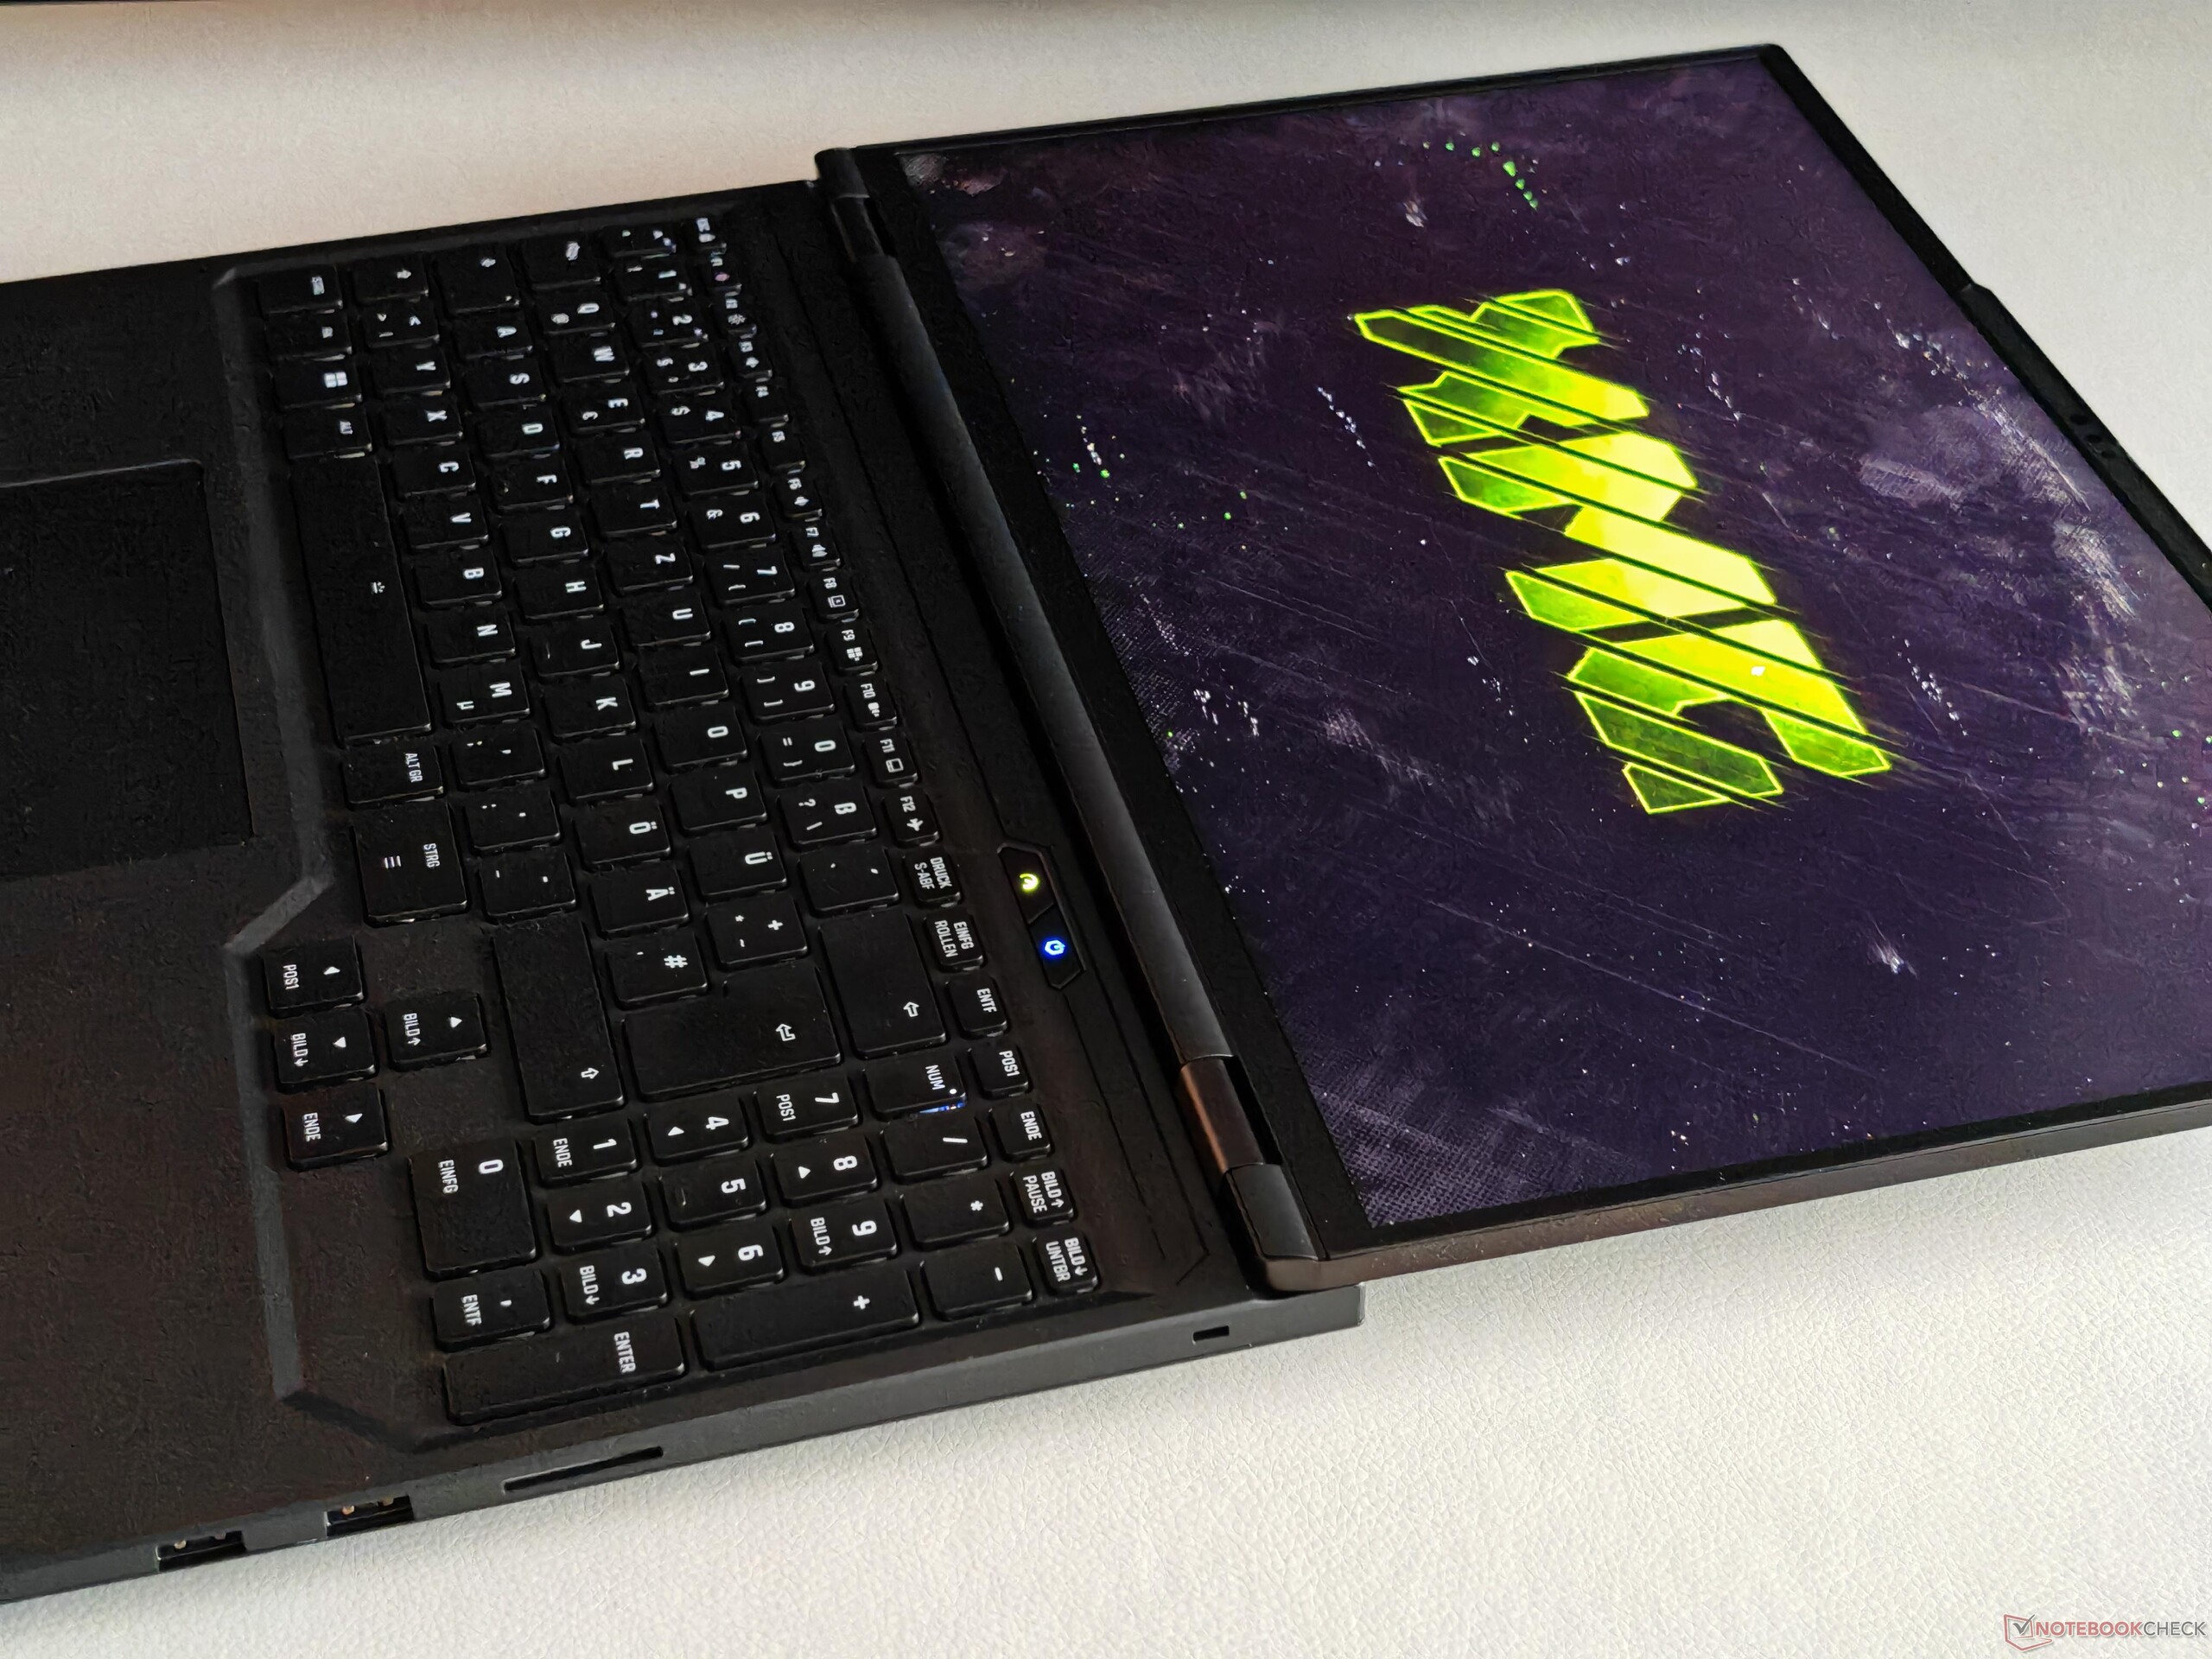
Ya conocemos este teclado con retroiluminación por tecla de otros modelos XMG, y tampoco decepciona en el Apex 16 Max. El recorrido de las teclas es suficientemente largo, la respuesta es precisa y dispone de un teclado numérico dedicado. El clickpad también rinde bien, aunque los clics mecánicos de la zona inferior son un poco ruidosos.


Pantalla - Mini LED con 1.000 cd/m²
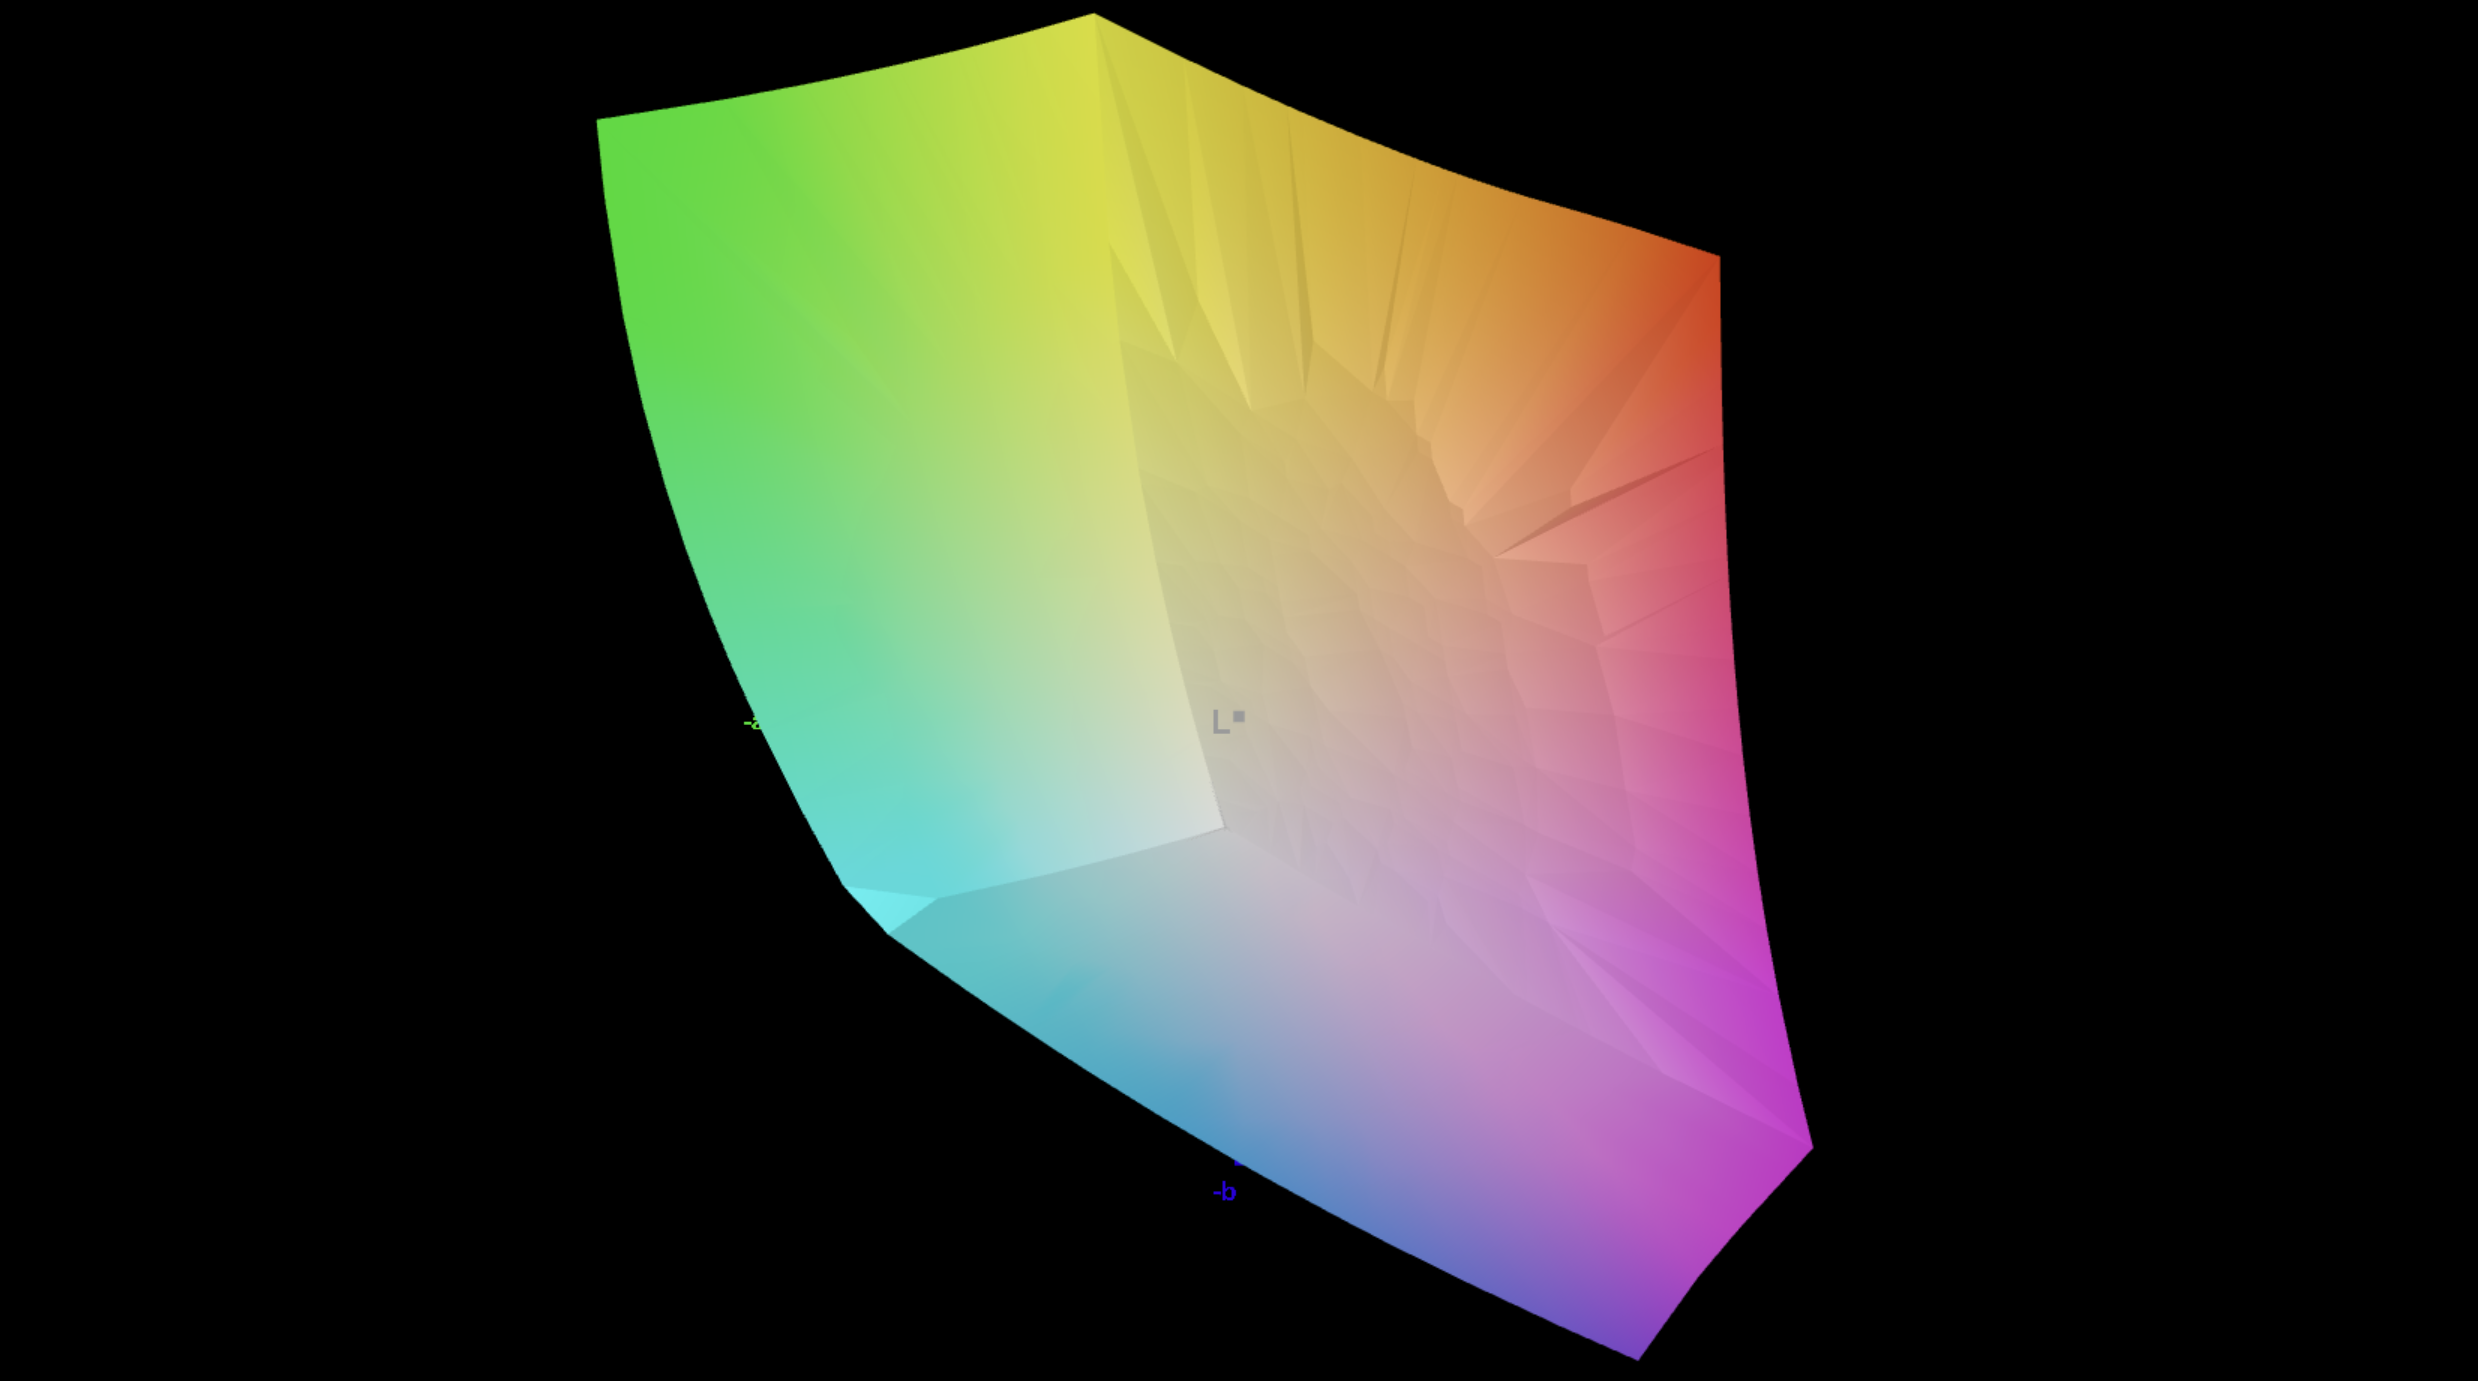
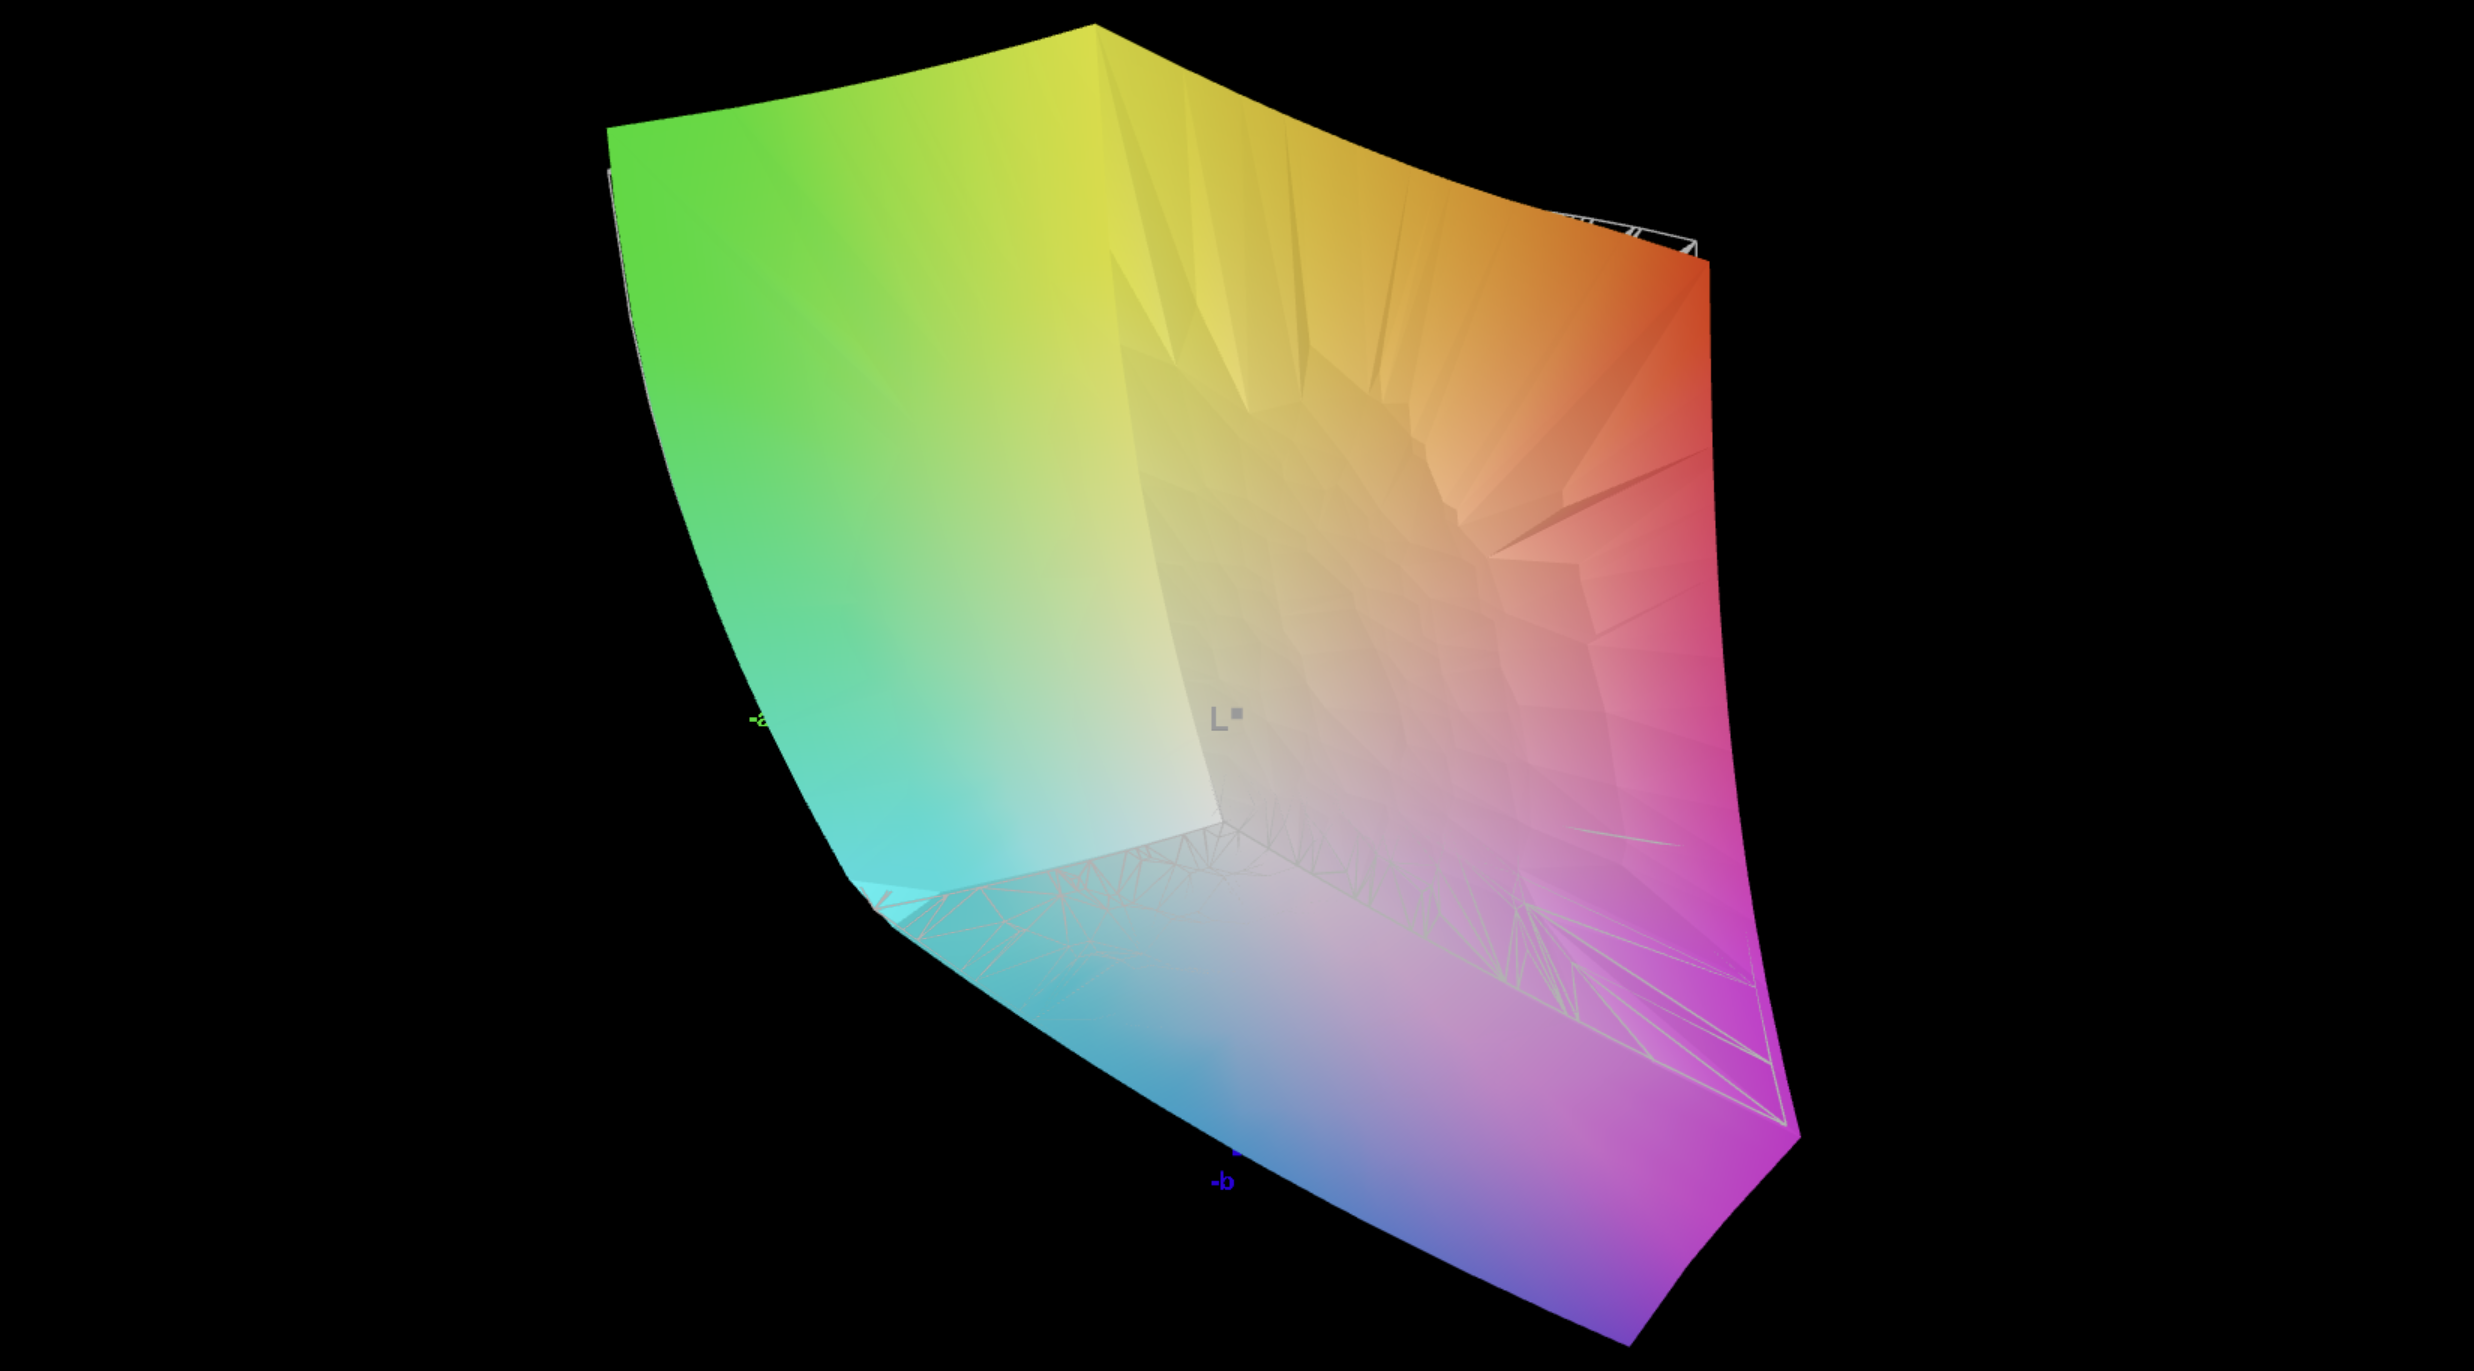
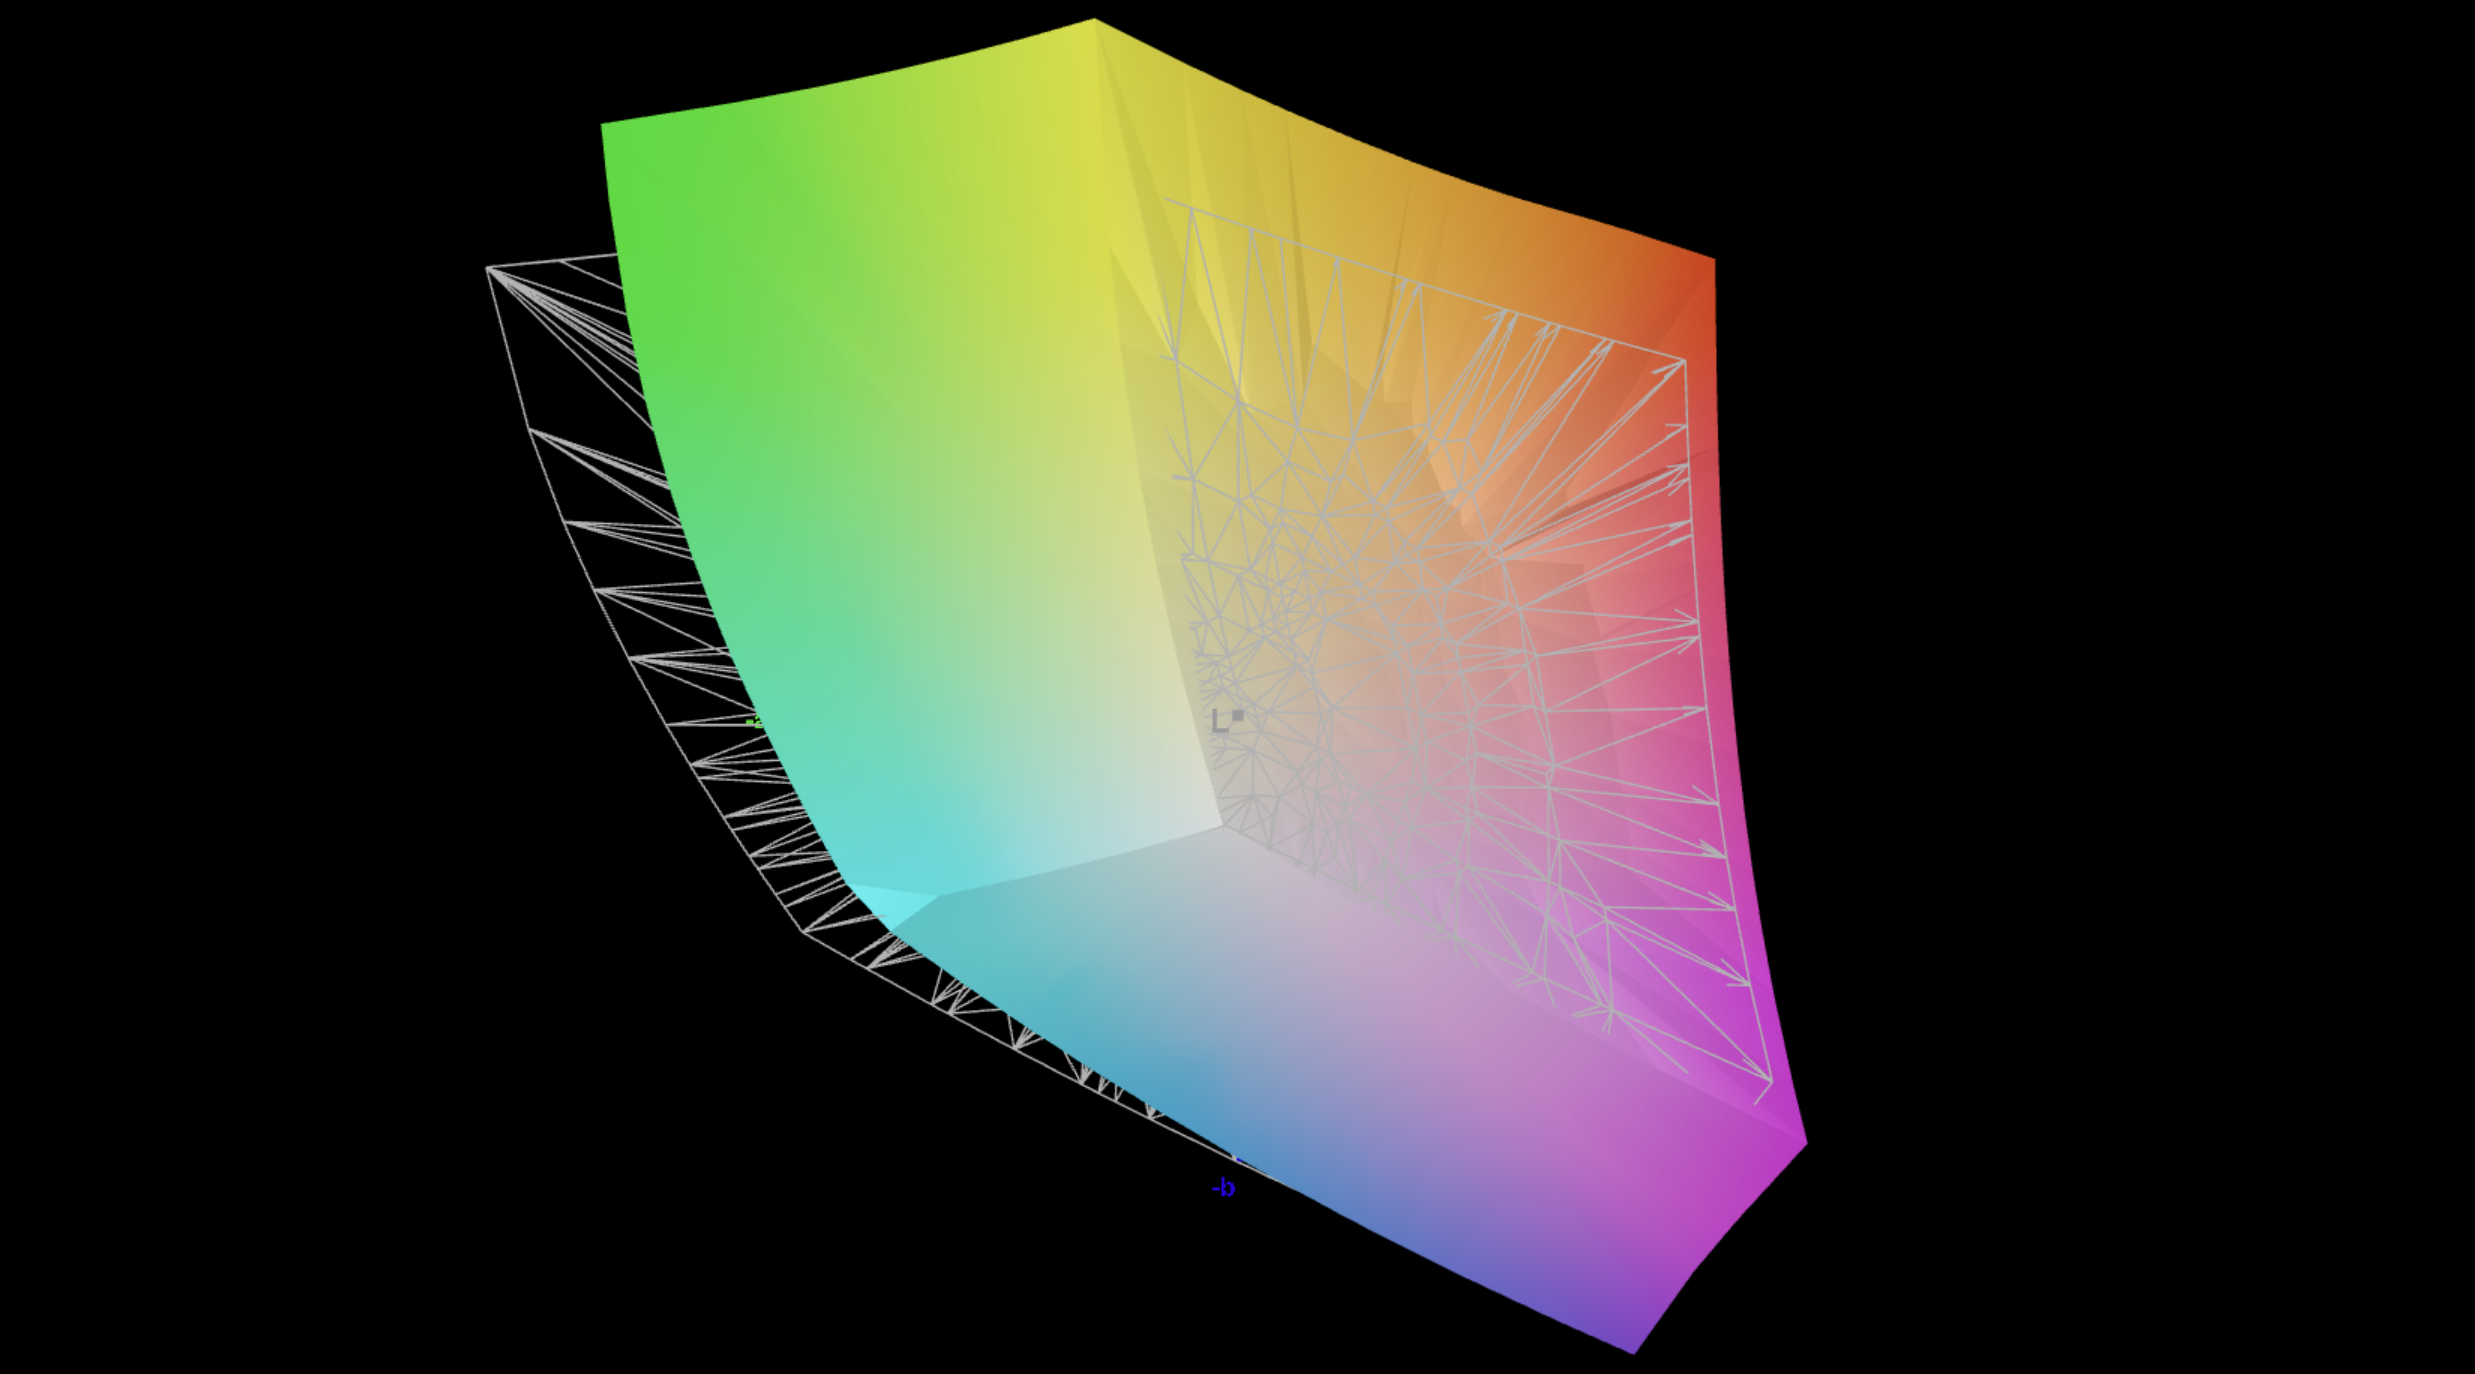
Nuestro dispositivo de prueba está equipado con el panel Mini-LED mate (2.560 × 1.600 píxeles, 16:10, 300 Hz) que ya conocemos del XMG Neo 16. La calidad de imagen es excelente y, especialmente en términos de brillo (hasta 752 cd/m² en SDR y 974 cd/m² en HDR), supera claramente al panel IPS estándar. La atenuación local puede desactivarse, lo que resulta útil para tareas como la edición fotográfica.
Sin embargo, los perfiles de color incluidos (para P3 y sRGB) no son óptimos, aunque la precisión del color mejora ligeramente a niveles de brillo más bajos. Nuestra propia calibración muestra que aún hay margen de mejora. Los tiempos de respuesta son difíciles de medir debido al parpadeo constante del PWM (aunque a una frecuencia muy alta de 20 kHz), pero en general se trata de un panel rápido de tipo IPS, y no tuvimos problemas mientras jugábamos.


| |||||||||||||||||||||||||
iluminación: 93 %
Brillo con batería: 742 cd/m²
Contraste: 74200:1 (Negro: 0.01 cd/m²)
ΔE ColorChecker Calman: 3 | ∀{0.5-29.43 Ø4.72}
calibrated: 1.2
ΔE Greyscale Calman: 3.6 | ∀{0.09-98 Ø4.97}
87.9% AdobeRGB 1998 (Argyll 3D)
100% sRGB (Argyll 3D)
99.7% Display P3 (Argyll 3D)
Gamma: 2.43
CCT: 6559 K
| Schenker XMG APEX 16 MAX NE160QDM-NM9, Mini-LED, 2560x1600, 16", 300 Hz | Acer Predator Helios Neo 16S AI PHN16S-71-94L9 Samsung ATNA60DL03-0, OLED, 2560x1600, 16", 240 Hz | Chuwi Gamebook, R9 9955HX BOE0D55, IPS, 2560x1600, 16", 300 Hz | Medion Erazer Major 16 X1 MD62736 NE160QDM-NZL (BOE0D55), IPS, 2560x1600, 16", 300 Hz | Lenovo Legion 5 Pro 16IAX10H ATNA60HS01-0 (Samsung SDC420A), OLED, 2560x1600, 16", 165 Hz | MSI Vector 16 HX AI A2XWHG B160QAN02.3 (AUO7DB2), IPS, 2560x1600, 16", 240 Hz | Schenker XMG Pro 16 (E25) NE160QDM-NZL, IPS, 2560x1600, 16", 300 Hz | |
|---|---|---|---|---|---|---|---|
| Display | 3% | -16% | -14% | 2% | -2% | -13% | |
| Display P3 Coverage (%) | 99.7 | 99.9 0% | 72.5 -27% | 73.2 -27% | 99.9 0% | 96.6 -3% | 74.7 -25% |
| sRGB Coverage (%) | 100 | 100 0% | 97.9 -2% | 99.8 0% | 100 0% | 99.8 0% | 99.8 0% |
| AdobeRGB 1998 Coverage (%) | 87.9 | 96.5 10% | 72.5 -18% | 73.9 -16% | 94.1 7% | 84.4 -4% | 75.4 -14% |
| Response Times | 77% | 39% | 52% | 85% | 65% | 49% | |
| Response Time Grey 50% / Grey 80% * (ms) | 17.4 ? | 0.2 ? 99% | 12.4 ? 29% | 10 ? 43% | 2 ? 89% | 4.3 ? 75% | 10.5 ? 40% |
| Response Time Black / White * (ms) | 13 ? | 0.25 ? 98% | 6.8 ? 48% | 5.2 ? 60% | 1.4 ? 89% | 6 ? 54% | 5.4 ? 58% |
| PWM Frequency (Hz) | 20253 ? | 960 | 1300 | ||||
| PWM Amplitude * (%) | 75 | 50 33% | 16.7 78% | ||||
| Screen | -42% | -557% | -553% | -18% | -485% | -587% | |
| Brightness middle (cd/m²) | 742 | 390 -47% | 576 -22% | 577 -22% | 518 -30% | 473 -36% | 538 -27% |
| Brightness (cd/m²) | 733 | 394 -46% | 545 -26% | 539 -26% | 522 -29% | 426 -42% | 508 -31% |
| Brightness Distribution (%) | 93 | 98 5% | 88 -5% | 85 -9% | 97 4% | 85 -9% | 88 -5% |
| Black Level * (cd/m²) | 0.01 | 0.04 -300% | 0.5 -4900% | 0.5 -4900% | 0.42 -4100% | 0.47 -4600% | |
| Contrast (:1) | 74200 | 9750 -87% | 1152 -98% | 1154 -98% | 1126 -98% | 1145 -98% | |
| Colorchecker dE 2000 * | 3 | 1.61 46% | 2.04 32% | 2.12 29% | 2.49 17% | 3.47 -16% | 1.9 37% |
| Colorchecker dE 2000 max. * | 4.3 | 3.49 19% | 3.56 17% | 3.32 23% | 5.25 -22% | 7.24 -68% | 4 7% |
| Colorchecker dE 2000 calibrated * | 1.2 | 1.59 -33% | 1.85 -54% | 1.33 -11% | 2.15 -79% | 1.36 -13% | |
| Greyscale dE 2000 * | 3.6 | 1.2 67% | 2.09 42% | 2.2 39% | 3.02 16% | 3.1 14% | 2.7 25% |
| Gamma | 2.43 91% | 2.235 98% | 2.3 96% | 2.123 104% | 2.37 93% | 2.486 88% | 2.24 98% |
| CCT | 6559 99% | 6580 99% | 6492 100% | 6457 101% | 6426 101% | 6832 95% | 7027 93% |
| Media total (Programa/Opciones) | 13% /
-9% | -178% /
-356% | -172% /
-351% | 23% /
11% | -141% /
-303% | -184% /
-356% |
* ... más pequeño es mejor


Tiempos de respuesta del display
| ↔ Tiempo de respuesta de Negro a Blanco | ||
|---|---|---|
| 13 ms ... subida ↗ y bajada ↘ combinada | ↗ 4.6 ms subida | 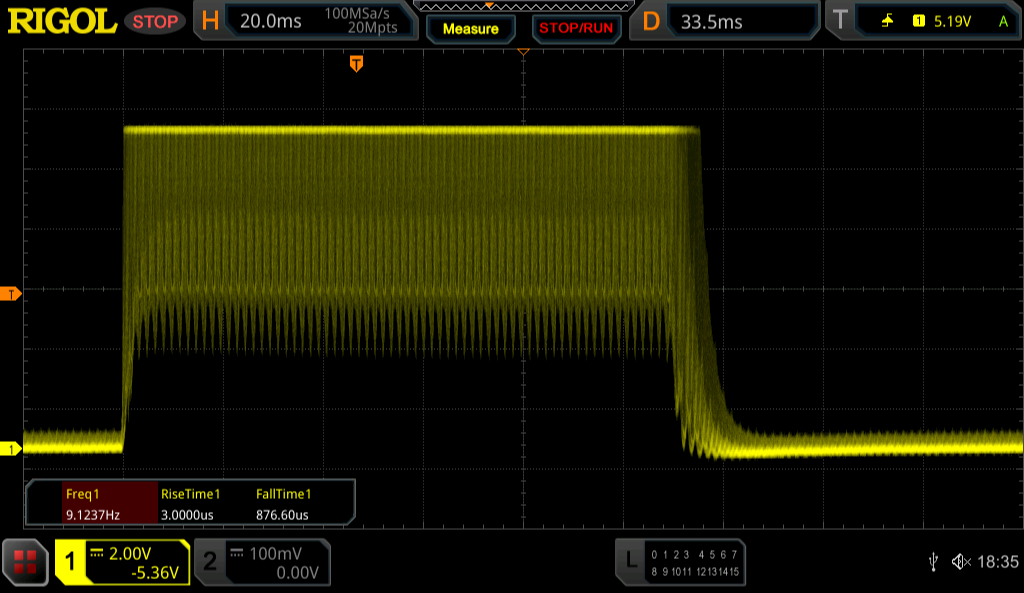 |
| ↘ 8.4 ms bajada | ||
| La pantalla mostró buenos tiempos de respuesta en nuestros tests pero podría ser demasiado lenta para los jugones competitivos. En comparación, todos los dispositivos de prueba van de ##min### (mínimo) a 240 (máximo) ms. » 33 % de todos los dispositivos son mejores. Esto quiere decir que el tiempo de respuesta medido es mejor que la media (19.8 ms) de todos los dispositivos testados. | ||
| ↔ Tiempo de respuesta 50% Gris a 80% Gris | ||
| 17.4 ms ... subida ↗ y bajada ↘ combinada | ↗ 8.4 ms subida | 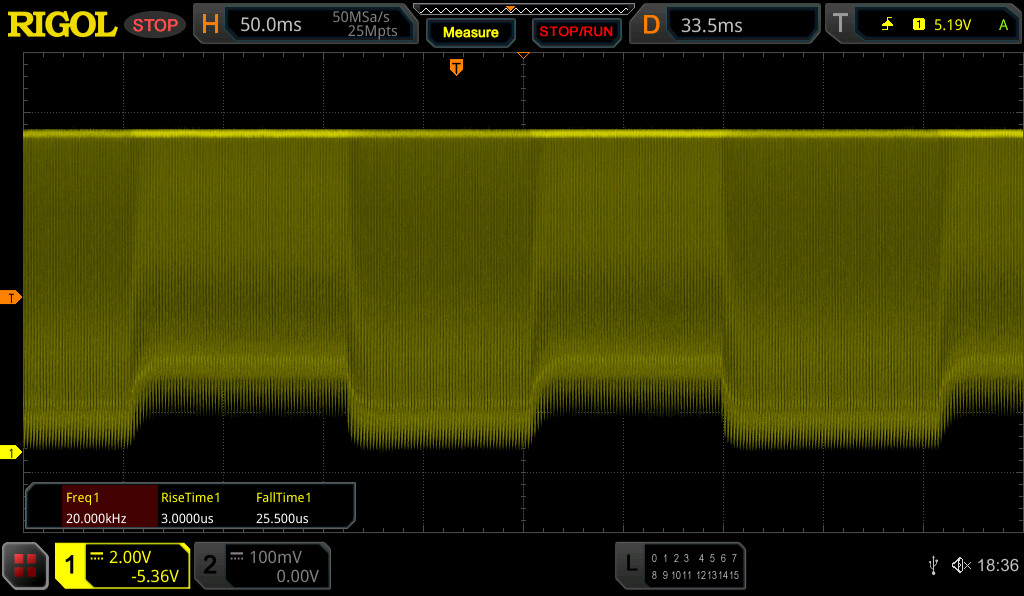 |
| ↘ 9 ms bajada | ||
| La pantalla mostró buenos tiempos de respuesta en nuestros tests pero podría ser demasiado lenta para los jugones competitivos. En comparación, todos los dispositivos de prueba van de ##min### (mínimo) a 636 (máximo) ms. » 32 % de todos los dispositivos son mejores. Esto quiere decir que el tiempo de respuesta medido es mejor que la media (31 ms) de todos los dispositivos testados. | ||
Parpadeo de Pantalla / PWM (Pulse-Width Modulation)
| Parpadeo de Pantalla / PWM detectado | 20253 Hz Amplitude: 75 % | ≤ 100 % de brillo | 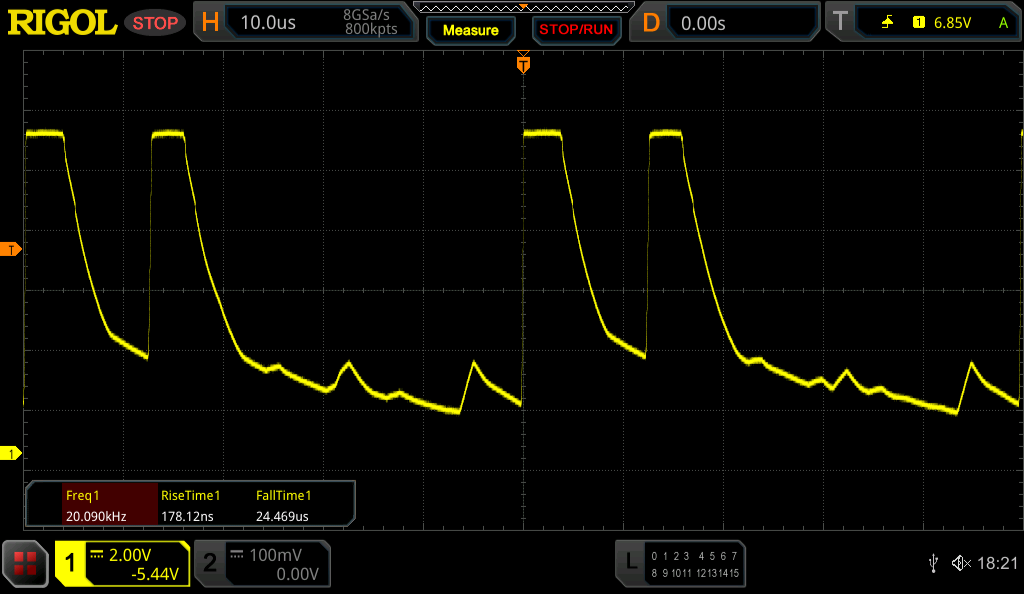 |
La retroiluminación del display parpadea a 20253 Hz (seguramente usa PWM - Pulse-Width Modulation) a un brillo del 100 % e inferior. Sobre este nivel de brillo no debería darse parpadeo / PWM. La frecuencia de 20253 Hz es bastante alta, por lo que la mayoría de gente sensible al parpadeo no debería ver parpadeo o tener fatiga visual. Comparación: 52 % de todos los dispositivos testados no usaron PWM para atenuar el display. Si se usó, medimos una media de 7747 (mínimo: 5 - máxmo: 343500) Hz. | |||


Rendimiento
Condiciones de la prueba
Hemos realizado las siguientes pruebas de rendimiento en elmodo Overboost (Normal). Cuando funciona con batería, el modo Enthusiast es el ajuste más alto disponible.
Procesador
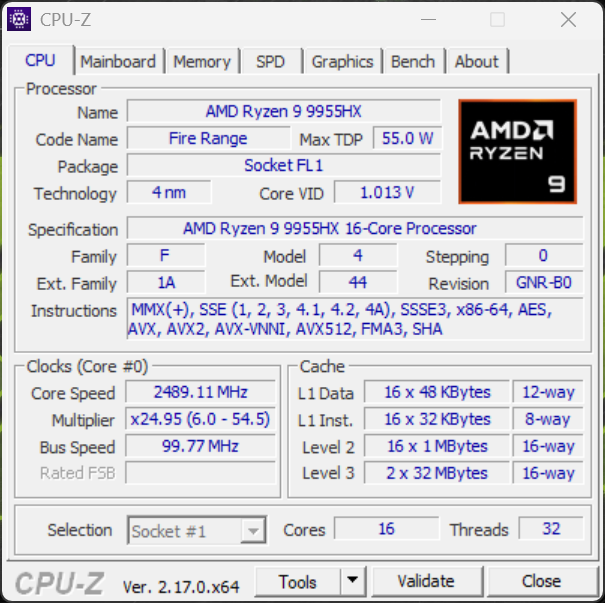
El AMD Ryzen 9 9955HX (Zen 5) es un procesador móvil muy rápido y puede consumir hasta 135/130 vatios, lo que le ayuda a ofrecer un rendimiento muy constante. En nuestras pruebas comparativas, por ejemplo, puede incluso superar al Intel Core Ultra 9 275HXa pesar de que el chip de Intel consume más energía. Sin embargo, en batería (35 vatios), el rendimiento multinúcleo se reduce significativamente (-55%).
Cinebench R15 Prueba de resistencia múltiple
Cinebench R23: Multi Core | Single Core
Cinebench R20: CPU (Multi Core) | CPU (Single Core)
Cinebench R15: CPU Multi 64Bit | CPU Single 64Bit
Blender: v2.79 BMW27 CPU
7-Zip 18.03: 7z b 4 | 7z b 4 -mmt1
Geekbench 6.7: Multi-Core | Single-Core
Geekbench 5.5: Multi-Core | Single-Core
HWBOT x265 Benchmark v2.2: 4k Preset
LibreOffice : 20 Documents To PDF
R Benchmark 2.5: Overall mean
| CPU Performance rating | |
| Medio AMD Ryzen 9 9955HX | |
| Schenker XMG APEX 16 MAX | |
| Chuwi Gamebook, R9 9955HX | |
| Lenovo Legion 5 Pro 16IAX10H | |
| Schenker XMG Pro 16 (E25) | |
| Acer Predator Helios Neo 16S AI PHN16S-71-94L9 | |
| Medion Erazer Major 16 X1 MD62736 | |
| MSI Vector 16 HX AI A2XWHG | |
| Media de la clase Gaming | |
| Cinebench R23 / Multi Core | |
| Medio AMD Ryzen 9 9955HX (35960 - 39690, n=9) | |
| Lenovo Legion 5 Pro 16IAX10H | |
| Schenker XMG Pro 16 (E25) | |
| Chuwi Gamebook, R9 9955HX | |
| Schenker XMG APEX 16 MAX | |
| Medion Erazer Major 16 X1 MD62736 | |
| Acer Predator Helios Neo 16S AI PHN16S-71-94L9 | |
| MSI Vector 16 HX AI A2XWHG | |
| Media de la clase Gaming (10488 - 40970, n=106, últimos 2 años) | |
| Cinebench R23 / Single Core | |
| Acer Predator Helios Neo 16S AI PHN16S-71-94L9 | |
| Lenovo Legion 5 Pro 16IAX10H | |
| Schenker XMG Pro 16 (E25) | |
| Chuwi Gamebook, R9 9955HX | |
| Schenker XMG APEX 16 MAX | |
| MSI Vector 16 HX AI A2XWHG | |
| Medio AMD Ryzen 9 9955HX (1828 - 2183, n=9) | |
| Medion Erazer Major 16 X1 MD62736 | |
| Media de la clase Gaming (1166 - 2387, n=106, últimos 2 años) | |
| Cinebench R20 / CPU (Multi Core) | |
| Lenovo Legion 5 Pro 16IAX10H | |
| Medio AMD Ryzen 9 9955HX (13963 - 15524, n=9) | |
| Schenker XMG Pro 16 (E25) | |
| Chuwi Gamebook, R9 9955HX | |
| Schenker XMG APEX 16 MAX | |
| Acer Predator Helios Neo 16S AI PHN16S-71-94L9 | |
| Medion Erazer Major 16 X1 MD62736 | |
| MSI Vector 16 HX AI A2XWHG | |
| Media de la clase Gaming (4029 - 16108, n=105, últimos 2 años) | |
| Cinebench R20 / CPU (Single Core) | |
| Acer Predator Helios Neo 16S AI PHN16S-71-94L9 | |
| Lenovo Legion 5 Pro 16IAX10H | |
| Schenker XMG Pro 16 (E25) | |
| Schenker XMG APEX 16 MAX | |
| Chuwi Gamebook, R9 9955HX | |
| Medio AMD Ryzen 9 9955HX (819 - 856, n=9) | |
| MSI Vector 16 HX AI A2XWHG | |
| Medion Erazer Major 16 X1 MD62736 | |
| Media de la clase Gaming (442 - 904, n=105, últimos 2 años) | |
| Cinebench R15 / CPU Multi 64Bit | |
| Lenovo Legion 5 Pro 16IAX10H | |
| Medio AMD Ryzen 9 9955HX (5624 - 6103, n=9) | |
| Chuwi Gamebook, R9 9955HX | |
| Schenker XMG APEX 16 MAX | |
| Schenker XMG Pro 16 (E25) | |
| Medion Erazer Major 16 X1 MD62736 | |
| Acer Predator Helios Neo 16S AI PHN16S-71-94L9 | |
| MSI Vector 16 HX AI A2XWHG | |
| Media de la clase Gaming (1578 - 6271, n=104, últimos 2 años) | |
| Cinebench R15 / CPU Single 64Bit | |
| Chuwi Gamebook, R9 9955HX | |
| Schenker XMG APEX 16 MAX | |
| Schenker XMG Pro 16 (E25) | |
| Acer Predator Helios Neo 16S AI PHN16S-71-94L9 | |
| Medio AMD Ryzen 9 9955HX (320 - 338, n=9) | |
| Lenovo Legion 5 Pro 16IAX10H | |
| MSI Vector 16 HX AI A2XWHG | |
| Medion Erazer Major 16 X1 MD62736 | |
| Media de la clase Gaming (188.8 - 344, n=105, últimos 2 años) | |
| Blender / v2.79 BMW27 CPU | |
| Media de la clase Gaming (80 - 330, n=103, últimos 2 años) | |
| MSI Vector 16 HX AI A2XWHG | |
| Acer Predator Helios Neo 16S AI PHN16S-71-94L9 | |
| Medion Erazer Major 16 X1 MD62736 | |
| Lenovo Legion 5 Pro 16IAX10H | |
| Schenker XMG Pro 16 (E25) | |
| Chuwi Gamebook, R9 9955HX | |
| Schenker XMG APEX 16 MAX | |
| Medio AMD Ryzen 9 9955HX (80 - 91, n=9) | |
| 7-Zip 18.03 / 7z b 4 | |
| Schenker XMG APEX 16 MAX | |
| Medio AMD Ryzen 9 9955HX (132435 - 144064, n=9) | |
| Chuwi Gamebook, R9 9955HX | |
| Schenker XMG Pro 16 (E25) | |
| Lenovo Legion 5 Pro 16IAX10H | |
| Acer Predator Helios Neo 16S AI PHN16S-71-94L9 | |
| Medion Erazer Major 16 X1 MD62736 | |
| Media de la clase Gaming (33491 - 148086, n=104, últimos 2 años) | |
| MSI Vector 16 HX AI A2XWHG | |
| 7-Zip 18.03 / 7z b 4 -mmt1 | |
| Schenker XMG APEX 16 MAX | |
| Medio AMD Ryzen 9 9955HX (7061 - 7462, n=9) | |
| Chuwi Gamebook, R9 9955HX | |
| Schenker XMG Pro 16 (E25) | |
| Acer Predator Helios Neo 16S AI PHN16S-71-94L9 | |
| Lenovo Legion 5 Pro 16IAX10H | |
| Medion Erazer Major 16 X1 MD62736 | |
| Media de la clase Gaming (4199 - 7436, n=104, últimos 2 años) | |
| MSI Vector 16 HX AI A2XWHG | |
| Geekbench 6.7 / Multi-Core | |
| Schenker XMG Pro 16 (E25) | |
| Lenovo Legion 5 Pro 16IAX10H | |
| Schenker XMG APEX 16 MAX | |
| Acer Predator Helios Neo 16S AI PHN16S-71-94L9 | |
| Chuwi Gamebook, R9 9955HX | |
| Medio AMD Ryzen 9 9955HX (16313 - 19725, n=9) | |
| Medion Erazer Major 16 X1 MD62736 | |
| MSI Vector 16 HX AI A2XWHG | |
| Media de la clase Gaming (6625 - 22104, n=105, últimos 2 años) | |
| Geekbench 6.7 / Single-Core | |
| Schenker XMG APEX 16 MAX | |
| Medio AMD Ryzen 9 9955HX (3156 - 3259, n=9) | |
| Chuwi Gamebook, R9 9955HX | |
| Acer Predator Helios Neo 16S AI PHN16S-71-94L9 | |
| Schenker XMG Pro 16 (E25) | |
| Lenovo Legion 5 Pro 16IAX10H | |
| Medion Erazer Major 16 X1 MD62736 | |
| MSI Vector 16 HX AI A2XWHG | |
| Media de la clase Gaming (1490 - 3259, n=105, últimos 2 años) | |
| Geekbench 5.5 / Multi-Core | |
| Schenker XMG Pro 16 (E25) | |
| Schenker XMG APEX 16 MAX | |
| Lenovo Legion 5 Pro 16IAX10H | |
| Acer Predator Helios Neo 16S AI PHN16S-71-94L9 | |
| Medio AMD Ryzen 9 9955HX (20576 - 22716, n=9) | |
| Chuwi Gamebook, R9 9955HX | |
| Medion Erazer Major 16 X1 MD62736 | |
| MSI Vector 16 HX AI A2XWHG | |
| Media de la clase Gaming (6460 - 27010, n=104, últimos 2 años) | |
| Geekbench 5.5 / Single-Core | |
| Schenker XMG APEX 16 MAX | |
| Medio AMD Ryzen 9 9955HX (2307 - 2474, n=9) | |
| Chuwi Gamebook, R9 9955HX | |
| Schenker XMG Pro 16 (E25) | |
| Lenovo Legion 5 Pro 16IAX10H | |
| Acer Predator Helios Neo 16S AI PHN16S-71-94L9 | |
| MSI Vector 16 HX AI A2XWHG | |
| Medion Erazer Major 16 X1 MD62736 | |
| Media de la clase Gaming (986 - 2474, n=104, últimos 2 años) | |
| HWBOT x265 Benchmark v2.2 / 4k Preset | |
| Medio AMD Ryzen 9 9955HX (38.9 - 43, n=9) | |
| Chuwi Gamebook, R9 9955HX | |
| Schenker XMG APEX 16 MAX | |
| Schenker XMG Pro 16 (E25) | |
| Lenovo Legion 5 Pro 16IAX10H | |
| Medion Erazer Major 16 X1 MD62736 | |
| Acer Predator Helios Neo 16S AI PHN16S-71-94L9 | |
| MSI Vector 16 HX AI A2XWHG | |
| Media de la clase Gaming (11.5 - 44.3, n=104, últimos 2 años) | |
| LibreOffice / 20 Documents To PDF | |
| Media de la clase Gaming (33.2 - 88.8, n=104, últimos 2 años) | |
| Schenker XMG Pro 16 (E25) | |
| Schenker XMG APEX 16 MAX | |
| Medio AMD Ryzen 9 9955HX (42.2 - 52.4, n=9) | |
| Chuwi Gamebook, R9 9955HX | |
| Acer Predator Helios Neo 16S AI PHN16S-71-94L9 | |
| Medion Erazer Major 16 X1 MD62736 | |
| MSI Vector 16 HX AI A2XWHG | |
| Lenovo Legion 5 Pro 16IAX10H | |
| R Benchmark 2.5 / Overall mean | |
| Media de la clase Gaming (0.3439 - 0.759, n=105, últimos 2 años) | |
| MSI Vector 16 HX AI A2XWHG | |
| Medion Erazer Major 16 X1 MD62736 | |
| Lenovo Legion 5 Pro 16IAX10H | |
| Schenker XMG Pro 16 (E25) | |
| Acer Predator Helios Neo 16S AI PHN16S-71-94L9 | |
| Chuwi Gamebook, R9 9955HX | |
| Medio AMD Ryzen 9 9955HX (0.3439 - 0.3737, n=9) | |
| Schenker XMG APEX 16 MAX | |
* ... más pequeño es mejor
AIDA64: FP32 Ray-Trace | FPU Julia | CPU SHA3 | CPU Queen | FPU SinJulia | FPU Mandel | CPU AES | CPU ZLib | FP64 Ray-Trace | CPU PhotoWorxx
| Performance rating | |
| Schenker XMG APEX 16 MAX | |
| Medio AMD Ryzen 9 9955HX | |
| Chuwi Gamebook, R9 9955HX | |
| Lenovo Legion 5 Pro 16IAX10H | |
| Schenker XMG Pro 16 (E25) | |
| Medion Erazer Major 16 X1 MD62736 | |
| Acer Predator Helios Neo 16S AI PHN16S-71-94L9 | |
| Media de la clase Gaming | |
| MSI Vector 16 HX AI A2XWHG | |
| AIDA64 / FP32 Ray-Trace | |
| Schenker XMG APEX 16 MAX | |
| Chuwi Gamebook, R9 9955HX | |
| Medio AMD Ryzen 9 9955HX (66596 - 85542, n=9) | |
| Lenovo Legion 5 Pro 16IAX10H | |
| Schenker XMG Pro 16 (E25) | |
| Medion Erazer Major 16 X1 MD62736 | |
| Media de la clase Gaming (10227 - 85542, n=103, últimos 2 años) | |
| Acer Predator Helios Neo 16S AI PHN16S-71-94L9 | |
| MSI Vector 16 HX AI A2XWHG | |
| AIDA64 / FPU Julia | |
| Schenker XMG APEX 16 MAX | |
| Medio AMD Ryzen 9 9955HX (191535 - 232031, n=9) | |
| Chuwi Gamebook, R9 9955HX | |
| Lenovo Legion 5 Pro 16IAX10H | |
| Schenker XMG Pro 16 (E25) | |
| Medion Erazer Major 16 X1 MD62736 | |
| Acer Predator Helios Neo 16S AI PHN16S-71-94L9 | |
| MSI Vector 16 HX AI A2XWHG | |
| Media de la clase Gaming (51376 - 238426, n=103, últimos 2 años) | |
| AIDA64 / CPU SHA3 | |
| Schenker XMG APEX 16 MAX | |
| Medio AMD Ryzen 9 9955HX (8489 - 9780, n=9) | |
| Chuwi Gamebook, R9 9955HX | |
| Schenker XMG Pro 16 (E25) | |
| Lenovo Legion 5 Pro 16IAX10H | |
| Medion Erazer Major 16 X1 MD62736 | |
| Acer Predator Helios Neo 16S AI PHN16S-71-94L9 | |
| MSI Vector 16 HX AI A2XWHG | |
| Media de la clase Gaming (2180 - 9817, n=103, últimos 2 años) | |
| AIDA64 / CPU Queen | |
| Medio AMD Ryzen 9 9955HX (153027 - 164154, n=9) | |
| Schenker XMG APEX 16 MAX | |
| Chuwi Gamebook, R9 9955HX | |
| Lenovo Legion 5 Pro 16IAX10H | |
| Schenker XMG Pro 16 (E25) | |
| Medion Erazer Major 16 X1 MD62736 | |
| Acer Predator Helios Neo 16S AI PHN16S-71-94L9 | |
| Media de la clase Gaming (49785 - 173351, n=89, últimos 2 años) | |
| MSI Vector 16 HX AI A2XWHG | |
| AIDA64 / FPU SinJulia | |
| Schenker XMG APEX 16 MAX | |
| Medio AMD Ryzen 9 9955HX (29876 - 32647, n=9) | |
| Chuwi Gamebook, R9 9955HX | |
| Media de la clase Gaming (4424 - 33636, n=103, últimos 2 años) | |
| Schenker XMG Pro 16 (E25) | |
| Lenovo Legion 5 Pro 16IAX10H | |
| Medion Erazer Major 16 X1 MD62736 | |
| Acer Predator Helios Neo 16S AI PHN16S-71-94L9 | |
| MSI Vector 16 HX AI A2XWHG | |
| AIDA64 / FPU Mandel | |
| Schenker XMG APEX 16 MAX | |
| Medio AMD Ryzen 9 9955HX (101131 - 128721, n=9) | |
| Chuwi Gamebook, R9 9955HX | |
| Schenker XMG Pro 16 (E25) | |
| Lenovo Legion 5 Pro 16IAX10H | |
| Medion Erazer Major 16 X1 MD62736 | |
| Acer Predator Helios Neo 16S AI PHN16S-71-94L9 | |
| MSI Vector 16 HX AI A2XWHG | |
| Media de la clase Gaming (25115 - 128721, n=103, últimos 2 años) | |
| AIDA64 / CPU AES | |
| Schenker XMG APEX 16 MAX | |
| Medio AMD Ryzen 9 9955HX (146979 - 218385, n=9) | |
| Chuwi Gamebook, R9 9955HX | |
| Lenovo Legion 5 Pro 16IAX10H | |
| Schenker XMG Pro 16 (E25) | |
| Medion Erazer Major 16 X1 MD62736 | |
| Media de la clase Gaming (39258 - 247074, n=103, últimos 2 años) | |
| Acer Predator Helios Neo 16S AI PHN16S-71-94L9 | |
| MSI Vector 16 HX AI A2XWHG | |
| AIDA64 / CPU ZLib | |
| Medio AMD Ryzen 9 9955HX (2186 - 2531, n=9) | |
| Schenker XMG APEX 16 MAX | |
| Chuwi Gamebook, R9 9955HX | |
| Lenovo Legion 5 Pro 16IAX10H | |
| Schenker XMG Pro 16 (E25) | |
| Medion Erazer Major 16 X1 MD62736 | |
| Acer Predator Helios Neo 16S AI PHN16S-71-94L9 | |
| Media de la clase Gaming (574 - 2531, n=103, últimos 2 años) | |
| MSI Vector 16 HX AI A2XWHG | |
| AIDA64 / FP64 Ray-Trace | |
| Schenker XMG APEX 16 MAX | |
| Chuwi Gamebook, R9 9955HX | |
| Medio AMD Ryzen 9 9955HX (35252 - 45446, n=9) | |
| Lenovo Legion 5 Pro 16IAX10H | |
| Schenker XMG Pro 16 (E25) | |
| Medion Erazer Major 16 X1 MD62736 | |
| Media de la clase Gaming (5509 - 45446, n=103, últimos 2 años) | |
| Acer Predator Helios Neo 16S AI PHN16S-71-94L9 | |
| MSI Vector 16 HX AI A2XWHG | |
| AIDA64 / CPU PhotoWorxx | |
| Acer Predator Helios Neo 16S AI PHN16S-71-94L9 | |
| Schenker XMG Pro 16 (E25) | |
| Medion Erazer Major 16 X1 MD62736 | |
| Lenovo Legion 5 Pro 16IAX10H | |
| Media de la clase Gaming (12271 - 89891, n=103, últimos 2 años) | |
| Schenker XMG APEX 16 MAX | |
| Chuwi Gamebook, R9 9955HX | |
| Medio AMD Ryzen 9 9955HX (35974 - 42495, n=9) | |
| MSI Vector 16 HX AI A2XWHG | |
Rendimiento del sistema
Como era de esperar, el rendimiento del sistema es excelente y los resultados de las pruebas comparativas también son muy buenos.
PCMark 10: Score | Essentials | Productivity | Digital Content Creation
CrossMark: Overall | Productivity | Creativity | Responsiveness
WebXPRT 3: Overall
WebXPRT 4: Overall
Mozilla Kraken 1.1: Total
| Performance rating | |
| Lenovo Legion 5 Pro 16IAX10H | |
| Chuwi Gamebook, R9 9955HX | |
| Medio AMD Ryzen 9 9955HX, NVIDIA GeForce RTX 5070 Ti Laptop | |
| Schenker XMG APEX 16 MAX | |
| Schenker XMG Pro 16 (E25) | |
| Acer Predator Helios Neo 16S AI PHN16S-71-94L9 | |
| Medion Erazer Major 16 X1 MD62736 | |
| Media de la clase Gaming | |
| MSI Vector 16 HX AI A2XWHG | |
| PCMark 10 / Score | |
| Schenker XMG APEX 16 MAX | |
| Medio AMD Ryzen 9 9955HX, NVIDIA GeForce RTX 5070 Ti Laptop (9208 - 10060, n=3) | |
| Chuwi Gamebook, R9 9955HX | |
| Schenker XMG Pro 16 (E25) | |
| Media de la clase Gaming (5828 - 11730, n=92, últimos 2 años) | |
| Acer Predator Helios Neo 16S AI PHN16S-71-94L9 | |
| Lenovo Legion 5 Pro 16IAX10H | |
| Medion Erazer Major 16 X1 MD62736 | |
| MSI Vector 16 HX AI A2XWHG | |
| PCMark 10 / Essentials | |
| Schenker XMG APEX 16 MAX | |
| Medio AMD Ryzen 9 9955HX, NVIDIA GeForce RTX 5070 Ti Laptop (11178 - 11719, n=3) | |
| Schenker XMG Pro 16 (E25) | |
| Chuwi Gamebook, R9 9955HX | |
| Acer Predator Helios Neo 16S AI PHN16S-71-94L9 | |
| Medion Erazer Major 16 X1 MD62736 | |
| Lenovo Legion 5 Pro 16IAX10H | |
| MSI Vector 16 HX AI A2XWHG | |
| Media de la clase Gaming (8810 - 11935, n=96, últimos 2 años) | |
| PCMark 10 / Productivity | |
| Schenker XMG APEX 16 MAX | |
| Medio AMD Ryzen 9 9955HX, NVIDIA GeForce RTX 5070 Ti Laptop (10734 - 16314, n=3) | |
| Media de la clase Gaming (6845 - 21327, n=94, últimos 2 años) | |
| Chuwi Gamebook, R9 9955HX | |
| Acer Predator Helios Neo 16S AI PHN16S-71-94L9 | |
| Lenovo Legion 5 Pro 16IAX10H | |
| Schenker XMG Pro 16 (E25) | |
| MSI Vector 16 HX AI A2XWHG | |
| Medion Erazer Major 16 X1 MD62736 | |
| PCMark 10 / Digital Content Creation | |
| Chuwi Gamebook, R9 9955HX | |
| Medio AMD Ryzen 9 9955HX, NVIDIA GeForce RTX 5070 Ti Laptop (14454 - 18192, n=3) | |
| Schenker XMG Pro 16 (E25) | |
| Lenovo Legion 5 Pro 16IAX10H | |
| Acer Predator Helios Neo 16S AI PHN16S-71-94L9 | |
| Schenker XMG APEX 16 MAX | |
| Media de la clase Gaming (7602 - 19954, n=94, últimos 2 años) | |
| Medion Erazer Major 16 X1 MD62736 | |
| MSI Vector 16 HX AI A2XWHG | |
| CrossMark / Overall | |
| Chuwi Gamebook, R9 9955HX | |
| Schenker XMG Pro 16 (E25) | |
| Lenovo Legion 5 Pro 16IAX10H | |
| Medio AMD Ryzen 9 9955HX, NVIDIA GeForce RTX 5070 Ti Laptop (2111 - 2215, n=3) | |
| Acer Predator Helios Neo 16S AI PHN16S-71-94L9 | |
| Schenker XMG APEX 16 MAX | |
| Medion Erazer Major 16 X1 MD62736 | |
| Media de la clase Gaming (1366 - 2409, n=93, últimos 2 años) | |
| MSI Vector 16 HX AI A2XWHG | |
| CrossMark / Productivity | |
| Lenovo Legion 5 Pro 16IAX10H | |
| Schenker XMG Pro 16 (E25) | |
| Chuwi Gamebook, R9 9955HX | |
| Acer Predator Helios Neo 16S AI PHN16S-71-94L9 | |
| Medion Erazer Major 16 X1 MD62736 | |
| Medio AMD Ryzen 9 9955HX, NVIDIA GeForce RTX 5070 Ti Laptop (1882 - 1999, n=3) | |
| Schenker XMG APEX 16 MAX | |
| Media de la clase Gaming (1386 - 2254, n=93, últimos 2 años) | |
| MSI Vector 16 HX AI A2XWHG | |
| CrossMark / Creativity | |
| Medio AMD Ryzen 9 9955HX, NVIDIA GeForce RTX 5070 Ti Laptop (2592 - 2660, n=3) | |
| Chuwi Gamebook, R9 9955HX | |
| Schenker XMG APEX 16 MAX | |
| Schenker XMG Pro 16 (E25) | |
| Lenovo Legion 5 Pro 16IAX10H | |
| Acer Predator Helios Neo 16S AI PHN16S-71-94L9 | |
| Medion Erazer Major 16 X1 MD62736 | |
| MSI Vector 16 HX AI A2XWHG | |
| Media de la clase Gaming (1343 - 2729, n=93, últimos 2 años) | |
| CrossMark / Responsiveness | |
| Chuwi Gamebook, R9 9955HX | |
| Lenovo Legion 5 Pro 16IAX10H | |
| Schenker XMG Pro 16 (E25) | |
| Acer Predator Helios Neo 16S AI PHN16S-71-94L9 | |
| Medion Erazer Major 16 X1 MD62736 | |
| Medio AMD Ryzen 9 9955HX, NVIDIA GeForce RTX 5070 Ti Laptop (1608 - 1854, n=3) | |
| Media de la clase Gaming (1226 - 2334, n=93, últimos 2 años) | |
| Schenker XMG APEX 16 MAX | |
| MSI Vector 16 HX AI A2XWHG | |
| WebXPRT 3 / Overall | |
| Lenovo Legion 5 Pro 16IAX10H | |
| Schenker XMG Pro 16 (E25) | |
| Medio AMD Ryzen 9 9955HX, NVIDIA GeForce RTX 5070 Ti Laptop (328 - 361, n=3) | |
| Chuwi Gamebook, R9 9955HX | |
| Acer Predator Helios Neo 16S AI PHN16S-71-94L9 | |
| Schenker XMG APEX 16 MAX | |
| Medion Erazer Major 16 X1 MD62736 | |
| MSI Vector 16 HX AI A2XWHG | |
| Media de la clase Gaming (220 - 532, n=97, últimos 2 años) | |
| WebXPRT 4 / Overall | |
| Schenker XMG Pro 16 (E25) | |
| Lenovo Legion 5 Pro 16IAX10H | |
| Medion Erazer Major 16 X1 MD62736 | |
| Acer Predator Helios Neo 16S AI PHN16S-71-94L9 | |
| MSI Vector 16 HX AI A2XWHG | |
| Medio AMD Ryzen 9 9955HX, NVIDIA GeForce RTX 5070 Ti Laptop (282 - 322, n=3) | |
| Chuwi Gamebook, R9 9955HX | |
| Media de la clase Gaming (165 - 354, n=97, últimos 2 años) | |
| Schenker XMG APEX 16 MAX | |
| Mozilla Kraken 1.1 / Total | |
| Media de la clase Gaming (391 - 590, n=99, últimos 2 años) | |
| Schenker XMG APEX 16 MAX | |
| MSI Vector 16 HX AI A2XWHG | |
| Medion Erazer Major 16 X1 MD62736 | |
| Medio AMD Ryzen 9 9955HX, NVIDIA GeForce RTX 5070 Ti Laptop (403 - 440, n=3) | |
| Lenovo Legion 5 Pro 16IAX10H | |
| Acer Predator Helios Neo 16S AI PHN16S-71-94L9 | |
| Schenker XMG Pro 16 (E25) | |
| Chuwi Gamebook, R9 9955HX | |
* ... más pequeño es mejor
| PCMark 10 Score | 10060 puntos | |
ayuda | ||
| AIDA64 / Memory Copy | |
| Acer Predator Helios Neo 16S AI PHN16S-71-94L9 | |
| Schenker XMG Pro 16 (E25) | |
| Lenovo Legion 5 Pro 16IAX10H | |
| Medion Erazer Major 16 X1 MD62736 | |
| Media de la clase Gaming (21750 - 129946, n=103, últimos 2 años) | |
| MSI Vector 16 HX AI A2XWHG | |
| Schenker XMG APEX 16 MAX | |
| Chuwi Gamebook, R9 9955HX | |
| Medio AMD Ryzen 9 9955HX (53598 - 62777, n=9) | |
| AIDA64 / Memory Read | |
| Schenker XMG Pro 16 (E25) | |
| Acer Predator Helios Neo 16S AI PHN16S-71-94L9 | |
| Lenovo Legion 5 Pro 16IAX10H | |
| Medion Erazer Major 16 X1 MD62736 | |
| MSI Vector 16 HX AI A2XWHG | |
| Media de la clase Gaming (22956 - 118858, n=103, últimos 2 años) | |
| Schenker XMG APEX 16 MAX | |
| Medio AMD Ryzen 9 9955HX (63953 - 67256, n=9) | |
| Chuwi Gamebook, R9 9955HX | |
| AIDA64 / Memory Write | |
| Medion Erazer Major 16 X1 MD62736 | |
| Acer Predator Helios Neo 16S AI PHN16S-71-94L9 | |
| Schenker XMG Pro 16 (E25) | |
| Lenovo Legion 5 Pro 16IAX10H | |
| Media de la clase Gaming (22297 - 135096, n=103, últimos 2 años) | |
| Schenker XMG APEX 16 MAX | |
| Medio AMD Ryzen 9 9955HX (65421 - 72060, n=9) | |
| Chuwi Gamebook, R9 9955HX | |
| MSI Vector 16 HX AI A2XWHG | |
| AIDA64 / Memory Latency | |
| Lenovo Legion 5 Pro 16IAX10H | |
| Acer Predator Helios Neo 16S AI PHN16S-71-94L9 | |
| Medion Erazer Major 16 X1 MD62736 | |
| Media de la clase Gaming (75.3 - 259, n=103, últimos 2 años) | |
| MSI Vector 16 HX AI A2XWHG | |
| Schenker XMG Pro 16 (E25) | |
| Chuwi Gamebook, R9 9955HX | |
| Medio AMD Ryzen 9 9955HX (92.1 - 103.5, n=9) | |
| Schenker XMG APEX 16 MAX | |
* ... más pequeño es mejor
Latencias del CPD
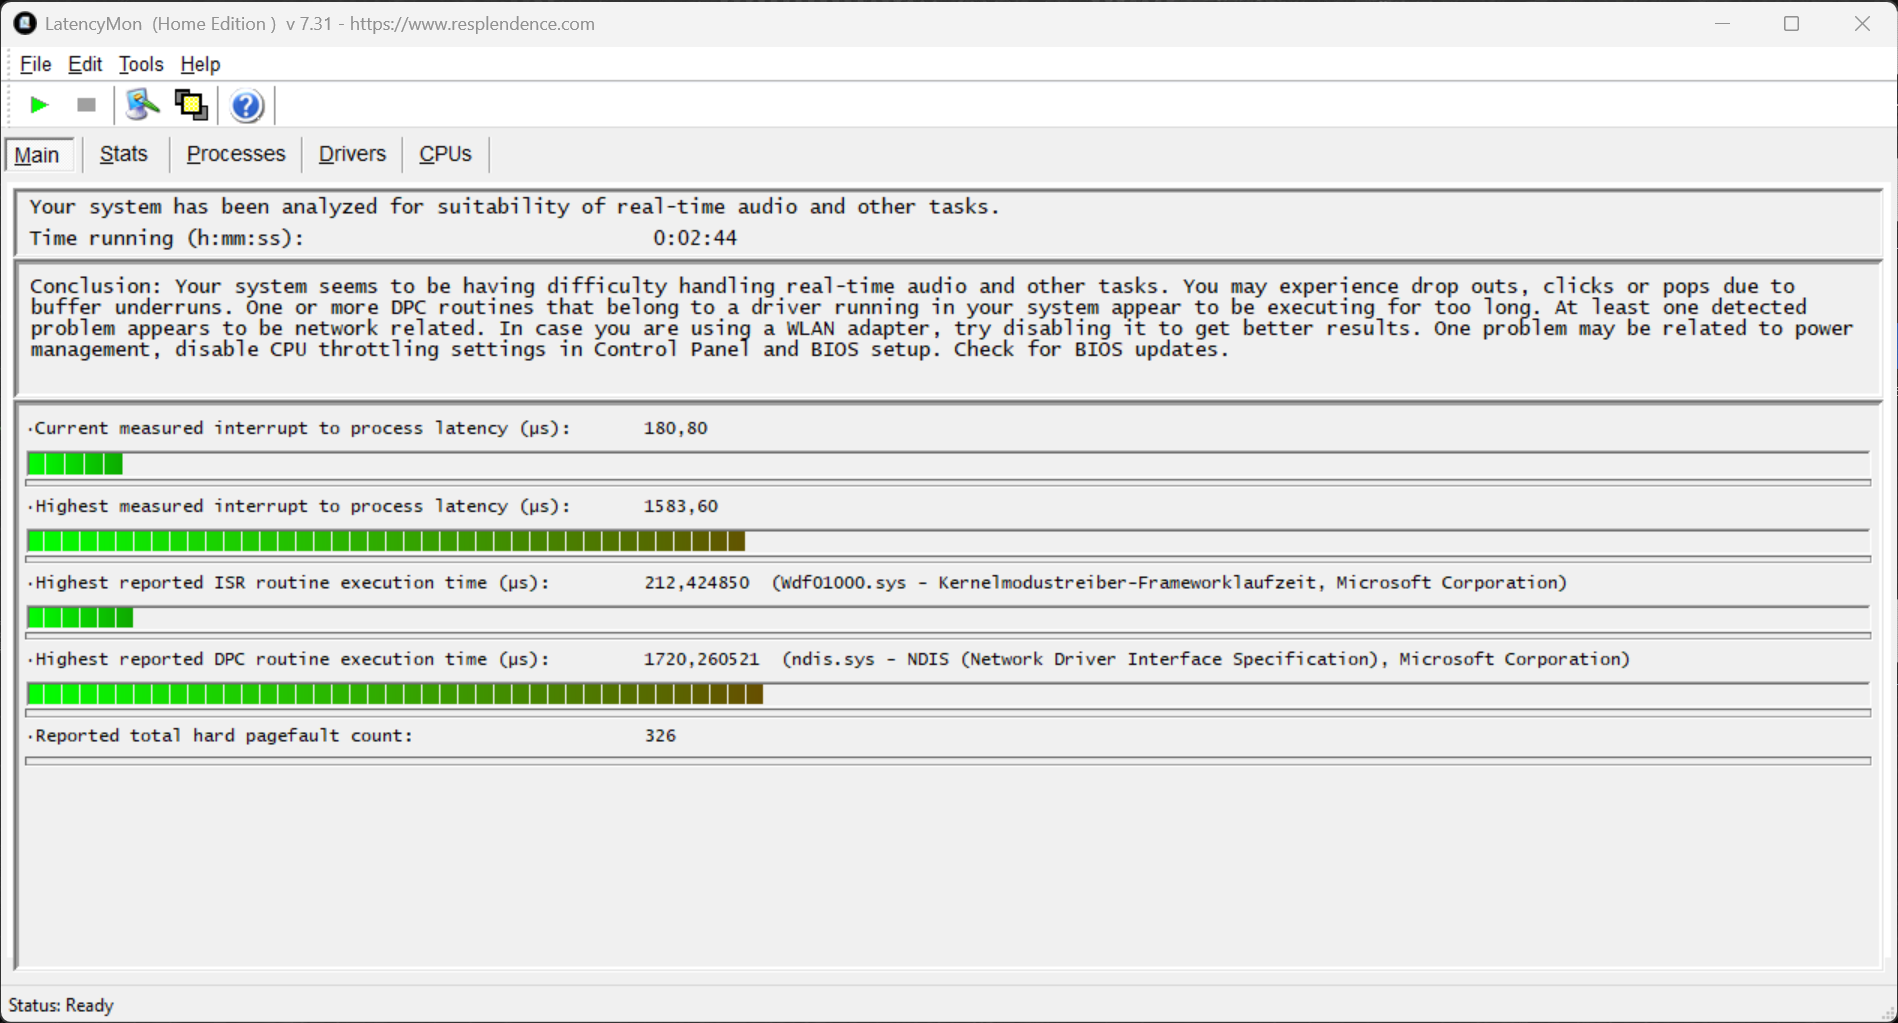
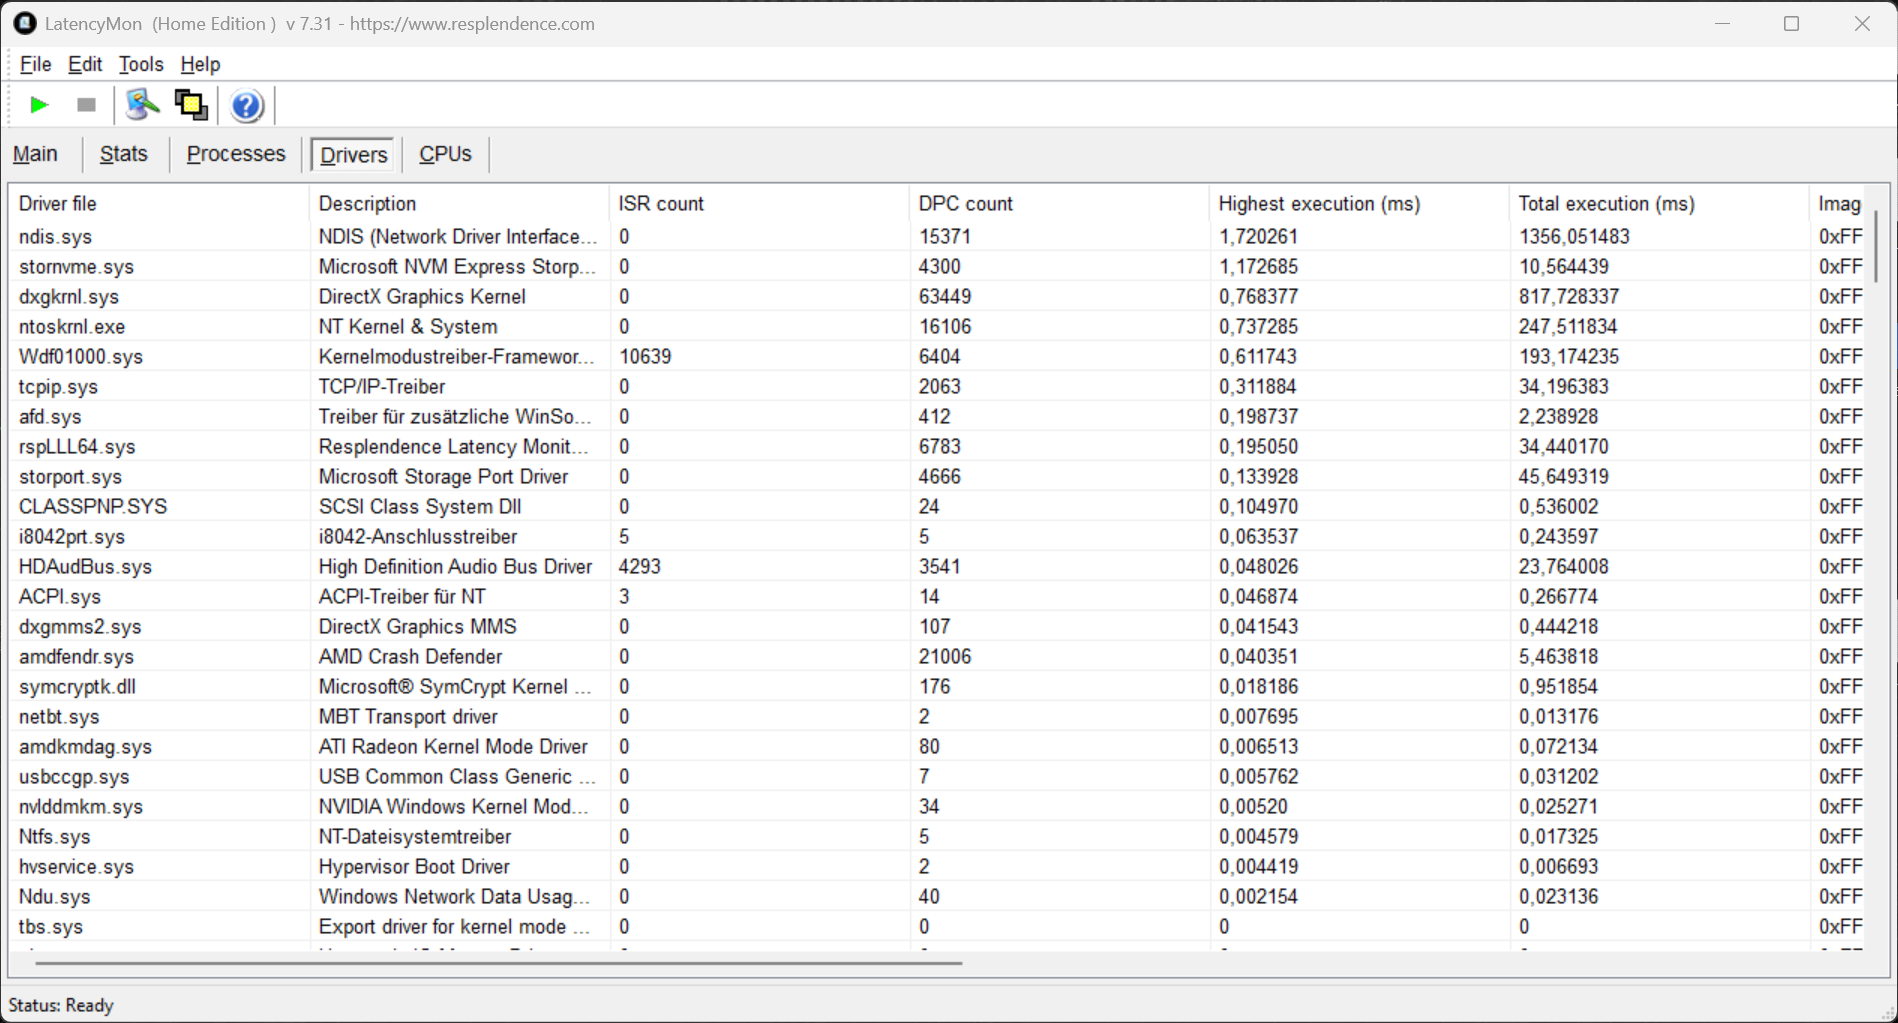
| DPC Latencies / LatencyMon - interrupt to process latency (max), Web, Youtube, Prime95 | |
| Chuwi Gamebook, R9 9955HX | |
| MSI Vector 16 HX AI A2XWHG | |
| Medion Erazer Major 16 X1 MD62736 | |
| Acer Predator Helios Neo 16S AI PHN16S-71-94L9 | |
| Schenker XMG Pro 16 (E25) | |
| Schenker XMG APEX 16 MAX | |
| Lenovo Legion 5 Pro 16IAX10H | |
* ... más pequeño es mejor
Almacenamiento
El Apex 16 Max ya es compatible con PCIe 5.0 y en el sistema de prueba se ha instalado el correspondiente Samsung 9100 Pro (2 TB, 1,73 TB utilizables). El rendimiento es muy bueno y también se mantiene estable. La segunda ranura M.2 2280 está conectada a través de PCIe 4.0.

* ... más pequeño es mejor
Rendimiento continuo de lectura: Bucle de lectura DiskSpd, profundidad de cola 8
Rendimiento de la GPU
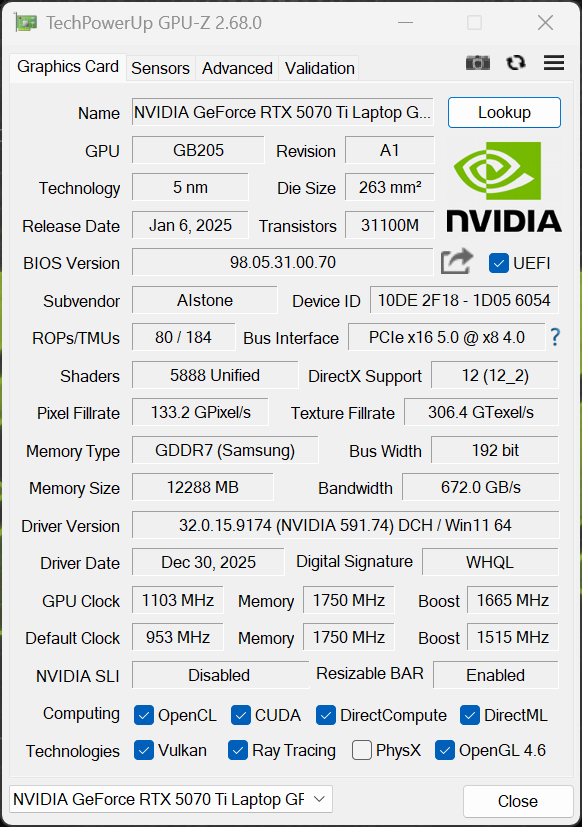
XMG utiliza la versión más rápida de 140 vatios de la GeForce RTX 5070 Ti con 12 GB de VRAM. La conmutación de gráficos se realiza a través de Optimus, pero se incluye un conmutador MUX. El rendimiento gráfico general es muy bueno y permanece completamente estable incluso bajo carga prolongada. En batería (40 vatios), el rendimiento es alrededor de un 60% inferior.
| 3DMark 11 Performance | 45731 puntos | |
| 3DMark Fire Strike Score | 39568 puntos | |
| 3DMark Time Spy Score | 17095 puntos | |
| 3DMark Steel Nomad Score | 3953 puntos | |
| 3DMark Steel Nomad Light Score | 18188 puntos | |
ayuda | ||
| Blender / v3.3 Classroom OPTIX/RTX | |
| Media de la clase Gaming (9 - 32, n=105, últimos 2 años) | |
| Acer Predator Helios Neo 16S AI PHN16S-71-94L9 | |
| MSI Vector 16 HX AI A2XWHG | |
| Medion Erazer Major 16 X1 MD62736 | |
| Schenker XMG APEX 16 MAX | |
| Medio NVIDIA GeForce RTX 5070 Ti Laptop (13 - 19, n=14) | |
| Lenovo Legion 5 Pro 16IAX10H | |
| Schenker XMG Pro 16 (E25) | |
| Chuwi Gamebook, R9 9955HX | |
| Blender / v3.3 Classroom CUDA | |
| Media de la clase Gaming (15 - 228, n=105, últimos 2 años) | |
| Acer Predator Helios Neo 16S AI PHN16S-71-94L9 | |
| Schenker XMG APEX 16 MAX | |
| Medio NVIDIA GeForce RTX 5070 Ti Laptop (24 - 33, n=14) | |
| Schenker XMG Pro 16 (E25) | |
| Medion Erazer Major 16 X1 MD62736 | |
| MSI Vector 16 HX AI A2XWHG | |
| Lenovo Legion 5 Pro 16IAX10H | |
| Chuwi Gamebook, R9 9955HX | |
| Blender / v3.3 Classroom CPU | |
| Media de la clase Gaming (122 - 565, n=101, últimos 2 años) | |
| MSI Vector 16 HX AI A2XWHG | |
| Medio NVIDIA GeForce RTX 5070 Ti Laptop (122 - 361, n=14) | |
| Acer Predator Helios Neo 16S AI PHN16S-71-94L9 | |
| Medion Erazer Major 16 X1 MD62736 | |
| Lenovo Legion 5 Pro 16IAX10H | |
| Schenker XMG Pro 16 (E25) | |
| Chuwi Gamebook, R9 9955HX | |
| Schenker XMG APEX 16 MAX | |
* ... más pequeño es mejor
Rendimiento en juegos
El rendimiento en juegos es muy bueno, y todos los juegos modernos se ejecutan sin problemas con los ajustes de detalle más altos y la resolución nativa. Sólo el trazado de rayos requiere a veces DLSS o generación de fotogramas. El rendimiento también se mantiene completamente estable en sesiones de juego prolongadas.
| Final Fantasy XV Benchmark - 1920x1080 High Quality | |
| Lenovo Legion 5 Pro 16IAX10H | |
| Medion Erazer Major 16 X1 MD62736 | |
| Chuwi Gamebook, R9 9955HX | |
| MSI Vector 16 HX AI A2XWHG | |
| Schenker XMG APEX 16 MAX | |
| Media de la clase Gaming (41 - 215, n=94, últimos 2 años) | |
| Schenker XMG Pro 16 (E25) | |
| Strange Brigade - 1920x1080 ultra AA:ultra AF:16 | |
| Lenovo Legion 5 Pro 16IAX10H | |
| Schenker XMG APEX 16 MAX | |
| Chuwi Gamebook, R9 9955HX | |
| Media de la clase Gaming (76.3 - 456, n=86, últimos 2 años) | |
| Schenker XMG Pro 16 (E25) | |
| F1 24 | |
| 2560x1440 Ultra High Preset AA:T AF:16x | |
| Media de la clase Gaming (36.7 - 108.2, n=57, últimos 2 años) | |
| Schenker XMG APEX 16 MAX | |
| Schenker XMG Pro 16 (E25) | |
| Chuwi Gamebook, R9 9955HX | |
| Medio NVIDIA GeForce RTX 5070 Ti Laptop (53.2 - 72.1, n=10) | |
| 2560x1440 Ultra High Preset + Quality DLSS AF:16x | |
| Schenker XMG APEX 16 MAX | |
| Media de la clase Gaming (14.3 - 159.3, n=48, últimos 2 años) | |
| Chuwi Gamebook, R9 9955HX | |
| Medio NVIDIA GeForce RTX 5070 Ti Laptop (78.1 - 115.8, n=9) | |
| F1 25 | |
| 2560x1440 Ultra Max Preset AA:T AF:16x | |
| Schenker XMG APEX 16 MAX | |
| Chuwi Gamebook, R9 9955HX | |
| Medio NVIDIA GeForce RTX 5070 Ti Laptop (18 - 26, n=7) | |
| Media de la clase Gaming (5 - 37.7, n=25, últimos 2 años) | |
| Lenovo Legion 5 Pro 16IAX10H | |
| 2560x1440 Ultra Max Preset + DLSS Quality AA:DLSS AF:16x | |
| Schenker XMG APEX 16 MAX | |
| Chuwi Gamebook, R9 9955HX | |
| Medio NVIDIA GeForce RTX 5070 Ti Laptop (32 - 48.1, n=7) | |
| Media de la clase Gaming (9 - 67.5, n=23, últimos 2 años) | |
| Lenovo Legion 5 Pro 16IAX10H | |

Cyberpunk 2077 ultra FPS gráfico
| bajo | medio | alto | ultra | QHD DLSS | QHD | |
|---|---|---|---|---|---|---|
| GTA V (2015) | 166.3 | 157.3 | ||||
| Dota 2 Reborn (2015) | 259 | 240 | 209 | 188.4 | ||
| Final Fantasy XV Benchmark (2018) | 232 | 211 | 158.2 | 121.8 | ||
| X-Plane 11.11 (2018) | 155.8 | 123.9 | 105.6 | |||
| Strange Brigade (2018) | 579 | 468 | 387 | 340 | 236 | |
| Baldur's Gate 3 (2023) | 221 | 178.7 | 157.5 | 155.6 | 110.5 | |
| Cyberpunk 2077 (2023) | 183.7 | 164.6 | 140.6 | 128 | 96.1 | 82.9 |
| F1 24 (2024) | 315 | 270 | 110.6 | 112.4 | 72 | |
| F1 25 (2025) | 249 | 231 | 218 | 42.9 | 48.1 | 26 |
| Call of Duty Black Ops 7 (2025) | 239 | 188 | 151 | 60 | 39 |
Emisiones y energía
Emisiones sonoras

El ruido de los ventiladores depende en gran medida del modo de rendimiento seleccionado. El modo Equilibrado es el más adecuado para el uso diario, ya que los ventiladores están inactivos o sólo producen un silencioso silbido. En el modo Overboost Normal, sin embargo, el portátil se vuelve muy ruidoso durante los juegos con 51 dB(A)(Overboost Extreme: 55 dB(A), Enthusiast: 47,9 dB(A), Equilibrado: 43,3 dB(A), Batería: 35,8 dB(A)). No hemos notado ningún zumbido de la bobina en nuestra unidad de prueba.
Ruido
| Ocioso |
| 25.9 / 26.5 / 26.5 dB(A) |
| Carga |
| 42.1 / 51 dB(A) |
 | ||
30 dB silencioso 40 dB(A) audible 50 dB(A) ruidosamente alto |
||
min: | ||
| Schenker XMG APEX 16 MAX R9 9955HX, GeForce RTX 5070 Ti Laptop | Acer Predator Helios Neo 16S AI PHN16S-71-94L9 Ultra 9 275HX, GeForce RTX 5070 Ti Laptop | Chuwi Gamebook, R9 9955HX R9 9955HX, GeForce RTX 5070 Ti Laptop | Medion Erazer Major 16 X1 MD62736 Ultra 7 255HX, GeForce RTX 5070 Ti Laptop | Lenovo Legion 5 Pro 16IAX10H Ultra 9 275HX, GeForce RTX 5070 Ti Laptop | MSI Vector 16 HX AI A2XWHG Ultra 7 255HX, GeForce RTX 5070 Ti Laptop | Schenker XMG Pro 16 (E25) Ultra 9 275HX, GeForce RTX 5070 Ti Laptop | |
|---|---|---|---|---|---|---|---|
| Noise | -9% | -3% | -7% | -7% | -13% | 1% | |
| apagado / medio ambiente * (dB) | 25.9 | 24 7% | 25 3% | 25 3% | 24 7% | 25 3% | 23.3 10% |
| Idle Minimum * (dB) | 25.9 | 24 7% | 26.3 -2% | 26 -0% | 24 7% | 33 -27% | 25 3% |
| Idle Average * (dB) | 26.5 | 30 -13% | 26.5 -0% | 27 -2% | 24 9% | 34 -28% | 25 6% |
| Idle Maximum * (dB) | 26.5 | 35 -32% | 27.3 -3% | 30 -13% | 30.9 -17% | 38 -43% | 25 6% |
| Load Average * (dB) | 42.1 | 53 -26% | 50.4 -20% | 53 -26% | 55.9 -33% | 46 -9% | 45.5 -8% |
| Cyberpunk 2077 ultra * (dB) | 51 | 52 -2% | 50.3 1% | 54 -6% | 56.72 -11% | 47 8% | 53.3 -5% |
| Load Maximum * (dB) | 51 | 54 -6% | 50.4 1% | 54 -6% | 56.72 -11% | 49 4% | 53.3 -5% |
| Witcher 3 ultra * (dB) | 50.4 |
* ... más pequeño es mejor
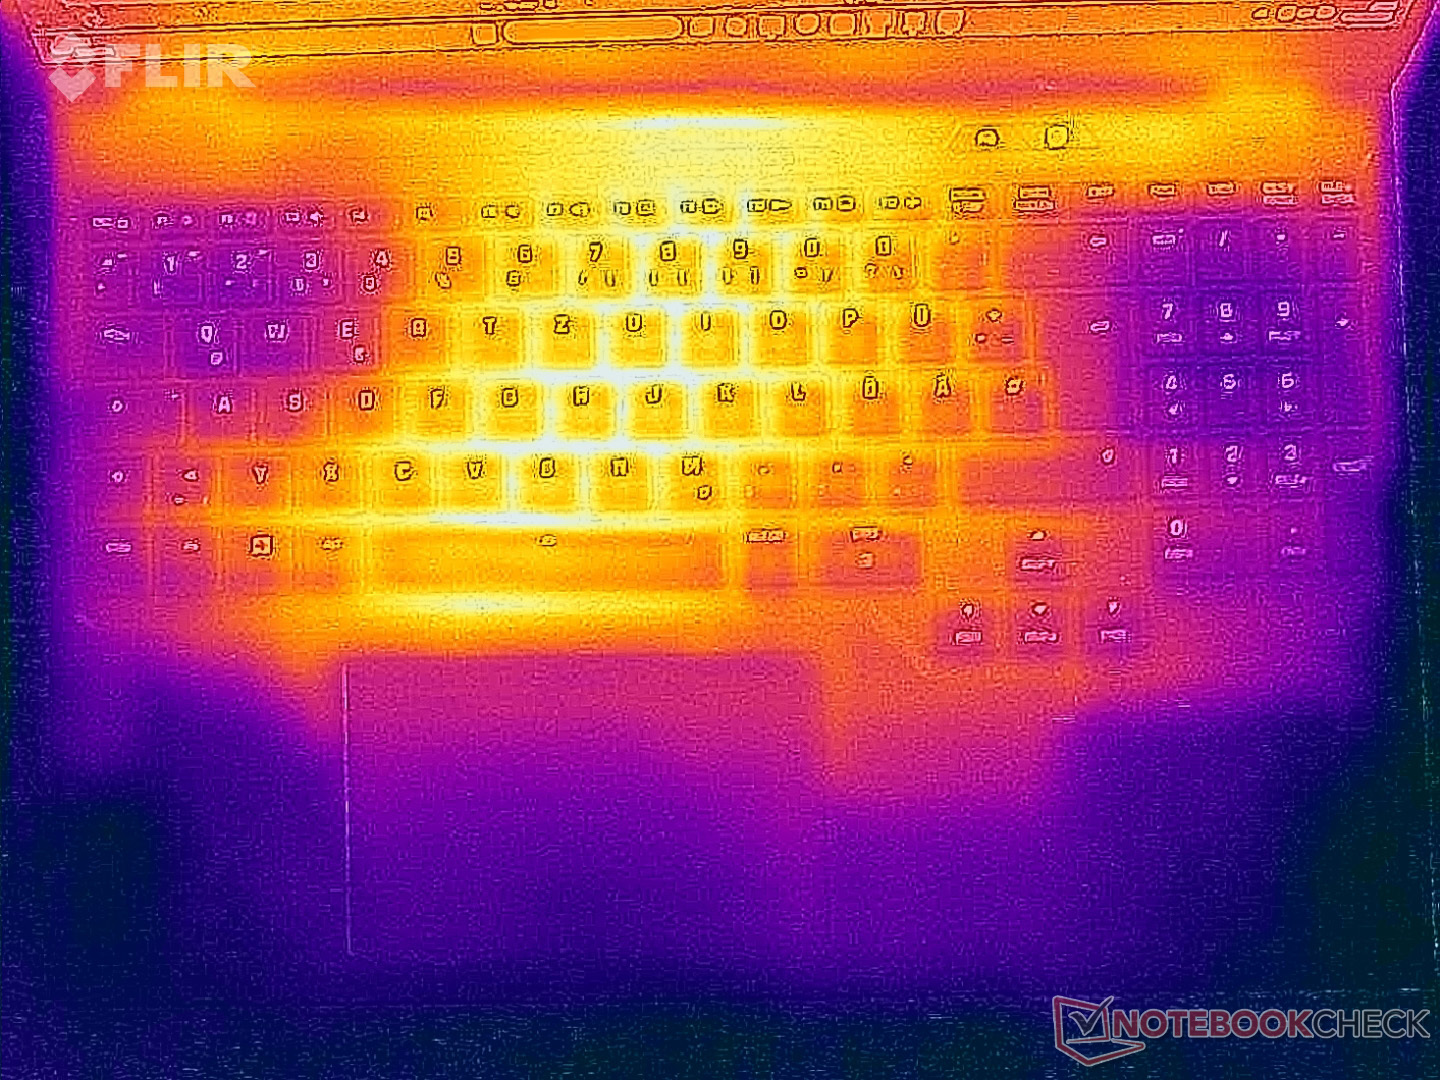
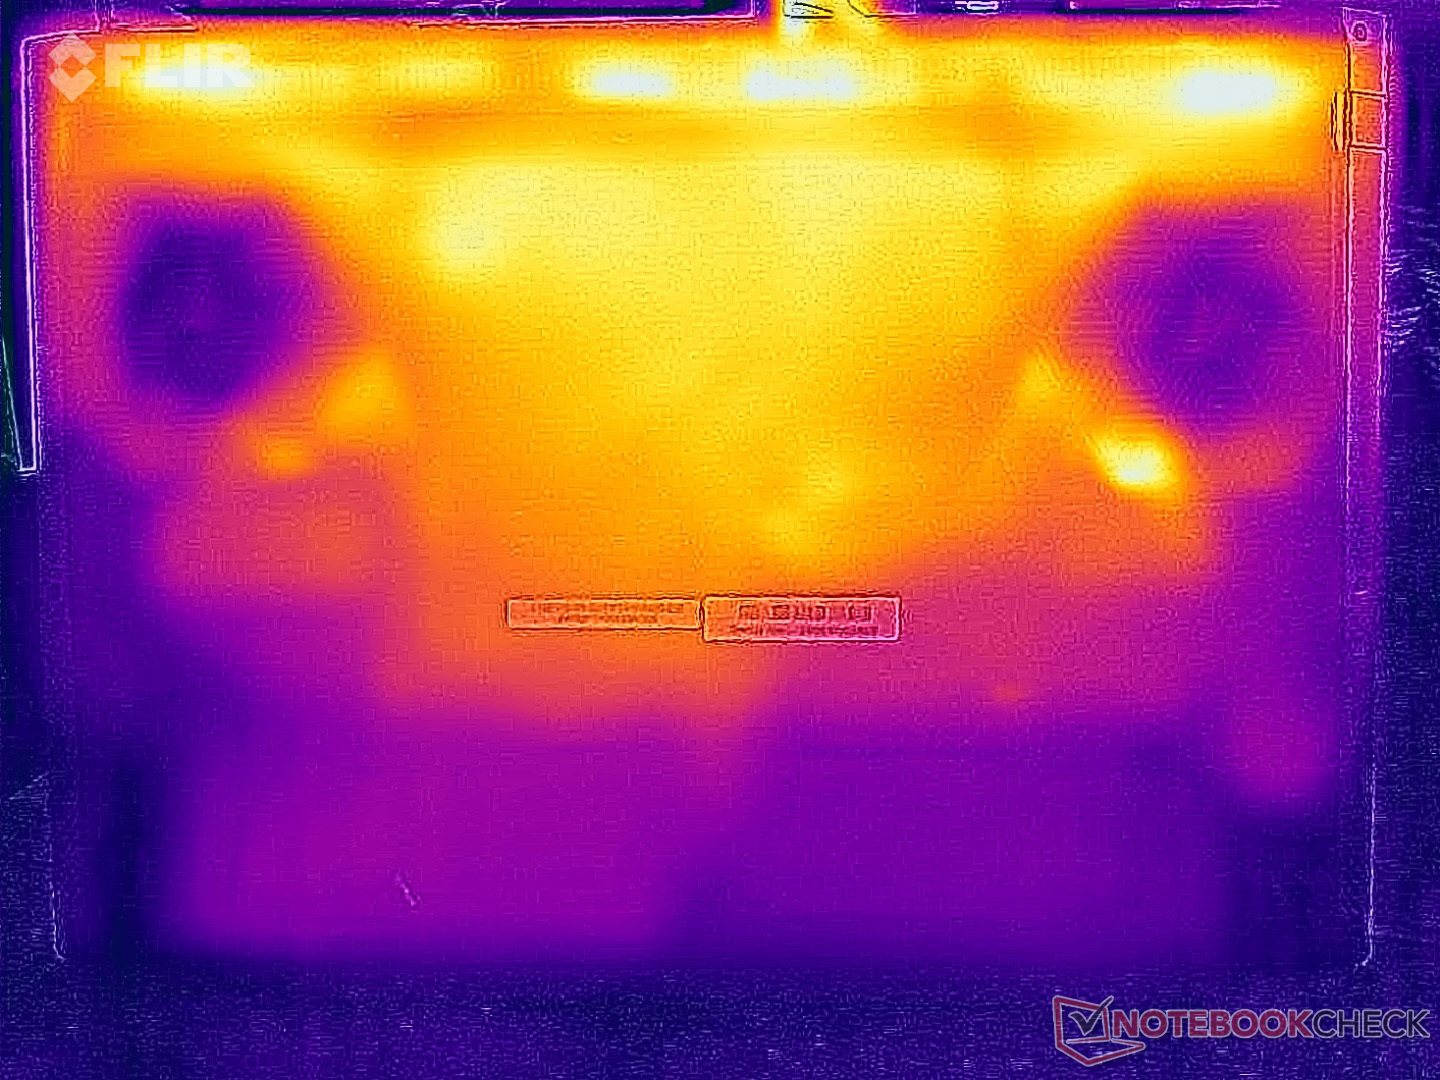
Temperatura
Las temperaturas superficiales no suelen ser problemáticas. Aunque medimos hasta 46 °C tanto en la parte superior como en la inferior bajo carga elevada, esto no causa ninguna limitación real. En la prueba de estrés, se da prioridad a la GPU (140 vatios completos a 80 °C), mientras que la CPU se conforma con 45 vatios (70 °C).

(-) La temperatura máxima en la parte superior es de 46.5 °C / 116 F, frente a la media de 40.4 °C / 105 F, que oscila entre 21.2 y 68.8 °C para la clase Gaming.
(-) El fondo se calienta hasta un máximo de 46.4 °C / 116 F, frente a la media de 43.2 °C / 110 F
(+) En reposo, la temperatura media de la parte superior es de 30.1 °C / 86# F, frente a la media del dispositivo de 33.9 °C / 93 F.
(-) 3: The average temperature for the upper side is 40 °C / 104 F, compared to the average of 33.9 °C / 93 F for the class Gaming.
(+) Los reposamanos y el panel táctil alcanzan como máximo la temperatura de la piel (35.4 °C / 95.7 F) y, por tanto, no están calientes.
(-) La temperatura media de la zona del reposamanos de dispositivos similares fue de 28.8 °C / 83.8 F (-6.6 °C / -11.9 F).
| Schenker XMG APEX 16 MAX R9 9955HX, GeForce RTX 5070 Ti Laptop | Acer Predator Helios Neo 16S AI PHN16S-71-94L9 Ultra 9 275HX, GeForce RTX 5070 Ti Laptop | Chuwi Gamebook, R9 9955HX R9 9955HX, GeForce RTX 5070 Ti Laptop | Medion Erazer Major 16 X1 MD62736 Ultra 7 255HX, GeForce RTX 5070 Ti Laptop | Lenovo Legion 5 Pro 16IAX10H Ultra 9 275HX, GeForce RTX 5070 Ti Laptop | MSI Vector 16 HX AI A2XWHG Ultra 7 255HX, GeForce RTX 5070 Ti Laptop | Schenker XMG Pro 16 (E25) Ultra 9 275HX, GeForce RTX 5070 Ti Laptop | |
|---|---|---|---|---|---|---|---|
| Heat | 2% | -5% | -9% | -14% | -4% | -167% | |
| Maximum Upper Side * (°C) | 46.5 | 47 -1% | 51.8 -11% | 49 -5% | 48 -3% | 53 -14% | 43.2 7% |
| Maximum Bottom * (°C) | 46.4 | 55 -19% | 46.6 -0% | 50 -8% | 50 -8% | 52 -12% | 46 1% |
| Idle Upper Side * (°C) | 32.1 | 28 13% | 34.9 -9% | 36 -12% | 38 -18% | 33 -3% | 27.7 14% |
| Idle Bottom * (°C) | 33.5 | 29 13% | 33.4 -0% | 37 -10% | 42 -25% | 29 13% | 264 -688% |
* ... más pequeño es mejor
Altavoces
Schenker XMG APEX 16 MAX análisis de audio
(±) | la sonoridad del altavoz es media pero buena (78.3 dB)
Graves 100 - 315 Hz
(-) | casi sin bajos - de media 16.7% inferior a la mediana
(±) | la linealidad de los graves es media (10.3% delta a frecuencia anterior)
Medios 400 - 2000 Hz
(±) | medias más altas - de media 5.6% más altas que la mediana
(+) | los medios son lineales (4.2% delta a la frecuencia anterior)
Altos 2 - 16 kHz
(+) | máximos equilibrados - a sólo 2.2% de la mediana
(+) | los máximos son lineales (6.2% delta a la frecuencia anterior)
Total 100 - 16.000 Hz
(±) | la linealidad del sonido global es media (16.8% de diferencia con la mediana)
En comparación con la misma clase
» 44% de todos los dispositivos probados de esta clase eran mejores, 11% similares, 46% peores
» El mejor tuvo un delta de 6%, la media fue 18%, el peor fue ###max##%
En comparación con todos los dispositivos probados
» 30% de todos los dispositivos probados eran mejores, 8% similares, 63% peores
» El mejor tuvo un delta de 4%, la media fue 23%, el peor fue ###max##%
Acer Predator Helios Neo 16S AI PHN16S-71-94L9 análisis de audio
(+) | los altavoces pueden reproducir a un volumen relativamente alto (#86 dB)
Graves 100 - 315 Hz
(-) | casi sin bajos - de media 24.8% inferior a la mediana
(±) | la linealidad de los graves es media (12.6% delta a frecuencia anterior)
Medios 400 - 2000 Hz
(±) | medias más altas - de media 5.9% más altas que la mediana
(+) | los medios son lineales (6.4% delta a la frecuencia anterior)
Altos 2 - 16 kHz
(+) | máximos equilibrados - a sólo 2.8% de la mediana
(+) | los máximos son lineales (5.9% delta a la frecuencia anterior)
Total 100 - 16.000 Hz
(±) | la linealidad del sonido global es media (17.3% de diferencia con la mediana)
En comparación con la misma clase
» 47% de todos los dispositivos probados de esta clase eran mejores, 12% similares, 41% peores
» El mejor tuvo un delta de 6%, la media fue 18%, el peor fue ###max##%
En comparación con todos los dispositivos probados
» 32% de todos los dispositivos probados eran mejores, 8% similares, 59% peores
» El mejor tuvo un delta de 4%, la media fue 23%, el peor fue ###max##%
Chuwi Gamebook, R9 9955HX análisis de audio
(±) | la sonoridad del altavoz es media pero buena (75.7 dB)
Graves 100 - 315 Hz
(-) | casi sin bajos - de media 18.7% inferior a la mediana
(±) | la linealidad de los graves es media (10.3% delta a frecuencia anterior)
Medios 400 - 2000 Hz
(±) | medias más altas - de media 7.2% más altas que la mediana
(±) | la linealidad de los medios es media (9.9% delta respecto a la frecuencia anterior)
Altos 2 - 16 kHz
(+) | máximos equilibrados - a sólo 3.2% de la mediana
(±) | la linealidad de los máximos es media (8.1% delta a frecuencia anterior)
Total 100 - 16.000 Hz
(±) | la linealidad del sonido global es media (21.2% de diferencia con la mediana)
En comparación con la misma clase
» 76% de todos los dispositivos probados de esta clase eran mejores, 4% similares, 19% peores
» El mejor tuvo un delta de 6%, la media fue 18%, el peor fue ###max##%
En comparación con todos los dispositivos probados
» 59% de todos los dispositivos probados eran mejores, 7% similares, 34% peores
» El mejor tuvo un delta de 4%, la media fue 23%, el peor fue ###max##%
Medion Erazer Major 16 X1 MD62736 análisis de audio
(+) | los altavoces pueden reproducir a un volumen relativamente alto (#82 dB)
Graves 100 - 315 Hz
(-) | casi sin bajos - de media 19.4% inferior a la mediana
(±) | la linealidad de los graves es media (13.5% delta a frecuencia anterior)
Medios 400 - 2000 Hz
(±) | medias más altas - de media 8.4% más altas que la mediana
(±) | la linealidad de los medios es media (9.1% delta respecto a la frecuencia anterior)
Altos 2 - 16 kHz
(+) | máximos equilibrados - a sólo 4.2% de la mediana
(+) | los máximos son lineales (6.4% delta a la frecuencia anterior)
Total 100 - 16.000 Hz
(±) | la linealidad del sonido global es media (20.8% de diferencia con la mediana)
En comparación con la misma clase
» 75% de todos los dispositivos probados de esta clase eran mejores, 4% similares, 21% peores
» El mejor tuvo un delta de 6%, la media fue 18%, el peor fue ###max##%
En comparación con todos los dispositivos probados
» 56% de todos los dispositivos probados eran mejores, 8% similares, 36% peores
» El mejor tuvo un delta de 4%, la media fue 23%, el peor fue ###max##%
Lenovo Legion 5 Pro 16IAX10H análisis de audio
(±) | la sonoridad del altavoz es media pero buena (78.2 dB)
Graves 100 - 315 Hz
(-) | casi sin bajos - de media 21.1% inferior a la mediana
(±) | la linealidad de los graves es media (8% delta a frecuencia anterior)
Medios 400 - 2000 Hz
(±) | medias más altas - de media 6.3% más altas que la mediana
(+) | los medios son lineales (6.5% delta a la frecuencia anterior)
Altos 2 - 16 kHz
(+) | máximos equilibrados - a sólo 1.6% de la mediana
(+) | los máximos son lineales (4.9% delta a la frecuencia anterior)
Total 100 - 16.000 Hz
(±) | la linealidad del sonido global es media (18.3% de diferencia con la mediana)
En comparación con la misma clase
» 58% de todos los dispositivos probados de esta clase eran mejores, 9% similares, 33% peores
» El mejor tuvo un delta de 6%, la media fue 18%, el peor fue ###max##%
En comparación con todos los dispositivos probados
» 40% de todos los dispositivos probados eran mejores, 8% similares, 52% peores
» El mejor tuvo un delta de 4%, la media fue 23%, el peor fue ###max##%
MSI Vector 16 HX AI A2XWHG análisis de audio
(+) | los altavoces pueden reproducir a un volumen relativamente alto (#86 dB)
Graves 100 - 315 Hz
(±) | lubina reducida - en promedio 12.3% inferior a la mediana
(±) | la linealidad de los graves es media (8.5% delta a frecuencia anterior)
Medios 400 - 2000 Hz
(±) | medias más altas - de media 9.9% más altas que la mediana
(+) | los medios son lineales (6.8% delta a la frecuencia anterior)
Altos 2 - 16 kHz
(+) | máximos equilibrados - a sólo 1.8% de la mediana
(+) | los máximos son lineales (2.9% delta a la frecuencia anterior)
Total 100 - 16.000 Hz
(±) | la linealidad del sonido global es media (15.8% de diferencia con la mediana)
En comparación con la misma clase
» 37% de todos los dispositivos probados de esta clase eran mejores, 7% similares, 56% peores
» El mejor tuvo un delta de 6%, la media fue 18%, el peor fue ###max##%
En comparación con todos los dispositivos probados
» 24% de todos los dispositivos probados eran mejores, 5% similares, 70% peores
» El mejor tuvo un delta de 4%, la media fue 23%, el peor fue ###max##%
Schenker XMG Pro 16 (E25) análisis de audio
(±) | la sonoridad del altavoz es media pero buena (79.2 dB)
Graves 100 - 315 Hz
(±) | lubina reducida - en promedio 14.2% inferior a la mediana
(±) | la linealidad de los graves es media (10.6% delta a frecuencia anterior)
Medios 400 - 2000 Hz
(±) | medias más altas - de media 8.2% más altas que la mediana
(±) | la linealidad de los medios es media (9.9% delta respecto a la frecuencia anterior)
Altos 2 - 16 kHz
(+) | máximos equilibrados - a sólo 3.8% de la mediana
(+) | los máximos son lineales (5.9% delta a la frecuencia anterior)
Total 100 - 16.000 Hz
(±) | la linealidad del sonido global es media (18.5% de diferencia con la mediana)
En comparación con la misma clase
» 60% de todos los dispositivos probados de esta clase eran mejores, 8% similares, 32% peores
» El mejor tuvo un delta de 6%, la media fue 18%, el peor fue ###max##%
En comparación con todos los dispositivos probados
» 42% de todos los dispositivos probados eran mejores, 8% similares, 51% peores
» El mejor tuvo un delta de 4%, la media fue 23%, el peor fue ###max##%
Consumo de energía
El brillante panel Mini-LED es particularmente notable en términos de consumo de energía en reposo. Al principio de la prueba de estrés, medimos brevemente hasta 320 vatios, antes de que el consumo se estabilizara en 242 vatios. Por tanto, el adaptador de corriente de 280 vatios tiene un tamaño adecuado. Sin embargo, el consumo en espera de más de 3 vatios es demasiado elevado.
| Off / Standby | |
| Ocioso | |
| Carga |
|
Clave:
min: | |
| Schenker XMG APEX 16 MAX R9 9955HX, GeForce RTX 5070 Ti Laptop, Samsung 9100 Pro 2 TB, Mini-LED, 2560x1600, 16" | Acer Predator Helios Neo 16S AI PHN16S-71-94L9 Ultra 9 275HX, GeForce RTX 5070 Ti Laptop, Micron 3500 1TB MTFDKBA1T0TGD, OLED, 2560x1600, 16" | Chuwi Gamebook, R9 9955HX R9 9955HX, GeForce RTX 5070 Ti Laptop, YMTC PC41Q-1TB-B, IPS, 2560x1600, 16" | Medion Erazer Major 16 X1 MD62736 Ultra 7 255HX, GeForce RTX 5070 Ti Laptop, Phison E31 2 TB, IPS, 2560x1600, 16" | Lenovo Legion 5 Pro 16IAX10H Ultra 9 275HX, GeForce RTX 5070 Ti Laptop, Western Digital PC SN8000S SDEPNRK-1T00, OLED, 2560x1600, 16" | MSI Vector 16 HX AI A2XWHG Ultra 7 255HX, GeForce RTX 5070 Ti Laptop, Micron 2400 MTFDKBA512QFM, IPS, 2560x1600, 16" | Schenker XMG Pro 16 (E25) Ultra 9 275HX, GeForce RTX 5070 Ti Laptop, Samsung 9100 Pro 1 TB, IPS, 2560x1600, 16" | Medio NVIDIA GeForce RTX 5070 Ti Laptop | Media de la clase Gaming | |
|---|---|---|---|---|---|---|---|---|---|
| Power Consumption | 41% | 6% | 8% | 7% | 16% | 16% | 19% | 22% | |
| Idle Minimum * (Watt) | 15.4 | 3.9 75% | 16.4 -6% | 17.8 -16% | 14 9% | 7.1 54% | 11.7 24% | 12.4 ? 19% | 13 ? 16% |
| Idle Average * (Watt) | 29.9 | 11 63% | 21.2 29% | 20.7 31% | 14.3 52% | 15.9 47% | 16.6 44% | 19.7 ? 34% | 18.7 ? 37% |
| Idle Maximum * (Watt) | 30.1 | 16.9 44% | 28.3 6% | 23.4 22% | 20.1 33% | 29.5 2% | 17.1 43% | 24.9 ? 17% | 24.3 ? 19% |
| Load Average * (Watt) | 136.4 | 123 10% | 145.6 -7% | 110 19% | 177 -30% | 124 9% | 122.4 10% | 123.6 ? 9% | 110.2 ? 19% |
| Cyberpunk 2077 ultra * (Watt) | 231 | 152.7 34% | 221 4% | 233 -1% | 255 -10% | 222 4% | 245 -6% | ||
| Cyberpunk 2077 ultra external monitor * (Watt) | 226 | 144.9 36% | 218 4% | 232 -3% | 255 -13% | 217 4% | 241 -7% | ||
| Load Maximum * (Watt) | 315 | 229 27% | 284 10% | 297 6% | 294 7% | 336 -7% | 291.5 7% | 272 ? 14% | 258 ? 18% |
* ... más pequeño es mejor
consumo de energía Cyberpunk / Prueba de estrés
consumo de energía con monitor externo
Duración de las pilas
A pesar de la gran batería de 99 Wh, el elevado consumo de energía se traduce en una corta autonomía. En la prueba Wi-Fi a 150 cd/m², medimos algo menos de 5 horas, bajando a poco menos de 3 horas a brillo máximo.
| Schenker XMG APEX 16 MAX R9 9955HX, GeForce RTX 5070 Ti Laptop, 99.8 Wh | Acer Predator Helios Neo 16S AI PHN16S-71-94L9 Ultra 9 275HX, GeForce RTX 5070 Ti Laptop, 76 Wh | Chuwi Gamebook, R9 9955HX R9 9955HX, GeForce RTX 5070 Ti Laptop, 77 Wh | Medion Erazer Major 16 X1 MD62736 Ultra 7 255HX, GeForce RTX 5070 Ti Laptop, 80 Wh | Lenovo Legion 5 Pro 16IAX10H Ultra 9 275HX, GeForce RTX 5070 Ti Laptop, 80 Wh | MSI Vector 16 HX AI A2XWHG Ultra 7 255HX, GeForce RTX 5070 Ti Laptop, 90 Wh | Schenker XMG Pro 16 (E25) Ultra 9 275HX, GeForce RTX 5070 Ti Laptop, 99.8 Wh | Media de la clase Gaming | |
|---|---|---|---|---|---|---|---|---|
| Battery Runtime | 2% | 0% | 29% | -4% | 43% | 100% | 68% | |
| WiFi Websurfing (h) | 4.9 | 5 2% | 4.9 0% | 6.3 29% | 4.9 0% | 7 43% | 9.1 86% | 7.15 ? 46% |
| WiFi Websurfing max. Brightness (h) | 2.9 | 2.7 -7% | 6.2 114% | 5.48 ? 89% |
Valoración general de Notebookcheck
Schenker XMG APEX 16 MAX
- 01/16/2026 v8
Andreas Osthoff
 Total Sustainability Score:
 Posibles alternativas en comparación
Imagen | Modelo | Precio | Peso | Altura | Pantalla |
|---|---|---|---|---|---|
1. 87.8%  | Schenker XMG APEX 16 MAX AMD Ryzen 9 9955HX ⎘ NVIDIA GeForce RTX 5070 Ti Laptop ⎘ 64 GB Memoría, 2048 GB SSD | Amazon: Precio de catálogo: 2815€ | 2.7 kg | 26 mm | 16.00" 2560x1600 189 PPI Mini-LED |
2. 82%  | Acer Predator Helios Neo 16S AI PHN16S-71-94L9 Intel Core Ultra 9 275HX ⎘ NVIDIA GeForce RTX 5070 Ti Laptop ⎘ 32 GB Memoría, 1024 GB SSD | Amazon: Precio de catálogo: 2400 EUR | 2.2 kg | 19.9 mm | 16.00" 2560x1600 189 PPI OLED |
3. 84.9%  | Chuwi Gamebook, R9 9955HX AMD Ryzen 9 9955HX ⎘ NVIDIA GeForce RTX 5070 Ti Laptop ⎘ 32 GB Memoría, 1024 GB SSD | Amazon: 1. $389.96 CHUWI 2-in-1 Touchscreen Lap... 2. $328.99 CHUWI 2 in 1 Laptop Tablet, ... 3. $309.99 CHUWI LarkBox X Mini PC, Int... Precio de catálogo: 2300 EUR | 2.5 kg | 21.4 mm | 16.00" 2560x1600 189 PPI IPS |
4. 85.2%  | Medion Erazer Major 16 X1 MD62736 Intel Core Ultra 7 255HX ⎘ NVIDIA GeForce RTX 5070 Ti Laptop ⎘ 32 GB Memoría, SSD | Amazon: Precio de catálogo: 2600 EUR | 2.5 kg | 22.7 mm | 16.00" 2560x1600 189 PPI IPS |
5. 84.5%  | Lenovo Legion 5 Pro 16IAX10H Intel Core Ultra 9 275HX ⎘ NVIDIA GeForce RTX 5070 Ti Laptop ⎘ 32 GB Memoría, 1024 GB SSD | Amazon: 1. $2,999.00 Lenovo Legion Pro 5i Gen 10 ... 2. $99.97 Lenovo Slim 245W AC Adapter ... 3. $3,489.99 Lenovo Legion Pro 7 16IAX10H... Precio de catálogo: 2500 Euro | 2.4 kg | 25.95 mm | 16.00" 2560x1600 189 PPI OLED |
6. 84%  | MSI Vector 16 HX AI A2XWHG Intel Core Ultra 7 255HX ⎘ NVIDIA GeForce RTX 5070 Ti Laptop ⎘ 16 GB Memoría, 512 GB SSD | Amazon: Precio de catálogo: 2000 EUR | 2.6 kg | 28.6 mm | 16.00" 2560x1600 189 PPI IPS |
7. 87.4%  | Schenker XMG Pro 16 (E25) Intel Core Ultra 9 275HX ⎘ NVIDIA GeForce RTX 5070 Ti Laptop ⎘ 32 GB Memoría, 1024 GB SSD | Amazon: 1. $140.00 16.0" WQXGA 2560(RGB)×1600 ... 2. $150.00 Replacement Screen 16.0" for... Precio de catálogo: 2480€ | 2.5 kg | 26.5 mm | 16.00" 2560x1600 189 PPI IPS |
Transparencia
La selección de los dispositivos que se van a reseñar corre a cargo de nuestro equipo editorial. La muestra de prueba fue proporcionada al autor en calidad de préstamo por el fabricante o el minorista a los efectos de esta reseña. El prestamista no tuvo ninguna influencia en esta reseña, ni el fabricante recibió una copia de la misma antes de su publicación. No había ninguna obligación de publicar esta reseña. Como empresa de medios independiente, Notebookcheck no está sujeta a la autoridad de fabricantes, minoristas o editores.
Así es como prueba Notebookcheck
Cada año, Notebookcheck revisa de forma independiente cientos de portátiles y smartphones utilizando procedimientos estandarizados para asegurar que todos los resultados son comparables. Hemos desarrollado continuamente nuestros métodos de prueba durante unos 20 años y hemos establecido los estándares de la industria en el proceso. En nuestros laboratorios de pruebas, técnicos y editores experimentados utilizan equipos de medición de alta calidad. Estas pruebas implican un proceso de validación en varias fases. Nuestro complejo sistema de clasificación se basa en cientos de mediciones y puntos de referencia bien fundamentados, lo que mantiene la objetividad.