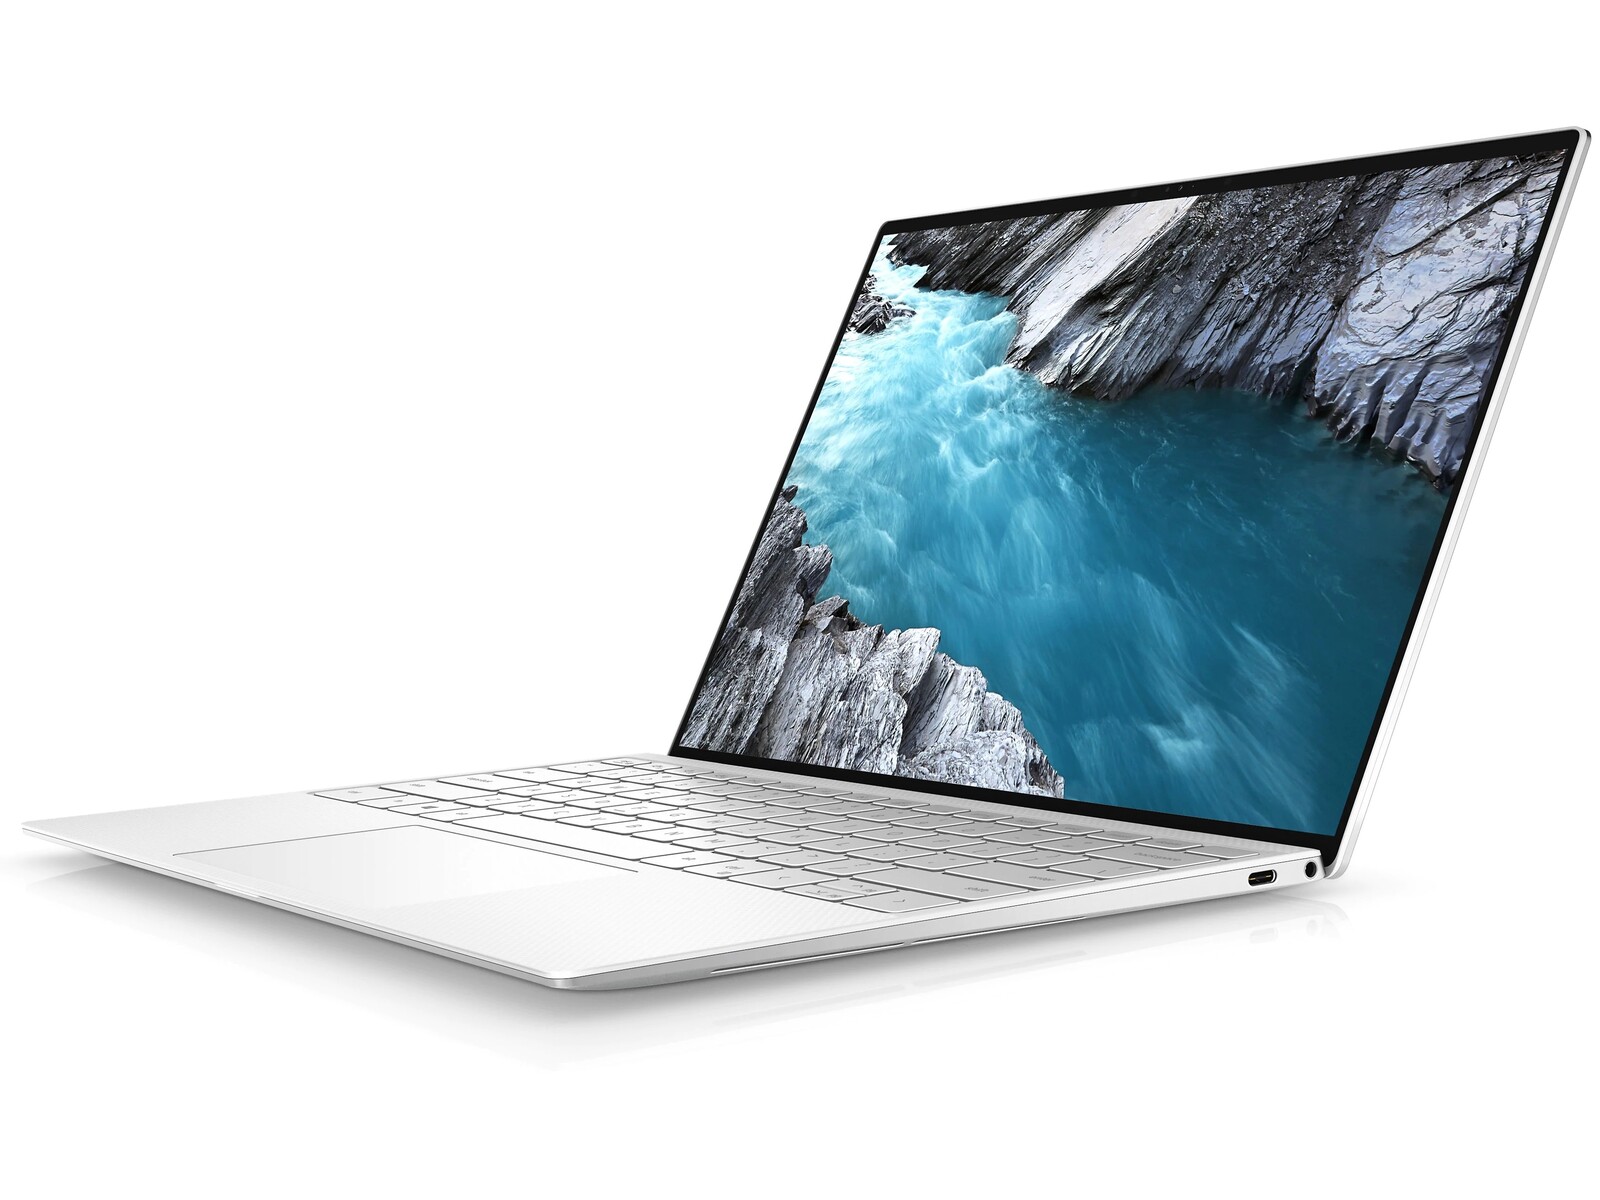
Análisis del portátil Dell XPS 13 9310 OLED: ¿Es mejor que el IPS?
El XPS 13 9310 se lanzó a finales del año pasado junto con la serie 11ª generación de Intel Tiger Lake. Las configuraciones de entonces incluían opciones FHD (1920 x 1200) y 4K (3840 x 2400), todas con paneles IPS. Dell había prometido que el OLED llegaría en una fecha posterior para complementar los SKUs IPS existentes.
Ahora que a mitad de 2021, la prometida SKU OLED finalmente se está enviando a los clientes por alrededor de $1650 USD completa con la CPU Core i7-1185G7, 16 GB de RAM soldada y pantalla táctil de 3,5K (3456 x 2160) de resolución. Es cierto que otros portátiles emblemáticos han tenido opciones OLED durante mucho más tiempo, pero esta es la primera vez que lo vemos en un factor de forma 16:10 de 13,4 pulgadas.
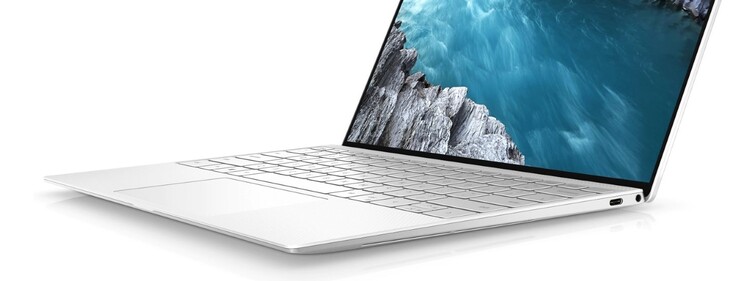
Te recomendamos que consultes nuestros tres análisis existentes sobre el XPS 13 9310 FHD, XPS 13 9310 4Ky el XPS 13 9300 para saber más sobre el chasis y sus características, ya que el XPS 13 9310 OLED es visualmente idéntico a estas configuraciones. Este análisis se centrará más en la pantalla táctil OLED y en lo que los usuarios pueden esperar de ella en comparación con las opciones habituales del XPS 13 IPS.
Más análisis de Dell:
potential competitors in comparison
Valoración | Fecha | Modelo | Peso | Altura | Tamaño | Resolución | Precio |
|---|---|---|---|---|---|---|---|
| 88.3 % v7 (old) | 06/2021 | Dell XPS 13 9310 OLED i7-1185G7, Iris Xe G7 96EUs | 1.2 kg | 14.8 mm | 13.40" | 3456x2160 | |
| 87.4 % v7 (old) | 12/2020 | Dell XPS 13 9310 Core i7 4K i7-1185G7, Iris Xe G7 96EUs | 1.3 kg | 14.8 mm | 13.40" | 3840x2400 | |
| 88.1 % v7 (old) | 10/2020 | Dell XPS 13 9310 Core i7 FHD i7-1165G7, Iris Xe G7 96EUs | 1.3 kg | 14.8 mm | 13.40" | 1920x1200 | |
| 85.9 % v7 (old) | 11/2019 | Dell XPS 13 7390 Core i7-10710U i7-10710U, UHD Graphics 620 | 1.2 kg | 11.6 mm | 13.30" | 3840x2160 | |
| 86.9 % v7 (old) | 04/2021 | MSI Summit E13 Flip Evo A11MT i7-1185G7, Iris Xe G7 96EUs | 1.4 kg | 14.9 mm | 13.40" | 1920x1200 | |
v (old) | 09/2021 | Asus ZenBook 13 OLED UM325UA R7 5700U, Vega 8 | 1.1 kg | 14.8 mm | 13.30" | 1920x1080 |
Caso
Lector de tarjetas SD
| SD Card Reader | |
| average JPG Copy Test (av. of 3 runs) | |
| Dell XPS 13 9310 Core i7 FHD (Toshiba Exceria Pro M501 64 GB UHS-II) | |
| Dell XPS 13 9310 Core i7 4K (Toshiba Exceria Pro M501 32 GB UHS-II) | |
| Dell XPS 13 9310 OLED (AV PRO microSD 128 GB V60) | |
| Dell XPS 13 7390 Core i7-10710U (Toshiba Exceria Pro M501 64 GB UHS-II) | |
| MSI Summit E13 Flip Evo A11MT (AV PRO microSD 128 GB V60) | |
| maximum AS SSD Seq Read Test (1GB) | |
| Dell XPS 13 9310 Core i7 4K (Toshiba Exceria Pro M501 32 GB UHS-II) | |
| Dell XPS 13 9310 Core i7 FHD (Toshiba Exceria Pro M501 64 GB UHS-II) | |
| Dell XPS 13 7390 Core i7-10710U (Toshiba Exceria Pro M501 64 GB UHS-II) | |
| Dell XPS 13 9310 OLED (AV PRO microSD 128 GB V60) | |
| MSI Summit E13 Flip Evo A11MT (AV PRO microSD 128 GB V60) | |
Comunicación
Las velocidades de transmisión son más lentas que las que experimentamos en nuestras antiguas unidades de prueba del XPS 13, incluso después de repetir esta prueba varias veces. En la práctica, sin embargo, la conexión sigue siendo estable y fiable para el streaming y la navegación.
Cámara web


Mostrar
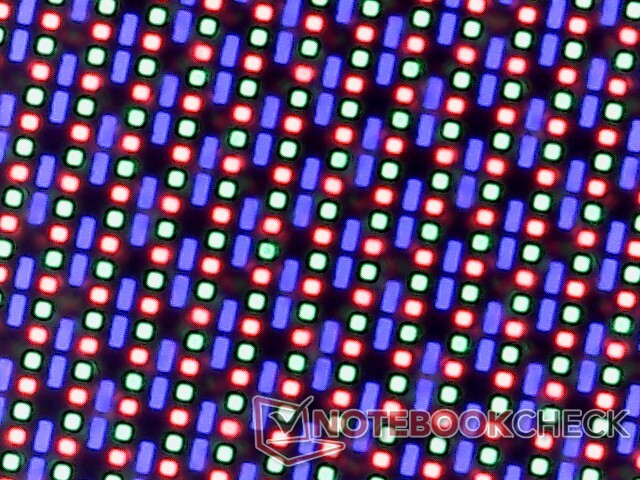
Dado que la resolución nativa es 3.5K (3456 x 2160) en vez de 4K (3840 x 2400), el PPI es ligeramente inferior al de la configuración 4K IPS del XPS 13 (304 vs. 338). Sospechamos que la resolución es menor porque actualmente no hay paneles OLED 4K disponibles en el factor de forma 16:10 de 13,4 pulgadas. No obstante, esto puede jugar a favor del OLED en algunos casos ya que el texto puede ser demasiado pequeño en la pantalla 4K de 338 PPI.
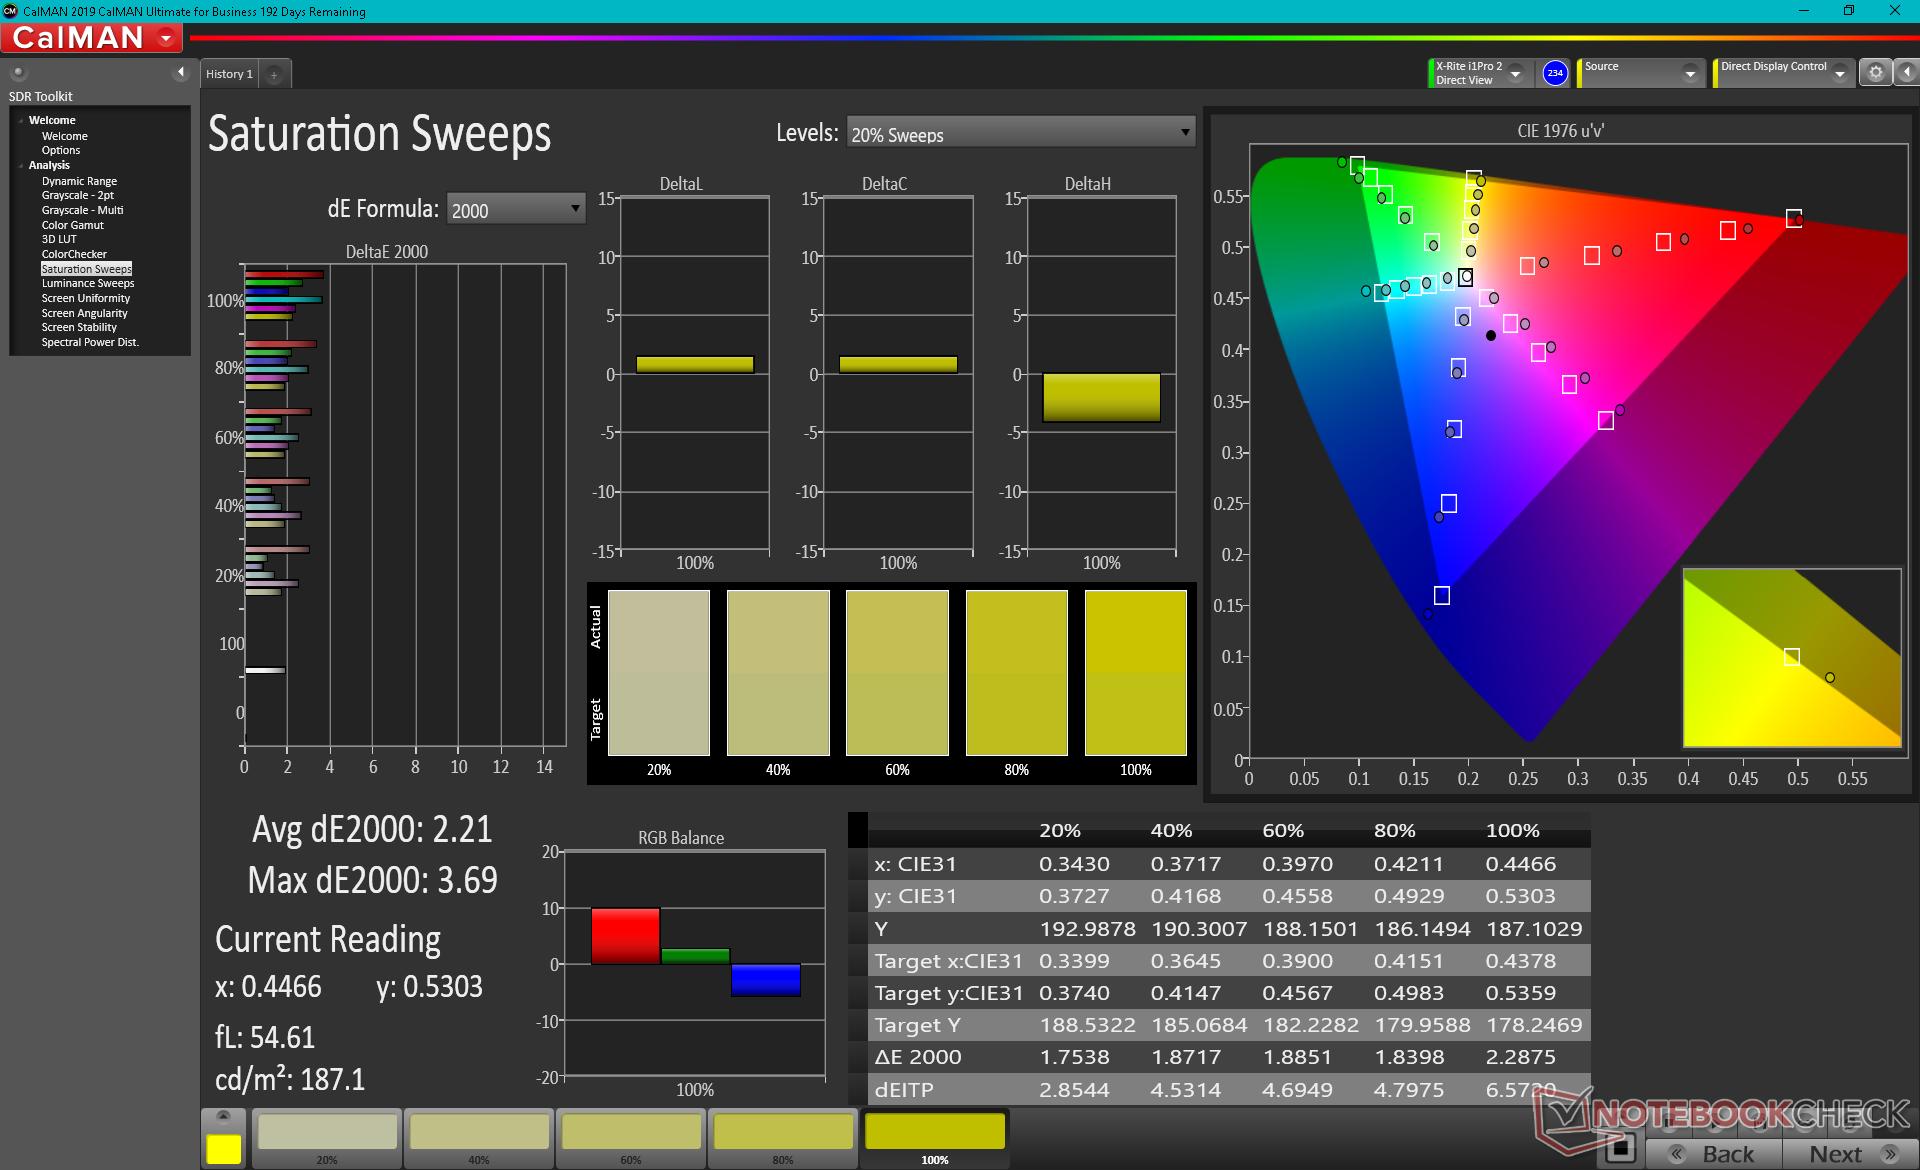
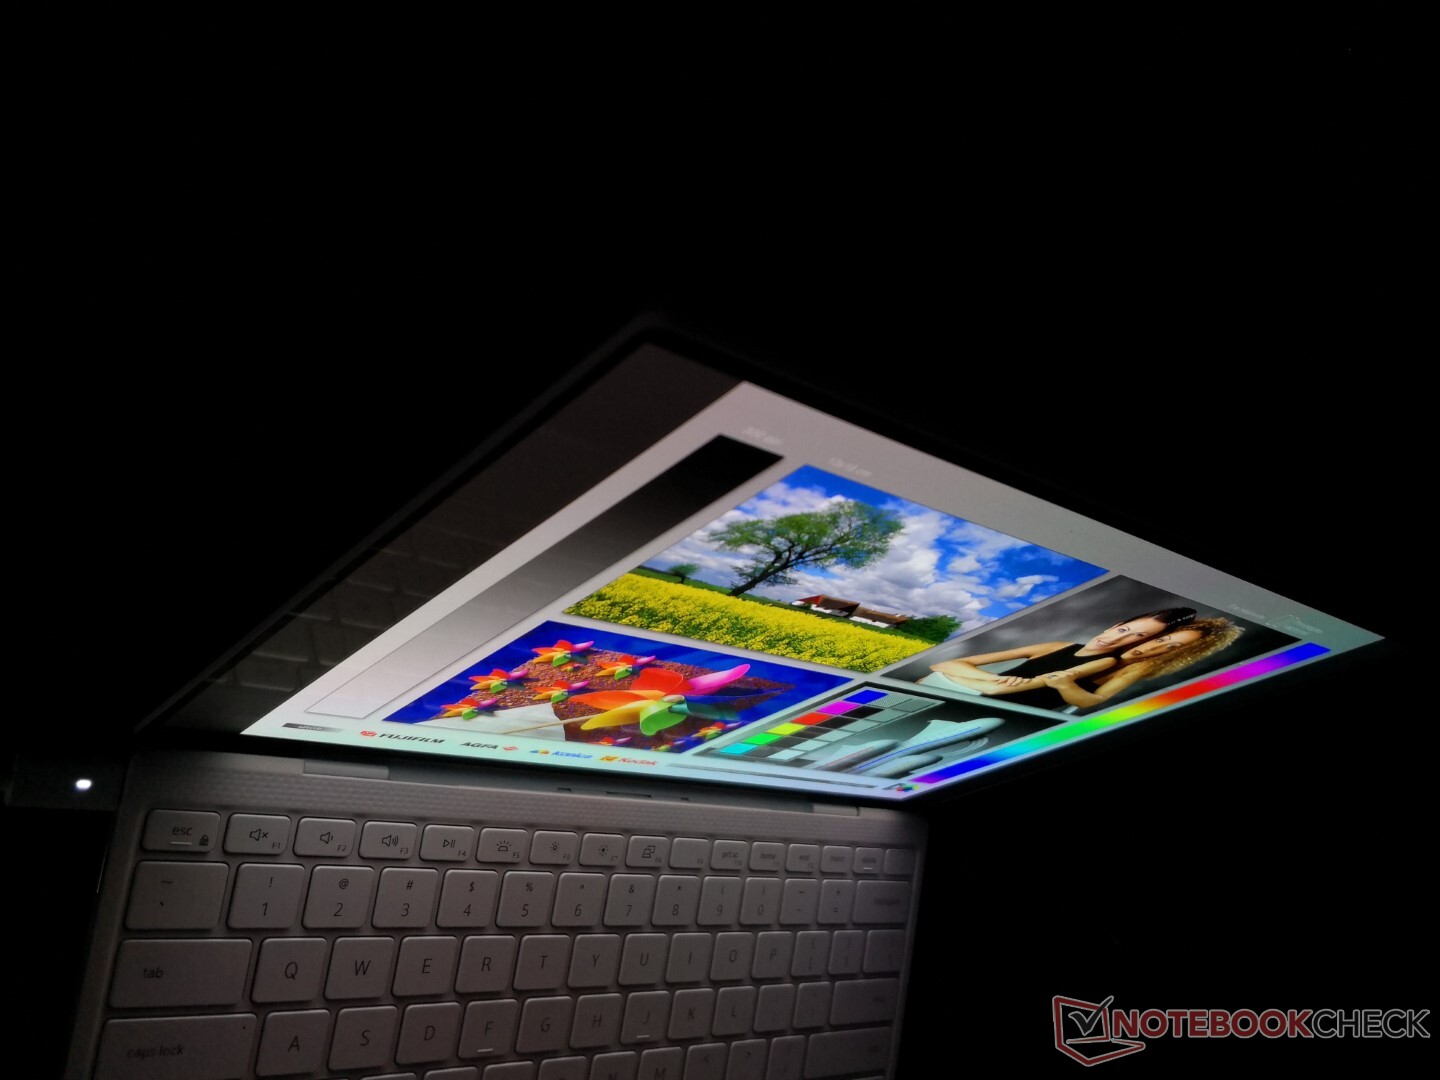
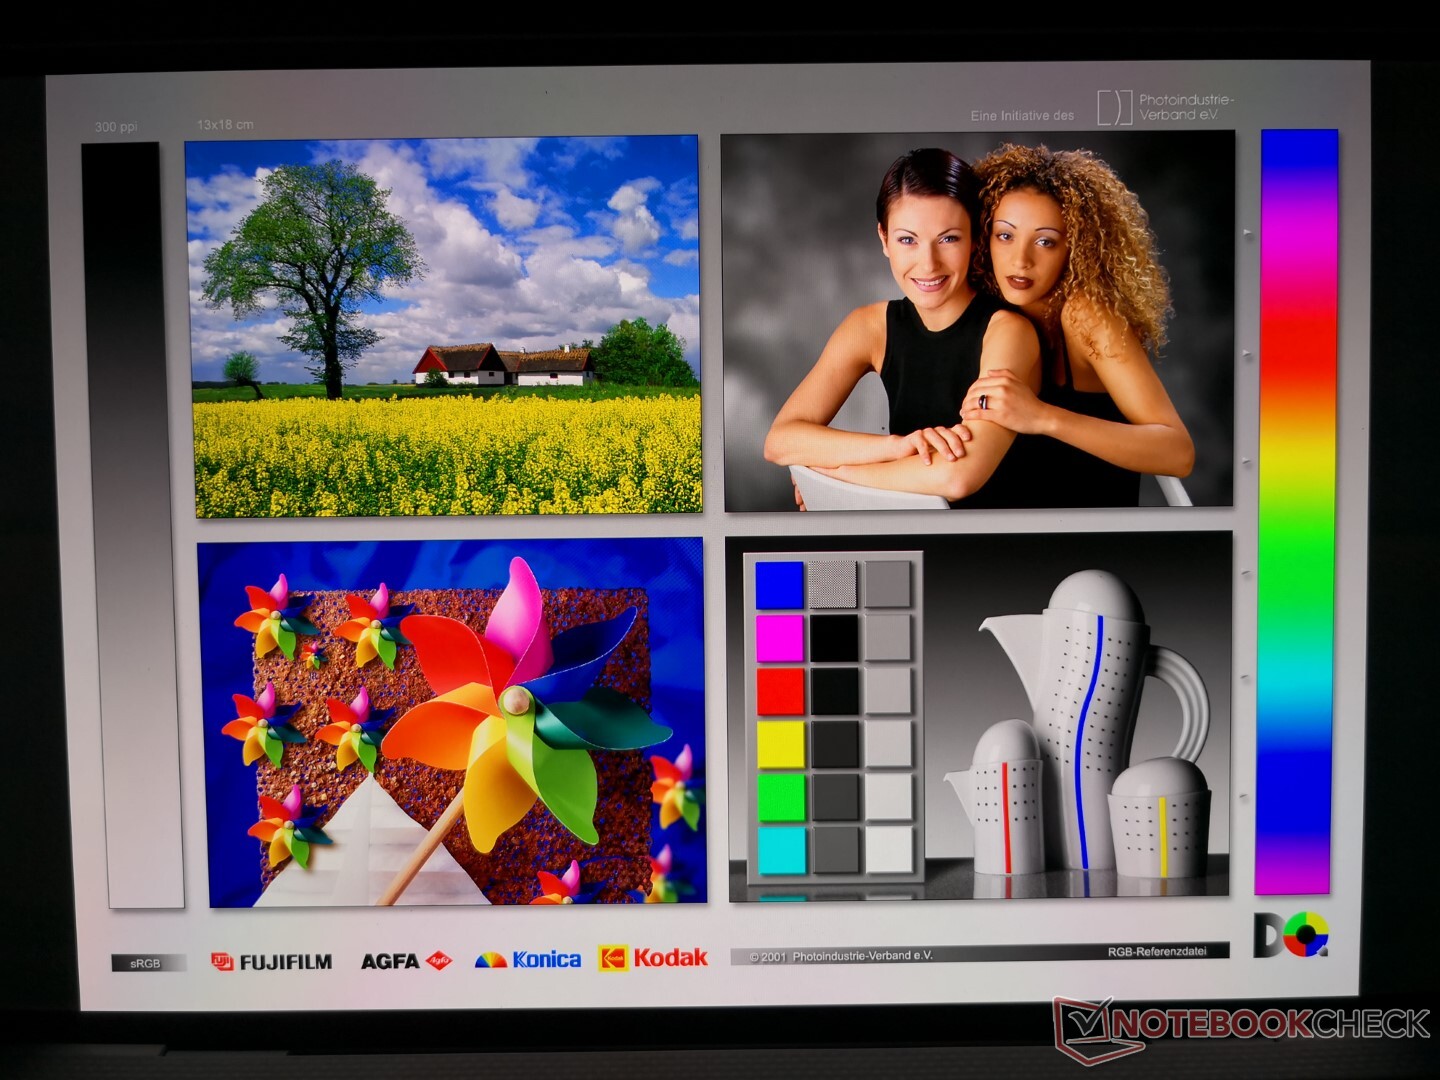
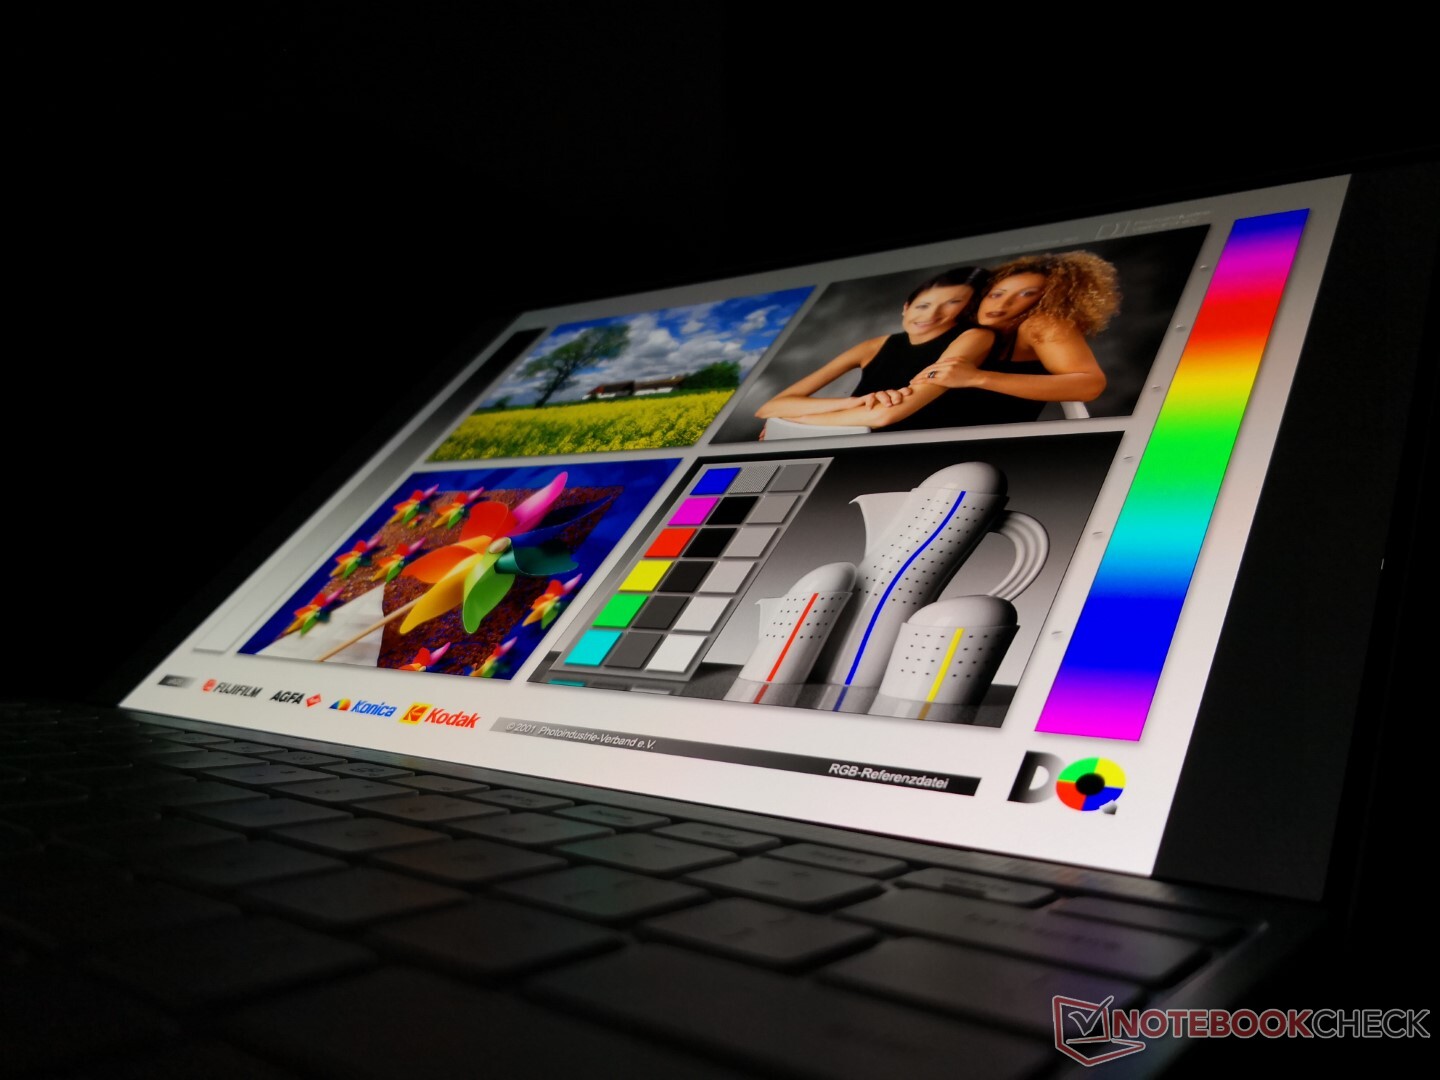
Las tres mayores ventajas de nuestro SKU OLED frente a los otros SKUs XPS 13 IPS son los tiempos de respuesta blanco-negro más rápidos, la relación de contraste infinita y la mayor cobertura de color DCI-P3. Los colores resaltan sin casi ningún efecto fantasma para una calidad de imagen increíble, especialmente durante la reproducción de películas
Aunque la pantalla es compatible con HDR, la configuración predeterminada de Windows 10 desactivará automáticamente el HDR cuando se ejecute en la batería para extender la vida de la batería. Esta transición de HDR a no HDR o viceversa implica un parpadeo momentáneo de la pantalla cada vez que el portátil se conecta o desconecta de una toma de corriente. Afortunadamente, los usuarios pueden alternar fácilmente la configuración por defecto introduciendo "Windows HD Color" en la barra de búsqueda del menú Inicio, asegurándose de que "Usar HDR" está activado y, a continuación, configurando las opciones de Batería como "Optimizar para la calidad de imagen" en lugar de "Optimizar para la duración de la batería". Sabrás que los ajustes están funcionando cuando la pantalla deje de parpadear al cambiar entre la alimentación del adaptador de CA y la de la batería.
| |||||||||||||||||||||||||
iluminación: 97 %
Brillo con batería: 384 cd/m²
Contraste: ∞:1 (Negro: 0 cd/m²)
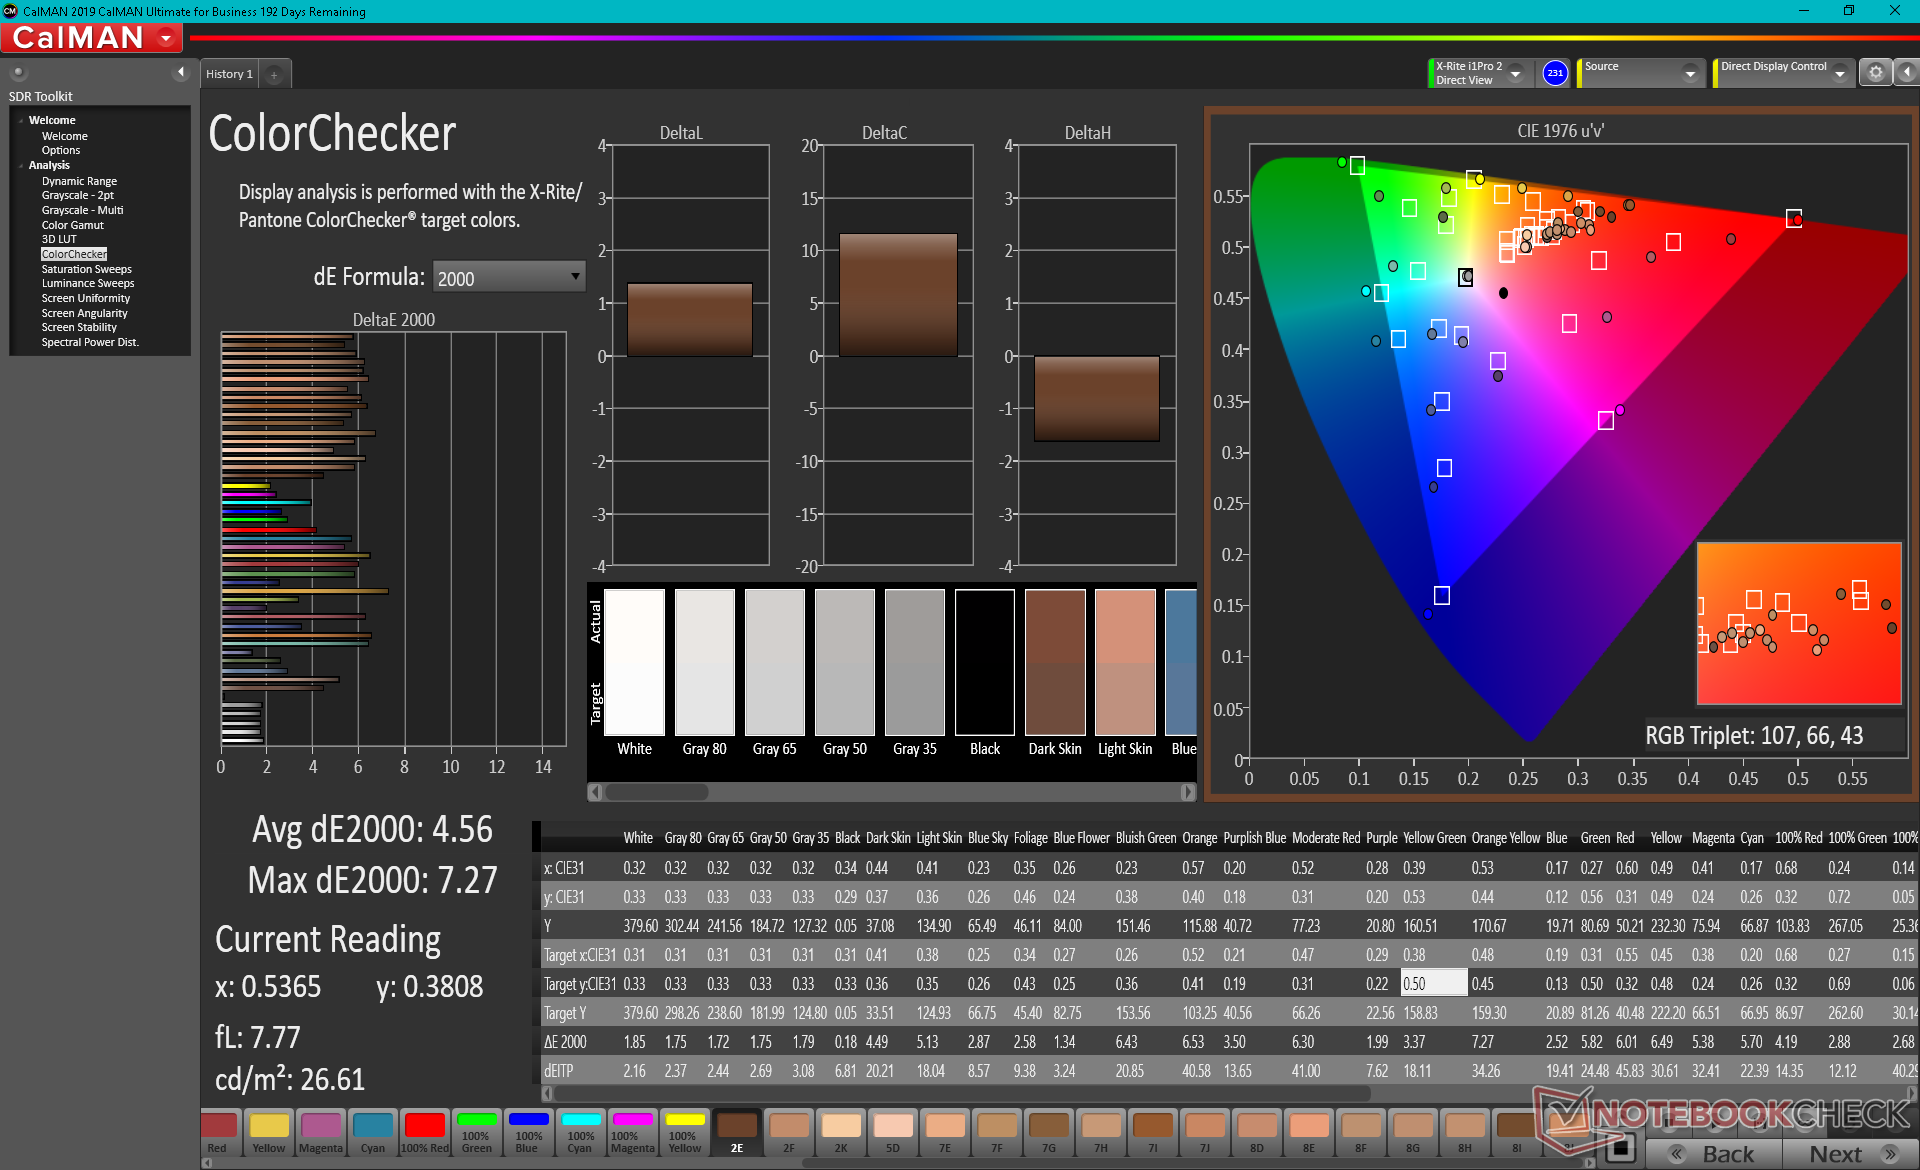
ΔE ColorChecker Calman: 4.56 | ∀{0.5-29.43 Ø4.71}
calibrated: 4.52
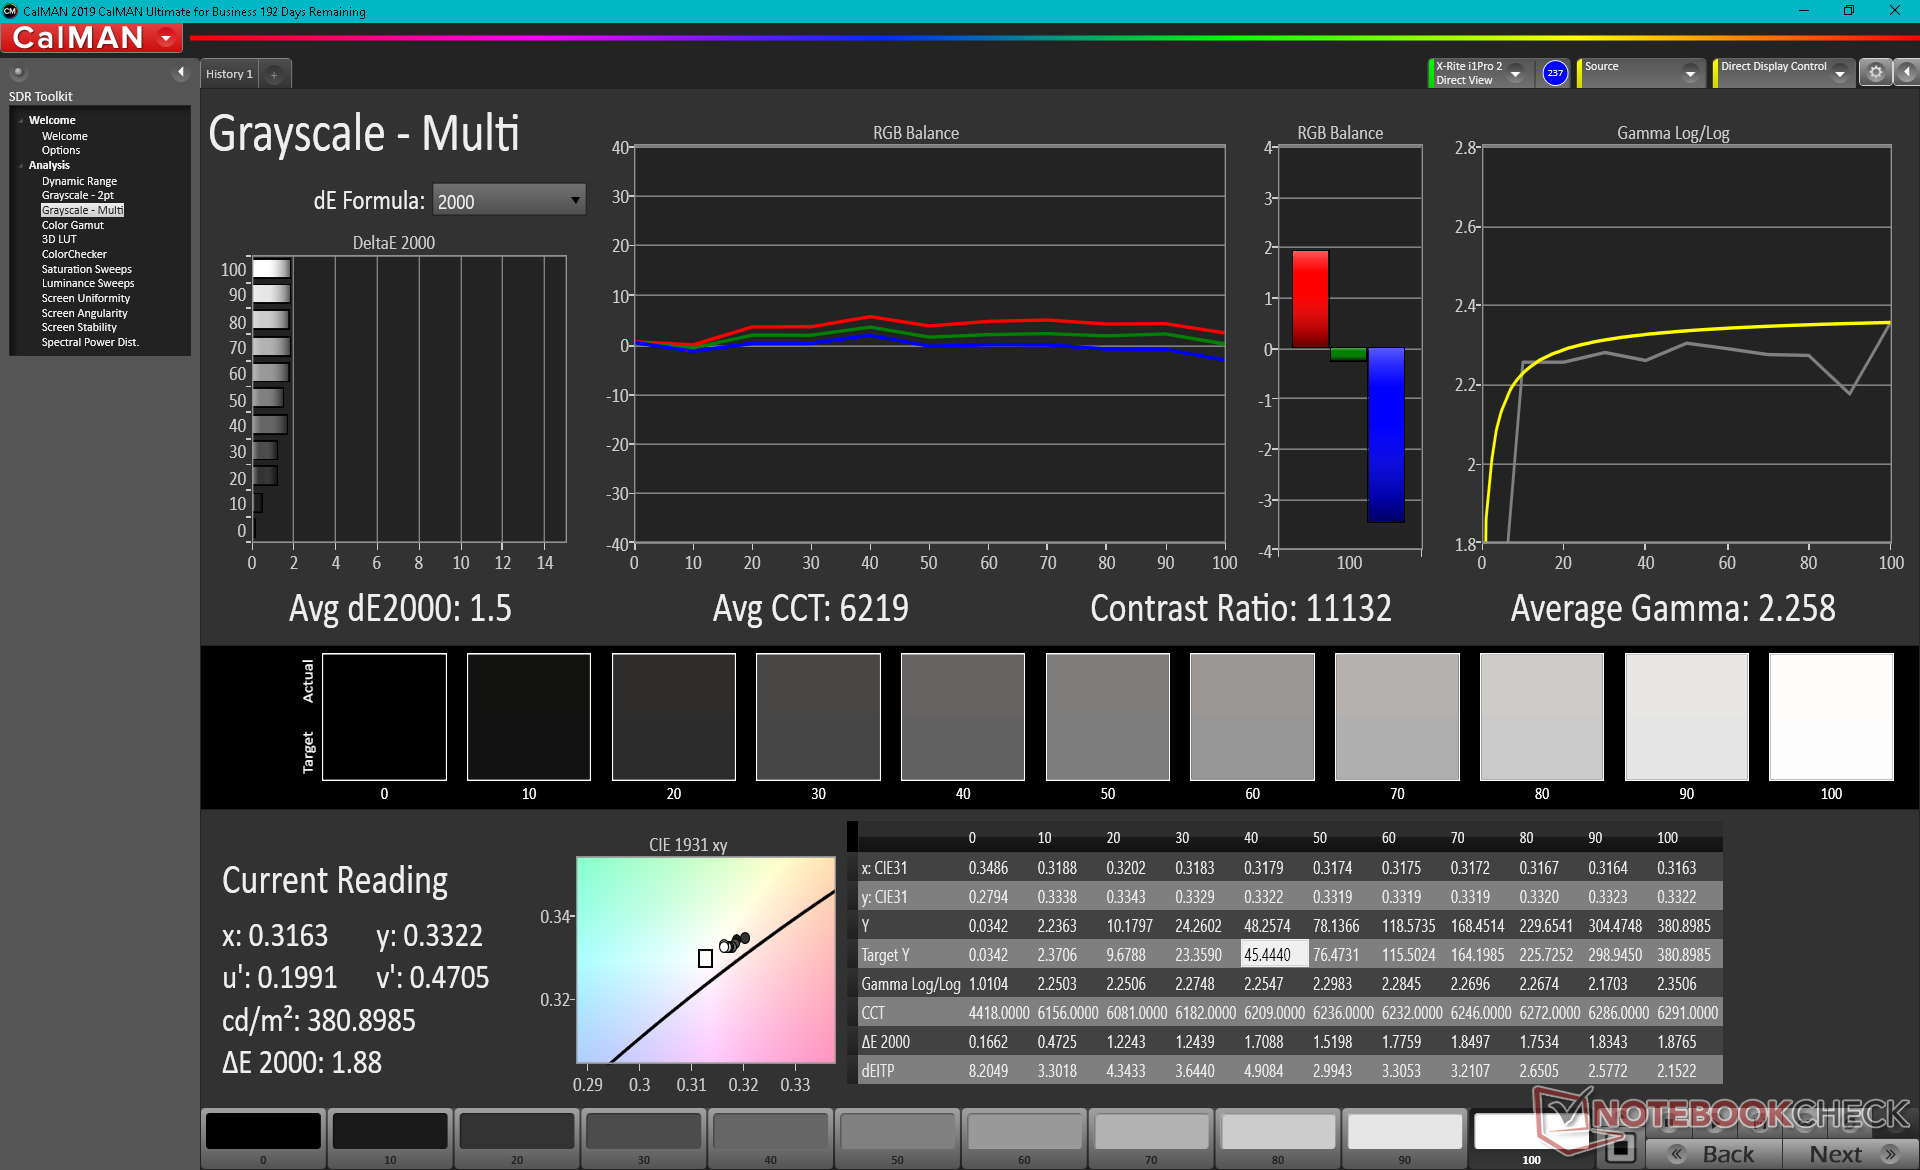
ΔE Greyscale Calman: 1.5 | ∀{0.09-98 Ø4.96}
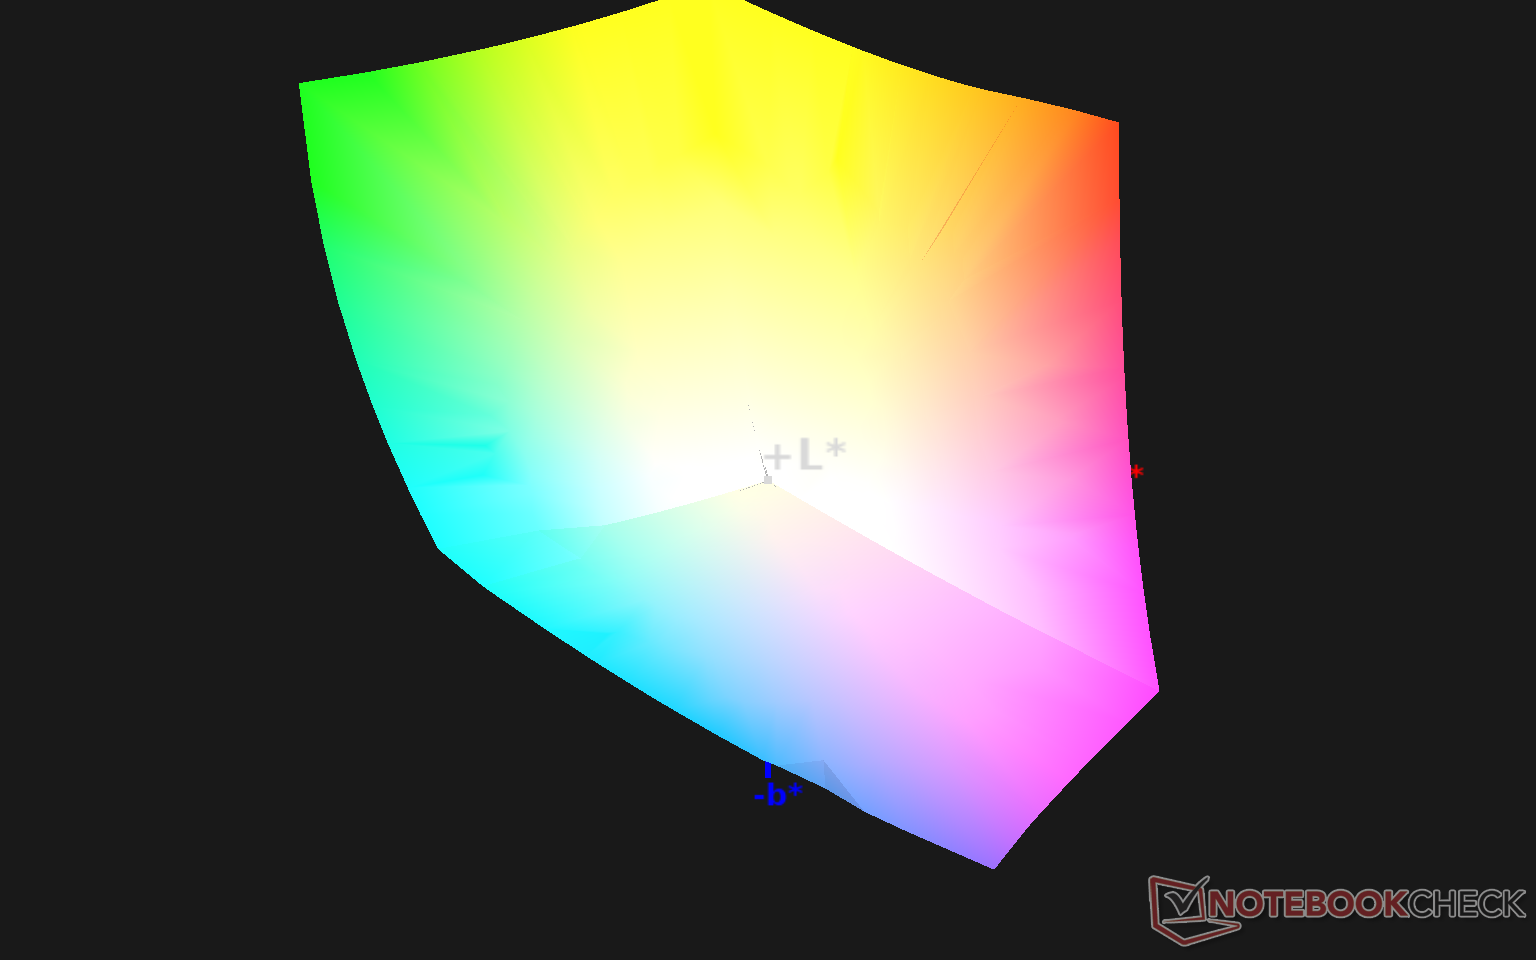
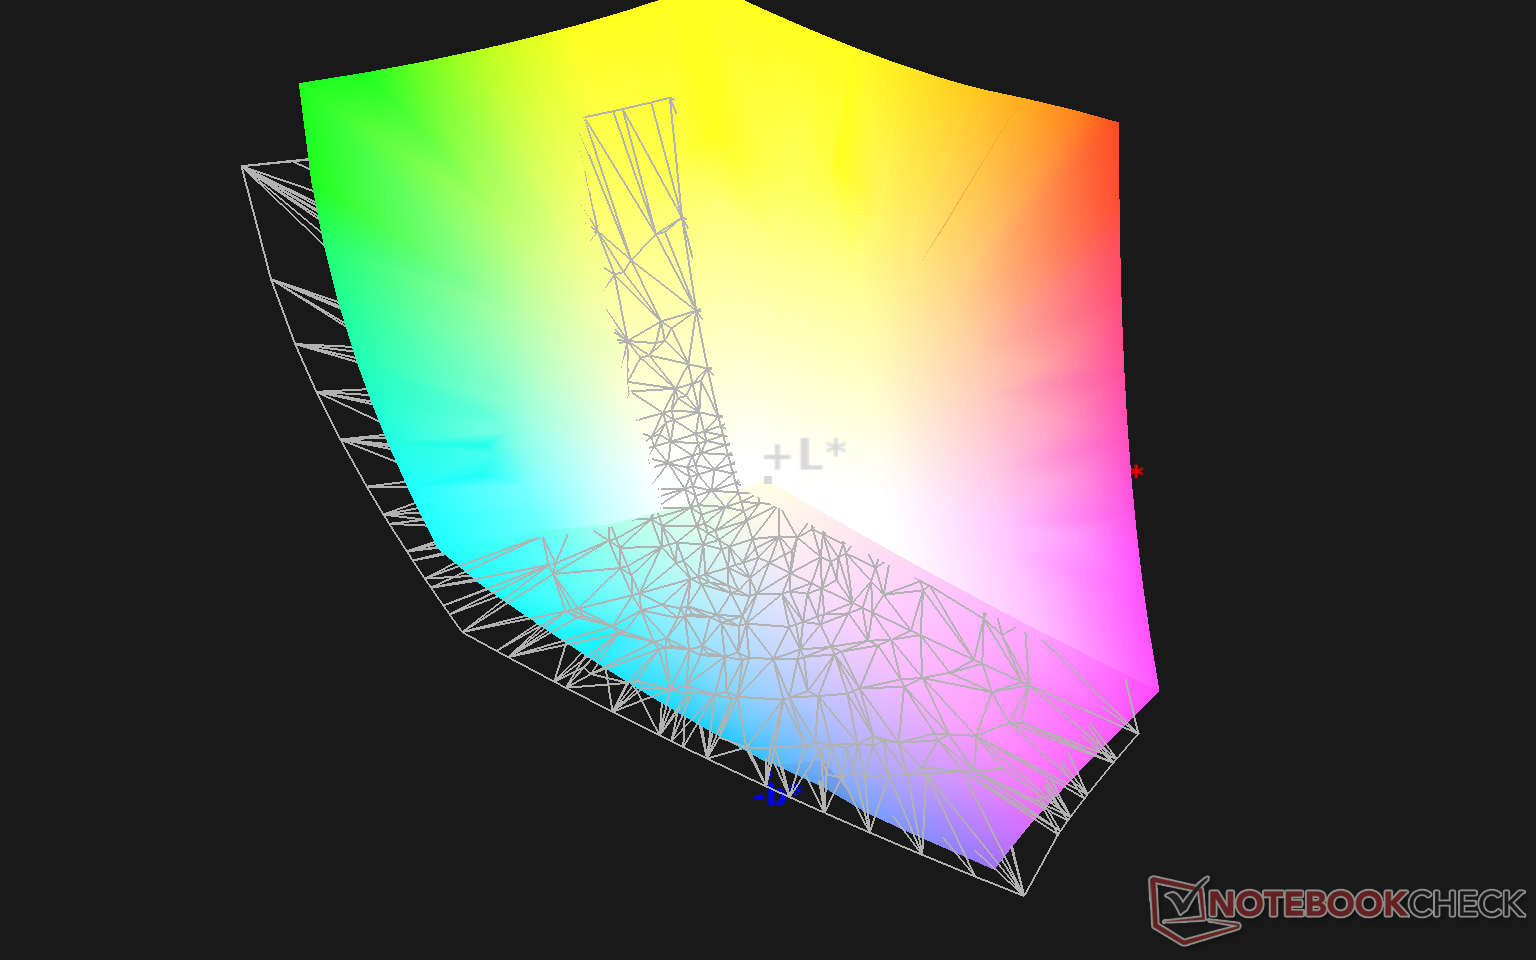
100% sRGB (Argyll 1.6.3 3D)
87.1% AdobeRGB 1998 (Argyll 1.6.3 3D)
97.7% AdobeRGB 1998 (Argyll 3D)
100% sRGB (Argyll 3D)
99.7% Display P3 (Argyll 3D)
Gamma: 2.26
CCT: 6219 K
| Dell XPS 13 9310 OLED Samsung 134XK01, OLED, 13.4", 3456x2160 | Dell XPS 13 9310 Core i7 4K Sharp LQ134R1, IPS, 13.4", 3840x2400 | Dell XPS 13 9310 Core i7 FHD Sharp LQ134N1, IPS, 13.4", 1920x1200 | Dell XPS 13 7390 Core i7-10710U AU Optronics B133ZAN, Dell P/N: 90NTH, IPS, 13.3", 3840x2160 | MSI Summit E13 Flip Evo A11MT Sharp LQ134N1JW53, IPS, 13.4", 1920x1200 | |
|---|---|---|---|---|---|
| Display | -13% | -18% | -25% | -20% | |
| Display P3 Coverage (%) | 99.7 | 80.2 -20% | 70.9 -29% | 63.4 -36% | 69.8 -30% |
| sRGB Coverage (%) | 100 | 100 0% | 99.1 -1% | 93.7 -6% | 98.8 -1% |
| AdobeRGB 1998 Coverage (%) | 97.7 | 78.9 -19% | 72.9 -25% | 64.3 -34% | 70.6 -28% |
| Response Times | -2164% | -1837% | -1836% | -2355% | |
| Response Time Grey 50% / Grey 80% * (ms) | 2.2 ? | 59.2 ? -2591% | 52 ? -2264% | 51.6 ? -2245% | 64 ? -2809% |
| Response Time Black / White * (ms) | 2.2 ? | 40.4 ? -1736% | 33.2 ? -1409% | 33.6 ? -1427% | 44 ? -1900% |
| PWM Frequency (Hz) | 240.4 ? | 2137 ? | 2475 ? | ||
| Screen | 3% | -9% | -50% | 28% | |
| Brightness middle (cd/m²) | 384 | 508.7 32% | 543.3 41% | 408.2 6% | 551.3 44% |
| Brightness (cd/m²) | 387 | 479 24% | 524 35% | 399 3% | 517 34% |
| Brightness Distribution (%) | 97 | 84 -13% | 92 -5% | 89 -8% | 91 -6% |
| Black Level * (cd/m²) | 0.3 | 0.38 | 0.39 | 0.37 | |
| Colorchecker dE 2000 * | 4.56 | 2.72 40% | 3.02 34% | 4.6 -1% | 1.45 68% |
| Colorchecker dE 2000 max. * | 7.27 | 4.7 35% | 7.61 -5% | 11.84 -63% | 2.86 61% |
| Colorchecker dE 2000 calibrated * | 4.52 | 1.92 58% | 1.23 73% | 2.03 55% | 1.7 62% |
| Greyscale dE 2000 * | 1.5 | 3.4 -127% | 5 -233% | 7.5 -400% | 1.3 13% |
| Gamma | 2.26 97% | 2.11 104% | 2.02 109% | 2.12 104% | 2.14 103% |
| CCT | 6219 105% | 6245 104% | 6550 99% | 7966 82% | 6580 99% |
| Color Space (Percent of AdobeRGB 1998) (%) | 87.1 | 70.7 -19% | 66.8 -23% | 59.5 -32% | 65 -25% |
| Color Space (Percent of sRGB) (%) | 100 | 100 0% | 99.6 0% | 93.5 -6% | 99 -1% |
| Contrast (:1) | 1696 | 1430 | 1047 | 1490 | |
| Media total (Programa/Opciones) | -725% /
-310% | -621% /
-272% | -637% /
-300% | -782% /
-323% |
* ... más pequeño es mejor
El espacio de color cubre todo el sRGB (o aproximadamente el 158%) y el 87% del AdobeRGB. Su volumen se extiende más hacia los espacios rojo, amarillo y verde que AdobeRGB, que es exactamente lo que esperaríamos de un panel que cumple con DCI-P3.
Tiempos de respuesta del display
| ↔ Tiempo de respuesta de Negro a Blanco | ||
|---|---|---|
| 2.2 ms ... subida ↗ y bajada ↘ combinada | ↗ 1 ms subida | 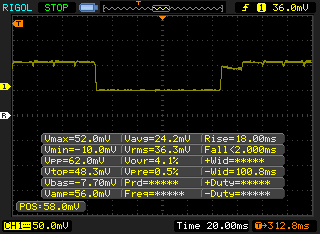 |
| ↘ 1.2 ms bajada | ||
| La pantalla mostró tiempos de respuesta muy rápidos en nuestros tests y debería ser adecuada para juegos frenéticos. En comparación, todos los dispositivos de prueba van de ##min### (mínimo) a 240 (máximo) ms. » 12 % de todos los dispositivos son mejores. Esto quiere decir que el tiempo de respuesta medido es mejor que la media (19.8 ms) de todos los dispositivos testados. | ||
| ↔ Tiempo de respuesta 50% Gris a 80% Gris | ||
| 2.2 ms ... subida ↗ y bajada ↘ combinada | ↗ 1.2 ms subida | 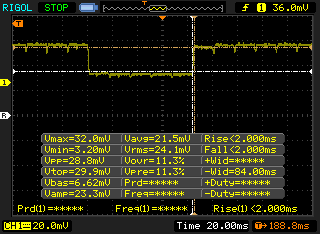 |
| ↘ 1 ms bajada | ||
| La pantalla mostró tiempos de respuesta muy rápidos en nuestros tests y debería ser adecuada para juegos frenéticos. En comparación, todos los dispositivos de prueba van de ##min### (mínimo) a 636 (máximo) ms. » 11 % de todos los dispositivos son mejores. Esto quiere decir que el tiempo de respuesta medido es mejor que la media (31 ms) de todos los dispositivos testados. | ||
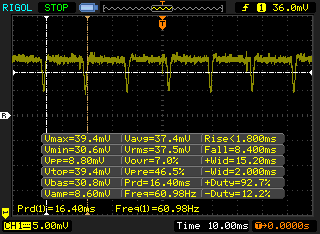
Parpadeo de Pantalla / PWM (Pulse-Width Modulation)
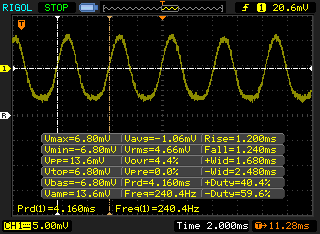
| Parpadeo de Pantalla / PWM detectado | 240.4 Hz | ≤ 51 % de brillo |  |
La retroiluminación del display parpadea a 240.4 Hz (seguramente usa PWM - Pulse-Width Modulation) a un brillo del 51 % e inferior. Sobre este nivel de brillo no debería darse parpadeo / PWM. La frecuencia de 240.4 Hz es relativamente baja, por lo que la gente sensible debería ver parpadeos y padecer fatiga visual por la pantalla (usado al brillo indicado a continuación). Comparación: 52 % de todos los dispositivos testados no usaron PWM para atenuar el display. Si se usó, medimos una media de 7754 (mínimo: 5 - máxmo: 343500) Hz. | |||
Mientras que los paneles IPS suelen presentar una sola frecuencia de modulación del ancho de pulso, este panel OLED presenta dos frecuencias discretas de modulación del ancho de pulso en función del nivel de brillo. Podemos registrar una frecuencia de 240,4 Hz y 61 Hz desde el 0 por ciento hasta el 51 por ciento de brillo y desde el 52 por ciento hasta el brillo máximo, respectivamente. En comparación, el panel IPS del XPS 13 4K mostraría un PWM más alto de 2137 MHz sólo desde el 0 por ciento hasta el 31 por ciento de brillo. Los SKUs XPS 13 IPS pueden, por tanto, ser la mejor opción si tus ojos son sensibles al parpadeo de la pantalla.
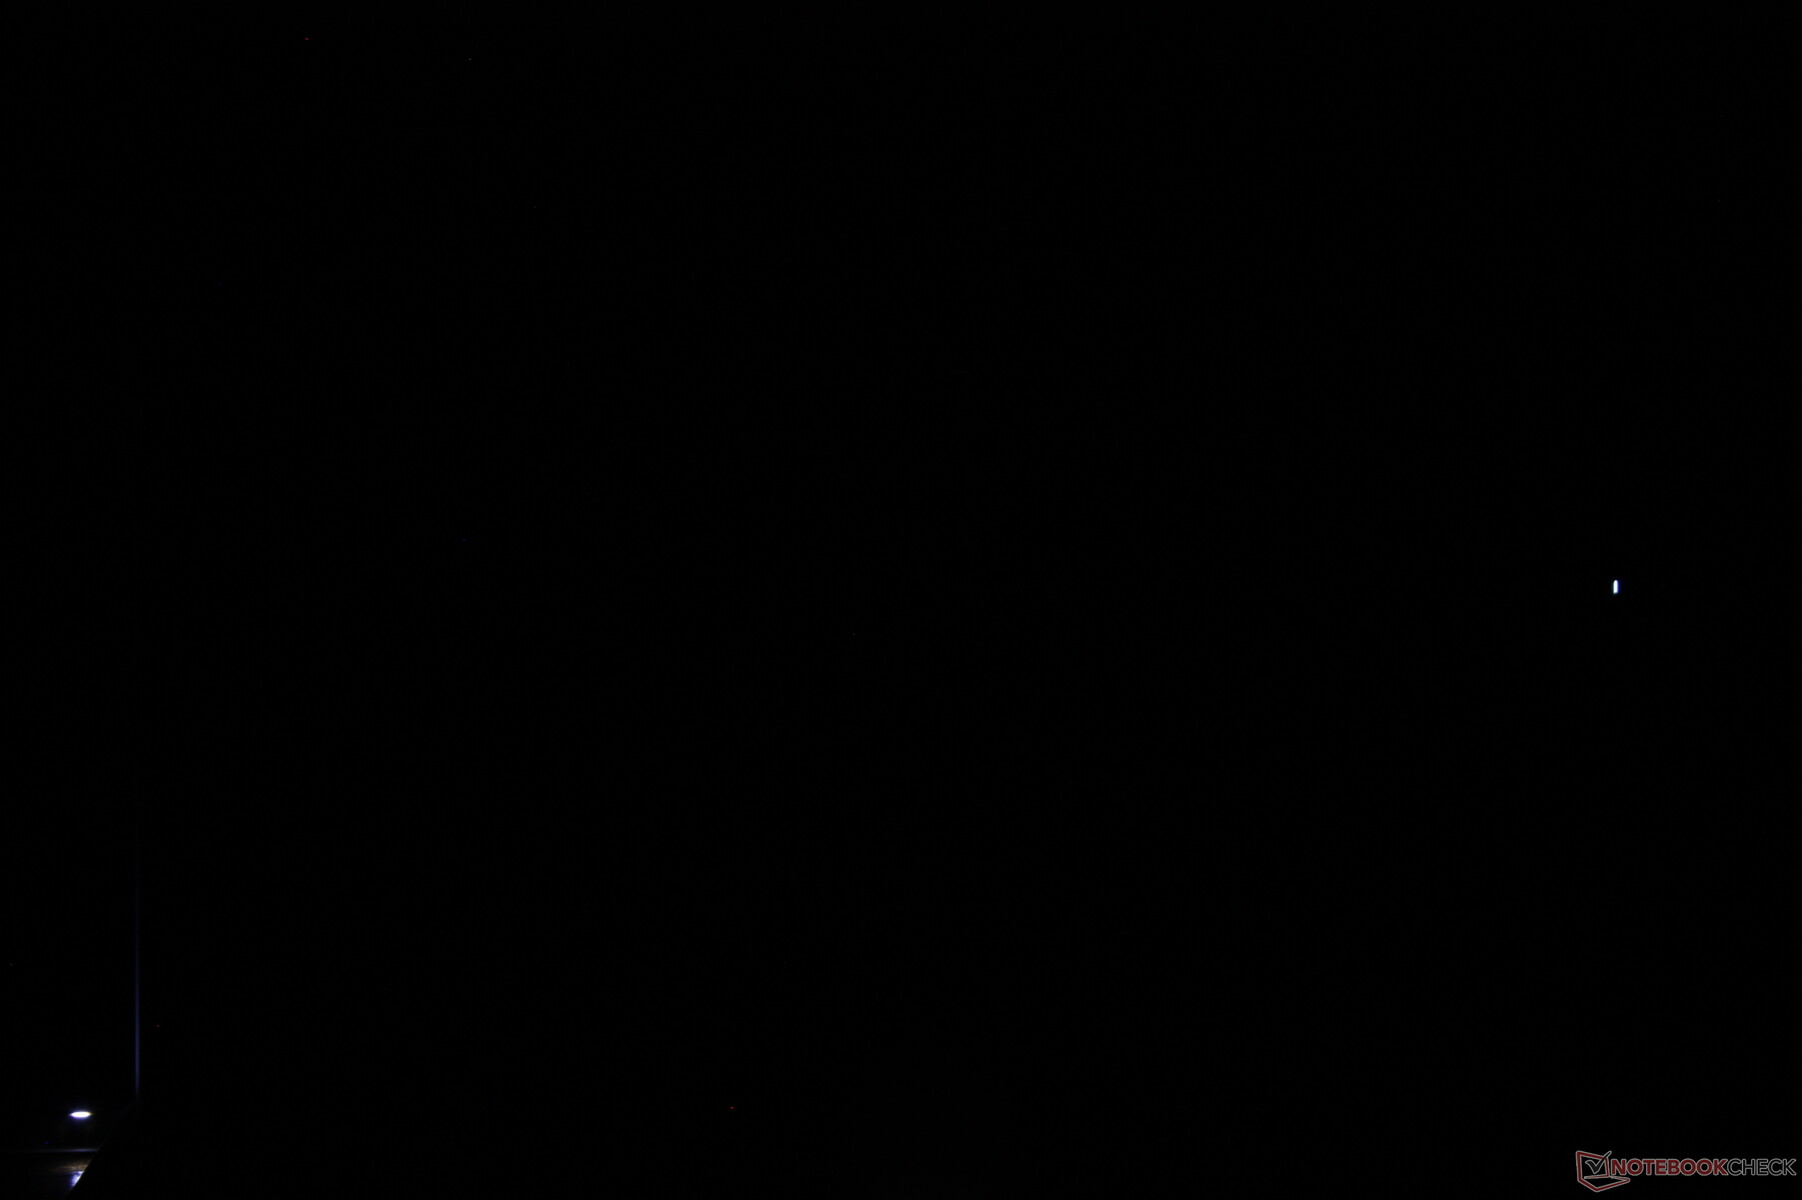
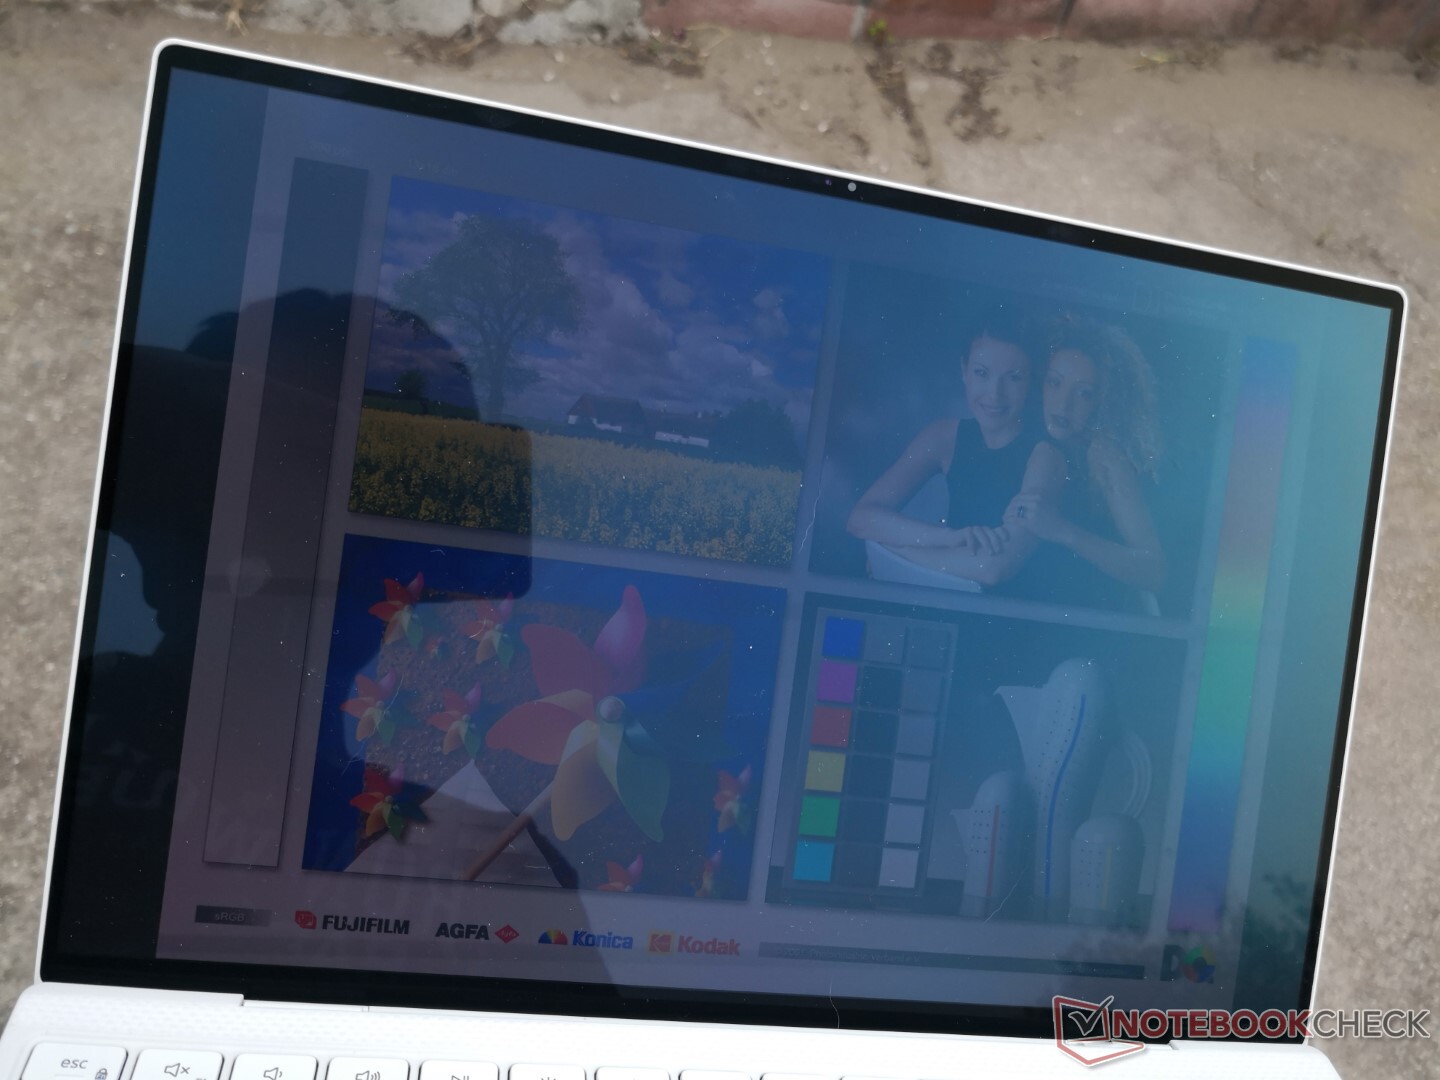
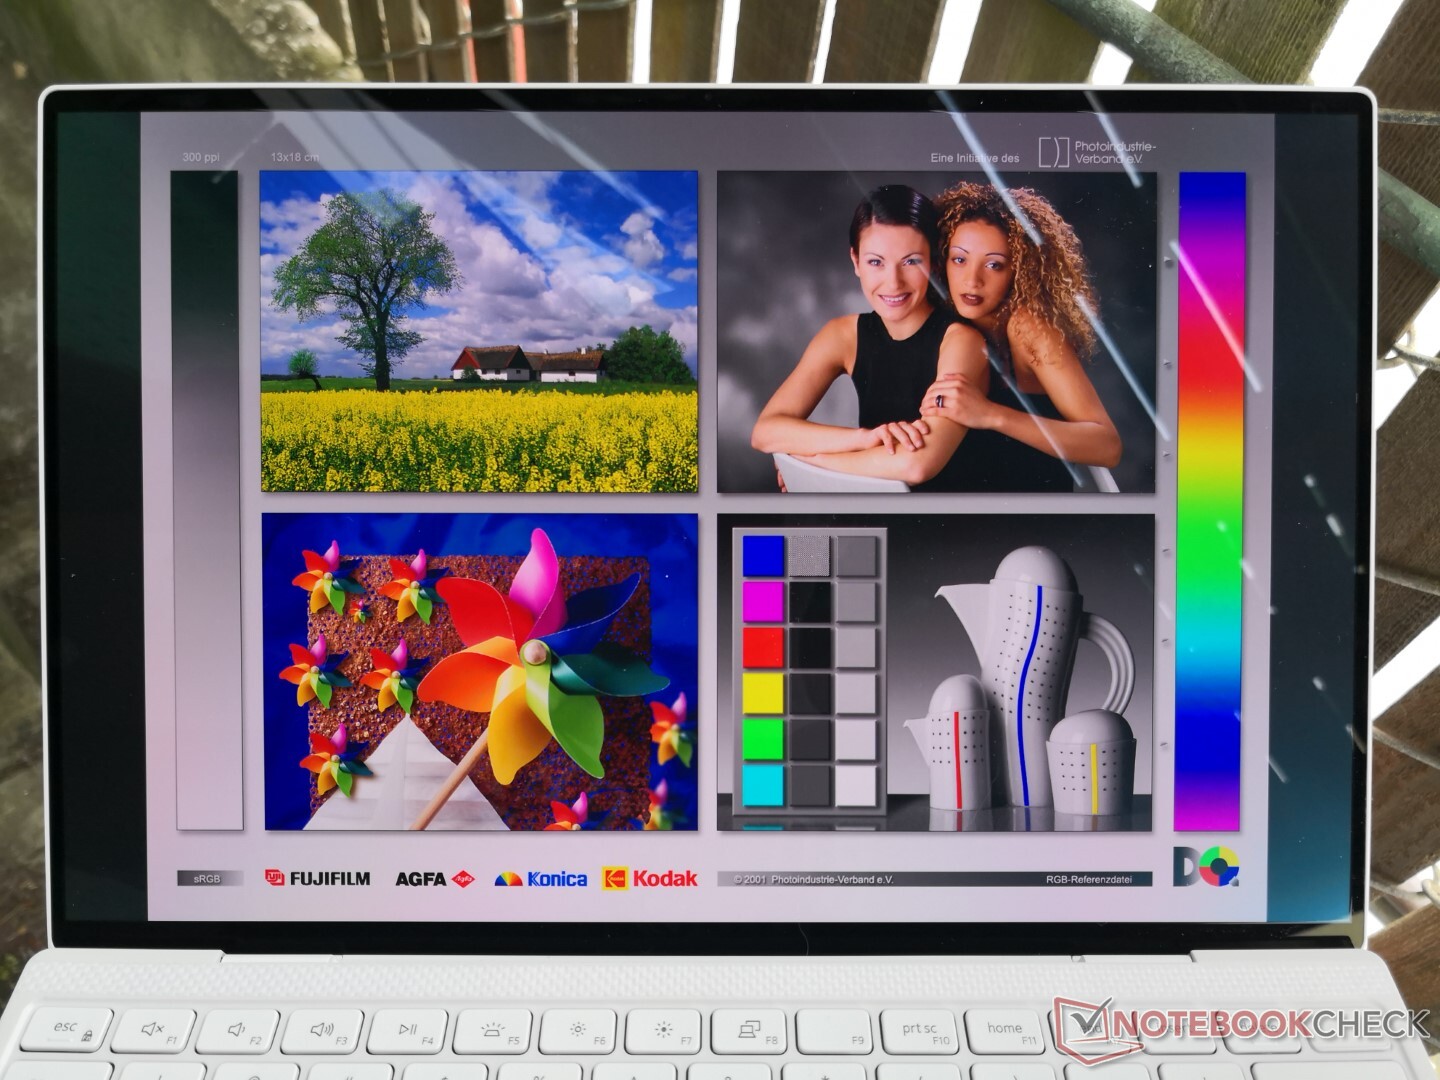
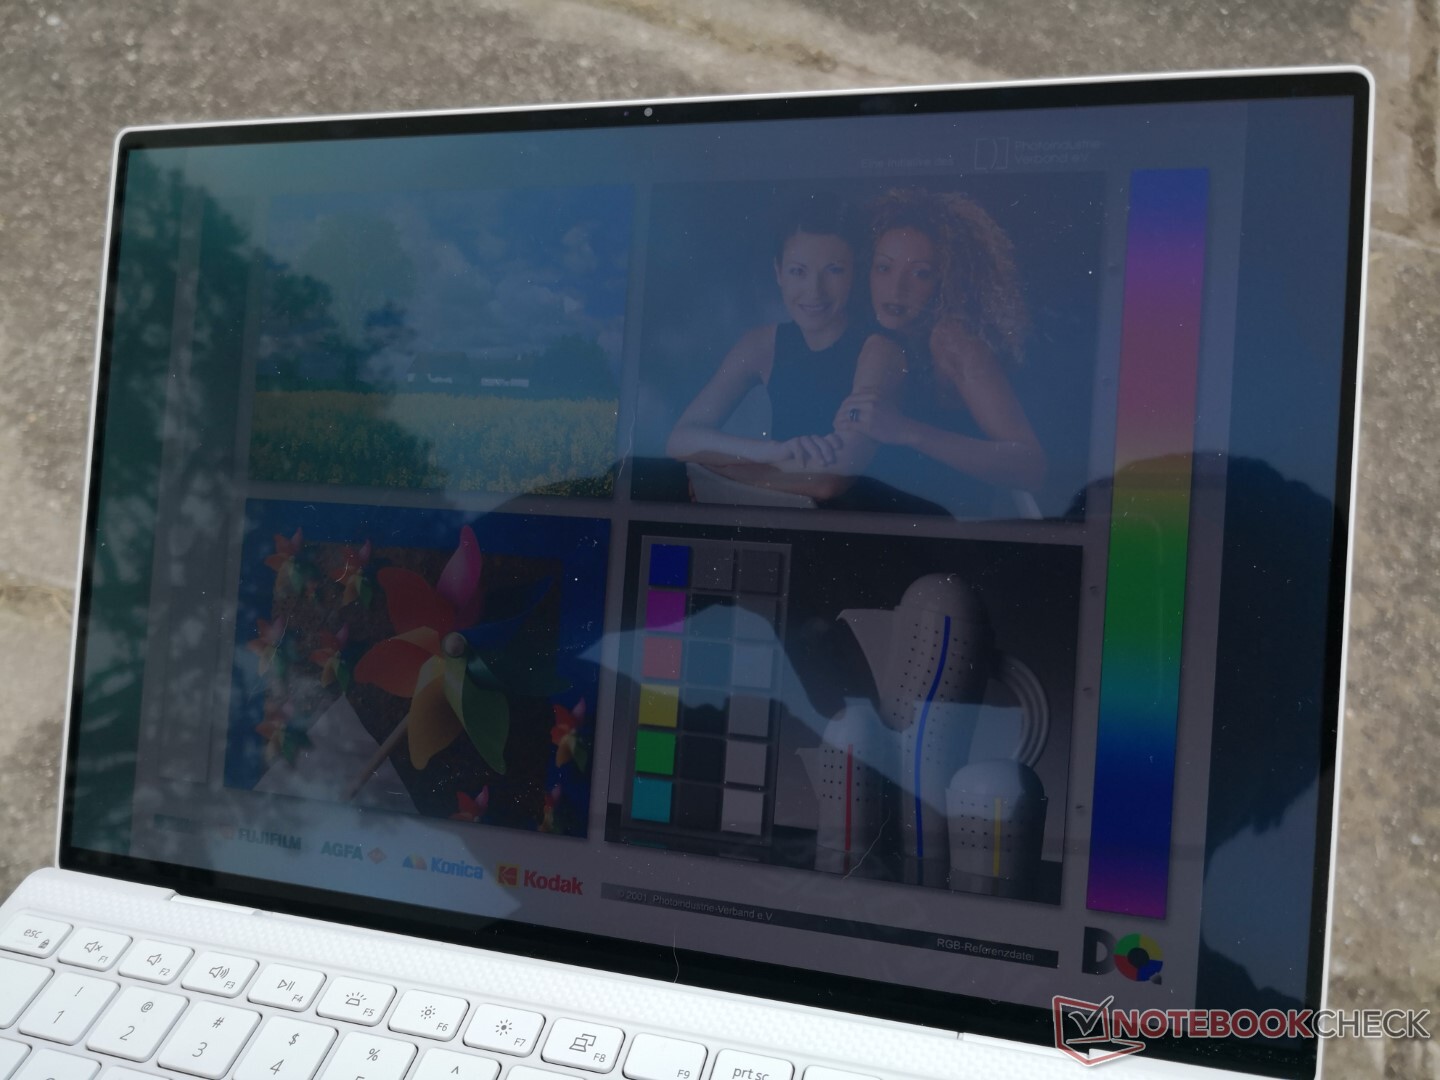
La visibilidad en exteriores es una mezcla. Aunque la OLED ofrece un mayor contraste para facilitar la lectura, no es tan brillante como la típica pantalla IPS del XPS 13 (384 nits frente a >500 nits). Por tanto, los reflejos siguen siendo un problema en la mayoría de condiciones. También vale la pena notar que la pantalla tiene un tono azul-verde cuando los reflejos son fuertes, lo cual es otra característica única que no se observa en IPS.
Rendimiento
Procesador
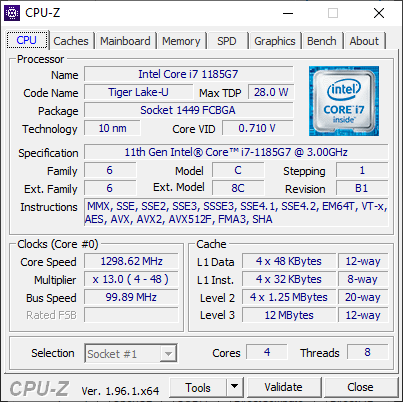
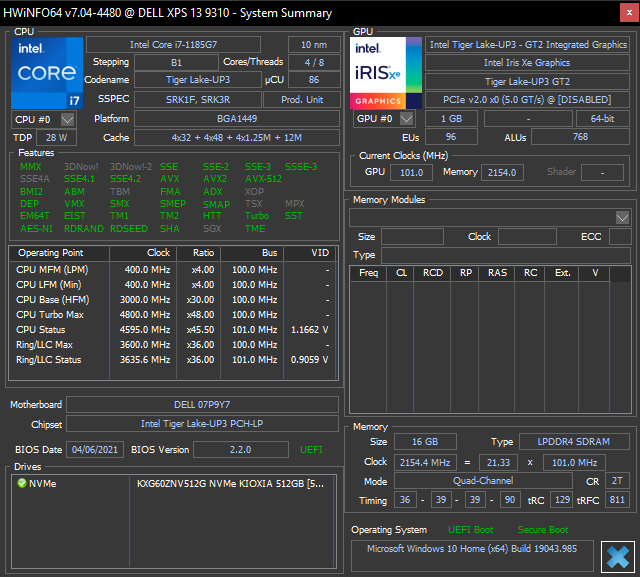
Como se señaló en nuestros anteriores análisis del XPS 13las frecuencias de reloj de la CPU se ciclan mucho cuando se ejecutan pruebas o juegos debido a la La política de energía dinámica de Dell. Esto puede observarse cuando se ejecuta CineBench R15 xT en un bucle o cuando se juega a juegos, ya que las puntuaciones y las tasas de fotogramas tienden a ciclar para reflejar las tasas de reloj inestables. Por ejemplo, las puntuaciones de CineBench R15 xT oscilan entre 609 y 765 puntos, mientras que las velocidades de Witcher 3 mientras que las velocidades de fotogramas oscilarían entre 66 y 95 simplemente al estar en reposo en el mapa del mundo.
Cinebench R23: Multi Core | Single Core
Cinebench R15: CPU Multi 64Bit | CPU Single 64Bit
Blender: v2.79 BMW27 CPU
7-Zip 18.03: 7z b 4 -mmt1 | 7z b 4
Geekbench 5.5: Single-Core | Multi-Core
HWBOT x265 Benchmark v2.2: 4k Preset
LibreOffice : 20 Documents To PDF
R Benchmark 2.5: Overall mean
| Cinebench R20 / CPU (Multi Core) | |
| Asus ZenBook 13 UM325S | |
| Lenovo Yoga Slim 7 14ARE05 82A20008GE | |
| Asus ZenBook 13 OLED UM325UA | |
| Dell XPS 13 7390 Core i7-10710U | |
| Medio Intel Core i7-1185G7 (1425 - 2493, n=28) | |
| Dell XPS 13 9310 OLED | |
| Dell XPS 13 9305 Core i5 FHD | |
| HP Envy 13-ba1475ng | |
| Asus VivoBook S13 S333JA-DS51 | |
| Asus ZenBook 13 UX325JA | |
| Dell Latitude 7300-P99G | |
| HP Envy 13-ba0001ng | |
| HP Envy 13-aq0003ng | |
| Cinebench R20 / CPU (Single Core) | |
| Medio Intel Core i7-1185G7 (489 - 593, n=28) | |
| Dell XPS 13 9310 OLED | |
| Asus ZenBook 13 UM325S | |
| HP Envy 13-ba1475ng | |
| Dell XPS 13 9305 Core i5 FHD | |
| Asus ZenBook 13 OLED UM325UA | |
| Lenovo Yoga Slim 7 14ARE05 82A20008GE | |
| Dell XPS 13 7390 Core i7-10710U | |
| Asus ZenBook 13 UX325JA | |
| HP Envy 13-ba0001ng | |
| Dell Latitude 7300-P99G | |
| Asus VivoBook S13 S333JA-DS51 | |
| HP Envy 13-aq0003ng | |
| Cinebench R23 / Multi Core | |
| Asus ZenBook 13 UM325S | |
| Lenovo Yoga Slim 7 14ARE05 82A20008GE | |
| Asus ZenBook 13 OLED UM325UA | |
| Dell XPS 13 9305 Core i5 FHD | |
| Medio Intel Core i7-1185G7 (3610 - 6383, n=24) | |
| Dell XPS 13 9310 OLED | |
| HP Envy 13-ba1475ng | |
| Asus VivoBook S13 S333JA-DS51 | |
| Cinebench R23 / Single Core | |
| Dell XPS 13 9310 OLED | |
| Medio Intel Core i7-1185G7 (1251 - 1532, n=24) | |
| Asus ZenBook 13 UM325S | |
| HP Envy 13-ba1475ng | |
| Dell XPS 13 9305 Core i5 FHD | |
| Asus ZenBook 13 OLED UM325UA | |
| Lenovo Yoga Slim 7 14ARE05 82A20008GE | |
| Asus VivoBook S13 S333JA-DS51 | |
| Cinebench R15 / CPU Multi 64Bit | |
| Asus ZenBook 13 UM325S | |
| Asus ZenBook 13 OLED UM325UA | |
| Lenovo Yoga Slim 7 14ARE05 82A20008GE | |
| Dell XPS 13 7390 Core i7-10710U | |
| Medio Intel Core i7-1185G7 (617 - 1066, n=32) | |
| Dell XPS 13 9310 OLED | |
| Dell XPS 13 9305 Core i5 FHD | |
| Asus ZenBook 13 UX325JA | |
| HP Envy 13-ba1475ng | |
| Dell Latitude 7300-P99G | |
| Asus VivoBook S13 S333JA-DS51 | |
| HP Envy 13-ba0001ng | |
| HP Envy 13-aq0003ng | |
| Cinebench R15 / CPU Single 64Bit | |
| Asus ZenBook 13 UM325S | |
| Dell XPS 13 9310 OLED | |
| Medio Intel Core i7-1185G7 (168 - 230, n=27) | |
| HP Envy 13-ba1475ng | |
| Dell Latitude 7300-P99G | |
| Asus ZenBook 13 OLED UM325UA | |
| Asus ZenBook 13 UX325JA | |
| Dell XPS 13 7390 Core i7-10710U | |
| Lenovo Yoga Slim 7 14ARE05 82A20008GE | |
| HP Envy 13-ba0001ng | |
| HP Envy 13-aq0003ng | |
| Asus VivoBook S13 S333JA-DS51 | |
| Blender / v2.79 BMW27 CPU | |
| Asus ZenBook 13 UX325JA | |
| HP Envy 13-ba0001ng | |
| Asus VivoBook S13 S333JA-DS51 | |
| HP Envy 13-ba1475ng | |
| Dell XPS 13 9310 OLED | |
| Dell XPS 13 9305 Core i5 FHD | |
| Medio Intel Core i7-1185G7 (478 - 745, n=28) | |
| Dell XPS 13 7390 Core i7-10710U | |
| Lenovo Yoga Slim 7 14ARE05 82A20008GE | |
| Asus ZenBook 13 OLED UM325UA | |
| Asus ZenBook 13 UM325S | |
| 7-Zip 18.03 / 7z b 4 -mmt1 | |
| Asus ZenBook 13 UM325S | |
| Medio Intel Core i7-1185G7 (3678 - 5507, n=27) | |
| HP Envy 13-ba1475ng | |
| HP Envy 13-ba0001ng | |
| Dell XPS 13 9305 Core i5 FHD | |
| Asus ZenBook 13 OLED UM325UA | |
| Dell XPS 13 7390 Core i7-10710U | |
| Lenovo Yoga Slim 7 14ARE05 82A20008GE | |
| Asus ZenBook 13 UX325JA | |
| Asus VivoBook S13 S333JA-DS51 | |
| Dell XPS 13 9310 OLED | |
| 7-Zip 18.03 / 7z b 4 | |
| Asus ZenBook 13 UM325S | |
| Asus ZenBook 13 OLED UM325UA | |
| Lenovo Yoga Slim 7 14ARE05 82A20008GE | |
| Dell XPS 13 7390 Core i7-10710U | |
| Dell XPS 13 9305 Core i5 FHD | |
| Medio Intel Core i7-1185G7 (18812 - 27693, n=27) | |
| Dell XPS 13 9310 OLED | |
| HP Envy 13-ba1475ng | |
| Asus VivoBook S13 S333JA-DS51 | |
| HP Envy 13-ba0001ng | |
| Asus ZenBook 13 UX325JA | |
| Geekbench 5.5 / Single-Core | |
| Dell XPS 13 9310 OLED | |
| Medio Intel Core i7-1185G7 (1398 - 1626, n=21) | |
| HP Envy 13-ba1475ng | |
| Asus ZenBook 13 UM325S | |
| Dell XPS 13 9305 Core i5 FHD | |
| Asus ZenBook 13 UX325JA | |
| HP Envy 13-ba0001ng | |
| Asus ZenBook 13 OLED UM325UA | |
| Asus VivoBook S13 S333JA-DS51 | |
| Lenovo Yoga Slim 7 14ARE05 82A20008GE | |
| Geekbench 5.5 / Multi-Core | |
| Asus ZenBook 13 UM325S | |
| Asus ZenBook 13 OLED UM325UA | |
| Lenovo Yoga Slim 7 14ARE05 82A20008GE | |
| Dell XPS 13 9310 OLED | |
| Medio Intel Core i7-1185G7 (4620 - 5944, n=21) | |
| Dell XPS 13 9305 Core i5 FHD | |
| HP Envy 13-ba1475ng | |
| Asus ZenBook 13 UX325JA | |
| Asus VivoBook S13 S333JA-DS51 | |
| HP Envy 13-ba0001ng | |
| HWBOT x265 Benchmark v2.2 / 4k Preset | |
| Asus ZenBook 13 UM325S | |
| Lenovo Yoga Slim 7 14ARE05 82A20008GE | |
| Asus ZenBook 13 OLED UM325UA | |
| Medio Intel Core i7-1185G7 (5.02 - 8.13, n=27) | |
| Dell XPS 13 9310 OLED | |
| Dell XPS 13 7390 Core i7-10710U | |
| HP Envy 13-ba1475ng | |
| Asus VivoBook S13 S333JA-DS51 | |
| HP Envy 13-ba0001ng | |
| Asus ZenBook 13 UX325JA | |
| LibreOffice / 20 Documents To PDF | |
| Lenovo Yoga Slim 7 14ARE05 82A20008GE | |
| Asus VivoBook S13 S333JA-DS51 | |
| Asus ZenBook 13 OLED UM325UA | |
| Dell XPS 13 9305 Core i5 FHD | |
| HP Envy 13-ba0001ng | |
| HP Envy 13-ba1475ng | |
| Asus ZenBook 13 UM325S | |
| Asus ZenBook 13 UX325JA | |
| Medio Intel Core i7-1185G7 (41.3 - 61.7, n=26) | |
| Dell XPS 13 9310 OLED | |
| R Benchmark 2.5 / Overall mean | |
| Asus VivoBook S13 S333JA-DS51 | |
| Asus ZenBook 13 UX325JA | |
| HP Envy 13-ba0001ng | |
| Dell XPS 13 9305 Core i5 FHD | |
| Lenovo Yoga Slim 7 14ARE05 82A20008GE | |
| HP Envy 13-ba1475ng | |
| Asus ZenBook 13 OLED UM325UA | |
| Dell XPS 13 9310 OLED | |
| Medio Intel Core i7-1185G7 (0.55 - 0.615, n=27) | |
| Asus ZenBook 13 UM325S | |
Cinebench R23: Multi Core | Single Core
Cinebench R15: CPU Multi 64Bit | CPU Single 64Bit
Blender: v2.79 BMW27 CPU
7-Zip 18.03: 7z b 4 -mmt1 | 7z b 4
Geekbench 5.5: Single-Core | Multi-Core
HWBOT x265 Benchmark v2.2: 4k Preset
LibreOffice : 20 Documents To PDF
R Benchmark 2.5: Overall mean
* ... más pequeño es mejor
Rendimiento del sistema
| PCMark 10 Score | 5226 puntos | |
ayuda | ||
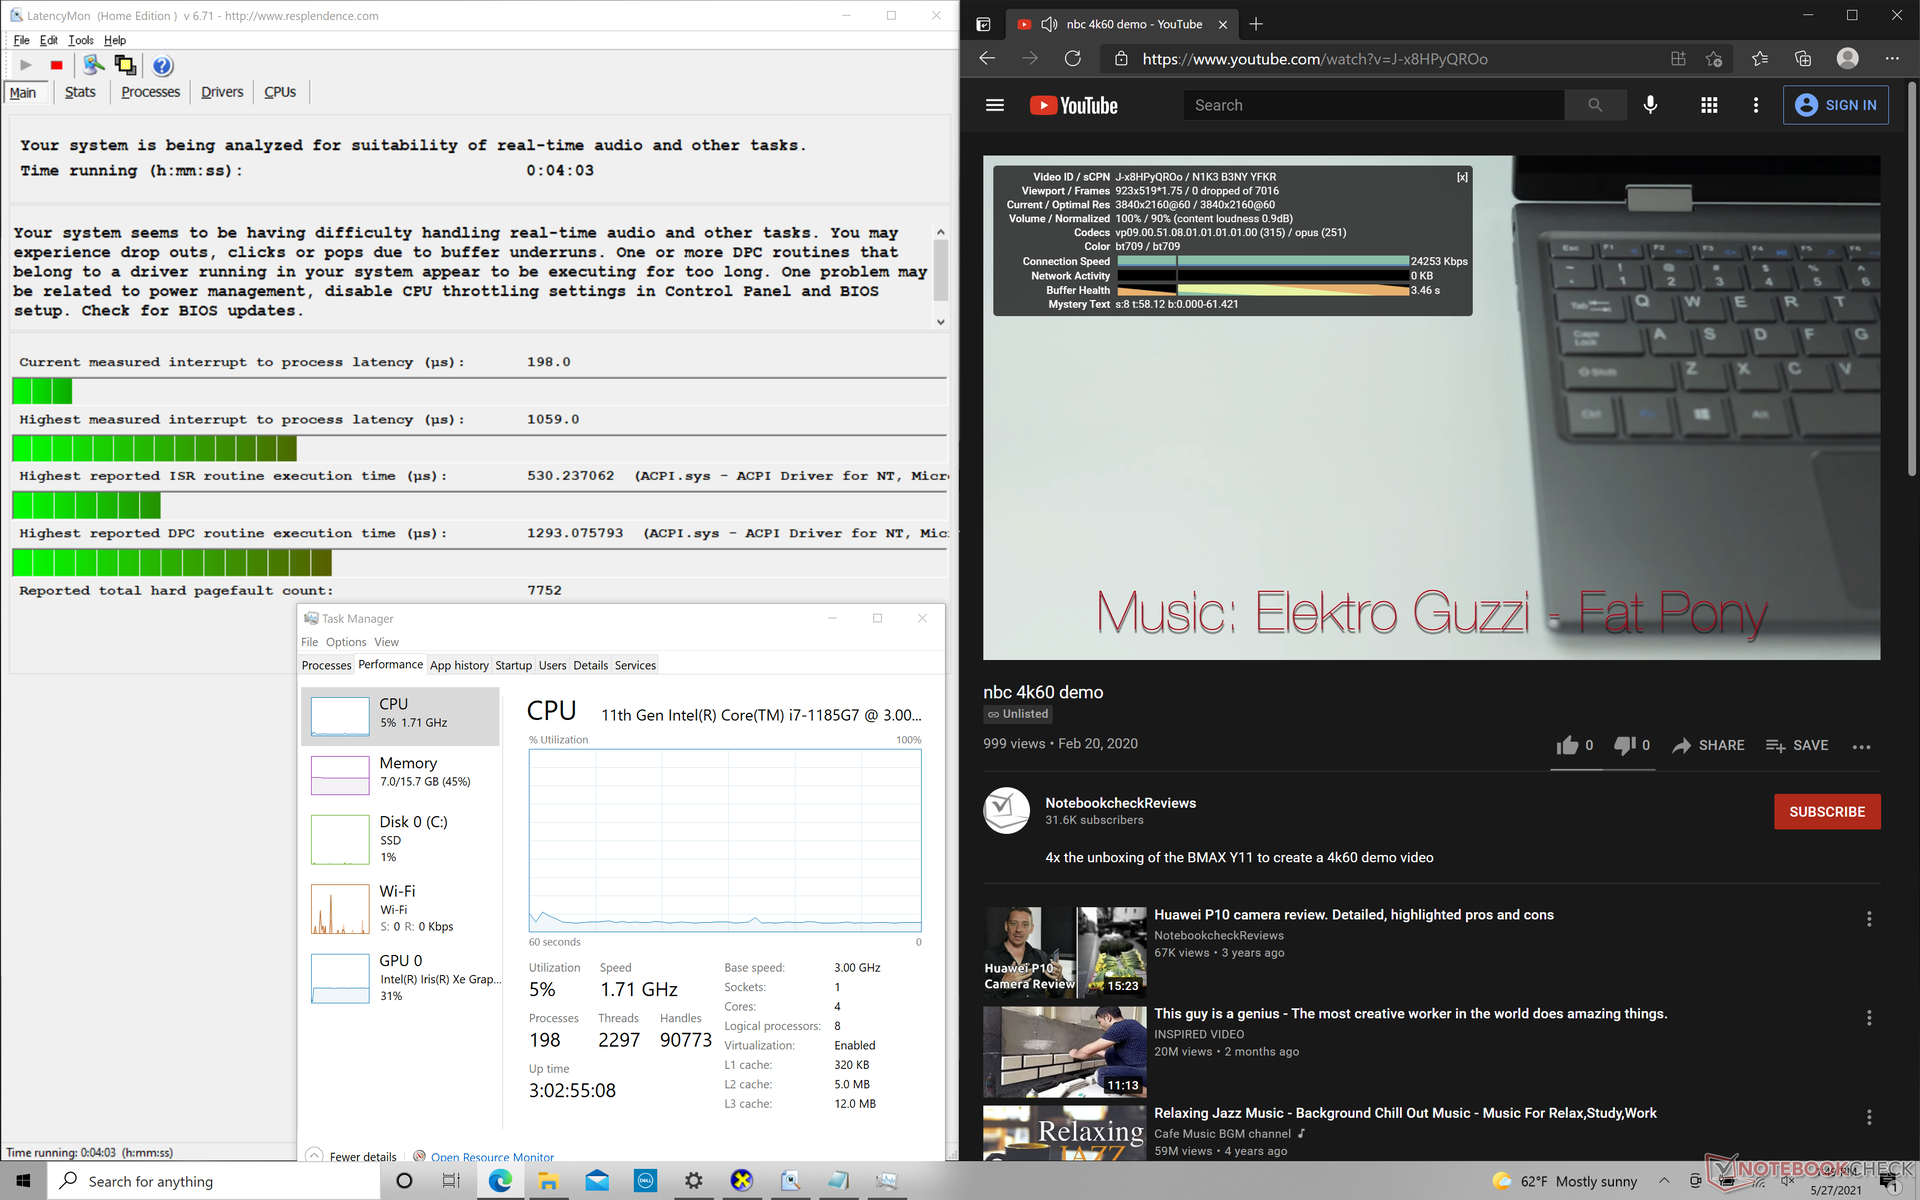
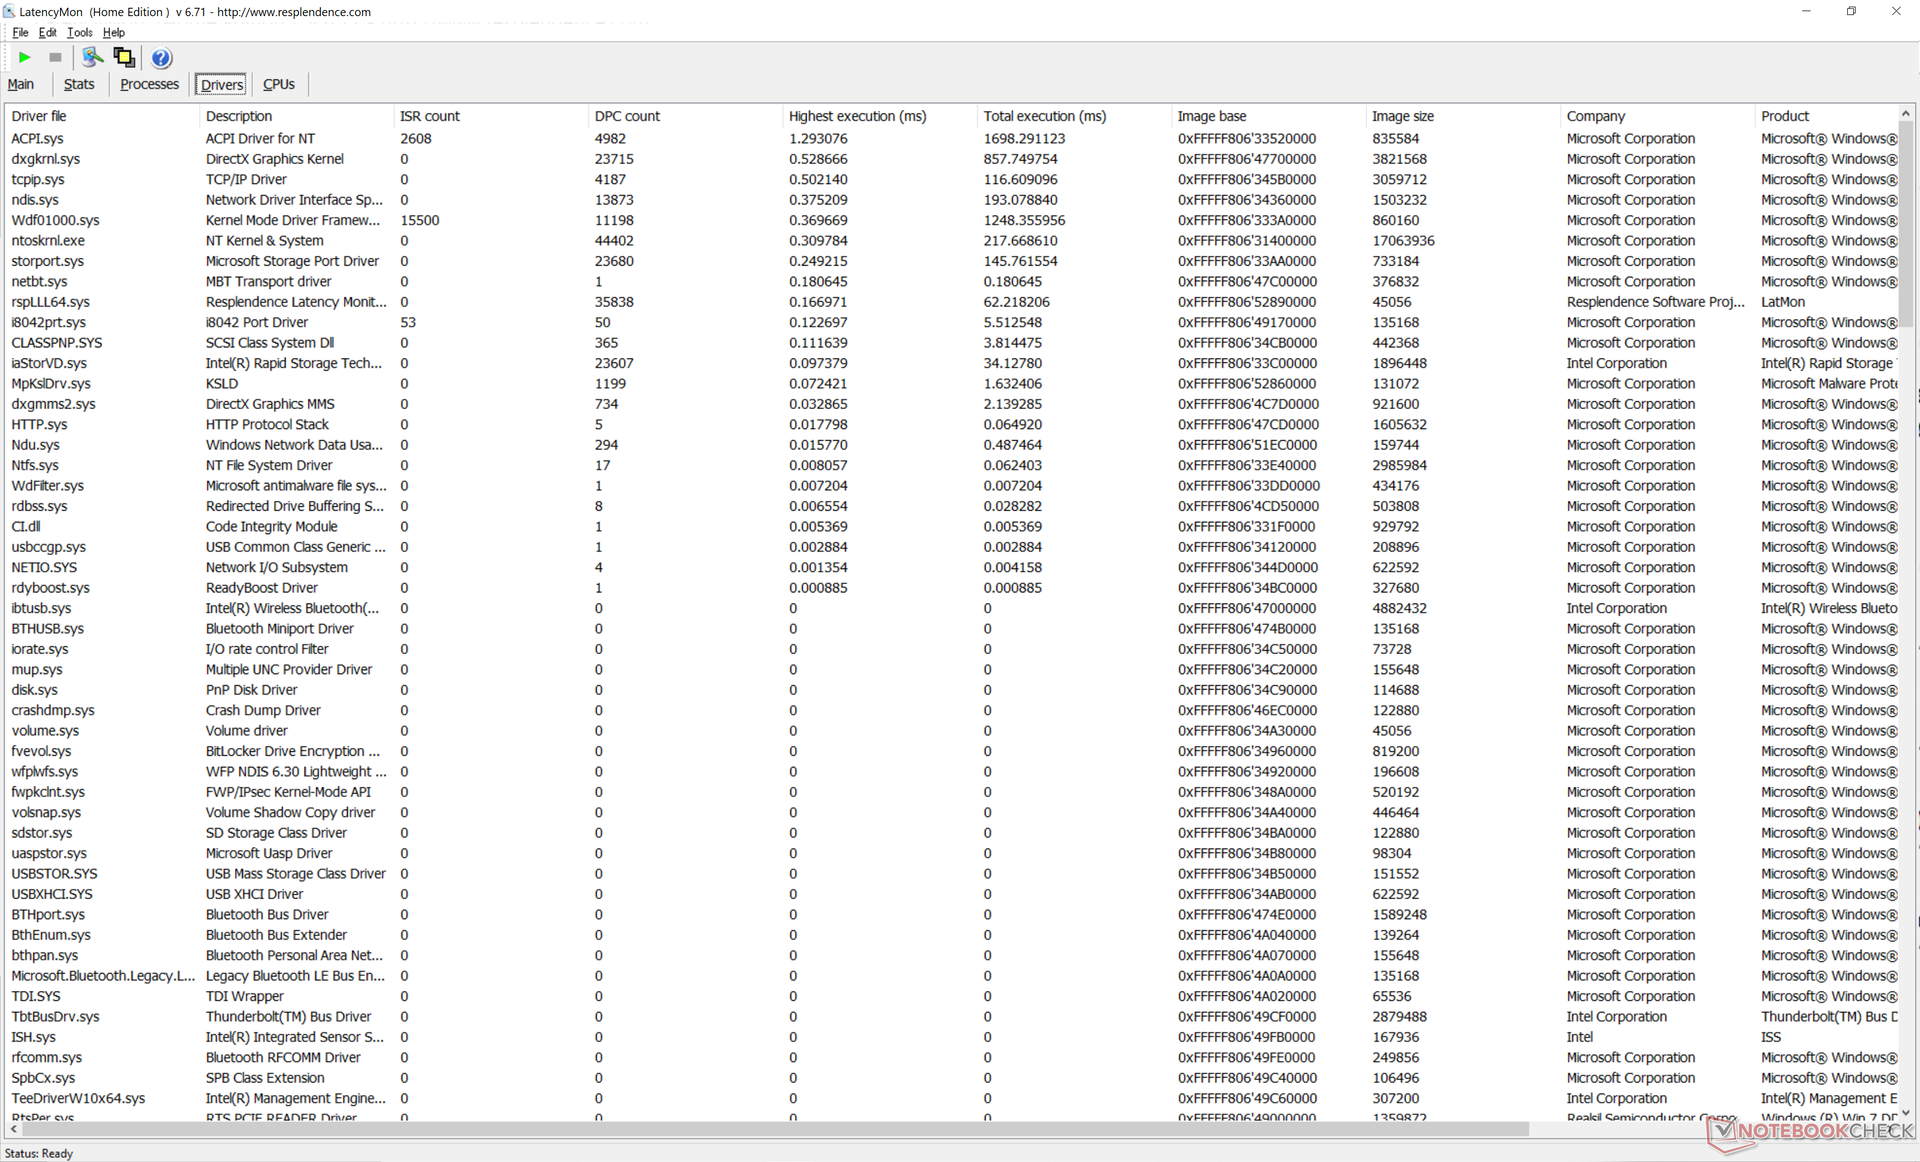
Latencia del CPD
La serie sigue mostrando ligeros problemas de latencia DPC. La reproducción de vídeo 4K a 60 FPS, por suerte, sigue siendo fluida y sin pérdida de fotogramas.
| DPC Latencies / LatencyMon - interrupt to process latency (max), Web, Youtube, Prime95 | |
| MSI Summit E13 Flip Evo A11MT | |
| Dell XPS 13 9310 Core i7 4K | |
| Dell XPS 13 9310 OLED | |
| Dell XPS 13 9310 Core i7 FHD | |
* ... más pequeño es mejor
Dispositivos de almacenamiento
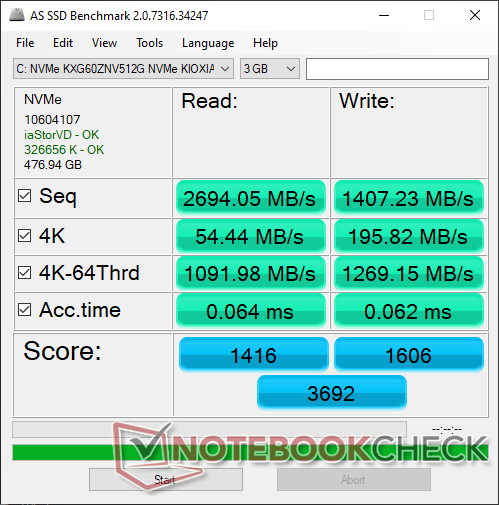
| Dell XPS 13 9310 OLED Toshiba XG6 KXG60ZNV512G | Dell XPS 13 9310 Core i7 FHD Micron 2300 512GB MTFDHBA512TDV | Dell XPS 13 7390 Core i7-10710U SK Hynix PC601 NVMe 512 GB | MSI Summit E13 Flip Evo A11MT Phison 1TB SM2801T24GKBB4S-E162 | |
|---|---|---|---|---|
| AS SSD | -43% | -25% | 23% | |
| Seq Read (MB/s) | 2694 | 2091 -22% | 1804 -33% | 3789 41% |
| Seq Write (MB/s) | 1407 | 1396 -1% | 1000 -29% | 2257 60% |
| 4K Read (MB/s) | 54.4 | 49.29 -9% | 45.1 -17% | 54.2 0% |
| 4K Write (MB/s) | 195.8 | 104.2 -47% | 115 -41% | 78.7 -60% |
| 4K-64 Read (MB/s) | 1092 | 827 -24% | 893 -18% | 1330 22% |
| 4K-64 Write (MB/s) | 1269 | 1636 29% | 732 -42% | 2038 61% |
| Access Time Read * (ms) | 0.064 | 0.066 -3% | 0.044 31% | 0.042 34% |
| Access Time Write * (ms) | 0.062 | 0.365 -489% | 0.095 -53% | 0.04 35% |
| Score Read (Points) | 1416 | 1086 -23% | 1119 -21% | 1763 25% |
| Score Write (Points) | 1606 | 1880 17% | 947 -41% | 2343 46% |
| Score Total (Points) | 3692 | 3499 -5% | 2608 -29% | 4938 34% |
| Copy ISO MB/s (MB/s) | 1782 | 1544 -13% | 1515 -15% | 2270 27% |
| Copy Program MB/s (MB/s) | 1023 | 613 -40% | 535 -48% | 670 -35% |
| Copy Game MB/s (MB/s) | 1148 | 1451 26% | 1211 5% | 1525 33% |
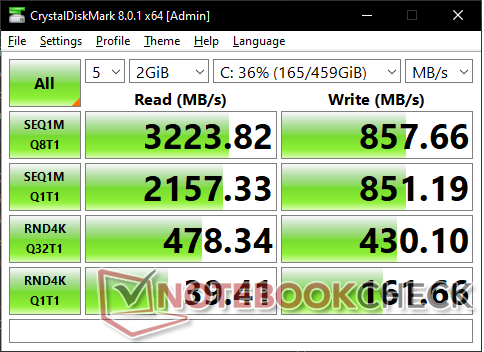
| CrystalDiskMark 5.2 / 6 | 41% | 30% | 95% | |
| Write 4K (MB/s) | 156.8 | 97.5 -38% | 134 -15% | 311.1 98% |
| Read 4K (MB/s) | 39.66 | 50.9 28% | 42.91 8% | 56.6 43% |
| Write Seq (MB/s) | 854 | 1811 112% | 1841 116% | 2397 181% |
| Read Seq (MB/s) | 2167 | 1836 -15% | 1707 -21% | 2277 5% |
| Write 4K Q32T1 (MB/s) | 441.1 | 521 18% | 394.7 -11% | 803 82% |
| Read 4K Q32T1 (MB/s) | 395.5 | 357.5 -10% | 398.5 1% | 849 115% |
| Write Seq Q32T1 (MB/s) | 858 | 2879 236% | 2250 162% | 2410 181% |
| Read Seq Q32T1 (MB/s) | 3258 | 3204 -2% | 3265 0% | 4954 52% |
| Media total (Programa/Opciones) | -1% /
-13% | 3% /
-5% | 59% /
49% |
* ... más pequeño es mejor

Disk Throttling: DiskSpd Read Loop, Queue Depth 8
Rendimiento de la GPU
| 3DMark 11 Performance | 6398 puntos | |
| 3DMark Cloud Gate Standard Score | 15019 puntos | |
| 3DMark Fire Strike Score | 4449 puntos | |
| 3DMark Time Spy Score | 1526 puntos | |
ayuda | ||
| bajo | medio | alto | ultra | QHD | 4K | |
|---|---|---|---|---|---|---|
| The Witcher 3 (2015) | 98.6 | 61.1 | 32 | 13.9 | ||
| Dota 2 Reborn (2015) | 76.1 | 74.7 | 41.6 | 43.4 | 21.5 | |
| Final Fantasy XV Benchmark (2018) | 35 | 19.9 | 15.1 | 15.1 | 15.1 | |
| X-Plane 11.11 (2018) | 25.1 | 35.2 | 29.4 | 17.1 | ||
| Strange Brigade (2018) | 88.4 | 33.2 | 29.7 | 22.3 | 16.9 |
Emissions
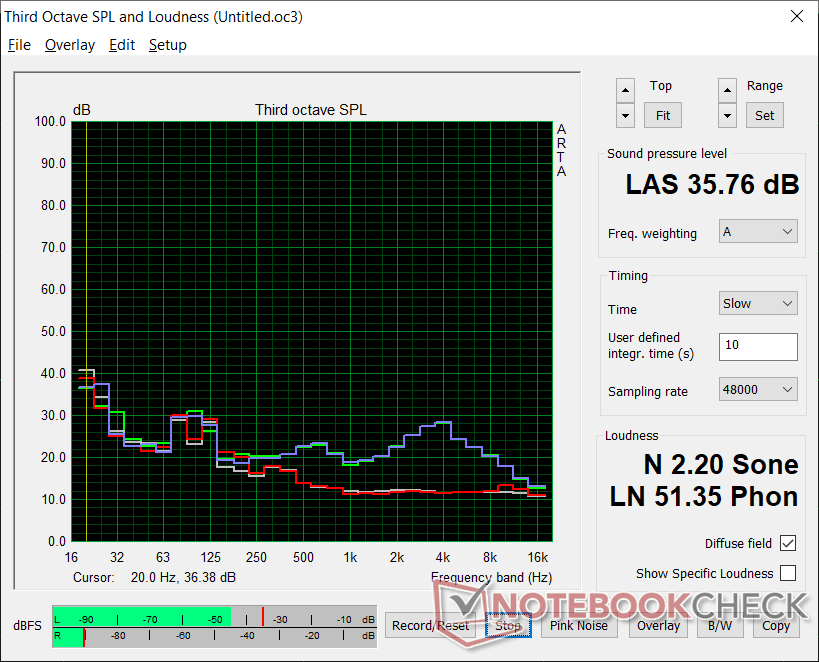
Ruido del sistema
| Dell XPS 13 9310 OLED Iris Xe G7 96EUs, i7-1185G7, Toshiba XG6 KXG60ZNV512G | Dell XPS 13 9310 Core i7 4K Iris Xe G7 96EUs, i7-1185G7, Micron 2300 512GB MTFDHBA512TDV | Dell XPS 13 9310 Core i7 FHD Iris Xe G7 96EUs, i7-1165G7, Micron 2300 512GB MTFDHBA512TDV | Dell XPS 13 7390 Core i7-10710U UHD Graphics 620, i7-10710U, SK Hynix PC601 NVMe 512 GB | MSI Summit E13 Flip Evo A11MT Iris Xe G7 96EUs, i7-1185G7, Phison 1TB SM2801T24GKBB4S-E162 | |
|---|---|---|---|---|---|
| Noise | -7% | -3% | -19% | -15% | |
| apagado / medio ambiente * (dB) | 24.8 | 27.7 -12% | 25.7 -4% | 28 -13% | 24.5 1% |
| Idle Minimum * (dB) | 25 | 27.8 -11% | 25.7 -3% | 28 -12% | 24.7 1% |
| Idle Average * (dB) | 25 | 27.8 -11% | 25.7 -3% | 28 -12% | 24.7 1% |
| Idle Maximum * (dB) | 25 | 27.8 -11% | 25.9 -4% | 28 -12% | 26.4 -6% |
| Load Average * (dB) | 25.3 | 27.9 -10% | 26.2 -4% | 33.7 -33% | 37.8 -49% |
| Witcher 3 ultra * (dB) | 35.8 | 32.8 8% | 36.5 -2% | 41.4 -16% | |
| Load Maximum * (dB) | 35.8 | 37 -3% | 36.6 -2% | 46.5 -30% | 48.8 -36% |
* ... más pequeño es mejor
Ruido
| Ocioso |
| 25 / 25 / 25 dB(A) |
| Carga |
| 25.3 / 35.8 dB(A) |
 | ||
30 dB silencioso 40 dB(A) audible 50 dB(A) ruidosamente alto |
||
min: | ||
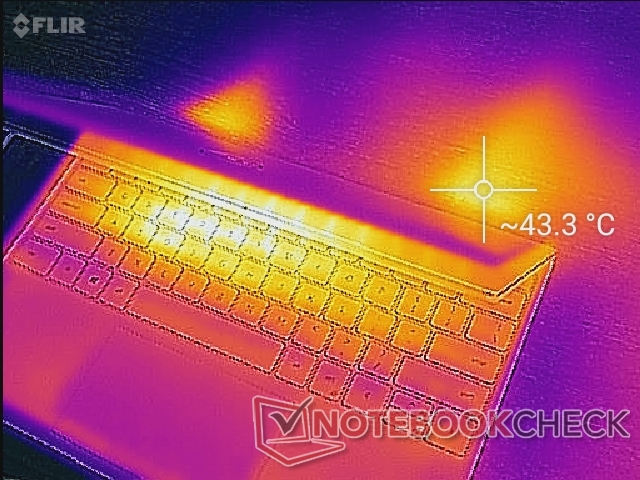
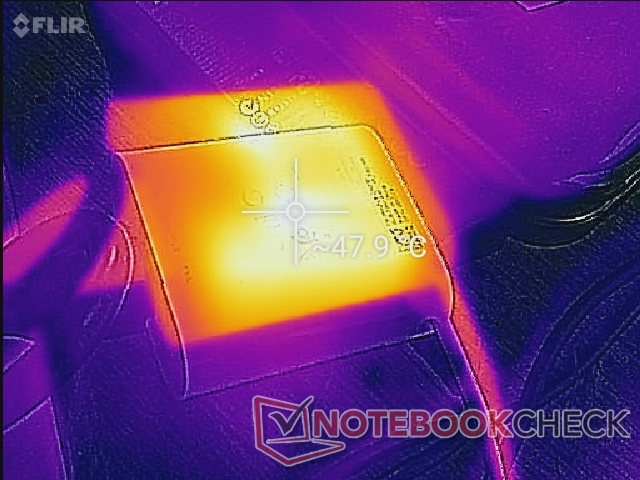
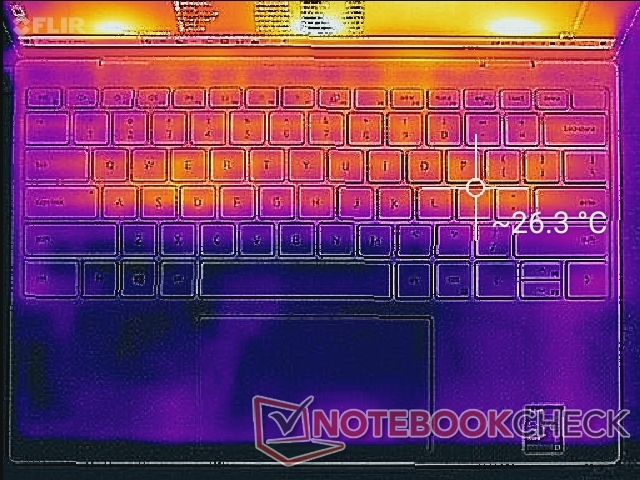
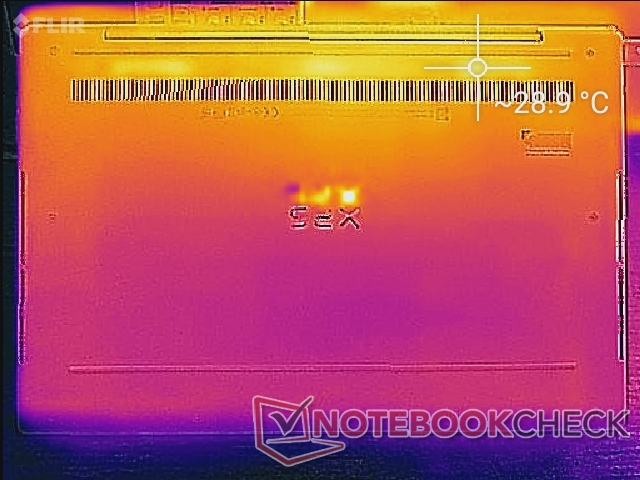
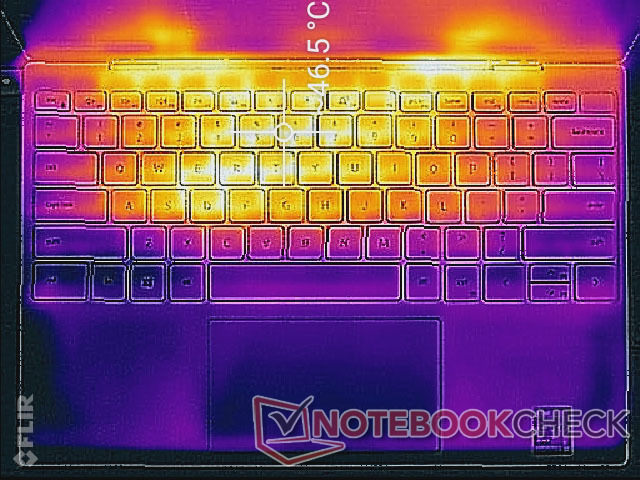
Temperatura
Altavoces

Energy Management
Consumo de energía
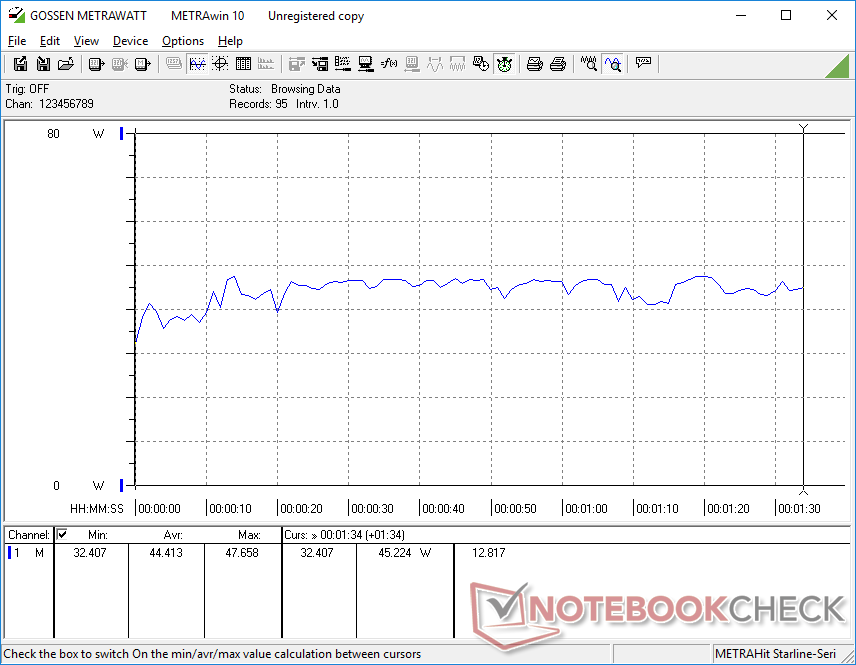
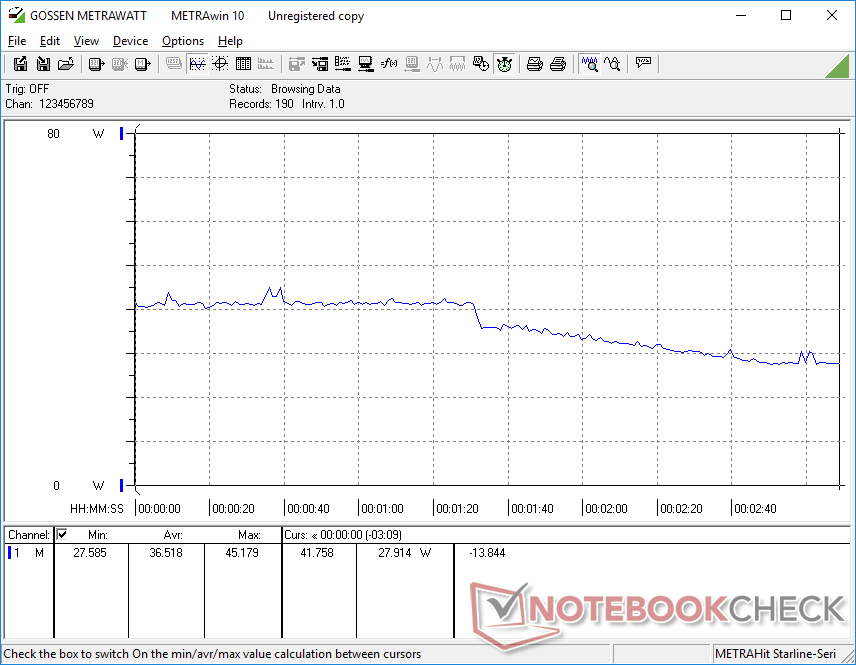
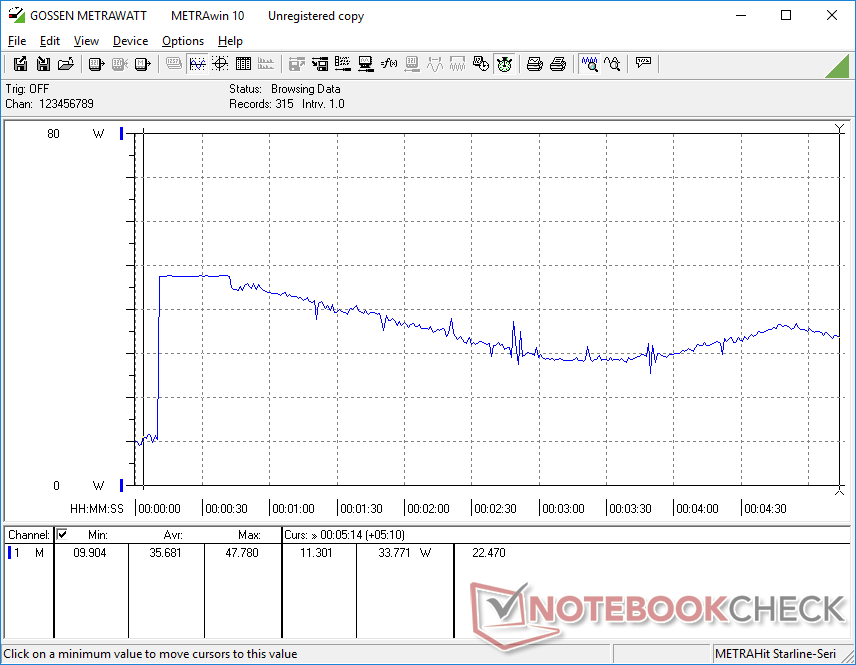
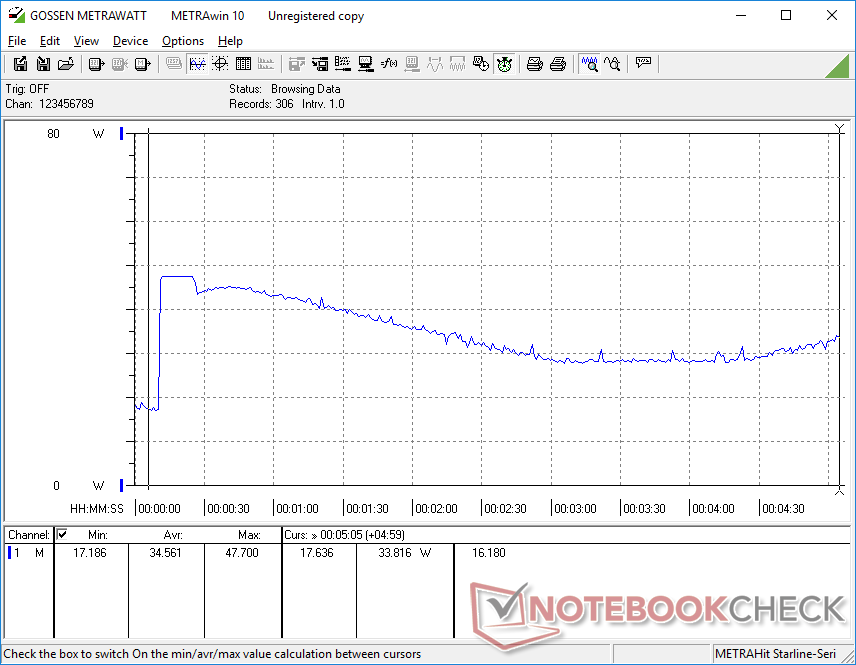
El comportamiento del consumo de energía es exactamente como lo que observamos en el Razer Blade 15 OLED. En resumen, se necesita más energía para hacer funcionar la pantalla OLED con ajustes más brillantes y colores más vivos que en un panel IPS. Por el contrario, se necesita menos energía para hacer funcionar una pantalla OLED con ajustes más tenues y colores más oscuros. Por ejemplo, la visualización de todos los blancos en el ajuste de brillo máximo en nuestro XPS 13 OLED consume 6,2 W más que el ajuste de brillo mínimo, mientras que la diferencia sólo sería de 2 W y 4 W en el XPS 13 FHD IPS y XPS 13 4K IPS SKU, respectivamente. Eso es alrededor de 3 veces más energía para OLED que una solución típica IPS FHD
Mostrar todo en negro consume la misma cantidad de energía sin importar el ajuste de brillo, ya que los píxeles individuales de OLED están esencialmente apagados para un contraste infinito. Hemos podido medir un consumo de sólo 6 W en tales condiciones, como se muestra en la tabla siguiente.
| Color en pantalla completa | Ajuste de brillo | Consumo de energía (W) |
|---|---|---|
| Blanco | 0% | 6.1 |
| Blanco | 100% | 12.3 |
| Negro | 0% | 6 |
| Negro | 100% | 6 |
| Off / Standby | |
| Ocioso | |
| Carga |
|
Clave:
min: | |
| Dell XPS 13 9310 OLED i7-1185G7, Iris Xe G7 96EUs, Toshiba XG6 KXG60ZNV512G, OLED, 3456x2160, 13.4" | Dell XPS 13 9310 Core i7 4K i7-1185G7, Iris Xe G7 96EUs, Micron 2300 512GB MTFDHBA512TDV, IPS, 3840x2400, 13.4" | Dell XPS 13 9310 Core i7 FHD i7-1165G7, Iris Xe G7 96EUs, Micron 2300 512GB MTFDHBA512TDV, IPS, 1920x1200, 13.4" | Dell XPS 13 7390 Core i7-10710U i7-10710U, UHD Graphics 620, SK Hynix PC601 NVMe 512 GB, IPS, 3840x2160, 13.3" | MSI Summit E13 Flip Evo A11MT i7-1185G7, Iris Xe G7 96EUs, Phison 1TB SM2801T24GKBB4S-E162, IPS, 1920x1200, 13.4" | |
|---|---|---|---|---|---|
| Power Consumption | -1% | 17% | 2% | -13% | |
| Idle Minimum * (Watt) | 5.7 | 4.3 25% | 3.9 32% | 4.7 18% | 4.8 16% |
| Idle Average * (Watt) | 6 | 8.3 -38% | 5.9 2% | 8.3 -38% | 8.4 -40% |
| Idle Maximum * (Watt) | 12.3 | 8.8 28% | 6.3 49% | 9 27% | 8.6 30% |
| Load Average * (Watt) | 44.4 | 46.2 -4% | 39.7 11% | 42 5% | 47.1 -6% |
| Witcher 3 ultra * (Watt) | 36.5 | 42.2 -16% | 34.8 5% | 51.6 -41% | |
| Load Maximum * (Watt) | 47.8 | 47.3 1% | 47.5 1% | 49 -3% | 65.9 -38% |
* ... más pequeño es mejor
Duración de la batería
La duración depende en gran medida del brillo y el color, como demuestran nuestros resultados de consumo de energía anteriores. Al navegar por la web en modo equilibrado con la pantalla ajustada a 150 nits, pudimos registrar una duración de 6 horas y 31 minutos con una carga completa. Cuando se ejecuta esta misma prueba con el modo de alto contraste de Windows activado, los tiempos de ejecución se duplican hasta llegar a 13 horas y 40 minutos. El modo de alto contraste no siempre es el ideal, por supuesto, pero ayuda a ilustrar lo mucho que puede durar la batería simplemente cambiando la pantalla a colores más oscuros. Esto es especialmente cierto cuando se navega por la web o el procesamiento de textos, ya que la mayor parte de la pantalla es blanca en estos escenarios.
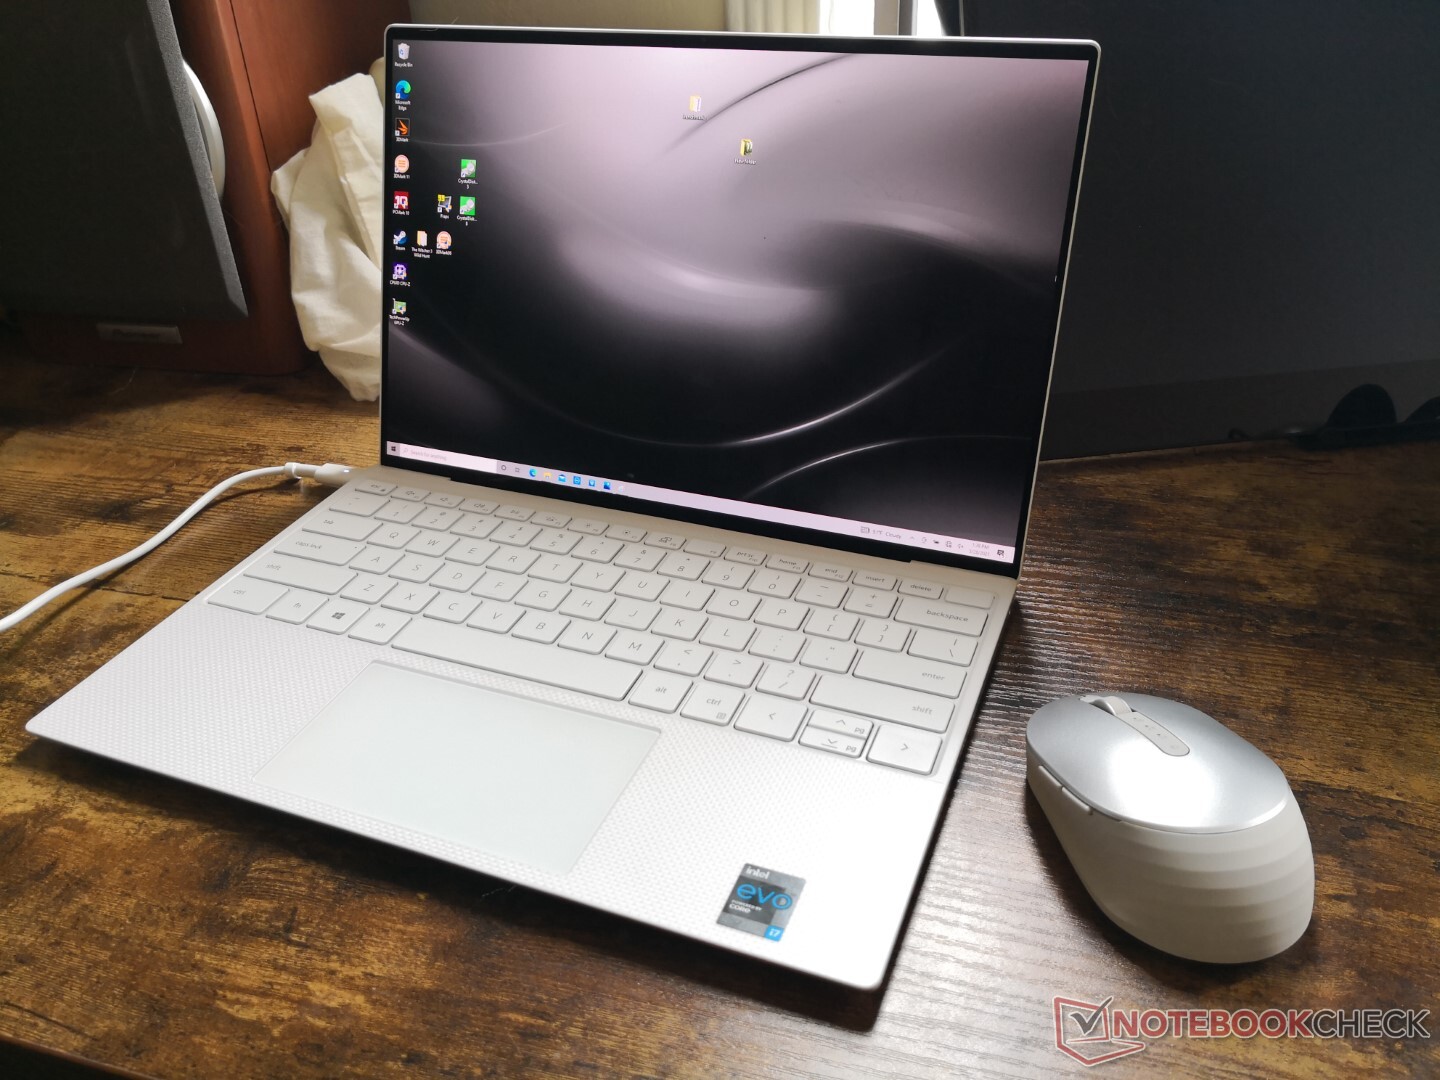
La duración de la batería es notablemente más corta que en el XPS 13 4K IPS SKU y especialmente el XPS 13 FHD IPS SKU donde la diferencia puede ser de varias horas. Se recomiendan temas de colores más oscuros o grises si la duración es importante. Quizá no sea casualidad que Dell haya puesto el fondo de pantalla de Windows y las ventanas del explorador en gris en vez del habitual azul y blanco brillante que siempre vemos en los XPS 13 IPS normales y en la mayoría de portátiles.
| Dell XPS 13 9310 OLED i7-1185G7, Iris Xe G7 96EUs, 52 Wh | Dell XPS 13 9310 Core i7 4K i7-1185G7, Iris Xe G7 96EUs, 52 Wh | Dell XPS 13 9310 Core i7 FHD i7-1165G7, Iris Xe G7 96EUs, 52 Wh | Dell XPS 13 7390 Core i7-10710U i7-10710U, UHD Graphics 620, 52 Wh | MSI Summit E13 Flip Evo A11MT i7-1185G7, Iris Xe G7 96EUs, 70 Wh | |
|---|---|---|---|---|---|
| Duración de Batería | 11% | 69% | 29% | 72% | |
| WiFi v1.3 (h) | 6.5 | 7.2 11% | 11 69% | 8.4 29% | 11.2 72% |
| Reader / Idle (h) | 30 | 21.1 | |||
| Load (h) | 3.2 | 1.8 |
Pro
Contra
Veredicto
Al igual que lo que concluimos con el reciente HP Spectre x360 13, OLED no es la tecnología definitiva cuando se trata de pantallas. Ciertamente tiene sus ventajas sobre IPS, pero su lista de desventajas es posiblemente igual de importante.
Las ventajas más importantes y evidentes están relacionadas con la calidad de la imagen. No hay duda de que OLED ofrece colores superiores, niveles de negro y tiempos de respuesta de negro-blanco-gris-gris para una experiencia de visualización notablemente mejor. Si esto es un lujo importante para tu trabajo diario, entonces OLED te parecerá mucho más convincente que IPS.
Las ventajas visuales de OLED son fáciles de notar, pero no vienen sin algunos compromisos en otras áreas.
Los inconvenientes de OLED son, en general, menos obvios y no se notan tanto a primera vista. En primer lugar, tanto el brillo como la resolución son más tenues y menores, respectivamente, que la opción 4K del XPS 13. En segundo lugar, la modulación de ancho de pulso está presente en frecuencias más bajas para un parpadeo potencialmente más notable. Y por último, el consumo de energía variará más salvajemente dependiendo de los colores actuales y el brillo para una vida de la batería potencialmente más corta que IPS.
Hay que tener en cuenta que el XPS 13 OLED cuesta casi lo mismo que el XPS 13 4K IPS. Por lo tanto, los usuarios ya no tienen que pagar fuertes primas sólo por el lujo de un panel OLED a diferencia de muchos portátiles OLED anteriores. Esto hace que hoy en día sea más fácil recomendar el OLED, siempre y cuando los usuarios estén informados de sus pros y sus contras.
Precio y disponibilidad
Dell acaba de lanzar el XPS 13 9310 OLED SKU y todavía no está disponible en la mayoría de los minoristas en el momento de escribir este artículo. El sistema está actualmente agotado en Best Buy por $1949 USD, lo que significa que su mejor opción para una SKU OLED en este momento es pedirla directamente a través de Dell.com
Dell XPS 13 9310 OLED
- 08/31/2022 v7 (old)
Allen Ngo
Price comparison

