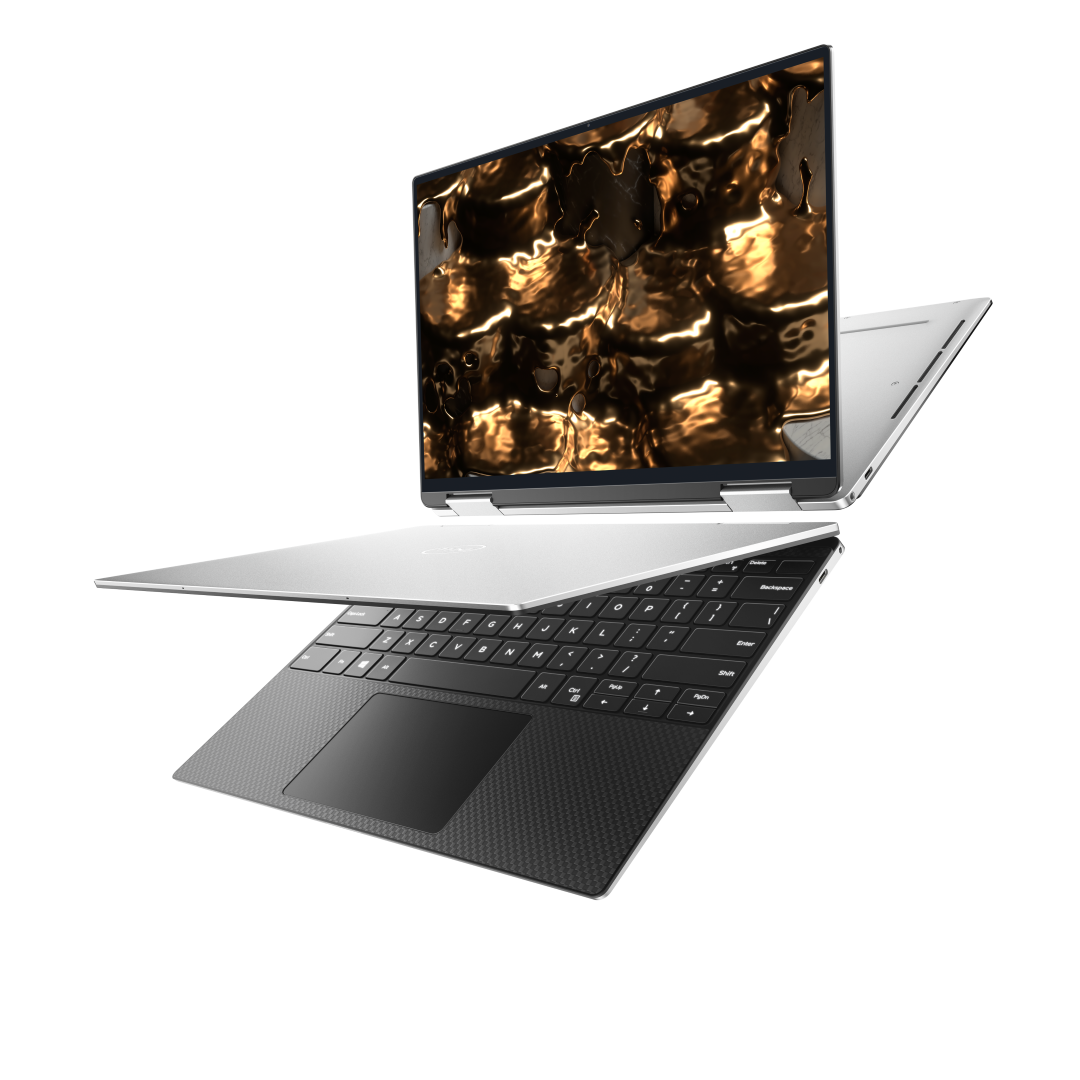
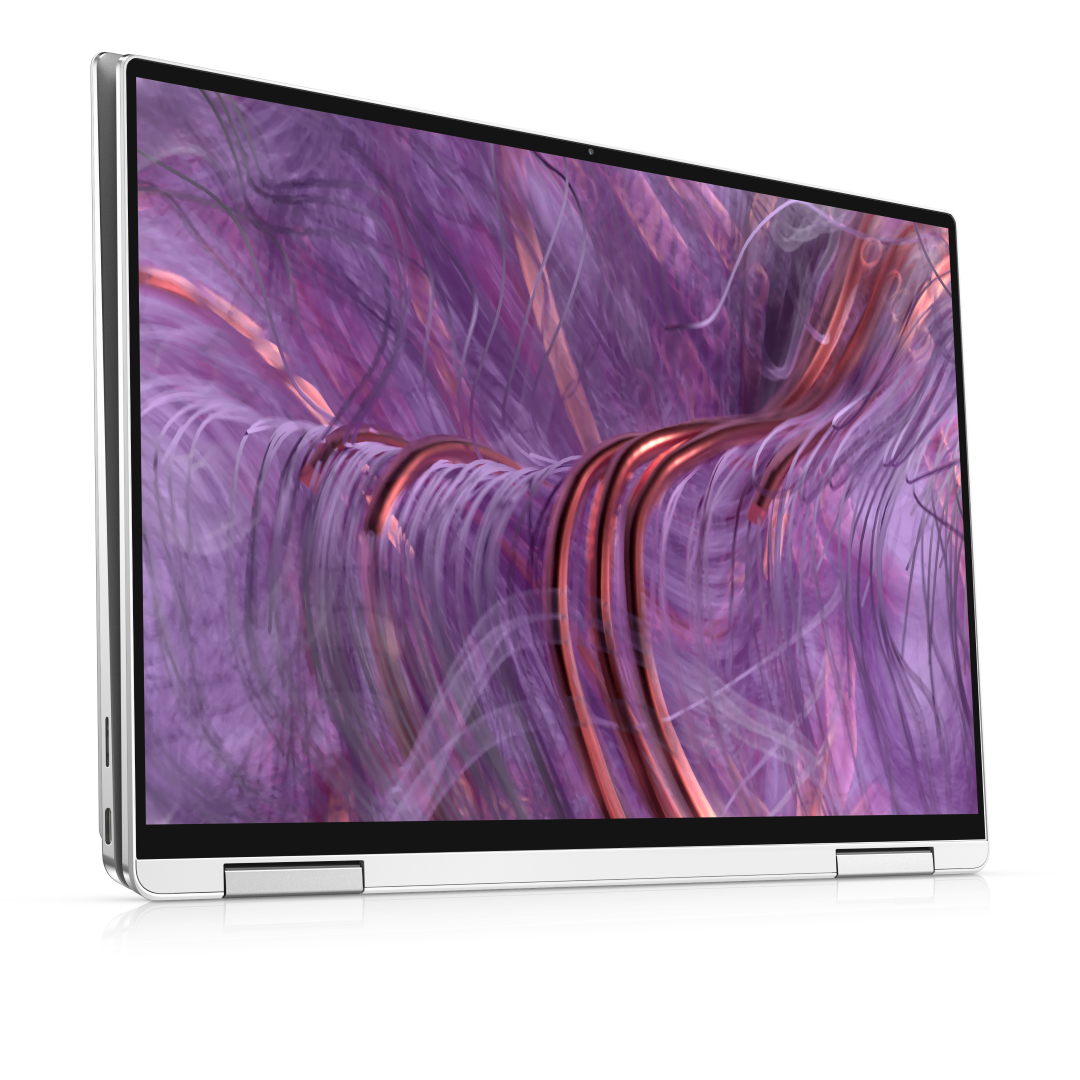
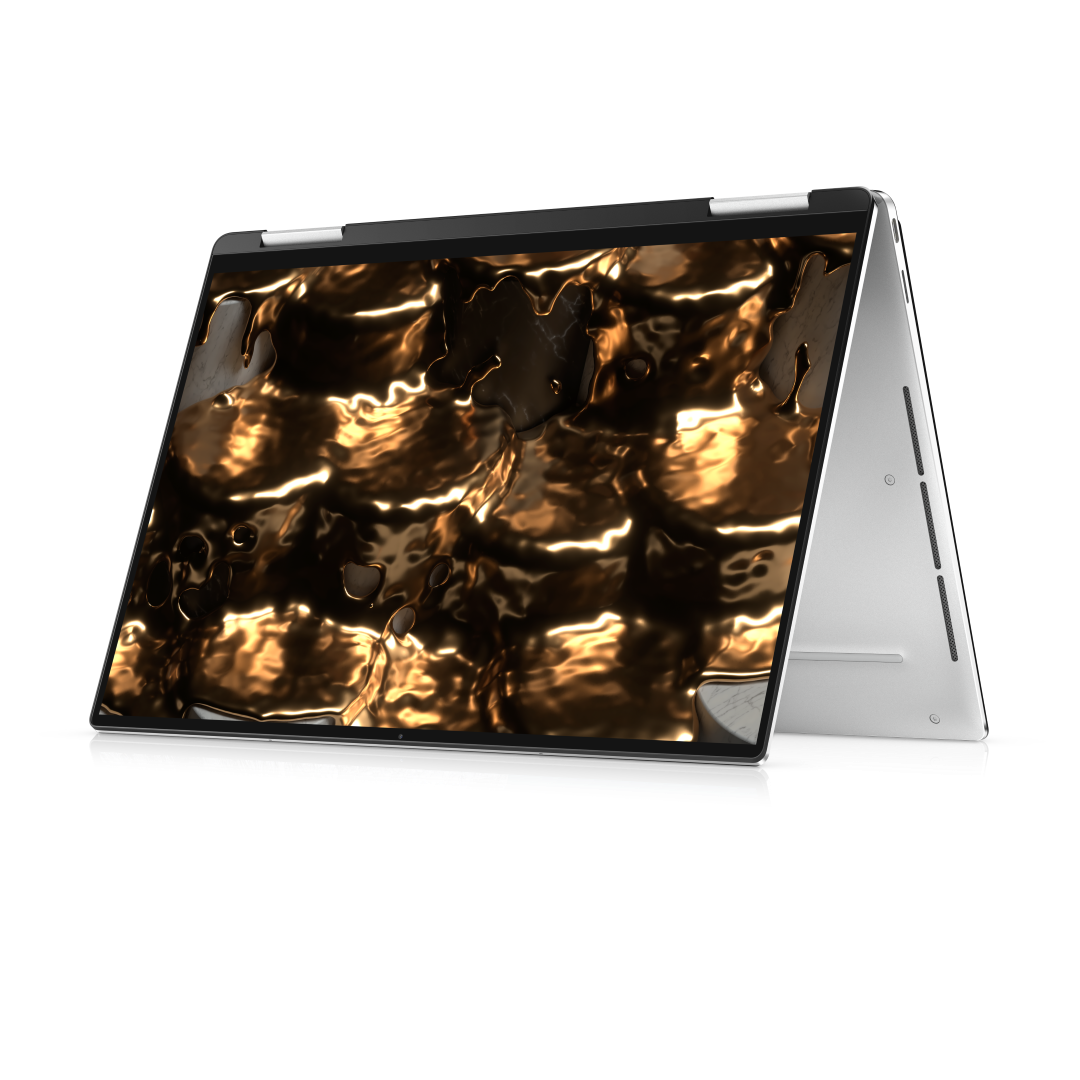
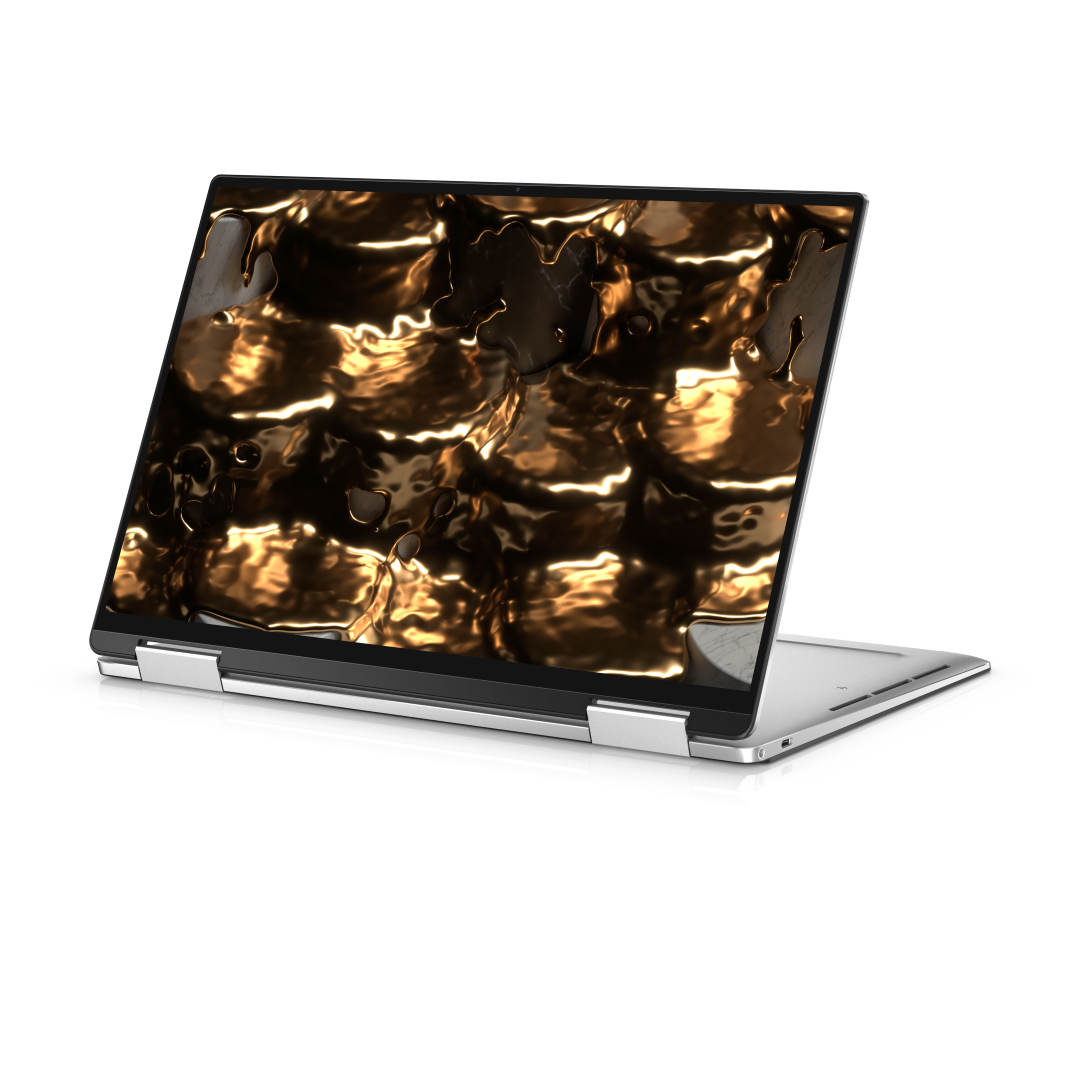
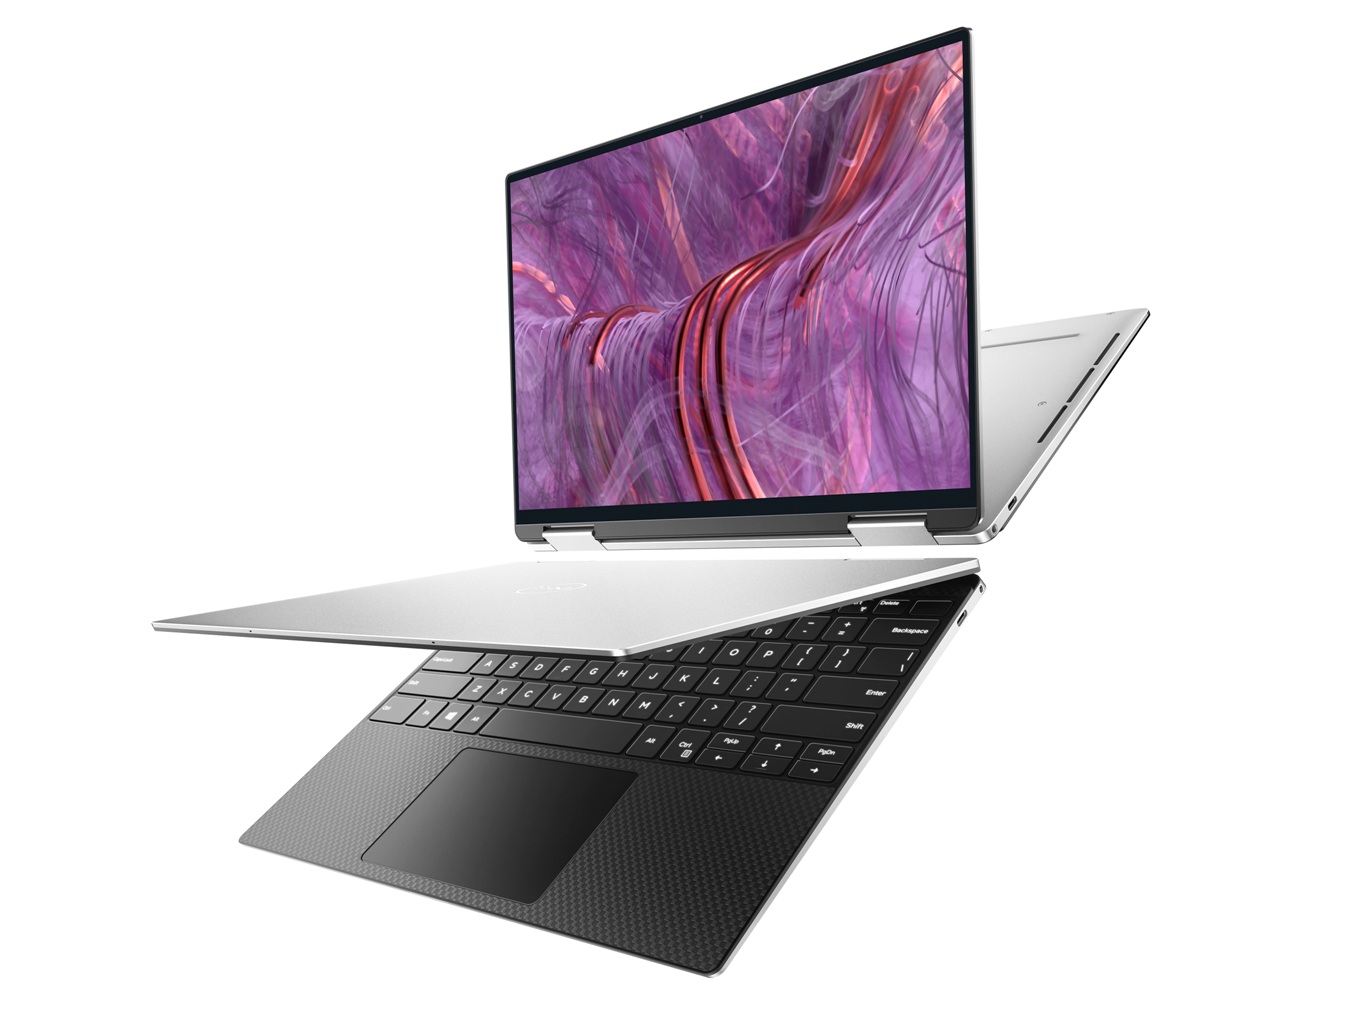
Análisis del Dell XPS 13 9310 2-en-1: Mejor que el XPS 13 7390 2 en 1 en un aspecto concreto
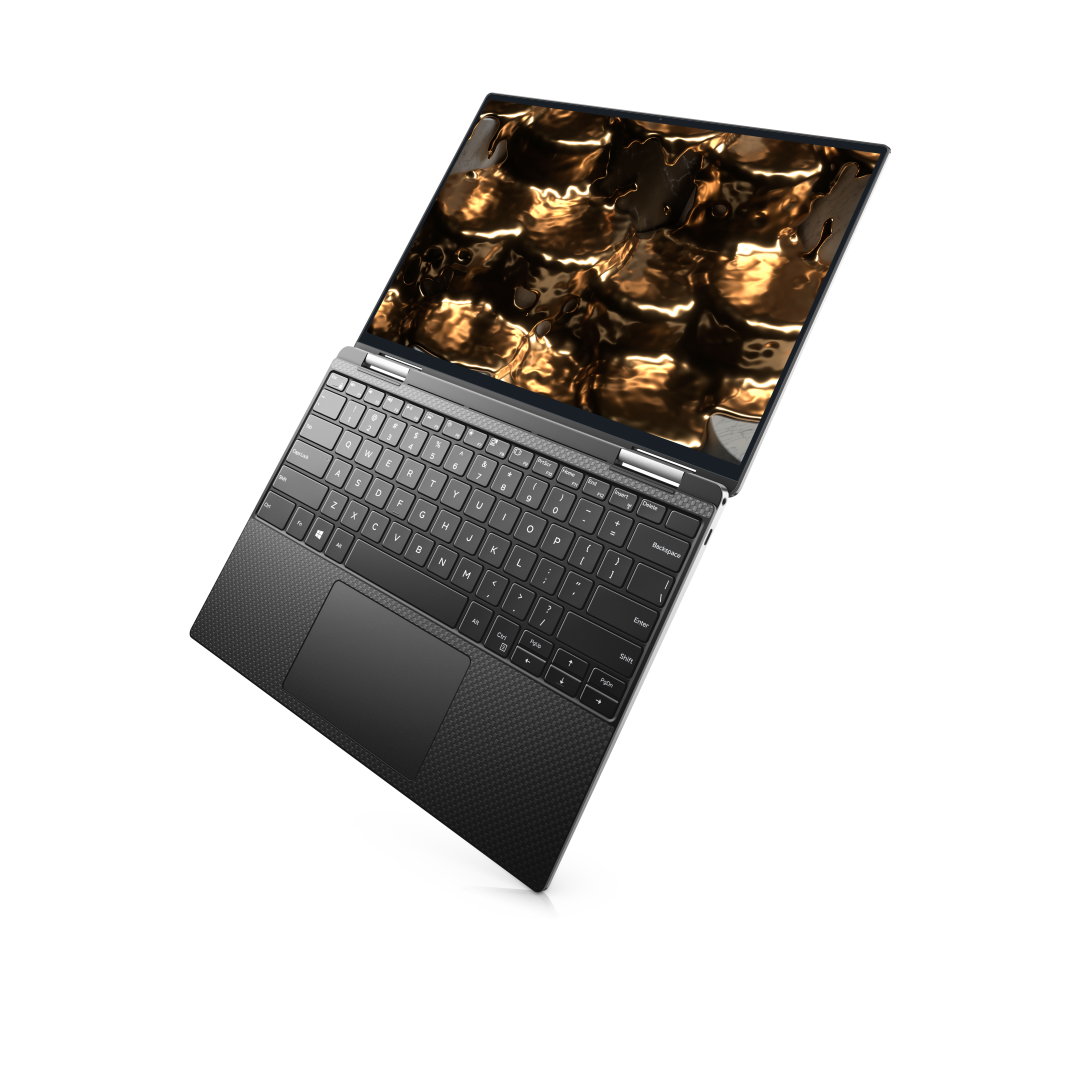
El Dell XPS 13 9310 2 en 1 comparte el mismo chasis que el XPS 13 7390 2 en 1 de 2019, pero con las nuevas opciones de Intel Tiger Lake-U 11th gen para reemplazar las antiguas Ice Lake 10th gen. Por lo tanto, las características clave del 7390 2 en 1 permanecen todas intactas en el 9310 2 en 1, incluidas las teclas del teclado MagLev, el refrigerador de la cámara de vapor, la pantalla táctil de 13,4 pulgadas 16:10 y la cámara web correctamente posicionada.
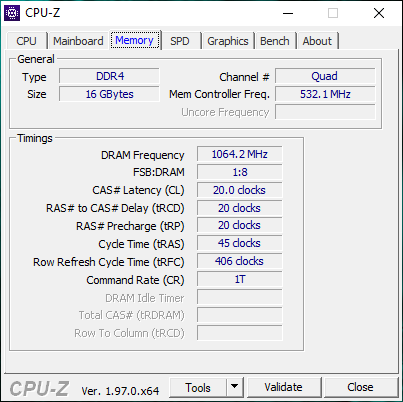
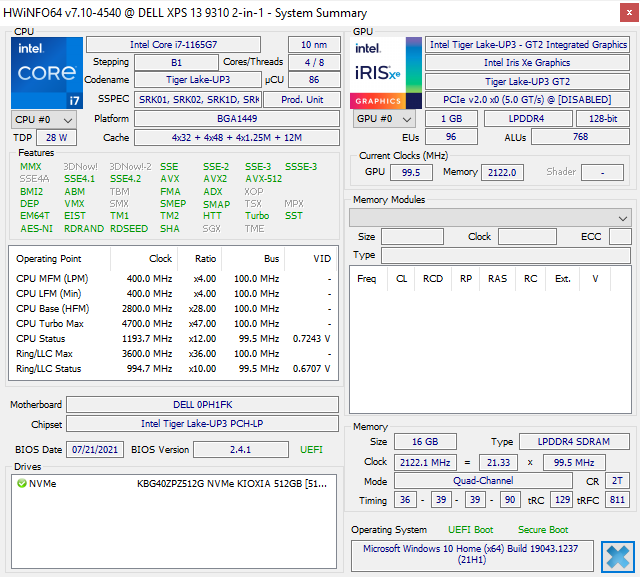
Nuestra unidad de prueba ha sido configurada con la CPU Core i7-1165G7, 16 GB de RAM LPDDR4x a 4267 MHz, y pantalla táctil de 1920 x 1200 por aproximadamente $1600 USD. Otras opciones incluyen una CPU Core i5-1135G7 con la mitad de RAM o una pantalla de mayor resolución de 3840 x 2400. No hay opciones OLED disponibles a diferencia del XPS 13 9310 clamshell.
Recomendamos consultar nuestro análisis existente sobre el XPS 13 7390 2 en 1 para saber más sobre las características físicas del chasis, ya que todos nuestros comentarios se aplican también al 9310 2-en-1. Este análisis se centrará en el rendimiento del XPS 13 9310 2-en-1 y en lo que los usuarios pueden esperar que gane con respecto al antiguo pero visualmente idéntico 7390 2-en-1.
Los competidores en este espacio incluyen otros subportátiles convertibles de 13 pulgadas como el Lenovo Yoga 6 13, Asus ZenBook Flip 13, Samsung Galaxy Book Pro 360 13o MSI Summit E13 Flip. También está disponible una versión clamshell del XPS 13 9310 2-en-1 llamada simplemente XPS 13 9310.
Más opiniones de Dell
potential competitors in comparison
Valoración | Fecha | Modelo | Peso | Altura | Tamaño | Resolución | Precio |
|---|---|---|---|---|---|---|---|
| 86.7 % v7 (old) | 10/2021 | Dell XPS 13 9310 2-in-1 i7-1165G7, Iris Xe G7 96EUs | 1.3 kg | 14.35 mm | 13.40" | 1920x1200 | |
| 88.1 % v7 (old) | 10/2020 | Dell XPS 13 9310 Core i7 FHD i7-1165G7, Iris Xe G7 96EUs | 1.3 kg | 14.8 mm | 13.40" | 1920x1200 | |
| 86.3 % v7 (old) | 10/2019 | Dell XPS 13 7390 2-in-1 Core i7 i7-1065G7, Iris Plus Graphics G7 (Ice Lake 64 EU) | 1.3 kg | 13 mm | 13.40" | 1920x1200 | |
| 84.7 % v7 (old) | 07/2021 | Lenovo Yoga 6 13 82ND0009US R5 5500U, Vega 7 | 1.3 kg | 18.2 mm | 13.30" | 1920x1080 | |
| 86.3 % v7 (old) | 07/2021 | Asus ZenBook Flip 13 UX363EA-HP069T i7-1165G7, Iris Xe G7 96EUs | 1.2 kg | 13 mm | 13.30" | 1920x1080 | |
| 85.4 % v7 (old) | 06/2021 | Samsung Galaxy Book Pro 360 13 i5-1135G7, Iris Xe G7 80EUs | 1.1 kg | 13 mm | 13.20" | 1920x1080 |
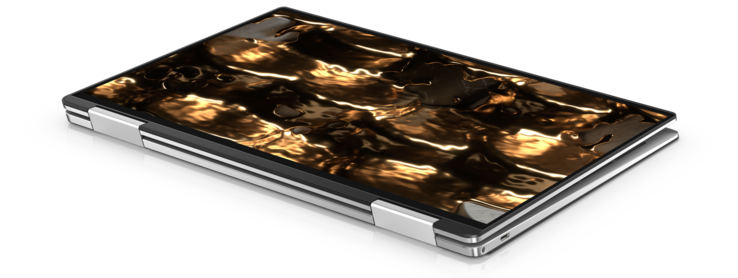
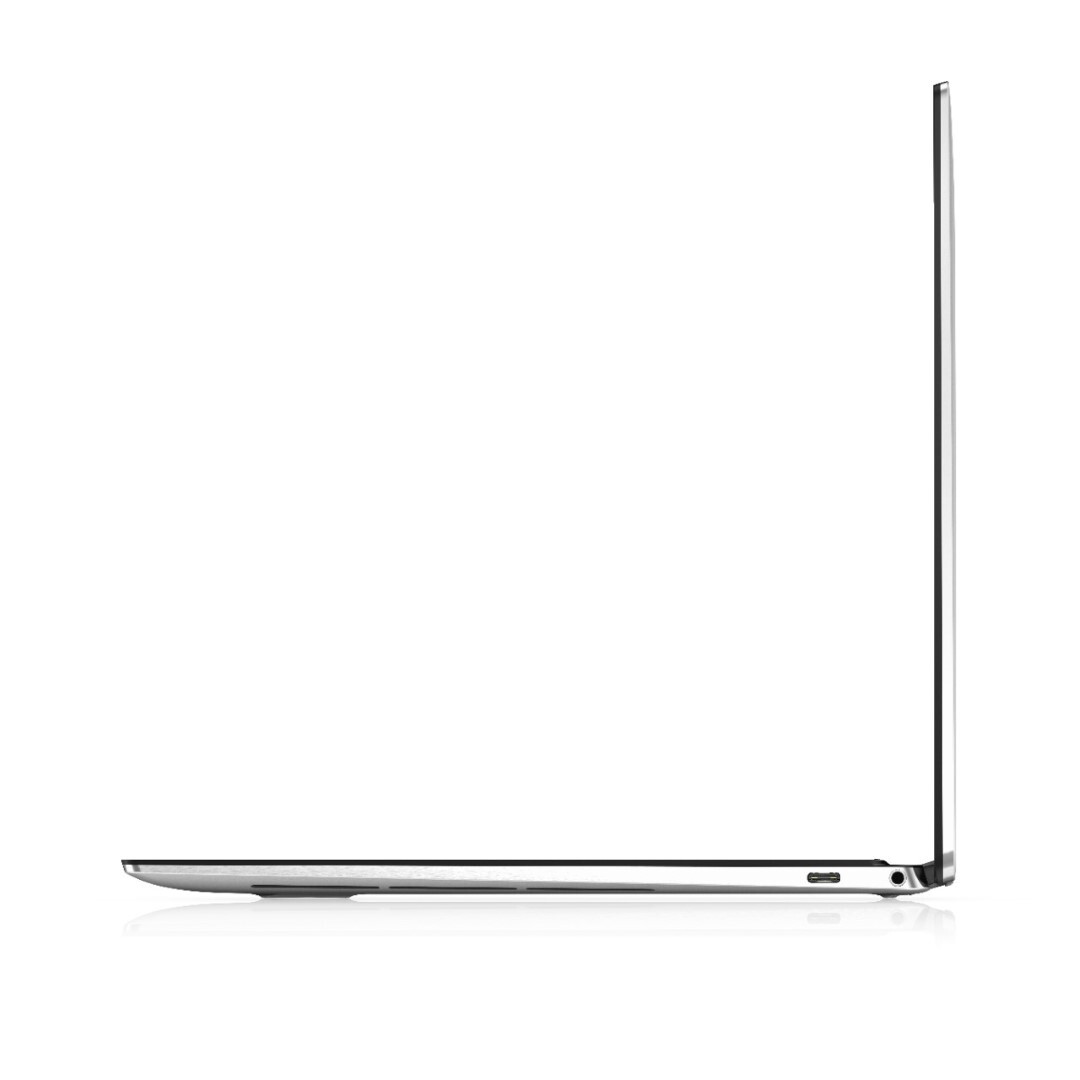
Case - Sigue siendo el descapotable más elegante
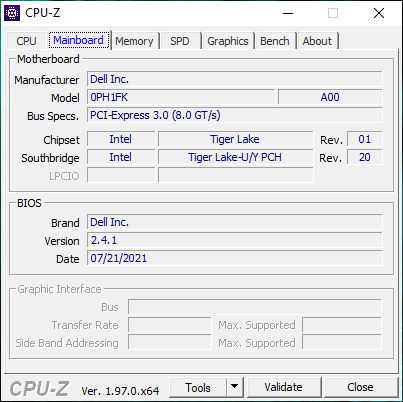
El chasis sigue siendo idéntico al del XPS 13 7390 2-en-1. Sin embargo, la forma en que Dell mide las dimensiones ha cambiado desde entonces, por lo que las medidas oficiales son ahora de 14,35 x 297 x 207 mm en lugar de 13 x 296 x 207 mm en el antiguo 7390 2-en-1.
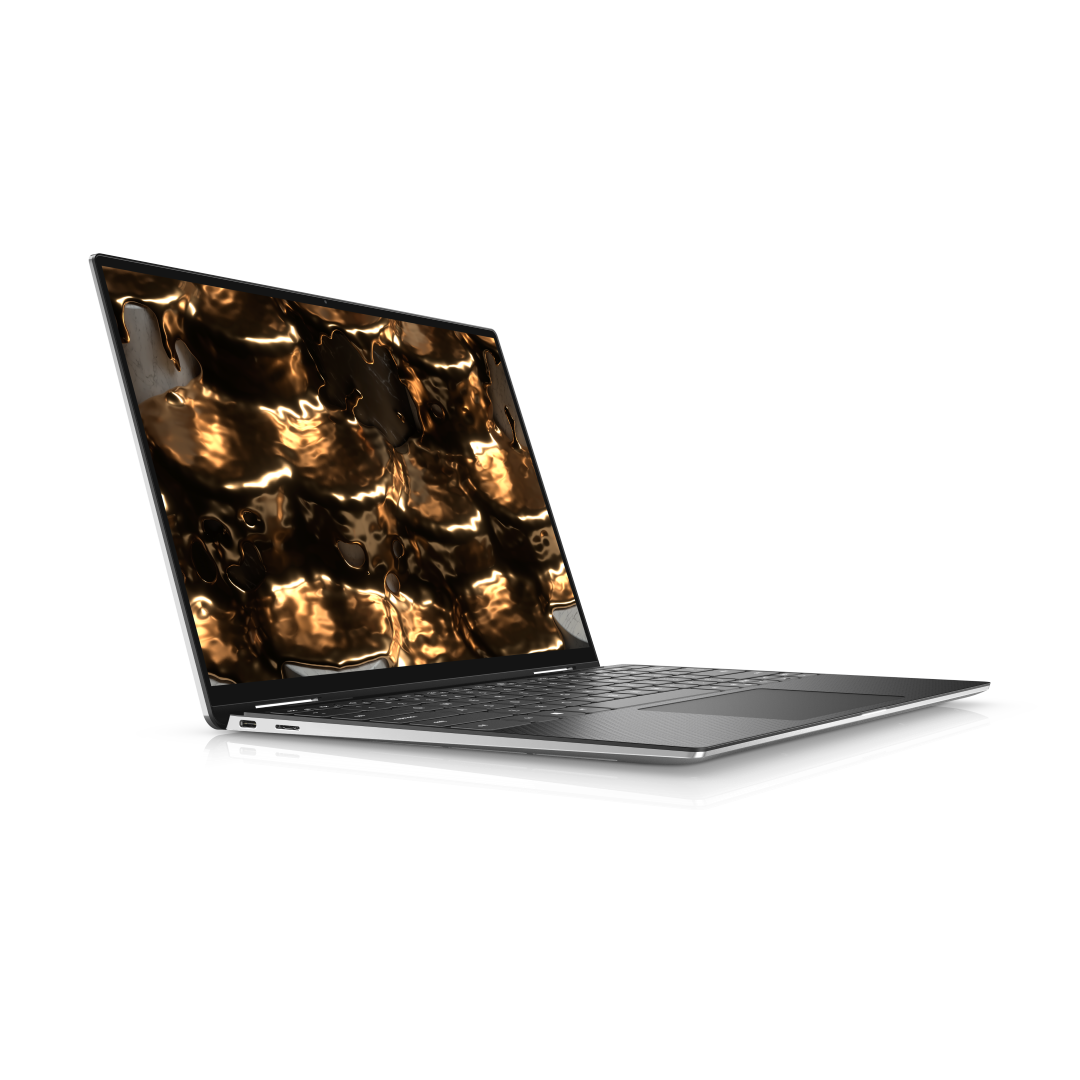

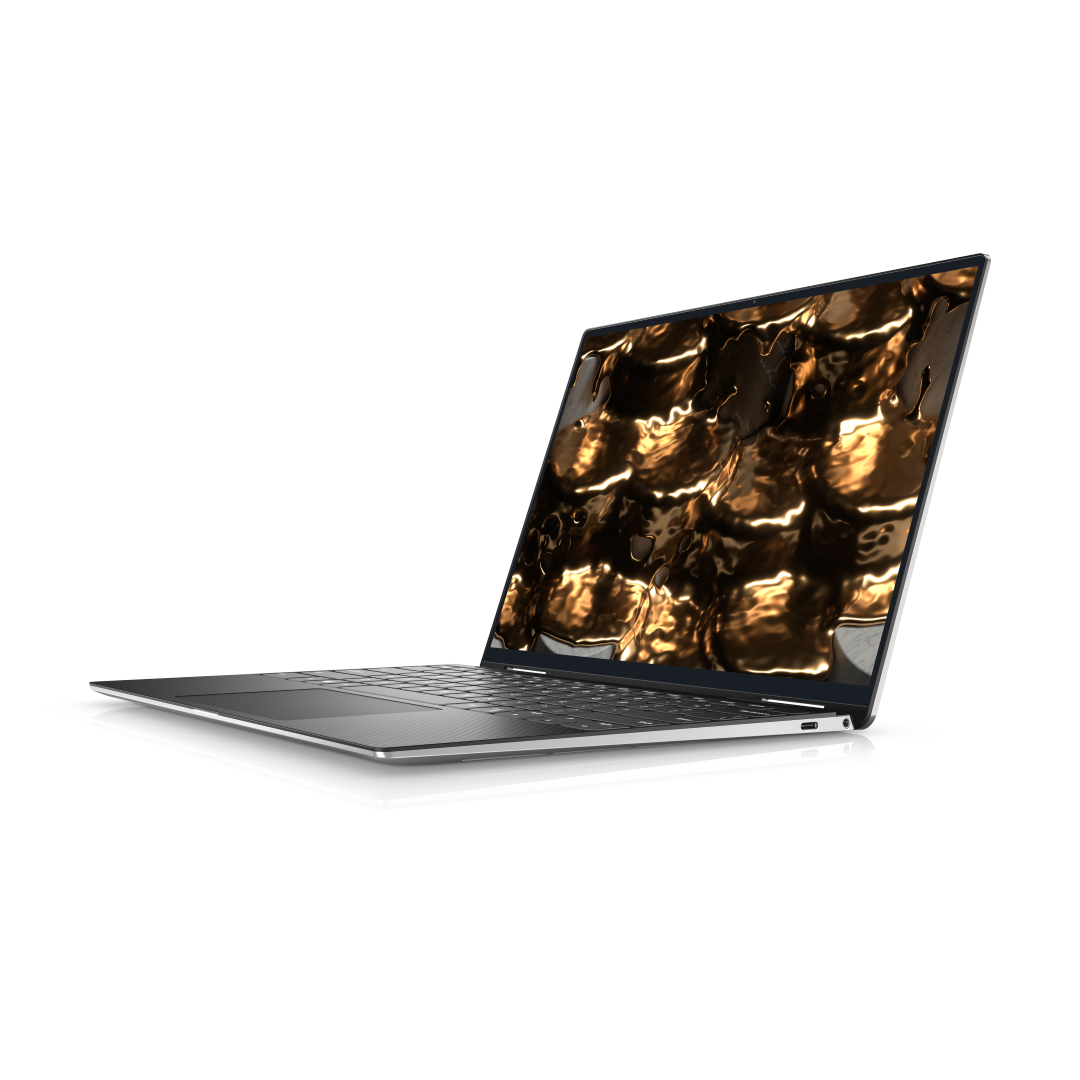
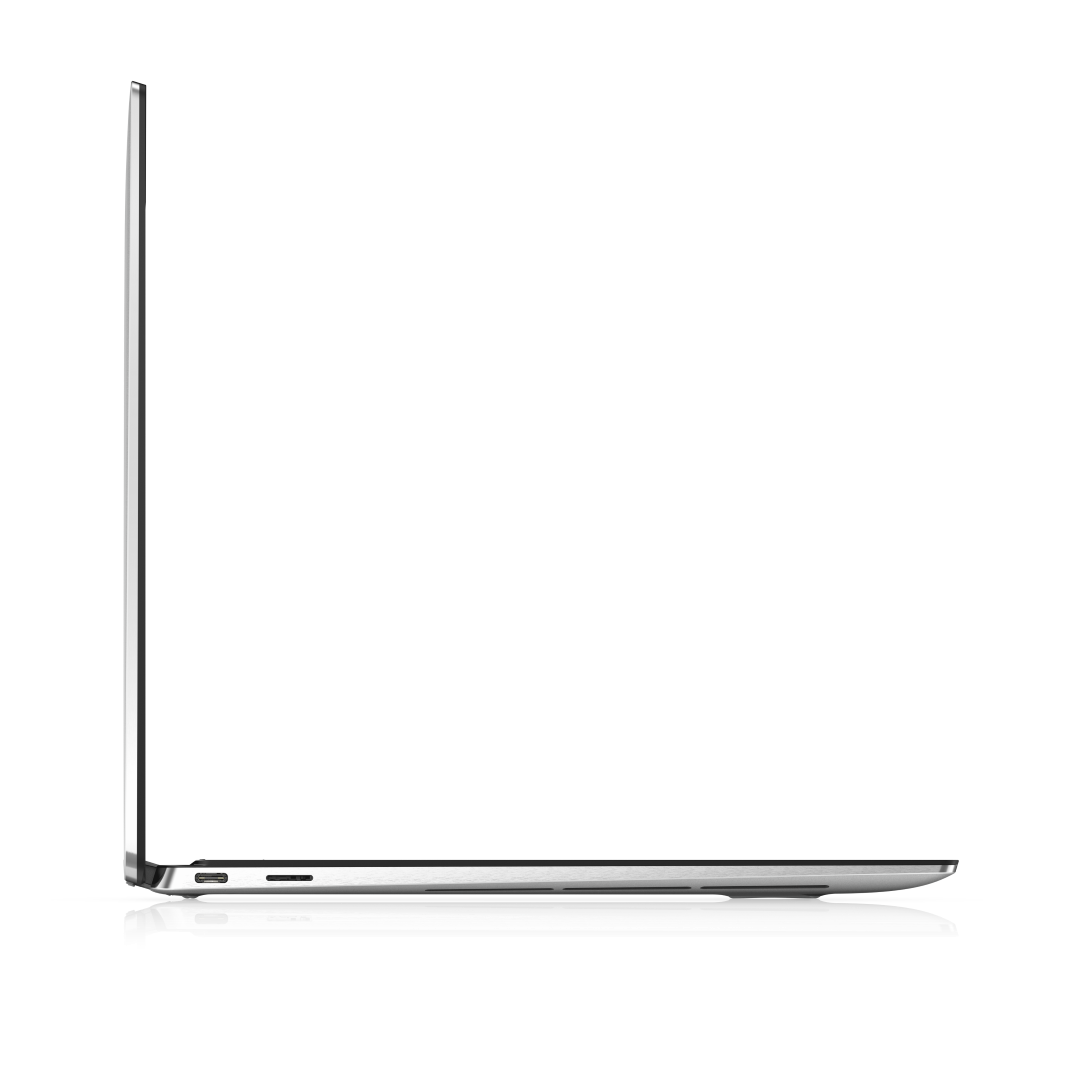
Conectividad - Ahora con Thunderbolt 4
Los dos puertos Thunderbolt 3 del modelo de la generación anterior se han actualizado a Thunderbolt 4. Esto no supondrá una diferencia para la mayoría de usuarios, salvo para los que pretendan conectar gráficas externas.
Lector de tarjetas SD
| SD Card Reader | |
| average JPG Copy Test (av. of 3 runs) | |
| Dell XPS 13 9310 Core i7 FHD (Toshiba Exceria Pro M501 64 GB UHS-II) | |
| Dell XPS 13 9310 2-in-1 (AV Pro V60) | |
| Dell XPS 13 7390 2-in-1 Core i7 (Toshiba Exceria Pro M501 64 GB UHS-II) | |
| Samsung Galaxy Book Pro 360 13 | |
| maximum AS SSD Seq Read Test (1GB) | |
| Dell XPS 13 9310 Core i7 FHD (Toshiba Exceria Pro M501 64 GB UHS-II) | |
| Dell XPS 13 9310 2-in-1 (AV Pro V60) | |
| Dell XPS 13 7390 2-in-1 Core i7 (Toshiba Exceria Pro M501 64 GB UHS-II) | |
| Samsung Galaxy Book Pro 360 13 | |
Comunicación
Cámara web
La cámara web de 720p de baja resolución no ha cambiado, lo que es una verdadera lástima. El último portátil Razer Blade actualizó su cámara web de 720p a 1080p sin ningún otro cambio en el chasis, por lo que habría sido genial ver algo similar en esta actualización del XPS 13.


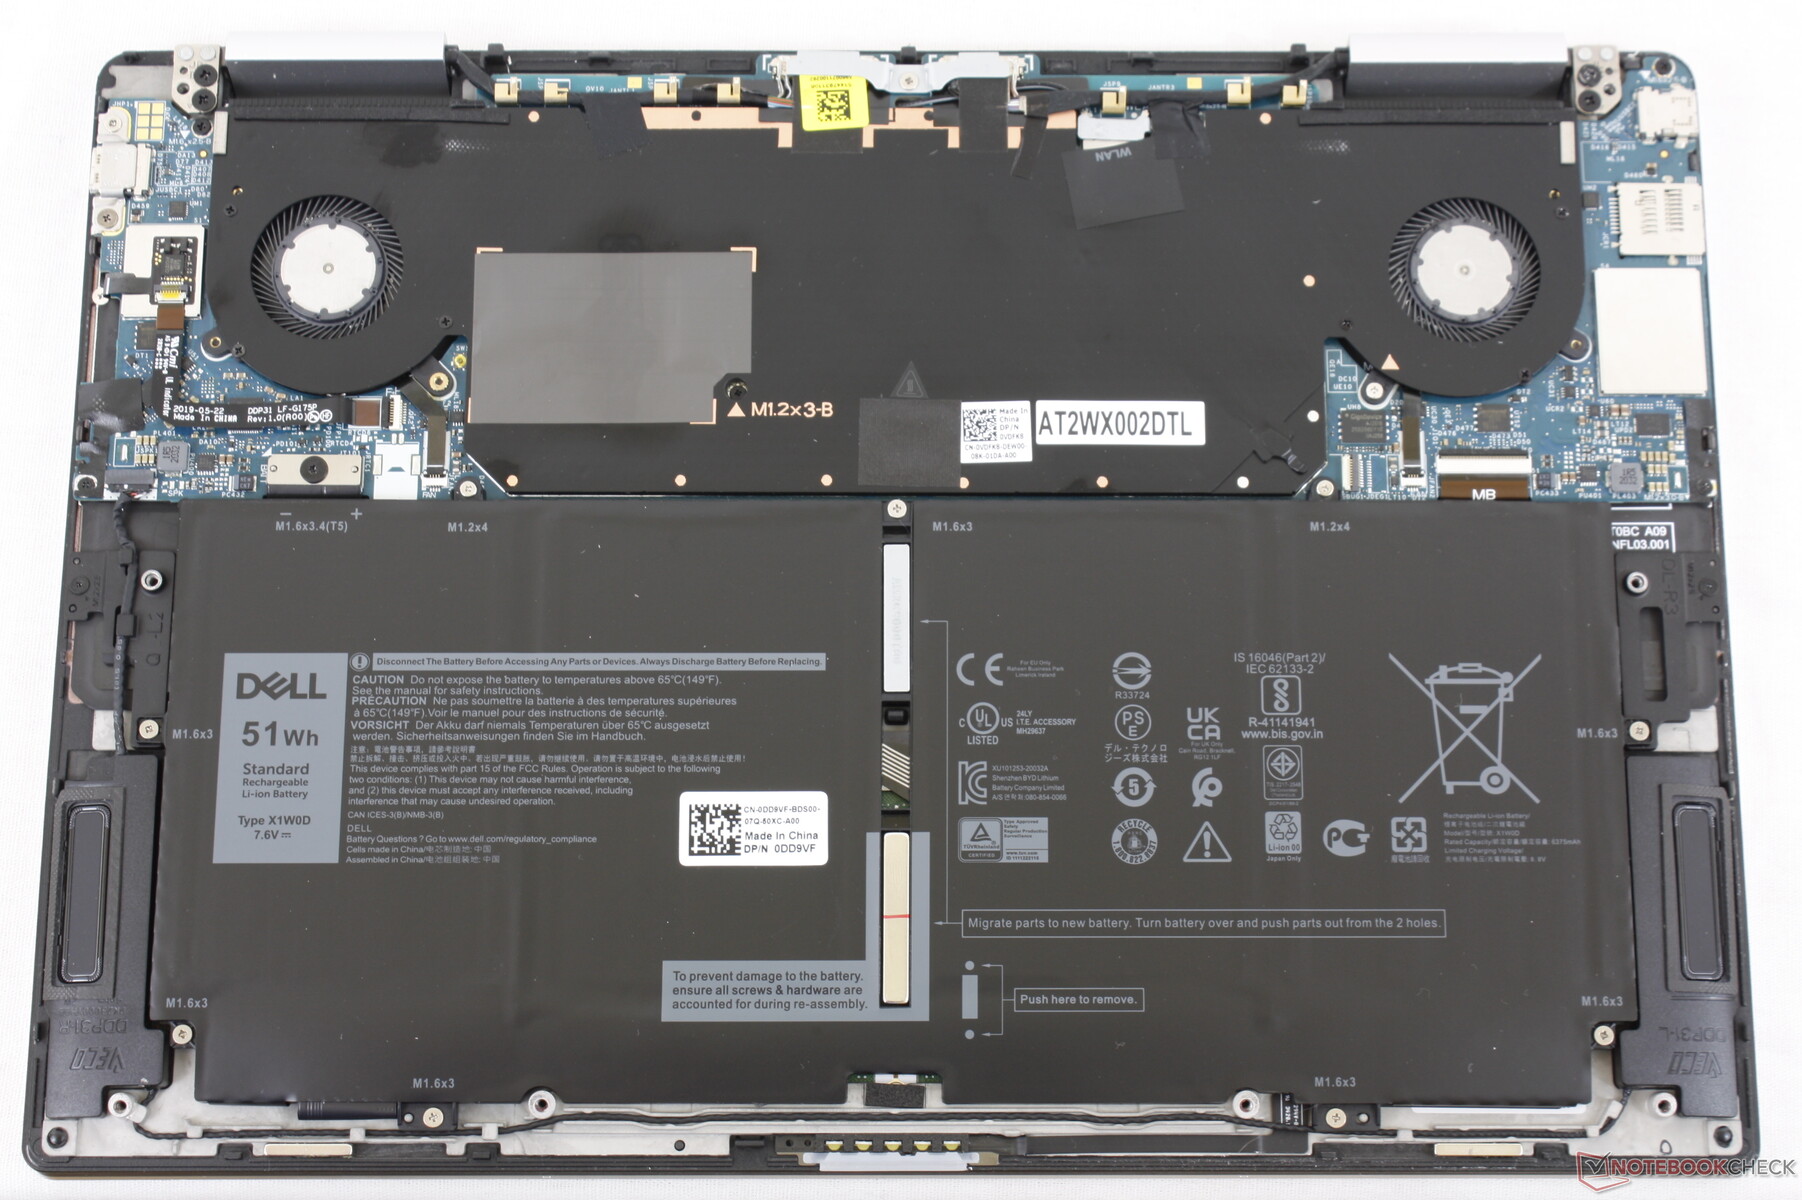
Mantenimiento

Accesorios y garantía
Los extras incluyen un adaptador de USB-C a USB-A, ya que el sistema no integra puertos USB-A de tamaño completo. El embalaje también está hecho completamente de materiales reciclados y 25 por ciento de plásticos de origen oceánico, lo que es un buen toque ecológico
Se aplica la garantía limitada estándar de un año con muchas opciones de ampliación si se compra directamente a Dell.
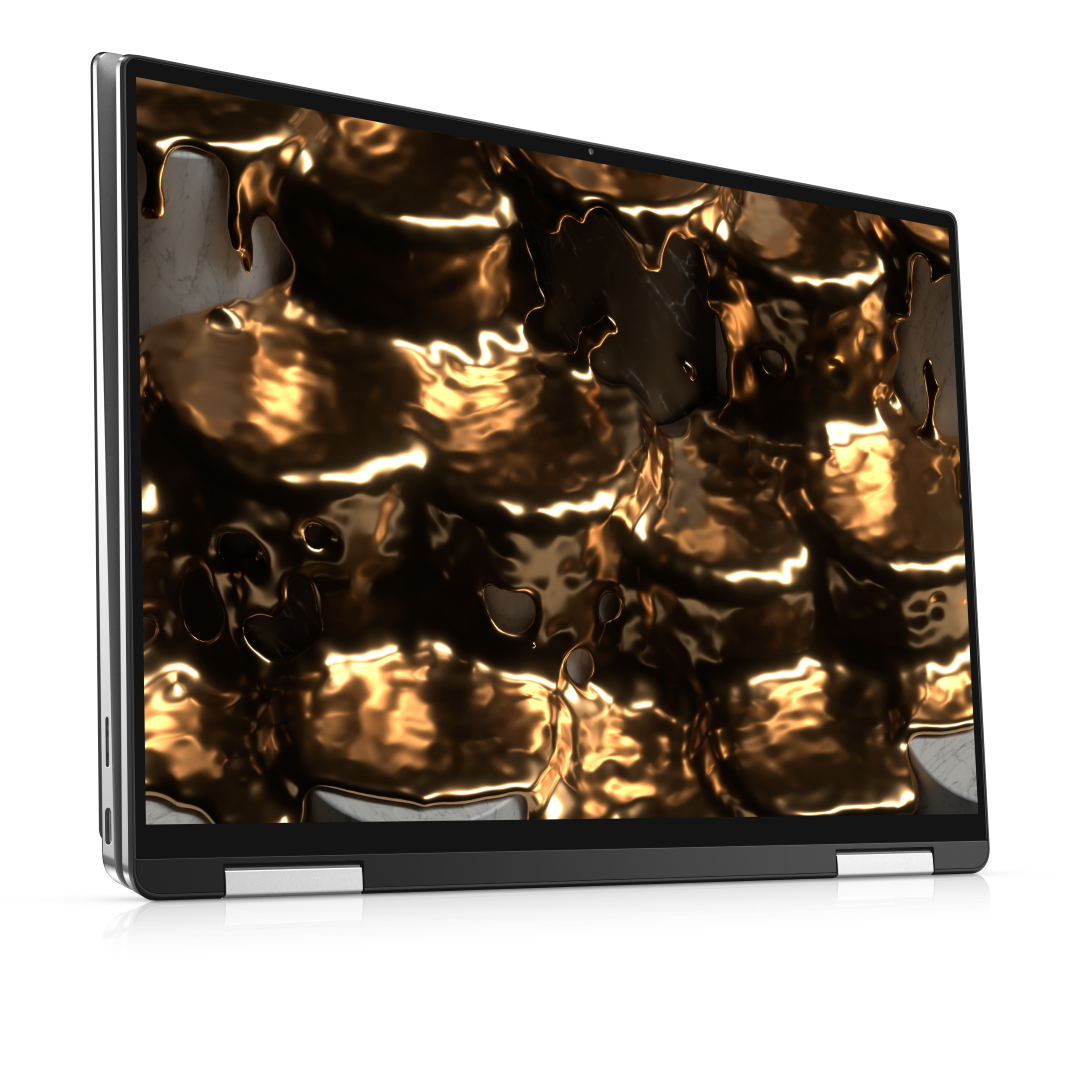
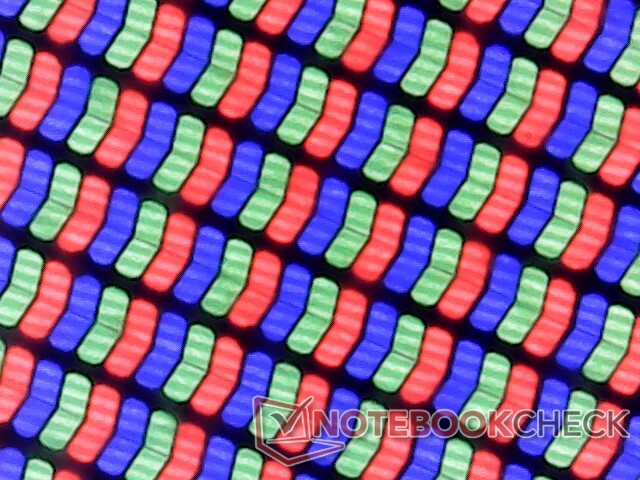
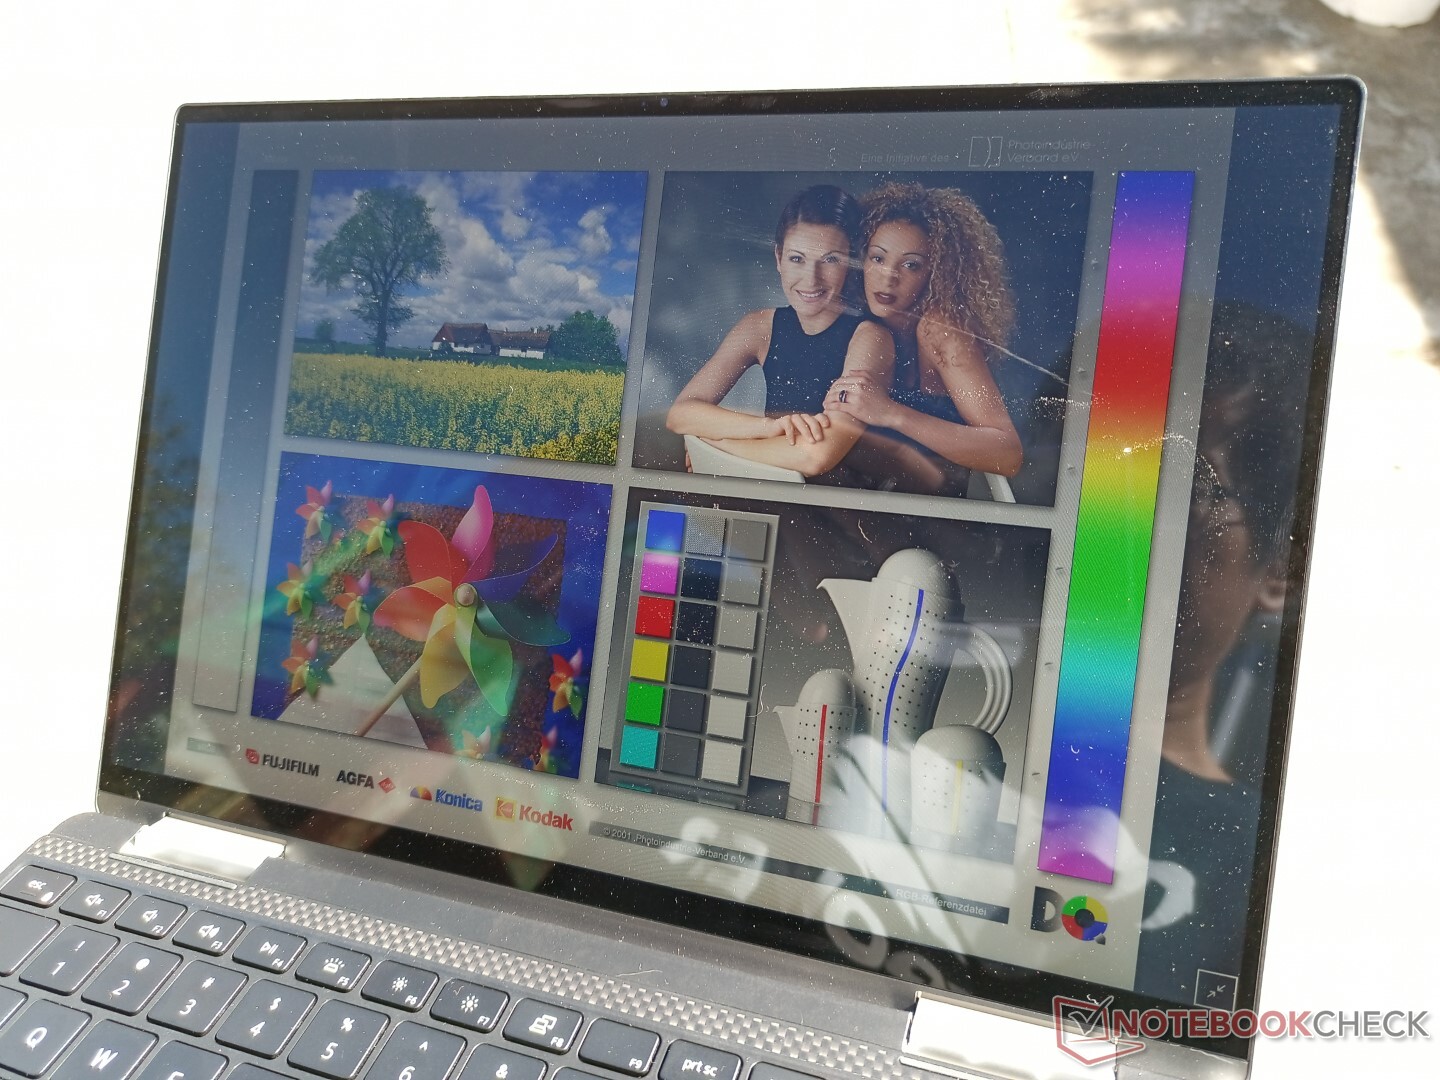
Pantalla - Ya lo hemos visto antes
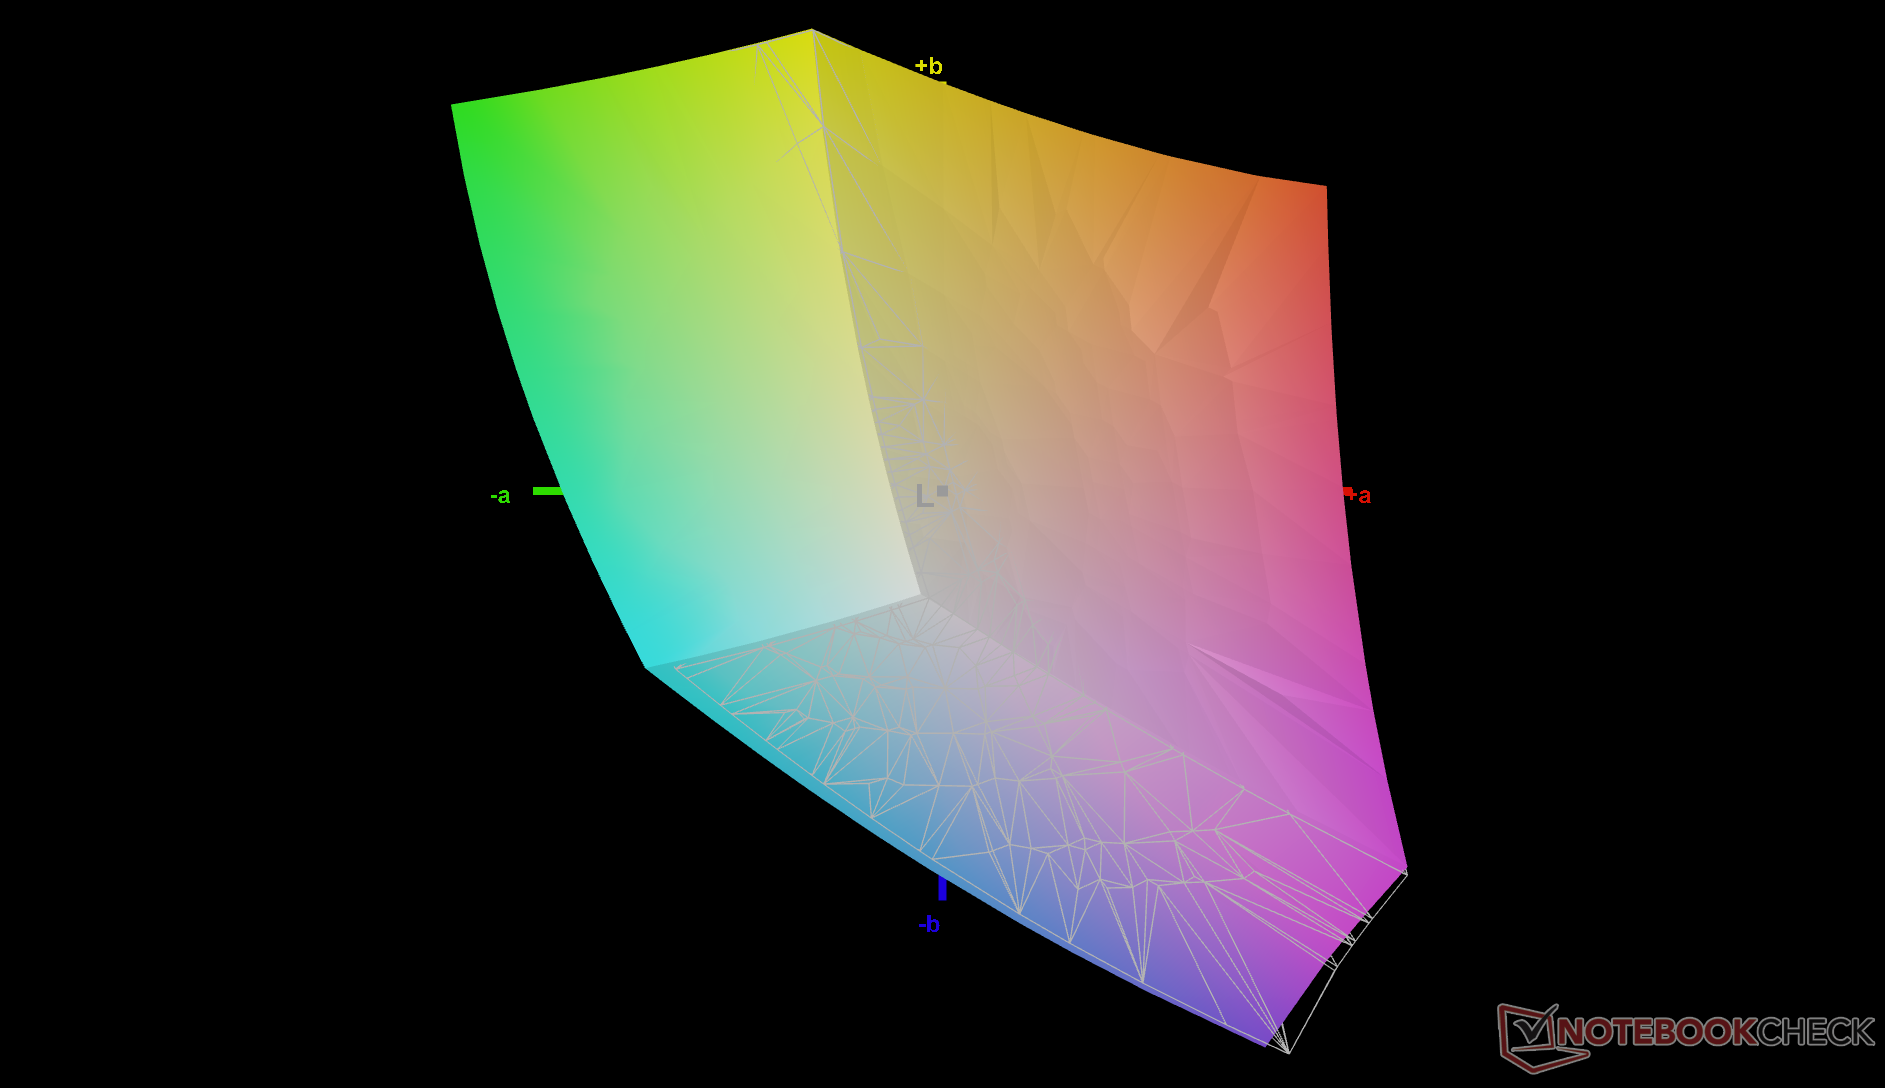
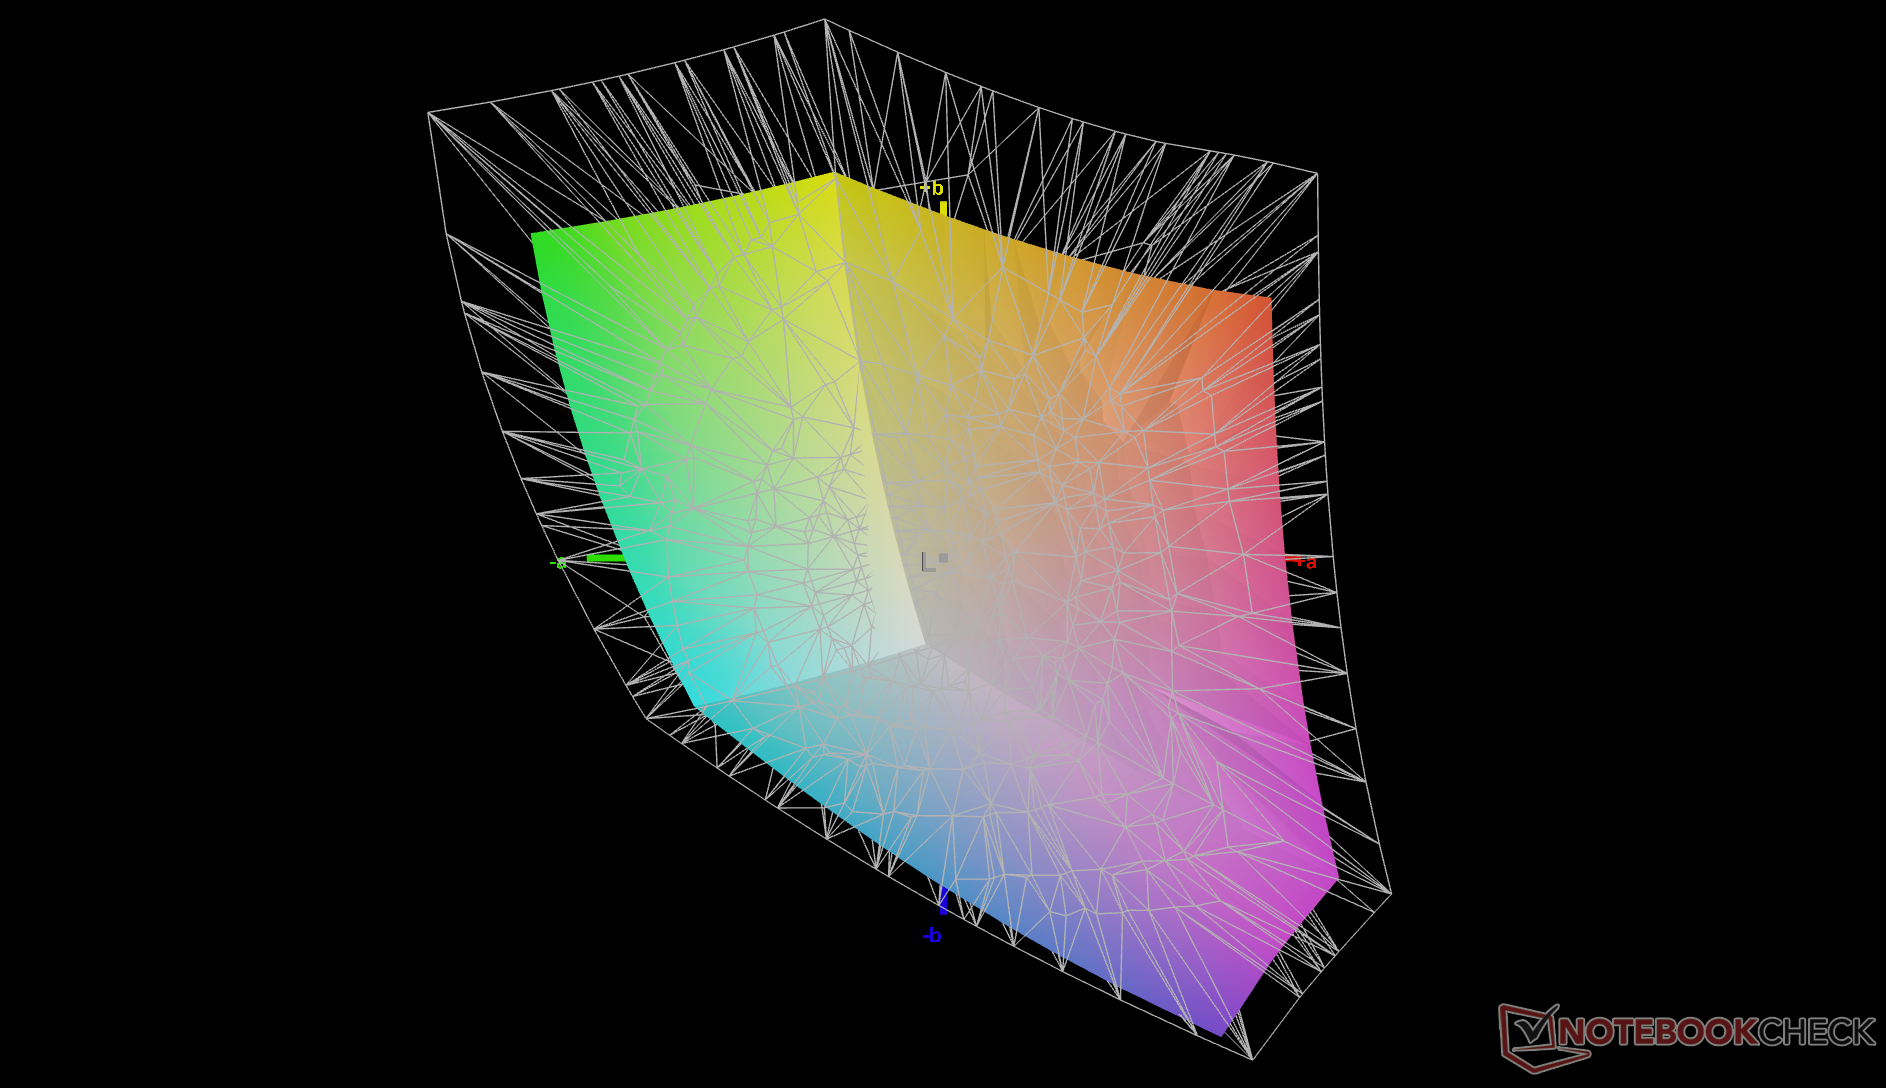
Dell utiliza el mismo panel IPS Sharp LQ134N1 de 1200p en todos sus portátiles XPS 13 de 16:10, incluyendo el XPS 13 7390 2-en-1, el XPS 13 9300 clamshell, el XPS 13 9310 clamshell y nuestro XPS 13 9310 2-en-1. Esto no es necesariamente algo malo, ya que sigue siendo un panel brillante y de alta calidad de 13,4 pulgadas con una excelente cobertura de color (>99 por ciento sRGB), alto contraste y píxeles nítidos sin problemas de grano en absoluto. Los lentos tiempos de respuesta en blanco y negro siguen siendo un punto débil, lo que significa que el ghosting es muy notable, especialmente si se juega.
Existe una opción de mayor resolución UHD+ (3840 x 2400) que sospechamos que es el mismo panel IPS Sharp LQ134R1 que se encuentra en el XPS 13 9300.

| |||||||||||||||||||||||||
iluminación: 90 %
Brillo con batería: 555.7 cd/m²
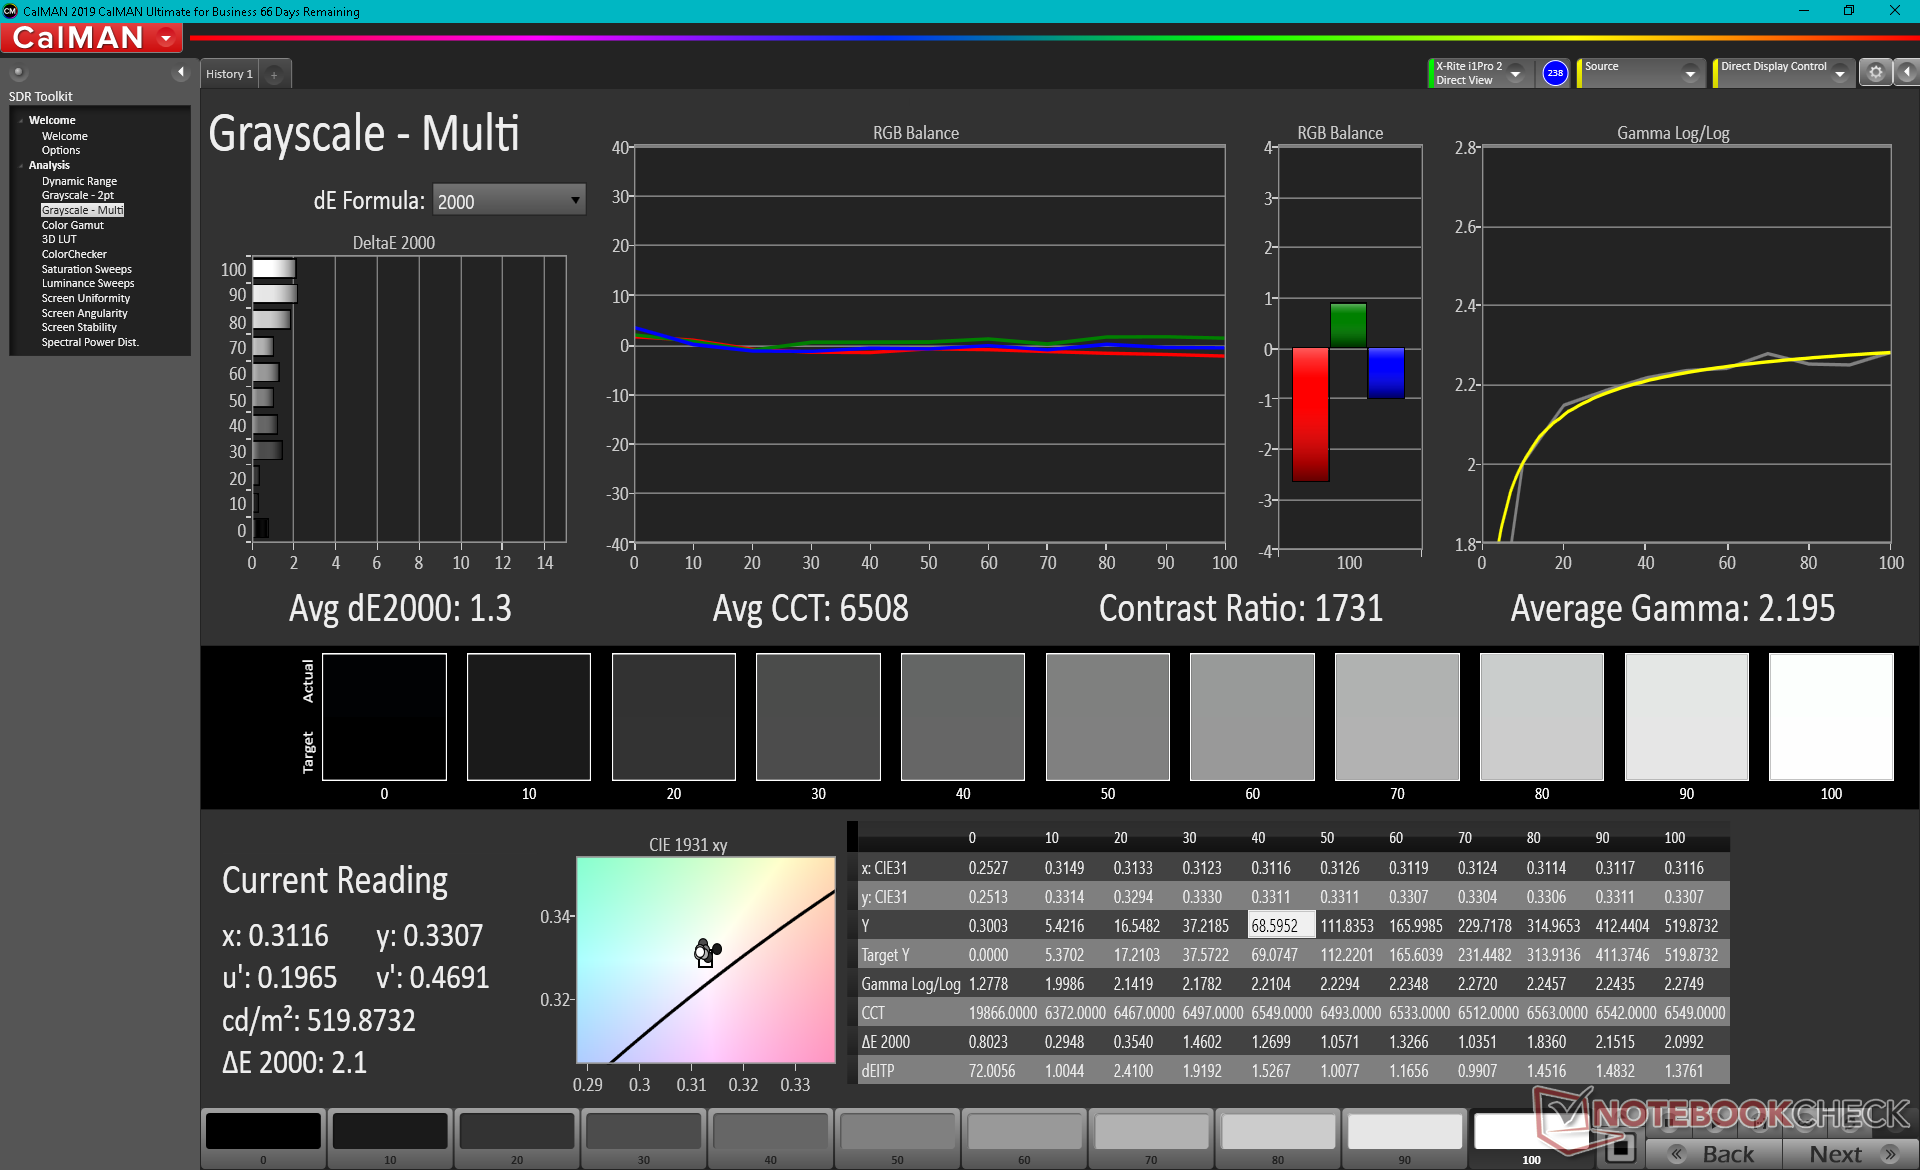
Contraste: 1588:1 (Negro: 0.35 cd/m²)
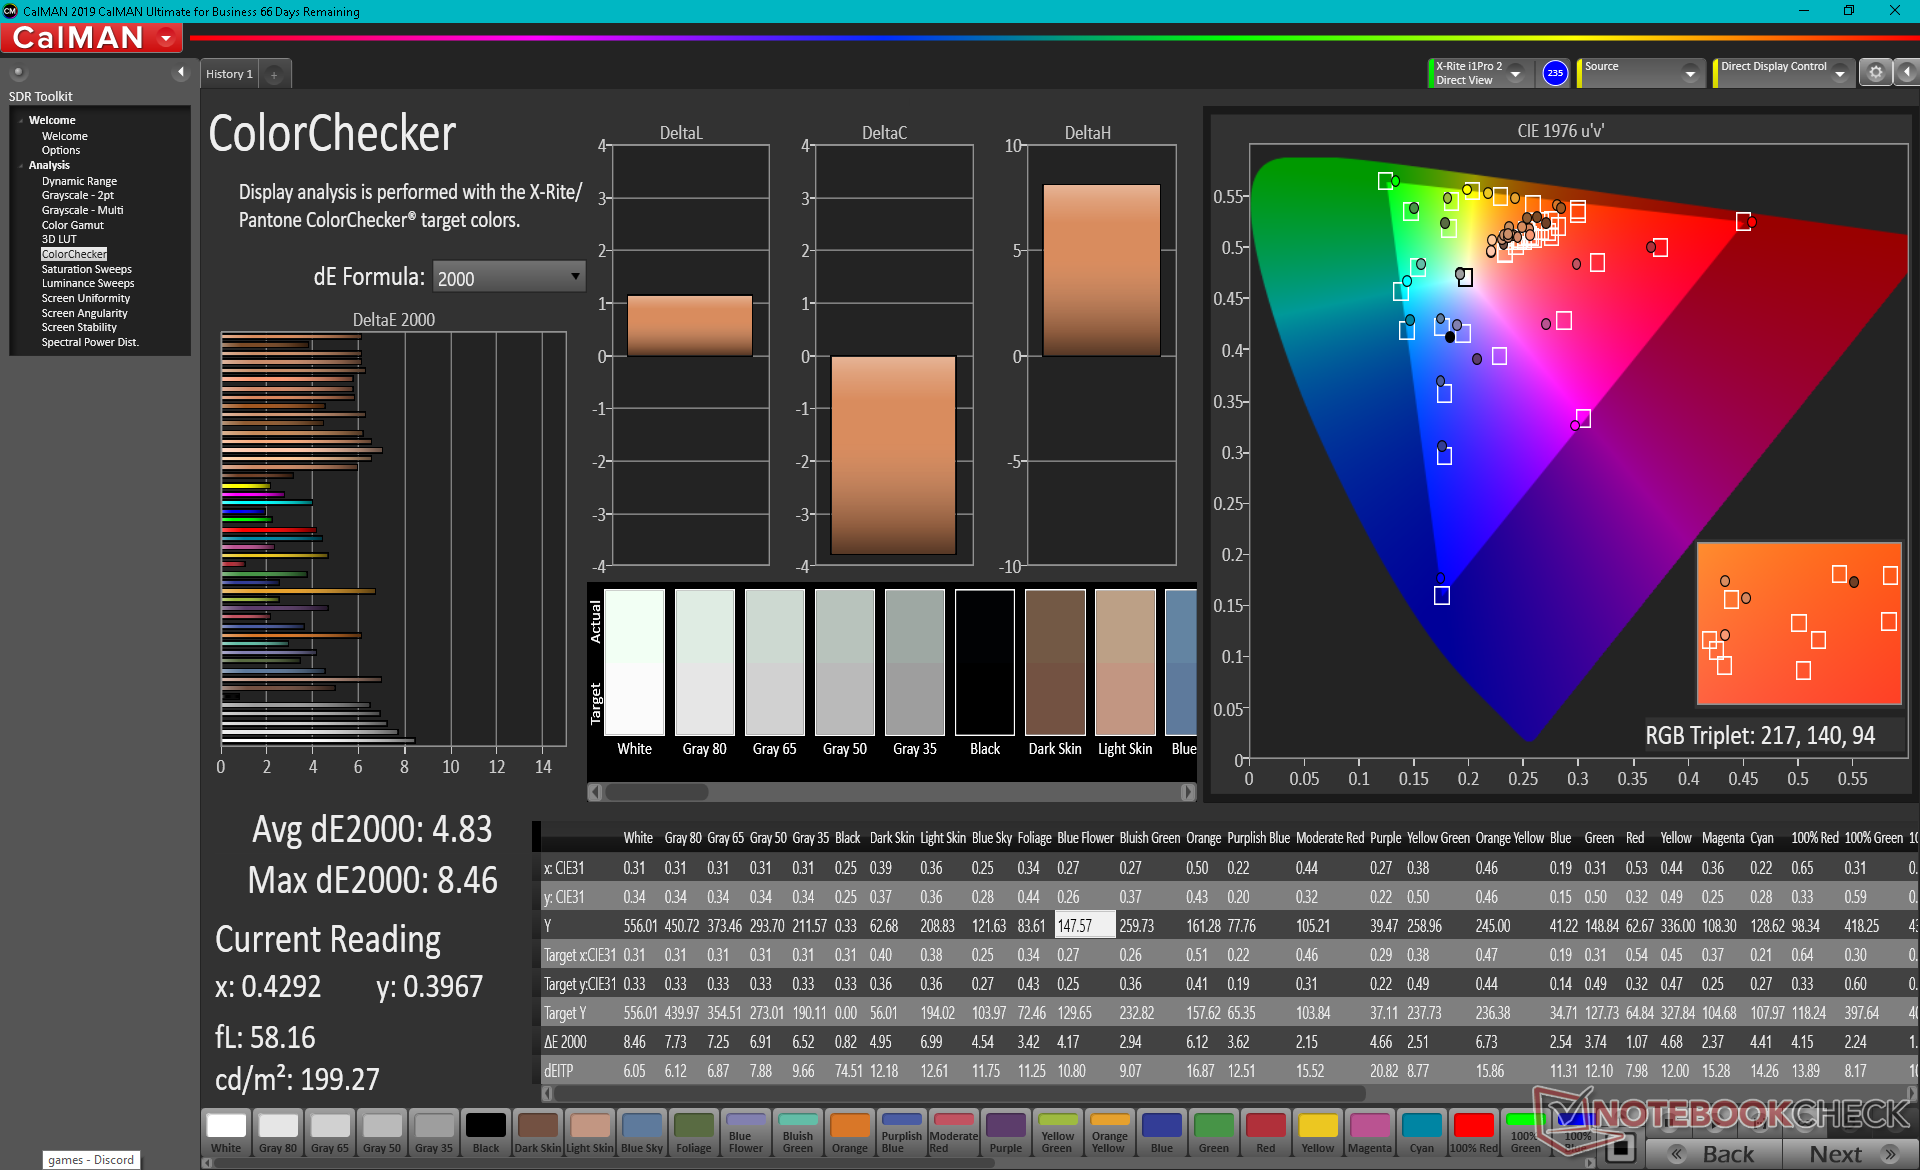
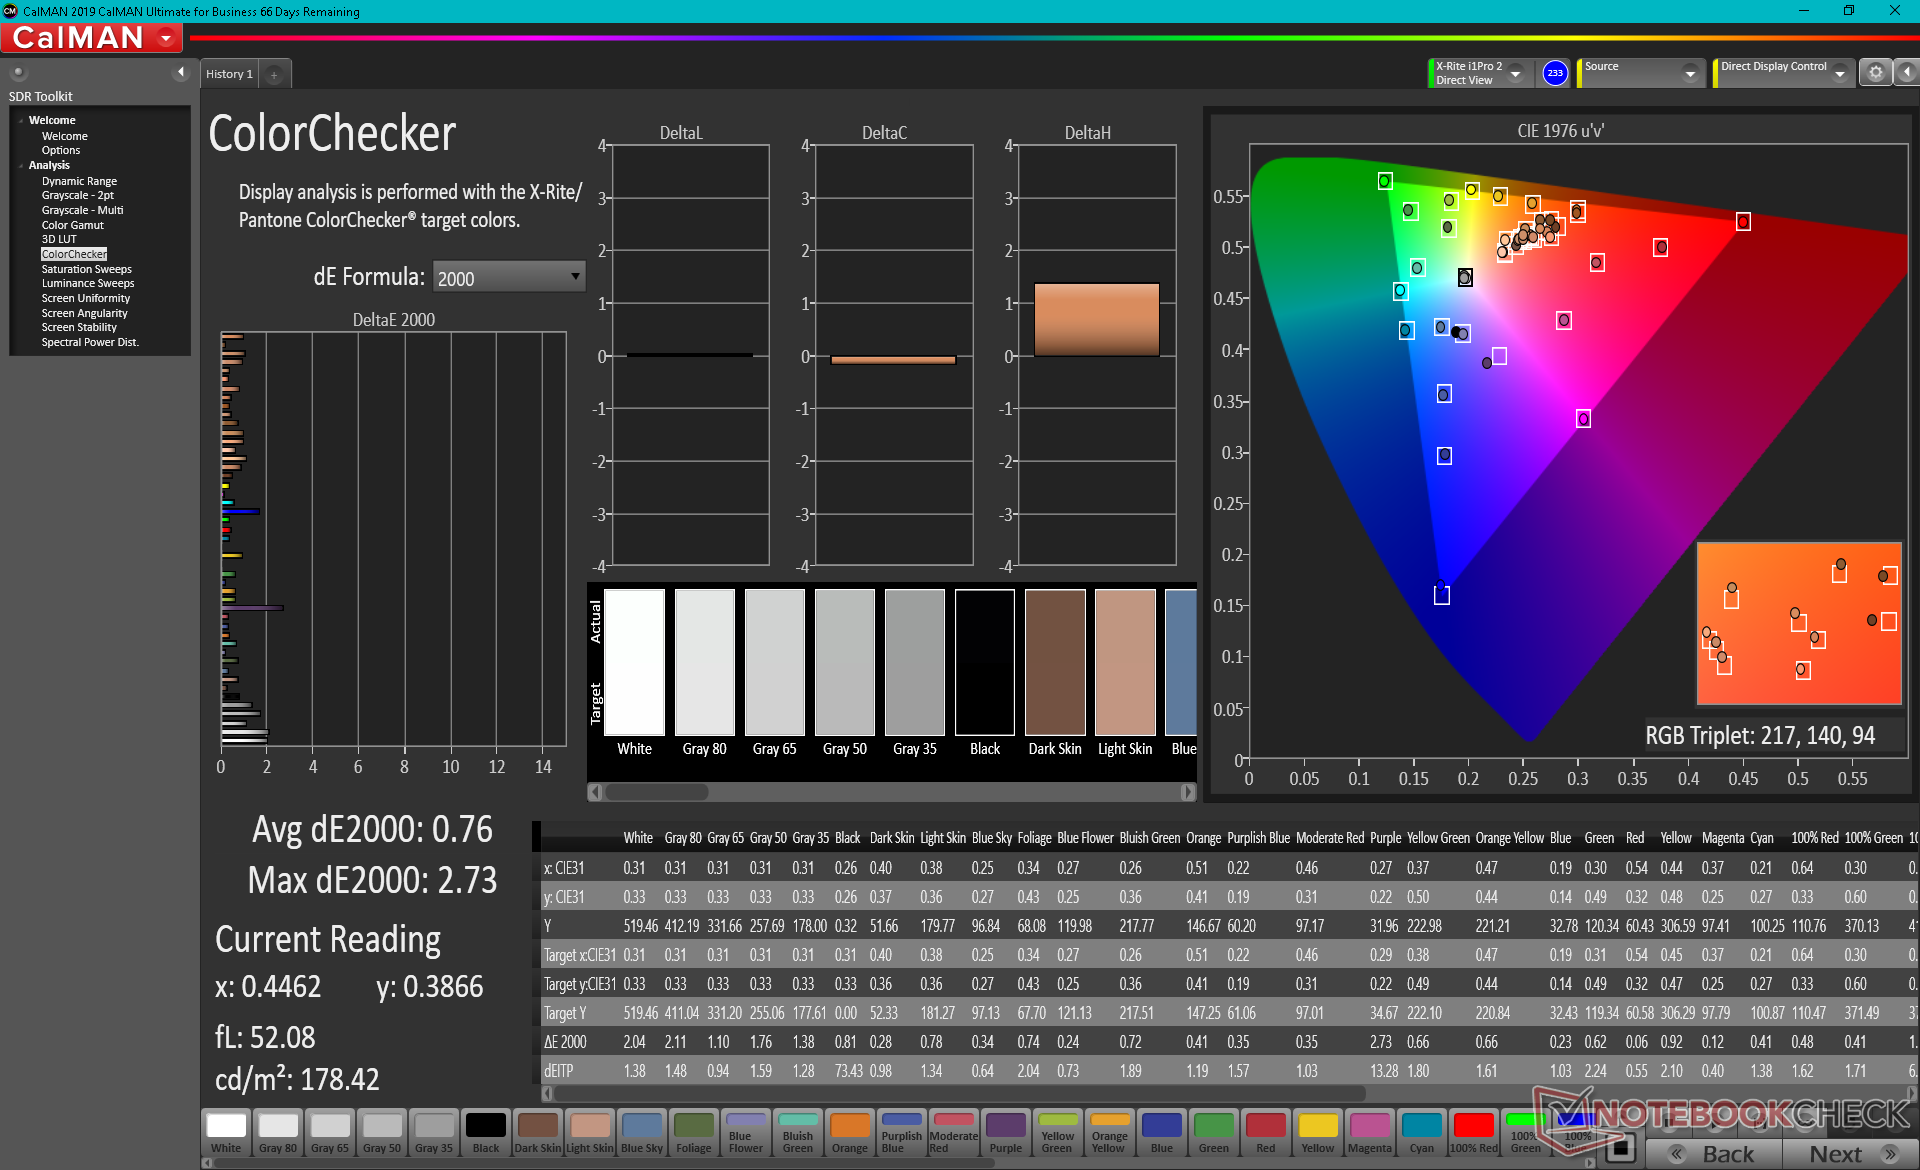
ΔE ColorChecker Calman: 4.83 | ∀{0.5-29.43 Ø4.72}
calibrated: 0.76
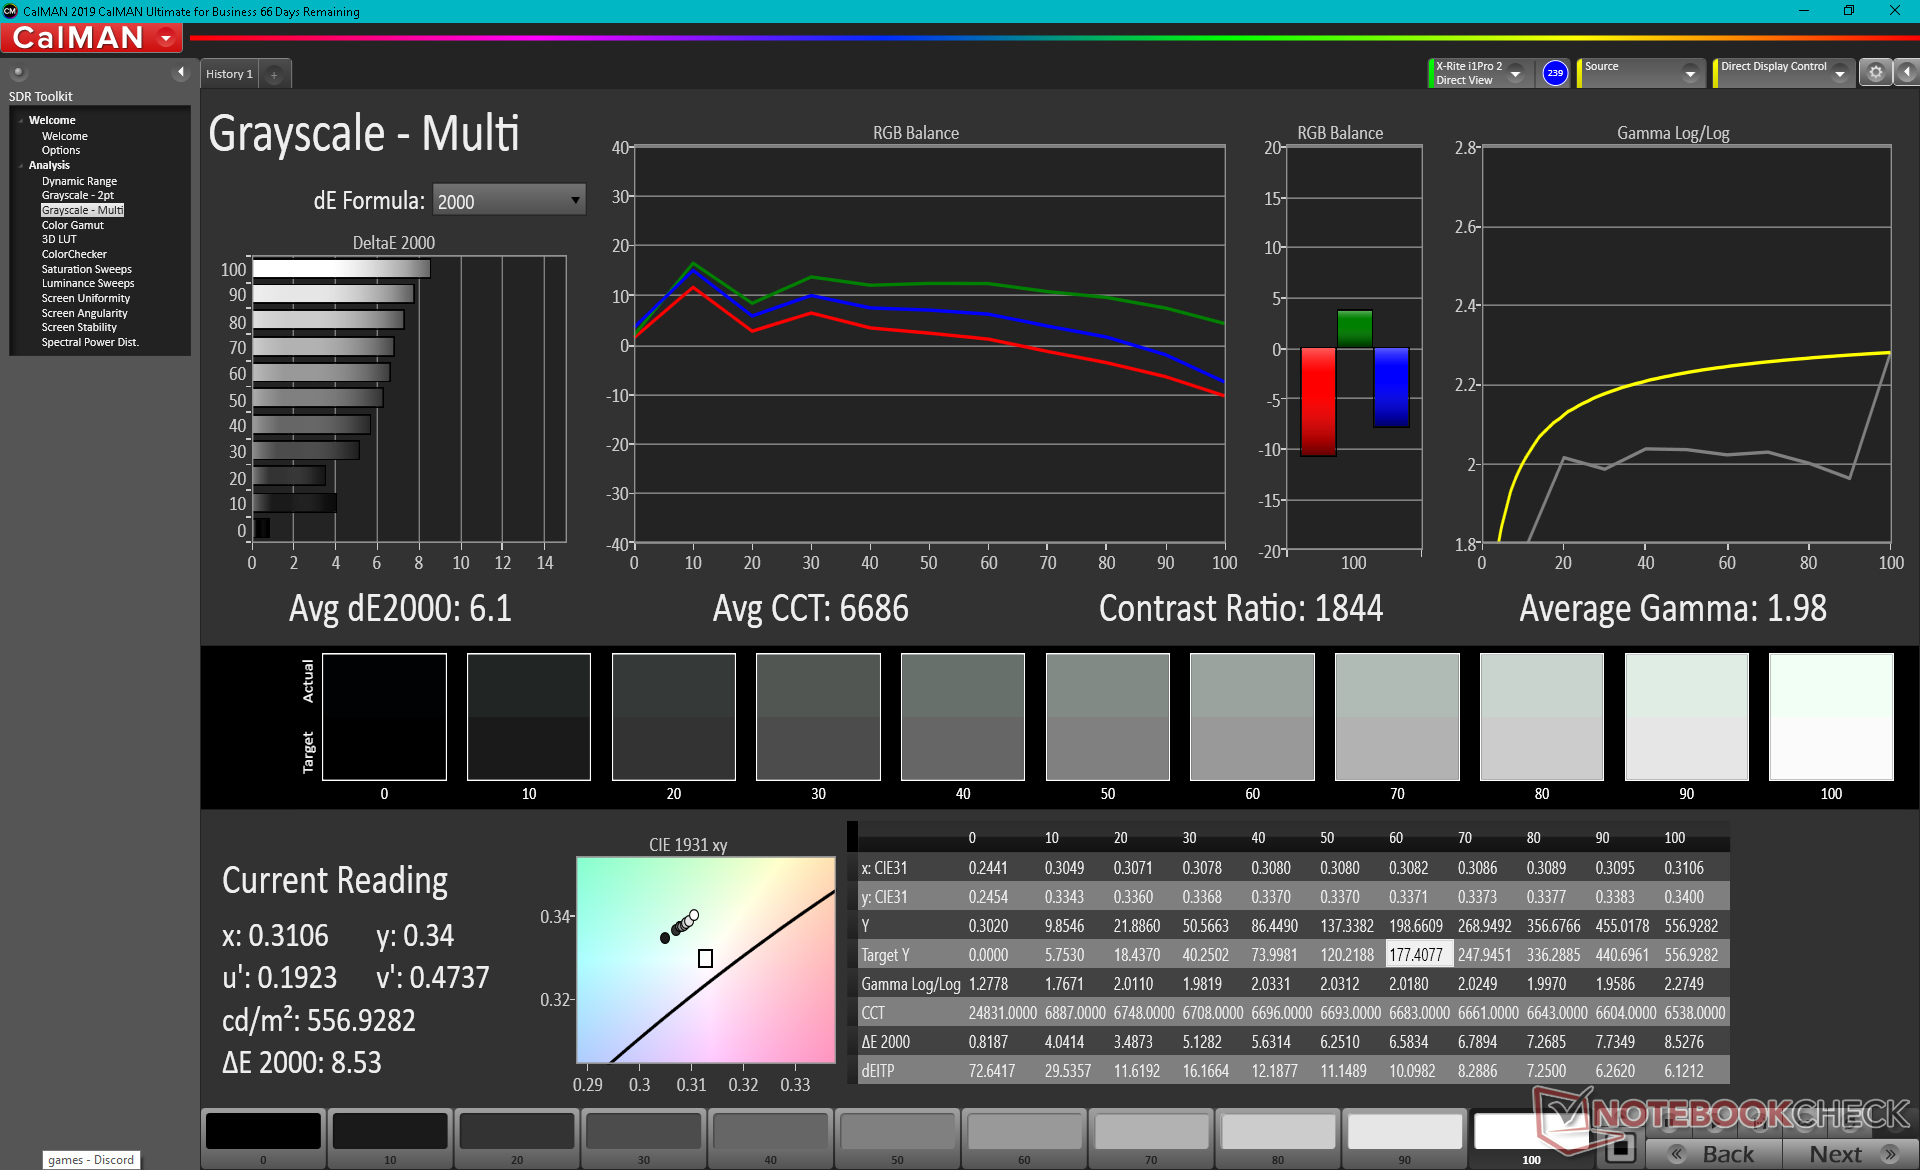
ΔE Greyscale Calman: 6.1 | ∀{0.09-98 Ø4.97}
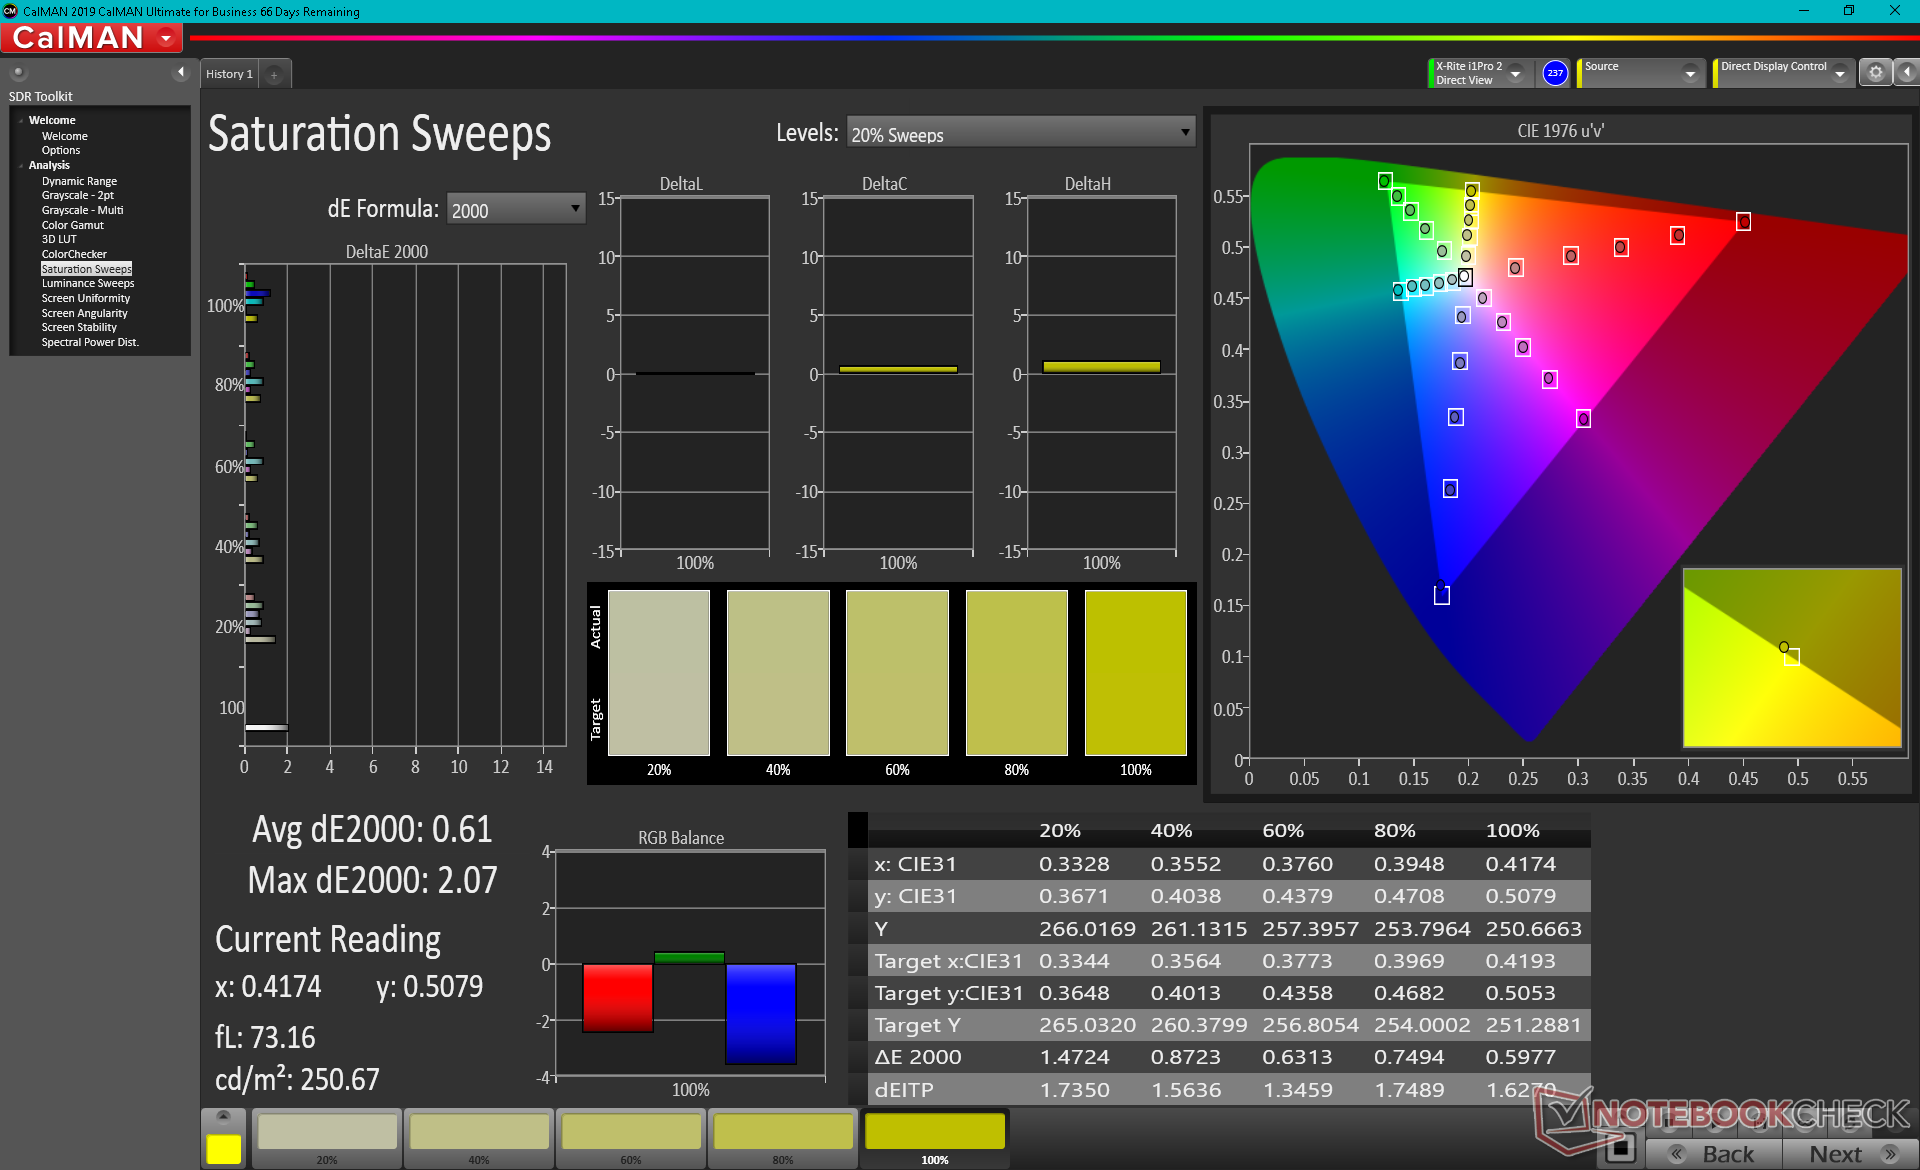
71.7% AdobeRGB 1998 (Argyll 3D)
99% sRGB (Argyll 3D)
69.7% Display P3 (Argyll 3D)
Gamma: 1.98
CCT: 6686 K
| Dell XPS 13 9310 2-in-1 Sharp LQ134N1, IPS, 13.4", 1920x1200 | Dell XPS 13 9310 Core i7 FHD Sharp LQ134N1, IPS, 13.4", 1920x1200 | Dell XPS 13 7390 2-in-1 Core i7 Sharp LQ134N1, IPS, 13.4", 1920x1200 | Lenovo Yoga 6 13 82ND0009US AU Optronics B133HAN05.F, IPS, 13.3", 1920x1080 | Asus ZenBook Flip 13 UX363EA-HP069T Samsung, SDC414A, OLED, 13.3", 1920x1080 | Samsung Galaxy Book Pro 360 13 AMOLED, 13.2", 1920x1080 | |
|---|---|---|---|---|---|---|
| Display | 1% | 0% | 0% | 26% | ||
| Display P3 Coverage (%) | 69.7 | 70.9 2% | 69.9 0% | 69.7 0% | 99.4 43% | |
| sRGB Coverage (%) | 99 | 99.1 0% | 99.2 0% | 99.2 0% | 100 1% | |
| AdobeRGB 1998 Coverage (%) | 71.7 | 72.9 2% | 71.5 0% | 71.4 0% | 96 34% | |
| Response Times | 12% | 21% | 23% | 96% | 96% | |
| Response Time Grey 50% / Grey 80% * (ms) | 55.6 ? | 52 ? 6% | 47.6 ? 14% | 46.8 ? 16% | 2 ? 96% | 2 ? 96% |
| Response Time Black / White * (ms) | 40.4 ? | 33.2 ? 18% | 29.2 ? 28% | 28.8 ? 29% | 2 ? 95% | 2 ? 95% |
| PWM Frequency (Hz) | 2500 ? | 2475 ? | 2500 ? | 60 | 60 ? | |
| Screen | -2% | 7% | -8% | -38% | 235% | |
| Brightness middle (cd/m²) | 555.7 | 543.3 -2% | 549.8 -1% | 291.5 -48% | 353 -36% | 287 -48% |
| Brightness (cd/m²) | 528 | 524 -1% | 520 -2% | 294 -44% | 359 -32% | 289 -45% |
| Brightness Distribution (%) | 90 | 92 2% | 86 -4% | 93 3% | 95 6% | 96 7% |
| Black Level * (cd/m²) | 0.35 | 0.38 -9% | 0.39 -11% | 0.19 46% | 0.1 71% | 0.01 97% |
| Contrast (:1) | 1588 | 1430 -10% | 1410 -11% | 1534 -3% | 3530 122% | 28700 1707% |
| Colorchecker dE 2000 * | 4.83 | 3.02 37% | 2.12 56% | 3.83 21% | 3.98 18% | 2.24 54% |
| Colorchecker dE 2000 max. * | 8.46 | 7.61 10% | 3.66 57% | 8.43 -0% | 53.07 -527% | 3.69 56% |
| Colorchecker dE 2000 calibrated * | 0.76 | 1.23 -62% | 1.37 -80% | 1.07 -41% | ||
| Greyscale dE 2000 * | 6.1 | 5 18% | 2.6 57% | 6.2 -2% | 1.41 77% | 2.73 55% |
| Gamma | 1.98 111% | 2.02 109% | 2.3 96% | 2.2 100% | 2.39 92% | 2.46 89% |
| CCT | 6686 97% | 6550 99% | 6884 94% | 6469 100% | 6346 102% | 6523 100% |
| Color Space (Percent of AdobeRGB 1998) (%) | 66.8 | 65.4 | ||||
| Color Space (Percent of sRGB) (%) | 99.6 | 99.7 | ||||
| Media total (Programa/Opciones) | 4% /
1% | 9% /
7% | 5% /
-2% | 29% /
-11% | 119% /
166% |
* ... más pequeño es mejor
Tiempos de respuesta del display
| ↔ Tiempo de respuesta de Negro a Blanco | ||
|---|---|---|
| 40.4 ms ... subida ↗ y bajada ↘ combinada | ↗ 22 ms subida | 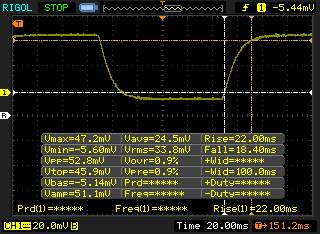 |
| ↘ 18.4 ms bajada | ||
| La pantalla mostró tiempos de respuesta lentos en nuestros tests y podría ser demasiado lenta para los jugones. En comparación, todos los dispositivos de prueba van de ##min### (mínimo) a 240 (máximo) ms. » 97 % de todos los dispositivos son mejores. Eso quiere decir que el tiempo de respuesta es peor que la media (19.8 ms) de todos los dispositivos testados. | ||
| ↔ Tiempo de respuesta 50% Gris a 80% Gris | ||
| 55.6 ms ... subida ↗ y bajada ↘ combinada | ↗ 27.6 ms subida | 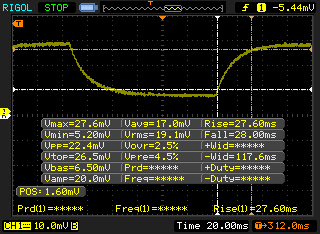 |
| ↘ 28 ms bajada | ||
| La pantalla mostró tiempos de respuesta lentos en nuestros tests y podría ser demasiado lenta para los jugones. En comparación, todos los dispositivos de prueba van de ##min### (mínimo) a 636 (máximo) ms. » 92 % de todos los dispositivos son mejores. Eso quiere decir que el tiempo de respuesta es peor que la media (31 ms) de todos los dispositivos testados. | ||
Parpadeo de Pantalla / PWM (Pulse-Width Modulation)
| Parpadeo de Pantalla / PWM detectado | 2500 Hz | ≤ 25 % de brillo | 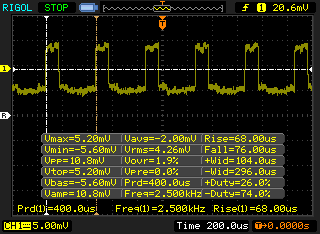 |
La retroiluminación del display parpadea a 2500 Hz (seguramente usa PWM - Pulse-Width Modulation) a un brillo del 25 % e inferior. Sobre este nivel de brillo no debería darse parpadeo / PWM. La frecuencia de 2500 Hz es bastante alta, por lo que la mayoría de gente sensible al parpadeo no debería ver parpadeo o tener fatiga visual. Comparación: 52 % de todos los dispositivos testados no usaron PWM para atenuar el display. Si se usó, medimos una media de 7763 (mínimo: 5 - máxmo: 343500) Hz. | |||

Rendimiento - Intel Tiger Lake-U al rescate
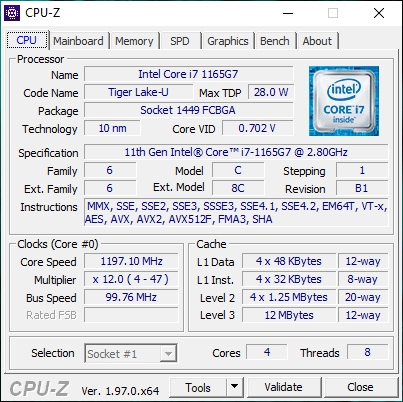
Procesador - Bajo rendimiento
El rendimiento de la CPU fluctúa mucho como lo que observamos en el XPS 9310 clamshell equipado con el mismo Core i7-1165G7 que el mismo Core i7-1165G7. Las puntuaciones de CineBench R15 xT pueden oscilar entre 480 y 750 puntos, respectivamente, en comparación con las velocidades de reloj más consistentes del XPS 13 7390 2-en-1 o el ZenBook Flip 13. El rendimiento del procesador, por tanto, puede ser más lento que el de la última generación Core i7-1065G7 a veces.
Nuestra unidad se puso en modo Ultra Performance a través del software Dell Power Manager antes de ejecutar cualquier prueba para obtener las puntuaciones más altas posibles.
Cinebench R15 Multi Loop
Cinebench R23: Multi Core | Single Core
Cinebench R15: CPU Multi 64Bit | CPU Single 64Bit
Blender: v2.79 BMW27 CPU
7-Zip 18.03: 7z b 4 -mmt1 | 7z b 4
Geekbench 5.5: Single-Core | Multi-Core
HWBOT x265 Benchmark v2.2: 4k Preset
LibreOffice : 20 Documents To PDF
R Benchmark 2.5: Overall mean
| Cinebench R23 / Multi Core | |
| Lenovo Yoga Slim 7-14ARE | |
| Asus ZenBook 13 OLED UM325UA | |
| Lenovo Yoga 6 13 82ND0009US | |
| Medio Intel Core i7-1165G7 (2525 - 6862, n=64) | |
| Dell XPS 13 9310 OLED | |
| Dell XPS 13 9310 2-in-1 | |
| HP Spectre x360 13-aw2003dx | |
| Asus VivoBook S13 S333JA-DS51 | |
| Cinebench R23 / Single Core | |
| Dell XPS 13 9310 OLED | |
| Medio Intel Core i7-1165G7 (1110 - 1539, n=59) | |
| Dell XPS 13 9310 2-in-1 | |
| HP Spectre x360 13-aw2003dx | |
| Asus ZenBook 13 OLED UM325UA | |
| Lenovo Yoga Slim 7-14ARE | |
| Lenovo Yoga 6 13 82ND0009US | |
| Asus VivoBook S13 S333JA-DS51 | |
| Geekbench 5.5 / Single-Core | |
| Dell XPS 13 9310 OLED | |
| Medio Intel Core i7-1165G7 (1302 - 1595, n=77) | |
| HP Spectre x360 13-aw2003dx | |
| Asus Zenbook S UX393JA | |
| HP Envy 13-ba0001ng | |
| Asus ZenBook 13 OLED UM325UA | |
| Lenovo Yoga Slim 7-14ARE | |
| Lenovo Yoga Slim 7-14ARE | |
| Asus VivoBook S13 S333JA-DS51 | |
| Geekbench 5.5 / Multi-Core | |
| Lenovo Yoga Slim 7-14ARE | |
| Lenovo Yoga Slim 7-14ARE | |
| Asus ZenBook 13 OLED UM325UA | |
| Dell XPS 13 9310 OLED | |
| HP Spectre x360 13-aw2003dx | |
| Medio Intel Core i7-1165G7 (3078 - 5926, n=77) | |
| Asus Zenbook S UX393JA | |
| Asus VivoBook S13 S333JA-DS51 | |
| HP Envy 13-ba0001ng | |
| HWBOT x265 Benchmark v2.2 / 4k Preset | |
| Lenovo Yoga Slim 7-14ARE | |
| Asus ZenBook 13 OLED UM325UA | |
| Lenovo Yoga 6 13 82ND0009US | |
| Dell XPS 13 9310 OLED | |
| Dell XPS 13 9310 2-in-1 | |
| Medio Intel Core i7-1165G7 (1.39 - 8.47, n=80) | |
| HP Spectre x360 13-aw2003dx | |
| Dell XPS 13 7390 Core i7-10710U | |
| Asus VivoBook S13 S333JA-DS51 | |
| Asus Zenbook S UX393JA | |
| HP Envy 13-ba0001ng | |
| LibreOffice / 20 Documents To PDF | |
| Lenovo Yoga 6 13 82ND0009US | |
| Asus VivoBook S13 S333JA-DS51 | |
| Asus ZenBook 13 OLED UM325UA | |
| Lenovo Yoga Slim 7-14ARE | |
| HP Envy 13-ba0001ng | |
| HP Spectre x360 13-aw2003dx | |
| Medio Intel Core i7-1165G7 (21.5 - 88.1, n=78) | |
| Asus Zenbook S UX393JA | |
| Dell XPS 13 9310 OLED | |
| R Benchmark 2.5 / Overall mean | |
| Asus VivoBook S13 S333JA-DS51 | |
| Asus Zenbook S UX393JA | |
| HP Envy 13-ba0001ng | |
| HP Spectre x360 13-aw2003dx | |
| Lenovo Yoga 6 13 82ND0009US | |
| Lenovo Yoga Slim 7-14ARE | |
| Dell XPS 13 9310 2-in-1 | |
| Asus ZenBook 13 OLED UM325UA | |
| Dell XPS 13 9310 OLED | |
| Medio Intel Core i7-1165G7 (0.552 - 1.002, n=80) | |
* ... más pequeño es mejor
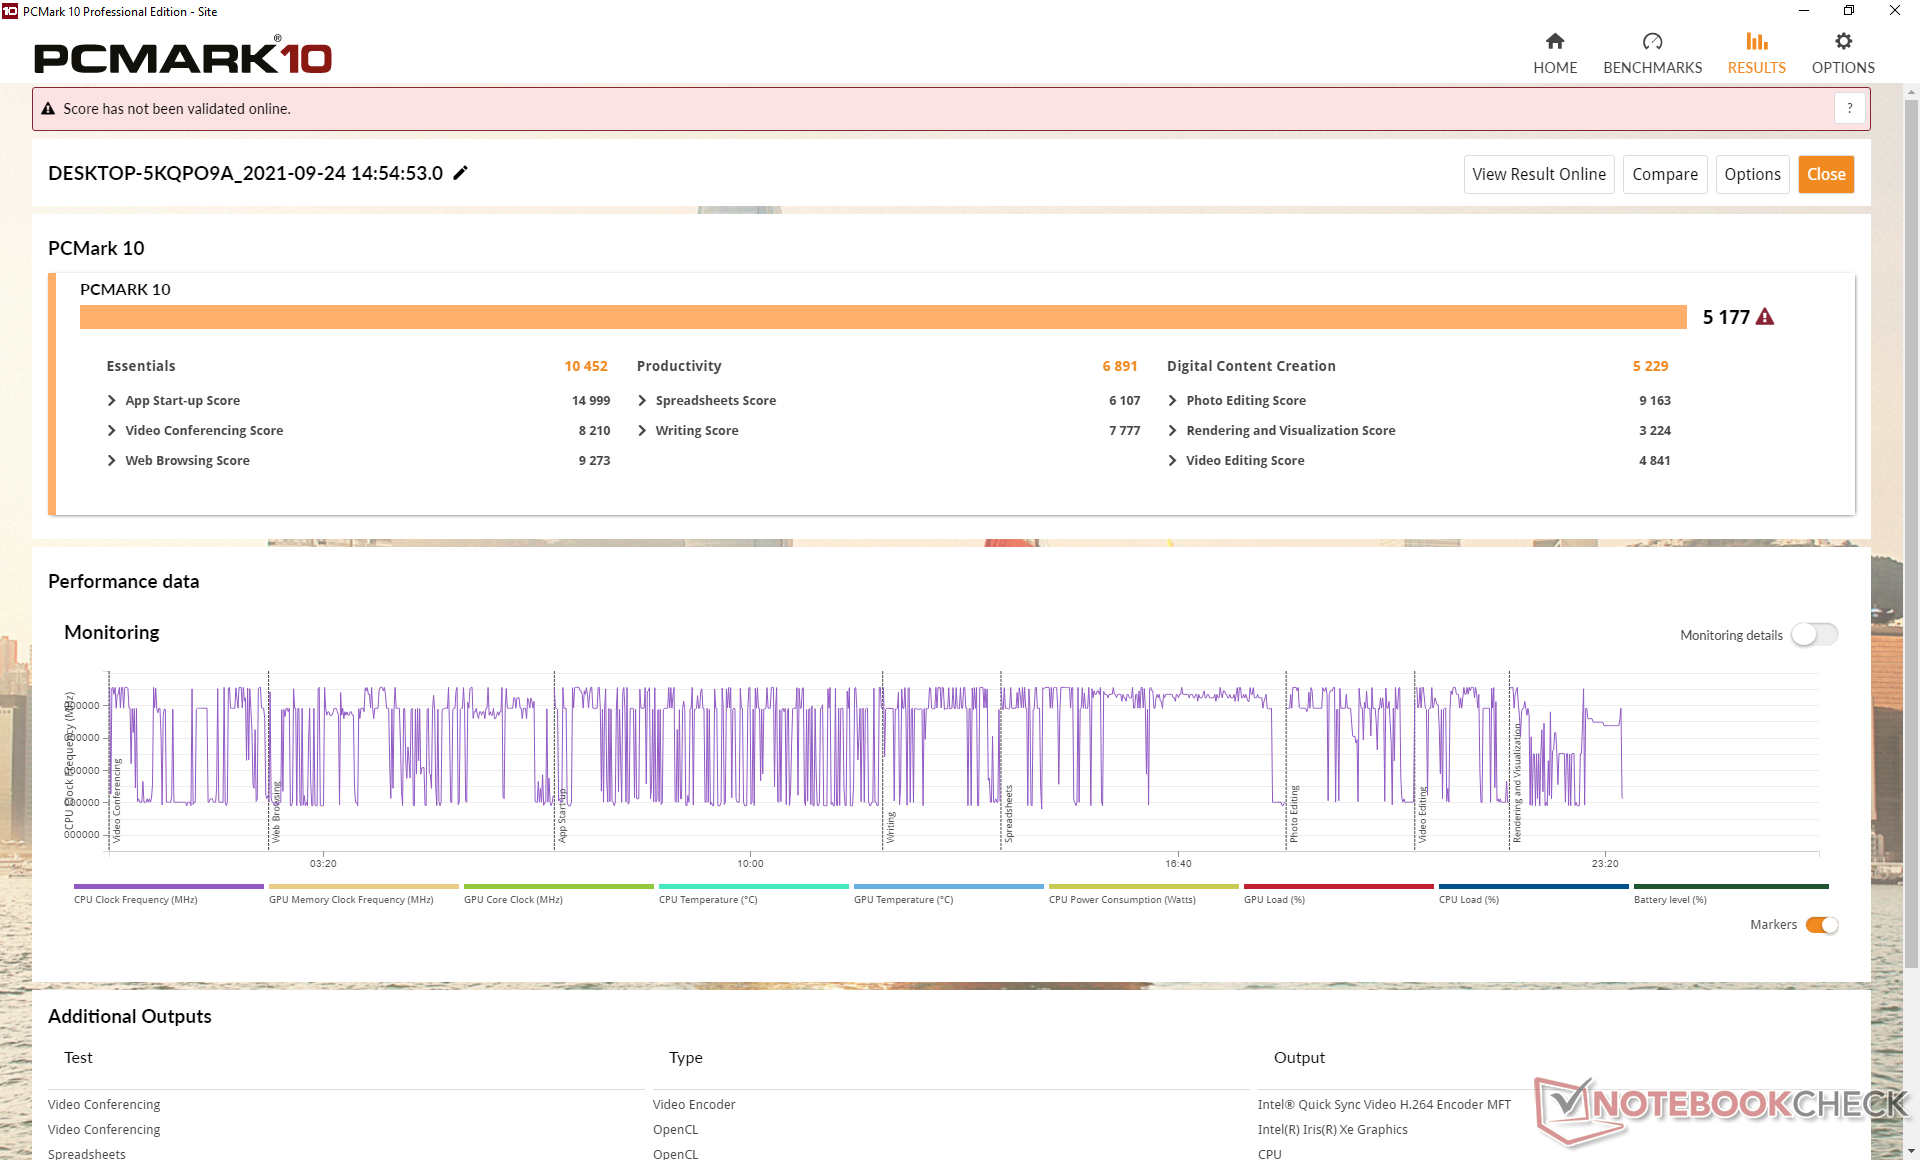
Rendimiento del sistema
Las puntuaciones de PCMark 10 están donde esperamos que estén en relación con otros portátiles equipados con la misma CPU Core i7. La mayor mejora con respecto al antiguo XPS 13 7390 2 en 1 se produce en la prueba de creación de contenidos digitales, en la que nuestra Iris Xe supera con creces a la Iris Plus G7.
| PCMark 10 / Score | |
| Lenovo Yoga 6 13 82ND0009US | |
| Dell XPS 13 9310 2-in-1 | |
| Medio Intel Core i7-1165G7, Intel Iris Xe Graphics G7 96EUs (4531 - 5454, n=50) | |
| Dell XPS 13 9310 Core i7 FHD | |
| Asus ZenBook Flip 13 UX363EA-HP069T | |
| Dell XPS 13 7390 2-in-1 Core i7 | |
| Samsung Galaxy Book Pro 360 13 | |
| PCMark 10 / Essentials | |
| Dell XPS 13 9310 2-in-1 | |
| Asus ZenBook Flip 13 UX363EA-HP069T | |
| Medio Intel Core i7-1165G7, Intel Iris Xe Graphics G7 96EUs (8997 - 11505, n=50) | |
| Lenovo Yoga 6 13 82ND0009US | |
| Dell XPS 13 9310 Core i7 FHD | |
| Dell XPS 13 7390 2-in-1 Core i7 | |
| Samsung Galaxy Book Pro 360 13 | |
| PCMark 10 / Productivity | |
| Lenovo Yoga 6 13 82ND0009US | |
| Dell XPS 13 7390 2-in-1 Core i7 | |
| Asus ZenBook Flip 13 UX363EA-HP069T | |
| Dell XPS 13 9310 2-in-1 | |
| Dell XPS 13 9310 Core i7 FHD | |
| Medio Intel Core i7-1165G7, Intel Iris Xe Graphics G7 96EUs (5570 - 7136, n=50) | |
| Samsung Galaxy Book Pro 360 13 | |
| PCMark 10 / Digital Content Creation | |
| Lenovo Yoga 6 13 82ND0009US | |
| Dell XPS 13 9310 2-in-1 | |
| Medio Intel Core i7-1165G7, Intel Iris Xe Graphics G7 96EUs (4083 - 5550, n=50) | |
| Dell XPS 13 9310 Core i7 FHD | |
| Samsung Galaxy Book Pro 360 13 | |
| Asus ZenBook Flip 13 UX363EA-HP069T | |
| Dell XPS 13 7390 2-in-1 Core i7 | |
| PCMark 10 Score | 5177 puntos | |
ayuda | ||
Latencia del CPD
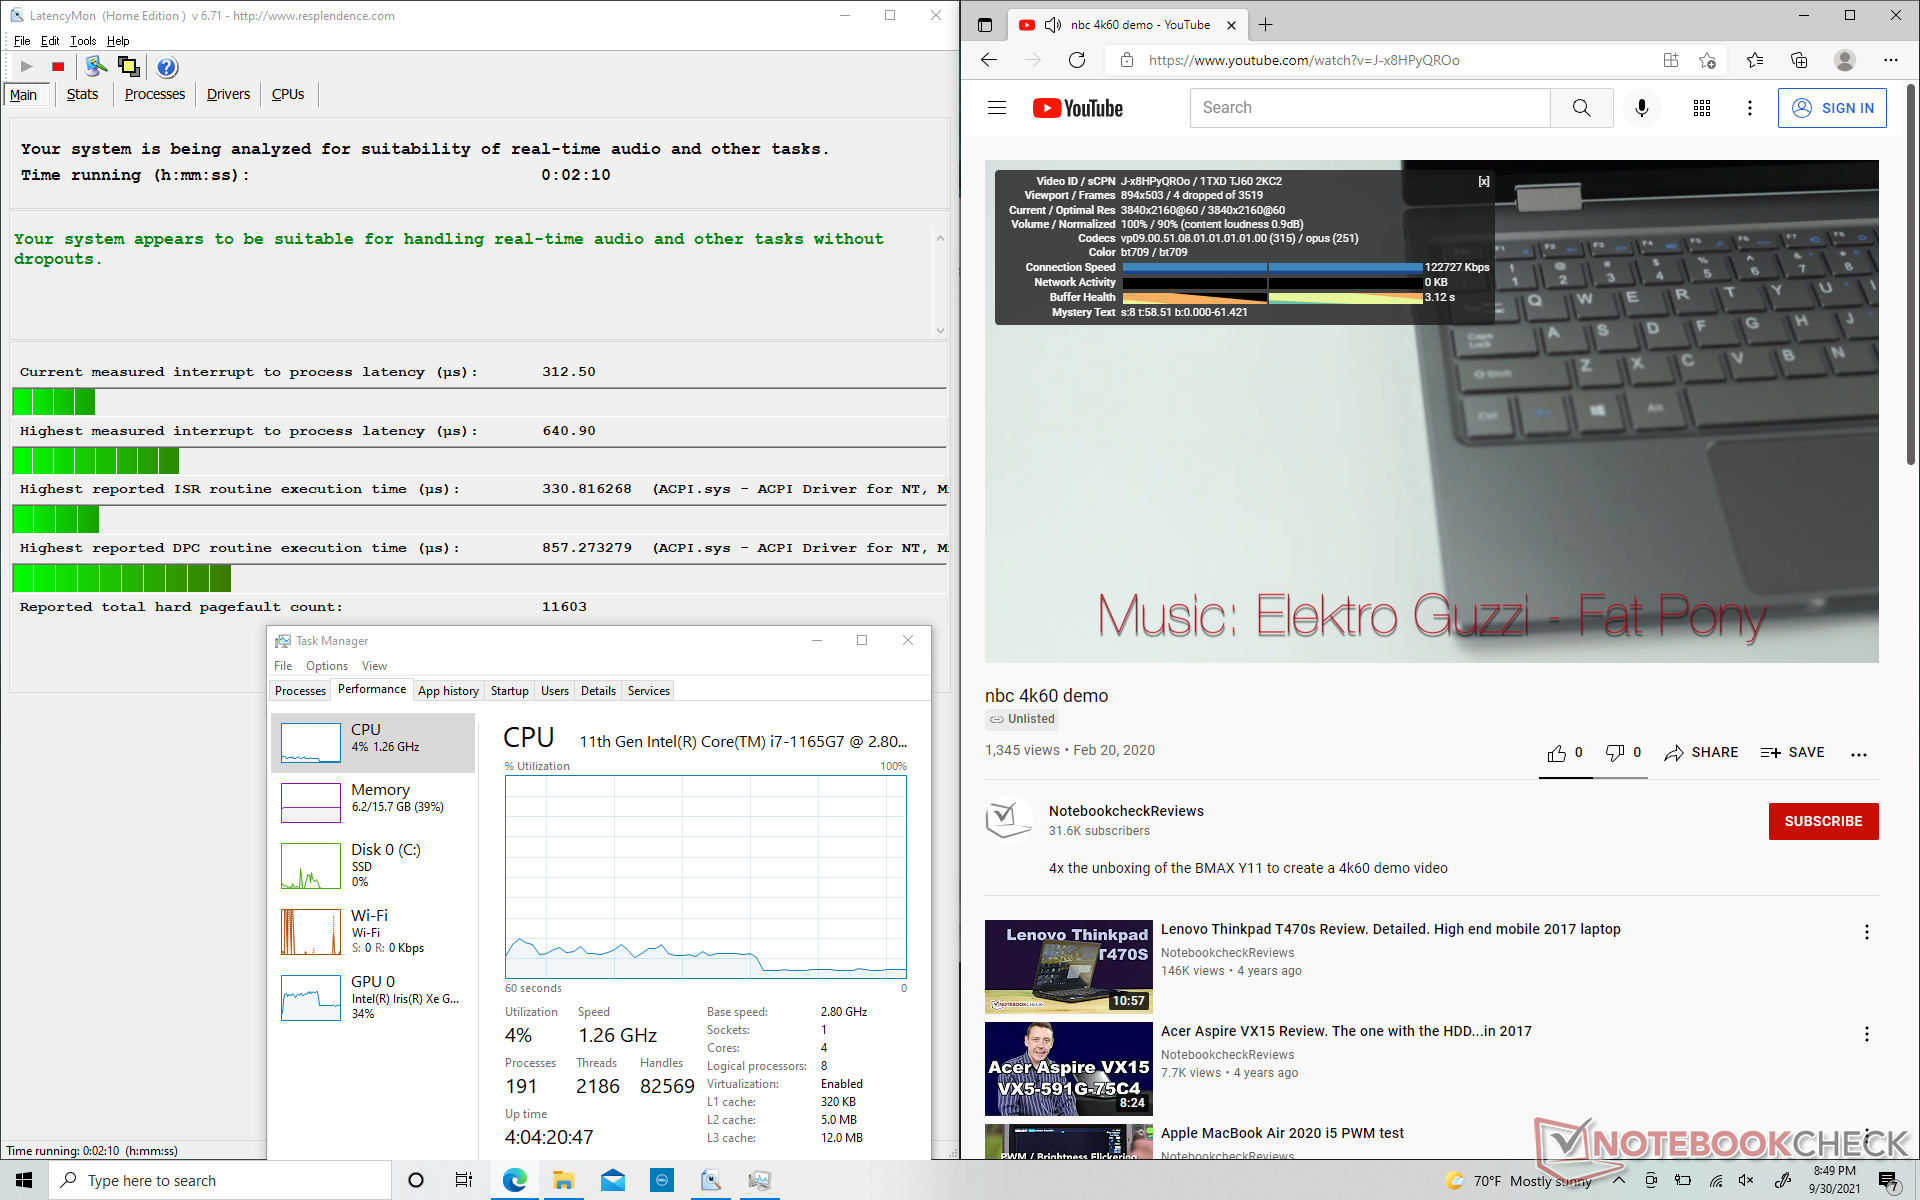
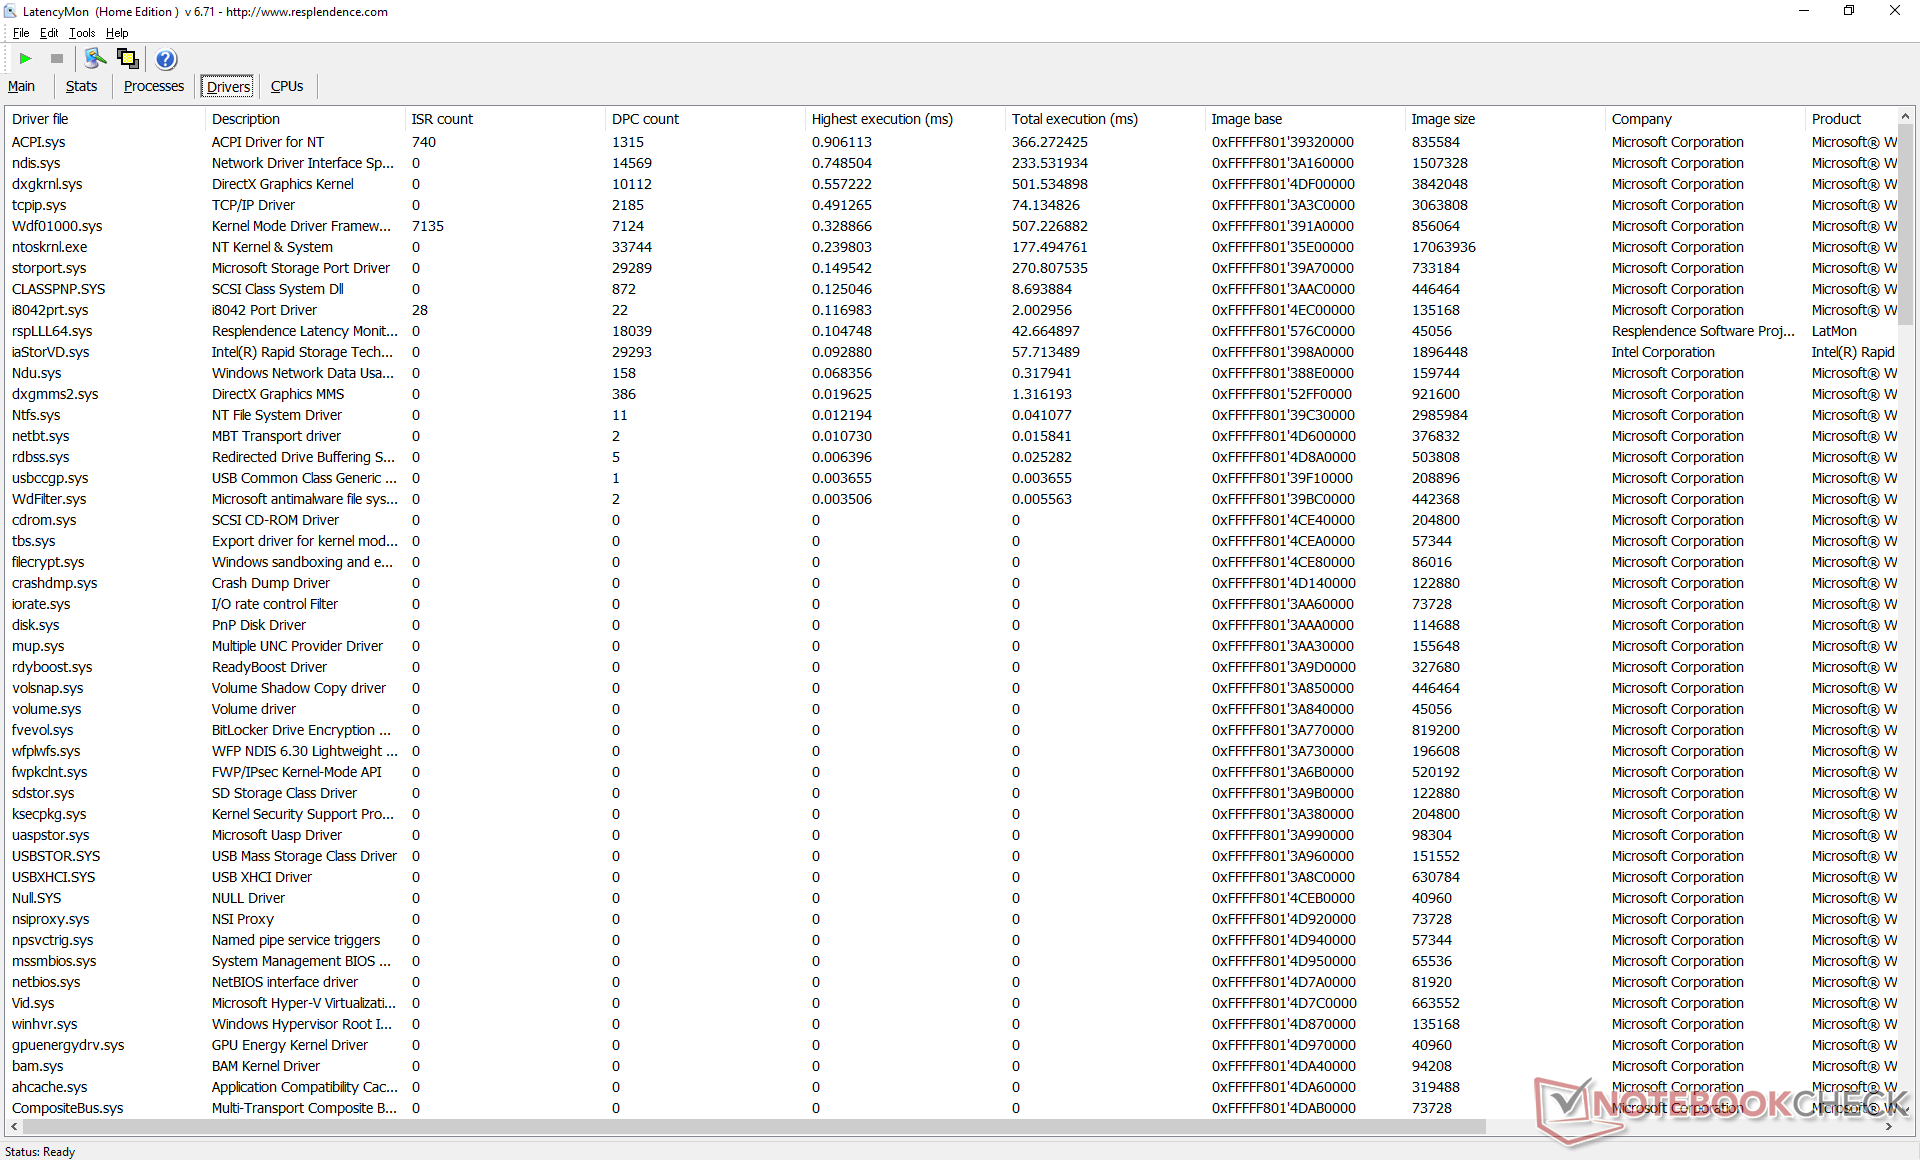
LatencyMon no muestra problemas de latencia al abrir varias pestañas en nuestra página web o al ejecutar el estrés de Prime95. La reproducción 4K UHD a 60 FPS también es fluida.
| DPC Latencies / LatencyMon - interrupt to process latency (max), Web, Youtube, Prime95 | |
| Samsung Galaxy Book Pro 360 13 | |
| Asus ZenBook Flip 13 UX363EA-HP069T | |
| Lenovo Yoga 6 13 82ND0009US | |
| Dell XPS 13 9310 Core i7 FHD | |
| Dell XPS 13 9310 2-in-1 | |
* ... más pequeño es mejor
Dispositivos de almacenamiento
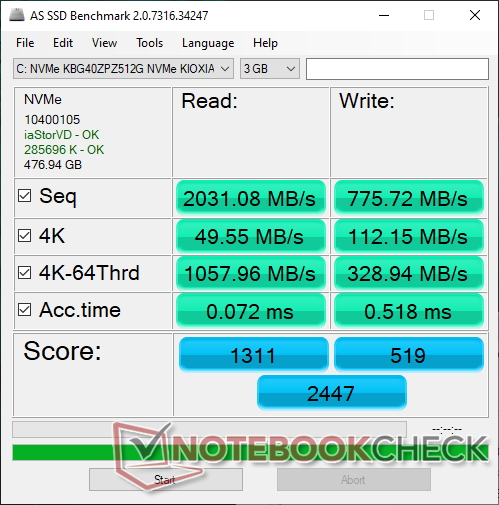
Nuestra unidad de prueba viene con el mismoSSD Toshiba BG4 PCIe3 NVMe que se encuentra en el antiguo XPS 13 7390 2-en-1. Sin embargo, no nos sorprendería ver que algunas unidades vienen con SSDs Micron en su lugar. No hay soporte para las velocidades PCIe4 a diferencia del último Vaio Z.
| Dell XPS 13 9310 2-in-1 Toshiba BG4 KBG40ZPZ512G | Dell XPS 13 9310 Core i7 FHD Micron 2300 512GB MTFDHBA512TDV | Dell XPS 13 7390 2-in-1 Core i7 Toshiba BG4 KBG40ZPZ512G | Lenovo Yoga 6 13 82ND0009US WDC PC SN530 SDBPMPZ-265G | Samsung Galaxy Book Pro 360 13 Samsung PM991 MZVLQ256HAJD | |
|---|---|---|---|---|---|
| AS SSD | 70% | 2% | -28% | 15% | |
| Seq Read (MB/s) | 2031 | 2091 3% | 1801 -11% | 1860 -8% | 1771 -13% |
| Seq Write (MB/s) | 776 | 1396 80% | 1125 45% | 500 -36% | 894 15% |
| 4K Read (MB/s) | 49.55 | 49.29 -1% | 39.7 -20% | 36.26 -27% | 53.5 8% |
| 4K Write (MB/s) | 112.2 | 104.2 -7% | 67 -40% | 118.6 6% | 157.8 41% |
| 4K-64 Read (MB/s) | 1058 | 827 -22% | 1253 18% | 419 -60% | 478.1 -55% |
| 4K-64 Write (MB/s) | 328.9 | 1636 397% | 209 -36% | 219 -33% | 741 125% |
| Access Time Read * (ms) | 0.072 | 0.066 8% | 0.069 4% | 0.102 -42% | 0.156 -117% |
| Access Time Write * (ms) | 0.518 | 0.365 30% | 0.625 -21% | 0.17 67% | 0.023 96% |
| Score Read (Points) | 1311 | 1086 -17% | 1472 12% | 641 -51% | 709 -46% |
| Score Write (Points) | 519 | 1880 262% | 388 -25% | 388 -25% | 988 90% |
| Score Total (Points) | 2447 | 3499 43% | 2583 6% | 1300 -47% | 2034 -17% |
| Copy ISO MB/s (MB/s) | 1103 | 1544 40% | 1293 17% | 880 -20% | 960 -13% |
| Copy Program MB/s (MB/s) | 331.7 | 613 85% | 560 69% | 185.3 -44% | 648 95% |
| Copy Game MB/s (MB/s) | 828 | 1451 75% | 927 12% | 212.7 -74% | 882 7% |
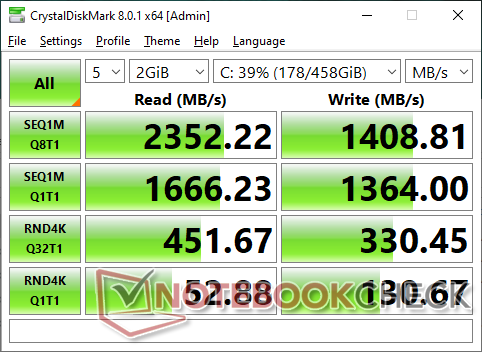
| CrystalDiskMark 5.2 / 6 | 24% | -3% | -20% | -12% | |
| Write 4K (MB/s) | 129.6 | 97.5 -25% | 106.7 -18% | 89.2 -31% | 170.6 32% |
| Read 4K (MB/s) | 52.2 | 50.9 -2% | 49.94 -4% | 33.09 -37% | 44.51 -15% |
| Write Seq (MB/s) | 1310 | 1811 38% | 1223 -7% | 988 -25% | 872 -33% |
| Read Seq (MB/s) | 1726 | 1836 6% | 1801 4% | 1322 -23% | 1188 -31% |
| Write 4K Q32T1 (MB/s) | 334.7 | 521 56% | 325.3 -3% | 332.6 -1% | 483.1 44% |
| Read 4K Q32T1 (MB/s) | 447.6 | 357.5 -20% | 551 23% | 389.3 -13% | 284.3 -36% |
| Write Seq Q32T1 (MB/s) | 1410 | 2879 104% | 1224 -13% | 984 -30% | 950 -33% |
| Read Seq Q32T1 (MB/s) | 2390 | 3204 34% | 2350 -2% | 2461 3% | 1872 -22% |
| Media total (Programa/Opciones) | 47% /
53% | -1% /
0% | -24% /
-25% | 2% /
6% |
* ... más pequeño es mejor

Disk Throttling: DiskSpd Read Loop, Queue Depth 8
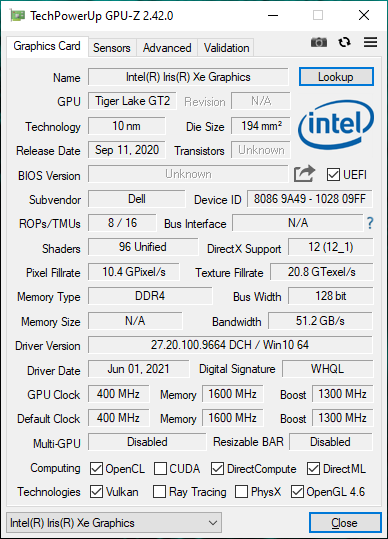
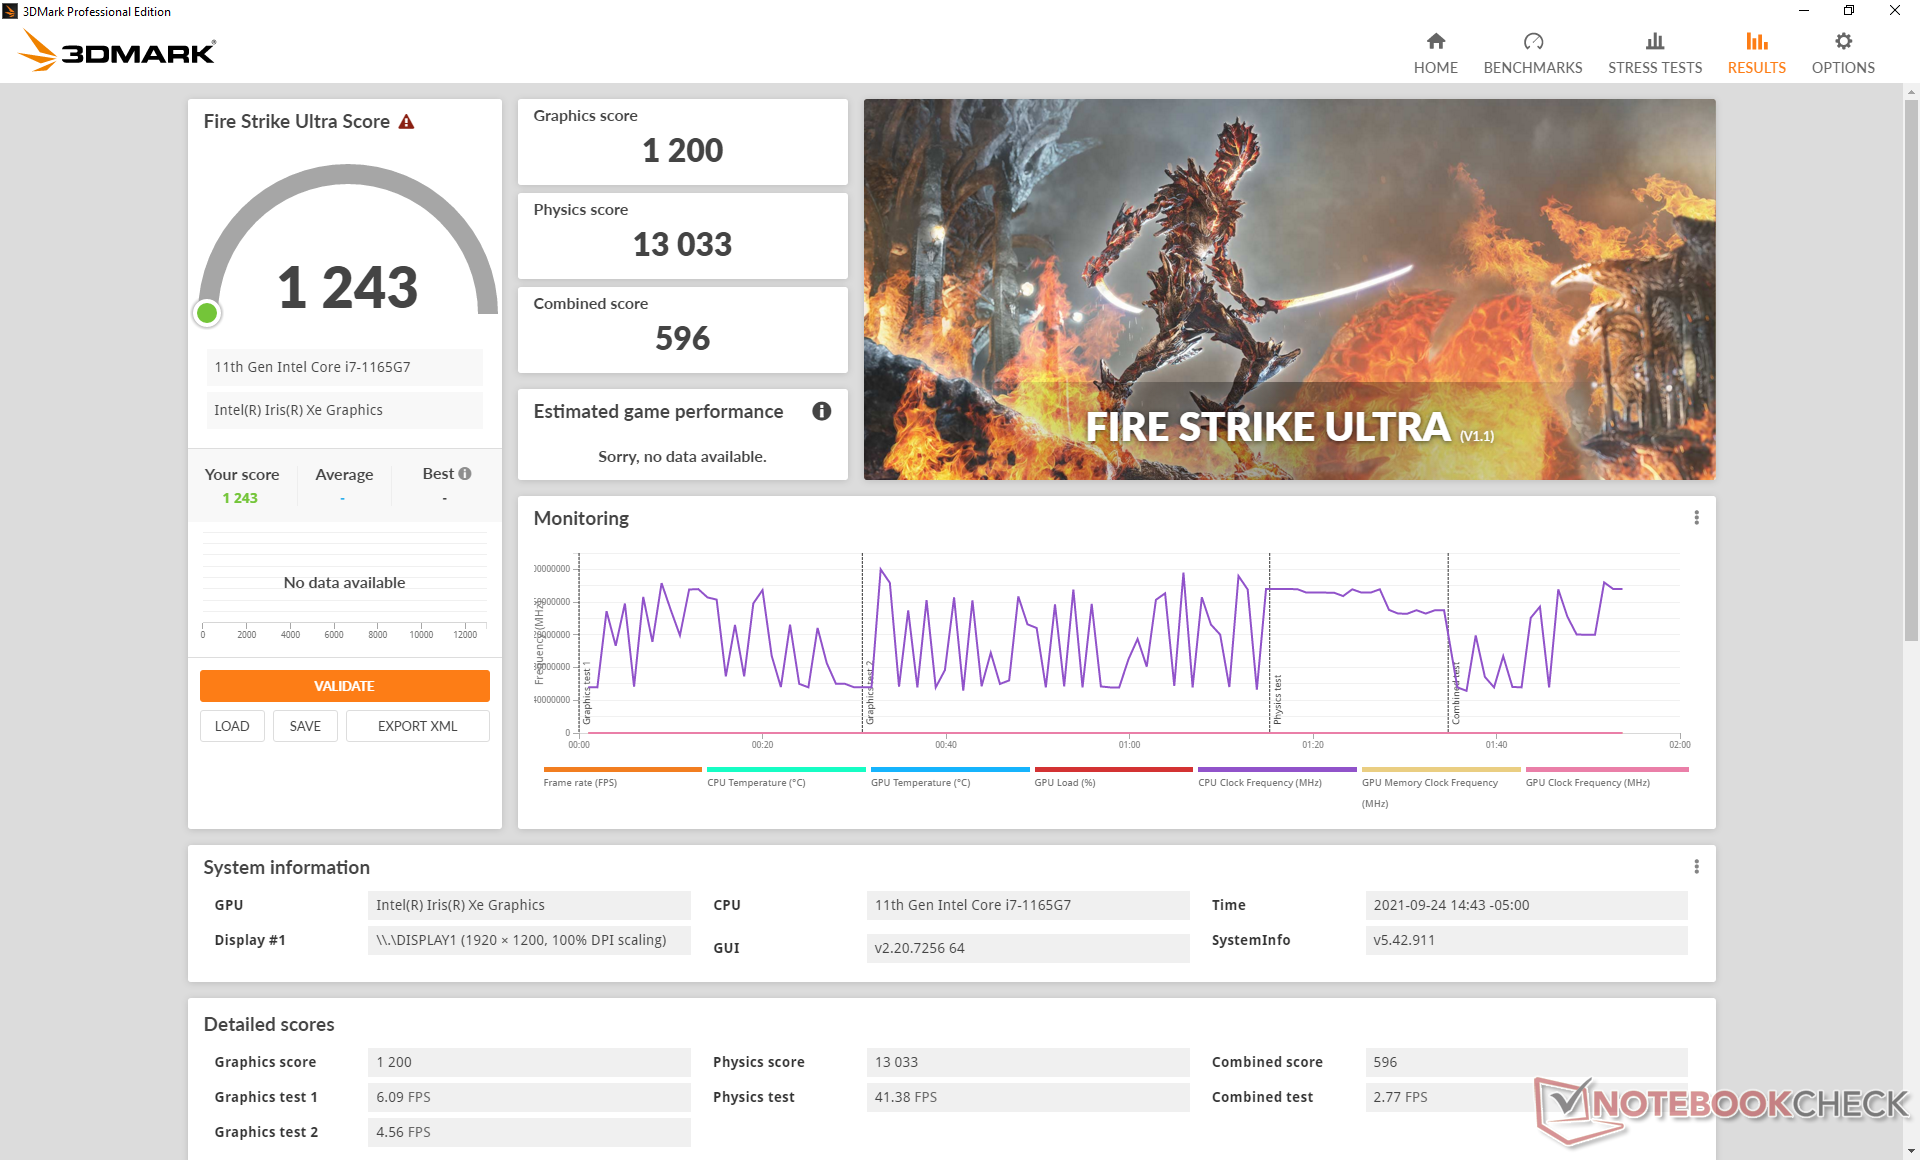
Rendimiento de la GPU: enormes mejoras respecto a la Iris Plus G7
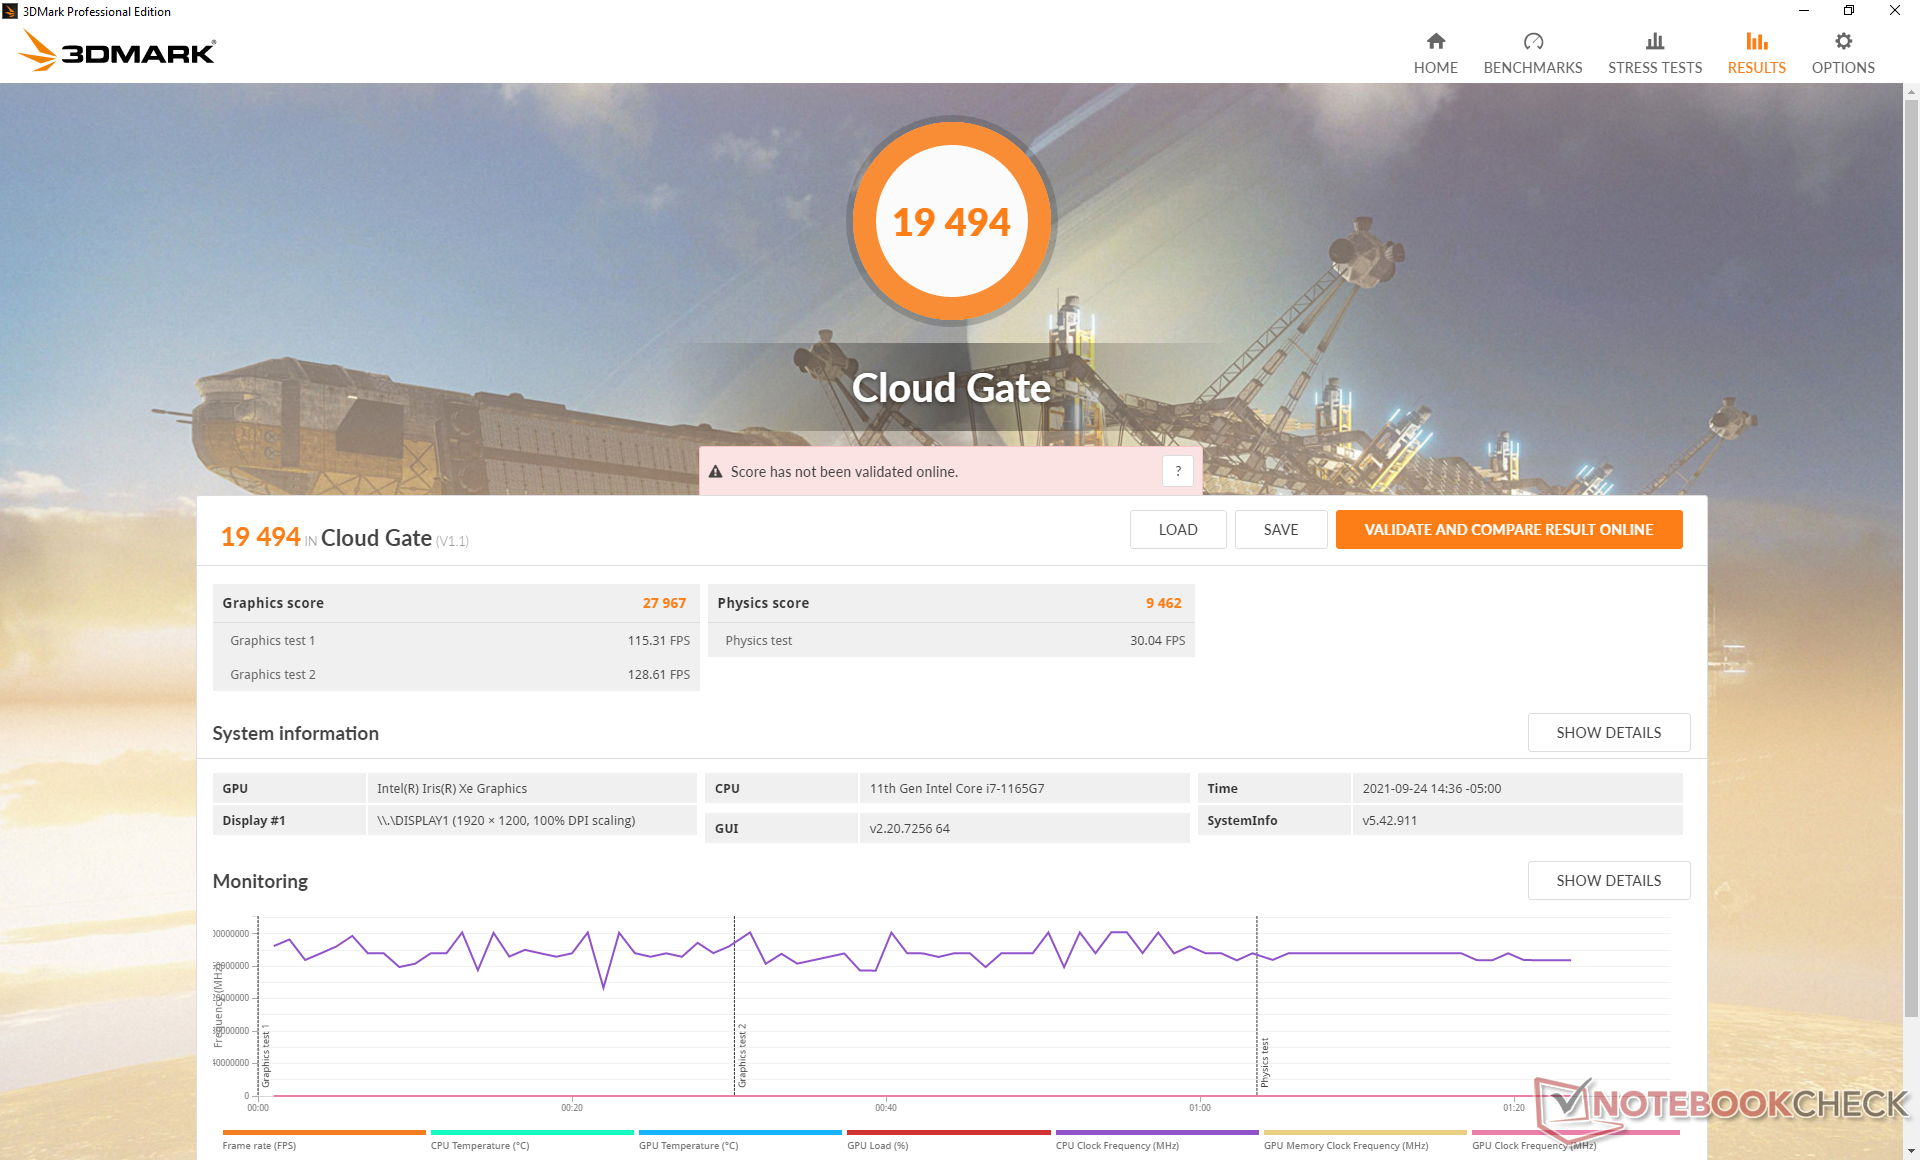
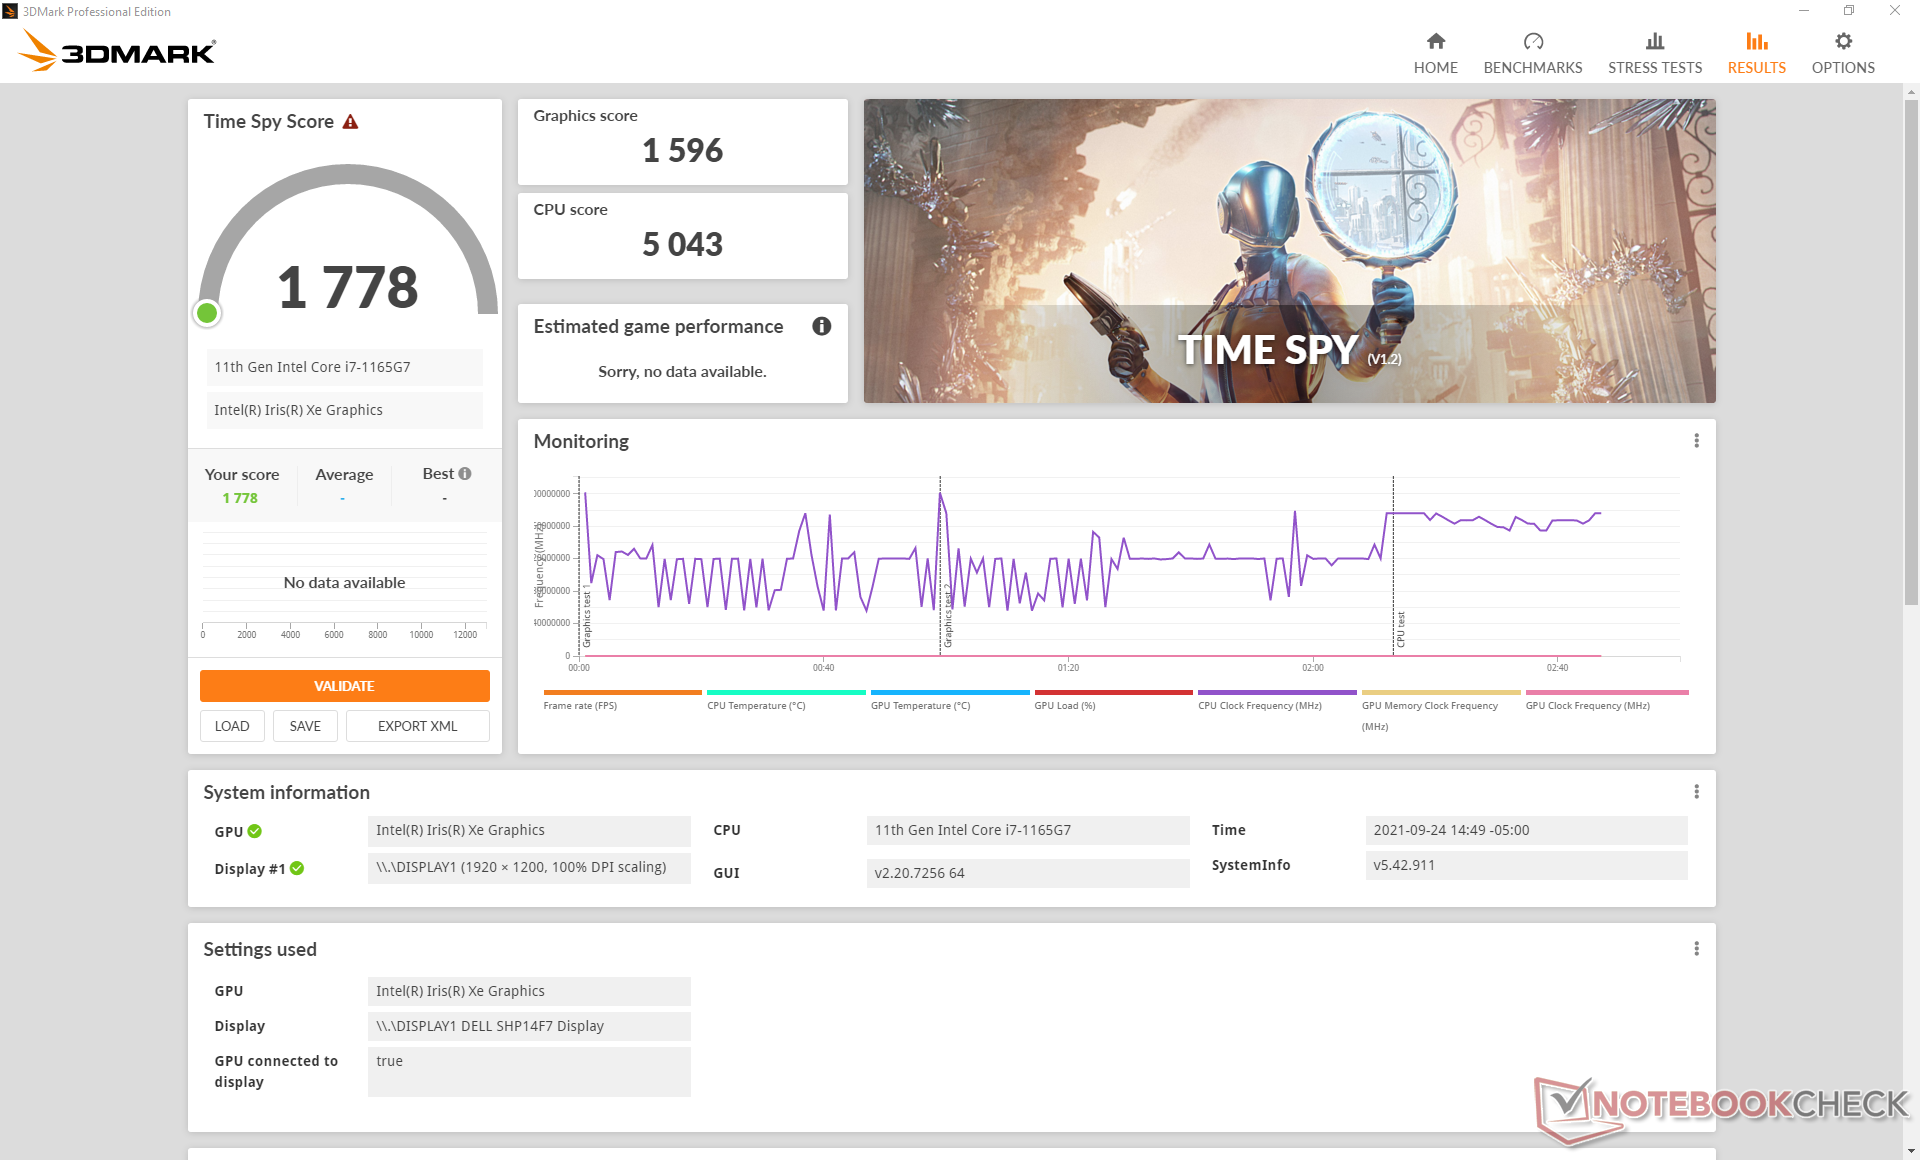
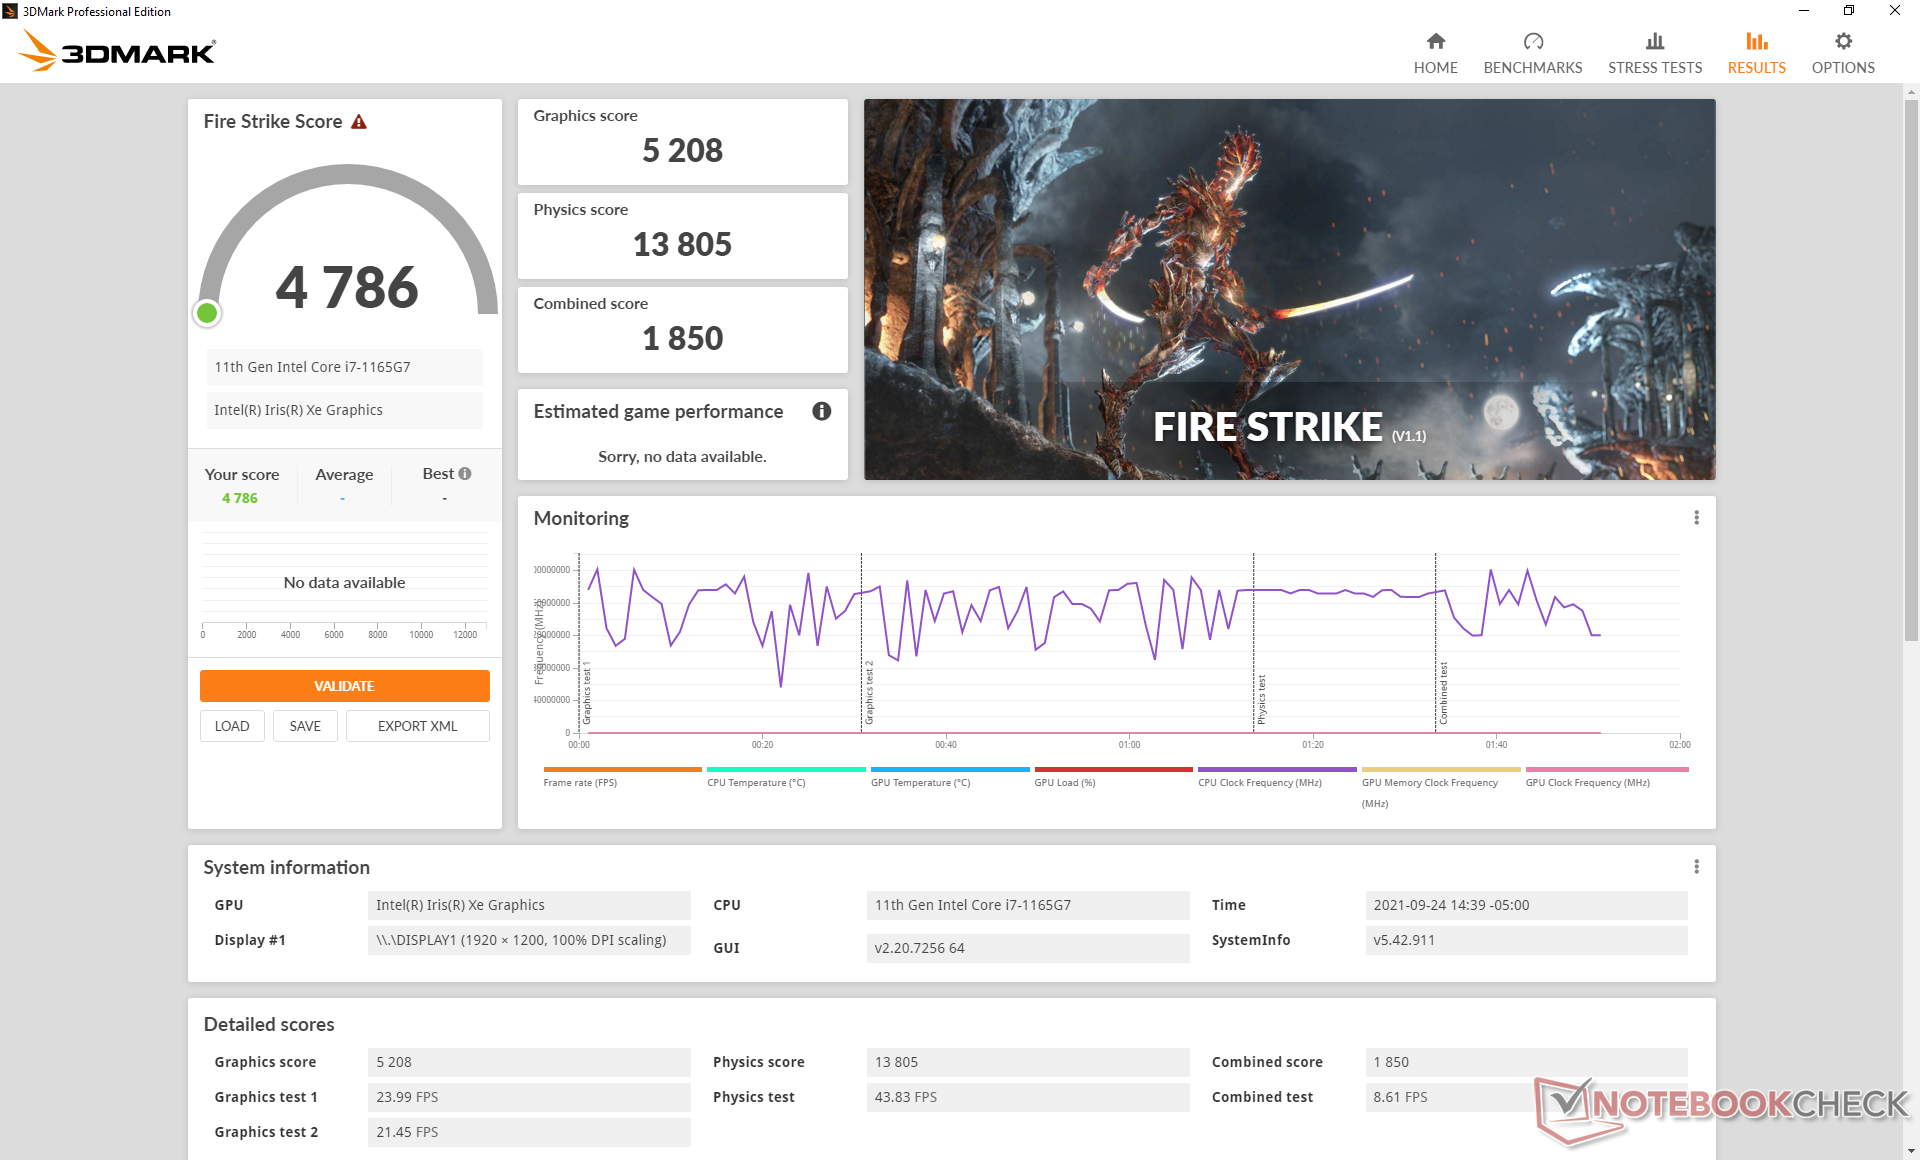
Iris Xe El rendimiento de los gráficos es una mejora significativa con respecto a la Iris Plus G7 del XPS 13 7390 2 en 1 del año pasado, entre un 60 y un 90 por ciento según las pruebas 3DMark. Los usuarios deberían ver los mayores saltos en los títulos que soportan DX12 sobre DX11.
Sin embargo, el rendimiento no siempre es constante. Por ejemplo, si se deja en reposo en Witcher 3 con una configuración baja durante una hora, la velocidad de fotogramas fluctúa entre 70 y 98 FPS. Por lo tanto, aunque el rendimiento es muy bueno en promedio, puede bajar periódicamente por un margen bastante grande. Este comportamiento es algo que hemos observado en la generación anterior de modelos XPS 13 también.
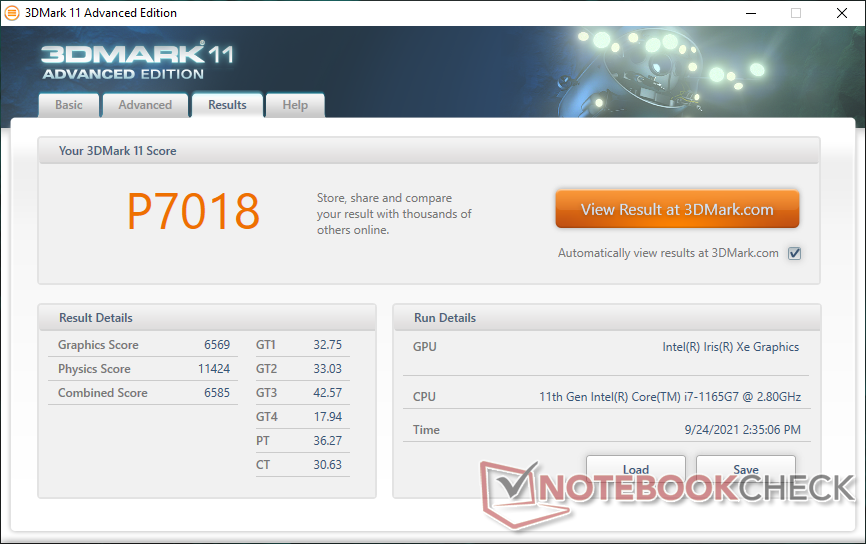
| 3DMark 11 Performance | 7018 puntos | |
| 3DMark Cloud Gate Standard Score | 19494 puntos | |
| 3DMark Fire Strike Score | 4786 puntos | |
| 3DMark Time Spy Score | 1778 puntos | |
ayuda | ||
| GTA V | |
| 1024x768 Lowest Settings possible | |
| Lenovo Yoga Slim 7-14ARE | |
| Medio Intel Iris Xe Graphics G7 96EUs (52 - 166.4, n=168) | |
| Dell XPS 13 9310 2-in-1 | |
| Lenovo Yoga 6 13 82ND0009US | |
| 1920x1080 Lowest Settings possible | |
| Dell XPS 13 9310 2-in-1 | |
| Medio Intel Iris Xe Graphics G7 96EUs (34.7 - 132.1, n=141) | |
| Lenovo Yoga Slim 7-14ARE | |
| Lenovo Yoga 6 13 82ND0009US | |
| 1366x768 Normal/Off AF:4x | |
| Medio Intel Iris Xe Graphics G7 96EUs (24.1 - 152.7, n=169) | |
| Dell XPS 13 9310 2-in-1 | |
| 1920x1080 Normal/Off AF:4x | |
| Dell XPS 13 9310 2-in-1 | |
| Lenovo Yoga Slim 7-14ARE | |
| Medio Intel Iris Xe Graphics G7 96EUs (20 - 119.3, n=142) | |
| Lenovo Yoga 6 13 82ND0009US | |
| 1920x1080 High/On (Advanced Graphics Off) AA:2xMSAA + FX AF:8x | |
| Lenovo Yoga Slim 7-14ARE | |
| Dell XPS 13 9310 2-in-1 | |
| Medio Intel Iris Xe Graphics G7 96EUs (9.39 - 51.6, n=162) | |
| Lenovo Yoga 6 13 82ND0009US | |
| 1920x1080 Highest AA:4xMSAA + FX AF:16x | |
| Lenovo Yoga Slim 7-14ARE | |
| Dell XPS 13 9310 2-in-1 | |
| Medio Intel Iris Xe Graphics G7 96EUs (4.13 - 22.9, n=156) | |
| Lenovo Yoga 6 13 82ND0009US | |
| Far Cry 5 | |
| 1280x720 Low Preset AA:T | |
| Dell XPS 13 9310 2-in-1 | |
| Medio Intel Iris Xe Graphics G7 96EUs (23 - 75, n=93) | |
| 1920x1080 Low Preset AA:T | |
| Medio Intel Iris Xe Graphics G7 96EUs (15 - 48, n=41) | |
| Dell XPS 13 9310 2-in-1 | |
| 1920x1080 Medium Preset AA:T | |
| Medio Intel Iris Xe Graphics G7 96EUs (14 - 39, n=91) | |
| Dell XPS 13 9310 2-in-1 | |
| 1920x1080 High Preset AA:T | |
| Medio Intel Iris Xe Graphics G7 96EUs (10 - 35, n=89) | |
| Dell XPS 13 9310 2-in-1 | |
| 1920x1080 Ultra Preset AA:T | |
| Medio Intel Iris Xe Graphics G7 96EUs (11 - 33, n=75) | |
| Dell XPS 13 9310 2-in-1 | |
Witcher 3 FPS Chart
| bajo | medio | alto | ultra | |
|---|---|---|---|---|
| GTA V (2015) | 96.7 | 80.5 | 25.4 | 10 |
| The Witcher 3 (2015) | 86.2 | 54.3 | 29.9 | 14.7 |
| Dota 2 Reborn (2015) | 109 | 61.4 | 52.8 | 52.8 |
| Final Fantasy XV Benchmark (2018) | 36.8 | 21.8 | 15.9 | |
| X-Plane 11.11 (2018) | 23.5 | 31.9 | 31.3 | |
| Far Cry 5 (2018) | 49 | 23 | 22 | 22 |
| Strange Brigade (2018) | 78.1 | 36.8 | 29.4 | 24 |
Emissions
Ruido del sistema: silencioso bajo la mayoría de las cargas bajas y medias
El comportamiento del ventilador es casi idéntico al que observamos en el XPS 13 7390 2-en-1. La principal diferencia es que el ruido del ventilador puede aumentar antes cuando se ejecutan cargas altas como 3DMark 06 posiblemente debido a los mayores límites Turbo Boost y PL2 de Tiger Lake-U en comparación con Ice Lake. Por lo demás, los usuarios pueden esperar un ruido de ventilador de entre 38 y 43 dB(A) cuando se ejecutan cargas exigentes o hasta 27,2 dB(A) cuando se hace streaming de vídeo o se navega por la web frente a un fondo silencioso de 24,3 dB(A). El nuevo Galaxy Book Pro 360 13 presentaría resultados similares.
| Dell XPS 13 9310 2-in-1 Iris Xe G7 96EUs, i7-1165G7, Toshiba BG4 KBG40ZPZ512G | Dell XPS 13 9310 Core i7 FHD Iris Xe G7 96EUs, i7-1165G7, Micron 2300 512GB MTFDHBA512TDV | Dell XPS 13 7390 2-in-1 Core i7 Iris Plus Graphics G7 (Ice Lake 64 EU), i7-1065G7, Toshiba BG4 KBG40ZPZ512G | Lenovo Yoga 6 13 82ND0009US Vega 7, R5 5500U, WDC PC SN530 SDBPMPZ-265G | Asus ZenBook Flip 13 UX363EA-HP069T Iris Xe G7 96EUs, i7-1165G7, WDC PC SN730 SDBPNTY-1T00 | Samsung Galaxy Book Pro 360 13 Iris Xe G7 80EUs, i5-1135G7, Samsung PM991 MZVLQ256HAJD | |
|---|---|---|---|---|---|---|
| Noise | 4% | -8% | -1% | -12% | -7% | |
| apagado / medio ambiente * (dB) | 24.3 | 25.7 -6% | 28.1 -16% | 25.1 -3% | 27 -11% | 27 -11% |
| Idle Minimum * (dB) | 24.8 | 25.7 -4% | 28.1 -13% | 25.1 -1% | 27 -9% | 27 -9% |
| Idle Average * (dB) | 24.8 | 25.7 -4% | 28.1 -13% | 25.1 -1% | 27 -9% | 27 -9% |
| Idle Maximum * (dB) | 24.8 | 25.9 -4% | 28.1 -13% | 25.1 -1% | 27 -9% | 27 -9% |
| Load Average * (dB) | 38 | 26.2 31% | 31.7 17% | 41 -8% | 46 -21% | 40.7 -7% |
| Witcher 3 ultra * (dB) | 38 | 36.5 4% | 43.4 -14% | 38.6 -2% | ||
| Load Maximum * (dB) | 41.5 | 36.6 12% | 43.4 -5% | 38.7 7% | 46.6 -12% | 40.7 2% |
* ... más pequeño es mejor
Ruido
| Ocioso |
| 24.8 / 24.8 / 24.8 dB(A) |
| Carga |
| 38 / 41.5 dB(A) |
 | ||
30 dB silencioso 40 dB(A) audible 50 dB(A) ruidosamente alto |
||
min: | ||
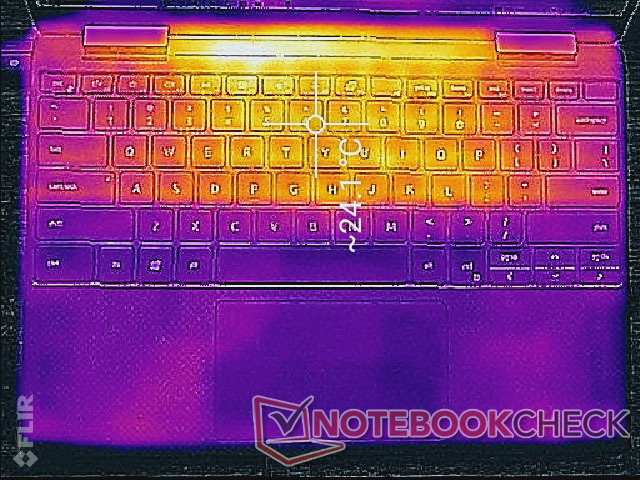
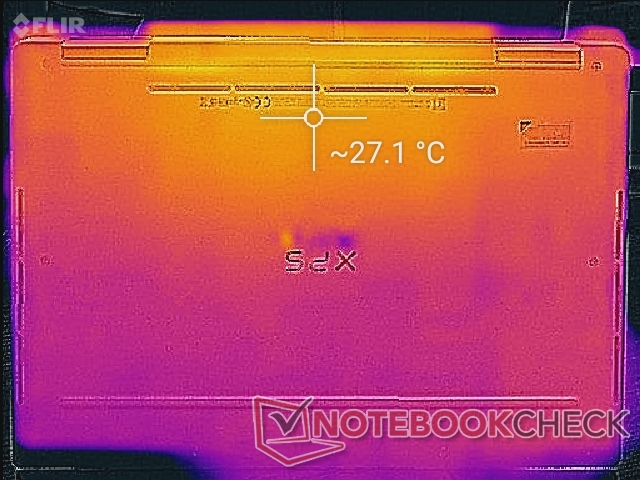
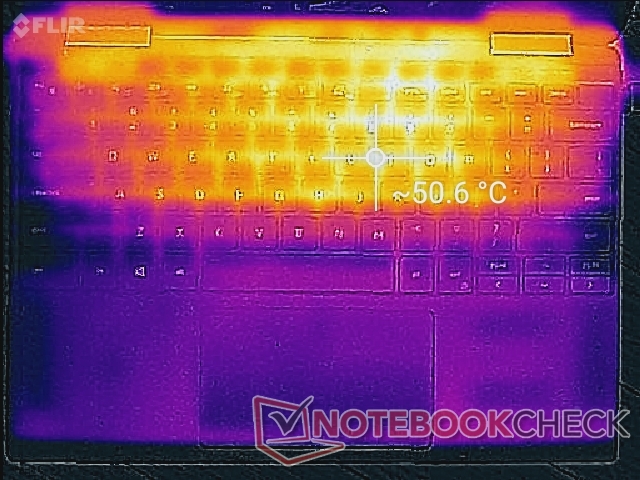
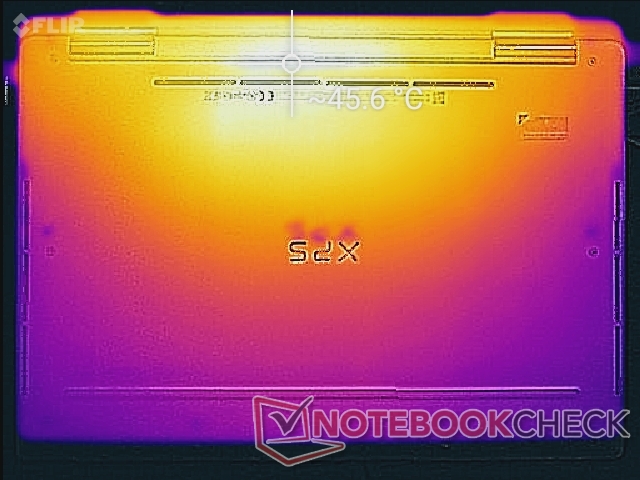
Temperatura - Reposamanos relativamente frío
Las temperaturas de la superficie son casi idénticas a las que observamos en el XPS 13 7390 2-en-1 con Ice Lake, con unos 50 C y 57 C en los puntos calientes superiores e inferiores, respectivamente. La cubierta del teclado sigue siendo notablemente más caliente que en la mayoría de los otros subportátiles, incluyendo el nuevoSamsung Galaxy Book Pro 360.
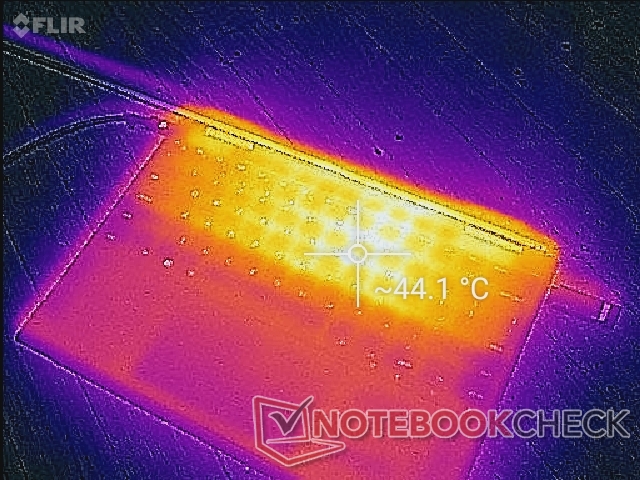
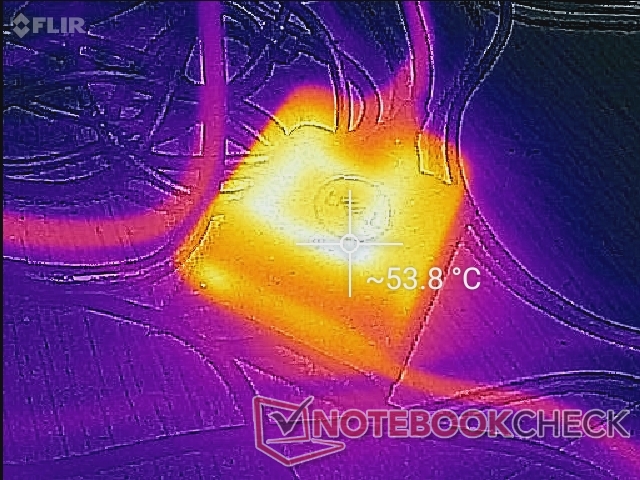
(-) La temperatura máxima en la parte superior es de 51 °C / 124 F, frente a la media de 35.4 °C / 96 F, que oscila entre 19.6 y 60 °C para la clase Convertible.
(-) El fondo se calienta hasta un máximo de 45.4 °C / 114 F, frente a la media de 36.9 °C / 98 F
(+) En reposo, la temperatura media de la parte superior es de 22.9 °C / 73# F, frente a la media del dispositivo de 30.3 °C / 87 F.
(+) El reposamanos y el panel táctil están a una temperatura inferior a la de la piel, con un máximo de 30.6 °C / 87.1 F y, por tanto, son fríos al tacto.
(-) La temperatura media de la zona del reposamanos de dispositivos similares fue de 28 °C / 82.4 F (-2.6 °C / -4.7 F).
Prueba de esfuerzo - Ciclos de frecuencias de reloj y de fotogramas
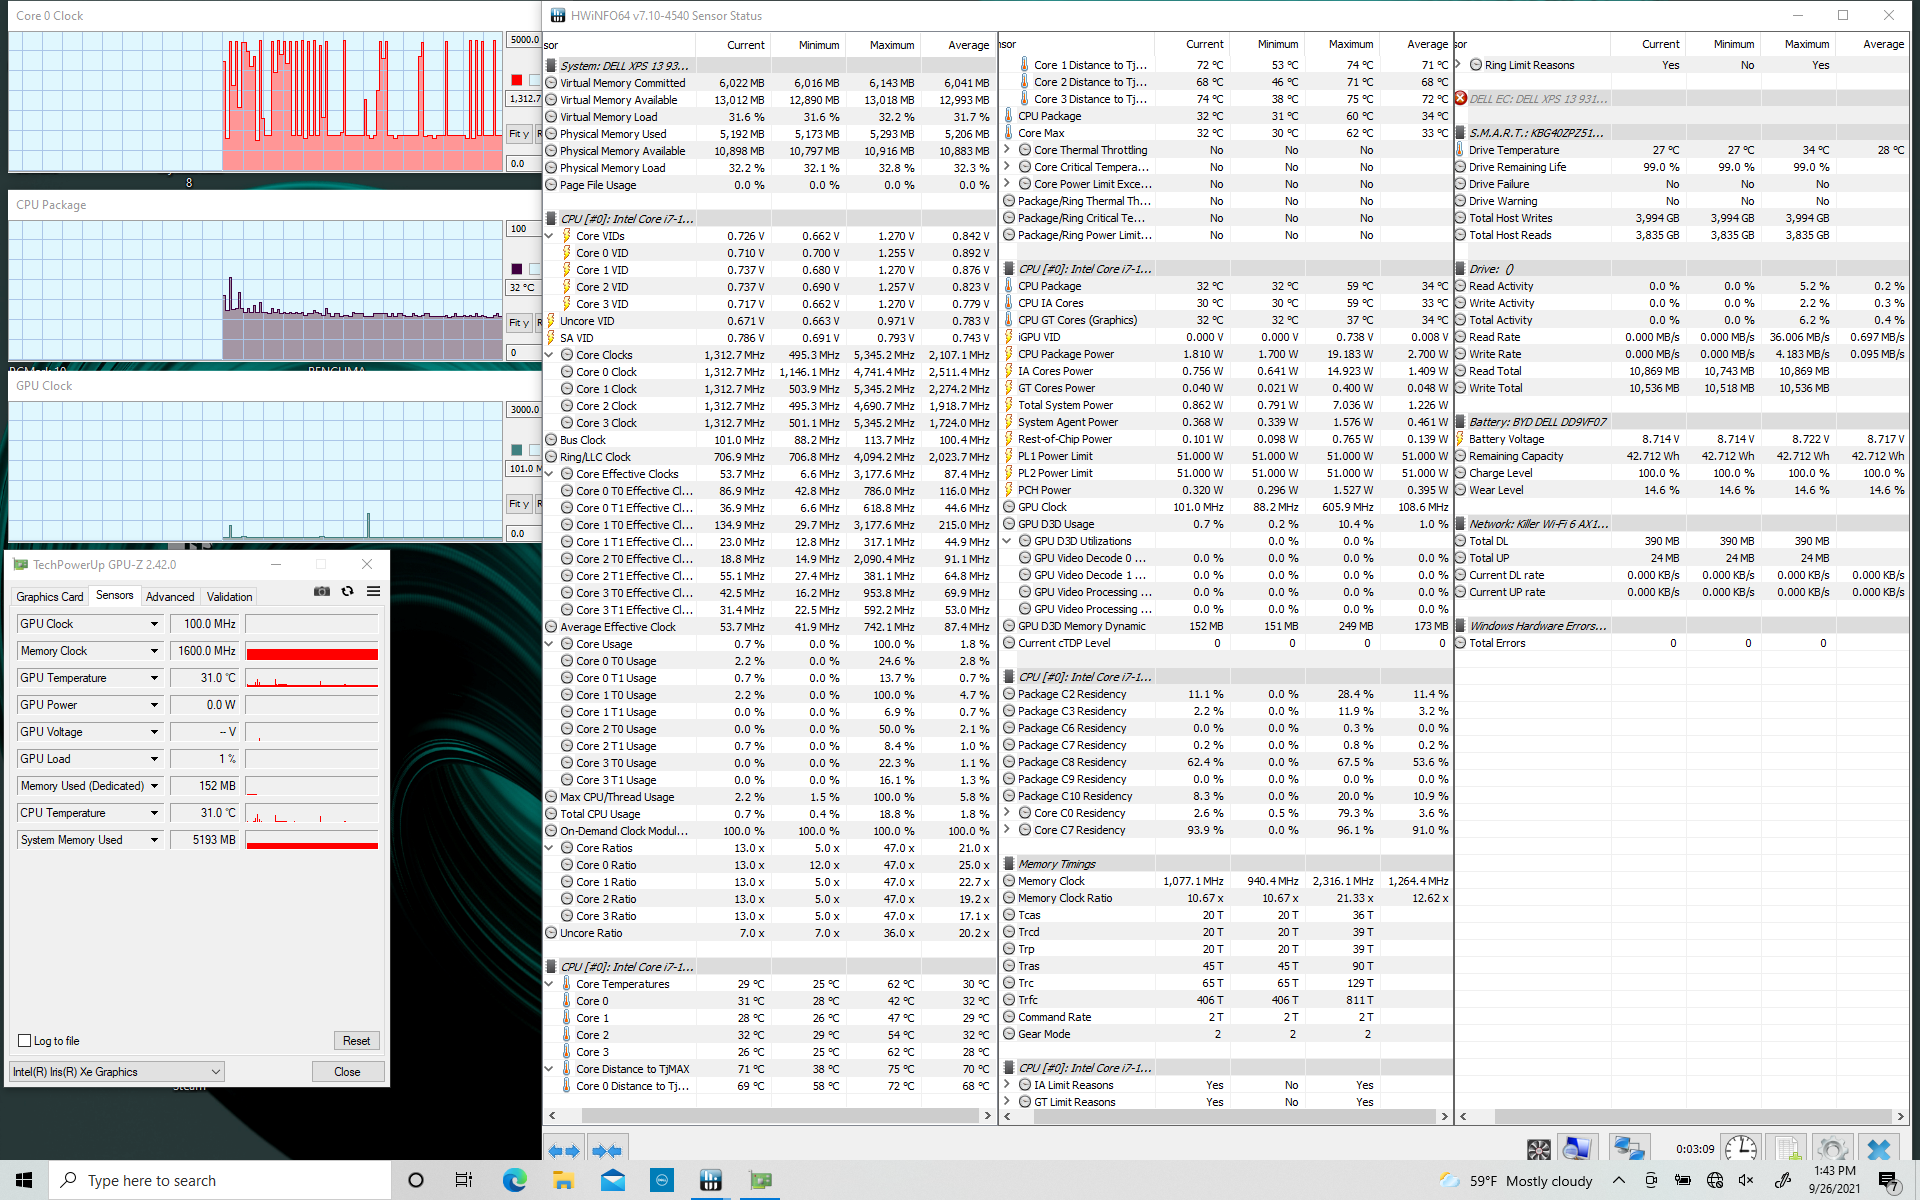
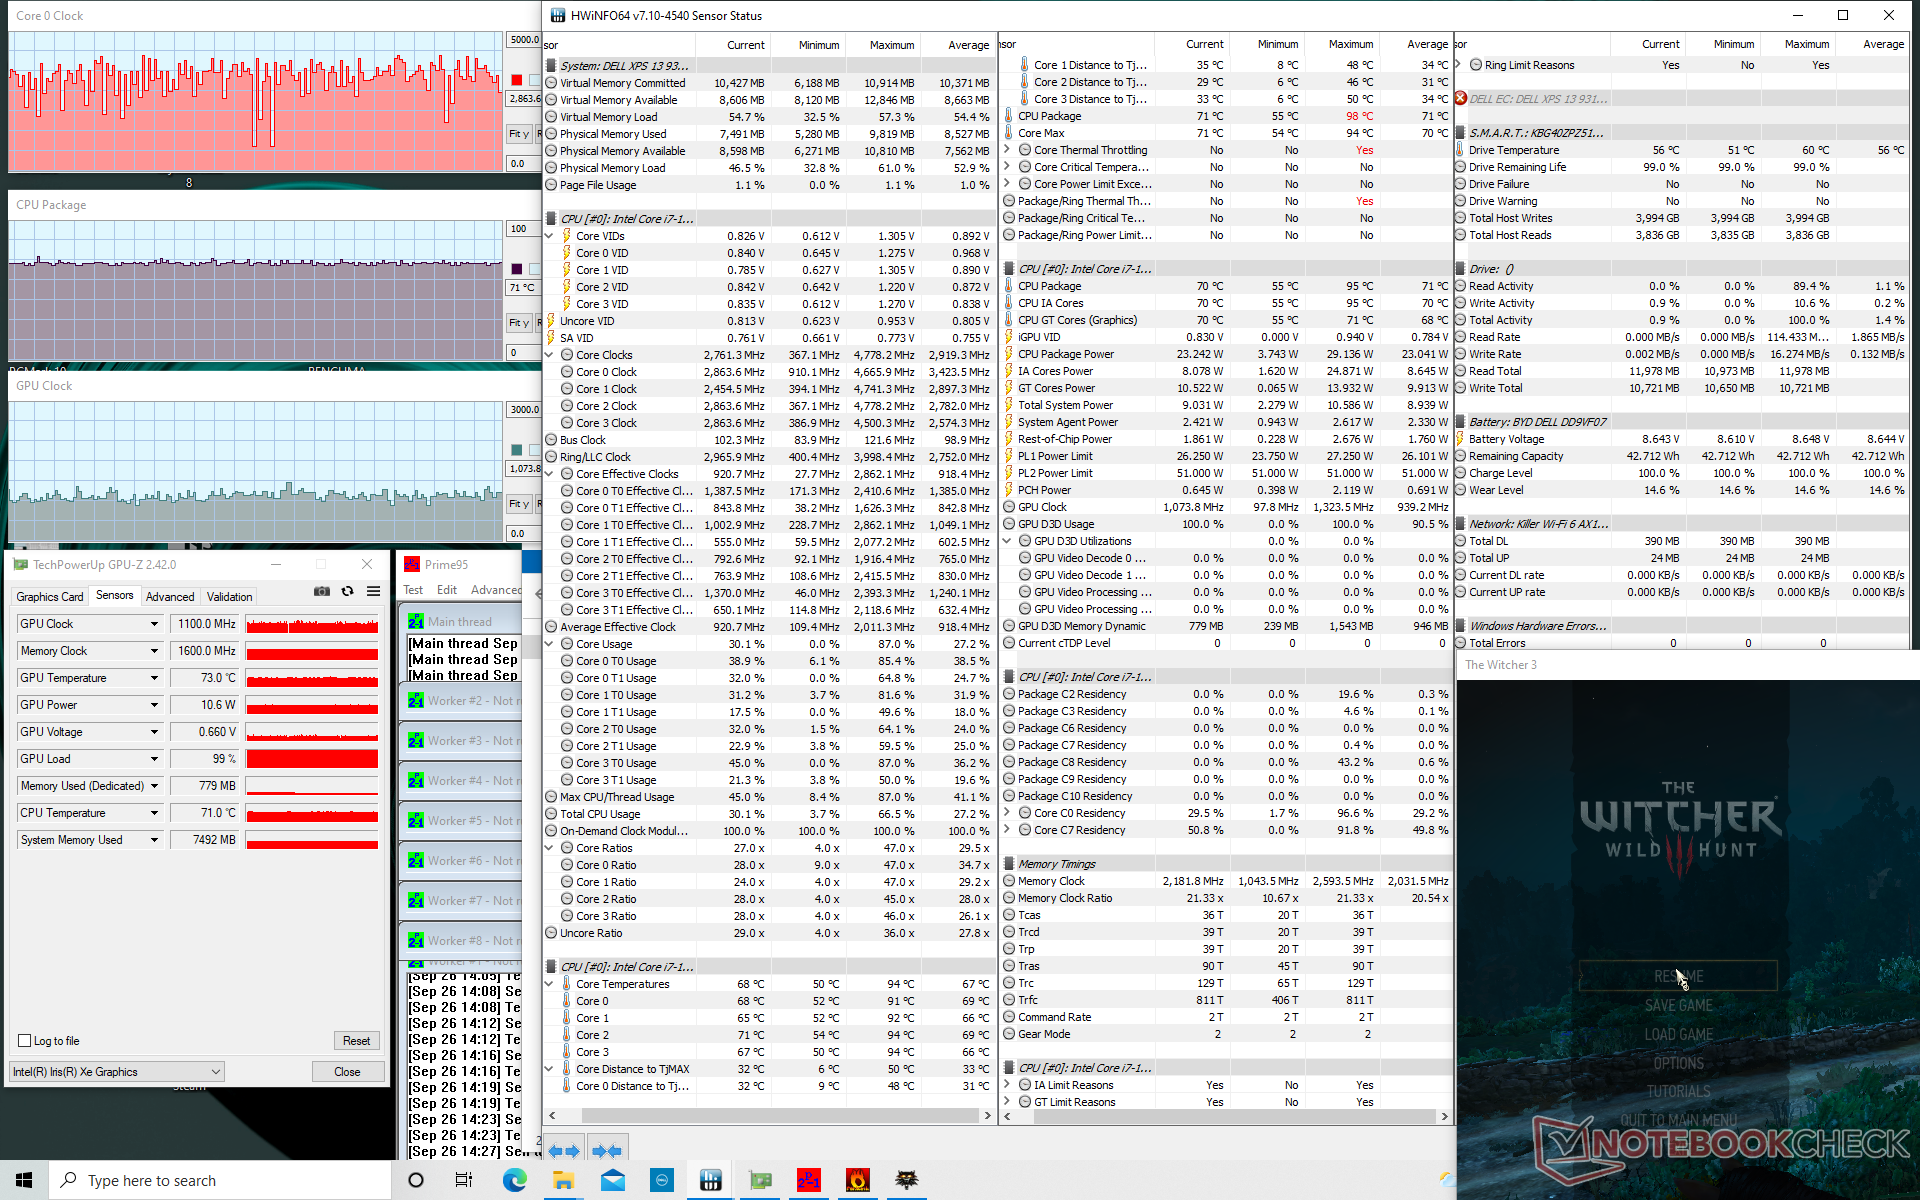
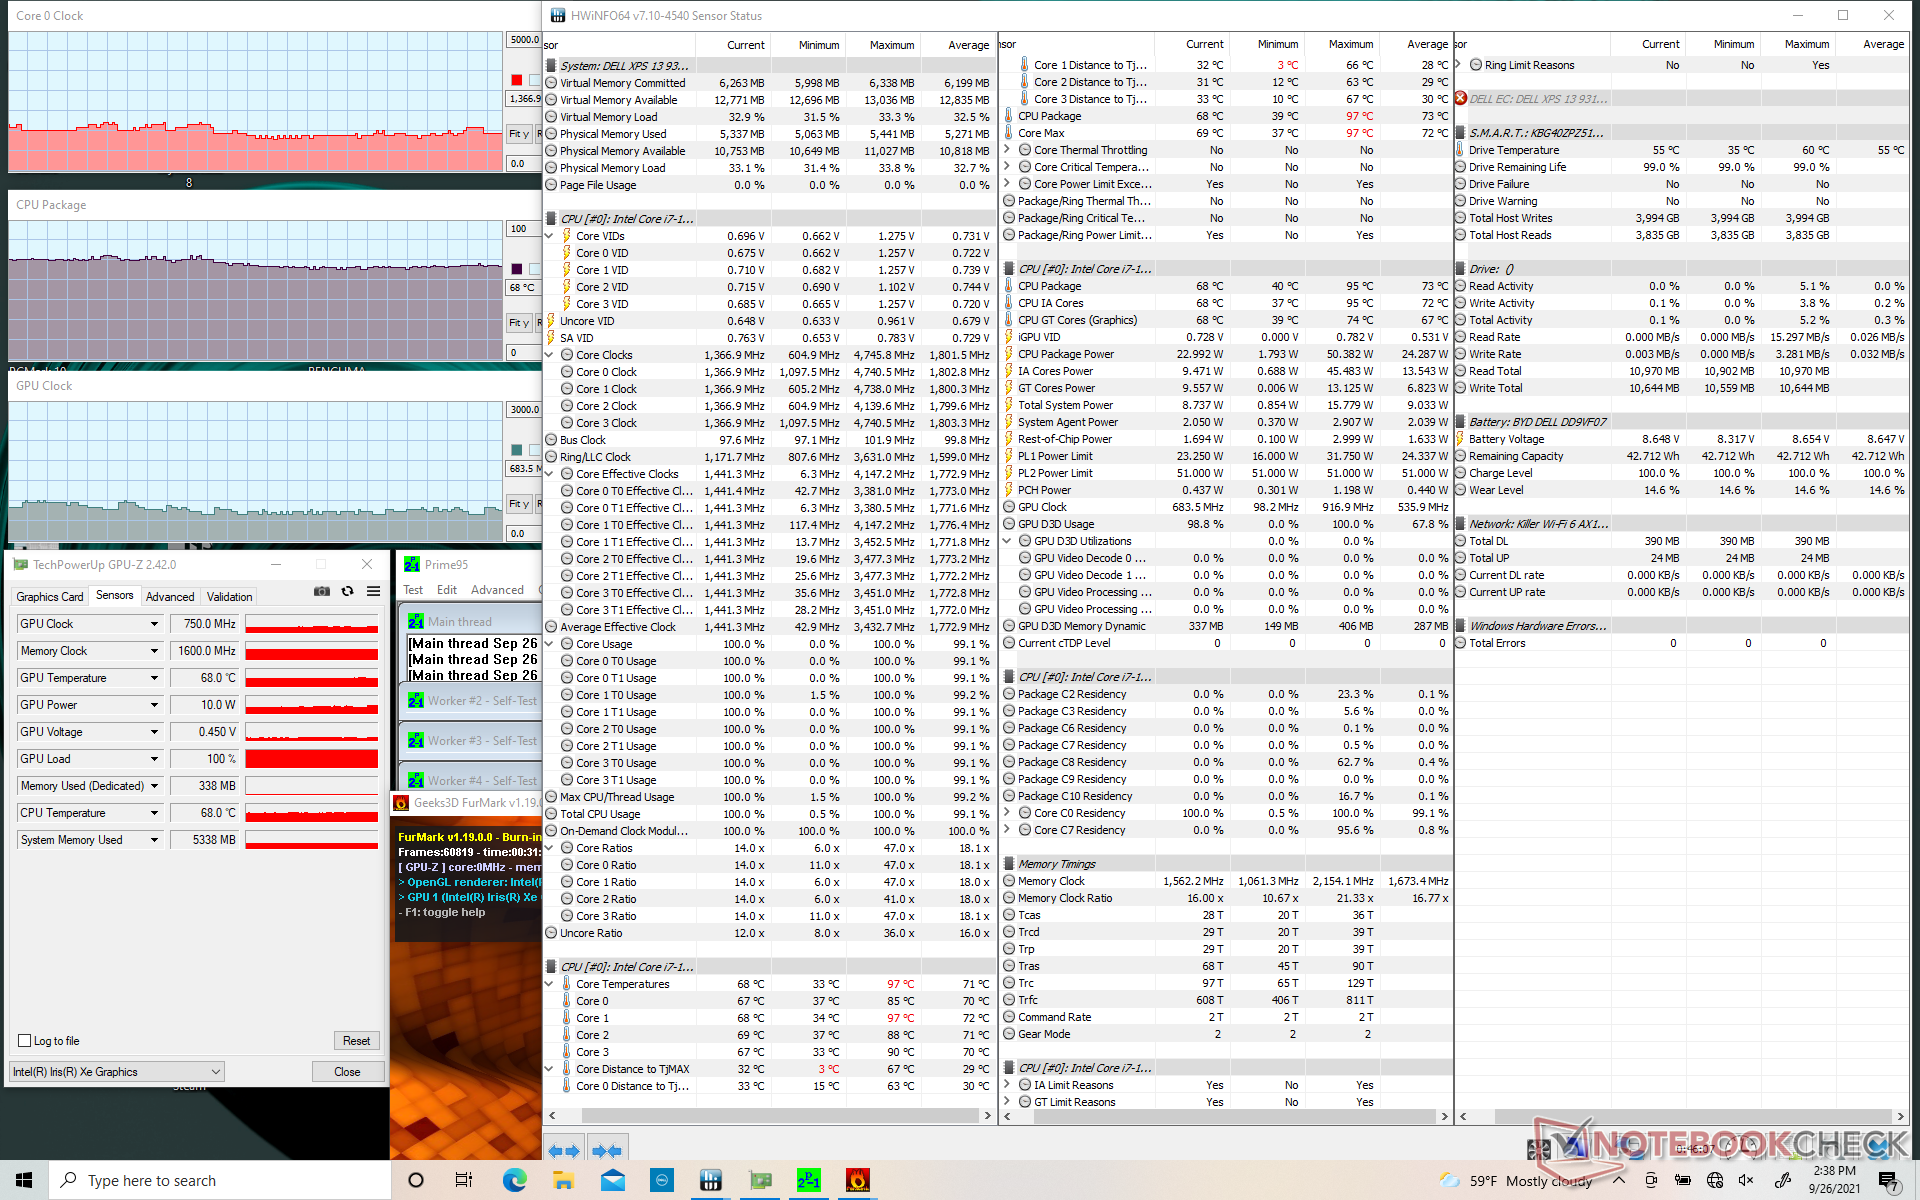
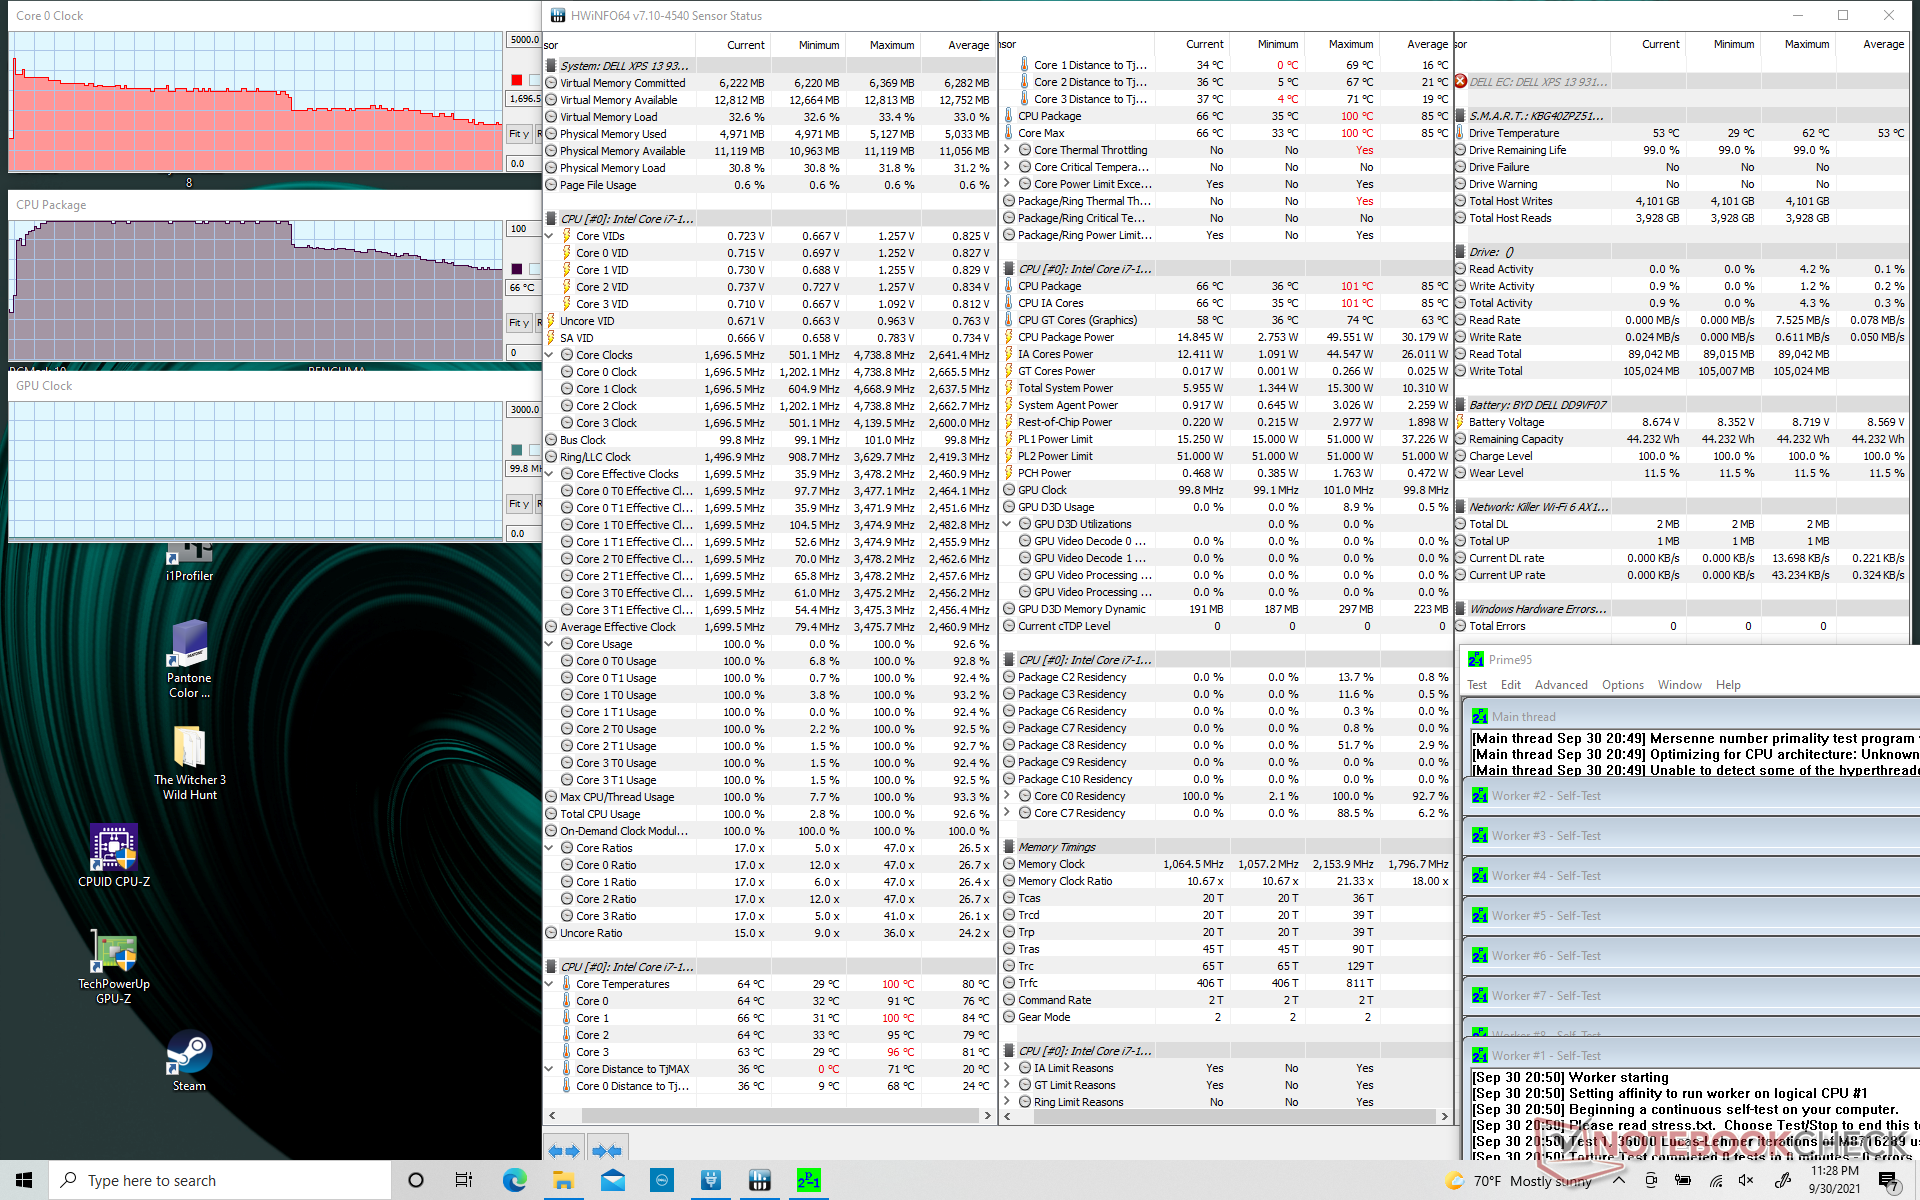
Cuando se estresa con Prime95, las velocidades de reloj de la CPU y la temperatura se disparan y permanecen estables hasta 2,9 GHz y 100 C durante los primeros minutos. Después, las velocidades de reloj y la temperatura caen y se estabilizan en el rango de 1,8 a 2,2 GHz y 66 a 75 C, respectivamente, incluso cuando se configura el modo de Ultra Rendimiento a través del software Dell Power Manager. En comparación, el XPS 13 7390 2 en 1, alimentado por Ice Lake, se estabilizaba a velocidades de reloj y temperaturas más altas. Por lo tanto, parece que el nuevo XPS 13 9310 2 en 1 está apuntando a temperaturas de núcleo más bajas, aunque a costa de un mayor rendimiento de Turbo Boost. Las velocidades de reloj cíclicas bajo estrés reflejan nuestras puntuaciones cíclicas del bucle CineBench R15 xT de arriba
Las frecuencias de la GPU también oscilan entre 800 y 1280 MHz cuando se ejecuta Witcher 3, lo que también refleja nuestras frecuencias de cuadro cíclicas mencionadas anteriormente. Es desafortunado que no haya una "opción de rendimiento estable" disponible en el XPS 13 para los usuarios que podrían preferirlo sobre este comportamiento cíclico
Funcionar con batería limitará el rendimiento. Una prueba 3DMark 11 en baterías devolvería puntuaciones de Física y Gráficos de 9805 y 5106 puntos, respectivamente, comparado con 11424 y 6569 puntos cuando está conectado a la red.

| Relojde la CPU(GHz) | Reloj dela GPU(MHz) | Temperaturamediade la CPU (°C) | |
| Sistema en reposo | |||
| EstrésPrime95 | 1,8 - 2,2 | -- | 66 - 75 |
| Estrés Prime95+ FurMark | 1,4 - 1,6 | ~650 - 750 | 68 |
| Witcher 3 Estrés | ~0,6 - 1,4 | ~800 - 1280 | 71 |
Altavoces

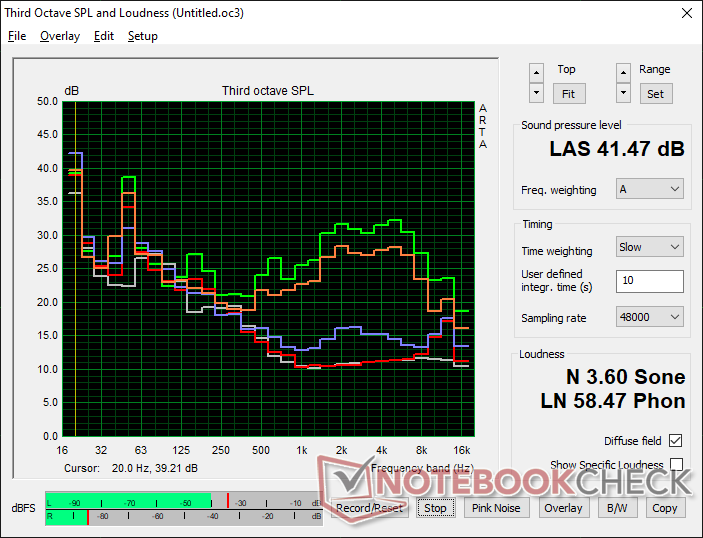
Dell XPS 13 9310 2-in-1 análisis de audio
(±) | la sonoridad del altavoz es media pero buena (80.7 dB)
Graves 100 - 315 Hz
(±) | lubina reducida - en promedio 11.7% inferior a la mediana
(±) | la linealidad de los graves es media (10.6% delta a frecuencia anterior)
Medios 400 - 2000 Hz
(±) | medias más altas - de media 6.1% más altas que la mediana
(+) | los medios son lineales (4.1% delta a la frecuencia anterior)
Altos 2 - 16 kHz
(+) | máximos equilibrados - a sólo 1.4% de la mediana
(+) | los máximos son lineales (3.6% delta a la frecuencia anterior)
Total 100 - 16.000 Hz
(+) | el sonido global es lineal (12.7% de diferencia con la mediana)
En comparación con la misma clase
» 16% de todos los dispositivos probados de esta clase eran mejores, 2% similares, 82% peores
» El mejor tuvo un delta de 6%, la media fue 20%, el peor fue ###max##%
En comparación con todos los dispositivos probados
» 12% de todos los dispositivos probados eran mejores, 3% similares, 86% peores
» El mejor tuvo un delta de 4%, la media fue 24%, el peor fue ###max##%
Apple MacBook 12 (Early 2016) 1.1 GHz análisis de audio
(+) | los altavoces pueden reproducir a un volumen relativamente alto (#83.6 dB)
Graves 100 - 315 Hz
(±) | lubina reducida - en promedio 11.3% inferior a la mediana
(±) | la linealidad de los graves es media (14.2% delta a frecuencia anterior)
Medios 400 - 2000 Hz
(+) | medios equilibrados - a sólo 2.4% de la mediana
(+) | los medios son lineales (5.5% delta a la frecuencia anterior)
Altos 2 - 16 kHz
(+) | máximos equilibrados - a sólo 2% de la mediana
(+) | los máximos son lineales (4.5% delta a la frecuencia anterior)
Total 100 - 16.000 Hz
(+) | el sonido global es lineal (10.2% de diferencia con la mediana)
En comparación con la misma clase
» 7% de todos los dispositivos probados de esta clase eran mejores, 2% similares, 91% peores
» El mejor tuvo un delta de 5%, la media fue 18%, el peor fue ###max##%
En comparación con todos los dispositivos probados
» 5% de todos los dispositivos probados eran mejores, 1% similares, 94% peores
» El mejor tuvo un delta de 4%, la media fue 24%, el peor fue ###max##%
Energy Management
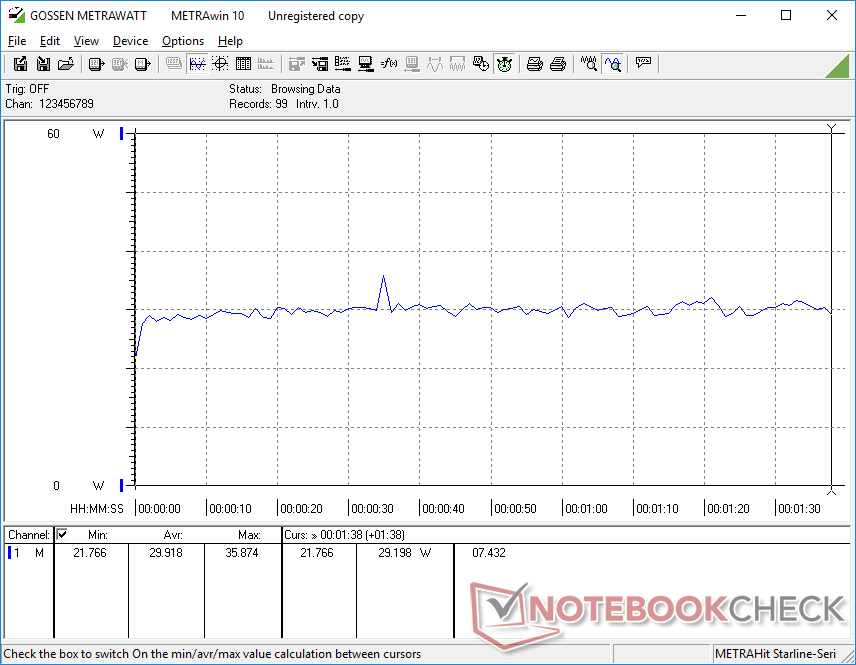
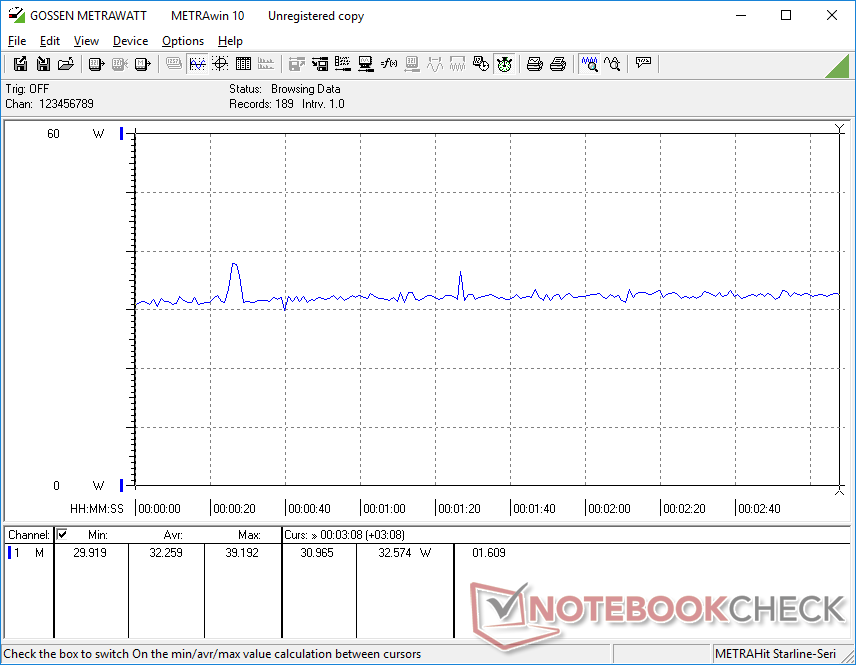
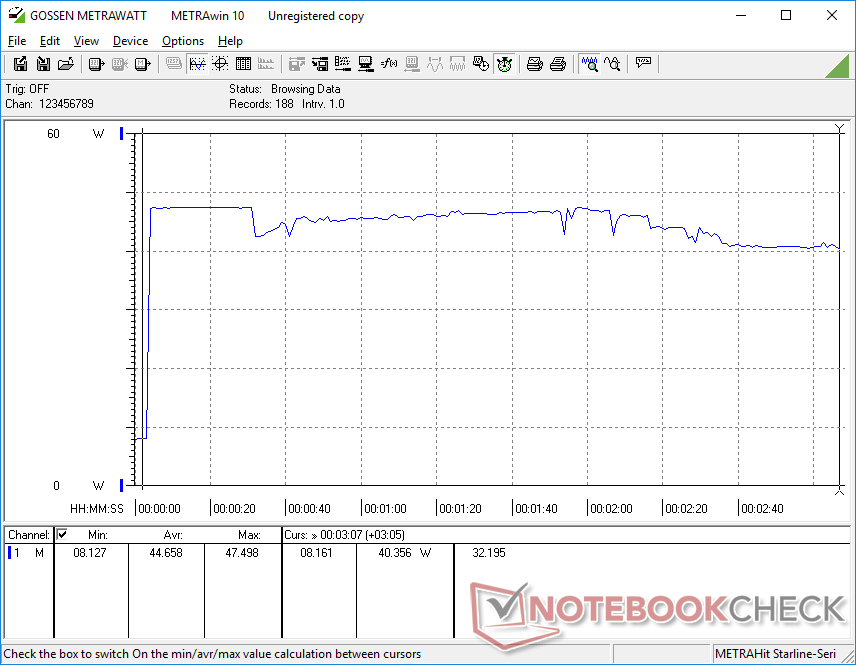
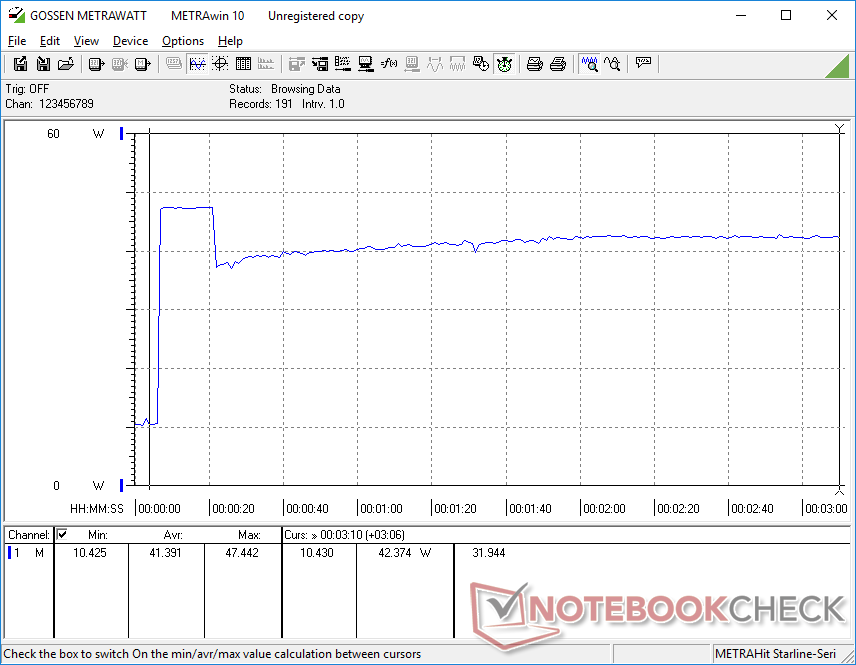
Consumo de energía: mucho más eficiente
El sistema consume menos energía cuando se juega que en el antiguo XPS 13 7390 2-en-1 a pesar del aumento sustancial del rendimiento gráfico. Esto demuestra el gran salto que puede suponer la Iris Xe sobre la Iris Plus G7 en términos de eficiencia energética y rendimiento.
| Off / Standby | |
| Ocioso | |
| Carga |
|
Clave:
min: | |
| Dell XPS 13 9310 2-in-1 i7-1165G7, Iris Xe G7 96EUs, Toshiba BG4 KBG40ZPZ512G, IPS, 1920x1200, 13.4" | Dell XPS 13 9310 Core i7 FHD i7-1165G7, Iris Xe G7 96EUs, Micron 2300 512GB MTFDHBA512TDV, IPS, 1920x1200, 13.4" | Dell XPS 13 7390 2-in-1 Core i7 i7-1065G7, Iris Plus Graphics G7 (Ice Lake 64 EU), Toshiba BG4 KBG40ZPZ512G, IPS, 1920x1200, 13.4" | Lenovo Yoga 6 13 82ND0009US R5 5500U, Vega 7, WDC PC SN530 SDBPMPZ-265G, IPS, 1920x1080, 13.3" | Asus ZenBook Flip 13 UX363EA-HP069T i7-1165G7, Iris Xe G7 96EUs, WDC PC SN730 SDBPNTY-1T00, OLED, 1920x1080, 13.3" | Samsung Galaxy Book Pro 360 13 i5-1135G7, Iris Xe G7 80EUs, Samsung PM991 MZVLQ256HAJD, AMOLED, 1920x1080, 13.2" | |
|---|---|---|---|---|---|---|
| Power Consumption | -11% | -9% | -20% | -11% | -22% | |
| Idle Minimum * (Watt) | 2.6 | 3.9 -50% | 2.6 -0% | 5 -92% | 4.4 -69% | 5 -92% |
| Idle Average * (Watt) | 6.4 | 5.9 8% | 5.3 17% | 6.3 2% | 7.4 -16% | 6 6% |
| Idle Maximum * (Watt) | 7.7 | 6.3 18% | 7 9% | 6.9 10% | 11.3 -47% | 11.7 -52% |
| Load Average * (Watt) | 29.9 | 39.7 -33% | 43.1 -44% | 41.5 -39% | 22 26% | 28 6% |
| Witcher 3 ultra * (Watt) | 32.2 | 34.8 -8% | 43.1 -34% | 33.2 -3% | 22.8 29% | 28.3 12% |
| Load Maximum * (Watt) | 47.5 | 47.5 -0% | 49 -3% | 46.5 2% | 42.5 11% | 53 -12% |
* ... más pequeño es mejor
Power Consumption Witcher 3 / Stresstest
Duración de la batería - Tiempos de ejecución de dos dígitos
Las duraciones se acercan mucho a las que registramos en el XPS 13 9310 clamshell mientras que son casi dos horas más que en el antiguo XPS 13 7390 2-en-1. Con 11 horas de navegación WLAN en el mundo real, la batería debería ser suficiente para un día de uso productivo
La carga desde el vacío hasta la capacidad total sigue tardando alrededor de 1,5 horas. El adaptador USB-C de 45 W puede usarse para cargar otros dispositivos también.
| Dell XPS 13 9310 2-in-1 i7-1165G7, Iris Xe G7 96EUs, 51 Wh | Dell XPS 13 9310 Core i7 FHD i7-1165G7, Iris Xe G7 96EUs, 52 Wh | Dell XPS 13 7390 2-in-1 Core i7 i7-1065G7, Iris Plus Graphics G7 (Ice Lake 64 EU), 51 Wh | Lenovo Yoga 6 13 82ND0009US R5 5500U, Vega 7, 60 Wh | Asus ZenBook Flip 13 UX363EA-HP069T i7-1165G7, Iris Xe G7 96EUs, 67 Wh | Samsung Galaxy Book Pro 360 13 i5-1135G7, Iris Xe G7 80EUs, 63 Wh | |
|---|---|---|---|---|---|---|
| Duración de Batería | 5% | -16% | -16% | -6% | 12% | |
| Reader / Idle (h) | 25.4 | 30 18% | 17.5 -31% | 20.5 -19% | 31.3 23% | |
| WiFi v1.3 (h) | 10.7 | 11 3% | 9 -16% | 13.2 23% | 10.7 0% | 12.1 13% |
| Load (h) | 3.4 | 3.2 -6% | 2 -41% | 3.4 0% | 3.4 0% |
Pro
Contra
Veredicto - Más rápido sin costes adicionales
El XPS 13 9310 2-en-1 ofrece un rendimiento gráfico significativamente más rápido que el XPS 13 7390 2-en-1. Y lo que es mejor, el sistema lo consigue con la misma potencia, lo que significa que los usuarios obtienen mejores gráficos sin tener que sacrificar la duración de la batería, la temperatura de la superficie o el ruido del ventilador. Si realizas muchos trabajos de edición de gráficos, sin duda te beneficiarás enormemente de pasar a Iris Xe desde la antigua UHD Graphics o la Iris Plus G7 del año pasado.
Intel Iris Xe ha sido una gran ayuda para la serie XPS 13, pero la inestabilidad de las frecuencias de reloj de la CPU y la GPU en comparación con la mayoría de los demás Ultrabooks o subportátiles puede resultar molesta para algunos usuarios avanzados.
Por desgracia, el rendimiento del procesador apenas ha mejorado respecto al Core i7 XPS 13 7390 2 en 1. Las frecuencias de reloj tienden a fluctuar mucho más fácilmente en nuestro Core i7 XPS 13 9310 2-en-1 mientras que la falta de nuevas opciones de pantalla es un incentivo menos para poseer el nuevo modelo. Como resultado, muchos usuarios domésticos encontrarán poco que ganar en el mejor de los casos del XPS 13 9310 2-en-1 en comparación con el XPS 13 7390 2-en-1 especialmente cuando el modelo más antiguo se puede encontrar más barato.
Precio y disponibilidad
Dell XPS 13 9310 2-in-1
- 10/02/2021 v7 (old)
Allen Ngo
Price comparison

