Core i7-1165G7 vs. Core i7-1185G7: Revisión del portátil Dell XPS 13 9310 4K
")
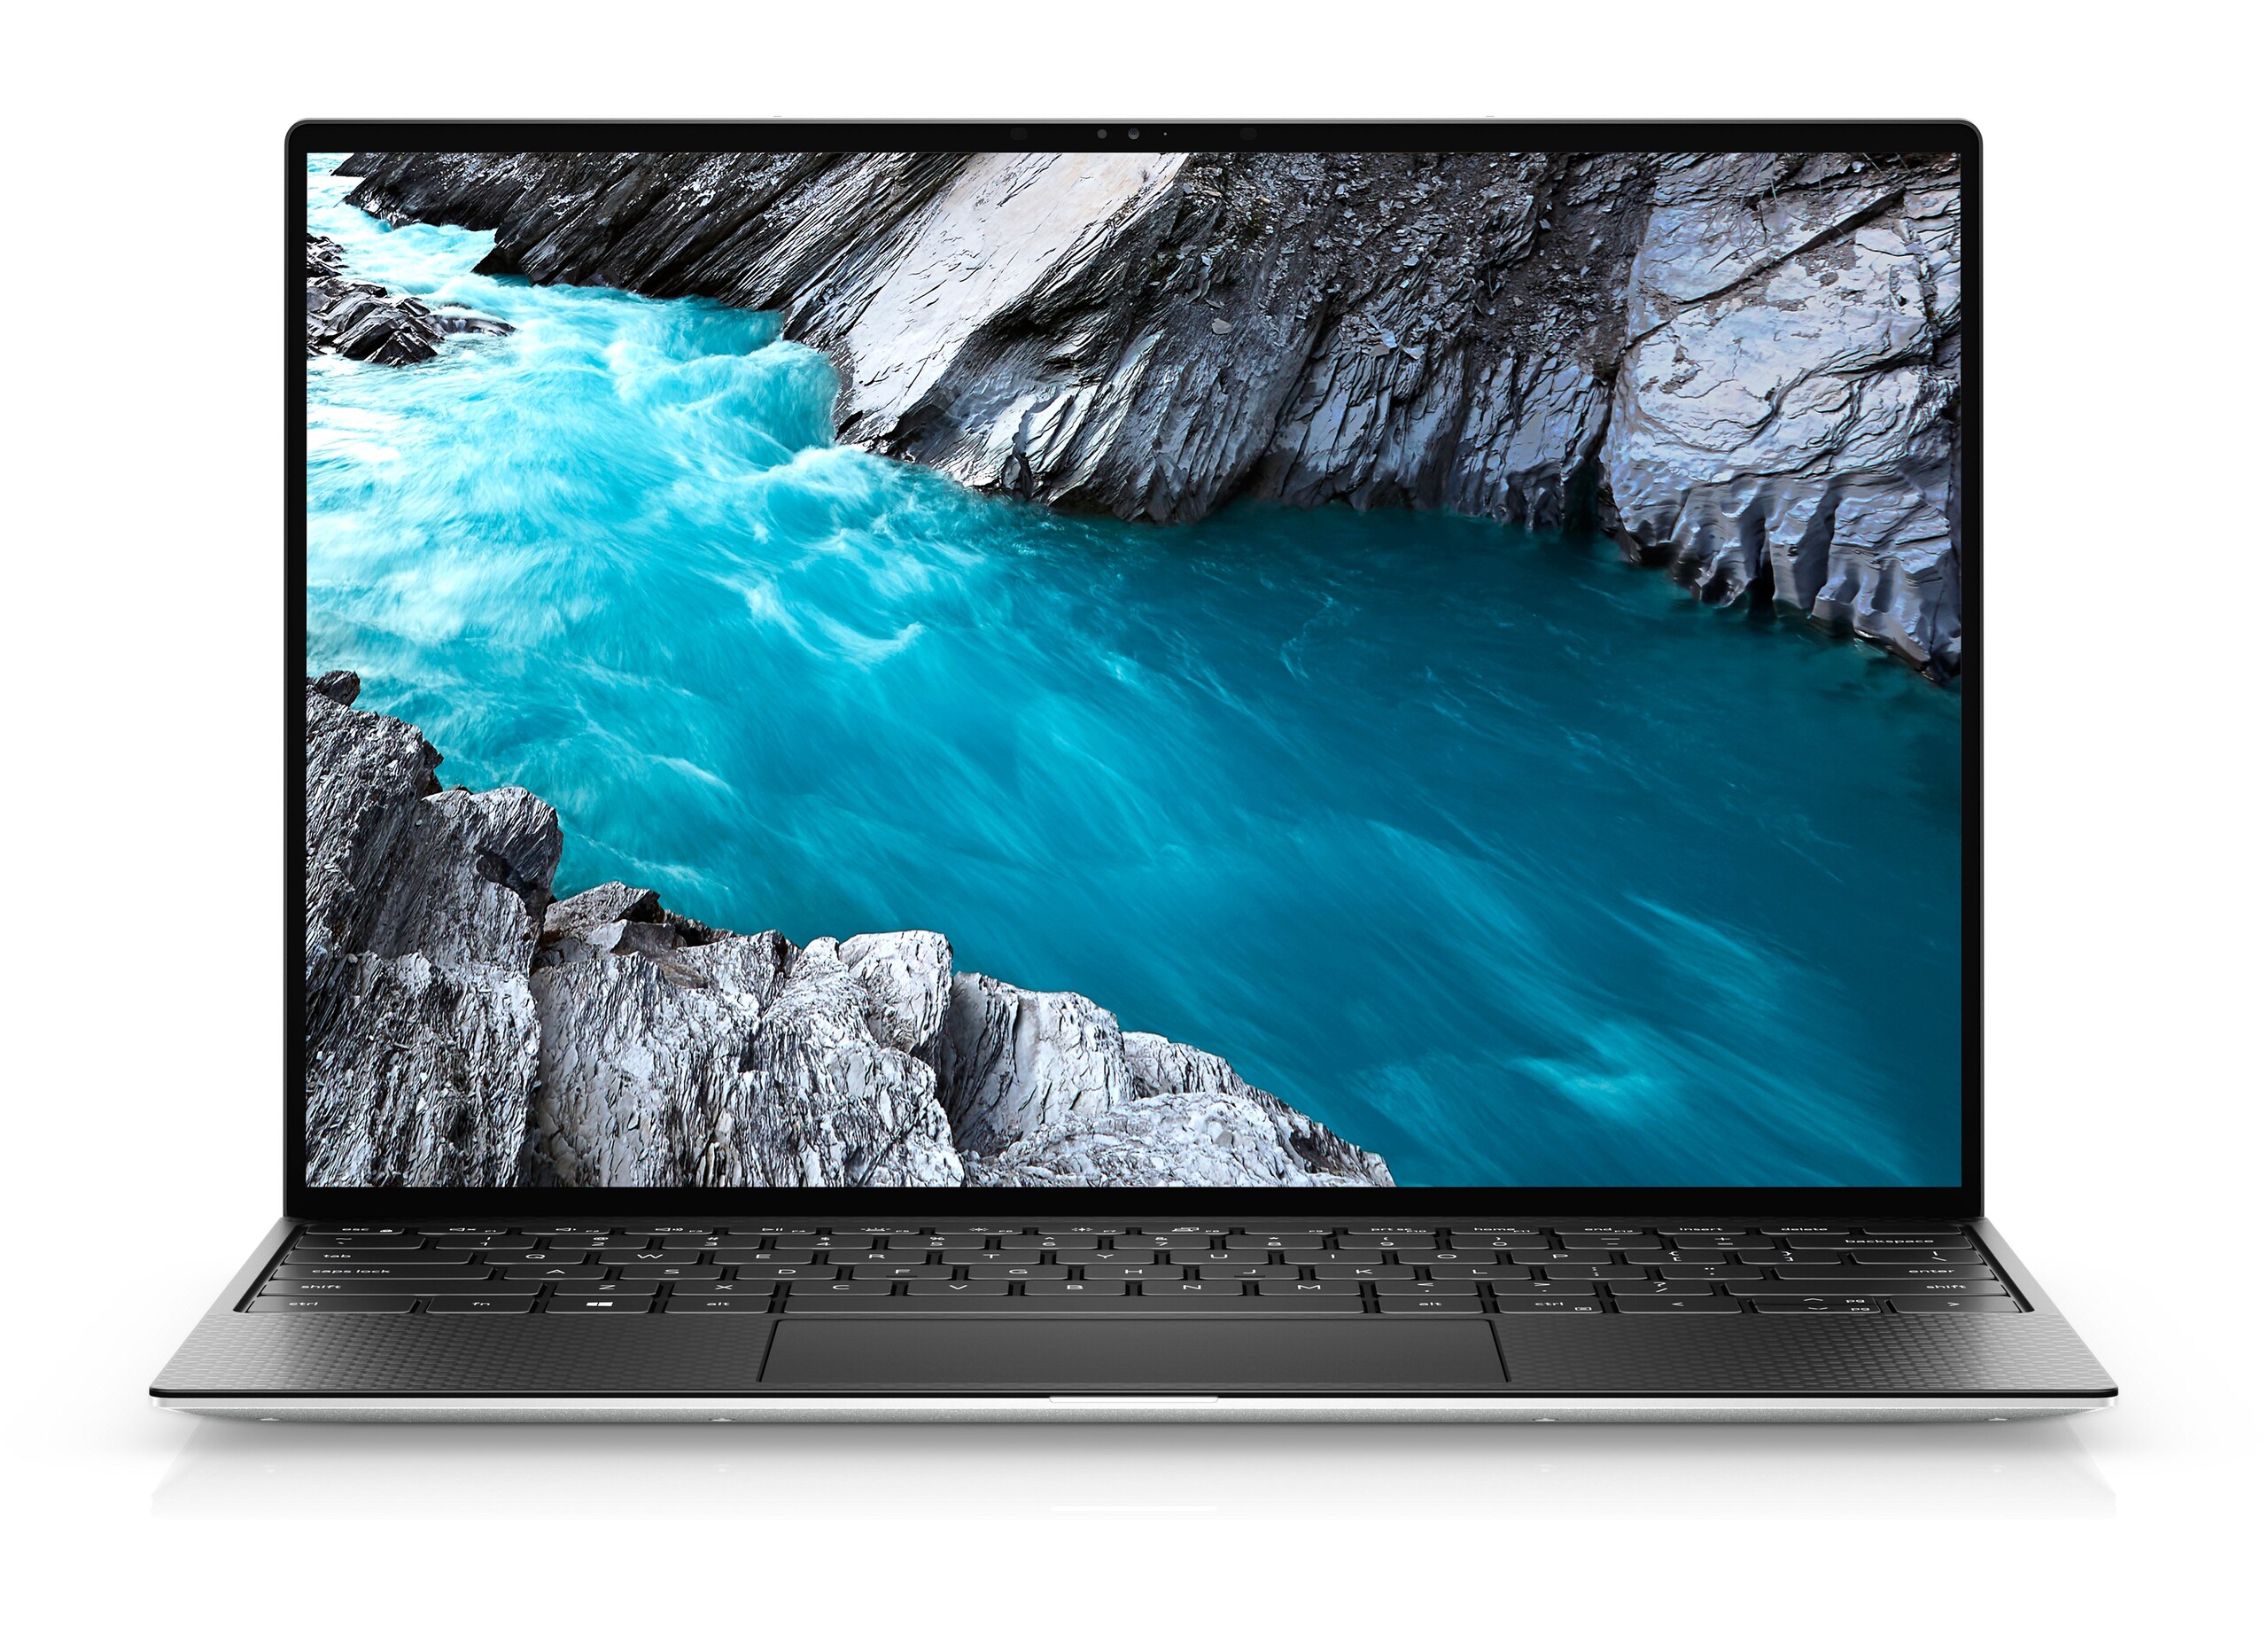
El Dell XPS 13 9310 fue lanzado hace un par de meses junto con la nueva plataforma de la 11ª generación de Intel Tiger Lake-U. Basándonos en nuestro tiempo con una unidad, el rendimiento demostró ser una notable mejora del XPS 13 9300 especialmente en términos de gráficos, aunque no hubo cambios en el diseño externo. Si usted tenía un modelo XPS más antiguo o podía usar el aumento de gráficos, entonces una actualización al XPS 13 9310 tendría mucho sentido.
Esta vez, Dell nos ha enviado una segunda unidad XPS 13 9310 de gama alta equipada con el CPU Core i7-1185G7 y una pantalla 4K UHD en contraste con nuestra primera unidad equipada con el Core i7-1165G7 y una pantalla FHD. La configuración se vende actualmente por unos 1600 dólares o aproximadamente 300 dólares más que la opción Core i7-1165G7/FHD. Consulte nuestras revisiones existentes sobre el XPS 13 9300 y el XPS 13 9310 para conocer más sobre el chasis y sus características, ya que nuestra revisión aquí se centrará en las diferencias entre el Core i7-1165G7/FHD y el Core i7-1185G7/4K XPS 13 9310 SKU. ¿La opción más costosa vale los Benjamines extra?
Más reseñas de Dell:
potential competitors in comparison
Valoración | Fecha | Modelo | Peso | Altura | Tamaño | Resolución | Precio |
|---|---|---|---|---|---|---|---|
| 87.4 % v7 (old) | 12/2020 | Dell XPS 13 9310 Core i7 4K i7-1185G7, Iris Xe G7 96EUs | 1.3 kg | 14.8 mm | 13.40" | 3840x2400 | |
| 85.1 % v7 (old) | 10/2020 | Asus Zenbook S UX393JA i7-1065G7, Iris Plus Graphics G7 (Ice Lake 64 EU) | 1.4 kg | 15.7 mm | 13.90" | 3300x2200 | |
| 87.4 % v7 (old) | 06/2020 | Huawei MateBook X Pro 2020 i7 i7-10510U, GeForce MX250 | 1.3 kg | 14.6 mm | 13.90" | 3000x2000 | |
| 88.9 % v7 (old) | 03/2020 | Dell XPS 13 9300 Core i7-1065G7 i7-1065G7, Iris Plus Graphics G7 (Ice Lake 64 EU) | 1.2 kg | 14.8 mm | 13.40" | 1920x1200 | |
| 85.3 % v7 (old) | 08/2020 | Lenovo Yoga Slim 7-14ARE R7 4800U, Vega 8 | 1.4 kg | 14.9 mm | 14.00" | 1920x1080 | |
| 88.4 % v7 (old) | 12/2019 | HP Spectre x360 13-aw0013dx i7-1065G7, Iris Plus Graphics G7 (Ice Lake 64 EU) | 1.2 kg | 16.9 mm | 13.30" | 1920x1080 |
Caso
Lector de tarjetas SD
| SD Card Reader | |
| average JPG Copy Test (av. of 3 runs) | |
| Dell XPS 13 9310 Core i7 4K (Toshiba Exceria Pro M501 32 GB UHS-II) | |
| HP Spectre x360 13-aw0013dx (Toshiba Exceria Pro M501 microSDXC 64GB) | |
| Dell XPS 13 9300 Core i7-1065G7 (Toshiba Exceria Pro M501 64 GB UHS-II) | |
| Asus Zenbook S UX393JA (Toshiba Exceria Pro M501 64 GB UHS-II) | |
| Lenovo Yoga Slim 7-14ARE (Toshiba Exceria Pro M501 64 GB UHS-II) | |
| maximum AS SSD Seq Read Test (1GB) | |
| Dell XPS 13 9310 Core i7 4K (Toshiba Exceria Pro M501 32 GB UHS-II) | |
| Dell XPS 13 9300 Core i7-1065G7 (Toshiba Exceria Pro M501 64 GB UHS-II) | |
| HP Spectre x360 13-aw0013dx (Toshiba Exceria Pro M501 microSDXC 64GB) | |
| Lenovo Yoga Slim 7-14ARE (Toshiba Exceria Pro M501 64 GB UHS-II) | |
| Asus Zenbook S UX393JA (Toshiba Exceria Pro M501 64 GB UHS-II) | |
Comunicación
Webcam


Pantalla
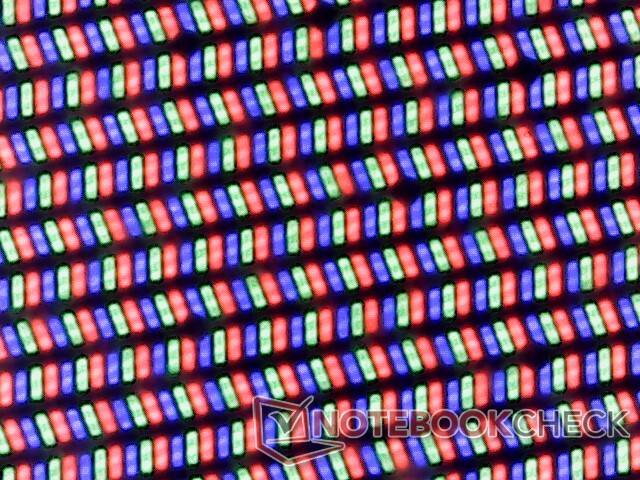
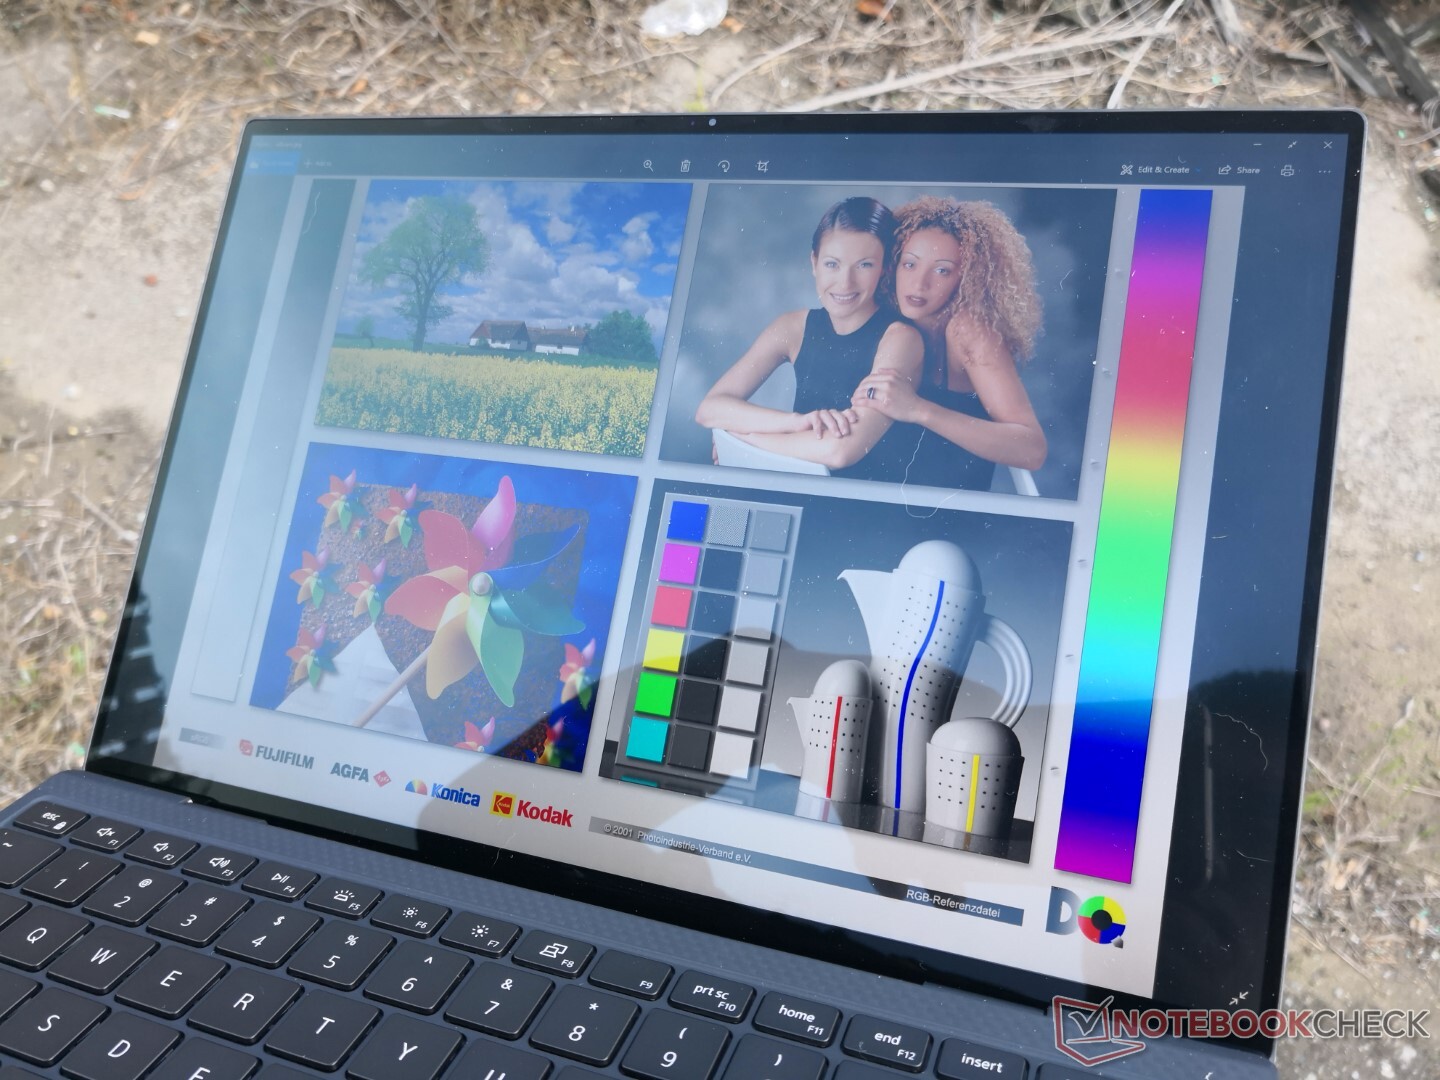
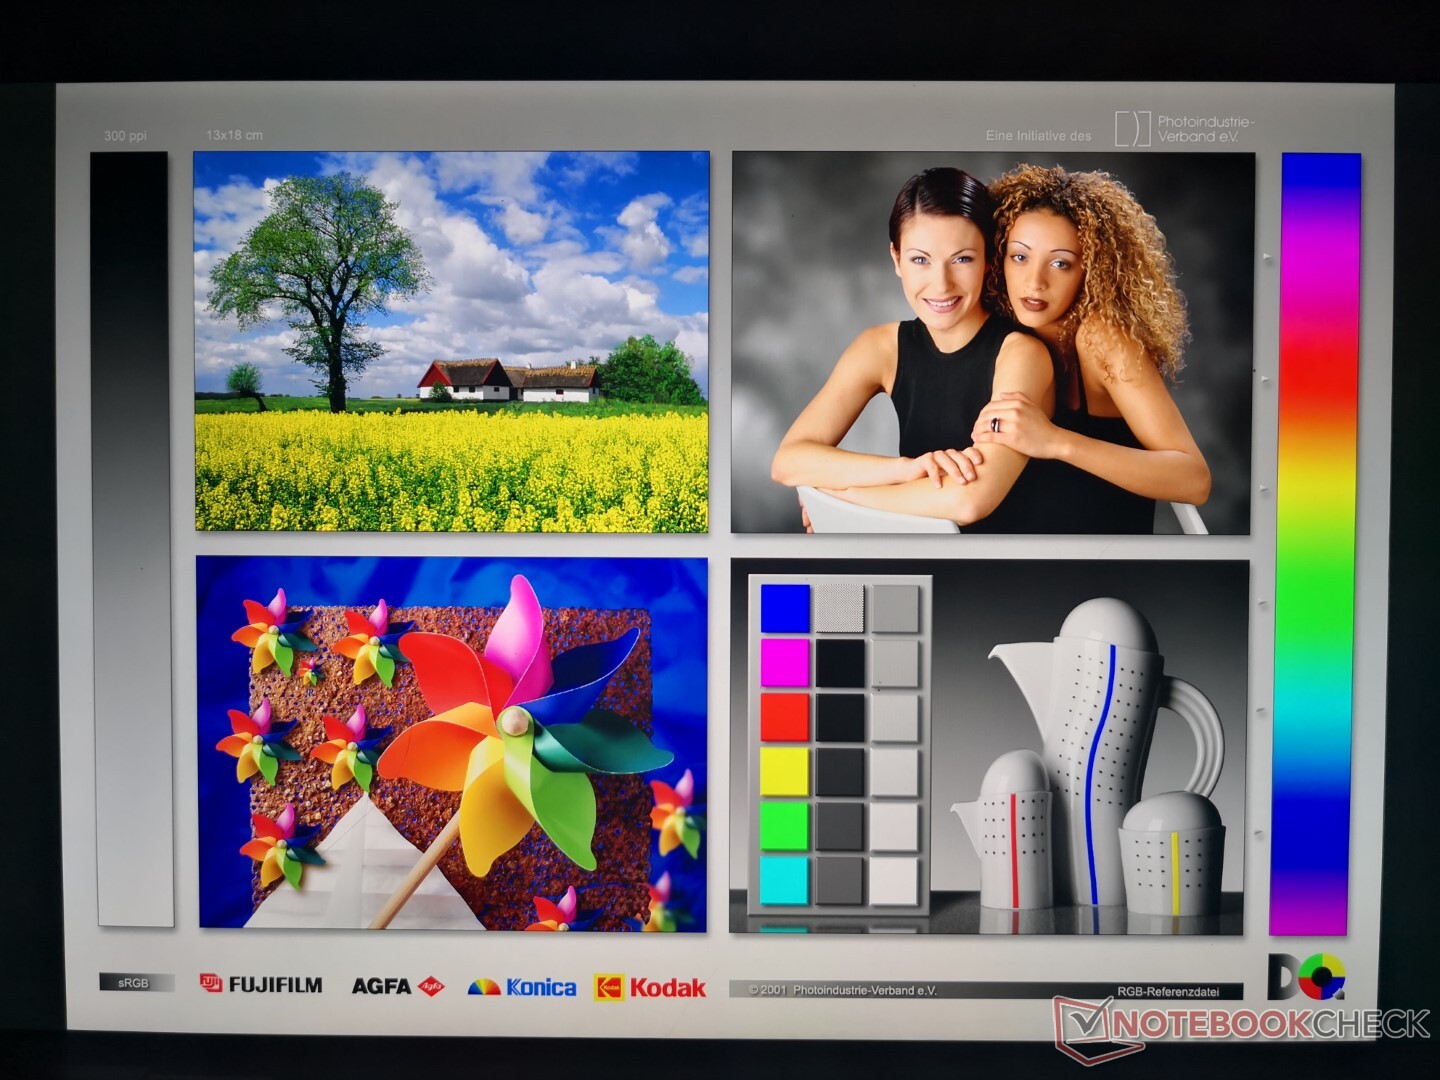
Dell utiliza el mismo panel IPS Sharp LQ134R1 para su XPS 13 9300 4K de última generación y el XPS 13 9310 4K de la generación actual para una experiencia visual similar de generación a generación. Sin embargo, una diferencia importante que hemos notado entre nuestras dos unidades se relaciona con la pantalla más brillante del más reciente XPS 13 9310 (479 nits vs 401 nits). La modulación del ancho de pulso también está presente en el nuevo modelo mientras que estaba ausente en el antiguo XPS 13 9300 4K para sugerir que Dell podría estar usando una luz de fondo diferente esta vez.
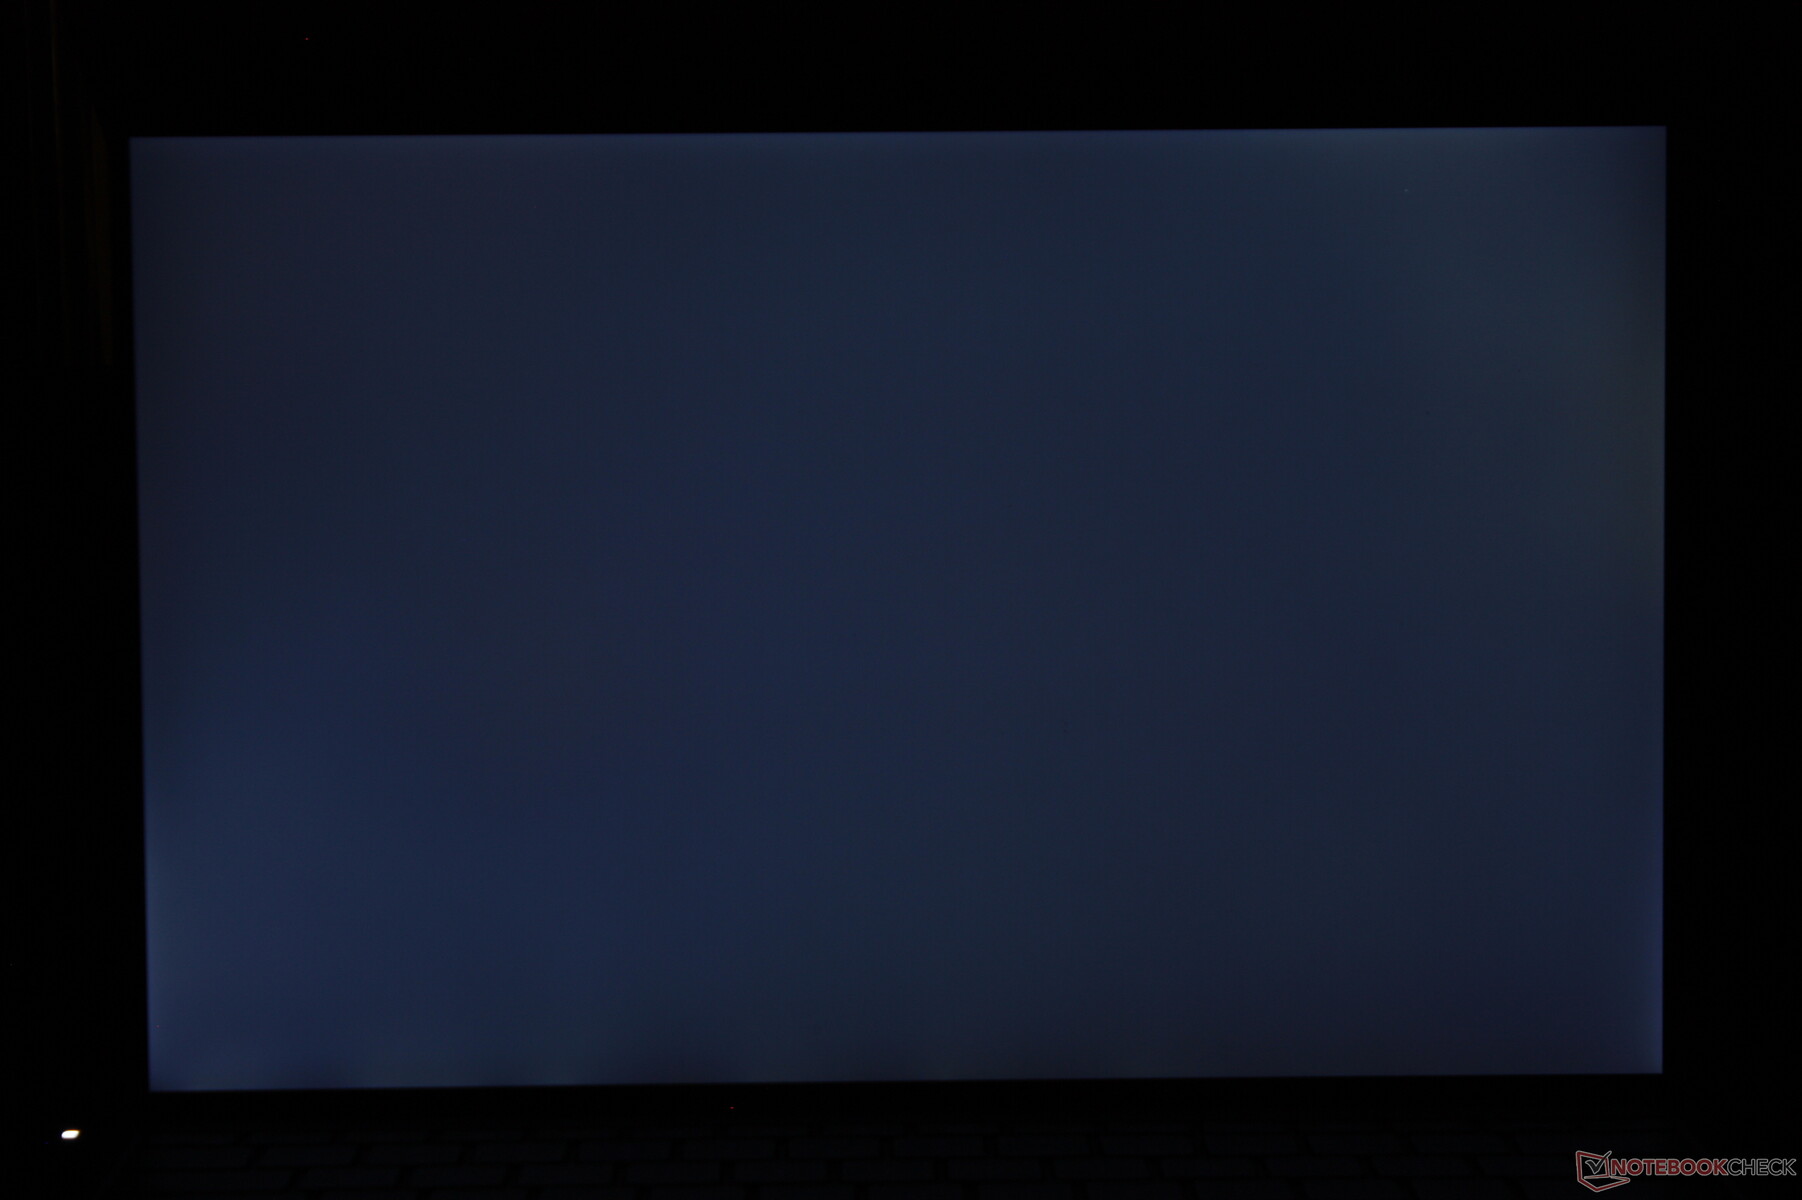
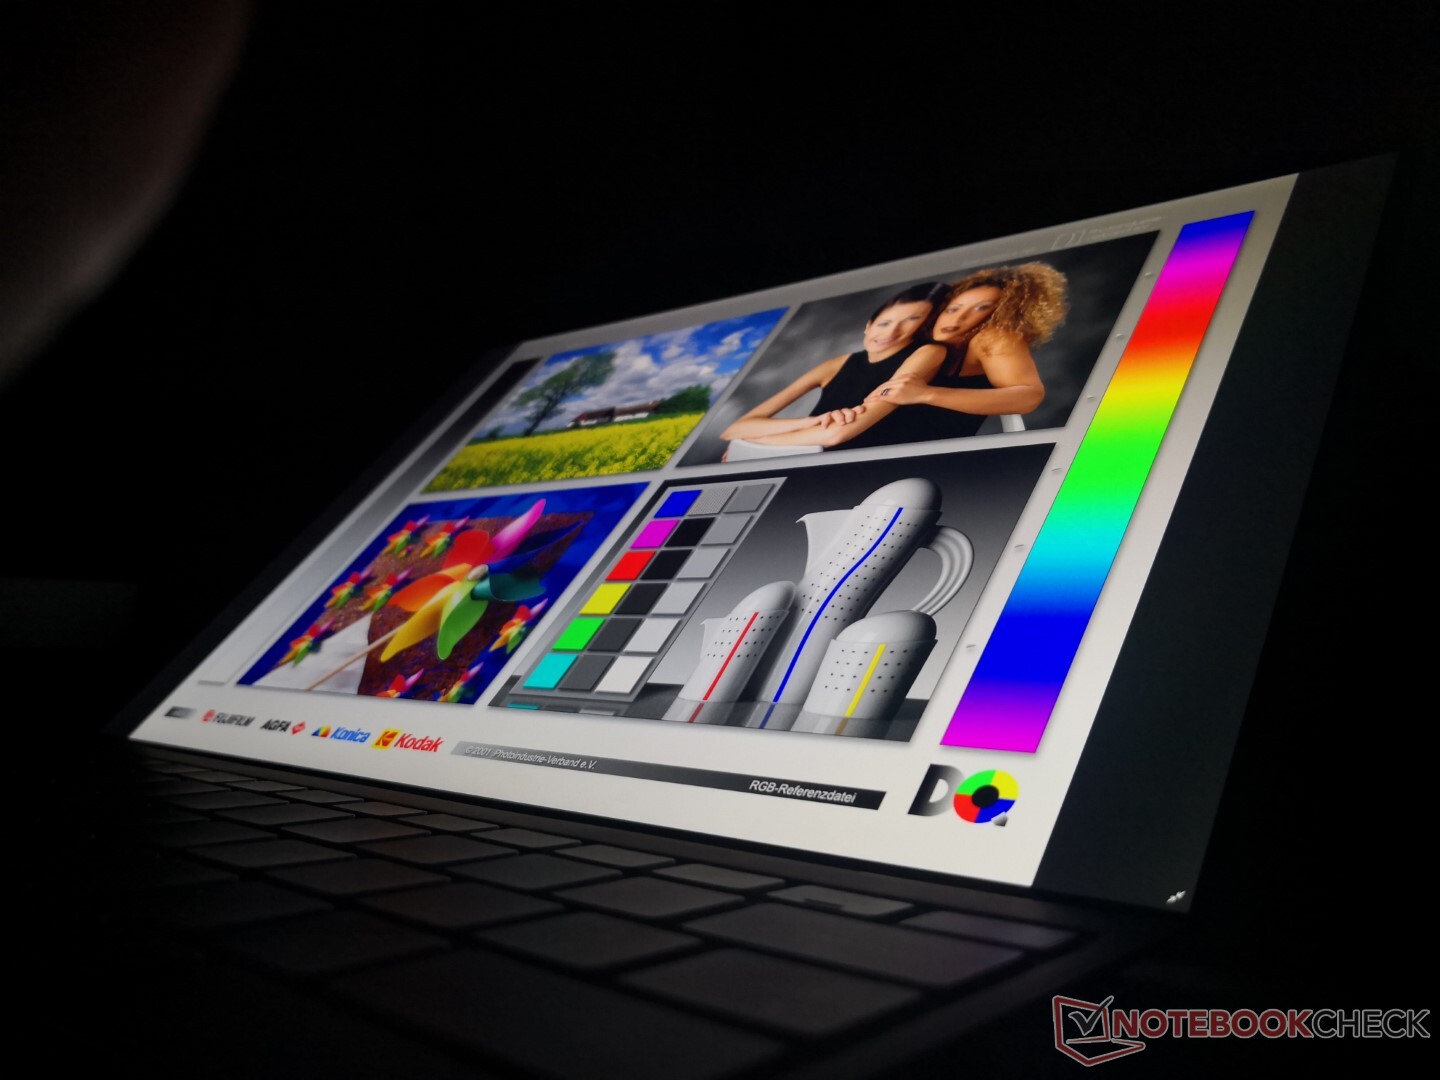
La uniformidad del brillo podría ser un poco mejor en nuestra unidad. La esquina superior izquierda de nuestra pantalla es ligeramente más tenue de lo que debería ser, como muestran nuestras mediciones de abajo. No es suficiente con ser tan notorio, pero esperamos algo mejor de una serie insignia como el XPS.

| |||||||||||||||||||||||||
iluminación: 84 %
Brillo con batería: 508.7 cd/m²
Contraste: 1696:1 (Negro: 0.3 cd/m²)
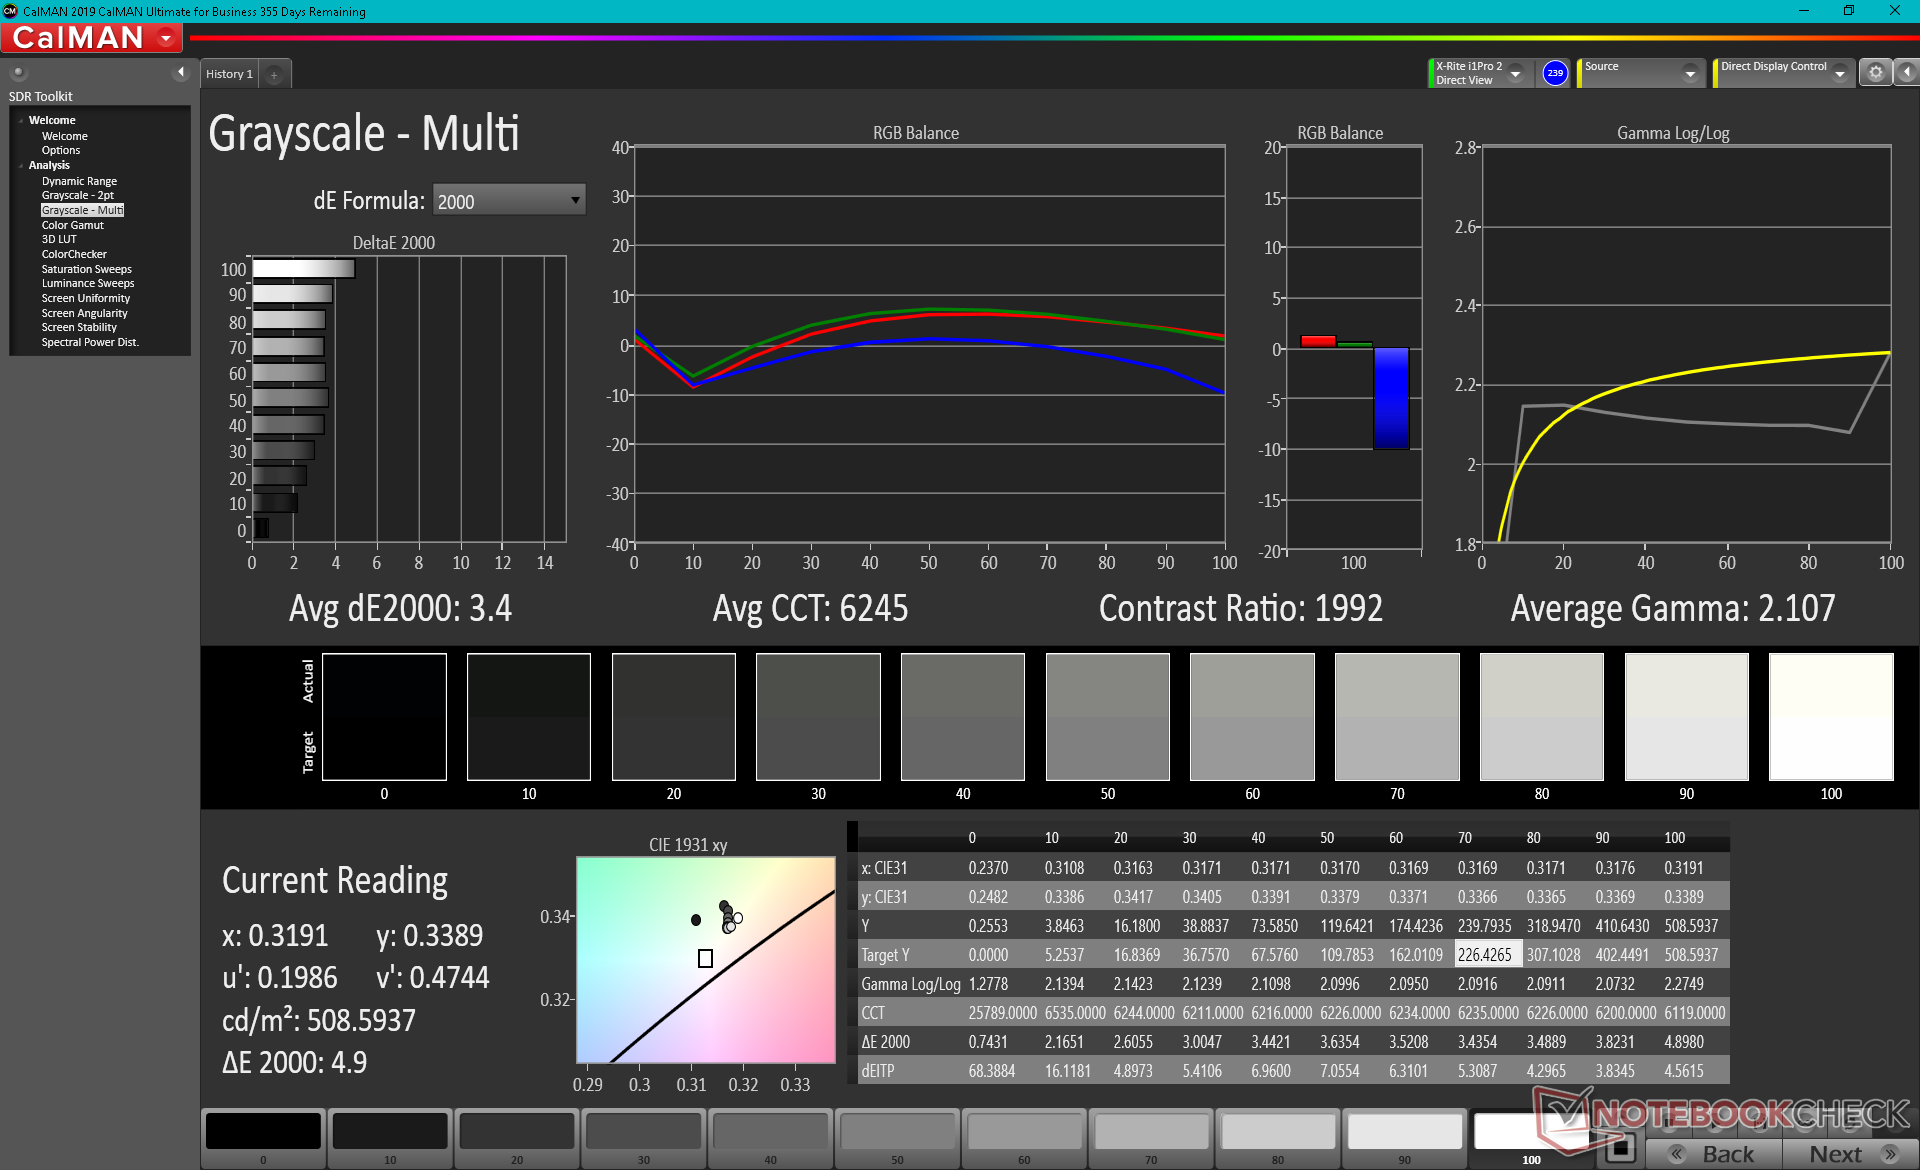
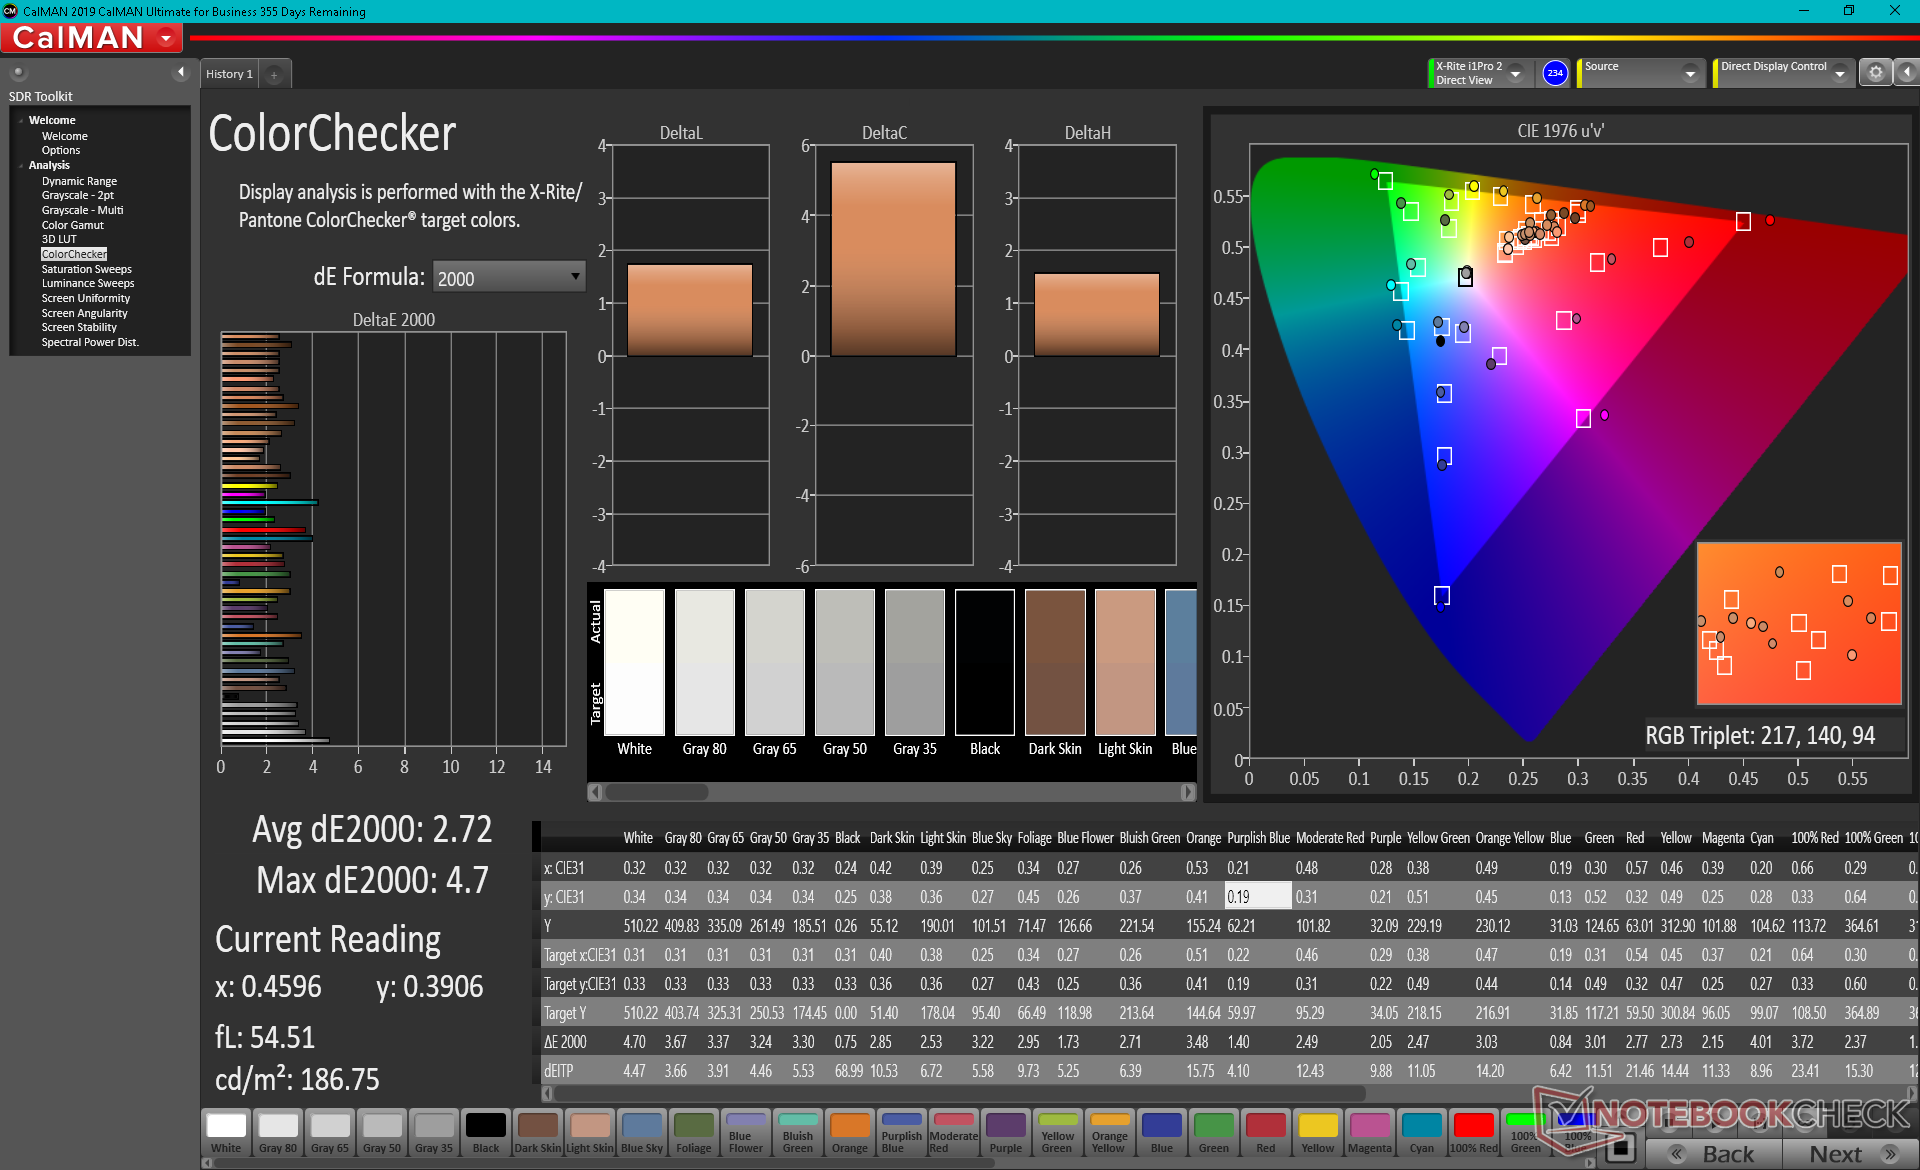
ΔE ColorChecker Calman: 2.72 | ∀{0.5-29.43 Ø4.71}
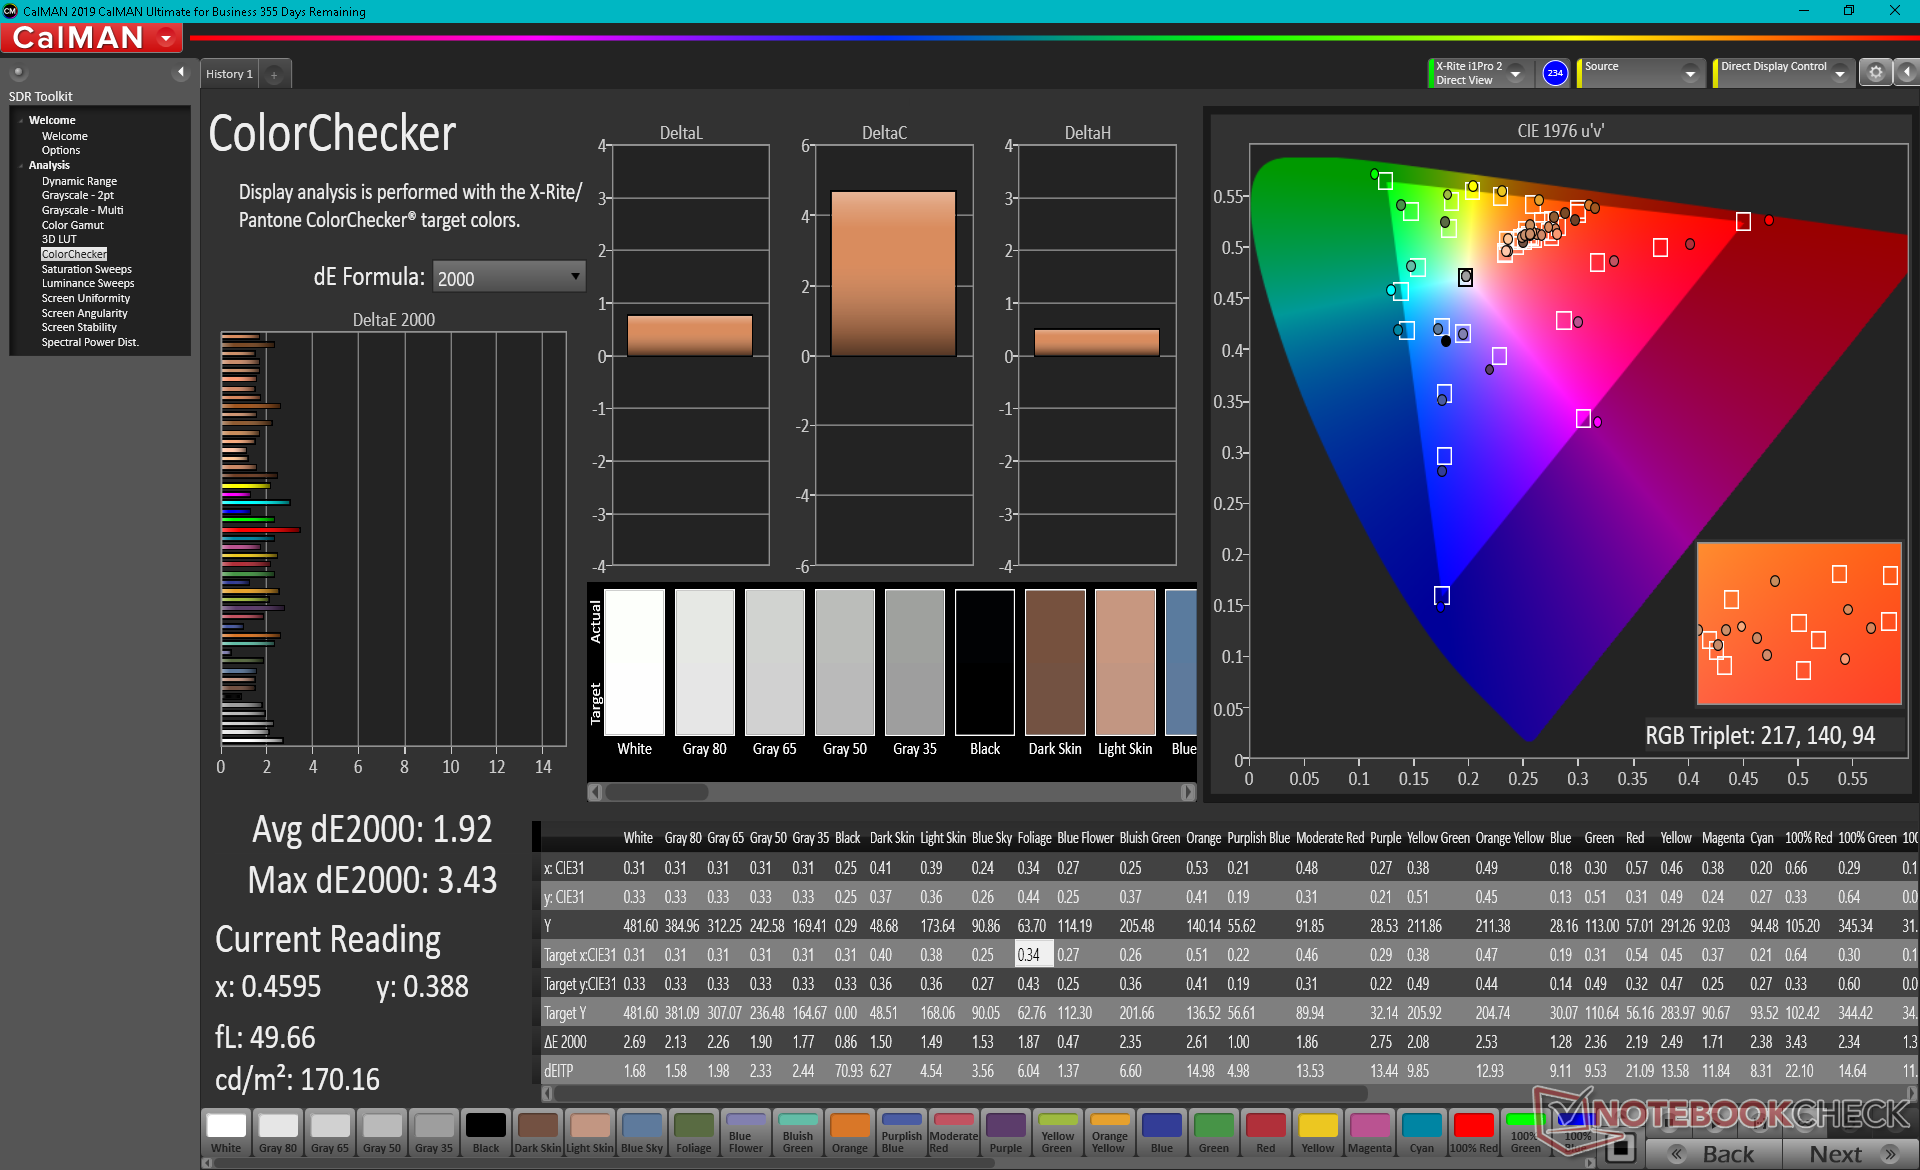
calibrated: 1.92
ΔE Greyscale Calman: 3.4 | ∀{0.09-98 Ø4.96}
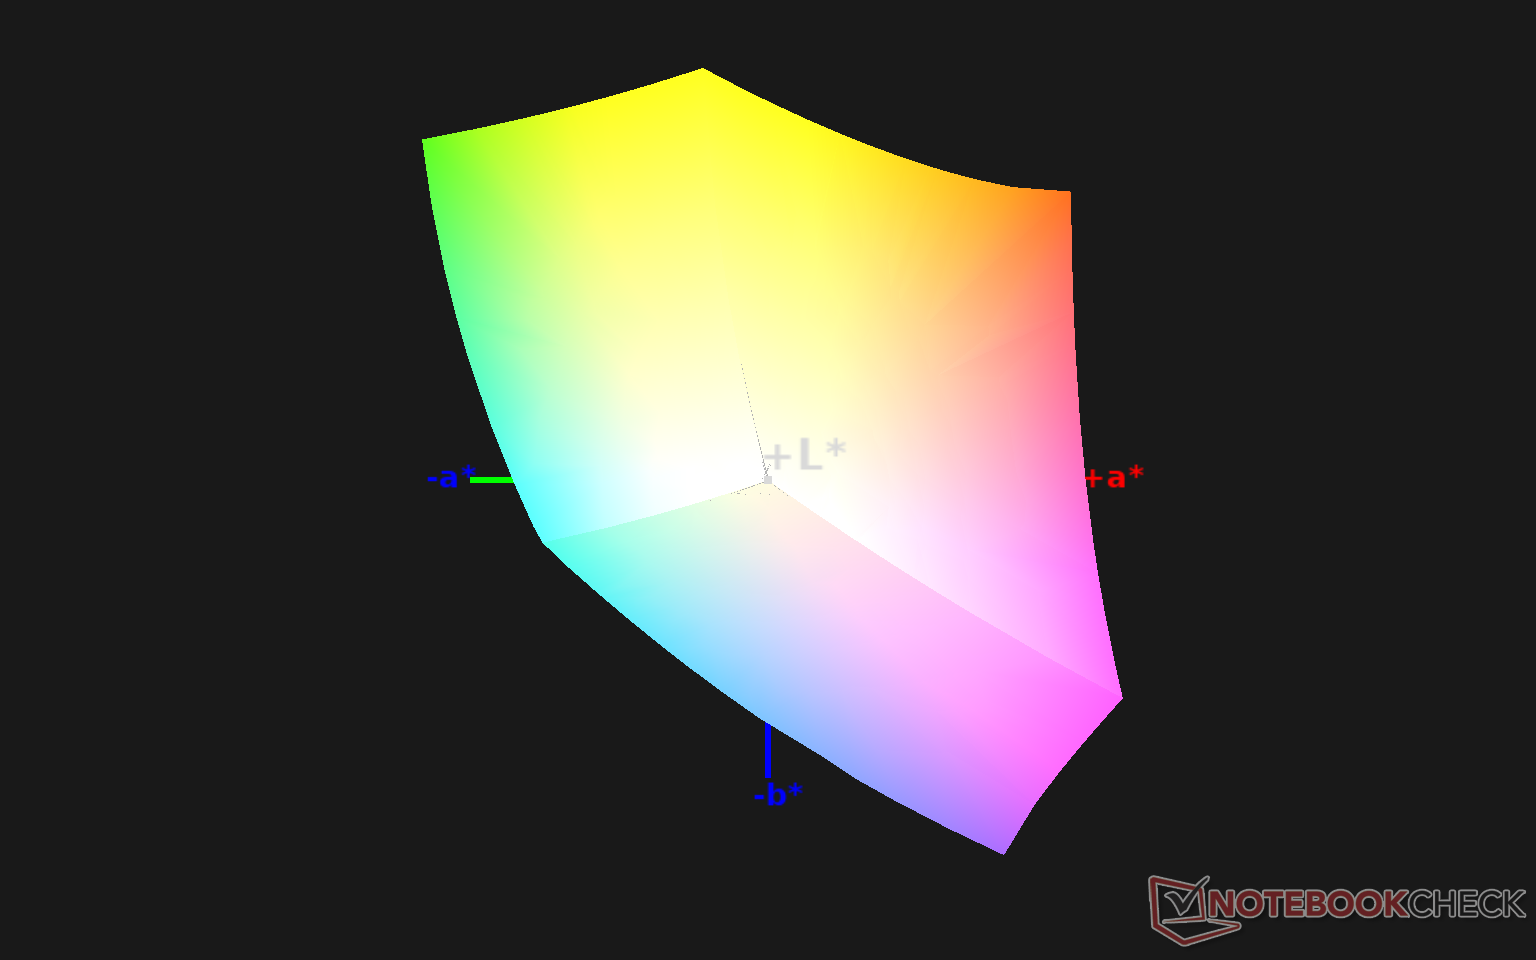
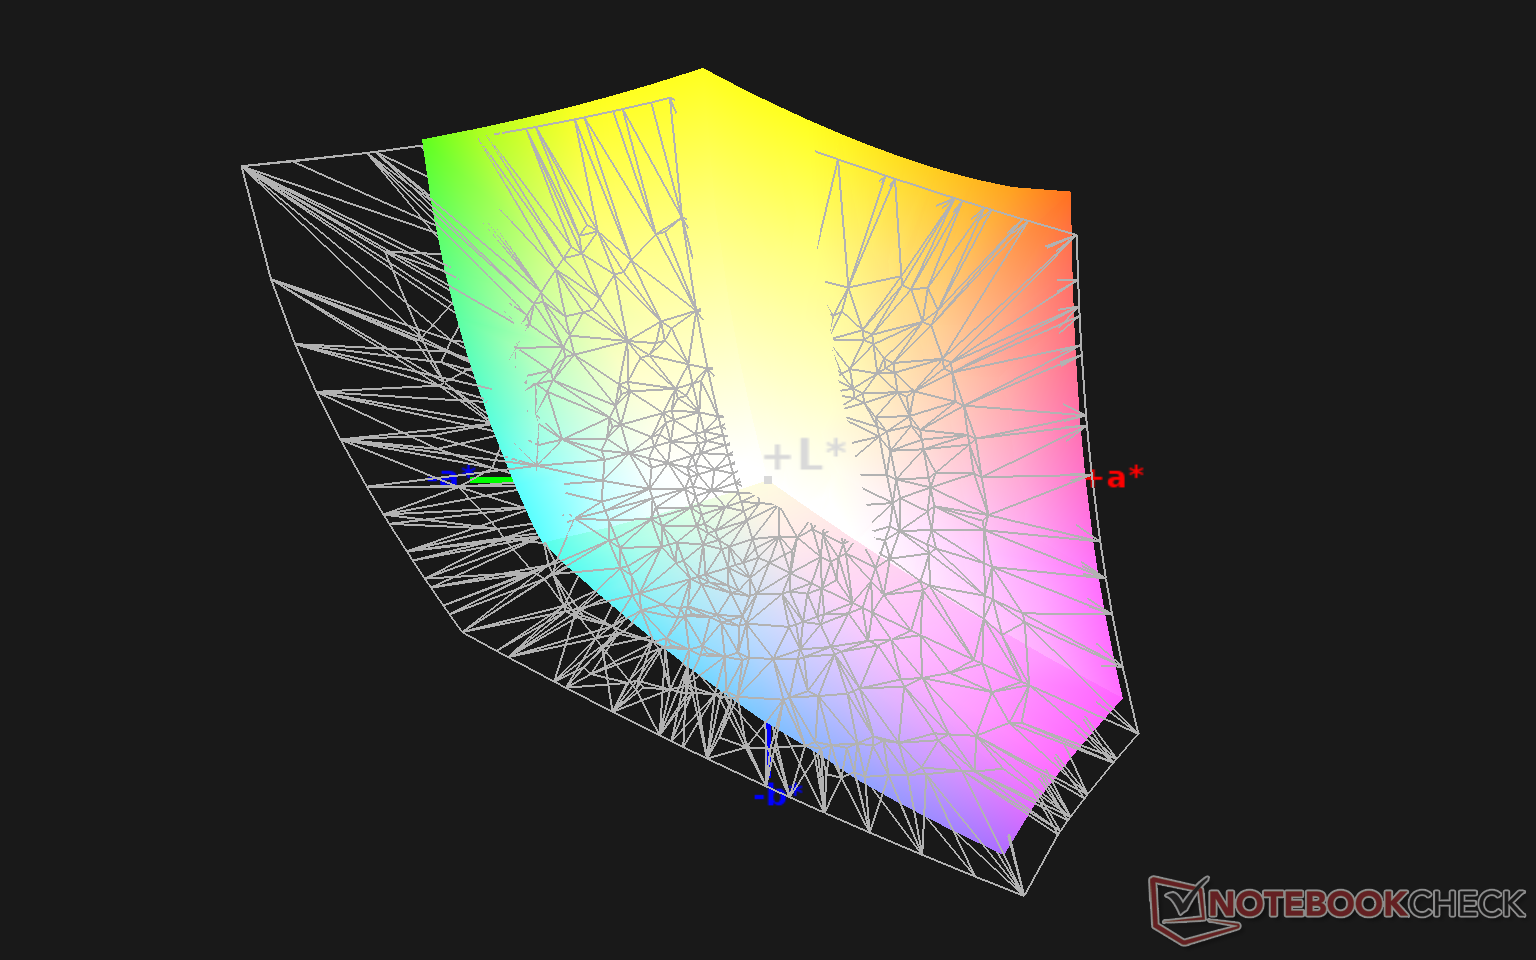
100% sRGB (Argyll 1.6.3 3D)
70.7% AdobeRGB 1998 (Argyll 1.6.3 3D)
78.9% AdobeRGB 1998 (Argyll 3D)
100% sRGB (Argyll 3D)
80.2% Display P3 (Argyll 3D)
Gamma: 2.11
CCT: 6245 K
| Dell XPS 13 9310 Core i7 4K Sharp LQ134R1, IPS, 13.4", 3840x2400 | Asus Zenbook S UX393JA AU Optronics B139KAN01.0, IPS, 13.9", 3300x2200 | Huawei MateBook X Pro 2020 i7 JDI LPM139M422A, LTPS, 13.9", 3000x2000 | Dell XPS 13 9300 Core i7-1065G7 Sharp LQ134N1, IPS, 13.4", 1920x1200 | Lenovo Yoga Slim 7-14ARE AU Optronics B140HAN06.8, IPS, 14", 1920x1080 | HP Spectre x360 13-aw0013dx AU Optronics AUO5E2D, IPS, 13.3", 1920x1080 | |
|---|---|---|---|---|---|---|
| Display | 11% | -10% | -11% | -7% | -8% | |
| Display P3 Coverage (%) | 80.2 | 97.7 22% | 66.6 -17% | 66.3 -17% | 71.7 -11% | 69.6 -13% |
| sRGB Coverage (%) | 100 | 99.8 0% | 99.4 -1% | 97.3 -3% | 99.3 -1% | 98.9 -1% |
| AdobeRGB 1998 Coverage (%) | 78.9 | 87.9 11% | 68.6 -13% | 68.5 -13% | 72.9 -8% | 71.5 -9% |
| Response Times | 5% | 20% | 17% | 25% | 3% | |
| Response Time Grey 50% / Grey 80% * (ms) | 59.2 ? | 56.4 ? 5% | 49.6 ? 16% | 50 ? 16% | 45.6 ? 23% | 60.8 ? -3% |
| Response Time Black / White * (ms) | 40.4 ? | 38.8 ? 4% | 30.8 ? 24% | 33.2 ? 18% | 29.6 ? 27% | 36.8 ? 9% |
| PWM Frequency (Hz) | 2137 ? | 29070 ? | 2500 ? | |||
| Screen | -15% | 18% | -11% | -17% | -23% | |
| Brightness middle (cd/m²) | 508.7 | 444.1 -13% | 557 9% | 607.6 19% | 399.6 -21% | 447.4 -12% |
| Brightness (cd/m²) | 479 | 423 -12% | 532 11% | 595 24% | 385 -20% | 420 -12% |
| Brightness Distribution (%) | 84 | 89 6% | 87 4% | 96 14% | 89 6% | 85 1% |
| Black Level * (cd/m²) | 0.3 | 0.37 -23% | 0.33 -10% | 0.4 -33% | 0.37 -23% | 0.31 -3% |
| Contrast (:1) | 1696 | 1200 -29% | 1688 0% | 1519 -10% | 1080 -36% | 1443 -15% |
| Colorchecker dE 2000 * | 2.72 | 2.94 -8% | 1.4 49% | 3.23 -19% | 3.2 -18% | 4.23 -56% |
| Colorchecker dE 2000 max. * | 4.7 | 7.37 -57% | 2.5 47% | 8.67 -84% | 6.44 -37% | 9.34 -99% |
| Colorchecker dE 2000 calibrated * | 1.92 | 3.05 -59% | 0.7 64% | 1.01 47% | 1.73 10% | 1.32 31% |
| Greyscale dE 2000 * | 3.4 | 2.9 15% | 2 41% | 5.5 -62% | 4.7 -38% | 6.1 -79% |
| Gamma | 2.11 104% | 2.1 105% | 2.14 103% | 2.12 104% | 2.21 100% | 2.11 104% |
| CCT | 6245 104% | 6766 96% | 6689 97% | 6413 101% | 7184 90% | 6136 106% |
| Color Space (Percent of AdobeRGB 1998) (%) | 70.7 | 78.2 11% | 62.5 -12% | 63 -11% | 66.3 -6% | 64.8 -8% |
| Color Space (Percent of sRGB) (%) | 100 | 99.8 0% | 99.5 0% | 97.5 -2% | 99.5 0% | 98.9 -1% |
| Media total (Programa/Opciones) | 0% /
-8% | 9% /
13% | -2% /
-7% | 0% /
-10% | -9% /
-17% |
* ... más pequeño es mejor
El espacio de color cubre todo el sRGB y aproximadamente el 70 por ciento del AdobeRGB. No hay opciones AMOLED o AdobeRGB/DCI-P3 completo probablemente porque tales paneles no están ampliamente disponibles en el tamaño de pantalla de 16:10 13.4 pulgadas.
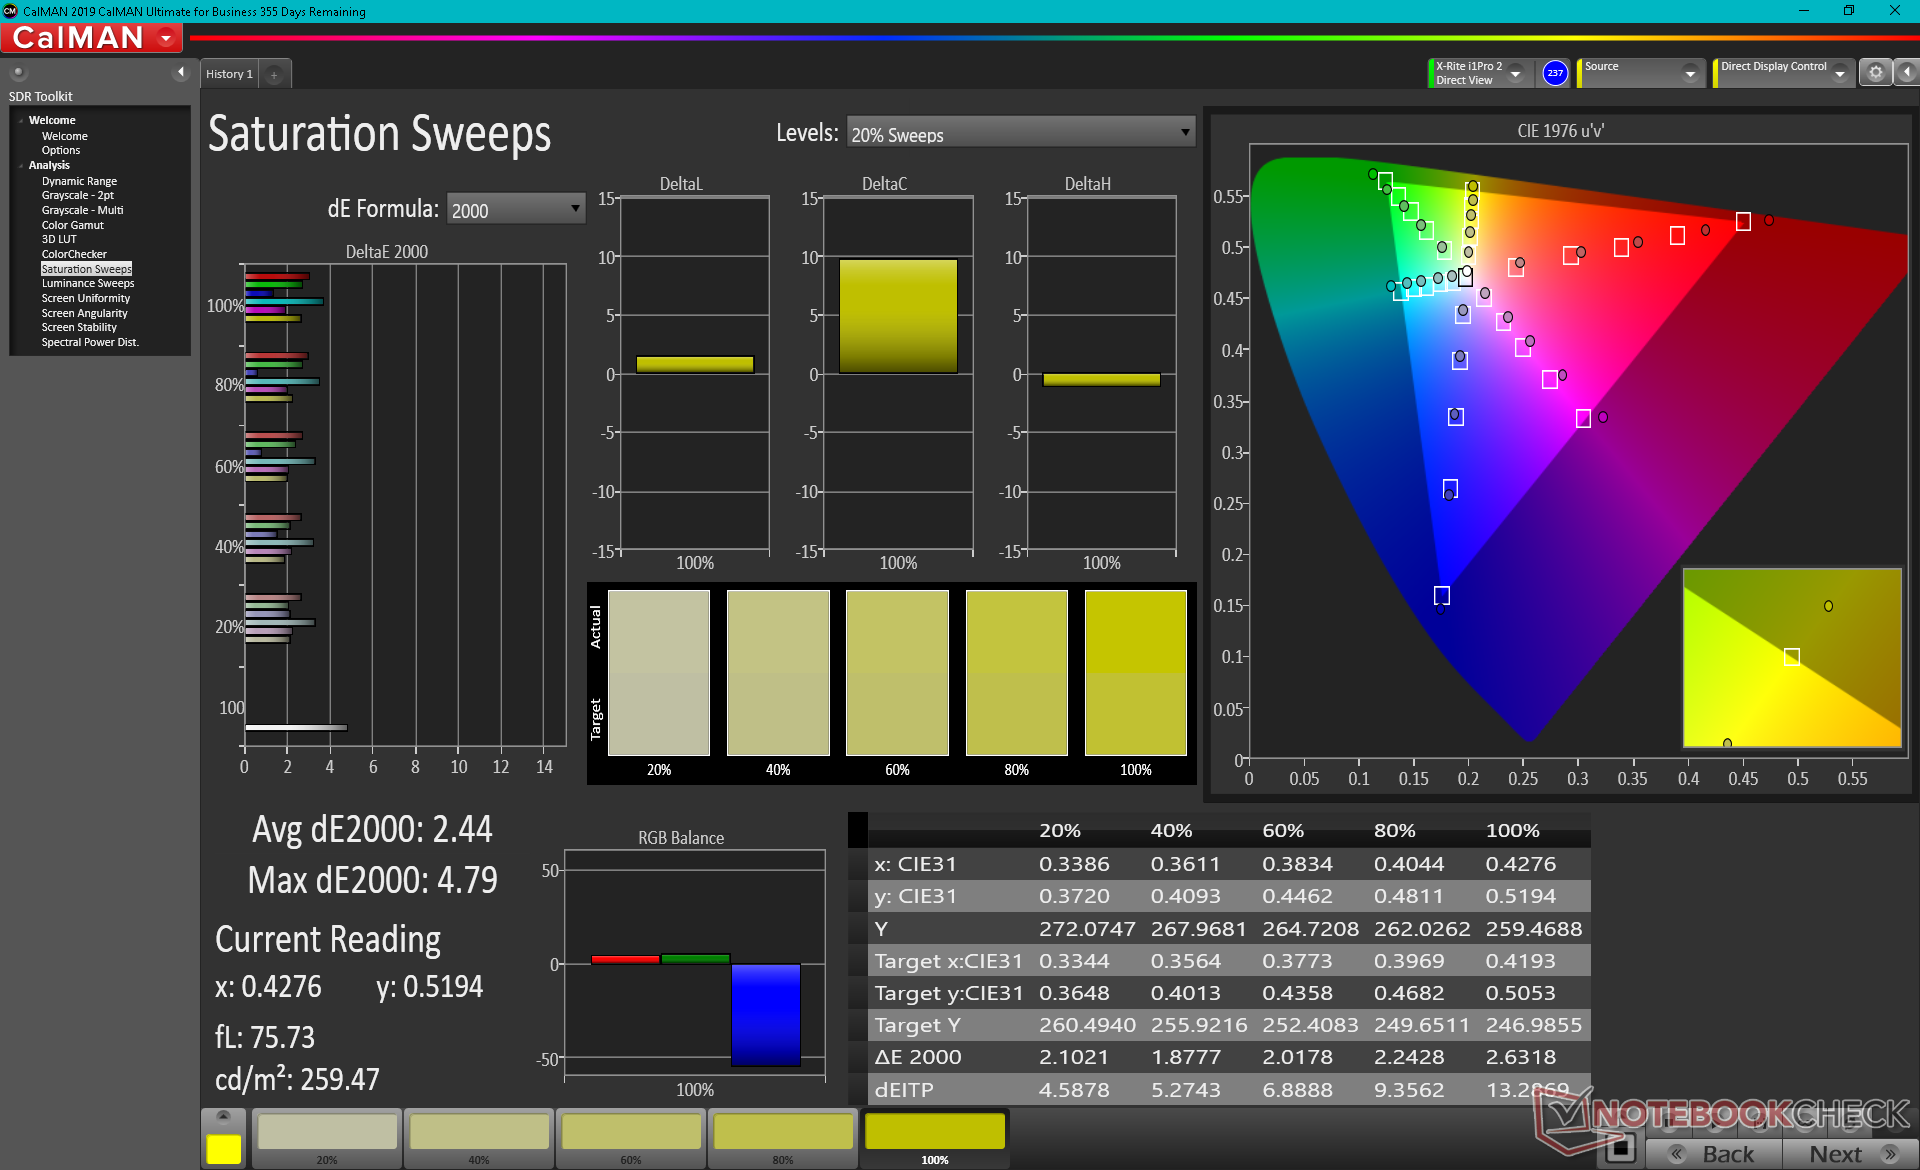
La temperatura del color es un poco demasiado cálida fuera de la caja, pero esto no es nada que nuestro colorímetro X-Rite no pueda arreglar después de una calibración (6245 a 6442 CCT). Los valores promedio de color y de escala de grises DeltaE también mejorarían sólo marginalmente después de un poco de ajuste no muy diferente a nuestra experiencia con las configuraciones XPS 13 9310 FHD o XPS 13 9300 4K.

Tiempos de respuesta del display
| ↔ Tiempo de respuesta de Negro a Blanco | ||
|---|---|---|
| 40.4 ms ... subida ↗ y bajada ↘ combinada | ↗ 22.4 ms subida | 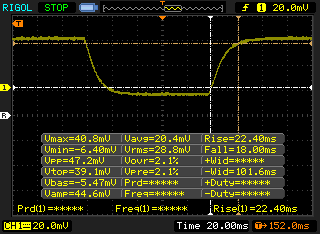 |
| ↘ 18 ms bajada | ||
| La pantalla mostró tiempos de respuesta lentos en nuestros tests y podría ser demasiado lenta para los jugones. En comparación, todos los dispositivos de prueba van de ##min### (mínimo) a 240 (máximo) ms. » 98 % de todos los dispositivos son mejores. Eso quiere decir que el tiempo de respuesta es peor que la media (19.8 ms) de todos los dispositivos testados. | ||
| ↔ Tiempo de respuesta 50% Gris a 80% Gris | ||
| 59.2 ms ... subida ↗ y bajada ↘ combinada | ↗ 30 ms subida | 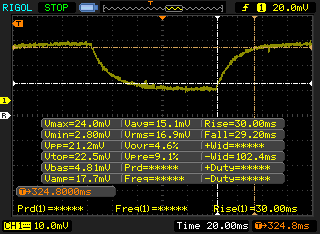 |
| ↘ 29.2 ms bajada | ||
| La pantalla mostró tiempos de respuesta lentos en nuestros tests y podría ser demasiado lenta para los jugones. En comparación, todos los dispositivos de prueba van de ##min### (mínimo) a 636 (máximo) ms. » 95 % de todos los dispositivos son mejores. Eso quiere decir que el tiempo de respuesta es peor que la media (31 ms) de todos los dispositivos testados. | ||
Parpadeo de Pantalla / PWM (Pulse-Width Modulation)
| Parpadeo de Pantalla / PWM detectado | 2137 Hz | ≤ 31 % de brillo | 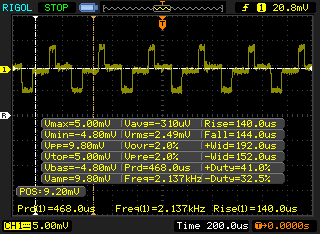 |
La retroiluminación del display parpadea a 2137 Hz (seguramente usa PWM - Pulse-Width Modulation) a un brillo del 31 % e inferior. Sobre este nivel de brillo no debería darse parpadeo / PWM. La frecuencia de 2137 Hz es bastante alta, por lo que la mayoría de gente sensible al parpadeo no debería ver parpadeo o tener fatiga visual. Comparación: 52 % de todos los dispositivos testados no usaron PWM para atenuar el display. Si se usó, medimos una media de 7757 (mínimo: 5 - máxmo: 343500) Hz. | |||
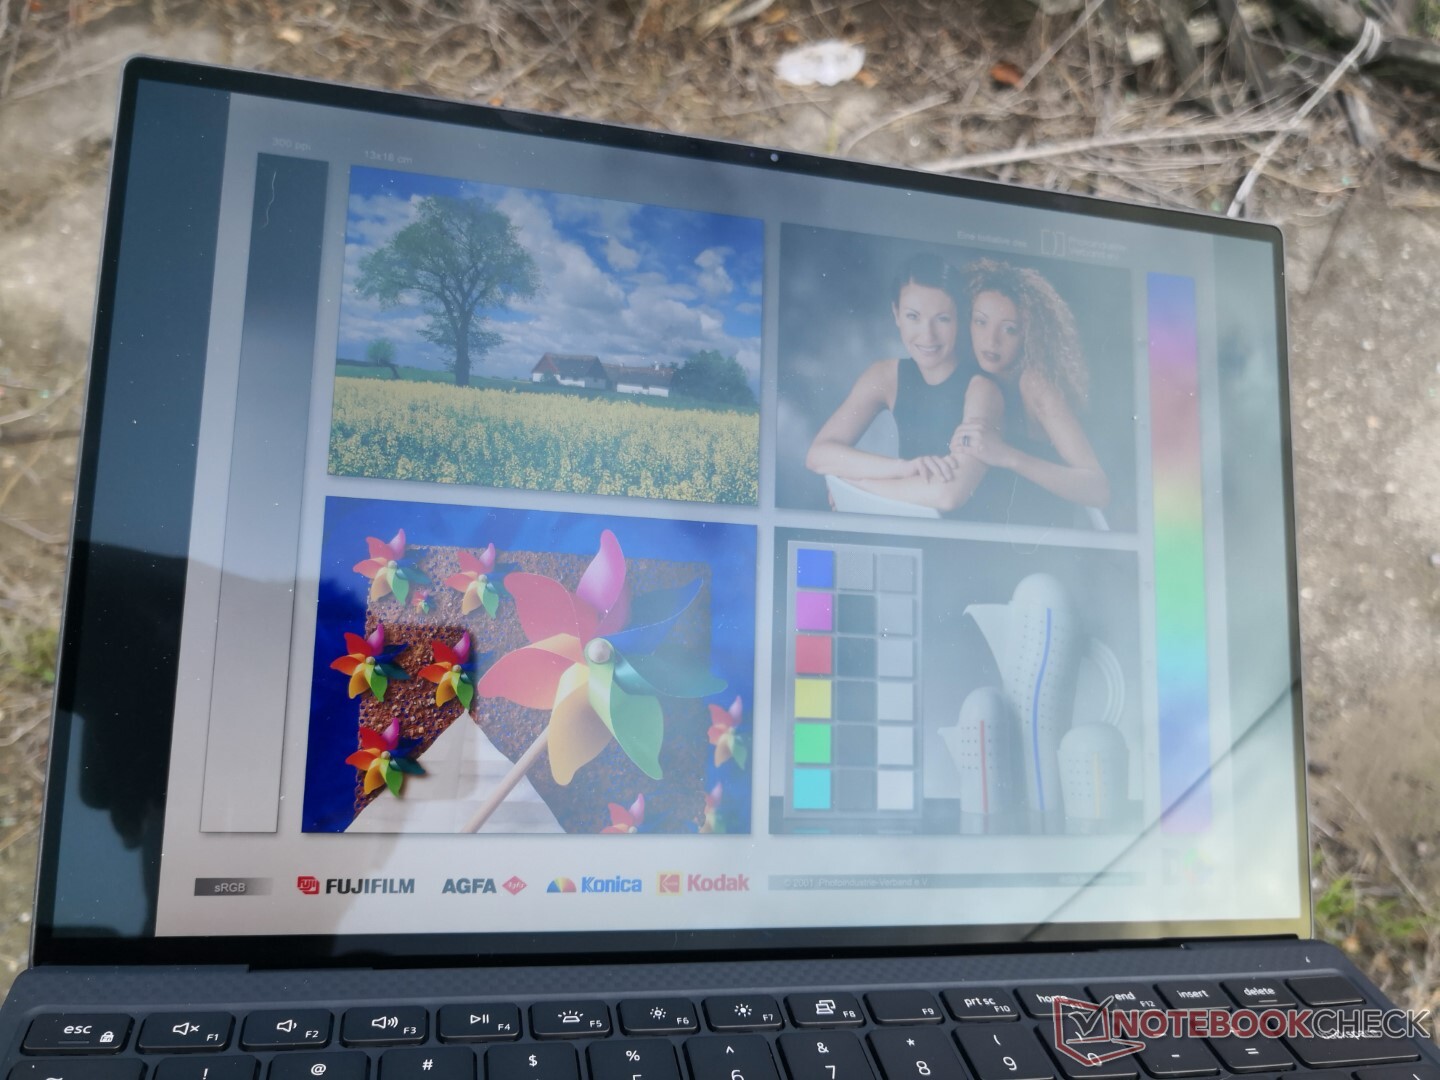
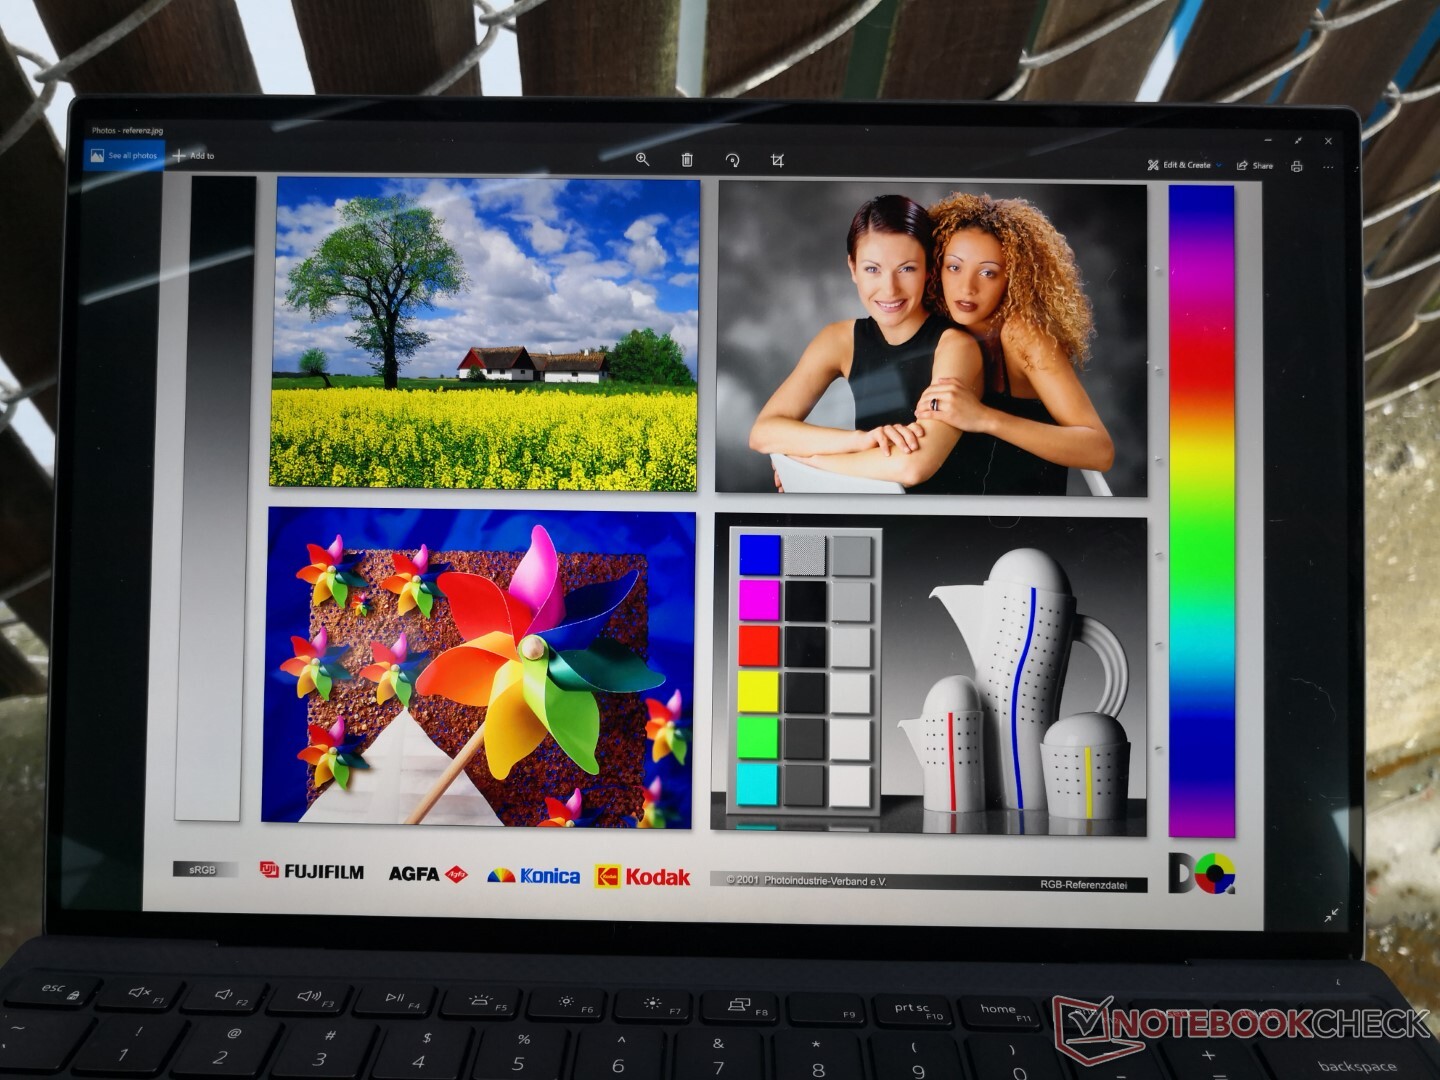
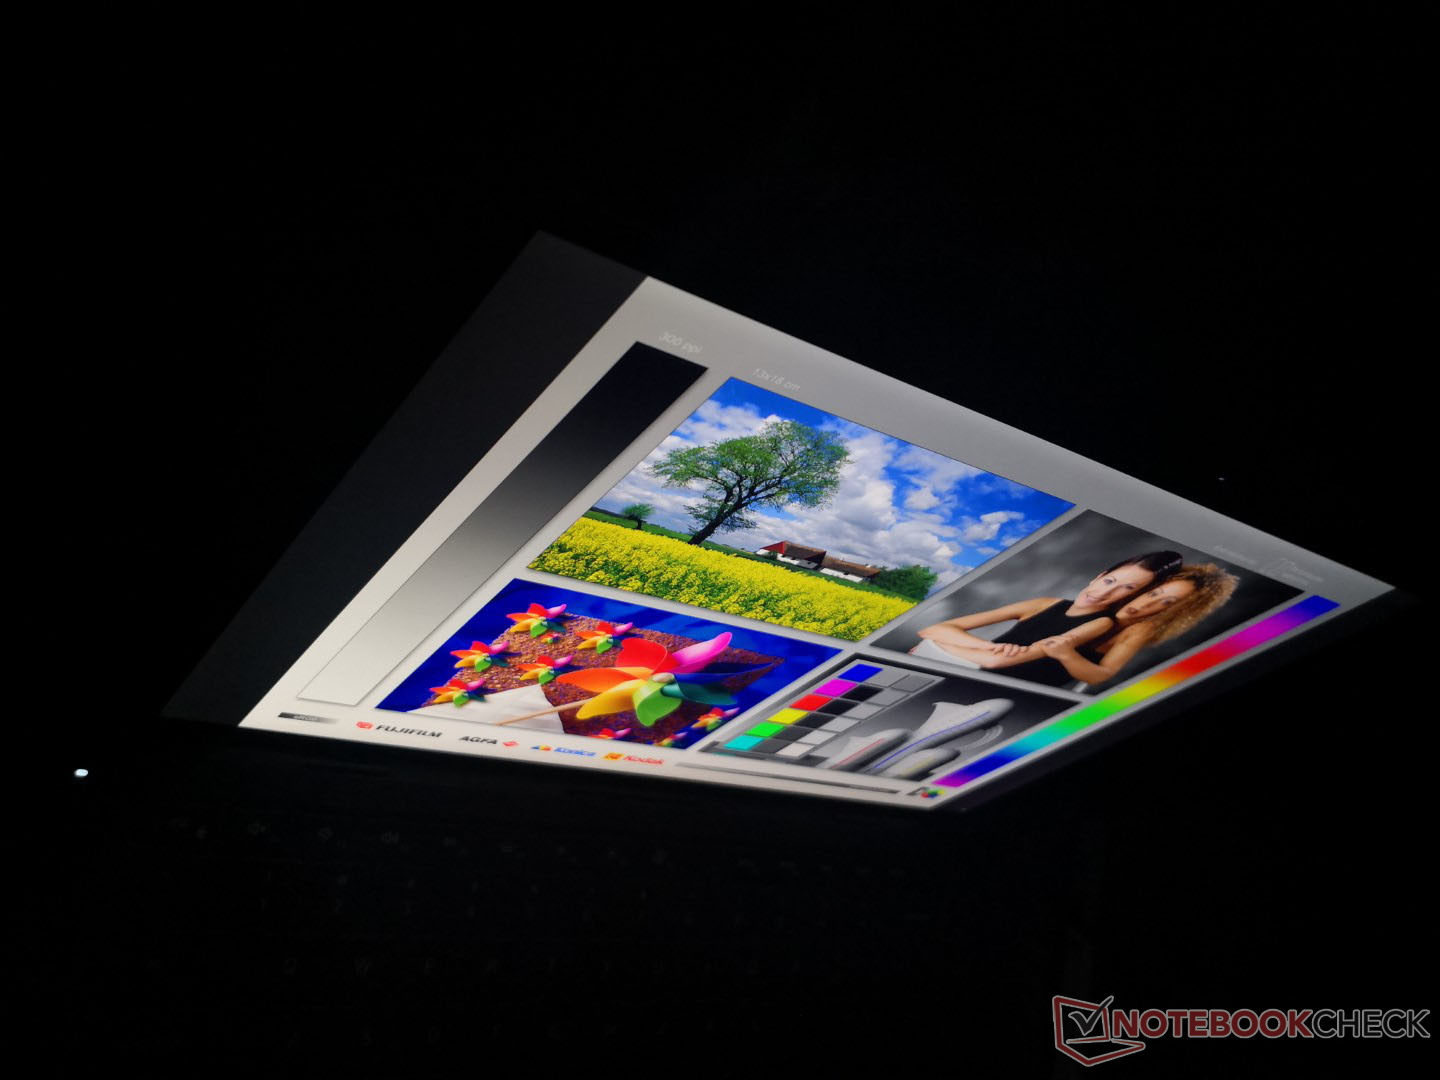
La visibilidad al aire libre no es muy buena si en un día brillante debido al panel brillante. A diferencia de algunos modelos antiguos de XPS 13, Dell no ofrece ninguna opción mate para su serie XPS 13 9310. Sin embargo, la pantalla es generalmente lo suficientemente brillante para una visión cómoda si se trabaja bajo la sombra.
Actuación
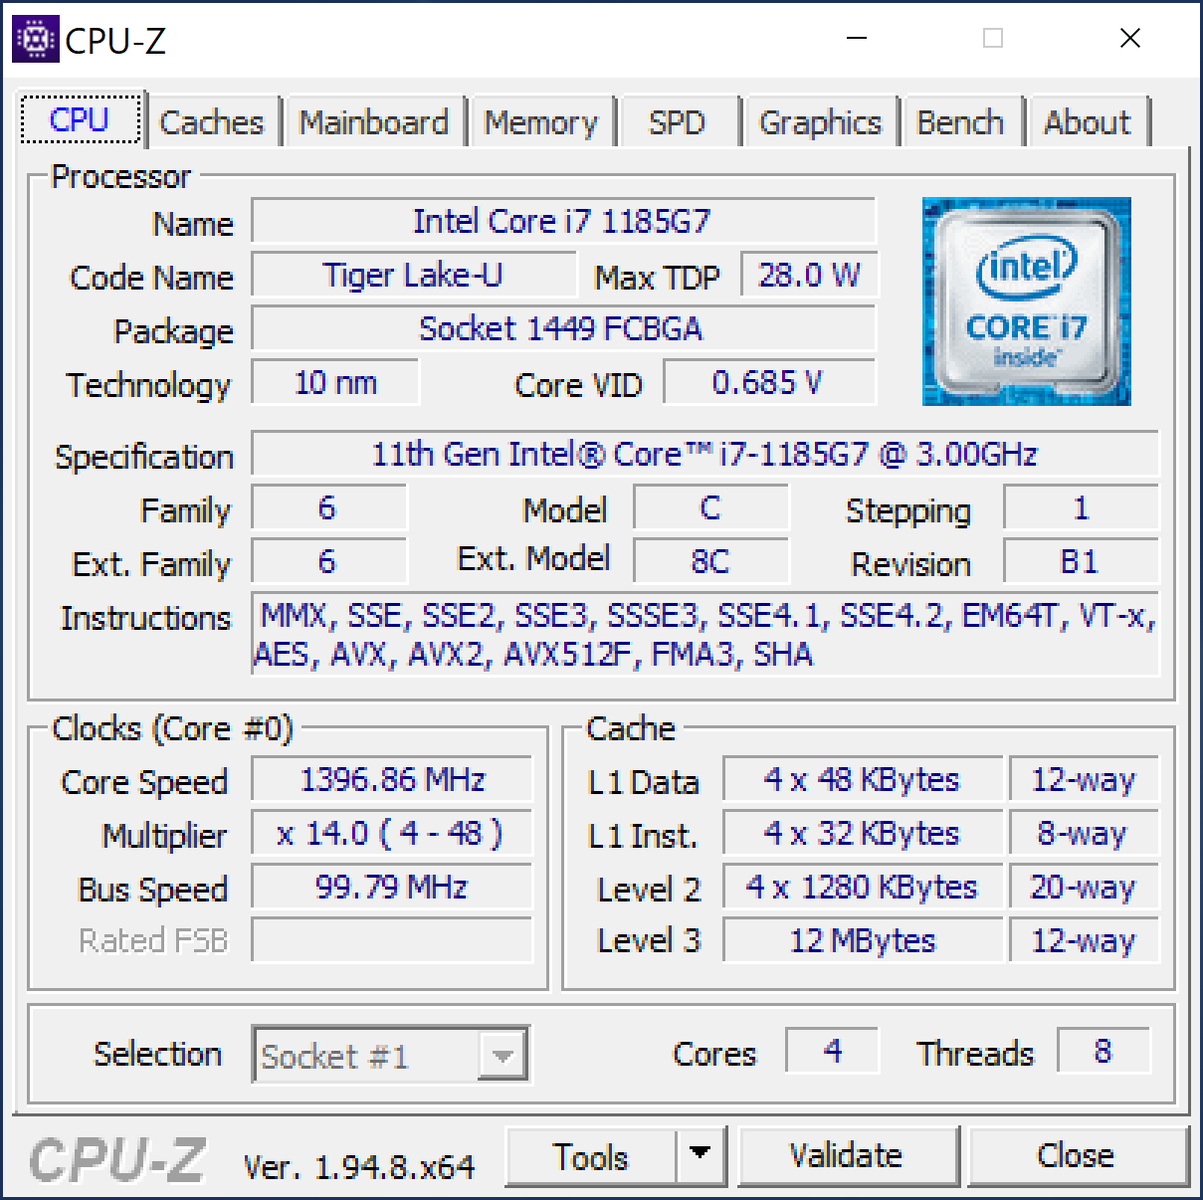
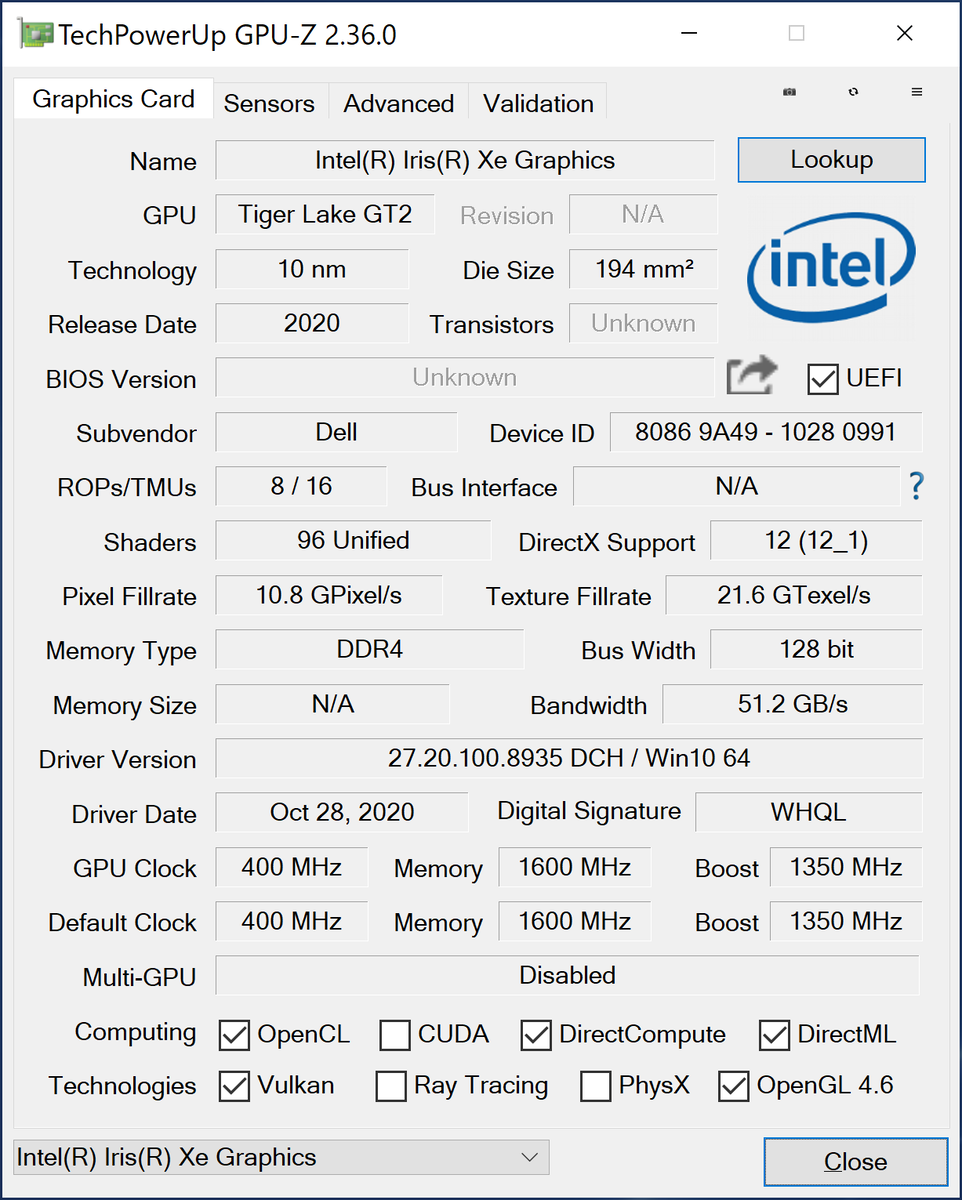
Sobre el papel, el Core i7-1185G7 tiene velocidades de reloj base y velocidades de reloj Turbo Boost ligeramente más rápidas que el Core i7-1165G7 (3,0 a 4,8 GHz frente a 2,8 a 4,7 GHz). En la práctica, sin embargo, vamos a demostrar que estas especificaciones impresas no significan mucho cuando ambos procesadores están a merced de la misma solución de refrigeración del chasis. No hay otras diferencias importantes entre los dos procesadores, ya que sus tamaños de caché, rango de TDP y número de núcleos son idénticos. GPU-Z informa de algunas leves diferencias en la tasa de llenado entre la GPU Iris Xe integrada, pero nada significativo.
Configuramos nuestra unidad en modo de ultra rendimiento a través del software Dell Power Manager antes de ejecutar cualquier prueba de rendimiento a continuación para obtener los mejores números posibles. Los propietarios deberían familiarizarse con este software ya que aquí se encuentran muchas opciones específicas para el XPS.
Procesador
Al igual que lo que observamos entre el XPS 15 Core i7-8750H y el XPS 15 Core i9-8950HK, las diferencias de rendimiento entre nuestras configuraciones XPS 13 Core i7-1185G7 y Core i7-1165G7 son mínimas en el mejor de los casos. Los resultados de las pruebas de referencia son casi idénticos entre ellos hasta el punto de que el Core i7-1165G7 puede a veces incluso adelantarse al Core i7-1185G7 como en la codificación HWBOT x265. Cuando se ejecuta CineBench R15 xT en un bucle, se producen las mismas fluctuaciones de la velocidad de reloj para puntuaciones inestables debido a la implementación de la política de energía dinámica de Dell.
Es una lástima que el XPS 13 no ofrezca opciones AMD Ryzen, ya que el Ryzen 5 4500U o el Ryzen 7 4700U tienen un rendimiento multihilo aún más rápido que estas CPU Intel Tiger Lake, aunque a costa de un rendimiento más lento de un solo hilo.
Cinebench R15: CPU Multi 64Bit | CPU Single 64Bit
Blender: v2.79 BMW27 CPU
7-Zip 18.03: 7z b 4 -mmt1 | 7z b 4
Geekbench 5.5: Single-Core | Multi-Core
HWBOT x265 Benchmark v2.2: 4k Preset
LibreOffice : 20 Documents To PDF
R Benchmark 2.5: Overall mean
| LibreOffice / 20 Documents To PDF | |
| Dell XPS 13 9300 4K UHD | |
| Lenovo Yoga Slim 7 14ARE05 82A20008GE | |
| HP Envy x360 13-ay0010nr | |
| Lenovo Yoga Slim 7-14ARE | |
| Huawei MateBook X Pro 2020 i7 | |
| Medio Intel Core i7-1185G7 (41.3 - 61.7, n=26) | |
| Razer Book 13 FHD | |
| Asus Zenbook S UX393JA | |
| Dell XPS 13 9310 Core i7 4K | |
| Dell XPS 13 9310 Core i7 FHD | |
Cinebench R15: CPU Multi 64Bit | CPU Single 64Bit
Blender: v2.79 BMW27 CPU
7-Zip 18.03: 7z b 4 -mmt1 | 7z b 4
Geekbench 5.5: Single-Core | Multi-Core
HWBOT x265 Benchmark v2.2: 4k Preset
LibreOffice : 20 Documents To PDF
R Benchmark 2.5: Overall mean
* ... más pequeño es mejor
Rendimiento del sistema
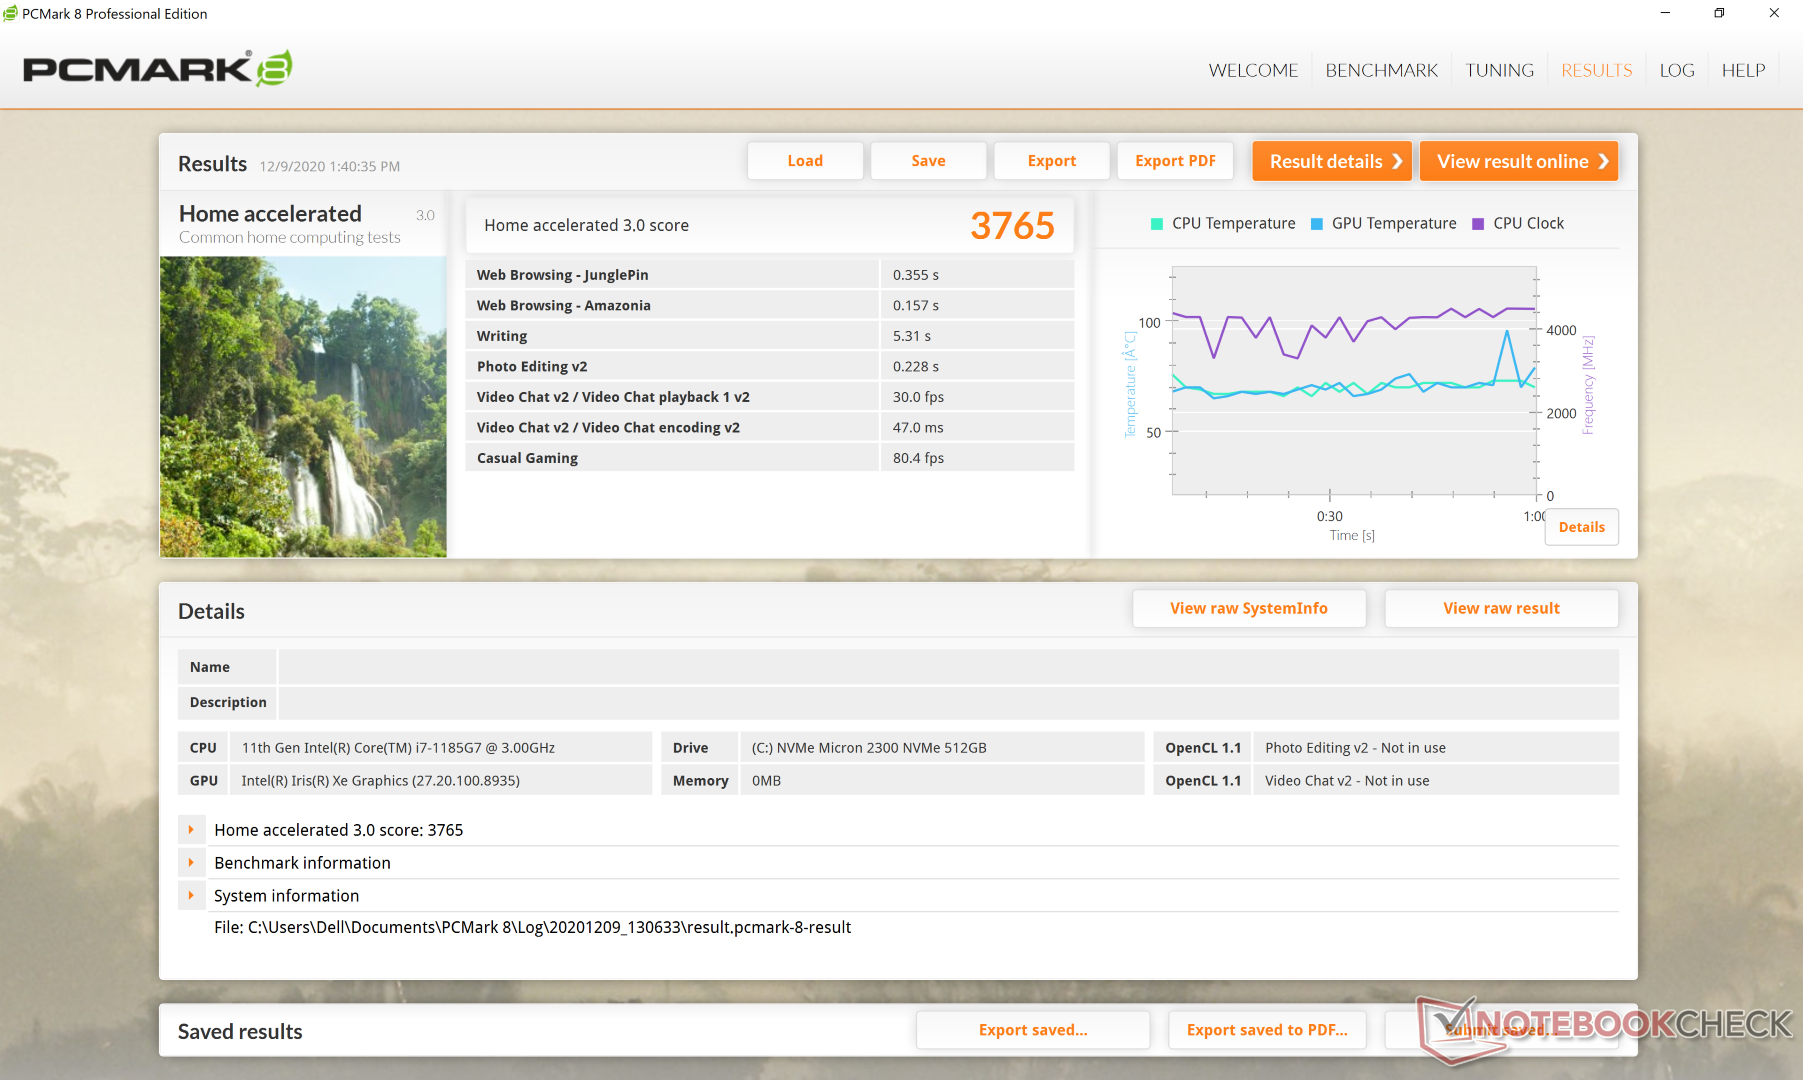
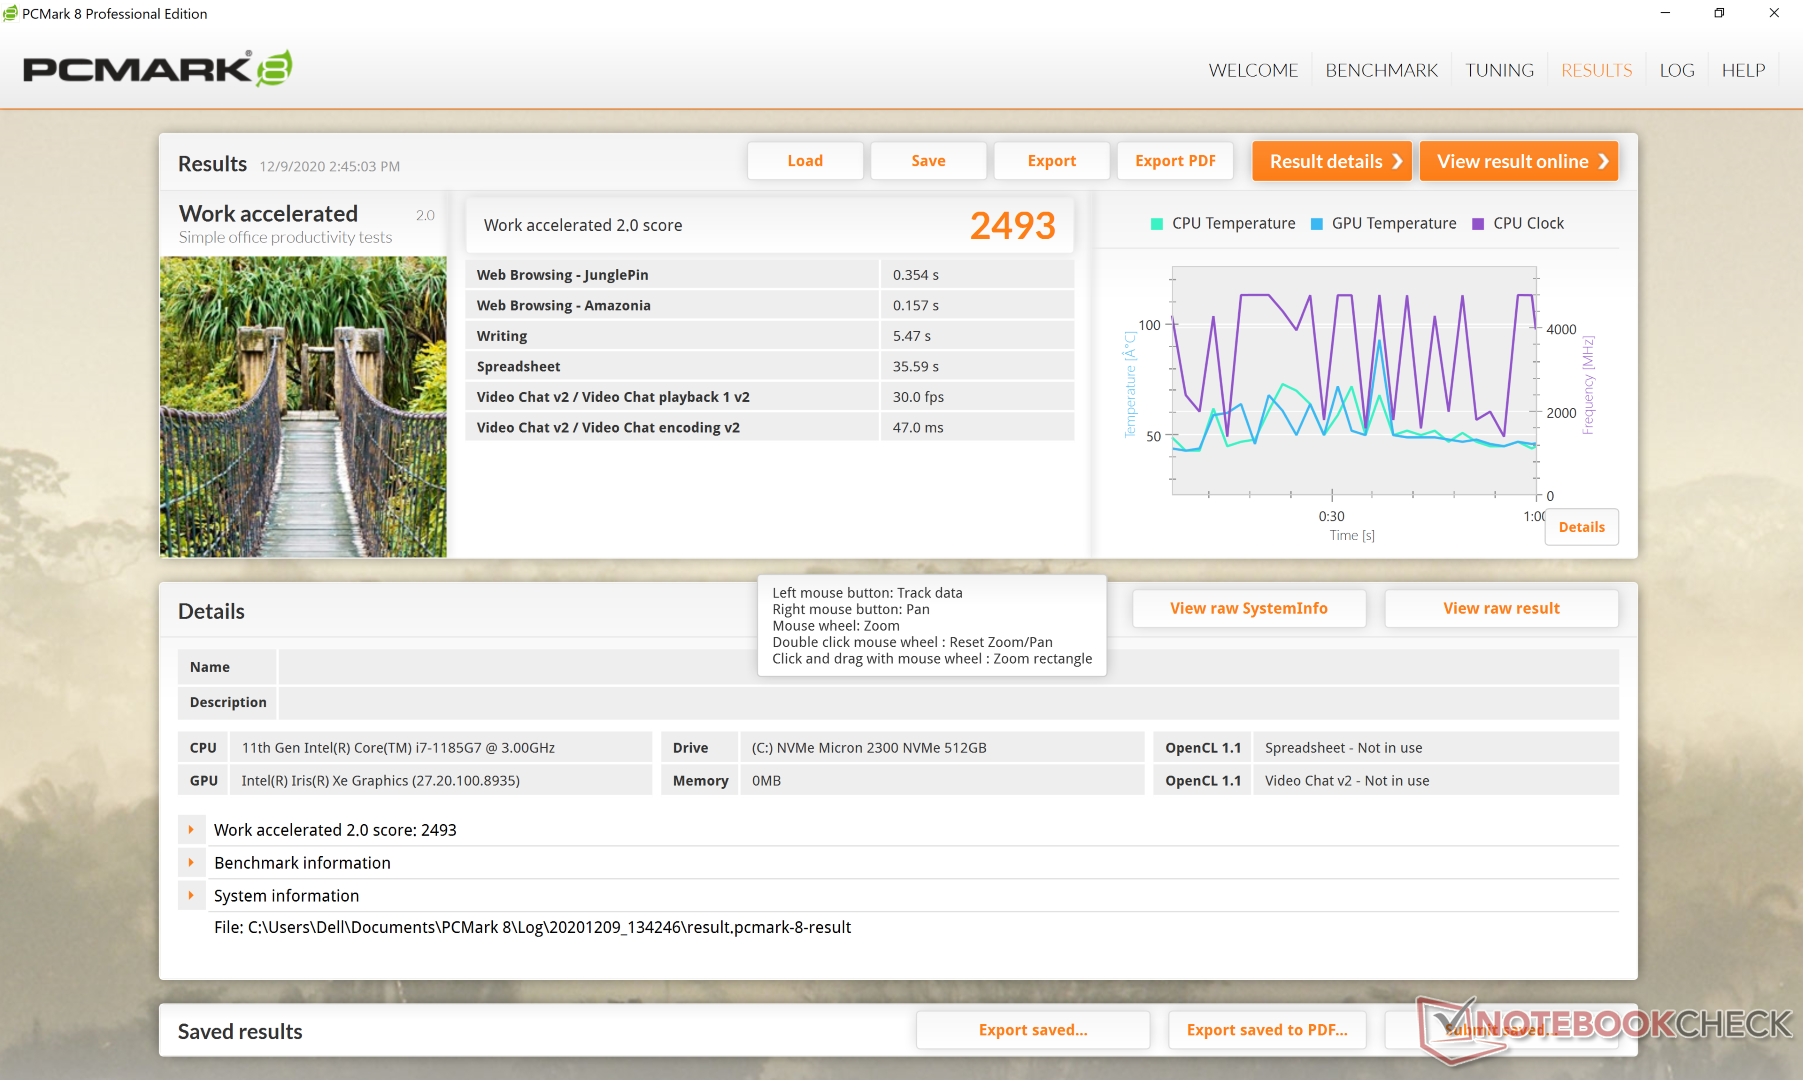
| PCMark 8 Home Score Accelerated v2 | 3765 puntos | |
| PCMark 8 Work Score Accelerated v2 | 2493 puntos | |
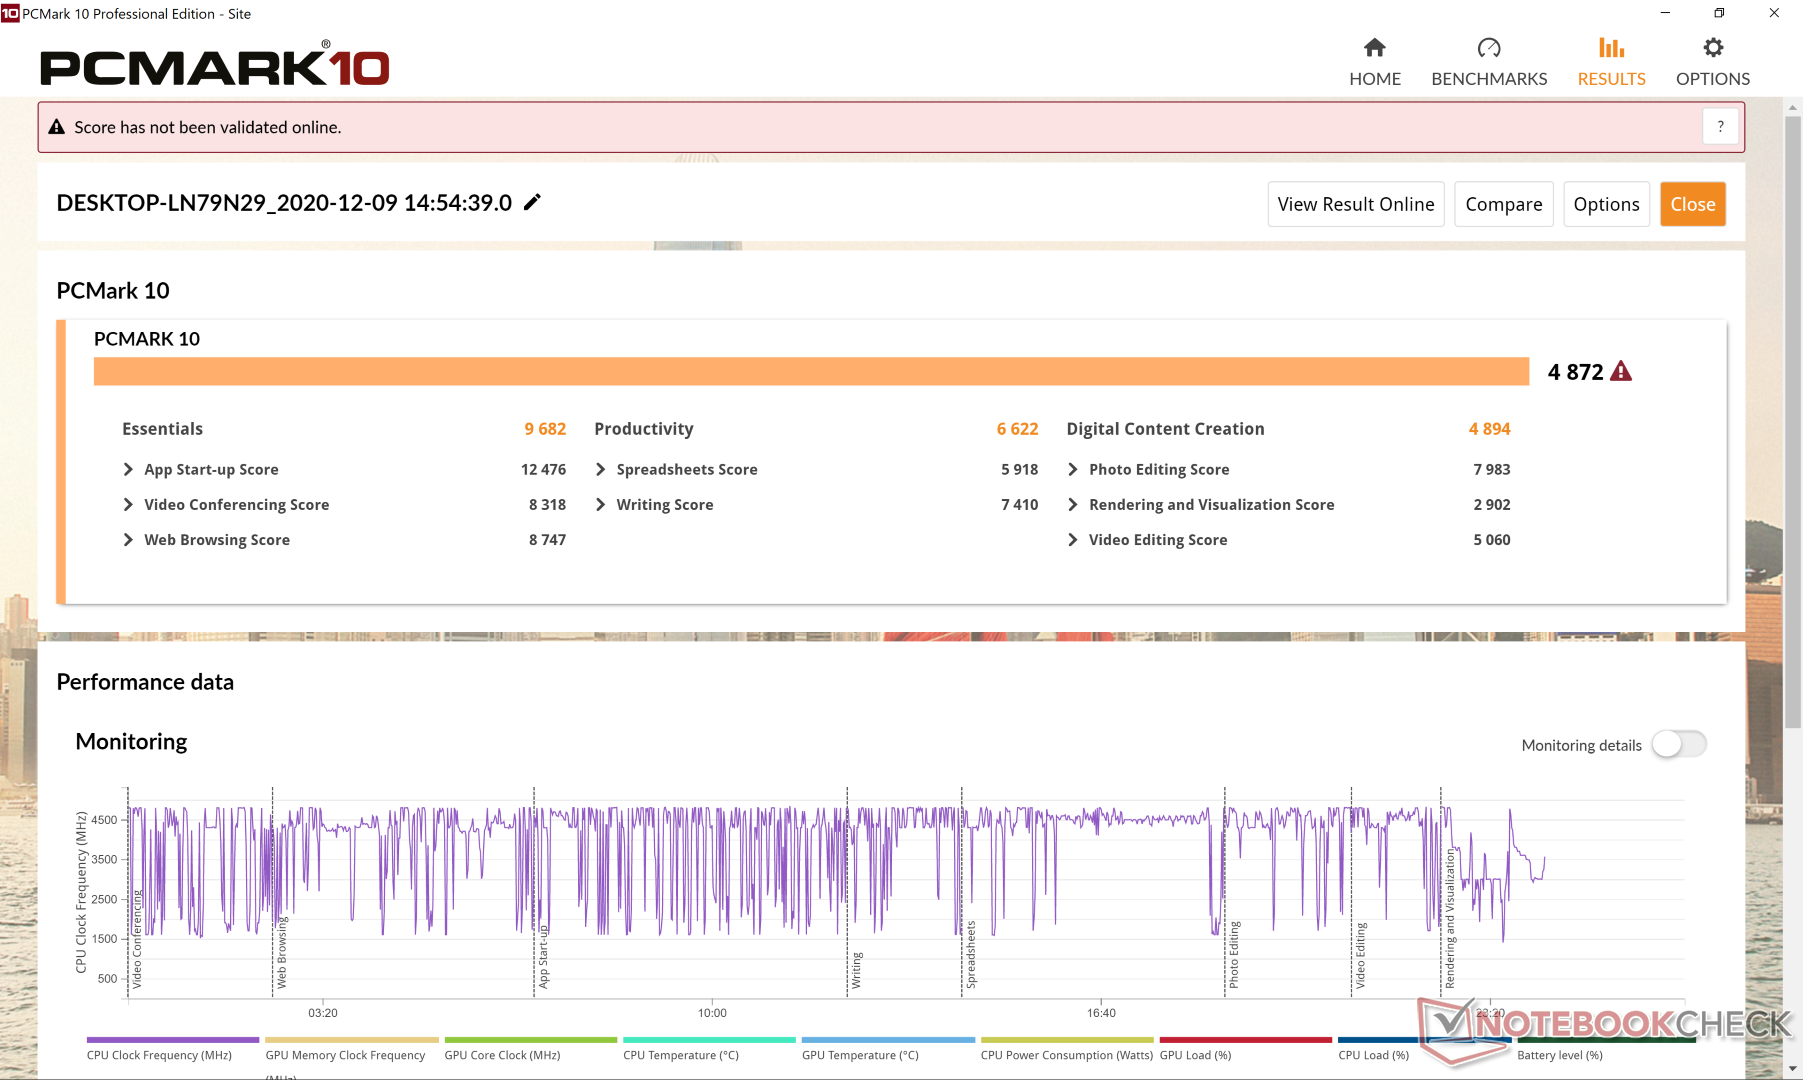
| PCMark 10 Score | 4872 puntos | |
ayuda | ||
Latencia DPC
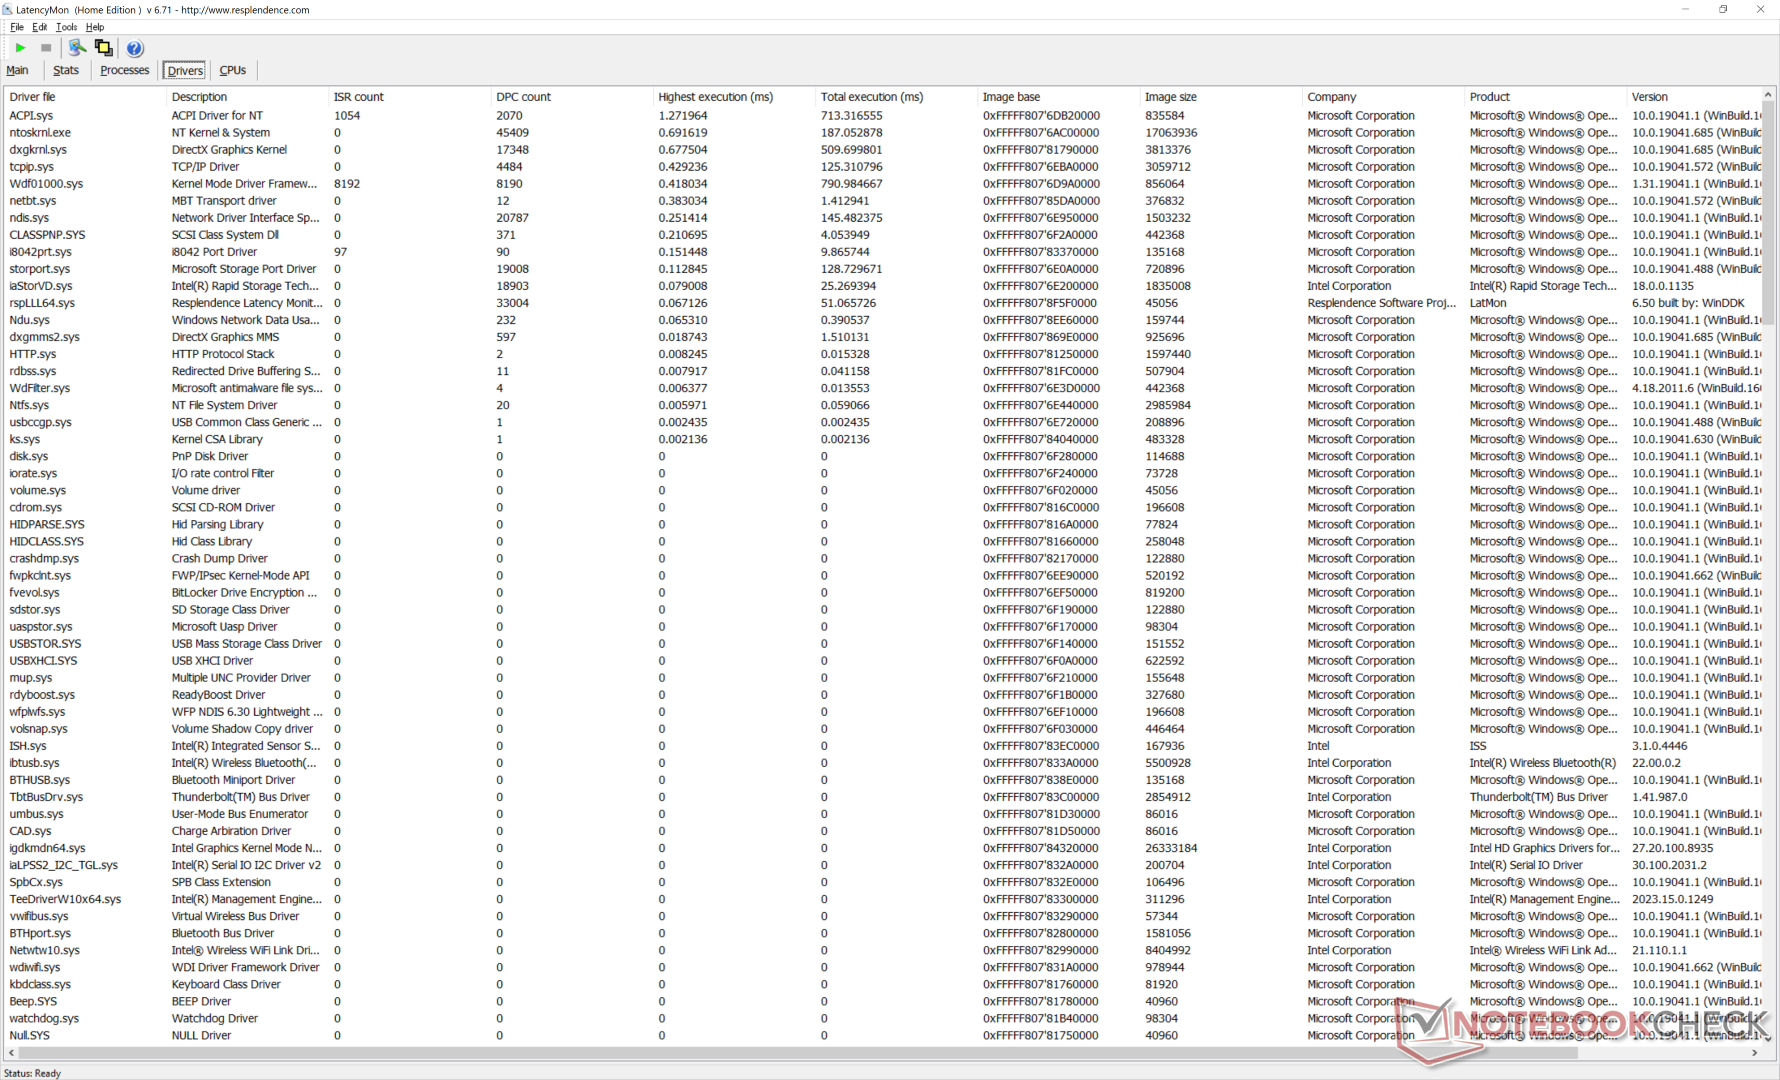
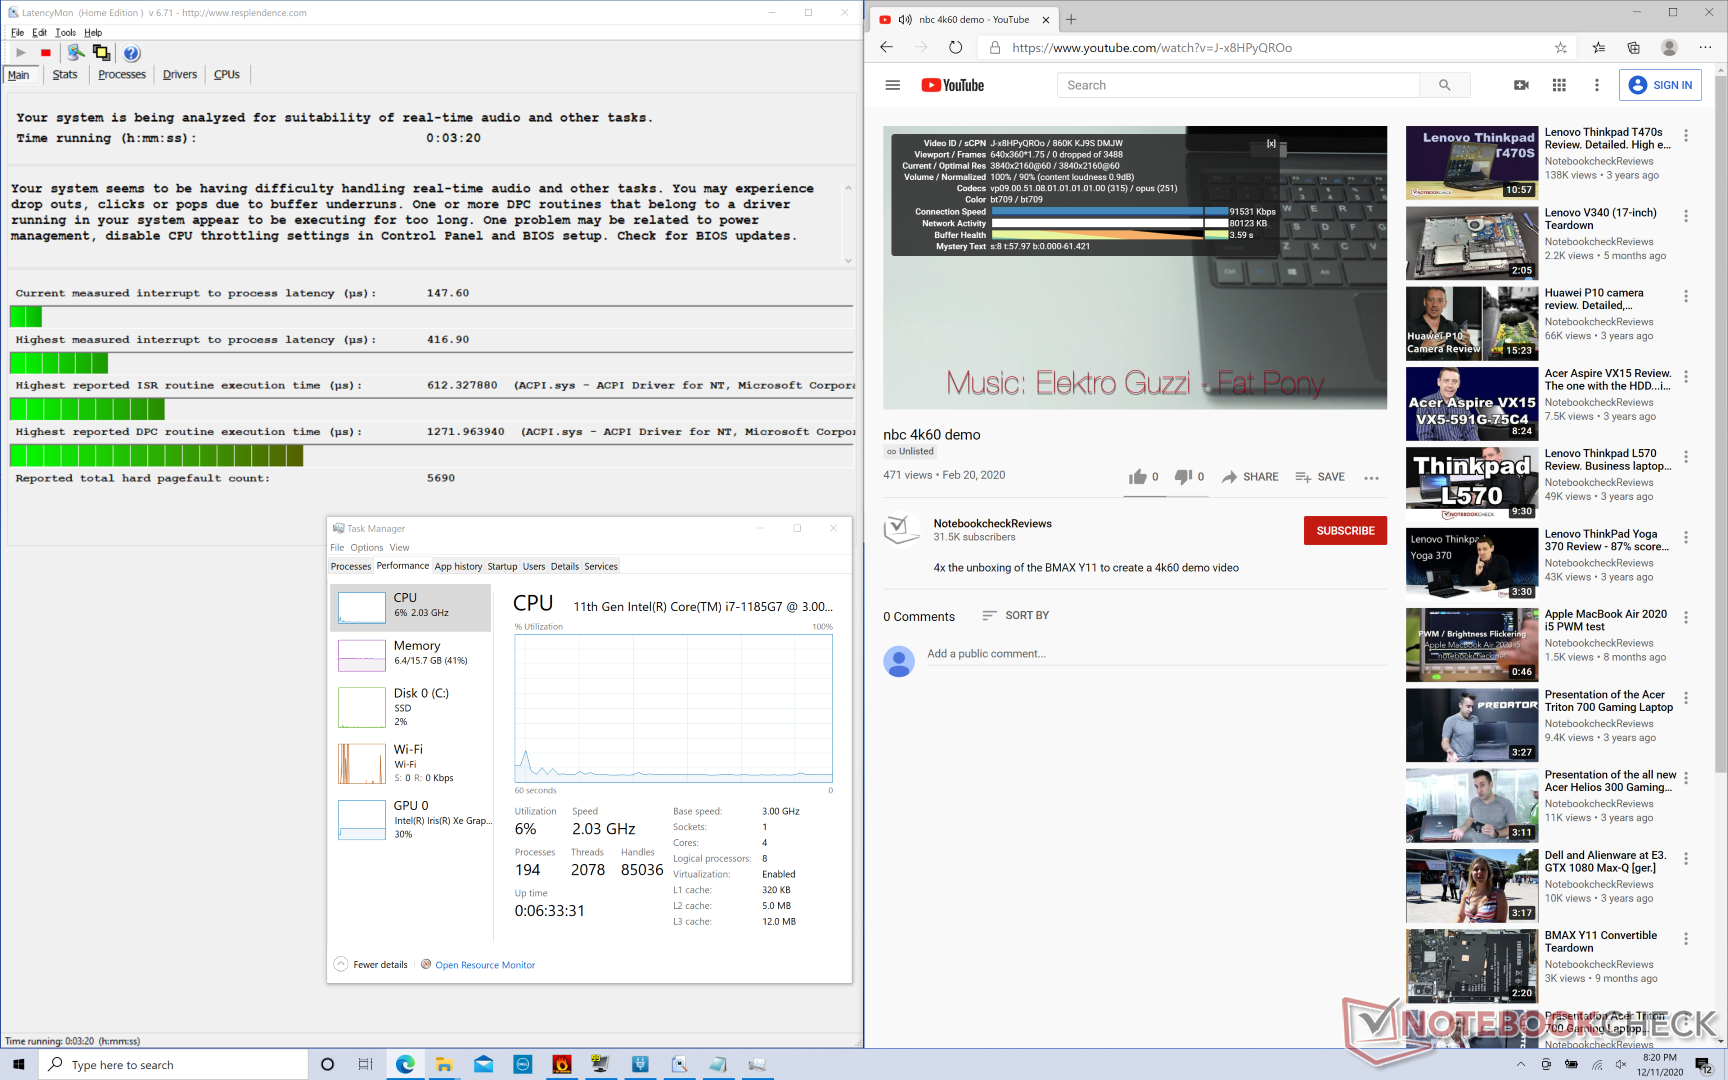
| DPC Latencies / LatencyMon - interrupt to process latency (max), Web, Youtube, Prime95 | |
| Dell XPS 13 9300 Core i7-1065G7 | |
| Asus Zenbook S UX393JA | |
| Lenovo Yoga Slim 7-14ARE | |
| Dell XPS 13 9310 Core i7 4K | |
| Dell XPS 13 9310 Core i7 FHD | |
* ... más pequeño es mejor
Dispositivos de almacenamiento
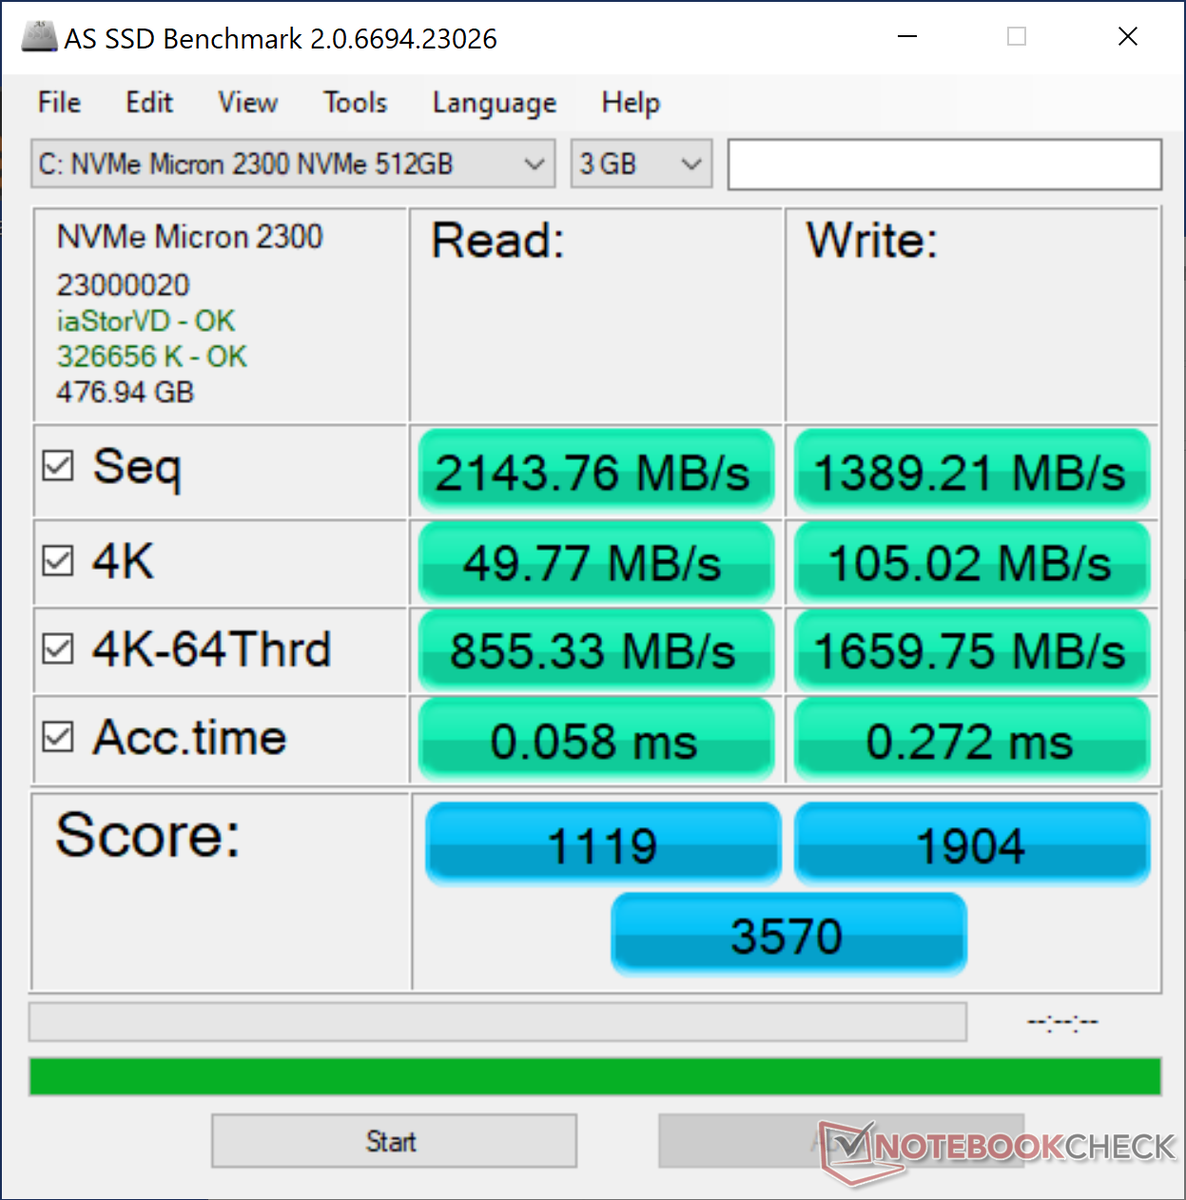
| Dell XPS 13 9310 Core i7 4K Micron 2300 512GB MTFDHBA512TDV | Asus Zenbook S UX393JA Intel SSD 660p 1TB SSDPEKNW010T8 | Huawei MateBook X Pro 2020 i7 Samsung PM981a MZVLB1T0HBLR | Dell XPS 13 9300 Core i7-1065G7 Intel SSDPEMKF512G8 NVMe SSD | Lenovo Yoga Slim 7-14ARE Samsung SSD PM981a MZVLB512HBJQ | HP Spectre x360 13-aw0013dx Intel Optane Memory H10 with Solid State Storage 32GB + 512GB HBRPEKNX0202A(L/H) | |
|---|---|---|---|---|---|---|
| AS SSD | -16% | 45% | -21% | 23% | -36% | |
| Seq Read (MB/s) | 2144 | 1405 -34% | 2737 28% | 1956 -9% | 1658 -23% | 1039 -52% |
| Seq Write (MB/s) | 1389 | 1062 -24% | 2530 82% | 1227 -12% | 2464 77% | 310.1 -78% |
| 4K Read (MB/s) | 49.77 | 50.8 2% | 54 8% | 63 27% | 59.5 20% | 76 53% |
| 4K Write (MB/s) | 105 | 124.9 19% | 152.5 45% | 156.6 49% | 128.6 22% | 118 12% |
| 4K-64 Read (MB/s) | 855 | 590 -31% | 2011 135% | 475.6 -44% | 1576 84% | 371.8 -57% |
| 4K-64 Write (MB/s) | 1660 | 840 -49% | 1260 -24% | 539 -68% | 1986 20% | 469.5 -72% |
| Access Time Read * (ms) | 0.058 | 0.041 29% | 0.066 -14% | 0.042 28% | 0.049 16% | 0.067 -16% |
| Access Time Write * (ms) | 0.272 | 0.118 57% | 0.024 91% | 0.105 61% | 0.087 68% | 0.138 49% |
| Score Read (Points) | 1119 | 781 -30% | 2339 109% | 734 -34% | 1802 61% | 552 -51% |
| Score Write (Points) | 1904 | 1071 -44% | 1666 -12% | 818 -57% | 2361 24% | 618 -68% |
| Score Total (Points) | 3570 | 2251 -37% | 5191 45% | 1915 -46% | 5133 44% | 1448 -59% |
| Copy ISO MB/s (MB/s) | 1929 | 1459 -24% | 1022 -47% | 1588 -18% | 764 -60% | |
| Copy Program MB/s (MB/s) | 1012 | 600 -41% | 302.8 -70% | 550 -46% | 465.8 -54% | |
| Copy Game MB/s (MB/s) | 1737 | 1411 -19% | 491.4 -72% | 1329 -23% | 764 -56% | |
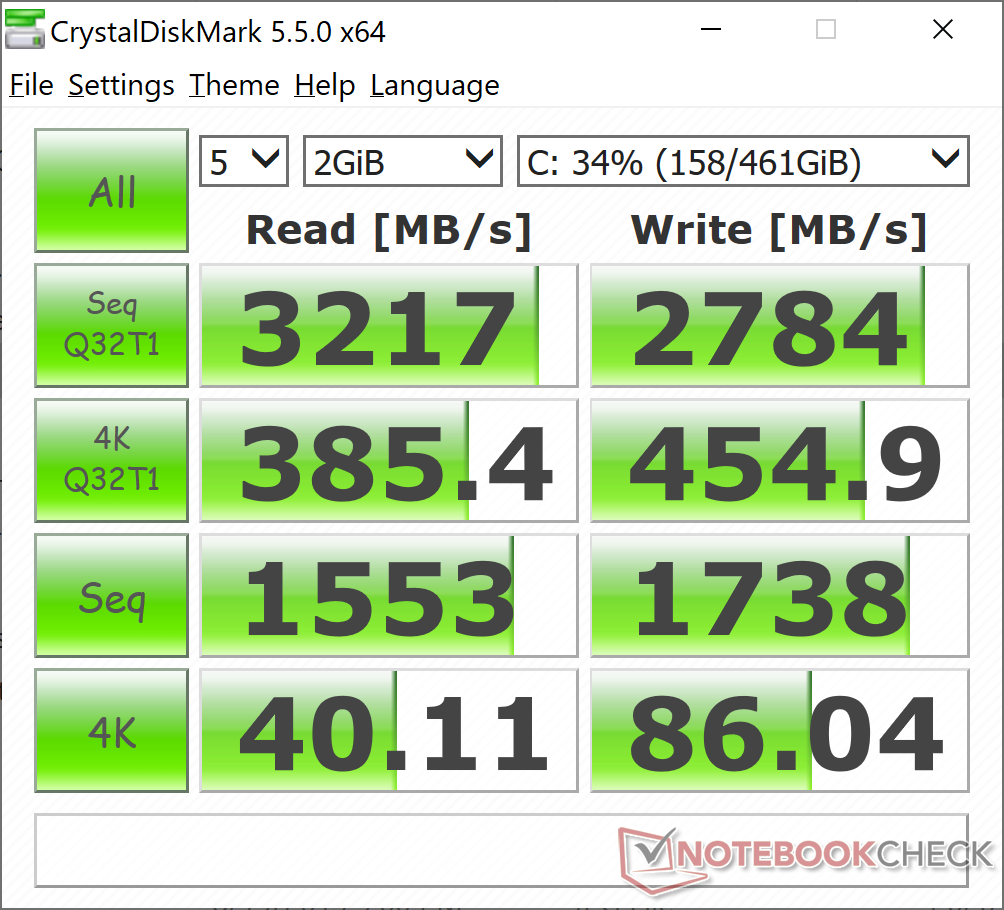
| CrystalDiskMark 5.2 / 6 | -6% | 24% | 27% | 35% | 6% | |
| Write 4K (MB/s) | 86 | 129.5 51% | 165.6 93% | 186.8 117% | 146.1 70% | 112.6 31% |
| Read 4K (MB/s) | 40.11 | 54 35% | 50.2 25% | 71.4 78% | 47.18 18% | 131 227% |
| Write Seq (MB/s) | 1738 | 1265 -27% | 1905 10% | 1203 -31% | 2896 67% | 458.9 -74% |
| Read Seq (MB/s) | 1553 | 1410 -9% | 1669 7% | 2600 67% | 2754 77% | 1355 -13% |
| Write 4K Q32T1 (MB/s) | 454.9 | 420.3 -8% | 474.6 4% | 514 13% | 425.8 -6% | 341.3 -25% |
| Read 4K Q32T1 (MB/s) | 385.4 | 357.7 -7% | 508 32% | 570 48% | 514 33% | 320.6 -17% |
| Write Seq Q32T1 (MB/s) | 2784 | 1799 -35% | 3007 8% | 786 -72% | 2989 7% | 1219 -56% |
| Read Seq Q32T1 (MB/s) | 3217 | 1616 -50% | 3556 11% | 2947 -8% | 3568 11% | 2462 -23% |
| Media total (Programa/Opciones) | -11% /
-13% | 35% /
36% | 3% /
-4% | 29% /
27% | -15% /
-21% |
* ... más pequeño es mejor

Disk Throttling: DiskSpd Read Loop, Queue Depth 8
Rendimiento de la GPU
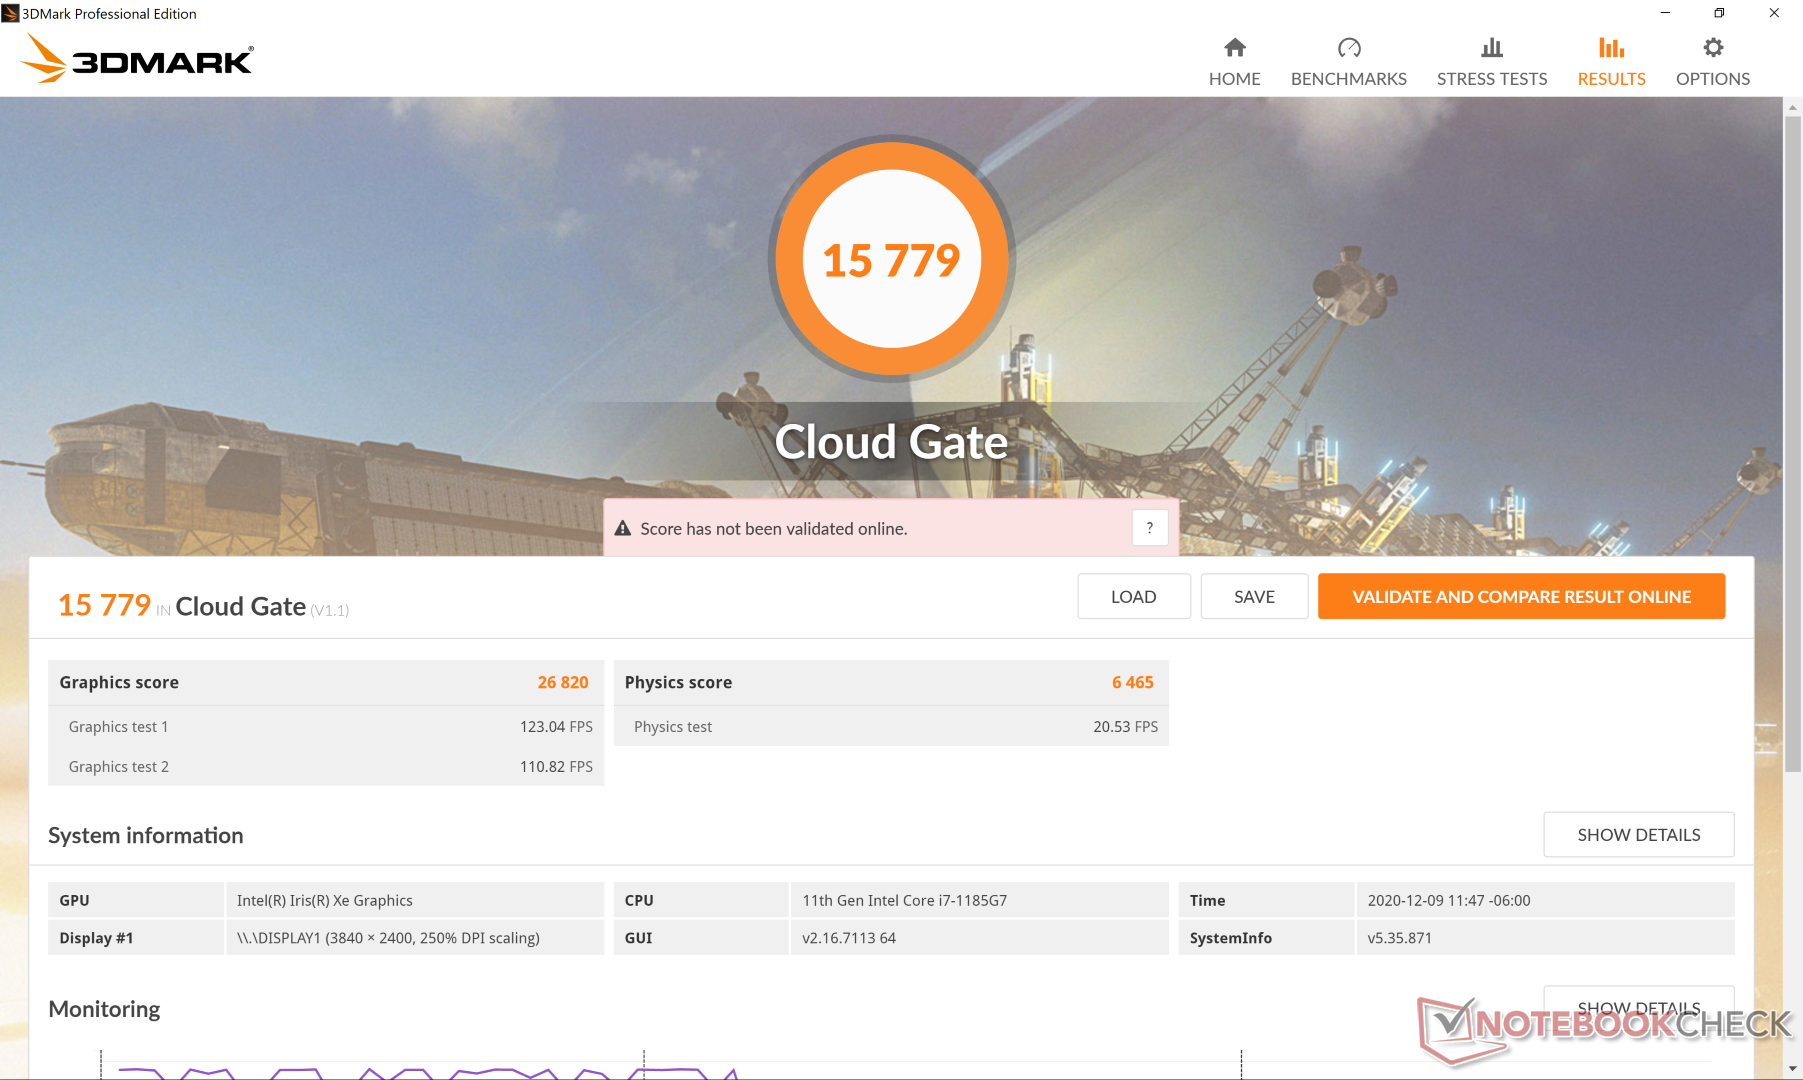
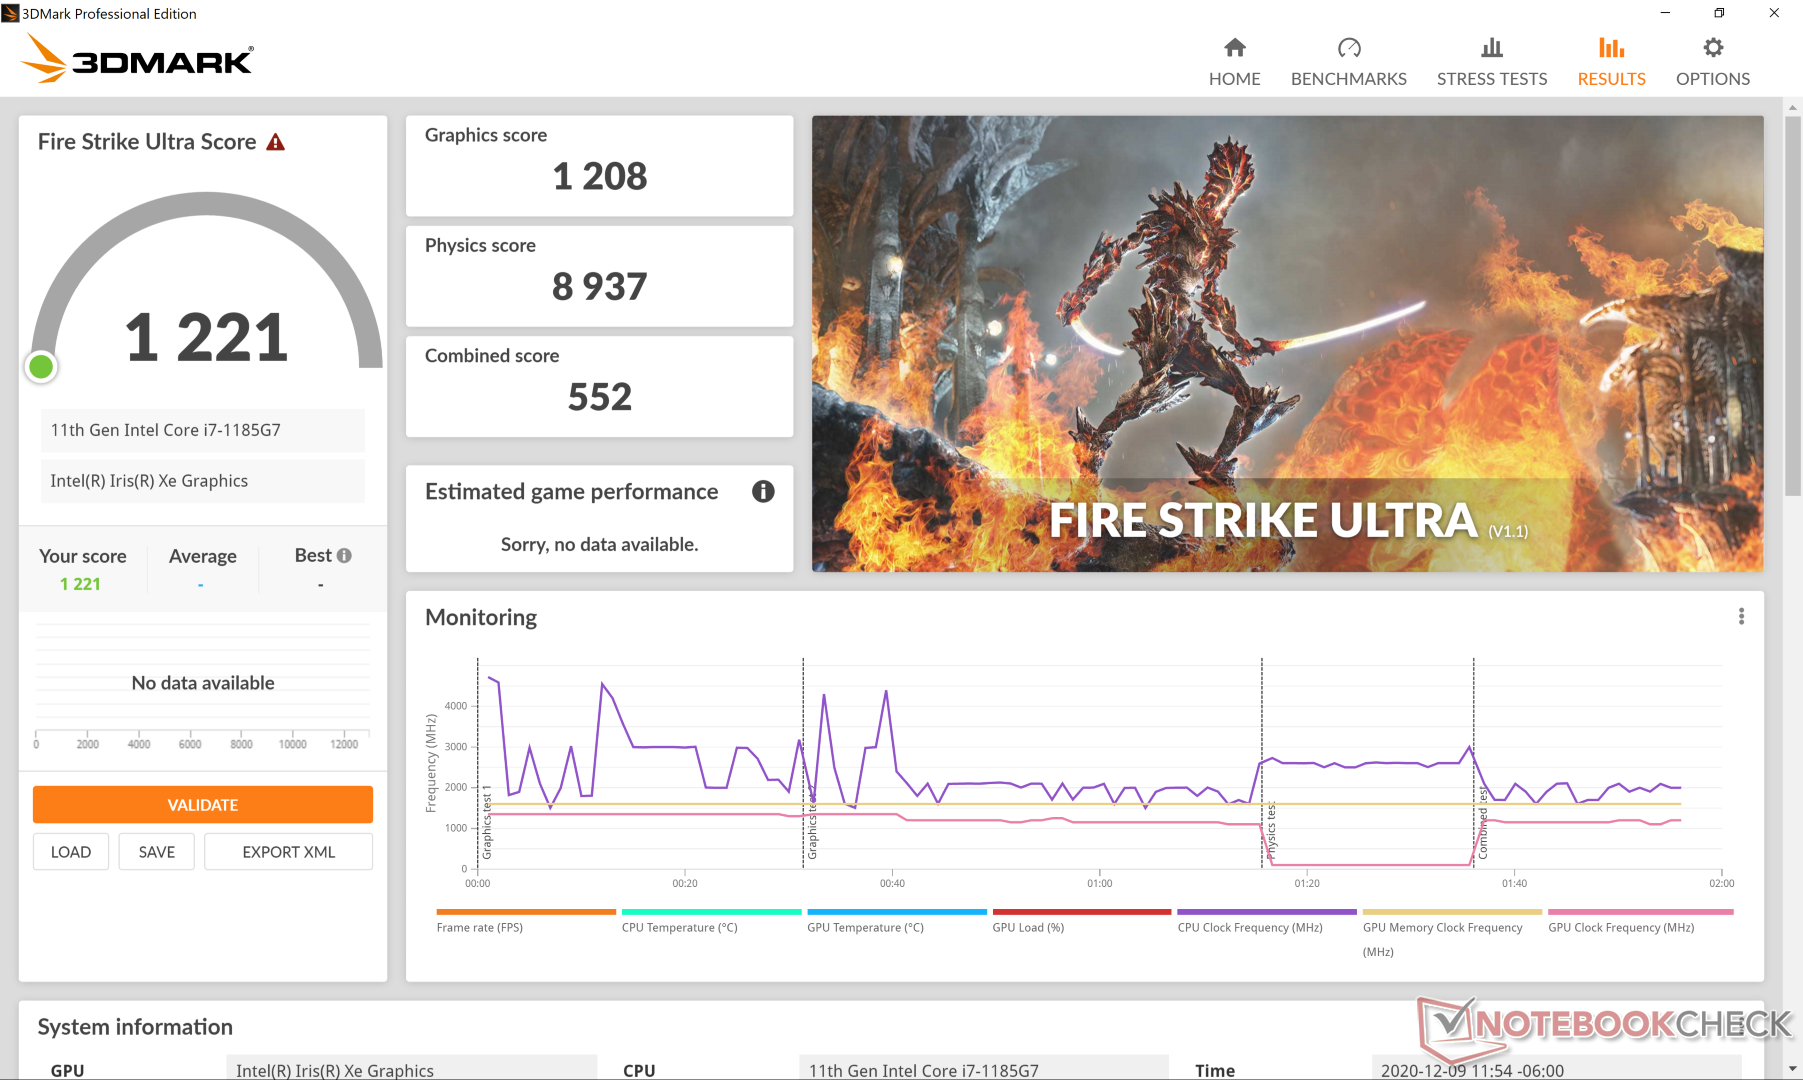
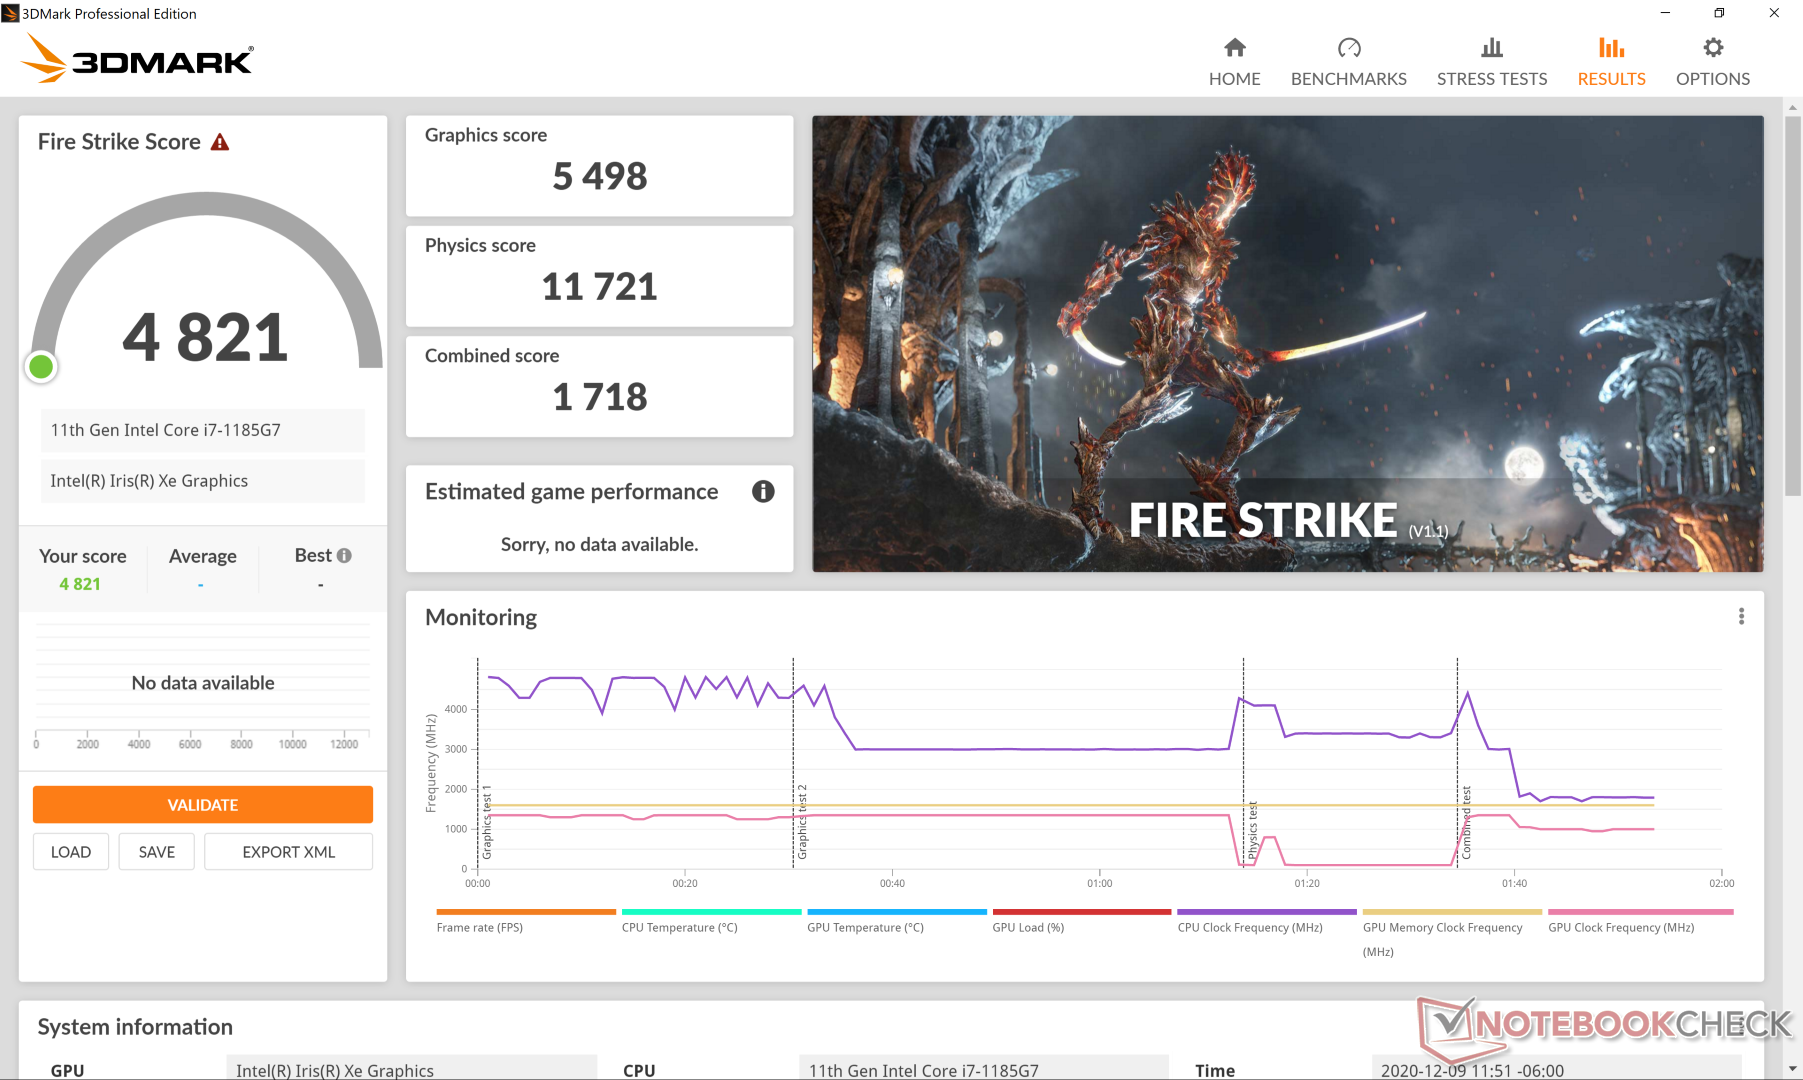
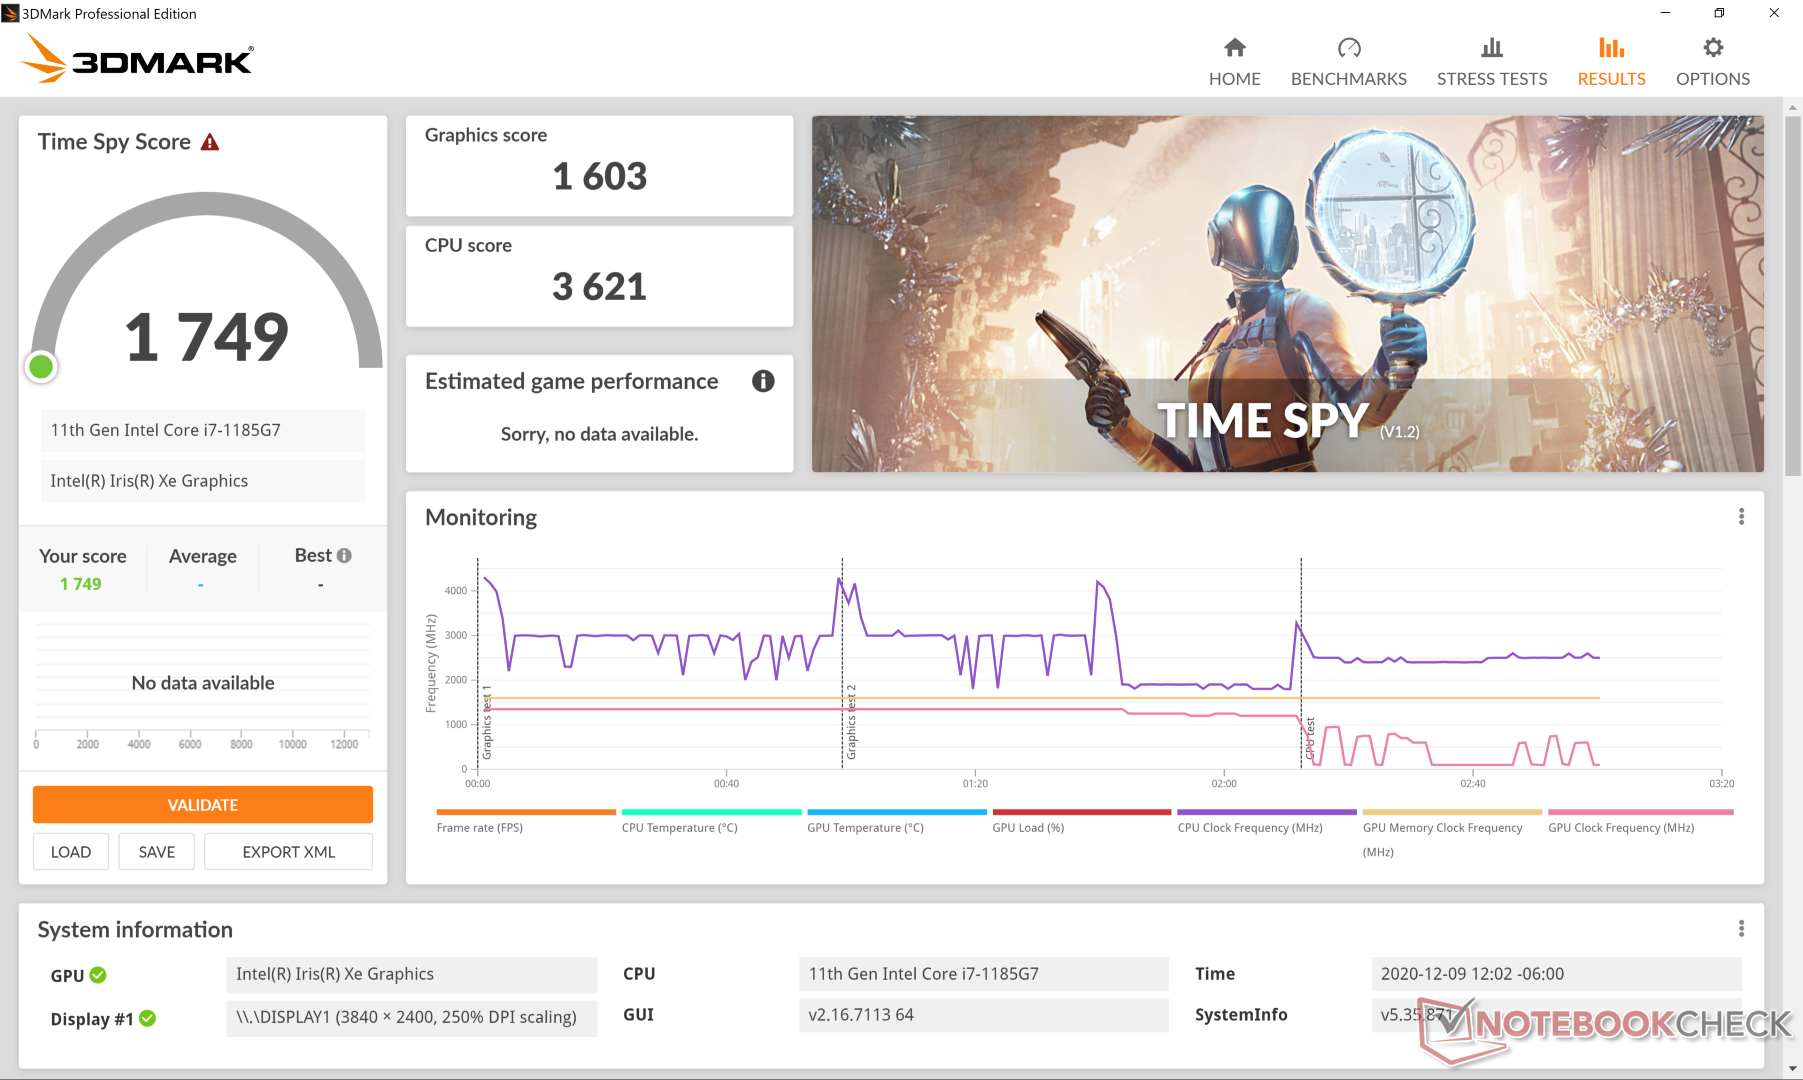
Extrañamente, los resultados de 3DMark son consistentemente más altos que los que registramos en el XPS 13 Core i7-1165G7 aunque los juegos parecen correr un poco más rápido en esta última configuración. Los gráficos de Time Spy, por ejemplo, son un 30 por ciento más altos para nuestro SKU XPS 13 Core i7-1185G7 mientras que las velocidades de cuadro cuando se corren juegos como DOTA 2, Final Fantasy XV y GTA Vson unos pocos cuadros más bajos que en el XPS 13 Core i7-1165G7. No tenemos una explicación firme sobre las discrepancias, pero sí significan que los usuarios deben esperar aproximadamente el mismo rendimiento gráfico que el del XPS 13 Core i7-1165G7 en más escenarios del mundo real fuera de 3DMark. Sospechamos que las fluctuaciones de las velocidades del reloj y las diferencias en el estado de frío antes de realizar las pruebas pueden haber influido en las puntuaciones finales.
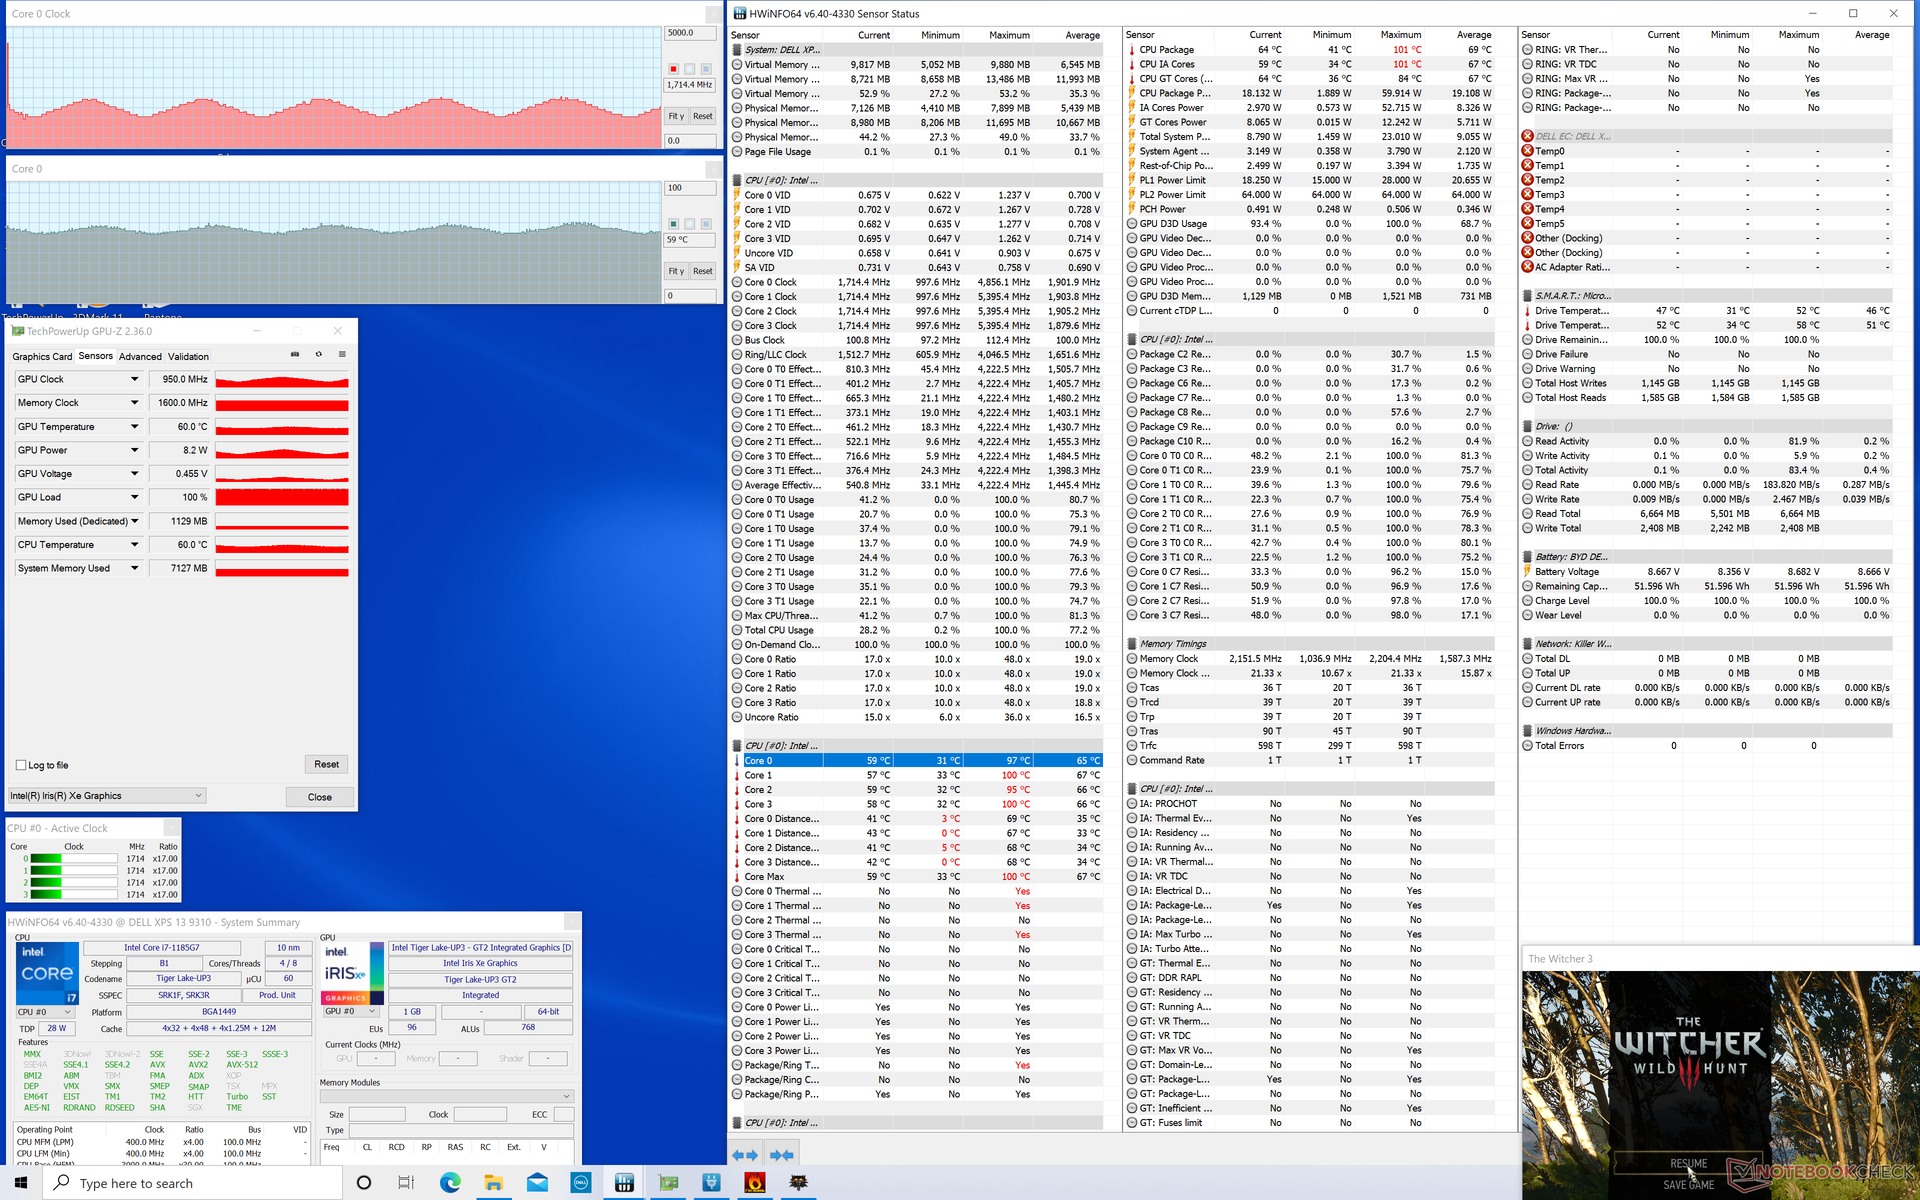
Ocioso Witcher 3 en configuraciones bajas muestra las mismas fluctuaciones sinusoidales en las frecuencias de cuadro, muy parecidas a las que observamos en la prueba de bucle del XPS 13 9310 Core i7-1165G7 y el CineBench R15 xT de arriba. En este ejemplo, las velocidades de cuadro oscilarían entre 50 FPS y 90 FPS debido a las velocidades de reloj cíclicas.
Vea nuestra página dedicada al Iris Xe para más información técnica y comparaciones de referencia.
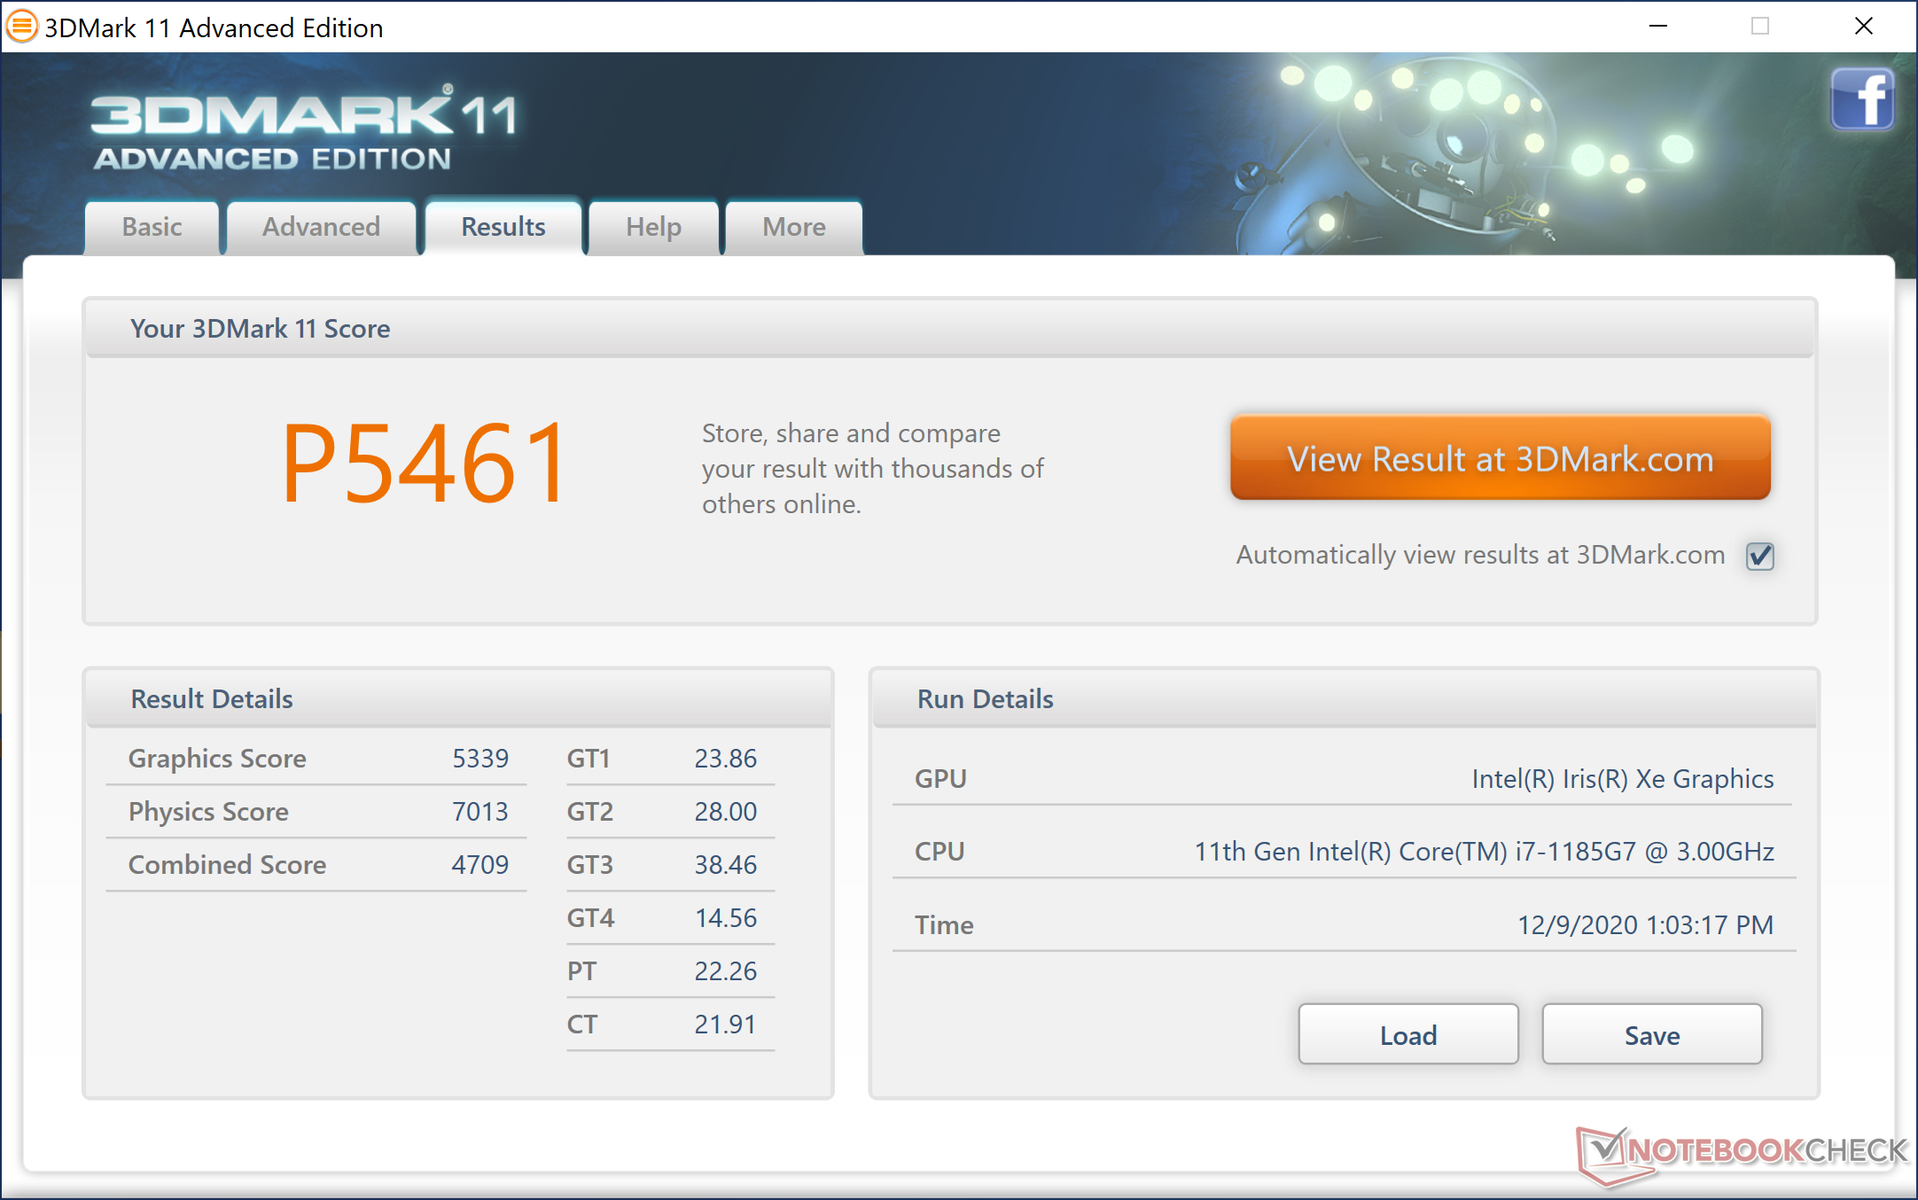
| 3DMark 11 Performance | 5461 puntos | |
| 3DMark Cloud Gate Standard Score | 15779 puntos | |
| 3DMark Fire Strike Score | 4821 puntos | |
| 3DMark Time Spy Score | 1749 puntos | |
ayuda | ||
| GTA V | |
| 1024x768 Lowest Settings possible | |
| Lenovo Yoga Slim 7-14ARE | |
| Razer Book 13 FHD | |
| Medio Intel Iris Xe Graphics G7 96EUs (52 - 166.4, n=168) | |
| Dell XPS 13 9310 Core i7 FHD | |
| Dell XPS 13 9310 Core i7 4K | |
| 1920x1080 Lowest Settings possible | |
| Medio Intel Iris Xe Graphics G7 96EUs (34.7 - 132.1, n=141) | |
| Dell XPS 13 9310 Core i7 FHD | |
| Razer Book 13 FHD | |
| Lenovo Yoga Slim 7-14ARE | |
| Dell XPS 13 9310 Core i7 4K | |
| 1920x1080 Normal/Off AF:4x | |
| Lenovo Yoga Slim 7-14ARE | |
| Dell XPS 13 9310 Core i7 FHD | |
| Medio Intel Iris Xe Graphics G7 96EUs (20 - 119.3, n=142) | |
| Razer Book 13 FHD | |
| Dell XPS 13 9310 Core i7 4K | |
| 1920x1080 High/On (Advanced Graphics Off) AA:2xMSAA + FX AF:8x | |
| Lenovo Yoga Slim 7-14ARE | |
| Razer Book 13 FHD | |
| Dell XPS 13 9310 Core i7 FHD | |
| Medio Intel Iris Xe Graphics G7 96EUs (9.39 - 51.6, n=162) | |
| Dell XPS 13 9310 Core i7 4K | |
| 1920x1080 Highest AA:4xMSAA + FX AF:16x | |
| Razer Book 13 FHD | |
| Lenovo Yoga Slim 7-14ARE | |
| Dell XPS 13 9310 Core i7 FHD | |
| Dell XPS 13 9310 Core i7 4K | |
| Medio Intel Iris Xe Graphics G7 96EUs (4.13 - 22.9, n=156) | |
| bajo | medio | alto | ultra | QHD | 4K | |
|---|---|---|---|---|---|---|
| GTA V (2015) | 80.8 | 64.6 | 20.5 | 9.75 | ||
| The Witcher 3 (2015) | 107 | 61.9 | 34.5 | 15.3 | ||
| Dota 2 Reborn (2015) | 80.7 | 51.4 | 38.2 | 38.6 | 20 | |
| Final Fantasy XV Benchmark (2018) | 31.3 | 18.8 | 14.6 | 11.4 | 7.54 | |
| X-Plane 11.11 (2018) | 26 | 27.8 | 31.8 | 14.9 |
Emissions
Ruido del sistema
Aunque las velocidades del reloj siempre fluctúan cuando están cargadas, el ruido del ventilador afortunadamente se mantiene constante. De hecho, el sistema es siempre silencioso o inaudible hasta que se introducen cargas más pesadas como las de los juegos. Siendo realistas, la mayoría de los usuarios no escucharán nada más allá de 33 dB(A) a menos que el procesador esté estresado al máximo durante períodos más largos.
| Dell XPS 13 9310 Core i7 4K Iris Xe G7 96EUs, i7-1185G7, Micron 2300 512GB MTFDHBA512TDV | Asus Zenbook S UX393JA Iris Plus Graphics G7 (Ice Lake 64 EU), i7-1065G7, Intel SSD 660p 1TB SSDPEKNW010T8 | Huawei MateBook X Pro 2020 i7 GeForce MX250, i7-10510U, Samsung PM981a MZVLB1T0HBLR | Dell XPS 13 9300 Core i7-1065G7 Iris Plus Graphics G7 (Ice Lake 64 EU), i7-1065G7, Intel SSDPEMKF512G8 NVMe SSD | Lenovo Yoga Slim 7-14ARE Vega 8, R7 4800U, Samsung SSD PM981a MZVLB512HBJQ | HP Spectre x360 13-aw0013dx Iris Plus Graphics G7 (Ice Lake 64 EU), i7-1065G7, Intel Optane Memory H10 with Solid State Storage 32GB + 512GB HBRPEKNX0202A(L/H) | |
|---|---|---|---|---|---|---|
| Noise | -10% | -12% | -7% | 0% | -2% | |
| apagado / medio ambiente * (dB) | 27.7 | 26.9 3% | 29.6 -7% | 28.3 -2% | 26.3 5% | 28.5 -3% |
| Idle Minimum * (dB) | 27.8 | 26.9 3% | 29.6 -6% | 28.3 -2% | 26.5 5% | 28.5 -3% |
| Idle Average * (dB) | 27.8 | 29 -4% | 29.6 -6% | 28.3 -2% | 26.5 5% | 28.5 -3% |
| Idle Maximum * (dB) | 27.8 | 31.1 -12% | 30.3 -9% | 28.3 -2% | 26.5 5% | 28.5 -3% |
| Load Average * (dB) | 27.9 | 37.7 -35% | 38 -36% | 32.5 -16% | 31.8 -14% | 28.5 -2% |
| Witcher 3 ultra * (dB) | 32.8 | 40.2 -23% | 38 -16% | 39.3 -20% | 35.9 -9% | 35.3 -8% |
| Load Maximum * (dB) | 37 | 38.1 -3% | 38 -3% | 39.3 -6% | 35.9 3% | 35.3 5% |
* ... más pequeño es mejor
Ruido
| Ocioso |
| 27.8 / 27.8 / 27.8 dB(A) |
| Carga |
| 27.9 / 37 dB(A) |
 | ||
30 dB silencioso 40 dB(A) audible 50 dB(A) ruidosamente alto |
||
min: | ||
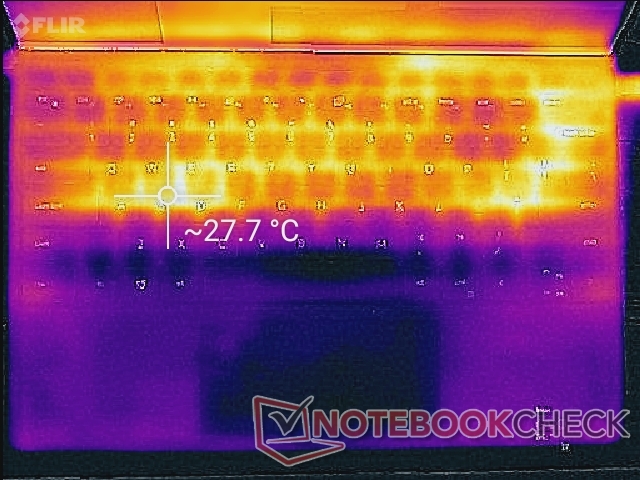
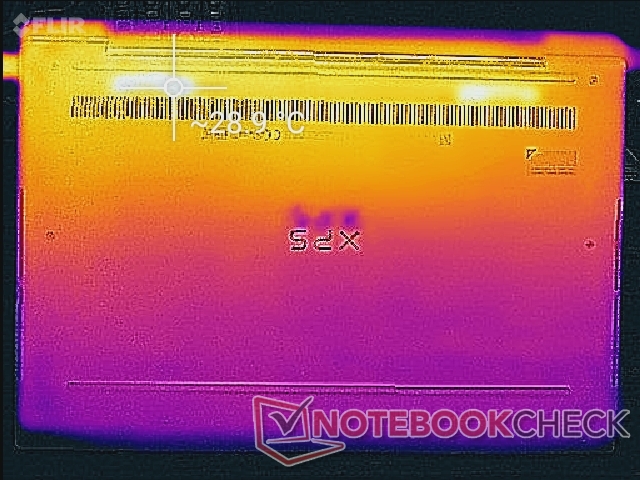
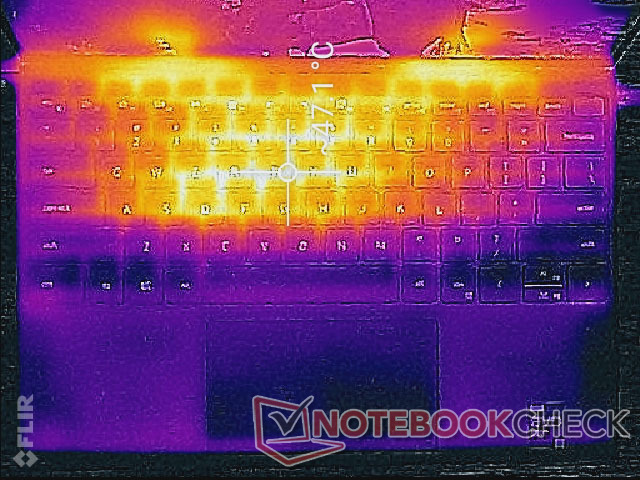
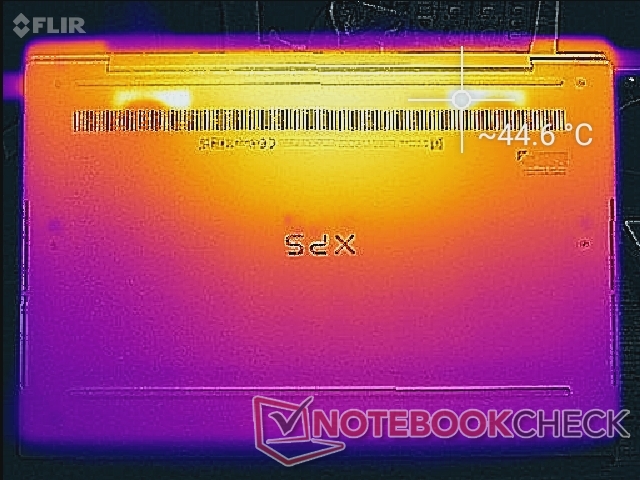
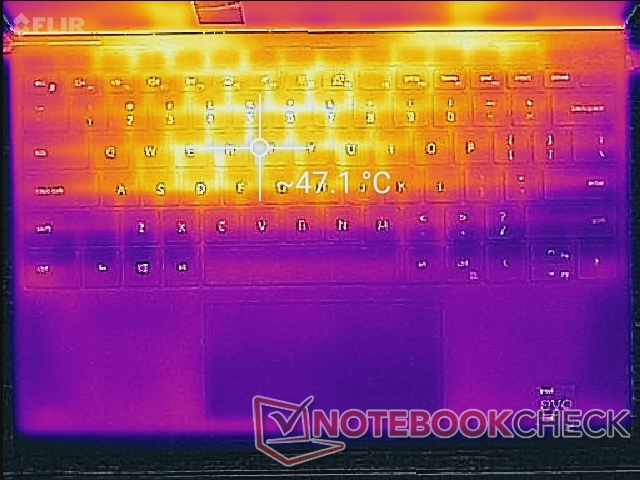
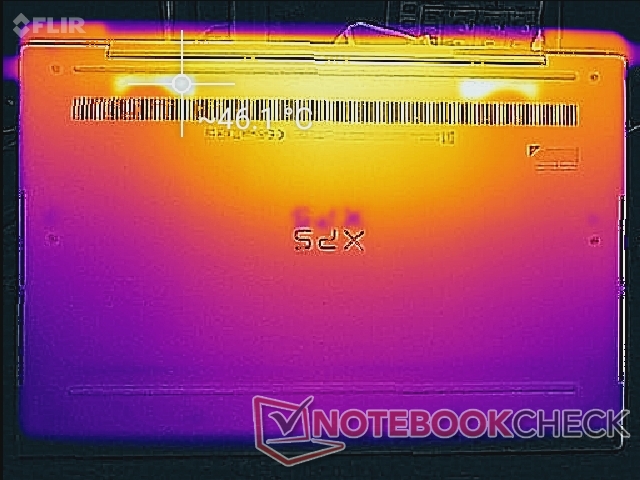
Temperatura
Los puntos calientes son casi los mismos que los que grabamos en el XPS 13 9310 con el CPU Core i7-1165G7 menor. Por lo tanto, la actualización a la opción Core i7-1185G7 no significa necesariamente que el portátil se sienta más caliente al tacto.
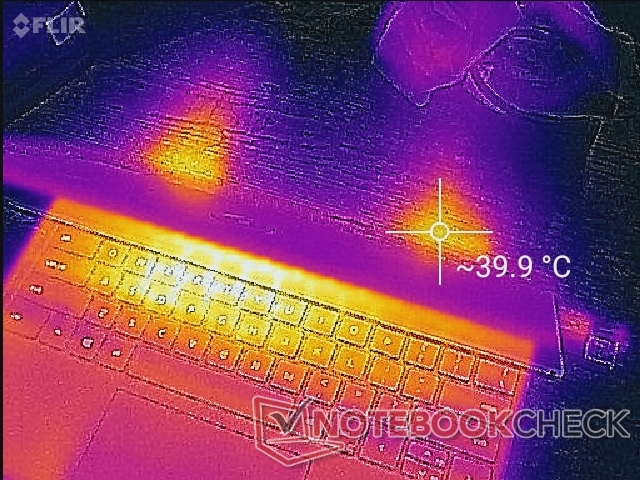
(-) La temperatura máxima en la parte superior es de 47 °C / 117 F, frente a la media de 35.9 °C / 97 F, que oscila entre 21.4 y 59 °C para la clase Subnotebook.
(±) El fondo se calienta hasta un máximo de 45 °C / 113 F, frente a la media de 39.2 °C / 103 F
(+) En reposo, la temperatura media de la parte superior es de 26.1 °C / 79# F, frente a la media del dispositivo de 30.8 °C / 87 F.
(±) Jugando a The Witcher 3, la temperatura media de la parte superior es de 34.4 °C / 94 F, frente a la media del dispositivo de 30.8 °C / 87 F.
(+) El reposamanos y el panel táctil están a una temperatura inferior a la de la piel, con un máximo de 28.8 °C / 83.8 F y, por tanto, son fríos al tacto.
(±) La temperatura media de la zona del reposamanos de dispositivos similares fue de 28.2 °C / 82.8 F (-0.6 °C / -1 F).
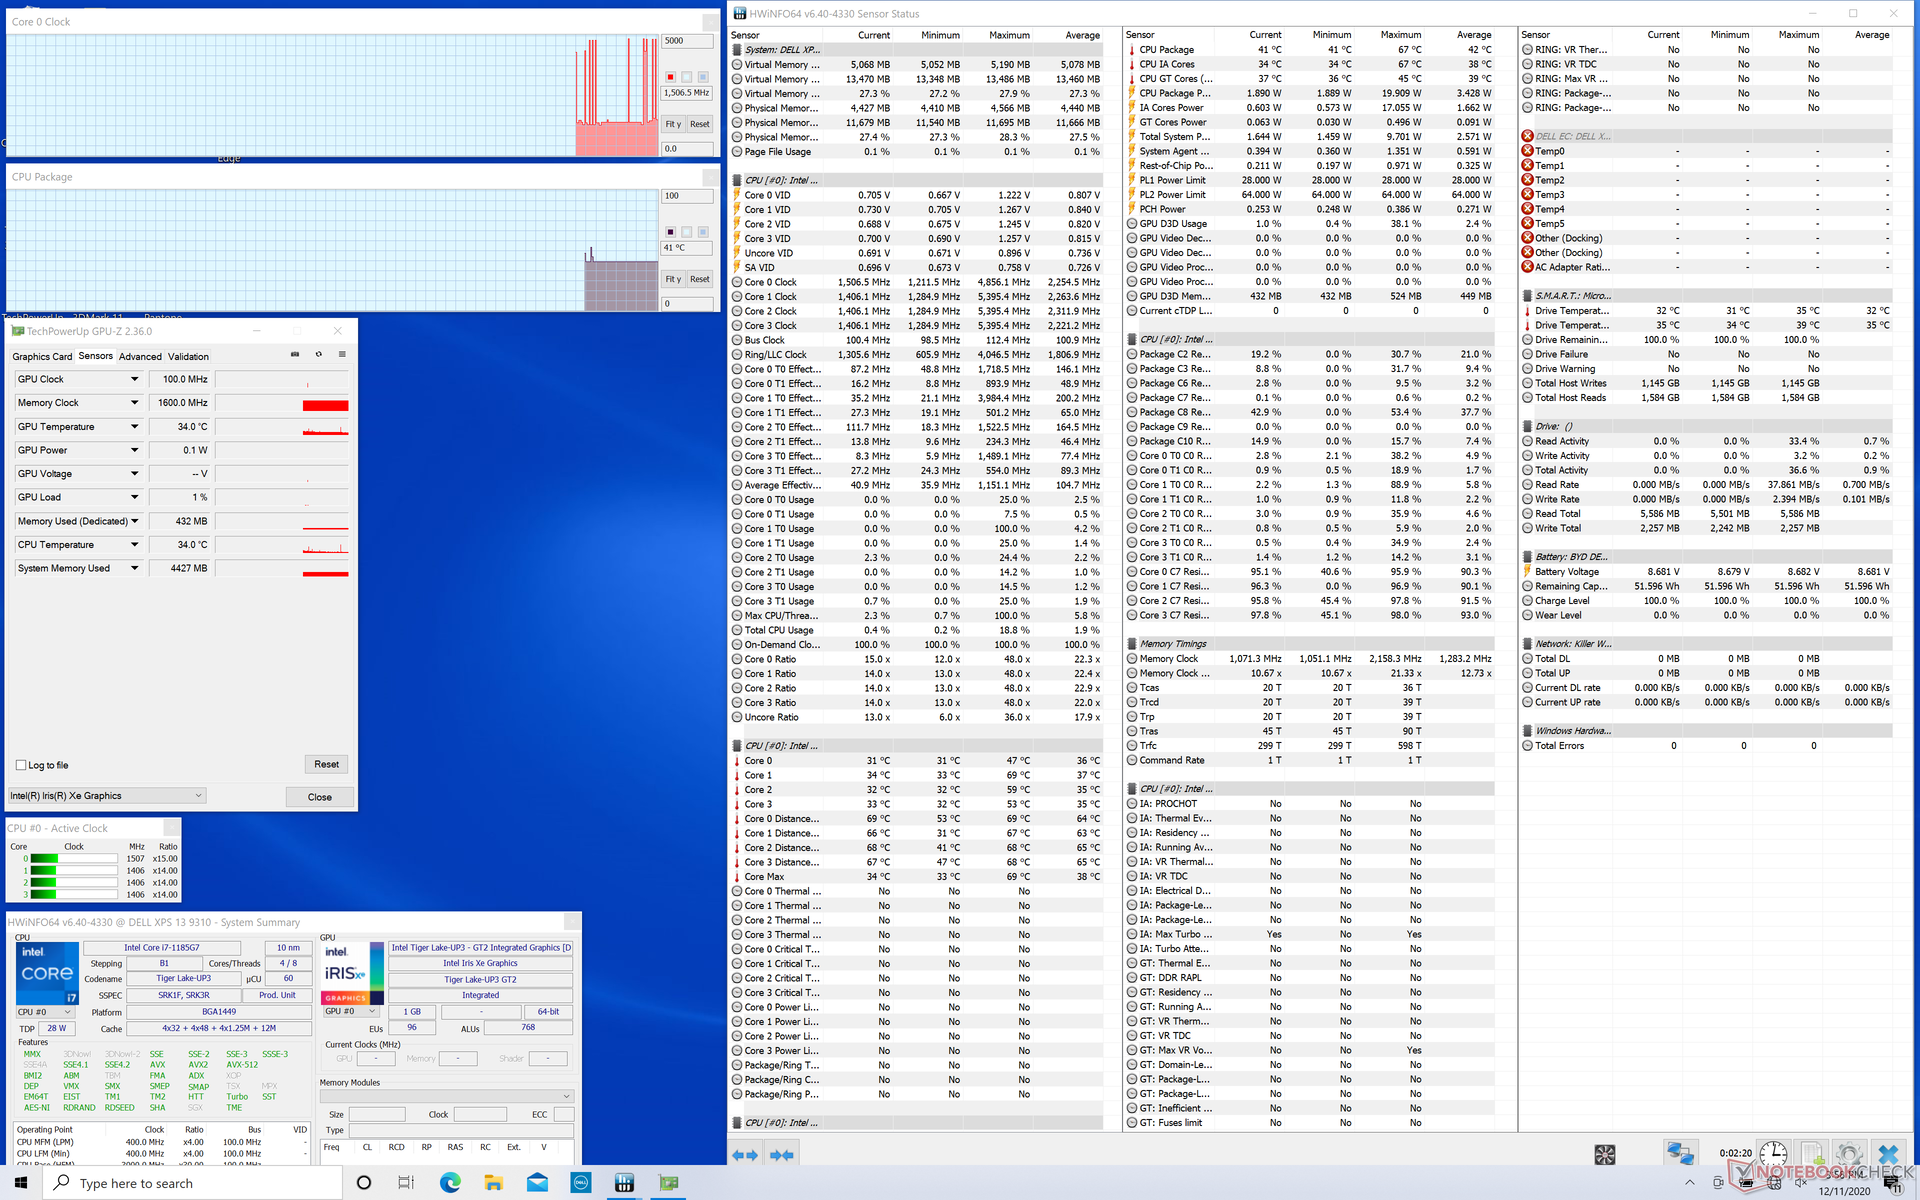
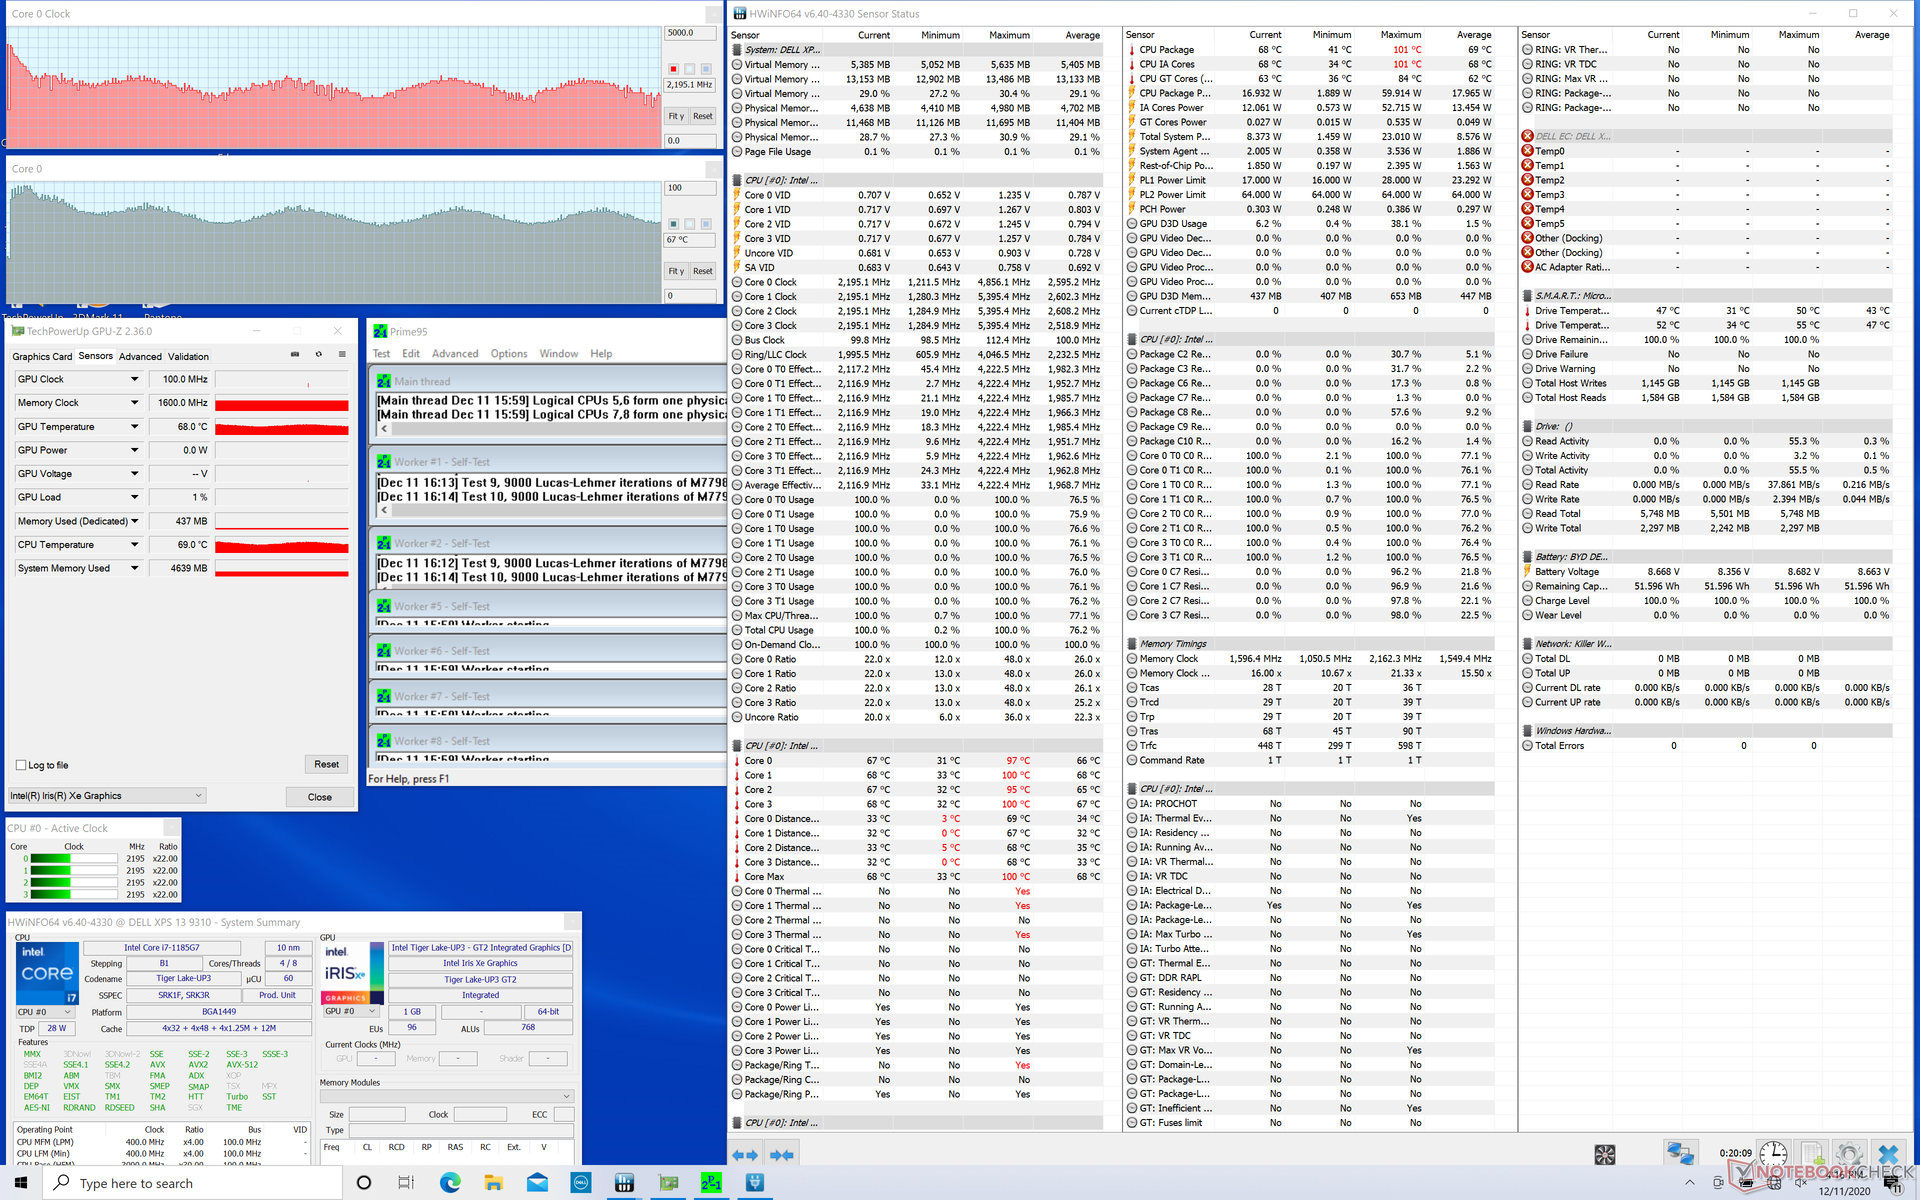
Prueba de estrés
Cuando se estresaba con Prime95, el sistema se elevaba a la gama de 3,9 GHz a 4,3 GHz durante unos pocos segundos hasta alcanzar una temperatura central de 101 C. A partir de entonces, las velocidades de reloj disminuían constantemente hasta que comenzaban a funcionar en ciclos indefinidos entre 2,1 GHz a 3 GHz y 63 C a 81 C. Estas velocidades se acercan mucho a lo que observamos en el XPS 13 Core i7-1165G7, donde las velocidades de reloj funcionaban en ciclos entre 1,9 GHz y 3,1 GHz a una temperatura central de 71 C a 78 C
Las velocidades de reloj de la CPU y la GPU tendrían ciclos muy fuertes cuando se ejecutan Witcher 3 que también tienen profundos efectos en las velocidades de cuadro como se mencionó anteriormente. La potencia de la GPU fluctuaría entre 5,7 W y 9,2 W también según la GPU-Z.
No hay grandes déficits de rendimiento si se utiliza la energía de la batería. Una prueba 3DMark 11 con baterías daría unos resultados de Física y Gráficos de 10181 y 6463 puntos, respectivamente, en comparación con los 7013 y 5339 puntos cuando se utiliza la red eléctrica. Las puntuaciones más altas en energía de la batería pueden atribuirse a un estado del sistema más frío antes de realizar la prueba.
| Reloj de la UCP(GHz) Reloj de la UGP(MHz) Temperatura promedio de la UCP (°C) | |
| Sistema Idle.. | |
| Prime95 Stress | 2.1 - 3 |
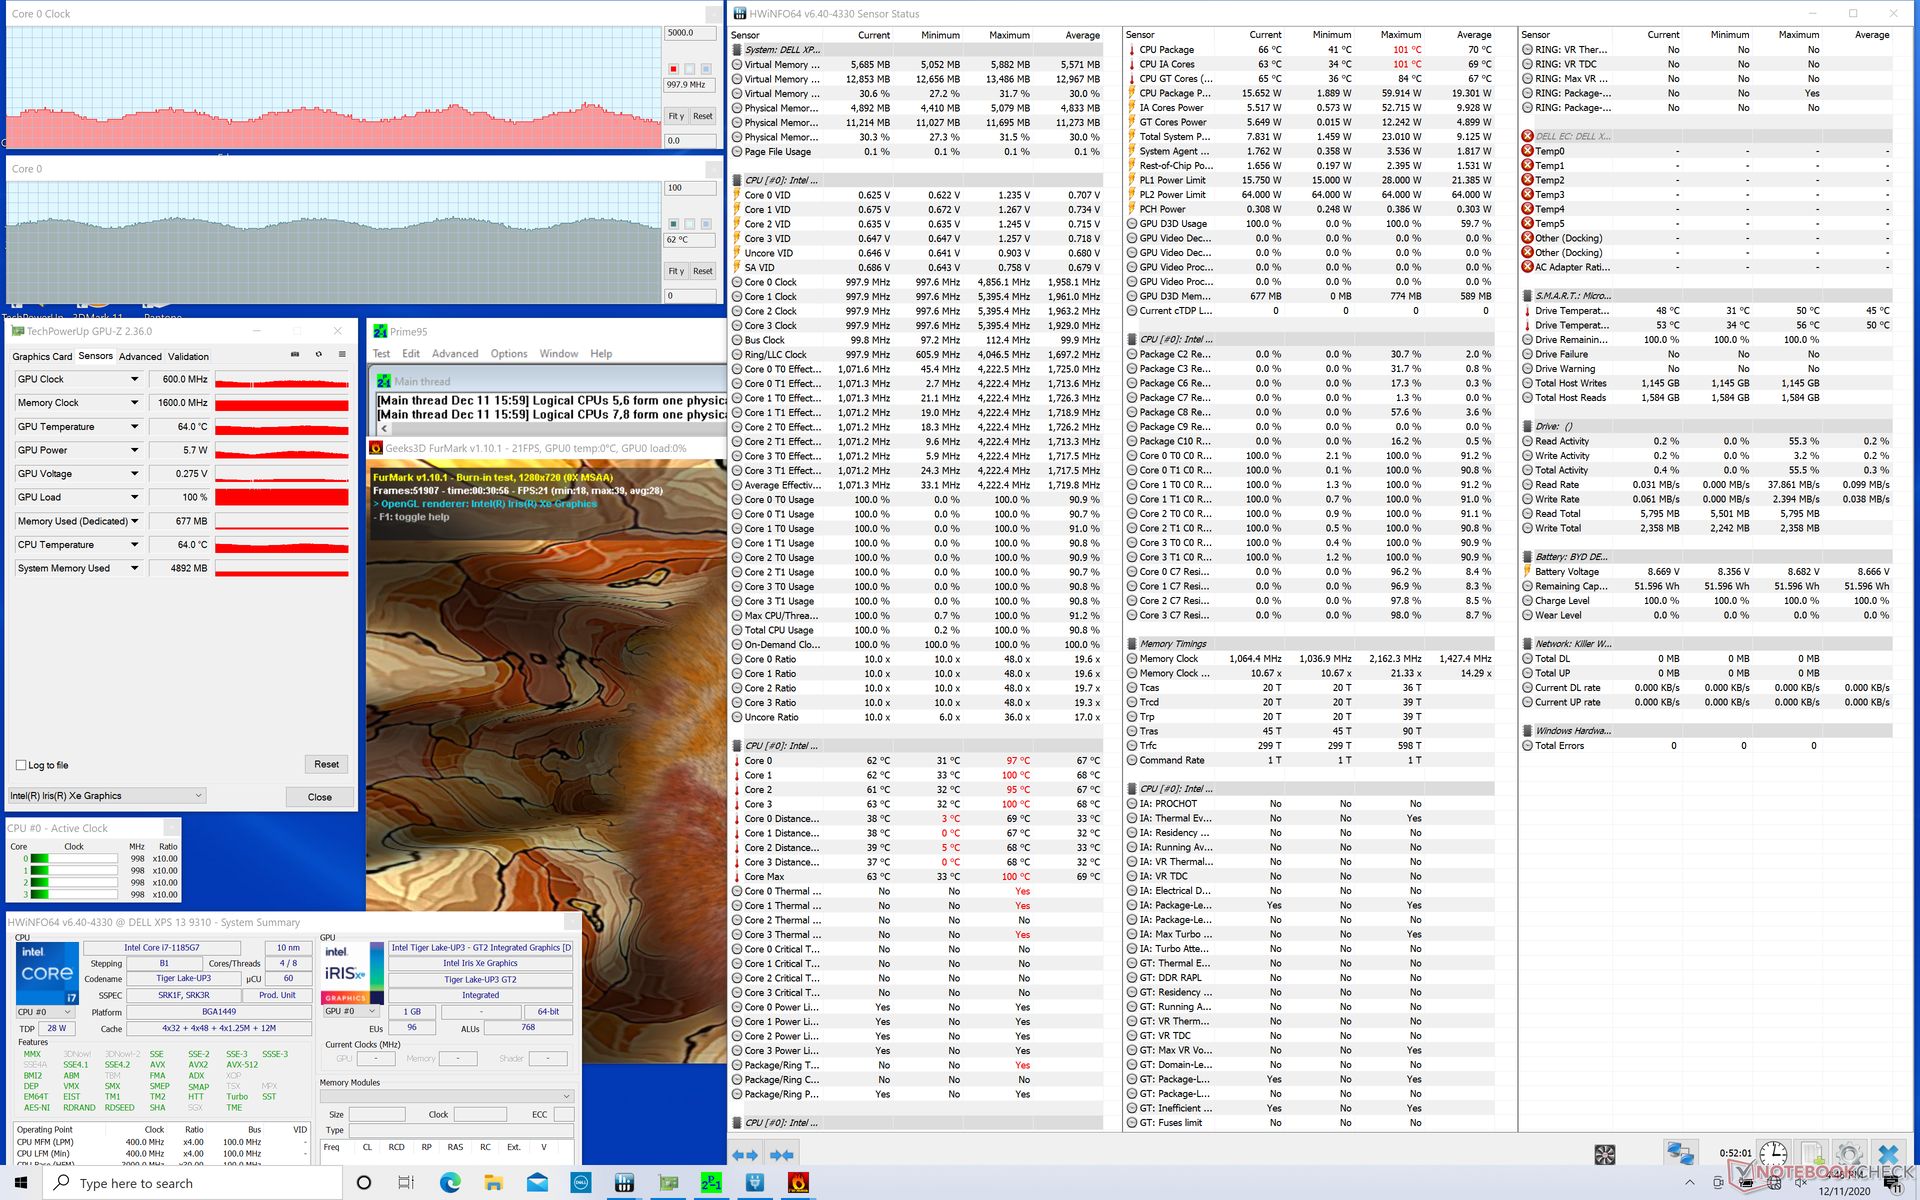
| Prime95 + FurMark Stress | 0.9 - 1.8 |
| Witcher 3 Estrés | 1.3 - 2.1 |
Oradores
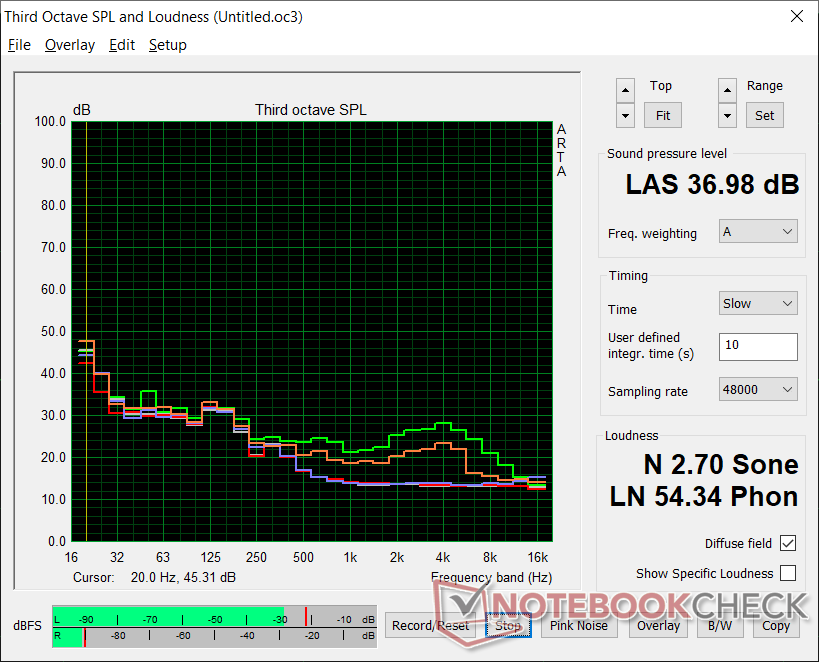
Dell XPS 13 9310 Core i7 4K análisis de audio
(+) | los altavoces pueden reproducir a un volumen relativamente alto (#84.6 dB)
Graves 100 - 315 Hz
(±) | lubina reducida - en promedio 13.1% inferior a la mediana
(±) | la linealidad de los graves es media (11.1% delta a frecuencia anterior)
Medios 400 - 2000 Hz
(+) | medios equilibrados - a sólo 4.3% de la mediana
(+) | los medios son lineales (4.2% delta a la frecuencia anterior)
Altos 2 - 16 kHz
(+) | máximos equilibrados - a sólo 1.5% de la mediana
(+) | los máximos son lineales (3.8% delta a la frecuencia anterior)
Total 100 - 16.000 Hz
(+) | el sonido global es lineal (10.9% de diferencia con la mediana)
En comparación con la misma clase
» 10% de todos los dispositivos probados de esta clase eran mejores, 3% similares, 87% peores
» El mejor tuvo un delta de 5%, la media fue 18%, el peor fue ###max##%
En comparación con todos los dispositivos probados
» 6% de todos los dispositivos probados eran mejores, 2% similares, 92% peores
» El mejor tuvo un delta de 4%, la media fue 23%, el peor fue ###max##%
Apple MacBook 12 (Early 2016) 1.1 GHz análisis de audio
(+) | los altavoces pueden reproducir a un volumen relativamente alto (#83.6 dB)
Graves 100 - 315 Hz
(±) | lubina reducida - en promedio 11.3% inferior a la mediana
(±) | la linealidad de los graves es media (14.2% delta a frecuencia anterior)
Medios 400 - 2000 Hz
(+) | medios equilibrados - a sólo 2.4% de la mediana
(+) | los medios son lineales (5.5% delta a la frecuencia anterior)
Altos 2 - 16 kHz
(+) | máximos equilibrados - a sólo 2% de la mediana
(+) | los máximos son lineales (4.5% delta a la frecuencia anterior)
Total 100 - 16.000 Hz
(+) | el sonido global es lineal (10.2% de diferencia con la mediana)
En comparación con la misma clase
» 7% de todos los dispositivos probados de esta clase eran mejores, 2% similares, 90% peores
» El mejor tuvo un delta de 5%, la media fue 18%, el peor fue ###max##%
En comparación con todos los dispositivos probados
» 5% de todos los dispositivos probados eran mejores, 1% similares, 94% peores
» El mejor tuvo un delta de 4%, la media fue 23%, el peor fue ###max##%
Energy Management
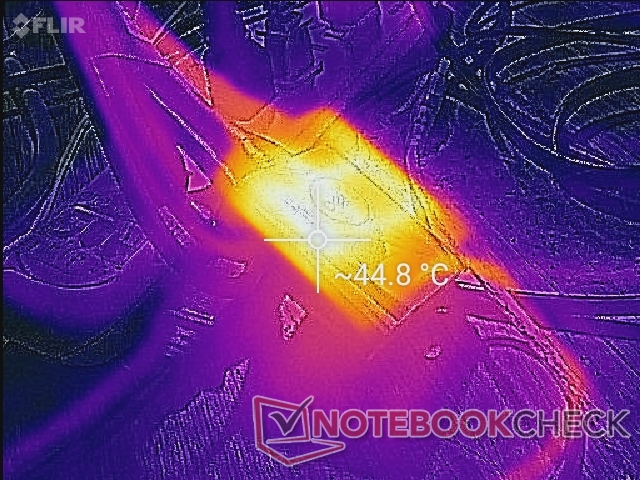
Consumo de energía
La inactividad en el escritorio en la configuración de mayor brillo consume alrededor de 8,3 W a 8,8 W en comparación con 5,9 W a 6,3 W en la configuración FHD. El ligero aumento probablemente se atribuye en parte al panel de resolución de 4K más exigente.
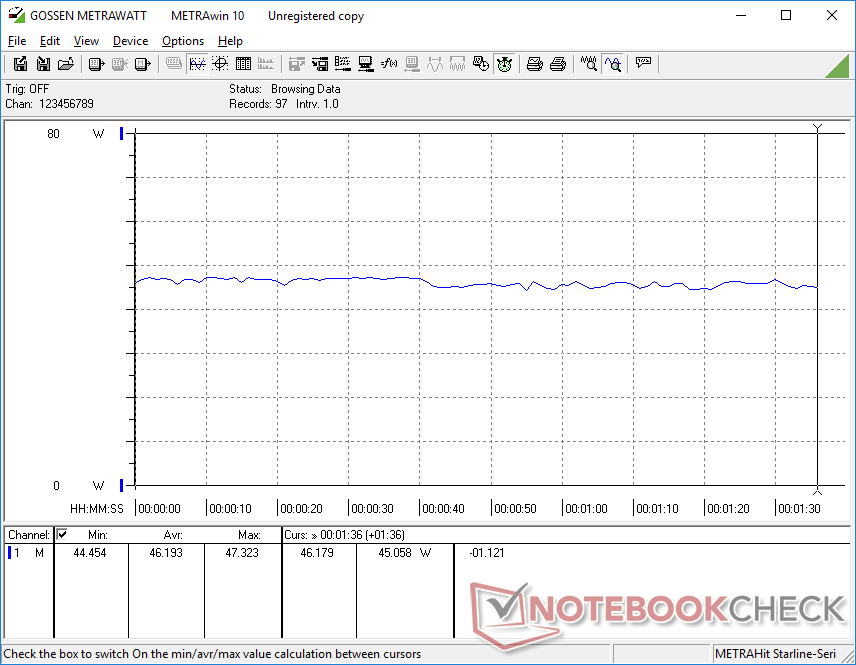
El consumo de energía es generalmente más alto que el de otros Core i7 Ultrabooks con gráficos integrados cuando se utiliza 3DMark 06. Somos capaces de medir un promedio de 46 W en comparación con sólo 32 W a 37 W en el HP Spectre x360 13, ZenBook S, o XPS 13 9310, cada uno equipado con el más lento Core i7-1065G7 del año pasado. Sin embargo, el rendimiento por vatio sigue siendo increíble cuando se compara con los antiguos sistemas Whiskey Lake-U o Comet Lake-U.
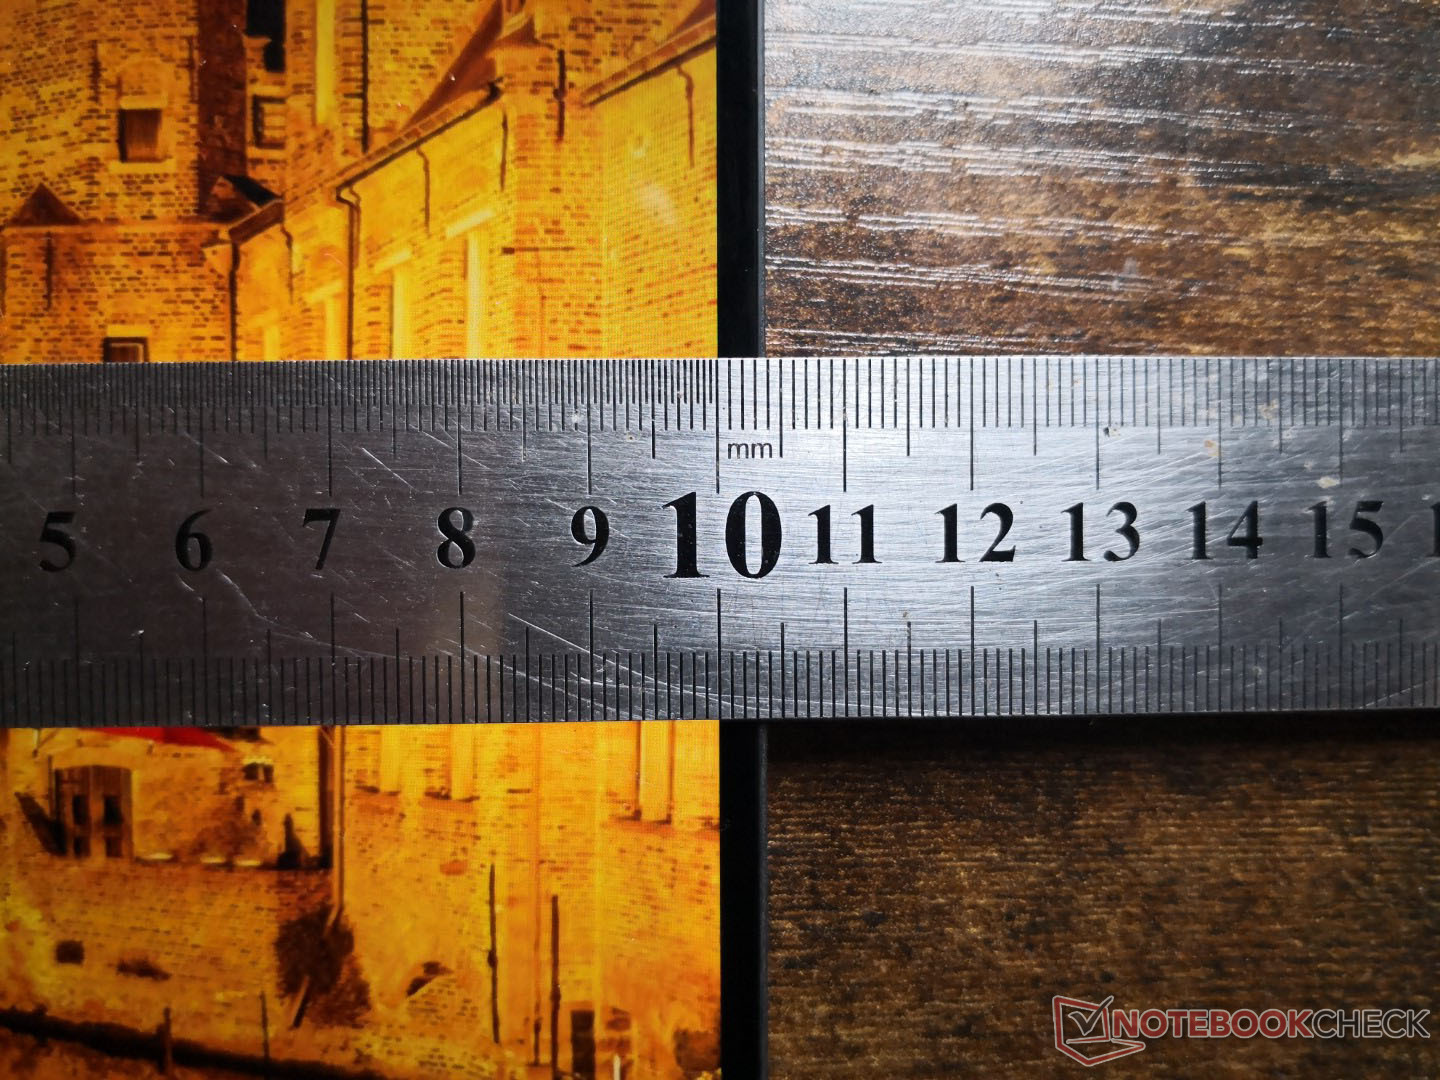
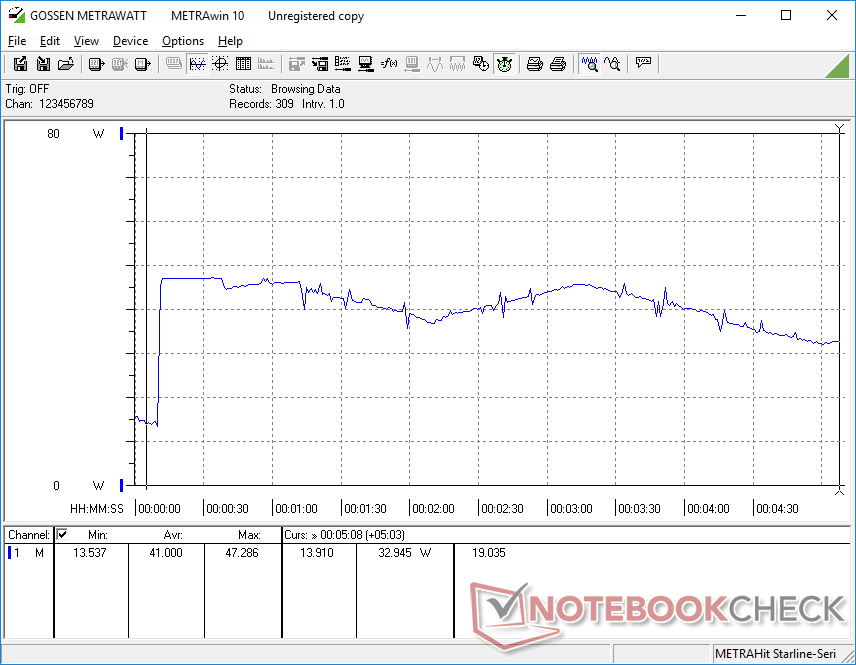
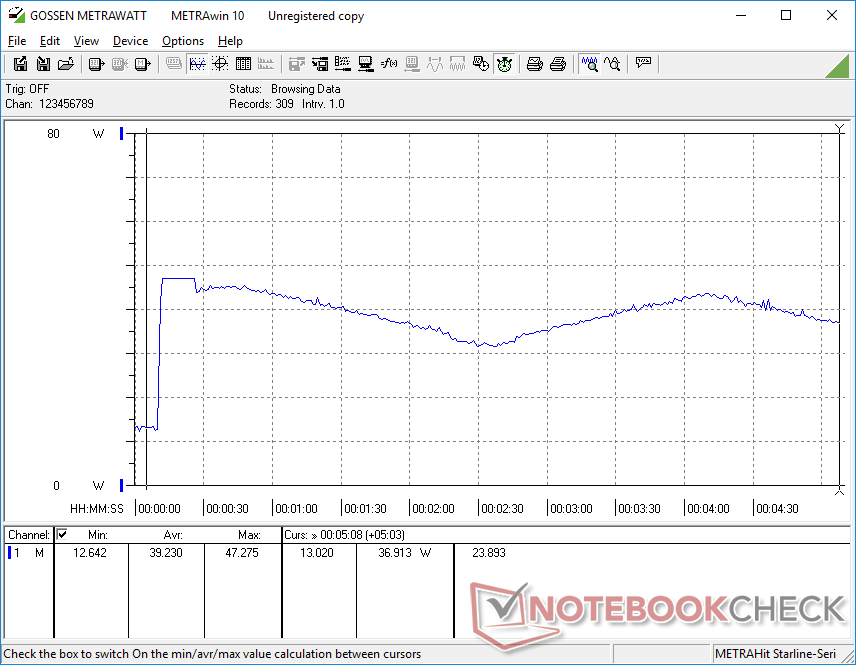
Corriendo Prime95 sacaría 47 W del pequeño (~6 x 5,5 x 2,3 cm) adaptador de CA de 45 W. Sin embargo, esta tasa sólo duraría unos pocos segundos antes de que comience el ciclo, como se muestra en los siguientes gráficos, para coincidir con las observaciones de la tasa de reloj de la prueba de esfuerzo desde arriba.
| Off / Standby | |
| Ocioso | |
| Carga |
|
Clave:
min: | |
| Dell XPS 13 9310 Core i7 4K i7-1185G7, Iris Xe G7 96EUs, Micron 2300 512GB MTFDHBA512TDV, IPS, 3840x2400, 13.4" | Asus Zenbook S UX393JA i7-1065G7, Iris Plus Graphics G7 (Ice Lake 64 EU), Intel SSD 660p 1TB SSDPEKNW010T8, IPS, 3300x2200, 13.9" | Huawei MateBook X Pro 2020 i7 i7-10510U, GeForce MX250, Samsung PM981a MZVLB1T0HBLR, LTPS, 3000x2000, 13.9" | Dell XPS 13 9300 Core i7-1065G7 i7-1065G7, Iris Plus Graphics G7 (Ice Lake 64 EU), Intel SSDPEMKF512G8 NVMe SSD, IPS, 1920x1200, 13.4" | Lenovo Yoga Slim 7-14ARE R7 4800U, Vega 8, Samsung SSD PM981a MZVLB512HBJQ, IPS, 1920x1080, 14" | HP Spectre x360 13-aw0013dx i7-1065G7, Iris Plus Graphics G7 (Ice Lake 64 EU), Intel Optane Memory H10 with Solid State Storage 32GB + 512GB HBRPEKNX0202A(L/H), IPS, 1920x1080, 13.3" | |
|---|---|---|---|---|---|---|
| Power Consumption | 3% | -17% | 12% | 0% | 17% | |
| Idle Minimum * (Watt) | 4.3 | 4.1 5% | 4.3 -0% | 4.2 2% | 4 7% | 3.9 9% |
| Idle Average * (Watt) | 8.3 | 7.5 10% | 8.5 -2% | 6.9 17% | 6.3 24% | 6.3 24% |
| Idle Maximum * (Watt) | 8.8 | 8.5 3% | 12 -36% | 7.5 15% | 7.7 12% | 6.8 23% |
| Load Average * (Watt) | 46.2 | 36.8 20% | 54.8 -19% | 33.3 28% | 48.3 -5% | 32.6 29% |
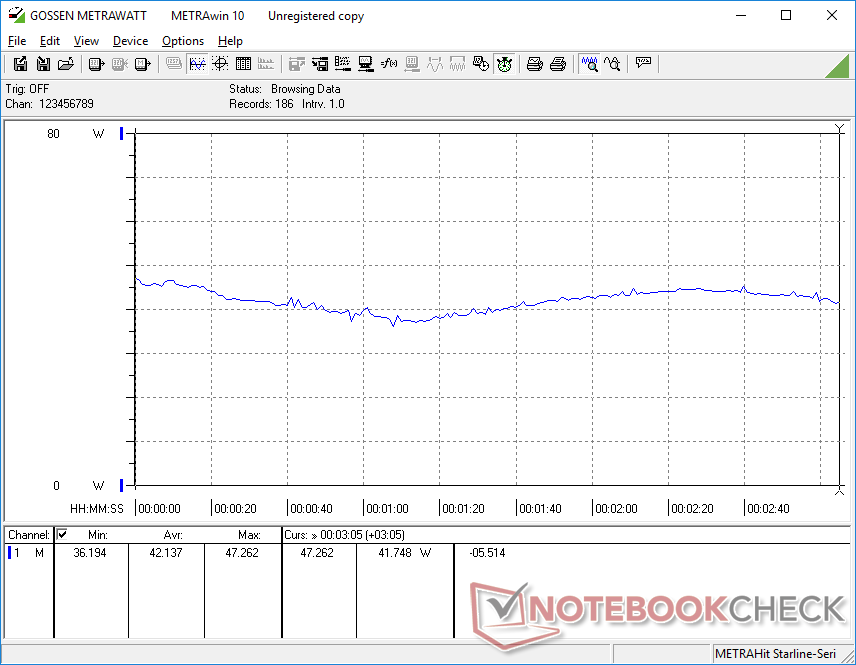
| Witcher 3 ultra * (Watt) | 42.2 | 39.2 7% | 47.1 -12% | 37.1 12% | 49 -16% | 25.6 39% |
| Load Maximum * (Watt) | 47.3 | 61.6 -30% | 61.5 -30% | 48.4 -2% | 57.6 -22% | 59 -25% |
* ... más pequeño es mejor
La vida de la batería
Los tiempos de ejecución son mucho más cortos que los que registramos en el XPS 13 FHD. Mientras que nuestra unidad FHD duraría más de 12 horas de uso de WLAN en el mundo real, nuestra unidad 4K sólo duraría 7 horas cuando estuviera en el mismo perfil de rendimiento y ajuste de brillo Dell Optimizado. Incluso volvimos a realizar la prueba de vida de la batería para comprobar si había alguna discrepancia, pero el tiempo de funcionamiento aproximado de 7 horas no cambió.
La carga de la capacidad vacía a la plena capacidad es lenta en 2,5 a 3 horas. Muchos otros Ultrabooks pueden recargarse casi dos veces más rápido como el Razer Book 13.
| Dell XPS 13 9310 Core i7 4K i7-1185G7, Iris Xe G7 96EUs, 52 Wh | Asus Zenbook S UX393JA i7-1065G7, Iris Plus Graphics G7 (Ice Lake 64 EU), 67 Wh | Huawei MateBook X Pro 2020 i7 i7-10510U, GeForce MX250, 57.4 Wh | Dell XPS 13 9300 Core i7-1065G7 i7-1065G7, Iris Plus Graphics G7 (Ice Lake 64 EU), 52 Wh | Lenovo Yoga Slim 7-14ARE R7 4800U, Vega 8, 61 Wh | HP Spectre x360 13-aw0013dx i7-1065G7, Iris Plus Graphics G7 (Ice Lake 64 EU), 60 Wh | |
|---|---|---|---|---|---|---|
| Duración de Batería | 15% | 44% | 76% | 43% | 38% | |
| WiFi v1.3 (h) | 7.2 | 8.3 15% | 10.4 44% | 12.7 76% | 10.3 43% | 9.9 38% |
| Reader / Idle (h) | 38.4 | 27.1 | 37.1 | |||
| Load (h) | 2.7 | 2.4 | 1.3 | 2.7 |
Pro
Contra
Veredicto

Desde el punto de vista del rendimiento, el Core i7-1185G7 no ofrece muchas mejoras con respecto al Core i7-1165G7, por lo que recomendamos que se ahorre unos cuantos dólares al optar por el Core i7-1165G7. El dinero ahorrado puede ir en cambio hacia la RAM o el almacenamiento adicional o la opción de 4K de mayor resolución donde las actualizaciones son más tangibles. La vida de la batería será un par de horas más corta que la opción FHD, sin embargo, que es el precio a pagar por esos pixeles más densos.
Si pudiéramos hacer un cambio en el XPS 13 9310, entonces sería incluir una opción para velocidades de reloj más estables en el modo de Alto Rendimiento. Las velocidades de reloj cíclicas funcionan bien para maximizar el rendimiento medio de la CPU cuando la solución de refrigeración es el factor limitante, pero las fluctuaciones de rendimiento resultantes pueden ser desfavorables para ciertas aplicaciones.
Invertir en más RAM o almacenamiento o en la pantalla de 4K de mayor resolución valdría más la pena que el Core i7-1185G7 ya que las ganancias de rendimiento son mínimas en el mejor de los casos con respecto al Core i7-1165G7.
Dell XPS 13 9310 Core i7 4K
- 05/31/2021 v7 (old)
Allen Ngo
Price comparison

