Análisis del convertible HP Dragonfly Folio 13.5 G3: No más Snapdragon ni Windows en ARM
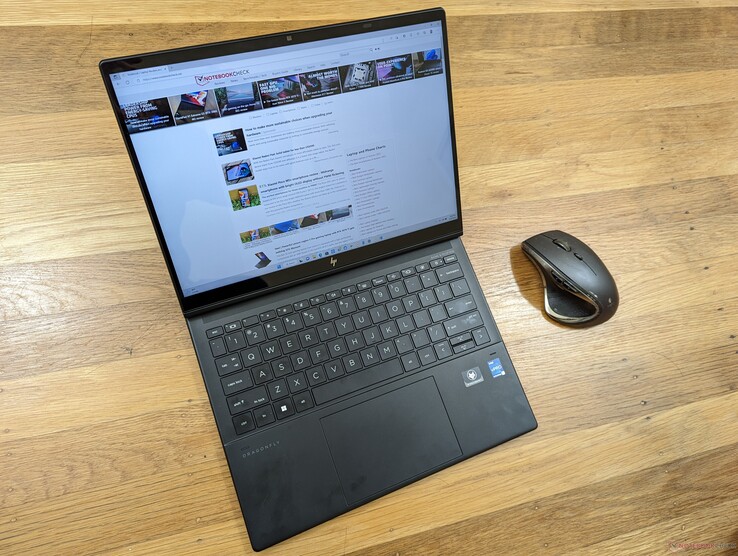
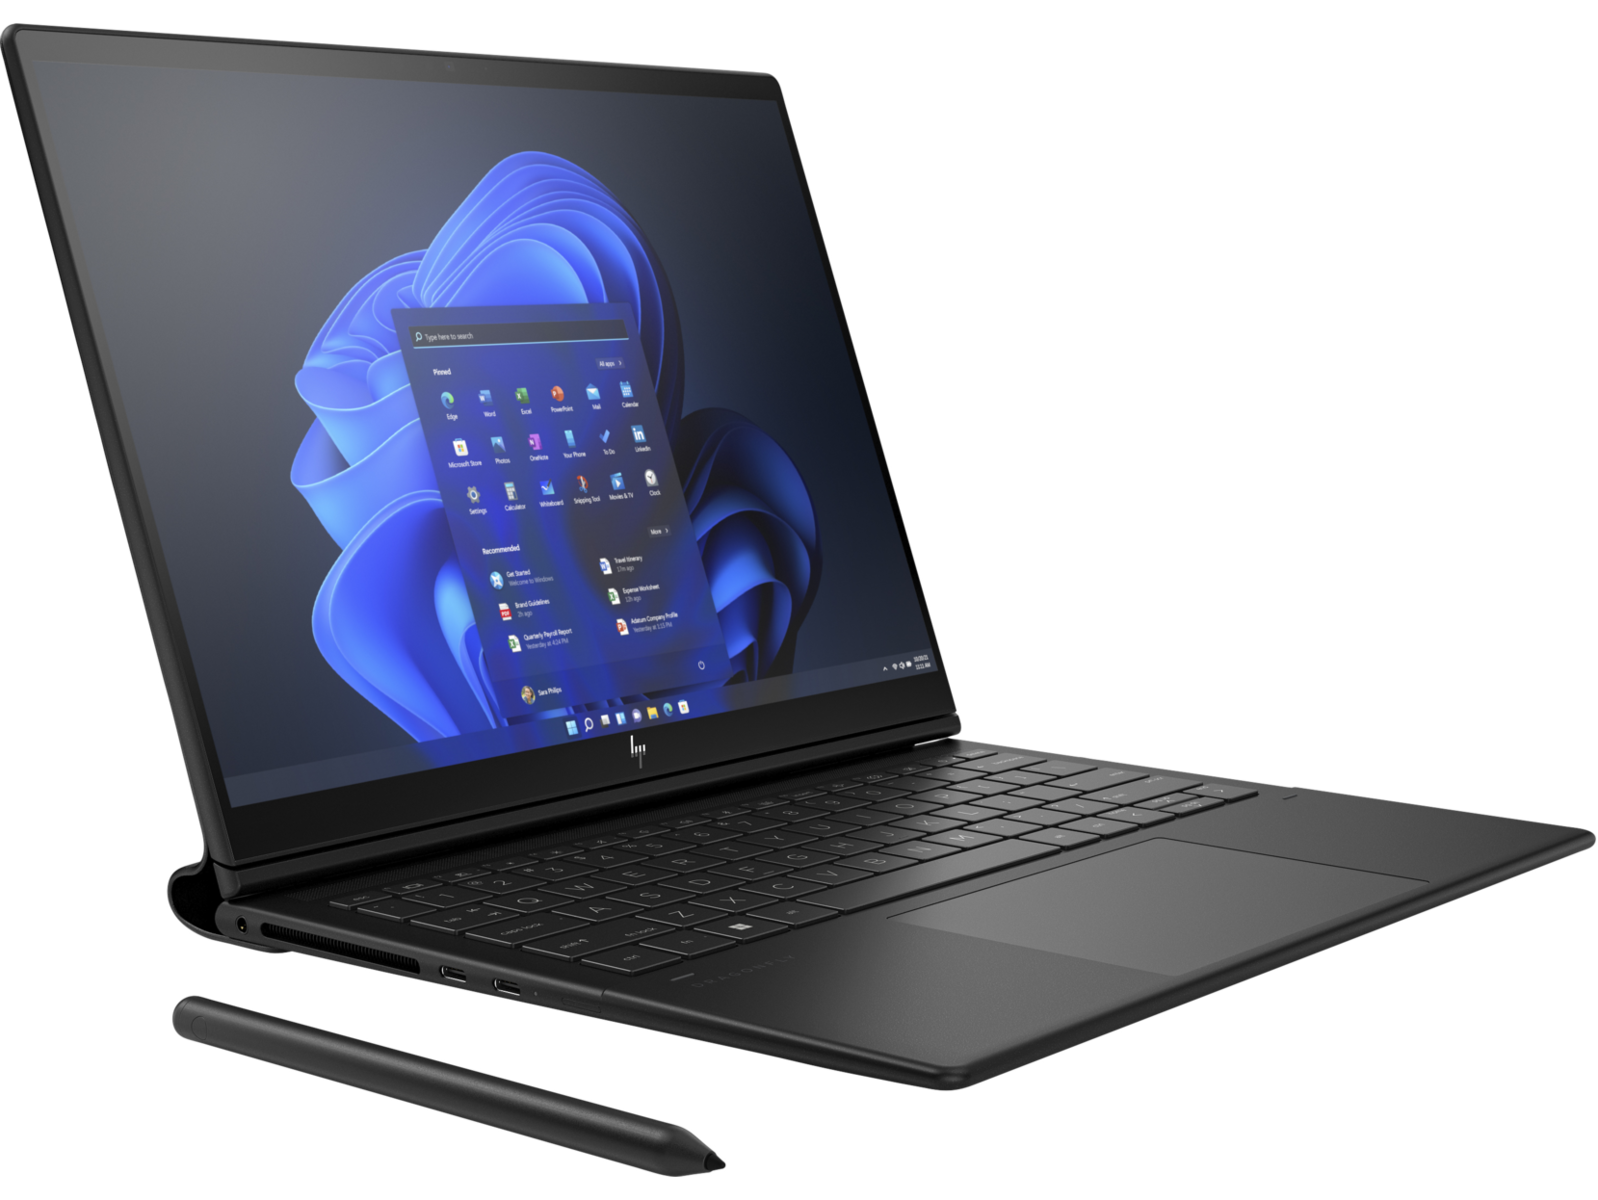
No confundir con el concha Dragonfly G3el Dragonfly Folio G3 es la versión 2-en-1 con su propio diseño y características únicas. Es un subportátil muy diferente en muchos aspectos, pero se dirige al mismo mercado de usuarios empresariales de oficina y ejecutivos. El Dragonfly Folio G3 sustituye directamente al EliteBook Folio G2
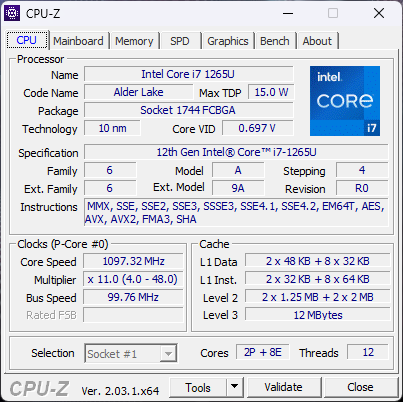
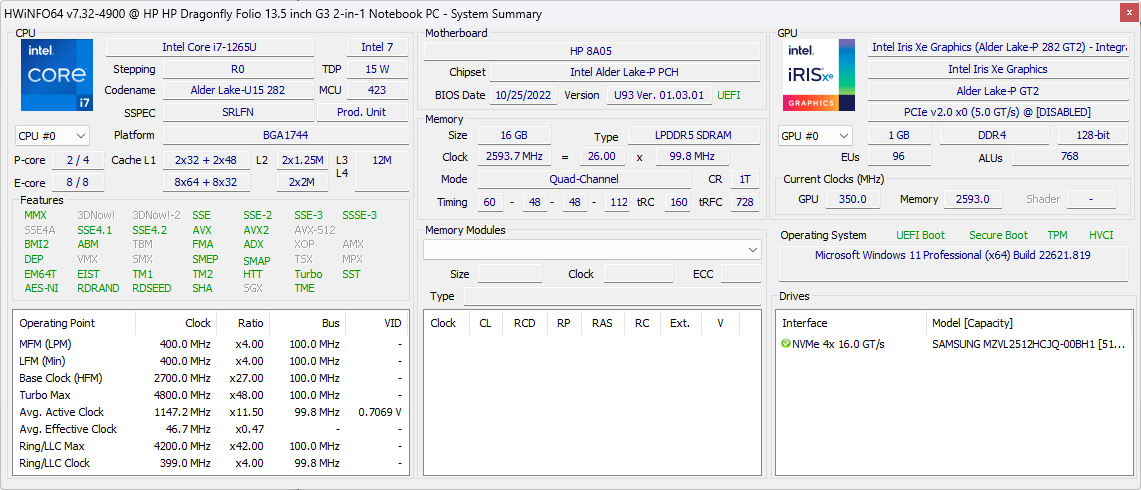
Nuestra unidad de análisis es una SKU intermedia con la CPU Core i7-1265U de 12ª generación y pantalla táctil brillante de 400 nits por unos 3900 dólares. Existen otras opciones con WAN, varios tamaños de RAM/SSD y CPU Core i5-1235U, i5-1245U o i7-1255U de menor tamaño, pero la resolución nativa 3:2 1920 x 1280 permanece constante en toda la gama.
La competencia en este segmento incluye otras soluciones de 13 pulgadas centradas en la empresa como el MSI Summit E13 Flip, Dell Latitude 7330 2 en 1,Lenovo ThinkPad L13 Yoga Gen 2o la serie Serie Microsoft Surface Pro.
Más opiniones sobre HP:
Posibles contendientes en la comparación
Valoración | Fecha | Modelo | Peso | Altura | Tamaño | Resolución | Precio |
|---|---|---|---|---|---|---|---|
| 90.3 % v7 (old) | 12/2022 | HP Elite Dragonfly Folio 13.5 G3 i7-1265U, Iris Xe G7 96EUs | 1.4 kg | 17.8 mm | 13.50" | 1920x1280 | |
| 91 % v7 (old) | 08/2022 | HP Elite Dragonfly G3 i7-1265U, Iris Xe G7 96EUs | 1.2 kg | 16.3 mm | 13.50" | 1920x1280 | |
| 89 % v7 (old) | 07/2022 | Dell Latitude 13 7330 i7-1265U, Iris Xe G7 96EUs | 1 kg | 16.96 mm | 13.30" | 1920x1080 | |
| 85.1 % v7 (old) | 07/2022 | Framework Laptop 13.5 12th Gen Intel i7-1260P, Iris Xe G7 96EUs | 1.3 kg | 15.85 mm | 13.50" | 2256x1504 | |
| 86.6 % v7 (old) | 12/2020 | Razer Book 13 FHD i7-1165G7, Iris Xe G7 96EUs | 1.4 kg | 15.15 mm | 13.40" | 1920x1200 | |
| 86.1 % v7 (old) | 01/2021 | Lenovo ThinkPad L13 Gen2-20VH0017GE i5-1135G7, Iris Xe G7 80EUs | 1.4 kg | 17.6 mm | 13.30" | 1920x1080 |
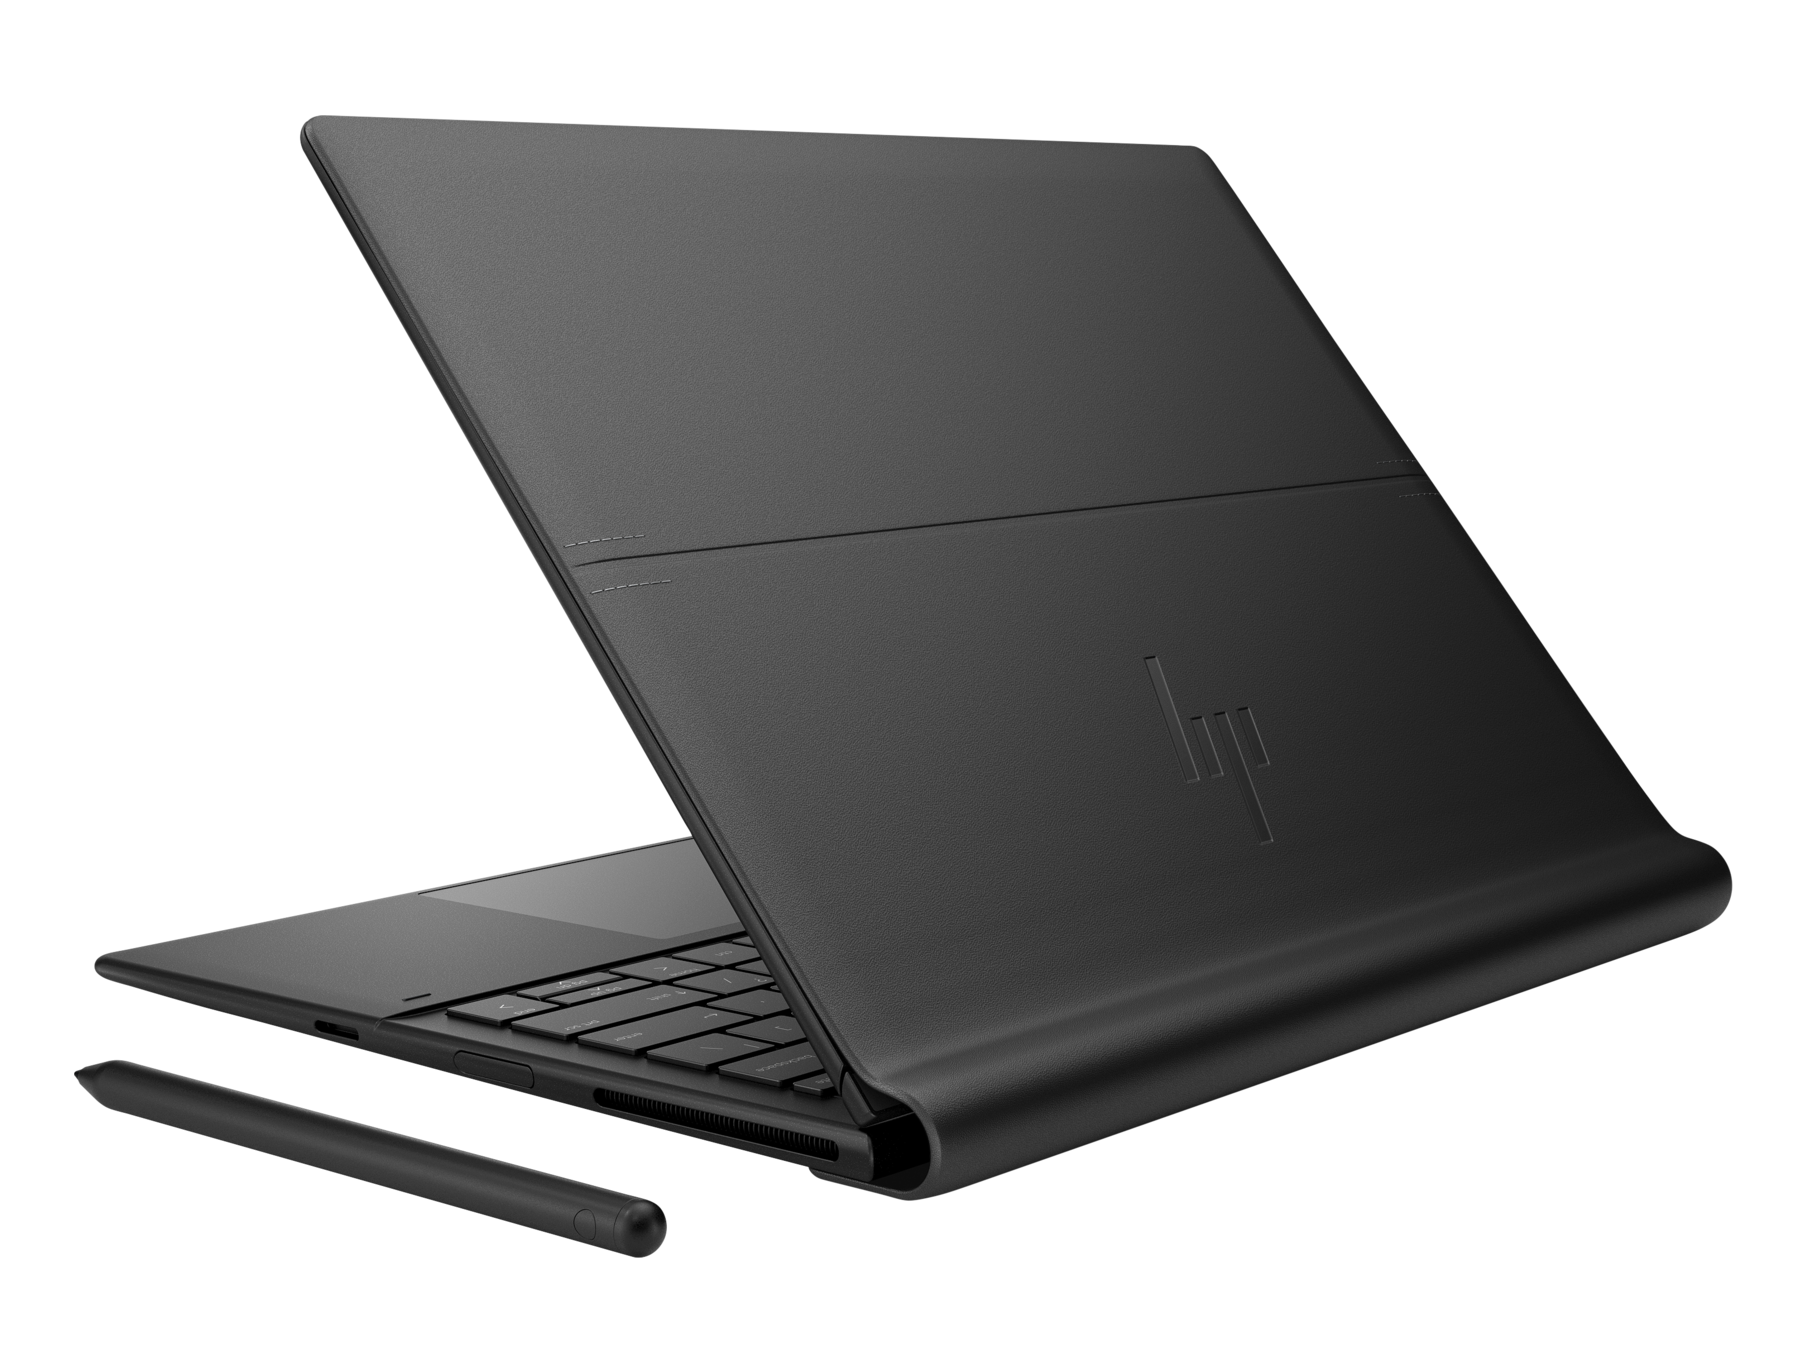
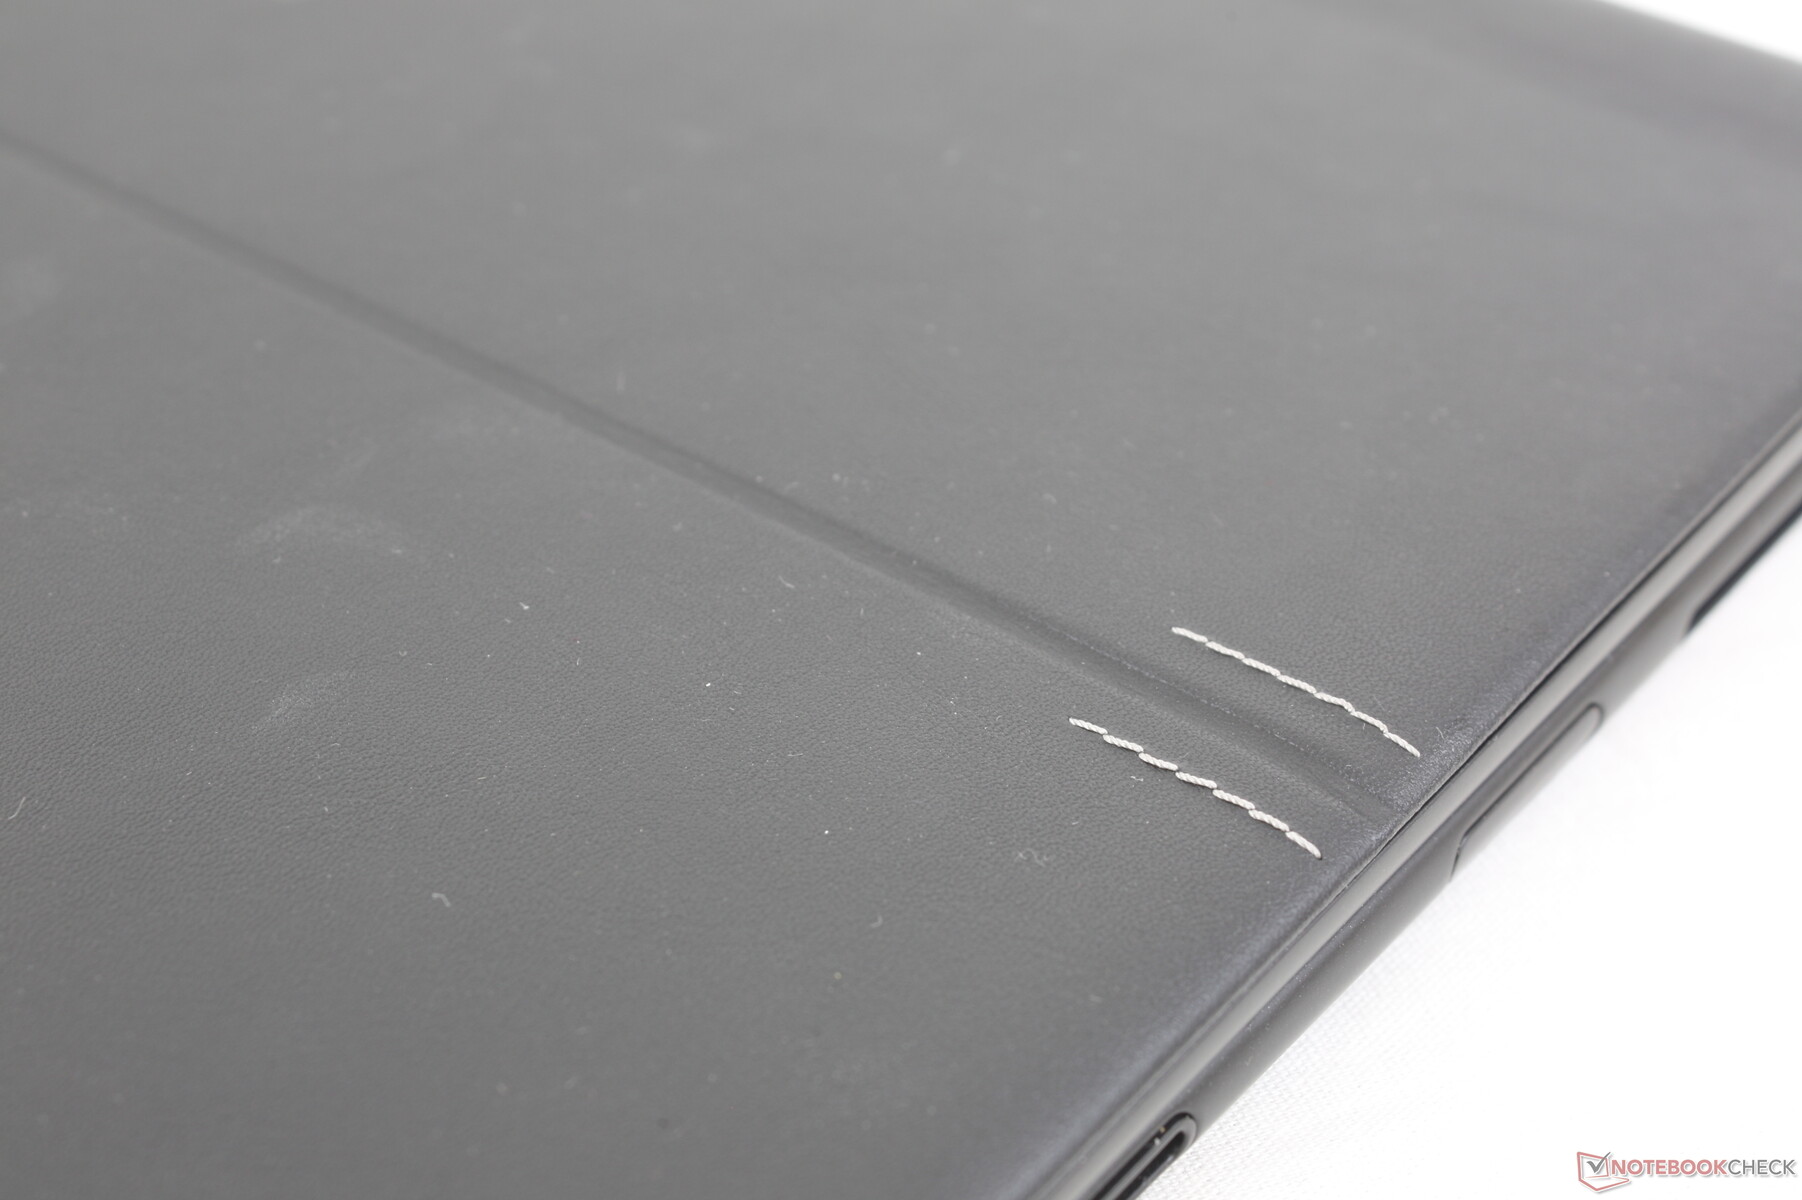
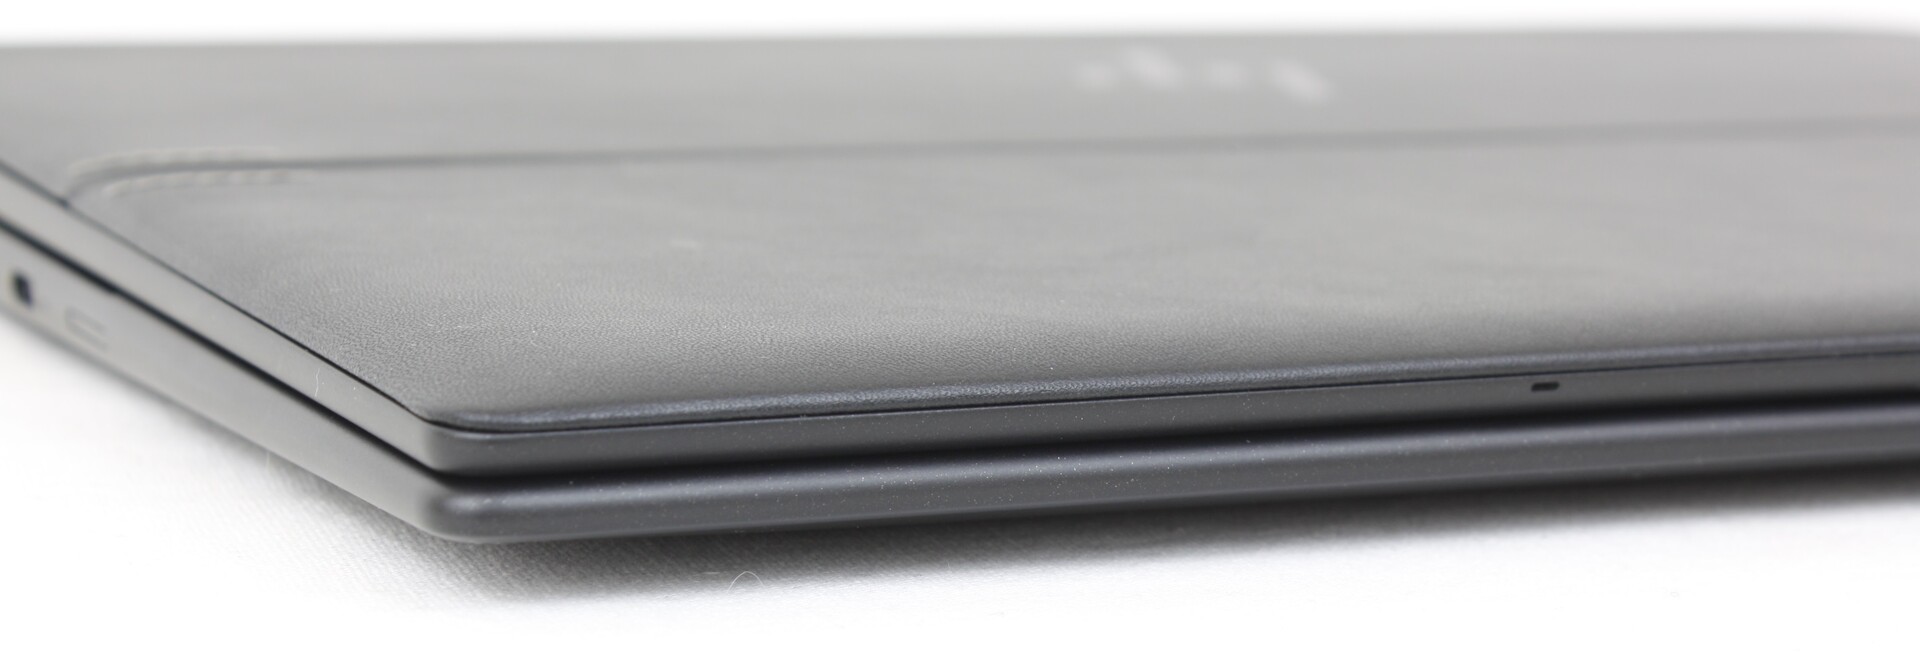
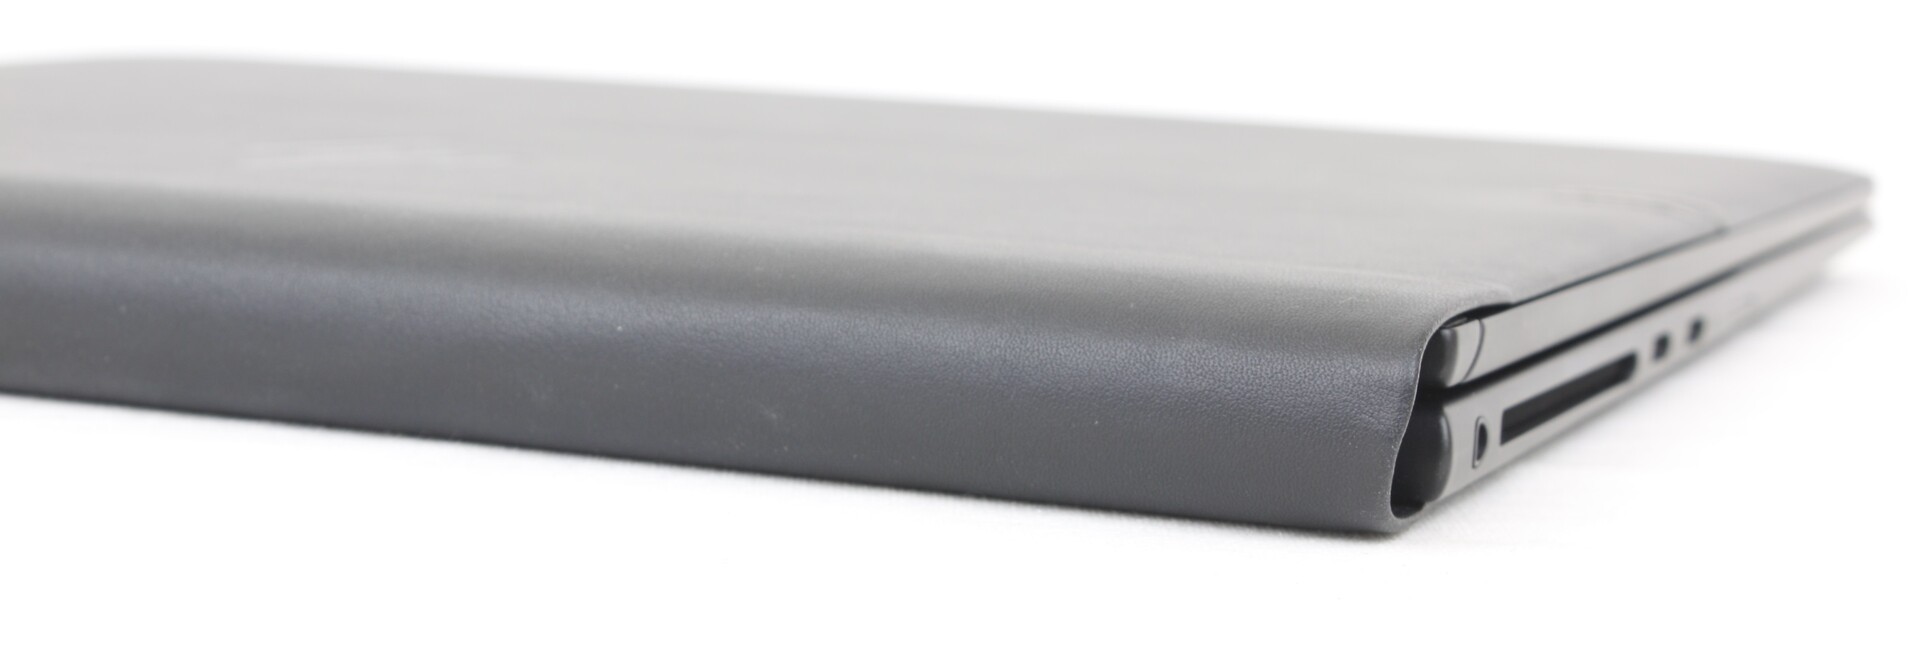
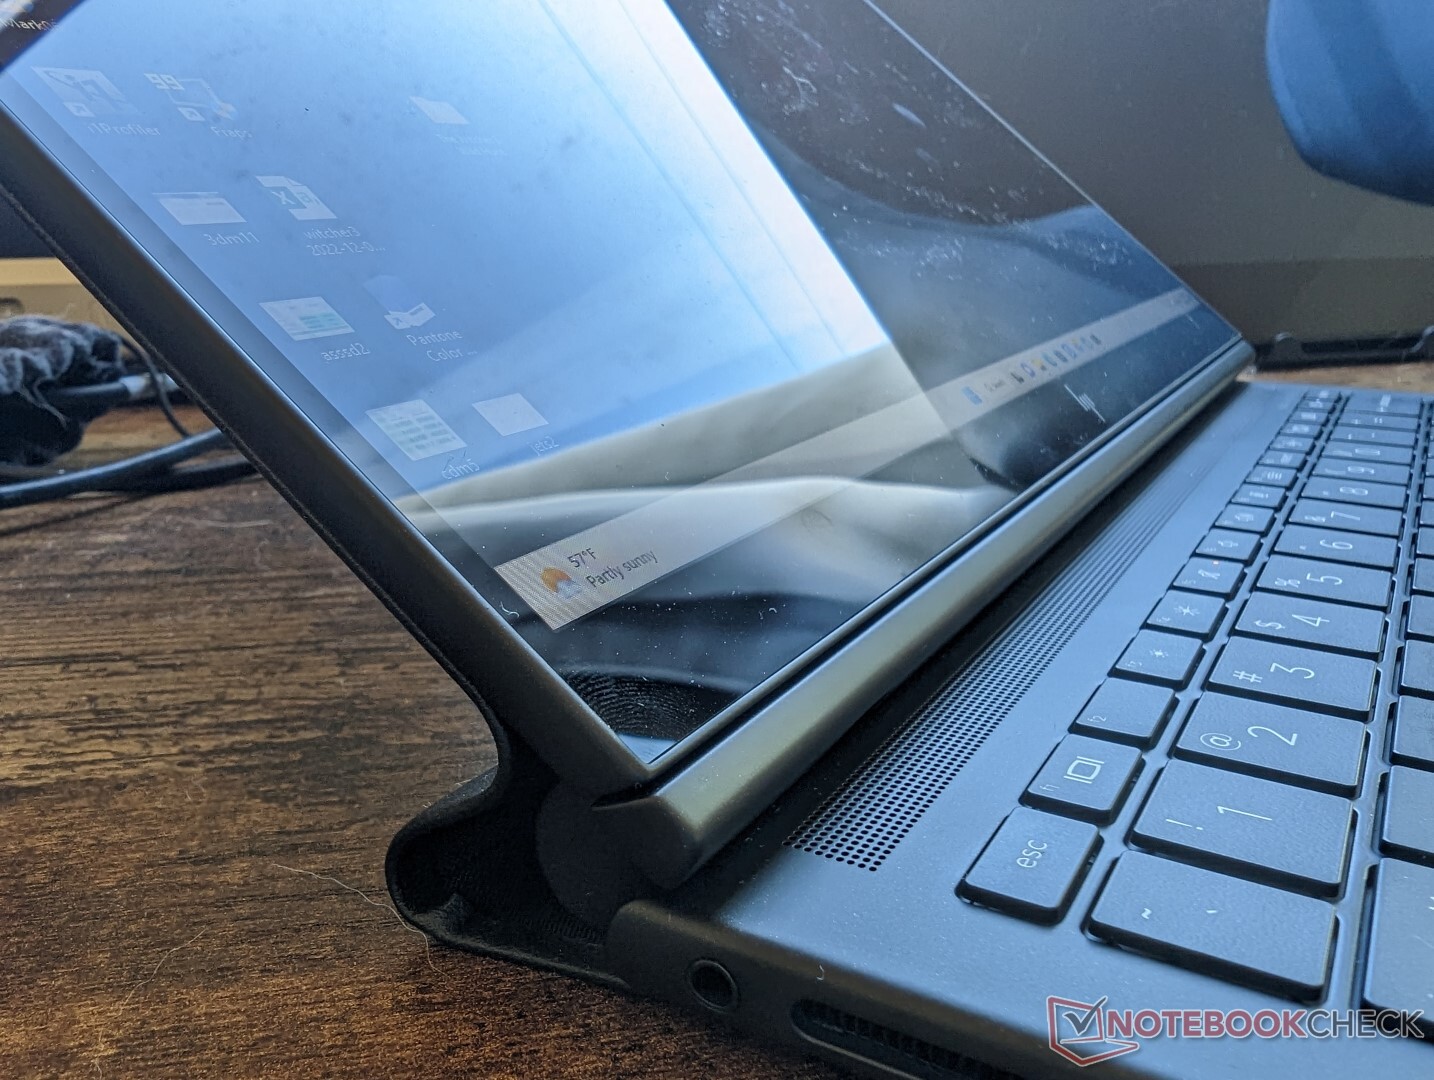
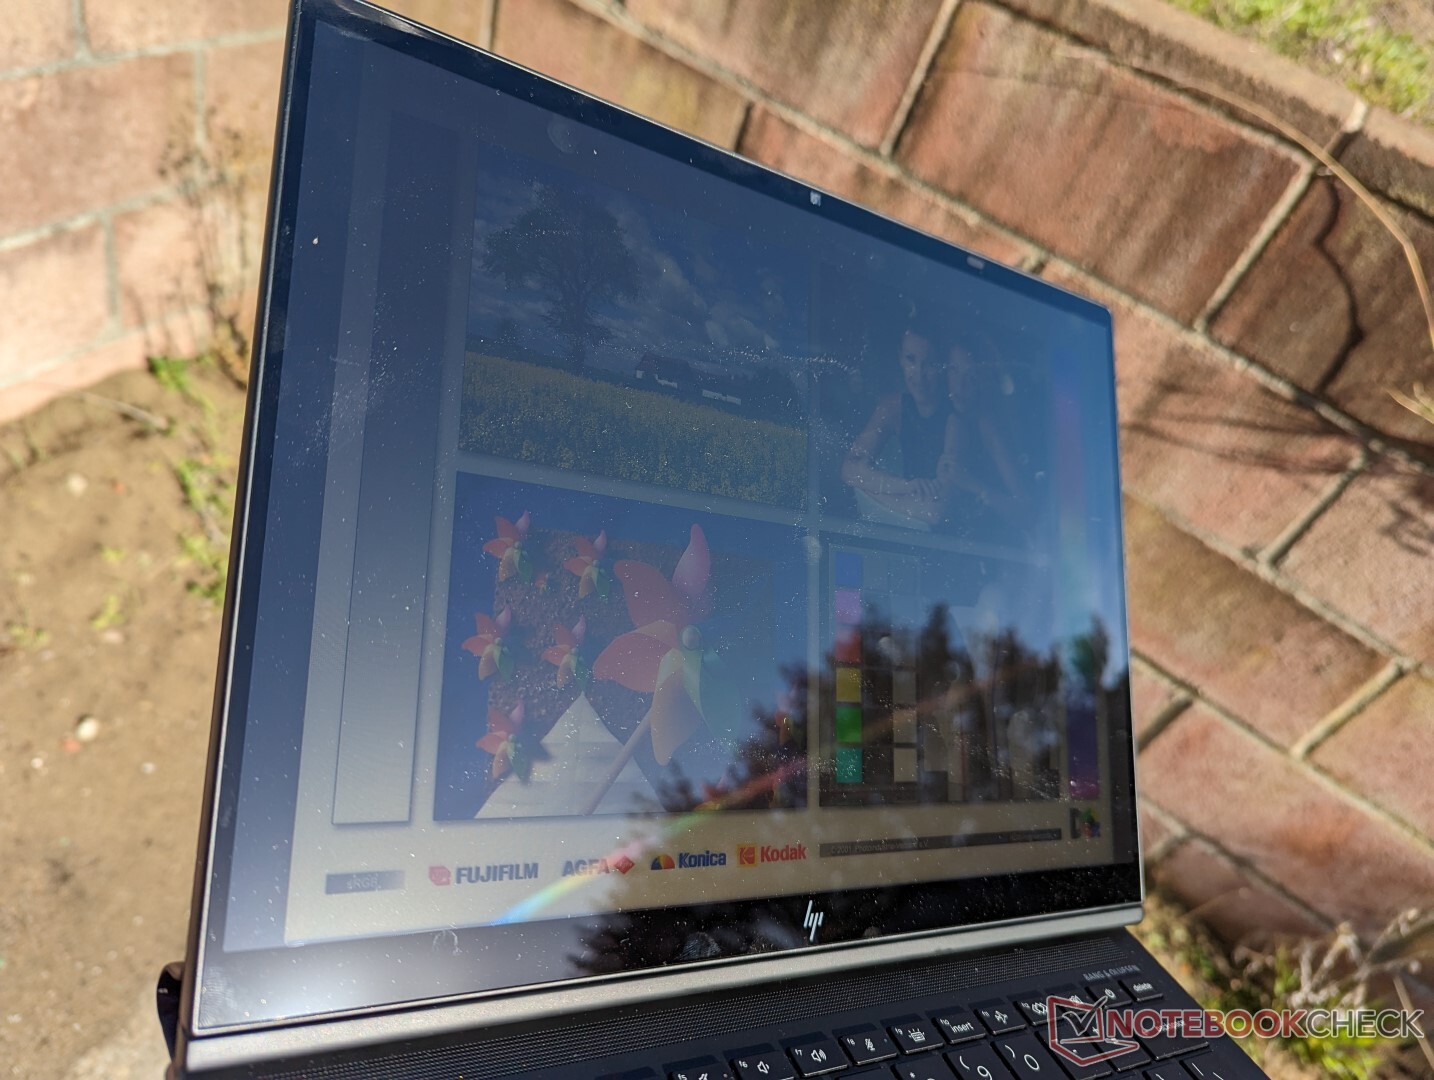
Funda - Metal con piel sintética
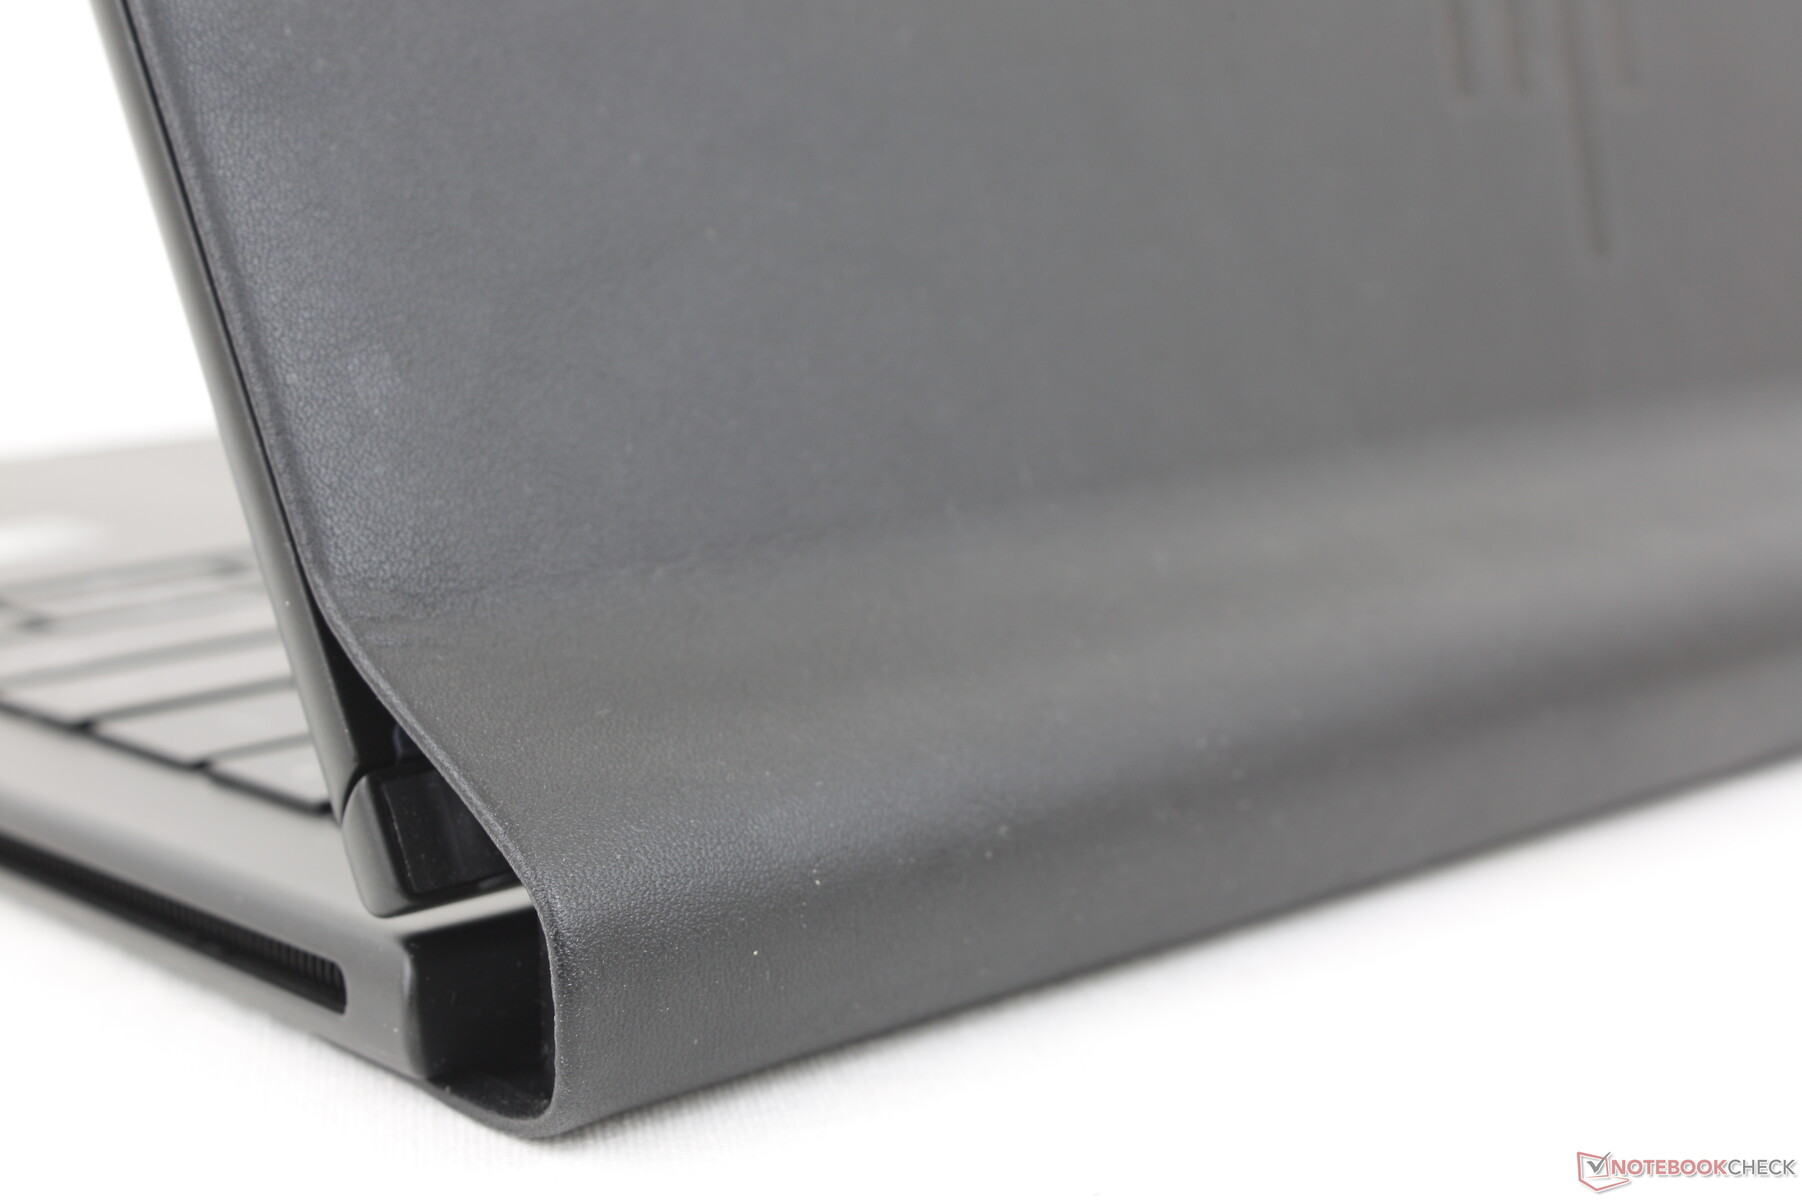
El chasis es una evolución del original 2020 Dragonfly Folio G1 y el 2021 EliteBook Folio G2. Su característica más notable es la tapa exterior de piel sintética que envuelve parcialmente la parte posterior de la base. El material es más fácil de agarrar que el metal para el modo tableta y reduce las huellas dactilares visibles. Además, añade una sensación de "atemporalidad" al diseño visual general, frente a las típicas soluciones de plástico o aleación de aluminio.
La rigidez del chasis es tan buena como la del modelo del año pasado, ya que nuestra versión 2022 utiliza materiales similares. El objetivo de HP esta vez era mejorar la facilidad de mantenimiento y el rendimiento sin sacrificar lo que hace que la serie Dragonfly Folio sea visualmente única. Aún así, la base del sistema sigue mostrando algo más de flexión que en un Spectre 13.5 o Elitebook x360 1040 por lo que aún hay margen de mejora.
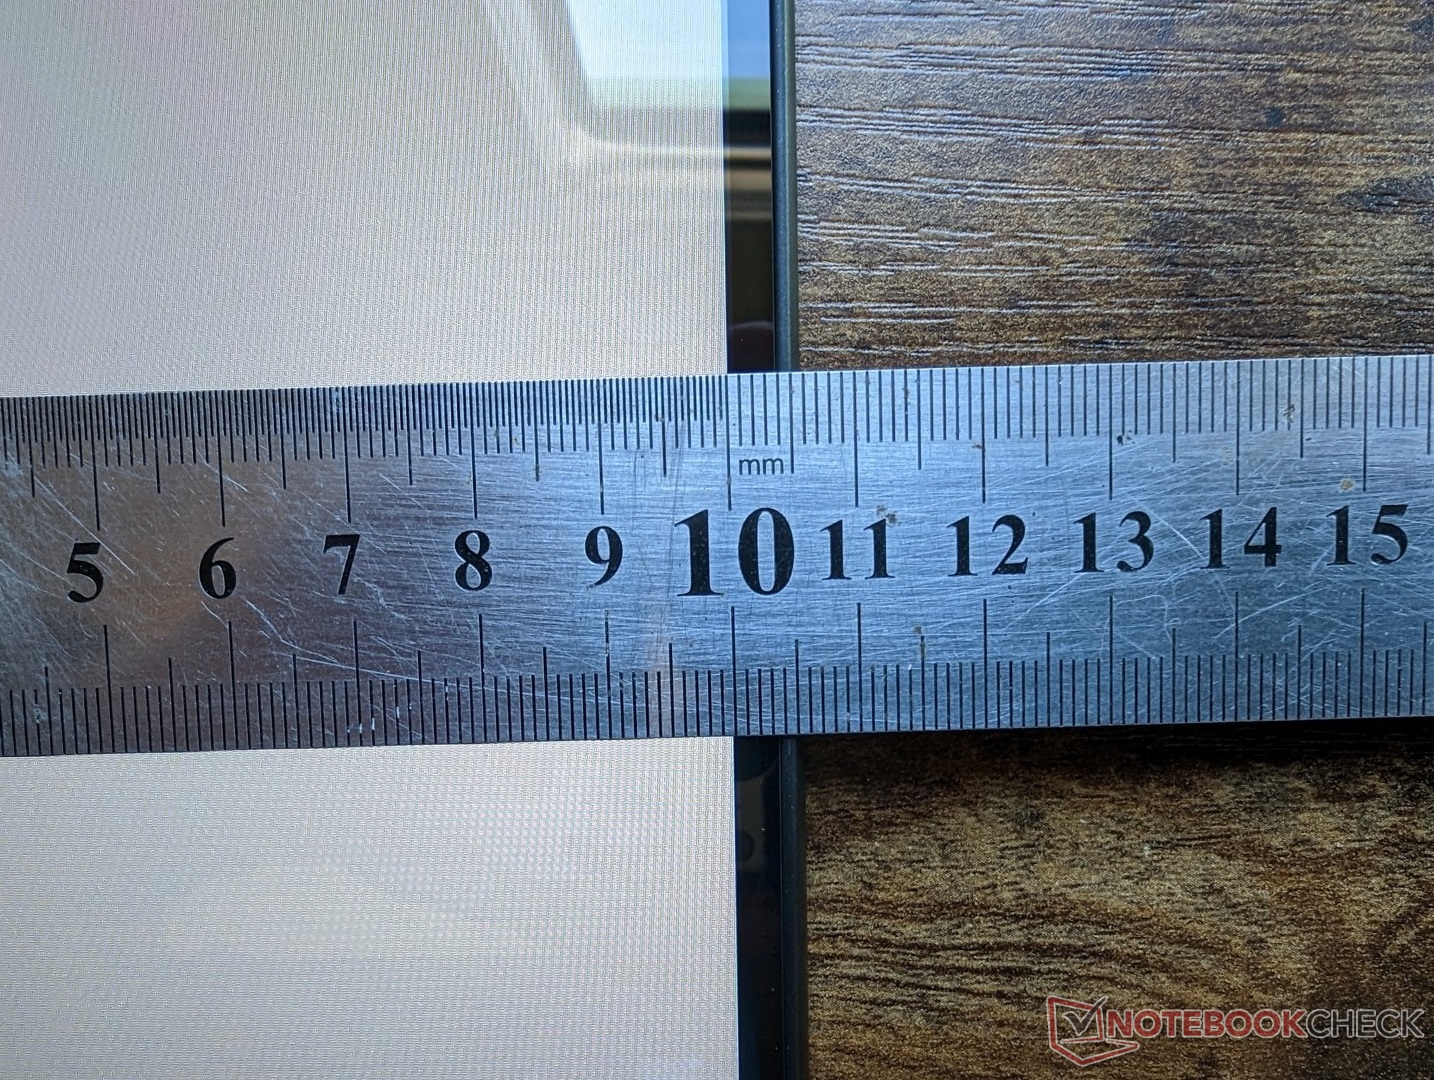
Los biseles superior e inferior son más gruesos que en la mayoría de portátiles, ya que deben soportar un diseño 2 en 1 de piel sintética poco común y un gran sensor de cámara web de 8 MP. Incluso el más potentePortátil Frameworkes ligeramente más fino, pequeño y ligero que el Dragonfly Folio G3. No es pesado o grande de ninguna manera, pero el Dragonfly Folio G3 no es ciertamente el más delgado o ligero en su clase de tamaño.


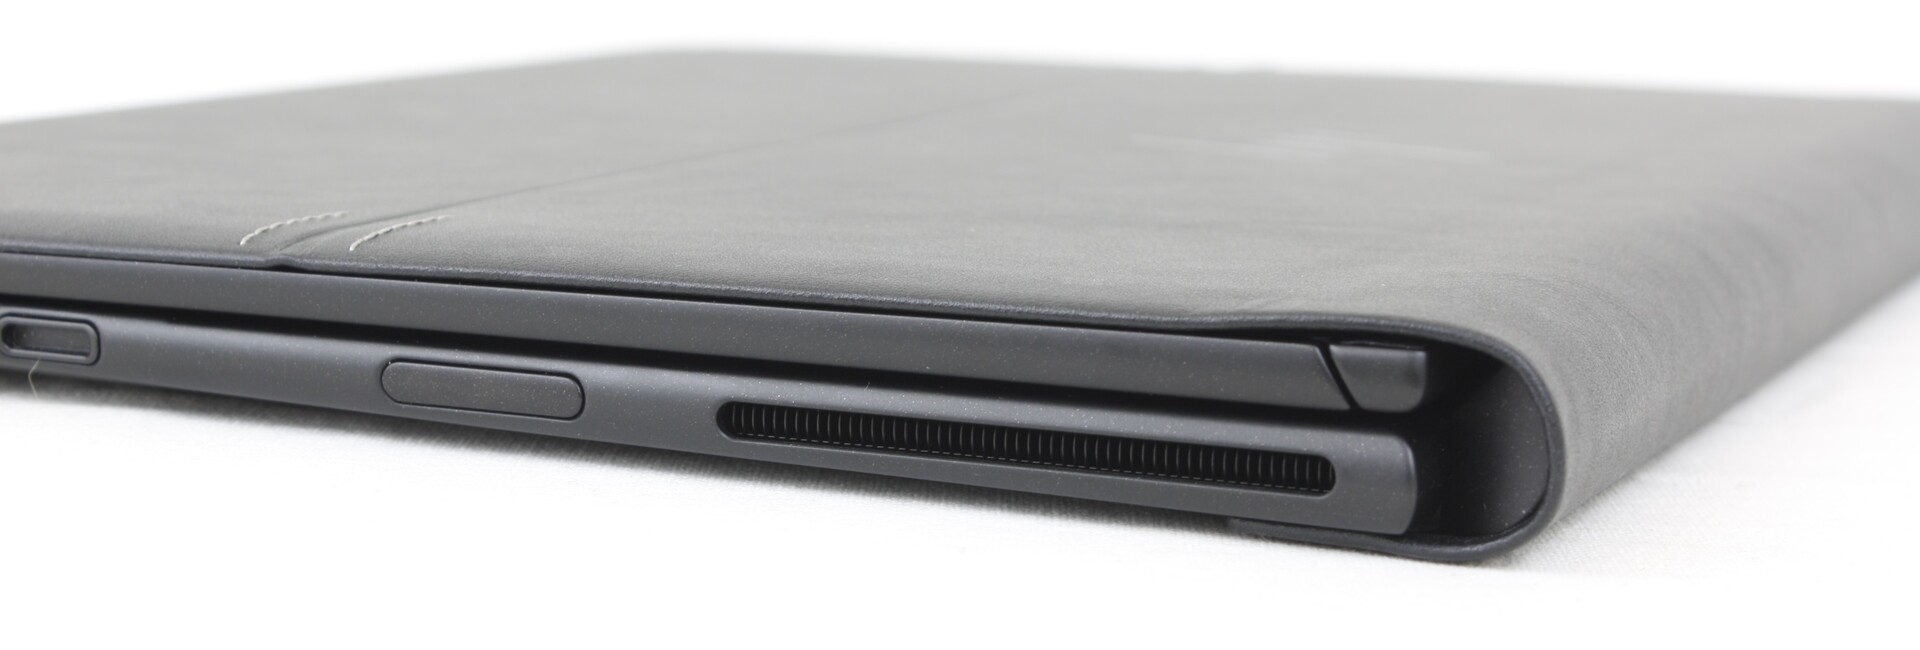
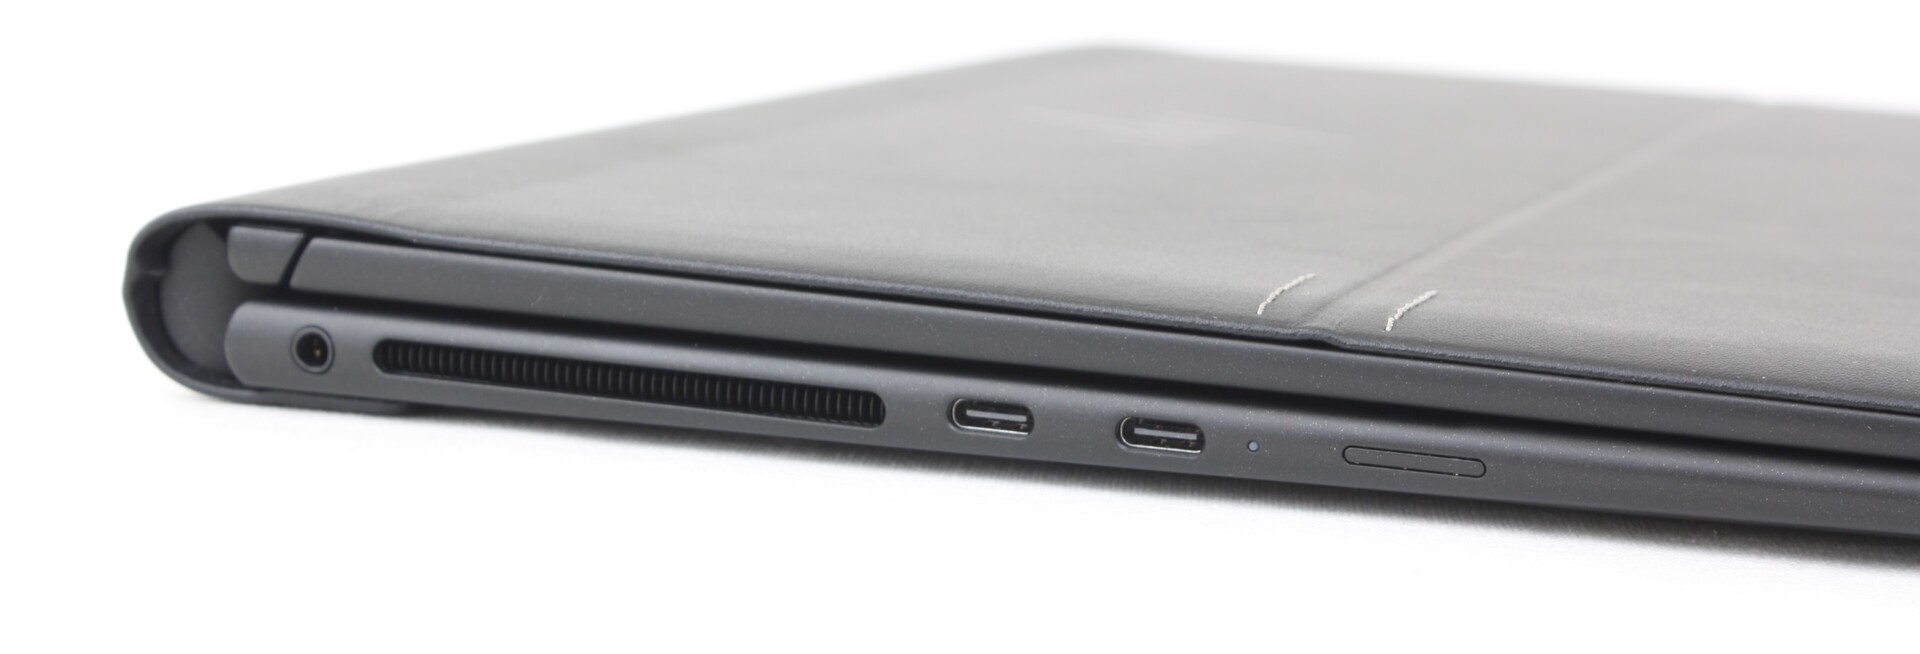
Conectividad - Solo USB-C
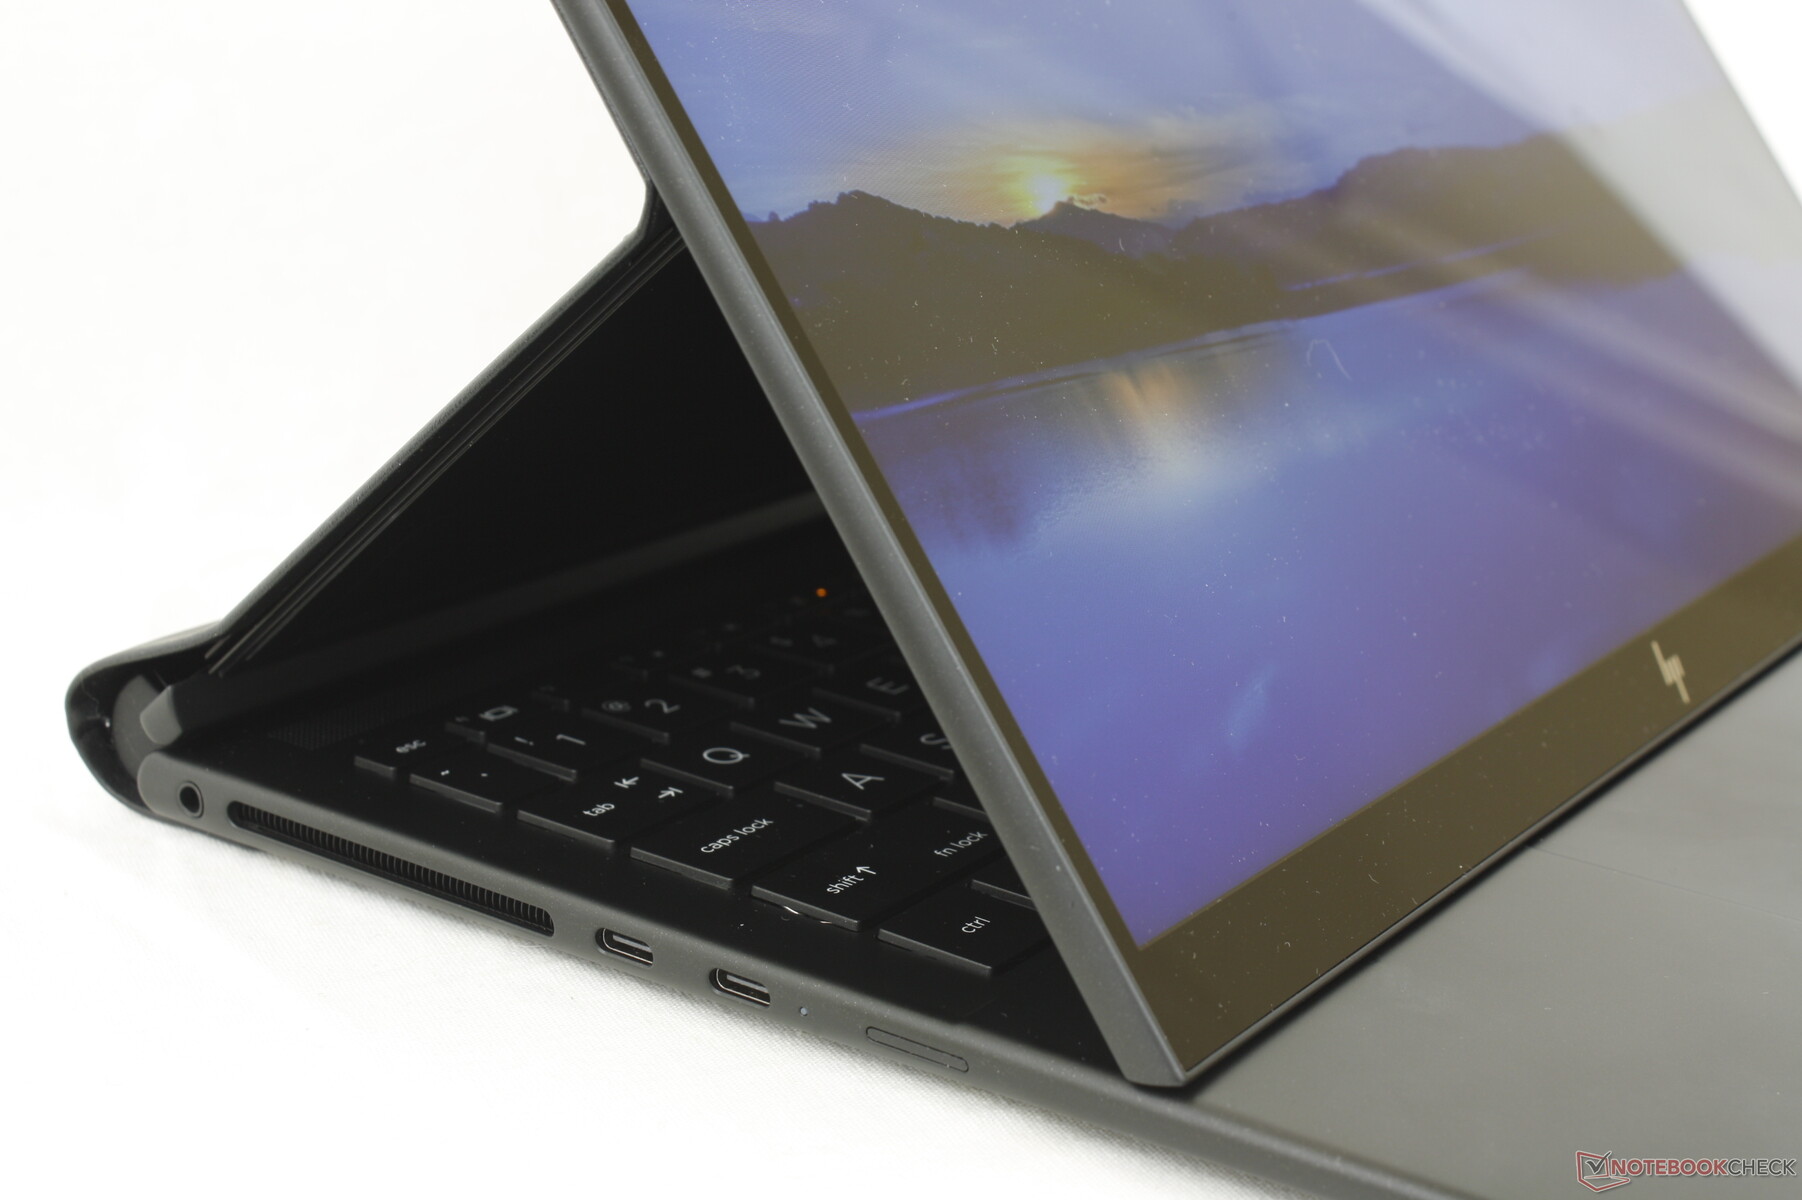
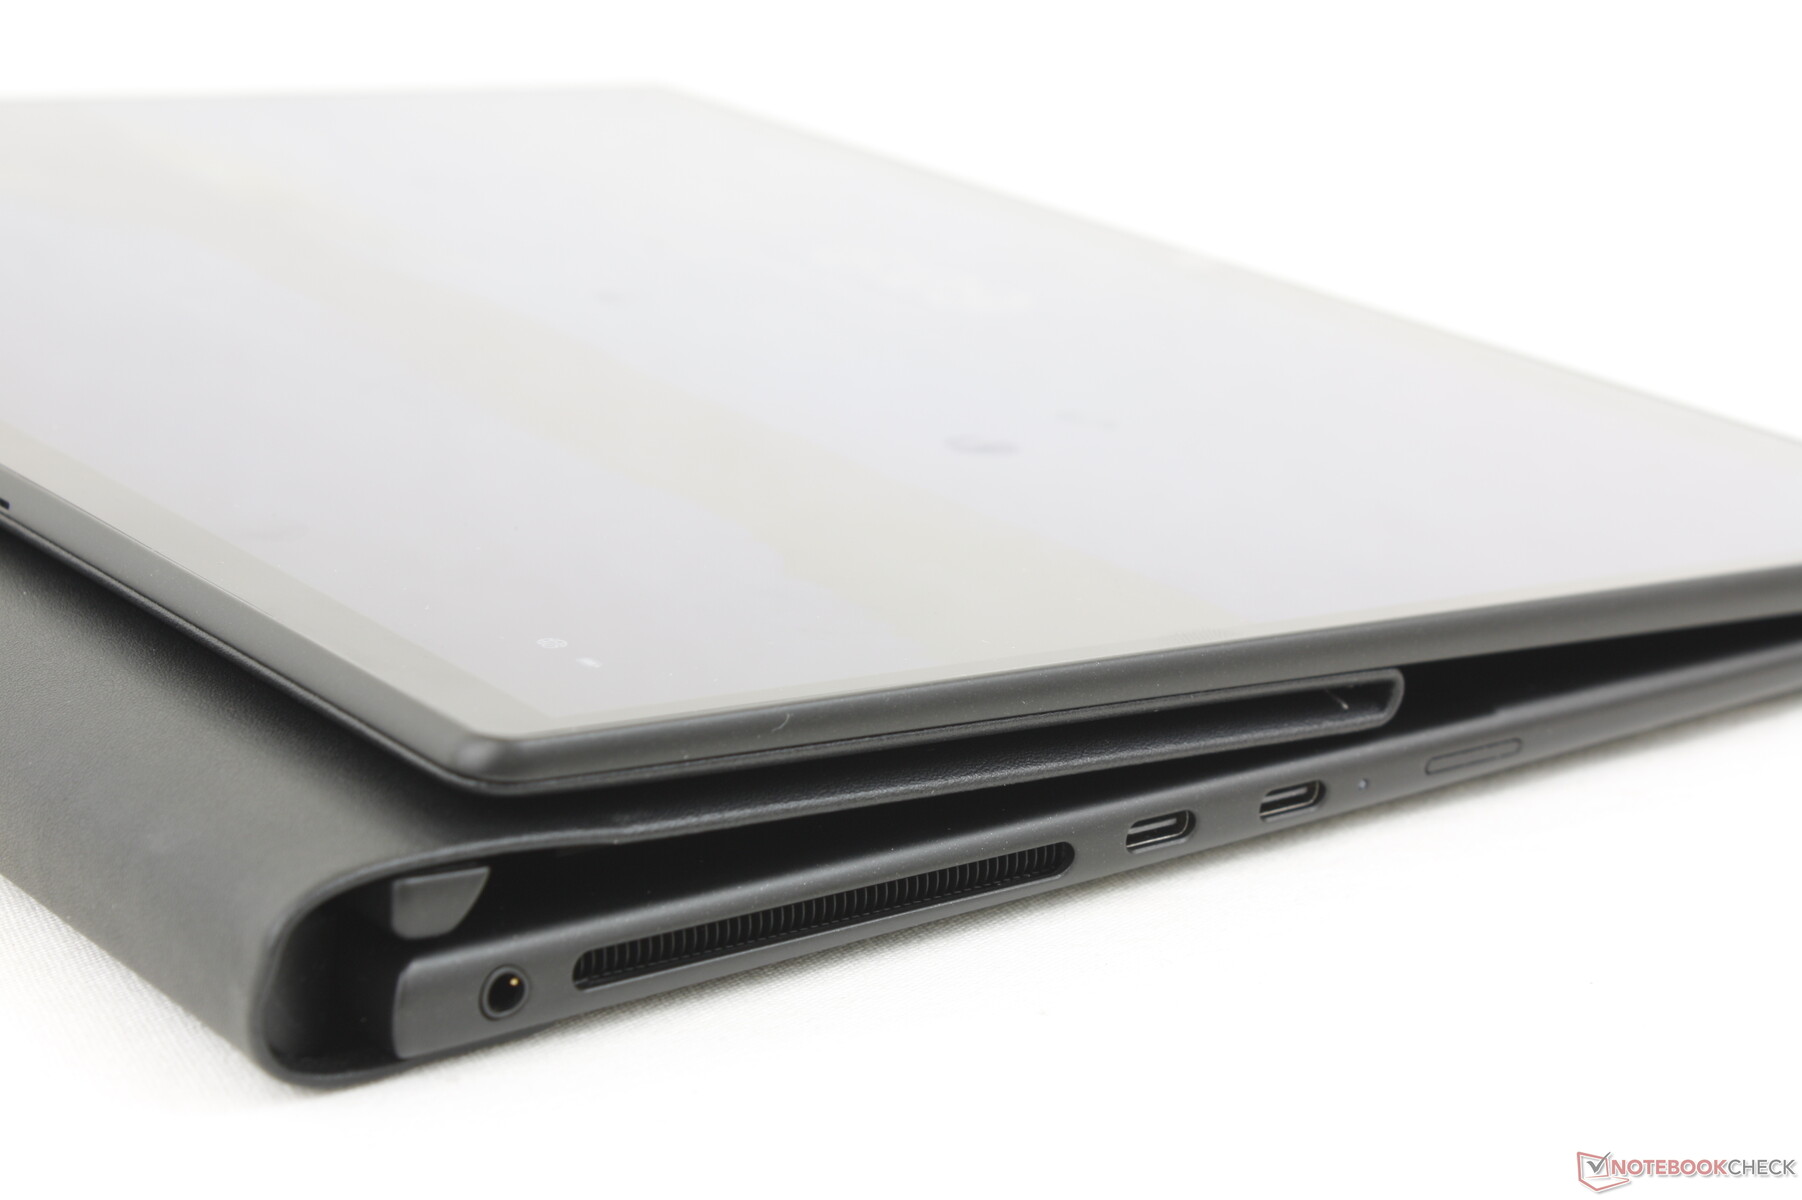
El sistema integra solo dos puertos USB-C 4.0 compatibles cada uno con accesorios y monitores Thunderbolt 4. La mayoría de los demás subportátiles empresariales como el Dragonfly G3 o el Latitude 7330 son capaces de integrar una mayor variedad de puertos para reducir la dependencia de estaciones de acoplamiento o dongles.
Ambos puertos USB-C están a lo largo del borde izquierdo sin ninguno a la derecha en contraste con el Razer Book que tiene un puerto USB-C a cada lado. Esto último es una ventaja, ya que permite la carga desde cualquier lado del portátil, mientras que la carga debe realizarse en el lado izquierdo del Dragonfly Folio G3.
Comunicación
Un Intel AX211 viene de serie para la conectividad Bluetooth 5.3 y Wi-Fi E. Las velocidades de transferencia son rápidas y constantes, sin problemas cuando se empareja con nuestro router de 6 GHz
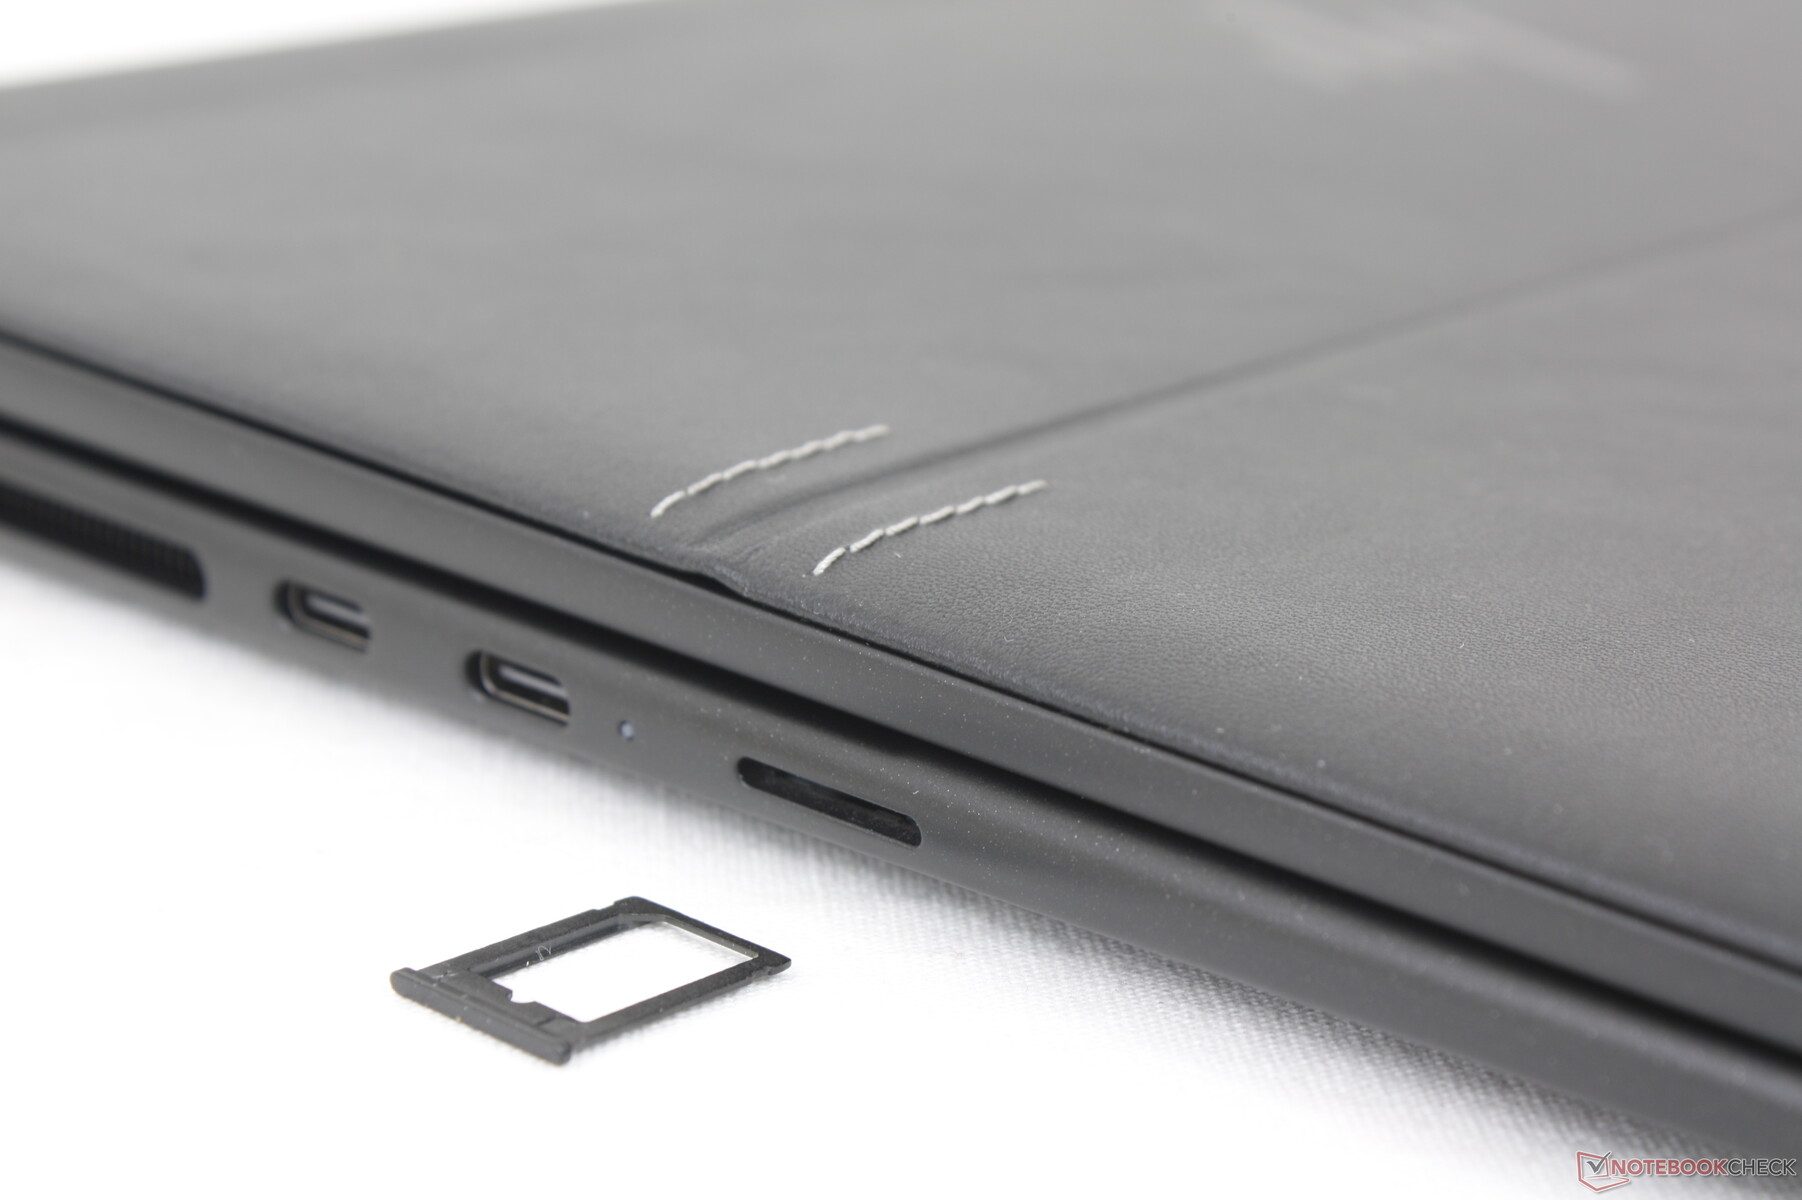
la WAN 5G es opcional y el módulo WAN M.2 es fácilmente extraíble. No hay soporte eSIM, sin embargo, por lo que los propietarios tendrán que suministrar sus propias tarjetas Nano-SIM.
| Networking | |
| iperf3 transmit AX12 | |
| Lenovo ThinkPad L13 Gen2-20VH0017GE | |
| Razer Book 13 FHD | |
| iperf3 receive AX12 | |
| Razer Book 13 FHD | |
| Lenovo ThinkPad L13 Gen2-20VH0017GE | |
| iperf3 receive AXE11000 6GHz | |
| Framework Laptop 13.5 12th Gen Intel | |
| HP Elite Dragonfly Folio 13.5 G3 | |
| HP Elite Dragonfly G3 | |
| Dell Latitude 13 7330 | |
| iperf3 receive AXE11000 | |
| HP Elite Dragonfly Folio 13.5 G3 | |
| iperf3 transmit AXE11000 | |
| HP Elite Dragonfly Folio 13.5 G3 | |
| iperf3 transmit AXE11000 6GHz | |
| Dell Latitude 13 7330 | |
| HP Elite Dragonfly Folio 13.5 G3 | |
| Framework Laptop 13.5 12th Gen Intel | |
| HP Elite Dragonfly G3 | |
Cámara web: ¡8 megapíxeles!
El Dragonfly Folio G3 es uno de los primeros portátiles en incorporar una webcam de 8 MP, mientras que otros grandes fabricantes siguen utilizando sensores de 2 MP o incluso 1 MP. También admite grabación de vídeo de hasta 1836p. La calidad de imagen es una de las más nítidas de cualquier portátil, pero hay algunas limitaciones. En primer lugar, la grabación de vídeo a 60 FPS no es compatible con la aplicación de cámara predeterminada a pesar del elevado número de MP. En segundo lugar, los colores y la usabilidad en condiciones de poca luz no parecen ser mejores que en la mayoría de portátiles. Y por último, cualquier movimiento aparece muy borroso, probablemente debido en parte a los lentos tiempos de respuesta en blanco y negro de la pantalla. Es una webcam excelente en condiciones de mucha luz y poco movimiento, pero aún se puede mejorar.
Dispone de un sensor de infrarrojos y un obturador digital. La activación del obturador digital de la webcam no tapa físicamente el objetivo.


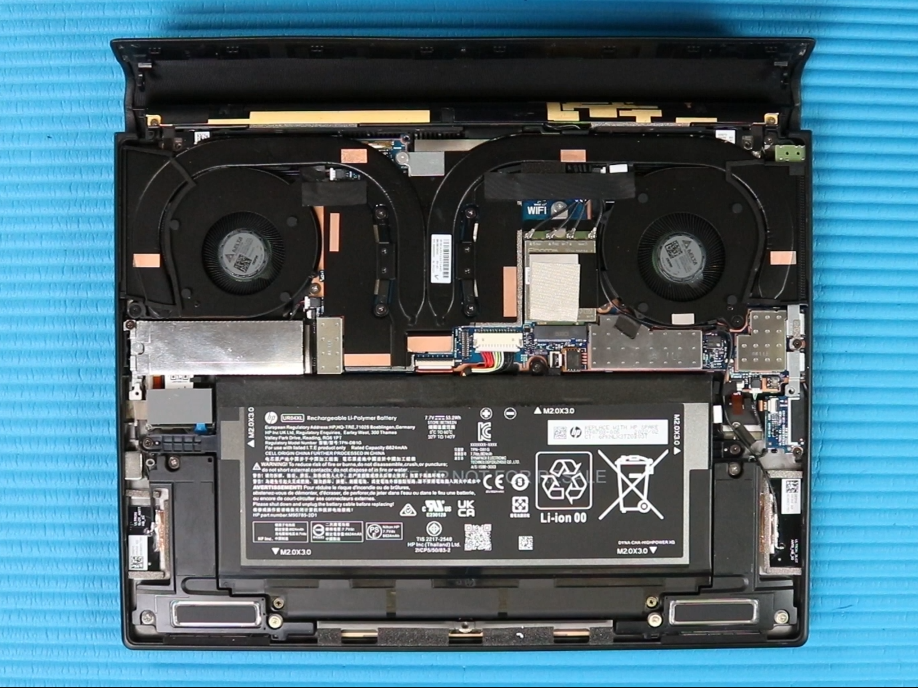
Mantenimiento
A diferencia de la mayoría de fabricantes de portátiles, HP sube vídeos oficiales de desmontaje de muchos de sus modelos, incluido el Dragonfly Folio G3. Recomendamos encarecidamente comprobar el vídeo si está interesado en reparar el portátil usted mismo o ver exactamente lo que hay dentro y lo que se puede o no se puede actualizar. El fabricante ha facilitado considerablemente el mantenimiento en comparación con los antiguos modelos 2020 o 2021
Retirar el panel inferior requiere algunos pasos adicionales en comparación con la mayoría de portátiles debido a la cubierta de piel sintética. En primer lugar, hay que retirar dos tapones de las esquinas traseras para dejar al descubierto dos tornillos Philips situados debajo. A continuación, el cuero de imitación se puede separar con cuidado de la base inferior para exponer tornillos Torx adicionales. Una vez dentro, los usuarios sólo verán una ranura M.2 2280 PCIe4 x4 para almacenamiento y una ranura de expansión M.2 para WAN. Los módulos RAM y WLAN están soldados.
Accesorios y garantía
La caja incluye un bolígrafo activo que se fija magnéticamente al borde derecho del portátil. Agradecemos que el bolígrafo venga de serie teniendo en cuenta que suelen ser extras caros.
La garantía limitada del fabricante de un año viene de serie en EE.UU., lo que es decepcionante teniendo en cuenta que la mayoría de modelos EliteBook de gama alta vienen con una garantía básica de tres años.
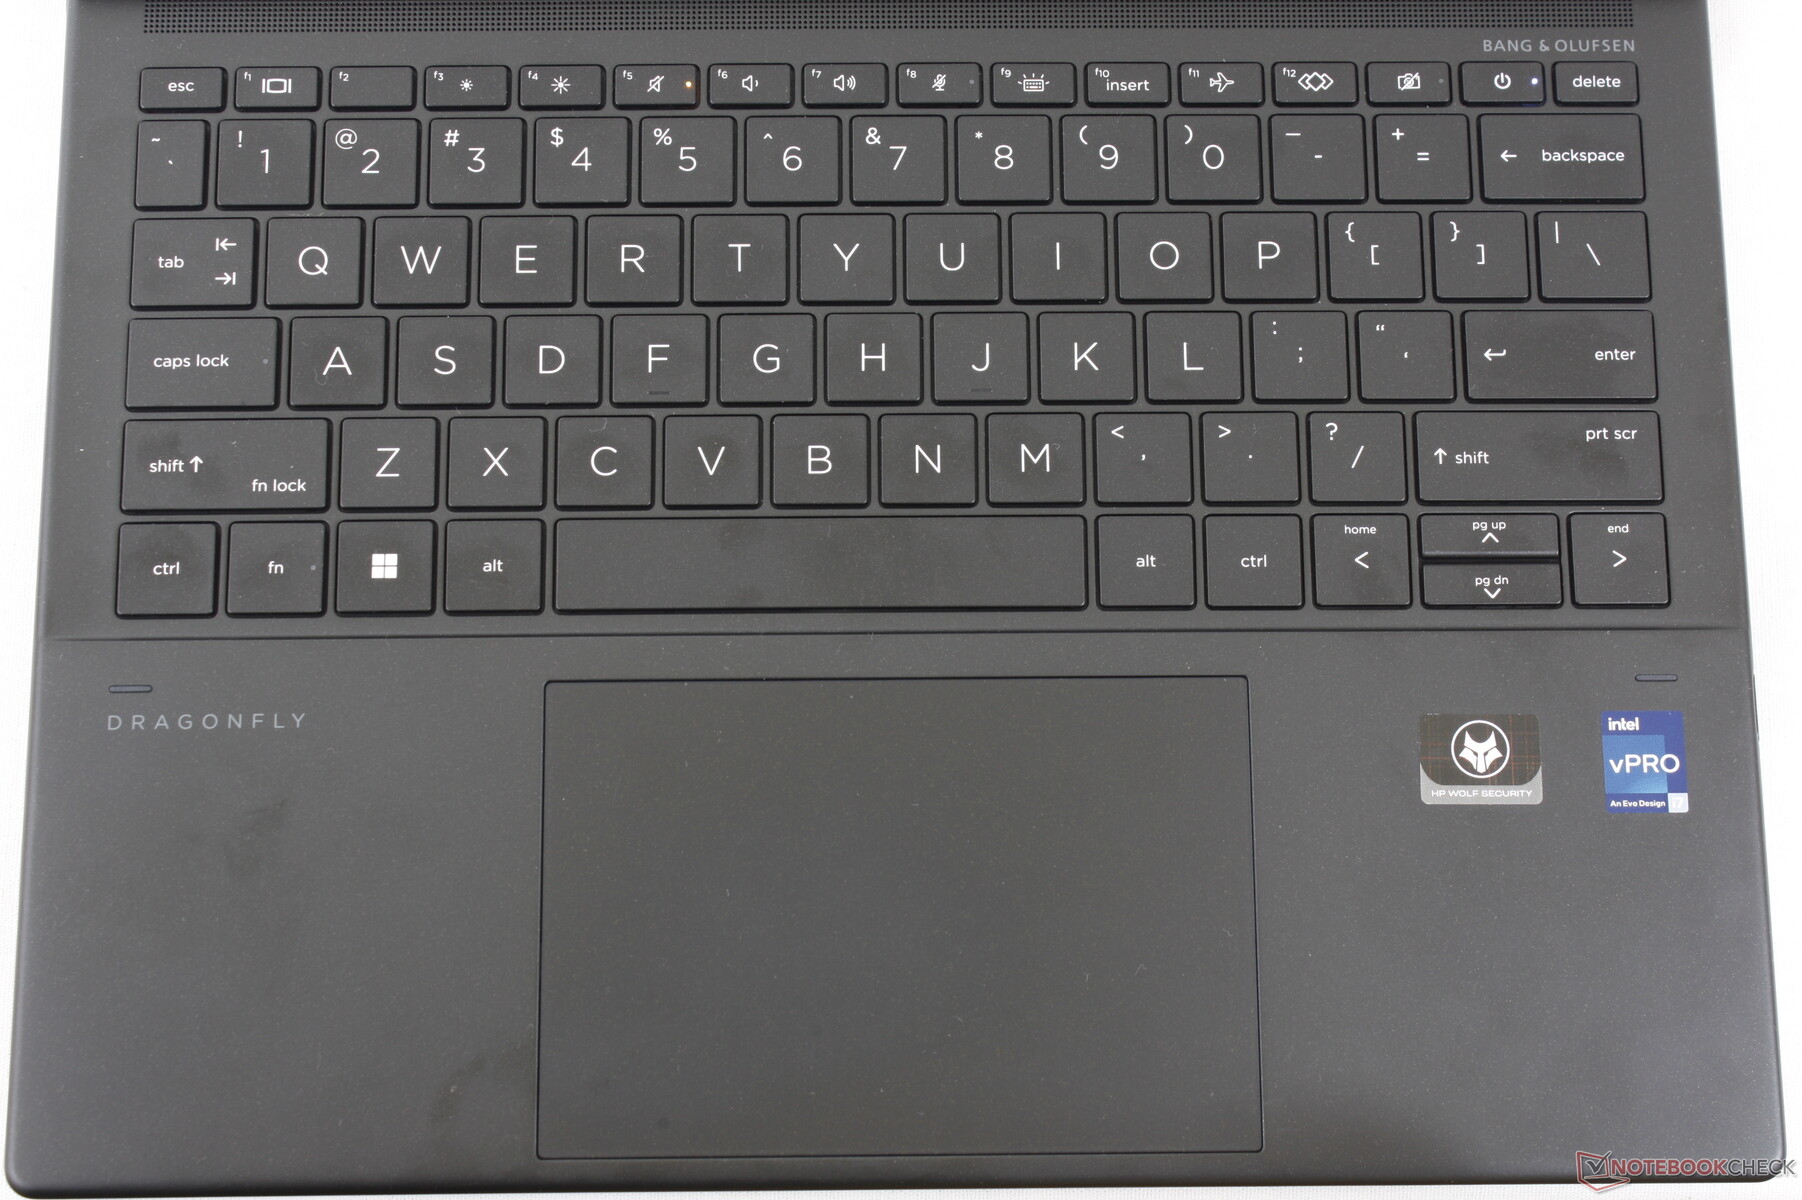
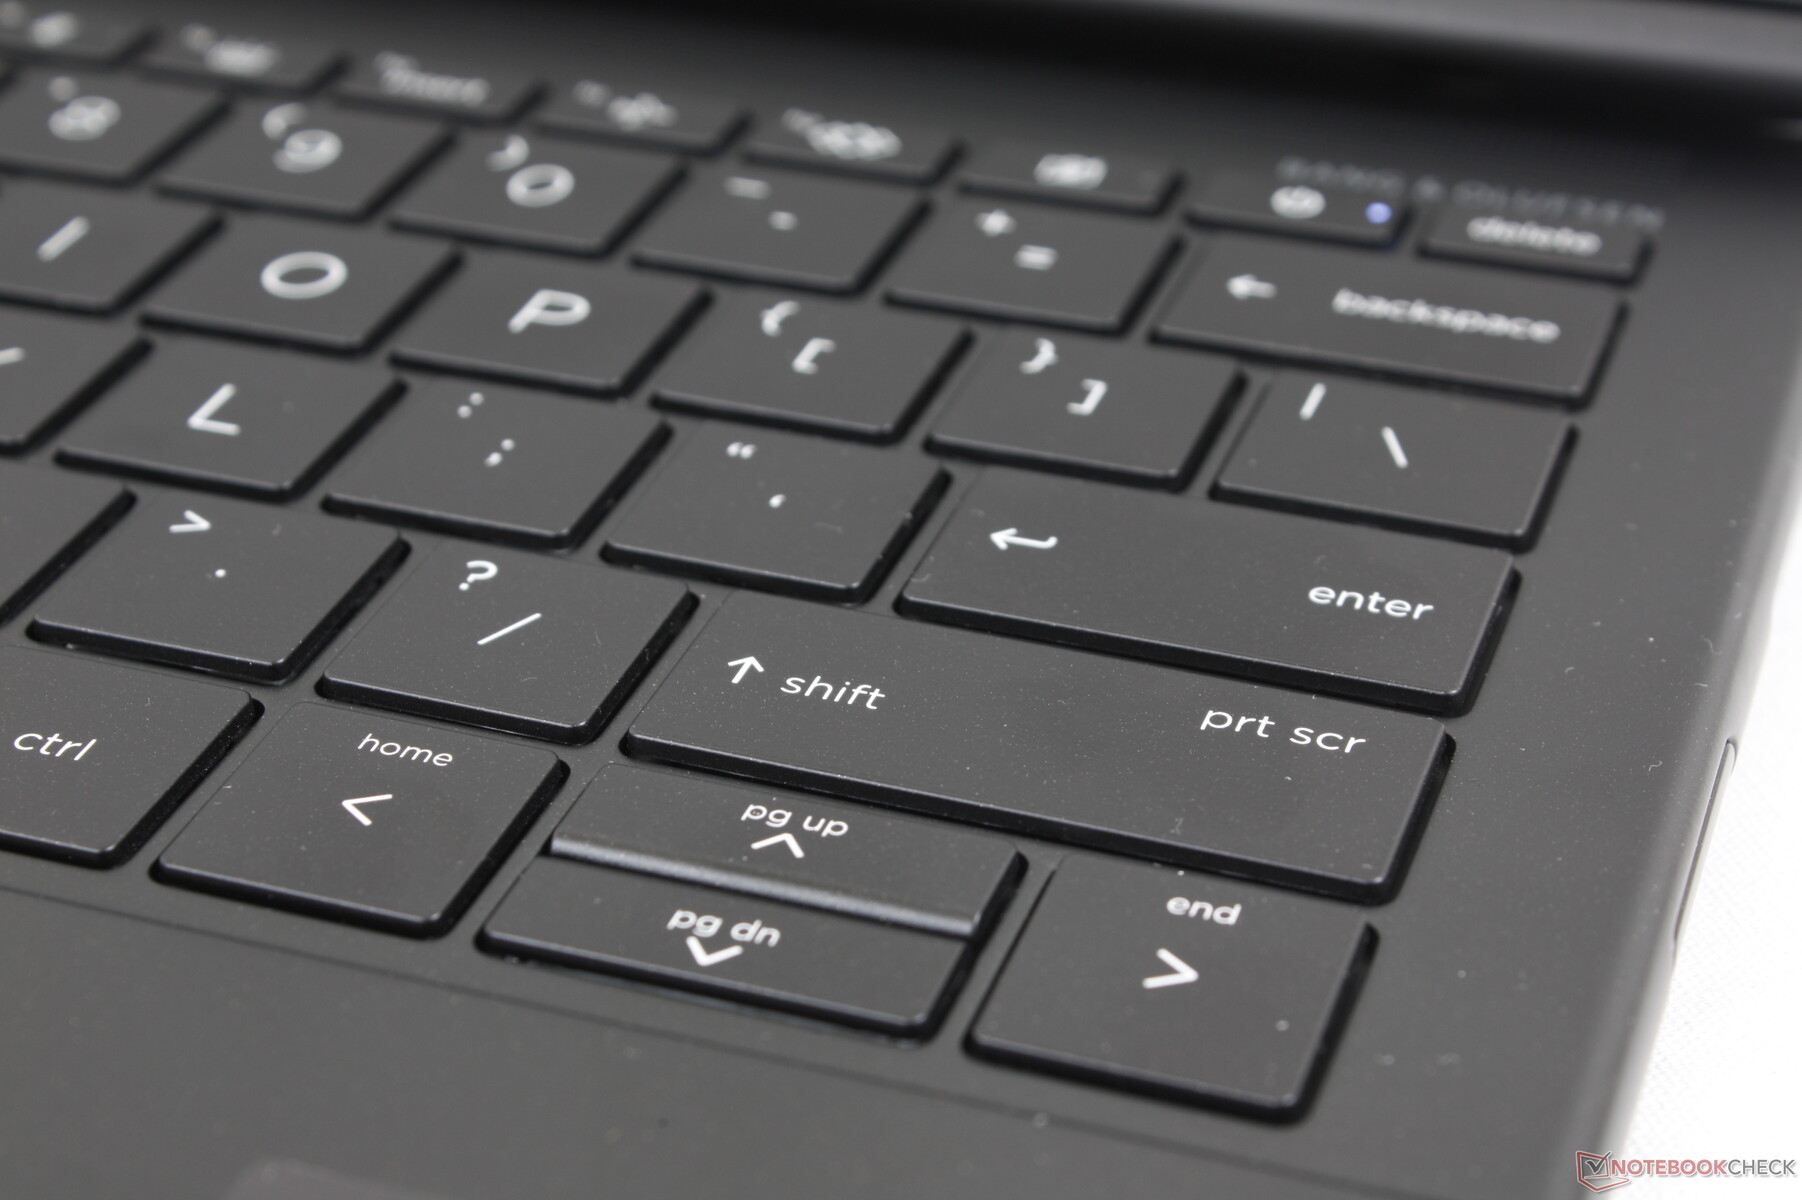
Dispositivos de entrada: como un EliteBook
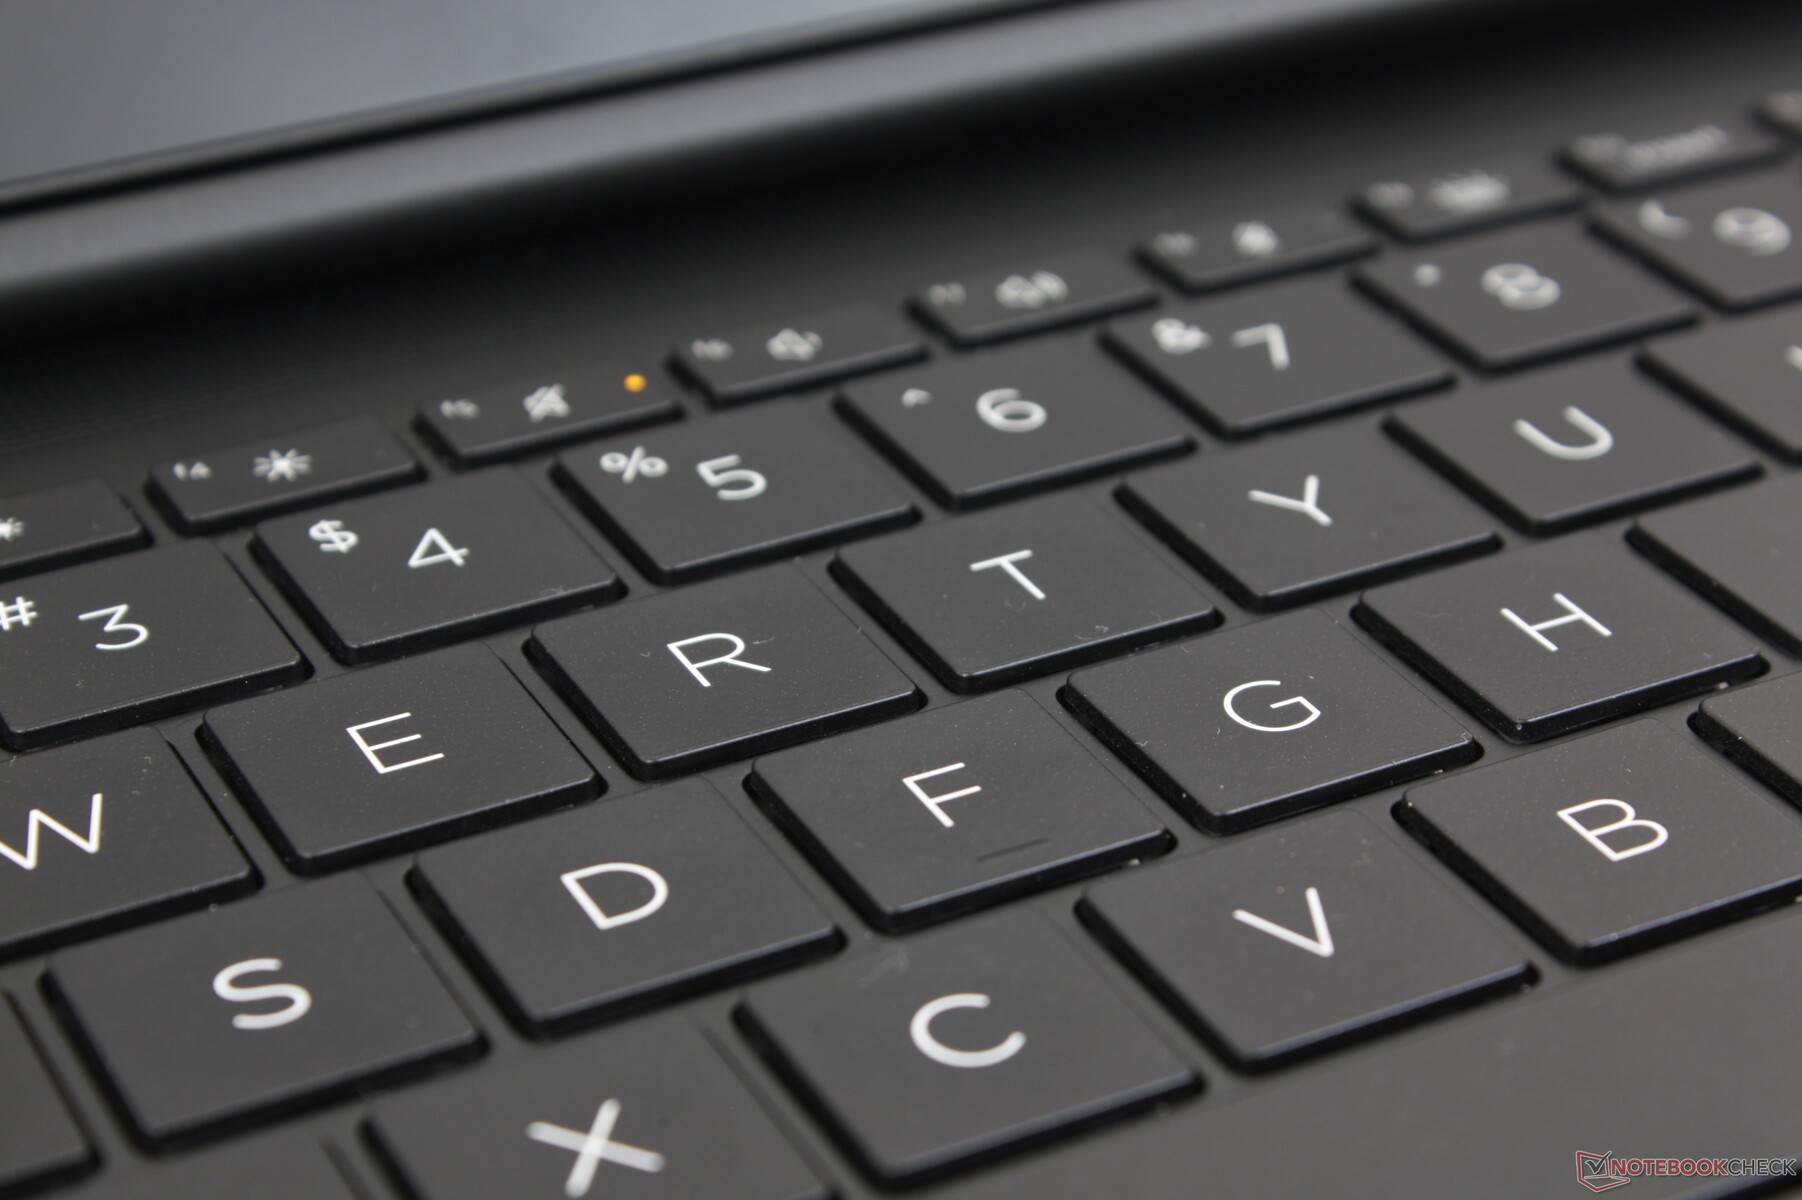
Teclado
La distribución del teclado es idéntica a la del Dragonfly G3 para una experiencia de tecleo similar. Los teclados de los HP Spectre y EliteBook tienden a tener una respuesta más nítida para evitar la habitual sensación esponjosa de la que adolecen muchos otros Ultrabooks más baratos
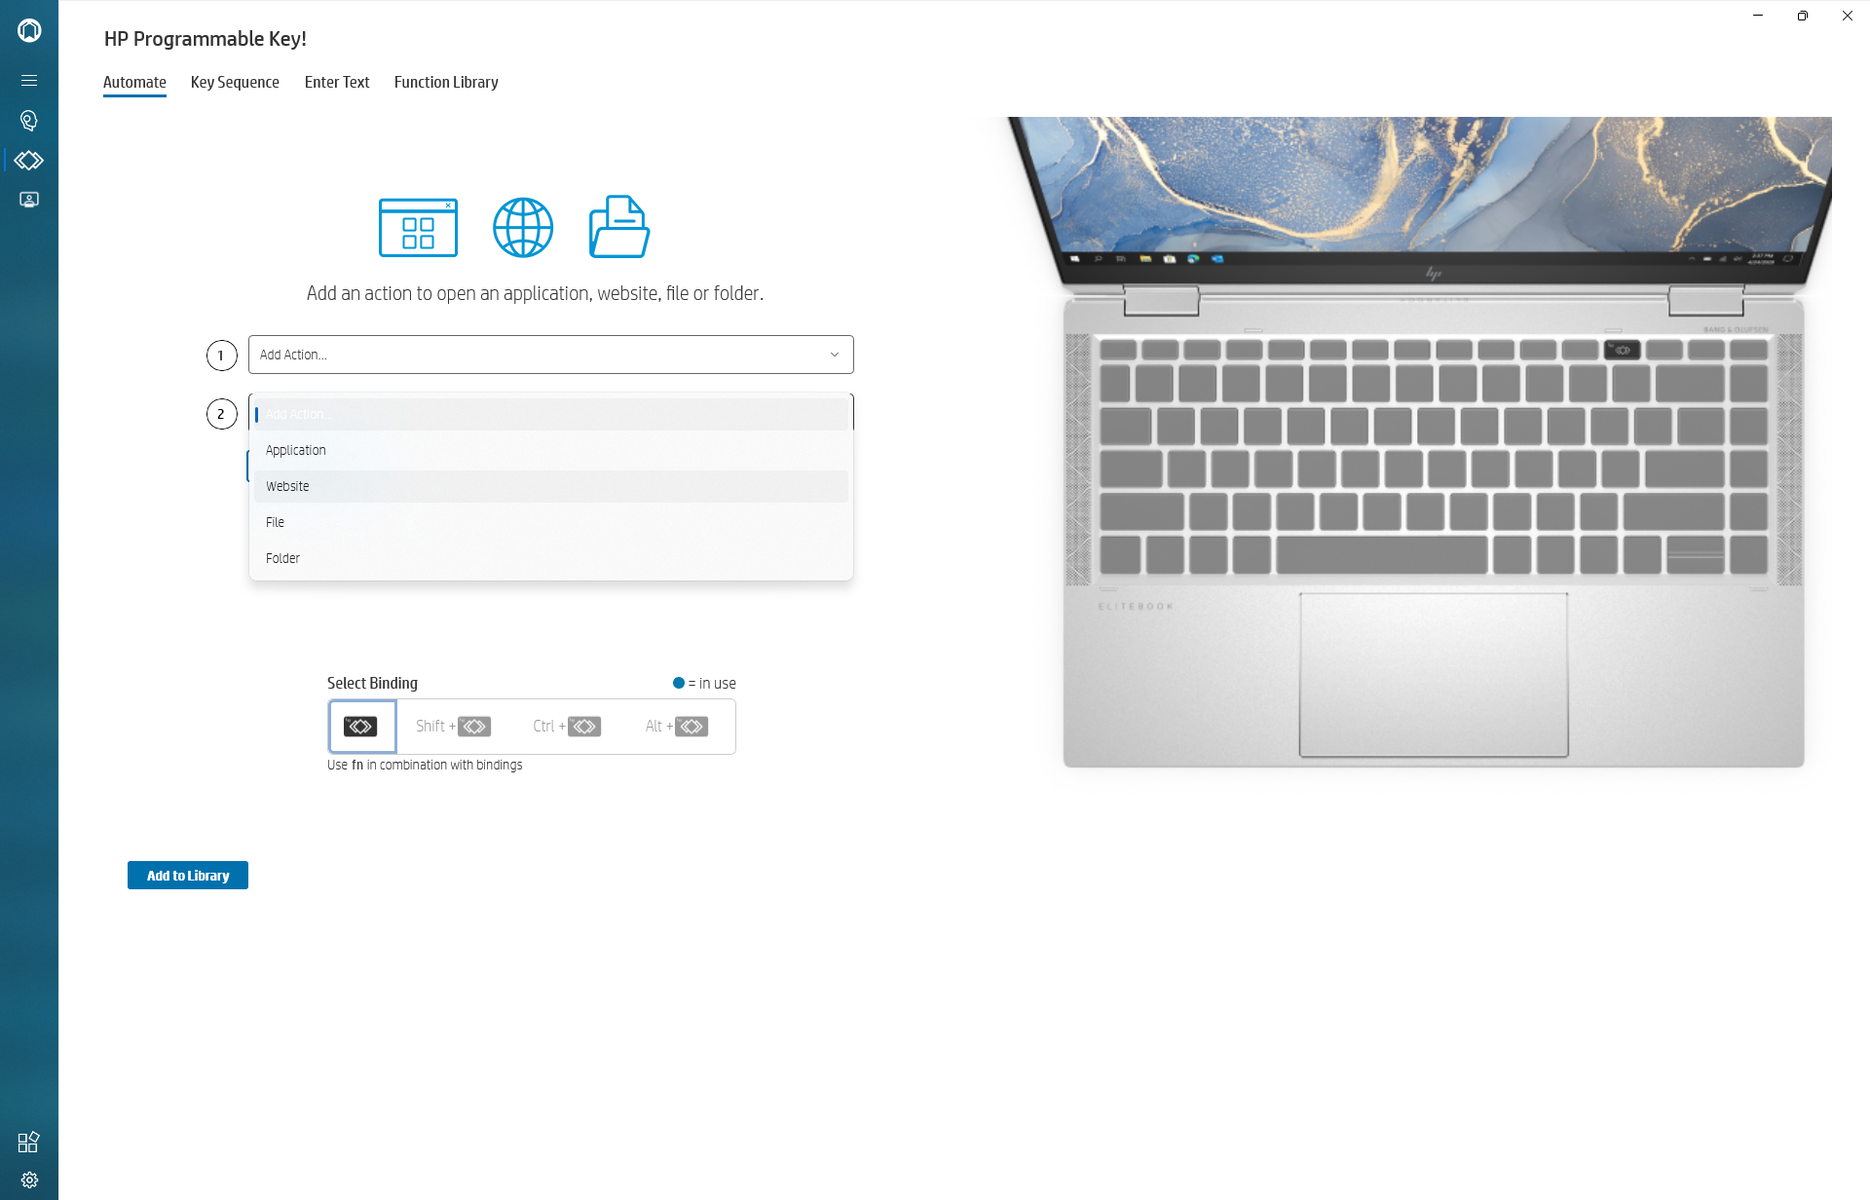
Una característica única en muchos portátiles HP más recientes es la tecla personalizable por el usuario llamada "Tecla programable". La tecla se puede configurar para iniciar una aplicación o para introducir una cadena de texto. La mayoría de los portátiles no incorporan esta función o requieren aplicaciones de terceros para lograr el mismo objetivo.
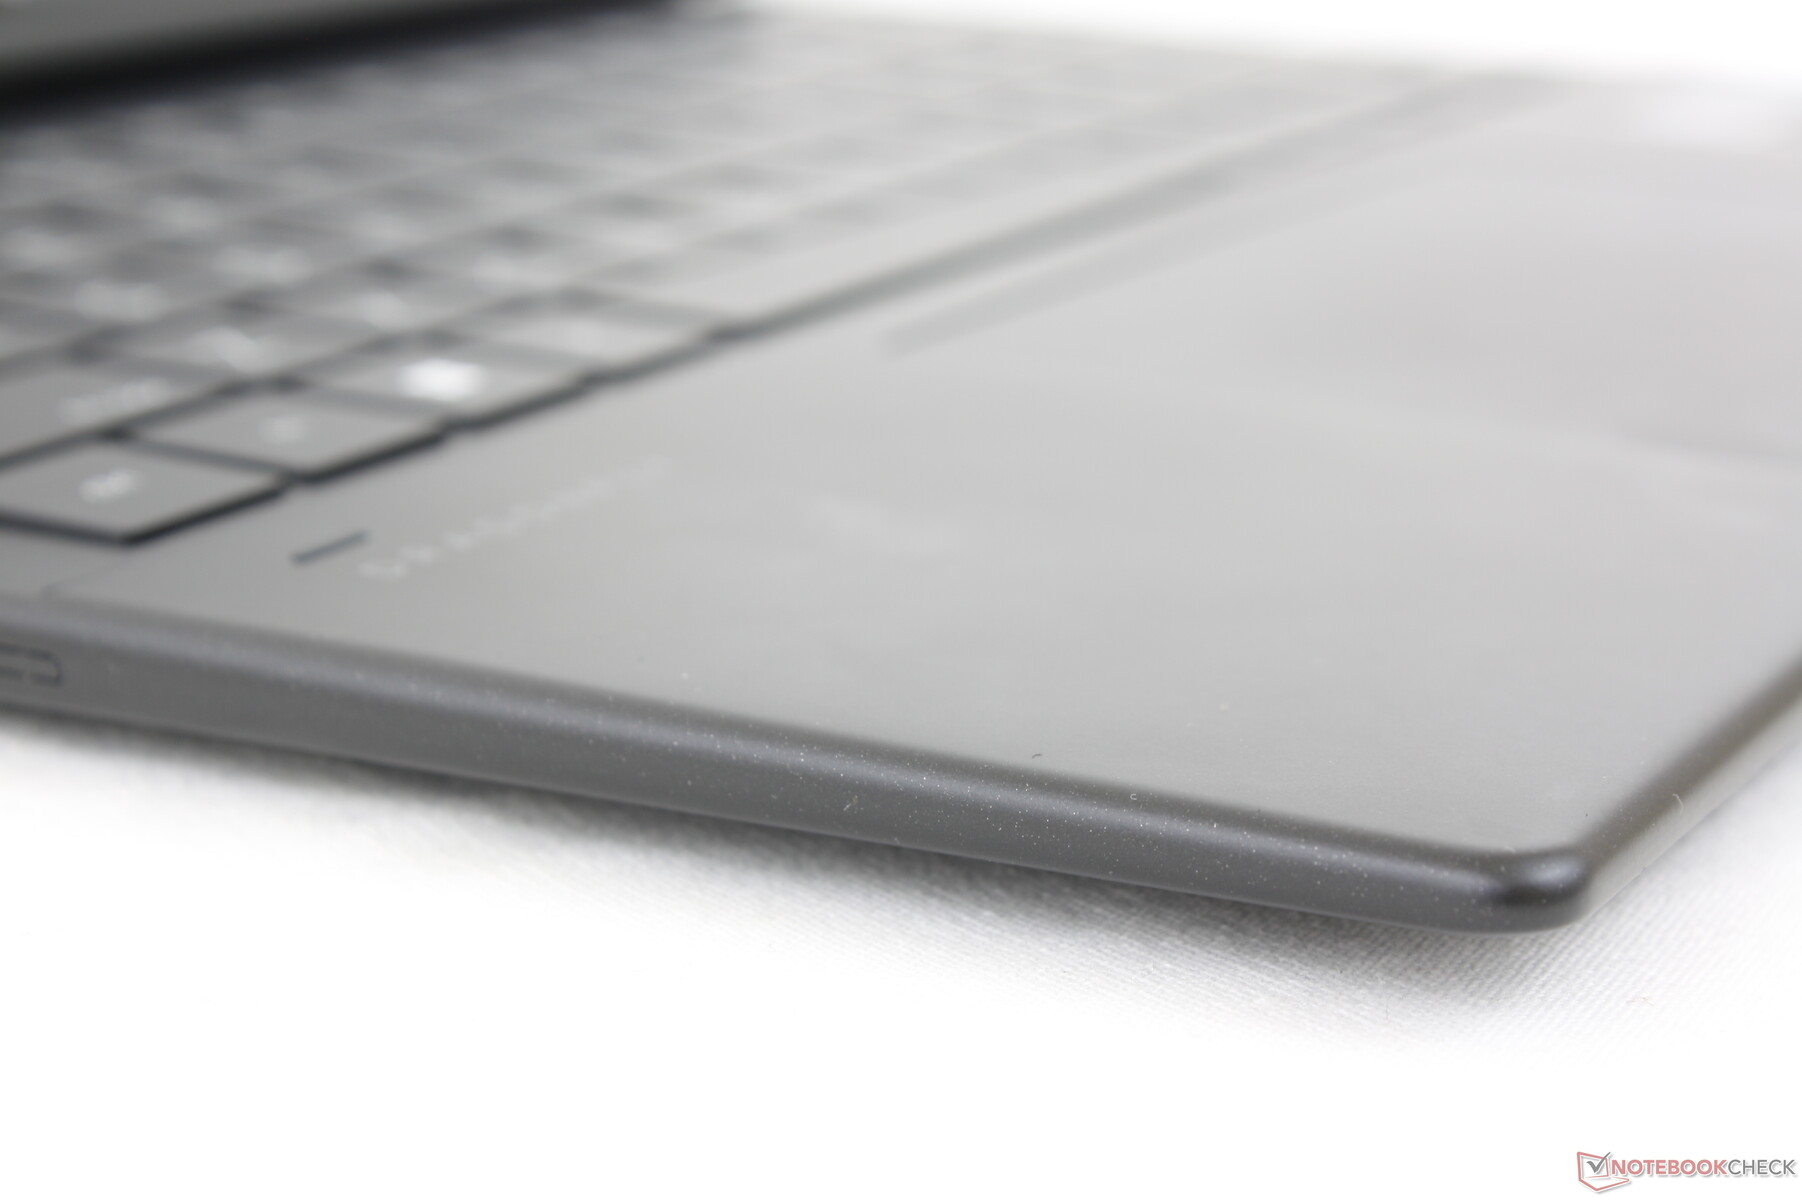
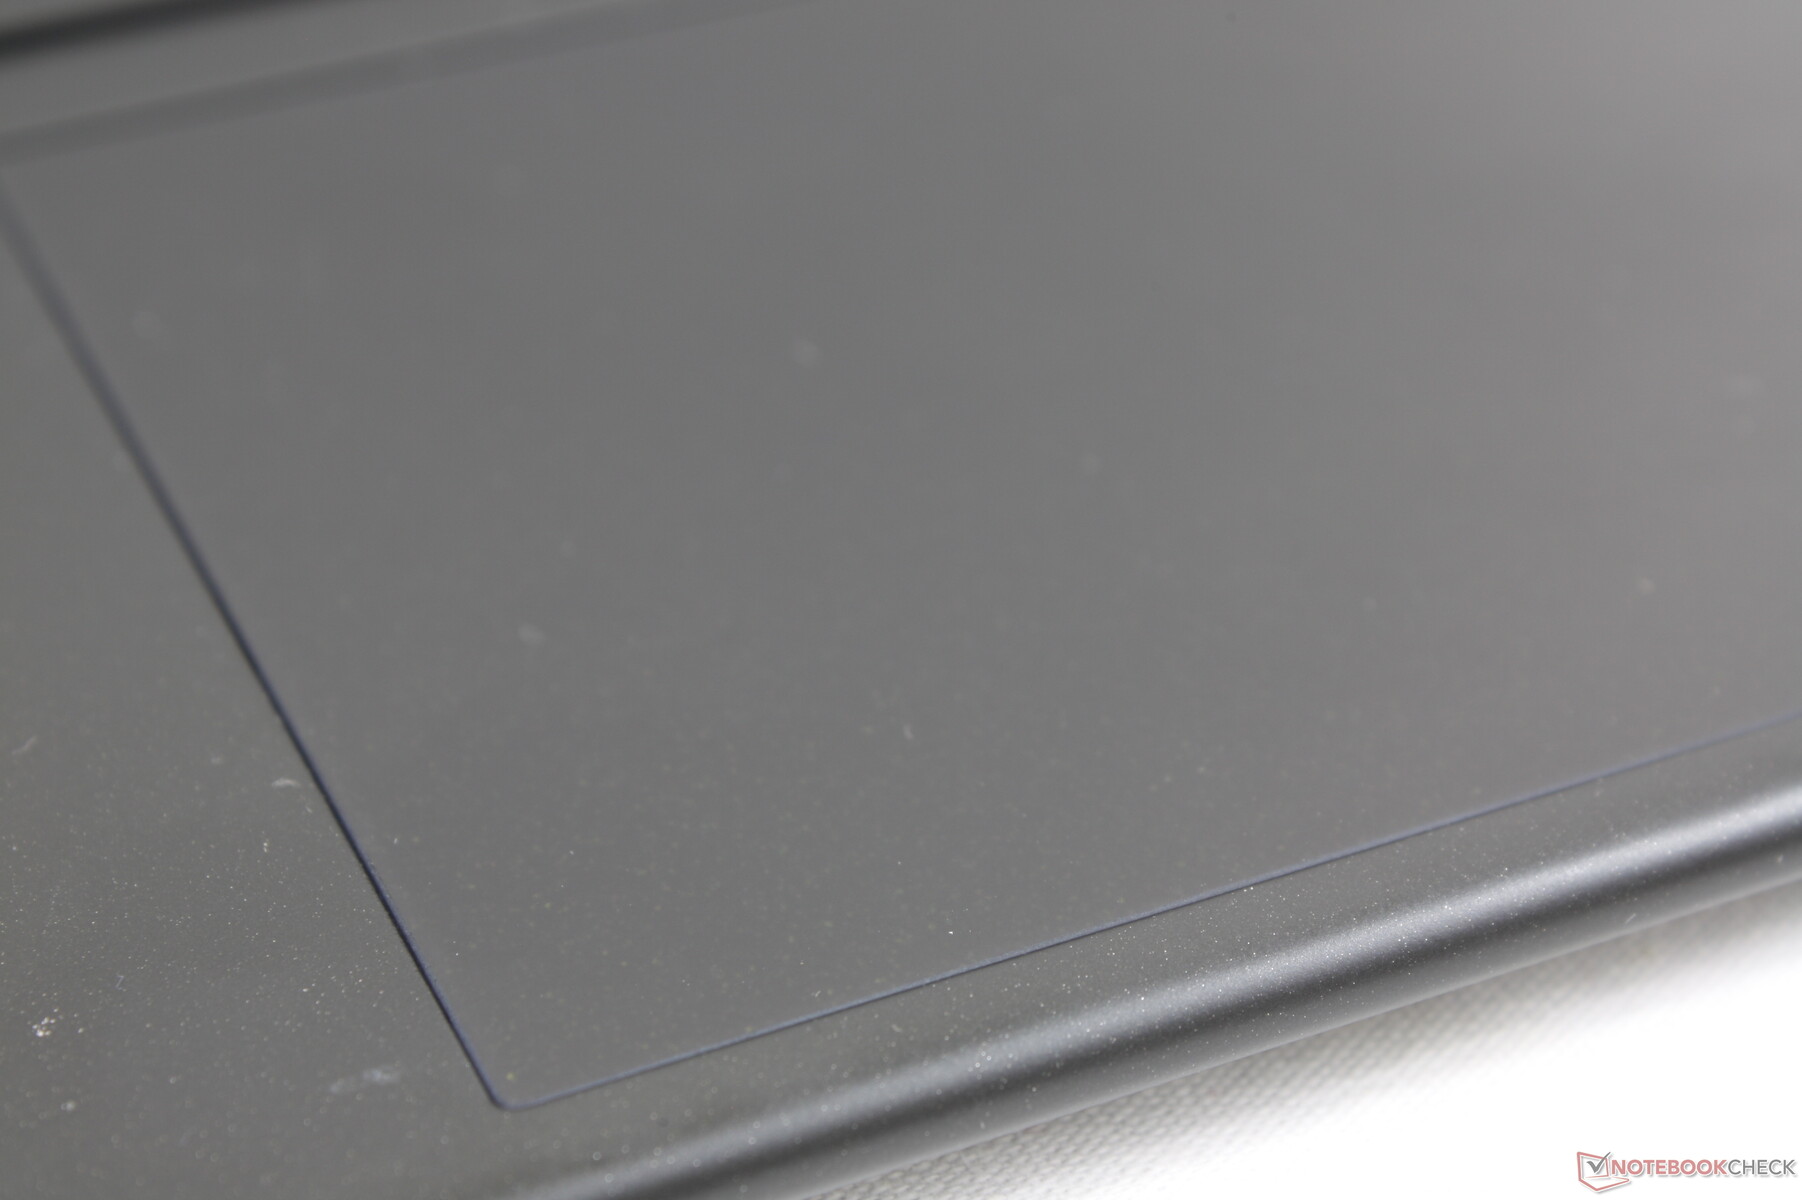
Panel táctil
El clickpad tiene exactamente el mismo tamaño que en el Dragonfly G3 (12 x 8 cm). Sin embargo, éste carece de la opción NFC del Dragonfly G3, lo que es una pena para los usuarios que confían en esta función. Por lo demás, el control del cursor es fiable y se traba muy poco al deslizar a velocidades lentas o rápidas
La respuesta al hacer clic en el clickpad es poco profunda y débil, por lo que la sensación es ligeramente insatisfactoria. El traqueteo es más silencioso, pero habría sido preferible un clic más firme.
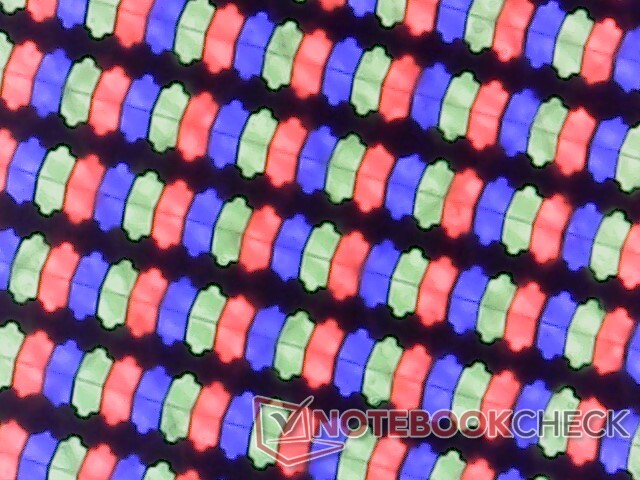
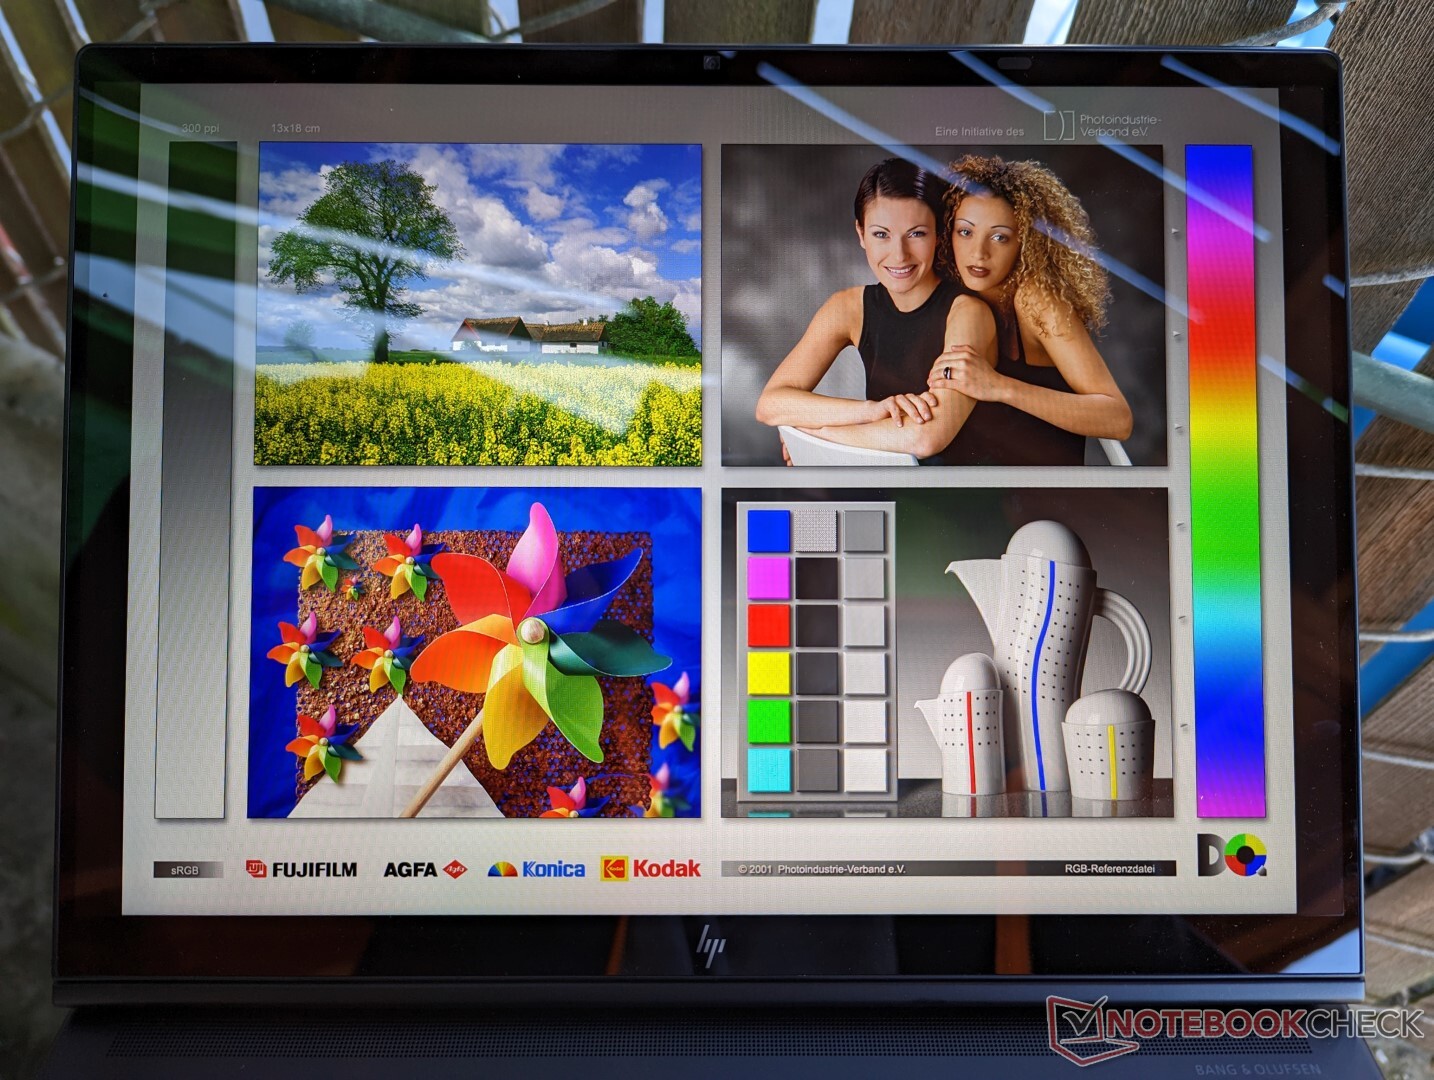
Pantalla - Sólo IPS 60 Hz
Hay tres opciones de pantalla táctil para elegir
- 1920 x 1280, IPS, 400 nits, mate, 60 Hz
- 1920 x 1280, IPS, 400 nits, brillante, 60 Hz
- 1920 x 1280, IPS, 1000 nits, brillante, Sure View, 60 Hz
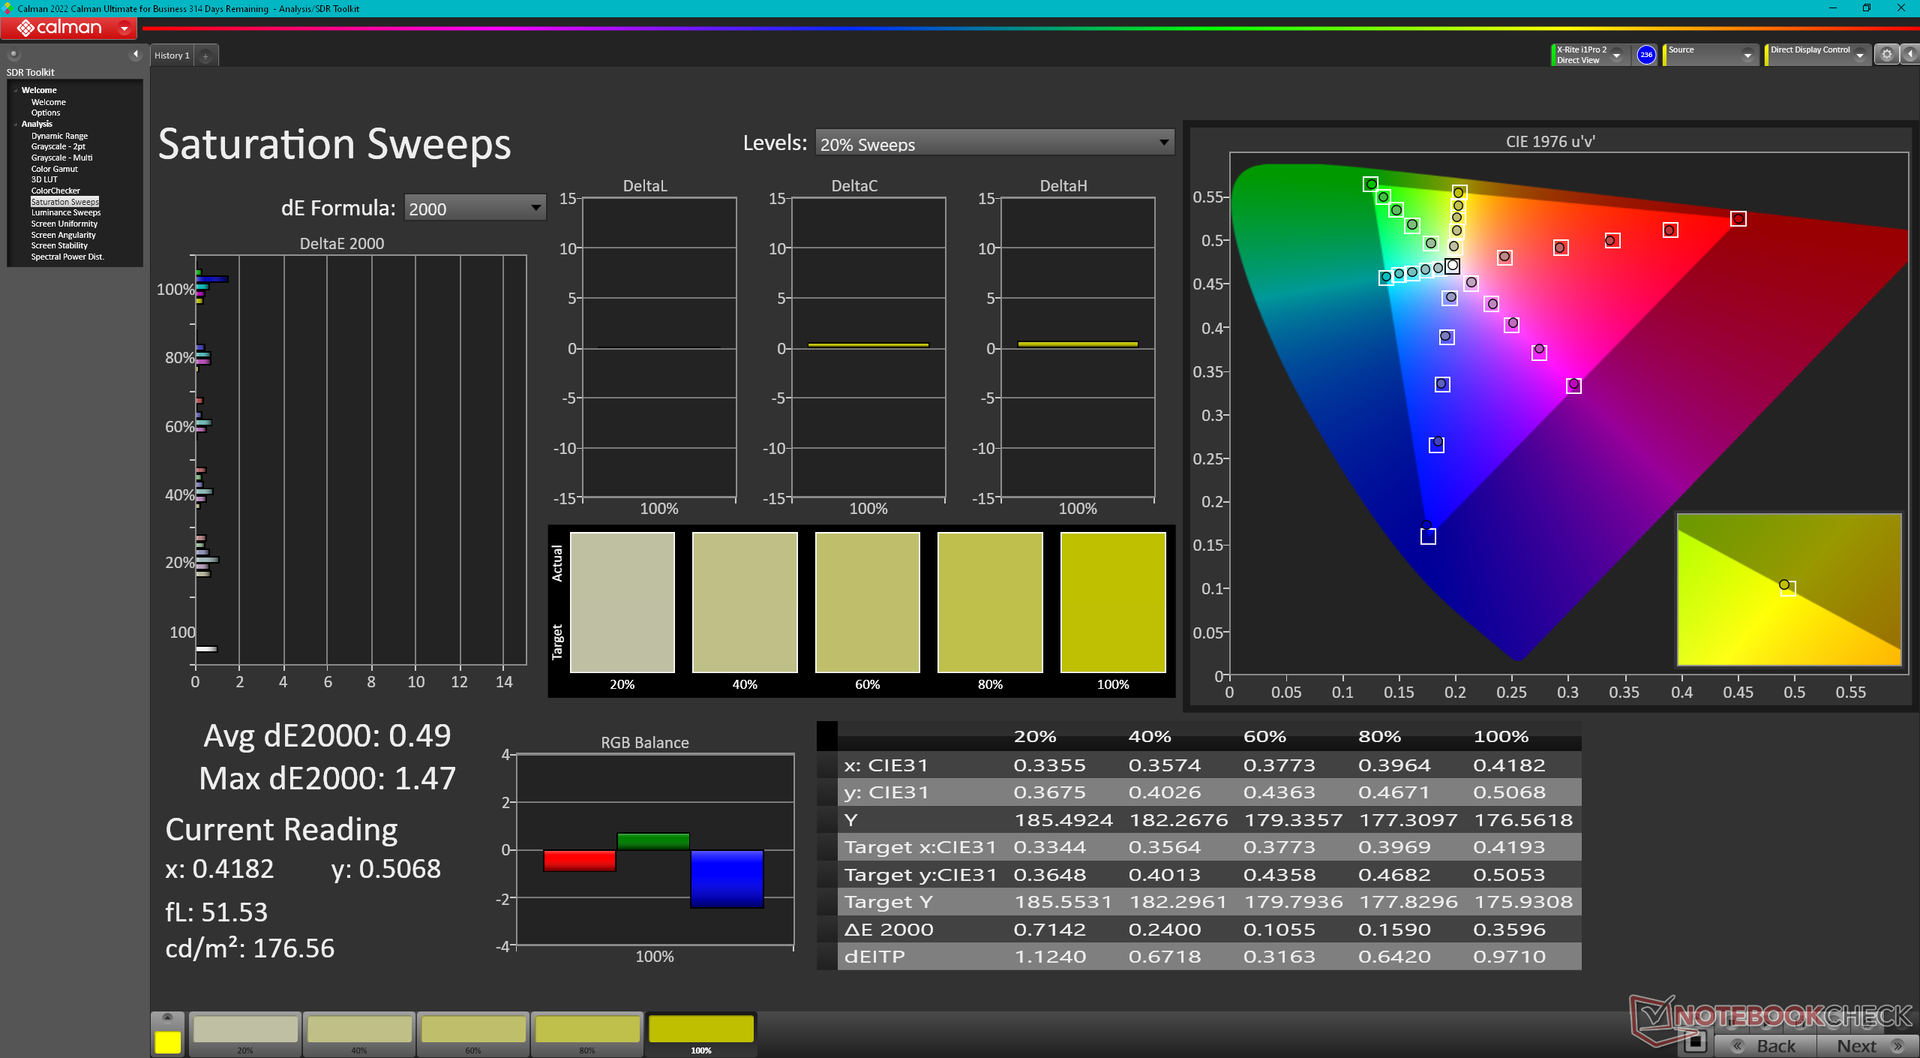
Nuestras mediciones a continuación reflejan sólo la selección en negrita arriba, pero todos son propensos a tener coberturas de color similares y tiempos de respuesta entre ellos. Los usuarios pueden esperar una cobertura sRGB del 99% y un buen ratio de contraste de ~1500:1 de nuestra configuración particular. Por desgracia, el efecto fantasma es muy notable debido a la lentitud de los tiempos de respuesta blanco-negro y gris-gris, lo que significa que cualquier movimiento rápido en vídeos o juegos aparecerá borroso. Una opción OLED habría resuelto este problema pero, por desgracia, no existe tal configuración.
Sure View está vinculado al panel de 1000 nits sin opción de separarlos. Sure View es una experiencia mixta, ya que sacrifica algo de fidelidad visual a cambio de ángulos de visión más estrechos y privados.
Nuestro sistema comparte el mismo controlador de pantalla Chi Mei CMN13C0 que el Dragonfly G3, lo que sugiere que HP utiliza los mismos paneles en ambos modelos.
| |||||||||||||||||||||||||
iluminación: 87 %
Brillo con batería: 369.5 cd/m²
Contraste: 1540:1 (Negro: 0.24 cd/m²)
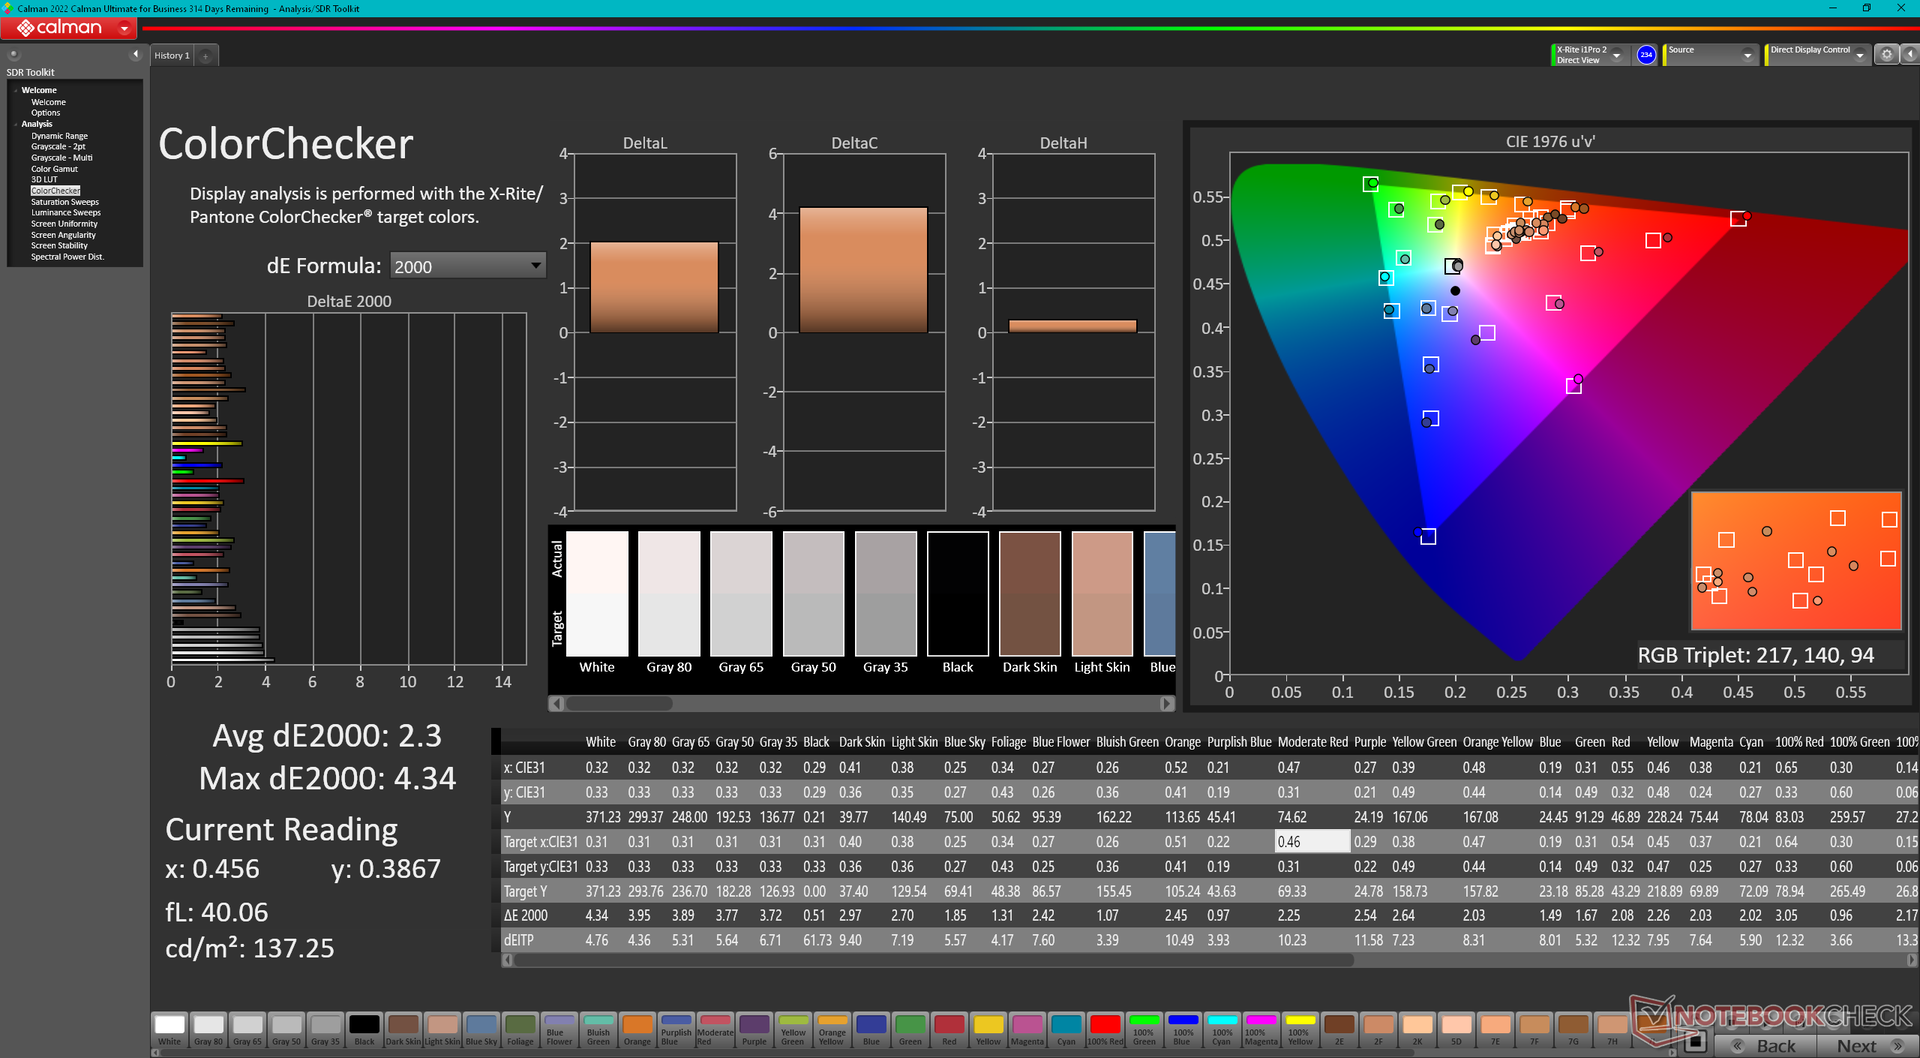
ΔE ColorChecker Calman: 2.3 | ∀{0.5-29.43 Ø4.71}
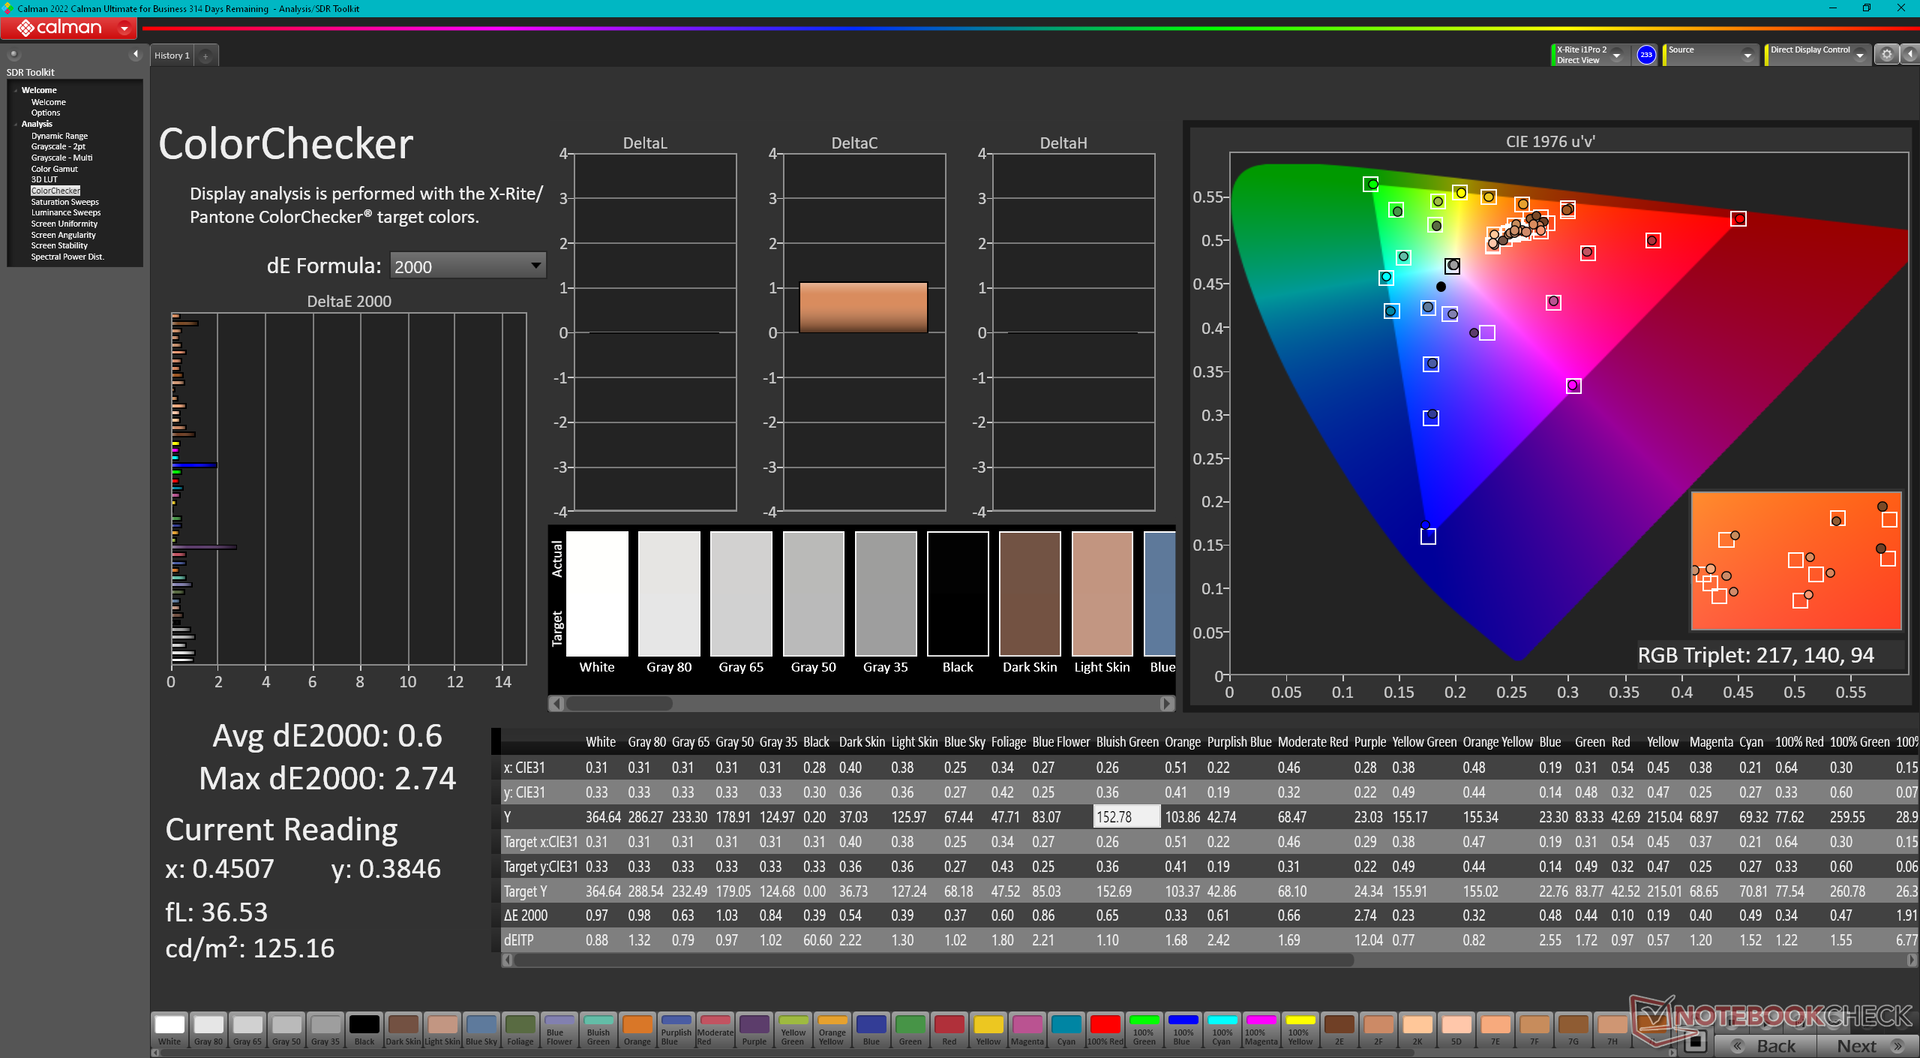
calibrated: 0.6
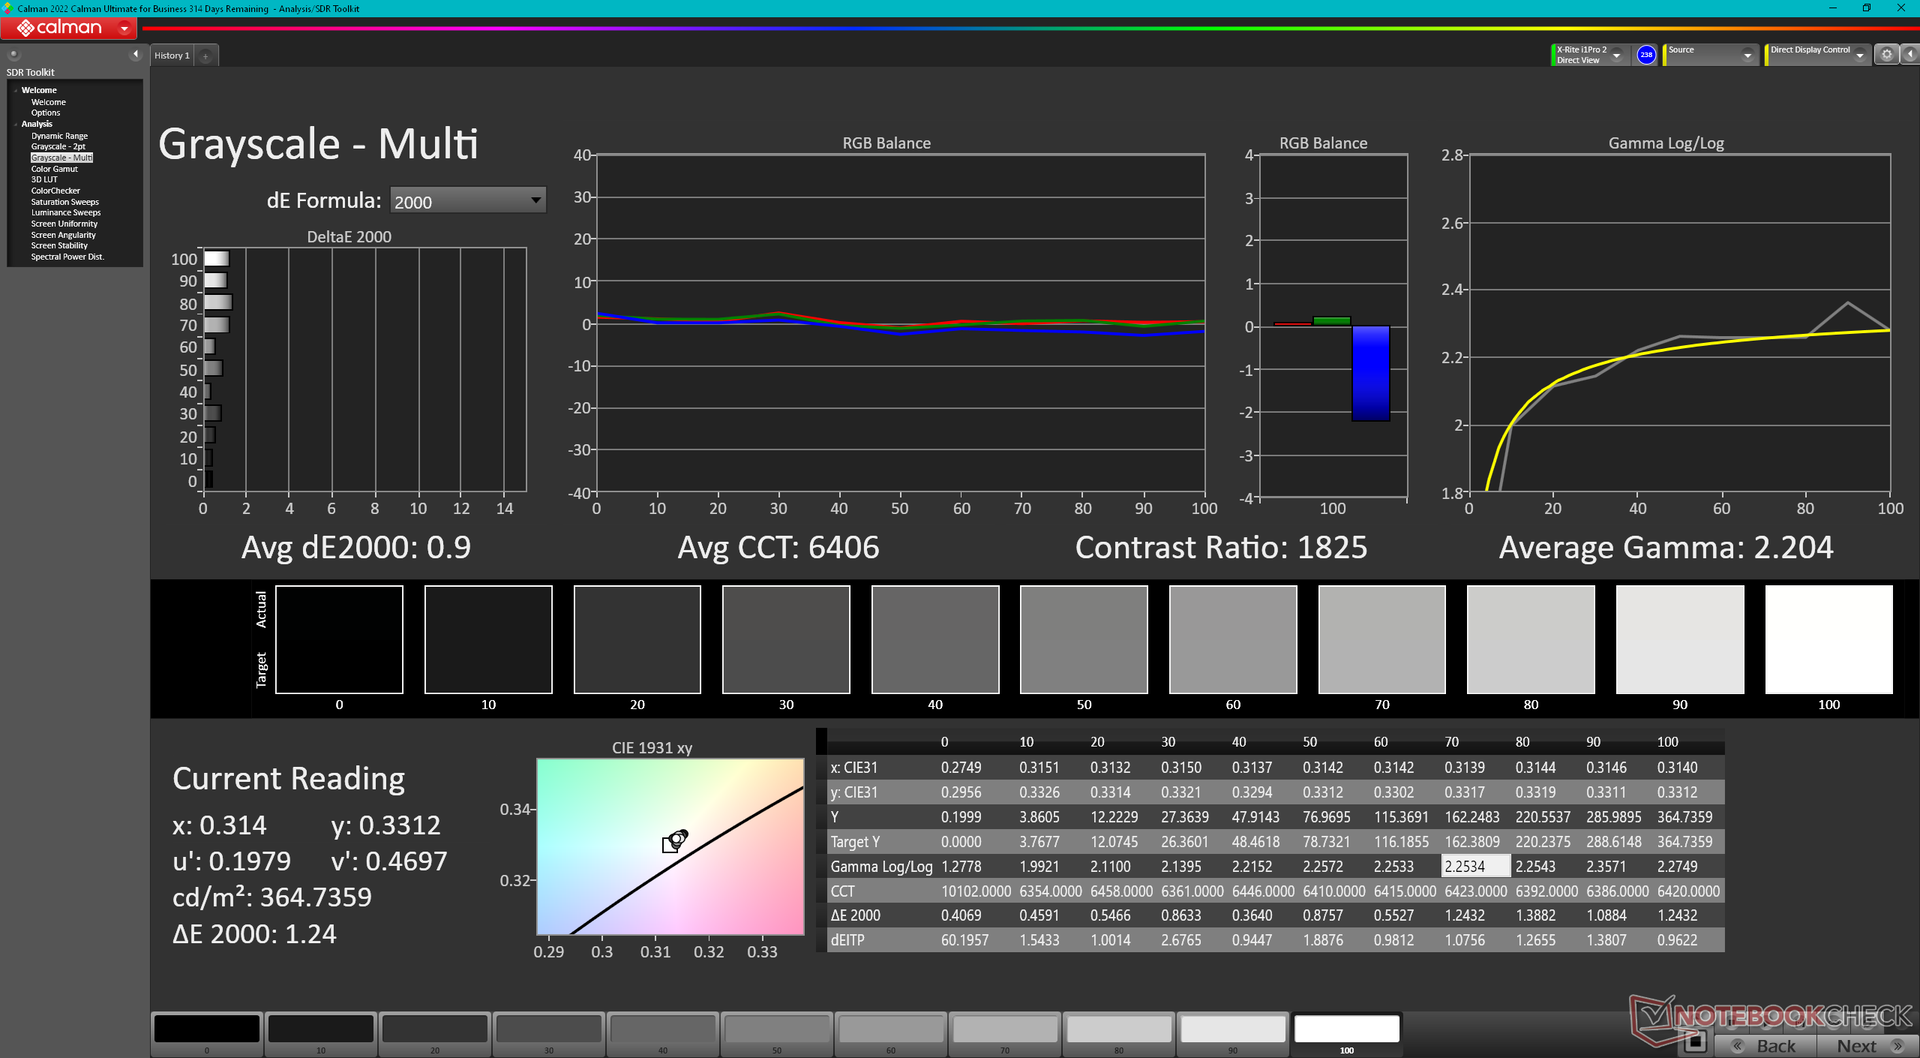
ΔE Greyscale Calman: 3.1 | ∀{0.09-98 Ø4.96}
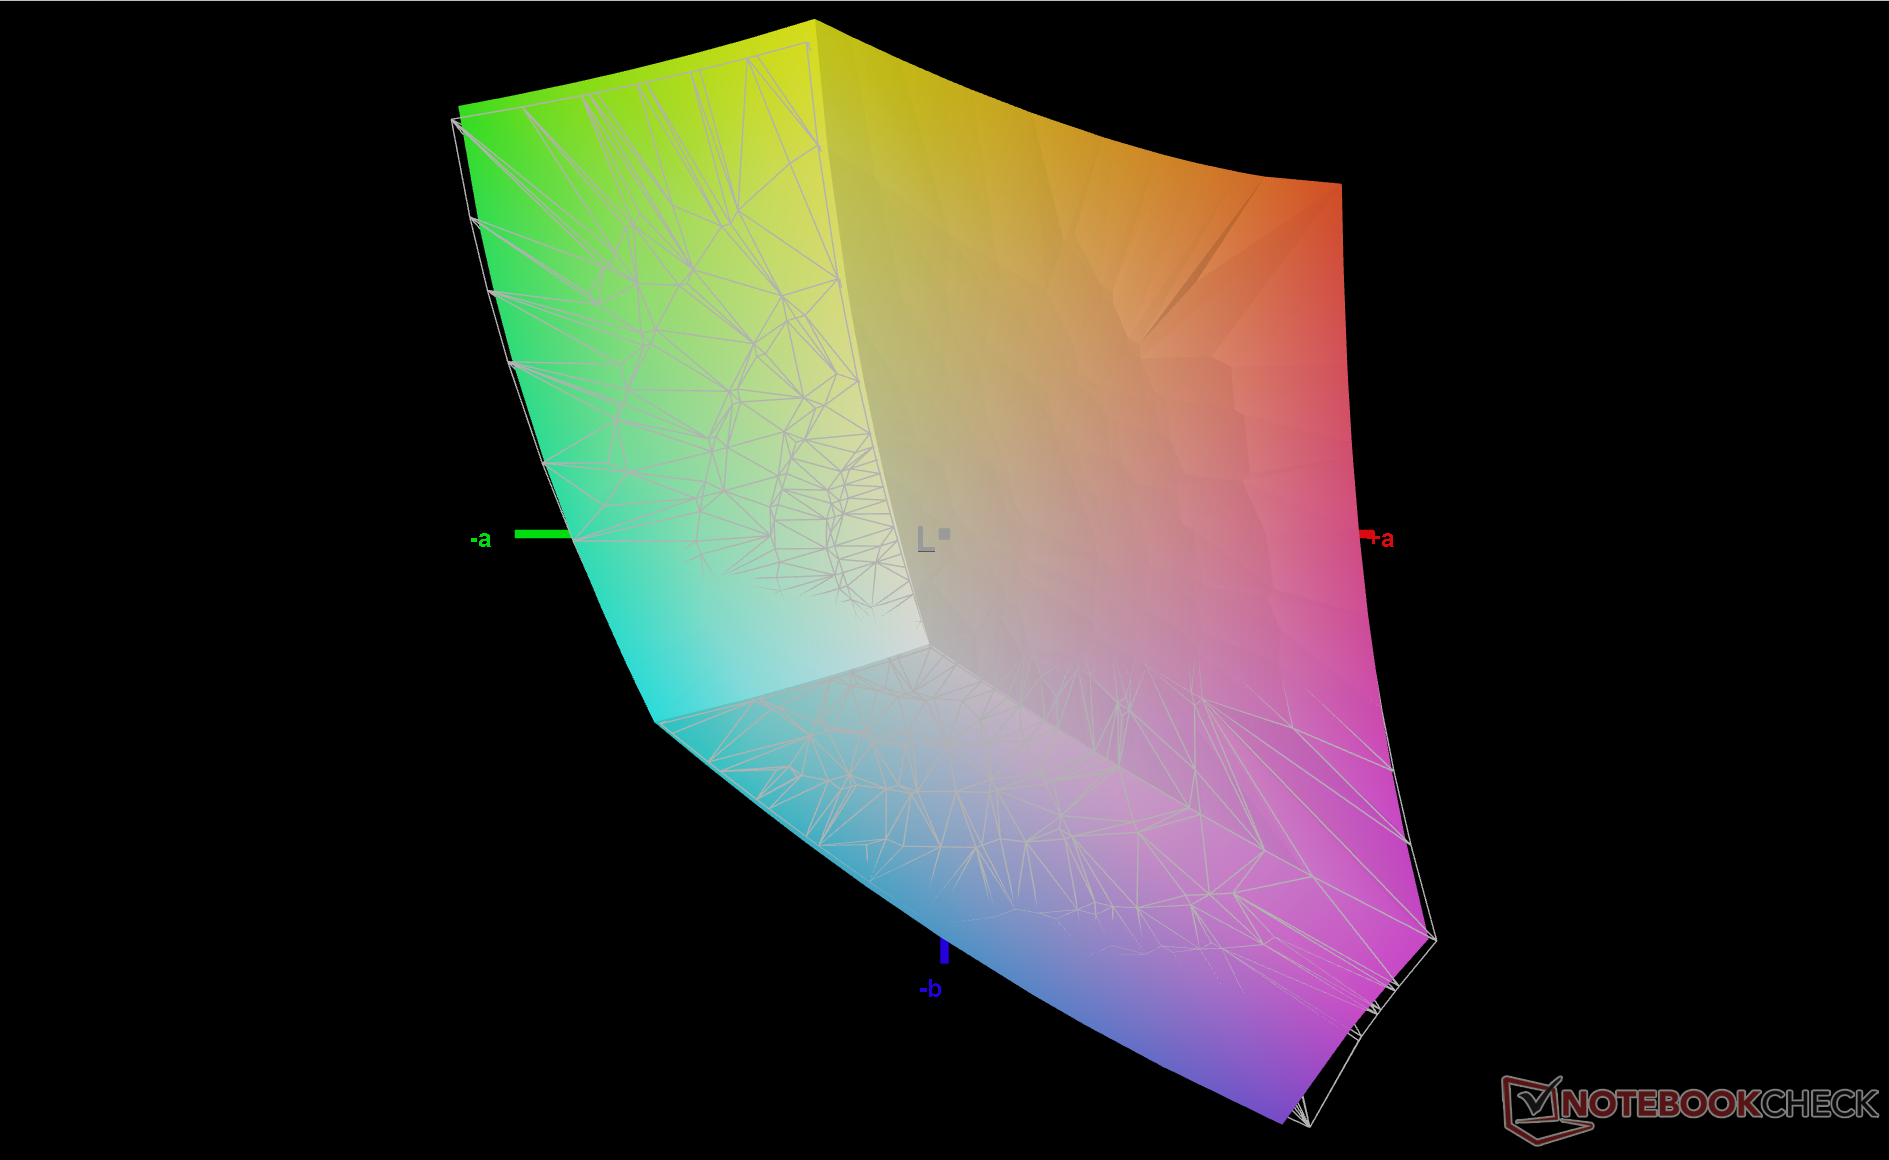
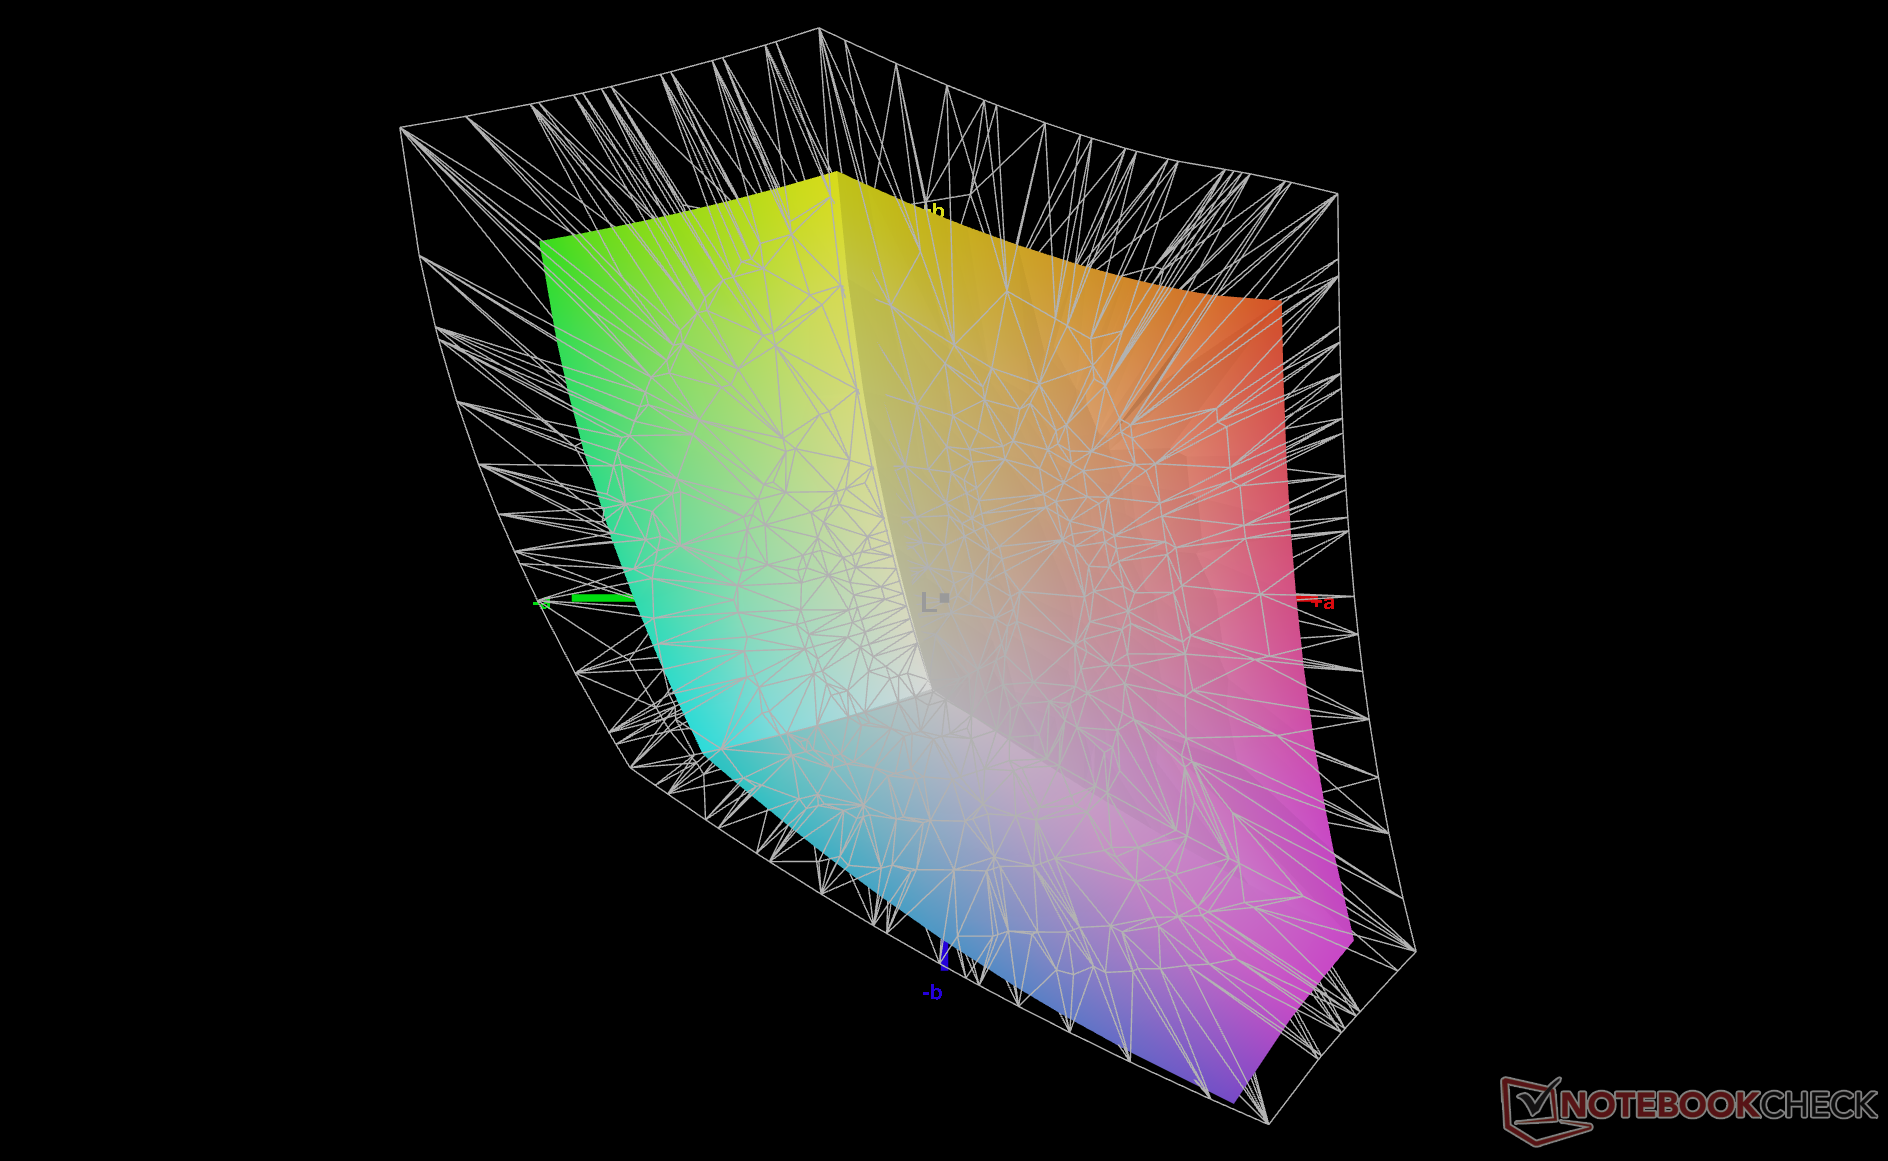
70.2% AdobeRGB 1998 (Argyll 3D)
98.6% sRGB (Argyll 3D)
68.3% Display P3 (Argyll 3D)
Gamma: 2.1
CCT: 6248 K
| HP Elite Dragonfly Folio 13.5 G3 Chi Mei CMN13C0, IPS, 1920x1280, 13.5" | HP Elite Dragonfly G3 Chi Mei CMN13C0, IPS, 1920x1280, 13.5" | Dell Latitude 13 7330 LG Philips 133WF9, IPS, 1920x1080, 13.3" | Framework Laptop 13.5 12th Gen Intel BOE CQ NE135FBM-N41, IPS, 2256x1504, 13.5" | Razer Book 13 FHD Sharp LQ134N1JW48, IPS, 1920x1200, 13.4" | Lenovo ThinkPad L13 Gen2-20VH0017GE B133HAN06.6, IPS, 1920x1080, 13.3" | |
|---|---|---|---|---|---|---|
| Display | 0% | -4% | 1% | 2% | -38% | |
| Display P3 Coverage (%) | 68.3 | 68 0% | 66.1 -3% | 69.9 2% | 70.1 3% | 42.49 -38% |
| sRGB Coverage (%) | 98.6 | 98.3 0% | 93.5 -5% | 99.4 1% | 99.3 1% | |
| AdobeRGB 1998 Coverage (%) | 70.2 | 69.9 0% | 68.2 -3% | 71.1 1% | 71.6 2% | 43.92 -37% |
| Response Times | 23% | 31% | 43% | 14% | 26% | |
| Response Time Grey 50% / Grey 80% * (ms) | 66.8 ? | 50.8 ? 24% | 48.4 ? 28% | 34.7 ? 48% | 56.8 ? 15% | 52.4 ? 22% |
| Response Time Black / White * (ms) | 44.4 ? | 35.2 ? 21% | 29.6 ? 33% | 27.5 ? 38% | 38.8 ? 13% | 31.2 ? 30% |
| PWM Frequency (Hz) | 2475 ? | |||||
| Screen | -3% | 3% | -17% | -15% | -121% | |
| Brightness middle (cd/m²) | 369.5 | 387.2 5% | 460.1 25% | 449.6 22% | 545.3 48% | 244 -34% |
| Brightness (cd/m²) | 350 | 360 3% | 445 27% | 431 23% | 507 45% | 237 -32% |
| Brightness Distribution (%) | 87 | 80 -8% | 89 2% | 90 3% | 88 1% | 93 7% |
| Black Level * (cd/m²) | 0.24 | 0.26 -8% | 0.31 -29% | 0.31 -29% | 0.31 -29% | 0.21 12% |
| Contrast (:1) | 1540 | 1489 -3% | 1484 -4% | 1450 -6% | 1759 14% | 1162 -25% |
| Colorchecker dE 2000 * | 2.3 | 2.36 -3% | 2.42 -5% | 2.76 -20% | 1.39 40% | 4.7 -104% |
| Colorchecker dE 2000 max. * | 4.34 | 4.79 -10% | 3.97 9% | 7.96 -83% | 2.61 40% | 17.7 -308% |
| Colorchecker dE 2000 calibrated * | 0.6 | 0.63 -5% | 0.77 -28% | 0.58 3% | 2.72 -353% | 4.3 -617% |
| Greyscale dE 2000 * | 3.1 | 3 3% | 2.3 26% | 5.2 -68% | 1.3 58% | 2.8 10% |
| Gamma | 2.1 105% | 2.17 101% | 2.23 99% | 2.23 99% | 2.2 100% | 2.24 98% |
| CCT | 6248 104% | 6137 106% | 6262 104% | 6475 100% | 6476 100% | 6259 104% |
| Color Space (Percent of AdobeRGB 1998) (%) | 65.9 | 40.3 | ||||
| Color Space (Percent of sRGB) (%) | 99.6 | 63 | ||||
| Media total (Programa/Opciones) | 7% /
1% | 10% /
5% | 9% /
-5% | 0% /
-7% | -44% /
-86% |
* ... más pequeño es mejor
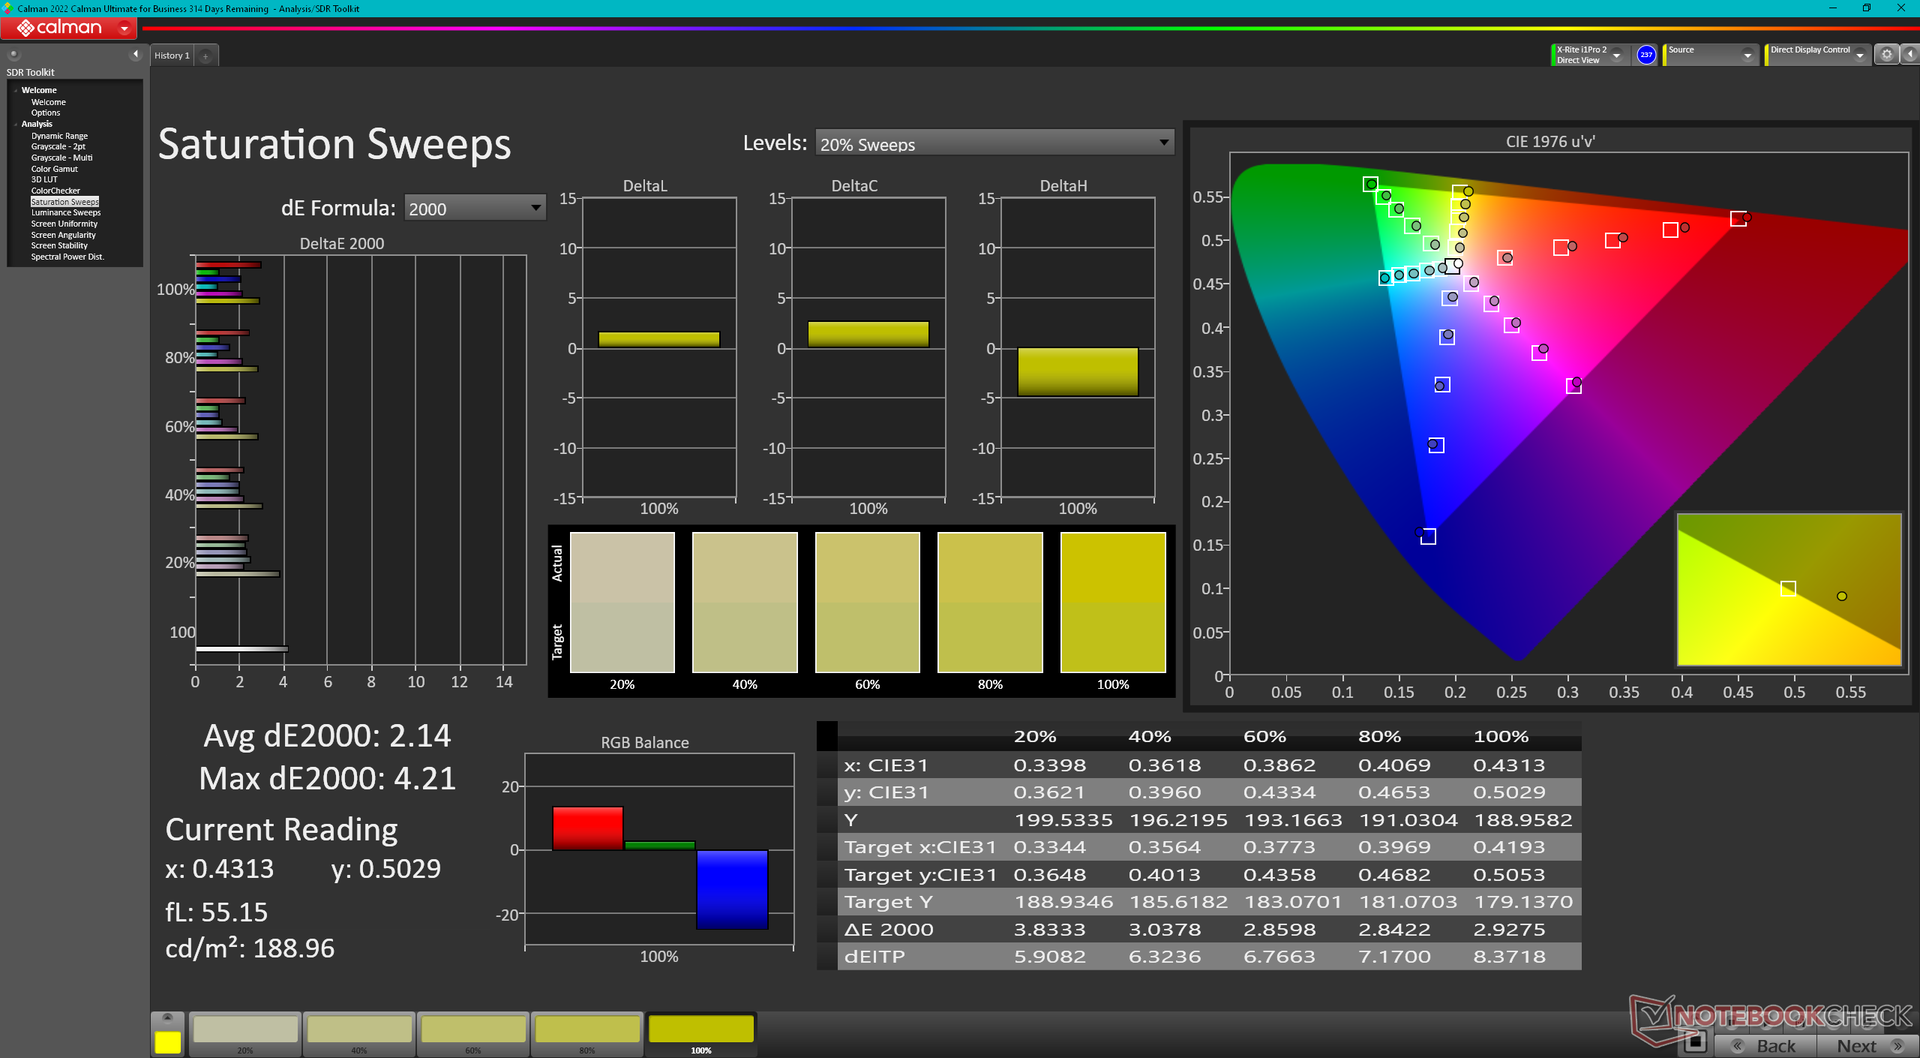
El panel está bien calibrado de fábrica, con unos valores deltaE medios de escala de grises y color de 3,1 y 2,3, respectivamente. No obstante, nuestro propio intento de calibración mejoraría aún más la precisión, con unos valores medios de escala de grises y color de sólo 0,9 y 0,6, respectivamente. Por tanto, una calibración para el usuario final puede ser beneficiosa, pero en gran medida innecesaria para la mayoría de los usuarios. Nuestro perfil ICM calibrado está disponible más arriba para los propietarios que puedan estar interesados.

Tiempos de respuesta del display
| ↔ Tiempo de respuesta de Negro a Blanco | ||
|---|---|---|
| 44.4 ms ... subida ↗ y bajada ↘ combinada | ↗ 24.4 ms subida | 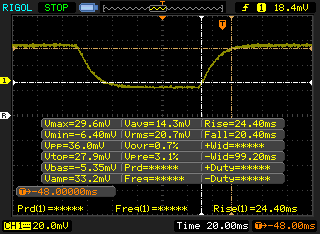 |
| ↘ 20.4 ms bajada | ||
| La pantalla mostró tiempos de respuesta lentos en nuestros tests y podría ser demasiado lenta para los jugones. En comparación, todos los dispositivos de prueba van de ##min### (mínimo) a 240 (máximo) ms. » 99 % de todos los dispositivos son mejores. Eso quiere decir que el tiempo de respuesta es peor que la media (19.8 ms) de todos los dispositivos testados. | ||
| ↔ Tiempo de respuesta 50% Gris a 80% Gris | ||
| 66.8 ms ... subida ↗ y bajada ↘ combinada | ↗ 35.6 ms subida | 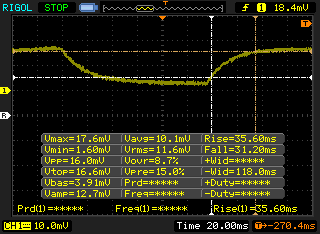 |
| ↘ 31.2 ms bajada | ||
| La pantalla mostró tiempos de respuesta lentos en nuestros tests y podría ser demasiado lenta para los jugones. En comparación, todos los dispositivos de prueba van de ##min### (mínimo) a 636 (máximo) ms. » 98 % de todos los dispositivos son mejores. Eso quiere decir que el tiempo de respuesta es peor que la media (31 ms) de todos los dispositivos testados. | ||
Parpadeo de Pantalla / PWM (Pulse-Width Modulation)
| Parpadeo de Pantalla / PWM no detectado | 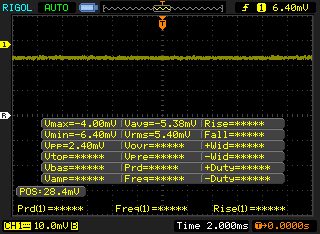 | ||
Comparación: 52 % de todos los dispositivos testados no usaron PWM para atenuar el display. Si se usó, medimos una media de 7757 (mínimo: 5 - máxmo: 343500) Hz. | |||
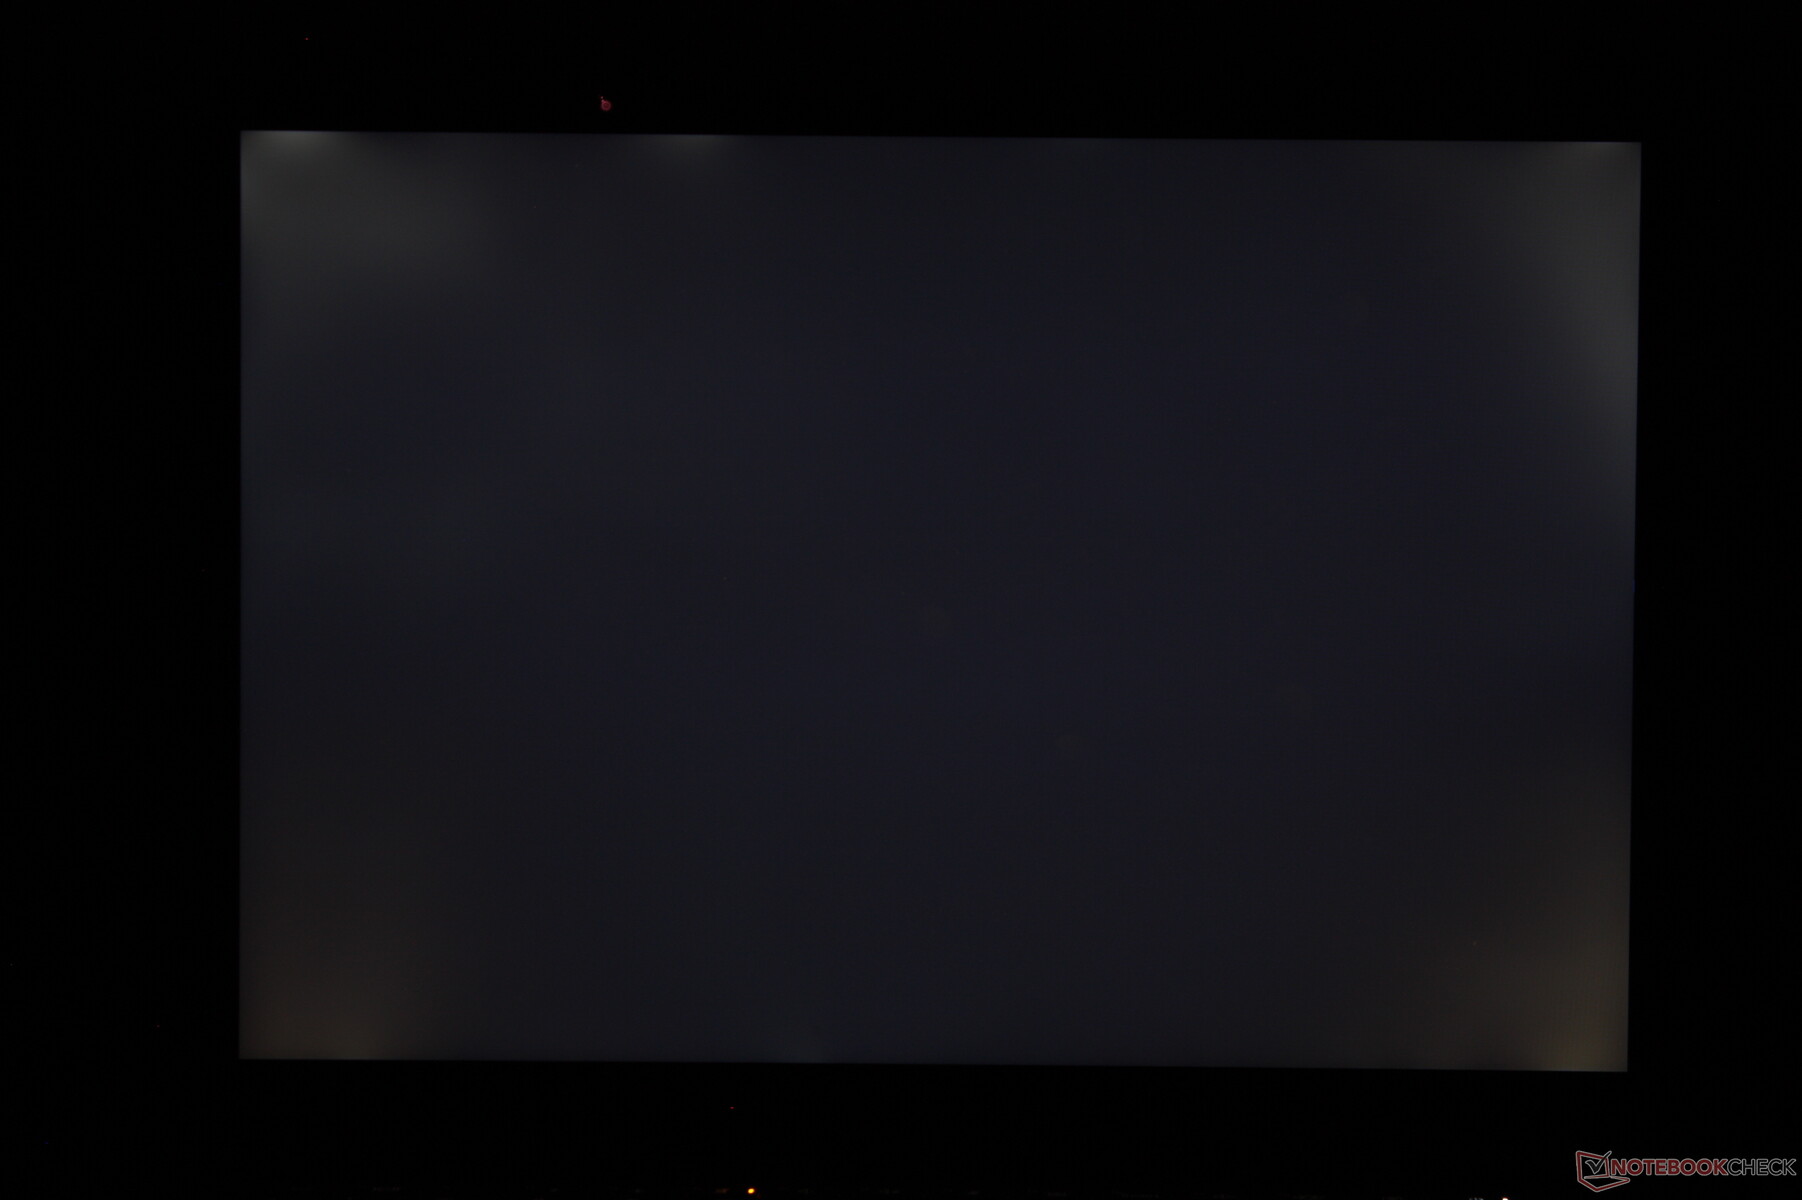
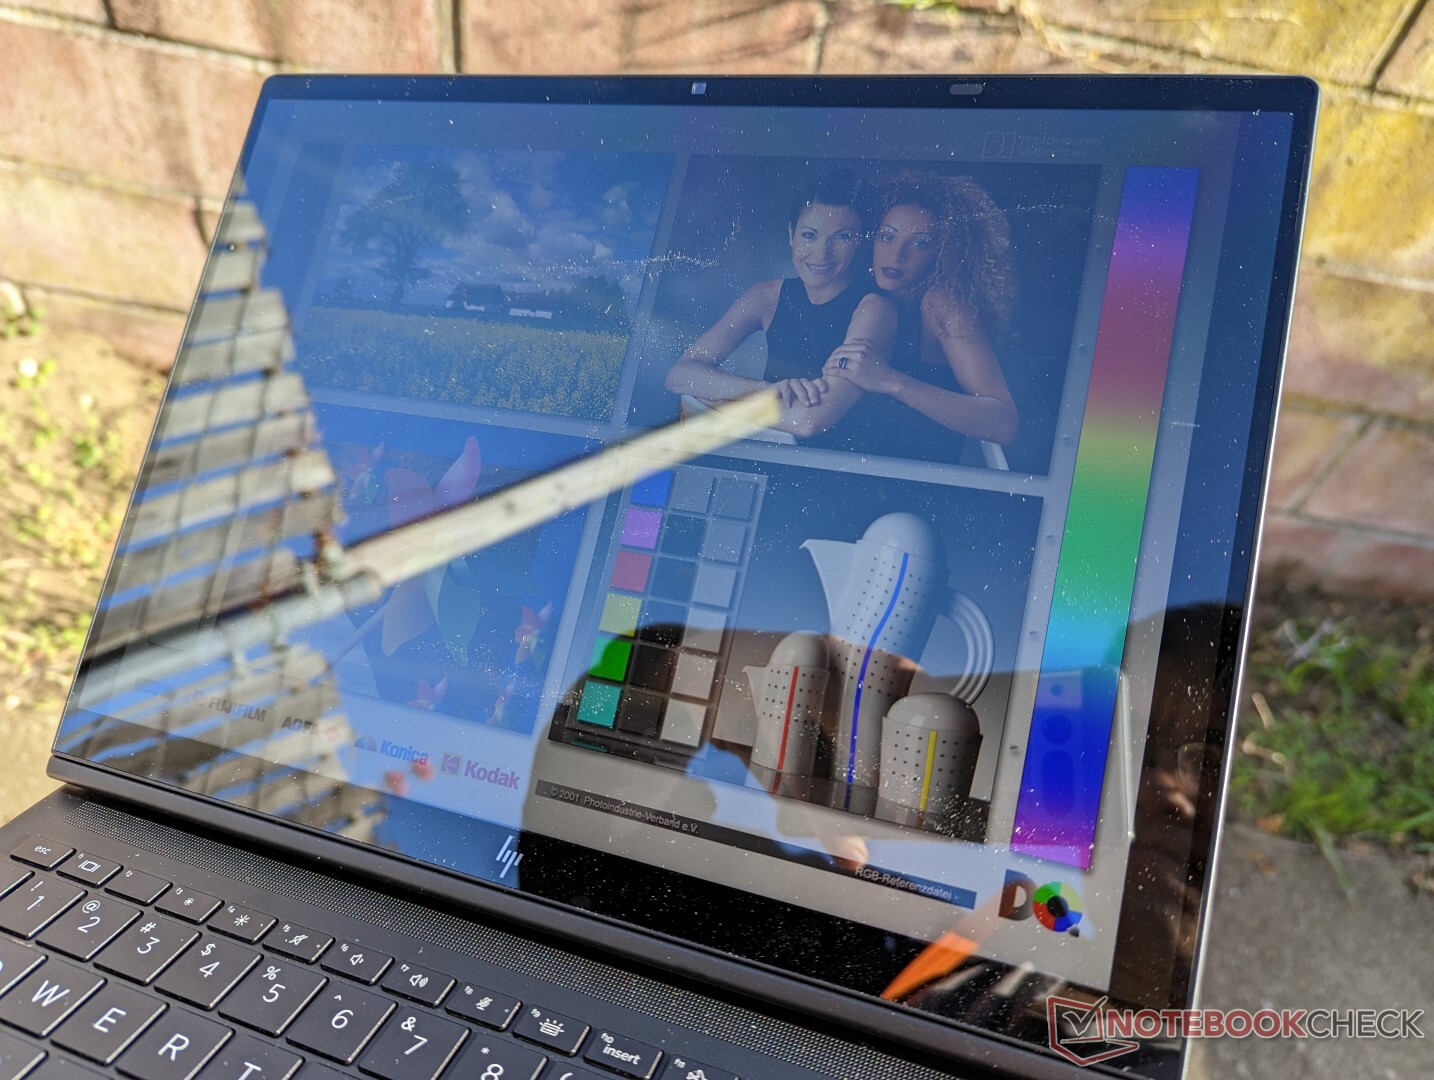
La visibilidad en exteriores es decente sólo cuando está a la sombra, ya que las condiciones más brillantes desteñirán los colores y crearán aún más reflejos. Como ya se ha mencionado, HP ofrece paneles de 1000 nits para mejorar la visibilidad en exteriores. Lenovo y Dell aún tienen que igualar esta característica con sus respectivos convertibles ThinkPad o Latitude.
Rendimiento - Opciones adecuadas de la serie U Core
Condiciones de ensayo
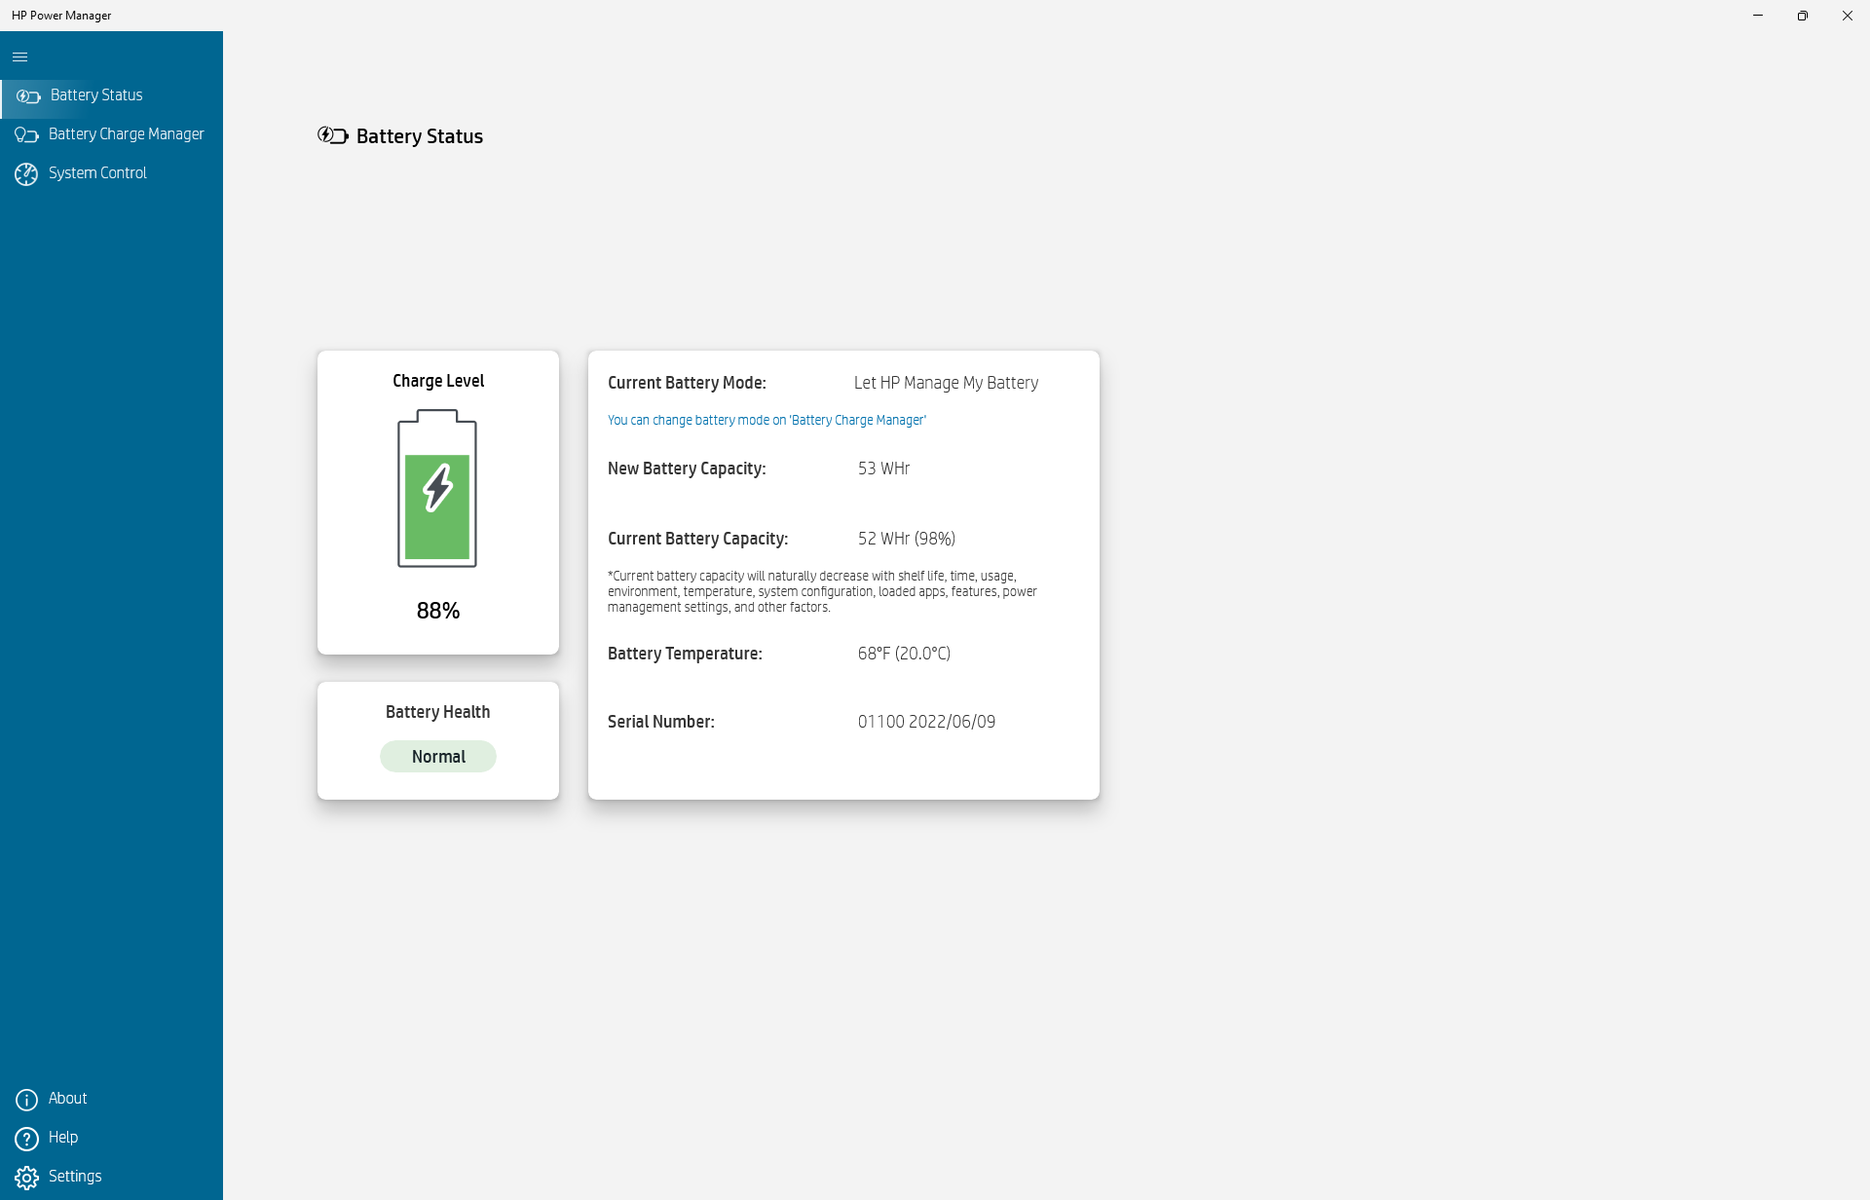
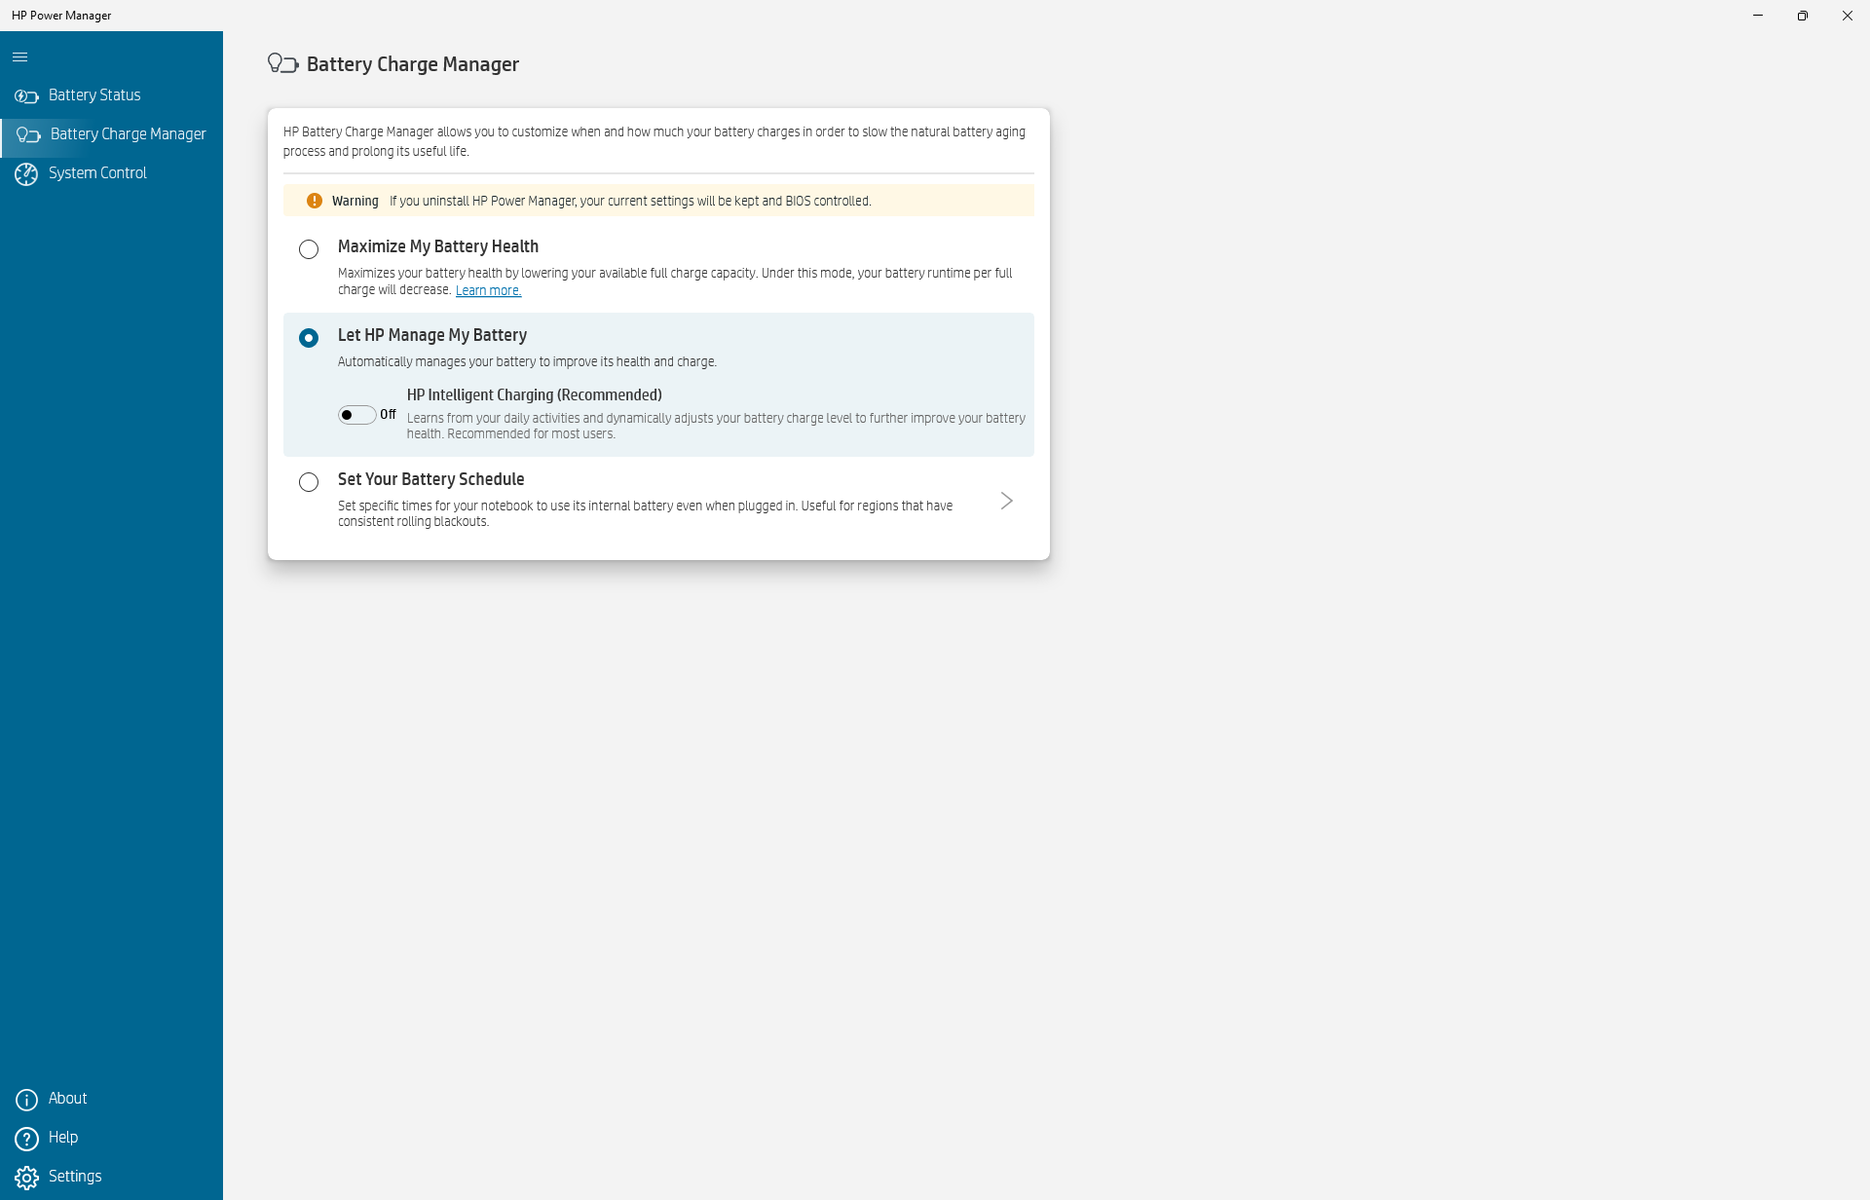
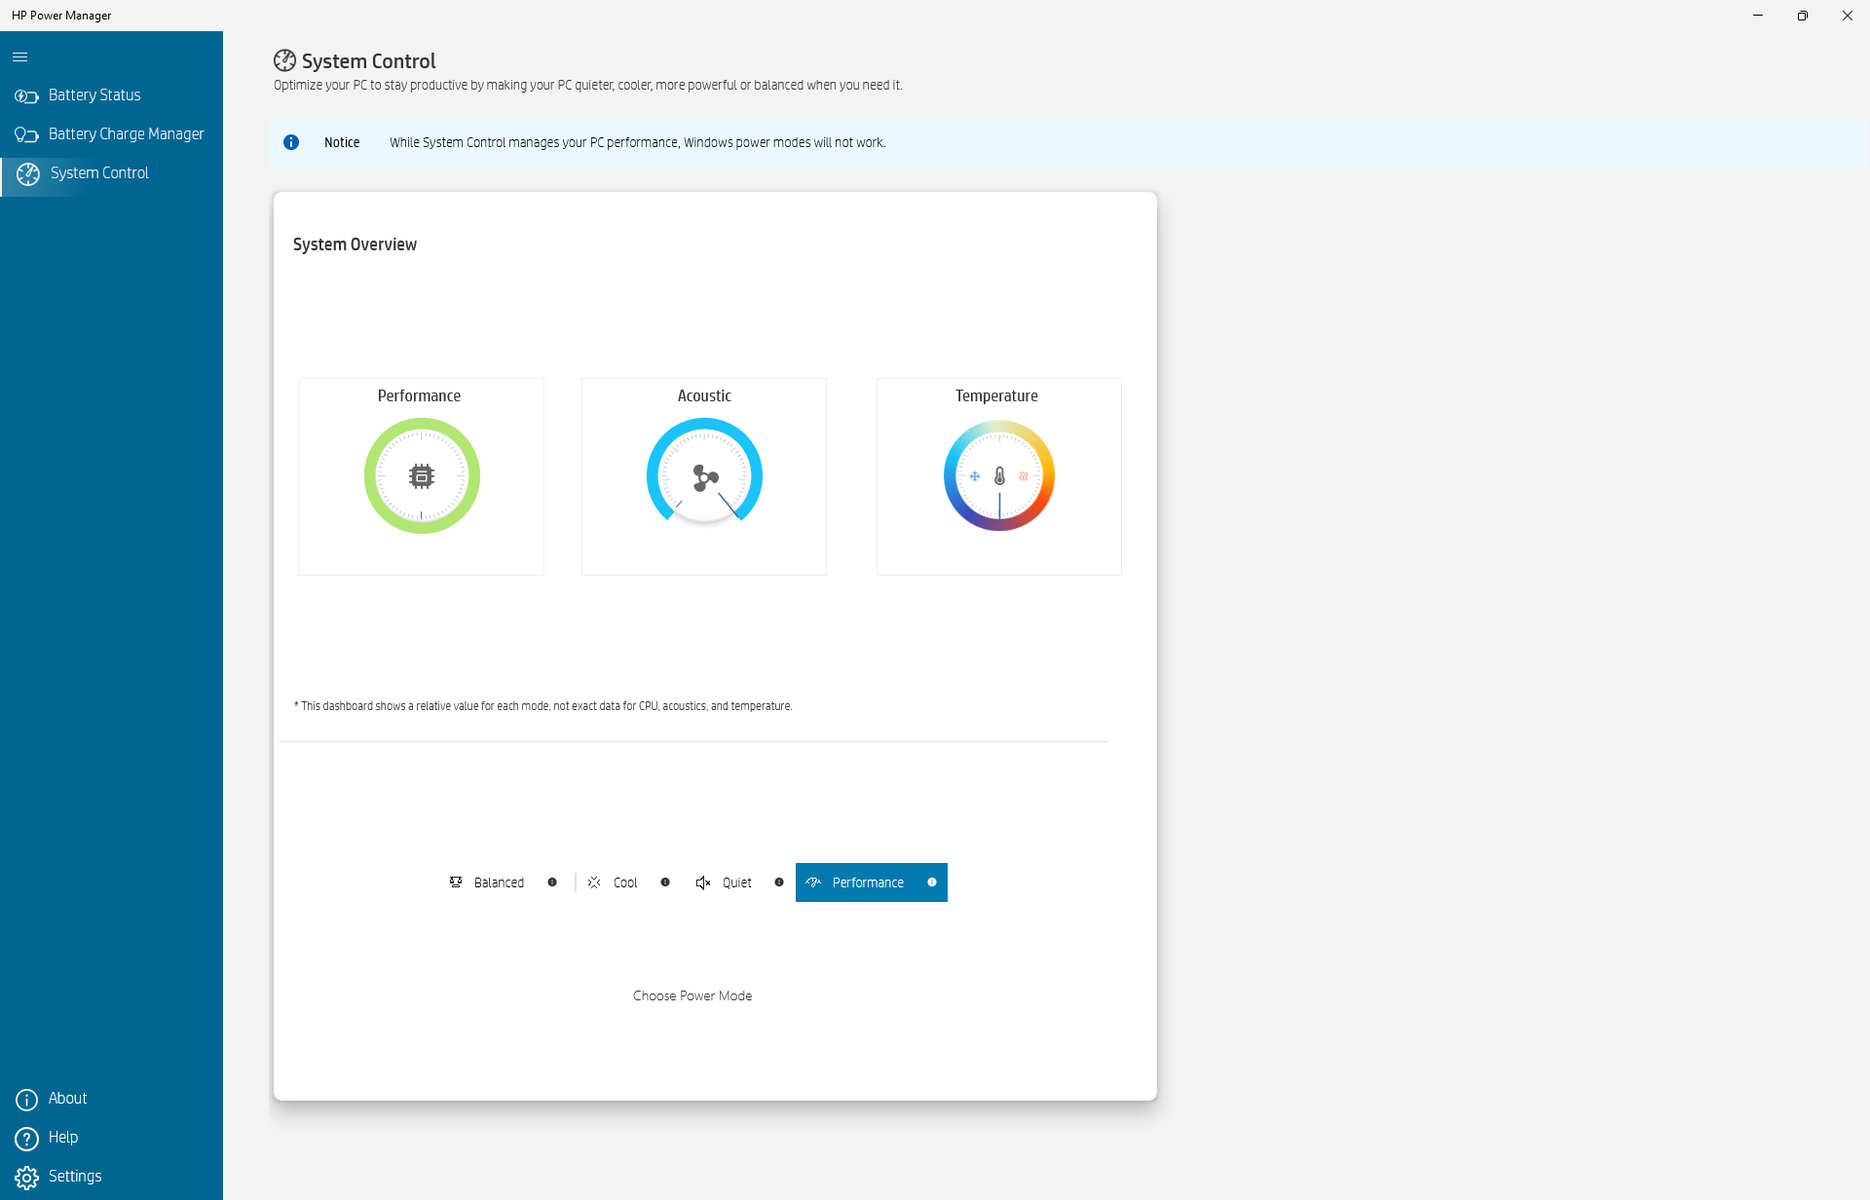
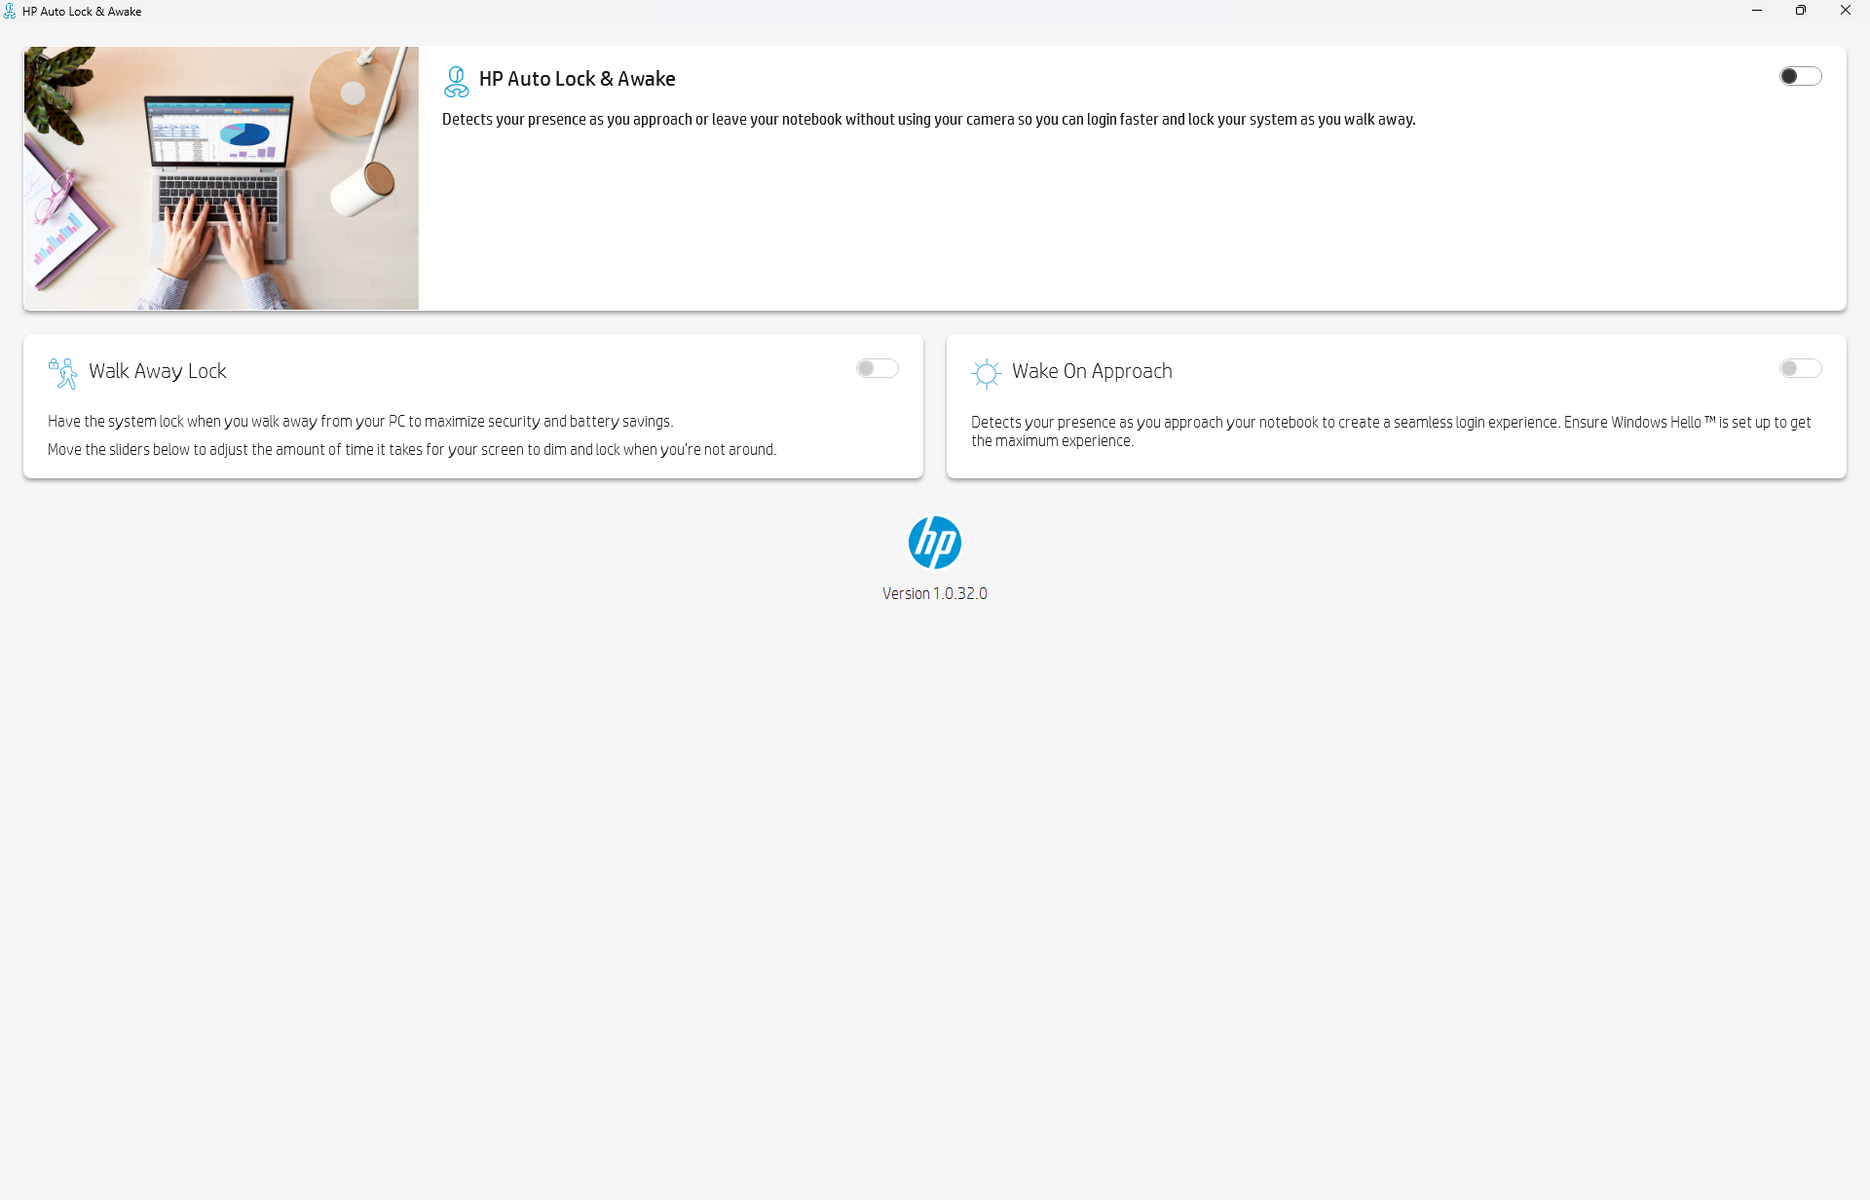
Configuramos nuestra unidad en el modo de mejor rendimiento a través de Windows y en el modo de rendimiento a través del software HP Power Manager antes de ejecutar cualquier prueba de rendimiento a continuación. Se recomienda que los propietarios se familiaricen con HP Power Manager, Auto Lock and Awake y las aplicaciones de teclas programables. Power Manager ajusta los diferentes niveles de rendimiento del portátil, Auto Lock and Awake activa el sensor de infrarrojos y las funciones de atenuación automática, y Programmable Key personaliza la función de ciertas teclas del teclado.

Procesador
El rendimiento de la CPU es excelente, con resultados multihilo que son entre un 10 y un 15 por ciento más rápidos que el portátil medio de nuestra base de datos equipado con el mismo Core i7-1265U CORE I7-1265U. Lo más notable es que rinde sistemáticamente más rápido que el Core i7-1265U del Dragonfly G3 incluso después de tener en cuenta cualquier ralentización. Los usuarios que se actualicen desde unCore i7-1065G7 verán enormes mejoras en el rendimiento multihilo de casi el doble
La sostenibilidad de Turbo Boost no es indefinida, lo que es de esperar de un Ultrabook de la serie U. Ejecutar CineBench R15 xT en bucle muestra una caída del rendimiento de alrededor del 20 por ciento con el tiempo, como se muestra en el siguiente gráfico.
Cinebench R15 Multi Loop
Cinebench R23: Multi Core | Single Core
Cinebench R15: CPU Multi 64Bit | CPU Single 64Bit
Blender: v2.79 BMW27 CPU
7-Zip 18.03: 7z b 4 | 7z b 4 -mmt1
Geekbench 5.5: Multi-Core | Single-Core
HWBOT x265 Benchmark v2.2: 4k Preset
LibreOffice : 20 Documents To PDF
R Benchmark 2.5: Overall mean
| Cinebench R23 / Multi Core | |
| Dell XPS 13 Plus 9320 i7-1280P OLED | |
| Asus Zenbook S 13 OLED | |
| Framework Laptop 13.5 12th Gen Intel | |
| Lenovo ThinkBook 13s G3 20YA0005GE | |
| HP Elite Dragonfly Folio 13.5 G3 | |
| HP Envy x360 13-bf0013dx | |
| Medio Intel Core i7-1265U (4332 - 9219, n=10) | |
| Lenovo Yoga 6 13ALC6 | |
| Dell Latitude 9330 | |
| HP Elite Dragonfly G3 | |
| Razer Book 13 FHD | |
| Asus ExpertBook B5 Flip B5302FEA | |
| Lenovo ThinkPad L13 Gen2-20VH0017GE | |
| Cinebench R23 / Single Core | |
| HP Elite Dragonfly Folio 13.5 G3 | |
| Framework Laptop 13.5 12th Gen Intel | |
| Dell XPS 13 Plus 9320 i7-1280P OLED | |
| Medio Intel Core i7-1265U (1144 - 1820, n=10) | |
| HP Envy x360 13-bf0013dx | |
| Dell Latitude 9330 | |
| HP Elite Dragonfly G3 | |
| Asus Zenbook S 13 OLED | |
| Lenovo ThinkBook 13s G3 20YA0005GE | |
| Lenovo ThinkPad L13 Gen2-20VH0017GE | |
| Asus ExpertBook B5 Flip B5302FEA | |
| Lenovo Yoga 6 13ALC6 | |
| Cinebench R15 / CPU Multi 64Bit | |
| Lenovo ThinkBook 13s G3 20YA0005GE | |
| Lenovo ThinkBook 13s G3 20YA0005GE | |
| Dell XPS 13 Plus 9320 i7-1280P OLED | |
| Asus Zenbook S 13 OLED | |
| Framework Laptop 13.5 12th Gen Intel | |
| HP Elite Dragonfly Folio 13.5 G3 | |
| HP Envy x360 13-bf0013dx | |
| Medio Intel Core i7-1265U (706 - 1572, n=10) | |
| HP Elite Dragonfly G3 | |
| Lenovo Yoga 6 13ALC6 | |
| Dell Latitude 9330 | |
| Razer Book 13 FHD | |
| Asus ExpertBook B5 Flip B5302FEA | |
| Acer Spin 5 SP513-54N-79EY | |
| Lenovo ThinkPad L13 Gen2-20VH0017GE | |
| Lenovo ThinkPad L13 Gen2-20VH0017GE | |
| HP Envy 13-ba0001ng | |
| HWBOT x265 Benchmark v2.2 / 4k Preset | |
| Dell XPS 13 Plus 9320 i7-1280P OLED | |
| Asus Zenbook S 13 OLED | |
| Framework Laptop 13.5 12th Gen Intel | |
| Lenovo ThinkBook 13s G3 20YA0005GE | |
| Lenovo Yoga 6 13ALC6 | |
| HP Elite Dragonfly Folio 13.5 G3 | |
| HP Envy x360 13-bf0013dx | |
| Medio Intel Core i7-1265U (5.09 - 10.6, n=10) | |
| Dell Latitude 9330 | |
| Razer Book 13 FHD | |
| HP Elite Dragonfly G3 | |
| Asus ExpertBook B5 Flip B5302FEA | |
| Lenovo ThinkPad L13 Gen2-20VH0017GE | |
| Lenovo ThinkPad L13 Gen2-20VH0017GE | |
| HP Envy 13-ba0001ng | |
| R Benchmark 2.5 / Overall mean | |
| HP Envy 13-ba0001ng | |
| Lenovo ThinkPad L13 Gen2-20VH0017GE | |
| Lenovo ThinkPad L13 Gen2-20VH0017GE | |
| Asus ExpertBook B5 Flip B5302FEA | |
| Lenovo Yoga 6 13ALC6 | |
| Razer Book 13 FHD | |
| Lenovo ThinkBook 13s G3 20YA0005GE | |
| HP Envy x360 13-bf0013dx | |
| HP Elite Dragonfly G3 | |
| Dell Latitude 9330 | |
| Asus Zenbook S 13 OLED | |
| Medio Intel Core i7-1265U (0.4666 - 0.578, n=10) | |
| Dell XPS 13 Plus 9320 i7-1280P OLED | |
| HP Elite Dragonfly Folio 13.5 G3 | |
| Framework Laptop 13.5 12th Gen Intel | |
Cinebench R23: Multi Core | Single Core
Cinebench R15: CPU Multi 64Bit | CPU Single 64Bit
Blender: v2.79 BMW27 CPU
7-Zip 18.03: 7z b 4 | 7z b 4 -mmt1
Geekbench 5.5: Multi-Core | Single-Core
HWBOT x265 Benchmark v2.2: 4k Preset
LibreOffice : 20 Documents To PDF
R Benchmark 2.5: Overall mean
* ... más pequeño es mejor
AIDA64: FP32 Ray-Trace | FPU Julia | CPU SHA3 | CPU Queen | FPU SinJulia | FPU Mandel | CPU AES | CPU ZLib | FP64 Ray-Trace | CPU PhotoWorxx
| Performance rating | |
| Framework Laptop 13.5 12th Gen Intel | |
| HP Elite Dragonfly Folio 13.5 G3 | |
| Dell Latitude 13 7330 | |
| Medio Intel Core i7-1265U | |
| HP Elite Dragonfly G3 | |
| Lenovo ThinkPad L13 Gen2-20VH0017GE | |
| AIDA64 / FP32 Ray-Trace | |
| HP Elite Dragonfly Folio 13.5 G3 | |
| Dell Latitude 13 7330 | |
| Medio Intel Core i7-1265U (2619 - 8178, n=10) | |
| Lenovo ThinkPad L13 Gen2-20VH0017GE | |
| Lenovo ThinkPad L13 Gen2-20VH0017GE | |
| HP Elite Dragonfly G3 | |
| Framework Laptop 13.5 12th Gen Intel | |
| AIDA64 / FPU SinJulia | |
| Framework Laptop 13.5 12th Gen Intel | |
| HP Elite Dragonfly Folio 13.5 G3 | |
| Lenovo ThinkPad L13 Gen2-20VH0017GE | |
| Lenovo ThinkPad L13 Gen2-20VH0017GE | |
| Medio Intel Core i7-1265U (3105 - 5135, n=10) | |
| Dell Latitude 13 7330 | |
| HP Elite Dragonfly G3 | |
| AIDA64 / FP64 Ray-Trace | |
| HP Elite Dragonfly Folio 13.5 G3 | |
| Dell Latitude 13 7330 | |
| Lenovo ThinkPad L13 Gen2-20VH0017GE | |
| Lenovo ThinkPad L13 Gen2-20VH0017GE | |
| Medio Intel Core i7-1265U (1473 - 4376, n=10) | |
| HP Elite Dragonfly G3 | |
| Framework Laptop 13.5 12th Gen Intel | |
| AIDA64 / CPU PhotoWorxx | |
| HP Elite Dragonfly Folio 13.5 G3 | |
| HP Elite Dragonfly G3 | |
| Medio Intel Core i7-1265U (20213 - 47031, n=10) | |
| Framework Laptop 13.5 12th Gen Intel | |
| Lenovo ThinkPad L13 Gen2-20VH0017GE | |
| Lenovo ThinkPad L13 Gen2-20VH0017GE | |
| Dell Latitude 13 7330 | |
Rendimiento del sistema
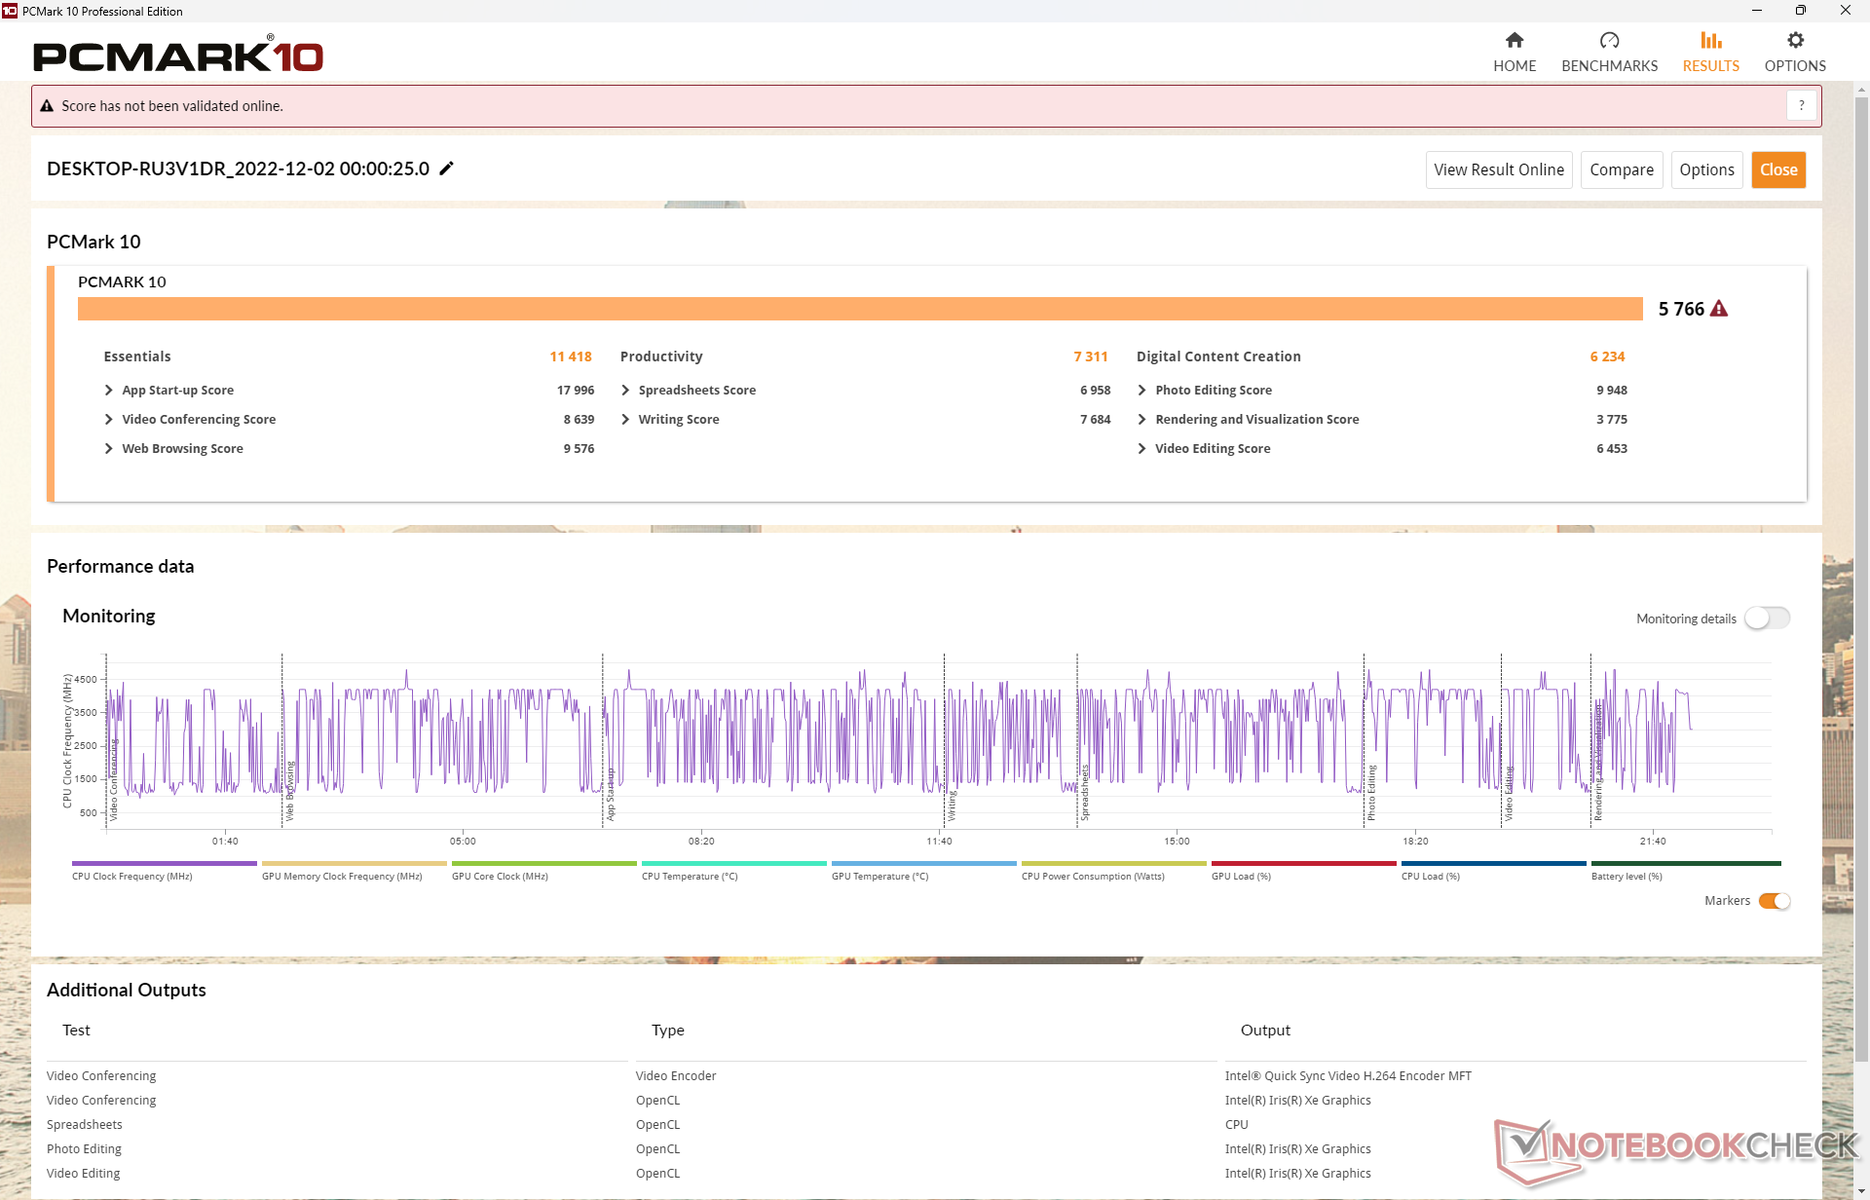
Los resultados de PCMark 10 son superiores a los de la mayoría de convertibles y subportátiles empresariales de la competencia, incluido el propio Dragonfly G3 de HP. Atribuimos las puntuaciones más altas al SSD PCIe4 x4 Samsung, que suele ser más rápido que el Micron 3400 en la mayoría de escenarios.
CrossMark: Overall | Productivity | Creativity | Responsiveness
| PCMark 10 / Score | |
| Media de la clase Convertible (3229 - 10123, n=45, últimos 2 años) | |
| Framework Laptop 13.5 12th Gen Intel | |
| HP Elite Dragonfly Folio 13.5 G3 | |
| Medio Intel Core i7-1265U, Intel Iris Xe Graphics G7 96EUs (4753 - 5766, n=7) | |
| Dell Latitude 13 7330 | |
| Razer Book 13 FHD | |
| HP Elite Dragonfly G3 | |
| Lenovo ThinkPad L13 Gen2-20VH0017GE | |
| PCMark 10 / Essentials | |
| HP Elite Dragonfly Folio 13.5 G3 | |
| Framework Laptop 13.5 12th Gen Intel | |
| Dell Latitude 13 7330 | |
| Media de la clase Convertible (7233 - 12222, n=45, últimos 2 años) | |
| Medio Intel Core i7-1265U, Intel Iris Xe Graphics G7 96EUs (9278 - 11418, n=7) | |
| Razer Book 13 FHD | |
| Lenovo ThinkPad L13 Gen2-20VH0017GE | |
| HP Elite Dragonfly G3 | |
| PCMark 10 / Productivity | |
| Media de la clase Convertible (5062 - 17914, n=45, últimos 2 años) | |
| HP Elite Dragonfly Folio 13.5 G3 | |
| Framework Laptop 13.5 12th Gen Intel | |
| Dell Latitude 13 7330 | |
| Razer Book 13 FHD | |
| Medio Intel Core i7-1265U, Intel Iris Xe Graphics G7 96EUs (5828 - 7311, n=7) | |
| Lenovo ThinkPad L13 Gen2-20VH0017GE | |
| HP Elite Dragonfly G3 | |
| PCMark 10 / Digital Content Creation | |
| Media de la clase Convertible (2496 - 16551, n=45, últimos 2 años) | |
| Framework Laptop 13.5 12th Gen Intel | |
| HP Elite Dragonfly Folio 13.5 G3 | |
| Medio Intel Core i7-1265U, Intel Iris Xe Graphics G7 96EUs (5127 - 6330, n=7) | |
| HP Elite Dragonfly G3 | |
| Razer Book 13 FHD | |
| Dell Latitude 13 7330 | |
| Lenovo ThinkPad L13 Gen2-20VH0017GE | |
| CrossMark / Overall | |
| Framework Laptop 13.5 12th Gen Intel | |
| HP Elite Dragonfly Folio 13.5 G3 | |
| Media de la clase Convertible (524 - 2274, n=48, últimos 2 años) | |
| Medio Intel Core i7-1265U, Intel Iris Xe Graphics G7 96EUs (1301 - 1615, n=7) | |
| Dell Latitude 13 7330 | |
| HP Elite Dragonfly G3 | |
| CrossMark / Productivity | |
| Framework Laptop 13.5 12th Gen Intel | |
| HP Elite Dragonfly Folio 13.5 G3 | |
| Media de la clase Convertible (554 - 1942, n=48, últimos 2 años) | |
| Dell Latitude 13 7330 | |
| Medio Intel Core i7-1265U, Intel Iris Xe Graphics G7 96EUs (1230 - 1586, n=7) | |
| HP Elite Dragonfly G3 | |
| CrossMark / Creativity | |
| Framework Laptop 13.5 12th Gen Intel | |
| Media de la clase Convertible (550 - 2949, n=48, últimos 2 años) | |
| HP Elite Dragonfly Folio 13.5 G3 | |
| Medio Intel Core i7-1265U, Intel Iris Xe Graphics G7 96EUs (1413 - 1706, n=7) | |
| HP Elite Dragonfly G3 | |
| Dell Latitude 13 7330 | |
| CrossMark / Responsiveness | |
| HP Elite Dragonfly Folio 13.5 G3 | |
| Framework Laptop 13.5 12th Gen Intel | |
| Medio Intel Core i7-1265U, Intel Iris Xe Graphics G7 96EUs (1193 - 1521, n=7) | |
| Media de la clase Convertible (381 - 1719, n=48, últimos 2 años) | |
| Dell Latitude 13 7330 | |
| HP Elite Dragonfly G3 | |
| PCMark 10 Score | 5766 puntos | |
ayuda | ||
| AIDA64 / Memory Write | |
| HP Elite Dragonfly Folio 13.5 G3 | |
| Medio Intel Core i7-1265U (41382 - 76027, n=10) | |
| HP Elite Dragonfly G3 | |
| Framework Laptop 13.5 12th Gen Intel | |
| Dell Latitude 13 7330 | |
| Lenovo ThinkPad L13 Gen2-20VH0017GE | |
| Lenovo ThinkPad L13 Gen2-20VH0017GE | |
| AIDA64 / Memory Latency | |
| HP Elite Dragonfly Folio 13.5 G3 | |
| HP Elite Dragonfly G3 | |
| Medio Intel Core i7-1265U (74.6 - 112.4, n=10) | |
| Framework Laptop 13.5 12th Gen Intel | |
| Dell Latitude 13 7330 | |
| Lenovo ThinkPad L13 Gen2-20VH0017GE | |
| Lenovo ThinkPad L13 Gen2-20VH0017GE | |
* ... más pequeño es mejor
Latencia del CPD
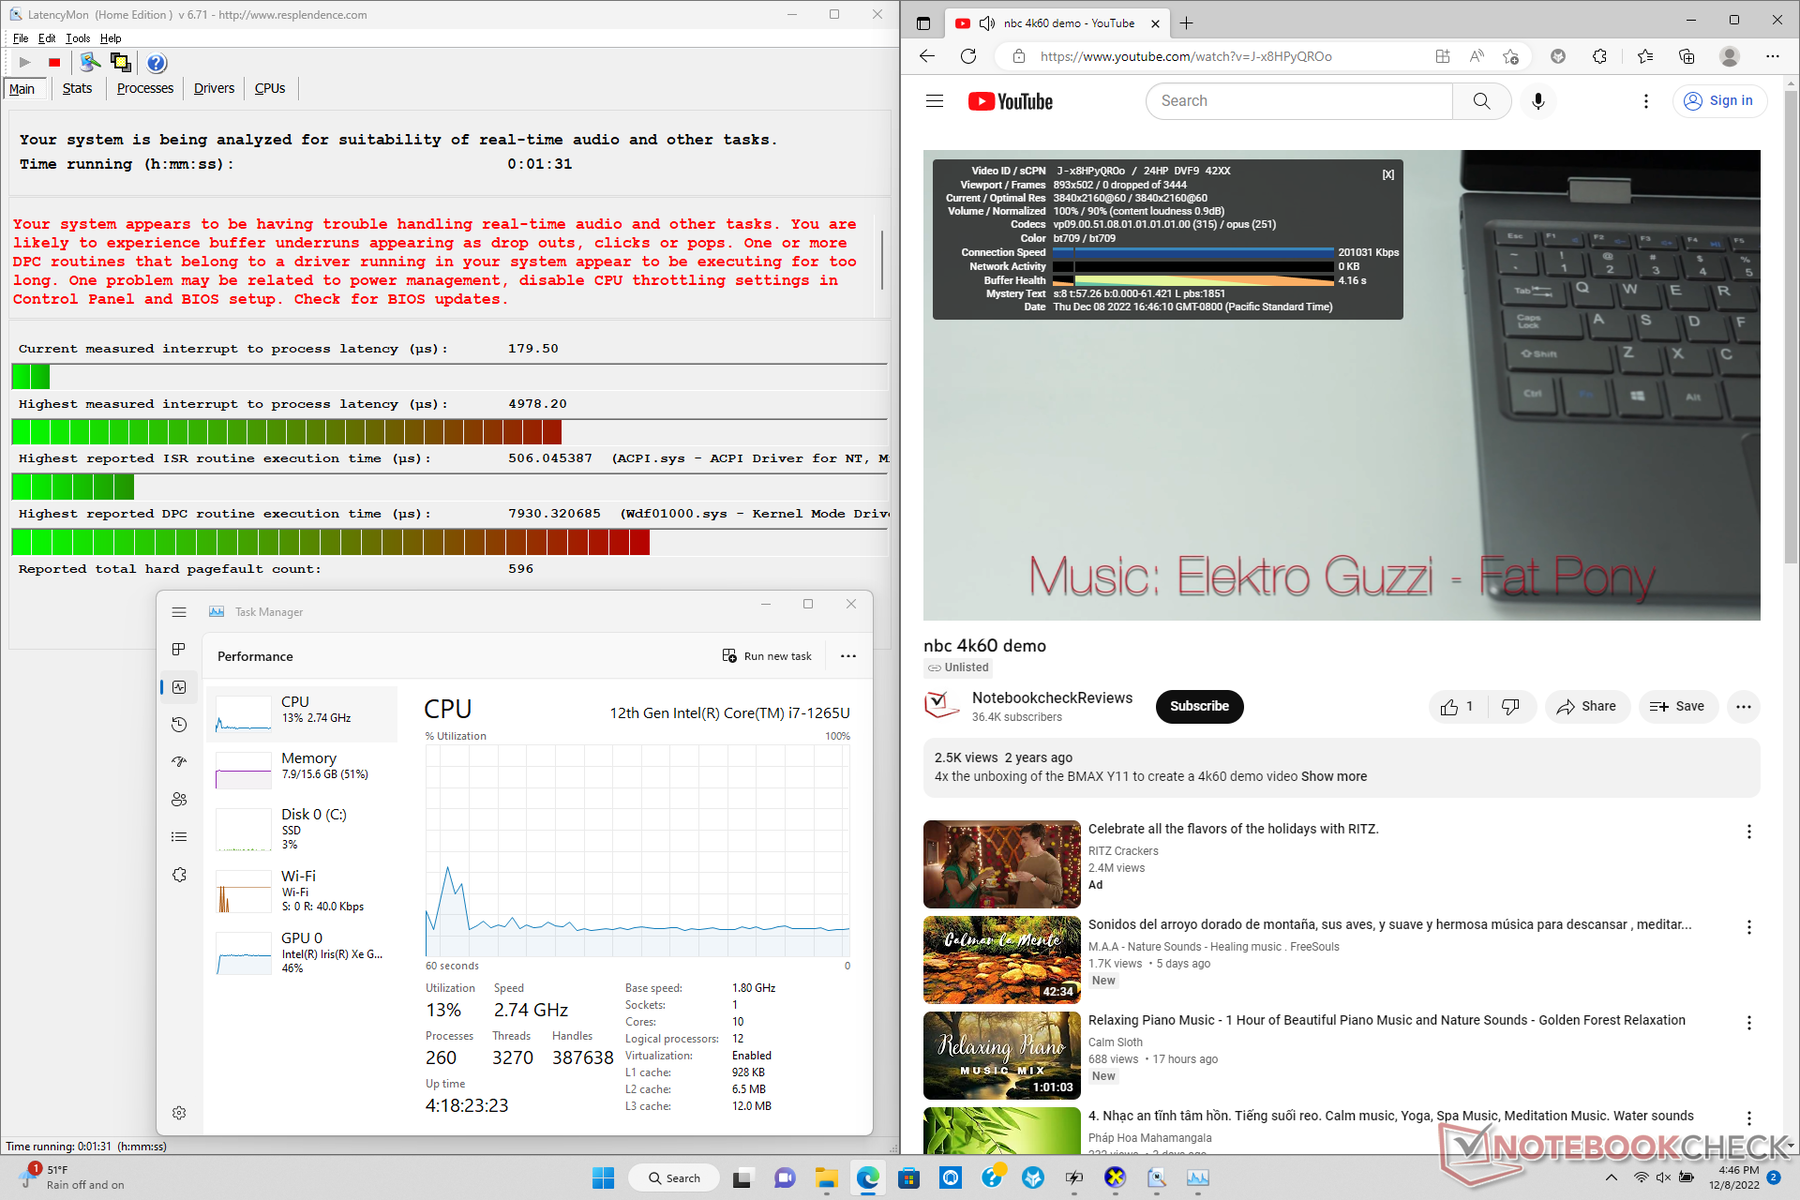
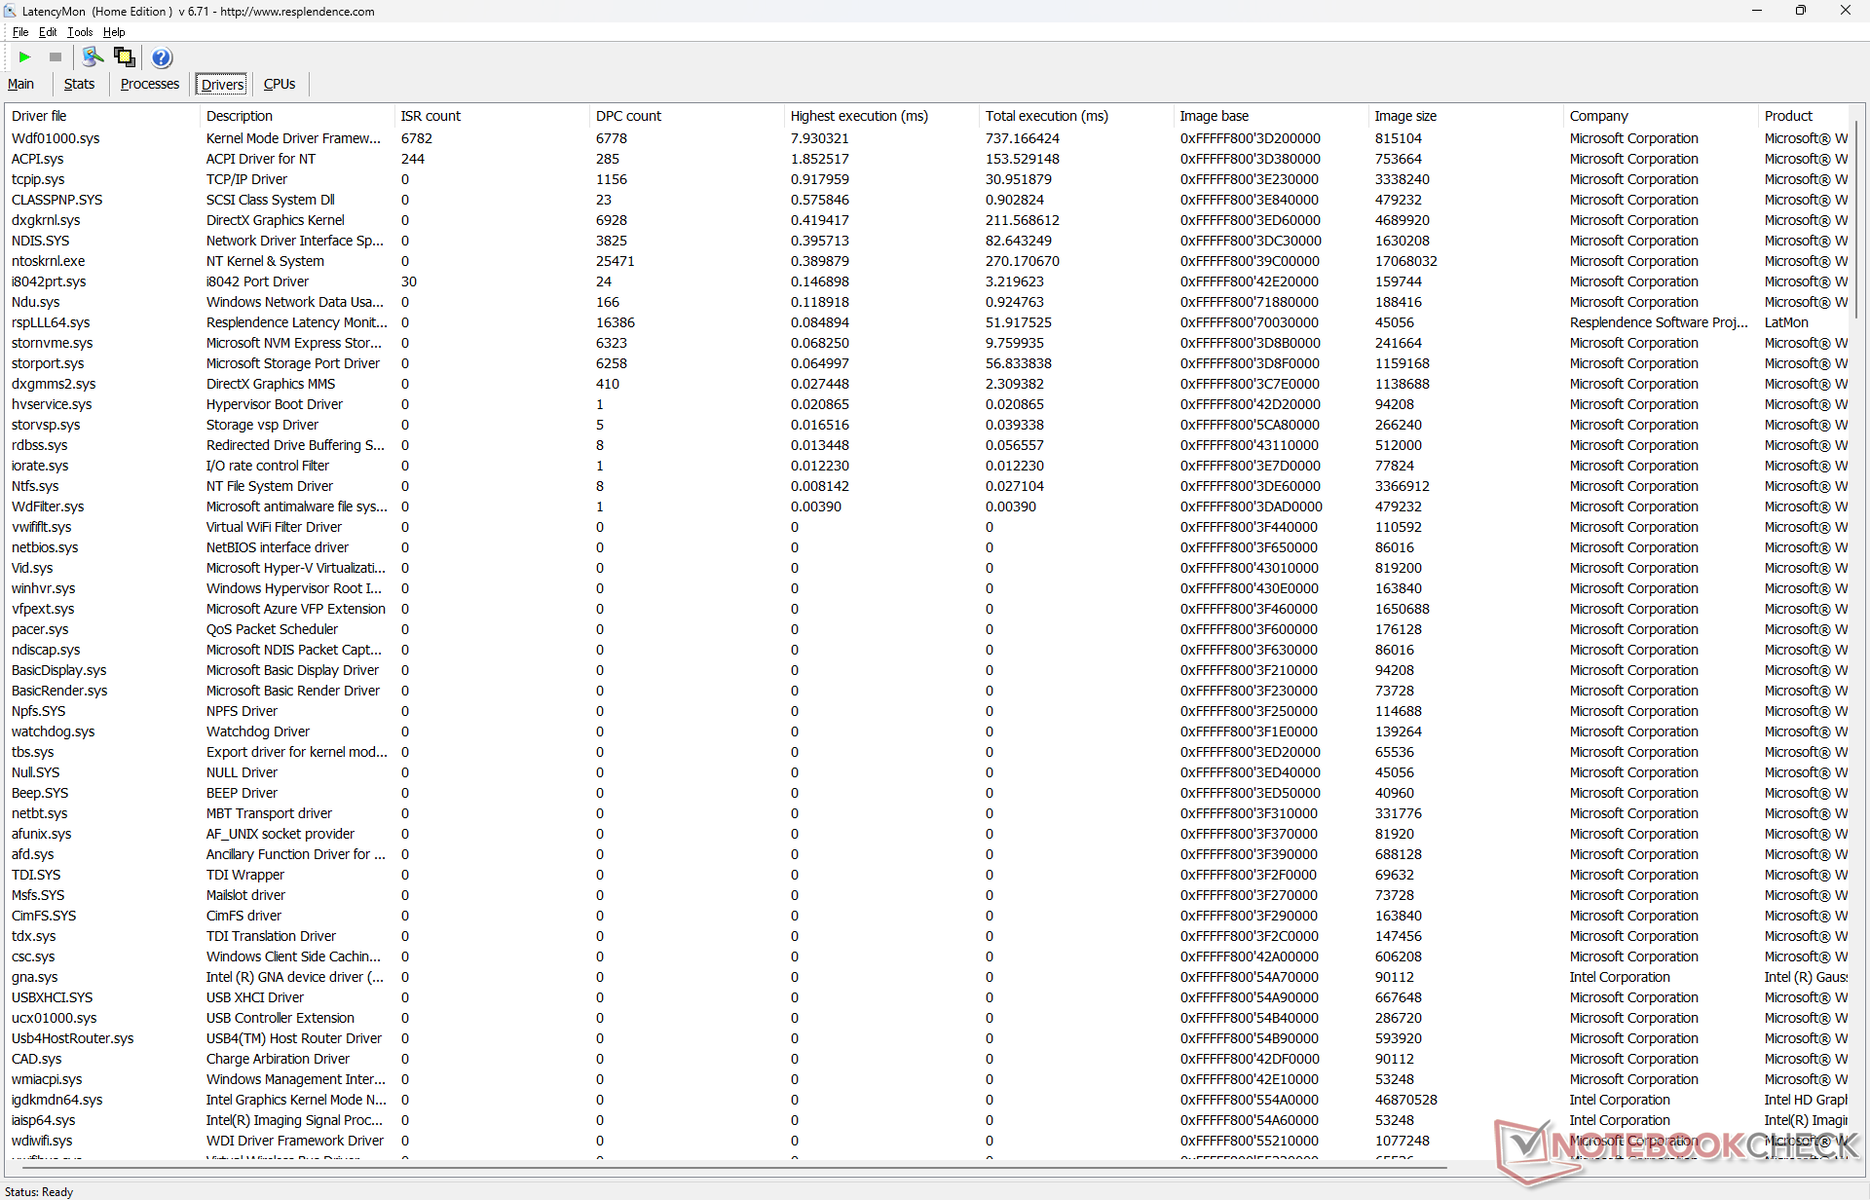
LastencyMon muestra problemas significativos de CPD al abrir varias pestañas del navegador en nuestra página de inicio. Repetimos esta prueba varias veces y los resultados no cambiaron. por lo demás, la reproducción de vídeo 4K a 60 FPS es perfecta, sin caídas de fotogramas.
| DPC Latencies / LatencyMon - interrupt to process latency (max), Web, Youtube, Prime95 | |
| HP Elite Dragonfly Folio 13.5 G3 | |
| Razer Book 13 FHD | |
| Lenovo ThinkPad L13 Gen2-20VH0017GE | |
| Framework Laptop 13.5 12th Gen Intel | |
| Dell Latitude 13 7330 | |
| HP Elite Dragonfly G3 | |
* ... más pequeño es mejor
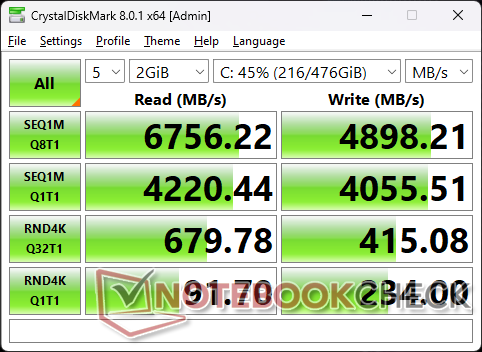
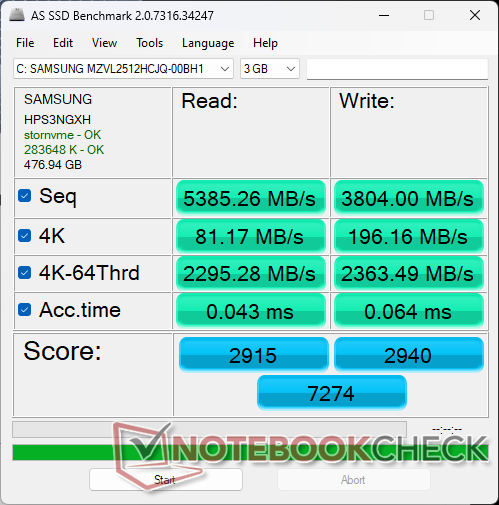
Dispositivos de almacenamiento - Compatibilidad con PCIe4 x4
Sólo hay espacio para un SSD M.2 PCIe4 x4 NVMe sin opciones secundarias. Nuestra unidad de pruebas se entrega con un Samsung PM9A1 para velocidades máximas de lectura y escritura de hasta 6700 MB/s y 4900 MB/s, respectivamente. Por desgracia, la unidad no puede mantener tasas de transferencia tan altas durante periodos largos, como muestran nuestros resultados de la prueba en bucle DiskSpd a continuación. El Dragonfly Folio G3 carece de un disipador de calor SSD, lo que significa que la unidad debe acelerar para mantener las temperaturas a niveles más seguros. Sin embargo, se necesitan unos minutos de uso intensivo del SSD antes de que se produzca cualquier ralentización, por lo que esto no debería ser un problema para la mayoría de los usuarios.

| Drive Performance rating - Percent | |
| HP Elite Dragonfly Folio 13.5 G3 -11! | |
| HP Elite Dragonfly G3 | |
| Lenovo ThinkPad L13 Gen2-20VH0017GE | |
| Framework Laptop 13.5 12th Gen Intel | |
| Razer Book 13 FHD | |
| Dell Latitude 13 7330 | |
* ... más pequeño es mejor
Disk Throttling: DiskSpd Read Loop, Queue Depth 8
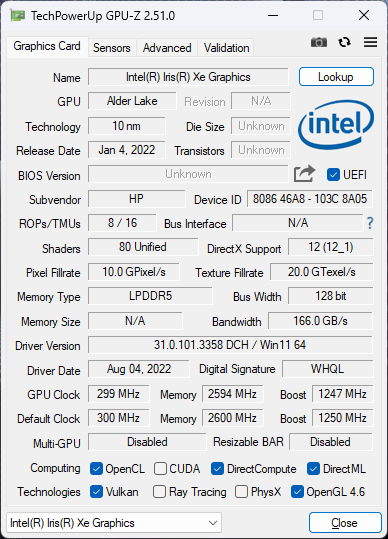
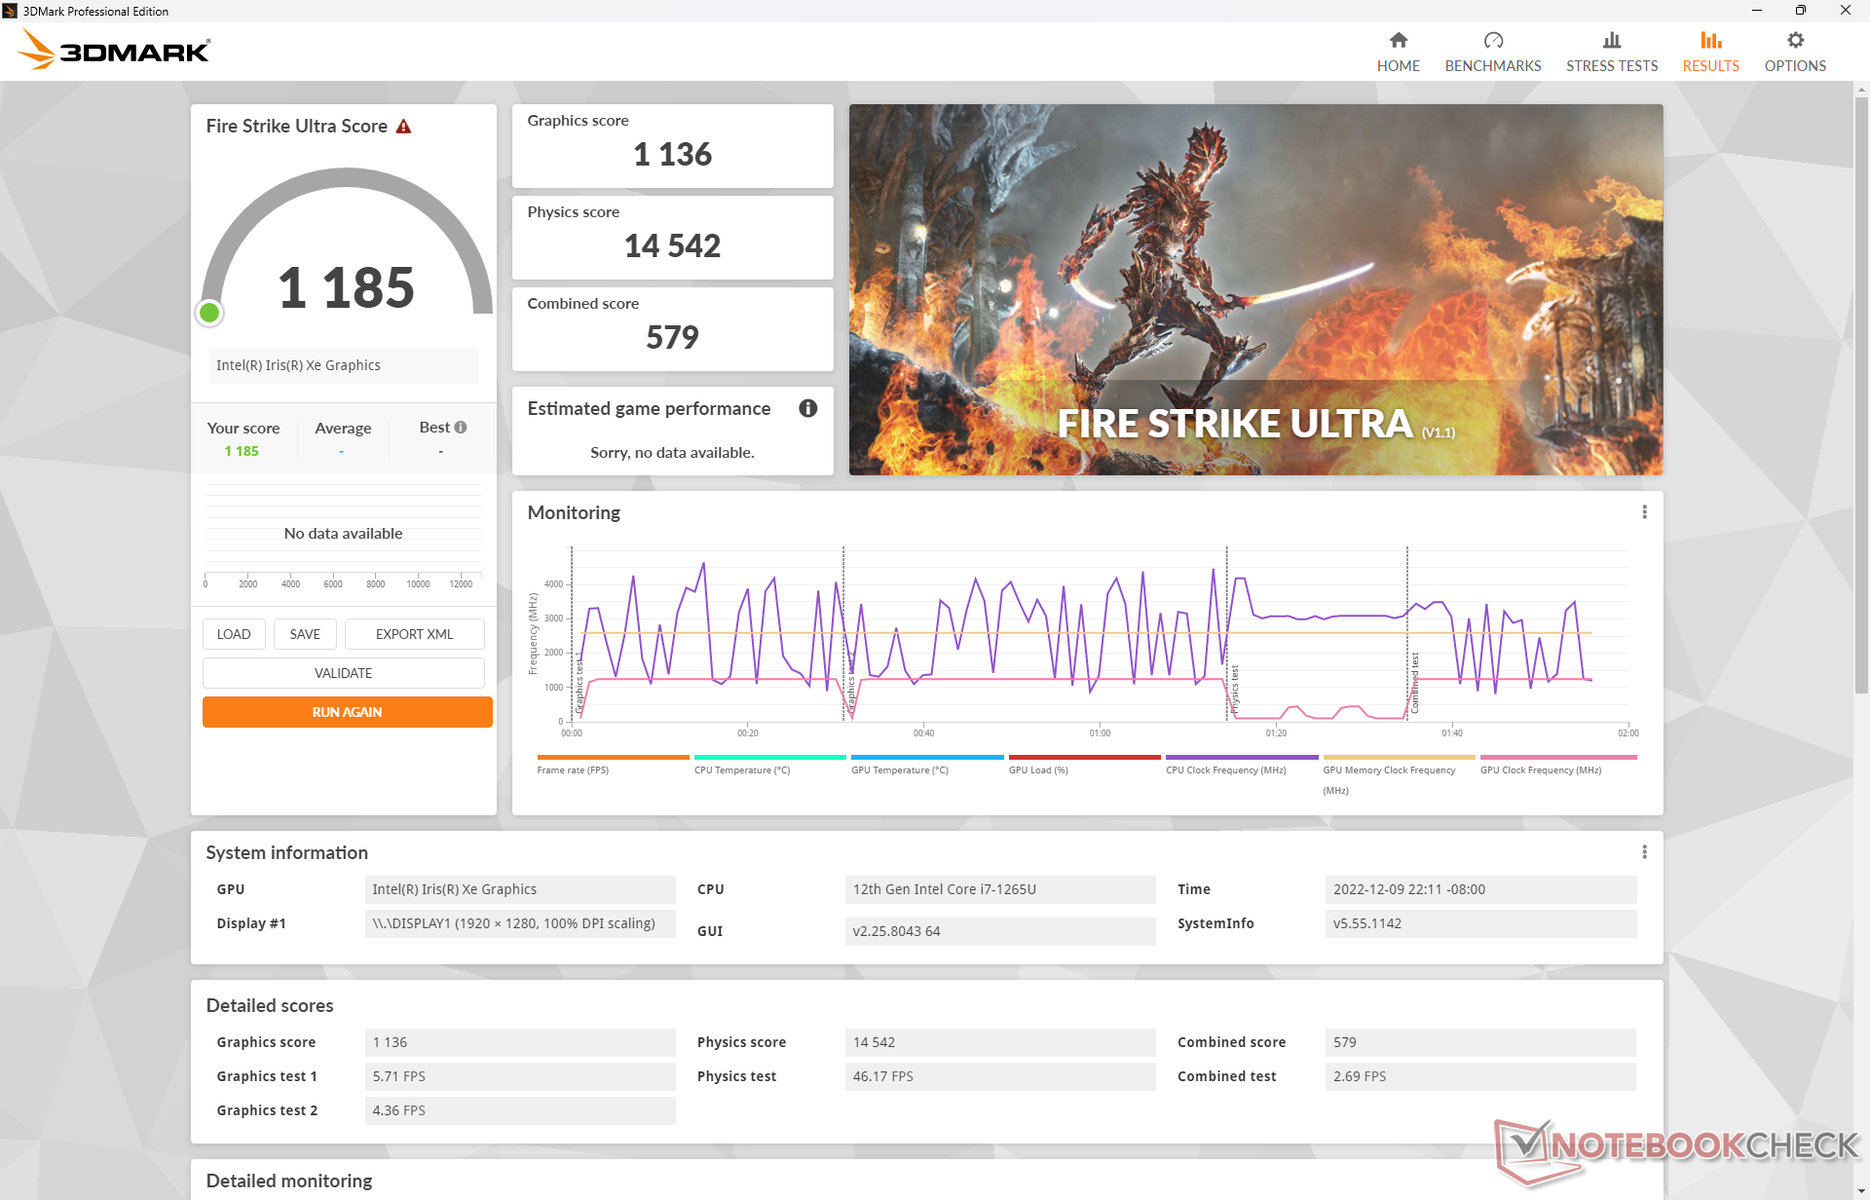
Rendimiento de la GPU - Iris Xe All The Way
En Iris Xe 96 UE sigue siendo la solución gráfica integrada más rápida que Intel ofrece en este momento. Aunque ha quedado por detrás de AMD, el alto rendimiento gráfico no es exactamente el objetivo de un subportátil 2-en-1 para empresas. Cambiar a un Core i5 inferior con Iris Xe 80 EU supondrá una caída del rendimiento gráfico de entre el 20 y el 30 por ciento.
Ejecutar 3DMark 11 en modo Equilibrado o Rendimiento muestra diferencias de rendimiento insignificantes entre los dos modos.
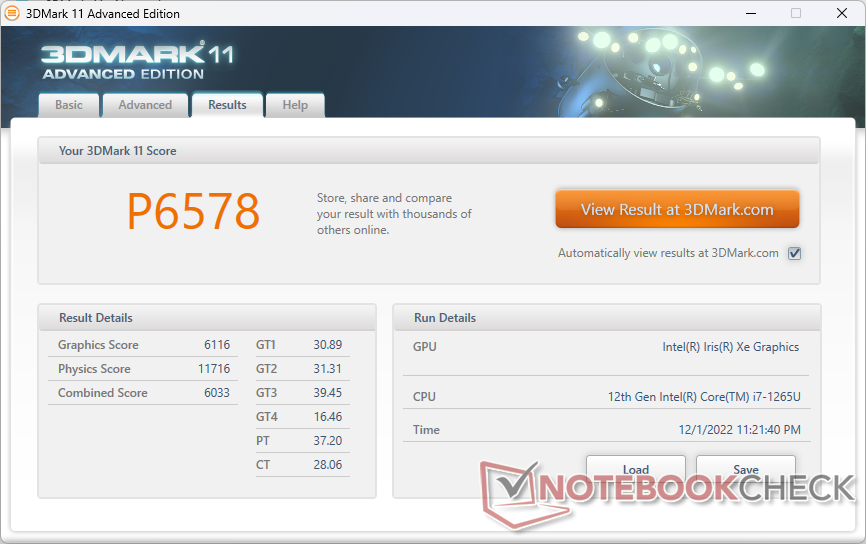
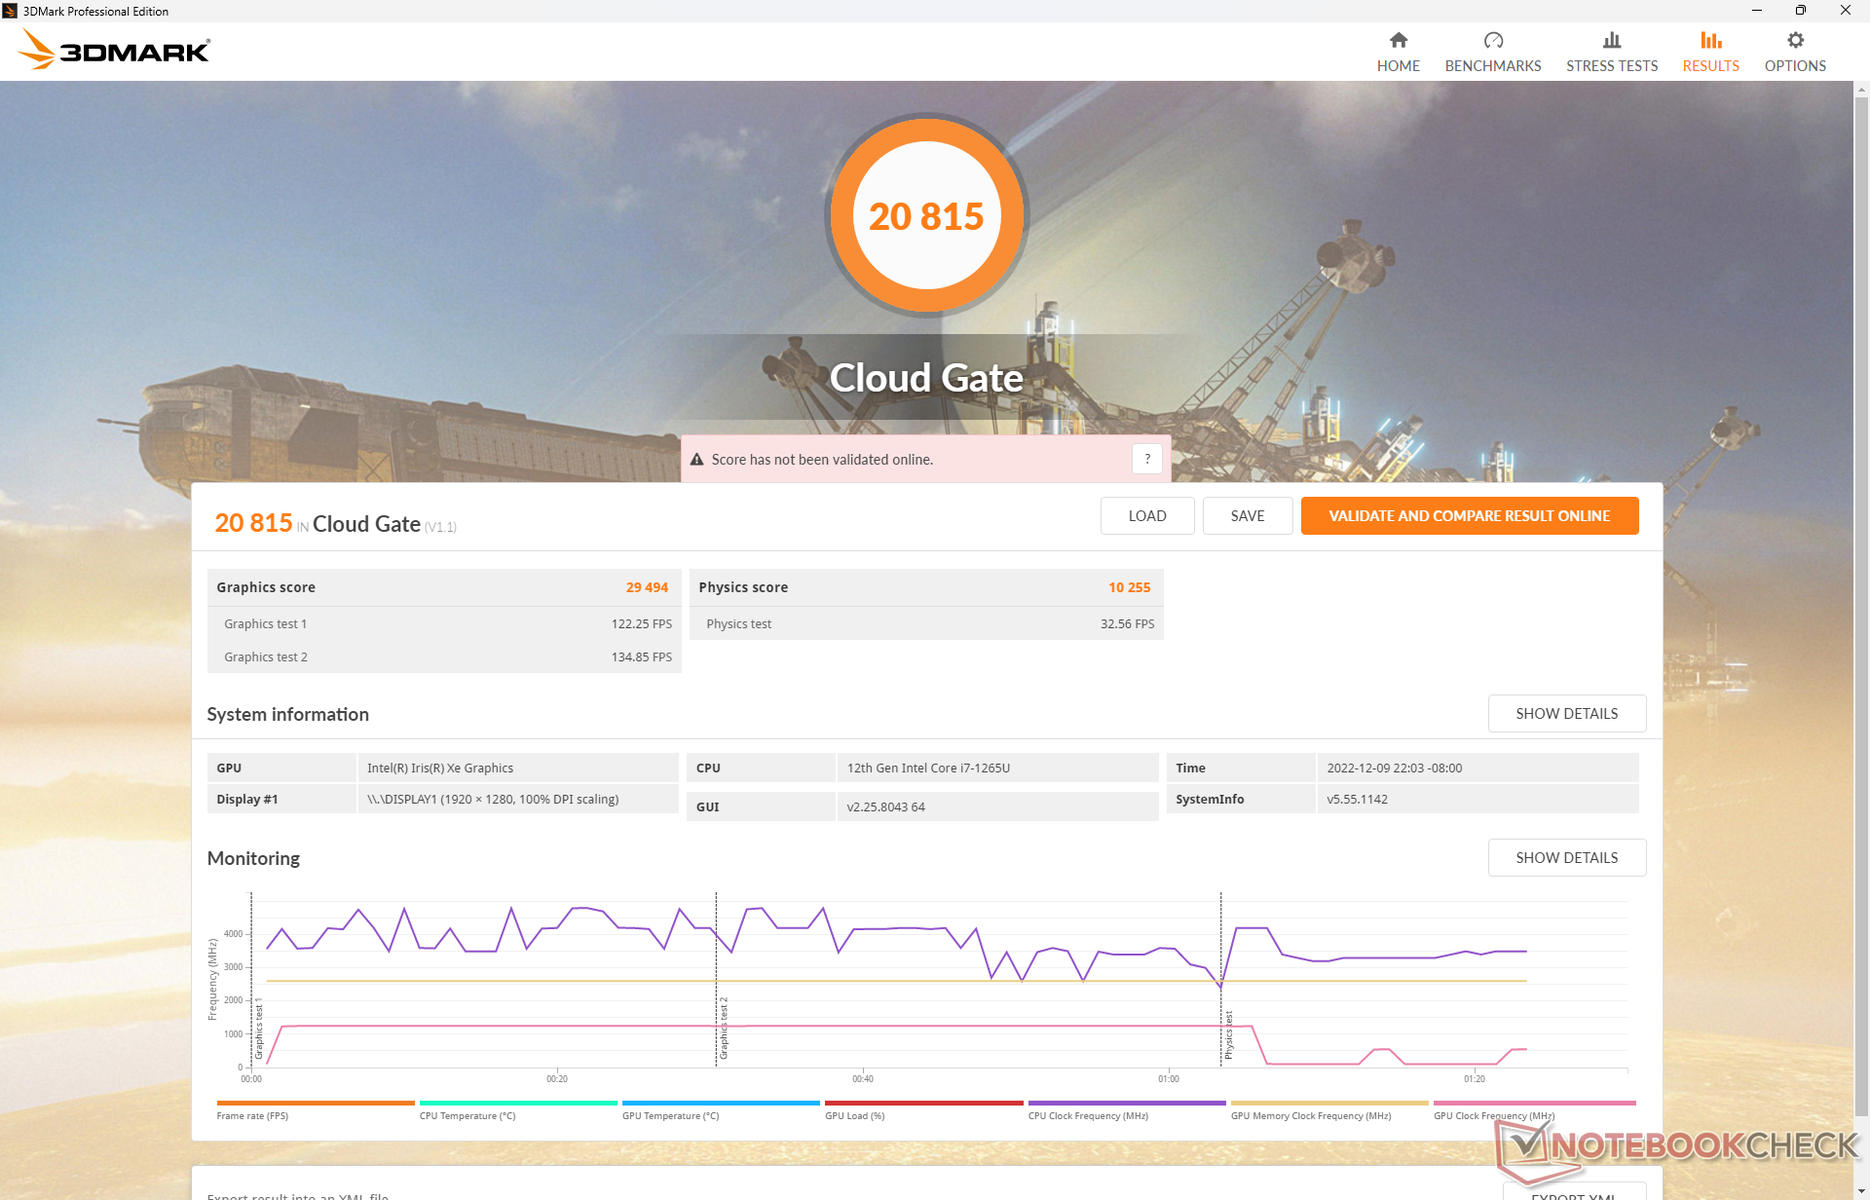
| 3DMark 11 Performance | 6578 puntos | |
| 3DMark Cloud Gate Standard Score | 20815 puntos | |
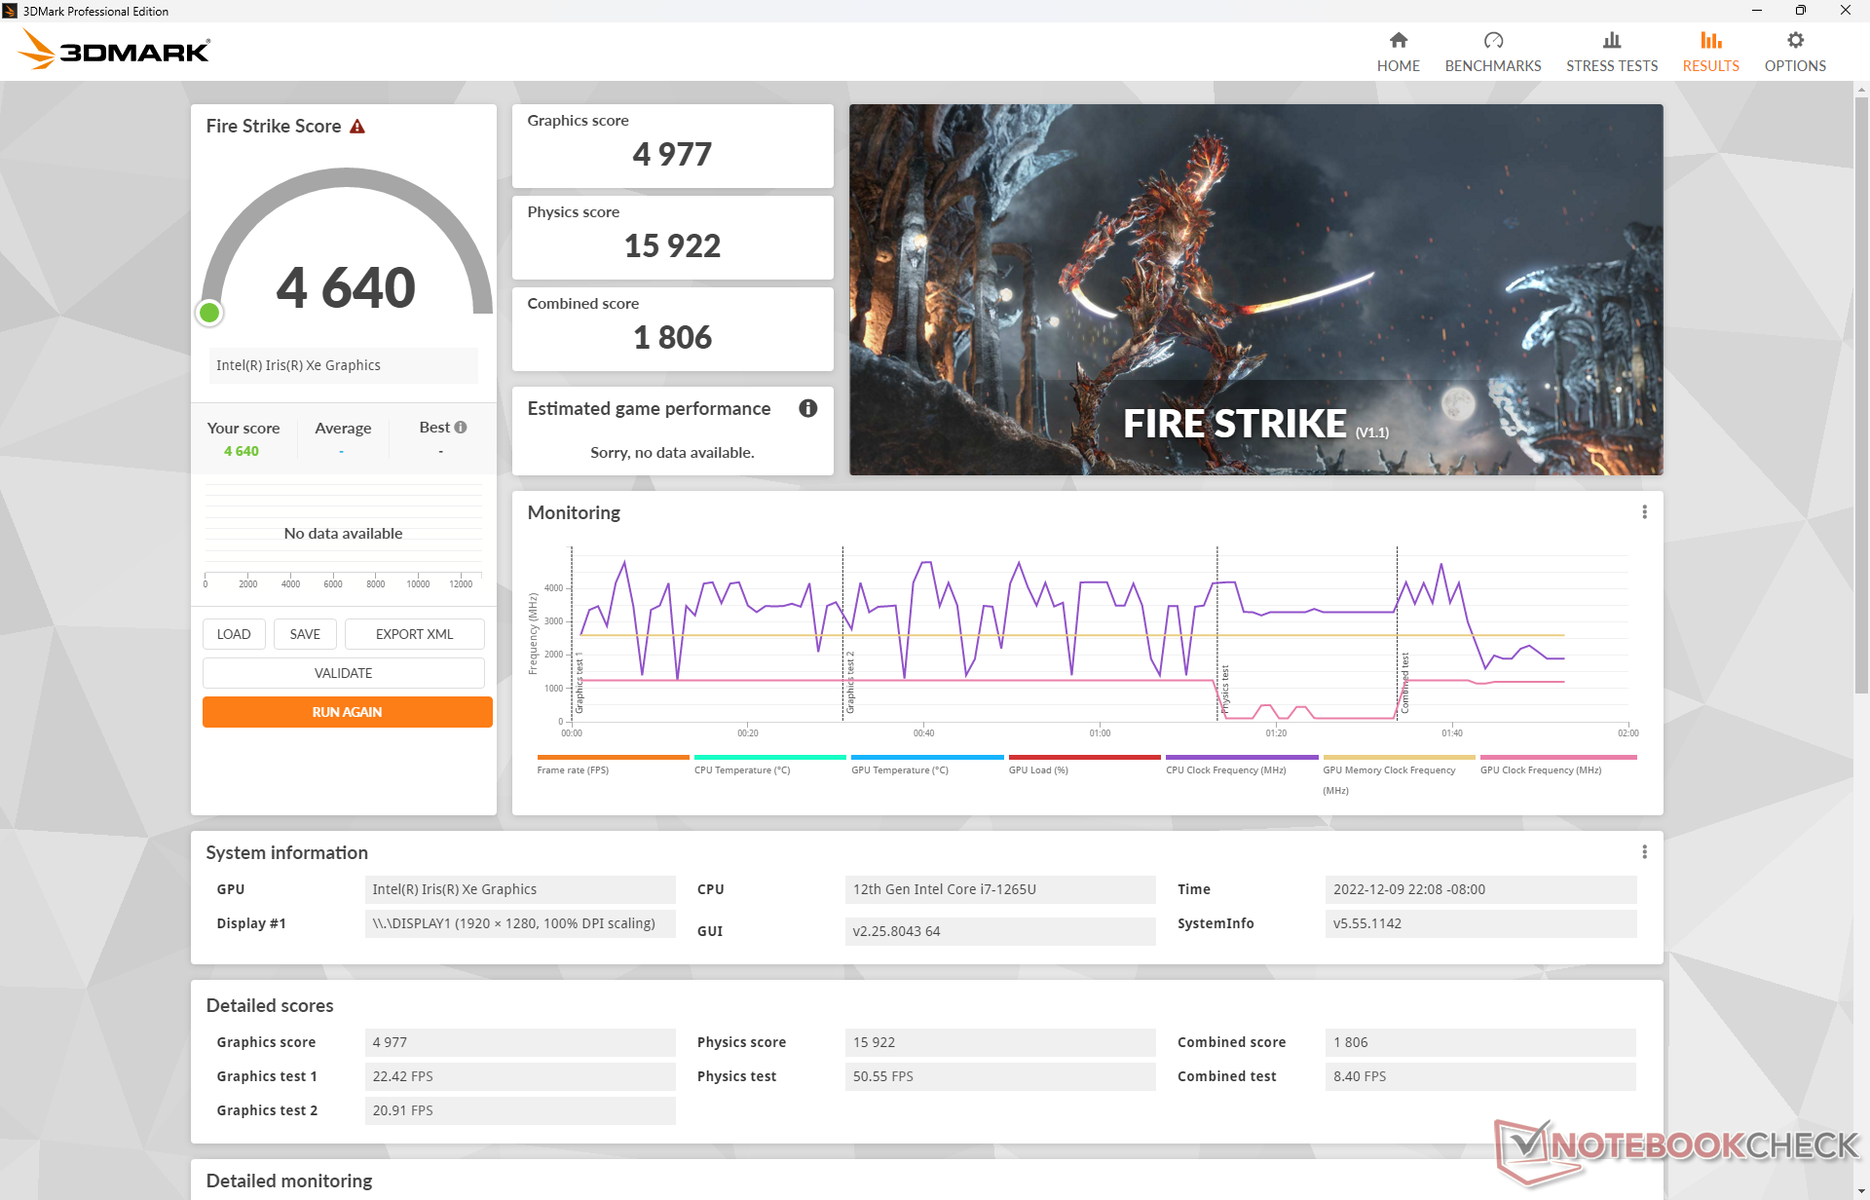
| 3DMark Fire Strike Score | 4640 puntos | |
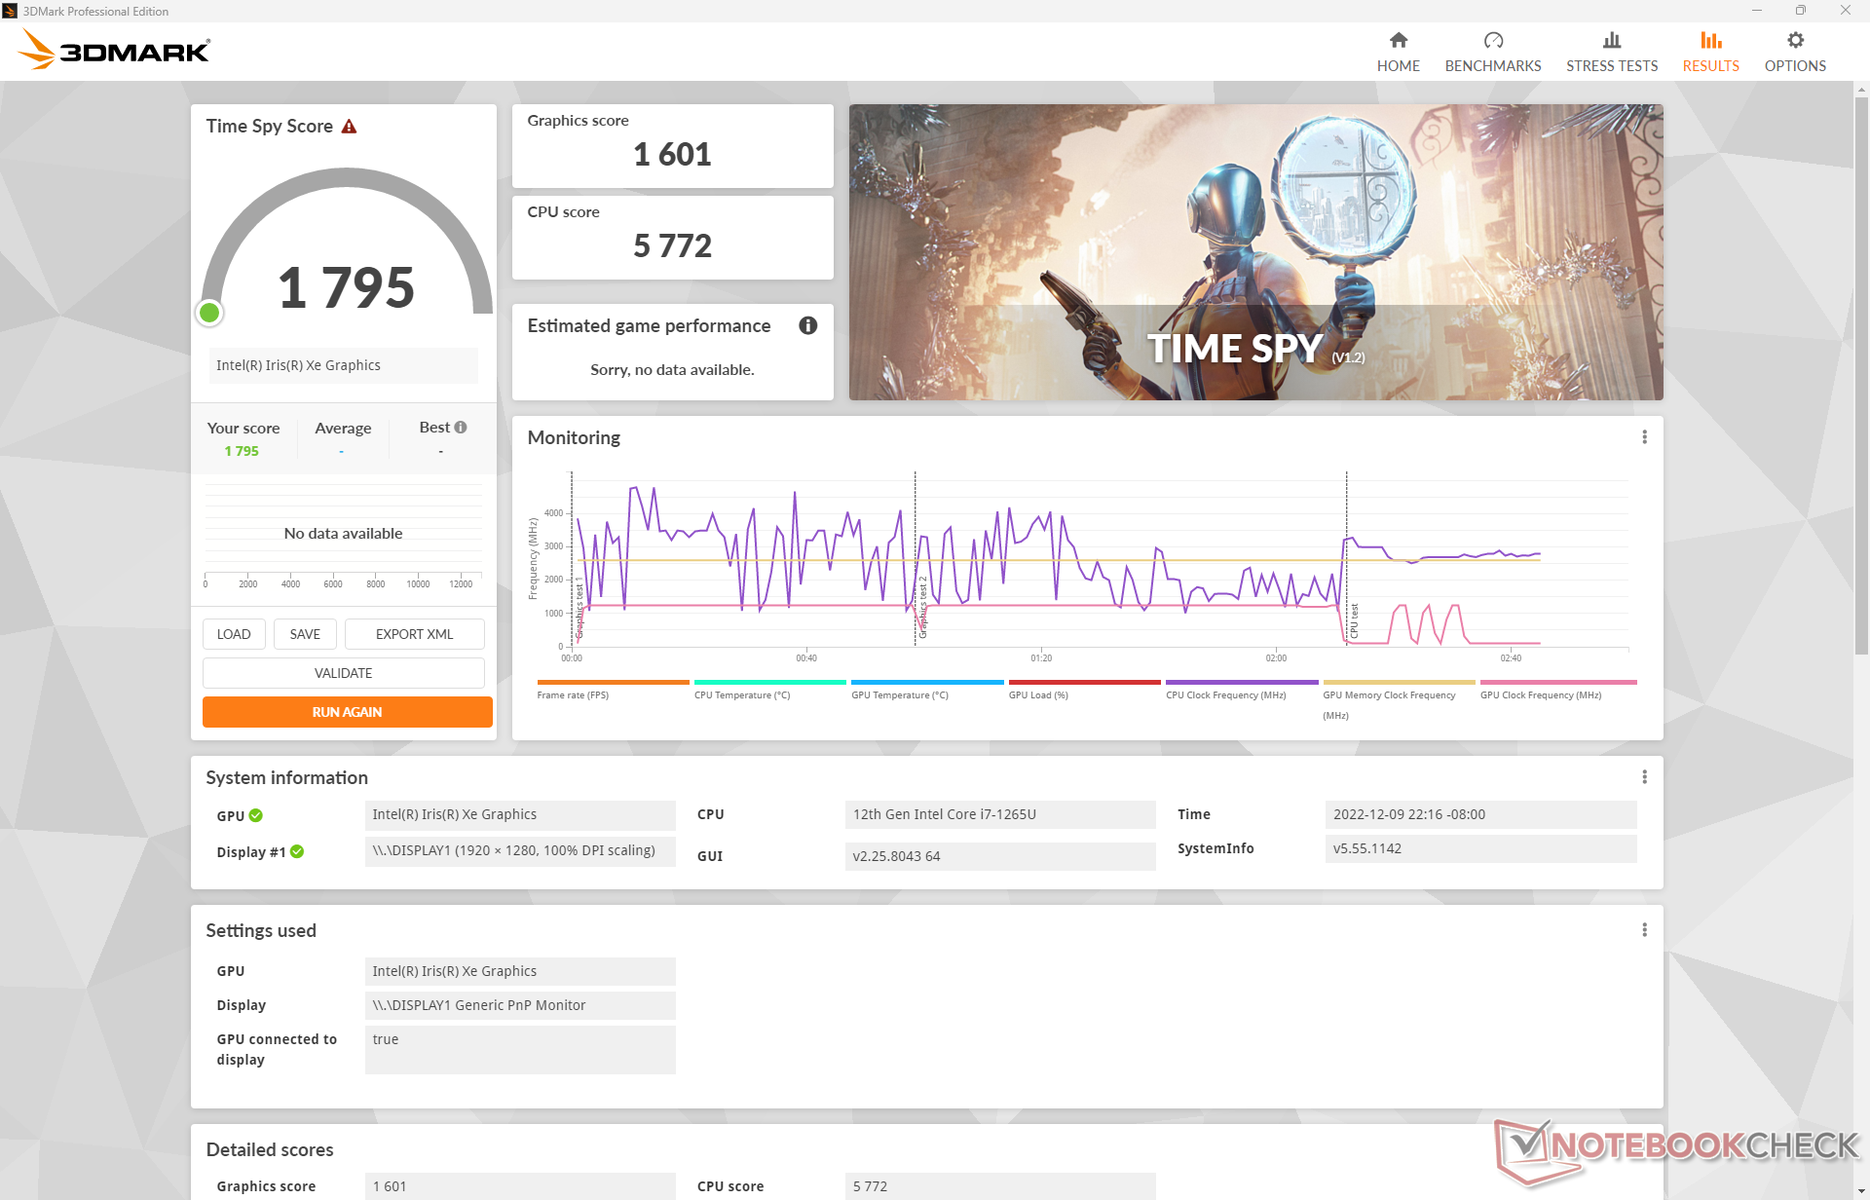
| 3DMark Time Spy Score | 1795 puntos | |
ayuda | ||
* ... más pequeño es mejor
| Performance rating - Percent | |
| Asus Zenbook S 13 OLED | |
| Framework Laptop 13.5 12th Gen Intel | |
| Razer Book 13 FHD -1! | |
| Dell XPS 13 Plus 9320 i7-1280P OLED | |
| HP Envy 13-ba0001ng -3! | |
| HP Elite Dragonfly Folio 13.5 G3 | |
| Lenovo ThinkBook 13s G3 20YA0005GE -2! | |
| HP Elite Dragonfly G3 | |
| Dell Latitude 9330 | |
| HP Envy x360 13-bf0013dx -1! | |
| Lenovo Yoga 6 13ALC6 | |
| Lenovo ThinkPad L13 Gen2-20VH0017GE -4! | |
| Asus ExpertBook B5 Flip B5302FEA | |
| The Witcher 3 - 1920x1080 Ultra Graphics & Postprocessing (HBAO+) | |
| Asus Zenbook S 13 OLED | |
| Dell XPS 13 Plus 9320 i7-1280P OLED | |
| Razer Book 13 FHD | |
| Lenovo Yoga 6 13ALC6 | |
| Framework Laptop 13.5 12th Gen Intel | |
| HP Elite Dragonfly Folio 13.5 G3 | |
| Lenovo ThinkBook 13s G3 20YA0005GE | |
| HP Elite Dragonfly G3 | |
| HP Envy x360 13-bf0013dx | |
| Dell Latitude 9330 | |
| HP Envy 13-ba0001ng | |
| Asus ExpertBook B5 Flip B5302FEA | |
| Final Fantasy XV Benchmark - 1920x1080 High Quality | |
| Framework Laptop 13.5 12th Gen Intel | |
| Asus Zenbook S 13 OLED | |
| Razer Book 13 FHD | |
| Dell XPS 13 Plus 9320 i7-1280P OLED | |
| HP Elite Dragonfly Folio 13.5 G3 | |
| HP Elite Dragonfly G3 | |
| Dell Latitude 9330 | |
| Lenovo ThinkBook 13s G3 20YA0005GE | |
| HP Envy x360 13-bf0013dx | |
| Lenovo Yoga 6 13ALC6 | |
| Asus ExpertBook B5 Flip B5302FEA | |
| Asus ExpertBook B5 Flip B5302FEA | |
Witcher 3 FPS Chart
| bajo | medio | alto | ultra | |
|---|---|---|---|---|
| GTA V (2015) | 94.4 | 84.5 | 23.6 | 10.1 |
| The Witcher 3 (2015) | 89.7 | 52.9 | 32.6 | 14.5 |
| Dota 2 Reborn (2015) | 109 | 76.4 | 60.3 | 54.5 |
| Final Fantasy XV Benchmark (2018) | 42.2 | 23.1 | 16.5 | |
| X-Plane 11.11 (2018) | 48.4 | 39.5 | 35.1 | |
| Strange Brigade (2018) | 86.4 | 39.8 | 31.9 | 25.5 |
| Cyberpunk 2077 1.6 (2022) | 19.7 | 16.3 | 12.5 | 10.1 |
Emisiones
Ruido del sistema: increíblemente silencioso
El ruido del ventilador es uno de los más silenciosos que hemos observado en cualquier subportátil con una CPU Core serie U. Si lo comparamos con el Dragonfly Folio G2 del año pasado, el modelo G3 incorpora aspas de ventilador más finas y un nuevo algoritmo de ventilador para limitar el comportamiento pulsante. El resultado final es bastante sorprendente; ejecutar 3DMark 06 varias veces en bucle daría como resultado un ruido de ventilador de algo menos de 28 dB(A) frente a los 38 dB(A) o 34 dB(A) del Latitude 7330 oThinkPad L13 Gen 2respectivamente. Sólo pudimos registrar un máximo de apenas 33 dB(A) al ejecutar cargas más pesadas como juegos
HP tiene cuatro modos de energía para elegir: Silencioso, Frío, Equilibrado y Rendimiento. Hay pocas razones para elegir los modos más lentos ya que el ruido del ventilador ya es muy silencioso incluso cuando se configura en Rendimiento.
Ruido
| Ocioso |
| 24.6 / 24.6 / 24.6 dB(A) |
| Carga |
| 27.8 / 33.4 dB(A) |
 | ||
30 dB silencioso 40 dB(A) audible 50 dB(A) ruidosamente alto |
||
min: | ||
| HP Elite Dragonfly Folio 13.5 G3 Iris Xe G7 96EUs, i7-1265U, Samsung PM9A1 MZVL2512HCJQ | HP Elite Dragonfly G3 Iris Xe G7 96EUs, i7-1265U, Micron 3400 MTFDKBA512TFH 512GB | Dell Latitude 13 7330 Iris Xe G7 96EUs, i7-1265U, Toshiba KBG40ZNS512G NVMe | Framework Laptop 13.5 12th Gen Intel Iris Xe G7 96EUs, i7-1260P, WDC PC SN730 SDBPNTY-512G | Razer Book 13 FHD Iris Xe G7 96EUs, i7-1165G7, Samsung SSD PM981a MZVLB256HBHQ | Lenovo ThinkPad L13 Gen2-20VH0017GE Iris Xe G7 80EUs, i5-1135G7, Samsung SSD PM981a MZVLB512HBJQ | |
|---|---|---|---|---|---|---|
| Noise | 5% | -9% | -19% | -11% | -18% | |
| apagado / medio ambiente * (dB) | 24.6 | 22.8 7% | 23.4 5% | 22.8 7% | 27 -10% | 29.3 -19% |
| Idle Minimum * (dB) | 24.6 | 23.2 6% | 23.4 5% | 23 7% | 27 -10% | 29.3 -19% |
| Idle Average * (dB) | 24.6 | 23.2 6% | 23.4 5% | 23 7% | 27 -10% | 29.3 -19% |
| Idle Maximum * (dB) | 24.6 | 23.2 6% | 23.4 5% | 23 7% | 27.1 -10% | 29.3 -19% |
| Load Average * (dB) | 27.8 | 25.1 10% | 37.8 -36% | 47.3 -70% | 29 -4% | 34.3 -23% |
| Witcher 3 ultra * (dB) | 33.4 | 32 4% | 39.2 -17% | 47.3 -42% | 33.3 -0% | |
| Load Maximum * (dB) | 33.4 | 35.2 -5% | 43 -29% | 49.8 -49% | 44.8 -34% | 36.3 -9% |
* ... más pequeño es mejor
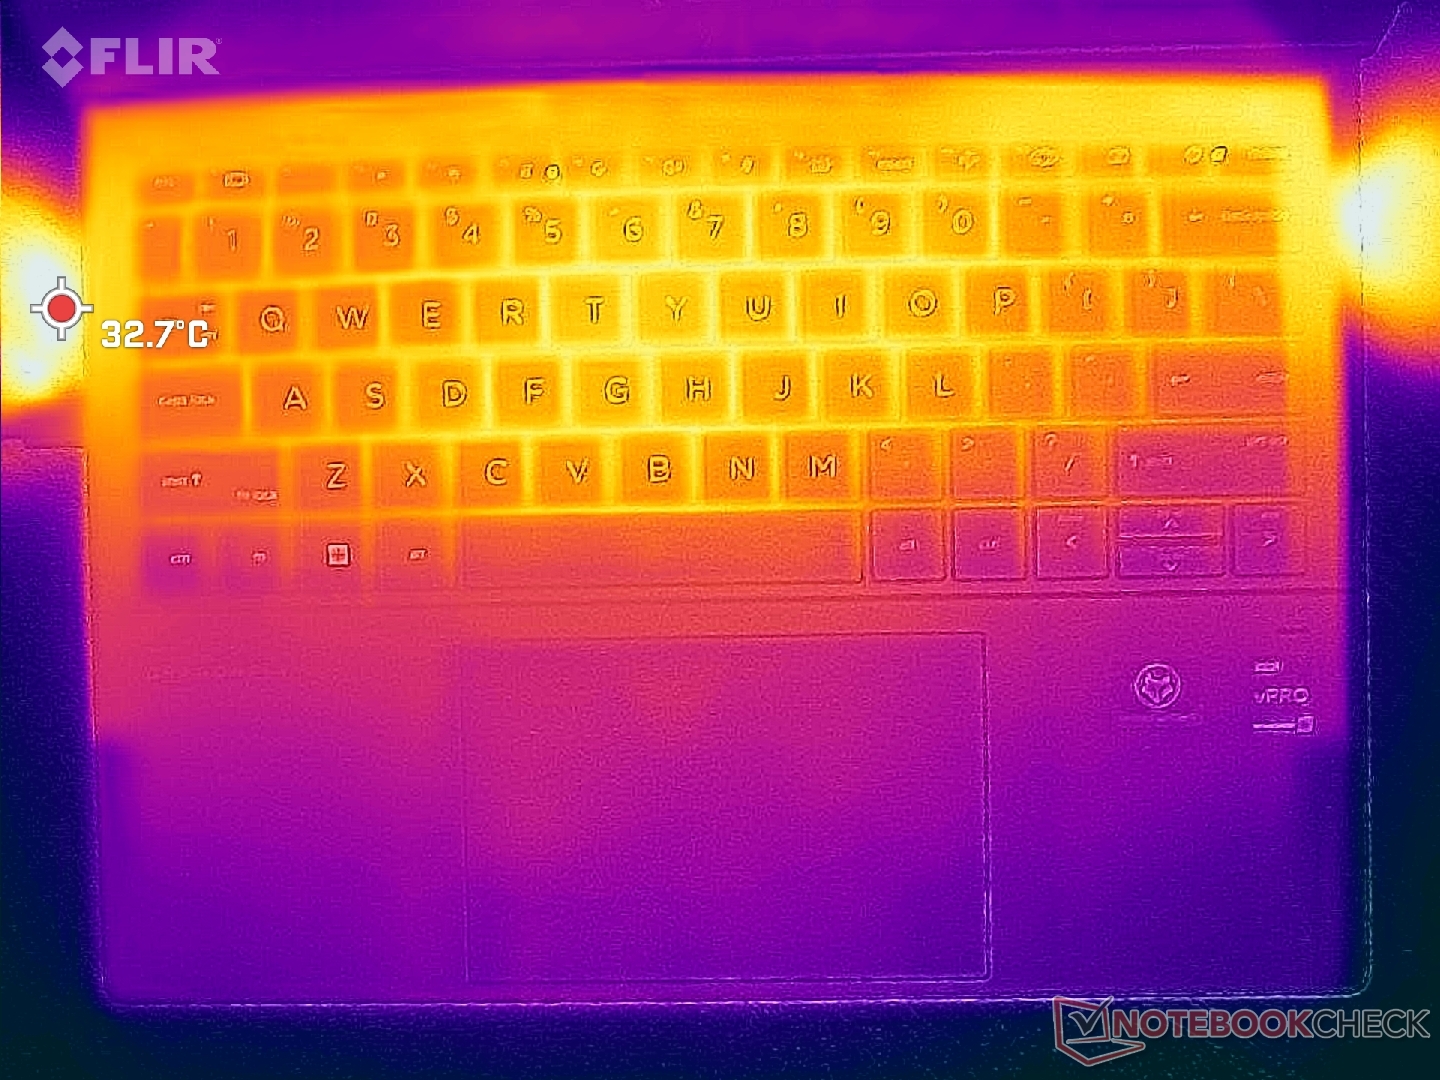
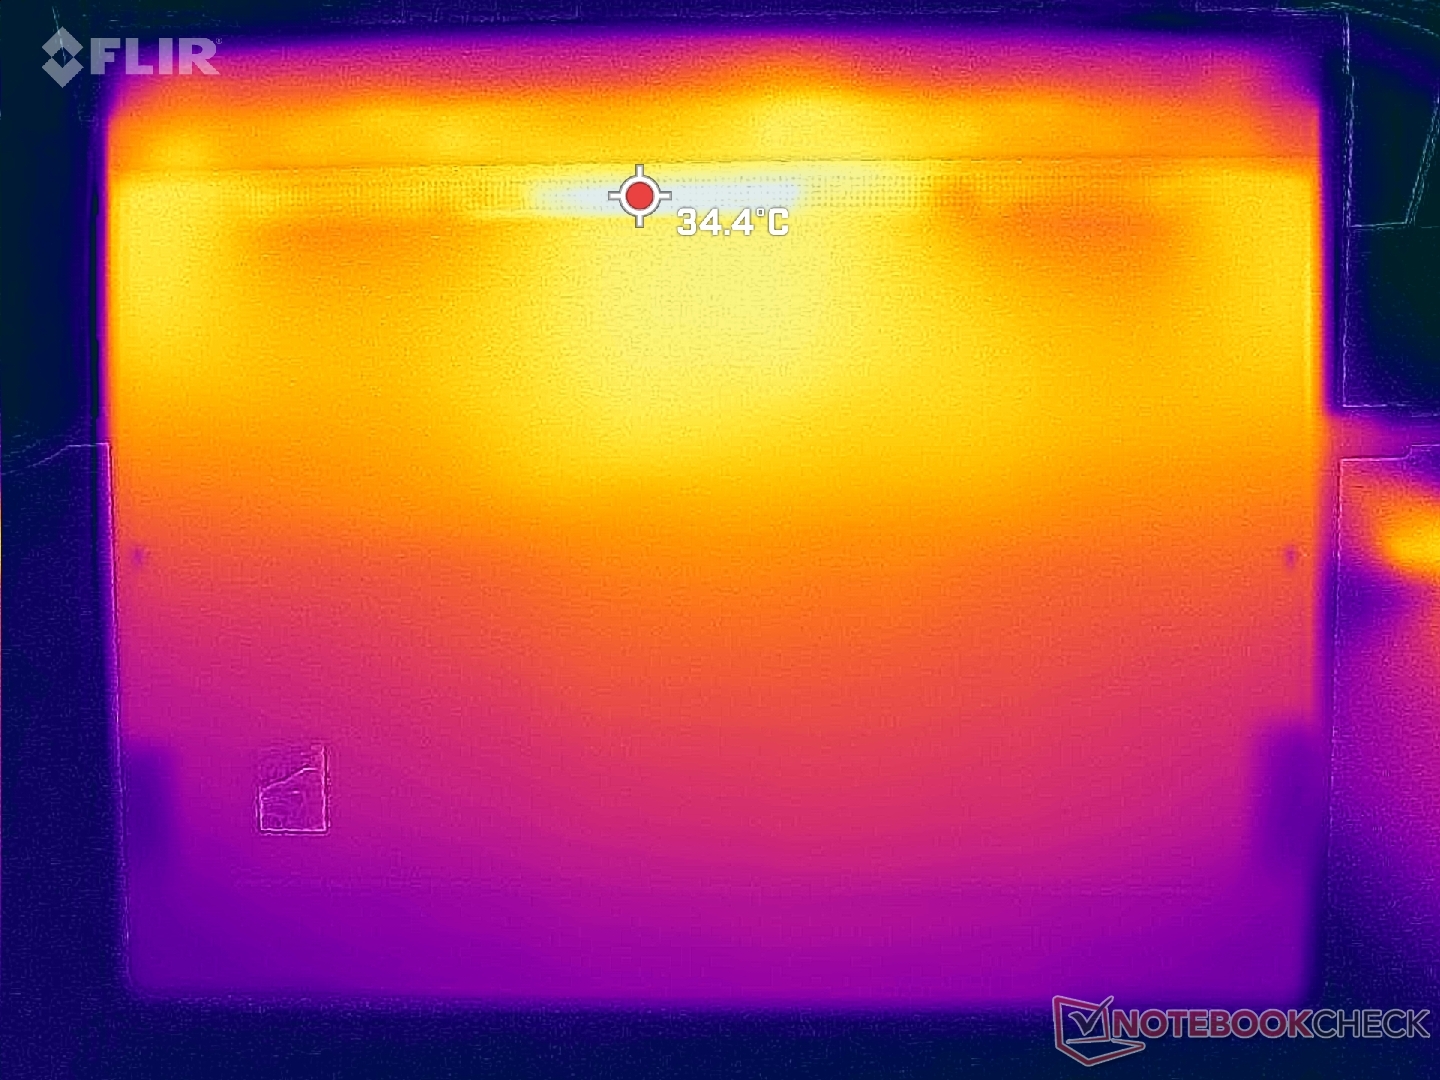
Temperatura
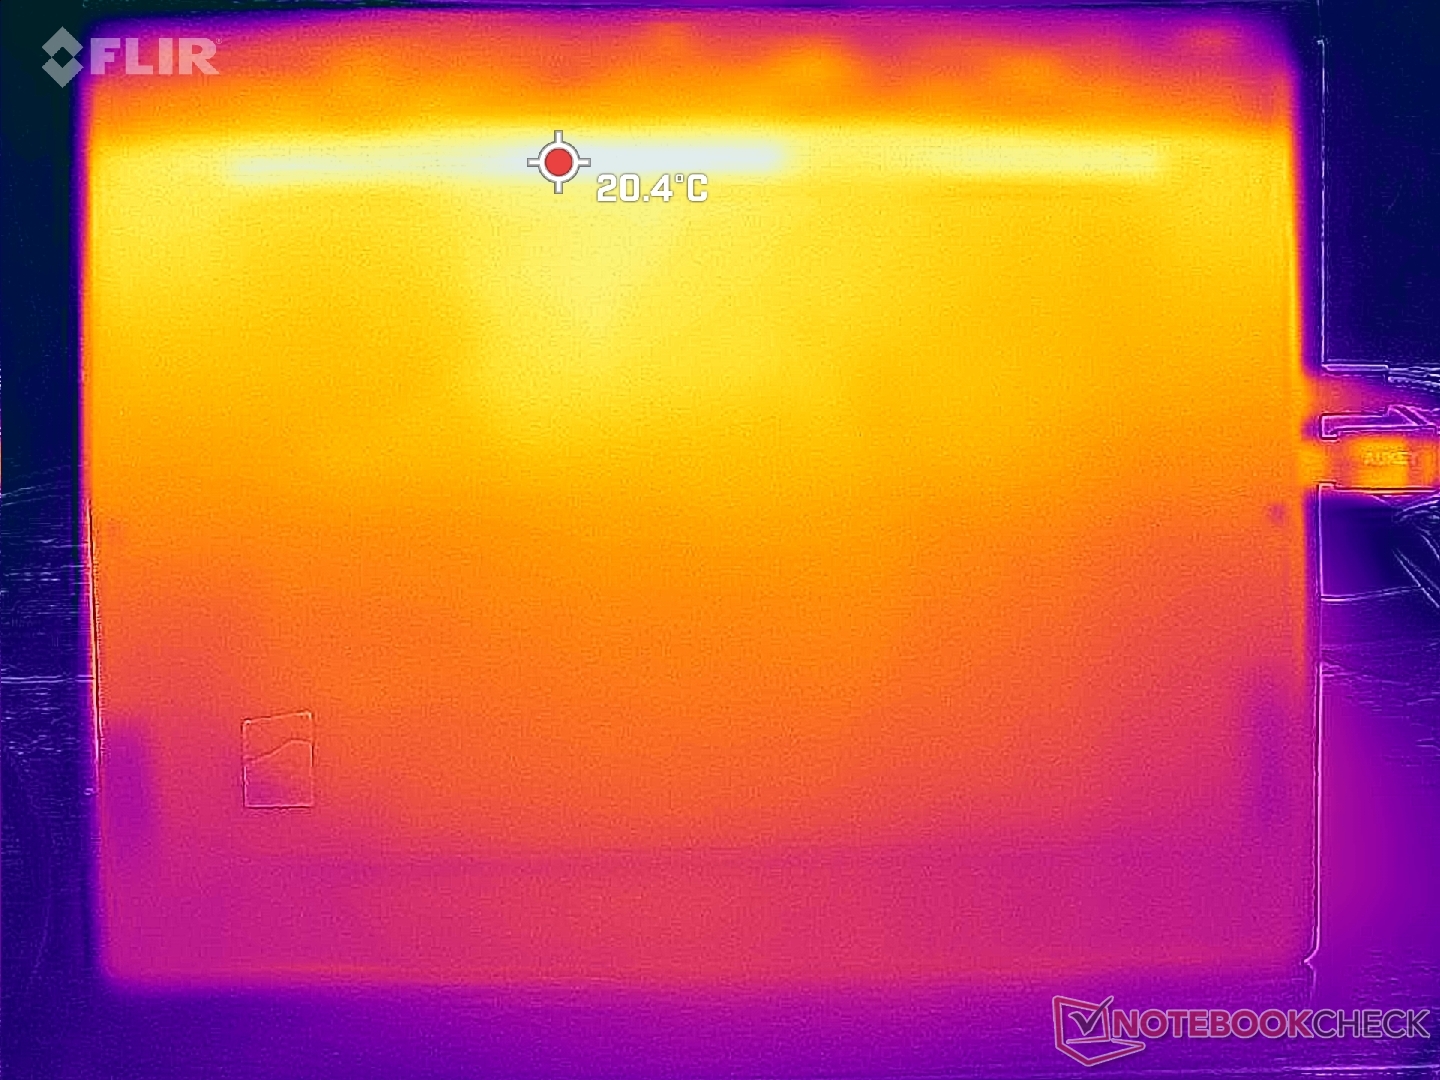
Las temperaturas superficiales son más frescas de lo esperado incluso con cargas exigentes. Los puntos calientes alcanzan un máximo de sólo 33 C y 34 C en la parte superior e inferior, respectivamente, en comparación con los 37 C o 39 C del Dragonfly G3 o el Dell Latitude 13 7330, respectivamente. El Dragonfly Folio G3 usa más ventiladores que en el Dell y tubos de calor más largos que en el Dragonfly G3 para mejorar el potencial de refrigeración. Las menores temperaturas superficiales también pueden atribuirse a las menores temperaturas del núcleo, como se detalla en la siguiente sección.
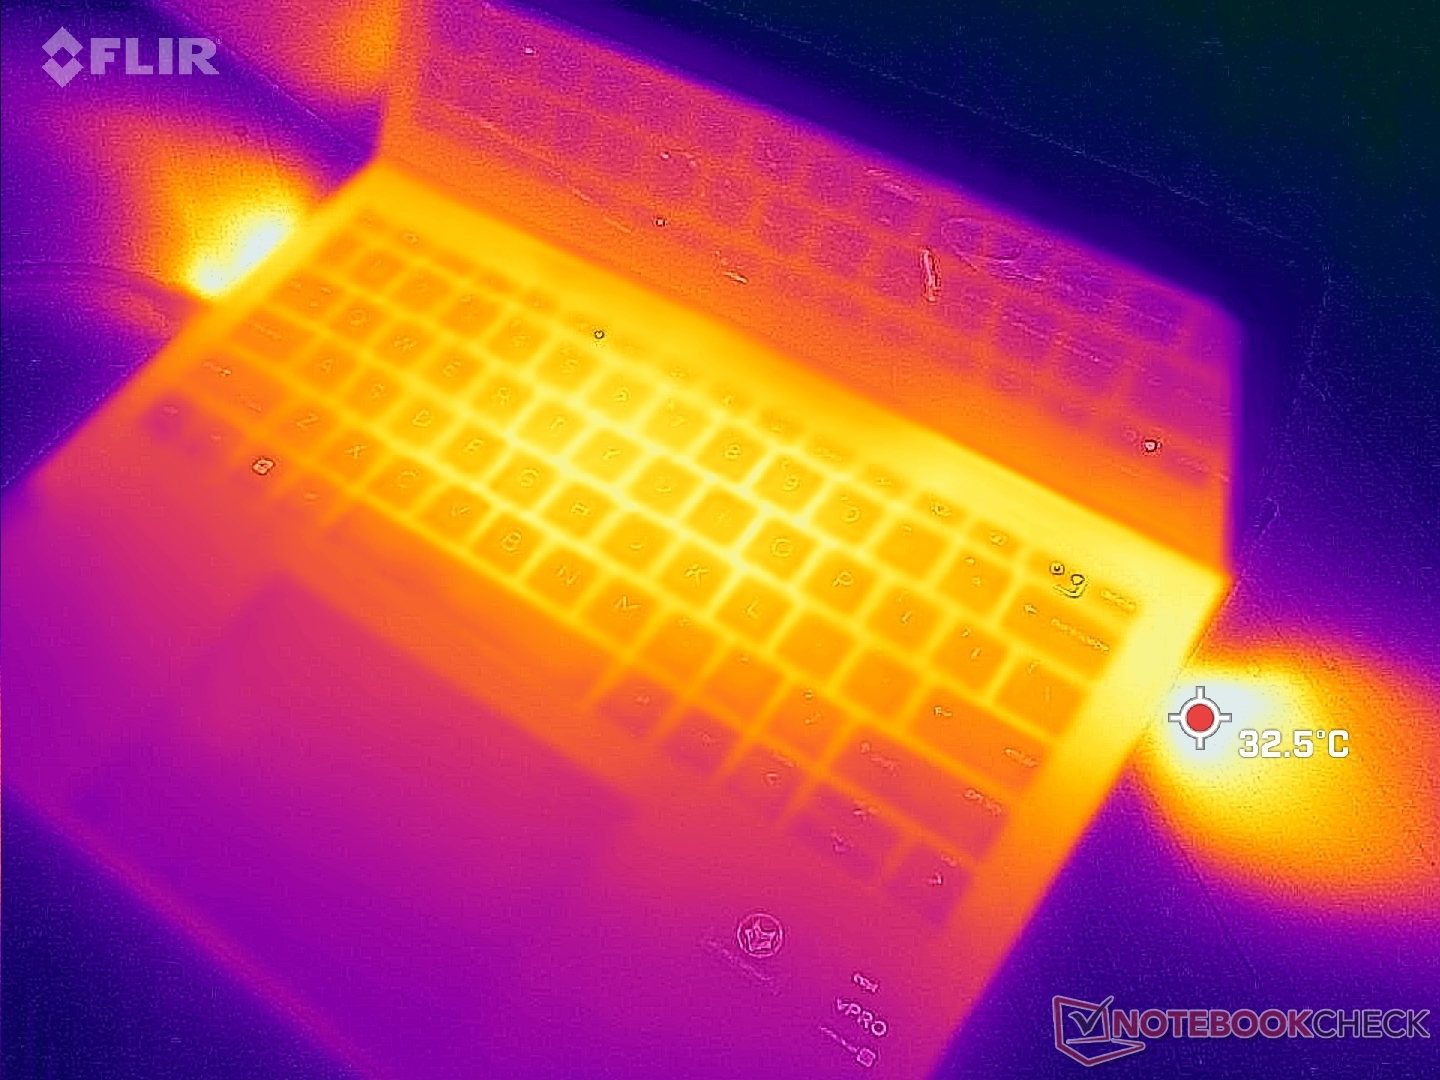
(+) La temperatura máxima en la parte superior es de 32.8 °C / 91 F, frente a la media de 35.4 °C / 96 F, que oscila entre 19.6 y 60 °C para la clase Convertible.
(+) El fondo se calienta hasta un máximo de 33.4 °C / 92 F, frente a la media de 36.9 °C / 98 F
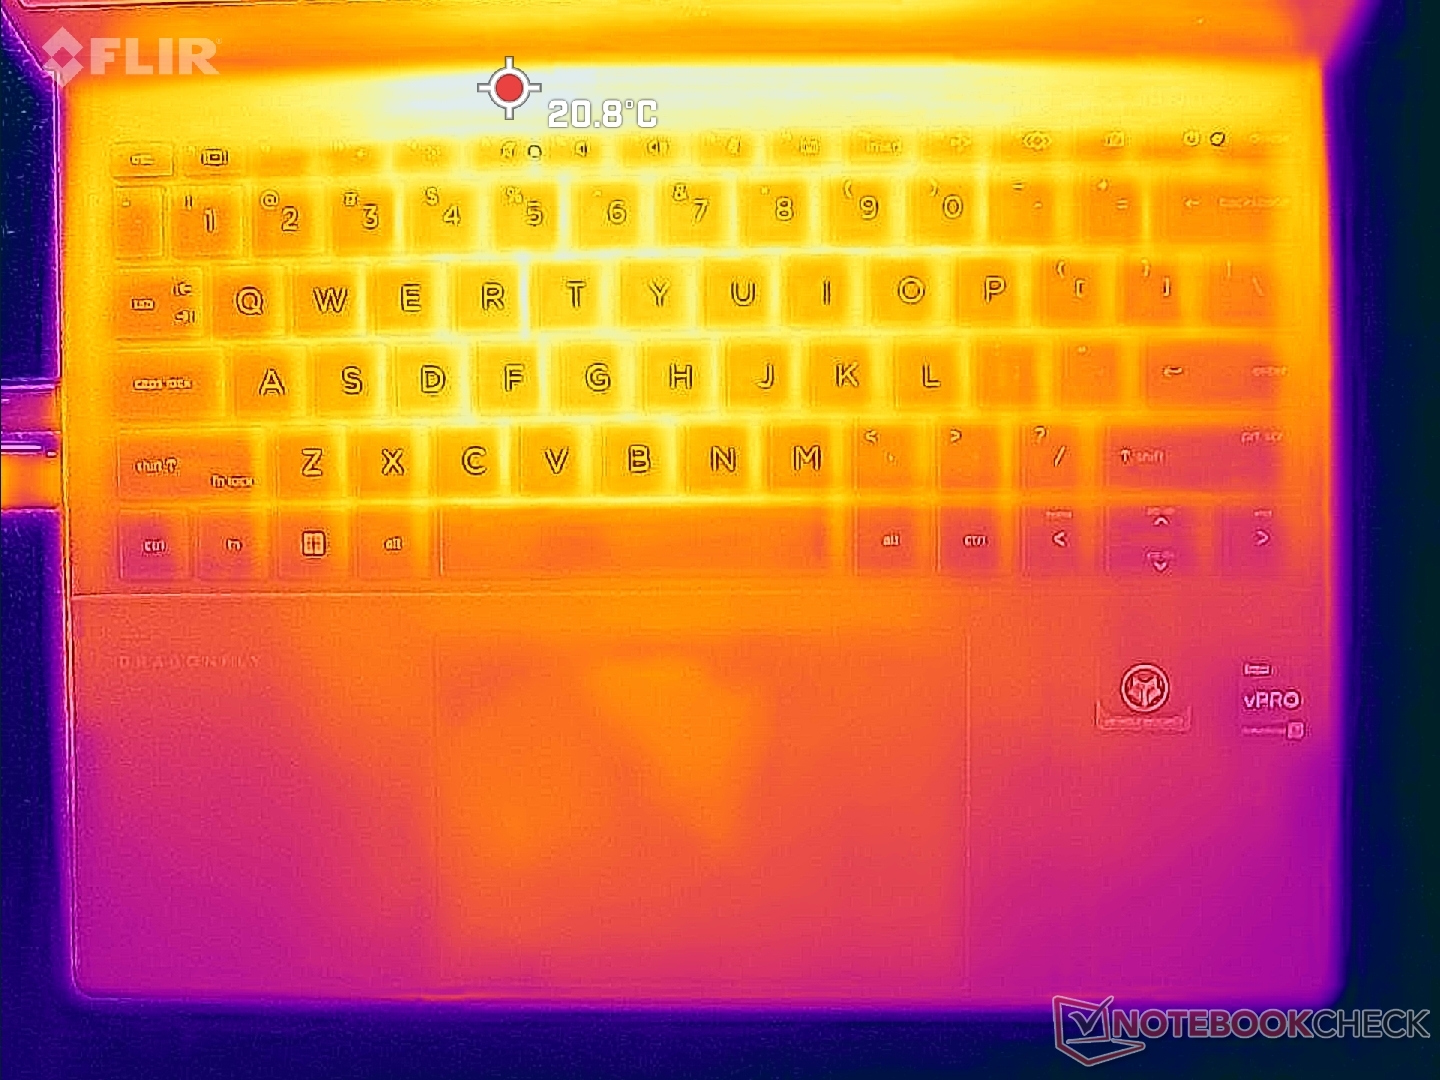
(+) En reposo, la temperatura media de la parte superior es de 22.2 °C / 72# F, frente a la media del dispositivo de 30.3 °C / 87 F.
(+) El reposamanos y el panel táctil están a una temperatura inferior a la de la piel, con un máximo de 22.4 °C / 72.3 F y, por tanto, son fríos al tacto.
(+) La temperatura media de la zona del reposamanos de dispositivos similares fue de 28 °C / 82.4 F (+5.6 °C / 10.1 F).
| HP Elite Dragonfly Folio 13.5 G3 Intel Core i7-1265U, Intel Iris Xe Graphics G7 96EUs | HP Elite Dragonfly G3 Intel Core i7-1265U, Intel Iris Xe Graphics G7 96EUs | Dell Latitude 13 7330 Intel Core i7-1265U, Intel Iris Xe Graphics G7 96EUs | Framework Laptop 13.5 12th Gen Intel Intel Core i7-1260P, Intel Iris Xe Graphics G7 96EUs | Razer Book 13 FHD Intel Core i7-1165G7, Intel Iris Xe Graphics G7 96EUs | Lenovo ThinkPad L13 Gen2-20VH0017GE Intel Core i5-1135G7, Intel Iris Xe Graphics G7 80EUs | |
|---|---|---|---|---|---|---|
| Heat | -17% | -10% | -14% | -14% | -32% | |
| Maximum Upper Side * (°C) | 32.8 | 39 -19% | 38.6 -18% | 36.8 -12% | 39.2 -20% | 43.3 -32% |
| Maximum Bottom * (°C) | 33.4 | 42.2 -26% | 42 -26% | 42.4 -27% | 44 -32% | 58 -74% |
| Idle Upper Side * (°C) | 24.6 | 26.8 -9% | 23.8 3% | 24.2 2% | 23 7% | 25.6 -4% |
| Idle Bottom * (°C) | 24.6 | 28.2 -15% | 24.6 -0% | 29 -18% | 26.8 -9% | 28.8 -17% |
* ... más pequeño es mejor
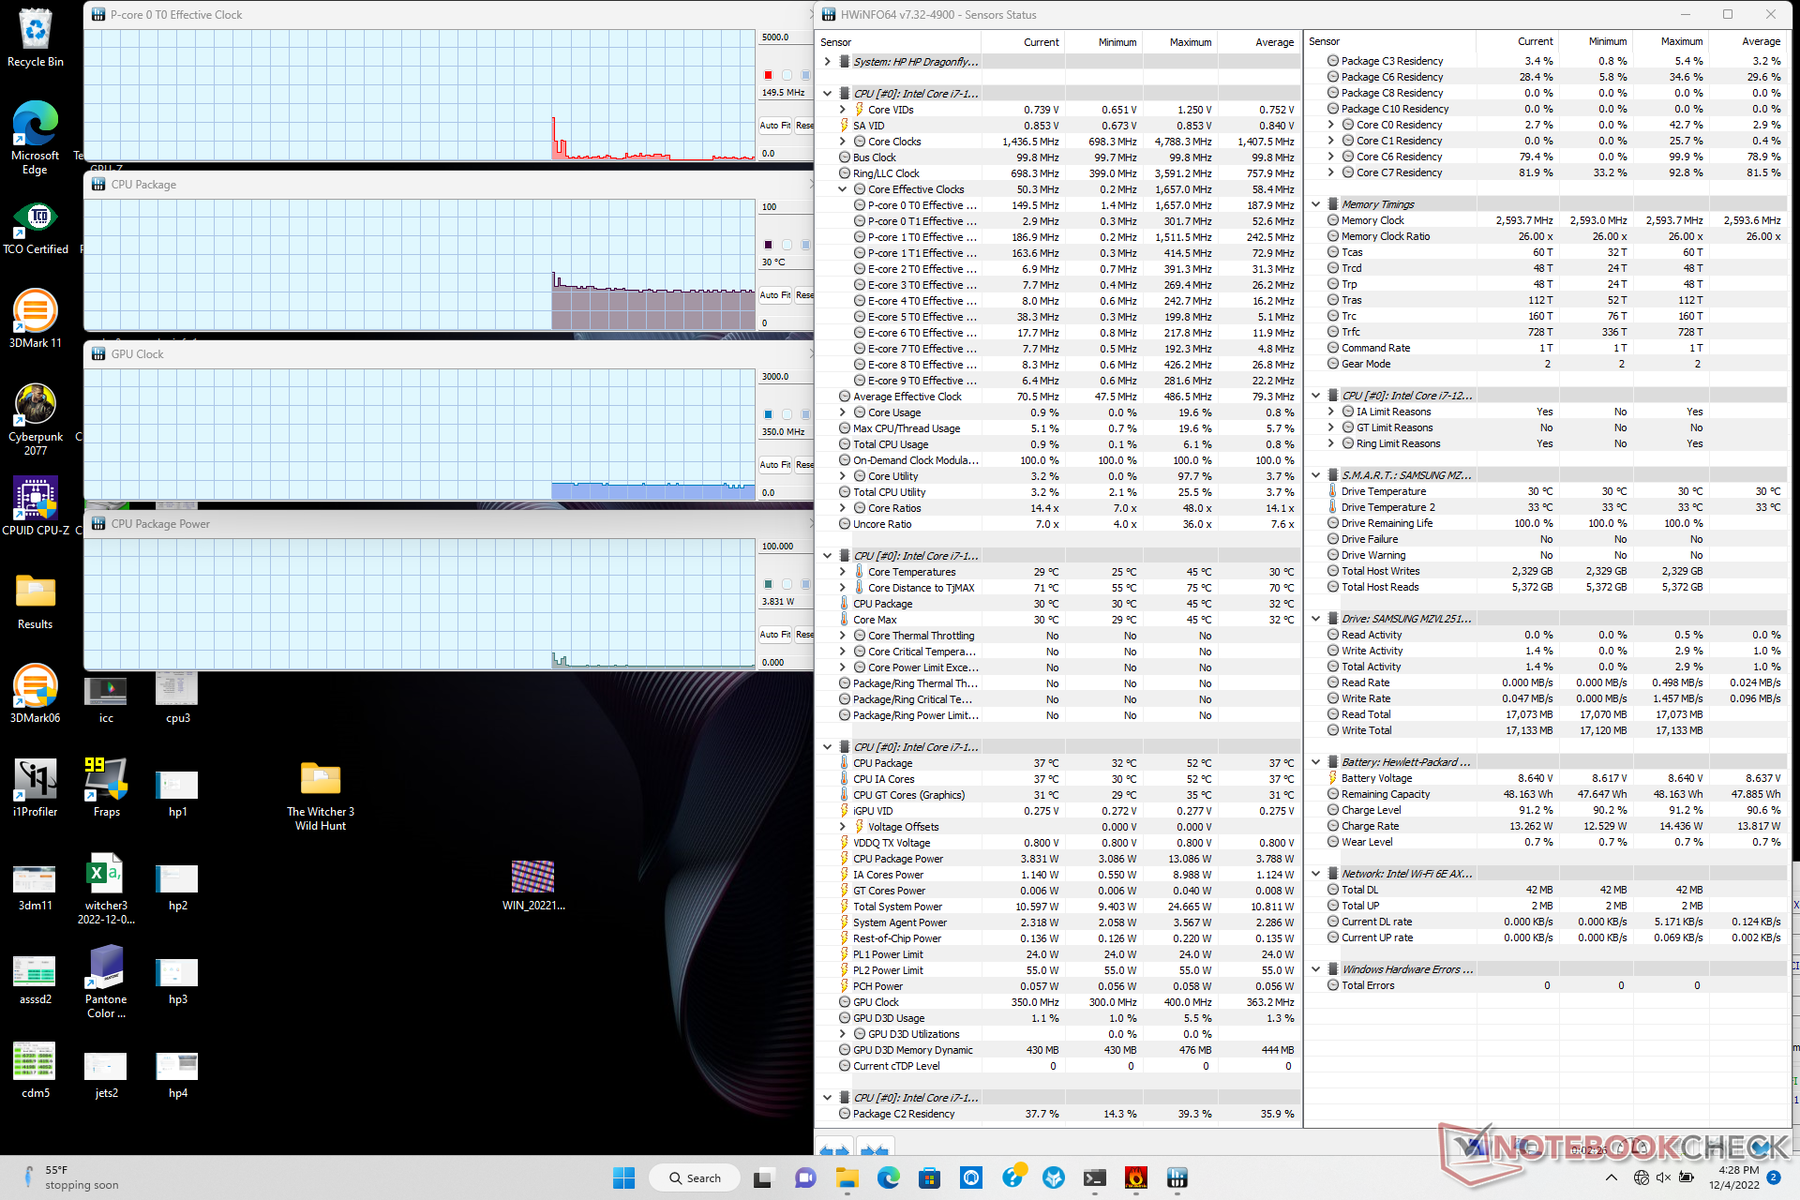
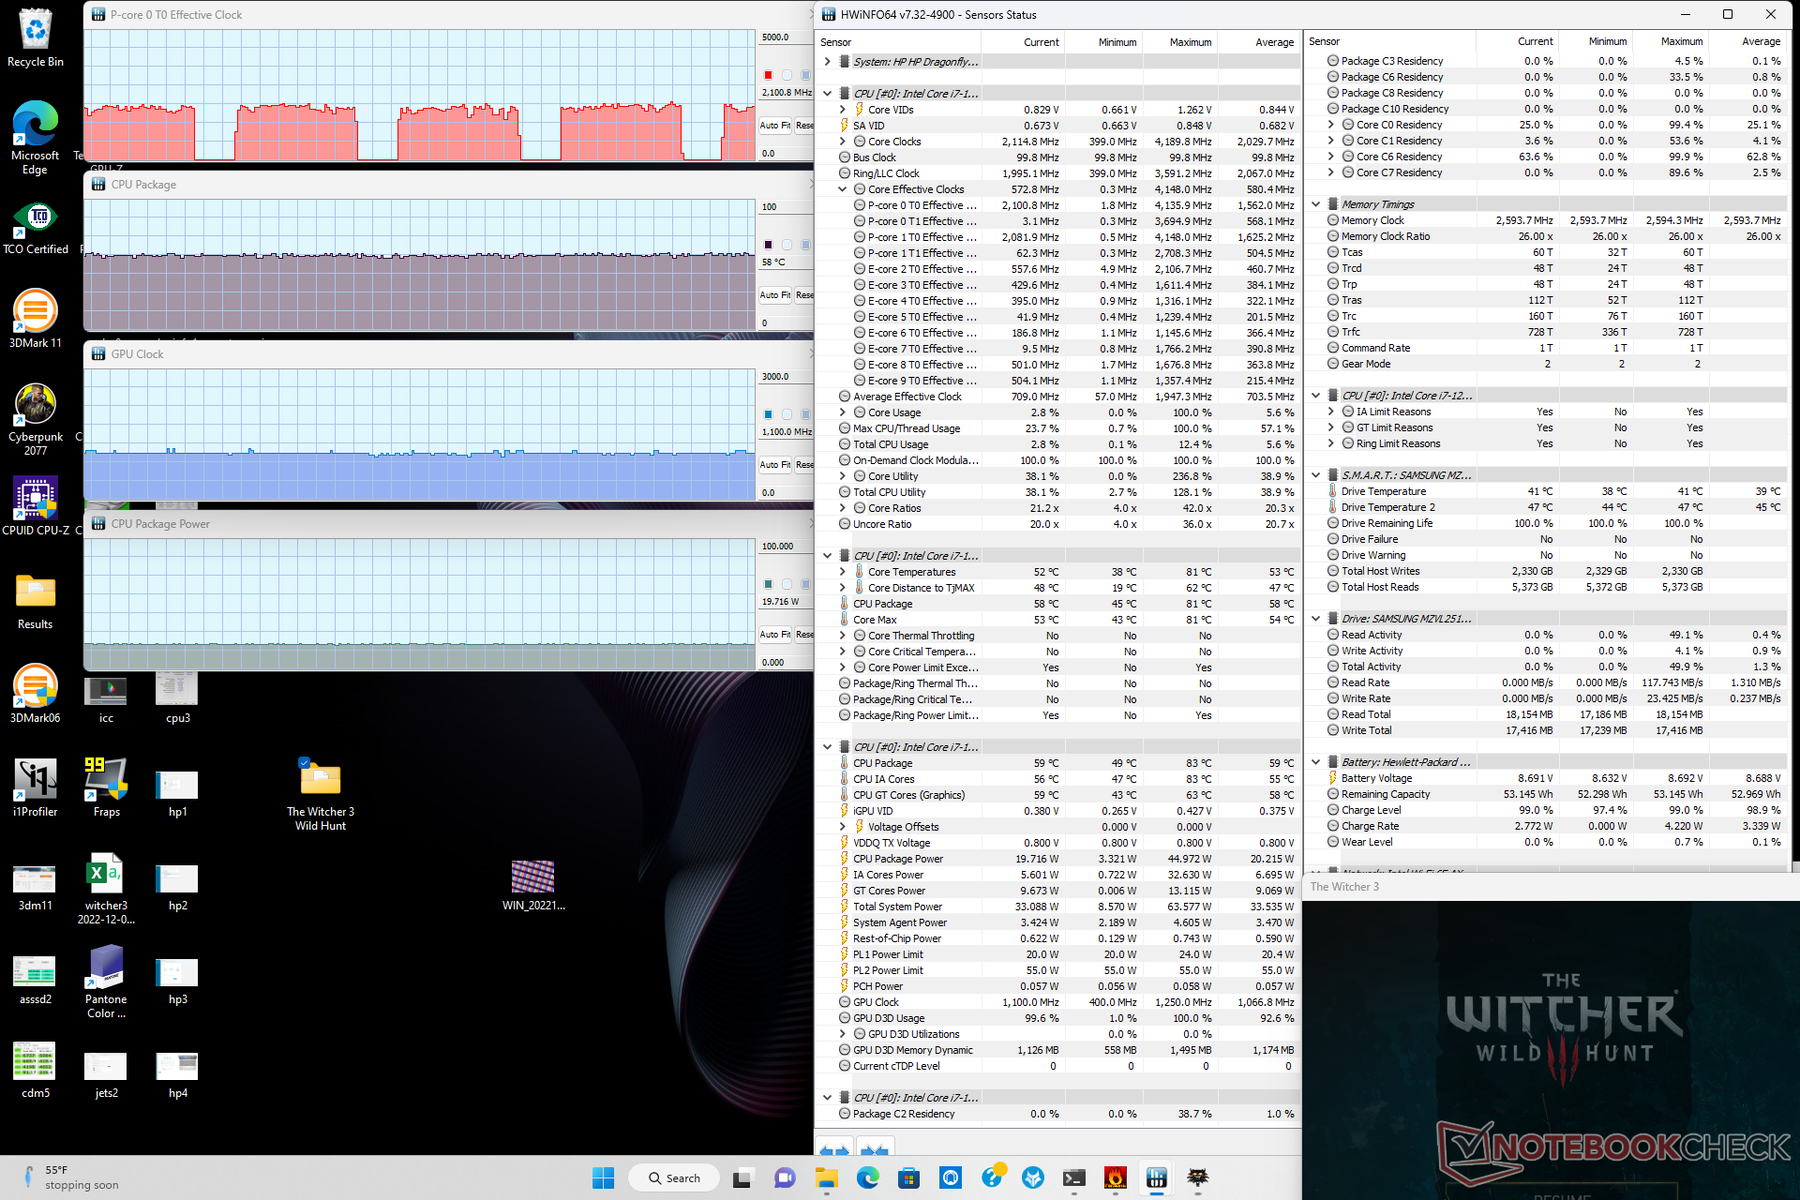
Prueba de resistencia
Cuando se ejecuta Prime95, la CPU aumenta a 3.5 GHz y 49 W sólo durante los primeros segundos hasta alcanzar una temperatura de núcleo de 69 C. A partir de entonces, las frecuencias de reloj y el consumo de energía caen a sólo 2.3 GHz y 20 W, respectivamente, para mantener una temperatura de núcleo de sólo 60 C. La mayoría de portátiles suelen tener techos de temperatura de núcleo mucho más altos, por lo que el rango bajo de 60 C es inesperado. El Core i7-1265U del Latitude 7330por ejemplo, puede alcanzar 85 C y 2,5 GHz al ejecutar la misma prueba Prime95.
La velocidad de reloj de la GPU y la temperatura al ejecutar Witcher 3 se estabilizarían en 1100 MHz y 58 C, respectivamente, frente a los 1247 MHz y 83 C del Latitude 7330.
El rendimiento se reduce ligeramente si funciona con batería. 3DMark 11 a pilas da unas puntuaciones de Física y Gráficos de 10407 y 5888 puntos, respectivamente, frente a los 11716 y 6116 puntos de la red eléctrica.

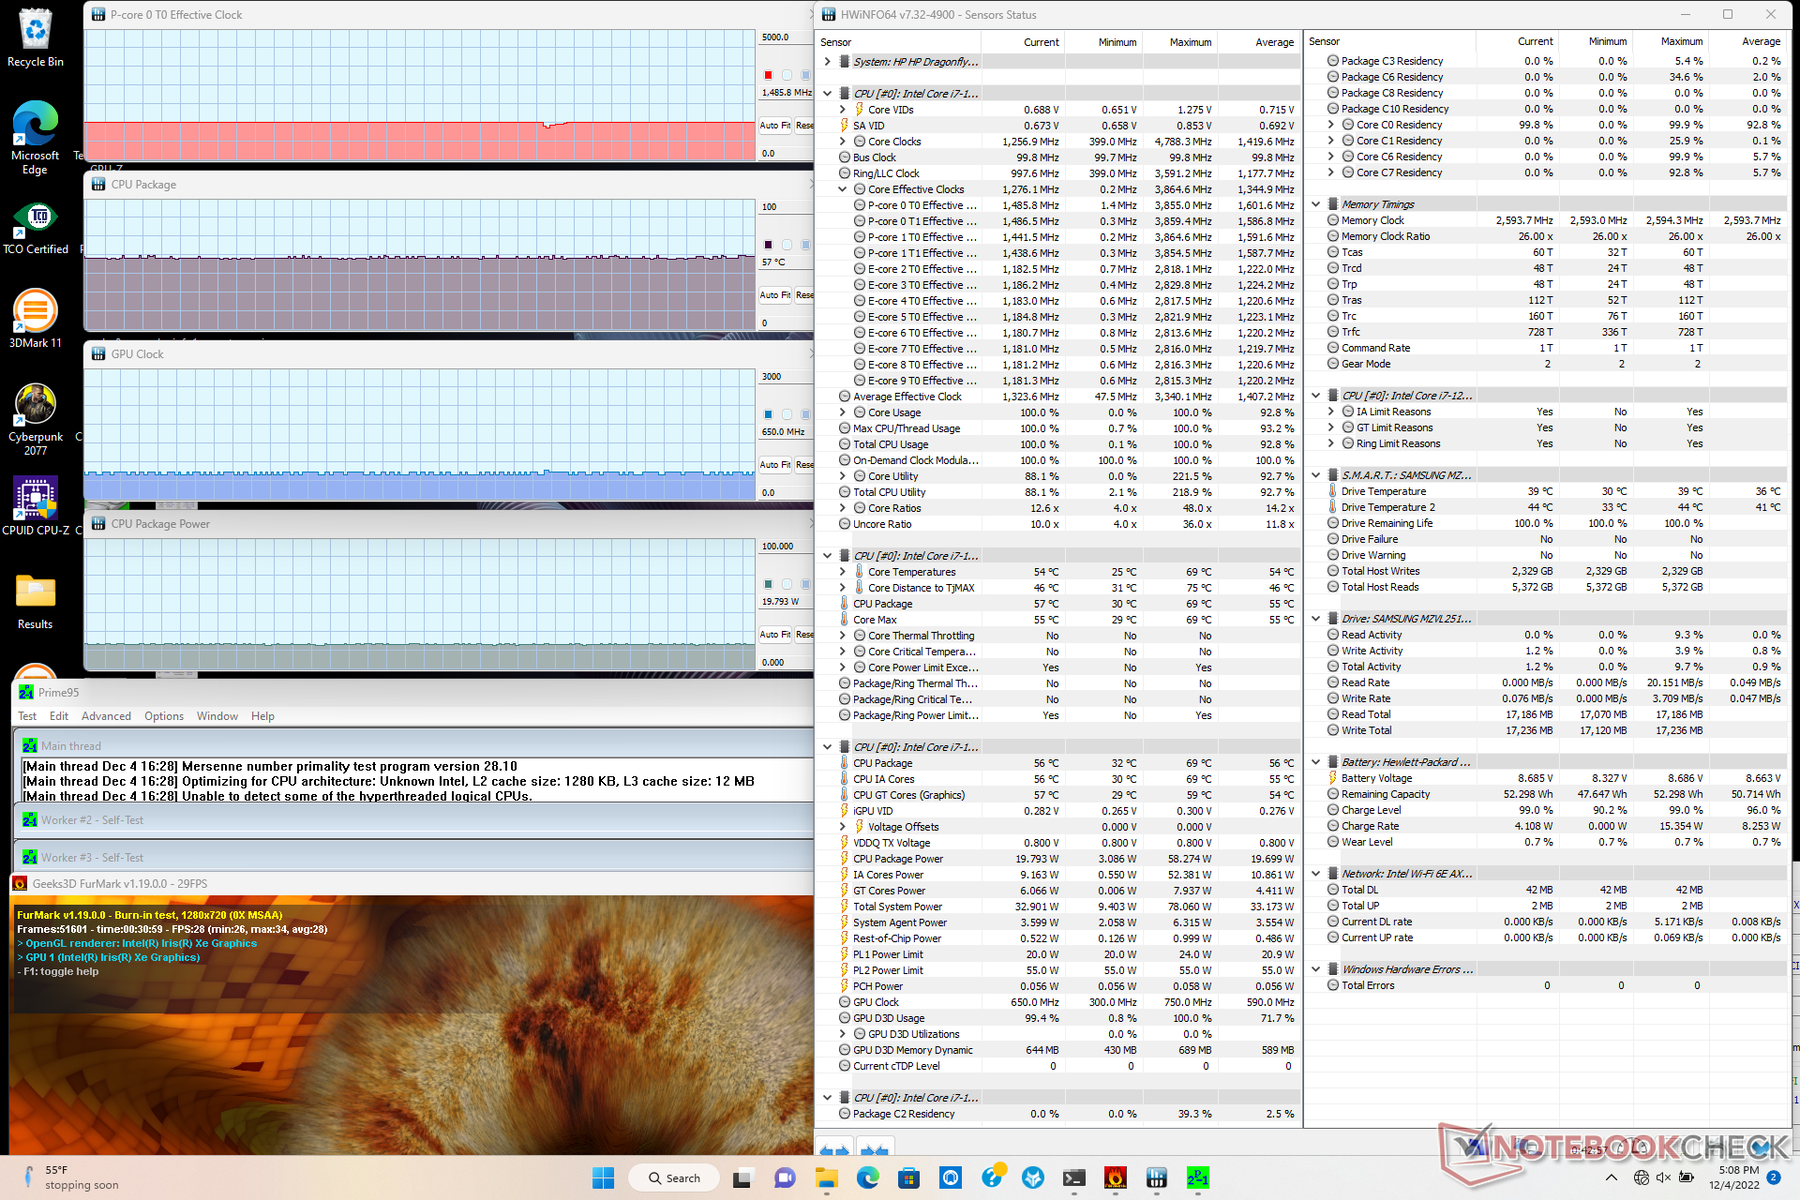
| Relojde laCPU (GHz) | Reloj de la GPU (MHz) | Temperatura media de la CPU (°C) | |
| Sistema en reposo | -- | -- | 30 |
| Prime95 Stress | 2.3 | -- | 60 |
| Prime95+ FurMark Estrés | 1,5 | 650 | 57 |
| Witcher 3 Estrés | 2.1 | 1100 | 58 |
Altavoces
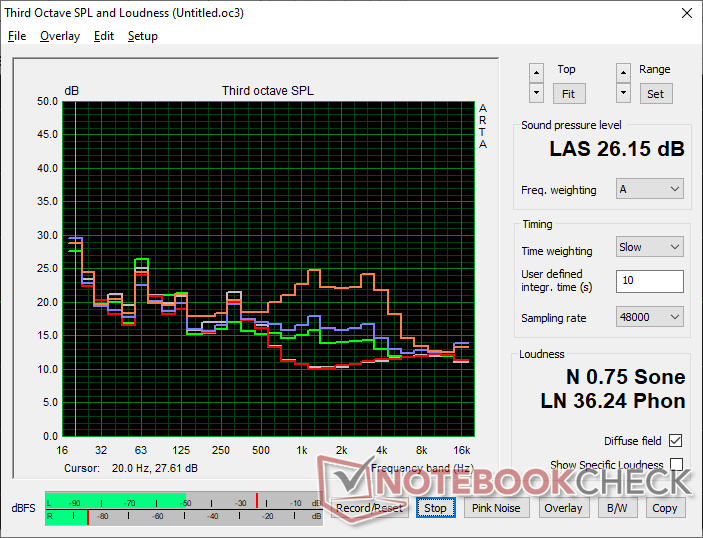
Los altavoces cuádruples son de excelente calidad a pesar de su reducido tamaño. Nuestras mediciones con micrófono revelan que tienen un volumen muy alto de casi 89 dB(A) y una amplia curva de ruido rosa para un amplio rango de reproducción. Como resultado, los altavoces funcionan bien tanto para videollamadas como para contenidos multimedia.
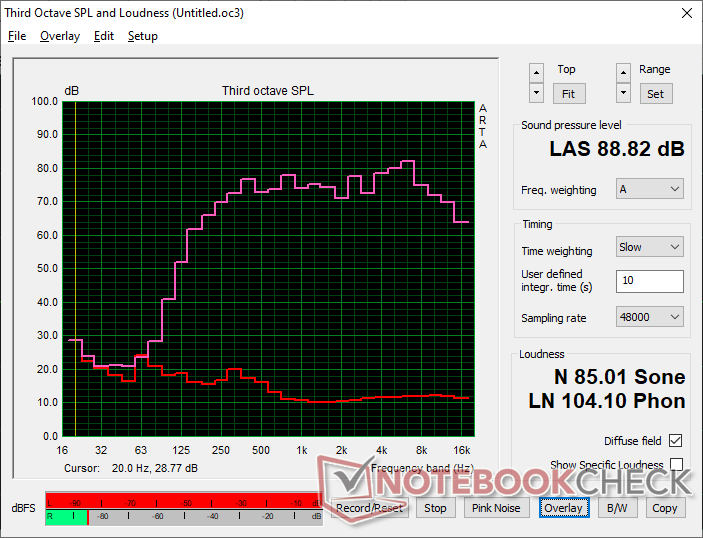
HP Elite Dragonfly Folio 13.5 G3 análisis de audio
(+) | los altavoces pueden reproducir a un volumen relativamente alto (#88.8 dB)
Graves 100 - 315 Hz
(±) | lubina reducida - en promedio 13.2% inferior a la mediana
(±) | la linealidad de los graves es media (11.9% delta a frecuencia anterior)
Medios 400 - 2000 Hz
(+) | medios equilibrados - a sólo 1.7% de la mediana
(+) | los medios son lineales (4.5% delta a la frecuencia anterior)
Altos 2 - 16 kHz
(+) | máximos equilibrados - a sólo 4% de la mediana
(±) | la linealidad de los máximos es media (7.3% delta a frecuencia anterior)
Total 100 - 16.000 Hz
(+) | el sonido global es lineal (10.4% de diferencia con la mediana)
En comparación con la misma clase
» 6% de todos los dispositivos probados de esta clase eran mejores, 2% similares, 91% peores
» El mejor tuvo un delta de 6%, la media fue 20%, el peor fue ###max##%
En comparación con todos los dispositivos probados
» 5% de todos los dispositivos probados eran mejores, 1% similares, 93% peores
» El mejor tuvo un delta de 4%, la media fue 23%, el peor fue ###max##%
Apple MacBook Pro 16 2021 M1 Pro análisis de audio
(+) | los altavoces pueden reproducir a un volumen relativamente alto (#84.7 dB)
Graves 100 - 315 Hz
(+) | buen bajo - sólo 3.8% lejos de la mediana
(+) | el bajo es lineal (5.2% delta a la frecuencia anterior)
Medios 400 - 2000 Hz
(+) | medios equilibrados - a sólo 1.3% de la mediana
(+) | los medios son lineales (2.1% delta a la frecuencia anterior)
Altos 2 - 16 kHz
(+) | máximos equilibrados - a sólo 1.9% de la mediana
(+) | los máximos son lineales (2.7% delta a la frecuencia anterior)
Total 100 - 16.000 Hz
(+) | el sonido global es lineal (4.6% de diferencia con la mediana)
En comparación con la misma clase
» 0% de todos los dispositivos probados de esta clase eran mejores, 0% similares, 100% peores
» El mejor tuvo un delta de 5%, la media fue 17%, el peor fue ###max##%
En comparación con todos los dispositivos probados
» 0% de todos los dispositivos probados eran mejores, 0% similares, 100% peores
» El mejor tuvo un delta de 4%, la media fue 23%, el peor fue ###max##%
Gestión de la energía
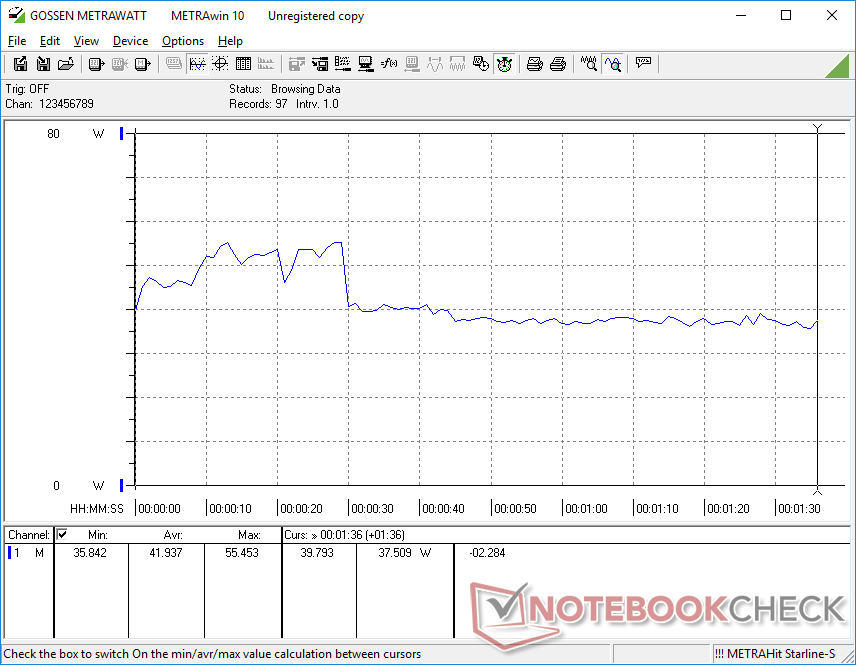
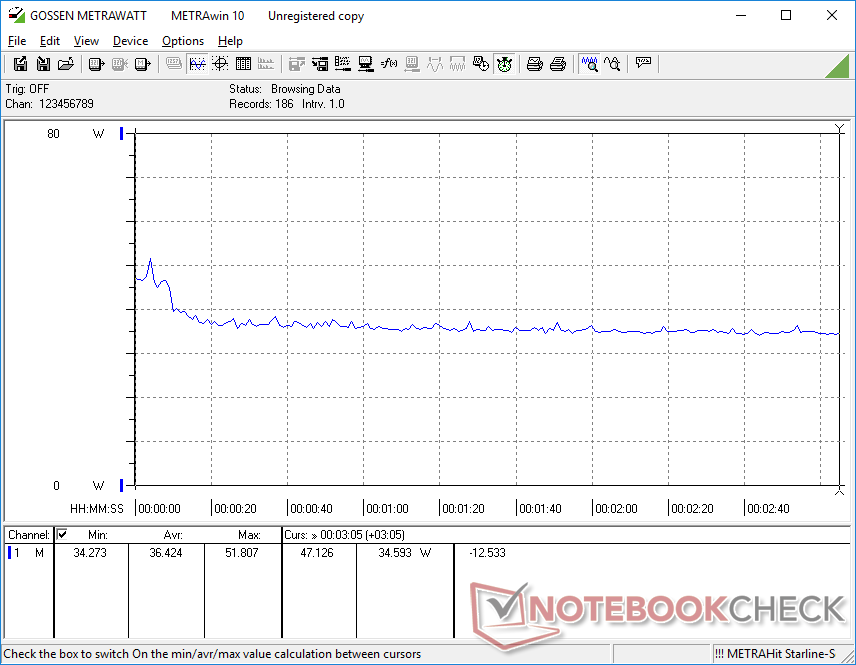
Consumo de energía
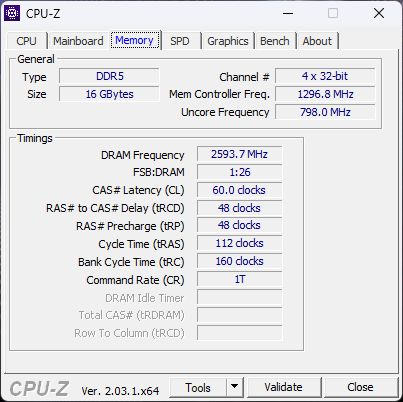
Los niveles de consumo de energía son casi idénticos en general a los que registramos en el Dragonfly G3 ya que ambos comparten los mismos paneles y procesadores. Hay que tener en cuenta que el modelo de 1000 nits probablemente consumirá más energía si está en el ajuste de brillo máximo
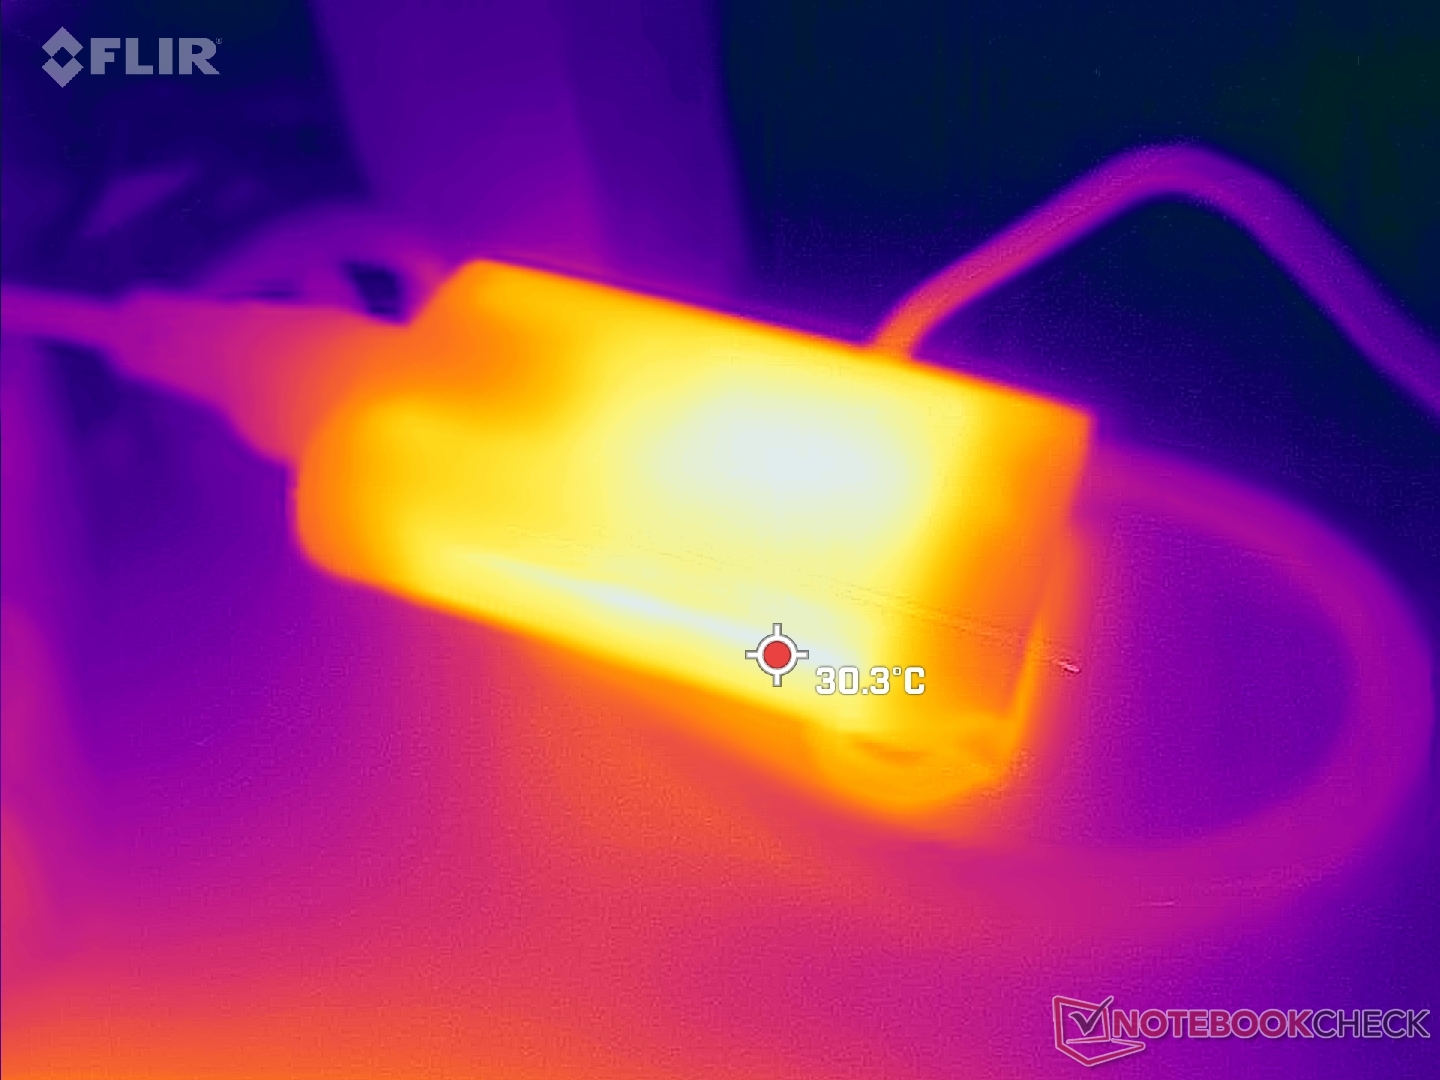
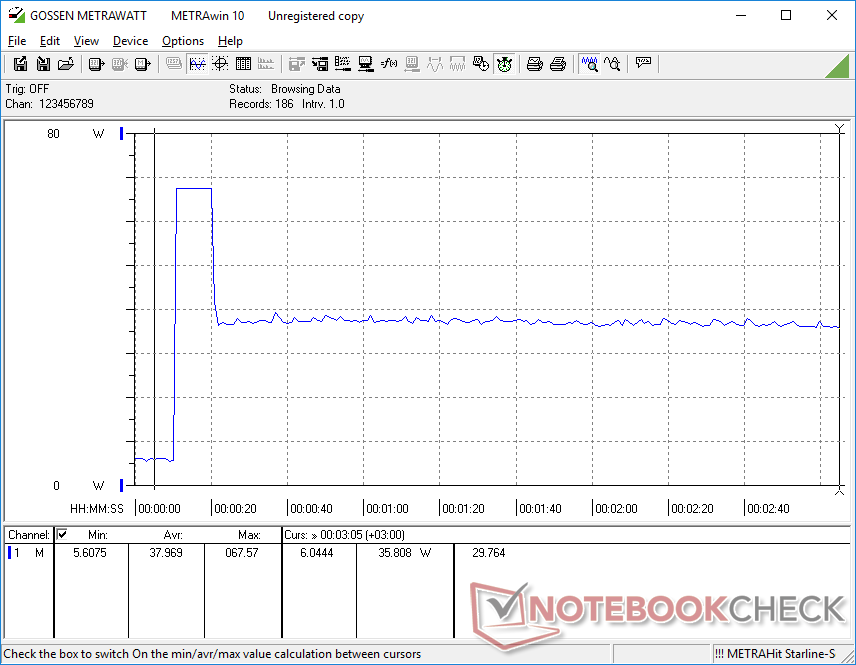
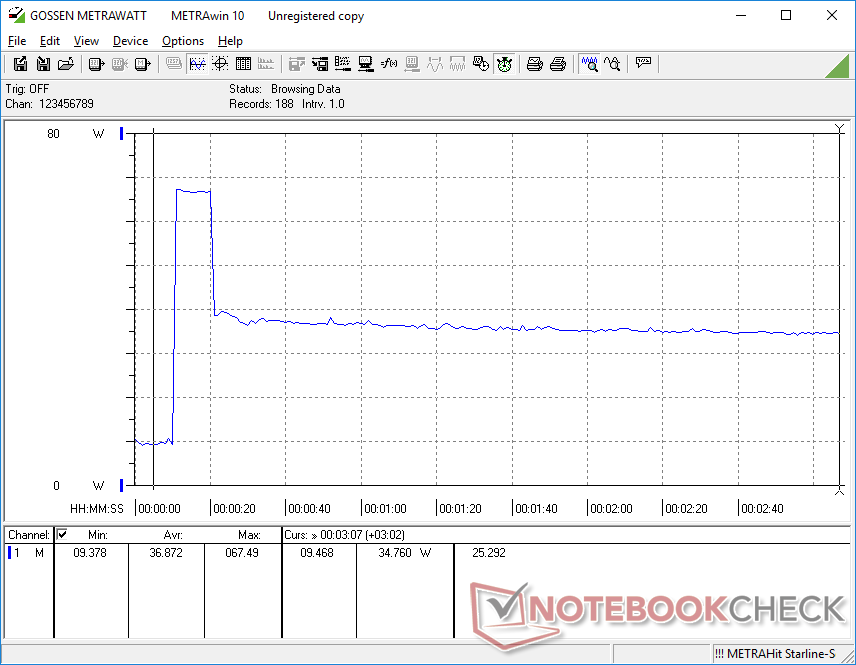
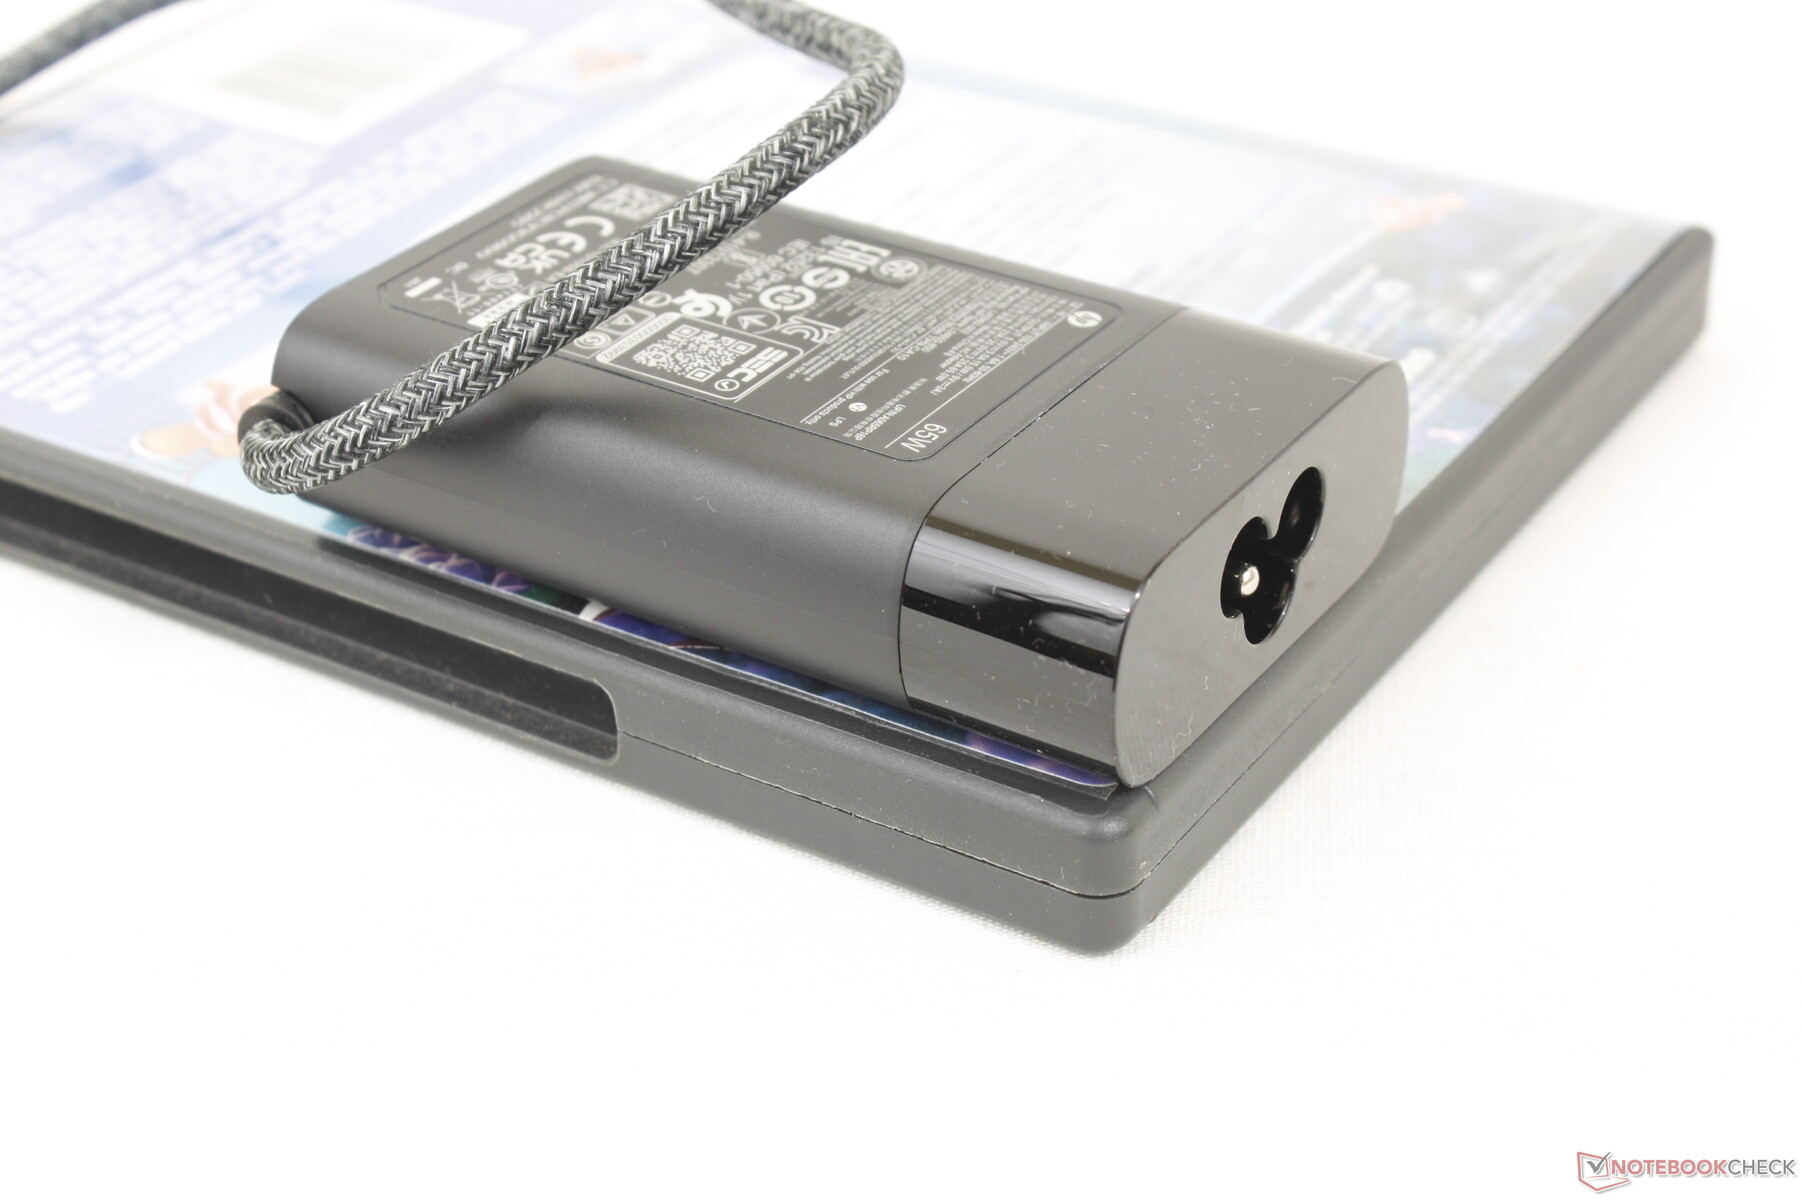
Pudimos registrar un consumo máximo de 67,5 W con el pequeño adaptador de CA USB-C de 65 W (~8,8 x 5,4 x 2,2 cm). Esta tasa es sólo temporal, como muestran las capturas de pantalla a continuación, por lo que el sistema aún puede cargar y ejecutar cargas exigentes simultáneamente. Los modelos de la competencia con el Core i7-1260P como el Portátil Framework pueden ofrecer un rendimiento más rápido pero con un aumento linealmente mayor del consumo de energía
Hay tres adaptadores de CA USB-C de 65 W disponibles en diferentes tamaños y conectores de red.
| Off / Standby | |
| Ocioso | |
| Carga |
|
Clave:
min: | |
| HP Elite Dragonfly Folio 13.5 G3 i7-1265U, Iris Xe G7 96EUs, Samsung PM9A1 MZVL2512HCJQ, IPS, 1920x1280, 13.5" | HP Elite Dragonfly G3 i7-1265U, Iris Xe G7 96EUs, Micron 3400 MTFDKBA512TFH 512GB, IPS, 1920x1280, 13.5" | Dell Latitude 13 7330 i7-1265U, Iris Xe G7 96EUs, Toshiba KBG40ZNS512G NVMe, IPS, 1920x1080, 13.3" | Framework Laptop 13.5 12th Gen Intel i7-1260P, Iris Xe G7 96EUs, WDC PC SN730 SDBPNTY-512G, IPS, 2256x1504, 13.5" | Razer Book 13 FHD i7-1165G7, Iris Xe G7 96EUs, Samsung SSD PM981a MZVLB256HBHQ, IPS, 1920x1200, 13.4" | Lenovo ThinkPad L13 Gen2-20VH0017GE i5-1135G7, Iris Xe G7 80EUs, Samsung SSD PM981a MZVLB512HBJQ, IPS, 1920x1080, 13.3" | |
|---|---|---|---|---|---|---|
| Power Consumption | 0% | 6% | -34% | 5% | -8% | |
| Idle Minimum * (Watt) | 3.4 | 3.4 -0% | 2.8 18% | 5.3 -56% | 3.3 3% | 4.4 -29% |
| Idle Average * (Watt) | 4.9 | 5.6 -14% | 4.8 2% | 8.4 -71% | 6.4 -31% | 7.2 -47% |
| Idle Maximum * (Watt) | 9.3 | 8.4 10% | 7.3 22% | 11.2 -20% | 7 25% | 9.8 -5% |
| Load Average * (Watt) | 41.9 | 40.8 3% | 48.1 -15% | 57.4 -37% | 37.3 11% | 31.7 24% |
| Witcher 3 ultra * (Watt) | 36.4 | 35.5 2% | 35.4 3% | 46.7 -28% | 36.4 -0% | 33.3 9% |
| Load Maximum * (Watt) | 67.5 | 68.4 -1% | 63.6 6% | 61.2 9% | 53.7 20% | 66.6 1% |
* ... más pequeño es mejor
Power Consumption Witcher 3 / Stresstest
Power Consumption external Monitor
Duración de la batería - Pequeña capacidad de 53 Wh
La capacidad de la batería es un 22 por ciento menor que en el Dragonfly G3. Quizás no por coincidencia, somos capaces de registrar una autonomía WLAN que es un 20 por ciento más corta en nuestro Dragonfly Folio G3 para un total de 9 horas y 25 minutos. La duración de la batería sigue siendo superior a la que registramos en el Latitude 13 7330, el Framework Laptop o elThinkPad L13 en al menos una hora cada uno.
La carga de vacío a plena capacidad tarda menos de 90 minutos con el adaptador de CA incluido.
| HP Elite Dragonfly Folio 13.5 G3 i7-1265U, Iris Xe G7 96EUs, 53 Wh | HP Elite Dragonfly G3 i7-1265U, Iris Xe G7 96EUs, 68 Wh | Dell Latitude 13 7330 i7-1265U, Iris Xe G7 96EUs, 41 Wh | Framework Laptop 13.5 12th Gen Intel i7-1260P, Iris Xe G7 96EUs, 55 Wh | Razer Book 13 FHD i7-1165G7, Iris Xe G7 96EUs, 55 Wh | Lenovo ThinkPad L13 Gen2-20VH0017GE i5-1135G7, Iris Xe G7 80EUs, 46 Wh | |
|---|---|---|---|---|---|---|
| Duración de Batería | 33% | -26% | -20% | 24% | -39% | |
| Reader / Idle (h) | 27.3 | 37.8 38% | 21.9 -20% | 36.8 35% | ||
| WiFi v1.3 (h) | 9.4 | 11.8 26% | 8.3 -12% | 7.5 -20% | 14.8 57% | 6.1 -35% |
| Load (h) | 2.6 | 3.5 35% | 1.4 -46% | 2.1 -19% | 1.5 -42% | |
| H.264 (h) | 7.6 |
Pro
Contra
Veredicto - Para los amantes del cuero
El Dragonfly Folio G3 abandona el SoC Snapdragon del modelo del año pasado por una CPU Intel Core serie U más tradicional. Este cambio por sí solo hace que el modelo sea mucho más atractivo para una mayor variedad de usuarios que no están interesados en Windows en ARM o que prefieren una experiencia de PC Windows más convencional. El sistema también es ahora mucho más fácil de mantener sin necesidad de sacrificar el exclusivo diseño de piel sintética. Estos cambios son sin duda un paso adelante para la serie en su conjunto.
El mayor rival del Dragonfly Folio G3 es quizá la propia HP, ya que ya hay una serie 2 en 1 excelente para usuarios business: el EliteBook x360. El EliteBook x360 1040 G9 en particular es más ligero, más delgado, integra más puertos, ofrece opciones similares de paneles de 400 y 1000 nits, conectividad 5G e incluso la misma CPU Core i7-1265U. Es difícil elegir el Dragonfly Folio G3 cuando tienes una alternativa más elegante y mejor equipada exactamente del mismo fabricante.
El Dragonfly Folio G3 se inclina demasiado hacia el estilo. Las alternativas EliteBook más delgadas de HP incluyen más puertos y, por lo tanto, son más versátiles si el diseño único del Dragonfly no es de su agrado.
El principal argumento de venta del Dragonfly Folio G3 se reduce a cuánto valoras el estilo de piel sintética. No cabe duda de que es un convertible ejecutivo de aspecto sólido, pero no estamos seguros de que merezca la pena su mayor grosor y renunciar a un montón de puertos en el proceso.
Precio y disponibilidad
HP ya está comercializando su modelo Dragonfly Folio G3 en múltiples configuraciones desde $2479 hasta casi $4000 USD.
HP Elite Dragonfly Folio 13.5 G3
- 12/10/2022 v7 (old)
Allen Ngo
Price comparison

