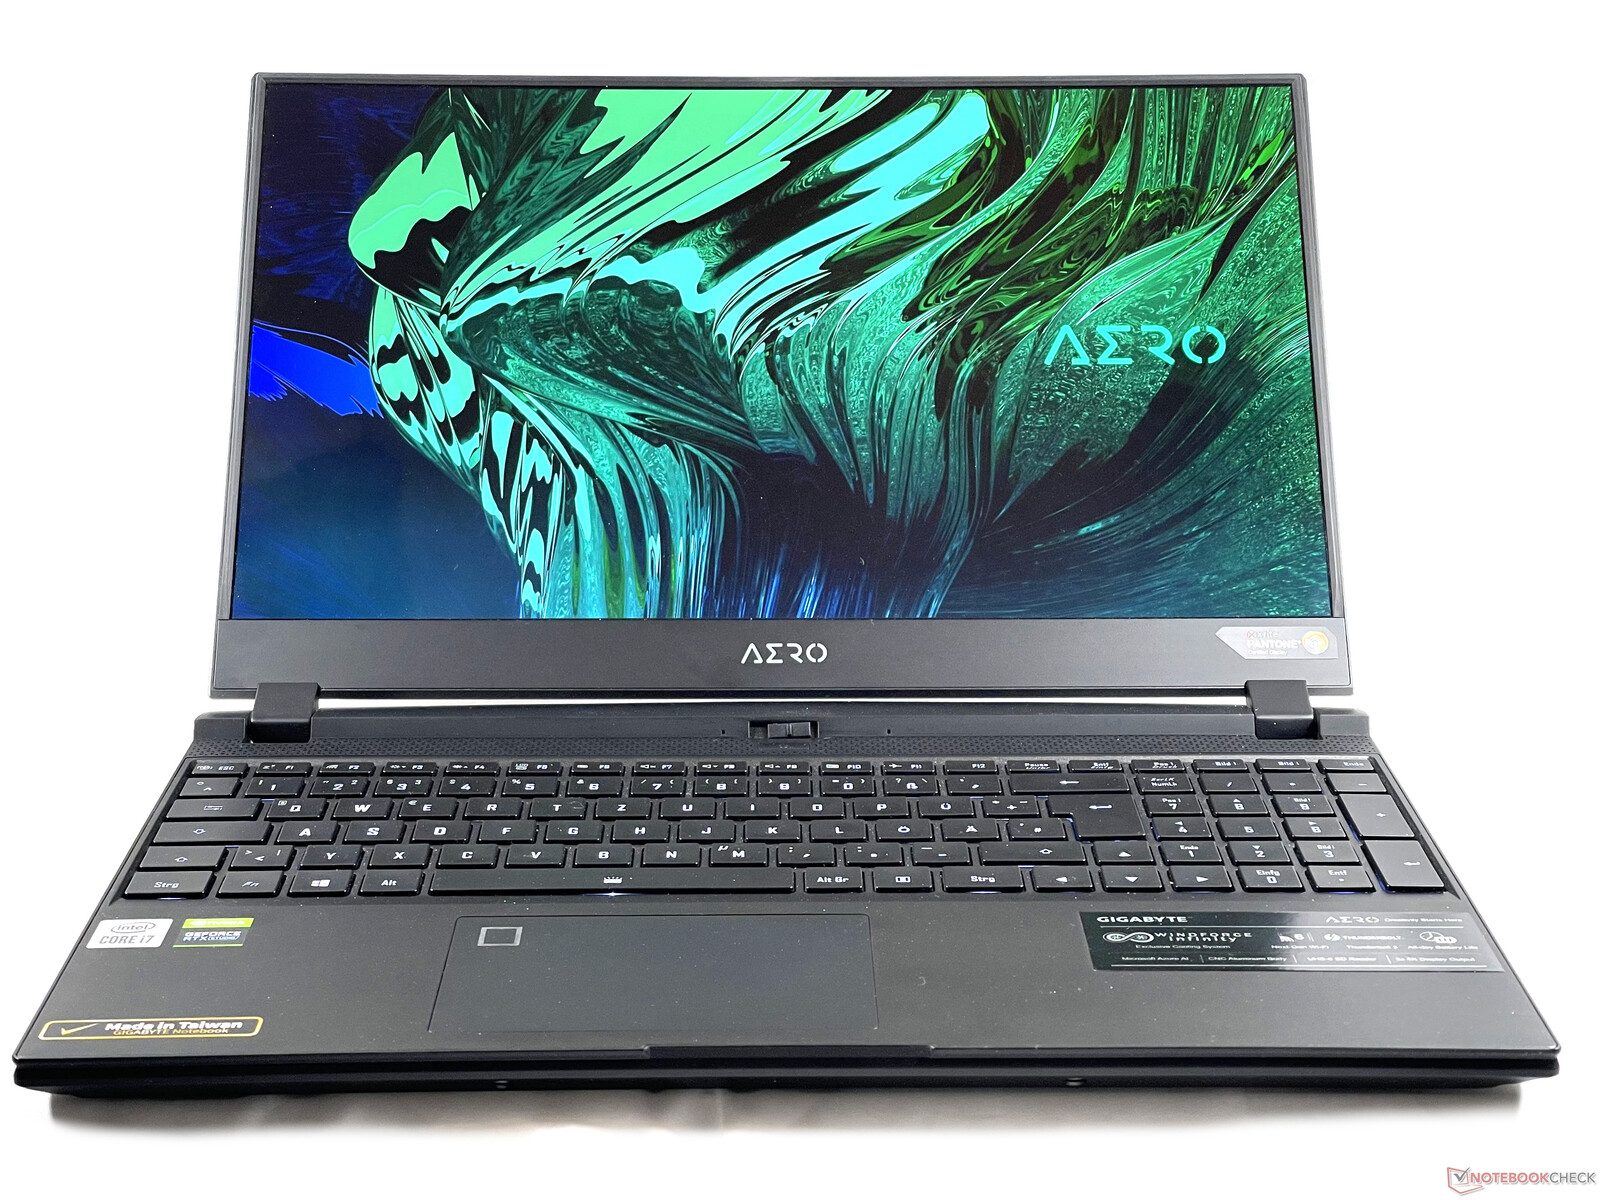
Gigabyte Aero 15 OLED XC laptop review: 4K OLED and the corresponding performance
In contrast to the Aorus series, the Gigabyte Aero series focuses on multimedia suitability, while the resulting gaming features are rather a nice side effect. Compared to its predecessor, last year's Aero 15 XB, not too much seems to have improved at first glance, except for the new Ampere graphics card. Since the number of multimedia laptops with GeForce RTX 3000 graphics cards that we have tested is currently still relatively low, we'll also compare the Gigabyte laptop with similarly equipped gaming laptops and multimedia laptops from the previous generation in the following review to better assess the performance level of our test device.
Possible contenders in comparison
Valoración | Fecha | Modelo | Peso | Altura | Tamaño | Resolución | Precio |
|---|---|---|---|---|---|---|---|
| 85.6 % v7 (old) | 03/2021 | Gigabyte Aero 15 OLED XC i7-10870H, GeForce RTX 3070 Laptop GPU | 2.2 kg | 20 mm | 15.60" | 3840x2160 | |
| 86.6 % v7 (old) | 02/2021 | Asus ROG Zephyrus Duo 15 SE GX551QS R9 5900HX, GeForce RTX 3080 Laptop GPU | 2.5 kg | 20.9 mm | 15.60" | 3840x2160 | |
| 84 % v7 (old) | 02/2021 | MSI GS66 Stealth 10UG i7-10870H, GeForce RTX 3070 Laptop GPU | 2.1 kg | 19.8 mm | 15.60" | 1920x1080 | |
| 90.1 % v7 (old) | 01/2021 | Lenovo ThinkPad X1 Extreme Gen3-20TLS0UV00 i7-10750H, GeForce GTX 1650 Ti Max-Q | 1.7 kg | 18.7 mm | 15.60" | 1920x1080 | |
| 85.8 % v7 (old) | 05/2020 | Gigabyte Aero 15 OLED XB-8DE51B0SP i7-10875H, GeForce RTX 2070 Super Max-Q | 2.2 kg | 20 mm | 15.60" | 3840x2160 | |
| 83 % v7 (old) | 08/2020 | HP Envy 15-ep0098nr i7-10750H, GeForce RTX 2060 Max-Q | 2 kg | 19 mm | 15.60" | 3840x2160 |
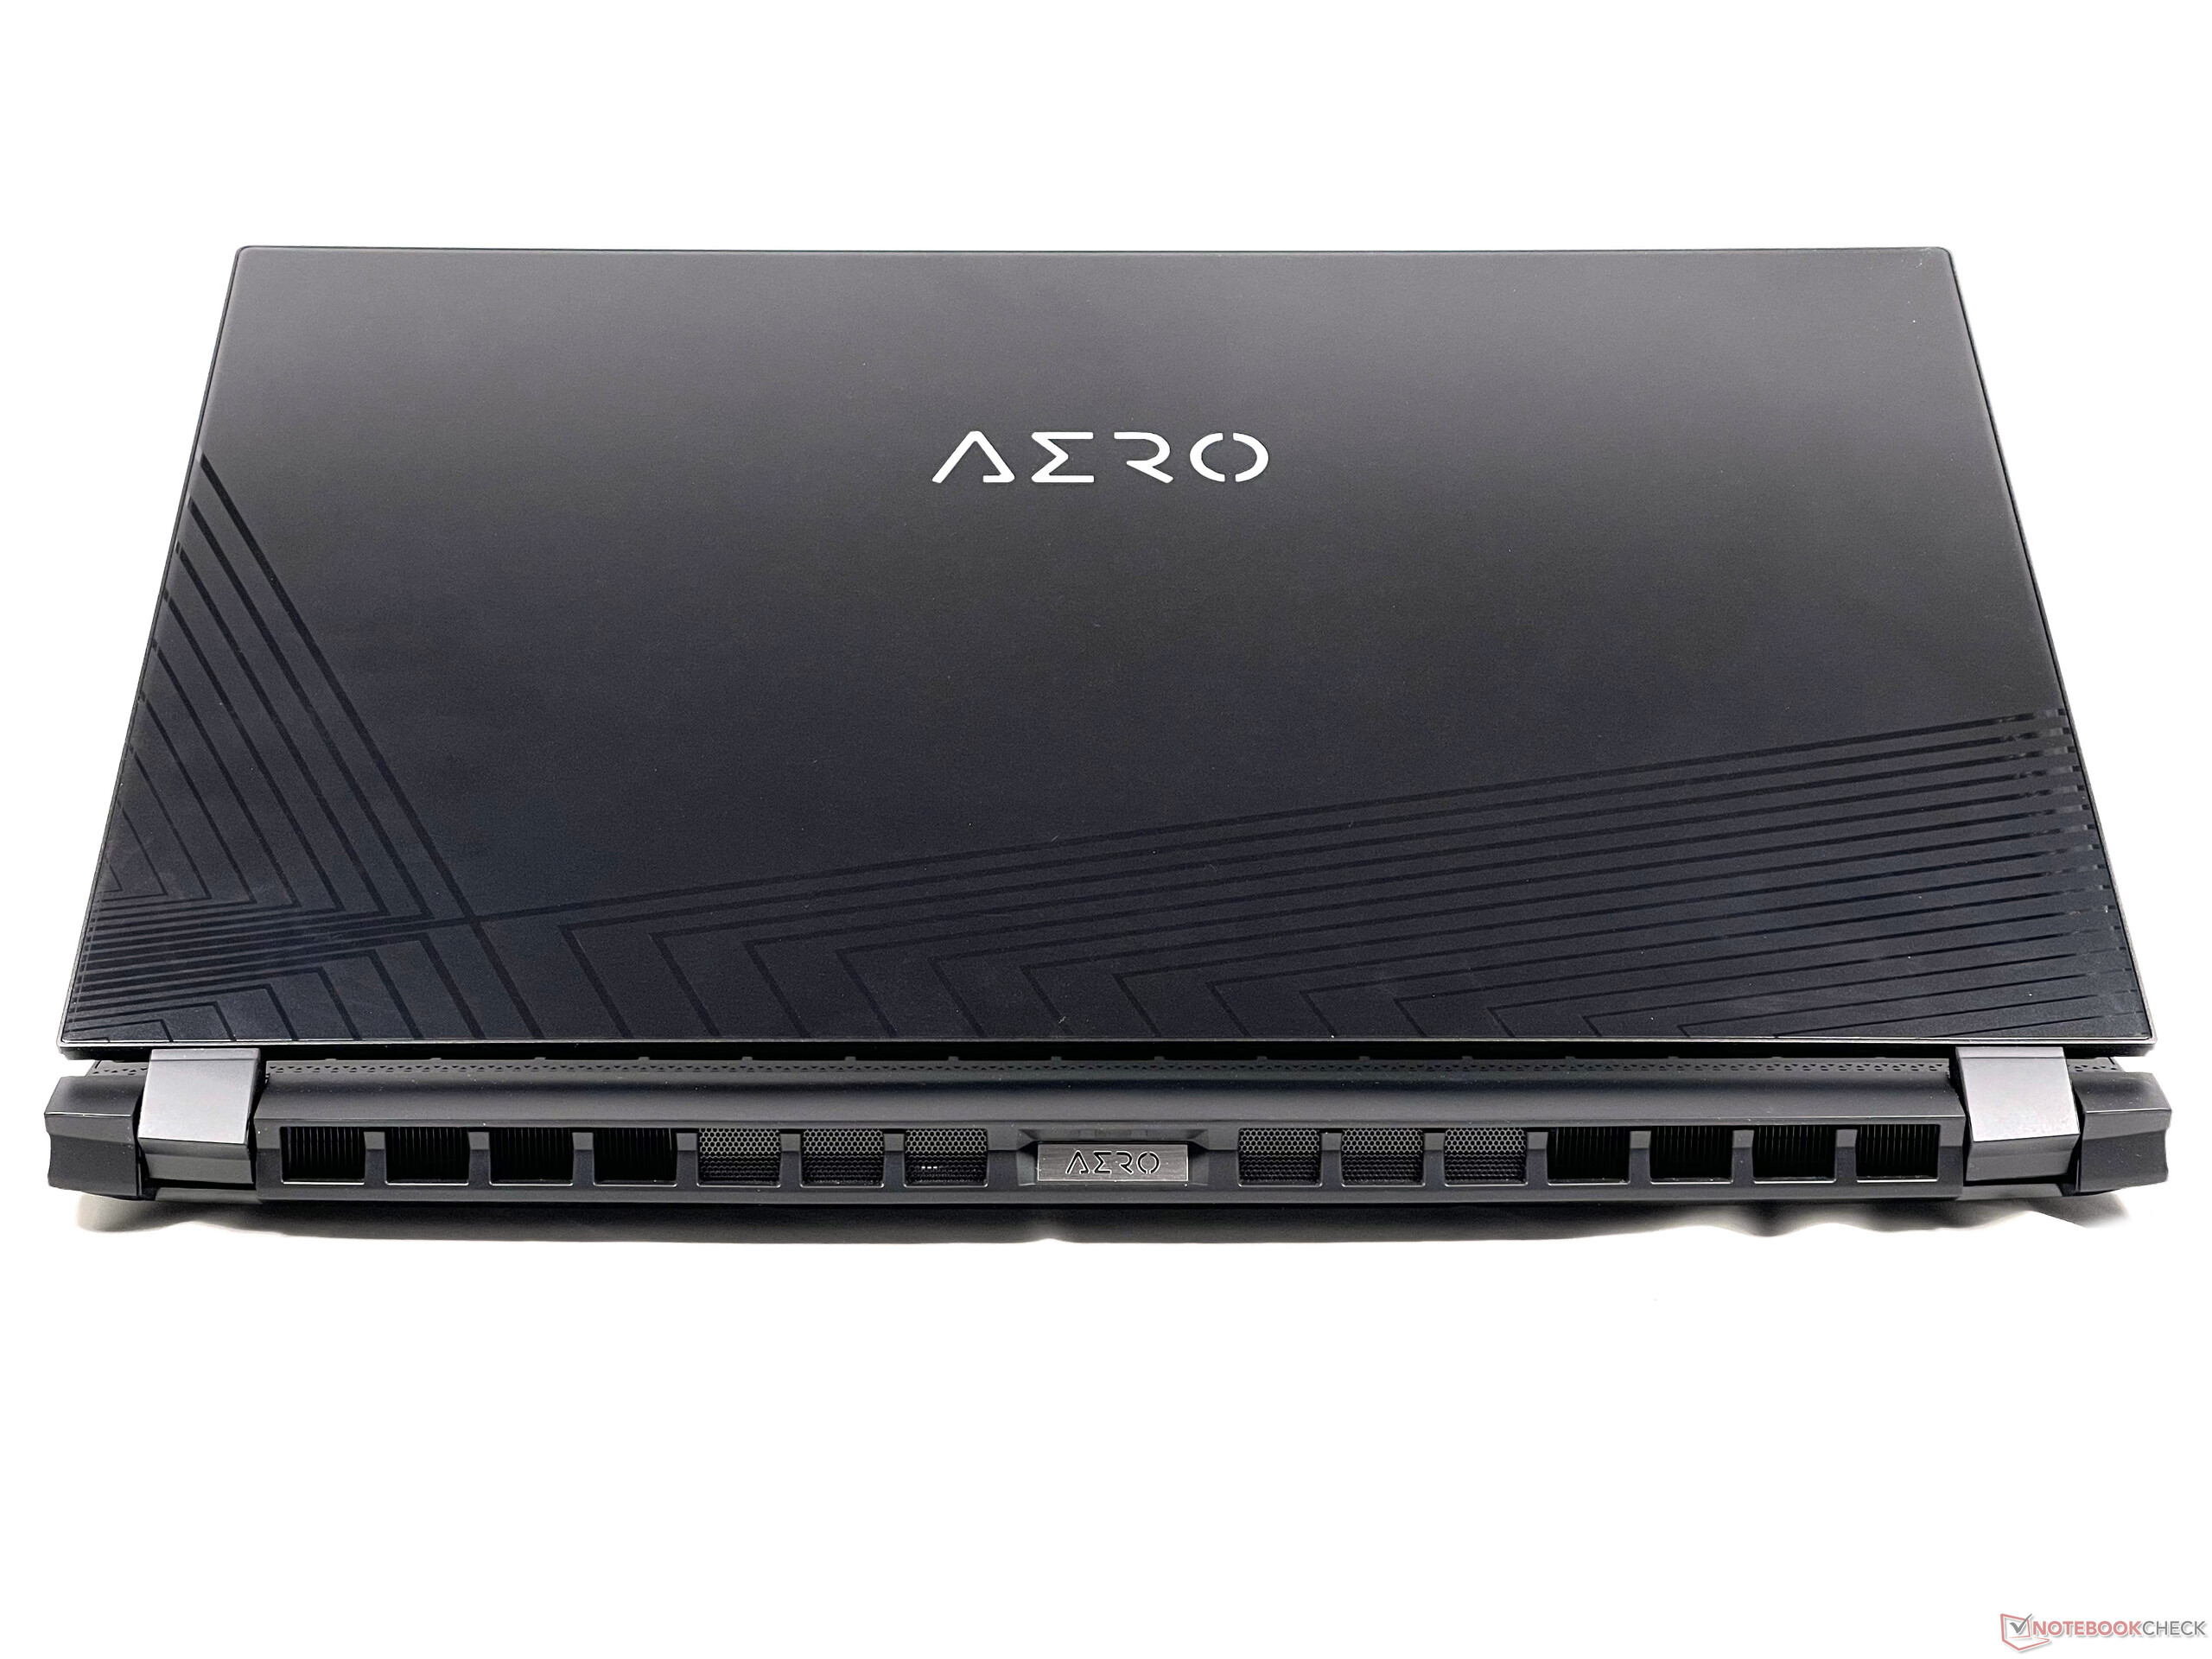
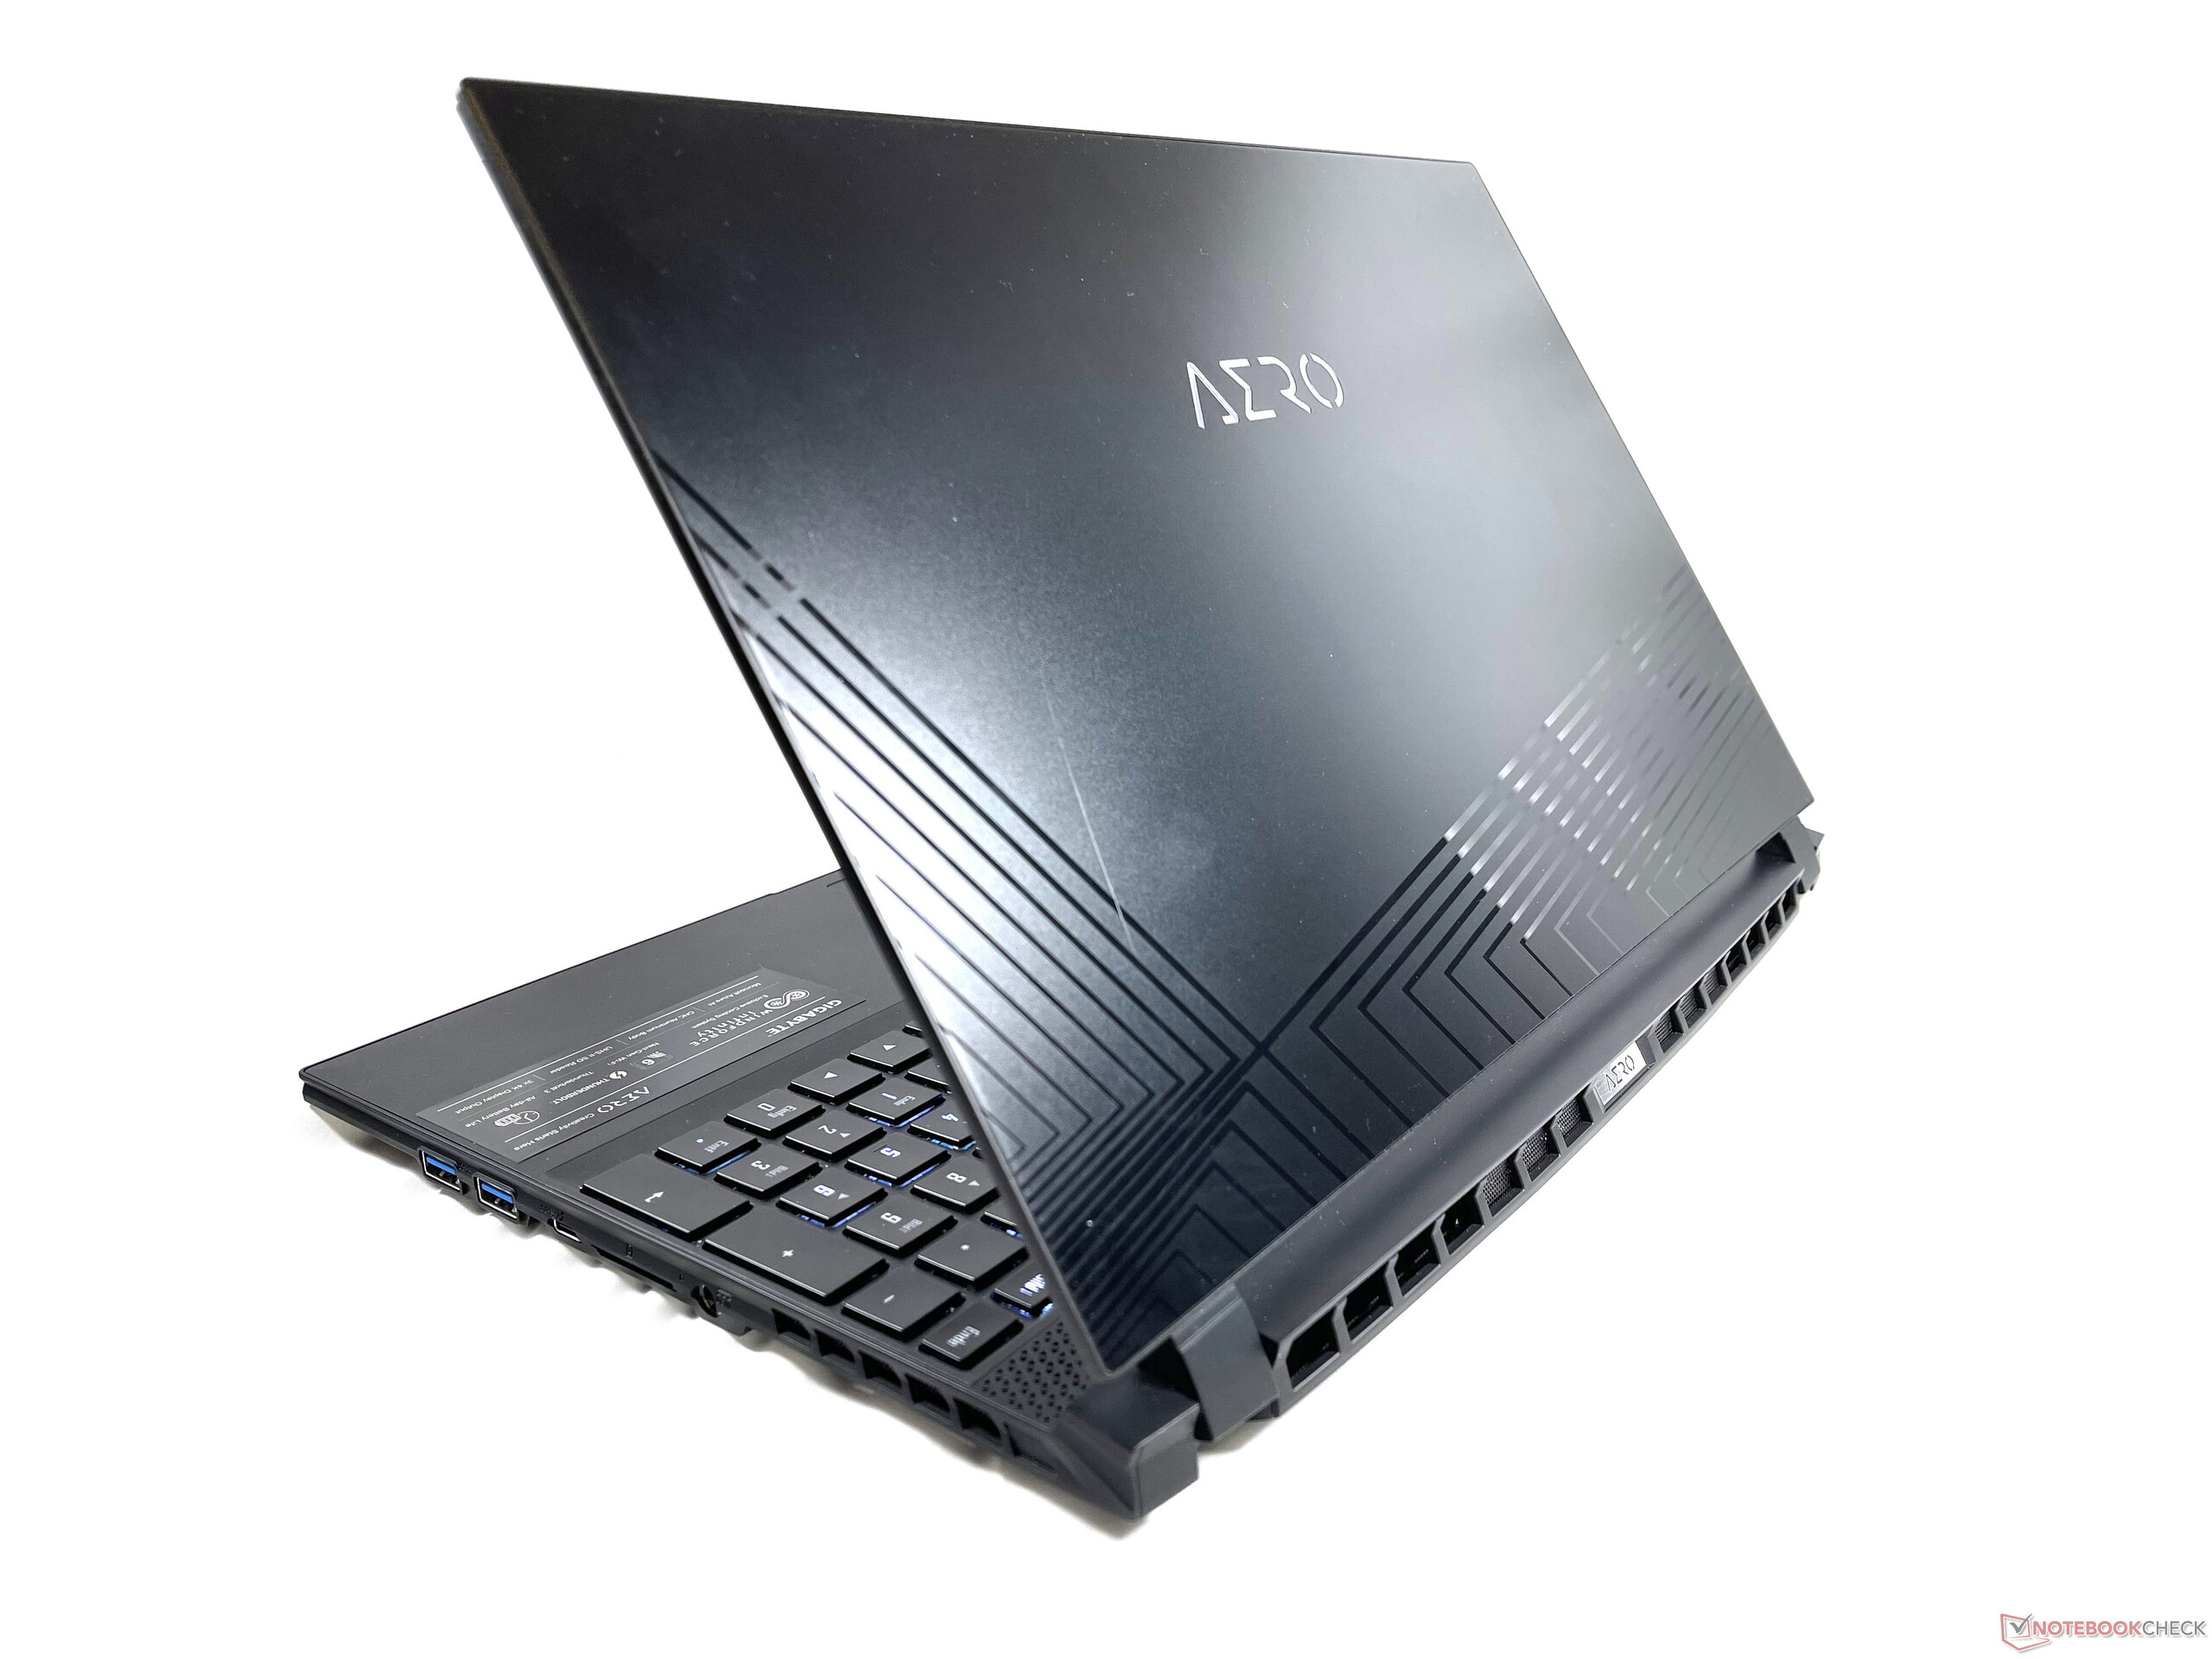
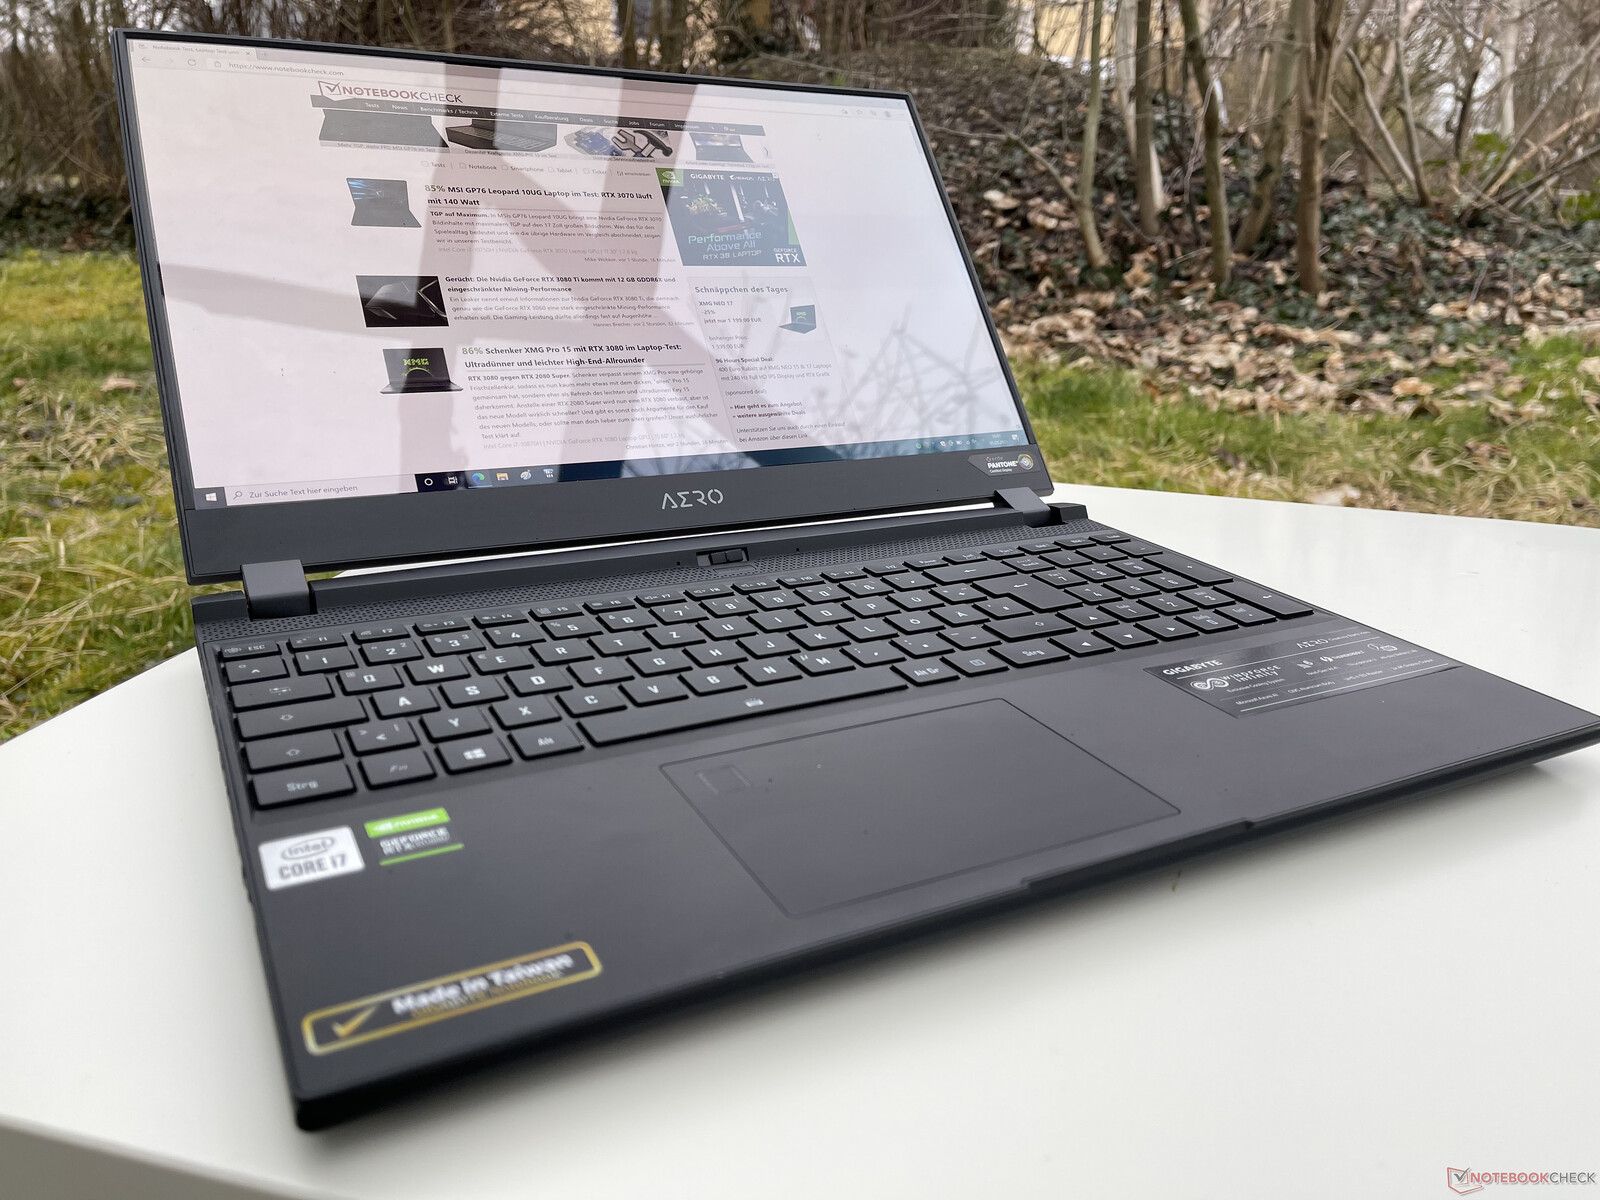
Case - Aero with impressive metal housing
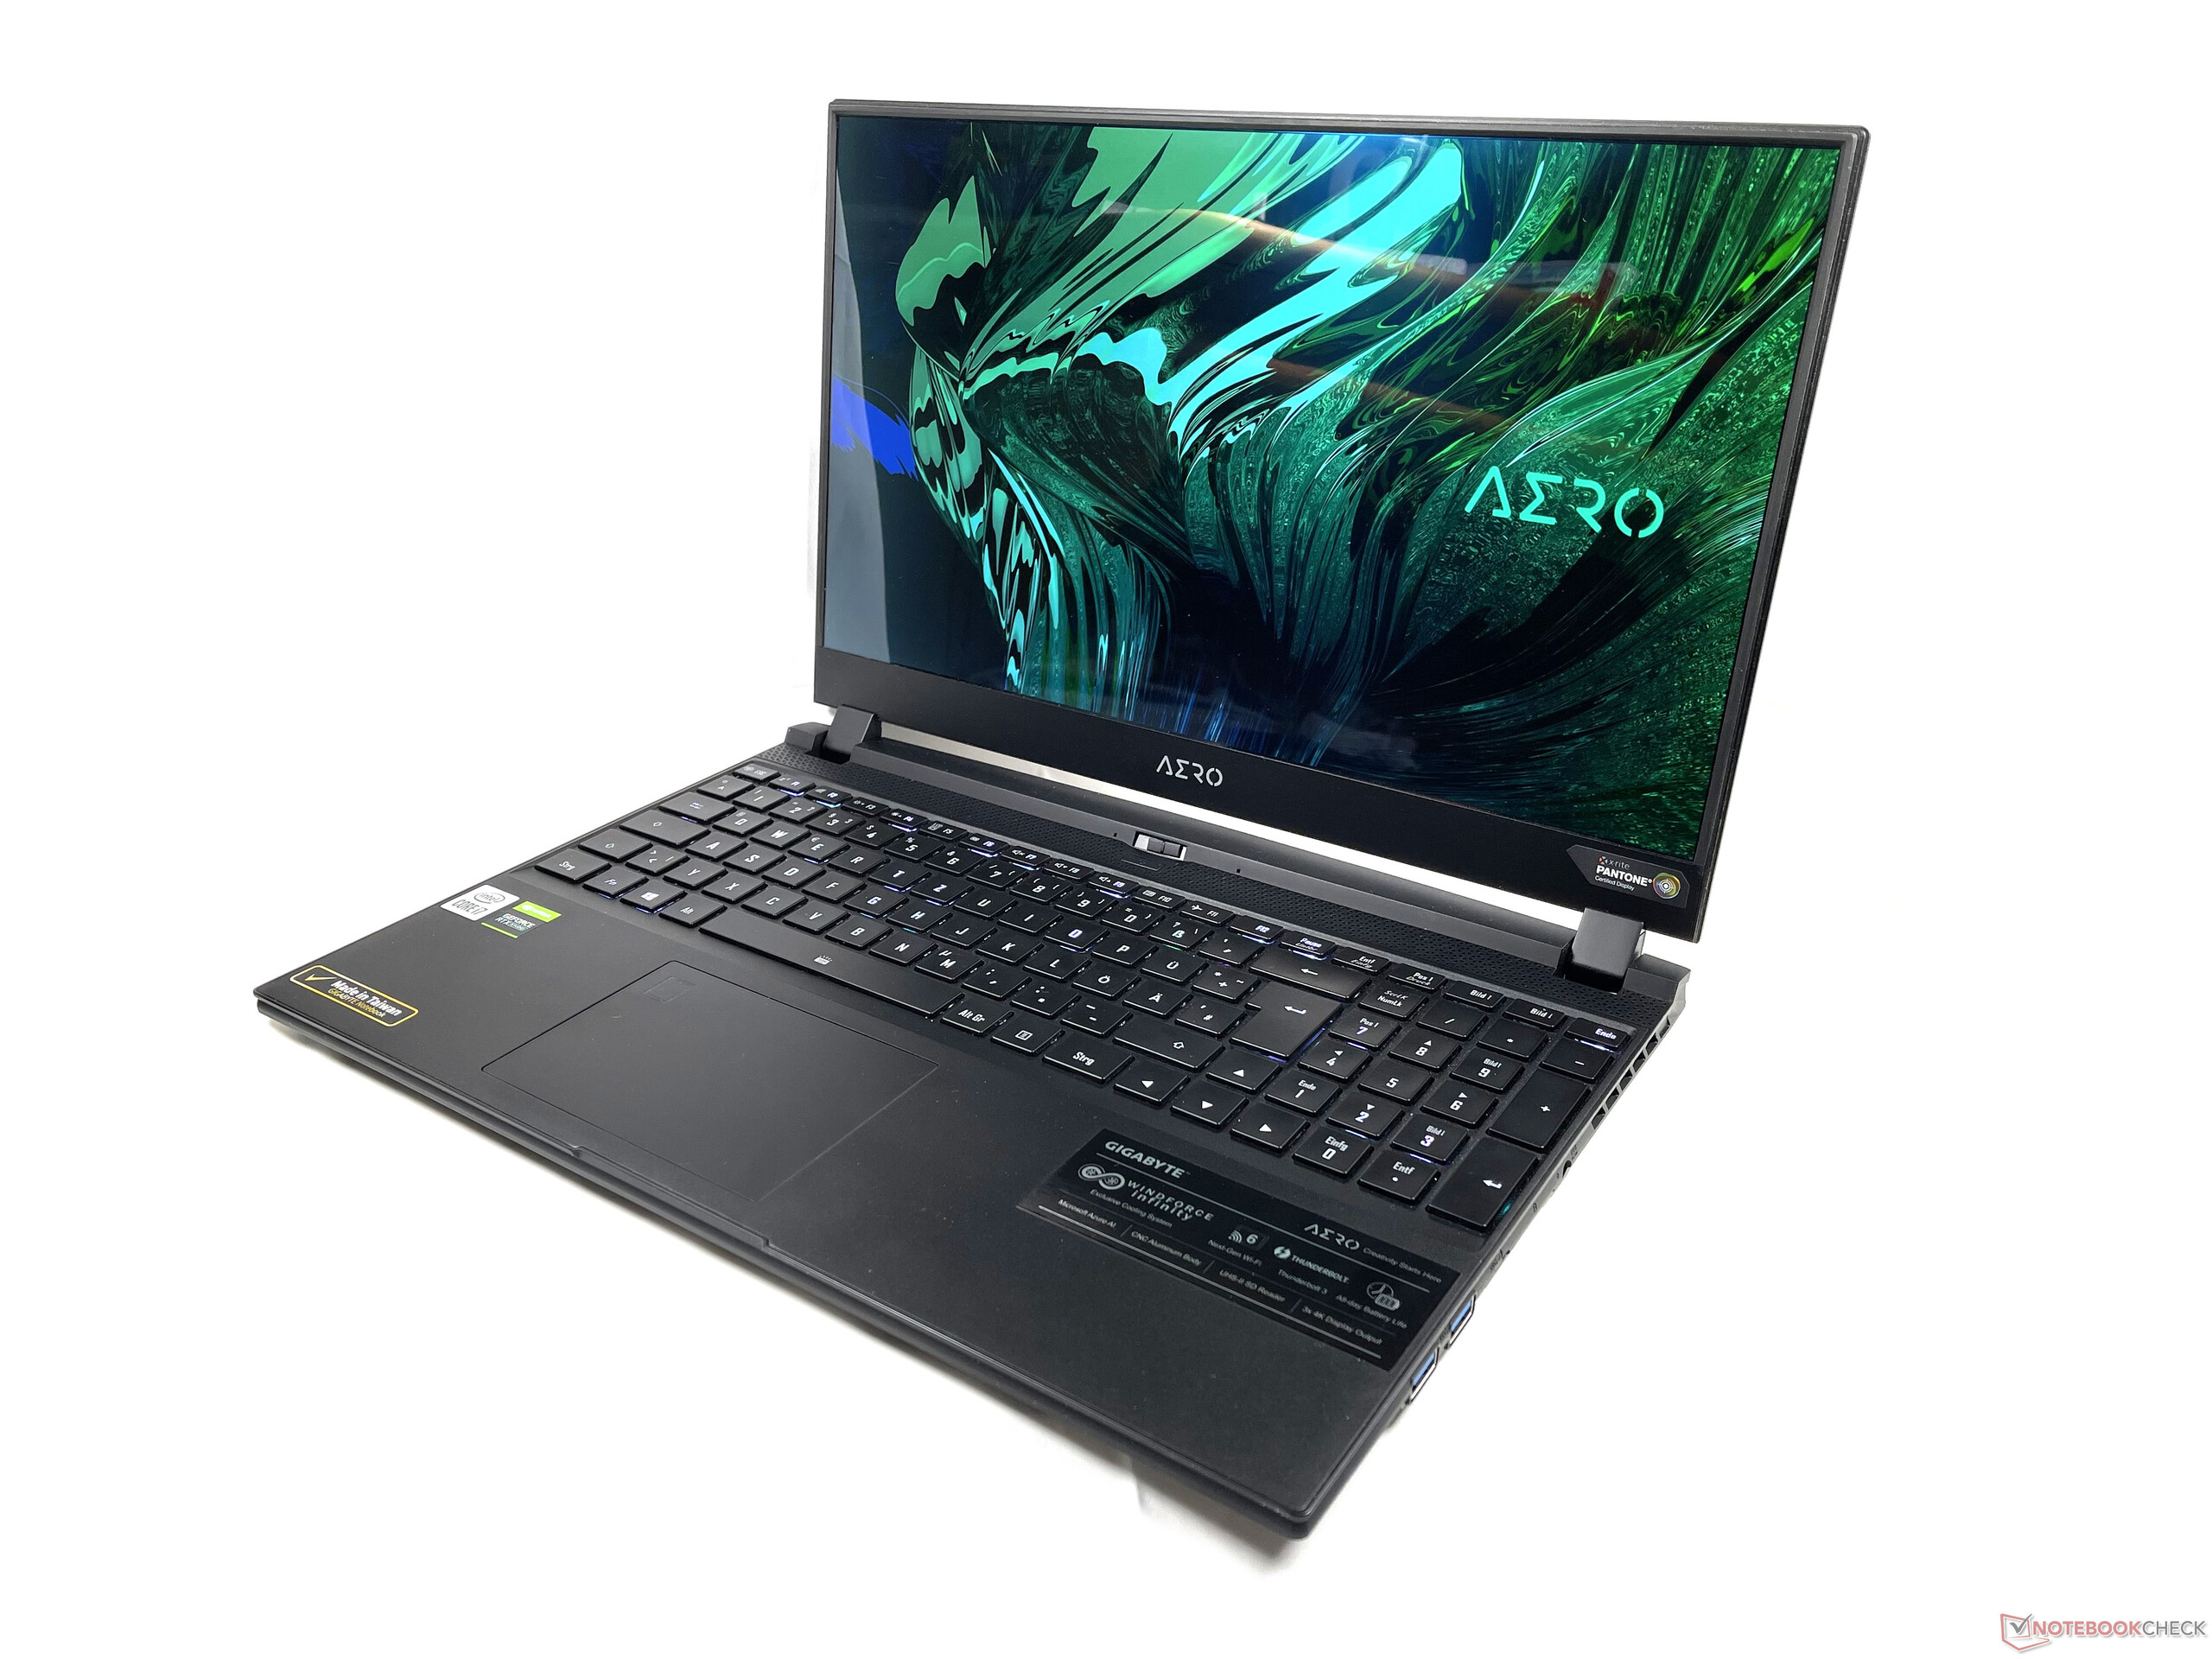
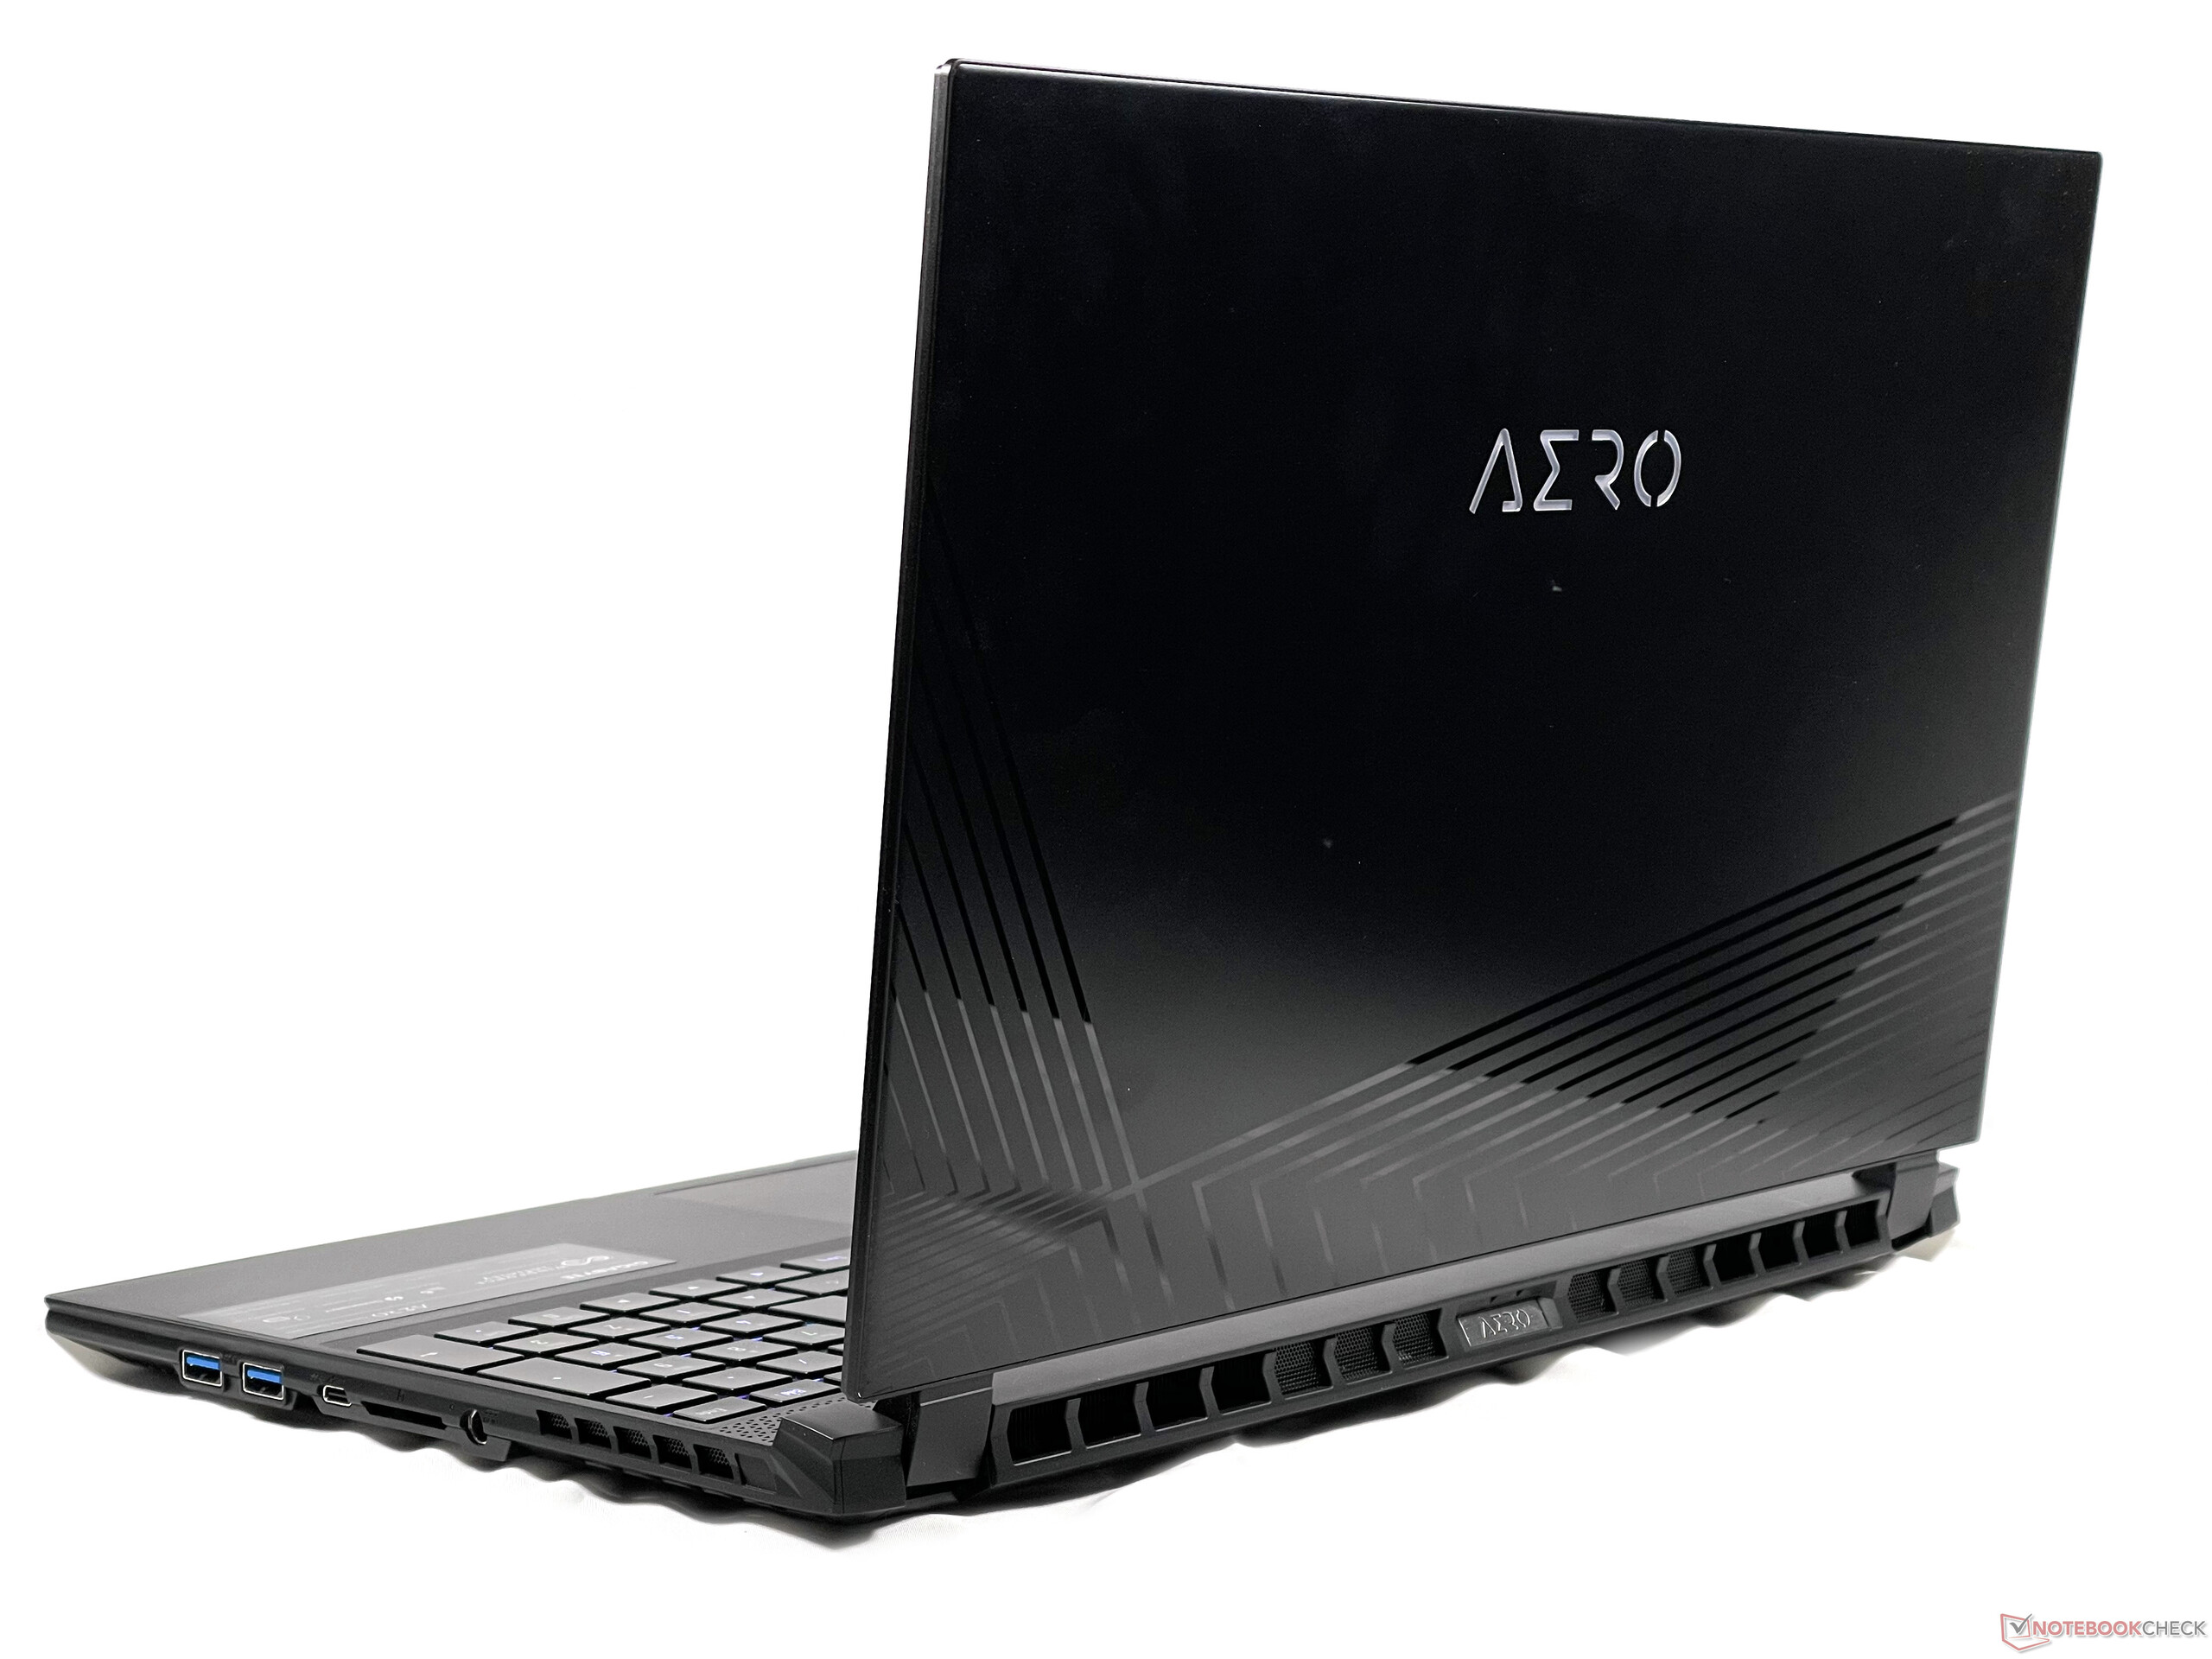
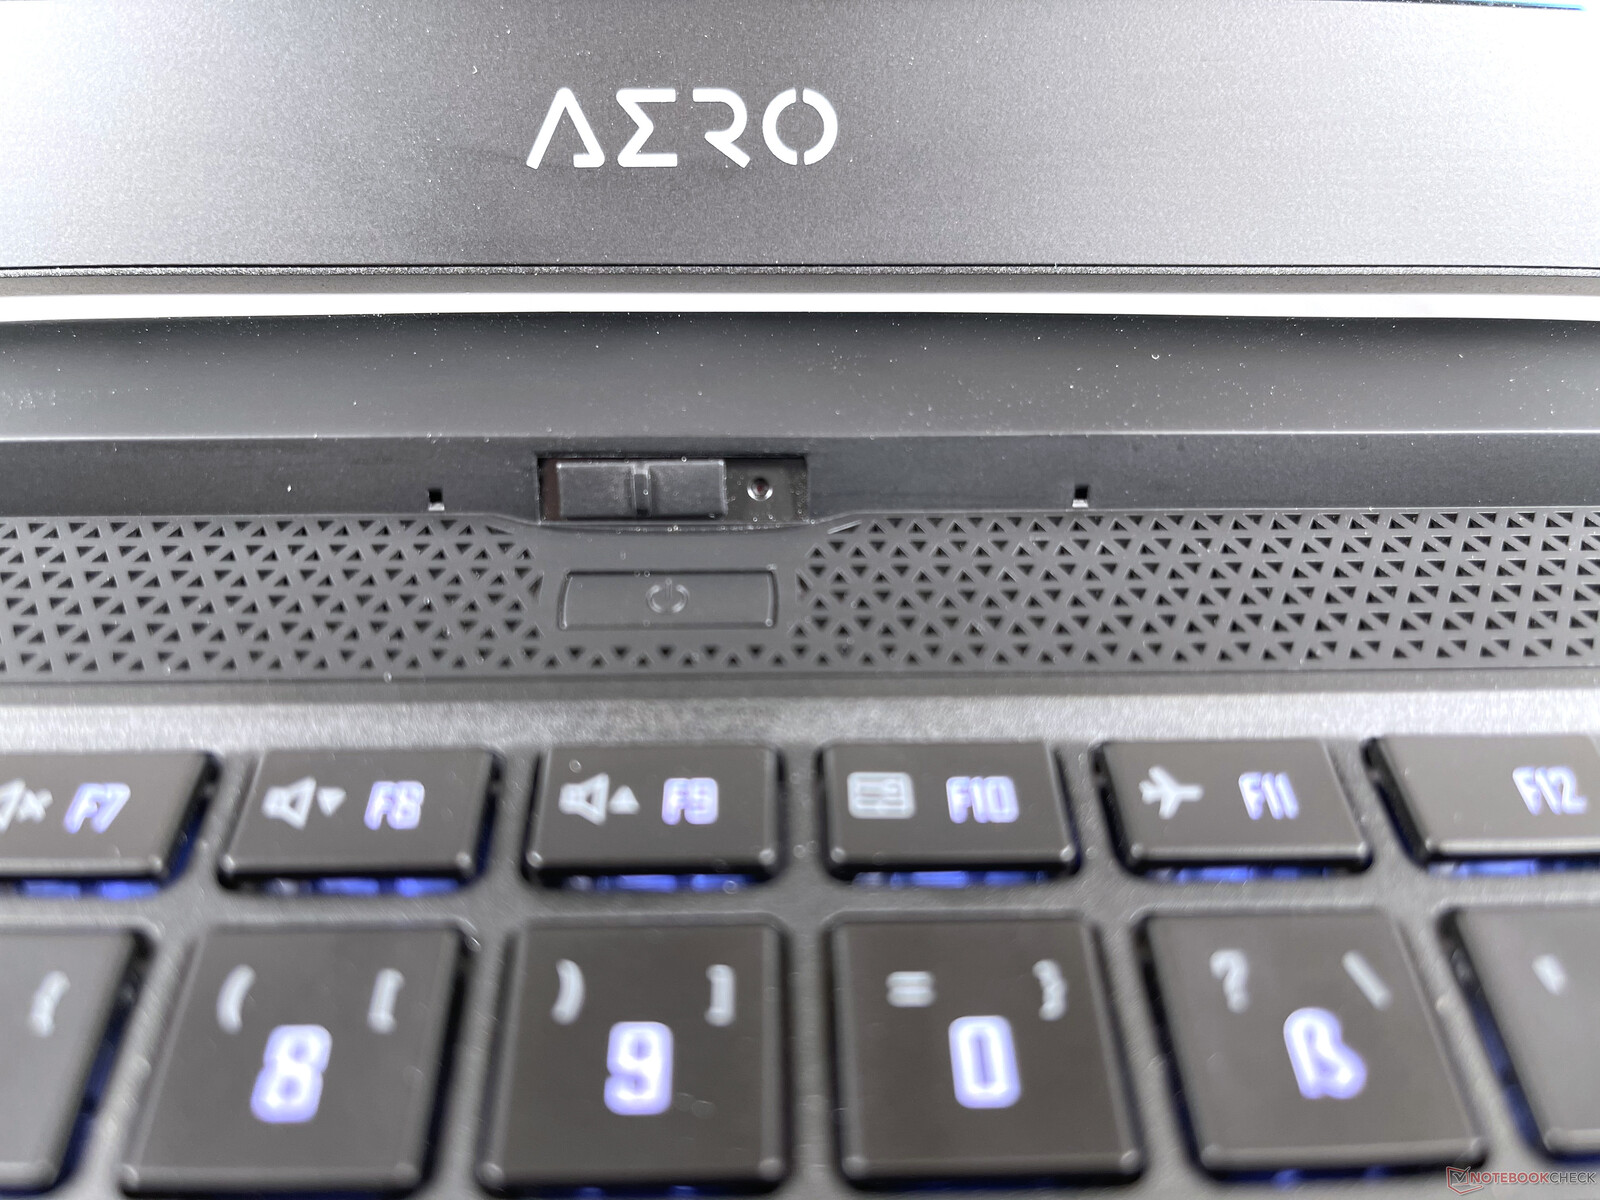
The Aero's case is visually very appealing. The subtle, relatively slim aluminum chassis is only decorated with the Aero logo and some glossy black stripes. Together with the sturdy case, this creates a thoroughly high-quality impression. The build quality is good, and there are no uneven gaps; only the webcam cover under the screen looks a bit cheap.
The lid has a recessed section, allowing it to be opened with one hand without any problems, which proved to be very useful in practice. Compared to the predecessor, there were no changes in the Aero 15 XC in this regard.
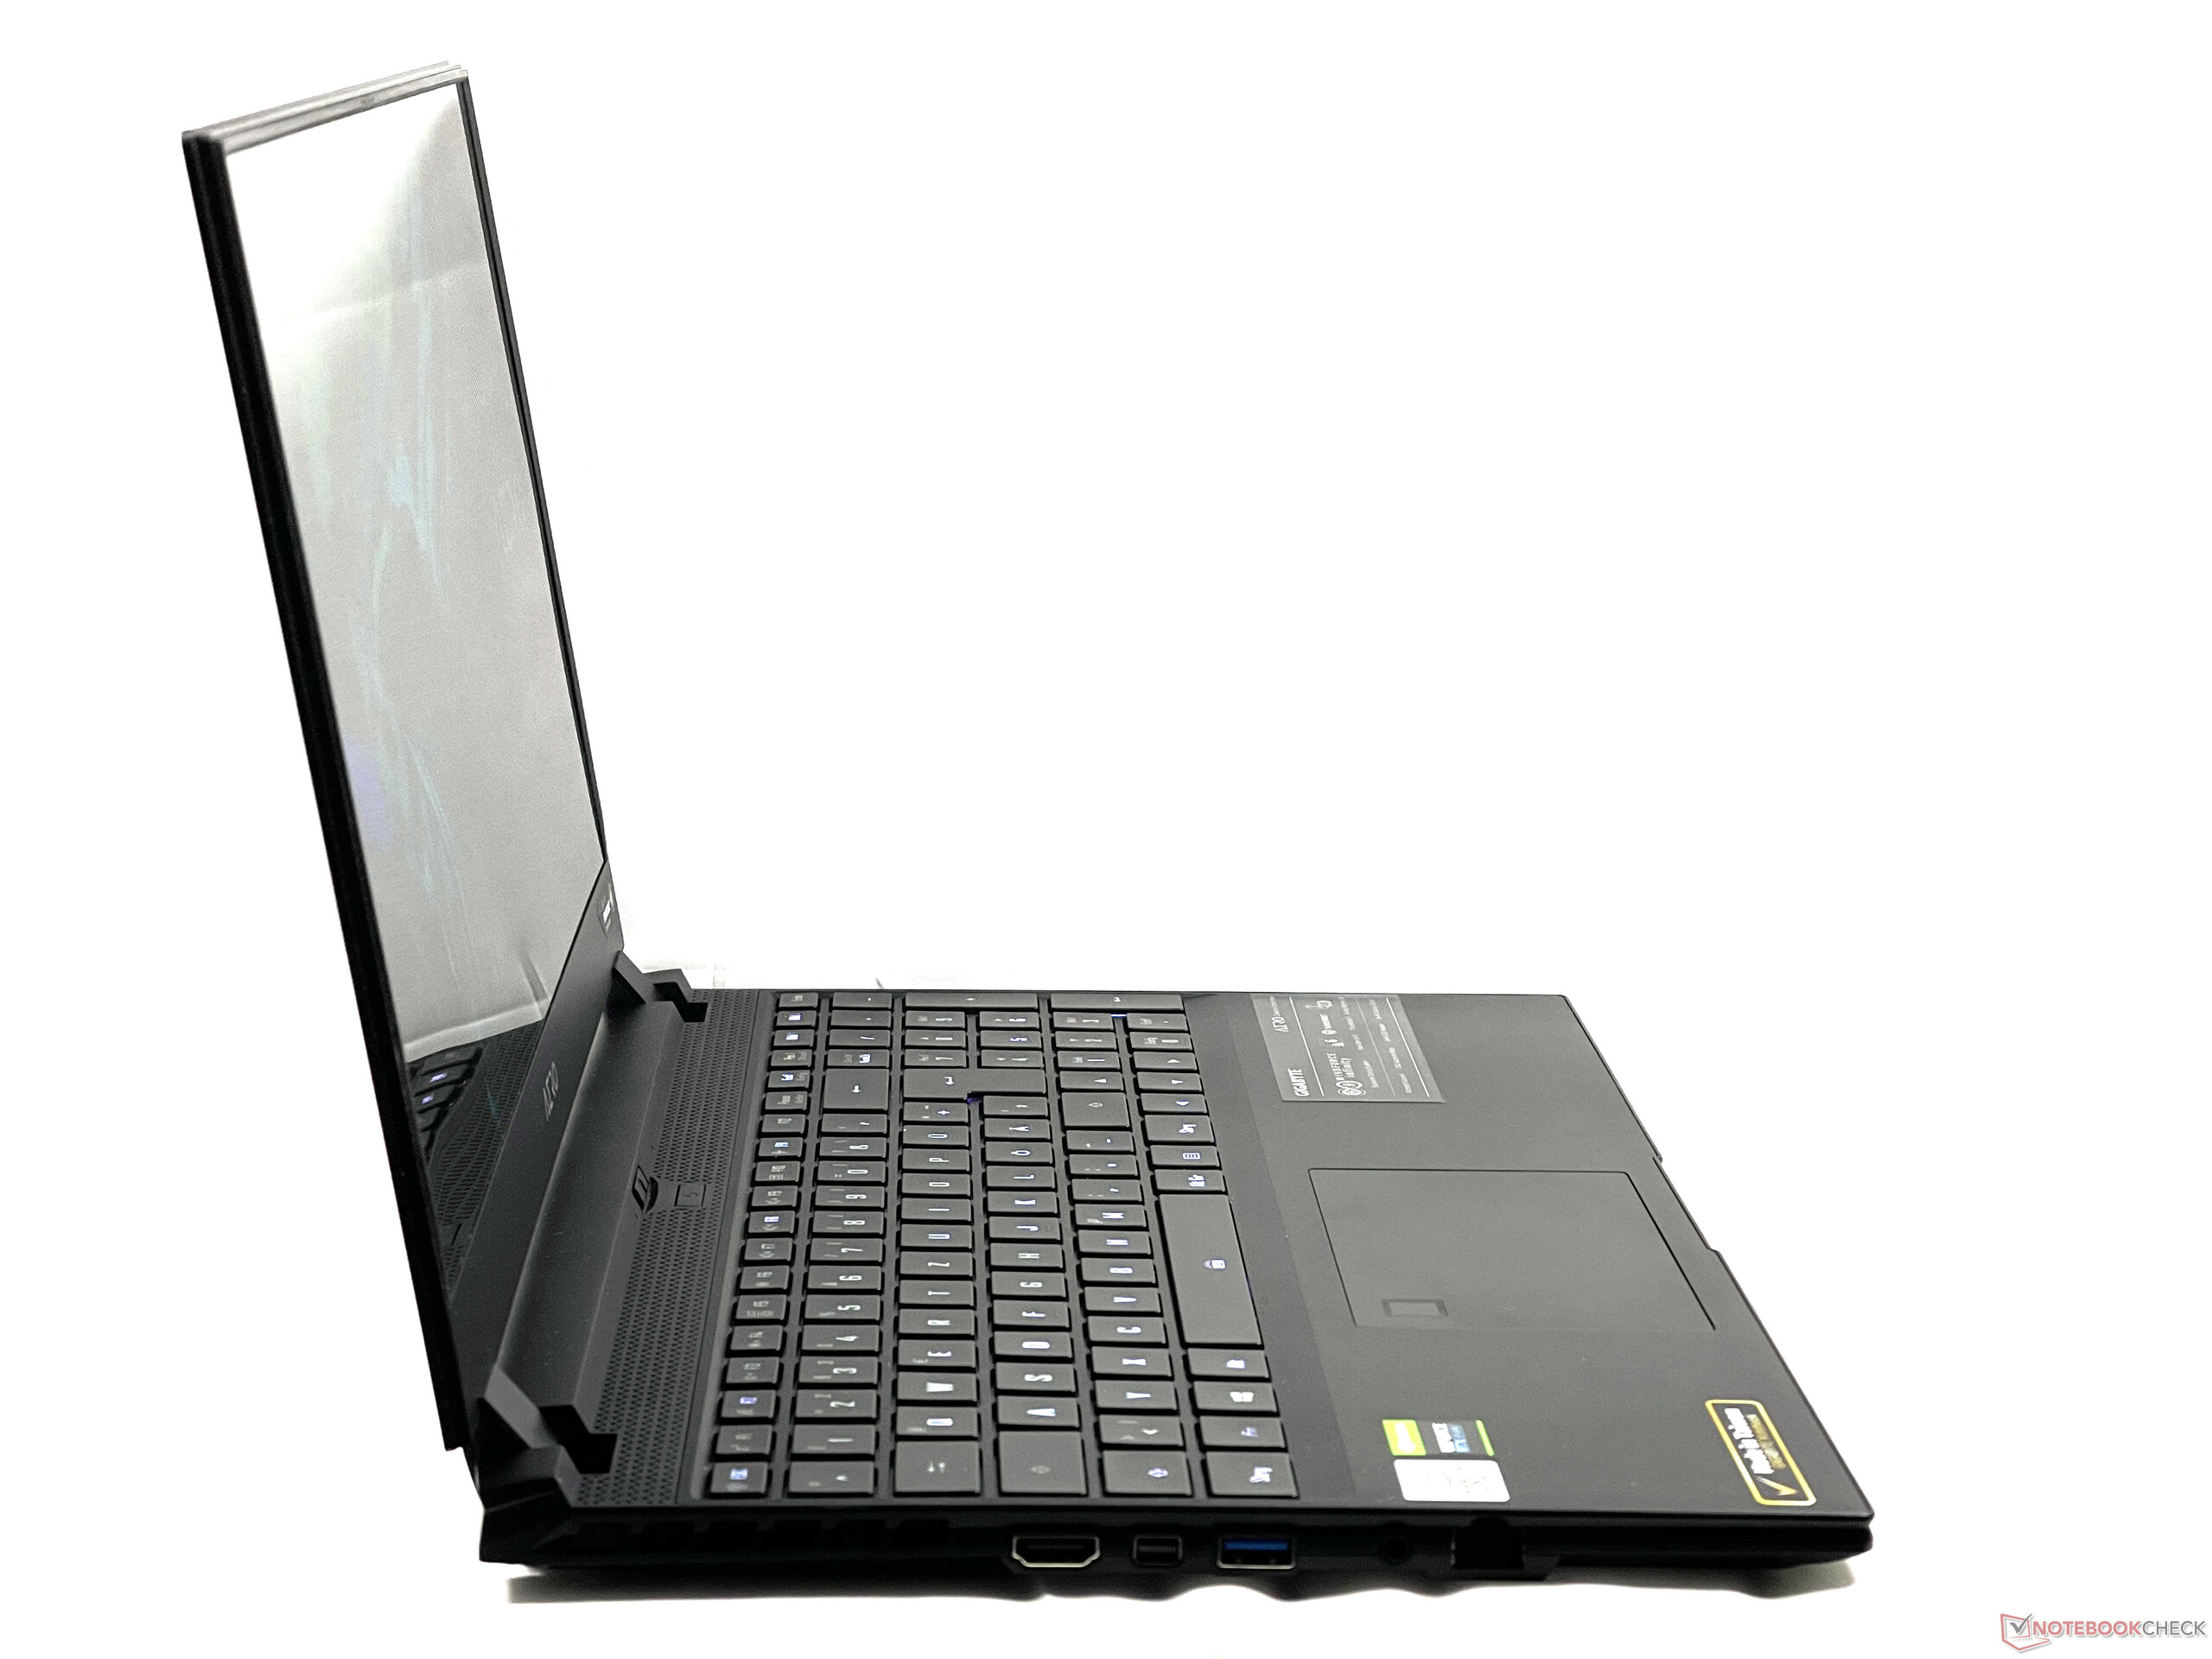
Compared to the competition, the Aero 15 OLED XC is quite compact. In addition to the small footprint, it's also one of the slimmest laptops. Only the ThinkPad X1 Extreme and the HP Envy 15 are even thinner and also a good bit lighter at only 1.7 kg and 2 kg, respectively.
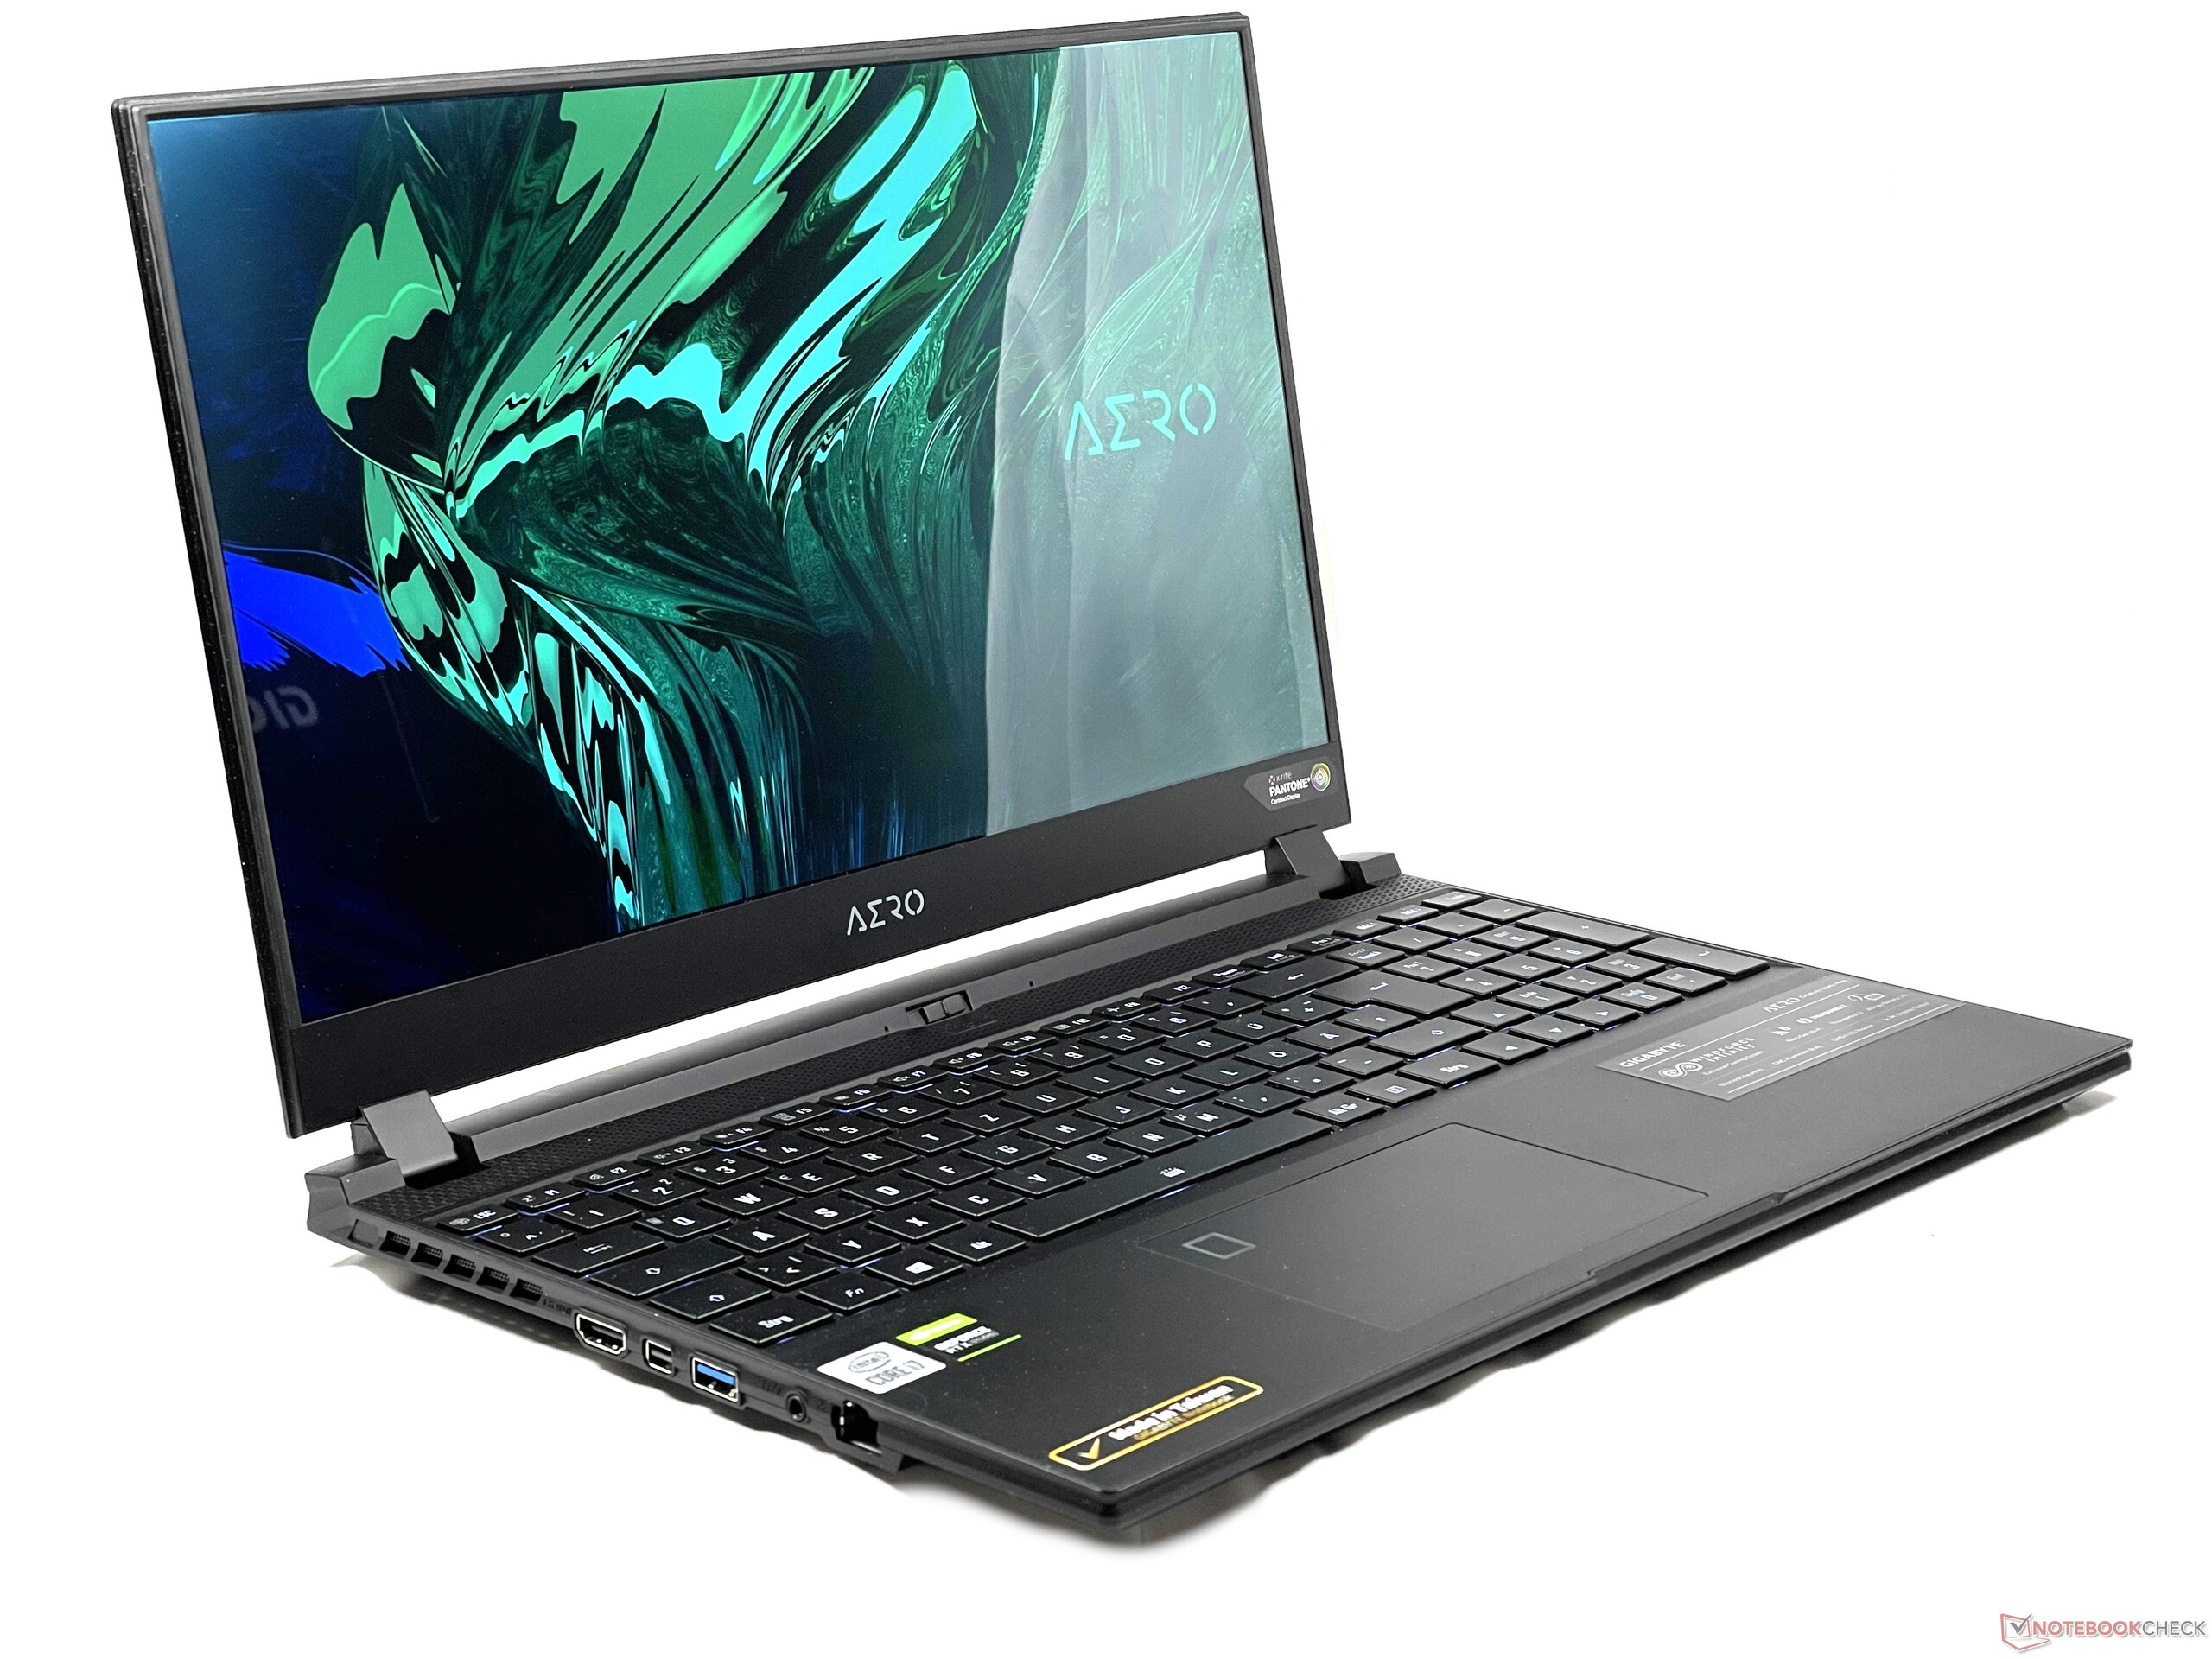
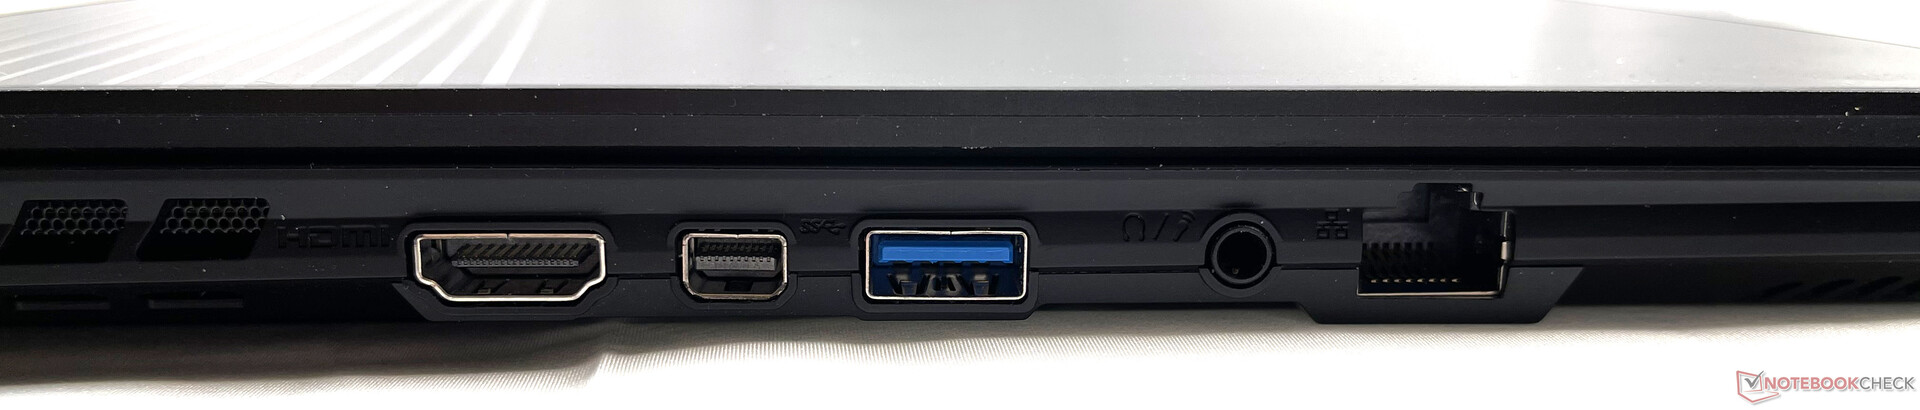
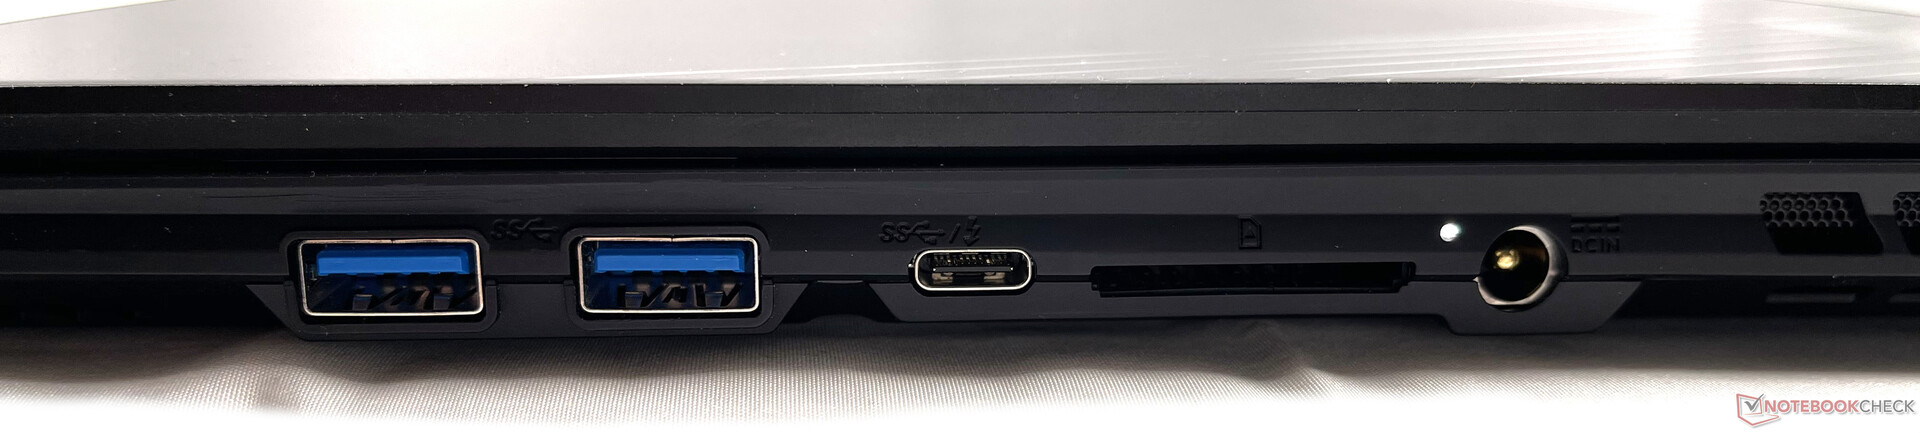
Connectivity - Gigabyte Aero with Thunderbolt and SD card reader
The ports are distributed across the left and right sides of the laptop with sufficient spacing between them. The Thunderbolt 3 port, which you have to do without in many of the currently popular AMD-based models, is a particularly positive feature. In addition to the integrated DisplayPort in the Thunderbolt 3 port, you also get a separate Mini DisplayPort, so that theoretically, up to three external displays (2x DisplayPort, 1x HDMI) can be connected.
SD card reader
The Gigabyte Aero 15 OLED XC has a built-in card reader that can accommodate regular-sized SD cards. In a class comparison, it achieves very good transfer rates with our UHS II reference memory card, the 64 GB Toshiba Exceria Pro SDXC. However, the card reader of last year's Aero 15 OLED XB was still a bit faster in this respect.
| SD Card Reader | |
| average JPG Copy Test (av. of 3 runs) | |
| Gigabyte Aero 15 OLED XB-8DE51B0SP (Toshiba Exceria Pro SDXC 64 GB UHS-II) | |
| Gigabyte Aero 15 OLED XC (Toshiba Exceria Pro SDXC 64 GB UHS-II) | |
| Asus ROG Zephyrus Duo 15 SE GX551QS (Toshiba Exceria Pro M501 microSDXC 32GB) | |
| Media de la clase Multimedia (23 - 531, n=37, últimos 2 años) | |
| Lenovo ThinkPad X1 Extreme Gen3-20TLS0UV00 (Toshiba Exceria Pro SDXC 64 GB UHS-II) | |
| HP Envy 15-ep0098nr (Toshiba Exceria Pro M501 UHS-II) | |
| maximum AS SSD Seq Read Test (1GB) | |
| Gigabyte Aero 15 OLED XB-8DE51B0SP (Toshiba Exceria Pro SDXC 64 GB UHS-II) | |
| Asus ROG Zephyrus Duo 15 SE GX551QS (Toshiba Exceria Pro M501 microSDXC 32GB) | |
| Gigabyte Aero 15 OLED XC (Toshiba Exceria Pro SDXC 64 GB UHS-II) | |
| Lenovo ThinkPad X1 Extreme Gen3-20TLS0UV00 (Toshiba Exceria Pro SDXC 64 GB UHS-II) | |
| Media de la clase Multimedia (37.3 - 1455, n=36, últimos 2 años) | |
| HP Envy 15-ep0098nr (Toshiba Exceria Pro M501 UHS-II) | |
Communication
The wireless features Bluetooth 5.1 and WLAN 6 are provided by Intel's AX200 WLAN module. While the transmission rates meet our expectations for sending data, the Asus Zephyrus Duo 15 SE, for example, achieves an approximately 25% higher rate for receiving data with the same WLAN module.
Webcam


")
")


Security
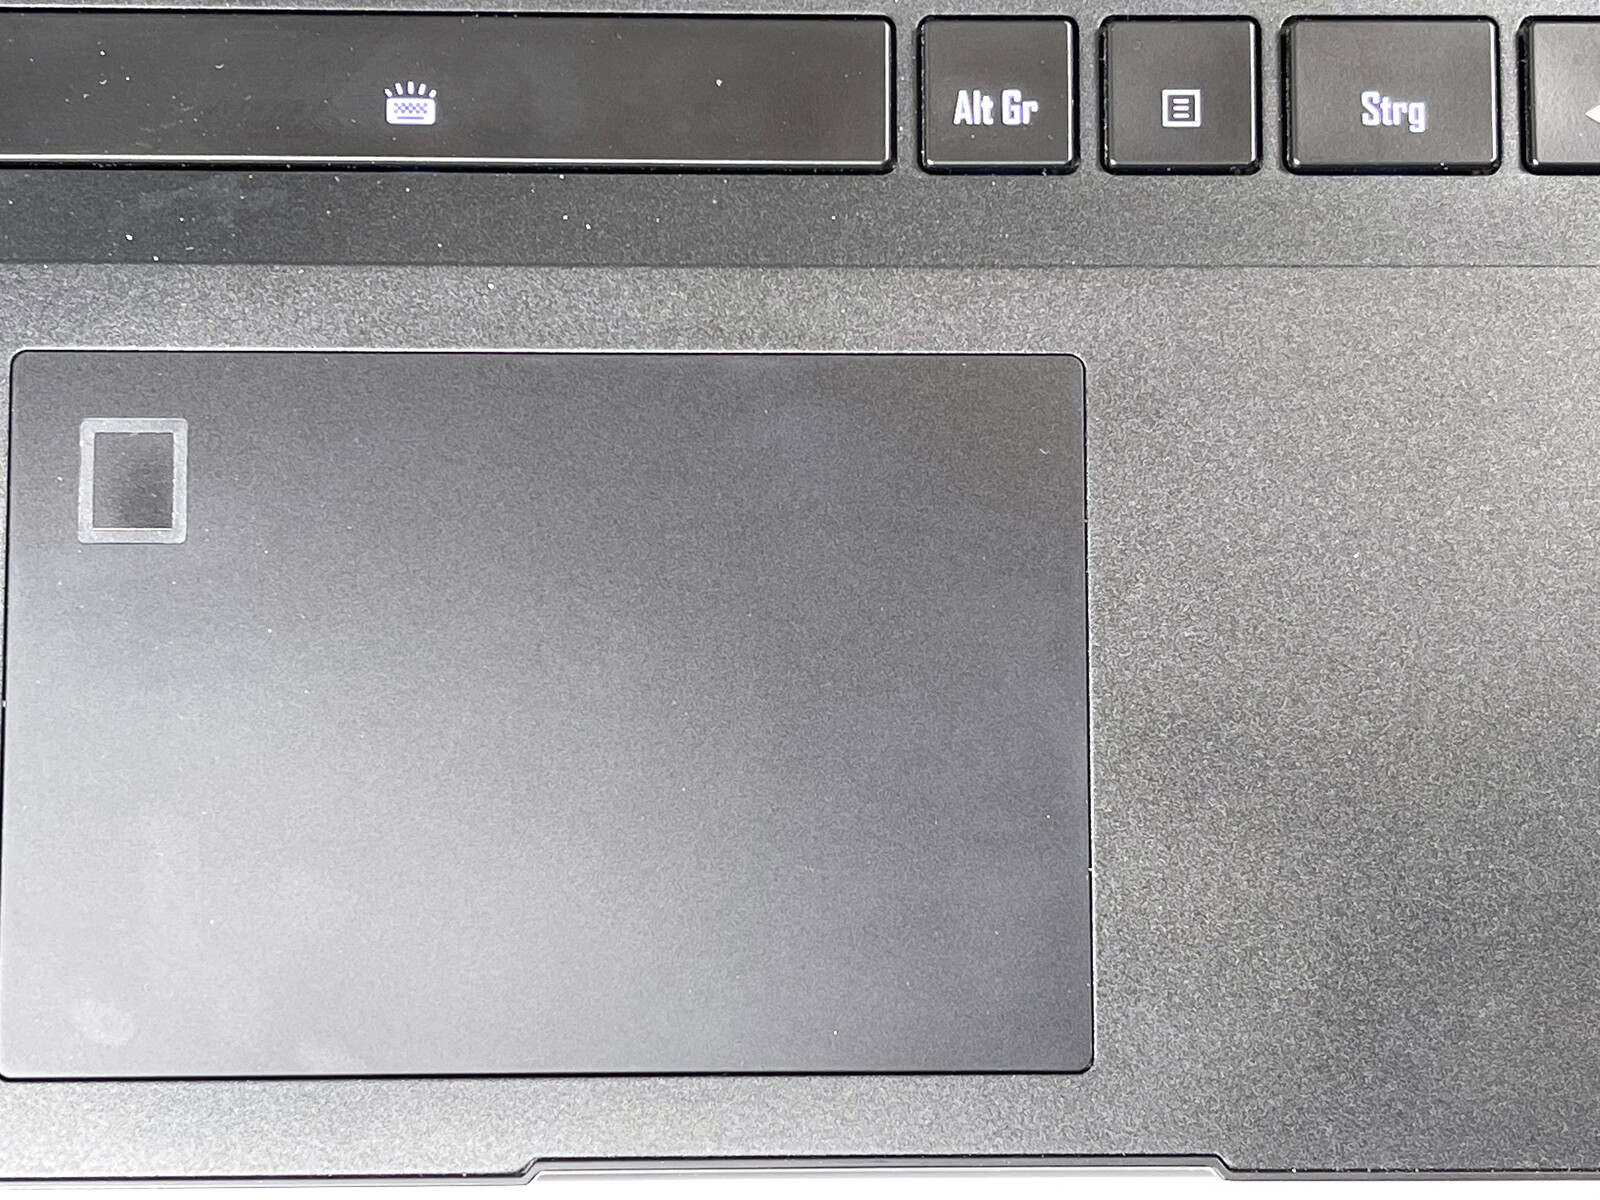
The Aero 15 is equipped with a fingerprint scanner that is integrated into the touchpad and supports firmware-based TPM via Intel PTT.
Accessories
In addition to the device itself and the power adapter, a fabric sleeve, and a thermal pad for an M.2 SSD are included.
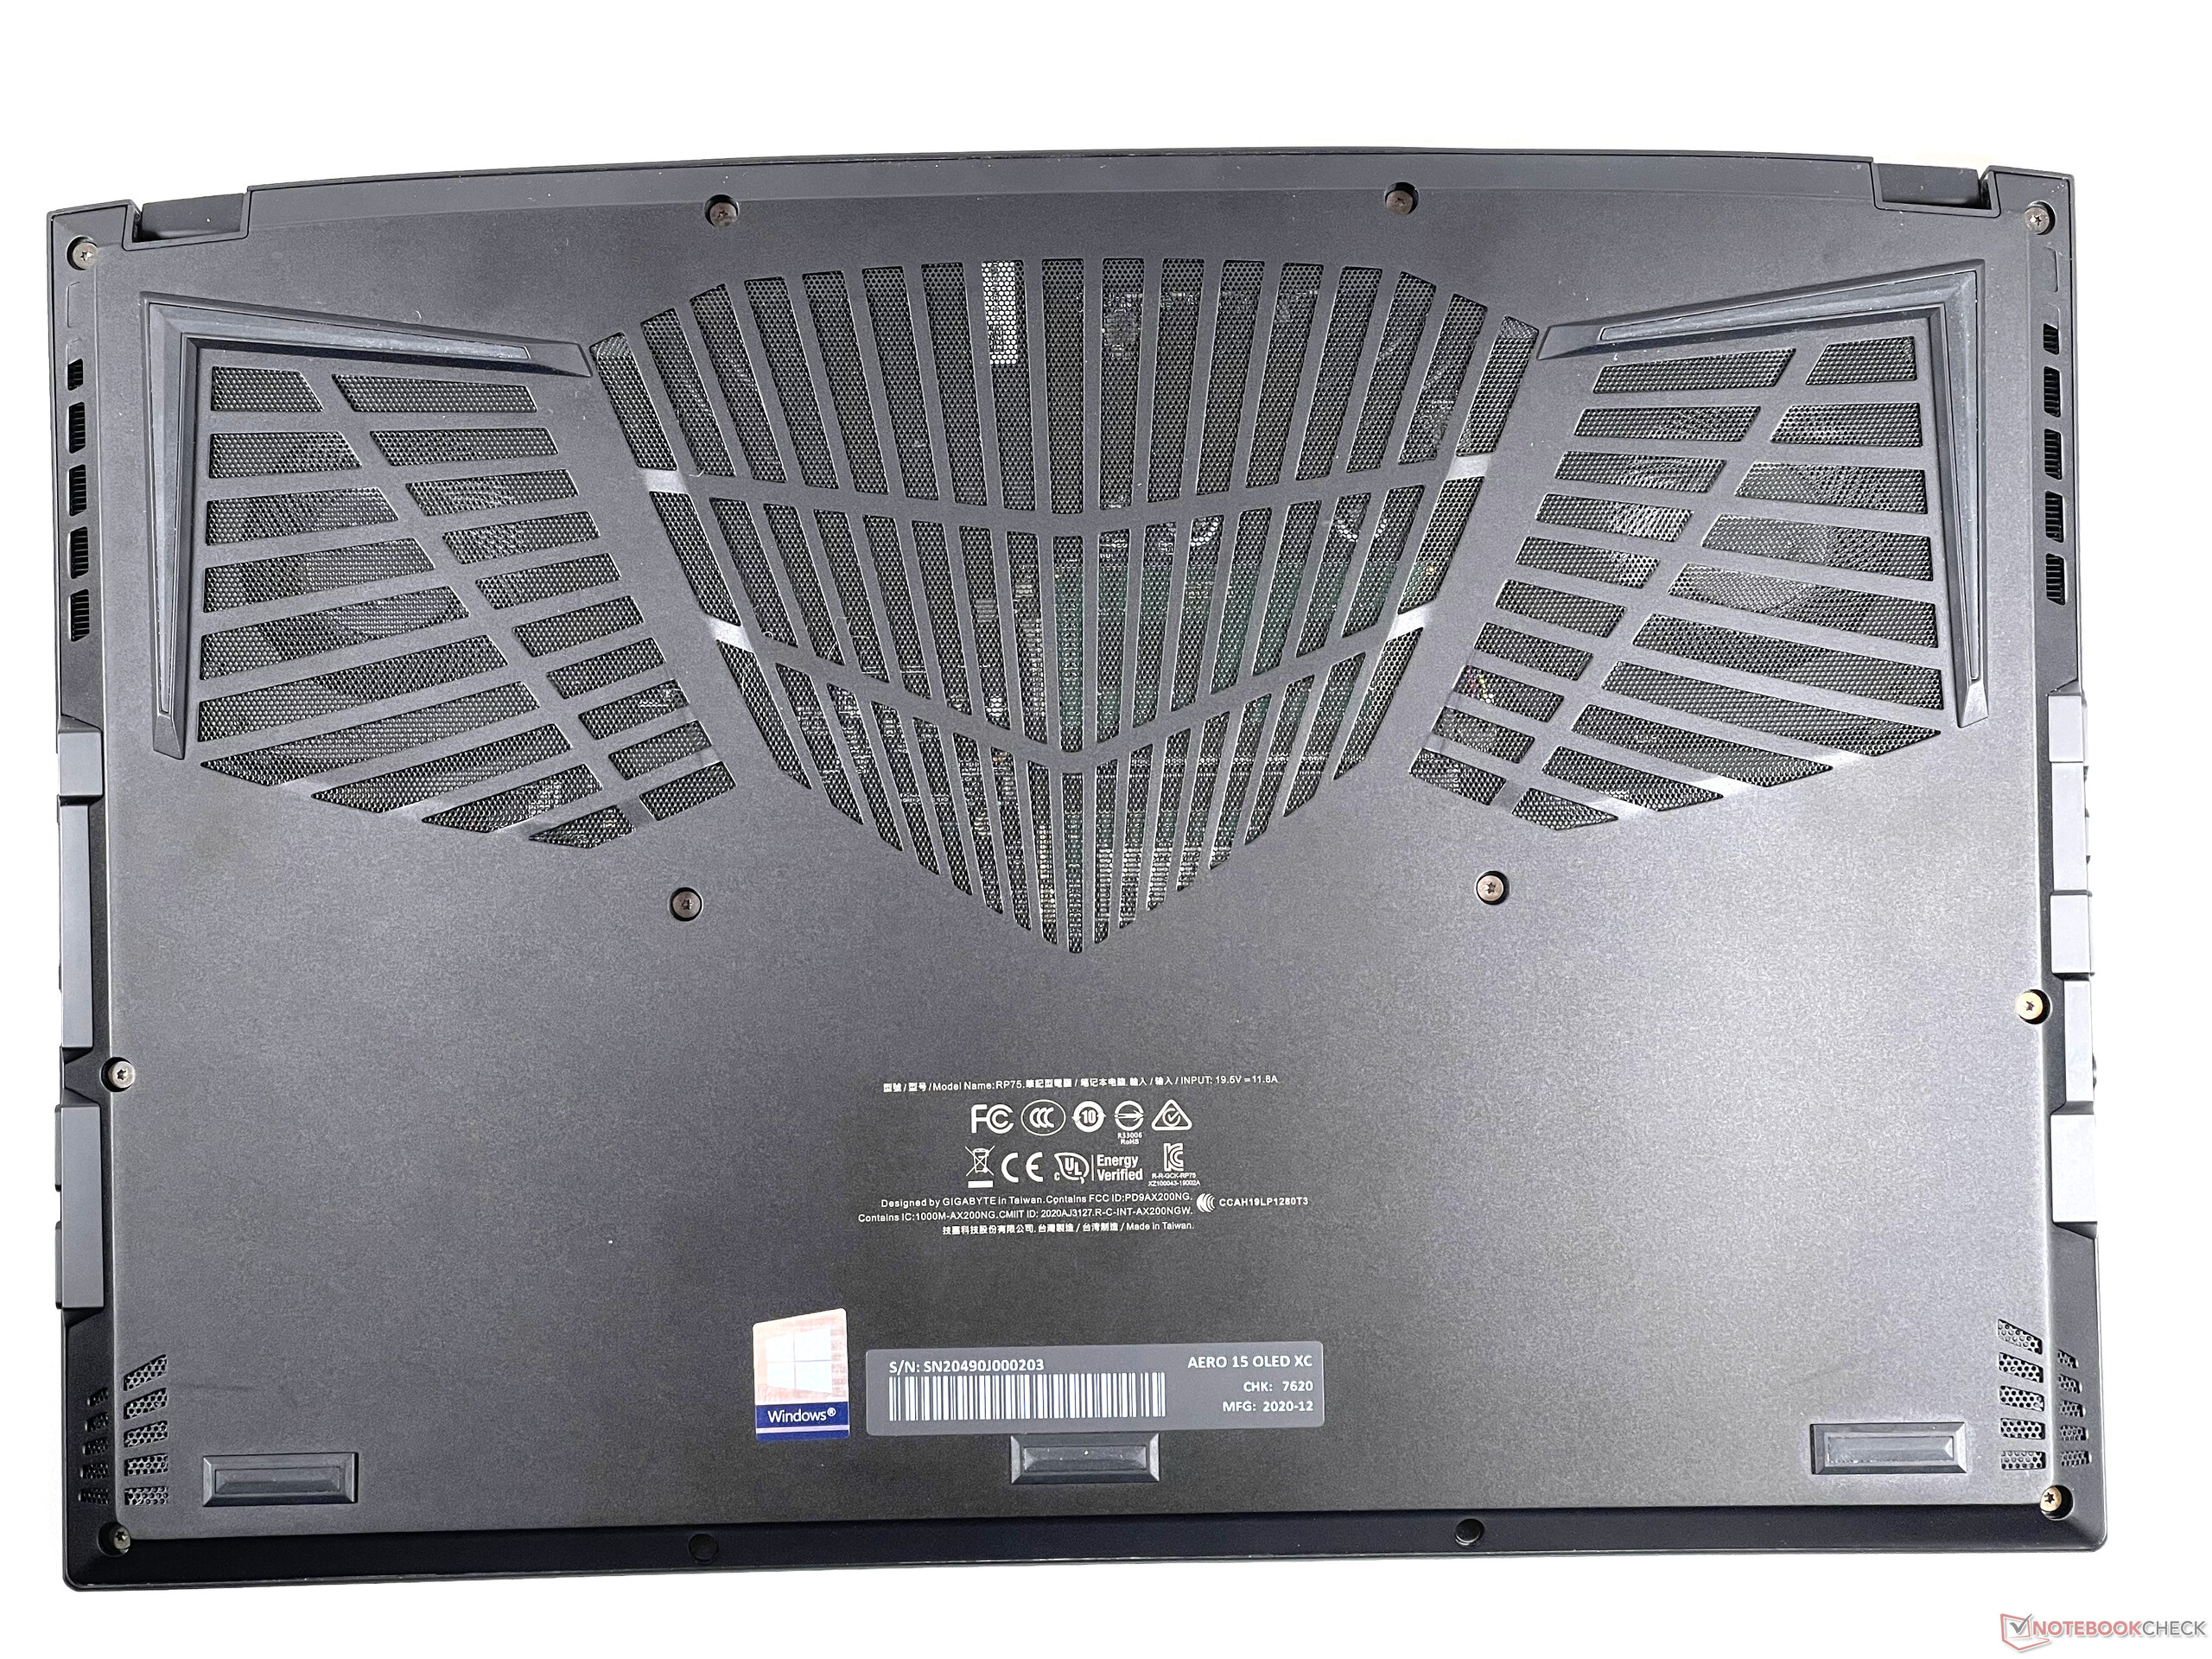
Maintenance
Opening the case requires unscrewing 12 hex cap screws, two of which are covered with stickers. This procedure is outdated, unnecessarily complicates the maintenance process, and possibly unsettles users who want to replace simple things like the SSD or RAM.
Warranty
Gigabyte offers users a warranty period of two years. Warranty extension options require online registration of the respective product.
Input devices - Keyboard with room for improvement
Keyboard
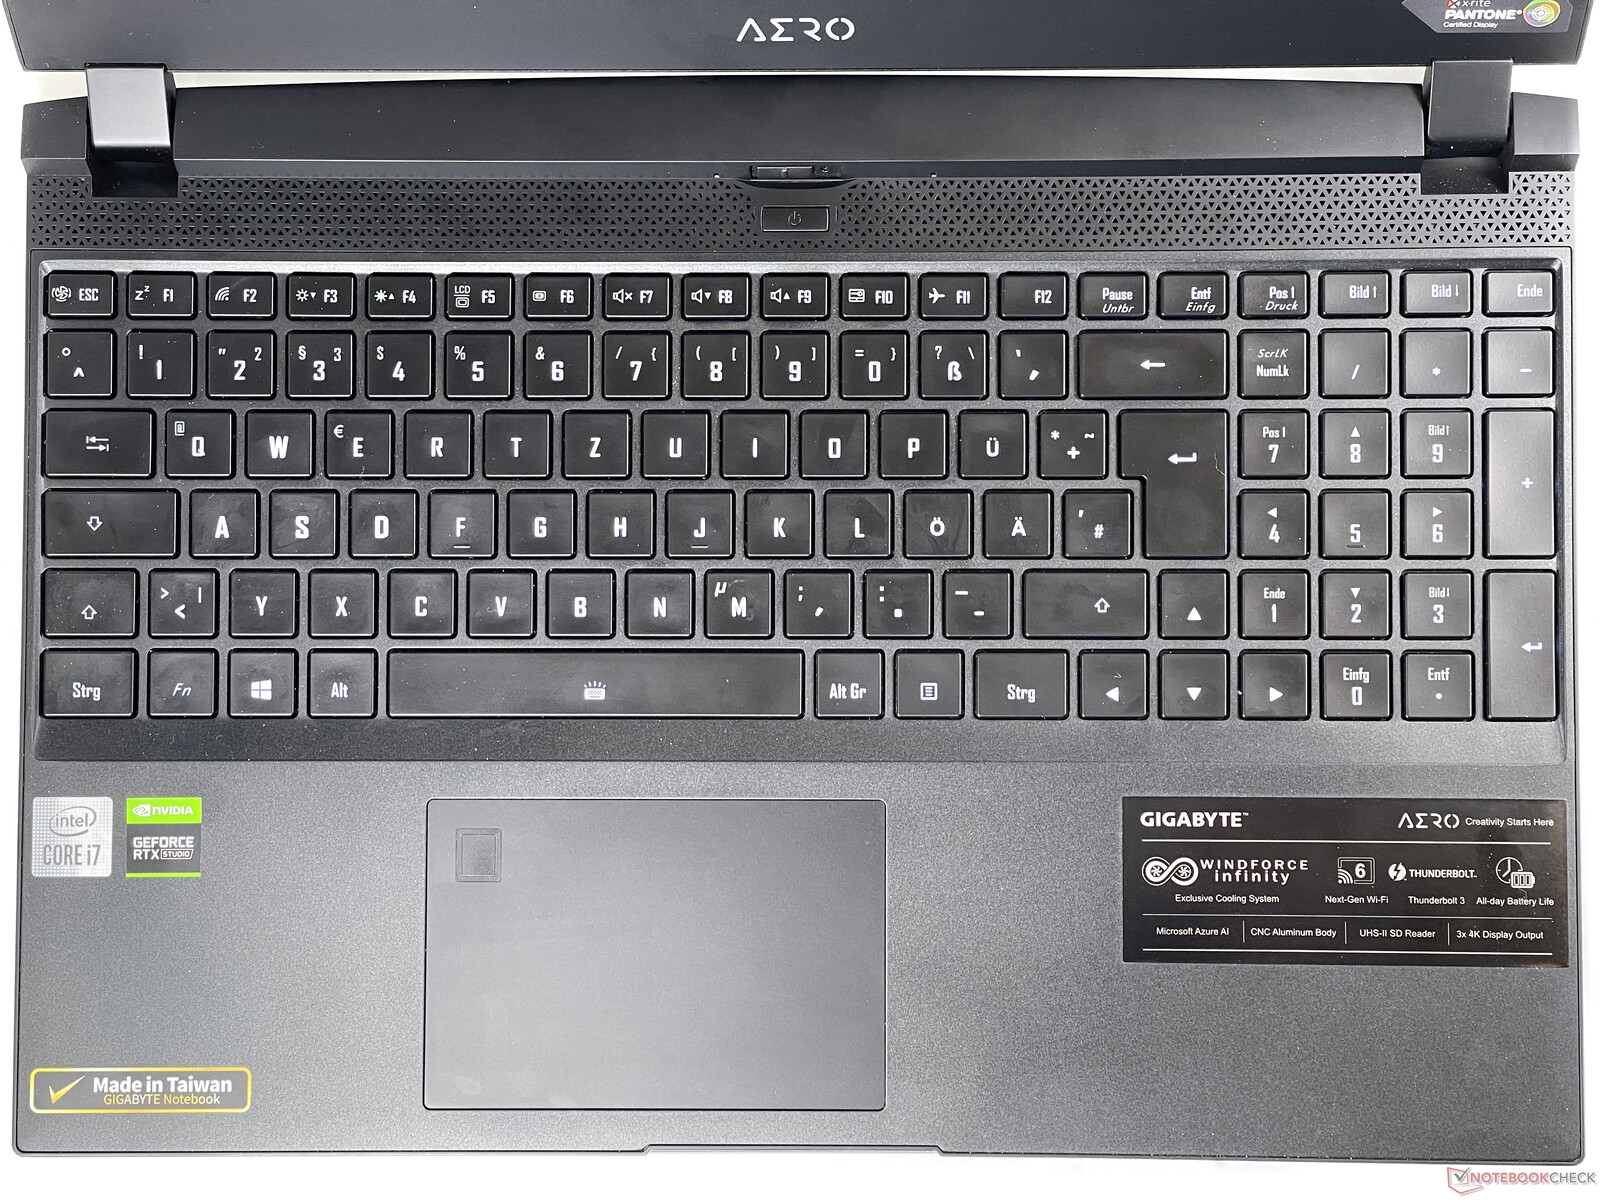
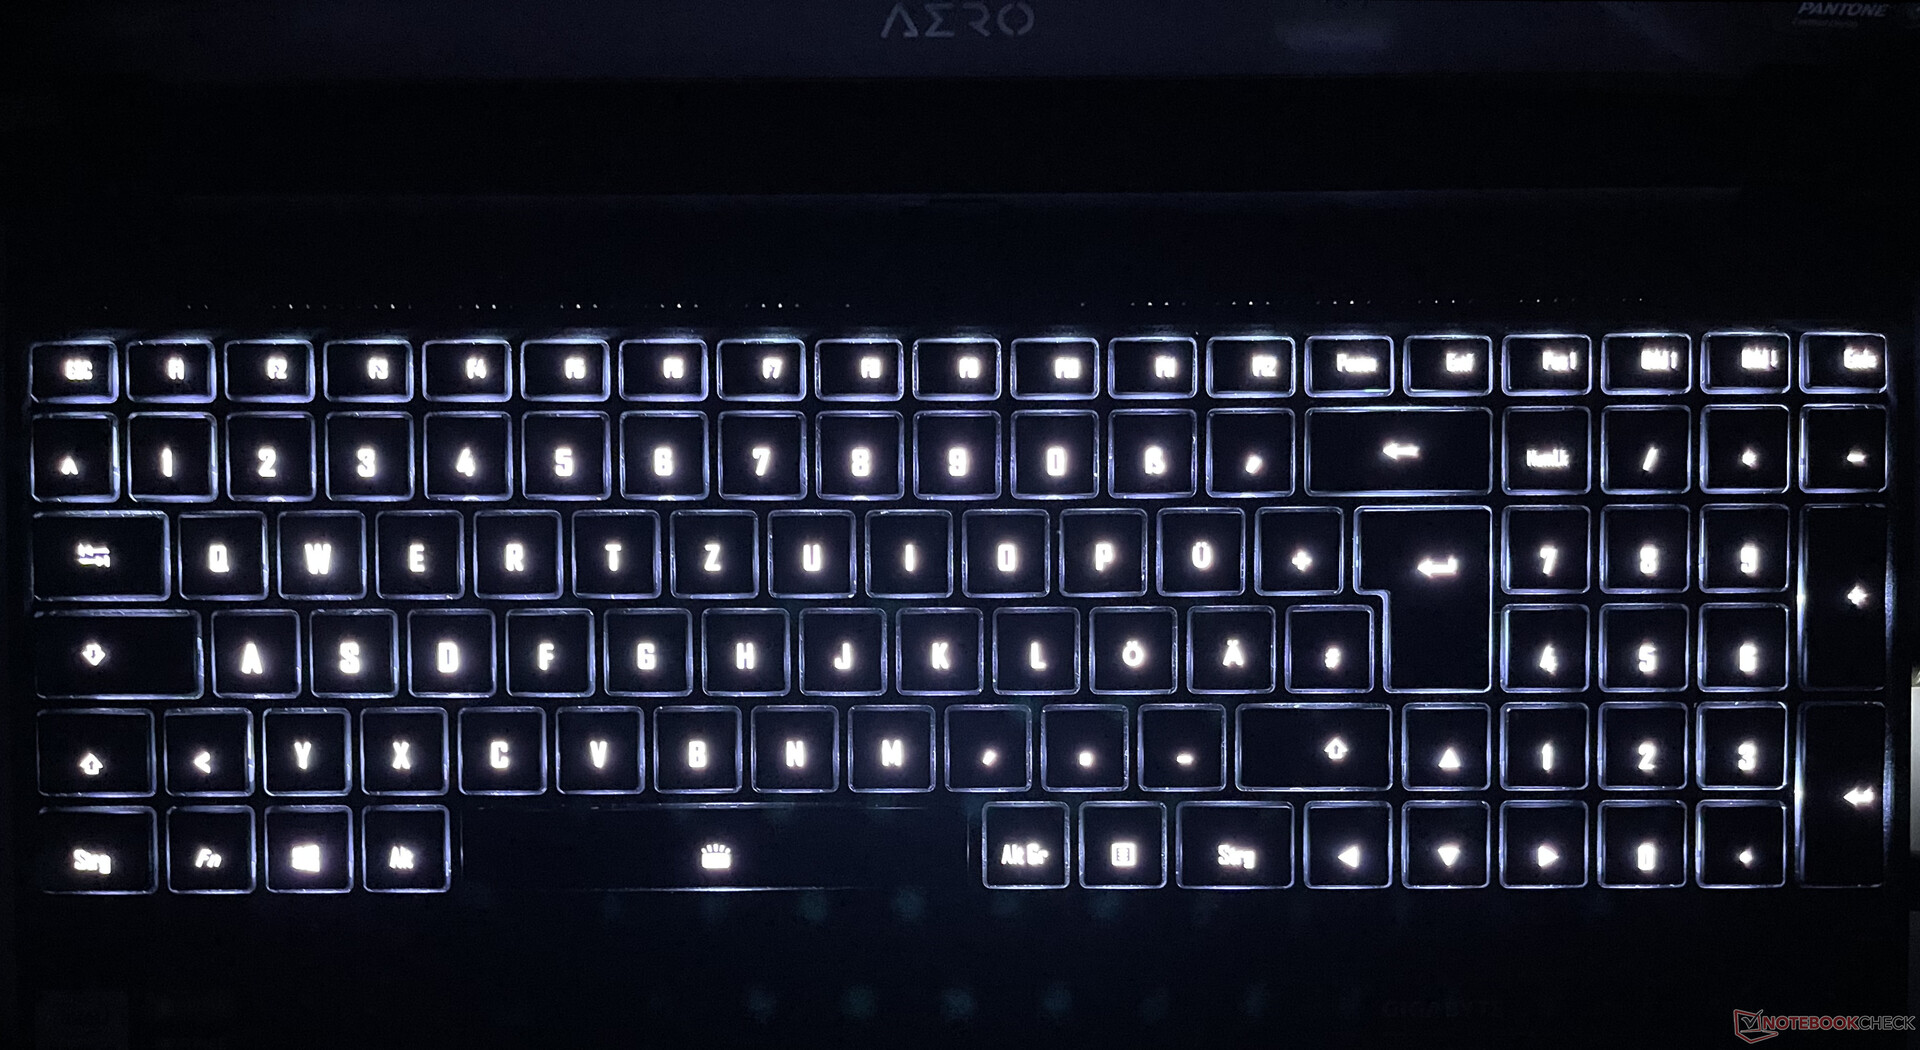
The keyboard includes a numeric keypad and extends across the entire width of the base unit, providing enough space for regular-sized keys. By making minimal adjustments to the width of individual keys, Gigabyte has managed to arrange all keys in a rectangular layout here, which gives the laptop an uncluttered overall look when opened.
Unfortunately, this technique doesn't quite live up to what the looks promise, though, since the keys offer low and quite mushy resistance as well as a shallow key travel. This makes the keyboard only partially suitable for typing longer text, but at least the keys are relatively quiet and visible even in low light thanks to the individual RGB lighting.
Touchpad
With an area of 10.5 x 7 cm, the touchpad is relatively small by today's standards, especially since the integrated fingerprint scanner further limits the usable area. However, the gliding properties of the plastic ClickPad are at the usual good level, and in contrast to the keyboard's keys, the integrated mouse buttons offer a clear pressure point and satisfying feedback.
Display - Impressive 4K OLED panel
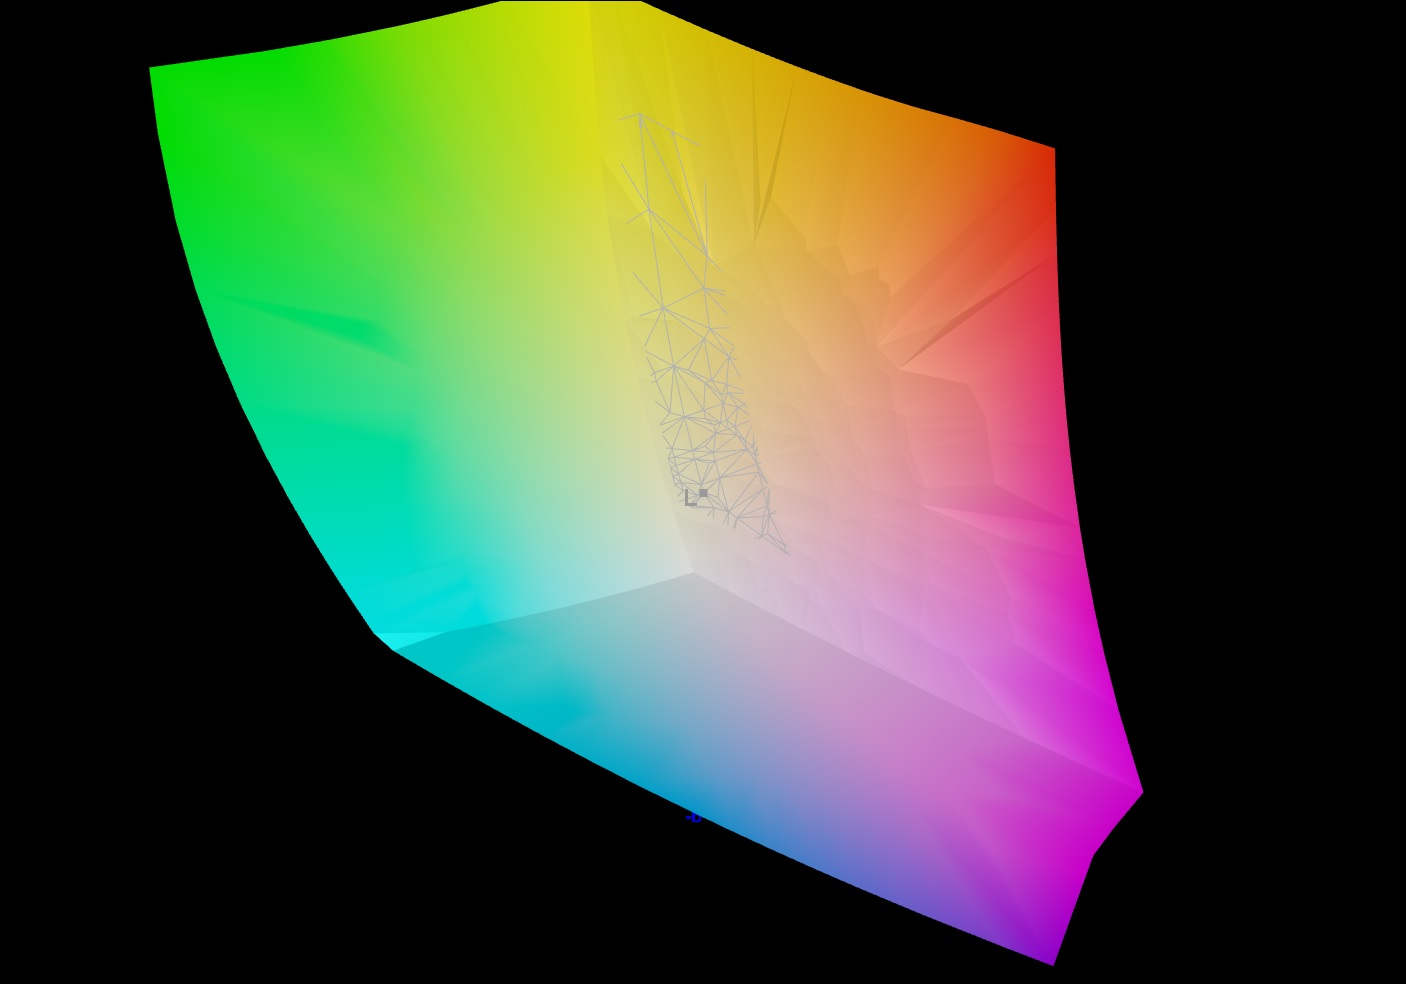
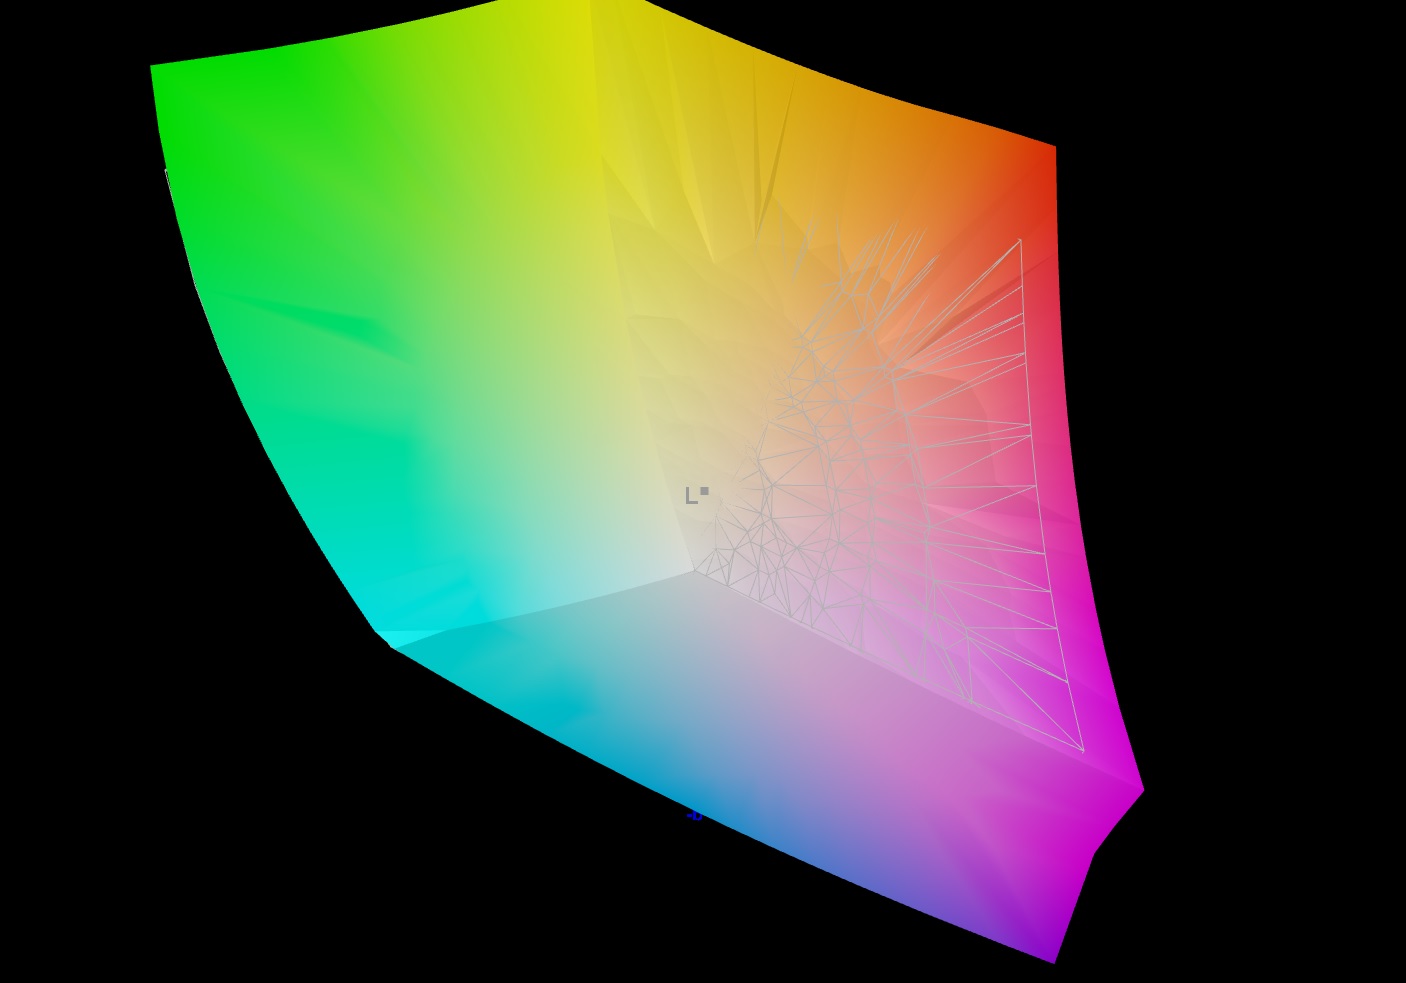
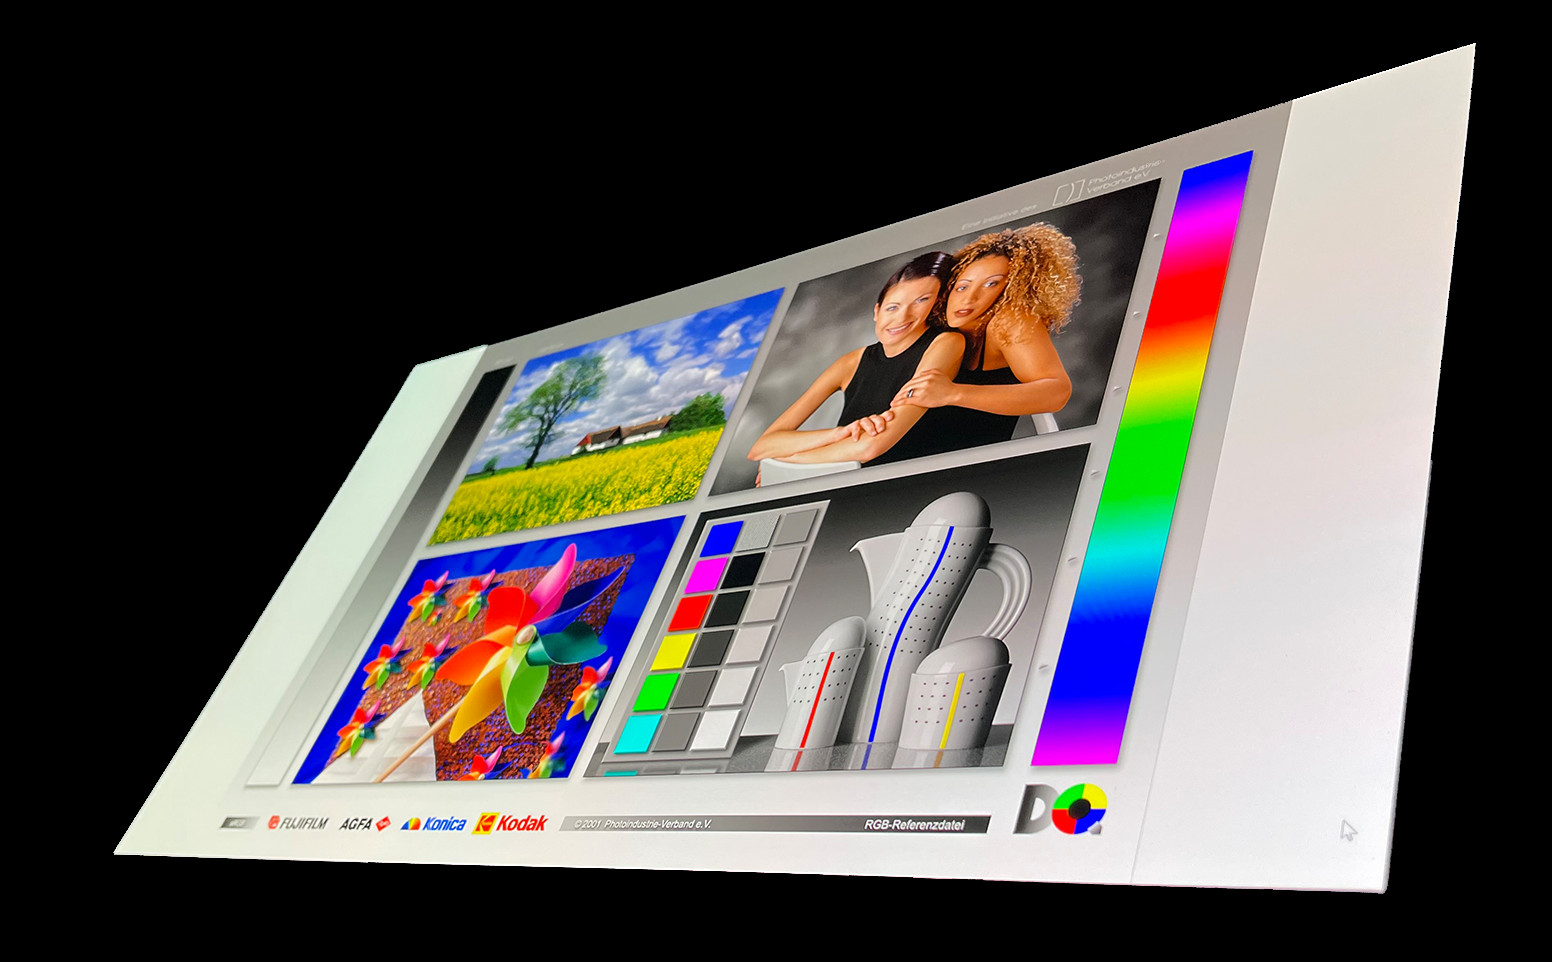
The built-in glossy AMOLED panel has a resolution of 3840x2160 pixels (4K) and features a Pantone X Rite certification. The numerous rich colors of Gigabyte's cleverly chosen background image come into their own as a result and quickly show that the display of content on the 15.6-inch screen is the main focus here. Therefore, no other display options are available within the series.
The display is optimally equipped for media playback. The OLED display also has an HDR400 certification, which acknowledges its higher-quality reproduction of image areas with different brightness levels. Unfortunately, PWM is used for brightness control (as is common with OLED displays), which can be a problem for users who are sensitive to this. That being said, this is an excellent panel with a brightness distribution of 95% and a brightness level that is around 450 cd/m² according to our independent measurements. The OLED display doesn't suffer from screen bleeding due to the underlying technology.
| |||||||||||||||||||||||||
iluminación: 95 %
Brillo con batería: 442 cd/m²
Contraste: 8840:1 (Negro: 0.05 cd/m²)
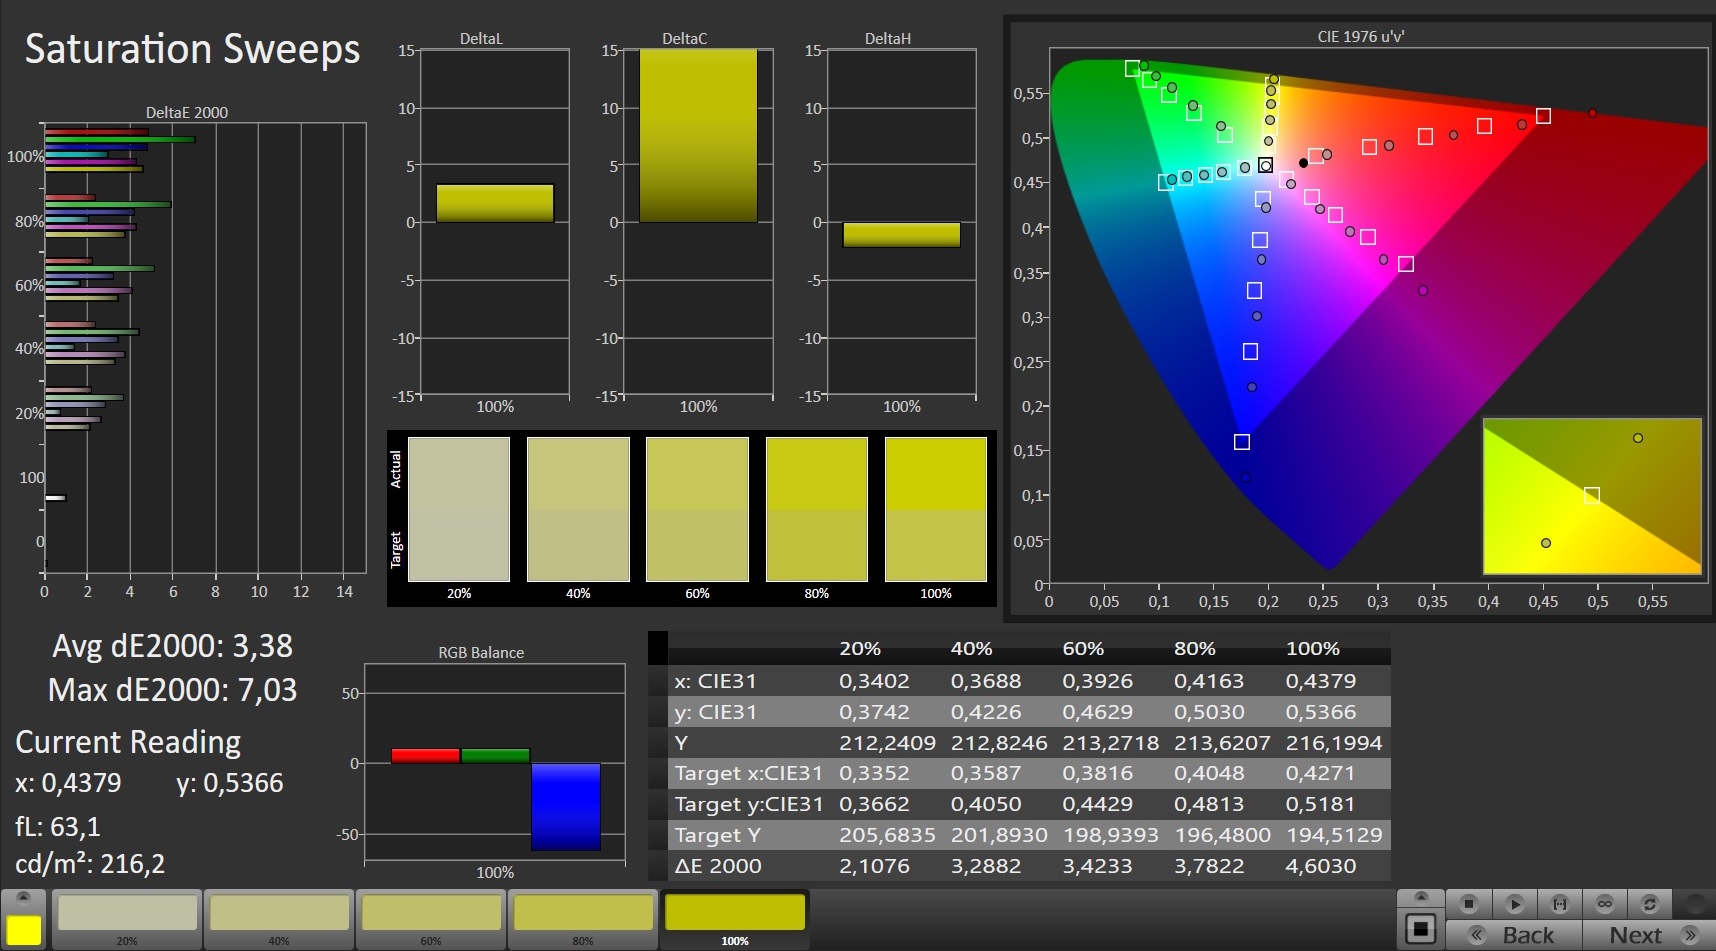
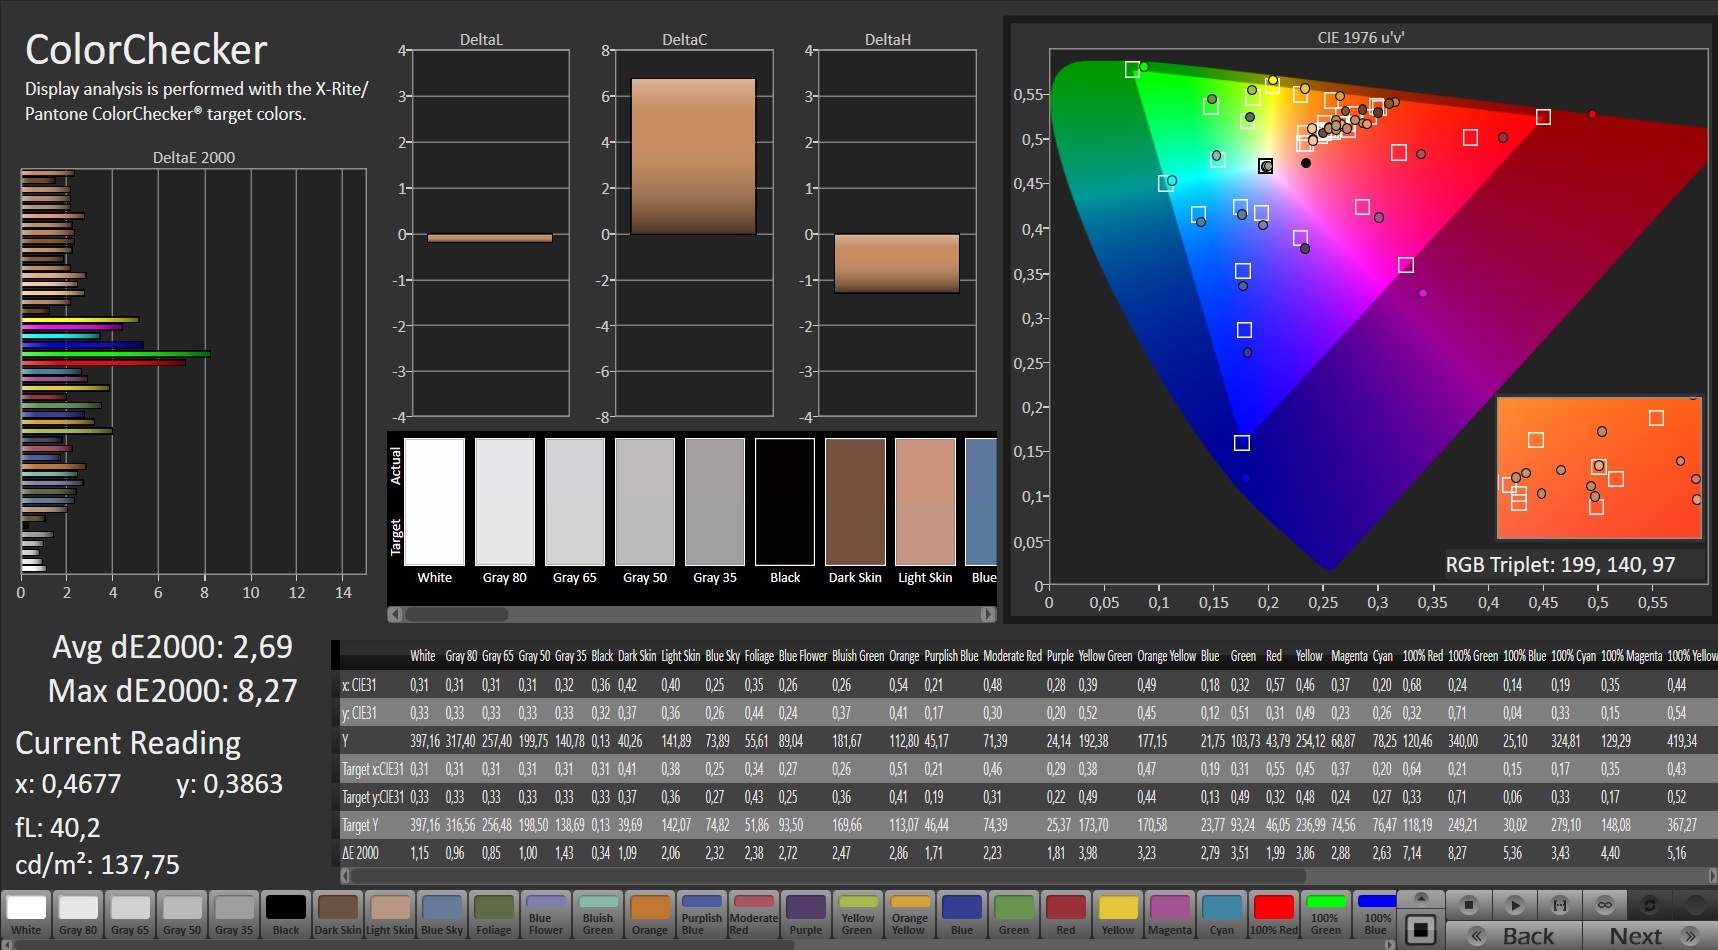
ΔE ColorChecker Calman: 2.69 | ∀{0.5-29.43 Ø4.71}
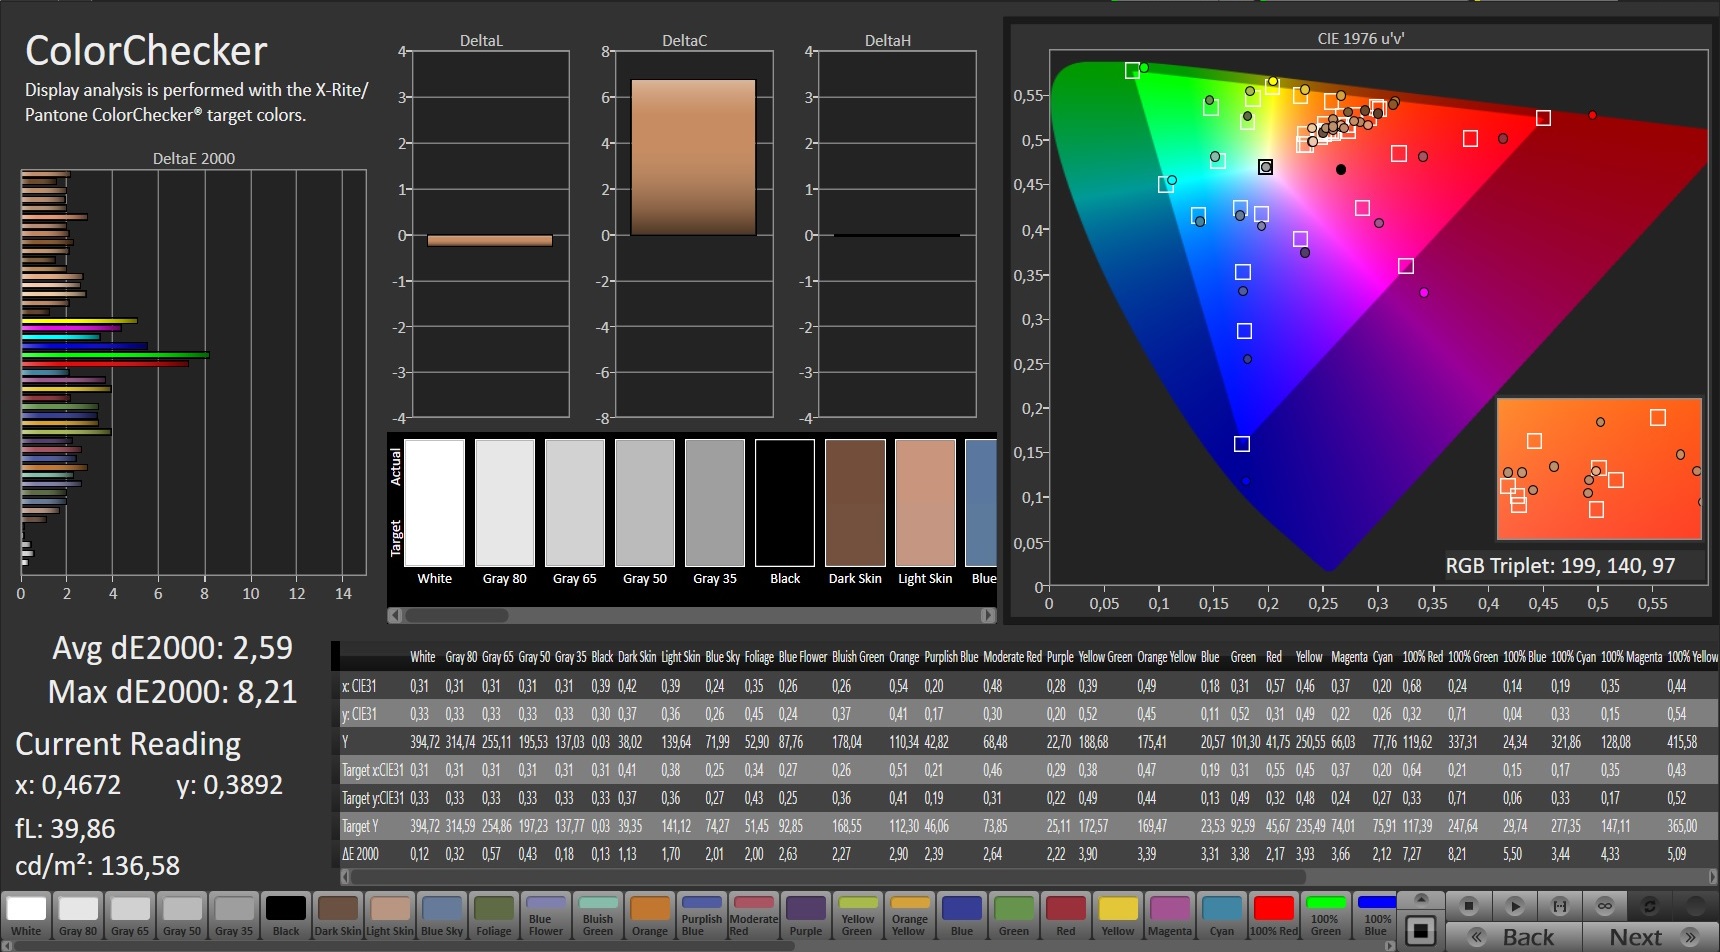
calibrated: 2.59
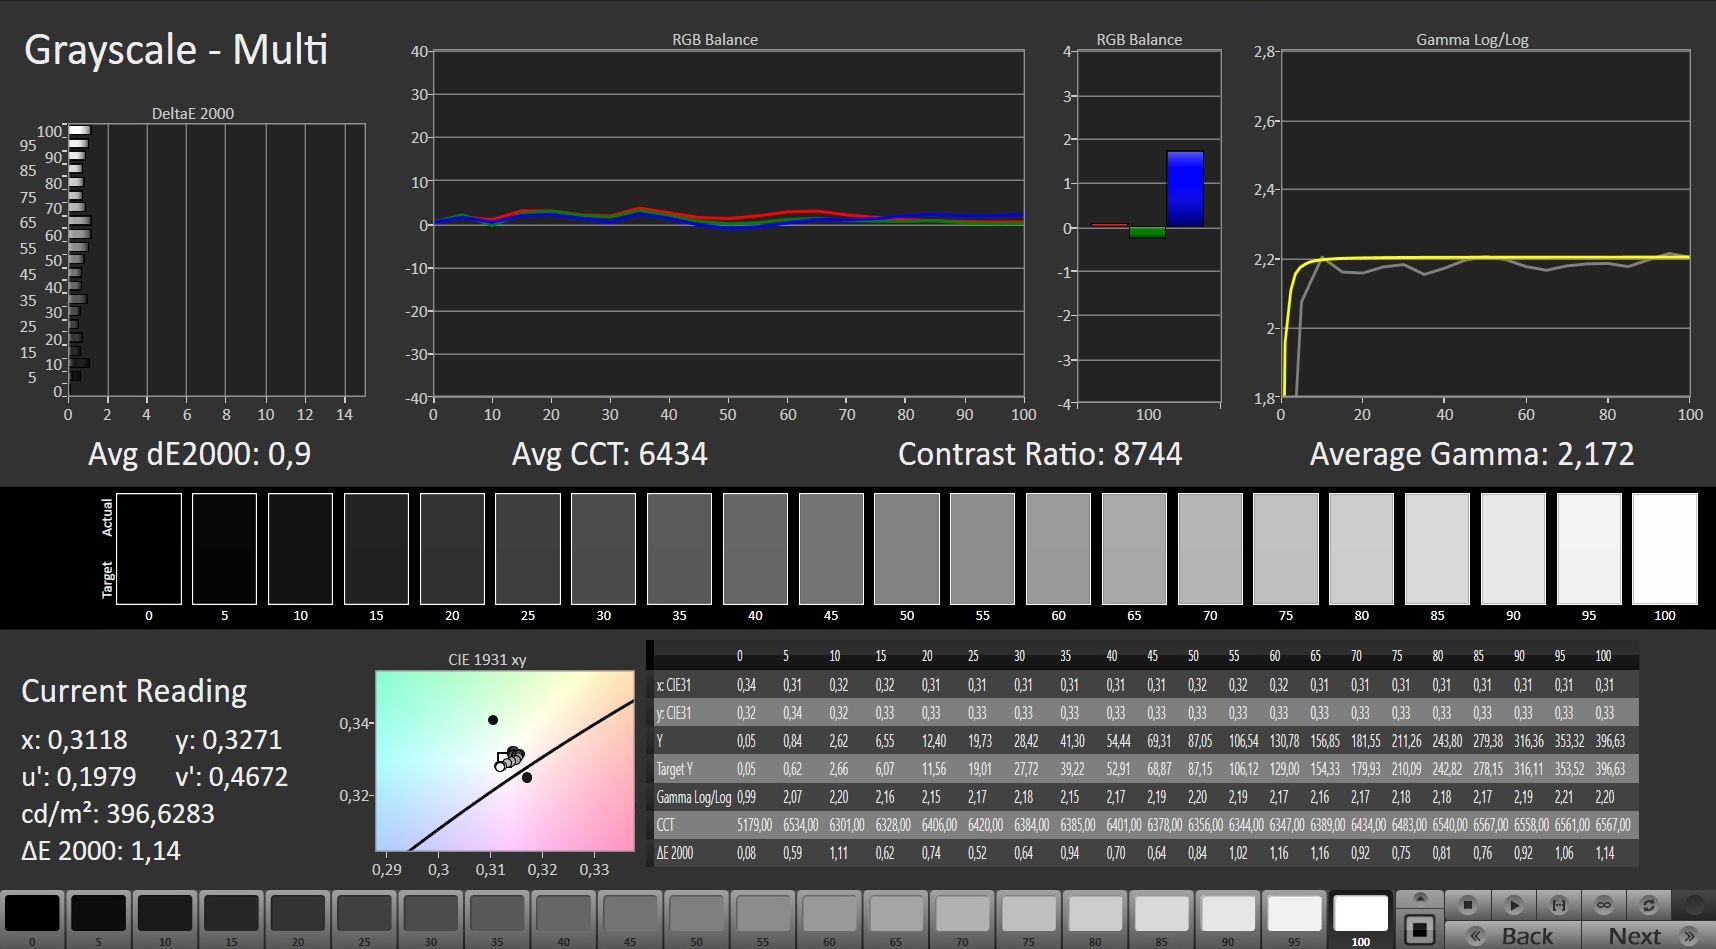
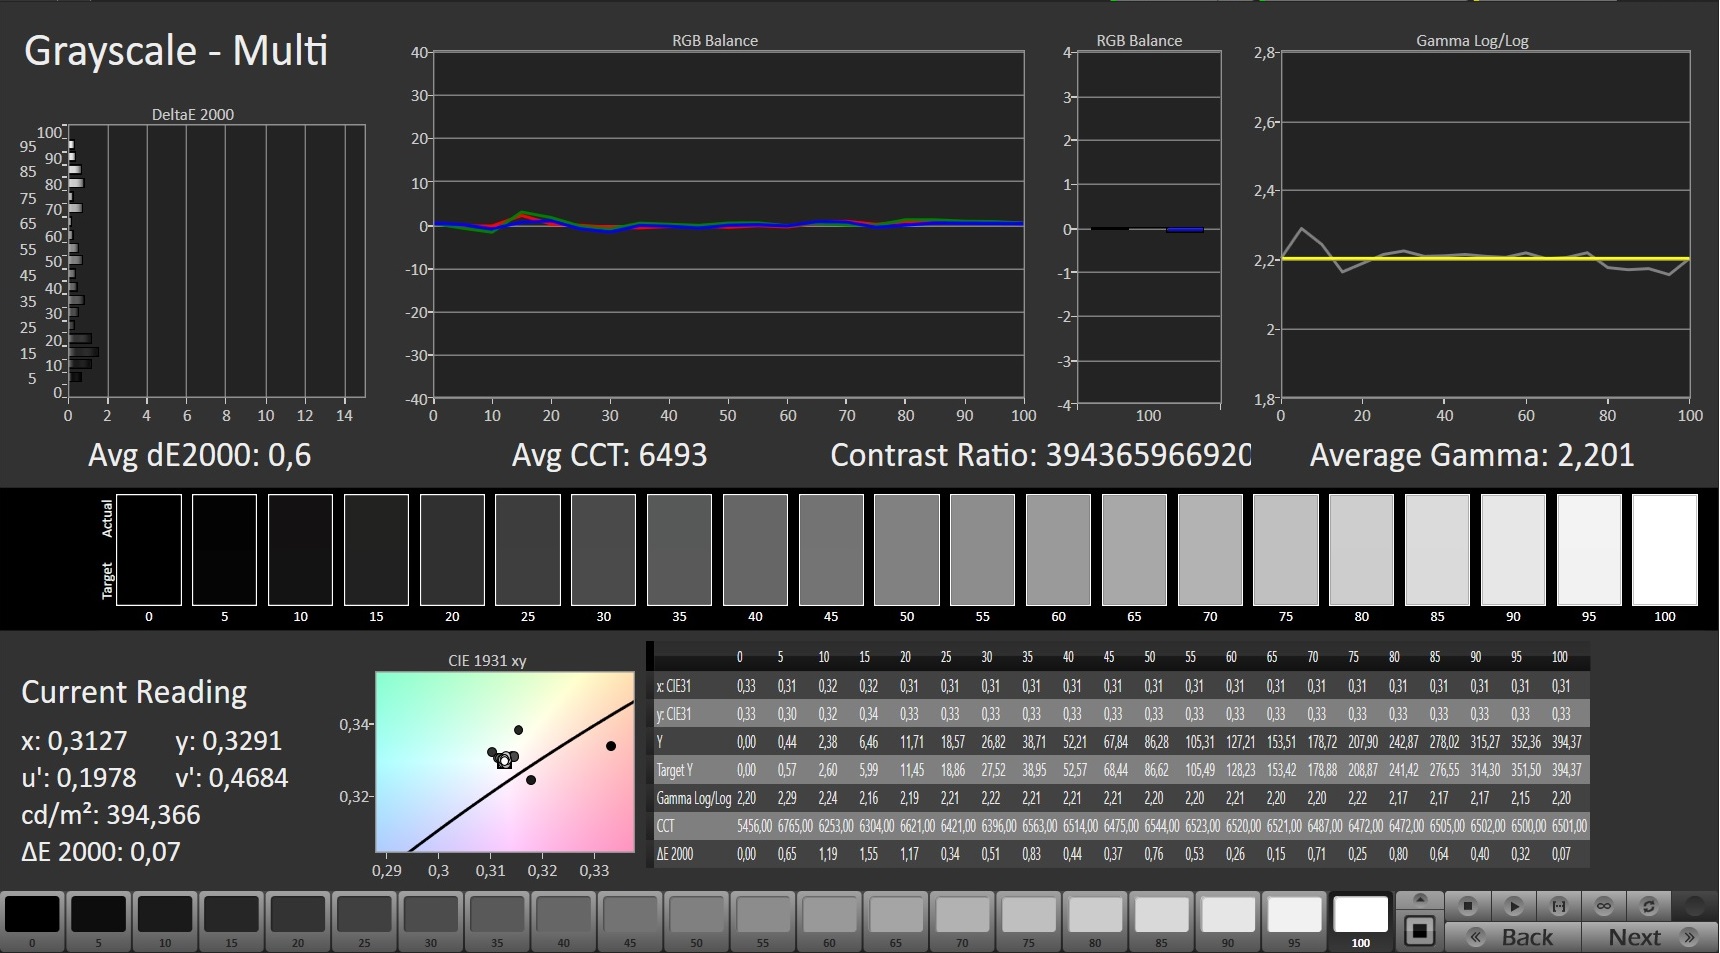
ΔE Greyscale Calman: 0.9 | ∀{0.09-98 Ø4.96}
100% sRGB (Argyll 1.6.3 3D)
99% AdobeRGB 1998 (Argyll 1.6.3 3D)
98.5% AdobeRGB 1998 (Argyll 3D)
100% sRGB (Argyll 3D)
99.9% Display P3 (Argyll 3D)
Gamma: 2.172
CCT: 6434 K
| Gigabyte Aero 15 OLED XC SDCA029, OLED, 3840x2160, 15.6" | HP Envy 15-ep0098nr Samsung SDC4145, AMOLED, 3840x2160, 15.6" | Gigabyte Aero 15 OLED XB-8DE51B0SP Samsung SDCA029, OLED, 3840x2160, 15.6" | Asus ROG Zephyrus Duo 15 SE GX551QS AU Optronics B156ZAN05.1, IPS, 3840x2160, 15.6" | Lenovo ThinkPad X1 Extreme Gen3-20TLS0UV00 N156HCE-GN1, IPS, 1920x1080, 15.6" | MSI GS66 Stealth 10UG AU Optronics B156HAN12.0, IPS, 1920x1080, 15.6" | |
|---|---|---|---|---|---|---|
| Display | -3% | 0% | -3% | -29% | -21% | |
| Display P3 Coverage (%) | 99.9 | 88.5 -11% | 99.9 0% | 89.1 -11% | 61 -39% | 67.7 -32% |
| sRGB Coverage (%) | 100 | 100 0% | 100 0% | 99.9 0% | 89.9 -10% | 98.4 -2% |
| AdobeRGB 1998 Coverage (%) | 98.5 | 99.9 1% | 98.2 0% | 99.1 1% | 62.2 -37% | 69.1 -30% |
| Response Times | 9% | 4% | -360% | -1222% | -522% | |
| Response Time Grey 50% / Grey 80% * (ms) | 2.4 ? | 0.8 ? 67% | 2.2 ? 8% | 8.2 ? -242% | 33.6 ? -1300% | 14.4 ? -500% |
| Response Time Black / White * (ms) | 1.8 ? | 2.7 ? -50% | 1.8 ? -0% | 10.4 ? -478% | 22.4 ? -1144% | 11.6 ? -544% |
| PWM Frequency (Hz) | 240 ? | 242.7 ? | 60 ? | 26040 ? | ||
| Screen | -42% | -3% | -109% | -78% | -58% | |
| Brightness middle (cd/m²) | 442 | 374.3 -15% | 385 -13% | 406 -8% | 518 17% | 259.5 -41% |
| Brightness (cd/m²) | 452 | 379 -16% | 390 -14% | 407 -10% | 513 13% | 264 -42% |
| Brightness Distribution (%) | 95 | 91 -4% | 93 -2% | 88 -7% | 88 -7% | 90 -5% |
| Black Level * (cd/m²) | 0.05 | 0.42 -740% | 0.38 -660% | 0.25 -400% | ||
| Contrast (:1) | 8840 | 967 -89% | 1363 -85% | 1038 -88% | ||
| Colorchecker dE 2000 * | 2.69 | 5.47 -103% | 2.46 9% | 4.36 -62% | 2.1 22% | 2.52 6% |
| Colorchecker dE 2000 max. * | 8.27 | 8.22 1% | 4.01 52% | 7.55 9% | 4.5 46% | 5.55 33% |
| Colorchecker dE 2000 calibrated * | 2.59 | 4.61 -78% | 2.6 -0% | 3.63 -40% | 1.3 50% | 1.93 25% |
| Greyscale dE 2000 * | 0.9 | 2.3 -156% | 1.39 -54% | 3.1 -244% | 2.7 -200% | 1.7 -89% |
| Gamma | 2.172 101% | 2.09 105% | 2.31 95% | 2.36 93% | 2.35 94% | 2.04 108% |
| CCT | 6434 101% | 6340 103% | 6395 102% | 6371 102% | 7042 92% | 6414 101% |
| Color Space (Percent of AdobeRGB 1998) (%) | 99 | 87.8 -11% | 98 -1% | 86.7 -12% | 57.7 -42% | 63.3 -36% |
| Color Space (Percent of sRGB) (%) | 100 | 100 0% | 100 0% | 99.9 0% | 90.4 -10% | 98.8 -1% |
| Media total (Programa/Opciones) | -12% /
-27% | 0% /
-1% | -157% /
-121% | -443% /
-212% | -200% /
-109% |
* ... más pequeño es mejor
The glossy 4K display is razor-sharp, and the black level of only 0.05 is excellent thanks to OLED technology. As a result, it achieves a contrast ratio of 8,840:1, which is almost unattainable for IPS displays. In addition, we were able to register a color-space coverage of 100% for sRGB and 99% for AdobeRGB in an independent measurement, which shows that the laptop is very well suited for digital image and video-editing.
Using the Aero 15 OLED XC outdoors is a double-edged sword, since the high brightness is an advantage on the one hand, but the glossy display restricts the view considerably at times on the other hand. Overall, however, legibility is still above average.
Tiempos de respuesta del display
| ↔ Tiempo de respuesta de Negro a Blanco | ||
|---|---|---|
| 1.8 ms ... subida ↗ y bajada ↘ combinada | ↗ 1 ms subida | 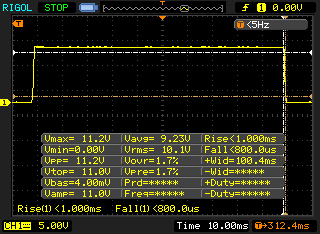 |
| ↘ 0.8 ms bajada | ||
| La pantalla mostró tiempos de respuesta muy rápidos en nuestros tests y debería ser adecuada para juegos frenéticos. En comparación, todos los dispositivos de prueba van de ##min### (mínimo) a 240 (máximo) ms. » 11 % de todos los dispositivos son mejores. Esto quiere decir que el tiempo de respuesta medido es mejor que la media (19.8 ms) de todos los dispositivos testados. | ||
| ↔ Tiempo de respuesta 50% Gris a 80% Gris | ||
| 2.4 ms ... subida ↗ y bajada ↘ combinada | ↗ 1.2 ms subida | 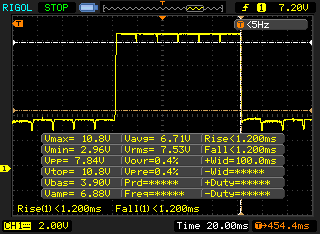 |
| ↘ 1.2 ms bajada | ||
| La pantalla mostró tiempos de respuesta muy rápidos en nuestros tests y debería ser adecuada para juegos frenéticos. En comparación, todos los dispositivos de prueba van de ##min### (mínimo) a 636 (máximo) ms. » 11 % de todos los dispositivos son mejores. Esto quiere decir que el tiempo de respuesta medido es mejor que la media (31 ms) de todos los dispositivos testados. | ||
Parpadeo de Pantalla / PWM (Pulse-Width Modulation)
| Parpadeo de Pantalla / PWM detectado | 240 Hz | ≤ 79 % de brillo | 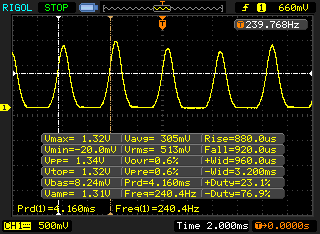 |
La retroiluminación del display parpadea a 240 Hz (seguramente usa PWM - Pulse-Width Modulation) a un brillo del 79 % e inferior. Sobre este nivel de brillo no debería darse parpadeo / PWM. La frecuencia de 240 Hz es relativamente baja, por lo que la gente sensible debería ver parpadeos y padecer fatiga visual por la pantalla (usado al brillo indicado a continuación). Comparación: 52 % de todos los dispositivos testados no usaron PWM para atenuar el display. Si se usó, medimos una media de 7754 (mínimo: 5 - máxmo: 343500) Hz. | |||
The OLED panel's viewing angles are excellent, and even when viewing it from extremely steep angles, the colors and contrast don't become distorted.
Performance - Plenty of performance potential
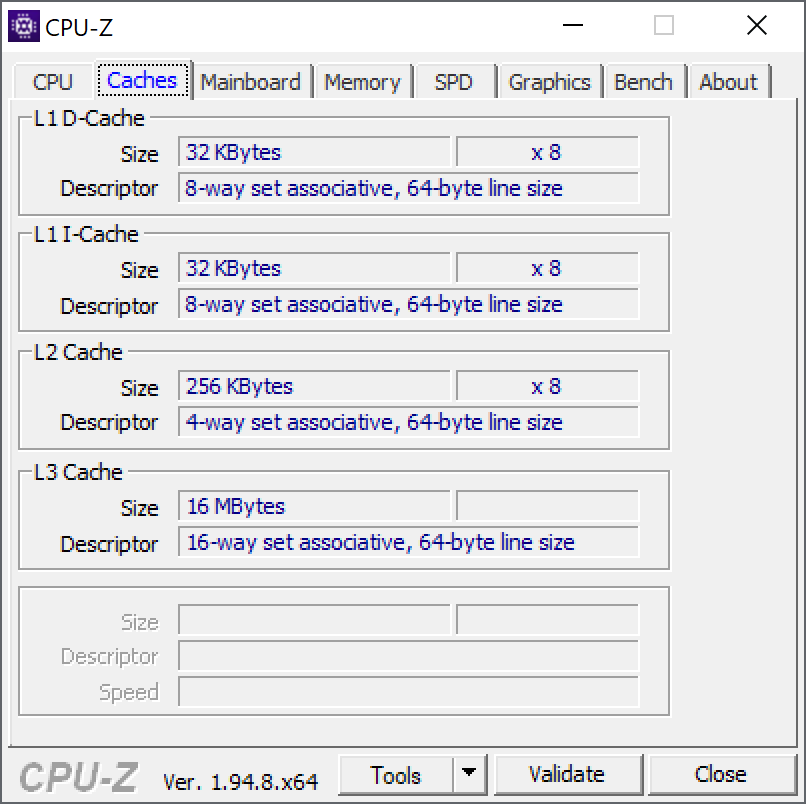
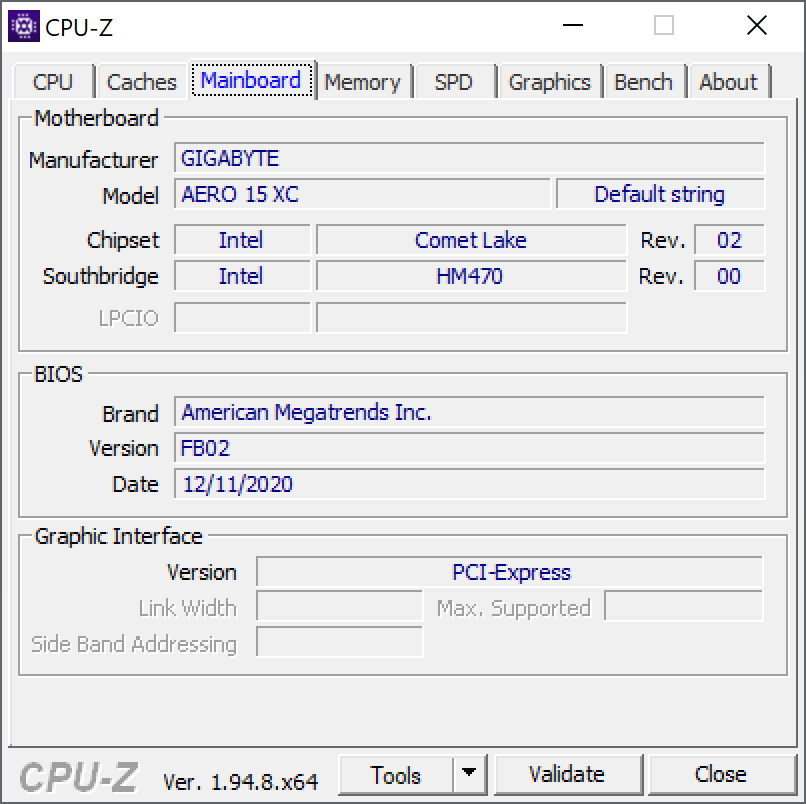
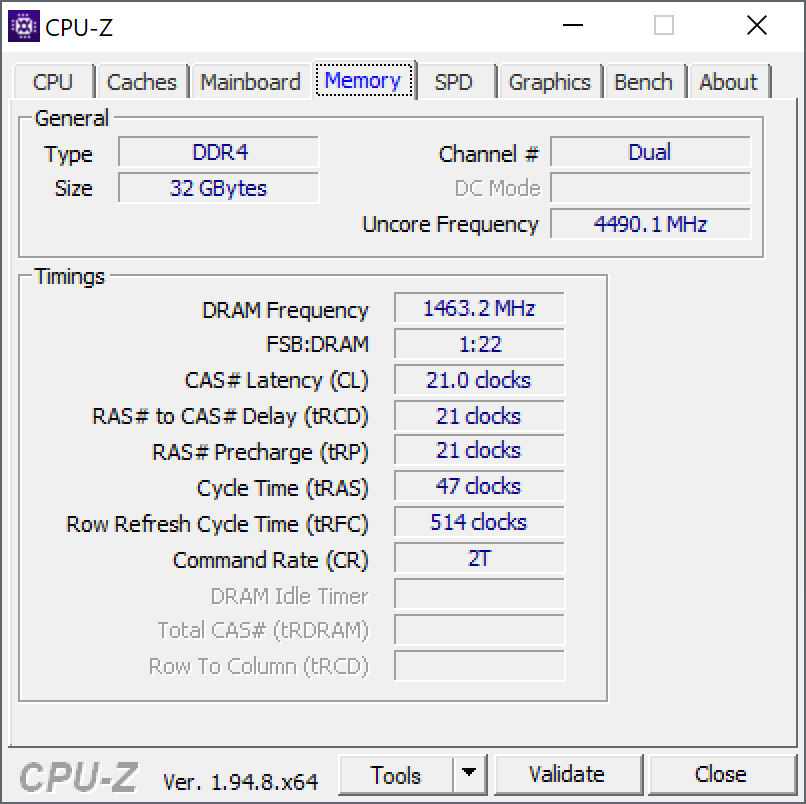
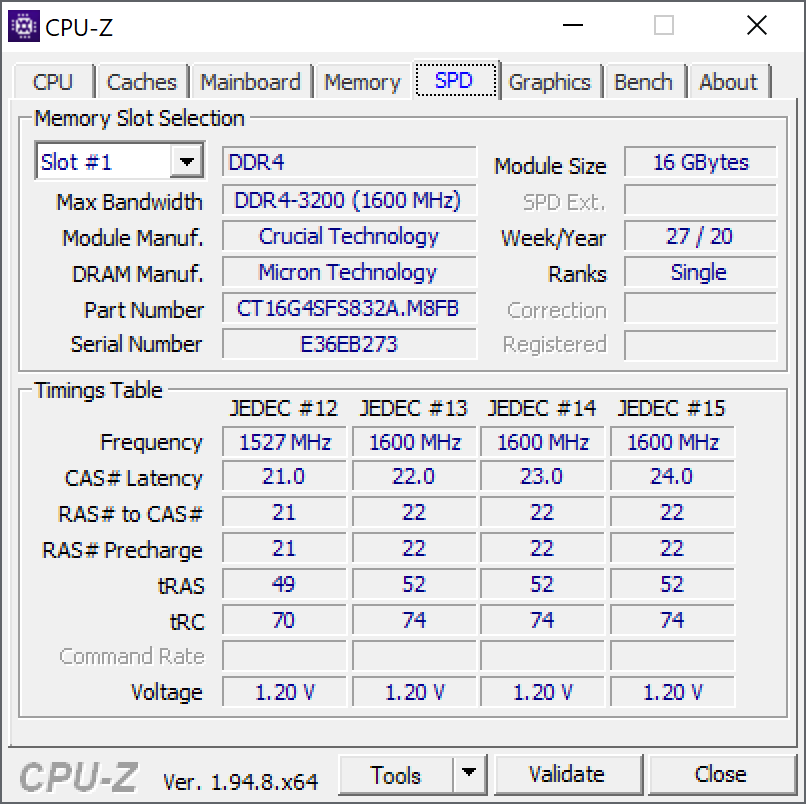
The Aero 15 OLED XC is equipped with an Intel Core i7-10870H, a laptop version of the GeForce RTX 3070, and an NVMe SSD. This is accompanied by 32 GB of DDR4-3200 RAM in dual-channel mode. As a result, it offers enough performance for common office tasks, multimedia applications, and a little more, so that there are plenty of resources for video and image-editing on the go. The two sibling models, the Aero 15 OLED YC and KC, respectively, only differ in terms of the graphics card: The former is equipped with a 105-watt laptop GeForce RTX 3080 and the latter with a 105-watt laptop GeForce RTX 3060.
However, for many application scenarios, the model that we have with us as well as the smaller KC model already offer enough graphics performance like we will see below.
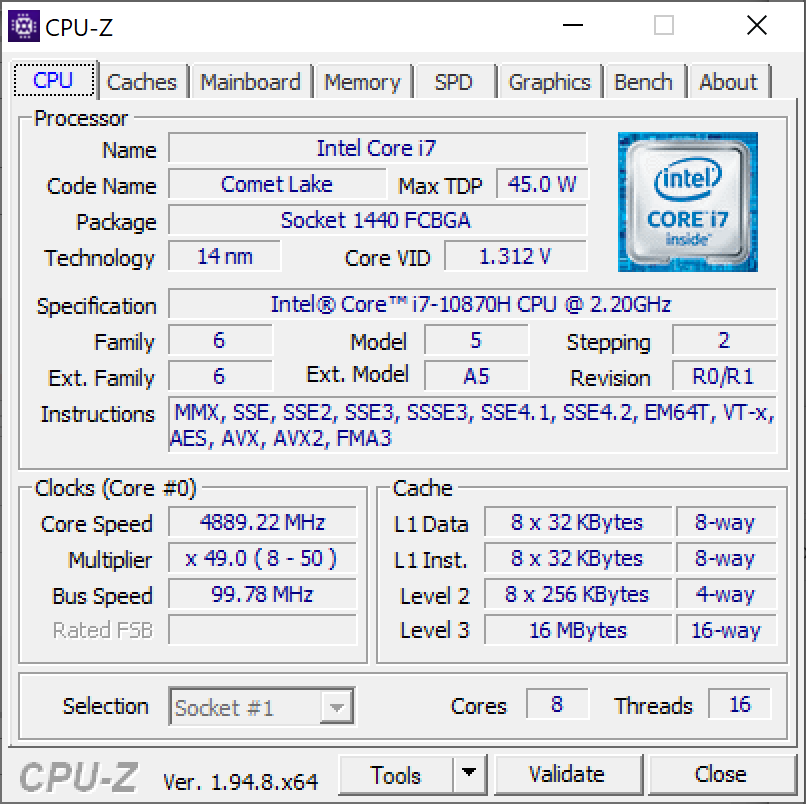
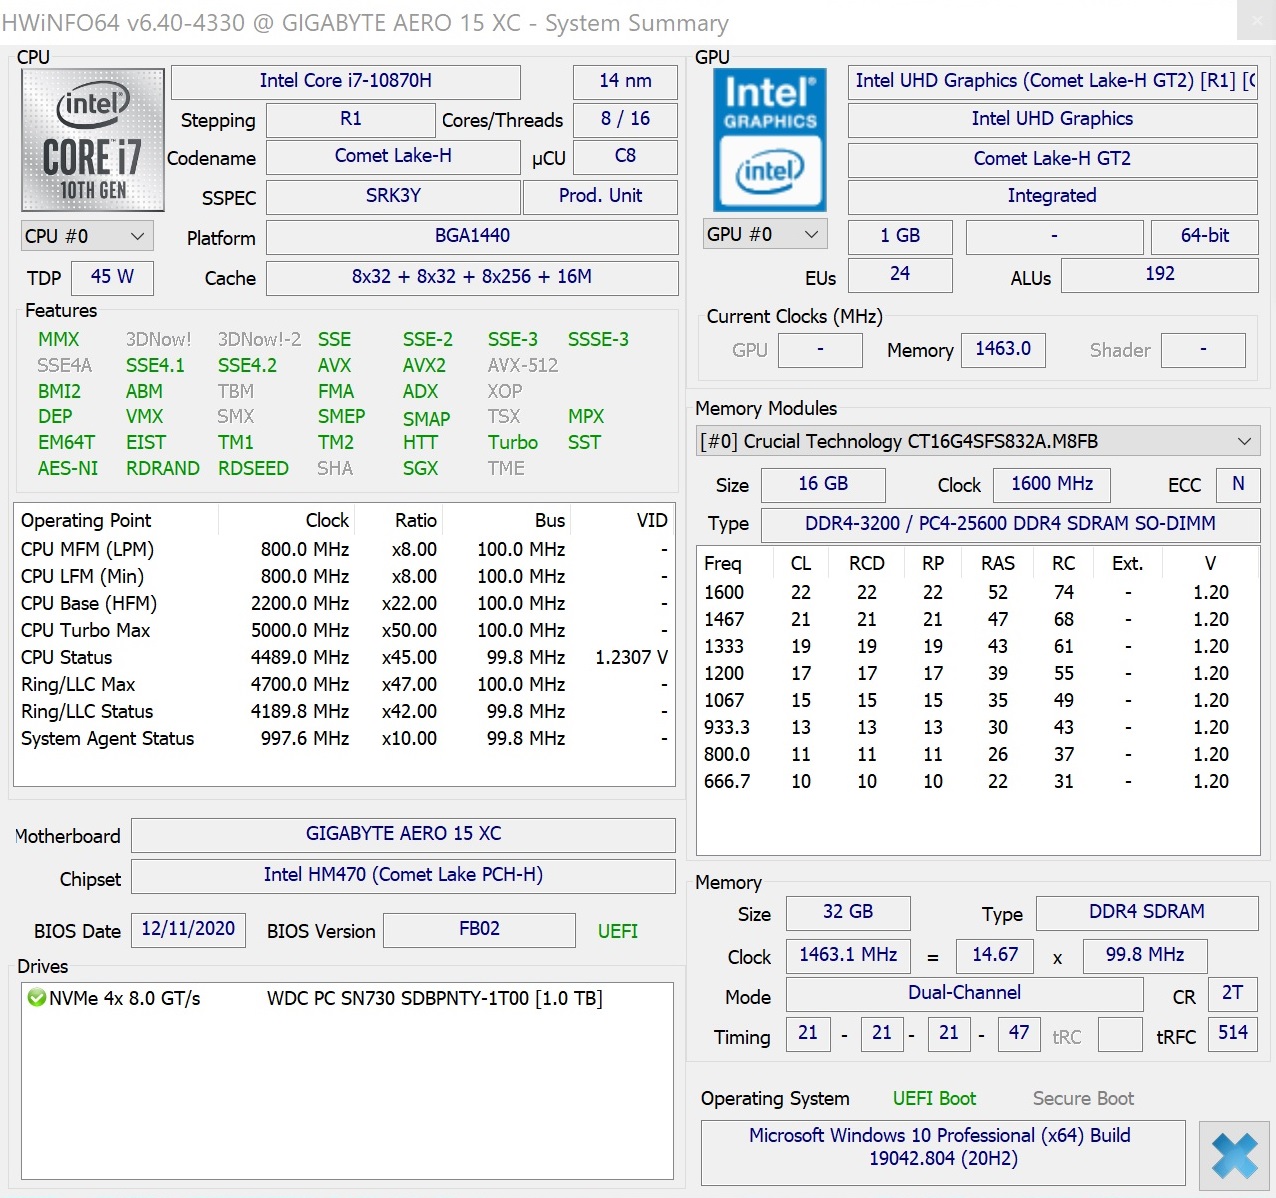
Processor
The processor used here is the Core i7-10870H, an octa-core CPU from Intel's Comet Lake generation. If you look closely, you'll notice that the predecessor was actually equipped with the faster Core i7-10875H. The reason for using the weaker CPU, which only loses 100 MHz of base clock speed, is the significantly better efficiency in production. Although little changes for end users (the performance differences are usually within 5-8%), the differences in the production of the processors are quite substantial.
You don't have to worry about the processor's performance in either case, since it's at a very high level. However, the benchmarks also suggest that AMD's Ryzen 5000 CPUs are currently ahead in terms of raw performance and especially in multi-thread scenarios. Compared with other laptops that are equipped with the same CPU or with the Core i7-10875H, our review sample lags behind its rivals by a maximum of 7% in the Cinebench benchmarks depending on the case.
Based on our Cinebench R15 test, performance is limited by approximately 30% on battery power.
* ... más pequeño es mejor
System performance
In the PCMark benchmarks, the result varies depending on the load scenario. While the PCMark 10 overall score is sufficient for a place just below the top spot, the Aero 15 OLED XC ends up in last place in the Essentials test, for example. The large differences between the results can possibly be explained by an aggressive energy management. Subjectively, the laptop's speed doesn't give any reason for criticism, since all actions are executed at lightning speed.
| PCMark 8 Home Score Accelerated v2 | 4246 puntos | |
| PCMark 8 Work Score Accelerated v2 | 4878 puntos | |
| PCMark 10 Score | 6442 puntos | |
ayuda | ||
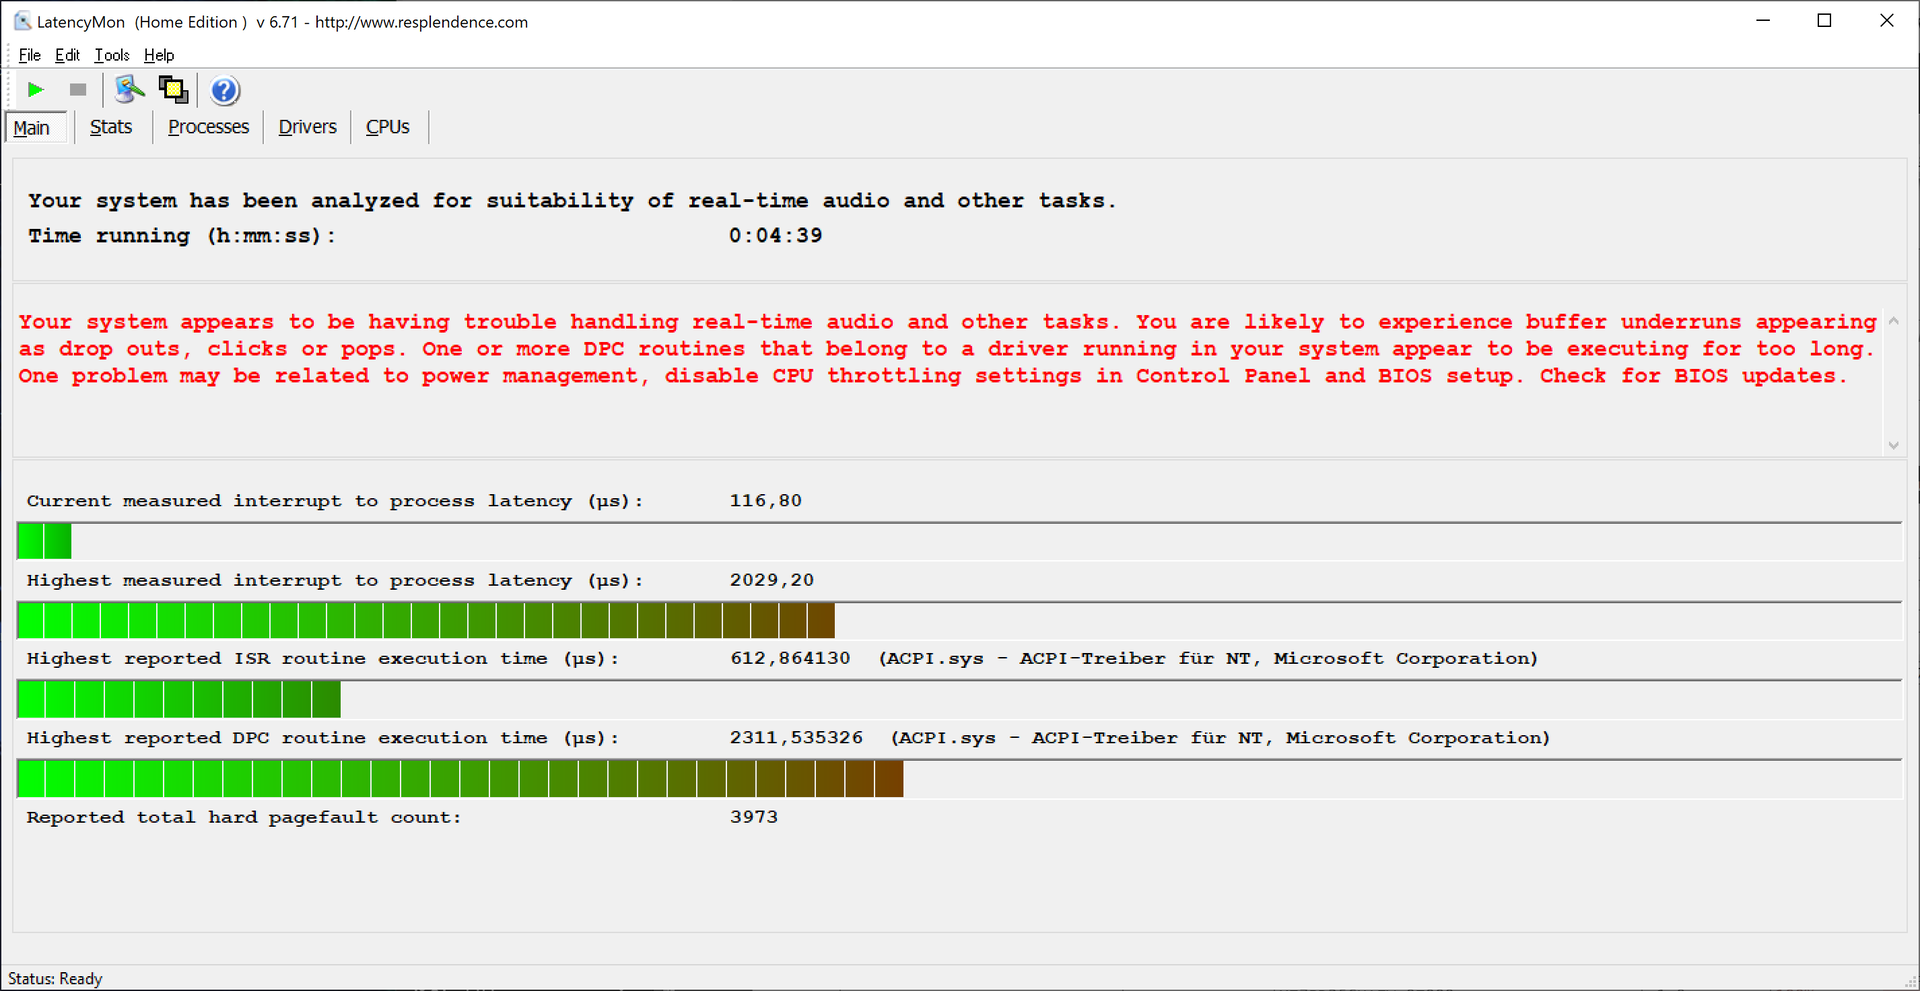
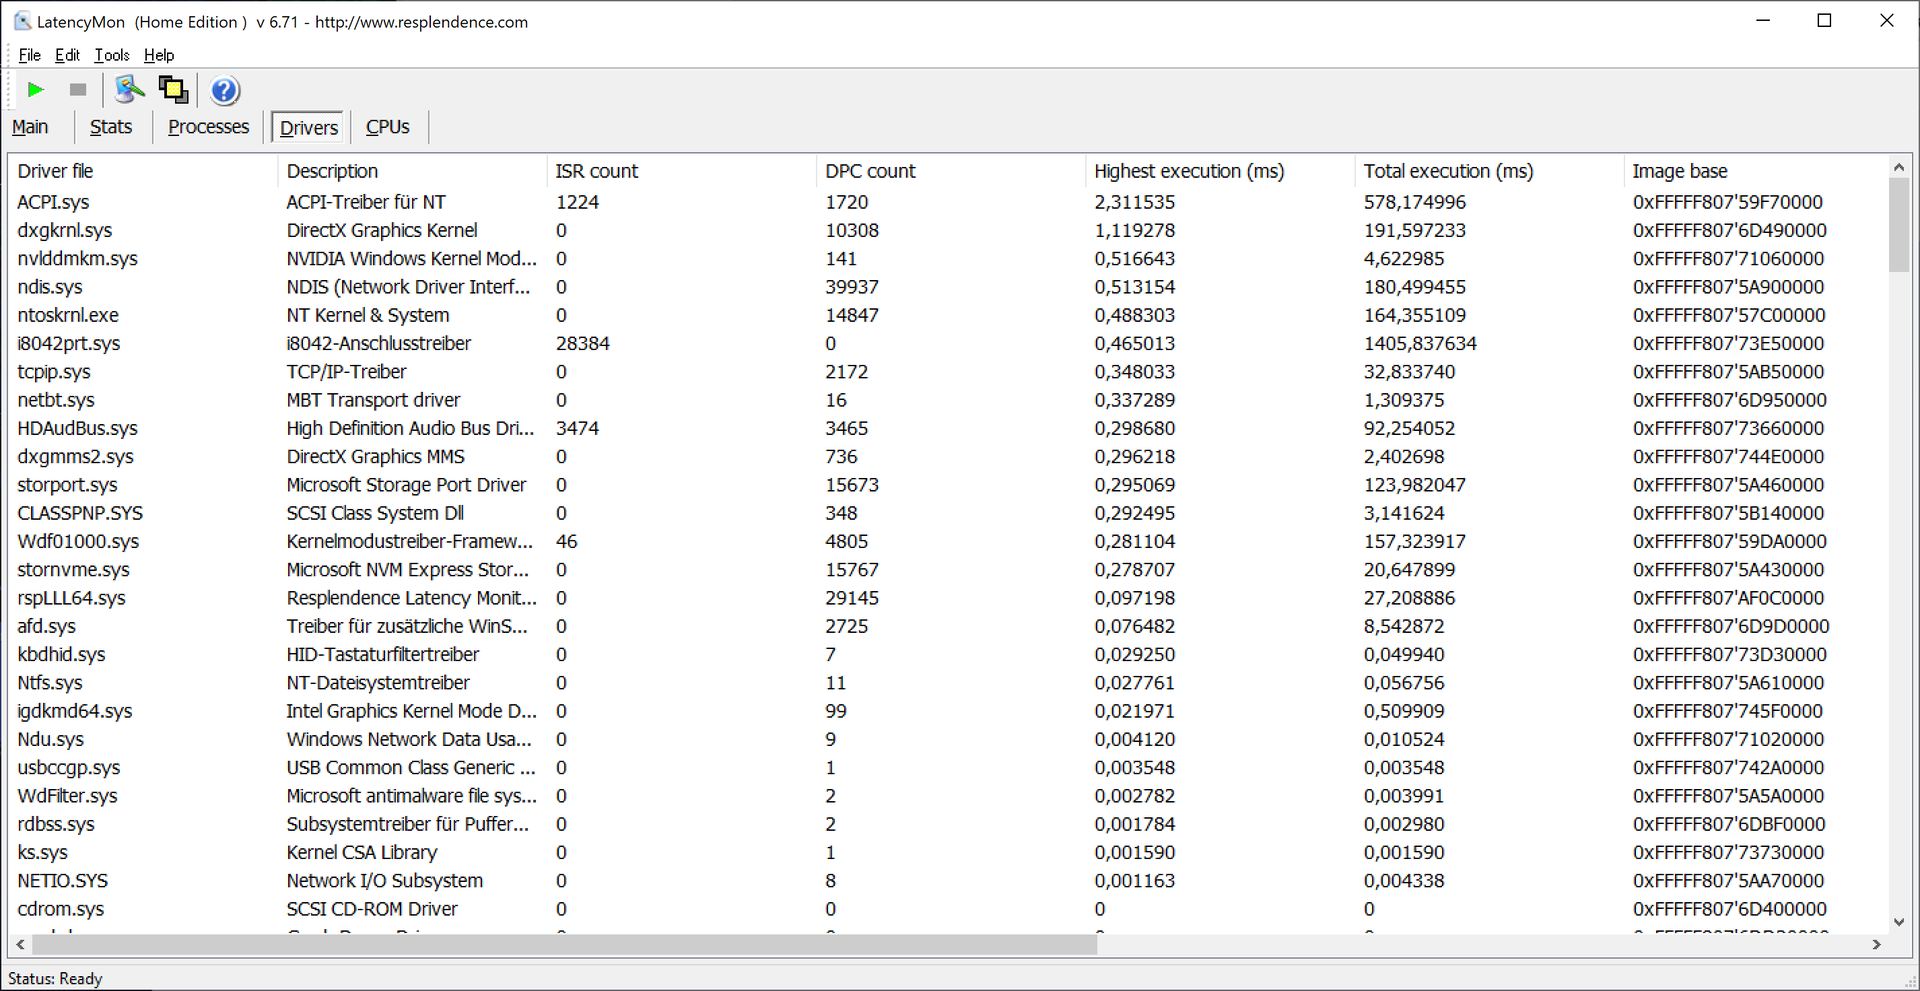
DPC latencies
LatencyMon reports problematic DPC latencies, meaning that the laptop is rather unsuitable for editing video and audio files in real time out of the box.
| DPC Latencies / LatencyMon - interrupt to process latency (max), Web, Youtube, Prime95 | |
| HP Envy 15-ep0098nr | |
| Gigabyte Aero 15 OLED XC | |
| Gigabyte Aero 15 OLED XB-8DE51B0SP | |
| Asus ROG Zephyrus Duo 15 SE GX551QS | |
| MSI GS66 Stealth 10UG | |
| Lenovo ThinkPad X1 Extreme Gen3-20TLS0UV00 | |
* ... más pequeño es mejor
Storage
In the drive tests, the Aero 15 OLED tends to perform slightly worse than the competition. Overall, however, only the ROG Zephyrus Duo 15 is considerably faster with its PM981 RAID configuration; in addition, the access times are pleasingly low here. The storage solution of the HP Envy 15 consistently achieves lower rates than the remaining comparison devices.
More information and benchmark comparisons can be found in our HDD/SSD Benchmarks article.
| Gigabyte Aero 15 OLED XC WDC PC SN730 SDBPNTY-1T00 | Asus ROG Zephyrus Duo 15 SE GX551QS 2x Samsung PM981a MZVLB1T0HBLR (RAID 0) | MSI GS66 Stealth 10UG WDC PC SN730 SDBPNTY-1T00 | Lenovo ThinkPad X1 Extreme Gen3-20TLS0UV00 Toshiba XG6 KXG6AZNV1T02 | Gigabyte Aero 15 OLED XB-8DE51B0SP Intel Optane Memory H10 with Solid State Storage 32GB + 512GB HBRPEKNX0202A(L/H) | HP Envy 15-ep0098nr Intel Optane Memory H10 with Solid State Storage 32GB + 512GB HBRPEKNX0202A(L/H) | |
|---|---|---|---|---|---|---|
| CrystalDiskMark 5.2 / 6 | 54% | 5% | 5% | 6% | -10% | |
| Write 4K (MB/s) | 126 | 229.7 82% | 163.1 29% | 159.5 27% | 127.4 1% | 100.2 -20% |
| Read 4K (MB/s) | 44.94 | 47.13 5% | 48.97 9% | 53.1 18% | 147.5 228% | 112.8 151% |
| Write Seq (MB/s) | 2763 | 4455 61% | 2607 -6% | 1723 -38% | 485.9 -82% | 537 -81% |
| Read Seq (MB/s) | 1671 | 2933 76% | 2316 39% | 2164 30% | 1352 -19% | 1270 -24% |
| Write 4K Q32T1 (MB/s) | 451.6 | 597 32% | 338 -25% | 469.2 4% | 476.5 6% | 480.6 6% |
| Read 4K Q32T1 (MB/s) | 552 | 387 -30% | 475.6 -14% | 543 -2% | 531 -4% | 364.9 -34% |
| Write Seq Q32T1 (MB/s) | 3060 | 5623 84% | 3090 1% | 3055 0% | 1061 -65% | 1224 -60% |
| Read Seq Q32T1 (MB/s) | 3192 | 7042 121% | 3421 7% | 3296 3% | 2552 -20% | 2635 -17% |
| AS SSD | 7% | -7% | -5% | -30% | -57% | |
| Seq Read (MB/s) | 2331 | 3010 29% | 2198 -6% | 2553 10% | 1200 -49% | 1005 -57% |
| Seq Write (MB/s) | 2312 | 3116 35% | 2596 12% | 974 -58% | 836 -64% | 436.8 -81% |
| 4K Read (MB/s) | 39.13 | 49.58 27% | 43.81 12% | 49.69 27% | 65.8 68% | 51.5 32% |
| 4K Write (MB/s) | 98.1 | 185 89% | 115.5 18% | 139.5 42% | 103.8 6% | 88 -10% |
| 4K-64 Read (MB/s) | 1663 | 1401 -16% | 1692 2% | 1462 -12% | 789 -53% | 517 -69% |
| 4K-64 Write (MB/s) | 2138 | 1426 -33% | 2162 1% | 1474 -31% | 929 -57% | 839 -61% |
| Access Time Read * (ms) | 0.099 | 0.037 63% | 0.056 43% | 0.063 36% | 0.103 -4% | 0.088 11% |
| Access Time Write * (ms) | 0.038 | 0.061 -61% | 0.098 -158% | 0.031 18% | 0.045 -18% | 0.151 -297% |
| Score Read (Points) | 1935 | 1751 -10% | 1956 1% | 1767 -9% | 975 -50% | 669 -65% |
| Score Write (Points) | 2468 | 1923 -22% | 2537 3% | 1711 -31% | 1117 -55% | 970 -61% |
| Score Total (Points) | 5388 | 4580 -15% | 5513 2% | 4308 -20% | 2594 -52% | 1972 -63% |
| Copy ISO MB/s (MB/s) | 2903 | 3196 10% | 2236 -23% | 2094 -28% | 1173 -60% | |
| Copy Program MB/s (MB/s) | 686 | 710 3% | 690 1% | 657 -4% | 769 12% | |
| Copy Game MB/s (MB/s) | 1594 | 1669 5% | 1546 -3% | 1447 -9% | 1045 -34% | |
| Media total (Programa/Opciones) | 31% /
24% | -1% /
-3% | 0% /
-1% | -12% /
-15% | -34% /
-40% |
* ... más pequeño es mejor

Continuous load read: DiskSpd Read Loop, Queue Depth 8
Graphics card
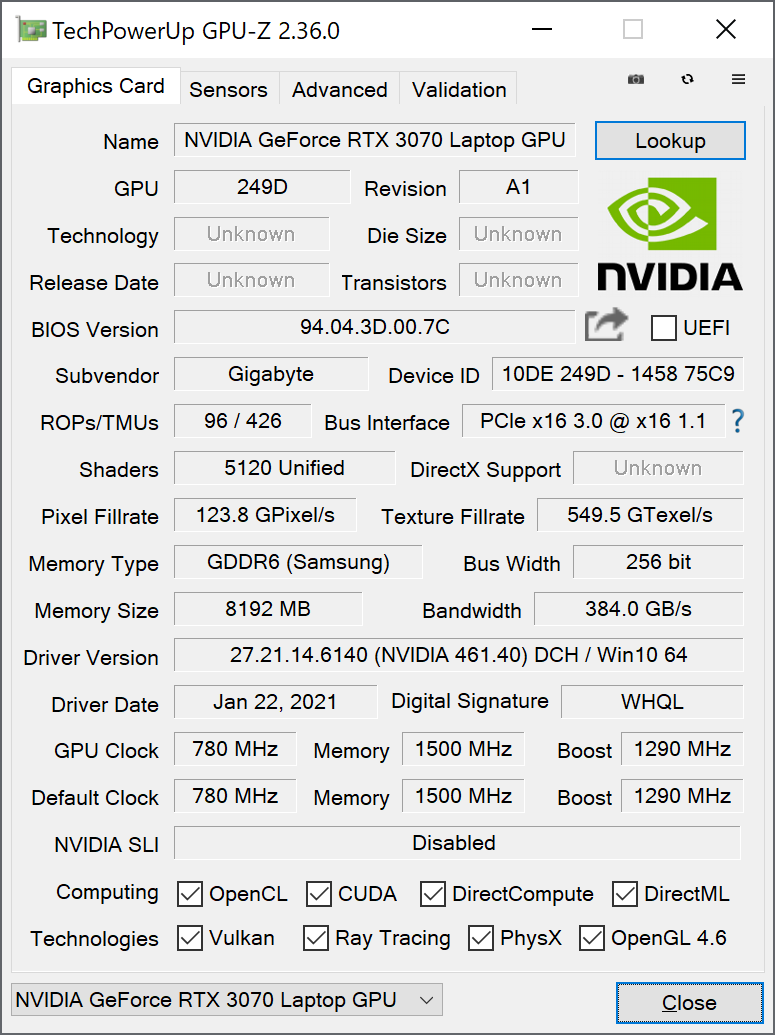
Our configuration of the Aero 15 uses a laptop version of the GeForce RTX 3070 with a TDP of 105 watts. The chip is based on Nvidia's current Ampere generation and has a lot to offer in terms of performance. Consequently, the laptop hardly breaks a sweat even in high resolutions and can also fully show its strengths in demanding 3D applications.
The "Max-Q" designation no longer denotes graphics cards with a good balance between performance and heat development but rather special functionality features of the GPU. In our case, Dynamic Boost 2.0, Resizable BAR (a new technology that grants the CPU access to the graphics memory), and Optimus are supported.
Our test laptop develops its performance well in the 3DMark benchmarks, and the results are mostly in line with our expectations. Only with the slightly older, lower-resolution Cloud Gate benchmark does the brand-new graphics card not seem to harmonize quite well.
Performance is limited on battery power. A Fire Strike run delivers Physics and Graphics scores of 13,950 and 16,387, respectively, here, while 20,756 and 23,674 points are achieved when plugged in. More information can be found on our article regarding the laptop version of the GeForce RTX 3070.
| 3DMark 11 Performance | 25475 puntos | |
| 3DMark Cloud Gate Standard Score | 37238 puntos | |
| 3DMark Fire Strike Score | 19995 puntos | |
| 3DMark Time Spy Score | 9243 puntos | |
ayuda | ||
Gaming performance
Gaming performance is excellent thanks to the GeForce RTX 3070 laptop GPU. As you can see from the frame rates, most modern games are also playable in the full 4K resolution. For a multimedia laptop, the graphics performance is already way above average. Therefore, a great gaming experience in games that don't require a high display refresh rate is a nice bonus.
Although frame rates drop slightly over time and aren't quite as consistent as with some competitors in our test with The Witcher 3, during which the character isn't moved for the entire period, we don't notice any major frame drops or fluctuations.
| bajo | medio | alto | ultra | QHD | 4K | |
|---|---|---|---|---|---|---|
| GTA V (2015) | 179 | 172 | 153 | 90.6 | 76.1 | |
| The Witcher 3 (2015) | 335 | 243 | 168 | 92.1 | 62.9 | |
| Dota 2 Reborn (2015) | 151 | 132 | 124 | 117 | 98.8 | |
| Final Fantasy XV Benchmark (2018) | 150 | 112 | 87.6 | 65.7 | 40.9 | |
| X-Plane 11.11 (2018) | 108 | 96.3 | 80.7 | 60.4 | ||
| Far Cry 5 (2018) | 50 | |||||
| Strange Brigade (2018) | 375 | 224 | 183 | 161 | 72 |
Emissions - Hot surfaces
Noise emissions
The Aero 15 remains very quiet in idle usage and under low load, but it's not completely silent. You can hear quiet electronic noises when you are directly next to the device, but they didn't prove to be annoying or obtrusive in the test. The fan's noise characteristic is not too high-frequency, but it can't be described as emitting a particularly deep noise, either. Even under load, the fans usually produce a moderate noise level and only get really loud in the rarest cases. The volume diagram shows the slightly high-frequency noise characteristics of the fans in the MSI GS66 Stealth.
Ruido
| Ocioso |
| 29 / 31 / 33 dB(A) |
| Carga |
| 43 / 51 dB(A) |
 | ||
30 dB silencioso 40 dB(A) audible 50 dB(A) ruidosamente alto |
||
min: | ||
Temperatures
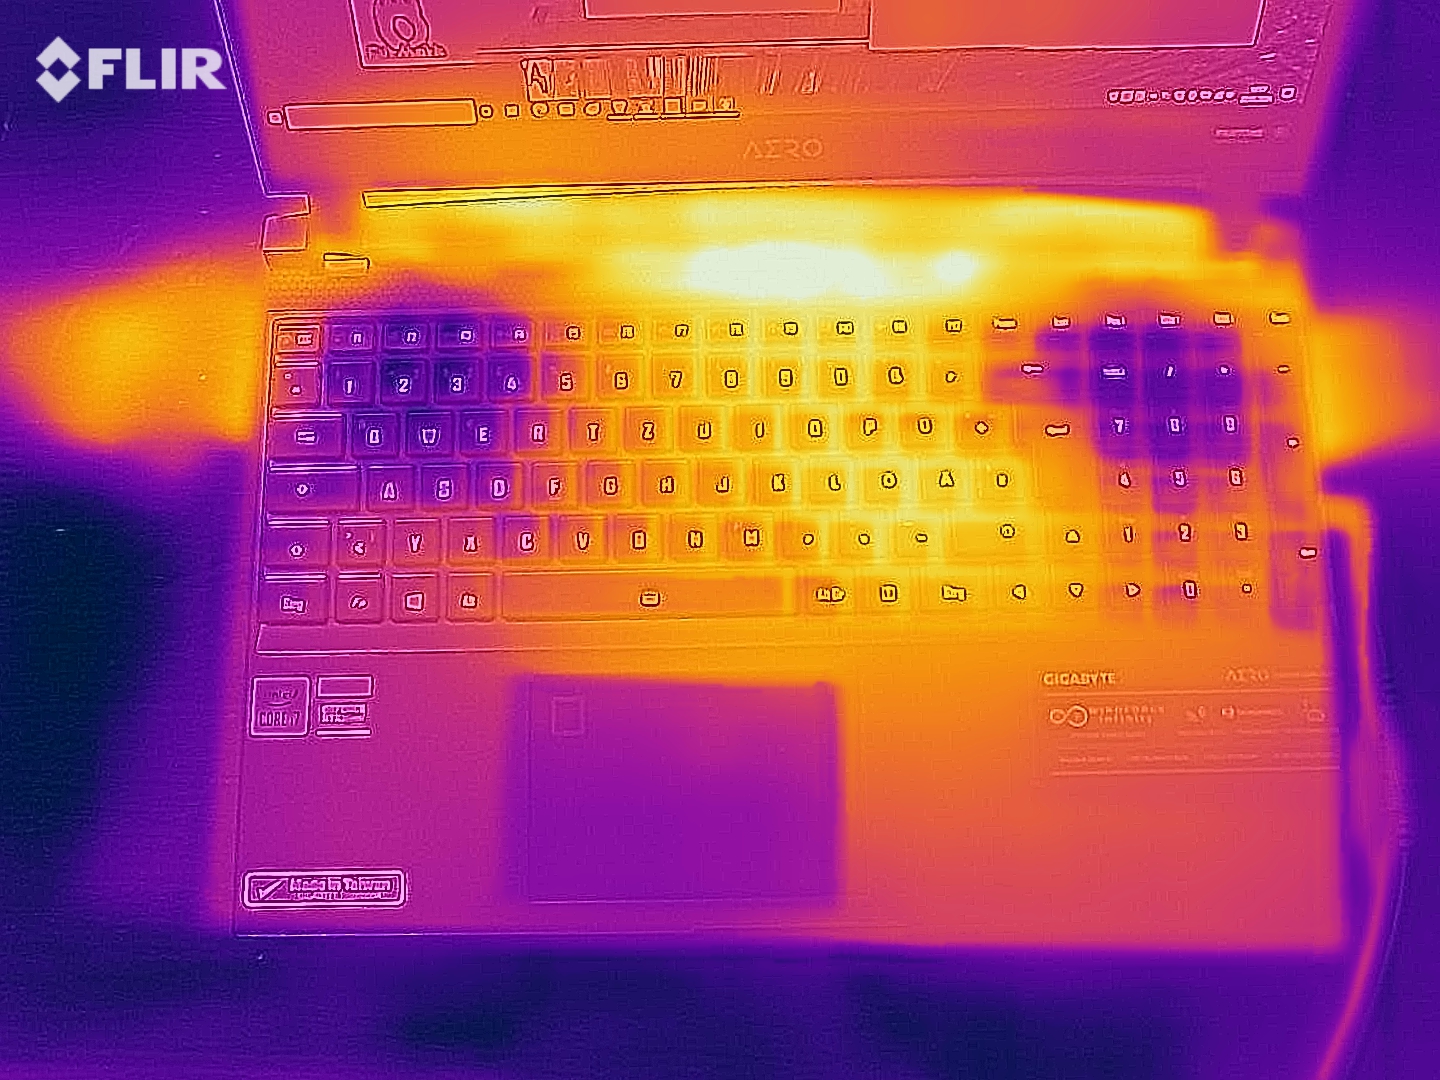
Due to the powerful hardware inside and the sluggish fans, not only does the laptop get quite warm in extreme situations but also while playing The Witcher 3, for example. Since the keyboard surface also reaches relatively high temperatures, the question of whether the manufacturer has geared the laptop a bit too much towards quiet operation inevitably arises here. It can quickly become uncomfortable, especially when using the device on the lap.
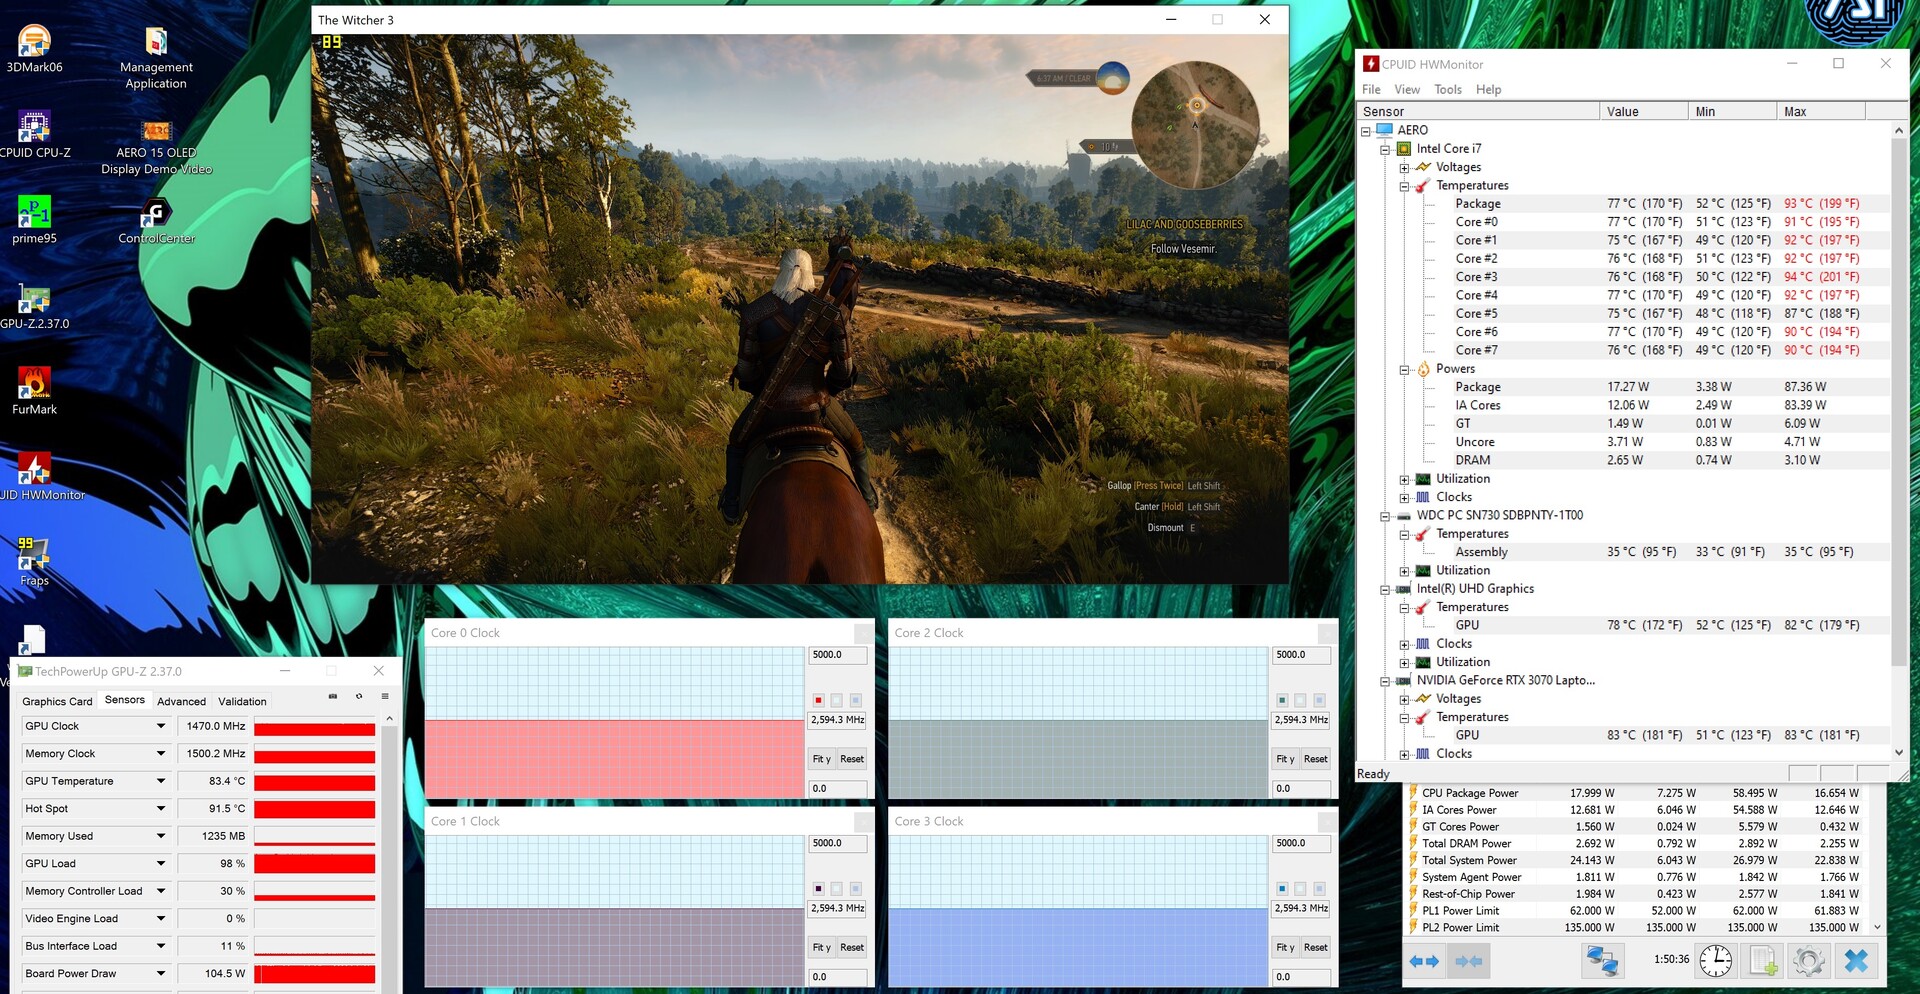
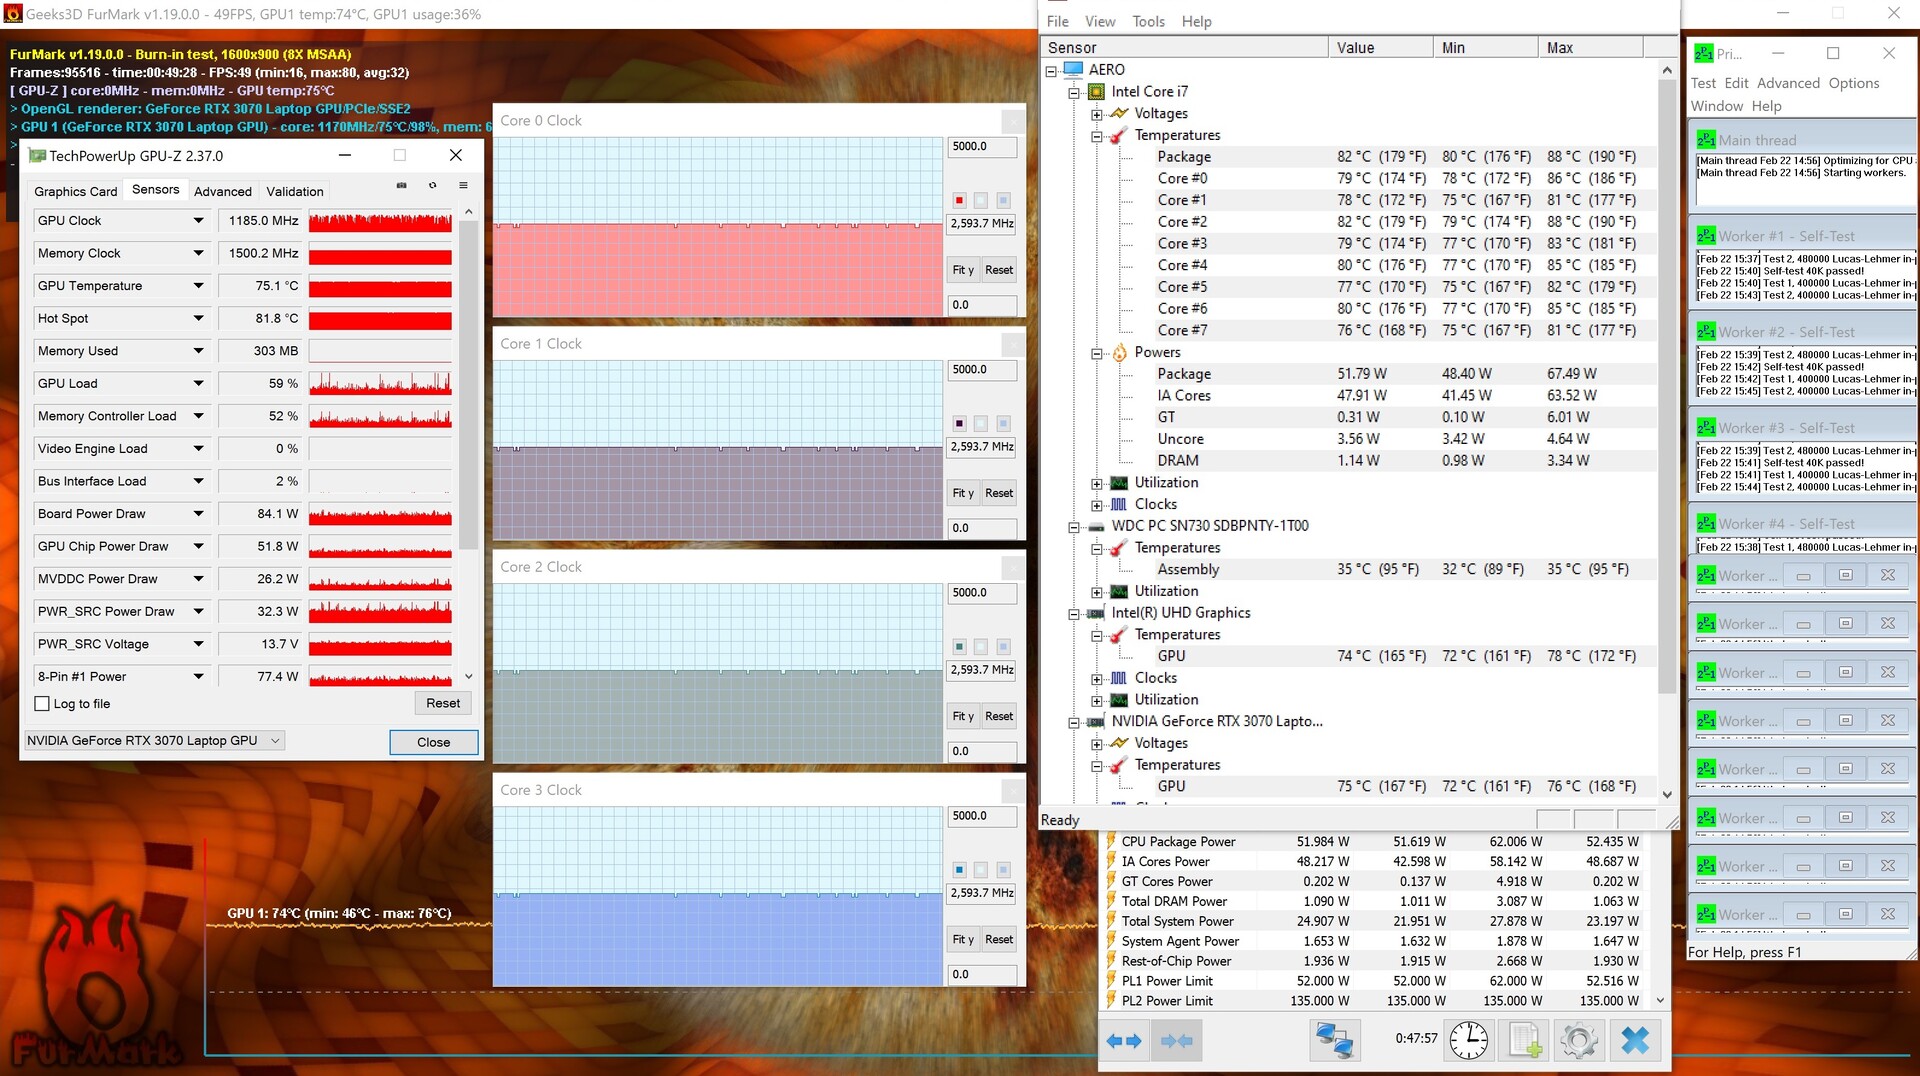
At the beginning of the stress test, the clock rates of the CPU and GPU are 4 GHz and 1,300-1,700 MHz, respectively. The processor reaches a temperature of 88 °C (~190 °F) within seconds and then lowers its clock speed to 3.3 GHz. The GPU slowly approaches a core temperature of around 75 °C (~167 °F) and reduces its clock rate to 1,200 MHz in the long run. The CPU settles at around 2.6 GHz and 80 °C (~176°F) after a few minutes. This shouldn't result in any limitations in everyday use, especially since the Aero will probably only reach the limit of its performance potential very rarely being a multimedia laptop.
(-) La temperatura máxima en la parte superior es de 49 °C / 120 F, frente a la media de 36.8 °C / 98 F, que oscila entre 21 y 71 °C para la clase Multimedia.
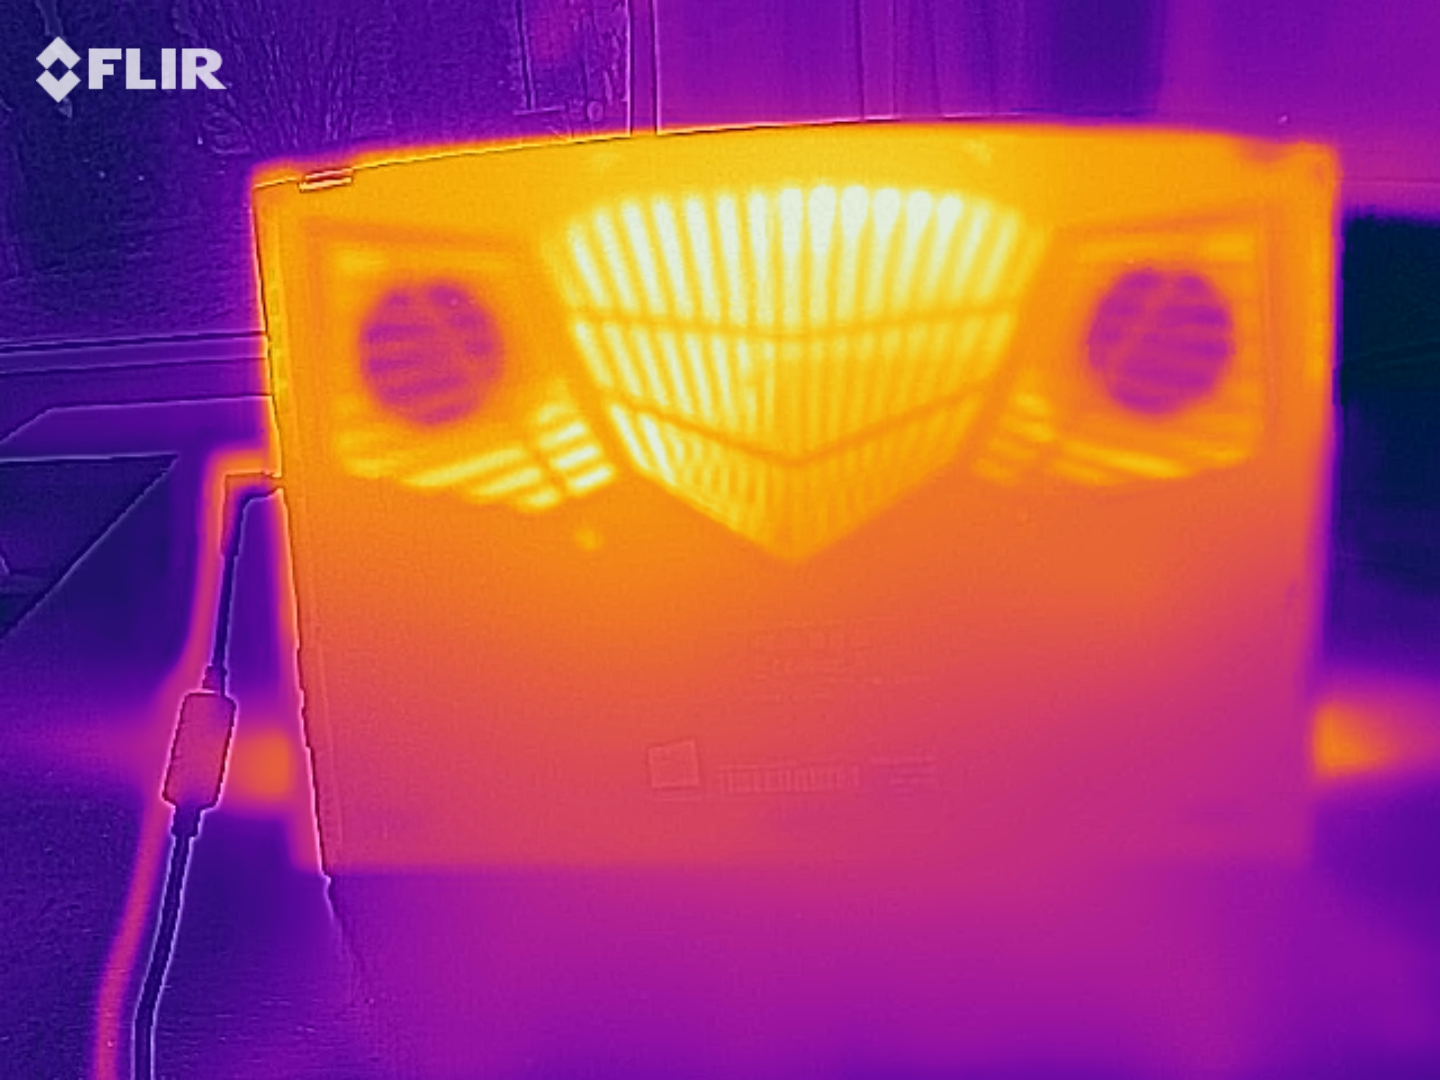
(-) El fondo se calienta hasta un máximo de 57 °C / 135 F, frente a la media de 39.1 °C / 102 F
(+) En reposo, la temperatura media de la parte superior es de 25.6 °C / 78# F, frente a la media del dispositivo de 31.3 °C / 88 F.
(-) Jugando a The Witcher 3, la temperatura media de la parte superior es de 41.1 °C / 106 F, frente a la media del dispositivo de 31.3 °C / 88 F.
(±) El reposamanos y el touchpad pueden calentarse mucho al tacto con un máximo de 37 °C / 98.6 F.
(-) La temperatura media de la zona del reposamanos de dispositivos similares fue de 28.7 °C / 83.7 F (-8.3 °C / -14.9 F).
Speakers
The built-in speakers reproduce instruments clearly, but voices sound very muffled, and bass is almost completely missing. Although the sound is sufficient for VoIP applications or YouTube videos, we would have expected more, especially for a multimedia laptop. Fortunately, external audio devices can be connected via Bluetooth or the 3.5 mm audio jack.
Gigabyte Aero 15 OLED XC análisis de audio
(+) | los altavoces pueden reproducir a un volumen relativamente alto (#84 dB)
Graves 100 - 315 Hz
(-) | casi sin bajos - de media 23.4% inferior a la mediana
(±) | la linealidad de los graves es media (10.2% delta a frecuencia anterior)
Medios 400 - 2000 Hz
(±) | medias más altas - de media 5.1% más altas que la mediana
(+) | los medios son lineales (4.3% delta a la frecuencia anterior)
Altos 2 - 16 kHz
(+) | máximos equilibrados - a sólo 2.9% de la mediana
(±) | la linealidad de los máximos es media (7.2% delta a frecuencia anterior)
Total 100 - 16.000 Hz
(±) | la linealidad del sonido global es media (17.6% de diferencia con la mediana)
En comparación con la misma clase
» 50% de todos los dispositivos probados de esta clase eran mejores, 7% similares, 43% peores
» El mejor tuvo un delta de 5%, la media fue 17%, el peor fue ###max##%
En comparación con todos los dispositivos probados
» 35% de todos los dispositivos probados eran mejores, 8% similares, 57% peores
» El mejor tuvo un delta de 4%, la media fue 23%, el peor fue ###max##%
Lenovo ThinkPad X1 Extreme Gen3-20TLS0UV00 análisis de audio
(±) | la sonoridad del altavoz es media pero buena (77.2 dB)
Graves 100 - 315 Hz
(±) | lubina reducida - en promedio 9.1% inferior a la mediana
(±) | la linealidad de los graves es media (11.6% delta a frecuencia anterior)
Medios 400 - 2000 Hz
(±) | medias más altas - de media 7.2% más altas que la mediana
(+) | los medios son lineales (5.4% delta a la frecuencia anterior)
Altos 2 - 16 kHz
(+) | máximos equilibrados - a sólo 3.9% de la mediana
(+) | los máximos son lineales (5.7% delta a la frecuencia anterior)
Total 100 - 16.000 Hz
(±) | la linealidad del sonido global es media (19.7% de diferencia con la mediana)
En comparación con la misma clase
» 65% de todos los dispositivos probados de esta clase eran mejores, 6% similares, 29% peores
» El mejor tuvo un delta de 5%, la media fue 17%, el peor fue ###max##%
En comparación con todos los dispositivos probados
» 50% de todos los dispositivos probados eran mejores, 7% similares, 43% peores
» El mejor tuvo un delta de 4%, la media fue 23%, el peor fue ###max##%
Energy management - OLED display increases consumption
Energy consumption
Consumption in idle usage is between 11 and 34 watts depending on the brightness level and performance profile, an acceptable value in view of the built-in high-resolution OLED display, although the HP Envy 15, for example, is a bit more frugal despite its OLED display. However, the average idle consumption of 14 watts is a good result overall.
Under load, we are able to measure a maximum consumption of 216 Watts, meaning that the included 180-watt power adapter falls a bit short. The predecessor still included a 230-watt power adapter that was also slightly underpowered.
| Off / Standby | |
| Ocioso | |
| Carga |
|
Clave:
min: | |
| Gigabyte Aero 15 OLED XC i7-10870H, GeForce RTX 3070 Laptop GPU | Asus ROG Zephyrus Duo 15 SE GX551QS R9 5900HX, GeForce RTX 3080 Laptop GPU | MSI GS66 Stealth 10UG i7-10870H, GeForce RTX 3070 Laptop GPU | Lenovo ThinkPad X1 Extreme Gen3-20TLS0UV00 i7-10750H, GeForce GTX 1650 Ti Max-Q | Gigabyte Aero 15 OLED XB-8DE51B0SP i7-10875H, GeForce RTX 2070 Super Max-Q | HP Envy 15-ep0098nr i7-10750H, GeForce RTX 2060 Max-Q | Media de la clase Multimedia | |
|---|---|---|---|---|---|---|---|
| Power Consumption | -26% | -4% | 39% | -27% | 12% | 43% | |
| Idle Minimum * (Watt) | 11 | 16.3 -48% | 12.9 -17% | 5 55% | 18 -64% | 9.2 16% | 5.66 ? 49% |
| Idle Average * (Watt) | 14 | 22.5 -61% | 15.4 -10% | 9 36% | 21 -50% | 14.5 -4% | 10.2 ? 27% |
| Idle Maximum * (Watt) | 34 | 39.9 -17% | 27.1 20% | 12.2 64% | 38 -12% | 18 47% | 12.5 ? 63% |
| Load Average * (Watt) | 95 | 116.1 -22% | 98.2 -3% | 94.4 1% | 113 -19% | 110.9 -17% | 65.2 ? 31% |
| Witcher 3 ultra * (Watt) | 152 | 181.2 -19% | 164.9 -8% | 89 41% | 149 2% | 125.5 17% | |
| Load Maximum * (Watt) | 216 | 196.7 9% | 232.9 -8% | 133.9 38% | 256 -19% | 194.6 10% | 113.5 ? 47% |
* ... más pequeño es mejor
Battery life
The Aero 15 OLED is equipped with a 99 Wh battery, with which it achieves a battery runtime of 6:39 hours in our standardized WLAN test (web-browsing script, 150 cd/m² brightness). This is slightly above the class average. While the same is true for our video test with the short film Big Buck Bunny, the runtime under load of 3:22 hours is unusually high. This is probably due to aggressive energy management that limits performance depending on the situation.
| Gigabyte Aero 15 OLED XC i7-10870H, GeForce RTX 3070 Laptop GPU, 99 Wh | Asus ROG Zephyrus Duo 15 SE GX551QS R9 5900HX, GeForce RTX 3080 Laptop GPU, 90 Wh | MSI GS66 Stealth 10UG i7-10870H, GeForce RTX 3070 Laptop GPU, 99.9 Wh | Lenovo ThinkPad X1 Extreme Gen3-20TLS0UV00 i7-10750H, GeForce GTX 1650 Ti Max-Q, 80 Wh | Gigabyte Aero 15 OLED XB-8DE51B0SP i7-10875H, GeForce RTX 2070 Super Max-Q, 94.2 Wh | HP Envy 15-ep0098nr i7-10750H, GeForce RTX 2060 Max-Q, 83 Wh | Media de la clase Multimedia | |
|---|---|---|---|---|---|---|---|
| Duración de Batería | -43% | -15% | 29% | -14% | -32% | 57% | |
| H.264 (h) | 7.1 | 12.2 72% | 17.1 ? 141% | ||||
| WiFi v1.3 (h) | 6.7 | 5.3 -21% | 7.1 6% | 11.6 73% | 6.1 -9% | 6 -10% | 12.2 ? 82% |
| Load (h) | 3.4 | 1.2 -65% | 2.2 -35% | 1.4 -59% | 2.8 -18% | 1.6 -53% | 1.664 ? -51% |
| Reader / Idle (h) | 6.8 | 10.8 | 8.6 | 15 | 24.9 ? |
Pro
Contra
Verdict - Solid laptop with Thunderbolt, OLED, and RTX 3070
The Aero 15 OLED XC makes a great first impression. The case looks sturdy, has a high-quality build, and does without flashy design features or an LED light show. Considering the installed hardware, it's still compact and relatively light. The 105-watt Nvidia GPU offers an enormous amount of performance, which might not even be fully utilized by many users of the laptop. Nevertheless, the power is available, should it ever be needed, to let the bright, impressive 4K OLED display shine in all its glory. However, we can only hope that the high heat development in combination with the sluggish fans will not have a negative impact on the lifespan of the multimedia laptop.
You're better off watching a movie than typing text on the Gigabyte Aero 15 OLED's great display.
One of the laptop's biggest weaknesses is its rather mushy keyboard, which makes typing longer text a bit tedious. The relatively small touchpad, on the other hand, is more acceptable, especially since the built-in buttons are thoroughly convincing.
The Gigabyte laptop has a lot to offer in terms of connectivity: Besides three video outputs, you get a fast SD card reader and a Thunderbolt 3 port, which makes the device even more flexible. For users who don't spend much time typing, the Aero 15 OLED XC is a good choice thanks to its excellent display and strong results in a variety of disciplines.
Price and availability
Gigabyte has listed the official sellers of the Aero 15 OLED XC on its website. Unfortunately, the laptop is largely out of stock at the time of writing. However, you can find a configuration with a 1 TB SSD and 64 GB of RAM on newegg right now for $2,540. You can also keep an eye out for the item on Amazon or for this other newegg listing, in which the laptop is officially sold by newegg itself.
Gigabyte Aero 15 OLED XC
- 03/06/2021 v7 (old)
Marius Schell
Price comparison

