Notebookcheck Logo

Review del portátil Dell XPS 13 9310 Core i7: La diferencia de la 11ª generación de Tiger Lake

Intel Evo(lution). La décima generación de Intel Ice Lake introdujo importantes mejoras gráficas sobre la vieja UHD Graphics 620 y la undécima generación de la serie Tiger Lake es otro gran salto. El rendimiento de la CPU, sin embargo, no ha cambiado mucho.

El Dell XPS 13 9300 tiene apenas un año y su sucesor ya está disponible. Llamado el XPS 13 9310, el nuevo modelo reemplaza la CPU Intel Ice Lake de 10ª generación con opciones Tiger Lake de 11ª generación junto con velocidades de memoria más rápidas. Por lo demás, el XPS 13 9310 es visualmente idéntico a su predecesor inmediato.

Para esta revisión, compararemos el rendimiento del 9310 con el del 9300 para ver cuánto aumento de rendimiento pueden esperar los usuarios y cómo las temperaturas, los tiempos de ejecución, la calidad de la pantalla o el consumo de energía pueden ser diferentes entre ellos - si es que lo son. Más información sobre el chasis y otras características físicas se puede encontrar en nuestra revisión del XPS 13 9300.

Más reviews de Dell:

Dell XPS 13 9310 Core i7 FHD (XPS 13 9310 Serie)
Procesador
Intel Core i7-1165G7 4 x 2.8 - 4.7 GHz, Tiger Lake-UP3
Adaptador gráfico
Intel Iris Xe Graphics G7 96EUs, Núcleo: 400 MHz, Memoría: 1600 MHz, LPDDR4x, 27.20.100.8680
Memoría
16 GB 
, LPDDR4x 2133.3 MHz, 20-20-20-45, Doble Canal, Soldado
pantalla
13.40 pulgadas 16:10, 1920 x 1200 pixels 169 PPI, Capacitiva de 10 puntos, Sharp LQ134N1, IPS, Controlador SHP14F9, Dell P/N: VVK8Y, lustroso: si, 60 Hz
Placa base
Intel Tiger Lake-UP3 PCH-LP
Disco duro
Micron 2300 512GB MTFDHBA512TDV, 512 GB 
Tarjeta de sonido
Intel Tiger Lake-U/Y PCH-LP - cAVS (Audio, Voice, Speech)
Conexiones
2 USB 3.1 Gen2, 2 Thunderbolt, USB-C Power Delivery (PD), 2 DisplayPort, Audio Conexiones: 3.5 mm combo, Card Reader: MicroSD, Brightness Sensor
Equipamento de red
Intel Killer Wi-Fi 6 AX1650s (ax = Wi-Fi 6/), Bluetooth 5.1
Tamaño
Alto x ancho x profundidad (en mm): 14.8 x 296 x 199
Battería
52 Wh Litio-Polimero
Sistema Operativo
Microsoft Windows 10 Home 64 Bit
Camera
Webcam: 720p
Primary Camera: 0.9 MPix
Características adicionales
Altavoces: Estéreo 2x 2.5 W, Teclado: Chiclet, Luz de Teclado: si, Dell Mobile Connect, Power Manager, Update, CinemaCenter, Digital Delivery, 12 Meses Garantía
Peso
1.292 kg, Suministro de Electricidad: 218 g
Precio
1500 USD
Note: The manufacturer may use components from different suppliers including display panels, drives or memory sticks with similar specifications.


Valoración
Fecha
Modelo
Peso
Altura
Tamaño
Resolución
Best Price
88.1 %
10/2020
Dell XPS 13 9310 Core i7 FHD
i7-1165G7, Iris Xe G7 96EUs
1.3 kg14.8 mm13.40"1920x1200
88.9 %
03/2020
Dell XPS 13 9300 Core i7-1065G7
i7-1065G7, Iris Plus Graphics G7 (Ice Lake 64 EU)
1.2 kg14.8 mm13.40"1920x1200
92.1 %
06/2020
Apple MacBook Pro 13 2020 2GHz i5 10th-Gen
i5-1038NG7, Iris Plus Graphics G7 (Ice Lake 64 EU)
1.4 kg15.6 mm13.30"2560x1600
87.4 %
06/2020
Huawei MateBook X Pro 2020 i7
i7-10510U, GeForce MX250
1.3 kg14.6 mm13.90"3000x2000
85.3 %
08/2020
Lenovo Yoga Slim 7-14ARE
R7 4800U, Vega 8
1.4 kg14.9 mm14.00"1920x1080
88.4 %
12/2019
HP Spectre x360 13-aw0013dx
i7-1065G7, Iris Plus Graphics G7 (Ice Lake 64 EU)
1.2 kg16.9 mm13.30"1920x1080

Carcasa

Dell introdujo el actual diseño del XPS 13 de 16:10 a principios de este año con el XPS 13 9300, por lo que el XPS 13 9310 es todavía relativamente nuevo aunque no hay grandes actualizaciones visuales. Quizás lo más notable es que la opción de color blanco de la antigua serie de XPS 13 de 16:9 ha vuelto, mientras que el XPS 9300 sólo estaba disponible en negro. El principal atractivo de la opción blanca es sobre todo estético, ya que la antiestética acumulación de huellas dactilares no será tan obvia.

La textura del reposapalmas blanco disuade las huellas dactilares mucho mejor que la versión negra normal.
El mismo diseño que el XPS 13 9300
Las rejillas de ventilación están metidas debajo de las bisagras
Una proporción muy alta de pantalla a cuerpo debido a los estrechos biseles en los cuatro lados
Todavía no hay ningún obturador o botón de la cámara para mayor privacidad
Tapa abierta al máximo ángulo
320.6 mm 208.2 mm 14.9 mm 1.4 kg306 mm 194.5 mm 16.9 mm 1.2 kg304.1 mm 212.4 mm 15.6 mm 1.4 kg304 mm 217 mm 14.6 mm 1.3 kg296 mm 199 mm 14.8 mm 1.3 kg296 mm 199 mm 14.8 mm 1.2 kg297 mm 210 mm 1 mm 5.7 g

Conectividad

Frente: No hay conectividad
Derecha: USB Tipo C con DisplayPort + Thunderbolt 3, 3.5 mm combo audio
Detrás: No hay conectividad
Izquierda: USB Tipo C con DisplayPort + Thunderbolt 3, lector MicroSD

Lector de tarjetas SD

El lector MicroSD completamente insertado se sienta casi al ras del borde
SD Card Reader
average JPG Copy Test (av. of 3 runs)
Dell XPS 13 9310 Core i7 FHD
  (Toshiba Exceria Pro M501 64 GB UHS-II)
194.7 MB/s
HP Spectre x360 13-aw0013dx
  (Toshiba Exceria Pro M501 microSDXC 64GB)
155.2 MB/s -20%
Dell XPS 13 9300 Core i7-1065G7
  (Toshiba Exceria Pro M501 64 GB UHS-II)
146.3 MB/s -25%
Lenovo Yoga Slim 7-14ARE
  (Toshiba Exceria Pro M501 64 GB UHS-II)
36.3 MB/s -81%
maximum AS SSD Seq Read Test (1GB)
Dell XPS 13 9310 Core i7 FHD
  (Toshiba Exceria Pro M501 64 GB UHS-II)
204.2 MB/s
Dell XPS 13 9300 Core i7-1065G7
  (Toshiba Exceria Pro M501 64 GB UHS-II)
187.3 MB/s -8%
HP Spectre x360 13-aw0013dx
  (Toshiba Exceria Pro M501 microSDXC 64GB)
185.7 MB/s -9%
Lenovo Yoga Slim 7-14ARE
  (Toshiba Exceria Pro M501 64 GB UHS-II)
37.8 MB/s -81%

Comunicación

El Intel Killer AX1650s viene de nuevo como estándar para la conectividad Wi-Fi 6 y Bluetooth 5.1. Aunque no experimentamos ningún problema de conectividad cuando se emparejó a nuestro enrutador Netgear RAX200, las tasas de transmisión no son ni de cerca tan rápidas como las tasas de recepción por segundo año consecutivo.

Módulo WLAN no removible
Networking
iperf3 transmit AX12
Lenovo Yoga Slim 7-14ARE
Intel Wi-Fi 6 AX200
1461 (1327min - 1616max) MBit/s +50%
Huawei MateBook X Pro 2020 i7
Intel Wireless-AC 9560
1338 (1304min - 1355max) MBit/s +37%
Dell XPS 13 9310 Core i7 FHD
Intel Killer Wi-Fi 6 AX1650s
975 (786min - 1026max) MBit/s
Dell XPS 13 9300 Core i7-1065G7
Intel Killer Wi-Fi 6 AX1650s
852 (232min - 1307max) MBit/s -13%
Apple MacBook Pro 13 2020 2GHz i5 10th-Gen
802.11 a/b/g/n/ac
809 MBit/s -17%
iperf3 receive AX12
Dell XPS 13 9310 Core i7 FHD
Intel Killer Wi-Fi 6 AX1650s
1439 (1386min - 1504max) MBit/s
Dell XPS 13 9300 Core i7-1065G7
Intel Killer Wi-Fi 6 AX1650s
1360 (1290min - 1408max) MBit/s -5%
Lenovo Yoga Slim 7-14ARE
Intel Wi-Fi 6 AX200
1343 (1313min - 1380max) MBit/s -7%
Huawei MateBook X Pro 2020 i7
Intel Wireless-AC 9560
1293 (628min - 1379max) MBit/s -10%
Apple MacBook Pro 13 2020 2GHz i5 10th-Gen
802.11 a/b/g/n/ac
765 MBit/s -47%
05010015020025030035040045050055060065070075080085090095010001050110011501200125013001350140014501500Tooltip
Dell XPS 13 9310 Core i7 FHD; iperf3 receive AX12; iperf 3.1.3: Ø1439 (1386-1504)
Dell XPS 13 9310 Core i7 FHD; iperf3 transmit AX12; iperf 3.1.3: Ø975 (786-1026)

Webcam

ColorChecker
12.9 ∆E
15.4 ∆E
3.9 ∆E
5.3 ∆E
3 ∆E
6.3 ∆E
12.3 ∆E
4.4 ∆E
20 ∆E
8.7 ∆E
8.3 ∆E
8.3 ∆E
10.1 ∆E
4.1 ∆E
19 ∆E
6 ∆E
15.7 ∆E
12 ∆E
2.9 ∆E
3.1 ∆E
3.2 ∆E
2.7 ∆E
9.8 ∆E
13.8 ∆E
ColorChecker Dell XPS 13 9310 Core i7 FHD: 8.8 ∆E min: 2.66 - max: 19.97 ∆E

Mantenimiento

No hay grandes cambios en el interior del sistema

Accesorios

La caja incluye un adaptador de USB-C a USB-A y un práctico adaptador de cable de alimentación para que no tengas que llevar un cable de alimentación de dos o tres puntas contigo a todas partes.

Dispositivos de entrada
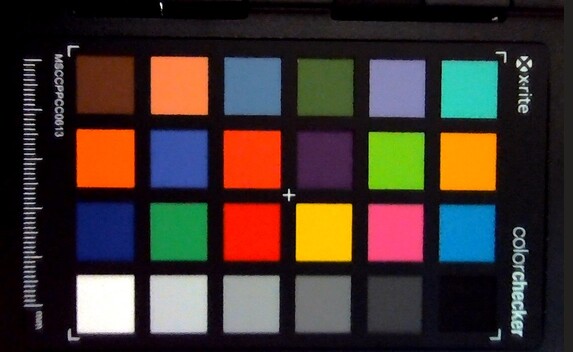
Diseño de teclado idéntico al del XPS 13 9300
Un espacioso clickpad de 11,2 x 6,5 cm.
A diferencia de la versión negra con teclas negras, las teclas blancas aquí no contrastan muy bien con el grabado.
Las teclas de flecha hacia arriba y hacia abajo siguen siendo de tamaño medio y están apretadas.

Display

The 9310 uses the same Sharp LQ134N1 IPS panel as found on the XPS 13 9300 but with slightly different brightness levels and PWM values. Displays on XPS laptops have always been some of the best in their respective categories and this remains true on the 9310. Major drawbacks continue to be the relatively slow response times and lack of both adaptive sync and OLED options. The AMD-powered Lenovo Yoga Slim 7, for example, comes with adaptive sync to reduce screen tearing.

Vidrio de Gorila de punta a punta. Aunque hay opciones sin contacto, ninguna viene sin Gorilla Glass
La webcam está a lo largo del borde superior a pesar de los estrechos biseles en los cuatro lados
No hay grandes problemas de sangrado de luz de fondo
Subpíxeles RGB nítidos sin problemas de granularidad
502.3
cd/m²
519.7
cd/m²
511.4
cd/m²
544.3
cd/m²
543.3
cd/m²
544.3
cd/m²
523.7
cd/m²
513
cd/m²
517.7
cd/m²
Temperatura del cuarto
Sharp LQ134N1 tested with X-Rite i1Pro 2
Máximo: 544.3 cd/m² (Nits) Médio: 524.4 cd/m² Minimum: 60.2 cd/m²
iluminación: 92 %
Brillo con batería: 543.3 cd/m²
Contraste: 1430:1 (Negro: 0.38 cd/m²)
ΔE Color 3.02 | 0.5-29.43 Ø5, calibrated: 1.23
ΔE Greyscale 5 | 0.57-98 Ø5.3
99.6% sRGB (Argyll 1.6.3 3D)
66.8% AdobeRGB 1998 (Argyll 1.6.3 3D)
72.9% AdobeRGB 1998 (Argyll 2.2.0 3D)
99.1% sRGB (Argyll 2.2.0 3D)
70.9% Display P3 (Argyll 2.2.0 3D)
Gamma: 2.02
Dell XPS 13 9310 Core i7 FHD
Sharp LQ134N1, IPS, 13.40, 1920x1200
Dell XPS 13 9300 Core i7-1065G7
Sharp LQ134N1, IPS, 13.40, 1920x1200
Apple MacBook Pro 13 2020 2GHz i5 10th-Gen
APPA03D, IPS, 13.30, 2560x1600
Huawei MateBook X Pro 2020 i7
JDI LPM139M422A, LTPS, 13.90, 3000x2000
Lenovo Yoga Slim 7-14ARE
AU Optronics B140HAN06.8, IPS, 14.00, 1920x1080
HP Spectre x360 13-aw0013dx
AU Optronics AUO5E2D, IPS, 13.30, 1920x1080
Display
-5%
20%
-4%
0%
-1%
Display P3 Coverage
70.9
66.3
-6%
98.8
39%
66.6
-6%
71.7
1%
69.6
-2%
sRGB Coverage
99.1
97.3
-2%
99.9
1%
99.4
0%
99.3
0%
98.9
0%
AdobeRGB 1998 Coverage
72.9
68.5
-6%
86.4
19%
68.6
-6%
72.9
0%
71.5
-2%
Response Times
2%
1501%
362%
12%
-14%
Response Time Grey 50% / Grey 80% *
52 ?(27.6, 24.4)
50 ?(22, 28)
4%
46 ?(22, 24)
12%
49.6 ?(23.6, 26)
5%
45.6 ?(23.6, 22)
12%
60.8 ?(26, 34.8)
-17%
Response Time Black / White *
33.2 ?(19.2, 14)
33.2 ?(16, 17.2)
-0%
32.4 ?(18.4, 14)
2%
30.8 ?(14, 16.8)
7%
29.6 ?(14.8, 14.8)
11%
36.8 ?(15.6, 21.2)
-11%
PWM Frequency
2475 ?(20)
2500 ?(25)
1%
113600 ?(75)
4490%
29070 ?(40)
1075%
Screen
1%
19%
23%
-9%
-11%
Brightness middle
543.3
607.6
12%
512
-6%
557
3%
399.6
-26%
447.4
-18%
Brightness
524
595
14%
491
-6%
532
2%
385
-27%
420
-20%
Brightness Distribution
92
96
4%
91
-1%
87
-5%
89
-3%
85
-8%
Black Level *
0.38
0.4
-5%
0.32
16%
0.33
13%
0.37
3%
0.31
18%
Contrast
1430
1519
6%
1600
12%
1688
18%
1080
-24%
1443
1%
Colorchecker dE 2000 *
3.02
3.23
-7%
1.7
44%
1.4
54%
3.2
-6%
4.23
-40%
Colorchecker dE 2000 max. *
7.61
8.67
-14%
3.4
55%
2.5
67%
6.44
15%
9.34
-23%
Colorchecker dE 2000 calibrated *
1.23
1.01
18%
1
19%
0.7
43%
1.73
-41%
1.32
-7%
Greyscale dE 2000 *
5
5.5
-10%
1.9
62%
2
60%
4.7
6%
6.1
-22%
Gamma
2.02 109%
2.12 104%
2.19 100%
2.14 103%
2.21 100%
2.11 104%
CCT
6550 99%
6413 101%
6817 95%
6689 97%
7184 90%
6136 106%
Color Space (Percent of AdobeRGB 1998)
66.8
63
-6%
77.4
16%
62.5
-6%
66.3
-1%
64.8
-3%
Color Space (Percent of sRGB)
99.6
97.5
-2%
99.9
0%
99.5
0%
99.5
0%
98.9
-1%
Media total (Programa/Opciones)
-1% / 0%
513% / 281%
127% / 78%
1% / -5%
-9% / -10%

* ... más pequeño es mejor

Todos los modelos XPS 13 9300/9310 tienen una cobertura del 100% de sRGB sin opciones para AdobeRGB o DCI-P3, a diferencia de los modelos de la serie XPS 15. Esto no debería ser un problema para nadie que no sea un editor gráfico profesional.

vs. sRGB
vs. sRGB
vs. AdobeRGB
vs. AdobeRGB

El valor gamma de 2.0 podría haber sido mejor. Calibrando la pantalla nosotros mismos con un colorímetro X-Rite acercamos el gamma al objetivo 2.2 con una mejor escala de grises y colores en general.

Escala de grises antes de la calibración
Barridos de saturación antes de la calibración
ColorChecker antes de la calibración
Escala de grises después de la calibración
Barridos de saturación después de la calibración
ColorChecker después de la calibración

Tiempos de respuesta del display

Los tiempos de respuesta del display muestran lo rápido que puede cambiar la pantalla de un color al siguiente. Tiempos lentos de respuesta pueden llevar a imágenes persistentes alrededor de objetos en movimiento o a displays borrosos. Particularmente los aficionados a los juegos 3D frenéticos deberían usar una pantalla con tiempos de respuesta rápidos.
       Tiempo de respuesta de Negro a Blanco
33.2 ms ... subida ↗ y bajada ↘ combinada↗ 19.2 ms subida
↘ 14 ms bajada
La pantalla mostró tiempos de respuesta lentos en nuestros tests y podría ser demasiado lenta para los jugones.
En comparación, todos los dispositivos de prueba van de ##min### (mínimo) a 240 (máximo) ms. » 88 % de todos los dispositivos son mejores.
Eso quiere decir que el tiempo de respuesta es peor que la media (21.4 ms) de todos los dispositivos testados.
       Tiempo de respuesta 50% Gris a 80% Gris
52 ms ... subida ↗ y bajada ↘ combinada↗ 27.6 ms subida
↘ 24.4 ms bajada
La pantalla mostró tiempos de respuesta lentos en nuestros tests y podría ser demasiado lenta para los jugones.
En comparación, todos los dispositivos de prueba van de ##min### (mínimo) a 636 (máximo) ms. » 87 % de todos los dispositivos son mejores.
Eso quiere decir que el tiempo de respuesta es peor que la media (33.7 ms) de todos los dispositivos testados.

Parpadeo de Pantalla / PWM (Pulse-Width Modulation)

Para atenuar el brillo de pantalla algunos portátiles están encendiendo y apagando la retroiluminación muy rápidamente. Esto se hace a una frecuencia que no debiera detectarse a simple vista. Si la frecuencia es demasiado lenta, la gente sensible podría experimentar problemas visuales, dolores de cabeza e incluso ver parpadeos.
Parpadeo de Pantalla / PWM detectado 2475 Hz ≤ 20 % de brillo

La retroiluminación del display parpadea a 2475 Hz (seguramente usa PWM - Pulse-Width Modulation) a un brillo del 20 % e inferior. Sobre este nivel de brillo no debería darse parpadeo / PWM.

La frecuencia de 2475 Hz es bastante alta, por lo que la mayoría de gente sensible al parpadeo no debería ver parpadeo o tener fatiga visual.

Comparación: 53 % de todos los dispositivos testados no usaron PWM para atenuar el display. Si se usó, medimos una media de 17803 (mínimo: 5 - máxmo: 3846000) Hz.

En el exterior, bajo la luz del sol
Al aire libre, bajo sombra. Siempre habrá un poco de brillo presente en la pantalla brillante
En el exterior, bajo la luz del sol
Amplios ángulos de visión del IPS. Los colores y el contraste se degradan sólo marginalmente si se mira desde ángulos obtusos

Rendimiento

Todas las versiones XPS 13 9310 vienen con el CPU Core i3-1115G4, Core i5-1135G7, o Core i7-1165G7 con 8 GB a 32 GB de 4267 MHz de RAM. Los gráficos Iris Xe integrados vienen de serie en todas las configuraciones, pero se espera que se ejecute más lentamente y con menos EUs en la opción Core i3-1115G4.


A menos que se indique lo contrario, nuestras pruebas a continuación se realizaron en el modo de Ultra Rendimiento para obtener las mayores puntuaciones posibles del sistema. Los perfiles de potencia se encuentran en el software preinstalado Dell Power Manager.


Procesador

Como cuarto ordenador portátil de nuestra base de datos equipado con el Core i7-1165G7, el XPS 13 9310 está funcionando donde esperamos que esté a sólo unos pocos puntos porcentuales de la media. Desafortunadamente, esto también significa que cualquier ganancia de rendimiento bruto sobre el Core i7-1065G7 del año pasado es relativamente menor.

Dell continúa confiando en Dynamic Tuning para exprimir el máximo rendimiento del procesador dentro de las capacidades de la solución de refrigeración subyacente. Esto se ejemplifica con las puntuaciones cíclicas del CineBench R15 xT cuando se ejecuta el punto de referencia en un bucle, como se muestra en el gráfico siguiente, en comparación con las puntuaciones más planas de la serie Asus ZenBook 14 que se ejecuta en la misma CPU. Las puntuaciones de CineBench R20 en el Core i7 XPS 13 9300 pueden oscilar entre 1396 puntos y 1883 puntos debido a las diferentes velocidades. Exploraremos esto más a fondo en la sección de pruebas de esfuerzo que sigue a continuación.

CineBench R15
CineBench R15
CineBench R20
CineBench R20
050100150200250300350400450500550600650700750800850900Tooltip
Dell XPS 13 9310 Core i7 FHD Iris Xe G7 96EUs, i7-1165G7, Micron 2300 512GB MTFDHBA512TDV; CPU Multi 64Bit: Ø718 (617.03-918.32)
Dell XPS 13 9300 Core i7-1065G7 Iris Plus Graphics G7 (Ice Lake 64 EU), i7-1065G7, Intel SSDPEMKF512G8 NVMe SSD; CPU Multi 64Bit: Ø636 (559.86-812.55)
Asus ZenBook 14 UX425EA Iris Xe G7 96EUs, i7-1165G7, Intel SSD 660p 1TB SSDPEKNW010T8; CPU Multi 64Bit: Ø653 (629.83-862.05)
Asus ZenBook 14 UX434FL-DB77 GeForce MX250, i7-8565U, WDC PC SN520 SDAPNUW-512G; CPU Multi 64Bit: Ø547 (525.27-680.19)
Cinebench R20: CPU (Multi Core) | CPU (Single Core)
Cinebench R15: CPU Multi 64Bit | CPU Single 64Bit
Blender: v2.79 BMW27 CPU
7-Zip 18.03: 7z b 4 -mmt1 | 7z b 4
Geekbench 5.5: Single-Core | Multi-Core
HWBOT x265 Benchmark v2.2: 4k Preset
LibreOffice : 20 Documents To PDF
R Benchmark 2.5: Overall mean
Cinebench R20 / CPU (Multi Core)
Lenovo Yoga Slim 7-14ARE
AMD Ryzen 7 4800U
3213 Points +68%
Asus VivoBook Flip 14 TM420IA
AMD Ryzen 7 4700U
2829 Points +48%
Dell XPS 15 9500 Core i5
Intel Core i5-10300H
2107 Points +10%
HP Envy x360 13-ay0010nr
AMD Ryzen 5 4500U
2095 Points +10%
Apple MacBook Pro 13 2020 2GHz i5 10th-Gen
Intel Core i5-1038NG7
1998 Points +4%
Average Intel Core i7-1165G7
  (1060 - 2657, n=81)
1967 Points +3%
Dell XPS 13 9310 Core i7 FHD
Intel Core i7-1165G7
1913 Points
Dell XPS 13 9300 Core i7-1065G7
Intel Core i7-1065G7
1883 Points -2%
HP Spectre x360 13-aw0013dx
Intel Core i7-1065G7
1655 Points -13%
Acer Swift 3 SF314-42-R27B
AMD Ryzen 3 4300U
1432 Points -25%
Dell XPS 13 9300 4K UHD
Intel Core i7-1065G7
1396 Points -27%
Asus ZenBook 14 UX434FL-DB77
Intel Core i7-8565U
1394 Points -27%
Microsoft Surface Laptop Go Core i5
Intel Core i5-1035G1
1178 Points -38%
Huawei MateBook X Pro 2020 i7
Intel Core i7-10510U
1087 Points -43%
HP Elite Dragonfly-8MK79EA
Intel Core i5-8265U
1038 Points -46%
Cinebench R20 / CPU (Single Core)
Dell XPS 13 9310 Core i7 FHD
Intel Core i7-1165G7
559 Points
Average Intel Core i7-1165G7
  (442 - 589, n=81)
552 Points -1%
Lenovo Yoga Slim 7-14ARE
AMD Ryzen 7 4800U
474 Points -15%
Asus VivoBook Flip 14 TM420IA
AMD Ryzen 7 4700U
461 Points -18%
Dell XPS 13 9300 Core i7-1065G7
Intel Core i7-1065G7
458 Points -18%
Dell XPS 13 9300 4K UHD
Intel Core i7-1065G7
453 Points -19%
Dell XPS 15 9500 Core i5
Intel Core i5-10300H
446 Points -20%
Asus ZenBook 14 UX434FL-DB77
Intel Core i7-8565U
446 Points -20%
Apple MacBook Pro 13 2020 2GHz i5 10th-Gen
Intel Core i5-1038NG7
438 Points -22%
Acer Swift 3 SF314-42-R27B
AMD Ryzen 3 4300U
427 Points -24%
HP Envy x360 13-ay0010nr
AMD Ryzen 5 4500U
424 Points -24%
Microsoft Surface Laptop Go Core i5
Intel Core i5-1035G1
413 Points -26%
Huawei MateBook X Pro 2020 i7
Intel Core i7-10510U
403 Points -28%
HP Spectre x360 13-aw0013dx
Intel Core i7-1065G7
377 Points -33%
HP Elite Dragonfly-8MK79EA
Intel Core i5-8265U
370 Points -34%
Cinebench R15 / CPU Multi 64Bit
Lenovo Yoga Slim 7-14ARE
AMD Ryzen 7 4800U
1639 (1505.17min - 1639.01max) Points +79%
Asus VivoBook Flip 14 TM420IA
AMD Ryzen 7 4700U
1049 (803.97min - 1049.04max) Points +14%
Dell XPS 13 9310 Core i7 FHD
Intel Core i7-1165G7
918 Points
Dell XPS 15 9500 Core i5
Intel Core i5-10300H
889 (827.87min - 893.75max) Points -3%
Average Intel Core i7-1165G7
  (553 - 1027, n=86)
846 Points -8%
HP Envy x360 13-ay0010nr
AMD Ryzen 5 4500U
835 (768.42min - 834.85max) Points -9%
Apple MacBook Pro 13 2020 2GHz i5 10th-Gen
Intel Core i5-1038NG7
768 (720min - 768max) Points -16%
Dell XPS 13 9300 4K UHD
Intel Core i7-1065G7
760 (489.25min - 610.17max) Points -17%
Dell XPS 13 9300 Core i7-1065G7
Intel Core i7-1065G7
750 Points -18%
Asus ZenBook 14 UX434FL-DB77
Intel Core i7-8565U
680 (525.27min - 680.19max) Points -26%
HP Spectre x360 13-aw0013dx
Intel Core i7-1065G7
643 Points -30%
Huawei MateBook X Pro 2020 i7
Intel Core i7-10510U
590 (456.98min - 589.46max) Points -36%
Acer Swift 3 SF314-42-R27B
AMD Ryzen 3 4300U
580 Points -37%
Microsoft Surface Laptop Go Core i5
Intel Core i5-1035G1
527 (466.1min - 527.11max) Points -43%
HP Elite Dragonfly-8MK79EA
Intel Core i5-8265U
496 (406.64min - 496.34max) Points -46%
Cinebench R15 / CPU Single 64Bit
Dell XPS 13 9310 Core i7 FHD
Intel Core i7-1165G7
218 Points
Average Intel Core i7-1165G7
  (115 - 230, n=78)
212 Points -3%
Dell XPS 15 9500 Core i5
Intel Core i5-10300H
186 Points -15%
Lenovo Yoga Slim 7-14ARE
AMD Ryzen 7 4800U
182 Points -17%
Dell XPS 13 9300 4K UHD
Intel Core i7-1065G7
182 Points -17%
Asus VivoBook Flip 14 TM420IA
AMD Ryzen 7 4700U
182 Points -17%
Dell XPS 13 9300 Core i7-1065G7
Intel Core i7-1065G7
180 Points -17%
HP Spectre x360 13-aw0013dx
Intel Core i7-1065G7
178 Points -18%
Asus ZenBook 14 UX434FL-DB77
Intel Core i7-8565U
178 Points -18%
HP Envy x360 13-ay0010nr
AMD Ryzen 5 4500U
173 Points -21%
Huawei MateBook X Pro 2020 i7
Intel Core i7-10510U
171 Points -22%
Apple MacBook Pro 13 2020 2GHz i5 10th-Gen
Intel Core i5-1038NG7
169 Points -22%
Acer Swift 3 SF314-42-R27B
AMD Ryzen 3 4300U
165 Points -24%
Microsoft Surface Laptop Go Core i5
Intel Core i5-1035G1
161 Points -26%
HP Elite Dragonfly-8MK79EA
Intel Core i5-8265U
146 Points -33%
Blender / v2.79 BMW27 CPU
HP Elite Dragonfly-8MK79EA
Intel Core i5-8265U
1039 Seconds * -64%
Huawei MateBook X Pro 2020 i7
Intel Core i7-10510U
959 Seconds * -52%
Microsoft Surface Laptop Go Core i5
Intel Core i5-1035G1
944 Seconds * -49%
Acer Swift 3 SF314-42-R27B
AMD Ryzen 3 4300U
907 Seconds * -44%
Asus ZenBook 14 UX434FL-DB77
Intel Core i7-8565U
766 Seconds * -21%
Dell XPS 13 9300 4K UHD
Intel Core i7-1065G7
681 Seconds * -8%
Dell XPS 13 9310 Core i7 FHD
Intel Core i7-1165G7
632 Seconds *
Average Intel Core i7-1165G7
  (468 - 1138, n=80)
618 Seconds * +2%
HP Envy x360 13-ay0010nr
AMD Ryzen 5 4500U
605 Seconds * +4%
Dell XPS 15 9500 Core i5
Intel Core i5-10300H
508 Seconds * +20%
Asus VivoBook Flip 14 TM420IA
AMD Ryzen 7 4700U
447 Seconds * +29%
Lenovo Yoga Slim 7-14ARE
AMD Ryzen 7 4800U
322 Seconds * +49%
Apple MacBook Pro 13 2020 2GHz i5 10th-Gen
Intel Core i5-1038NG7
4.2 Seconds * +99%
7-Zip 18.03 / 7z b 4 -mmt1
Dell XPS 13 9310 Core i7 FHD
Intel Core i7-1165G7
5283 MIPS
Average Intel Core i7-1165G7
  (4478 - 5507, n=80)
5182 MIPS -2%
Dell XPS 15 9500 Core i5
Intel Core i5-10300H
4889 MIPS -7%
Huawei MateBook X Pro 2020 i7
Intel Core i7-10510U
4742 MIPS -10%
Dell XPS 13 9300 4K UHD
Intel Core i7-1065G7
4438 MIPS -16%
Lenovo Yoga Slim 7-14ARE
AMD Ryzen 7 4800U
4436 MIPS -16%
Asus VivoBook Flip 14 TM420IA
AMD Ryzen 7 4700U
4422 MIPS -16%
HP Envy x360 13-ay0010nr
AMD Ryzen 5 4500U
4281 MIPS -19%
Apple MacBook Pro 13 2020 2GHz i5 10th-Gen
Intel Core i5-1038NG7
4161 MIPS -21%
Acer Swift 3 SF314-42-R27B
AMD Ryzen 3 4300U
4014 MIPS -24%
Microsoft Surface Laptop Go Core i5
Intel Core i5-1035G1
3932 MIPS -26%
HP Elite Dragonfly-8MK79EA
Intel Core i5-8265U
3885 MIPS -26%
Asus ZenBook 14 UX434FL-DB77
Intel Core i7-8565U
3755 MIPS -29%
7-Zip 18.03 / 7z b 4
Lenovo Yoga Slim 7-14ARE
AMD Ryzen 7 4800U
44804 MIPS +115%
Asus VivoBook Flip 14 TM420IA
AMD Ryzen 7 4700U
31114 MIPS +49%
Dell XPS 15 9500 Core i5
Intel Core i5-10300H
24388 MIPS +17%
HP Envy x360 13-ay0010nr
AMD Ryzen 5 4500U
23237 MIPS +11%
Average Intel Core i7-1165G7
  (15347 - 27405, n=80)
22935 MIPS +10%
Dell XPS 13 9300 4K UHD
Intel Core i7-1065G7
21139 MIPS +1%
Dell XPS 13 9310 Core i7 FHD
Intel Core i7-1165G7
20843 MIPS
Apple MacBook Pro 13 2020 2GHz i5 10th-Gen
Intel Core i5-1038NG7
19485 MIPS -7%
Asus ZenBook 14 UX434FL-DB77
Intel Core i7-8565U
16748 MIPS -20%
Huawei MateBook X Pro 2020 i7
Intel Core i7-10510U
16346 MIPS -22%
Acer Swift 3 SF314-42-R27B
AMD Ryzen 3 4300U
15043 MIPS -28%
HP Elite Dragonfly-8MK79EA
Intel Core i5-8265U
13812 MIPS -34%
Microsoft Surface Laptop Go Core i5
Intel Core i5-1035G1
13715 MIPS -34%
Geekbench 5.5 / Single-Core
Dell XPS 13 9310 Core i7 FHD
Intel Core i7-1165G7
1547 Points
Average Intel Core i7-1165G7
  (1302 - 1595, n=77)
1524 Points -1%
Dell XPS 13 9300 4K UHD
Intel Core i7-1065G7
1324 Points -14%
Apple MacBook Pro 13 2020 2GHz i5 10th-Gen
Intel Core i5-1038NG7
1265 Points -18%
Dell XPS 15 9500 Core i5
Intel Core i5-10300H
1183 Points -24%
Asus ZenBook 14 UX434FL-DB77
Intel Core i7-8565U
1163 Points -25%
Asus VivoBook Flip 14 TM420IA
AMD Ryzen 7 4700U
1157 Points -25%
Lenovo Yoga Slim 7-14ARE
AMD Ryzen 7 4800U
1154 Points -25%
Lenovo Yoga Slim 7-14ARE
AMD Ryzen 7 4800U
1150 Points -26%
Microsoft Surface Laptop Go Core i5
Intel Core i5-1035G1
1144 Points -26%
HP Envy x360 13-ay0010nr
AMD Ryzen 5 4500U
1096 Points -29%
Acer Swift 3 SF314-42-R27B
AMD Ryzen 3 4300U
1027 Points -34%
Huawei MateBook X Pro 2020 i7
Intel Core i7-10510U
977 Points -37%
Geekbench 5.5 / Multi-Core
Lenovo Yoga Slim 7-14ARE
AMD Ryzen 7 4800U
6950 Points +22%
Lenovo Yoga Slim 7-14ARE
AMD Ryzen 7 4800U
5798 Points +2%
Dell XPS 13 9310 Core i7 FHD
Intel Core i7-1165G7
5682 Points
Asus VivoBook Flip 14 TM420IA
AMD Ryzen 7 4700U
5443 Points -4%
Average Intel Core i7-1165G7
  (3078 - 5926, n=77)
5155 Points -9%
Dell XPS 13 9300 4K UHD
Intel Core i7-1065G7
4855 Points -15%
Apple MacBook Pro 13 2020 2GHz i5 10th-Gen
Intel Core i5-1038NG7
4564 Points -20%
HP Envy x360 13-ay0010nr
AMD Ryzen 5 4500U
4469 Points -21%
Dell XPS 15 9500 Core i5
Intel Core i5-10300H
4399 Points -23%
Microsoft Surface Laptop Go Core i5
Intel Core i5-1035G1
3522 Points -38%
Acer Swift 3 SF314-42-R27B
AMD Ryzen 3 4300U
3330 Points -41%
Asus ZenBook 14 UX434FL-DB77
Intel Core i7-8565U
2839 Points -50%
Huawei MateBook X Pro 2020 i7
Intel Core i7-10510U
2636 Points -54%
HWBOT x265 Benchmark v2.2 / 4k Preset
Lenovo Yoga Slim 7-14ARE
AMD Ryzen 7 4800U
10.77 fps +84%
Asus VivoBook Flip 14 TM420IA
AMD Ryzen 7 4700U
8.81 fps +51%
Dell XPS 15 9500 Core i5
Intel Core i5-10300H
7.28 fps +25%
HP Envy x360 13-ay0010nr
AMD Ryzen 5 4500U
6.7 fps +15%
Average Intel Core i7-1165G7
  (1.39 - 8.47, n=80)
6.3 fps +8%
Dell XPS 13 9300 4K UHD
Intel Core i7-1065G7
6.08 fps +4%
Apple MacBook Pro 13 2020 2GHz i5 10th-Gen
Intel Core i5-1038NG7
5.99 fps +3%
Dell XPS 13 9310 Core i7 FHD
Intel Core i7-1165G7
5.84 fps
Asus ZenBook 14 UX434FL-DB77
Intel Core i7-8565U
4.82 fps -17%
Acer Swift 3 SF314-42-R27B
AMD Ryzen 3 4300U
4.37 fps -25%
Microsoft Surface Laptop Go Core i5
Intel Core i5-1035G1
3.89 fps -33%
Huawei MateBook X Pro 2020 i7
Intel Core i7-10510U
3.88 fps -34%
HP Elite Dragonfly-8MK79EA
Intel Core i5-8265U
3.51 fps -40%
LibreOffice / 20 Documents To PDF
Apple MacBook Pro 13 2020 2GHz i5 10th-Gen
Intel Core i5-1038NG7
88.6 s * -92%
Dell XPS 13 9300 4K UHD
Intel Core i7-1065G7
85.3 s * -85%
Asus ZenBook 14 UX434FL-DB77
Intel Core i7-8565U
69.6 s * -51%
Microsoft Surface Laptop Go Core i5
Intel Core i5-1035G1
64.5 s * -40%
Dell XPS 15 9500 Core i5
Intel Core i5-10300H
63.6 s * -38%
Acer Swift 3 SF314-42-R27B
AMD Ryzen 3 4300U
62.2 s * -35%
HP Envy x360 13-ay0010nr
AMD Ryzen 5 4500U
61.8 s * -34%
Lenovo Yoga Slim 7-14ARE
AMD Ryzen 7 4800U
57.8 s * -25%
Asus VivoBook Flip 14 TM420IA
AMD Ryzen 7 4700U
57 s * -23%
Huawei MateBook X Pro 2020 i7
Intel Core i7-10510U
56.1 s * -21%
Average Intel Core i7-1165G7
  (21.5 - 88.1, n=78)
49.2 s * -6%
Dell XPS 13 9310 Core i7 FHD
Intel Core i7-1165G7
46.2 s *
R Benchmark 2.5 / Overall mean
Asus ZenBook 14 UX434FL-DB77
Intel Core i7-8565U
0.851 sec * -45%
Microsoft Surface Laptop Go Core i5
Intel Core i5-1035G1
0.743 sec * -27%
Apple MacBook Pro 13 2020 2GHz i5 10th-Gen
Intel Core i5-1038NG7
0.702 sec * -20%
Acer Swift 3 SF314-42-R27B
AMD Ryzen 3 4300U
0.686 sec * -17%
Dell XPS 13 9300 4K UHD
Intel Core i7-1065G7
0.682 sec * -16%
Dell XPS 15 9500 Core i5
Intel Core i5-10300H
0.646 sec * -10%
Huawei MateBook X Pro 2020 i7
Intel Core i7-10510U
0.642 sec * -10%
HP Envy x360 13-ay0010nr
AMD Ryzen 5 4500U
0.629 sec * -7%
Lenovo Yoga Slim 7-14ARE
AMD Ryzen 7 4800U
0.613 sec * -5%
Asus VivoBook Flip 14 TM420IA
AMD Ryzen 7 4700U
0.611 sec * -4%
Average Intel Core i7-1165G7
  (0.552 - 1.002, n=80)
0.594 sec * -1%
Dell XPS 13 9310 Core i7 FHD
Intel Core i7-1165G7
0.586 sec *
Cinebench R20: CPU (Multi Core) | CPU (Single Core)
Cinebench R15: CPU Multi 64Bit | CPU Single 64Bit
Blender: v2.79 BMW27 CPU
7-Zip 18.03: 7z b 4 -mmt1 | 7z b 4
Geekbench 5.5: Single-Core | Multi-Core
HWBOT x265 Benchmark v2.2: 4k Preset
LibreOffice : 20 Documents To PDF
R Benchmark 2.5: Overall mean

* ... más pequeño es mejor

Cinebench R15 CPU Multi 64Bit
918 Points
Cinebench R15 OpenGL 64Bit
102 fps
Cinebench R15 Ref. Match 64Bit
97.8 %
Cinebench R15 CPU Single 64Bit
218 Points
ayuda

Rendimiento del sistema

Los puntos de referencia de PCMark son consistentemente más altos que el XPS 13 9300 del año pasado, impulsado por el Lago de Hielo, por lo menos en puntos porcentuales de dos dígitos, probablemente debido a la GPU integrada más rápida. Sin embargo, el Lenovo Yoga Slim 7, más económico y alimentado por AMD, sigue siendo el mejor.


Durante el tiempo que estuvimos con la unidad de prueba, el sistema se reinició al azar una noche para actualizar su BIOS. Luego se quedaba atascado en la pantalla de arranque durante casi 20 minutos antes de entrar finalmente en el modo seguro de Windows. El sistema volvió a la normalidad después de reiniciarse desde allí, pero todo el proceso fue definitivamente una experiencia indeseable, especialmente en un nuevo portátil de bandera.

PCMark 10 Standard
PCMark 10 Standard
PCMark 8 Home Accelerated
PCMark 8 Work Accelerated
PCMark 10
Score
Lenovo Yoga Slim 7-14ARE
Vega 8, R7 4800U, Samsung SSD PM981a MZVLB512HBJQ
5383 Points +10%
Average Intel Core i7-1165G7, Intel Iris Xe Graphics G7 96EUs
  (4531 - 5454, n=50)
4959 Points +1%
Dell XPS 13 9310 Core i7 FHD
Iris Xe G7 96EUs, i7-1165G7, Micron 2300 512GB MTFDHBA512TDV
4914 Points
HP Spectre x360 13-aw0013dx
Iris Plus Graphics G7 (Ice Lake 64 EU), i7-1065G7, Intel Optane Memory H10 with Solid State Storage 32GB + 512GB HBRPEKNX0202A(L/H)
4522 Points -8%
Dell XPS 13 9300 Core i7-1065G7
Iris Plus Graphics G7 (Ice Lake 64 EU), i7-1065G7, Intel SSDPEMKF512G8 NVMe SSD
4154 Points -15%
Huawei MateBook X Pro 2020 i7
GeForce MX250, i7-10510U, Samsung PM981a MZVLB1T0HBLR
3861 Points -21%
Apple MacBook Pro 13 2020 2GHz i5 10th-Gen
Iris Plus Graphics G7 (Ice Lake 64 EU), i5-1038NG7, Apple SSD SM0512F
3222 Points -34%
Essentials
Average Intel Core i7-1165G7, Intel Iris Xe Graphics G7 96EUs
  (8997 - 11505, n=50)
10014 Points +3%
Dell XPS 13 9310 Core i7 FHD
Iris Xe G7 96EUs, i7-1165G7, Micron 2300 512GB MTFDHBA512TDV
9749 Points
HP Spectre x360 13-aw0013dx
Iris Plus Graphics G7 (Ice Lake 64 EU), i7-1065G7, Intel Optane Memory H10 with Solid State Storage 32GB + 512GB HBRPEKNX0202A(L/H)
9664 Points -1%
Lenovo Yoga Slim 7-14ARE
Vega 8, R7 4800U, Samsung SSD PM981a MZVLB512HBJQ
9637 Points -1%
Dell XPS 13 9300 Core i7-1065G7
Iris Plus Graphics G7 (Ice Lake 64 EU), i7-1065G7, Intel SSDPEMKF512G8 NVMe SSD
8763 Points -10%
Huawei MateBook X Pro 2020 i7
GeForce MX250, i7-10510U, Samsung PM981a MZVLB1T0HBLR
8190 Points -16%
Apple MacBook Pro 13 2020 2GHz i5 10th-Gen
Iris Plus Graphics G7 (Ice Lake 64 EU), i5-1038NG7, Apple SSD SM0512F
7827 Points -20%
Productivity
Lenovo Yoga Slim 7-14ARE
Vega 8, R7 4800U, Samsung SSD PM981a MZVLB512HBJQ
7631 Points +12%
Huawei MateBook X Pro 2020 i7
GeForce MX250, i7-10510U, Samsung PM981a MZVLB1T0HBLR
7334 Points +7%
HP Spectre x360 13-aw0013dx
Iris Plus Graphics G7 (Ice Lake 64 EU), i7-1065G7, Intel Optane Memory H10 with Solid State Storage 32GB + 512GB HBRPEKNX0202A(L/H)
7051 Points +3%
Dell XPS 13 9310 Core i7 FHD
Iris Xe G7 96EUs, i7-1165G7, Micron 2300 512GB MTFDHBA512TDV
6838 Points
Average Intel Core i7-1165G7, Intel Iris Xe Graphics G7 96EUs
  (5570 - 7136, n=50)
6711 Points -2%
Dell XPS 13 9300 Core i7-1065G7
Iris Plus Graphics G7 (Ice Lake 64 EU), i7-1065G7, Intel SSDPEMKF512G8 NVMe SSD
5759 Points -16%
Apple MacBook Pro 13 2020 2GHz i5 10th-Gen
Iris Plus Graphics G7 (Ice Lake 64 EU), i5-1038NG7, Apple SSD SM0512F
3568 Points -48%
Digital Content Creation
Lenovo Yoga Slim 7-14ARE
Vega 8, R7 4800U, Samsung SSD PM981a MZVLB512HBJQ
5758 Points +19%
Average Intel Core i7-1165G7, Intel Iris Xe Graphics G7 96EUs
  (4083 - 5550, n=50)
4937 Points +2%
Dell XPS 13 9310 Core i7 FHD
Iris Xe G7 96EUs, i7-1165G7, Micron 2300 512GB MTFDHBA512TDV
4832 Points
Dell XPS 13 9300 Core i7-1065G7
Iris Plus Graphics G7 (Ice Lake 64 EU), i7-1065G7, Intel SSDPEMKF512G8 NVMe SSD
3856 Points -20%
HP Spectre x360 13-aw0013dx
Iris Plus Graphics G7 (Ice Lake 64 EU), i7-1065G7, Intel Optane Memory H10 with Solid State Storage 32GB + 512GB HBRPEKNX0202A(L/H)
3684 Points -24%
Apple MacBook Pro 13 2020 2GHz i5 10th-Gen
Iris Plus Graphics G7 (Ice Lake 64 EU), i5-1038NG7, Apple SSD SM0512F
3256 Points -33%
Huawei MateBook X Pro 2020 i7
GeForce MX250, i7-10510U, Samsung PM981a MZVLB1T0HBLR
2621 Points -46%
PCMark 8
Home Score Accelerated v2
Lenovo Yoga Slim 7-14ARE
Vega 8, R7 4800U, Samsung SSD PM981a MZVLB512HBJQ
4657 Points +6%
Average Intel Core i7-1165G7, Intel Iris Xe Graphics G7 96EUs
  (3769 - 5686, n=17)
4459 Points +1%
Dell XPS 13 9310 Core i7 FHD
Iris Xe G7 96EUs, i7-1165G7, Micron 2300 512GB MTFDHBA512TDV
4407 Points
Apple MacBook Pro 13 2020 2GHz i5 10th-Gen
Iris Plus Graphics G7 (Ice Lake 64 EU), i5-1038NG7, Apple SSD SM0512F
3928 Points -11%
HP Spectre x360 13-aw0013dx
Iris Plus Graphics G7 (Ice Lake 64 EU), i7-1065G7, Intel Optane Memory H10 with Solid State Storage 32GB + 512GB HBRPEKNX0202A(L/H)
3911 Points -11%
Huawei MateBook X Pro 2020 i7
GeForce MX250, i7-10510U, Samsung PM981a MZVLB1T0HBLR
3841 Points -13%
Dell XPS 13 9300 Core i7-1065G7
Iris Plus Graphics G7 (Ice Lake 64 EU), i7-1065G7, Intel SSDPEMKF512G8 NVMe SSD
3825 Points -13%
Work Score Accelerated v2
Lenovo Yoga Slim 7-14ARE
Vega 8, R7 4800U, Samsung SSD PM981a MZVLB512HBJQ
5661 Points +84%
HP Spectre x360 13-aw0013dx
Iris Plus Graphics G7 (Ice Lake 64 EU), i7-1065G7, Intel Optane Memory H10 with Solid State Storage 32GB + 512GB HBRPEKNX0202A(L/H)
5227 Points +70%
Dell XPS 13 9300 Core i7-1065G7
Iris Plus Graphics G7 (Ice Lake 64 EU), i7-1065G7, Intel SSDPEMKF512G8 NVMe SSD
5039 Points +64%
Huawei MateBook X Pro 2020 i7
GeForce MX250, i7-10510U, Samsung PM981a MZVLB1T0HBLR
4599 Points +50%
Dell XPS 13 9310 Core i7 FHD
Iris Xe G7 96EUs, i7-1165G7, Micron 2300 512GB MTFDHBA512TDV
3073 Points
Average Intel Core i7-1165G7, Intel Iris Xe Graphics G7 96EUs
  (2431 - 3221, n=15)
2940 Points -4%
Apple MacBook Pro 13 2020 2GHz i5 10th-Gen
Iris Plus Graphics G7 (Ice Lake 64 EU), i5-1038NG7, Apple SSD SM0512F
2407 Points -22%
PCMark 8 Home Score Accelerated v2
4407 puntos
PCMark 8 Work Score Accelerated v2
3073 puntos
PCMark 10 Score
4914 puntos
ayuda

Latencia DPC

Abrir múltiples pestañas del navegador en nuestra página web no resultaría en ningún problema de latencia de DPC según LatencyMon. Iniciar Prime95, sin embargo, causaría leves latencias. La reproducción de 4K60 es suave con sólo dos cuadros caídos durante nuestro video de prueba de un minuto en YouTube.

YouTube
YouTube
Prime95
Prime95
Latencias de los Driver
DPC Latencies / LatencyMon - interrupt to process latency (max), Web, Youtube, Prime95
Dell XPS 13 9300 Core i7-1065G7
Iris Plus Graphics G7 (Ice Lake 64 EU), i7-1065G7, Intel SSDPEMKF512G8 NVMe SSD
14995 μs * -1386%
Lenovo Yoga Slim 7-14ARE
Vega 8, R7 4800U, Samsung SSD PM981a MZVLB512HBJQ
2164 μs * -114%
Dell XPS 13 9310 Core i7 FHD
Iris Xe G7 96EUs, i7-1165G7, Micron 2300 512GB MTFDHBA512TDV
1009 μs *

* ... más pequeño es mejor

Dispositivos de almacenamiento

Mientras que los anteriores modelos XPS 13 han sido enviados con SSDs M.2 NVMe de Samsung, SK Hynix, Intel o Toshiba, nuestra última unidad viene con uno de Micron. Es casi una ruleta en cuanto a qué SSD obtendrás al comprar un XPS 13 en un momento dado.

Por suerte para nosotros, el Micron 2200 es una unidad NVMe de alta gama con velocidades de lectura y escritura secuenciales que se acercan a los 3300 MB/s y 2700 MB/s, respectivamente, para acercarse a la popular serie Samsung PM981. Aún así, no nos sorprendería que los usuarios recibieran unidades completamente diferentes si pidieran modelos de diferentes tamaños de SSD.

Puede encontrar más referencias de almacenamiento en nuestra tabla de SSDs y HDDs.

CDM 5.5
CDM 5.5
AS SSD
AS SSD
SSD M.2 extraíble con esparcidor de calor
Dell XPS 13 9310 Core i7 FHD
Micron 2300 512GB MTFDHBA512TDV
Dell XPS 13 9300 Core i7-1065G7
Intel SSDPEMKF512G8 NVMe SSD
Apple MacBook Pro 13 2020 2GHz i5 10th-Gen
Apple SSD SM0512F
Huawei MateBook X Pro 2020 i7
Samsung PM981a MZVLB1T0HBLR
HP Spectre x360 13-aw0013dx
Intel Optane Memory H10 with Solid State Storage 32GB + 512GB HBRPEKNX0202A(L/H)
AS SSD
-16%
-49%
48%
-30%
Seq Read
2091
1956
-6%
1300
-38%
2737
31%
1039
-50%
Seq Write
1396
1227
-12%
1518
9%
2530
81%
310.1
-78%
4K Read
49.29
63
28%
14.09
-71%
54
10%
76
54%
4K Write
104.2
156.6
50%
24.25
-77%
152.5
46%
118
13%
4K-64 Read
827
475.6
-42%
725
-12%
2011
143%
371.8
-55%
4K-64 Write
1636
539
-67%
169.6
-90%
1260
-23%
469.5
-71%
Access Time Read *
0.066
0.042
36%
0.172
-161%
0.066
-0%
0.067
-2%
Access Time Write *
0.365
0.105
71%
0.155
58%
0.024
93%
0.138
62%
Score Read
1086
734
-32%
869
-20%
2339
115%
552
-49%
Score Write
1880
818
-56%
346
-82%
1666
-11%
618
-67%
Score Total
3499
1915
-45%
1667
-52%
5191
48%
1448
-59%
Copy ISO MB/s
1544
1022
-34%
764
-51%
Copy Program MB/s
613
302.8
-51%
465.8
-24%
Copy Game MB/s
1451
491.4
-66%
764
-47%
CrystalDiskMark 5.2 / 6
15%
-31%
14%
-7%
Write 4K
97.5
186.8
92%
28.16
-71%
165.6
70%
112.6
15%
Read 4K
50.9
71.4
40%
17.5
-66%
50.2
-1%
131
157%
Write Seq
1811
1203
-34%
1195
-34%
1905
5%
458.9
-75%
Read Seq
1836
2600
42%
1470
-20%
1669
-9%
1355
-26%
Write 4K Q32T1
521
514
-1%
205
-61%
474.6
-9%
341.3
-34%
Read 4K Q32T1
357.5
570
59%
692
94%
508
42%
320.6
-10%
Write Seq Q32T1
2879
786
-73%
1475
-49%
3007
4%
1219
-58%
Read Seq Q32T1
3204
2947
-8%
1920
-40%
3556
11%
2462
-23%
Media total (Programa/Opciones)
-1% / -5%
-40% / -41%
31% / 34%
-19% / -22%

* ... más pequeño es mejor

Micron 2300 512GB MTFDHBA512TDV
CDM 5/6 Read Seq Q32T1: 3204 MB/s
CDM 5/6 Write Seq Q32T1: 2879 MB/s
CDM 5/6 Read 4K Q32T1: 357.5 MB/s
CDM 5/6 Write 4K Q32T1: 521 MB/s
CDM 5 Read Seq: 1836 MB/s
CDM 5 Write Seq: 1811 MB/s
CDM 5/6 Read 4K: 50.9 MB/s
CDM 5/6 Write 4K: 97.5 MB/s

Estrangulamiento del disco: DiskSpd Read Loop, Queue Depth 8

No graph data

Rendimiento de la GPU

Los resultados de 3DMark son impresionantes para una GPU integrada con puntuaciones que son entre un 30 y un 35 por ciento más altas que incluso la GeForce MX250 discreta o casi un 50 por ciento más altas que el Iris Plus G7 en el XPS 13 9300. Sin embargo, como ya hemos demostrado, estos resultados sintéticos no se traducen bien en el rendimiento de los juegos en el mundo real, por lo que los usuarios no deberían esperar entre un 30 y un 35 por ciento más de velocidad de fotogramas en toda la placa que en un portátil GeForce MX250. Final Fantasy 15, Strange Brigade y Witcher 3, por ejemplo, corren más rápido en nuestro XPS 13 9310 que en el ZenBook 14 alimentado por MX250, mientras que lo contrario es cierto para DOTA 2 Reborn, X-Plane 11.11 y GTA V.

Tengan en cuenta que el Dynamic Tuning de Dell tiene un efecto adverso en las velocidades de cuadro. Por ejemplo, en Witcher 3, cuando está en reposo con la configuración más baja, la frecuencia de fotogramas fluctuaría entre 61 y 80 FPS, como se muestra en el siguiente gráfico, mientras que la frecuencia de fotogramas sería más constante y estable en la mayoría de los demás portátiles.

Consulte nuestra página sobre el Intel Iris Xe para obtener más información técnica y comparaciones de referencia. Esperamos que el desempeño general de los juegos mejore con el tiempo gracias a las actualizaciones de los controladores.

3DMark 11
3DMark 11
Cloud Gate
Cloud Gate
Fire Strike
Fire Strike
Time Spy
Time Spy
3DMark
1280x720 Cloud Gate Standard Graphics
Asus ZenBook 14 UX425EA
Intel Iris Xe Graphics G7 96EUs, i7-1165G7
27289 Points +18%
Lenovo Yoga Slim 7-14ARE
AMD Radeon RX Vega 8 (Ryzen 4000/5000), R7 4800U
27160 Points +18%
Average Intel Iris Xe Graphics G7 96EUs
  (13162 - 38578, n=174)
26432 Points +15%
Dell XPS 13 9310 Core i7 FHD
Intel Iris Xe Graphics G7 96EUs, i7-1165G7
23053 Points
HP Envy x360 13-ay0010nr
AMD Radeon RX Vega 6 (Ryzen 4000/5000), R5 4500U
22109 Points -4%
Asus VivoBook Flip 14 TM420IA
AMD Radeon RX Vega 7, R7 4700U
21630 Points -6%
Asus ZenBook 14 UX434FL-DB77
NVIDIA GeForce MX250, i7-8565U
20445 Points -11%
Huawei MateBook X Pro 2020 i7
NVIDIA GeForce MX250, i7-10510U
19583 Points -15%
Acer Swift 3 SF314-42-R27B
AMD Radeon RX Vega 5, R3 4300U
18282 Points -21%
Apple MacBook Pro 13 2020 2GHz i5 10th-Gen
Intel Iris Plus Graphics G7 (Ice Lake 64 EU), i5-1038NG7
18163 Points -21%
Dell XPS 13 9300 Core i7-1065G7
Intel Iris Plus Graphics G7 (Ice Lake 64 EU), i7-1065G7
17803 Points -23%
HP Spectre x360 13-aw0013dx
Intel Iris Plus Graphics G7 (Ice Lake 64 EU), i7-1065G7
17712 Points -23%
Microsoft Surface Laptop Go Core i5
Intel UHD Graphics G1 (Ice Lake 32 EU), i5-1035G1
11894 Points -48%
Dell XPS 15 9500 Core i5
Intel UHD Graphics 630, i5-10300H
9873 Points -57%
Apple MacBook 12 (Early 2016) 1.1 GHz
Intel HD Graphics 515, 6Y30
6078 Points -74%
1920x1080 Fire Strike Graphics
Asus ZenBook 14 UX425EA
Intel Iris Xe Graphics G7 96EUs, i7-1165G7
5139 Points +23%
Average Intel Iris Xe Graphics G7 96EUs
  (2286 - 6482, n=209)
4915 Points +18%
Dell XPS 13 9310 Core i7 FHD
Intel Iris Xe Graphics G7 96EUs, i7-1165G7
4170 Points
Lenovo Yoga Slim 7-14ARE
AMD Radeon RX Vega 8 (Ryzen 4000/5000), R7 4800U
3938 Points -6%
Asus VivoBook Flip 14 TM420IA
AMD Radeon RX Vega 7, R7 4700U
3036 Points -27%
Huawei MateBook X Pro 2020 i7
NVIDIA GeForce MX250, i7-10510U
2951 Points -29%
Dell XPS 13 9300 Core i7-1065G7
Intel Iris Plus Graphics G7 (Ice Lake 64 EU), i7-1065G7
2950 Points -29%
Asus ZenBook 14 UX434FL-DB77
NVIDIA GeForce MX250, i7-8565U
2945 Points -29%
Apple MacBook Pro 13 2020 2GHz i5 10th-Gen
Intel Iris Plus Graphics G7 (Ice Lake 64 EU), i5-1038NG7
2883 Points -31%
HP Spectre x360 13-aw0013dx
Intel Iris Plus Graphics G7 (Ice Lake 64 EU), i7-1065G7
2874 Points -31%
HP Envy x360 13-ay0010nr
AMD Radeon RX Vega 6 (Ryzen 4000/5000), R5 4500U
2854 Points -32%
Acer Swift 3 SF314-42-R27B
AMD Radeon RX Vega 5, R3 4300U
2438 Points -42%
Microsoft Surface Laptop Go Core i5
Intel UHD Graphics G1 (Ice Lake 32 EU), i5-1035G1
1713 Points -59%
HP Elite Dragonfly-8MK79EA
Intel UHD Graphics 620, i5-8265U
1216 Points -71%
Dell XPS 15 9500 Core i5
Intel UHD Graphics 630, i5-10300H
1189 Points -71%
Apple MacBook 12 (Early 2016) 1.1 GHz
Intel HD Graphics 515, 6Y30
735 Points -82%
2560x1440 Time Spy Graphics
Average Intel Iris Xe Graphics G7 96EUs
  (707 - 1871, n=206)
1496 Points +24%
Asus ZenBook 14 UX425EA
Intel Iris Xe Graphics G7 96EUs, i7-1165G7
1401 Points +16%
Dell XPS 13 9310 Core i7 FHD
Intel Iris Xe Graphics G7 96EUs, i7-1165G7
1209 Points
Lenovo Yoga Slim 7-14ARE
AMD Radeon RX Vega 8 (Ryzen 4000/5000), R7 4800U
1173 Points -3%
Asus VivoBook Flip 14 TM420IA
AMD Radeon RX Vega 7, R7 4700U
903 Points -25%
Asus ZenBook 14 UX434FL-DB77
NVIDIA GeForce MX250, i7-8565U
886 Points -27%
Huawei MateBook X Pro 2020 i7
NVIDIA GeForce MX250, i7-10510U
881 Points -27%
Apple MacBook Pro 13 2020 2GHz i5 10th-Gen
Intel Iris Plus Graphics G7 (Ice Lake 64 EU), i5-1038NG7
825 Points -32%
Dell XPS 13 9300 Core i7-1065G7
Intel Iris Plus Graphics G7 (Ice Lake 64 EU), i7-1065G7
824 Points -32%
HP Envy x360 13-ay0010nr
AMD Radeon RX Vega 6 (Ryzen 4000/5000), R5 4500U
821 Points -32%
Acer Swift 3 SF314-42-R27B
AMD Radeon RX Vega 5, R3 4300U
733 Points -39%
HP Spectre x360 13-aw0013dx
Intel Iris Plus Graphics G7 (Ice Lake 64 EU), i7-1065G7
685 Points -43%
Microsoft Surface Laptop Go Core i5
Intel UHD Graphics G1 (Ice Lake 32 EU), i5-1035G1
440 Points -64%
Dell XPS 15 9500 Core i5
Intel UHD Graphics 630, i5-10300H
382 Points -68%
HP Elite Dragonfly-8MK79EA
Intel UHD Graphics 620, i5-8265U
365 Points -70%
2560x1440 Time Spy Score
Average Intel Iris Xe Graphics G7 96EUs
  (789 - 2133, n=203)
1676 Points +26%
Asus ZenBook 14 UX425EA
Intel Iris Xe Graphics G7 96EUs, i7-1165G7
1541 Points +16%
Lenovo Yoga Slim 7-14ARE
AMD Radeon RX Vega 8 (Ryzen 4000/5000), R7 4800U
1338 Points 0%
Dell XPS 13 9310 Core i7 FHD
Intel Iris Xe Graphics G7 96EUs, i7-1165G7
1333 Points
Asus VivoBook Flip 14 TM420IA
AMD Radeon RX Vega 7, R7 4700U
1028 Points -23%
Asus ZenBook 14 UX434FL-DB77
NVIDIA GeForce MX250, i7-8565U
990 Points -26%
Huawei MateBook X Pro 2020 i7
NVIDIA GeForce MX250, i7-10510U
980 Points -26%
Dell XPS 13 9300 Core i7-1065G7
Intel Iris Plus Graphics G7 (Ice Lake 64 EU), i7-1065G7
937 Points -30%
Apple MacBook Pro 13 2020 2GHz i5 10th-Gen
Intel Iris Plus Graphics G7 (Ice Lake 64 EU), i5-1038NG7
932 Points -30%
HP Envy x360 13-ay0010nr
AMD Radeon RX Vega 6 (Ryzen 4000/5000), R5 4500U
929 Points -30%
Acer Swift 3 SF314-42-R27B
AMD Radeon RX Vega 5, R3 4300U
825 Points -38%
HP Spectre x360 13-aw0013dx
Intel Iris Plus Graphics G7 (Ice Lake 64 EU), i7-1065G7
771 Points -42%
Microsoft Surface Laptop Go Core i5
Intel UHD Graphics G1 (Ice Lake 32 EU), i5-1035G1
505 Points -62%
Dell XPS 15 9500 Core i5
Intel UHD Graphics 630, i5-10300H
441 Points -67%
HP Elite Dragonfly-8MK79EA
Intel UHD Graphics 620, i5-8265U
417 Points -69%
3DMark 11
1280x720 Performance GPU
Dell XPS 13 9310 Core i7 FHD
Intel Iris Xe Graphics G7 96EUs, i7-1165G7
6698 Points
Asus ZenBook 14 UX425EA
Intel Iris Xe Graphics G7 96EUs, i7-1165G7
6563 Points -2%
Average Intel Iris Xe Graphics G7 96EUs
  (2867 - 7652, n=196)
6355 Points -5%
Lenovo Yoga Slim 7-14ARE
AMD Radeon RX Vega 8 (Ryzen 4000/5000), R7 4800U
6085 Points -9%
Asus VivoBook Flip 14 TM420IA
AMD Radeon RX Vega 7, R7 4700U
4927 Points -26%
HP Spectre x360 13-aw0013dx
Intel Iris Plus Graphics G7 (Ice Lake 64 EU), i7-1065G7
4512 Points -33%
Dell XPS 13 9300 Core i7-1065G7
Intel Iris Plus Graphics G7 (Ice Lake 64 EU), i7-1065G7
4508 Points -33%
HP Envy x360 13-ay0010nr
AMD Radeon RX Vega 6 (Ryzen 4000/5000), R5 4500U
4419 Points -34%
Apple MacBook Pro 13 2020 2GHz i5 10th-Gen
Intel Iris Plus Graphics G7 (Ice Lake 64 EU), i5-1038NG7
4374 Points -35%
Huawei MateBook X Pro 2020 i7
NVIDIA GeForce MX250, i7-10510U
3614 Points -46%
Asus ZenBook 14 UX434FL-DB77
NVIDIA GeForce MX250, i7-8565U
3585 Points -46%
Acer Swift 3 SF314-42-R27B
AMD Radeon RX Vega 5, R3 4300U
3535 Points -47%
Microsoft Surface Laptop Go Core i5
Intel UHD Graphics G1 (Ice Lake 32 EU), i5-1035G1
2280 Points -66%
HP Elite Dragonfly-8MK79EA
Intel UHD Graphics 620, i5-8265U
1789 Points -73%
Dell XPS 15 9500 Core i5
Intel UHD Graphics 630, i5-10300H
1744 Points -74%
Apple MacBook 12 (Early 2016) 1.1 GHz
Intel HD Graphics 515, 6Y30
1186 Points -82%
1280x720 Performance Combined
Average Intel Iris Xe Graphics G7 96EUs
  (1926 - 7657, n=195)
5527 Points +36%
Asus ZenBook 14 UX425EA
Intel Iris Xe Graphics G7 96EUs, i7-1165G7
4691 Points +15%
Lenovo Yoga Slim 7-14ARE
AMD Radeon RX Vega 8 (Ryzen 4000/5000), R7 4800U
4323 Points +6%
Dell XPS 13 9300 Core i7-1065G7
Intel Iris Plus Graphics G7 (Ice Lake 64 EU), i7-1065G7
4086 Points 0%
Dell XPS 13 9310 Core i7 FHD
Intel Iris Xe Graphics G7 96EUs, i7-1165G7
4067 Points
Asus ZenBook 14 UX434FL-DB77
NVIDIA GeForce MX250, i7-8565U
3943 Points -3%
Apple MacBook Pro 13 2020 2GHz i5 10th-Gen
Intel Iris Plus Graphics G7 (Ice Lake 64 EU), i5-1038NG7
3828 Points -6%
Huawei MateBook X Pro 2020 i7
NVIDIA GeForce MX250, i7-10510U
3790 Points -7%
HP Spectre x360 13-aw0013dx
Intel Iris Plus Graphics G7 (Ice Lake 64 EU), i7-1065G7
3767 Points -7%
Asus VivoBook Flip 14 TM420IA
AMD Radeon RX Vega 7, R7 4700U
3601 Points -11%
HP Envy x360 13-ay0010nr
AMD Radeon RX Vega 6 (Ryzen 4000/5000), R5 4500U
3322 Points -18%
Acer Swift 3 SF314-42-R27B
AMD Radeon RX Vega 5, R3 4300U
3288 Points -19%
Microsoft Surface Laptop Go Core i5
Intel UHD Graphics G1 (Ice Lake 32 EU), i5-1035G1
1989 Points -51%
Dell XPS 15 9500 Core i5
Intel UHD Graphics 630, i5-10300H
1783 Points -56%
HP Elite Dragonfly-8MK79EA
Intel UHD Graphics 620, i5-8265U
1546 Points -62%
Apple MacBook 12 (Early 2016) 1.1 GHz
Intel HD Graphics 515, 6Y30
1014 Points -75%
3DMark 11 Performance
6554 puntos
3DMark Cloud Gate Standard Score
14167 puntos
3DMark Fire Strike Score
3656 puntos
3DMark Time Spy Score
1333 puntos
ayuda
Final Fantasy XV Benchmark
1280x720 Lite Quality
Average Intel Iris Xe Graphics G7 96EUs
  (14.9 - 56.5, n=177)
39.3 fps +17%
Lenovo Yoga Slim 7-14ARE
AMD Ryzen 7 4800U, AMD Radeon RX Vega 8 (Ryzen 4000/5000)
37.5 fps +11%
Asus ZenBook 14 UX425EA
Intel Core i7-1165G7, Intel Iris Xe Graphics G7 96EUs
35.4 fps +5%
Asus ZenBook 14 UX434FL-DB77
Intel Core i7-8565U, NVIDIA GeForce MX250
33.7 fps 0%
Dell XPS 13 9310 Core i7 FHD
Intel Core i7-1165G7, Intel Iris Xe Graphics G7 96EUs
33.7 fps
Asus VivoBook Flip 14 TM420IA
AMD Ryzen 7 4700U, AMD Radeon RX Vega 7
30.2 fps -10%
Microsoft Surface Laptop Go Core i5
Intel Core i5-1035G1, Intel UHD Graphics G1 (Ice Lake 32 EU)
15.1 fps -55%
1920x1080 Standard Quality
Average Intel Iris Xe Graphics G7 96EUs
  (10.5 - 31.2, n=173)
21.8 fps +11%
Asus ZenBook 14 UX425EA
Intel Core i7-1165G7, Intel Iris Xe Graphics G7 96EUs
20.8 fps +6%
Dell XPS 13 9310 Core i7 FHD
Intel Core i7-1165G7, Intel Iris Xe Graphics G7 96EUs
19.6 fps
Lenovo Yoga Slim 7-14ARE
AMD Ryzen 7 4800U, AMD Radeon RX Vega 8 (Ryzen 4000/5000)
18.8 fps -4%
Asus ZenBook 14 UX434FL-DB77
Intel Core i7-8565U, NVIDIA GeForce MX250
16.4 fps -16%
Asus VivoBook Flip 14 TM420IA
AMD Ryzen 7 4700U, AMD Radeon RX Vega 7
15.2 fps -22%
Microsoft Surface Laptop Go Core i5
Intel Core i5-1035G1, Intel UHD Graphics G1 (Ice Lake 32 EU)
7.49 fps -62%
1920x1080 High Quality
Average Intel Iris Xe Graphics G7 96EUs
  (8.15 - 27.8, n=166)
16.8 fps +9%
Asus ZenBook 14 UX425EA
Intel Core i7-1165G7, Intel Iris Xe Graphics G7 96EUs
15.8 fps +3%
Dell XPS 13 9310 Core i7 FHD
Intel Core i7-1165G7, Intel Iris Xe Graphics G7 96EUs
15.4 fps
Lenovo Yoga Slim 7-14ARE
AMD Ryzen 7 4800U, AMD Radeon RX Vega 8 (Ryzen 4000/5000)
12 fps -22%
Asus ZenBook 14 UX434FL-DB77
Intel Core i7-8565U, NVIDIA GeForce MX250
11 fps -29%
Asus VivoBook Flip 14 TM420IA
AMD Ryzen 7 4700U, AMD Radeon RX Vega 7
9.86 fps -36%
Microsoft Surface Laptop Go Core i5
Intel Core i5-1035G1, Intel UHD Graphics G1 (Ice Lake 32 EU)
5.21 fps -66%
Dota 2 Reborn
1280x720 min (0/3) fastest
Asus ZenBook 14 UX434FL-DB77
Intel Core i7-8565U, NVIDIA GeForce MX250
113 (93.1min) fps +46%
Huawei MateBook X Pro 2020 i7
Intel Core i7-10510U, NVIDIA GeForce MX250
112 (81.5min) fps +45%
Average Intel Iris Xe Graphics G7 96EUs
  (36 - 148, n=209)
100.2 fps +29%
Lenovo Yoga Slim 7-14ARE
AMD Ryzen 7 4800U, AMD Radeon RX Vega 8 (Ryzen 4000/5000)
97.1 (87.3min) fps +25%
HP Envy x360 13-ay0010nr
AMD Ryzen 5 4500U, AMD Radeon RX Vega 6 (Ryzen 4000/5000)
95.1 (85.7min) fps +23%
Apple MacBook Pro 13 2020 2GHz i5 10th-Gen
Intel Core i5-1038NG7, Intel Iris Plus Graphics G7 (Ice Lake 64 EU)
94.7 (84.3min) fps +22%
Asus VivoBook Flip 14 TM420IA
AMD Ryzen 7 4700U, AMD Radeon RX Vega 7
93.9 (83.7min) fps +21%
Acer Swift 3 SF314-42-R27B
AMD Ryzen 3 4300U, AMD Radeon RX Vega 5
93.3 (76.1min) fps +20%
Dell XPS 15 9500 Core i5
Intel Core i5-10300H, Intel UHD Graphics 630
79 (70.3min) fps +2%
Microsoft Surface Laptop Go Core i5
Intel Core i5-1035G1, Intel UHD Graphics G1 (Ice Lake 32 EU)
78.1 (66.3min) fps +1%
Dell XPS 13 9310 Core i7 FHD
Intel Core i7-1165G7, Intel Iris Xe Graphics G7 96EUs
77.5 (42.7min) fps
Asus ZenBook 14 UX425EA
Intel Core i7-1165G7, Intel Iris Xe Graphics G7 96EUs
76.9 (40.9min) fps -1%
HP Elite Dragonfly-8MK79EA
Intel Core i5-8265U, Intel UHD Graphics 620
66.4 (59min) fps -14%
1366x768 med (1/3)
Huawei MateBook X Pro 2020 i7
Intel Core i7-10510U, NVIDIA GeForce MX250
92.6 (76.8min) fps +71%
Asus ZenBook 14 UX434FL-DB77
Intel Core i7-8565U, NVIDIA GeForce MX250
88.6 (77.1min) fps +63%
Lenovo Yoga Slim 7-14ARE
AMD Ryzen 7 4800U, AMD Radeon RX Vega 8 (Ryzen 4000/5000)
82.3 (74.1min) fps +52%
Average Intel Iris Xe Graphics G7 96EUs
  (31.6 - 108.5, n=209)
75.7 fps +39%
HP Envy x360 13-ay0010nr
AMD Ryzen 5 4500U, AMD Radeon RX Vega 6 (Ryzen 4000/5000)
75.6 (69.4min) fps +39%
Acer Swift 3 SF314-42-R27B
AMD Ryzen 3 4300U, AMD Radeon RX Vega 5
74.2 (52.3min) fps +37%
Asus VivoBook Flip 14 TM420IA
AMD Ryzen 7 4700U, AMD Radeon RX Vega 7
70.3 (61.6min) fps +29%
Asus ZenBook 14 UX425EA
Intel Core i7-1165G7, Intel Iris Xe Graphics G7 96EUs
67.4 (45.7min) fps +24%
Apple MacBook Pro 13 2020 2GHz i5 10th-Gen
Intel Core i5-1038NG7, Intel Iris Plus Graphics G7 (Ice Lake 64 EU)
62.8 (46.3min) fps +16%
Dell XPS 13 9310 Core i7 FHD
Intel Core i7-1165G7, Intel Iris Xe Graphics G7 96EUs
54.3 (36.6min) fps
Dell XPS 15 9500 Core i5
Intel Core i5-10300H, Intel UHD Graphics 630
50 (45.3min) fps -8%
HP Elite Dragonfly-8MK79EA
Intel Core i5-8265U, Intel UHD Graphics 620
40.2 (35.6min) fps -26%
Microsoft Surface Laptop Go Core i5
Intel Core i5-1035G1, Intel UHD Graphics G1 (Ice Lake 32 EU)
40.1 (28.6min) fps -26%
1920x1080 high (2/3)
Asus ZenBook 14 UX434FL-DB77
Intel Core i7-8565U, NVIDIA GeForce MX250
61.3 (54.4min) fps +51%
Huawei MateBook X Pro 2020 i7
Intel Core i7-10510U, NVIDIA GeForce MX250
59.7 (51.6min) fps +47%
Lenovo Yoga Slim 7-14ARE
AMD Ryzen 7 4800U, AMD Radeon RX Vega 8 (Ryzen 4000/5000)
56 (50.6min) fps +38%
Average Intel Iris Xe Graphics G7 96EUs
  (23.2 - 88.1, n=209)
54 fps +33%
Asus ZenBook 14 UX425EA
Intel Core i7-1165G7, Intel Iris Xe Graphics G7 96EUs
46.4 (25.8min) fps +15%
HP Envy x360 13-ay0010nr
AMD Ryzen 5 4500U, AMD Radeon RX Vega 6 (Ryzen 4000/5000)
46.3 (42.4min) fps +14%
Asus VivoBook Flip 14 TM420IA
AMD Ryzen 7 4700U, AMD Radeon RX Vega 7
44.5 (36.7min) fps +10%
Acer Swift 3 SF314-42-R27B
AMD Ryzen 3 4300U, AMD Radeon RX Vega 5
41.4 (37.7min) fps +2%
Dell XPS 13 9310 Core i7 FHD
Intel Core i7-1165G7, Intel Iris Xe Graphics G7 96EUs
40.5 (28.7min) fps
Apple MacBook Pro 13 2020 2GHz i5 10th-Gen
Intel Core i5-1038NG7, Intel Iris Plus Graphics G7 (Ice Lake 64 EU)
38.5 (30.9min) fps -5%
Microsoft Surface Laptop Go Core i5
Intel Core i5-1035G1, Intel UHD Graphics G1 (Ice Lake 32 EU)
23.5 (13min) fps -42%
Dell XPS 15 9500 Core i5
Intel Core i5-10300H, Intel UHD Graphics 630
19.7 (18.4min) fps -51%
HP Elite Dragonfly-8MK79EA
Intel Core i5-8265U, Intel UHD Graphics 620
18.7 (17.3min) fps -54%
1920x1080 ultra (3/3) best looking
Asus ZenBook 14 UX434FL-DB77
Intel Core i7-8565U, NVIDIA GeForce MX250
54.1 (46.7min) fps +27%
Huawei MateBook X Pro 2020 i7
Intel Core i7-10510U, NVIDIA GeForce MX250
52.7 (45min) fps +24%
Lenovo Yoga Slim 7-14ARE
AMD Ryzen 7 4800U, AMD Radeon RX Vega 8 (Ryzen 4000/5000)
52.5 (47.3min) fps +24%
Average Intel Iris Xe Graphics G7 96EUs
  (20.6 - 78.5, n=209)
49.2 fps +16%
HP Envy x360 13-ay0010nr
AMD Ryzen 5 4500U, AMD Radeon RX Vega 6 (Ryzen 4000/5000)
43.3 (39.9min) fps +2%
Dell XPS 13 9310 Core i7 FHD
Intel Core i7-1165G7, Intel Iris Xe Graphics G7 96EUs
42.5 (24.8min) fps
Asus ZenBook 14 UX425EA
Intel Core i7-1165G7, Intel Iris Xe Graphics G7 96EUs
42.3 (27.3min) fps 0%
Asus VivoBook Flip 14 TM420IA
AMD Ryzen 7 4700U, AMD Radeon RX Vega 7
41.5 (32.7min) fps -2%
Acer Swift 3 SF314-42-R27B
AMD Ryzen 3 4300U, AMD Radeon RX Vega 5
39.1 (36min) fps -8%
Apple MacBook Pro 13 2020 2GHz i5 10th-Gen
Intel Core i5-1038NG7, Intel Iris Plus Graphics G7 (Ice Lake 64 EU)
35.7 (24.8min) fps -16%
Microsoft Surface Laptop Go Core i5
Intel Core i5-1035G1, Intel UHD Graphics G1 (Ice Lake 32 EU)
21.4 (10.6min) fps -50%
Dell XPS 15 9500 Core i5
Intel Core i5-10300H, Intel UHD Graphics 630
17.4 (16.3min) fps -59%
HP Elite Dragonfly-8MK79EA
Intel Core i5-8265U, Intel UHD Graphics 620
16.9 (15.9min) fps -60%
The Witcher 3
1024x768 Low Graphics & Postprocessing
Dell XPS 13 9310 Core i7 FHD
Intel Core i7-1165G7, Intel Iris Xe Graphics G7 96EUs
97.7 (89min - 107max) fps
Average Intel Iris Xe Graphics G7 96EUs
  (28.9 - 117.2, n=184)
84.1 fps -14%
Asus ZenBook 14 UX425EA
Intel Core i7-1165G7, Intel Iris Xe Graphics G7 96EUs
74.4 (38min - 89max) fps -24%
Lenovo Yoga Slim 7-14ARE
AMD Ryzen 7 4800U, AMD Radeon RX Vega 8 (Ryzen 4000/5000)
70.8 fps -28%
Asus VivoBook Flip 14 TM420IA
AMD Ryzen 7 4700U, AMD Radeon RX Vega 7
61.4 (52min - 70max) fps -37%
Asus ZenBook 14 UX434FL-DB77
Intel Core i7-8565U, NVIDIA GeForce MX250
59.5 (54min - 72max) fps -39%
HP Envy x360 13-ay0010nr
AMD Ryzen 5 4500U, AMD Radeon RX Vega 6 (Ryzen 4000/5000)
56.4 (52min - 60max) fps -42%
Apple MacBook Pro 13 2020 2GHz i5 10th-Gen
Intel Core i5-1038NG7, Intel Iris Plus Graphics G7 (Ice Lake 64 EU)
54.2 fps -45%
Huawei MateBook X Pro 2020 i7
Intel Core i7-10510U, NVIDIA GeForce MX250
52 fps -47%
Dell XPS 13 9300 Core i7-1065G7
Intel Core i7-1065G7, Intel Iris Plus Graphics G7 (Ice Lake 64 EU)
50.7 (17min - 59max) fps -48%
Acer Swift 3 SF314-42-R27B
AMD Ryzen 3 4300U, AMD Radeon RX Vega 5
44.5 fps -54%
HP Spectre x360 13-aw0013dx
Intel Core i7-1065G7, Intel Iris Plus Graphics G7 (Ice Lake 64 EU)
43.9 fps -55%
Dell XPS 15 9500 Core i5
Intel Core i5-10300H, Intel UHD Graphics 630
17.3 fps -82%
HP Elite Dragonfly-8MK79EA
Intel Core i5-8265U, Intel UHD Graphics 620
17.1 fps -82%
Apple MacBook 12 (Early 2016) 1.1 GHz
Intel Core m3-6Y30, Intel HD Graphics 515
7.4 fps -92%
1366x768 Medium Graphics & Postprocessing
Dell XPS 13 9310 Core i7 FHD
Intel Core i7-1165G7, Intel Iris Xe Graphics G7 96EUs
58.4 (17min - 66max) fps
Average Intel Iris Xe Graphics G7 96EUs
  (21.4 - 77.8, n=182)
53.6 fps -8%
Asus ZenBook 14 UX425EA
Intel Core i7-1165G7, Intel Iris Xe Graphics G7 96EUs
41 (37min - 45max) fps -30%
Asus VivoBook Flip 14 TM420IA
AMD Ryzen 7 4700U, AMD Radeon RX Vega 7
38.6 (37min - 43max) fps -34%
Dell XPS 13 9300 Core i7-1065G7
Intel Core i7-1065G7, Intel Iris Plus Graphics G7 (Ice Lake 64 EU)
33.5 (29min - 39max) fps -43%
Apple MacBook Pro 13 2020 2GHz i5 10th-Gen
Intel Core i5-1038NG7, Intel Iris Plus Graphics G7 (Ice Lake 64 EU)
33.1 (28min, 31.07P1 - 36max) fps -43%
Asus ZenBook 14 UX434FL-DB77
Intel Core i7-8565U, NVIDIA GeForce MX250
33 (30min - 36max) fps -43%
Huawei MateBook X Pro 2020 i7
Intel Core i7-10510U, NVIDIA GeForce MX250
30 (28min, 29P1 - 35max) fps -49%
HP Spectre x360 13-aw0013dx
Intel Core i7-1065G7, Intel Iris Plus Graphics G7 (Ice Lake 64 EU)
28.9 fps -51%
Acer Swift 3 SF314-42-R27B
AMD Ryzen 3 4300U, AMD Radeon RX Vega 5
28.4 fps -51%
Dell XPS 15 9500 Core i5
Intel Core i5-10300H, Intel UHD Graphics 630
10.8 fps -82%
1920x1080 High Graphics & Postprocessing (Nvidia HairWorks Off)
Dell XPS 13 9310 Core i7 FHD
Intel Core i7-1165G7, Intel Iris Xe Graphics G7 96EUs
32.7 (29min - 36max) fps
Average Intel Iris Xe Graphics G7 96EUs
  (10.6 - 45.9, n=187)
28.7 fps -12%
Asus ZenBook 14 UX425EA
Intel Core i7-1165G7, Intel Iris Xe Graphics G7 96EUs
25.4 (22min - 29max) fps -22%
Lenovo Yoga Slim 7-14ARE
AMD Ryzen 7 4800U, AMD Radeon RX Vega 8 (Ryzen 4000/5000)
23.1 fps -29%
Asus VivoBook Flip 14 TM420IA
AMD Ryzen 7 4700U, AMD Radeon RX Vega 7
20.2 (17min - 22max) fps -38%
Asus ZenBook 14 UX434FL-DB77
Intel Core i7-8565U, NVIDIA GeForce MX250
19.4 (16min - 24max) fps -41%
Dell XPS 13 9300 Core i7-1065G7
Intel Core i7-1065G7, Intel Iris Plus Graphics G7 (Ice Lake 64 EU)
18.4 (14min - 23max) fps -44%
Apple MacBook Pro 13 2020 2GHz i5 10th-Gen
Intel Core i5-1038NG7, Intel Iris Plus Graphics G7 (Ice Lake 64 EU)
18 fps -45%
HP Envy x360 13-ay0010nr
AMD Ryzen 5 4500U, AMD Radeon RX Vega 6 (Ryzen 4000/5000)
16.6 (15min - 18max) fps -49%
Huawei MateBook X Pro 2020 i7
Intel Core i7-10510U, NVIDIA GeForce MX250
16.3 fps -50%
Acer Swift 3 SF314-42-R27B
AMD Ryzen 3 4300U, AMD Radeon RX Vega 5
14.1 fps -57%
HP Spectre x360 13-aw0013dx
Intel Core i7-1065G7, Intel Iris Plus Graphics G7 (Ice Lake 64 EU)
13.8 fps -58%
1920x1080 Ultra Graphics & Postprocessing (HBAO+)
Lenovo Yoga Slim 7-14ARE
AMD Ryzen 7 4800U, AMD Radeon RX Vega 8 (Ryzen 4000/5000)
14.9 fps +4%
Dell XPS 13 9310 Core i7 FHD
Intel Core i7-1165G7, Intel Iris Xe Graphics G7 96EUs
14.3 (12min - 17max) fps
Average Intel Iris Xe Graphics G7 96EUs
  (8.79 - 20.1, n=177)
14 fps -2%
Asus VivoBook Flip 14 TM420IA
AMD Ryzen 7 4700U, AMD Radeon RX Vega 7
13.2 (12min - 15max) fps -8%
Asus ZenBook 14 UX425EA
Intel Core i7-1165G7, Intel Iris Xe Graphics G7 96EUs
11.9 (9min - 14max) fps -17%
HP Envy x360 13-ay0010nr
AMD Ryzen 5 4500U, AMD Radeon RX Vega 6 (Ryzen 4000/5000)
10.6 (9min - 12max) fps -26%
Asus ZenBook 14 UX434FL-DB77
Intel Core i7-8565U, NVIDIA GeForce MX250
10.3 (7min - 13max) fps -28%
Dell XPS 13 9300 Core i7-1065G7
Intel Core i7-1065G7, Intel Iris Plus Graphics G7 (Ice Lake 64 EU)
9.1 (6min - 13max) fps -36%
Huawei MateBook X Pro 2020 i7
Intel Core i7-10510U, NVIDIA GeForce MX250
9 fps -37%
Acer Swift 3 SF314-42-R27B
AMD Ryzen 3 4300U, AMD Radeon RX Vega 5
8.9 fps -38%
HP Spectre x360 13-aw0013dx
Intel Core i7-1065G7, Intel Iris Plus Graphics G7 (Ice Lake 64 EU)
7.2 fps -50%
X-Plane 11.11
1280x720 low (fps_test=1)
Huawei MateBook X Pro 2020 i7
Intel Core i7-10510U, NVIDIA GeForce MX250
55.6 fps +16%
Asus ZenBook 14 UX425EA
Intel Core i7-1165G7, Intel Iris Xe Graphics G7 96EUs
50.1 fps +4%
Asus ZenBook 14 UX434FL-DB77
Intel Core i7-8565U, NVIDIA GeForce MX250
49.2 fps +3%
Dell XPS 13 9310 Core i7 FHD
Intel Core i7-1165G7, Intel Iris Xe Graphics G7 96EUs
48 fps
Lenovo Yoga Slim 7-14ARE
AMD Ryzen 7 4800U, AMD Radeon RX Vega 8 (Ryzen 4000/5000)
42.7 fps -11%
Average Intel Iris Xe Graphics G7 96EUs
  (13.4 - 88.4, n=209)
41.5 fps -14%
Asus VivoBook Flip 14 TM420IA
AMD Ryzen 7 4700U, AMD Radeon RX Vega 7
40.6 fps -15%
HP Envy x360 13-ay0010nr
AMD Ryzen 5 4500U, AMD Radeon RX Vega 6 (Ryzen 4000/5000)
39.1 fps -19%
Acer Swift 3 SF314-42-R27B
AMD Ryzen 3 4300U, AMD Radeon RX Vega 5
31.5 fps -34%
Apple MacBook Pro 13 2020 2GHz i5 10th-Gen
Intel Core i5-1038NG7, Intel Iris Plus Graphics G7 (Ice Lake 64 EU)
25.9 fps -46%
Dell XPS 15 9500 Core i5
Intel Core i5-10300H, Intel UHD Graphics 630
22.4 fps -53%
Microsoft Surface Laptop Go Core i5
Intel Core i5-1035G1, Intel UHD Graphics G1 (Ice Lake 32 EU)
17.3 fps -64%
HP Elite Dragonfly-8MK79EA
Intel Core i5-8265U, Intel UHD Graphics 620
11.7 fps -76%
1920x1080 med (fps_test=2)
Asus ZenBook 14 UX434FL-DB77
Intel Core i7-8565U, NVIDIA GeForce MX250
41.1 fps +10%
Huawei MateBook X Pro 2020 i7
Intel Core i7-10510U, NVIDIA GeForce MX250
40.8 fps +9%
Dell XPS 13 9310 Core i7 FHD
Intel Core i7-1165G7, Intel Iris Xe Graphics G7 96EUs
37.3 fps
Asus ZenBook 14 UX425EA
Intel Core i7-1165G7, Intel Iris Xe Graphics G7 96EUs
35.4 fps -5%
Average Intel Iris Xe Graphics G7 96EUs
  (11.6 - 69.5, n=210)
35.3 fps -5%
Lenovo Yoga Slim 7-14ARE
AMD Ryzen 7 4800U, AMD Radeon RX Vega 8 (Ryzen 4000/5000)
34.5 fps -8%
Asus VivoBook Flip 14 TM420IA
AMD Ryzen 7 4700U, AMD Radeon RX Vega 7
32.5 fps -13%
HP Envy x360 13-ay0010nr
AMD Ryzen 5 4500U, AMD Radeon RX Vega 6 (Ryzen 4000/5000)
30.1 fps -19%
Acer Swift 3 SF314-42-R27B
AMD Ryzen 3 4300U, AMD Radeon RX Vega 5
24.9 fps -33%
Dell XPS 15 9500 Core i5
Intel Core i5-10300H, Intel UHD Graphics 630
14.3 fps -62%
Apple MacBook Pro 13 2020 2GHz i5 10th-Gen
Intel Core i5-1038NG7, Intel Iris Plus Graphics G7 (Ice Lake 64 EU)
11.7 fps -69%
Microsoft Surface Laptop Go Core i5
Intel Core i5-1035G1, Intel UHD Graphics G1 (Ice Lake 32 EU)
10.4 fps -72%
HP Elite Dragonfly-8MK79EA
Intel Core i5-8265U, Intel UHD Graphics 620
9.84 fps -74%
1920x1080 high (fps_test=3)
Huawei MateBook X Pro 2020 i7
Intel Core i7-10510U, NVIDIA GeForce MX250
37.9 fps +17%
Asus ZenBook 14 UX434FL-DB77
Intel Core i7-8565U, NVIDIA GeForce MX250
37.5 fps +15%
Asus ZenBook 14 UX425EA
Intel Core i7-1165G7, Intel Iris Xe Graphics G7 96EUs
32.6 fps 0%
Dell XPS 13 9310 Core i7 FHD
Intel Core i7-1165G7, Intel Iris Xe Graphics G7 96EUs
32.5 fps
Average Intel Iris Xe Graphics G7 96EUs
  (11.1 - 59.8, n=209)
31.6 fps -3%
Lenovo Yoga Slim 7-14ARE
AMD Ryzen 7 4800U, AMD Radeon RX Vega 8 (Ryzen 4000/5000)
30.5 fps -6%
Asus VivoBook Flip 14 TM420IA
AMD Ryzen 7 4700U, AMD Radeon RX Vega 7
28.6 fps -12%
HP Envy x360 13-ay0010nr
AMD Ryzen 5 4500U, AMD Radeon RX Vega 6 (Ryzen 4000/5000)
26.8 fps -18%
Acer Swift 3 SF314-42-R27B
AMD Ryzen 3 4300U, AMD Radeon RX Vega 5
22.4 fps -31%
Dell XPS 15 9500 Core i5
Intel Core i5-10300H, Intel UHD Graphics 630
12.8 fps -61%
Apple MacBook Pro 13 2020 2GHz i5 10th-Gen
Intel Core i5-1038NG7, Intel Iris Plus Graphics G7 (Ice Lake 64 EU)
10.9 fps -66%
Microsoft Surface Laptop Go Core i5
Intel Core i5-1035G1, Intel UHD Graphics G1 (Ice Lake 32 EU)
10.8 fps -67%
HP Elite Dragonfly-8MK79EA
Intel Core i5-8265U, Intel UHD Graphics 620
9.25 fps -72%
GTA V
1024x768 Lowest Settings possible
Asus ZenBook 14 UX434FL-DB77
Intel Core i7-8565U, NVIDIA GeForce MX250
109 (19.9min, 62.5P1 - 217max) fps +29%
Lenovo Yoga Slim 7-14ARE
AMD Ryzen 7 4800U, AMD Radeon RX Vega 8 (Ryzen 4000/5000)
101 (10.4min, 66.7P1 - 168max) fps +20%
Average Intel Iris Xe Graphics G7 96EUs
  (52 - 166.4, n=157)
98.1 fps +16%
Dell XPS 13 9310 Core i7 FHD
Intel Core i7-1165G7, Intel Iris Xe Graphics G7 96EUs
84.3 (19.6min, 45.5P1 - 137max) fps
Asus ZenBook 14 UX425EA
Intel Core i7-1165G7, Intel Iris Xe Graphics G7 96EUs
81.7 (15.4min, 35.7P1 - 162max) fps -3%
Acer Swift 3 SF314-42-R27B
AMD Ryzen 3 4300U, AMD Radeon RX Vega 5
80.3 fps -5%
1920x1080 Lowest Settings possible
Asus ZenBook 14 UX434FL-DB77
Intel Core i7-8565U, NVIDIA GeForce MX250
80.9 (31.1min, 41.7P1 - 155max) fps +11%
Average Intel Iris Xe Graphics G7 96EUs
  (34.7 - 132.1, n=131)
73.2 fps +1%
Dell XPS 13 9310 Core i7 FHD
Intel Core i7-1165G7, Intel Iris Xe Graphics G7 96EUs
72.6 (15.3min, 38.5P1 - 138max) fps
Lenovo Yoga Slim 7-14ARE
AMD Ryzen 7 4800U, AMD Radeon RX Vega 8 (Ryzen 4000/5000)
69.1 (4.94min, 50P1 - 109max) fps -5%
Asus ZenBook 14 UX425EA
Intel Core i7-1165G7, Intel Iris Xe Graphics G7 96EUs
55.2 (12min, 22.2P1 - 128max) fps -24%
Acer Swift 3 SF314-42-R27B
AMD Ryzen 3 4300U, AMD Radeon RX Vega 5
50 fps -31%
1366x768 Normal/Off AF:4x
Asus ZenBook 14 UX434FL-DB77
Intel Core i7-8565U, NVIDIA GeForce MX250
95.4 (19.3min, 45.5P1 - 155max) fps +24%
Average Intel Iris Xe Graphics G7 96EUs
  (24.1 - 149.3, n=160)
82.7 fps +8%
Dell XPS 13 9310 Core i7 FHD
Intel Core i7-1165G7, Intel Iris Xe Graphics G7 96EUs
76.8 (5.78min, 40P1 - 185max) fps
Acer Swift 3 SF314-42-R27B
AMD Ryzen 3 4300U, AMD Radeon RX Vega 5
70.7 fps -8%
Asus ZenBook 14 UX425EA
Intel Core i7-1165G7, Intel Iris Xe Graphics G7 96EUs
66.6 (14.4min, 22.7P1 - 131max) fps -13%
1920x1080 Normal/Off AF:4x
Asus ZenBook 14 UX434FL-DB77
Intel Core i7-8565U, NVIDIA GeForce MX250
82.1 (25.8min, 40P1 - 136max) fps +25%
Lenovo Yoga Slim 7-14ARE
AMD Ryzen 7 4800U, AMD Radeon RX Vega 8 (Ryzen 4000/5000)
69.6 (5min, 45.5P1 - 119max) fps +6%
Dell XPS 13 9310 Core i7 FHD
Intel Core i7-1165G7, Intel Iris Xe Graphics G7 96EUs
65.5 (14.1min, 35.7P1 - 117max) fps
Average Intel Iris Xe Graphics G7 96EUs
  (20 - 119.3, n=132)
64.8 fps -1%
Acer Swift 3 SF314-42-R27B
AMD Ryzen 3 4300U, AMD Radeon RX Vega 5
49.5 fps -24%
Asus ZenBook 14 UX425EA
Intel Core i7-1165G7, Intel Iris Xe Graphics G7 96EUs
48.4 (9.05min, 16.1P1 - 122max) fps -26%
1920x1080 High/On (Advanced Graphics Off) AA:2xMSAA + FX AF:8x
Asus ZenBook 14 UX434FL-DB77
Intel Core i7-8565U, NVIDIA GeForce MX250
35.9 (13.5min, 23.8P1 - 83.3max) fps +45%
Lenovo Yoga Slim 7-14ARE
AMD Ryzen 7 4800U, AMD Radeon RX Vega 8 (Ryzen 4000/5000)
29.8 (3.22min, 21.3P1 - 83.4max) fps +21%
Dell XPS 13 9310 Core i7 FHD
Intel Core i7-1165G7, Intel Iris Xe Graphics G7 96EUs
24.7 (7.44min, 17.9P1 - 101max) fps
Average Intel Iris Xe Graphics G7 96EUs
  (9.39 - 51.6, n=152)
22.8 fps -8%
Acer Swift 3 SF314-42-R27B
AMD Ryzen 3 4300U, AMD Radeon RX Vega 5
20 fps -19%
Asus ZenBook 14 UX425EA
Intel Core i7-1165G7, Intel Iris Xe Graphics G7 96EUs
18.7 (6.48min, 9.26P1 - 104max) fps -24%
Strange Brigade
1280x720 lowest AF:1
Dell XPS 13 9310 Core i7 FHD
Intel Core i7-1165G7, Intel Iris Xe Graphics G7 96EUs
94.4 (16.2min, 33.1P1 - 363max) fps
Average Intel Iris Xe Graphics G7 96EUs
  (48.5 - 115.1, n=163)
84.8 fps -10%
Lenovo Yoga Slim 7-14ARE
AMD Ryzen 7 4800U, AMD Radeon RX Vega 8 (Ryzen 4000/5000)
79.7 (49.2min, 68.9P1 - 151max) fps -16%
Asus ZenBook 14 UX425EA
Intel Core i7-1165G7, Intel Iris Xe Graphics G7 96EUs
77.5 (15.6min, 29P1 - 281max) fps -18%
Asus ZenBook 14 UX434FL-DB77
Intel Core i7-8565U, NVIDIA GeForce MX250
71.3 (49.1min, 57.4P1 - 118max) fps -24%
1920x1080 medium AA:medium AF:4
Dell XPS 13 9310 Core i7 FHD
Intel Core i7-1165G7, Intel Iris Xe Graphics G7 96EUs
38.5 (8.5min, 10P1 - 315max) fps
Average Intel Iris Xe Graphics G7 96EUs
  (18.2 - 51.4, n=161)
36.5 fps -5%
Asus ZenBook 14 UX425EA
Intel Core i7-1165G7, Intel Iris Xe Graphics G7 96EUs
35.2 (8.6min, 12P1 - 225max) fps -9%
Lenovo Yoga Slim 7-14ARE
AMD Ryzen 7 4800U, AMD Radeon RX Vega 8 (Ryzen 4000/5000)
32.5 (25.4min, 28.5P1 - 41.2max) fps -16%
Asus ZenBook 14 UX434FL-DB77
Intel Core i7-8565U, NVIDIA GeForce MX250
26.7 (18.6min, 20.2P1 - 40.2max) fps -31%
1920x1080 high AA:high AF:8
Dell XPS 13 9310 Core i7 FHD
Intel Core i7-1165G7, Intel Iris Xe Graphics G7 96EUs
30.4 (6.3min, 7.97P1 - 280max) fps
Average Intel Iris Xe Graphics G7 96EUs
  (15.4 - 39.8, n=160)
29.3 fps -4%
Asus ZenBook 14 UX425EA
Intel Core i7-1165G7, Intel Iris Xe Graphics G7 96EUs
28.3 (5.2min, 7.9P1 - 253max) fps -7%
Lenovo Yoga Slim 7-14ARE
AMD Ryzen 7 4800U, AMD Radeon RX Vega 8 (Ryzen 4000/5000)
27.4 (17.2min, 21.5P1 - 44.5max) fps -10%
Asus ZenBook 14 UX434FL-DB77
Intel Core i7-8565U, NVIDIA GeForce MX250
19.9 (14.3min, 15.4P1 - 36.3max) fps -35%
0306090120150180210240270300330360390420450480510Tooltip
Dell XPS 13 9310 Core i7 FHD Iris Xe G7 96EUs, i7-1165G7, Micron 2300 512GB MTFDHBA512TDV: Ø71.4 (51-88)
bajo medio alto ultra
GTA V (2015) 84.3 76.8 24.7 10.5
The Witcher 3 (2015) 97.7 58.4 32.7 14.3
Dota 2 Reborn (2015) 77.5 54.3 40.5 42.5
Final Fantasy XV Benchmark (2018) 33.7 19.6 15.4
X-Plane 11.11 (2018) 48 37.3 32.5
Strange Brigade (2018) 94.4 38.5 30.4 24

Emisiones

Ruido de sistema

Las características del ruido del ventilador son en gran medida las mismas cuando se comparan con el XPS 9300. Lo más importante es que las RPM de los ventiladores son constantes a pesar de las siempre cambiantes velocidades de la CPU cuando se encuentran bajo cargas altas. El sistema es capaz de permanecer casi completamente silencioso incluso durante toda la primera escena de referencia de 90 segundos del 3DMark 06.

Dos ventiladores gemelos de ~35 mm con un solo tubo de calor grueso entre ellos
No hemos notado ningún ruido electrónico en nuestra unidad
Perfil de ruido de los ventiladores (Blanco: Fondo, Rojo: Sistema en reposo, Azul: 3DMark 06, Naranja: Witcher 3, Verde: Prime95+estrés de furMark)
Dell XPS 13 9310 Core i7 FHD
Iris Xe G7 96EUs, i7-1165G7, Micron 2300 512GB MTFDHBA512TDV
Dell XPS 13 9300 Core i7-1065G7
Iris Plus Graphics G7 (Ice Lake 64 EU), i7-1065G7, Intel SSDPEMKF512G8 NVMe SSD
Apple MacBook Pro 13 2020 2GHz i5 10th-Gen
Iris Plus Graphics G7 (Ice Lake 64 EU), i5-1038NG7, Apple SSD SM0512F
Huawei MateBook X Pro 2020 i7
GeForce MX250, i7-10510U, Samsung PM981a MZVLB1T0HBLR
Lenovo Yoga Slim 7-14ARE
Vega 8, R7 4800U, Samsung SSD PM981a MZVLB512HBJQ
Noise
-11%
-15%
-16%
-4%
off / environment *
25.7
28.3
-10%
29.6
-15%
29.6
-15%
26.3
-2%
Idle Minimum *
25.7
28.3
-10%
29.6
-15%
29.6
-15%
26.5
-3%
Idle Average *
25.7
28.3
-10%
29.6
-15%
29.6
-15%
26.5
-3%
Idle Maximum *
25.9
28.3
-9%
29.6
-14%
30.3
-17%
26.5
-2%
Load Average *
26.2
32.5
-24%
34.4
-31%
38
-45%
31.8
-21%
Witcher 3 ultra *
36.5
39.3
-8%
36.1
1%
38
-4%
35.9
2%
Load Maximum *
36.6
39.3
-7%
42.1
-15%
38
-4%
35.9
2%

* ... más pequeño es mejor

Ruido

Ocioso
25.7 / 25.7 / 25.9 dB(A)
Carga
26.2 / 36.6 dB(A)
  red to green bar
 
 
30 dB
silencioso
40 dB(A)
audible
50 dB(A)
ruidosamente alto
 
min: dark, med: mid, max: light   Earthworks M23R, Arta (15 cm de distancia)   environment noise: 25.7 dB(A)
dB(A) 0102030405060708090Deep BassMiddle BassHigh BassLower RangeMidsHigher MidsLower HighsMid HighsUpper HighsSuper Highs2031.940.532.833.138.631.92529.736.236.931.231.729.73122.73026.13132.622.74023.524.422.421.723.723.55020.723.52424.724.120.76319.630.931.831.731.219.68019.722.721.22323.119.710024.224.519.319.92024.212523.724.724.922.924.923.716017.620.719.119.619.917.62001820.318.419.318.8182501920.517.117.817.11931520.120.216.818.316.620.140020.620.91515.814.520.650022.923.114.314.714.422.963023.824.41414.613.823.880022.722.913.513.613.522.7100021.12113.113.313.121.1125021.722.113.413.11321.7160022.122.51312.913.122.1200024.223.915.413.513.224.2250025.825.613.413.41325.8315026.726.513.613.413.226.7400028.929.21413.313.328.9500026.126.113.813.213.326.163002424.113.613.313.324800019.7201413.513.319.71000017.918.113.613.313.217.91250016.316.613.813.11316.3160001313.513.212.512.313SPL36.536.626.225.925.736.5N2.42.40.80.80.72.4median 22.1median 22.5median 14median 13.5median 13.3median 22.1Delta2.32.11.61.81.92.3hearing rangehide median Fan NoiseDell XPS 13 9310 Core i7 FHD

Temperatura

Las temperaturas de la superficie son casi idénticas a las del XPS 13 9300 del año pasado, a pesar del salto a un procesador de nueva generación con gráficos integrados más rápidos. A diferencia de la mayoría de los Ultrabooks más baratos que sólo tienen un ventilador interno, el Dell integra dos para un perfil de temperatura más simétrico.

Doble escape trasero
Adaptador de CA después de ejecutar Witcher 3 durante más de una hora
 40.2 °C46.2 °C36.2 °C 
 42.8 °C35 °C33.8 °C 
 32 °C31 °C31.4 °C 
Máximo: 46.2 °C
Médio: 36.5 °C
41.8 °C45.2 °C46 °C
36.2 °C39.2 °C37.2 °C
33.6 °C35 °C34.6 °C
Máximo: 46 °C
Médio: 38.8 °C
Conector de corriente  45 °C | Temperatura del cuarto 22.6 °C | Fluke 62 Mini IR Thermometer
(±) The average temperature for the upper side under maximal load is 36.5 °C / 98 F, compared to the average of 30.7 °C / 87 F for the devices in the class Subnotebook.
(-) The maximum temperature on the upper side is 46.2 °C / 115 F, compared to the average of 35.9 °C / 97 F, ranging from 21.4 to 59 °C for the class Subnotebook.
(-) The bottom heats up to a maximum of 46 °C / 115 F, compared to the average of 39.4 °C / 103 F
(+) In idle usage, the average temperature for the upper side is 20.7 °C / 69 F, compared to the device average of 30.7 °C / 87 F.
(±) Playing The Witcher 3, the average temperature for the upper side is 34.2 °C / 94 F, compared to the device average of 30.7 °C / 87 F.
(+) The palmrests and touchpad are reaching skin temperature as a maximum (32 °C / 89.6 F) and are therefore not hot.
(-) The average temperature of the palmrest area of similar devices was 28.3 °C / 82.9 F (-3.7 °C / -6.7 F).
Sistema inactivo (abajo)
Sistema inactivo (arriba)
Witcher 3 (arriba)
Witcher 3 (arriba)
Witcher 3  (abajo)
Witcher 3 (abajo)
Prime95+FurMark (arriba)
Prime95+FurMark  (abajo)
Prime95+FurMark (abajo)

Prueba de estrés

Correr Prime95 revela por qué los resultados de nuestro CineBench grabado y las tasas de fotogramas de arriba son inestables. Las frecuencias primero aumentarían a 4,1 GHz durante los primeros segundos de la prueba, pero luego empezarían a oscilar entre 2,5 GHz y 3,1 GHz y 71 C y 78 C, respectivamente, en comparación con los 2,3 GHz y 68 C del Asus ZenBook 14 UX425 con el mismo procesador Core i7-1165G7. En otras palabras, la sintonización dinámica de Dell permite un rendimiento más rápido en promedio a costa de velocidades  y temperaturas constantes. Este enfoque puede ser útil cuando se ejecutan tareas de gran carga de CPU, pero puede ser un escenario de pesadilla para los juegos .

Por ejemplo, si se ejecuta Witcher 3 con una configuración baja, la velocidad de la CPU y la GPU oscilará entre 1,4 GHz y 2,0 GHz y 850 MHz y 1100 MHz, respectivamente, para velocidades de cuadro desiguales. La activación de v-sync puede aliviar el ritmo desigual de los cuadros, según el juego y la configuración.

Si se utiliza la energía de la batería, el rendimiento de los gráficos se verá más afectado que el rendimiento de la CPU. Una prueba de 3DMark 11 con baterías arrojaría unos resultados en Física y Gráficos de 10904 y 6093 puntos, respectivamente, en comparación con los 9375 y 6698 puntos que se obtienen con la red eléctrica.

Sistema inactivo
Sistema inactivo
Witcher 3
Witcher 3
Prime95
Prime95
Prime95+FurMark
Prime95+FurMark
CPU Clock (GHz) GPU Clock (MHz) Average CPU Temperature (°C)
System Idle -- -- 36
Prime95 Stress 2.5 - 3.1 -- 71 - 78
Prime95 + FurMark Stress 1.2 - 1.6 700 - 850 61 - 69
Witcher 3 Stress 1.4 - 2.0 850 - 1100 61 - 65

Altavoces

Altavoces estéreo cerca de las esquinas delanteras
Ruido rosa al máximo volumen. El equilibrio es bastante bueno considerando el pequeño factor de forma
dB(A) 0102030405060708090Deep BassMiddle BassHigh BassLower RangeMidsHigher MidsLower HighsMid HighsUpper HighsSuper Highs2032.933.132.92527.531.227.53125.13125.1402721.7275023.624.723.6633231.7328021.72321.71003419.9341254822.94816054.819.654.820059.419.359.425066.117.866.131567.118.367.140065.515.865.55007114.77163074.714.674.780072.613.672.610007613.376125074.413.174.4160072.912.972.920007113.571250072.913.472.9315072.213.472.240007013.370500073.313.273.3630070.613.370.6800073.413.573.4100007113.3711250067.513.167.51600066.612.566.6SPL84.625.984.6N65.80.865.8median 71median 13.5median 71Delta4.61.84.635.335.132.931.831.83236.535.132.428.93328.936.328.848.32761.52752.924.860.92462.822.763.32269.521.267.82174.82075.919.472.718.97117.770.117.86917.671.817.668.117.671.417.673.717.670.417.571.617.671.617.669.617.459.717.583.630.662.51.5median 69.6median 17.84.72.4hearing rangehide median Pink NoiseDell XPS 13 9310 Core i7 FHDApple MacBook 12 (Early 2016) 1.1 GHz
Diagrama de frecuencia en comparación (¡las casillas de verificación se pueden marcar y desmarcar!)
Dell XPS 13 9310 Core i7 FHD audio analysis

(+) | speakers can play relatively loud (84.6 dB)
Bass 100 - 315 Hz
(-) | nearly no bass - on average 16.1% lower than median
(±) | linearity of bass is average (13.1% delta to prev. frequency)
Mids 400 - 2000 Hz
(+) | balanced mids - only 2.6% away from median
(+) | mids are linear (4.6% delta to prev. frequency)
Highs 2 - 16 kHz
(+) | balanced highs - only 1.3% away from median
(+) | highs are linear (4% delta to prev. frequency)
Overall 100 - 16.000 Hz
(+) | overall sound is linear (10.7% difference to median)
Compared to same class
» 6% of all tested devices in this class were better, 3% similar, 91% worse
» The best had a delta of 5%, average was 19%, worst was 53%
Compared to all devices tested
» 4% of all tested devices were better, 1% similar, 95% worse
» The best had a delta of 4%, average was 25%, worst was 134%

Apple MacBook 12 (Early 2016) 1.1 GHz audio analysis

(+) | speakers can play relatively loud (83.6 dB)
Bass 100 - 315 Hz
(±) | reduced bass - on average 11.3% lower than median
(±) | linearity of bass is average (14.2% delta to prev. frequency)
Mids 400 - 2000 Hz
(+) | balanced mids - only 2.4% away from median
(+) | mids are linear (5.5% delta to prev. frequency)
Highs 2 - 16 kHz
(+) | balanced highs - only 2% away from median
(+) | highs are linear (4.5% delta to prev. frequency)
Overall 100 - 16.000 Hz
(+) | overall sound is linear (10.2% difference to median)
Compared to same class
» 5% of all tested devices in this class were better, 2% similar, 93% worse
» The best had a delta of 5%, average was 19%, worst was 53%
Compared to all devices tested
» 3% of all tested devices were better, 1% similar, 96% worse
» The best had a delta of 4%, average was 25%, worst was 134%

Gestión de la energía

Consumo de energía

Our Tiger Lake unit demands about as much power as the older Ice Lake unit despite the gen-to-gen improvements in integrated graphics. Thus, the Iris Xe G7 is able to provide additional graphics performance for "free" without needing to draw more from the outlet.

Performance-per-watt is excellent when compared to competing systems with the GeForce MX250 or Radeon Vega 8 like the MateBook X Pro or Lenovo Yoga Slim 7, respectively, which consume about 10 W to 15 W more each when subjected to similar demanding loads.

We're able to measure a maximum consumption of 47.5 W from the small (~6.0 x 5.5 x 2.2 cm) 45 W AC adapter. The system battery will still recharge since this maximum rate is not steady as shown by our graphs below.

El consumo fluctuaría entre 31 W y 46 W al ejecutar 3DMark 06
El consumo al correr Witcher 3 cambiaría con el tiempo debido a las velocidades del núcleo  y de los cuadros mencionados anteriormente.
El consumo al correr Witcher 3 cambiaría con el tiempo debido a las velocidades del núcleo y de los cuadros mencionados anteriormente.
Prime95 iniciado a los 10s El consumo se dispararía a 47,5 W durante unos 20 segundos hasta que la temperatura del núcleo alcance los 81 C. A partir de entonces, tendría un ciclo entre 26 W y 39 W
Prime95+FurMark iniciado en la marca de los 10s. El comportamiento de consumo de los ciclos sigue siendo
Consumo de corriente
Off / Standbydarklight 0.31 / 0.48 Watt
Ociosodarkmidlight 3.9 / 5.9 / 6.3 Watt
Carga midlight 39.7 / 47.5 Watt
 color bar
Clave: min: dark, med: mid, max: light        Metrahit Energy
Currently we use the Metrahit Energy, a professional single phase power quality and energy measurement digital multimeter, for our measurements. Find out more about it here. All of our test methods can be found here.
Dell XPS 13 9310 Core i7 FHD
i7-1165G7, Iris Xe G7 96EUs, Micron 2300 512GB MTFDHBA512TDV, IPS, 1920x1200, 13.40
Dell XPS 13 9300 Core i7-1065G7
i7-1065G7, Iris Plus Graphics G7 (Ice Lake 64 EU), Intel SSDPEMKF512G8 NVMe SSD, IPS, 1920x1200, 13.40
Apple MacBook Pro 13 2020 2GHz i5 10th-Gen
i5-1038NG7, Iris Plus Graphics G7 (Ice Lake 64 EU), Apple SSD SM0512F, IPS, 2560x1600, 13.30
Huawei MateBook X Pro 2020 i7
i7-10510U, GeForce MX250, Samsung PM981a MZVLB1T0HBLR, LTPS, 3000x2000, 13.90
Lenovo Yoga Slim 7-14ARE
R7 4800U, Vega 8, Samsung SSD PM981a MZVLB512HBJQ, IPS, 1920x1080, 14.00
HP Spectre x360 13-aw0013dx
i7-1065G7, Iris Plus Graphics G7 (Ice Lake 64 EU), Intel Optane Memory H10 with Solid State Storage 32GB + 512GB HBRPEKNX0202A(L/H), IPS, 1920x1080, 13.30
Power Consumption
-6%
-36%
-41%
-19%
1%
Idle Minimum *
3.9
4.2
-8%
3.8
3%
4.3
-10%
4
-3%
3.9
-0%
Idle Average *
5.9
6.9
-17%
8.6
-46%
8.5
-44%
6.3
-7%
6.3
-7%
Idle Maximum *
6.3
7.5
-19%
10.3
-63%
12
-90%
7.7
-22%
6.8
-8%
Load Average *
39.7
33.3
16%
52.1
-31%
54.8
-38%
48.3
-22%
32.6
18%
Witcher 3 ultra *
34.8
37.1
-7%
48.2
-39%
47.1
-35%
49
-41%
25.6
26%
Load Maximum *
47.5
48.4
-2%
65.2
-37%
61.5
-29%
57.6
-21%
59
-24%

* ... más pequeño es mejor

Duración de la batería

Los tiempos de ejecución no son tan diferentes de los del XPS 13 9300. De hecho, pueden ser ligeramente más cortos según nuestras propias pruebas. Sin embargo, 11 horas de uso de la WLAN en el mundo real deberían ser más que suficientes para la mayoría de los usuarios.


La carga de vacío a lleno toma un poco más de 2 horas en comparación con 1,5 horas en la mayoría de los otros Ultrabooks.

Tiempo de Ejecución de la Batería
Ocioso (sin WLAN, min brillo)
30h 00min
WiFi Websurfing
10h 57min
Carga (máximo brillo)
3h 13min
Dell XPS 13 9310 Core i7 FHD
i7-1165G7, Iris Xe G7 96EUs, 52 Wh
Dell XPS 13 9300 Core i7-1065G7
i7-1065G7, Iris Plus Graphics G7 (Ice Lake 64 EU), 52 Wh
Apple MacBook Pro 13 2020 2GHz i5 10th-Gen
i5-1038NG7, Iris Plus Graphics G7 (Ice Lake 64 EU), 58 Wh
Huawei MateBook X Pro 2020 i7
i7-10510U, GeForce MX250, 57.4 Wh
Lenovo Yoga Slim 7-14ARE
R7 4800U, Vega 8, 61 Wh
HP Spectre x360 13-aw0013dx
i7-1065G7, Iris Plus Graphics G7 (Ice Lake 64 EU), 60 Wh
Duración de Batería
16%
11%
-15%
-25%
-1%
Reader / Idle
1800
1623
-10%
2223
24%
WiFi v1.3
657
763
16%
728
11%
622
-5%
619
-6%
594
-10%
Load
193
146
-24%
79
-59%
160
-17%

Pro

+ una pantalla brillante y de alta calidad de 1200p incluso en la configuración base
+ alto rendimiento por vatio, especialmente en términos de gráficos
+ silencioso durante las cargas bajas y medias
+ una calidad de audio respetable para el tamaño
+ x4 SSD M.2 NVMe PCIe actualizable
+ Cámara IR y lector de huellas dactilares
+ pequeño, ligero y elegante diseño
+ rápido lector de MicroSD

Contra

- La sintonía dinámica de Dell hace que las velocidades de cuadro fluctúen cuando se juega.
- gamma podría venir mejor calibrado de serie
- La RAM y la WLAN están soldadas y no se pueden actualizar.
- las altas tasas de reloj de Turbo Boost son insostenibles
- los tiempos de respuesta de la pantalla podrían ser mejores
- El rendimiento de los juegos es una mezcla
- no hay obturador de la webcam
- no hay sincronización adaptativa

Veredicto

Review: Dell XPS 13 9310 Core i7 FHD. Unidad de prueba proporcionada por Dell US

Si ya tienes un portátil de Ice Lake, entonces no hay muchas razones para actualizar a Tiger Lake. El rendimiento general del sistema no es notablemente mejor que el del XPS 13 9300 que no tiene ni un año. La principal excepción está relacionada con el rendimiento gráfico, ya que el Iris Xe integrado es mucho más rápido que el Iris Plus G7, sin necesidad de exigir más potencia ni de funcionar a mayor volumen o temperatura. Esto es particularmente atractivo para los editores de vídeo o gráficos que saben que pueden explotar la GPU para sacar el máximo provecho del XPS 13 9310 y su nuevo procesador.

Para todos los demás, el XPS 13 9300, más económico, será más que suficiente, sobre todo porque la diferencia de rendimiento de la CPU entre el Core i7 de 10ª generación y el Core i7 de 11ª generación es marginal. La mayor ventaja de Tiger Lake, que es su nueva GPU integrada, no es muy útil para los jugadores aquí aparte de los ocasionales porque las velocidades de cuadro tienden a ser menos estables y a veces incluso más lentas que las probadas series de GeForce MX150/MX250. Además, tanto los tiempos medios de respuesta de la pantalla como la falta de sincronización adaptativa sólo consolidan este hecho. Sería bueno ver mejoras en estas áreas específicas o al menos un obturador de cámara web para futuras revisiones del modelo. Una opción de software para cambiar la sintonía dinámica a favor de velocidades consistentes también estaría bien.

¿No puede elegir entre el XPS 13 9300 o 9310? Para procesamiento de textos, transmisión de video y juegos casuales, el XPS 13 9300 se sentirá tan rápido como el 9310. Para los editores y las aplicaciones con uso intensivo de gráficos fuera de los juegos, la potencia adicional de la GPU y el alto rendimiento por vatio del Iris Xe deberían resultar útiles.

Download your licensed rating image as SVG / PNG

Dell XPS 13 9310 Core i7 FHD - 10/28/2020 v7
Allen Ngo

Acabado
91 / 98 → 93%
Teclado
84%
Ratón
88%
Conectividad
62 / 75 → 82%
Peso
72 / 20-75 → 94%
Battería
89%
Pantalla
84%
Rendimiento de juegos
69 / 78 → 89%
Rendimiento de la Aplicación
91 / 85 → 100%
Temperatura
89%
Ruido
95%
Audio
83 / 91 → 92%
Cámara
31 / 85 → 37%
Médio
79%
88%
Subnotebook - media ponderada

Pricecompare

Please share our article, every link counts!
> Análisis y pruebas de ordenadores portátiles y móviles teléfonos > Análisis > Review del portátil Dell XPS 13 9310 Core i7: La diferencia de la 11ª generación de Tiger Lake
Allen Ngo, 2020-10-29 (Update: 2020-10-29)