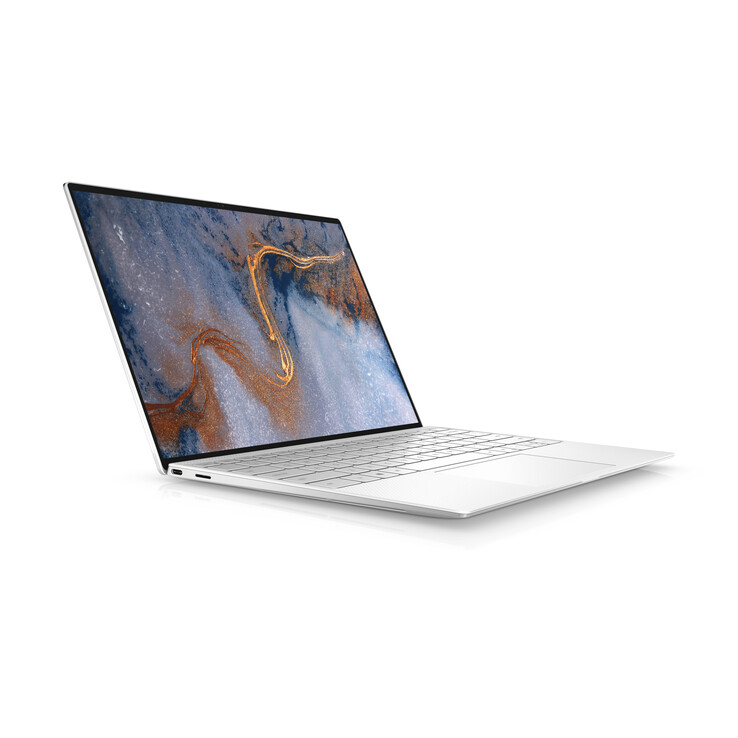
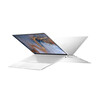
Review del portátil Dell XPS 13 9300 Core i7: El nuevo diseño del chasis es más excitante que la nueva CPU
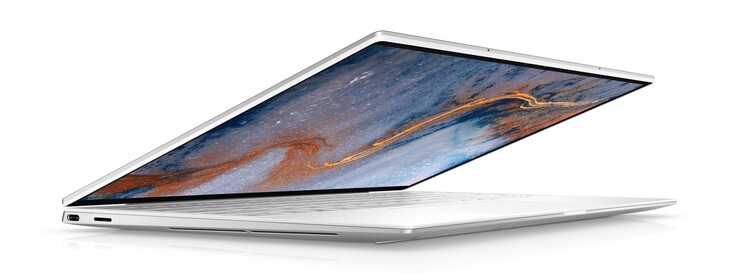
Dell lanzó el primer portátil de Ice Lake en 2019 con su XPS 13 7390 2-in-1. Mientras tanto, el XPS 13 7390 recibiría las opciones de Comet Lake-U para complementar el nuevo XPS 13 convertible. No sería hasta ahora que Dell ofrecería las mismas opciones de CPU Ice Lake para su línea de XPS 13 clamshell como las encontradas en la línea de convertibles XPS 13 del año pasado.
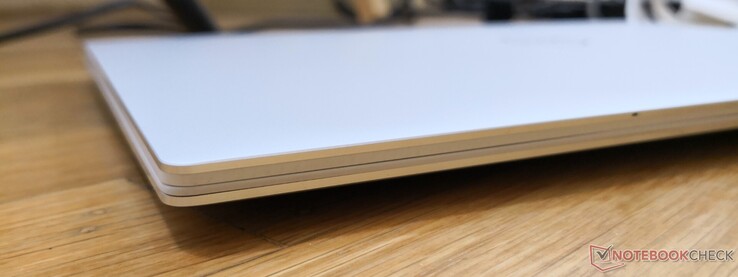
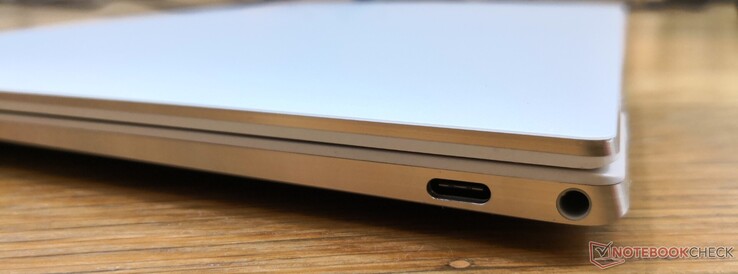
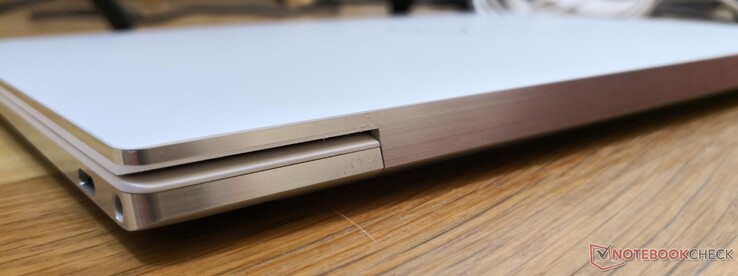
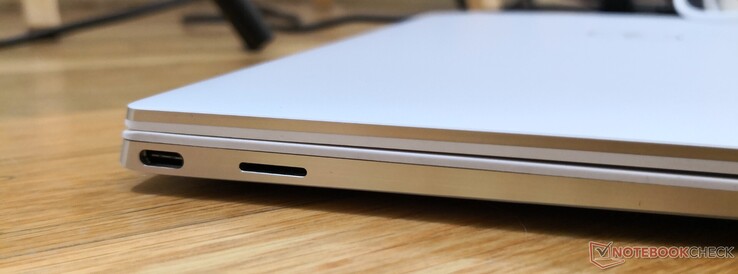
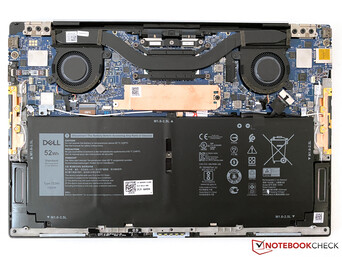
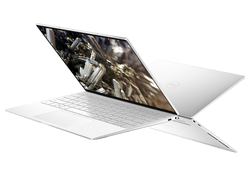
El último XPS 13 9300 es el sucesor del XPS 13 7390 del año pasado, ya que introduce un diseño de chasis renovado que es aún más pequeño que antes, a la vez que aumenta el tamaño de la pantalla y del panel de control. Puede encontrar más detalles sobre el chasis y sus características en nuestra página de revisión del XPS 13 9300 Core i5 existente aquí. Nuestra unidad de prueba de hoy es la versión XPS 13 9300 Core i7 para ver qué tipo de beneficios o inconvenientes puede haber entre ella y el modelo menor Core i5.
Más reseñas de Dell:
Valoración | Fecha | Modelo | Peso | Altura | Tamaño | Resolución | Precio |
|---|---|---|---|---|---|---|---|
| 88.9 % v7 (old) | 03/2020 | Dell XPS 13 9300 Core i7-1065G7 i7-1065G7, Iris Plus Graphics G7 (Ice Lake 64 EU) | 1.2 kg | 14.8 mm | 13.40" | 1920x1200 | |
| 85.9 % v7 (old) | 11/2019 | Dell XPS 13 7390 Core i7-10710U i7-10710U, UHD Graphics 620 | 1.2 kg | 11.6 mm | 13.30" | 3840x2160 | |
| 86.3 % v7 (old) | 10/2019 | Dell XPS 13 7390 2-in-1 Core i7 i7-1065G7, Iris Plus Graphics G7 (Ice Lake 64 EU) | 1.3 kg | 13 mm | 13.40" | 1920x1200 | |
| 86.6 % v6 (old) | 05/2019 | Asus ZenBook S13 UX392FN i7-8565U, GeForce MX150 | 1.1 kg | 12.9 mm | 13.90" | 1920x1080 | |
| 84 % v7 (old) | 02/2020 | Microsoft Surface Laptop 3 13 Core i5-1035G7 i5-1035G7, Iris Plus Graphics G7 (Ice Lake 64 EU) | 1.3 kg | 14.5 mm | 13.50" | 2256x1504 |
Top 10 Análisis
» Top 10 Portátiles Multimedia
» Top 10 Portátiles de Juego
» Top 10 Portátiles de Juego ligeros
» Top 10 Portátiles Asequibles de Oficina/Empresa
» Top 10 Portátiles de Juego Ligeros
» Top 10 Portátiles de Oficina/Empresa Premium
» Top 10 Estaciones de Trabajo
» Top 10 Subportátiles
» Top 10 Ultrabooks
» Top 10 Convertibles
» Top 10 Tablets
» Top 10 Tablets Windows
» Top 10 Tablets de menos de 250 Euros
» Top 10 Phablets (>5.5")
» Top 10 Smartphones
» Top 10 Smartphones (≤5")
» Top 10 Smartphones de menos de 300 Euros
» Top 10 Smartphones de menos de 120 Euros
» Top 10 Portátiles de menos de 1000 Euros
» Top 10 Portátiles de menos de 500 Euros
» Top 10 Portátiles de menos de 300 Euros
» Los Mejores Displays de Portátiles Analizados por Notebookcheck
Carcasa
Conectividad
Lector de tarjetas SD
| SD Card Reader | |
| average JPG Copy Test (av. of 3 runs) | |
| Dell XPS 13 7390 Core i7-10710U (Toshiba Exceria Pro M501 64 GB UHS-II) | |
| Dell XPS 13 9300 Core i7-1065G7 (Toshiba Exceria Pro M501 64 GB UHS-II) | |
| Dell XPS 13 7390 2-in-1 Core i7 (Toshiba Exceria Pro M501 64 GB UHS-II) | |
| Asus ZenBook S13 UX392FN (Toshiba Exceria Pro M501 64 GB UHS-II) | |
| maximum AS SSD Seq Read Test (1GB) | |
| Dell XPS 13 7390 Core i7-10710U (Toshiba Exceria Pro M501 64 GB UHS-II) | |
| Dell XPS 13 7390 2-in-1 Core i7 (Toshiba Exceria Pro M501 64 GB UHS-II) | |
| Dell XPS 13 9300 Core i7-1065G7 (Toshiba Exceria Pro M501 64 GB UHS-II) | |
| Asus ZenBook S13 UX392FN (Toshiba Exceria Pro M501 64 GB UHS-II) | |
Comunicación
La WLAN es proporcionada por el Intel Killer 1650x que es esencialmente idéntico al Intel AX200/201 pero con características adicionales de software específicas de Killer. Es un poco exagerado para un sistema XPS ya que Killer se dirige más a usuarios avanzados como los jugadores de la serie Dell G o la serie Alienware. Podemos registrar tasas de transferencia promedio de 800 Mbps a 1400 Mbps cuando estamos a un metro de nuestro enrutador Netgear RAX200 habilitado para Wi-Fi 6. Las velocidades de transmisión podrían haber sido más estables ya que bajó a tan sólo 232 Mbps incluso después de una nueva prueba.
Webcam
Display
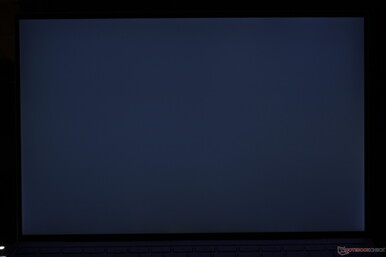
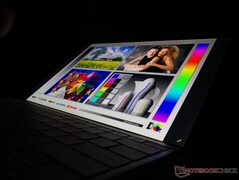
Dell anuncia un brillo de 500 nits para sus SKU XPS 13 9300 FHD. Curiosamente, podemos medir un brillo máximo de 600 nits en dos SKUs FHD diferentes para ser más brillante que lo que Dell anuncia. Hemos descubierto que la pantalla se atenuará automáticamente a un máximo de 500 nits sólo cuando se desconecte de la toma de corriente y funcione con la energía de la batería.
Afortunadamente, es posible obtener los 600 nits completos cuando funciona con energía de la batería con unos pocos clics como se detalla aquí. Los usuarios tendrán que desactivar el brillo adaptable a través de Windows, luego desactivar el brillo adaptable nuevamente a través del software del Centro de Control de Gráficos Intel, habilitar el Ahorro de Energía de la Pantalla y luego desactivar el Ahorro de Energía Mejorado en ese orden. Es un proceso enrevesado que involucra múltiples cajas cuando debería haber sido sólo uno o dos clics como máximo.
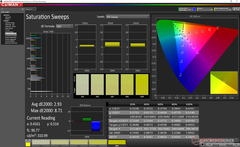
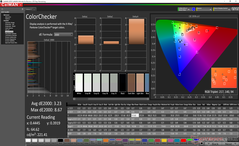
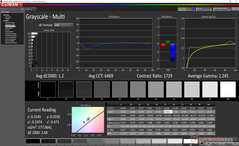
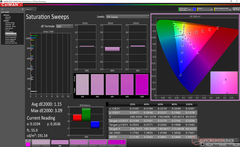
Vale la pena señalar que el XPS 13 9300 utiliza exactamente el mismo panel IPS de 13,4 pulgadas 16:10 Sharp LQ134N1 que se encuentra en el XPS 13 7390 2-in-1 y por lo tanto ambos sistemas comparten características muy similares. Incluso sus frecuencias de modulación de amplitud de pulso son las mismas a 2500 Hz para sugerir que pueden compartir otros componentes similares.
| |||||||||||||||||||||||||
iluminación: 96 %
Brillo con batería: 607.6 cd/m²
Contraste: 1519:1 (Negro: 0.4 cd/m²)
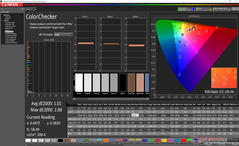
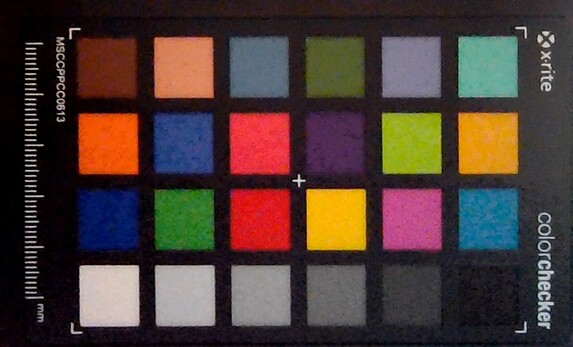
ΔE ColorChecker Calman: 3.23 | ∀{0.5-29.43 Ø4.77}
calibrated: 1.01
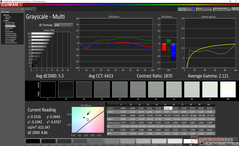
ΔE Greyscale Calman: 5.5 | ∀{0.09-98 Ø5}
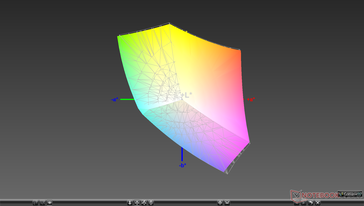
97.5% sRGB (Argyll 1.6.3 3D)
63% AdobeRGB 1998 (Argyll 1.6.3 3D)
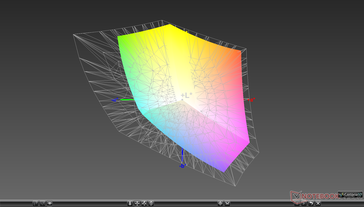
68.5% AdobeRGB 1998 (Argyll 3D)
97.3% sRGB (Argyll 3D)
66.3% Display P3 (Argyll 3D)
Gamma: 2.12
CCT: 6413 K
| Dell XPS 13 9300 Core i7-1065G7 Sharp LQ134N1, IPS, 13.4", 1920x1200 | Dell XPS 13 7390 Core i7-10710U AU Optronics B133ZAN, Dell P/N: 90NTH, IPS, 13.3", 3840x2160 | Dell XPS 13 7390 2-in-1 Core i7 Sharp LQ134N1, IPS, 13.4", 1920x1200 | Huawei Matebook X Pro i5 Tianma XM, IPS, 13.9", 3000x2000 | Asus ZenBook S13 UX392FN Tianma XM, IPS, 13.9", 1920x1080 | Microsoft Surface Laptop 3 13 Core i5-1035G7 Sharp LQ135P1JX51, IPS, 13.5", 2256x1504 | |
|---|---|---|---|---|---|---|
| Display | -5% | 4% | -1% | 0% | -0% | |
| Display P3 Coverage (%) | 66.3 | 63.4 -4% | 69.9 5% | 65.9 -1% | 67.5 2% | 65.7 -1% |
| sRGB Coverage (%) | 97.3 | 93.7 -4% | 99.2 2% | 95.2 -2% | 95.8 -2% | 98.6 1% |
| AdobeRGB 1998 Coverage (%) | 68.5 | 64.3 -6% | 71.5 4% | 67.6 -1% | 69 1% | 67.8 -1% |
| Response Times | -2% | 9% | 21% | 16% | -22% | |
| Response Time Grey 50% / Grey 80% * (ms) | 50 ? | 51.6 ? -3% | 47.6 ? 5% | 40.4 ? 19% | 47.2 ? 6% | 59.2 ? -18% |
| Response Time Black / White * (ms) | 33.2 ? | 33.6 ? -1% | 29.2 ? 12% | 25.6 ? 23% | 24.8 ? 25% | 41.6 ? -25% |
| PWM Frequency (Hz) | 2500 ? | 2500 ? | 21740 ? | |||
| Screen | -30% | 7% | -9% | 2% | 13% | |
| Brightness middle (cd/m²) | 607.6 | 408.2 -33% | 549.8 -10% | 442.7 -27% | 466 -23% | 403.4 -34% |
| Brightness (cd/m²) | 595 | 399 -33% | 520 -13% | 428 -28% | 462 -22% | 397 -33% |
| Brightness Distribution (%) | 96 | 89 -7% | 86 -10% | 84 -12% | 90 -6% | 89 -7% |
| Black Level * (cd/m²) | 0.4 | 0.39 2% | 0.39 2% | 0.31 22% | 0.33 17% | 0.34 15% |
| Contrast (:1) | 1519 | 1047 -31% | 1410 -7% | 1428 -6% | 1412 -7% | 1186 -22% |
| Colorchecker dE 2000 * | 3.23 | 4.6 -42% | 2.12 34% | 2.24 31% | 1.93 40% | 0.94 71% |
| Colorchecker dE 2000 max. * | 8.67 | 11.84 -37% | 3.66 58% | 7.19 17% | 4.26 51% | 2.92 66% |
| Colorchecker dE 2000 calibrated * | 1.01 | 2.03 -101% | 1.37 -36% | 1.11 -10% | 1.99 -97% | 0.99 2% |
| Greyscale dE 2000 * | 5.5 | 7.5 -36% | 2.6 53% | 9.7 -76% | 1.7 69% | 0.9 84% |
| Gamma | 2.12 104% | 2.12 104% | 2.3 96% | 1.42 155% | 2.15 102% | 2.13 103% |
| CCT | 6413 101% | 7966 82% | 6884 94% | 6227 104% | 6382 102% | 6620 98% |
| Color Space (Percent of AdobeRGB 1998) (%) | 63 | 59.5 -6% | 65.4 4% | 61.6 -2% | 62.2 -1% | 62.3 -1% |
| Color Space (Percent of sRGB) (%) | 97.5 | 93.5 -4% | 99.7 2% | 95 -3% | 95.7 -2% | 98.7 1% |
| Media total (Programa/Opciones) | -12% /
-22% | 7% /
7% | 4% /
-4% | 6% /
3% | -3% /
6% |
* ... más pequeño es mejor
Tiempos de respuesta del display
| ↔ Tiempo de respuesta de Negro a Blanco | ||
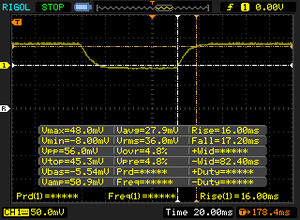
|---|---|---|
| 33.2 ms ... subida ↗ y bajada ↘ combinada | ↗ 16 ms subida | |
| ↘ 17.2 ms bajada | ||
| La pantalla mostró tiempos de respuesta lentos en nuestros tests y podría ser demasiado lenta para los jugones. En comparación, todos los dispositivos de prueba van de ##min### (mínimo) a 240 (máximo) ms. » 89 % de todos los dispositivos son mejores. Eso quiere decir que el tiempo de respuesta es peor que la media (20.2 ms) de todos los dispositivos testados. | ||
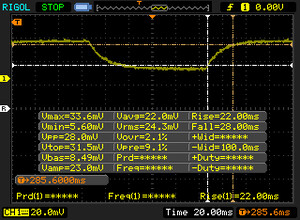
| ↔ Tiempo de respuesta 50% Gris a 80% Gris | ||
| 50 ms ... subida ↗ y bajada ↘ combinada | ↗ 22 ms subida | |
| ↘ 28 ms bajada | ||
| La pantalla mostró tiempos de respuesta lentos en nuestros tests y podría ser demasiado lenta para los jugones. En comparación, todos los dispositivos de prueba van de ##min### (mínimo) a 636 (máximo) ms. » 86 % de todos los dispositivos son mejores. Eso quiere decir que el tiempo de respuesta es peor que la media (31.5 ms) de todos los dispositivos testados. | ||
Parpadeo de Pantalla / PWM (Pulse-Width Modulation)
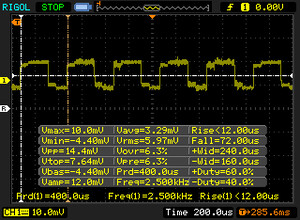
| Parpadeo de Pantalla / PWM detectado | 2500 Hz | ≤ 25 % de brillo | |
La retroiluminación del display parpadea a 2500 Hz (seguramente usa PWM - Pulse-Width Modulation) a un brillo del 25 % e inferior. Sobre este nivel de brillo no debería darse parpadeo / PWM. La frecuencia de 2500 Hz es bastante alta, por lo que la mayoría de gente sensible al parpadeo no debería ver parpadeo o tener fatiga visual. Comparación: 53 % de todos los dispositivos testados no usaron PWM para atenuar el display. Si se usó, medimos una media de 8070 (mínimo: 5 - máxmo: 343500) Hz. | |||
Rendimiento
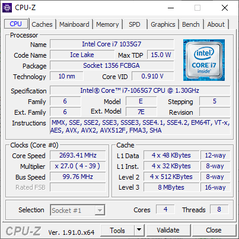
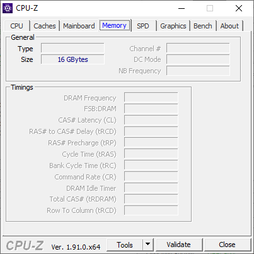
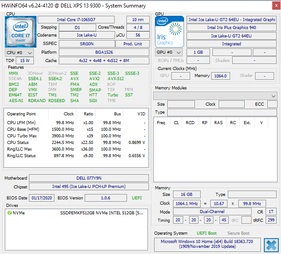
Actualmente, el XPS 13 9300 viene con el Core i5-1035G1 o Core i7-1065G7 sin Core i3 ni opciones de Comet Lake-U. Tampoco hay opciones de GPU discretas, lo que significa que los usuarios podrán elegir entre el Gráfico G1 de UHD integrado o el Iris Plus G7. La memoria RAM va de 8 GB a 16 GB de LPDDR4x de 3733 MHz soldada.
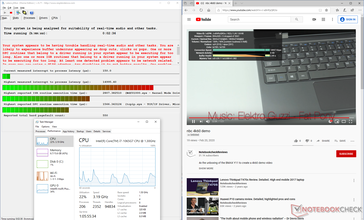
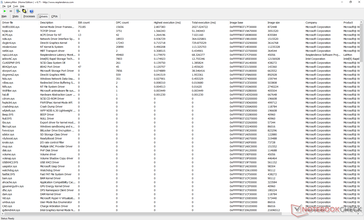
Nuestra unidad presenta problemas de latencia de DPC al abrir varias pestañas del navegador, al ejecutar un vídeo 4K60 de YouTube y al ejecutar Prime95 en secuencia.
Procesador
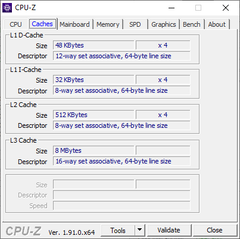
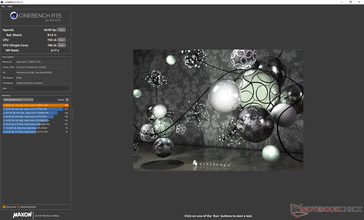
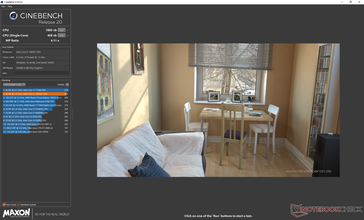
Para asegurarnos de obtener el rendimiento más rápido posible de nuestra unidad de prueba, habíamos configurado el sistema a Ultra Rendimiento a través del software preinstalado Dell Power Manager antes de ejecutar cualquiera de las pruebas descritas a continuación. Los resultados de CineBench son aproximadamente de un 9 a un 17 por ciento más rápidos que el Core i7-1065G7 medio de nuestra base de datos tomado de al menos otros 13 portátiles. Sin embargo, esto no cuenta toda la historia ya que los Ultrabooks tienden a reducir el rendimiento con el tiempo cuando están bajo un estrés continuo. Para simular esto, ejecutaríamos CineBench R15 Multi-Thread en un bucle como se muestra en el siguiente gráfico. El puntaje inicial de 811 puntos caería con el tiempo a cerca de 610 puntos en promedio para representar una caída de rendimiento del 25 por ciento. Curiosamente, las puntuaciones fluctuarían entre ~560 puntos y ~660 puntos para implicar el ciclo de las velocidades de reloj de la CPU cuando se encuentran en condiciones de procesamiento tan extremas.
El rendimiento general de la CPU es generalmente mejor que el del Core i7-8565U de última generación, especialmente cuando el procesador está frío debido a sus velocidades más rápidas de Turbo Boost. Sus ventajas comienzan a disminuir una vez que la CPU alcanza un cierto rango de temperatura en el que las velocidades de reloj empiezan a ciclar.
Consulte nuestra página dedicada al Core i7-1065G7 para obtener más información técnica y comparaciones de referencia. El Core i7-10710U de núcleo hexagonal ofrece un rendimiento multihilo más rápido, pero por ahora sólo está disponible en el XPS 13 7390.
| wPrime 2.10 - 1024m | |
| Dell XPS 13 7390 2-in-1 Core i3 | |
| Microsoft Surface Pro 7 Core i5-1035G4 | |
| Medio Intel Core i7-1065G7 (233 - 354, n=3) | |
| Dell XPS 13 7390 Core i7-10710U | |
* ... más pequeño es mejor
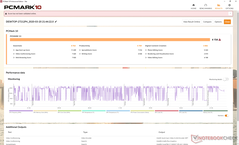
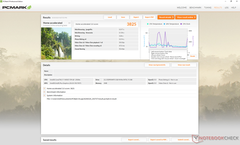
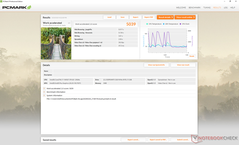
| PCMark 8 Home Score Accelerated v2 | 3825 puntos | |
| PCMark 8 Work Score Accelerated v2 | 5039 puntos | |
| PCMark 10 Score | 4154 puntos | |
ayuda | ||
Dispositivos de almacenamiento
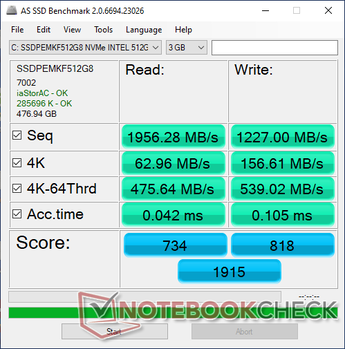
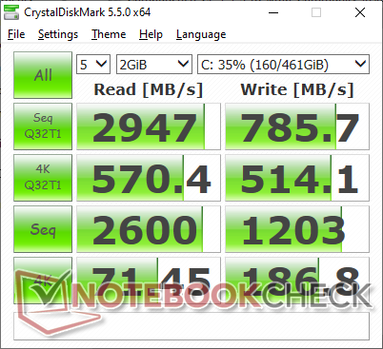
A diferencia de nuestro primer modelo XPS 13 9300 Core i5 y su SSD Toshiba de 512 GB, el modelo XPS 13 9300 Core i7 viene con un SSD Intel de 512 GB. Las velocidades de lectura y escritura secuenciales son similares entre ellos según CrystalDiskMark y AS SSD, pero la SSD de Toshiba parece ser mucho más rápida cuando se dirige a mayores profundidades de cola.
Consulte nuestra tabla de SSDs y HDDs para obtener más comparaciones de referencia.
| Dell XPS 13 9300 Core i7-1065G7 Intel SSDPEMKF512G8 NVMe SSD | Dell XPS 13 7390 Core i7-10710U SK Hynix PC601 NVMe 512 GB | Dell XPS 13 7390 2-in-1 Core i7 Toshiba BG4 KBG40ZPZ512G | Microsoft Surface Laptop 3 13 Core i5-1035G7 SK hynix BC501 HFM256GDGTNG | Asus ZenBook S13 UX392FN WDC PC SN520 SDAPNUW-512G | |
|---|---|---|---|---|---|
| AS SSD | 30% | -20% | -23% | 39% | |
| Seq Read (MB/s) | 1956 | 1804 -8% | 1801 -8% | 1387 -29% | 1224 -37% |
| Seq Write (MB/s) | 1227 | 1000 -19% | 1125 -8% | 504 -59% | 907 -26% |
| 4K Read (MB/s) | 63 | 45.1 -28% | 39.7 -37% | 42.35 -33% | 41.46 -34% |
| 4K Write (MB/s) | 156.6 | 115 -27% | 67 -57% | 120 -23% | 126.2 -19% |
| 4K-64 Read (MB/s) | 475.6 | 893 88% | 1253 163% | 497.4 5% | 1021 115% |
| 4K-64 Write (MB/s) | 539 | 732 36% | 209 -61% | 354.9 -34% | 1251 132% |
| Access Time Read * (ms) | 0.042 | 0.044 -5% | 0.069 -64% | 0.055 -31% | 0.053 -26% |
| Access Time Write * (ms) | 0.105 | 0.095 10% | 0.625 -495% | 0.093 11% | 0.027 74% |
| Score Read (Points) | 734 | 1119 52% | 1472 101% | 678 -8% | 1185 61% |
| Score Write (Points) | 818 | 947 16% | 388 -53% | 525 -36% | 1468 79% |
| Score Total (Points) | 1915 | 2608 36% | 2583 35% | 1520 -21% | 3250 70% |
| Copy ISO MB/s (MB/s) | 1022 | 1515 48% | 1293 27% | 764 -25% | 1404 37% |
| Copy Program MB/s (MB/s) | 302.8 | 535 77% | 560 85% | 256.1 -15% | 402.4 33% |
| Copy Game MB/s (MB/s) | 491.4 | 1211 146% | 927 89% | 368.4 -25% | 902 84% |
| CrystalDiskMark 5.2 / 6 | 12% | -13% | -35% | -9% | |
| Write 4K (MB/s) | 186.8 | 134 -28% | 106.7 -43% | 112.3 -40% | 149.2 -20% |
| Read 4K (MB/s) | 71.4 | 42.91 -40% | 49.94 -30% | 42.13 -41% | 47.18 -34% |
| Write Seq (MB/s) | 1203 | 1841 53% | 1223 2% | 630 -48% | 750 -38% |
| Read Seq (MB/s) | 2600 | 1707 -34% | 1801 -31% | 1023 -61% | 1137 -56% |
| Write 4K Q32T1 (MB/s) | 514 | 394.7 -23% | 325.3 -37% | 336.6 -35% | 749 46% |
| Read 4K Q32T1 (MB/s) | 570 | 398.5 -30% | 551 -3% | 399.6 -30% | 478.7 -16% |
| Write Seq Q32T1 (MB/s) | 786 | 2250 186% | 1224 56% | 821 4% | 1453 85% |
| Read Seq Q32T1 (MB/s) | 2947 | 3265 11% | 2350 -20% | 2030 -31% | 1713 -42% |
| Media total (Programa/Opciones) | 21% /
24% | -17% /
-18% | -29% /
-28% | 15% /
21% |
* ... más pequeño es mejor
GPU Performance
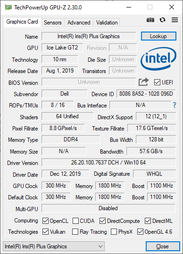
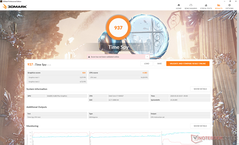
El rendimiento en los juegos es significativamente mejor que el anticuado UHD Graphics 620 pero sigue siendo decepcionante en general cuando se compara con las series RX Vega 8 o Vega 10 de la competencia. Los benchmarks sintéticos como 3DMark sugieren que el Iris Plus G7 está a la par con el RX Vega 10, pero los benchmarks de juegos del mundo real siguen mostrando que la solución de AMD supera a la nueva solución de Intel en ciertos juegos.
Quizás más notablemente, el salto de rendimiento de la GPU entre las SKU del XPS 13 Core i5-1035G1 y el Core i7-1065G7 es bastante significativo, alrededor del 70 por ciento, lo que significa que los usuarios pueden considerar la SKU del Core i7 si pretenden sacar el máximo provecho del Intel Ice Lake.
Consulte nuestra página dedicada al Iris Plus G7 para obtener más comparaciones de referencia.
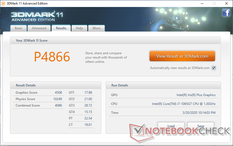
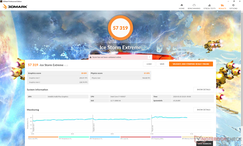
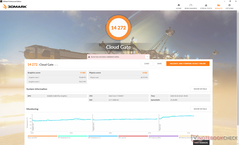
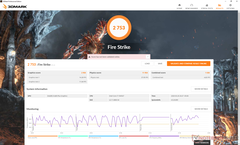
| 3DMark 11 Performance | 4866 puntos | |
| 3DMark Ice Storm Standard Score | 67829 puntos | |
| 3DMark Cloud Gate Standard Score | 14272 puntos | |
| 3DMark Fire Strike Score | 2753 puntos | |
| 3DMark Time Spy Score | 937 puntos | |
ayuda | ||
| Shadow of the Tomb Raider - 1280x720 Lowest Preset | |
| Desktop PC | |
| MSI Modern 15 A10RB | |
| Dell Inspiron 15 5000 5585 | |
| Dell XPS 13 9300 Core i7-1065G7 | |
| Medio Intel Iris Plus Graphics G7 (Ice Lake 64 EU) (15.6 - 33, n=13) | |
| Dell XPS 13 7390 Core i7-10710U | |
| The Witcher 3 | |
| 1024x768 Low Graphics & Postprocessing | |
| Huawei MateBook 13 i7 | |
| MSI Modern 15 A10RB | |
| Dell Inspiron 15 5000 5585 | |
| Dell XPS 13 9300 Core i7-1065G7 | |
| Medio Intel Iris Plus Graphics G7 (Ice Lake 64 EU) (28.2 - 58, n=20) | |
| Dell XPS 13 7390 Core i7-10710U | |
| HP Pavilion x360 15-dq0065cl | |
| 1366x768 Medium Graphics & Postprocessing | |
| MSI Modern 15 A10RB | |
| Huawei MateBook 13 i7 | |
| Dell XPS 13 9300 Core i7-1065G7 | |
| Medio Intel Iris Plus Graphics G7 (Ice Lake 64 EU) (20.8 - 36.8, n=18) | |
| HP Pavilion x360 15-dq0065cl | |
| 1920x1080 High Graphics & Postprocessing (Nvidia HairWorks Off) | |
| HP Pavilion Gaming 15t-cx0000 | |
| MSI Modern 15 A10RB | |
| Huawei MateBook 13 i7 | |
| Dell Inspiron 15 5000 5585 | |
| Dell XPS 13 9300 Core i7-1065G7 | |
| Medio Intel Iris Plus Graphics G7 (Ice Lake 64 EU) (10.9 - 20.1, n=18) | |
Estar inactivo en Witcher 3 durante más de una hora muestra la incapacidad del sistema para mantener velocidades de cuadro consistentes. Como se muestra en el siguiente gráfico, las velocidades de cuadro se mantendrían estables en alrededor de 50 FPS durante los primeros 15 minutos más o menos antes de comenzar el ciclo entre 40 y 60 FPS. Por el contrario, la mayoría de las demás computadoras portátiles funcionaría a velocidades de cuadro más estables de principio a fin. La tasa de reloj de la GPU de ciclismo que detallaremos en la sección de Prueba de esfuerzo a continuación es la probable culpable de este comportamiento indeseable al ejecutar los juegos.
| bajo | medio | alto | ultra | |
|---|---|---|---|---|
| BioShock Infinite (2013) | 104.2 | 66.8 | 56.7 | 21.1 |
| The Witcher 3 (2015) | 50.7 | 33.5 | 18.4 | 9.1 |
| Rocket League (2017) | 85.5 | 53.6 | 38.3 | |
| Shadow of the Tomb Raider (2018) | 28 |
Emisiones
Ruido de sistema
El ruido del ventilador es casi inexistente durante las típicas cargas de trabajo diarias como la navegación o la transmisión de vídeo. Incluso se las arregla para permanecer en silencio cuando se ejecuta 3DMark 06 hasta el final de la primera escena de referencia. En el peor de los casos, esperen un ruido del ventilador de sólo 32,5 dB(A) contra un fondo de 28,3 dB(A) cuando realicen tareas múltiples durante largos períodos.
Si se trabaja con cargas muy altas como en los juegos, el ruido del ventilador saltará y se estabilizará en 39,3 dB(A). La marca de 40 dB(A) es común para los Ultrabooks cuando están bajo un alto estrés de procesamiento, por lo que esto no es inesperado. Sin embargo, el ruido agudo del ventilador del XPS 13 9300 lo hace más notable de lo que debería.
Somos capaces de notar un ligero ruido electrónico o el quejido de la bobina de nuestra unidad de prueba al colocar un oído cerca de las teclas del teclado. Afortunadamente no se nota cuando se está sentado a una distancia normal del sistema.
| Dell XPS 13 9300 Core i7-1065G7 Iris Plus Graphics G7 (Ice Lake 64 EU), i7-1065G7, Intel SSDPEMKF512G8 NVMe SSD | Dell XPS 13 7390 Core i7-10710U UHD Graphics 620, i7-10710U, SK Hynix PC601 NVMe 512 GB | Dell XPS 13 7390 2-in-1 Core i7 Iris Plus Graphics G7 (Ice Lake 64 EU), i7-1065G7, Toshiba BG4 KBG40ZPZ512G | Huawei Matebook X Pro i5 GeForce MX150, i5-8250U, Samsung PM961 MZVLW256HEHP | Microsoft Surface Laptop 3 13 Core i5-1035G7 Iris Plus Graphics G7 (Ice Lake 64 EU), i5-1035G7, SK hynix BC501 HFM256GDGTNG | Dell XPS 13 9300 i5 FHD UHD Graphics G1 (Ice Lake 32 EU), i5-1035G1, Toshiba XG6 KXG60ZNV512G | |
|---|---|---|---|---|---|---|
| Noise | -3% | -2% | -5% | 0% | 2% | |
| apagado / medio ambiente * (dB) | 28.3 | 28 1% | 28.1 1% | 27.9 1% | 28.5 -1% | 29.3 -4% |
| Idle Minimum * (dB) | 28.3 | 28 1% | 28.1 1% | 27.9 1% | 28.5 -1% | 29.3 -4% |
| Idle Average * (dB) | 28.3 | 28 1% | 28.1 1% | 27.9 1% | 28.5 -1% | 29.3 -4% |
| Idle Maximum * (dB) | 28.3 | 28 1% | 28.1 1% | 27.9 1% | 28.5 -1% | 29.3 -4% |
| Load Average * (dB) | 32.5 | 33.7 -4% | 31.7 2% | 36.2 -11% | 28.5 12% | 30 8% |
| Witcher 3 ultra * (dB) | 39.3 | 43.4 -10% | 45 -15% | 40.4 -3% | ||
| Load Maximum * (dB) | 39.3 | 46.5 -18% | 43.4 -10% | 45.2 -15% | 40.4 -3% | 32.4 18% |
* ... más pequeño es mejor
Ruido
| Ocioso |
| 28.3 / 28.3 / 28.3 dB(A) |
| Carga |
| 32.5 / 39.3 dB(A) |
 | ||
30 dB silencioso 40 dB(A) audible 50 dB(A) ruidosamente alto |
||
min: | ||
Temperatura
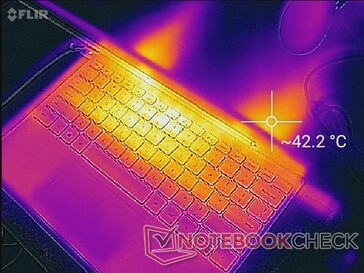
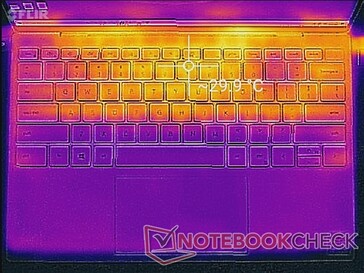
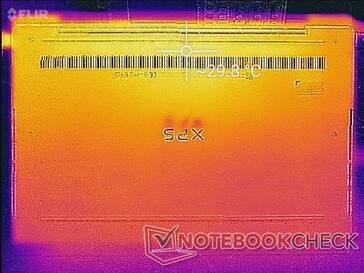
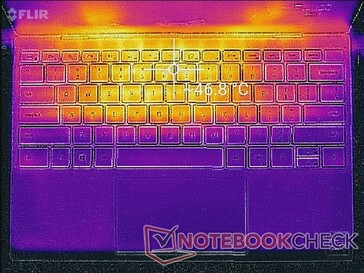
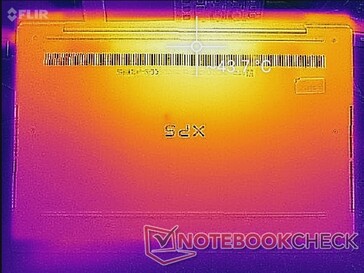
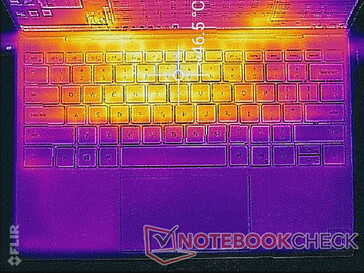
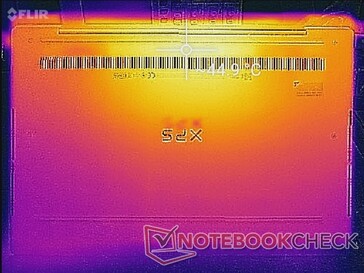
Las temperaturas de la superficie cuando está en reposo van desde los 26 C en la palma de la mano hasta los 30 C en los puntos calientes cerca de la parte trasera. Cuando están bajo cargas altas, los mismos puntos calientes pueden llegar a ser tan calientes como 47 C para estar muy cerca de lo que registramos en el XPS 13 2-en-1 con el mismo CPU Core i7.
(-) La temperatura máxima en la parte superior es de 46.6 °C / 116 F, frente a la media de 35.9 °C / 97 F, que oscila entre 21.4 y 59 °C para la clase Subnotebook.
(±) El fondo se calienta hasta un máximo de 44.8 °C / 113 F, frente a la media de 39.3 °C / 103 F
(+) En reposo, la temperatura media de la parte superior es de 27.4 °C / 81# F, frente a la media del dispositivo de 30.8 °C / 87 F.
(±) Jugando a The Witcher 3, la temperatura media de la parte superior es de 33.9 °C / 93 F, frente a la media del dispositivo de 30.8 °C / 87 F.
(+) El reposamanos y el panel táctil están a una temperatura inferior a la de la piel, con un máximo de 29.8 °C / 85.6 F y, por tanto, son fríos al tacto.
(±) La temperatura media de la zona del reposamanos de dispositivos similares fue de 28.2 °C / 82.8 F (-1.6 °C / -2.8 F).
Prueba de estrés
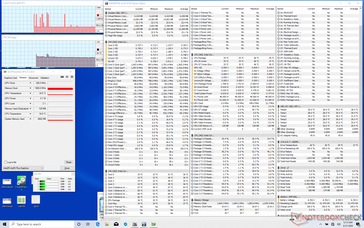
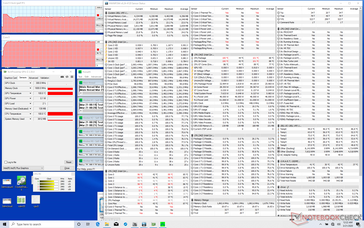
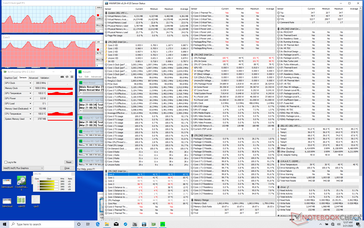
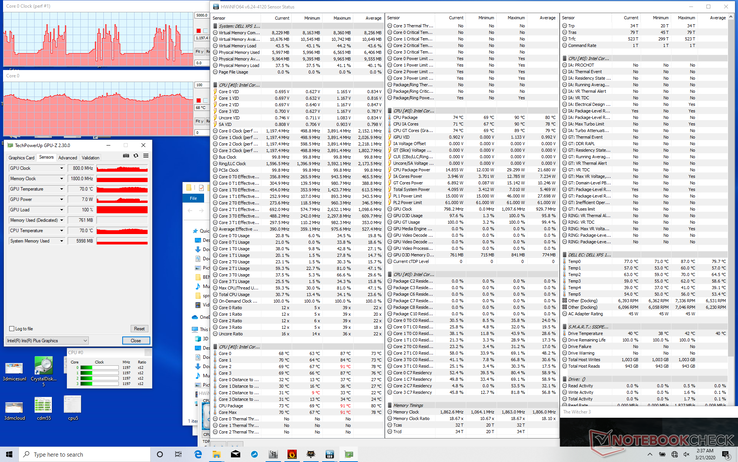
Enfatizamos el sistema con cargas sintéticas para identificar cualquier posible estrangulamiento o problemas de estabilidad. Cuando se ejecuta Prime95, la CPU aumentaría hasta 3,5 GHz durante los primeros 10 segundos más o menos hasta alcanzar una temperatura central de 99 C. A partir de entonces, las velocidades de reloj y la temperatura caerían inmediatamente y se estabilizarían en 3,0 GHz y ~96 C, respectivamente. Sin embargo, después de unos pocos minutos, las frecuencias de reloj y la temperatura comenzarán a oscilar entre 1,8 GHz y 3,3 GHz y entre 70 C y 97 C, respectivamente, como se muestra en las siguientes capturas de pantalla. Este comportamiento asegura que la temperatura del núcleo no se mantendrá a >95 C a costa de velocidades de reloj consistentes. Aunque el procesador no se acelerará por debajo de su velocidad de reloj base cuando se ejecute Prime95, tampoco podrá mantener una velocidad de reloj fija de Turbo Boost durante períodos prolongados.
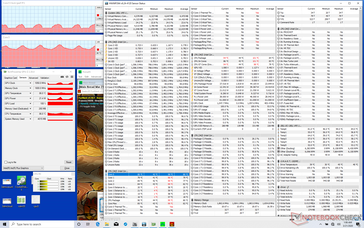
Ejecutar Witcher 3 es más representativo de las cargas estresantes del mundo real. En estas condiciones, las velocidades de reloj de la GPU oscilan entre 750 y 1.000 MHz, lo que, desafortunadamente, conduce a las velocidades de cuadro cíclico que hemos descrito anteriormente.
Correr con la batería afectará el rendimiento. Una prueba 3DMark 11 en baterías arroja unos resultados de Física y Gráficos de 4680 y 1675 puntos, respectivamente, en comparación con los 10249 y 4508 puntos que se obtienen con la red eléctrica.
| CPU Clock (GHz) | GPU Clock (MHz) | Average CPU Temperature (°C) | |
| System Idle | -- | -- | 35 |
| Prime95 Stress | 1.8 - 3.3 | -- | 70 - 97 |
| Prime95 + FurMark Stress | 0.9 - 1.6 | 550 - 1050 | 67 - 81 |
| Witcher 3 Stress | 1.2 - 3.8 | 750 - 1000 | 65 - 77 |
Gestión de la energía
Consumo de energía
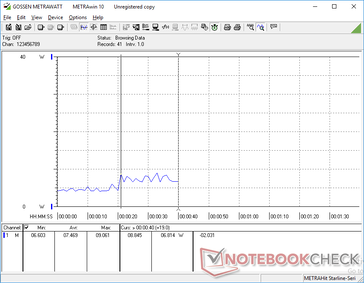
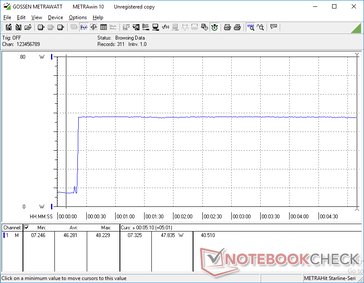
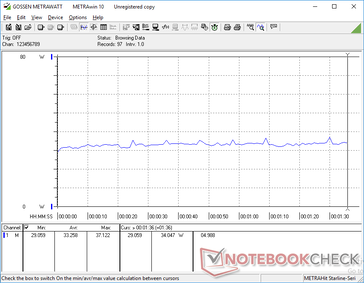
El sistema consume entre 4 W y 8 C cuando está en ralentí, dependiendo del perfil de potencia y el ajuste de brillo. Cuando se ejecutan cargas más altas, como en los juegos, el consumo oscilará entre 33 W y 37 W, no muy diferente de lo que medimos en el modelo de gama baja XPS 13 Core i5, a pesar de sus importantes diferencias de rendimiento en la GPU. Por lo tanto, el Core i7-1065G7 es capaz de ofrecer un rendimiento gráfico mucho más rápido que el modelo Core i5 sin necesidad de exigir más potencia a la toma de corriente.
Los ultraportátiles con la GeForce MX150 o MX250 consumirán sólo unos pocos vatios más cada uno que nuestro sistema Ice Lake cuando jueguen. El rendimiento por vatio sigue estando muy a favor de Nvidia, ya que el MX150/MX250 siempre superará al Iris Plus G7 en los juegos por márgenes notables.
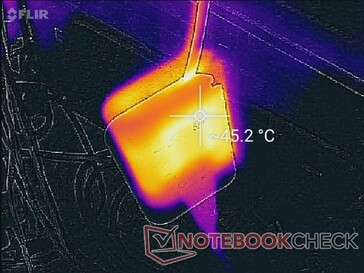
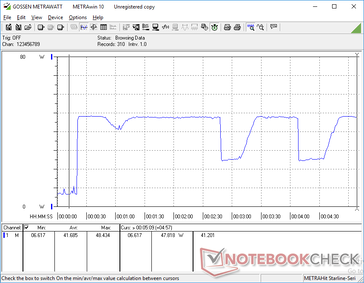
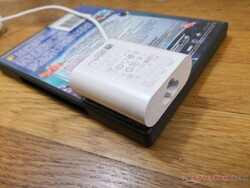
Somos capaces de medir un consumo máximo de 48,4 W del pequeño (~6 x 5,5 x 3,2 cm) adaptador de CA de 45 W. El consumo de energía puede variar durante cargas tan extremas como las mostradas en nuestros gráficos, lo que corrobora los resultados de los ciclos de reloj y el bucle CineBench de arriba.
| Off / Standby | |
| Ocioso | |
| Carga |
|
Clave:
min: | |
| Dell XPS 13 9300 Core i7-1065G7 i7-1065G7, Iris Plus Graphics G7 (Ice Lake 64 EU), Intel SSDPEMKF512G8 NVMe SSD, IPS, 1920x1200, 13.4" | Dell XPS 13 7390 Core i7-10710U i7-10710U, UHD Graphics 620, SK Hynix PC601 NVMe 512 GB, IPS, 3840x2160, 13.3" | Dell XPS 13 7390 2-in-1 Core i7 i7-1065G7, Iris Plus Graphics G7 (Ice Lake 64 EU), Toshiba BG4 KBG40ZPZ512G, IPS, 1920x1200, 13.4" | Huawei Matebook X Pro i5 i5-8250U, GeForce MX150, Samsung PM961 MZVLW256HEHP, IPS, 3000x2000, 13.9" | Asus ZenBook S13 UX392FN i7-8565U, GeForce MX150, WDC PC SN520 SDAPNUW-512G, IPS, 1920x1080, 13.9" | Microsoft Surface Laptop 3 13 Core i5-1035G7 i5-1035G7, Iris Plus Graphics G7 (Ice Lake 64 EU), SK hynix BC501 HFM256GDGTNG, IPS, 2256x1504, 13.5" | Dell XPS 13 9300 i5 FHD i5-1035G1, UHD Graphics G1 (Ice Lake 32 EU), Toshiba XG6 KXG60ZNV512G, IPS, 1920x1200, 13.4" | |
|---|---|---|---|---|---|---|---|
| Power Consumption | -16% | 4% | -27% | -17% | -14% | -3% | |
| Idle Minimum * (Watt) | 4.2 | 4.7 -12% | 2.6 38% | 3.5 17% | 3.4 19% | 4.4 -5% | 3.4 19% |
| Idle Average * (Watt) | 6.9 | 8.3 -20% | 5.3 23% | 8.9 -29% | 6.3 9% | 7.5 -9% | 6 13% |
| Idle Maximum * (Watt) | 7.5 | 9 -20% | 7 7% | 12.3 -64% | 10.4 -39% | 7.8 -4% | 10.2 -36% |
| Load Average * (Watt) | 33.3 | 42 -26% | 43.1 -29% | 54.2 -63% | 51 -53% | 41.9 -26% | 36.6 -10% |
| Witcher 3 ultra * (Watt) | 37.1 | 43.1 -16% | 42.4 -14% | 39 -5% | 40.8 -10% | ||
| Load Maximum * (Watt) | 48.4 | 49 -1% | 49 -1% | 52.1 -8% | 62.7 -30% | 63.9 -32% | 49.3 -2% |
* ... más pequeño es mejor
Duración de la batería
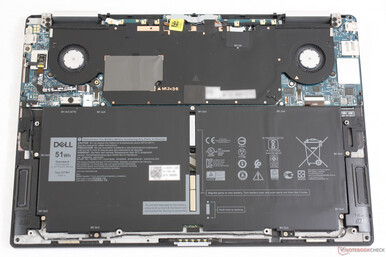
Los tiempos de ejecución son similares a los que registramos en el modelo XPS 13 9300 Core i5 a las 12 o 13 horas de uso de la WLAN en el mundo real. Los resultados son más largos que los de los Ultrabooks de la competencia, incluyendo el HP Spectre x360 13 que usa el mismo CPU de Ice Lake pero con una batería más grande de 60 Wh.
La recarga desde la capacidad vacía a la plena capacidad toma alrededor de dos horas. Este mismo adaptador puede ser usado para recargar otros dispositivos USB Tipo C, incluyendo teléfonos inteligentes, tabletas y el Interruptor de Nintendo.
| Dell XPS 13 9300 Core i7-1065G7 i7-1065G7, Iris Plus Graphics G7 (Ice Lake 64 EU), 52 Wh | Dell XPS 13 7390 Core i7-10710U i7-10710U, UHD Graphics 620, 52 Wh | Dell XPS 13 7390 2-in-1 Core i7 i7-1065G7, Iris Plus Graphics G7 (Ice Lake 64 EU), 51 Wh | Huawei Matebook X Pro i5 i5-8250U, GeForce MX150, 57.4 Wh | Asus ZenBook S13 UX392FN i7-8565U, GeForce MX150, 50 Wh | Microsoft Surface Laptop 3 13 Core i5-1035G7 i5-1035G7, Iris Plus Graphics G7 (Ice Lake 64 EU), 45 Wh | Dell XPS 13 9300 i5 FHD i5-1035G1, UHD Graphics G1 (Ice Lake 32 EU), 52 Wh | |
|---|---|---|---|---|---|---|---|
| Duración de Batería | -34% | -29% | -27% | -34% | -35% | -8% | |
| WiFi v1.3 (h) | 12.7 | 8.4 -34% | 9 -29% | 9.3 -27% | 8.4 -34% | 8.3 -35% | 11.7 -8% |
| Reader / Idle (h) | 20.7 | 28.5 | 34.4 | ||||
| Load (h) | 2.2 | 1.7 | 1.9 | 3.4 |
Pro
Contra
Veredicto
El salto del modelo Core i5-1035G1 al modelo Core i7-1065G7 aportará aproximadamente un 23 por ciento más de rendimiento de la CPU y un 70 por ciento más de rendimiento de la GPU sin coste adicional de energía. Por lo tanto, la mayor razón para poseer el modelo del Core i7 sobre el del Core i5 sería por la ventaja gráfica en aplicaciones como la edición de fotos ligeras o el juego ocasional de Rocket League o LoL. Sin embargo, si sus actividades principales implican el procesamiento de textos, la navegación web o la transmisión de vídeo, entonces la configuración del Core i5 será más que suficiente. De hecho, también puedes considerar un modelo más antiguo de Whiskey Lake-U Core i5-8265U o Core i7-8565U, ya que el Core i5-1035G1 tiene un rendimiento muy similar al de estas CPU de última generación.
El rendimiento de la CPU comienza a doblarse cuando se ejecutan cargas extremas durante períodos prolongados. Es probable que esto no se aplique al público objetivo de subportátiles ya que cualquier usuario de rendimiento debería considerar portátiles más potentes en su lugar como el XPS 15 o el Asus ZenBook Pro.
El aspecto más seductor del XPS 13 9300 es su mayor pantalla de 16:10 que tendrá más beneficios obvios para el usuario en comparación con las actualizaciones de rendimiento relativamente menores. Este es probablemente uno de los movimientos más inteligentes de Dell si querían atraer a más usuarios de MacBook Air o MacBook Pro 13 que han estado disfrutando de las pantallas 16:10 durante años. Encontramos que la relación de aspecto es un buen término medio entre los tradicionales portátiles 16:9 y los portátiles de oficina 3:2 como el Huawei MateBook X Pro o la serie Microsoft Surface.
El XPS 13 se está convirtiendo en una mejor alternativa al MacBook cada año. Su último rediseño añade una pantalla más grande 16:10 y un panel de control sin sacrificar ninguna de las principales características del modelo del año pasado..
Dell XPS 13 9300 Core i7-1065G7
- 03/25/2020 v7 (old)
Allen Ngo


