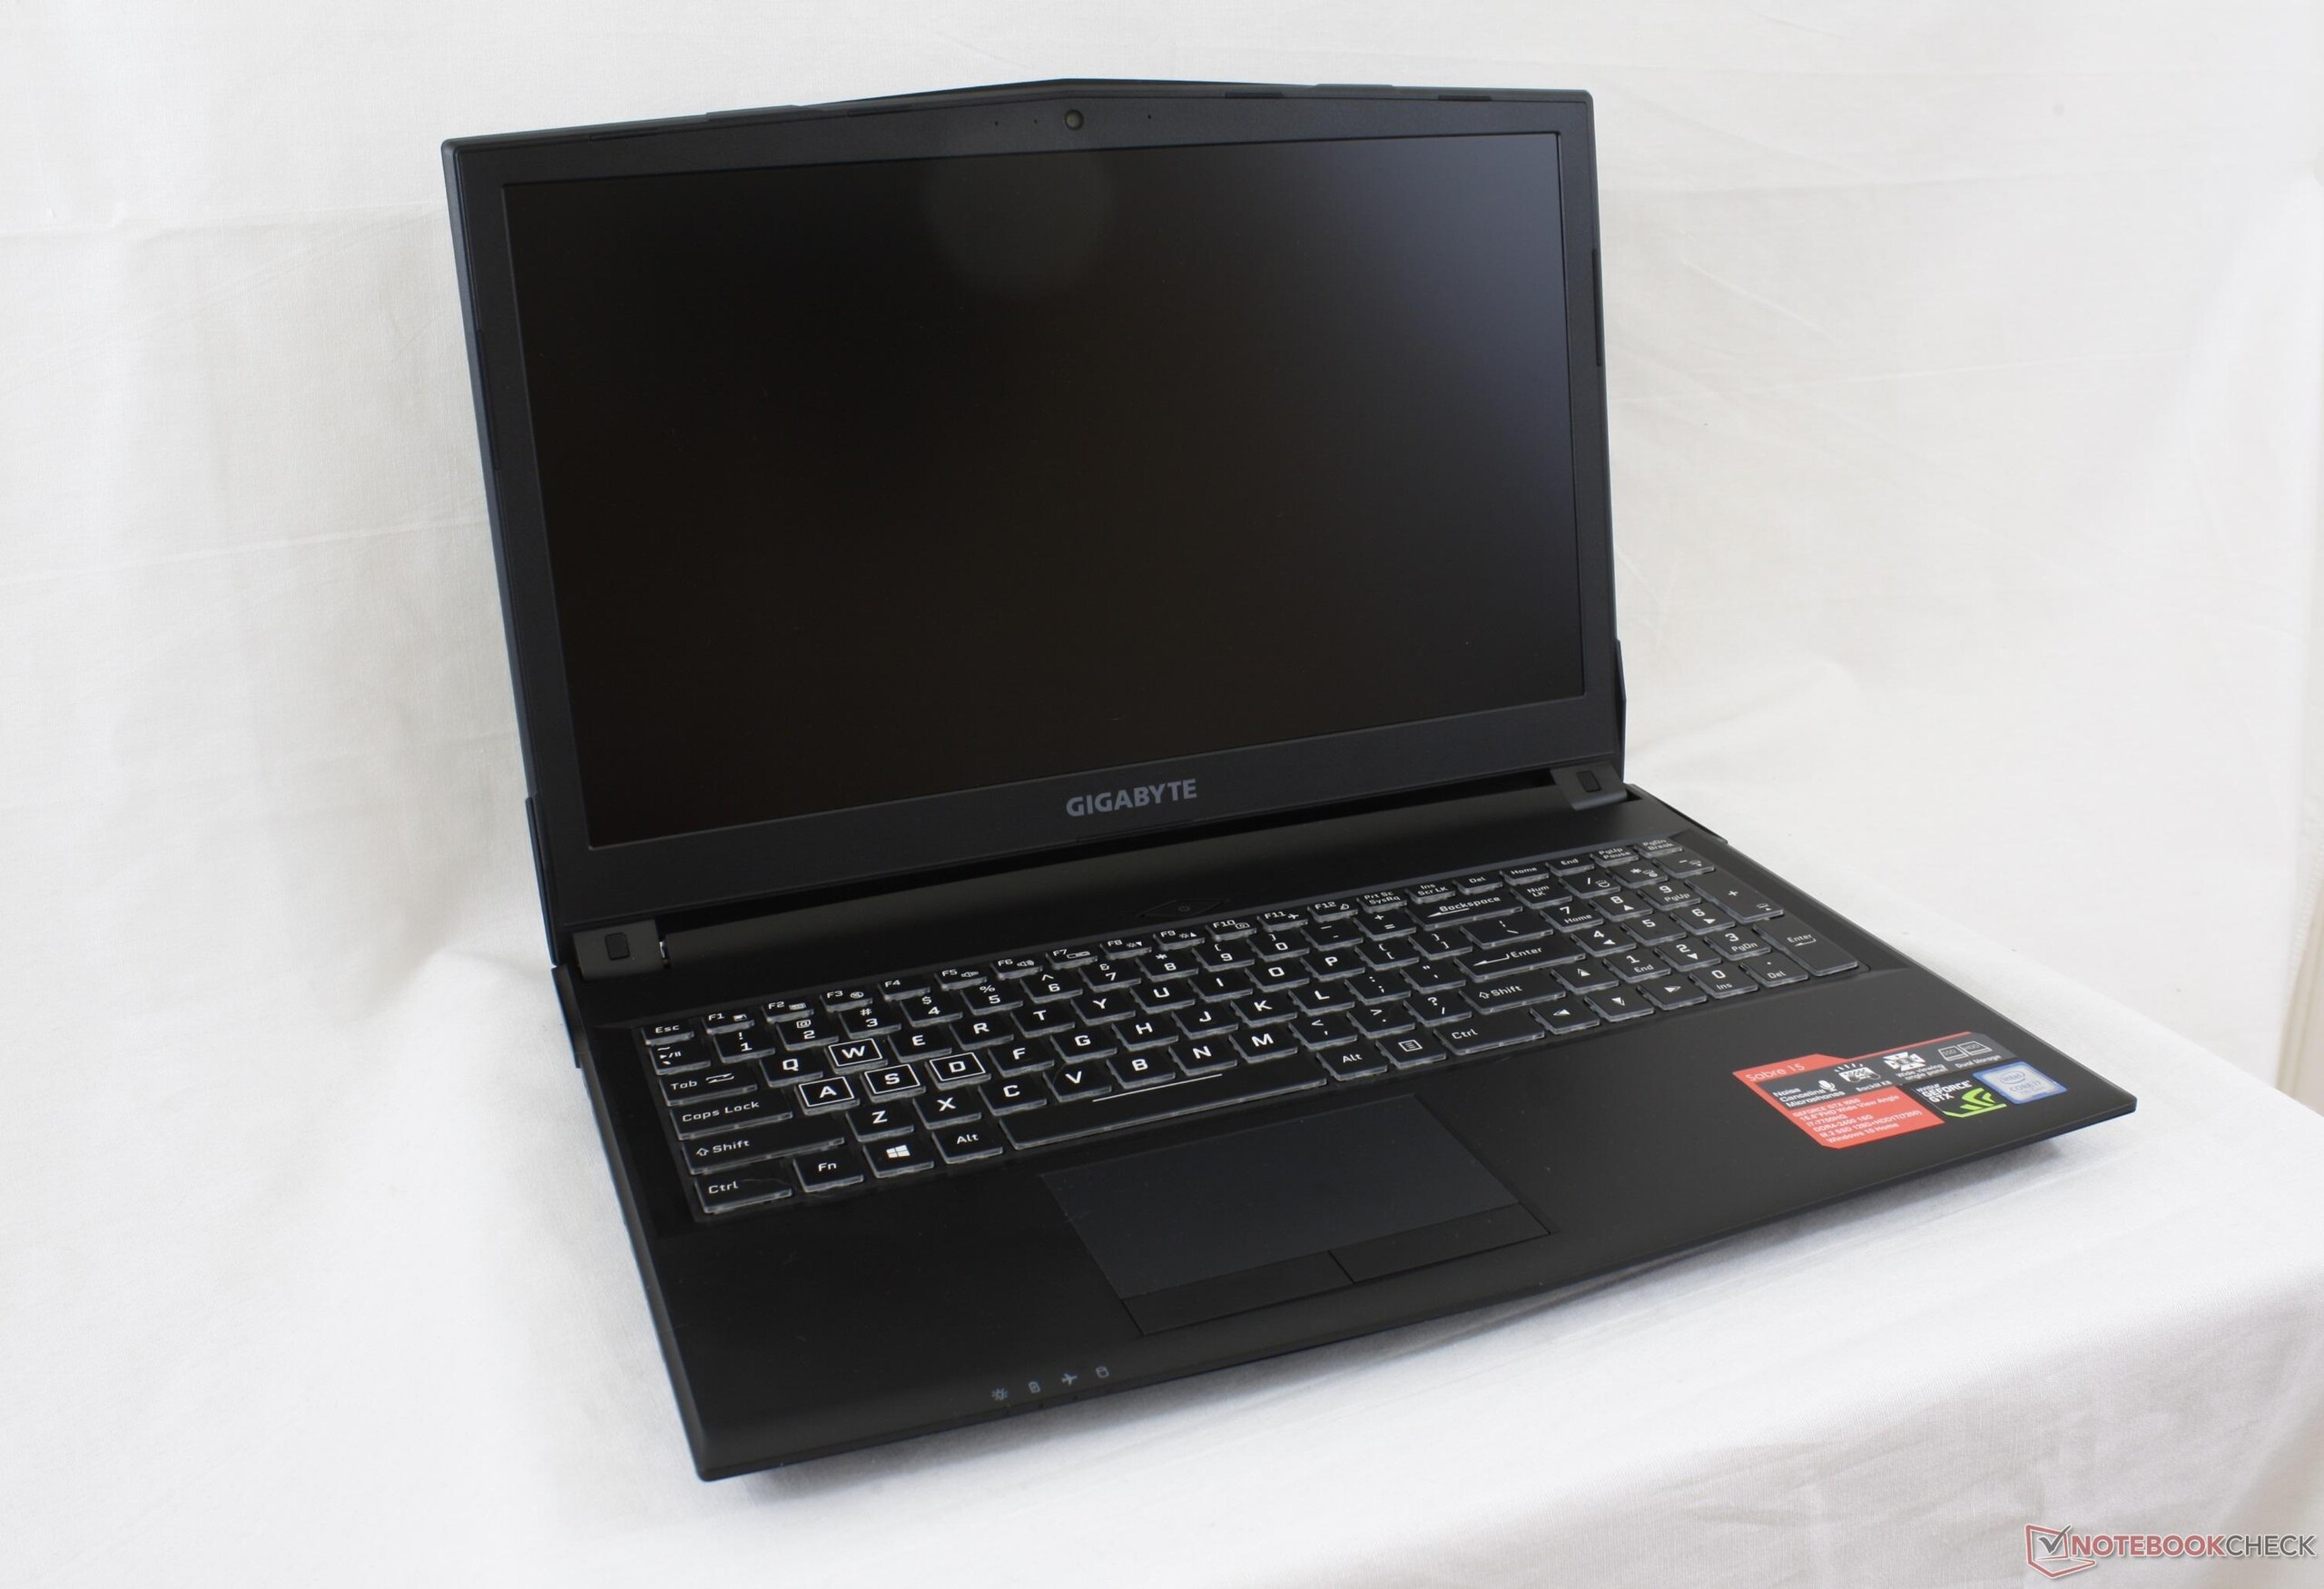
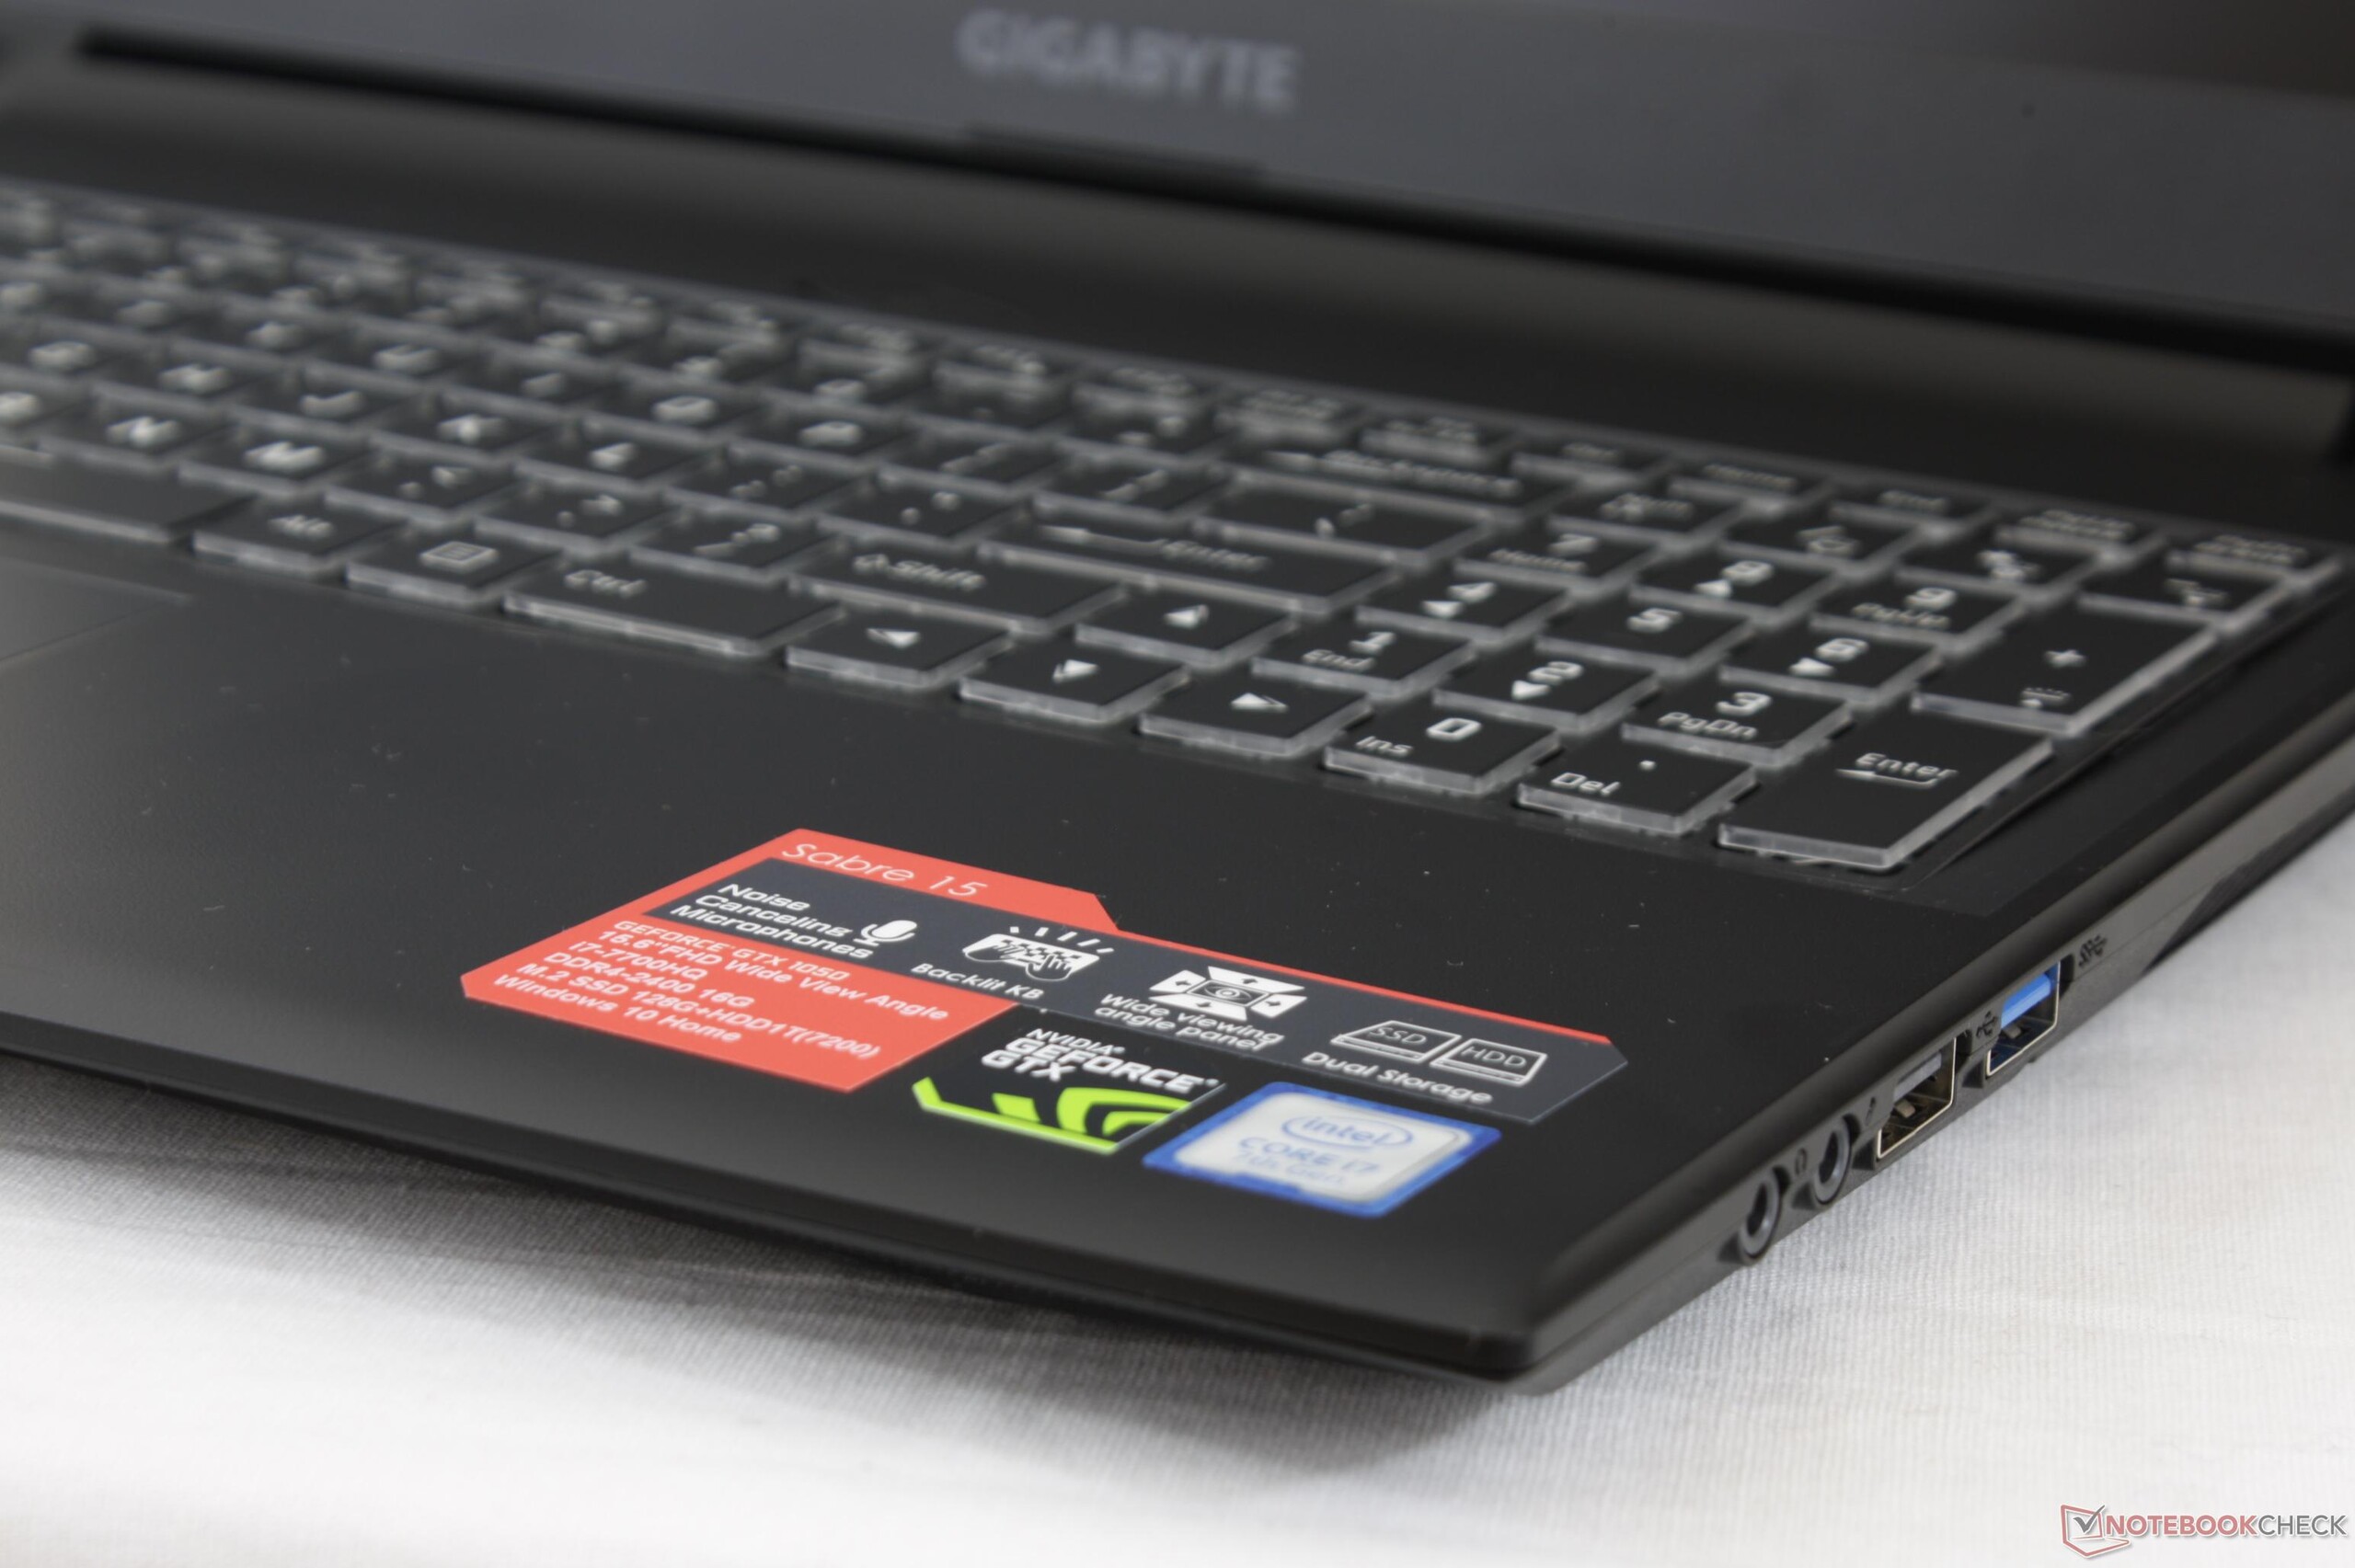
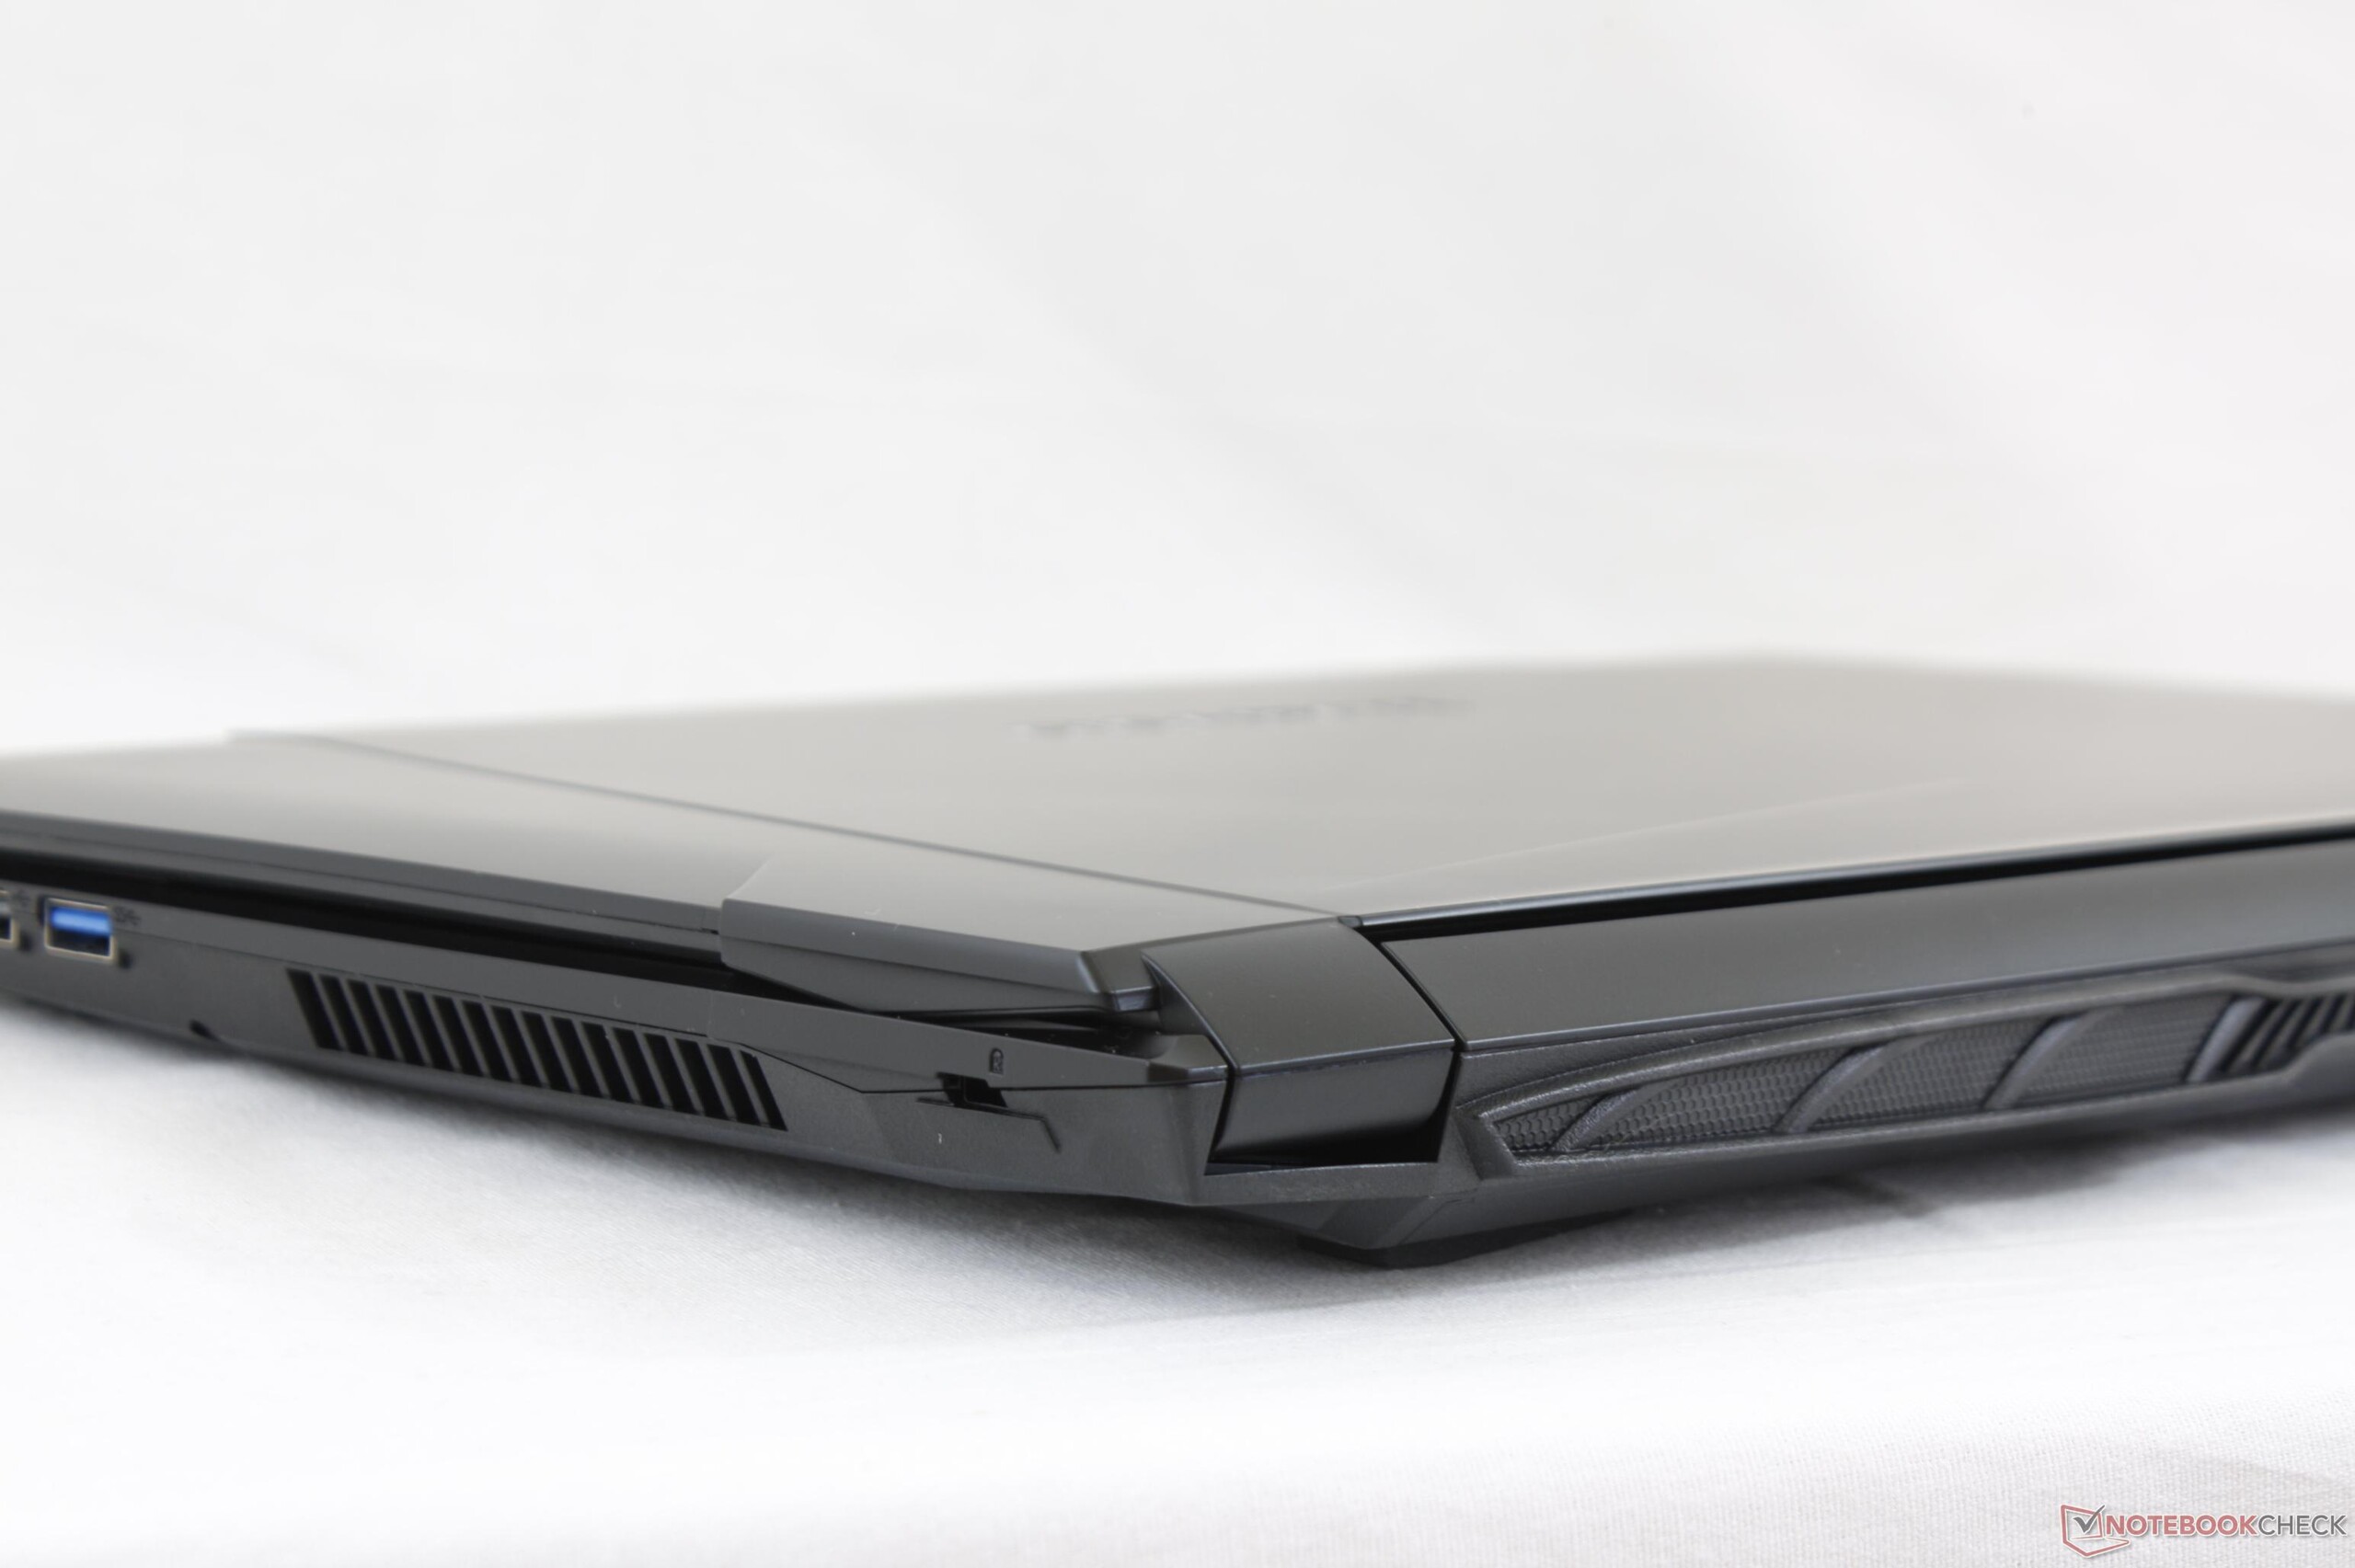
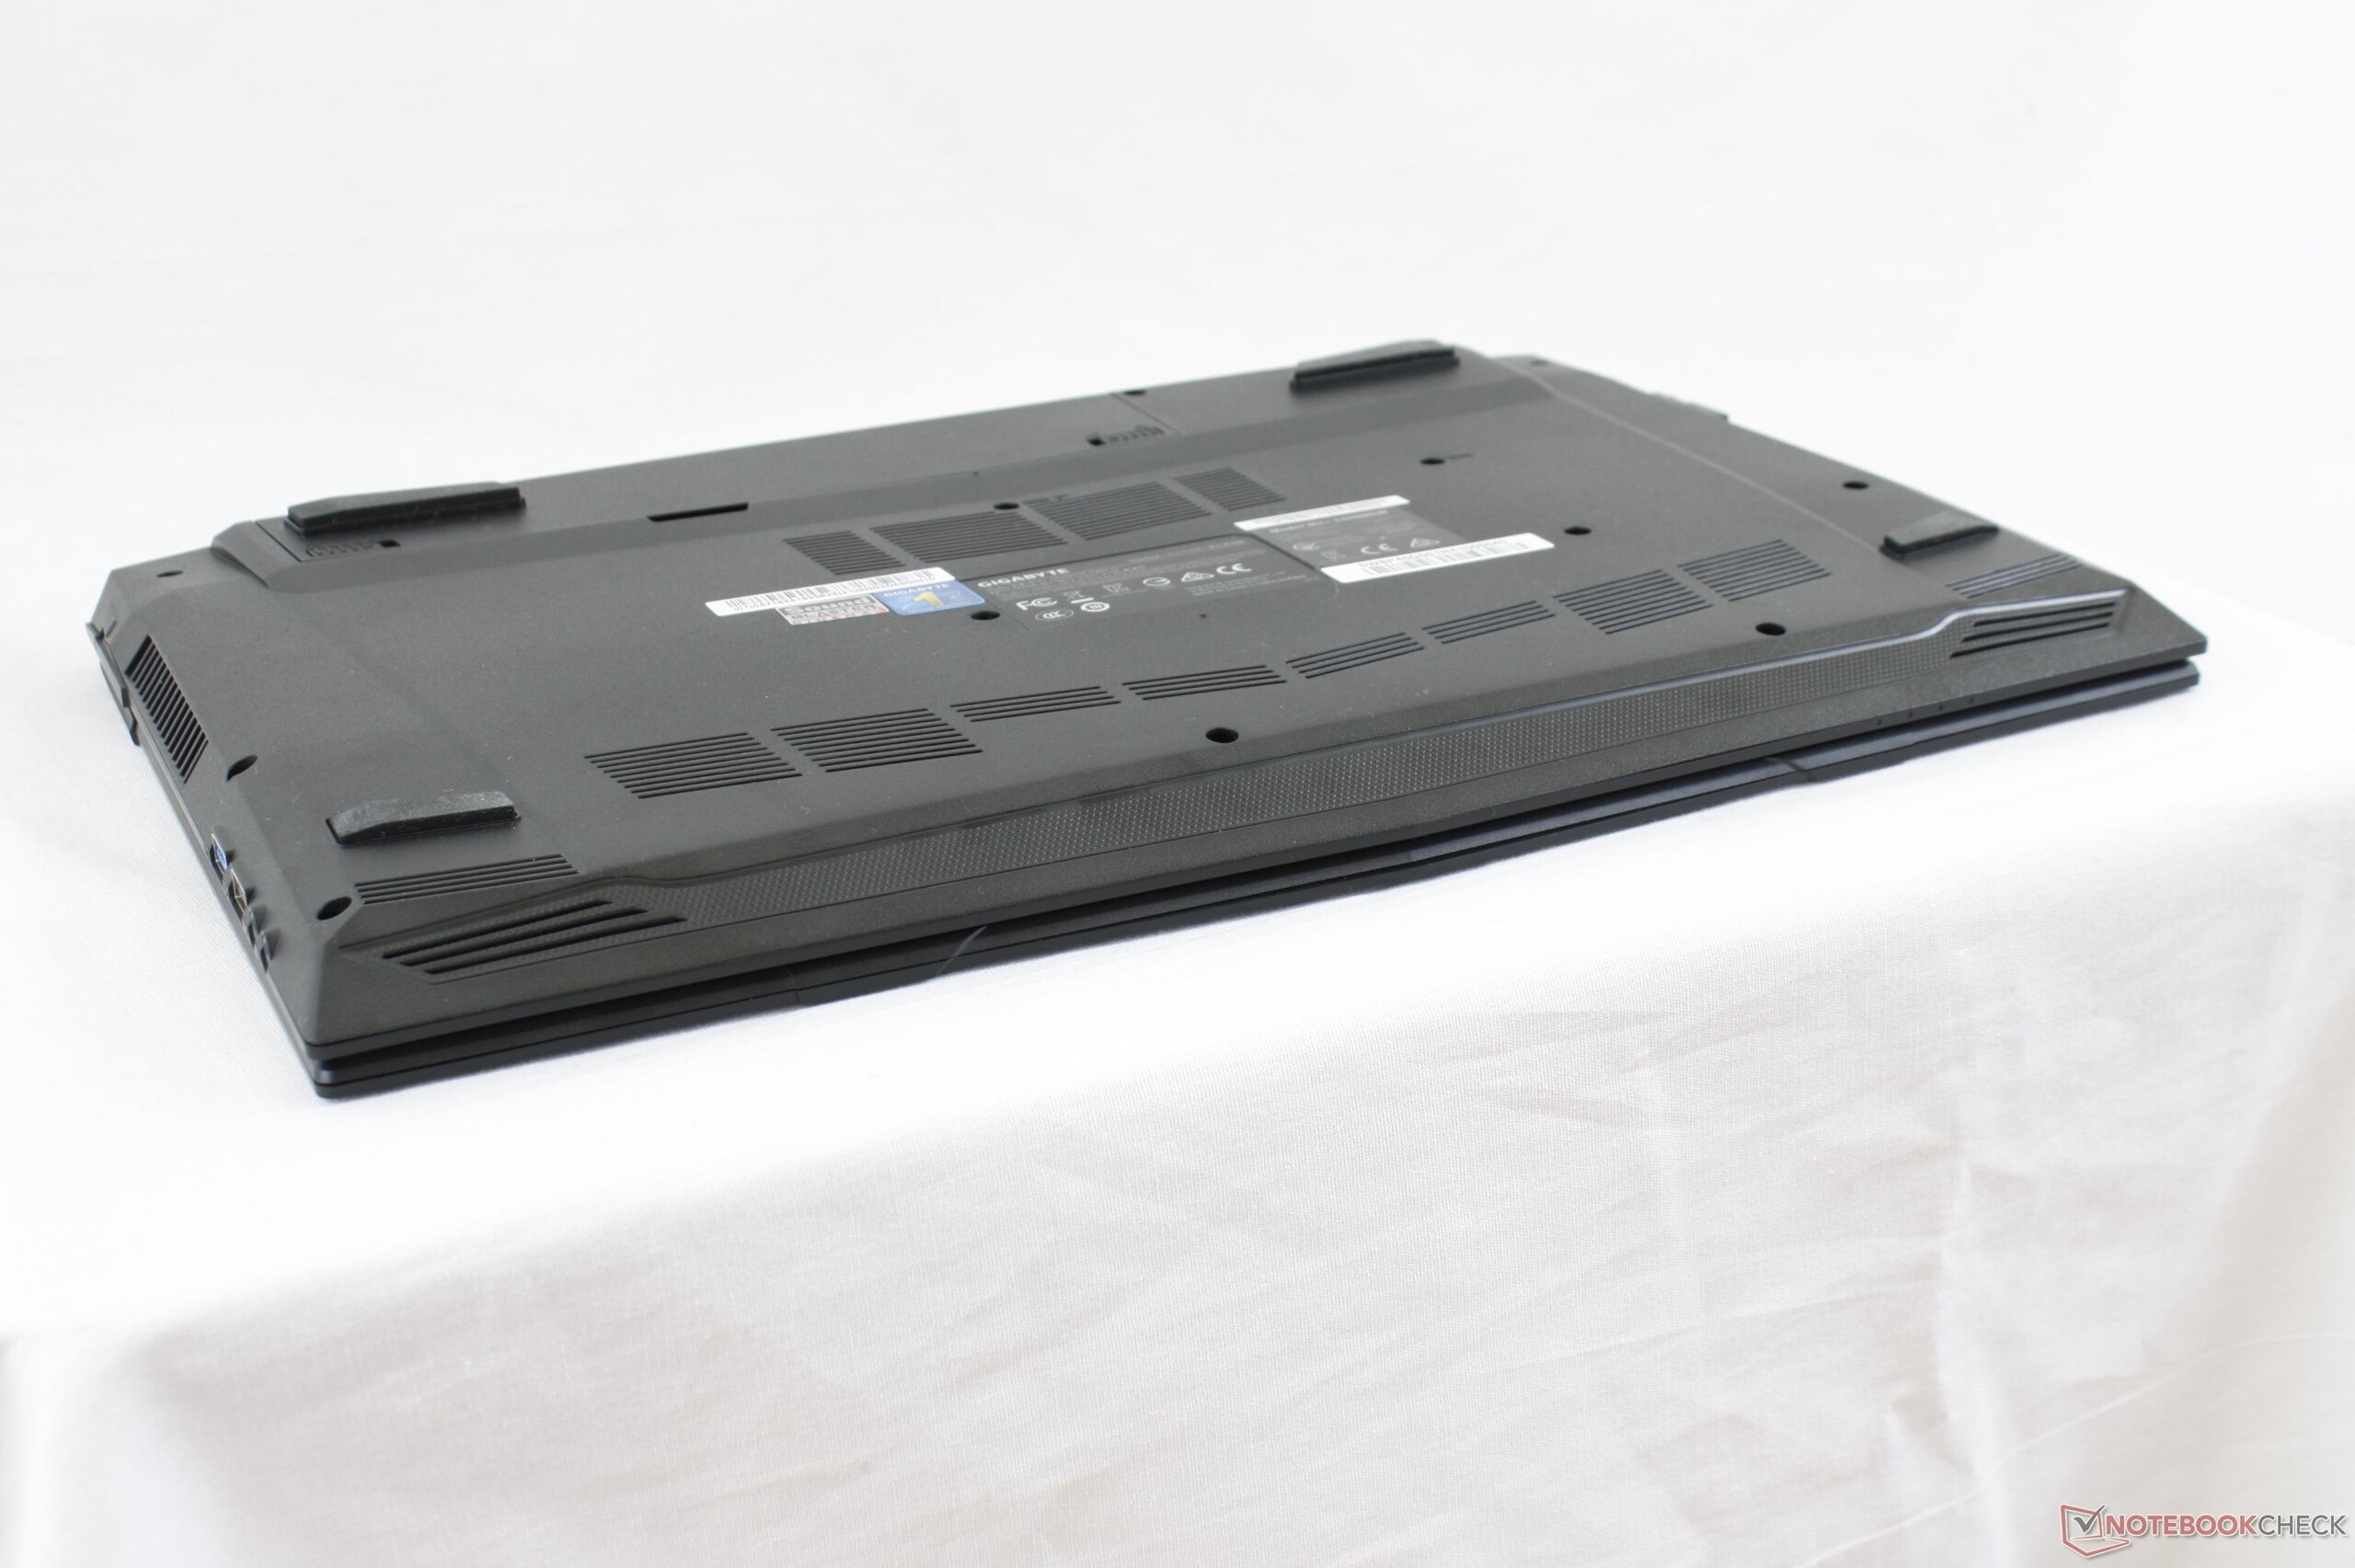
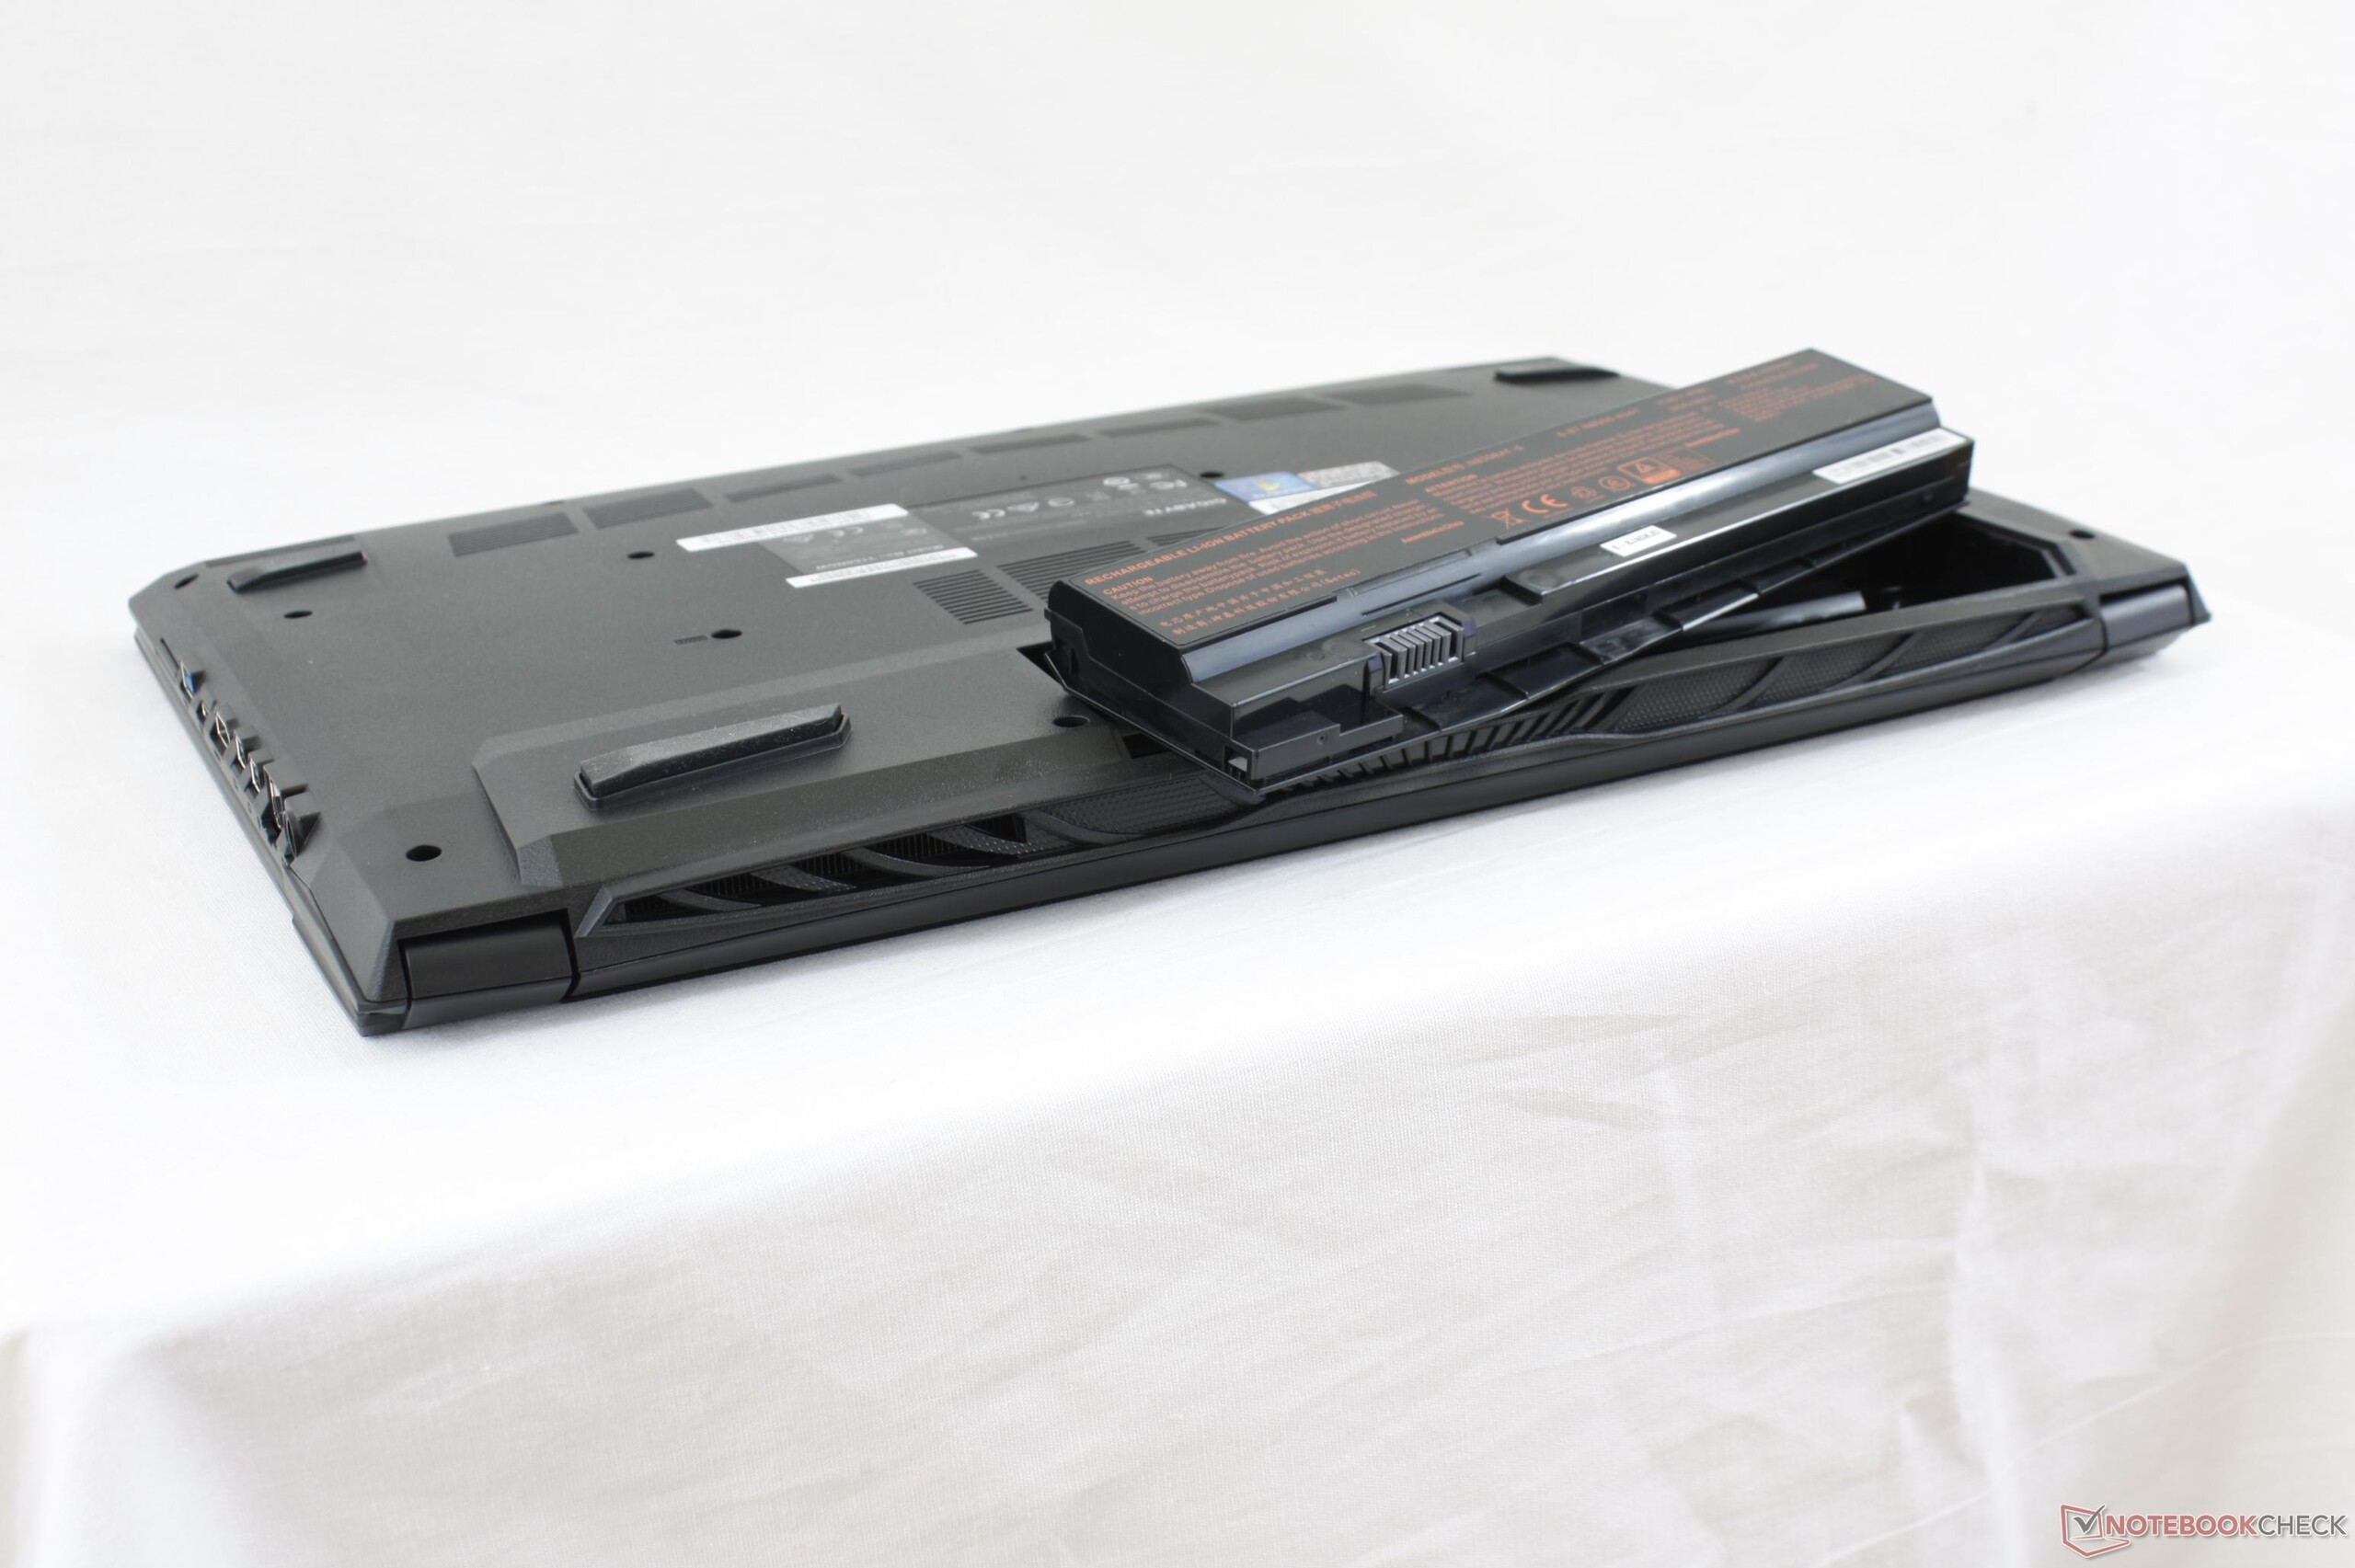
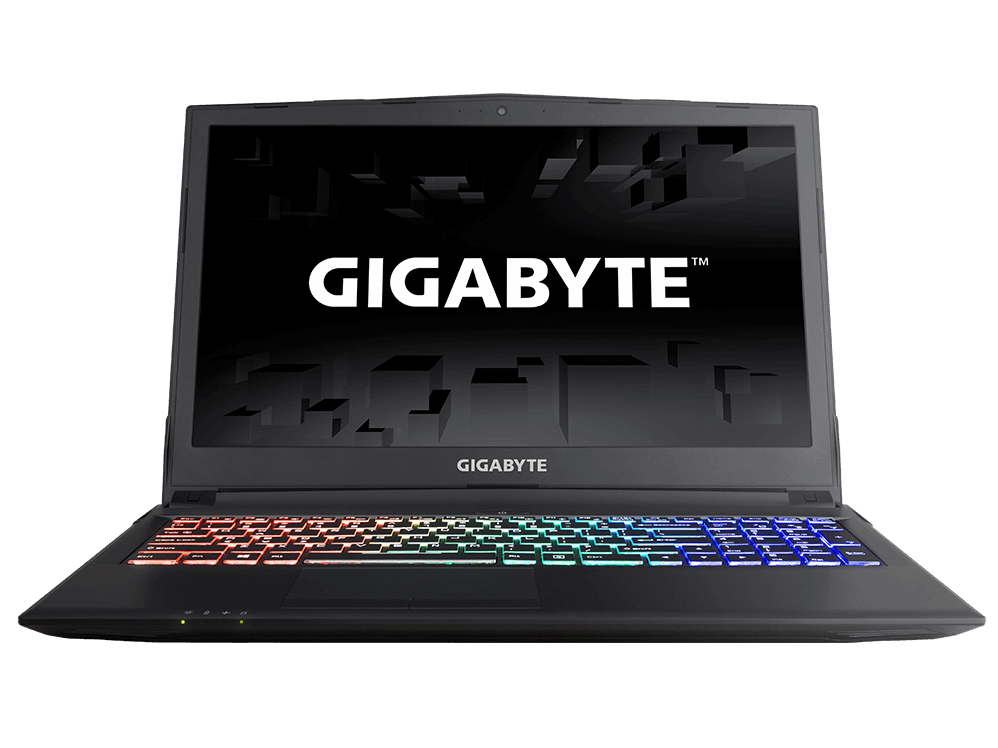
Análisis breve del portátil Gigabyte Sabre 15 (i7-7700HQ, GTX 1050)
| SD Card Reader | |
| average JPG Copy Test (av. of 3 runs) | |
| Dell XPS 15 9560 (i7-7700HQ, UHD) | |
| Gigabyte Sabre 15G | |
| Gigabyte Aero 15 | |
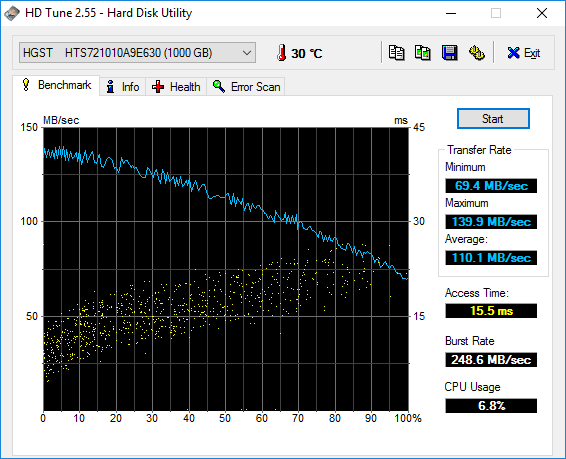
| maximum AS SSD Seq Read Test (1GB) | |
| Dell XPS 15 9560 (i7-7700HQ, UHD) | |
| Gigabyte Aero 15 | |
| Gigabyte Sabre 15G | |
| Networking | |
| iperf3 transmit AX12 | |
| Dell XPS 15 9560 (i7-7700HQ, UHD) | |
| Samsung Odyssey NP800G5M-X01US | |
| Gigabyte Sabre 15G | |
| iperf3 receive AX12 | |
| Dell XPS 15 9560 (i7-7700HQ, UHD) | |
| Samsung Odyssey NP800G5M-X01US | |
| Gigabyte Sabre 15G | |
| |||||||||||||||||||||||||
iluminación: 84 %
Brillo con batería: 248.4 cd/m²
Contraste: 828:1 (Negro: 0.3 cd/m²)
ΔE ColorChecker Calman: 7.5 | ∀{0.5-29.43 Ø4.71}
ΔE Greyscale Calman: 6.5 | ∀{0.09-98 Ø4.96}
57.9% sRGB (Argyll 1.6.3 3D)
37% AdobeRGB 1998 (Argyll 1.6.3 3D)
40.3% AdobeRGB 1998 (Argyll 3D)
58.2% sRGB (Argyll 3D)
38.97% Display P3 (Argyll 3D)
Gamma: 2.19
CCT: 7852 K
| Gigabyte Sabre 15G ID: LGD0533, Name: LG Display LP156WF6-SPK3, IPS, 15.6", 1920x1080 | Dell XPS 15 9560 (i7-7700HQ, UHD) IGZO IPS, 15.6", 3840x2160 | Gigabyte Aero 15 N156HCA-EA1 (CMN15D7), IPS, 15.6", 1920x1080 | HP Omen 15-ce002ng AUO42ED, IPS, 15.6", 1920x1080 | Samsung Odyssey NP800G5M-X01US IPS, 15.6", 1920x1080 | MSI GT62VR 7RE-223 LG Philips LP156WF6 (LGD046F), IPS, 15.6", 1920x1080 | |
|---|---|---|---|---|---|---|
| Display | 117% | 64% | 63% | 21% | 53% | |
| Display P3 Coverage (%) | 38.97 | 89.7 130% | 65.2 67% | 65.8 69% | 47.11 21% | 63.9 64% |
| sRGB Coverage (%) | 58.2 | 100 72% | 92.5 59% | 90.9 56% | 70.4 21% | 83.1 43% |
| AdobeRGB 1998 Coverage (%) | 40.3 | 100 148% | 66.5 65% | 66.5 65% | 48.71 21% | 60.8 51% |
| Response Times | -66% | -30% | -29% | -26% | -7% | |
| Response Time Grey 50% / Grey 80% * (ms) | 32 ? | 57.2 ? -79% | 42.8 ? -34% | 43.2 ? -35% | 38.8 ? -21% | 37 ? -16% |
| Response Time Black / White * (ms) | 25.6 ? | 39.2 ? -53% | 32 ? -25% | 31.2 ? -22% | 33.6 ? -31% | 25 ? 2% |
| PWM Frequency (Hz) | 20000 ? | 962 | 26000 ? | 19230 ? | ||
| Screen | 43% | 28% | 40% | 2% | 30% | |
| Brightness middle (cd/m²) | 248.4 | 370.1 49% | 320 29% | 304 22% | 255.9 3% | 310 25% |
| Brightness (cd/m²) | 241 | 356 48% | 316 31% | 289 20% | 249 3% | 311 29% |
| Brightness Distribution (%) | 84 | 87 4% | 90 7% | 86 2% | 90 7% | 85 1% |
| Black Level * (cd/m²) | 0.3 | 0.37 -23% | 0.36 -20% | 0.26 13% | 0.48 -60% | 0.3 -0% |
| Contrast (:1) | 828 | 1000 21% | 889 7% | 1169 41% | 533 -36% | 1033 25% |
| Colorchecker dE 2000 * | 7.5 | 5.3 29% | 4.62 38% | 3.46 54% | 5.9 21% | 4.82 36% |
| Colorchecker dE 2000 max. * | 25.2 | 9.9 61% | 9.75 61% | 7.72 69% | 18.9 25% | 10.14 60% |
| Greyscale dE 2000 * | 6.5 | 4.6 29% | 6 8% | 2.46 62% | 5.6 14% | 3.94 39% |
| Gamma | 2.19 100% | 2.31 95% | 2.46 89% | 2.38 92% | 2.21 100% | 2.45 90% |
| CCT | 7852 83% | 6284 103% | 6761 96% | 6915 94% | 7250 90% | 6877 95% |
| Color Space (Percent of AdobeRGB 1998) (%) | 37 | 88.3 139% | 60 62% | 59 59% | 44.8 21% | 54 46% |
| Color Space (Percent of sRGB) (%) | 57.9 | 100 73% | 92 59% | 91 57% | 70.1 21% | 83 43% |
| Media total (Programa/Opciones) | 31% /
43% | 21% /
28% | 25% /
35% | -1% /
2% | 25% /
30% |
* ... más pequeño es mejor
Tiempos de respuesta del display
| ↔ Tiempo de respuesta de Negro a Blanco | ||
|---|---|---|
| 25.6 ms ... subida ↗ y bajada ↘ combinada | ↗ 15.6 ms subida | 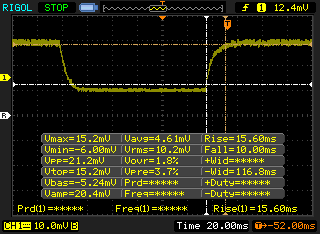 |
| ↘ 10 ms bajada | ||
| La pantalla mostró tiempos de respuesta relativamente lentos en nuestros tests pero podría ser demasiado lenta para los jugones. En comparación, todos los dispositivos de prueba van de ##min### (mínimo) a 240 (máximo) ms. » 61 % de todos los dispositivos son mejores. Eso quiere decir que el tiempo de respuesta es peor que la media (19.8 ms) de todos los dispositivos testados. | ||
| ↔ Tiempo de respuesta 50% Gris a 80% Gris | ||
| 32 ms ... subida ↗ y bajada ↘ combinada | ↗ 16.4 ms subida | 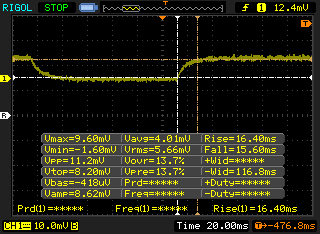 |
| ↘ 15.6 ms bajada | ||
| La pantalla mostró tiempos de respuesta lentos en nuestros tests y podría ser demasiado lenta para los jugones. En comparación, todos los dispositivos de prueba van de ##min### (mínimo) a 636 (máximo) ms. » 43 % de todos los dispositivos son mejores. Eso quiere decir que el tiempo de respuesta es similar al dispositivo testado medio (31 ms). | ||
Parpadeo de Pantalla / PWM (Pulse-Width Modulation)
| Parpadeo de Pantalla / PWM detectado | 20000 Hz | ≤ 99 % de brillo | 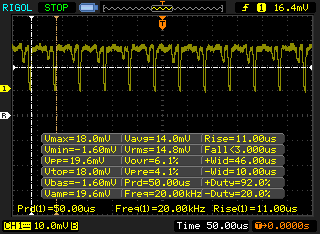 |
La retroiluminación del display parpadea a 20000 Hz (seguramente usa PWM - Pulse-Width Modulation) a un brillo del 99 % e inferior. Sobre este nivel de brillo no debería darse parpadeo / PWM. La frecuencia de 20000 Hz es bastante alta, por lo que la mayoría de gente sensible al parpadeo no debería ver parpadeo o tener fatiga visual. Comparación: 52 % de todos los dispositivos testados no usaron PWM para atenuar el display. Si se usó, medimos una media de 7754 (mínimo: 5 - máxmo: 343500) Hz. | |||
| wPrime 2.10 - 1024m | |
| Lenovo IdeaPad Y50 | |
| Gigabyte Sabre 15G | |
| Eurocom Sky MX5 R3 | |
| Gigabyte P55 V4 | |
| Eurocom Tornado F5 | |
* ... más pequeño es mejor
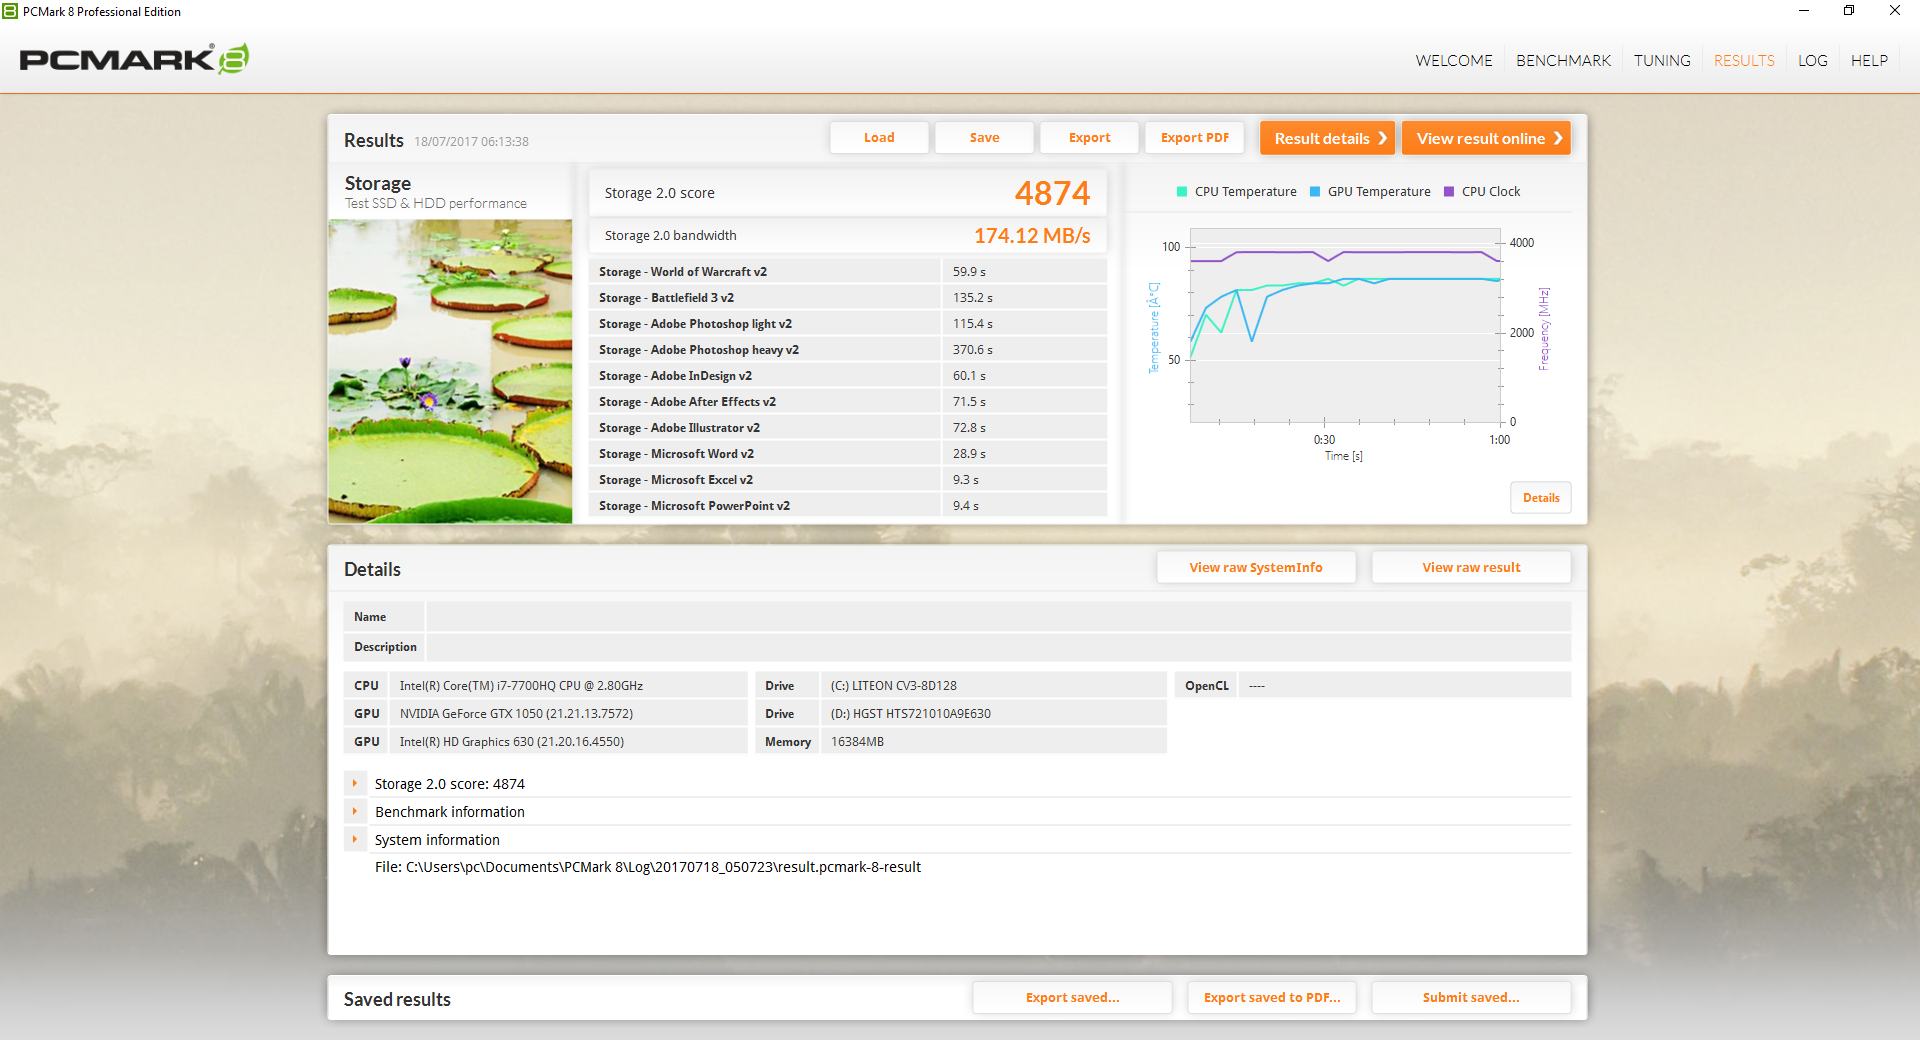
| PCMark 8 | |
| Home Score Accelerated v2 | |
| Eurocom Sky MX5 R3 | |
| Gigabyte Aero 15 | |
| Samsung Odyssey NP800G5M-X01US | |
| Dell XPS 15 9560 (i7-7700HQ, UHD) | |
| Gigabyte Sabre 15G | |
| Work Score Accelerated v2 | |
| Samsung Odyssey NP800G5M-X01US | |
| Gigabyte Aero 15 | |
| Eurocom Sky MX5 R3 | |
| Gigabyte Sabre 15G | |
| Dell XPS 15 9560 (i7-7700HQ, UHD) | |
| Creative Score Accelerated v2 | |
| Eurocom Sky MX5 R3 | |
| Samsung Odyssey NP800G5M-X01US | |
| Dell XPS 15 9560 (i7-7700HQ, UHD) | |
| Gigabyte Sabre 15G | |
| PCMark 8 Home Score Accelerated v2 | 3431 puntos | |
| PCMark 8 Creative Score Accelerated v2 | 4274 puntos | |
| PCMark 8 Work Score Accelerated v2 | 5063 puntos | |
| PCMark 10 Score | 4364 puntos | |
ayuda | ||
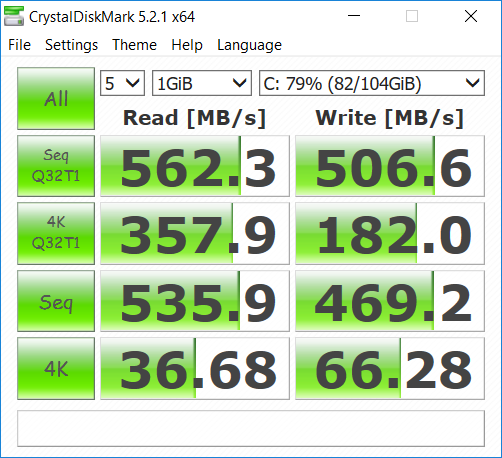
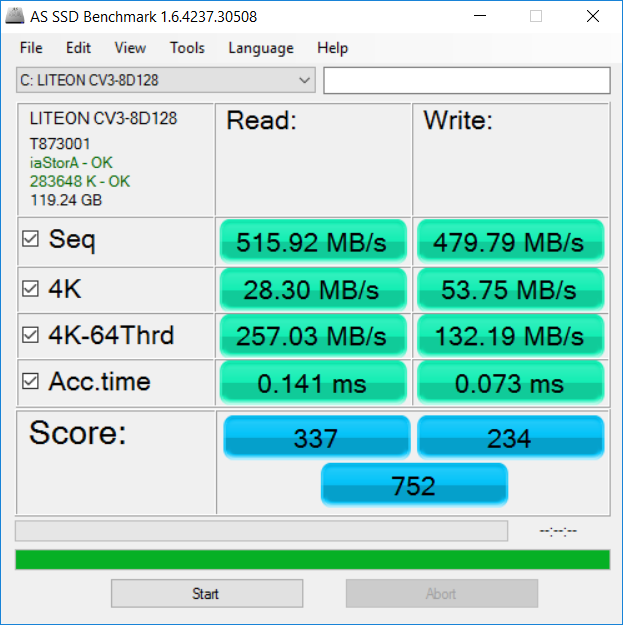
| Gigabyte Sabre 15G Liteonit CV3-8D128 | Dell XPS 15 9560 (i7-7700HQ, UHD) Lite-On CX2-8B512-Q11 | Samsung Odyssey NP800G5M-X01US Samsung PM961 NVMe MZVLW128HEGR | MSI GT62VR 7RE-223 Samsung SSD PM871a MZNLN256HMHQ | Aorus X5 v6 Samsung SM951 MZVPV256 m.2 | |
|---|---|---|---|---|---|
| AS SSD | 195% | 106% | 25% | 98% | |
| Copy Game MB/s (MB/s) | 323.5 | 540 67% | 240.5 -26% | 377.8 17% | 1073 232% |
| Copy Program MB/s (MB/s) | 195.3 | 411.5 111% | 299.5 53% | 199 2% | 351.5 80% |
| Copy ISO MB/s (MB/s) | 446.8 | 1272 185% | 1560 249% | 354.7 -21% | 351.1 -21% |
| Score Total (Points) | 752 | 2810 274% | 1592 112% | 1019 36% | 1630 117% |
| Score Write (Points) | 234 | 1022 337% | 376 61% | 304 30% | 514 120% |
| Score Read (Points) | 337 | 1206 258% | 852 153% | 472 40% | 756 124% |
| Access Time Write * (ms) | 0.073 | 0.034 53% | 0.031 58% | 0.037 49% | 0.025 66% |
| Access Time Read * (ms) | 0.141 | 0.034 76% | 0.066 53% | 0.1 29% | 0.367 -160% |
| 4K-64 Write (MB/s) | 132.2 | 789 497% | 176.4 33% | 171.6 30% | 272.5 106% |
| 4K-64 Read (MB/s) | 257 | 962 274% | 564 119% | 383.4 49% | 521 103% |
| 4K Write (MB/s) | 53.8 | 112.2 109% | 124.1 131% | 104 93% | 131.3 144% |
| 4K Read (MB/s) | 28.3 | 41.34 46% | 44.75 58% | 37.2 31% | 44.6 58% |
| Seq Write (MB/s) | 479.8 | 1207 152% | 752 57% | 288.2 -40% | 1099 129% |
| Seq Read (MB/s) | 516 | 2026 293% | 2433 372% | 510 -1% | 1904 269% |
* ... más pequeño es mejor

| 3DMark 11 Performance | 7609 puntos | |
| 3DMark Ice Storm Standard Score | 73178 puntos | |
| 3DMark Cloud Gate Standard Score | 20270 puntos | |
| 3DMark Fire Strike Score | 5582 puntos | |
| 3DMark Fire Strike Extreme Score | 2702 puntos | |
ayuda | ||
| Batman: Arkham Knight | |
| 1920x1080 High / On (Interactive Smoke & Paper Debris Off) AA:SM AF:8x | |
| EVGA SC15 | |
| DogHouse Systems Mobius SS | |
| Lenovo Legion Y520-15IKBN-80WK001KUS | |
| Gigabyte P55W v5 | |
| Dell XPS 15 9560 (i7-7700HQ, UHD) | |
| Gigabyte Sabre 15G | |
| HP Pavilion 17 FHD V3A33AV | |
| 1920x1080 High / On AA:SM AF:16x | |
| EVGA SC15 | |
| DogHouse Systems Mobius SS | |
| Lenovo Legion Y520-15IKBN-80WK001KUS | |
| Gigabyte P55W v5 | |
| Dell XPS 15 9560 (i7-7700HQ, UHD) | |
| Gigabyte Sabre 15G | |
| HP Pavilion 17 FHD V3A33AV | |
| Rise of the Tomb Raider | |
| 1920x1080 High Preset AA:FX AF:4x | |
| DogHouse Systems Mobius SS | |
| Lenovo Legion Y520-15IKBN-80WK001KUS | |
| Gigabyte P55W v5 | |
| Dell XPS 15 9560 (i7-7700HQ, UHD) | |
| Gigabyte Sabre 15G | |
| HP Pavilion 17 FHD V3A33AV | |
| 1920x1080 Very High Preset AA:FX AF:16x | |
| EVGA SC15 | |
| DogHouse Systems Mobius SS | |
| Lenovo Legion Y520-15IKBN-80WK001KUS | |
| Gigabyte P55W v5 | |
| Gigabyte Sabre 15G | |
| Dell XPS 15 9560 (i7-7700HQ, UHD) | |
| HP Pavilion 17 FHD V3A33AV | |
| BioShock Infinite - 1920x1080 Ultra Preset, DX11 (DDOF) | |
| EVGA SC15 | |
| DogHouse Systems Mobius SS | |
| Lenovo Legion Y520-15IKBN-80WK001KUS | |
| Gigabyte P55W v5 | |
| Dell XPS 15 9560 (i7-7700HQ, UHD) | |
| Gigabyte Sabre 15G | |
| HP Pavilion 17 FHD V3A33AV | |
| bajo | medio | alto | ultra | |
|---|---|---|---|---|
| BioShock Infinite (2013) | 130 | 61 | ||
| Metro: Last Light (2013) | 79 | 44 | ||
| Thief (2014) | 69.2 | 42.8 | ||
| The Witcher 3 (2015) | 41 | 22 | ||
| Batman: Arkham Knight (2015) | 78 | 46 | 25 | |
| Metal Gear Solid V (2015) | 60 | 53.2 | ||
| Fallout 4 (2015) | 42.8 | 35.5 | ||
| Rise of the Tomb Raider (2016) | 38.6 | 34.2 | ||
| Ashes of the Singularity (2016) | 34.1 | 29.4 | ||
| Doom (2016) | 48 | 42 | ||
| Overwatch (2016) | 59 | |||
| Mafia 3 (2016) | 38.3 | |||
| Prey (2017) | 62.2 | 54.4 |
| CPU Clock (GHz) | GPU Clock (MHz) | Average CPU Temperature (°C) | Average GPU Temperature (°C) | |
| Prime95 Stress | 3.2 | -- | 96 | -- |
| FurMark Stress | -- | 1152 | -- | 64 |
| Prime95 + FurMark Stress | 2.8 | 1152 | 80 | 63 |
| Witcher 3 Stress | 1.0 - 2.8 | 1696 | 49 - 55 | 78 |
Ruido
| Ocioso |
| 33 / 33.3 / 34.7 dB(A) |
| Carga |
| 44.5 / 52.8 dB(A) |
 | ||
30 dB silencioso 40 dB(A) audible 50 dB(A) ruidosamente alto |
||
min: | ||
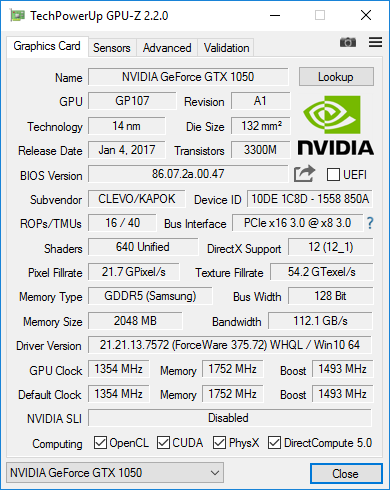
| Gigabyte Sabre 15G GeForce GTX 1050 Mobile, i7-7700HQ, Liteonit CV3-8D128 | Dell XPS 15 9560 (i7-7700HQ, UHD) GeForce GTX 1050 Mobile, i7-7700HQ, Lite-On CX2-8B512-Q11 | Gigabyte Aero 15 GeForce GTX 1060 Mobile, i7-7700HQ, Lite-On CX2-8B512-Q11 | HP Omen 15-ce002ng GeForce GTX 1060 Max-Q, i7-7700HQ, Samsung PM961 MZVLW256HEHP | Samsung Odyssey NP800G5M-X01US GeForce GTX 1050 Mobile, i7-7700HQ, Samsung PM961 NVMe MZVLW128HEGR | MSI GT62VR 7RE-223 GeForce GTX 1070 Mobile, i7-7700HQ, Samsung SSD PM871a MZNLN256HMHQ | |
|---|---|---|---|---|---|---|
| Noise | 4% | 4% | 4% | 7% | 1% | |
| apagado / medio ambiente * (dB) | 28.2 | 28.4 -1% | 31 -10% | 30 -6% | 28.1 -0% | 30 -6% |
| Idle Minimum * (dB) | 33 | 29 12% | 32 3% | 30 9% | 28.1 15% | 34 -3% |
| Idle Average * (dB) | 33.3 | 29 13% | 33 1% | 33 1% | 29.1 13% | 35 -5% |
| Idle Maximum * (dB) | 34.7 | 32.2 7% | 34 2% | 37 -7% | 29.1 16% | 36 -4% |
| Load Average * (dB) | 44.5 | 47.1 -6% | 39 12% | 41 8% | 49.2 -11% | 40 10% |
| Witcher 3 ultra * (dB) | 49.2 | 52 -6% | 43 13% | 42 15% | ||
| Load Maximum * (dB) | 52.8 | 47.1 11% | 50 5% | 50 5% | 49.2 7% | 46 13% |
* ... más pequeño es mejor
(±) La temperatura máxima en la parte superior es de 43.6 °C / 110 F, frente a la media de 40.4 °C / 105 F, que oscila entre 21.2 y 68.8 °C para la clase Gaming.
(±) El fondo se calienta hasta un máximo de 40.2 °C / 104 F, frente a la media de 43.2 °C / 110 F
(+) En reposo, la temperatura media de la parte superior es de 26.4 °C / 80# F, frente a la media del dispositivo de 33.9 °C / 93 F.
(+) Jugando a The Witcher 3, la temperatura media de la parte superior es de 27.8 °C / 82 F, frente a la media del dispositivo de 33.9 °C / 93 F.
(+) El reposamanos y el panel táctil están a una temperatura inferior a la de la piel, con un máximo de 30.4 °C / 86.7 F y, por tanto, son fríos al tacto.
(±) La temperatura media de la zona del reposamanos de dispositivos similares fue de 28.8 °C / 83.8 F (-1.6 °C / -2.9 F).

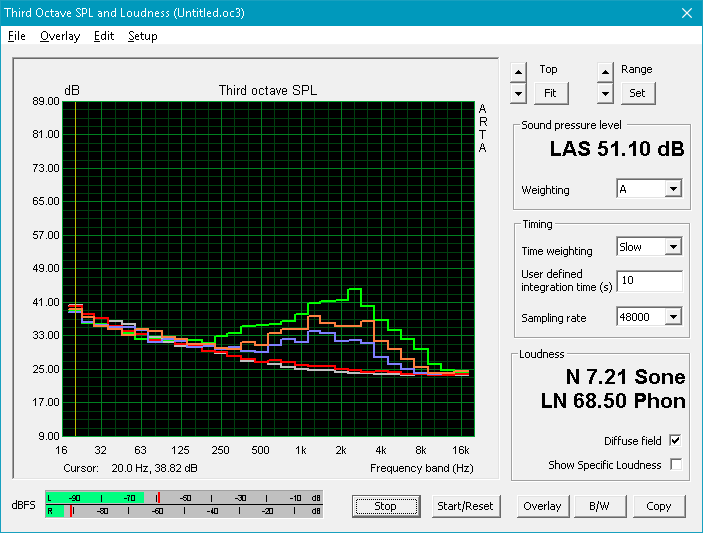
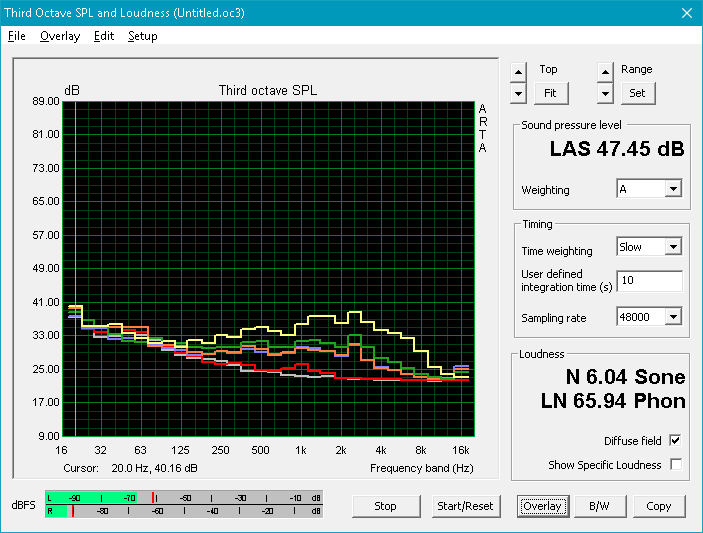
Gigabyte Sabre 15G análisis de audio
(±) | la sonoridad del altavoz es media pero buena (72 dB)
Graves 100 - 315 Hz
(-) | casi sin bajos - de media 26.3% inferior a la mediana
(+) | el bajo es lineal (6.3% delta a la frecuencia anterior)
Medios 400 - 2000 Hz
(±) | medios reducidos - de media 8.2% inferior a la mediana
(±) | la linealidad de los medios es media (14.6% delta respecto a la frecuencia anterior)
Altos 2 - 16 kHz
(±) | máximos más altos - de media 5.1% más altos que la mediana
(±) | la linealidad de los máximos es media (11.2% delta a frecuencia anterior)
Total 100 - 16.000 Hz
(-) | el sonido global no es lineal (36.7% de diferencia con la mediana)
En comparación con la misma clase
» 99% de todos los dispositivos probados de esta clase eran mejores, 0% similares, 1% peores
» El mejor tuvo un delta de 6%, la media fue 18%, el peor fue ###max##%
En comparación con todos los dispositivos probados
» 94% de todos los dispositivos probados eran mejores, 1% similares, 5% peores
» El mejor tuvo un delta de 4%, la media fue 23%, el peor fue ###max##%
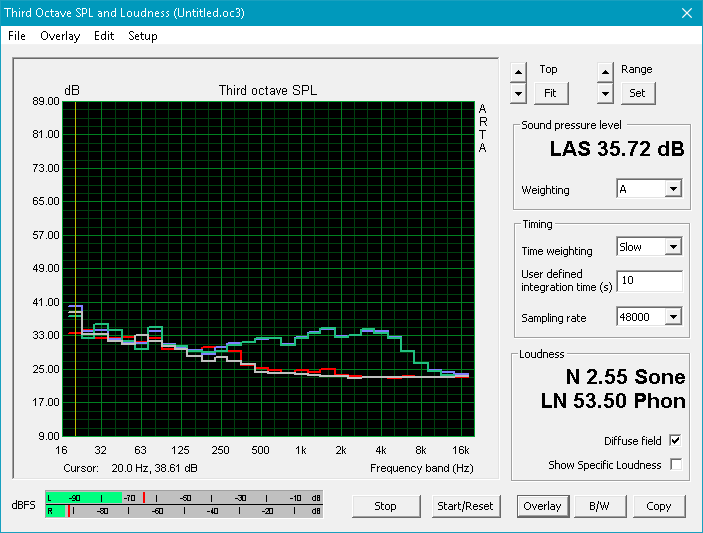
Apple MacBook 12 (Early 2016) 1.1 GHz análisis de audio
(+) | los altavoces pueden reproducir a un volumen relativamente alto (#83.6 dB)
Graves 100 - 315 Hz
(±) | lubina reducida - en promedio 11.3% inferior a la mediana
(±) | la linealidad de los graves es media (14.2% delta a frecuencia anterior)
Medios 400 - 2000 Hz
(+) | medios equilibrados - a sólo 2.4% de la mediana
(+) | los medios son lineales (5.5% delta a la frecuencia anterior)
Altos 2 - 16 kHz
(+) | máximos equilibrados - a sólo 2% de la mediana
(+) | los máximos son lineales (4.5% delta a la frecuencia anterior)
Total 100 - 16.000 Hz
(+) | el sonido global es lineal (10.2% de diferencia con la mediana)
En comparación con la misma clase
» 7% de todos los dispositivos probados de esta clase eran mejores, 2% similares, 90% peores
» El mejor tuvo un delta de 5%, la media fue 18%, el peor fue ###max##%
En comparación con todos los dispositivos probados
» 5% de todos los dispositivos probados eran mejores, 1% similares, 94% peores
» El mejor tuvo un delta de 4%, la media fue 23%, el peor fue ###max##%
Frequency Comparison (Checkbox selectable!)
Graph 1: Pink Noise 100% Vol.; Graph 2: Audio off
| Off / Standby | |
| Ocioso | |
| Carga |
|
Clave:
min: | |
| Gigabyte Sabre 15G i7-7700HQ, GeForce GTX 1050 Mobile, Liteonit CV3-8D128, IPS, 1920x1080, 15.6" | Dell XPS 15 9560 (i7-7700HQ, UHD) i7-7700HQ, GeForce GTX 1050 Mobile, Lite-On CX2-8B512-Q11, IGZO IPS, 3840x2160, 15.6" | Gigabyte Aero 15 i7-7700HQ, GeForce GTX 1060 Mobile, Lite-On CX2-8B512-Q11, IPS, 1920x1080, 15.6" | HP Omen 15-ce002ng i7-7700HQ, GeForce GTX 1060 Max-Q, Samsung PM961 MZVLW256HEHP, IPS, 1920x1080, 15.6" | Samsung Odyssey NP800G5M-X01US i7-7700HQ, GeForce GTX 1050 Mobile, Samsung PM961 NVMe MZVLW128HEGR, IPS, 1920x1080, 15.6" | MSI GT62VR 7RE-223 i7-7700HQ, GeForce GTX 1070 Mobile, Samsung SSD PM871a MZNLN256HMHQ, IPS, 1920x1080, 15.6" | |
|---|---|---|---|---|---|---|
| Power Consumption | -35% | -41% | -78% | 3% | -104% | |
| Idle Minimum * (Watt) | 8 | 11.9 -49% | 12 -50% | 18 -125% | 6.7 16% | 20 -150% |
| Idle Average * (Watt) | 10.9 | 17.1 -57% | 15 -38% | 23 -111% | 8.9 18% | 24 -120% |
| Idle Maximum * (Watt) | 11 | 17.3 -57% | 20 -82% | 30 -173% | 10.8 2% | 29 -164% |
| Load Average * (Watt) | 76.7 | 94.7 -23% | 82 -7% | 85 -11% | 81.8 -7% | 82 -7% |
| Witcher 3 ultra * (Watt) | 94.9 | 104.8 -10% | 111 -17% | 96 -1% | 92.2 3% | |
| Load Maximum * (Watt) | 106.4 | 122 -15% | 161 -51% | 158 -48% | 122.7 -15% | 193 -81% |
* ... más pequeño es mejor
| Gigabyte Sabre 15G i7-7700HQ, GeForce GTX 1050 Mobile, 47 Wh | Dell XPS 15 9560 (i7-7700HQ, UHD) i7-7700HQ, GeForce GTX 1050 Mobile, 97 Wh | Gigabyte Aero 15 i7-7700HQ, GeForce GTX 1060 Mobile, 94.24 Wh | HP Omen 15-ce002ng i7-7700HQ, GeForce GTX 1060 Max-Q, 70 Wh | Samsung Odyssey NP800G5M-X01US i7-7700HQ, GeForce GTX 1050 Mobile, 43 Wh | MSI GT62VR 7RE-223 i7-7700HQ, GeForce GTX 1070 Mobile, 75 Wh | |
|---|---|---|---|---|---|---|
| Duración de Batería | 55% | 45% | -24% | 8% | -2% | |
| Reader / Idle (h) | 8.2 | 13.9 70% | 10.6 29% | 4.3 -48% | 10.2 24% | 6.3 -23% |
| WiFi v1.3 (h) | 4.4 | 7.2 64% | 7 59% | 3.3 -25% | 4.4 0% | 4.1 -7% |
| Load (h) | 1.3 | 1.7 31% | 1.9 46% | 1.3 0% | 1.3 0% | 1.6 23% |
Pro
Contra
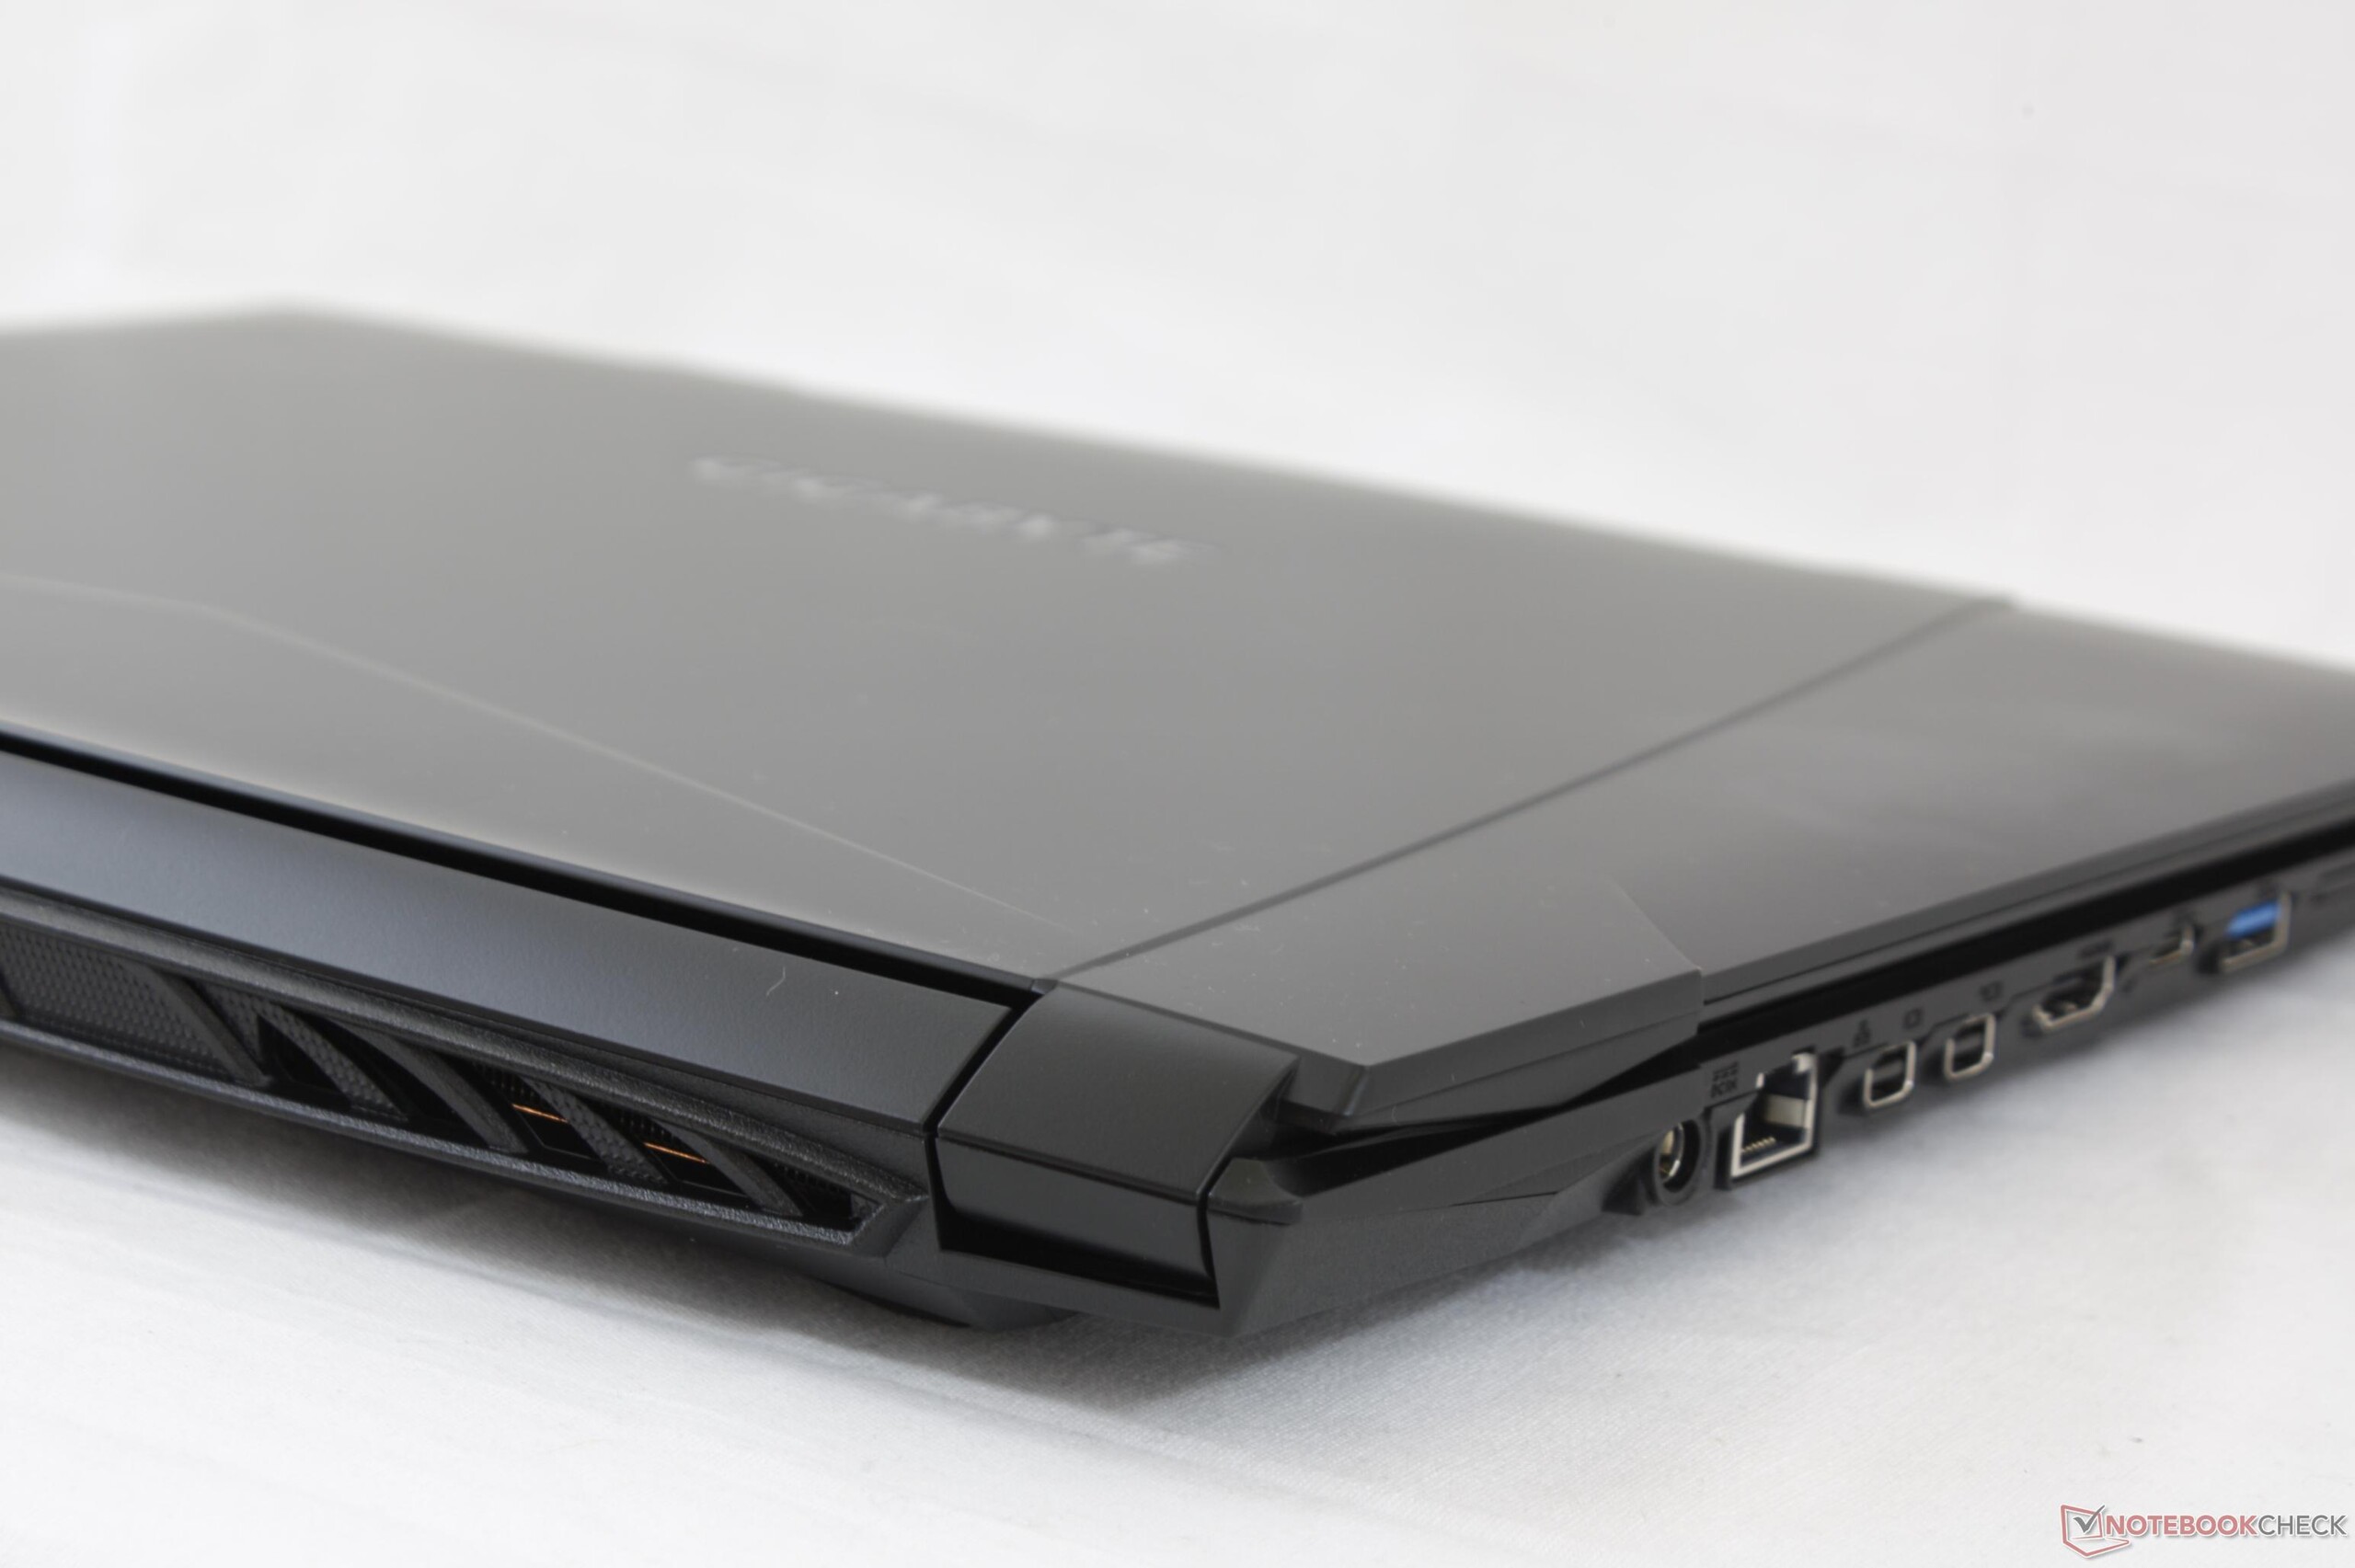
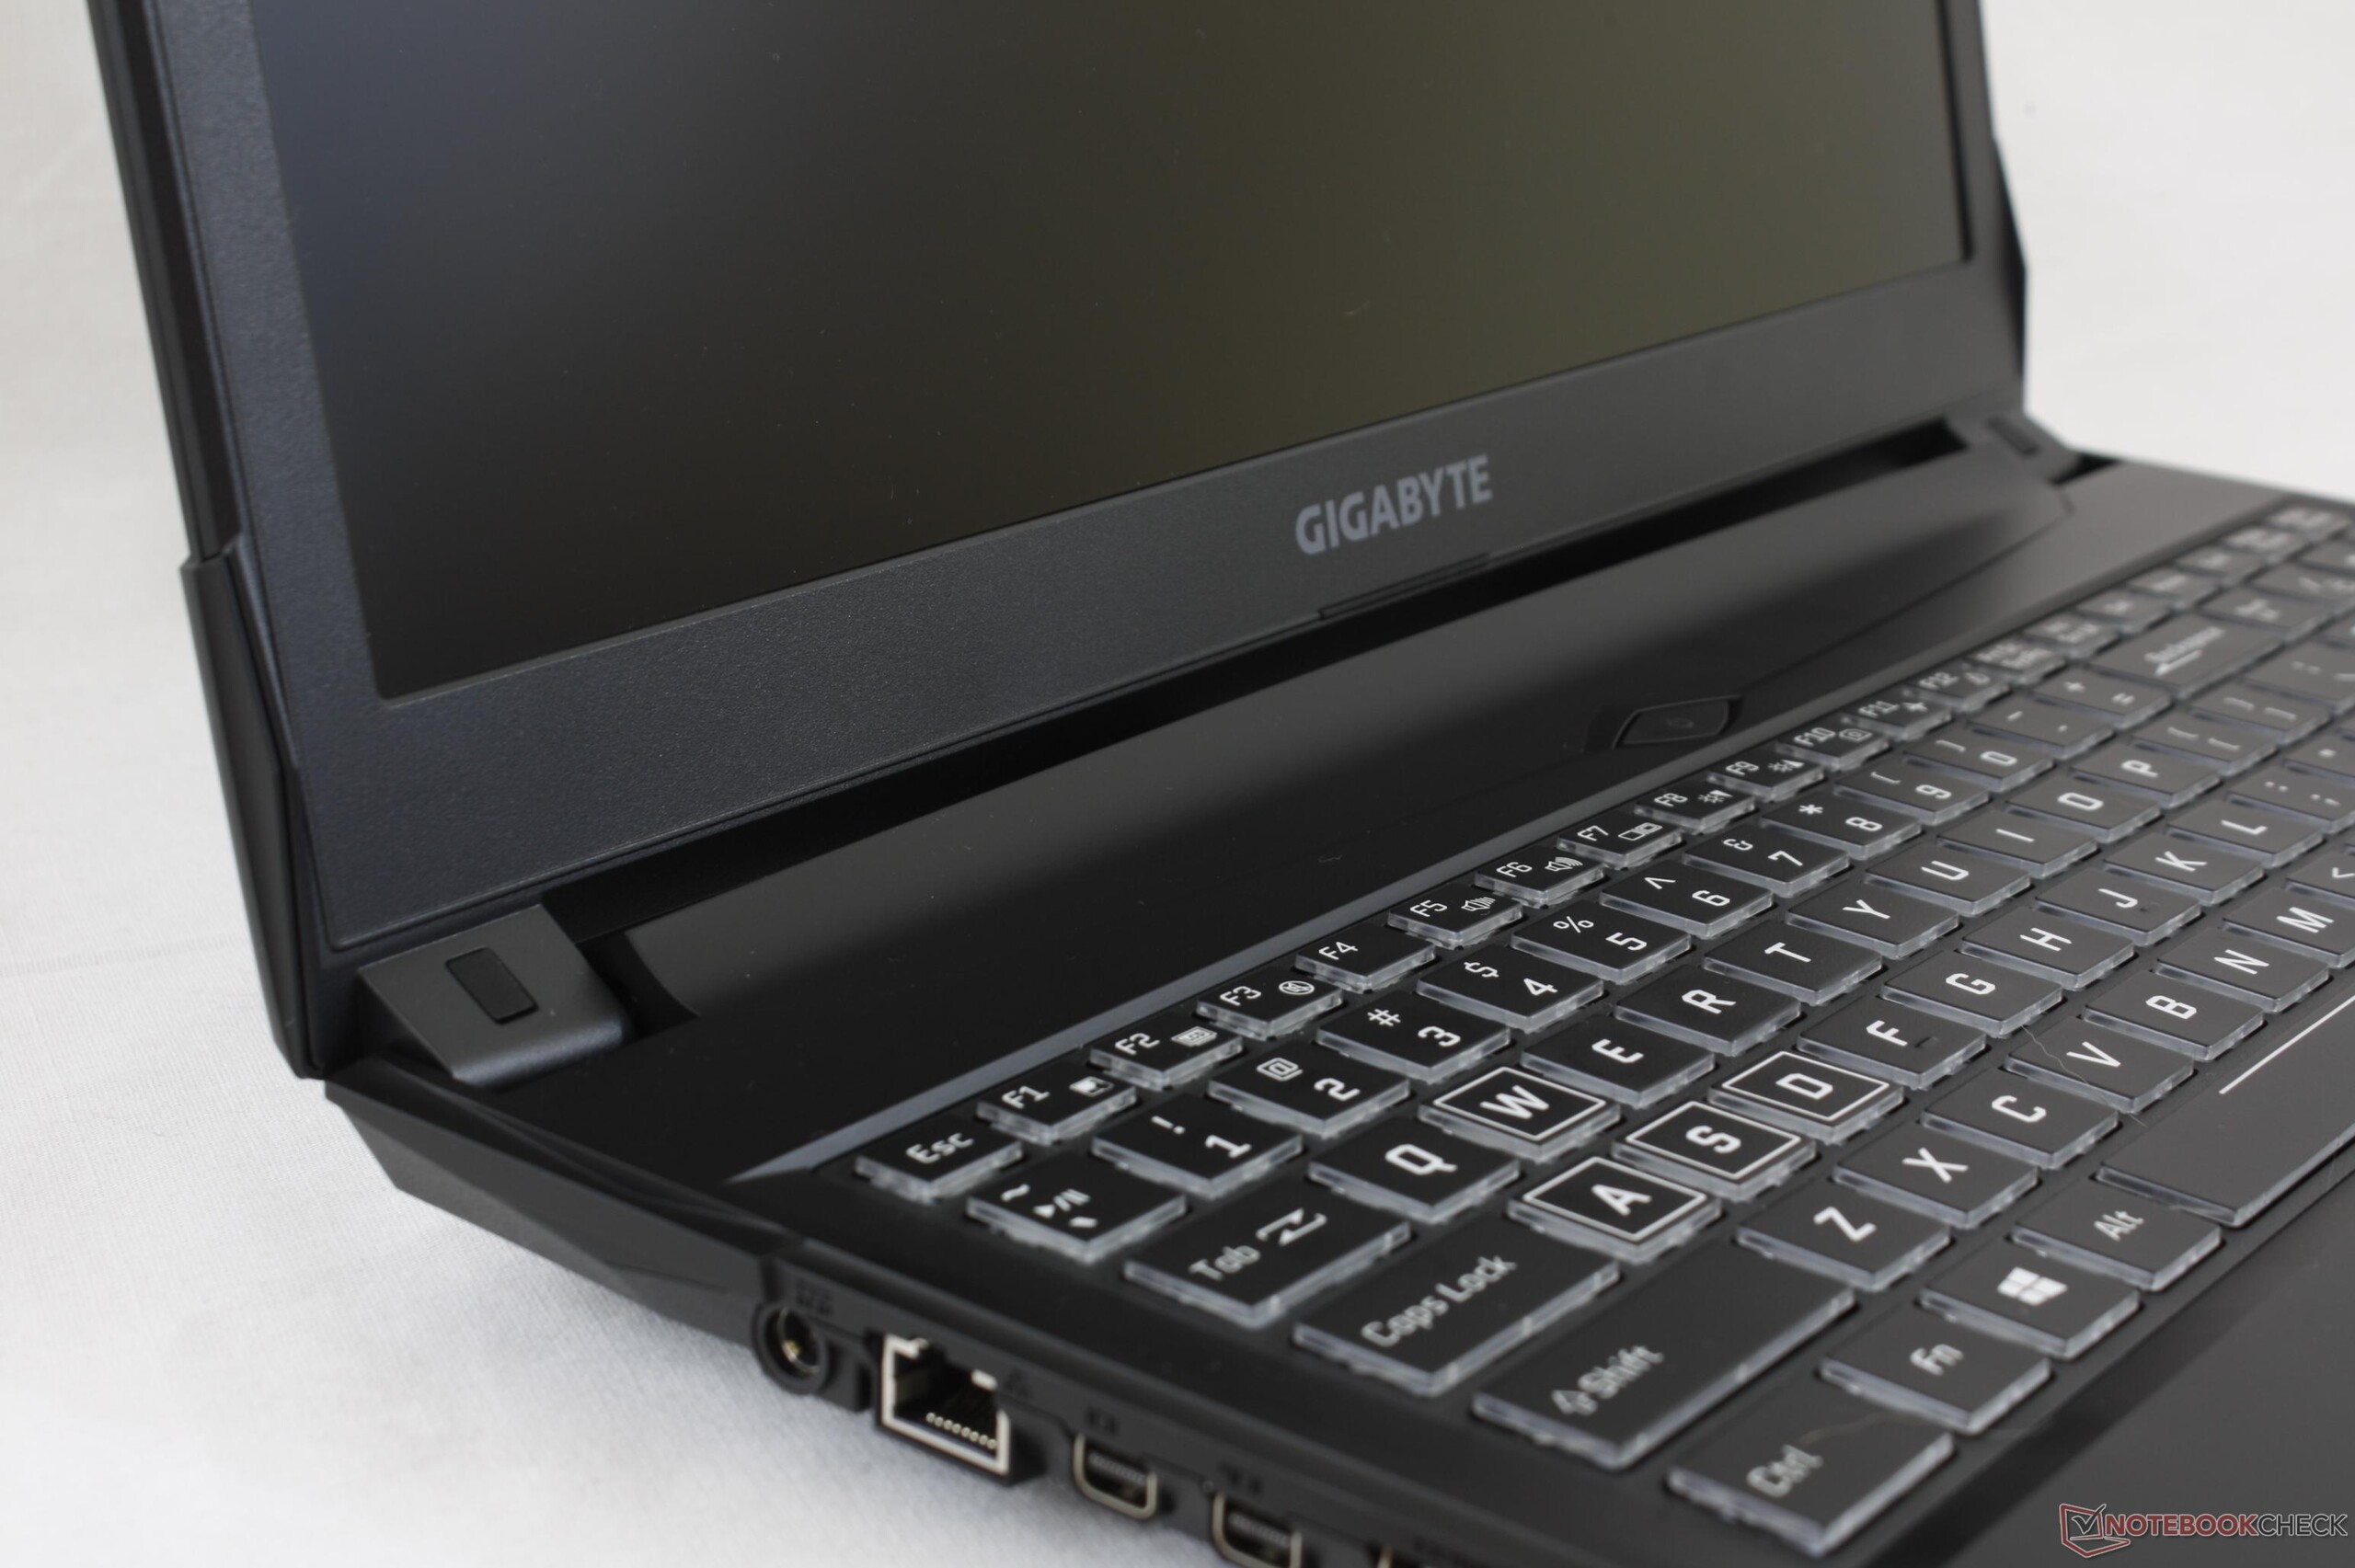
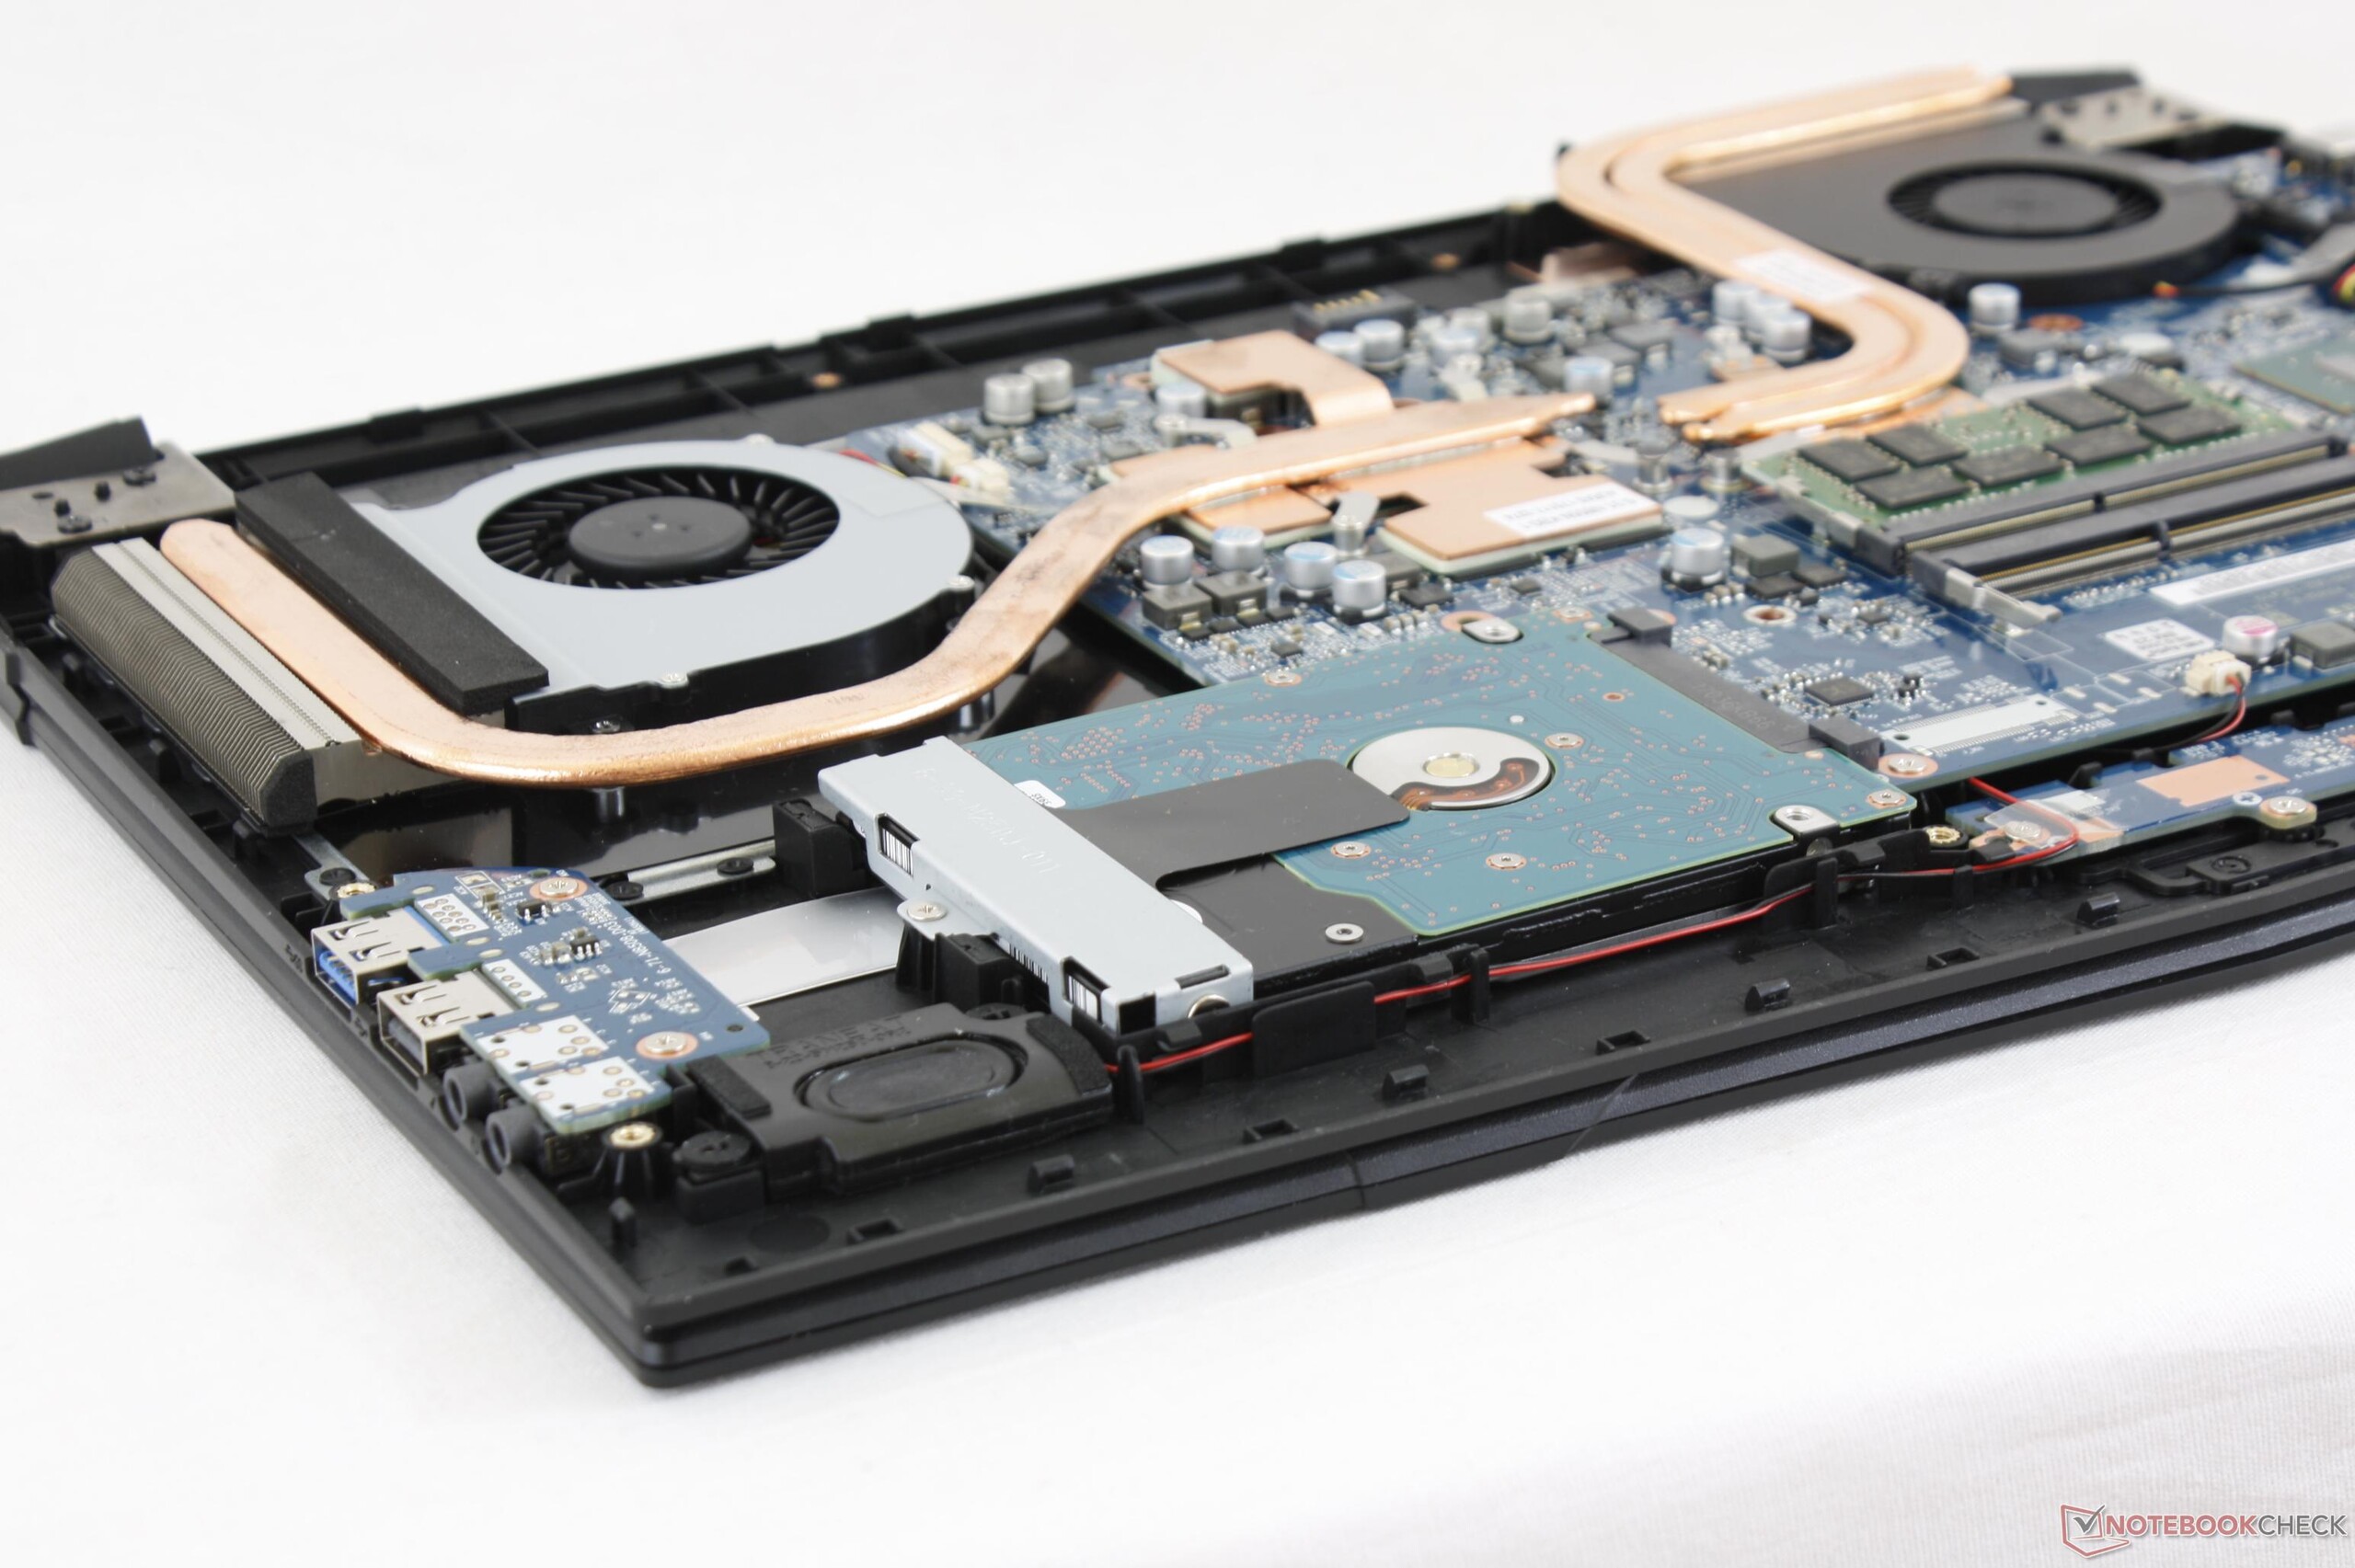
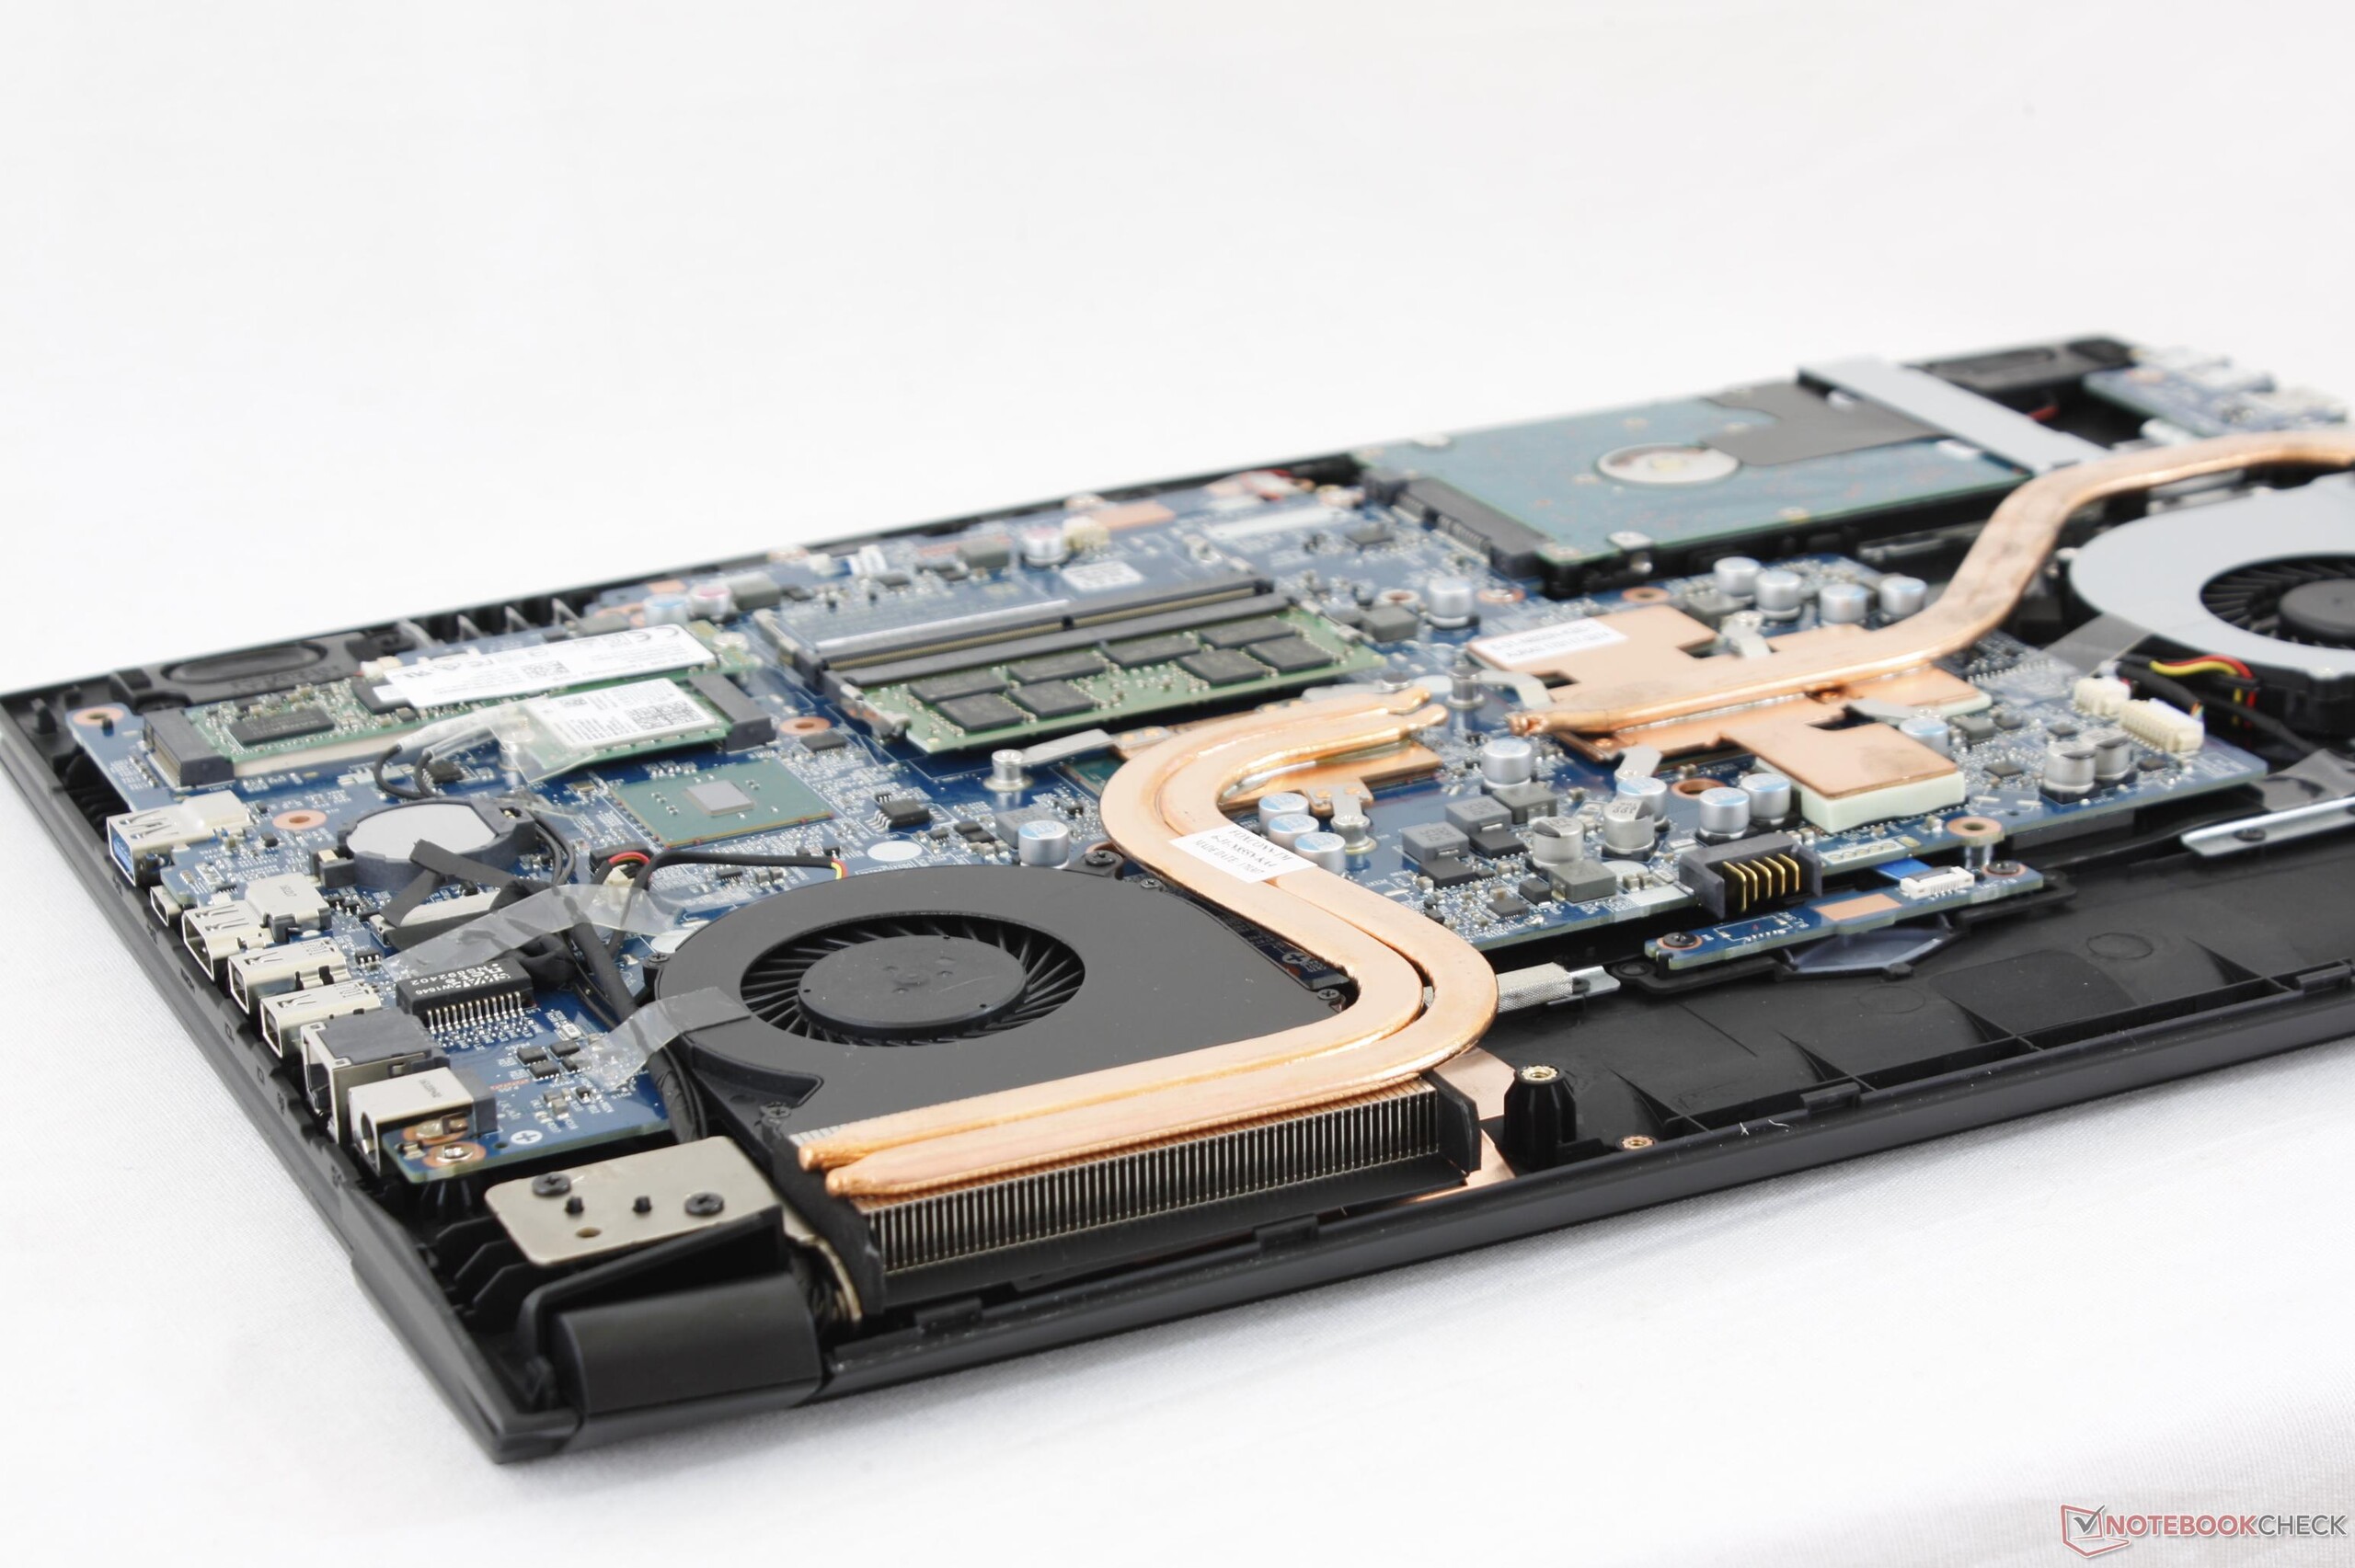
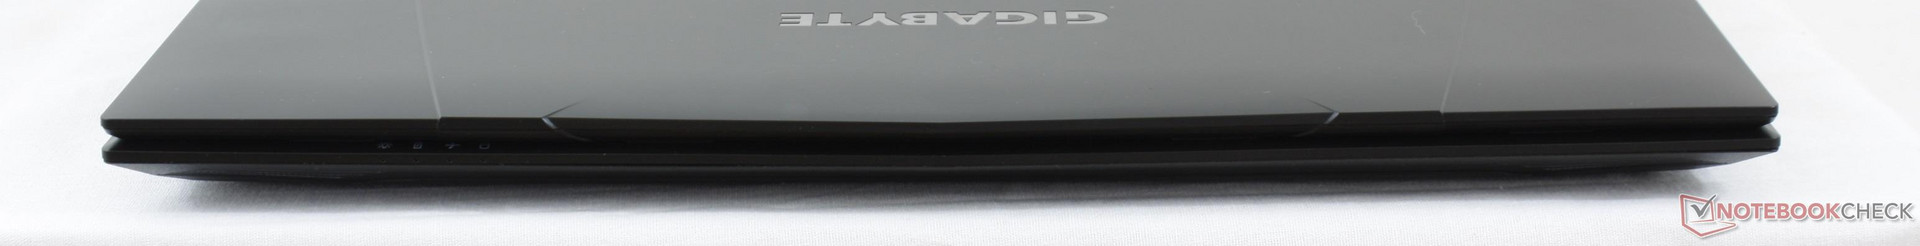
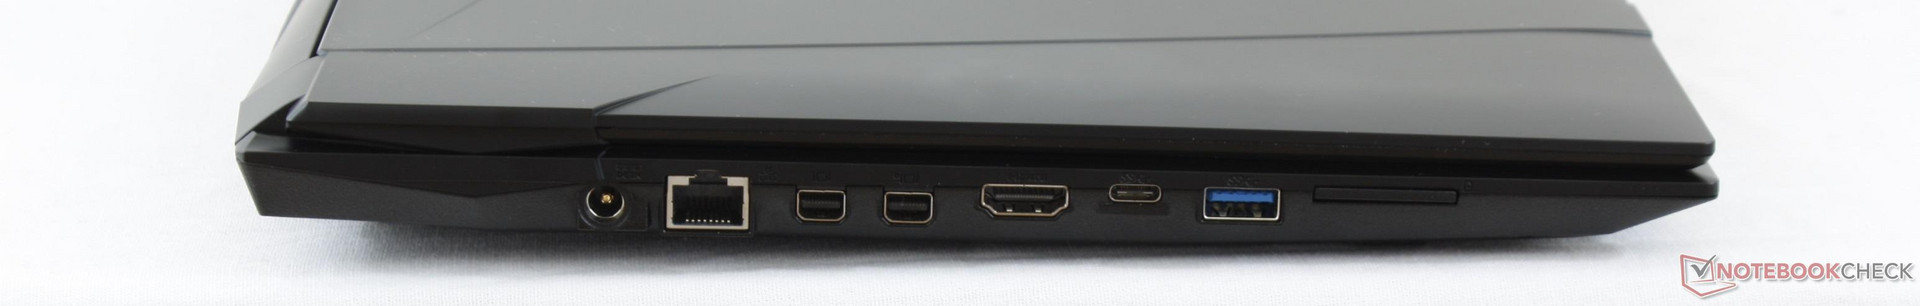
El nuevo Gigabyte Sabre 15 trae muchas características para un portátil gaming básico. El profundo desplazamiento de la tecla de 2 mm, la retroiluminación RGB de tres zonas, puertos de salida de vídeo triples, dobles bahías de almacenamiento y diseño energético son razones convincentes para comprar el Sabre sobre otros portátiles gaming de bajo presupuesto como el Pavilion 15 Power, el Samsung Odyssey o el Asus FX553 en la misma gama de precios. Es la fuerte primera impresión lo que creemos que es clave cuando se introduce un nuevo modelo y serie.
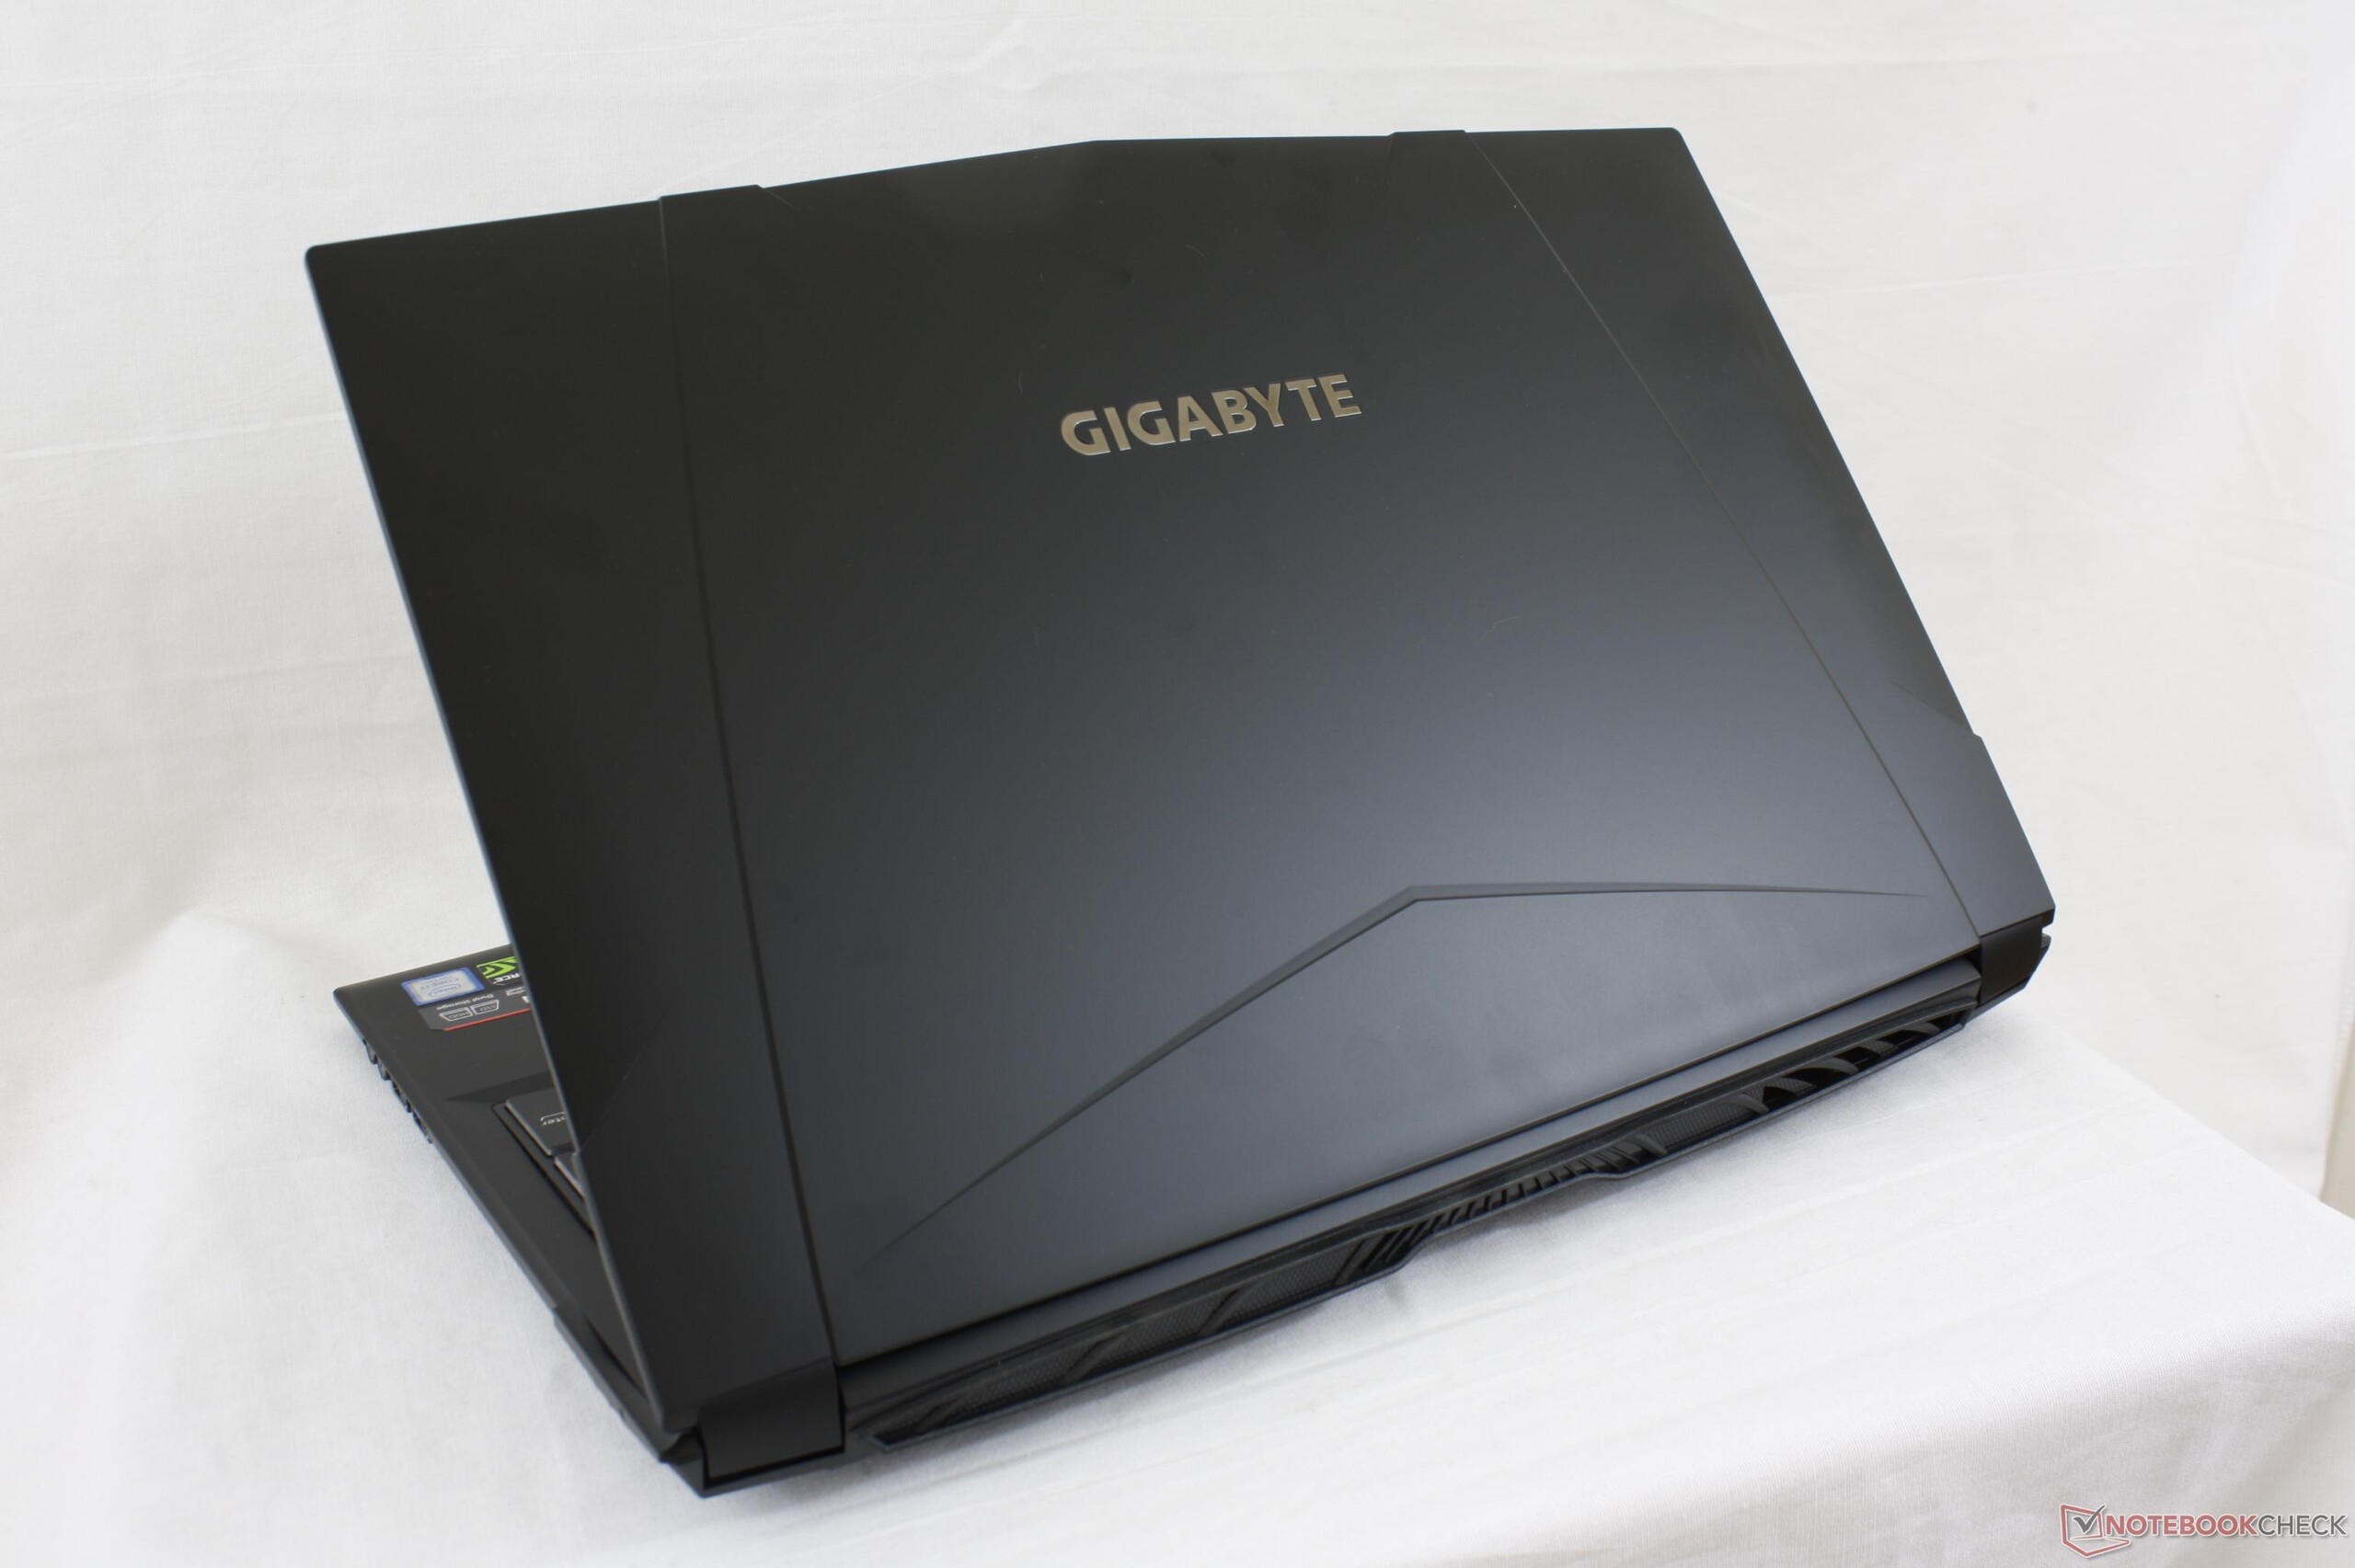
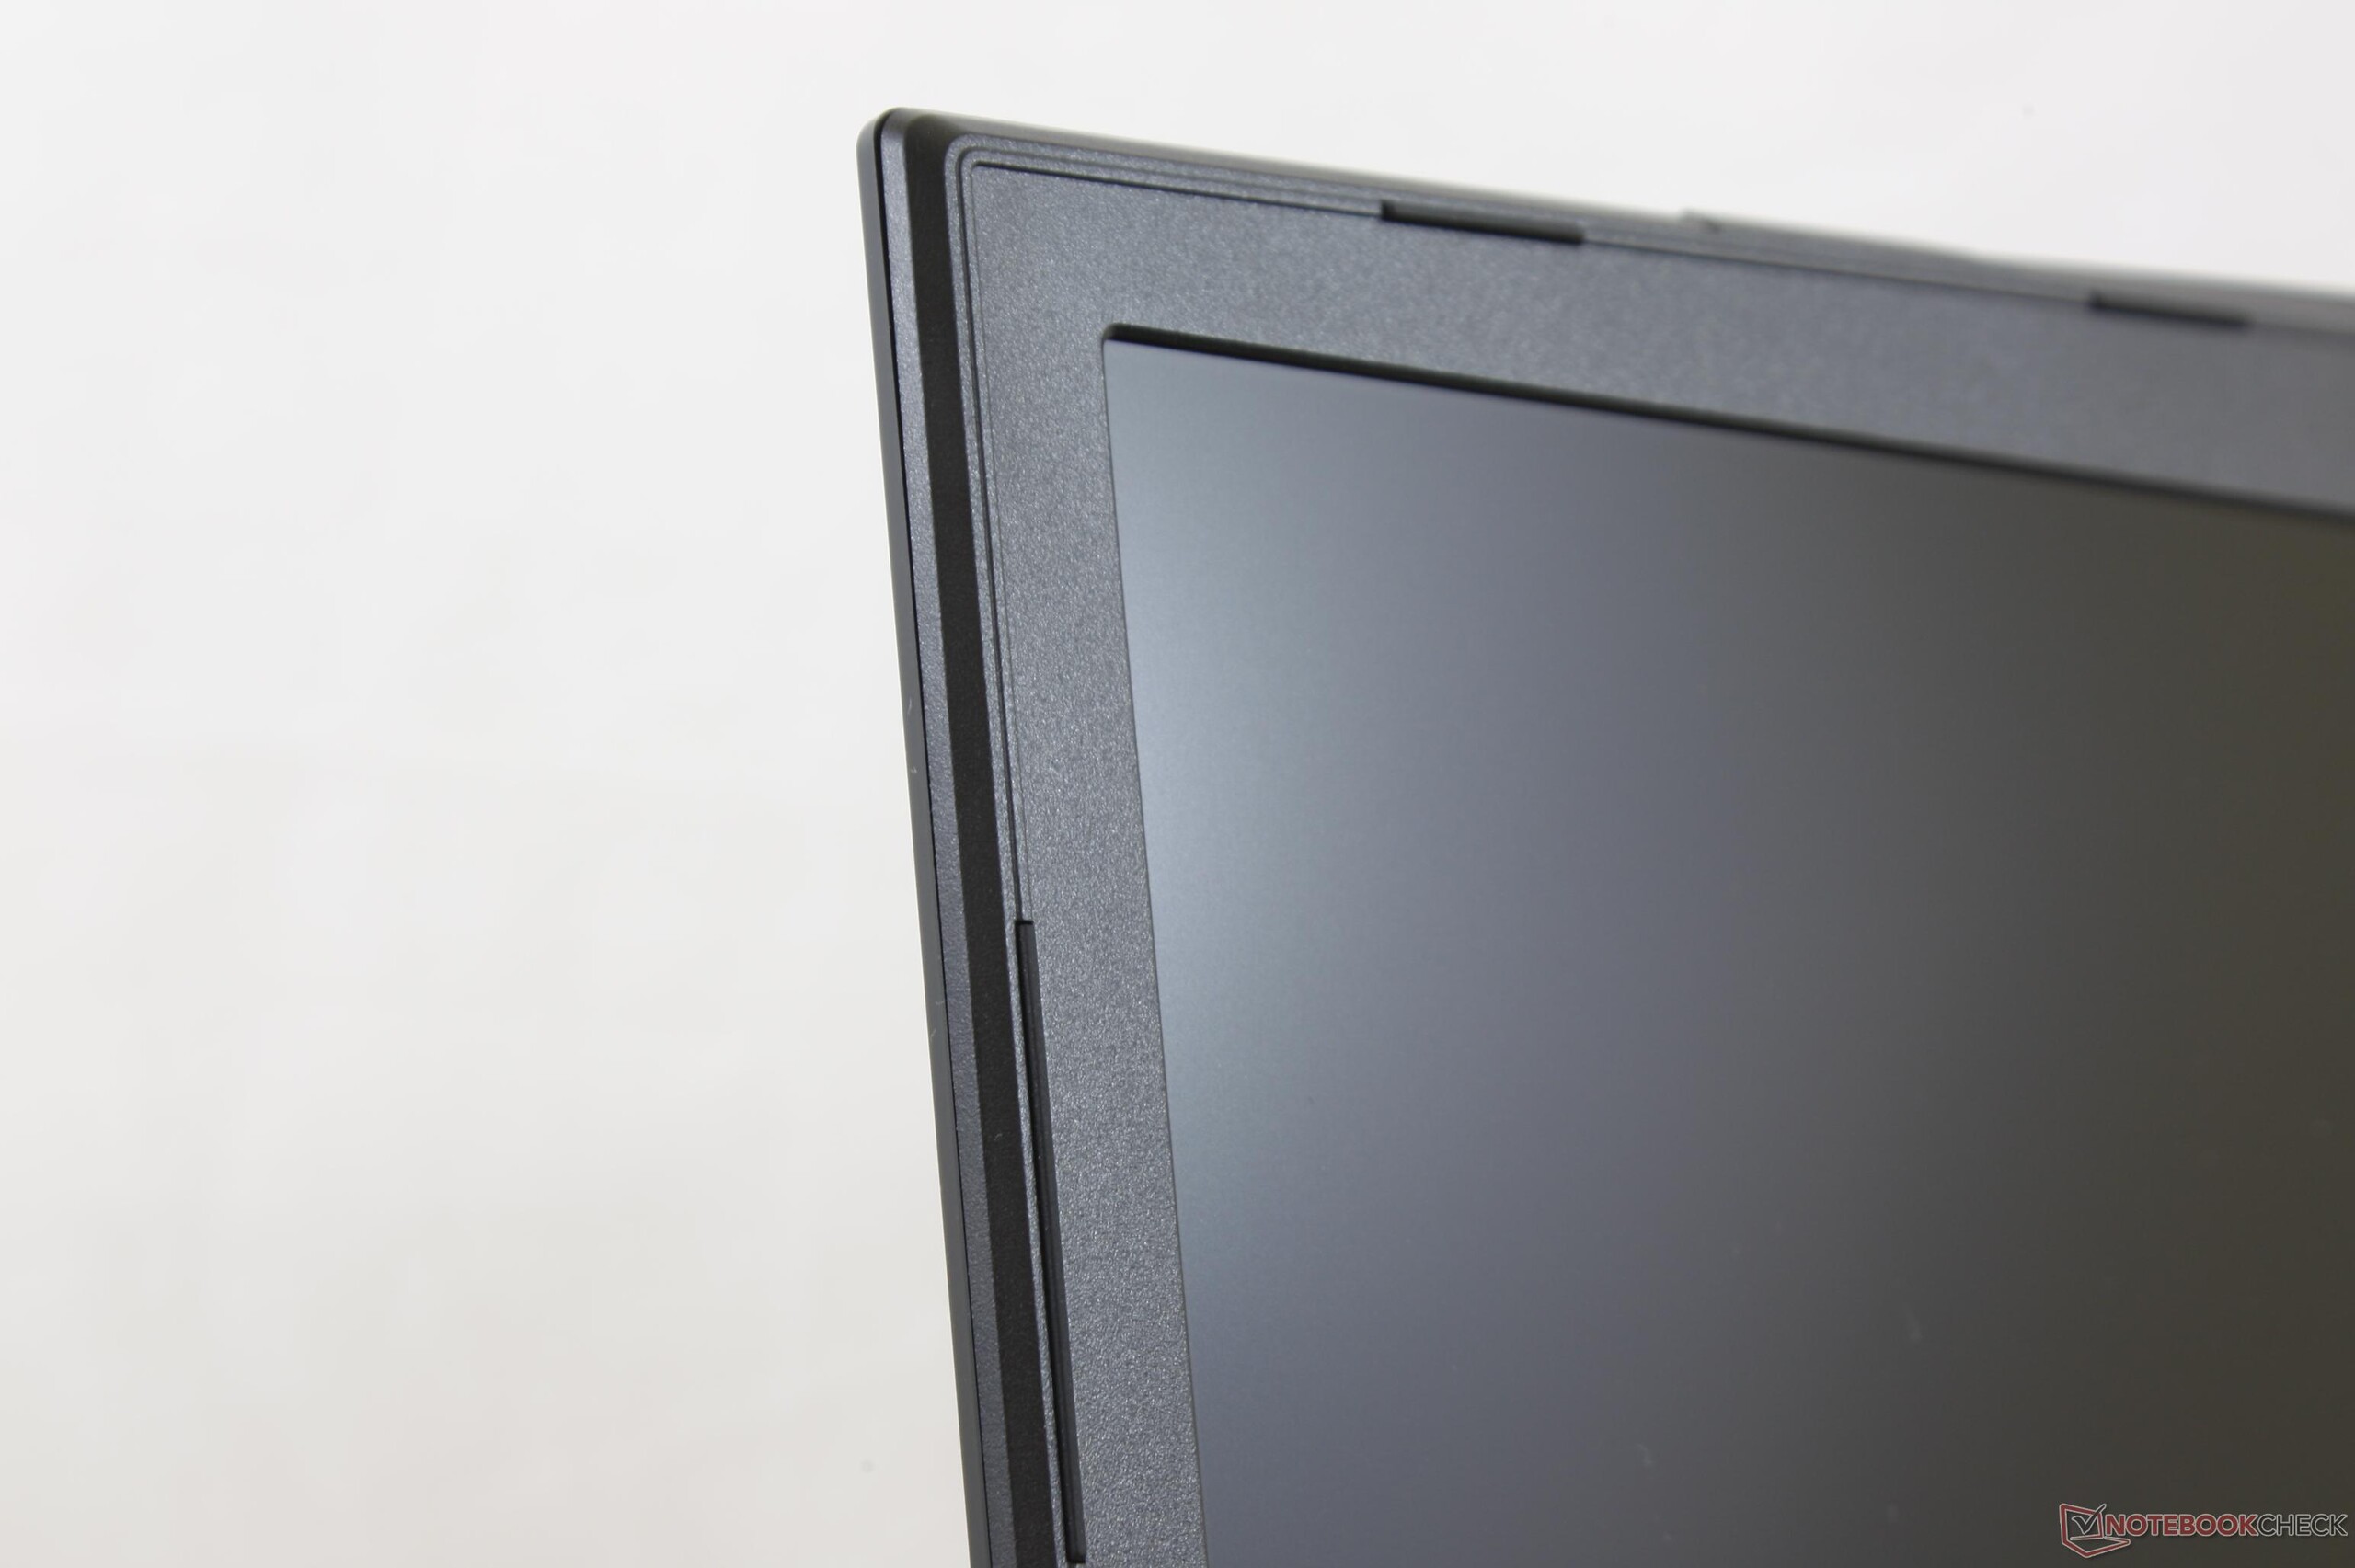
Todavía hay mucho que mejorar, especialmente en términos de ruido de los ventiladores y el audio. La GTX 1050 es menos potente que la GTX 1050 Ti y la GTX 1060, pero el Sabre 15 genera más ruido que los portátiles con GPUs más potentes. Combine el ruido del ventilador fuerte con la mala reproducción de bajos y tiene una experiencia de sonido instatisfactoria si no lleva un buen par de auriculares. La base es sólida y más firme que en el Asus FX553 y Odyssey, pero la tapa definitivamente podría ser mejor si redujera el sangrado de pantalla desigual y se solucionaran los biseles interiores sobresalientes. Esperamos que las revisiones futuras añadan aún más opciones de hardware como renovación de 120 Hz, tiempos de respuesta de 5 ms, G-Sync y Thunderbolt 3.
Si el tamaño pequeño es importante, entonces el Sabre 15 es uno de los mejores portáties gaming de bajo presupuesto disponibles con su respetable conjunto de características. Para ventiladores mas silenciosos y mejores altavoces, seguimos recomendando portátiles gaming de 15" y más gruesos como el GT62VR.
Ésta es una versión acortada del análisis original. Puedes leer el análisis completo en inglés aquí.
Gigabyte Sabre 15G
- 07/24/2017 v6 (old)
Allen Ngo
Price comparison
