Análisis del MSI Crosshair 15 Rainbow Six Extraction Edition: Un midranger QHD 165 Hz capaz más allá de la tematización

Los portátiles con temática de juegos son difíciles de encontrar hoy en día. Alienware celebró el lanzamiento de Cyberpunk 2077 con un m17 R3 pero se trataba más bien de una capa para embellecer el diseño. Con el Crosshair 15, MSI ha diseñado el portátil desde cero para impregnar las vibraciones de Rainbow Six: Extraction de Ubisoft en todos los aspectos del diseño.
Lo que ocurre con los portátiles temáticos es que sólo atraen a un nicho de público interesado en el juego en cuestión. Rainbow Six: Extraction ha recibido críticas mixtas en https://www.thegamer.com/rainbow-six-extraction-review-round-up/ por parte de la crítica y los aficionados, así que un portátil temático de este juego puede no despertar el interés de todo el mundo a primera vista.
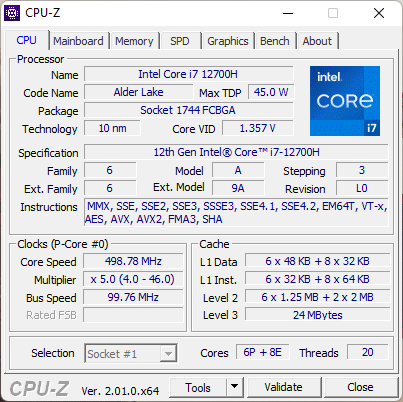
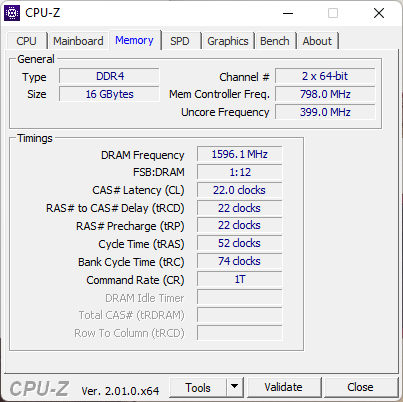
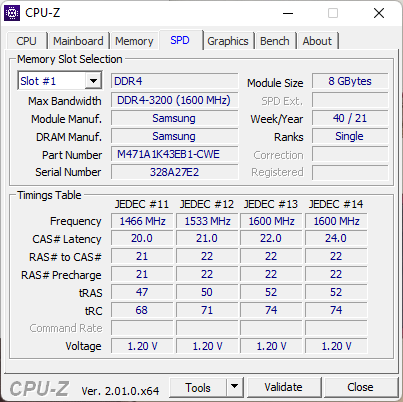
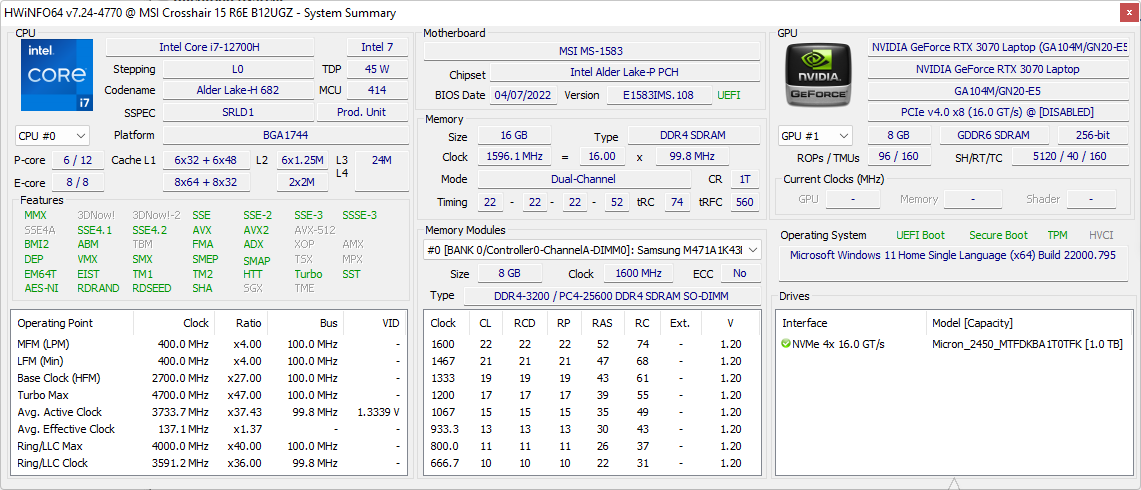
Sin embargo, más allá de la temática, MSI tiene mucho que ofrecer. Nuestro MSI Crosshair 15 Rainbow Six: Extraction Edition (R6E) venía equipado con un Procesador Intel Core i7-12700H procesador, GPU Nvidia GeForce RTX 3070 para portátiles16 GB de RAM DDR4-3200, una unidad SSD NVMe de 1 TB y una pantalla QHD de 165 Hz
La combinación de una CPU Alder Lake-H y la GPU RTX 3070 Laptop no se ve a menudo dado que Nvidia ha suplantado esta GPU con la RTX 3070 Ti para portátiles. No obstante, esta configuración del Crosshair 15 le costará ₹1.90.990 (US$2.312) en la India.
En este análisis, evaluamos el MSI Crosshair 15 Rainbow Six: Extraction Edition y vemos cómo se comporta frente a la competencia como portátil de juegos de gama media-alta.
Posibles contendientes en la comparación
Valoración | Fecha | Modelo | Peso | Altura | Tamaño | Resolución | Precio |
|---|---|---|---|---|---|---|---|
| 85.8 % v7 (old) | 12/2022 | MSI Crosshair 15 R6E B12UGZ-050 i7-12700H, GeForce RTX 3070 Laptop GPU | 2.5 kg | 26.9 mm | 15.60" | 2560x1440 | |
| 84.5 % v7 (old) | 02/2022 | MSI Stealth GS66 12UGS i7-12700H, GeForce RTX 3070 Ti Laptop GPU | 2.2 kg | 19.8 mm | 15.60" | 2560x1440 | |
| 88 % v7 (old) | 03/2022 | Lenovo Legion 5 Pro 16 G7 i7 RTX 3070Ti i7-12700H, GeForce RTX 3070 Ti Laptop GPU | 2.6 kg | 26.6 mm | 16.00" | 2560x1600 | |
| 80.3 % v7 (old) | 06/2022 | MSI Katana GF66 12UGS i7-12700H, GeForce RTX 3070 Ti Laptop GPU | 2.3 kg | 27.5 mm | 15.60" | 1920x1080 | |
| 80.7 % v7 (old) | 04/2022 | MSI Pulse GL66 12UEK i9-12900H, GeForce RTX 3060 Laptop GPU | 2.3 kg | 25 mm | 15.60" | 1920x1080 | |
| 84 % v7 (old) | 06/2022 | Acer Nitro 5 AN515-58-72QR i7-12700H, GeForce RTX 3070 Ti Laptop GPU | 2.5 kg | 26.8 mm | 15.60" | 2560x1440 | |
| 85.5 % v7 (old) | 12/2022 | Aorus 15 XE5 i7-12700H, GeForce RTX 3070 Ti Laptop GPU | 2.3 kg | 24 mm | 15.60" | 2560x1440 | |
| 88.4 % v7 (old) | 07/2022 | Schenker XMG Neo 15 (i7-12700H, RTX 3080 Ti) i7-12700H, GeForce RTX 3080 Ti Laptop GPU | 2.3 kg | 26.6 mm | 15.60" | 2560x1440 | |
| 85.8 % v7 (old) | 07/2022 | Asus TUF Dash F15 FX517ZR i7-12650H, GeForce RTX 3070 Laptop GPU | 2 kg | 20.7 mm | 15.60" | 2560x1440 | |
| 88 % v7 (old) | 11/2022 | Schenker XMG Neo 15 (Ryzen 9 6900HX, RTX 3070 Ti) R9 6900HX, GeForce RTX 3070 Ti Laptop GPU | 2.3 kg | 26.6 mm | 15.60" | 2560x1440 |
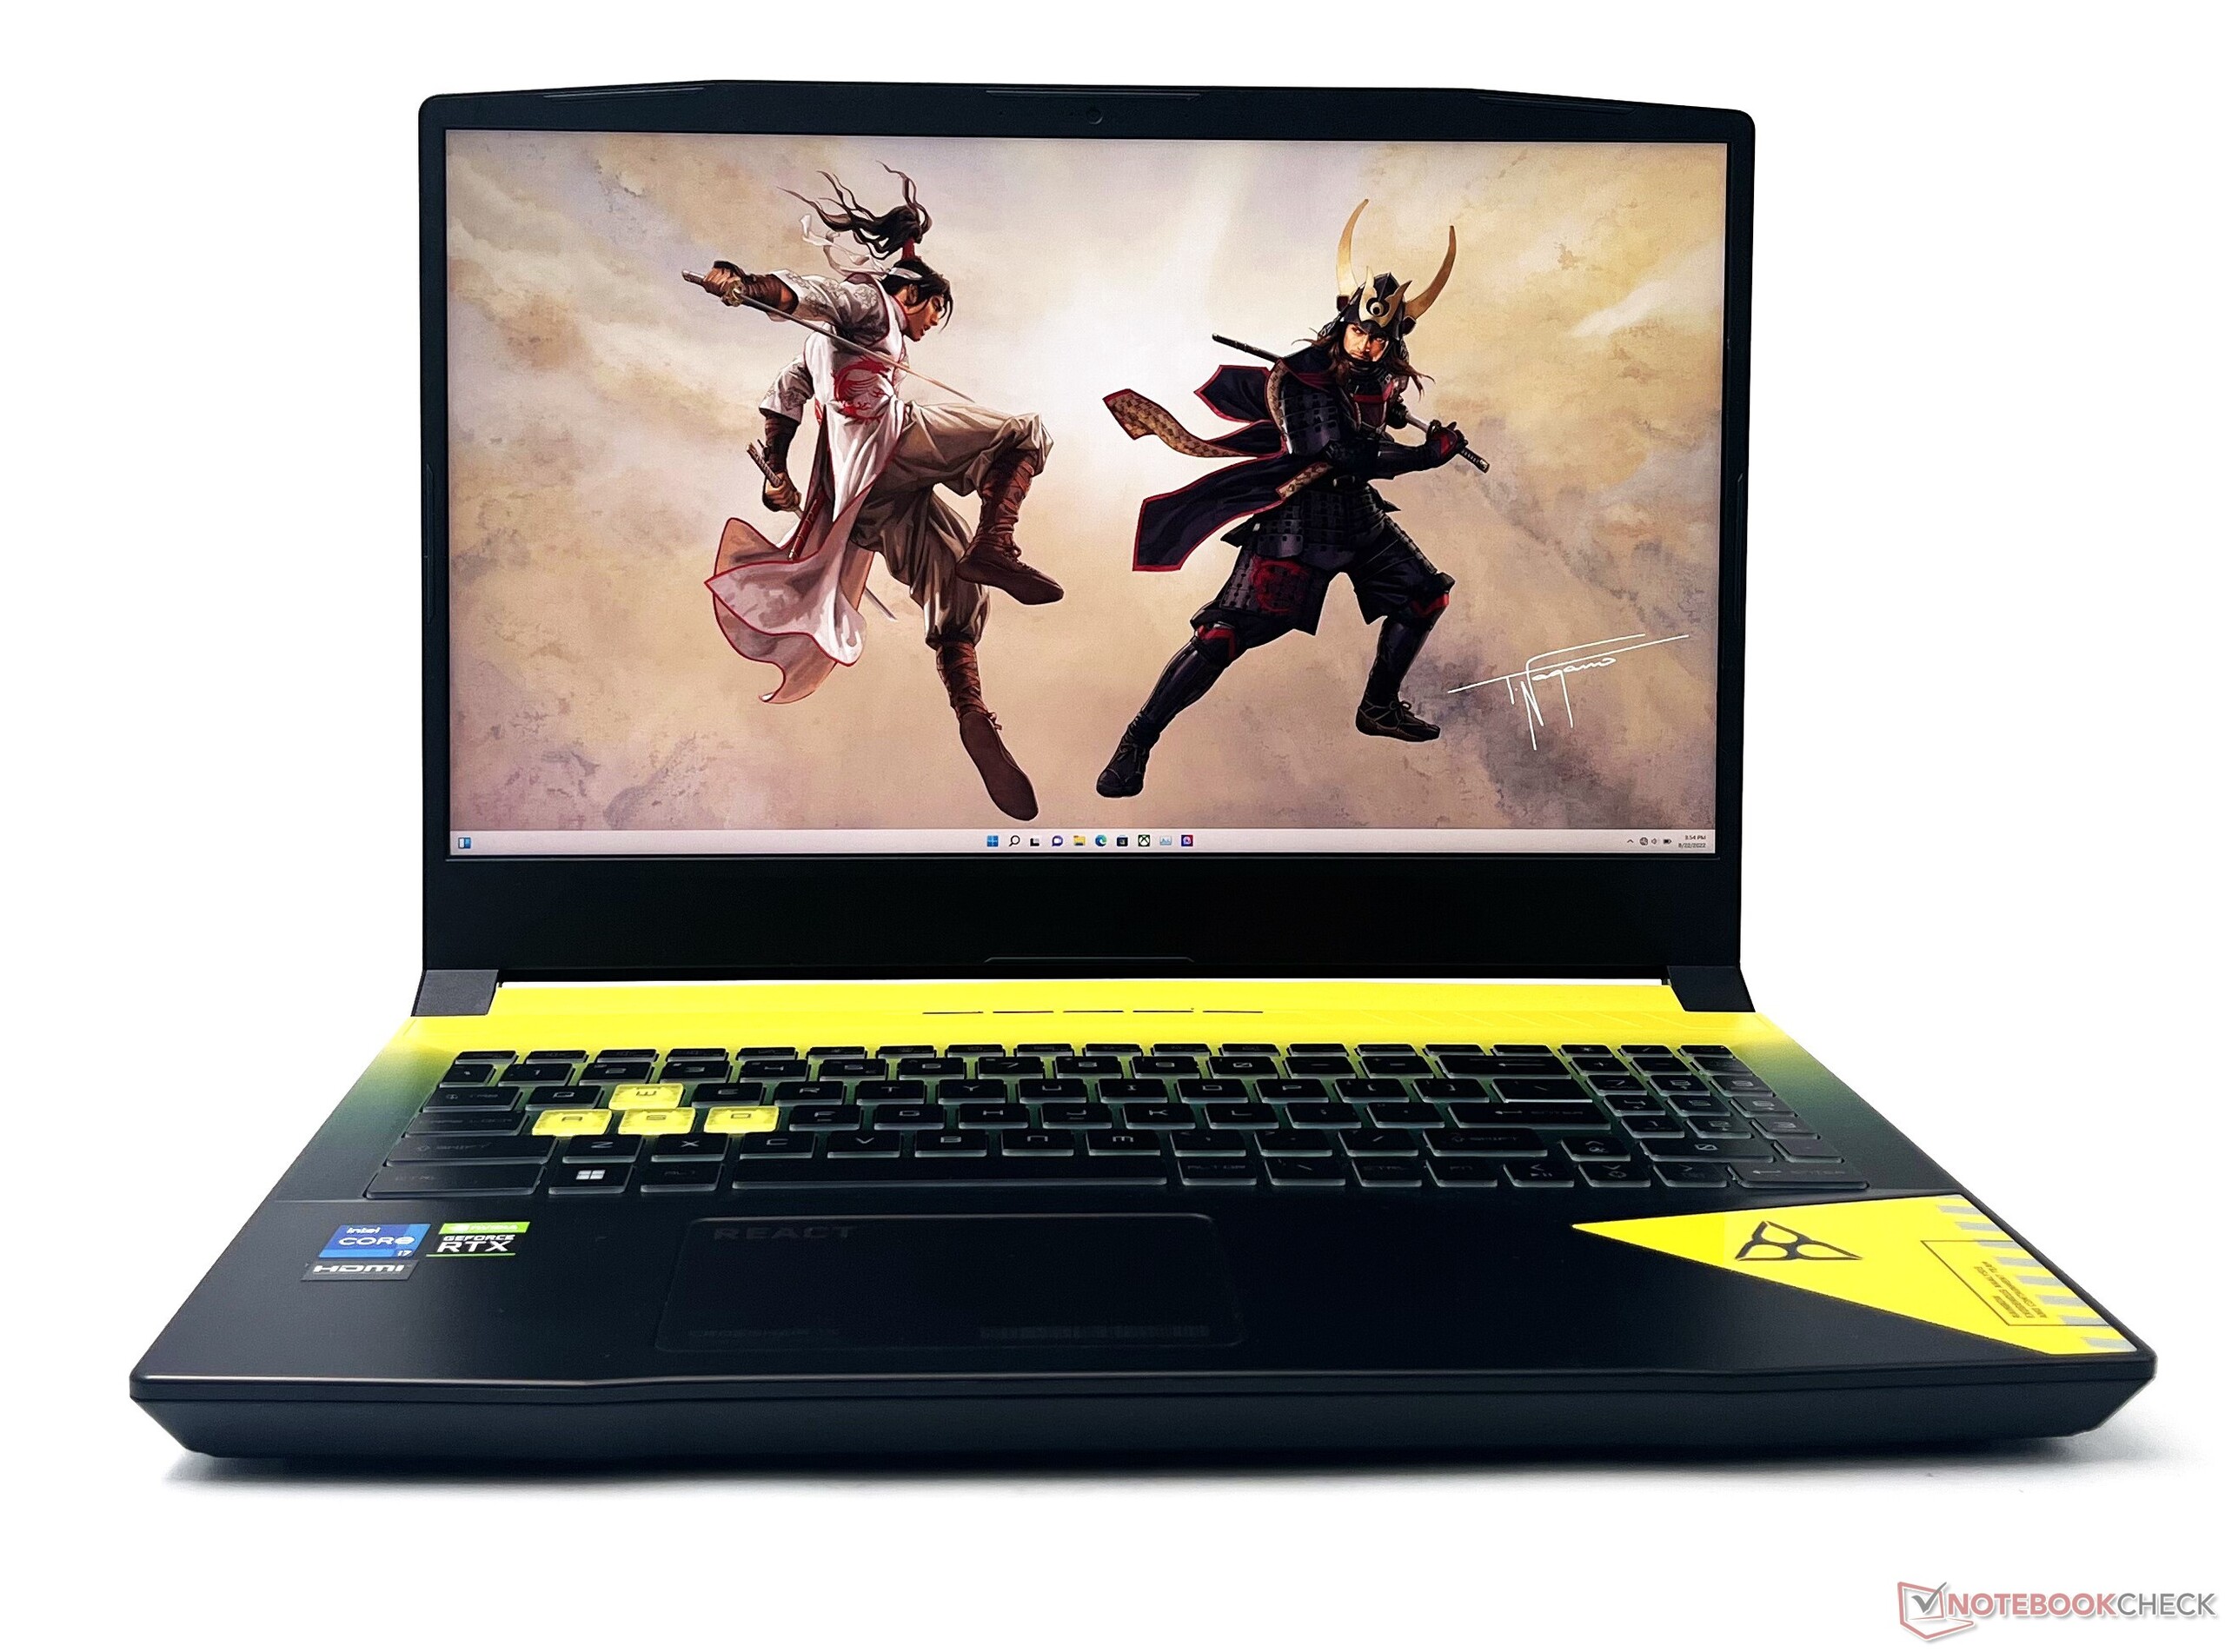
Maletín: Pulse GL66 pintado en Rainbow Six: Extraction
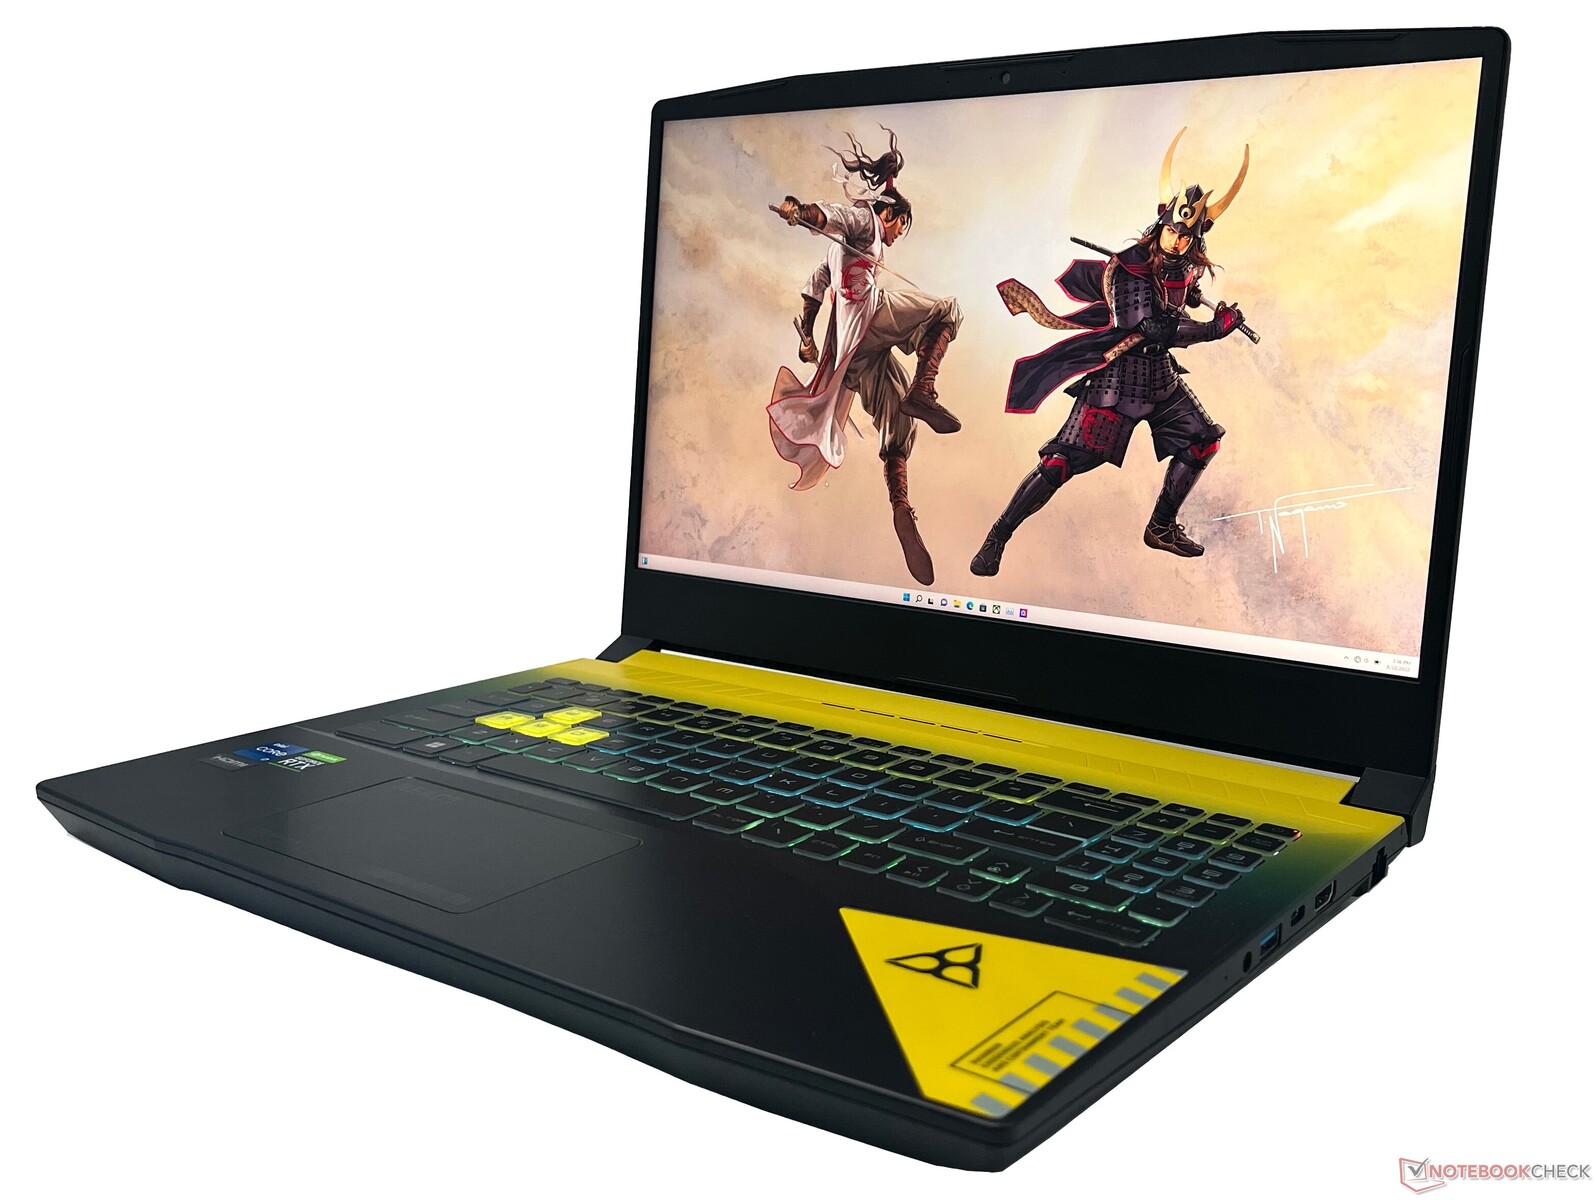
El chasis del MSI Crosshair 15 R6E está hecho principalmente de plástico. La construcción no emana ninguna vibración premium, pero se siente lo suficientemente resistente para el uso diario. Hay una flexión notable en la cubierta del teclado, pero no obstaculizó el uso regular.
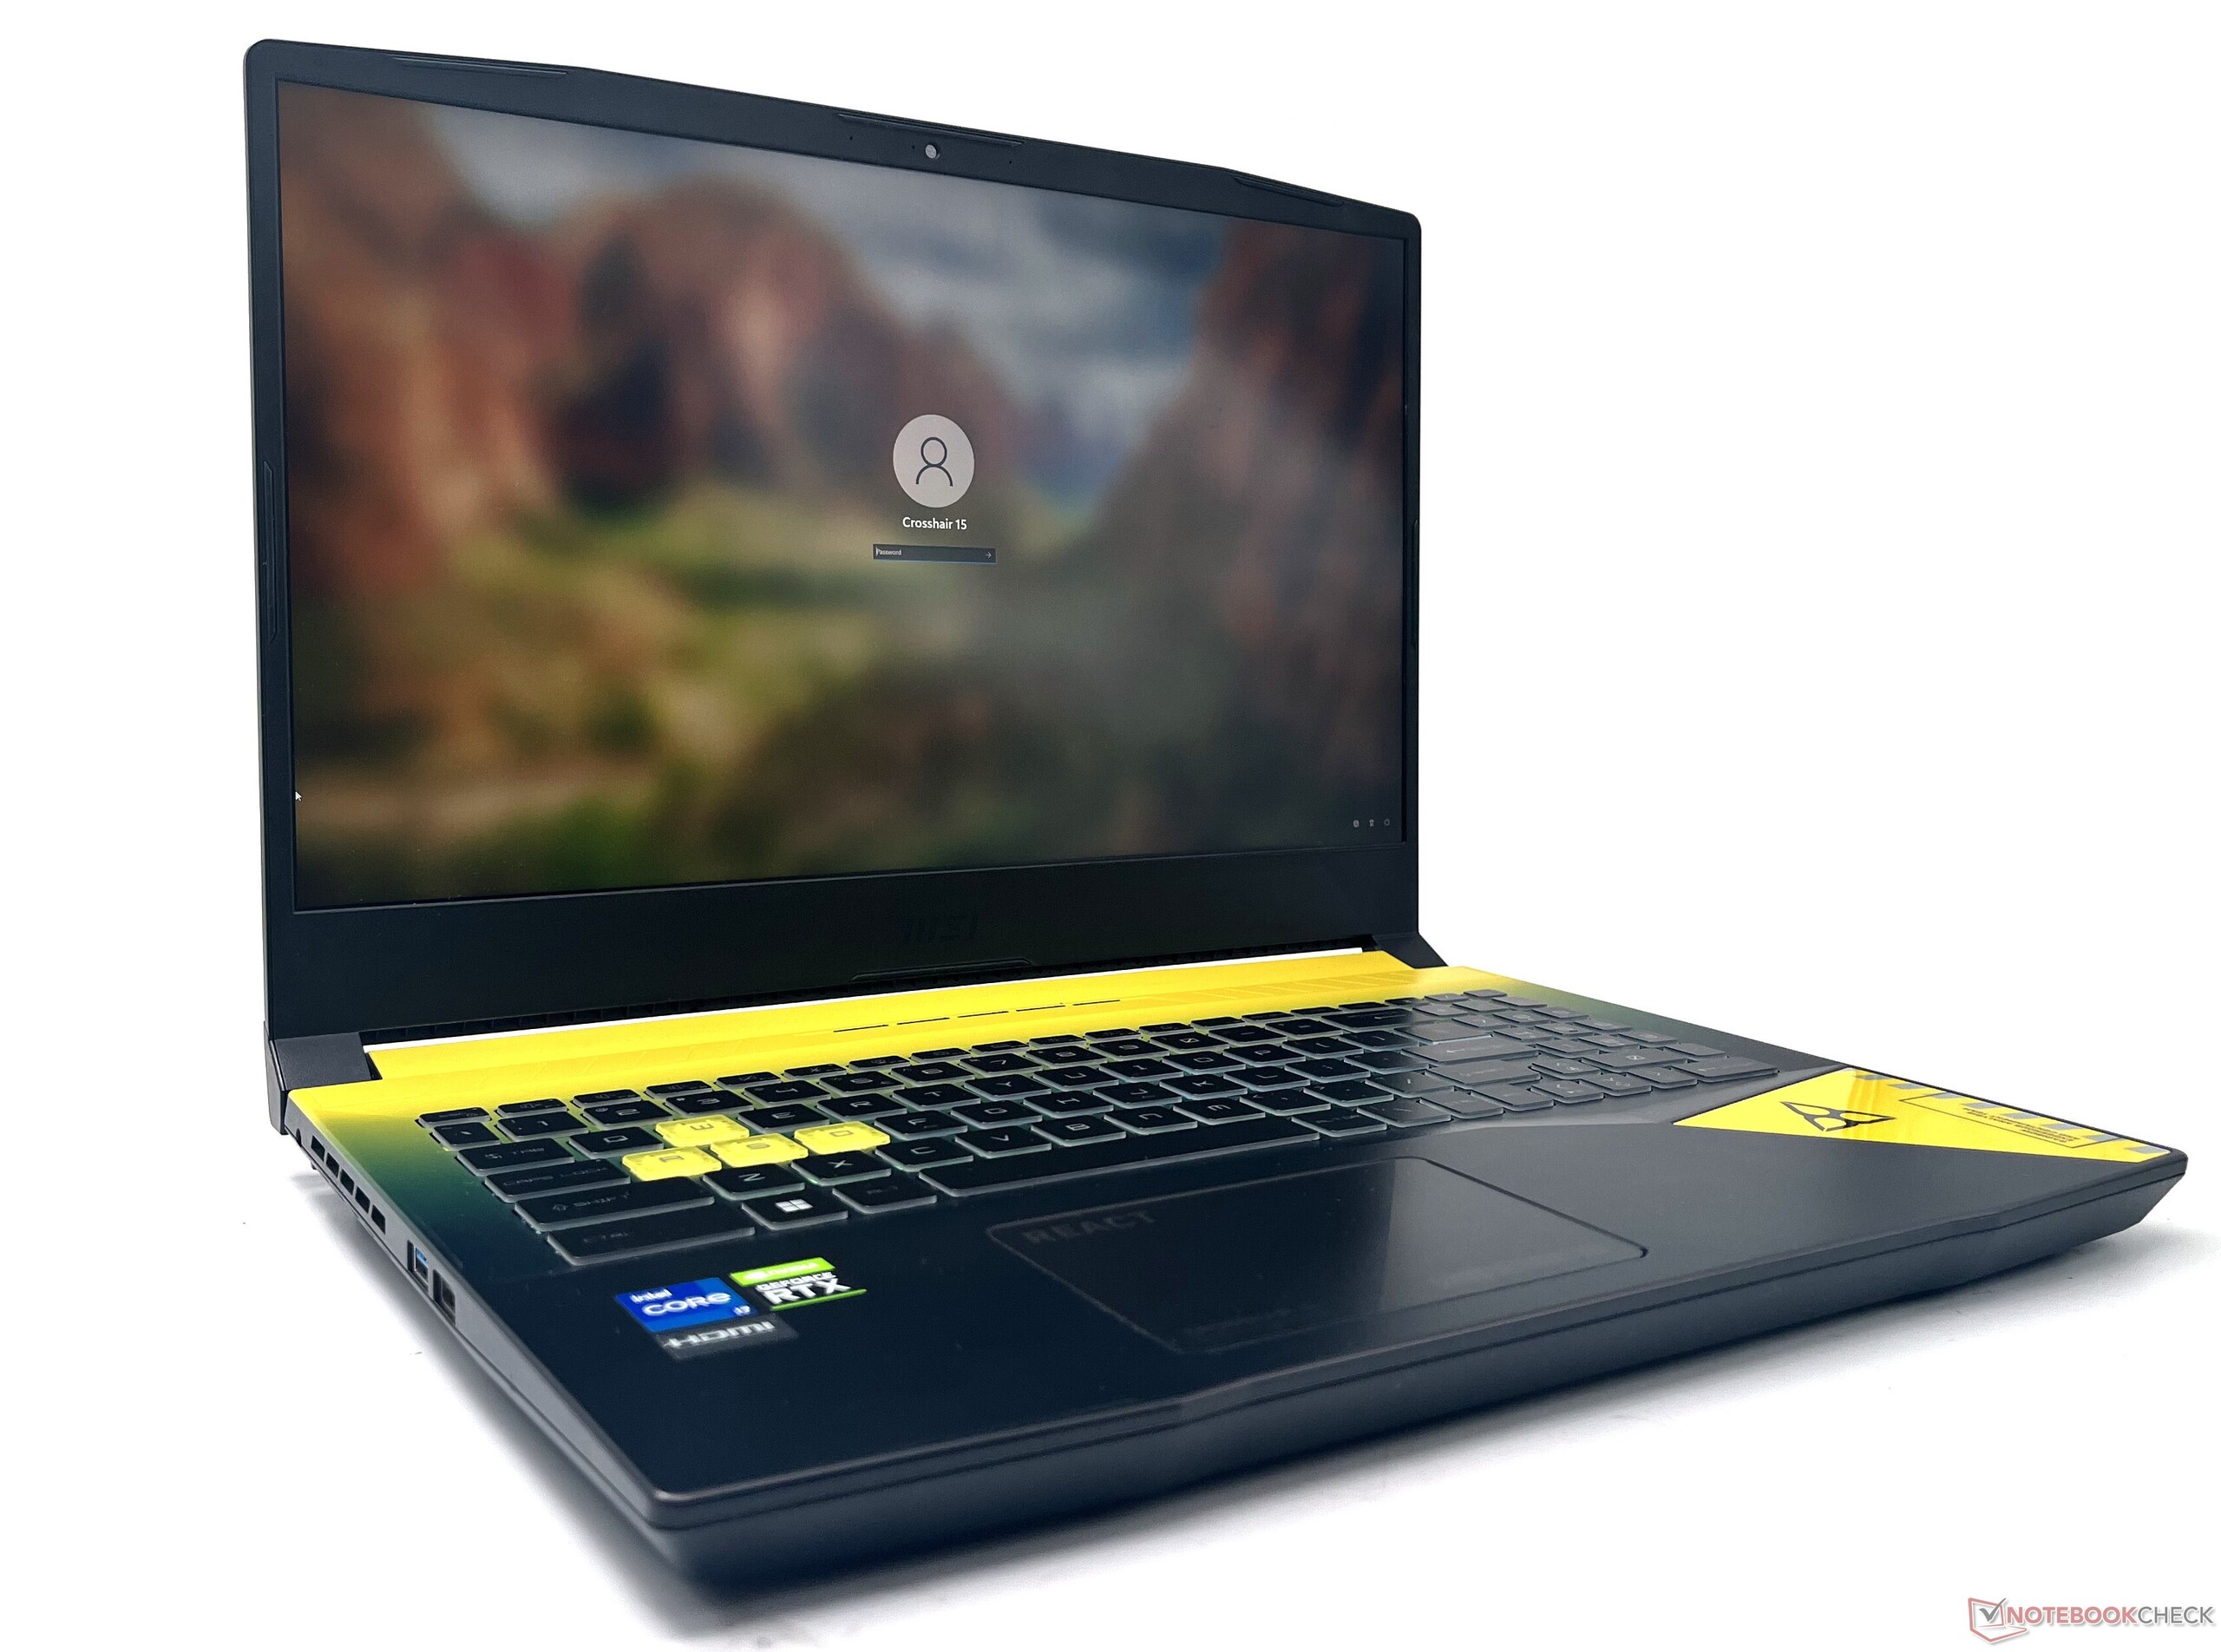
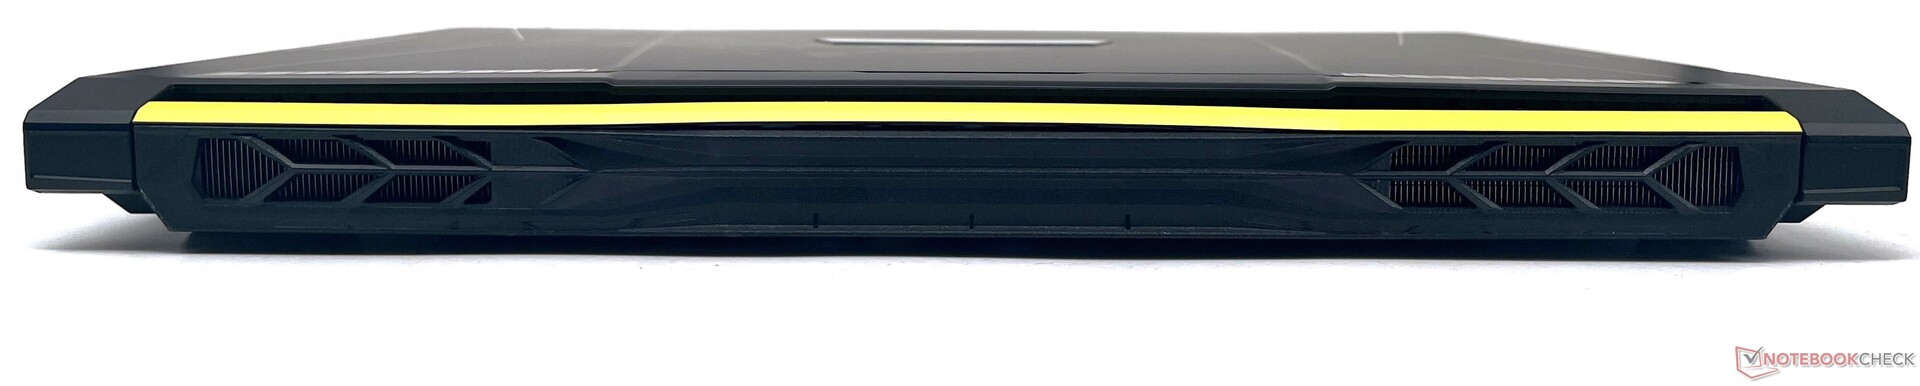
El Crosshair 15 R6E hace un uso extensivo de un esquema de color de doble tono amarillo-negro y los elementos de diseño REACT del juego desde el embalaje hasta el chasis, proclamando así su lealtad a Rainbow Six: Extraction.
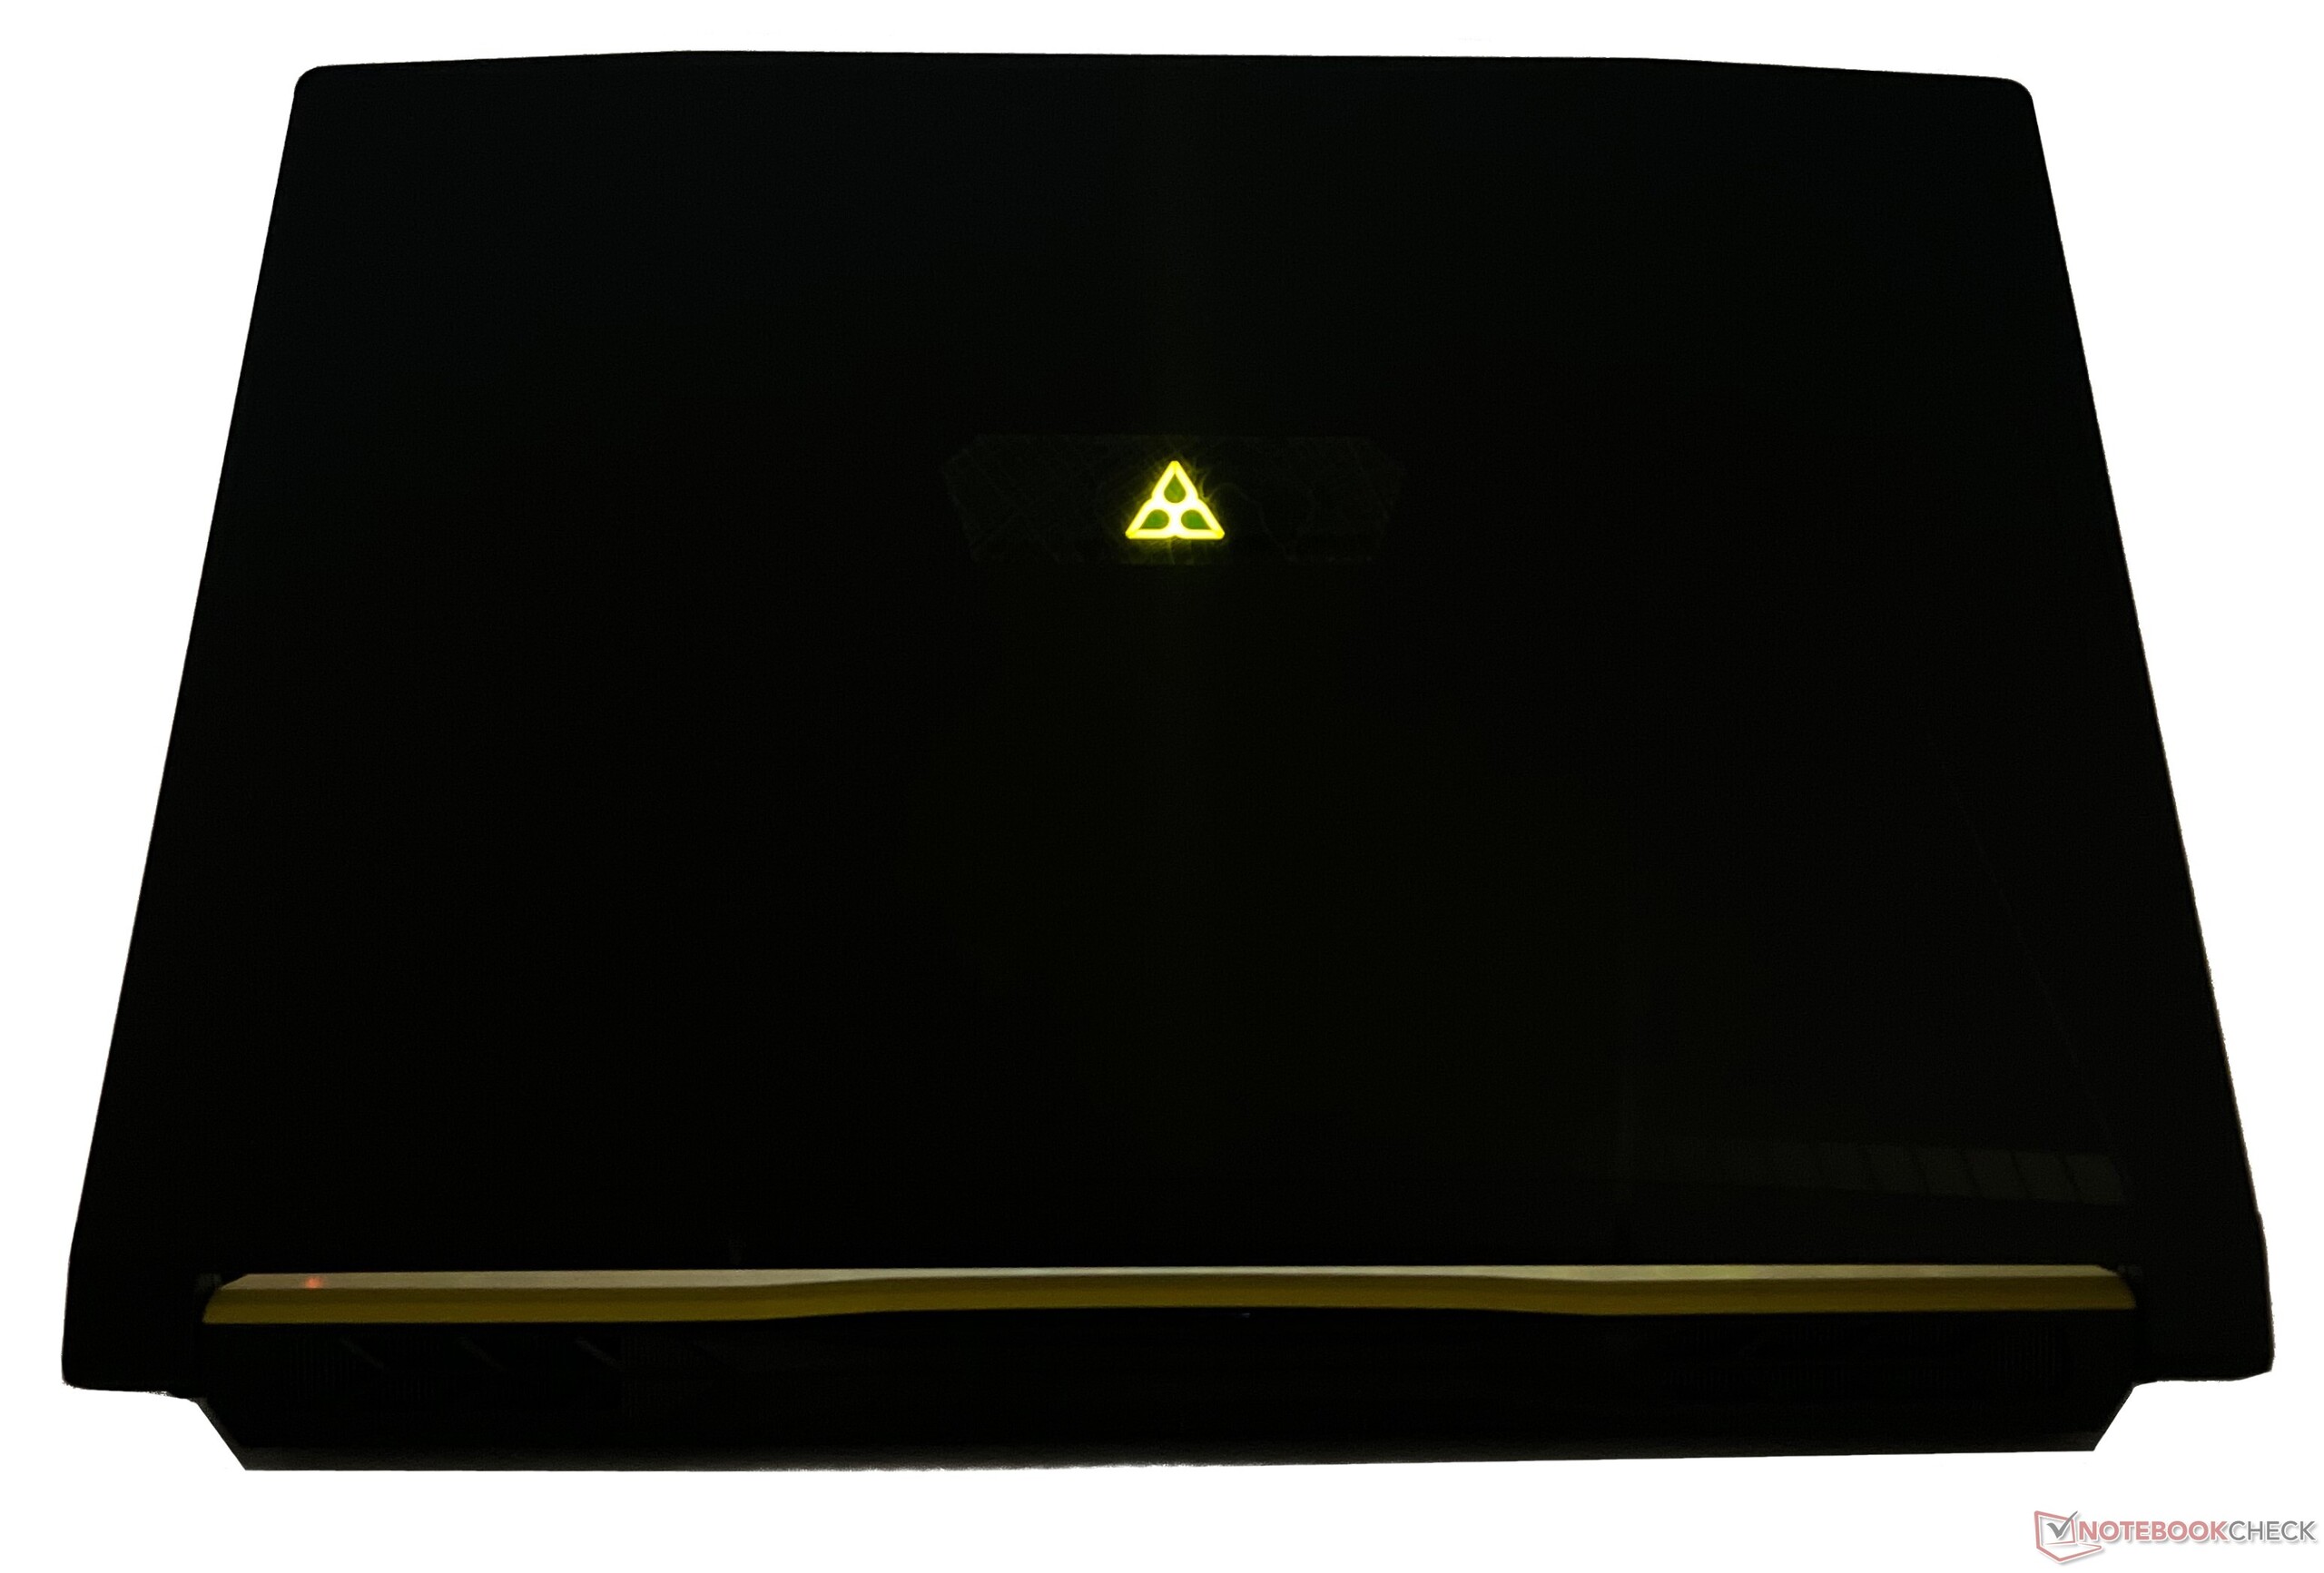
MSI incluso ha sustituido su logotipo por el del juego en la parte trasera de la pantalla. El logotipo de Rainbow Six : Extraction no es demasiado grande, pero sí lo bastante llamativo y brilla en amarillo intenso. No hay patrones de iluminación RGB, así que tendrás que conformarte con el esquema de colores que se ofrece.
Con un grosor de 26,9 mm, no es el portátil más delgado de su clase; ese mérito es del MSI Stealth GS66 y el Razer Blade 15. Aun así, es lo bastante portátil como para meterlo en una mochila y sus 2,5 kg de peso tampoco resultan demasiado pesados.
En general, el chasis del MSI Crosshair 15 Rainbow Six: Extraction Edition está decentemente construido para el precio y esencialmente viene a través como un refrito de la Pulse GL66y, en muchos aspectos, del Katana GF66con una nueva capa de pintura.

Conectividad: Cubre sólo lo esencial
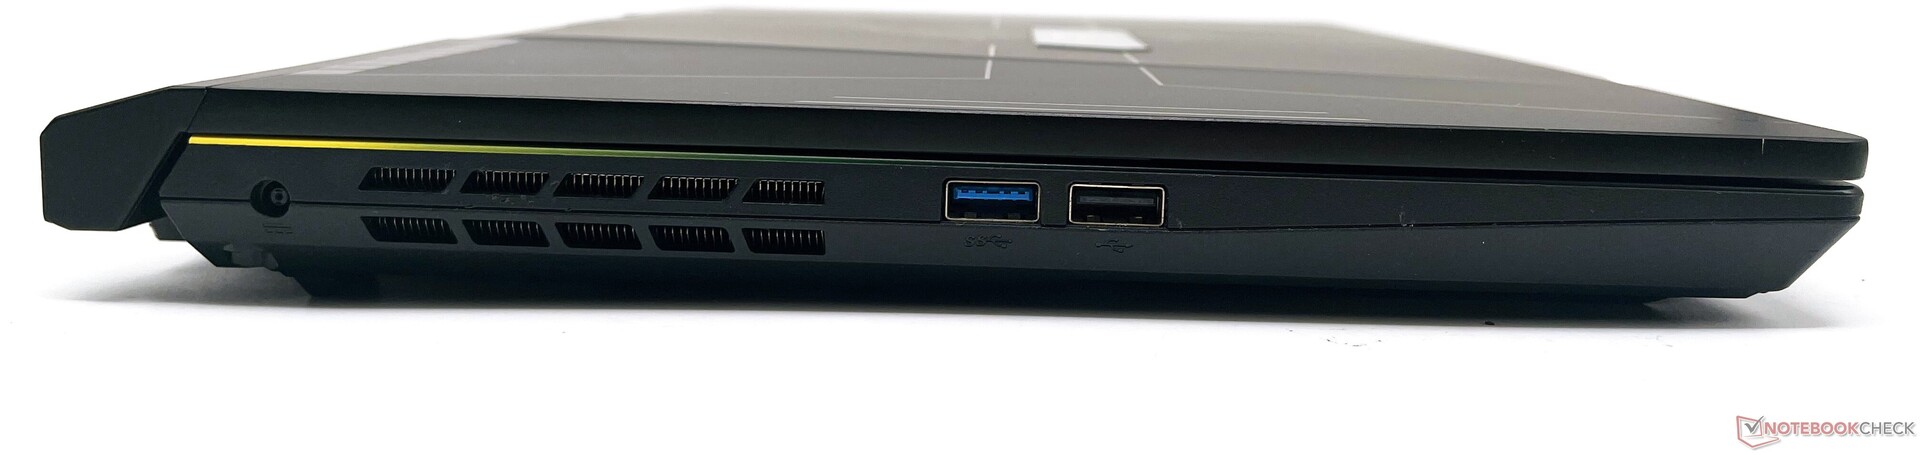
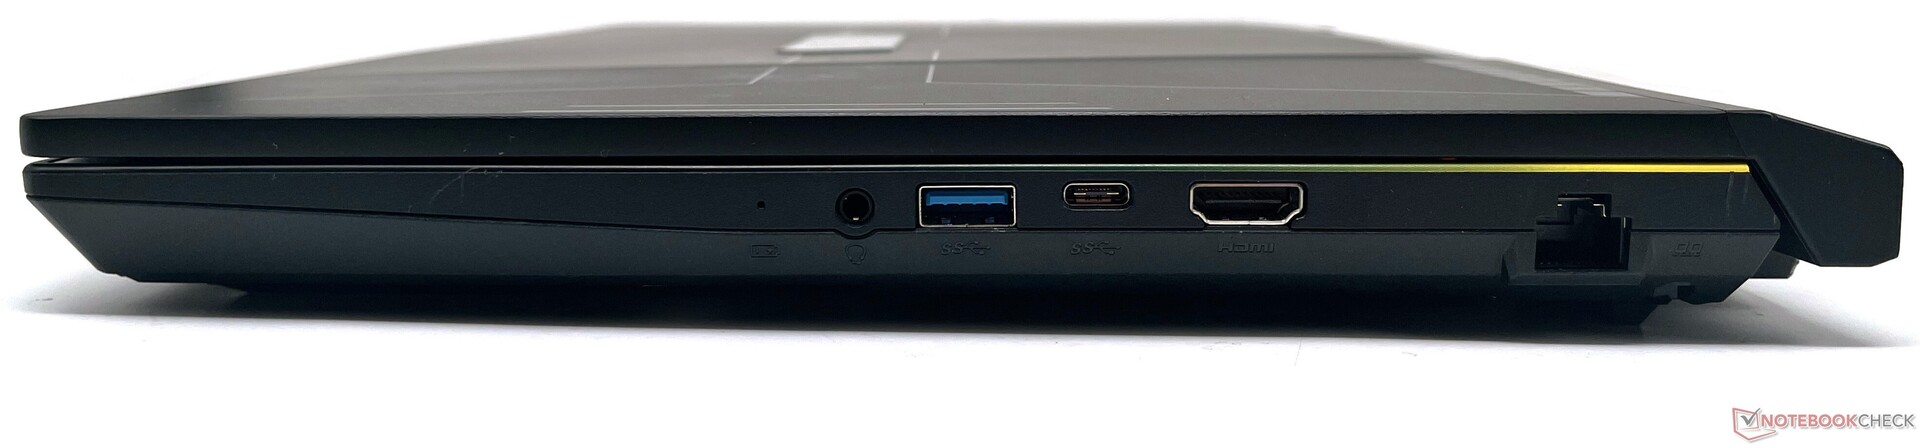
El Crosshair 15 R6E no ofrece una amplia selección de puertos, pero lo esencial está cubierto. Hacia la izquierda, tenemos puertos USB 3.2 Gen1 Tipo-A y USB 2.0 Tipo-A. A la derecha, tenemos una clavija de audio combo de 3.5 mm, otro USB 3.2 Gen1 Type-A, un puerto USB 3.2 Gen1 Type-C, salida HDMI, y Gigabit Ethernet
El puerto HDMI sólo admite salida 4K 60 Hz. No hay lector de tarjetas, Thunderbolt 4, o ranura de bloqueo Kensington.
La ubicación de los puertos no es realmente ideal, ya que la mayoría están situados hacia el lado derecho del dispositivo. A los puertos de la izquierda les vendría bien algo de espacio adicional, dado que queda una buena cantidad de espacio sin usar. Dicho esto, no hay impedimentos para conectar varios periféricos.
Comunicación
El Crosshair 15 R6E viene equipado con un módulo WLAN Intel Wi-Fi 6 AX201 con Bluetooth 5.2. El portátil se sitúa al final de nuestras tablas Wi-Fi con el router de referencia Asus ROG Rapture GT-AXE11000.
Dicho esto, su rendimiento sigue siendo mejor que el del Pulse GL66. Las velocidades de recepción son bastante estables, pero notamos caídas durante la transmisión.
| Networking / iperf3 transmit AXE11000 | |
| Schenker XMG Neo 15 (i7-12700H, RTX 3080 Ti) | |
| Acer Nitro 5 AN515-58-72QR | |
| Schenker XMG Neo 15 (Ryzen 9 6900HX, RTX 3070 Ti) | |
| MSI Katana GF66 12UGS | |
| Asus TUF Dash F15 FX517ZR | |
| Medio Intel Wi-Fi 6 AX201 (438 - 1715, n=74) | |
| Media de la clase Gaming (560 - 1862, n=88, últimos 2 años) | |
| MSI Crosshair 15 R6E B12UGZ-050 | |
| Networking / iperf3 receive AXE11000 | |
| Acer Nitro 5 AN515-58-72QR | |
| MSI Katana GF66 12UGS | |
| Schenker XMG Neo 15 (i7-12700H, RTX 3080 Ti) | |
| Asus TUF Dash F15 FX517ZR | |
| MSI Stealth GS66 12UGS | |
| Schenker XMG Neo 15 (Ryzen 9 6900HX, RTX 3070 Ti) | |
| Media de la clase Gaming (680 - 1745, n=88, últimos 2 años) | |
| Medio Intel Wi-Fi 6 AX201 (390 - 1734, n=79) | |
| MSI Crosshair 15 R6E B12UGZ-050 | |
| Networking / iperf3 transmit AX12 | |
| Lenovo Legion 5 Pro 16 G7 i7 RTX 3070Ti | |
| Medio Intel Wi-Fi 6 AX201 (49.8 - 1775, n=324) | |
| MSI Pulse GL66 12UEK | |
| Networking / iperf3 receive AX12 | |
| Lenovo Legion 5 Pro 16 G7 i7 RTX 3070Ti | |
| Medio Intel Wi-Fi 6 AX201 (136 - 1743, n=324) | |
| MSI Pulse GL66 12UEK | |
Cámara web
La webcam de 720p es bastante útil para una o dos videollamadas ocasionales. Como se observa en nuestro ColorChecker Passport y en las capturas de la tabla de pruebas de abajo, la webcam del Crosshair 15 muestra mucho ruido y una falta general de nitidez.
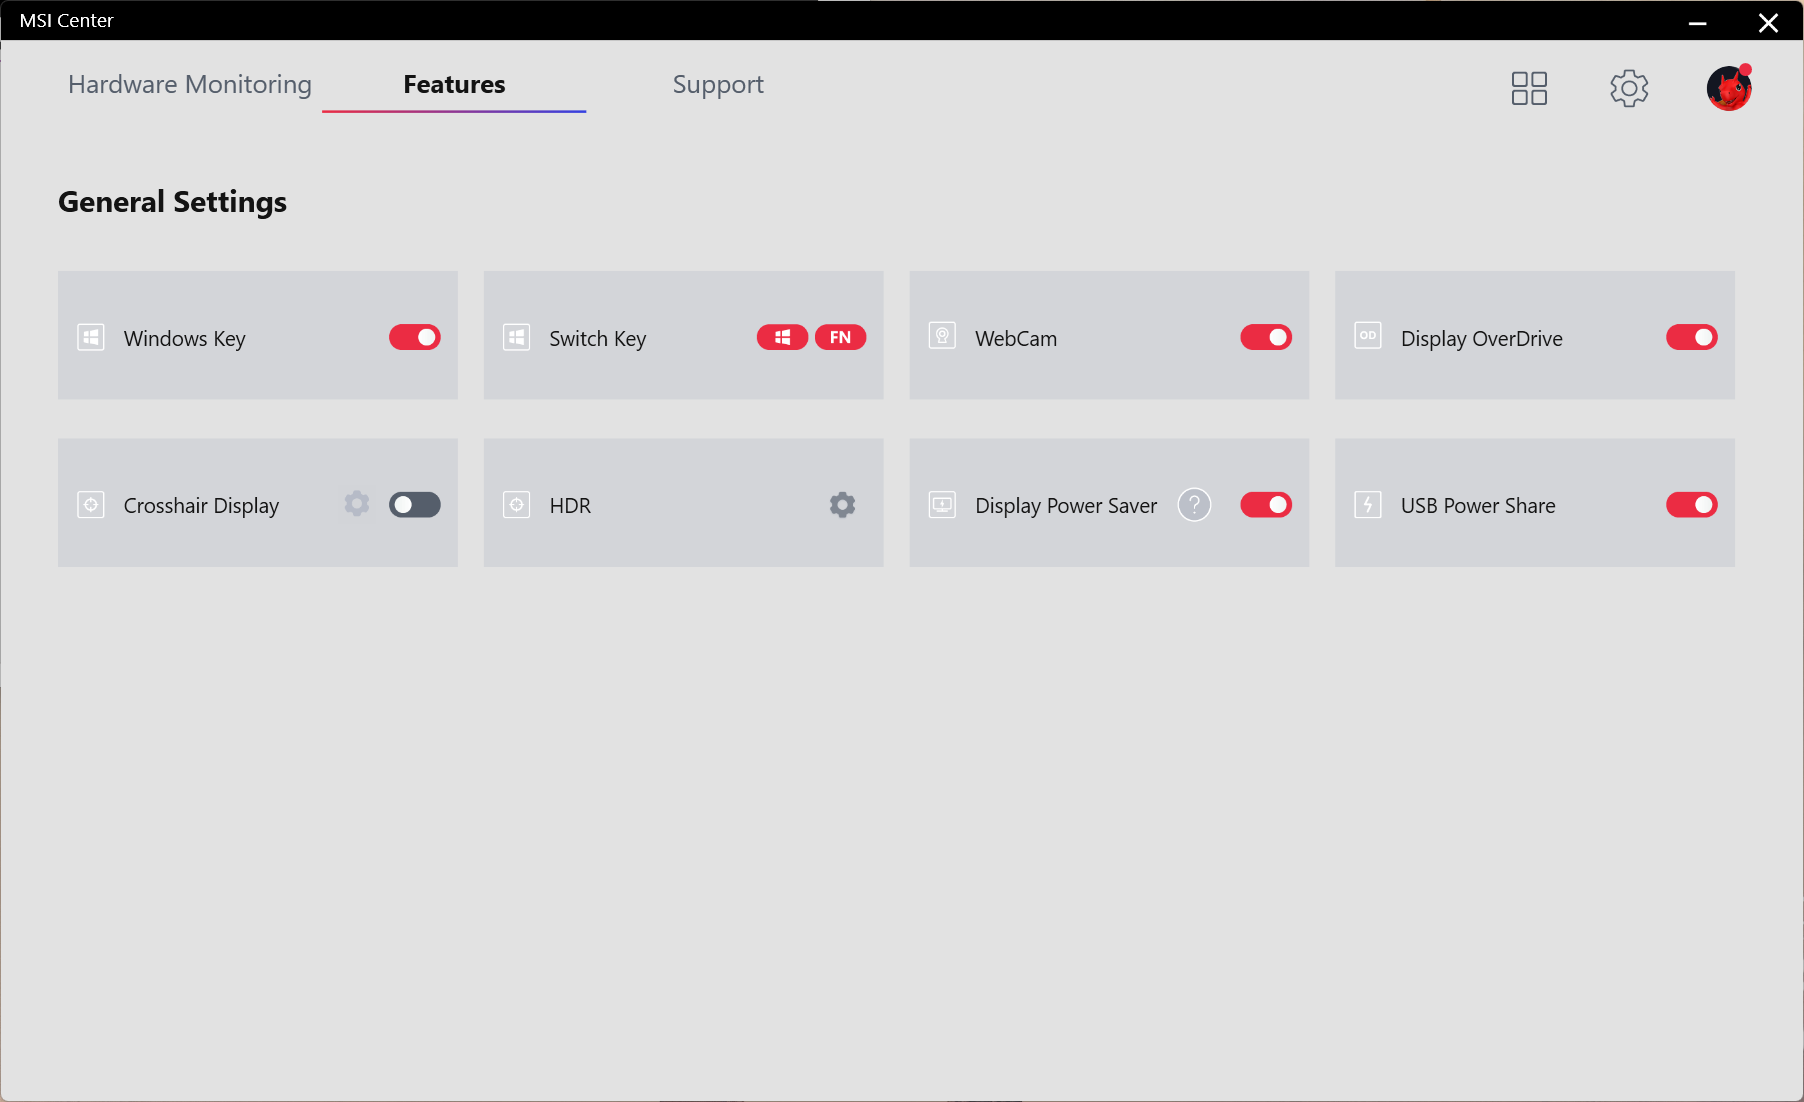
No hay obturador de privacidad físico disponible, pero es posible habilitar o deshabilitar la webcam usando el atajo en la tecla de función F6 o a través del Centro MSI.


Seguridad
No hay inicio de sesión biométrico disponible en el Crosshair 15 R6E. El único componente de seguridad importante es el módulo TPM 2.0.
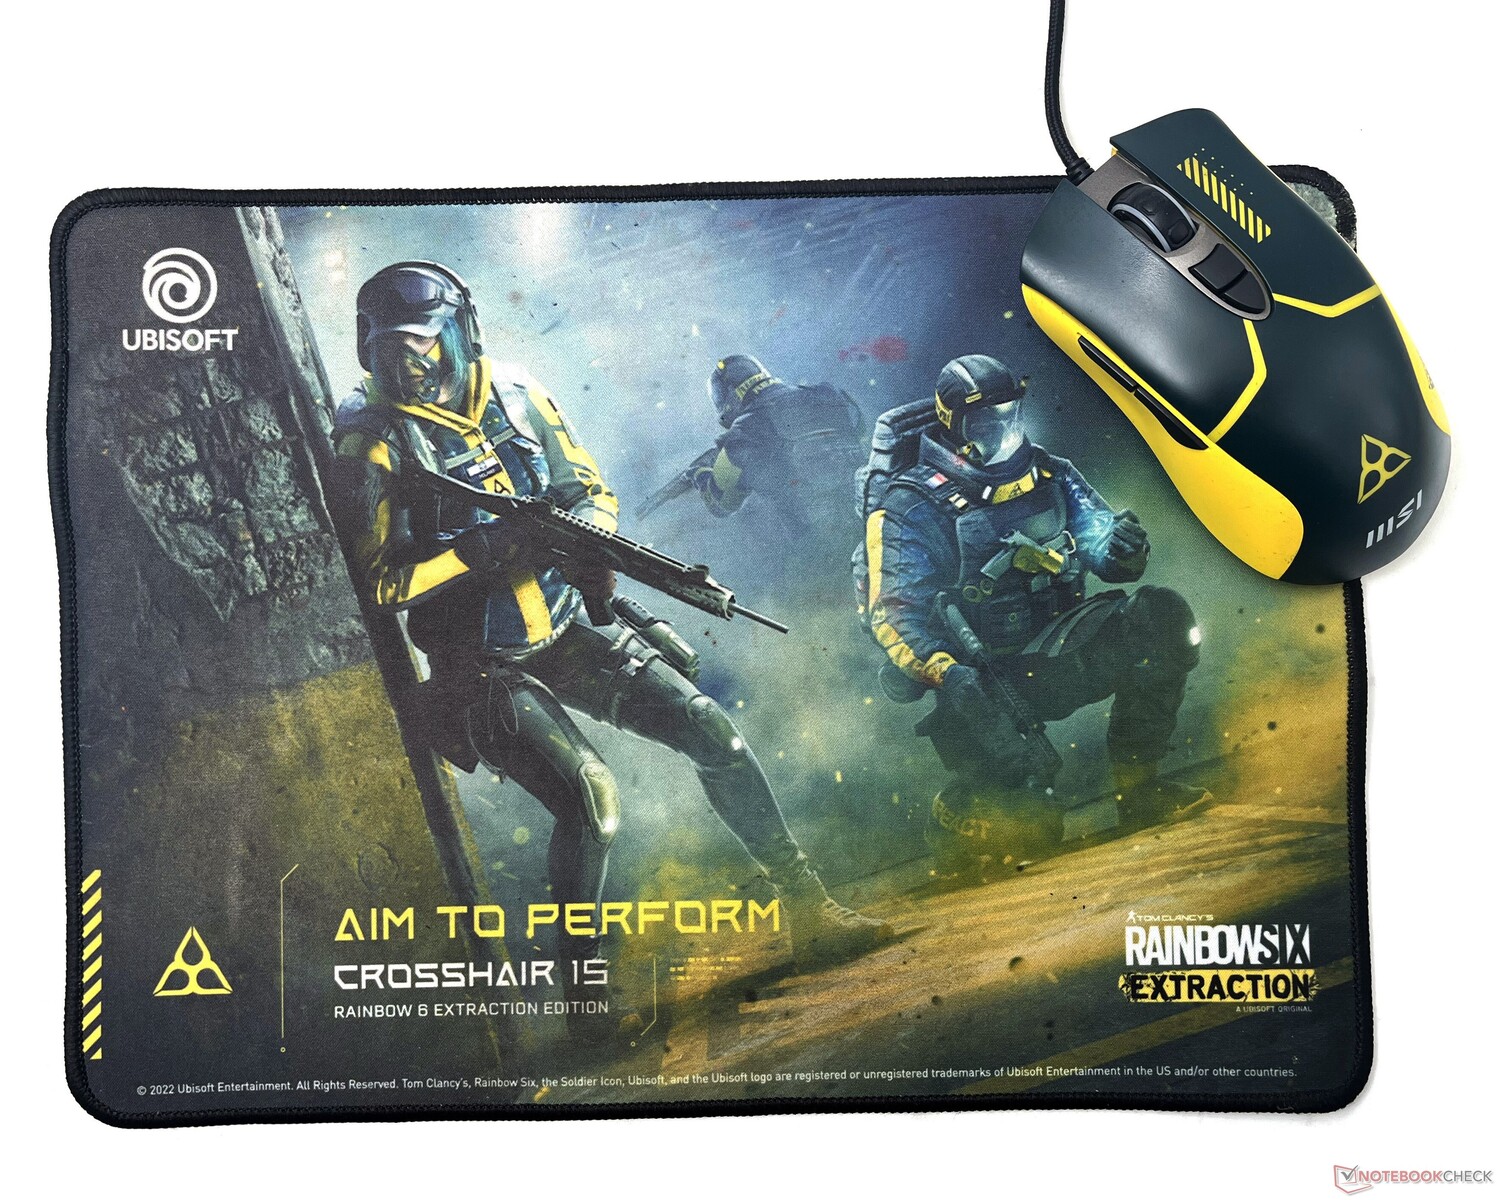
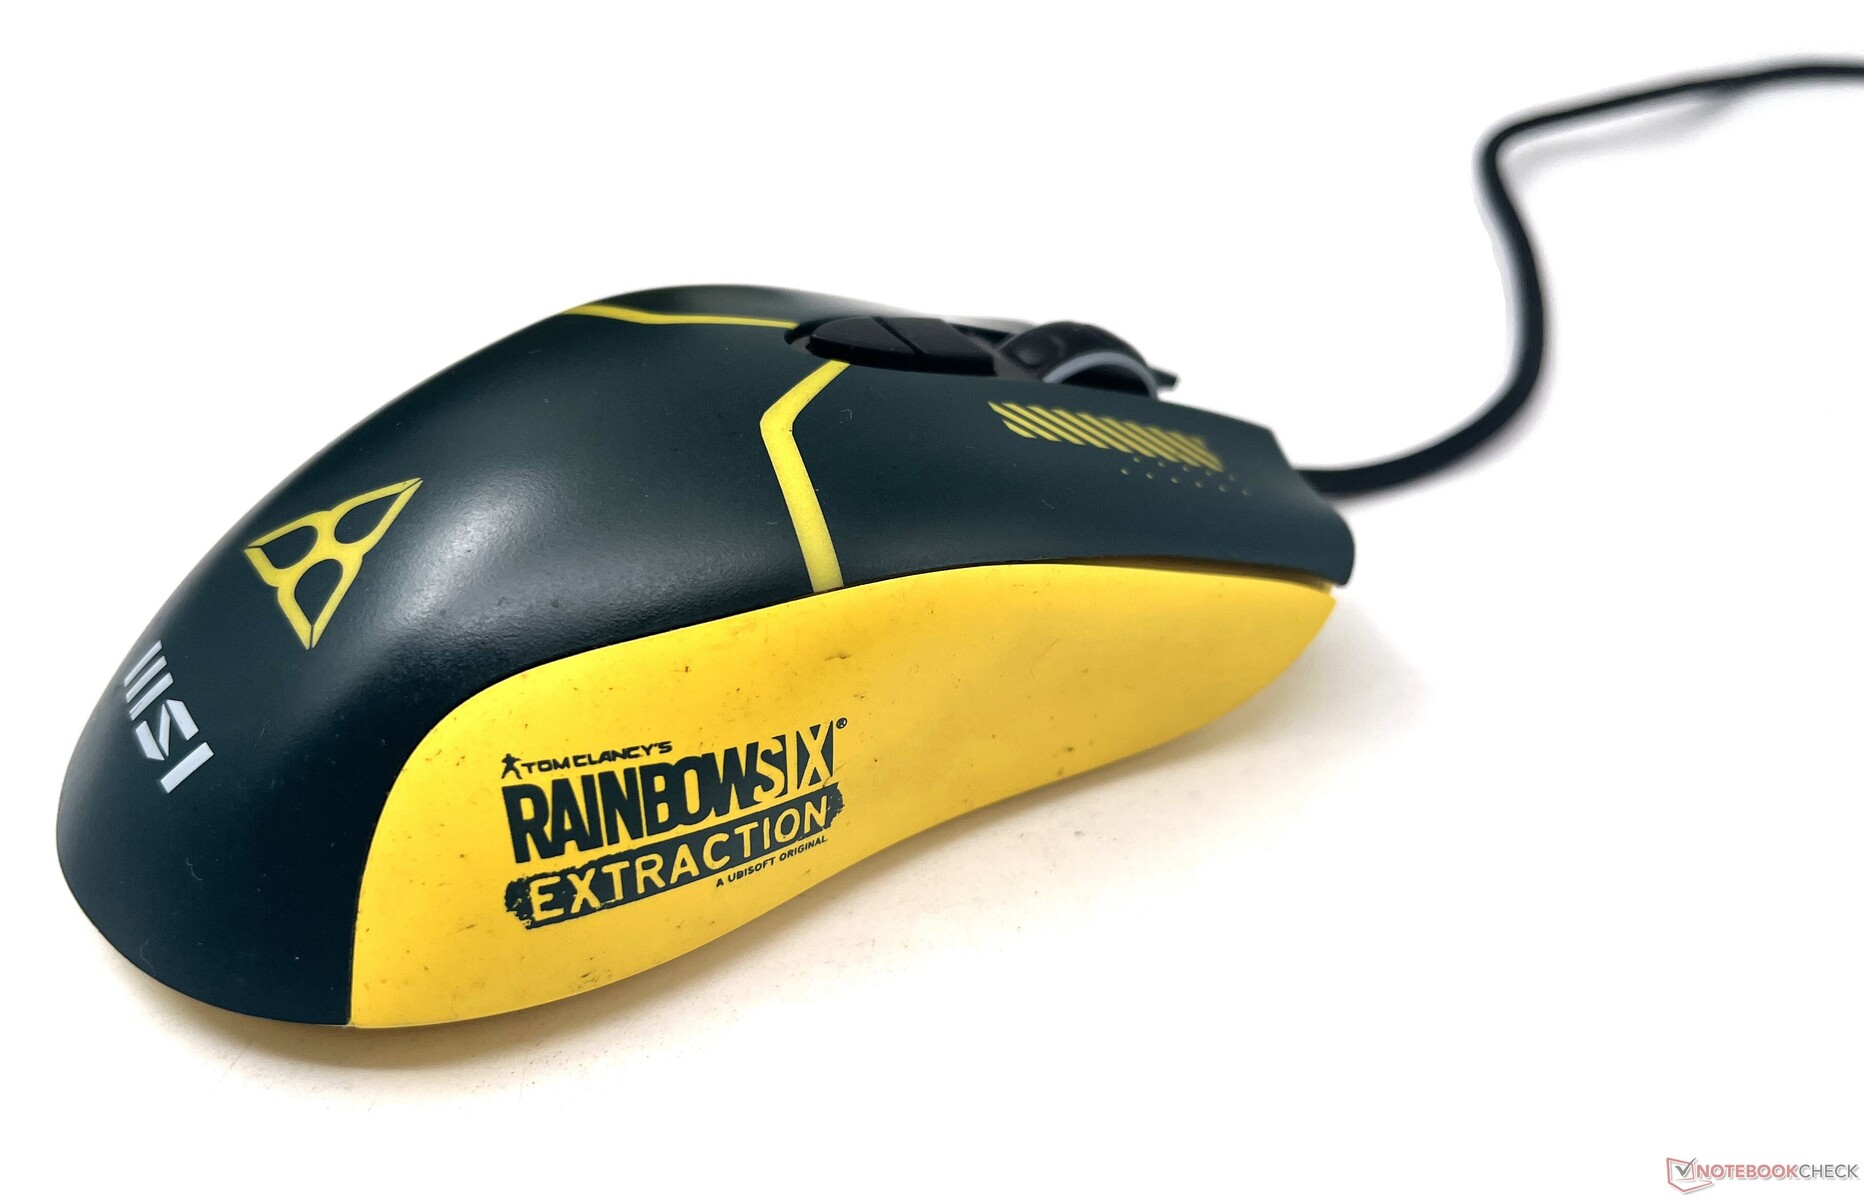
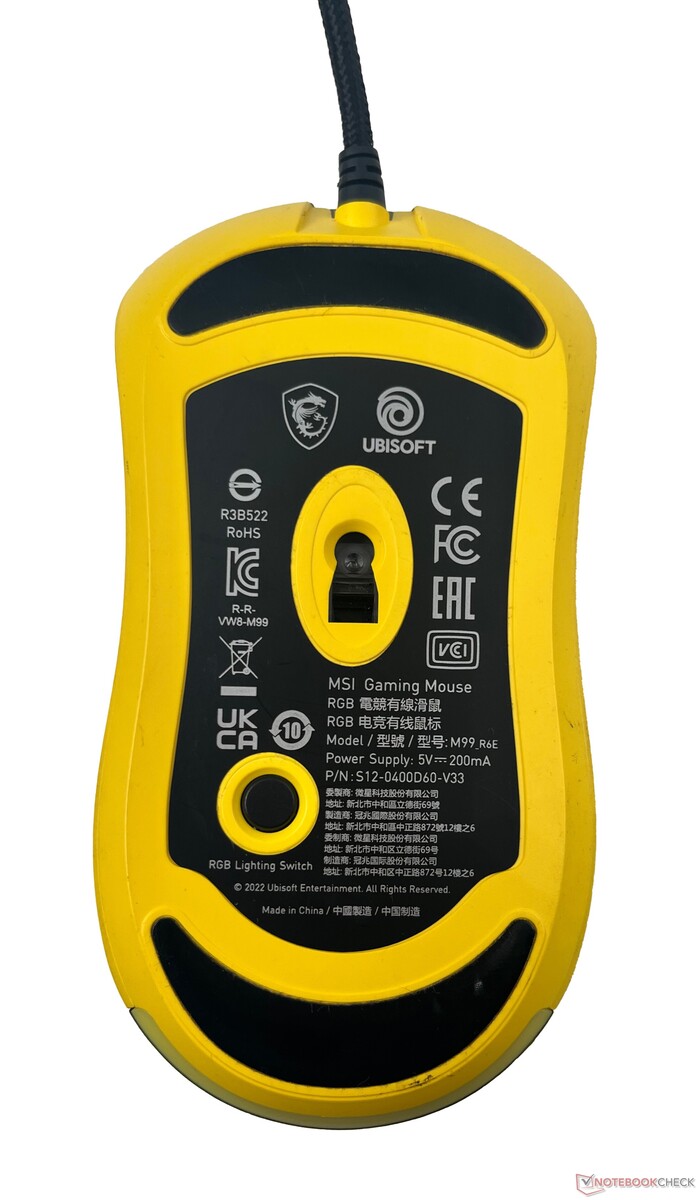
Accesorios
MSI intenta introducirte aún más en el universo Rainbow Six: Extraction con algunos accesorios adicionales. El paquete incluye una alfombrilla de ratón y un ratón para juegos con la temática del juego. Los compradores también podrán canjear una copia gratuita de Rainbow Six: Extraction Deluxe Edition a través de Ubisoft.
El ratón es una versión personalizada del MSI M99. Utiliza un sensor Avago 3050 con una resolución de 4.000 PPP y una frecuencia de sondeo de 500 Hz. Obviamente, no está a la altura de un Corsair IronClaw RGB o incluso el Mad Catz R.A.T. Airpero sigue siendo una oferta gratuita decente.
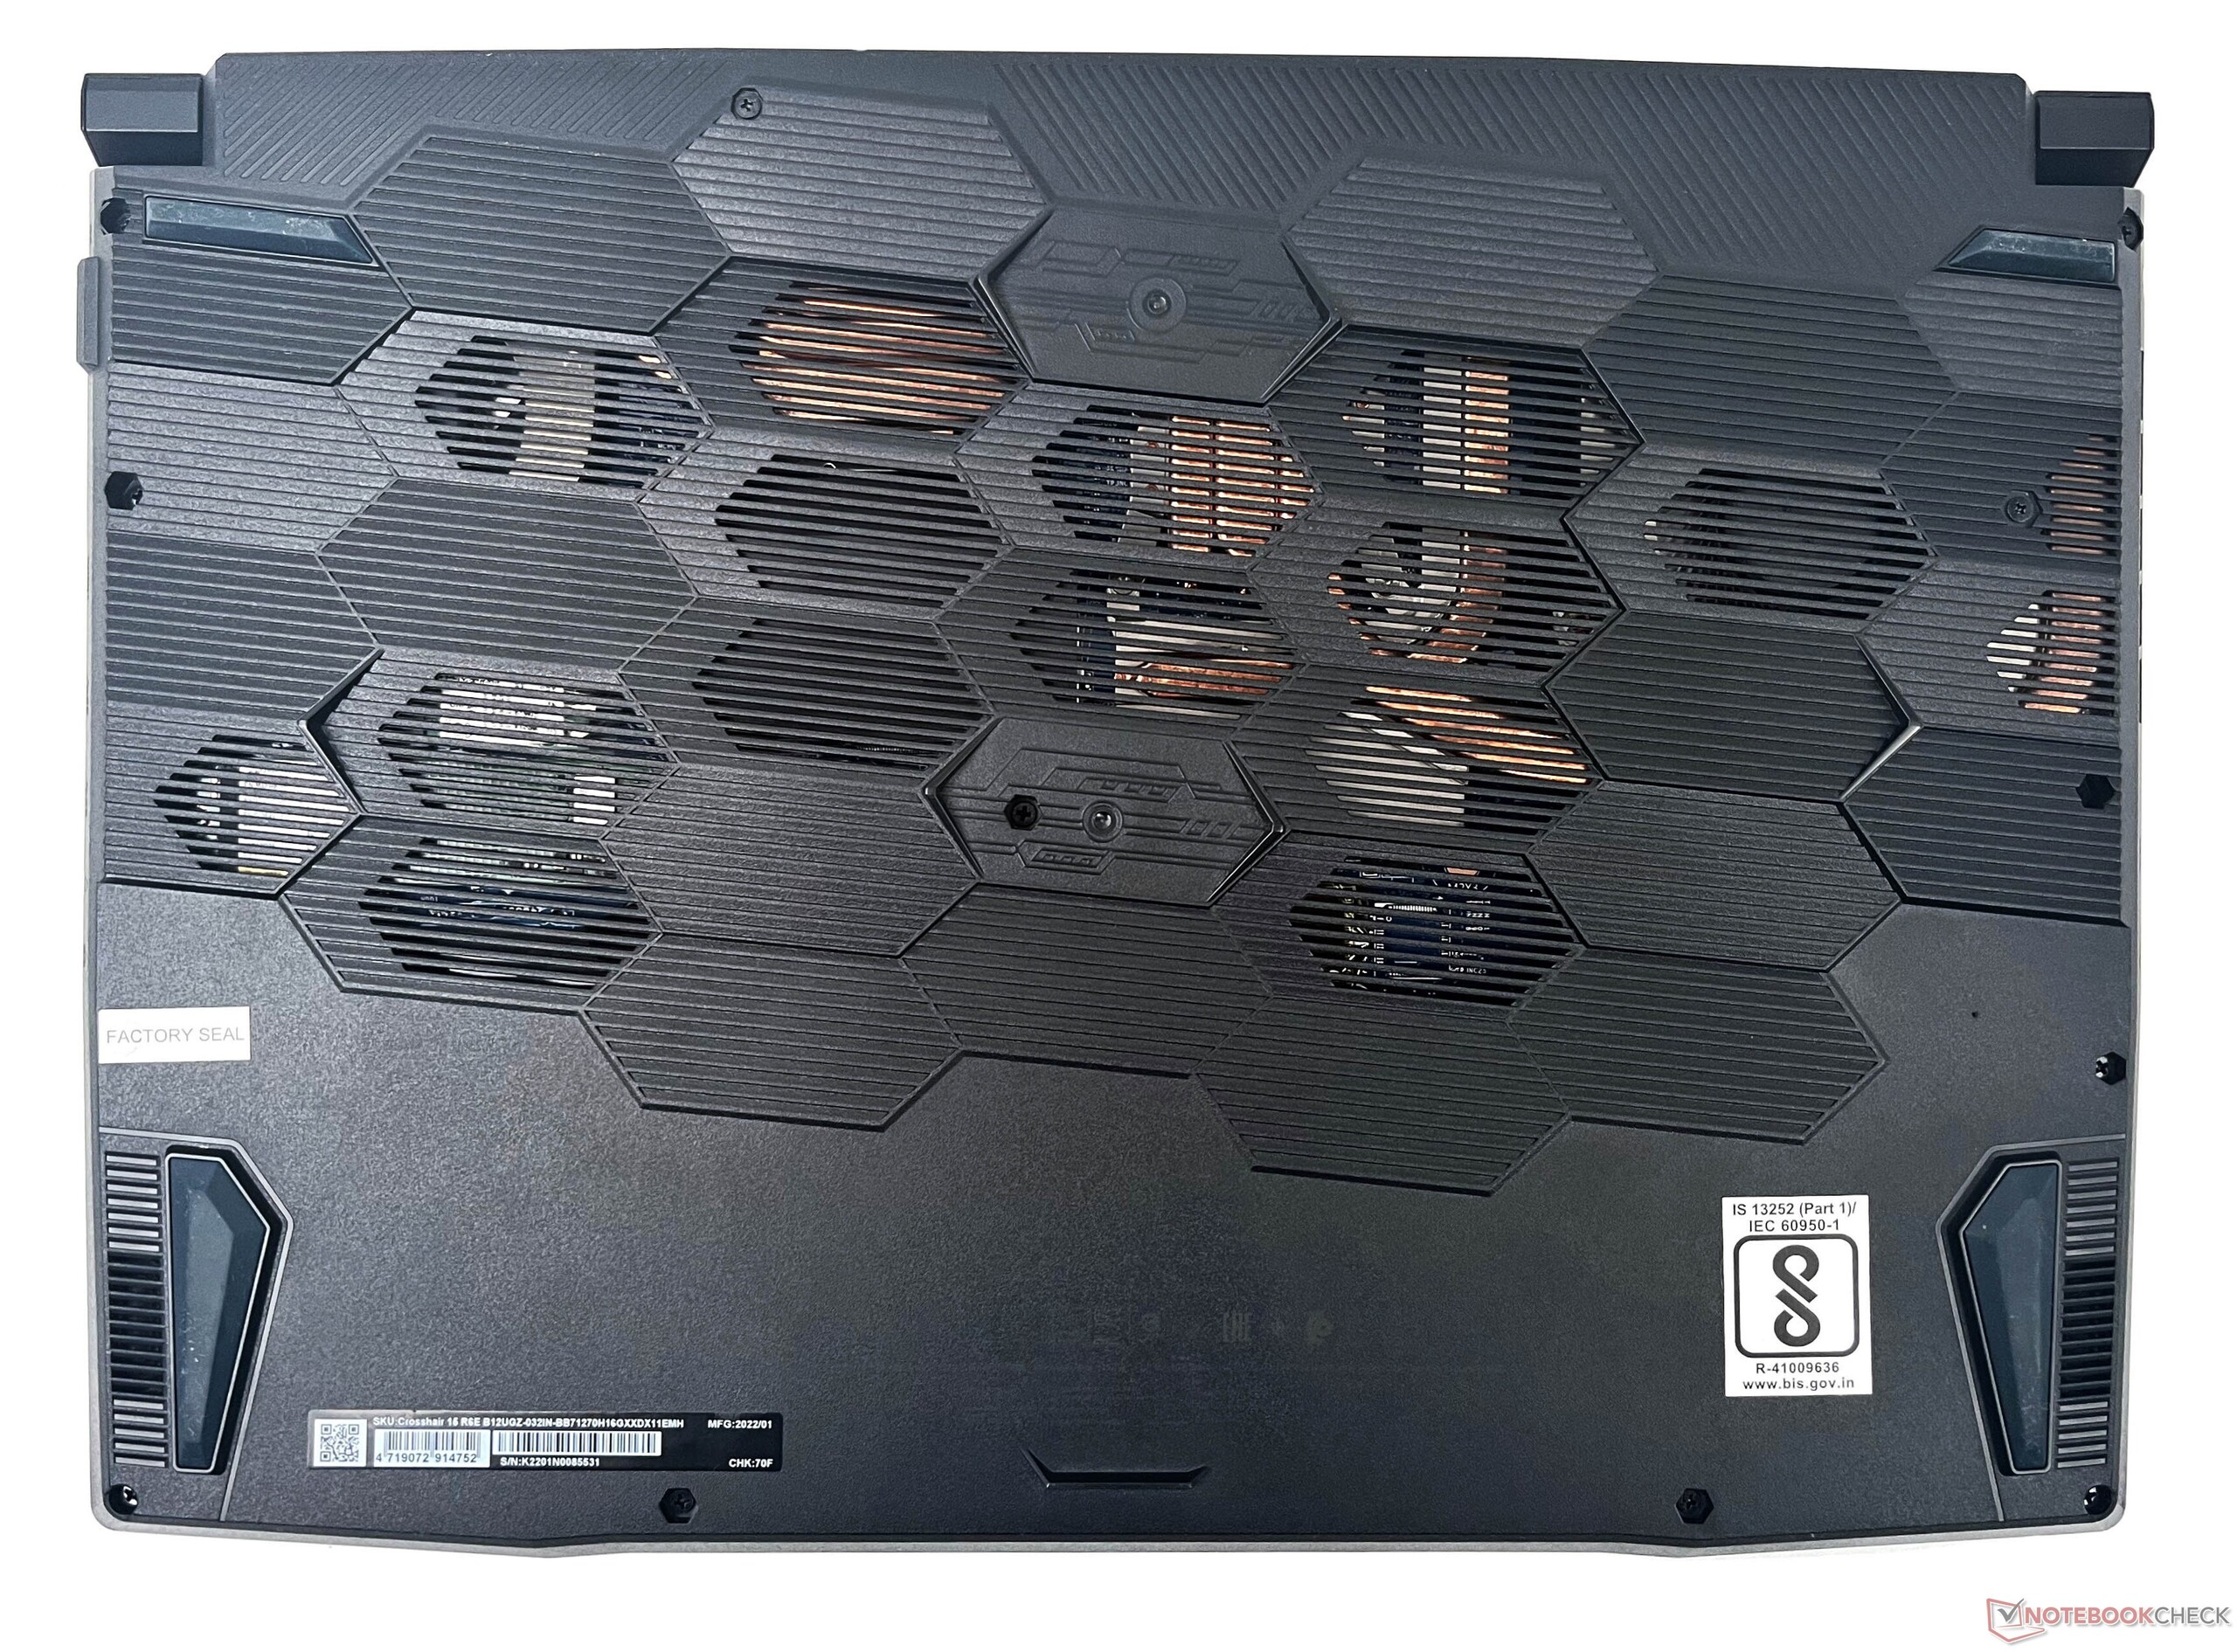
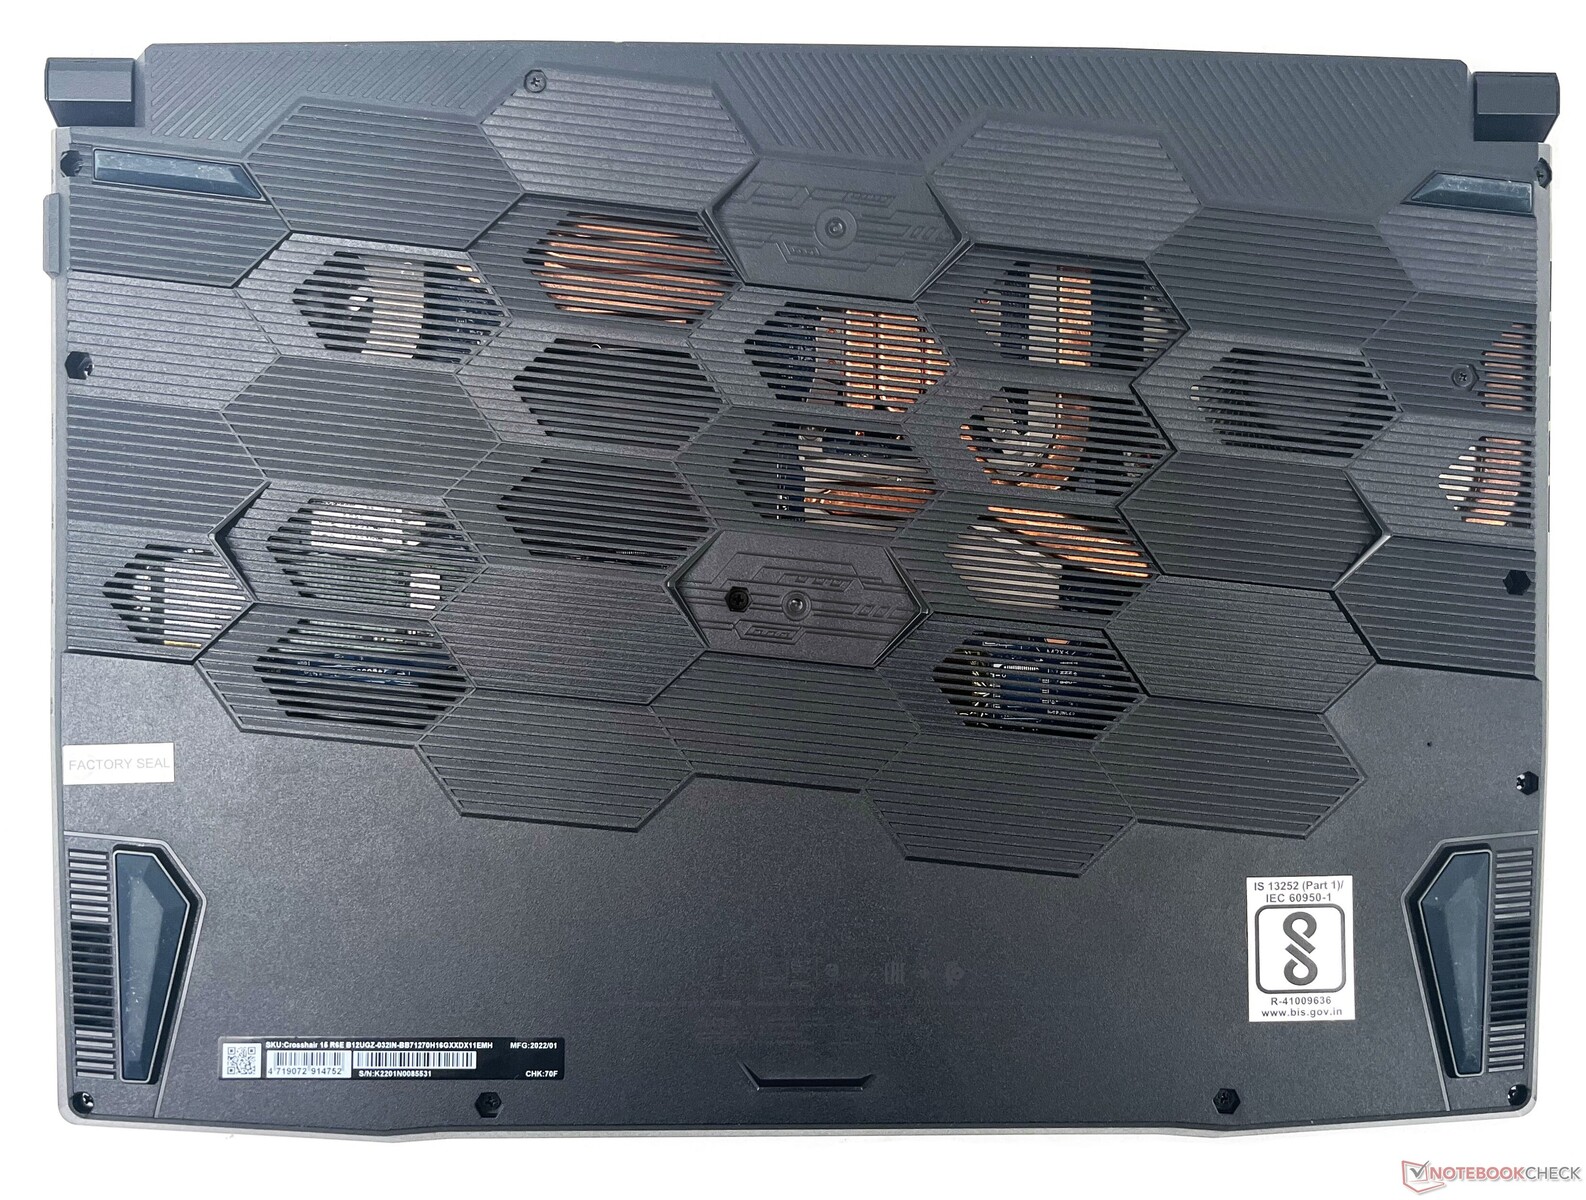
Mantenimiento
Como es habitual en los modelos de prueba de MSI, no pudimos quitar la pegatina del sello de fábrica que oculta uno de los tornillos. Dicho esto, abrir el panel trasero es bastante sencillo y los usuarios deberían poder realizar actualizaciones sin problemas.
Garantía
MSI ofrece una garantía de dos años para el Crosshair 15 R6E que también incluye un año de seguro de viaje global en los centros de servicio autorizados de MSI.
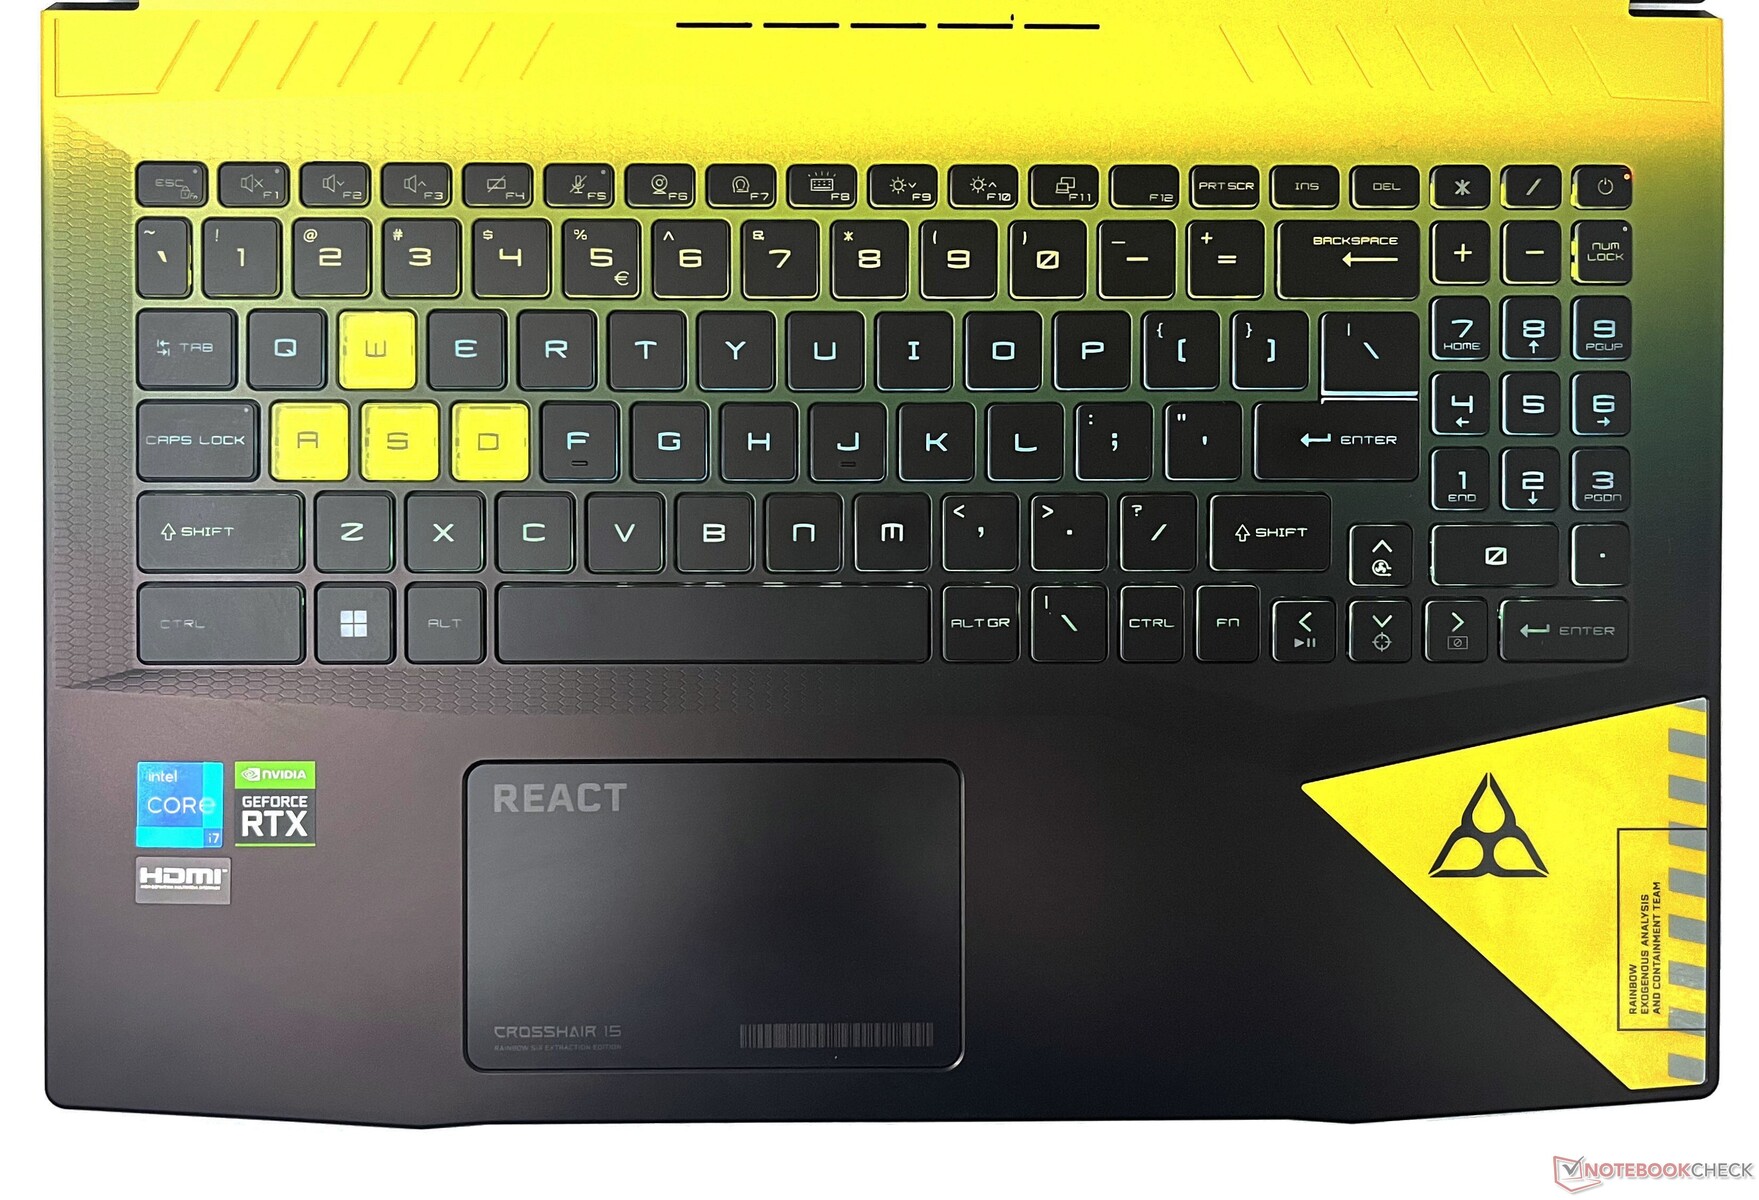
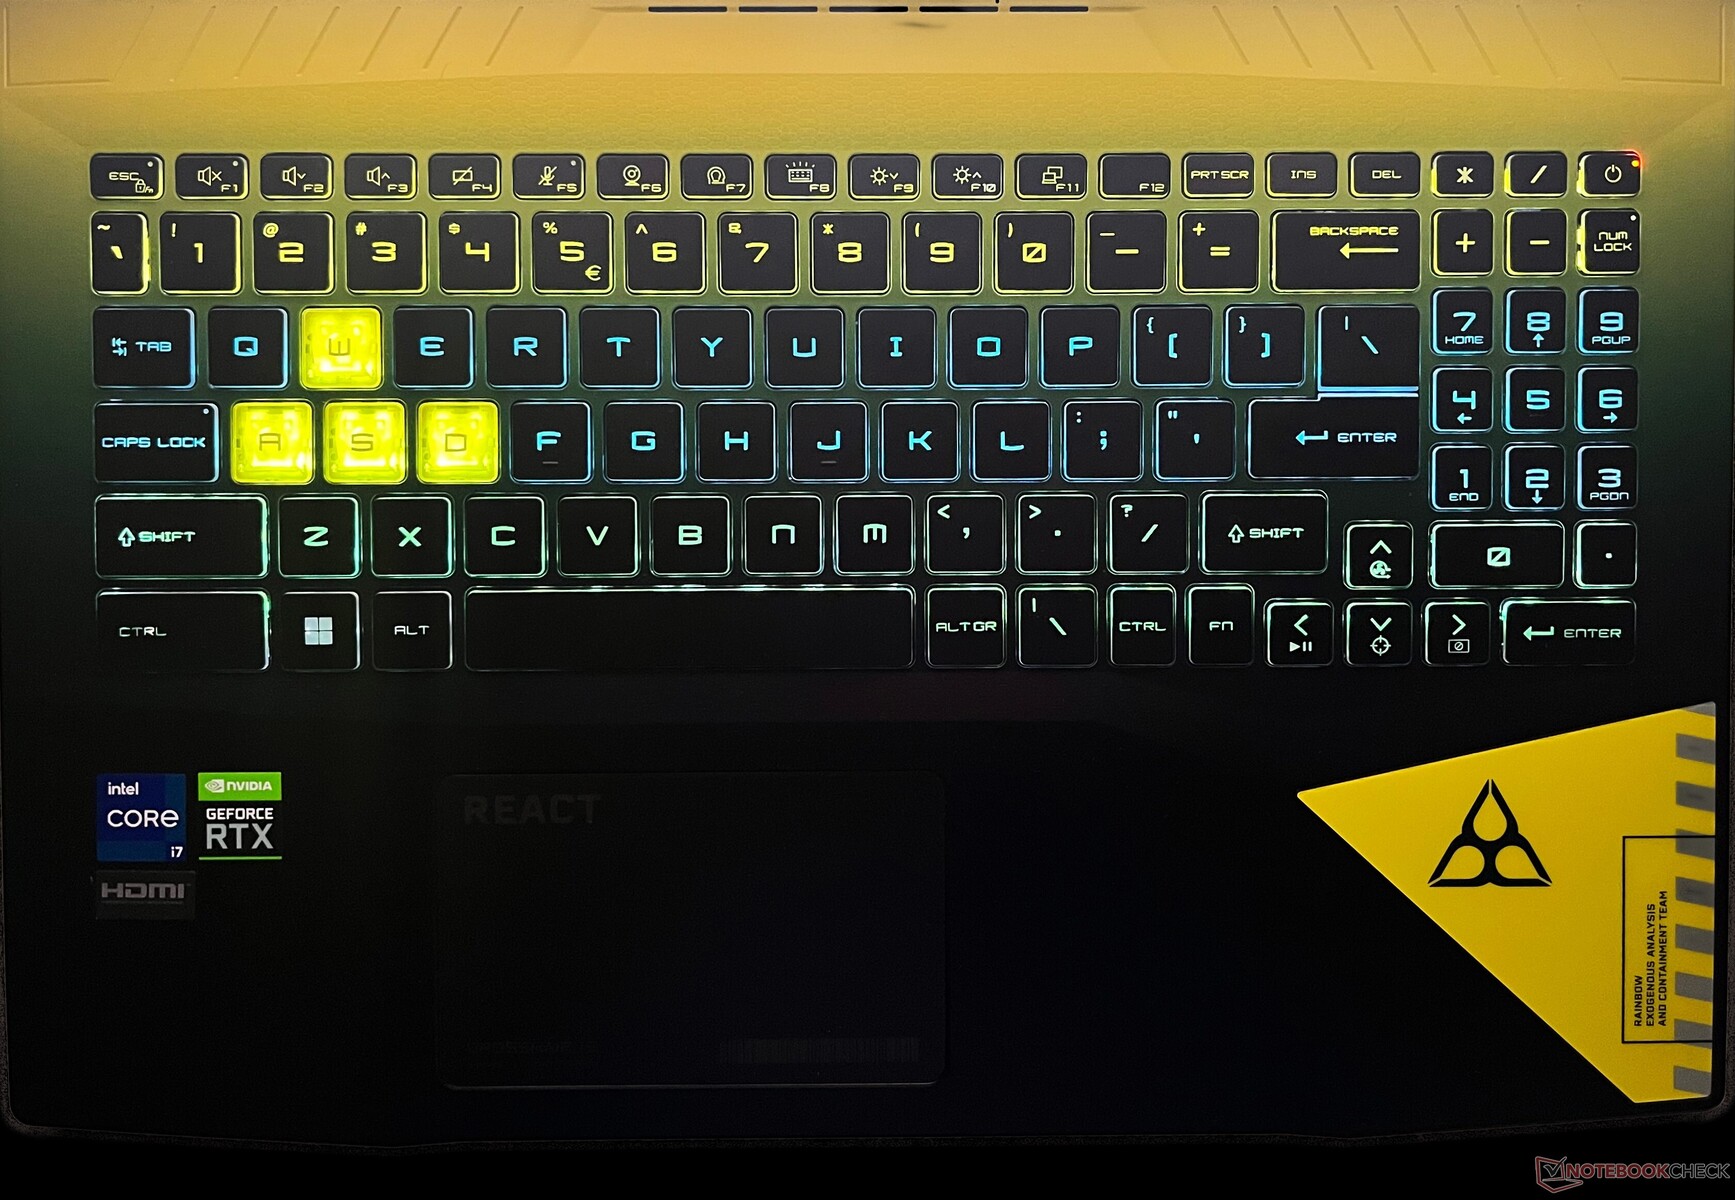
Dispositivos de entrada: Corregidos los colores de la retroiluminación temática
Teclado
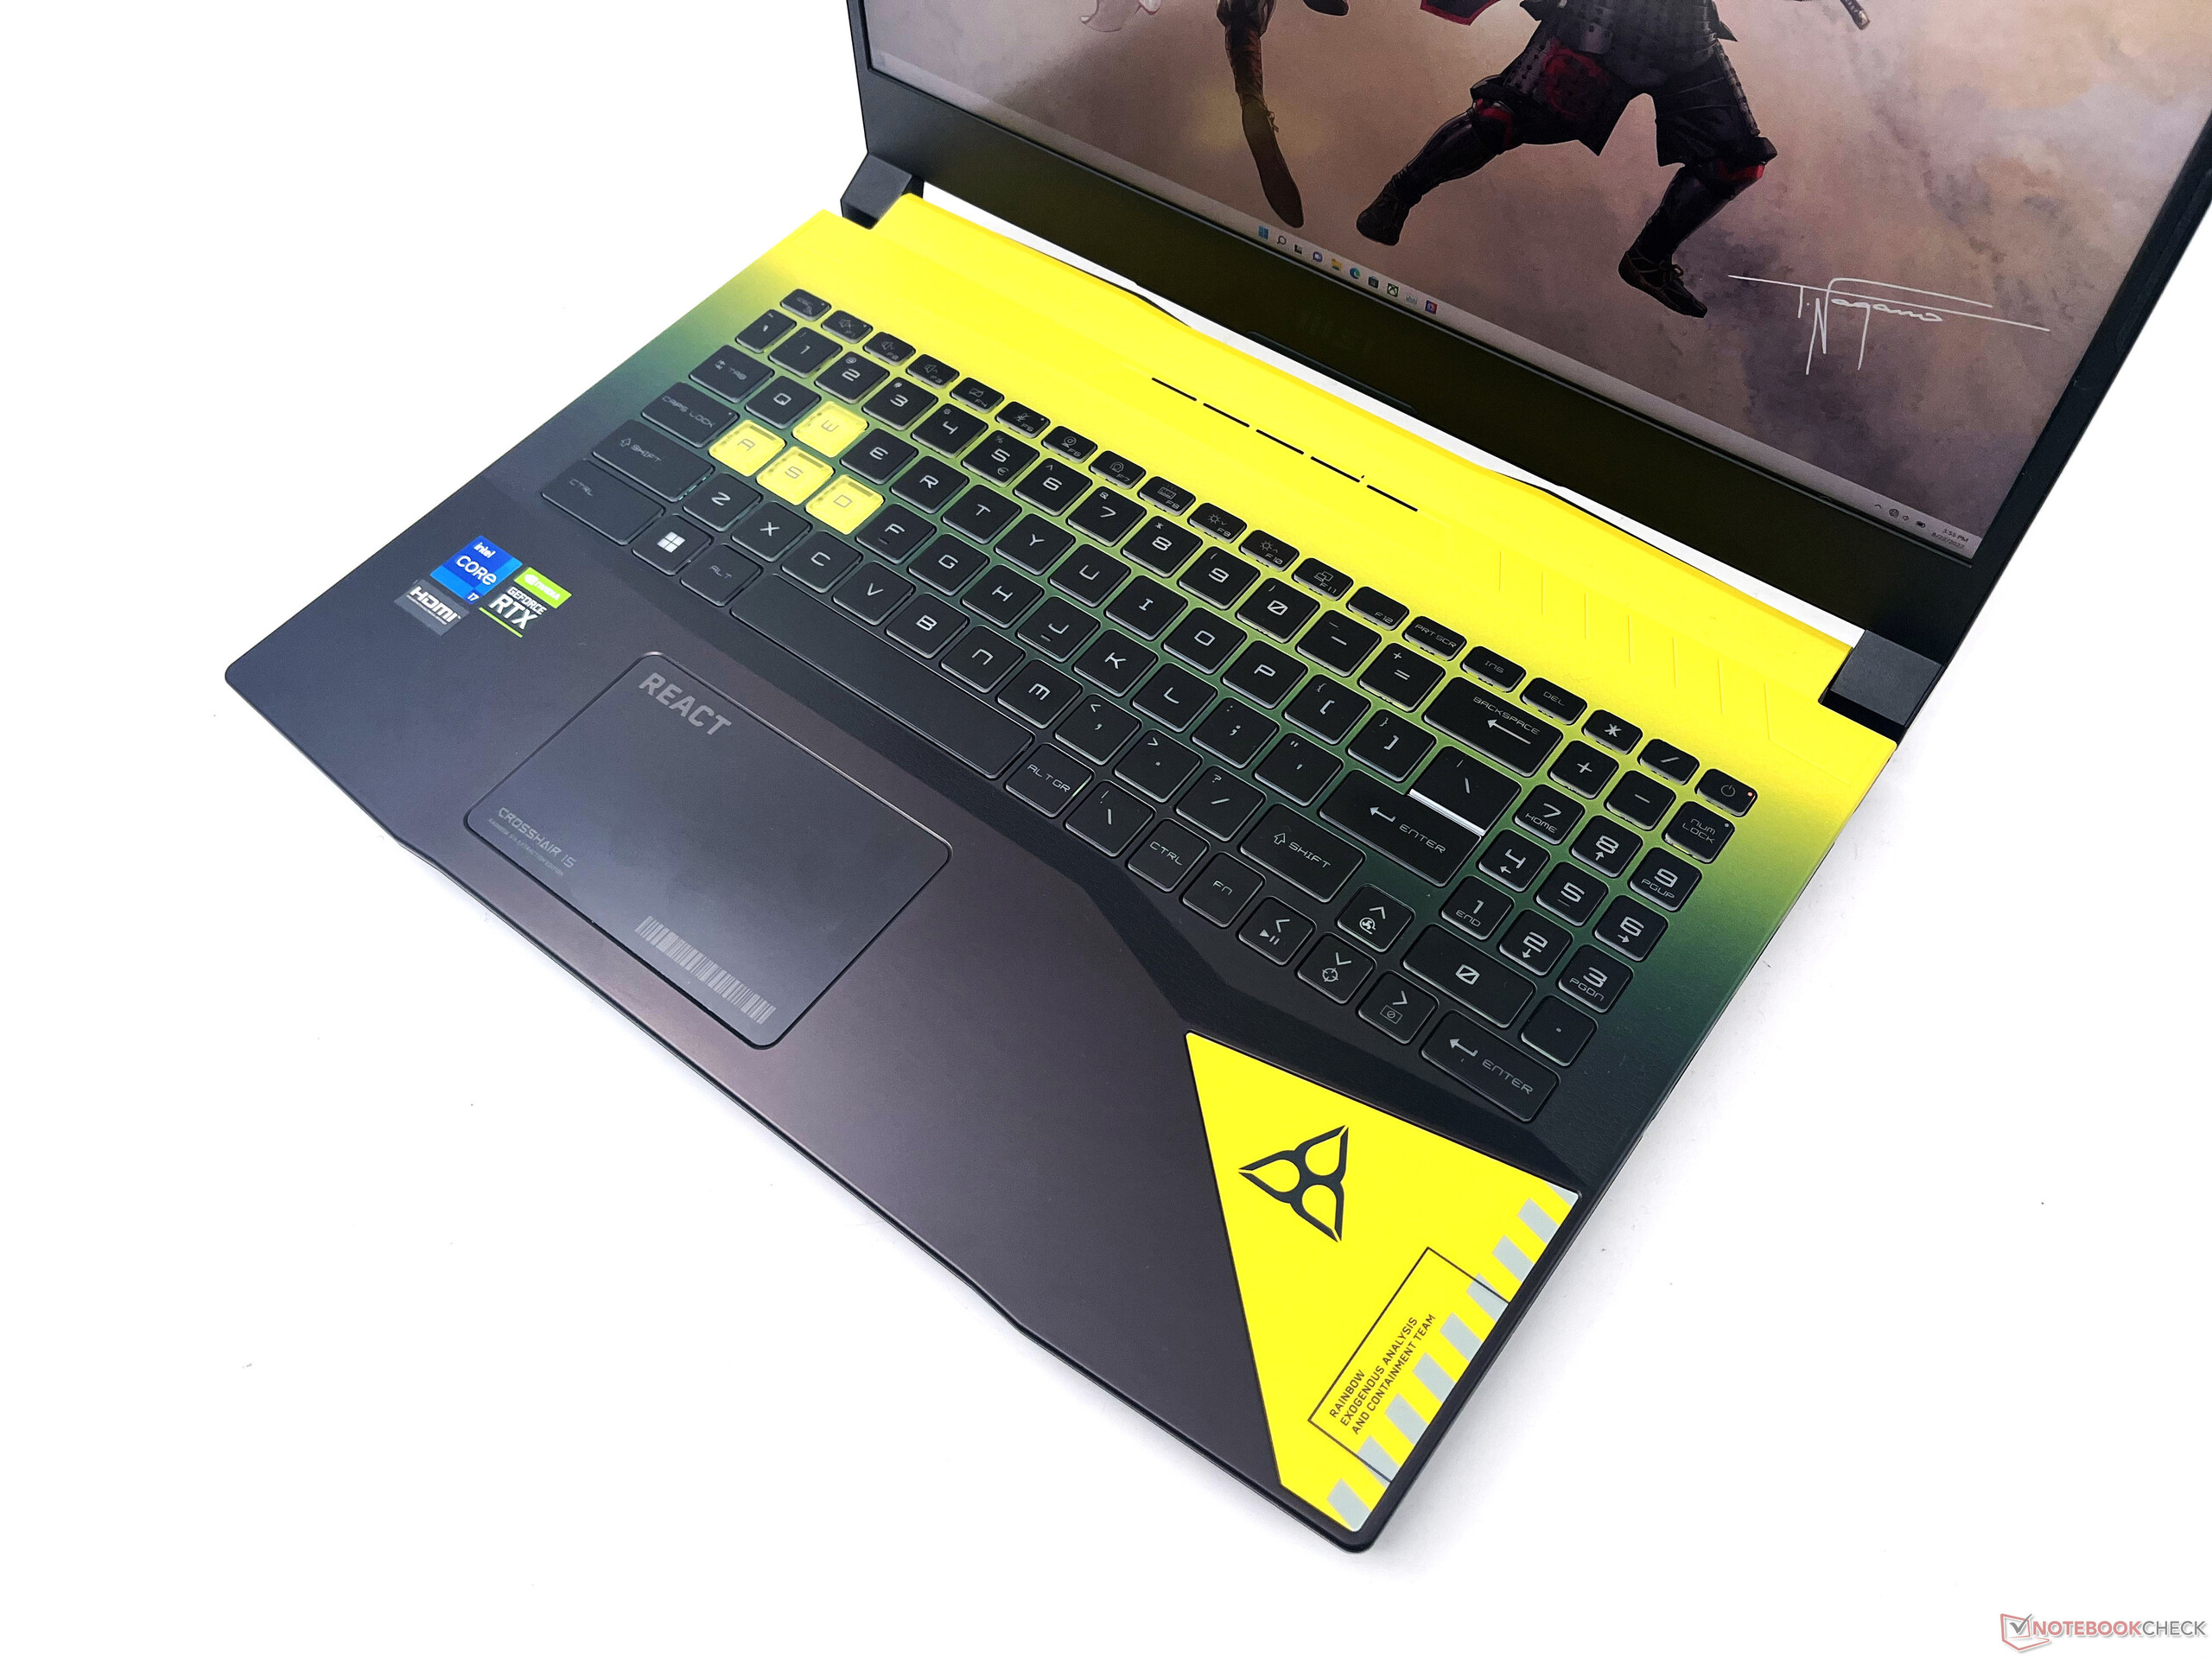
El teclado del Crosshair 15 R6E no cuenta con RGB ni ninguna de las lujosas funciones de SteelSeries, pero MSI ha incorporado lo que denomina un teclado Spectrum Backlight. Esencialmente, las luces del teclado están inspiradas en - lo has adivinado - el juego Rainbow Six: Extraction con colores amarillo y azul
Cada tecla tiene una iluminación fija que no se puede personalizar, aunque la intensidad de la retroiluminación general se puede ajustar mediante un atajo de teclado. Las teclas tienen un buen recorrido de 1,7 mm y una respuesta táctil decente
Se agradece la inclusión del teclado numérico, y las teclas de dirección no están aplastadas. Las funciones secundarias están iluminadas, lo que facilita su reconocimiento en la oscuridad.
Si eres nuevo en los portátiles MSI, debes tener en cuenta la incómoda colocación de la tecla Fn a la derecha en lugar de su posición habitual.
Panel táctil
El touchpad de 10,5 cm x 6,5 cm lleva el logotipo REACT del juego y la etiqueta Crosshair 15. En términos de funcionalidad, es similar a los touchpads que hemos visto con sus primos Pulse y Katana.
La respuesta del touchpad es buena y los gestos funcionan bien gracias a los controladores de Windows Precision. Los botones izquierdo y derecho del ratón están a ras del touchpad y hacen clic sin esfuerzo, aunque con algo de ruido.
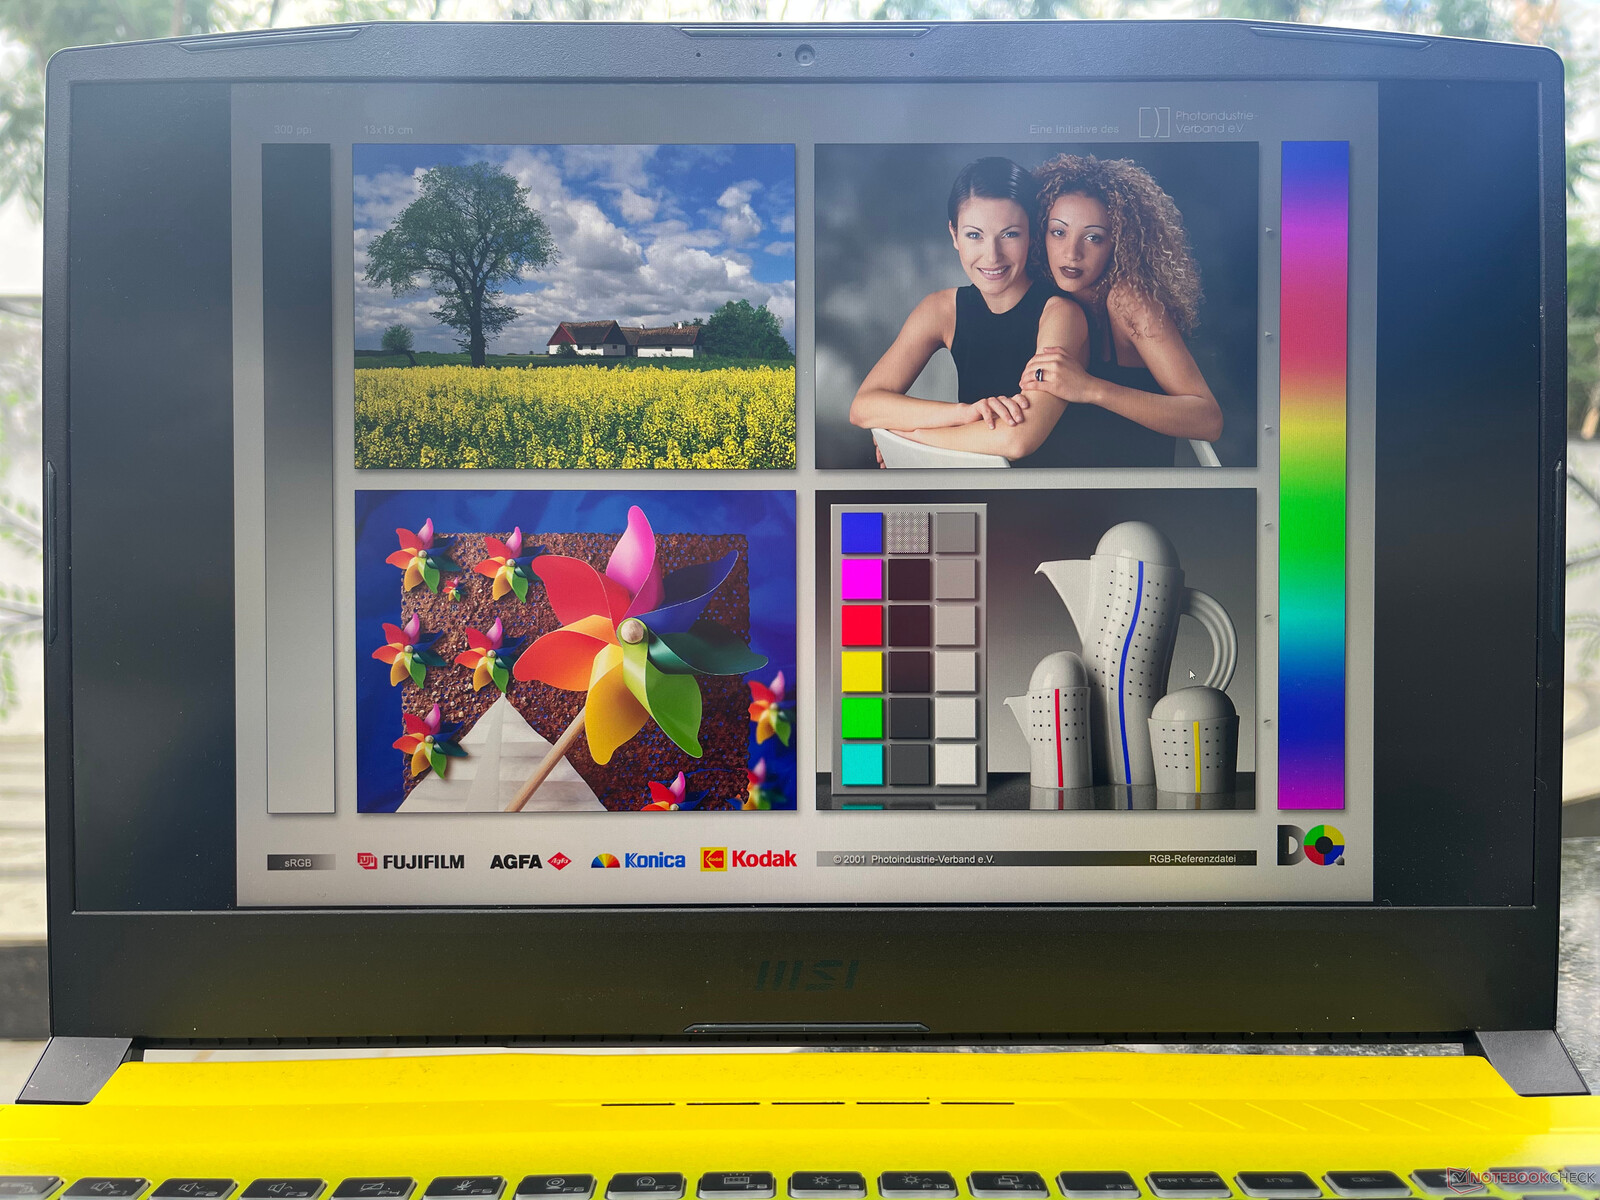
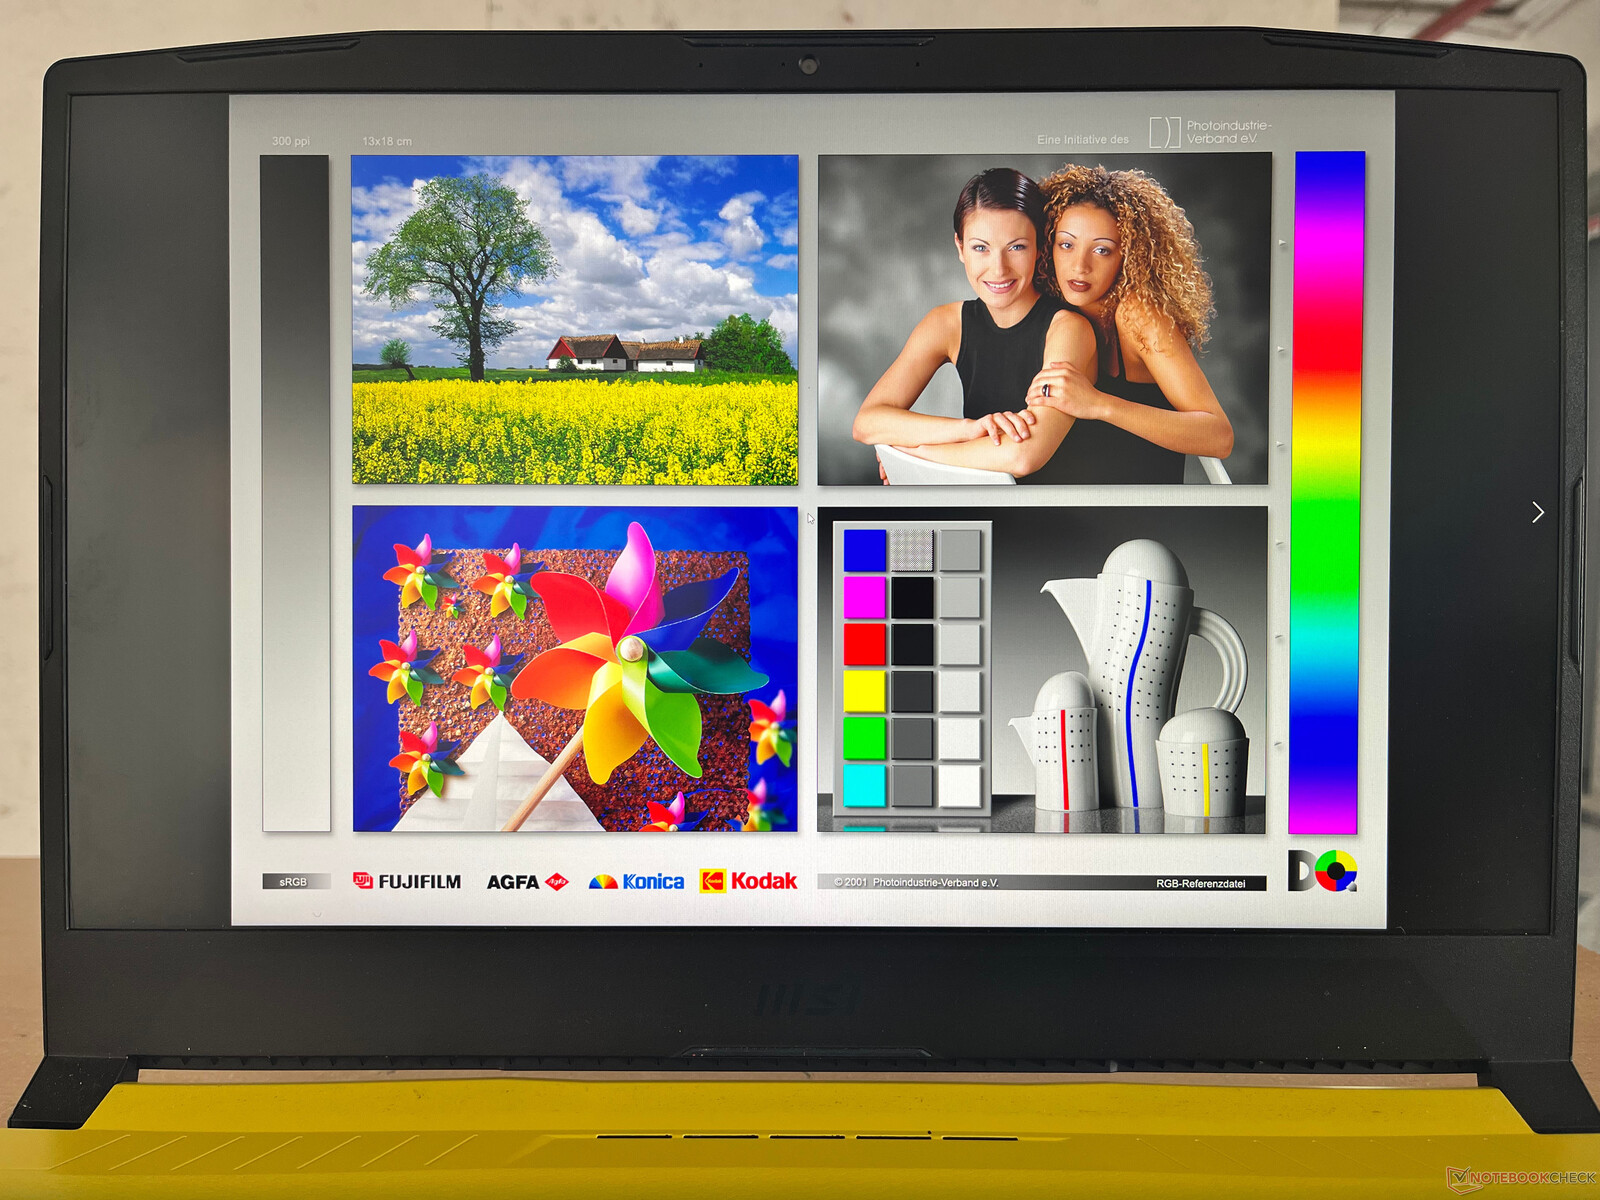
Pantalla: Panel QHD de 165 Hz con amplia cobertura de la gama de colores y sin PWM
MSI ofrece un panel QHD IPS de 15.6" con una tasa de refresco de 165 Hz en ambos modelos Crosshair 15 R6E. No soporta HDR10 ni Dolby Vision. Registramos un brillo máximo de 342 nits, lo que debería ser adecuado para el uso en interiores.
Una distribución del brillo del 89% y un contraste medido de 1069:1 ofrecen una experiencia de visión decente. Esto es similar a lo que habíamos observado anteriormente con el Asus ROG Zephyrus G15 y el Acer Nitro 5que usan el mismo panel.
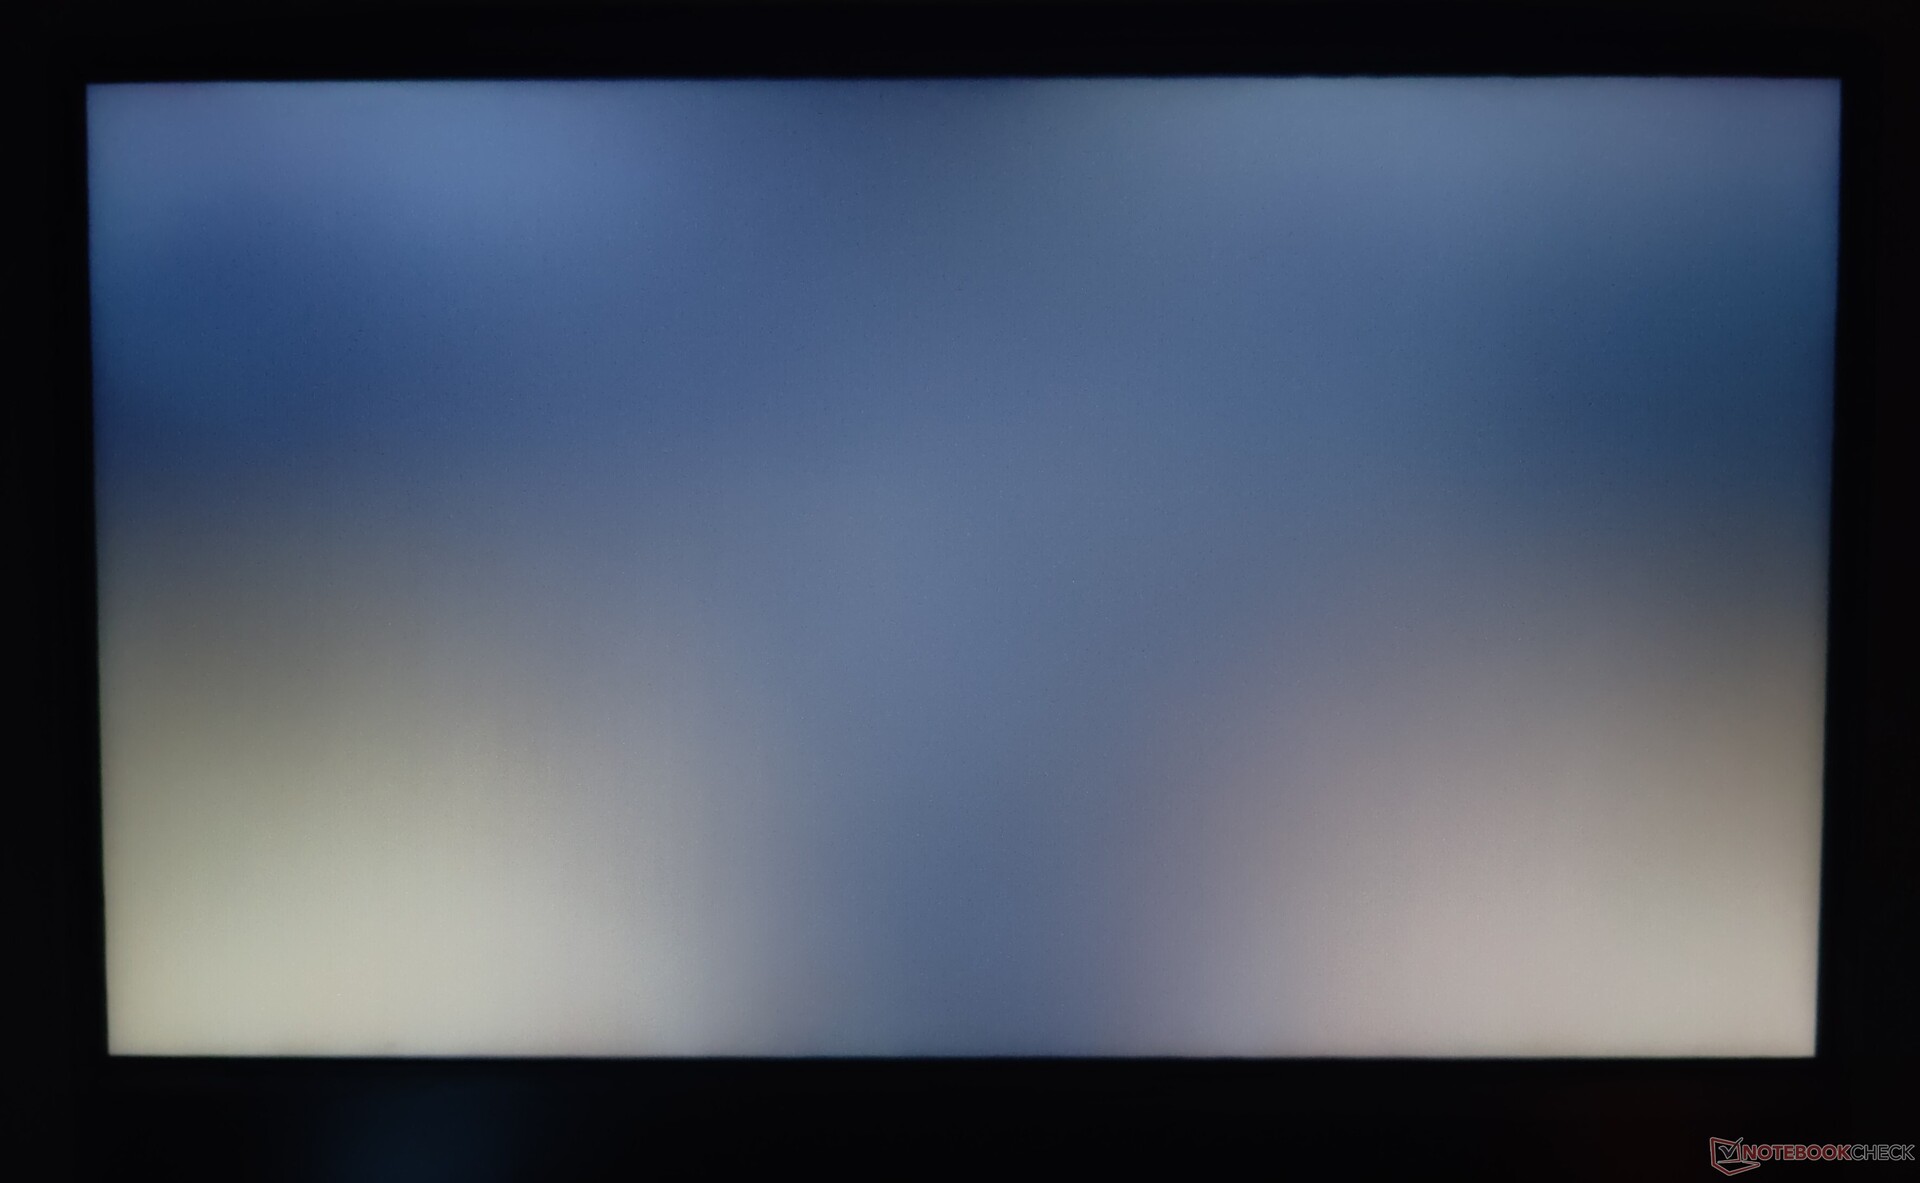
Sin embargo, vemos un sangrado de pantalla significativo cerca de las esquinas inferiores del display.
| |||||||||||||||||||||||||
iluminación: 89 %
Brillo con batería: 341 cd/m²
Contraste: 1069:1 (Negro: 0.32 cd/m²)
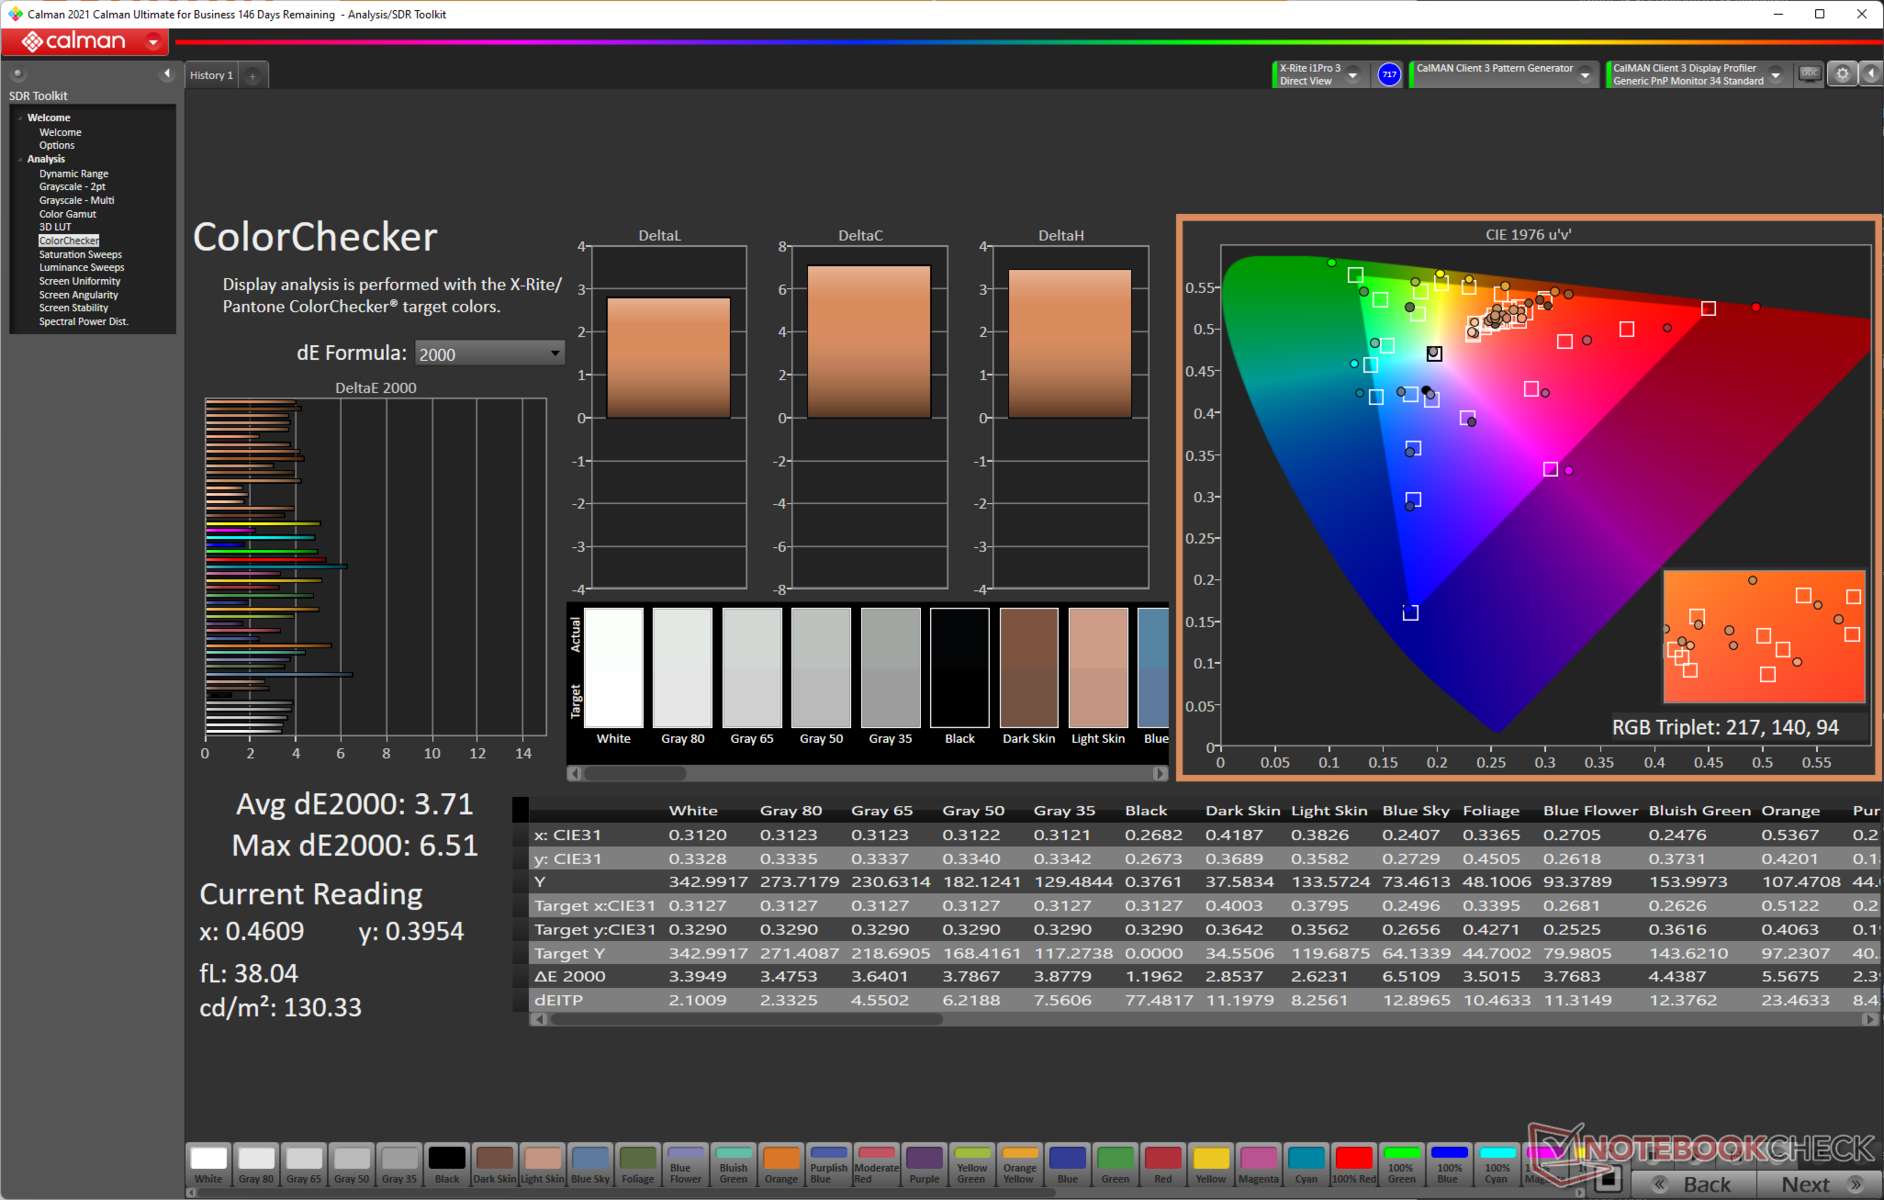
ΔE ColorChecker Calman: 3.71 | ∀{0.5-29.43 Ø4.71}
calibrated: 2.59
ΔE Greyscale Calman: 3 | ∀{0.09-98 Ø4.96}
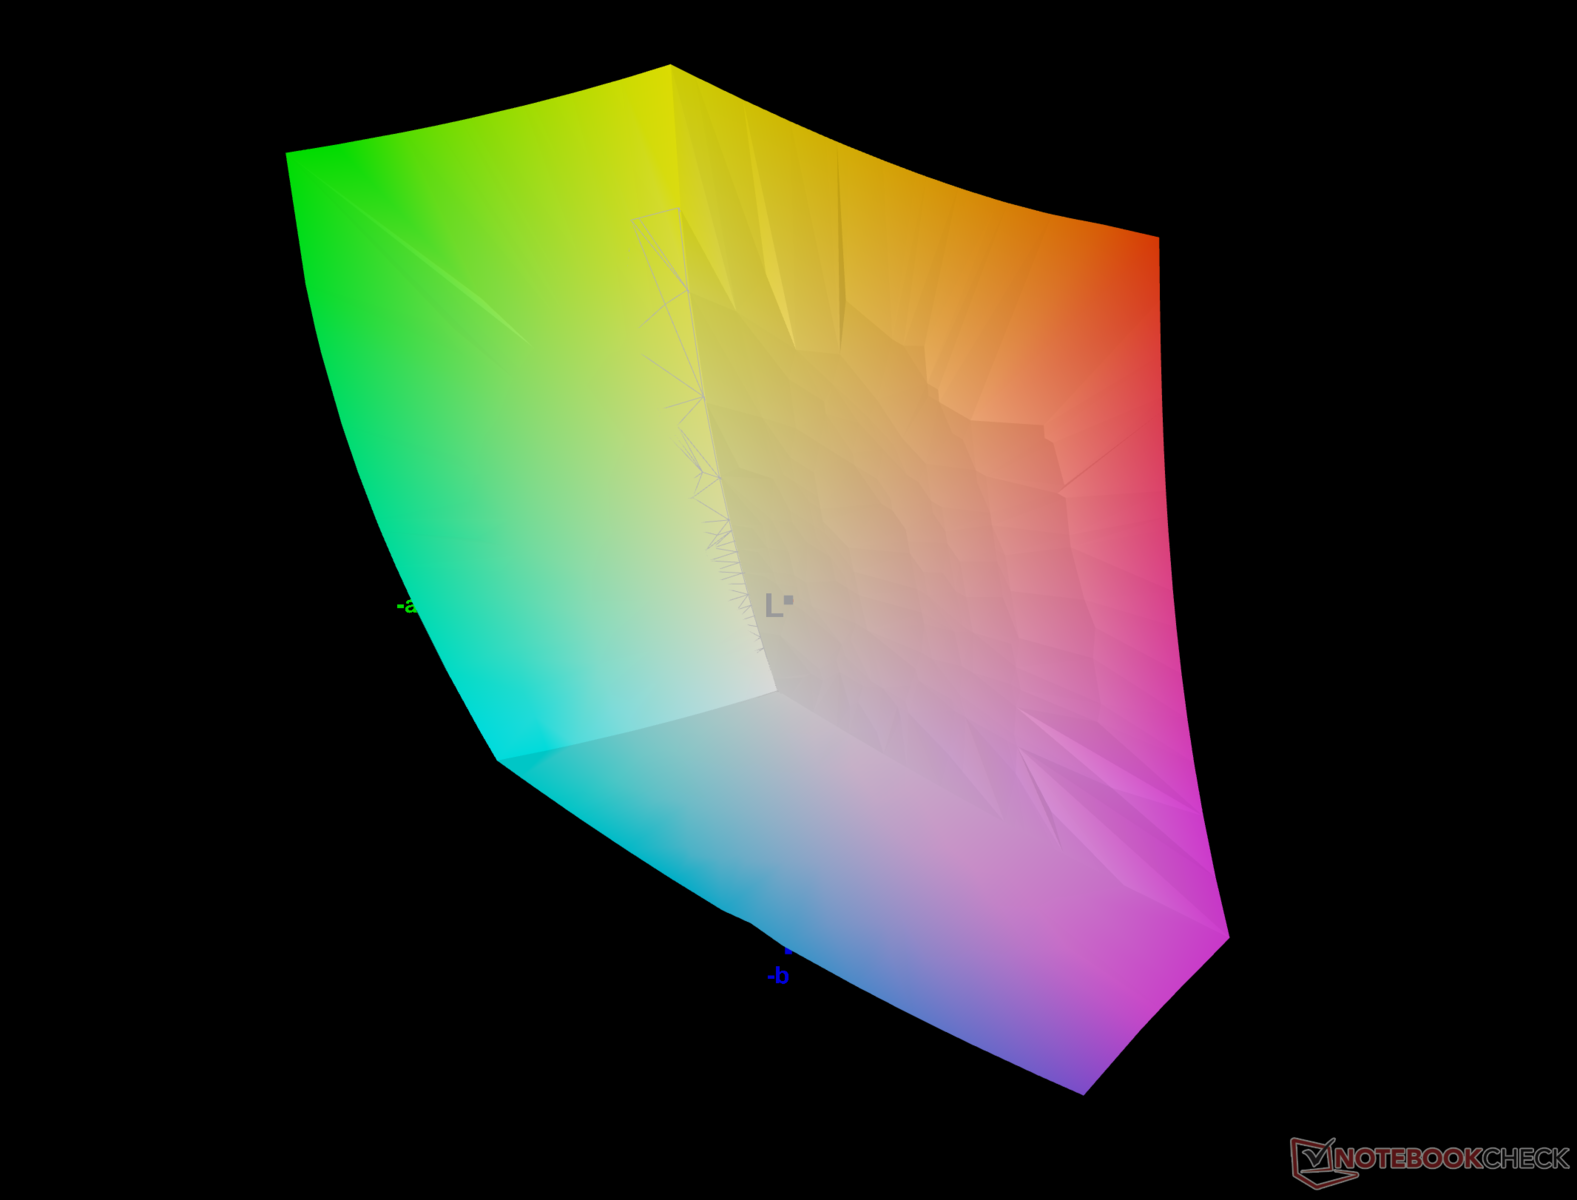
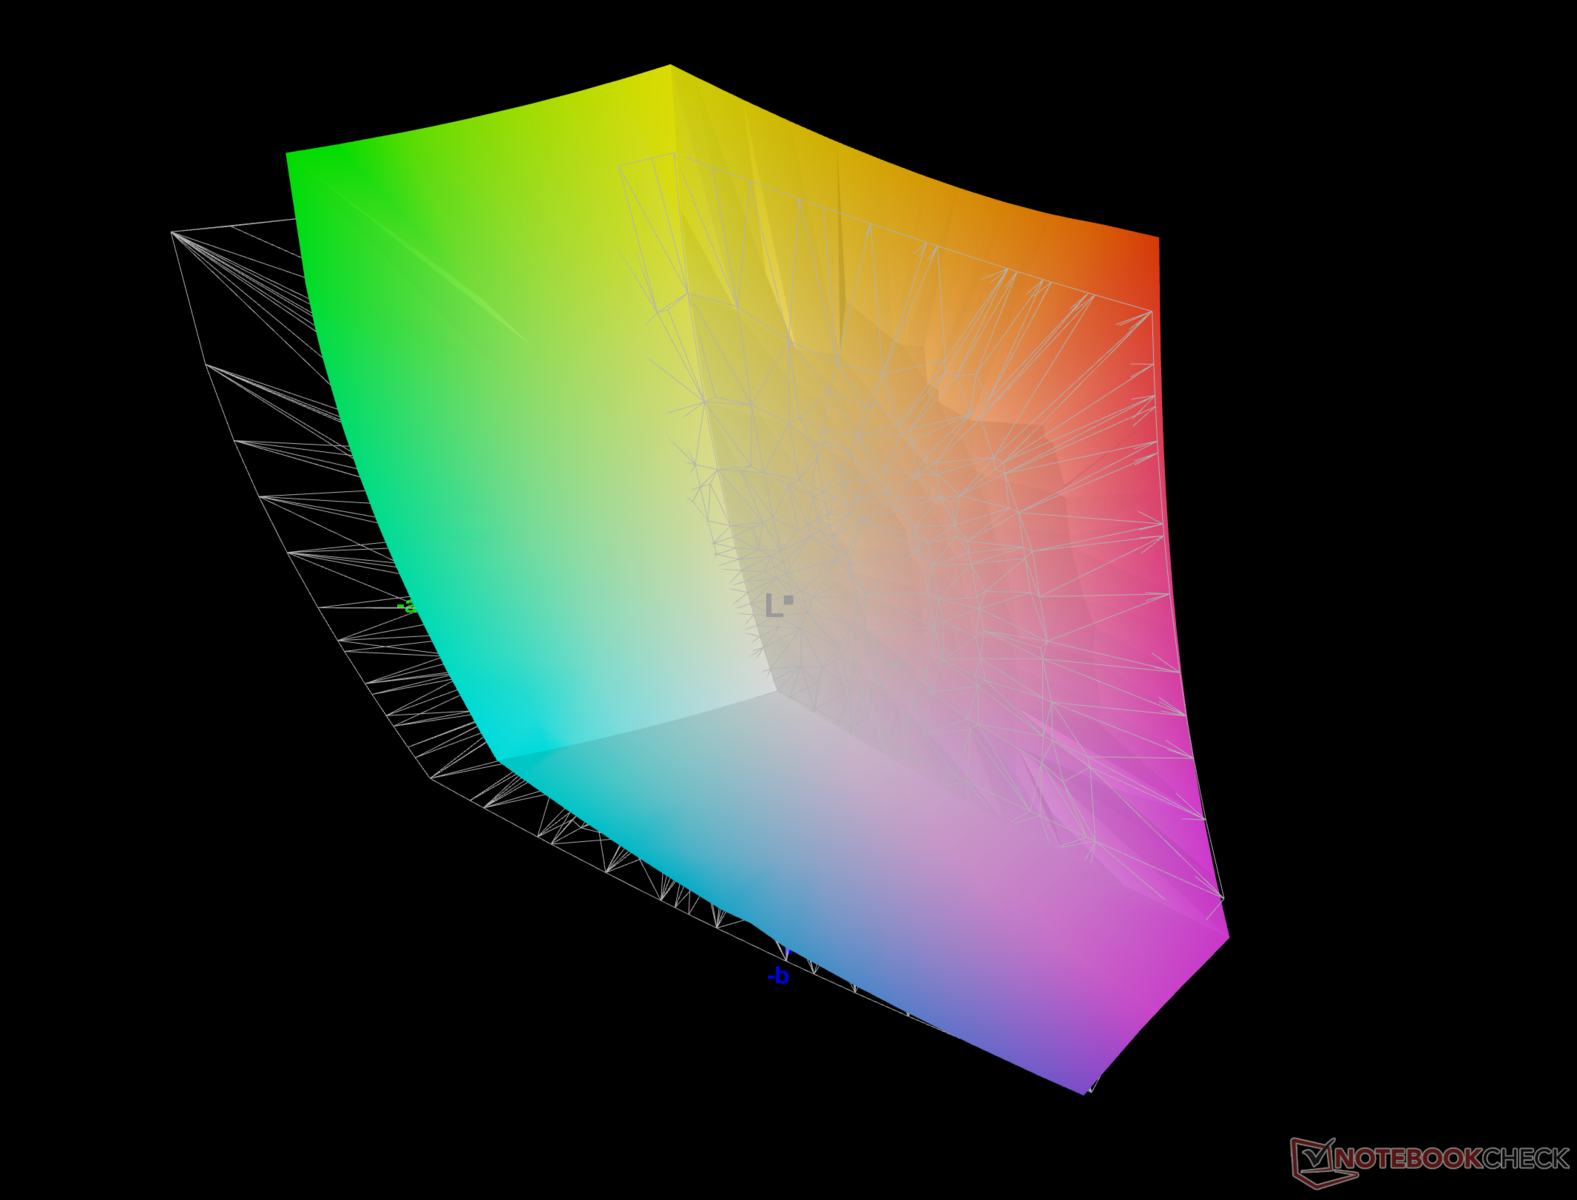
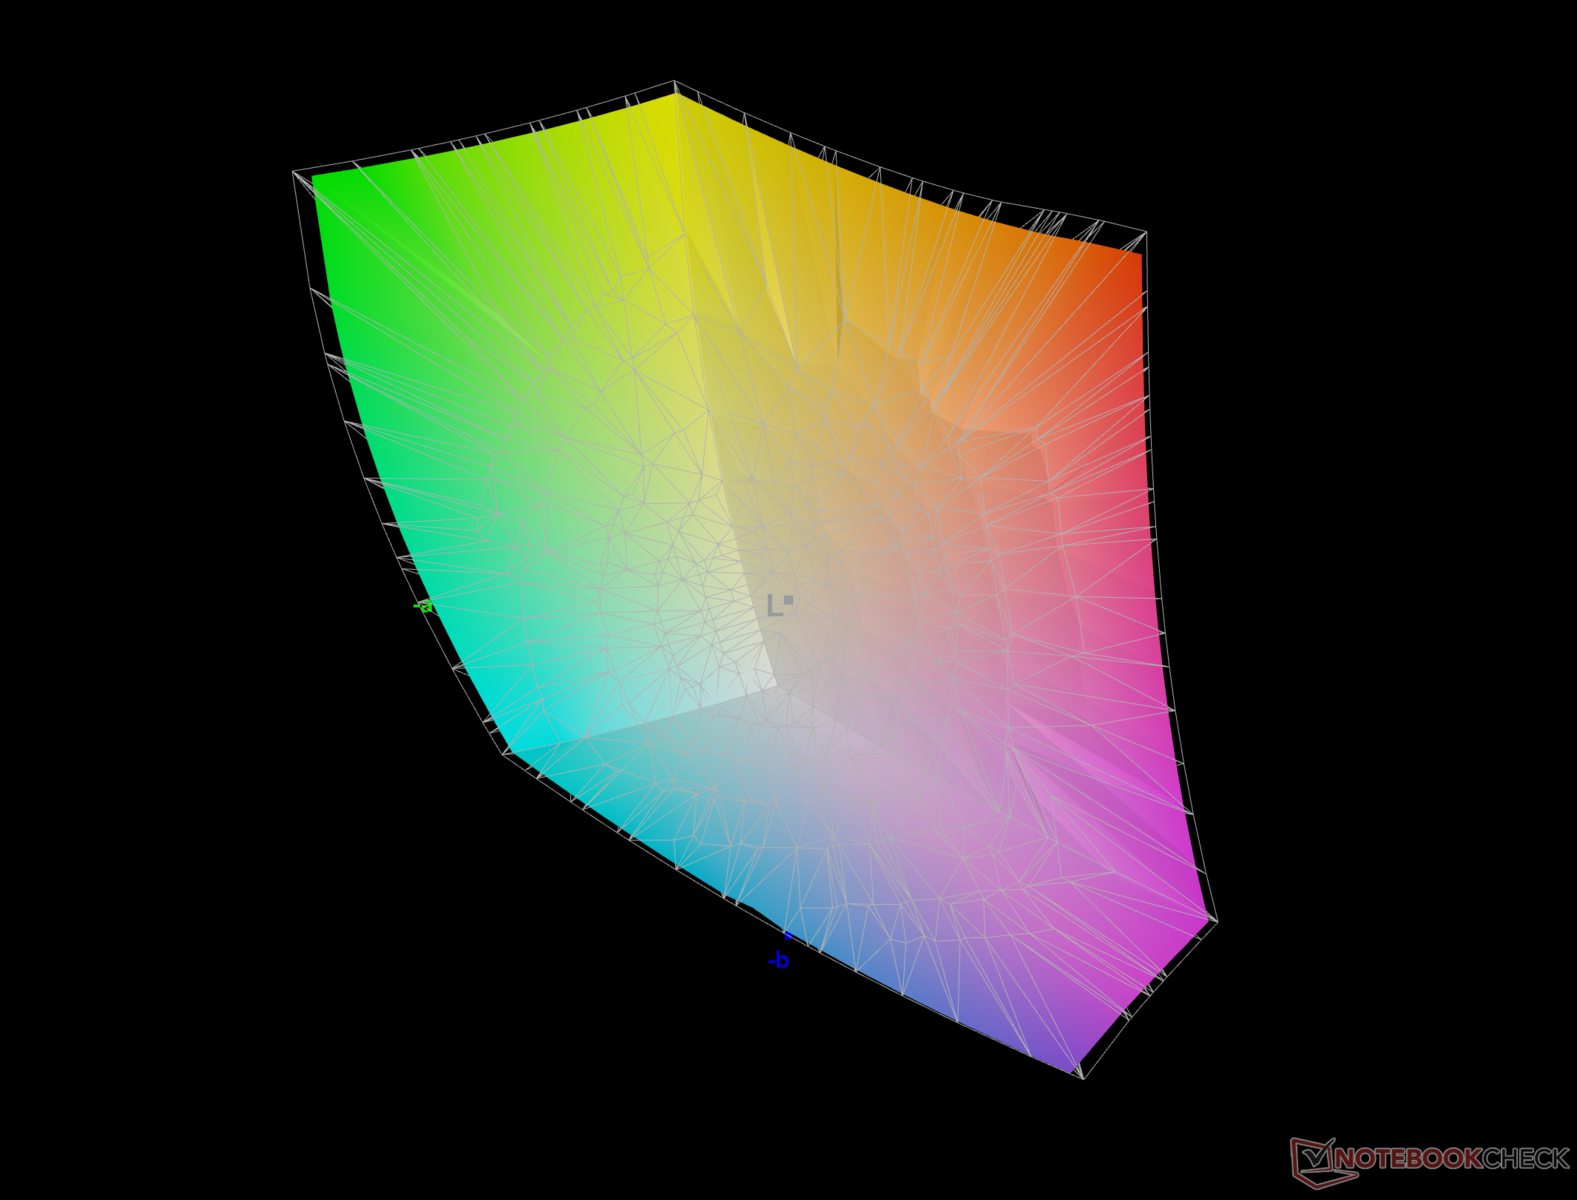
84.7% AdobeRGB 1998 (Argyll 3D)
99.8% sRGB (Argyll 3D)
94.8% Display P3 (Argyll 3D)
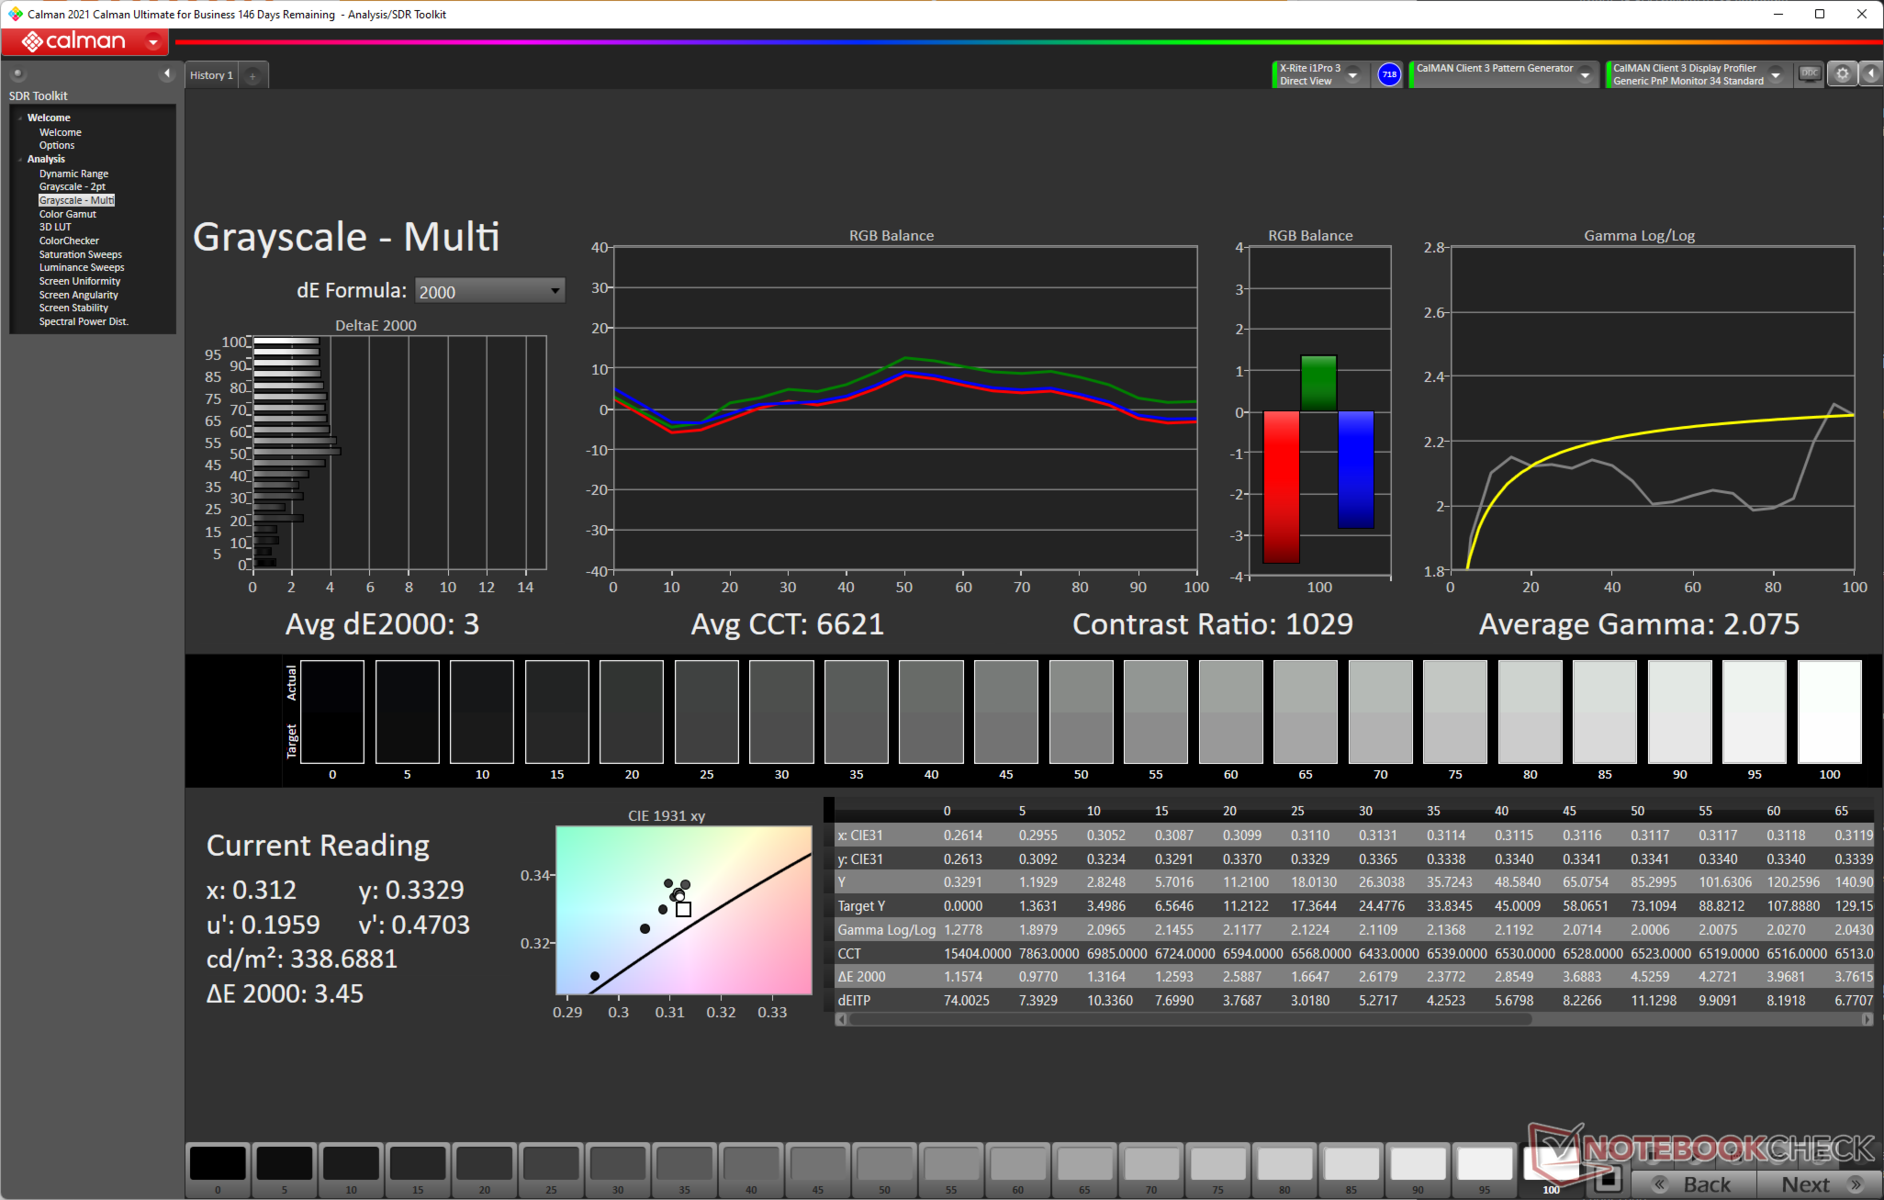
Gamma: 2.07
CCT: 6621 K
| MSI Crosshair 15 R6E B12UGZ-050 CMN N156KME-GNA, IPS-Level, 2560x1440, 15.6" | MSI Stealth GS66 12UGS Sharp LQ156T1JW04 (SHP153C), IPS-Level, 2560x1440, 15.6" | Lenovo Legion 5 Pro 16 G7 i7 RTX 3070Ti NE160QDM-NY1, IPS, 2560x1600, 16" | Acer Nitro 5 AN515-58-72QR Chi Mei N156KME-GNA, IPS, 2560x1440, 15.6" | Schenker XMG Neo 15 (Ryzen 9 6900HX, RTX 3070 Ti) BOE0A67, IPS, 2560x1440, 15.6" | |
|---|---|---|---|---|---|
| Display | 1% | -15% | 1% | -15% | |
| Display P3 Coverage (%) | 94.8 | 96.4 2% | 68.7 -28% | 95.6 1% | 68.9 -27% |
| sRGB Coverage (%) | 99.8 | 99.7 0% | 97.6 -2% | 99.8 0% | 97.7 -2% |
| AdobeRGB 1998 Coverage (%) | 84.7 | 85.6 1% | 70.9 -16% | 85.2 1% | 70.4 -17% |
| Response Times | -8% | -112% | -110% | -70% | |
| Response Time Grey 50% / Grey 80% * (ms) | 5.36 ? | 6 ? -12% | 17.6 ? -228% | 15.7 ? -193% | 12.4 ? -131% |
| Response Time Black / White * (ms) | 8.04 ? | 8.4 ? -4% | 7.6 ? 5% | 10.2 ? -27% | 8.8 ? -9% |
| PWM Frequency (Hz) | |||||
| Screen | -13% | 25% | -1% | 14% | |
| Brightness middle (cd/m²) | 342 | 272 -20% | 502 47% | 332 -3% | 370 8% |
| Brightness (cd/m²) | 326 | 253 -22% | 491 51% | 303 -7% | 343 5% |
| Brightness Distribution (%) | 89 | 87 -2% | 91 2% | 86 -3% | 82 -8% |
| Black Level * (cd/m²) | 0.32 | 0.25 22% | 0.37 -16% | 0.29 9% | 0.28 12% |
| Contrast (:1) | 1069 | 1088 2% | 1357 27% | 1145 7% | 1321 24% |
| Colorchecker dE 2000 * | 3.71 | 3.73 -1% | 2.7 27% | 3.61 3% | 2.31 38% |
| Colorchecker dE 2000 max. * | 6.51 | 9.43 -45% | 4.5 31% | 7.71 -18% | 4.03 38% |
| Colorchecker dE 2000 calibrated * | 2.59 | 0.98 62% | 1.4 46% | 0.59 77% | |
| Greyscale dE 2000 * | 3 | 6.5 -117% | 2.7 10% | 5.2 -73% | 3.28 -9% |
| Gamma | 2.07 106% | 2.172 101% | 2.44 90% | 2.155 102% | 2.47 89% |
| CCT | 6621 98% | 6485 100% | 6326 103% | 6724 97% | 6206 105% |
| Media total (Programa/Opciones) | -7% /
-10% | -34% /
-3% | -37% /
-16% | -24% /
-6% |
* ... más pequeño es mejor
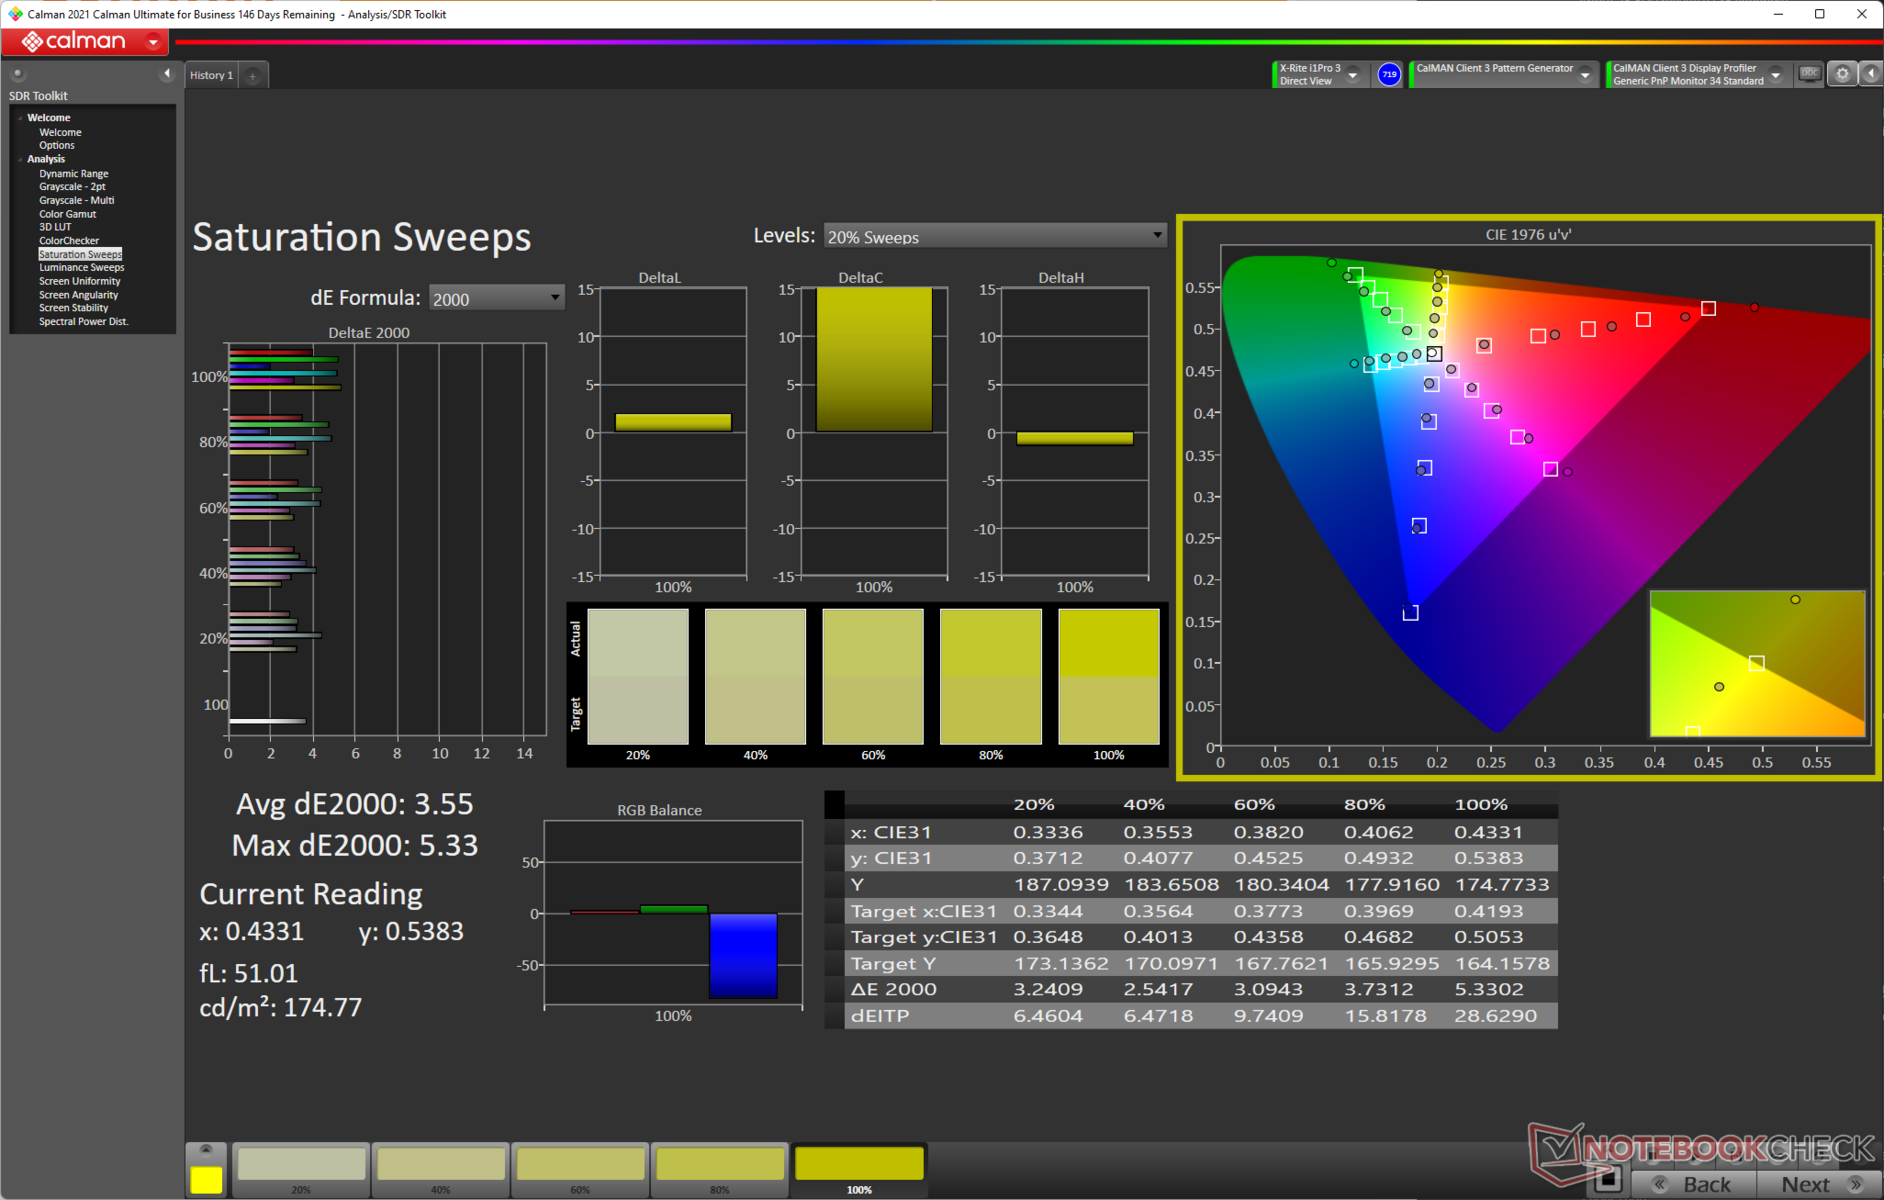
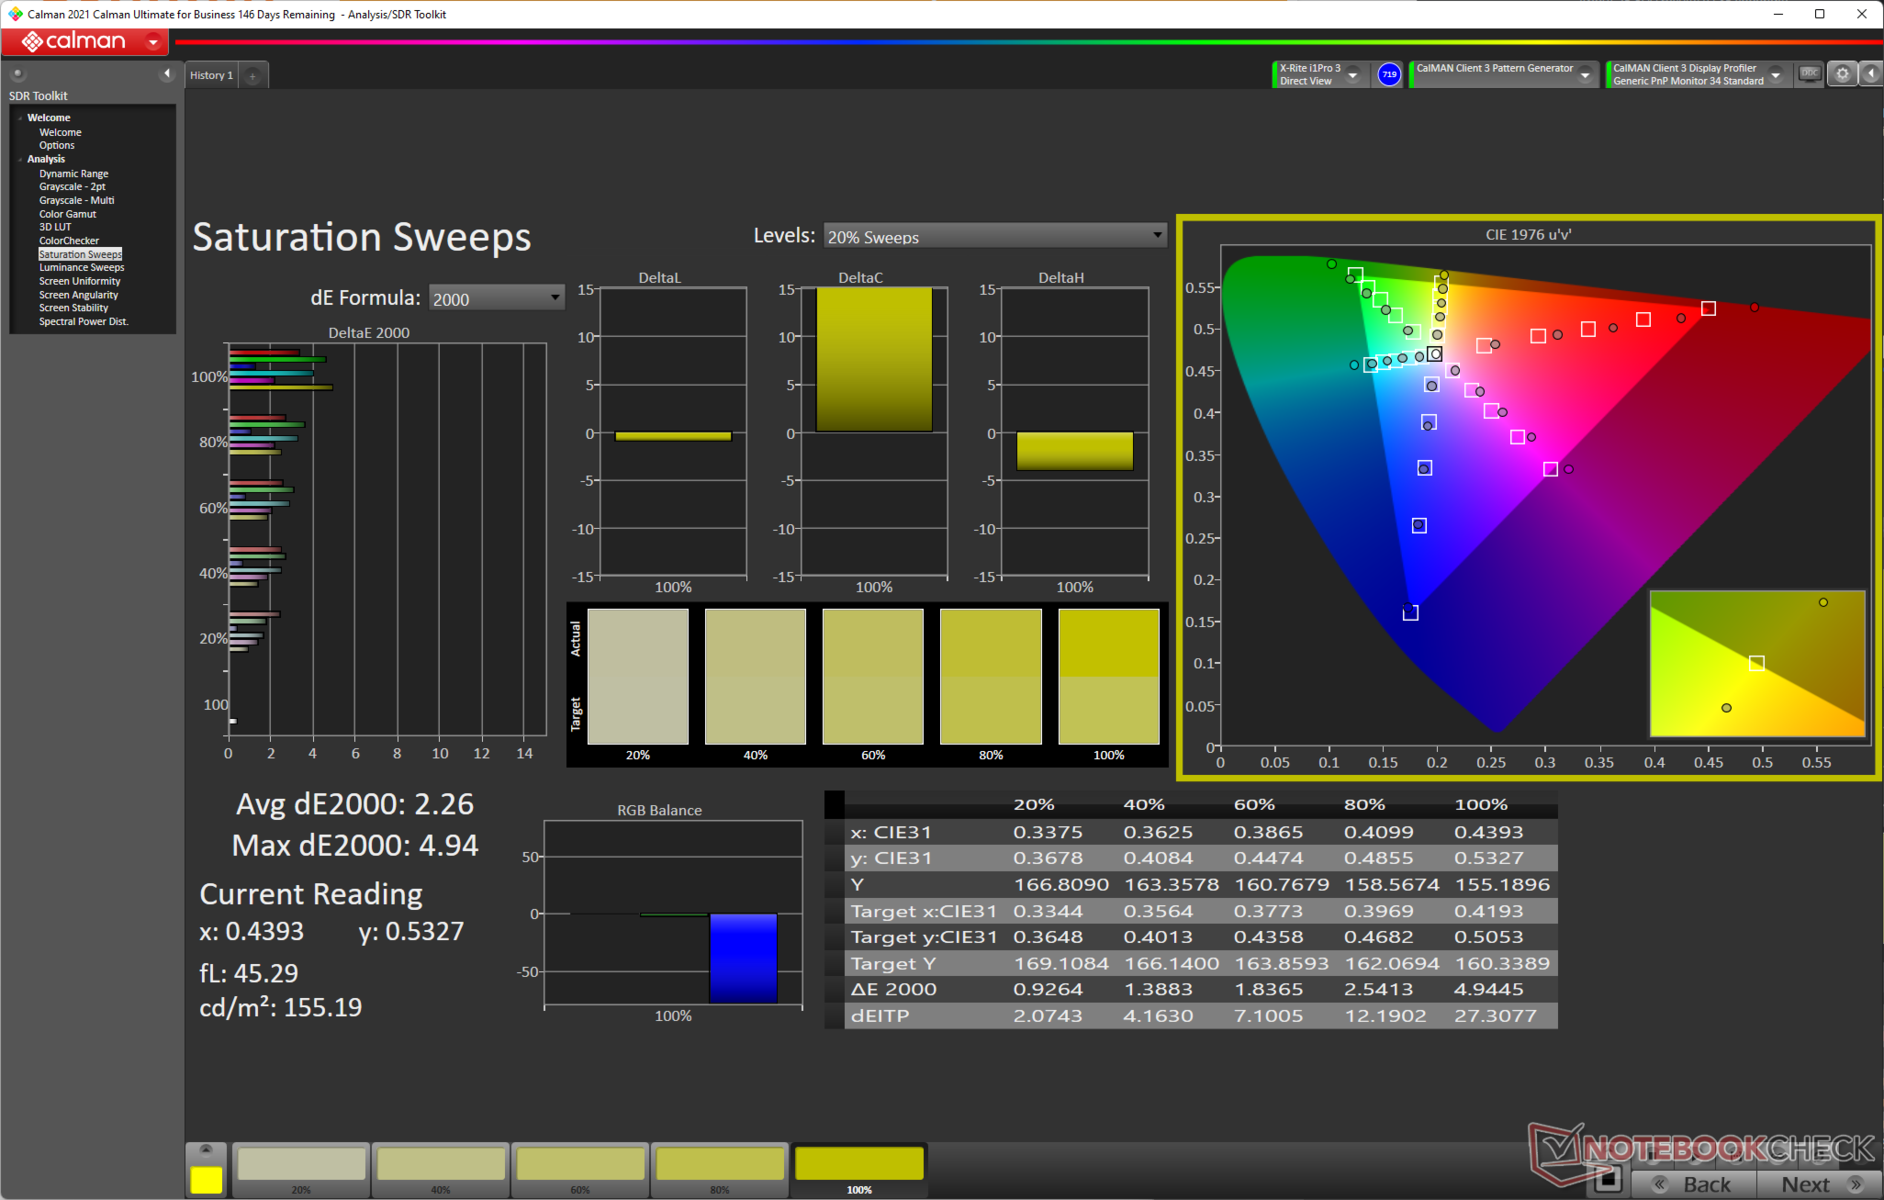
MSI afirma que el panel del Crosshair 15 puede cubrir el 100% del espacio de color DCI-P3. En nuestras pruebas, encontramos que puede hacer casi el 95% de Display P3, lo que debería despertar el interés de los creadores de contenido. El panel cubre toda la gama de colores sRGB. La cobertura Adobe RGB también es bastante decente, casi el 85%.
Observamos que la cobertura de la gama de colores es comparable a la del Acer Nitro 5 y el Aorus 15 XE5que también llevan el mismo panel Chi Mei N156KME-GNA. Es bueno ver que los fabricantes por fin tienen en cuenta el buen rendimiento del color a estos precios.
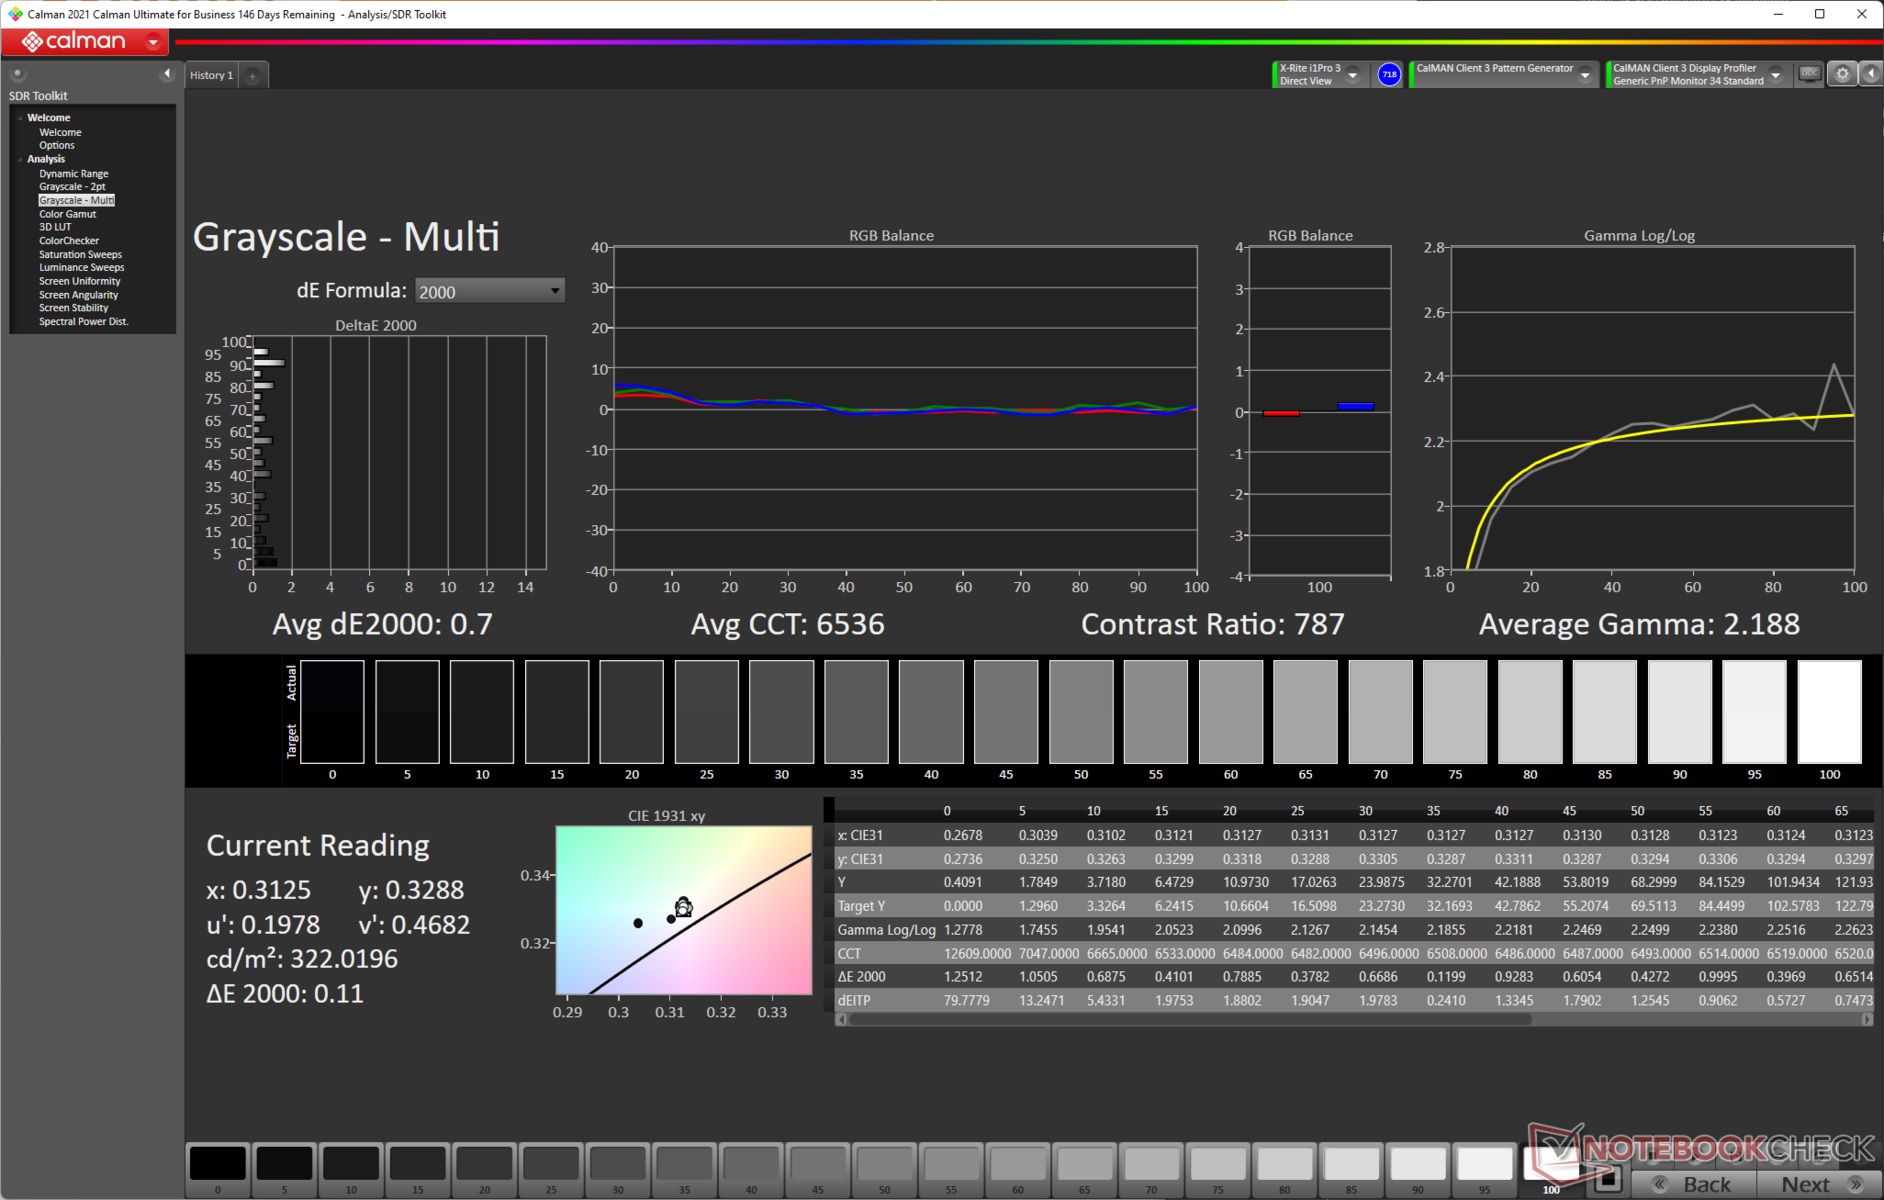
La precisión del color es definitivamente aceptable con un Delta E en escala de grises de 3 y un Delta E medio de ColorChecker de 3,71
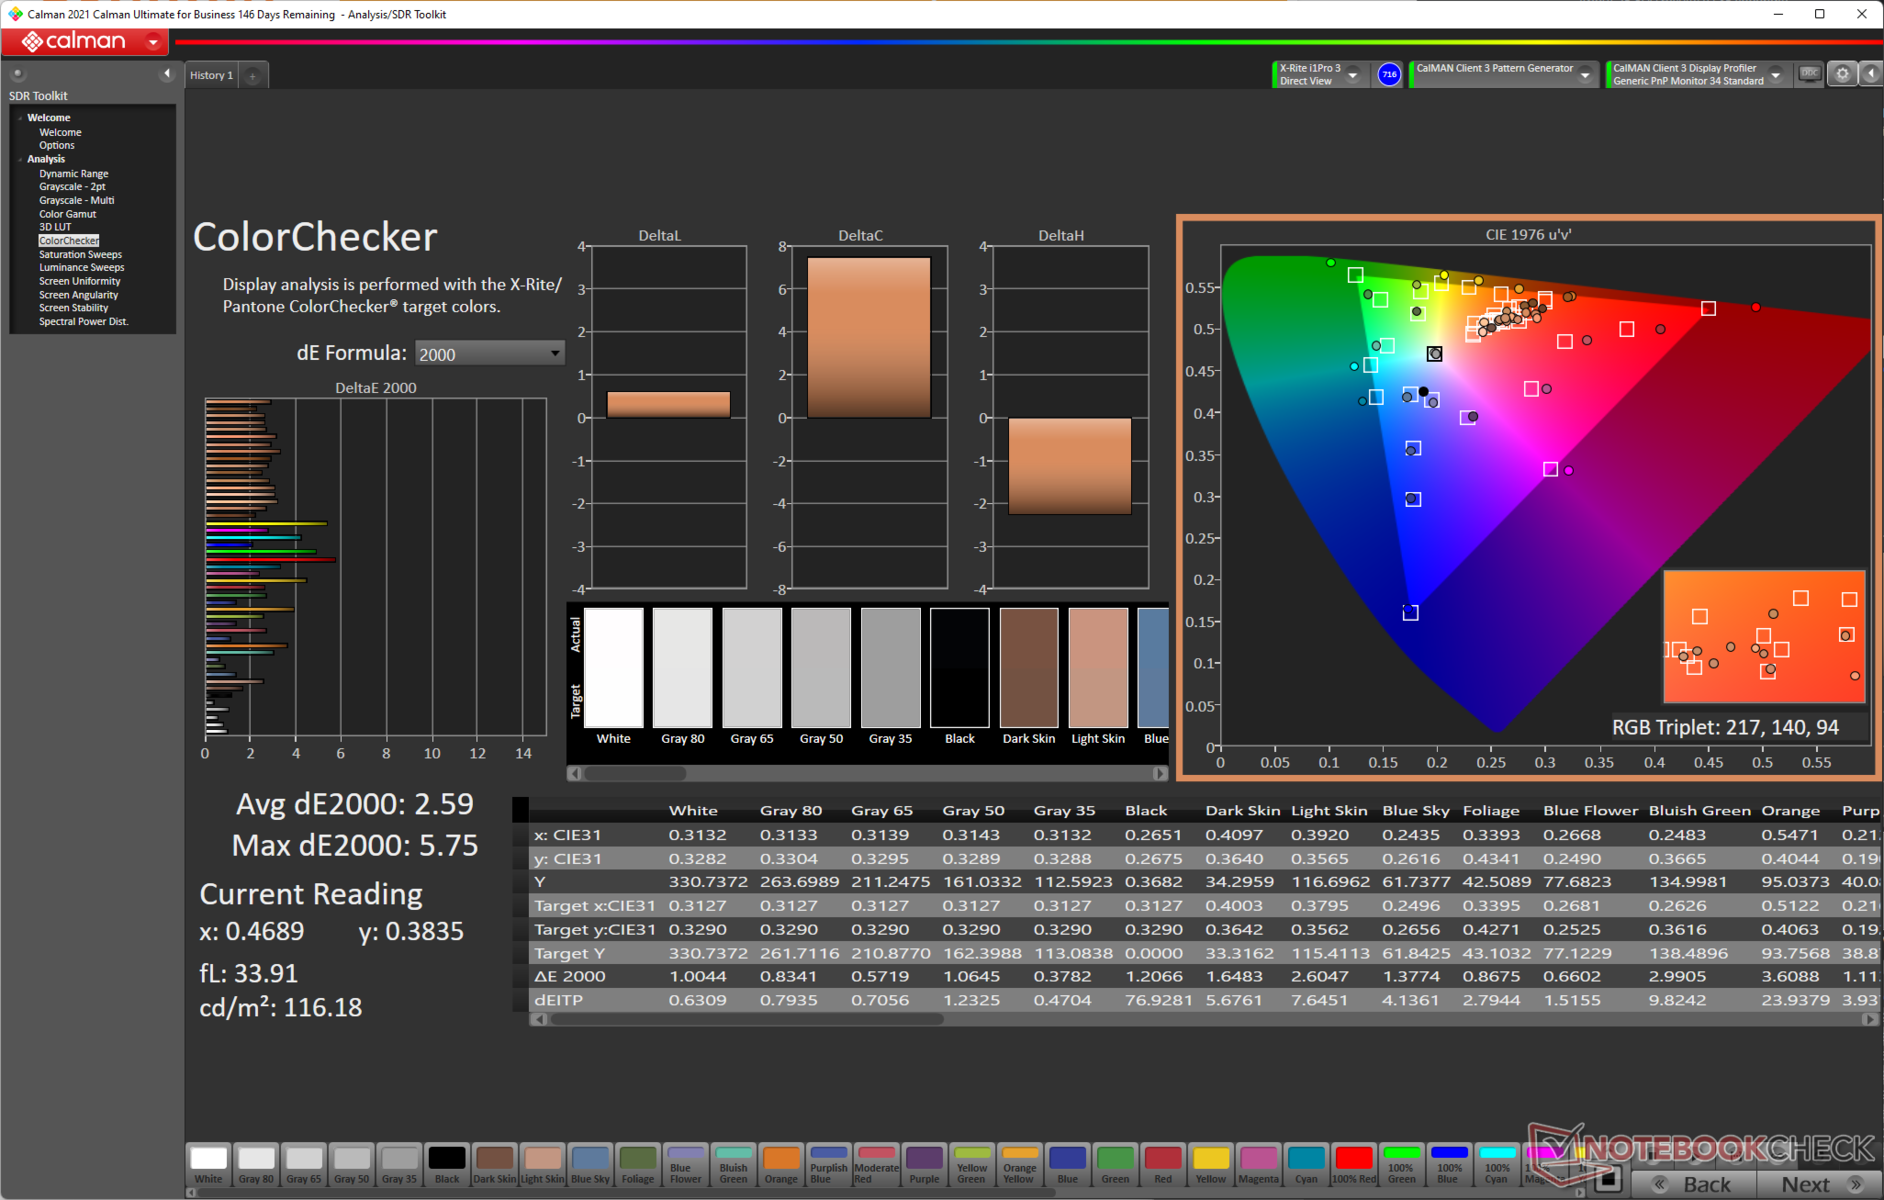
Nuestra rutina de calibración con el espectrofotómetro X-rite i1Basic Pro 3 y el software de calibración del color Calman Ultimate de Portrait Displays da como resultado una reducción significativa de la escala de grises Delta E de 0,7 y una mejora perceptible de la Delta E media a 2,59 en ColorChecker. Las desviaciones más altas se observan con el color rojo.
El archivo ICC calibrado puede descargarse desde el enlace anterior.
Tiempos de respuesta del display
| ↔ Tiempo de respuesta de Negro a Blanco | ||
|---|---|---|
| 8.04 ms ... subida ↗ y bajada ↘ combinada | ↗ 4.72 ms subida | 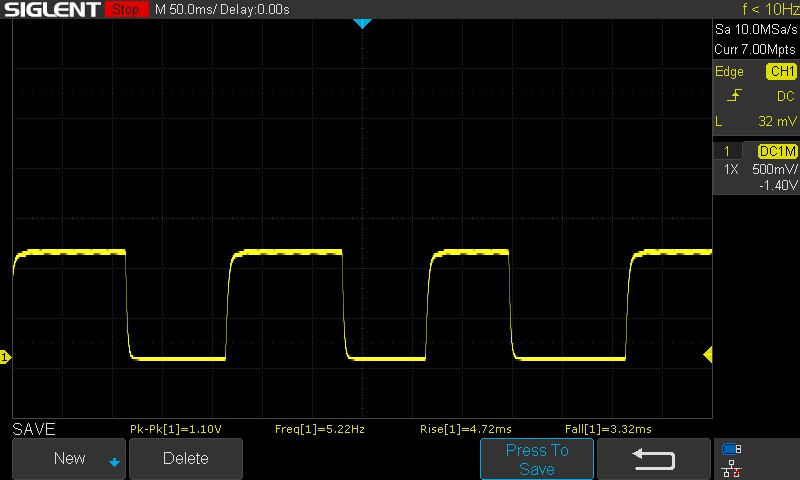 |
| ↘ 3.32 ms bajada | ||
| La pantalla mostró tiempos de respuesta rápidos en nuestros tests y debería ser adecuada para juegos. En comparación, todos los dispositivos de prueba van de ##min### (mínimo) a 240 (máximo) ms. » 24 % de todos los dispositivos son mejores. Esto quiere decir que el tiempo de respuesta medido es mejor que la media (19.8 ms) de todos los dispositivos testados. | ||
| ↔ Tiempo de respuesta 50% Gris a 80% Gris | ||
| 5.36 ms ... subida ↗ y bajada ↘ combinada | ↗ 2.71 ms subida | 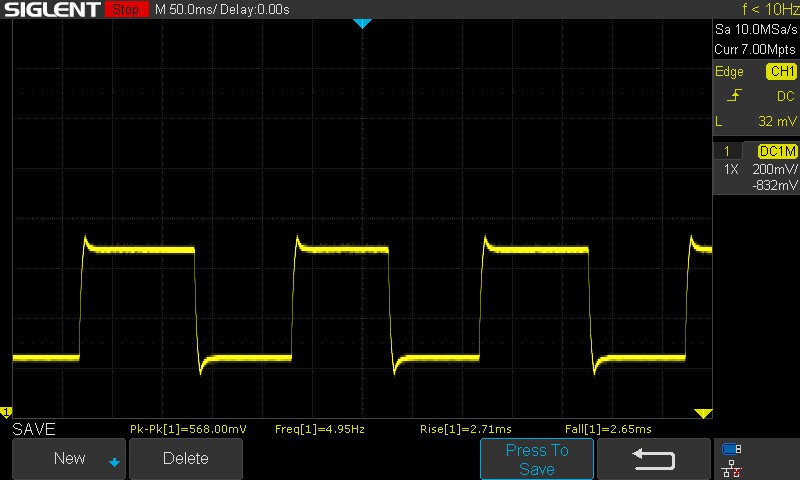 |
| ↘ 2.65 ms bajada | ||
| La pantalla mostró tiempos de respuesta muy rápidos en nuestros tests y debería ser adecuada para juegos frenéticos. En comparación, todos los dispositivos de prueba van de ##min### (mínimo) a 636 (máximo) ms. » 18 % de todos los dispositivos son mejores. Esto quiere decir que el tiempo de respuesta medido es mejor que la media (31 ms) de todos los dispositivos testados. | ||
Los tiempos de respuesta son decentes, aunque nos habría gustado ver valores más bajos para la transición del 100% de negro al 100% de blanco
El panel utiliza overdrive por defecto, lo que se ve como un "cuerno" en el patrón del osciloscopio del 50% de gris al 80% de gris.
Sin la sobremarcha activada, este valor puede aumentar hasta 11,19 ms.
Parpadeo de Pantalla / PWM (Pulse-Width Modulation)
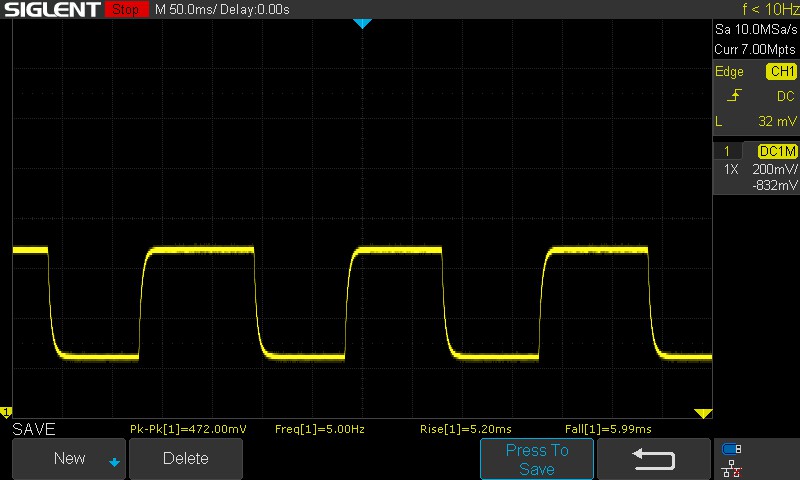
| Parpadeo de Pantalla / PWM no detectado | ≤ 100 % de brillo | 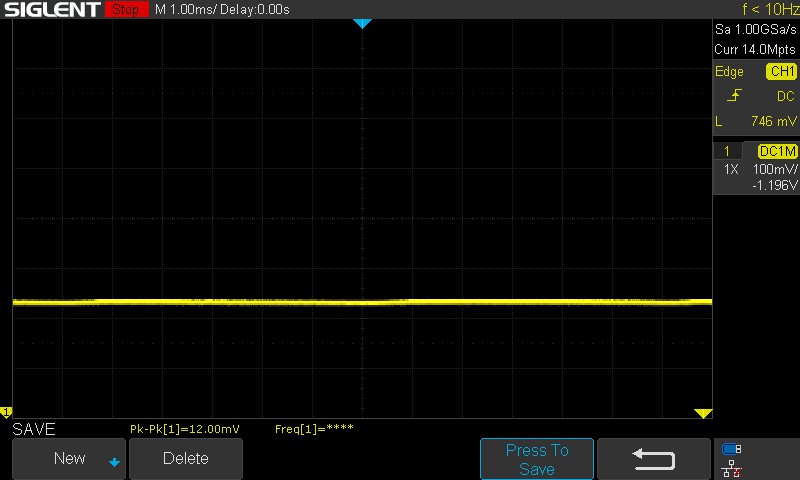 | |
Comparación: 52 % de todos los dispositivos testados no usaron PWM para atenuar el display. Si se usó, medimos una media de 7754 (mínimo: 5 - máxmo: 343500) Hz. | |||
No observamos parpadeo del PWM en ninguno de los niveles de brillo probados, así que es una cosa menos de la que preocuparse durante largas horas de trabajo o sesiones de juego.
Consulta nuestro artículo sobre "Por qué la modulación por ancho de pulsos (PWM) es un dolor de cabeza"y nuestra Tabla de clasificación PWM para comparar todos los dispositivos analizados.
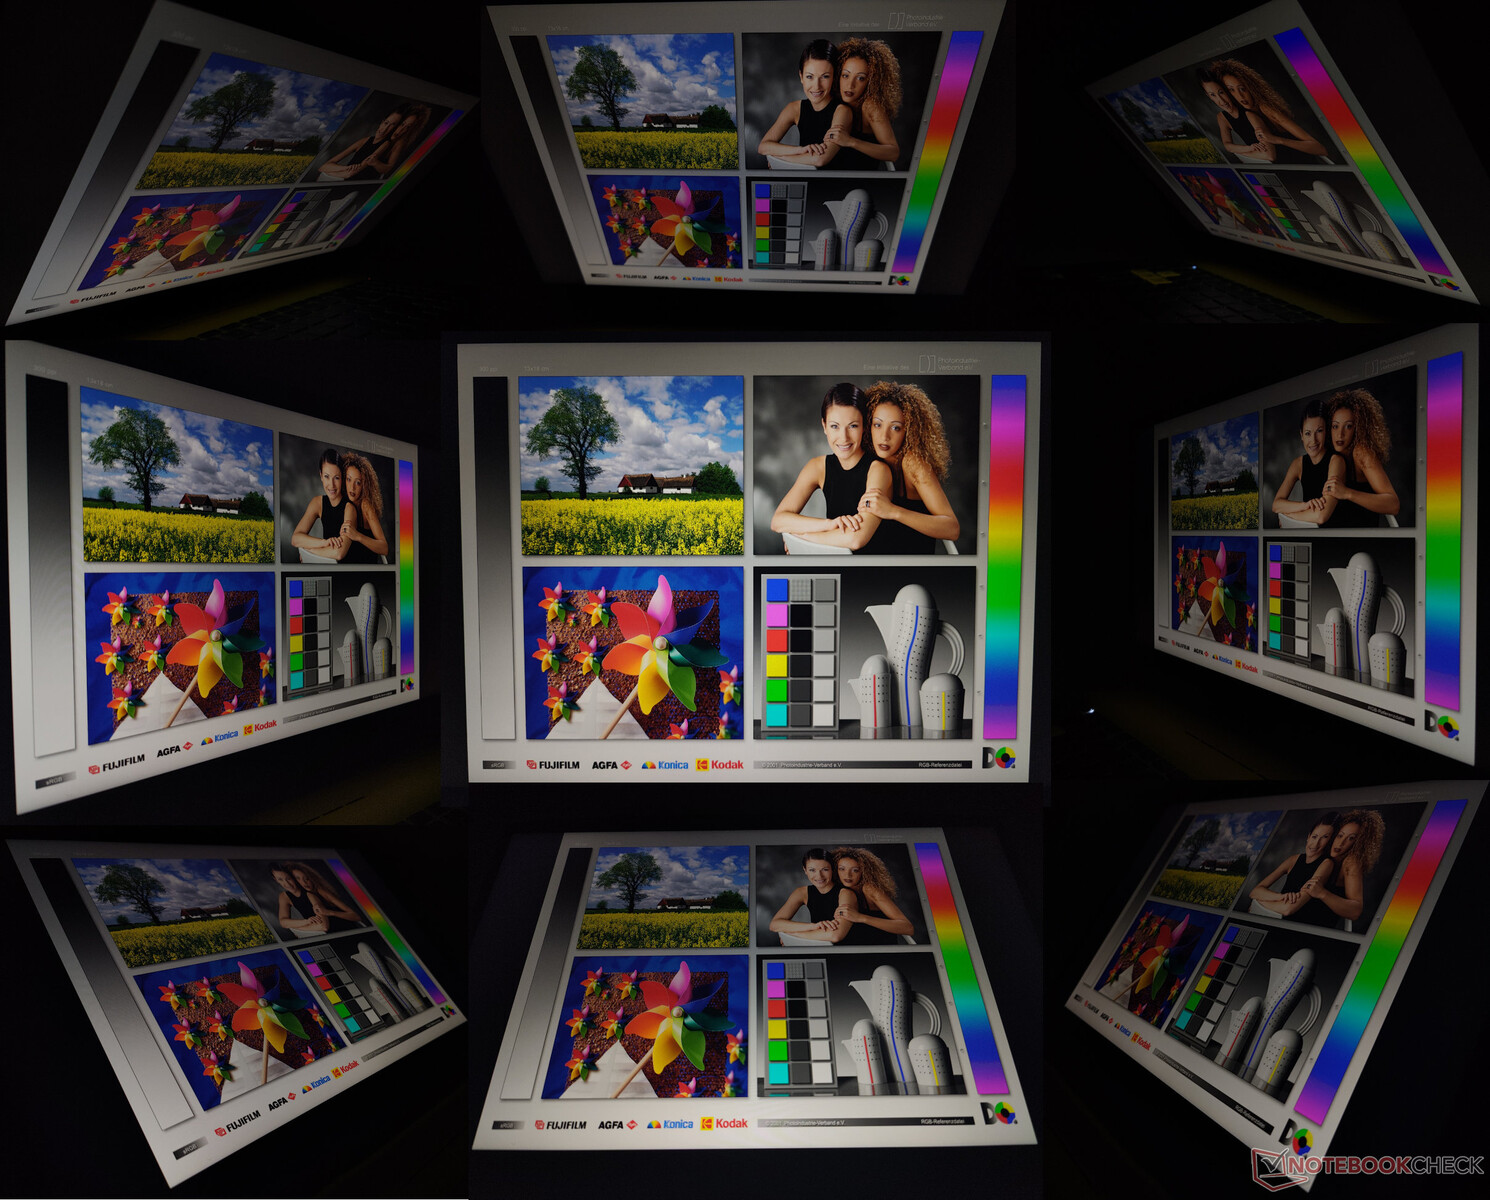
La visualización en exteriores es legible siempre que no incida directamente la luz del sol sobre la pantalla. Sin embargo, los ángulos de visión no son particularmente impresionantes. Observamos pérdida de brillo y color en ángulos de visión extremos.
Rendimiento: No es el Core i7-12700H más rápido que hemos visto
Nuestra unidad Crosshair 15 R6E está equipada con un Intel Core i7-12700H y una GPU Nvidia GPU Nvidia GeForce RTX 3070 para portátiles. Los compradores también tienen la opción de configurar el portátil con una GPU RTX 3060 para portátiles u opciones de CPU hasta el Core i9 Alder Lake.
Condiciones de ensayo
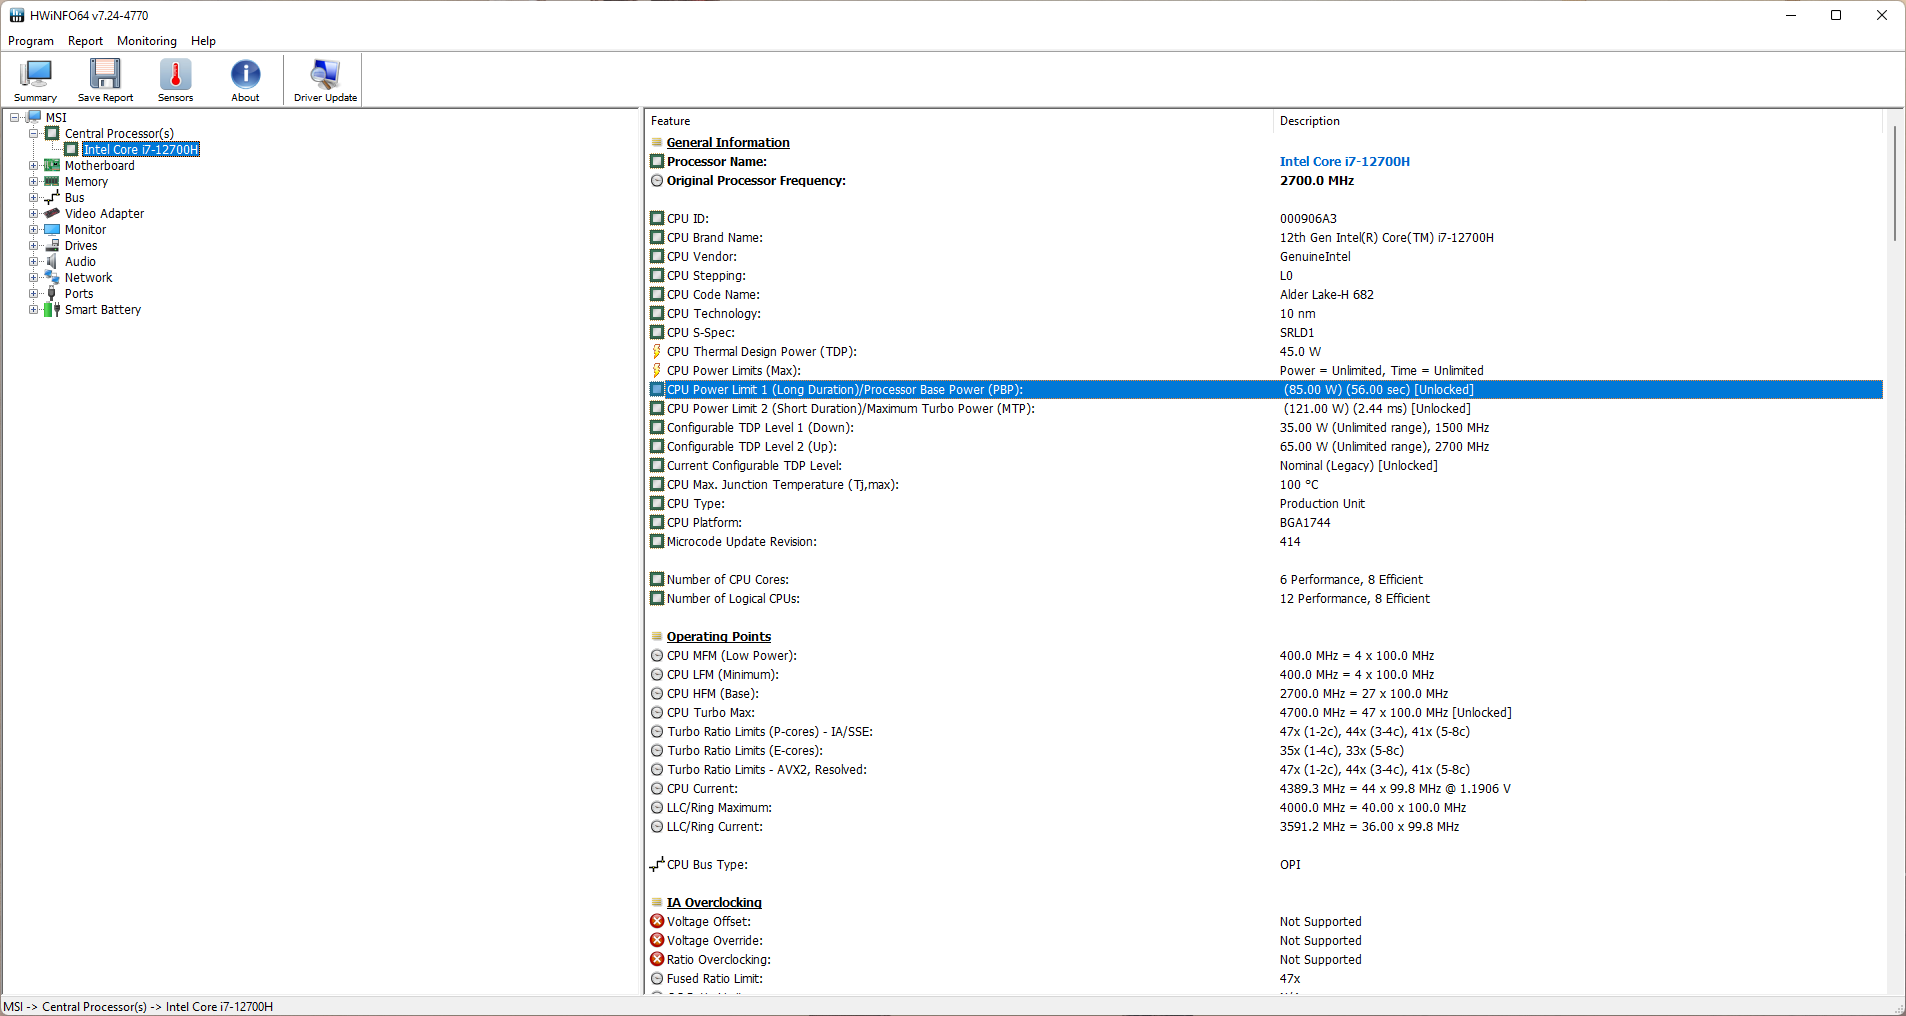
MSI Center ofrece una ventanilla única para ajustar varios parámetros de rendimiento del Crosshair 15 R6E. Usamos la configuración de Rendimiento Extremo para dejar que el Core i7-12700H sacara todo su potencial. Esto permite que el procesador funcione a un PL1 sostenido de 85 W y un PL2 a corto plazo de 121 W. No hay opción de conmutación MUX disponible para la dGPU.
Todas las pruebas se realizaron en el perfil de rendimiento extremo a menos que se especifique lo contrario.
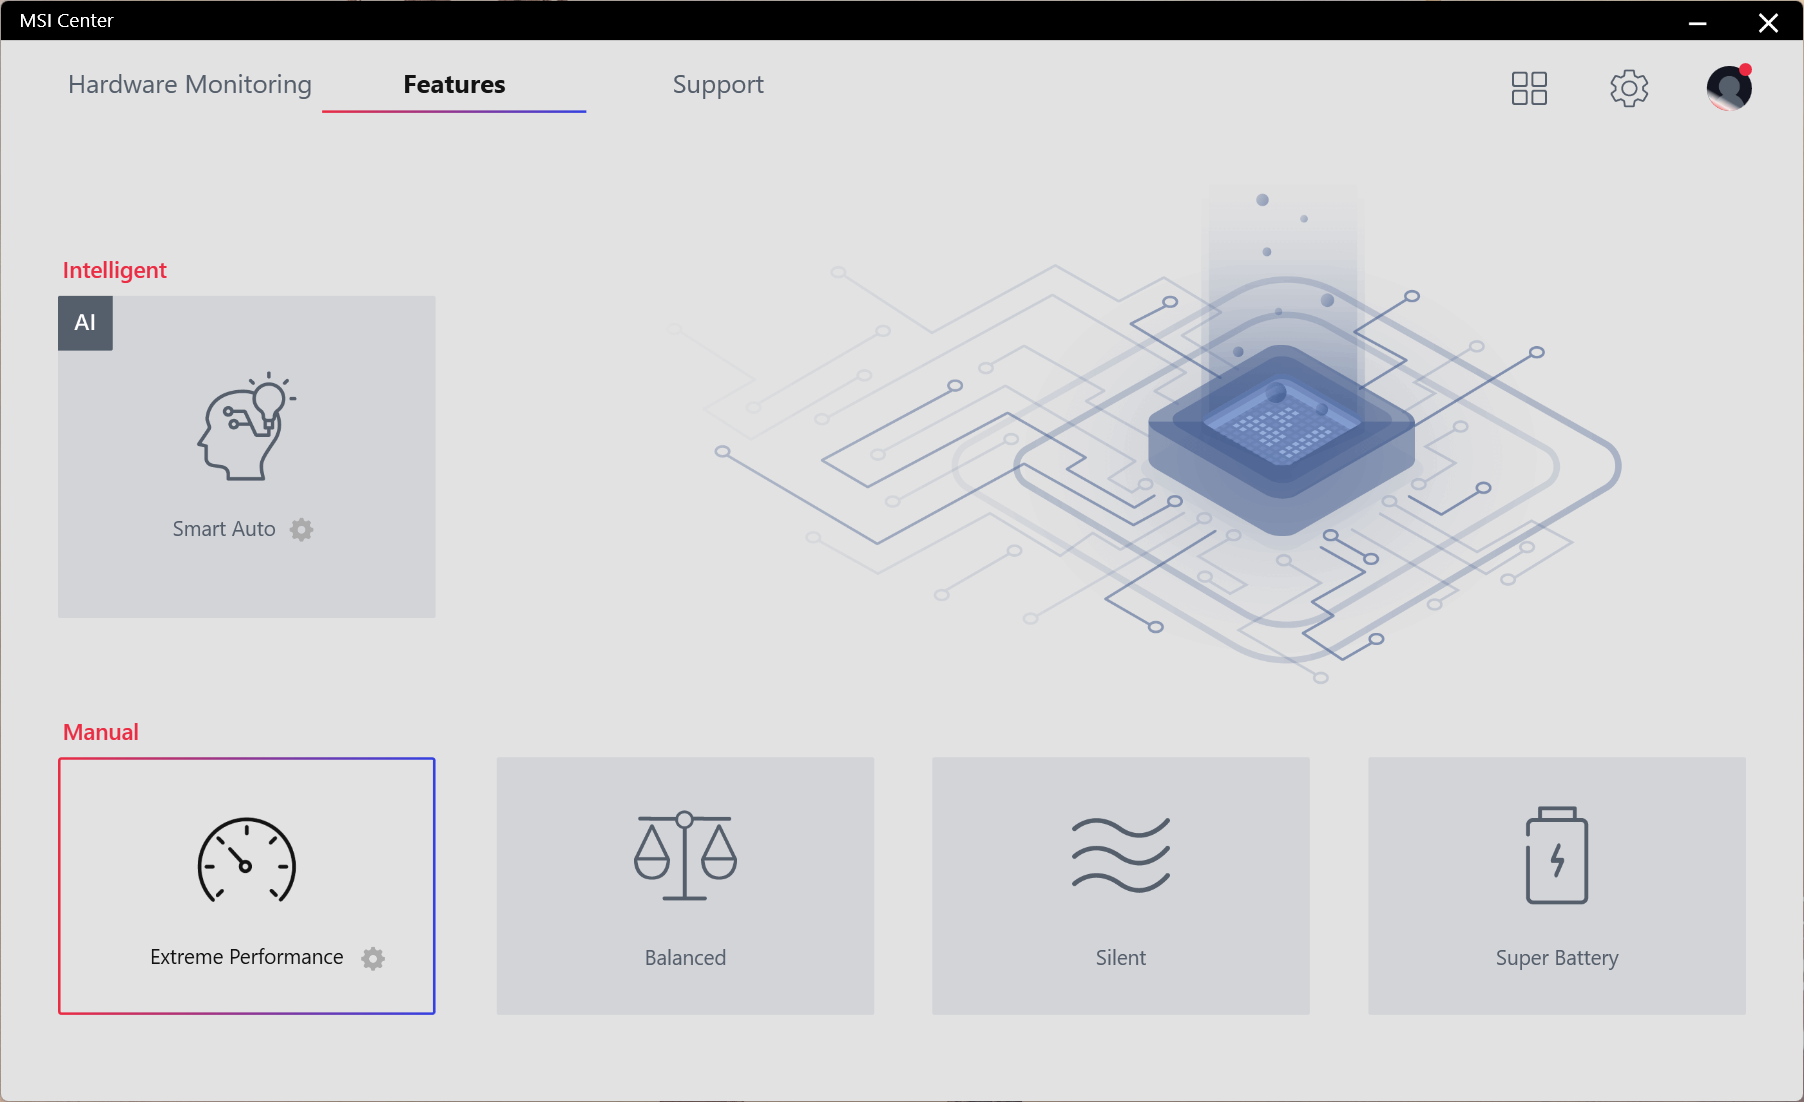
La siguiente tabla muestra cómo cambian la potencia base del procesador (PBP, PL1) y la potencia turbo máxima (MTP, PL2) con cada modo de rendimiento. El perfil Equilibrado debería satisfacer la mayoría de las necesidades. Quienes deseen extraer el máximo rendimiento posible del Core i7-12700H pueden optar por el modo Rendimiento extremo.
| Modo Rendimiento | PL1 (PBP) /Tau | PL2 (MTP) / Tau |
|---|---|---|
| Super Batería | 13 W / 56 s | 121 W / 2,44 ms |
| Silencioso | 23 W / 56 s | 121 W / 2,44 ms |
| Equilibrada | 38 W / 56 s | 121 W / 2,44 ms |
| Rendimiento extremo | 85 W / 56 s | 121 W / 2,44 ms |
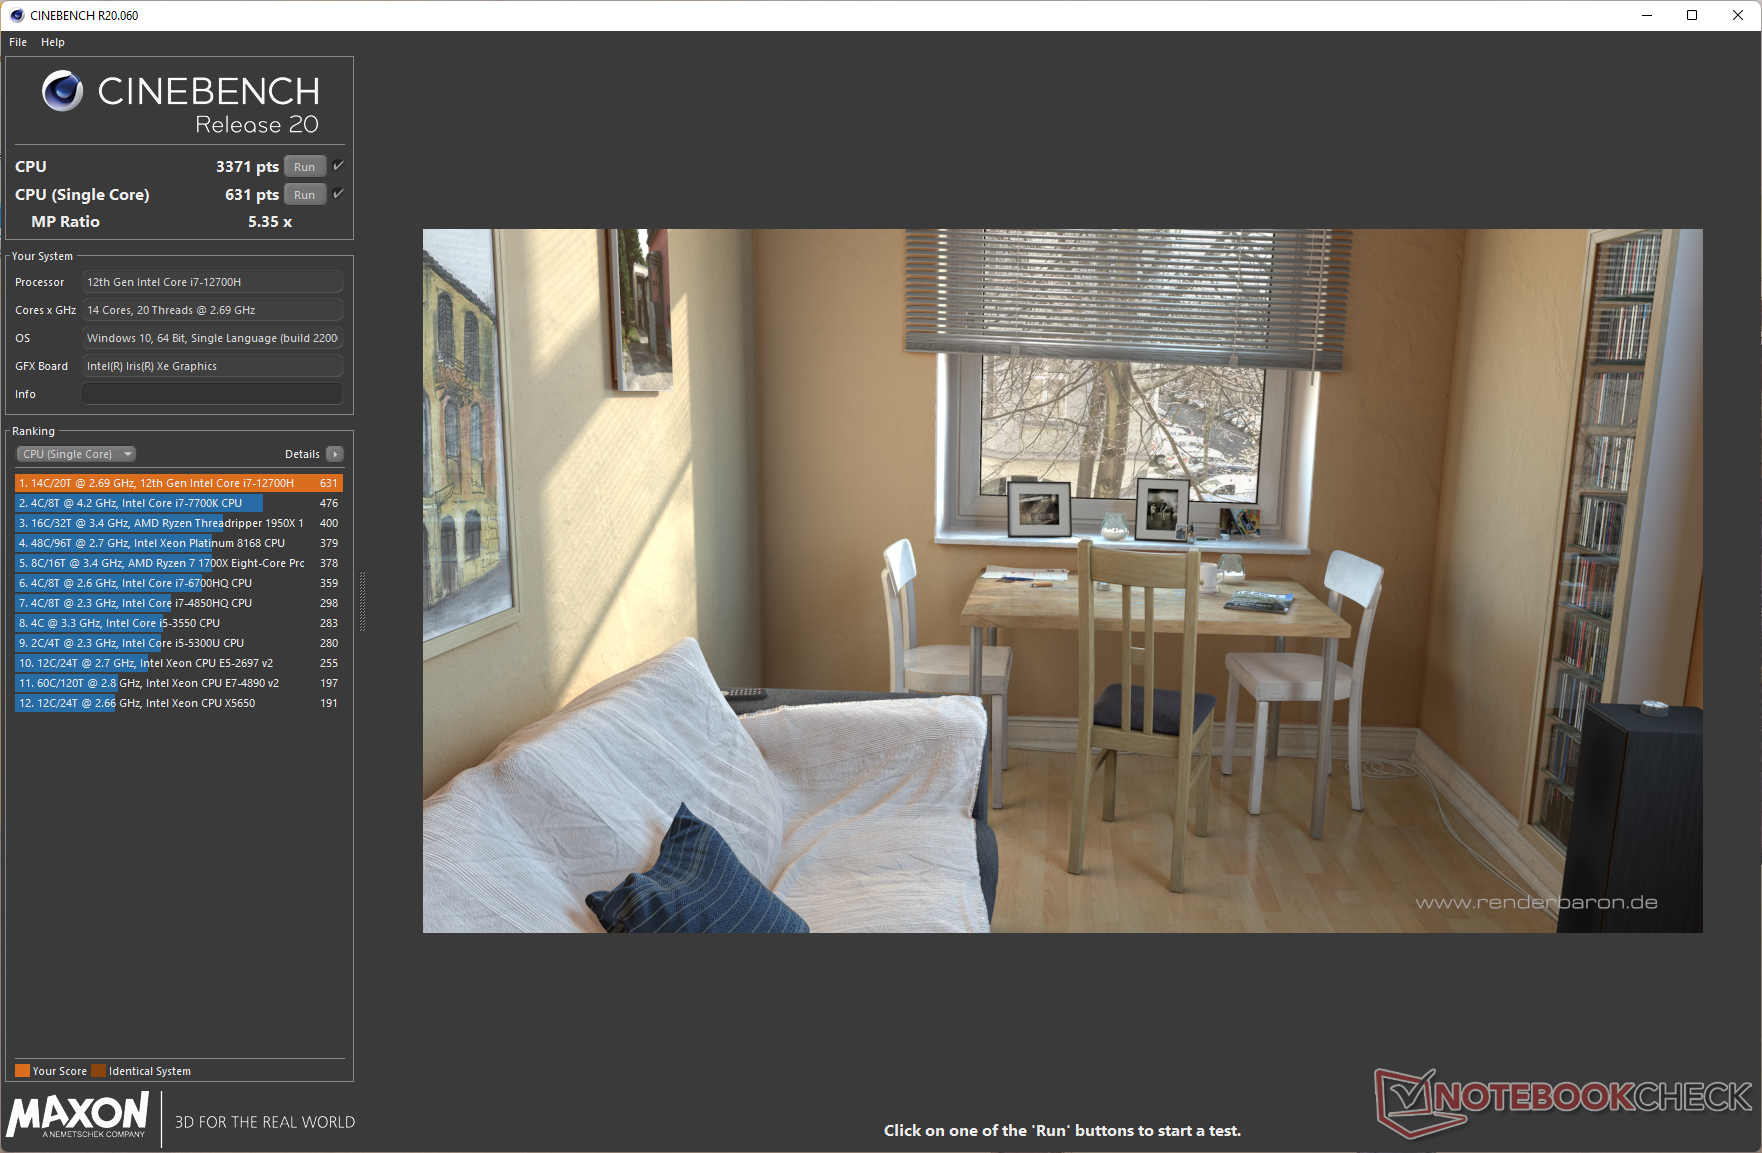
Procesador
El Core i7-12700H es un procesador Alder Lake-H con seis núcleos P y ocho núcleos E. El Crosshair 15 R6E es capaz de permitir un rendimiento sostenido decente para este procesador en nuestra prueba de bucle multinúcleo Cinebench R15, igualando al del AMD Ryzen 9 6900HX en el Schenker XMG Neo 15.
Sin embargo, no es el Core i7-12700H más rápido que hemos visto. La implementación del procesador en los MSI Stealth GS66 y Lenovo Legion 5i Pro 16 G7 obtiene mejores puntuaciones gracias a unos valores PL1 y PL2 más altos.
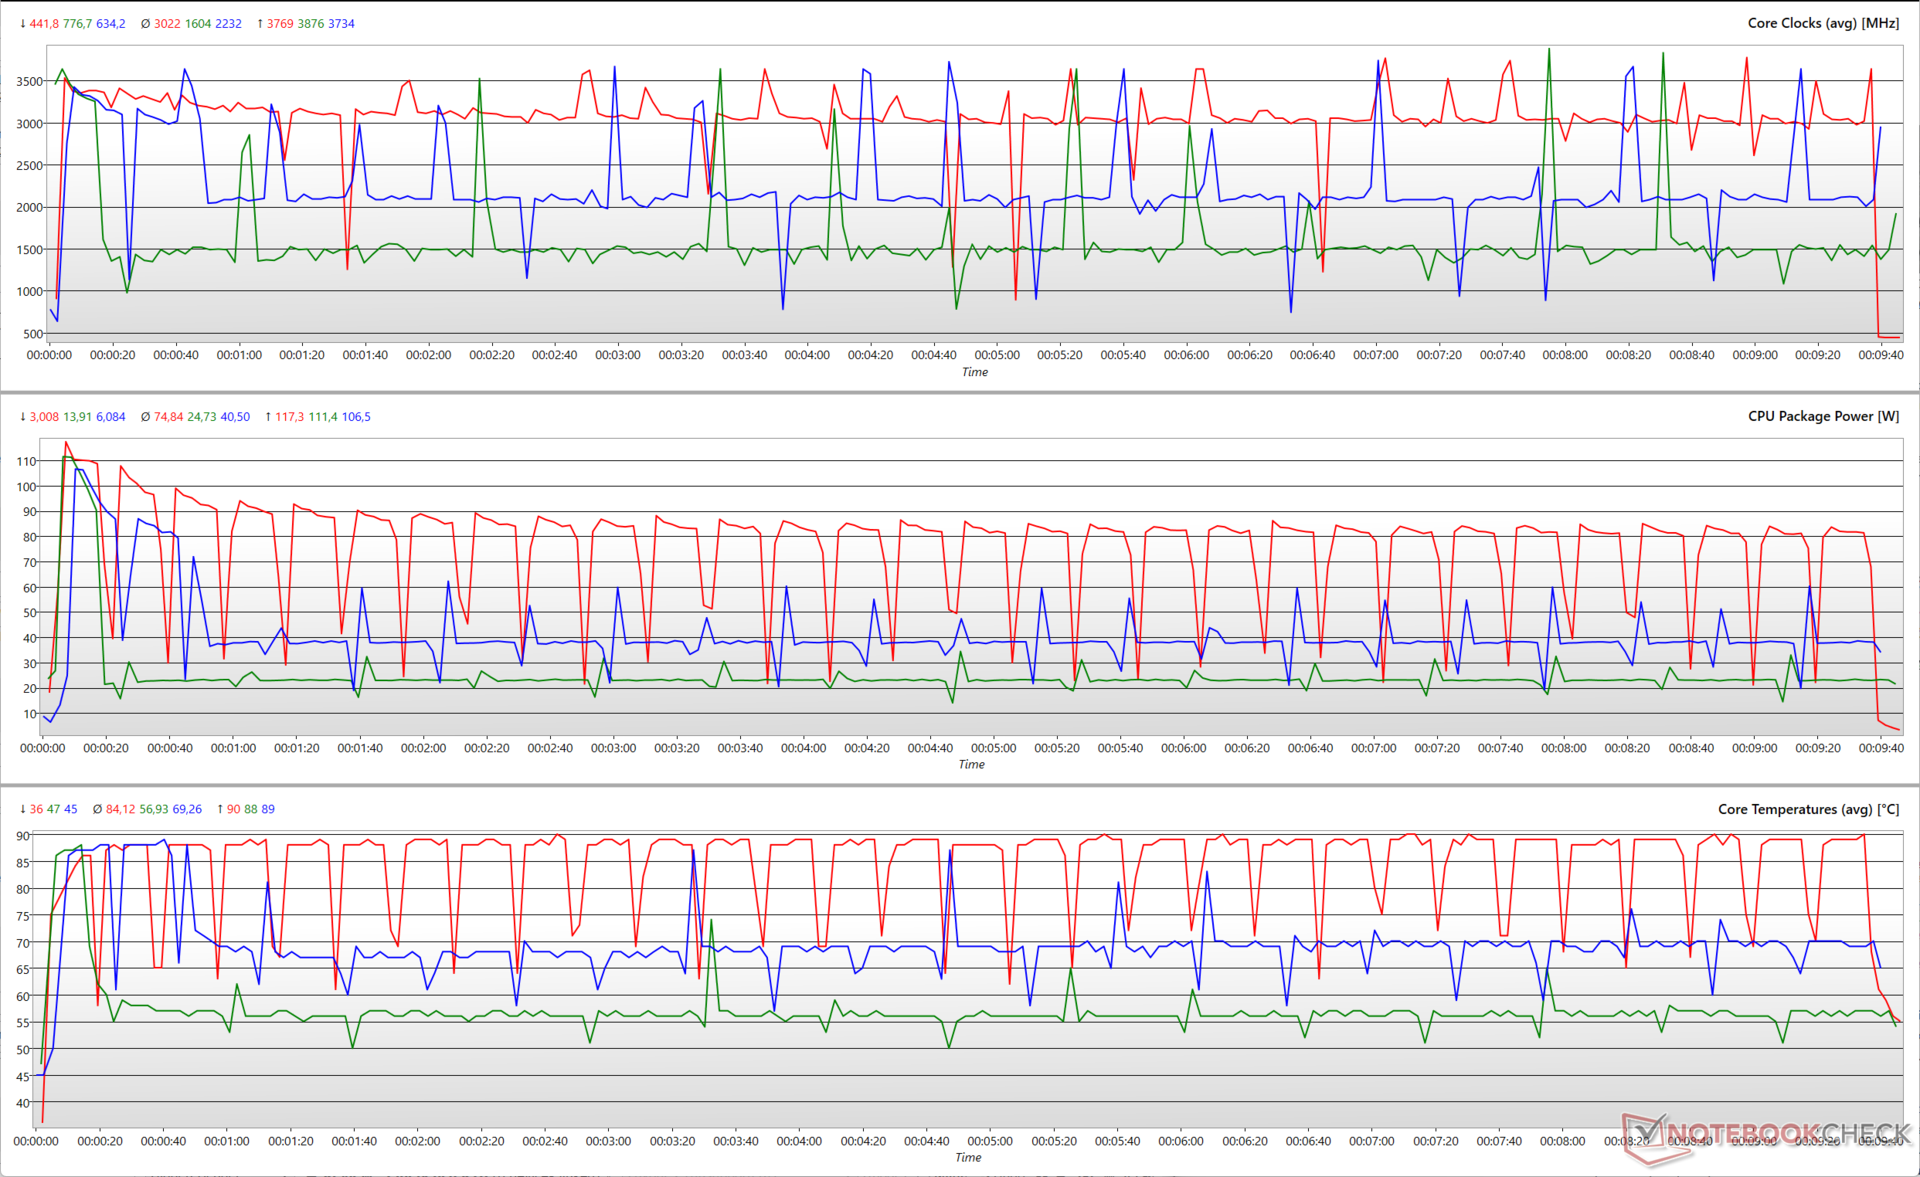
Cinebench R15 Multi Loop
El siguiente gráfico ilustra cómo varían los parámetros de la CPU durante una prueba de bucle multinúcleo Cinebench R15. Dado que el PL2 de 121 W permanece inalterado en los tres modos de rendimiento, el Core i7-12700H es capaz de aumentar hasta cerca de 3,8 GHz teniendo en cuenta los núcleos P y E. Los núcleos P y E pueden aumentar individualmente hasta 4,6 GHz y 3,5 GHz respectivamente. Los núcleos P y E pueden alcanzar individualmente hasta 4,6 GHz y 3,5 GHz, respectivamente.
Aunque la potencia máxima del paquete y las temperaturas de los núcleos son más o menos similares en todos los modos de rendimiento probados, los valores medios muestran marcadas diferencias. La potencia media del encapsulado durante el funcionamiento se acerca a los 75 W en el modo de Rendimiento Extremo, con temperaturas en torno a los 84 °C. El modo Equilibrado tiene temperaturas medias en torno a los 69 °C para una potencia media del paquete de 40,5 W
El modo Silencioso es el que menos emisiones presenta en la comparación, con una potencia media del encapsulado cercana a los 25 W y temperaturas medias del núcleo cercanas a los 57 °C.
Aunque el rendimiento multinúcleo se ve afectado en un 15% en comparación con el Core i7-12700H del Lenovo Legion 5i Pro 16 G7, el Crosshair 15 R6E sólo queda un 8% por detrás en rendimiento general de CPU.
El Crosshair 15 R6E es un 13% más rápido que el XMG Neo 15 con Ryzen 9 6900HX, pero este último obtiene un 32% más de rendimiento en las pruebas AIDA64.
El rendimiento multinúcleo de Cinebench R20 cae un enorme 45% en batería, aunque las puntuaciones mononúcleo sólo se reducen un 10%.
Cinebench R23: Multi Core | Single Core
Cinebench R20: CPU (Multi Core) | CPU (Single Core)
Cinebench R15: CPU Multi 64Bit | CPU Single 64Bit
Blender: v2.79 BMW27 CPU
7-Zip 18.03: 7z b 4 | 7z b 4 -mmt1
Geekbench 5.5: Multi-Core | Single-Core
HWBOT x265 Benchmark v2.2: 4k Preset
LibreOffice : 20 Documents To PDF
R Benchmark 2.5: Overall mean
| CPU Performance rating | |
| Media de la clase Gaming | |
| Lenovo Legion 5 Pro 16 G7 i7 RTX 3070Ti | |
| MSI Pulse GL66 12UEK | |
| MSI Stealth GS66 12UGS | |
| Schenker XMG Neo 15 (i7-12700H, RTX 3080 Ti) | |
| MSI Crosshair 15 R6E B12UGZ-050 | |
| Acer Nitro 5 AN515-58-72QR | |
| Aorus 15 XE5 | |
| MSI Katana GF66 12UGS | |
| Medio Intel Core i7-12700H | |
| Asus TUF Dash F15 FX517ZR | |
| Schenker XMG Neo 15 (Ryzen 9 6900HX, RTX 3070 Ti) | |
| Cinebench R20 / CPU (Multi Core) | |
| Media de la clase Gaming (4029 - 16433, n=106, últimos 2 años) | |
| Lenovo Legion 5 Pro 16 G7 i7 RTX 3070Ti | |
| Schenker XMG Neo 15 (i7-12700H, RTX 3080 Ti) | |
| MSI Pulse GL66 12UEK | |
| MSI Stealth GS66 12UGS | |
| Acer Nitro 5 AN515-58-72QR | |
| MSI Katana GF66 12UGS | |
| MSI Crosshair 15 R6E B12UGZ-050 | |
| Aorus 15 XE5 | |
| Medio Intel Core i7-12700H (1576 - 7407, n=64) | |
| Schenker XMG Neo 15 (Ryzen 9 6900HX, RTX 3070 Ti) | |
| Asus TUF Dash F15 FX517ZR | |
| Cinebench R20 / CPU (Single Core) | |
| Media de la clase Gaming (442 - 913, n=106, últimos 2 años) | |
| MSI Pulse GL66 12UEK | |
| MSI Katana GF66 12UGS | |
| Lenovo Legion 5 Pro 16 G7 i7 RTX 3070Ti | |
| Asus TUF Dash F15 FX517ZR | |
| MSI Crosshair 15 R6E B12UGZ-050 | |
| Acer Nitro 5 AN515-58-72QR | |
| MSI Stealth GS66 12UGS | |
| Schenker XMG Neo 15 (i7-12700H, RTX 3080 Ti) | |
| Aorus 15 XE5 | |
| Medio Intel Core i7-12700H (300 - 704, n=64) | |
| Schenker XMG Neo 15 (Ryzen 9 6900HX, RTX 3070 Ti) | |
| HWBOT x265 Benchmark v2.2 / 4k Preset | |
| Media de la clase Gaming (11.5 - 44.4, n=105, últimos 2 años) | |
| Lenovo Legion 5 Pro 16 G7 i7 RTX 3070Ti | |
| Schenker XMG Neo 15 (i7-12700H, RTX 3080 Ti) | |
| MSI Stealth GS66 12UGS | |
| MSI Pulse GL66 12UEK | |
| Acer Nitro 5 AN515-58-72QR | |
| MSI Crosshair 15 R6E B12UGZ-050 | |
| Schenker XMG Neo 15 (Ryzen 9 6900HX, RTX 3070 Ti) | |
| Asus TUF Dash F15 FX517ZR | |
| Medio Intel Core i7-12700H (4.67 - 21.8, n=64) | |
| Aorus 15 XE5 | |
| MSI Katana GF66 12UGS | |
| LibreOffice / 20 Documents To PDF | |
| Schenker XMG Neo 15 (Ryzen 9 6900HX, RTX 3070 Ti) | |
| Media de la clase Gaming (33.2 - 88.8, n=105, últimos 2 años) | |
| Schenker XMG Neo 15 (i7-12700H, RTX 3080 Ti) | |
| Medio Intel Core i7-12700H (34.2 - 95.3, n=63) | |
| MSI Crosshair 15 R6E B12UGZ-050 | |
| Lenovo Legion 5 Pro 16 G7 i7 RTX 3070Ti | |
| MSI Pulse GL66 12UEK | |
| Acer Nitro 5 AN515-58-72QR | |
| MSI Stealth GS66 12UGS | |
| Asus TUF Dash F15 FX517ZR | |
| Aorus 15 XE5 | |
| MSI Katana GF66 12UGS | |
| R Benchmark 2.5 / Overall mean | |
| Schenker XMG Neo 15 (Ryzen 9 6900HX, RTX 3070 Ti) | |
| Medio Intel Core i7-12700H (0.4441 - 1.052, n=63) | |
| Aorus 15 XE5 | |
| Asus TUF Dash F15 FX517ZR | |
| Schenker XMG Neo 15 (i7-12700H, RTX 3080 Ti) | |
| Acer Nitro 5 AN515-58-72QR | |
| MSI Katana GF66 12UGS | |
| Lenovo Legion 5 Pro 16 G7 i7 RTX 3070Ti | |
| MSI Stealth GS66 12UGS | |
| MSI Crosshair 15 R6E B12UGZ-050 | |
| Media de la clase Gaming (0.3439 - 0.759, n=106, últimos 2 años) | |
| MSI Pulse GL66 12UEK | |
* ... más pequeño es mejor
AIDA64: FP32 Ray-Trace | FPU Julia | CPU SHA3 | CPU Queen | FPU SinJulia | FPU Mandel | CPU AES | CPU ZLib | FP64 Ray-Trace | CPU PhotoWorxx
Eche un vistazo a nuestro Intel Core i7-12700H para obtener más información y comparaciones de rendimiento.
Rendimiento del sistema
Los dispositivos de la competencia son capaces de superar al Crosshair 15 R6E en las puntuaciones de PCMark 10, pero no por mucho. CrossMark ve que el Crosshair 15 R6E ofrece un rendimiento mucho mejor
Las pruebas AIDA64 ven al Crosshair 15 R6E detrás de otros portátiles con Core i7-12700H. No experimentamos ningún problema de rendimiento en particular con tareas de productividad diaria o navegación web
CrossMark: Overall | Productivity | Creativity | Responsiveness
| PCMark 10 / Score | |
| Media de la clase Gaming (5828 - 12414, n=93, últimos 2 años) | |
| Aorus 15 XE5 | |
| MSI Stealth GS66 12UGS | |
| Schenker XMG Neo 15 (i7-12700H, RTX 3080 Ti) | |
| Lenovo Legion 5 Pro 16 G7 i7 RTX 3070Ti | |
| MSI Katana GF66 12UGS | |
| Medio Intel Core i7-12700H, NVIDIA GeForce RTX 3070 Laptop GPU (7082 - 7647, n=2) | |
| Schenker XMG Neo 15 (Ryzen 9 6900HX, RTX 3070 Ti) | |
| MSI Pulse GL66 12UEK | |
| MSI Crosshair 15 R6E B12UGZ-050 | |
| Acer Nitro 5 AN515-58-72QR | |
| Asus TUF Dash F15 FX517ZR | |
| PCMark 10 / Essentials | |
| MSI Stealth GS66 12UGS | |
| Aorus 15 XE5 | |
| Media de la clase Gaming (8810 - 11935, n=97, últimos 2 años) | |
| Schenker XMG Neo 15 (i7-12700H, RTX 3080 Ti) | |
| Medio Intel Core i7-12700H, NVIDIA GeForce RTX 3070 Laptop GPU (10076 - 10926, n=2) | |
| Schenker XMG Neo 15 (Ryzen 9 6900HX, RTX 3070 Ti) | |
| MSI Pulse GL66 12UEK | |
| MSI Katana GF66 12UGS | |
| MSI Crosshair 15 R6E B12UGZ-050 | |
| Asus TUF Dash F15 FX517ZR | |
| Lenovo Legion 5 Pro 16 G7 i7 RTX 3070Ti | |
| Acer Nitro 5 AN515-58-72QR | |
| PCMark 10 / Productivity | |
| Media de la clase Gaming (6845 - 25323, n=95, últimos 2 años) | |
| Aorus 15 XE5 | |
| MSI Katana GF66 12UGS | |
| Lenovo Legion 5 Pro 16 G7 i7 RTX 3070Ti | |
| MSI Pulse GL66 12UEK | |
| Medio Intel Core i7-12700H, NVIDIA GeForce RTX 3070 Laptop GPU (9460 - 9877, n=2) | |
| Schenker XMG Neo 15 (Ryzen 9 6900HX, RTX 3070 Ti) | |
| Asus TUF Dash F15 FX517ZR | |
| MSI Stealth GS66 12UGS | |
| MSI Crosshair 15 R6E B12UGZ-050 | |
| Schenker XMG Neo 15 (i7-12700H, RTX 3080 Ti) | |
| Acer Nitro 5 AN515-58-72QR | |
| PCMark 10 / Digital Content Creation | |
| Media de la clase Gaming (7602 - 19954, n=95, últimos 2 años) | |
| Schenker XMG Neo 15 (i7-12700H, RTX 3080 Ti) | |
| Lenovo Legion 5 Pro 16 G7 i7 RTX 3070Ti | |
| MSI Stealth GS66 12UGS | |
| Aorus 15 XE5 | |
| MSI Katana GF66 12UGS | |
| Medio Intel Core i7-12700H, NVIDIA GeForce RTX 3070 Laptop GPU (10113 - 11245, n=2) | |
| Acer Nitro 5 AN515-58-72QR | |
| MSI Crosshair 15 R6E B12UGZ-050 | |
| Schenker XMG Neo 15 (Ryzen 9 6900HX, RTX 3070 Ti) | |
| MSI Pulse GL66 12UEK | |
| Asus TUF Dash F15 FX517ZR | |
| CrossMark / Overall | |
| MSI Pulse GL66 12UEK | |
| MSI Crosshair 15 R6E B12UGZ-050 | |
| Media de la clase Gaming (1366 - 2409, n=94, últimos 2 años) | |
| Lenovo Legion 5 Pro 16 G7 i7 RTX 3070Ti | |
| Aorus 15 XE5 | |
| MSI Katana GF66 12UGS | |
| Medio Intel Core i7-12700H, NVIDIA GeForce RTX 3070 Laptop GPU (1844 - 2003, n=2) | |
| Asus TUF Dash F15 FX517ZR | |
| Schenker XMG Neo 15 (i7-12700H, RTX 3080 Ti) | |
| Acer Nitro 5 AN515-58-72QR | |
| Schenker XMG Neo 15 (Ryzen 9 6900HX, RTX 3070 Ti) | |
| CrossMark / Productivity | |
| MSI Pulse GL66 12UEK | |
| MSI Crosshair 15 R6E B12UGZ-050 | |
| MSI Katana GF66 12UGS | |
| Aorus 15 XE5 | |
| Medio Intel Core i7-12700H, NVIDIA GeForce RTX 3070 Laptop GPU (1785 - 1971, n=2) | |
| Lenovo Legion 5 Pro 16 G7 i7 RTX 3070Ti | |
| Media de la clase Gaming (1386 - 2254, n=94, últimos 2 años) | |
| Acer Nitro 5 AN515-58-72QR | |
| Asus TUF Dash F15 FX517ZR | |
| Schenker XMG Neo 15 (i7-12700H, RTX 3080 Ti) | |
| Schenker XMG Neo 15 (Ryzen 9 6900HX, RTX 3070 Ti) | |
| CrossMark / Creativity | |
| Media de la clase Gaming (1343 - 2786, n=94, últimos 2 años) | |
| MSI Pulse GL66 12UEK | |
| Lenovo Legion 5 Pro 16 G7 i7 RTX 3070Ti | |
| Schenker XMG Neo 15 (i7-12700H, RTX 3080 Ti) | |
| Asus TUF Dash F15 FX517ZR | |
| Aorus 15 XE5 | |
| MSI Crosshair 15 R6E B12UGZ-050 | |
| Medio Intel Core i7-12700H, NVIDIA GeForce RTX 3070 Laptop GPU (1912 - 1979, n=2) | |
| MSI Katana GF66 12UGS | |
| Acer Nitro 5 AN515-58-72QR | |
| Schenker XMG Neo 15 (Ryzen 9 6900HX, RTX 3070 Ti) | |
| CrossMark / Responsiveness | |
| MSI Pulse GL66 12UEK | |
| MSI Crosshair 15 R6E B12UGZ-050 | |
| MSI Katana GF66 12UGS | |
| Aorus 15 XE5 | |
| Medio Intel Core i7-12700H, NVIDIA GeForce RTX 3070 Laptop GPU (1824 - 2182, n=2) | |
| Lenovo Legion 5 Pro 16 G7 i7 RTX 3070Ti | |
| Media de la clase Gaming (1226 - 2334, n=94, últimos 2 años) | |
| Acer Nitro 5 AN515-58-72QR | |
| Asus TUF Dash F15 FX517ZR | |
| Schenker XMG Neo 15 (i7-12700H, RTX 3080 Ti) | |
| Schenker XMG Neo 15 (Ryzen 9 6900HX, RTX 3070 Ti) | |
| PCMark 8 Home Score Accelerated v2 | 6083 puntos | |
| PCMark 8 Creative Score Accelerated v2 | 9960 puntos | |
| PCMark 8 Work Score Accelerated v2 | 6346 puntos | |
| PCMark 10 Score | 7082 puntos | |
ayuda | ||
* ... más pequeño es mejor
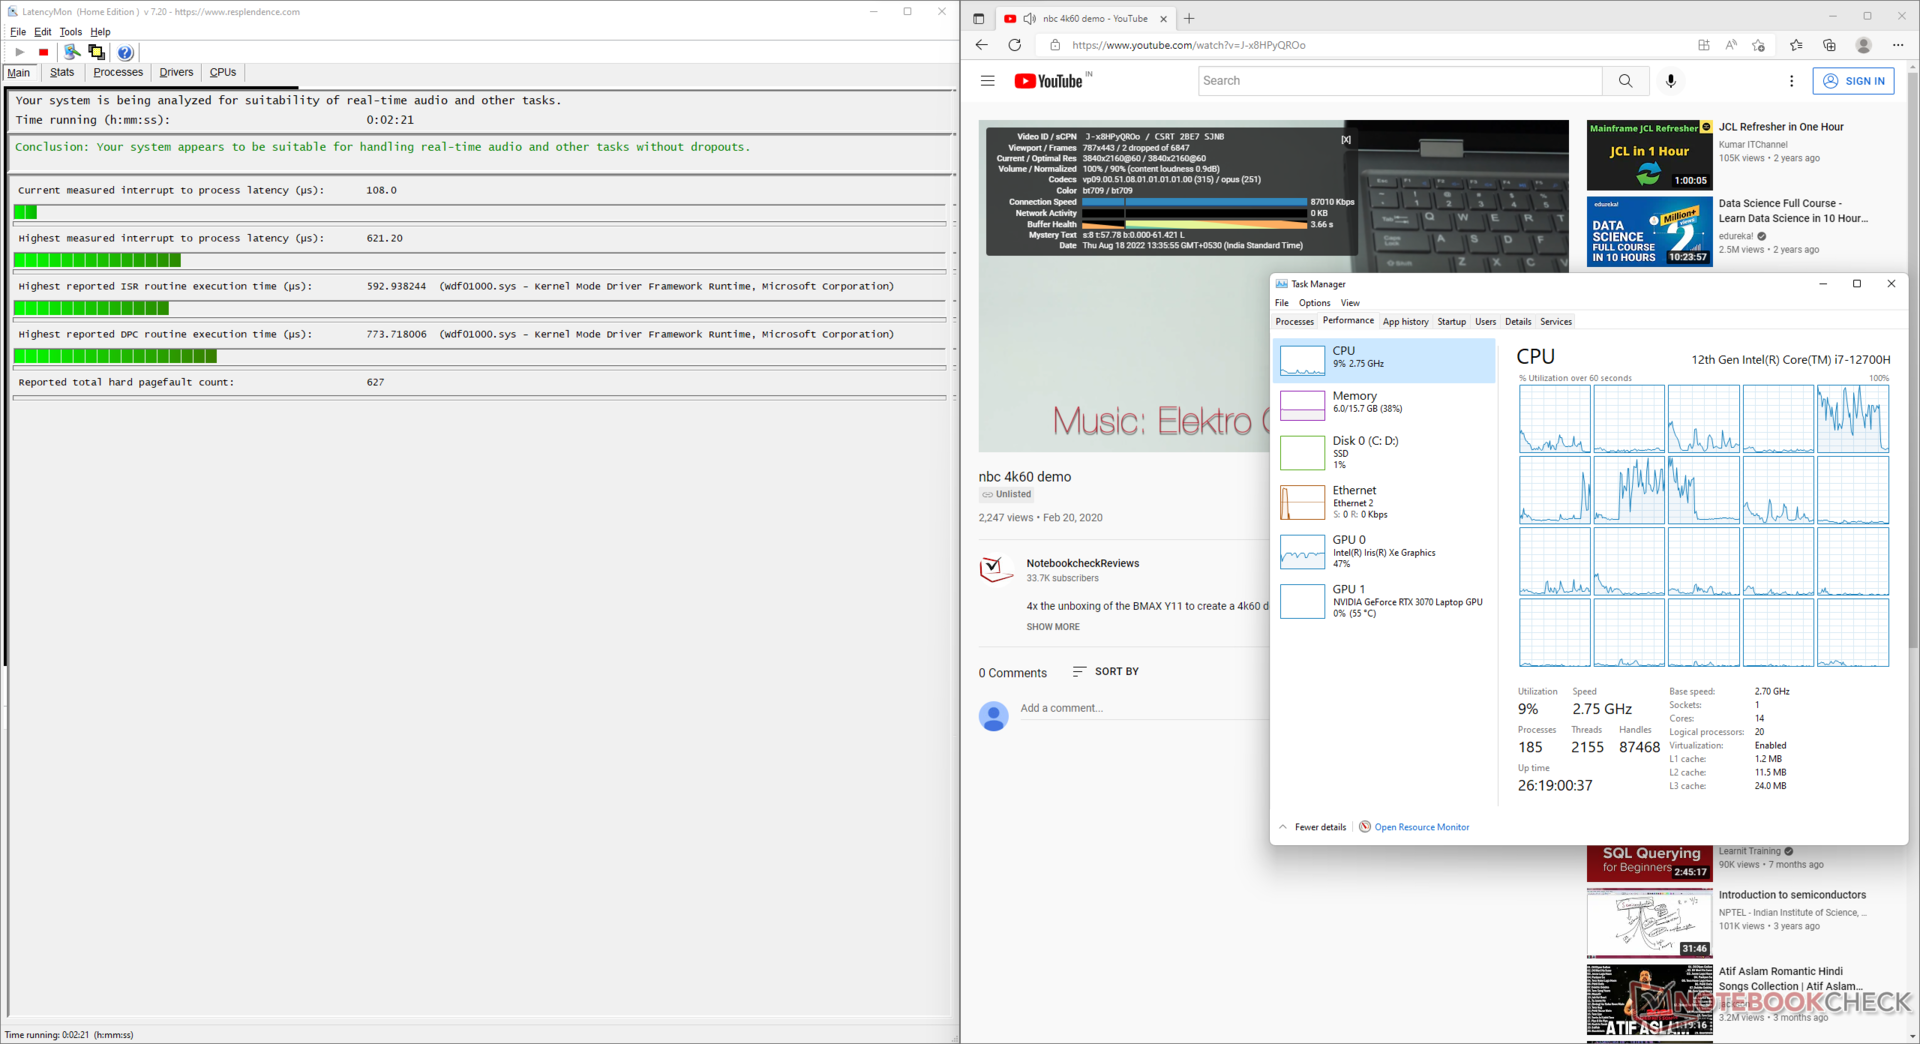
Latencia del CPD
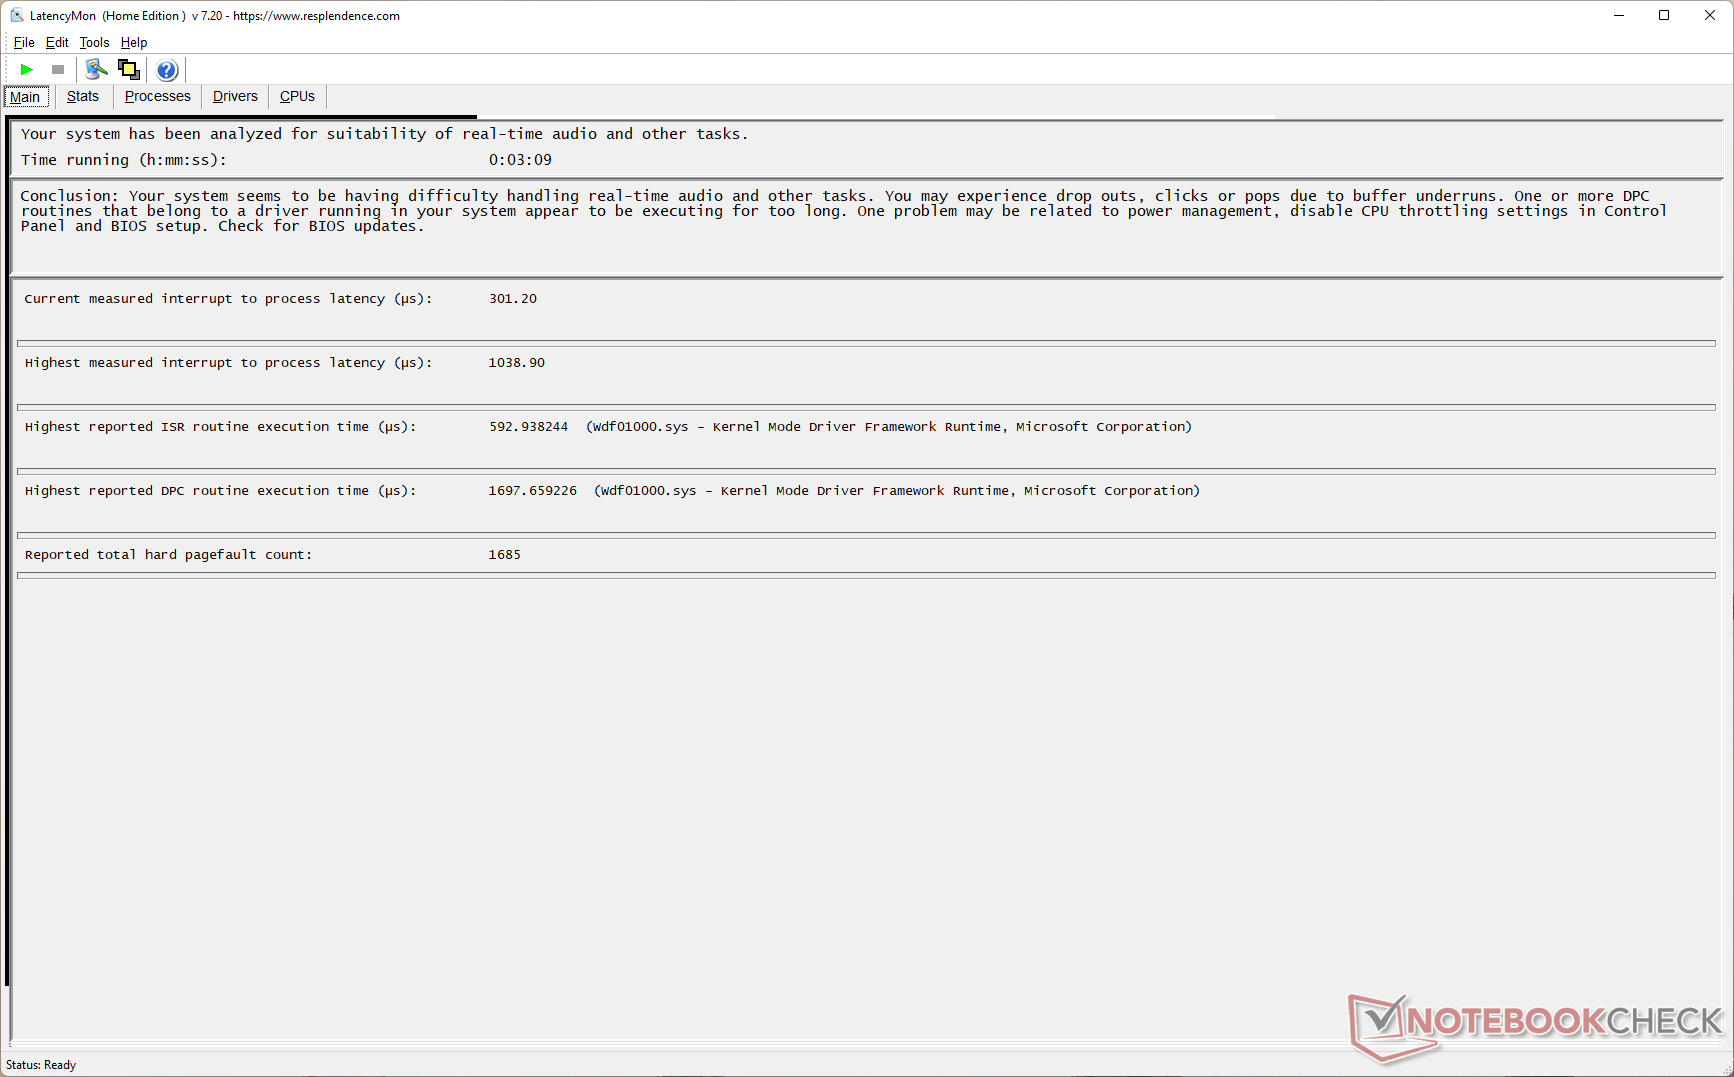
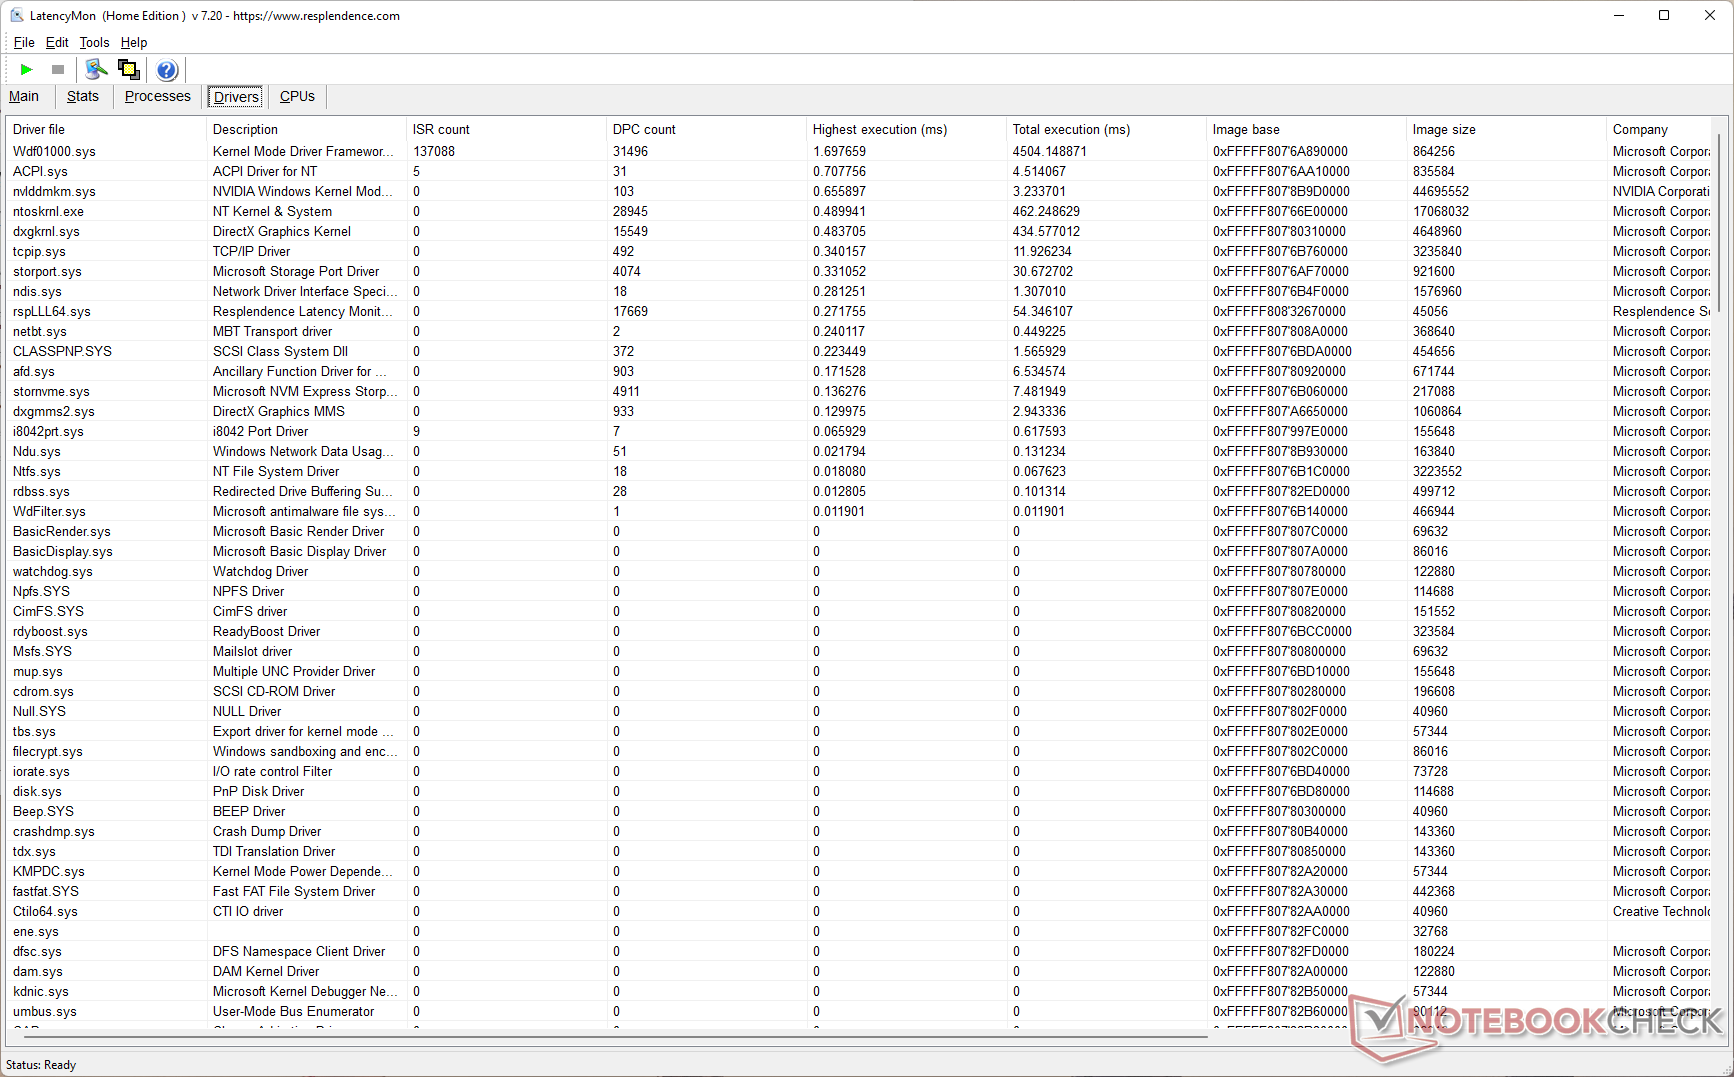
Nuestra prueba estandarizada LatencyMon ve que el Crosshair 15 R6E tiene una latencia DPC algo mayor que otros portátiles con Core i7-12700H. Observamos un aumento de la latencia después de ejecutar la prueba Prime95 in-place large FFTs después de nuestro benchmark YouTube
El Windows Kernel Mode Driver Framework parece ser la razón del aumento de los valores de latencia.
| DPC Latencies / LatencyMon - interrupt to process latency (max), Web, Youtube, Prime95 | |
| Schenker XMG Neo 15 (i7-12700H, RTX 3080 Ti) | |
| MSI Stealth GS66 12UGS | |
| Schenker XMG Neo 15 (Ryzen 9 6900HX, RTX 3070 Ti) | |
| Aorus 15 XE5 | |
| MSI Crosshair 15 R6E B12UGZ-050 | |
| MSI Pulse GL66 12UEK | |
| Acer Nitro 5 AN515-58-72QR | |
| Lenovo Legion 5 Pro 16 G7 i7 RTX 3070Ti | |
| MSI Katana GF66 12UGS | |
| Asus TUF Dash F15 FX517ZR | |
* ... más pequeño es mejor
Encontrará más comparaciones de latencia entre los dispositivos analizados en nuestro Clasificación de latencia del CPD del CPD.
Dispositivos de almacenamiento
El SSD NVMe PCIe Micron 2450 de 1 TB no bate ningún récord de velocidad. Las dos ranuras NVMe M.2 del Crosshair 15 R6E y la propia unidad Micron admiten PCIe Gen 4, pero el rendimiento está más en línea con las velocidades PCIe Gen 3. Dicho esto, la unidad es capaz de acercarse a sus especificaciones de E/S nominales en su mayor parte.
La unidad no muestra estrangulamiento en nuestra prueba de bucle de lectura DiskSpd a una profundidad de cola de 8. No hay posibilidad de añadir una expansión de almacenamiento SATA de 2,5 pulgadas.

* ... más pequeño es mejor
Disk Throttling: DiskSpd Read Loop, Queue Depth 8
Rendimiento de la GPU
Nuestra unidad de pruebas Crosshair 15 R6E usa una GPU RTX 3070 de 140 W para portátil con 8 GB de VRAM GDDR6. MSI no especifica el Dynamic Boost exacto para esta GPU.
el rendimiento 3DMark está por detrás de algunas RTX 3070 Ti-pero no por mucho. El Crosshair 15 R6E queda por detrás del RTX 3080 Ti-xMG Neo 15 en un 11% y un 13% en las pruebas 3DMark Fire Strike Graphics y Time Spy Graphics, respectivamente.
El Asus TUF Dash F15 con la misma GPU es un 19% más lento que el del Crosshair 15 R6E debido a un TGP inferior de 105 W.
| 3DMark 11 Performance | 30240 puntos | |
| 3DMark Ice Storm Standard Score | 158460 puntos | |
| 3DMark Cloud Gate Standard Score | 56797 puntos | |
| 3DMark Fire Strike Score | 24233 puntos | |
| 3DMark Fire Strike Extreme Score | 12959 puntos | |
| 3DMark Time Spy Score | 10496 puntos | |
ayuda | ||
La Crosshair 15 R6E tarda un 42% y un 33% menos en Blender Classroom Optix y Classroom CUDA, respectivamente, en comparación con los tiempos medios registrados por la GPU RTX 3070 para portátiles.
| Blender / v3.3 Classroom OPTIX/RTX | |
| Asus TUF Dash F15 FX517ZR | |
| Medio NVIDIA GeForce RTX 3070 Laptop GPU (26 - 30, n=8) | |
| MSI Crosshair 15 R6E B12UGZ-050 | |
| Aorus 15 XE5 | |
| Schenker XMG Neo 15 (Ryzen 9 6900HX, RTX 3070 Ti) | |
| Media de la clase Gaming (9 - 32, n=106, últimos 2 años) | |
| Blender / v3.3 Classroom CUDA | |
| Asus TUF Dash F15 FX517ZR | |
| Medio NVIDIA GeForce RTX 3070 Laptop GPU (43 - 51, n=9) | |
| MSI Crosshair 15 R6E B12UGZ-050 | |
| Aorus 15 XE5 | |
| Schenker XMG Neo 15 (Ryzen 9 6900HX, RTX 3070 Ti) | |
| Media de la clase Gaming (15 - 228, n=106, últimos 2 años) | |
| Blender / v3.3 Classroom CPU | |
| Medio NVIDIA GeForce RTX 3070 Laptop GPU (329 - 698, n=12) | |
| Asus TUF Dash F15 FX517ZR | |
| Aorus 15 XE5 | |
| MSI Crosshair 15 R6E B12UGZ-050 | |
| Schenker XMG Neo 15 (Ryzen 9 6900HX, RTX 3070 Ti) | |
| Media de la clase Gaming (122 - 565, n=102, últimos 2 años) | |
* ... más pequeño es mejor
Rendimiento en juegos
El rendimiento gaming en los juegos probados a 1080p Ultra está sólo un 8% por detrás del XMG Neo 15 con RTX 3080 Ti. El Lenovo Legion 5i Pro 16 G7 con una RTX 3070 Ti muestra ventajas perceptibles sobre el Crosshair 15 R6E en la mayoría de juegos, particularmente a QHD Ultra.
El XMG Neo 15 con RTX 3080 Ti puede ser hasta un 17% superior en Far Cry 5 QHD Ultra, pero este delta aumenta al 45% en El Witcher 3 a 1080p Alta. En Rainbow Six: Extraction, el Crosshair 15 R6E muestra buenas ventajas en los ajustes 1080p y QHD Ultra sobre el Stealth GS66 con una GPU RTX 3070 Ti para portátiles.
| F1 2021 | |
| 1920x1080 High Preset AA:T AF:16x | |
| Lenovo Legion 5 Pro 16 G7 i7 RTX 3070Ti | |
| MSI Stealth GS66 12UGS | |
| MSI Crosshair 15 R6E B12UGZ-050 | |
| Medio NVIDIA GeForce RTX 3070 Laptop GPU (66.1 - 256, n=16) | |
| Asus TUF Dash F15 FX517ZR | |
| Acer Nitro 5 AN515-58-72QR | |
| 1920x1080 Ultra High Preset + Raytracing AA:T AF:16x | |
| Lenovo Legion 5 Pro 16 G7 i7 RTX 3070Ti | |
| MSI Crosshair 15 R6E B12UGZ-050 | |
| MSI Stealth GS66 12UGS | |
| Acer Nitro 5 AN515-58-72QR | |
| Medio NVIDIA GeForce RTX 3070 Laptop GPU (33.1 - 123.1, n=23) | |
| Asus TUF Dash F15 FX517ZR | |
| 2560x1440 Ultra High Preset + Raytracing AA:T AF:16x | |
| Lenovo Legion 5 Pro 16 G7 i7 RTX 3070Ti | |
| MSI Crosshair 15 R6E B12UGZ-050 | |
| Medio NVIDIA GeForce RTX 3070 Laptop GPU (67.1 - 90.2, n=11) | |
| Acer Nitro 5 AN515-58-72QR | |
| MSI Stealth GS66 12UGS | |
| Asus TUF Dash F15 FX517ZR | |
| Rainbow Six Extraction | |
| 1920x1080 High Preset (with Fixed Resolution Quality) | |
| Medio NVIDIA GeForce RTX 3070 Laptop GPU (171 - 202, n=4) | |
| MSI Stealth GS66 12UGS | |
| MSI Crosshair 15 R6E B12UGZ-050 | |
| 1920x1080 Ultra Preset (with Fixed Resolution Quality) | |
| MSI Crosshair 15 R6E B12UGZ-050 | |
| Medio NVIDIA GeForce RTX 3070 Laptop GPU (149 - 157, n=4) | |
| MSI Stealth GS66 12UGS | |
| 2560x1440 Ultra Preset (with Fixed Resolution Quality) | |
| MSI Crosshair 15 R6E B12UGZ-050 | |
| Medio NVIDIA GeForce RTX 3070 Laptop GPU (97 - 103, n=3) | |
| MSI Stealth GS66 12UGS | |
Witcher 3 Tabla de FPS
La GPU RTX 3070 para portátiles muestra un buen rendimiento sostenido en The Witcher 3 a 1080p Ultra con el personaje inmóvil durante toda la prueba. Vemos fluctuaciones de frame rate, pero no son muy drásticas.
| bajo | medio | alto | ultra | QHD | 4K | |
|---|---|---|---|---|---|---|
| GTA V (2015) | 184.2 | 182 | 173.8 | 113.7 | 97.1 | |
| The Witcher 3 (2015) | 368 | 294 | 168 | 105.7 | ||
| Dota 2 Reborn (2015) | 177.7 | 161.4 | 150.4 | 142.7 | 127.2 | |
| Final Fantasy XV Benchmark (2018) | 166.6 | 127.5 | 98 | 79 | 46.9 | |
| X-Plane 11.11 (2018) | 150.1 | 133.1 | 106.3 | 98.7 | ||
| Far Cry 5 (2018) | 137 | 125 | 122 | 118 | 99 | |
| Strange Brigade (2018) | 444 | 251 | 211 | 185.5 | 140.5 | |
| F1 2021 (2021) | 319 | 228 | 192.6 | 115.4 | 86.3 | |
| Rainbow Six Extraction (2022) | 225 | 189 | 171 | 155 | 103 | |
| Cyberpunk 2077 1.6 (2022) | 123 | 111.6 | 90.8 | 76.9 | 49.5 |
Echa un vistazo a nuestro GPU Nvidia GeForce RTX 3070 para portátiles para obtener más información y comparaciones de rendimiento.
Emisiones: Niveles de ruido tolerables en el perfil Equilibrado
Ruido del sistema
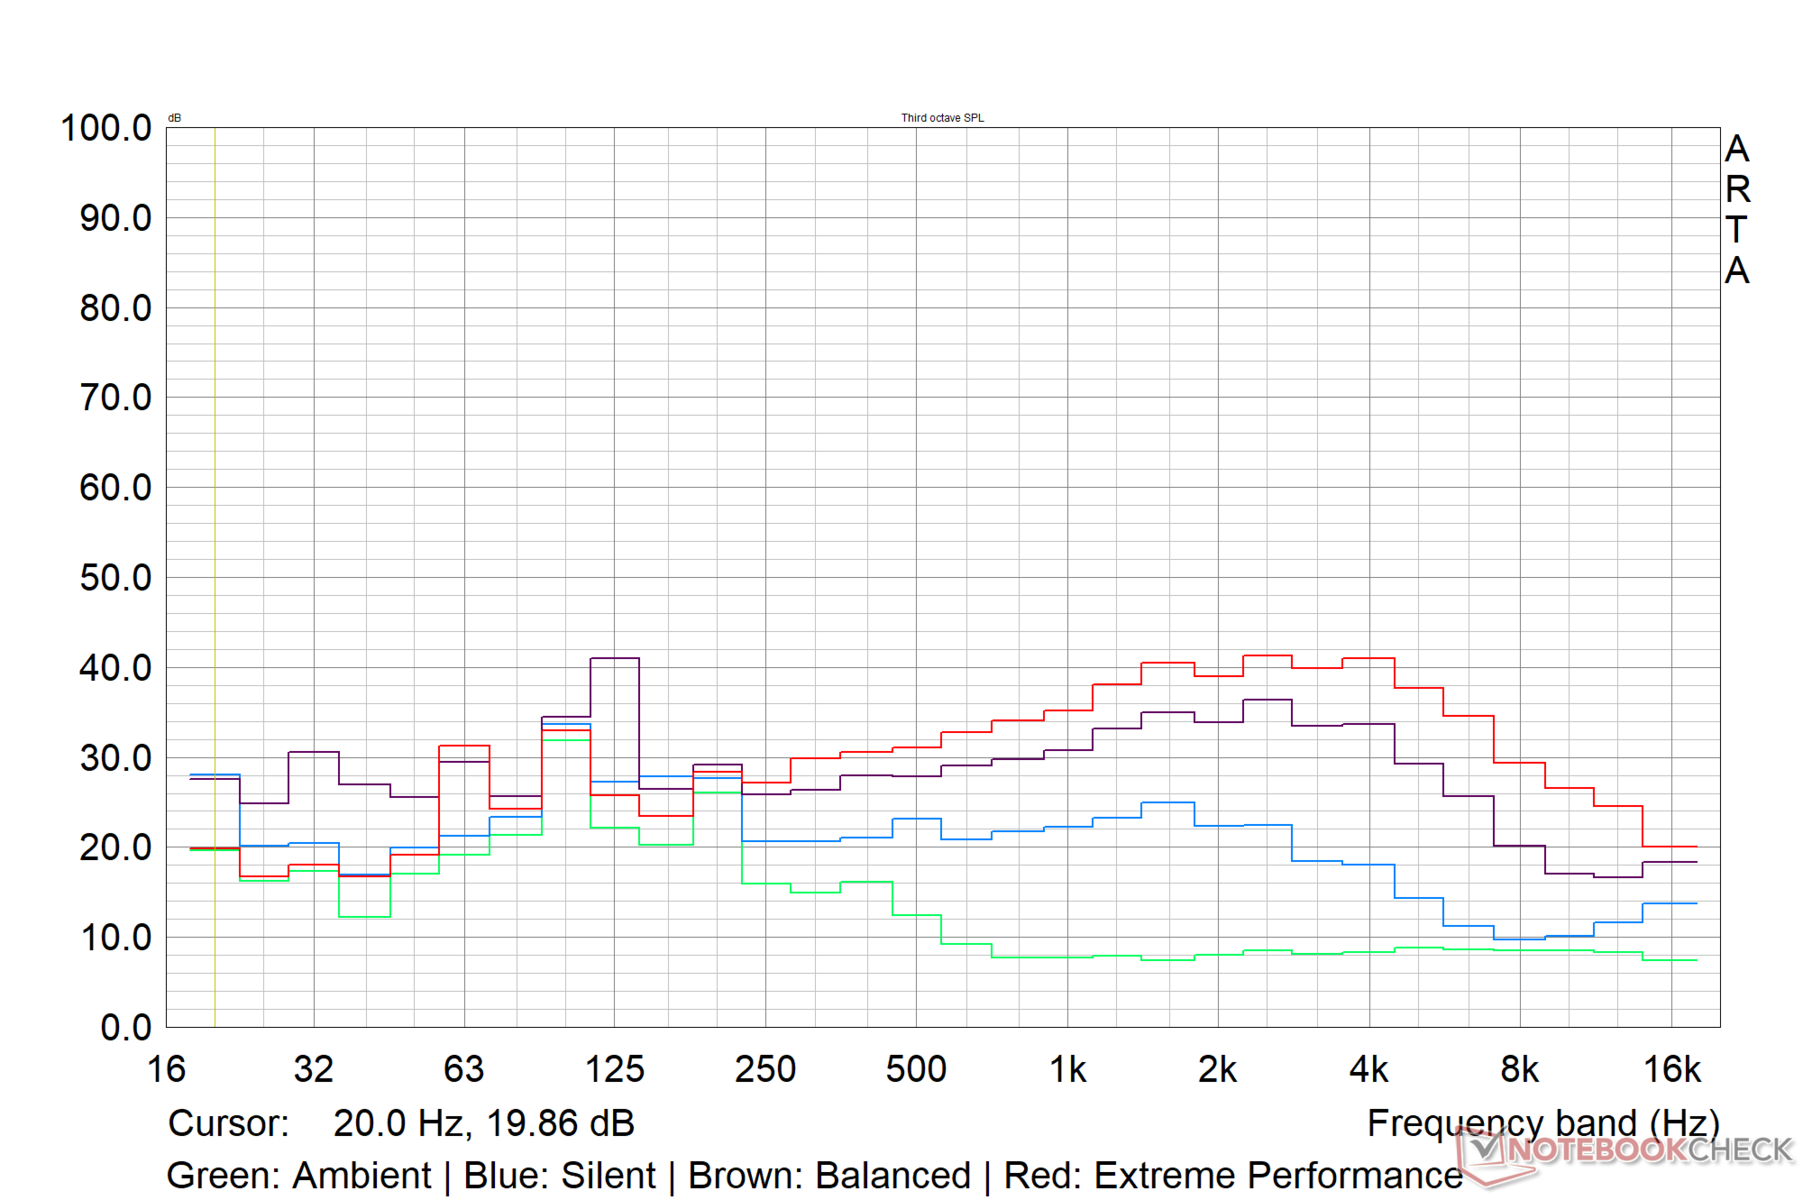
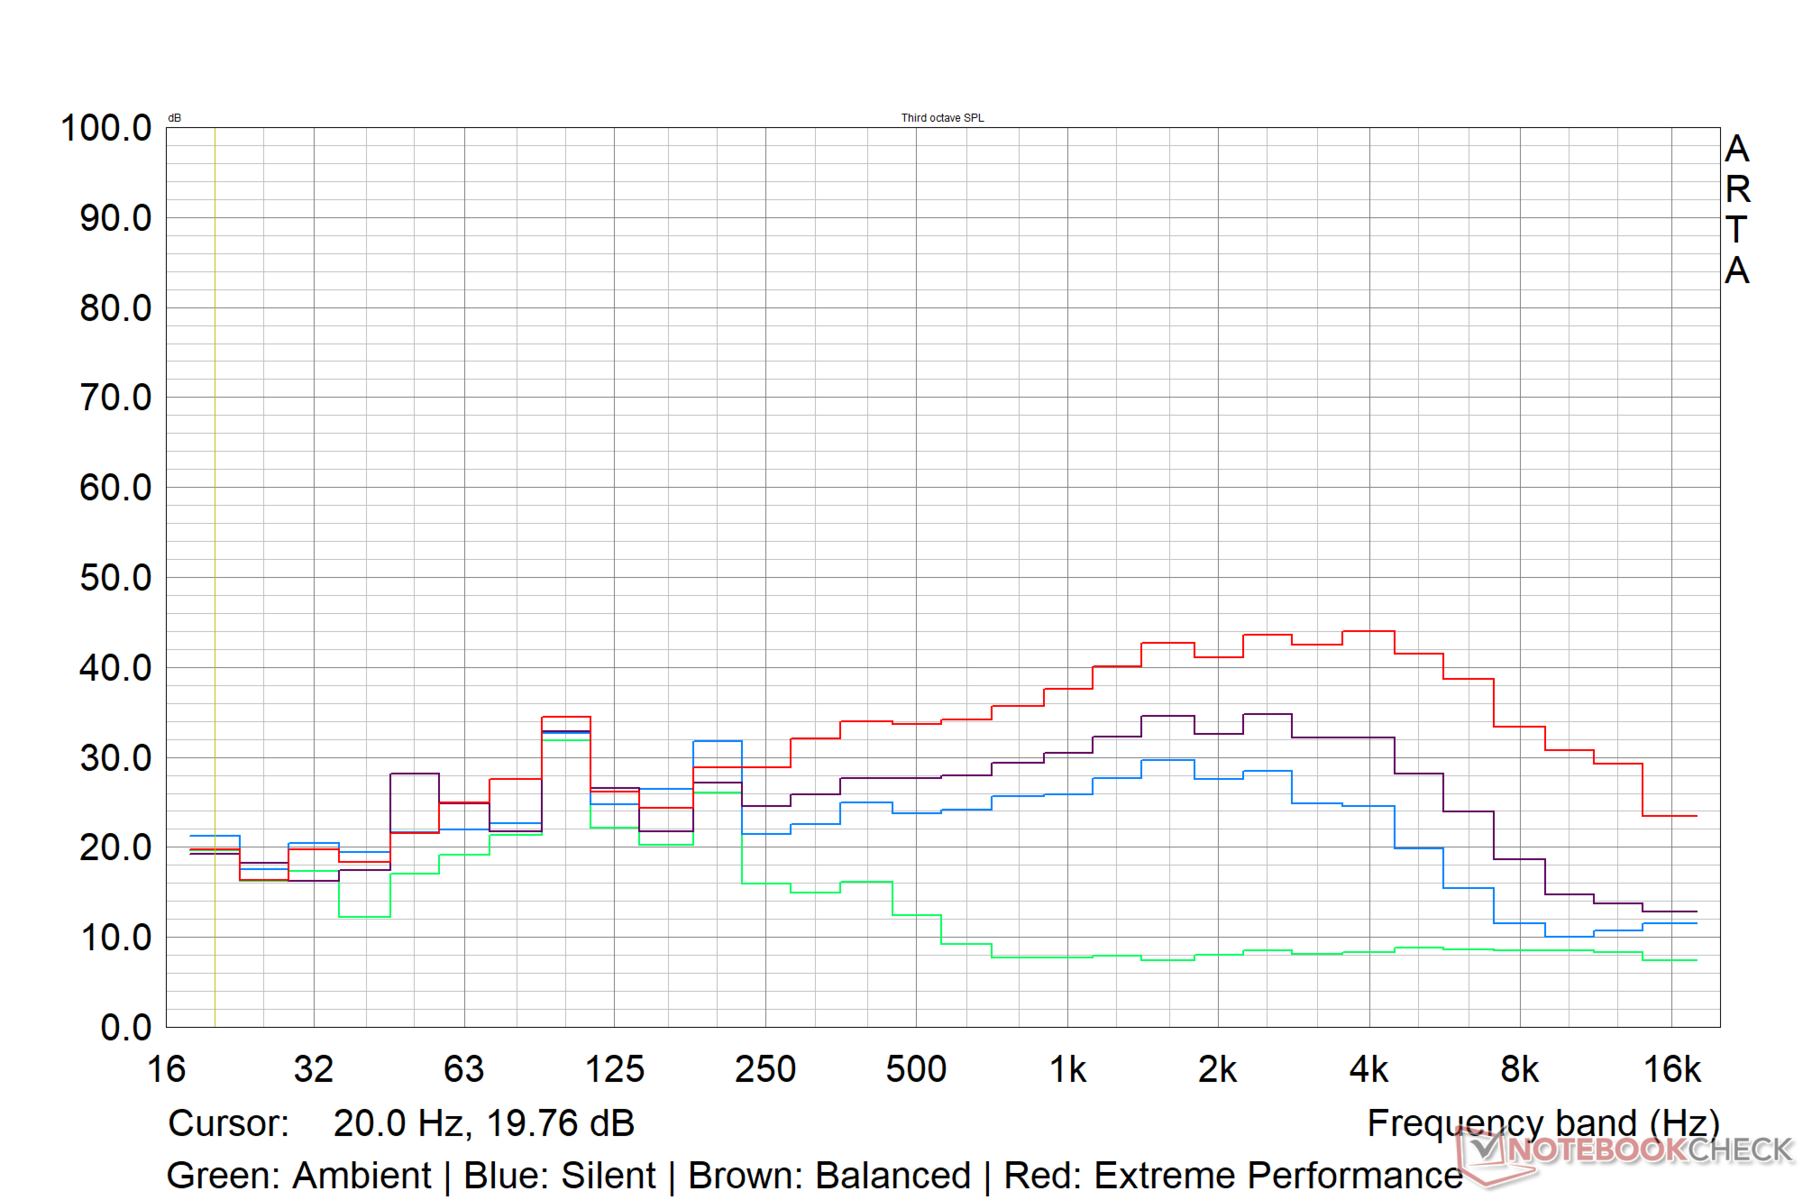
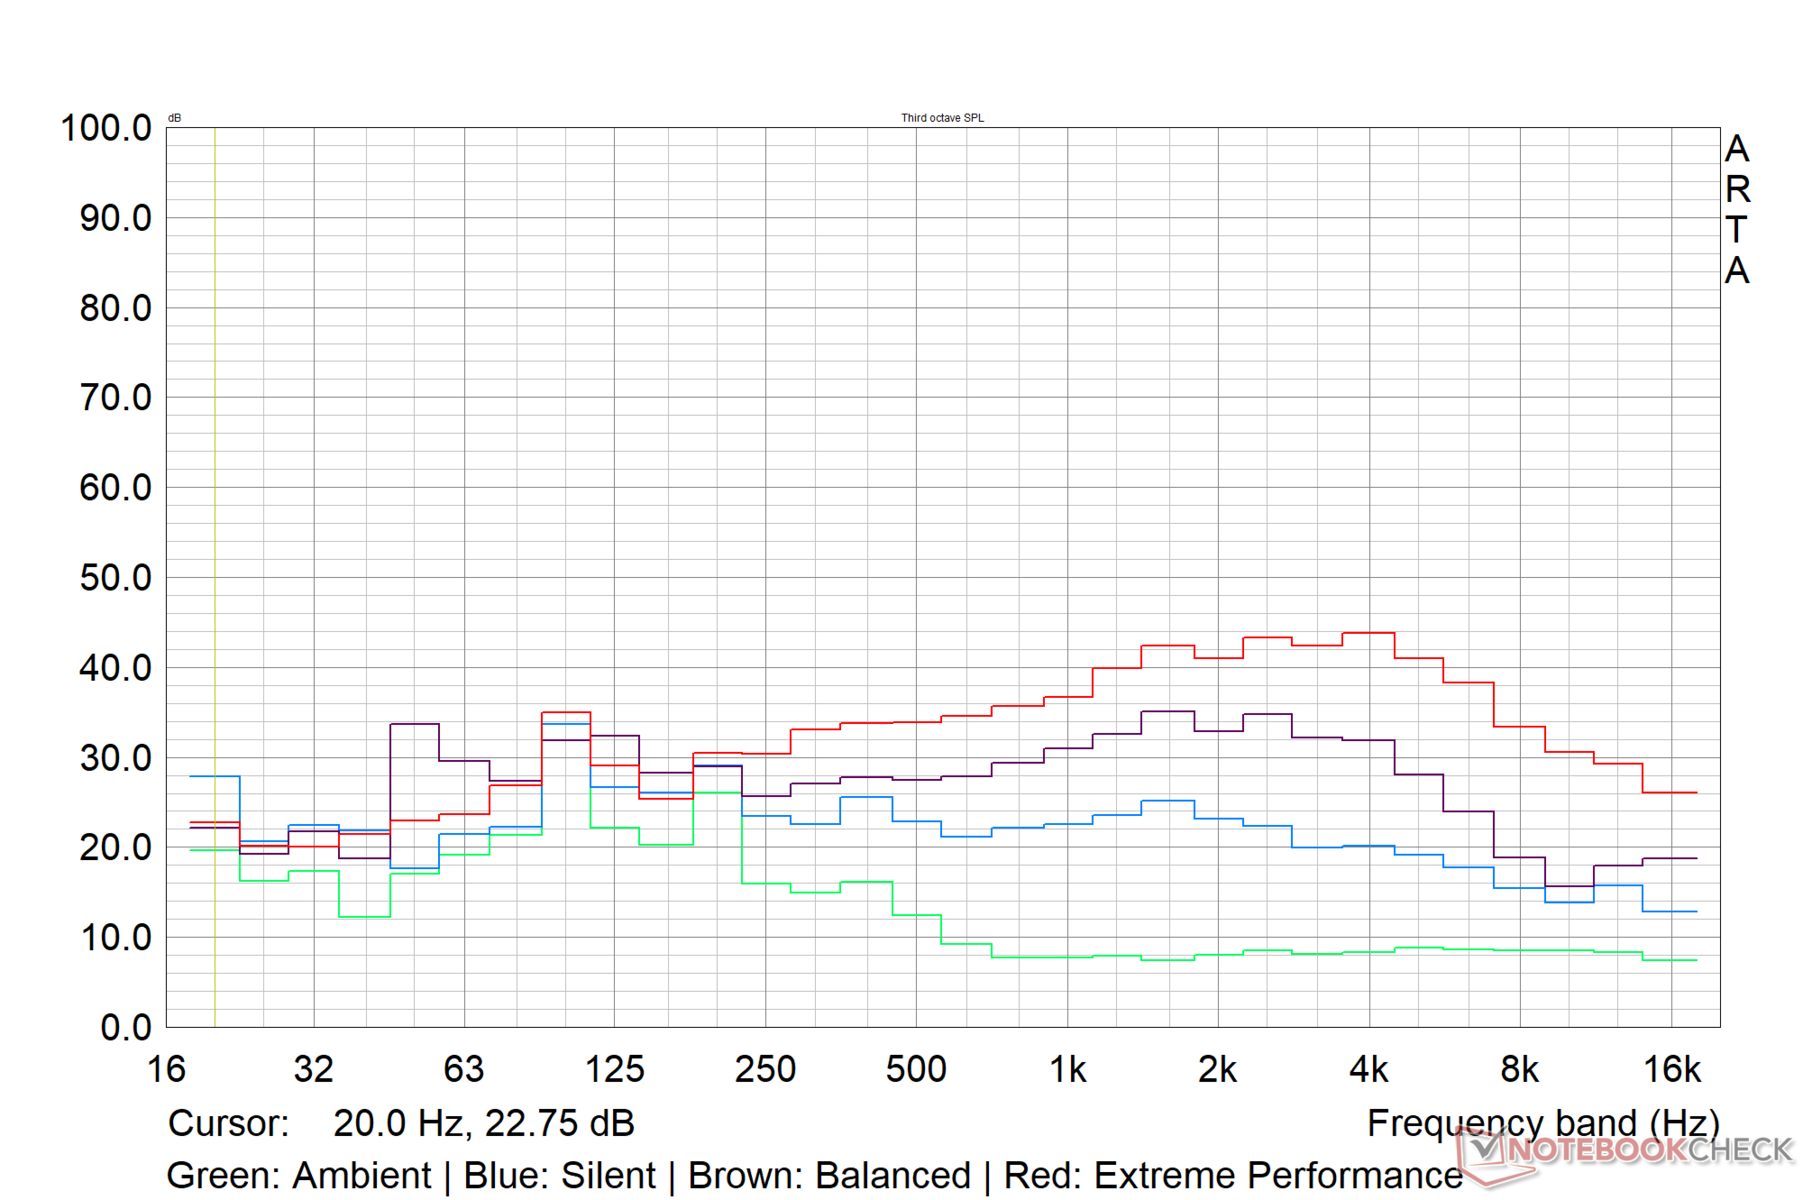
El ruido del ventilador en la configuración por defecto Equilibrada es bastante tolerable incluso bajo carga. MSI parece haber limitado el ruido máximo del ventilador del Crosshair 15 R6E a unos 45 db(A) en este modo.
La configuración de Rendimiento Extremo ve el nivel de presión sonora (SPL) aumentar a la marca de 52 dB(A). El SPL está limitado a menos de 40 dB(A) en el perfil Silencioso.
| Ajuste de rendimiento | Al ralentí dB(A) | Carga media dB(A) | Carga máxima dB(A) | El Witcher 3 dB(A) |
|---|---|---|---|---|
| Silencioso | 25,98 | 33,09 | 37,69 | 34 |
| Equilibrado | 26,14 | 44,33 | 43,20 | 43,34 |
| Rendimiento extremo | 26,14 | 50,07 | 52,66 | 52,43 |
Ruido
| Ocioso |
| 26.14 / 26.14 / 26.14 dB(A) |
| Carga |
| 44.33 / 43.2 dB(A) |
 | ||
30 dB silencioso 40 dB(A) audible 50 dB(A) ruidosamente alto |
||
min: | ||
| MSI Crosshair 15 R6E B12UGZ-050 Intel Core i7-12700H, NVIDIA GeForce RTX 3070 Laptop GPU | MSI Stealth GS66 12UGS Intel Core i7-12700H, NVIDIA GeForce RTX 3070 Ti Laptop GPU | Lenovo Legion 5 Pro 16 G7 i7 RTX 3070Ti Intel Core i7-12700H, NVIDIA GeForce RTX 3070 Ti Laptop GPU | Asus TUF Dash F15 FX517ZR Intel Core i7-12650H, NVIDIA GeForce RTX 3070 Laptop GPU | Schenker XMG Neo 15 (Ryzen 9 6900HX, RTX 3070 Ti) AMD Ryzen 9 6900HX, NVIDIA GeForce RTX 3070 Ti Laptop GPU | |
|---|---|---|---|---|---|
| Noise | -14% | -12% | -13% | -7% | |
| apagado / medio ambiente * (dB) | 22.82 | 24 -5% | 24.6 -8% | 26 -14% | 23 -1% |
| Idle Minimum * (dB) | 26.14 | 31 -19% | 28.4 -9% | 26 1% | 23 12% |
| Idle Average * (dB) | 26.14 | 32 -22% | 28.4 -9% | 32 -22% | 25.82 1% |
| Idle Maximum * (dB) | 26.14 | 35 -34% | 28.4 -9% | 33 -26% | 27.3 -4% |
| Load Average * (dB) | 44.33 | 48 -8% | 49.4 -11% | 48 -8% | 42.7 4% |
| Witcher 3 ultra * (dB) | 43.3 | 43 1% | 49.4 -14% | 47 -9% | 56 -29% |
| Load Maximum * (dB) | 43.2 | 48 -11% | 54.7 -27% | 49 -13% | 56 -30% |
* ... más pequeño es mejor
Temperatura
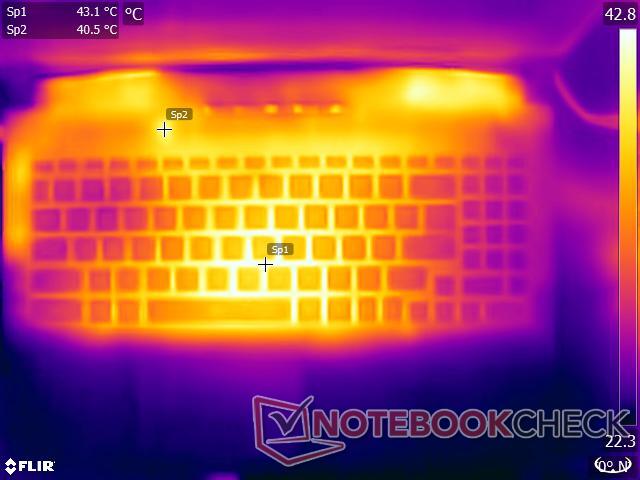
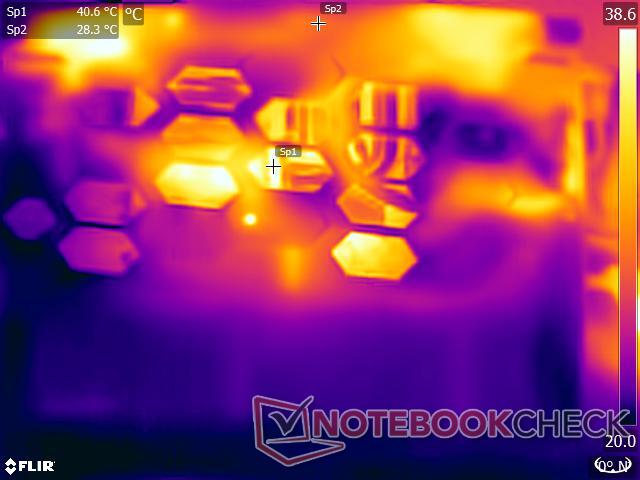
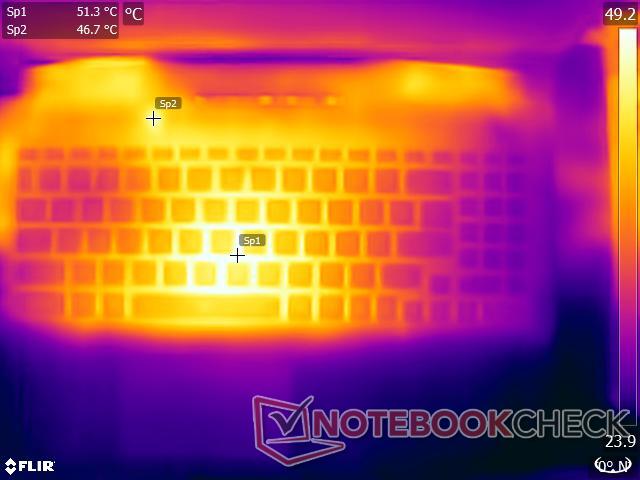
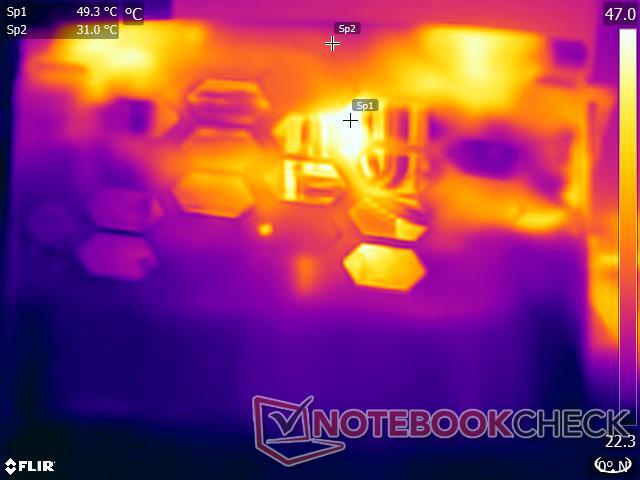
Las temperaturas superficiales son tolerables durante la mayoría de tareas de productividad que no llevan a la CPU y la GPU al límite. Bajo una carga combinada de Prime95 y FurMark, registramos temperaturas superficiales de hasta 48 °C en ambos lados de la unidad. Esto aumenta a casi 55 °C mientras se estresa con The Witcher 3 a 1080p Ultra
Las zonas del touchpad y el reposamuñecas se mantuvieron relativamente frías durante toda la prueba.
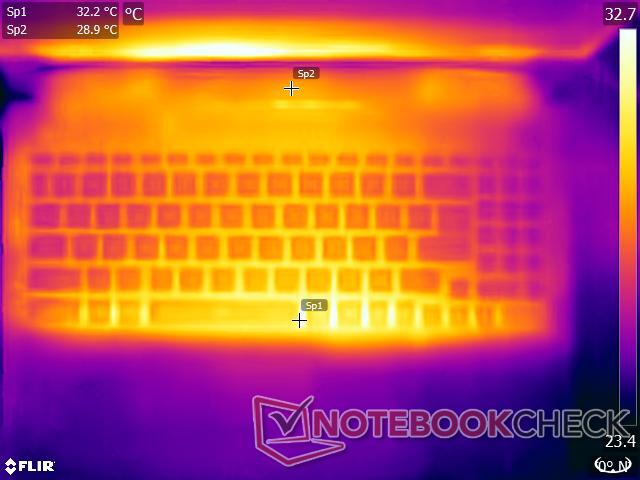
(-) La temperatura máxima en la parte superior es de 48.4 °C / 119 F, frente a la media de 40.4 °C / 105 F, que oscila entre 21.2 y 68.8 °C para la clase Gaming.
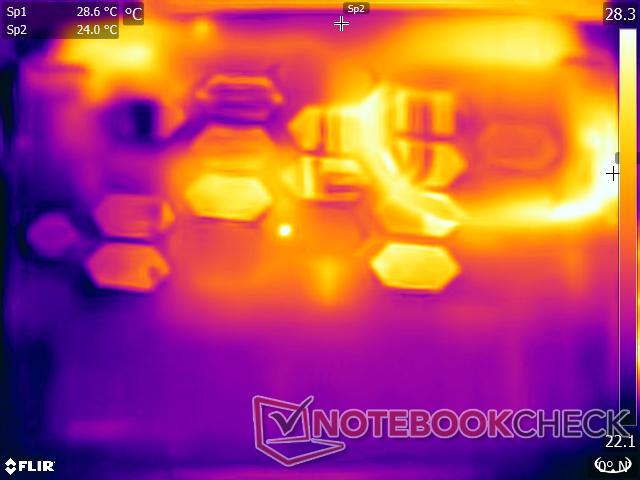
(-) El fondo se calienta hasta un máximo de 48.2 °C / 119 F, frente a la media de 43.2 °C / 110 F
(+) En reposo, la temperatura media de la parte superior es de 30.6 °C / 87# F, frente a la media del dispositivo de 33.9 °C / 93 F.
(-) Jugando a The Witcher 3, la temperatura media de la parte superior es de 43.5 °C / 110 F, frente a la media del dispositivo de 33.9 °C / 93 F.
(+) Los reposamanos y el panel táctil alcanzan como máximo la temperatura de la piel (32.8 °C / 91 F) y, por tanto, no están calientes.
(-) La temperatura media de la zona del reposamanos de dispositivos similares fue de 28.8 °C / 83.8 F (-4 °C / -7.2 F).
Aunque nuestras pruebas de estrés representan escenarios extremos, recomendamos optar por los modos de rendimiento Silencioso o Equilibrado si deseas utilizar el dispositivo sobre el regazo.
| MSI Crosshair 15 R6E B12UGZ-050 Intel Core i7-12700H, NVIDIA GeForce RTX 3070 Laptop GPU | MSI Stealth GS66 12UGS Intel Core i7-12700H, NVIDIA GeForce RTX 3070 Ti Laptop GPU | Lenovo Legion 5 Pro 16 G7 i7 RTX 3070Ti Intel Core i7-12700H, NVIDIA GeForce RTX 3070 Ti Laptop GPU | Asus TUF Dash F15 FX517ZR Intel Core i7-12650H, NVIDIA GeForce RTX 3070 Laptop GPU | Schenker XMG Neo 15 (Ryzen 9 6900HX, RTX 3070 Ti) AMD Ryzen 9 6900HX, NVIDIA GeForce RTX 3070 Ti Laptop GPU | |
|---|---|---|---|---|---|
| Heat | 2% | -1% | -6% | 6% | |
| Maximum Upper Side * (°C) | 48.4 | 54 -12% | 45.3 6% | 52 -7% | 41 15% |
| Maximum Bottom * (°C) | 48.2 | 59 -22% | 61.2 -27% | 52 -8% | 57 -18% |
| Idle Upper Side * (°C) | 34 | 26 24% | 28.6 16% | 33 3% | 28 18% |
| Idle Bottom * (°C) | 32.4 | 27 17% | 31.4 3% | 36 -11% | 30 7% |
* ... más pequeño es mejor
Prueba de resistencia
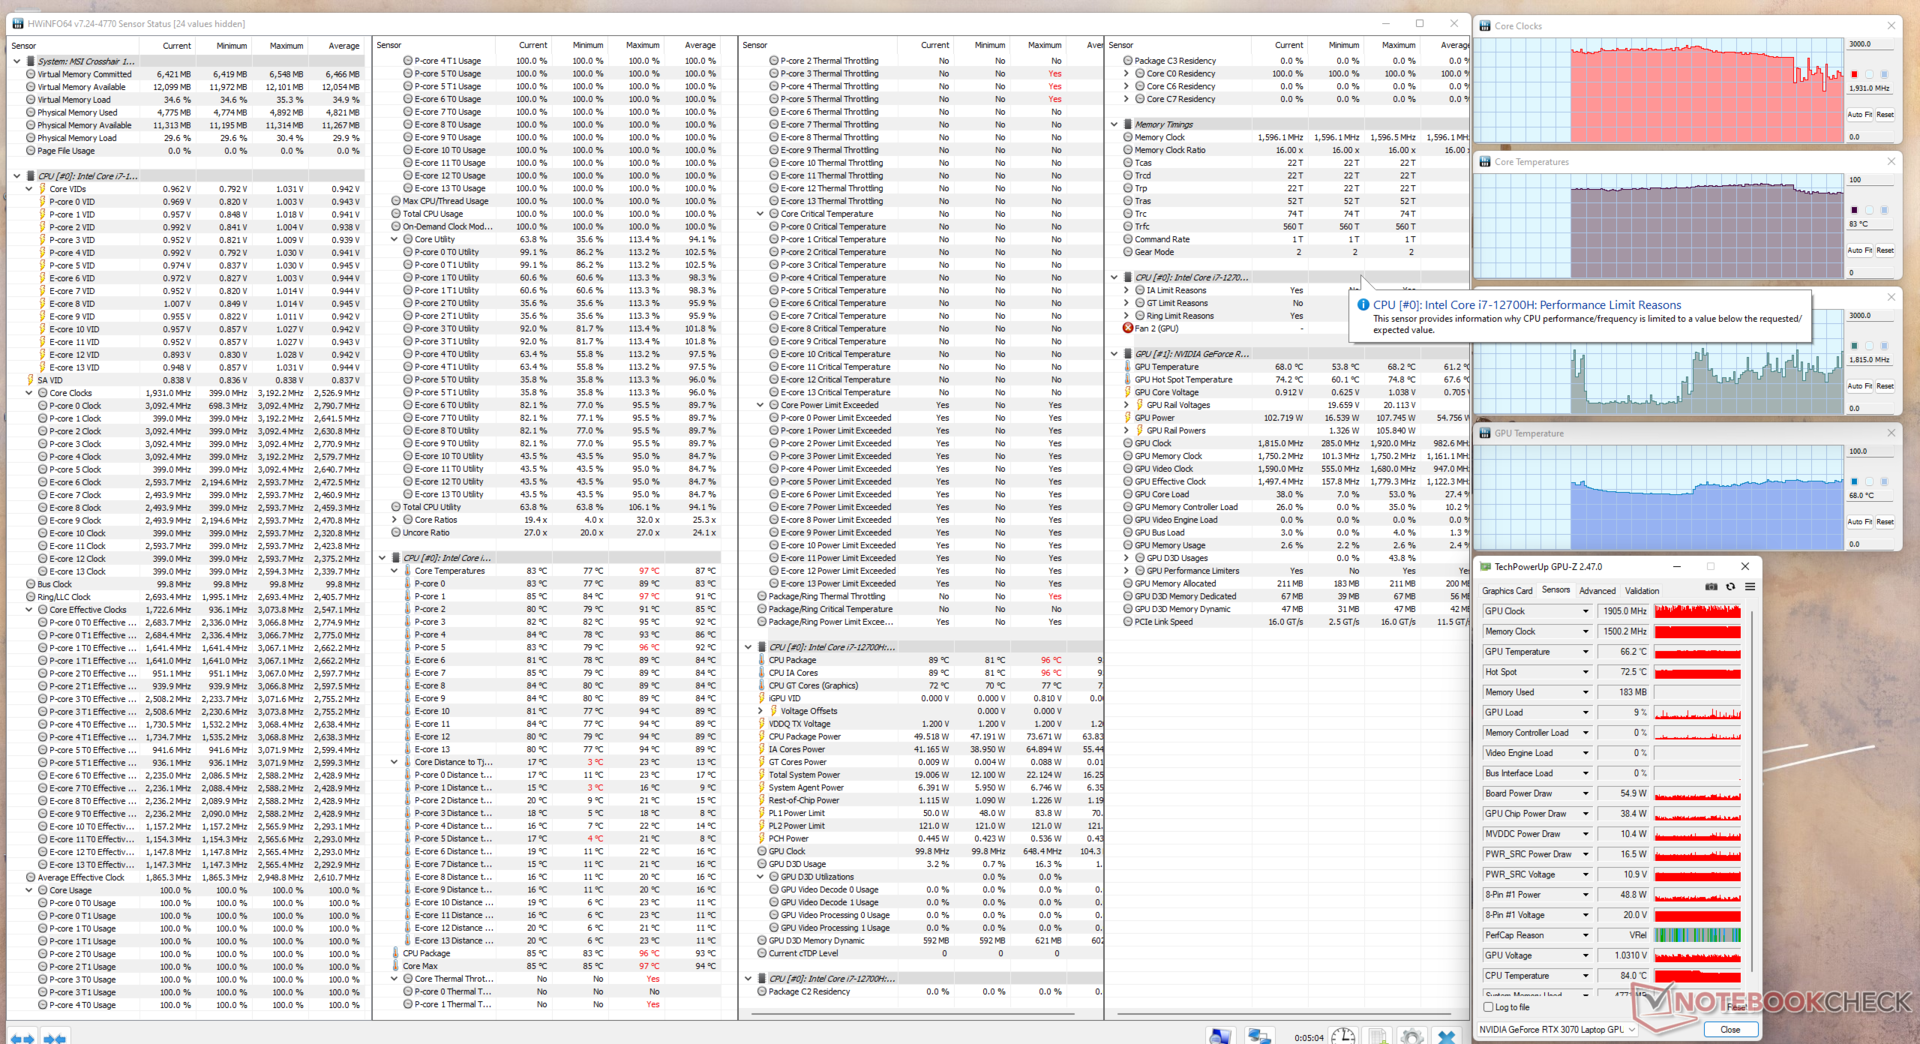
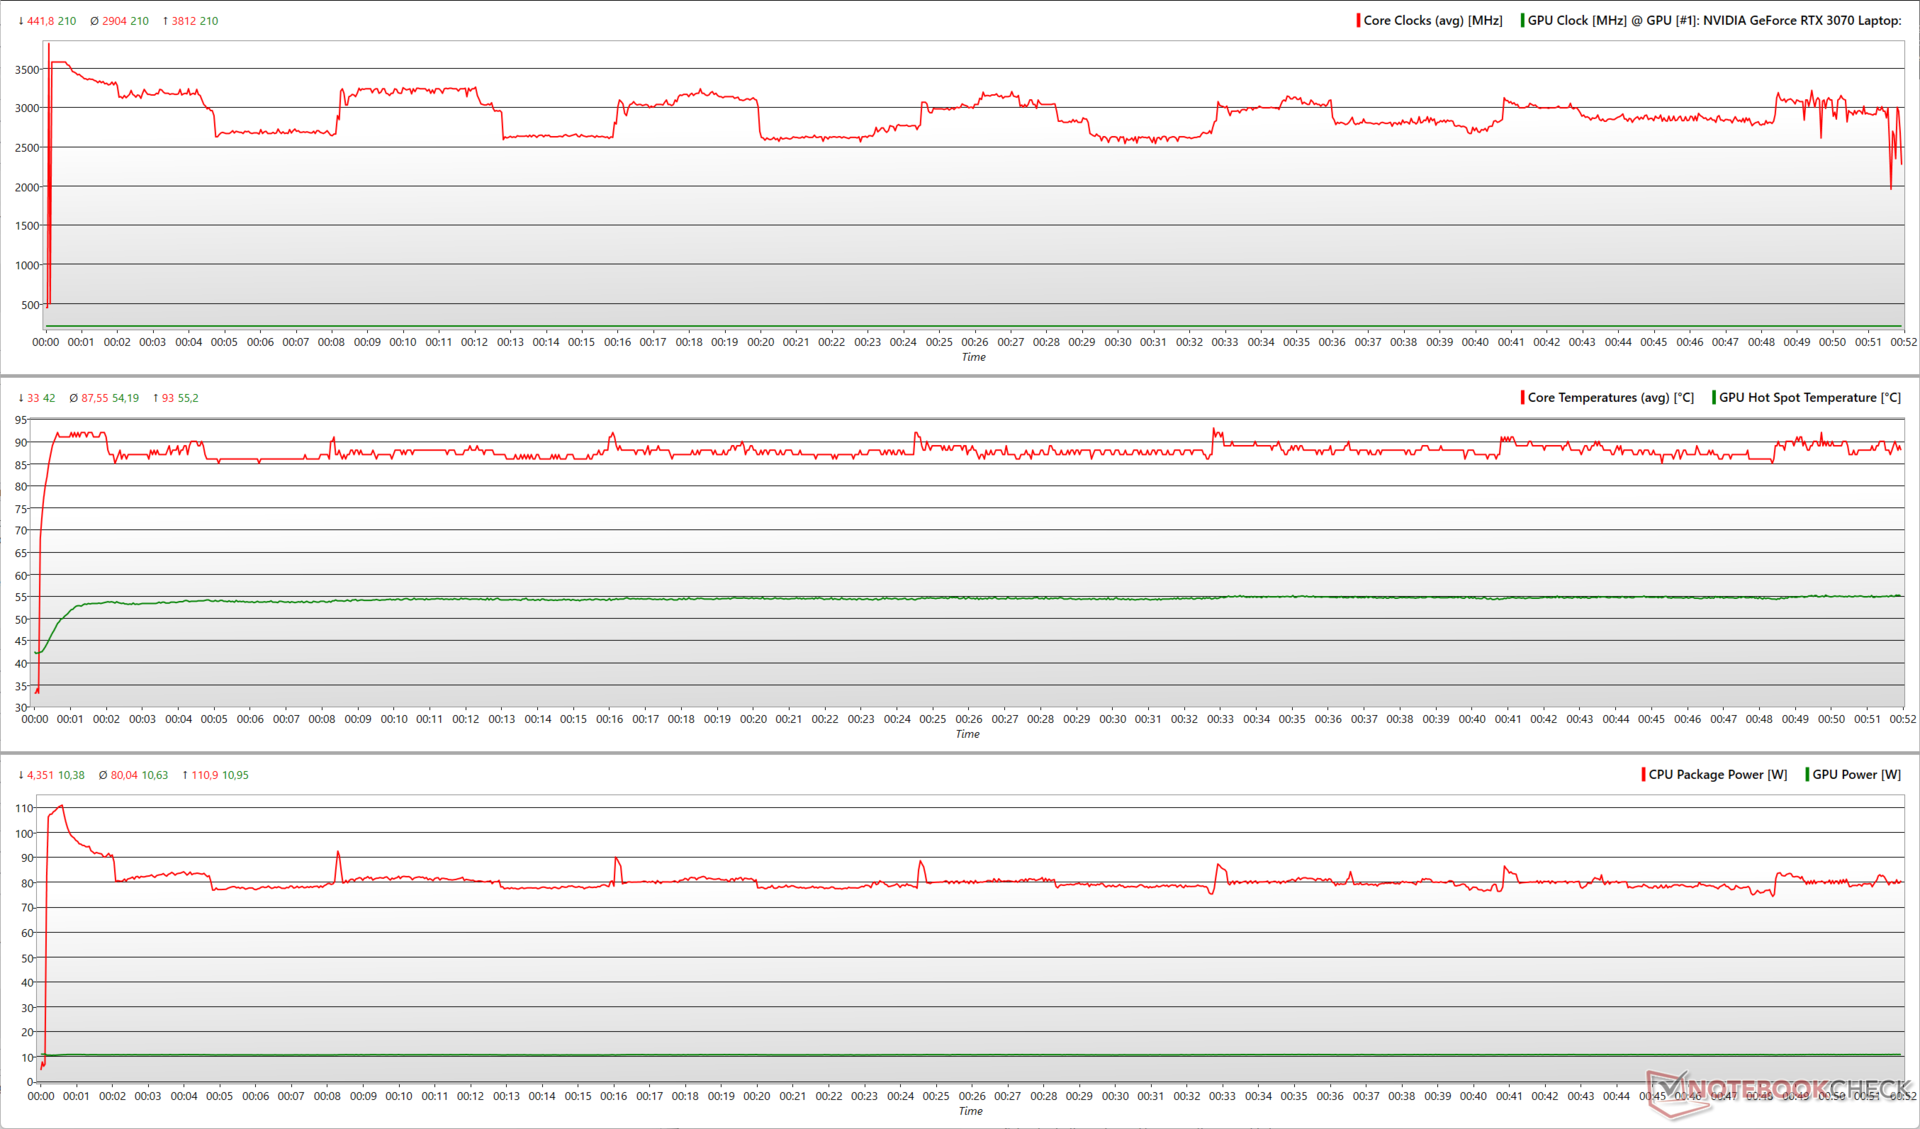
Durante el estrés Prime95, vemos que el Core i7-12700H es capaz de acelerar hasta los 3.8 GHz consumiendo 111 W. Sin embargo, la media de frecuencias de núcleo está más en el rango de los 2.9 GHz con una potencia media de paquete de unos 80 W. El procesador puede alcanzar los 93 °C durante este estrés.
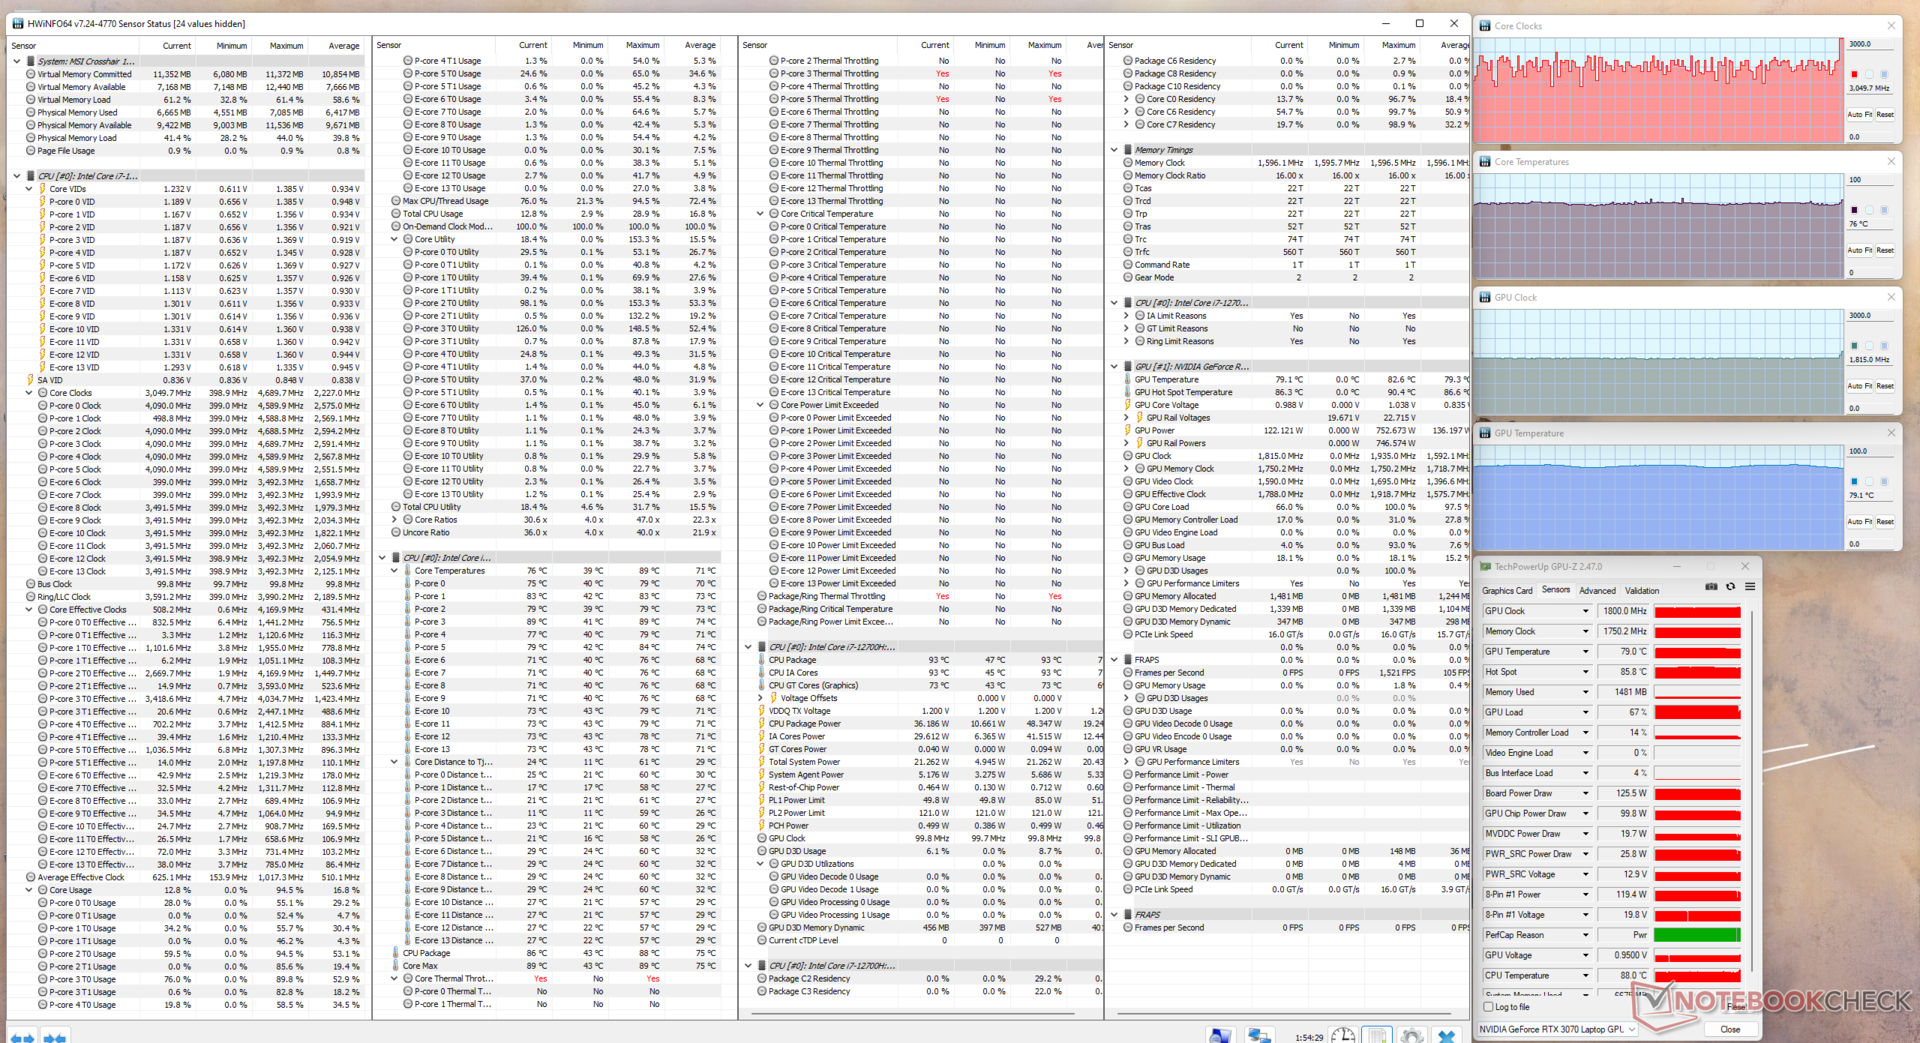
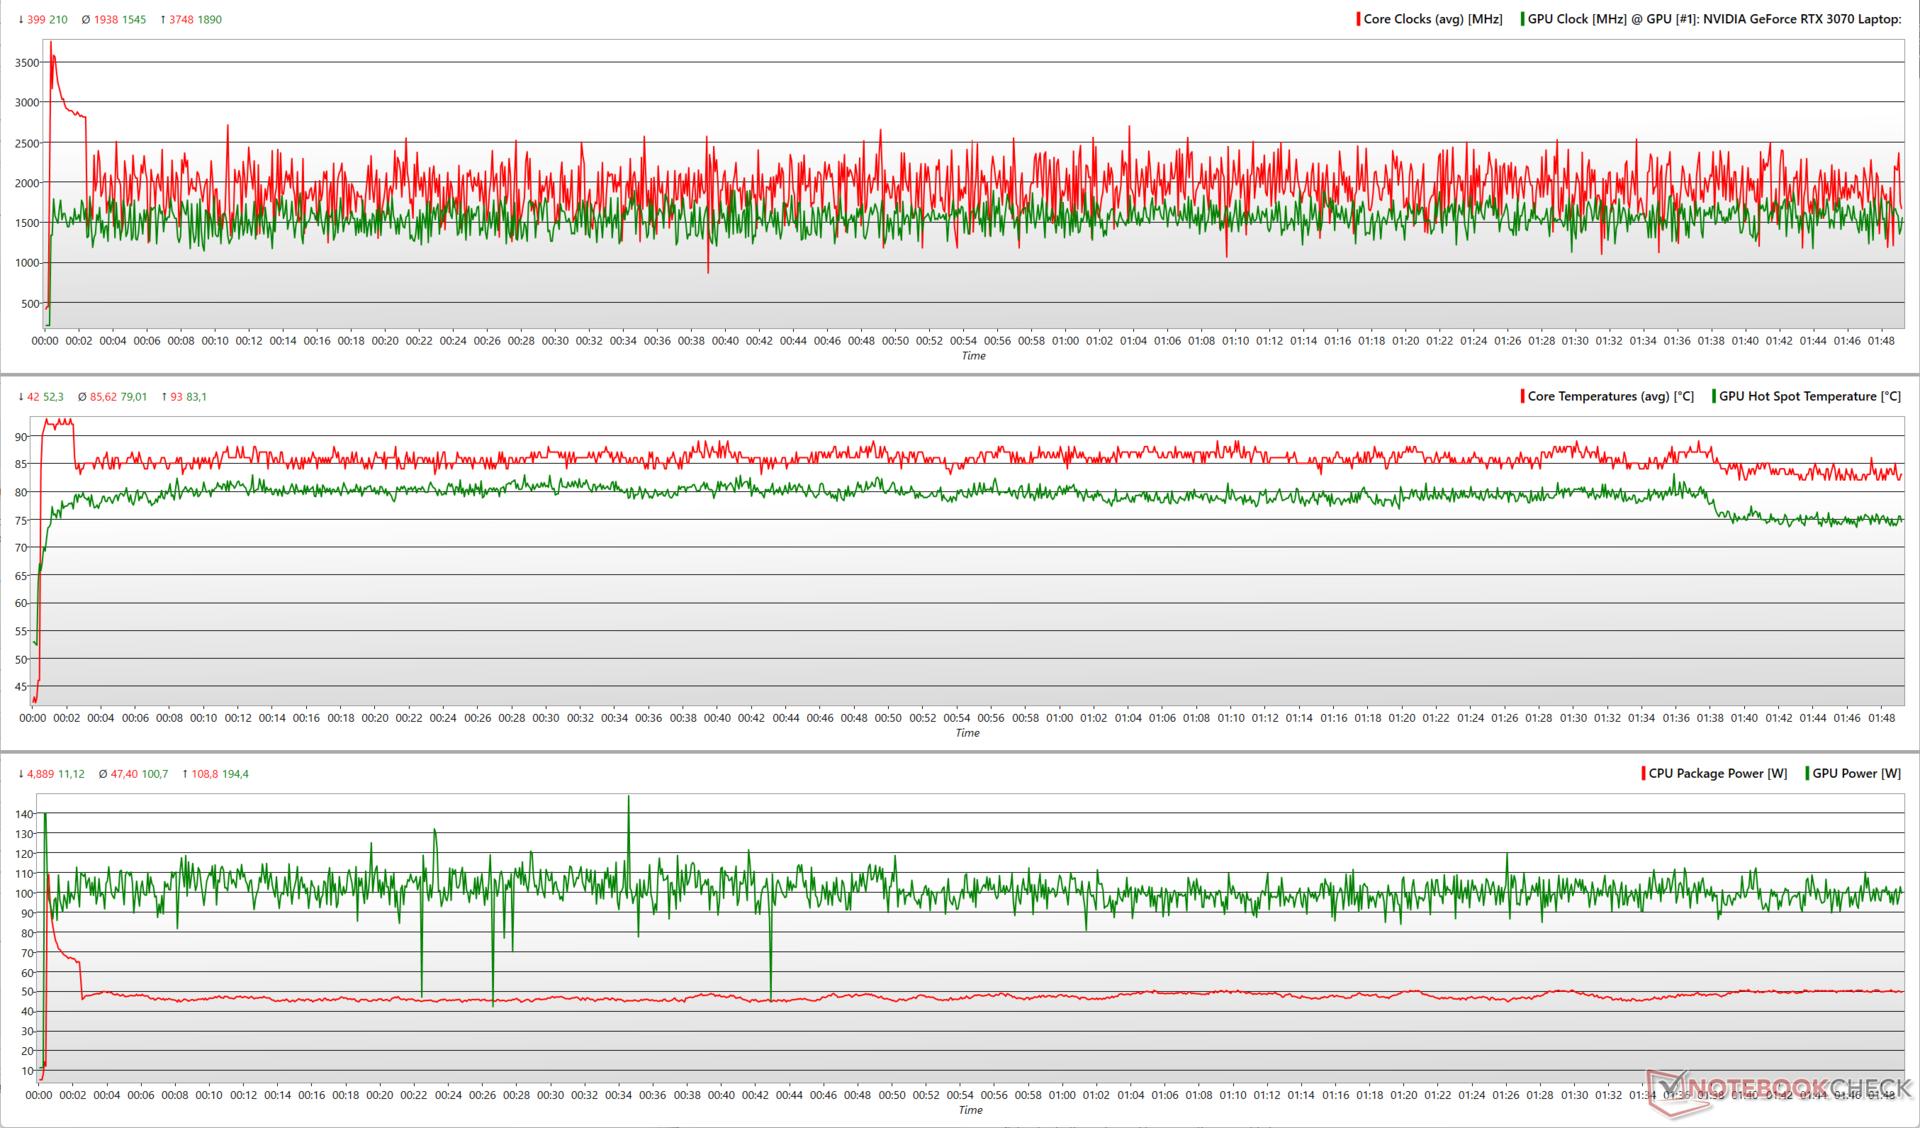
Al añadir FurMark, el Crosshair 15 R6E desplaza una parte del presupuesto total de energía a la RTX 3070. Esto se traduce en una reducción del promedio de frecuencias de reloj del núcleo de la CPU a 1,9 GHz con una caída de la potencia media del paquete a 47,4 W. La RTX 3070 es capaz de alcanzar cerca de su pico de reloj de 1,9 GHz y mantenerse a 1,54 GHz. Al hacerlo, la GPU consume cerca de 195 W de potencia máxima y una media de unos 101 W. Las temperaturas medias de la CPU y la GPU rondan los 85,6 °C y 79 °C, respectivamente.
El estrés de Witcher 3 a 1080p Ultra ve una distribución más equitativa de la energía, con el Core i7-12700H pudiendo trabajar ahora a velocidades medias de 2,2 GHz y la RTX 3070 también subiendo ligeramente a 1,6 GHz. La mayor velocidad media de la GPU se produce a expensas de un mayor consumo medio de energía de 138,5 W
Curiosamente, observamos que el Core i7-12700H es capaz de alcanzar un reloj más alto con algo menos de 20 W de consumo medio. Las temperaturas medias durante el estrés de Witcher 3 rondan los 71,4 °C y 88 °C para la CPU y la GPU, respectivamente.
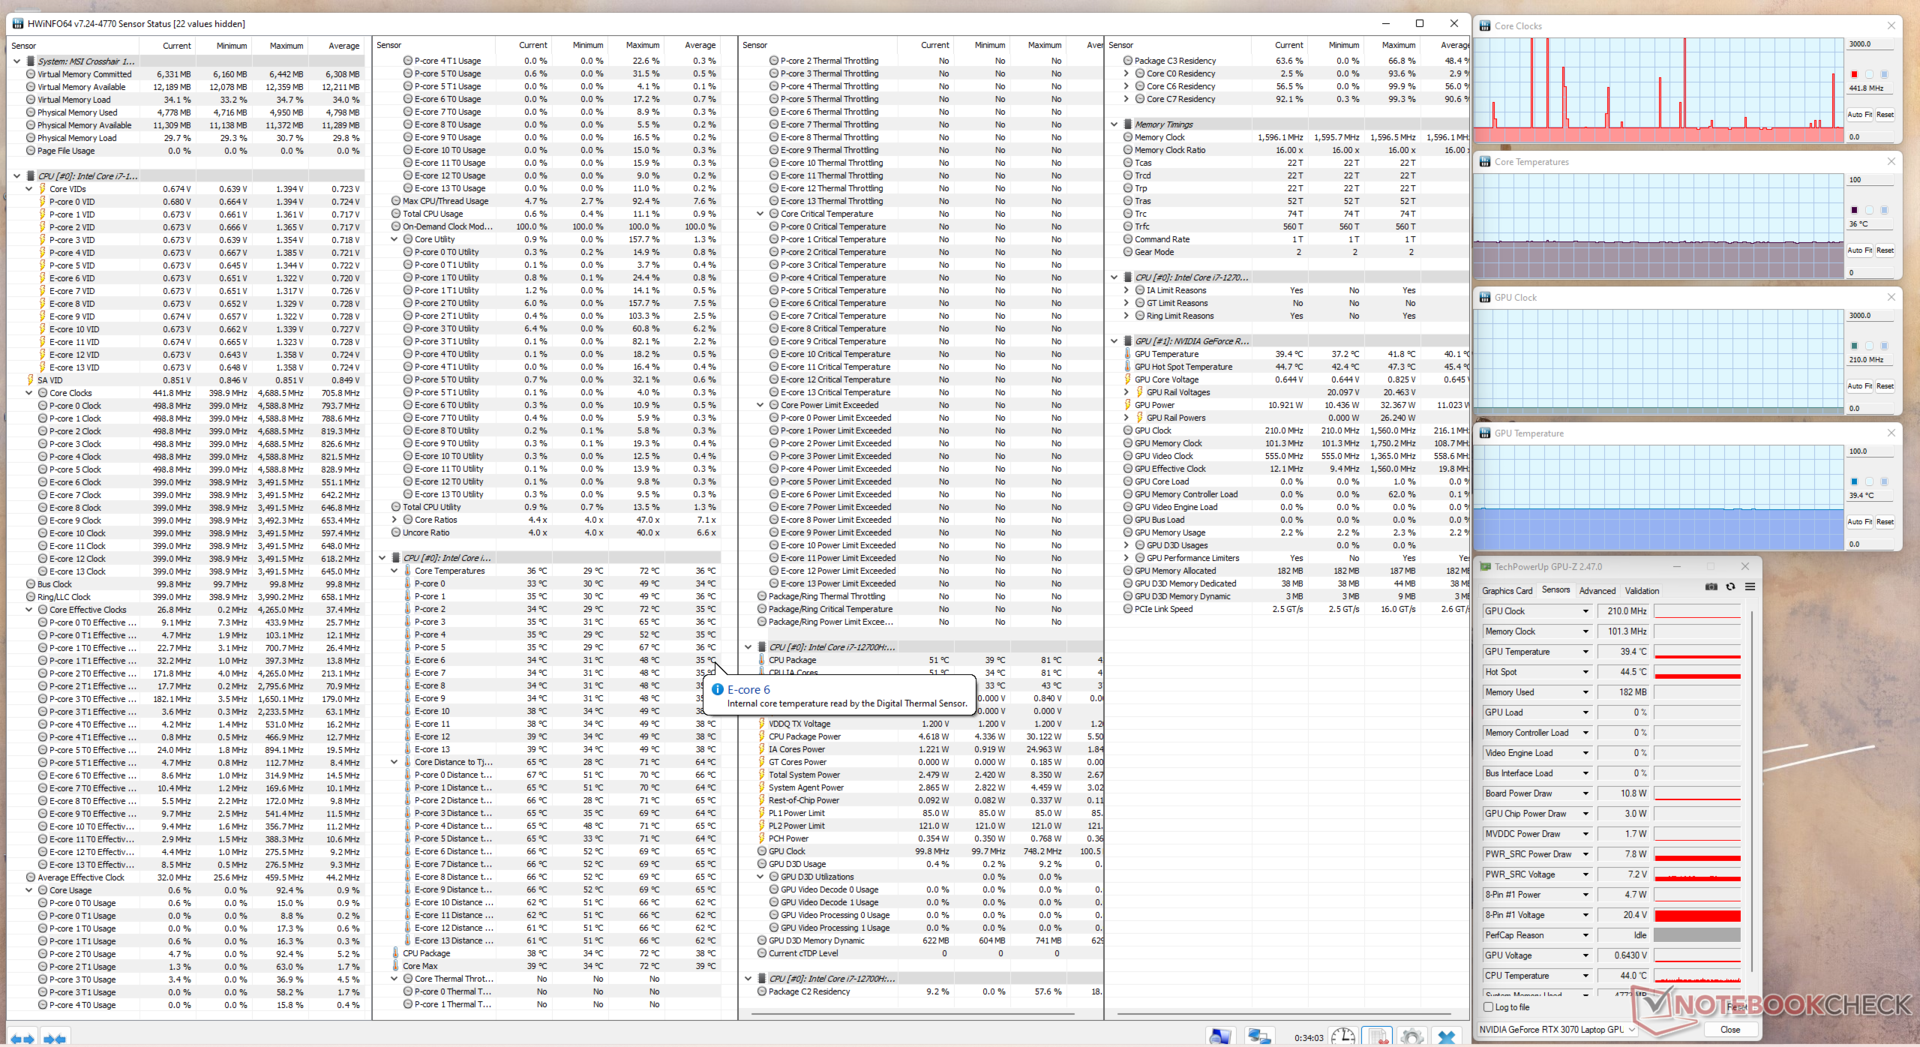
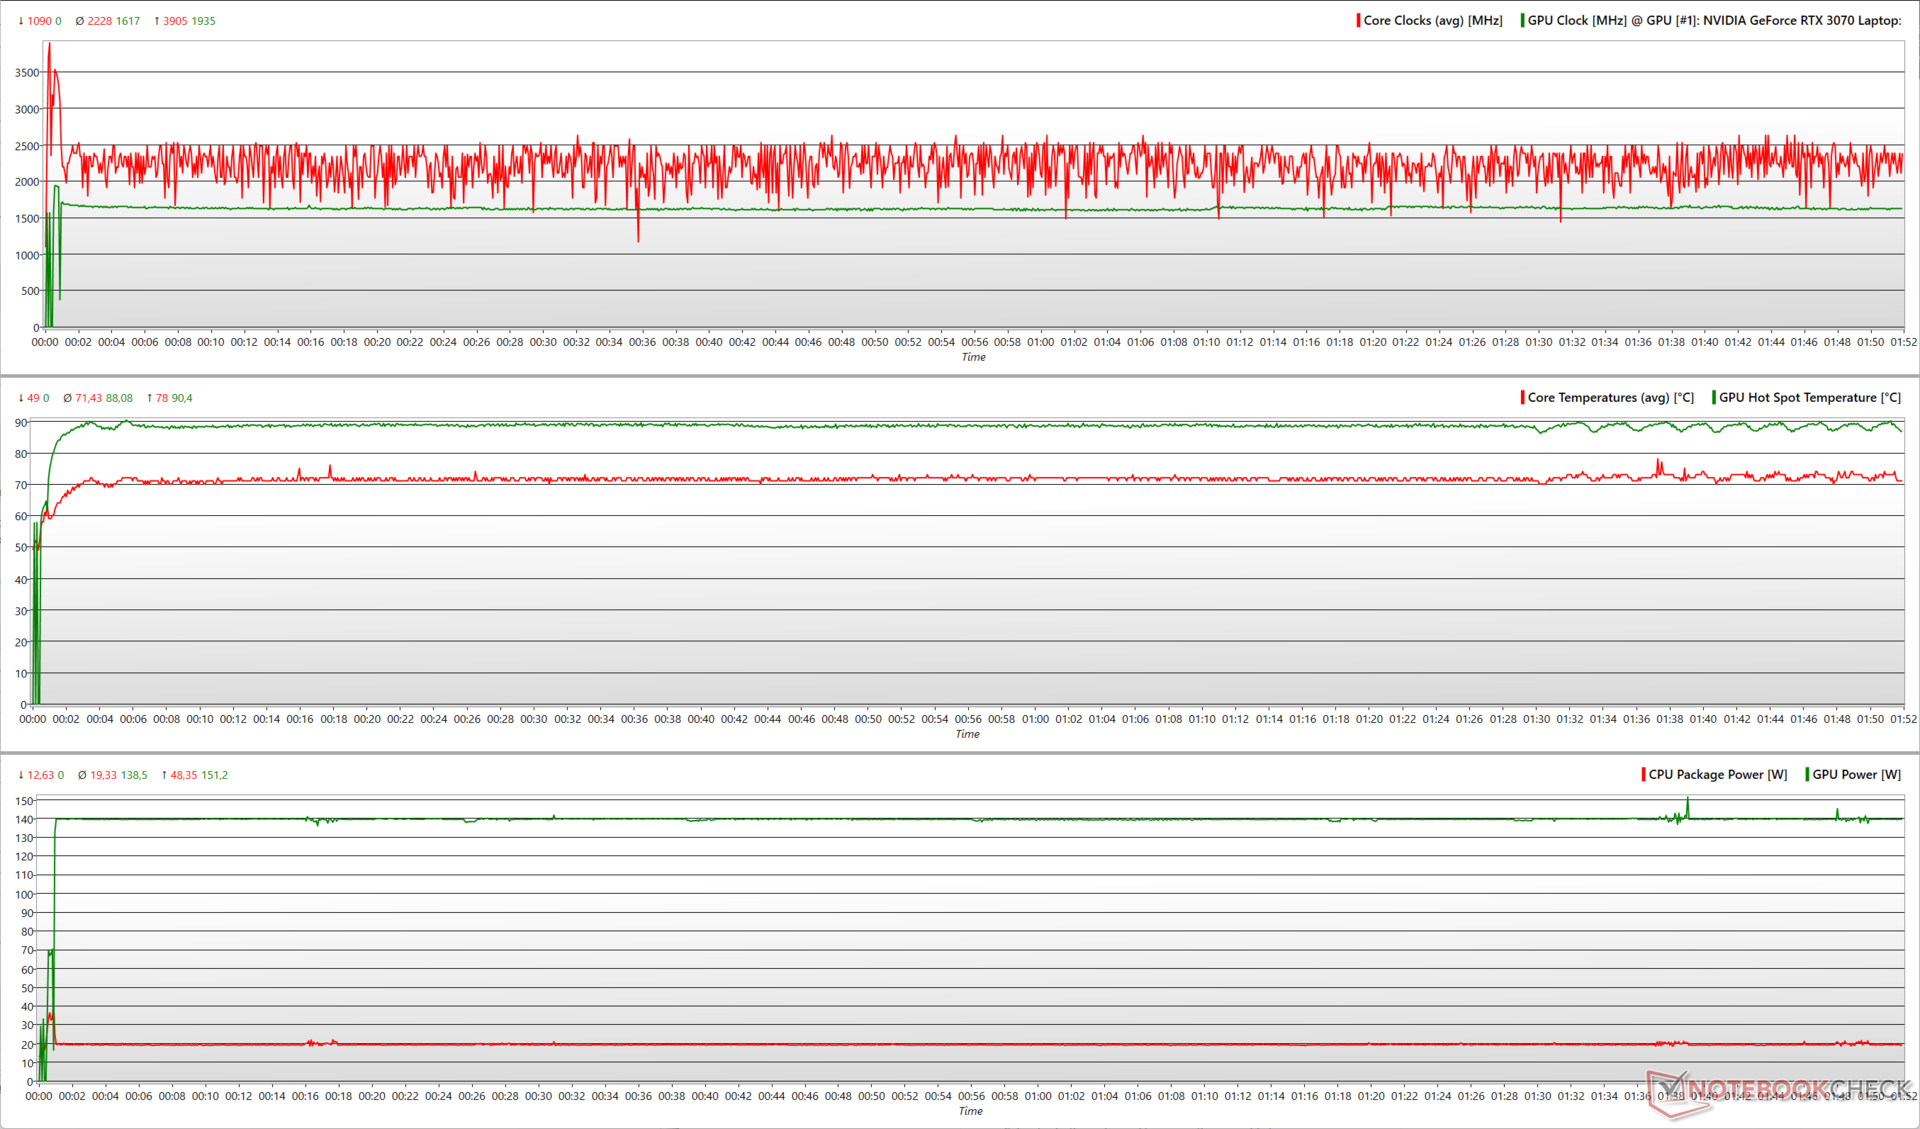
| Prueba de estrés | Relojdela CPU (GHz) | Reloj de la GPU (MHz) | Temperatura media dela CPU (°C) | Temperatura media de la GPU (°C) |
| Sistema en reposo | 0,4 | 210 | 36 | 40,1 |
| Prime95 | 2,53 | 210 | 51 | 41,3 |
| Prime95+ FurMark | 1,93 | 1,81 | 87 | 61,2 |
| El Witcher 3 | 3,04 | 1,81 | 71 | 79,3 |
Altavoces
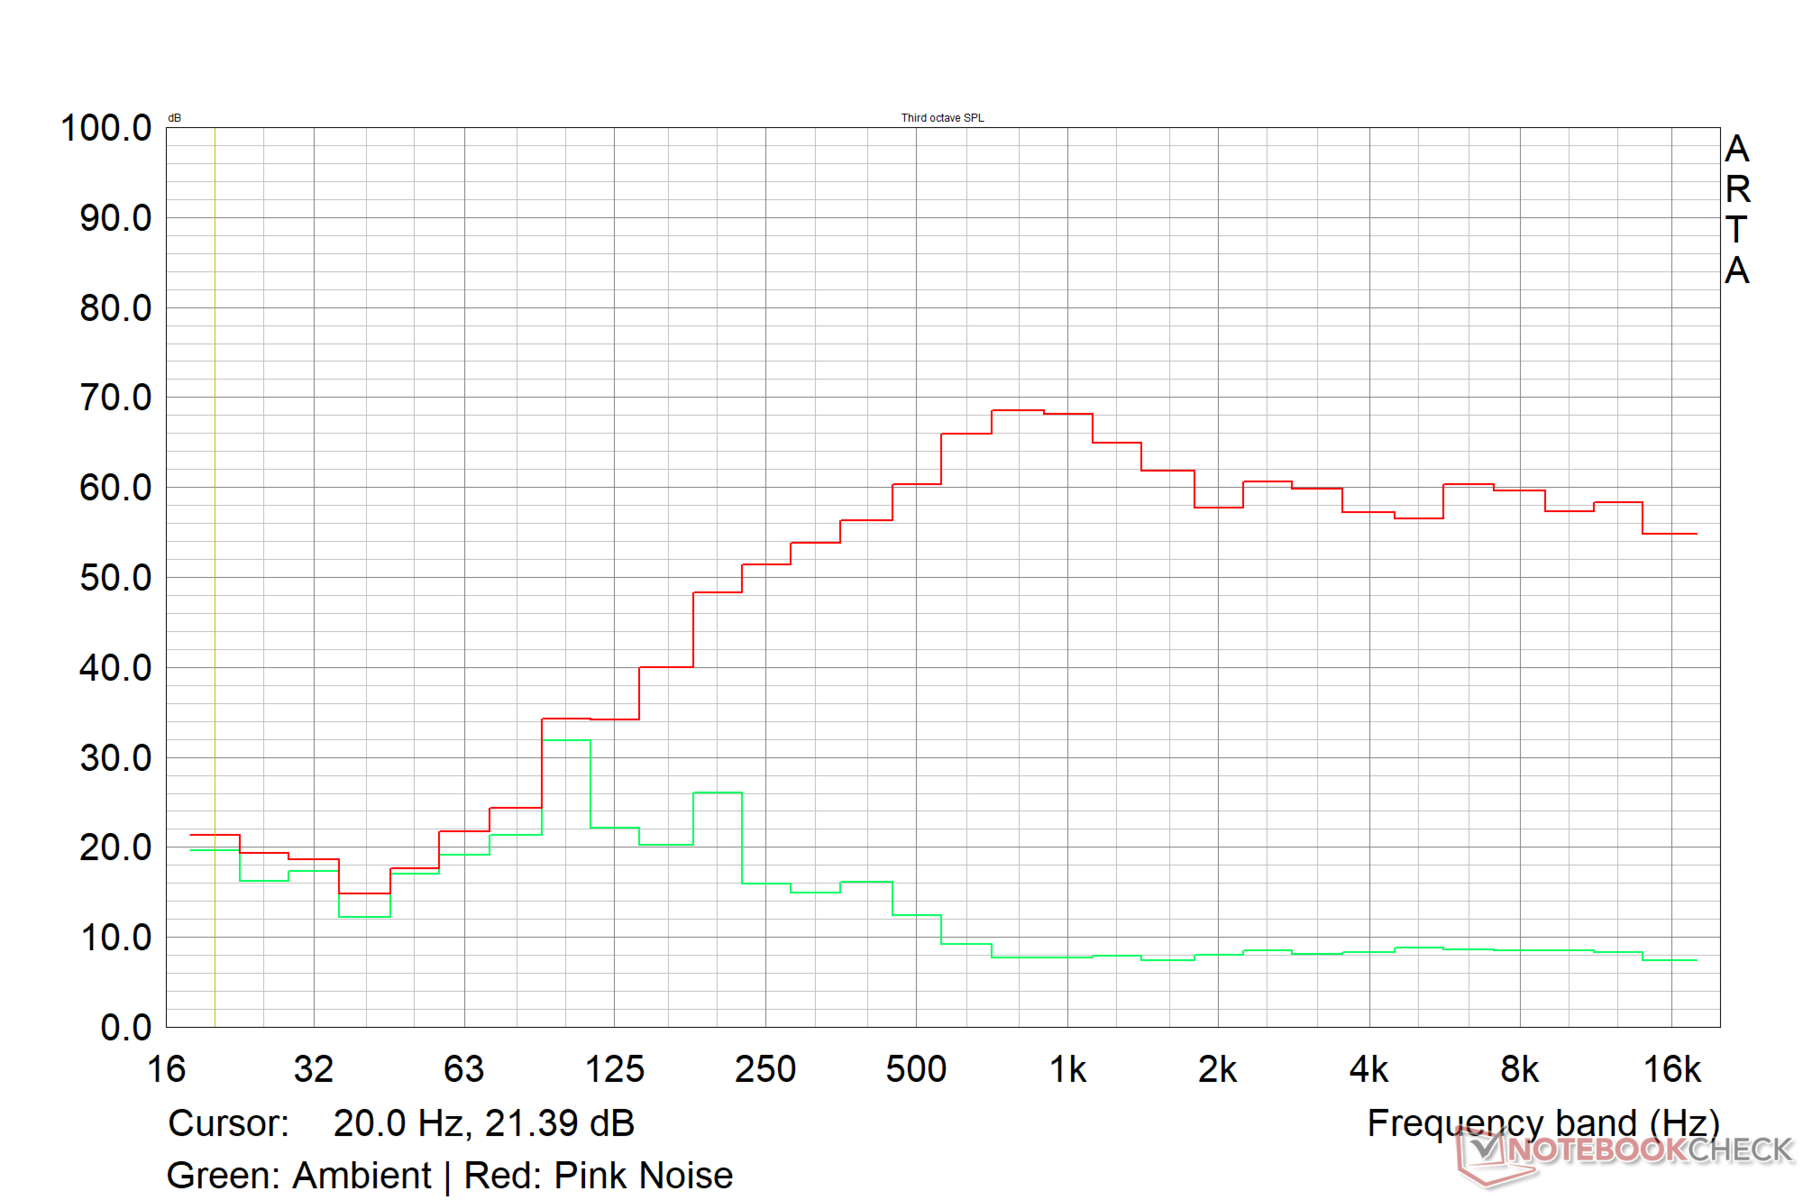
El Crosshair 15 R6E cuenta con 2 altavoces de 2 W que producen una sonoridad de 74,6 dB(A). La respuesta de graves es pasable, pero los medios y agudos son claramente discernibles sin distorsión. La calidad del sonido es aceptable para un consumo multimedia básico en una habitación de tamaño medio.
Se puede conectar audio externo mediante Bluetooth 5.2 o el conector de audio combinado de 3,5 mm.
MSI Crosshair 15 R6E B12UGZ-050 análisis de audio
(±) | la sonoridad del altavoz es media pero buena (74.6 dB)
Graves 100 - 315 Hz
(±) | lubina reducida - en promedio 14.1% inferior a la mediana
(±) | la linealidad de los graves es media (10% delta a frecuencia anterior)
Medios 400 - 2000 Hz
(±) | medias más altas - de media 5.6% más altas que la mediana
(+) | los medios son lineales (6.5% delta a la frecuencia anterior)
Altos 2 - 16 kHz
(+) | máximos equilibrados - a sólo 1.7% de la mediana
(+) | los máximos son lineales (4% delta a la frecuencia anterior)
Total 100 - 16.000 Hz
(±) | la linealidad del sonido global es media (15.1% de diferencia con la mediana)
En comparación con la misma clase
» 32% de todos los dispositivos probados de esta clase eran mejores, 6% similares, 62% peores
» El mejor tuvo un delta de 6%, la media fue 18%, el peor fue ###max##%
En comparación con todos los dispositivos probados
» 21% de todos los dispositivos probados eran mejores, 4% similares, 75% peores
» El mejor tuvo un delta de 4%, la media fue 23%, el peor fue ###max##%
Apple MacBook Pro 16 2021 M1 Pro análisis de audio
(+) | los altavoces pueden reproducir a un volumen relativamente alto (#84.7 dB)
Graves 100 - 315 Hz
(+) | buen bajo - sólo 3.8% lejos de la mediana
(+) | el bajo es lineal (5.2% delta a la frecuencia anterior)
Medios 400 - 2000 Hz
(+) | medios equilibrados - a sólo 1.3% de la mediana
(+) | los medios son lineales (2.1% delta a la frecuencia anterior)
Altos 2 - 16 kHz
(+) | máximos equilibrados - a sólo 1.9% de la mediana
(+) | los máximos son lineales (2.7% delta a la frecuencia anterior)
Total 100 - 16.000 Hz
(+) | el sonido global es lineal (4.6% de diferencia con la mediana)
En comparación con la misma clase
» 0% de todos los dispositivos probados de esta clase eran mejores, 0% similares, 100% peores
» El mejor tuvo un delta de 5%, la media fue 17%, el peor fue ###max##%
En comparación con todos los dispositivos probados
» 0% de todos los dispositivos probados eran mejores, 0% similares, 100% peores
» El mejor tuvo un delta de 4%, la media fue 23%, el peor fue ###max##%
Gestión de la energía: Consumo elevado con carga máxima
Consumo de energía
Incluso en el perfil de Rendimiento Extremo, el consumo de energía parece relativamente económico para el hardware que ofrece. El Asus TUF Dash F15 es 30% más económico que el Crosshair 15 R6E en las pruebas de carga máxima y The Witcher 3 debido a su CPU y GPU de menor vataje
La fuente de alimentación tiene una potencia nominal de 240 W, pero observamos consumos de hasta 290 W durante una carga combinada de Prime95 y FurMark. La fluctuación del consumo de energía durante esta ejecución está en consonancia con la fluctuación de los relojes de la CPU y la GPU que habíamos observado durante la prueba de estrés anterior.
| Off / Standby | |
| Ocioso | |
| Carga |
|
Clave:
min: | |
| MSI Crosshair 15 R6E B12UGZ-050 i7-12700H, GeForce RTX 3070 Laptop GPU, IPS-Level, 2560x1440, 15.6" | MSI Stealth GS66 12UGS i7-12700H, GeForce RTX 3070 Ti Laptop GPU, IPS-Level, 2560x1440, 15.6" | Lenovo Legion 5 Pro 16 G7 i7 RTX 3070Ti i7-12700H, GeForce RTX 3070 Ti Laptop GPU, IPS, 2560x1600, 16" | Asus TUF Dash F15 FX517ZR i7-12650H, GeForce RTX 3070 Laptop GPU, IPS, 2560x1440, 15.6" | Schenker XMG Neo 15 (Ryzen 9 6900HX, RTX 3070 Ti) R9 6900HX, GeForce RTX 3070 Ti Laptop GPU, IPS, 2560x1440, 15.6" | Medio NVIDIA GeForce RTX 3070 Laptop GPU | Media de la clase Gaming | |
|---|---|---|---|---|---|---|---|
| Power Consumption | -7% | -10% | 2% | -11% | -36% | -25% | |
| Idle Minimum * (Watt) | 9.6 | 11 -15% | 8.6 10% | 10 -4% | 13 -35% | 15.6 ? -63% | 13 ? -35% |
| Idle Average * (Watt) | 14.1 | 16 -13% | 17.6 -25% | 14 1% | 17 -21% | 20.1 ? -43% | 19 ? -35% |
| Idle Maximum * (Watt) | 14.96 | 23 -54% | 18.5 -24% | 20 -34% | 20 -34% | 29.4 ? -97% | 24.6 ? -64% |
| Load Average * (Watt) | 107.3 | 110 -3% | 110 -3% | 122 -14% | 89 17% | 110.8 ? -3% | 110.7 ? -3% |
| Witcher 3 ultra * (Watt) | 197 | 151 23% | 227 -15% | 138.6 30% | 200 -2% | ||
| Load Maximum * (Watt) | 289.93 | 230 21% | 294.6 -2% | 189 35% | 260 10% | 214 ? 26% | 259 ? 11% |
* ... más pequeño es mejor
Power Consumption - The Witcher 3 / Stress test
Power Consumption - External monitor
Duración de la batería
Las pruebas de batería se realizaron en el perfil Equilibrado con la frecuencia de refresco de pantalla a 60 Hz. Nuestro Crosshair 15 R6E B12UGZ venía equipado con una batería de 4 celdas de 90 WHr que ofrece tiempos de ejecución decentes en nuestra prueba estandarizada de navegación Wi-Fi a 150 nits. La reproducción de vídeo no llega a las 9 horas a 150 nits con todas las radios apagadas.
MSI también ofrece la variante Crosshair R6E B12UEZ que viene con una batería de 3 celdas y 56.5 WHr.
| MSI Crosshair 15 R6E B12UGZ-050 i7-12700H, GeForce RTX 3070 Laptop GPU, 90 Wh | MSI Stealth GS66 12UGS i7-12700H, GeForce RTX 3070 Ti Laptop GPU, 99.9 Wh | Lenovo Legion 5 Pro 16 G7 i7 RTX 3070Ti i7-12700H, GeForce RTX 3070 Ti Laptop GPU, 80 Wh | Asus TUF Dash F15 FX517ZR i7-12650H, GeForce RTX 3070 Laptop GPU, 76 Wh | Schenker XMG Neo 15 (Ryzen 9 6900HX, RTX 3070 Ti) R9 6900HX, GeForce RTX 3070 Ti Laptop GPU, 93 Wh | Media de la clase Gaming | |
|---|---|---|---|---|---|---|
| Duración de Batería | 4% | -35% | 18% | 34% | 5% | |
| H.264 (h) | 8.9 | 6.3 -29% | 5.8 -35% | 10.7 20% | 8.32 ? -7% | |
| WiFi v1.3 (h) | 7.3 | 5.4 -26% | 5.4 -26% | 7 -4% | 10.9 49% | 7.11 ? -3% |
| Witcher 3 ultra (h) | 1.6 | |||||
| Load (h) | 1.2 | 1.6 33% | 0.6 -50% | 2.3 92% | 1.6 33% | 1.502 ? 25% |
| Reader / Idle (h) | 7.8 | 10.8 | 8.27 ? |
Pro
Contra
Veredicto: El reskin de Pulse GL66 hace muchas cosas bien
Los portátiles temáticos de juegos específicos suelen tener un atractivo limitado más allá de los aficionados a dicho juego. El MSI Crosshair 15 Rainbow Six: Extraction Edition, que lleva el nombre de la popular franquicia de FPS cooperativo de Ubisoft, es el único Crosshair 15 de este año
El chasis es esencialmente un refrito del Pulse GL66 con elementos de diseño muy prestados del juego. MSI incluso ha llegado al extremo de sustituir su propio logotipo en la tapa de la pantalla por el de Rainbow Six: Extraction. Además, la caja incluye un ratón con la temática del juego, una alfombrilla de ratón y una copia Deluxe del juego
Como tal, el Crosshair 15 R6E hereda algunas deficiencias del diseño del Pulse GL66, como la flexión en la cubierta del teclado y una distribución de puertos no ideal. Sin embargo, el portátil viene con una pantalla QHD de 165 Hz muy funcional que debería ser un buen augurio tanto para los juegos como para la creación de contenidos.
El diseño del MSI Crosshair 15 Rainbow Six: Extraction puede tener un atractivo limitado, pero bajo la piel tienes un midranger muy capaz con buenas características de pantalla y emisiones tolerables"
La implementación del Core i7-12700H del Crosshair 15 R6E no es la más rápida que hemos visto. El MSI Stealth GS66 y el Lenovo Legion 5i Pro 16 G7 con el mismo procesador rinden perceptiblemente mejor en las pruebas multi-core. El rendimiento general del Crosshair 15 R6E en juegos puede ser mejor o igual que el de algunos portátiles con RTX 3070 Ti como el Schenker XMG Neo 15, Acer Nitro 5y el MSI Katana GF66
Las emisiones térmicas y de ruido son en gran medida tolerables siempre que estés bien con el perfil de rendimiento equilibrado. Sin embargo, el consumo de energía está en el lado más alto, especialmente con el consumo de energía bajo carga máxima y juegos
Incluso si no eres un fan del juego, el MSI Crosshair 15 Rainbow Six: Extraction Edition merece una consideración teniendo en cuenta el rendimiento que ofrece y el precio en relación con la competencia.
Precio y disponibilidad
El MSI Crosshair 15 Rainbow Six: Extraction Edition está disponible en Amazon US por 2.149 dólares. En la India, el portátil cuesta alrededor de 1.90.990 euros, pero actualmente está agotado en Amazon India y Flipkart.
MSI Crosshair 15 R6E B12UGZ-050
- 12/19/2022 v7 (old)
Vaidyanathan Subramaniam
Price comparison

