Intel Celeron N4100

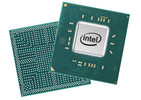
El Intel Pentium N4100 es un SoC quad-core hecho principalmente para portátiles económicos y fue anunciado a finales del 2017. Funciona a 1,1-2,4 GHz (Single Core Burst, Multi Core Burst máx. 2,3 GHz) y se basa en la plataforma Gemini Lake. Similar al predecesor Apollo Lake, el chip se fabrica en un proceso de 14 nm con FinFETs pero ofrece núcleos de procesador ligeramente mejorados, duplica la cantidad de caché L2, un paquete más pequeño, una nueva generación de salidas de monitor (Gen 10) y un chip WiFi parcialmente integrado. Además de cuatro núcleos de CPU, el chip también incluye una GPU con soporte para DirectX 12, así como un controlador de memoria DDR4/LPDDR4 (dual-channel, hasta 2400 MHz). El SoC no es reemplazable ya que está directamente soldado a la tarjeta madre.
Arquitectura
La arquitectura del procesador fue ligeramente modificada y ahora se llama Goldmont Plus. Cuenta con un caché aumentado de nivel 2 (a 4 MB). Eso significa que el rendimiento por velocidad debería ser un poco mejor, pero no cerca de las CPUs Core como Kaby Lake Y.
Rendimiento
El rendimiento de la CPU del Celeron N4100 es, gracias a la arquitectura de CPU ligeramente revisada y a la velocidad boost más alta de 200 MHz, ligeramente mejor que el antiguo Celeron N3450 y debe alcanzar el nivel del antiguo Pentium N4200 (1,1 - 2,5 GHz, 2 MB L2, Apollo Lake). En comparación con los procesadores Core Y más caros, especialmente el rendimiento single thread es mucho menor en los SoCs basados en Gemini Lake. Aun así, para tareas básicas como Office Suite, navegación con multitarea moderada, el rendimiento del procesador debería estar bien.
Rendimiento de la GPU
La UHD Graphics 600 (Gemini Lake) se basa en la arquitectura Gen9 de Intel, que soporta DirectX 12 y también es utilizada para los adaptadores gráficos Kaby Lake / Skylake / Apollo Lake (como la HD Graphics 520). Equipada con 12 EUs y una velocidad de hasta 700 MHz, el rendimiento debe estar casi al nivel de la antigua HD Graphics 500 (Apollo Lake).
El chip también incluye un motor de vídeo avanzado con soporte para hardware para la reproducción de material VP9 y H.265 (profundidad de colores de 8-bits).
Consumo de Energía
Similar al predecesor, Intel especifica el TDP con 6 Watts (SDP 4,8 Watts – Scenario Design Power). El chip puede, por tanto, ser enfriado pasivamente, en teoría, pero los SKUs con ventiladores también son posibles.
| Nombre código | Gemini Lake | ||||||||||||||||||||||||||||
| Serie | Intel Gemini Lake | ||||||||||||||||||||||||||||
Serie: Gemini Lake Gemini Lake
| |||||||||||||||||||||||||||||
| Velocidad de reloj | 1100 - 2400 MHz | ||||||||||||||||||||||||||||
| Caché de Nivel 2 | 4 MB | ||||||||||||||||||||||||||||
| Número de Núcleos/Subprocesos | 4 / 4 | ||||||||||||||||||||||||||||
| Consumo de Corriente (TDP = Thermal Design Power) | 6 Watt | ||||||||||||||||||||||||||||
| Tecnología de producción | 14 nm | ||||||||||||||||||||||||||||
| Temperatura Máx. | 105 °C | ||||||||||||||||||||||||||||
| Conector | BGA1090 | ||||||||||||||||||||||||||||
| Recursos | DDR4-2400/LPDDR4-2400 RAM, PCIe 2, MMX, SSE, SSE2, SSE3, SSSE3, SSE4.1, SSE4.2, VMX, SMEP, SMAP, MPX, EIST, TM1, TM2, Turbo, AES-NI, RDRAND, RDSEED, SHA, SGX | ||||||||||||||||||||||||||||
| GPU | Intel UHD Graphics 600 (200 - 700 MHz) | ||||||||||||||||||||||||||||
| 64 Bit | soporte para 64 Bit | ||||||||||||||||||||||||||||
| Architecture | x86 | ||||||||||||||||||||||||||||
| Precio inicial | $107 U.S. | ||||||||||||||||||||||||||||
| Fecha de anuncio | 12/11/2017 | ||||||||||||||||||||||||||||
| Enlace de Producto (externo) | ark.intel.com | ||||||||||||||||||||||||||||
Benchmarks
* A menor número, mayor rendimiento
Análisis para el Intel Celeron N4100 procesador


El portátil EZbook X3 Air de Jumper Tech en review: Un diseño atractivo a un precio razonable

Review del convertible Chuwi Hi10 X: Chasis de metal por $230 USD

Review del convertible BMAX MaxBook Y11 H1M6

Review de la tableta Chuwi UBook CWI509: La superficie de Go Wannabe
Chuwi LapBook Pro: Intel UHD Graphics 600, 14.00", 1.4 kg
análise » Review de Chuwi LapBook Pro Laptop: Un portátil asequible de 14 pulgadas con una buena duración de la batería y una amplia gama de colores
Chuwi MiniBook CWI526: Intel UHD Graphics 600, 8.00", 0.7 kg
análise » Chuwi en su mejor momento: Review de Chuwi MiniBook Netbook
Lenovo Tablet 10-20L3000KGE: Intel UHD Graphics 600, 10.10", 0.7 kg
análise » Review del Tablet Lenovo Tablet 10 (Celeron N4100, eMMC, LTE, WUXGA)
Chuwi LapBook SE: Intel UHD Graphics 600, 13.30", 1.4 kg
análise » Review del Chuwi LapBook SE
Lenovo IdeaPad 330-15IGM: Intel UHD Graphics 600, 15.60", 2 kg
análise » Review del Lenovo IdeaPad 330-15IGM (Celeron N4100)
Chuwi GBox CWI560: Intel UHD Graphics 600, 0.6 kg
análise » Review del Mini PC Chuwi GBox CWI560 (Celeron N4100)
Lenovo 500e Chromebook G2: Intel UHD Graphics 600, 11.60", 1.3 kg
análise externo » Lenovo 500e Chromebook G2
Prestigio Ecliptica 116 C3: Intel UHD Graphics 600, 11.60", 1.4 kg
análise externo » Prestigio Ecliptica 116 C3
Jumper EZbook X3 Air: Intel UHD Graphics 600, 13.30", 1.1 kg
análise externo » Jumper EZbook X3 Air
Acer Chromebook Spin 11 CP311-2H-C7BG: Intel UHD Graphics 600, 11.60", 1.2 kg
análise externo » Acer Chromebook Spin 11 CP311-2H-C7BG
Acer Chromebook 11 CB311-9HT-C783: Intel UHD Graphics 600, 11.60", 1.1 kg
análise externo » Acer Chromebook 11 CB311-9HT-C783
Chuwi MiniBook CWI526: Intel UHD Graphics 600, 8.00", 0.7 kg
análise externo » Chuwi MiniBook CWI526
Lenovo IdeaPad 330-15IGM-81D1003TUS: Intel UHD Graphics 600, 15.60", 2 kg
análise externo » Lenovo IdeaPad 330-15IGM-81D1003TUS
Lenovo Tablet 10-20L3000RGE: Intel UHD Graphics 600, 10.10", 0.7 kg
análise externo » Lenovo Tablet 10-20L3000RGE
Teclast F5: Intel UHD Graphics 600, 11.60", 1.1 kg
análise externo » Teclast F5
Lenovo Tablet 10-20L3000KGE: Intel UHD Graphics 600, 10.10", 0.7 kg
análise externo » Lenovo Tablet 10-20L3000KGE
Chuwi LapBook SE: Intel UHD Graphics 600, 13.30", 1.4 kg
análise externo » Chuwi LapBook SE
Chuwi SurBook SE: Intel UHD Graphics 600, 10.10"
análise externo » Chuwi SurBook SE
Jumper EZBook X4: Intel UHD Graphics 600, 14.00", 1.3 kg
análise externo » Jumper EZBook X4
Jumper EZBook X1: Intel UHD Graphics 600, 11.60", 1 kg
análise externo » Jumper EZBook X1


