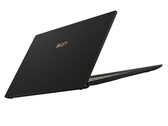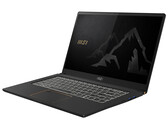
Análisis del portátil MSI Summit E14: gráficos GeForce GTX sin el peso de GeForce GTX
Intel Core i7-1185G7 | NVIDIA GeForce GTX 1650 Ti Max-Q | 14.00" | 1.3 kg

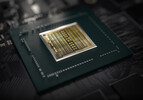
La Nvidia GeForce GTX 1650 Ti Max-Q (N18P-G62) es una tarjeta gráfica de gama media dedicada para portátiles basada en la arquitectura de Turing. La variante Max-Q es la versión de ahorro de energía de la GTX 1650Ti móvil con velocidades de reloj reducidas, rendimiento y, por supuesto, consumo de energía. Utiliza el mismo chip TU117 con 1.024 sombreadores. Por lo tanto, está destinado a portátiles de juegos delgados y ligeros. Comparado con las más rápidas GPU RTX 2000 (por ejemplo, RTX 2060), el 1650 Ti no integra núcleos de Raytracing o Tensor.
Hay dos variantes del 1650Ti Max-Q, una con 35 vatios y 1035 - 1200 MHz y una versión más rápida de 40 vatios con una velocidad de reloj de 1200 - 1365 MHz. Ambas, sin embargo, tienen un reloj significativamente más bajo que la versión Max-P normal con 50 / 55 Watt y 1350-1385 MHz. Lo más probable es que la memoria esté sincronizada a 1250 MHz = 10.000 MHz efectivos (Gbps) en la mayoría de los portátiles, aunque puede haber versiones con 1500 MHz = 12.000 Gbps.
La generación Turing no sólo introdujo el raytracing para las tarjetas RTX, sino que también optimizó la arquitectura de los núcleos y cachés. Según Nvidia, los núcleos CUDA ofrecen ahora una ejecución simultánea de operaciones en coma flotante y enteros para aumentar el rendimiento en las cargas de trabajo de los juegos modernos. Además, los cachés fueron reelaborados (nueva arquitectura de memoria unificada con el doble de caché en comparación con Pascal). Esto conlleva un 50% más de instrucciones por reloj y un 40% más de uso eficiente de la energía en comparación con Pascal.
Comparado con los chips más grandes de Turing (como el TU116 de la GTX 1660 Ti y la línea RTX), el TU117 no incluye el nuevo codificador NVENC sino uno más antiguo similar al usado en Pascal y Volta.
El consumo de energía de los portátiles 1650 Ti Max-Q está especificado en 35 Vatios TGP (Potencia Gráfica Total) por Nvidia y por lo tanto 25 Vatios menos que el móvil GTX 1650 Ti en el mismo paquete (otras variantes pueden alcanzar hasta 80 Vatios).
GeForce GTX 1600 Serie
| ||||||||||||||||||||||||||||||||||
| Nombre Código | N18P-G62 Max-Q | |||||||||||||||||||||||||||||||||
| Arquitectura | Turing | |||||||||||||||||||||||||||||||||
| Pipelines | 1024 - unificado | |||||||||||||||||||||||||||||||||
| Velocidad del núcleo | 1035 - 1200 (Boost) MHz | |||||||||||||||||||||||||||||||||
| Velocidad de Memoria | 10000 MHz | |||||||||||||||||||||||||||||||||
| Ancho de Bus de Memoria | 128 Bit | |||||||||||||||||||||||||||||||||
| Tipo de Memoria | GDDR6 | |||||||||||||||||||||||||||||||||
| Max. Cantidad de Memoria | 4 GB | |||||||||||||||||||||||||||||||||
| Memoria Compartida | no | |||||||||||||||||||||||||||||||||
| API | DirectX 12_1, OpenGL 4.6 | |||||||||||||||||||||||||||||||||
| Consumo de corriente | 35 Watt | |||||||||||||||||||||||||||||||||
| tecnología | 12 nm | |||||||||||||||||||||||||||||||||
| Tamaño de la portátil | de tamaño mediano | |||||||||||||||||||||||||||||||||
| Fecha de Anuncio | 02.04.2020 | |||||||||||||||||||||||||||||||||
| Link a la Página del Fabricante | www.nvidia.com | |||||||||||||||||||||||||||||||||
Los siguientes benchmarks se derivan de nuestros benchmarks de los portátiles de análisis. El rendimiento depende de la memoria gráfica utilizada, velocidad de reloj, procesador, configuración del sistema, controladores y sistemas operativos. Así que los resultados no tienen que ser representativos de todos los portátiles con esta GPU. Para información más detallada sobre los resultados del benchmark, haga clic en el número de fps.


| bajo | medio | alto | ultra | QHD | 4K | |
|---|---|---|---|---|---|---|
| Cyberpunk 2077 1.0 | 63.7 | 33 | 26.8 | 22.2 | ||
| Immortals Fenyx Rising | 74 | 47 | 35 | 29 | 24 | 14 |
| Yakuza Like a Dragon | 101 | 45 | 43 | 38 | 25.4 | 12.4 |
| Call of Duty Black Ops Cold War | 100 | 55.6 | 44.1 | 40.2 | 25.8 | 10.6 |
| Assassin´s Creed Valhalla | 61 | 38 | 25 | 10 | 12 | 5 |
| Watch Dogs Legion | 80 | 49 | 41 | 16 | 14 | |
| FIFA 21 | 210 | 202 | 192.9 | 165.2 | 129.6 | 79.6 |
| Star Wars Squadrons | 222 | 124 | 112.9 | 103.4 | 70 | 30.7 |
| Mafia Definitive Edition | 93.9 | 46.2 | 43 | 27.9 | 14.1 | |
| Serious Sam 4 | 105 | 50 | 39 | 26 | 22.3 | |
| Crysis Remastered | 154.1 | 59.8 | 31.9 | 23.6 | ||
| Horizon Zero Dawn | 90 | 50 | 40 | 36 | 30 | 8 |
| Death Stranding | 93 | 57 | 54 | 52 | 35.9 | 16.8 |
| F1 2020 | 211 | 107 | 82 | 57 | 41 | 22 |
| Gears Tactics | 162.9 | 73.7 | 44.4 | 33.4 | 23.5 | 13.5 |
| Doom Eternal | 145.1 | 91.2 | 52.6 | |||
| Hunt Showdown | 115.7 | 50.1 | 41.8 | |||
| Escape from Tarkov | 120.7 | 71.2 | 52.8 | 47 | ||
| Star Wars Jedi Fallen Order | 63.3 | 53.2 | 46 | |||
| Need for Speed Heat | 61.8 | 49.3 | 45.8 | 33.9 | ||
| GRID 2019 | 114 | 76.9 | 64.3 | 27.5 | ||
| Ghost Recon Breakpoint | 74 | 45 | 34 | 22 | ||
| Borderlands 3 | 102.8 | 52.6 | 34.7 | 26.1 | ||
| Control | 104.7 | 39.2 | 29.1 | |||
| F1 2019 | 171 | 89 | 71 | 62 | ||
| Total War: Three Kingdoms | 165 | 58 | 35 | 24 | ||
| Anno 1800 | 89.4 | 65.8 | 41.1 | 21.5 | ||
| The Division 2 | 93 | 51 | 41 | 30 | ||
| Dirt Rally 2.0 | 195.9 | 63.1 | 55.1 | 38.1 | ||
| Far Cry New Dawn | 89 | 56 | 53 | 49 | ||
| Metro Exodus | 83.1 | 40.1 | 29.8 | 23.2 | ||
| Apex Legends | 143.7 | 86.2 | 68.7 | 62.9 | ||
| Assassin´s Creed Odyssey | 63 | 49 | 41 | 19 | ||
| Shadow of the Tomb Raider | 106 | 57 | 48 | 40 | 15 | |
| Strange Brigade | 184 | 76 | 61 | 52 | 35 | 21.4 |
| Far Cry 5 | 102 | 55 | 51 | 48 | 33 | 16 |
| X-Plane 11.11 | 90 | 78 | 67 | 47 | ||
| Final Fantasy XV Benchmark | 85 | 44 | 31 | 19.3 | 10.1 | |
| Rise of the Tomb Raider | 127 | 96 | 59 | 49 | 21 | |
| Dota 2 Reborn | 137 | 120 | 113 | 106 | 50 | |
| The Witcher 3 | 168 | 102 | 55 | 32 | 20 | |
| GTA V | 165 | 155 | 84 | 43 | 26 | 24.8 |
| bajo | medio | alto | ultra | QHD | 4K | < 30 fps < 60 fps < 120 fps ≥ 120 fps | 25 16 | 24 14 4 | 4 28 9 1 | 13 18 4 1 | 10 5 1 1 | 16 3 1 |
Para ver más juegos jugables y una lista de todos los juegos y tarjetas gráficas visita nuestroListado de juegos


Lenovo ThinkPad X1 Extreme Gen3-20TLS0UV00: Intel Core i7-10750H, 15.60", 1.7 kg
análise » ThinkPad X1 Extreme Gen3 2020: El portátil multimedia premium de Lenovo con la GTX 1650 Ti Max-Q en revisión
Asus ZenBook UX535-M01440: Intel Core i7-10750H, 15.60", 2 kg
análise » Reseña del portátil Asus ZenBook Pro 15 UX535: Todavía podría ser un poco más Zen
Razer Blade Stealth i7-1165G7 GTX 1650 Ti Max-Q: Intel Core i7-1165G7, 13.30", 1.4 kg
análise » Review del portátil Razer Blade Stealth Tiger Lake GTX 1650 Ti Max-Q: Un pequeño paso adelante
Razer Blade Stealth Core i7 GTX 1650 Ti Max-Q 4K: Intel Core i7-1065G7, 13.30", 1.5 kg
análise » Review del portátil de 2020 Razer Blade Stealth GTX 1650 Ti Max-Q: Como la versión de 2019, pero bien hecha
HP Envy 14-eb0021tx: Intel Core i7-1165G7, 14.00", 1.5 kg
análise externo » HP Envy 14-eb0021tx
Razer Blade Stealth 13 2021 OLED: Intel Core i7-1165G7, 13.30", 1.5 kg
análise externo » Razer Blade Stealth 13 2021 OLED
MSI Summit E14 A11SCS: Intel Core i7-1185G7, 14.00", 1.3 kg
análise externo » MSI Summit E14 A11SCS
MSI Prestige 14 A11SCS-036DC: Intel Core i7-1185G7, 14.00", 1.3 kg
análise externo » MSI Prestige 14 A11SCS-036DC
MSI GF63 Thin 10SCSR-1051XES: Intel Core i7-10750H, 15.60", 1.9 kg
análise externo » MSI GF63 Thin 10SCSR-1051XES
Asus ROG Flow X13 GV301QH-K6200T: AMD Ryzen 9 5900HS, 13.40", 1.3 kg
análise externo » Asus ROG Flow X13 GV301QH-K6200T
HP Envy 14-eb0003ns: Intel Core i7-1165G7, 14.00", 1.5 kg
análise externo » HP Envy 14-eb0003ns
MSI Summit E15 A11SCS-091AU: Intel Core i7-1185G7, 15.60", 1.7 kg
análise externo » MSI Summit E15 A11SCS-091AU
MSI GF63 Thin 10SCSR-876XES: Intel Core i7-10750H, 15.60", 1.9 kg
análise externo » MSI GF63 Thin 10SCSR-876XES
MSI Prestige 15 A11SCS-033XES: Intel Core i7-1185G7, 15.60", 1.7 kg
análise externo » MSI Prestige 15 A11SCS-033XES
HP Envy 14-eb0775ng: Intel Core i7-1165G7, 14.00", 1.5 kg
análise externo » HP Envy 14-eb0775ng
Razer Blade Stealth i7-1165G7 GTX 1650 Ti Max-Q: Intel Core i7-1165G7, 13.30", 1.4 kg
análise externo » Razer Blade Stealth i7-1165G7 GTX 1650 Ti Max-Q
MSI Summit E15 A11SCST-067RU: Intel Core i7-1185G7, 15.60", 1.8 kg
análise externo » MSI Summit E15 A11SCST-067RU
Acer ConceptD 3 Ezel CC314-72G-7513: Intel Core i7-10750H, 14.00", 1.8 kg
análise externo » Acer ConceptD 3 Ezel CC314-72G-7513
MSI Summit E15 A11SCST-227ID: Intel Core i7-1185G7, 15.60"
análise externo » MSI Summit E15 A11SCST-227ID
Lenovo ThinkBook 15p IMH-20V30009GE: Intel Core i7-10750H, 15.60", 1.9 kg
análise externo » Lenovo ThinkBook 15p IMH-20V30009GE
MSI Summit E15 A11SCST: Intel Core i7-1185G7, 15.60", 1.8 kg
análise externo » MSI Summit E15 A11SCST
HP Envy 14-eb0010nr: Intel Core i5-1135G7, 14.00", 1.6 kg
análise externo » HP Envy 14-eb0010nr
Lenovo ThinkPad X1 Extreme G3, i7-10850H, 1650 Ti Max-Q: Intel Core i7-10850H, 15.60", 1.7 kg
análise externo » Lenovo ThinkPad X1 Extreme G3, i7-1850H, 1650 Ti Max-Q
Lenovo ThinkPad X1 Extreme G3-20TK000NGE: Intel Core i9-10885H, 15.60", 1.7 kg
análise externo » Lenovo ThinkPad X1 Extreme G3-20TK000NGE
Asus ZenBook Pro 15 UX535LI-E3089T: Intel Core i7-10750H, 15.60", 1.8 kg
análise externo » Asus ZenBook Pro 15 UX535LI-E3089T
HP Spectre x360 15-eb0036ng: Intel Core i7-10750H, 15.60", 1.9 kg
análise externo » HP Spectre x360 15-eb0036ng
Acer ConceptD 3 Ezel: Intel Core i7-10750H, 15.60", 2 kg
análise externo » Acer ConceptD 3 Ezel
MSI GF63 10SCSR-243: Intel Core i7-10750H, 15.60", 1.9 kg
análise externo » MSI GF63 10SCSR-243
Dell XPS 15 9500 i7-10750H, 1650 Ti Max-Q: Intel Core i7-10750H, 15.60", 2.1 kg
análise externo » Dell XPS 15 9500 i7-10750H, 1650 Ti Max-Q
Razer Blade Stealth 2020, i7-1065G7, GTX 1650 Ti Max-Q: Intel Core i7-1065G7, 13.30", 1.4 kg
análise externo » Razer Blade Stealth 2020, i7-1065G7, GTX 1650 Ti Max-Q
MSI Summit E15 A11SCST: Intel Core i7-1185G7, 15.60", 1.8 kg
» MSI Summit E15 - Un rival para el Dell XPS 15 y el Lenovo ThinkPad X1 Extreme
Lenovo ThinkPad X1 Extreme Gen3-20TLS0UV00: Intel Core i7-10750H, 15.60", 1.7 kg
» Lenovo mejora el rendimiento del ThinkPad X1 Extreme Gen3, pero nos gustaría ver una actualización mayor con AMD Ryzen
Asus ZenBook UX535-M01440: Intel Core i7-10750H, 15.60", 2 kg
» Asus ZenBook Pro 15 UX535: Más bien con más Zen la próxima vez
Posición aproximada del adaptador gráfico
Top 10 Análisis
» Top 10 Portátiles Multimedia
» Top 10 Portátiles de Juego
» Top 10 Portátiles de Juego ligeros
» Top 10 Portátiles Asequibles de Oficina/Empresa
» Top 10 Portátiles de Juego Ligeros
» Top 10 Portátiles de Oficina/Empresa Premium
» Top 10 Estaciones de Trabajo
» Top 10 Subportátiles
» Top 10 Ultrabooks
» Top 10 Convertibles
» Top 10 Tablets
» Top 10 Tablets Windows
» Top 10 Tablets de menos de 250 Euros
» Top 10 Phablets (>5.5")
» Top 10 Smartphones
» Top 10 Smartphones (≤5")
» Top 10 Smartphones de menos de 300 Euros
» Top 10 Smartphones de menos de 120 Euros
» Top 10 Portátiles de menos de 1000 Euros
» Top 10 Portátiles de menos de 500 Euros
» Top 10 Portátiles de menos de 300 Euros
» Los Mejores Displays de Portátiles Analizados por Notebookcheck