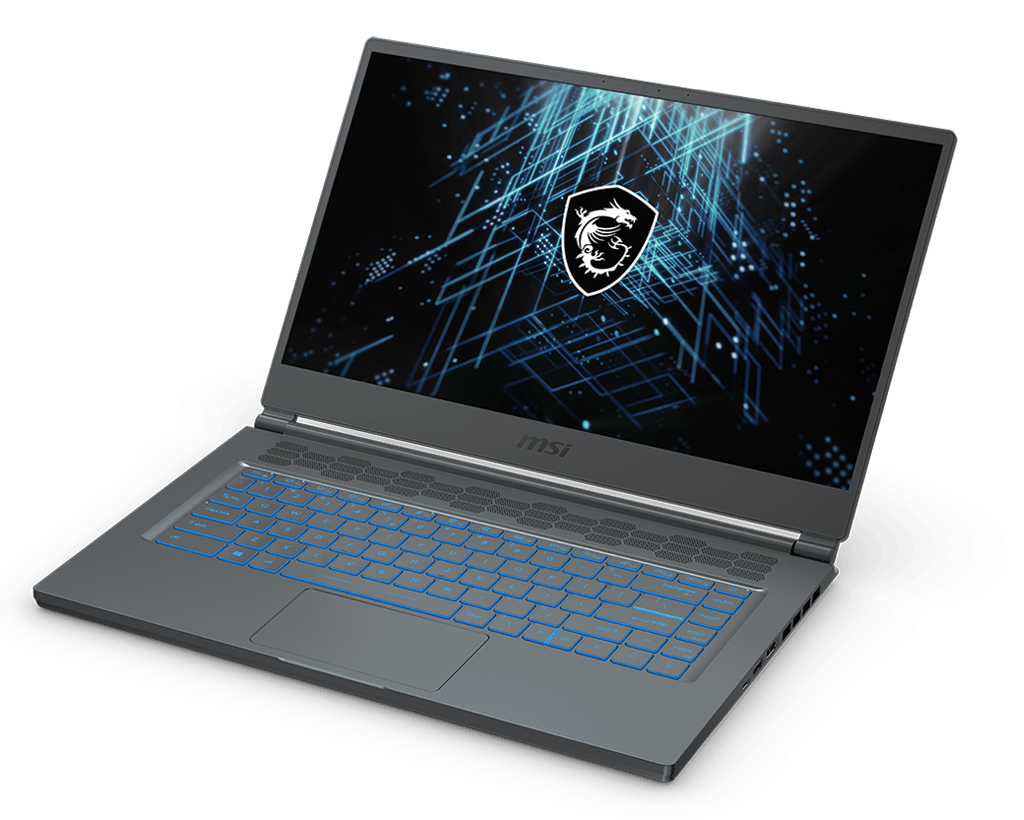
Análisis del portátil MSI Stealth 15M GeForce RTX: Gráficos más rápidos que el Dell XPS 15, el HP Spectre x360 o el Asus ZenBook
No hay que confundirlo con el MSI GS66 Stealth de 15,6 pulgadas, el MSI Stealth 15M es un modelo completamente diferente diseñado para creadores de contenidos, oficina o uso profesional. Está en la misma categoría que la serie de portátiles MSI Prestige, Creator, Summit o Modern, pero con importantes diferencias de especificaciones.
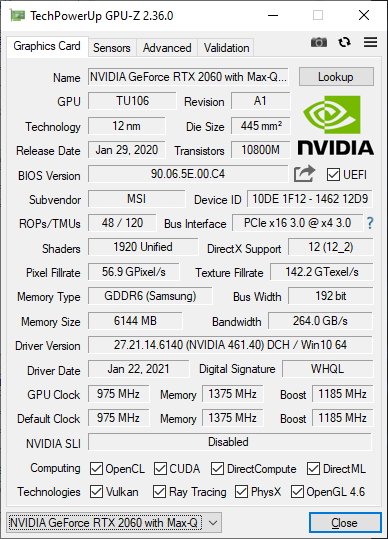
El rasgo distintivo del Stealth 15M es su rápida gráfica GeForce RTX 2060 Max-Q o RTX 3060 emparejada con una CPU Core serie U de 11ª generación. La mayoría de los demás portátiles de esta categoría se limitan a gráficos Geforce GTX o MX y vienen con CPU de la serie Core H en su lugar, como el Dell XPS 15, el HP Spectre x360 15 o el Asus ZenBook 15. Por lo tanto, el sistema de MSI ofrecerá un rendimiento gráfico significativamente más rápido que la mayoría de sus competidores inmediatos, al menos sobre el papel. Su competidor más cercano es el HP Envy 15 de 2020, que viene con la misma GPU RTX 2060 Max-Q pero con un procesador Core H aún más rápido.
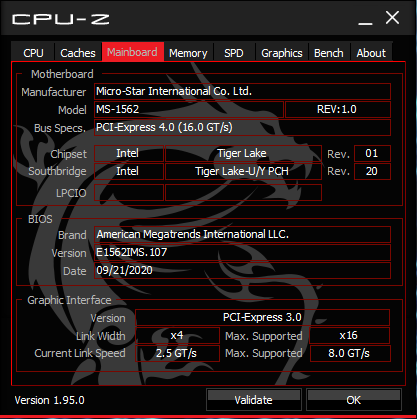
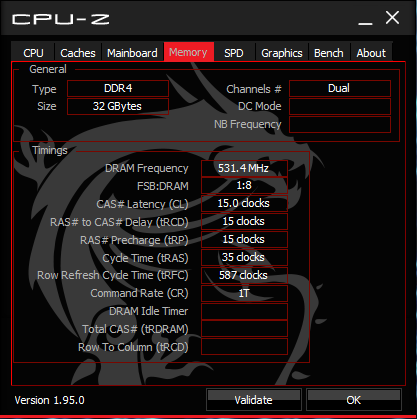
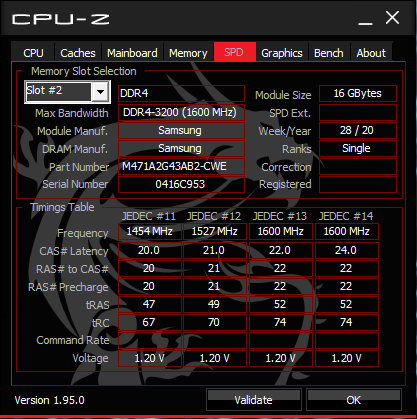
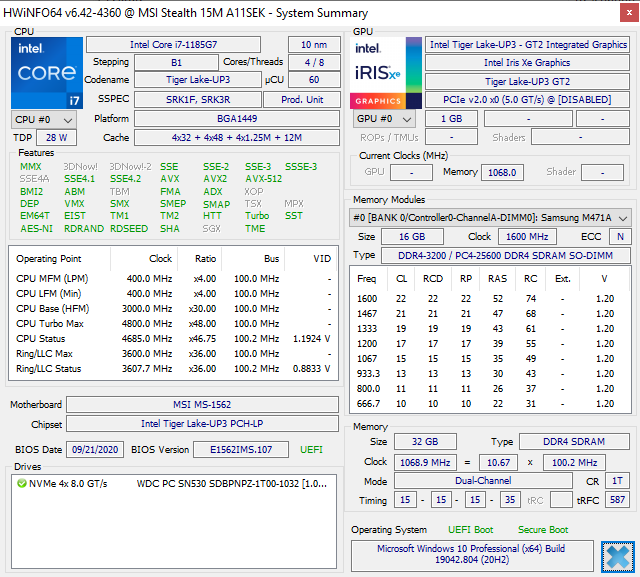
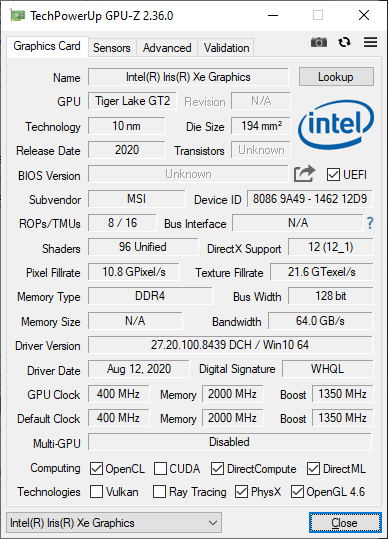
Nuestra configuración de análisis está equipada con la CPU Tiger Lake Core i7-1185G7, 32 GB de RAM, GPU GeForce RTX 2060 Max-Q, pantalla FHD de 60 Hz y SSD NVMe de 1 TB por aproximadamente 1.500 dólares al por menor. Las configuraciones actualizadas que se lanzarán en marzo de 2021 vendrán con la CPU Core i7-11375H, la pantalla de 144 Hz y la GPU GeForce RTX 3060 en su lugar. Todas las opciones hasta ahora tienen una pantalla de resolución fija de 1080p.
Más análisis de MSI:
potential competitors in comparison
Valoración | Fecha | Modelo | Peso | Altura | Tamaño | Resolución | Precio |
|---|---|---|---|---|---|---|---|
| 82.4 % v7 (old) | 02/2021 | MSI Stealth 15M A11SEK i7-1185G7, GeForce RTX 2060 Max-Q | 1.7 kg | 16.15 mm | 15.60" | 1920x1080 | |
| 85 % v7 (old) | 01/2020 | HP Spectre X360 15-5ZV31AV i7-10510U, GeForce MX250 | 2.1 kg | 19.3 mm | 15.60" | 3840x2160 | |
| 90.1 % v7 (old) | 06/2020 | Dell XPS 15 9500 Core i7 4K UHD i7-10875H, GeForce GTX 1650 Ti Mobile | 2 kg | 18 mm | 15.60" | 3840x2400 | |
| 86.6 % v7 (old) | 02/2021 | Lenovo ThinkPad T15p-20TN0006GE i7-10750H, GeForce GTX 1050 Mobile | 2.2 kg | 22.7 mm | 15.60" | 3840x2160 | |
| 87 % v7 (old) | 12/2020 | Asus ZenBook UX535-M01440 i7-10750H, GeForce GTX 1650 Ti Max-Q | 2 kg | 20 mm | 15.60" | 3840x2160 | |
| 85.2 % v7 (old) | 11/2019 | MSI Prestige 15 A10SC i7-10710U, GeForce GTX 1650 Max-Q | 1.7 kg | 16 mm | 15.60" | 3840x2160 |
Caso
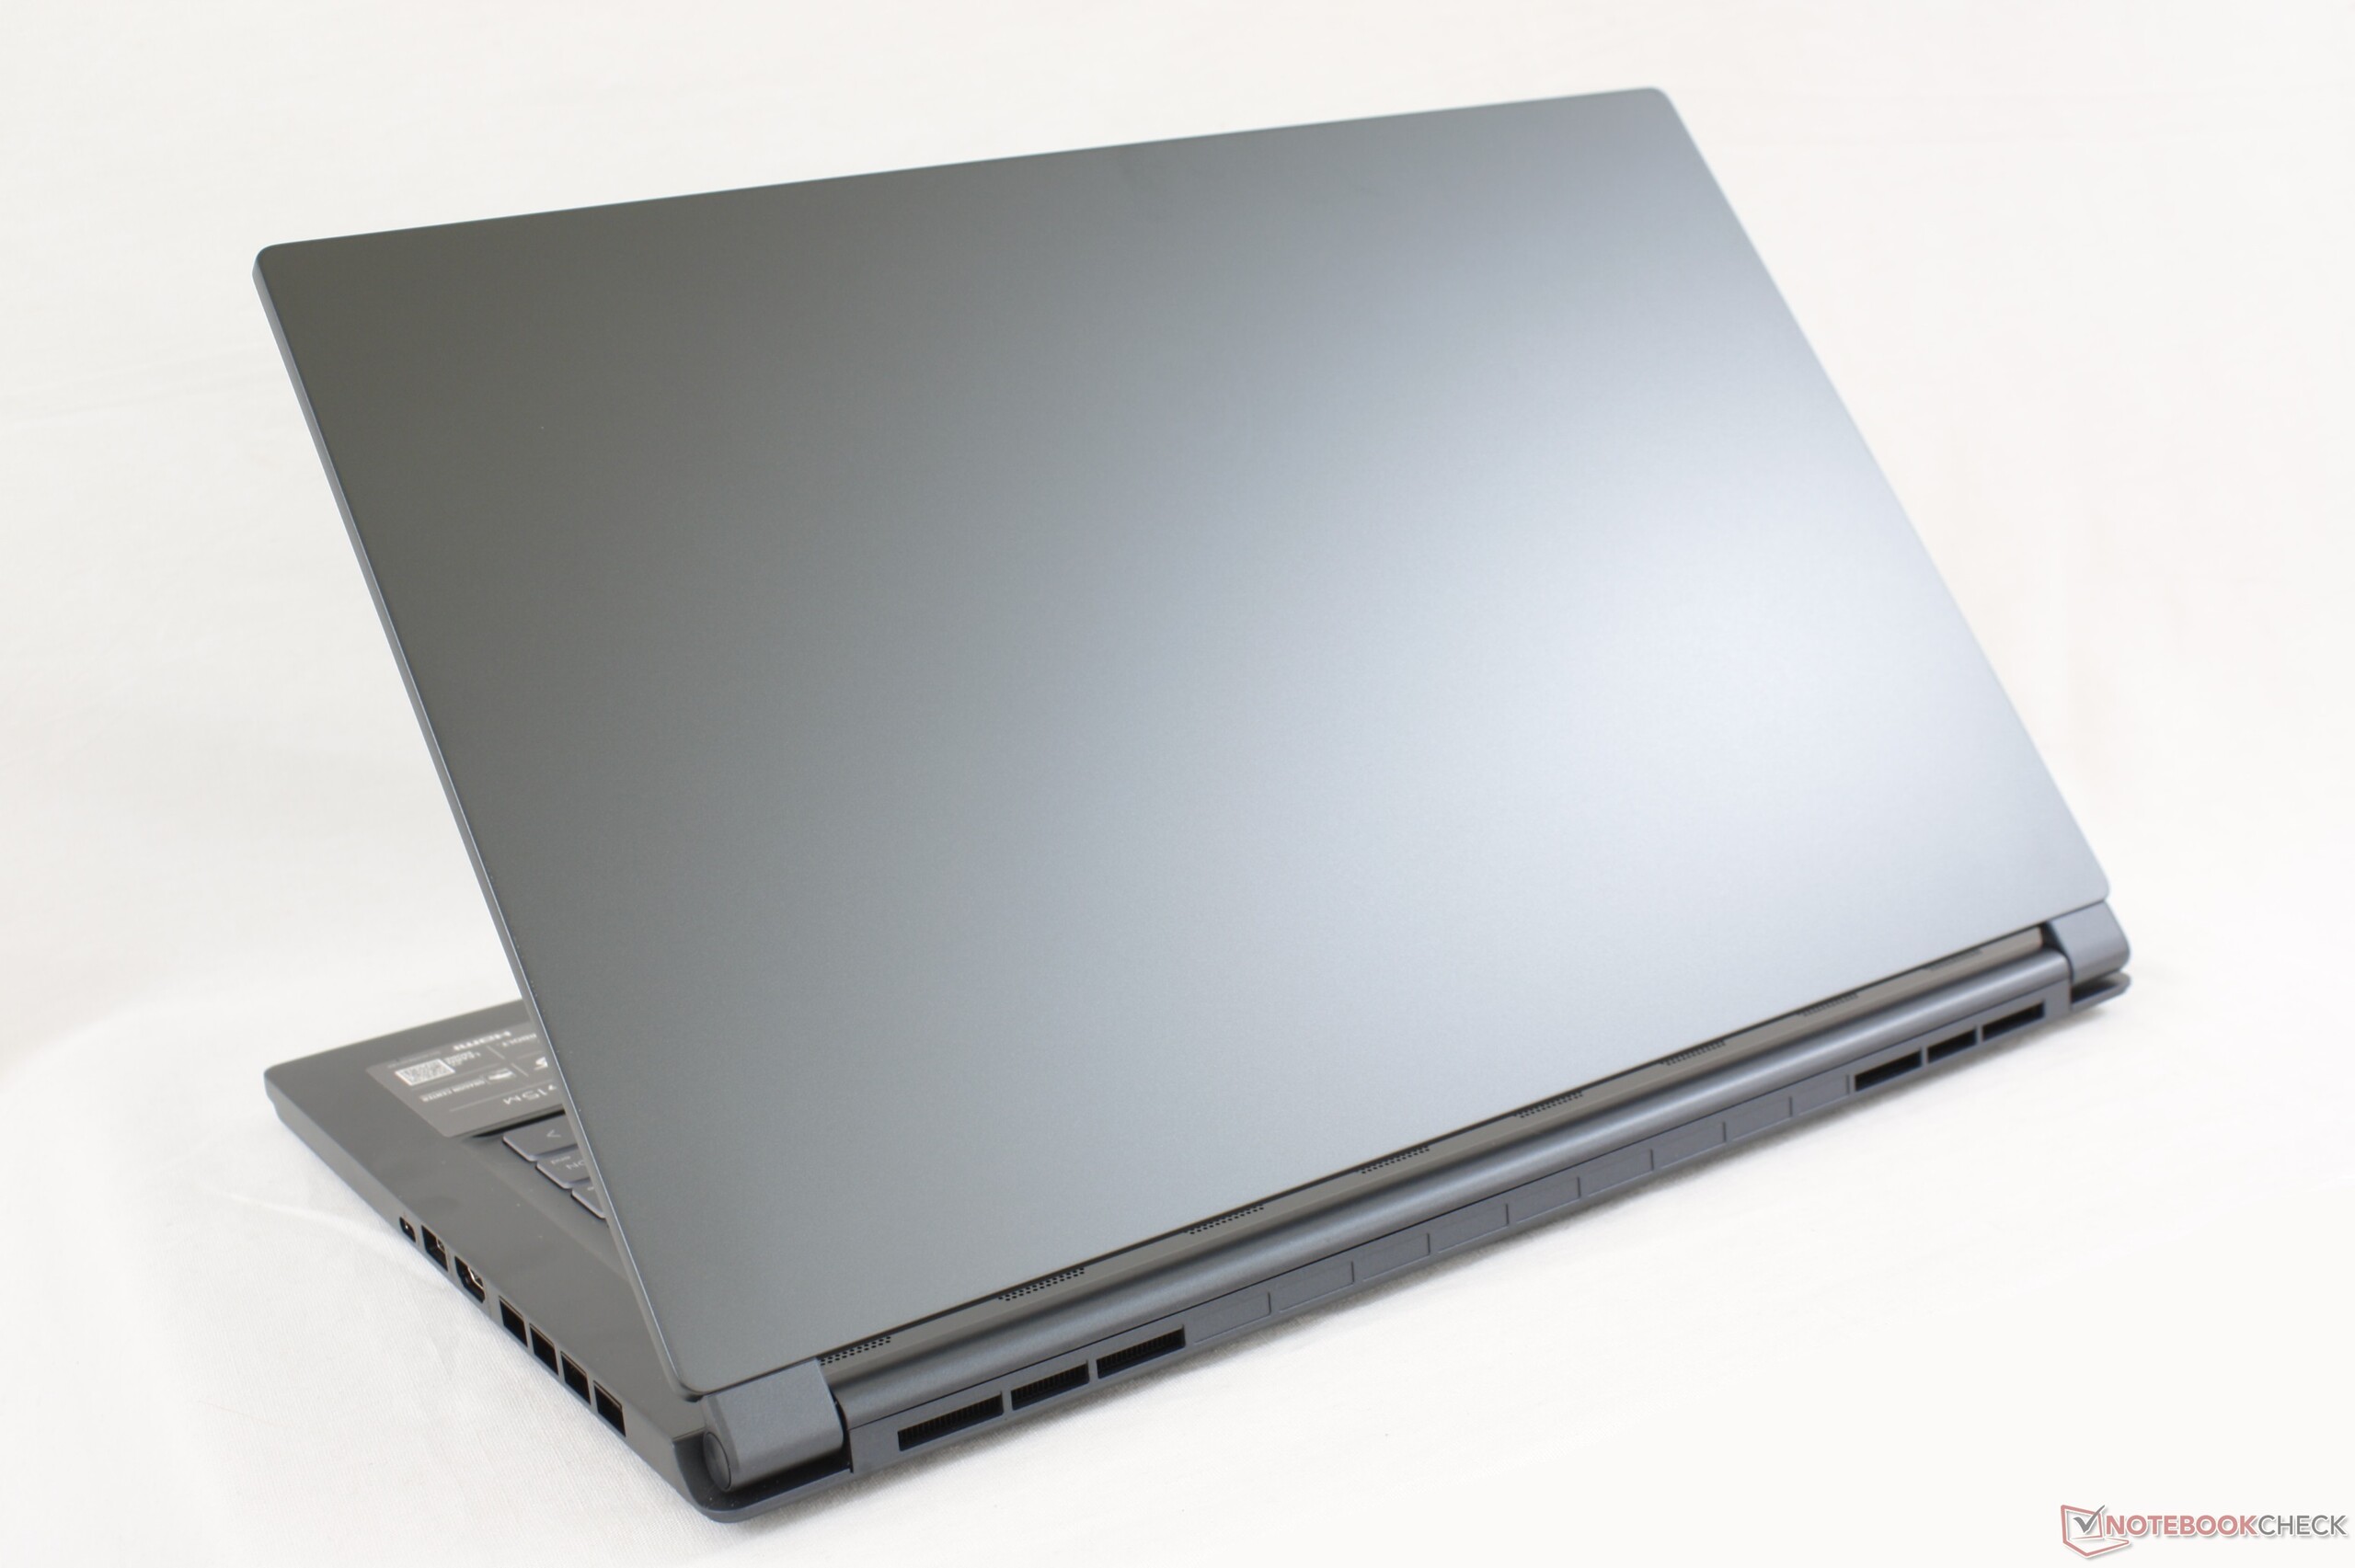
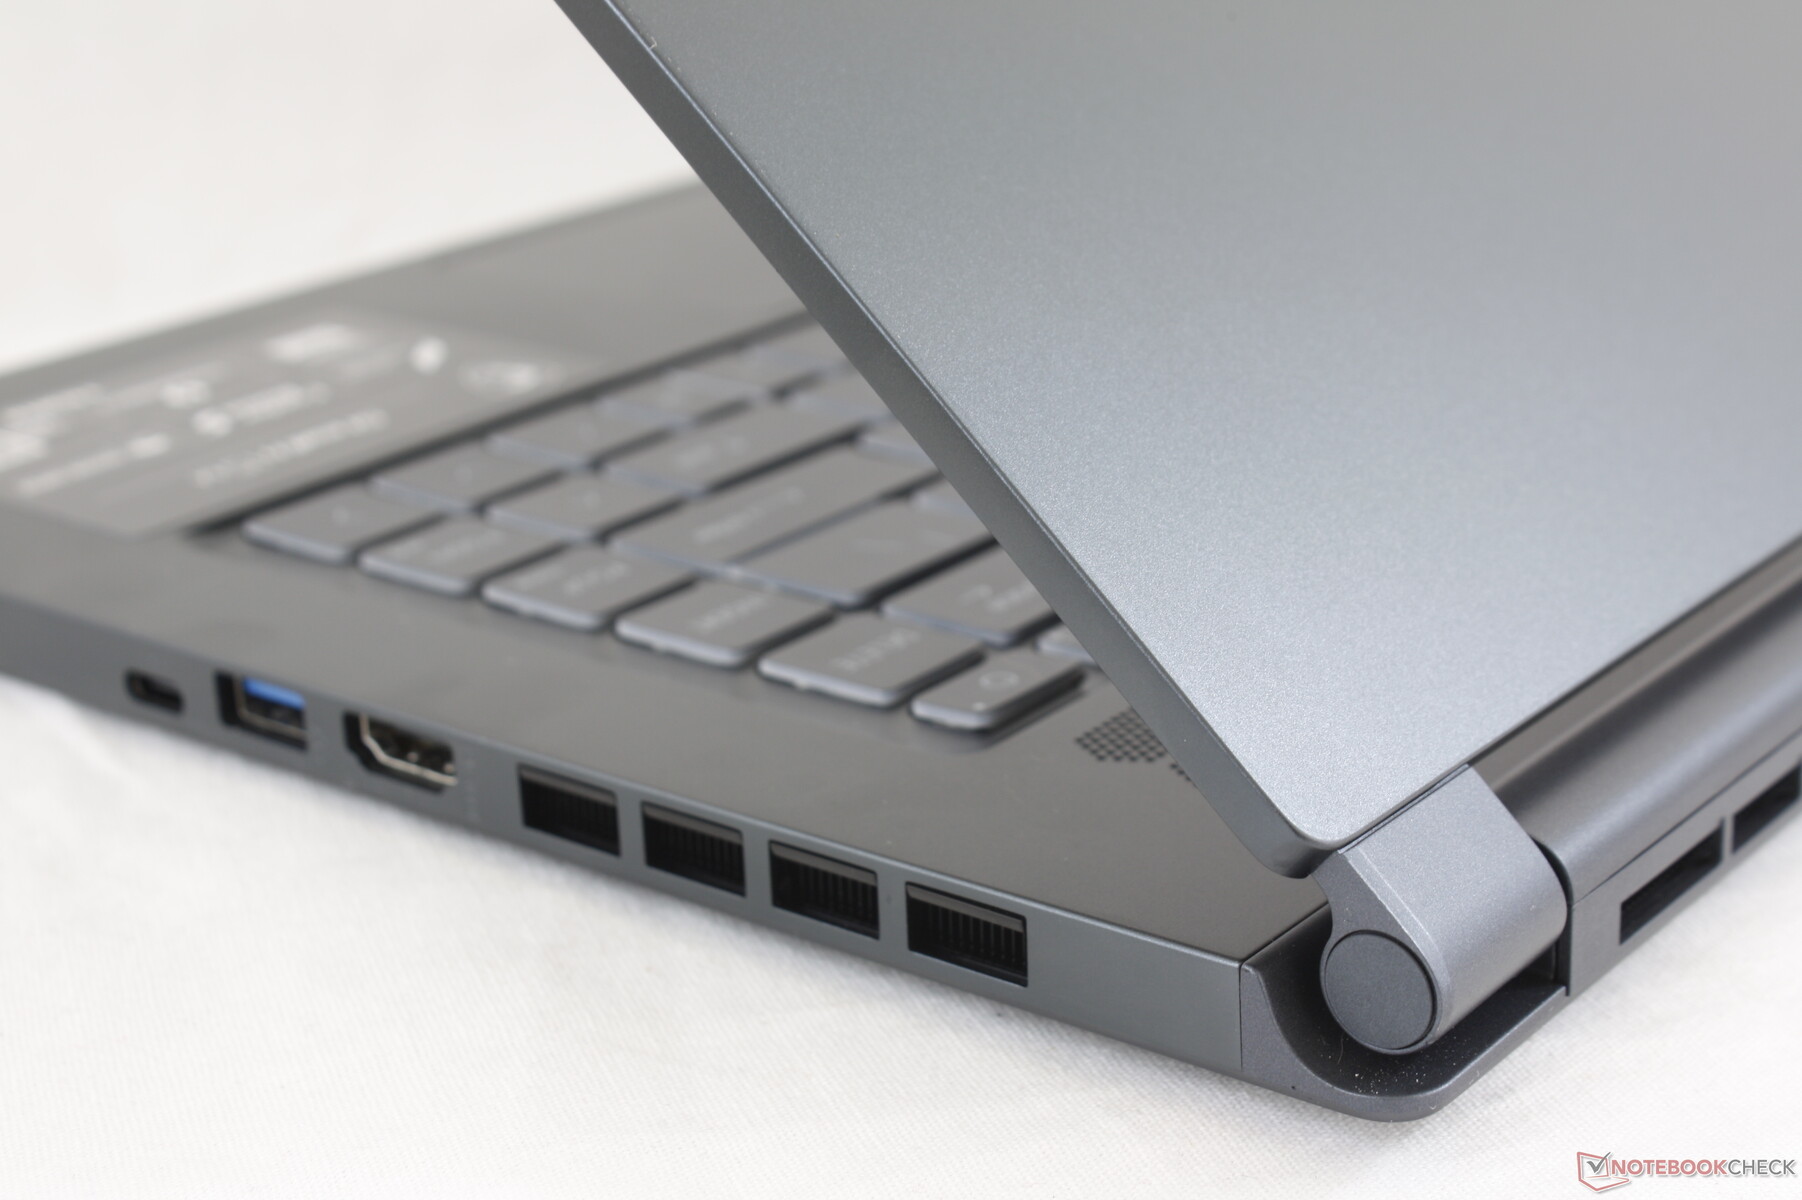
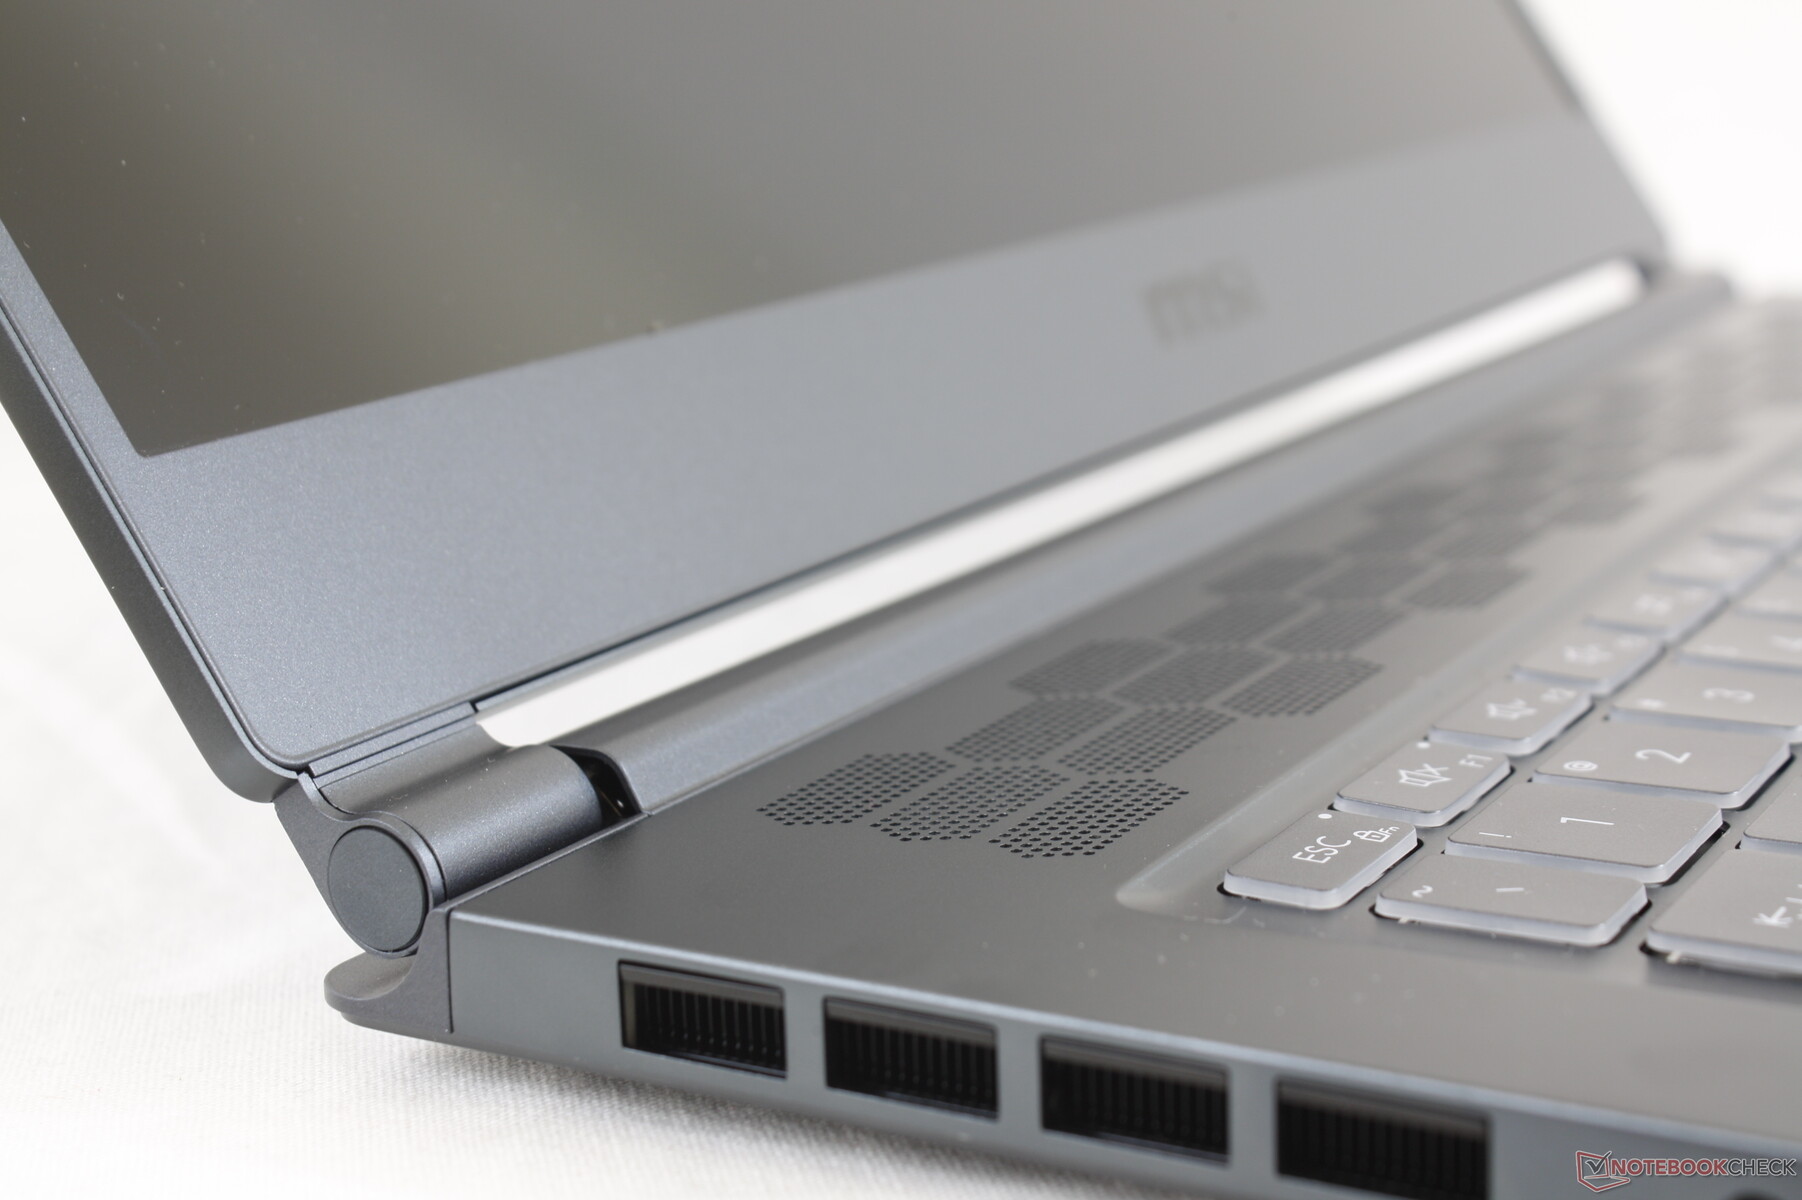
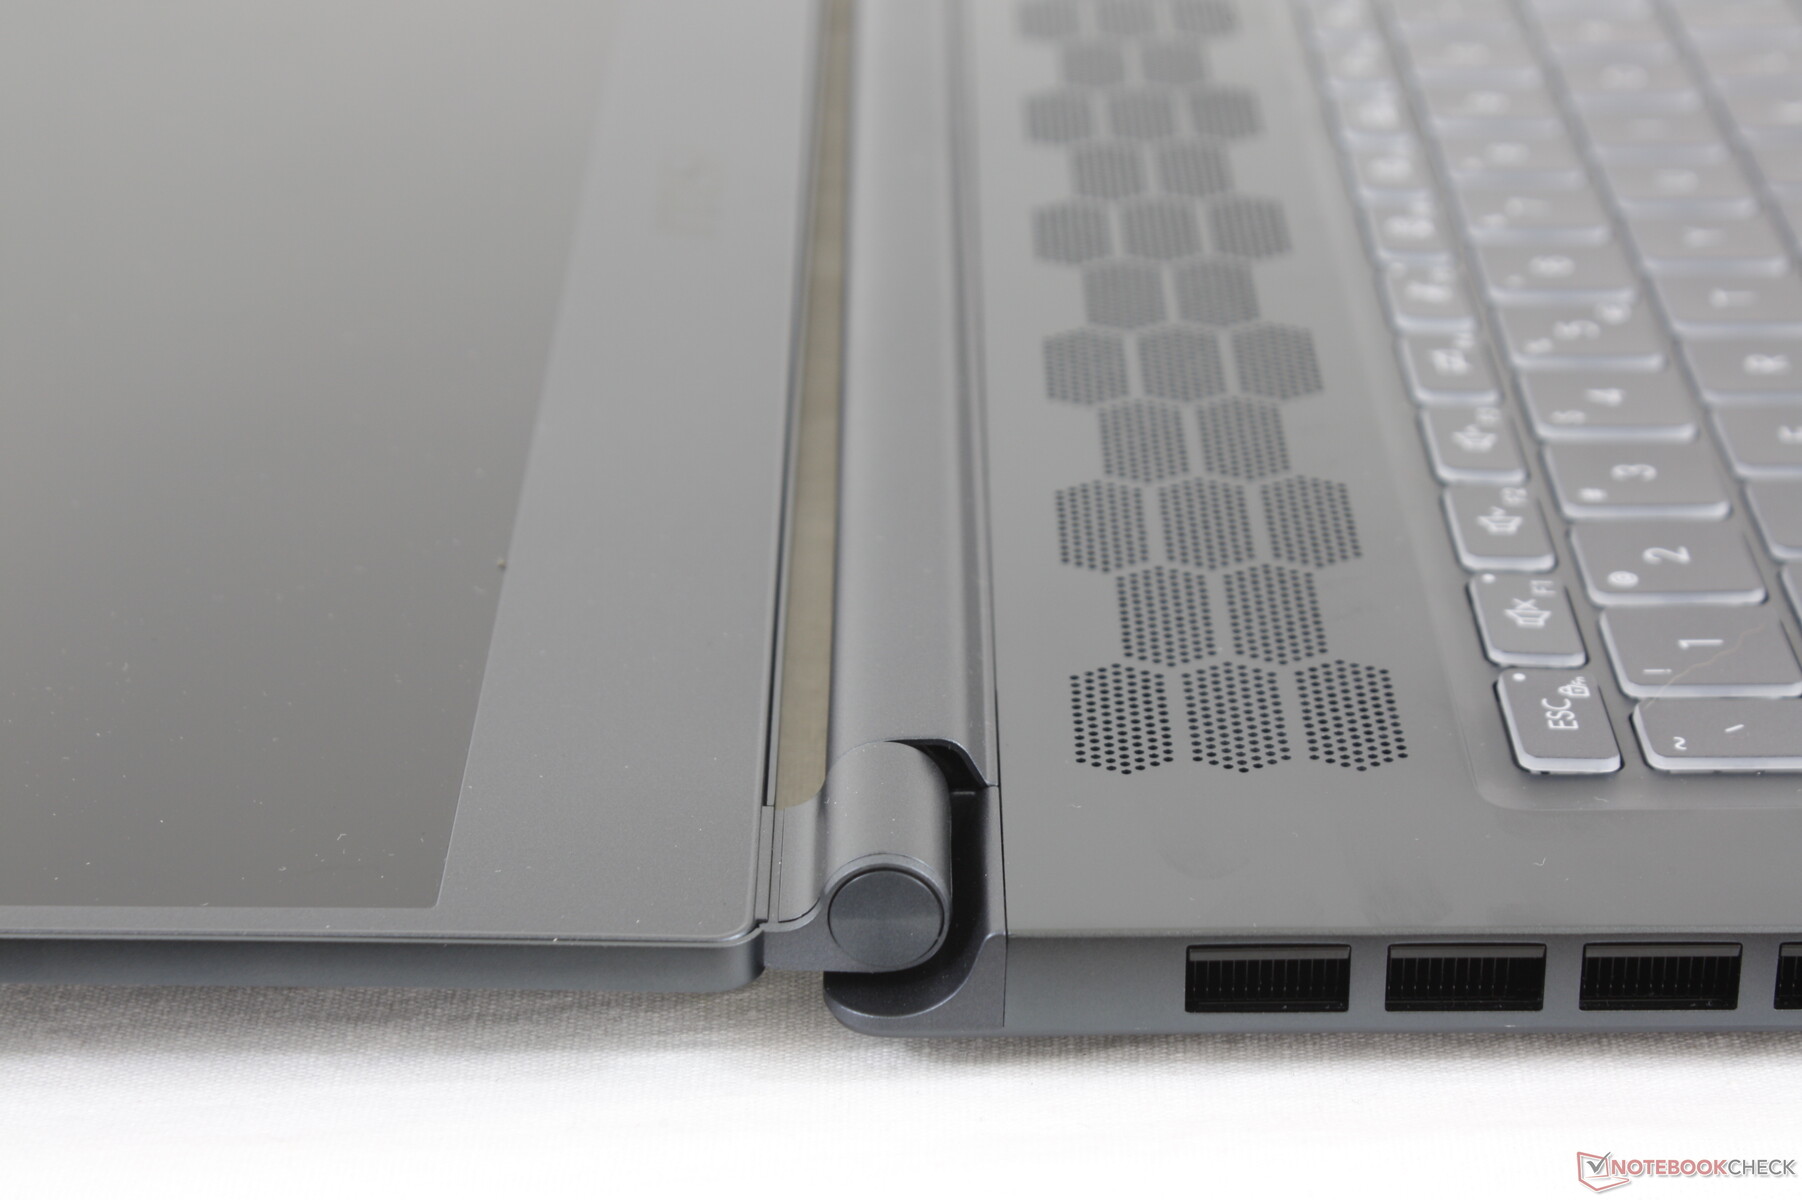
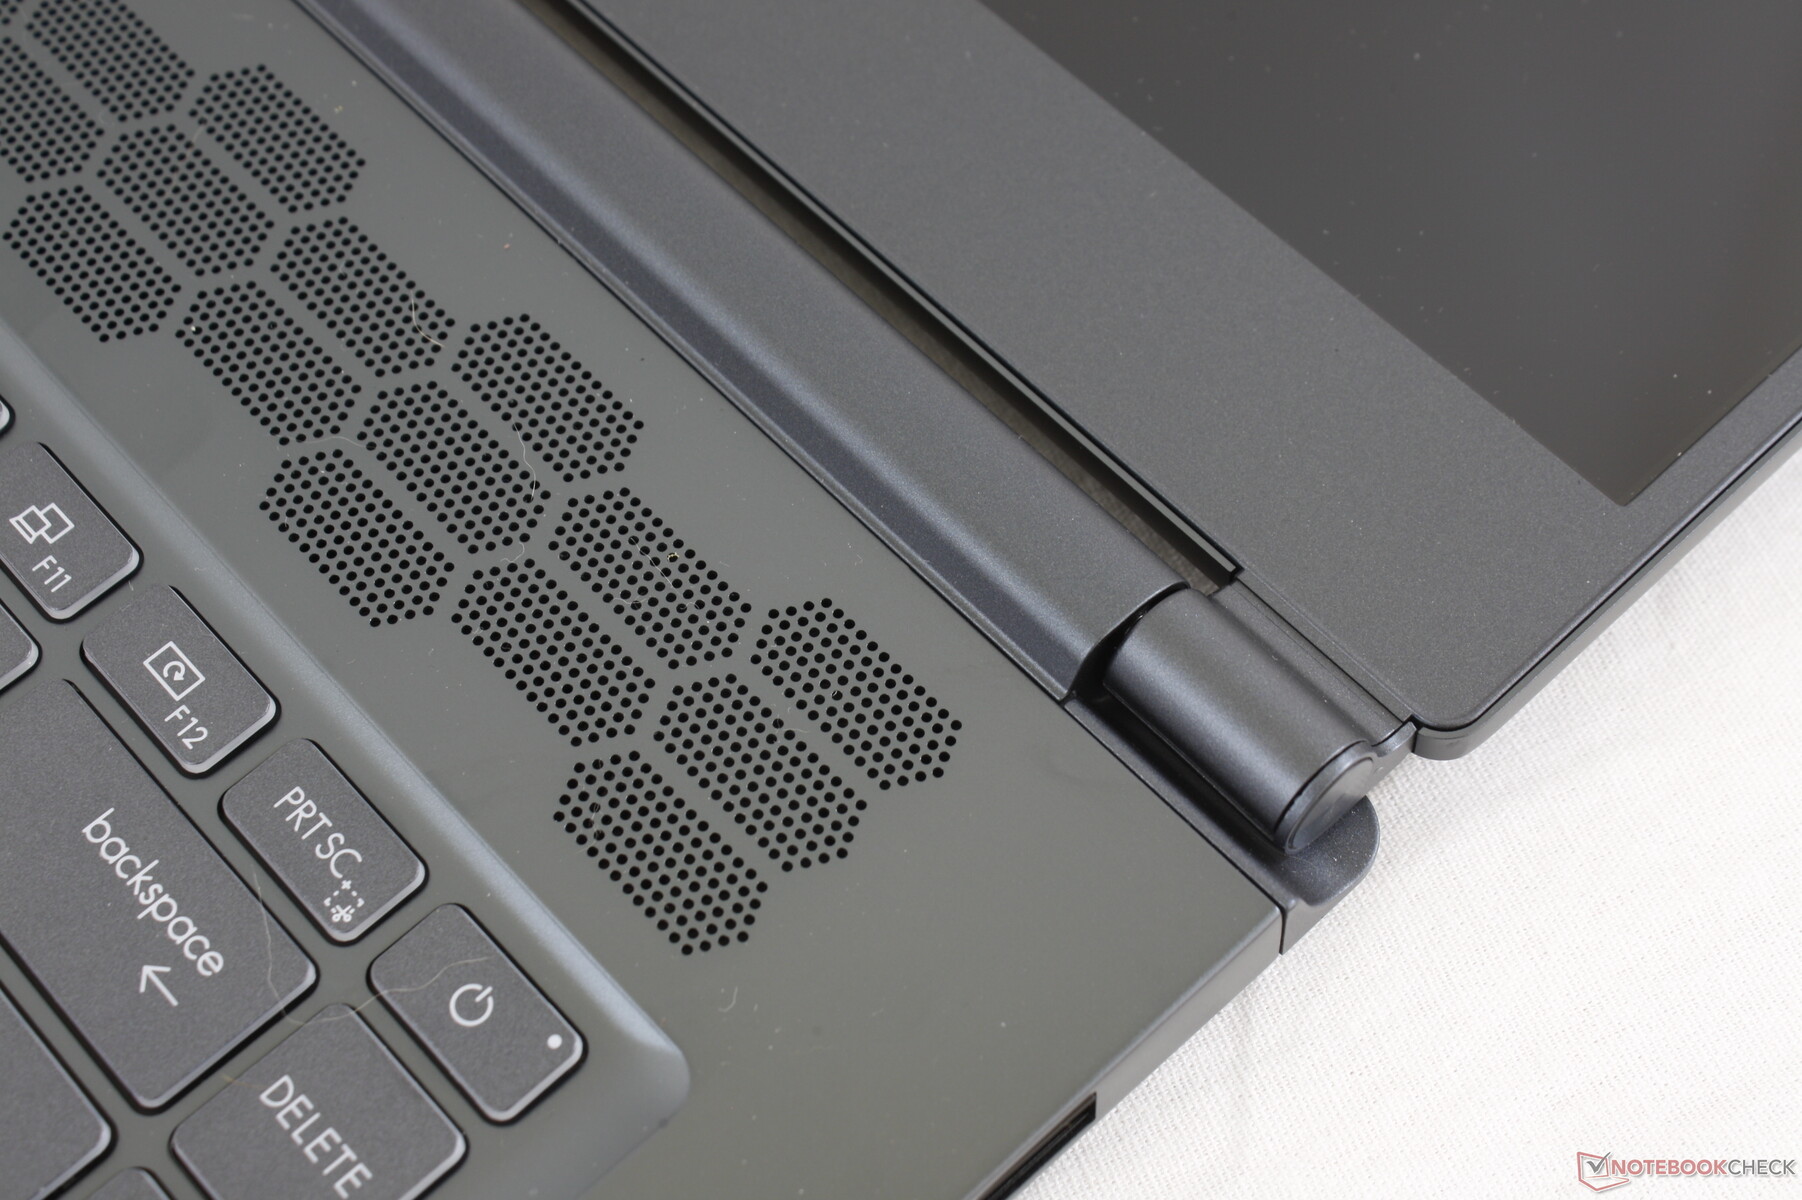
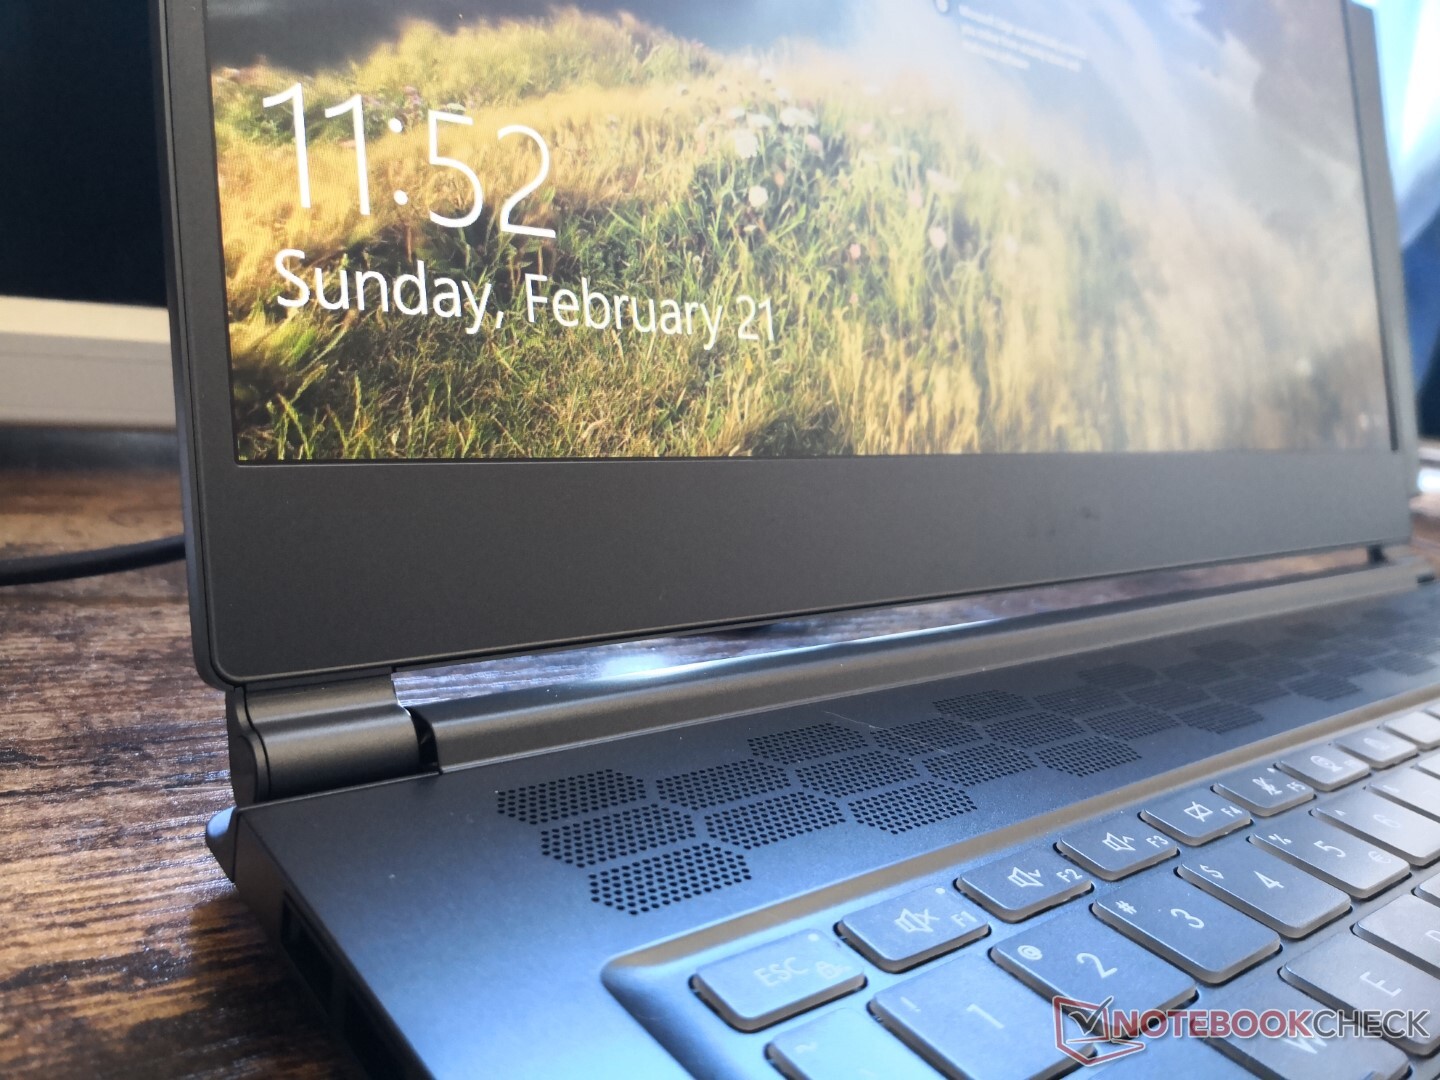
El diseño del chasis es diferente al de los modelos Modern, Creator y Prestige. Aun así, el Stealth 15M utiliza materiales de chasis metálicos similares para conseguir un aspecto y una sensación similares. Esto también significa que sufre las mismas ventajas y desventajas para bien o para mal. Su diseño delgado y elegante es posiblemente atractivo, pero la base y la tapa son muy propensas a flexionarse en comparación con el XPS 15, el Envy 15, el Spectre x360 15 y la mayoría de los otros portátiles multimedia de 15,6 pulgadas. Tampoco tenemos mucha fe en que las débiles bisagras duren más de un par de años.
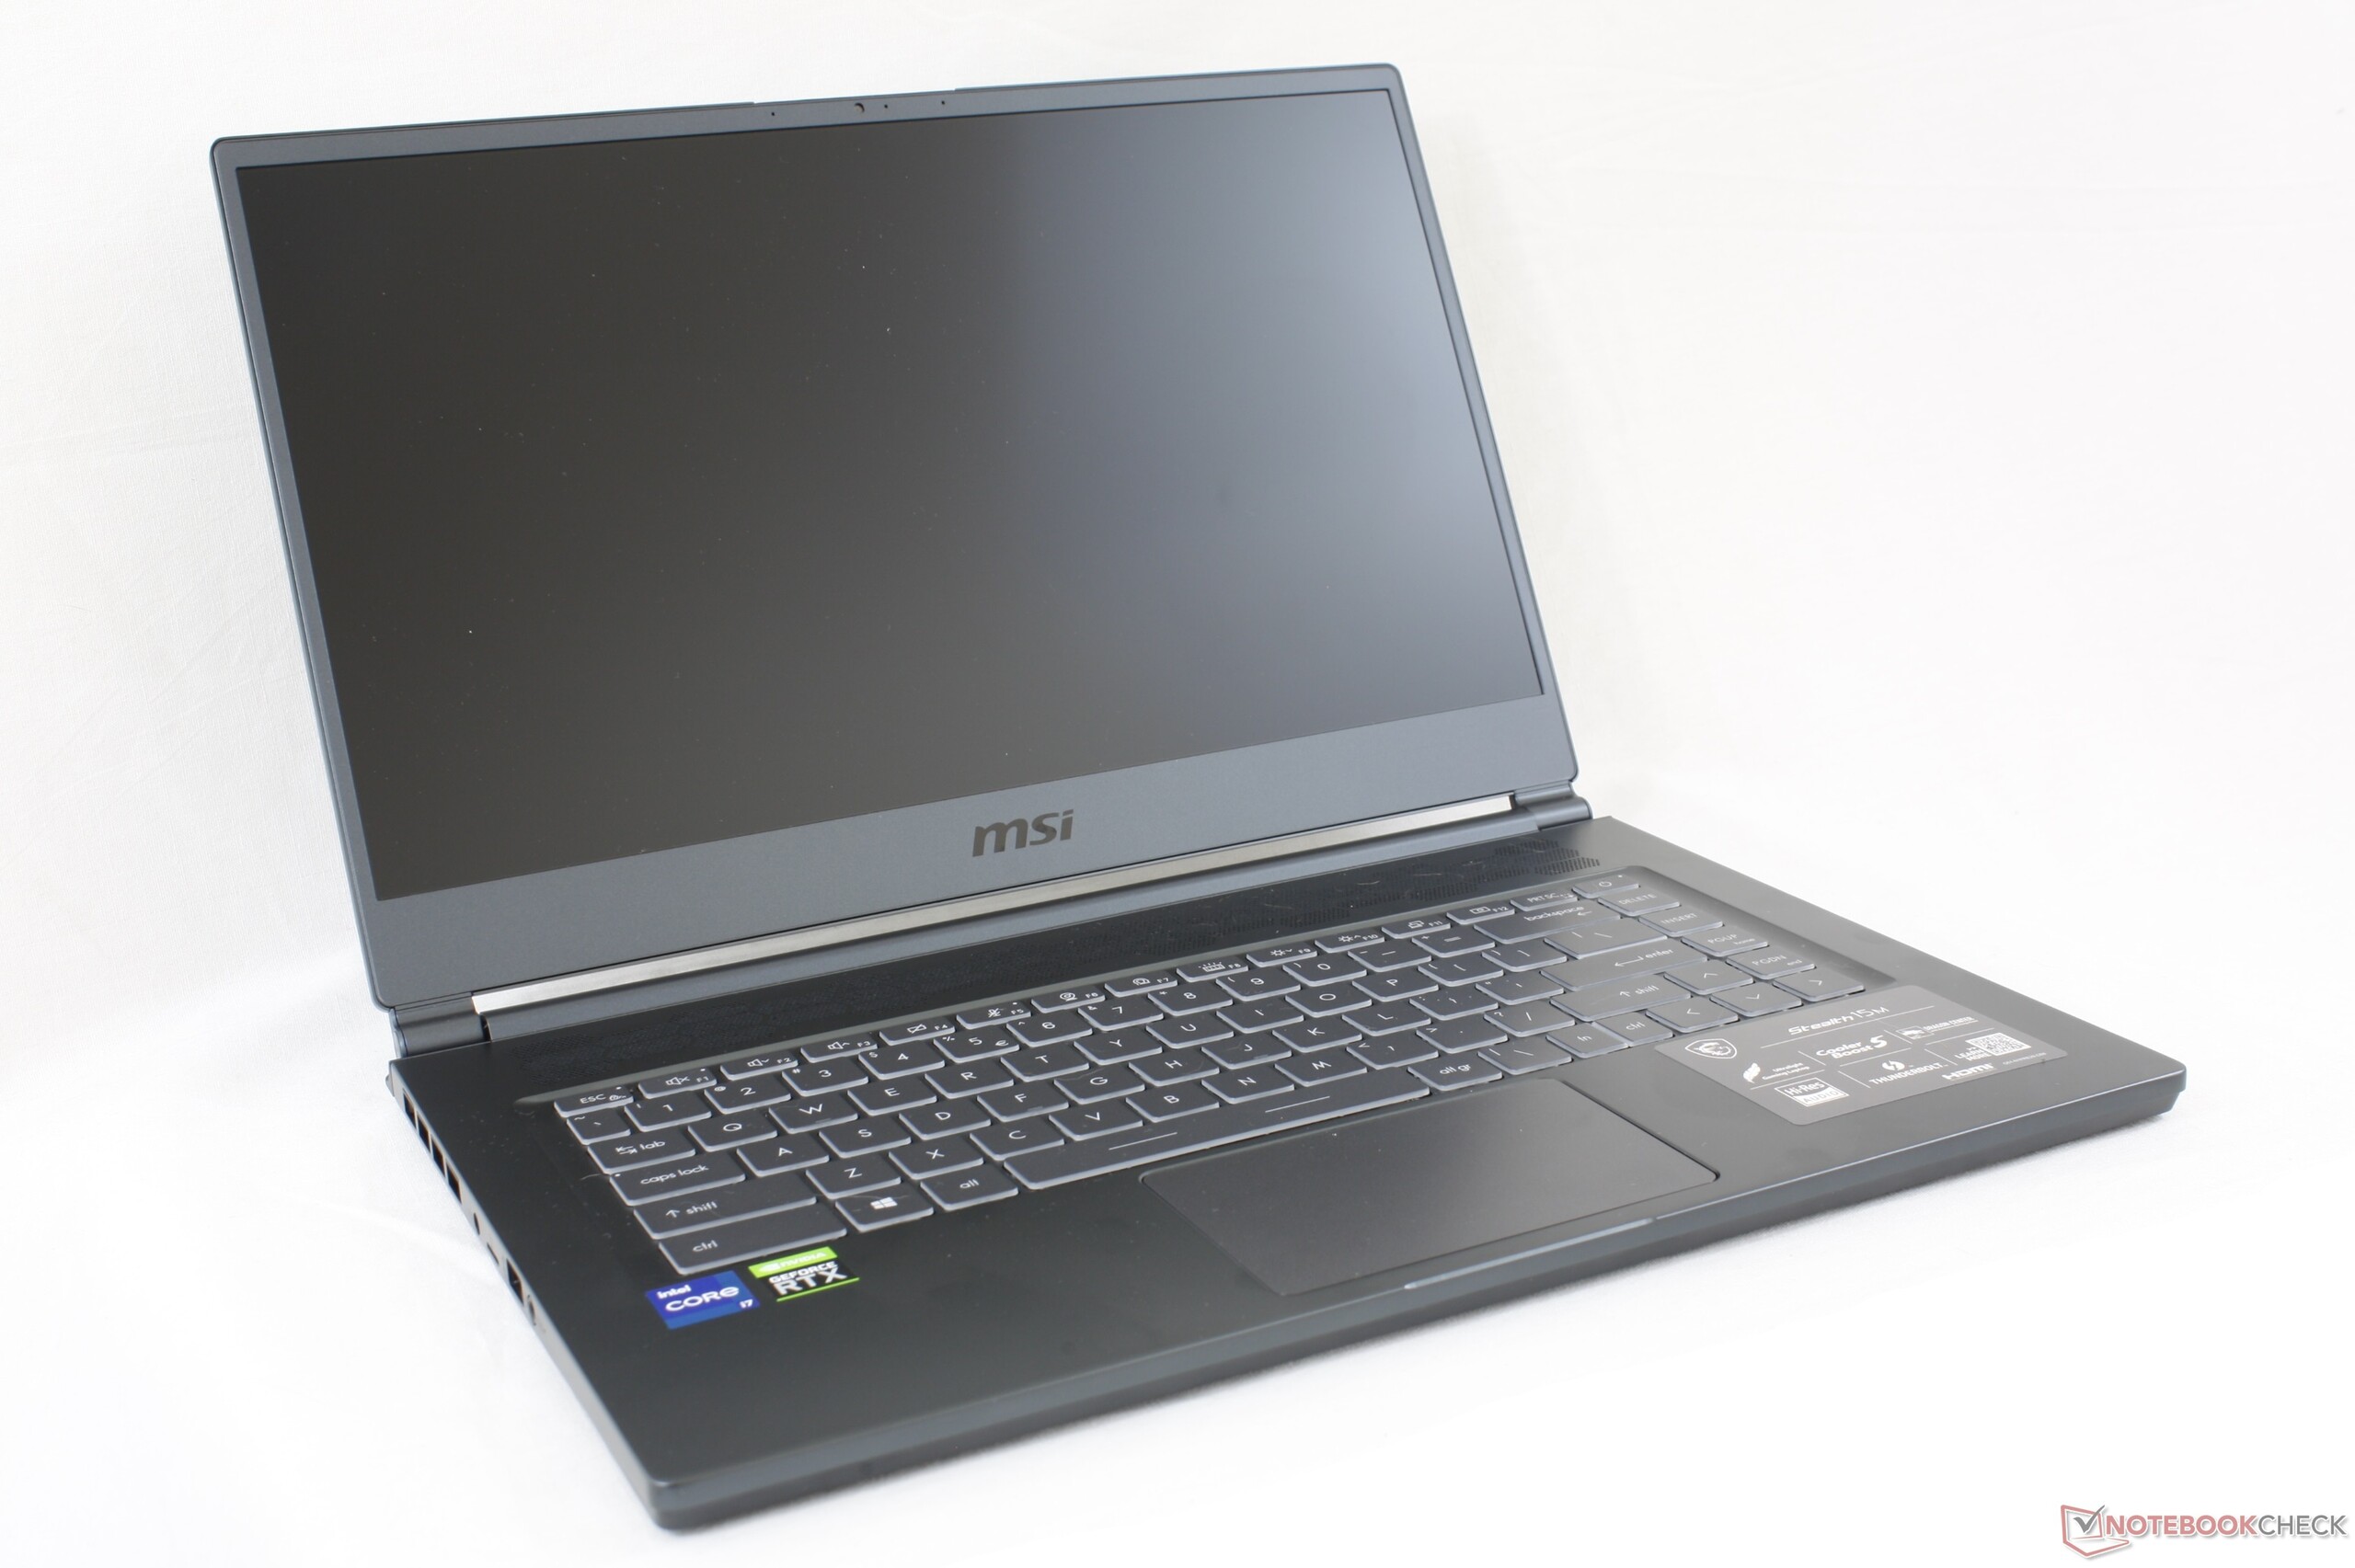
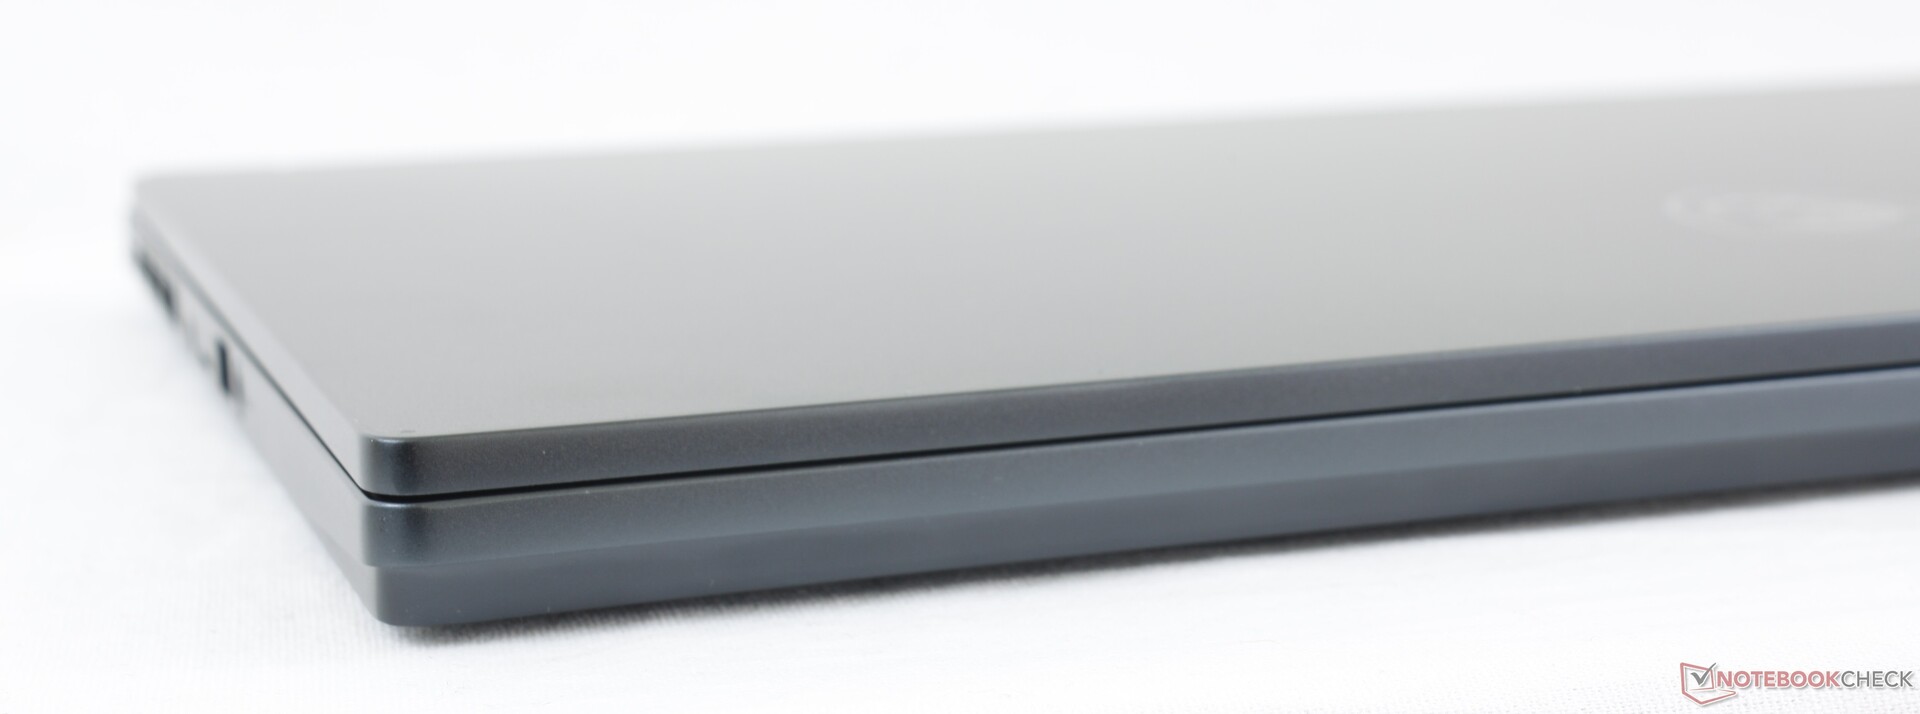
El bajo peso es una característica importante del Stealth 15M, ya que el sistema es aproximadamente 300 g más ligero que muchos de sus competidores de 15,6 pulgadas, incluido el XPS 15. Lo que hace que la diferencia de peso sea más notable es que el MSI también viene con opciones gráficas significativamente más rápidas que cualquiera de estas alternativas más pesadas. Es mucha potencia para no mucho peso.
Las dimensiones generales del MSI son mayores que las del XPS 15 y el Prestige 15 debido al mayor grosor del bisel de la barbilla.
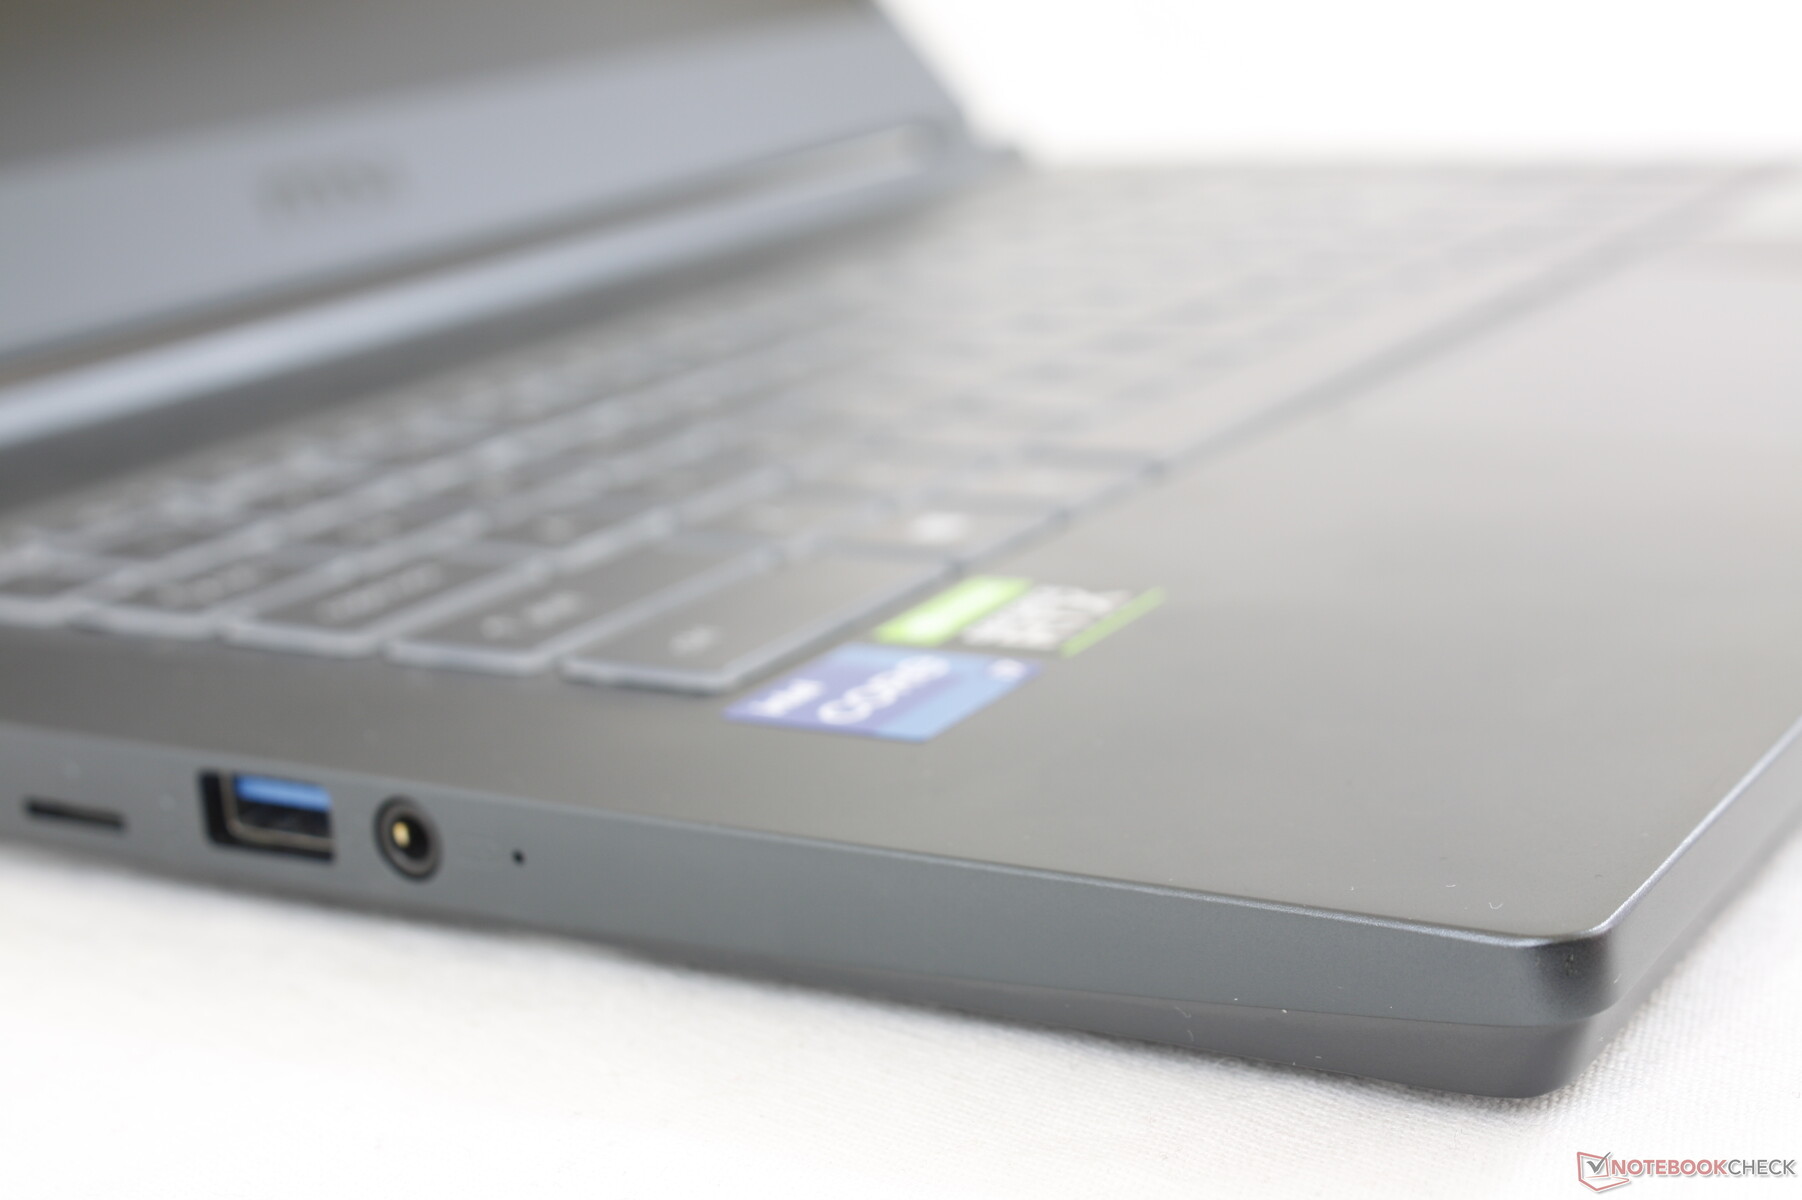
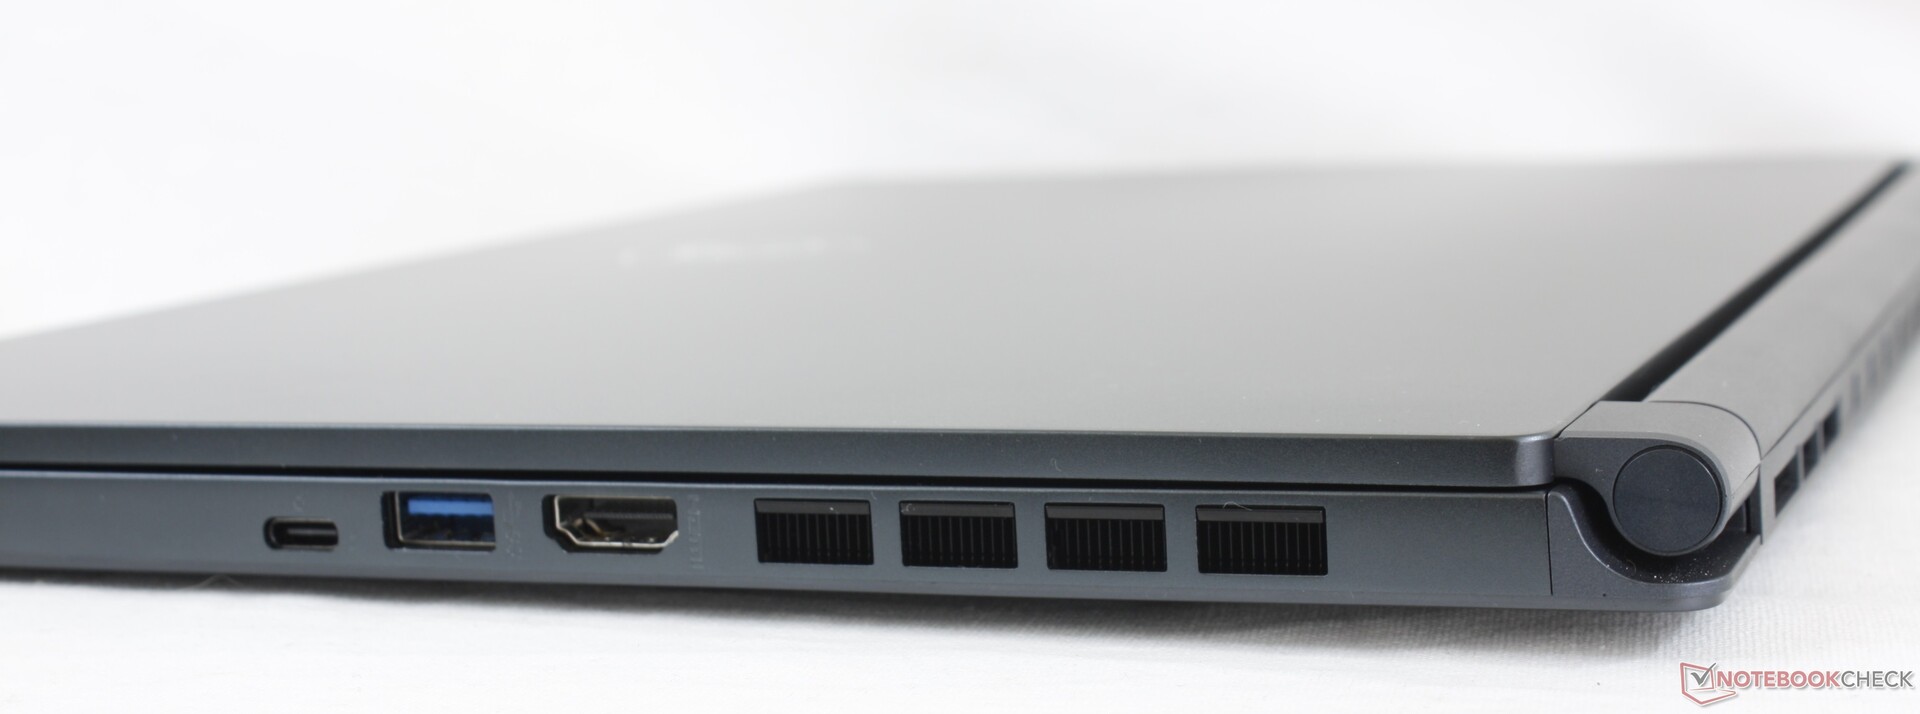
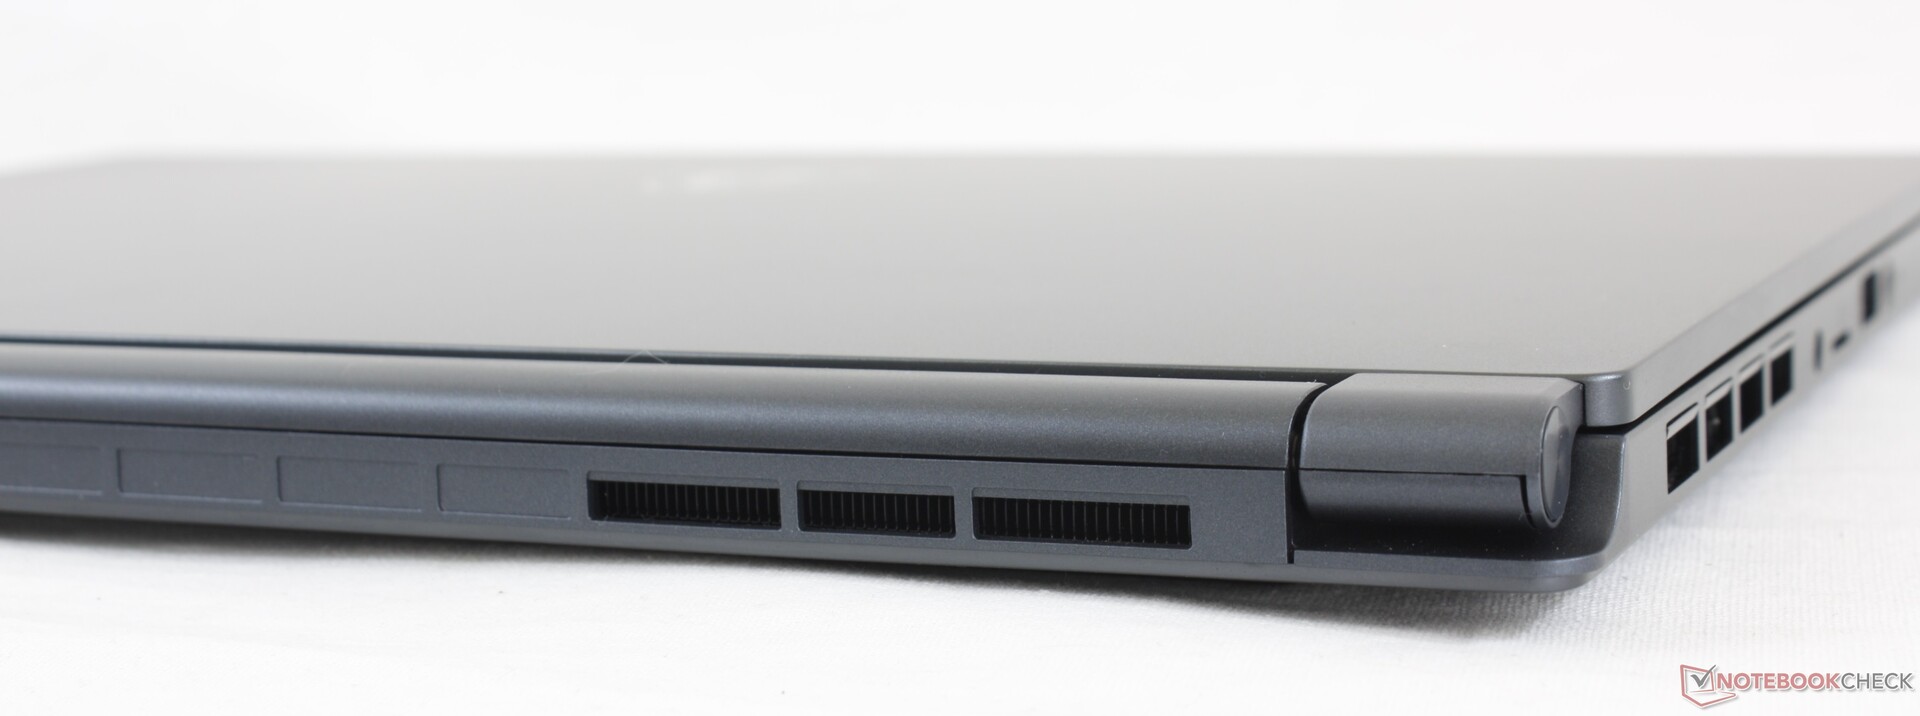
Conectividad
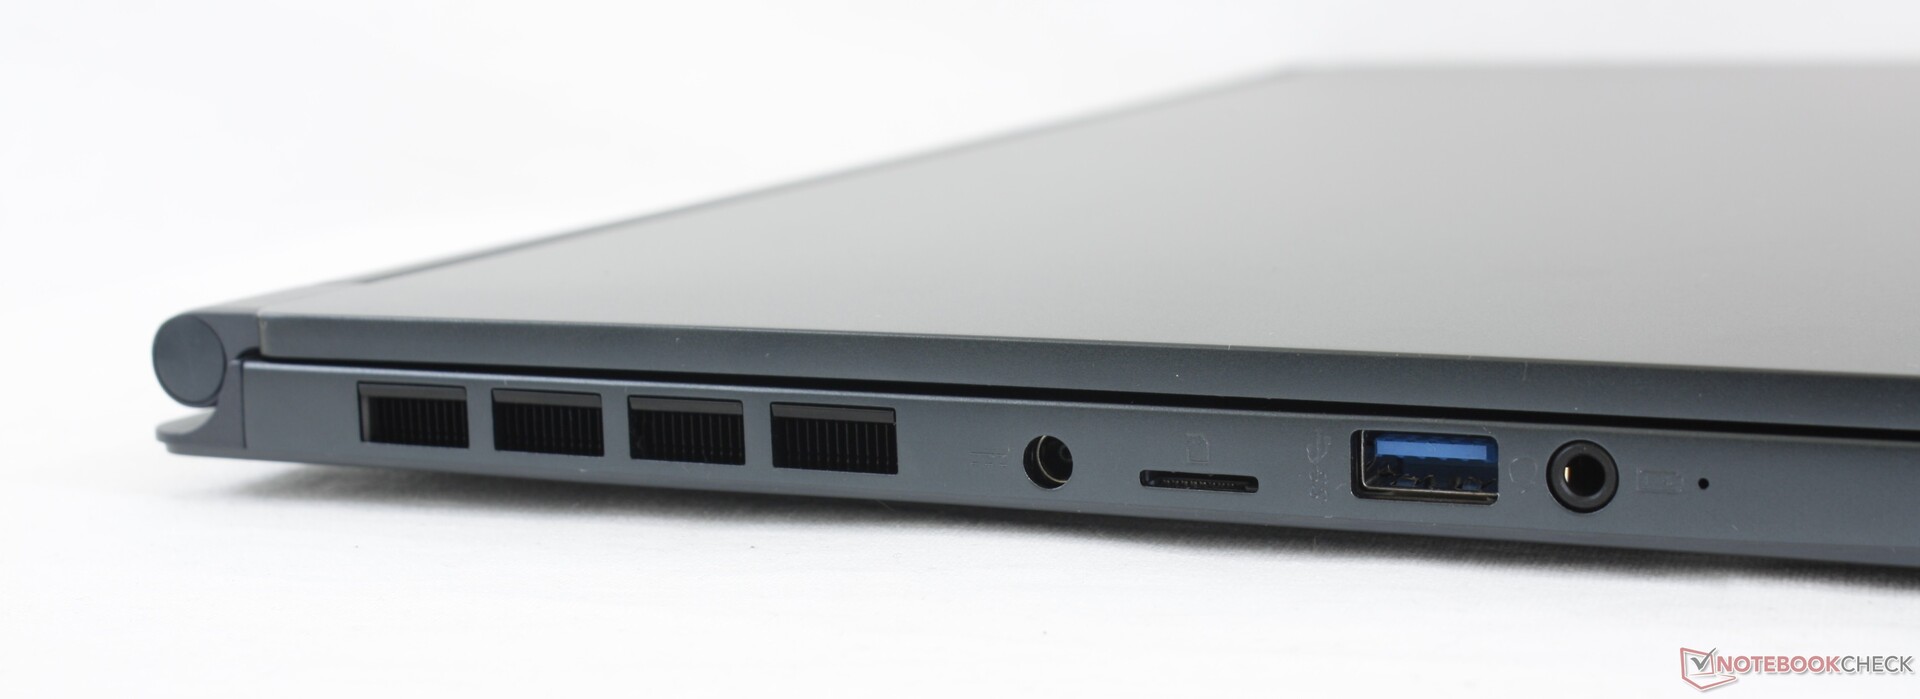
Las opciones de puerto son similares a las del Prestige 15 pero con un puerto de carga de barril propietario en lugar de uno de los puertos USB-C. MSI probablemente no podía confiar completamente en la carga USB-C aquí debido a las mayores demandas de energía de la GeForce RTX 2060 Max-Q en comparación con la GTX 1650 Max-Q del modelo Prestige. Los puertos aquí están apretados a lo largo de los bordes izquierdo y derecho.
Lector de tarjetas SD
El lector de MicroSD con resorte ofrece velocidades de transferencia muy rápidas, de unos 200 MB/s. Mover 1 GB de fotos desde nuestra tarjeta de prueba UHS-II al escritorio lleva unos 6 segundos.
| SD Card Reader | |
| average JPG Copy Test (av. of 3 runs) | |
| Dell XPS 15 9500 Core i7 4K UHD (Toshiba Exceria Pro SDXC 64 GB UHS-II) | |
| MSI Stealth 15M A11SEK (Toshiba Exceria Pro M501 microSDXC 32GB) | |
| HP Spectre X360 15-5ZV31AV (Toshiba Exceria Pro M501 UHS-II) | |
| MSI Prestige 15 A10SC (Toshiba Exceria Pro M501 UHS-II) | |
| Lenovo ThinkPad T15p-20TN0006GE (Toshiba Exceria Pro SDXC 64 GB UHS-II) | |
| Asus ZenBook UX535-M01440 (Toshiba Exceria Pro M501 microSDXC 64GB) | |
| maximum AS SSD Seq Read Test (1GB) | |
| MSI Stealth 15M A11SEK (Toshiba Exceria Pro M501 microSDXC 32GB) | |
| Dell XPS 15 9500 Core i7 4K UHD (Toshiba Exceria Pro SDXC 64 GB UHS-II) | |
| MSI Prestige 15 A10SC (Toshiba Exceria Pro M501 UHS-II) | |
| HP Spectre X360 15-5ZV31AV (Toshiba Exceria Pro M501 UHS-II) | |
| Lenovo ThinkPad T15p-20TN0006GE (Toshiba Exceria Pro SDXC 64 GB UHS-II) | |
| Asus ZenBook UX535-M01440 (Toshiba Exceria Pro M501 microSDXC 64GB) | |
Comunicación
Un Intel AX201 viene de serie para la conectividad Wi-Fi 6 y Bluetooth 5.1. No experimentamos ningún problema al emparejarlo con nuestro router de prueba Netgear RAX200, aunque las velocidades de transmisión son mucho más lentas de lo esperado.
Cámara web


Mantenimiento
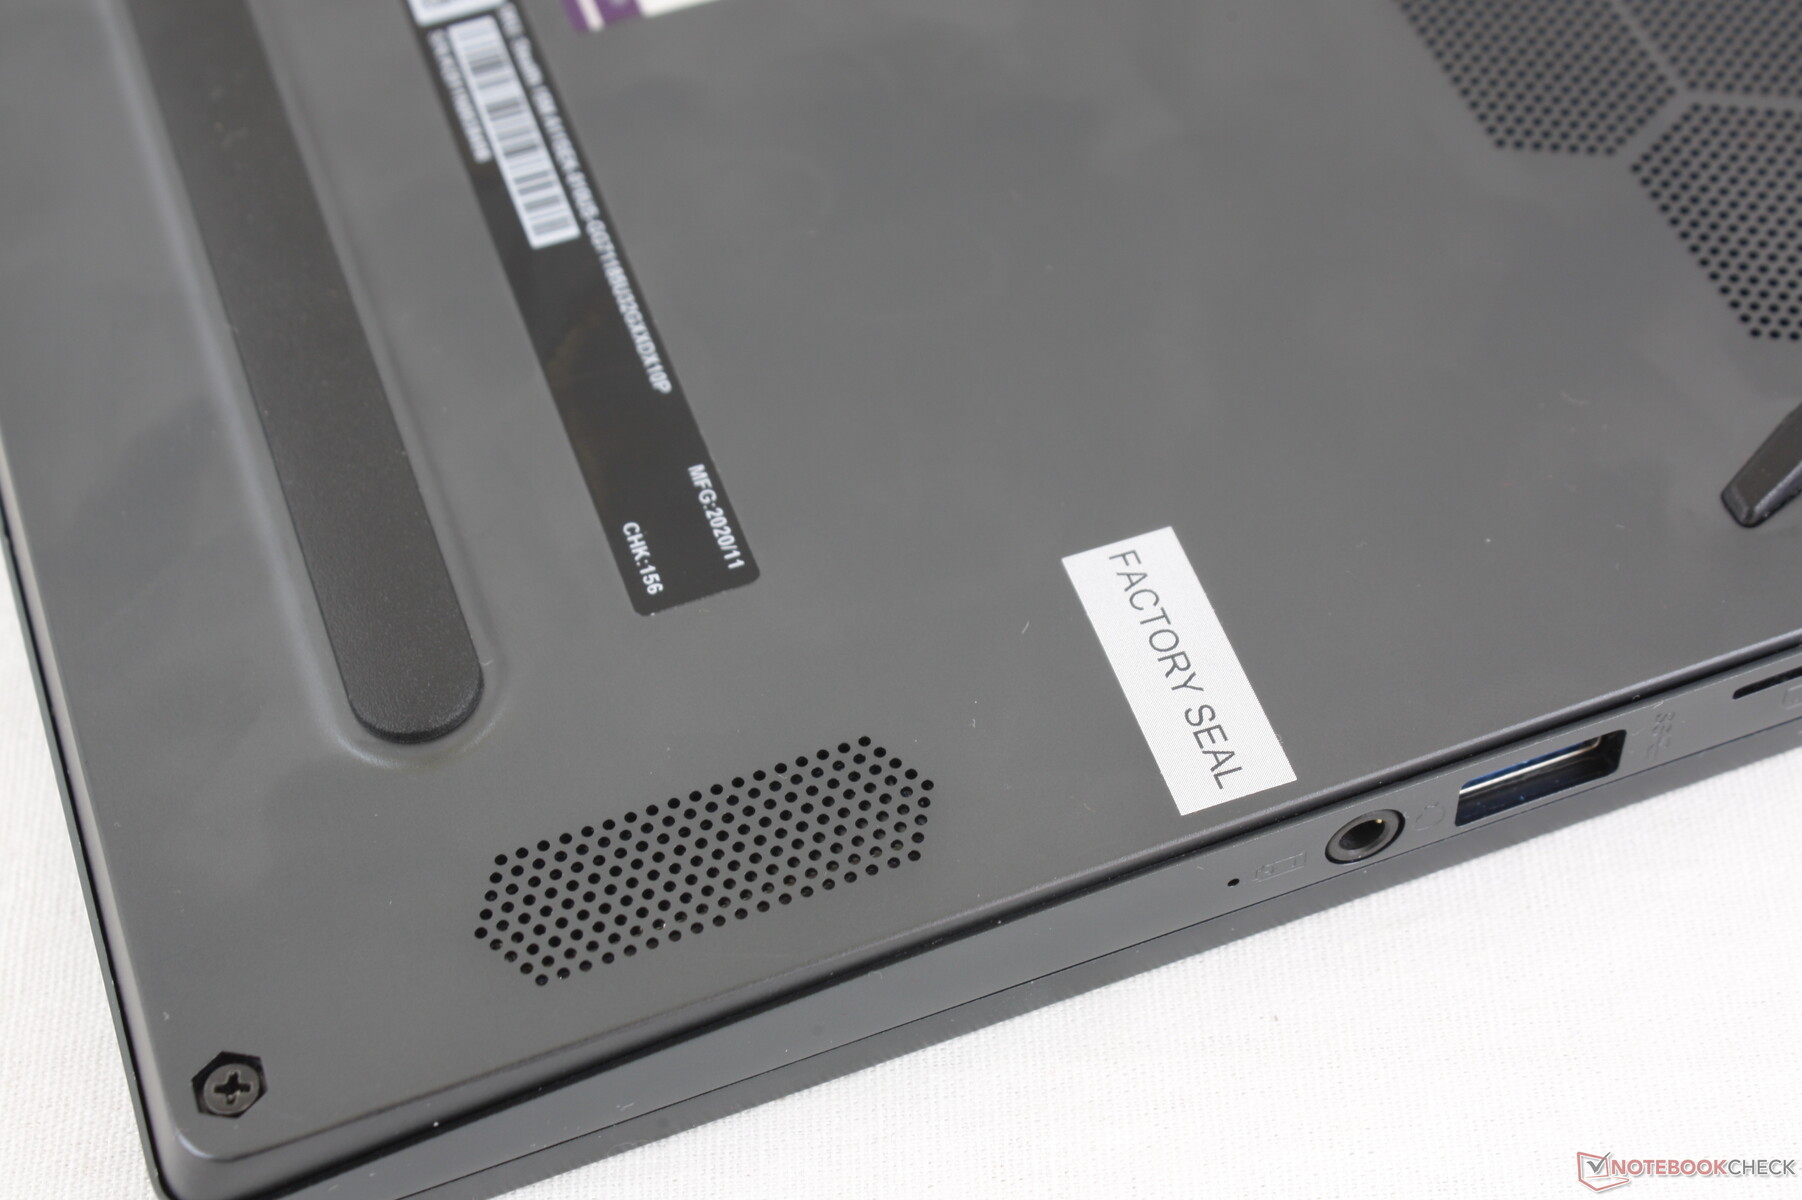
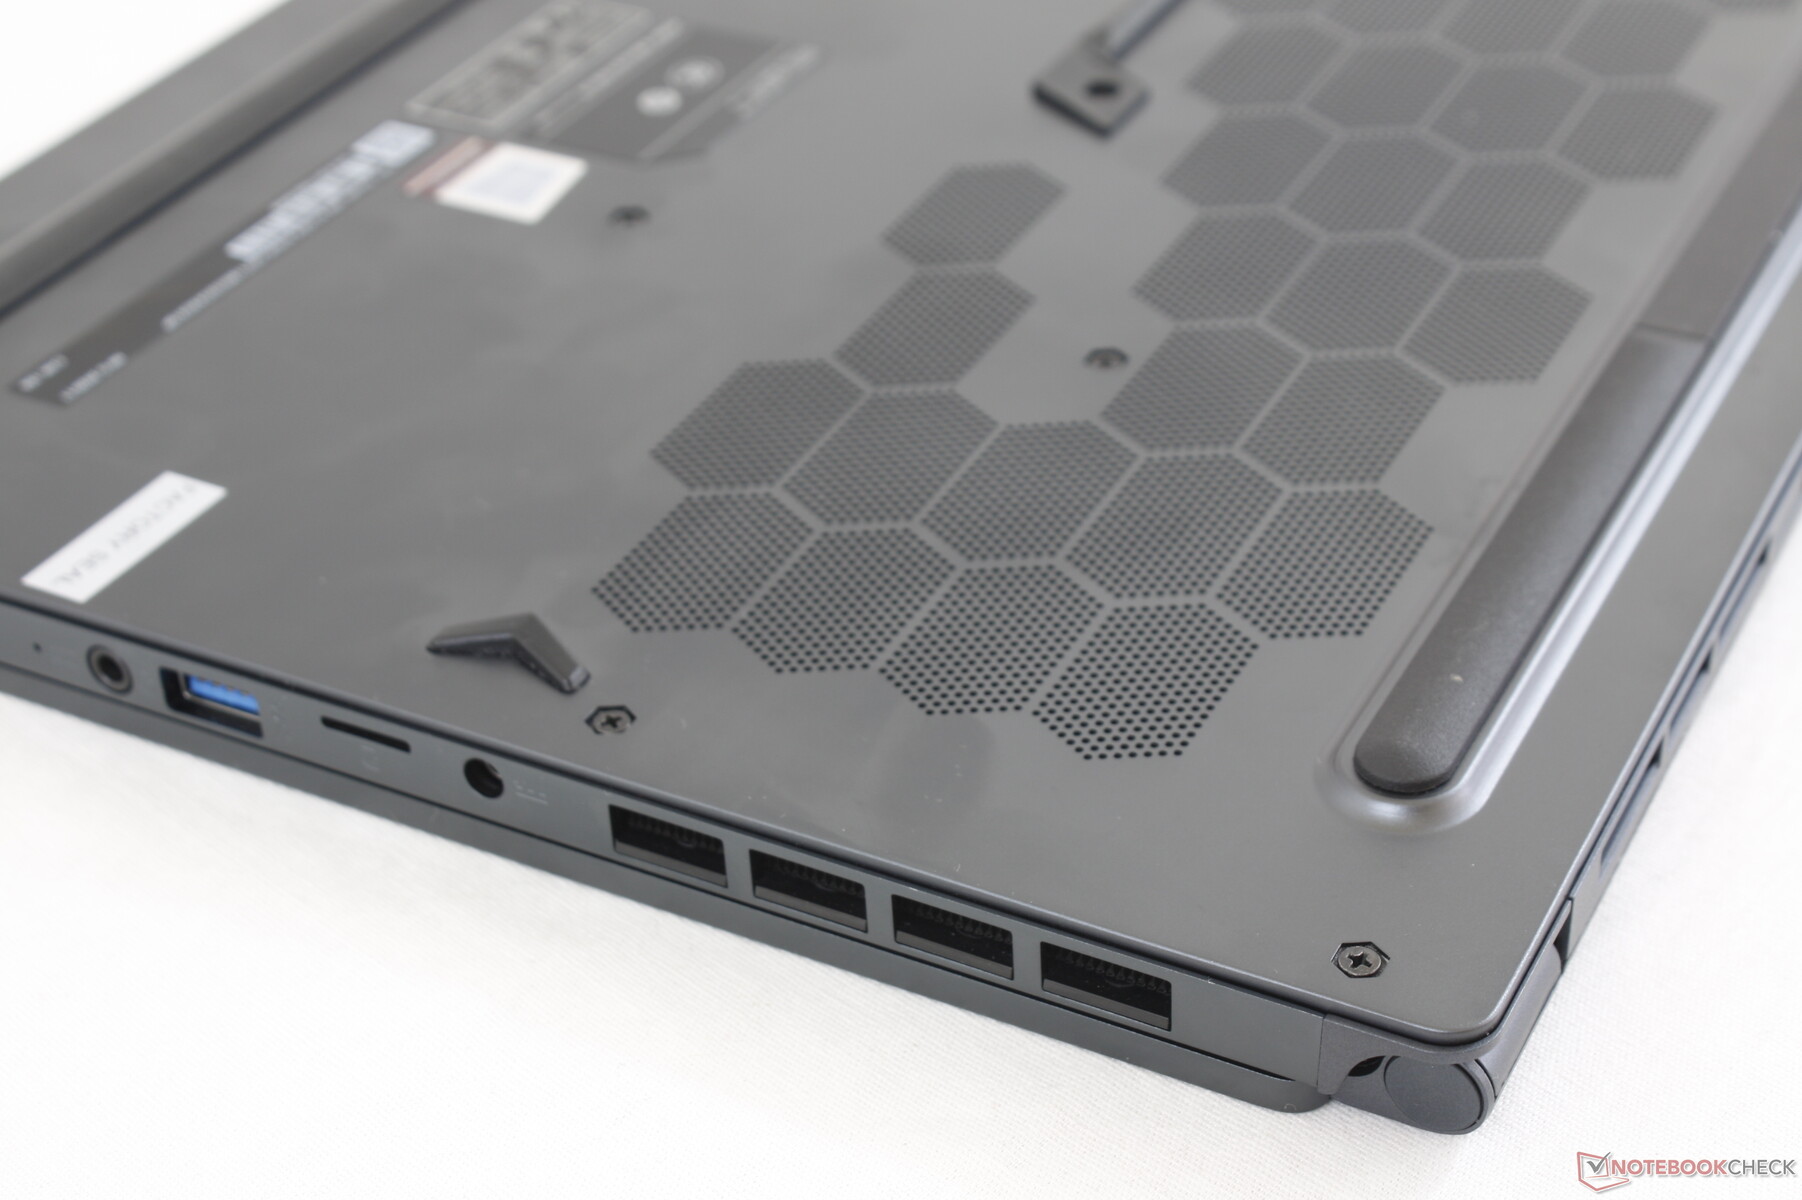
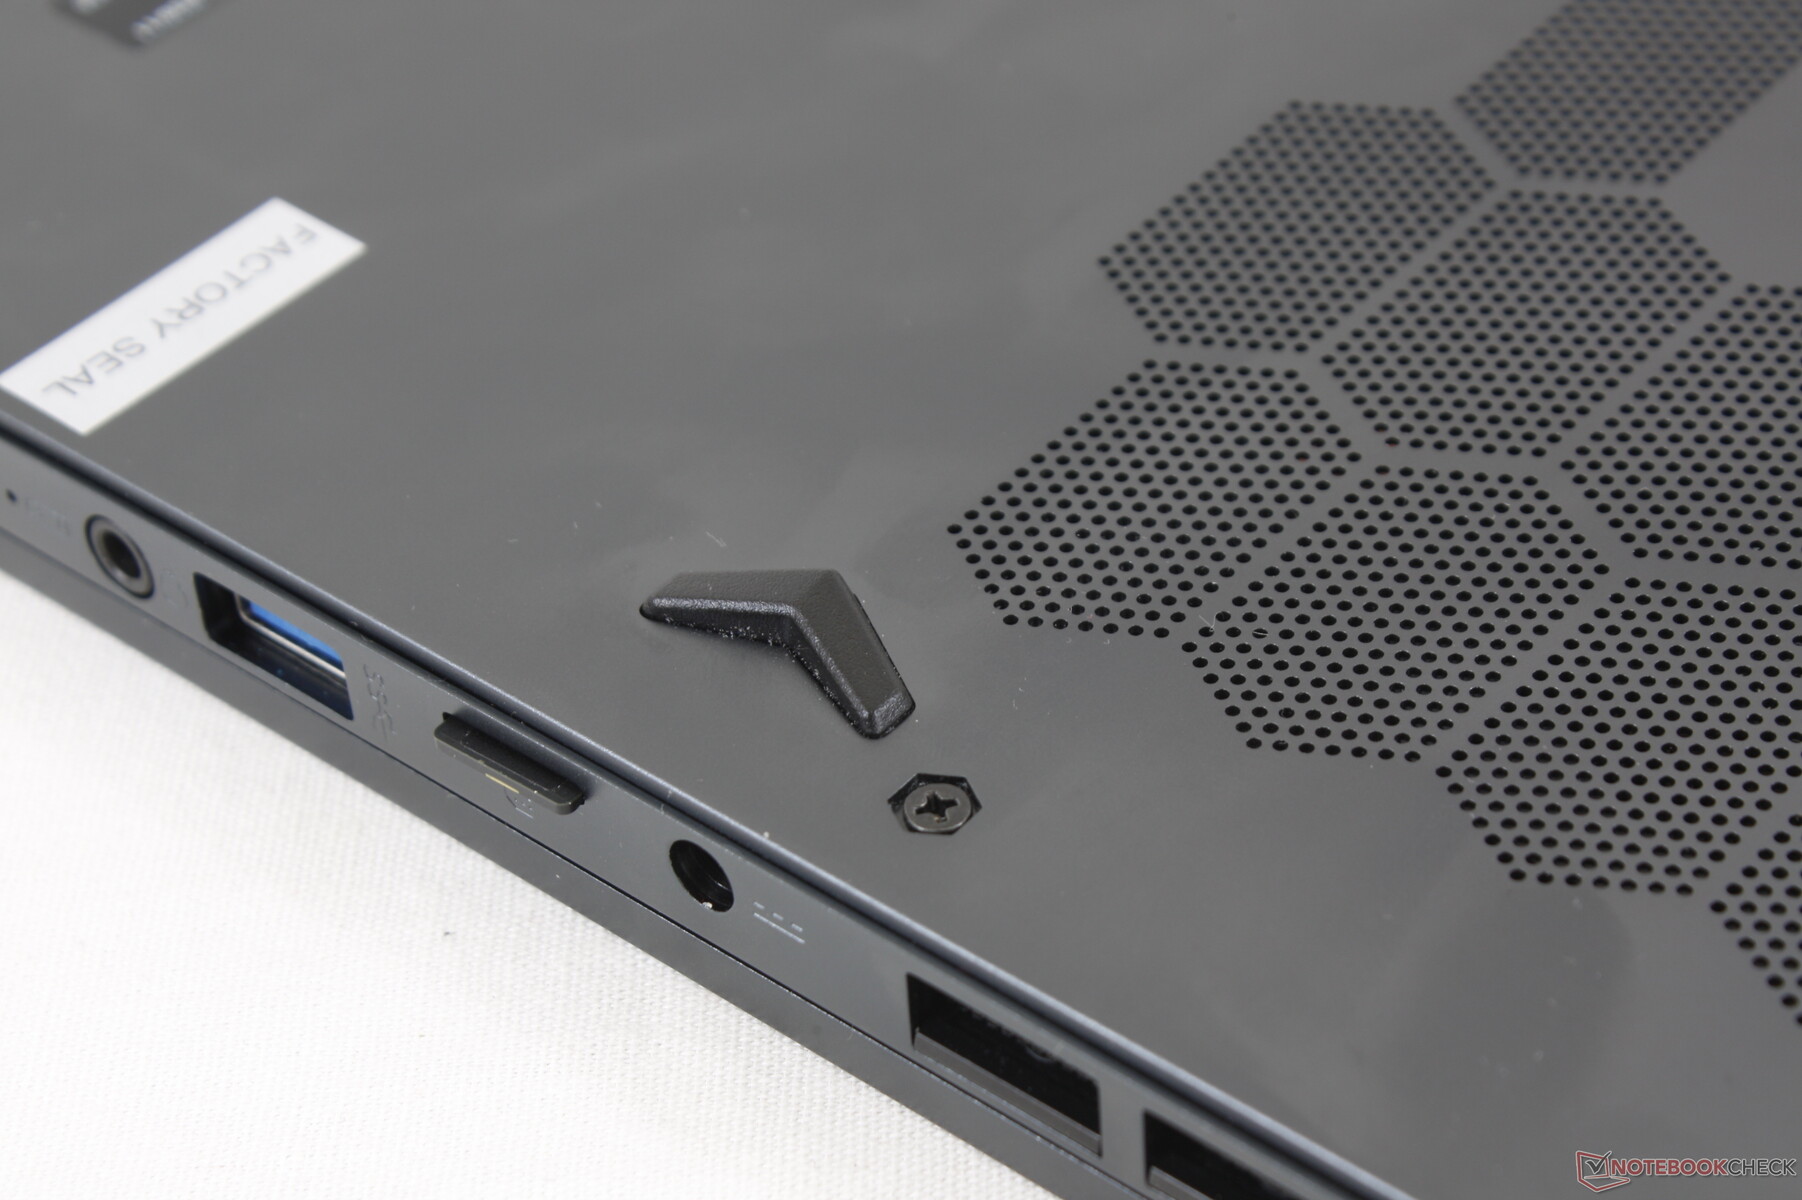
A pesar de nuestros gritos, MSI sigue desaconsejando las actualizaciones de los usuarios finales con una pegatina de "sello de fábrica" sobre uno de los tornillos de la placa inferior. Reclamar la garantía o las devoluciones al por menor puede ser difícil porque los vendedores pueden usar el sello roto en tu contra.
Accesorios y garantía
La caja de venta incluye un adaptador de USB-A a RJ-45 junto con la documentación y el adaptador de corriente. No hay un paño de limpieza de terciopelo, a diferencia de la caja de venta del GS66.
La garantía del fabricante es de dos años.
Dispositivos de entrada
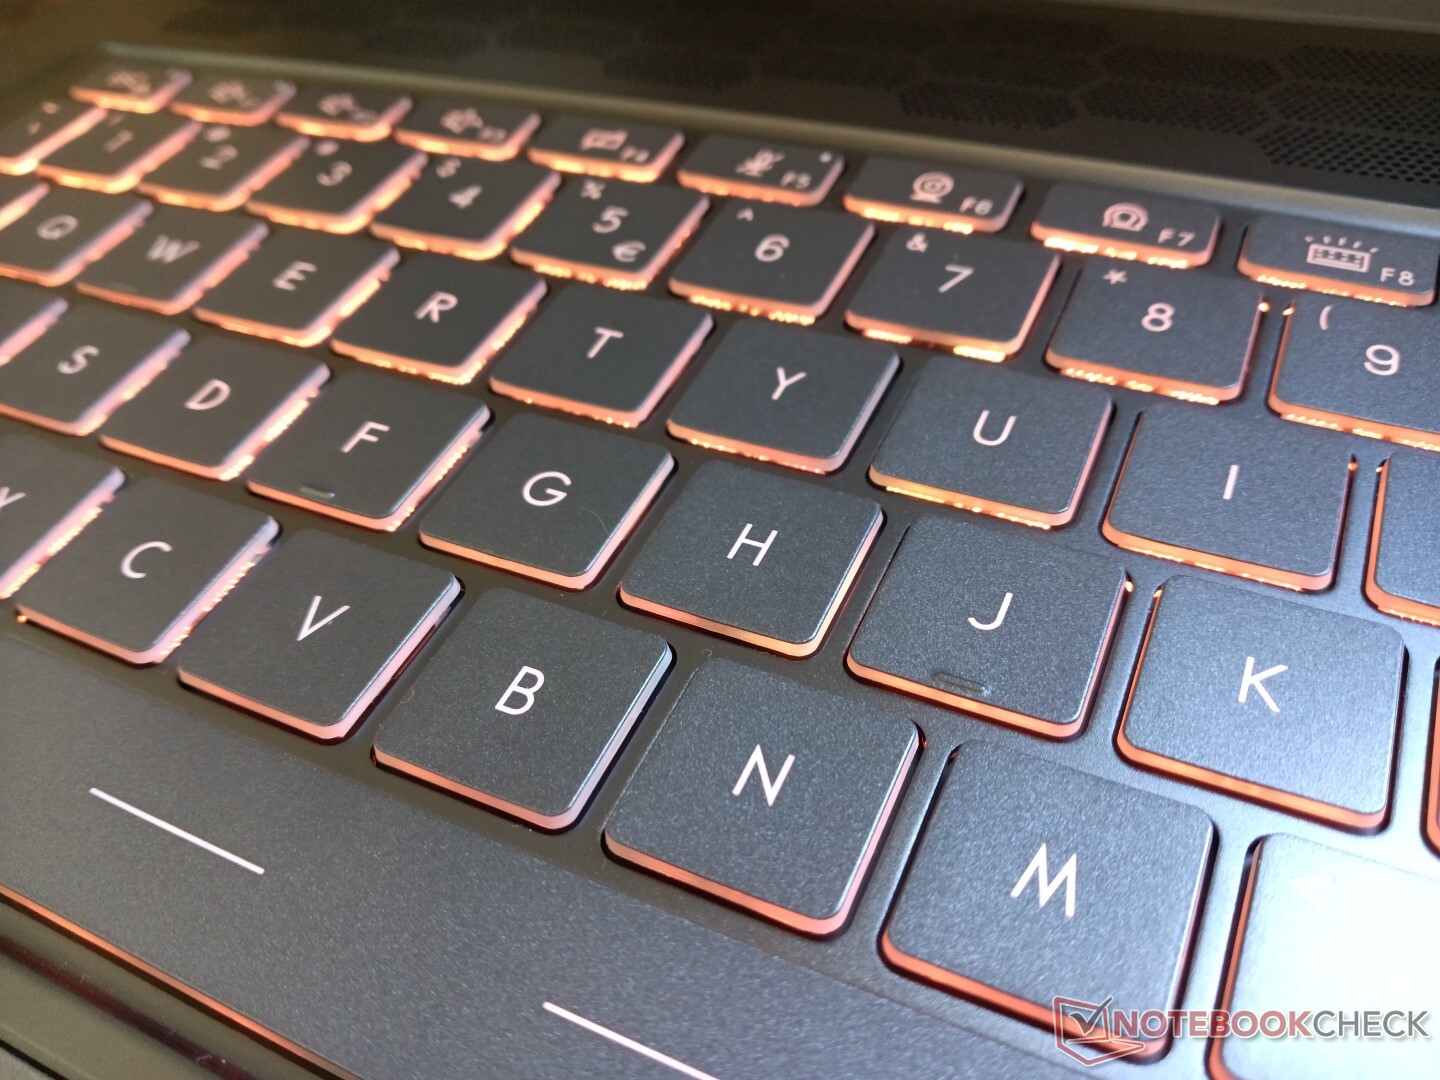
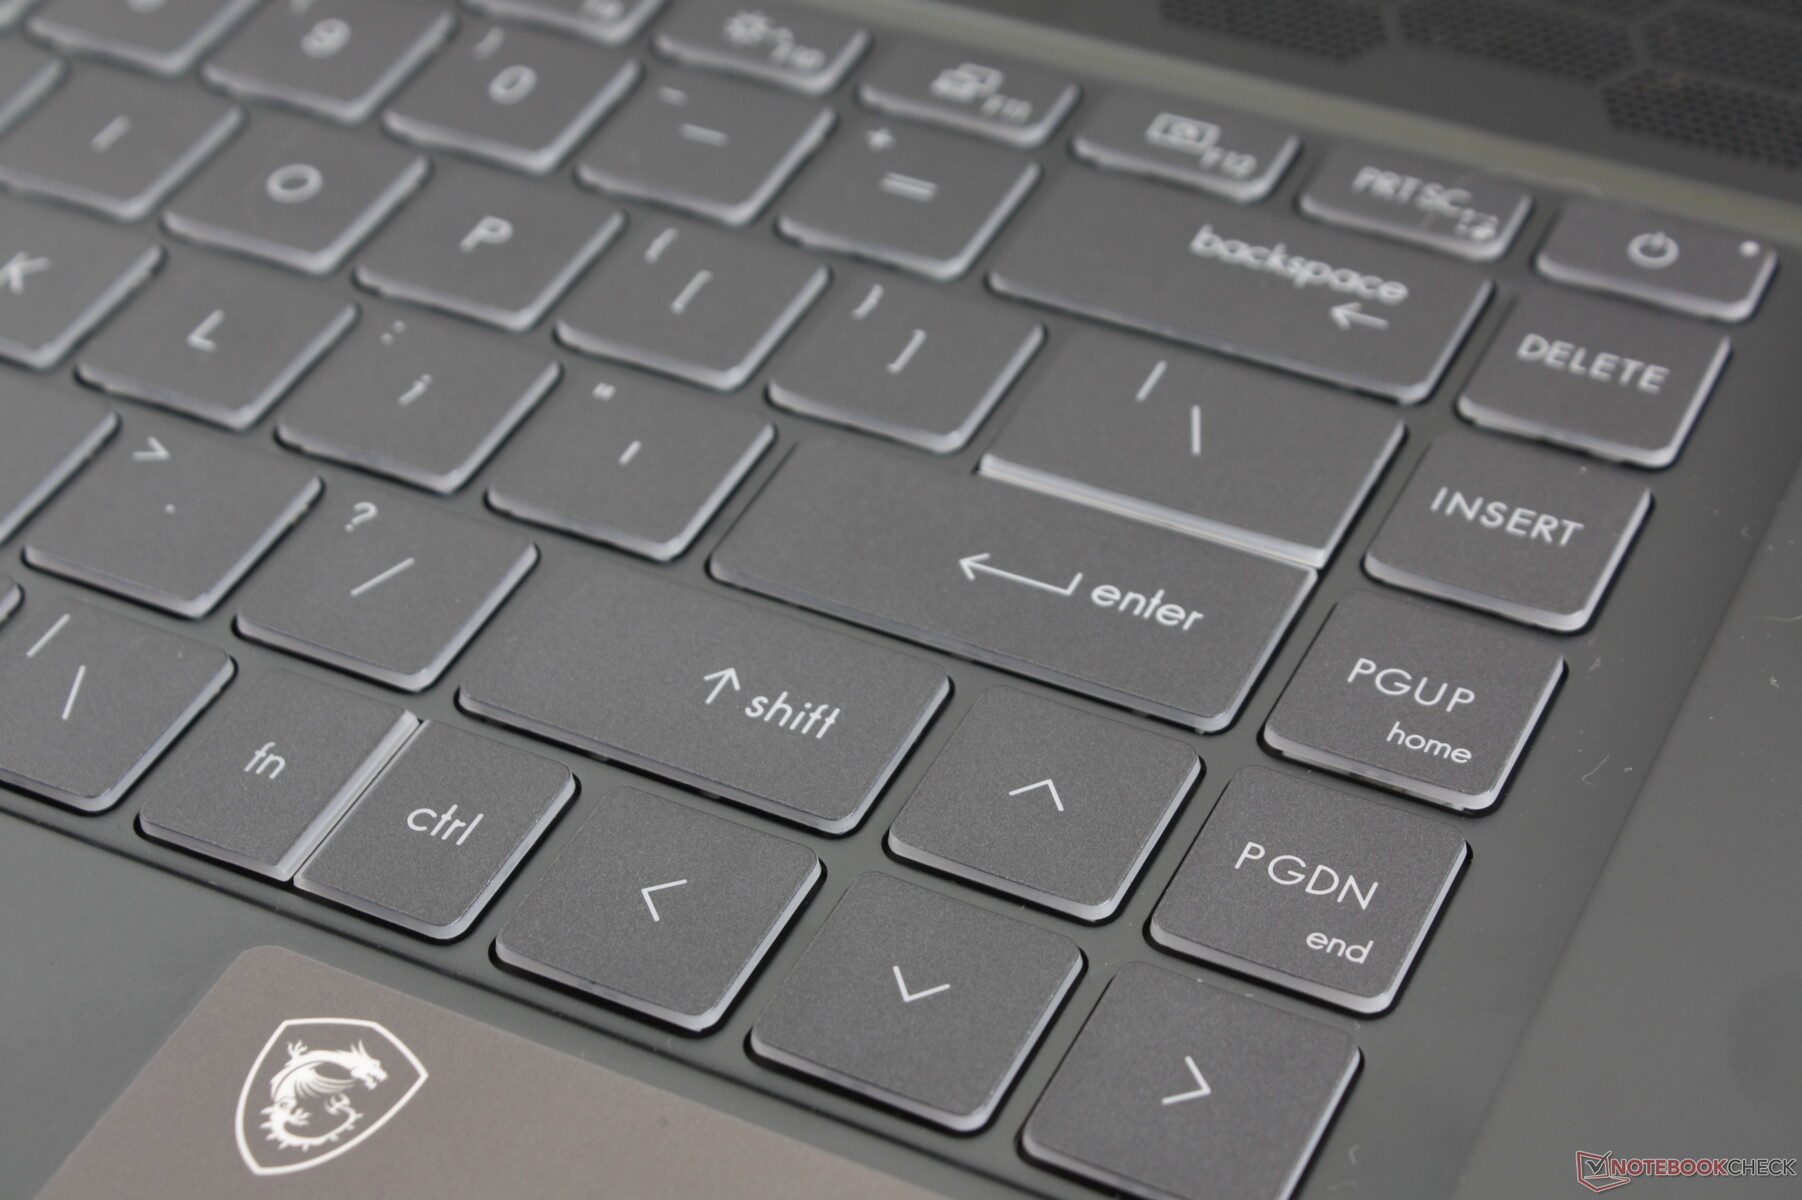
Teclado
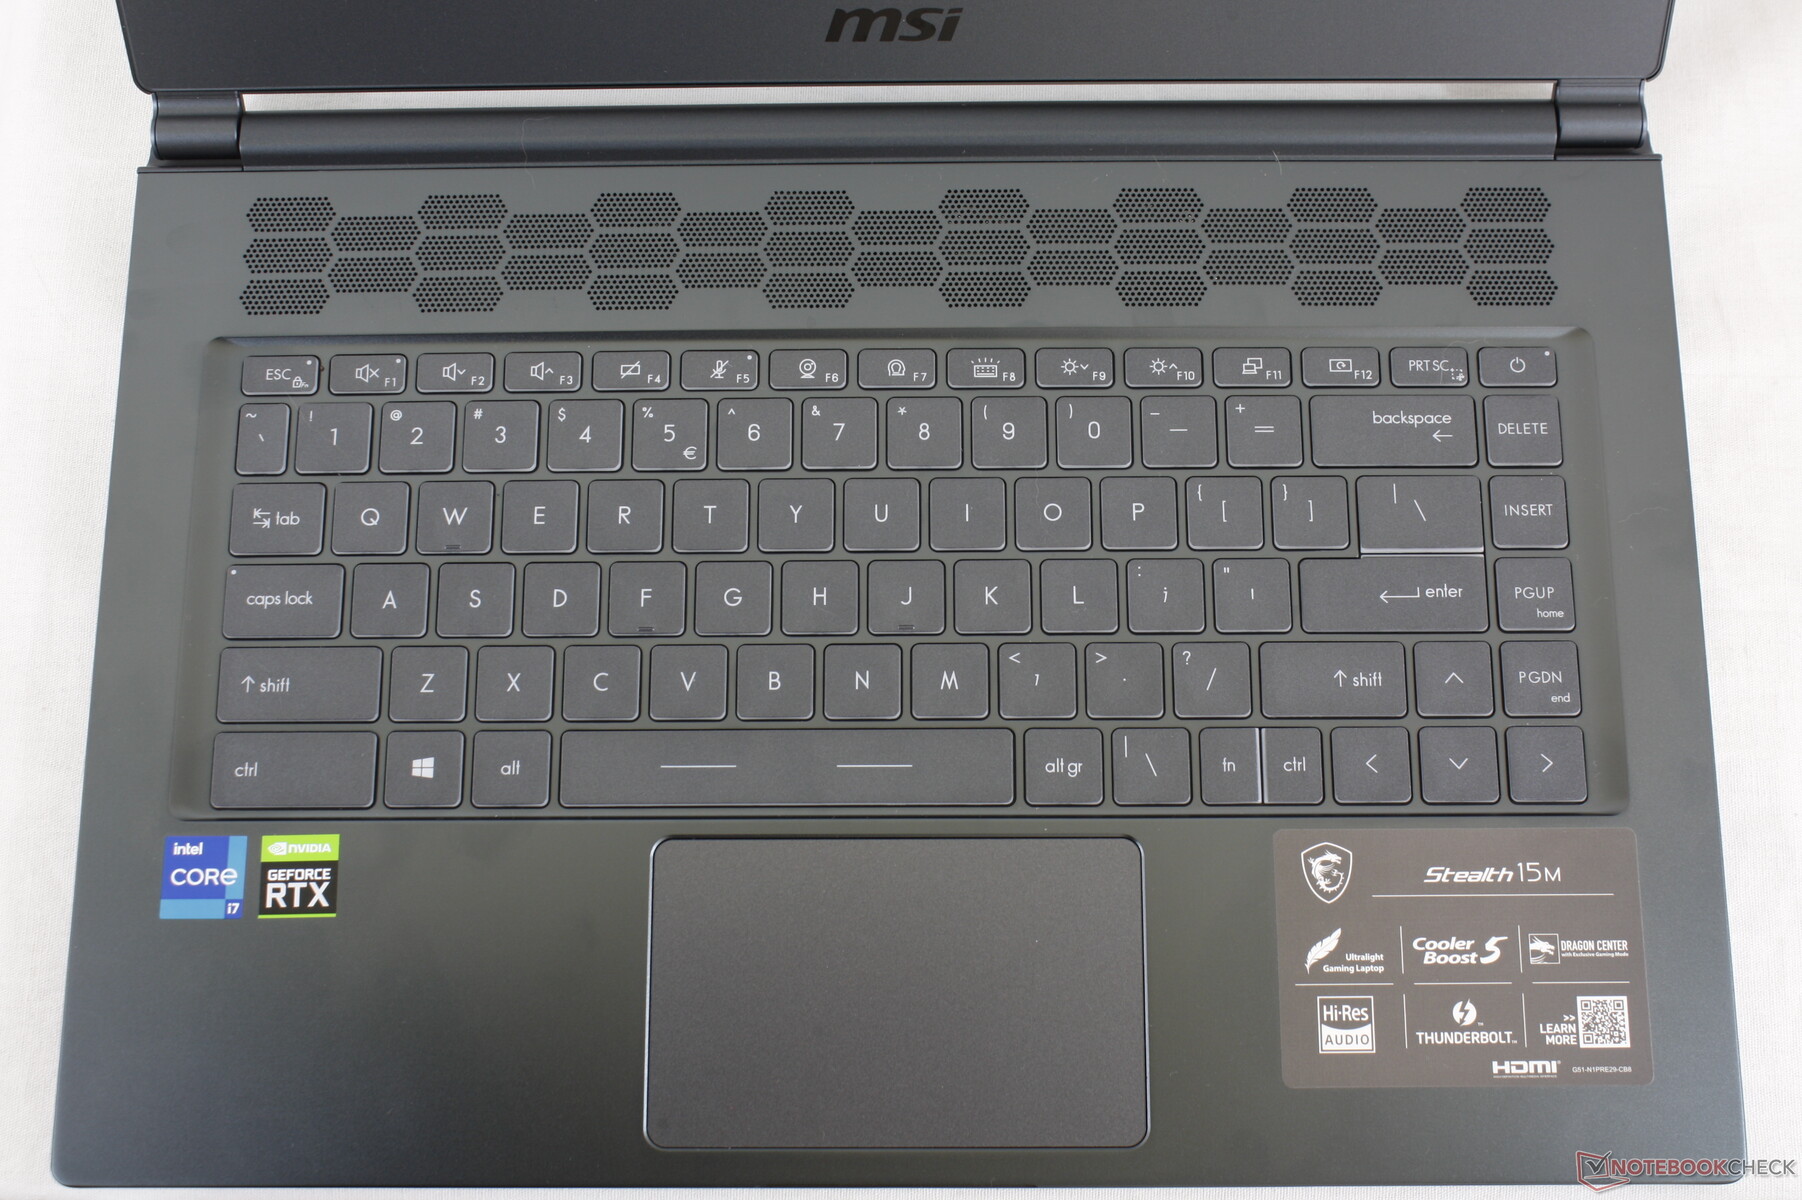
La respuesta y la distribución del teclado son idénticas a las del Prestige 15, salvo por las teclas FN/Ctrl divididas cerca de la parte inferior derecha. Por tanto, nuestros comentarios existentes sobre el teclado del Prestige se aplican aquí, incluyendo las teclas ligeras y poco profundas en relación con las teclas más firmes del HP Spectre o del Lenovo ThinkPad. Los usuarios acostumbrados a teclear en un Asus ZenBook o VivoBook encontrarán una experiencia de tecleo familiar en el Stealth 15M
A diferencia de los MSI Prestige, Modern o Creator, la retroiluminación del teclado aquí es compatible con colores RGB a través de MSI Mystic Light. Las opciones se limitan a una sola zona en contraste con los ajustes RGB por tecla de la serie GS66.
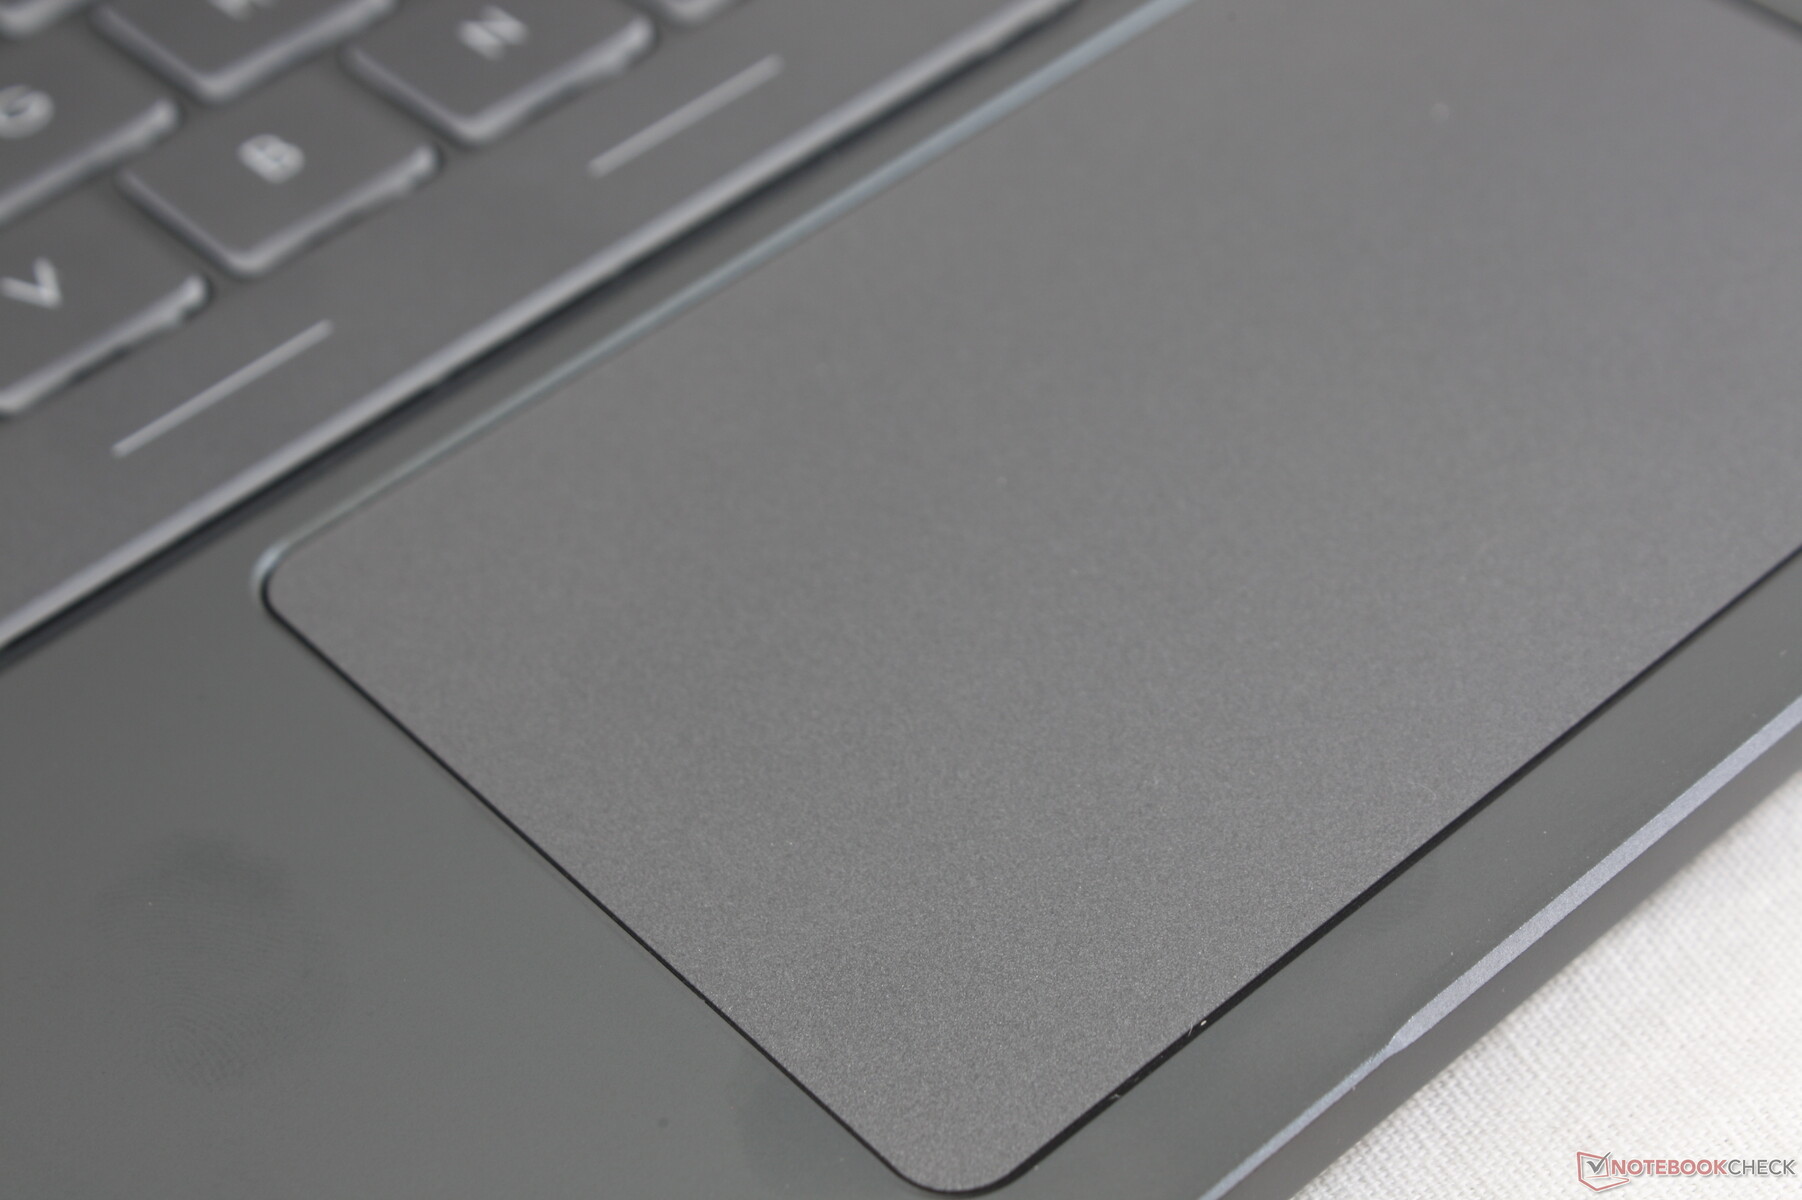
Panel táctil
El clickpad (10,5 x 6,5 cm) es más pequeño que el del XPS 15 (15,1 x 9 cm) o el HP Spectre x360 15 (12 x 6 cm). El control del cursor es suave y casi no se pega, incluso si se desliza muy lentamente por la superficie. Sus botones de clickpad integrados, sin embargo, son esponjosos y difíciles de usar durante mucho tiempo. Se recomienda encarecidamente el uso de un ratón externosi se necesita hacer muchos clics.
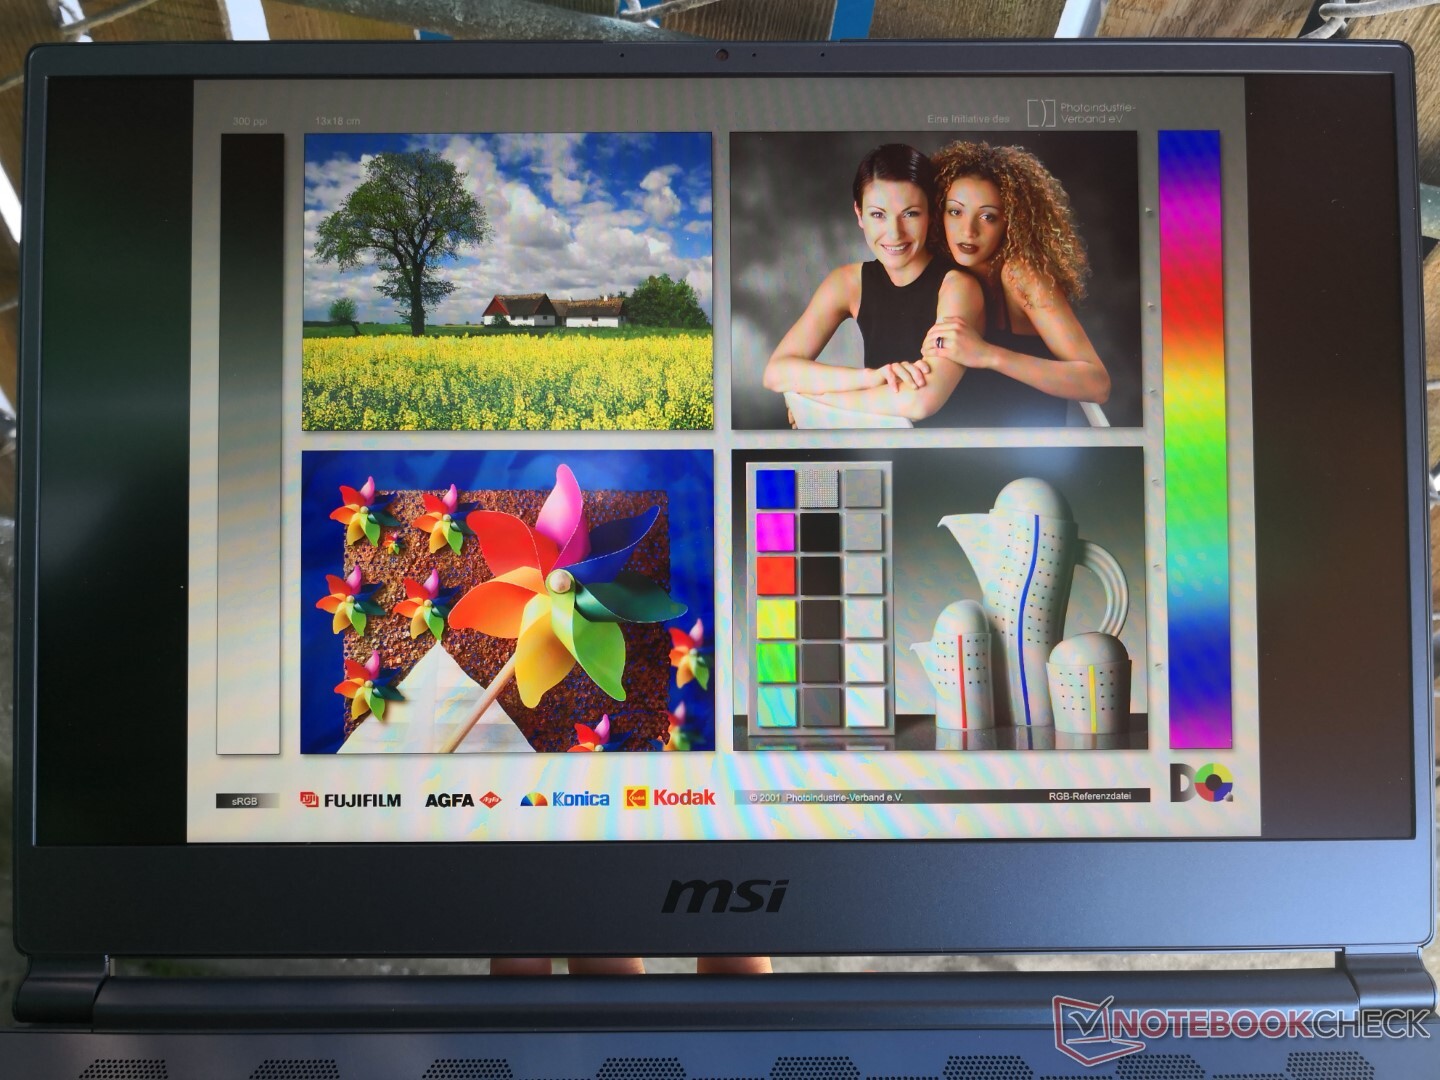
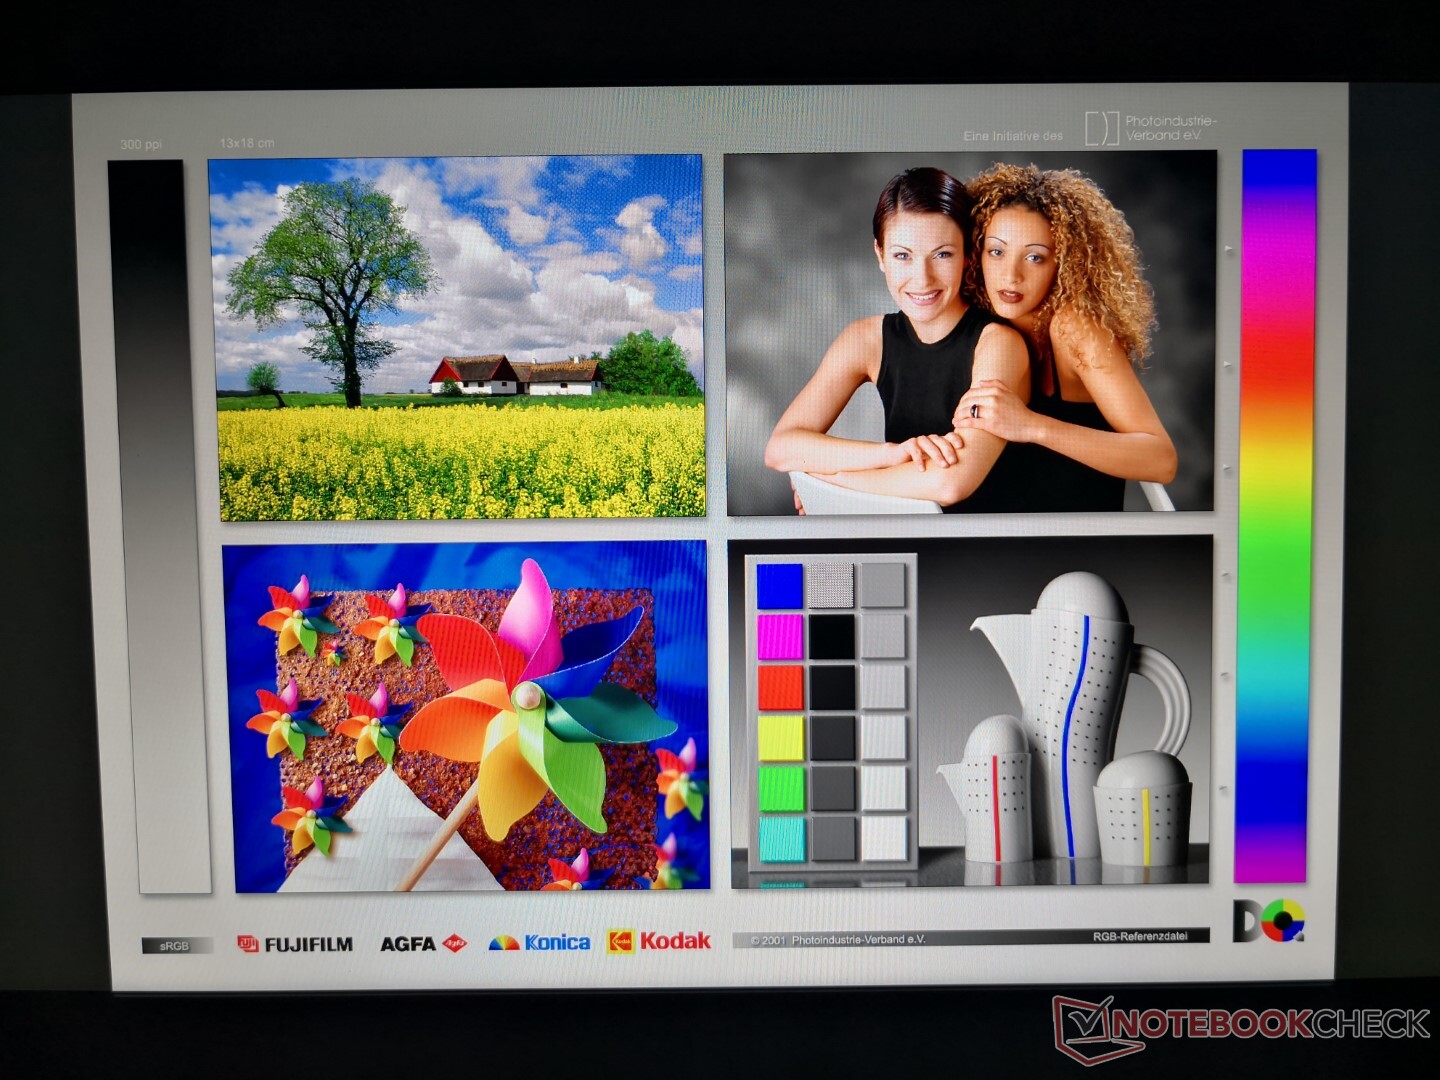
Mostrar
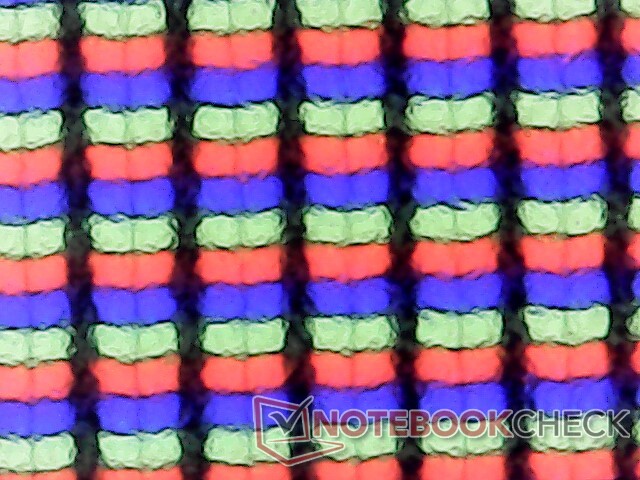
El Stealth 15M viene con el mismo panel IPS Chi Mei N156HCE-EN1 de 60 Hz que se encuentra en el Lenovo ThinkPad P52, Yoga 720-15IKB, Asus ZenBook Pro UX550, e incluso el propio Modern 15 de MSI. Características innatas como el decente ratio de contraste, el espacio de color, los tiempos de respuesta en blanco y negro, y la calidad visual general son, por tanto, bastante similares entre estos sistemas especialmente con el Modern 15.
Una desventaja notable de la pantalla es su mediocre brillo máximo de sólo 279 nits. Aunque es útil para condiciones de interior, es mucho más bajo que la mayoría de los portátiles multimedia de 15,6 pulgadas del mismo rango de precios, como muestra la siguiente tabla.


| |||||||||||||||||||||||||
iluminación: 82 %
Brillo con batería: 279 cd/m²
Contraste: 872:1 (Negro: 0.32 cd/m²)
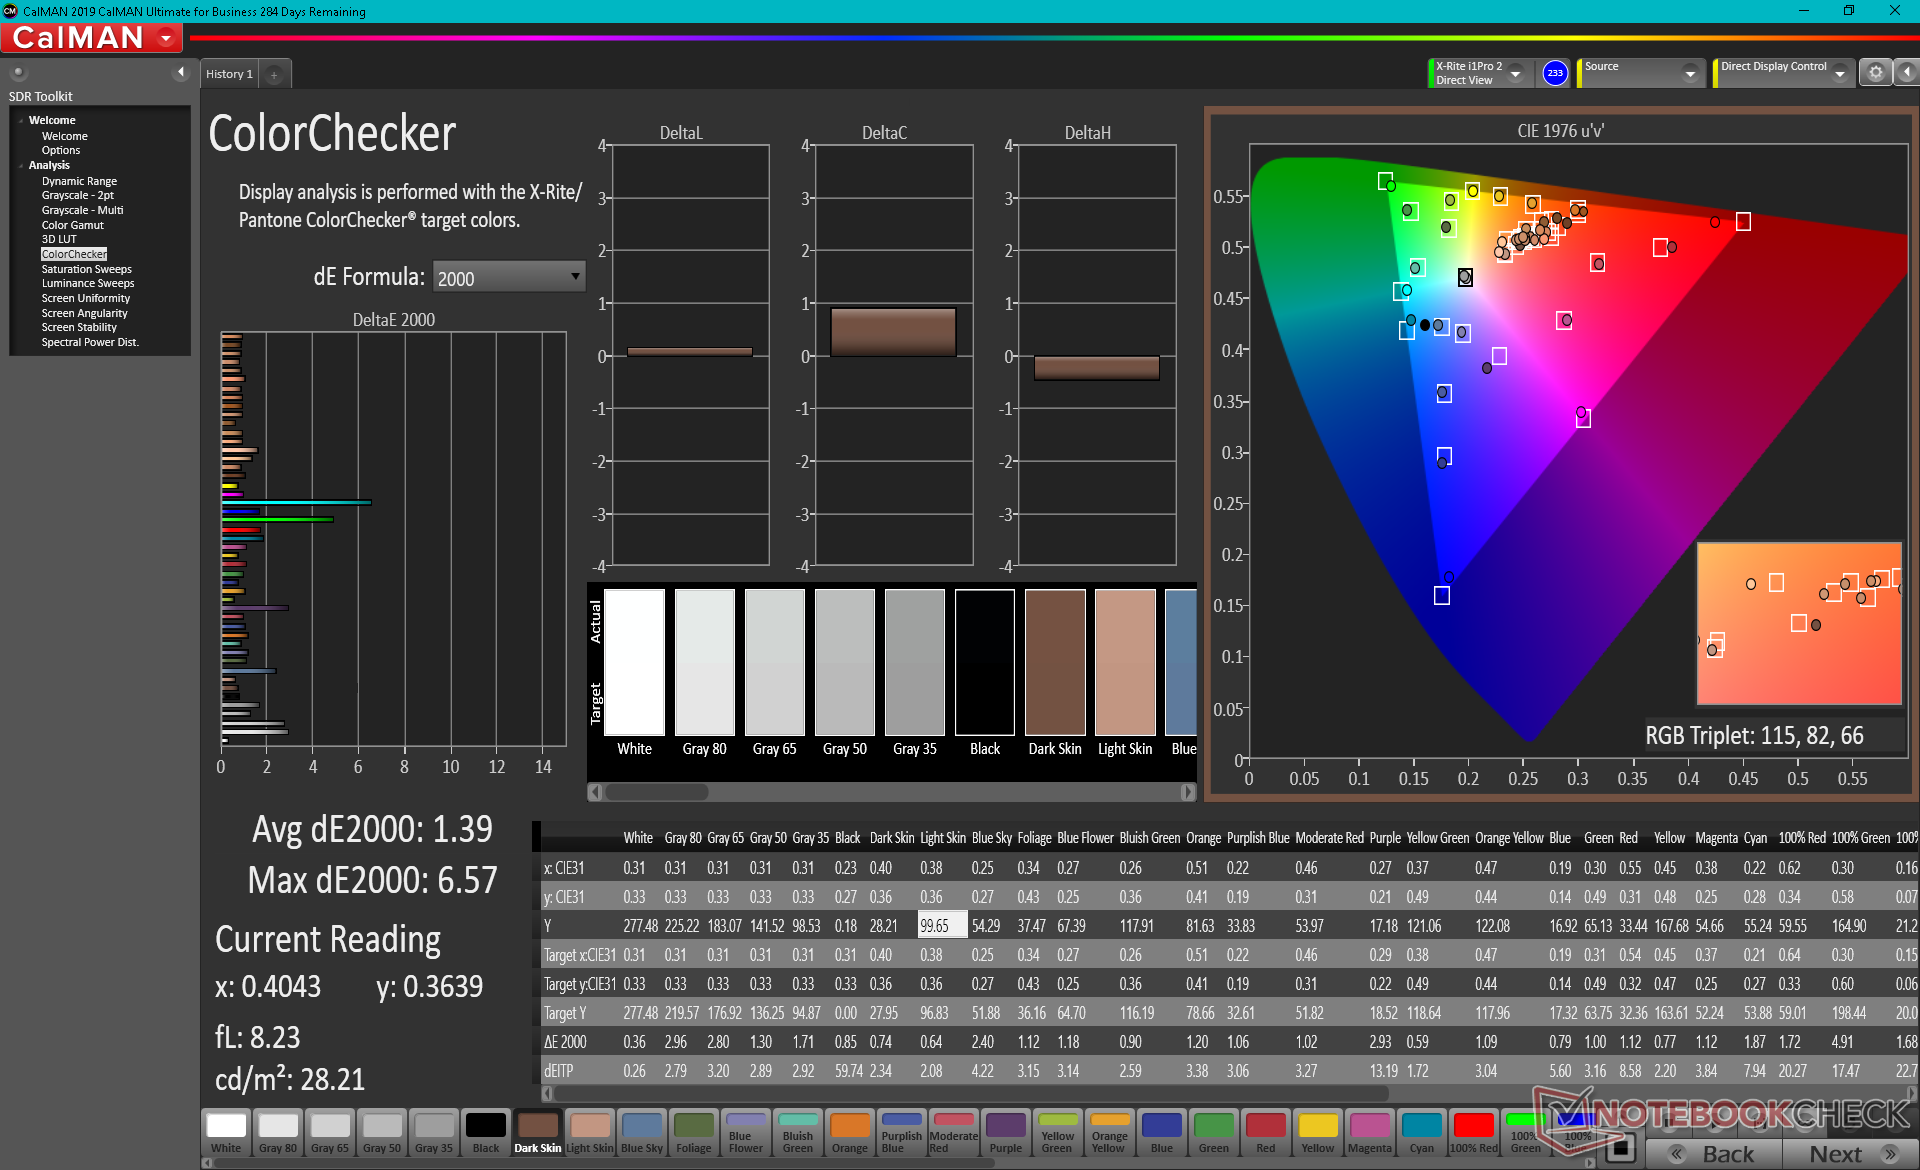
ΔE ColorChecker Calman: 1.72 | ∀{0.5-29.43 Ø4.73}
calibrated: 1.39
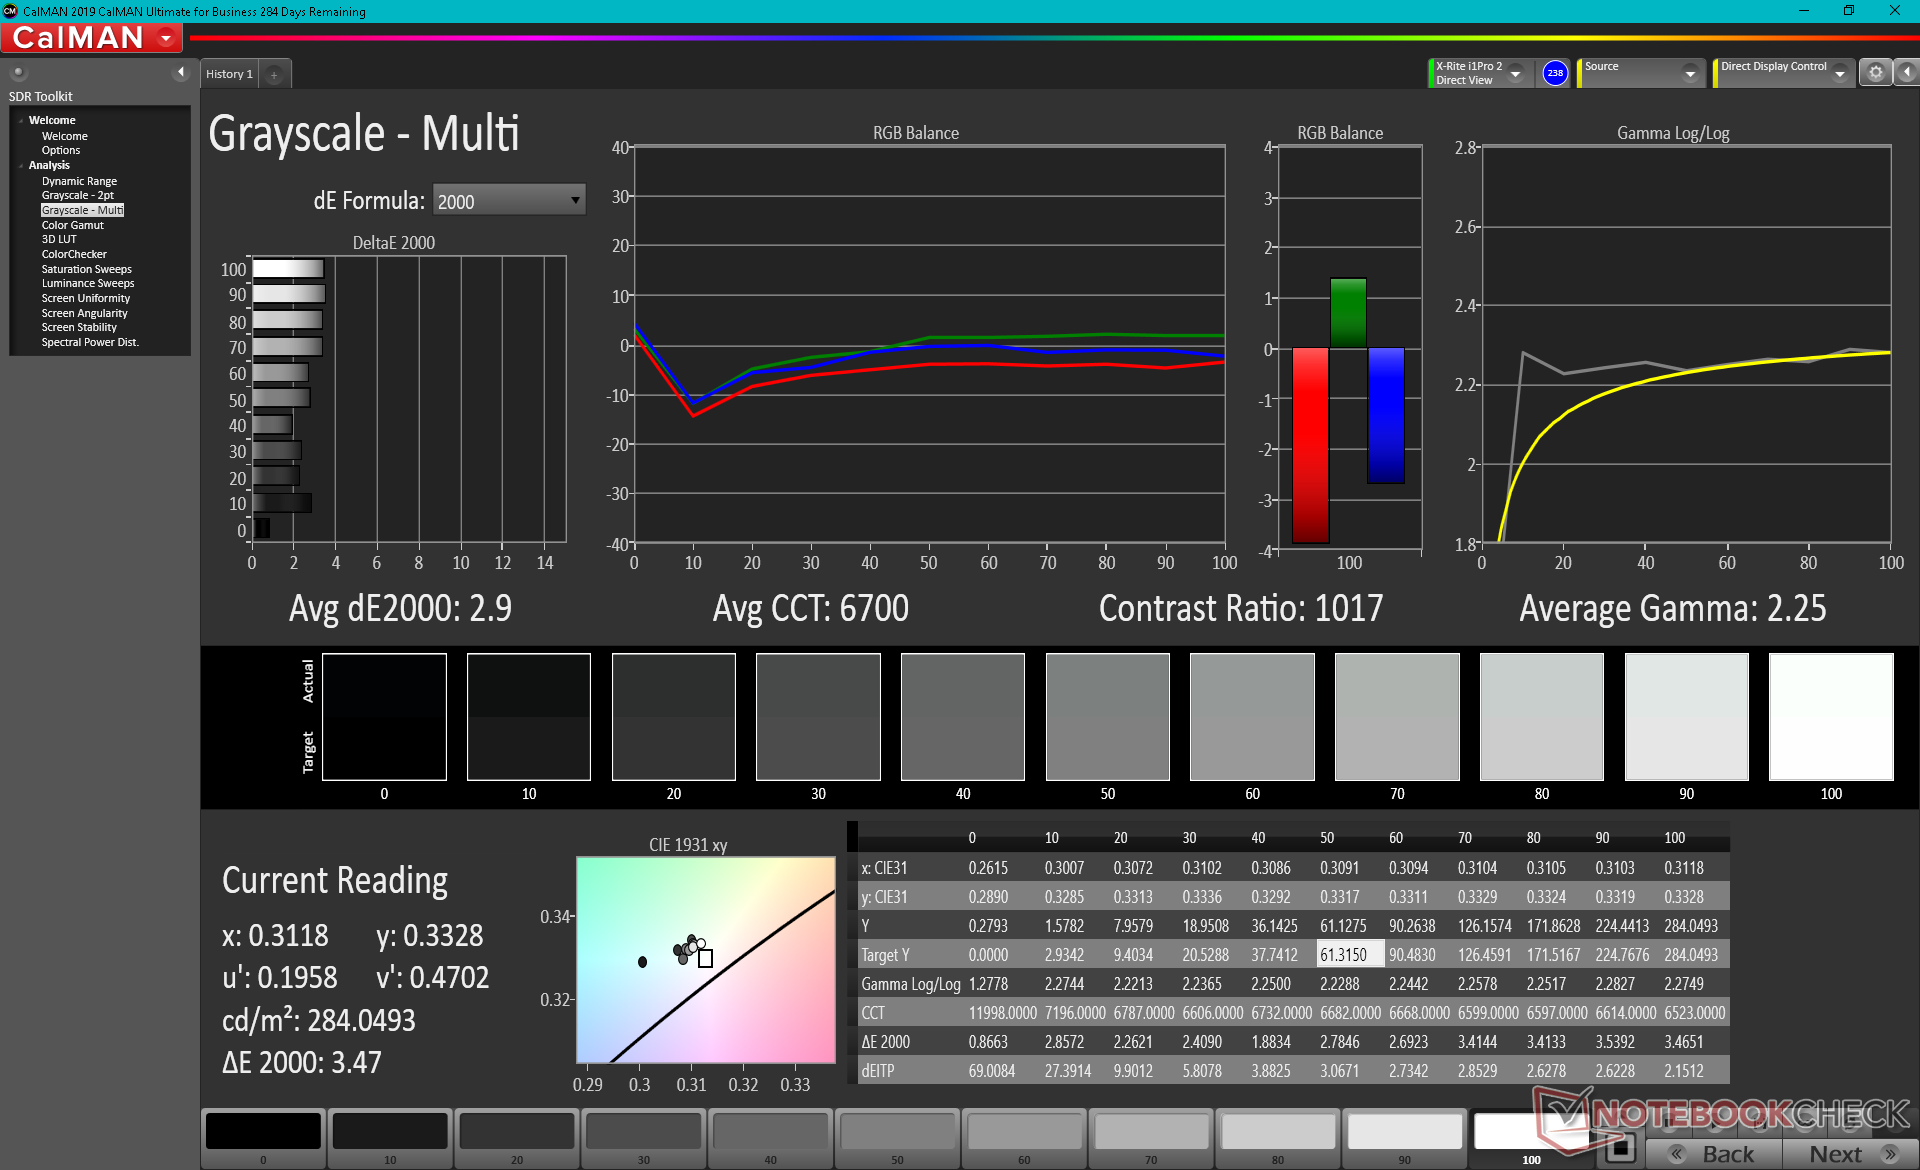
ΔE Greyscale Calman: 2.9 | ∀{0.09-98 Ø4.97}
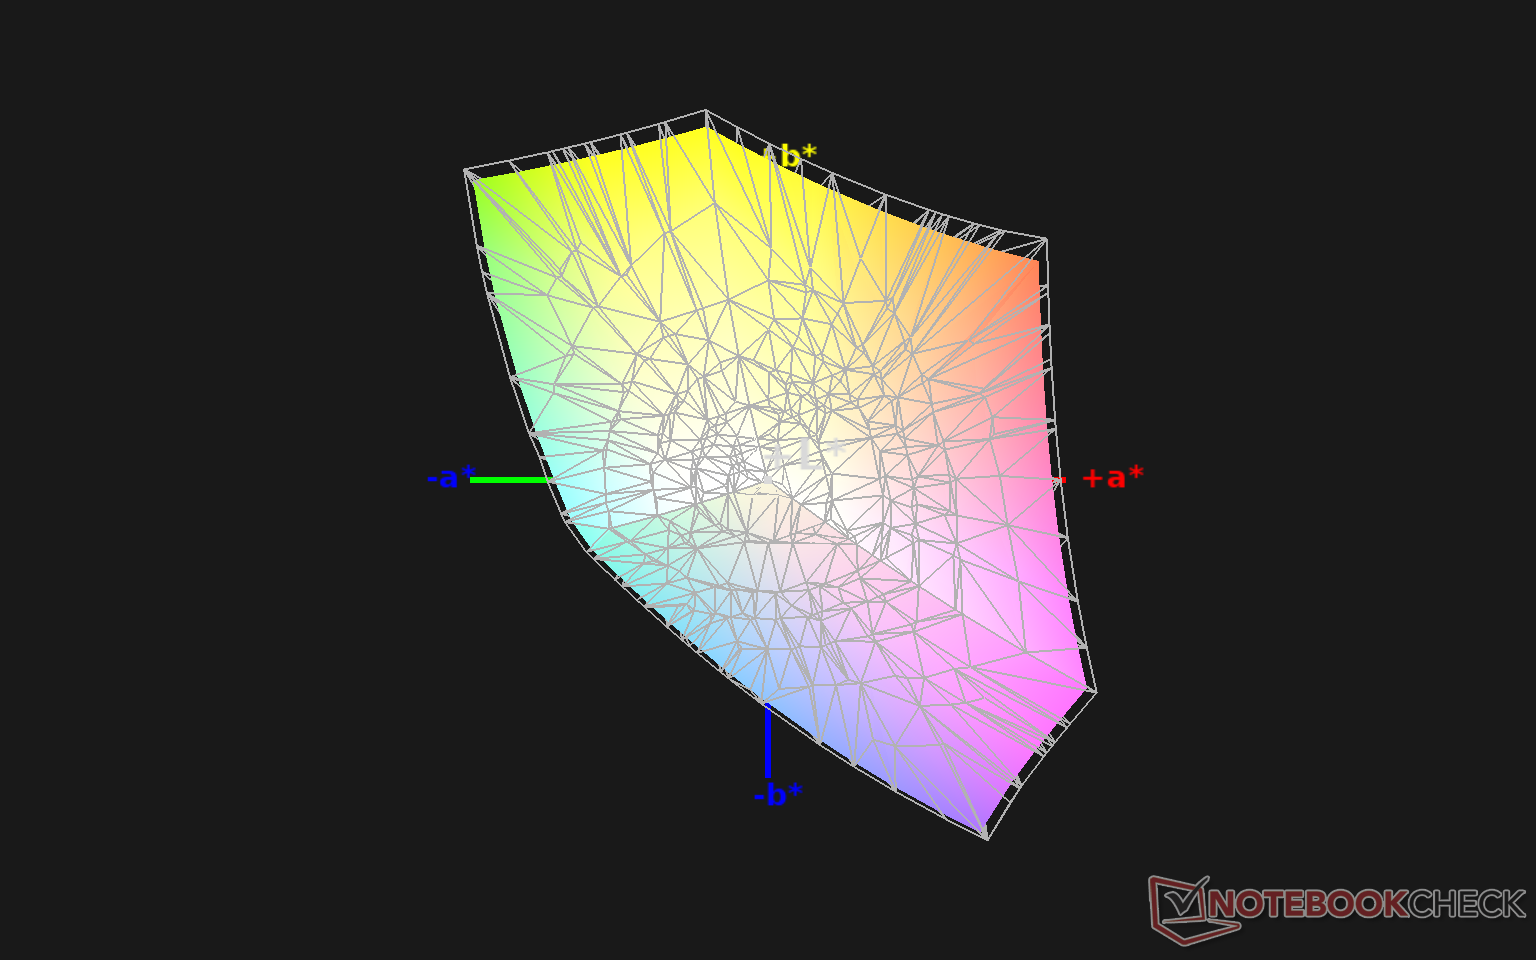
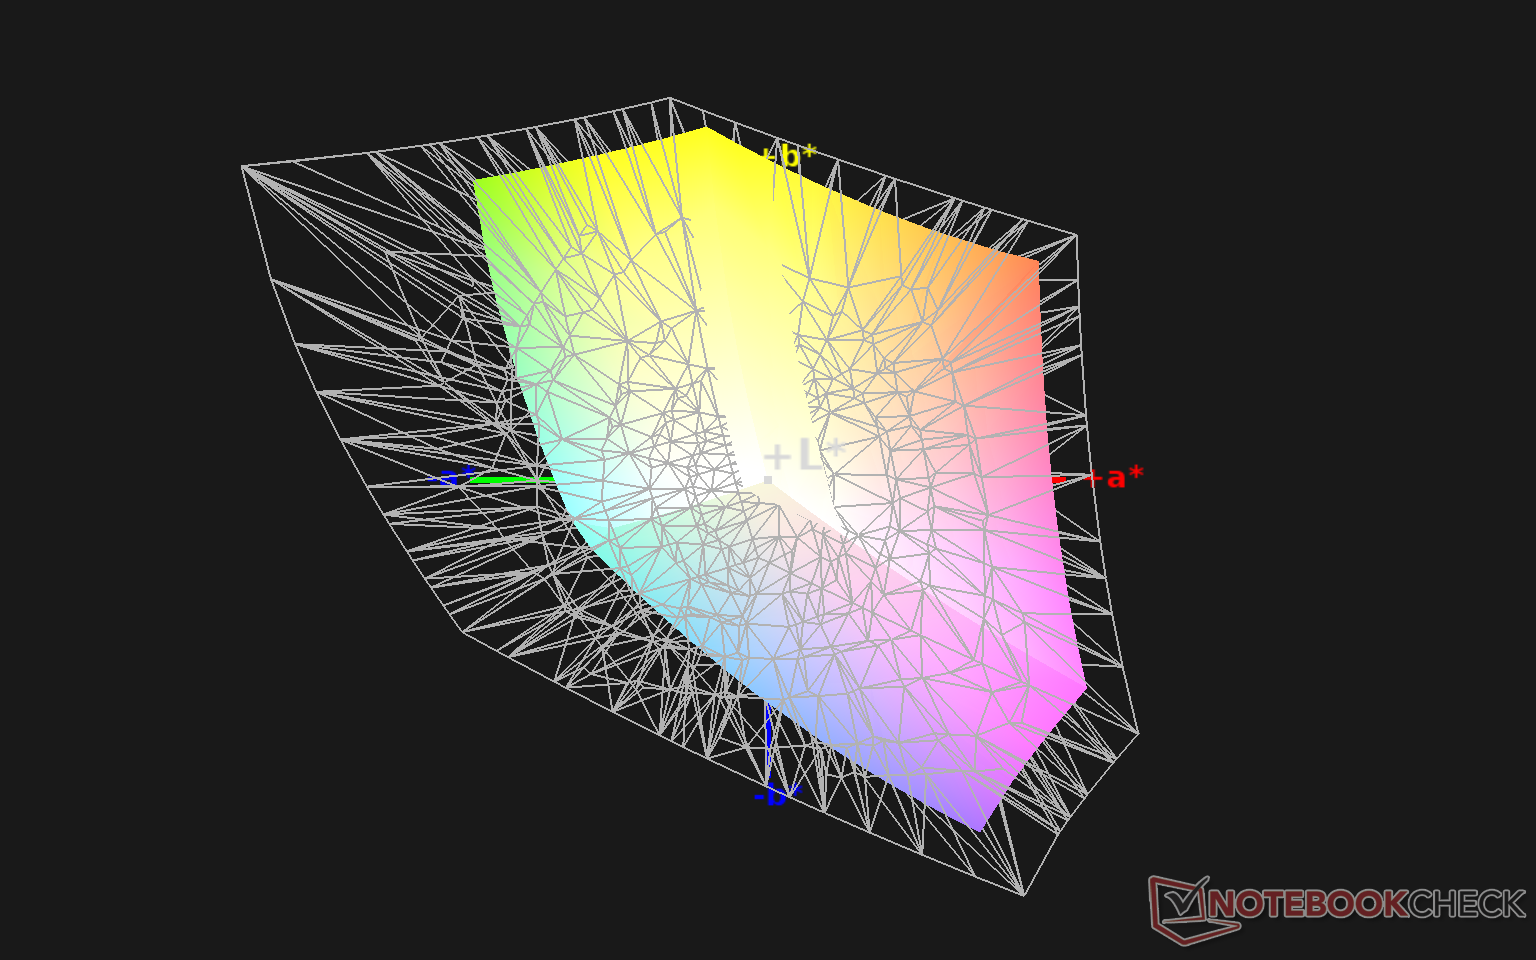
93.2% sRGB (Argyll 1.6.3 3D)
59% AdobeRGB 1998 (Argyll 1.6.3 3D)
64.1% AdobeRGB 1998 (Argyll 3D)
93.4% sRGB (Argyll 3D)
62% Display P3 (Argyll 3D)
Gamma: 2.3
CCT: 6700 K
| MSI Stealth 15M A11SEK Chi Mei N156HCE-EN1, IPS, 15.6", 1920x1080 | Dell XPS 15 9500 Core i7 4K UHD Sharp LQ156R1, IPS, 15.6", 3840x2400 | Lenovo ThinkPad T15p-20TN0006GE MNF601EA1-1, IPS LED, 15.6", 3840x2160 | Asus ZenBook UX535-M01440 BOE0866, IPS, 15.6", 3840x2160 | MSI Prestige 15 A10SC Sharp LQ156D1JW42, IPS, 15.6", 3840x2160 | HP Envy 15-ep0098nr Samsung SDC4145, AMOLED, 15.6", 3840x2160 | |
|---|---|---|---|---|---|---|
| Display | 36% | 33% | 9% | 29% | 35% | |
| Display P3 Coverage (%) | 62 | 89.7 45% | 86.8 40% | 68.8 11% | 82 32% | 88.5 43% |
| sRGB Coverage (%) | 93.4 | 100 7% | 99.3 6% | 99.5 7% | 98.3 5% | 100 7% |
| AdobeRGB 1998 Coverage (%) | 64.1 | 99.8 56% | 98.5 54% | 70.1 9% | 96.2 50% | 99.9 56% |
| Response Times | -4% | 27% | 31% | -22% | 95% | |
| Response Time Grey 50% / Grey 80% * (ms) | 47.6 ? | 54 ? -13% | 41.6 ? 13% | 34 ? 29% | 60 ? -26% | 0.8 ? 98% |
| Response Time Black / White * (ms) | 35.2 ? | 33.2 ? 6% | 21.2 ? 40% | 24 ? 32% | 41.2 ? -17% | 2.7 ? 92% |
| PWM Frequency (Hz) | 25000 ? | 26040 ? | 242.7 ? | |||
| Screen | -6% | 54% | 12% | -5% | -36% | |
| Brightness middle (cd/m²) | 279 | 557.9 100% | 595 113% | 402 44% | 464.5 66% | 374.3 34% |
| Brightness (cd/m²) | 252 | 541 115% | 594 136% | 375 49% | 451 79% | 379 50% |
| Brightness Distribution (%) | 82 | 91 11% | 94 15% | 84 2% | 92 12% | 91 11% |
| Black Level * (cd/m²) | 0.32 | 0.39 -22% | 0.32 -0% | 0.35 -9% | 0.5 -56% | |
| Contrast (:1) | 872 | 1431 64% | 1859 113% | 1149 32% | 929 7% | |
| Colorchecker dE 2000 * | 1.72 | 4.54 -164% | 1.2 30% | 2.47 -44% | 3.36 -95% | 5.47 -218% |
| Colorchecker dE 2000 max. * | 5.62 | 7.92 -41% | 2.5 56% | 4.32 23% | 7.06 -26% | 8.22 -46% |
| Colorchecker dE 2000 calibrated * | 1.39 | 3.82 -175% | 1 28% | 2.36 -70% | 3.42 -146% | 4.61 -232% |
| Greyscale dE 2000 * | 2.9 | 3.2 -10% | 1.4 52% | 2.26 22% | 1.3 55% | 2.3 21% |
| Gamma | 2.3 96% | 1.99 111% | 2.1 105% | 2.49 88% | 2.14 103% | 2.09 105% |
| CCT | 6700 97% | 6451 101% | 6492 100% | 6285 103% | 6596 99% | 6340 103% |
| Color Space (Percent of AdobeRGB 1998) (%) | 59 | 89.5 52% | 85.3 45% | 99 68% | 84.8 44% | 87.8 49% |
| Color Space (Percent of sRGB) (%) | 93.2 | 100 7% | 99.2 6% | 98.3 5% | 100 7% | |
| Media total (Programa/Opciones) | 9% /
2% | 38% /
47% | 17% /
14% | 1% /
-1% | 31% /
-2% |
* ... más pequeño es mejor
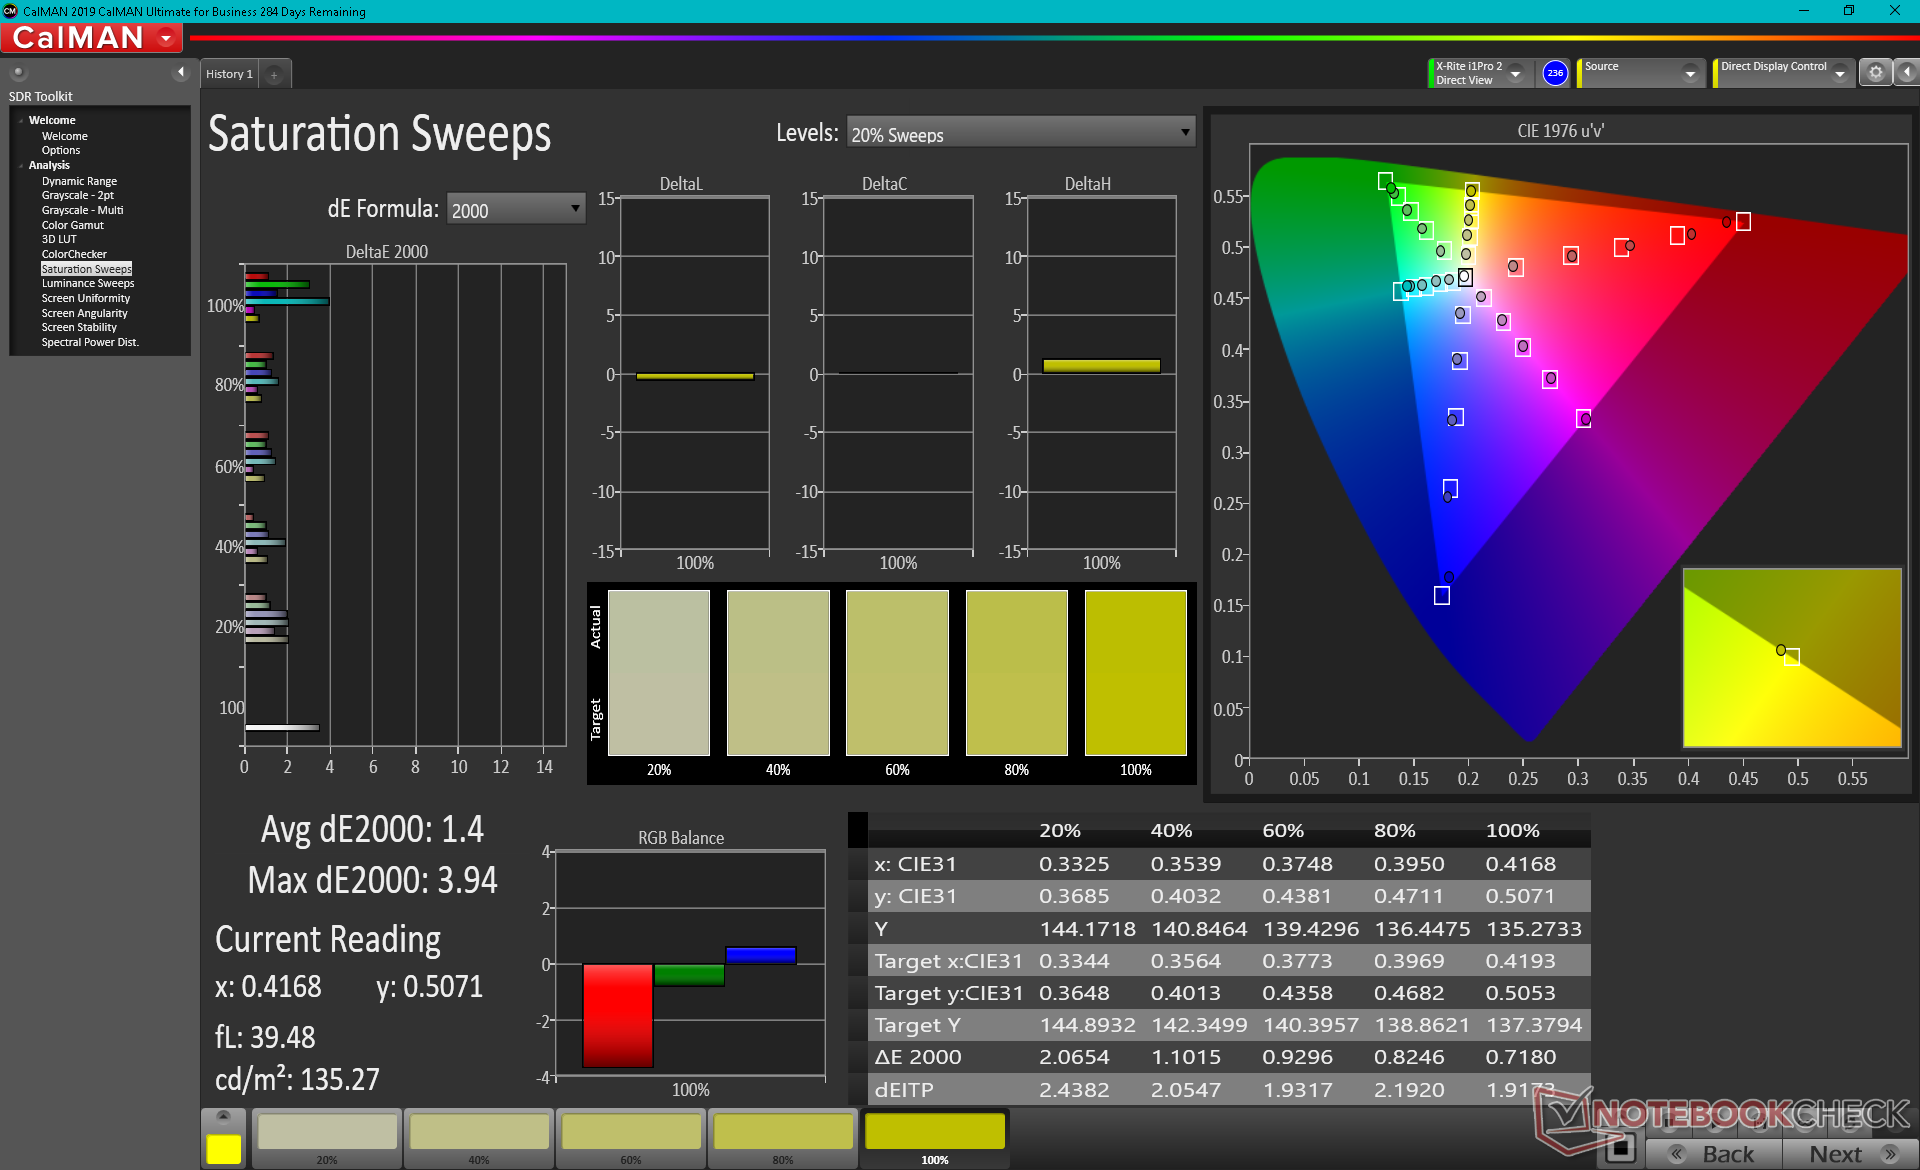
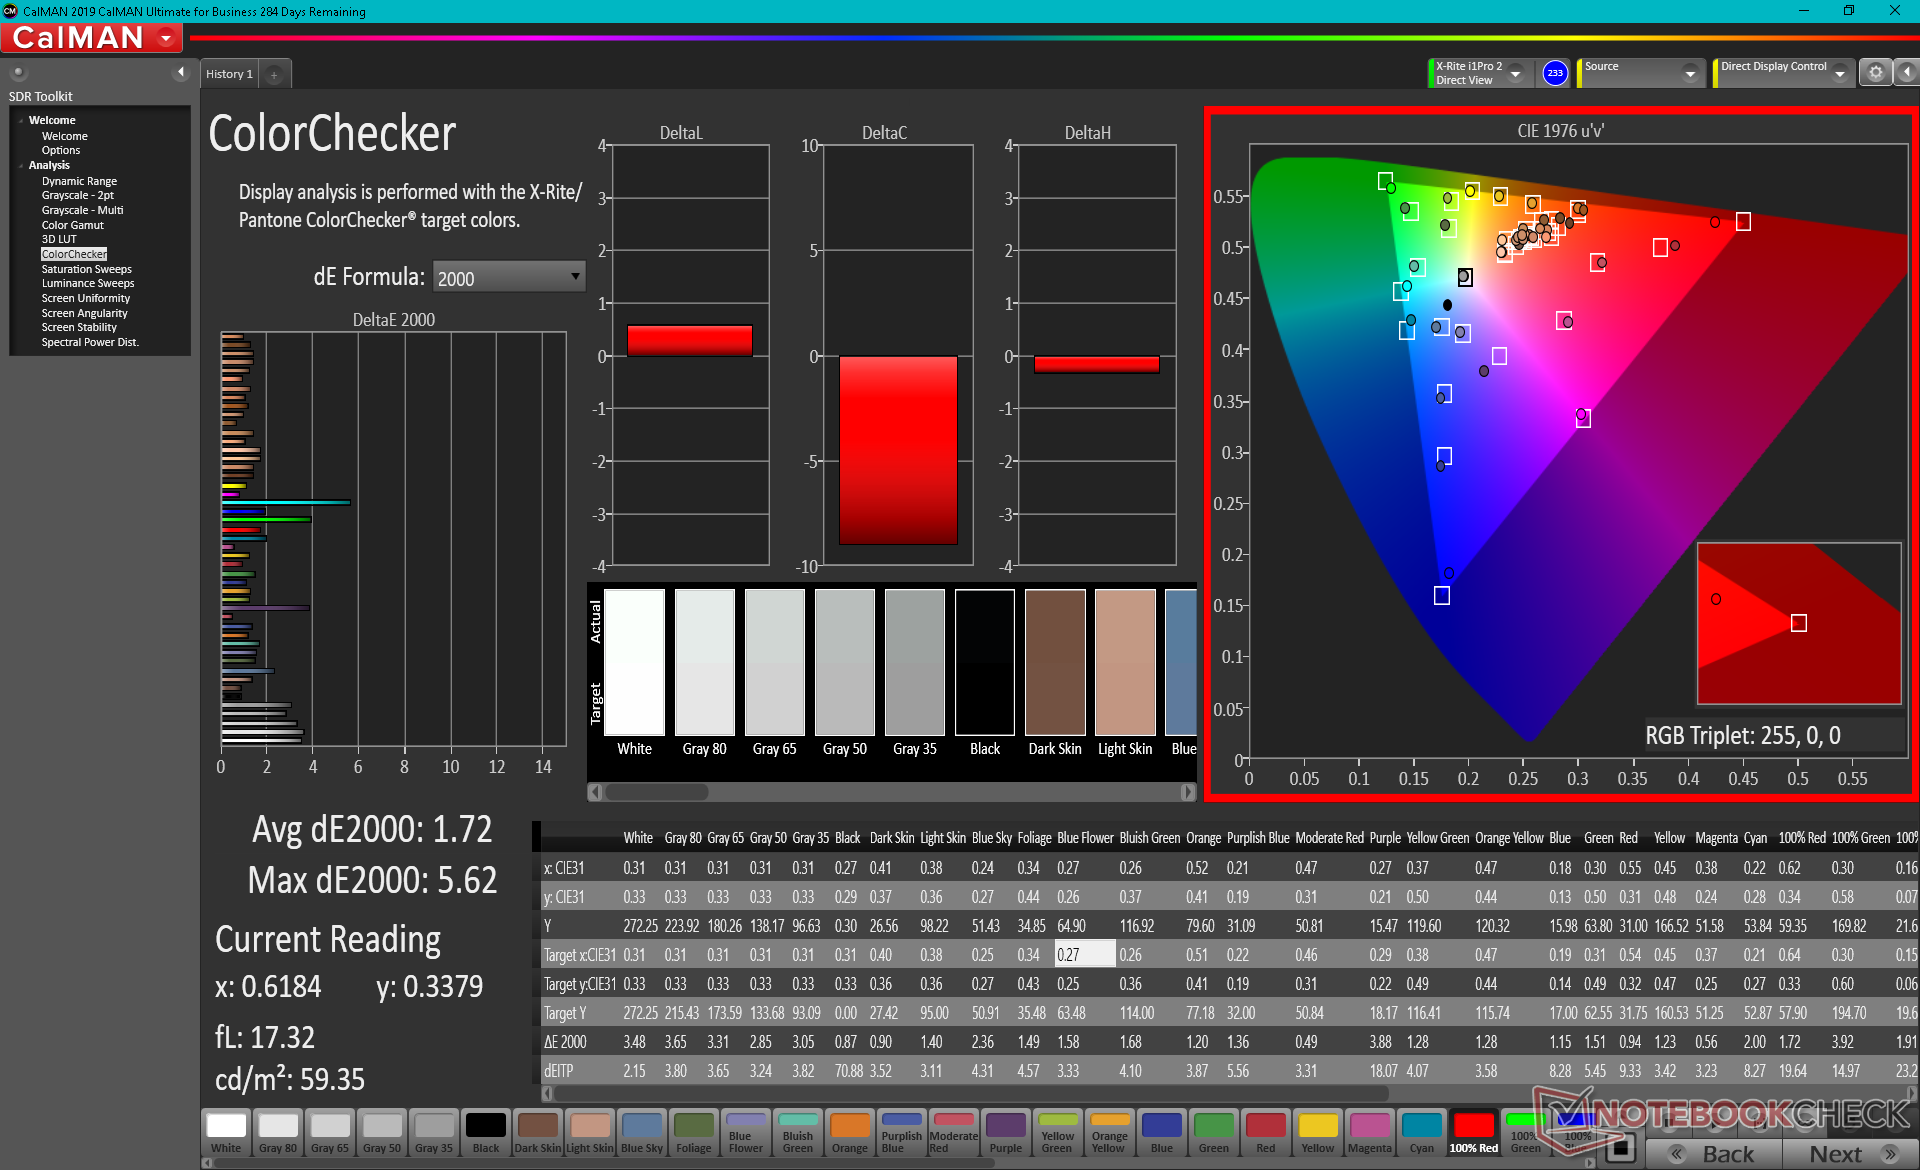
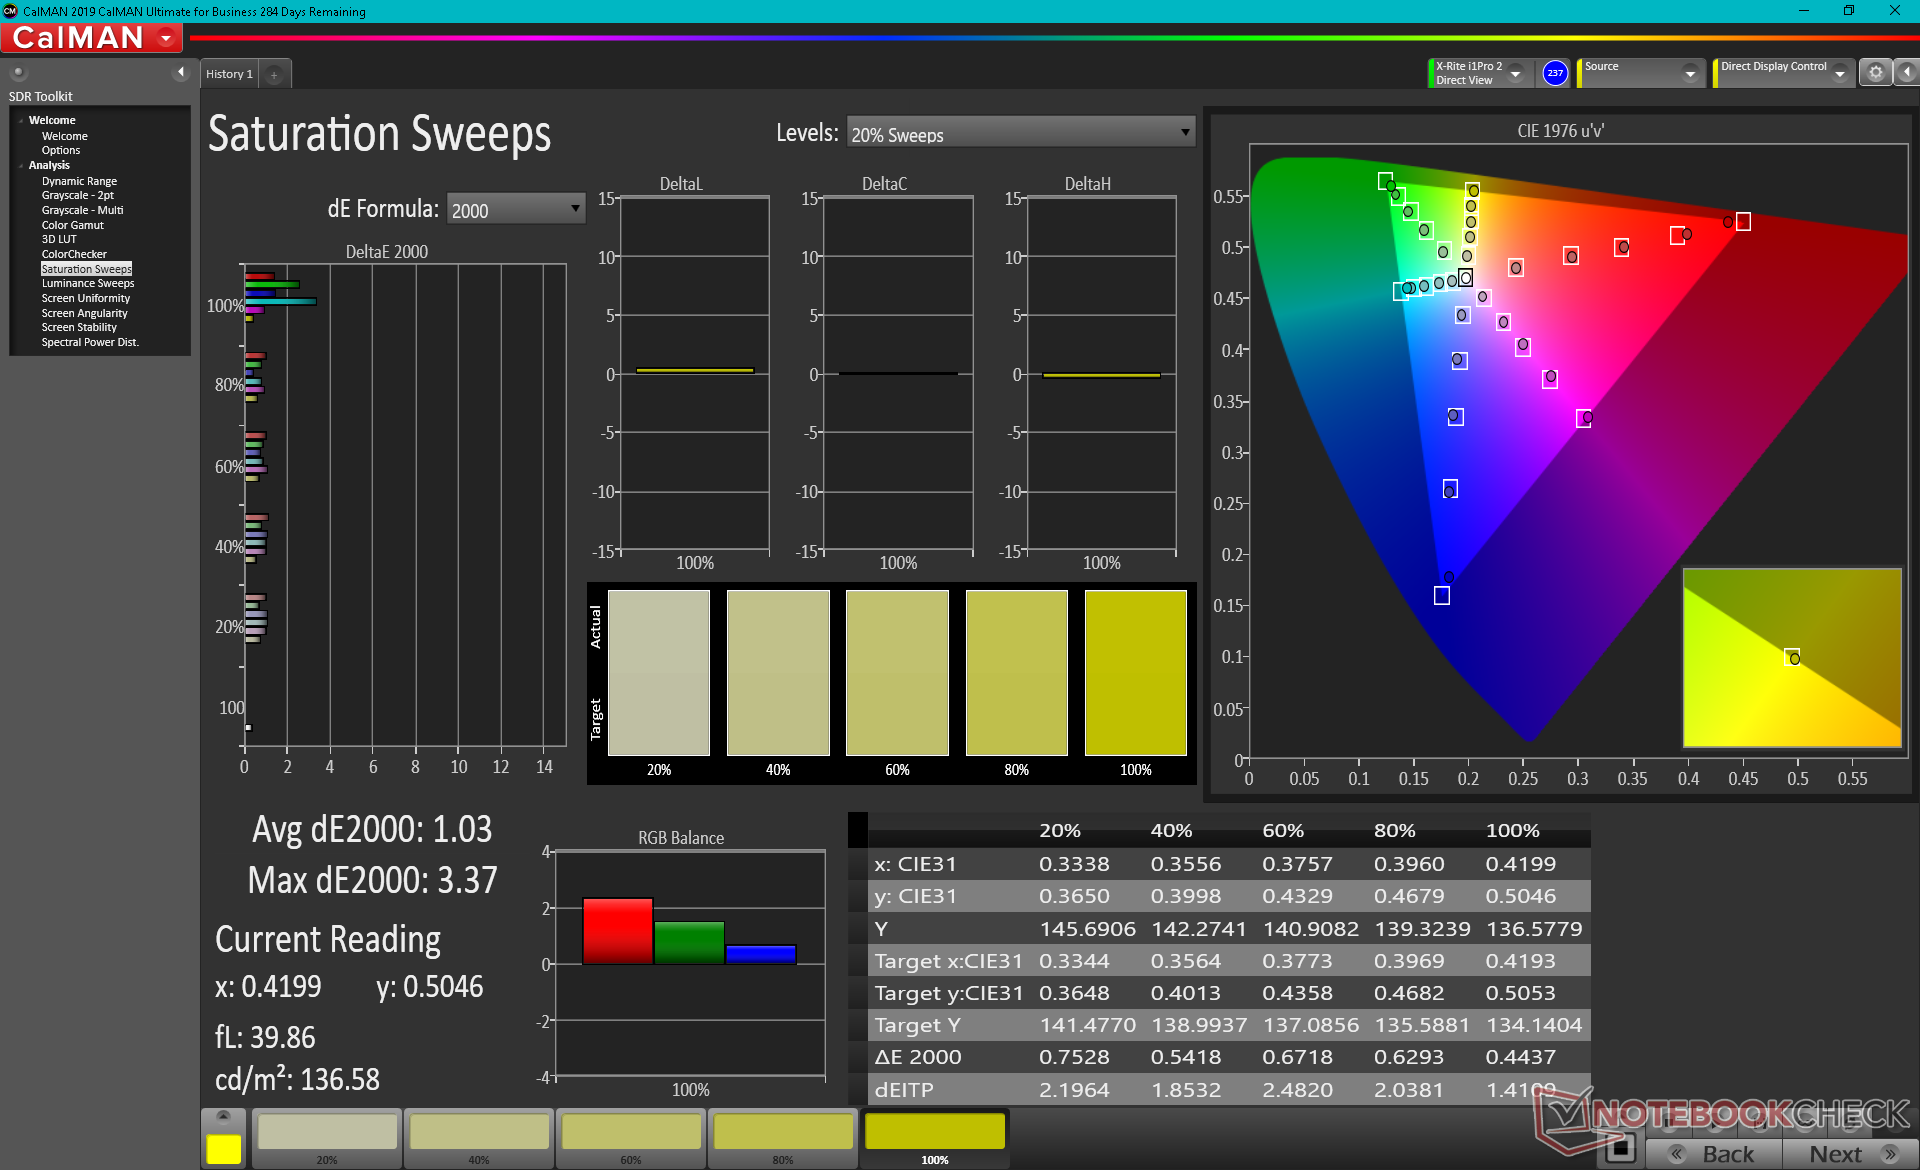
El panel cubre casi todo el sRGB y aproximadamente el 60 por ciento del AdobeRGB, que es el estándar en la mayoría de Ultrabooks insignia con pantallas 1080p. Otros portátiles con opciones de pantalla 4K como el propio Prestige 15 de MSI suelen ofrecer colores más profundos apuntando a AdobeRGB en su lugar.
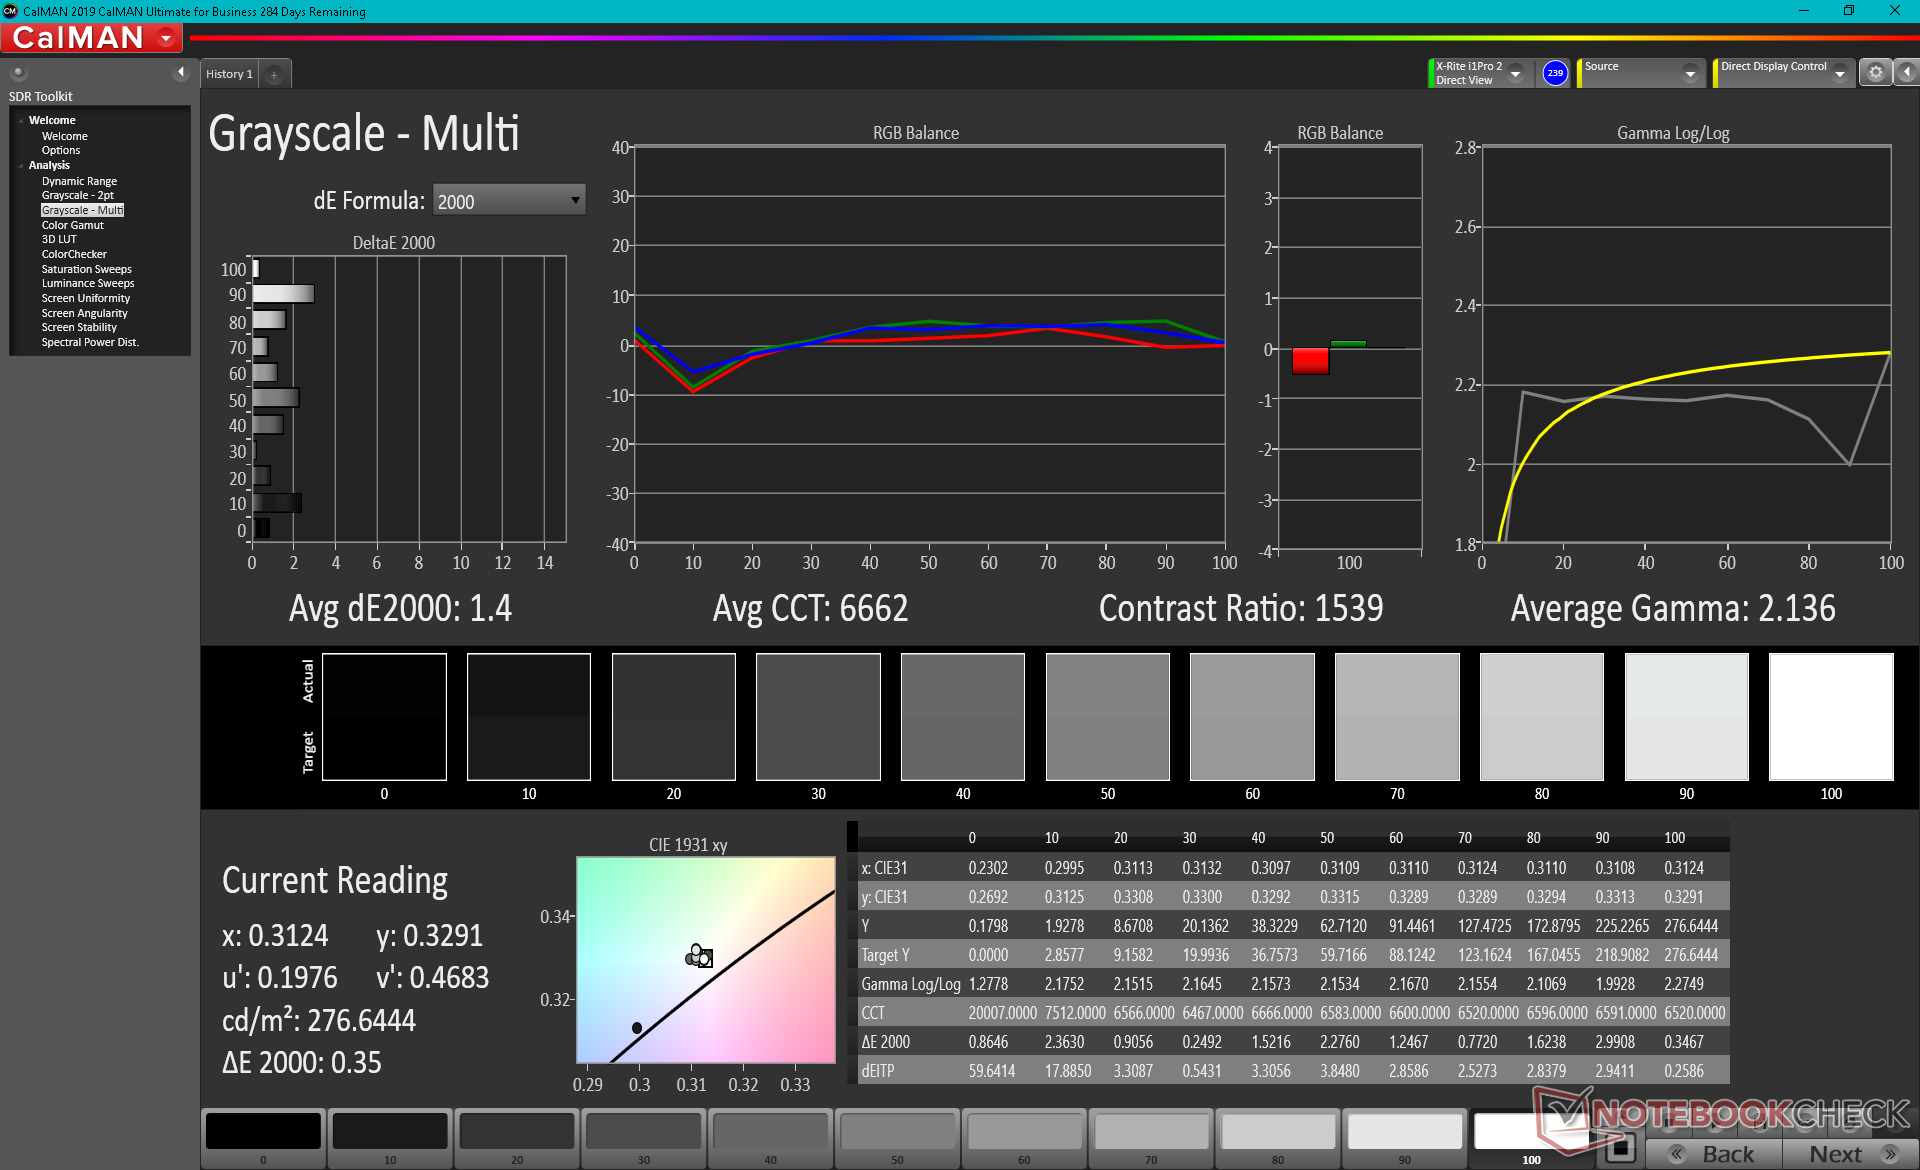
El sistema está bien calibrado desde el principio, con unos valores medios de escala de grises y deltaE de ColorChecker de sólo 2,9 y 1,72, respectivamente. Calibrar la pantalla aún más con nuestro colorímetro X-Rite mejoraría los promedios sólo marginalmente. Resulta interesante que los colores verde y azul marino se representen de forma más imprecisa que el resto de colores, incluso después de la calibración.
Tiempos de respuesta del display
| ↔ Tiempo de respuesta de Negro a Blanco | ||
|---|---|---|
| 35.2 ms ... subida ↗ y bajada ↘ combinada | ↗ 22 ms subida | 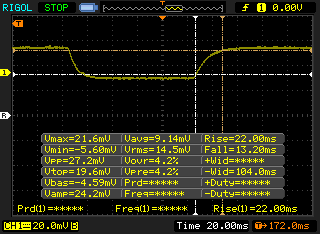 |
| ↘ 13.2 ms bajada | ||
| La pantalla mostró tiempos de respuesta lentos en nuestros tests y podría ser demasiado lenta para los jugones. En comparación, todos los dispositivos de prueba van de ##min### (mínimo) a 240 (máximo) ms. » 93 % de todos los dispositivos son mejores. Eso quiere decir que el tiempo de respuesta es peor que la media (19.9 ms) de todos los dispositivos testados. | ||
| ↔ Tiempo de respuesta 50% Gris a 80% Gris | ||
| 47.6 ms ... subida ↗ y bajada ↘ combinada | ↗ 25.2 ms subida | 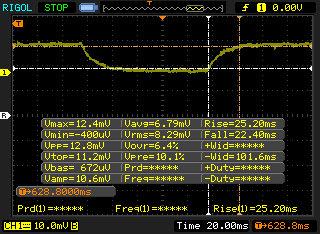 |
| ↘ 22.4 ms bajada | ||
| La pantalla mostró tiempos de respuesta lentos en nuestros tests y podría ser demasiado lenta para los jugones. En comparación, todos los dispositivos de prueba van de ##min### (mínimo) a 636 (máximo) ms. » 82 % de todos los dispositivos son mejores. Eso quiere decir que el tiempo de respuesta es peor que la media (31.1 ms) de todos los dispositivos testados. | ||
Parpadeo de Pantalla / PWM (Pulse-Width Modulation)
| Parpadeo de Pantalla / PWM detectado | 25000 Hz | ≤ 25 % de brillo | 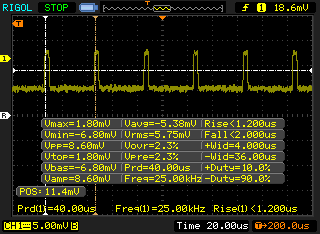 |
La retroiluminación del display parpadea a 25000 Hz (seguramente usa PWM - Pulse-Width Modulation) a un brillo del 25 % e inferior. Sobre este nivel de brillo no debería darse parpadeo / PWM. La frecuencia de 25000 Hz es bastante alta, por lo que la mayoría de gente sensible al parpadeo no debería ver parpadeo o tener fatiga visual. Comparación: 52 % de todos los dispositivos testados no usaron PWM para atenuar el display. Si se usó, medimos una media de 7794 (mínimo: 5 - máxmo: 343500) Hz. | |||
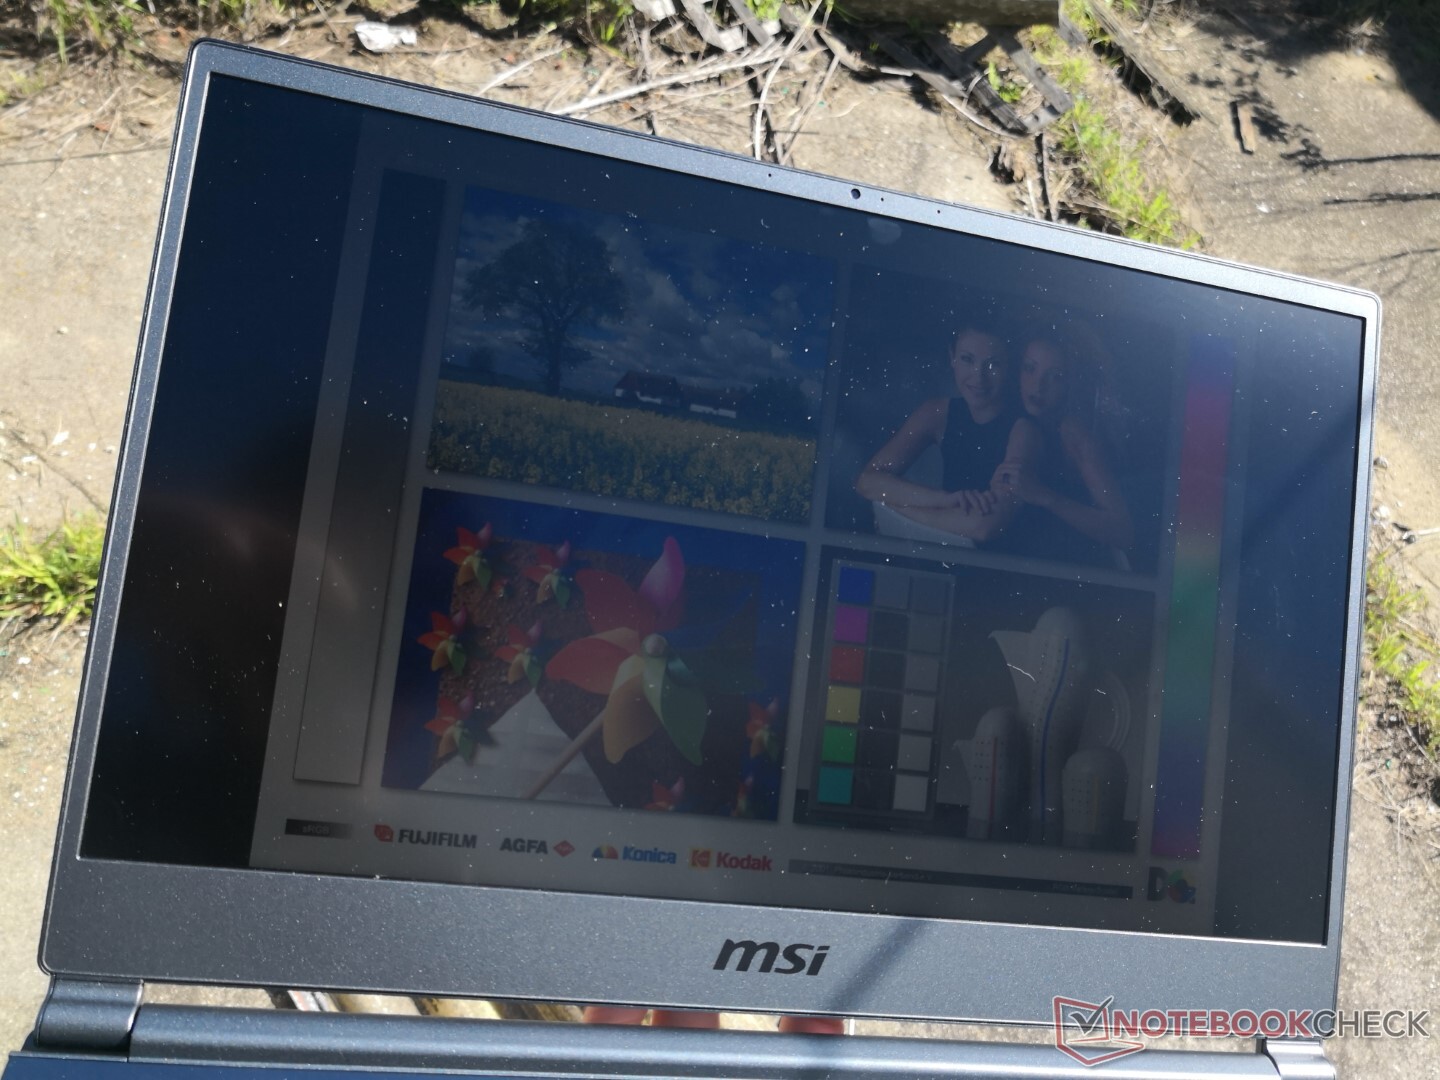
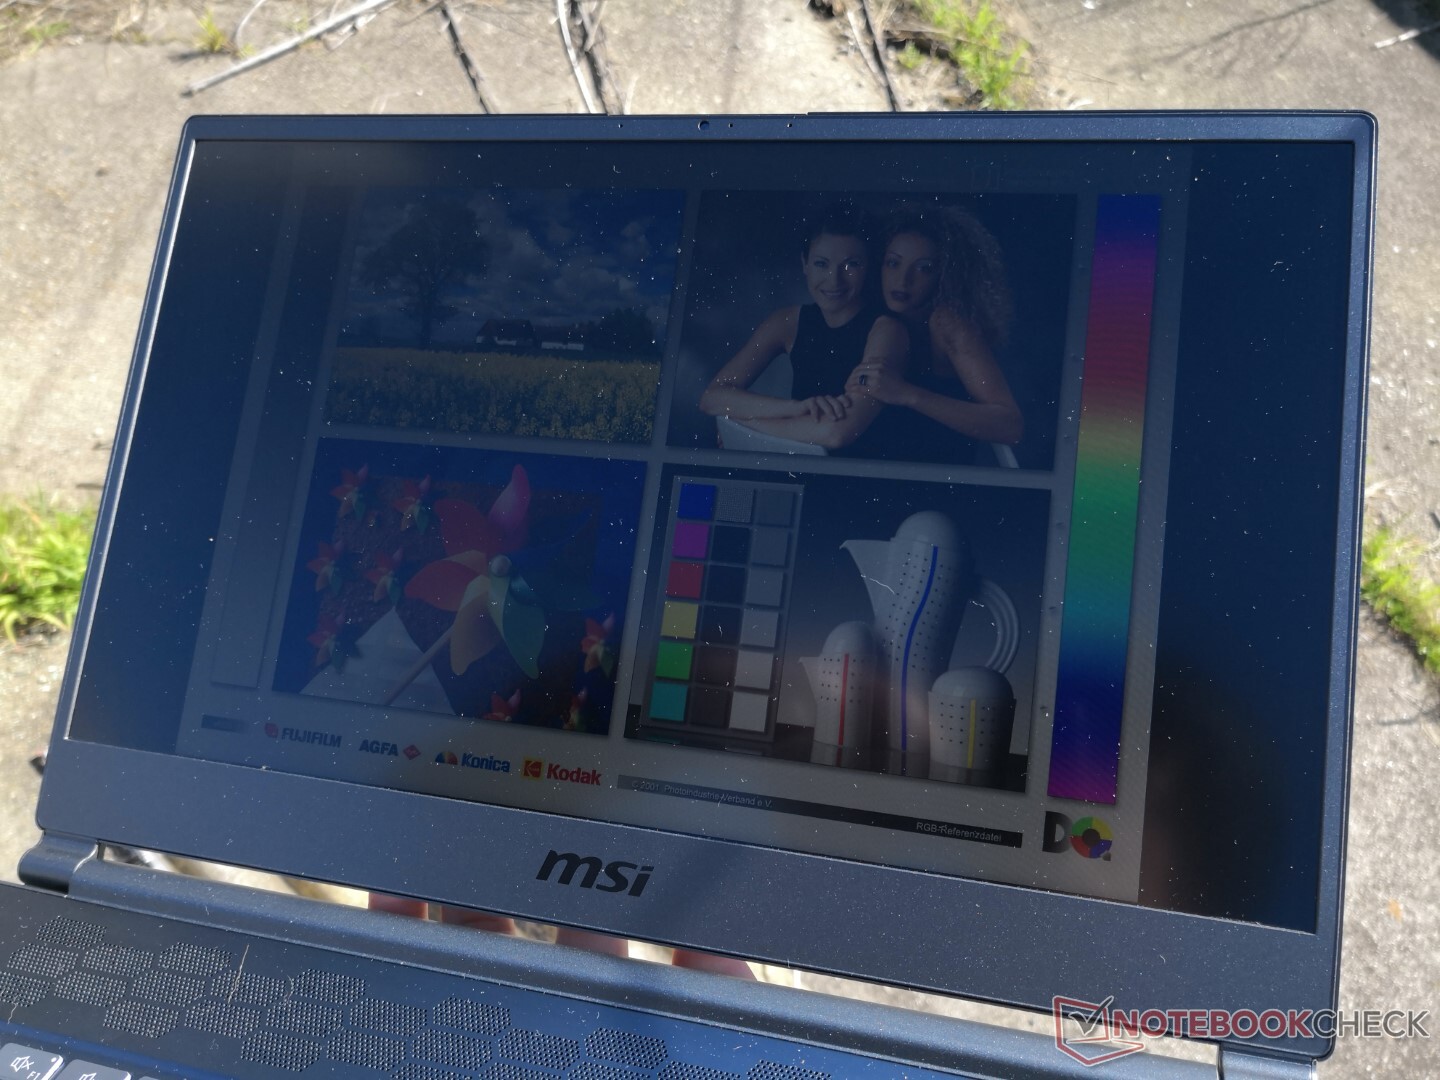
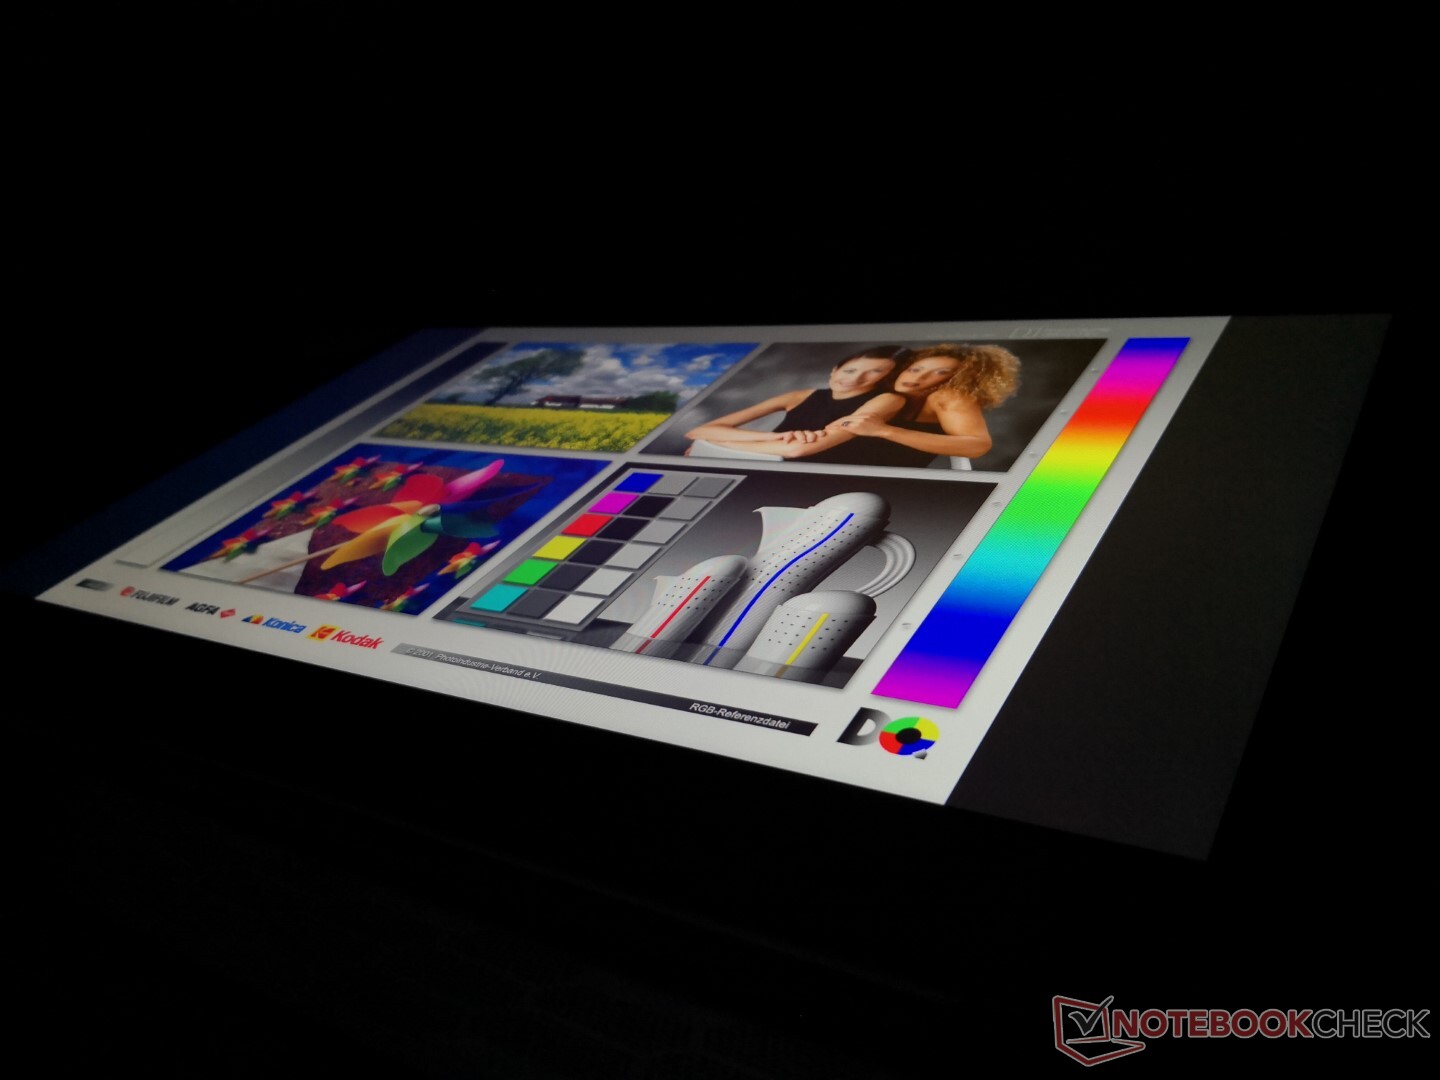
La visibilidad en exteriores es simplemente media debido al nivel de brillo máximo relativamente bajo. Esto es una lástima porque el diseño ligero del chasis podría animar a los propietarios a utilizar el Stealth 15M en exteriores con más frecuencia.
Rendimiento
El sistema de MSI es único en el sentido de que los usuarios tienen la opción de emparejar la GPU GeForce RTX 2060 Max-Q con una CPU de la serie Core U en lugar de la más común de la serie Core H. Las últimas configuraciones vienen con procesadores aún más rápidos, como el Core i7-11375H de 11ª generación y la Nvidia Ampere GeForce RTX 3060 para sustituir a las antiguas CPU de 10ª generación y las GPU Turing.
Nuestra unidad se configuró en modo de rendimiento extremo a través de MSI Dragon Center antes de ejecutar cualquier prueba de rendimiento.
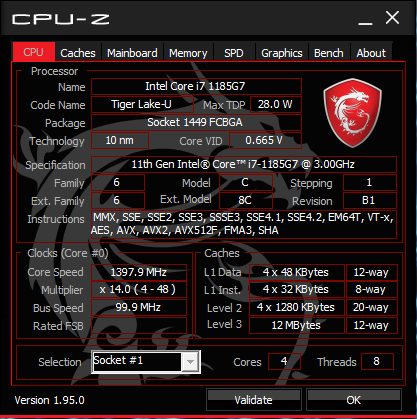
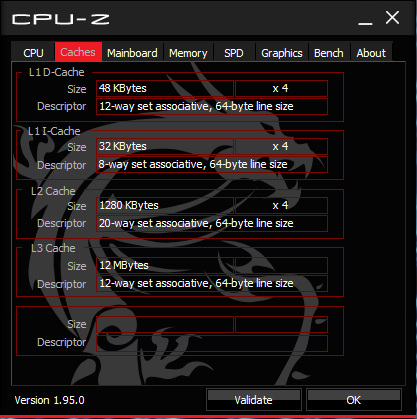
Procesador
De la docena de portátiles que hemos probado hasta ahora con la misma CPU Core i7-1185G7, nuestro Stealth 15M es uno de los más rápidos con puntuaciones CineBench xT que son entre un 12 y un 16 por ciento más altas que la media. Su excelente rendimiento puede atribuirse a la buena sostenibilidad de Turbo Boost de la CPU, como muestra nuestro gráfico de abajo. El Summit E15 equipado con la misma CPU, por ejemplo, funcionaría un 15 por ciento más lento que nuestro Stealth 15M después de tener en cuenta cualquier estrangulamiento del rendimiento en ambos sistemas. El rendimiento de un solo subproceso es aún más impresionante, ya que los resultados de CineBench superan incluso al Corei7-10875H.
El rendimiento multihilo general sigue siendo entre un 23 y un 27 por ciento más lento que el Core i7-10875H o el Core i7-10750H de ocho núcleos, que consumen más energía, y que se encuentran en la mayoría de los portátiles de alto rendimiento.
Cinebench R15: CPU Multi 64Bit | CPU Single 64Bit
Blender: v2.79 BMW27 CPU
7-Zip 18.03: 7z b 4 -mmt1 | 7z b 4
Geekbench 5.5: Single-Core | Multi-Core
HWBOT x265 Benchmark v2.2: 4k Preset
LibreOffice : 20 Documents To PDF
R Benchmark 2.5: Overall mean
Cinebench R15: CPU Multi 64Bit | CPU Single 64Bit
Blender: v2.79 BMW27 CPU
7-Zip 18.03: 7z b 4 -mmt1 | 7z b 4
Geekbench 5.5: Single-Core | Multi-Core
HWBOT x265 Benchmark v2.2: 4k Preset
LibreOffice : 20 Documents To PDF
R Benchmark 2.5: Overall mean
* ... más pequeño es mejor
Rendimiento del sistema
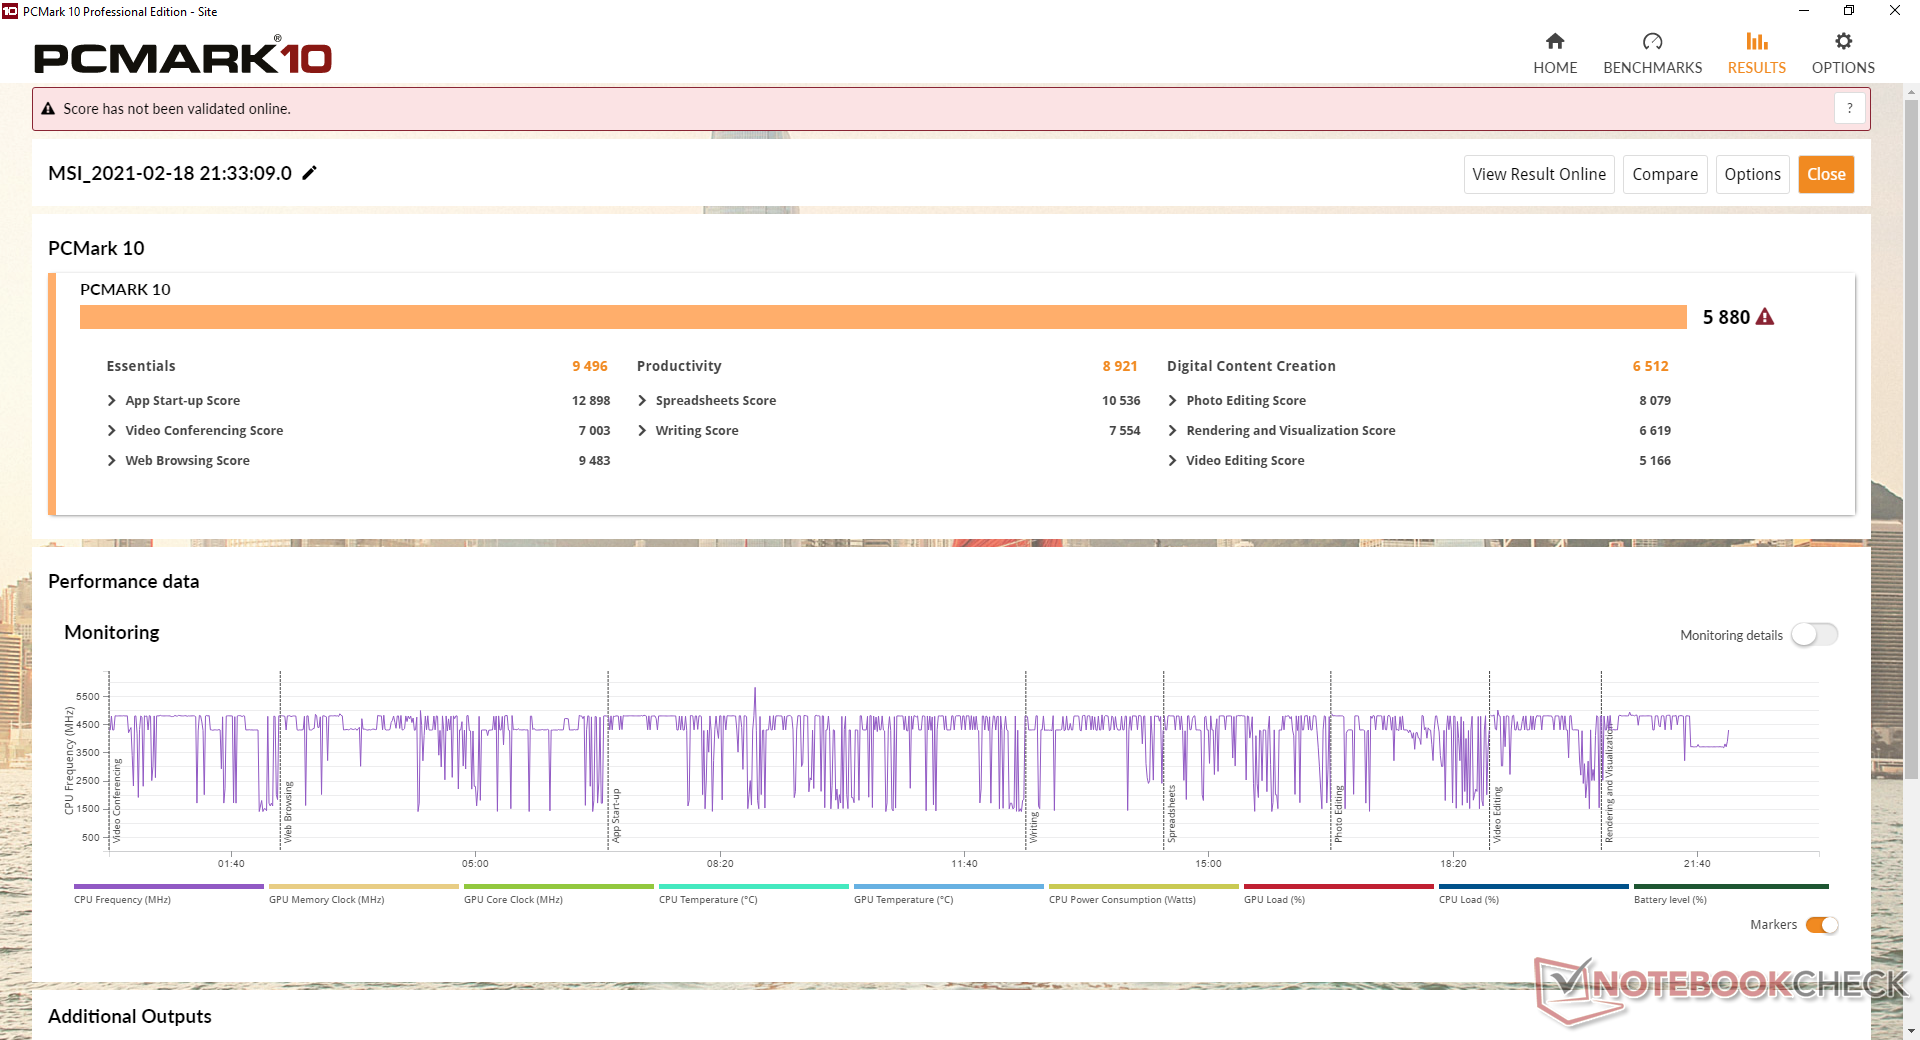
Los benchmarks PCMark son más altos que la mayoría de los otros portátiles multimedia de la serie Core H debido a la GPU GeForce RTX más rápida y al alto rendimiento por vatio de la CPU.
No experimentamos ningún problema de software durante nuestro tiempo con la unidad de pruebas. Los propietarios deberían familiarizarse con el software MSI Dragon Center ya que es un centro de control para la mayoría de los ajustes del sistema
| PCMark 10 Score | 5880 puntos | |
ayuda | ||
Latencia del CPD
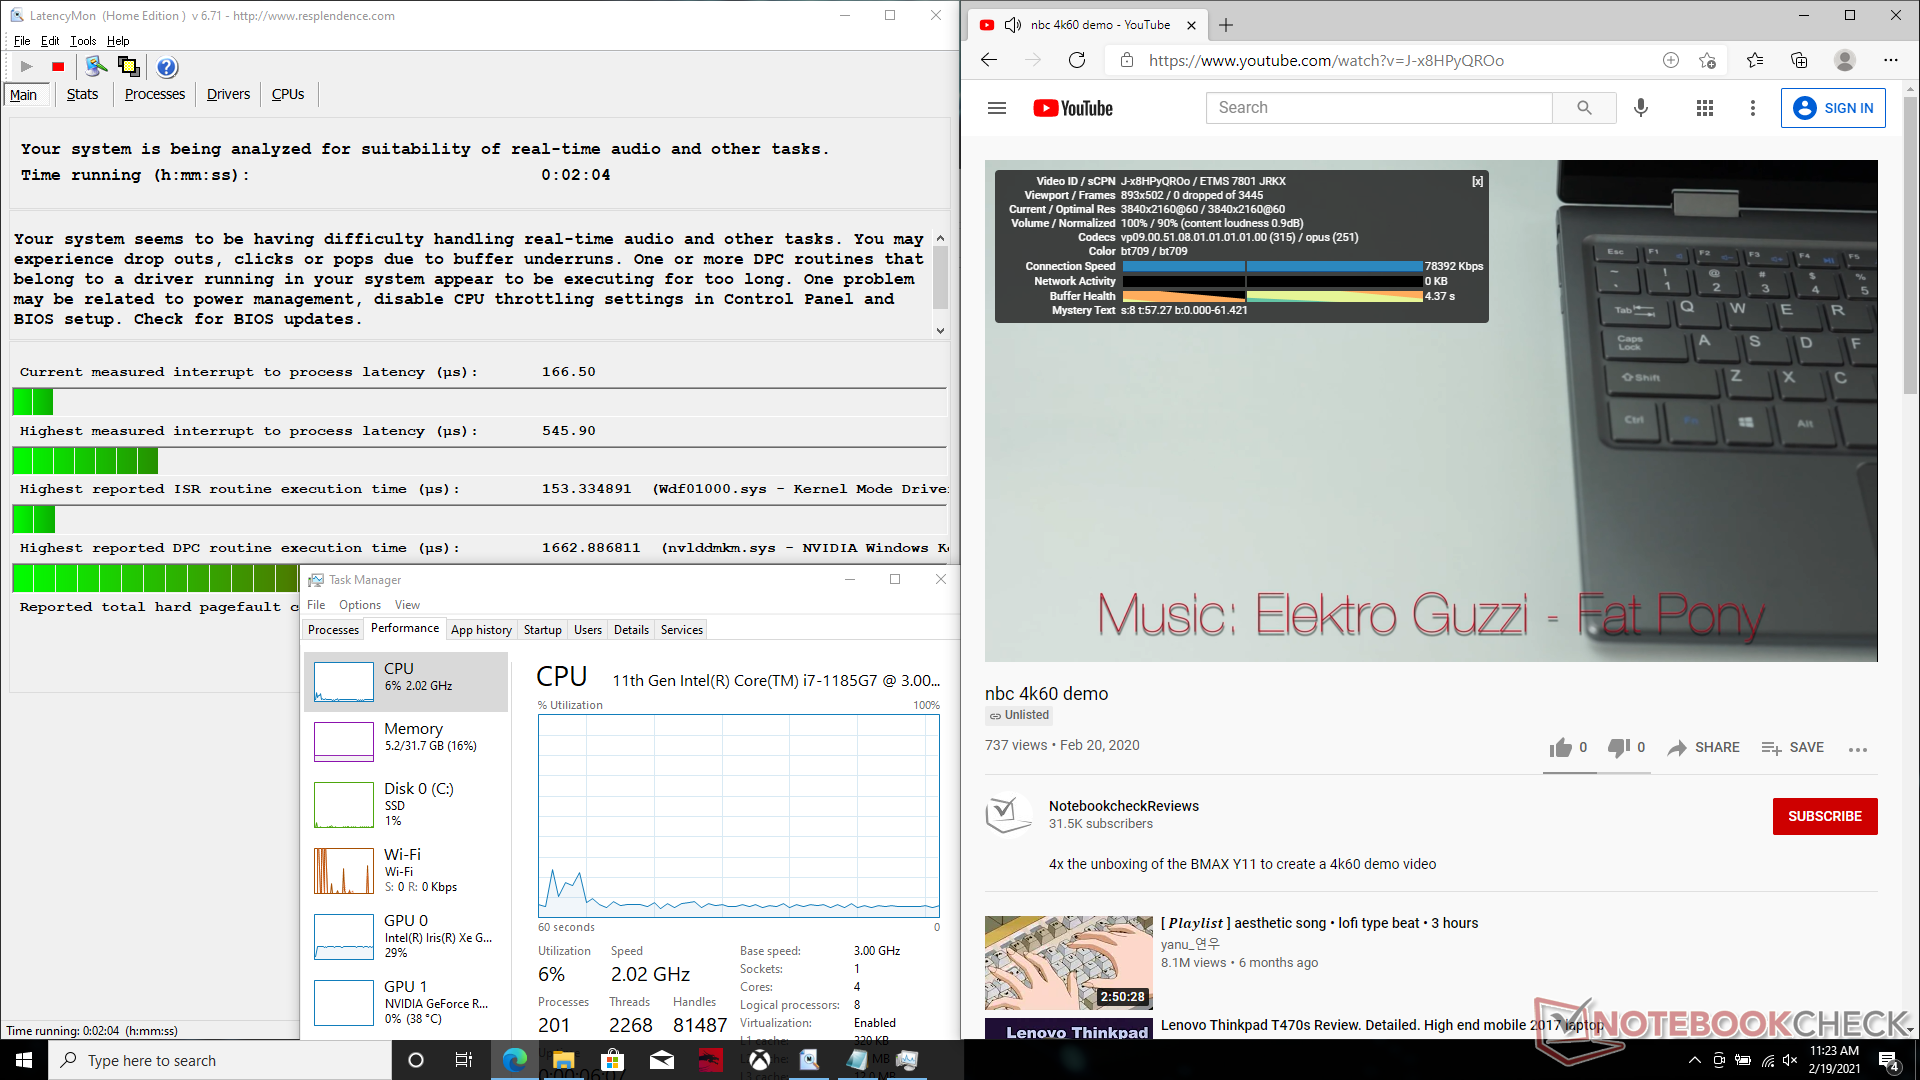
LatencyMon revela problemas de latencia del CPD relacionados con nvlddmkm.sys al abrir varias pestañas del navegador en nuestra página web. La reproducción de vídeo 4K a 60 FPS es, por lo demás, fluida y sin pérdida de fotogramas.
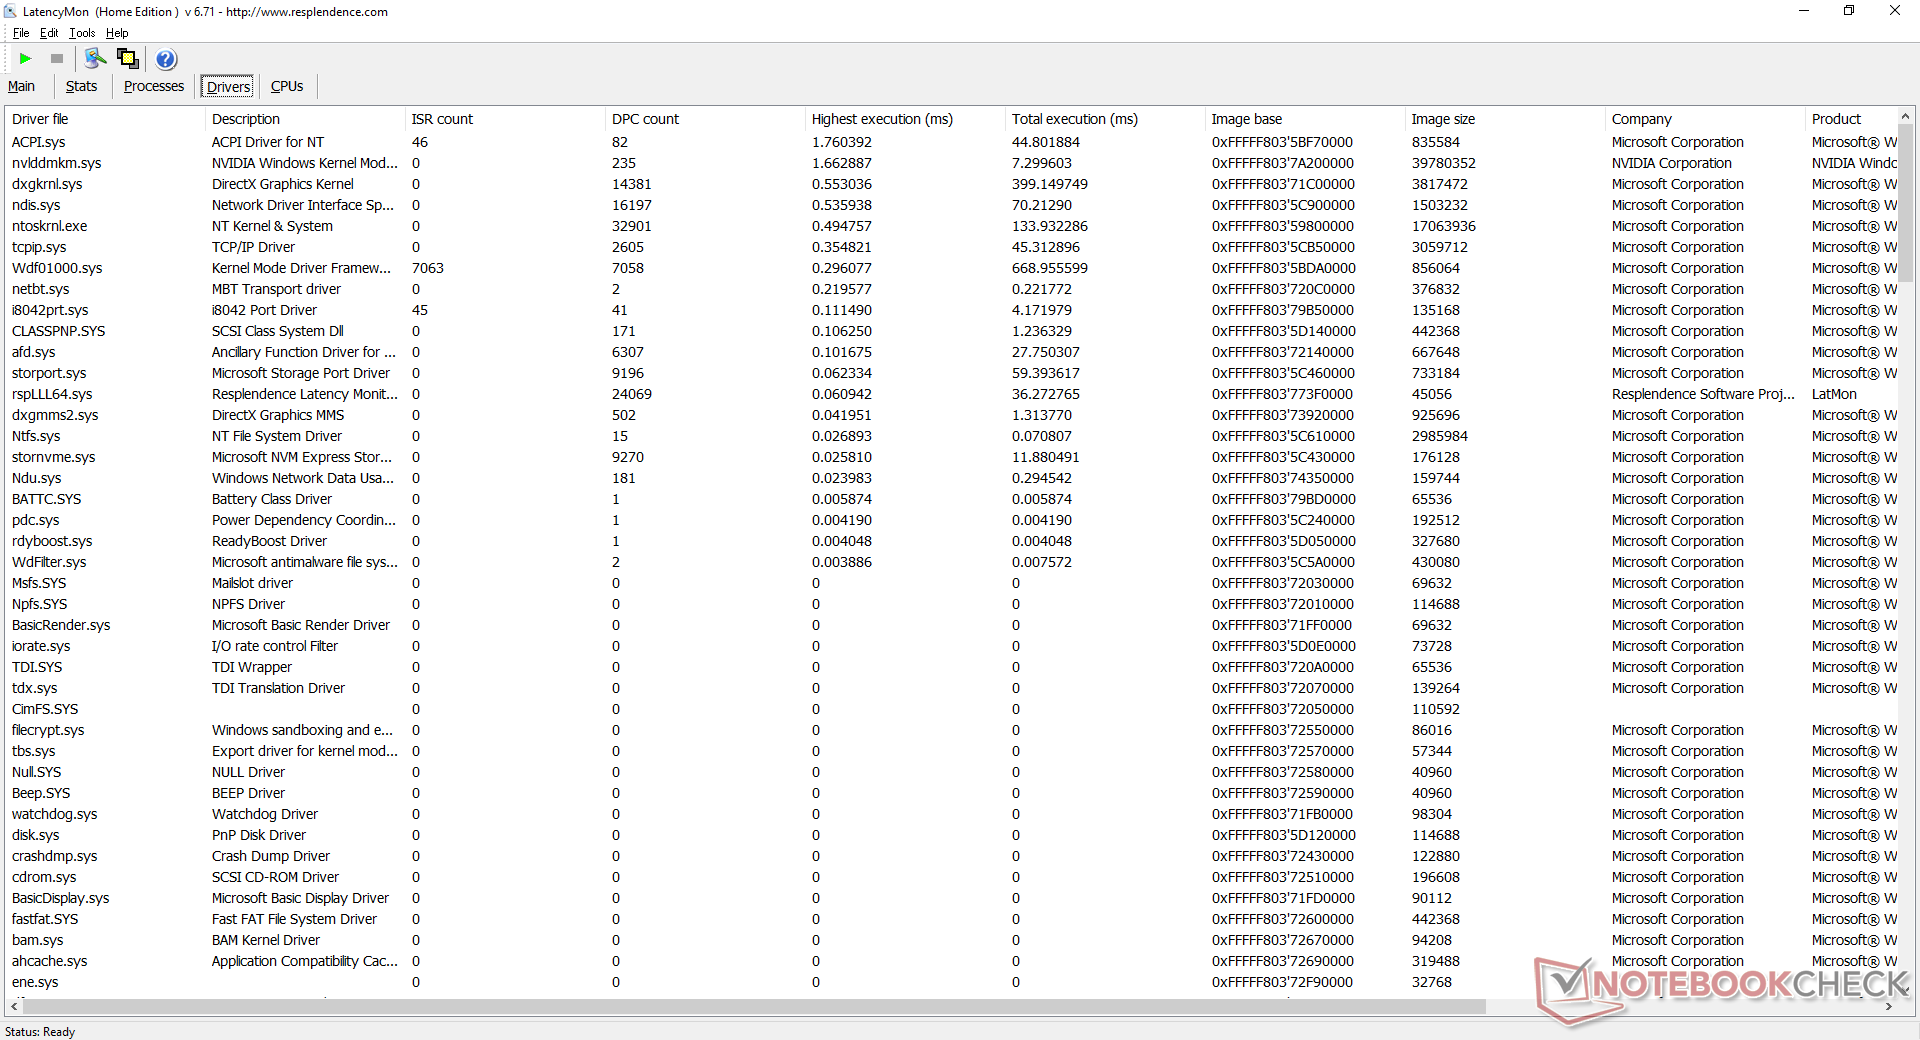
| DPC Latencies / LatencyMon - interrupt to process latency (max), Web, Youtube, Prime95 | |
| Dell XPS 15 9500 Core i7 4K UHD | |
| Lenovo ThinkPad T15p-20TN0006GE | |
| Asus ZenBook UX535-M01440 | |
| MSI Stealth 15M A11SEK | |
* ... más pequeño es mejor
Dispositivos de almacenamiento
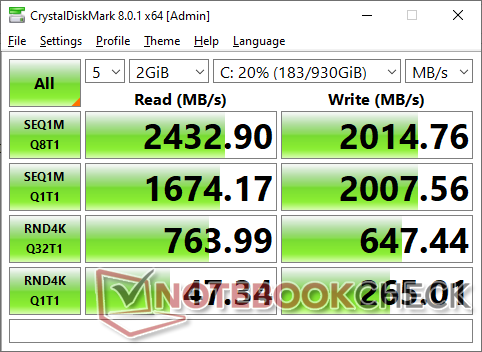
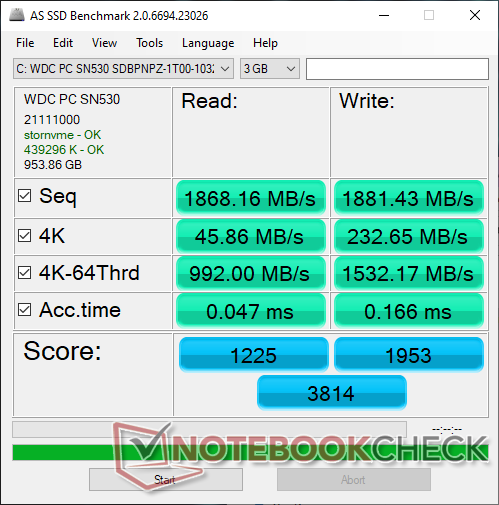
Las opciones de almacenamiento interno se limitan a una única ranura M.2 PCIe 3.0 x4. Nuestra unidad de pruebas viene con un WD SN530 de 1 TB que es un SSD NVMe de gama media en contraste con la serie SN750 de gama alta. Las tasas de lectura y escritura secuencial siguen siendo muy buenas, con unos 2400 MB/s y 2000 MB/s, respectivamente, en comparación con los >3000 MB/s de las unidades más caras.
| MSI Stealth 15M A11SEK WDC PC SN530 SDBPNPZ-1T00 | HP Spectre X360 15-5ZV31AV Intel SSD 660p 2TB SSDPEKNW020T8 | Dell XPS 15 9500 Core i7 4K UHD SK Hynix PC611 512GB | Asus ZenBook UX535-M01440 WDC PC SN730 SDBPNTY-1T00 | MSI Prestige 15 A10SC Samsung SSD PM981 MZVLB1T0HALR | |
|---|---|---|---|---|---|
| AS SSD | -26% | -16% | -11% | 4% | |
| Seq Read (MB/s) | 1868 | 1220 -35% | 2072 11% | 1886 1% | 1274 -32% |
| Seq Write (MB/s) | 1881 | 1152 -39% | 1486 -21% | 1221 -35% | 1395 -26% |
| 4K Read (MB/s) | 45.86 | 52.3 14% | 47.41 3% | 41.16 -10% | 50.3 10% |
| 4K Write (MB/s) | 232.6 | 146.6 -37% | 117.6 -49% | 101.2 -56% | 119.8 -48% |
| 4K-64 Read (MB/s) | 992 | 652 -34% | 967 -3% | 1022 3% | 1599 61% |
| 4K-64 Write (MB/s) | 1532 | 847 -45% | 715 -53% | 1618 6% | 1455 -5% |
| Access Time Read * (ms) | 0.047 | 0.077 -64% | 0.057 -21% | 0.058 -23% | 0.044 6% |
| Access Time Write * (ms) | 0.166 | 0.106 36% | 0.096 42% | 0.037 78% | 0.092 45% |
| Score Read (Points) | 1225 | 826 -33% | 1222 0% | 1252 2% | 1777 45% |
| Score Write (Points) | 1953 | 1109 -43% | 981 -50% | 1841 -6% | 1714 -12% |
| Score Total (Points) | 3814 | 2371 -38% | 2809 -26% | 3706 -3% | 4411 16% |
| Copy ISO MB/s (MB/s) | 2320 | 2070 -11% | 1999 -14% | 1611 -31% | 2830 22% |
| Copy Program MB/s (MB/s) | 681 | 571 -16% | 627 -8% | 509 -25% | 609 -11% |
| Copy Game MB/s (MB/s) | 1588 | 1219 -23% | 1001 -37% | 677 -57% | 1424 -10% |
| CrystalDiskMark 5.2 / 6 | -20% | -9% | -10% | -30% | |
| Write 4K (MB/s) | 262.6 | 151.5 -42% | 123.3 -53% | 110 -58% | 150.8 -43% |
| Read 4K (MB/s) | 45.41 | 59.3 31% | 41.85 -8% | 43.44 -4% | 47.3 4% |
| Write Seq (MB/s) | 2001 | 1424 -29% | 2054 3% | 1957 -2% | 981 -51% |
| Read Seq (MB/s) | 1659 | 1609 -3% | 1617 -3% | 1615 -3% | 976 -41% |
| Write 4K Q32T1 (MB/s) | 648 | 393.6 -39% | 413 -36% | 341.6 -47% | 442.7 -32% |
| Read 4K Q32T1 (MB/s) | 767 | 369.4 -52% | 377.5 -51% | 364.3 -53% | 499.7 -35% |
| Write Seq Q32T1 (MB/s) | 2002 | 1946 -3% | 2705 35% | 3081 54% | 1706 -15% |
| Read Seq Q32T1 (MB/s) | 2415 | 1934 -20% | 3442 43% | 3251 35% | 1758 -27% |
| Media total (Programa/Opciones) | -23% /
-24% | -13% /
-13% | -11% /
-11% | -13% /
-8% |
* ... más pequeño es mejor

Disk Throttling: DiskSpd Read Loop, Queue Depth 8
Rendimiento de la GPU
El rendimiento gráfico está a la altura de muchos portátiles de juego para superar fácilmente a casi todos los demás portátiles multimedia ultrafinos de 15,6 pulgadas. La actualización a la configuración GeForce RTX 3060 aportaría ventajas de rendimiento aún mayores, pero no podemos estimar el aumento por el momento ya que aún no hemos probado la SKU RTX 3060.
Consulta nuestra página dedicada a la GeForce RTX 2060 Max-Q para obtener más información técnica y comparaciones de benchmarks.
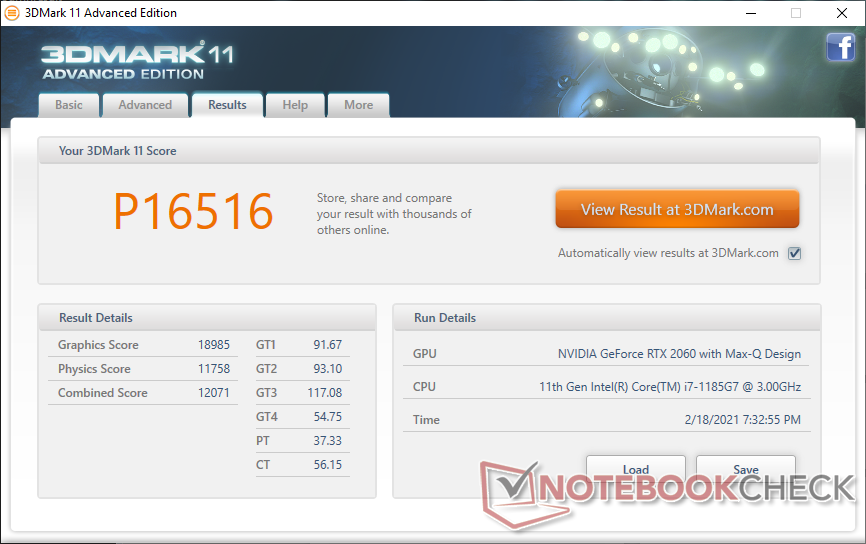
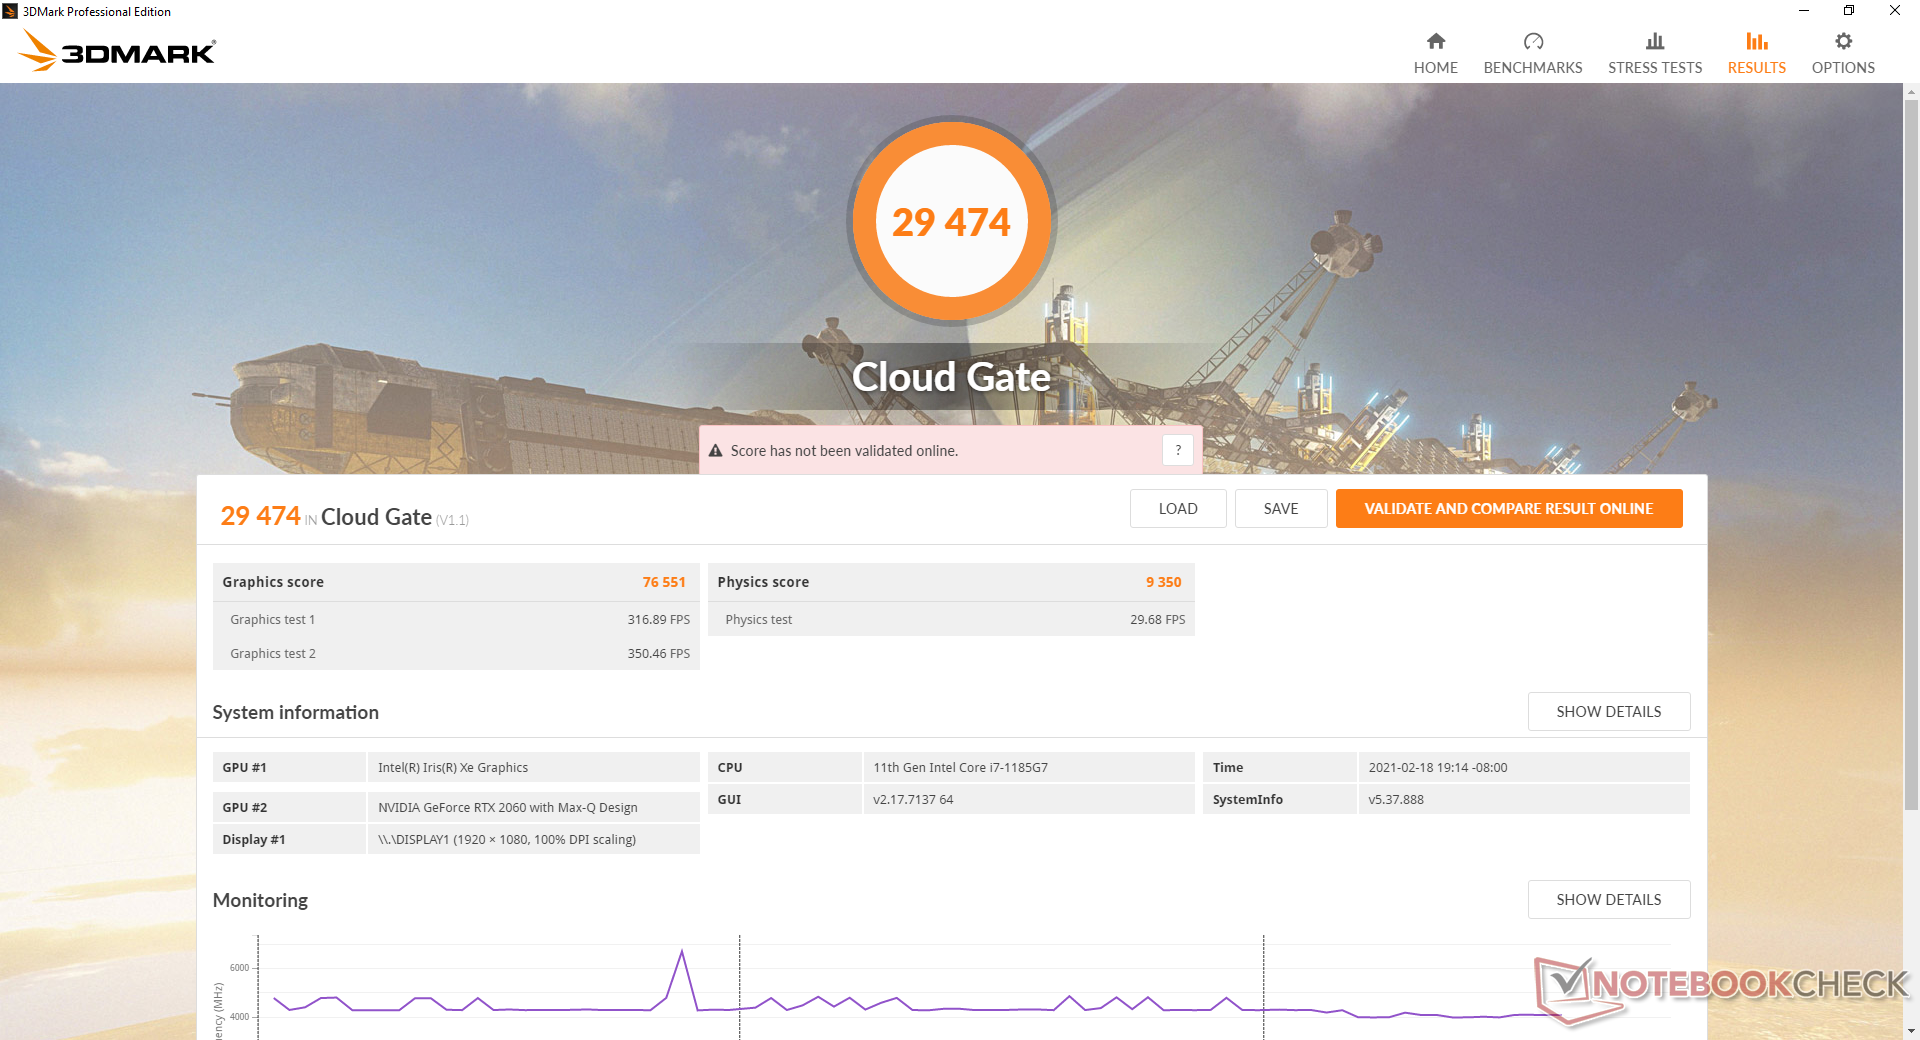
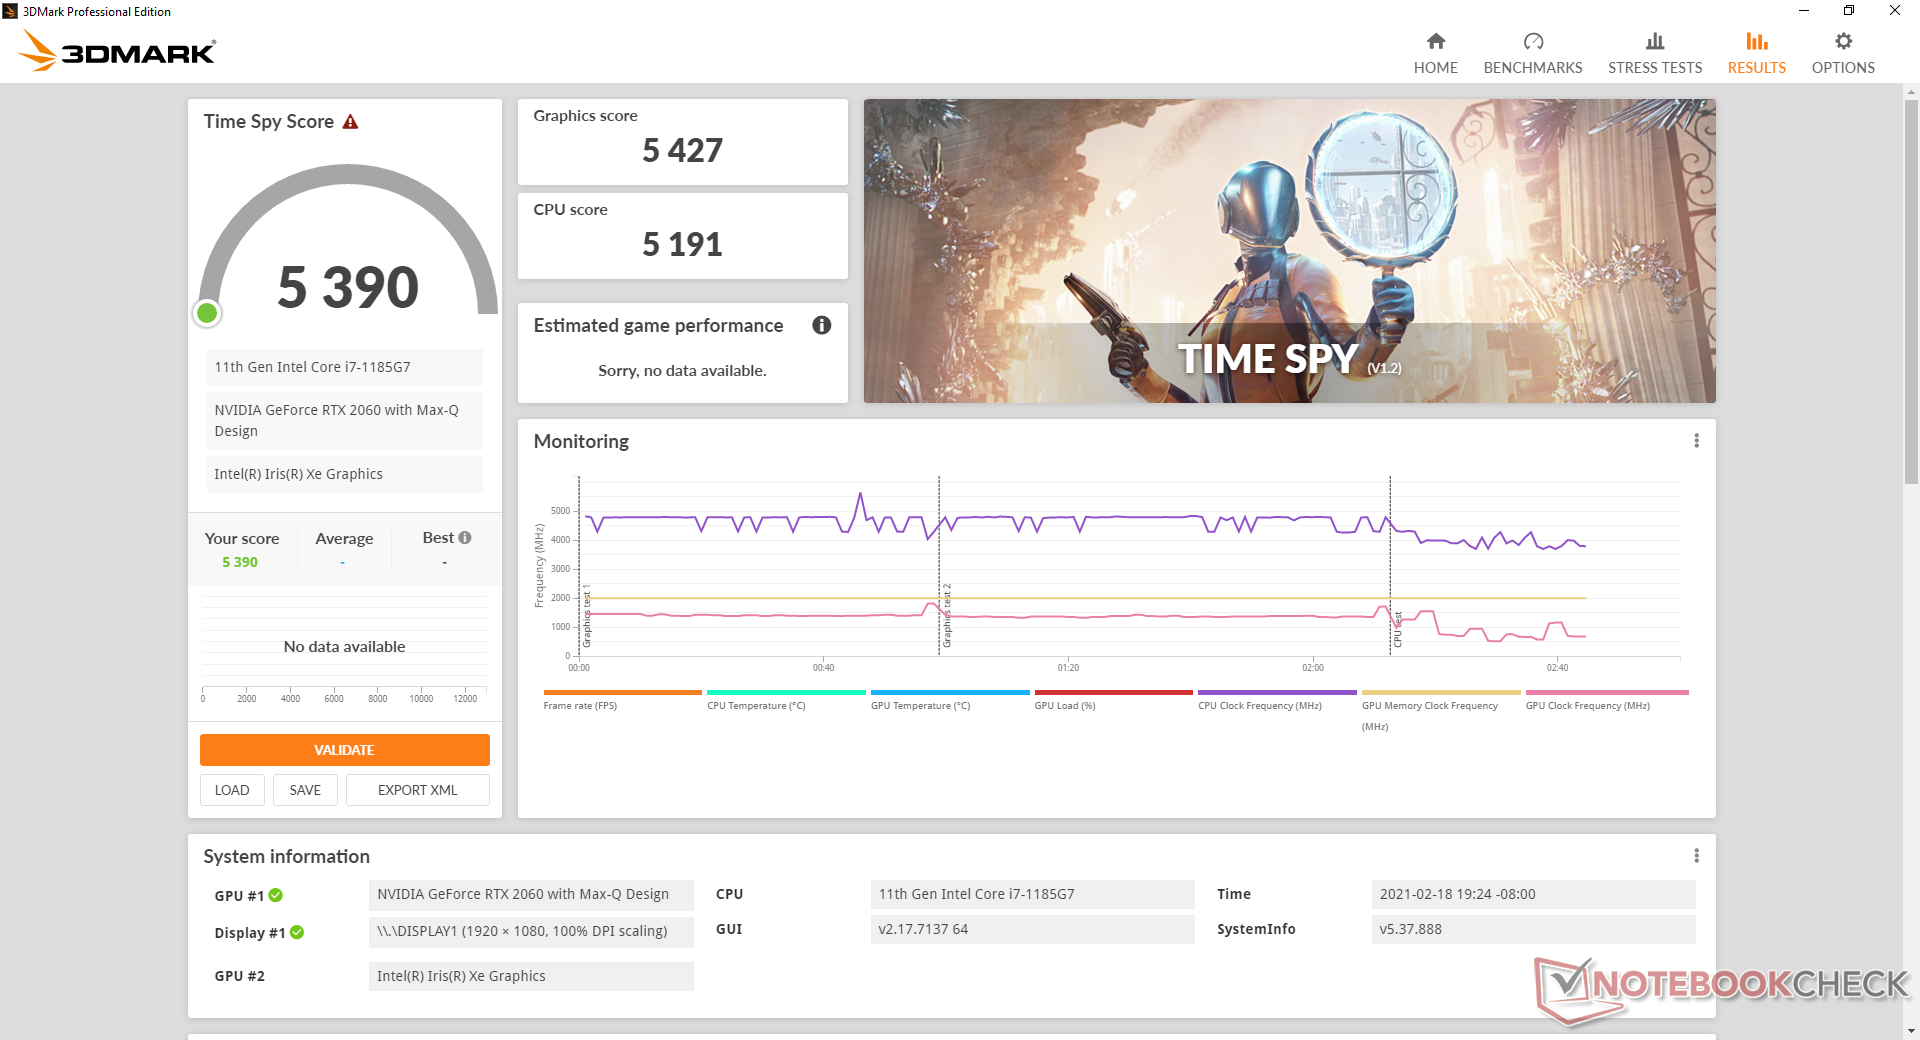
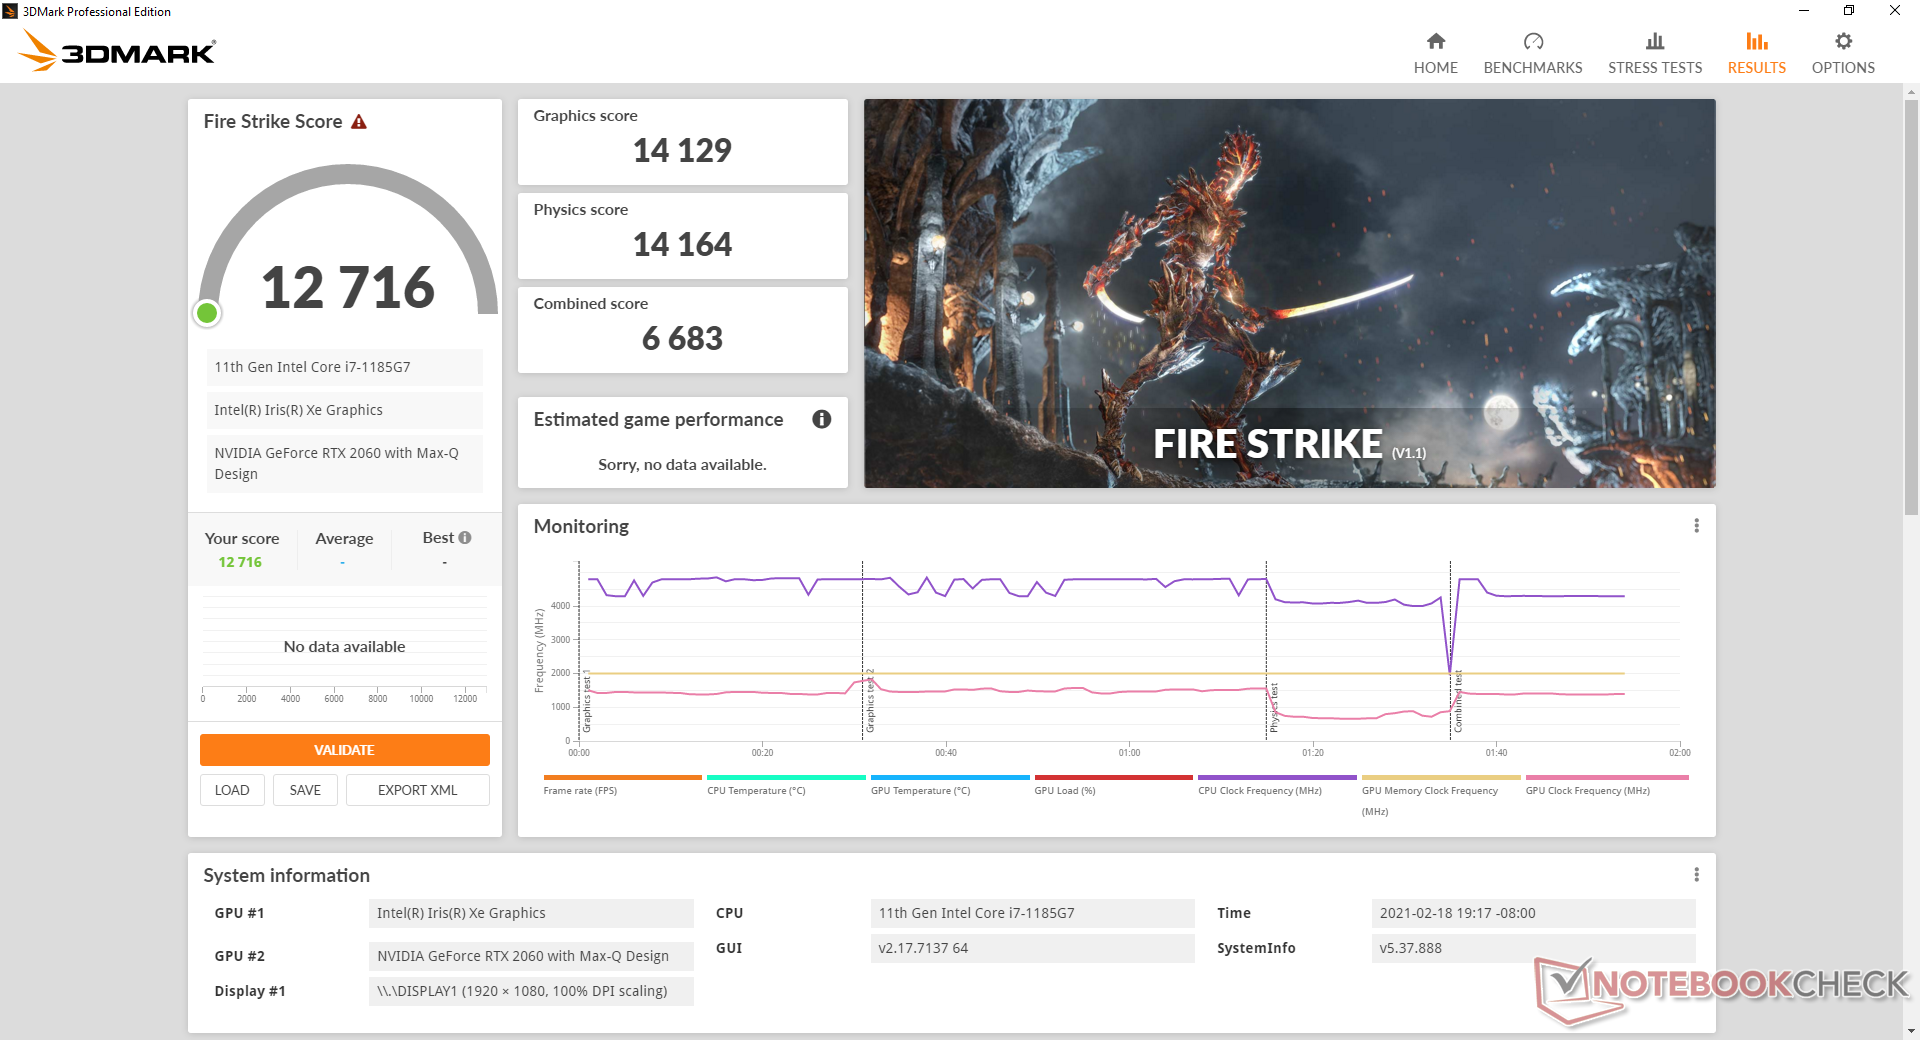
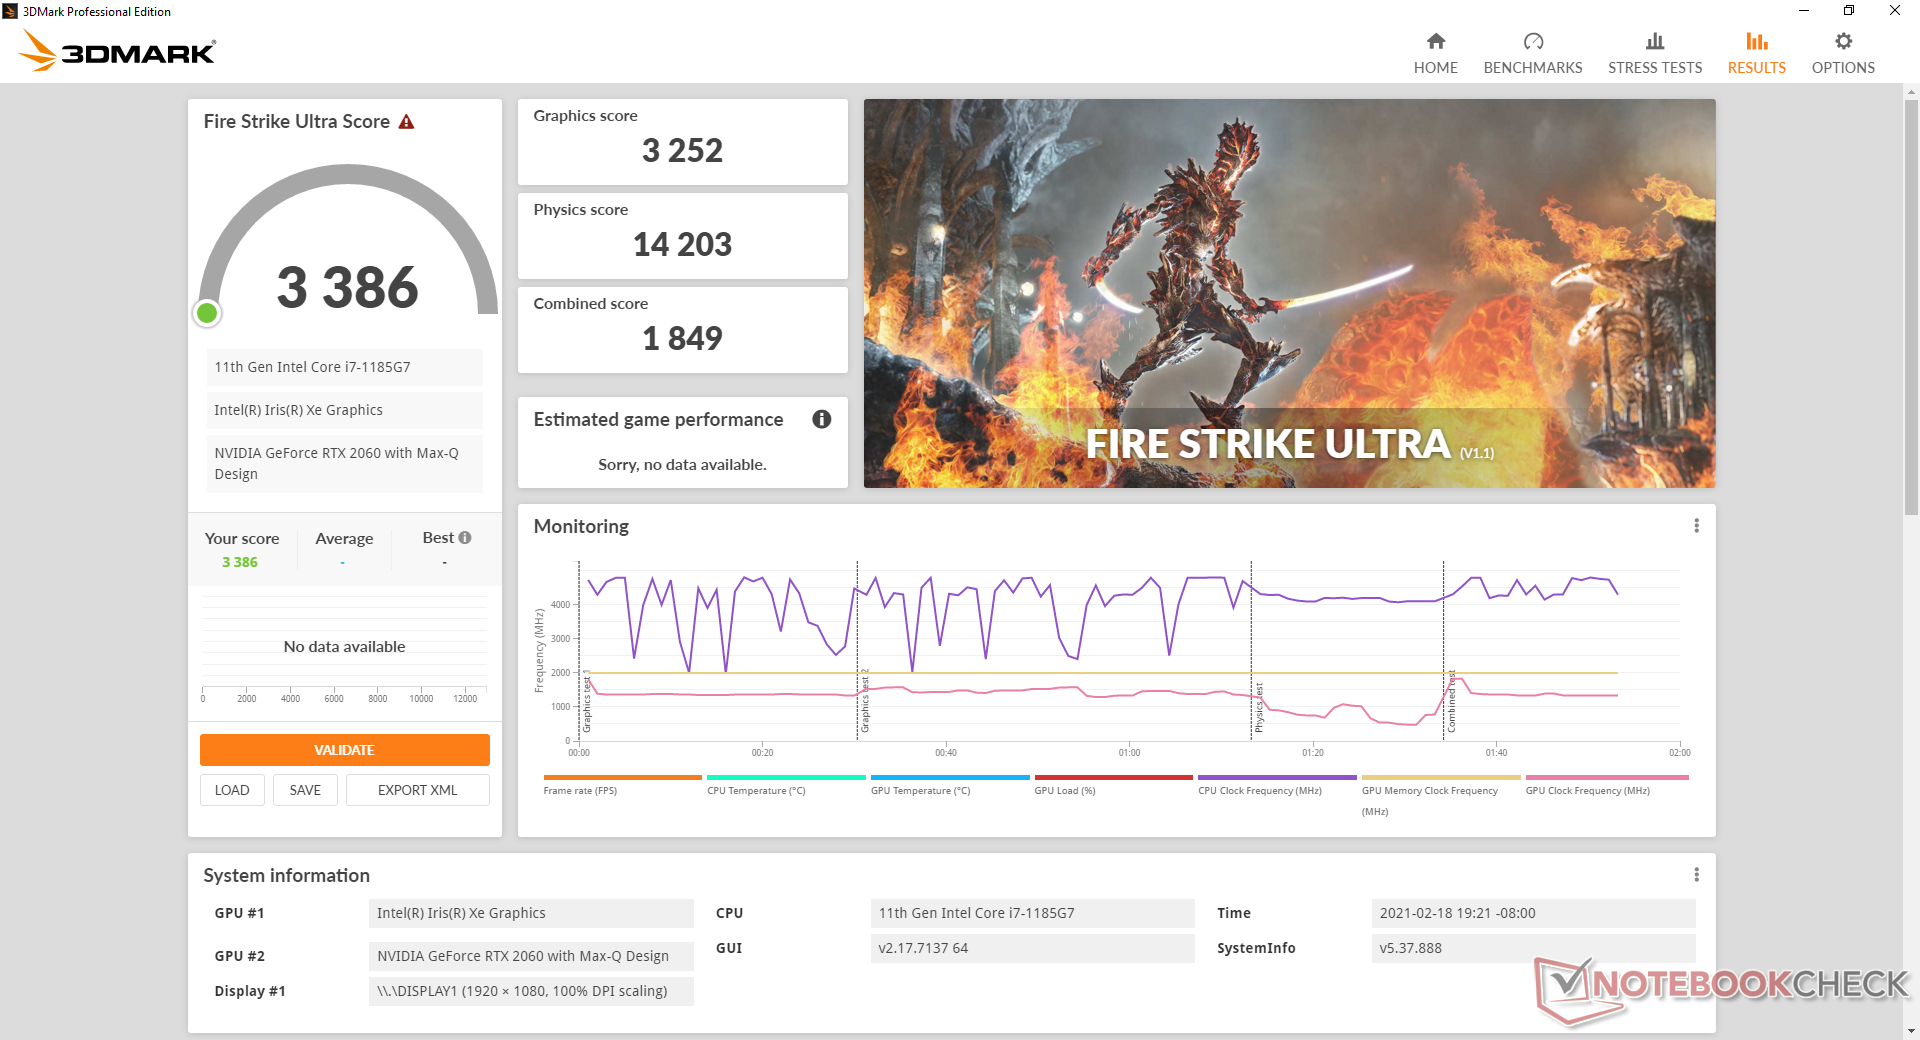
| 3DMark 11 Performance | 16516 puntos | |
| 3DMark Cloud Gate Standard Score | 29474 puntos | |
| 3DMark Fire Strike Score | 12716 puntos | |
| 3DMark Time Spy Score | 5390 puntos | |
ayuda | ||
| GTA V | |
| 1920x1080 Lowest Settings possible | |
| MSI Stealth 15M A11SEK | |
| Medio NVIDIA GeForce RTX 2060 Max-Q (n=1) | |
| Lenovo Yoga Slim 7-14ARE | |
| Acer Swift 3 SF314-42-R27B | |
| 1366x768 Normal/Off AF:4x | |
| MSI RTX 2060 Gaming Z 6G | |
| MSI Stealth 15M A11SEK | |
| Medio NVIDIA GeForce RTX 2060 Max-Q (n=1) | |
| Acer Swift 3 SF314-42-R27B | |
| 1920x1080 Highest AA:4xMSAA + FX AF:16x | |
| MSI RTX 2060 Gaming Z 6G | |
| MSI Stealth 15M A11SEK | |
| Medio NVIDIA GeForce RTX 2060 Max-Q (n=1) | |
| Lenovo Yoga Slim 7-14ARE | |
| Acer Swift 3 SF314-42-R27B | |
| Strange Brigade | |
| 1280x720 lowest AF:1 | |
| MSI Stealth 15M A11SEK | |
| Medio NVIDIA GeForce RTX 2060 Max-Q (n=1) | |
| Lenovo Yoga Slim 7-14ARE | |
| 1920x1080 medium AA:medium AF:4 | |
| MSI Stealth 15M A11SEK | |
| Medio NVIDIA GeForce RTX 2060 Max-Q (n=1) | |
| Lenovo Yoga Slim 7-14ARE | |
| 1920x1080 high AA:high AF:8 | |
| MSI Stealth 15M A11SEK | |
| Medio NVIDIA GeForce RTX 2060 Max-Q (n=1) | |
| Lenovo Yoga Slim 7-14ARE | |
| 1920x1080 ultra AA:ultra AF:16 | |
| MSI Stealth 15M A11SEK | |
| Medio NVIDIA GeForce RTX 2060 Max-Q (n=1) | |
| Lenovo Yoga Slim 7-14ARE | |
| bajo | medio | alto | ultra | |
|---|---|---|---|---|
| GTA V (2015) | 173 | 164 | 119 | 68.2 |
| The Witcher 3 (2015) | 235.1 | 139.9 | 88.9 | 51.2 |
| Dota 2 Reborn (2015) | 144 | 130 | 119 | 116 |
| Final Fantasy XV Benchmark (2018) | 126 | 74.1 | 55.7 | |
| X-Plane 11.11 (2018) | 102 | 90 | 75.6 | |
| Strange Brigade (2018) | 276 | 130 | 106 | 93.1 |
Emissions
Ruido del sistema
El ruido del ventilador siempre está presente cuando se conecta a una toma de corriente de CA, con 32 dB(A) contra un fondo de 28 dB(A), incluso si el sistema está configurado en modo silencioso a través de Dragon Center. No es hasta que se desconecta el adaptador de CA que los ventiladores realmente se detienen para una experiencia silenciosa. Nos encantaría que esto cambiara en futuras revisiones, ya que el modo "Silencioso" debería comportarse igual sin importar si el adaptador de CA está conectado o no.
Cuando se juega, el ruido del ventilador puede oscilar entre 41 y 46 dB(A) dependiendo de la carga de la CPU. Por ejemplo, el ruido del ventilador es estable en 41 dB(A) cuando se ejecuta Witcher 3 pero es más fuerte cuando se ejecuta 3DMark 06 aunque Witcher 3 puede ser más intensivo para la GPU. Este rango es similar al que registramos en el Dell XPS 15 mientras que es más silencioso que el Envy 15.
Activar el modo Cooler Boost elevará el ruido del ventilador a su máximo de 56 dB(A) sin importar la carga en pantalla. Este modo no suele ser necesario ni recomendable en la mayoría de casos, incluyendo los juegos, ya que no ofrece casi ningún aumento de rendimiento - sólo temperaturas más bajas.
No notamos ningún ruido de bobina en nuestra unidad de prueba.
| MSI Stealth 15M A11SEK GeForce RTX 2060 Max-Q, i7-1185G7, WDC PC SN530 SDBPNPZ-1T00 | Dell XPS 15 9500 Core i7 4K UHD GeForce GTX 1650 Ti Mobile, i7-10875H, SK Hynix PC611 512GB | Lenovo ThinkPad T15p-20TN0006GE GeForce GTX 1050 Mobile, i7-10750H, WDC PC SN730 SDBQNTY-512GB | Asus ZenBook UX535-M01440 GeForce GTX 1650 Ti Max-Q, i7-10750H, WDC PC SN730 SDBPNTY-1T00 | MSI Prestige 15 A10SC GeForce GTX 1650 Max-Q, i7-10710U, Samsung SSD PM981 MZVLB1T0HALR | HP Envy 15-ep0098nr GeForce RTX 2060 Max-Q, i7-10750H, Intel Optane Memory H10 with Solid State Storage 32GB + 512GB HBRPEKNX0202A(L/H) | |
|---|---|---|---|---|---|---|
| Noise | 7% | 7% | 17% | 11% | -4% | |
| apagado / medio ambiente * (dB) | 27.5 | 28.4 -3% | 29.3 -7% | 24.6 11% | 29.3 -7% | 26.4 4% |
| Idle Minimum * (dB) | 32.3 | 28.4 12% | 29.3 9% | 24.6 24% | 30.1 7% | 32.2 -0% |
| Idle Average * (dB) | 32.3 | 28.4 12% | 29.3 9% | 24.6 24% | 30.2 7% | 32.2 -0% |
| Idle Maximum * (dB) | 33.7 | 28.4 16% | 30.6 9% | 24.6 27% | 30.2 10% | 32.2 4% |
| Load Average * (dB) | 46.3 | 46 1% | 42.7 8% | 41.3 11% | 31.5 32% | 48.3 -4% |
| Witcher 3 ultra * (dB) | 41.3 | 42 -2% | 42.7 -3% | 42 -2% | 37 10% | 53.7 -30% |
| Load Maximum * (dB) | 56.2 | 47.1 16% | 42.7 24% | 41.4 26% | 47 16% | 58.8 -5% |
* ... más pequeño es mejor
Ruido
| Ocioso |
| 32.3 / 32.3 / 33.7 dB(A) |
| Carga |
| 46.3 / 56.2 dB(A) |
 | ||
30 dB silencioso 40 dB(A) audible 50 dB(A) ruidosamente alto |
||
min: | ||
Temperatura
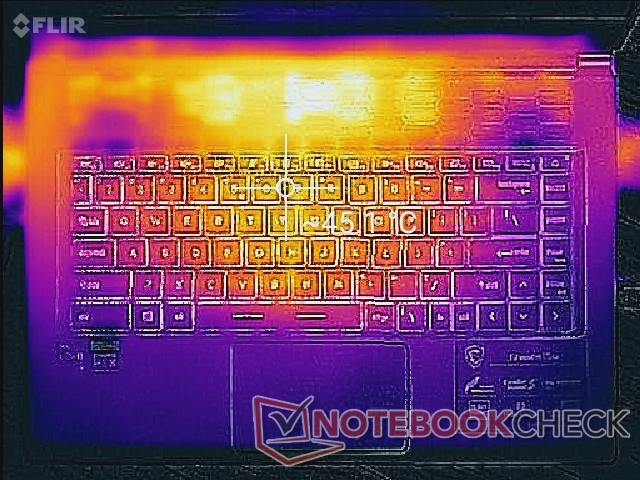
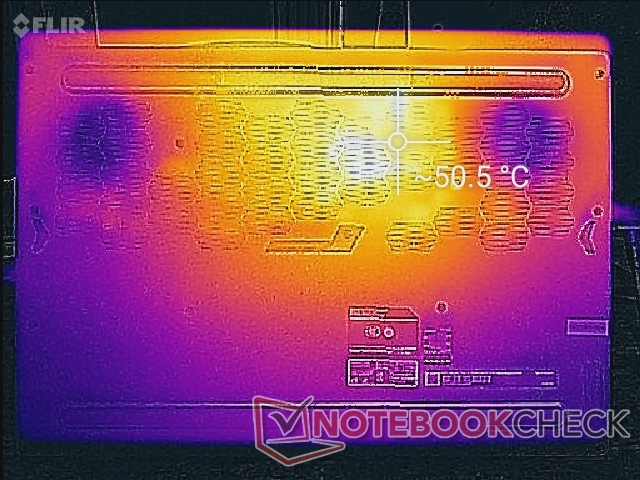
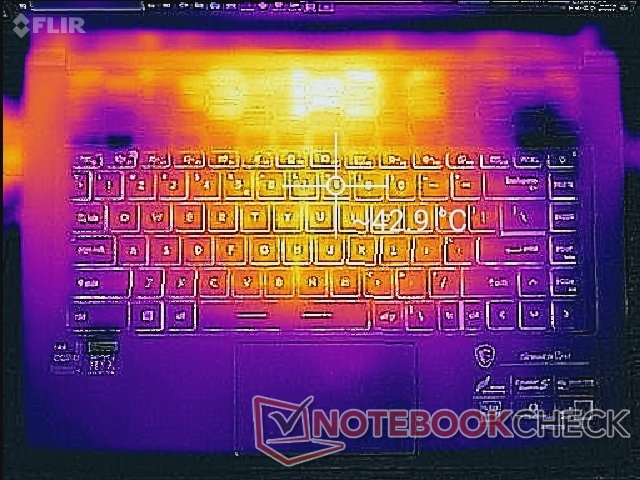
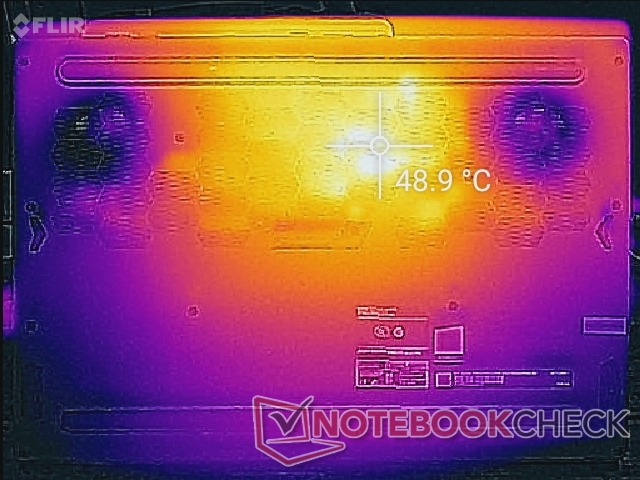
El desarrollo de la temperatura de la superficie es ampliamente simétrico. El punto caliente en el centro del teclado puede ser tan cálido como 43 C a 45 C cuando se ejecutan cargas exigentes como juegos para ser similar a lo que observamos en el GS66 pero aún más fresco que en el XPS 15 y el Lenovo ThinkPad T15p. Por tanto, el MSI es capaz de ofrecer un rendimiento gráfico más rápido que sus competidores sin que necesariamente se caliente más.
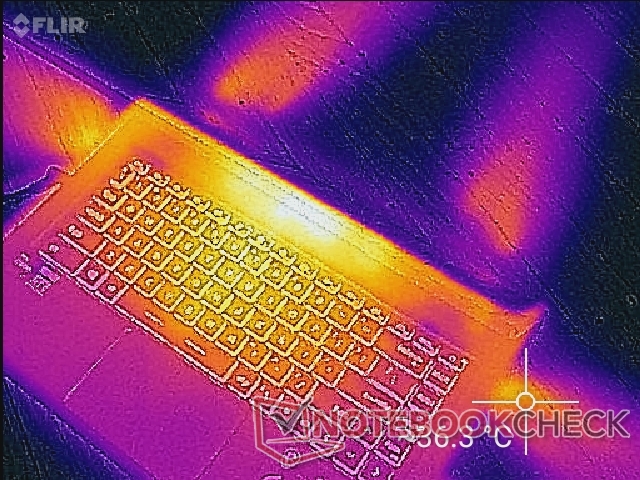
(-) La temperatura máxima en la parte superior es de 47.2 °C / 117 F, frente a la media de 36.8 °C / 98 F, que oscila entre 21 y 71 °C para la clase Multimedia.
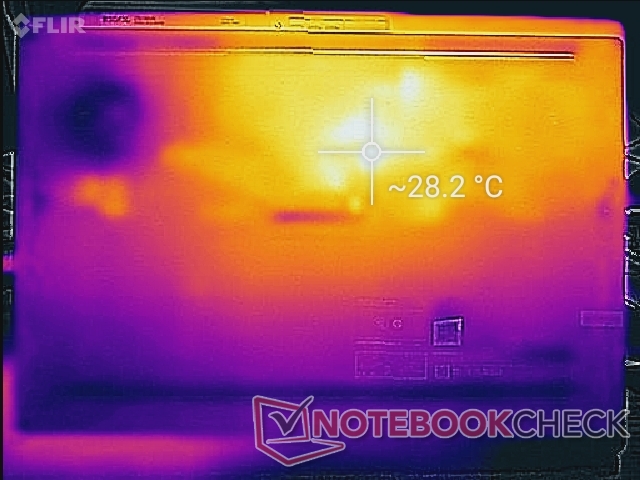
(-) El fondo se calienta hasta un máximo de 47.4 °C / 117 F, frente a la media de 39.1 °C / 102 F
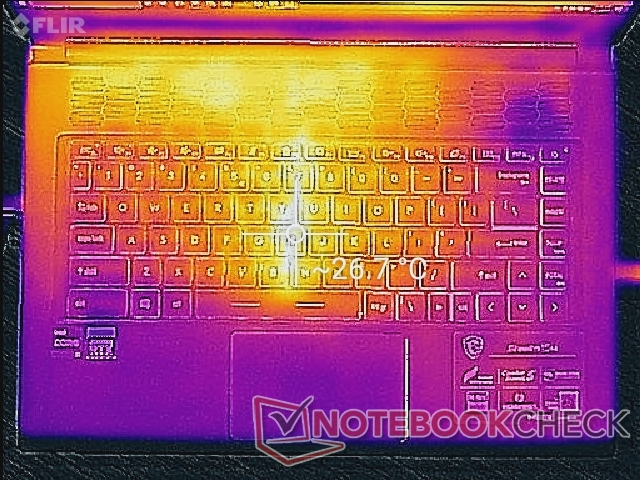
(+) En reposo, la temperatura media de la parte superior es de 22.6 °C / 73# F, frente a la media del dispositivo de 31.3 °C / 88 F.
(±) Jugando a The Witcher 3, la temperatura media de la parte superior es de 34.4 °C / 94 F, frente a la media del dispositivo de 31.3 °C / 88 F.
(+) El reposamanos y el panel táctil están a una temperatura inferior a la de la piel, con un máximo de 26.8 °C / 80.2 F y, por tanto, son fríos al tacto.
(±) La temperatura media de la zona del reposamanos de dispositivos similares fue de 28.7 °C / 83.7 F (+1.9 °C / 3.5 F).
Prueba de esfuerzo
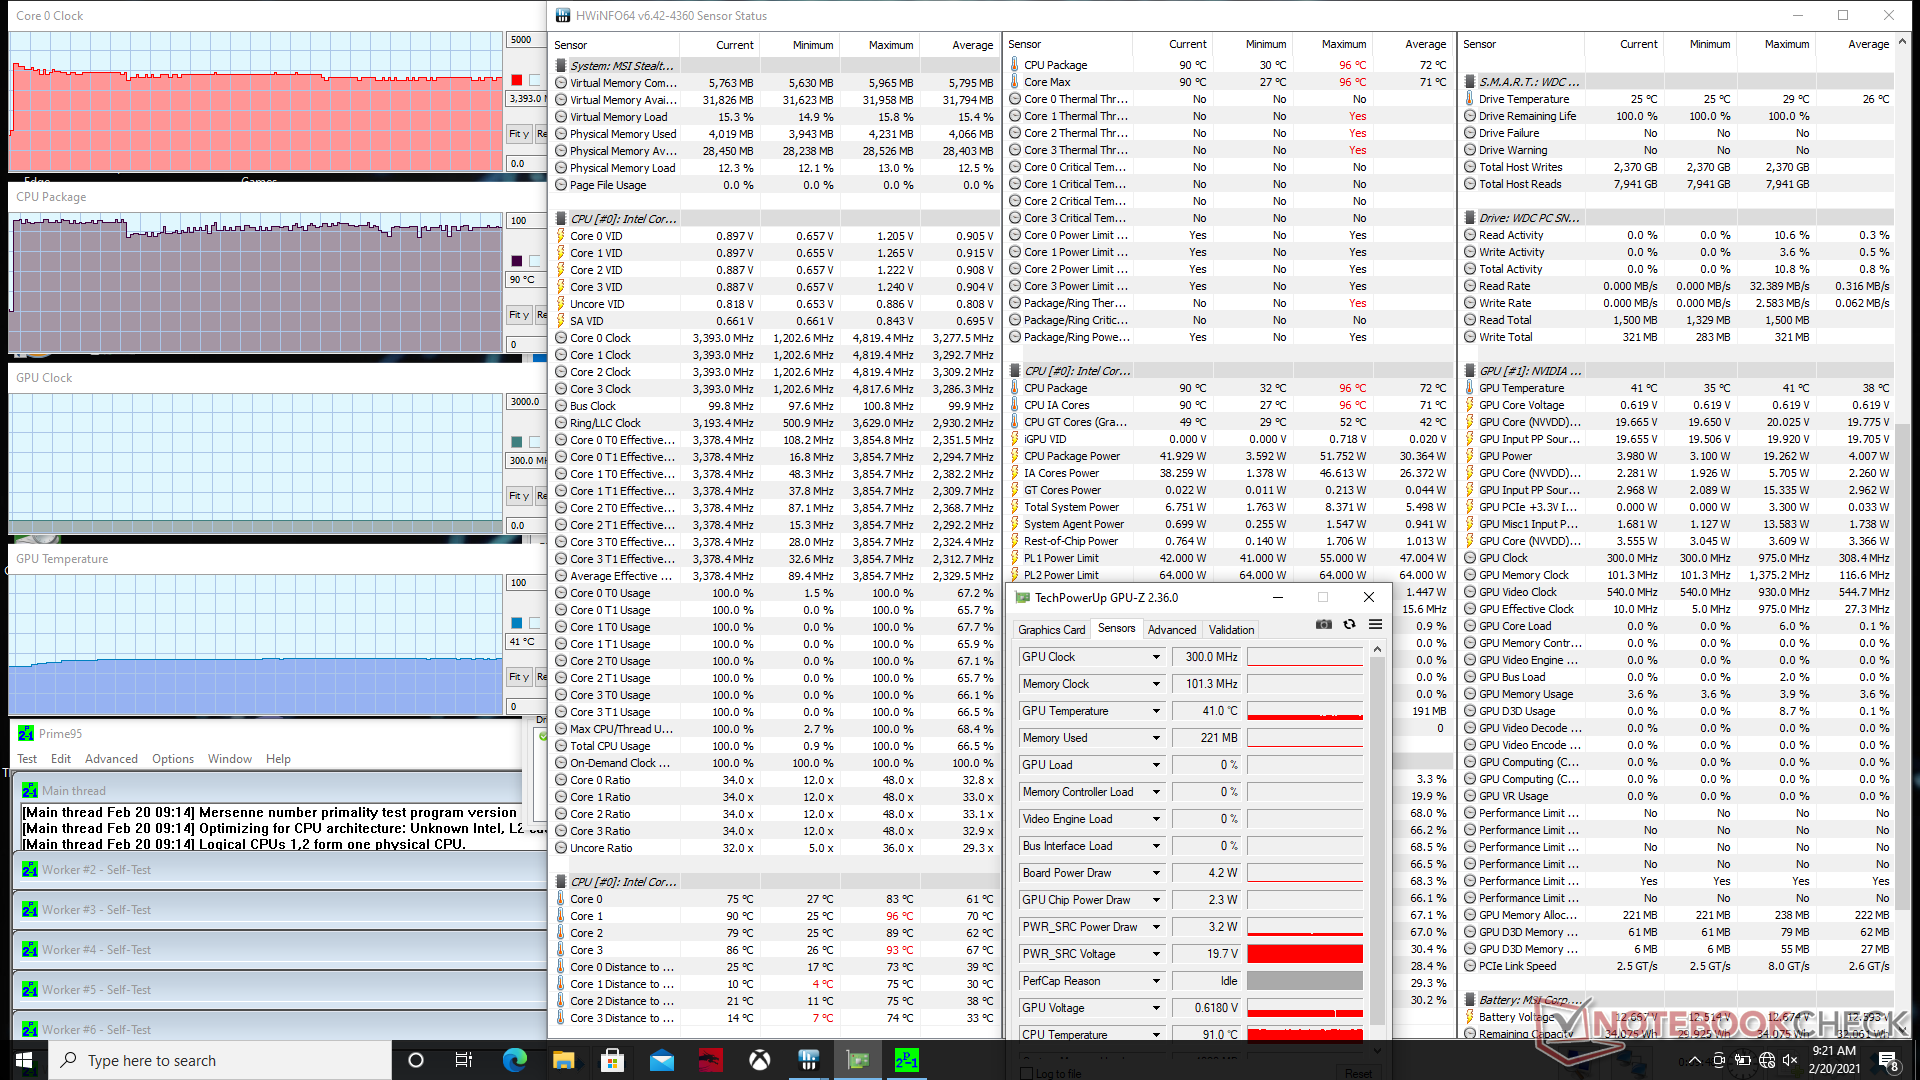
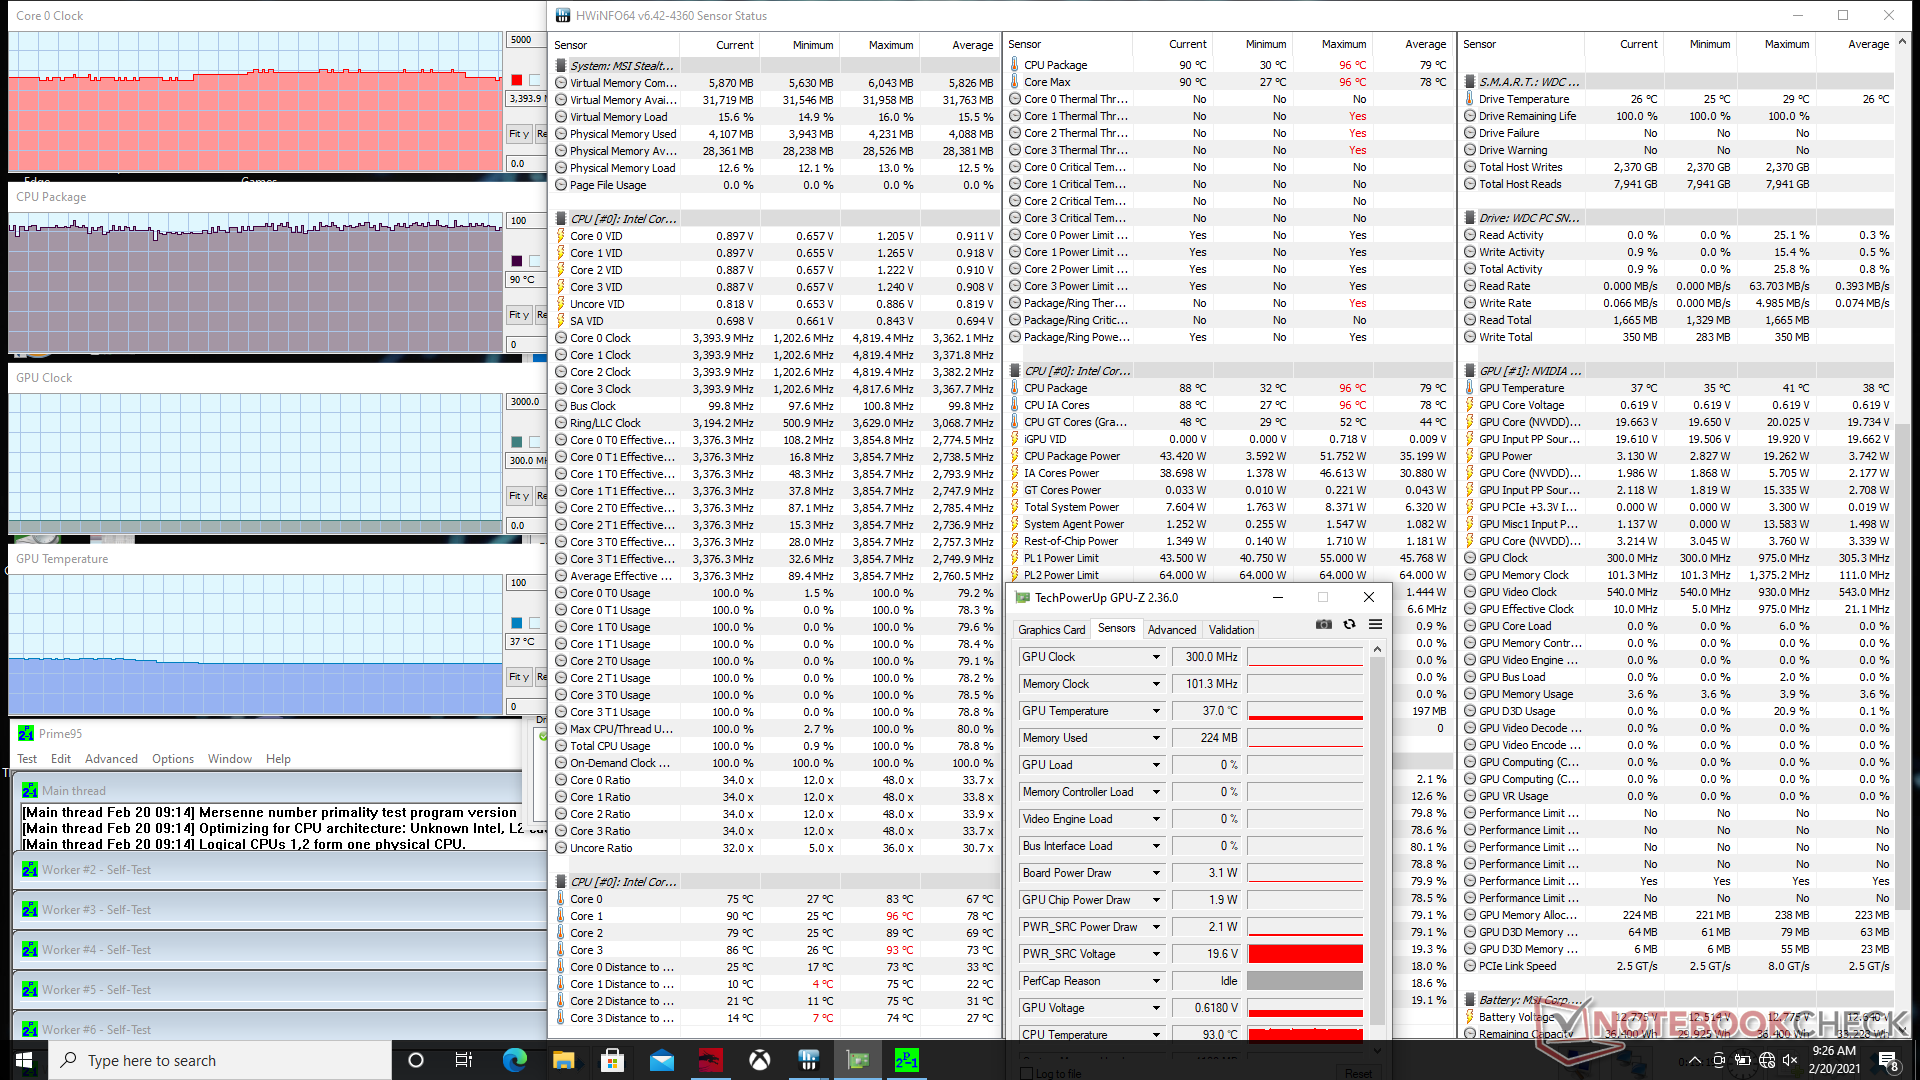
Cuando se estresa con Prime95, la velocidad de reloj de la CPU aumenta hasta 3,9 GHz durante los primeros segundos antes de caer a 3,5 GHz. El procesador se estabilizó finalmente en el rango de 3,3 a 3,4 GHz y a una temperatura del núcleo de 90 C. La activación del Cooler Boost no supuso casi ninguna diferencia.
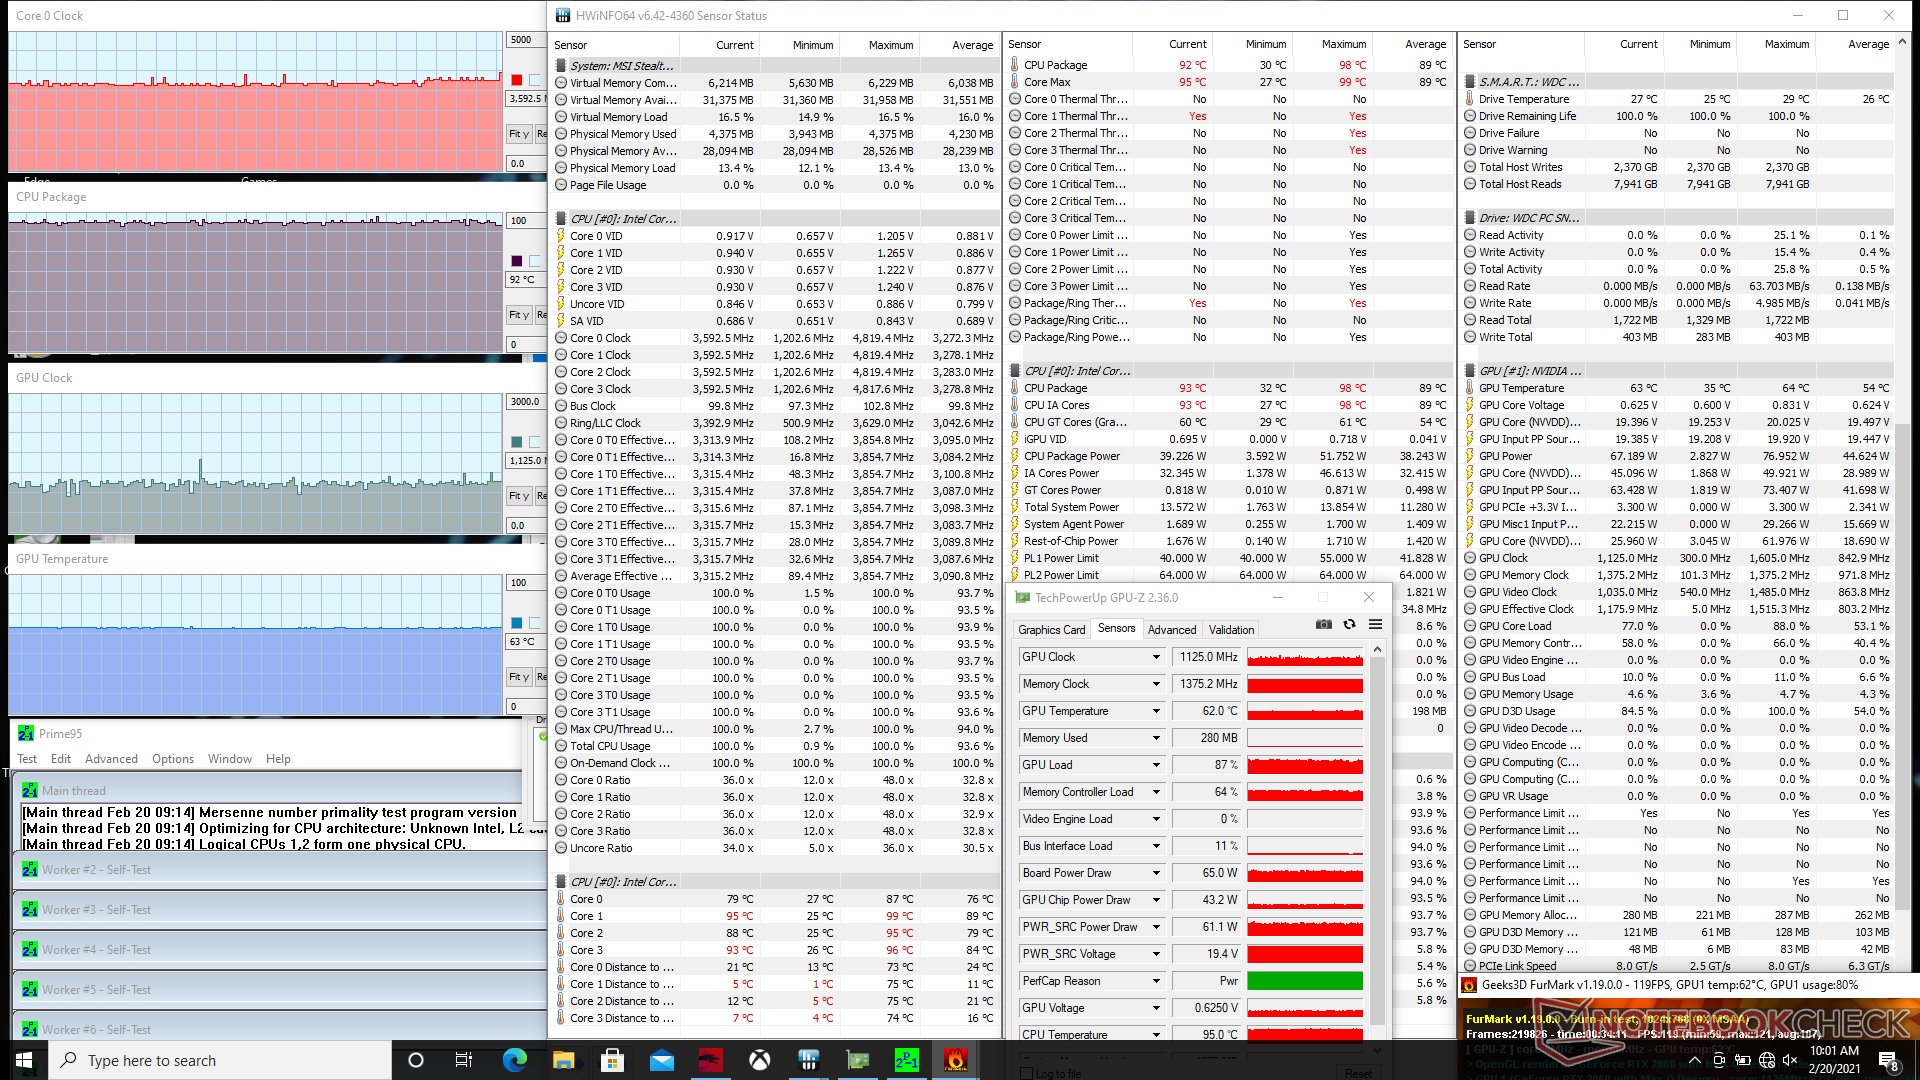
Cuando se estresa con Prime95 y FurMark simultáneamente, las temperaturas de la CPU y la GPU se estabilizan en 83 C y 70 C, respectivamente. Curiosamente, la activación de Cooler Boost aumentaría la velocidad de reloj de la CPU de 2,6 GHz a 3,3 GHz, mientras que la temperatura del núcleo aumentaría a 92 C. Por el contrario, la temperatura de la GPU caería de 70 C a 63 C.
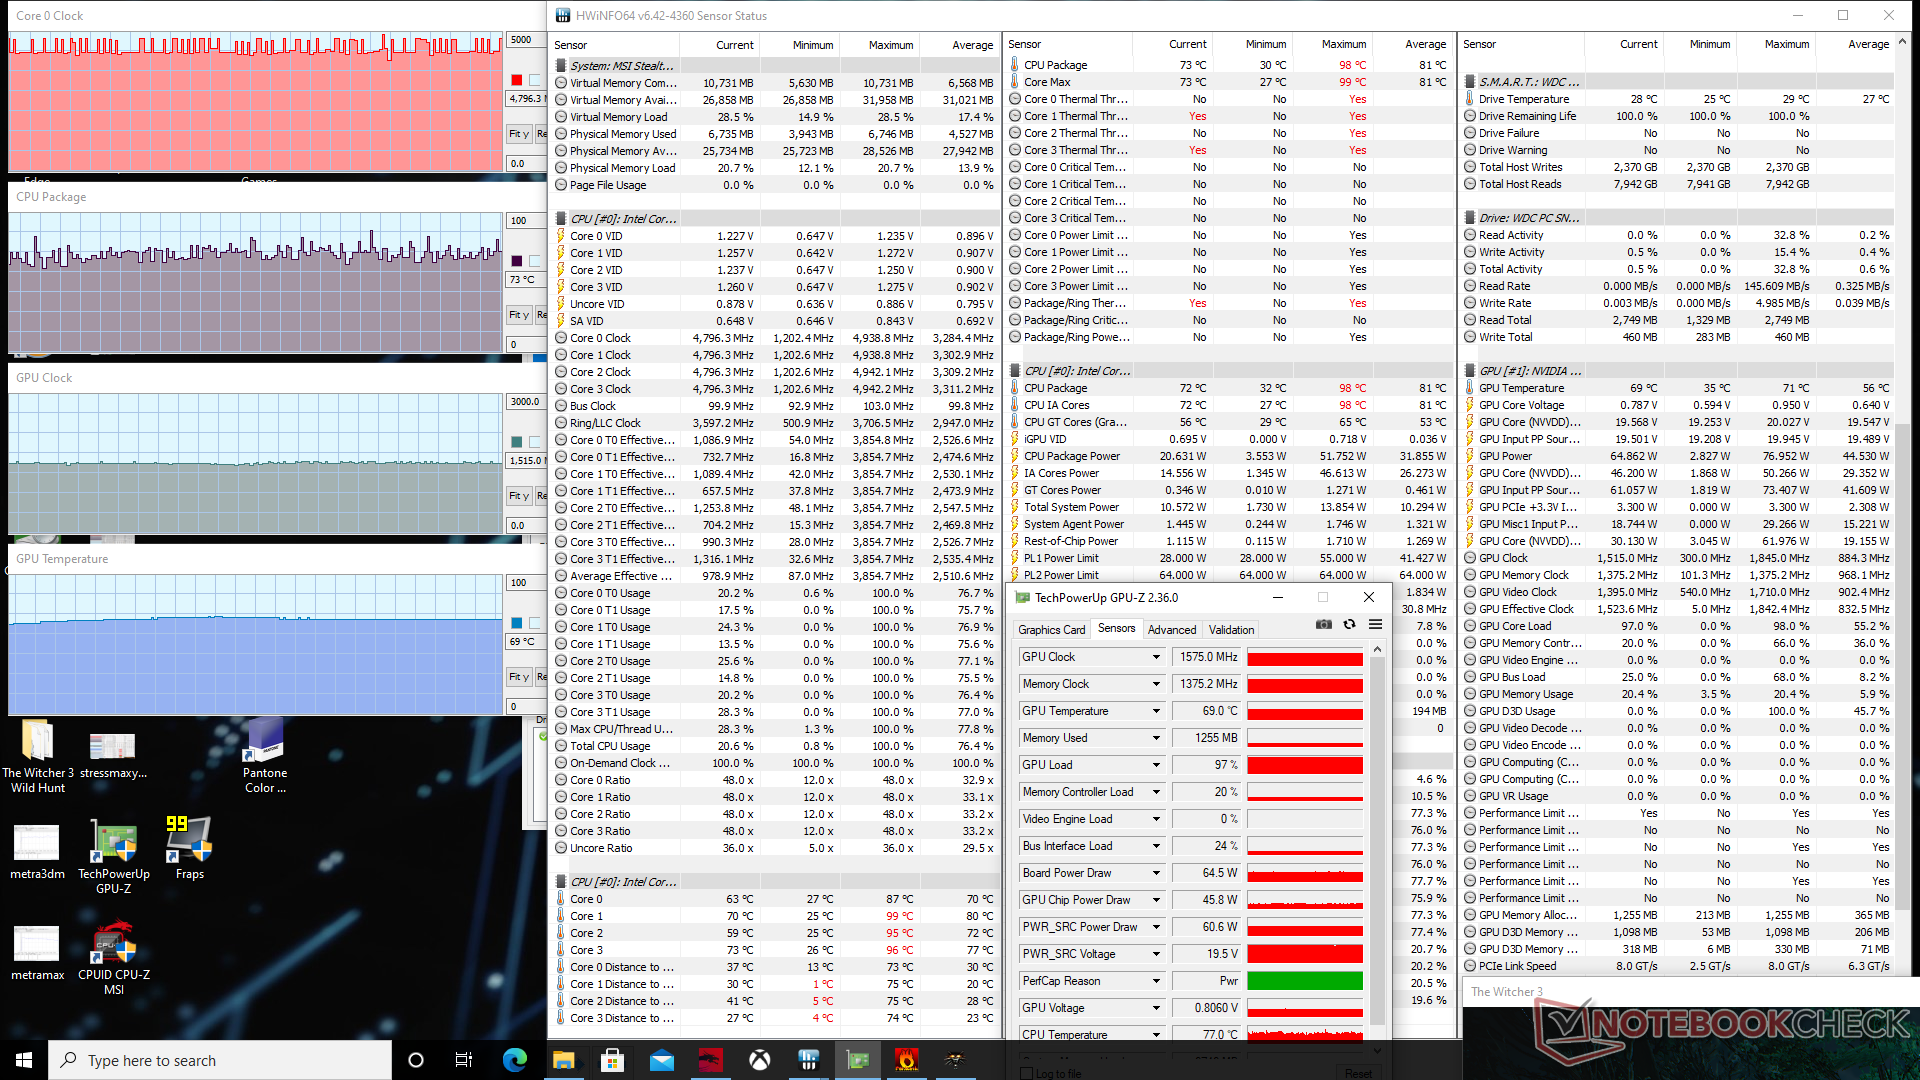
Si se ejecuta Witcher 3 hace que las temperaturas de la CPU y la GPU se estabilicen en 73 C y 69 C, respectivamente. Si se activa el Turbo Boost, las temperaturas del núcleo se reducen significativamente a sólo 53 C y 58 C. Sin embargo, las velocidades de reloj permanecen esencialmente sin cambios. El consumo de energía de la placa de la GPU se mantiene estable en algo menos de 65 W.
El funcionamiento con baterías limitará el rendimiento. En Fire Strike, las puntuaciones de Física y Gráficos son de 12781 y 4423 puntos, respectivamente, frente a los 14164 y 14129 puntos de la red eléctrica.

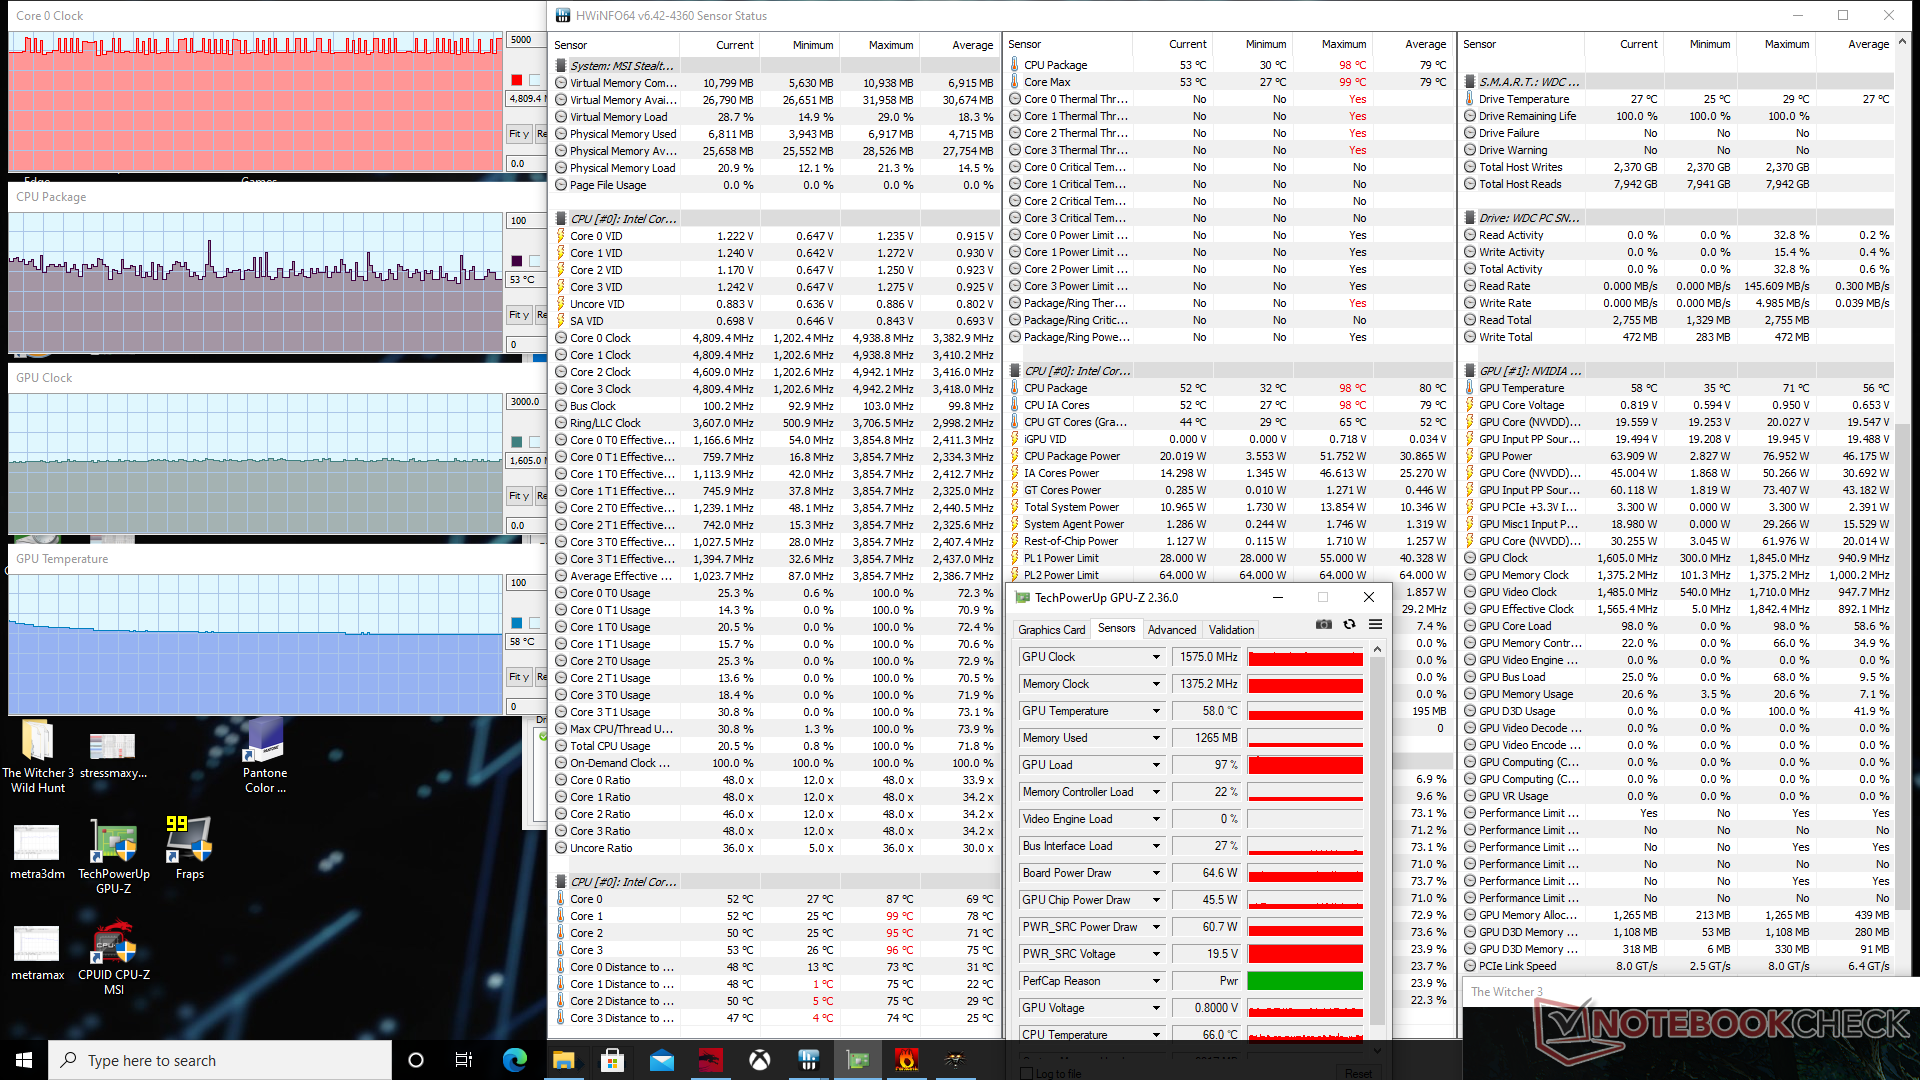
| Relojde la CPU(GHz) | Reloj dela GPU(MHz) | Temperatura media de la CPU (°C) | Temperaturamediade la GPU (°C) | |
| Sistema en reposo | 32 | 35 | ||
| Estrés Prime95 (Turbodesactivado) | 3,3 - 3,4 | -- | 90 | 41 |
| Estrés de Prime95 (Turboactivado) | 3,3 - 3,6 | -- | 90 | 37 |
| Prime95 + FurMark Stress (Turbo off) | 2,6 - 2,7 | 1050 | 83 | 70 |
| Prime95 + FurMark Stress (Turbo on) | 3,3 - 3,5 | 1125 | 92 | 63 |
| Witcher 3 Estrés (Turbo desactivado) | 4,4 - 4,8 | 1575 | 73 | 69 |
| Witcher 3 Estrés (Turbo activado) | 4,4 - 4,8 | 1575 | 53 | 58 |
Altavoces


MSI Stealth 15M A11SEK análisis de audio
(+) | los altavoces pueden reproducir a un volumen relativamente alto (#82.3 dB)
Graves 100 - 315 Hz
(-) | casi sin bajos - de media 18.9% inferior a la mediana
(±) | la linealidad de los graves es media (9.8% delta a frecuencia anterior)
Medios 400 - 2000 Hz
(+) | medios equilibrados - a sólo 4.6% de la mediana
(+) | los medios son lineales (4.4% delta a la frecuencia anterior)
Altos 2 - 16 kHz
(+) | máximos equilibrados - a sólo 3.2% de la mediana
(+) | los máximos son lineales (3.7% delta a la frecuencia anterior)
Total 100 - 16.000 Hz
(±) | la linealidad del sonido global es media (17.6% de diferencia con la mediana)
En comparación con la misma clase
» 51% de todos los dispositivos probados de esta clase eran mejores, 7% similares, 42% peores
» El mejor tuvo un delta de 5%, la media fue 17%, el peor fue ###max##%
En comparación con todos los dispositivos probados
» 34% de todos los dispositivos probados eran mejores, 8% similares, 57% peores
» El mejor tuvo un delta de 4%, la media fue 24%, el peor fue ###max##%
Apple MacBook 12 (Early 2016) 1.1 GHz análisis de audio
(+) | los altavoces pueden reproducir a un volumen relativamente alto (#83.6 dB)
Graves 100 - 315 Hz
(±) | lubina reducida - en promedio 11.3% inferior a la mediana
(±) | la linealidad de los graves es media (14.2% delta a frecuencia anterior)
Medios 400 - 2000 Hz
(+) | medios equilibrados - a sólo 2.4% de la mediana
(+) | los medios son lineales (5.5% delta a la frecuencia anterior)
Altos 2 - 16 kHz
(+) | máximos equilibrados - a sólo 2% de la mediana
(+) | los máximos son lineales (4.5% delta a la frecuencia anterior)
Total 100 - 16.000 Hz
(+) | el sonido global es lineal (10.2% de diferencia con la mediana)
En comparación con la misma clase
» 7% de todos los dispositivos probados de esta clase eran mejores, 2% similares, 91% peores
» El mejor tuvo un delta de 5%, la media fue 18%, el peor fue ###max##%
En comparación con todos los dispositivos probados
» 5% de todos los dispositivos probados eran mejores, 1% similares, 94% peores
» El mejor tuvo un delta de 4%, la media fue 24%, el peor fue ###max##%
Energy Management
Consumo de energía
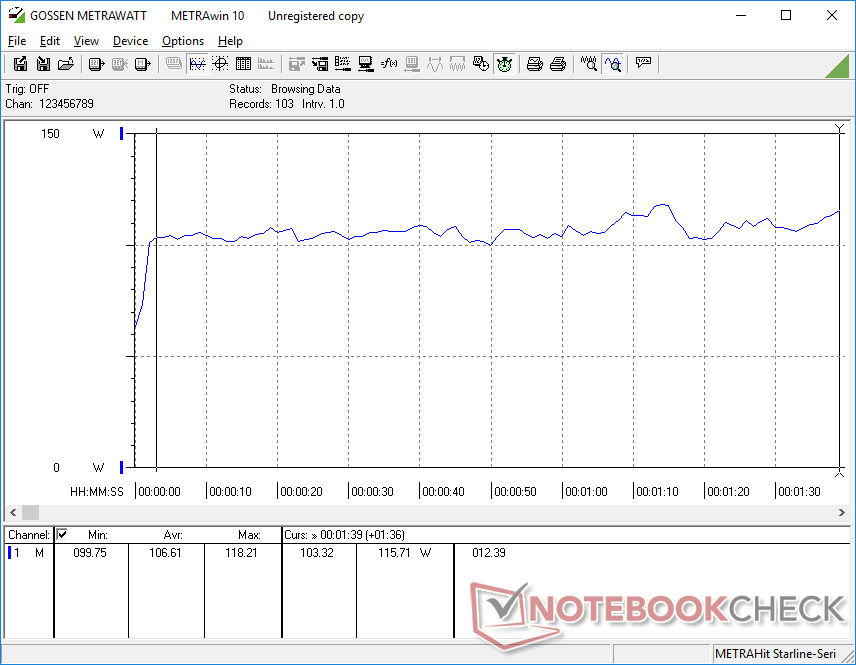
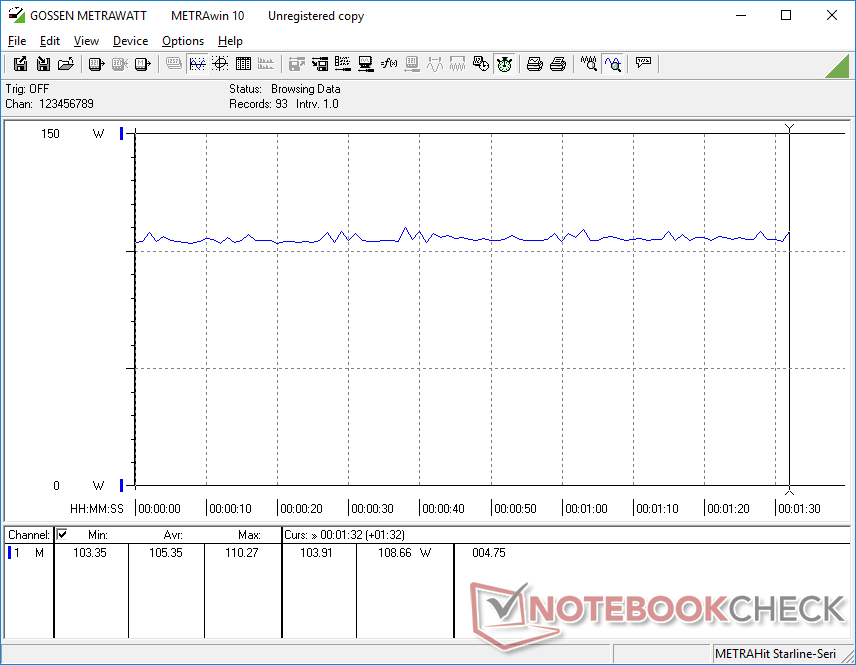
El funcionamiento en vacío del ordenador de sobremesa consume sólo 7 W con el ajuste de brillo más bajo y el perfil de ahorro de energía, y 18 W con el brillo máximo y el perfil de alto rendimiento. Ejecutando Witcher 3 consume alrededor de 105 W para ser mucho más alto que la mayoría de los Ultrabooks de la serie Core U e incluso algunos portátiles para juegos de nivel básico como el Lenovo Legion 5 debido a nuestra GPU GeForce RTX. Los propietarios de MSI están obteniendo alrededor de un 70 por ciento más de rendimiento gráfico que el Dell XPS 15 9500 para un aumento del 13 por ciento en el consumo de energía.
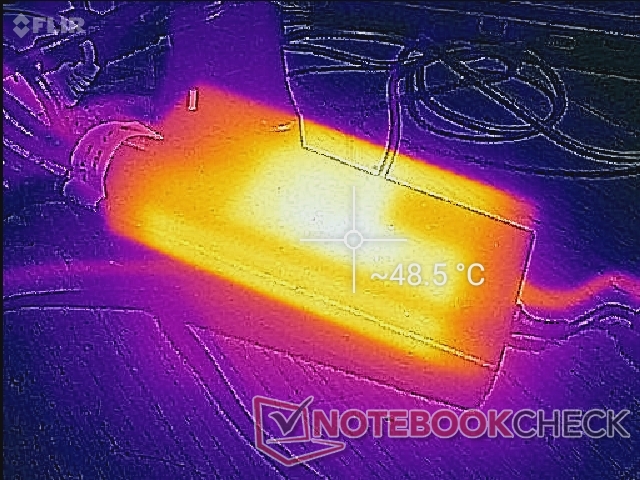
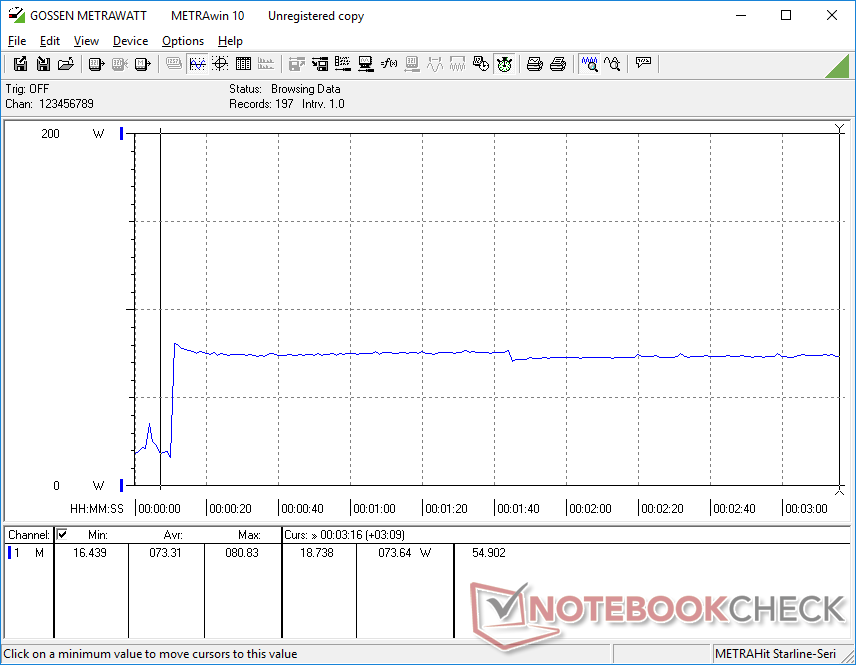
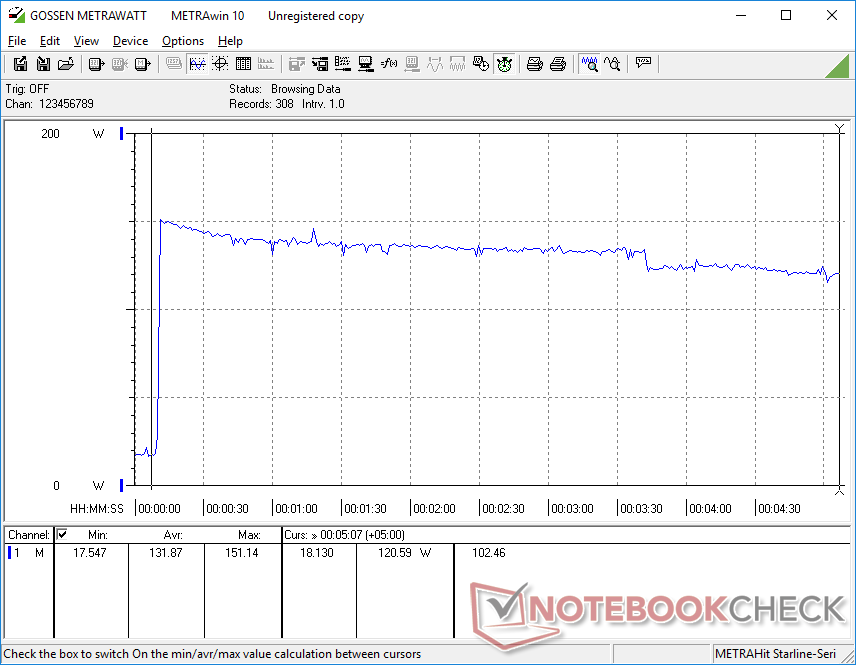
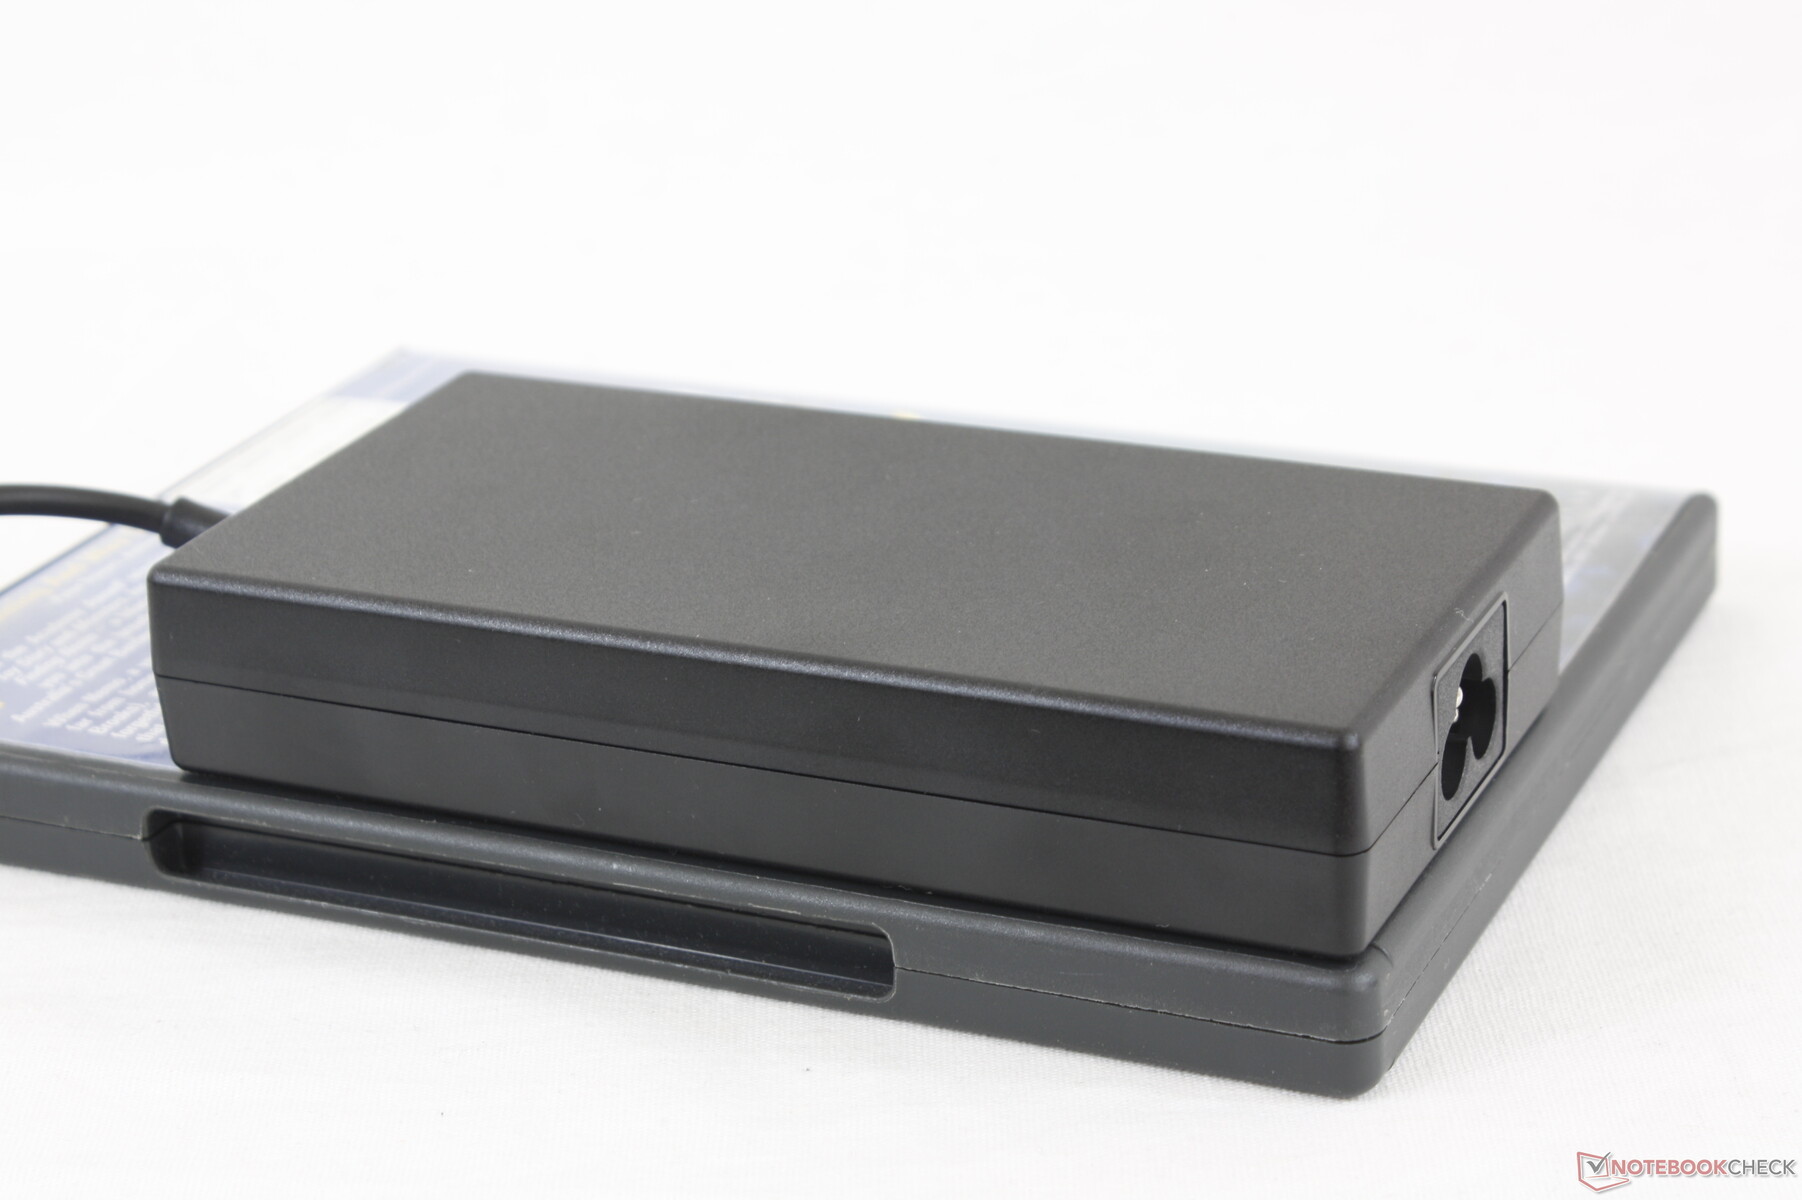
Somos capaces de medir un consumo máximo de 151 W desde el adaptador de CA pequeño-mediano (13,6 x 6,8 x 1,9 cm) de 150 W al ejecutar Prime95 y FurMark simultáneamente. Esta tasa finalmente cae y se estabiliza en torno a los 120 W, como muestra nuestro gráfico de abajo, debido a las limitaciones térmicas.
| Off / Standby | |
| Ocioso | |
| Carga |
|
Clave:
min: | |
| MSI Stealth 15M A11SEK i7-1185G7, GeForce RTX 2060 Max-Q, WDC PC SN530 SDBPNPZ-1T00, IPS, 1920x1080, 15.6" | Dell XPS 15 9500 Core i7 4K UHD i7-10875H, GeForce GTX 1650 Ti Mobile, SK Hynix PC611 512GB, IPS, 3840x2400, 15.6" | Lenovo ThinkPad T15p-20TN0006GE i7-10750H, GeForce GTX 1050 Mobile, WDC PC SN730 SDBQNTY-512GB, IPS LED, 3840x2160, 15.6" | Asus ZenBook UX535-M01440 i7-10750H, GeForce GTX 1650 Ti Max-Q, WDC PC SN730 SDBPNTY-1T00, IPS, 3840x2160, 15.6" | HP Envy 15-ep0098nr i7-10750H, GeForce RTX 2060 Max-Q, Intel Optane Memory H10 with Solid State Storage 32GB + 512GB HBRPEKNX0202A(L/H), AMOLED, 3840x2160, 15.6" | |
|---|---|---|---|---|---|
| Power Consumption | -1% | 7% | 23% | -21% | |
| Idle Minimum * (Watt) | 7.3 | 5.7 22% | 6 18% | 4.4 40% | 9.2 -26% |
| Idle Average * (Watt) | 10.1 | 13.5 -34% | 12.8 -27% | 9.8 3% | 14.5 -44% |
| Idle Maximum * (Watt) | 17.6 | 19.6 -11% | 16.1 9% | 14.5 18% | 18 -2% |
| Load Average * (Watt) | 106.6 | 114.1 -7% | 95.6 10% | 83 22% | 110.9 -4% |
| Witcher 3 ultra * (Watt) | 105.4 | 93 12% | 84 20% | 67 36% | 125.5 -19% |
| Load Maximum * (Watt) | 151.2 | 135.2 11% | 131.1 13% | 123 19% | 194.6 -29% |
* ... más pequeño es mejor
Duración de la batería
La duración media es de poco más de 6 horas de uso WLAN en el mundo real con la pequeña batería interna de 52 Wh. El XPS 15 de la competencia puede durar casi 3 horas más en condiciones de prueba similares. La carga de vacío a lleno, empero, es relativamente rápida con sólo 1 a 1.5 horas. También se pueden usar adaptadores USB-C genéricos para recargar el sistema, aunque a un ritmo más lento.
| MSI Stealth 15M A11SEK i7-1185G7, GeForce RTX 2060 Max-Q, 52 Wh | Dell XPS 15 9500 Core i7 4K UHD i7-10875H, GeForce GTX 1650 Ti Mobile, 86 Wh | Lenovo ThinkPad T15p-20TN0006GE i7-10750H, GeForce GTX 1050 Mobile, 68 Wh | Asus ZenBook UX535-M01440 i7-10750H, GeForce GTX 1650 Ti Max-Q, 96 Wh | MSI Prestige 15 A10SC i7-10710U, GeForce GTX 1650 Max-Q, 82 Wh | HP Envy 15-ep0098nr i7-10750H, GeForce RTX 2060 Max-Q, 83 Wh | |
|---|---|---|---|---|---|---|
| Duración de Batería | 88% | 13% | 78% | 71% | 33% | |
| Reader / Idle (h) | 10.5 | 23 119% | 18.3 74% | 19.1 82% | 15 43% | |
| WiFi v1.3 (h) | 6.3 | 9.1 44% | 7.3 16% | 10.1 60% | 7.6 21% | 6 -5% |
| Load (h) | 1 | 2 100% | 1.1 10% | 2 100% | 2.1 110% | 1.6 60% |
Pro
Contra
Veredicto
El Stealth 15M tiene algunas cosas a su favor cuando se compara con otros ultrabooks de 15,6 pulgadas. Sus opciones de GeForce RTX impulsan instantáneamente el sistema como uno de los más rápidos de su categoría en lo que a gráficos se refiere. También consigue ser más ligero que sus competidores a pesar del mayor rendimiento de la GPU. Las temperaturas y el ruido de los ventiladores bajo carga tampoco son tan elevados ni ruidosos.
Súper ligero y súper rápido. El Stealth 15M puede superar a la mayoría de los portátiles multimedia de su clase de tamaño, pero también es más frágil y propenso a dañarse con el tiempo.
Los mayores inconvenientes del sistema son difíciles de ignorar. En particular, el chasis o esqueleto es mucho más propenso a deformarse, doblarse y crujir que los esqueletos de los portátiles XPS 15, Spectre, ZenBook o Yoga, que cuestan casi lo mismo que nuestro MSI. Esto incluye las bisagras también que son muy débiles en el MSI. Es un portátil de gran aspecto con un rendimiento de nivel gaming, pero la endeble calidad de construcción nos preocupa sobre su longevidad.
Precio y disponibilidad
MSI Stealth 15M A11SEK
- 02/24/2021 v7 (old)
Allen Ngo
Price comparison

