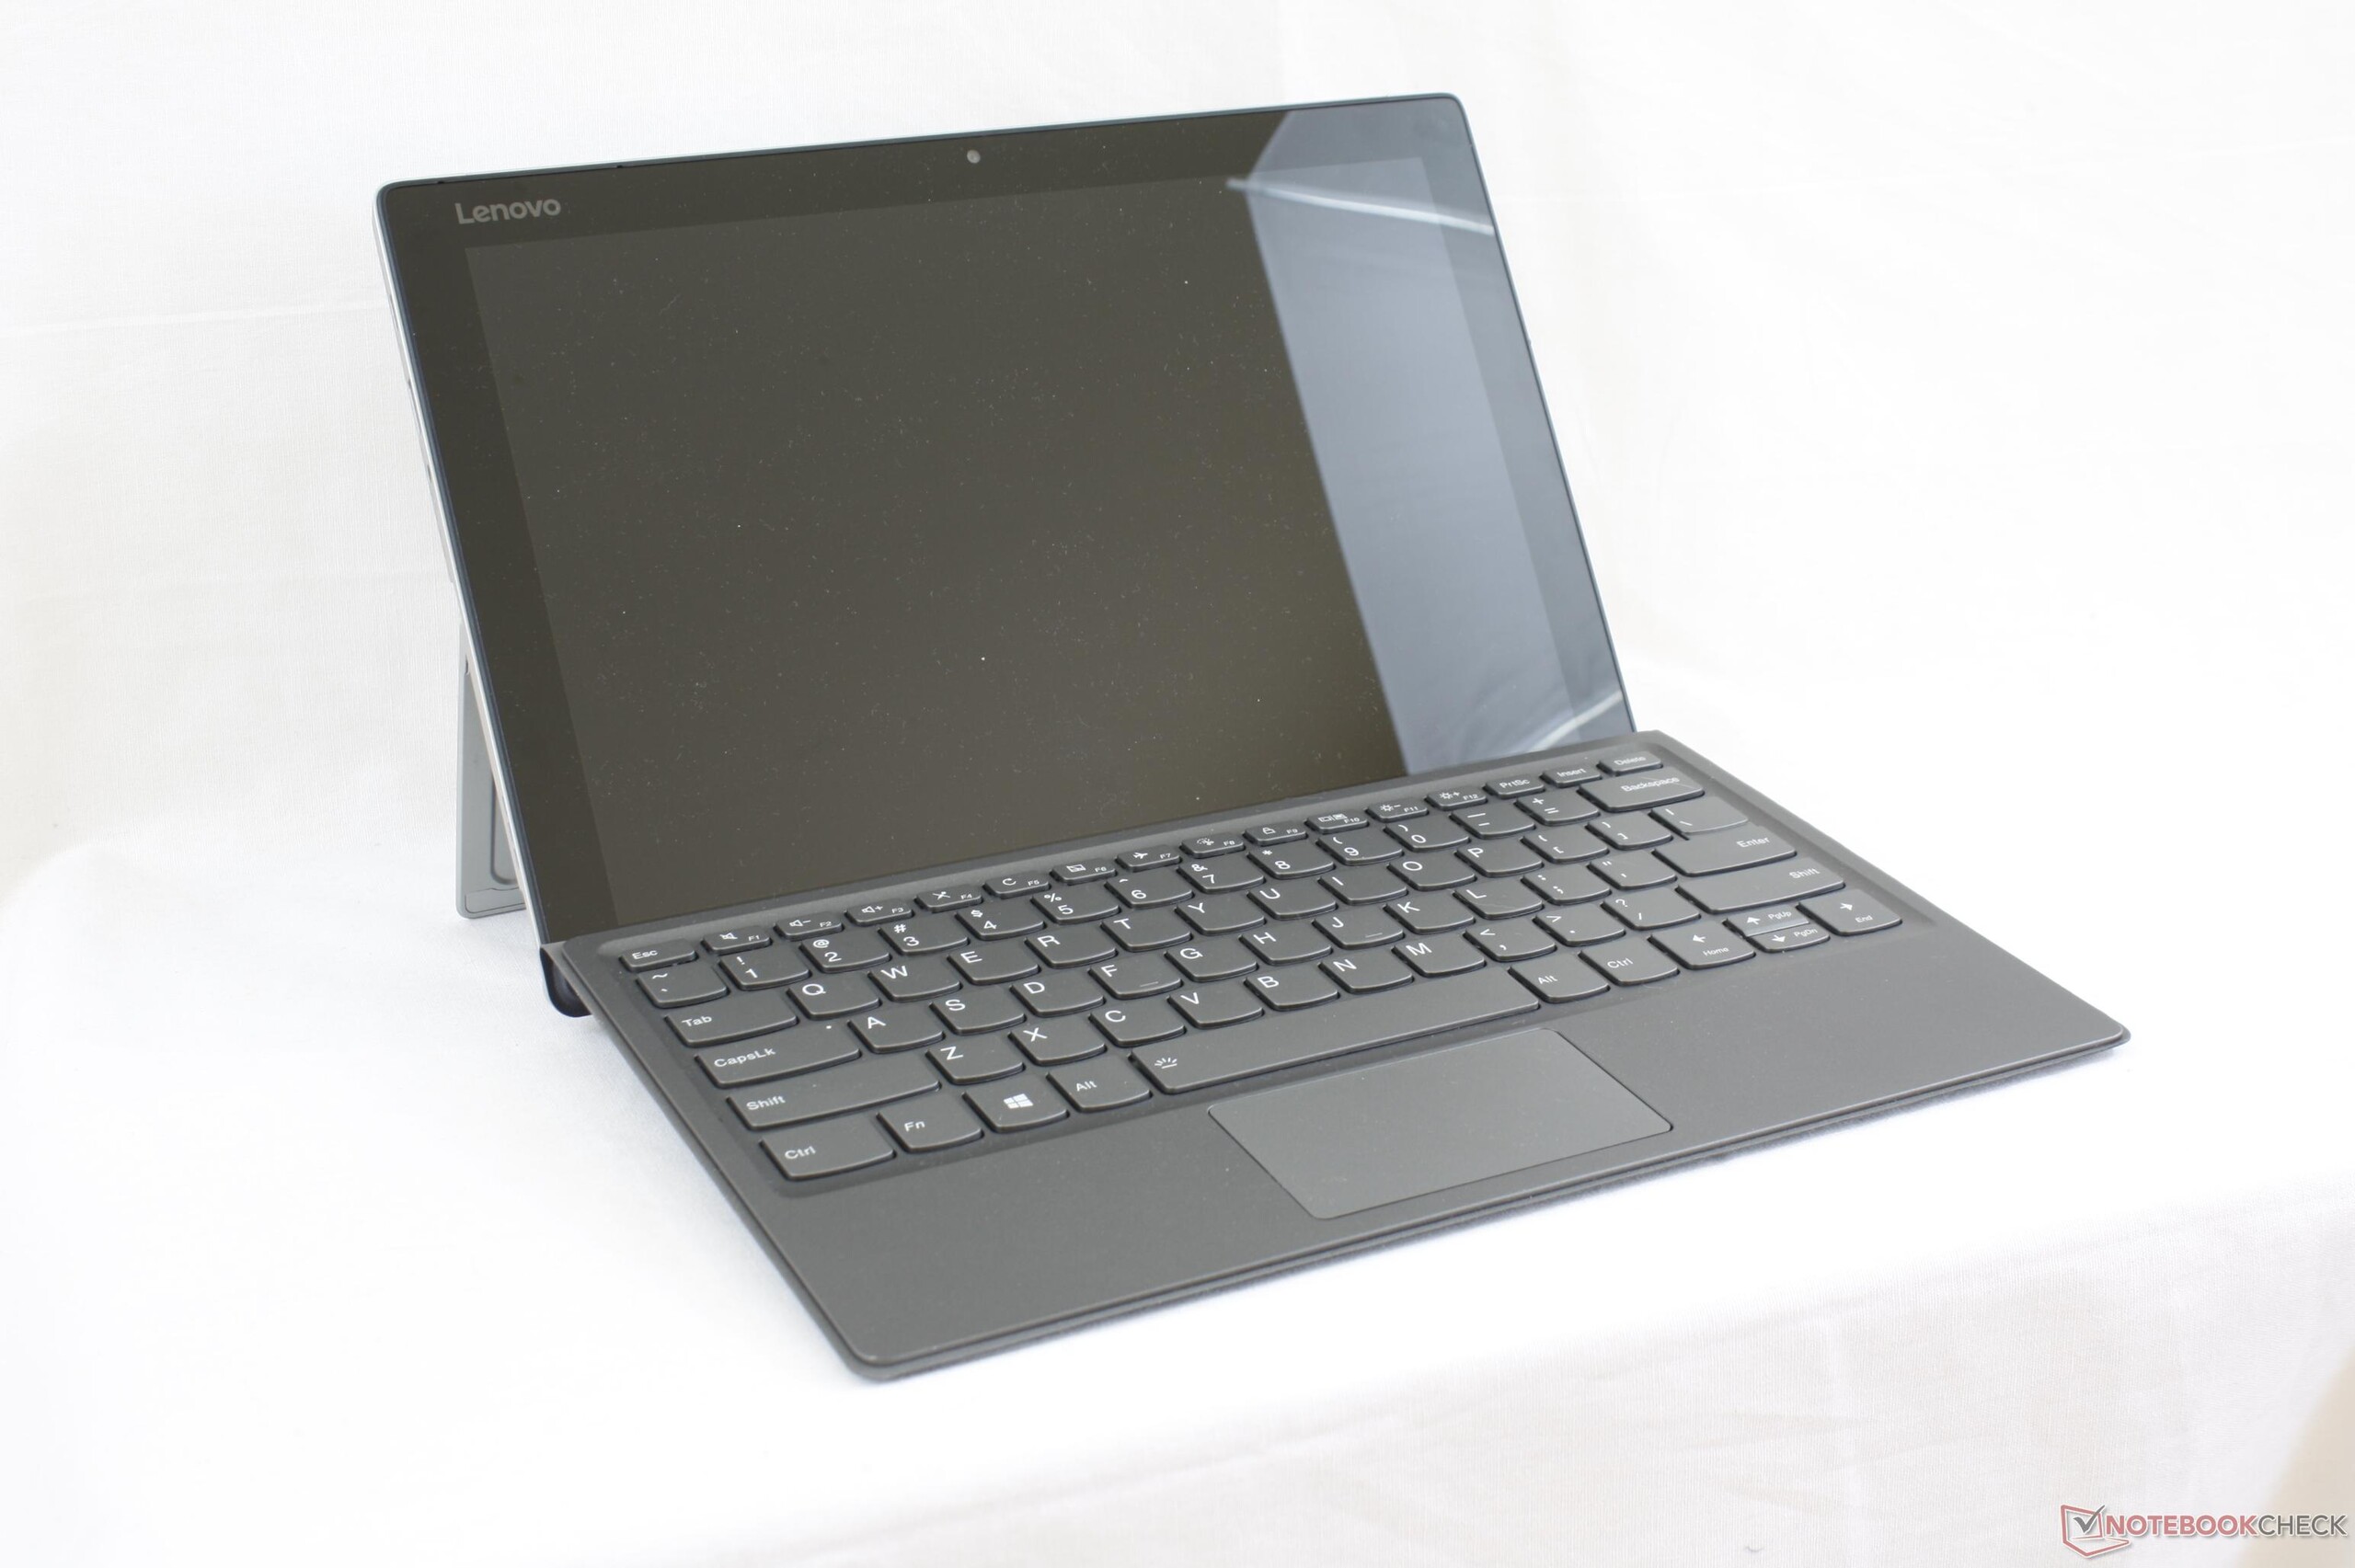
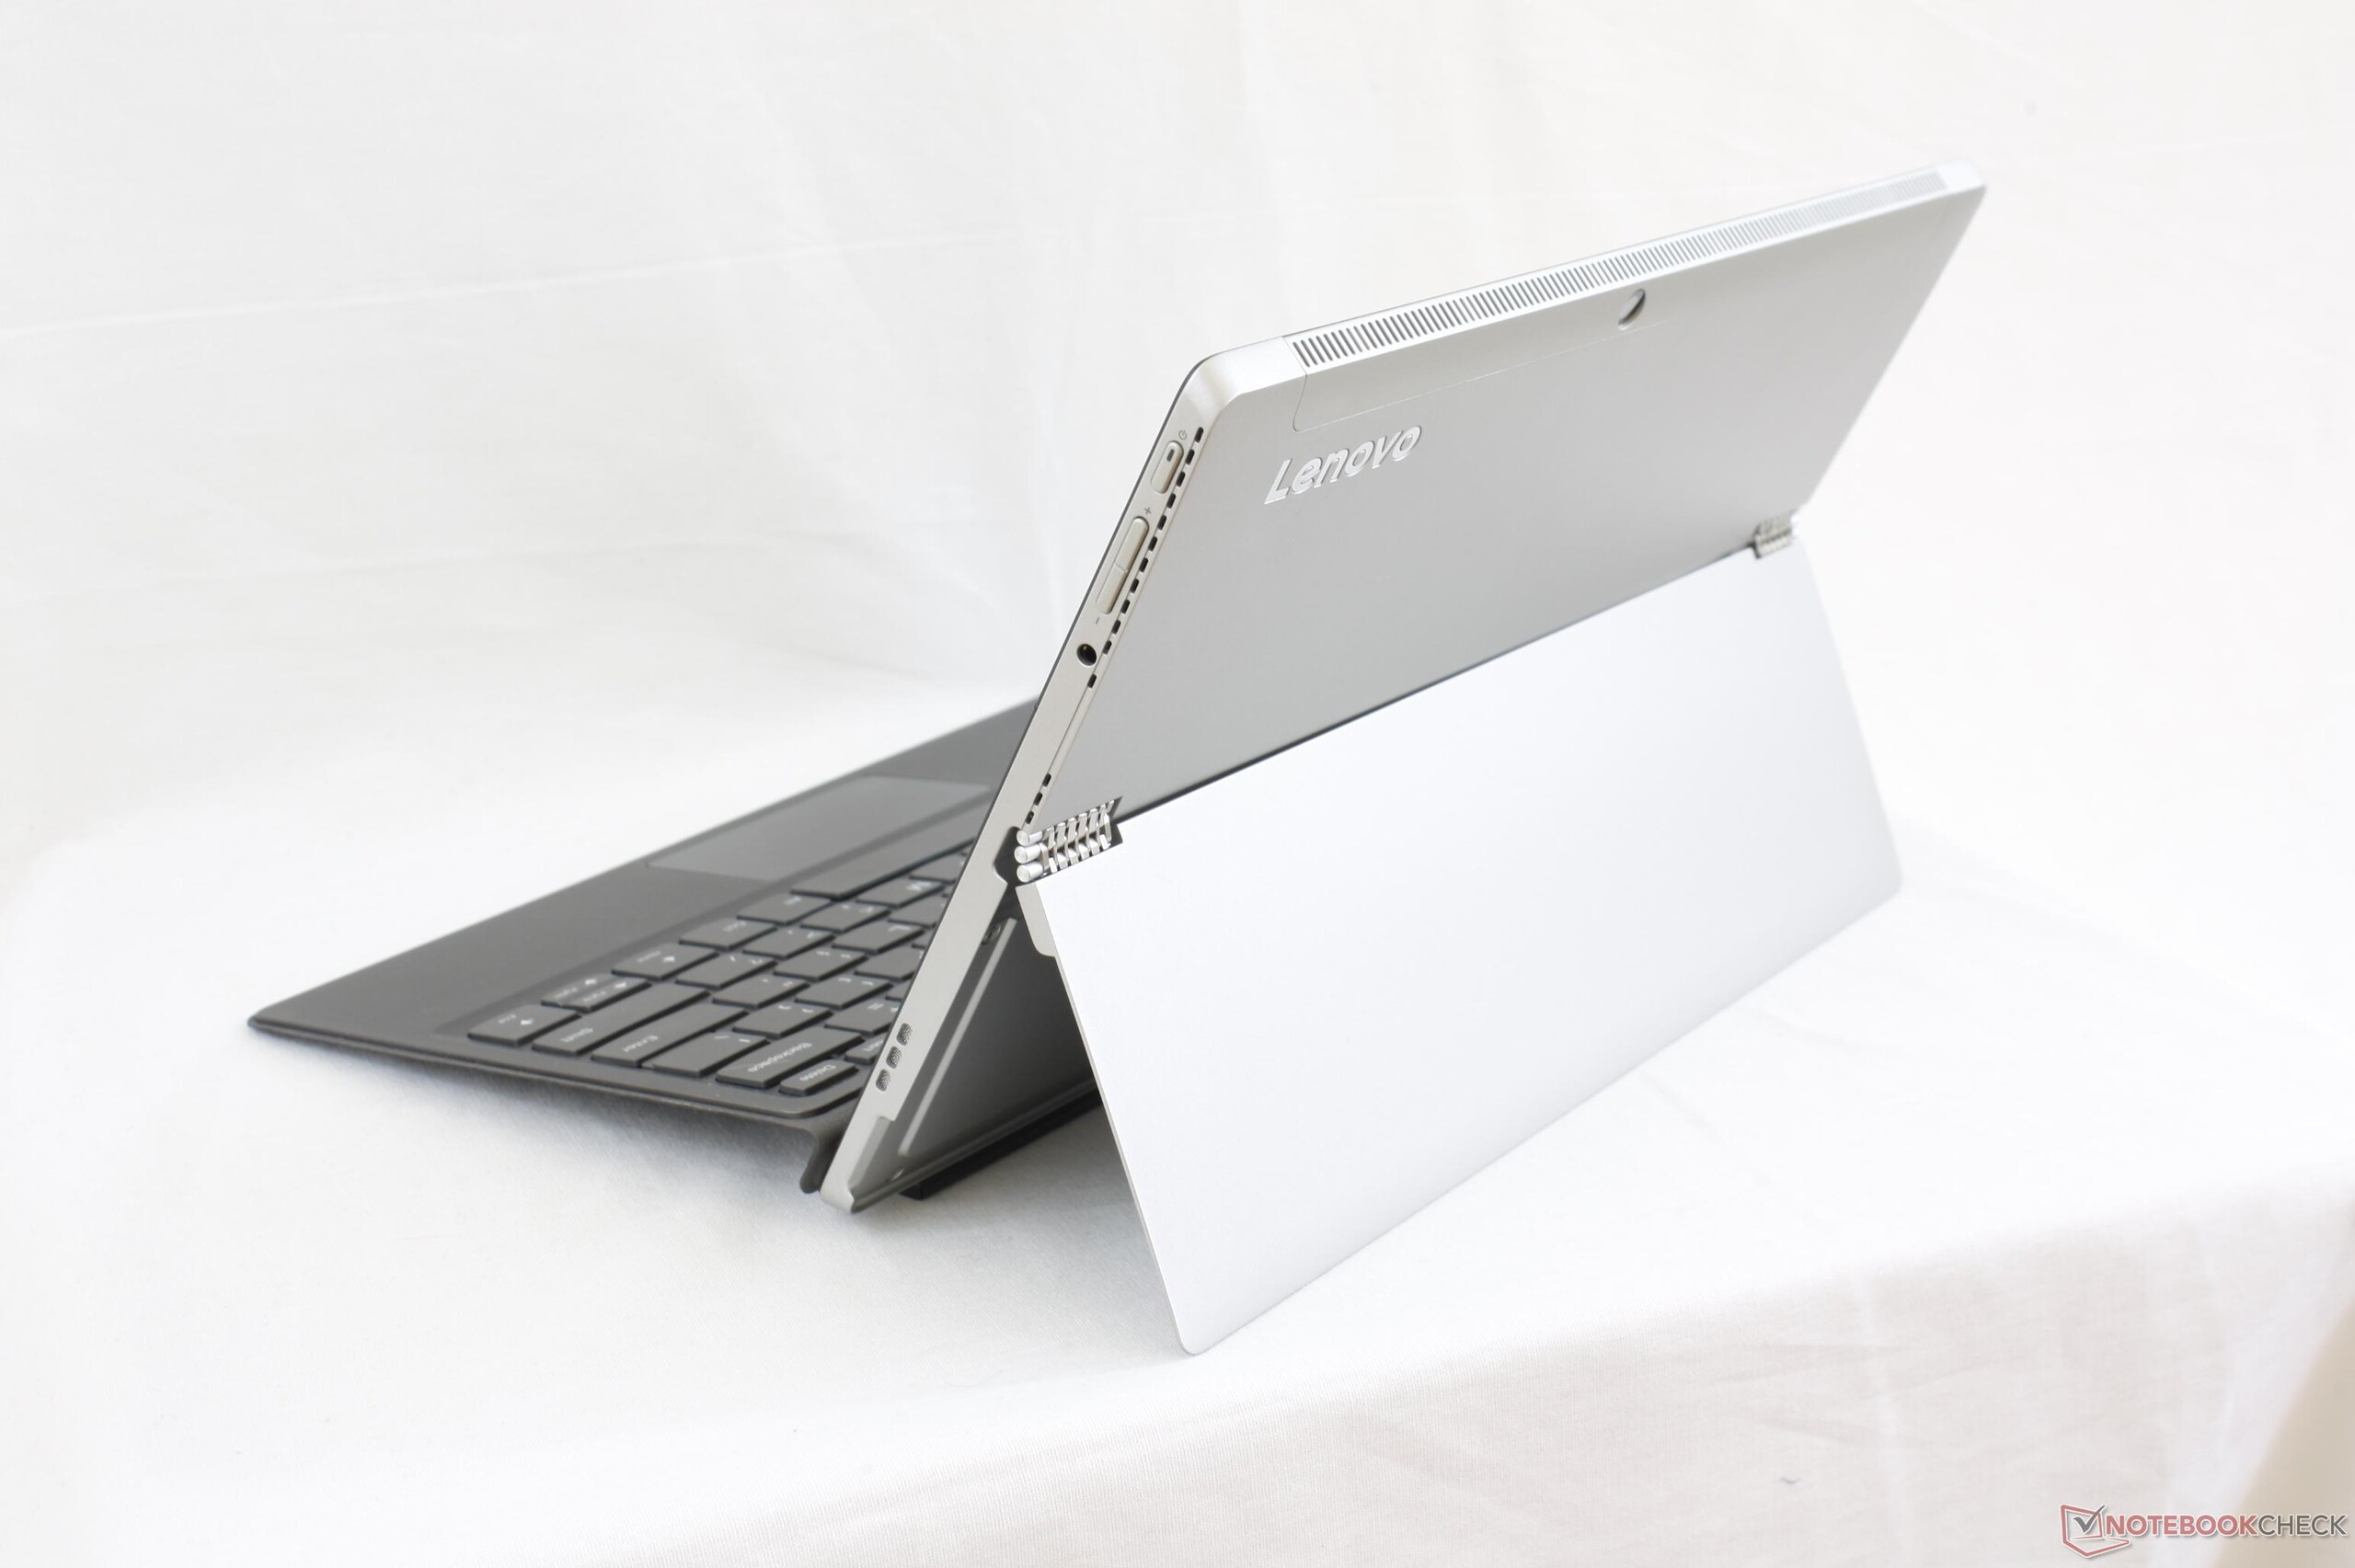
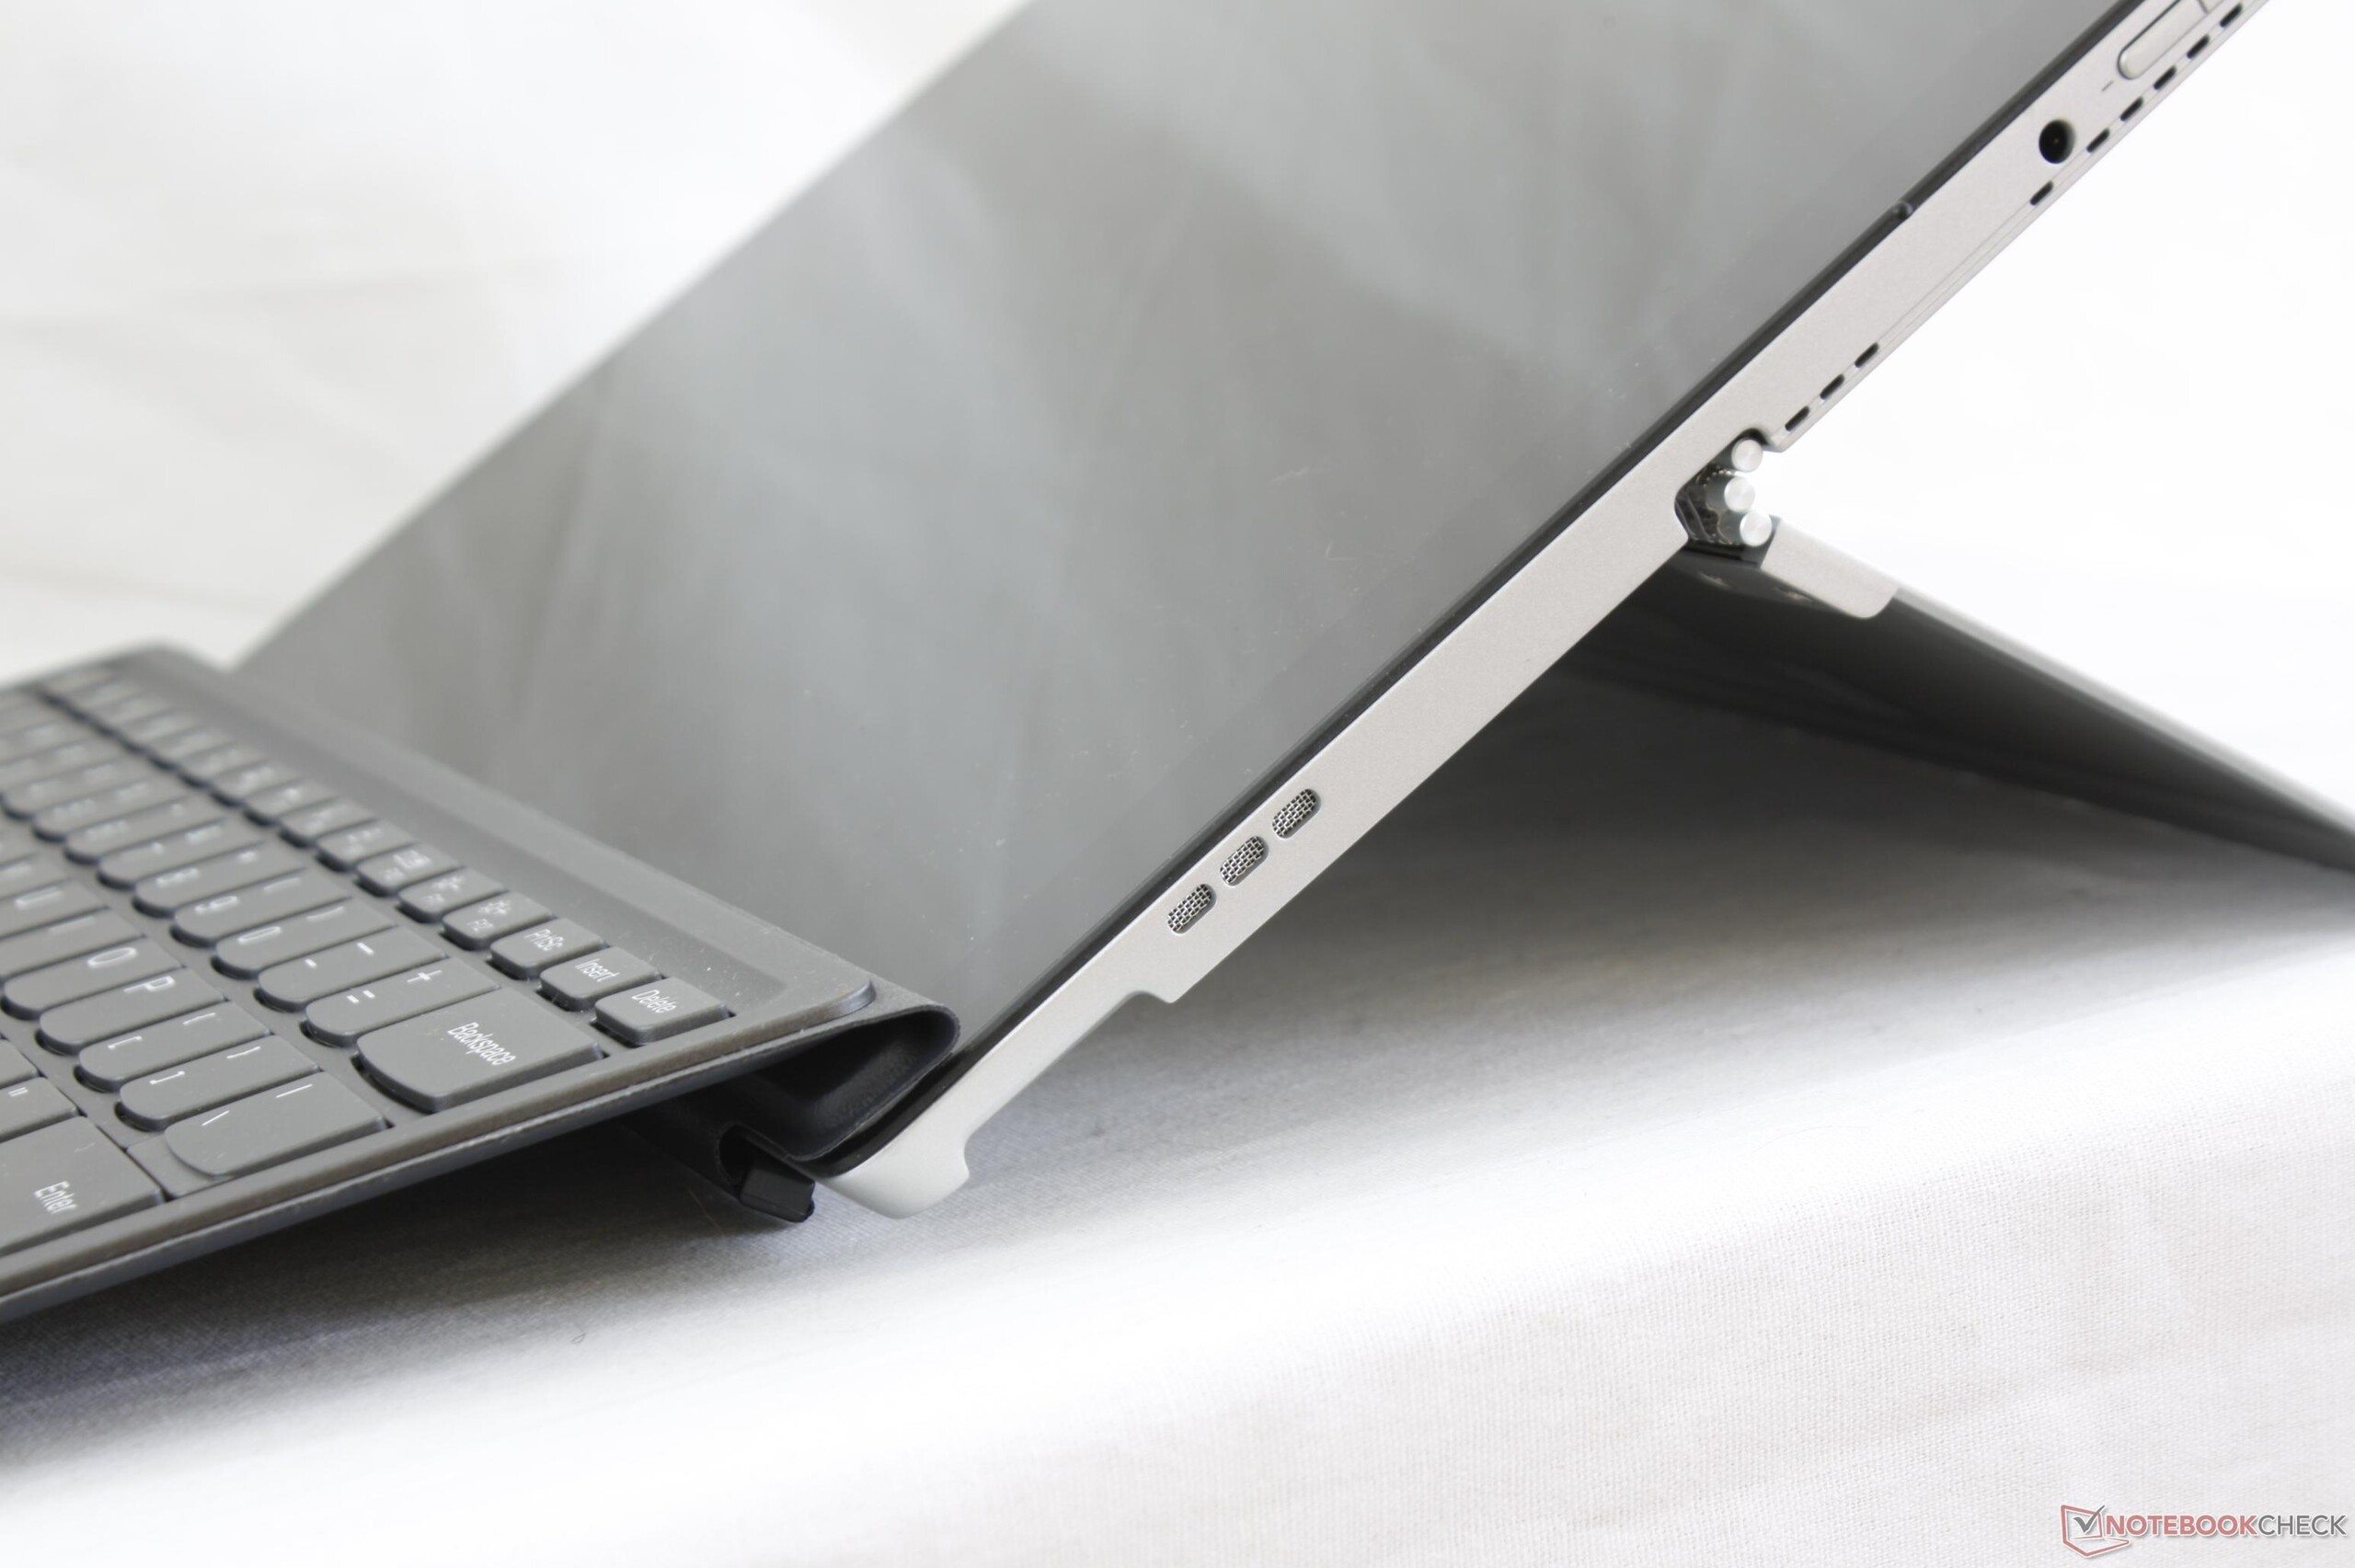
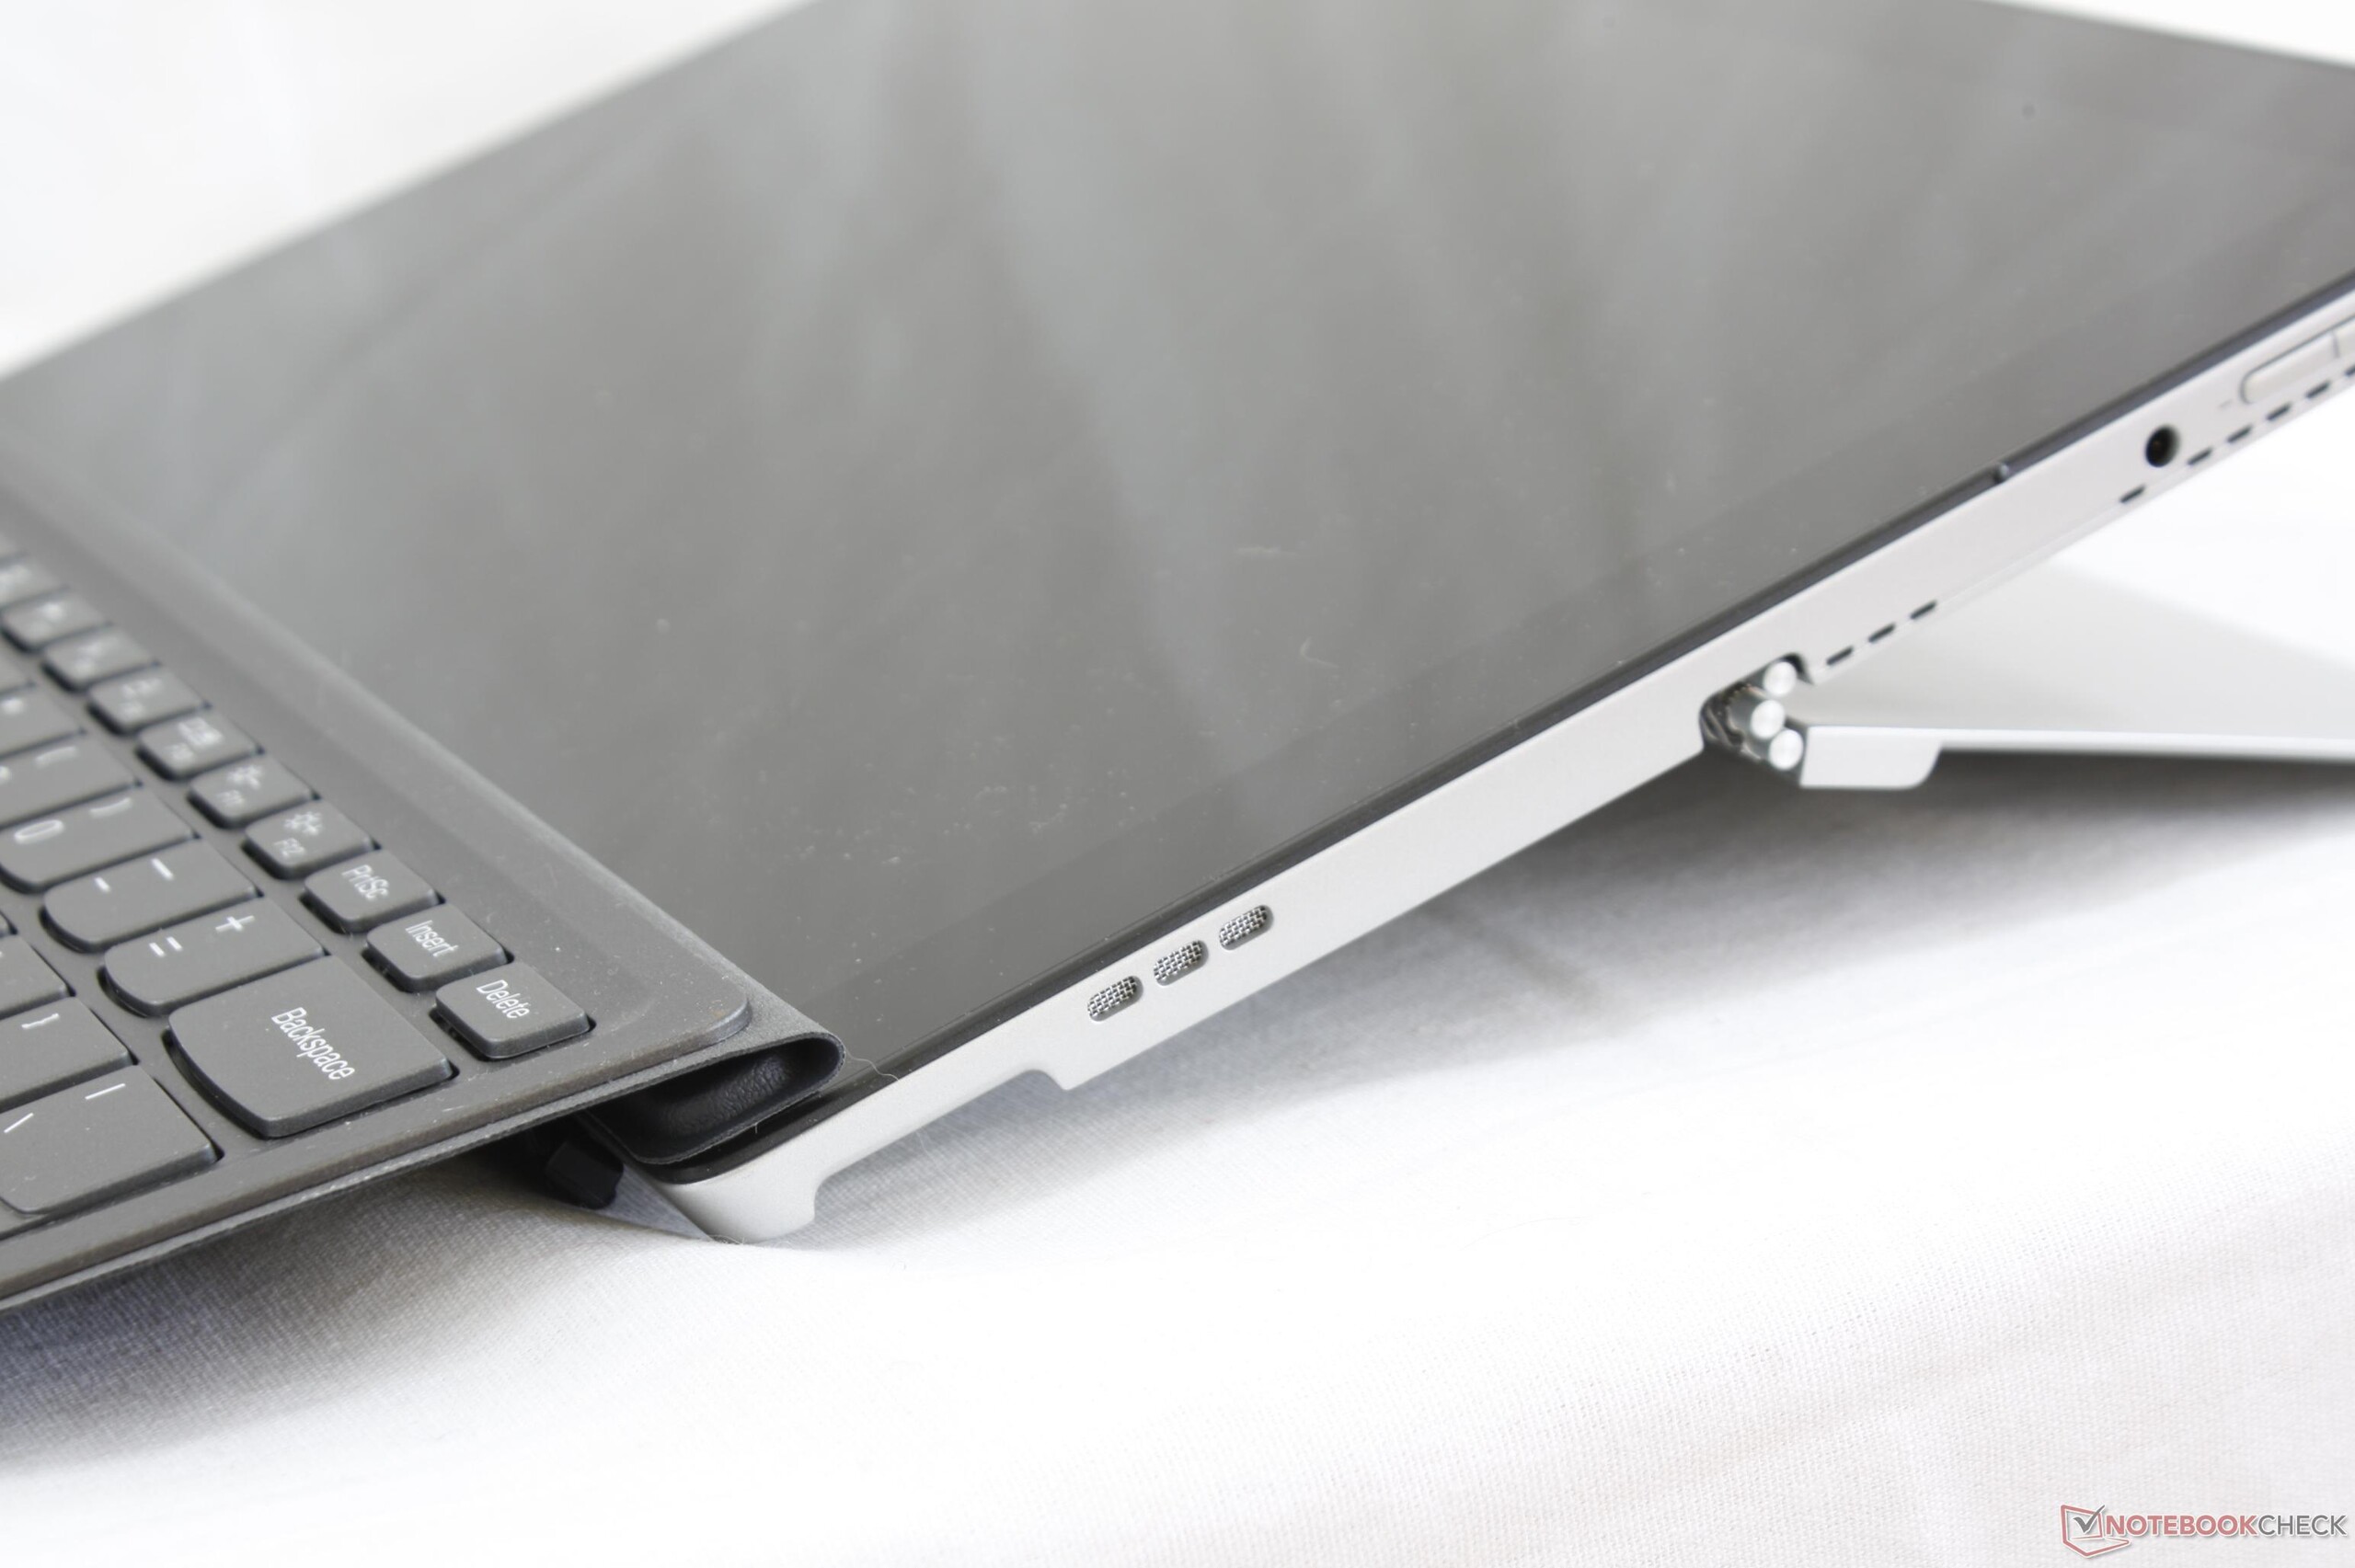
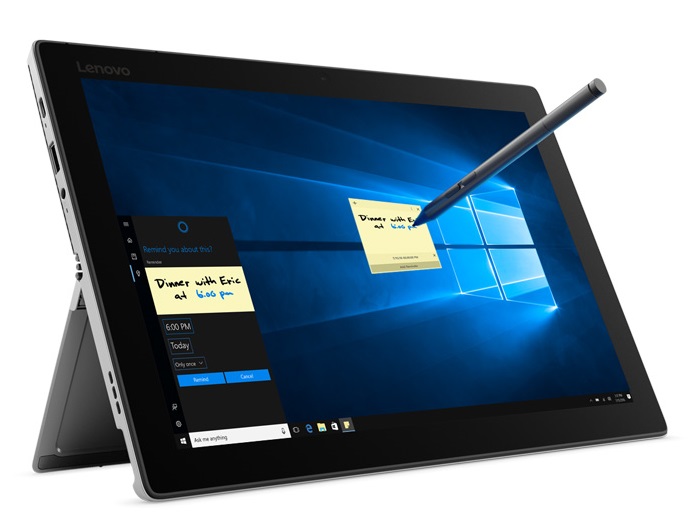
Breve análisis del convertible Lenovo Miix 520 (i5-8250U, FHD)
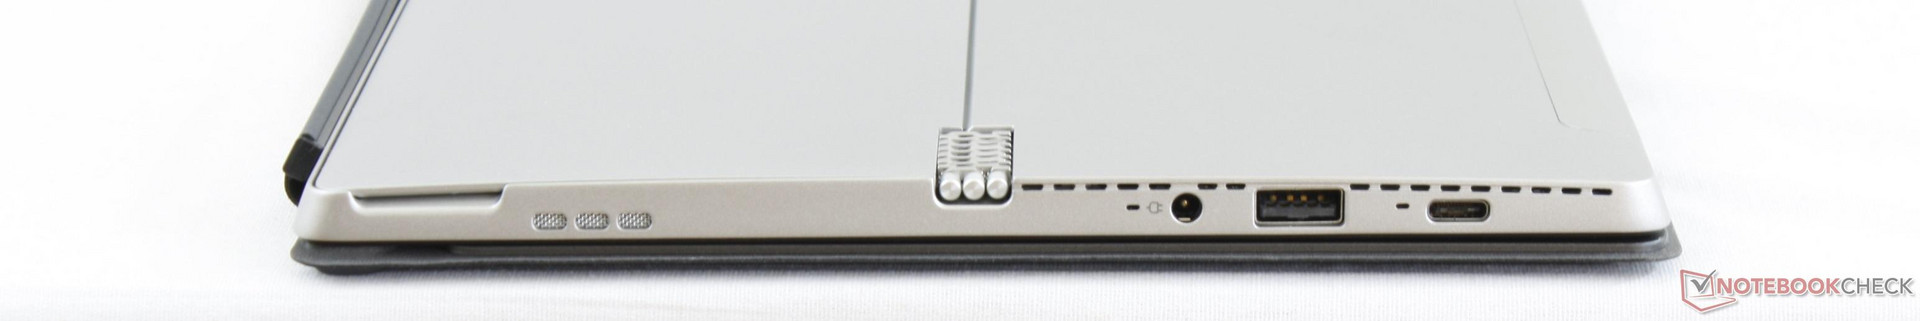

| SD Card Reader | |
| average JPG Copy Test (av. of 3 runs) | |
| HP Elite x2 1012 G2-1LV76EA | |
| Lenovo Miix 520-12IKB 81CG | |
| Lenovo ThinkPad X1 Tablet Gen 2 | |
| maximum AS SSD Seq Read Test (1GB) | |
| Lenovo ThinkPad X1 Tablet Gen 2 | |
| HP Elite x2 1012 G2-1LV76EA | |
| Lenovo Miix 520-12IKB 81CG | |
| Networking | |
| iperf3 transmit AX12 | |
| Lenovo Miix 520-12IKB 81CG | |
| Lenovo Miix 510 Pro 80U10006GE (jseb) | |
| Dell XPS 13-9365 2-in-1 | |
| HP Elite x2 1012 G2-1LV76EA | |
| iperf3 receive AX12 | |
| Lenovo Miix 510 Pro 80U10006GE (jseb) | |
| HP Elite x2 1012 G2-1LV76EA | |
| Lenovo Miix 520-12IKB 81CG | |
| Dell XPS 13-9365 2-in-1 | |
| |||||||||||||||||||||||||
iluminación: 87 %
Brillo con batería: 348.8 cd/m²
Contraste: 872:1 (Negro: 0.4 cd/m²)
ΔE ColorChecker Calman: 7 | ∀{0.5-29.43 Ø4.72}
ΔE Greyscale Calman: 10.1 | ∀{0.09-98 Ø4.97}
90.9% sRGB (Argyll 1.6.3 3D)
58.7% AdobeRGB 1998 (Argyll 1.6.3 3D)
65.4% AdobeRGB 1998 (Argyll 3D)
90.8% sRGB (Argyll 3D)
64.4% Display P3 (Argyll 3D)
Gamma: 2.22
CCT: 9065 K
| Lenovo Miix 520-12IKB 81CG Unknown, IPS, 12.2", 1920x1200 | Microsoft Surface Pro (2017) m3 LG Display LP123WQ112604, IPS, 12.3", 2736x1826 | Lenovo Miix 510 Pro 80U10006GE Unknown, IPS, 12.2", 1920x1200 | HP Elite x2 1012 G2-1LV76EA Samsung SDC4A49, IPS, 12.3", 2716x1824 | Dell XPS 13 9365-4537 2-in-1 Sharp LQ133Z1, IPS, 13.3", 3200x1800 | Lenovo ThinkPad X1 Tablet Gen 2 LSN120QL01L01, IPS, 12", 2160x1440 | |
|---|---|---|---|---|---|---|
| Display | 7% | 0% | 6% | 1% | ||
| Display P3 Coverage (%) | 64.4 | 68.5 6% | 64.5 0% | 66.7 4% | 64.4 0% | |
| sRGB Coverage (%) | 90.8 | 99.2 9% | 92 1% | 98 8% | 92.9 2% | |
| AdobeRGB 1998 Coverage (%) | 65.4 | 70.1 7% | 65.5 0% | 68.7 5% | 66.1 1% | |
| Response Times | -9% | 13% | -3% | -18% | 20% | |
| Response Time Grey 50% / Grey 80% * (ms) | 35.6 ? | 42 ? -18% | 33 ? 7% | 45.6 ? -28% | 48 ? -35% | 28.4 ? 20% |
| Response Time Black / White * (ms) | 28 ? | 28 ? -0% | 23 ? 18% | 21.6 ? 23% | 28 ? -0% | 22.8 ? 19% |
| PWM Frequency (Hz) | 198.4 ? | 125 ? | 2119 ? | 221.2 ? | ||
| Screen | 35% | 3% | 31% | 33% | 14% | |
| Brightness middle (cd/m²) | 348.8 | 461 32% | 327 -6% | 443 27% | 348 0% | 388.1 11% |
| Brightness (cd/m²) | 339 | 444 31% | 324 -4% | 446 32% | 306 -10% | 344 1% |
| Brightness Distribution (%) | 87 | 93 7% | 88 1% | 88 1% | 78 -10% | 78 -10% |
| Black Level * (cd/m²) | 0.4 | 0.34 15% | 0.35 13% | 0.41 -2% | 0.2 50% | 0.39 2% |
| Contrast (:1) | 872 | 1356 56% | 934 7% | 1080 24% | 1740 100% | 995 14% |
| Colorchecker dE 2000 * | 7 | 3.43 51% | 6.54 7% | 2.6 63% | 2.79 60% | 4.6 34% |
| Colorchecker dE 2000 max. * | 16.2 | 5.55 66% | 15.59 4% | 4 75% | 5.53 66% | 9.1 44% |
| Greyscale dE 2000 * | 10.1 | 3.08 70% | 9.52 6% | 3 70% | 3.47 66% | 6.1 40% |
| Gamma | 2.22 99% | 3.03 73% | 2.35 94% | 2.38 92% | 2.54 87% | 2.07 106% |
| CCT | 9065 72% | 7014 93% | 8802 74% | 6780 96% | 6564 99% | 7104 91% |
| Color Space (Percent of AdobeRGB 1998) (%) | 58.7 | 64 9% | 59 1% | 62.6 7% | 60 2% | 59 1% |
| Color Space (Percent of sRGB) (%) | 90.9 | 99 9% | 92 1% | 98 8% | 93 2% | 91 0% |
| Media total (Programa/Opciones) | 11% /
23% | 5% /
4% | 11% /
21% | 5% /
20% | 17% /
15% |
* ... más pequeño es mejor
Tiempos de respuesta del display
| ↔ Tiempo de respuesta de Negro a Blanco | ||
|---|---|---|
| 28 ms ... subida ↗ y bajada ↘ combinada | ↗ 14.8 ms subida | 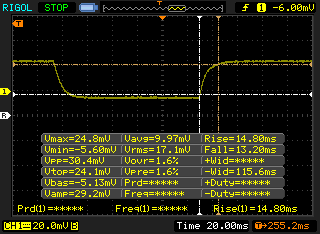 |
| ↘ 13.2 ms bajada | ||
| La pantalla mostró tiempos de respuesta relativamente lentos en nuestros tests pero podría ser demasiado lenta para los jugones. En comparación, todos los dispositivos de prueba van de ##min### (mínimo) a 240 (máximo) ms. » 71 % de todos los dispositivos son mejores. Eso quiere decir que el tiempo de respuesta es peor que la media (19.8 ms) de todos los dispositivos testados. | ||
| ↔ Tiempo de respuesta 50% Gris a 80% Gris | ||
| 35.6 ms ... subida ↗ y bajada ↘ combinada | ↗ 17.2 ms subida | 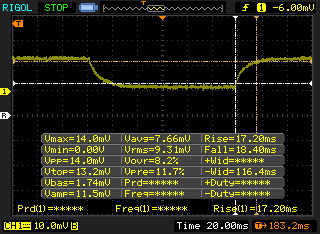 |
| ↘ 18.4 ms bajada | ||
| La pantalla mostró tiempos de respuesta lentos en nuestros tests y podría ser demasiado lenta para los jugones. En comparación, todos los dispositivos de prueba van de ##min### (mínimo) a 636 (máximo) ms. » 50 % de todos los dispositivos son mejores. Eso quiere decir que el tiempo de respuesta es peor que la media (31 ms) de todos los dispositivos testados. | ||
Parpadeo de Pantalla / PWM (Pulse-Width Modulation)
| Parpadeo de Pantalla / PWM detectado | 198.4 Hz | ≤ 99 % de brillo | 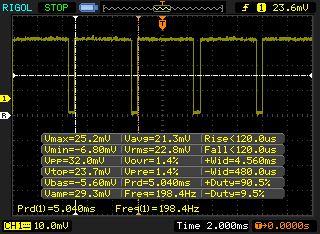 |
La retroiluminación del display parpadea a 198.4 Hz (seguramente usa PWM - Pulse-Width Modulation) a un brillo del 99 % e inferior. Sobre este nivel de brillo no debería darse parpadeo / PWM. La frecuencia de 198.4 Hz es relativamente baja, por lo que la gente sensible debería ver parpadeos y padecer fatiga visual por la pantalla (usado al brillo indicado a continuación). Comparación: 52 % de todos los dispositivos testados no usaron PWM para atenuar el display. Si se usó, medimos una media de 7781 (mínimo: 5 - máxmo: 343500) Hz. | |||
| wPrime 2.10 - 1024m | |
| Microsoft Surface Pro (2017) i7 | |
| HP Spectre x360 15t-bl100 | |
| Dell Inspiron 15 7000 7577 | |
| Lenovo Miix 520-12IKB 81CG | |
| HP Envy x360 15m-bq121dx | |
| MSI GF62VR 7RF-877 | |
* ... más pequeño es mejor
| PCMark 8 | |
| Home Score Accelerated v2 | |
| Lenovo Miix 520-12IKB 81CG | |
| HP Elite x2 1012 G2-1LV76EA | |
| Lenovo Miix 510 Pro 80U10006GE | |
| Microsoft Surface Pro (2017) m3 | |
| Work Score Accelerated v2 | |
| Lenovo Miix 510 Pro 80U10006GE | |
| HP Elite x2 1012 G2-1LV76EA | |
| Microsoft Surface Pro (2017) m3 | |
| Lenovo Miix 520-12IKB 81CG | |
| Creative Score Accelerated v2 | |
| Lenovo Miix 520-12IKB 81CG | |
| HP Elite x2 1012 G2-1LV76EA | |
| Microsoft Surface Pro (2017) m3 | |
| PCMark 10 - Score | |
| Lenovo Miix 520-12IKB 81CG | |
| HP Elite x2 1012 G2-1LV76EA | |
| Microsoft Surface Pro (2017) m3 | |
| PCMark 8 Home Score Accelerated v2 | 3733 puntos | |
| PCMark 8 Creative Score Accelerated v2 | 4869 puntos | |
| PCMark 8 Work Score Accelerated v2 | 2699 puntos | |
| PCMark 10 Score | 3295 puntos | |
ayuda | ||
| Lenovo Miix 520-12IKB 81CG Samsung PM961 MZVLW256HEHP | Microsoft Surface Pro (2017) m3 Samsung PM971 KUS020203M | Lenovo Miix 510 Pro 80U10006GE Samsung PM951 NVMe MZVLV256 | HP Elite x2 1012 G2-1LV76EA Samsung PM961 MZVLW256HEHP | Dell XPS 13 9365-4537 2-in-1 Toshiba NVMe THNSN5256GPUK | |
|---|---|---|---|---|---|
| AS SSD | -22% | -146% | 48% | -11% | |
| Copy Game MB/s (MB/s) | 410.8 | 140.7 -66% | 379.9 -8% | 457.8 11% | |
| Copy Program MB/s (MB/s) | 310.4 | 83.8 -73% | 198.2 -36% | 264.7 -15% | |
| Copy ISO MB/s (MB/s) | 659 | 173.2 -74% | 791 20% | 714 8% | |
| Score Total (Points) | 2378 | 1847 -22% | 1190 -50% | 4653 96% | 1388 -42% |
| Score Write (Points) | 572 | 284 -50% | 60 -90% | 879 54% | 389 -32% |
| Score Read (Points) | 1200 | 1053 -12% | 777 -35% | 2545 112% | 681 -43% |
| Access Time Write * (ms) | 0.33 | 0.04 88% | 4.206 -1175% | 0.027 92% | 0.041 88% |
| Access Time Read * (ms) | 0.49 | 0.074 85% | 0.053 89% | 0.041 92% | 0.169 66% |
| 4K-64 Write (MB/s) | 345.5 | 144.3 -58% | 43.14 -88% | 657 90% | 249.4 -28% |
| 4K-64 Read (MB/s) | 999 | 891 -11% | 611 -39% | 2280 128% | 512 -49% |
| 4K Write (MB/s) | 107.9 | 88.6 -18% | 0.96 -99% | 132.2 23% | 85.8 -20% |
| 4K Read (MB/s) | 48.69 | 38.82 -20% | 39.6 -19% | 45.24 -7% | 34.77 -29% |
| Seq Write (MB/s) | 1182 | 514 -57% | 158.3 -87% | 897 -24% | 543 -54% |
| Seq Read (MB/s) | 1523 | 1226 -20% | 1260 -17% | 2197 44% | 1342 -12% |
* ... más pequeño es mejor

| 3DMark 11 | |
| 1280x720 Performance GPU | |
| Intel Skull Canyon NUC6i7KYK | |
| Lenovo IdeaPad 320S-13IKB | |
| Microsoft Surface Laptop i7 | |
| Microsoft Surface Laptop i7 | |
| Razer Blade Stealth QHD i7-8550U | |
| Dell XPS 13 i5-8250U | |
| Toshiba Tecra X40-D | |
| Lenovo Miix 520-12IKB 81CG | |
| Acer TravelMate P249-M-5452 | |
| Lenovo Miix 510 Pro 80U10006GE | |
| 1280x720 Performance Combined | |
| Lenovo IdeaPad 320S-13IKB | |
| Intel Skull Canyon NUC6i7KYK | |
| Microsoft Surface Laptop i7 | |
| Microsoft Surface Laptop i7 | |
| Razer Blade Stealth QHD i7-8550U | |
| Dell XPS 13 i5-8250U | |
| Toshiba Tecra X40-D | |
| Lenovo Miix 520-12IKB 81CG | |
| Acer TravelMate P249-M-5452 | |
| Lenovo Miix 510 Pro 80U10006GE | |
| 3DMark | |
| 1280x720 Cloud Gate Standard Graphics | |
| Lenovo IdeaPad 320S-13IKB | |
| Intel Skull Canyon NUC6i7KYK | |
| Microsoft Surface Laptop i7 | |
| Razer Blade Stealth QHD i7-8550U | |
| Dell XPS 13 i5-8250U | |
| Toshiba Tecra X40-D | |
| Lenovo Miix 520-12IKB 81CG | |
| Acer TravelMate P249-M-5452 | |
| Lenovo Miix 510 Pro 80U10006GE | |
| 1920x1080 Fire Strike Graphics | |
| Lenovo IdeaPad 320S-13IKB | |
| Intel Skull Canyon NUC6i7KYK | |
| Microsoft Surface Laptop i7 | |
| Toshiba Tecra X40-D | |
| Lenovo Miix 520-12IKB 81CG | |
| Acer TravelMate P249-M-5452 | |
| 1920x1080 Ice Storm Extreme Graphics | |
| Intel Skull Canyon NUC6i7KYK | |
| Lenovo Miix 520-12IKB 81CG | |
| Acer TravelMate P249-M-5452 | |
| 3DMark 11 Performance | 1800 puntos | |
| 3DMark Ice Storm Standard Score | 65197 puntos | |
| 3DMark Cloud Gate Standard Score | 7775 puntos | |
| 3DMark Fire Strike Score | 952 puntos | |
| 3DMark Fire Strike Extreme Score | 437 puntos | |
ayuda | ||
| bajo | medio | alto | ultra | |
|---|---|---|---|---|
| BioShock Infinite (2013) | 54.3 | 29.3 | 24.1 | 7.4 |
| Rise of the Tomb Raider (2016) | 21.3 | 11 |
Ruido
| Ocioso |
| 28.2 / 28.2 / 29.6 dB(A) |
| Carga |
| 34 / 36 dB(A) |
 | ||
30 dB silencioso 40 dB(A) audible 50 dB(A) ruidosamente alto |
||
min: | ||
| Lenovo Miix 520-12IKB 81CG UHD Graphics 620, i5-8250U, Samsung PM961 MZVLW256HEHP | Microsoft Surface Pro (2017) i7 Iris Plus Graphics 640, i7-7660U, Samsung PM971 KUS040202M | Lenovo Miix 510 Pro 80U10006GE HD Graphics 520, 6200U, Samsung PM951 NVMe MZVLV256 | HP Elite x2 1012 G2-1LV76EA HD Graphics 620, i5-7200U, Samsung PM961 MZVLW256HEHP | Dell XPS 13 9365-4537 2-in-1 HD Graphics 615, i5-7Y54, Toshiba NVMe THNSN5256GPUK | Lenovo ThinkPad X1 Tablet Gen 2 HD Graphics 615, i5-7Y54, Samsung PM961 MZVLW256HEHP | |
|---|---|---|---|---|---|---|
| Noise | -1% | -5% | 1% | |||
| apagado / medio ambiente * (dB) | 28.2 | 29.6 -5% | 30.15 -7% | 29.5 -5% | ||
| Idle Minimum * (dB) | 28.2 | 29.6 -5% | 30.15 -7% | 29.5 -5% | ||
| Idle Average * (dB) | 28.2 | 29.6 -5% | 30.8 -9% | 29.5 -5% | ||
| Idle Maximum * (dB) | 29.6 | 29.6 -0% | 31 -5% | 29.5 -0% | ||
| Load Average * (dB) | 34 | 33.4 2% | 36.8 -8% | 30.6 10% | ||
| Load Maximum * (dB) | 36 | 34.1 5% | 33.8 6% | 32.5 10% | ||
| Witcher 3 ultra * (dB) | 33.4 |
* ... más pequeño es mejor
(±) La temperatura máxima en la parte superior es de 44.8 °C / 113 F, frente a la media de 35.4 °C / 96 F, que oscila entre 19.6 y 60 °C para la clase Convertible.
(±) El fondo se calienta hasta un máximo de 44.2 °C / 112 F, frente a la media de 36.9 °C / 98 F
(+) En reposo, la temperatura media de la parte superior es de 28 °C / 82# F, frente a la media del dispositivo de 30.3 °C / 87 F.
(+) Los reposamanos y el panel táctil alcanzan como máximo la temperatura de la piel (35 °C / 95 F) y, por tanto, no están calientes.
(-) La temperatura media de la zona del reposamanos de dispositivos similares fue de 28 °C / 82.4 F (-7 °C / -12.6 F).
Lenovo Miix 520-12IKB 81CG análisis de audio
(-) | altavoces no muy altos (#61.3 dB)
Graves 100 - 315 Hz
(-) | casi sin bajos - de media 18.1% inferior a la mediana
(±) | la linealidad de los graves es media (12.5% delta a frecuencia anterior)
Medios 400 - 2000 Hz
(+) | medios equilibrados - a sólo 4% de la mediana
(±) | la linealidad de los medios es media (9.9% delta respecto a la frecuencia anterior)
Altos 2 - 16 kHz
(±) | máximos más altos - de media 5.1% más altos que la mediana
(±) | la linealidad de los máximos es media (10.9% delta a frecuencia anterior)
Total 100 - 16.000 Hz
(-) | el sonido global no es lineal (31% de diferencia con la mediana)
En comparación con la misma clase
» 90% de todos los dispositivos probados de esta clase eran mejores, 2% similares, 8% peores
» El mejor tuvo un delta de 6%, la media fue 20%, el peor fue ###max##%
En comparación con todos los dispositivos probados
» 90% de todos los dispositivos probados eran mejores, 2% similares, 8% peores
» El mejor tuvo un delta de 4%, la media fue 24%, el peor fue ###max##%
Apple MacBook 12 (Early 2016) 1.1 GHz análisis de audio
(+) | los altavoces pueden reproducir a un volumen relativamente alto (#83.6 dB)
Graves 100 - 315 Hz
(±) | lubina reducida - en promedio 11.3% inferior a la mediana
(±) | la linealidad de los graves es media (14.2% delta a frecuencia anterior)
Medios 400 - 2000 Hz
(+) | medios equilibrados - a sólo 2.4% de la mediana
(+) | los medios son lineales (5.5% delta a la frecuencia anterior)
Altos 2 - 16 kHz
(+) | máximos equilibrados - a sólo 2% de la mediana
(+) | los máximos son lineales (4.5% delta a la frecuencia anterior)
Total 100 - 16.000 Hz
(+) | el sonido global es lineal (10.2% de diferencia con la mediana)
En comparación con la misma clase
» 7% de todos los dispositivos probados de esta clase eran mejores, 2% similares, 91% peores
» El mejor tuvo un delta de 5%, la media fue 18%, el peor fue ###max##%
En comparación con todos los dispositivos probados
» 5% de todos los dispositivos probados eran mejores, 1% similares, 94% peores
» El mejor tuvo un delta de 4%, la media fue 24%, el peor fue ###max##%
| Off / Standby | |
| Ocioso | |
| Carga |
|
Clave:
min: | |
| Lenovo Miix 520-12IKB 81CG i5-8250U, UHD Graphics 620, Samsung PM961 MZVLW256HEHP, IPS, 1920x1200, 12.2" | Microsoft Surface Pro (2017) i7 i7-7660U, Iris Plus Graphics 640, Samsung PM971 KUS040202M, IPS, 2736x1824, 12.3" | Microsoft Surface Pro (2017) i5 i5-7300U, HD Graphics 620, Samsung PM971 KUS030202M, IPS, 2736x1824, 12.3" | Lenovo Miix 510 Pro 80U10006GE 6200U, HD Graphics 520, Samsung PM951 NVMe MZVLV256, IPS, 1920x1200, 12.2" | HP Elite x2 1012 G2-1LV76EA i5-7200U, HD Graphics 620, Samsung PM961 MZVLW256HEHP, IPS, 2716x1824, 12.3" | Dell XPS 13 9365-4537 2-in-1 i5-7Y54, HD Graphics 615, Toshiba NVMe THNSN5256GPUK, IPS, 3200x1800, 13.3" | |
|---|---|---|---|---|---|---|
| Power Consumption | -2% | 26% | 6% | -0% | -3% | |
| Idle Minimum * (Watt) | 5.5 | 4.2 24% | 3.6 35% | 4.2 24% | 4.1 25% | 8.2 -49% |
| Idle Average * (Watt) | 8.3 | 10.1 -22% | 8.1 2% | 11.5 -39% | 9.2 -11% | 10.8 -30% |
| Idle Maximum * (Watt) | 11.5 | 14 -22% | 8.7 24% | 11.7 -2% | 11.1 3% | 12.7 -10% |
| Load Average * (Watt) | 38.3 | 37.4 2% | 25.5 33% | 31 19% | 33.8 12% | 22.6 41% |
| Load Maximum * (Watt) | 37.7 | 34 10% | 23.5 38% | 27.4 27% | 49.2 -31% | 24.6 35% |
| Witcher 3 ultra * (Watt) | 38.1 |
* ... más pequeño es mejor
| Lenovo Miix 520-12IKB 81CG i5-8250U, UHD Graphics 620, 38 Wh | Microsoft Surface Pro (2017) i5 i5-7300U, HD Graphics 620, 45 Wh | Lenovo Miix 510 Pro 80U10006GE 6200U, HD Graphics 520, 50 Wh | HP Elite x2 1012 G2-1LV76EA i5-7200U, HD Graphics 620, 47 Wh | Dell XPS 13 9365-4537 2-in-1 i5-7Y54, HD Graphics 615, 46 Wh | Lenovo ThinkPad X1 Tablet Gen 2 i5-7Y54, HD Graphics 615, 37 Wh | |
|---|---|---|---|---|---|---|
| Duración de Batería | 106% | 21% | 45% | 21% | 40% | |
| Reader / Idle (h) | 12.3 | 17.6 43% | 11.6 -6% | 13.9 13% | 11 -11% | |
| WiFi v1.3 (h) | 5.6 | 12.4 121% | 5.4 -4% | 6.3 13% | 6.8 21% | 7.4 32% |
| Load (h) | 1.1 | 2.8 155% | 1.9 73% | 2.3 109% | 2.2 100% |
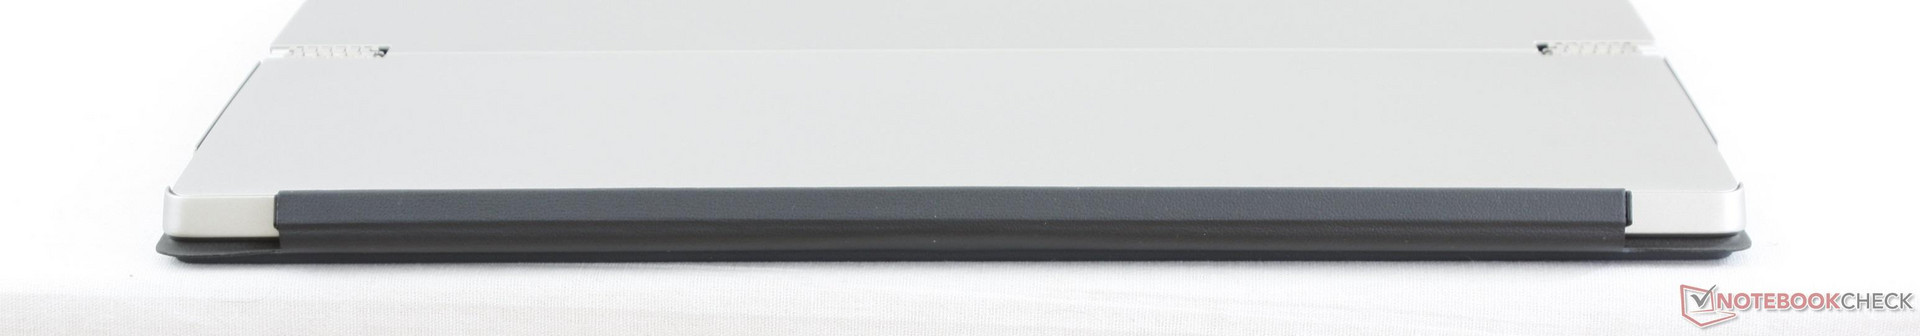
Pro
Contra
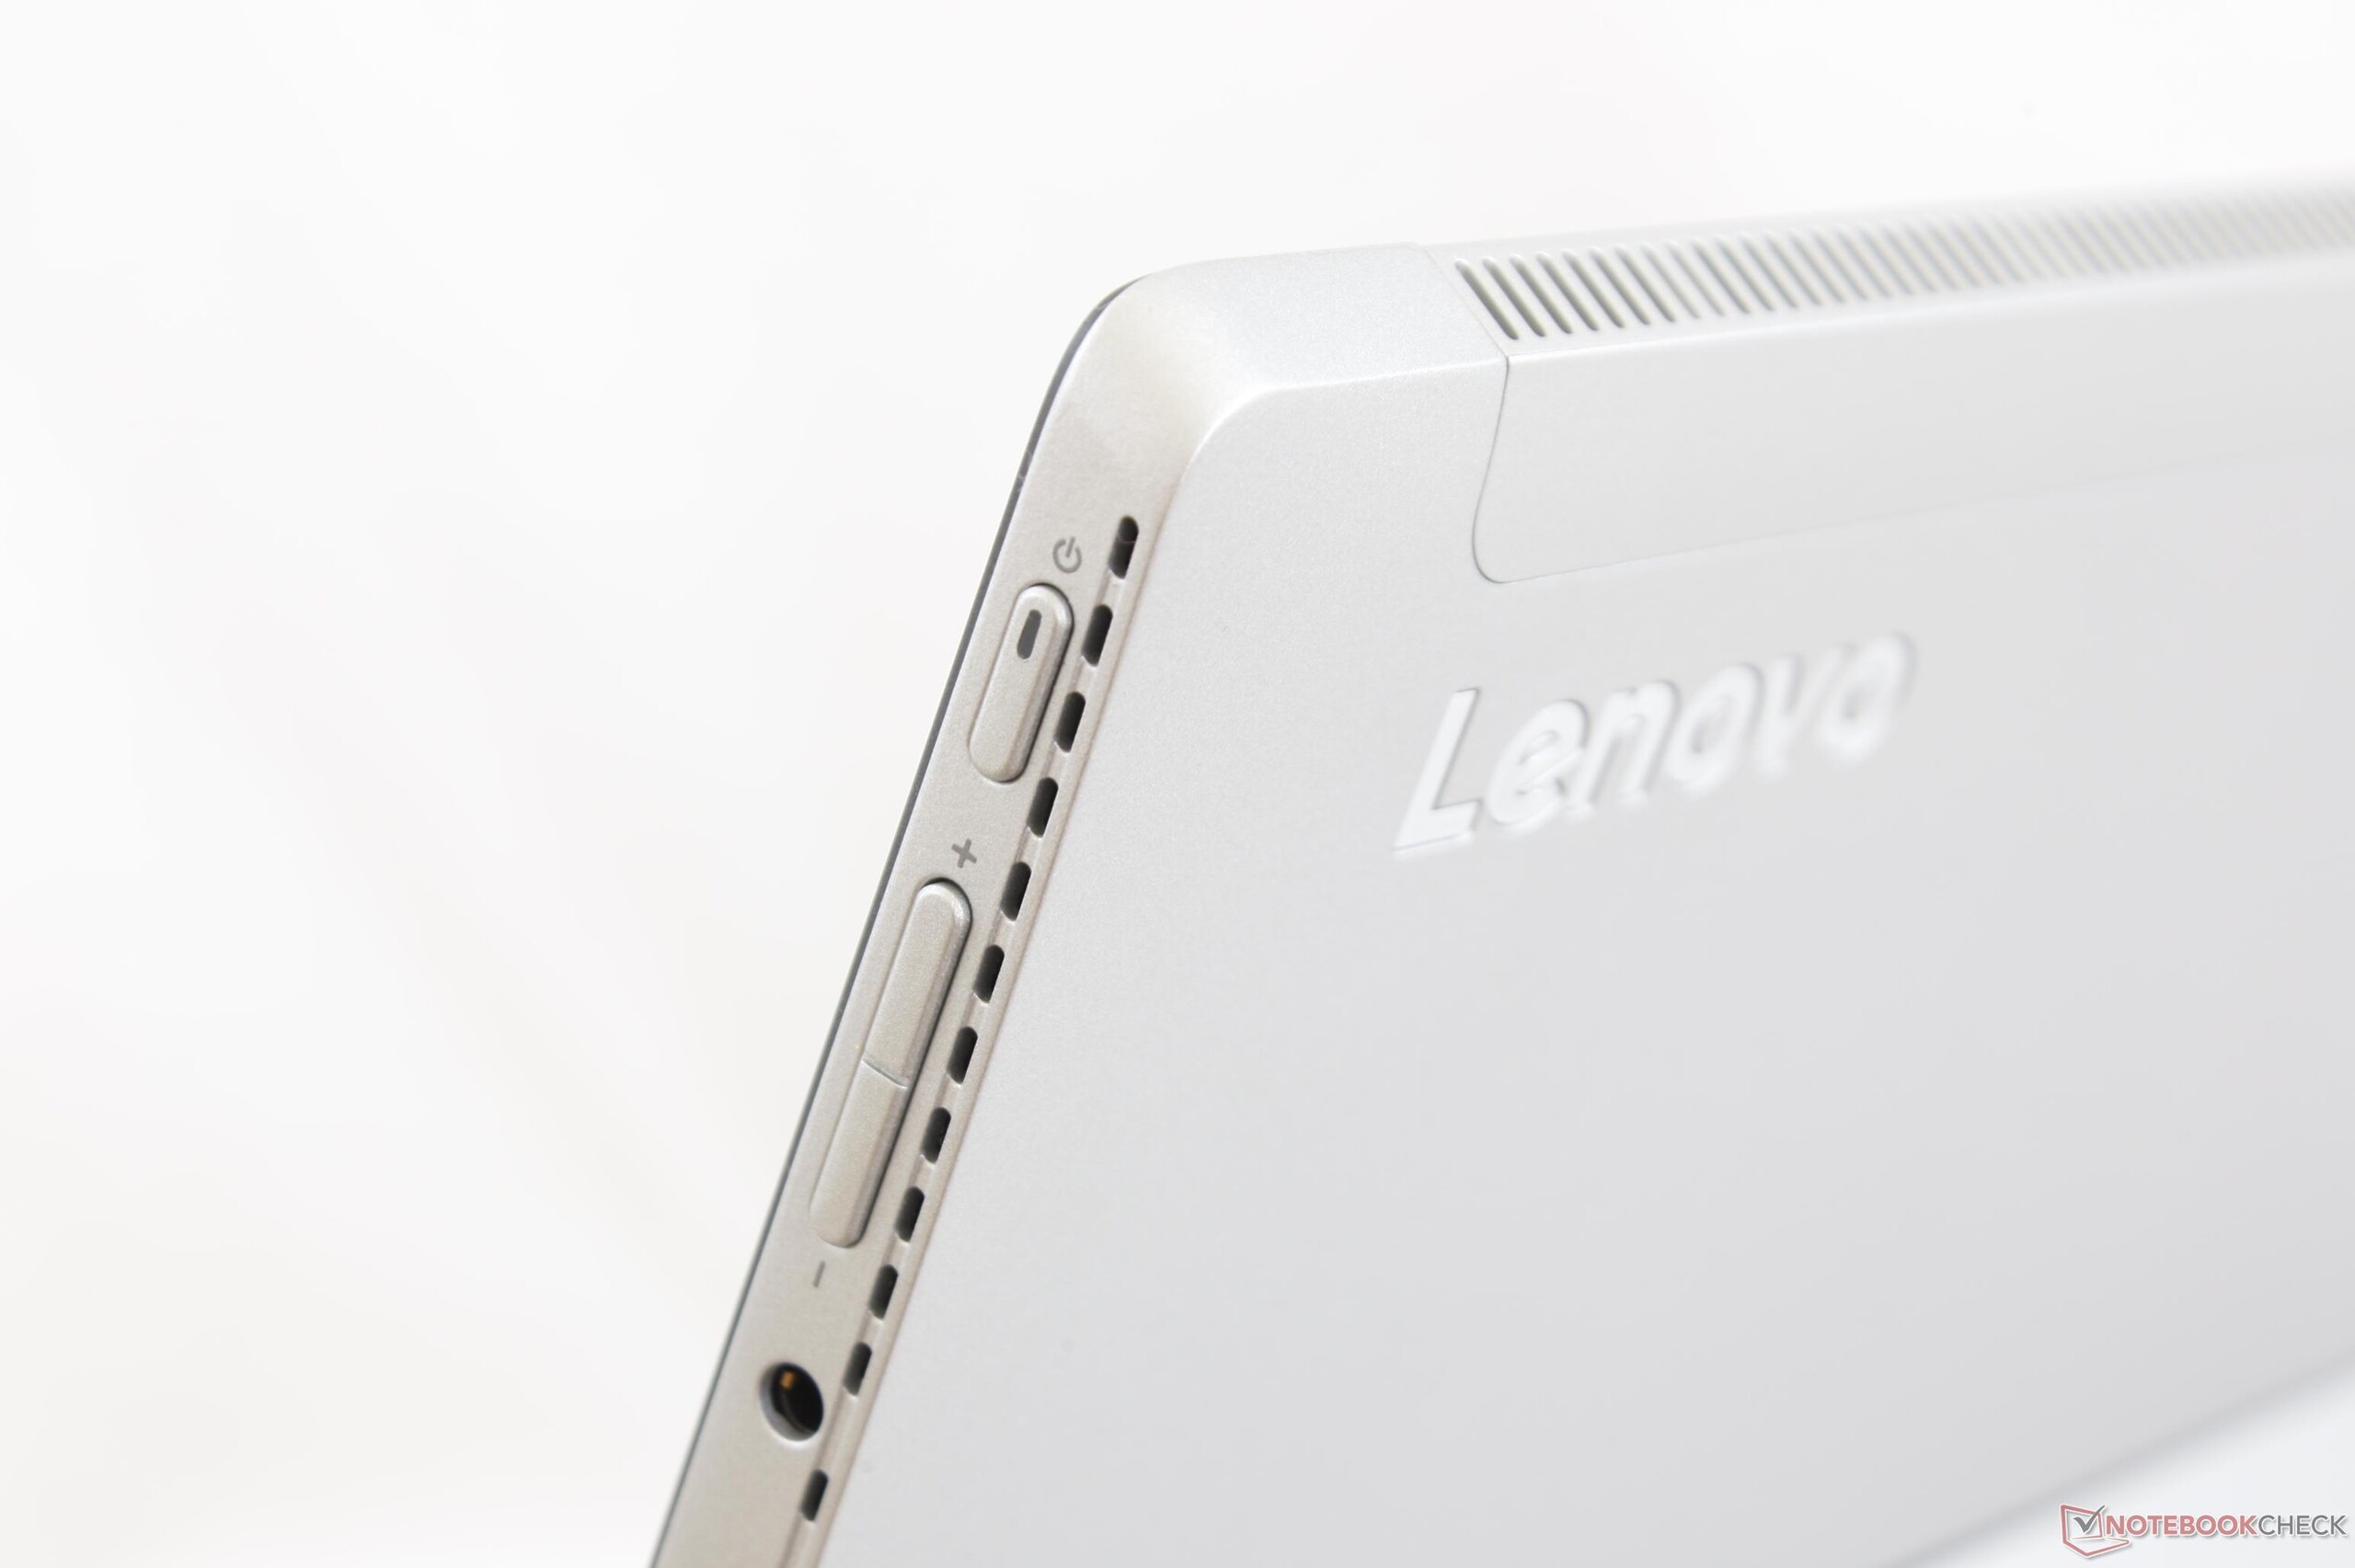
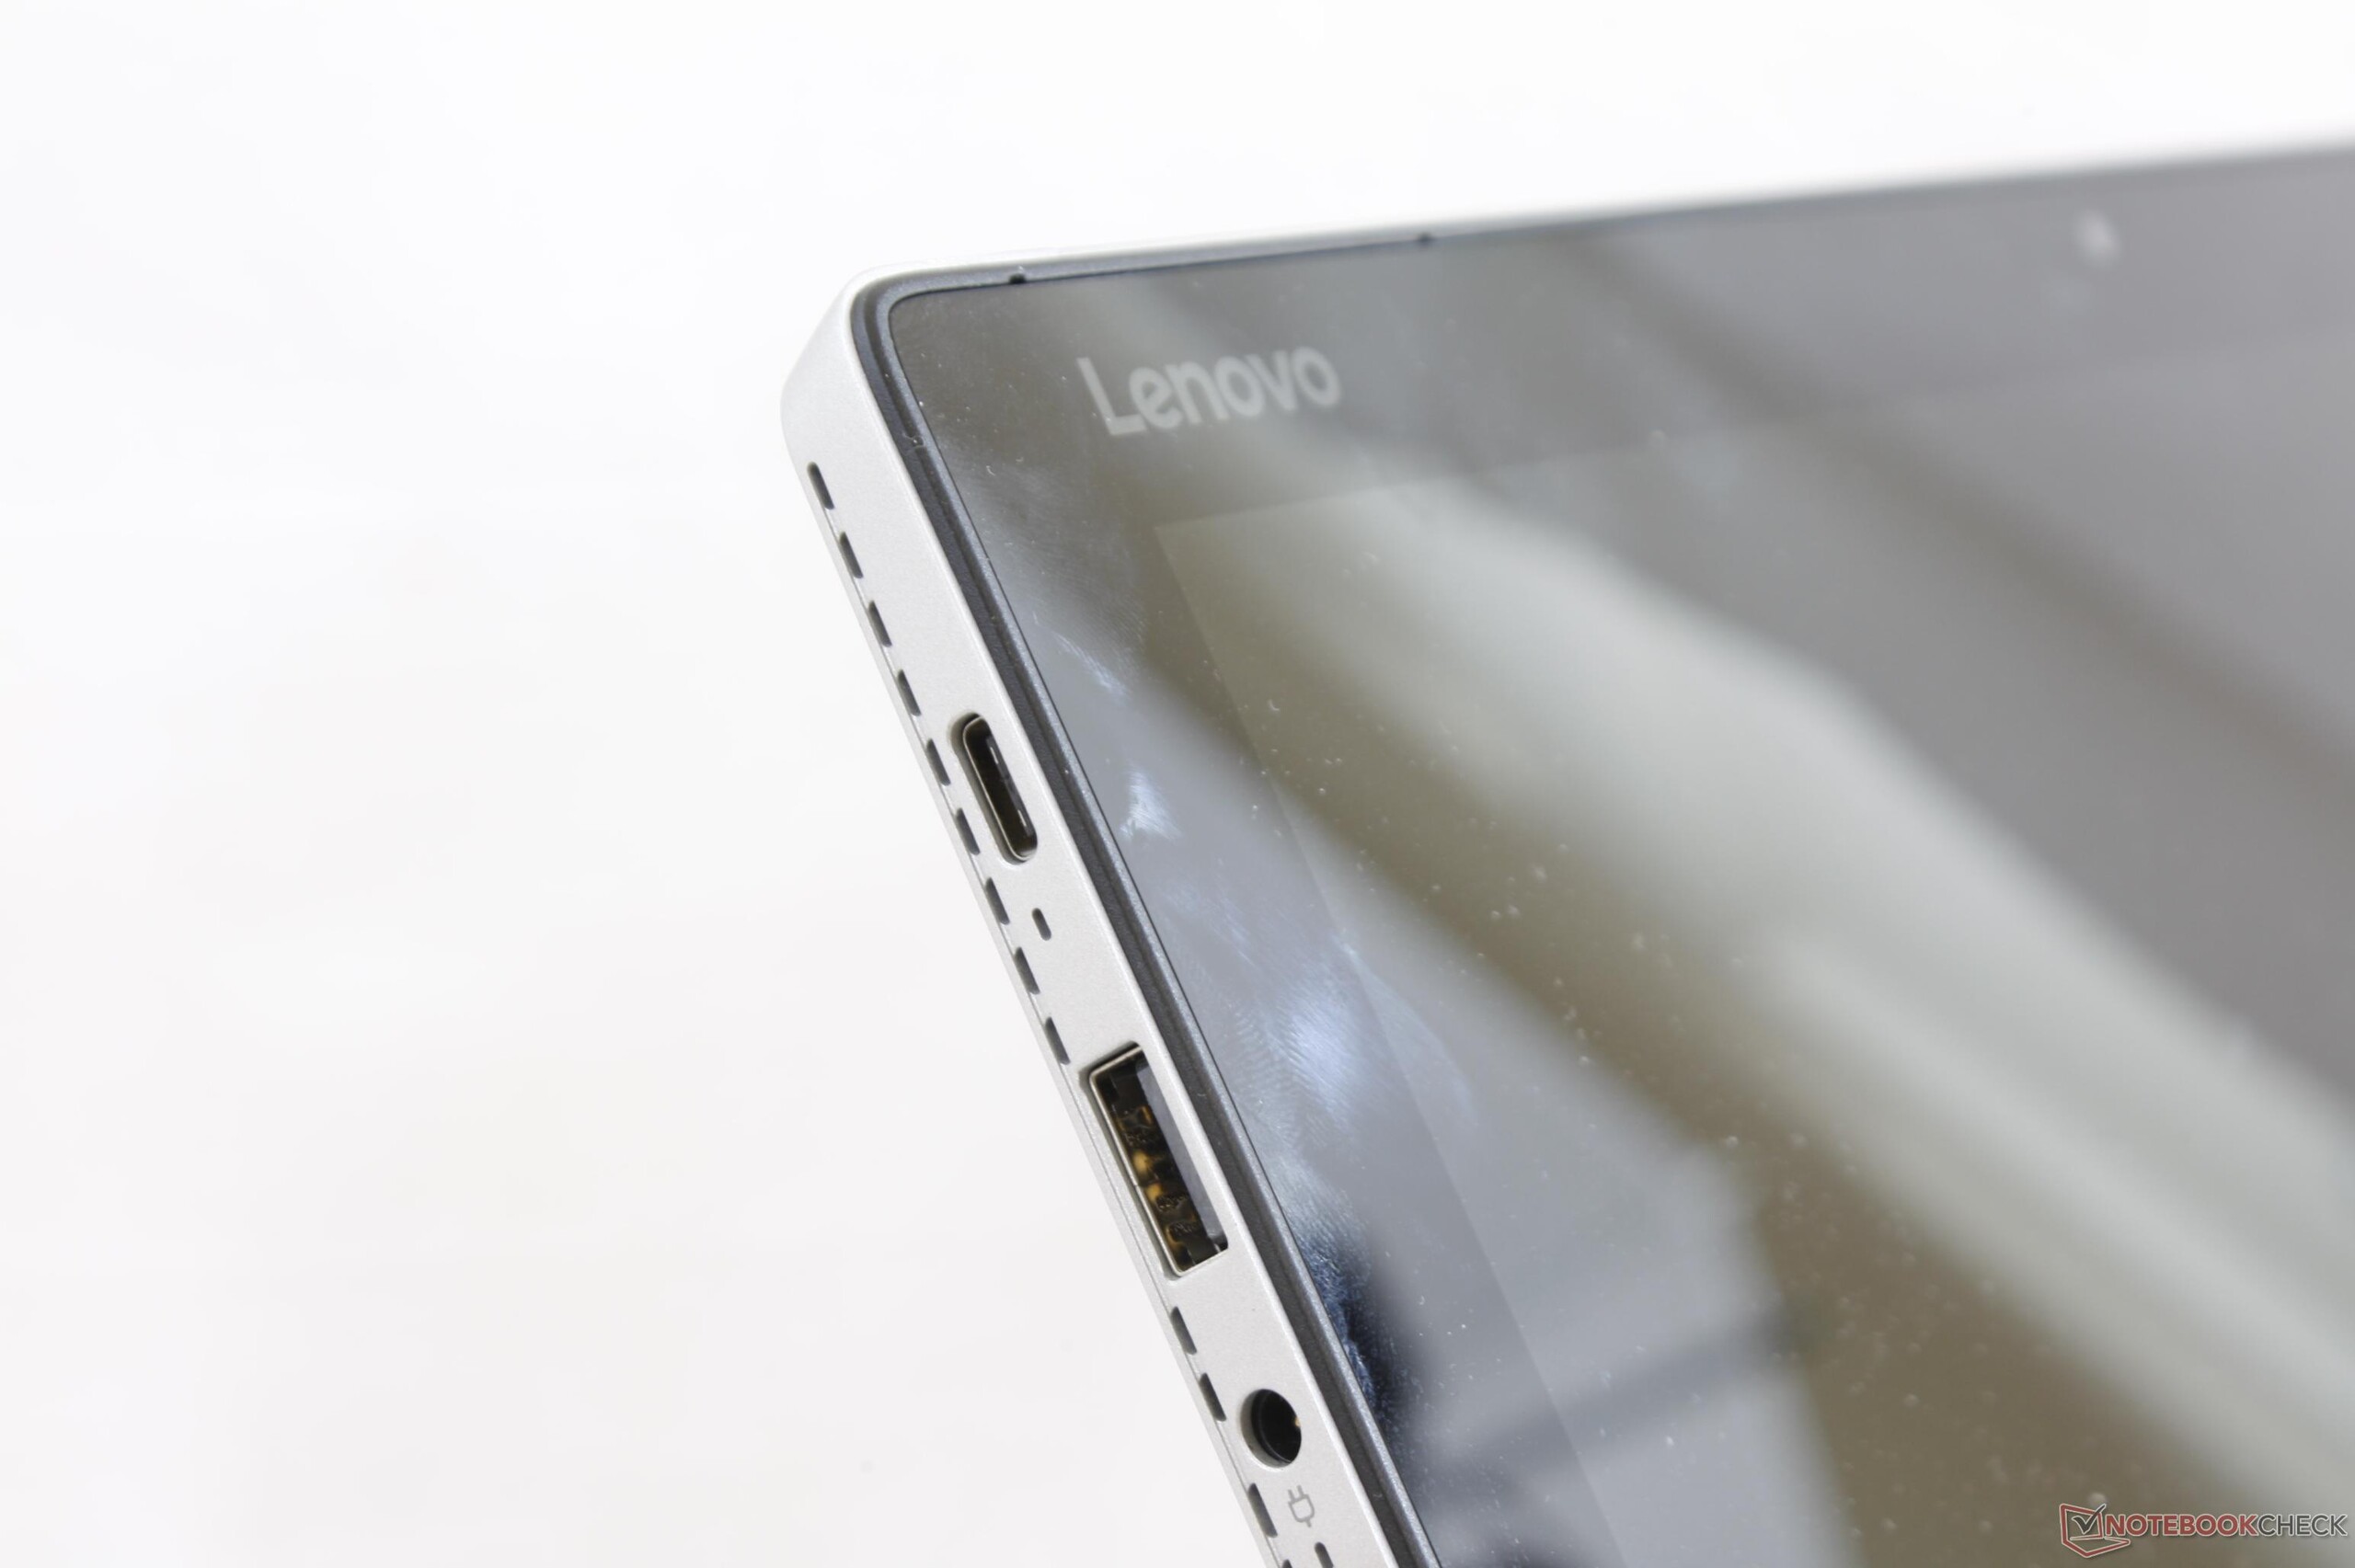
Los mejores aspectos del Miix 520 son su rendimiento de procesador, rendimiento de SSD, versatilidad de puertos y precio. Su ratio de rendimiento/dolar es uno de los mejores en el mercado actual, ya que otros tablets Windows aún tienen Core Y u otras opciones de la séptima generación. Los usuarios que quieran explotar los caballos adicionales de potencia encontrarán en el Miix 520 un buen pseudo-Ultrabook para viajar.
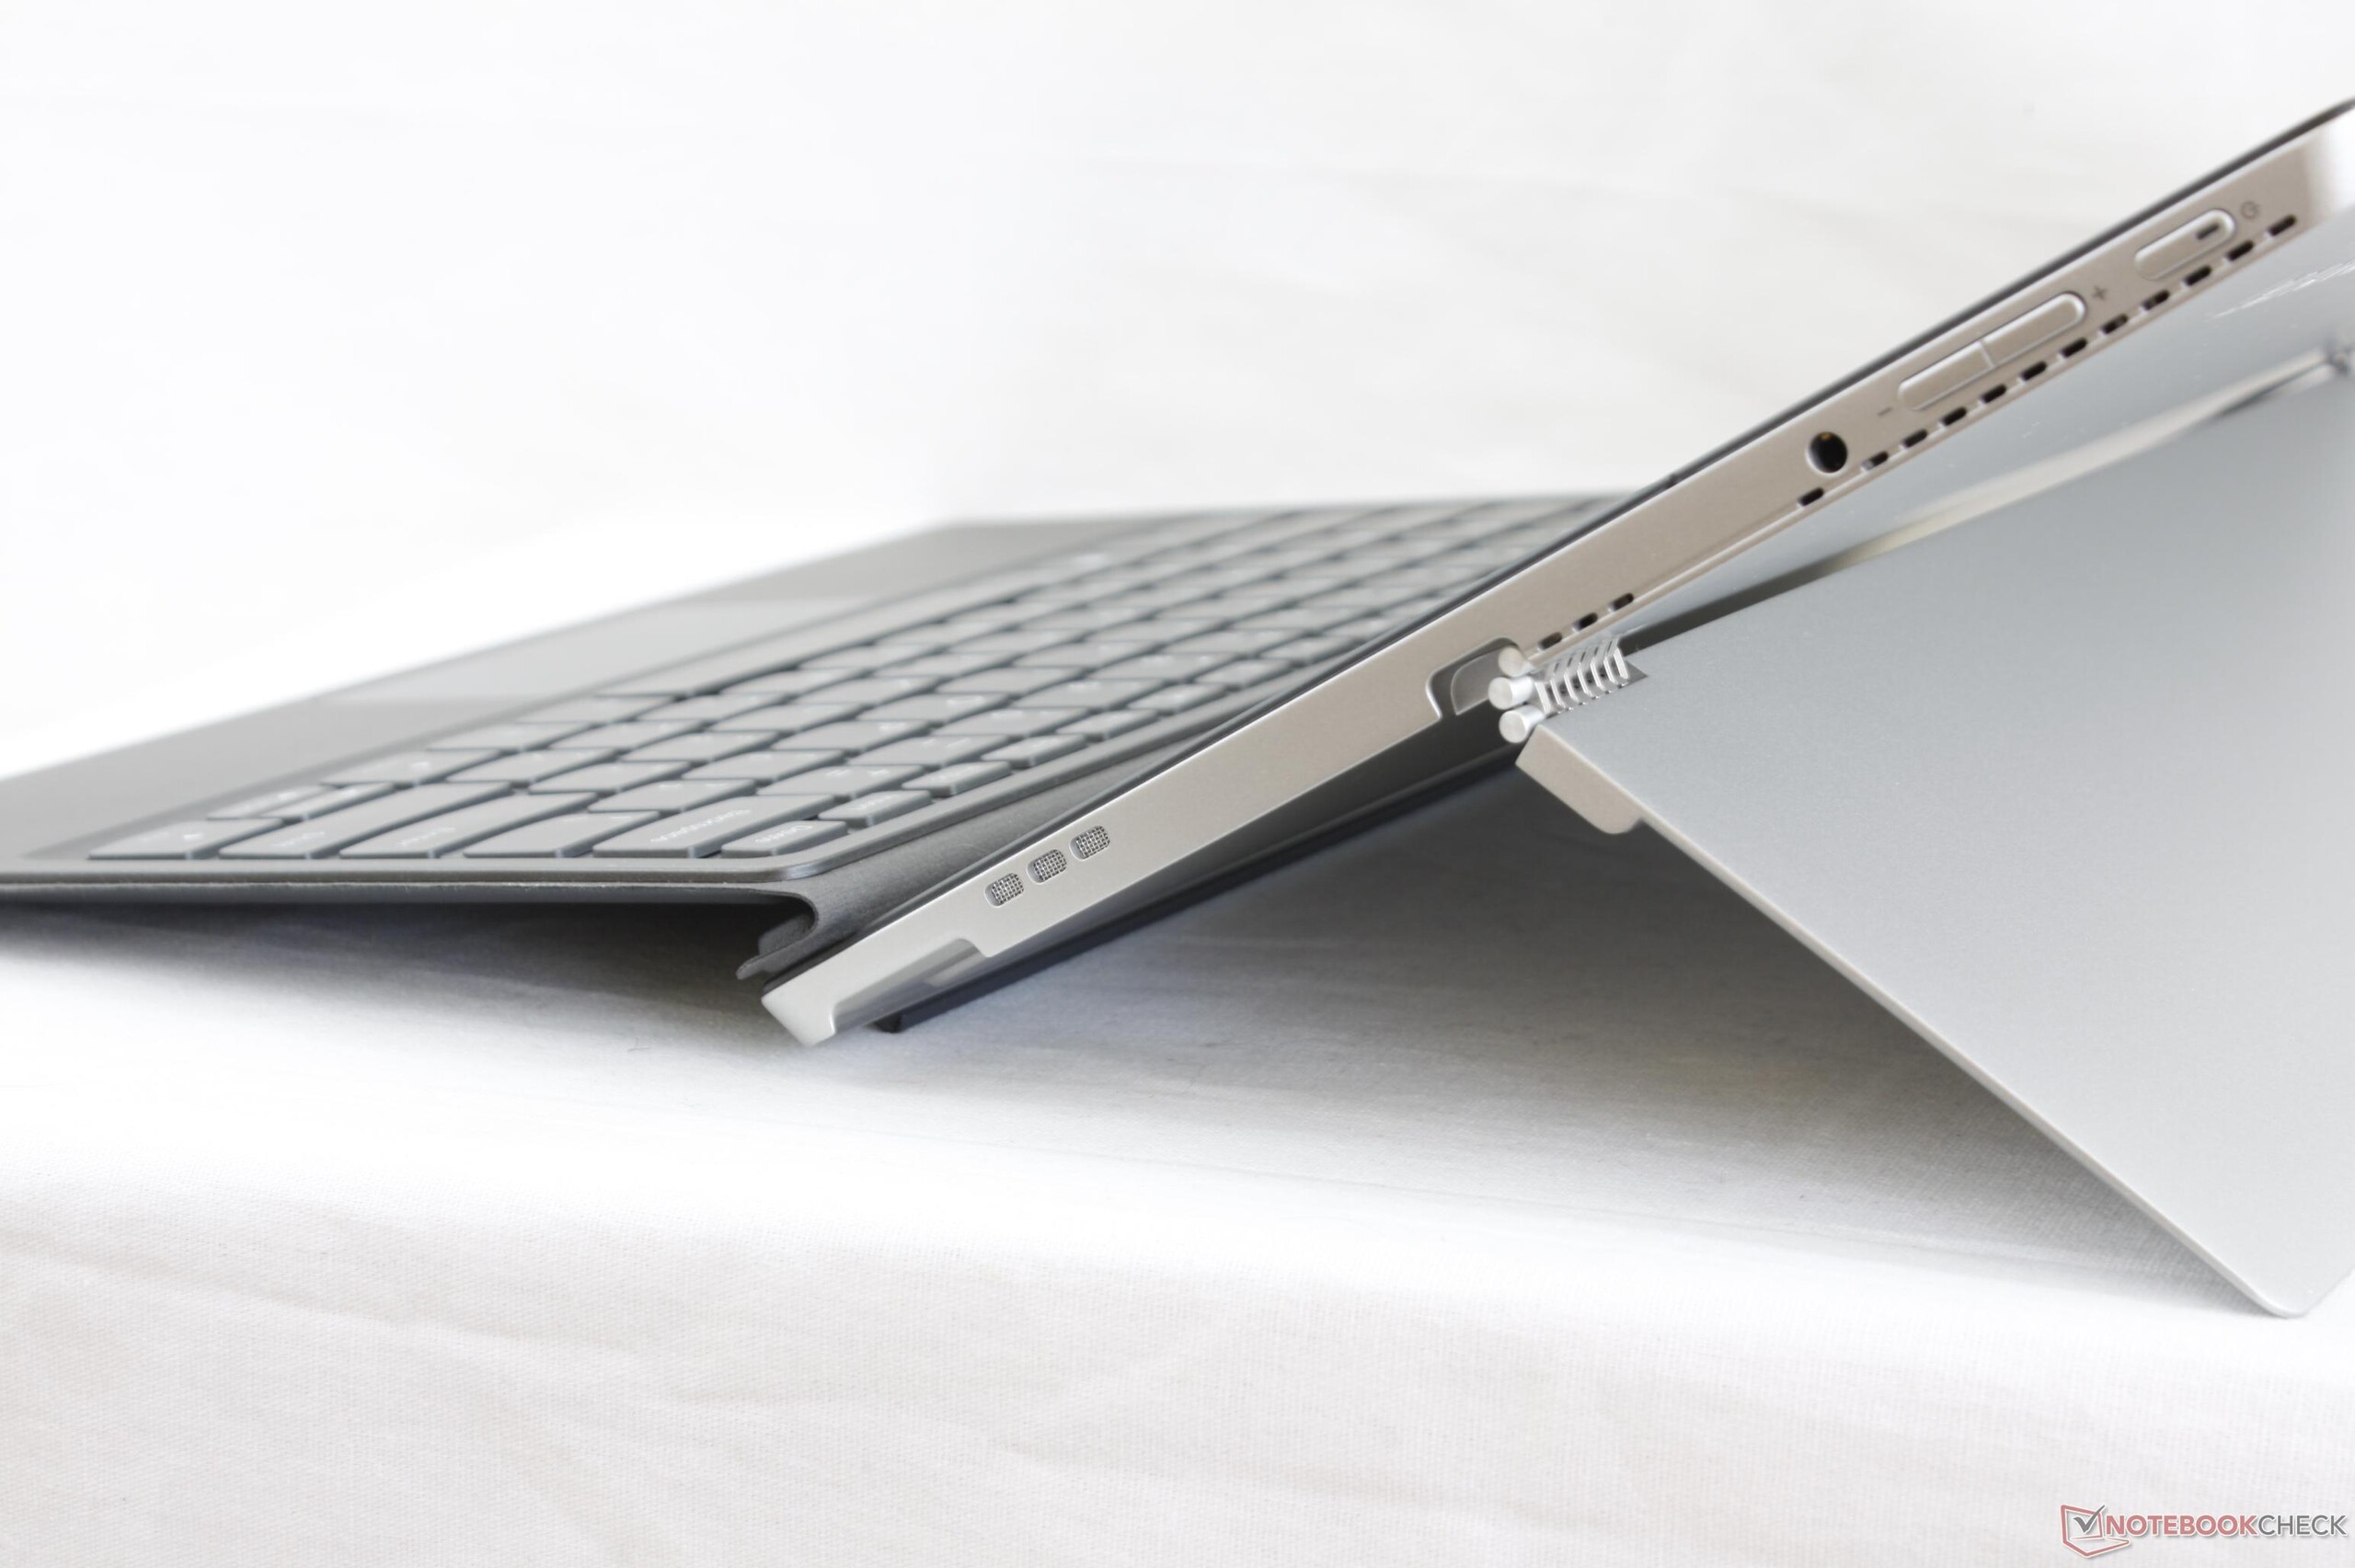
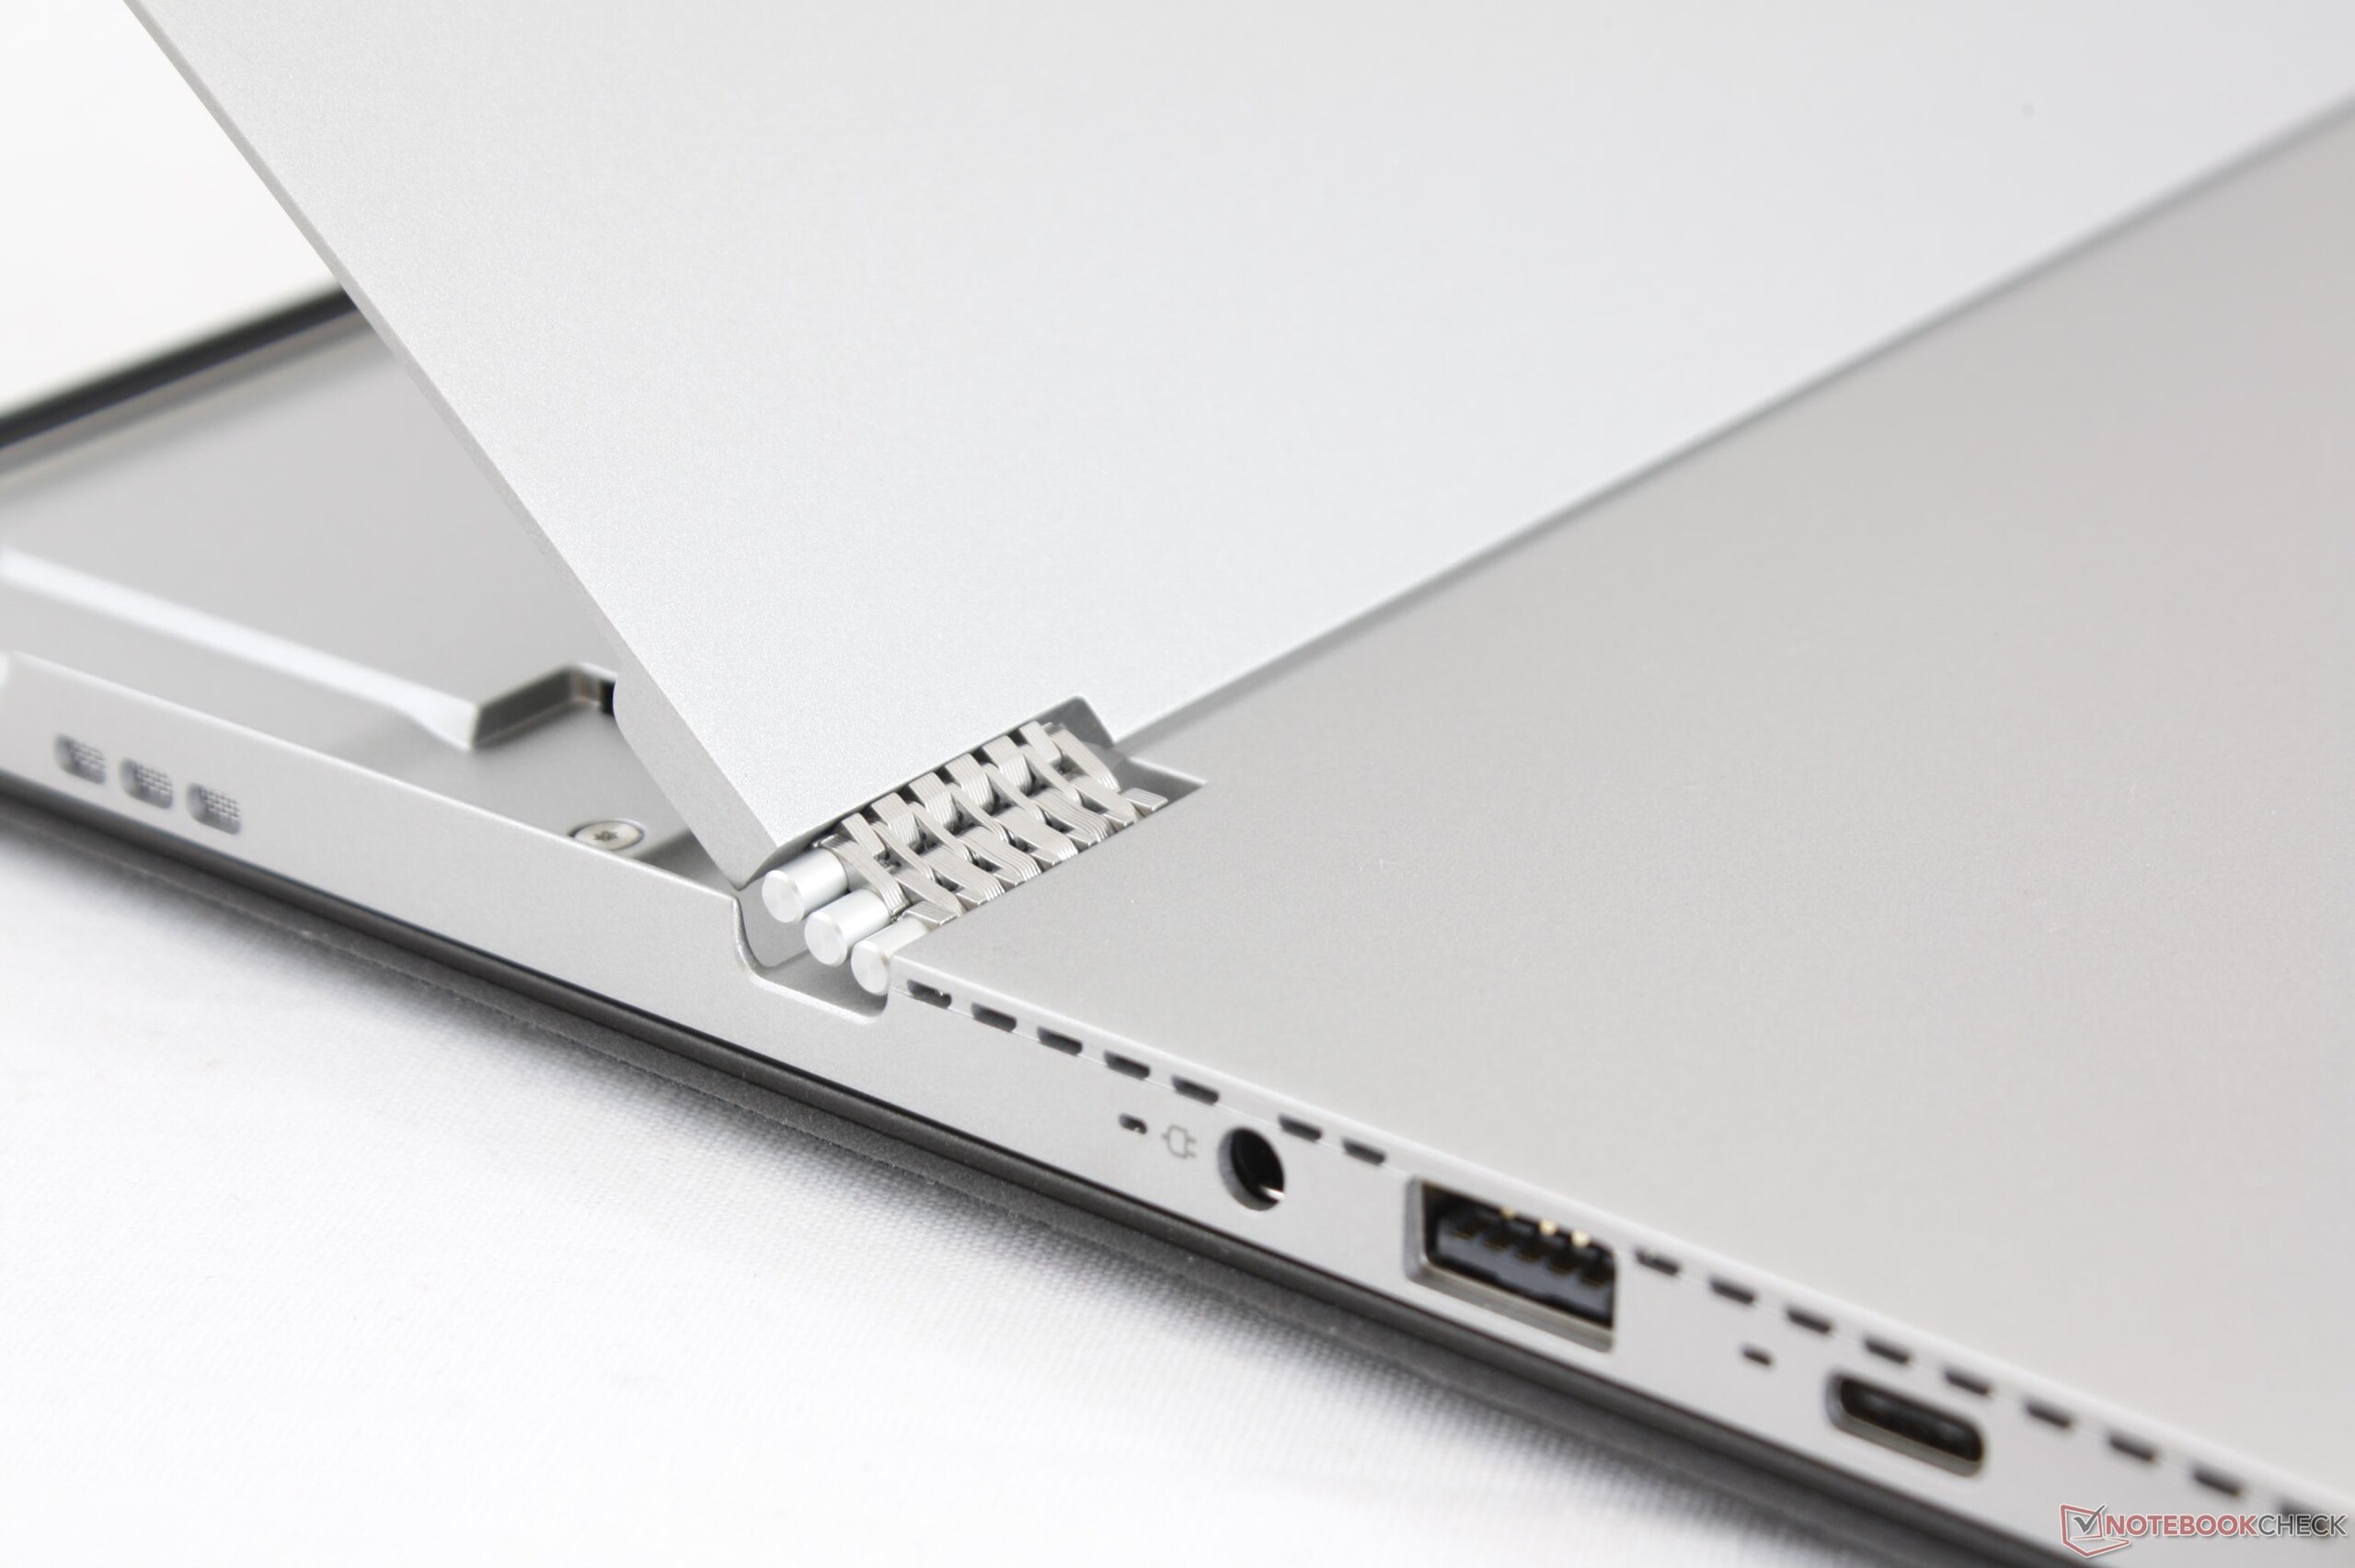
El resto de cosas del desmontable de Lenovo no son necesariamente malas o incluso promedio, pero definitivamente hay espacio para mejorar en comparación con algunas alternativas cercanas. Surface Pro y Elite x2 son más robustos en diseño, tienen pantallas más brillantes y de mayor resolución, colores más precisos y un mayor aguante de la batería. El tablet HP, en particular, también lleva Thunderbolt 3 para una gama aún más amplia de opciones de conectividad. Una base de teclado más firme para el Lenovo habría mejorado la experiencia de tecleo esponjoso en relación con los teclados en la mayoría de los Ultrabooks.
La desventaja más evidente de un procesador de alto rendimiento es el ruido del ventilador. El ventilador es un poco más ruidoso que el del Surface Pro y hará un ciclo mucho más frecuente durante el uso diario. No es tan fuerte como en la serie de convertibles HP Spectre, pero es, sin embargo, notable, especialmente para un formato tablet.
El Miix 520 es una gran compra siempre que los usuarios conozcan sus desventajas. El rápido rendimiento de la CPU viene con el costo de un ruido de ventilador más fuerte y más frecuente. Esperamos que en futuras revisiones actualicen la pantalla e incorporen Thunderbolt 3 para que la serie Miix sea aún más competitiva frente a Microsoft.
Ésta es una versión acortada del análisis original. Puedes leer el análisis completo en inglés aquí.
Lenovo Miix 520-12IKB 81CG
- 12/10/2017 v6 (old)
Allen Ngo
Price comparison
