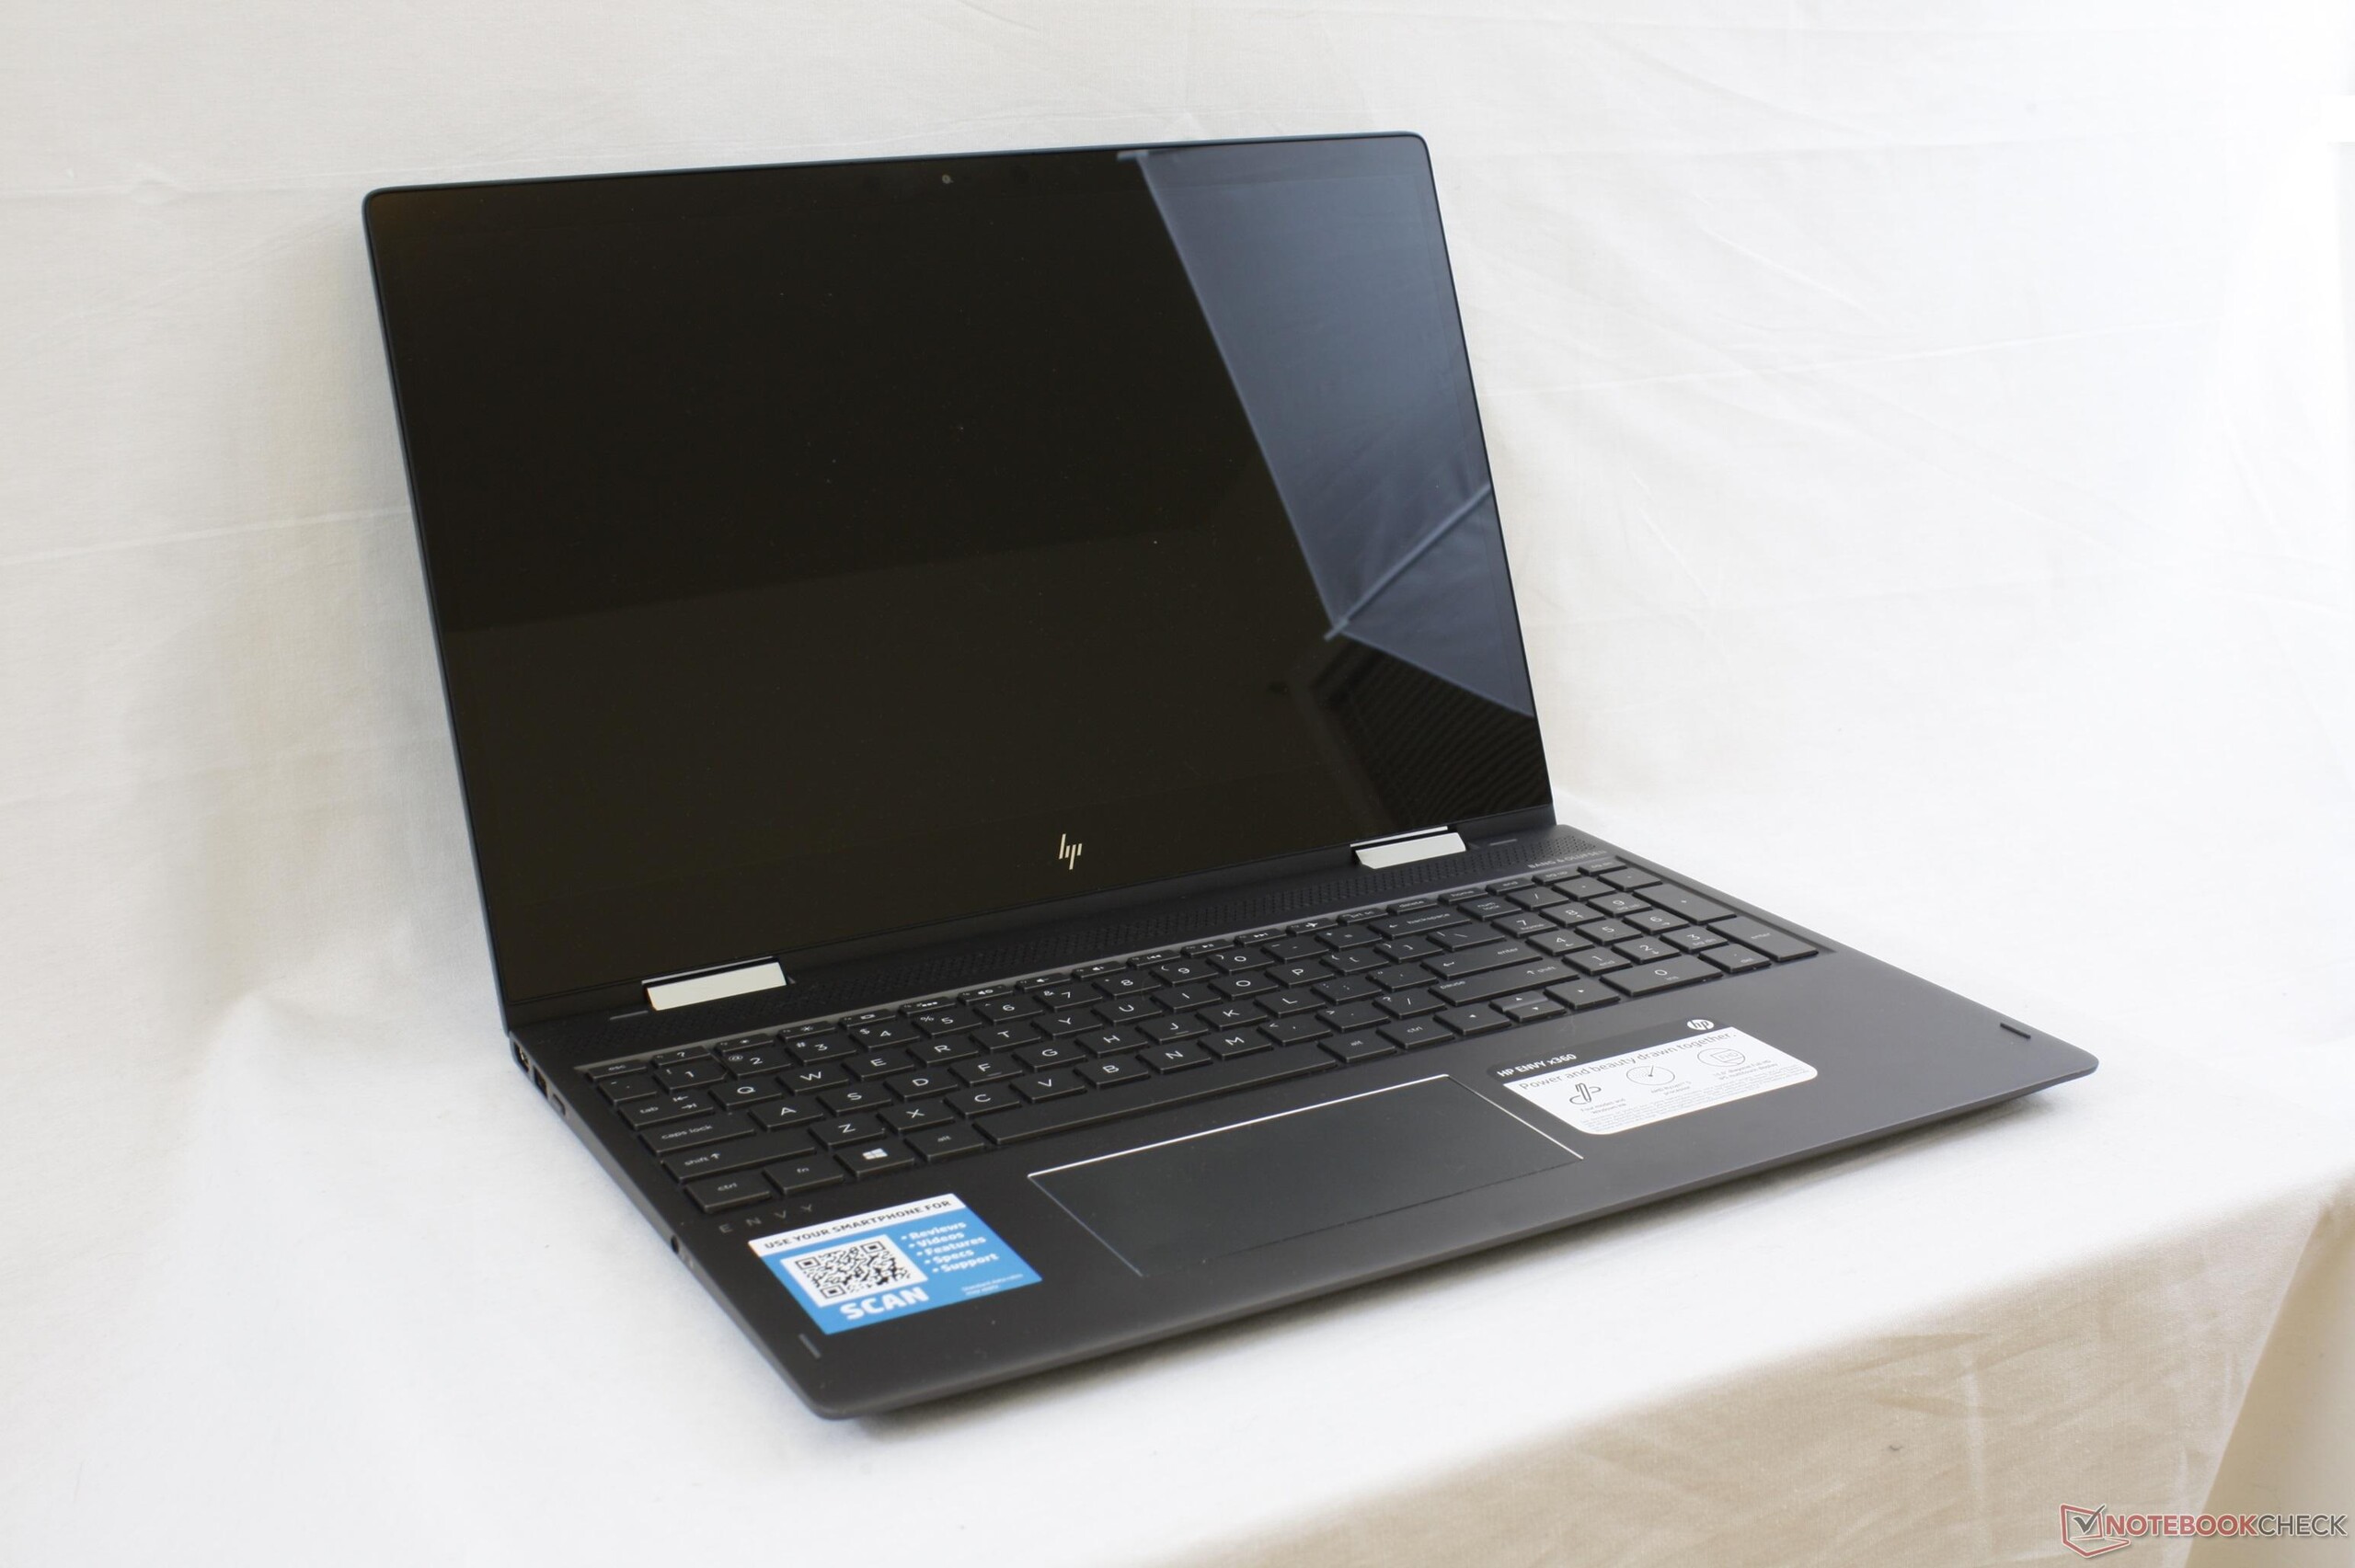
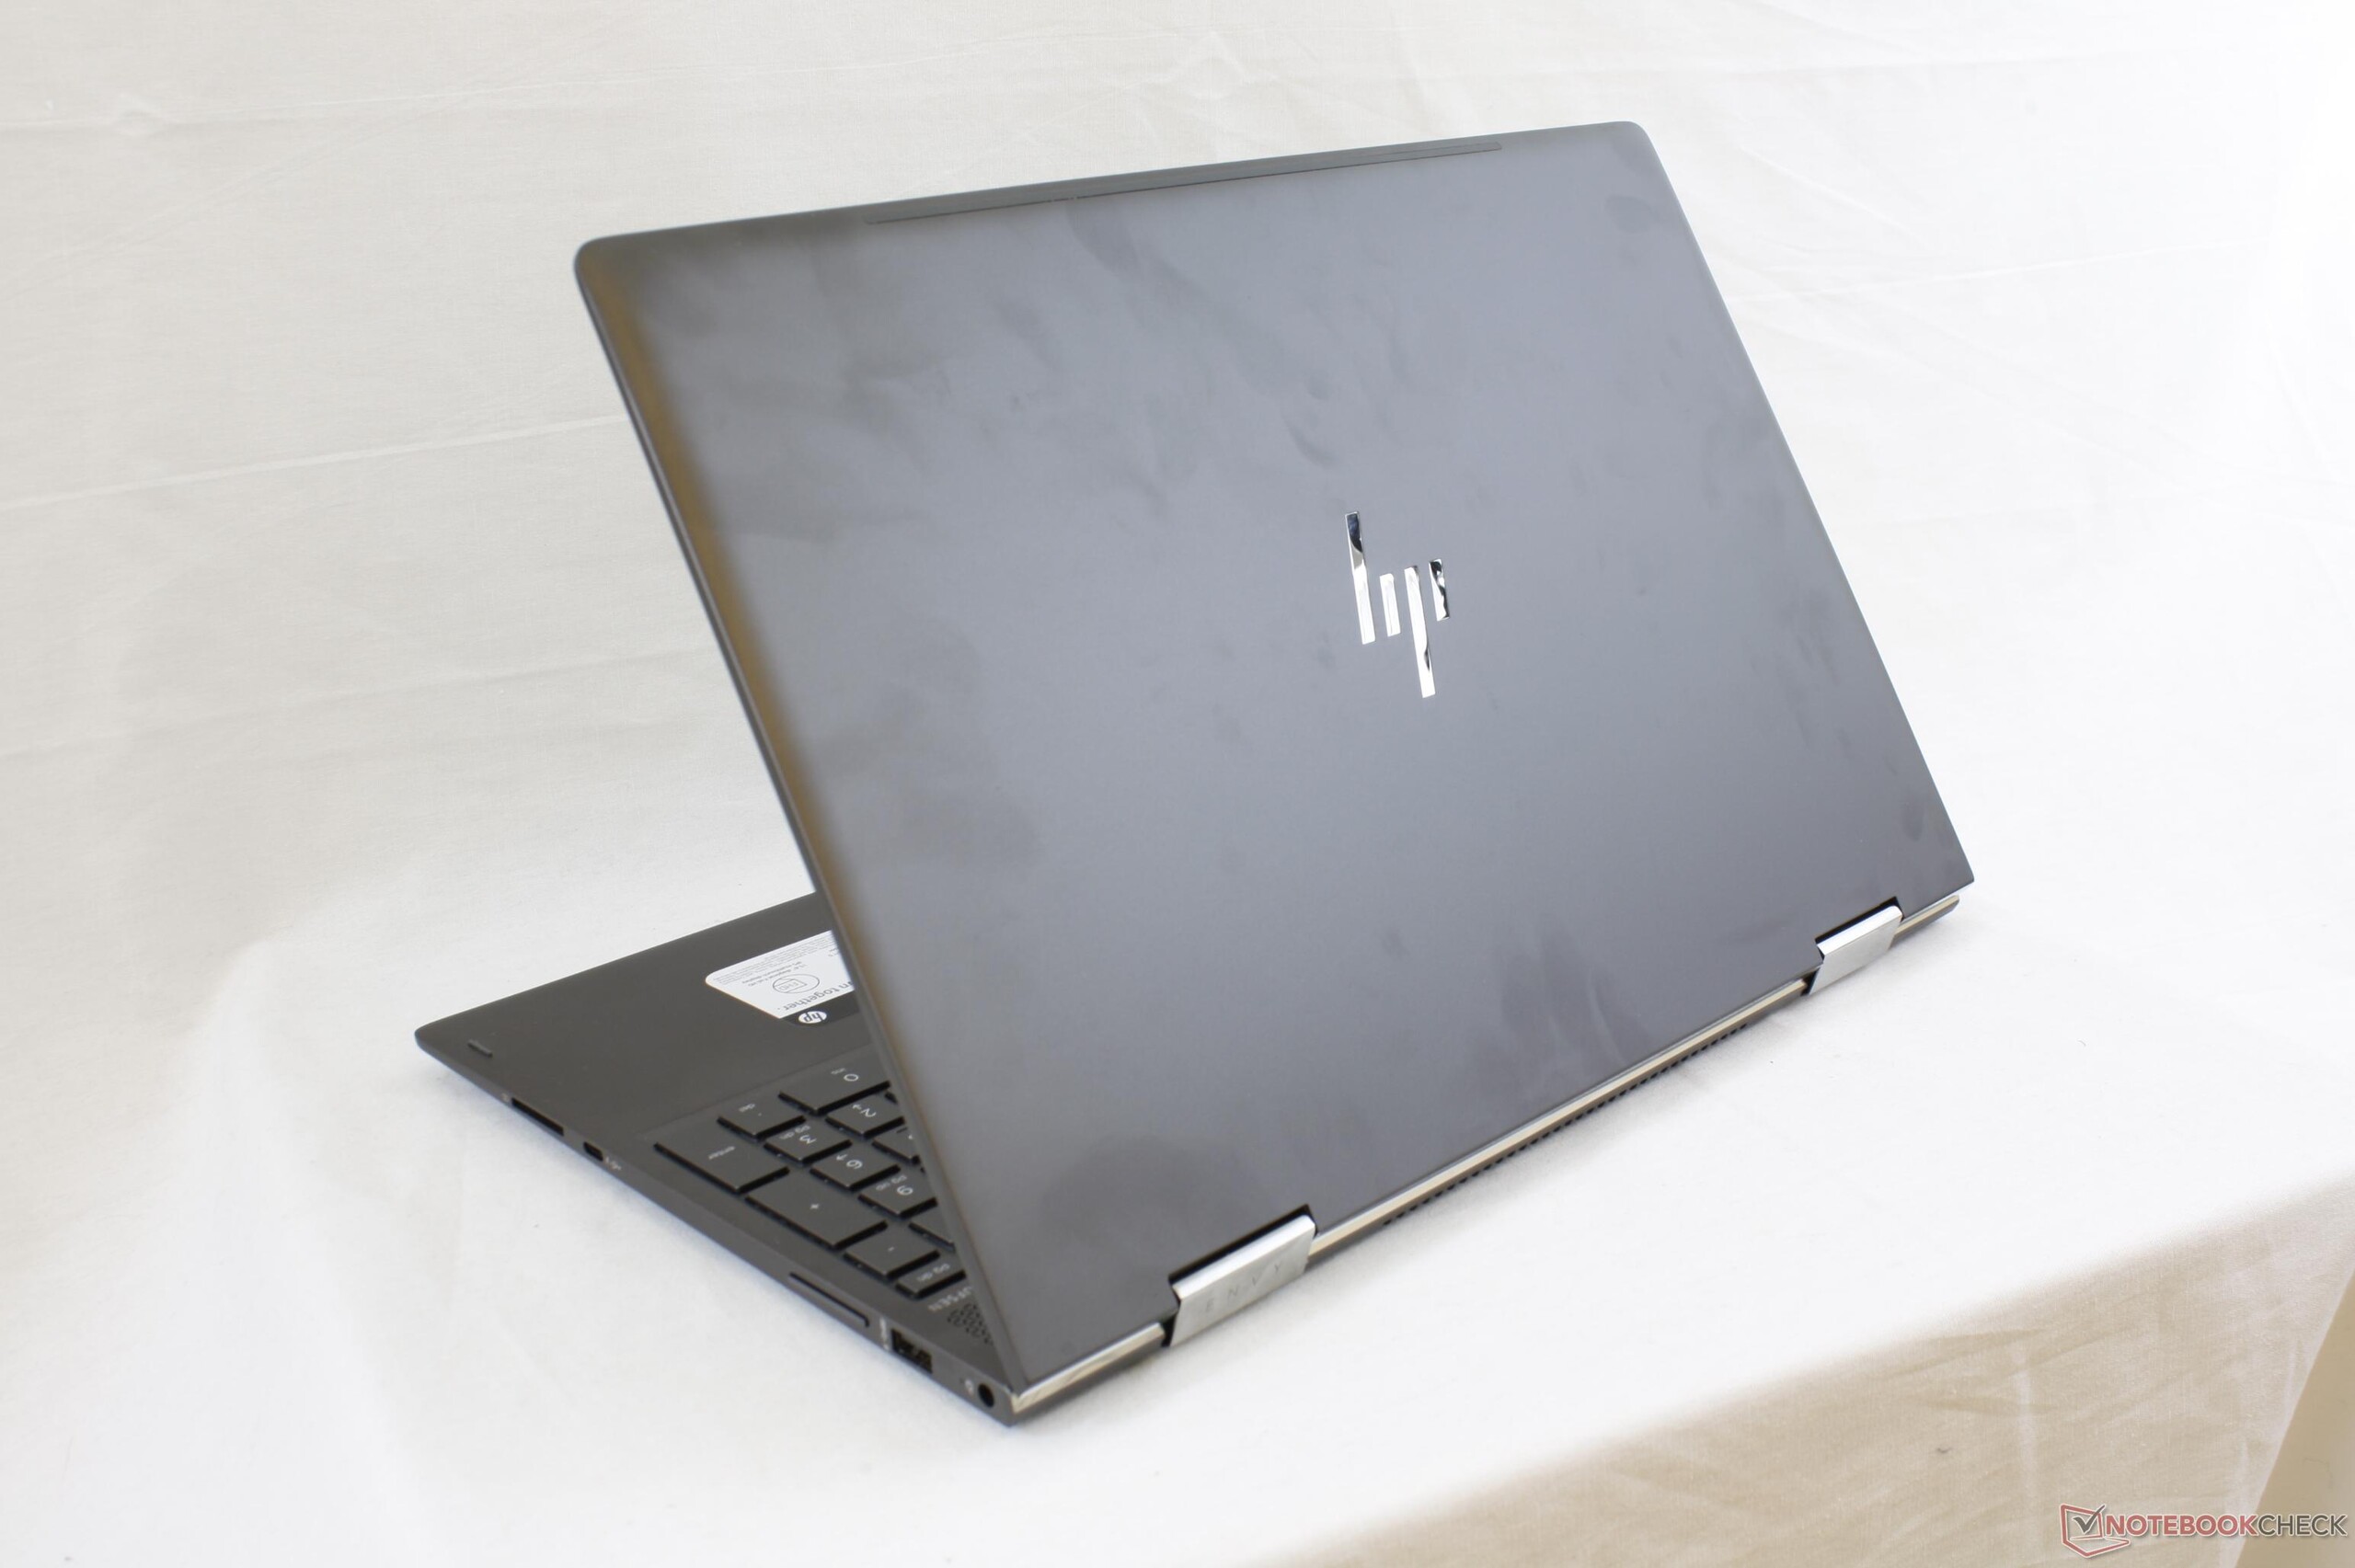
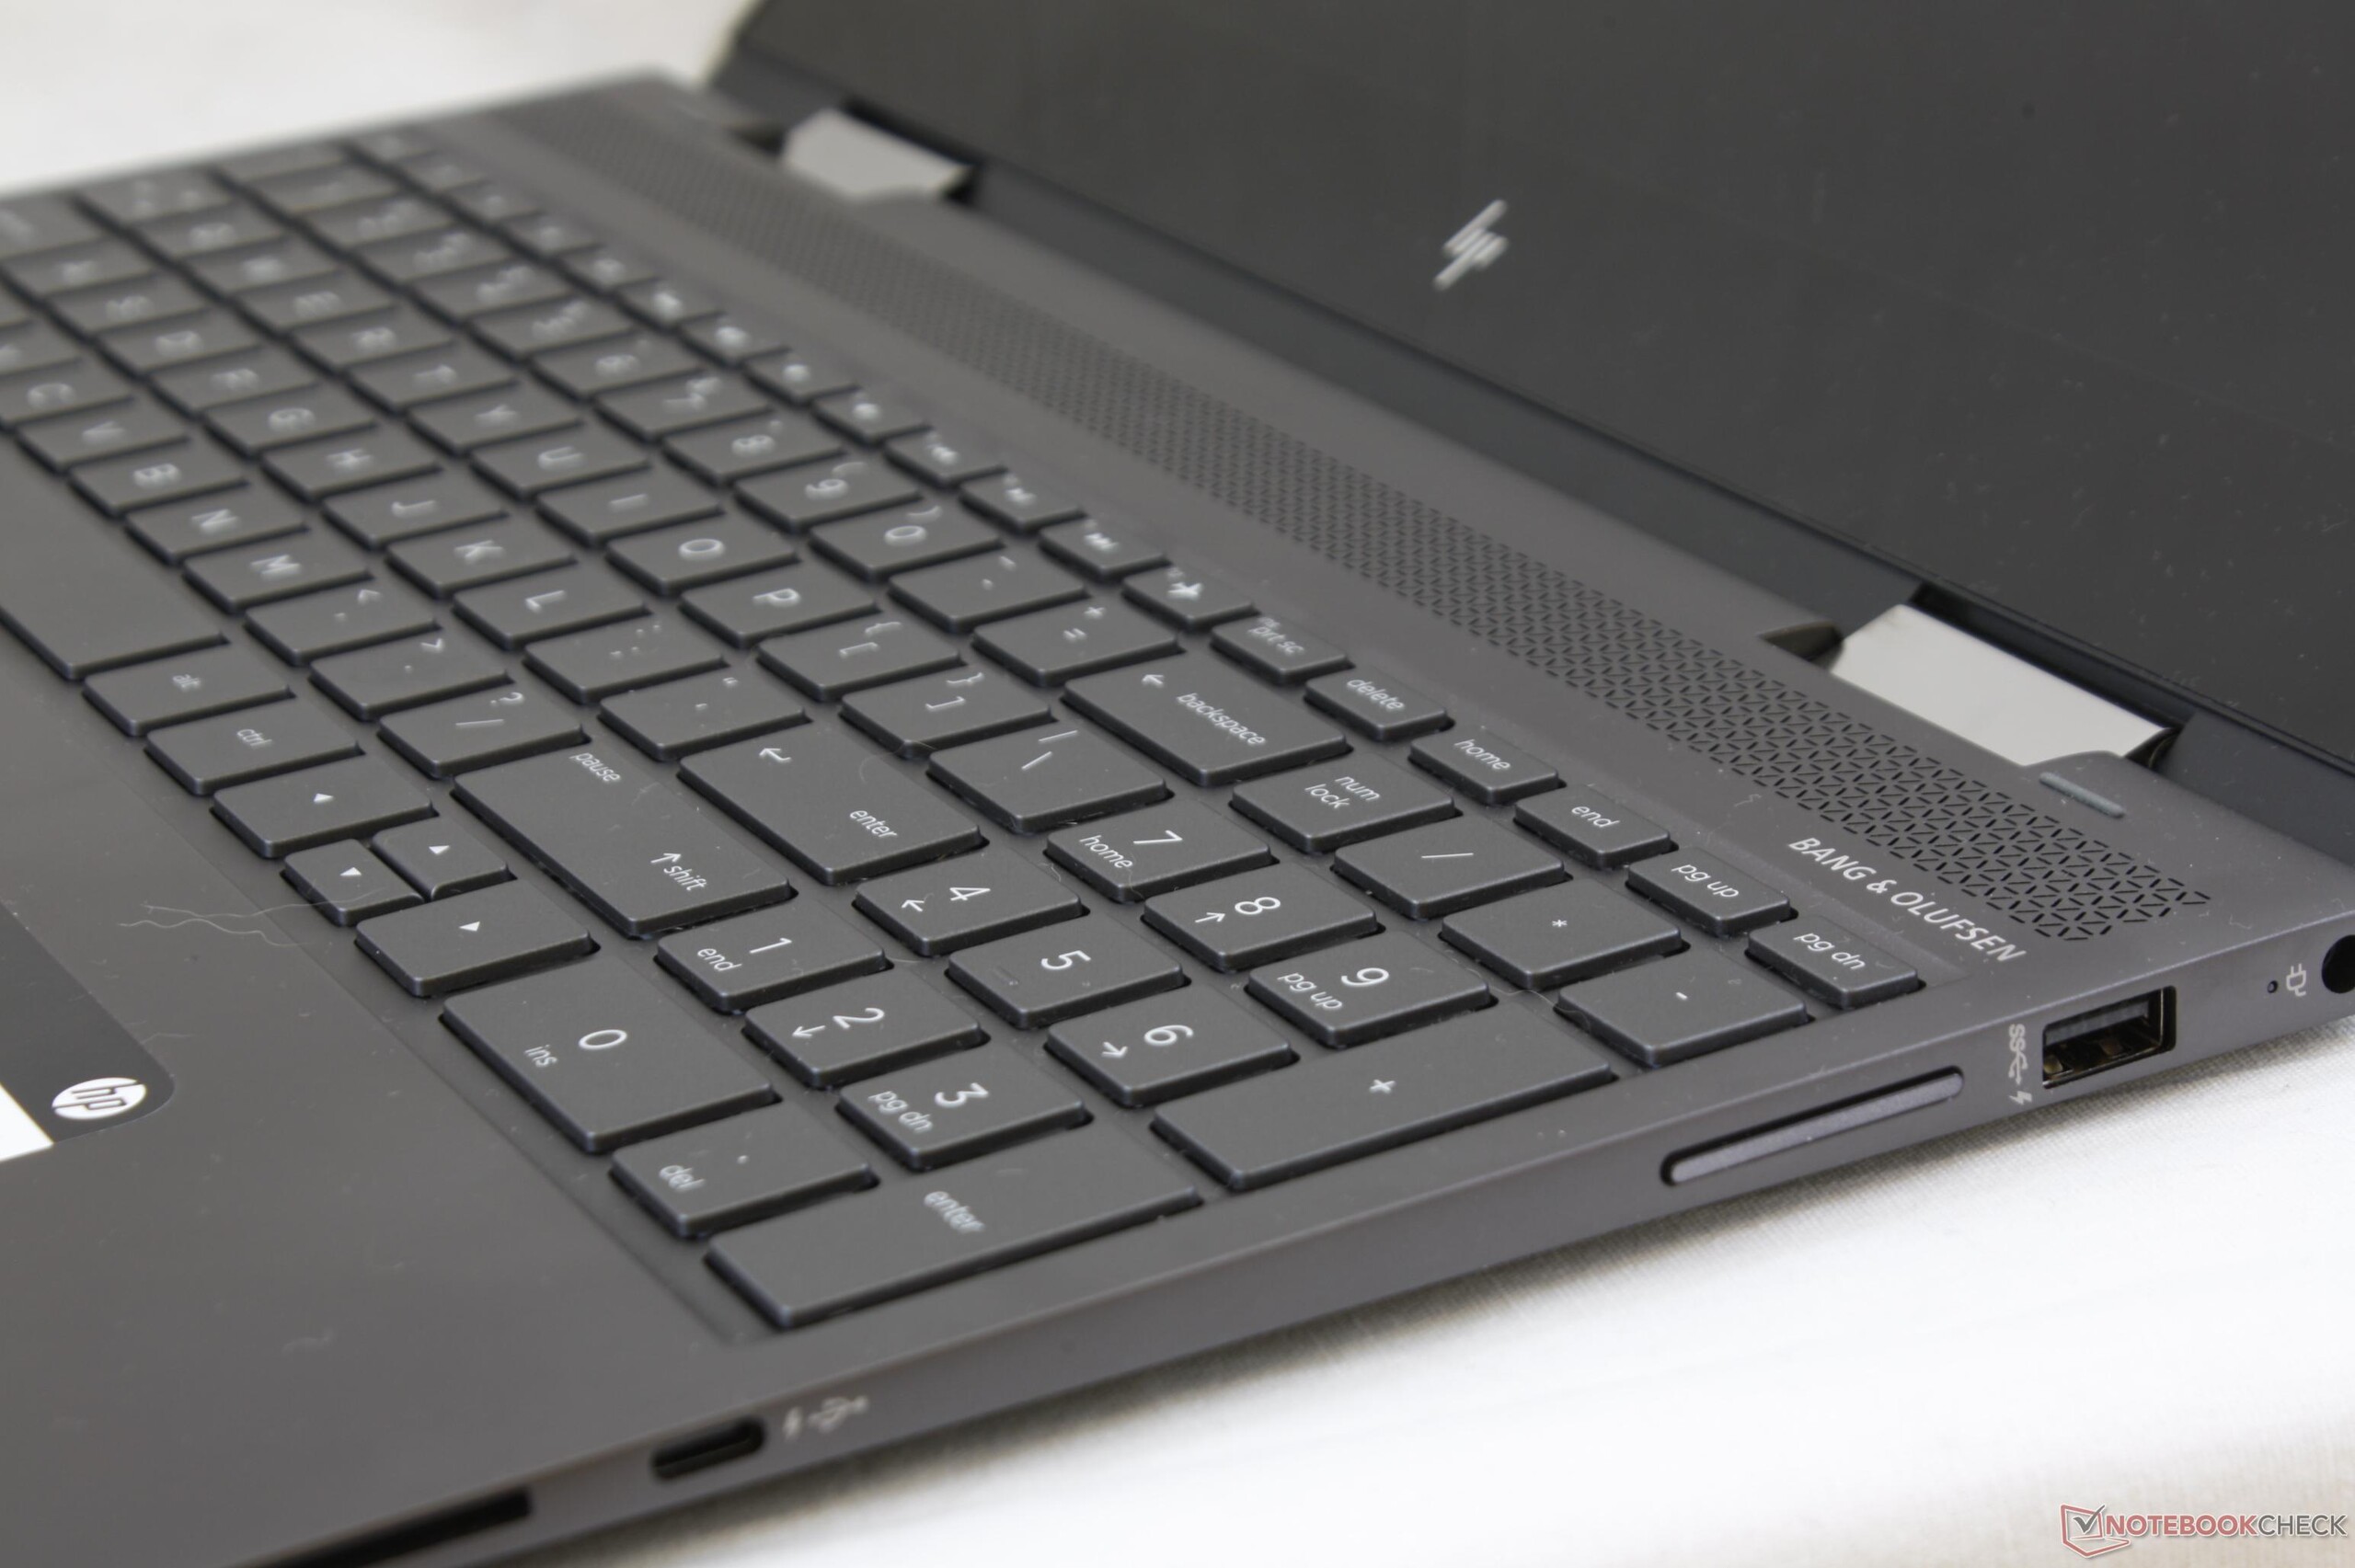
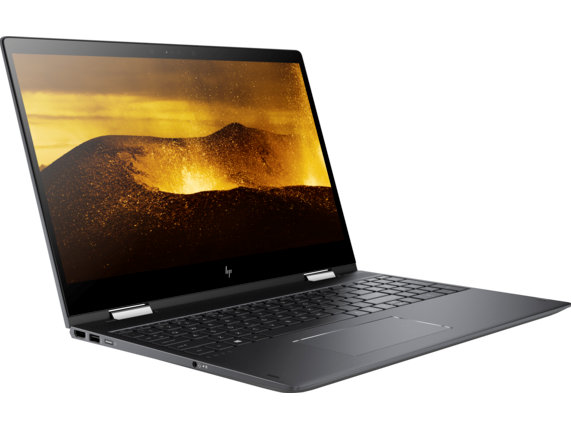
Breve análisis del portátil HP Envy x360 15 (Ryzen 5 2500U, Radeon Vega 8)

| SD Card Reader | |
| average JPG Copy Test (av. of 3 runs) | |
| HP Spectre x360 15-bl002xx | |
| Dell XPS 15 9560 (i7-7700HQ, UHD) | |
| HP Envy x360 15m-bq121dx | |
| MSI GS63VR 7RF-228US | |
| maximum AS SSD Seq Read Test (1GB) | |
| Dell XPS 15 9560 (i7-7700HQ, UHD) | |
| HP Spectre x360 15-bl002xx | |
| HP Envy x360 15m-bq121dx | |
| MSI GS63VR 7RF-228US | |
| |||||||||||||||||||||||||
iluminación: 88 %
Brillo con batería: 230.2 cd/m²
Contraste: 1151:1 (Negro: 0.2 cd/m²)
ΔE ColorChecker Calman: 5.7 | ∀{0.5-29.43 Ø4.71}
ΔE Greyscale Calman: 2.6 | ∀{0.09-98 Ø4.96}
57.9% sRGB (Argyll 1.6.3 3D)
37.5% AdobeRGB 1998 (Argyll 1.6.3 3D)
41.29% AdobeRGB 1998 (Argyll 3D)
58.3% sRGB (Argyll 3D)
39.97% Display P3 (Argyll 3D)
Gamma: 2.2
CCT: 6109 K
| HP Envy x360 15m-bq121dx ID: BOE06F9, IPS, 15.6", 1920x1080 | HP Spectre x360 15-bl002xx UHD UWVA eDP BrightView WLED-backlit , IPS, 15.6", 3840x2160 | HP Envy x360 15t-w200 BOE0679 , IPS, 15.6", 1920x1080 | Dell XPS 15 9560 (i7-7700HQ, UHD) IGZO IPS, 15.6", 3840x2160 | Lenovo Yoga 720-15IKB-80X7 Chi Mei CMN N156HCE-EN1, IPS, 15.6", 1920x1080 | |
|---|---|---|---|---|---|
| Display | 59% | 9% | 113% | 59% | |
| Display P3 Coverage (%) | 39.97 | 67.9 70% | 43.31 8% | 89.7 124% | 65 63% |
| sRGB Coverage (%) | 58.3 | 88.2 51% | 65 11% | 100 72% | 90.8 56% |
| AdobeRGB 1998 Coverage (%) | 41.29 | 64.4 56% | 44.75 8% | 100 142% | 65.8 59% |
| Response Times | -29% | -34% | -52% | 13% | |
| Response Time Grey 50% / Grey 80% * (ms) | 30.8 ? | 44 ? -43% | 56 ? -82% | 57.2 ? -86% | 29.6 ? 4% |
| Response Time Black / White * (ms) | 33.6 ? | 38.8 ? -15% | 28.8 ? 14% | 39.2 ? -17% | 26.4 ? 21% |
| PWM Frequency (Hz) | 201.6 ? | 1000 ? | 201.6 | 962 | 25510 ? |
| Screen | 36% | 0% | 21% | 6% | |
| Brightness middle (cd/m²) | 230.2 | 351.5 53% | 204.9 -11% | 370.1 61% | 300.9 31% |
| Brightness (cd/m²) | 222 | 336 51% | 190 -14% | 356 60% | 285 28% |
| Brightness Distribution (%) | 88 | 83 -6% | 82 -7% | 87 -1% | 92 5% |
| Black Level * (cd/m²) | 0.2 | 0.24 -20% | 0.203 -1% | 0.37 -85% | 0.24 -20% |
| Contrast (:1) | 1151 | 1465 27% | 1009 -12% | 1000 -13% | 1254 9% |
| Colorchecker dE 2000 * | 5.7 | 3.3 42% | 4.7 18% | 5.3 7% | 5 12% |
| Colorchecker dE 2000 max. * | 20.8 | 7.3 65% | 9.03 57% | 9.9 52% | 10.2 51% |
| Greyscale dE 2000 * | 2.6 | 1.9 27% | 3.86 -48% | 4.6 -77% | 7 -169% |
| Gamma | 2.2 100% | 2.09 105% | 2.36 93% | 2.31 95% | 2.34 94% |
| CCT | 6109 106% | 6784 96% | 6834 95% | 6284 103% | 6578 99% |
| Color Space (Percent of AdobeRGB 1998) (%) | 37.5 | 64.4 72% | 41 9% | 88.3 135% | 59 57% |
| Color Space (Percent of sRGB) (%) | 57.9 | 88.2 52% | 64 11% | 100 73% | 90 55% |
| Media total (Programa/Opciones) | 22% /
32% | -8% /
-3% | 27% /
30% | 26% /
17% |
* ... más pequeño es mejor
Tiempos de respuesta del display
| ↔ Tiempo de respuesta de Negro a Blanco | ||
|---|---|---|
| 33.6 ms ... subida ↗ y bajada ↘ combinada | ↗ 18 ms subida | 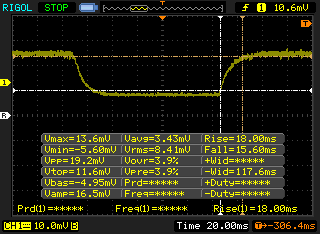 |
| ↘ 15.6 ms bajada | ||
| La pantalla mostró tiempos de respuesta lentos en nuestros tests y podría ser demasiado lenta para los jugones. En comparación, todos los dispositivos de prueba van de ##min### (mínimo) a 240 (máximo) ms. » 90 % de todos los dispositivos son mejores. Eso quiere decir que el tiempo de respuesta es peor que la media (19.8 ms) de todos los dispositivos testados. | ||
| ↔ Tiempo de respuesta 50% Gris a 80% Gris | ||
| 30.8 ms ... subida ↗ y bajada ↘ combinada | ↗ 14 ms subida | 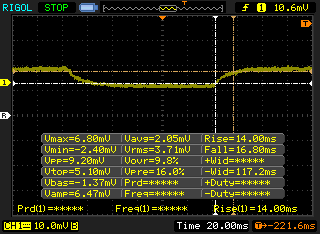 |
| ↘ 16.8 ms bajada | ||
| La pantalla mostró tiempos de respuesta lentos en nuestros tests y podría ser demasiado lenta para los jugones. En comparación, todos los dispositivos de prueba van de ##min### (mínimo) a 636 (máximo) ms. » 41 % de todos los dispositivos son mejores. Eso quiere decir que el tiempo de respuesta es similar al dispositivo testado medio (30.9 ms). | ||
Parpadeo de Pantalla / PWM (Pulse-Width Modulation)
| Parpadeo de Pantalla / PWM detectado | 201.6 Hz | ≤ 99 % de brillo | 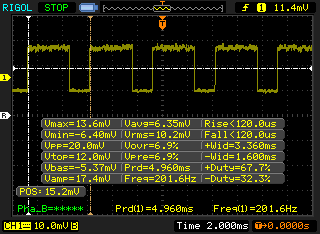 |
La retroiluminación del display parpadea a 201.6 Hz (seguramente usa PWM - Pulse-Width Modulation) a un brillo del 99 % e inferior. Sobre este nivel de brillo no debería darse parpadeo / PWM. La frecuencia de 201.6 Hz es relativamente baja, por lo que la gente sensible debería ver parpadeos y padecer fatiga visual por la pantalla (usado al brillo indicado a continuación). Comparación: 52 % de todos los dispositivos testados no usaron PWM para atenuar el display. Si se usó, medimos una media de 7744 (mínimo: 5 - máxmo: 343500) Hz. | |||
* ... más pequeño es mejor
| PCMark 8 Home Score Accelerated v2 | 3385 puntos | |
| PCMark 10 Score | 2814 puntos | |
ayuda | ||
| HP Envy x360 15m-bq121dx HGST Travelstar 7K1000 HTS721010A9E630 | HP Omen 15-ce002ng Samsung PM961 MZVLW256HEHP | Xiaomi Mi Notebook Pro i5 Samsung PM961 MZVLW256HEHP | HP Pavilion 17z 1EX13AV Avolusion MD1TBLSSHD | HP Pavilion 15z-bw000 Avolusion MD1TBLSSHD | |
|---|---|---|---|---|---|
| CrystalDiskMark 5.2 / 6 | 14649% | 11981% | -5% | -8% | |
| Write 4K (MB/s) | 1.168 | 156 13256% | 150 12742% | 1.322 13% | 1.171 0% |
| Read 4K (MB/s) | 0.536 | 47.14 8695% | 36 6616% | 0.545 2% | 0.422 -21% |
| Write Seq (MB/s) | 114.1 | 1266 1010% | 1057 826% | 89.1 -22% | 108.6 -5% |
| Read Seq (MB/s) | 114.9 | 1419 1135% | 1074 835% | 91.4 -20% | 106.3 -7% |
| Write 4K Q32T1 (MB/s) | 1.212 | 486 39999% | 429 35296% | 1.239 2% | 1.145 -6% |
| Read 4K Q32T1 (MB/s) | 1.189 | 586 49185% | 441 36990% | 1.548 30% | 1.104 -7% |
| Write Seq Q32T1 (MB/s) | 113.2 | 1246 1001% | 1283 1033% | 90.3 -20% | 107.4 -5% |
| Read Seq Q32T1 (MB/s) | 114.1 | 3431 2907% | 1838 1511% | 88.3 -23% | 104.1 -9% |

| 3DMark | |
| 1280x720 Cloud Gate Standard Graphics | |
| Asus FX550IU-WSFX | |
| Asus Zenbook UX510UW-CN044T | |
| Acer Aspire E5-575G-549D | |
| HP Envy 13-ad006ng | |
| HP Envy x360 15m-bq121dx | |
| Intel Skull Canyon NUC6i7KYK | |
| Lenovo ThinkPad 25 | |
| Apple MacBook Pro 13 2017 Touchbar i5 | |
| Microsoft Surface Laptop i7 | |
| Acer Switch 5 SW512-52-5819 | |
| HP 17-bs103ng | |
| HP 15-bw075ax | |
| 1920x1080 Fire Strike Graphics | |
| Asus FX550IU-WSFX | |
| Asus Zenbook UX510UW-CN044T | |
| Acer Aspire E5-575G-549D | |
| HP Envy 13-ad006ng | |
| HP Envy x360 15m-bq121dx | |
| Lenovo ThinkPad 25 | |
| Intel Skull Canyon NUC6i7KYK | |
| Apple MacBook Pro 13 2017 Touchbar i5 | |
| HP 17-bs103ng | |
| Microsoft Surface Laptop i7 | |
| Acer Switch 5 SW512-52-5819 | |
| HP 15-bw075ax | |
| 3DMark 11 | |
| 1280x720 Performance GPU | |
| Asus FX550IU-WSFX | |
| Asus Zenbook UX510UW-CN044T | |
| Acer Aspire E5-575G-549D | |
| HP Envy x360 15m-bq121dx | |
| HP Envy 13-ad006ng | |
| Intel Skull Canyon NUC6i7KYK | |
| Lenovo ThinkPad 25 | |
| Apple MacBook Pro 13 2017 Touchbar i5 | |
| Microsoft Surface Laptop i7 | |
| Microsoft Surface Laptop i7 | |
| HP 17-bs103ng | |
| Acer Switch 5 SW512-52-5819 | |
| 1280x720 Performance Combined | |
| Asus Zenbook UX510UW-CN044T | |
| Acer Aspire E5-575G-549D | |
| HP Envy 13-ad006ng | |
| Lenovo ThinkPad 25 | |
| HP Envy x360 15m-bq121dx | |
| Intel Skull Canyon NUC6i7KYK | |
| Asus FX550IU-WSFX | |
| Apple MacBook Pro 13 2017 Touchbar i5 | |
| Microsoft Surface Laptop i7 | |
| Microsoft Surface Laptop i7 | |
| HP 17-bs103ng | |
| Acer Switch 5 SW512-52-5819 | |
| 3DMark 11 Performance | 3759 puntos | |
| 3DMark Cloud Gate Standard Score | 10601 puntos | |
| 3DMark Fire Strike Score | 2262 puntos | |
| 3DMark Fire Strike Extreme Score | 1091 puntos | |
ayuda | ||
| BioShock Infinite - 1920x1080 Ultra Preset, DX11 (DDOF) | |
| Acer Aspire E5-575G-549D | |
| HP Spectre x360 15t-bl100 | |
| Lenovo ThinkPad 25 | |
| HP Envy x360 15m-bq121dx | |
| Intel Skull Canyon NUC6i7KYK | |
| Apple MacBook Pro 13 2017 | |
| HP Pavilion 17z 1EX13AV | |
| Dell XPS 13 i7-8550U | |
| Samsung Notebook 9 NP900X3N-K01US | |
| Rise of the Tomb Raider - 1920x1080 High Preset AA:FX AF:4x | |
| HP Spectre x360 15t-bl100 | |
| Acer Aspire E5-575G-549D | |
| Lenovo ThinkPad 25 | |
| HP Envy x360 15m-bq121dx | |
| Intel Skull Canyon NUC6i7KYK | |
| Dell XPS 13 i7-8550U | |
| bajo | medio | alto | ultra | |
|---|---|---|---|---|
| Guild Wars 2 (2012) | 72.3 | 12.9 | ||
| BioShock Infinite (2013) | 114.4 | 20 | ||
| Metro: Last Light (2013) | 60 | 14.2 | ||
| Thief (2014) | 45.9 | 14 | ||
| The Witcher 3 (2015) | 42.3 | 14 | ||
| Batman: Arkham Knight (2015) | 42 | 16 | ||
| Metal Gear Solid V (2015) | 60 | 31 | 20 | |
| Fallout 4 (2015) | 43.9 | 14.9 | ||
| Rise of the Tomb Raider (2016) | 49.3 | 15.4 | ||
| Ashes of the Singularity (2016) | 12.9 | |||
| Overwatch (2016) | 94.2 | 40 | ||
| Mafia 3 (2016) | 13 | |||
| Prey (2017) | 63.2 | 21.7 | ||
| Dirt 4 (2017) | 90.4 | 35.6 | 20.9 | |
| F1 2017 (2017) | 60 | 27 | 22 |
Ruido
| Ocioso |
| 32.3 / 32.4 / 34.2 dB(A) |
| Carga |
| 36.2 / 45.3 dB(A) |
 | ||
30 dB silencioso 40 dB(A) audible 50 dB(A) ruidosamente alto |
||
min: | ||
| HP Envy x360 15m-bq121dx Vega 8, R5 2500U, HGST Travelstar 7K1000 HTS721010A9E630 | HP Omen 15-ce002ng GeForce GTX 1060 Max-Q, i7-7700HQ, Samsung PM961 MZVLW256HEHP | Lenovo Yoga 720-15IKB-80X7 GeForce GTX 1050 Mobile, i7-7700HQ, Samsung PM961 MZVLW256HEHP | HP Spectre x360 15-bl002xx GeForce 940MX, i7-7500U, Toshiba XG4 NVMe (THNSN5512GPUK) | HP Envy x360 15t-w200 GeForce 930MX, i7-7500U, WDC Slim WD10SPCX-24HWST1 | Asus Zenbook UX510UW-CN044T GeForce GTX 960M, 6500U, SanDisk SD8SNAT256G1002 | |
|---|---|---|---|---|---|---|
| Noise | -4% | 6% | 1% | -2% | -3% | |
| apagado / medio ambiente * (dB) | 28.5 | 30 -5% | 28.2 1% | 28.5 -0% | 30.2 -6% | 31.6 -11% |
| Idle Minimum * (dB) | 32.3 | 30 7% | 28.2 13% | 28.5 12% | 33.8 -5% | 31.6 2% |
| Idle Average * (dB) | 32.4 | 33 -2% | 28.2 13% | 28.5 12% | 33.9 -5% | 31.6 2% |
| Idle Maximum * (dB) | 34.2 | 37 -8% | 28.2 18% | 36.3 -6% | 34.2 -0% | 33.4 2% |
| Load Average * (dB) | 36.2 | 41 -13% | 39 -8% | 42.7 -18% | 36 1% | 41.7 -15% |
| Witcher 3 ultra * (dB) | 42.8 | 42 2% | ||||
| Load Maximum * (dB) | 45.3 | 50 -10% | 46.3 -2% | 42.7 6% | 44 3% | 44.8 1% |
* ... más pequeño es mejor
(±) La temperatura máxima en la parte superior es de 40 °C / 104 F, frente a la media de 35.4 °C / 96 F, que oscila entre 19.6 y 60 °C para la clase Convertible.
(±) El fondo se calienta hasta un máximo de 44 °C / 111 F, frente a la media de 36.9 °C / 98 F
(+) En reposo, la temperatura media de la parte superior es de 22.4 °C / 72# F, frente a la media del dispositivo de 30.3 °C / 87 F.
(+) Jugando a The Witcher 3, la temperatura media de la parte superior es de 31.9 °C / 89 F, frente a la media del dispositivo de 30.3 °C / 87 F.
(+) El reposamanos y el panel táctil están a una temperatura inferior a la de la piel, con un máximo de 30.2 °C / 86.4 F y, por tanto, son fríos al tacto.
(-) La temperatura media de la zona del reposamanos de dispositivos similares fue de 28 °C / 82.4 F (-2.2 °C / -4 F).
HP Envy x360 15m-bq121dx análisis de audio
(-) | altavoces no muy altos (#65.5 dB)
Graves 100 - 315 Hz
(-) | casi sin bajos - de media 15.1% inferior a la mediana
(-) | los graves no son lineales (15.3% delta a la frecuencia anterior)
Medios 400 - 2000 Hz
(+) | medios equilibrados - a sólo 4.8% de la mediana
(±) | la linealidad de los medios es media (7.4% delta respecto a la frecuencia anterior)
Altos 2 - 16 kHz
(+) | máximos equilibrados - a sólo 2.3% de la mediana
(±) | la linealidad de los máximos es media (7.8% delta a frecuencia anterior)
Total 100 - 16.000 Hz
(±) | la linealidad del sonido global es media (26.3% de diferencia con la mediana)
En comparación con la misma clase
» 82% de todos los dispositivos probados de esta clase eran mejores, 3% similares, 15% peores
» El mejor tuvo un delta de 6%, la media fue 20%, el peor fue ###max##%
En comparación con todos los dispositivos probados
» 81% de todos los dispositivos probados eran mejores, 4% similares, 15% peores
» El mejor tuvo un delta de 4%, la media fue 23%, el peor fue ###max##%
Apple MacBook 12 (Early 2016) 1.1 GHz análisis de audio
(+) | los altavoces pueden reproducir a un volumen relativamente alto (#83.6 dB)
Graves 100 - 315 Hz
(±) | lubina reducida - en promedio 11.3% inferior a la mediana
(±) | la linealidad de los graves es media (14.2% delta a frecuencia anterior)
Medios 400 - 2000 Hz
(+) | medios equilibrados - a sólo 2.4% de la mediana
(+) | los medios son lineales (5.5% delta a la frecuencia anterior)
Altos 2 - 16 kHz
(+) | máximos equilibrados - a sólo 2% de la mediana
(+) | los máximos son lineales (4.5% delta a la frecuencia anterior)
Total 100 - 16.000 Hz
(+) | el sonido global es lineal (10.2% de diferencia con la mediana)
En comparación con la misma clase
» 7% de todos los dispositivos probados de esta clase eran mejores, 2% similares, 90% peores
» El mejor tuvo un delta de 5%, la media fue 18%, el peor fue ###max##%
En comparación con todos los dispositivos probados
» 5% de todos los dispositivos probados eran mejores, 1% similares, 94% peores
» El mejor tuvo un delta de 4%, la media fue 23%, el peor fue ###max##%
| Off / Standby | |
| Ocioso | |
| Carga |
|
Clave:
min: | |
| HP Envy x360 15m-bq121dx R5 2500U, Vega 8, HGST Travelstar 7K1000 HTS721010A9E630, IPS, 1920x1080, 15.6" | Xiaomi Mi Notebook Pro i5 i5-8250U, GeForce MX150, Samsung PM961 MZVLW256HEHP, IPS LED, 1920x1080, 15.6" | HP Spectre x360 15-bl002xx i7-7500U, GeForce 940MX, Toshiba XG4 NVMe (THNSN5512GPUK), IPS, 3840x2160, 15.6" | HP Envy x360 15t-w200 i7-7500U, GeForce 930MX, WDC Slim WD10SPCX-24HWST1, IPS, 1920x1080, 15.6" | HP Spectre x360 15t-bl100 i5-8550U, GeForce MX150, Samsung PM961 NVMe MZVLW512HMJP, IPS, 3840x2160, 15.6" | Lenovo Yoga 720-15IKB-80X7 i7-7700HQ, GeForce GTX 1050 Mobile, Samsung PM961 MZVLW256HEHP, IPS, 1920x1080, 15.6" | |
|---|---|---|---|---|---|---|
| Power Consumption | 8% | -26% | 16% | -54% | -59% | |
| Idle Minimum * (Watt) | 5.9 | 3.7 37% | 8.14 -38% | 5 15% | 11.6 -97% | 8.3 -41% |
| Idle Average * (Watt) | 8.7 | 7.5 14% | 10.91 -25% | 8.3 5% | 13.8 -59% | 10.2 -17% |
| Idle Maximum * (Watt) | 10.5 | 8 24% | 12.26 -17% | 7.8 26% | 14.2 -35% | 10.4 1% |
| Load Average * (Watt) | 45.7 | 49 -7% | 45.67 -0% | 28.8 37% | 67.9 -49% | 67.5 -48% |
| Witcher 3 ultra * (Watt) | 45.8 | 50.6 -10% | 59 -29% | 96.5 -111% | ||
| Load Maximum * (Watt) | 49.4 | 55.2 -12% | 74.94 -52% | 49.7 -1% | 76.9 -56% | 117.2 -137% |
* ... más pequeño es mejor
| HP Envy x360 15m-bq121dx R5 2500U, Vega 8, 55.8 Wh | Lenovo Yoga 720-15IKB-80X7 i7-7700HQ, GeForce GTX 1050 Mobile, 72 Wh | HP Spectre x360 15-bl002xx i7-7500U, GeForce 940MX, 79.2 Wh | HP Envy x360 15t-w200 i7-7500U, GeForce 930MX, 48 Wh | HP Spectre x360 15t-bl100 i5-8550U, GeForce MX150, 79.2 Wh | Dell XPS 15 9560 (i7-7700HQ, UHD) i7-7700HQ, GeForce GTX 1050 Mobile, 97 Wh | |
|---|---|---|---|---|---|---|
| Duración de Batería | 36% | 53% | -3% | 50% | 23% | |
| Reader / Idle (h) | 10.9 | 17.8 63% | 14.4 32% | 10.6 -3% | 15.6 43% | 13.9 28% |
| WiFi v1.3 (h) | 6.6 | 8.1 23% | 8.9 35% | 5.3 -20% | 8.5 29% | 7.2 9% |
| Load (h) | 1.3 | 1.6 23% | 2.5 92% | 1.5 15% | 2.3 77% | 1.7 31% |
Pro
Contra
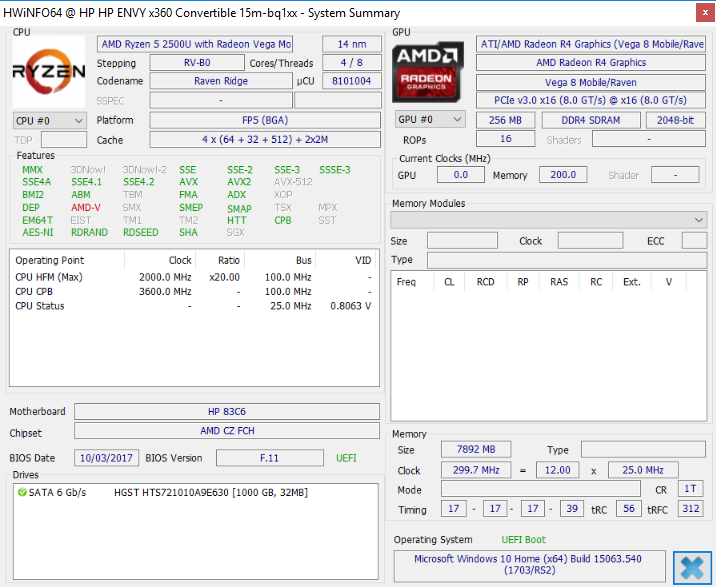
Ya que este es el primer portátil comercialmente disponible equipado con Raven Ridge, nuestro veredicto se puede dividir en dos partes. La primera parte se refiere al hardware AMD en sí. En papel, la GPU 25 W ctDP Ryzen 5 2500U y la GPU RX Vega 8 son capaces de codearse con las opciones actuales de 15 W Kaby Lake-R (i5-8250, i7-8550U) mientras superan incluso a la Iris Pro Graphics 580 en las pruebas. Combina esto con el precio generalmente más bajo y no parece que haya razón para no elegir Intel sobre AMD con todo lo demás igual.
Desafortunadamente para AMD, todo lo demás no es igual y Raven Ridge simplemente no está listo para el horario de máxima audiencia. Nuestro modelo de pruebas es extraordinariamente lento y sufre bloqueos aleatorios. En particular, el sistema se bloqueará con más frecuencia al estresar la GPU o al generar cargas al jugar similares a la generación anterior de portátiles AMD Dual Graphics, como en la Asus FX550IU. Las pruebas sintéticas pueden revelar que el Vega 8 es más rápido que el viejo GeForce 940MX, pero lo contrario es cierto cuando se juega a los juegos más modernos. Este es el AMD clásico para bien o para mal: un rendimiento excelente por dólar que acaba perdiéndose por controladores inferiores y soporte para desarrolladores.
Los compradores potenciales que se ven atraídos por el impresionante rendimiento del procesador encontrarán que el precio más bajo es atractivo con respecto a un equivalente de Intel Kaby Lake-R. Por otro lado, los jugadores no encontrarán más que una decepción con la RX Vega 8 hasta que sus drivers estén actualizados. Puede ser más del doble de potente que el UHD Graphics 620 en pruebas sintéticas, pero el MX150 sigue siendo la mejor inversión para jugar a 1080p con un presupuesto ajustado.
La segunda parte de nuestro veredicto está en el portátil HP como un todo. El fabricante ha incorporado con éxito biseles estrechos de la clase Specter en su línea principal de Envy que es más elegante y tan resistente como la generación saliente. Más allá del rediseño de la carcasa, sin embargo, no ha mejorado mucho más. Esta era la oportunidad de HP de mejorar todos los aspectos de la serie Envy x360 15, pero en su lugar tenemos la misma pantalla táctil de poco brillo de 1080p, espacio de color limitado y características de PWM como el modelo del año pasado. Los altavoces, el lector SD, el teclado, el panel táctil, las bisagras, el peso total y el ruido de los ventiladores tampoco mejoraron tangiblemente con respecto al modelo 2016. El mayor atractivo, entonces, es que parece más delgado y quizás el aguante de la batería un poco más largo y el puerto USB tipo C Gen. 1 en este último rediseño.
La nueva plataforma AMD Raven Ridge es un logro encomiable, pero es una lástima que siga teniendo los mismos problemas de software y controladores que han estado plagando al fabricante de chips durante años. No podemos recomendar este sistema AMD HP basado en HDD al menos hasta que se hayan corregido los fallos técnicos de la GPU.
Ésta es una versión acortada del análisis original. Puedes leer el análisis completo en inglés aquí.
HP Envy x360 15m-bq121dx
- 11/30/2017 v6 (old)
Allen Ngo
Price comparison
