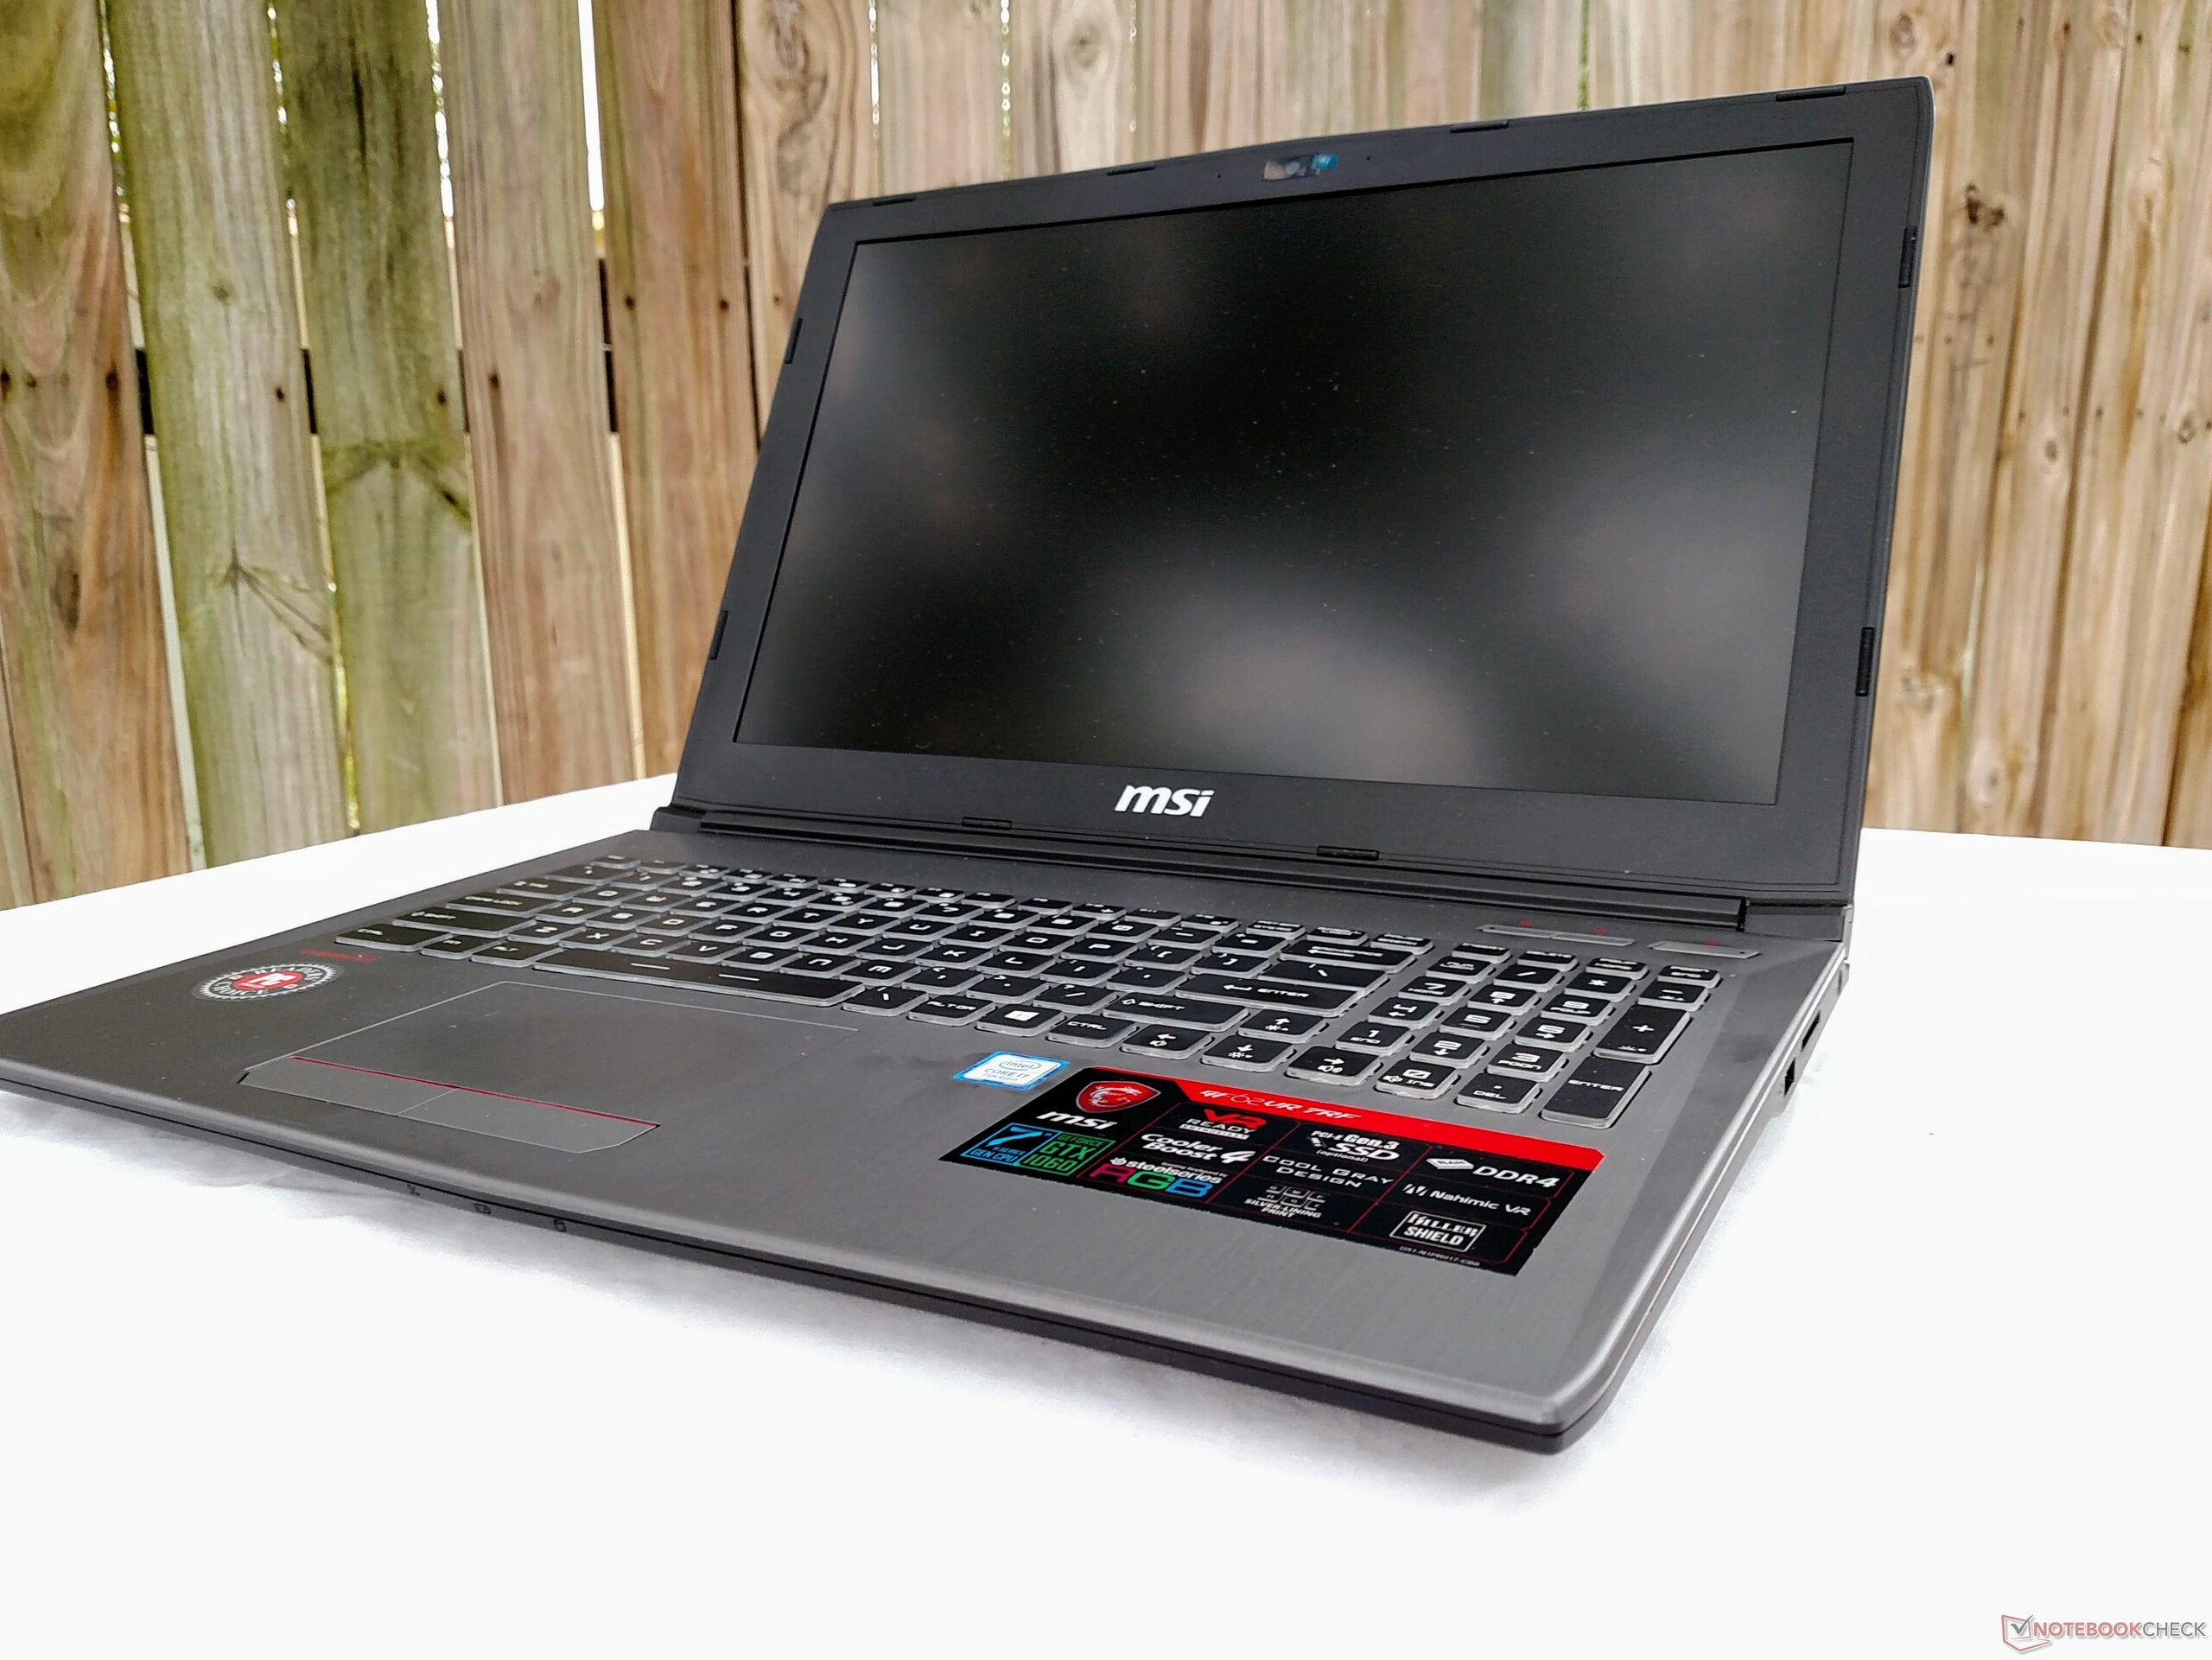
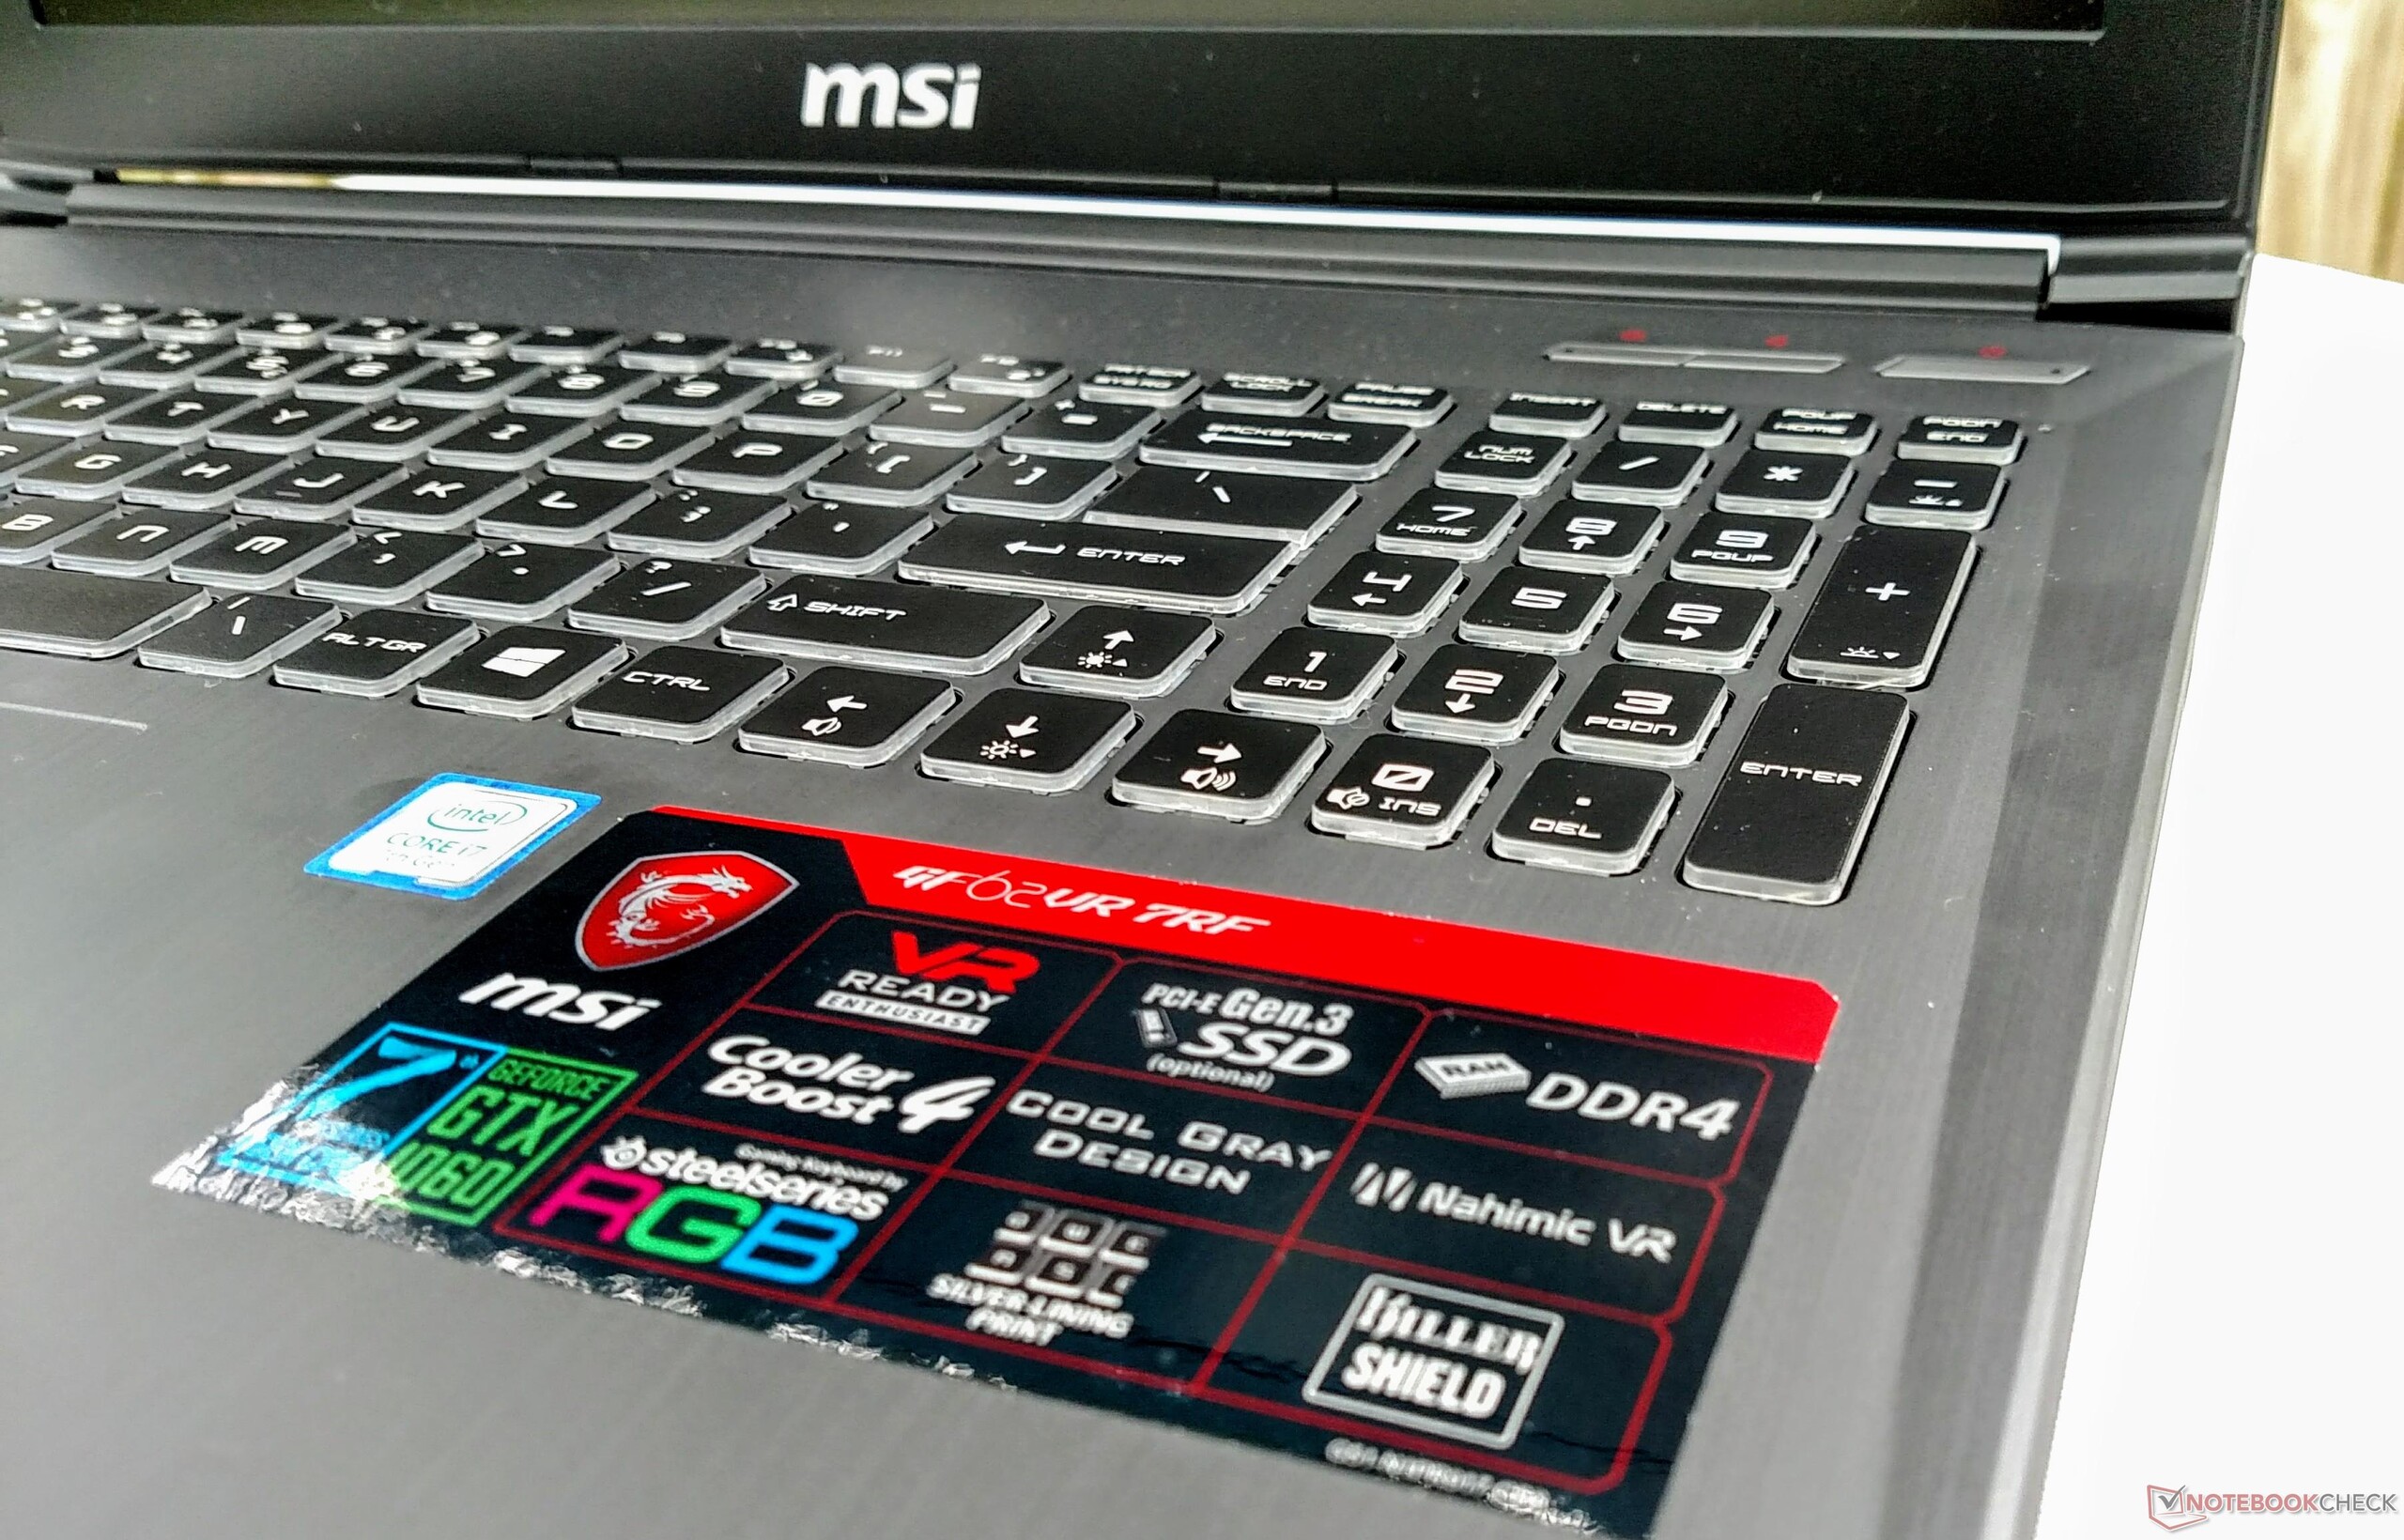
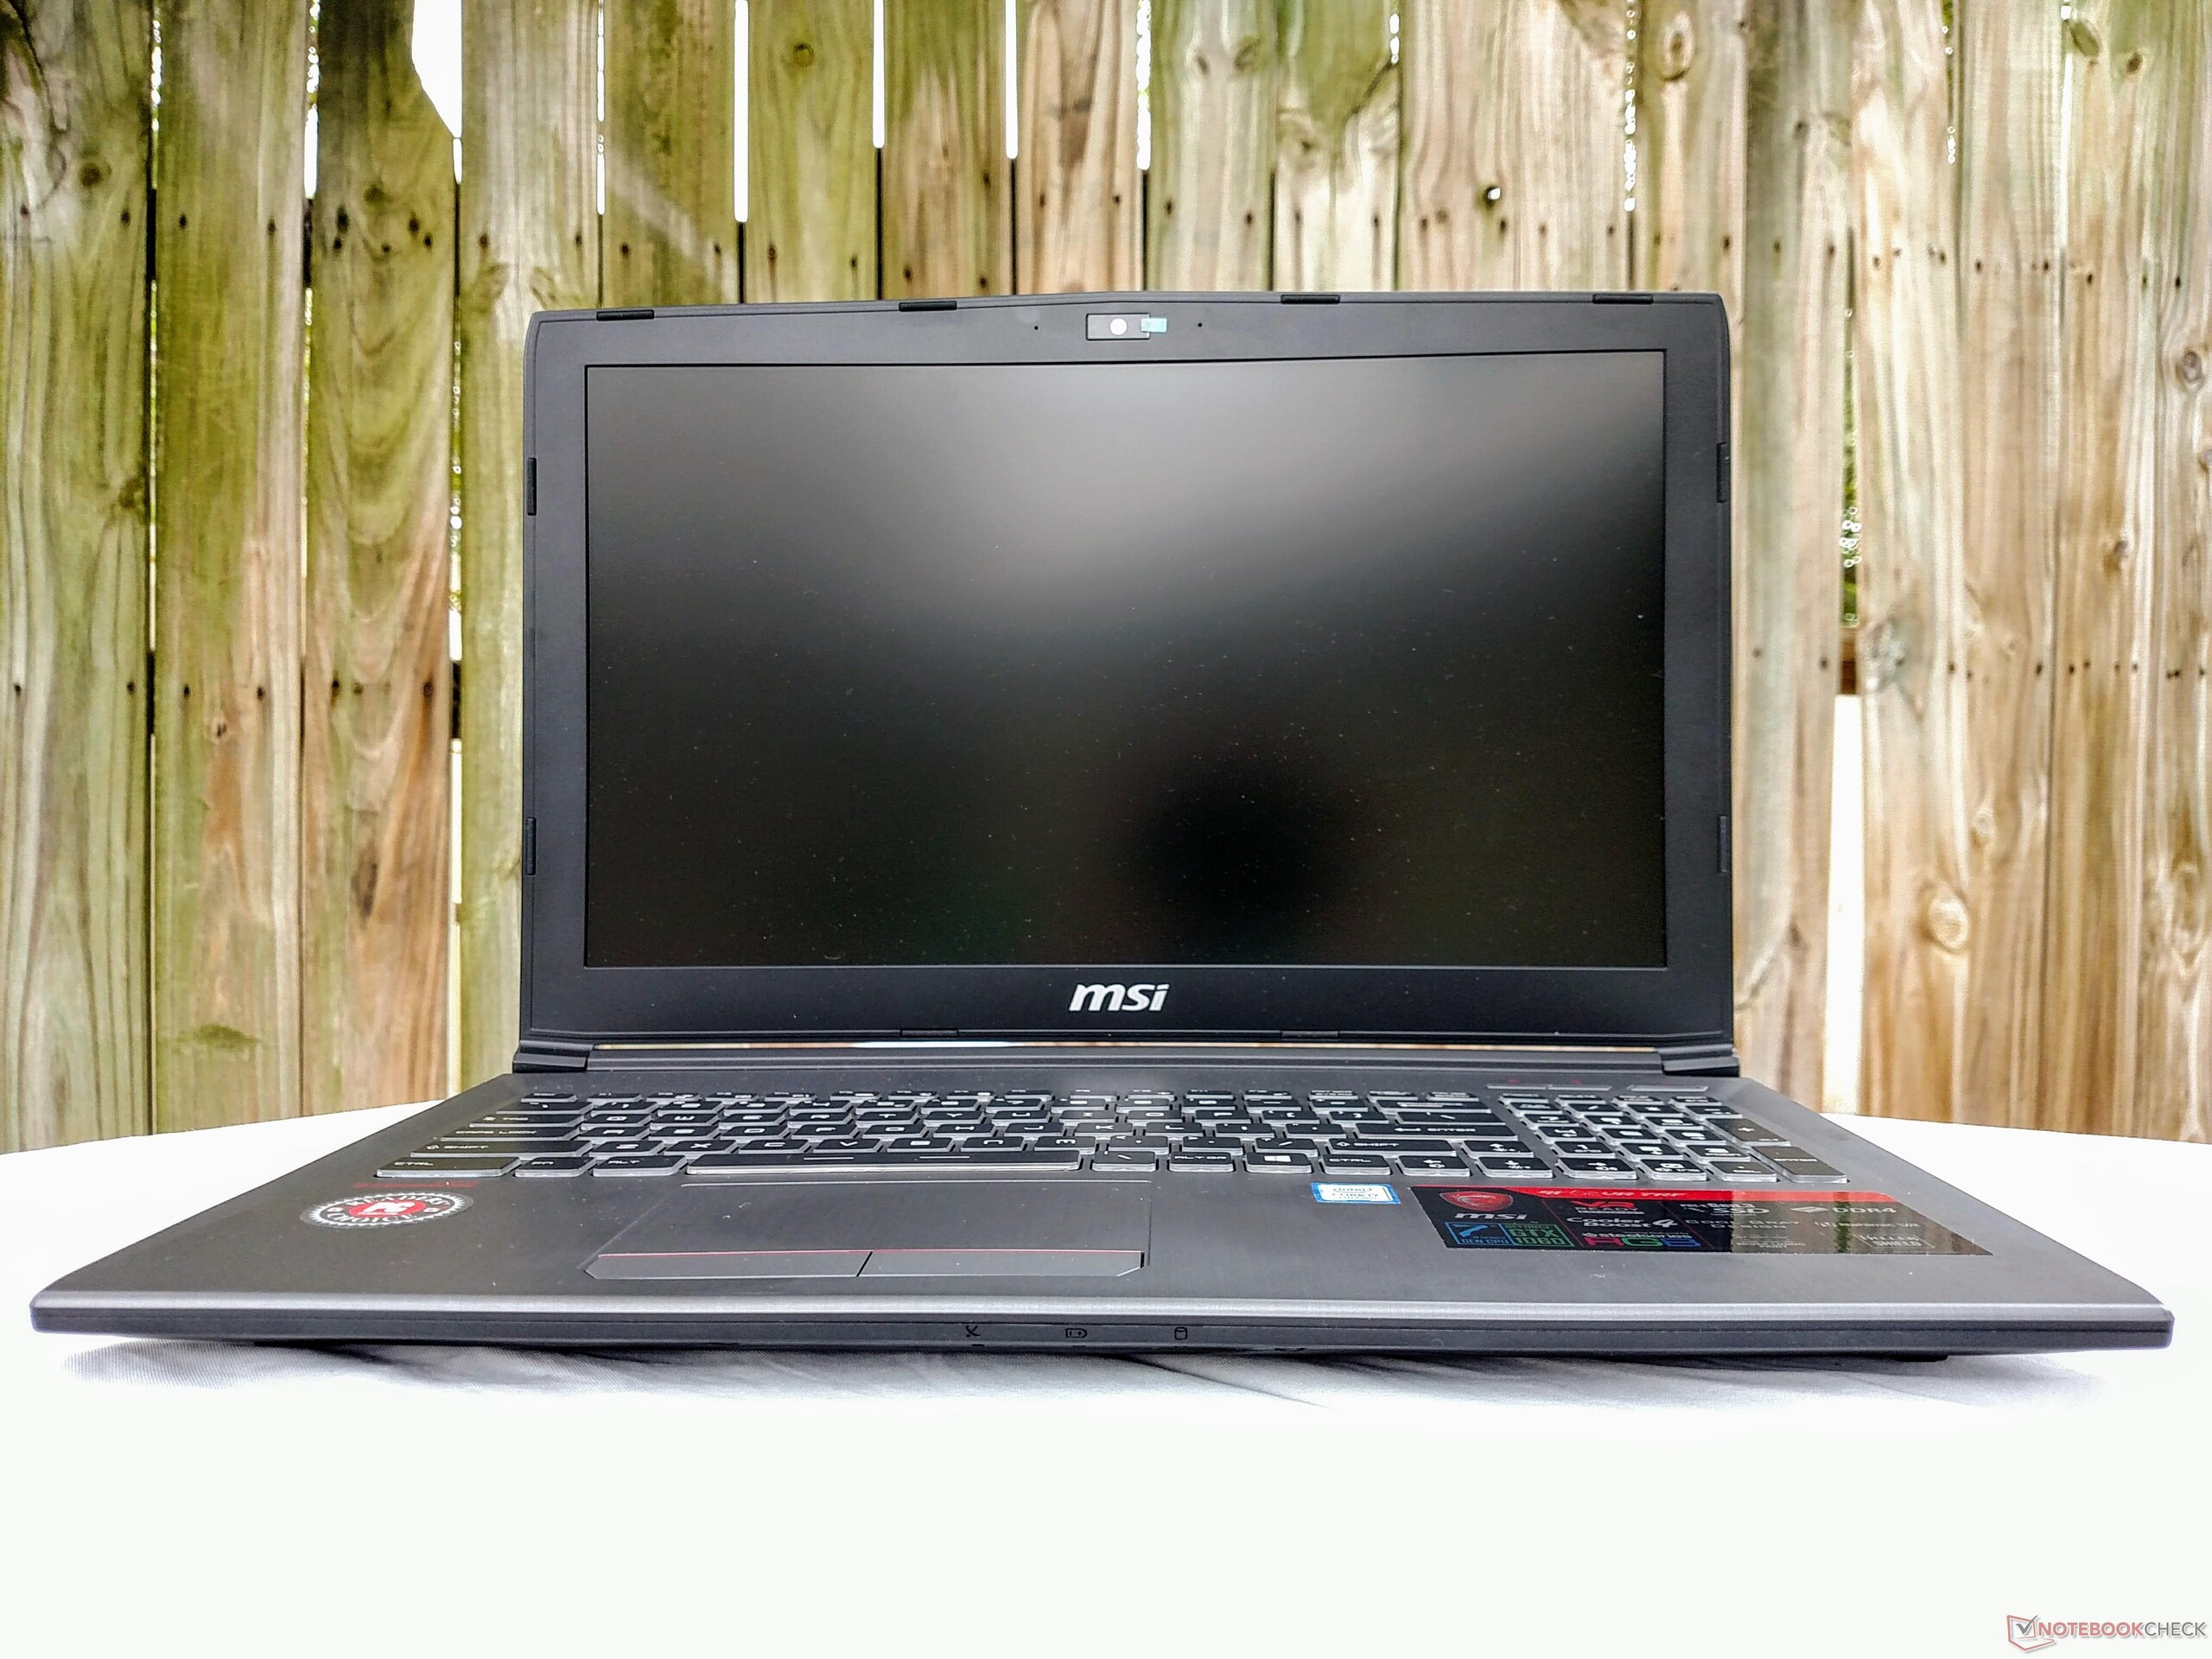
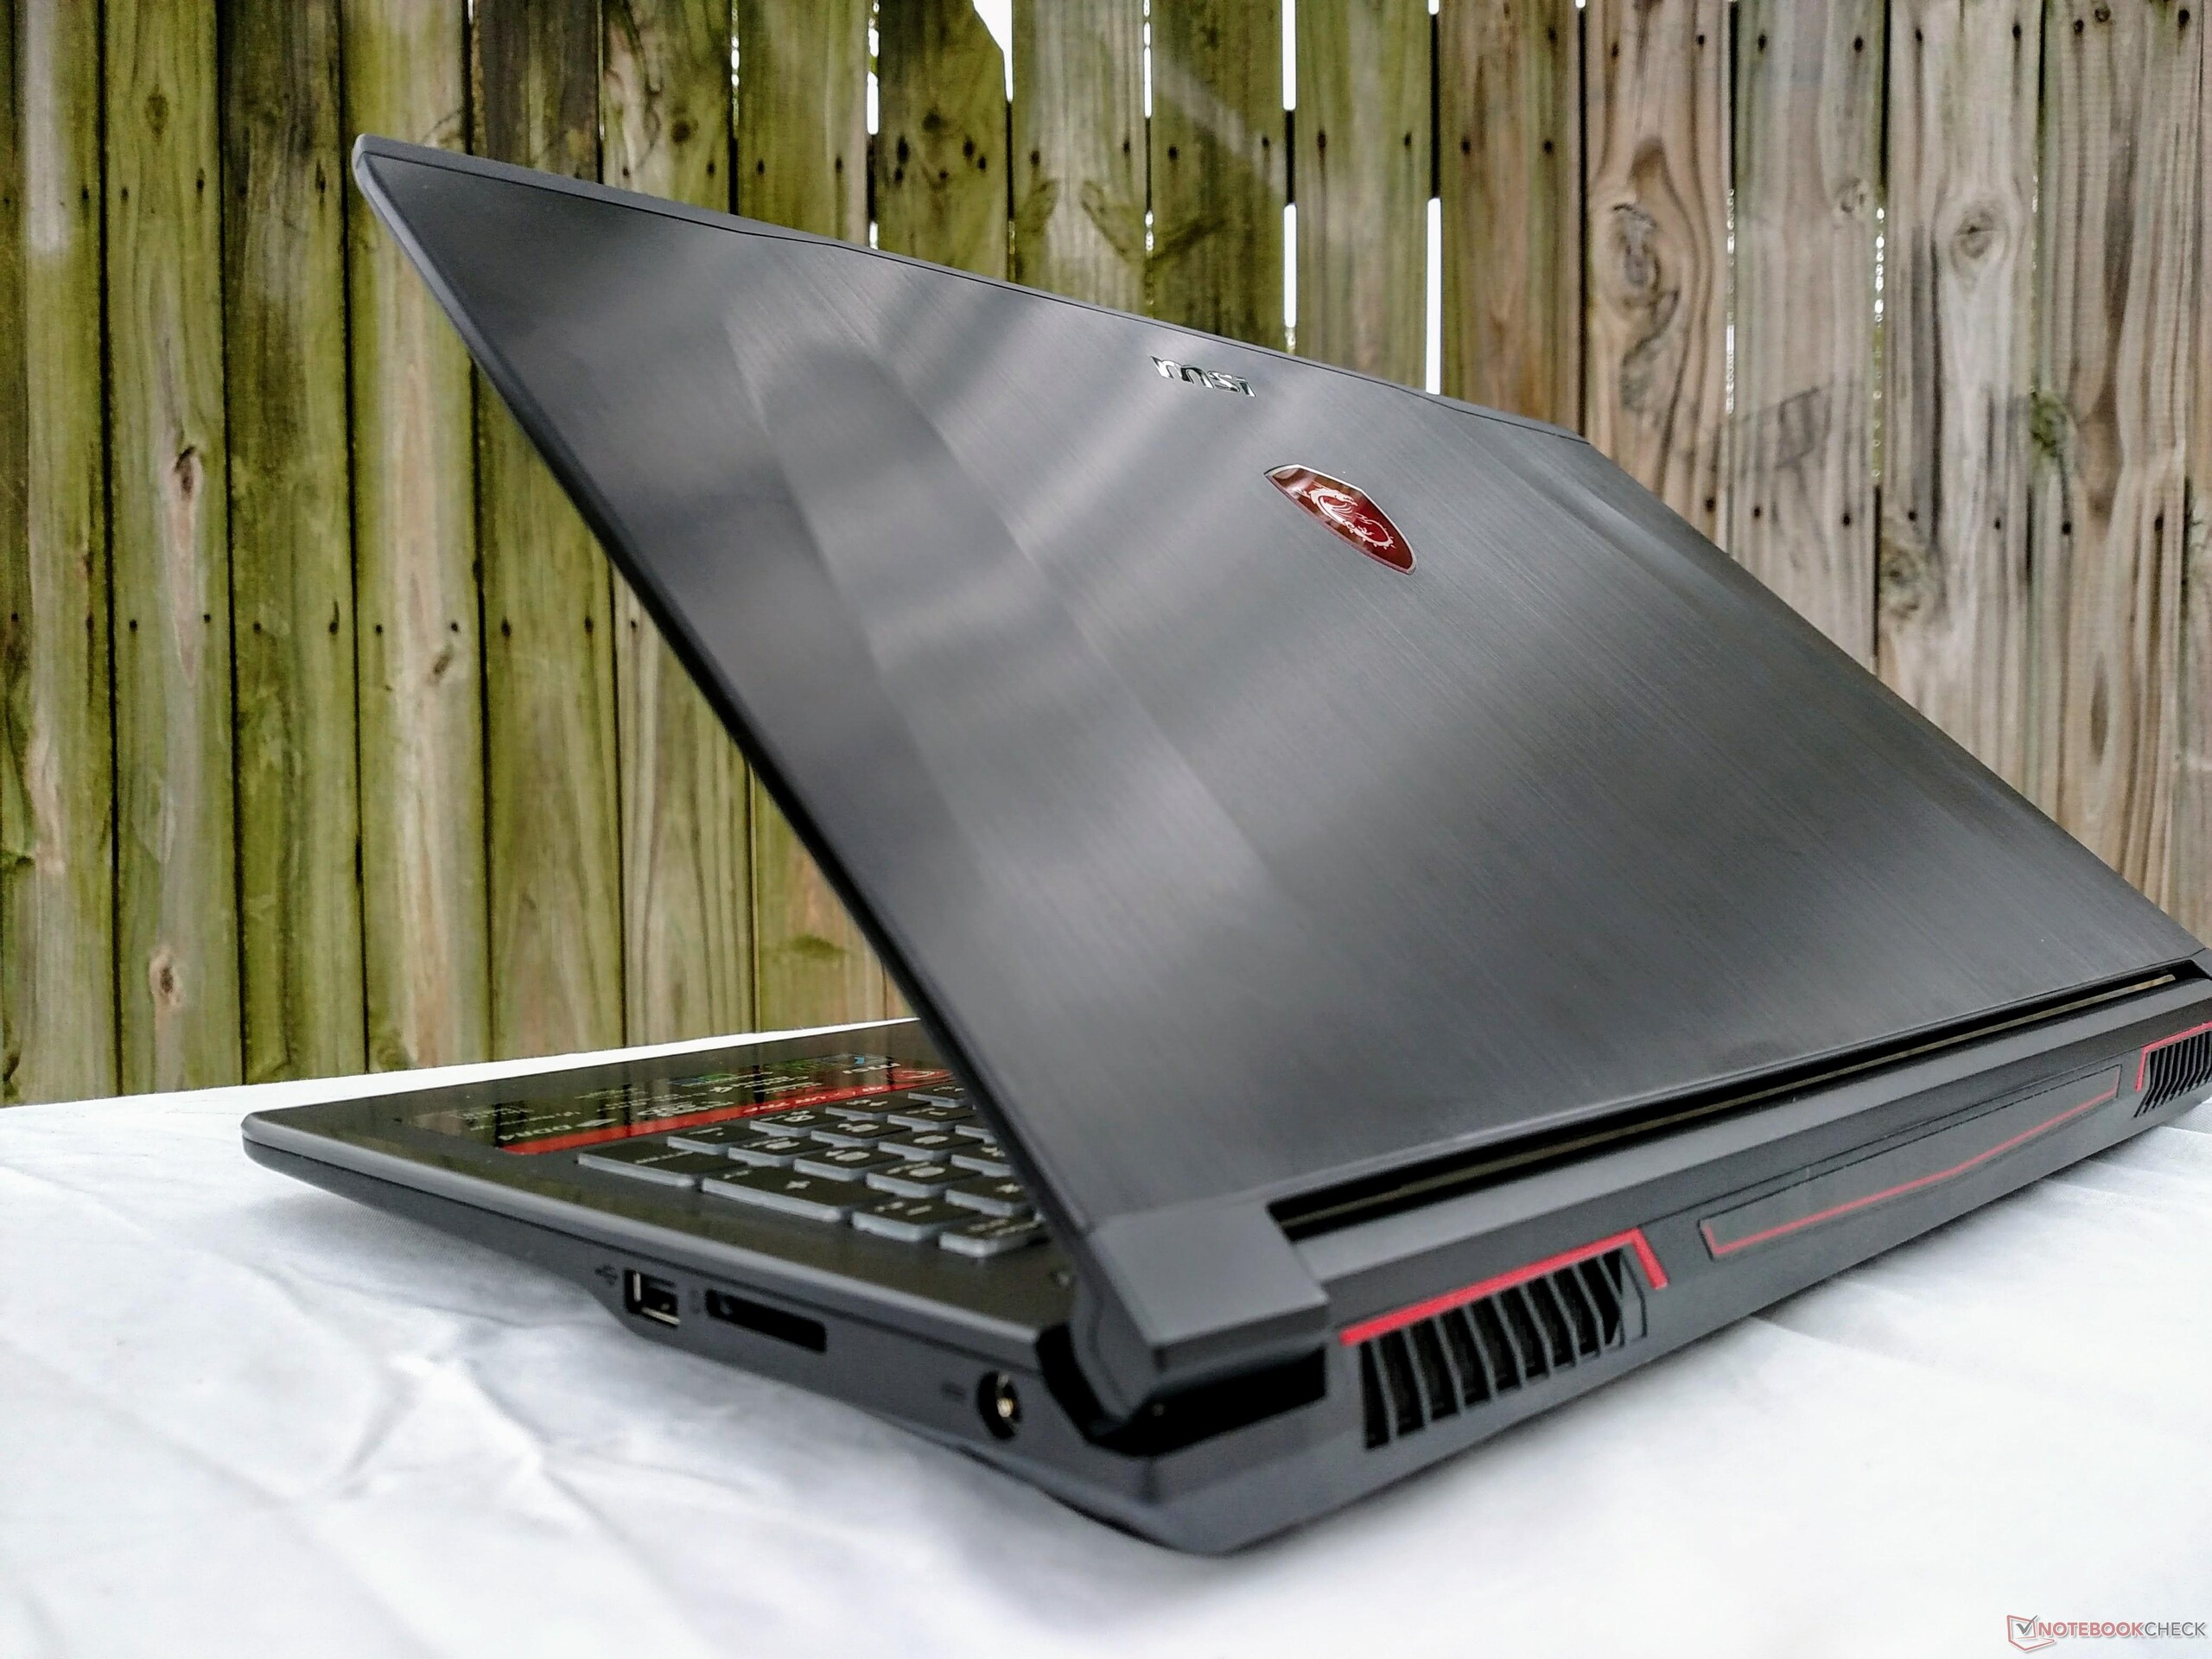
Breve análisis del portátil MSI GF62VR 7RF (7700HQ, GTX 1060, FHD 60 Hz)

| SD Card Reader | |
| average JPG Copy Test (av. of 3 runs) | |
| Asus Strix GL502VM-DS74 | |
| Gigabyte Aero 15 | |
| Schenker XMG A517 | |
| HP Omen 15-ce002ng | |
| Gigabyte P55W v7 | |
| MSI GF62VR 7RF-877 | |
| MSI GE62VR 6RF-001US | |
| maximum AS SSD Seq Read Test (1GB) | |
| Asus Strix GL502VM-DS74 | |
| Gigabyte Aero 15 | |
| Gigabyte P55W v7 | |
| Schenker XMG A517 | |
| HP Omen 15-ce002ng | |
| MSI GF62VR 7RF-877 | |
| MSI GE62VR 6RF-001US | |
| |||||||||||||||||||||||||
iluminación: 88 %
Brillo con batería: 223.9 cd/m²
Contraste: 400:1 (Negro: 0.56 cd/m²)
ΔE ColorChecker Calman: 9.7 | ∀{0.5-29.43 Ø4.72}
ΔE Greyscale Calman: 12.9 | ∀{0.09-98 Ø4.97}
100% sRGB (Argyll 1.6.3 3D)
75% AdobeRGB 1998 (Argyll 1.6.3 3D)
83.9% AdobeRGB 1998 (Argyll 3D)
99.9% sRGB (Argyll 3D)
85.6% Display P3 (Argyll 3D)
Gamma: 2.18
CCT: 15225 K
| MSI GF62VR 7RF-877 Chi Mei N156HGA-EAL, TN LED, 15.6", 1920x1080 | MSI GE62VR 6RF-001US IPS, 15.6", 1920x1080 | Schenker XMG A517 LG Philips LP156WF6 (LGD046F), IPS, 15.6", 1920x1080 | Gigabyte Aero 15 N156HCA-EA1 (CMN15D7), IPS, 15.6", 1920x1080 | Gigabyte P55W v7 LG Philips LP156WF6 (LGD046F), IPS, 15.6", 1920x1080 | Asus Strix GL502VM-DS74 IPS, 15.6", 1920x1080 | HP Omen 15-ce002ng AUO42ED, IPS, 15.6", 1920x1080 | Samsung Odyssey NP800G5M-X01US IPS, 15.6", 1920x1080 | |
|---|---|---|---|---|---|---|---|---|
| Display | -22% | -22% | -17% | -24% | -22% | -18% | -39% | |
| Display P3 Coverage (%) | 85.6 | 65.6 -23% | 65 -24% | 65.2 -24% | 63.5 -26% | 64.8 -24% | 65.8 -23% | 47.11 -45% |
| sRGB Coverage (%) | 99.9 | 84.3 -16% | 85.1 -15% | 92.5 -7% | 82 -18% | 84.9 -15% | 90.9 -9% | 70.4 -30% |
| AdobeRGB 1998 Coverage (%) | 83.9 | 61.7 -26% | 62.2 -26% | 66.5 -21% | 59.9 -29% | 62 -26% | 66.5 -21% | 48.71 -42% |
| Response Times | 9% | 15% | -9% | 12% | -10% | -8% | -8% | |
| Response Time Grey 50% / Grey 80% * (ms) | 49.6 ? | 36.8 ? 26% | 36 ? 27% | 42.8 ? 14% | 37 ? 25% | 42 ? 15% | 43.2 ? 13% | 38.8 ? 22% |
| Response Time Black / White * (ms) | 24.4 ? | 26.4 ? -8% | 24 ? 2% | 32 ? -31% | 25 ? -2% | 32.8 ? -34% | 31.2 ? -28% | 33.6 ? -38% |
| PWM Frequency (Hz) | 25510 ? | 21000 ? | 26000 ? | 19230 ? | ||||
| Screen | 63% | 38% | 38% | 38% | 40% | 50% | 11% | |
| Brightness middle (cd/m²) | 223.9 | 302 35% | 320 43% | 320 43% | 287 28% | 307.8 37% | 304 36% | 255.9 14% |
| Brightness (cd/m²) | 208 | 303 46% | 311 50% | 316 52% | 289 39% | 301 45% | 289 39% | 249 20% |
| Brightness Distribution (%) | 88 | 87 -1% | 90 2% | 90 2% | 87 -1% | 88 0% | 86 -2% | 90 2% |
| Black Level * (cd/m²) | 0.56 | 0.169 70% | 0.36 36% | 0.36 36% | 0.29 48% | 0.33 41% | 0.26 54% | 0.48 14% |
| Contrast (:1) | 400 | 1787 347% | 889 122% | 889 122% | 990 148% | 933 133% | 1169 192% | 533 33% |
| Colorchecker dE 2000 * | 9.7 | 4.61 52% | 5.08 48% | 4.62 52% | 4.92 49% | 4.5 54% | 3.46 64% | 5.9 39% |
| Colorchecker dE 2000 max. * | 19.7 | 9.98 49% | 10.73 46% | 9.75 51% | 11 44% | 10 49% | 7.72 61% | 18.9 4% |
| Greyscale dE 2000 * | 12.9 | 3.32 74% | 4.04 69% | 6 53% | 3.66 72% | 2.9 78% | 2.46 81% | 5.6 57% |
| Gamma | 2.18 101% | 2.24 98% | 2.34 94% | 2.46 89% | 2.32 95% | 2.22 99% | 2.38 92% | 2.21 100% |
| CCT | 15225 43% | 6358 102% | 7029 92% | 6761 96% | 6482 100% | 1136 572% | 6915 94% | 7250 90% |
| Color Space (Percent of AdobeRGB 1998) (%) | 75 | 55.4 -26% | 56 -25% | 60 -20% | 54 -28% | 55.4 -26% | 59 -21% | 44.8 -40% |
| Color Space (Percent of sRGB) (%) | 100 | 84.4 -16% | 85 -15% | 92 -8% | 82 -18% | 84.8 -15% | 91 -9% | 70.1 -30% |
| Media total (Programa/Opciones) | 17% /
39% | 10% /
23% | 4% /
21% | 9% /
22% | 3% /
21% | 8% /
28% | -12% /
-1% |
* ... más pequeño es mejor
Tiempos de respuesta del display
| ↔ Tiempo de respuesta de Negro a Blanco | ||
|---|---|---|
| 24.4 ms ... subida ↗ y bajada ↘ combinada | ↗ 20 ms subida | 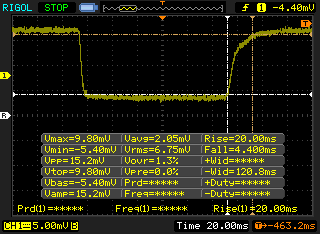 |
| ↘ 4.4 ms bajada | ||
| La pantalla mostró buenos tiempos de respuesta en nuestros tests pero podría ser demasiado lenta para los jugones competitivos. En comparación, todos los dispositivos de prueba van de ##min### (mínimo) a 240 (máximo) ms. » 57 % de todos los dispositivos son mejores. Eso quiere decir que el tiempo de respuesta es peor que la media (19.8 ms) de todos los dispositivos testados. | ||
| ↔ Tiempo de respuesta 50% Gris a 80% Gris | ||
| 49.6 ms ... subida ↗ y bajada ↘ combinada | ↗ 24.8 ms subida | 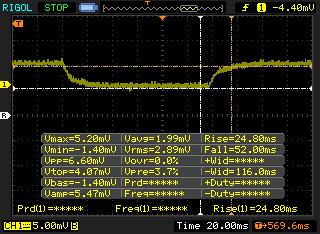 |
| ↘ 24.8 ms bajada | ||
| La pantalla mostró tiempos de respuesta lentos en nuestros tests y podría ser demasiado lenta para los jugones. En comparación, todos los dispositivos de prueba van de ##min### (mínimo) a 636 (máximo) ms. » 86 % de todos los dispositivos son mejores. Eso quiere decir que el tiempo de respuesta es peor que la media (31 ms) de todos los dispositivos testados. | ||
Parpadeo de Pantalla / PWM (Pulse-Width Modulation)
| Parpadeo de Pantalla / PWM detectado | 25510 Hz | ≤ 20 % de brillo | 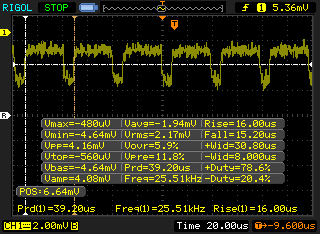 |
La retroiluminación del display parpadea a 25510 Hz (seguramente usa PWM - Pulse-Width Modulation) a un brillo del 20 % e inferior. Sobre este nivel de brillo no debería darse parpadeo / PWM. La frecuencia de 25510 Hz es bastante alta, por lo que la mayoría de gente sensible al parpadeo no debería ver parpadeo o tener fatiga visual. Comparación: 52 % de todos los dispositivos testados no usaron PWM para atenuar el display. Si se usó, medimos una media de 7772 (mínimo: 5 - máxmo: 343500) Hz. | |||
| Cinebench R15 | |
| CPU Single 64Bit | |
| Aorus X9 | |
| Alienware 15 R3 Max-Q | |
| Lenovo Legion Y920-17IKB | |
| HP Omen 15-ce002ng | |
| Asus Strix GL502VM-DS74 | |
| Gigabyte P55W v7 | |
| Samsung Odyssey NP800G5M-X01US | |
| Lenovo Legion Y520-15IKBM 80YY001APB | |
| Acer Aspire VX15 VX5-591G-589S | |
| MSI GF62VR 7RF-877 | |
| Dell Inspiron 15 7566 PL | |
| MSI GE62VR 6RF-001US | |
| CPU Multi 64Bit | |
| Aorus X9 | |
| Lenovo Legion Y920-17IKB | |
| Lenovo Legion Y920-17IKB | |
| Alienware 15 R3 Max-Q | |
| Asus Strix GL502VM-DS74 | |
| HP Omen 15-ce002ng | |
| Samsung Odyssey NP800G5M-X01US | |
| MSI GF62VR 7RF-877 | |
| Gigabyte P55W v7 | |
| Dell Inspiron 15 7566 PL | |
| MSI GE62VR 6RF-001US | |
| Lenovo Legion Y520-15IKBM 80YY001APB | |
| Acer Aspire VX15 VX5-591G-589S | |
| wPrime 2.10 - 1024m | |
| Lenovo Legion Y520-15IKBM 80YY001APB | |
| Lenovo Legion Y920-17IKB | |
| Dell Inspiron 15 7566 PL | |
| MSI GE62VR 6RF-001US | |
| MSI GF62VR 7RF-877 | |
| Asus Strix GL502VM-DS74 | |
| Samsung Odyssey NP800G5M-X01US | |
* ... más pequeño es mejor
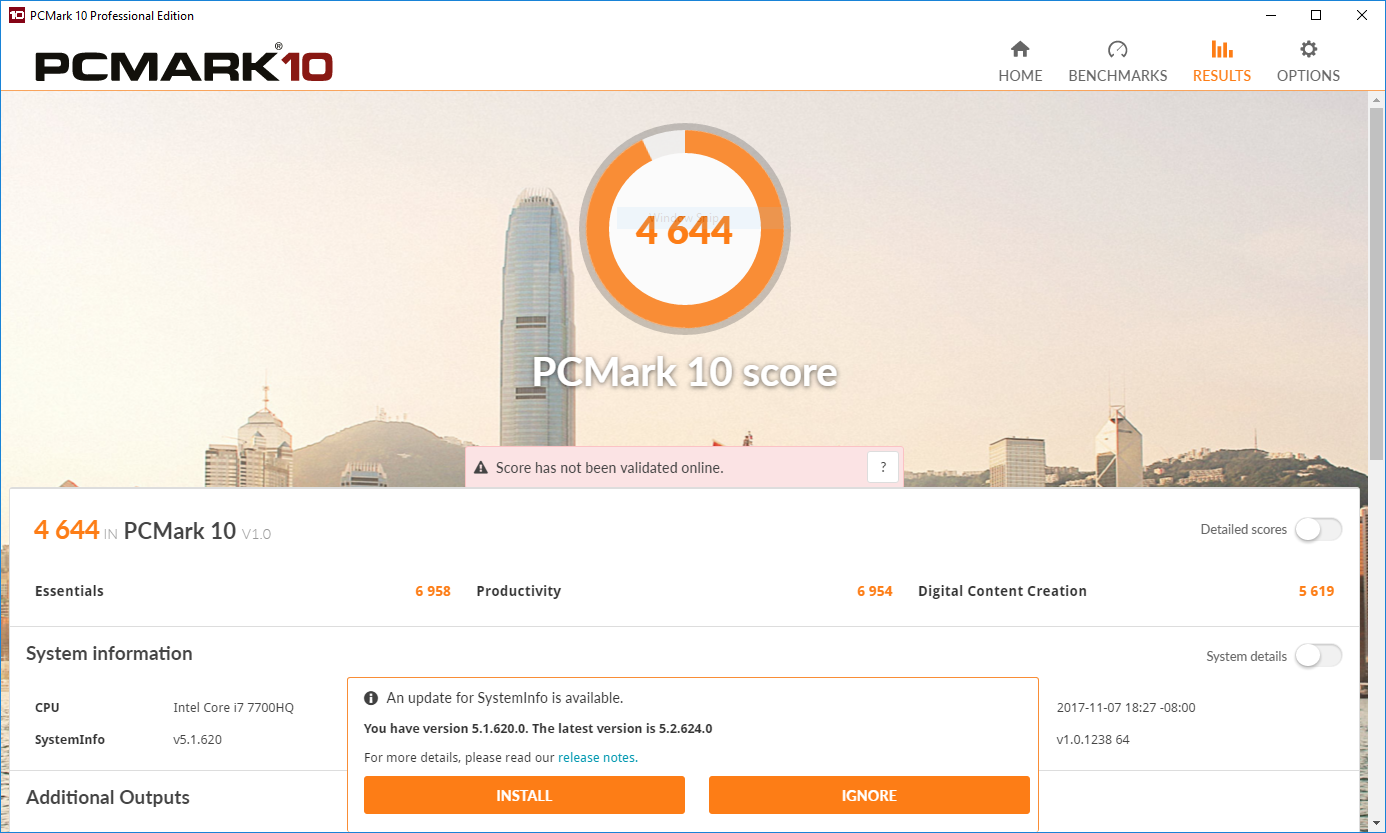
| PCMark 8 Home Score Accelerated v2 | 4069 puntos | |
| PCMark 8 Creative Score Accelerated v2 | 5136 puntos | |
| PCMark 8 Work Score Accelerated v2 | 5090 puntos | |
| PCMark 10 Score | 4644 puntos | |
ayuda | ||
| MSI GF62VR 7RF-877 Intel SSD 600p SSDPEKKW256G7 | MSI GE62VR 6RF-001US Samsung SM951 MZVPV512HDGL m.2 PCI-e | Lenovo Legion Y520-15IKBM 80YY001APB ADATA SX7000NP 256 GB | Schenker XMG A517 Samsung SSD 960 Evo 500GB m.2 NVMe | Gigabyte P55W v7 Liteonit CV3-8D256 | Asus Strix GL502VM-DS74 Samsung SSD 960 Evo 250GB m.2 NVMe | Samsung Odyssey NP800G5M-X01US Samsung PM961 NVMe MZVLW128HEGR | Dell Inspiron 15 7566 PL Toshiba SG5 THNSNK128GVN8 | Acer Aspire VX15 VX5-591G-589S Hynix HFS128G39TND | |
|---|---|---|---|---|---|---|---|---|---|
| AS SSD | 93% | 4% | 180% | -41% | 39% | 33% | -50% | -89% | |
| Copy Game MB/s (MB/s) | 471.7 | 898 90% | 1100 133% | 240.5 -49% | 157.6 -67% | ||||
| Copy Program MB/s (MB/s) | 286.5 | 403.5 41% | 483.6 69% | 299.5 5% | 111.1 -61% | ||||
| Copy ISO MB/s (MB/s) | 1069 | 1225 15% | 1599 50% | 1560 46% | 195 -82% | ||||
| Score Total (Points) | 1324 | 2572 94% | 898 -32% | 4063 207% | 840 -37% | 3501 164% | 1592 20% | 710 -46% | 882 -33% |
| Score Write (Points) | 693 | 581 -16% | 291 -58% | 1575 127% | 248 -64% | 1028 48% | 376 -46% | 218 -69% | 218 -69% |
| Score Read (Points) | 448 | 1327 196% | 409 -9% | 1677 274% | 393 -12% | 1670 273% | 852 90% | 332 -26% | 444 -1% |
| Access Time Write * (ms) | 0.03 | 0.038 -27% | 0.033 -10% | 0.026 13% | 0.083 -177% | 0.3 -900% | 0.031 -3% | 0.08 -167% | 0.261 -770% |
| Access Time Read * (ms) | 0.09 | 0.039 57% | 0.069 23% | 0.036 60% | 0.088 2% | 0.41 -356% | 0.066 27% | 0.099 -10% | 0.077 14% |
| 4K-64 Write (MB/s) | 551 | 329.8 -40% | 100.7 -82% | 1263 129% | 166.6 -70% | 768 39% | 176.4 -68% | 111.8 -80% | 113.9 -79% |
| 4K-64 Read (MB/s) | 280.1 | 1092 290% | 255.9 -9% | 1359 385% | 318.3 14% | 1375 391% | 564 101% | 256.9 -8% | 361.4 29% |
| 4K Write (MB/s) | 118.3 | 103 -13% | 110.6 -7% | 147 24% | 48.47 -59% | 118 0% | 124.1 5% | 92.6 -22% | 90.8 -23% |
| 4K Read (MB/s) | 31.27 | 44.04 41% | 30.9 -1% | 48 54% | 23.34 -25% | 44.55 42% | 44.75 43% | 25.39 -19% | 32.29 3% |
| Seq Write (MB/s) | 234.9 | 1480 530% | 795 238% | 1662 608% | 328.1 40% | 1424 506% | 752 220% | 134.1 -43% | 130.2 -45% |
| Seq Read (MB/s) | 1371 | 1912 39% | 1221 -11% | 2694 96% | 514 -63% | 2505 83% | 2433 77% | 493.2 -64% | 507 -63% |
* ... más pequeño es mejor

| 3DMark | |
| 1280x720 Cloud Gate Standard Graphics | |
| Aorus X9 | |
| MSI GT75VR 7RF-012 Titan Pro | |
| Alienware 15 R3 Max-Q | |
| MSI GF62VR 7RF-877 | |
| Asus Strix GL502VM-DS74 | |
| Lenovo Legion Y920-17IKB | |
| MSI GE62VR 6RF-001US | |
| Lenovo Legion Y520-15IKBM 80YY001APB | |
| Gigabyte P55W v7 | |
| Acer Predator 15 G9-592-7925 | |
| Acer Aspire Nitro BE VN7-793G-5811 | |
| Asus Strix GL502VT-DS74 | |
| Samsung Odyssey NP800G5M-X01US | |
| 1920x1080 Fire Strike Graphics | |
| Aorus X9 | |
| MSI GT75VR 7RF-012 Titan Pro | |
| Alienware 15 R3 Max-Q | |
| Lenovo Legion Y920-17IKB | |
| MSI GF62VR 7RF-877 | |
| MSI GE62VR 6RF-001US | |
| Gigabyte P55W v7 | |
| Asus Strix GL502VM-DS74 | |
| Lenovo Legion Y520-15IKBM 80YY001APB | |
| Acer Aspire Nitro BE VN7-793G-5811 | |
| Acer Predator 15 G9-592-7925 | |
| Asus Strix GL502VT-DS74 | |
| Samsung Odyssey NP800G5M-X01US | |
| 1920x1080 Ice Storm Extreme Graphics | |
| Alienware 15 R3 Max-Q | |
| Asus Strix GL502VM-DS74 | |
| Acer Aspire Nitro BE VN7-793G-5811 | |
| MSI GF62VR 7RF-877 | |
| Asus Strix GL502VT-DS74 | |
| Samsung Odyssey NP800G5M-X01US | |
| MSI GE62VR 6RF-001US | |
| Lenovo Legion Y520-15IKBM 80YY001APB | |
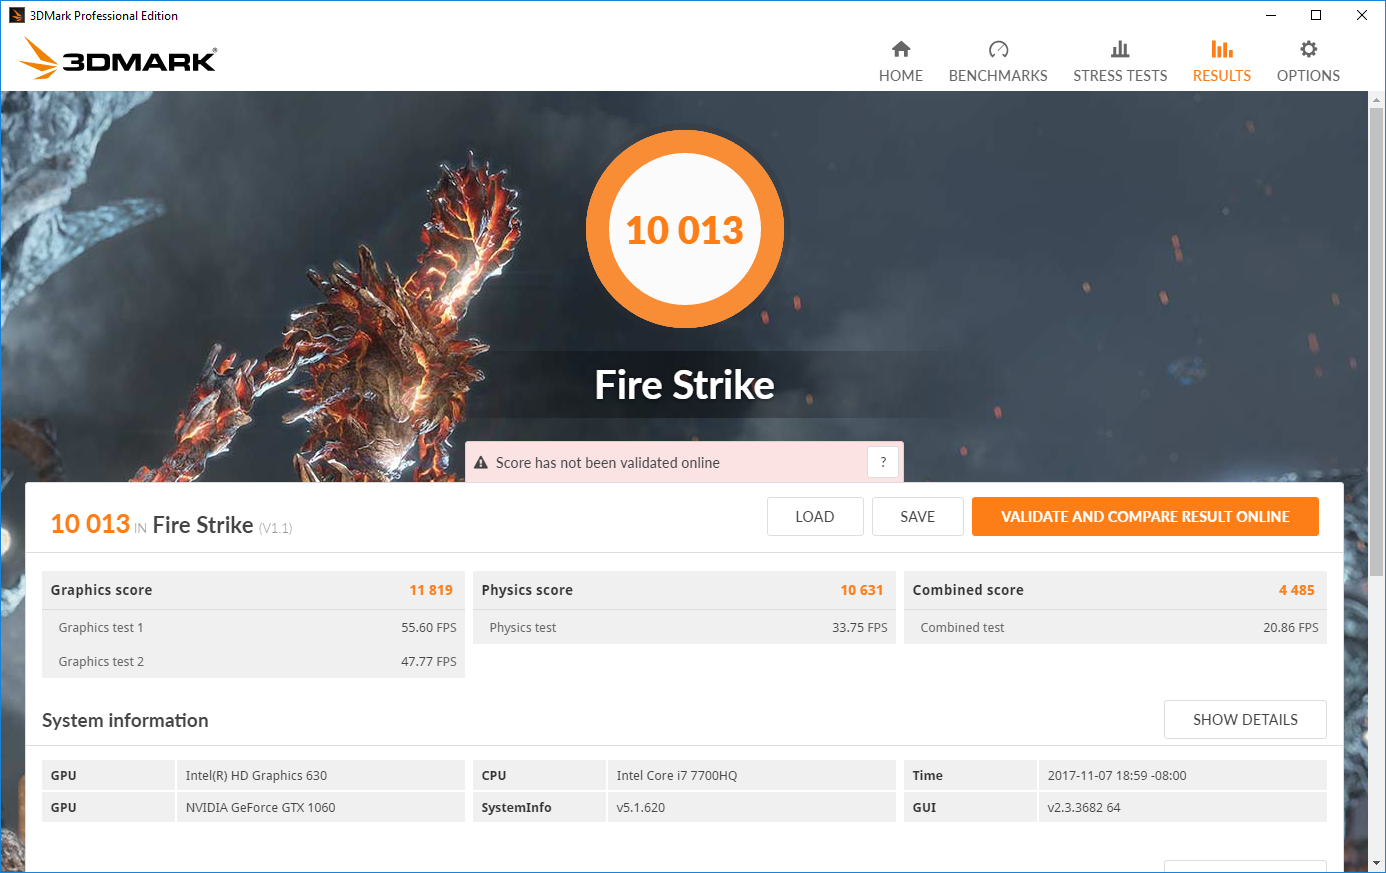
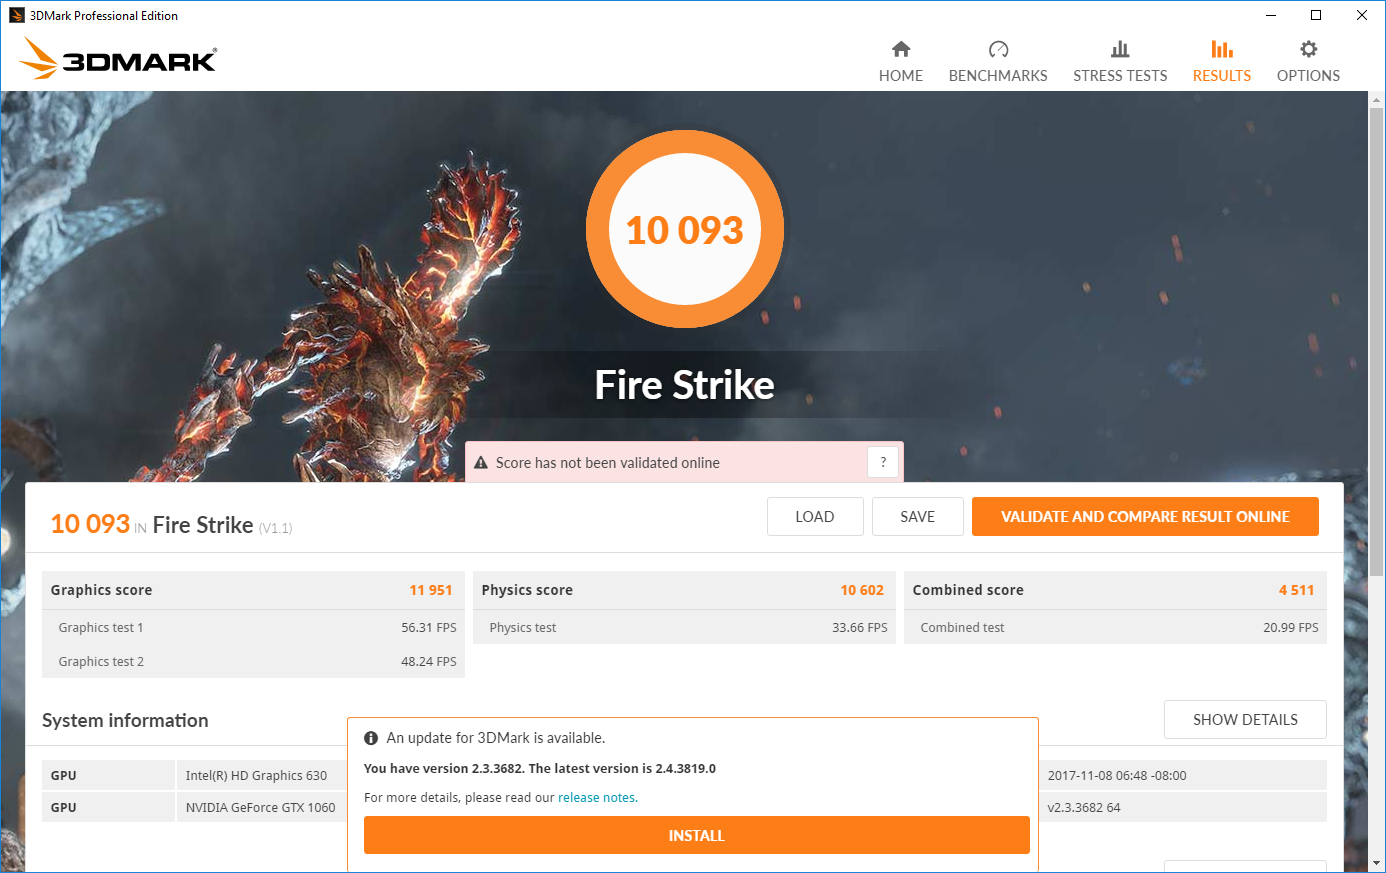
| 3DMark Ice Storm Standard Score | 116682 puntos | |
| 3DMark Cloud Gate Standard Score | 25422 puntos | |
| 3DMark Fire Strike Score | 10093 puntos | |
| 3DMark Fire Strike Extreme Score | 5256 puntos | |
ayuda | ||
| BioShock Infinite - 1920x1080 Ultra Preset, DX11 (DDOF) | |
| Alienware 15 R3 Max-Q | |
| Lenovo Legion Y920-17IKB | |
| MSI GF62VR 7RF-877 | |
| Asus FX502VM-AS73 | |
| MSI GS63VR 7RF-228US | |
| Hyperbook N85-7300-8-12-1060 | |
| MSI GE72VR-6RF16H21 | |
| MSI GE62VR 6RF-001US | |
| Lenovo Legion Y520-15IKBM 80YY001APB | |
| Acer Aspire Nitro BE VN7-793G-5811 | |
| Acer Aspire VX15 VX5-591G-589S | |
| Dell Inspiron 15 7566 PL | |
| Metro: Last Light - 1920x1080 Very High (DX11) AF:16x | |
| Lenovo Legion Y920-17IKB | |
| Asus FX502VM-AS73 | |
| MSI GS63VR 7RF-228US | |
| MSI GF62VR 7RF-877 | |
| MSI GE62VR 6RF-001US | |
| Thief - 1920x1080 Very High Preset AA:FXAA & High SS AF:8x | |
| Lenovo Legion Y920-17IKB | |
| Asus FX502VM-AS73 | |
| MSI GS63VR 7RF-228US | |
| MSI GF62VR 7RF-877 | |
| MSI GE62VR 6RF-001US | |
| Hyperbook N85-7300-8-12-1060 | |
| Lenovo Legion Y520-15IKBM 80YY001APB | |
| Dell Inspiron 15 7566 PL | |
| The Witcher 3 | |
| 1920x1080 Ultra Graphics & Postprocessing (HBAO+) | |
| Aorus X9 | |
| Alienware 15 R3 Max-Q | |
| Lenovo Legion Y920-17IKB | |
| Lenovo Legion Y920-17IKB | |
| MSI GS63VR 7RF-228US | |
| Hyperbook N85-7300-8-12-1060 | |
| MSI GF62VR 7RF-877 | |
| Gigabyte P55W v7 | |
| Gigabyte Aero 15 | |
| MSI GE72VR-6RF16H21 | |
| Lenovo Legion Y520-15IKBM 80YY001APB | |
| HP Omen 15-ce002ng | |
| Acer Aspire Nitro BE VN7-793G-5811 | |
| Dell Inspiron 15 7566 PL | |
| 1920x1080 High Graphics & Postprocessing (Nvidia HairWorks Off) | |
| Aorus X9 | |
| Alienware 15 R3 Max-Q | |
| MSI GS63VR 7RF-228US | |
| Gigabyte P55W v7 | |
| Gigabyte Aero 15 | |
| MSI GF62VR 7RF-877 | |
| MSI GE72VR-6RF16H21 | |
| HP Omen 15-ce002ng | |
| Hyperbook N85-7300-8-12-1060 | |
| Lenovo Legion Y520-15IKBM 80YY001APB | |
| Acer Aspire Nitro BE VN7-793G-5811 | |
| Dell Inspiron 15 7566 PL | |
| Fallout 4 | |
| 1920x1080 Ultra Preset AA:T AF:16x | |
| Asus FX502VM-AS73 | |
| MSI GF62VR 7RF-877 | |
| MSI GS63VR 7RF-228US | |
| MSI GE62VR 6RF-001US | |
| 1920x1080 High Preset AA:T AF:16x | |
| MSI GF62VR 7RF-877 | |
| Rise of the Tomb Raider | |
| 1920x1080 Very High Preset AA:FX AF:16x | |
| Lenovo Legion Y920-17IKB | |
| MSI GS63VR 7RF-228US | |
| Gigabyte P55W v7 | |
| Asus FX502VM-AS73 | |
| MSI GF62VR 7RF-877 | |
| MSI GE72VR-6RF16H21 | |
| MSI GE62VR 6RF-001US | |
| HP Omen 15-ce002ng | |
| 1920x1080 High Preset AA:FX AF:4x | |
| MSI GF62VR 7RF-877 | |
| Gigabyte P55W v7 | |
| MSI GE72VR-6RF16H21 | |
| HP Omen 15-ce002ng | |
| Hitman 2016 | |
| 1920x1080 Ultra / On AA:SM AF:16x | |
| MSI GF62VR 7RF-877 | |
| 1920x1080 High / On AA:FX AF:8x | |
| MSI GF62VR 7RF-877 | |
| Doom | |
| 1920x1080 Ultra Preset AA:SM | |
| Asus FX502VM-AS73 | |
| MSI GF62VR 7RF-877 | |
| MSI GS63VR 7RF-228US | |
| HP Omen 15-ce002ng | |
| MSI GE62VR 6RF-001US | |
| 1920x1080 High Preset AA:FX | |
| MSI GF62VR 7RF-877 | |
| HP Omen 15-ce002ng | |
| Rocket League | |
| 1920x1080 High Quality AA:High FX | |
| Aorus X9 | |
| MSI GF62VR 7RF-877 | |
| HP Omen 15-ce002ng | |
| 3840x2160 High Quality AA:High FX | |
| Aorus X9 | |
| MSI GF62VR 7RF-877 | |
| HP Omen 15-ce002ng | |
| 1920x1080 Quality AA:Medium FX | |
| MSI GF62VR 7RF-877 | |
| HP Omen 15-ce002ng | |
| Dirt 4 | |
| 3840x2160 Ultra Preset AF:16x | |
| MSI GF62VR 7RF-877 | |
| 1920x1080 Ultra Preset AA:4xMS AF:16x | |
| Aorus X9 | |
| MSI GF62VR 7RF-877 | |
| HP Omen 15-ce002ng | |
| 1920x1080 High Preset AA:2xMS AF:8x | |
| Aorus X9 | |
| MSI GF62VR 7RF-877 | |
| HP Omen 15-ce002ng | |
| Playerunknown's Battlegrounds (PUBG) | |
| 1920x1080 Ultra Preset | |
| Aorus X9 | |
| MSI GF62VR 7RF-877 | |
| 1920x1080 High Preset | |
| Aorus X9 | |
| MSI GF62VR 7RF-877 | |
| bajo | medio | alto | ultra | 4K | |
|---|---|---|---|---|---|
| BioShock Infinite (2013) | 108 | ||||
| Metro: Last Light (2013) | 75 | ||||
| Thief (2014) | 71 | ||||
| The Witcher 3 (2015) | 68 | 39 | |||
| Batman: Arkham Knight (2015) | 86 | 61 | |||
| Metal Gear Solid V (2015) | 60 | 60 | |||
| Fallout 4 (2015) | 83 | 69 | |||
| Just Cause 3 (2015) | 79 | 70 | |||
| Rise of the Tomb Raider (2016) | 73 | 60 | |||
| Hitman 2016 (2016) | 58 | 51 | |||
| Ashes of the Singularity (2016) | 45 | ||||
| Doom (2016) | 99 | 93 | |||
| Mafia 3 (2016) | 48 | 40 | |||
| Farming Simulator 17 (2016) | 162 | 150 | |||
| Resident Evil 7 (2017) | 104 | 83 | |||
| Rocket League (2017) | 238 | 171 | 64 | ||
| Dirt 4 (2017) | 98 | 58 | 31 | ||
| Playerunknown's Battlegrounds (PUBG) (2017) | 69 | 53 |
Ruido
| Ocioso |
| 33.5 / 33.5 / 33.5 dB(A) |
| Carga |
| 41.3 / 53.5 dB(A) |
 | ||
30 dB silencioso 40 dB(A) audible 50 dB(A) ruidosamente alto |
||
min: | ||
| MSI GF62VR 7RF-877 GeForce GTX 1060 Mobile, i7-7700HQ, Intel SSD 600p SSDPEKKW256G7 | MSI GE62VR 6RF-001US GeForce GTX 1060 Mobile, 6700HQ, Samsung SM951 MZVPV512HDGL m.2 PCI-e | Gigabyte P55W v7 GeForce GTX 1060 Mobile, i7-7700HQ, Liteonit CV3-8D256 | Lenovo Legion Y520-15IKBM 80YY001APB GeForce GTX 1060 Max-Q, i5-7300HQ, ADATA SX7000NP 256 GB | Schenker XMG A517 GeForce GTX 1060 Mobile, i7-7700HQ, Samsung SSD 960 Evo 500GB m.2 NVMe | Gigabyte Aero 15 GeForce GTX 1060 Mobile, i7-7700HQ, Lite-On CX2-8B512-Q11 | Asus Strix GL502VM-DS74 GeForce GTX 1060 Mobile, i7-7700HQ, Samsung SSD 960 Evo 250GB m.2 NVMe | HP Omen 15-ce002ng GeForce GTX 1060 Max-Q, i7-7700HQ, Samsung PM961 MZVLW256HEHP | Samsung Odyssey NP800G5M-X01US GeForce GTX 1050 Mobile, i7-7700HQ, Samsung PM961 NVMe MZVLW128HEGR | |
|---|---|---|---|---|---|---|---|---|---|
| Noise | 0% | 0% | 6% | -1% | 3% | -2% | 2% | 5% | |
| apagado / medio ambiente * (dB) | 28.1 | 28.2 -0% | 30 -7% | 30 -7% | 31 -10% | 30.8 -10% | 30 -7% | 28.1 -0% | |
| Idle Minimum * (dB) | 33.5 | 32.8 2% | 33 1% | 30.5 9% | 30 10% | 32 4% | 32 4% | 30 10% | 28.1 16% |
| Idle Average * (dB) | 33.5 | 32.9 2% | 34 -1% | 33 1% | 35 -4% | 33 1% | 32 4% | 33 1% | 29.1 13% |
| Idle Maximum * (dB) | 33.5 | 32.9 2% | 35 -4% | 36.1 -8% | 40 -19% | 34 -1% | 32 4% | 37 -10% | 29.1 13% |
| Load Average * (dB) | 41.3 | 41.6 -1% | 39 6% | 39.4 5% | 43 -4% | 39 6% | 48.3 -17% | 41 1% | 49.2 -19% |
| Witcher 3 ultra * (dB) | 48.5 | 43 11% | 43 11% | 42 13% | |||||
| Load Maximum * (dB) | 53.5 | 55 -3% | 50 7% | 41.5 22% | 49 8% | 50 7% | 51.2 4% | 50 7% | 49.2 8% |
* ... más pequeño es mejor
(-) La temperatura máxima en la parte superior es de 48.2 °C / 119 F, frente a la media de 40.4 °C / 105 F, que oscila entre 21.2 y 68.8 °C para la clase Gaming.
(-) El fondo se calienta hasta un máximo de 46 °C / 115 F, frente a la media de 43.2 °C / 110 F
(+) En reposo, la temperatura media de la parte superior es de 29.8 °C / 86# F, frente a la media del dispositivo de 33.9 °C / 93 F.
(±) Jugando a The Witcher 3, la temperatura media de la parte superior es de 37.9 °C / 100 F, frente a la media del dispositivo de 33.9 °C / 93 F.
(-) El reposamanos y el touchpad pueden calentarse mucho al tacto con un máximo de 44.2 °C / 111.6 F.
(-) La temperatura media de la zona del reposamanos de dispositivos similares fue de 28.8 °C / 83.8 F (-15.4 °C / -27.8 F).
MSI GF62VR 7RF-877 análisis de audio
(+) | los altavoces pueden reproducir a un volumen relativamente alto (#84.9 dB)
Graves 100 - 315 Hz
(-) | casi sin bajos - de media 27.4% inferior a la mediana
(±) | la linealidad de los graves es media (10.4% delta a frecuencia anterior)
Medios 400 - 2000 Hz
(±) | medias más altas - de media 8.5% más altas que la mediana
(±) | la linealidad de los medios es media (9.5% delta respecto a la frecuencia anterior)
Altos 2 - 16 kHz
(±) | máximos más altos - de media 8% más altos que la mediana
(±) | la linealidad de los máximos es media (8% delta a frecuencia anterior)
Total 100 - 16.000 Hz
(-) | el sonido global no es lineal (31.8% de diferencia con la mediana)
En comparación con la misma clase
» 97% de todos los dispositivos probados de esta clase eran mejores, 1% similares, 2% peores
» El mejor tuvo un delta de 6%, la media fue 18%, el peor fue ###max##%
En comparación con todos los dispositivos probados
» 91% de todos los dispositivos probados eran mejores, 2% similares, 7% peores
» El mejor tuvo un delta de 4%, la media fue 24%, el peor fue ###max##%
MSI GE62VR 6RF-001US análisis de audio
(±) | la sonoridad del altavoz es media pero buena (76.9 dB)
Graves 100 - 315 Hz
(±) | lubina reducida - en promedio 13.1% inferior a la mediana
(±) | la linealidad de los graves es media (12% delta a frecuencia anterior)
Medios 400 - 2000 Hz
(+) | medios equilibrados - a sólo 3% de la mediana
(±) | la linealidad de los medios es media (12% delta respecto a la frecuencia anterior)
Altos 2 - 16 kHz
(+) | máximos equilibrados - a sólo 4.4% de la mediana
(±) | la linealidad de los máximos es media (10.1% delta a frecuencia anterior)
Total 100 - 16.000 Hz
(±) | la linealidad del sonido global es media (18.6% de diferencia con la mediana)
En comparación con la misma clase
» 60% de todos los dispositivos probados de esta clase eran mejores, 9% similares, 31% peores
» El mejor tuvo un delta de 6%, la media fue 18%, el peor fue ###max##%
En comparación con todos los dispositivos probados
» 42% de todos los dispositivos probados eran mejores, 8% similares, 50% peores
» El mejor tuvo un delta de 4%, la media fue 24%, el peor fue ###max##%
| Off / Standby | |
| Ocioso | |
| Carga |
|
Clave:
min: | |
| MSI GF62VR 7RF-877 i7-7700HQ, GeForce GTX 1060 Mobile, Intel SSD 600p SSDPEKKW256G7, TN LED, 1920x1080, 15.6" | MSI GE62VR 6RF-001US 6700HQ, GeForce GTX 1060 Mobile, Samsung SM951 MZVPV512HDGL m.2 PCI-e, IPS, 1920x1080, 15.6" | Gigabyte P55W v7 i7-7700HQ, GeForce GTX 1060 Mobile, Liteonit CV3-8D256, IPS, 1920x1080, 15.6" | Lenovo Legion Y520-15IKBM 80YY001APB i5-7300HQ, GeForce GTX 1060 Max-Q, ADATA SX7000NP 256 GB, IPS, 1920x1080, 15.6" | Schenker XMG A517 i7-7700HQ, GeForce GTX 1060 Mobile, Samsung SSD 960 Evo 500GB m.2 NVMe, IPS, 1920x1080, 15.6" | Gigabyte Aero 15 i7-7700HQ, GeForce GTX 1060 Mobile, Lite-On CX2-8B512-Q11, IPS, 1920x1080, 15.6" | Asus Strix GL502VM-DS74 i7-7700HQ, GeForce GTX 1060 Mobile, Samsung SSD 960 Evo 250GB m.2 NVMe, IPS, 1920x1080, 15.6" | HP Omen 15-ce002ng i7-7700HQ, GeForce GTX 1060 Max-Q, Samsung PM961 MZVLW256HEHP, IPS, 1920x1080, 15.6" | Samsung Odyssey NP800G5M-X01US i7-7700HQ, GeForce GTX 1050 Mobile, Samsung PM961 NVMe MZVLW128HEGR, IPS, 1920x1080, 15.6" | |
|---|---|---|---|---|---|---|---|---|---|
| Power Consumption | -45% | 21% | 30% | 9% | 9% | -82% | -12% | 34% | |
| Idle Minimum * (Watt) | 16.2 | 25.4 -57% | 8 51% | 3.9 76% | 8 51% | 12 26% | 38.3 -136% | 18 -11% | 6.7 59% |
| Idle Average * (Watt) | 18.2 | 30.3 -66% | 13 29% | 10.7 41% | 12 34% | 15 18% | 40.5 -123% | 23 -26% | 8.9 51% |
| Idle Maximum * (Watt) | 18.9 | 31.5 -67% | 18 5% | 11.2 41% | 25 -32% | 20 -6% | 42.2 -123% | 30 -59% | 10.8 43% |
| Load Average * (Watt) | 82.7 | 111.8 -35% | 76 8% | 111.5 -35% | 85 -3% | 82 1% | 110.4 -33% | 85 -3% | 81.8 1% |
| Witcher 3 ultra * (Watt) | 125.7 | 110 12% | 111 12% | 96 24% | 92.2 27% | ||||
| Load Maximum * (Watt) | 162.3 | 163.2 -1% | 143 12% | 115.5 29% | 180 -11% | 161 1% | 155.7 4% | 158 3% | 122.7 24% |
* ... más pequeño es mejor
| MSI GF62VR 7RF-877 i7-7700HQ, GeForce GTX 1060 Mobile, 41 Wh | MSI GE62VR 6RF-001US 6700HQ, GeForce GTX 1060 Mobile, 51 Wh | Gigabyte P55W v7 i7-7700HQ, GeForce GTX 1060 Mobile, 63 Wh | Lenovo Legion Y520-15IKBM 80YY001APB i5-7300HQ, GeForce GTX 1060 Max-Q, 45 Wh | Schenker XMG A517 i7-7700HQ, GeForce GTX 1060 Mobile, 62 Wh | Gigabyte Aero 15 i7-7700HQ, GeForce GTX 1060 Mobile, 94.24 Wh | Asus Strix GL502VM-DS74 i7-7700HQ, GeForce GTX 1060 Mobile, 64 Wh | HP Omen 15-ce002ng i7-7700HQ, GeForce GTX 1060 Max-Q, 70 Wh | Samsung Odyssey NP800G5M-X01US i7-7700HQ, GeForce GTX 1050 Mobile, 43 Wh | |
|---|---|---|---|---|---|---|---|---|---|
| Duración de Batería | -14% | 235% | 300% | 158% | 239% | -6% | 71% | 161% | |
| Reader / Idle (h) | 2.8 | 2.3 -18% | 13.2 371% | 11.2 300% | 7.5 168% | 10.6 279% | 1.7 -39% | 4.3 54% | 10.2 264% |
| WiFi v1.3 (h) | 1.9 | 1.7 -11% | 5.8 205% | 5 163% | 7 268% | 1.5 -21% | 3.3 74% | 4.4 132% | |
| Load (h) | 0.7 | 0.6 -14% | 1.6 129% | 1.7 143% | 1.9 171% | 1 43% | 1.3 86% | 1.3 86% | |
| WiFi (h) | 4 |
Pro
Contra
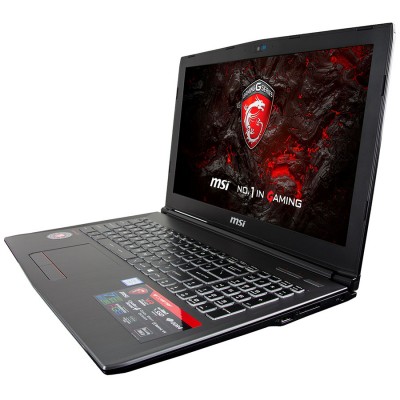

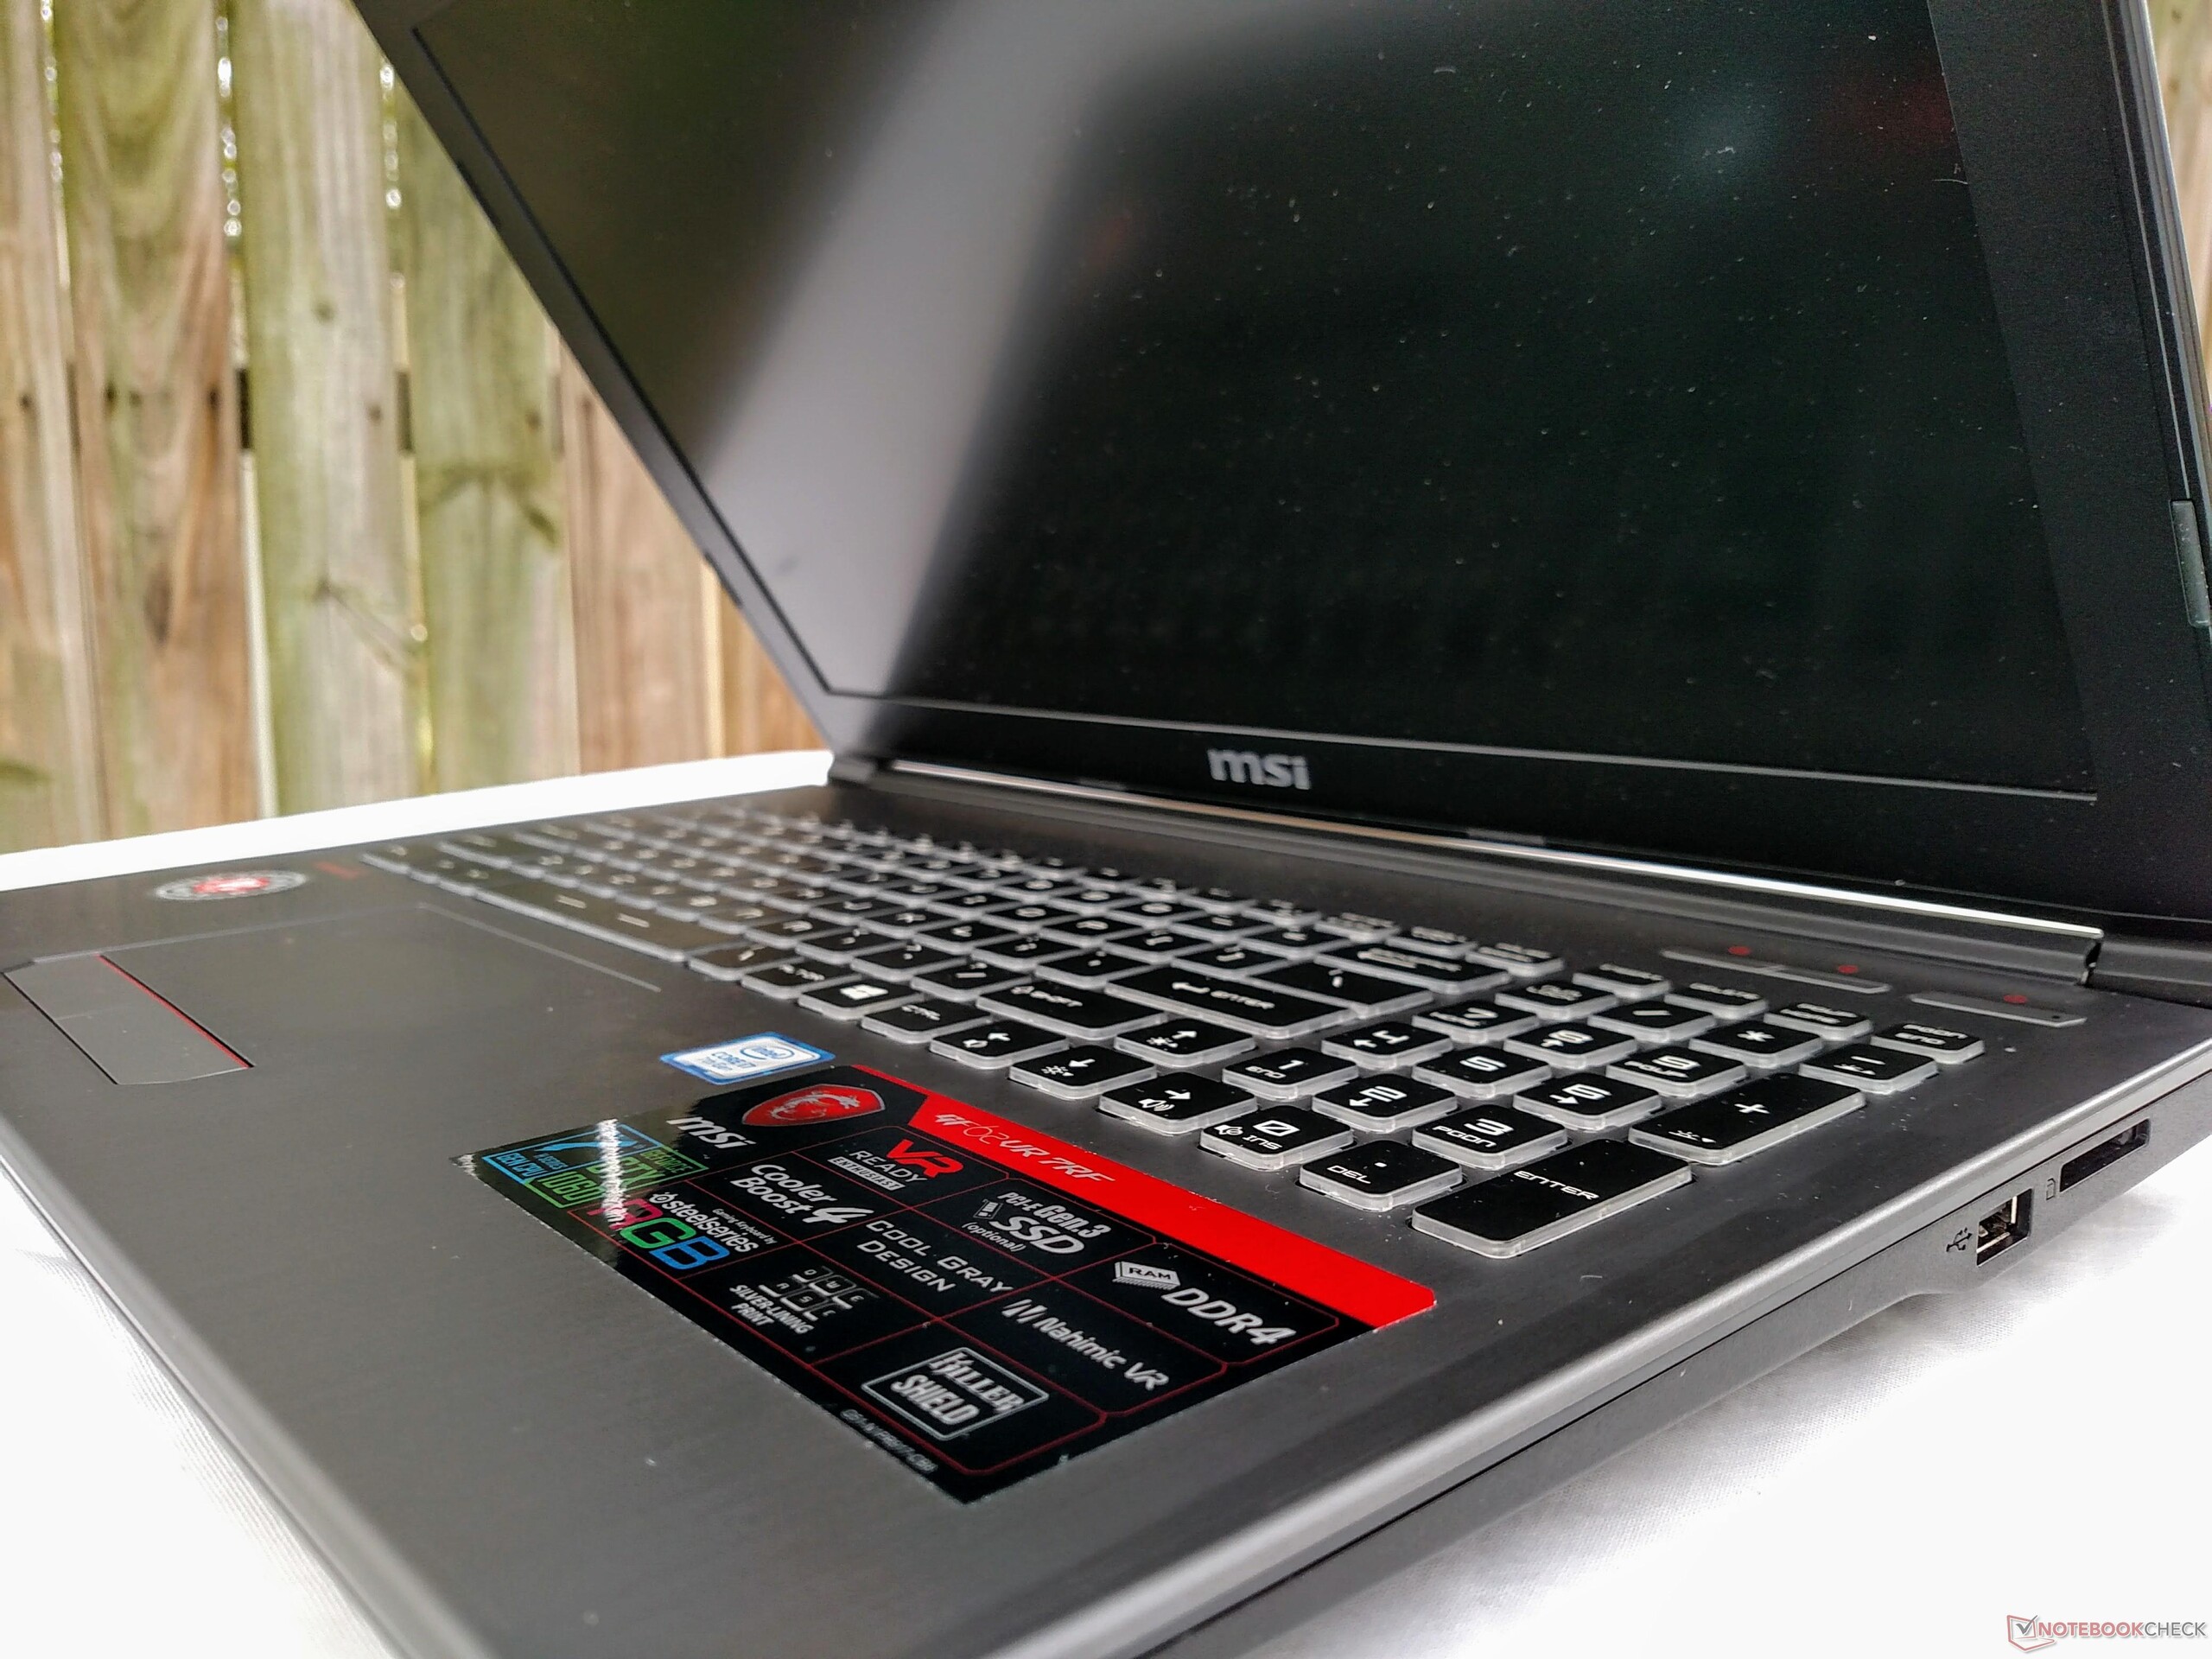
Sobre el papel, no hay nada muy especial sobre el MSI GF62VR. Si bien ofrece un buen rendimiento constante y una pantalla rica en color, lo contrarrestra con una pantalla TN de mala calidad con una precisión de color terrible y ventiladores molestos. La historia del GF62VR es de compromiso; por cada positivo, hay un negativo. El resultado final es un gran portátil gaming que se queda corto en algunas áreas críticas (principalmente calidad de pantalla, ruido de ventilador y calidad de construcción).
Sin embargo, cuando se considera el precio actual, el portátil se vuelve mucho más atractivo. A partir de $1300, el GF62VR se encuentra dentro del rango de precios para portátiles con GTX 1050 Ti. La mayoría de los portátiles con componentes similares comienzan alrededor de $200-300 más. Agrega el hecho de que el rendimiento de los juegos tiende a derribar a los competidores y el GF62VR de repente se convierte en uno de los mejores portátiles gaming "por su dinero" en el mercado ahora.
Hay una gran compensación a tener encuenta aquí. Por esa gran relación precio/rendimiento, los usuarios tendrán que soportar una pantalla (francamente) espantosa que exige calibración, ventiladores muy ruidosos, y una carcasa de plástico que intenta y no consigue imitar un chasis más premium. Pero la compensación puede valer la pena para algunos consumidores.
Para los jugadores a los que no les importe mucho la estética y solo quieren jugar mientras viajan, ahora mismo es difícil vencer al GF62VR. El principal competidor del GF62VR es en realidad el anterior GE62VR, al que está reemplazando. Si puedes encontrar un GE62VR en el mercado de segunda mano con una pantalla IPS, probablemente sea la mejor compra. Sin embargo, si necesitas tener un nuevo portátil gaming con una GTX 1060 que ofrezca el mejor valor, el GF62VR debe estar en la parte superior de su lista o cerca de ella.
Ésta es una versión acortada del análisis original. Puedes leer el análisis completo en inglés aquí.
MSI GF62VR 7RF-877
- 11/10/2017 v6 (old)
Sam Medley
Price comparison
