La caja de refrigeración líquida es más silenciosa de lo esperado: Análisis del portátil Uniwell Technology GM7AG8N
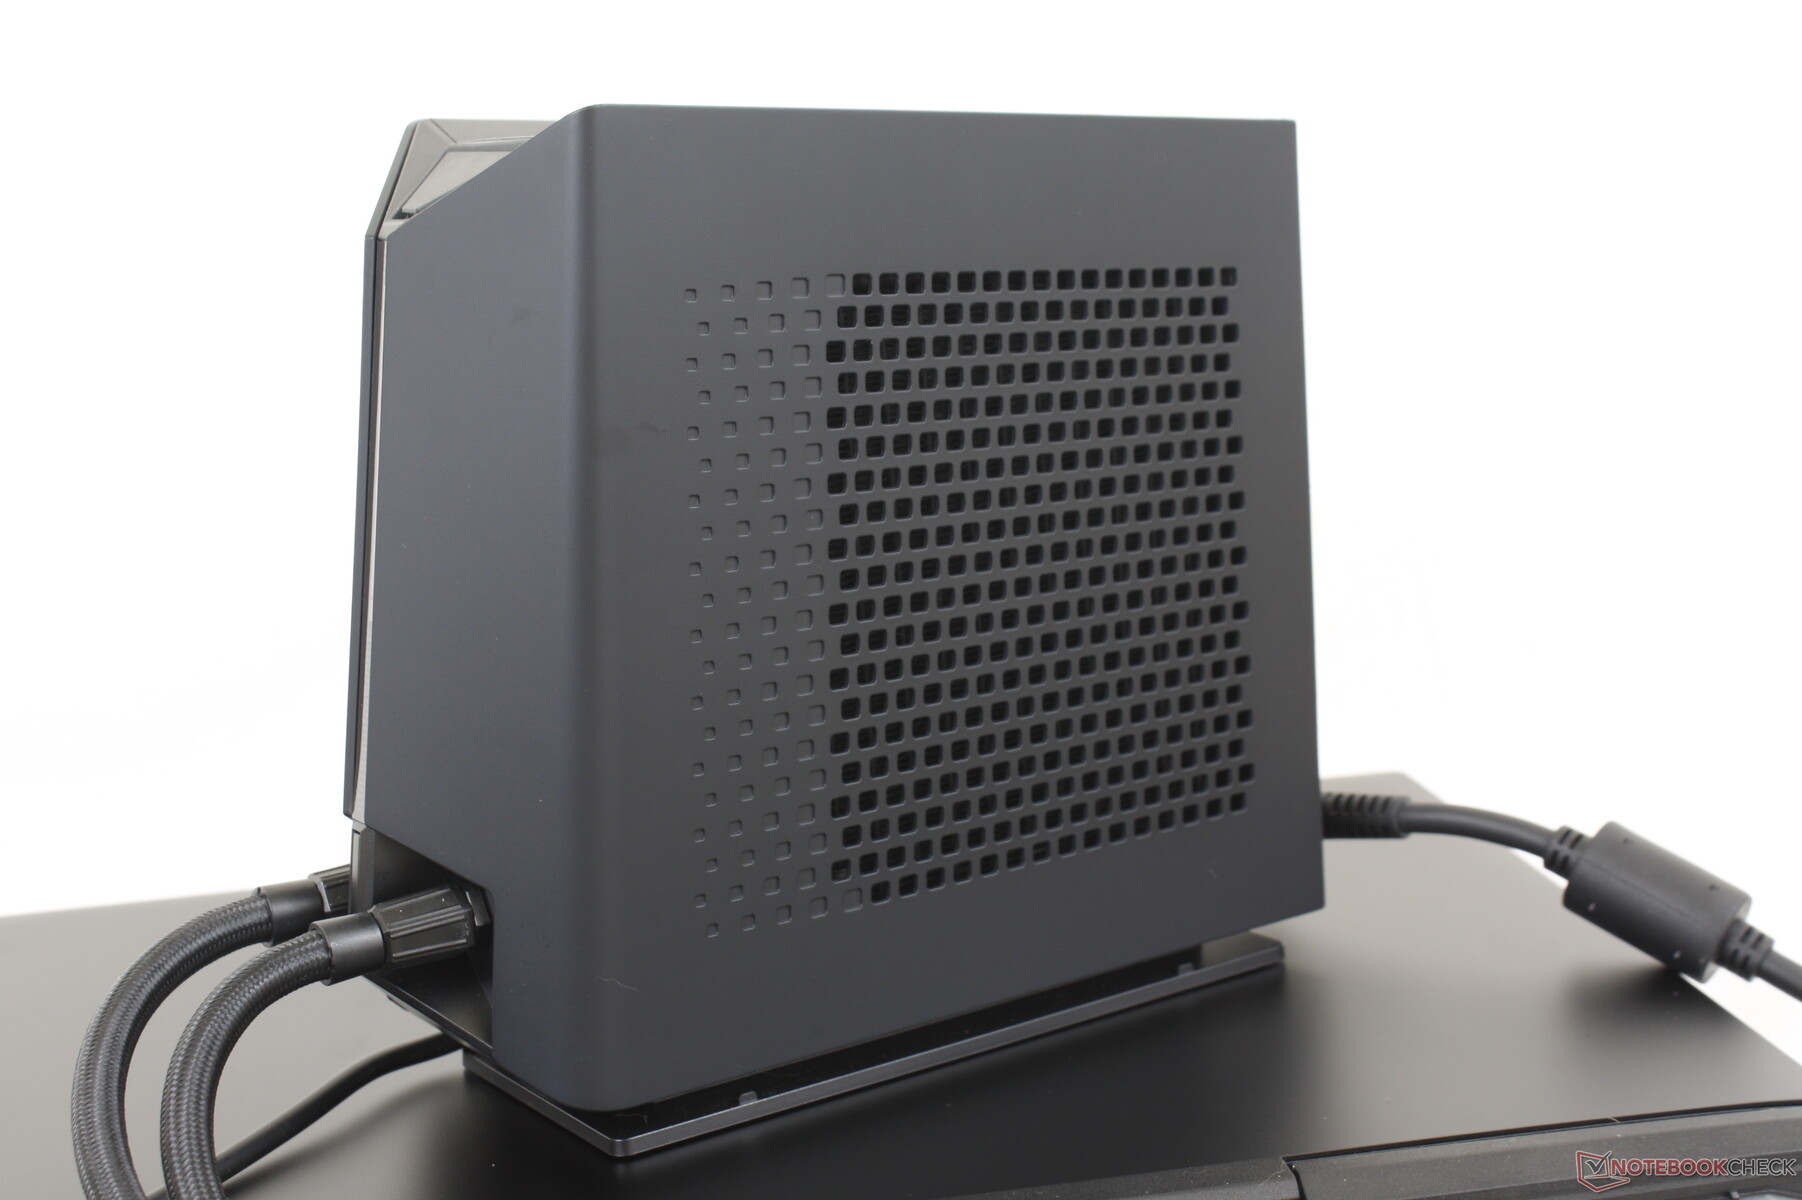
Después de probar eltongfang GM5AG8W de 15,6 pulgadas refrigerado por agua a principios de este año de Schenker, ahora estamos listos para probar el Tongfang GM7AG8N de 17 pulgadas refrigerado por agua, cortesía de Uniwell Technology. Las bases de refrigeración externa pueden considerarse una solución extrema para las elevadas exigencias de refrigeración de las nuevas CPU y GPU móviles. Mientras que los ordenadores de sobremesa tienen el lujo de disponer de espacio, los portátiles para juegos deben encajar procesadores cada vez más rápidos en factores de forma cada vez más finos.
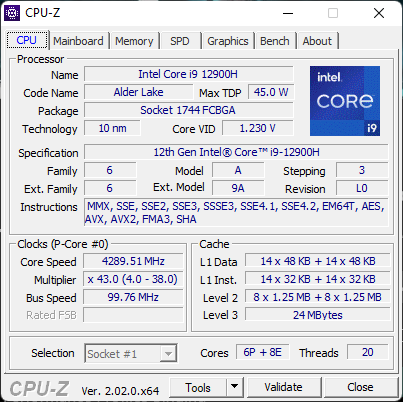
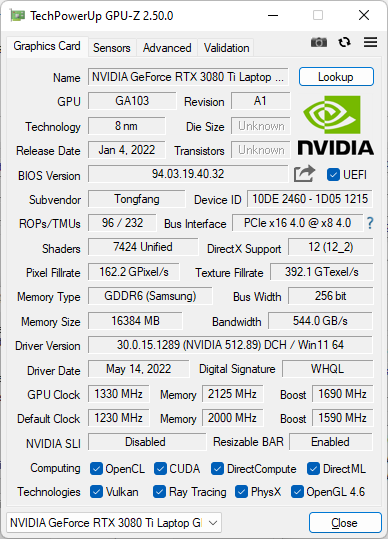
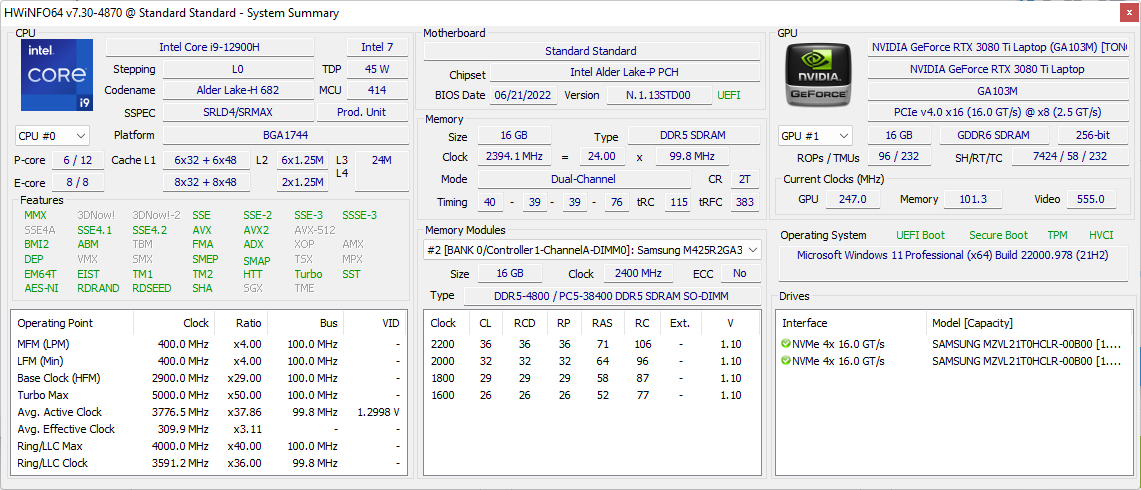
Nuestra unidad de prueba viene con la CPU Core i9-12900H de 12ª generación, la GPU GeForce RTX 3080 Ti de 175 W con MUX, una pantalla IPS de 17 pulgadas a 240 Hz y 1600p, y un teclado mecánico Cherry MX integrado. El modelo aún no está ampliamente disponible en el momento de la publicación.
El Uniwell Technology GM7AG8N compite directamente con portátiles para juegos de 17 pulgadas más tradicionales como el Razer Blade 17, Asus ROG Zephyrus S17, MSI Stealth GS77, o el Gigabyte Aorus 17X. Sin embargo, el Uniwell tiene un factor de forma 16:10 mientras que la mayoría de las otras alternativas de 17 pulgadas siguen siendo 16:9. La caja de refrigeración es la misma que en el Schenker GM5AG8W, por lo que recomendamos consultar nuestros análisis existentes aquí y aquí para obtener más detalles sobre la configuración del refrigerador externo.
Más reseñas de Uniwell Technology:
Posibles contendientes en la comparación
Valoración | Fecha | Modelo | Peso | Altura | Tamaño | Resolución | Precio |
|---|---|---|---|---|---|---|---|
| 88.1 % v7 (old) | 10/2022 | Uniwell Technology GM7AG8N Liquid Cooling Box i9-12900H, GeForce RTX 3080 Ti Laptop GPU | 2.7 kg | 27.6 mm | 17.00" | 2560x1600 | |
| 88.3 % v7 (old) | 08/2022 | MSI Titan GT77 12UHS i9-12900HX, GeForce RTX 3080 Ti Laptop GPU | 3.3 kg | 23 mm | 17.30" | 1920x1080 | |
| 83.7 % v7 (old) | 08/2022 | Aorus 17X XES i9-12900HX, GeForce RTX 3070 Ti Laptop GPU | 2.7 kg | 30 mm | 17.30" | 1920x1080 | |
| 89.9 % v7 (old) | 07/2022 | Razer Blade 17 Early 2022 i9-12900H, GeForce RTX 3080 Ti Laptop GPU | 2.8 kg | 19.9 mm | 17.30" | 3840x2160 | |
| 87.2 % v7 (old) | 04/2022 | MSI Stealth GS77 12UHS-083US i7-12700H, GeForce RTX 3080 Ti Laptop GPU | 2.9 kg | 20.8 mm | 17.30" | 2560x1440 | |
| 90.1 % v7 (old) | 07/2021 | Asus ROG Zephyrus S17 GX703HSD i9-11900H, GeForce RTX 3080 Laptop GPU | 2.8 kg | 19.9 mm | 17.30" | 2560x1440 |
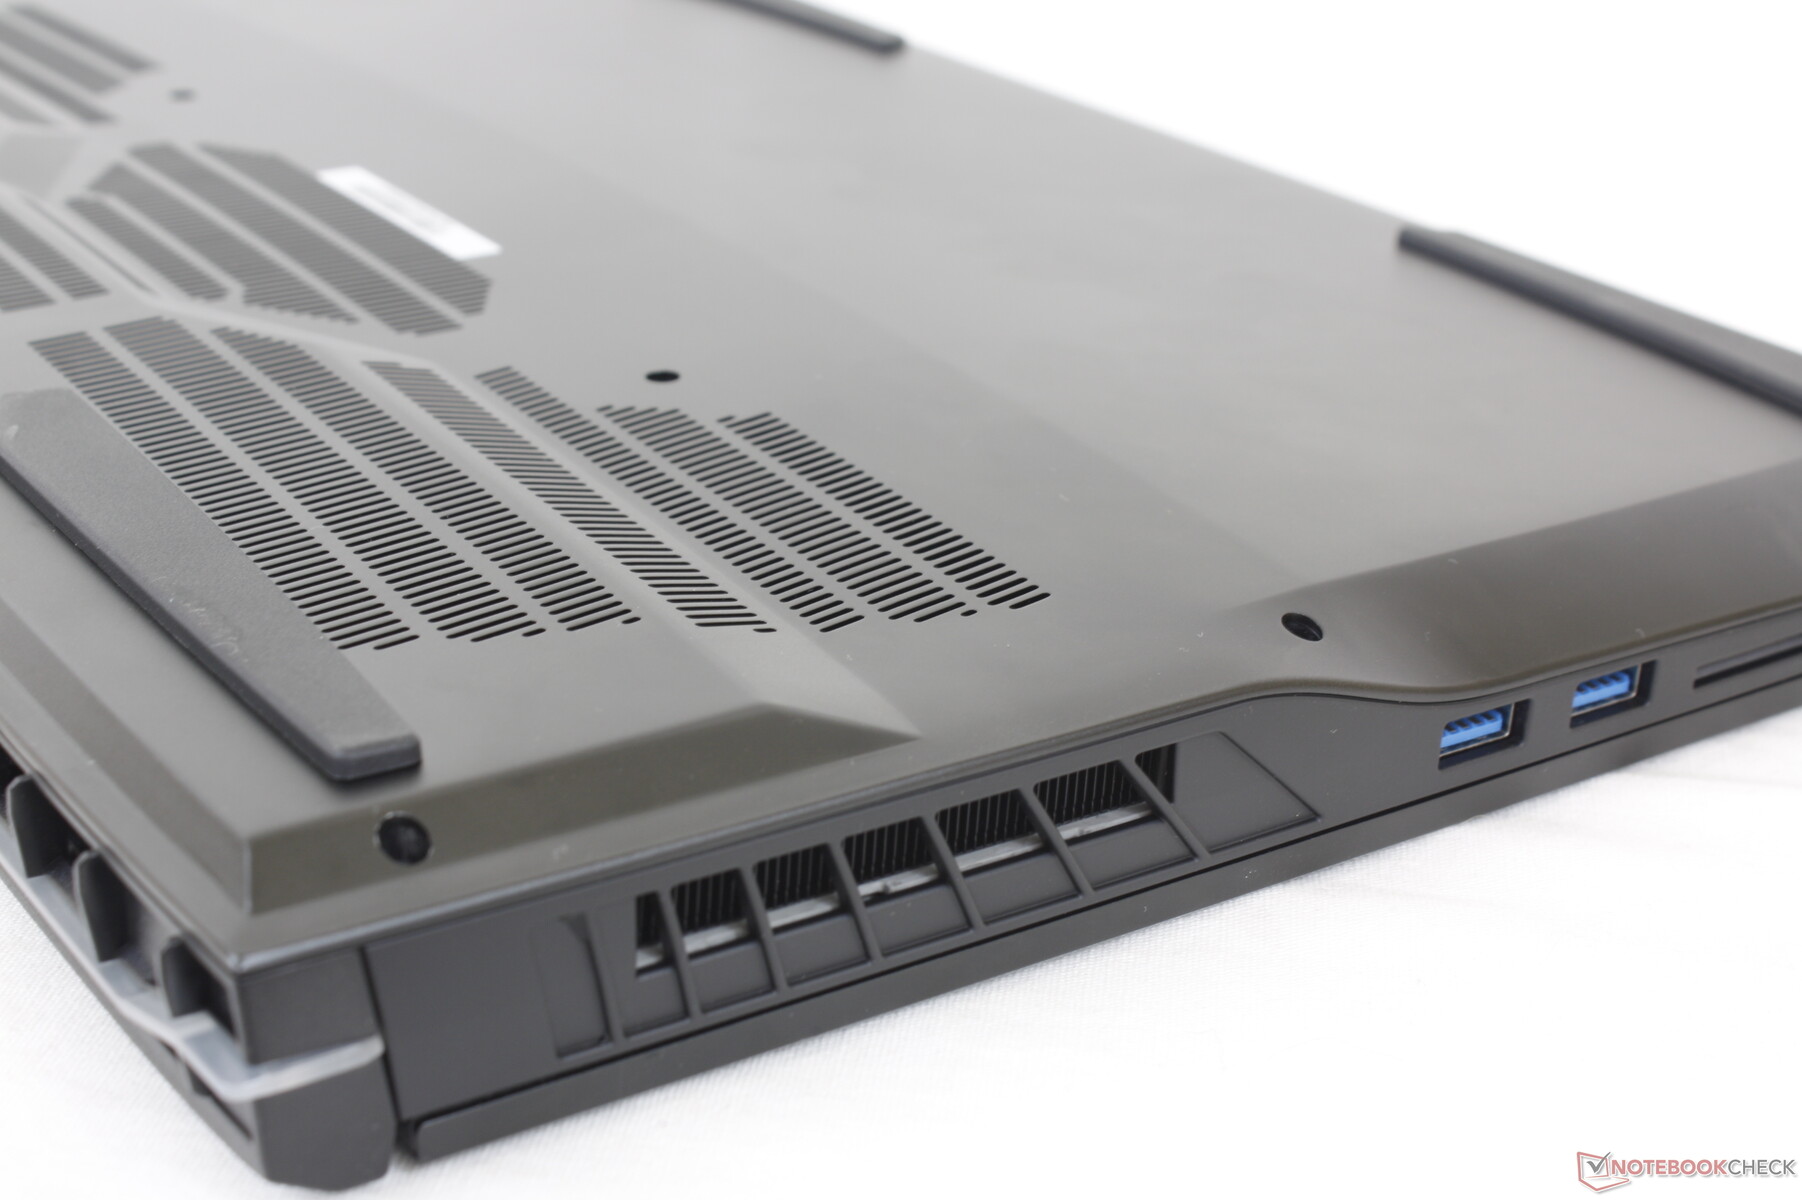
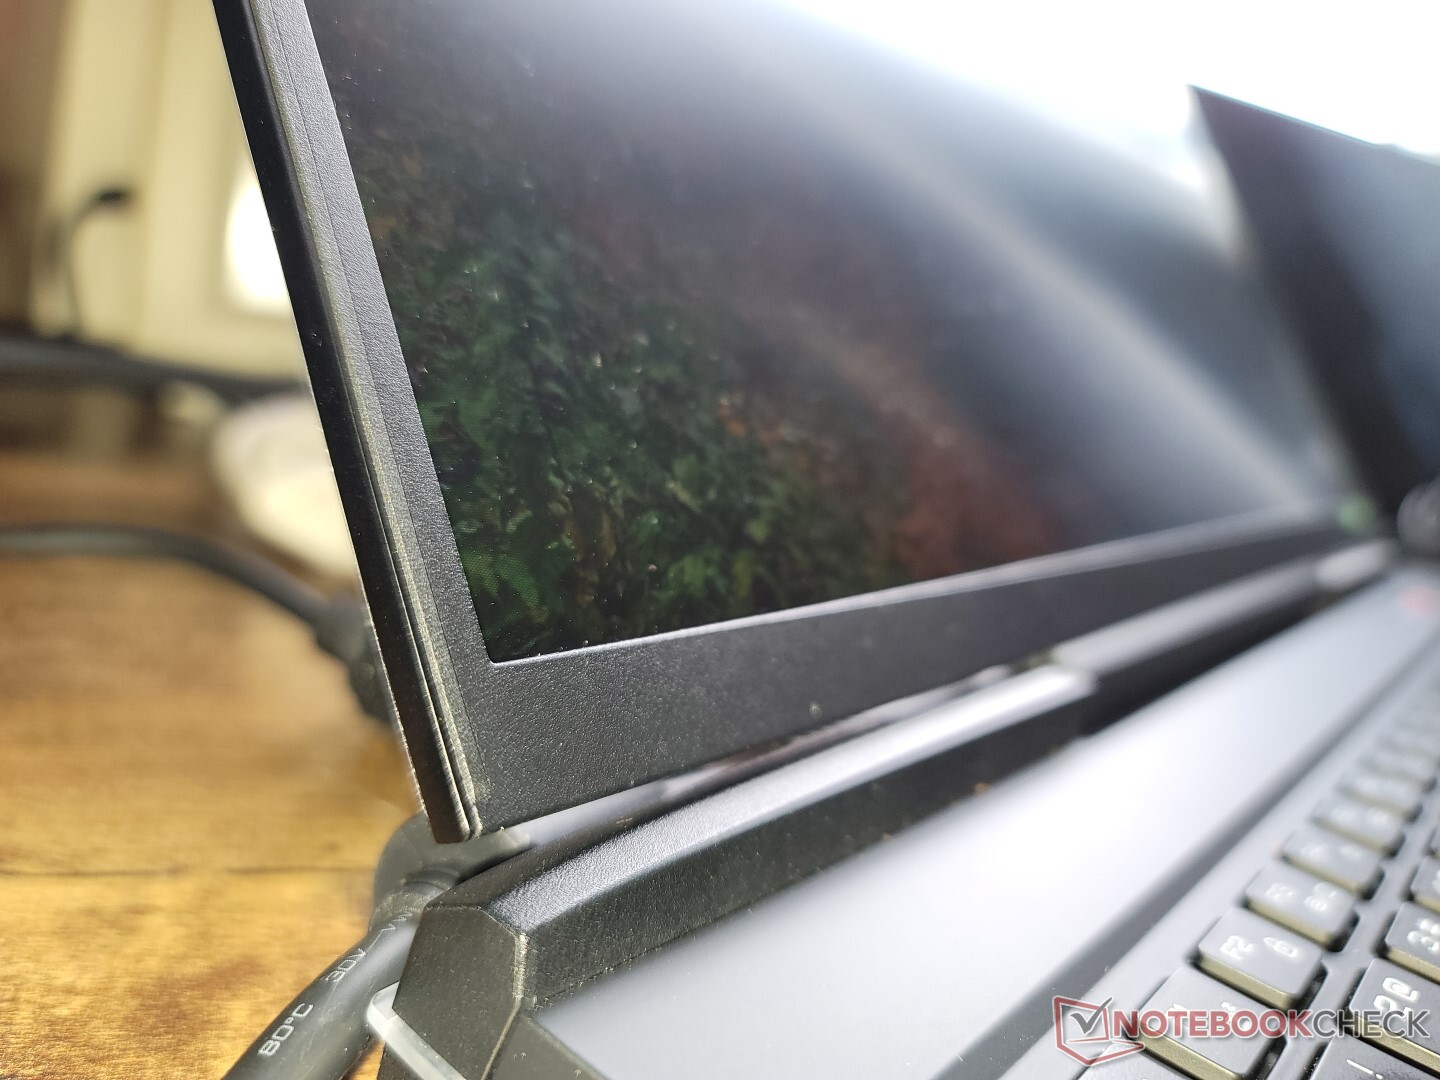
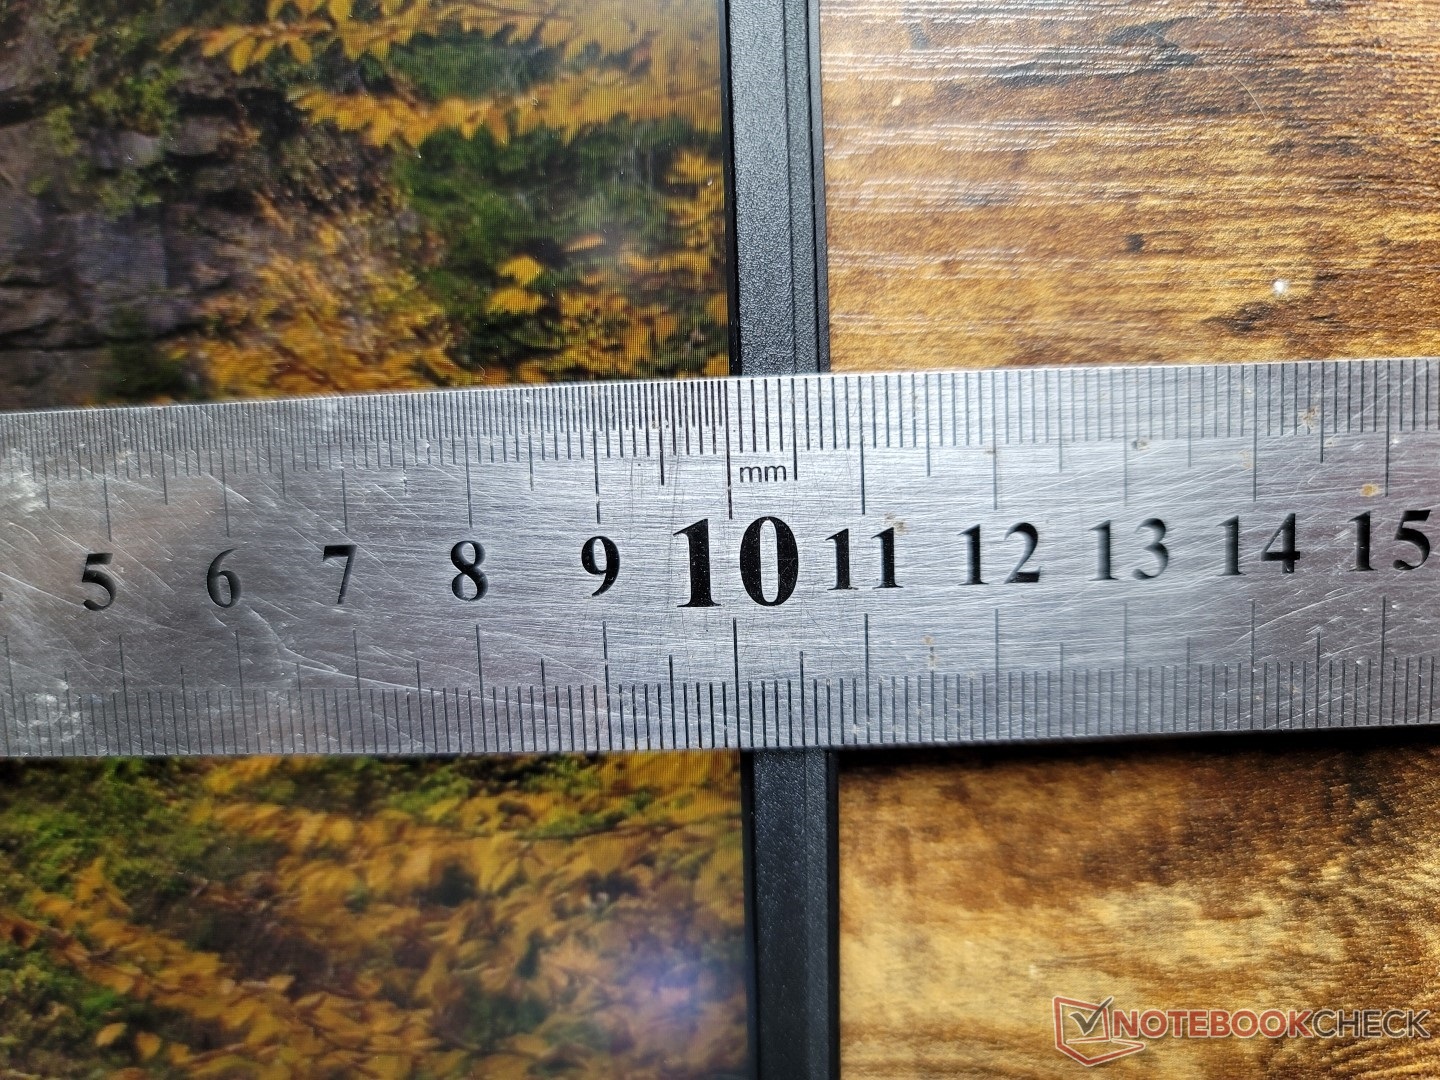
Caso - Un enorme imán de huellas dactilares
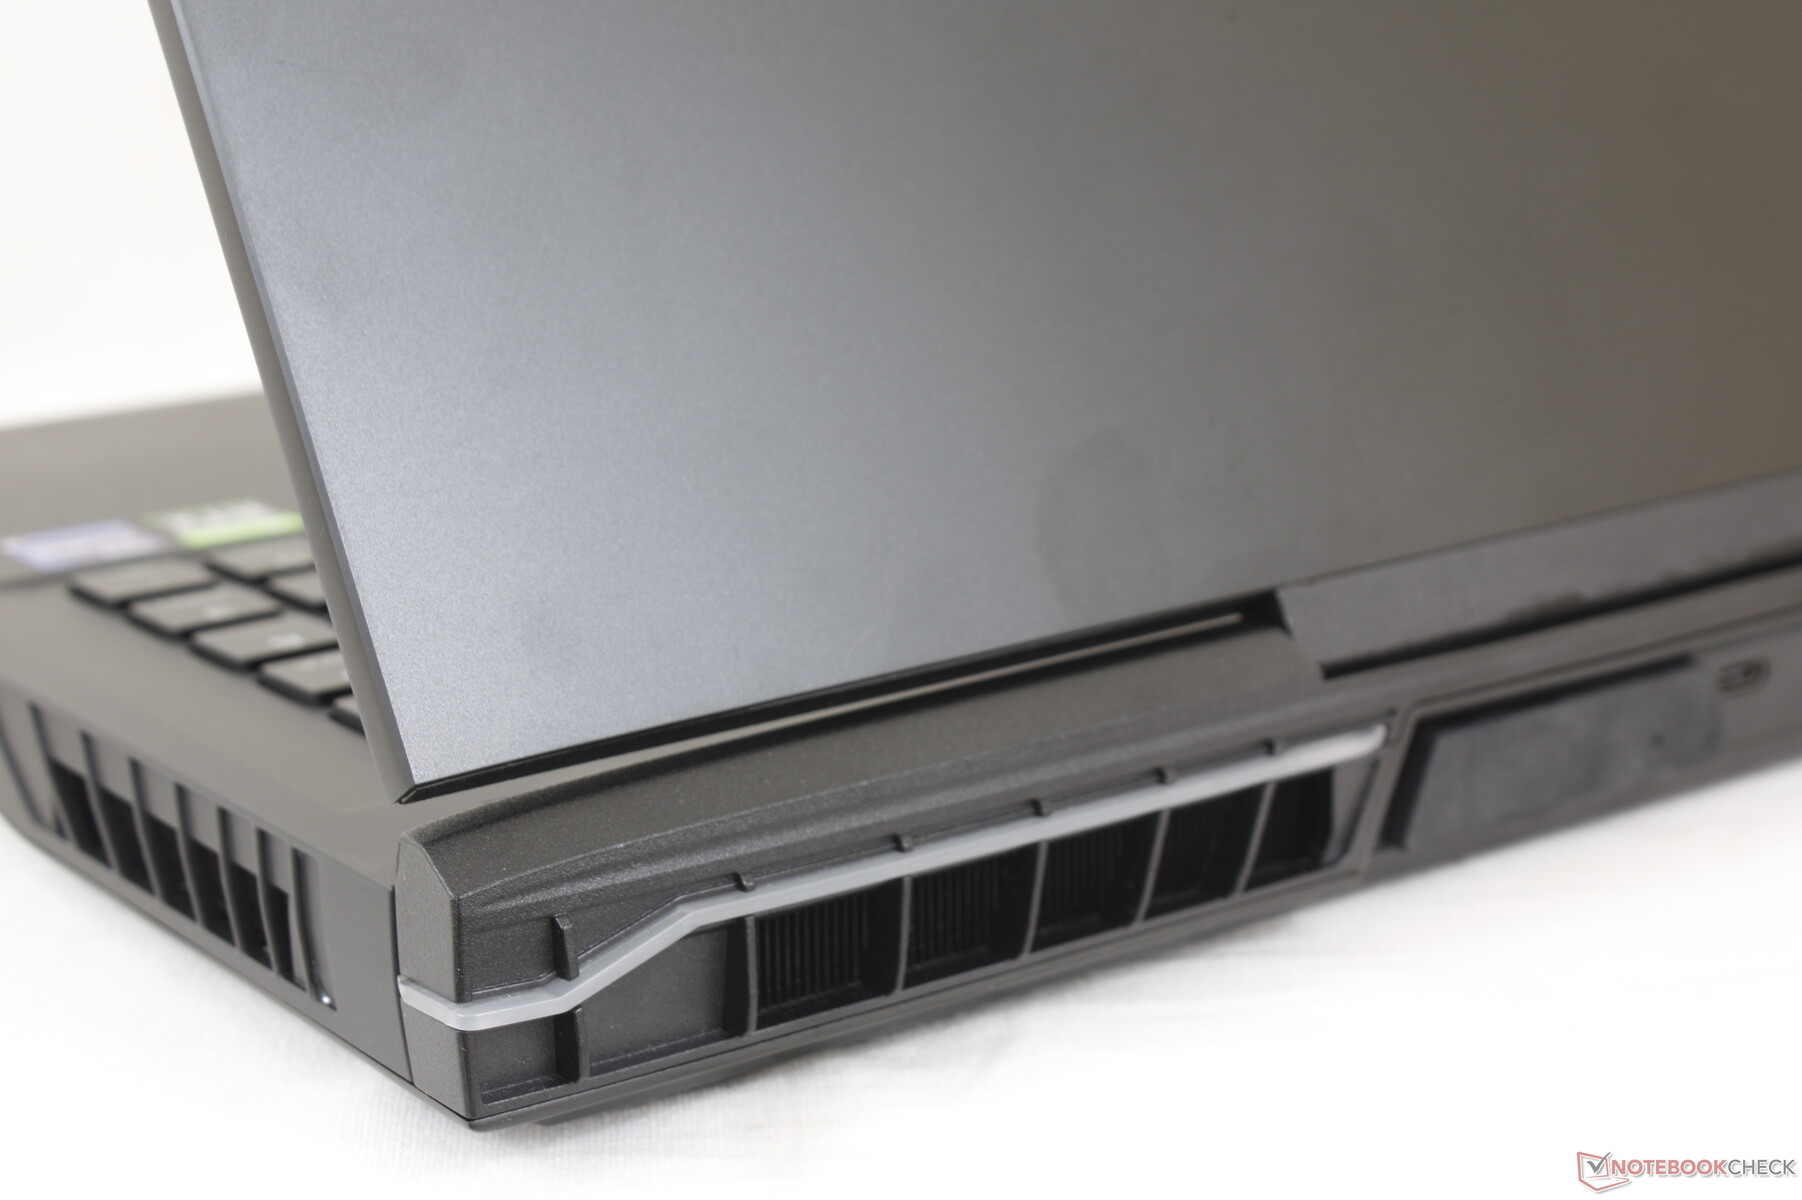
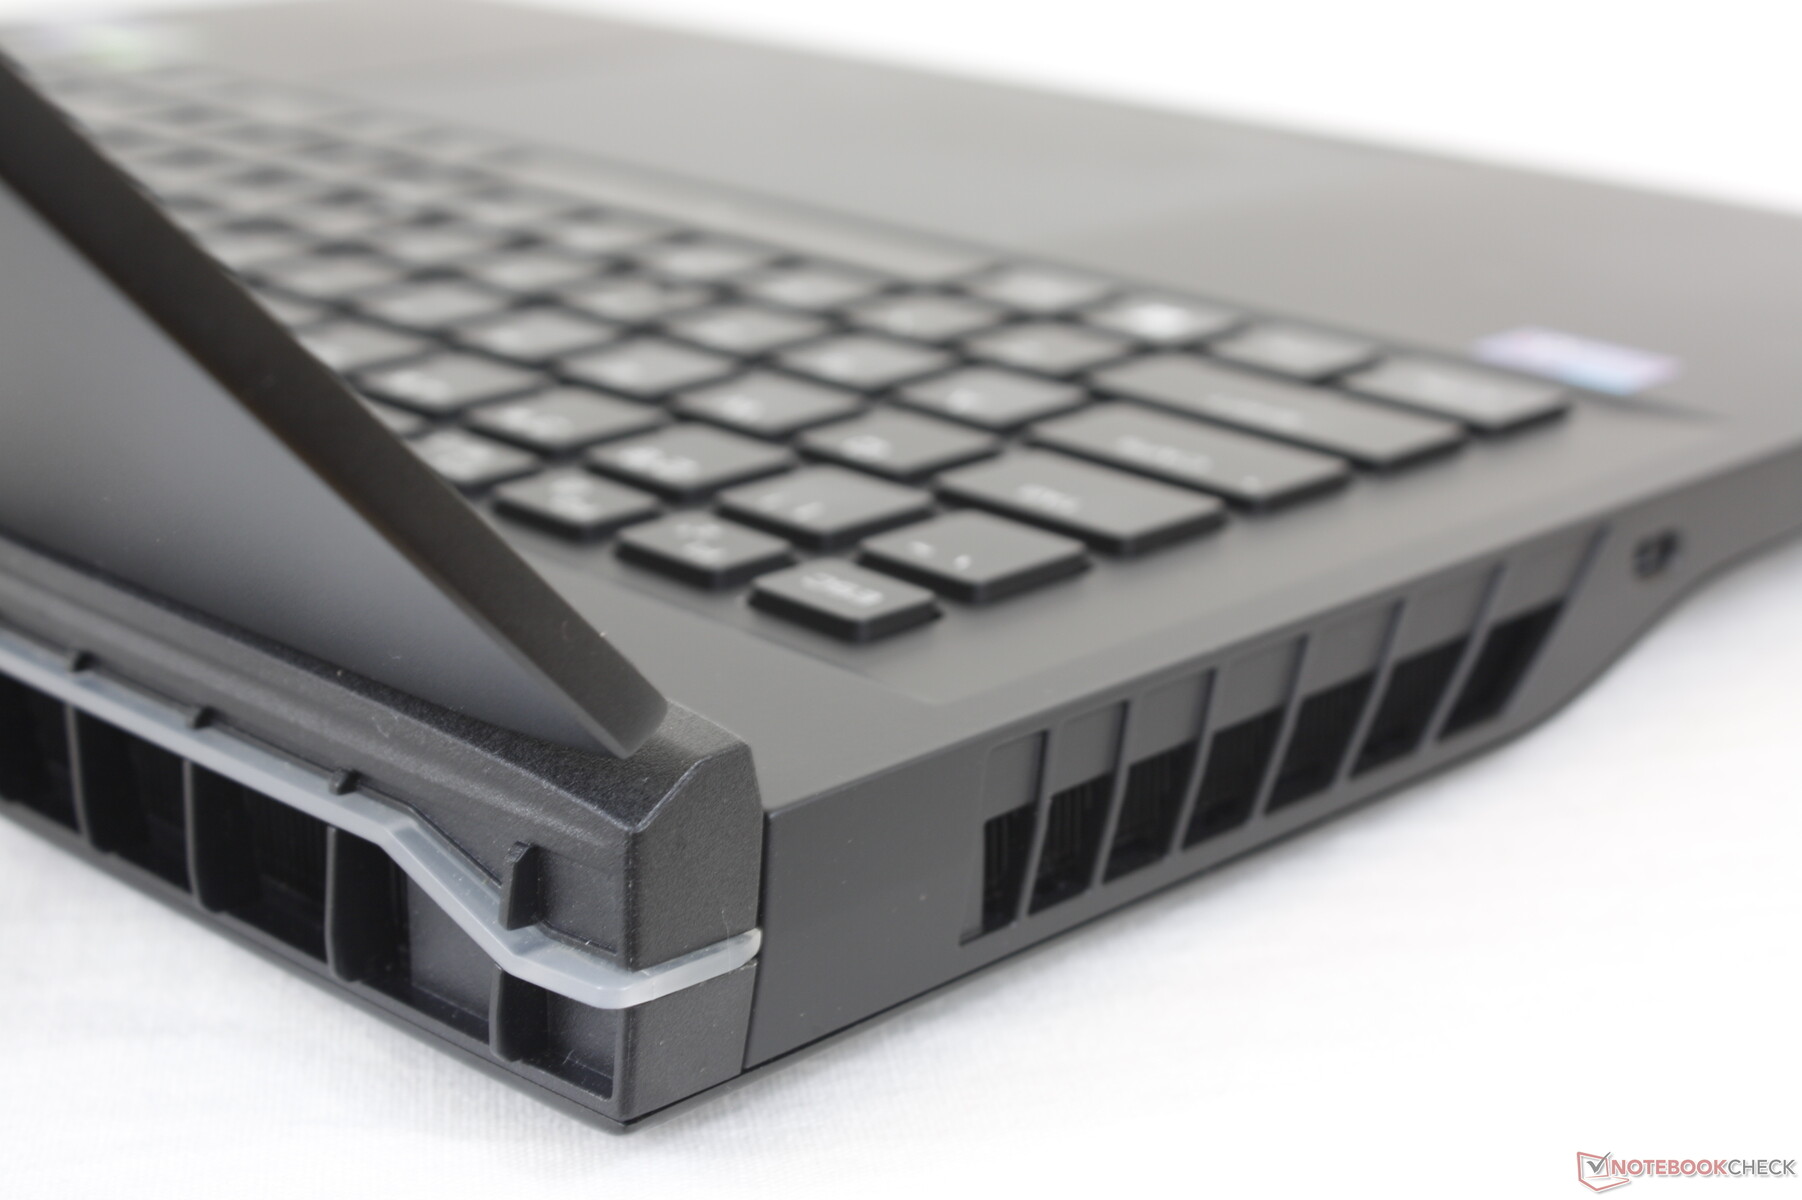
El Uniwell Technology GM7AG8N de 17 pulgadas comparte características similares con el GM5AG8W de 15,6 pulgadas ya que ambos soportan la misma caja de refrigeración por agua externa. Sin embargo, los dos modelos son muy diferentes cuando se trata de la cubierta del teclado y el diseño de la placa inferior. Mientras que el GM5AG8W integra un teclado biselado con muchas rejillas de ventilación en la parte inferior, el GM7AG8N tiene un teclado chiclet con rejillas de ventilación rediseñadas. El estilo de los LED también es diferente entre ellos, ya que el GM7AG8N tiene una barra de LED a lo largo de la parte trasera mientras que el GM5AG8W tiene una a lo largo de la parte delantera
La rigidez del chasis es excelente para la base y la cubierta del teclado. Si se intenta girar la base o aplicar presión sobre el centro del teclado, el resultado es una flexión mínima y ningún crujido. Las bisagras y la tapa también son fuertes, pero son ligeramente más flexibles que en la serie Razer Blade 17.
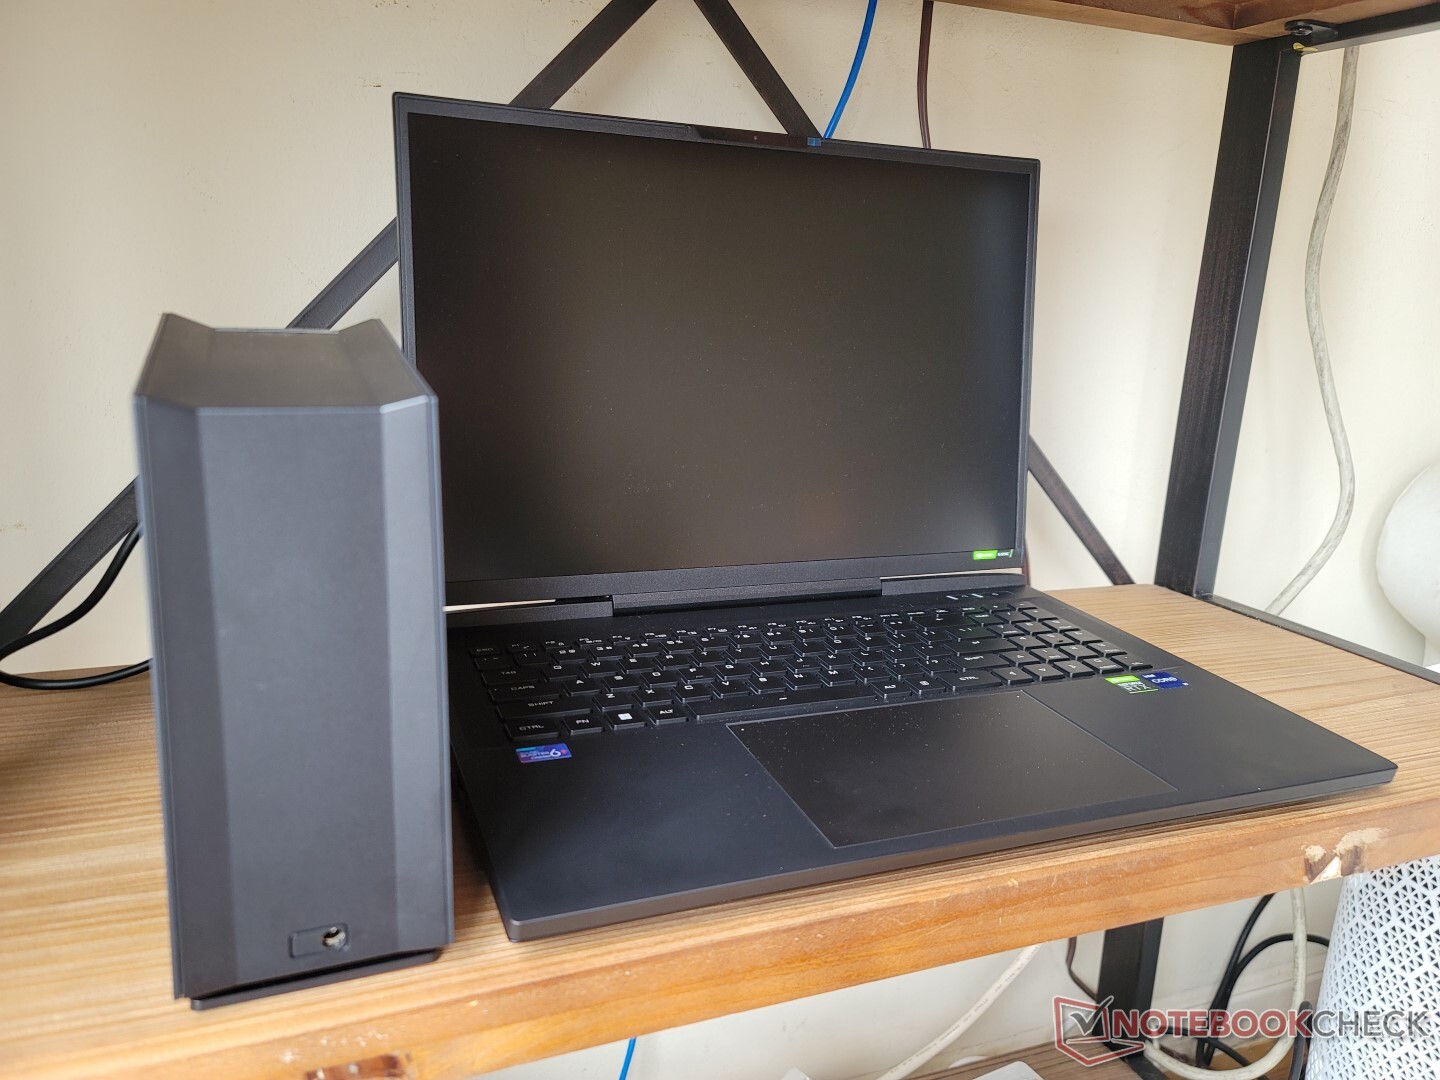
El Uniwell es más grueso y largo que la mayoría de los portátiles de 17 pulgadas para juegos, pero pesa más o menos lo mismo. Su tamaño ligeramente más cuadrado puede atribuirse a su relación de aspecto 16:10, poco común para un portátil de juegos de este tamaño de pantalla. El peso total es, afortunadamente, la media de la categoría antes de tener en cuenta la caja de refrigeración externa
- Peso del portátil: 2749 g
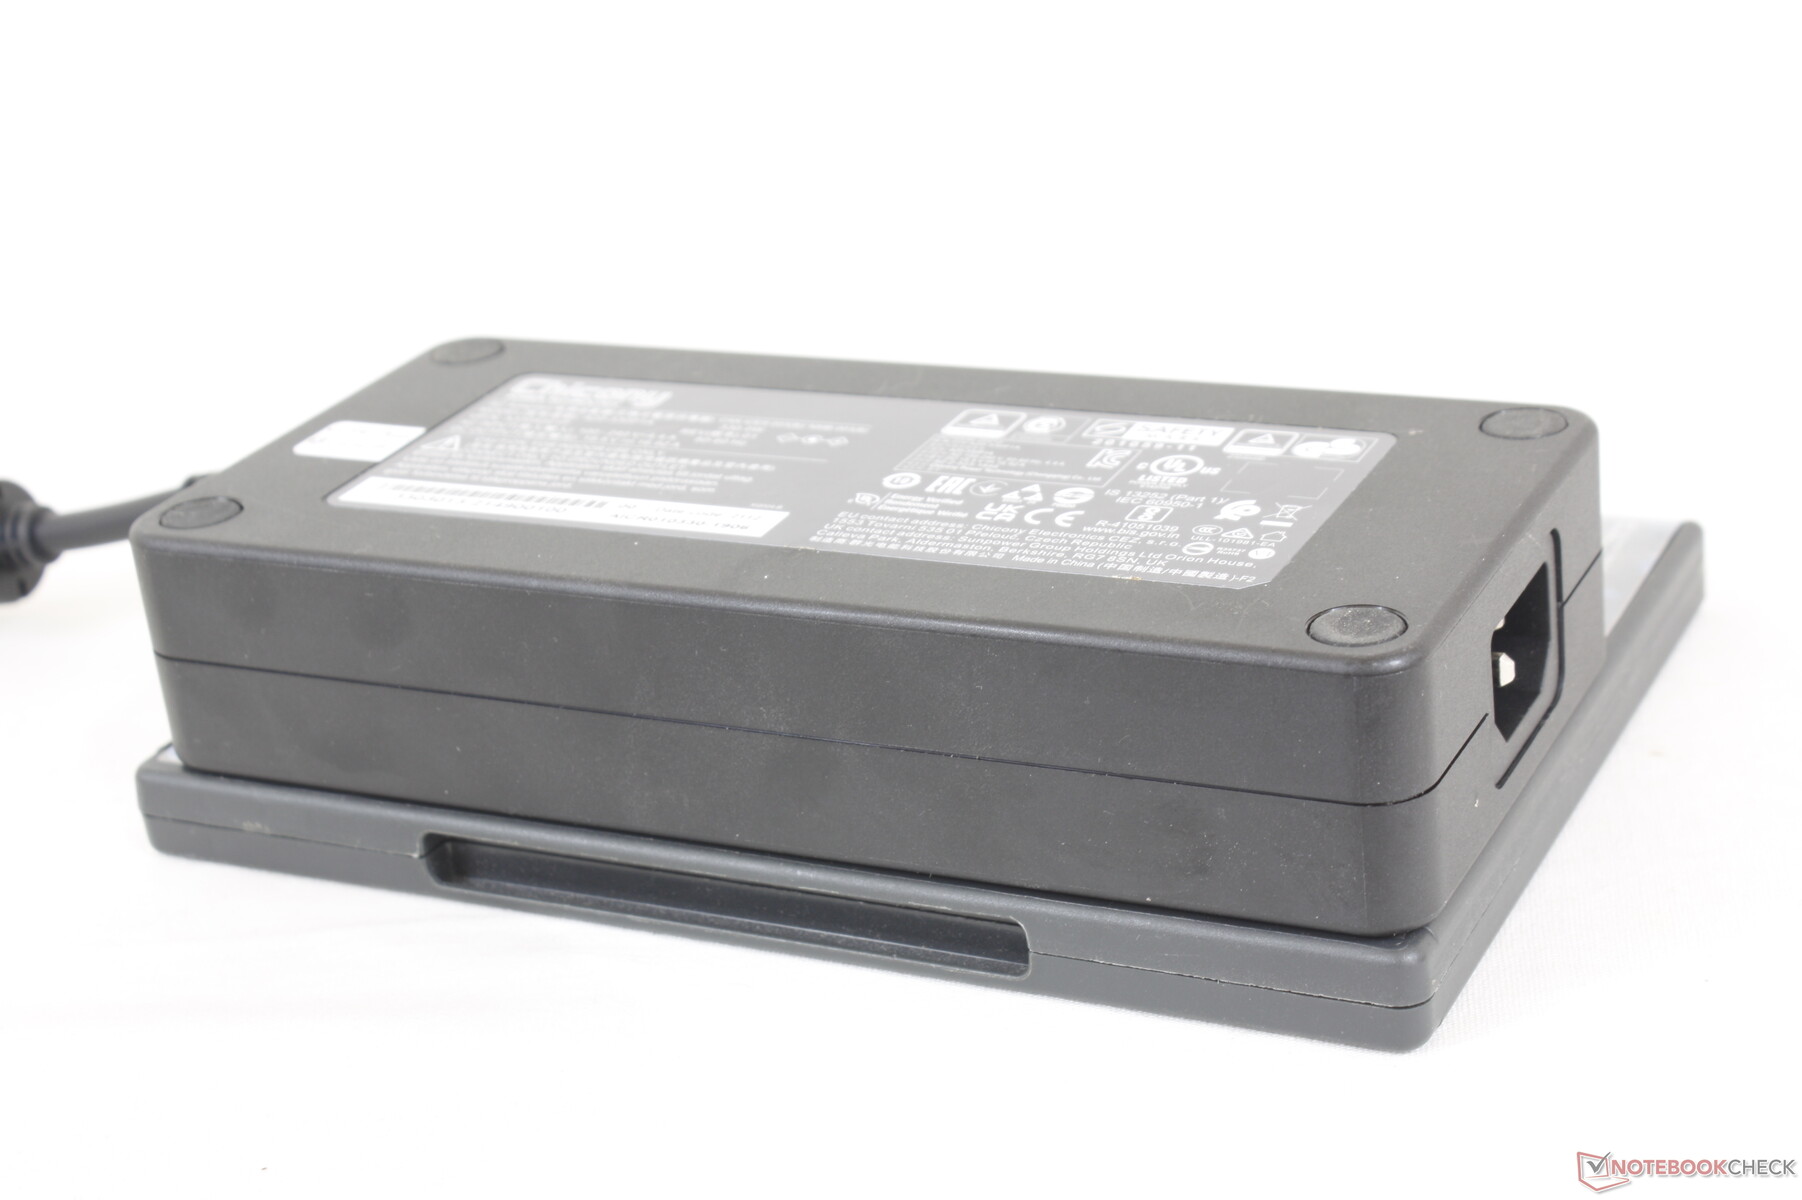
- Peso del adaptador de CA: 1057 g
- Caja de refrigeración externa con tubos de agua (sin agua) 1160 g
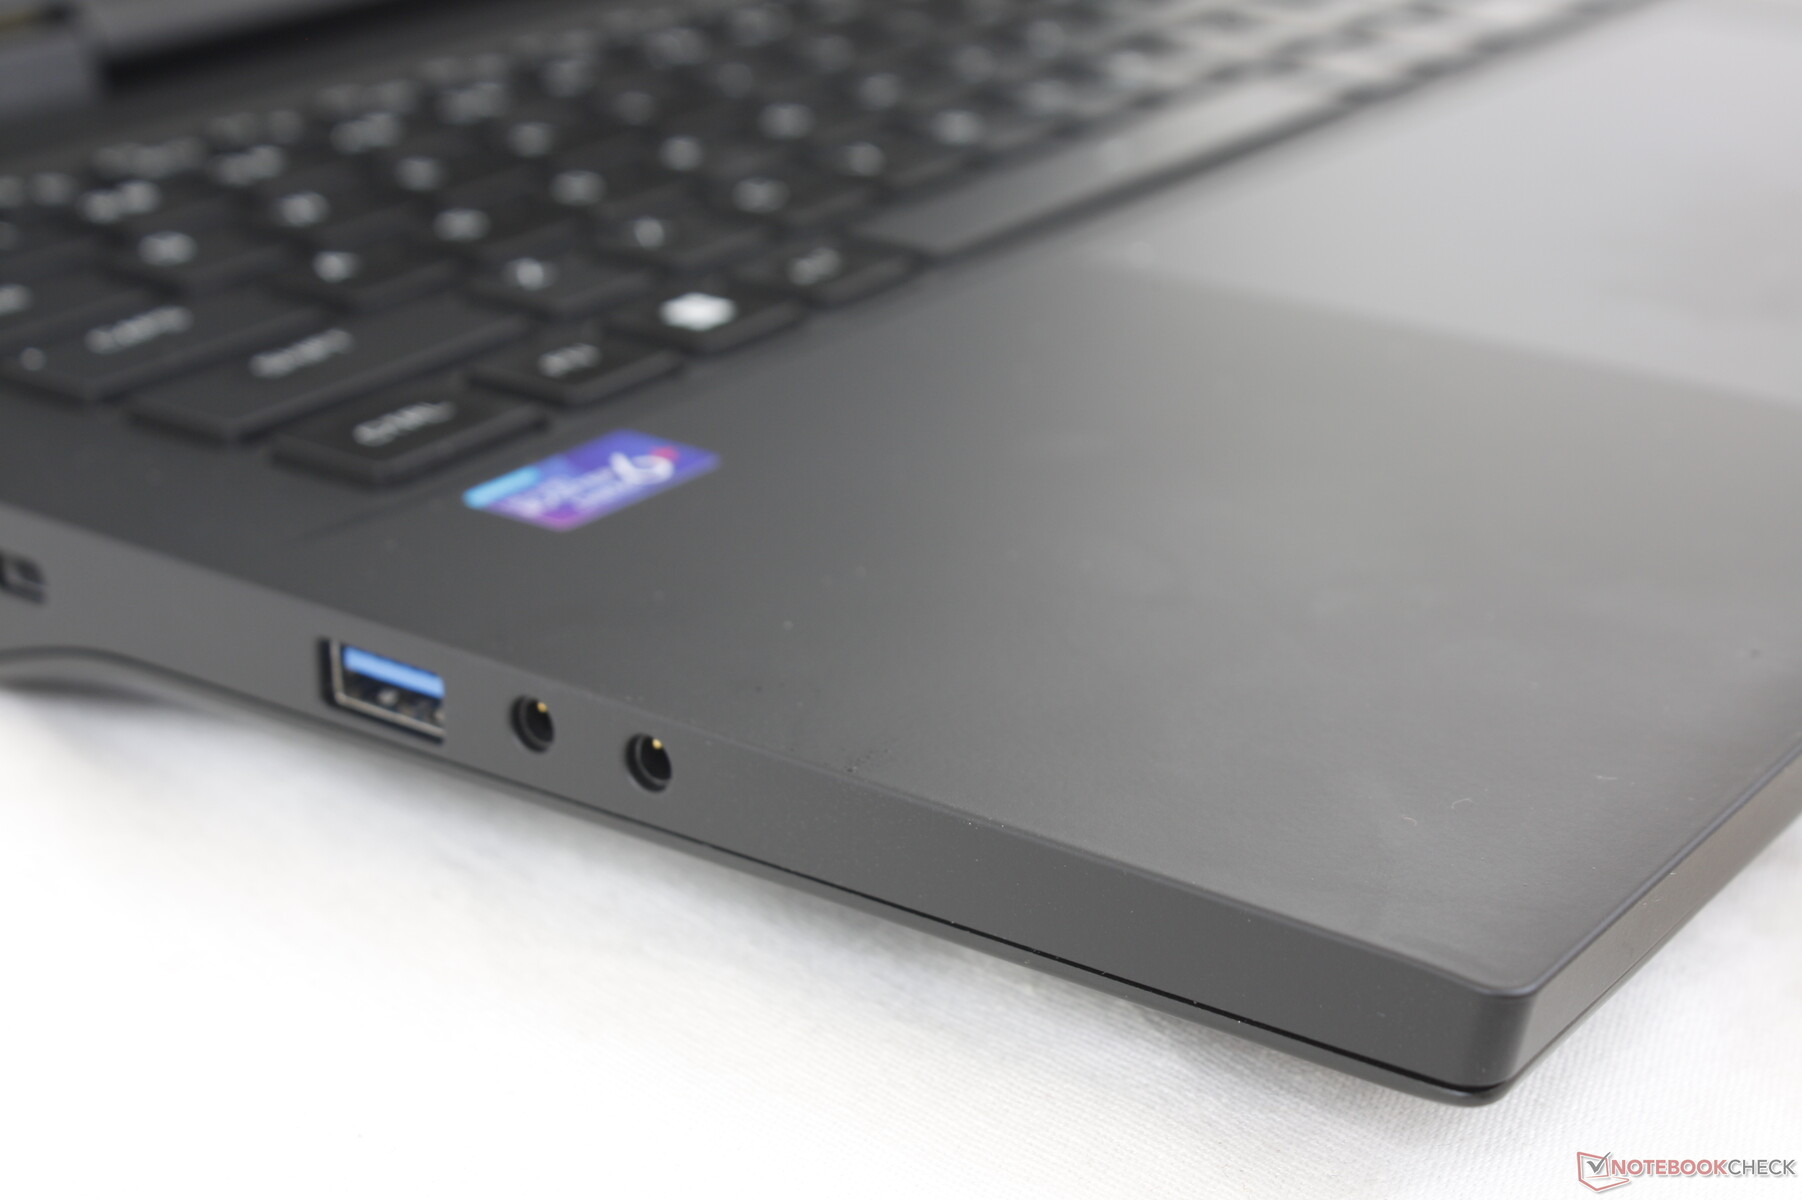
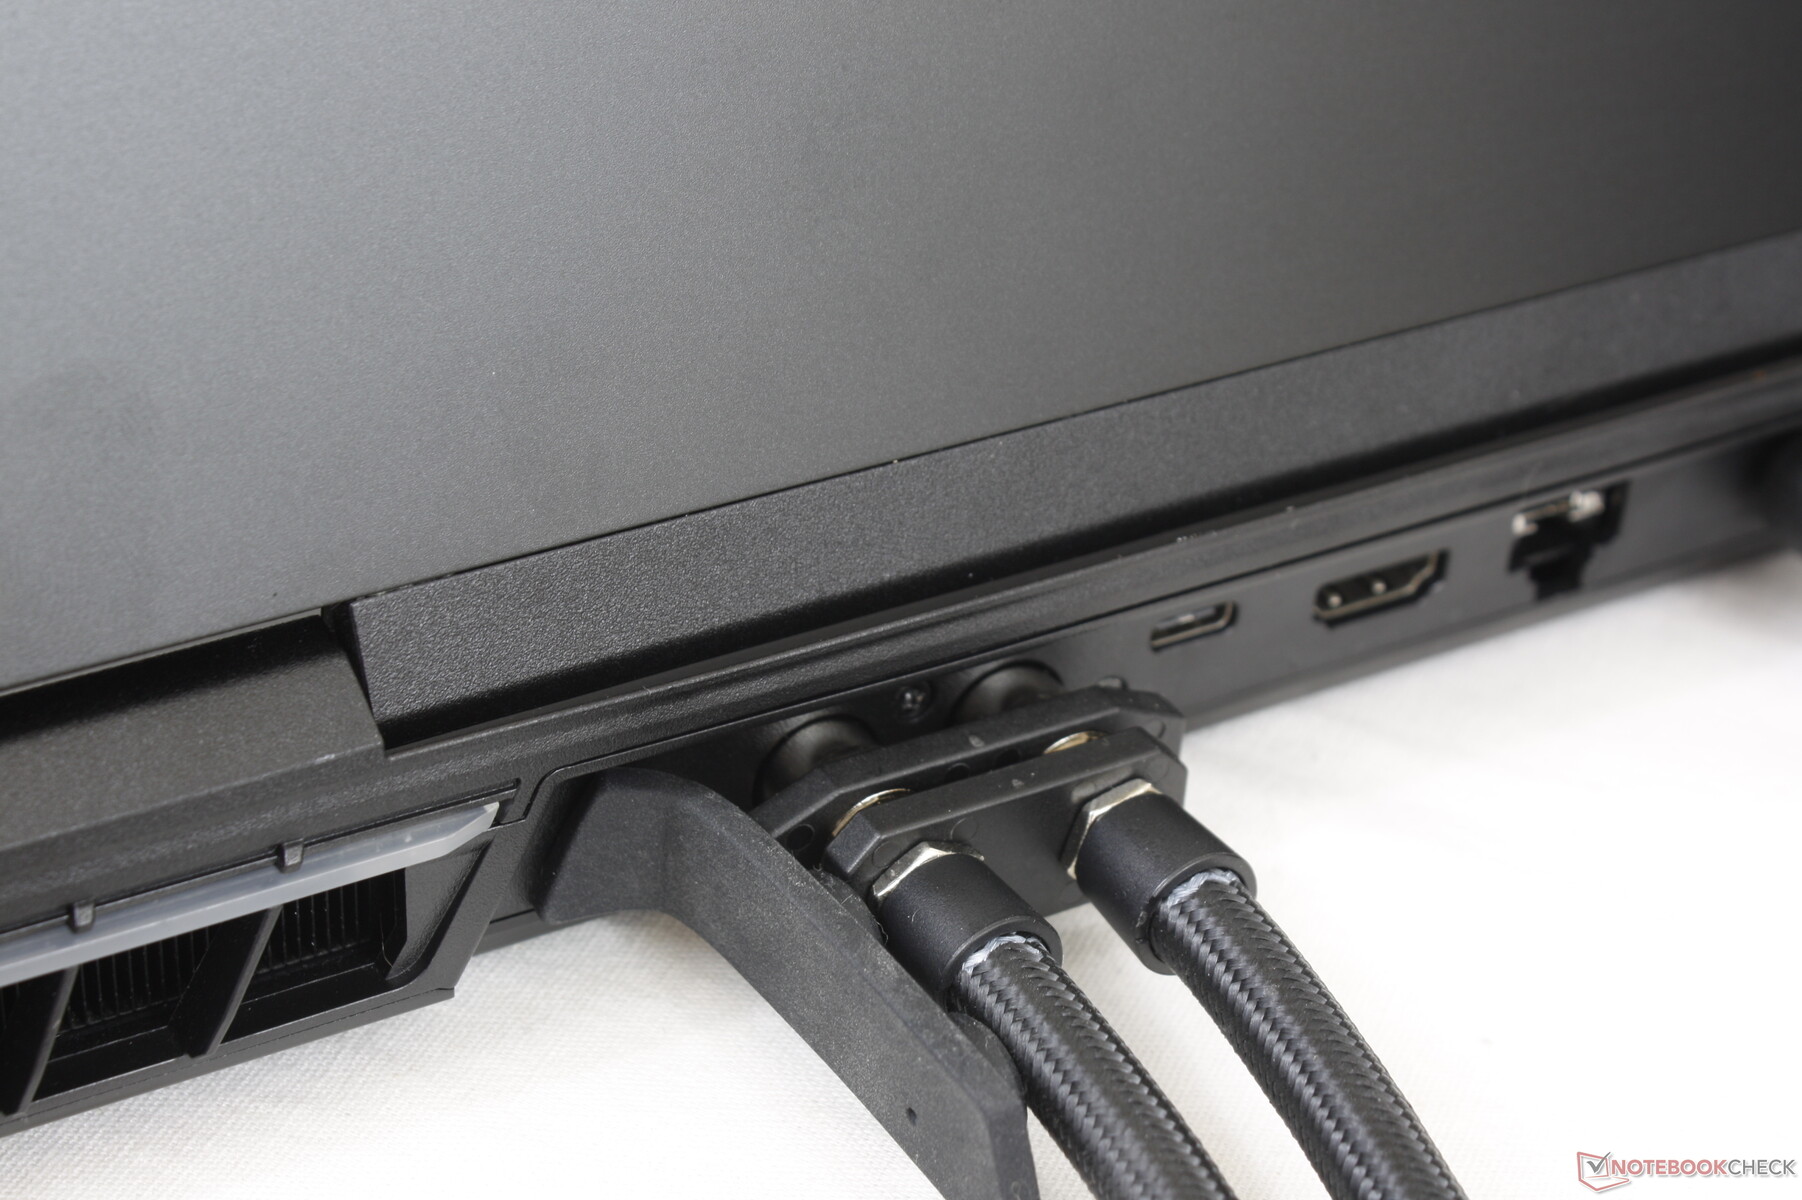
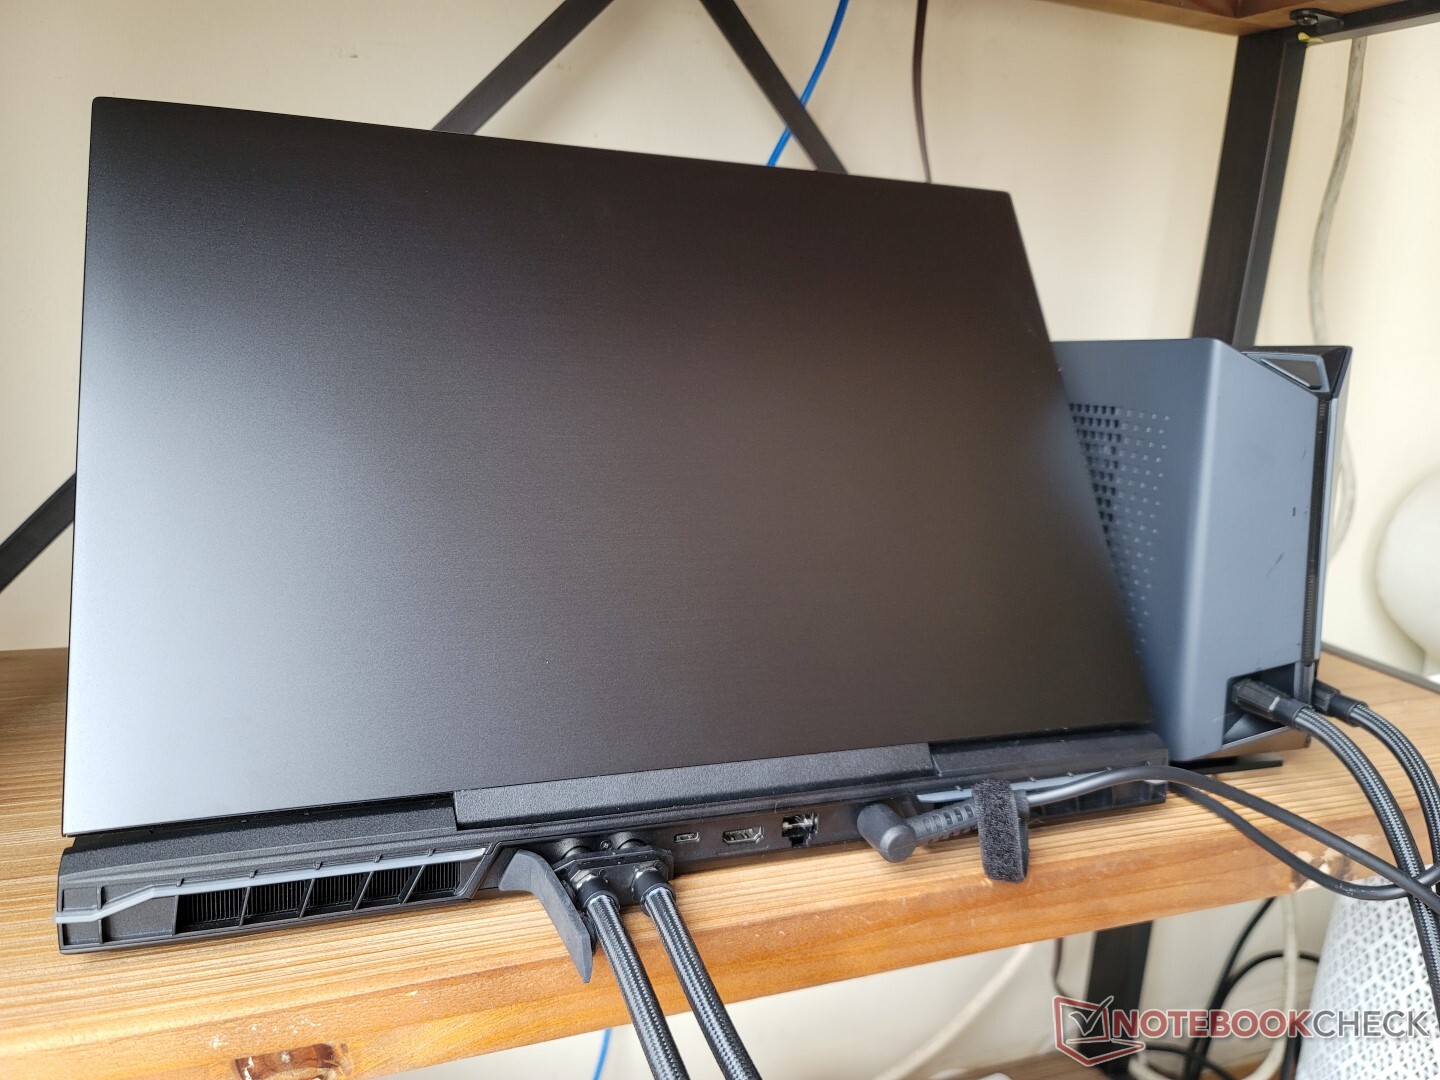
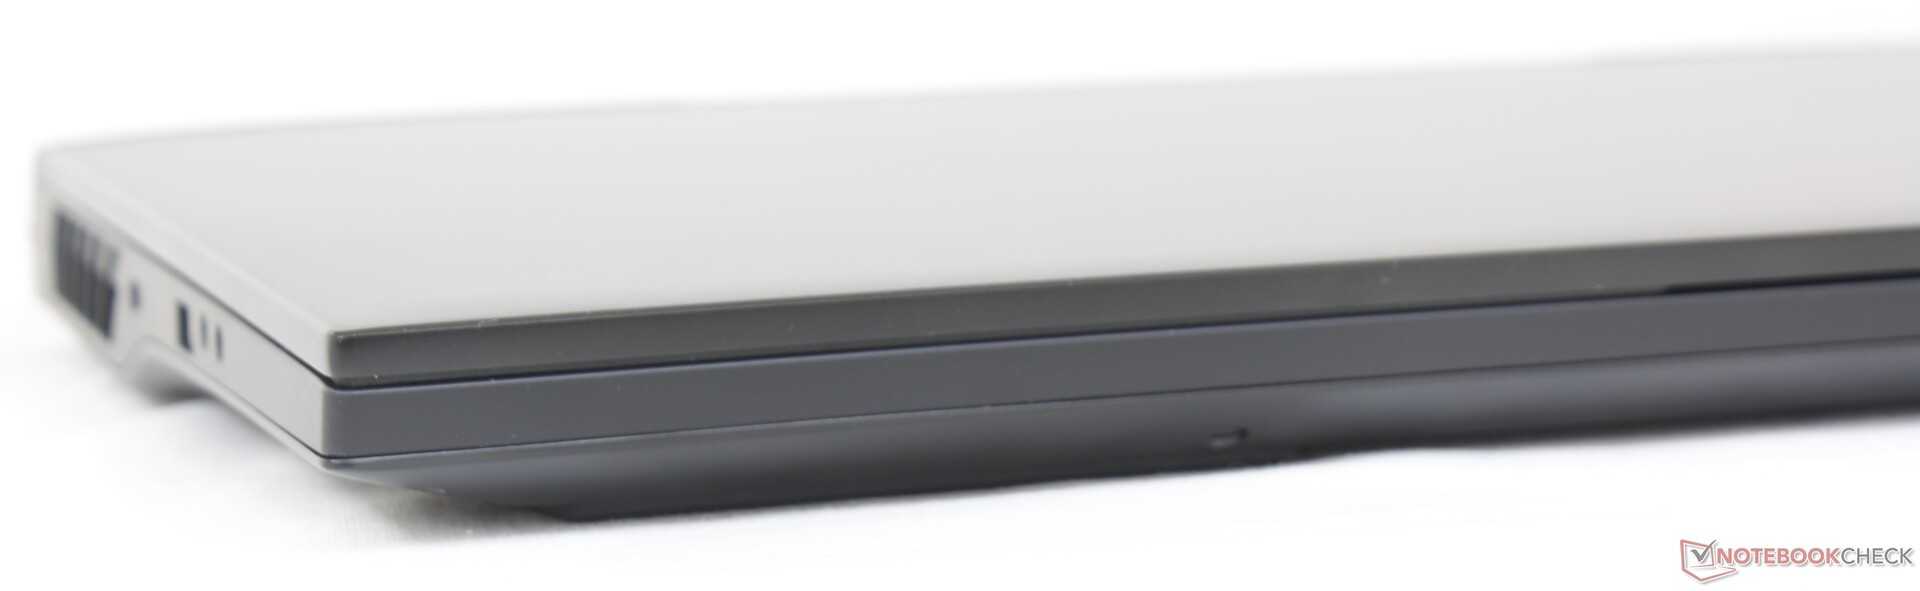
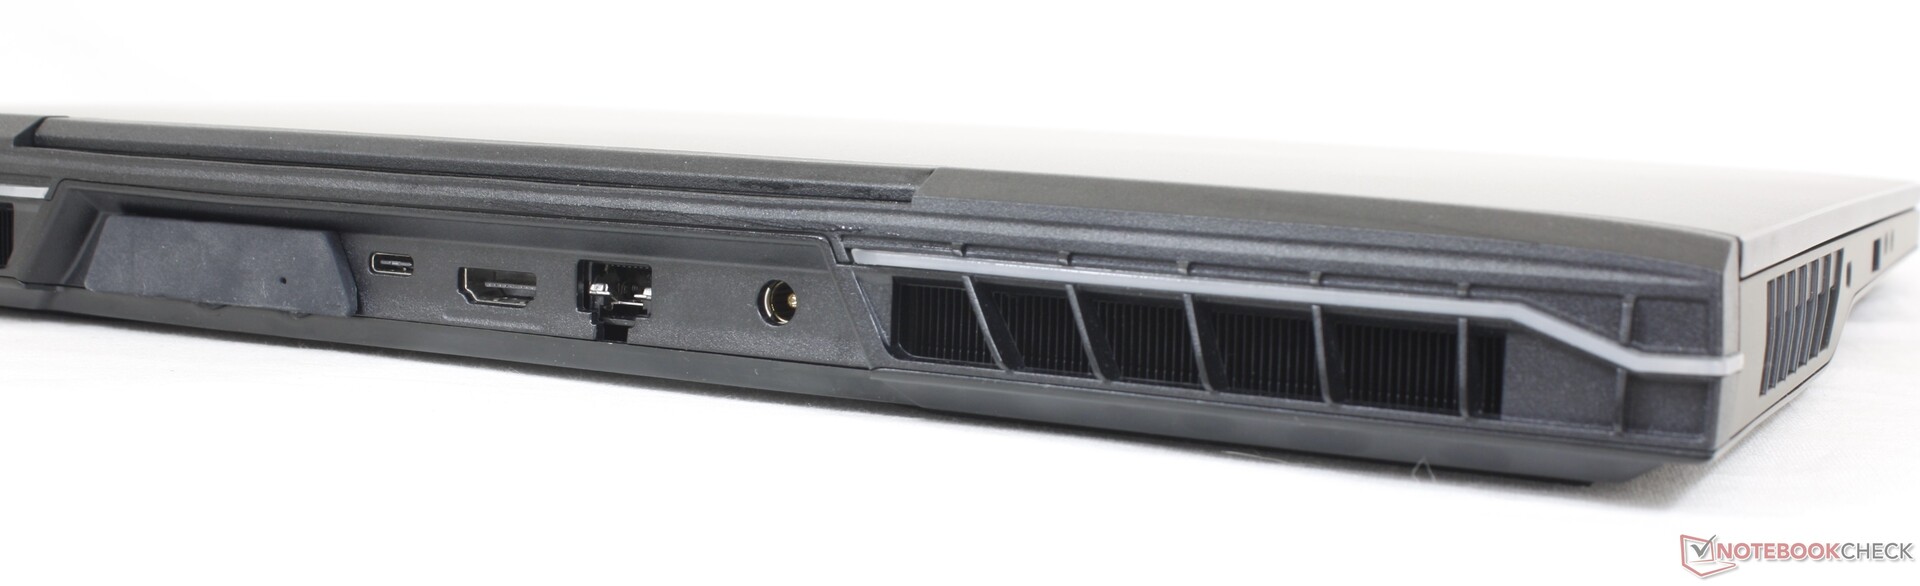
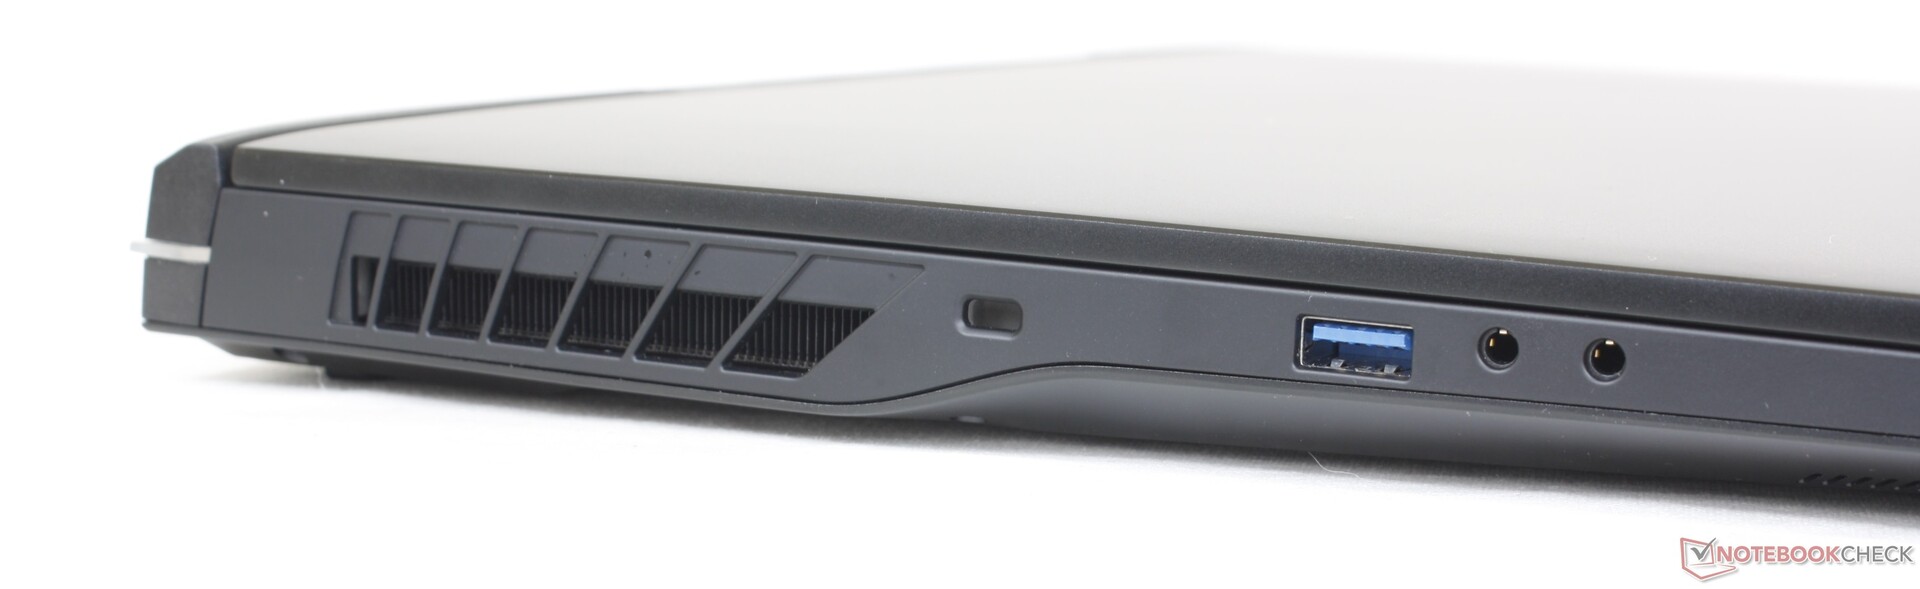
Conectividad - Soporte de Thunderbolt 4
Las opciones de puerto y la posición son idénticas a las del Schenker XMG Neo 15 E22 de 15.6 pulgadas aunque nuestro Uniwell tenga un formato mayor de 17 pulgadas. Nos gustaría ver más puertos USB-C en el futuro, ya que el único puerto parece limitado.
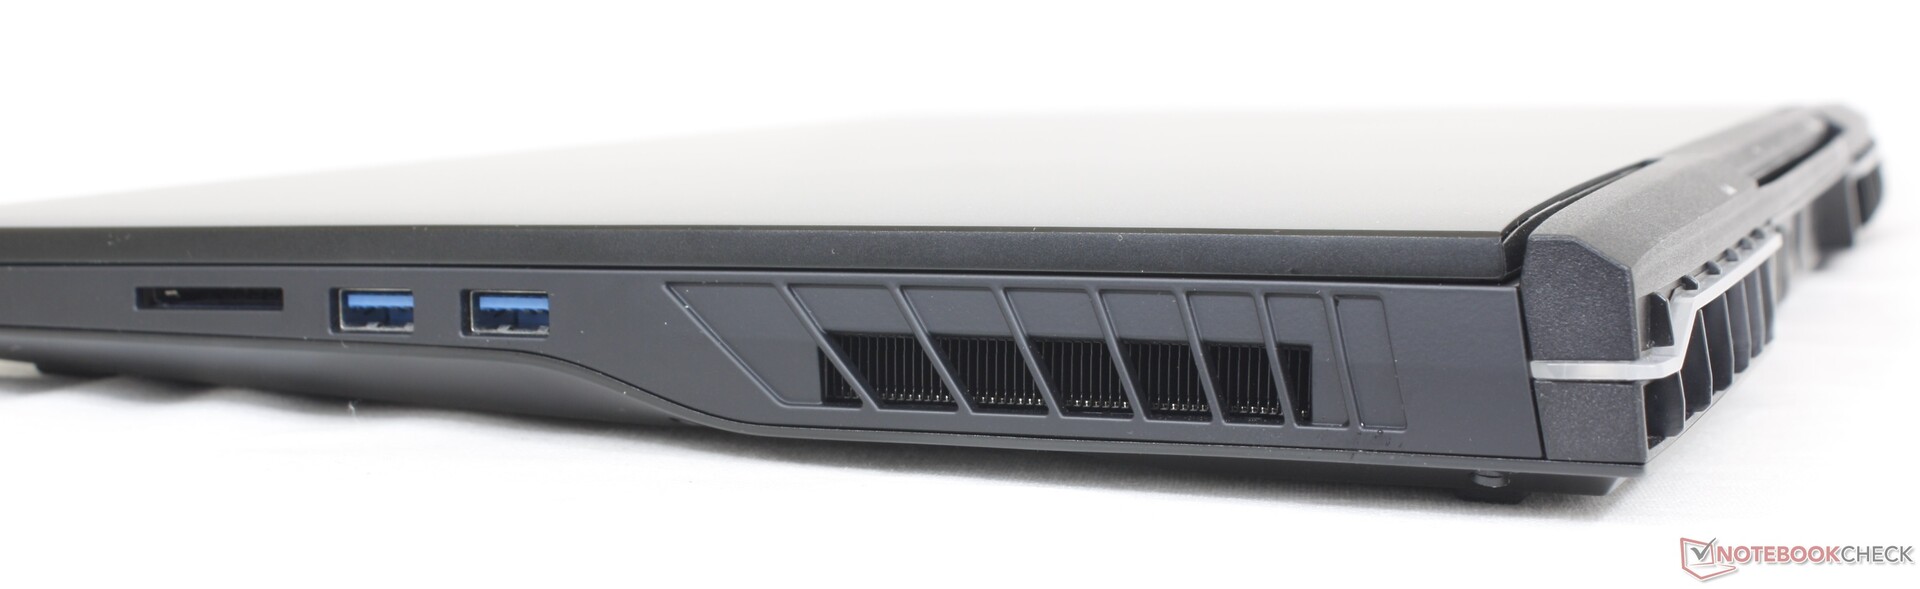
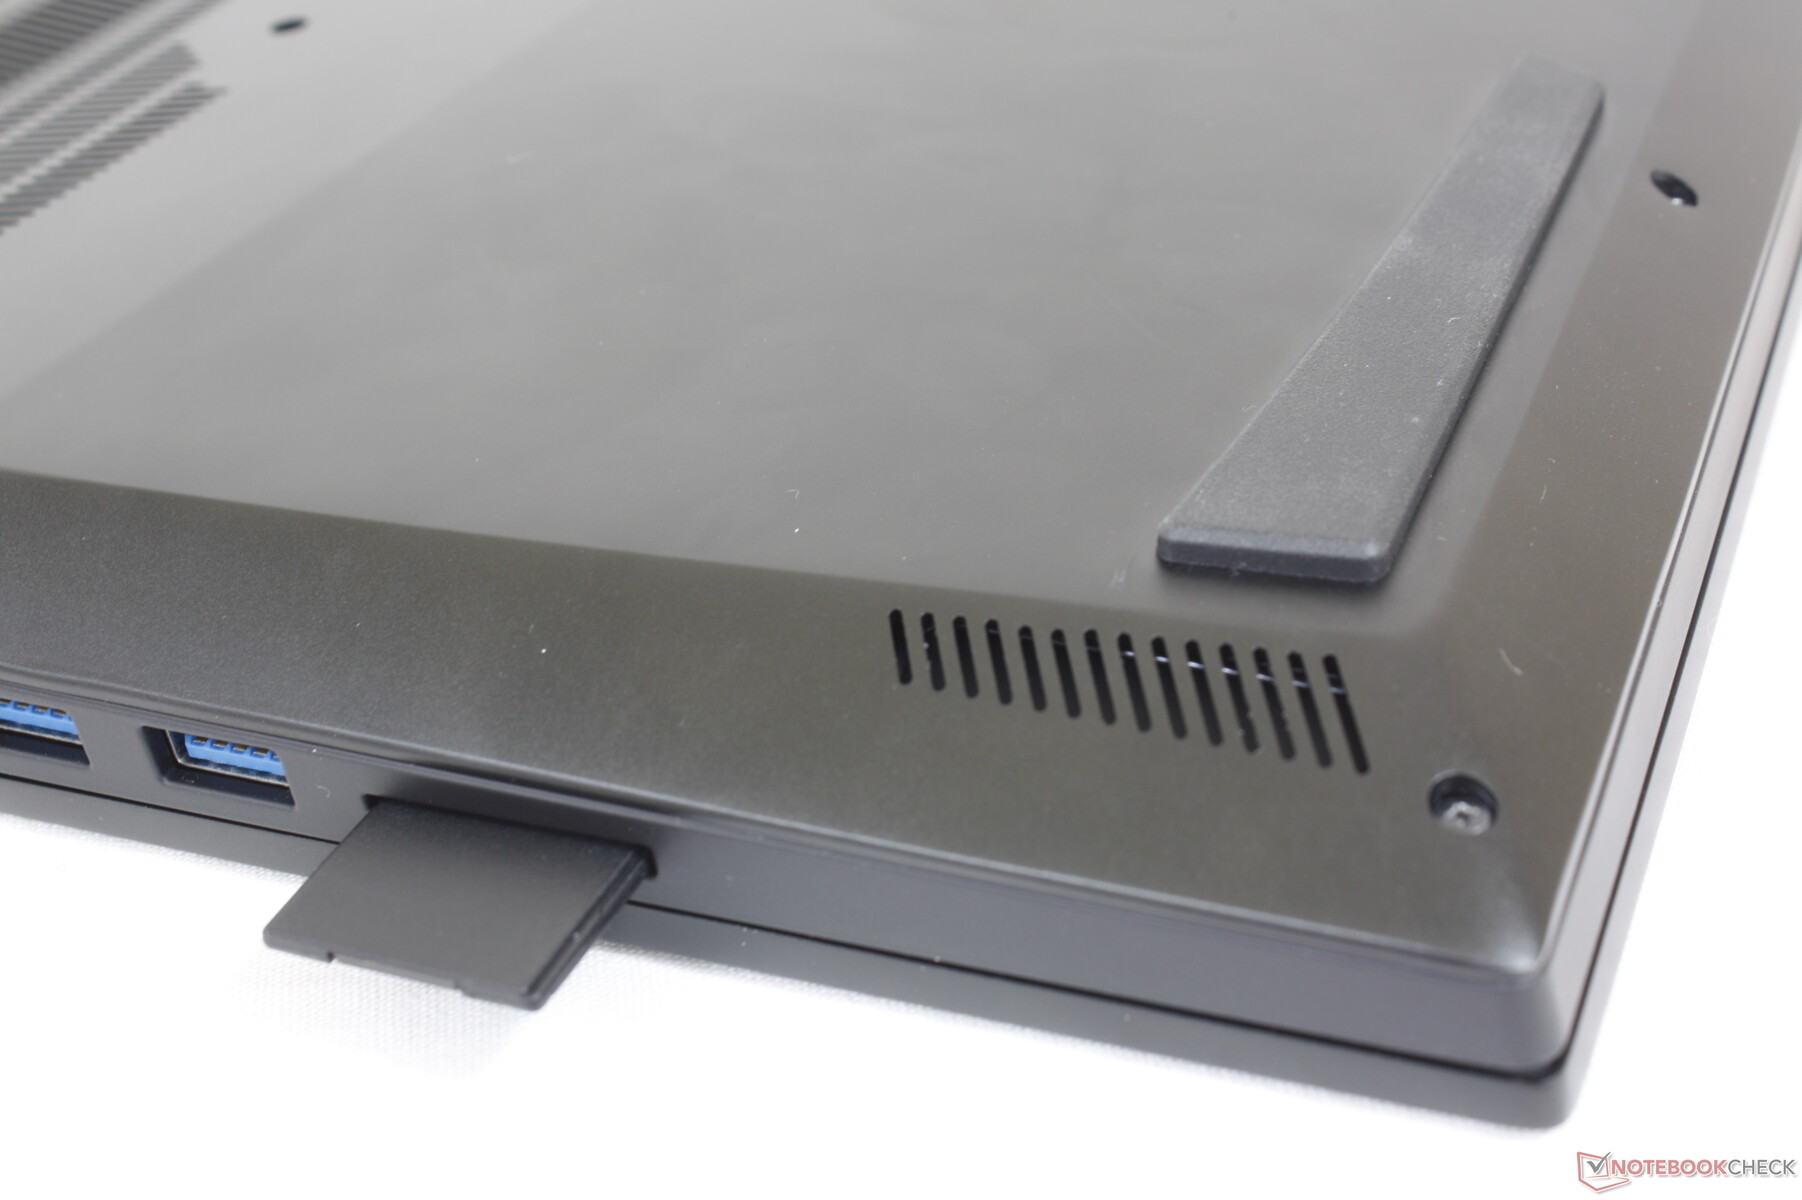
Lector de tarjetas SD
La velocidad de transferencia con el lector de tarjetas integrado es sólo la mitad de la del Asus Zephyrus S17 o el Razer Blade 17. Esto no debería ser un problema para la mayoría de usuarios, aparte de los que dependen en gran medida de la transferencia de grandes archivos a través de tarjetas SD.
| SD Card Reader | |
| average JPG Copy Test (av. of 3 runs) | |
| Asus ROG Zephyrus S17 GX703HSD | |
| Razer Blade 17 Early 2022 (AV PRO microSD 128 GB V60) | |
| Uniwell Technology GM7AG8N Liquid Cooling Box (AV PRO microSD 128 GB V60) | |
| MSI Stealth GS77 12UHS-083US (AV Pro V60) | |
| MSI Titan GT77 12UHS (AV PRO microSD 128 GB V60) | |
| maximum AS SSD Seq Read Test (1GB) | |
| Asus ROG Zephyrus S17 GX703HSD | |
| Uniwell Technology GM7AG8N Liquid Cooling Box (AV PRO microSD 128 GB V60) | |
| MSI Titan GT77 12UHS (AV PRO microSD 128 GB V60) | |
| MSI Stealth GS77 12UHS-083US (AV Pro V60) | |
Comunicación
Es un poco decepcionante no ver el Wi-Fi 6E incluido teniendo en cuenta el alto precio del portátil. No obstante, el Wi-Fi 6 sigue siendo más que suficiente para la mayoría de usuarios ya que el Wi-Fi 6E rara vez es mejor en la mayoría de escenarios del mundo real.
| Networking | |
| iperf3 transmit AX12 | |
| MSI Stealth GS77 12UHS-083US | |
| Asus ROG Zephyrus S17 GX703HSD | |
| iperf3 receive AX12 | |
| MSI Stealth GS77 12UHS-083US | |
| Asus ROG Zephyrus S17 GX703HSD | |
| iperf3 receive AXE11000 6GHz | |
| Aorus 17X XES | |
| MSI Titan GT77 12UHS | |
| iperf3 receive AXE11000 | |
| MSI Titan GT77 12UHS | |
| Razer Blade 17 Early 2022 | |
| Uniwell Technology GM7AG8N Liquid Cooling Box | |
| iperf3 transmit AXE11000 6GHz | |
| Aorus 17X XES | |
| MSI Titan GT77 12UHS | |
| iperf3 transmit AXE11000 | |
| MSI Titan GT77 12UHS | |
| Uniwell Technology GM7AG8N Liquid Cooling Box | |
Cámara web
La cámara de 2 MP tiene colores pobres incluso para los ya bajos estándares de las webcams. Soporta IR, pero no hay obturador de privacidad.


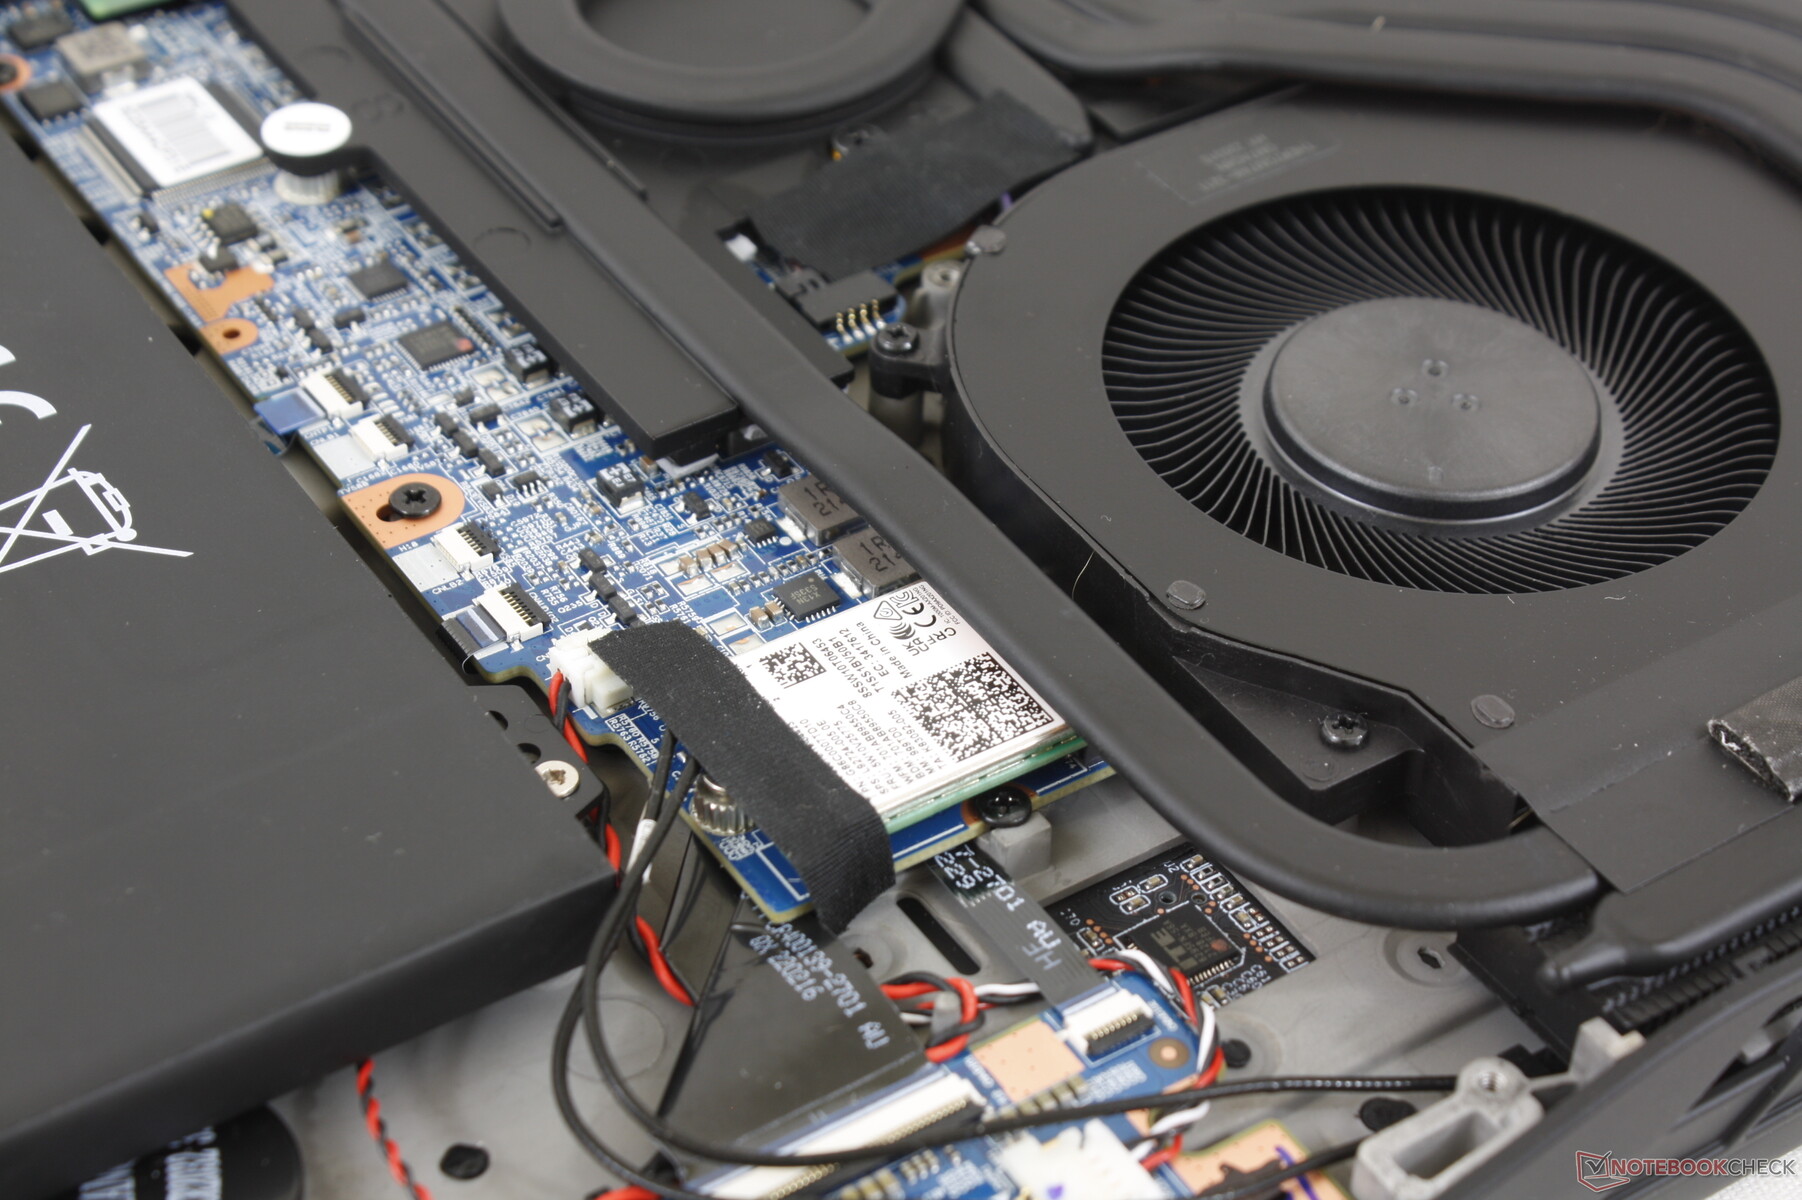
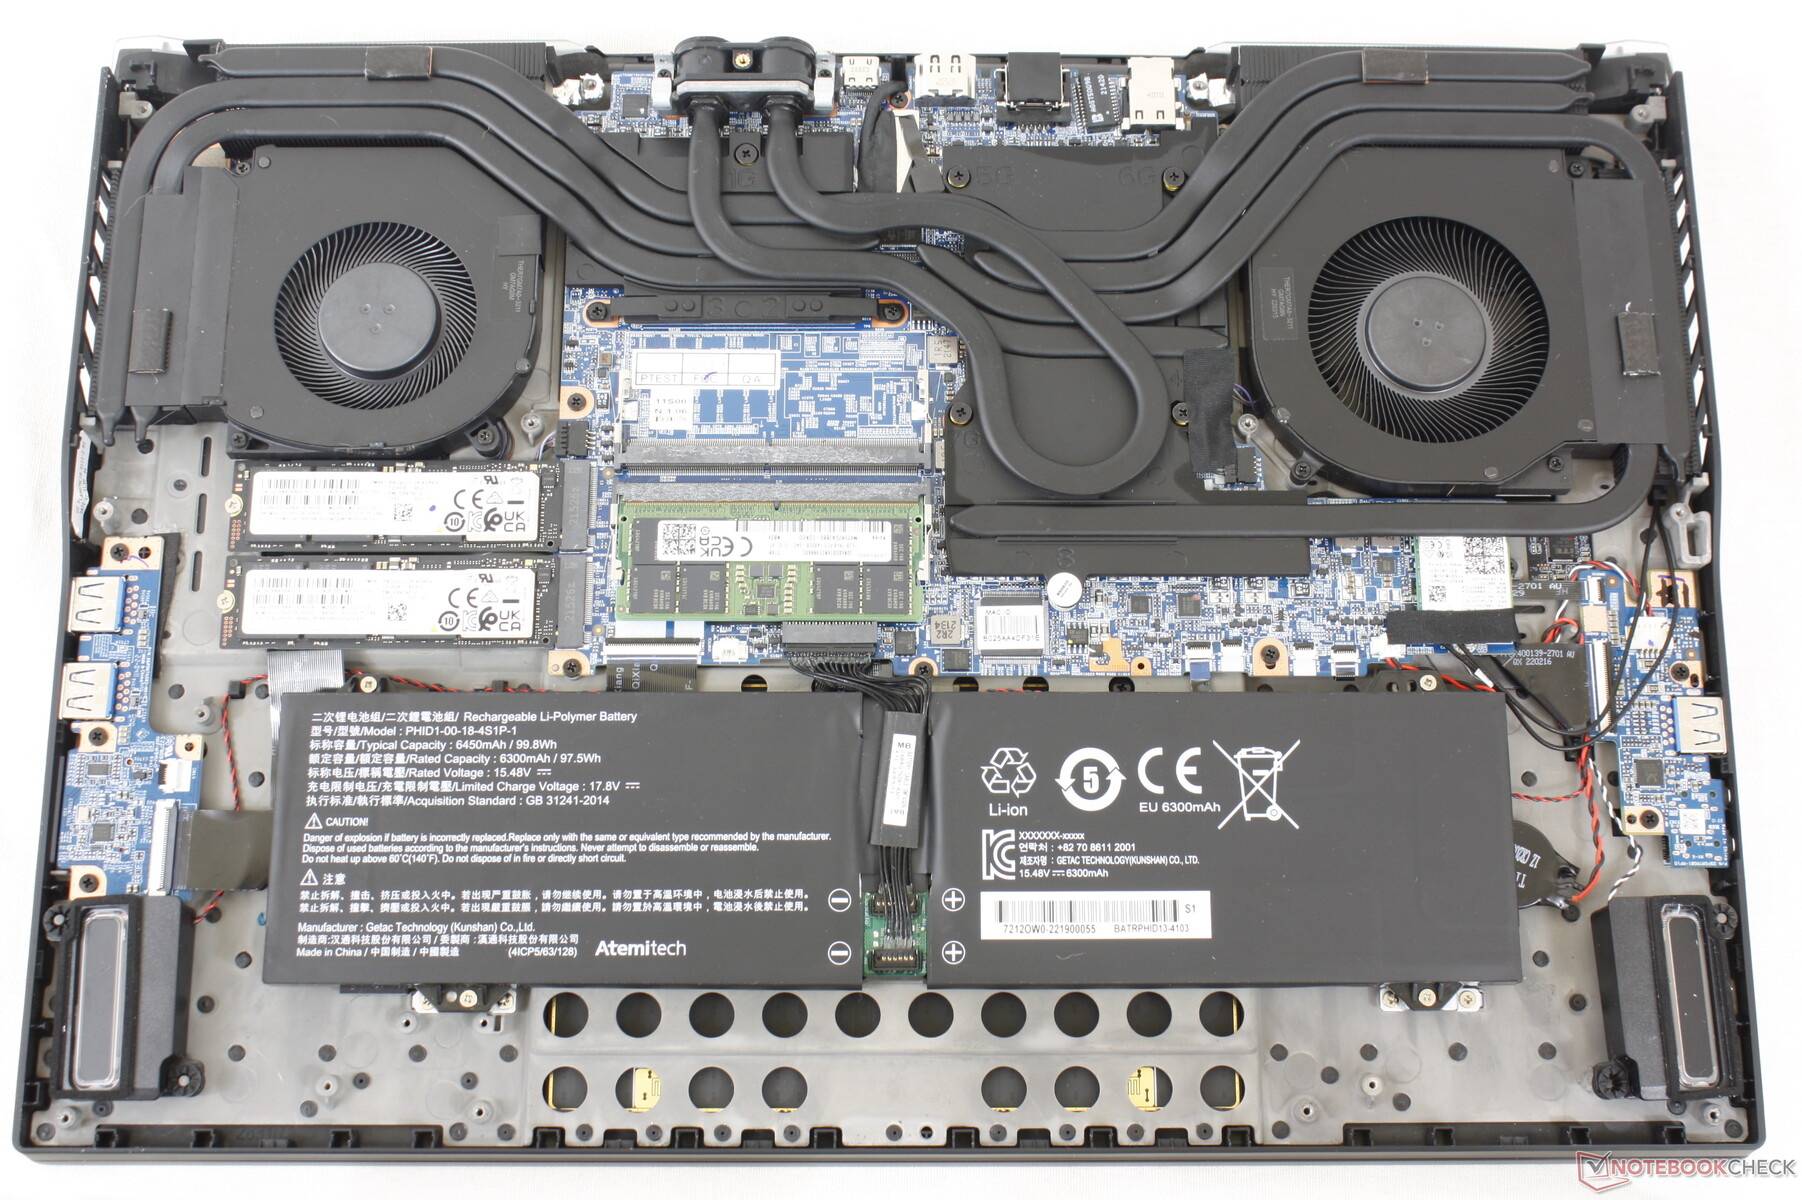
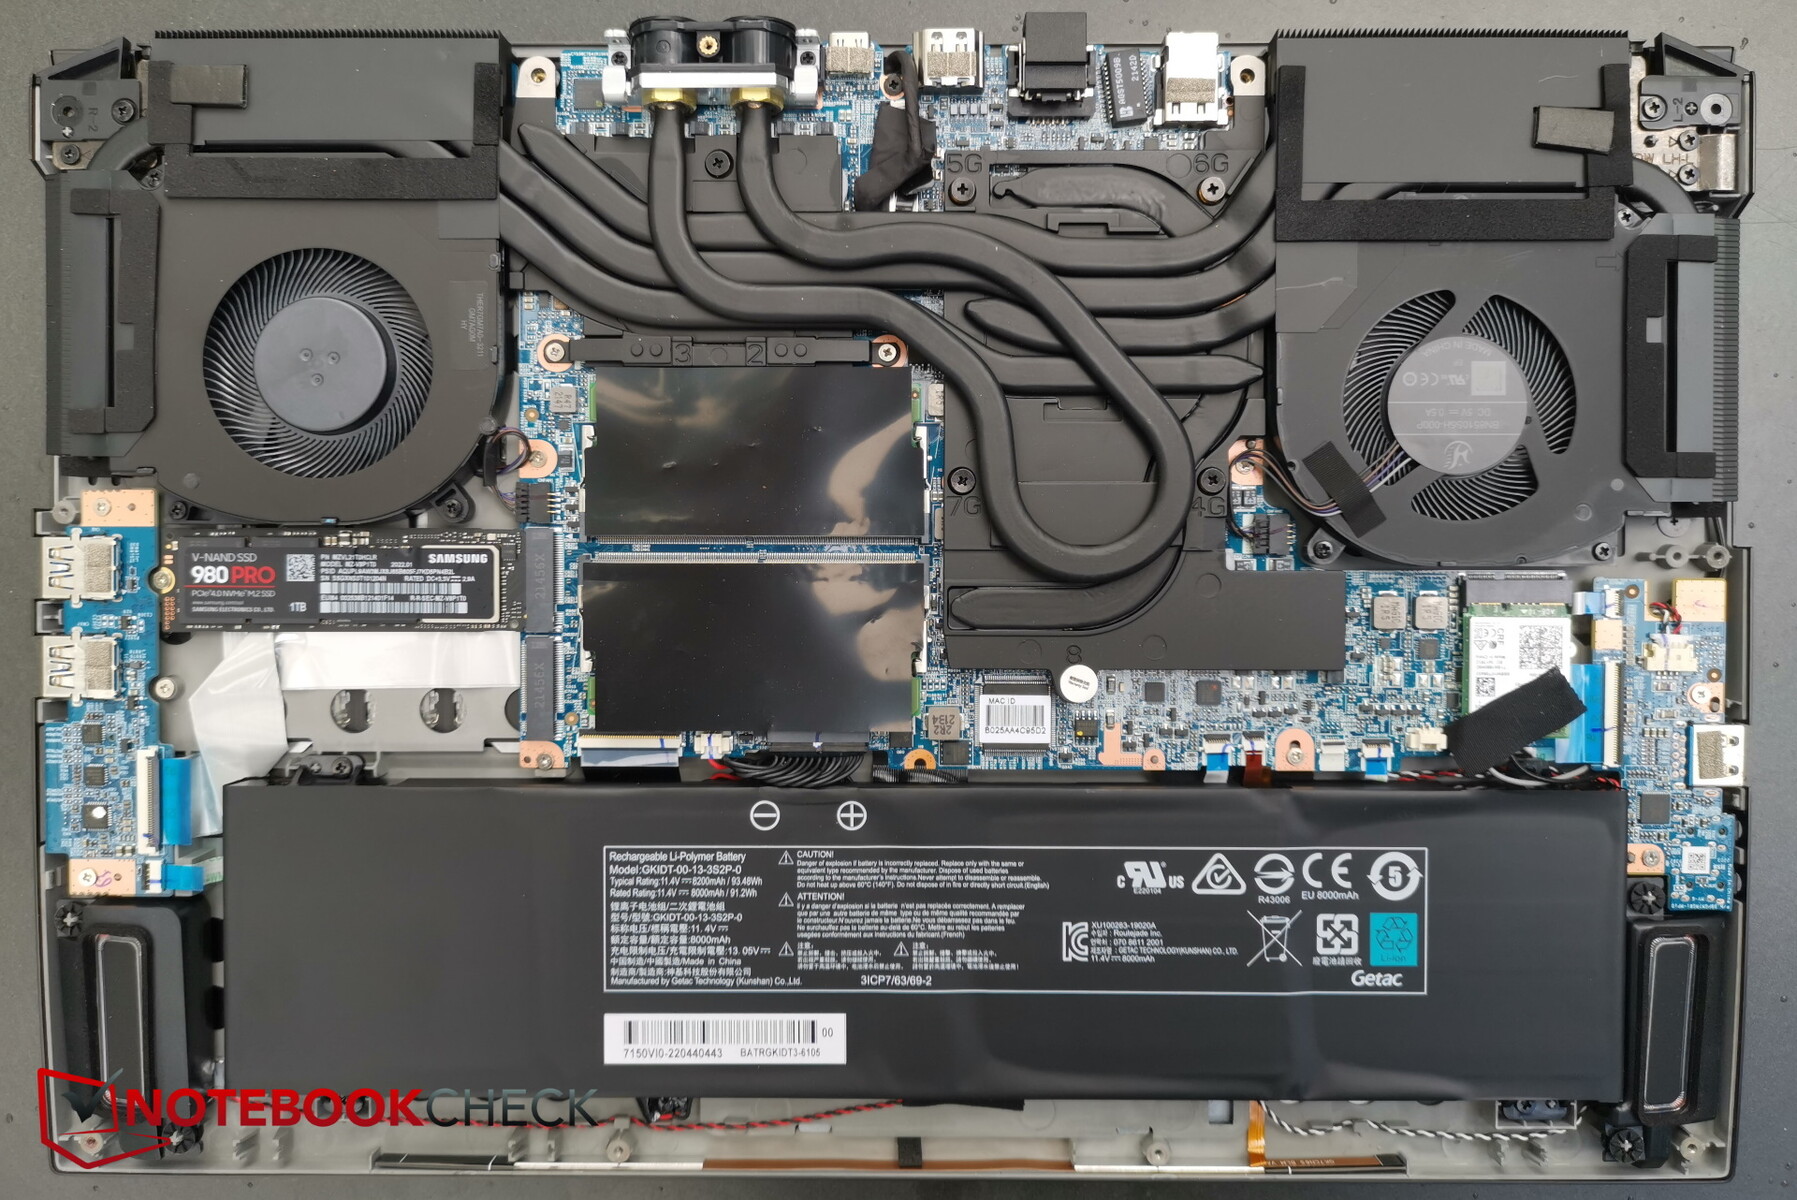
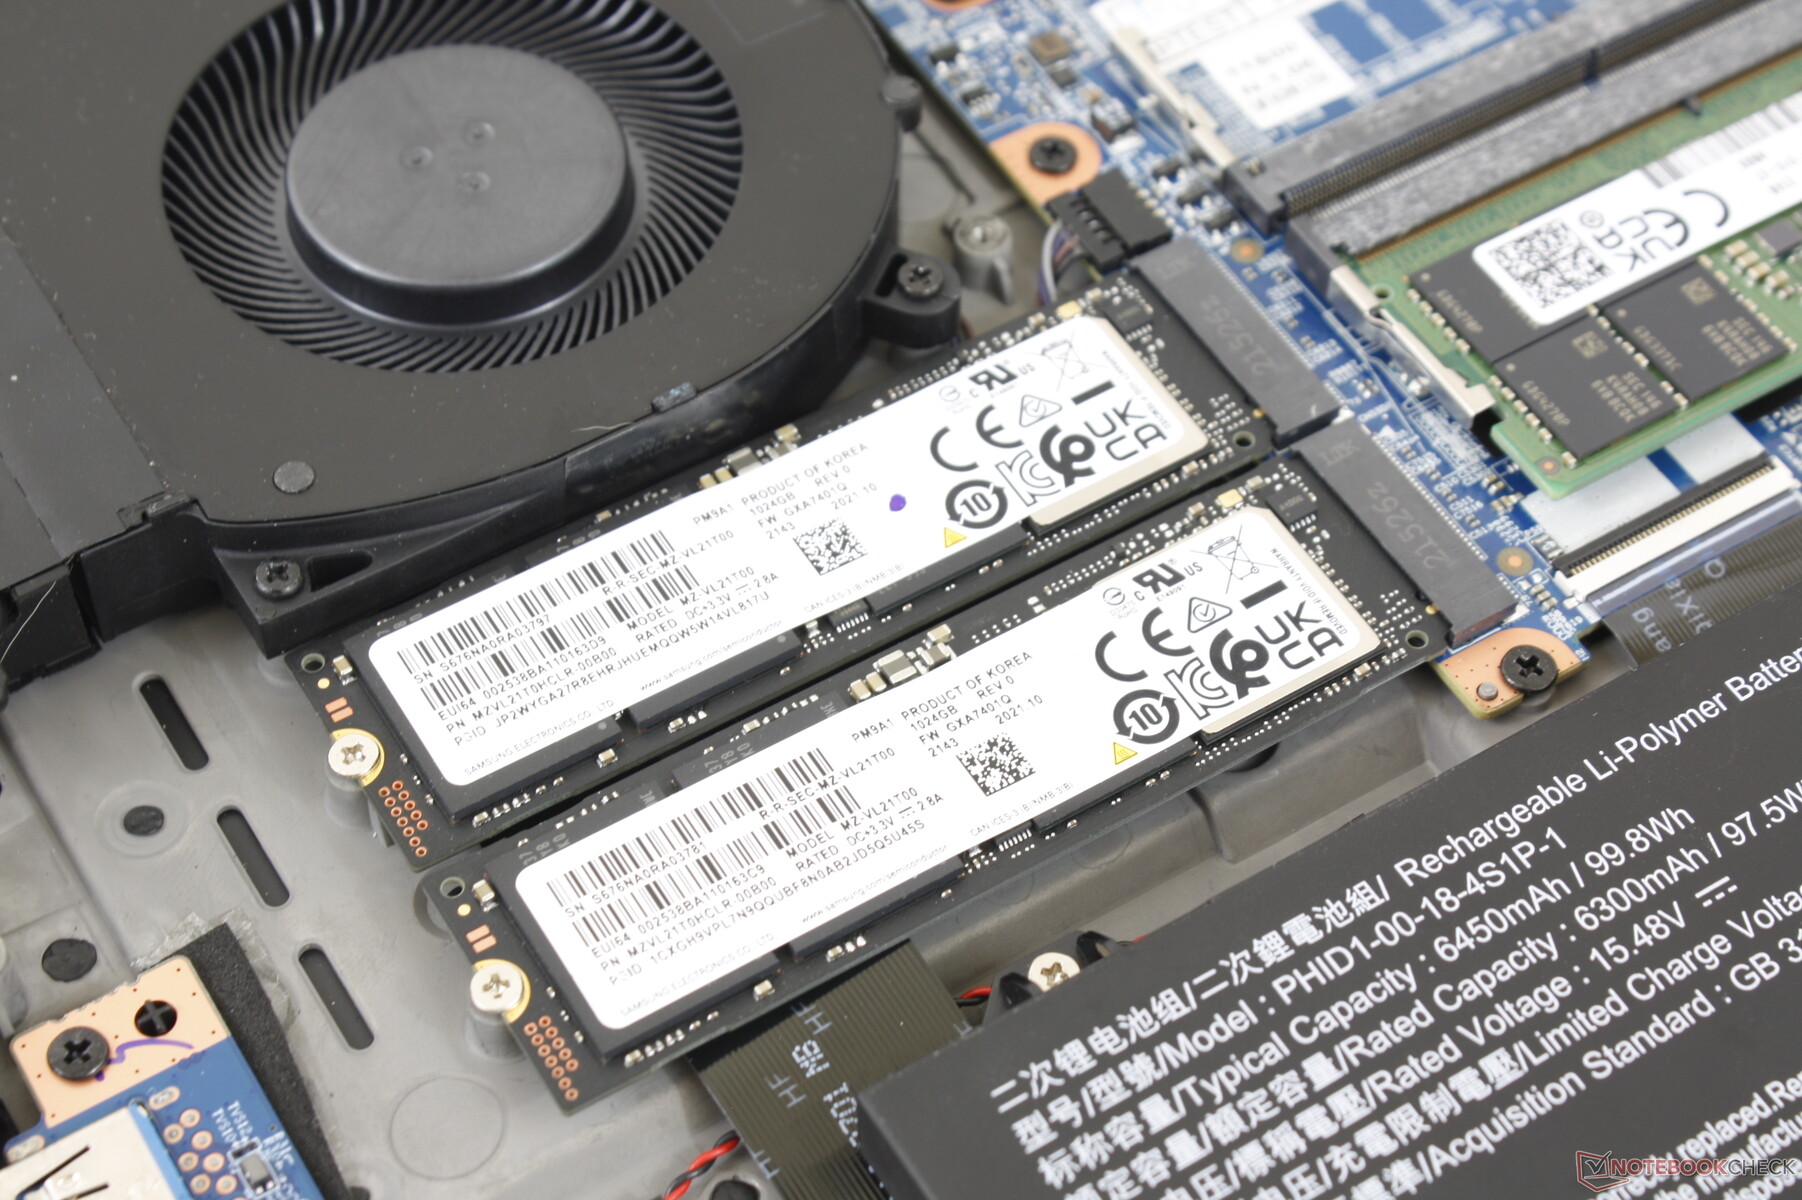
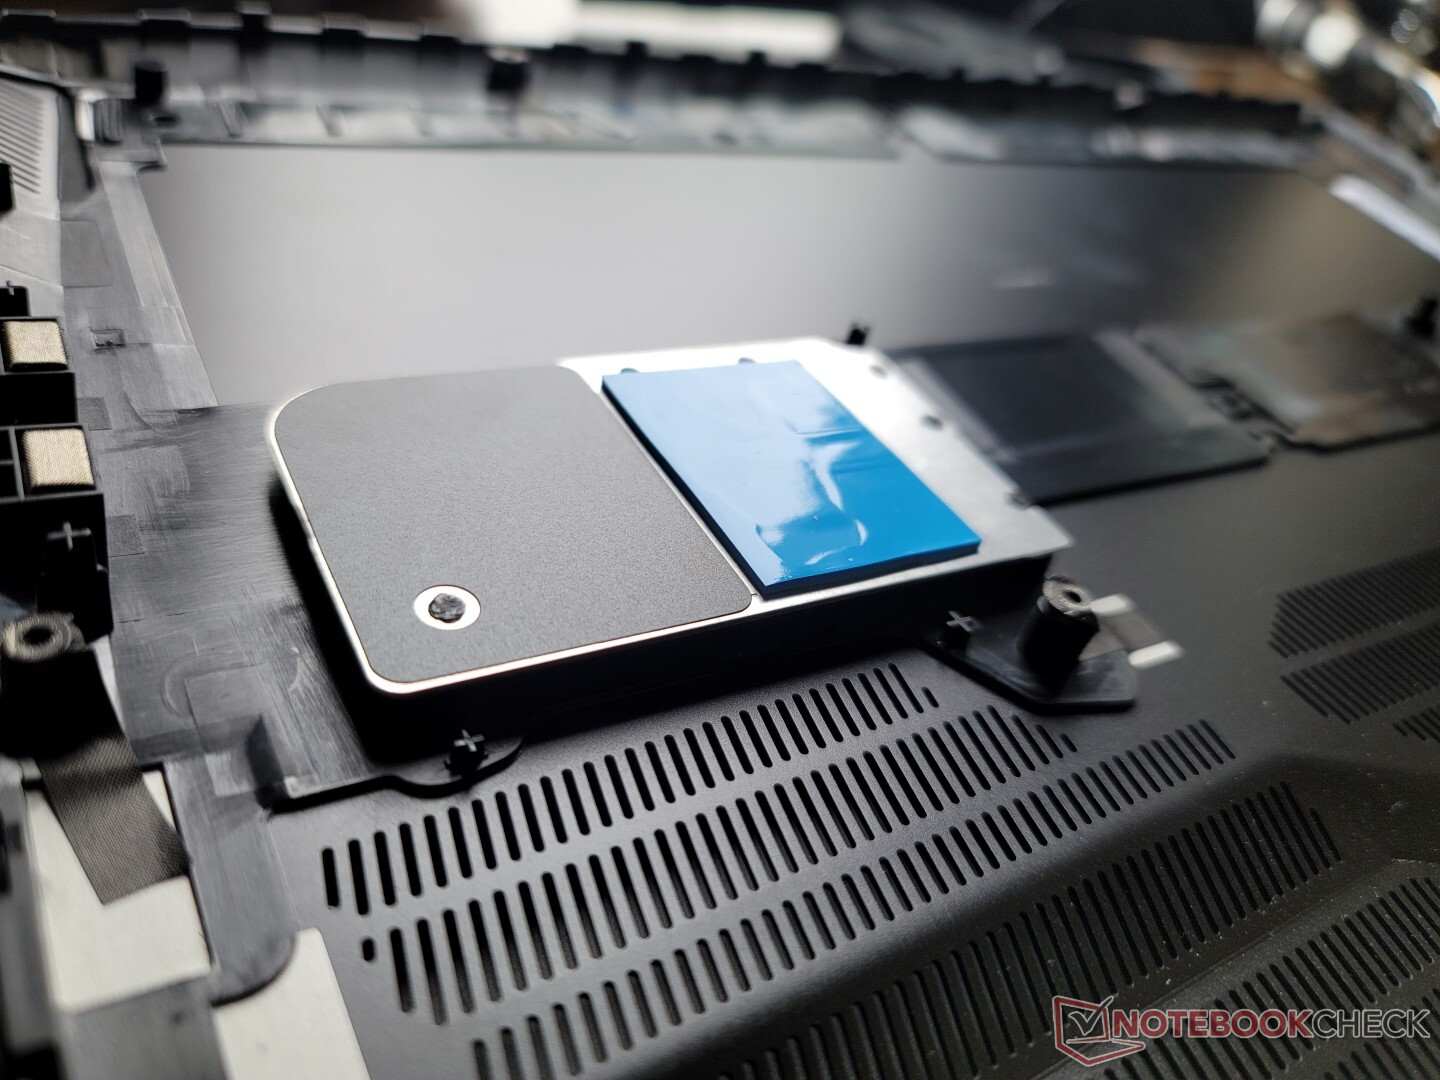
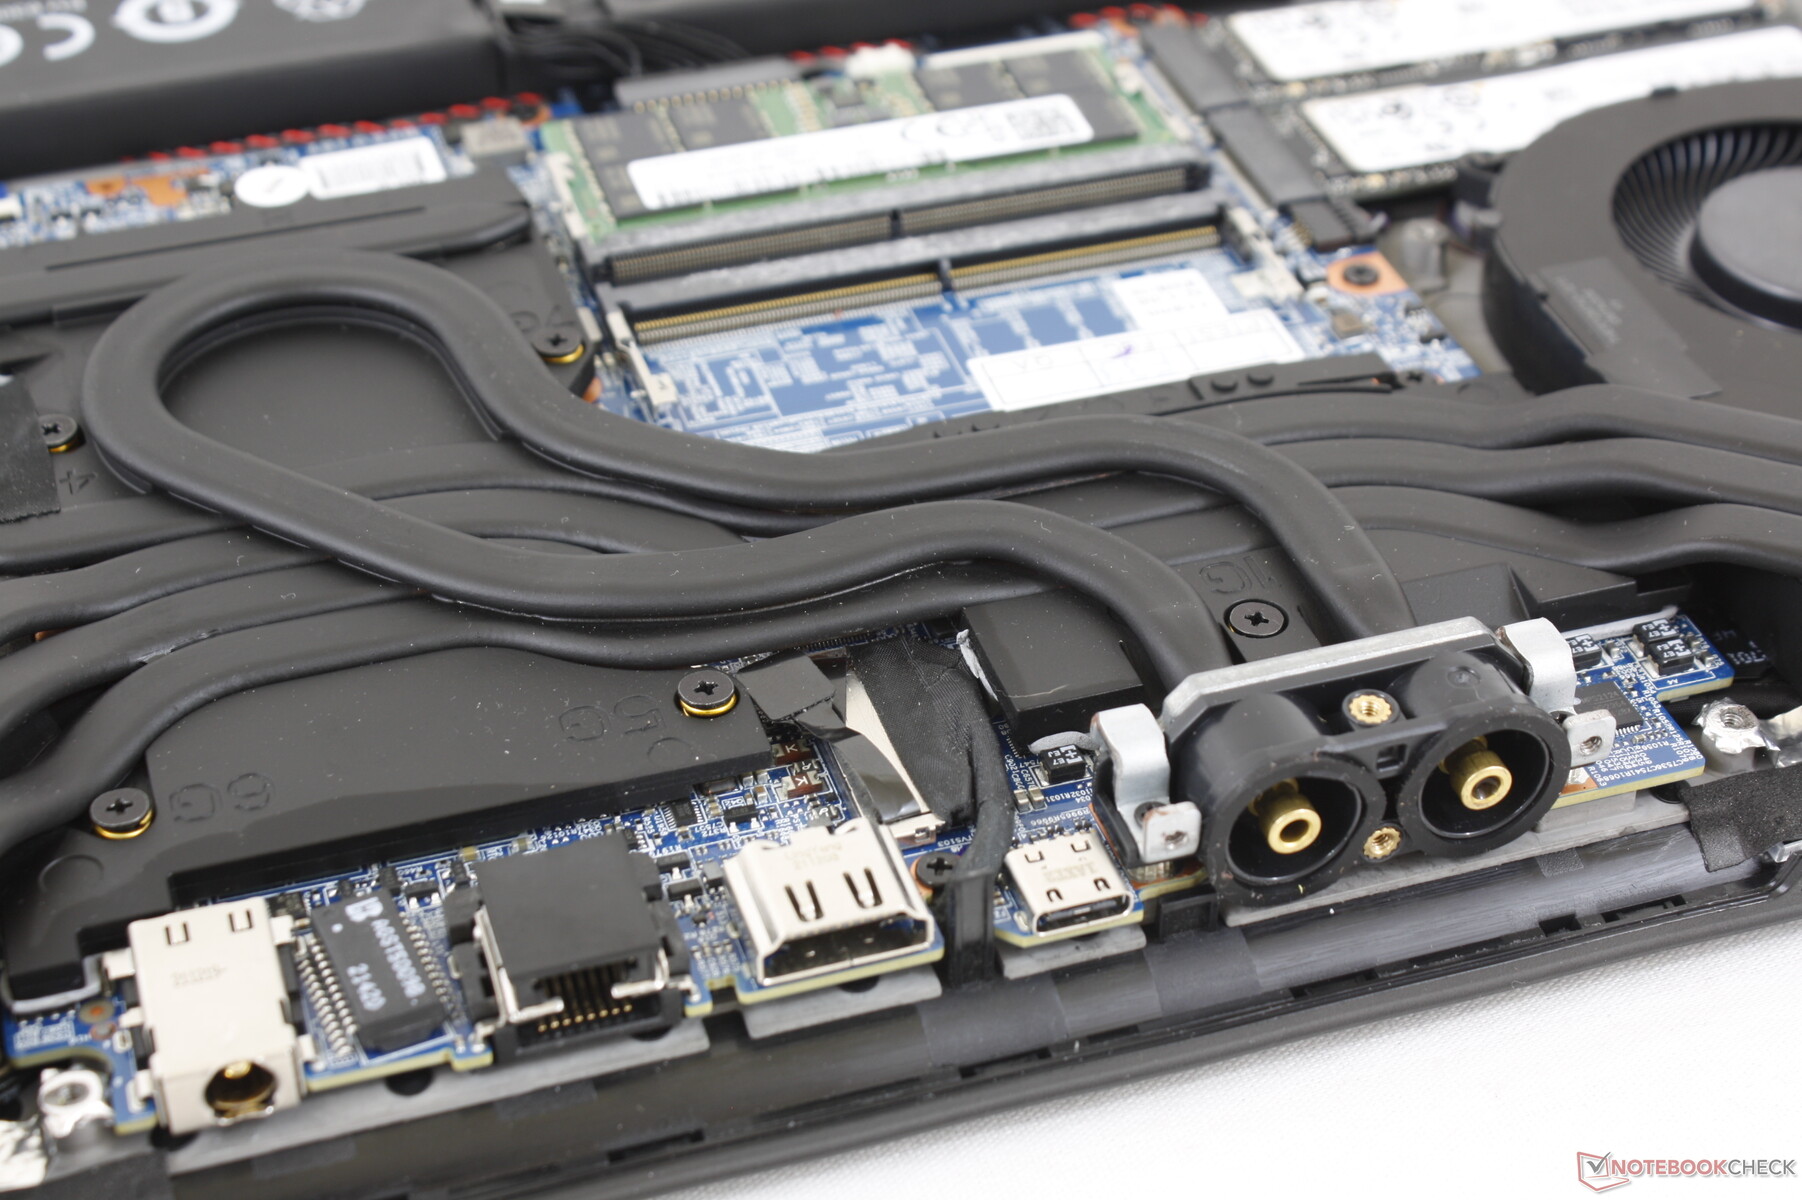
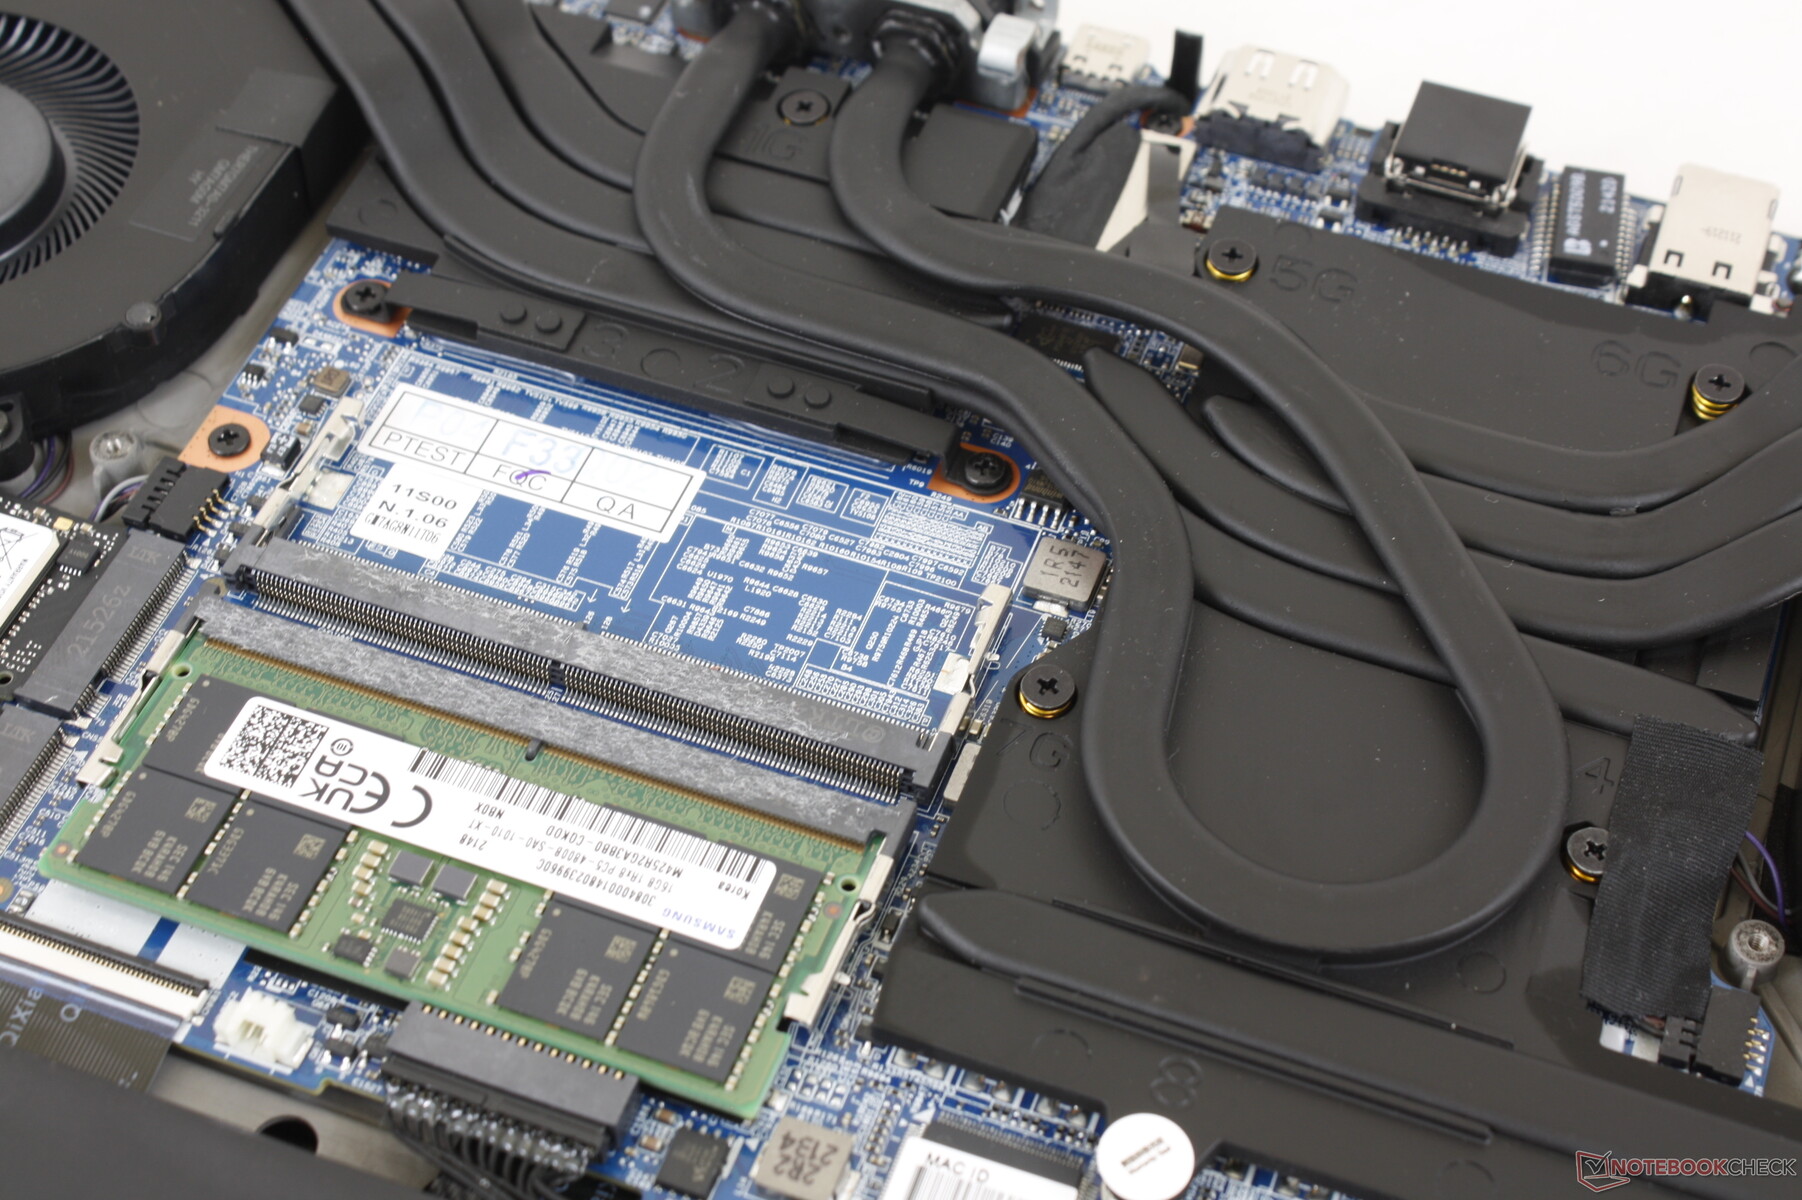
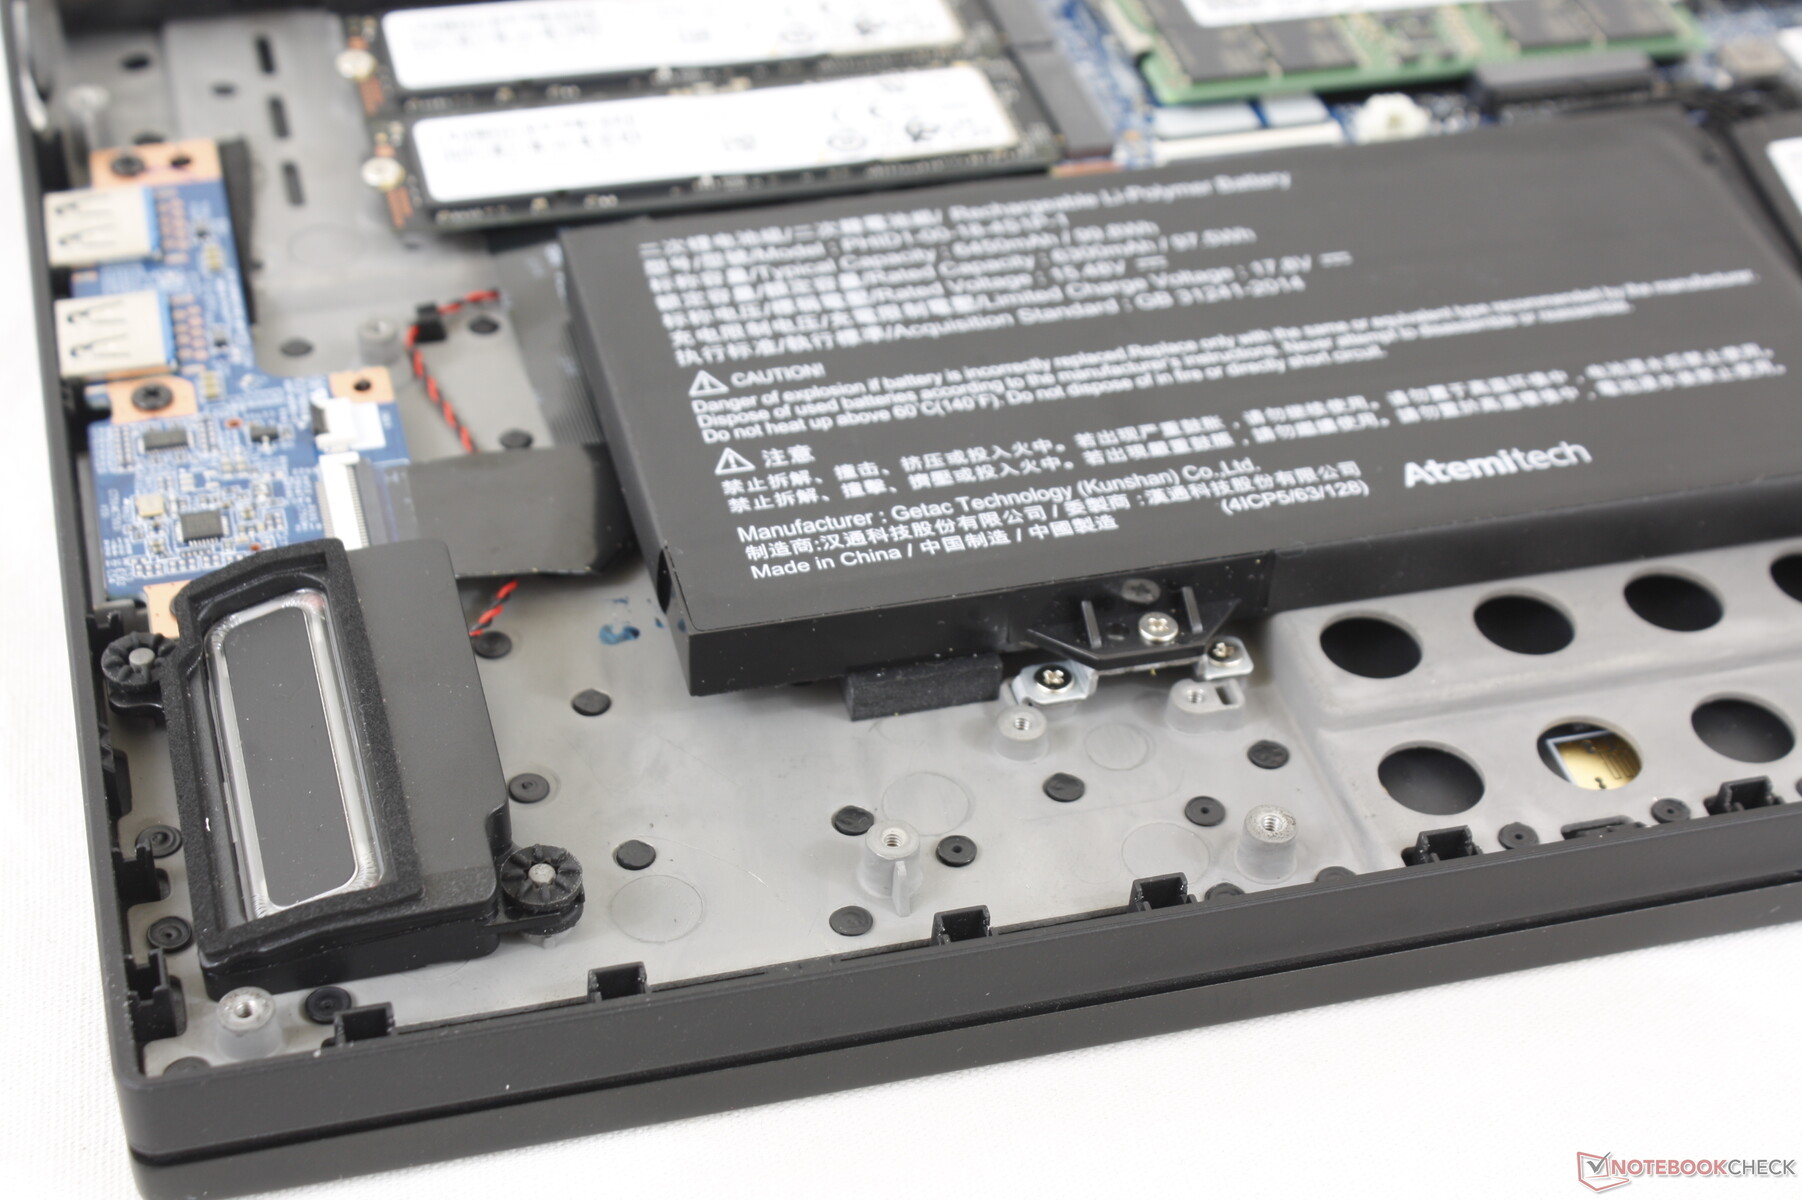
Mantenimiento
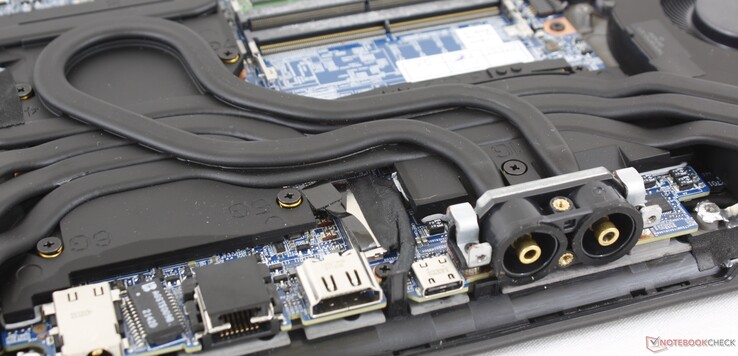
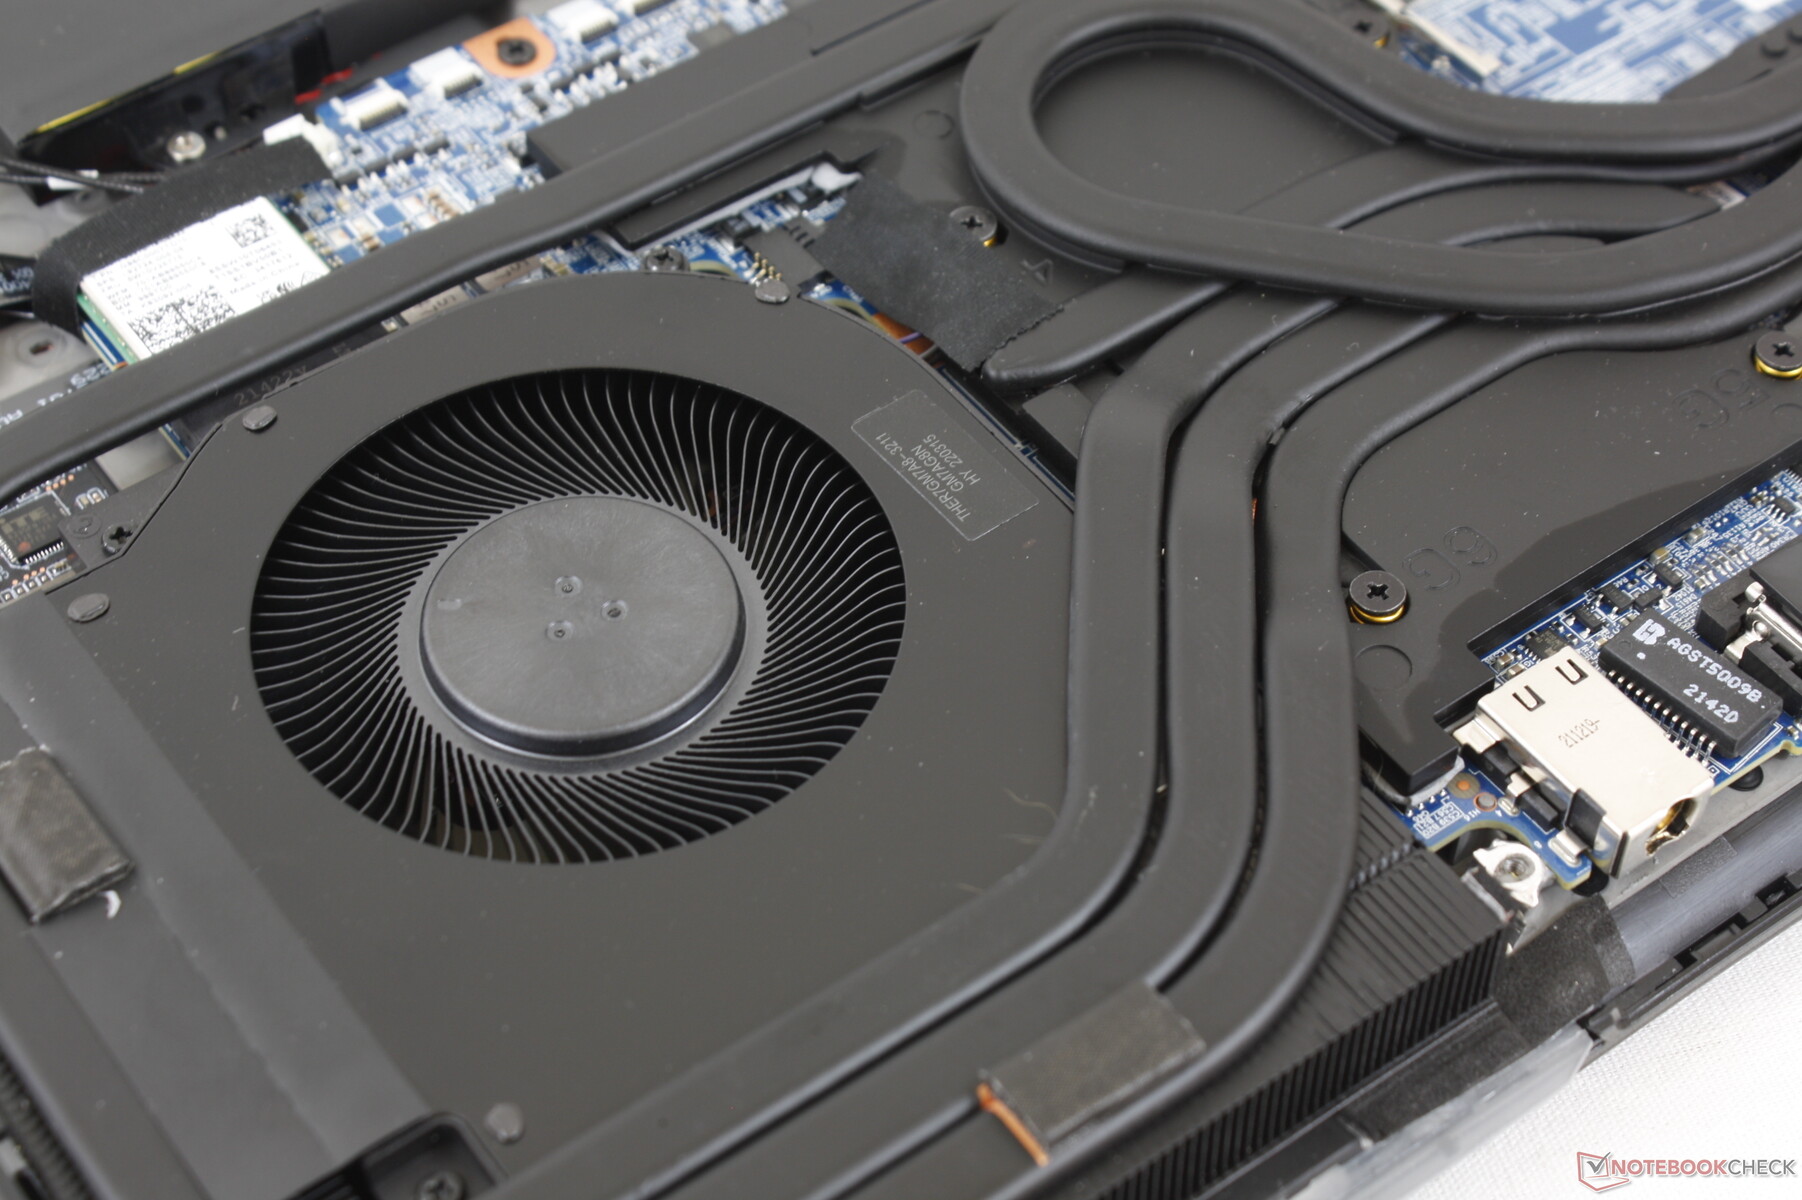
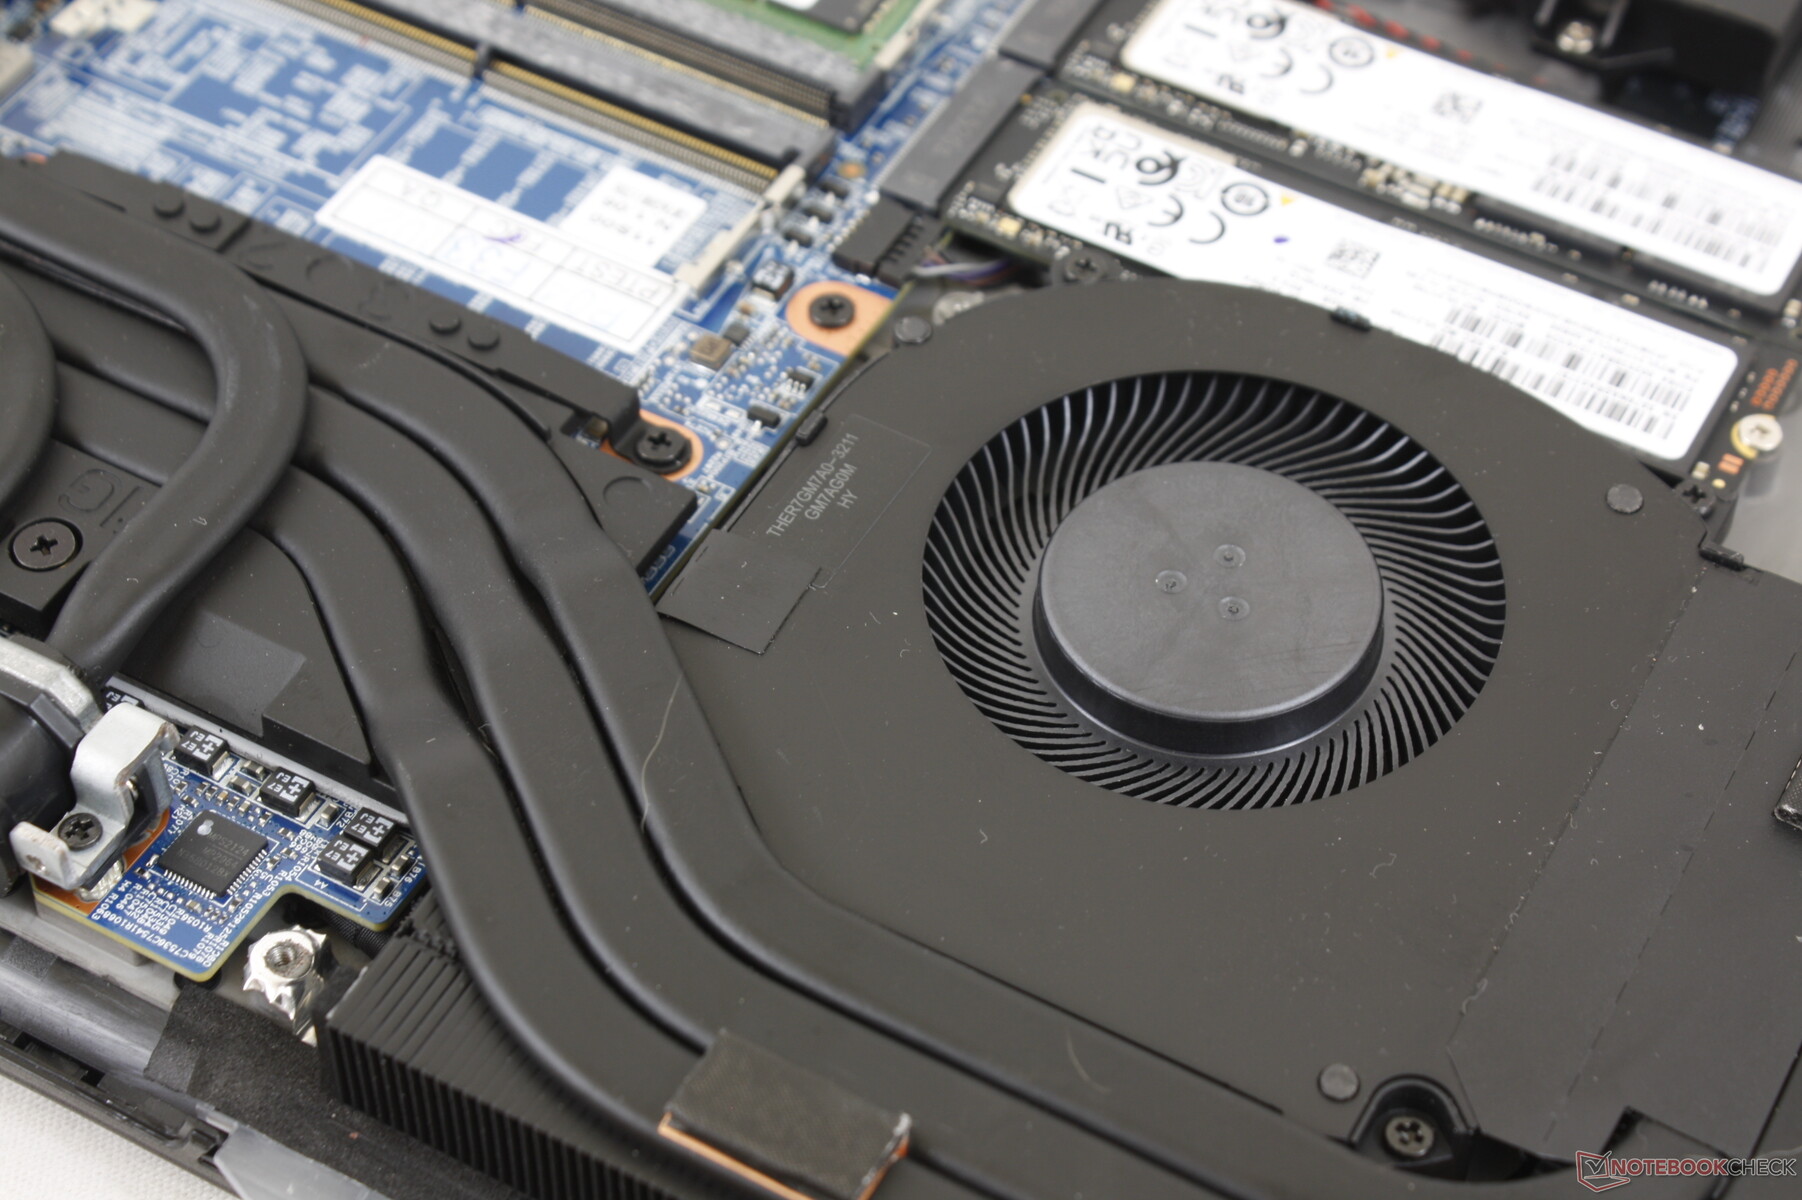
El panel inferior se quita fácilmente después de quitar varios tornillos Philips para actualizar directamente la RAM o el SSD. La placa base tiene muchas similitudes con la GM5AG8W, pero con ligeros cambios en la solución de refrigeración, como muestran las imágenes de comparación que aparecen a continuación.
Accesorios y garantía
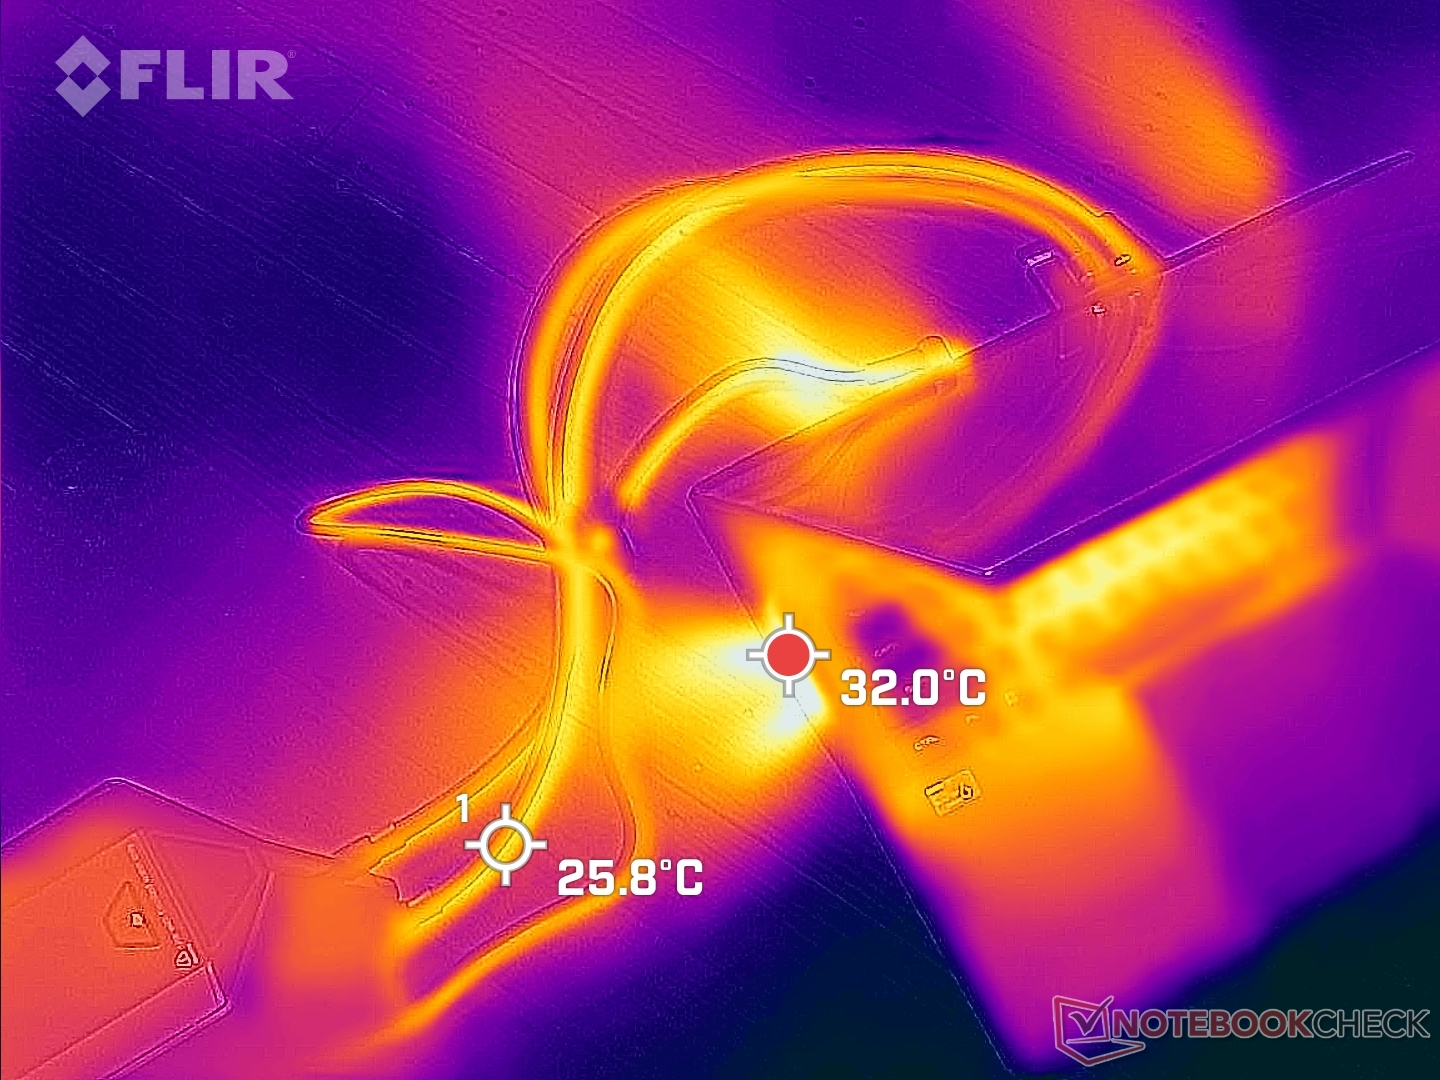
La caja de refrigeración externa incluye dos tapones de drenaje, dos tubos de agua, dos tapones de agua y un manual de usuario, además del habitual adaptador de CA.
Se aplica la garantía limitada estándar de un año si se adquiere en Estados Unidos.
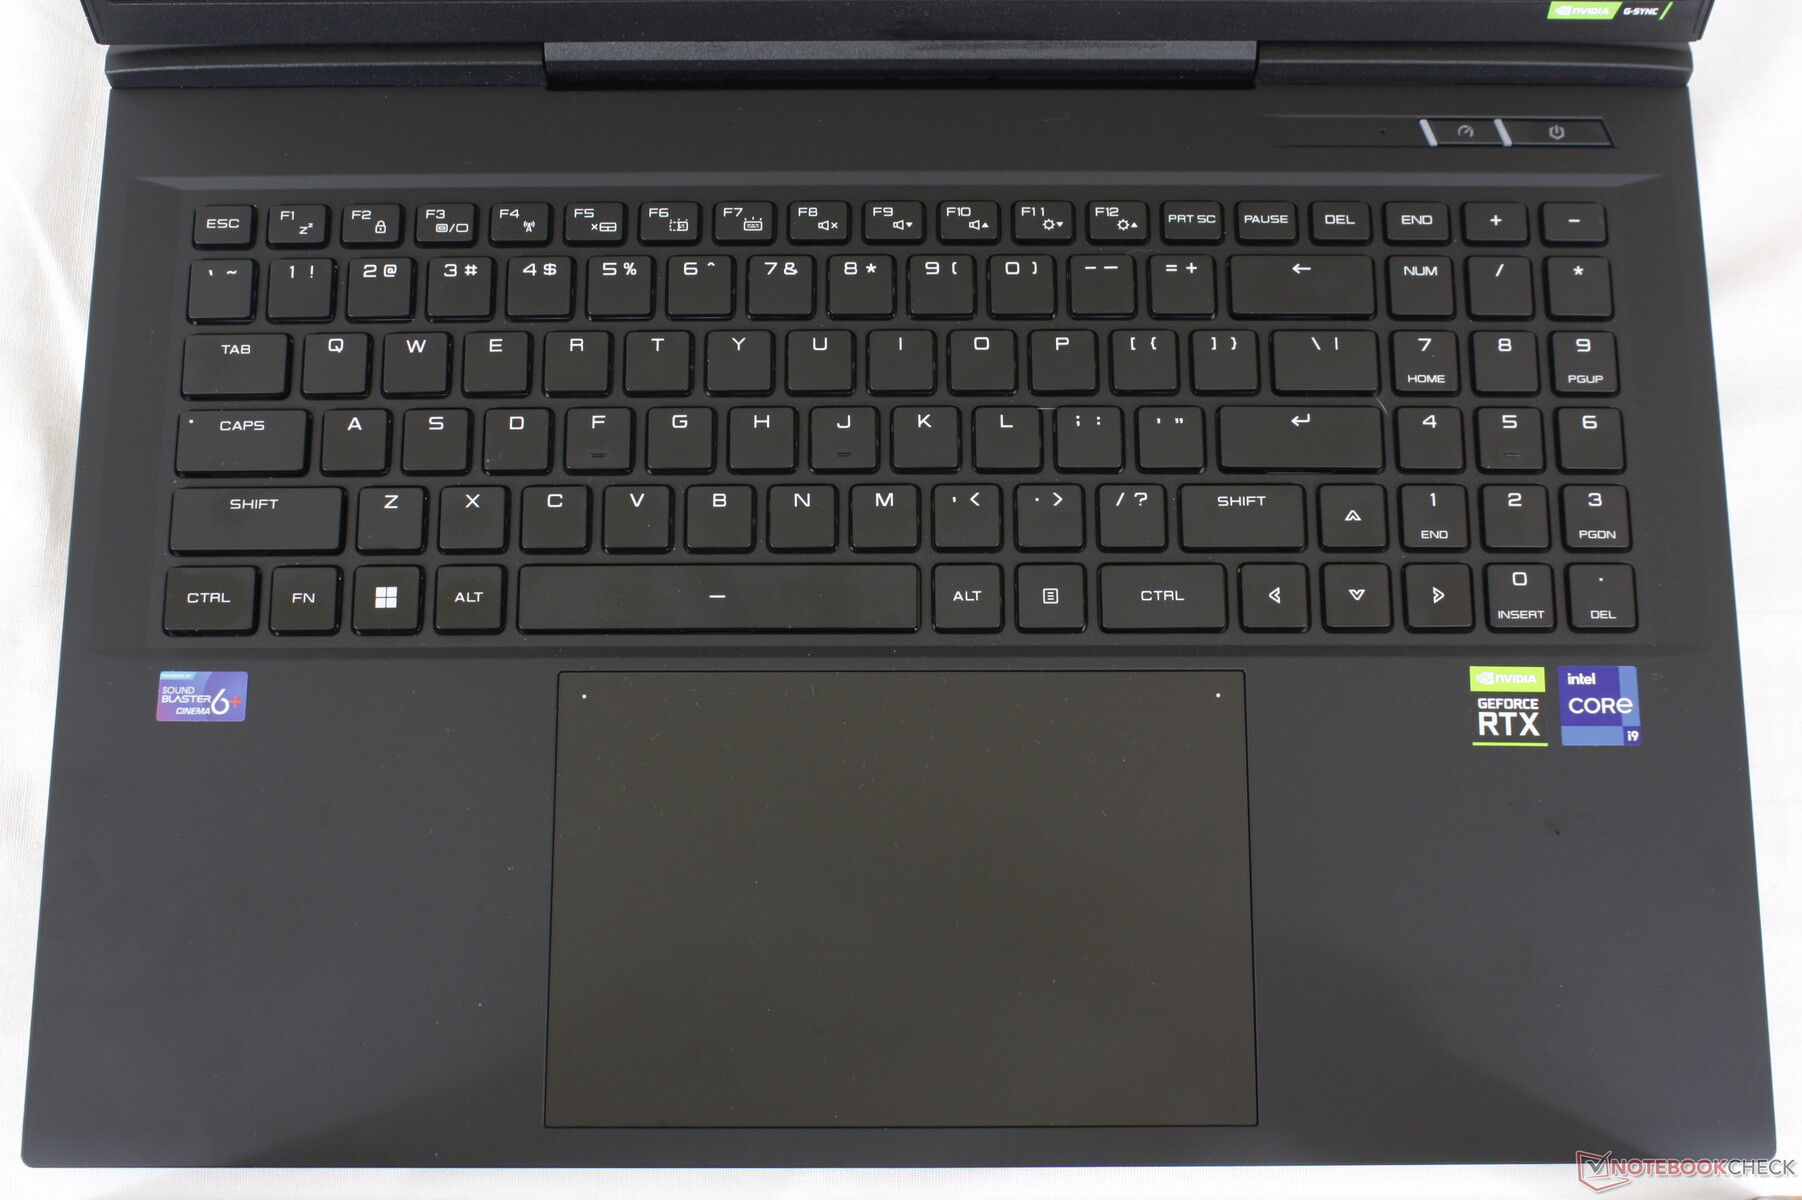
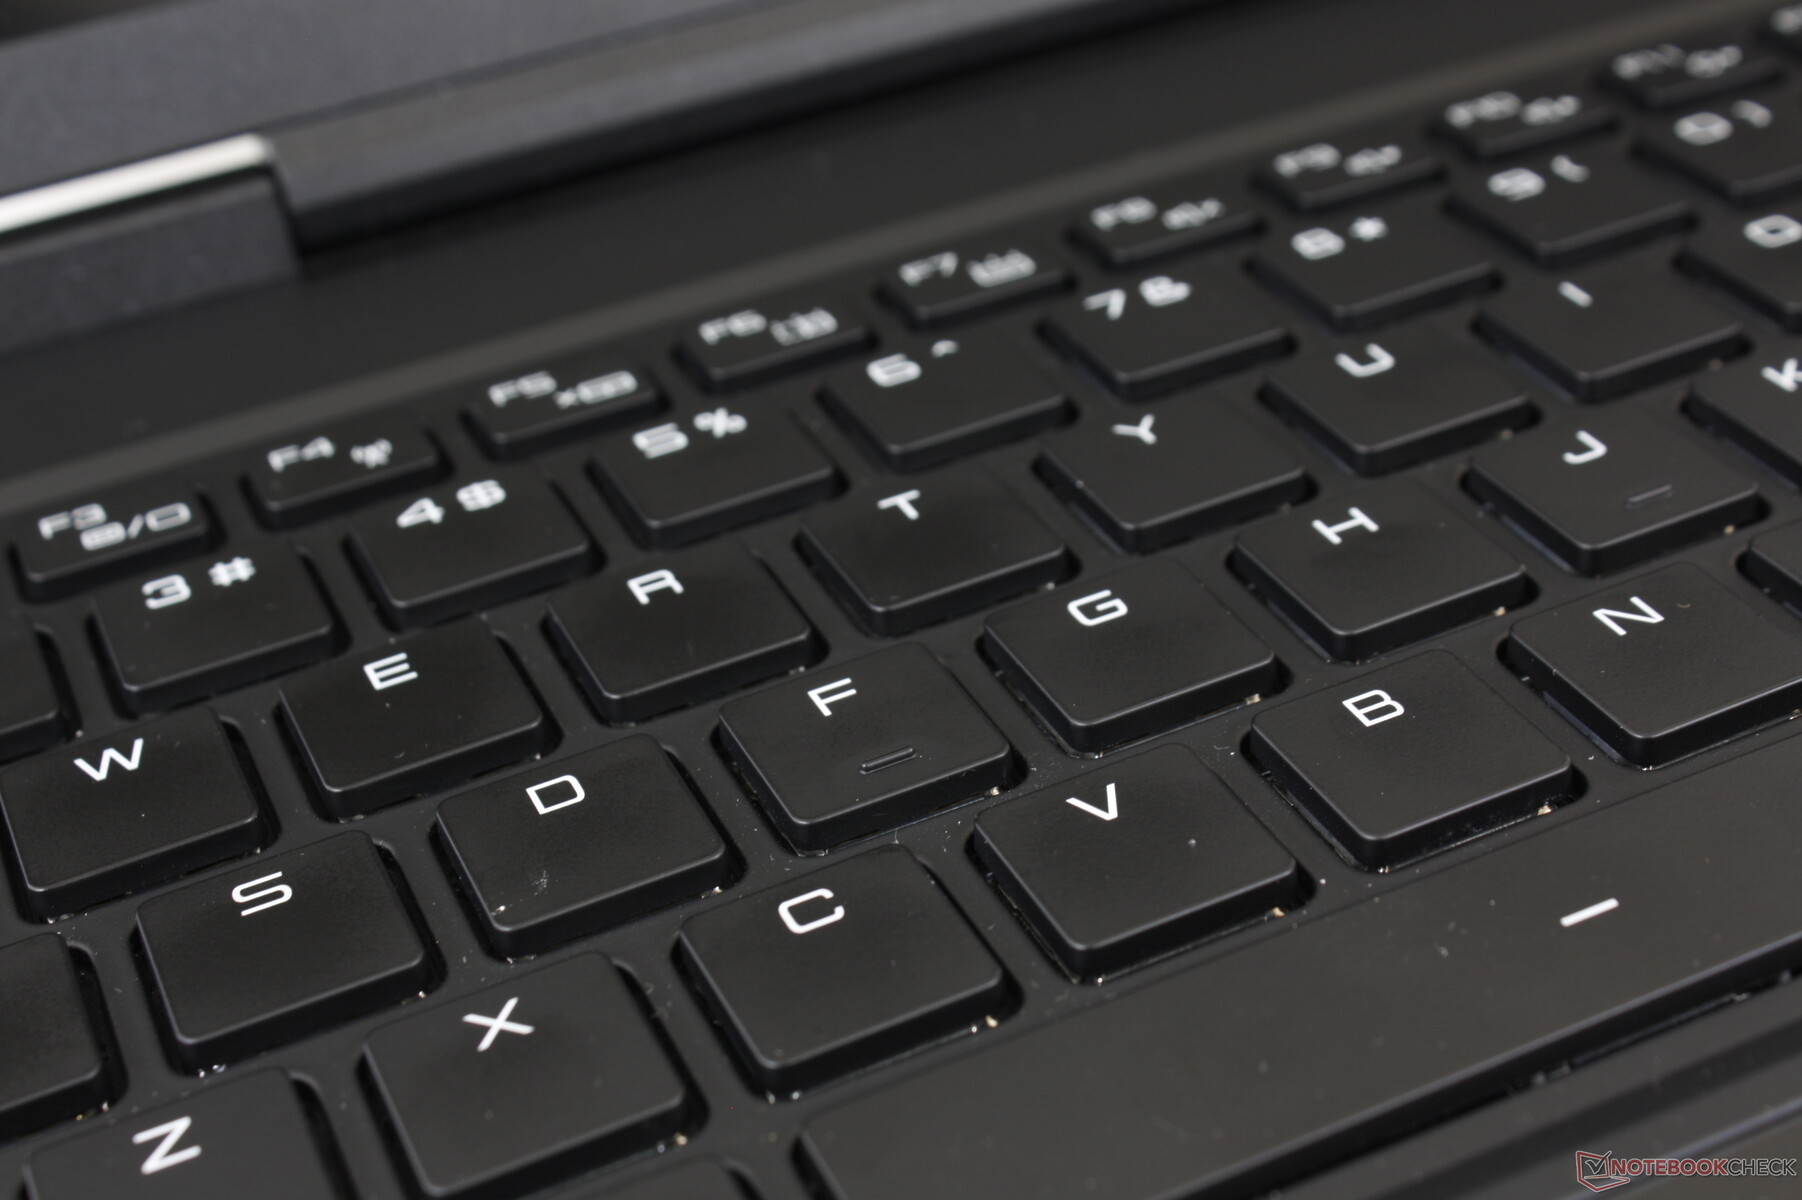
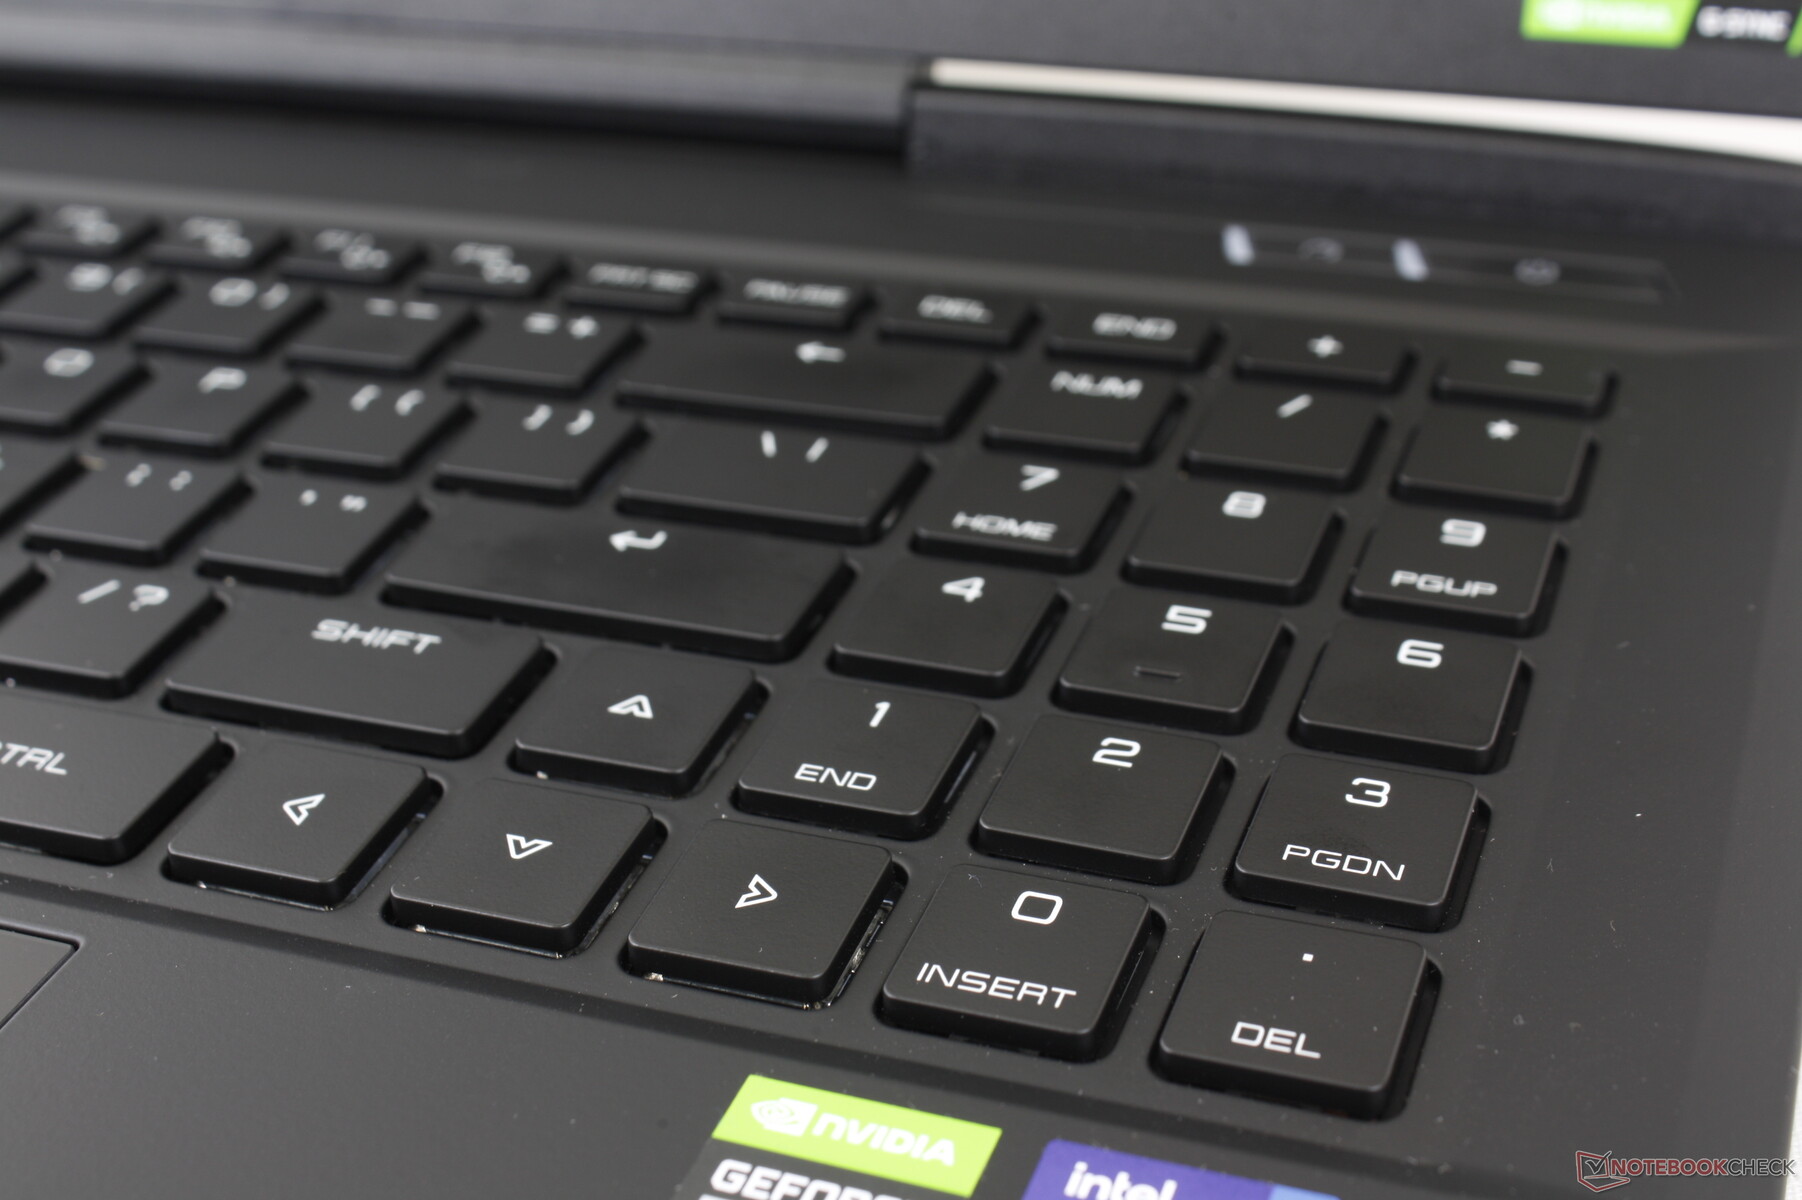
Dispositivos de entrada - Loud And Clicky
Teclado
El teclado RGB por tecla es diferente al delXMG Neo 15 E22 aunque los dos portátiles comparten los mismos puertos. Las teclas Cherry MX de nuestro Uniwell ofrecen un recorrido notablemente más profundo, una respuesta más nítida y un traqueteo mucho más fuerte que en la mayoría de los otros portátiles. Es preferible evitar el uso de este portátil en aulas, conferencias o bibliotecas debido al fuerte ruido que produce
Un aspecto molesto que notamos es que las teclas del teclado numérico son más suaves y silenciosas que las teclas principales del QWERTY, por lo que la respuesta no es uniforme en todas las teclas. Resulta incómodo escribir entre palabras y números porque la respuesta es muy diferente entre las teclas.
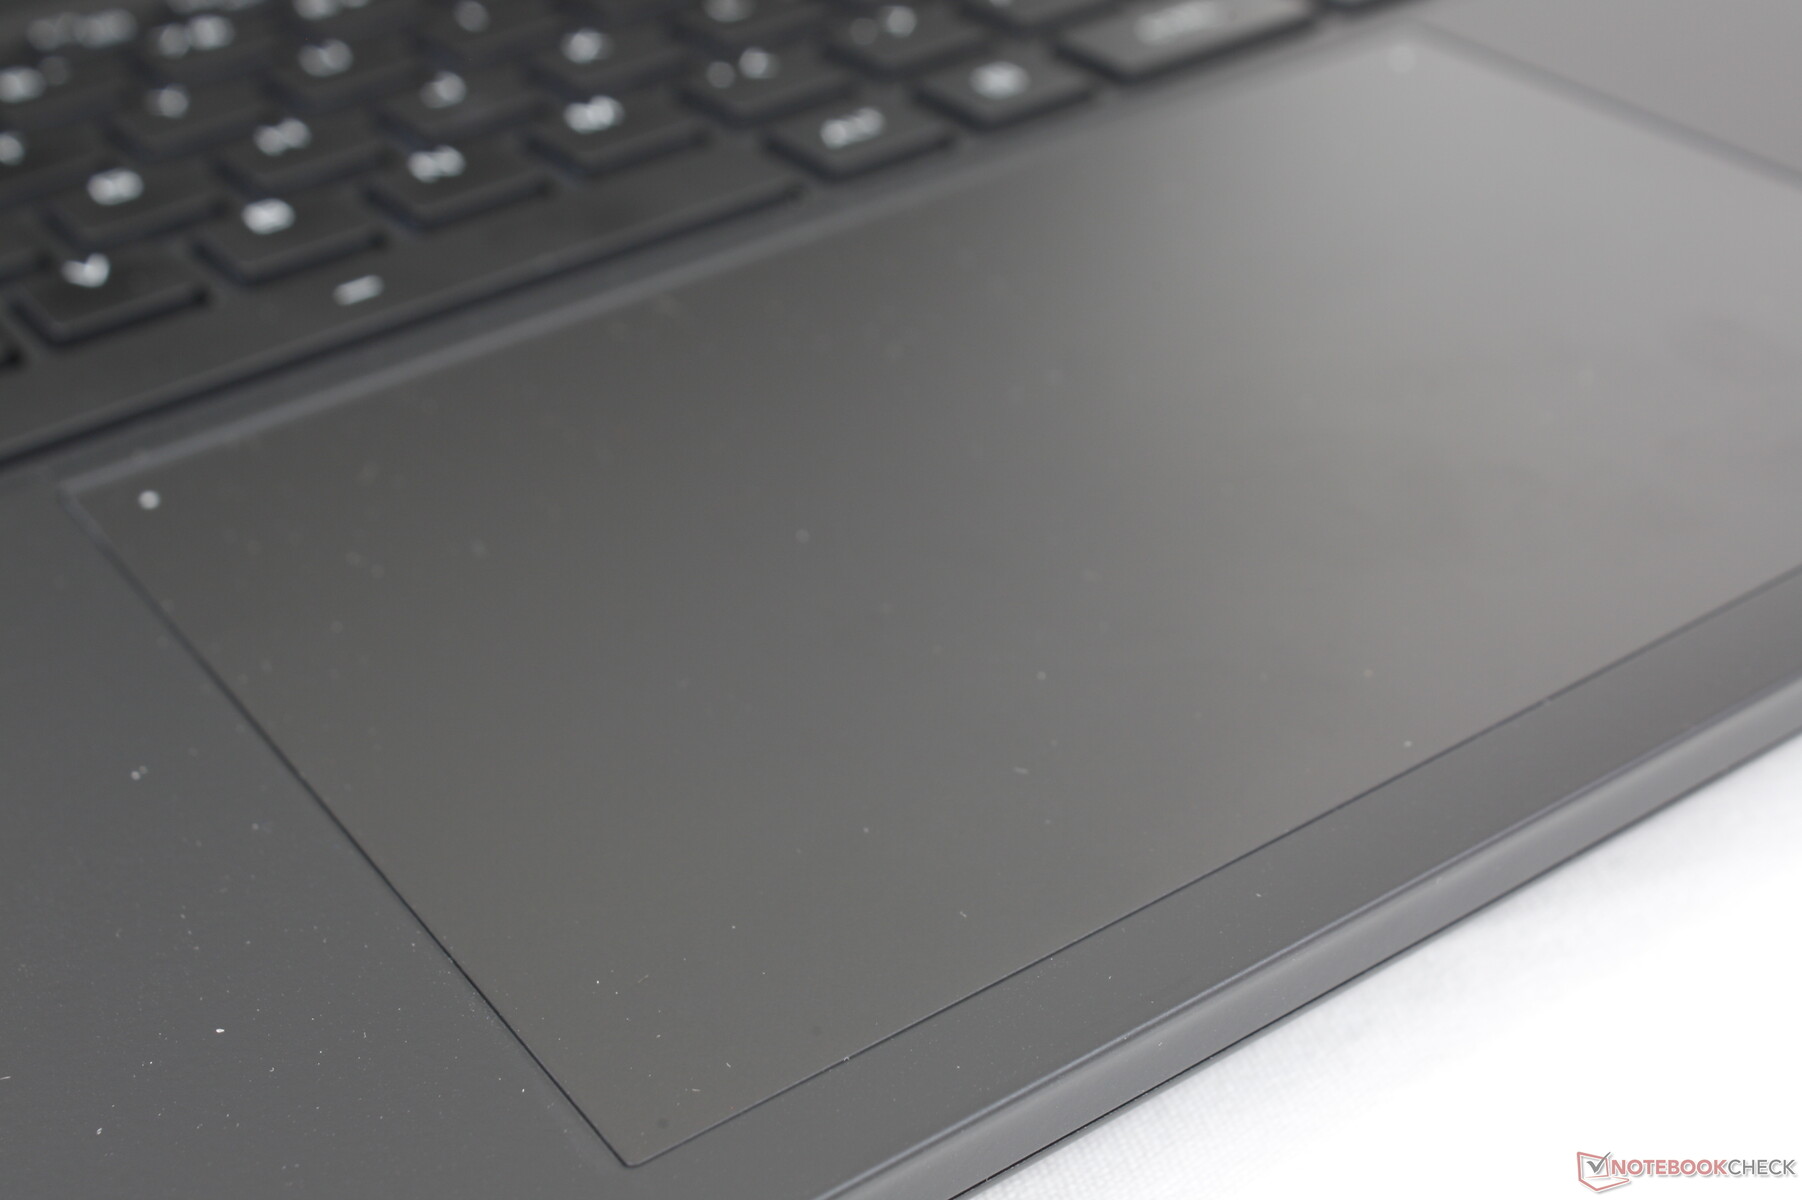
Teclado táctil
El clickpad sobredimensionado es incluso más grande que el ya grande clickpad del MSI GS77 (15,5 x 10 cm frente a 13,2 x 8,2 cm). Su superficie está ligeramente engomada para un deslizamiento muy suave a velocidades medias-altas con sólo un poco de adherencia a velocidades más lentas.
La respuesta al hacer clic en el clickpad es más firme que en el gran XPS 17 clickpad para una sensación más satisfactoria. Sin embargo, es definitivamente más ruidoso, pero no esperamos que esto sea un gran problema ya que las teclas mecánicas ya son bastante ruidosas de todos modos.
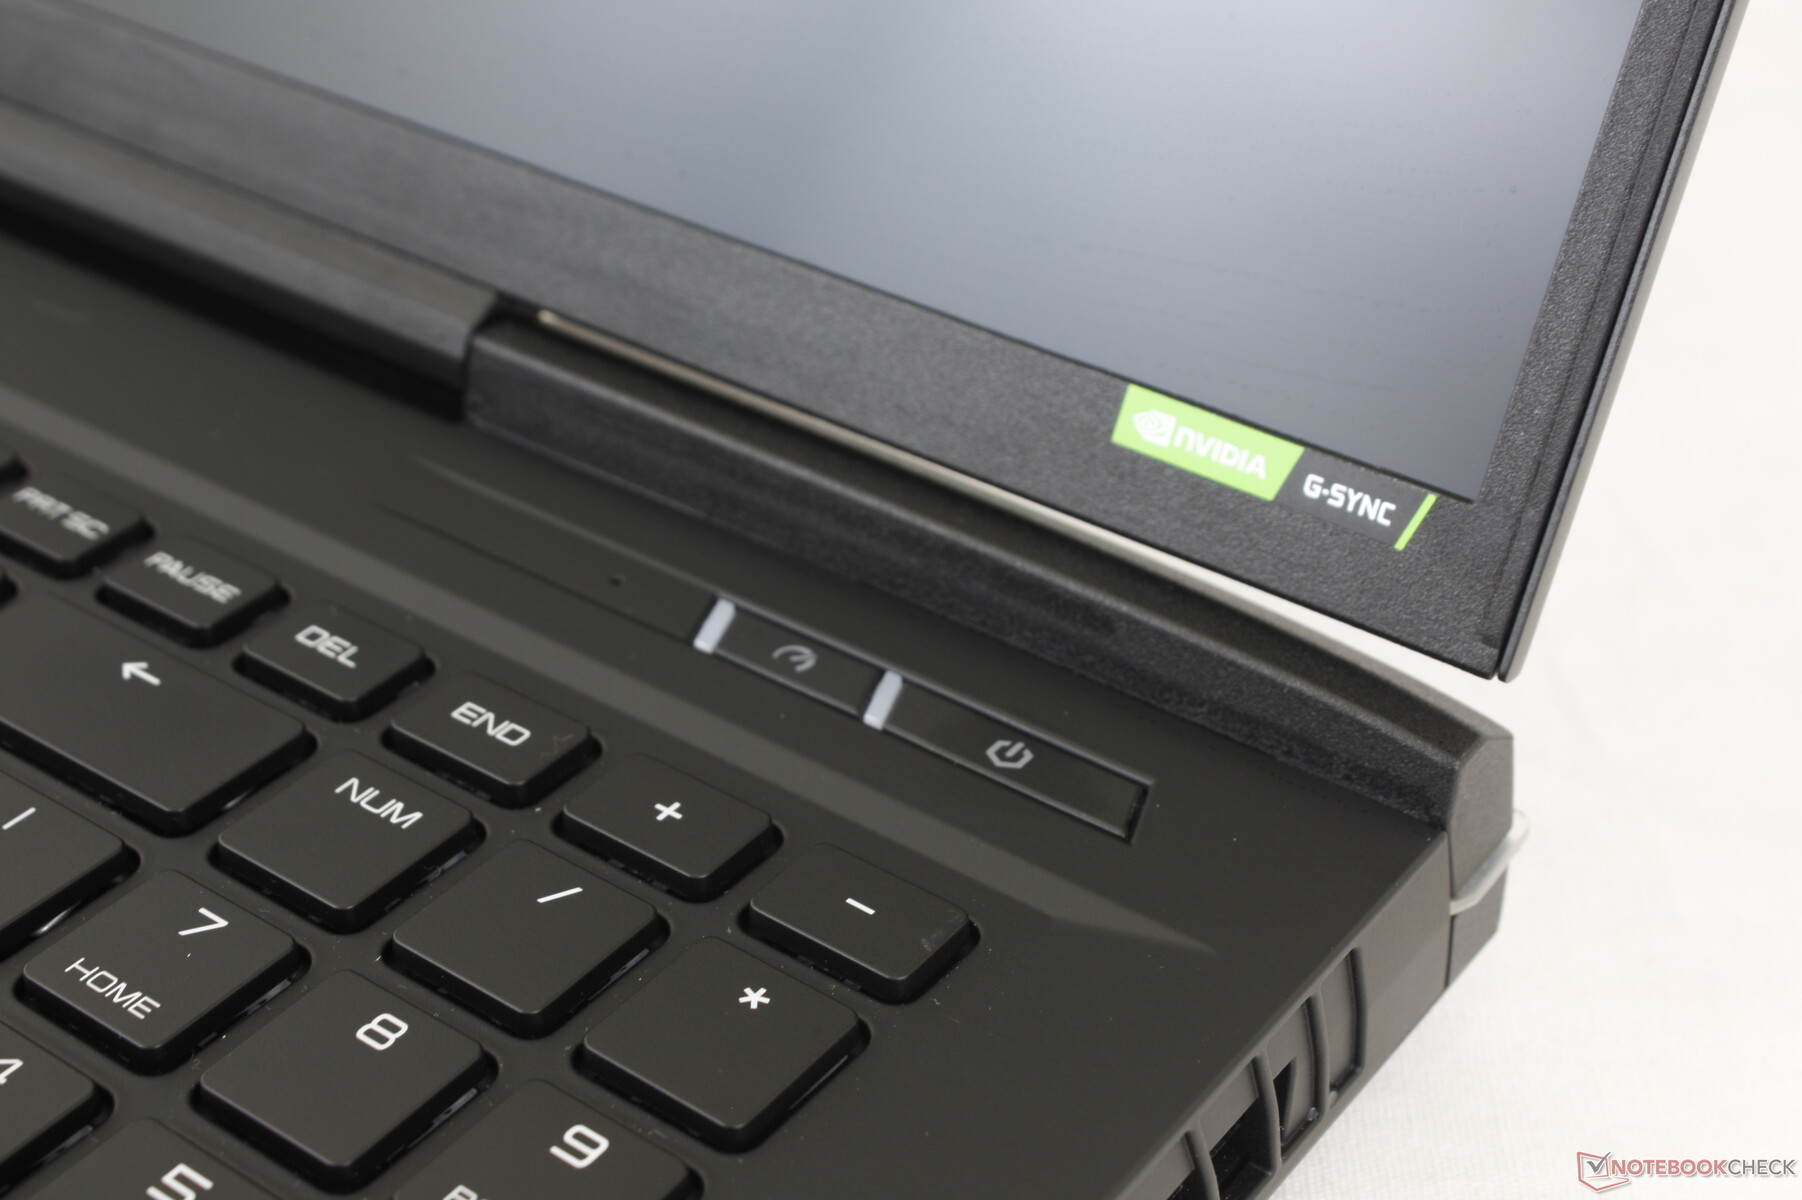
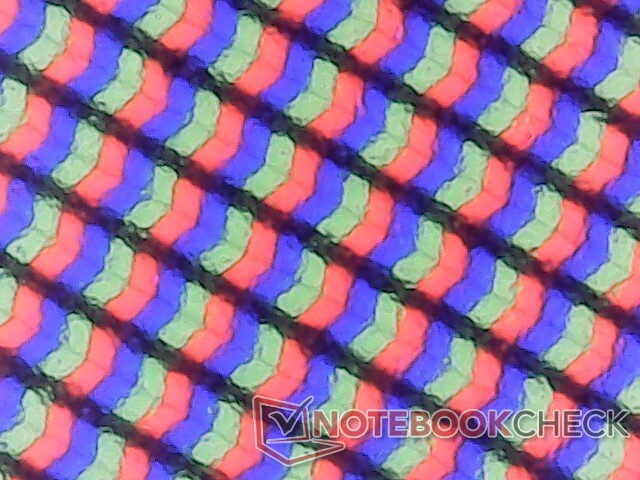
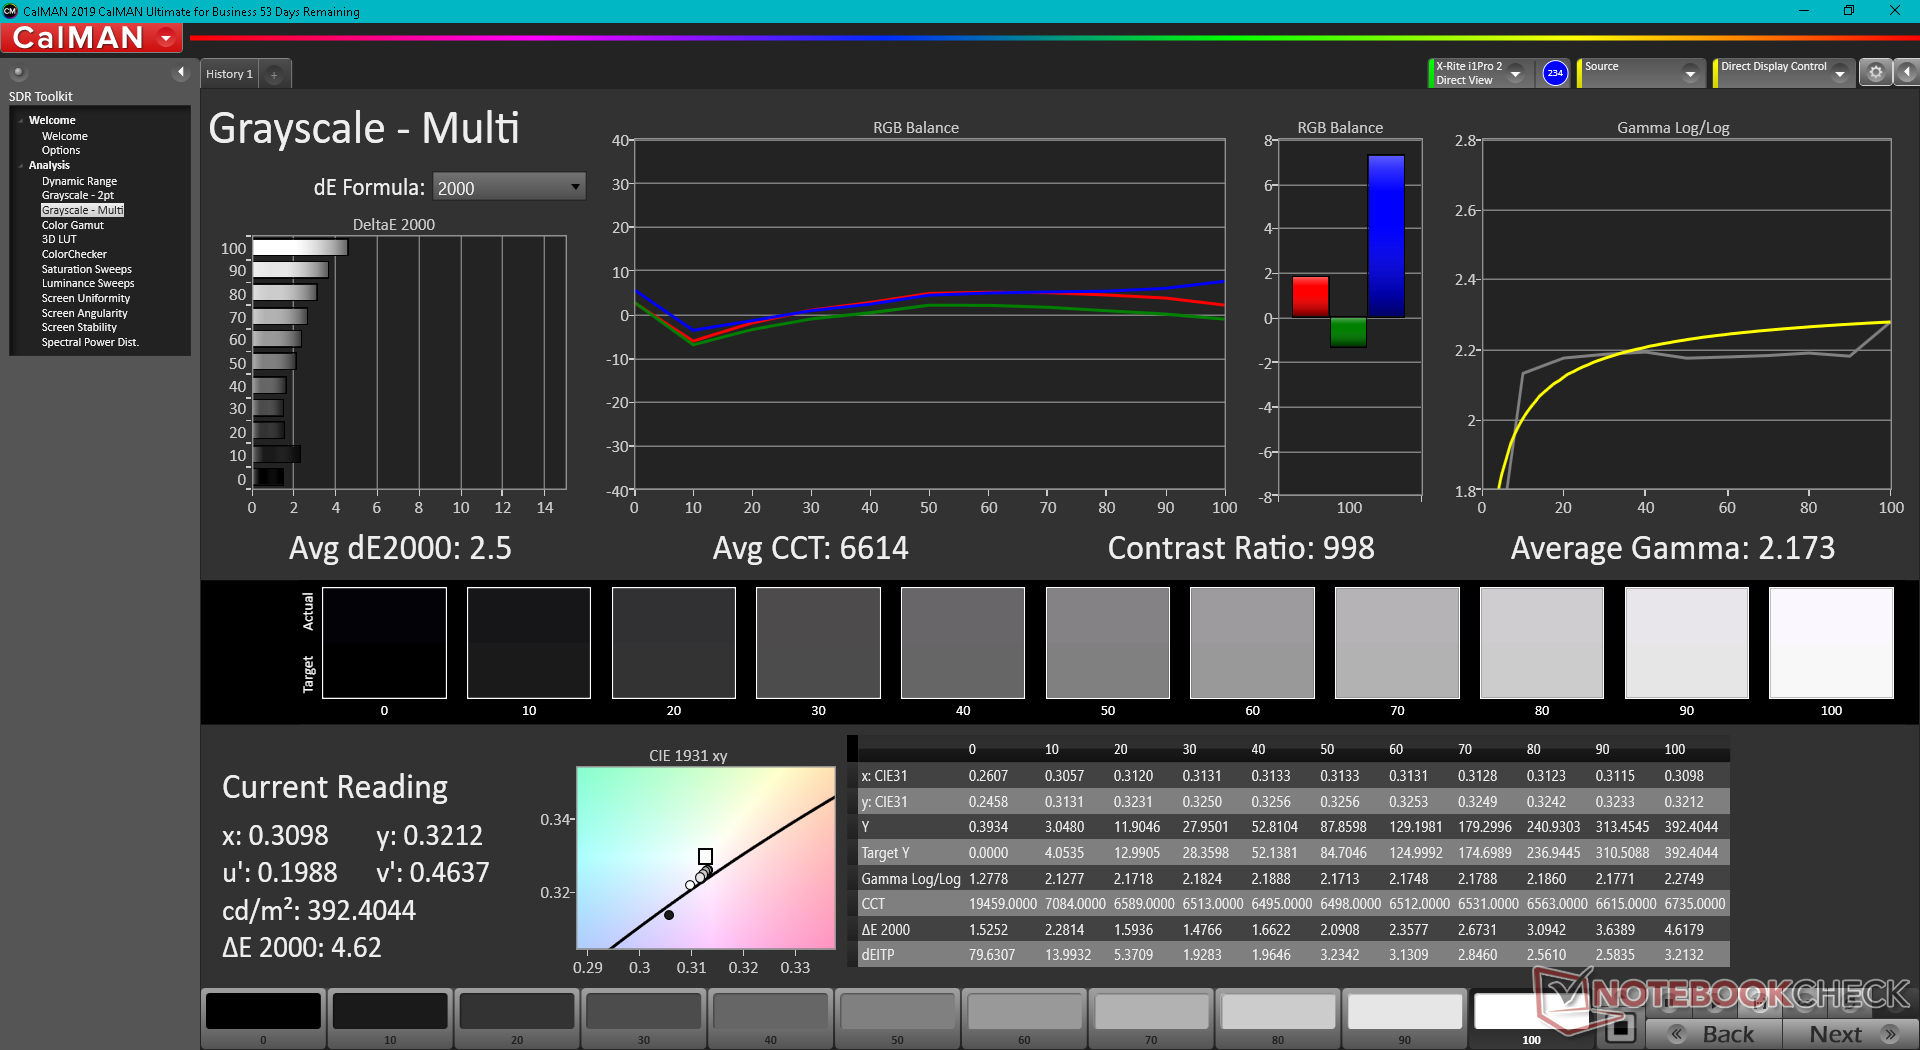
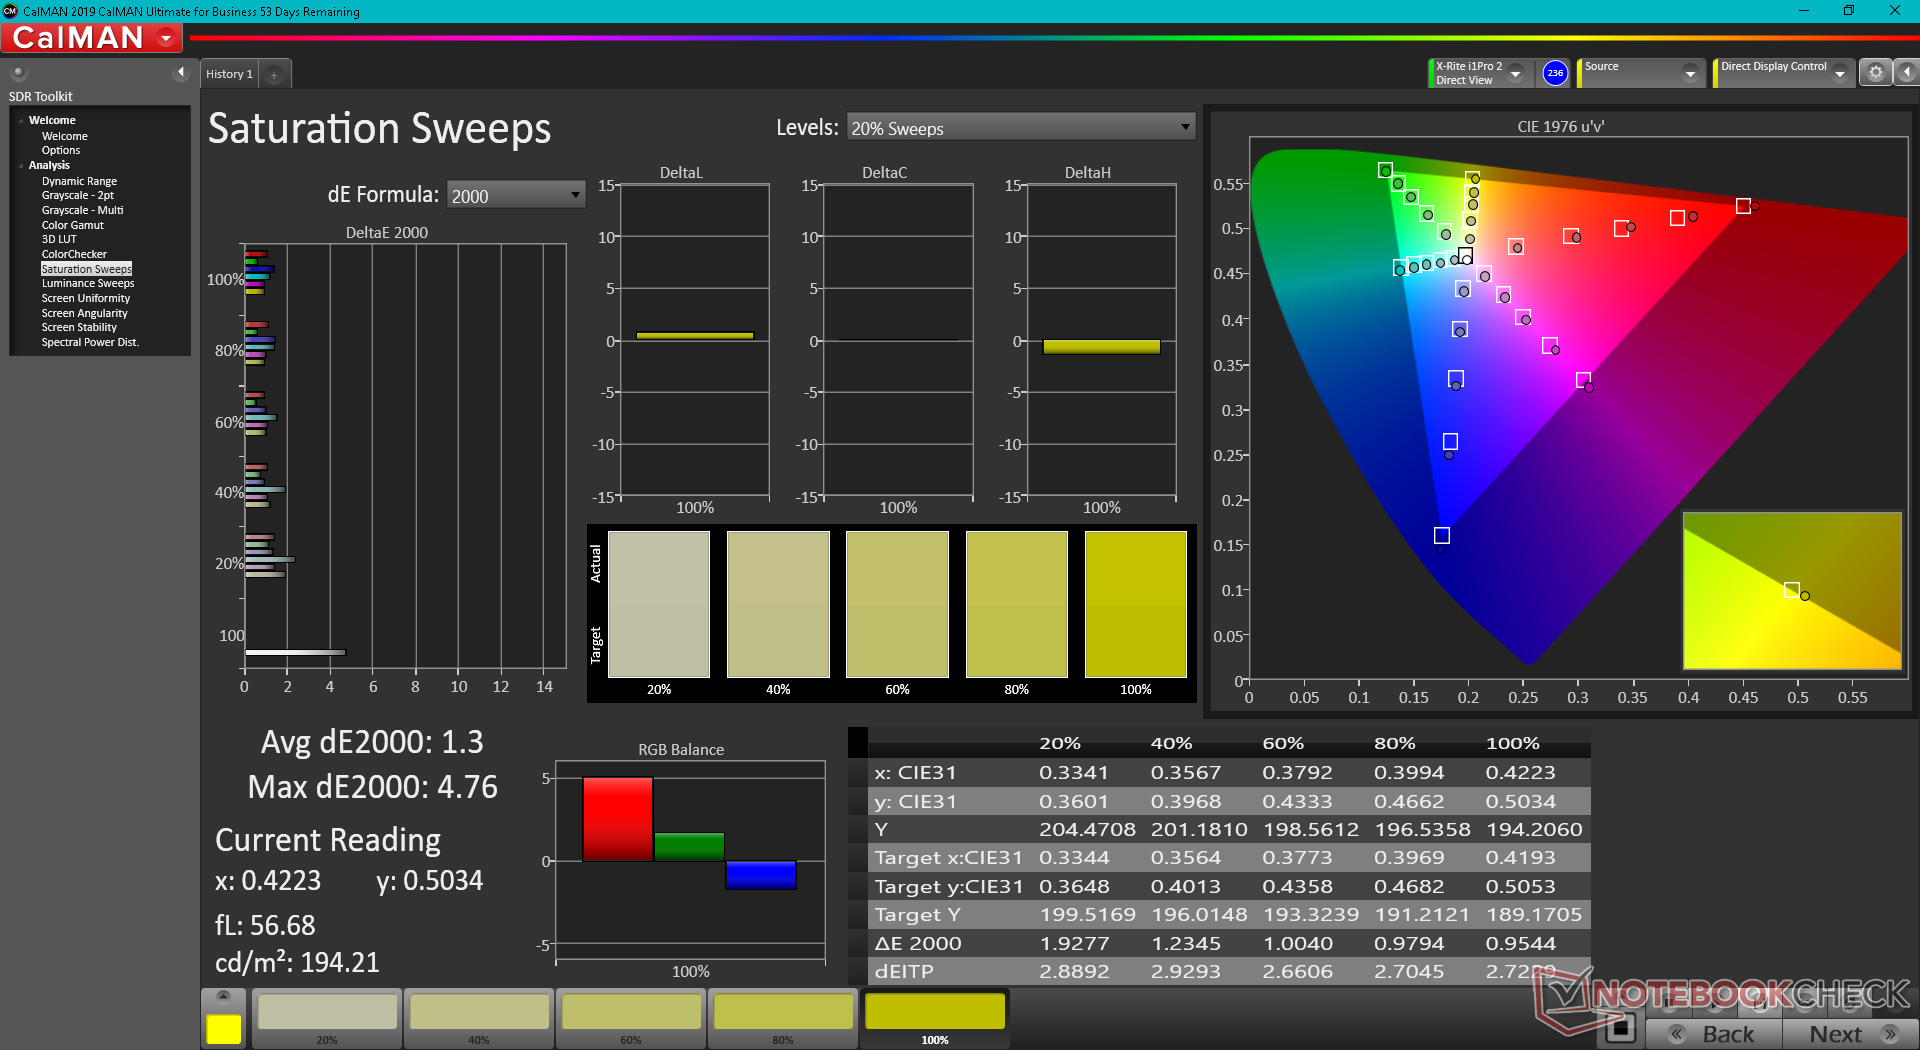
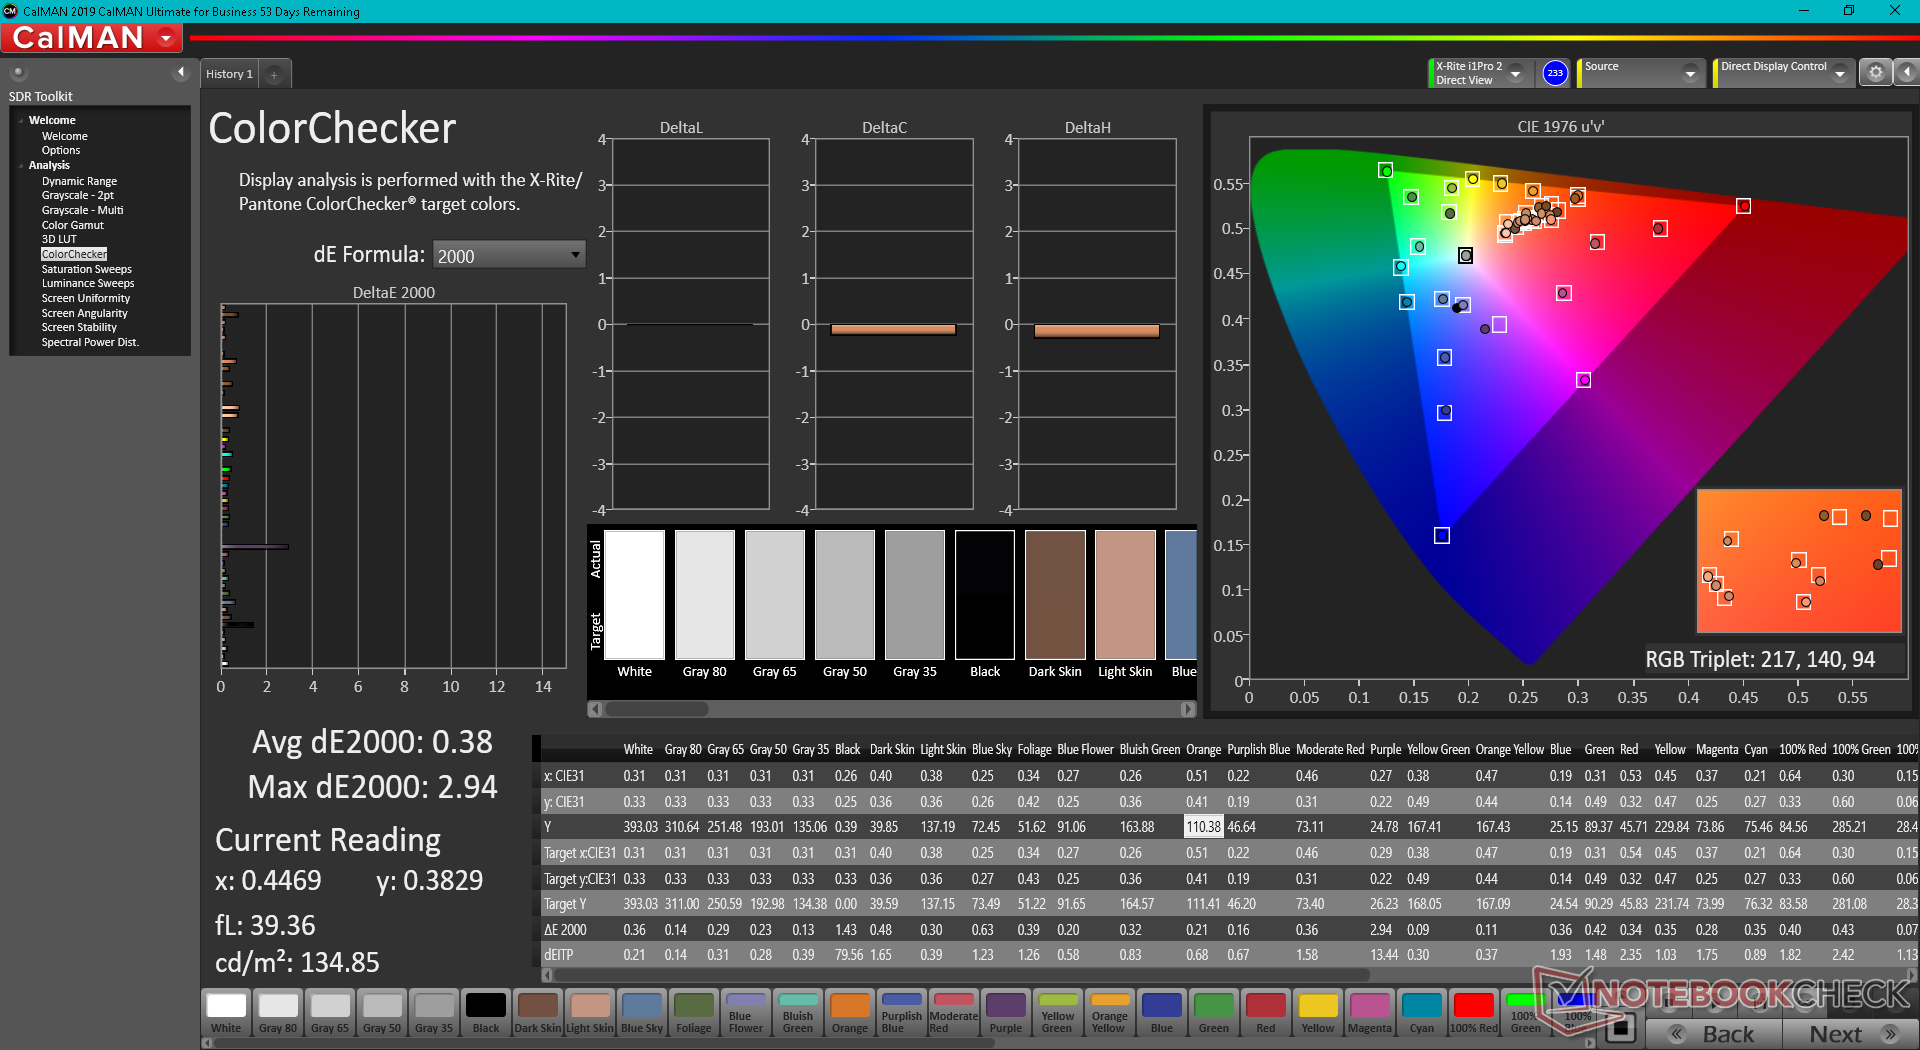
Pantalla: optimizada para juegos a 1440p
El panel BOE NE170QDM-NZ1 de nuestra unidad de pruebas Uniwell es el primero que aparece en nuestra base de datos. Este panel IPS compatible con G-Sync ofrece una cobertura sRGB completa, rápidos tiempos de respuesta, buen contraste, una rápida tasa de refresco de 240 Hz, y una retroiluminación de 400 nits relativamente brillante para ser digno de una máquina de juego entusiasta. Sin embargo, la mayoría de los otros portátiles para juegos, como el Razer Blade 17 tienen opciones de panel adicionales como 4K u OLED, ambas no disponibles en el Uniwell.
| |||||||||||||||||||||||||
iluminación: 91 %
Brillo con batería: 392.5 cd/m²
Contraste: 872:1 (Negro: 0.45 cd/m²)
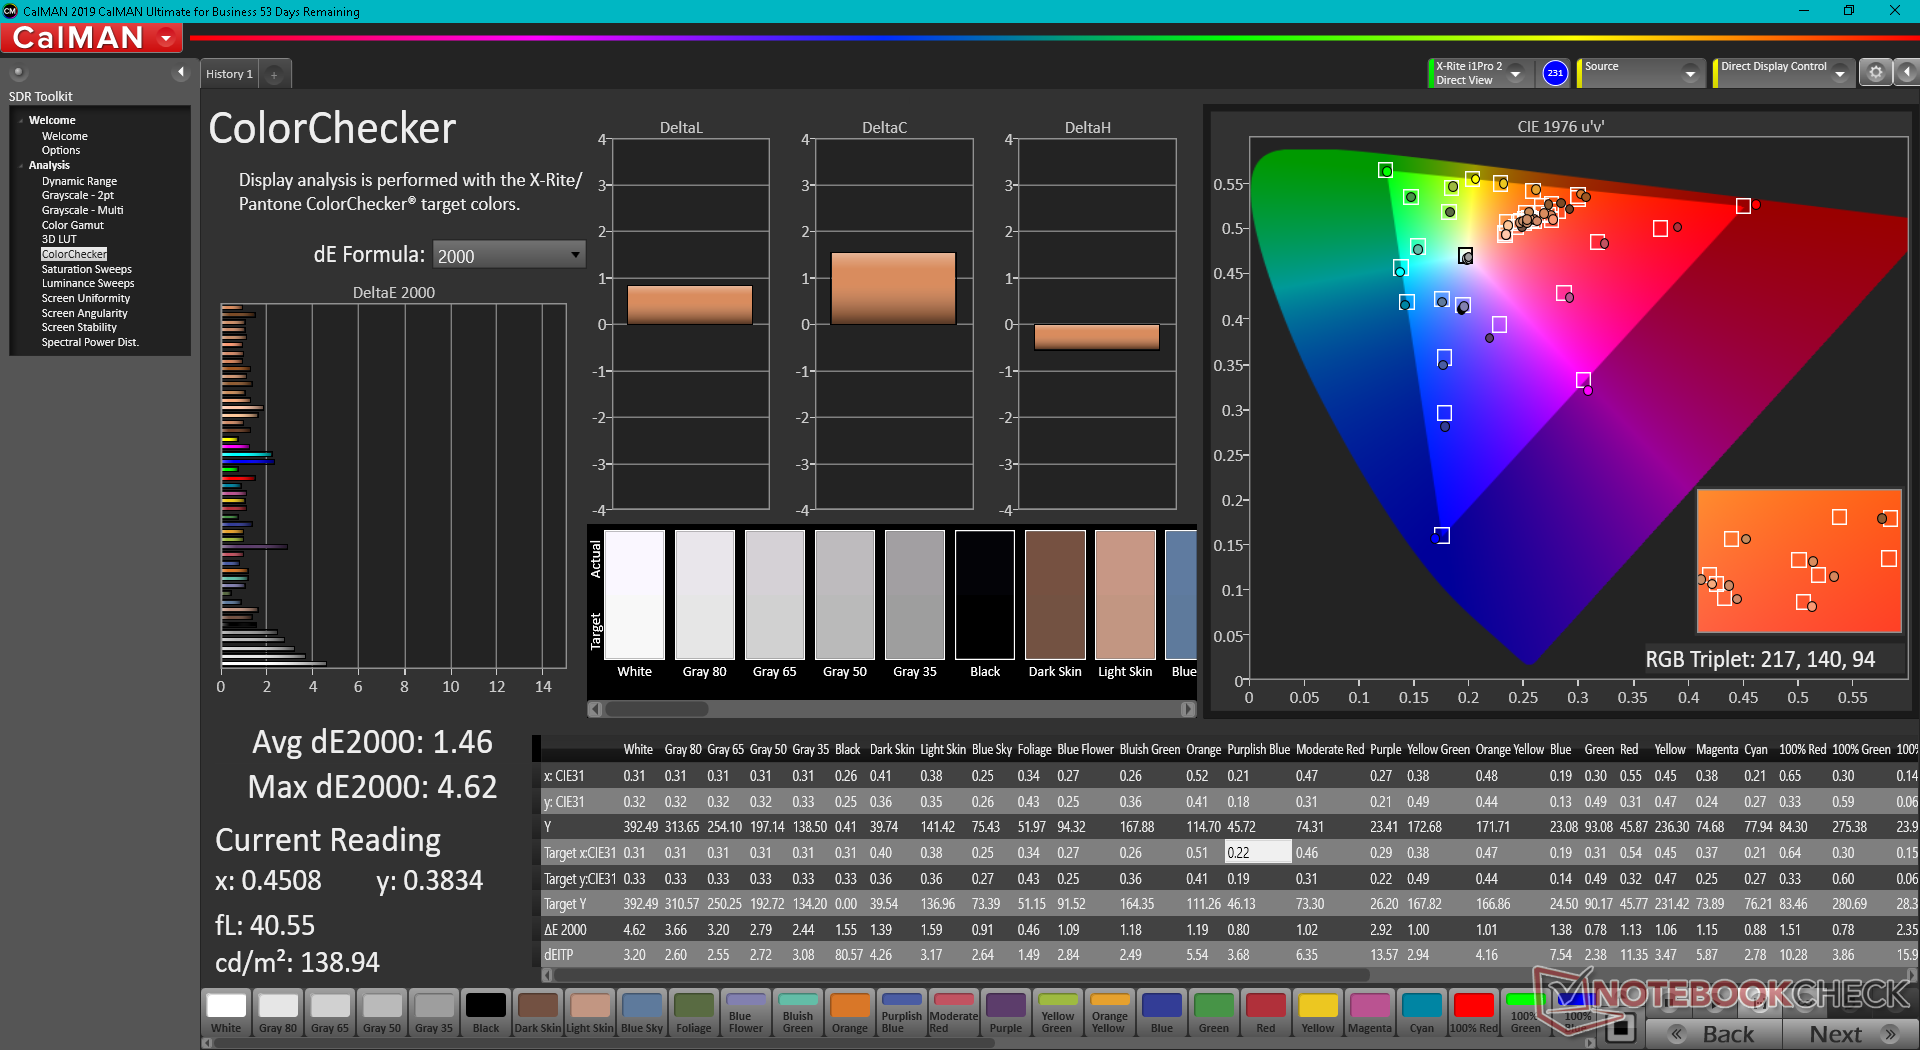
ΔE ColorChecker Calman: 1.46 | ∀{0.5-29.43 Ø4.71}
calibrated: 0.38
ΔE Greyscale Calman: 2.5 | ∀{0.09-98 Ø4.96}
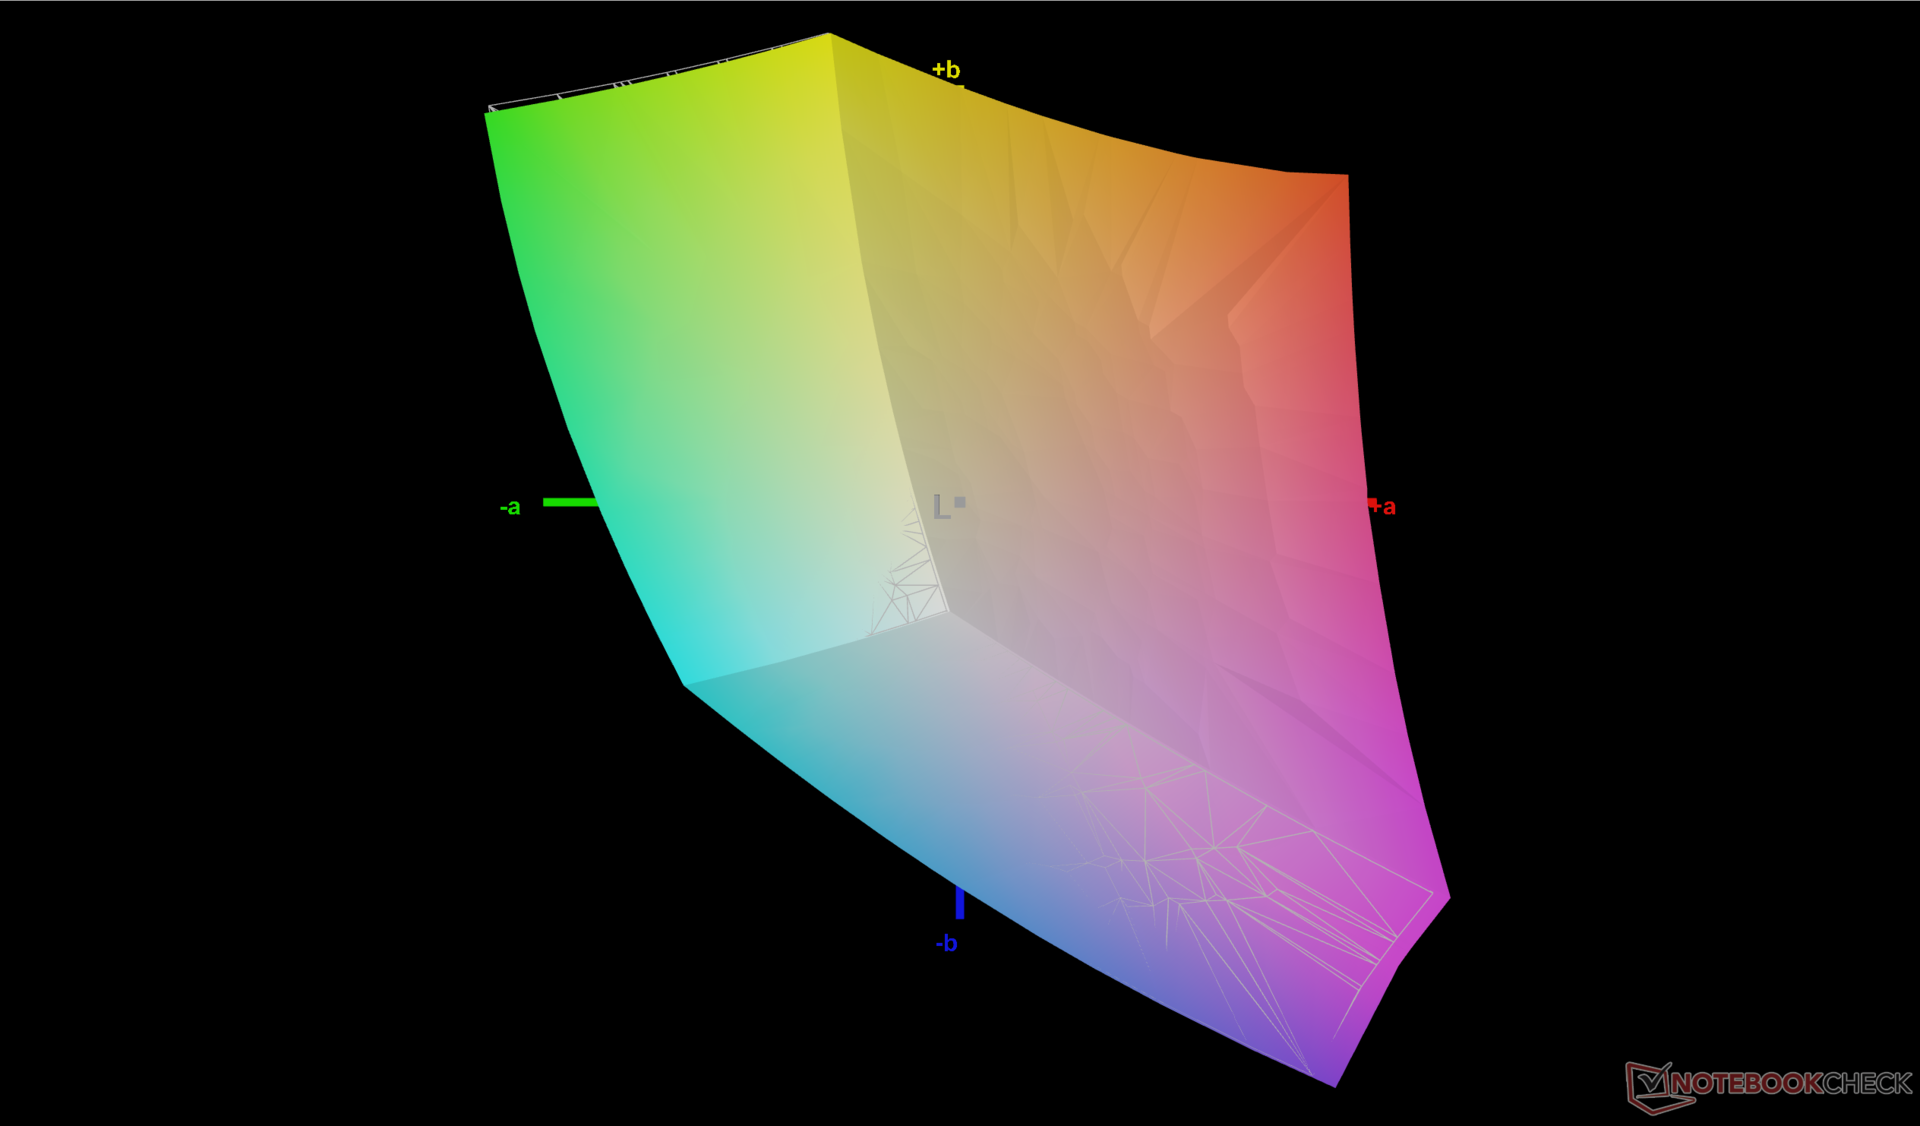
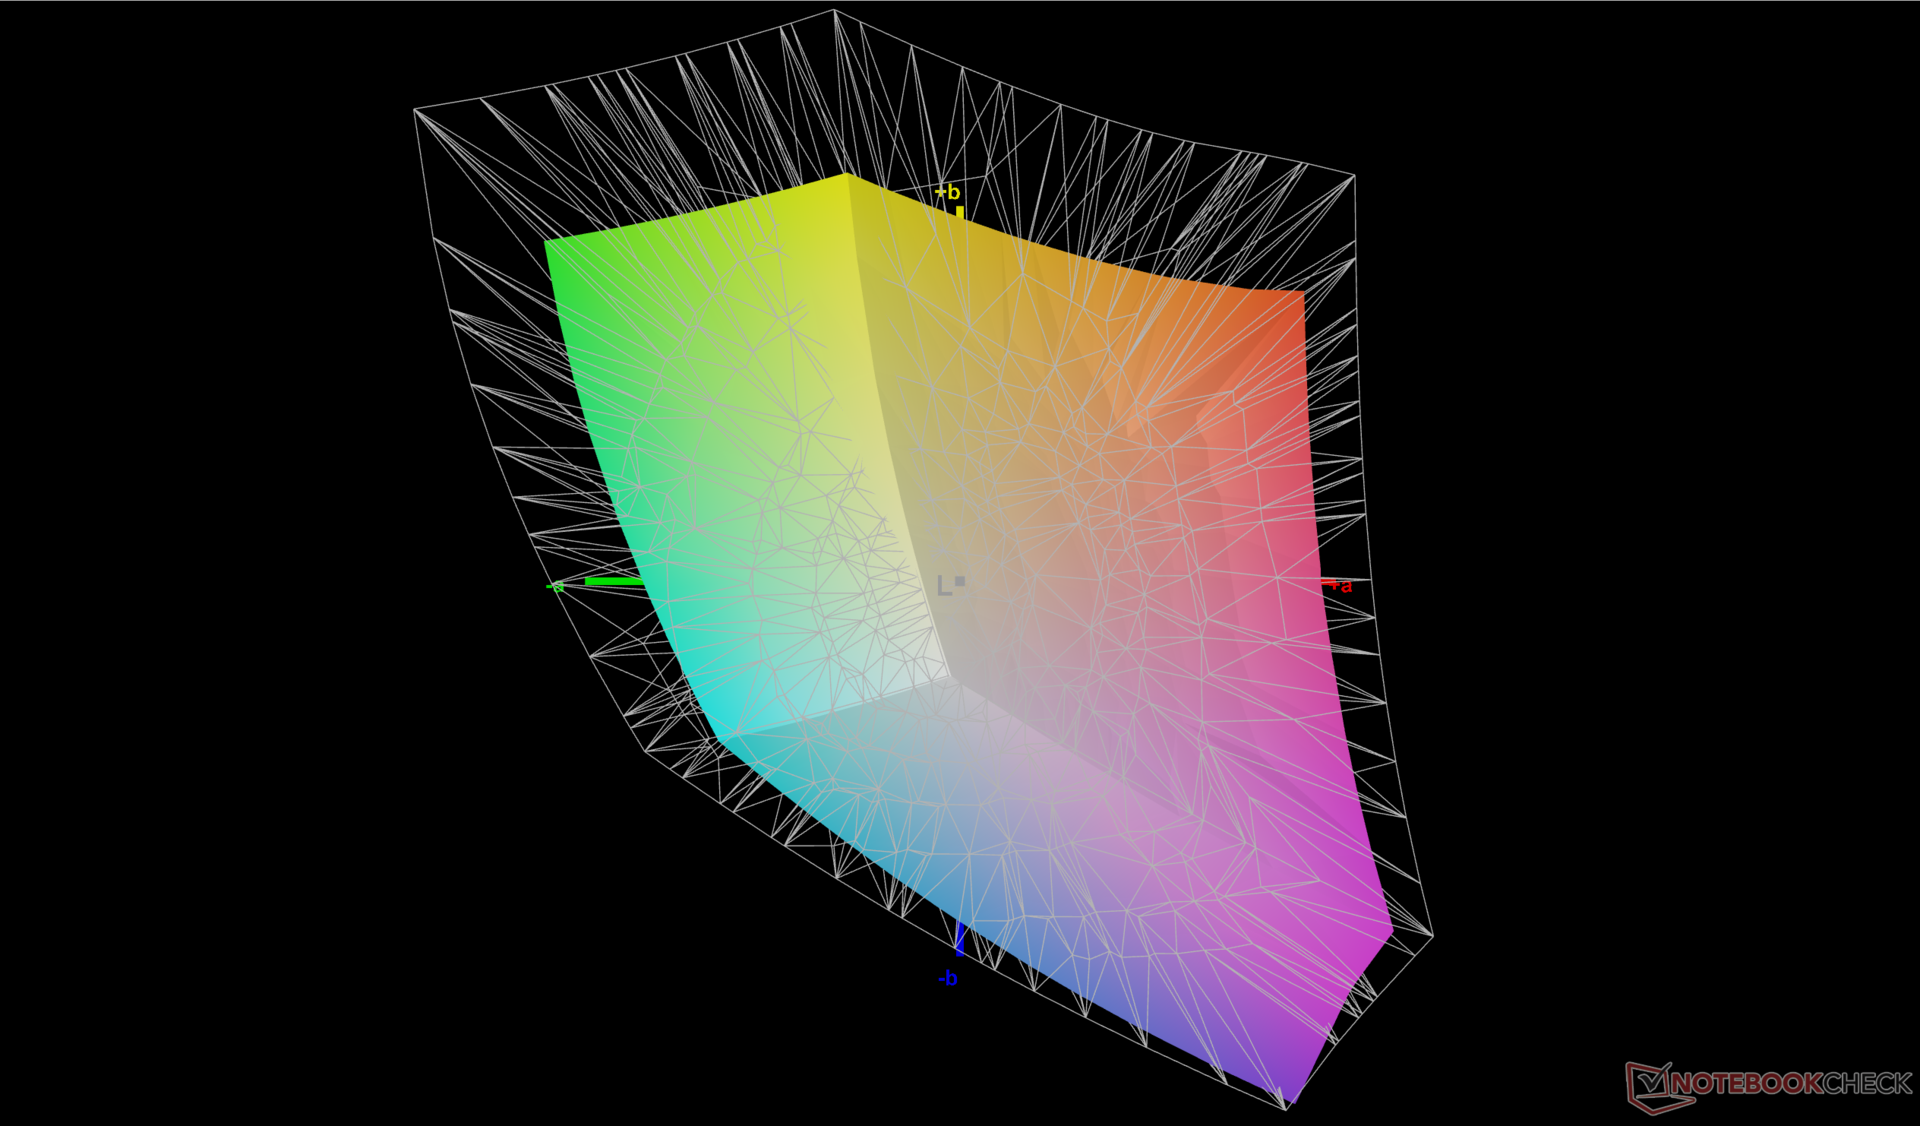
69.8% AdobeRGB 1998 (Argyll 3D)
99.7% sRGB (Argyll 3D)
69.1% Display P3 (Argyll 3D)
Gamma: 2.17
CCT: 6614 K
| Uniwell Technology GM7AG8N Liquid Cooling Box BOE NE170QDM-NZ1, IPS, 2560x1600, 17" | MSI Titan GT77 12UHS Sharp SHP1544 LQ173M1JW08, IPS-Level, 1920x1080, 17.3" | Aorus 17X XES Sharp SHP1563, IPS, 1920x1080, 17.3" | Razer Blade 17 Early 2022 AU Optronics B173ZAN06.9, IPS, 3840x2160, 17.3" | MSI Stealth GS77 12UHS-083US BOE NE173QHM-NZ1, IPS, 2560x1440, 17.3" | Asus ROG Zephyrus S17 GX703HSD BOE099D (BOE CQ NE173QHM-NY3), IPS, 2560x1440, 17.3" | |
|---|---|---|---|---|---|---|
| Display | 2% | 1% | 23% | 21% | 19% | |
| Display P3 Coverage (%) | 69.1 | 70.8 2% | 70.1 1% | 99.4 44% | 96.2 39% | 94.2 36% |
| sRGB Coverage (%) | 99.7 | 98.9 -1% | 99.9 0% | 100 0% | 99.7 0% | 98.7 -1% |
| AdobeRGB 1998 Coverage (%) | 69.8 | 73 5% | 71.9 3% | 87.3 25% | 85.8 23% | 84.4 21% |
| Response Times | 63% | 59% | 44% | -31% | 43% | |
| Response Time Grey 50% / Grey 80% * (ms) | 12.8 ? | 3.03 ? 76% | 3.4 ? 73% | 7.5 ? 41% | 17.6 ? -38% | 4.8 63% |
| Response Time Black / White * (ms) | 10.4 ? | 5.28 ? 49% | 5.8 ? 44% | 5.6 ? 46% | 12.8 ? -23% | 8 23% |
| PWM Frequency (Hz) | ||||||
| Screen | -55% | -74% | 11% | -47% | -62% | |
| Brightness middle (cd/m²) | 392.5 | 280 -29% | 278 -29% | 503 28% | 334.8 -15% | 322 -18% |
| Brightness (cd/m²) | 392 | 275 -30% | 273 -30% | 486 24% | 305 -22% | 288 -27% |
| Brightness Distribution (%) | 91 | 79 -13% | 79 -13% | 84 -8% | 79 -13% | 72 -21% |
| Black Level * (cd/m²) | 0.45 | 0.4 11% | 0.26 42% | 0.44 2% | 0.34 24% | 0.3 33% |
| Contrast (:1) | 872 | 700 -20% | 1069 23% | 1143 31% | 985 13% | 1073 23% |
| Colorchecker dE 2000 * | 1.46 | 2.1 -44% | 3.96 -171% | 1.08 26% | 4.1 -181% | 3.05 -109% |
| Colorchecker dE 2000 max. * | 4.62 | 5.83 -26% | 10.78 -133% | 4.54 2% | 7.28 -58% | 5.23 -13% |
| Colorchecker dE 2000 calibrated * | 0.38 | 1.58 -316% | 1.07 -182% | 0.6 -58% | 1.92 -405% | |
| Greyscale dE 2000 * | 2.5 | 3.3 -32% | 6.8 -172% | 1.3 48% | 5.6 -124% | 3.11 -24% |
| Gamma | 2.17 101% | 2.13 103% | 2.224 99% | 2.151 102% | 2.16 102% | 2.13 103% |
| CCT | 6614 98% | 7060 92% | 7651 85% | 6541 99% | 6314 103% | 6553 99% |
| Color Space (Percent of AdobeRGB 1998) (%) | 84 | |||||
| Color Space (Percent of sRGB) (%) | 99 | |||||
| Media total (Programa/Opciones) | 3% /
-26% | -5% /
-39% | 26% /
18% | -19% /
-29% | 0% /
-30% |
* ... más pequeño es mejor
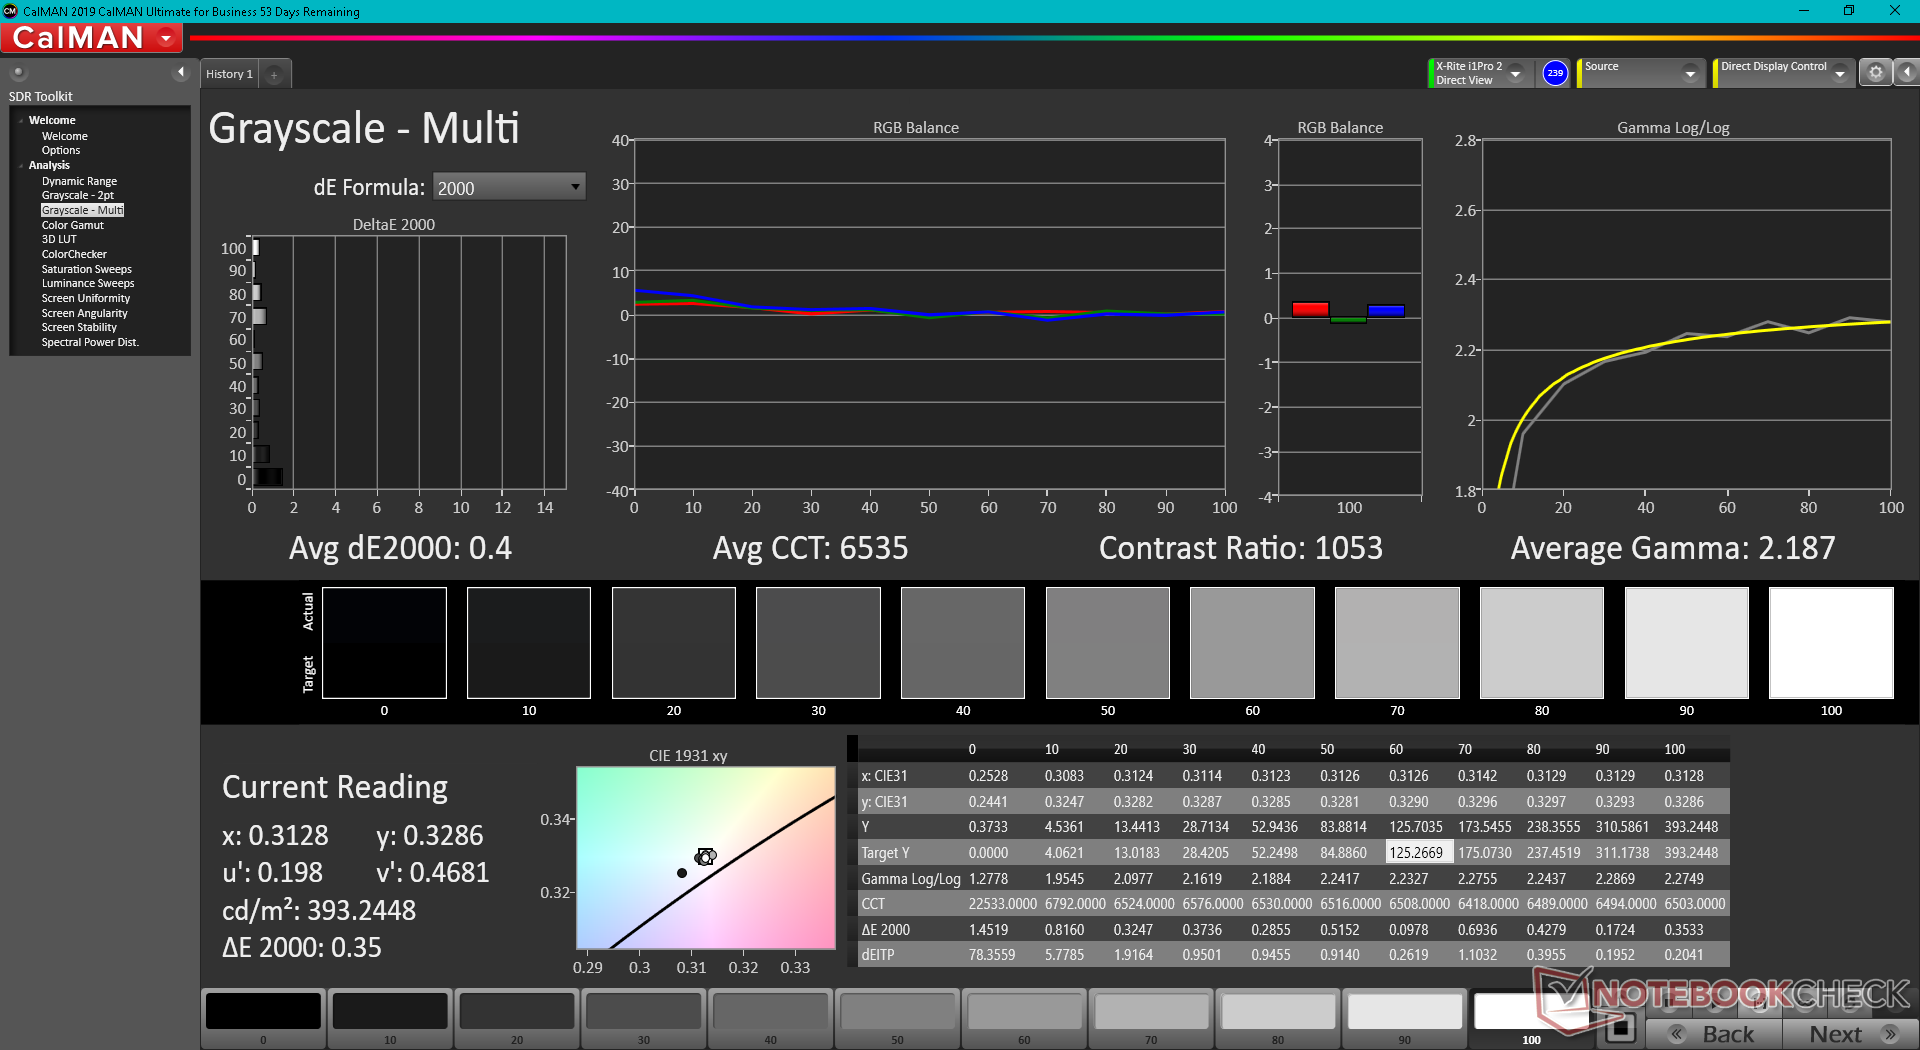
La pantalla ya está bien calibrada al sacarla de la caja, como muestran los resultados de CalMAN que aparecen a continuación. Si intentamos calibrarla aún más con nuestro colorímetro X-Rite, los valores medios de escala de grises y de color DeltaE mejorarán sólo marginalmente hasta 0,4 y 0,38, respectivamente.

Tiempos de respuesta del display
| ↔ Tiempo de respuesta de Negro a Blanco | ||
|---|---|---|
| 10.4 ms ... subida ↗ y bajada ↘ combinada | ↗ 6 ms subida | 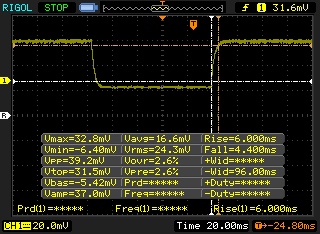 |
| ↘ 4.4 ms bajada | ||
| La pantalla mostró buenos tiempos de respuesta en nuestros tests pero podría ser demasiado lenta para los jugones competitivos. En comparación, todos los dispositivos de prueba van de ##min### (mínimo) a 240 (máximo) ms. » 28 % de todos los dispositivos son mejores. Esto quiere decir que el tiempo de respuesta medido es mejor que la media (19.8 ms) de todos los dispositivos testados. | ||
| ↔ Tiempo de respuesta 50% Gris a 80% Gris | ||
| 12.8 ms ... subida ↗ y bajada ↘ combinada | ↗ 6 ms subida | 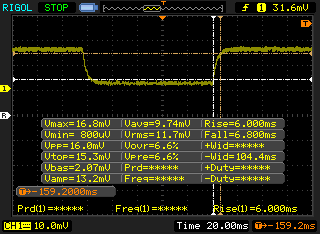 |
| ↘ 6.8 ms bajada | ||
| La pantalla mostró buenos tiempos de respuesta en nuestros tests pero podría ser demasiado lenta para los jugones competitivos. En comparación, todos los dispositivos de prueba van de ##min### (mínimo) a 636 (máximo) ms. » 26 % de todos los dispositivos son mejores. Esto quiere decir que el tiempo de respuesta medido es mejor que la media (31 ms) de todos los dispositivos testados. | ||
Parpadeo de Pantalla / PWM (Pulse-Width Modulation)
| Parpadeo de Pantalla / PWM no detectado | 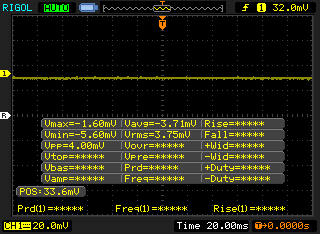 | ||
Comparación: 52 % de todos los dispositivos testados no usaron PWM para atenuar el display. Si se usó, medimos una media de 7754 (mínimo: 5 - máxmo: 343500) Hz. | |||
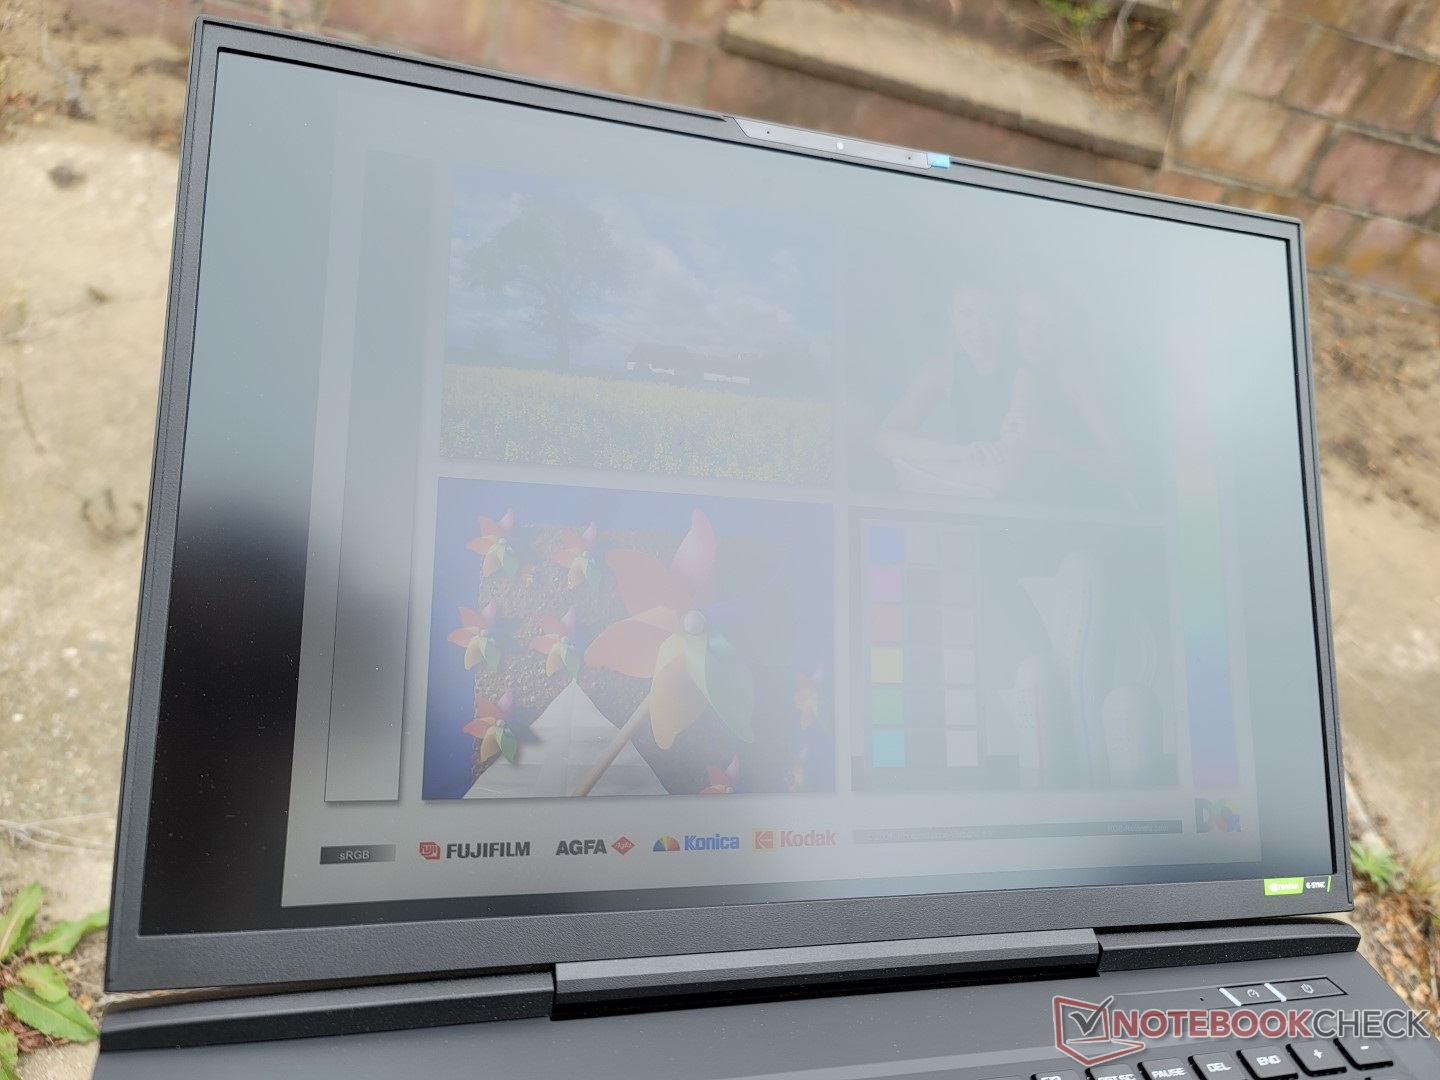
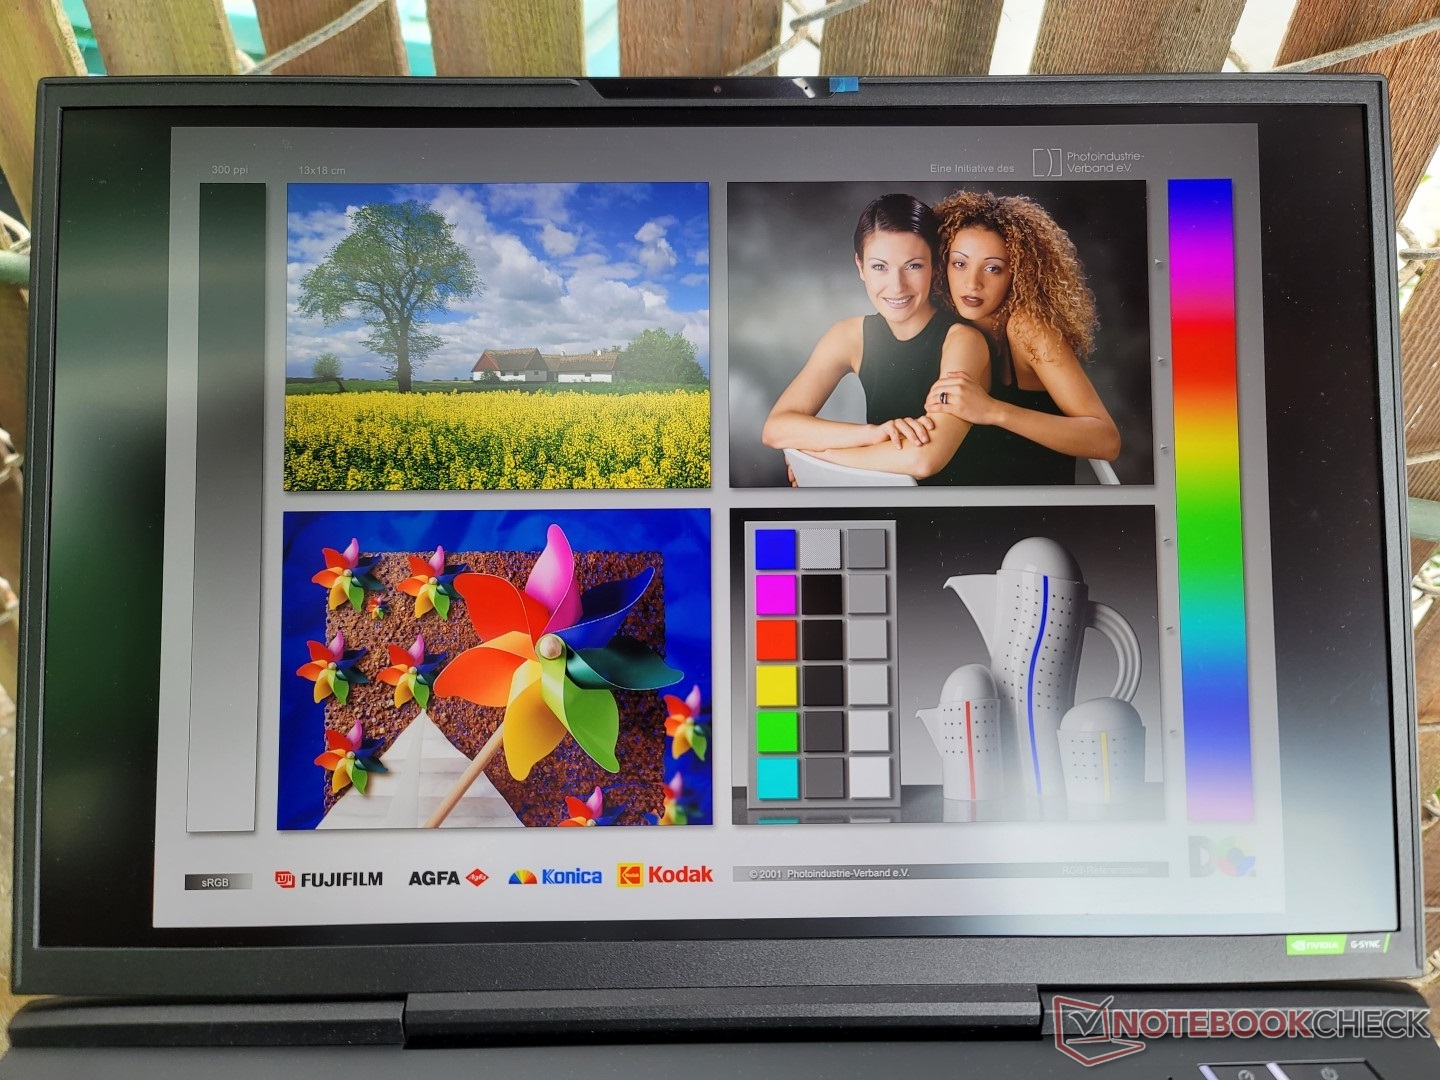
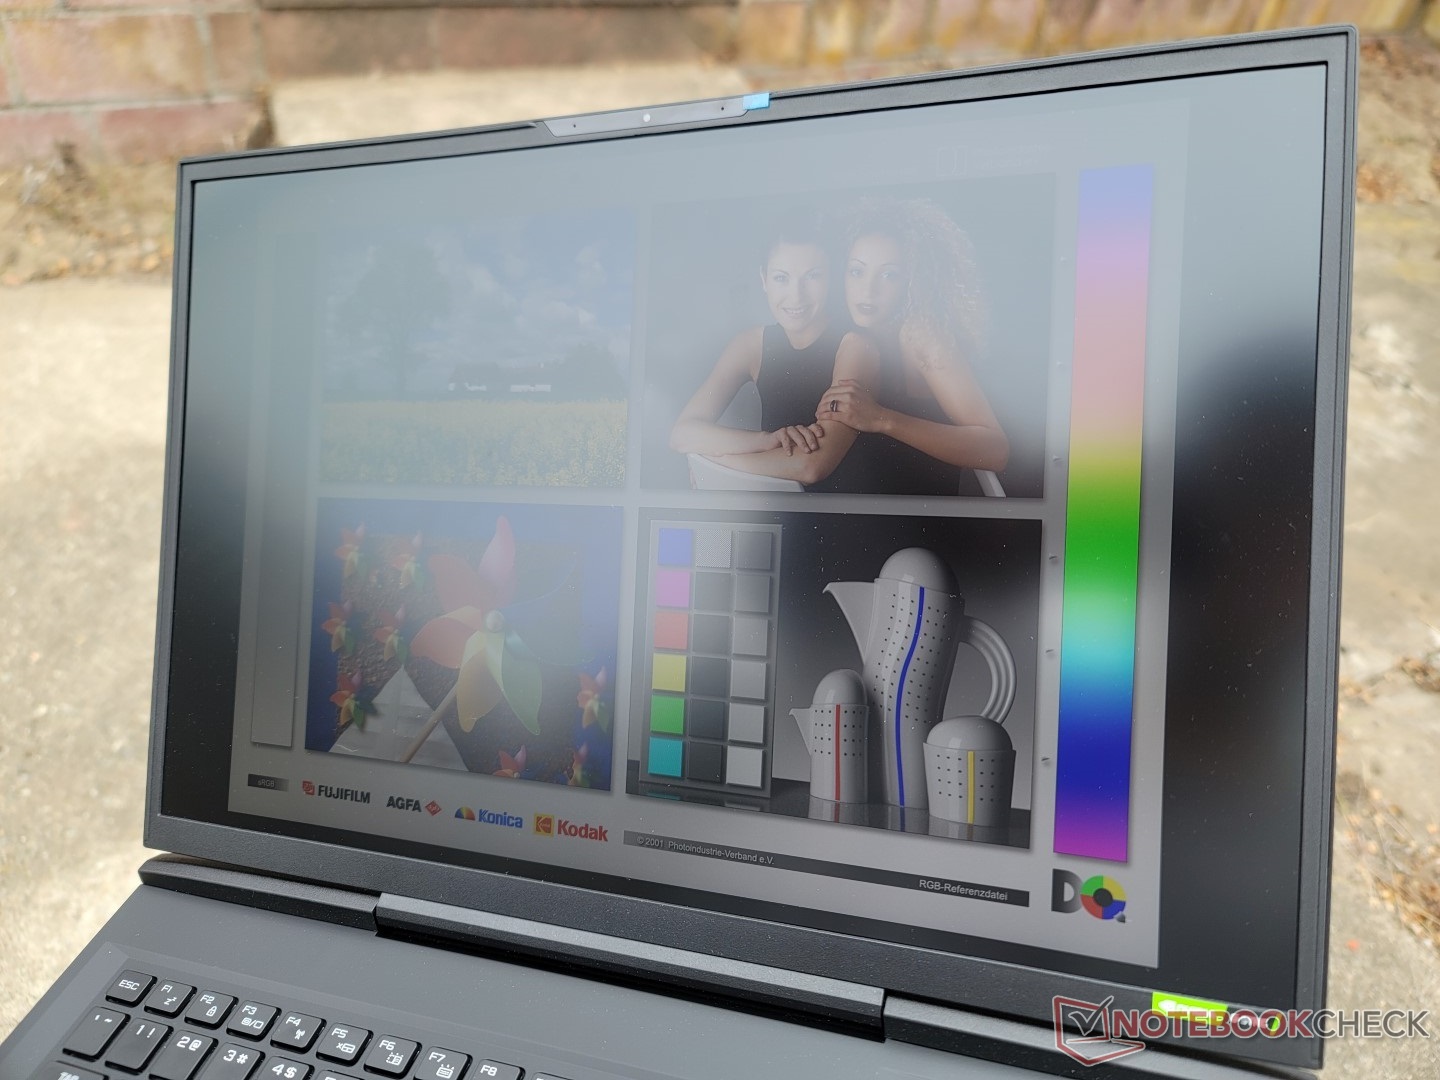
La visibilidad en exteriores es decente si está a la sombra. La retroiluminación de 400 nits es más brillante que en la mayoría de los portátiles para juegos como el Aorus 17X o el Asus Zephyrus S17, donde 300 nits son comunes.
Rendimiento - Sin estrangulamiento
Condiciones de la prueba
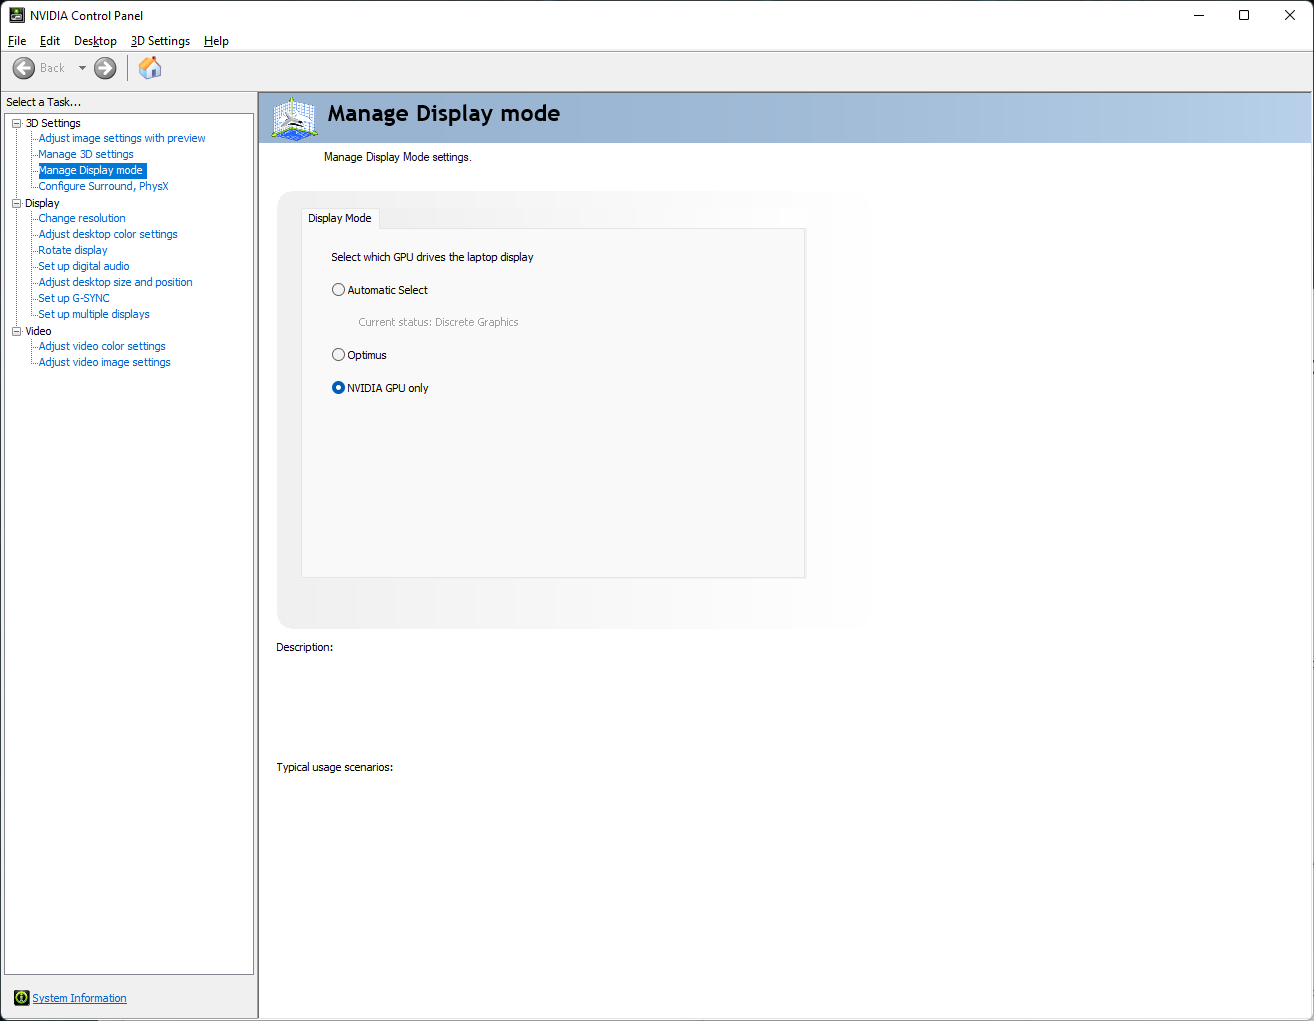
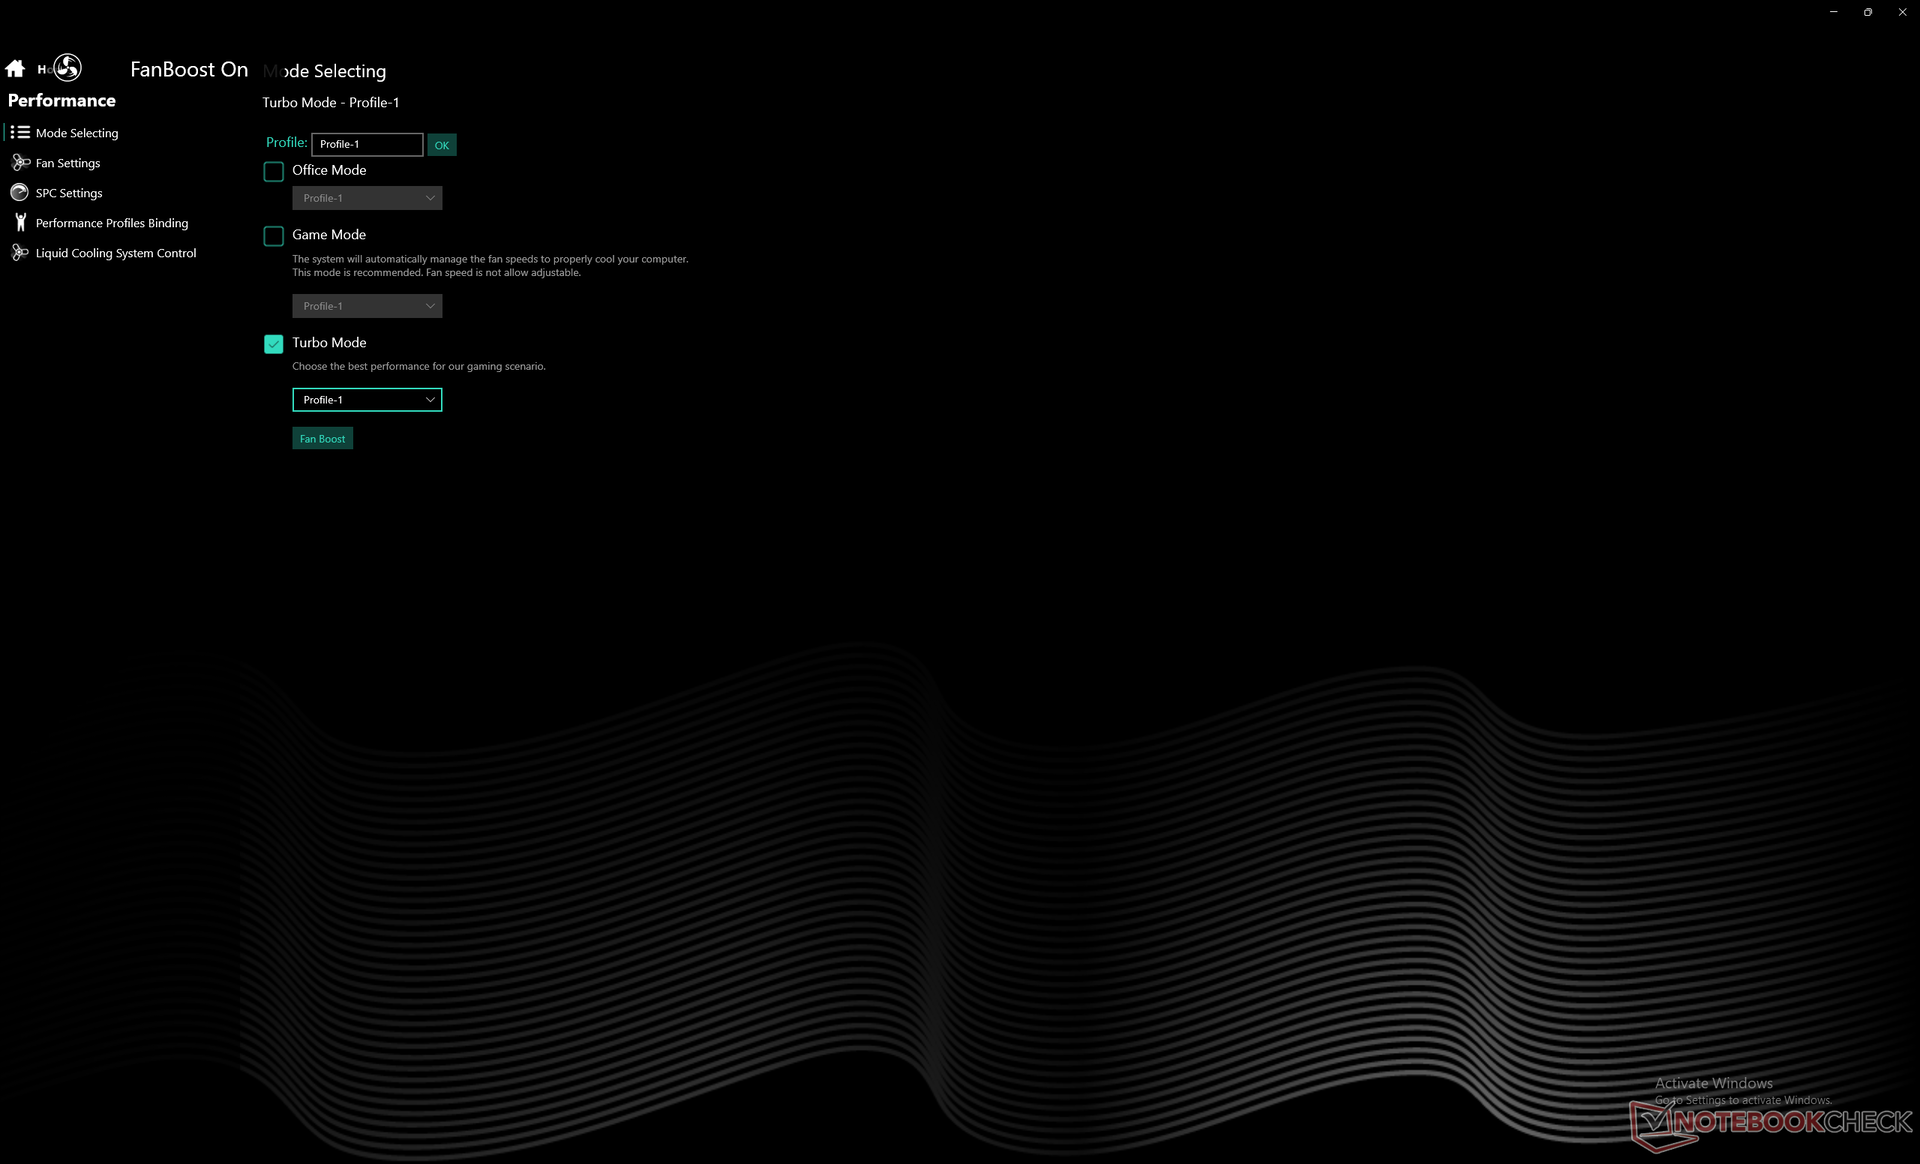
A menos que se indique lo contrario, todas las pruebas y los benchmarks que se presentan a continuación se realizaron con la caja de refrigeración externa conectada y activa. También nos aseguramos de configurar Windows en Rendimiento, desactivar Optimus en favor de MUX, y configurar el software del Centro de Control en "Fan Boost".
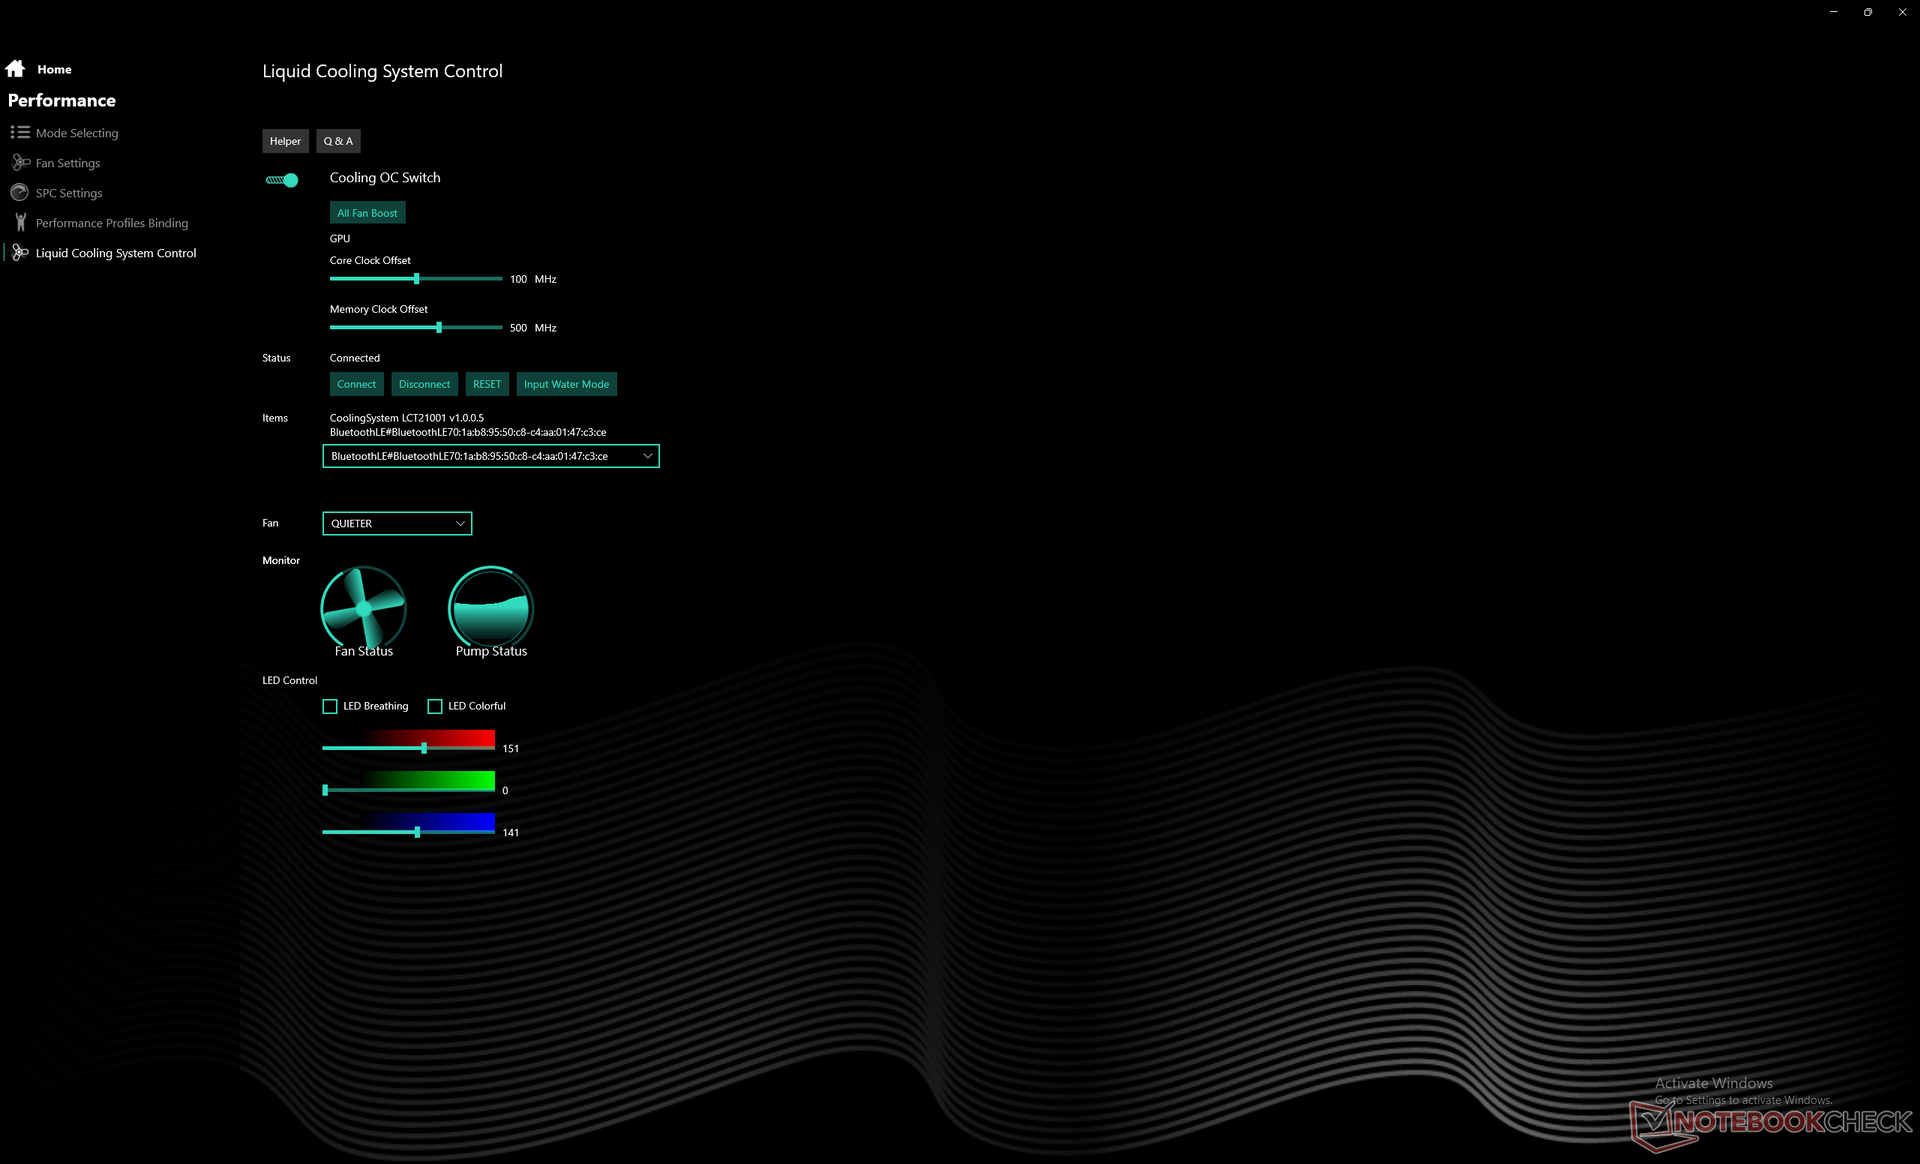
La caja de refrigeración tiene tres ajustes de nivel de ruido: Quieter, Quiet, y Balanced. Sin embargo, la denominación no engaña a nadie, ya que estos tres ajustes pueden traducirse en Bajo, Medio y Más fuerte. Para las pruebas, pusimos nuestra unidad de caja de refrigeración en "Equilibrado". Tenga en cuenta que la caja de refrigeración no funcionará con la energía de la batería.
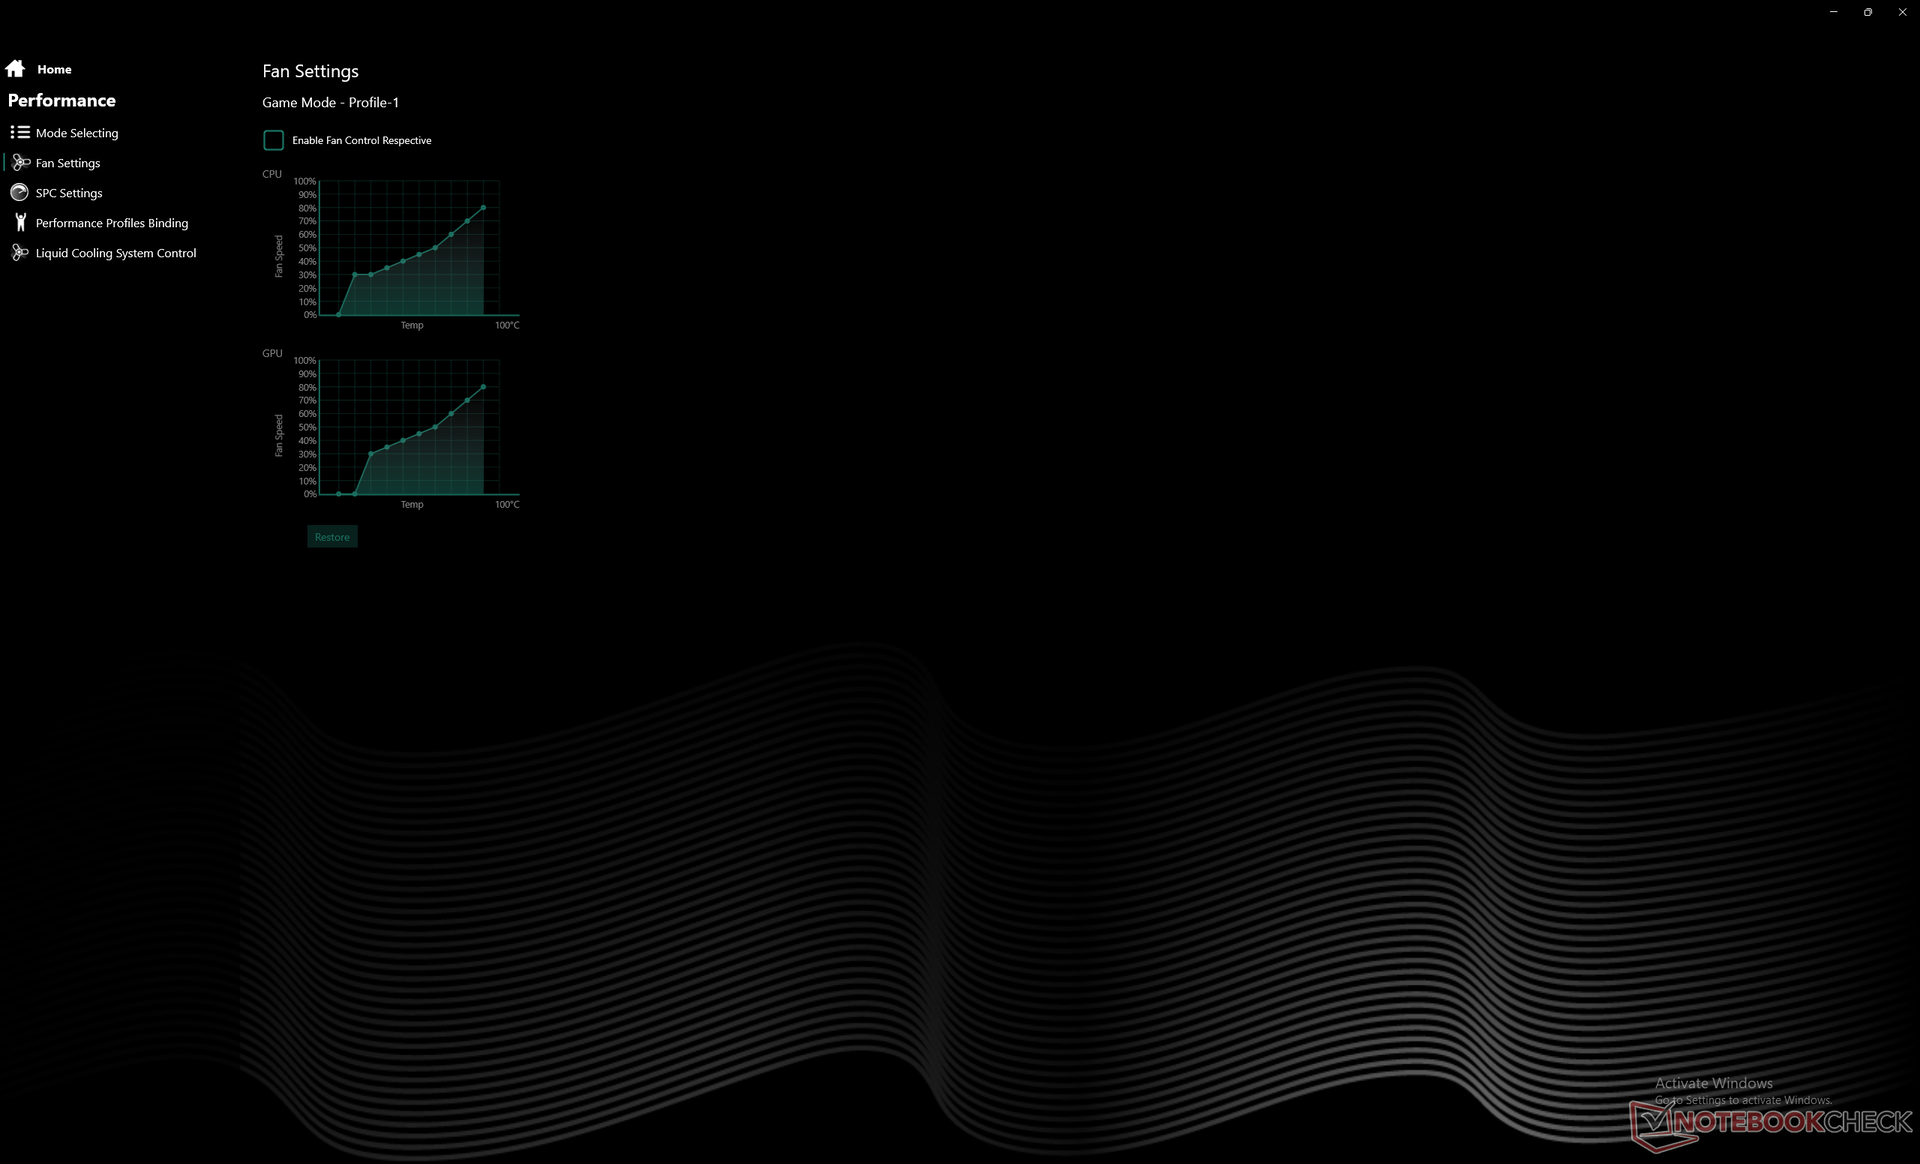
Es muy recomendable que los propietarios se familiaricen con el software preinstalado del Centro de Control, ya que es el centro de control del portátil. Aquí se controla todo, desde el rendimiento hasta la iluminación, pasando por los controles de los ventiladores y el overclocking, tal y como muestran algunas capturas de pantalla a continuación. Nuestra configuración de overclocking es la configuración por defecto del portátil tal y como se envía.
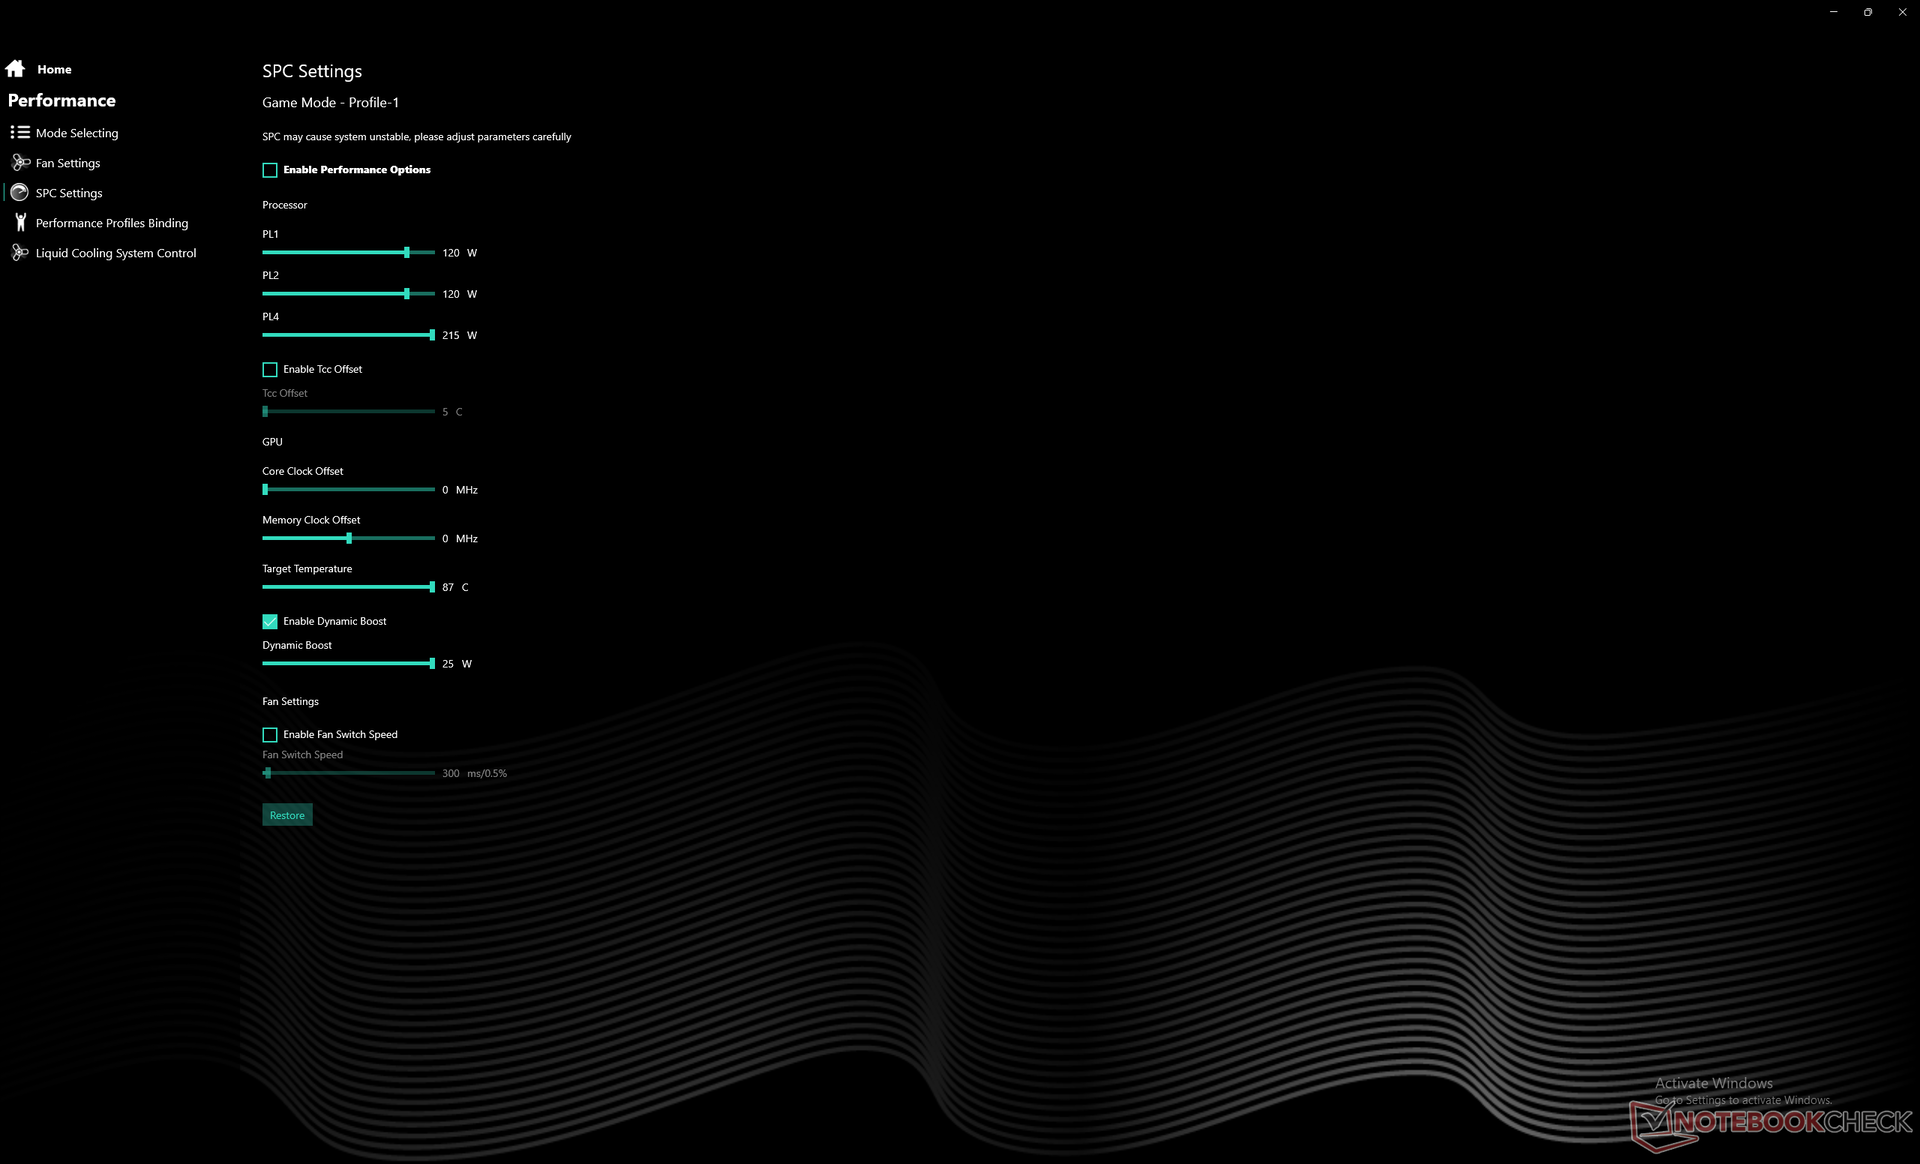
Procesador
El rendimiento de la CPU es mejor de lo esperado, con resultados entre un 15 y un 25 por ciento más rápidos que la media de portátiles de nuestra base de datos con el mismo Core i9-12900H. De hecho, este modelo de Uniwell es el portátil con Core i9-12900H más rápido que hemos probado hasta ahora.
La sostenibilidad del rendimiento también es excelente, como cabría esperar de cualquier portátil de juegos decente, especialmente de uno que esté refrigerado por agua.
Cinebench R15 Multi Loop
Cinebench R20: CPU (Multi Core) | CPU (Single Core)
Cinebench R23: Multi Core | Single Core
Cinebench R15: CPU Multi 64Bit | CPU Single 64Bit
Blender: v2.79 BMW27 CPU
7-Zip 18.03: 7z b 4 | 7z b 4 -mmt1
Geekbench 5.5: Multi-Core | Single-Core
HWBOT x265 Benchmark v2.2: 4k Preset
LibreOffice : 20 Documents To PDF
R Benchmark 2.5: Overall mean
* ... más pequeño es mejor
AIDA64: FP32 Ray-Trace | FPU Julia | CPU SHA3 | CPU Queen | FPU SinJulia | FPU Mandel | CPU AES | CPU ZLib | FP64 Ray-Trace | CPU PhotoWorxx
| Performance rating | |
| MSI Titan GT77 12UHS | |
| Uniwell Technology GM7AG8N Liquid Cooling Box | |
| Aorus 17X XES | |
| Medio Intel Core i9-12900H | |
| MSI Stealth GS77 12UHS-083US | |
| Razer Blade 17 Early 2022 | |
| Asus ROG Zephyrus S17 GX703HSD -9! | |
| AIDA64 / FP32 Ray-Trace | |
| MSI Titan GT77 12UHS | |
| Uniwell Technology GM7AG8N Liquid Cooling Box | |
| Aorus 17X XES | |
| Medio Intel Core i9-12900H (4074 - 18289, n=29) | |
| MSI Stealth GS77 12UHS-083US | |
| Razer Blade 17 Early 2022 | |
| AIDA64 / FPU Julia | |
| MSI Titan GT77 12UHS | |
| Uniwell Technology GM7AG8N Liquid Cooling Box | |
| Aorus 17X XES | |
| Medio Intel Core i9-12900H (22307 - 93236, n=29) | |
| MSI Stealth GS77 12UHS-083US | |
| Razer Blade 17 Early 2022 | |
| AIDA64 / CPU SHA3 | |
| MSI Titan GT77 12UHS | |
| Uniwell Technology GM7AG8N Liquid Cooling Box | |
| Aorus 17X XES | |
| MSI Stealth GS77 12UHS-083US | |
| Medio Intel Core i9-12900H (1378 - 4215, n=29) | |
| Razer Blade 17 Early 2022 | |
| AIDA64 / CPU Queen | |
| Uniwell Technology GM7AG8N Liquid Cooling Box | |
| Aorus 17X XES | |
| MSI Titan GT77 12UHS | |
| Medio Intel Core i9-12900H (78172 - 111241, n=28) | |
| MSI Stealth GS77 12UHS-083US | |
| Razer Blade 17 Early 2022 | |
| AIDA64 / FPU SinJulia | |
| MSI Titan GT77 12UHS | |
| Aorus 17X XES | |
| Uniwell Technology GM7AG8N Liquid Cooling Box | |
| MSI Stealth GS77 12UHS-083US | |
| Medio Intel Core i9-12900H (5709 - 10410, n=29) | |
| Razer Blade 17 Early 2022 | |
| AIDA64 / FPU Mandel | |
| MSI Titan GT77 12UHS | |
| Uniwell Technology GM7AG8N Liquid Cooling Box | |
| Aorus 17X XES | |
| Medio Intel Core i9-12900H (11257 - 45581, n=29) | |
| MSI Stealth GS77 12UHS-083US | |
| Razer Blade 17 Early 2022 | |
| AIDA64 / CPU AES | |
| MSI Titan GT77 12UHS | |
| Aorus 17X XES | |
| MSI Stealth GS77 12UHS-083US | |
| Uniwell Technology GM7AG8N Liquid Cooling Box | |
| Medio Intel Core i9-12900H (31935 - 151546, n=29) | |
| Razer Blade 17 Early 2022 | |
| AIDA64 / CPU ZLib | |
| MSI Titan GT77 12UHS | |
| Uniwell Technology GM7AG8N Liquid Cooling Box | |
| MSI Stealth GS77 12UHS-083US | |
| Aorus 17X XES | |
| Medio Intel Core i9-12900H (449 - 1193, n=29) | |
| Razer Blade 17 Early 2022 | |
| Asus ROG Zephyrus S17 GX703HSD | |
| AIDA64 / FP64 Ray-Trace | |
| MSI Titan GT77 12UHS | |
| Uniwell Technology GM7AG8N Liquid Cooling Box | |
| Aorus 17X XES | |
| Medio Intel Core i9-12900H (2235 - 10511, n=29) | |
| MSI Stealth GS77 12UHS-083US | |
| Razer Blade 17 Early 2022 | |
| AIDA64 / CPU PhotoWorxx | |
| MSI Titan GT77 12UHS | |
| Aorus 17X XES | |
| MSI Stealth GS77 12UHS-083US | |
| Razer Blade 17 Early 2022 | |
| Medio Intel Core i9-12900H (20960 - 48269, n=30) | |
| Uniwell Technology GM7AG8N Liquid Cooling Box | |
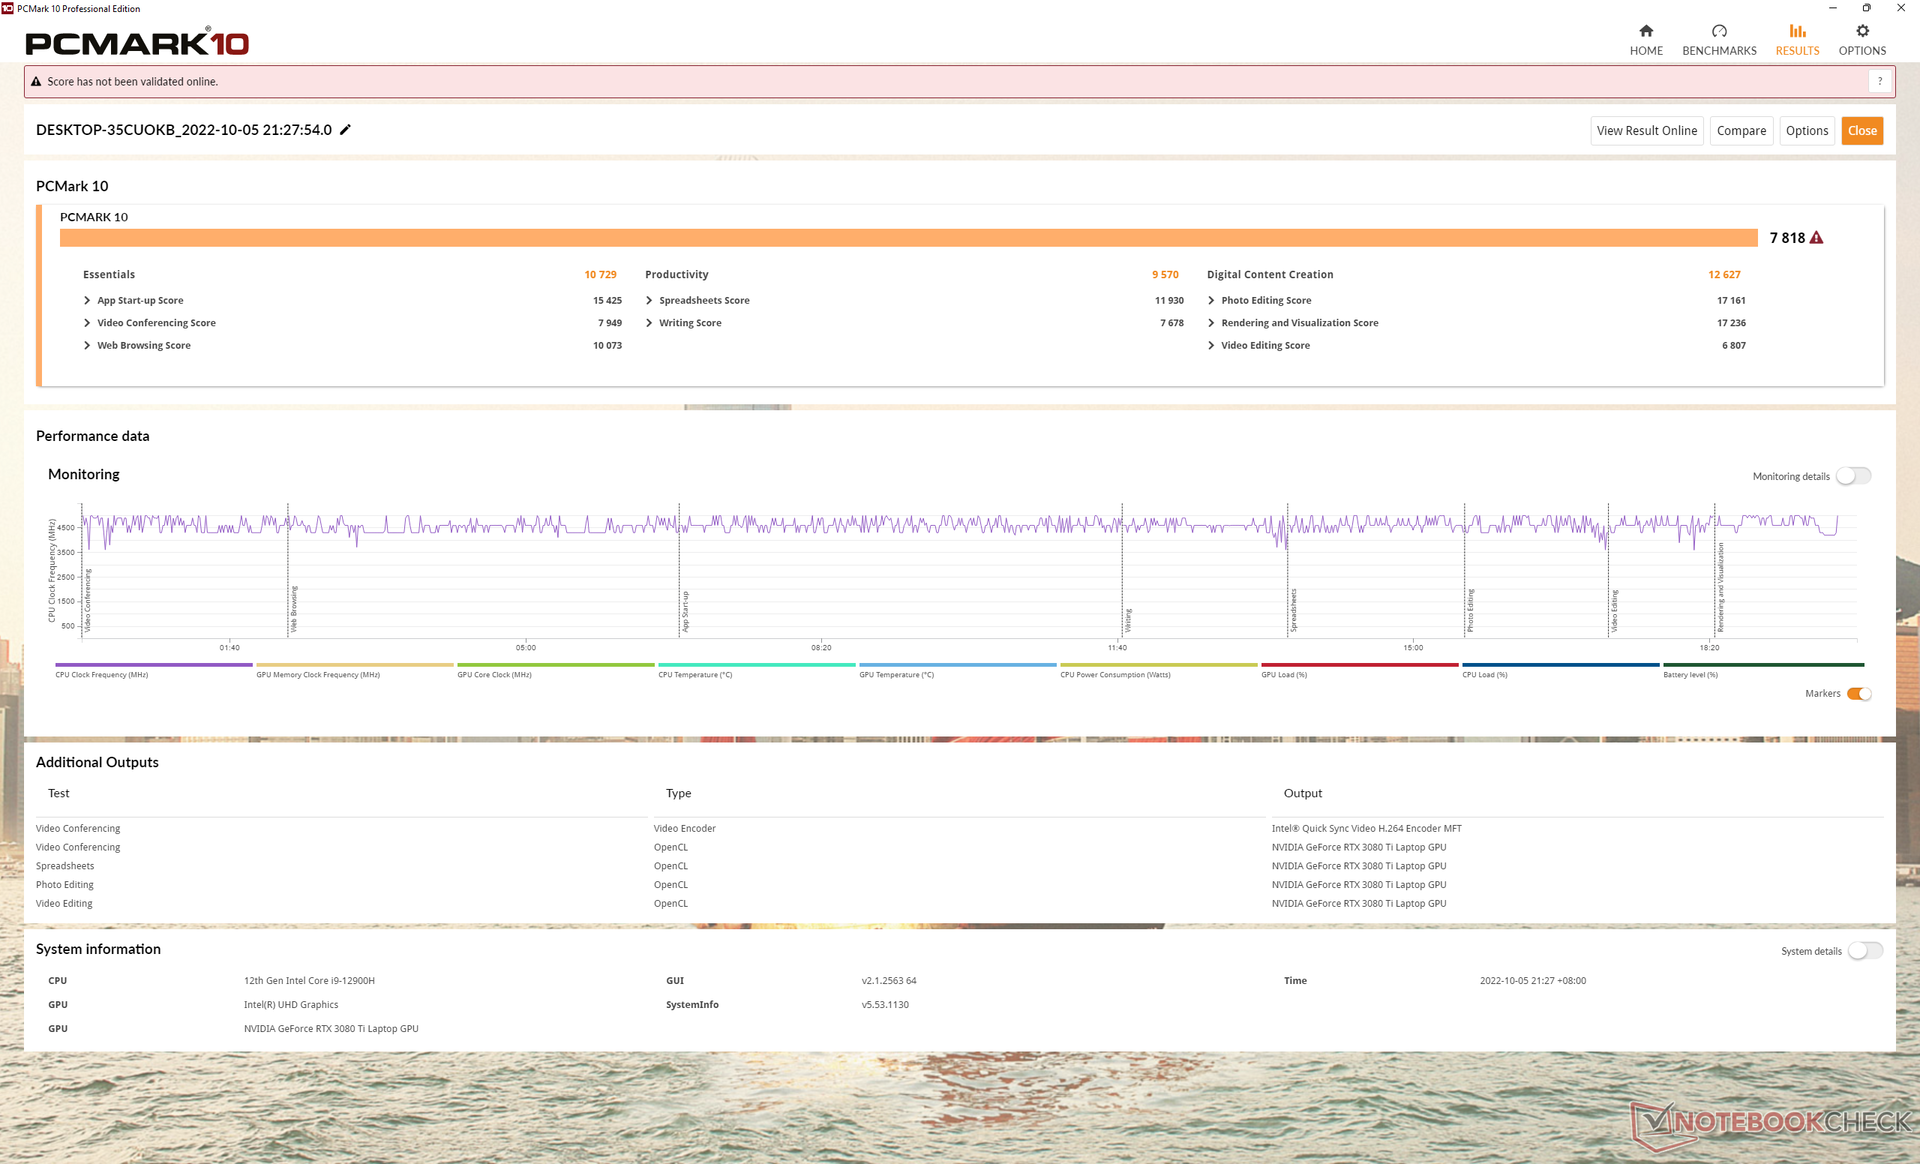
Rendimiento del sistema
Los resultados de PCMark 10 son comparables a los de otros portátiles con la misma CPU y GPU, como elAlienware x15 R2 P111F o el Razer Blade 17 Early 2022.
CrossMark: Overall | Productivity | Creativity | Responsiveness
| PCMark 10 / Score | |
| MSI Titan GT77 12UHS | |
| Aorus 17X XES | |
| Uniwell Technology GM7AG8N Liquid Cooling Box | |
| Medio Intel Core i9-12900H, NVIDIA GeForce RTX 3080 Ti Laptop GPU (7139 - 8083, n=6) | |
| MSI Stealth GS77 12UHS-083US | |
| Asus ROG Zephyrus S17 GX703HSD | |
| Razer Blade 17 Early 2022 | |
| PCMark 10 / Essentials | |
| MSI Titan GT77 12UHS | |
| Medio Intel Core i9-12900H, NVIDIA GeForce RTX 3080 Ti Laptop GPU (10254 - 11178, n=6) | |
| Uniwell Technology GM7AG8N Liquid Cooling Box | |
| Asus ROG Zephyrus S17 GX703HSD | |
| Aorus 17X XES | |
| MSI Stealth GS77 12UHS-083US | |
| Razer Blade 17 Early 2022 | |
| PCMark 10 / Productivity | |
| Aorus 17X XES | |
| MSI Titan GT77 12UHS | |
| Medio Intel Core i9-12900H, NVIDIA GeForce RTX 3080 Ti Laptop GPU (9102 - 11186, n=6) | |
| Uniwell Technology GM7AG8N Liquid Cooling Box | |
| MSI Stealth GS77 12UHS-083US | |
| Asus ROG Zephyrus S17 GX703HSD | |
| Razer Blade 17 Early 2022 | |
| PCMark 10 / Digital Content Creation | |
| MSI Titan GT77 12UHS | |
| Uniwell Technology GM7AG8N Liquid Cooling Box | |
| Aorus 17X XES | |
| Medio Intel Core i9-12900H, NVIDIA GeForce RTX 3080 Ti Laptop GPU (9847 - 12627, n=6) | |
| MSI Stealth GS77 12UHS-083US | |
| Razer Blade 17 Early 2022 | |
| Asus ROG Zephyrus S17 GX703HSD | |
| CrossMark / Overall | |
| Aorus 17X XES | |
| MSI Titan GT77 12UHS | |
| Medio Intel Core i9-12900H, NVIDIA GeForce RTX 3080 Ti Laptop GPU (1696 - 1965, n=3) | |
| Razer Blade 17 Early 2022 | |
| Uniwell Technology GM7AG8N Liquid Cooling Box | |
| CrossMark / Productivity | |
| Aorus 17X XES | |
| MSI Titan GT77 12UHS | |
| Medio Intel Core i9-12900H, NVIDIA GeForce RTX 3080 Ti Laptop GPU (1622 - 1870, n=3) | |
| Razer Blade 17 Early 2022 | |
| Uniwell Technology GM7AG8N Liquid Cooling Box | |
| CrossMark / Creativity | |
| Aorus 17X XES | |
| MSI Titan GT77 12UHS | |
| Medio Intel Core i9-12900H, NVIDIA GeForce RTX 3080 Ti Laptop GPU (1855 - 2135, n=3) | |
| Razer Blade 17 Early 2022 | |
| Uniwell Technology GM7AG8N Liquid Cooling Box | |
| CrossMark / Responsiveness | |
| Aorus 17X XES | |
| MSI Titan GT77 12UHS | |
| Razer Blade 17 Early 2022 | |
| Medio Intel Core i9-12900H, NVIDIA GeForce RTX 3080 Ti Laptop GPU (1483 - 1777, n=3) | |
| Uniwell Technology GM7AG8N Liquid Cooling Box | |
| PCMark 10 Score | 7818 puntos | |
ayuda | ||
| AIDA64 / Memory Copy | |
| MSI Titan GT77 12UHS | |
| Aorus 17X XES | |
| MSI Stealth GS77 12UHS-083US | |
| Razer Blade 17 Early 2022 | |
| Medio Intel Core i9-12900H (34438 - 74264, n=29) | |
| Uniwell Technology GM7AG8N Liquid Cooling Box | |
| AIDA64 / Memory Read | |
| Aorus 17X XES | |
| MSI Stealth GS77 12UHS-083US | |
| Razer Blade 17 Early 2022 | |
| MSI Titan GT77 12UHS | |
| Medio Intel Core i9-12900H (36365 - 74642, n=29) | |
| Uniwell Technology GM7AG8N Liquid Cooling Box | |
| AIDA64 / Memory Write | |
| MSI Stealth GS77 12UHS-083US | |
| MSI Titan GT77 12UHS | |
| Aorus 17X XES | |
| Medio Intel Core i9-12900H (32276 - 67858, n=29) | |
| Razer Blade 17 Early 2022 | |
| Uniwell Technology GM7AG8N Liquid Cooling Box | |
| AIDA64 / Memory Latency | |
| MSI Stealth GS77 12UHS-083US | |
| Uniwell Technology GM7AG8N Liquid Cooling Box | |
| MSI Titan GT77 12UHS | |
| Aorus 17X XES | |
| Medio Intel Core i9-12900H (74.7 - 118.1, n=28) | |
| Asus ROG Zephyrus S17 GX703HSD | |
* ... más pequeño es mejor
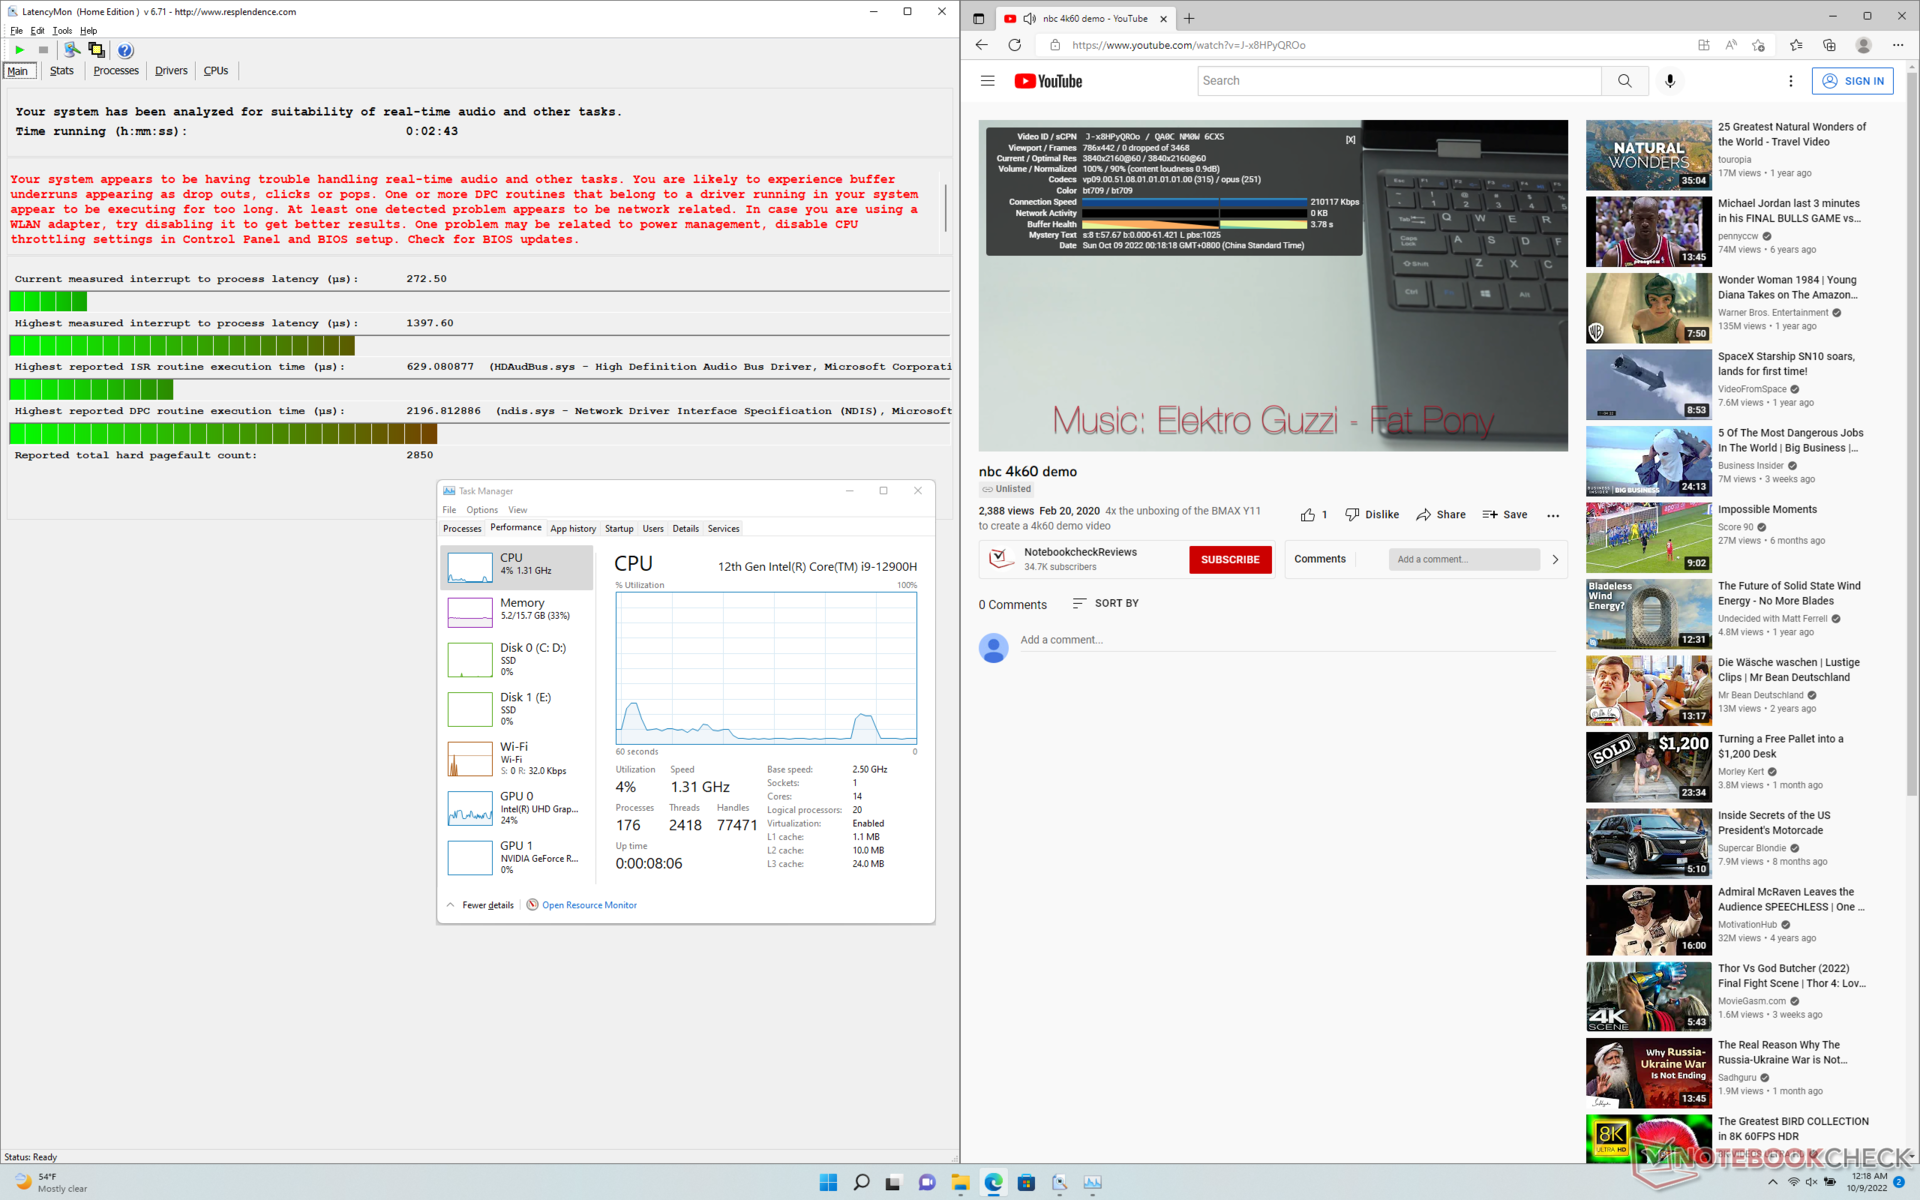
Latencia del CPD
LatencyMon revela problemas de CPD al abrir varias pestañas del navegador de nuestra página web. por lo demás, la reproducción de vídeo 4K60 es perfecta, sin pérdida de fotogramas.

| DPC Latencies / LatencyMon - interrupt to process latency (max), Web, Youtube, Prime95 | |
| MSI Stealth GS77 12UHS-083US | |
| Asus ROG Zephyrus S17 GX703HSD | |
| Uniwell Technology GM7AG8N Liquid Cooling Box | |
| Aorus 17X XES | |
| Razer Blade 17 Early 2022 | |
* ... más pequeño es mejor
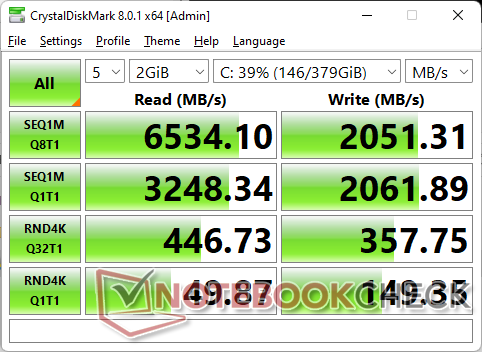
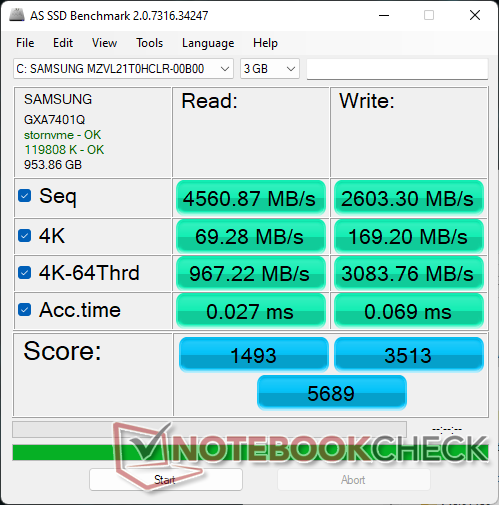
Dispositivos de almacenamiento - 2x M.2 2280 PCIe4 x4 Soporte
Nuestra unidad de prueba viene equipada con el mismoSamsung PM9A1 MZVL21T0HCLR PCIe4 x4 que se encuentra en muchos otros portátiles para juegos de gama alta como el MSI Titan GT77. Sin embargo, la unidad muestra problemas de rendimiento cuando se estresa a pesar de que se incluye un disipador de calor. Cuando se ejecuta DiskSpd en un bucle, las tasas de lectura comenzarían muy alto en ~ 6500 MB / s antes de caer rápidamente a ~ 1400 MB / s como se muestra en nuestro gráfico a continuación. Esto podría ser un error potencial del sistema.

| Drive Performance rating - Percent | |
| Asus ROG Zephyrus S17 GX703HSD | |
| Aorus 17X XES | |
| MSI Titan GT77 12UHS | |
| Razer Blade 17 Early 2022 | |
| MSI Stealth GS77 12UHS-083US | |
| Uniwell Technology GM7AG8N Liquid Cooling Box | |
* ... más pequeño es mejor
Disk Throttling: DiskSpd Read Loop, Queue Depth 8
Rendimiento de la GPU - GPU TGP de 175 W completa
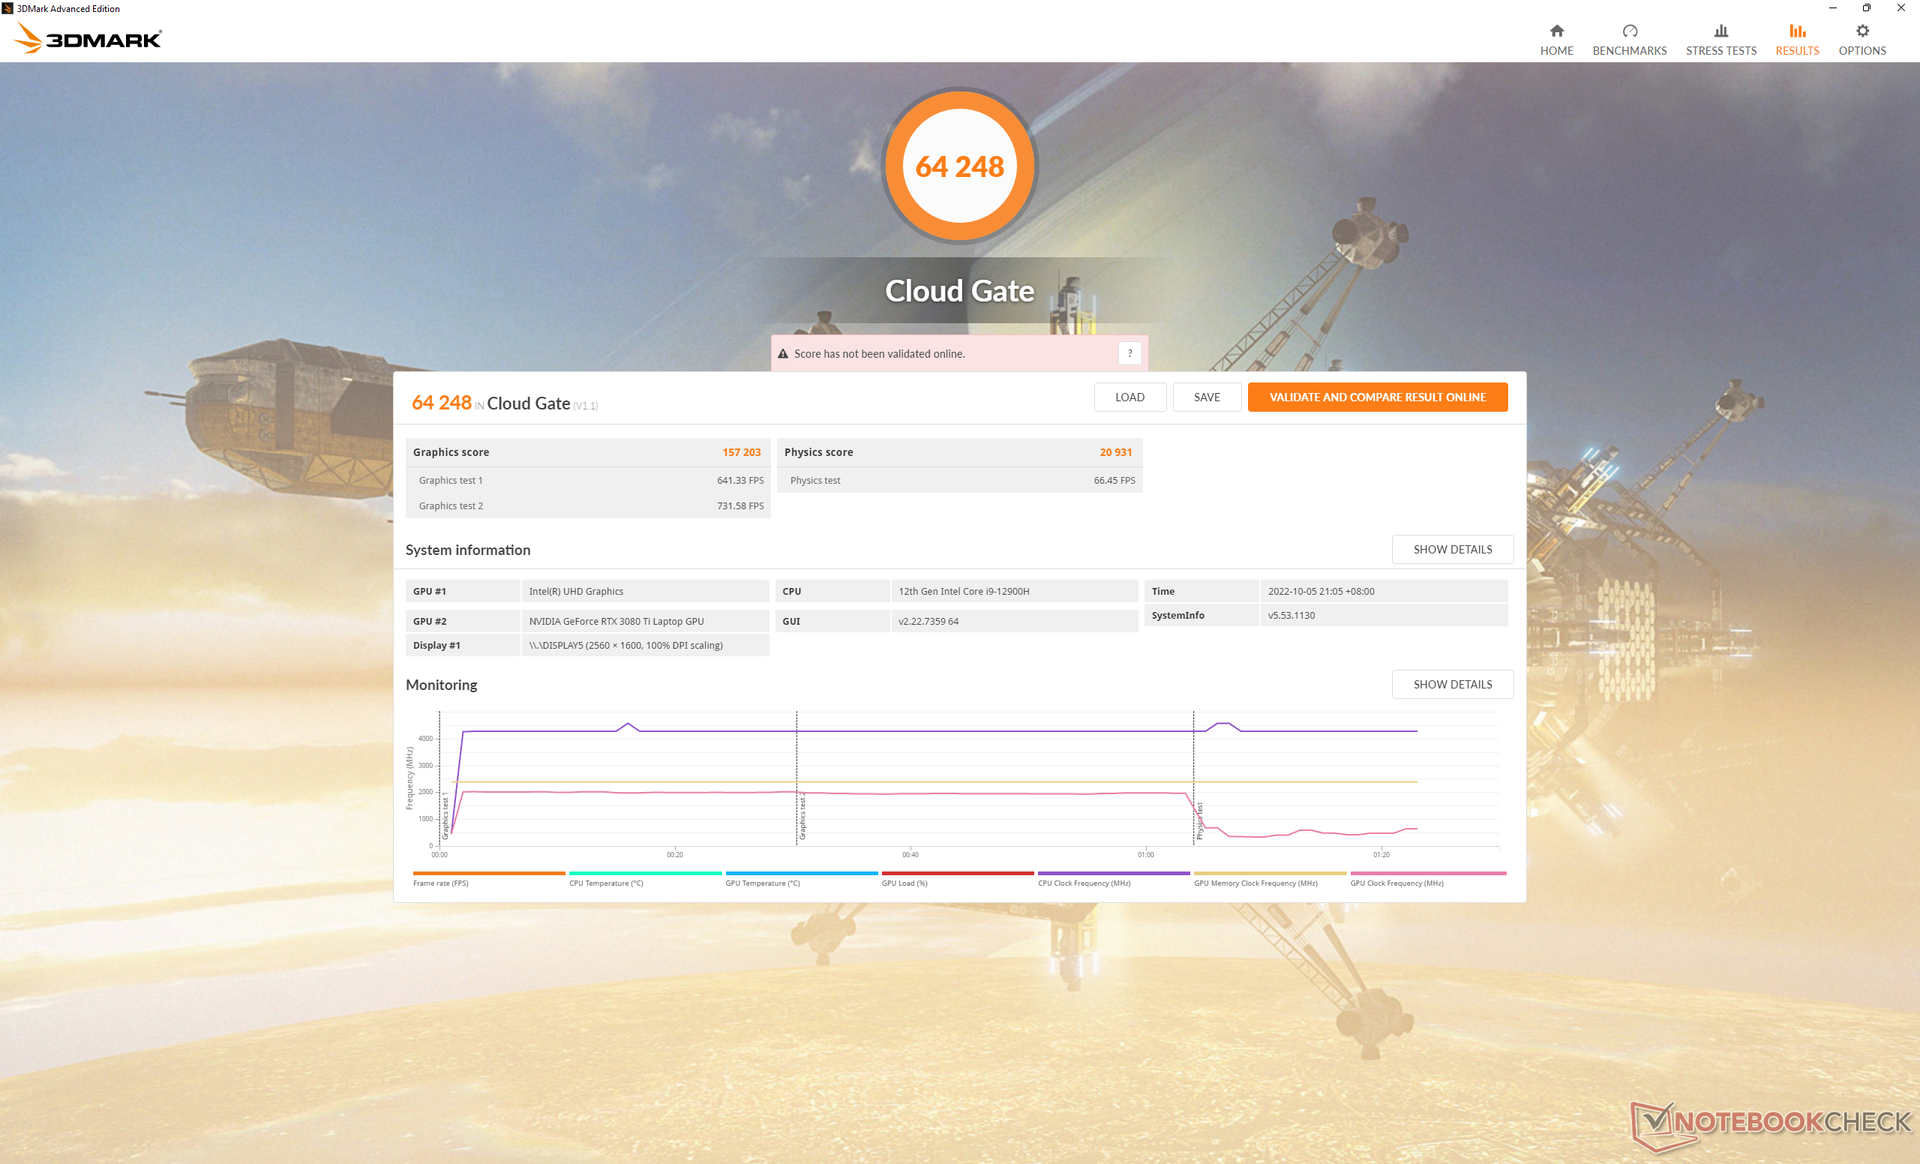
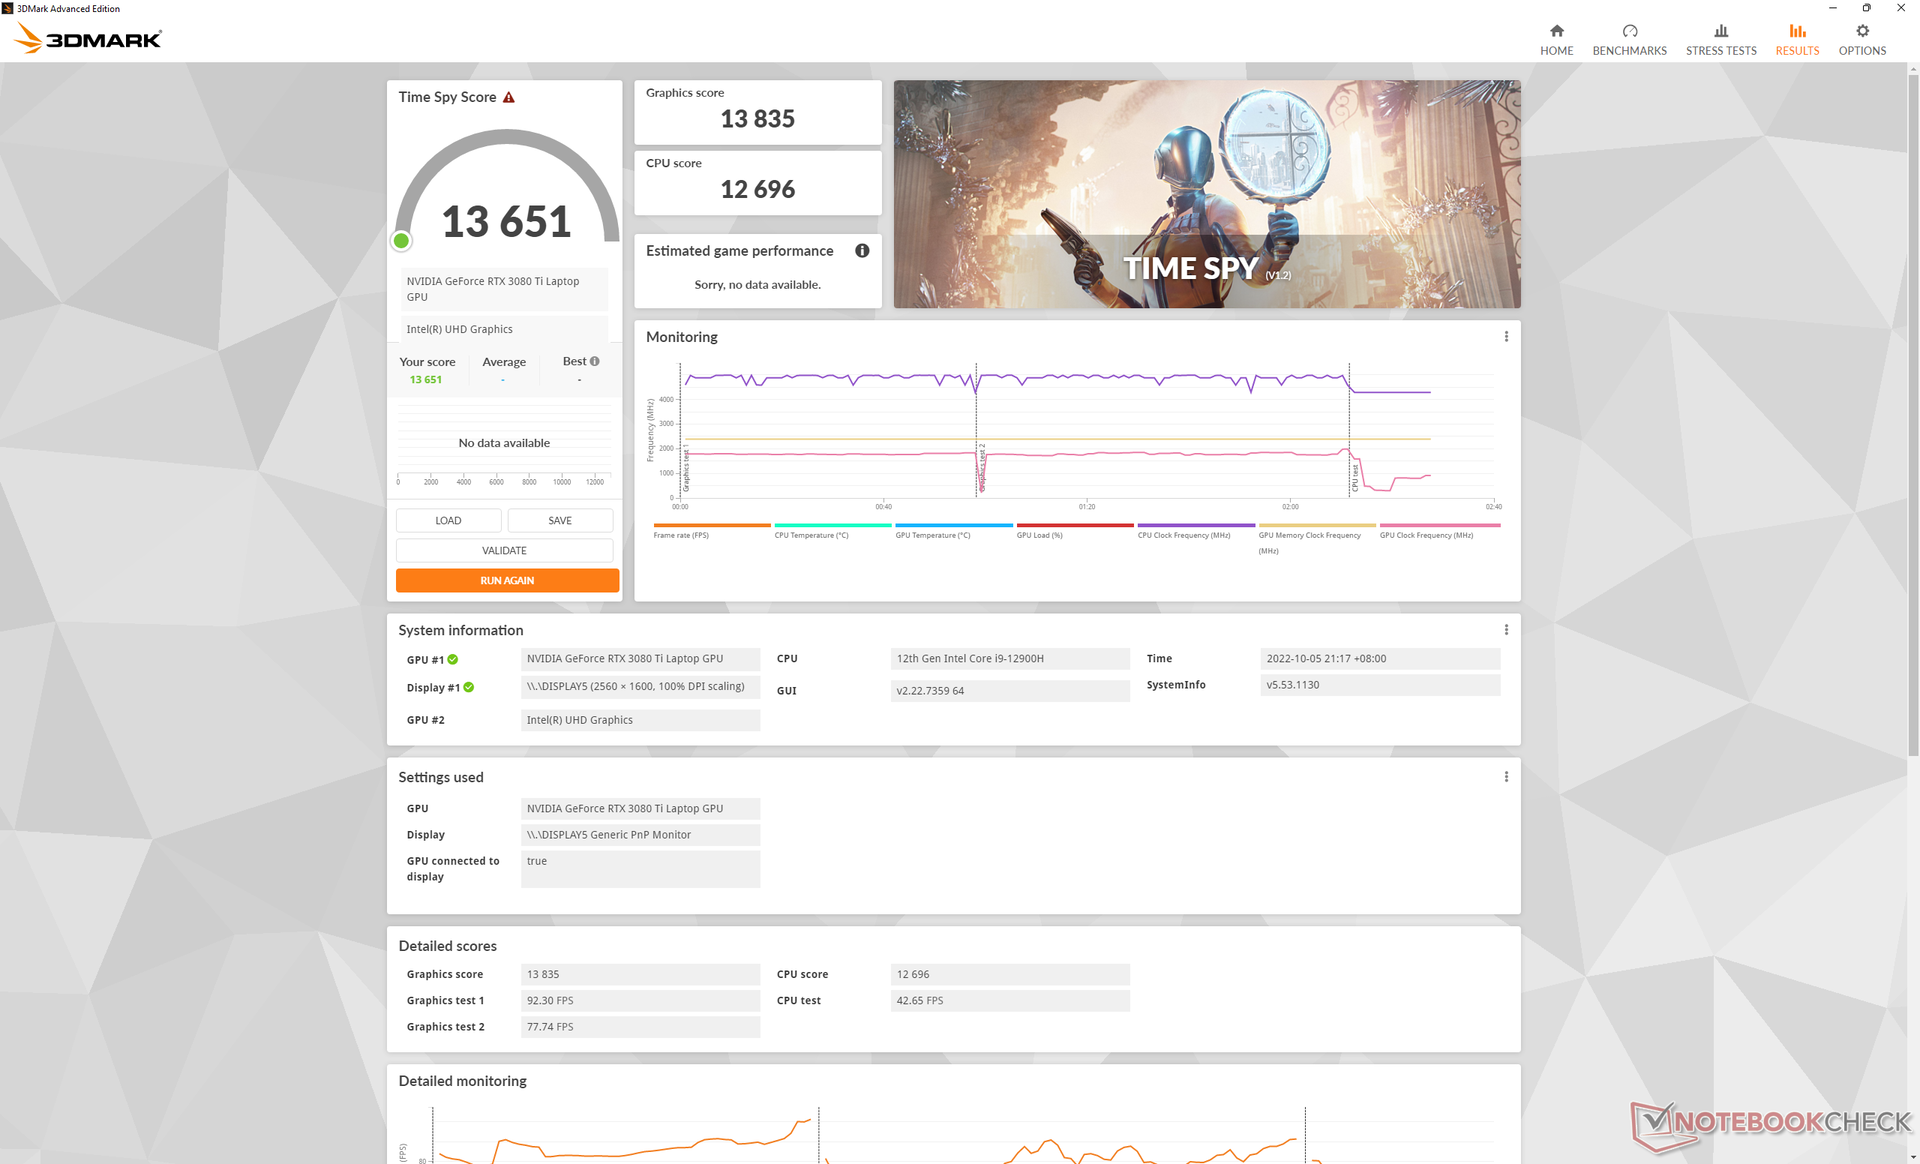
El rendimiento gráfico es entre un 5 y un 15 por ciento más rápido que el de la media de portátiles de nuestra base de datos equipados con la misma GeForce RTX 3080 Ti GPU. La GPU es capaz de funcionar aún más rápido si los usuarios deciden overclockearla más allá de los ajustes del fabricante
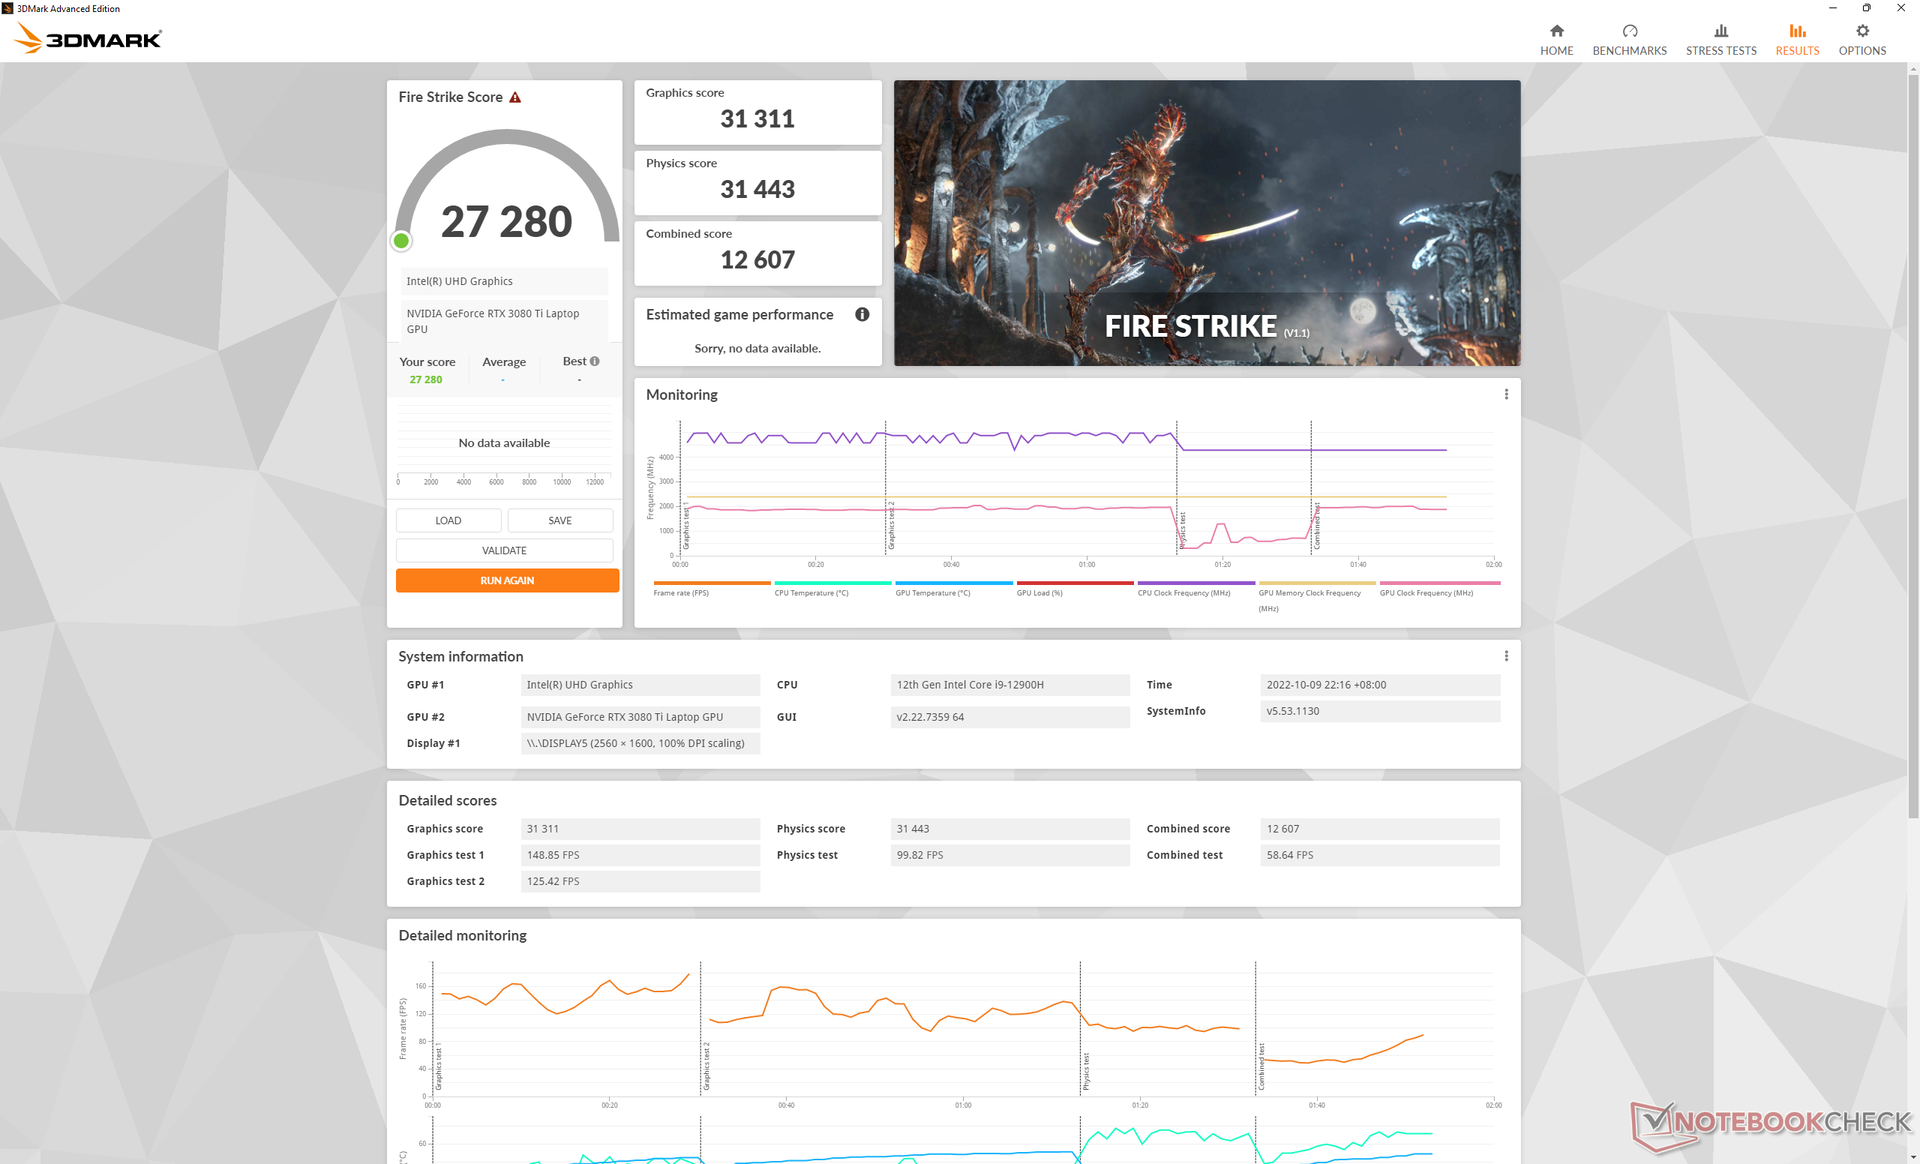
Curiosamente, el rendimiento gráfico no se reduce si se utiliza la caja de refrigeración en su configuración de nivel de ventilador más bajo. Si se ejecuta Fire Strike en el modo "más silencioso", las puntuaciones de Física y Gráficos serían de 31443 y 31311 puntos, respectivamente, en comparación con los 30601 y 30959 puntos cuando se utiliza el modo de caja de refrigeración "equilibrado". Esto es especialmente importante, ya que significa que no tienes que hacer funcionar el sistema con la configuración máxima del ventilador si no tienes intención de hacer overclocking en la GPU.
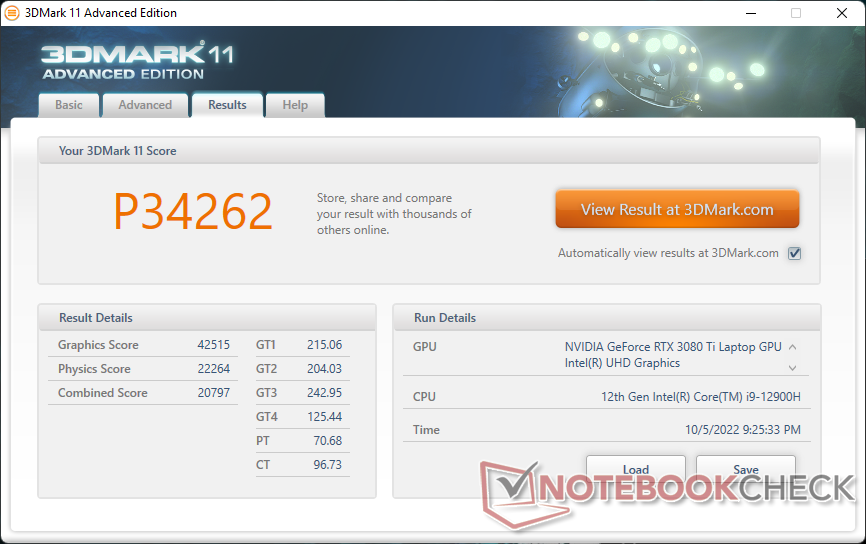

| 3DMark 11 Performance | 34262 puntos | |
| 3DMark Cloud Gate Standard Score | 64248 puntos | |
| 3DMark Fire Strike Score | 27342 puntos | |
| 3DMark Time Spy Score | 13651 puntos | |
ayuda | ||
| Blender | |
| v3.3 Classroom OPTIX/RTX | |
| Aorus 17X XES | |
| MSI Titan GT77 12UHS | |
| Uniwell Technology GM7AG8N Liquid Cooling Box | |
| v3.3 Classroom CUDA | |
| Aorus 17X XES | |
| Uniwell Technology GM7AG8N Liquid Cooling Box | |
| MSI Titan GT77 12UHS | |
| v3.3 Classroom CPU | |
| Aorus 17X XES | |
| Uniwell Technology GM7AG8N Liquid Cooling Box | |
| MSI Titan GT77 12UHS | |
* ... más pequeño es mejor
Witcher 3 FPS Chart
| bajo | medio | alto | ultra | QHD | |
|---|---|---|---|---|---|
| GTA V (2015) | 184.8 | 181.6 | 177.3 | 123.3 | 112.6 |
| The Witcher 3 (2015) | 464.9 | 366.2 | 257.5 | 127.2 | |
| Dota 2 Reborn (2015) | 171.3 | 158.9 | 152.3 | 145.3 | |
| Final Fantasy XV Benchmark (2018) | 188.7 | 164.4 | 122.7 | 97 | |
| X-Plane 11.11 (2018) | 149.2 | 133.8 | 106.2 | ||
| Strange Brigade (2018) | 448 | 311 | 255 | 224 | 166.8 |
| Cyberpunk 2077 1.6 (2022) | 144.9 | 140.1 | 115.8 | 96.7 | 63.3 |
Emisiones
Ruido del sistema
Como se mencionó anteriormente, la caja de refrigeración tiene tres modos de ventilador: Más silencioso, Silencioso y Equilibrado. El ruido del ventilador en el modo "Más silencioso" ya es bastante alto, con 41,6 dB(A), que es tan alto como el de la mayoría de los Ultrabooks cuando funcionan con cargas altas. Si se sube a los modos "Silencioso" y "Equilibrado", el ruido del ventilador aumentará a 44,2 dB(A) y 45,8 dB(A), respectivamente. Recomendamos colocar la caja de refrigeración lo más lejos posible de su asiento para reducir los niveles de ruido.
Hay un cuarto perfil de potencia en el software del Centro de Control llamado "Fan Boost" que hace funcionar los ventiladores internos a sus máximas RPM. Cuando los modos "Fan Boost" y "Balanced" de la caja de refrigeración están activos, el ruido general del sistema puede llegar a ser de 55,9 dB(A), lo que en realidad es muy similar al de la mayoría de los portátiles de juego "normales" de 17 pulgadas sin soluciones de refrigeración externas.
Lo mejor de todo es que no tienes que activar el Fan Boost ni tener la caja de refrigeración en su configuración más ruidosa para que la CPU o la GPU funcionen a velocidades normales. Por el contrario, la mayoría de los portátiles para juegos, como el Asus Zephyrus S17 o el Razer Blade 17, requieren que los usuarios activen el modo Turbo o, de lo contrario, el TGP se ralentizará al jugar. Esto significa que los propietarios de Uniwell pueden hacer funcionar la caja de refrigeración en su modo "más silencioso" de 41,6 dB(A) para obtener un rendimiento de juego de la RTX 3080 Ti mejor que la media, mientras que la mayoría de los otros portátiles para juegos deben soportar un ruido de ventilador de 50 dB(A) o más sólo para acercarse al rendimiento del Uniwell. En resumen, la caja de refrigeración es capaz de hacer casi todo el trabajo de refrigeración incluso cuando se juega con los ajustes más silenciosos del ventilador sin necesidad de acelerar la CPU o la GPU.
Ruido
| Ocioso |
| 41.6 / 42.1 / 42.1 dB(A) |
| Carga |
| 42.2 / 55.9 dB(A) |
 | ||
30 dB silencioso 40 dB(A) audible 50 dB(A) ruidosamente alto |
||
min: | ||
| Uniwell Technology GM7AG8N Liquid Cooling Box GeForce RTX 3080 Ti Laptop GPU, i9-12900H, Samsung PM9A1 MZVL21T0HCLR | MSI Titan GT77 12UHS GeForce RTX 3080 Ti Laptop GPU, i9-12900HX, Samsung PM9A1 MZVL21T0HCLR | Aorus 17X XES GeForce RTX 3070 Ti Laptop GPU, i9-12900HX, Gigabyte AG470S1TB-SI B10 | Razer Blade 17 Early 2022 GeForce RTX 3080 Ti Laptop GPU, i9-12900H, Samsung PM9A1 MZVL21T0HCLR | MSI Stealth GS77 12UHS-083US GeForce RTX 3080 Ti Laptop GPU, i7-12700H, Micron 3400 1TB MTFDKBA1T0TFH | Asus ROG Zephyrus S17 GX703HSD GeForce RTX 3080 Laptop GPU, i9-11900H, Samsung PM9A1 MZVL22T0HBLB | |
|---|---|---|---|---|---|---|
| Noise | 17% | 5% | 12% | 19% | 23% | |
| apagado / medio ambiente * (dB) | 22.8 | 21.9 4% | 26 -14% | 26 -14% | 24.5 -7% | 23 -1% |
| Idle Minimum * (dB) | 41.6 | 24.53 41% | 28 33% | 26 37% | 24.5 41% | 23 45% |
| Idle Average * (dB) | 42.1 | 24.53 42% | 32 24% | 27 36% | 24.5 42% | 23 45% |
| Idle Maximum * (dB) | 42.1 | 24.53 42% | 38 10% | 32 24% | 30.8 27% | 23 45% |
| Load Average * (dB) | 42.2 | 46.25 -10% | 53 -26% | 50 -18% | 34.6 18% | 41 3% |
| Witcher 3 ultra * (dB) | 55.9 | 56.86 -2% | 54 3% | 51 9% | 46.2 17% | 45 19% |
| Load Maximum * (dB) | 55.9 | 54.25 3% | 55 2% | 51 9% | 56.8 -2% | 52 7% |
* ... más pequeño es mejor
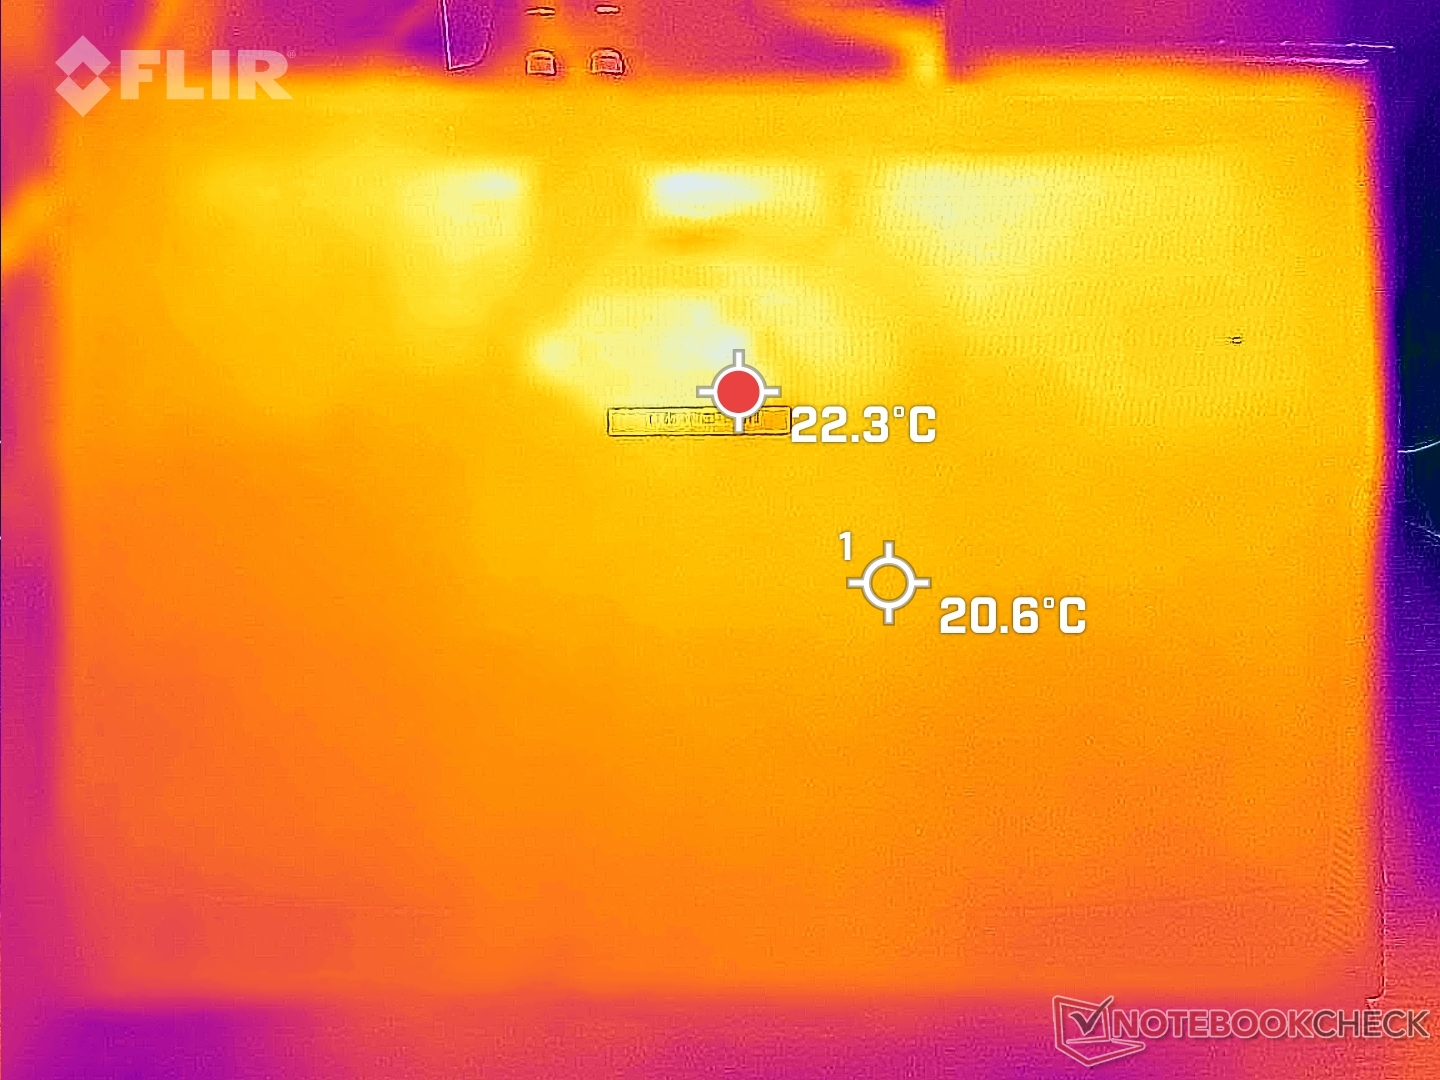
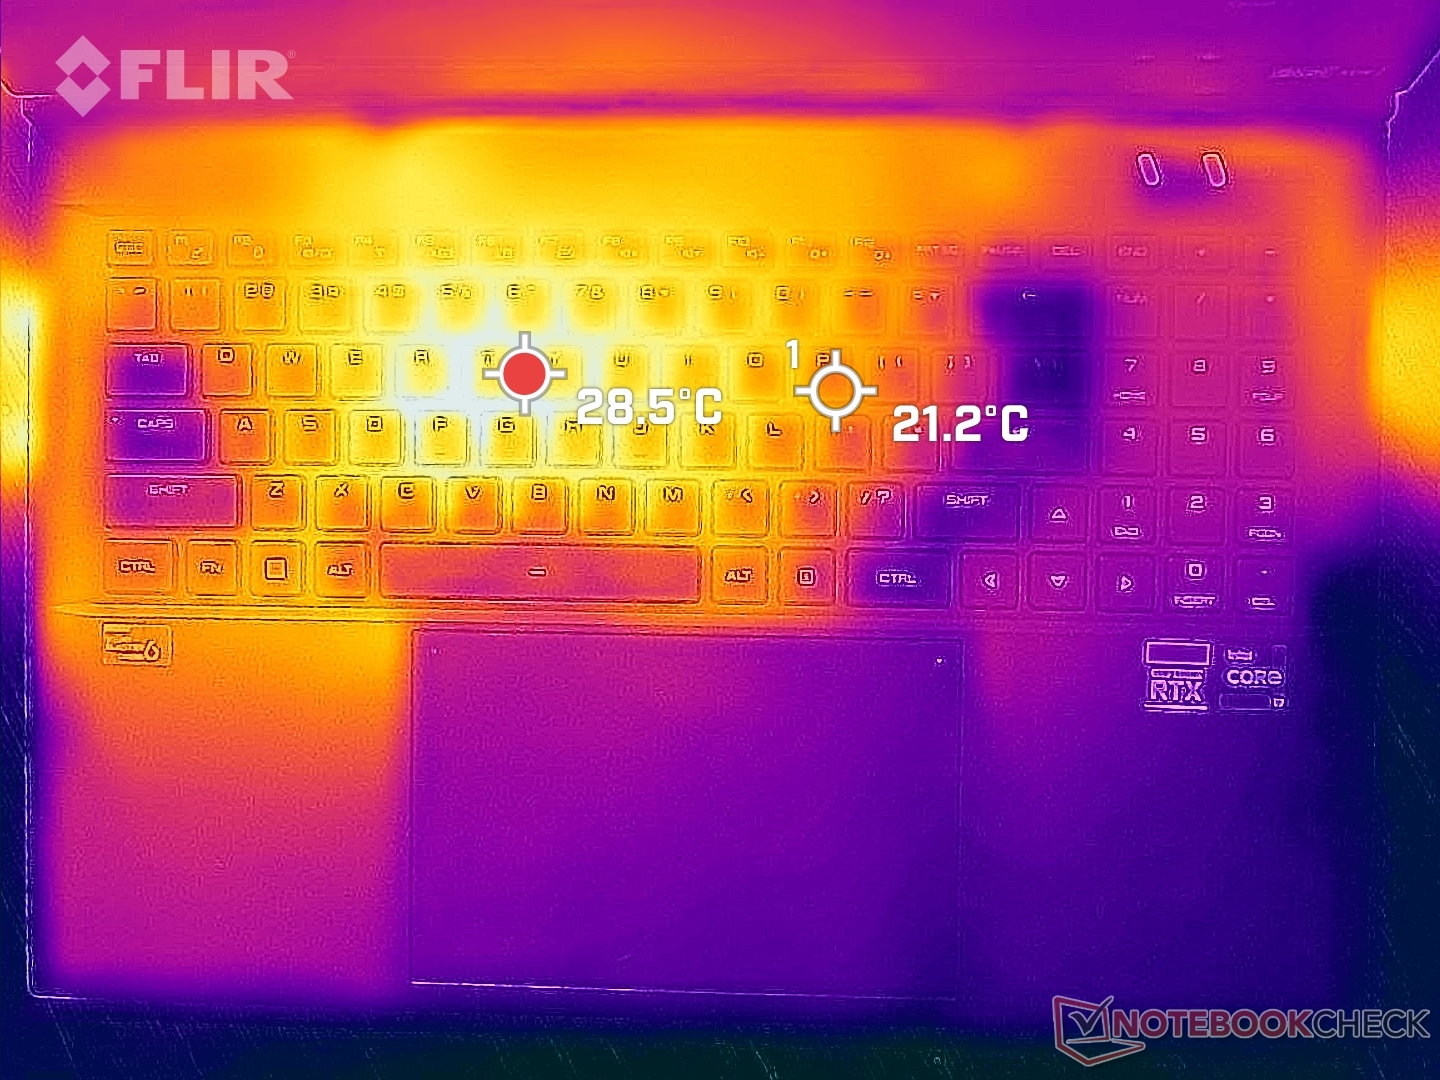
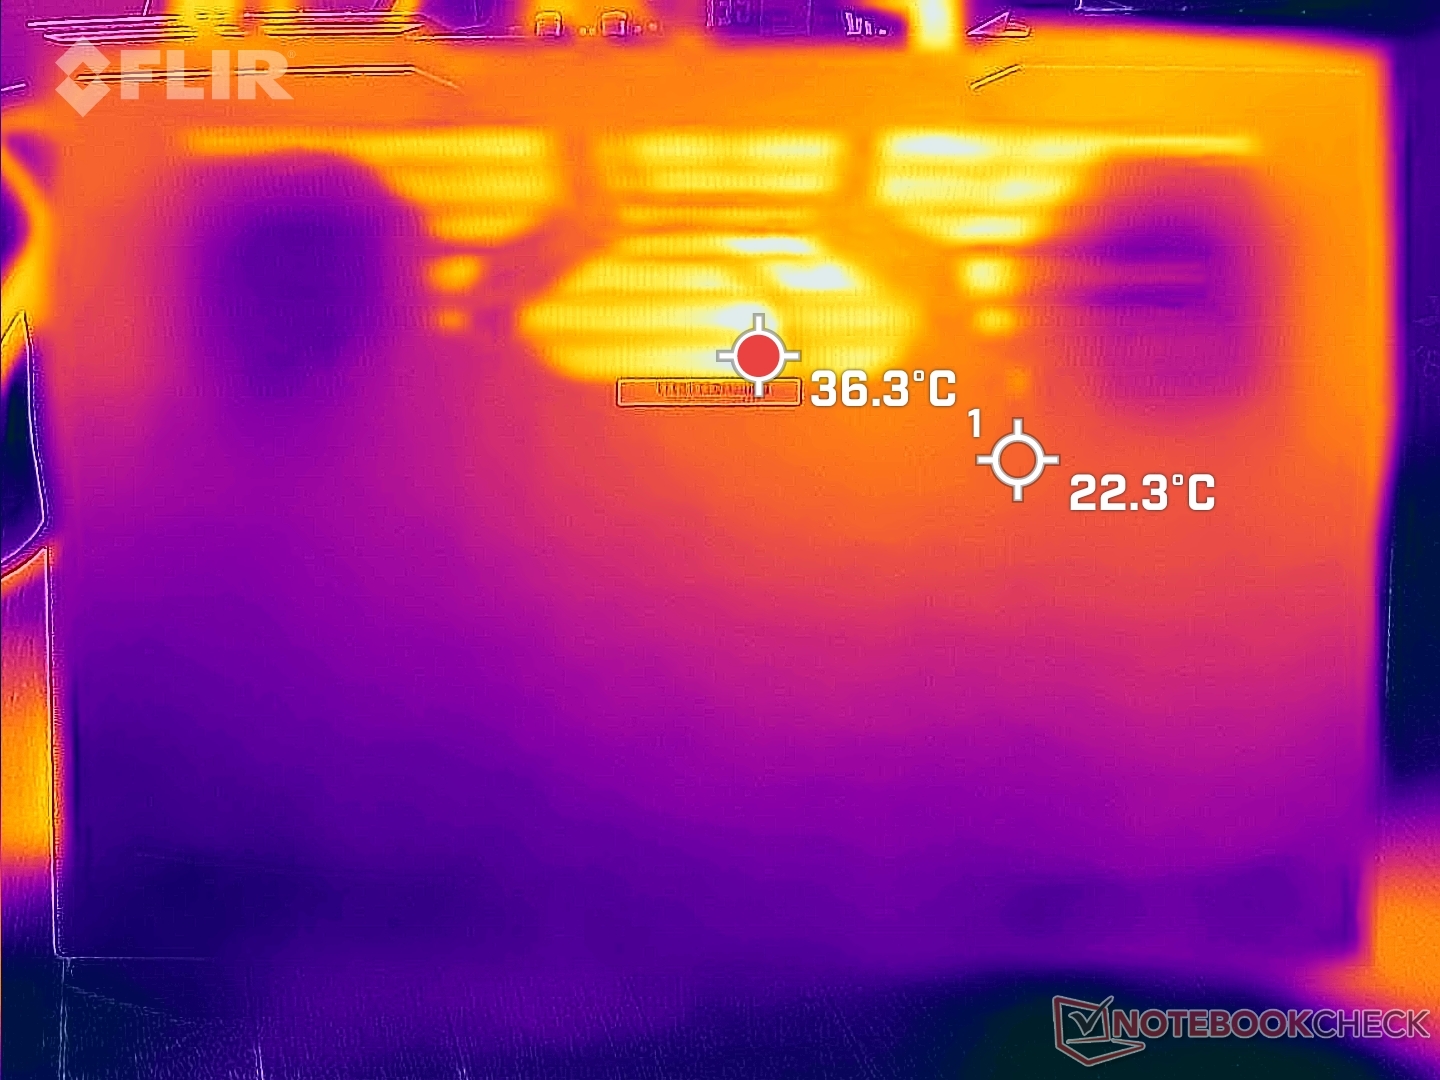
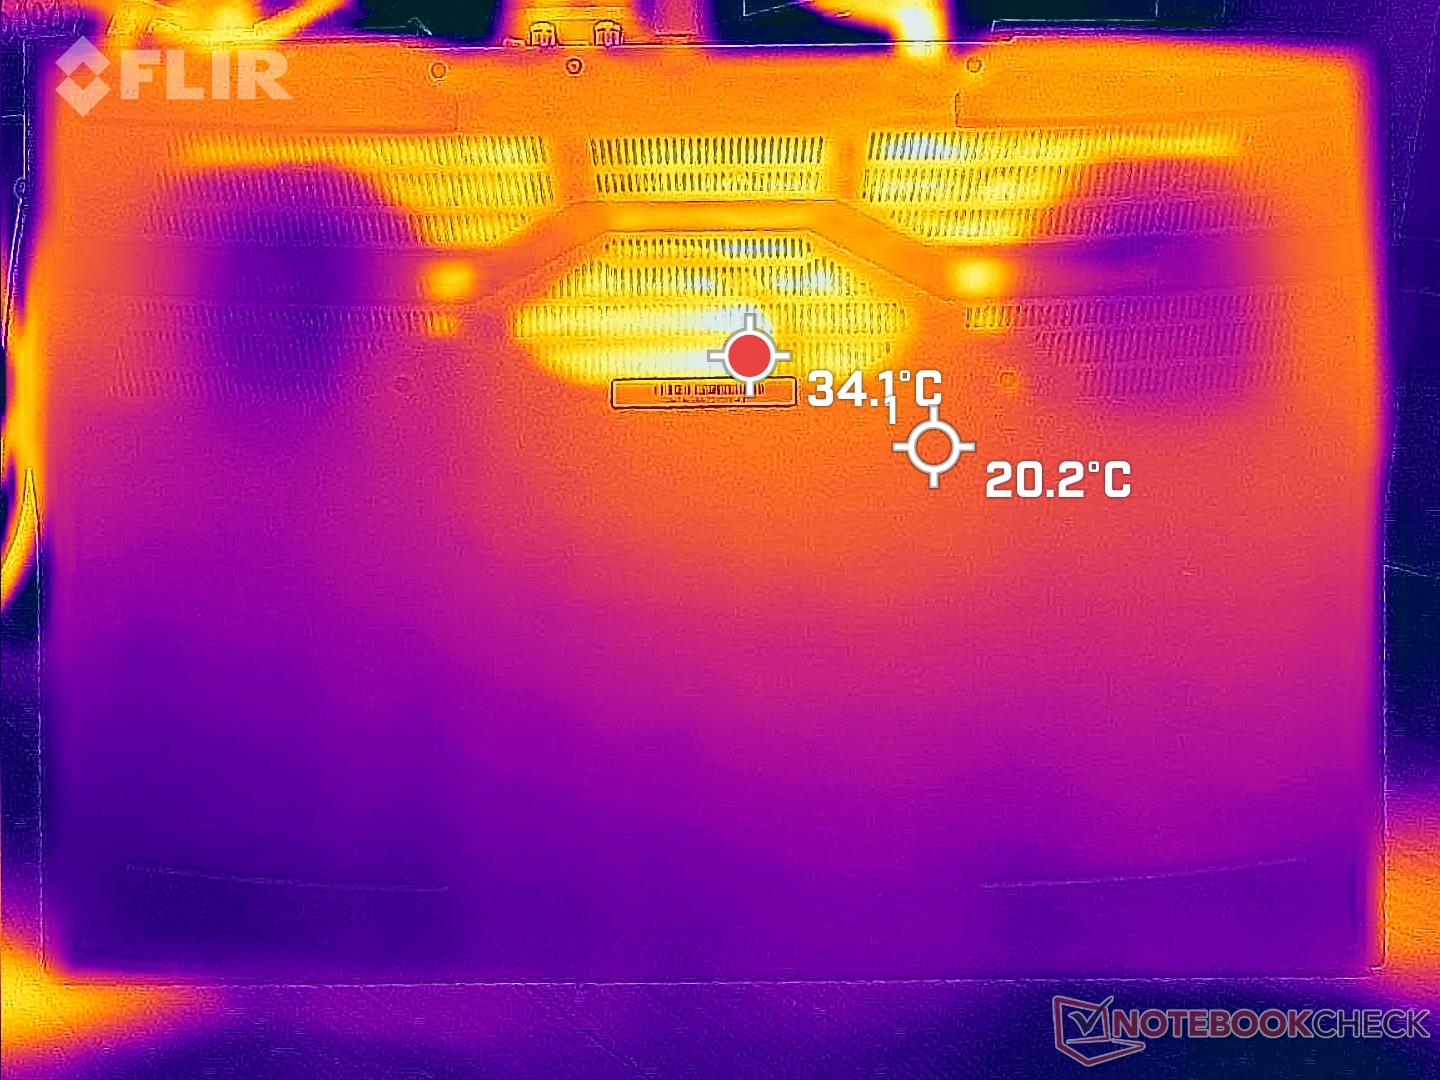
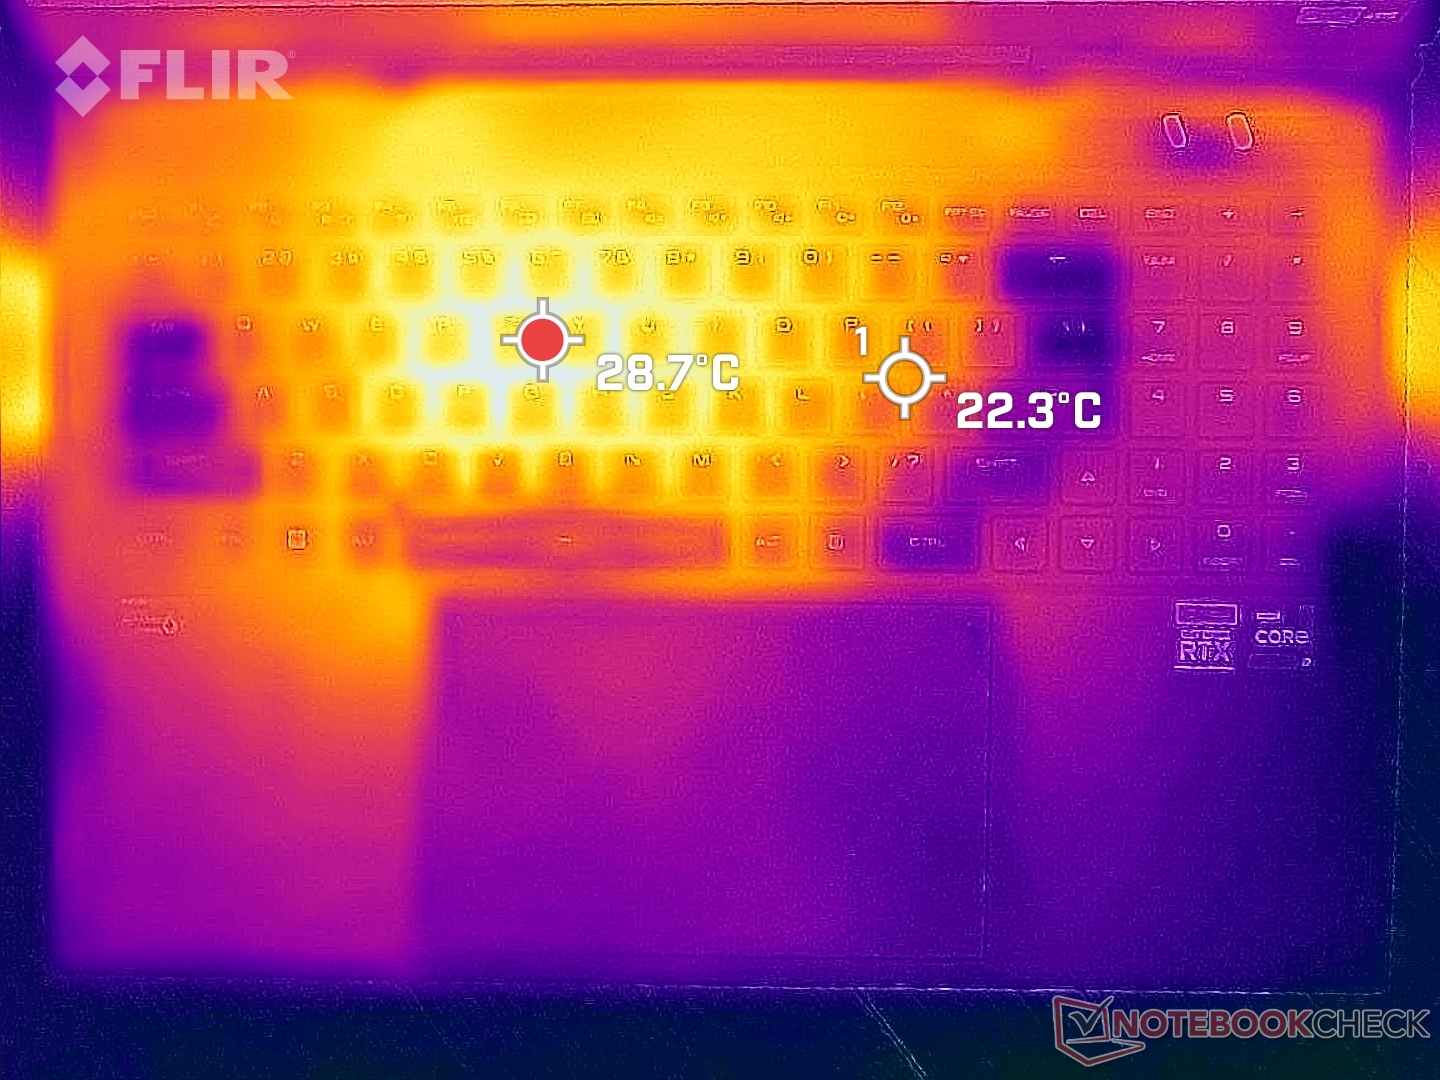
Temperatura - Mantenerlo fresco
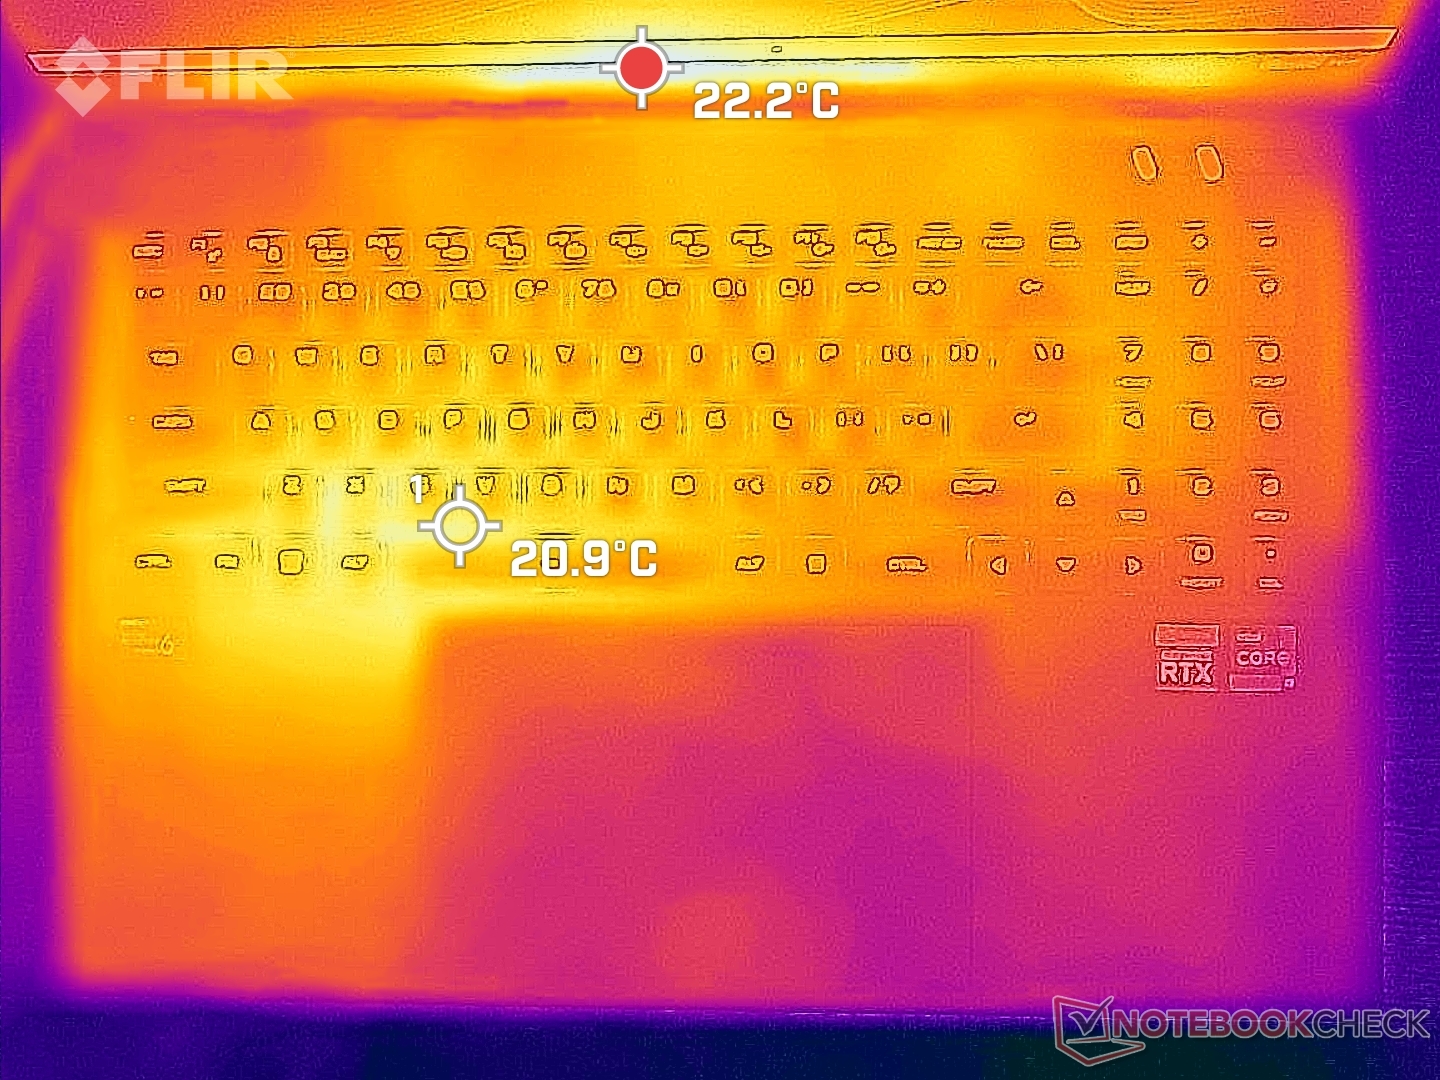
Las temperaturas de la superficie son las más frías que hemos registrado en un portátil para juegos. Cuando se somete al 100% de utilización de la CPU y la GPU, los puntos calientes de la parte superior e inferior sólo alcanzan los 32 C y 30 C, respectivamente, en comparación con los 50 C a 60+ C del MSI Stealth GS77. El aumento medio de la temperatura es de sólo unos 3 C en comparación con el estado de reposo. La caja de refrigeración es notable en términos de mantener las temperaturas bajo control.
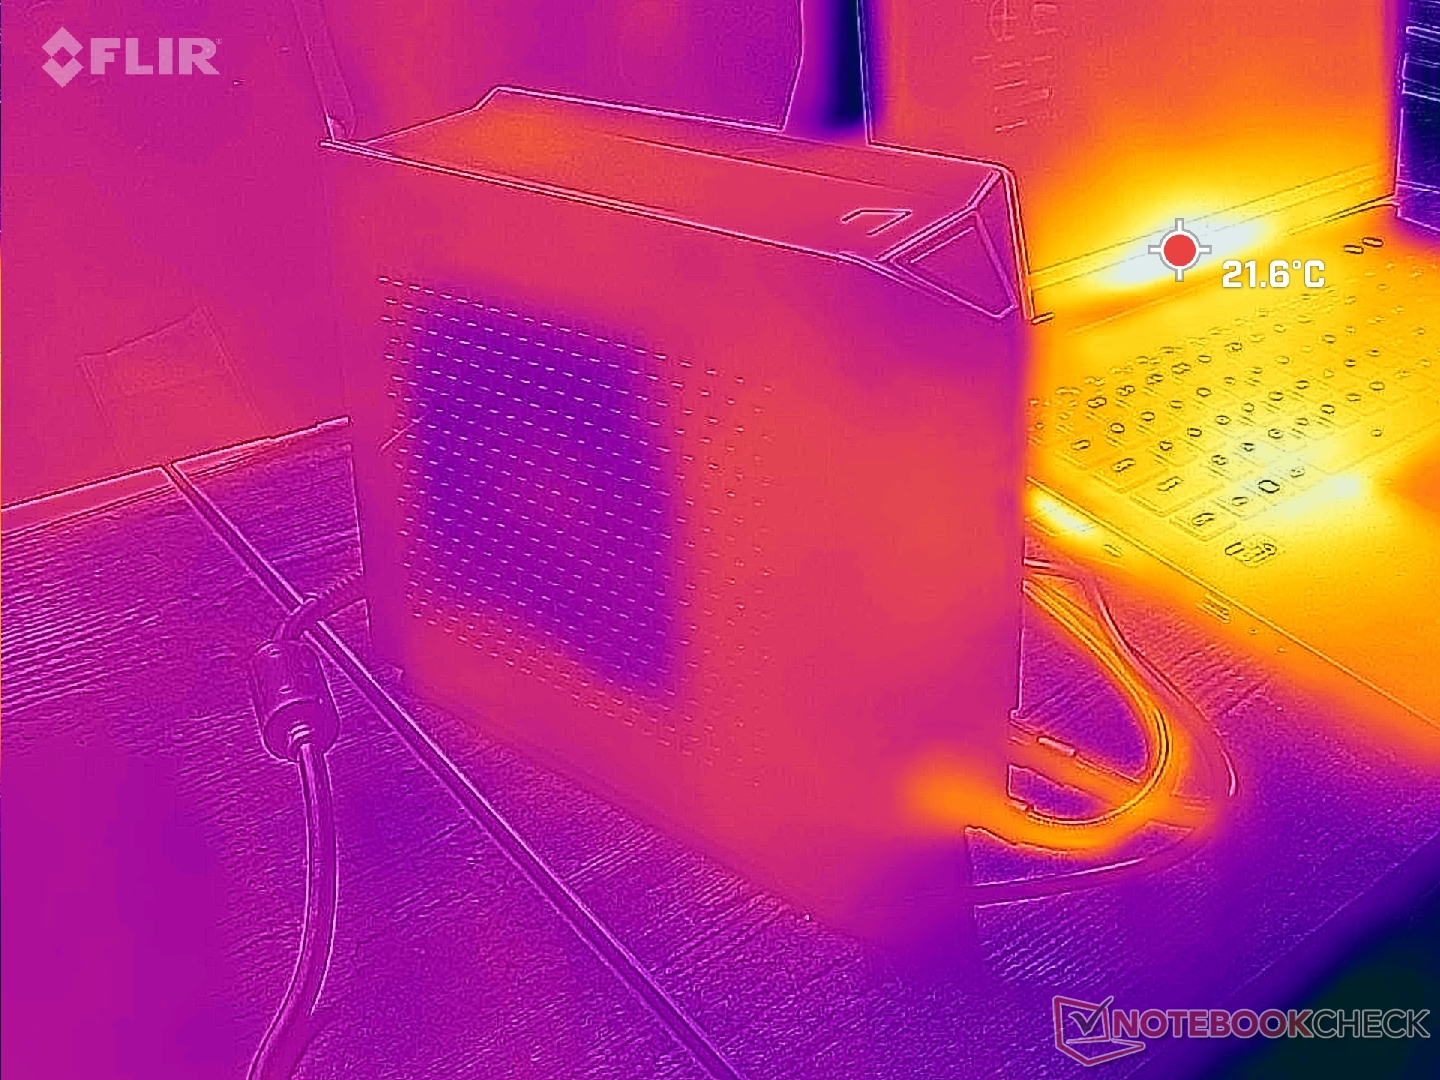
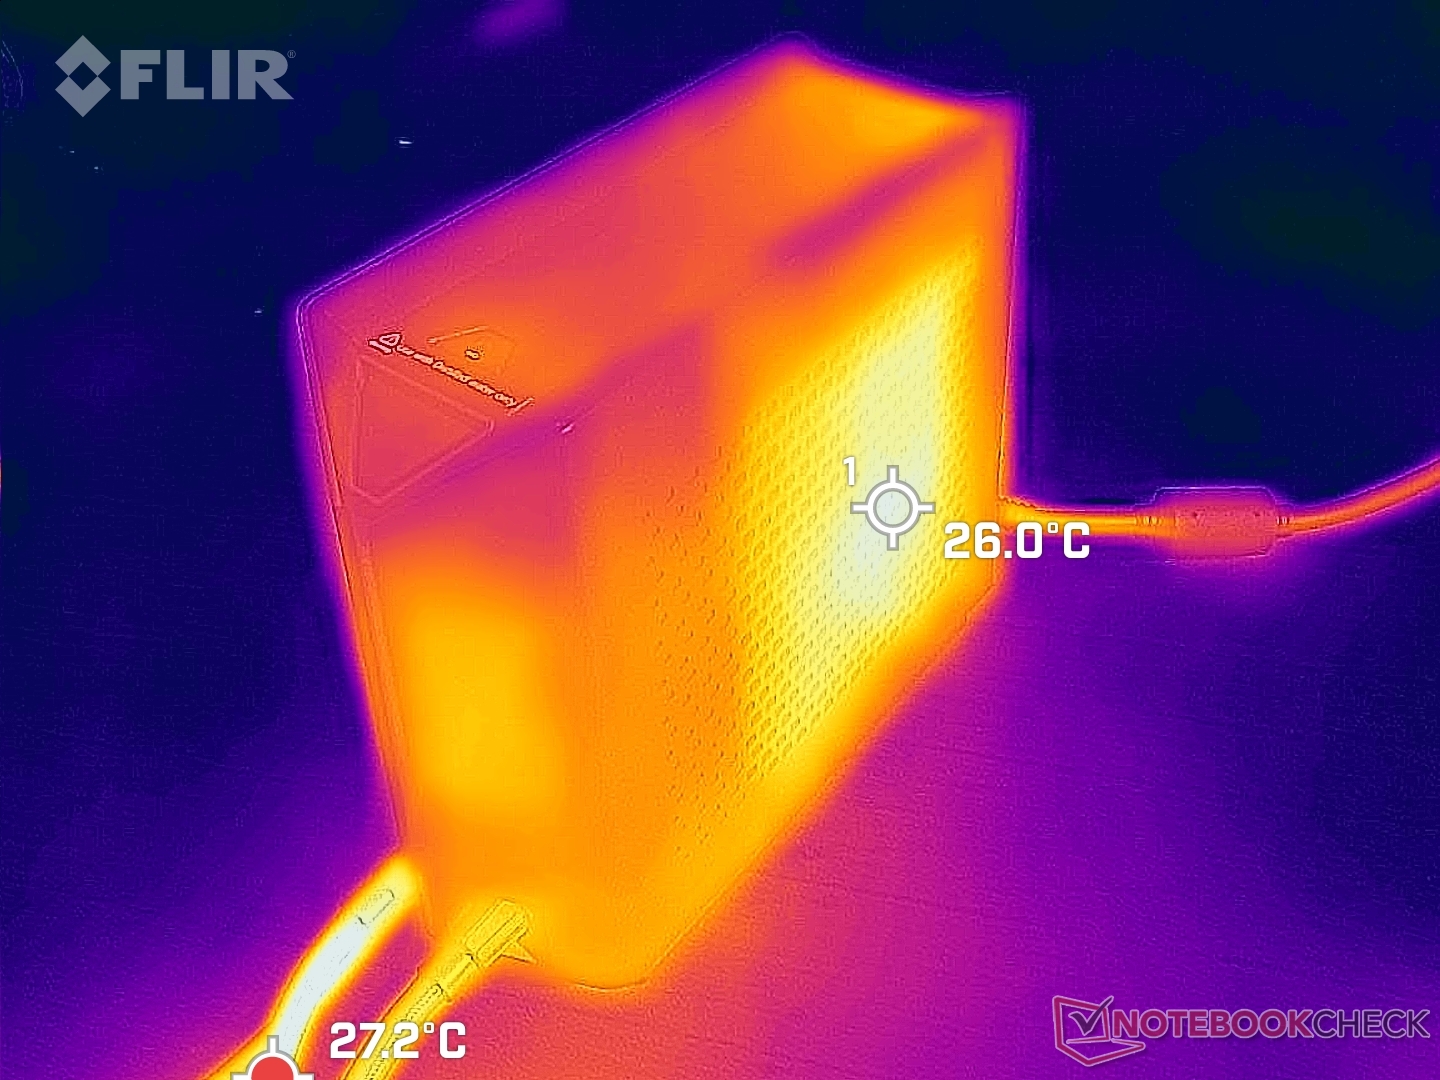
(+) La temperatura máxima en la parte superior es de 32 °C / 90 F, frente a la media de 40.4 °C / 105 F, que oscila entre 21.2 y 68.8 °C para la clase Gaming.
(+) El fondo se calienta hasta un máximo de 30 °C / 86 F, frente a la media de 43.2 °C / 110 F
(+) En reposo, la temperatura media de la parte superior es de 24.5 °C / 76# F, frente a la media del dispositivo de 33.9 °C / 93 F.
(+) Jugando a The Witcher 3, la temperatura media de la parte superior es de 27.2 °C / 81 F, frente a la media del dispositivo de 33.9 °C / 93 F.
(+) El reposamanos y el panel táctil están a una temperatura inferior a la de la piel, con un máximo de 25.2 °C / 77.4 F y, por tanto, son fríos al tacto.
(+) La temperatura media de la zona del reposamanos de dispositivos similares fue de 28.8 °C / 83.8 F (+3.6 °C / 6.4 F).
| Uniwell Technology GM7AG8N Liquid Cooling Box Intel Core i9-12900H, NVIDIA GeForce RTX 3080 Ti Laptop GPU | MSI Titan GT77 12UHS Intel Core i9-12900HX, NVIDIA GeForce RTX 3080 Ti Laptop GPU | Aorus 17X XES Intel Core i9-12900HX, NVIDIA GeForce RTX 3070 Ti Laptop GPU | Razer Blade 17 Early 2022 Intel Core i9-12900H, NVIDIA GeForce RTX 3080 Ti Laptop GPU | MSI Stealth GS77 12UHS-083US Intel Core i7-12700H, NVIDIA GeForce RTX 3080 Ti Laptop GPU | Asus ROG Zephyrus S17 GX703HSD Intel Core i9-11900H, NVIDIA GeForce RTX 3080 Laptop GPU | |
|---|---|---|---|---|---|---|
| Heat | -47% | -65% | -58% | -55% | -59% | |
| Maximum Upper Side * (°C) | 32 | 40.8 -27% | 54 -69% | 50 -56% | 50.6 -58% | 59 -84% |
| Maximum Bottom * (°C) | 30 | 52.4 -75% | 58 -93% | 56 -87% | 59.6 -99% | 53 -77% |
| Idle Upper Side * (°C) | 26.4 | 34.6 -31% | 37 -40% | 36 -36% | 30 -14% | 35 -33% |
| Idle Bottom * (°C) | 25 | 38.4 -54% | 39 -56% | 38 -52% | 37.4 -50% | 35 -40% |
* ... más pequeño es mejor
Prueba de esfuerzo - Mucho espacio para el overclocking
El sistema no muestra problemas para mantener una alta velocidad de reloj Turbo Boost de 4,3 GHz cuando la caja de refrigeración y los ventiladores internos están ajustados a sus respectivos máximos. La CPU se estabiliza a una velocidad de reloj alta de 4,3 GHz, una temperatura baja del núcleo de 54 C y un consumo de energía de la placa alto de 98 W cuando se ejecuta Prime95. Al ejecutar esta misma prueba de Prime95 en el MSI Vector GP66 con exactamente la misma CPU, el resultado sería una velocidad de reloj del núcleo más lenta, una temperatura más alta y un consumo de energía más bajo de 3,0 GHz, 90 C y 70 W, respectivamente.
La temperatura y el consumo de energía cuando se ejecuta Prime95 a veces se disparan a 78 C y 140 W, respectivamente, sin afectar a la velocidad del reloj. No estamos seguros de por qué ocurre esto, pero no deja de ser notable
La GPU se estabilizaría a 1890 MHz, 2125 MHz de VRAM, 55 C y 163 W (frente a su TGP nominal de 175 W) al ejecutar Witcher 3. Si se repitiera esta prueba en la MSI GS77 con la misma GPU 3080 Ti, se obtendría una velocidad de reloj más lenta de 1432 MHz y una VRAM de 1750 MHz, una temperatura más cálida de 75 C y un menor consumo de energía de 105 W. Las ventajas de una caja de refrigeración por agua externa son muy claras en este sentido.
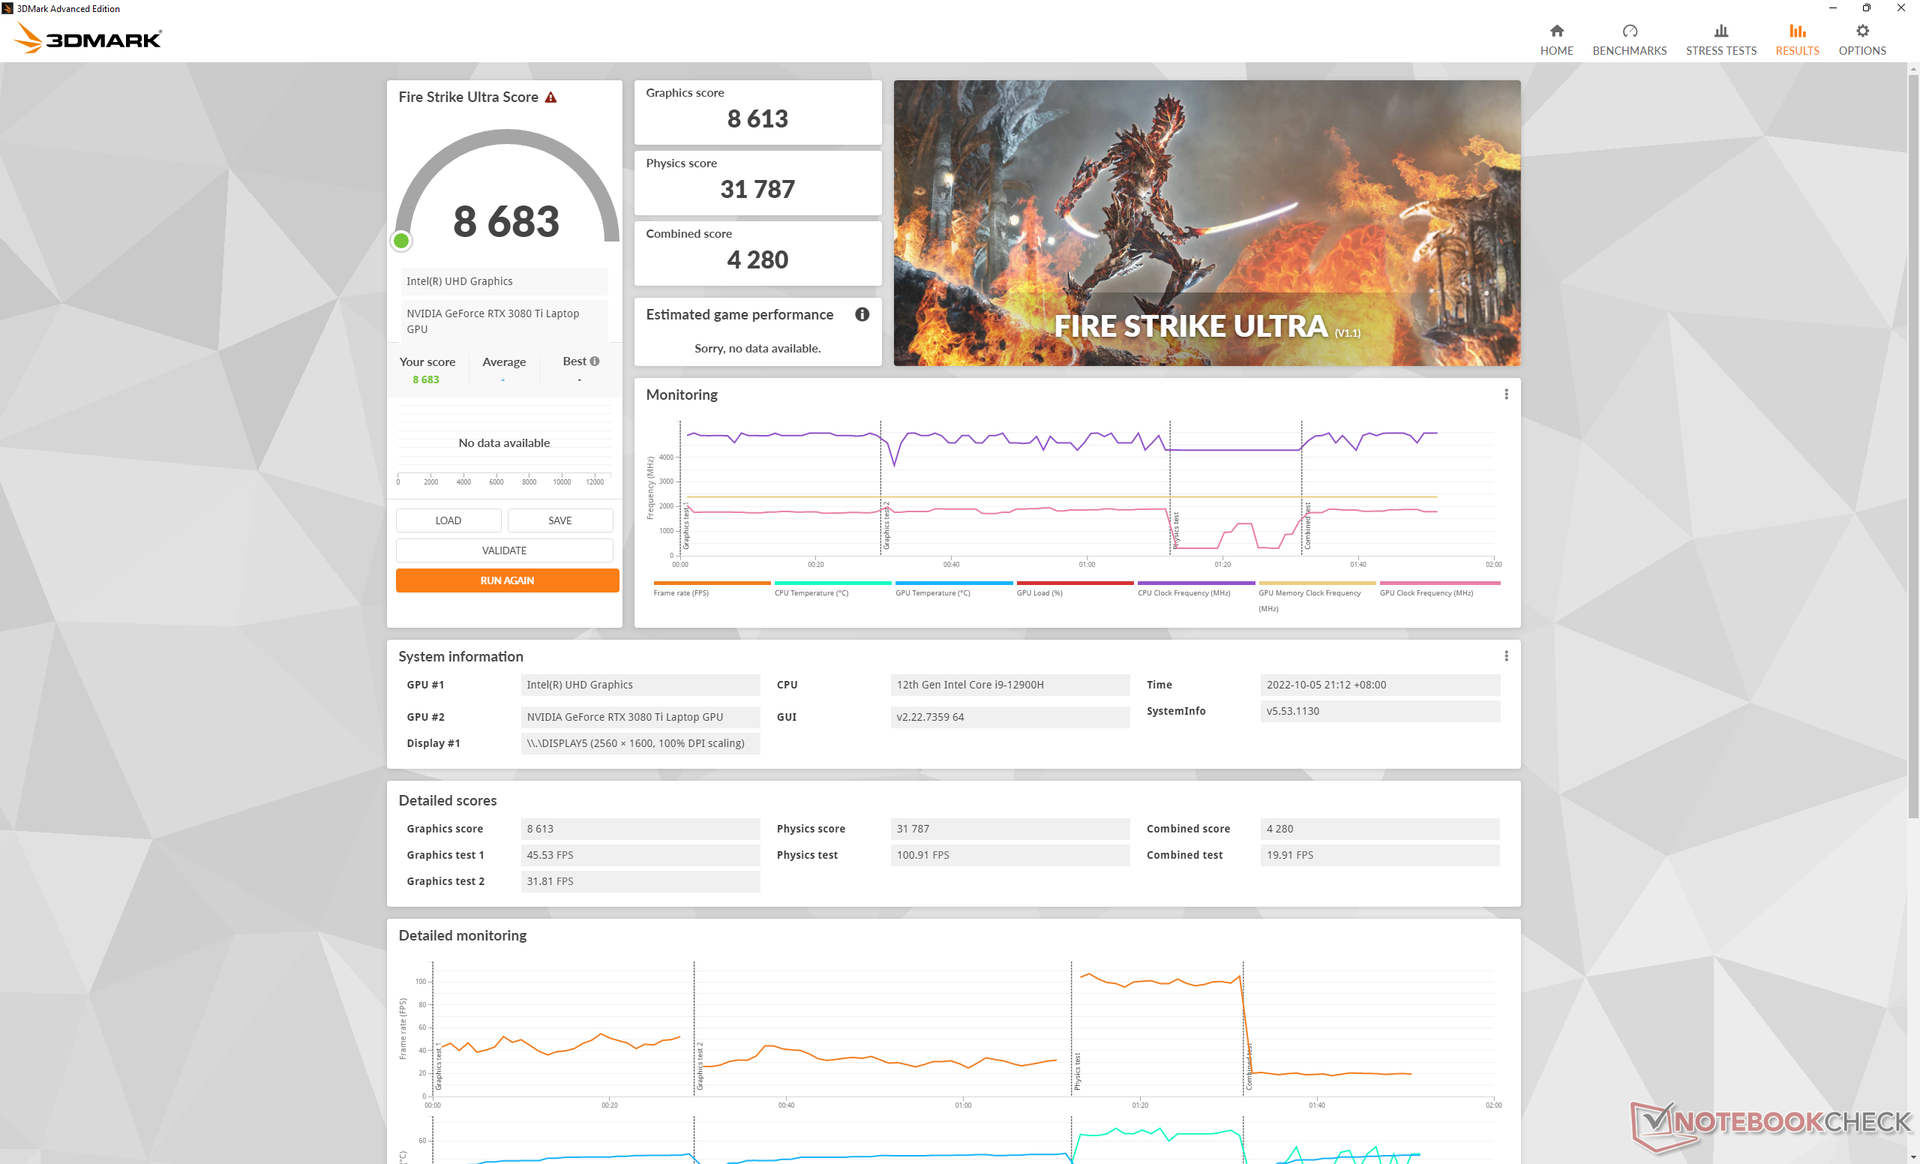
El uso de la batería limita el rendimiento, como era de esperar. Una prueba de Fire Strike con baterías arrojaría unas puntuaciones de Física y Gráficos de sólo 11276 y 4393 puntos, respectivamente, comparado con los 30601 y 30959 puntos cuando está conectado a la red eléctrica.
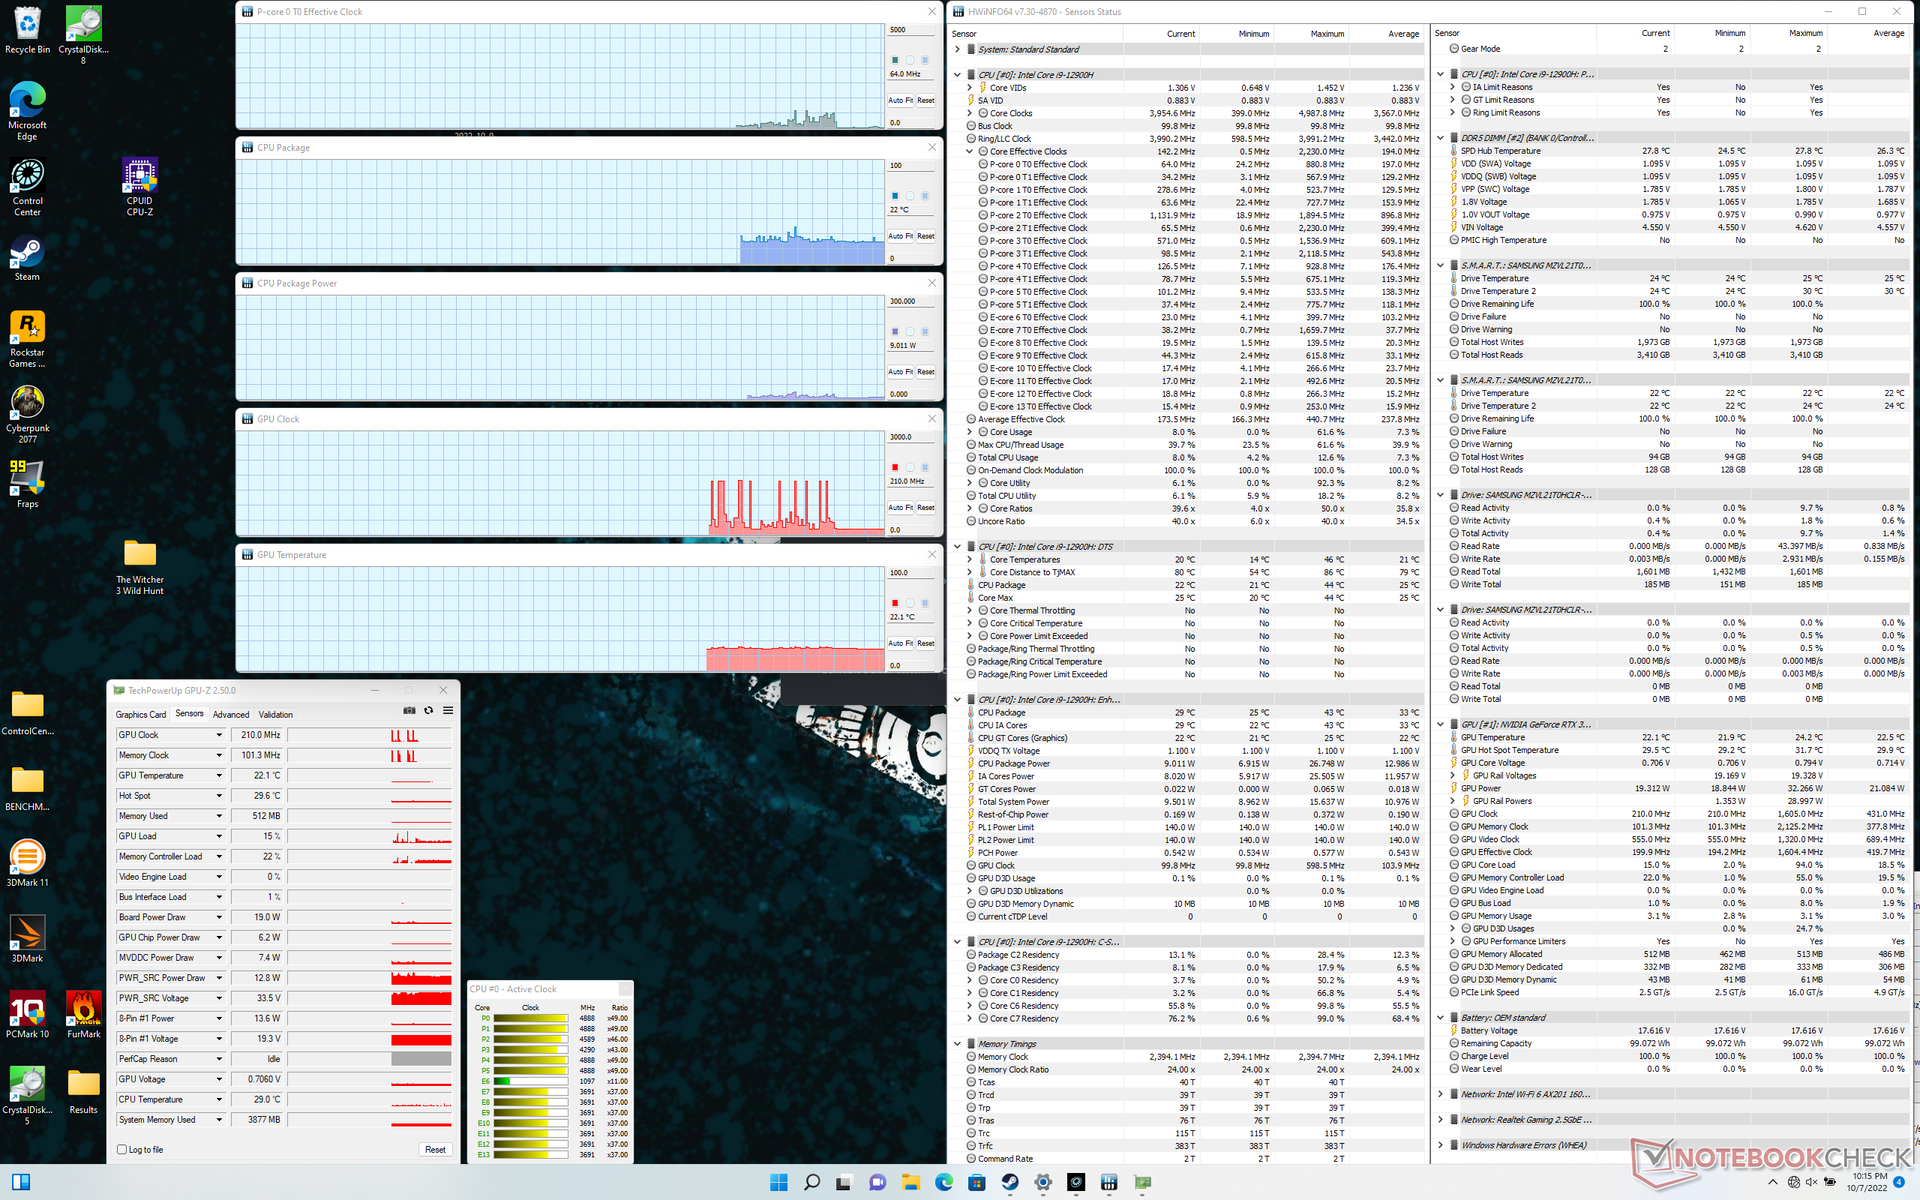
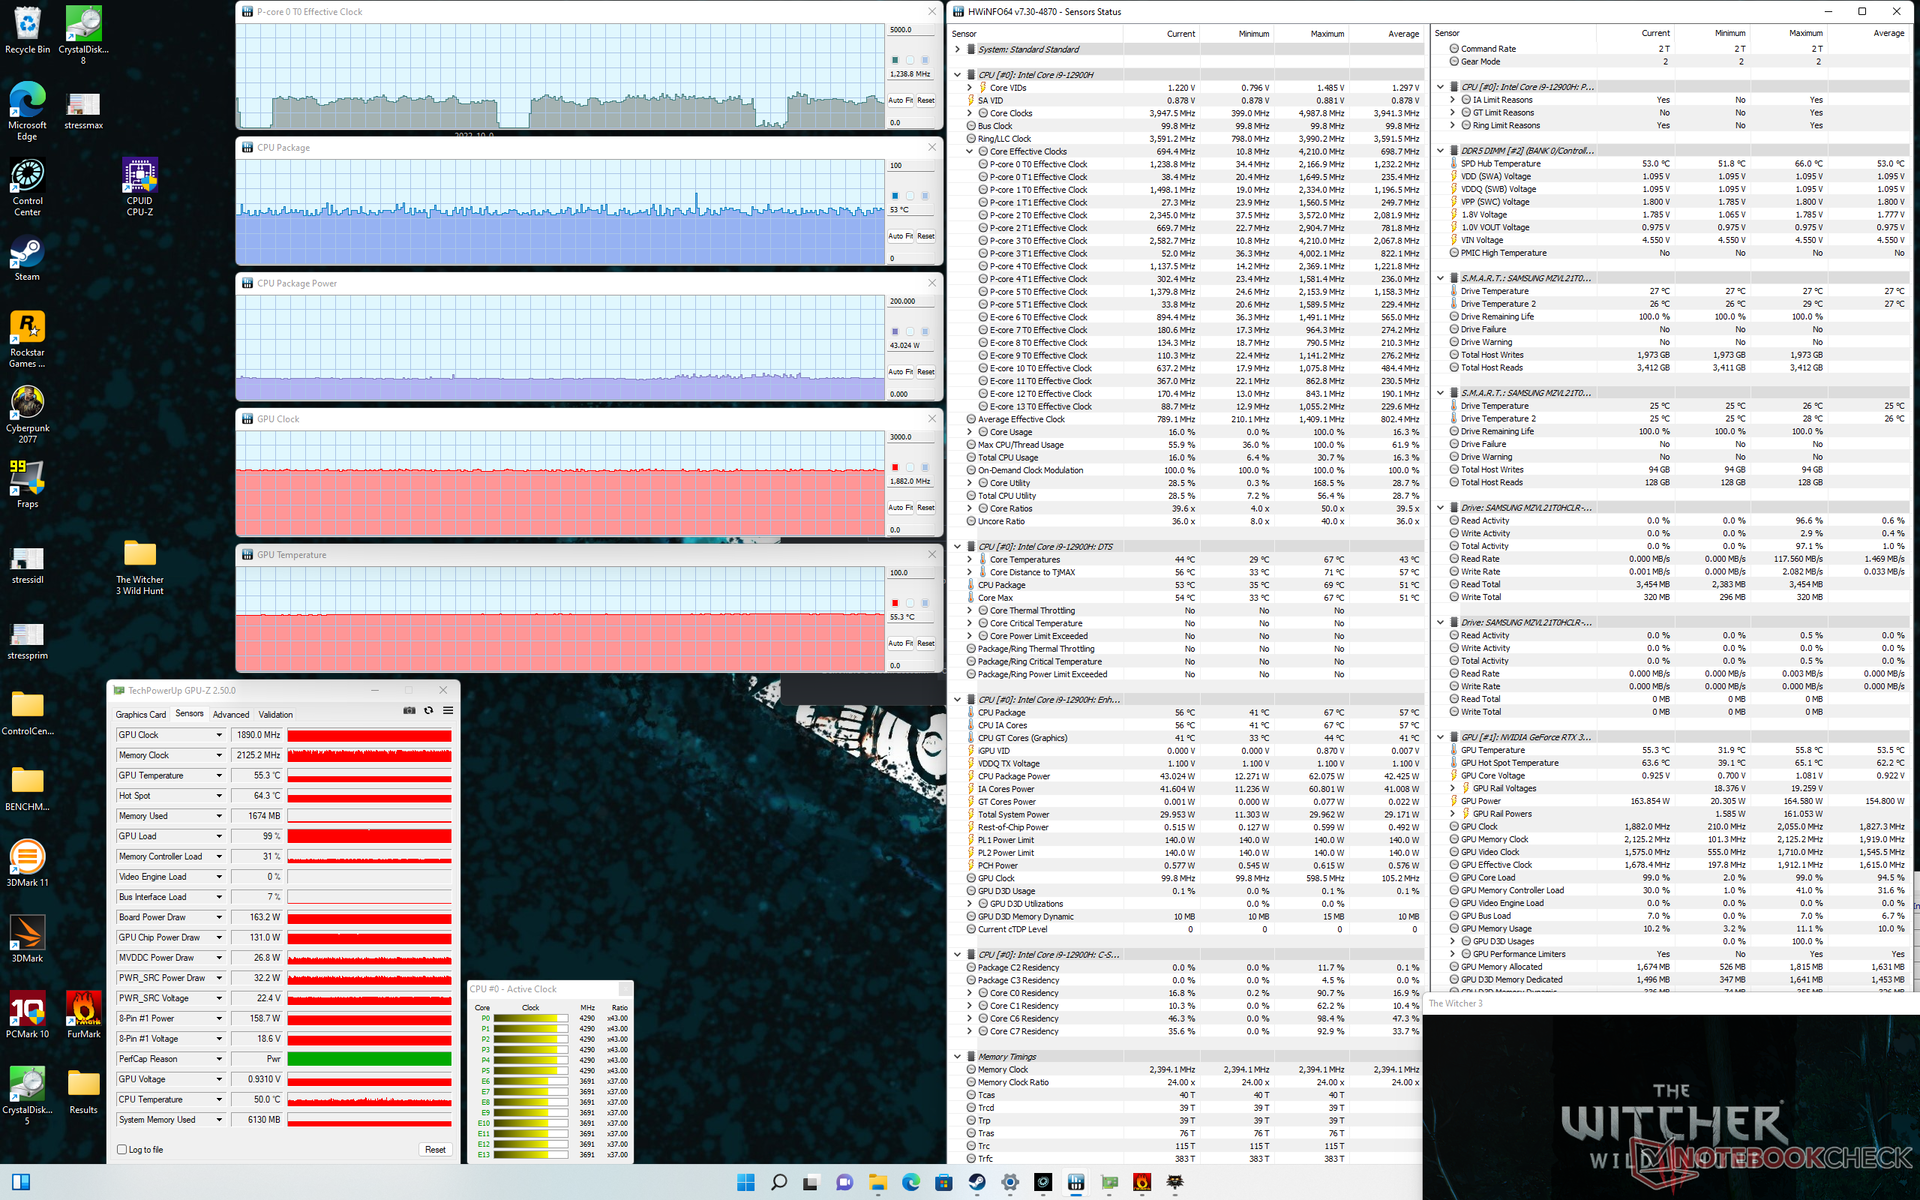
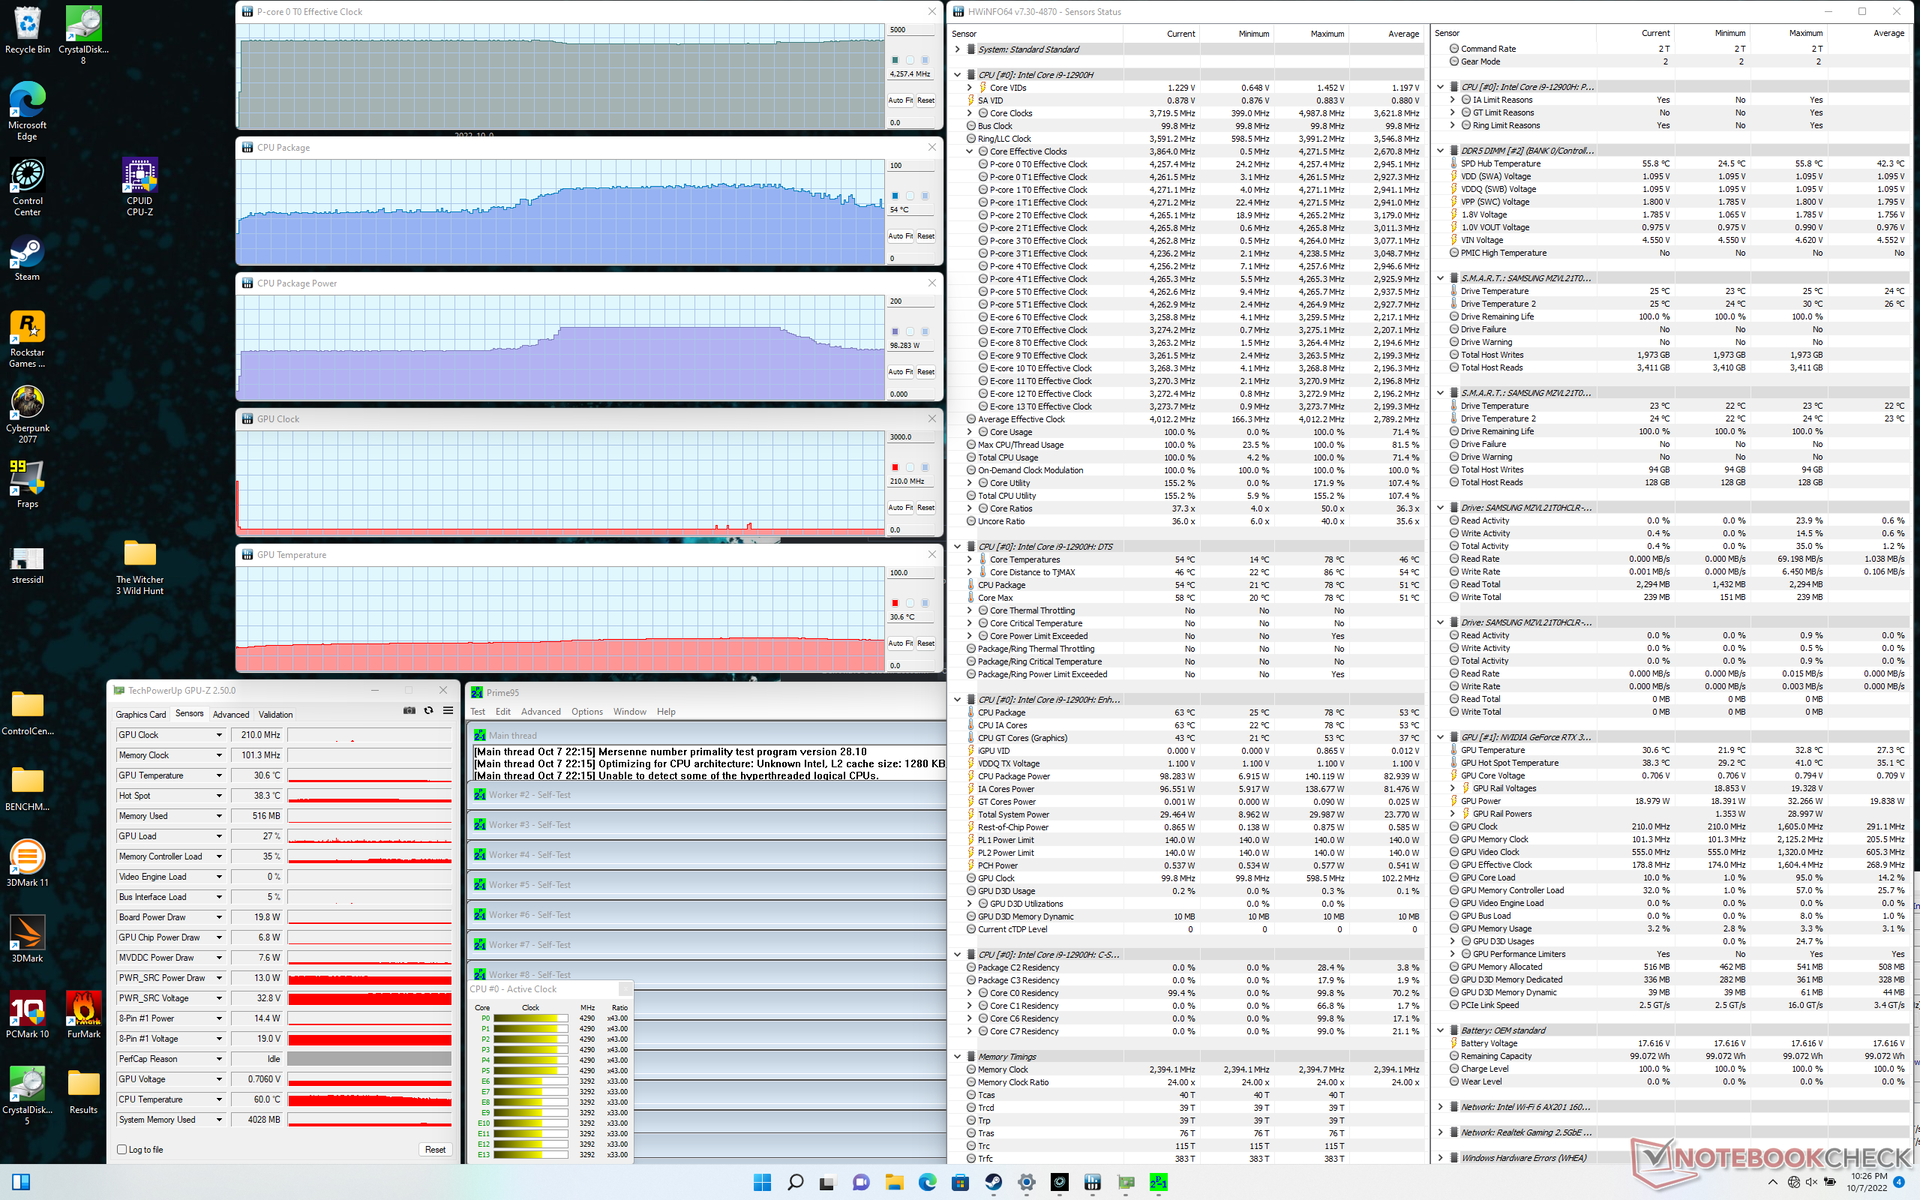
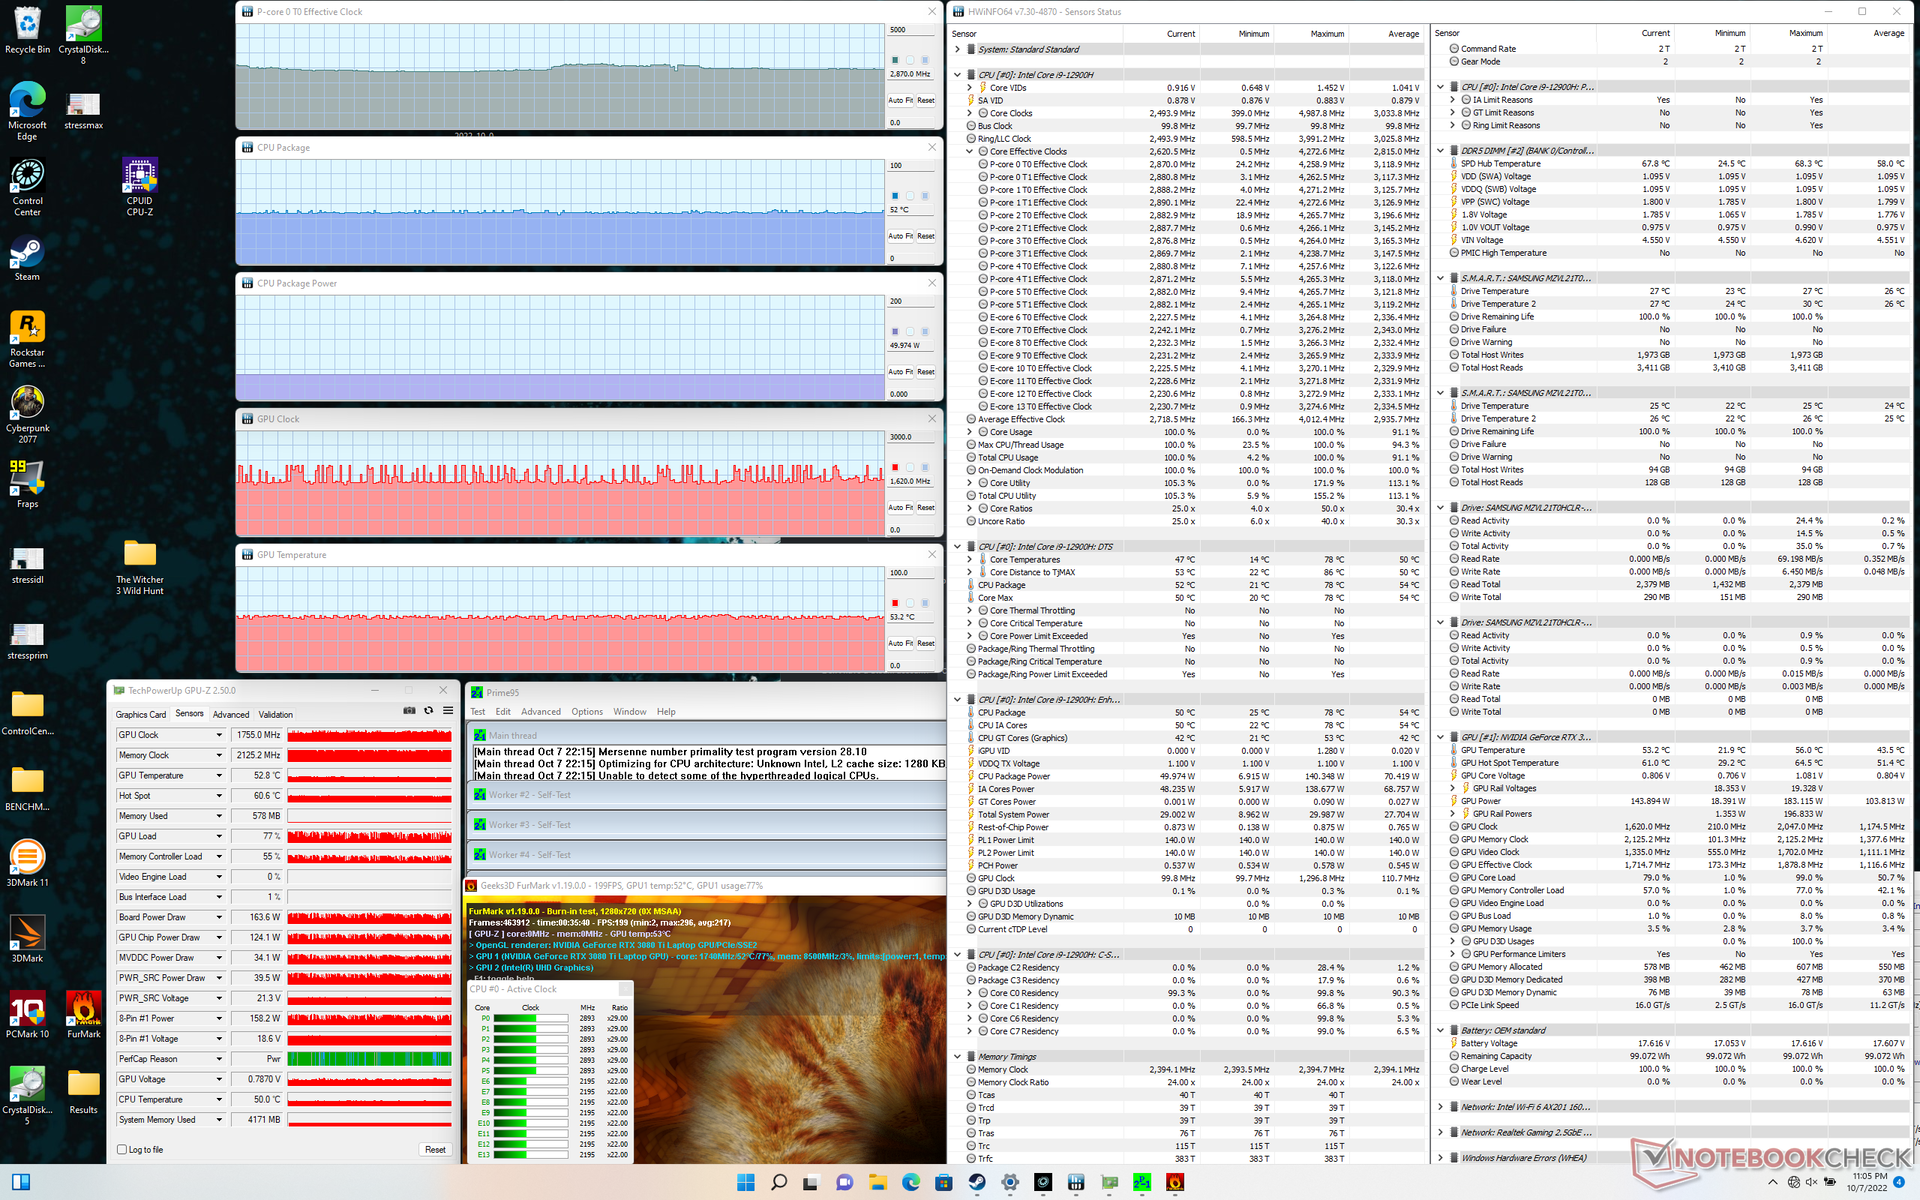
| Reloj dela CPU (GHz) | Reloj de la GPU (MHz) | Temperatura media dela CPU (°C) | Temperatura media de la GPU (°C) | |
| Sistema en reposo | -- | -- | 22 | 22 |
| Estrésde Prime95 | 4,3 | -- | 54 | 31 |
| Prime95+ FurMark Stress | 2,9 | ~1755 | 52 | 53 |
| Witcher 3 Stress | ~1,3 | 1890 | 53 | 55 |
Altavoces
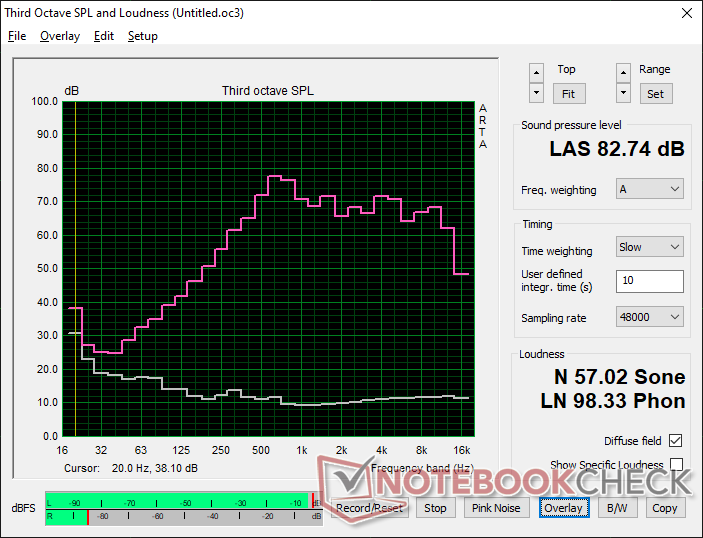
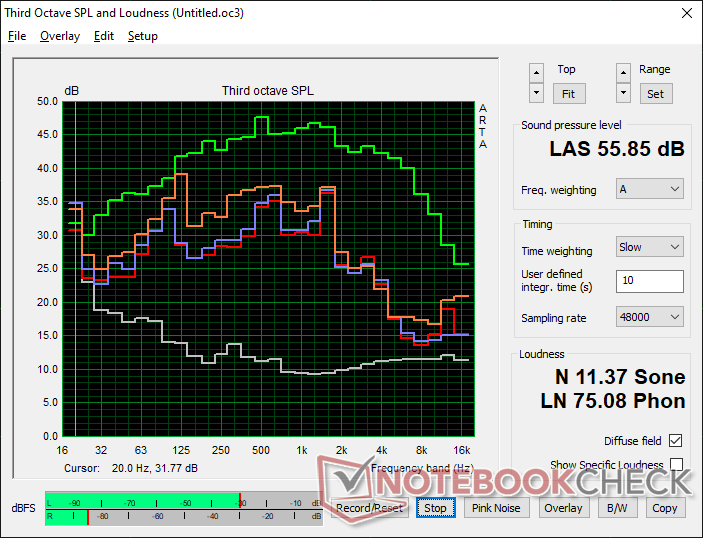
Uniwell Technology GM7AG8N Liquid Cooling Box análisis de audio
(+) | los altavoces pueden reproducir a un volumen relativamente alto (#82.7 dB)
Graves 100 - 315 Hz
(-) | casi sin bajos - de media 17.5% inferior a la mediana
(±) | la linealidad de los graves es media (8% delta a frecuencia anterior)
Medios 400 - 2000 Hz
(±) | medias más altas - de media 5% más altas que la mediana
(±) | la linealidad de los medios es media (7.8% delta respecto a la frecuencia anterior)
Altos 2 - 16 kHz
(+) | máximos equilibrados - a sólo 2.2% de la mediana
(+) | los máximos son lineales (5.5% delta a la frecuencia anterior)
Total 100 - 16.000 Hz
(±) | la linealidad del sonido global es media (15.1% de diferencia con la mediana)
En comparación con la misma clase
» 32% de todos los dispositivos probados de esta clase eran mejores, 6% similares, 62% peores
» El mejor tuvo un delta de 6%, la media fue 18%, el peor fue ###max##%
En comparación con todos los dispositivos probados
» 21% de todos los dispositivos probados eran mejores, 4% similares, 75% peores
» El mejor tuvo un delta de 4%, la media fue 23%, el peor fue ###max##%
Apple MacBook Pro 16 2021 M1 Pro análisis de audio
(+) | los altavoces pueden reproducir a un volumen relativamente alto (#84.7 dB)
Graves 100 - 315 Hz
(+) | buen bajo - sólo 3.8% lejos de la mediana
(+) | el bajo es lineal (5.2% delta a la frecuencia anterior)
Medios 400 - 2000 Hz
(+) | medios equilibrados - a sólo 1.3% de la mediana
(+) | los medios son lineales (2.1% delta a la frecuencia anterior)
Altos 2 - 16 kHz
(+) | máximos equilibrados - a sólo 1.9% de la mediana
(+) | los máximos son lineales (2.7% delta a la frecuencia anterior)
Total 100 - 16.000 Hz
(+) | el sonido global es lineal (4.6% de diferencia con la mediana)
En comparación con la misma clase
» 0% de todos los dispositivos probados de esta clase eran mejores, 0% similares, 100% peores
» El mejor tuvo un delta de 5%, la media fue 17%, el peor fue ###max##%
En comparación con todos los dispositivos probados
» 0% de todos los dispositivos probados eran mejores, 0% similares, 100% peores
» El mejor tuvo un delta de 4%, la media fue 23%, el peor fue ###max##%
Gestión de la energía
Consumo de energía - ¡Caramba!
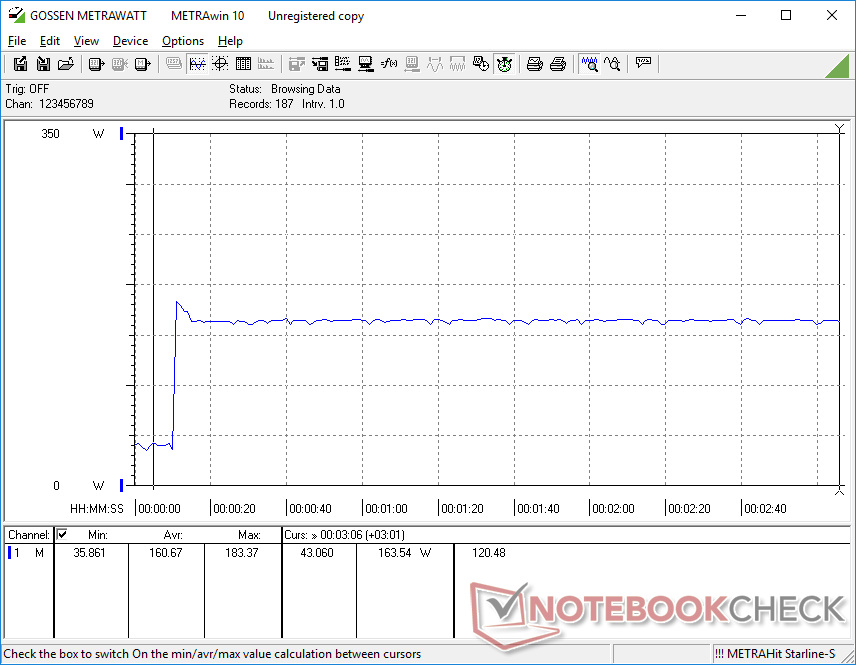
El ralentí en el escritorio con los ajustes de brillo y perfil de potencia más bajos y con la caja de refrigeración desconectada consume sólo 14 W de la toma de corriente. Por el contrario, el funcionamiento en reposo en el escritorio con los ajustes de brillo y perfil de energía más altos y con la caja de refrigeración activa consumiría casi 44 W comparado con ~35 W o menos en elAsus ROG Zephyrus S17 o el Razer Blade 17. Puede que quieras apagar la caja de refrigeración si no la usas para ahorrar en la factura de la luz
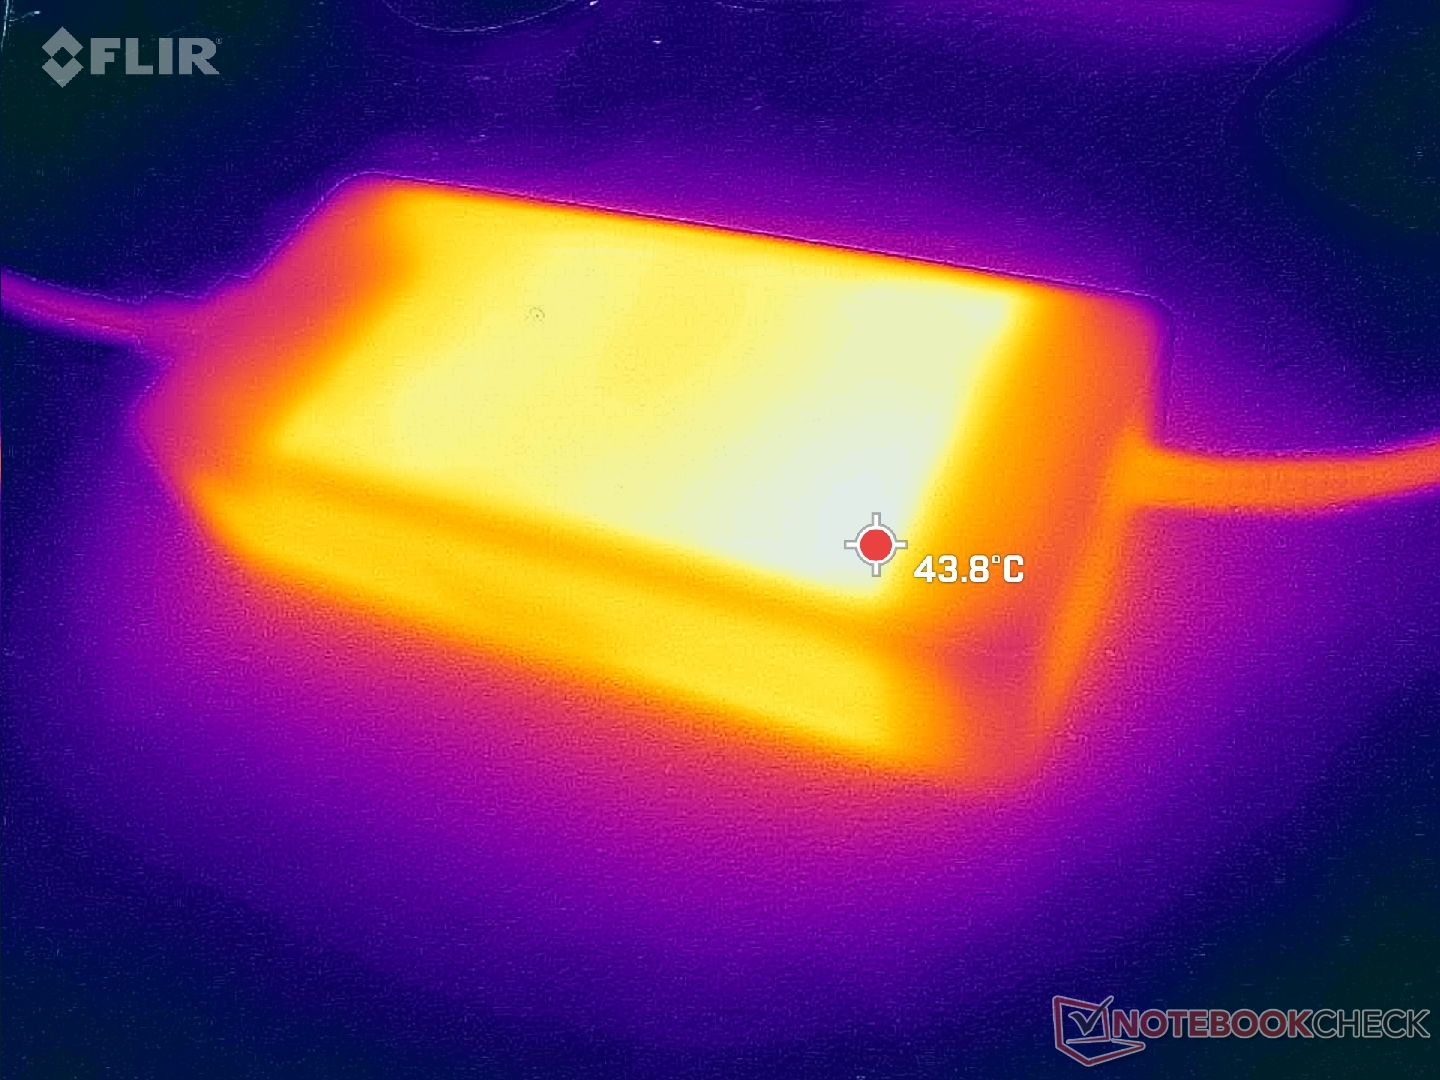
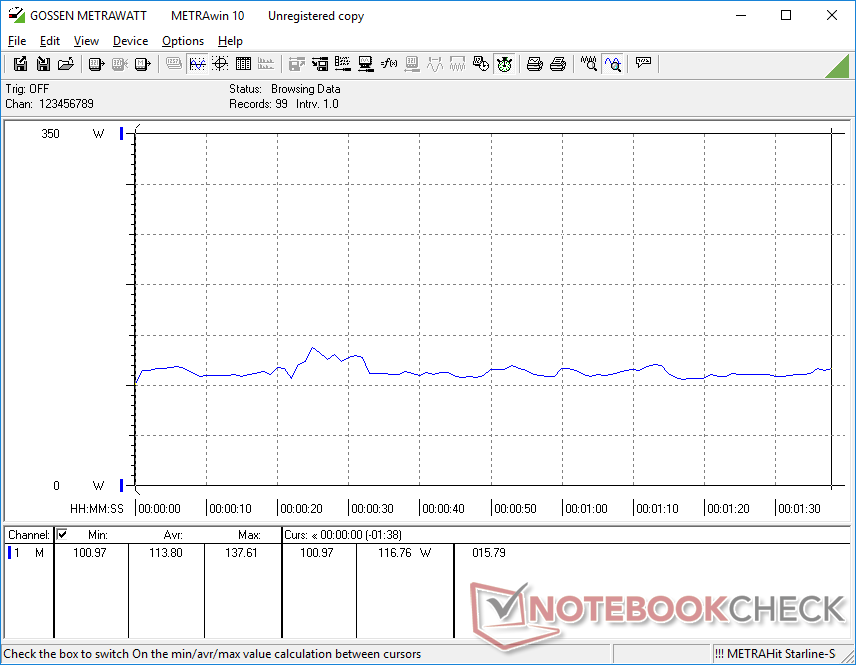
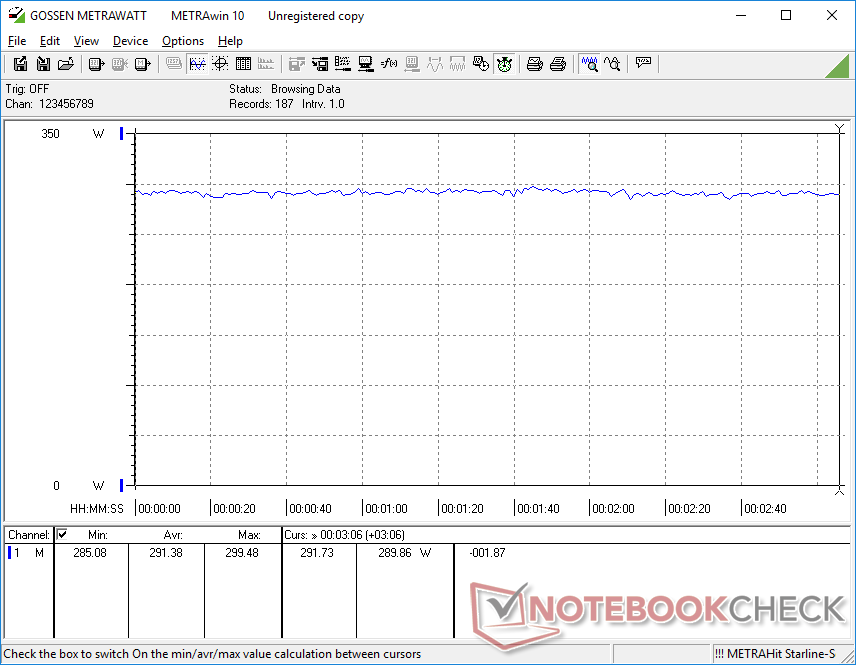
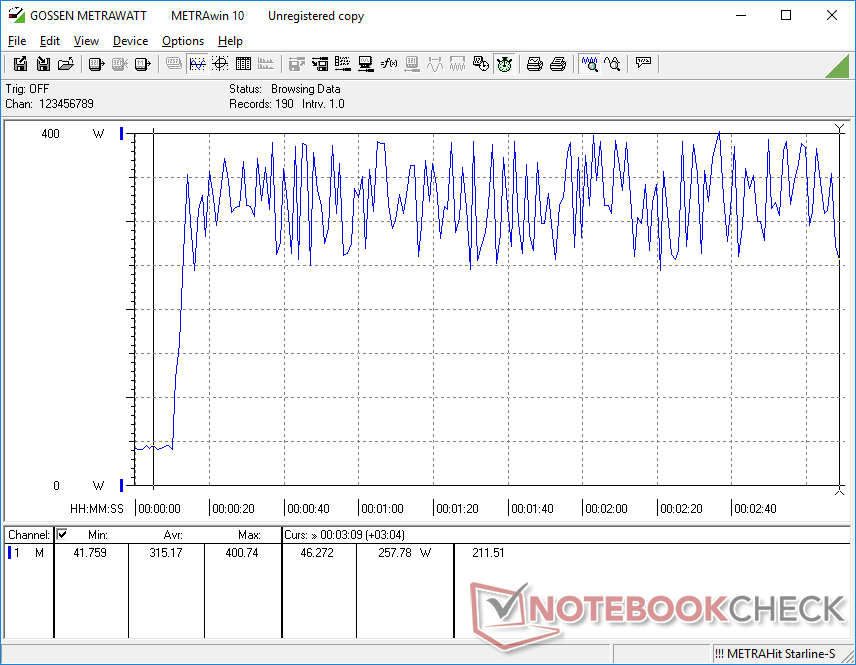
El gran adaptador de corriente (~18.5 x 8.5 x 3.5 cm) tiene una capacidad de 330 W. El funcionamiento Witcher 3 ya dibuja 291 W para ser significativamente más que la mayoría de los otros portátiles, incluyendo incluso el enorme MSI Titan GT77 por casi 15 por ciento. Si la CPU y la GPU están cada una al 100 por ciento de utilización, el consumo de energía puede oscilar entre 250 W y 400 W como muestran nuestros gráficos de abajo. El adaptador de CA de 330 W incluido es suficiente para los juegos, pero evidentemente se necesita más potencia si se pretende hacer funcionar tanto la CPU como la GPU a sus respectivos máximos.
| Off / Standby | |
| Ocioso | |
| Carga |
|
Clave:
min: | |
| Uniwell Technology GM7AG8N Liquid Cooling Box i9-12900H, GeForce RTX 3080 Ti Laptop GPU, Samsung PM9A1 MZVL21T0HCLR, IPS, 2560x1600, 17" | MSI Titan GT77 12UHS i9-12900HX, GeForce RTX 3080 Ti Laptop GPU, Samsung PM9A1 MZVL21T0HCLR, IPS-Level, 1920x1080, 17.3" | Aorus 17X XES i9-12900HX, GeForce RTX 3070 Ti Laptop GPU, Gigabyte AG470S1TB-SI B10, IPS, 1920x1080, 17.3" | Razer Blade 17 Early 2022 i9-12900H, GeForce RTX 3080 Ti Laptop GPU, Samsung PM9A1 MZVL21T0HCLR, IPS, 3840x2160, 17.3" | MSI Stealth GS77 12UHS-083US i7-12700H, GeForce RTX 3080 Ti Laptop GPU, Micron 3400 1TB MTFDKBA1T0TFH, IPS, 2560x1440, 17.3" | Asus ROG Zephyrus S17 GX703HSD i9-11900H, GeForce RTX 3080 Laptop GPU, Samsung PM9A1 MZVL22T0HBLB, IPS, 2560x1440, 17.3" | |
|---|---|---|---|---|---|---|
| Power Consumption | -10% | 5% | 15% | 22% | 14% | |
| Idle Minimum * (Watt) | 13.7 | 30.21 -121% | 18 -31% | 17 -24% | 20 -46% | 21.7 -58% |
| Idle Average * (Watt) | 38 | 32.42 15% | 28 26% | 23 39% | 21.4 44% | 27 29% |
| Idle Maximum * (Watt) | 43.4 | 33.7 22% | 36 17% | 34 22% | 27 38% | 33 24% |
| Load Average * (Watt) | 113.8 | 125.09 -10% | 153 -34% | 120 -5% | 100.5 12% | 108 5% |
| Witcher 3 ultra * (Watt) | 291 | 256 12% | 221 24% | 229 21% | 165 43% | 195 33% |
| Load Maximum * (Watt) | 400.8 | 321.88 20% | 290 28% | 243 39% | 247.1 38% | 210 48% |
* ... más pequeño es mejor
Power Consumption Witcher 3 / Stresstest
Power Consumption external Monitor
Duración de la batería - En realidad no está mal
La capacidad de la batería es similar a la del MSI Stealth GS77 con 99 Wh. La duración general es similar a la del MSI GT77 a pesar de sus diferencias de tamaño.
No soporta USB-PD, por lo que el portátil no puede cargarse por USB-C.
| Uniwell Technology GM7AG8N Liquid Cooling Box i9-12900H, GeForce RTX 3080 Ti Laptop GPU, 99 Wh | MSI Titan GT77 12UHS i9-12900HX, GeForce RTX 3080 Ti Laptop GPU, 99.9 Wh | Aorus 17X XES i9-12900HX, GeForce RTX 3070 Ti Laptop GPU, 99 Wh | Razer Blade 17 Early 2022 i9-12900H, GeForce RTX 3080 Ti Laptop GPU, 82 Wh | MSI Stealth GS77 12UHS-083US i7-12700H, GeForce RTX 3080 Ti Laptop GPU, 99 Wh | Asus ROG Zephyrus S17 GX703HSD i9-11900H, GeForce RTX 3080 Laptop GPU, 90 Wh | |
|---|---|---|---|---|---|---|
| Duración de Batería | -7% | -25% | -19% | 0% | 38% | |
| Reader / Idle (h) | 8.7 | 7.1 -18% | 10.8 24% | |||
| WiFi v1.3 (h) | 7 | 6.9 -1% | 4.4 -37% | 3.8 -46% | 6.2 -11% | 7.5 7% |
| Load (h) | 1.6 | 1.4 -13% | 1.4 -13% | 1.7 6% | 1.4 -13% | 2.7 69% |
| H.264 (h) | 7.2 | 3.8 | 4.8 | 7.2 | ||
| Witcher 3 ultra (h) | 1.5 | 1 |
Pro
Contra
Veredicto - Realmente funciona
Una bomba de agua externa es una solución absurda para refrigerar un portátil para juegos. No sólo es aparatosa con sus cables y tubos, sino que también hace que el transporte sea una gran molestia. Esencialmente, ancla el portátil al escritorio y desalienta los viajes incluso más que una estación de acoplamiento eGPU.
La caja de refrigeración líquida es para un mercado de portátiles de entusiastas relativamente pequeño, pero su rendimiento y su relativamente bajo nivel de ruido son, no obstante, impresionantes y mejores de lo esperado. Sin embargo, se enfrenta a grandes retos frente al creciente mercado de las eGPU.
Los resultados, sin embargo, son difíciles de ignorar. El rendimiento general es más rápido que el de la mayoría de portátiles equipados con la misma CPU Core i9-12900H y GPU RTX 3080 Ti, incluso cuando el Uniwell y la caja de refrigeración están configurados en sus ajustes de ventilador más bajos. Es capaz de funcionar de forma notablemente más silenciosa que los portátiles de juego tradicionales sin necesidad de reducir el rendimiento, algo que no podemos decir de casi ningún otro portátil de juego.
Los resultados son igualmente impresionantes cuando el sistema se ajusta a su configuración máxima de ventiladores. Las temperaturas estables del núcleo, de unos 55 C, son más de 30 C más frías que en la mayoría de los portátiles de juego ultradelgados, siendo la temperatura más baja registrada en la categoría. Esto deja mucho margen de overclocking para los entusiastas si están dispuestos a tolerar el ruido más fuerte del ventilador.
Precio y disponibilidad
Nombrar el precio y la disponibilidad del modelo probado, si es necesario, desviando las variantes de equipamiento pertinentes. Affil enlace a una tienda de la lista en la ventana de enlace.
Uniwell Technology GM7AG8N Liquid Cooling Box
- 10/13/2022 v7 (old)
Allen Ngo
Price comparison

