Review de Beelink GT-R Mini Desktop
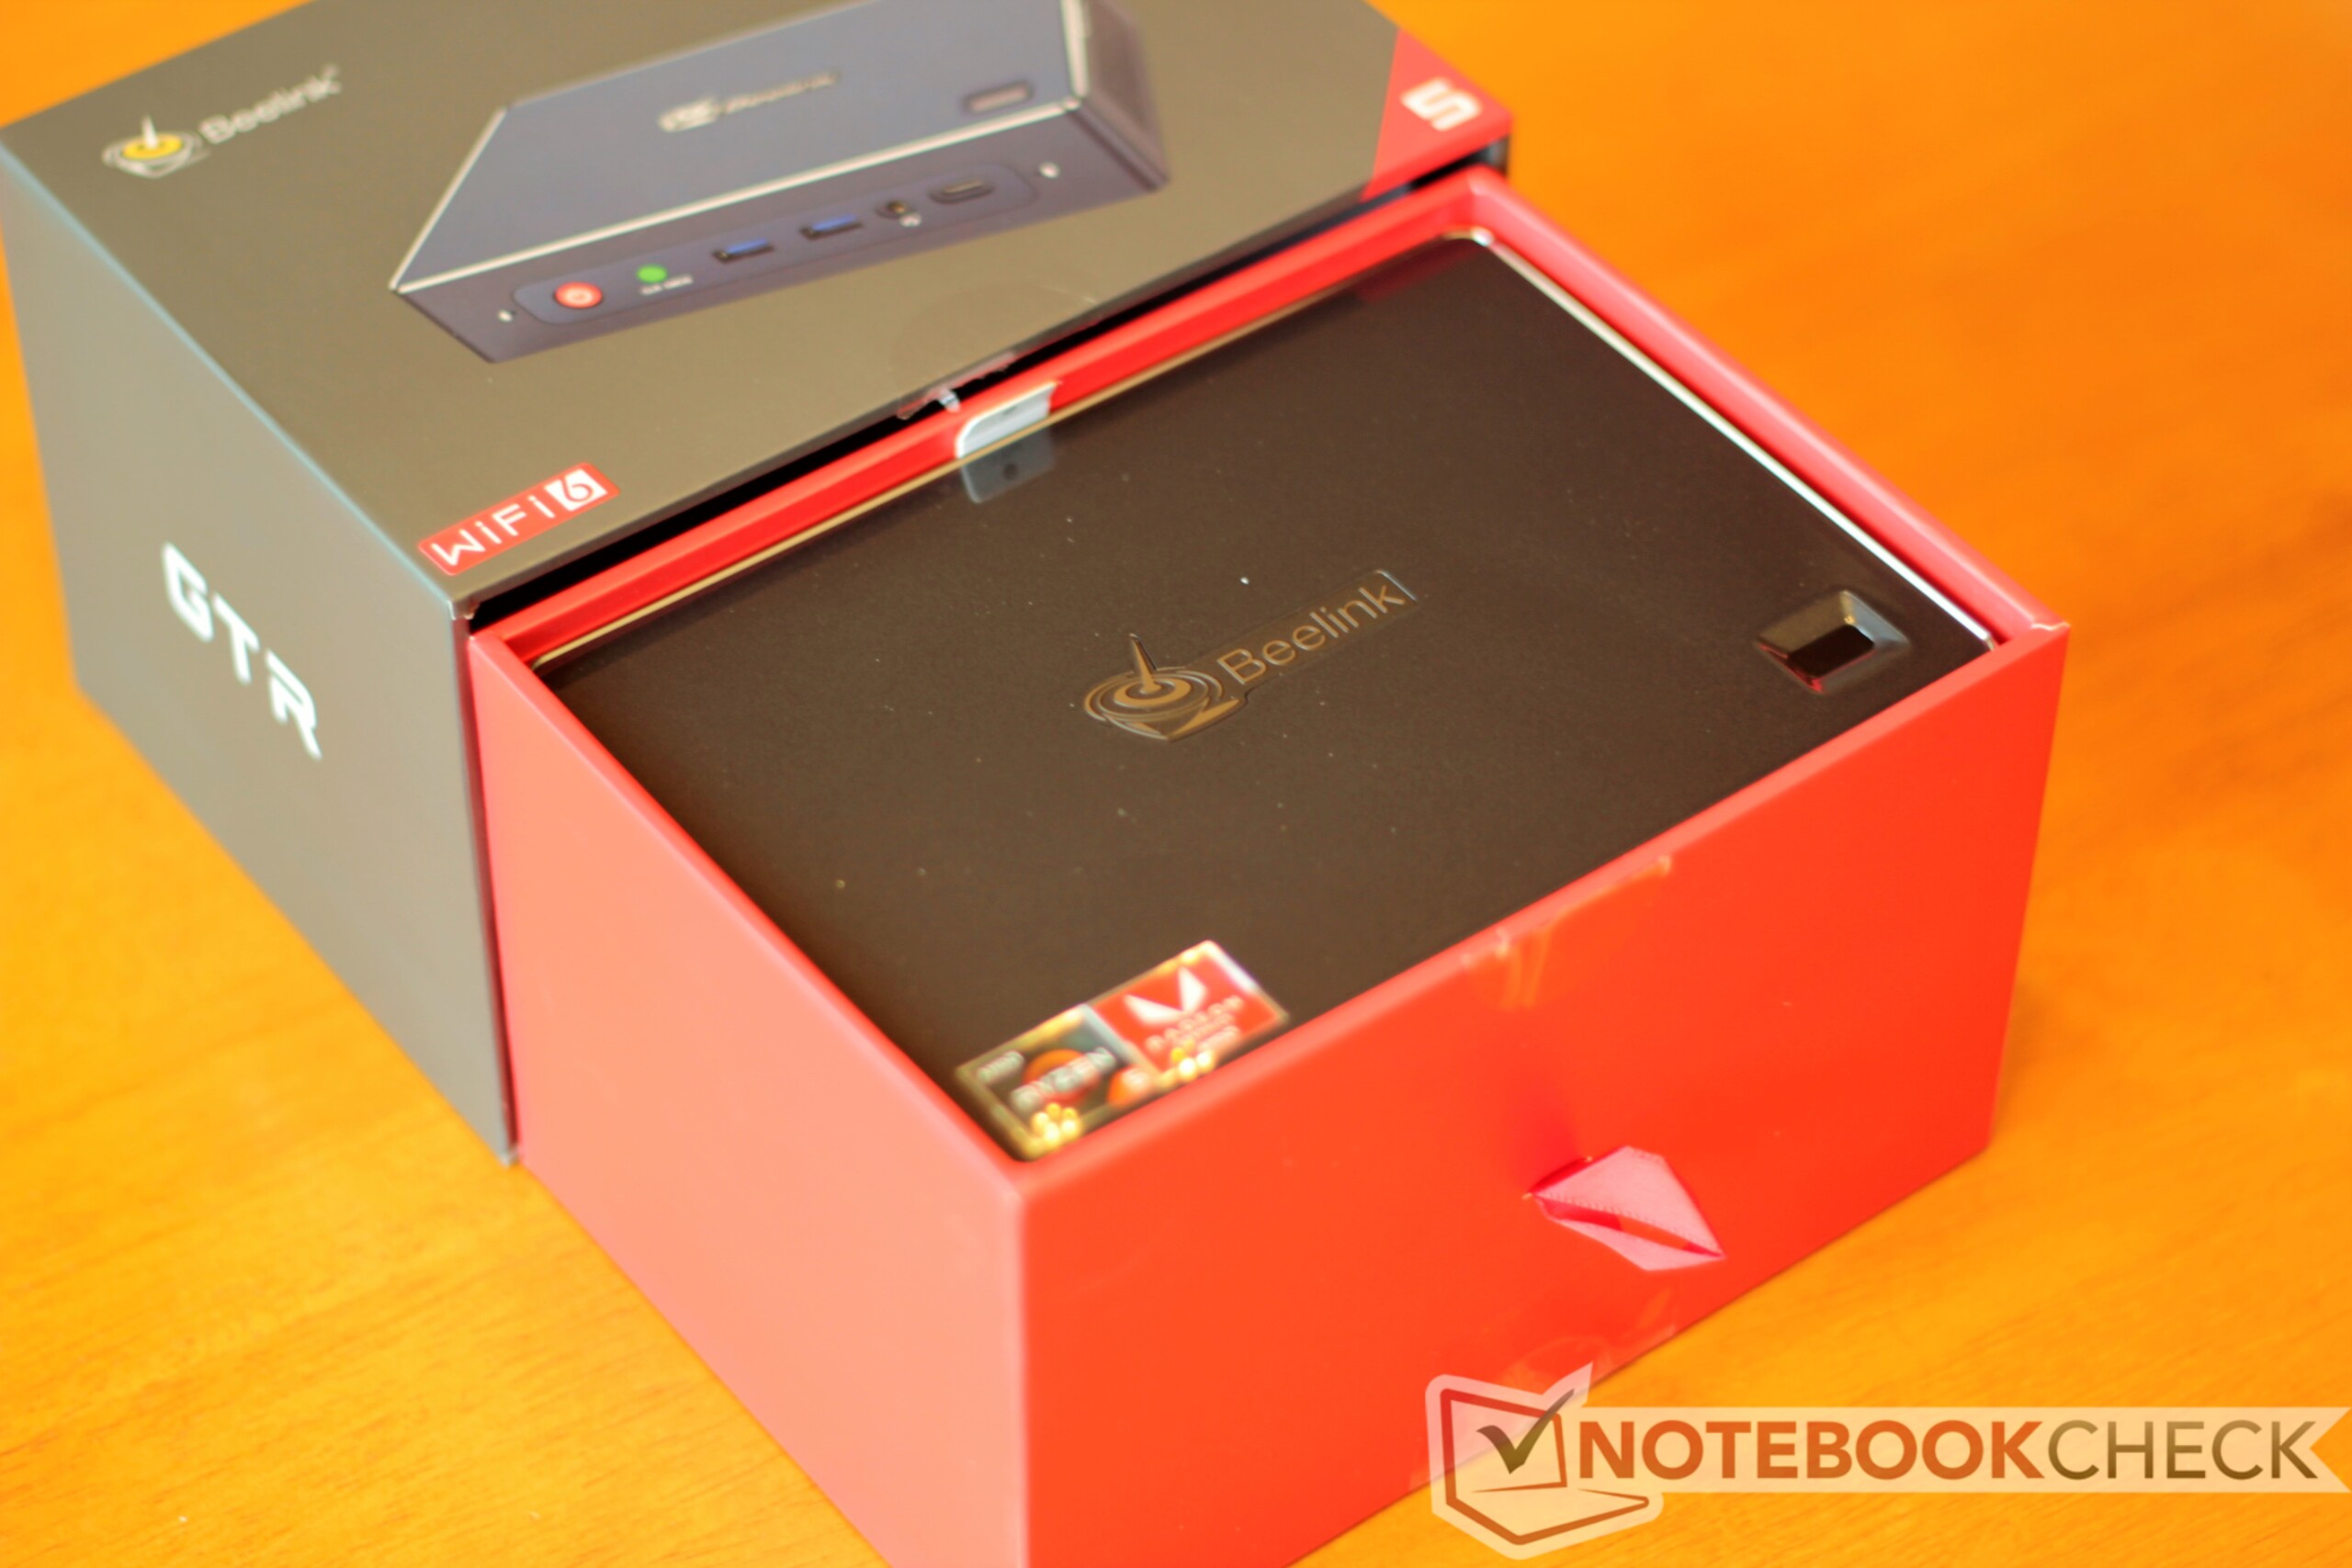
Beelink es una pequeña empresa con sede en Shenzen que fabrica mini PCs de escritorio y pequeñas cajas de TV Android. El dispositivo de revisión de hoy, el GT-R, es uno de sus últimos escritorios Windows de pequeño factor de forma (SFF). Aunque técnicamente es uno de los dispositivos más grandes que fabrica Beelink, el GT-R es una computadora compacta que ocupa alrededor de un tercio del espacio del escritorio de un teclado de tamaño completo.
El GT-R se ejecuta en un AMD Ryzen 5 3550H con una GPU Radeon RX Vega 8 incorporada. Esta APU está diseñada para portátiles, en particular el Asus TUF Gaming FX705, pero veremos si se siente como en casa en un pequeño PC de escritorio y examinaremos cuánta potencia puede caber en una caja tan pequeña.
Beelink no vende el GT-R directamente, optando en su lugar por vendedores terceros como Geekbuying y Gearbest. La mayoría de estos vendedores ofrecen el GT-R en varias configuraciones, lo que permite a los compradores elegir la memoria RAM y las opciones de almacenamiento que deseen. El GT-R también puede ser comprado como un kit de barebones por unos 400 dólares. Esta opción requiere que el comprador provea su propia RAM y unidades de almacenamiento. Todas las opciones vienen con el Ryzen 5 3550H/Radeon RX Vega 8 APU, que está soldado a la placa madre.
El mercado de mini PC tiene algunos dispositivos notables que se apilan bien contra el GT-R. Compararemos el BOX-CI660 Nano (i7-8550U), el Intel NUC Kit NUC8i7BEH (i7-8559U), y el Intel Hades Canyon NUC8i7HVK (i7-8809G).
Valoración | Fecha | Modelo | Peso | Altura | Tamaño | Resolución | Precio |
|---|---|---|---|---|---|---|---|
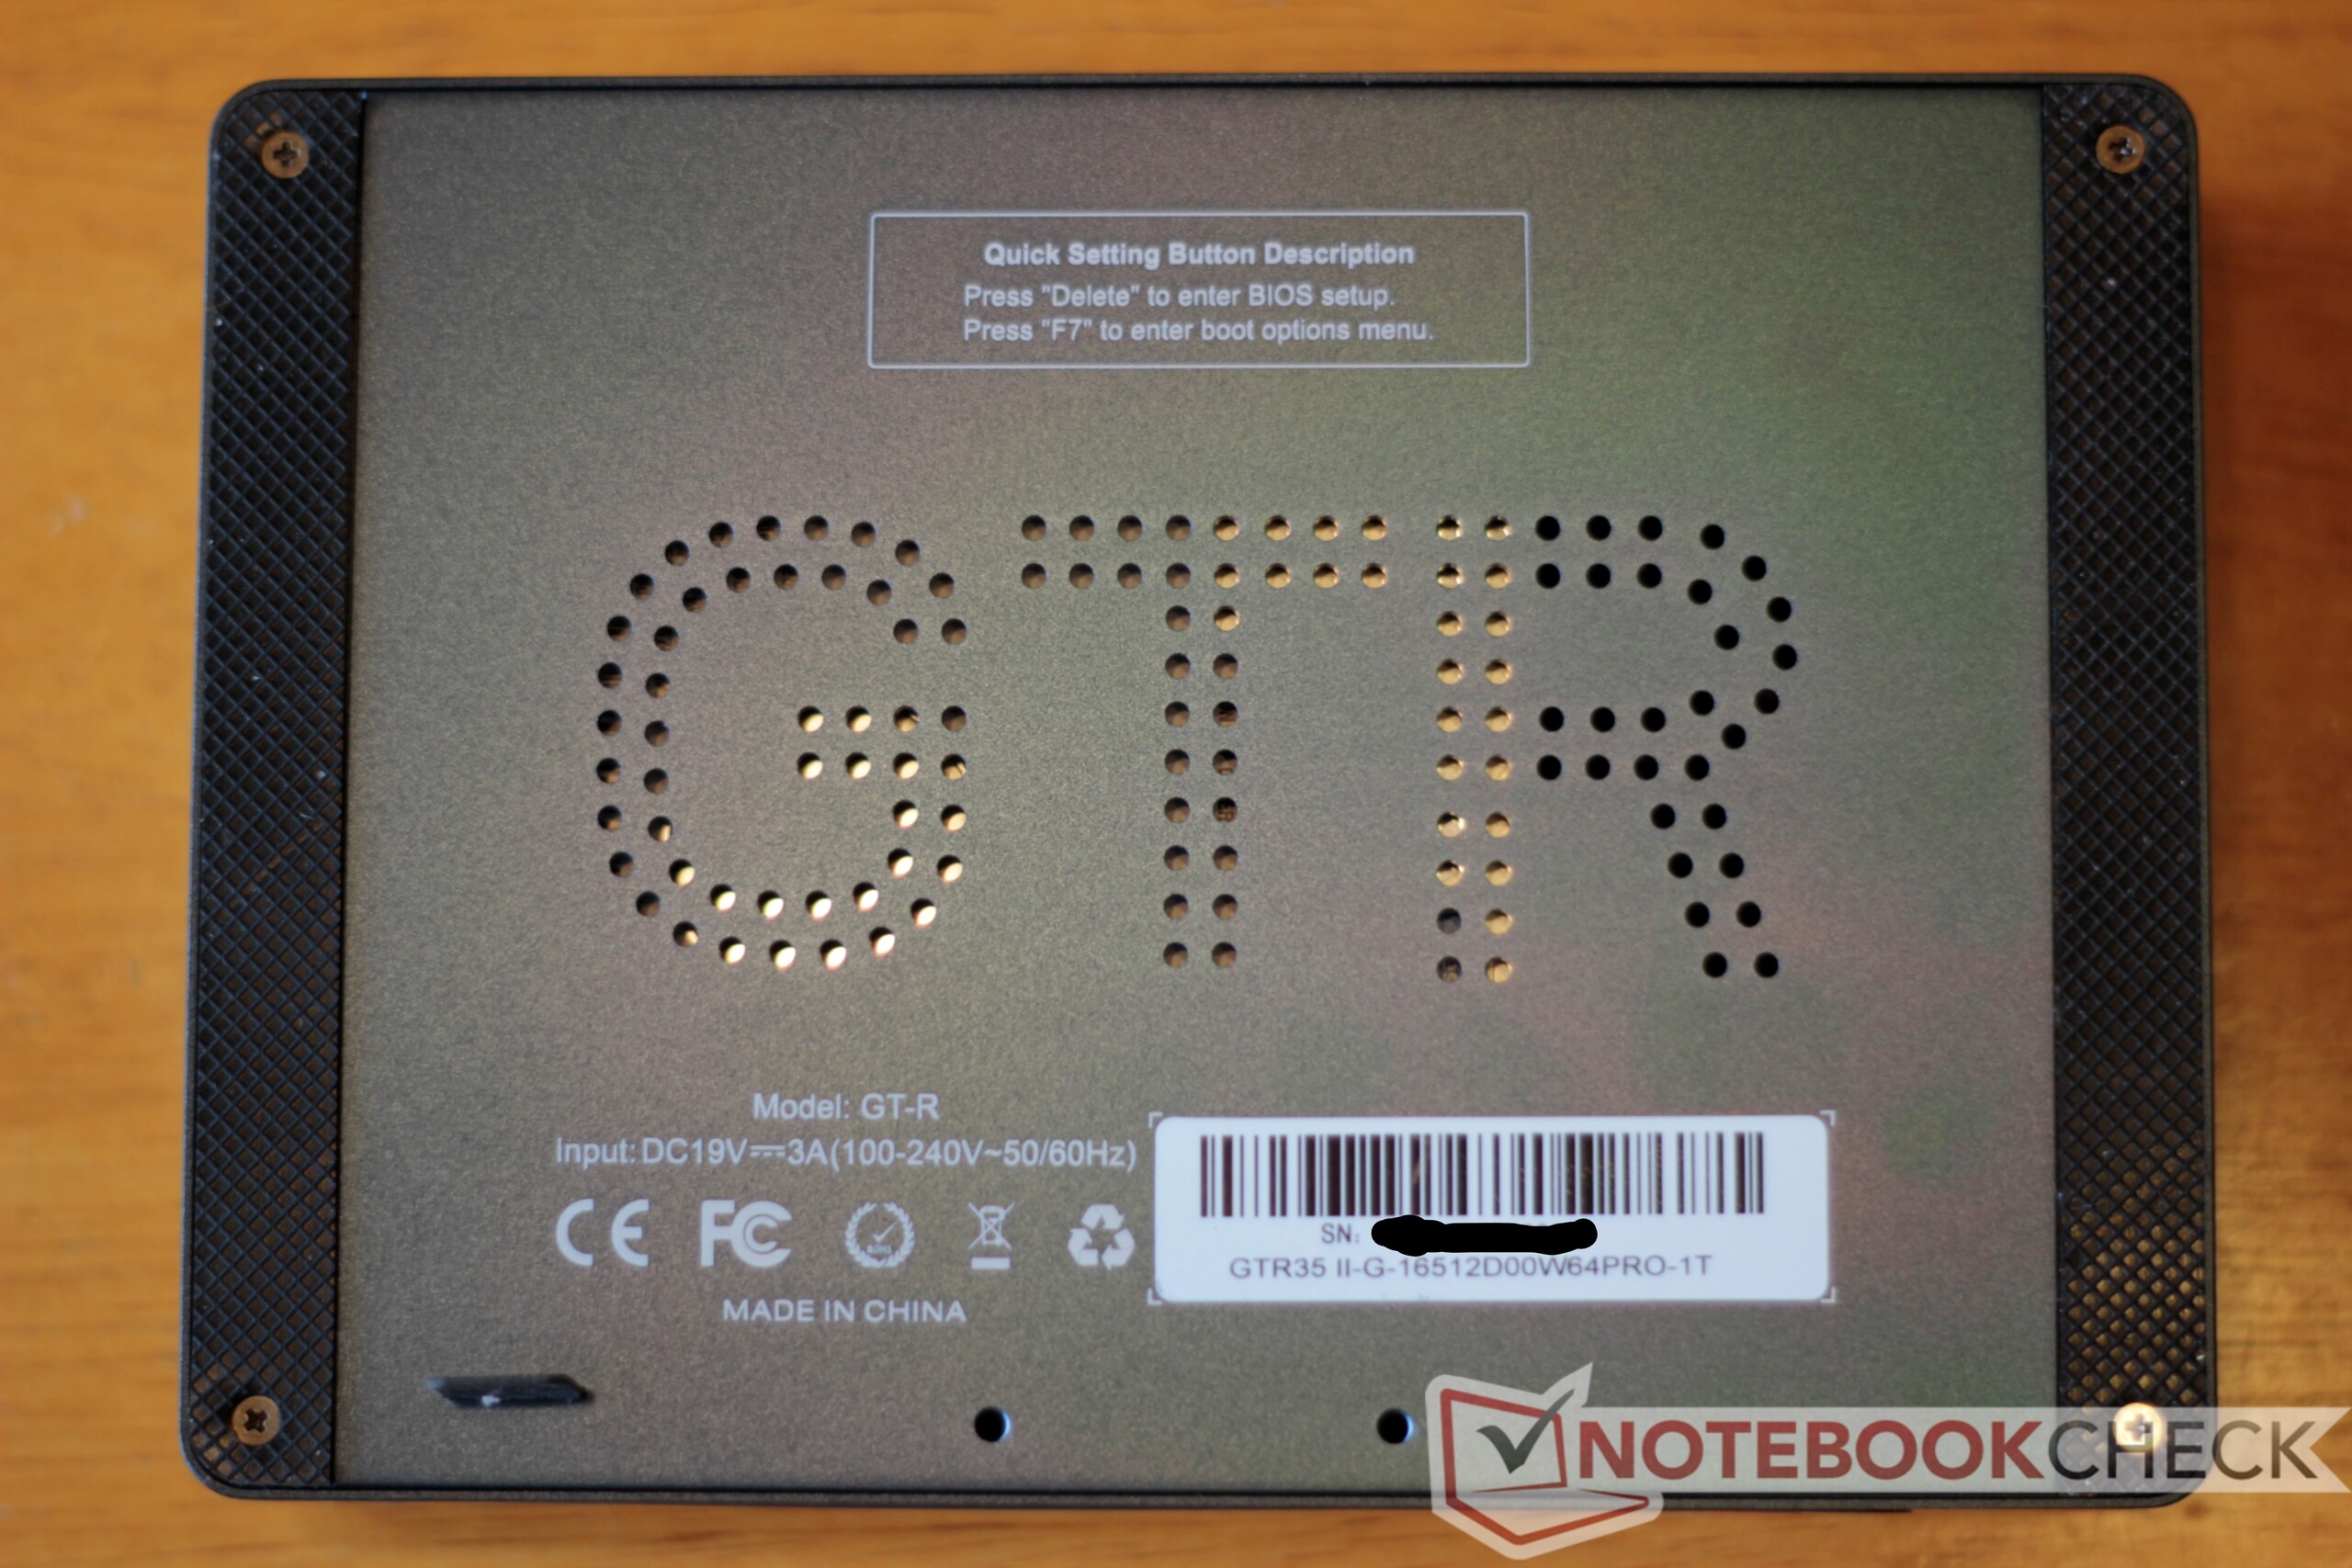
v (old) | 08/2020 | Beelink GTR35 II-G-16512D00W64PRO-1T R5 3550H, Vega 8 | 843 g | 39 mm | x | ||
v (old) | 09/2018 | Zotac ZBOX-CI660 Nano i5-8550U, UHD Graphics 620 | 1.1 kg | 68 mm | x | ||
v (old) | 02/2020 | Intel NUC10i7FNH i7-10710U, UHD Graphics 620 | 697 g | 51 mm | 0.00" | 0x0 | |
v (old) | 02/2020 | Intel NUC10i5FNK i5-10210U, UHD Graphics 620 | 493 g | 36 mm | 0.00" | 0x0 | |
v (old) | 11/2018 | Intel NUC8i7BE i7-8559U, Iris Plus Graphics 655 | 683 g | 51 mm | x | ||
v (old) | 03/2018 | Intel Hades Canyon NUC8i7HVK i7-8809G, Vega M GH | 1.3 kg | 39 mm | x |
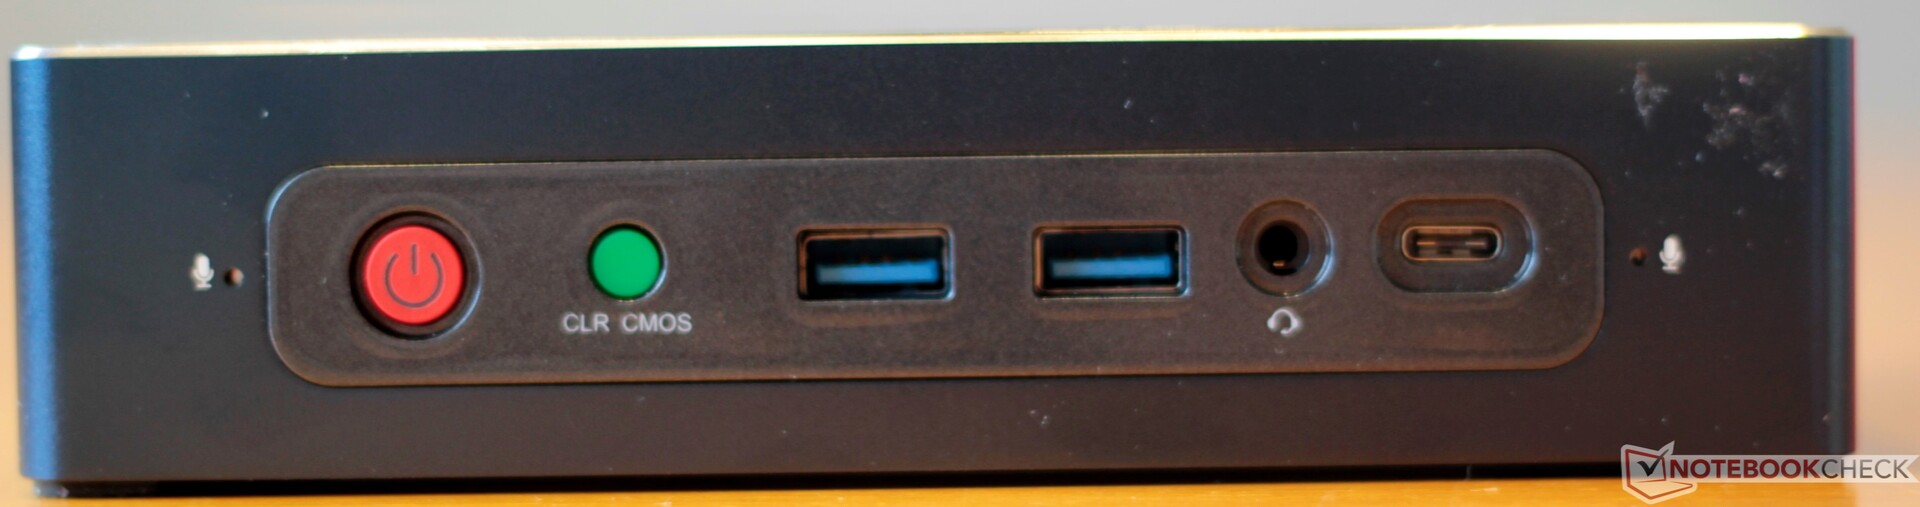
Carcasa y conectividad
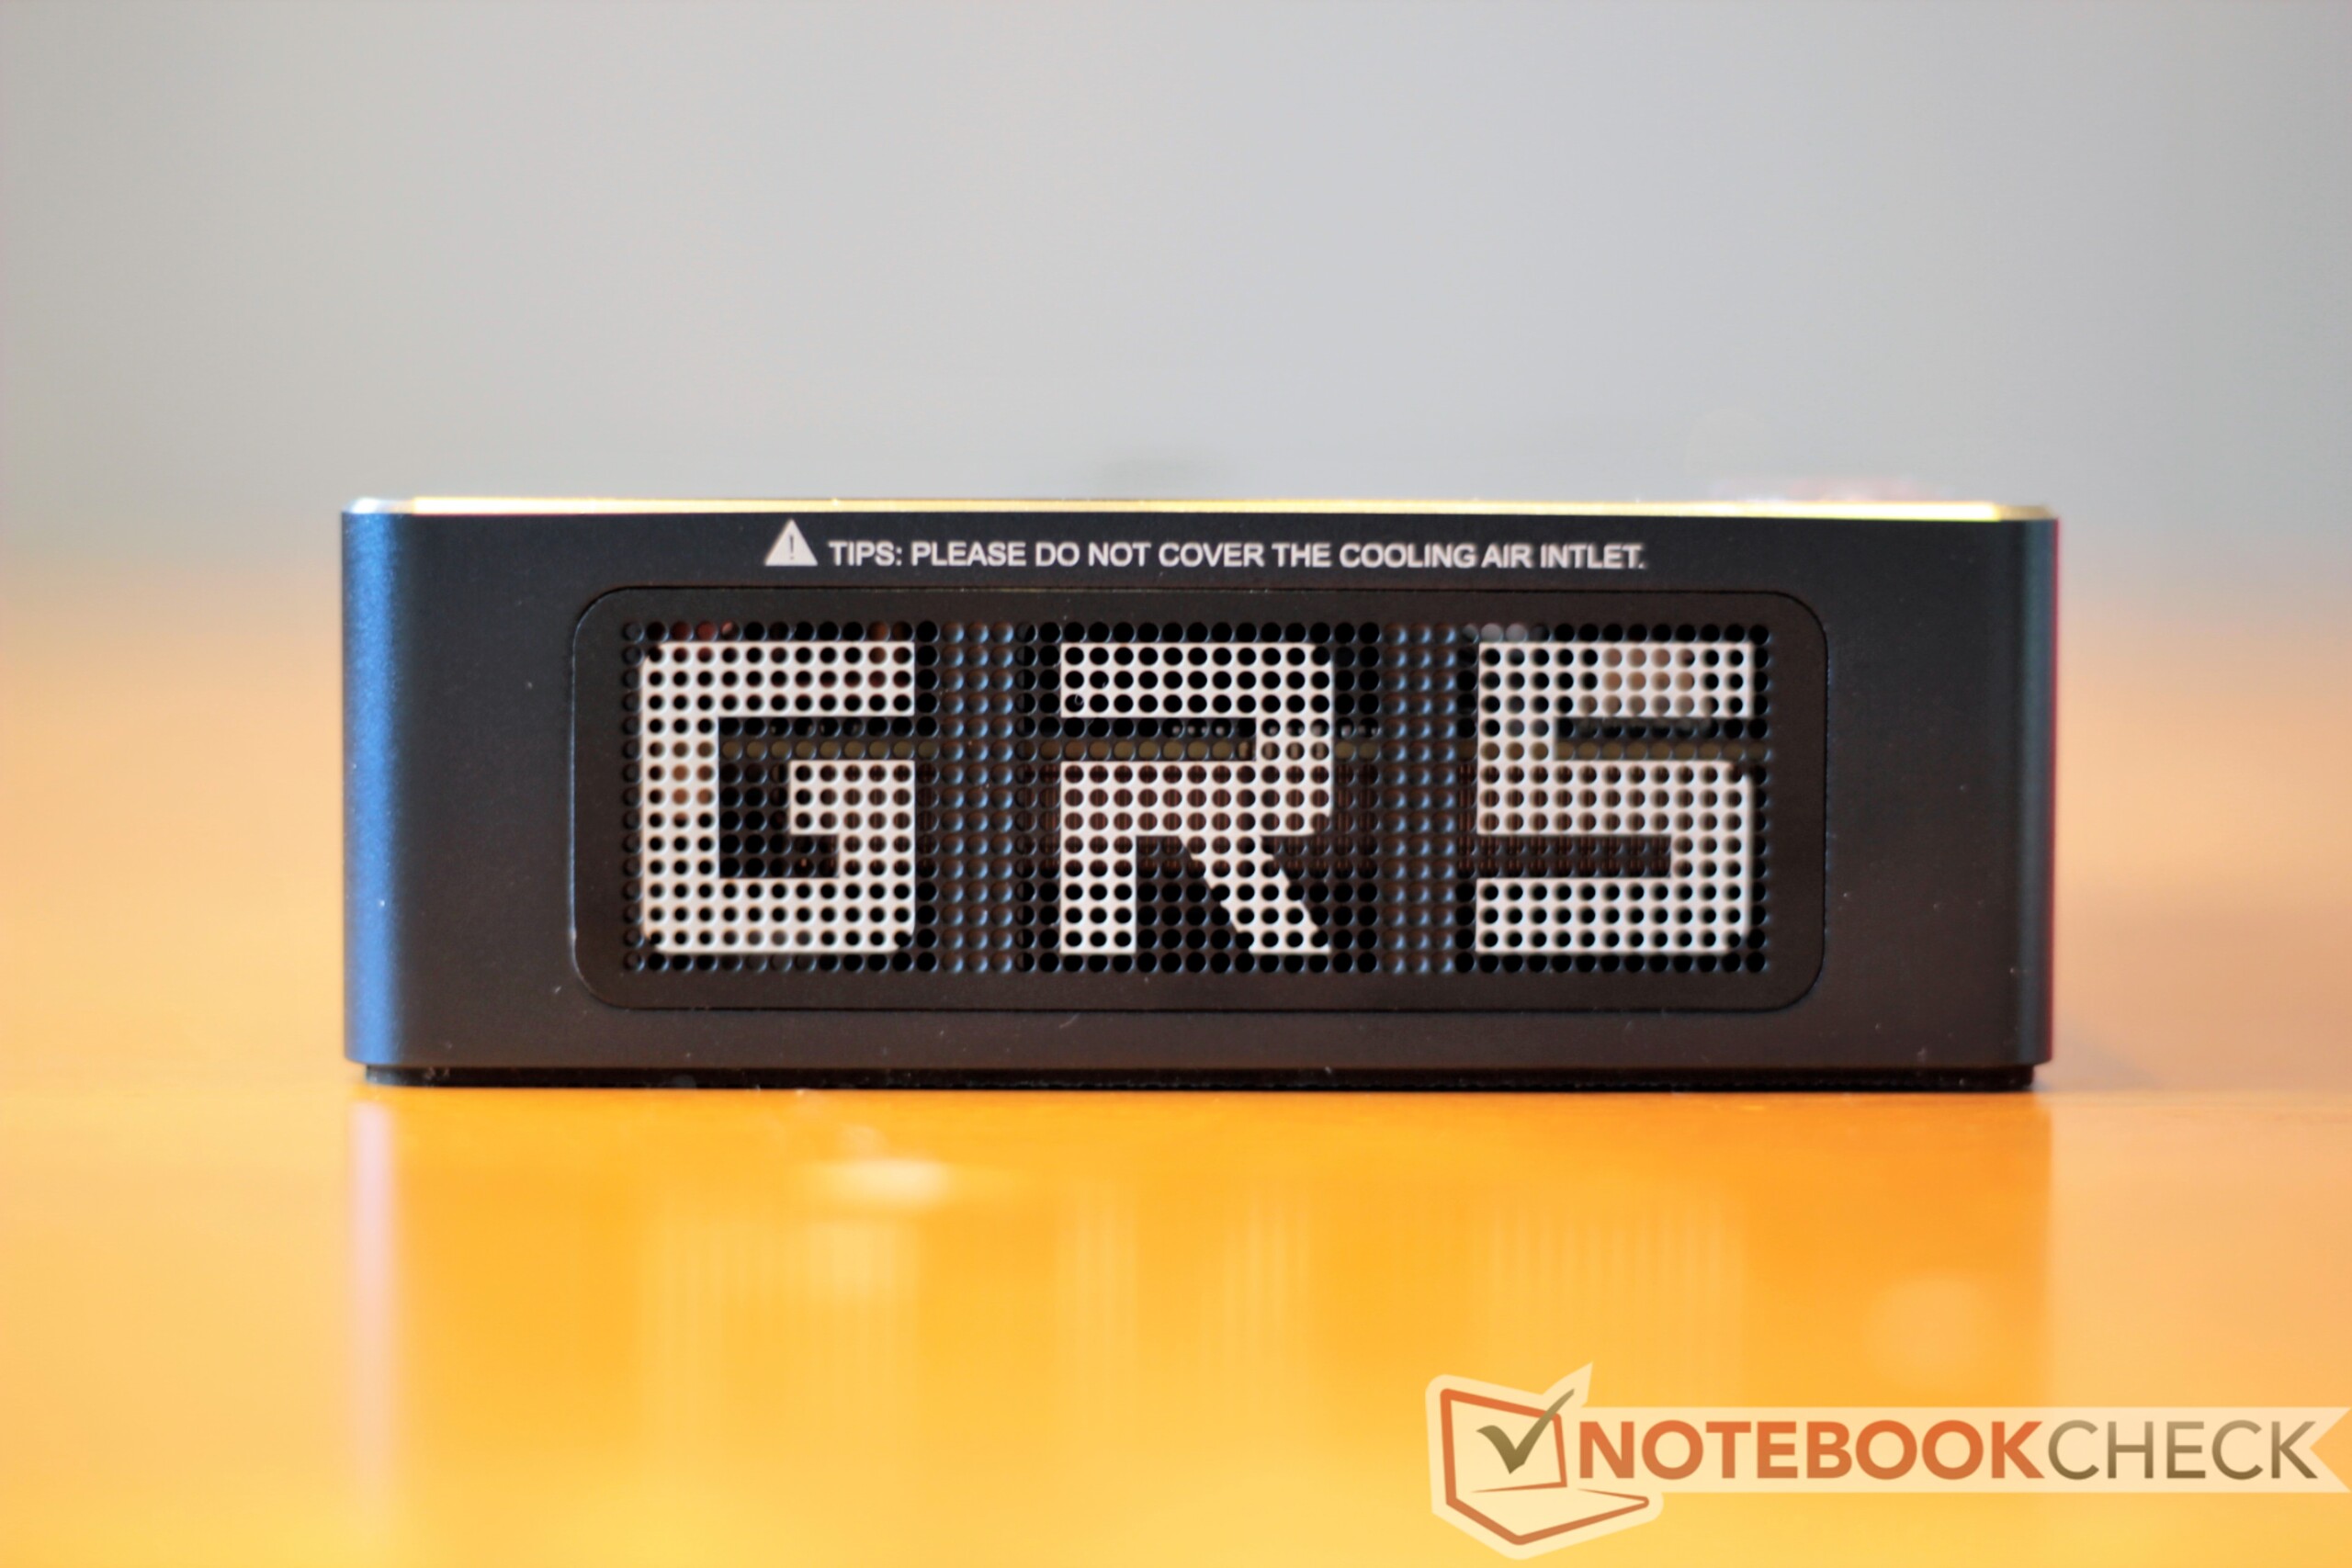
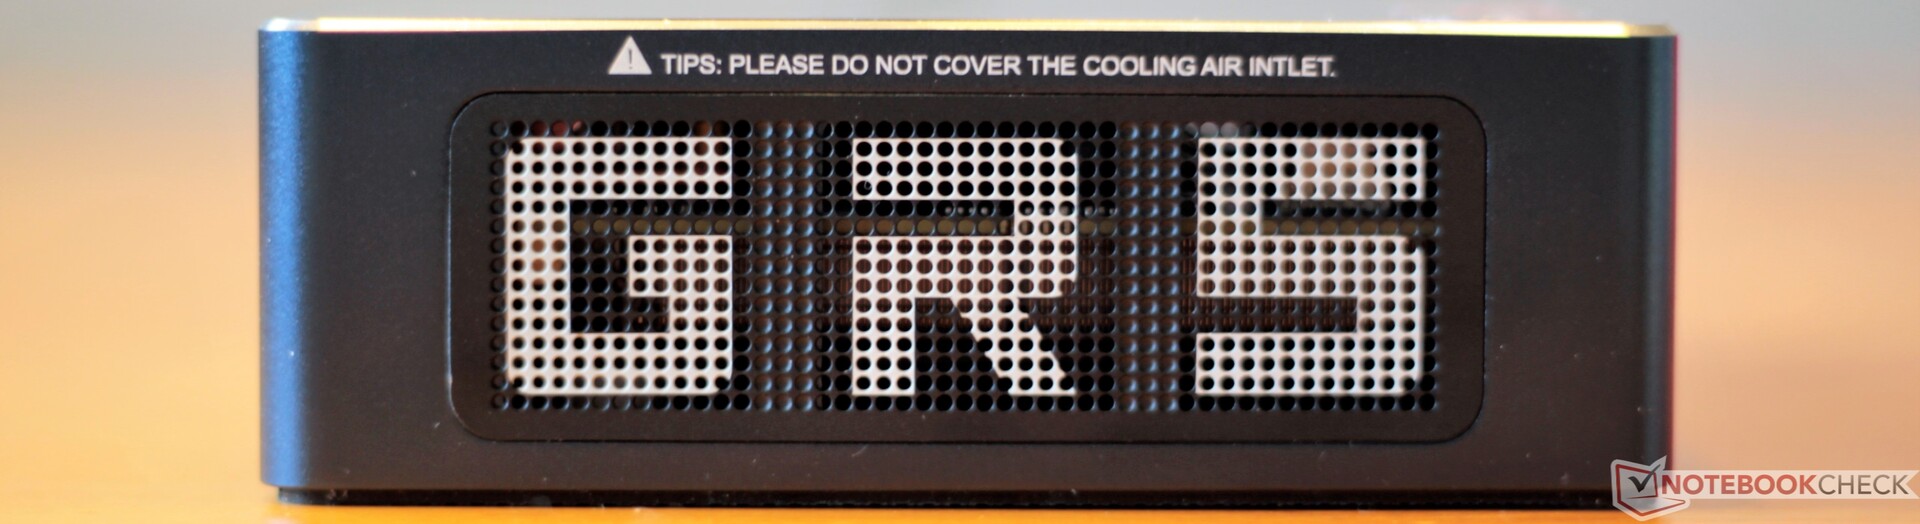
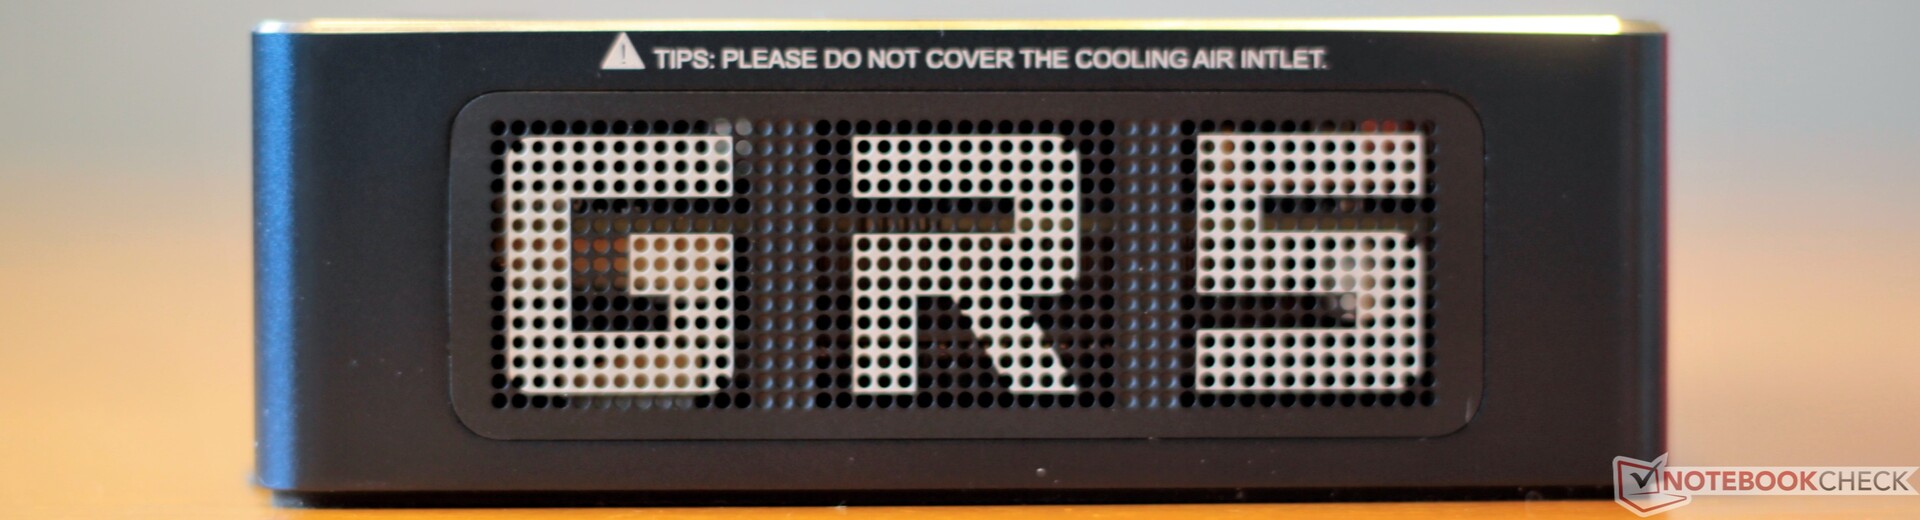
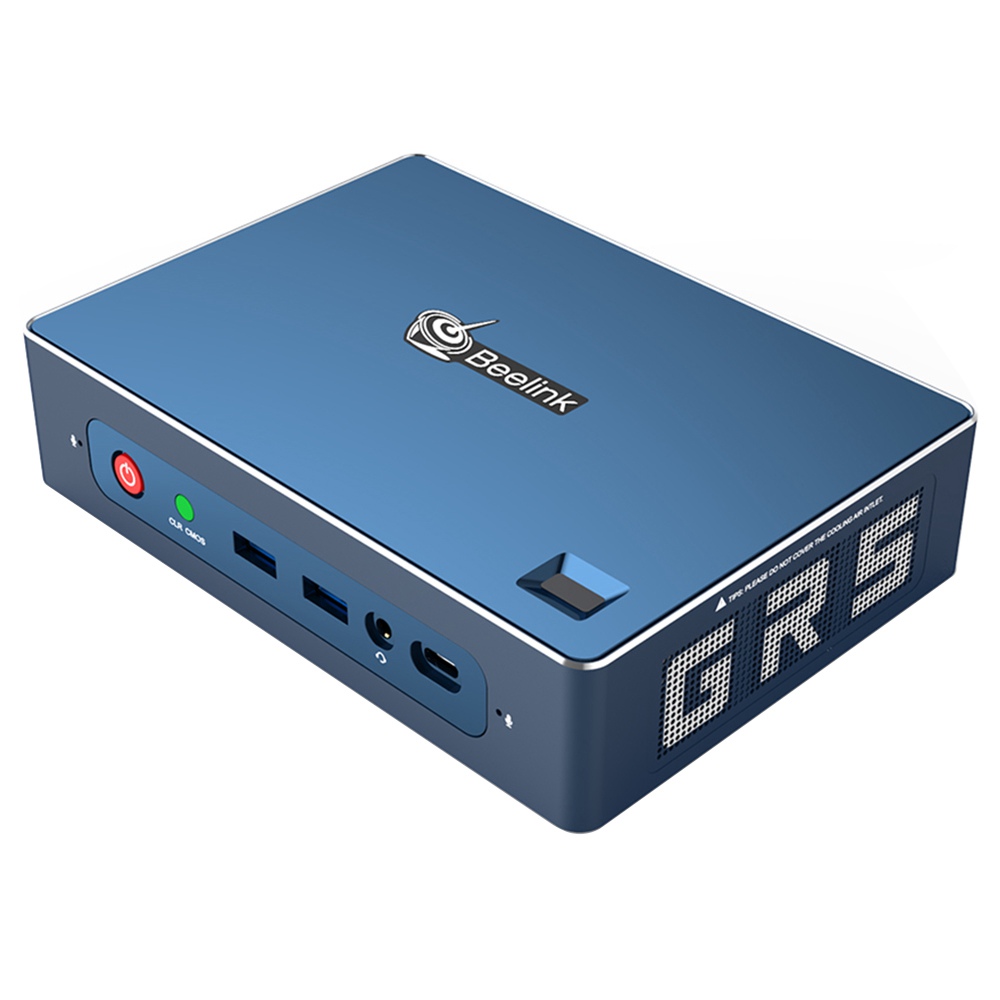
La carcasa del GT-R está bien hecha, es estéticamente agradable y está hecha de una aleación de magnesio. El panel superior está cubierto de vidrio, dando un poco de chispa extra. La carcasa se siente robusta y se mantiene firme bajo presión directa. Su color gris neutro le da un aspecto profesional, y el acabado mate de los paneles laterales resiste a las huellas dactilares. Sin embargo, el vidrio superior muestra manchas fácilmente. La carcasa del GT-R es hermosa y fuerte.
La huella del GT-R es bastante pequeña, ocupando alrededor de un tercio del espacio de un teclado de tamaño estándar. Es más pequeño que algunos mini PC, como el NUC del Cañón del Hades y el Zotac ZBOX Nano, pero es bastante más grande que la mayoría de los NUC de Intel.
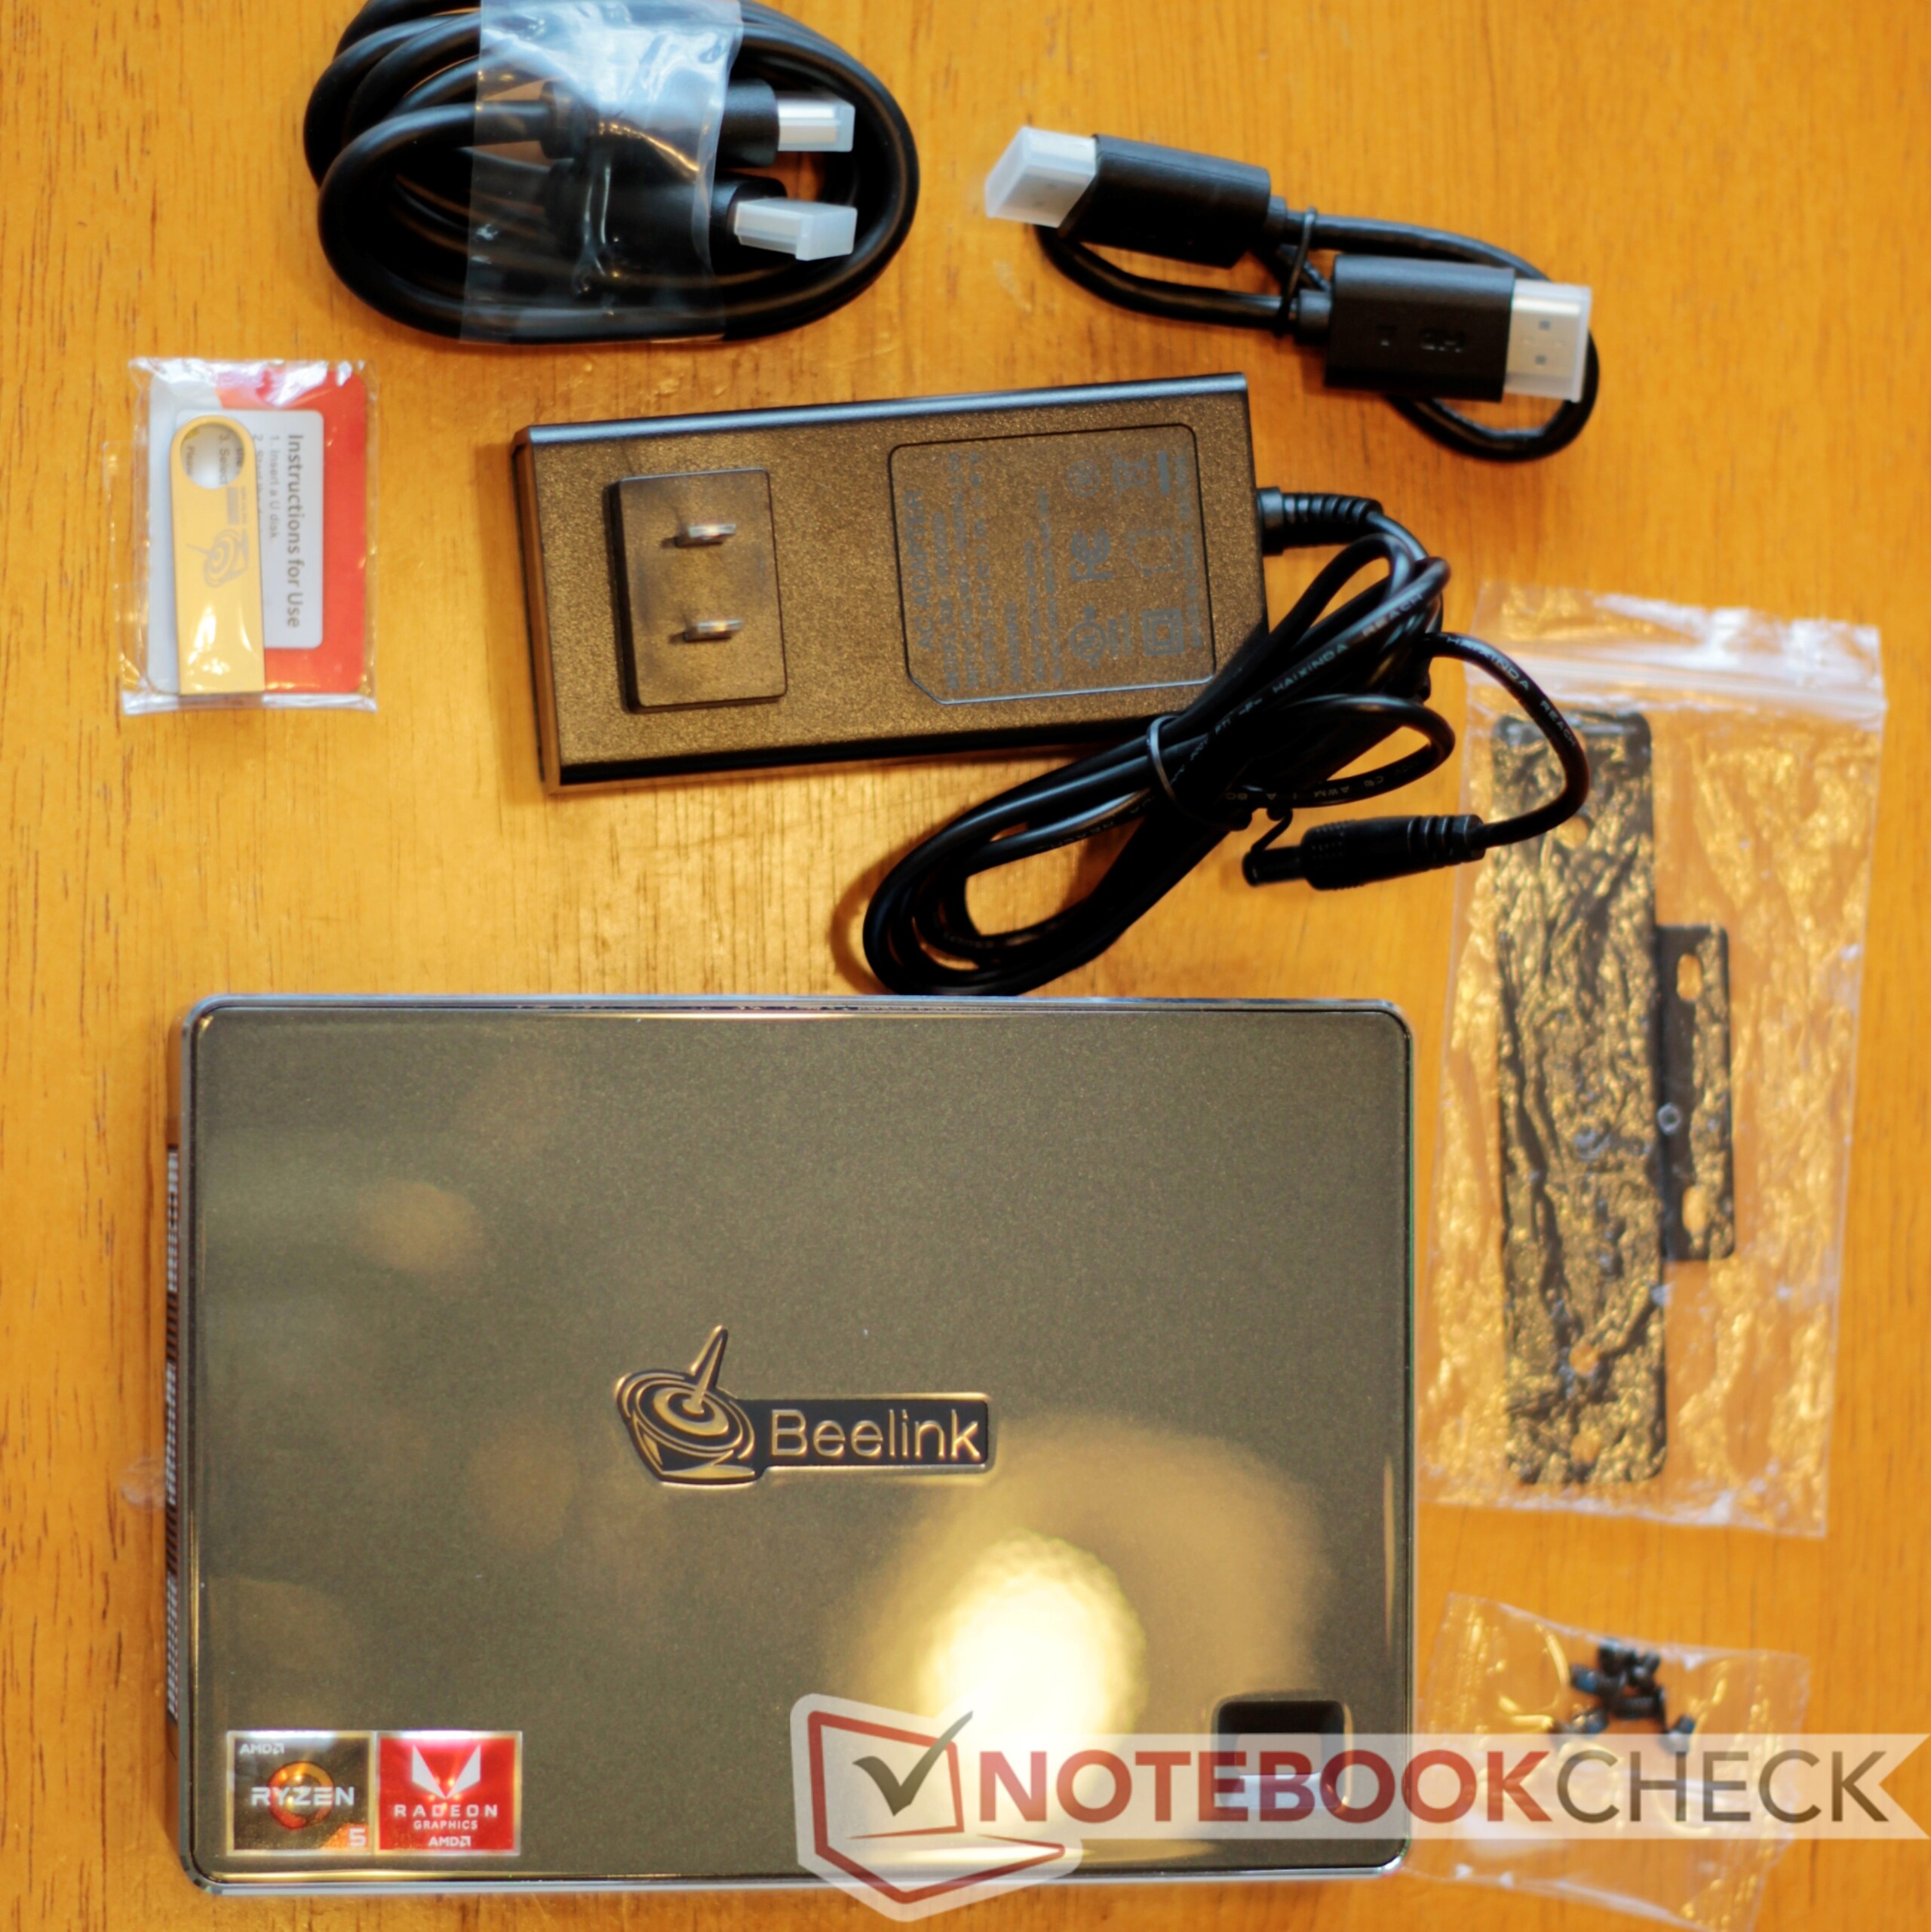
Beelink incluye un soporte de montaje VESA con el GT-R para montar el dispositivo en la parte posterior de un monitor.
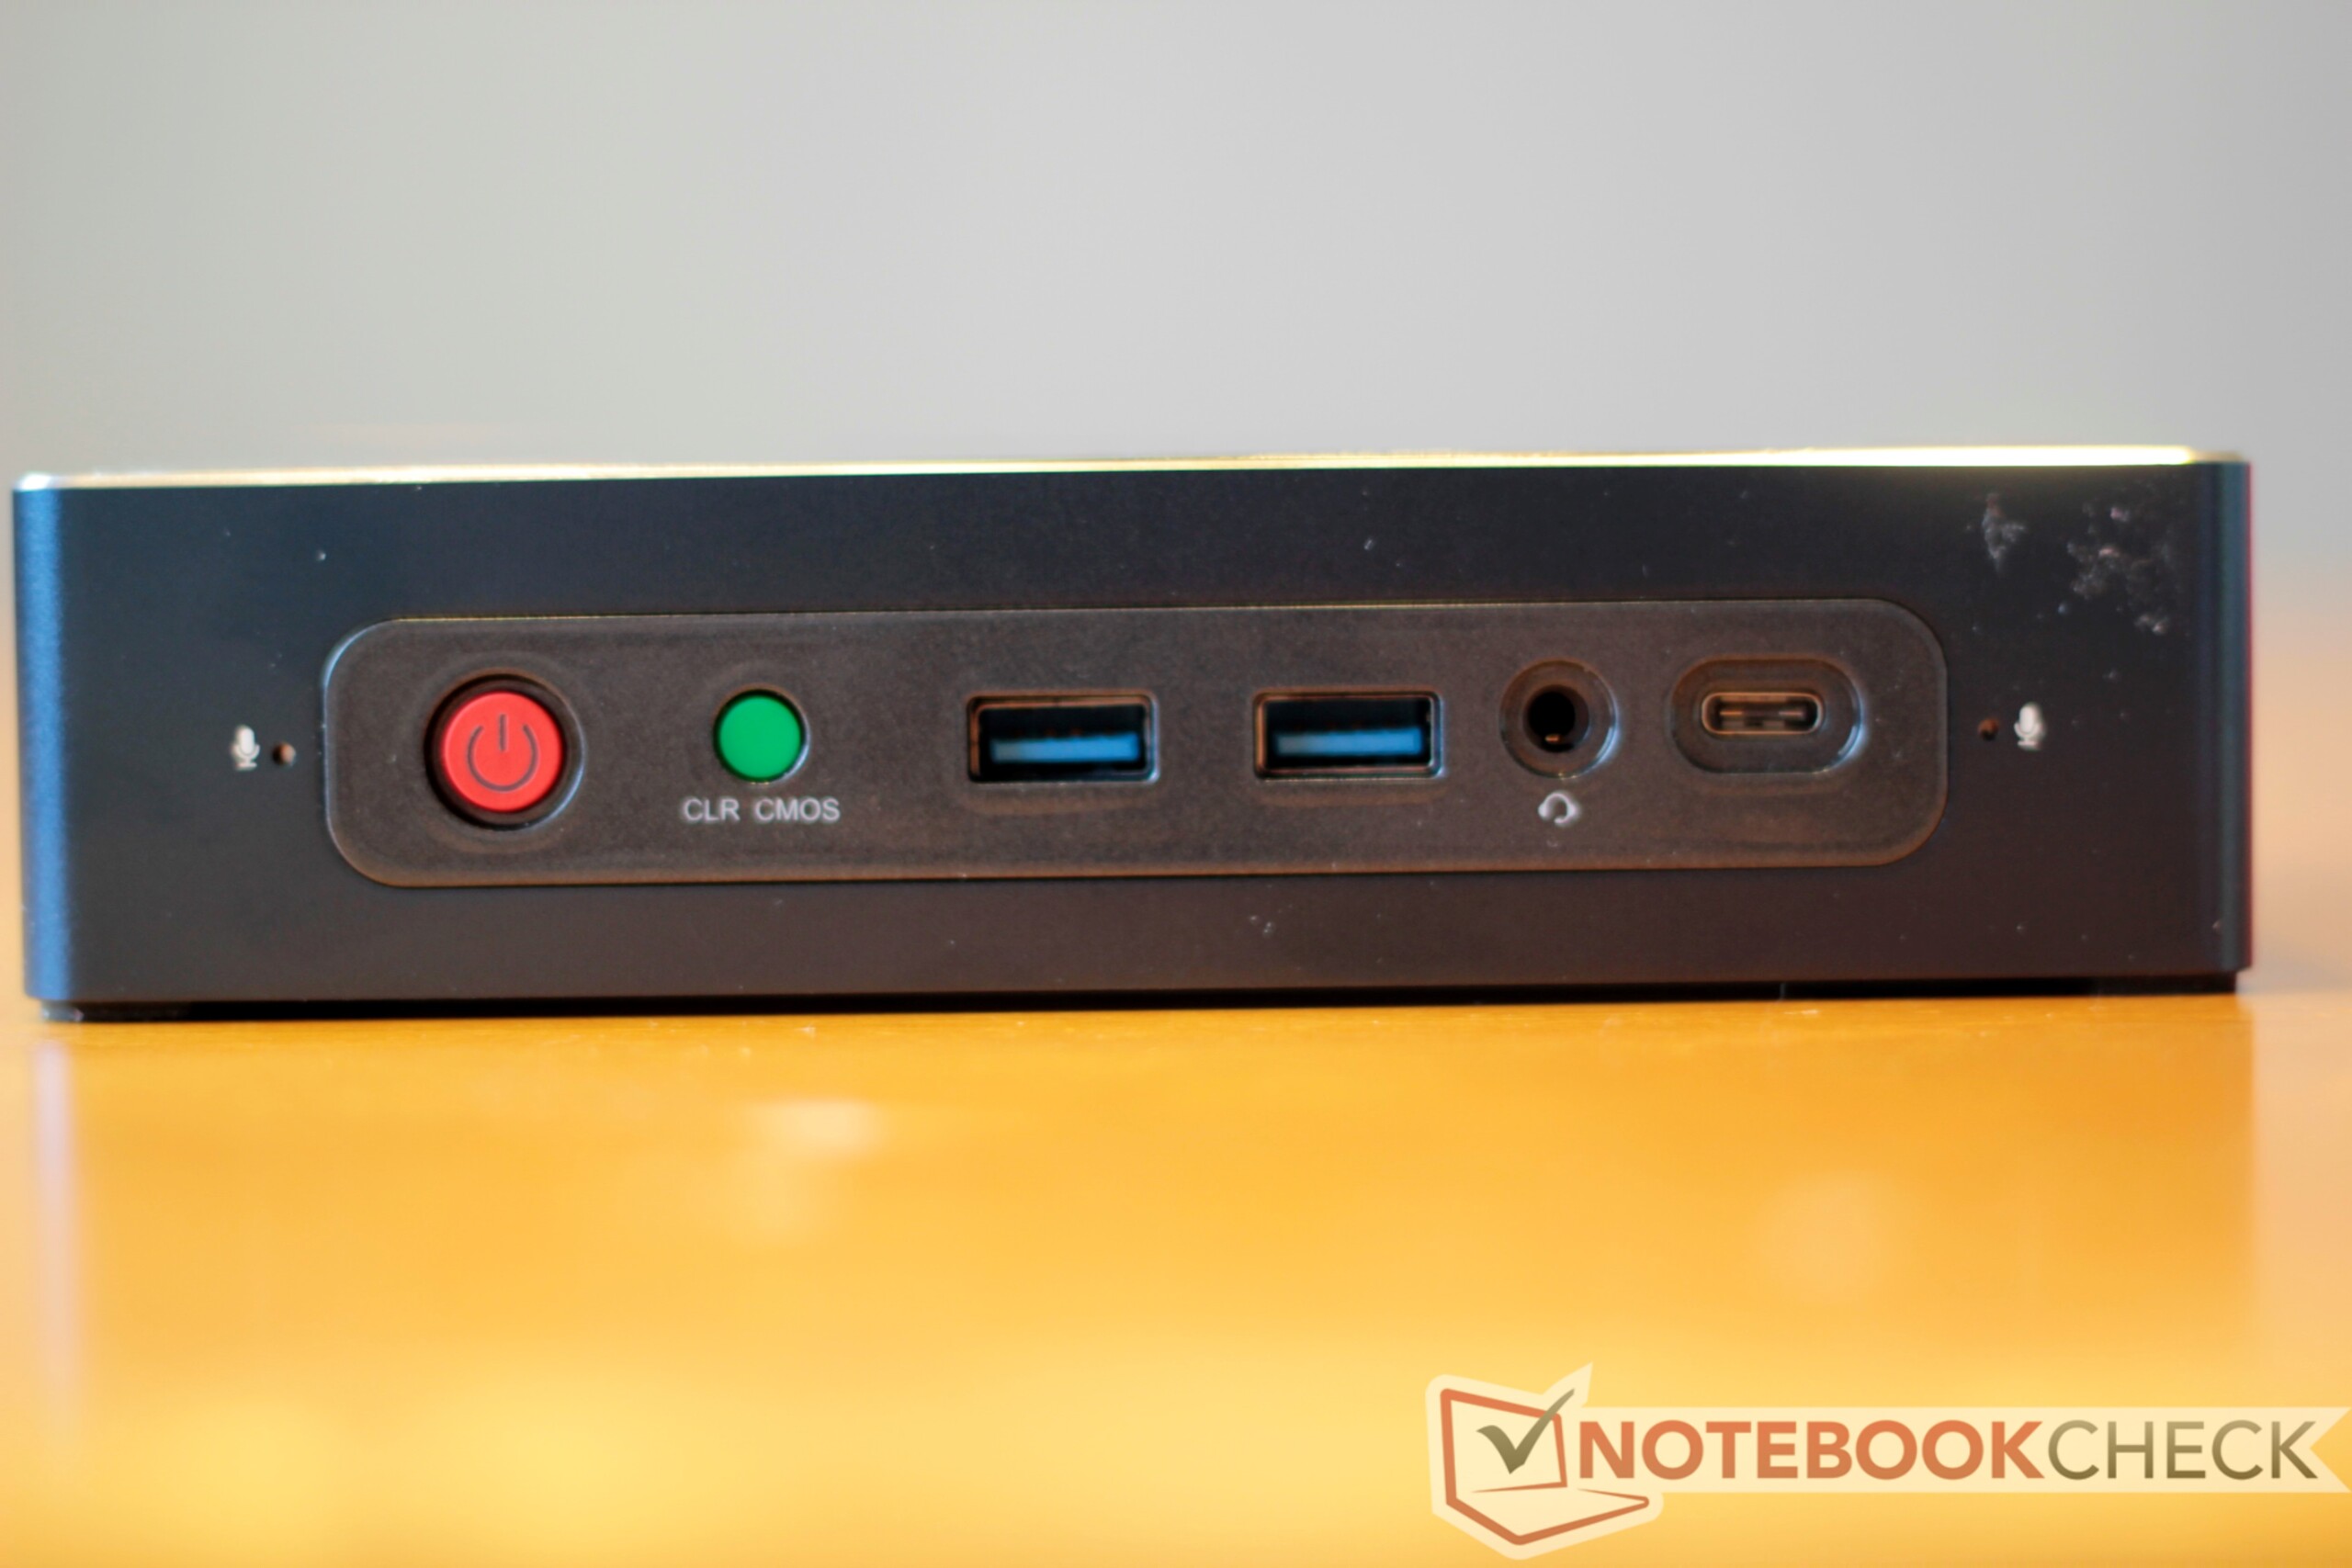

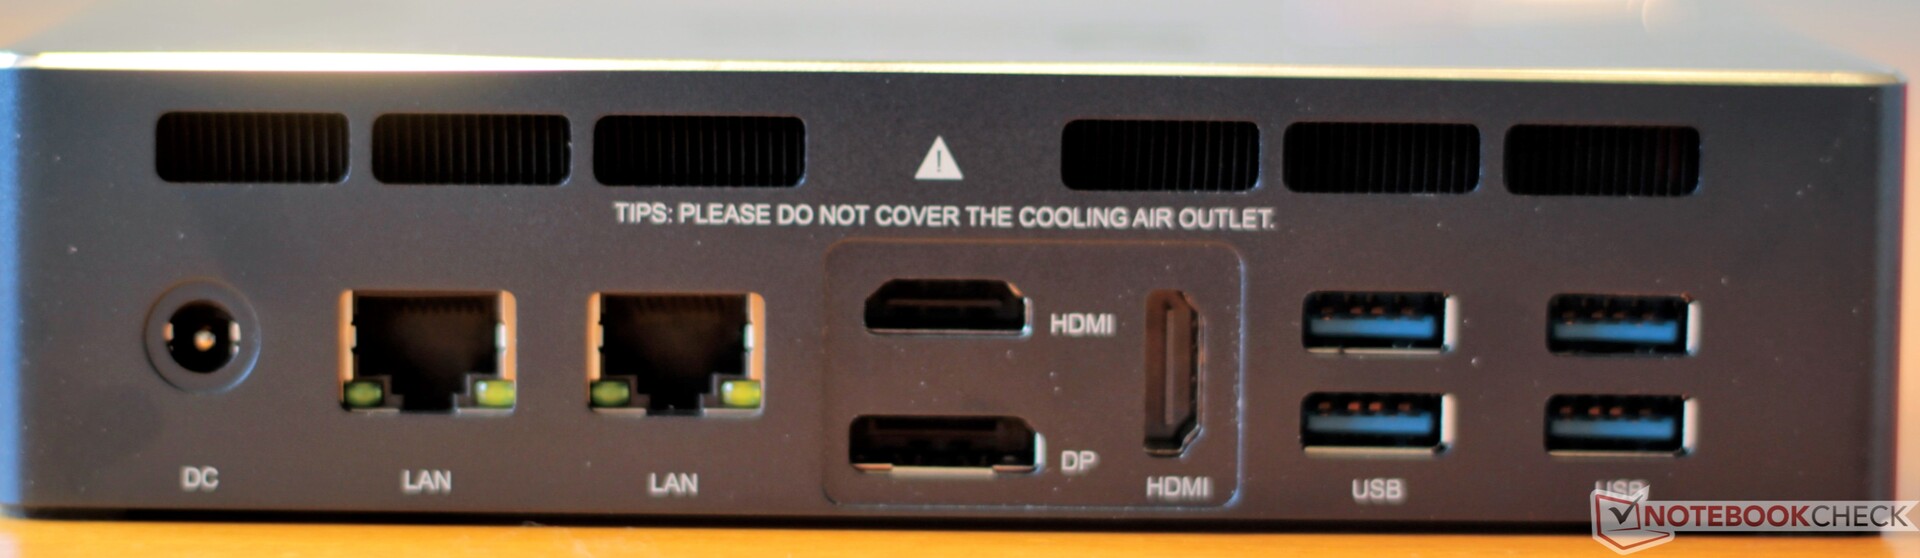
Conectividad
| Networking | |
| iperf3 transmit AX12 | |
| Beelink GTR35 II-G-16512D00W64PRO-1T | |
| Intel NUC8i7BE | |
| Intel Hades Canyon NUC8i7HVK | |
| Zotac ZBOX-CI660 Nano | |
| iperf3 receive AX12 | |
| Beelink GTR35 II-G-16512D00W64PRO-1T | |
| Intel NUC8i7BE | |
| Intel Hades Canyon NUC8i7HVK | |
| Zotac ZBOX-CI660 Nano | |
Mantenimiento
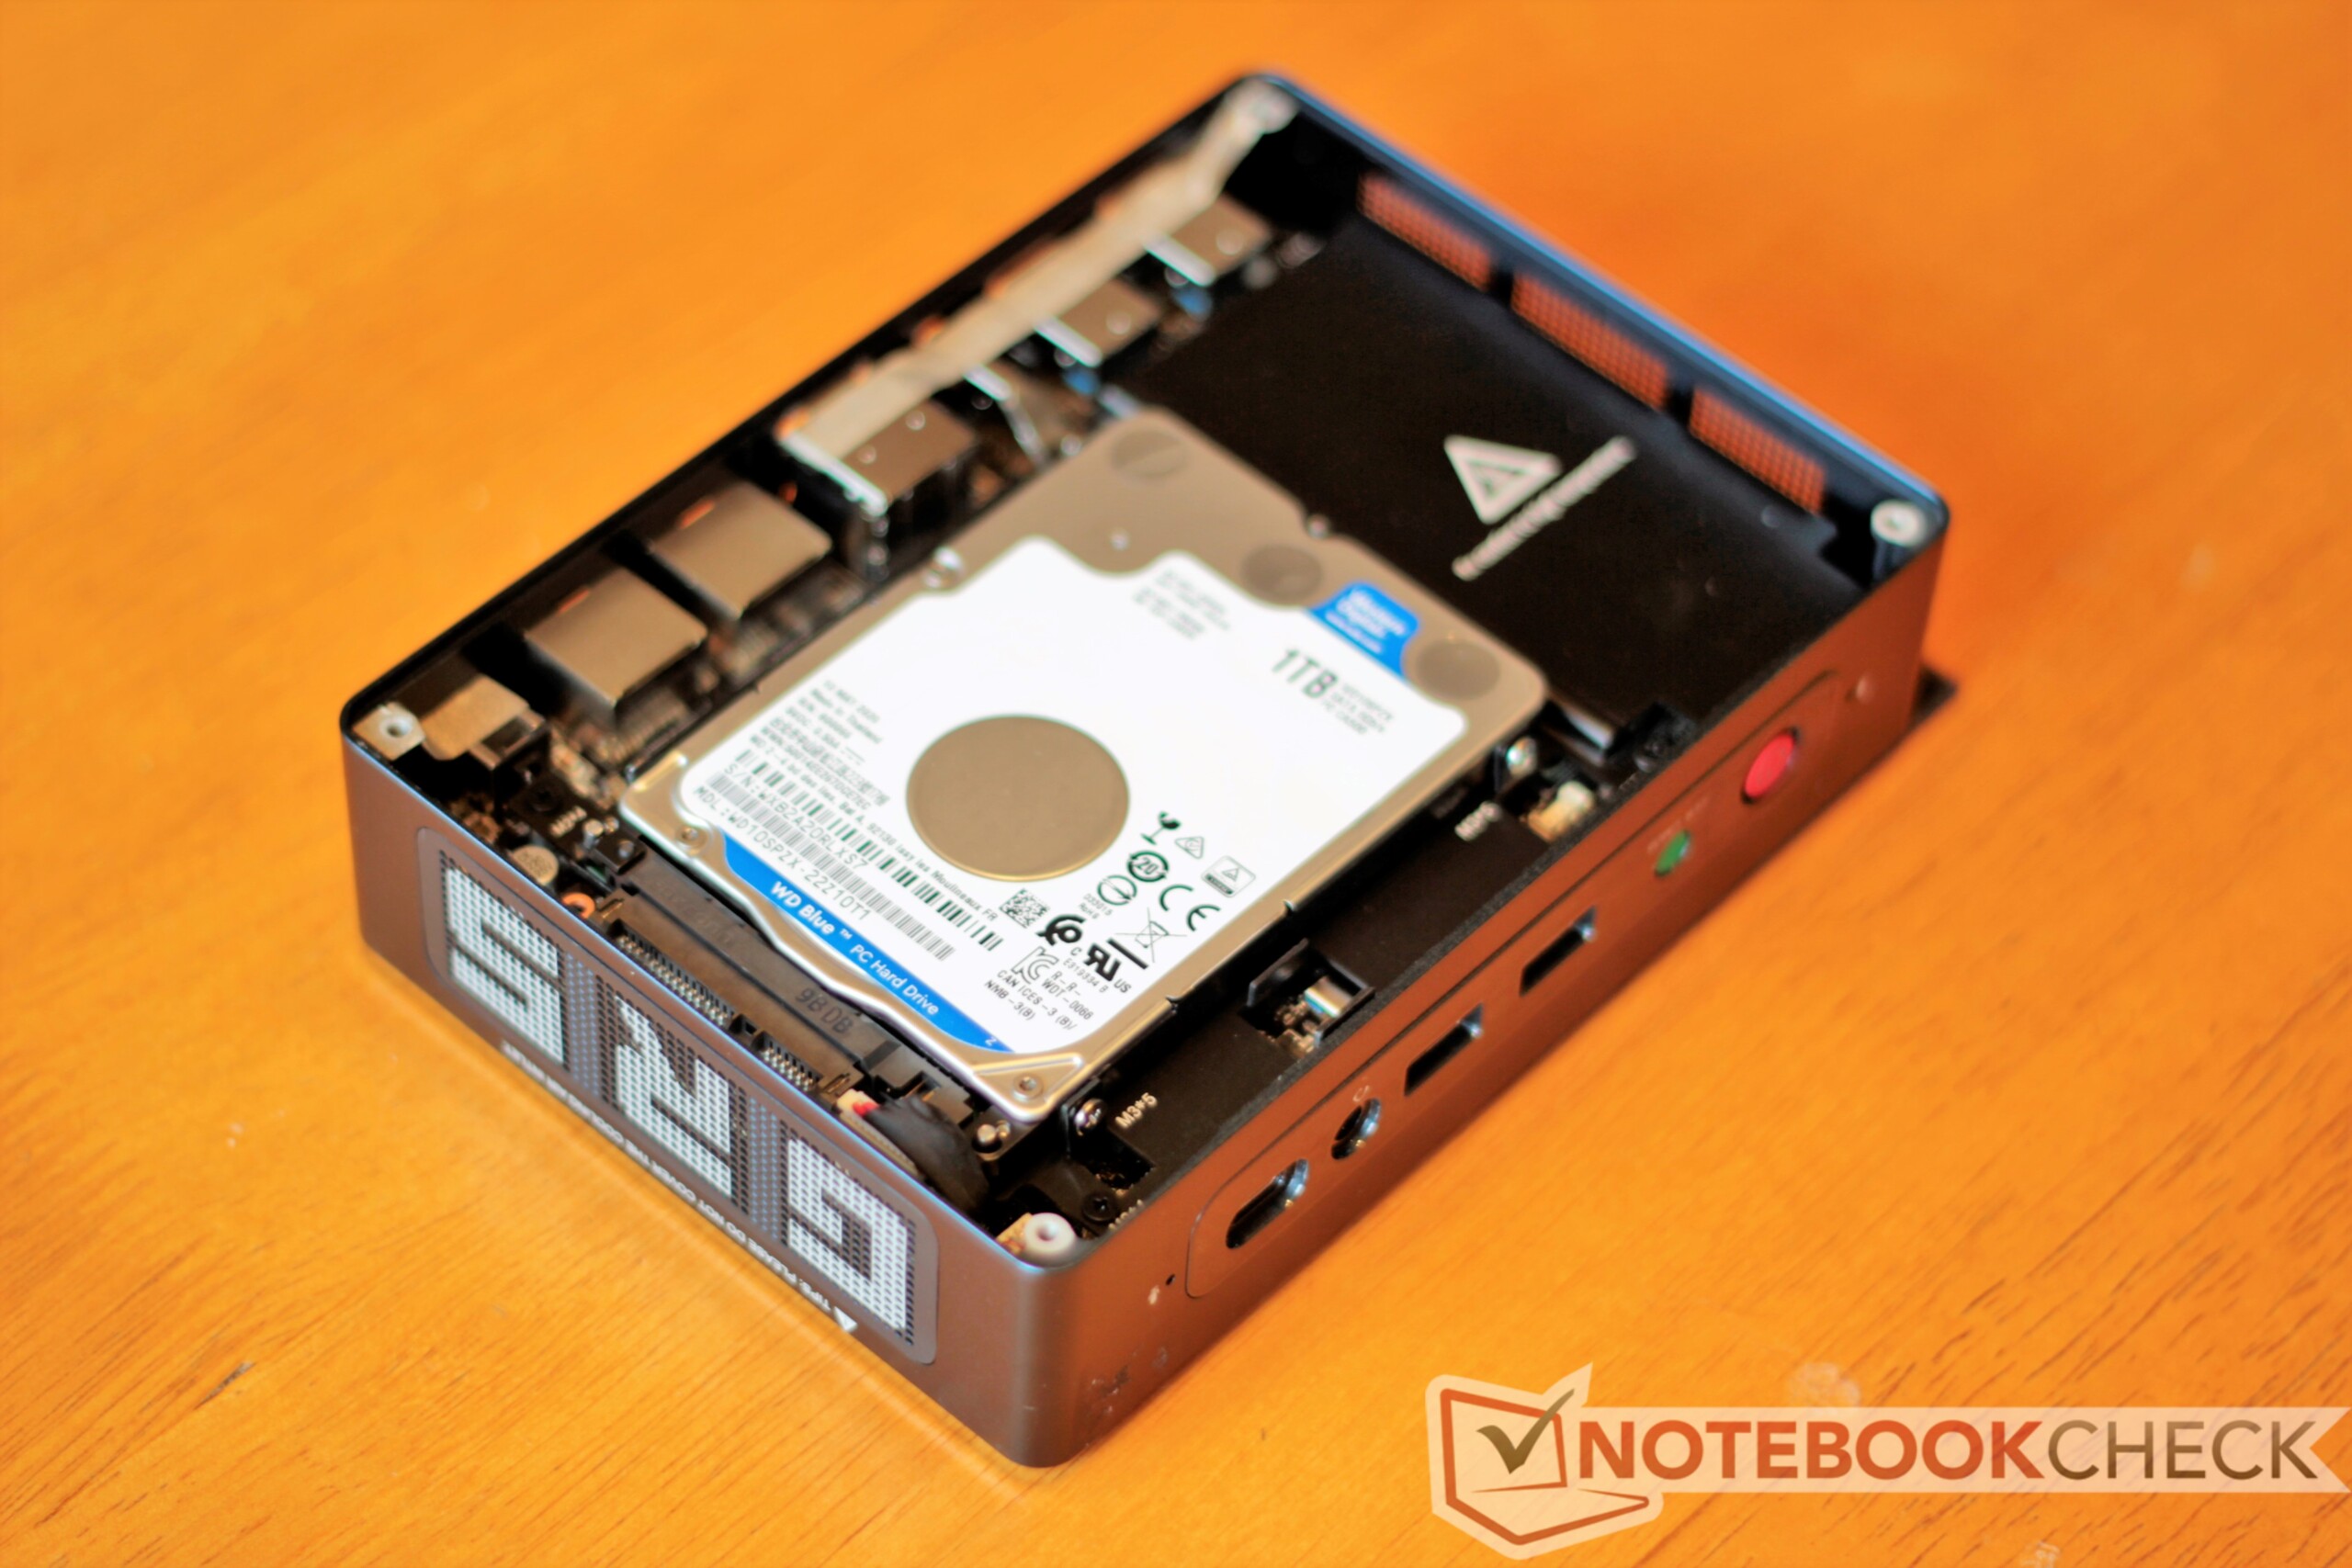
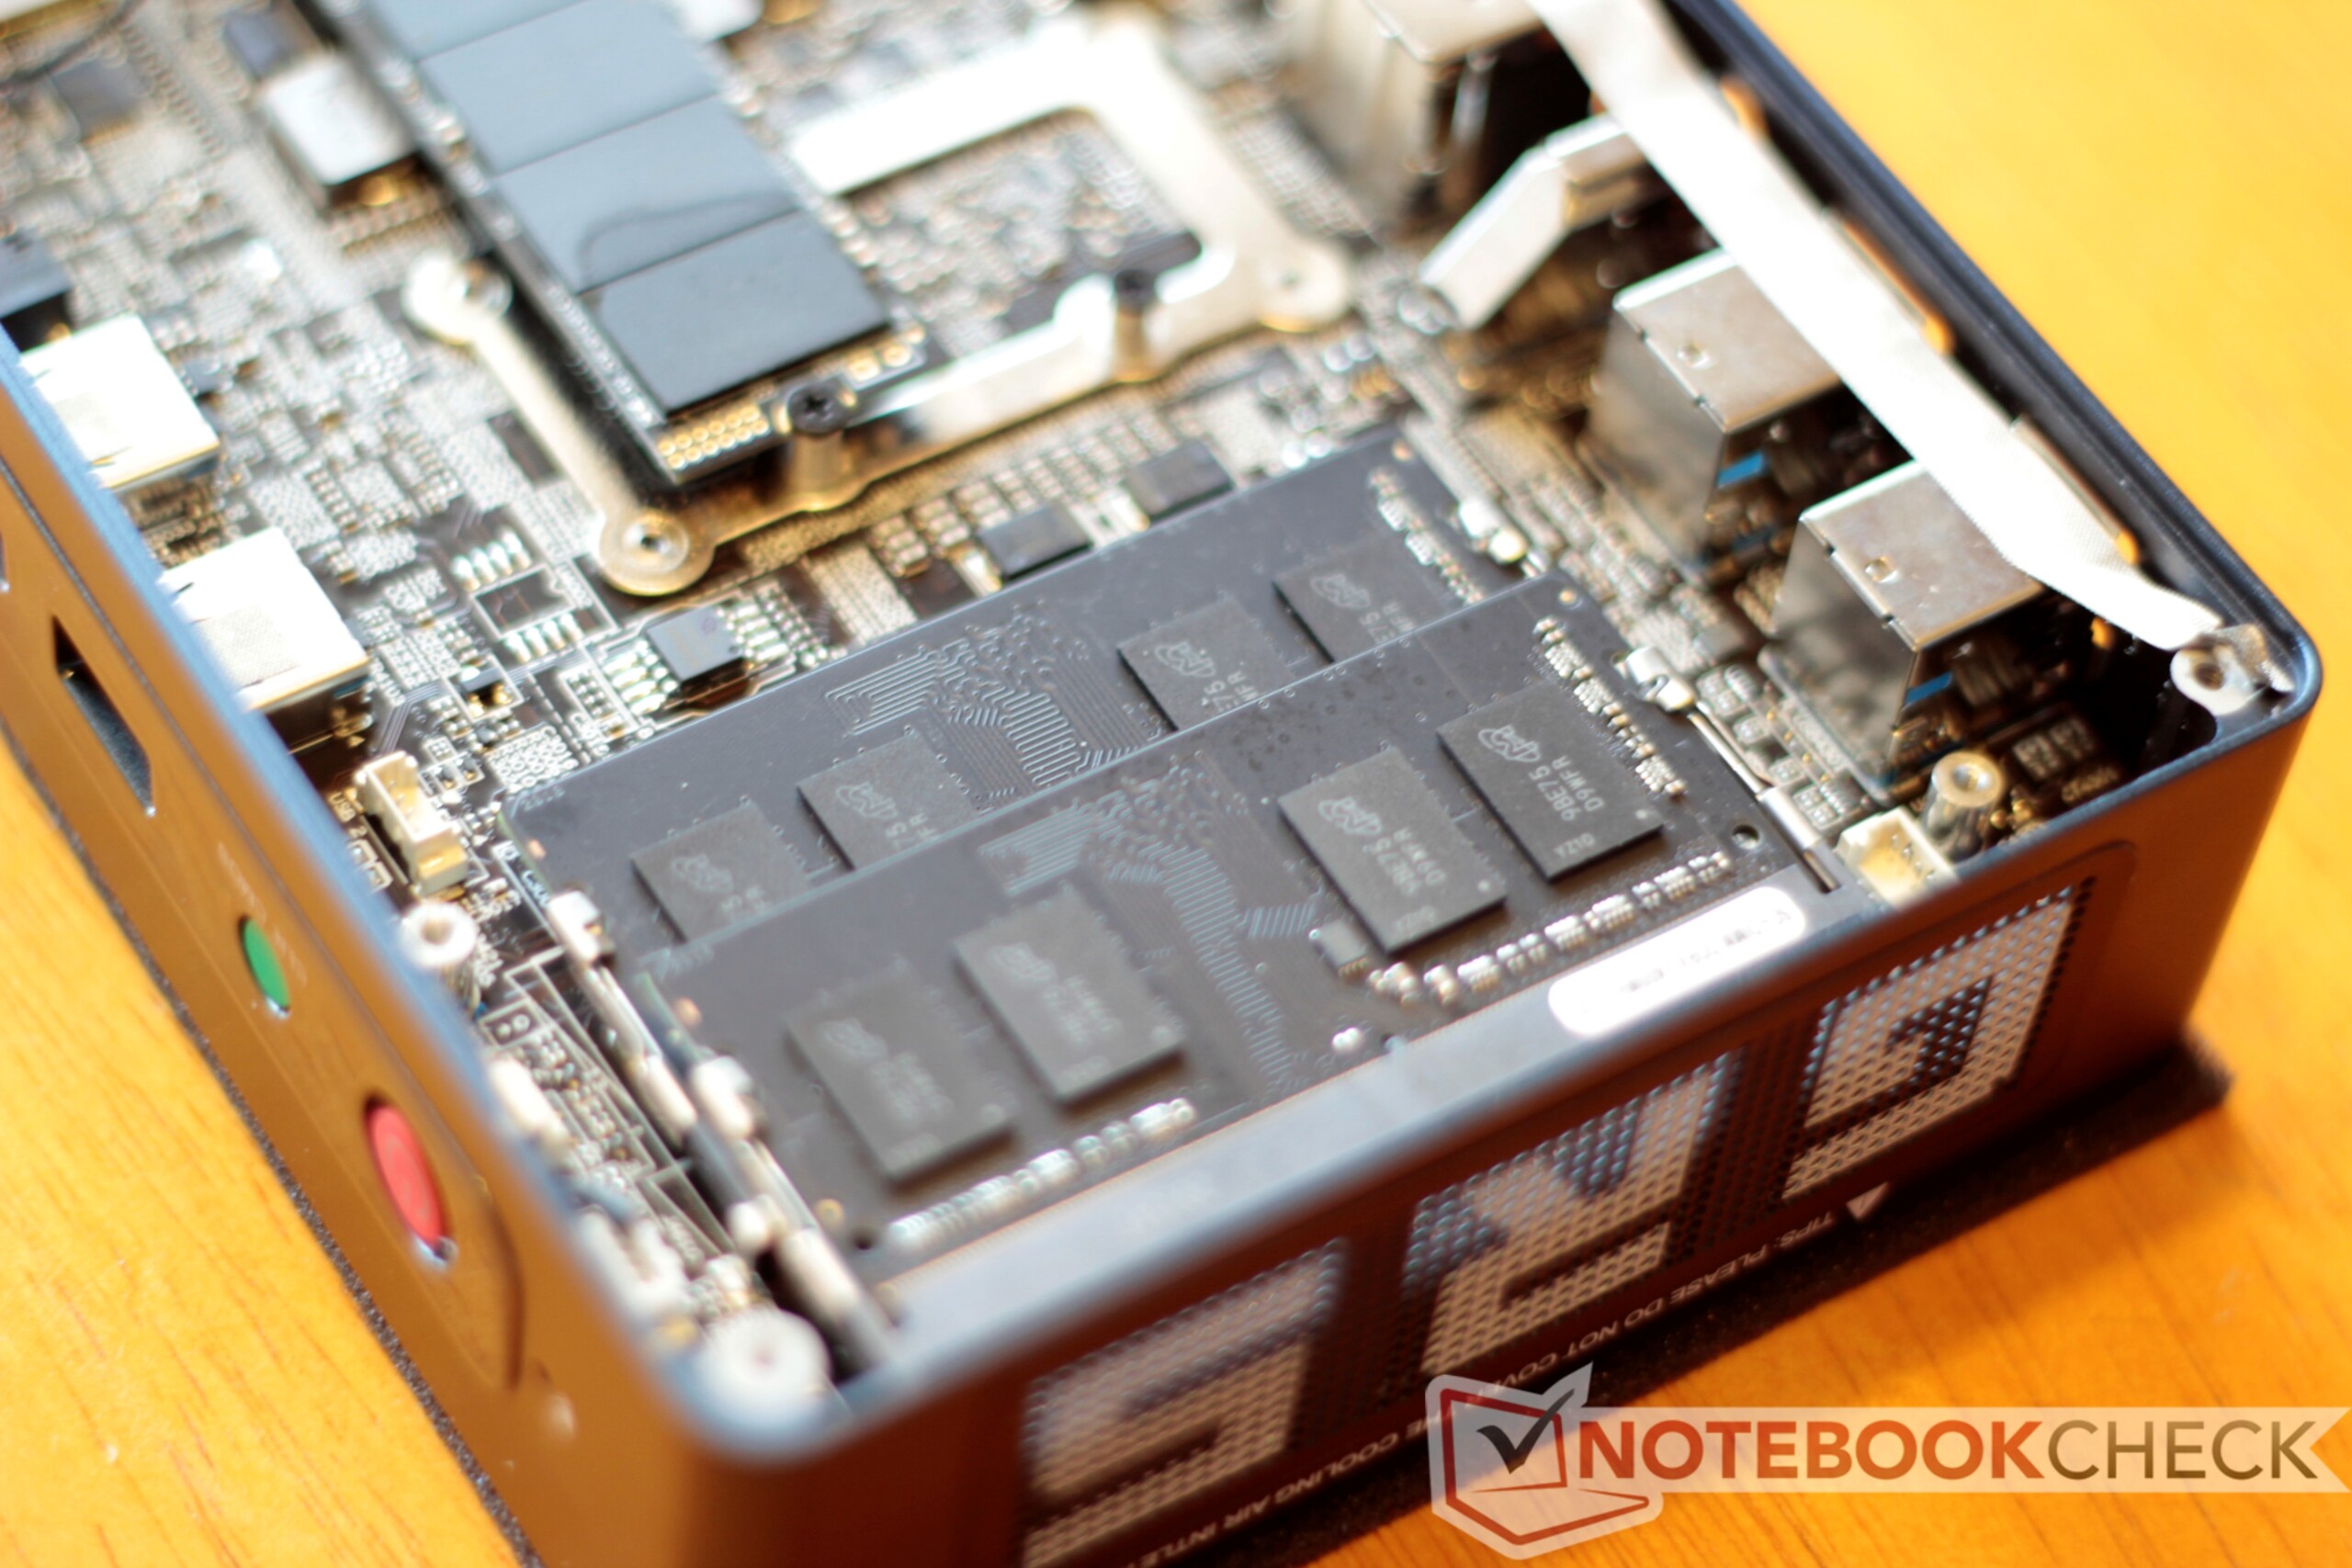
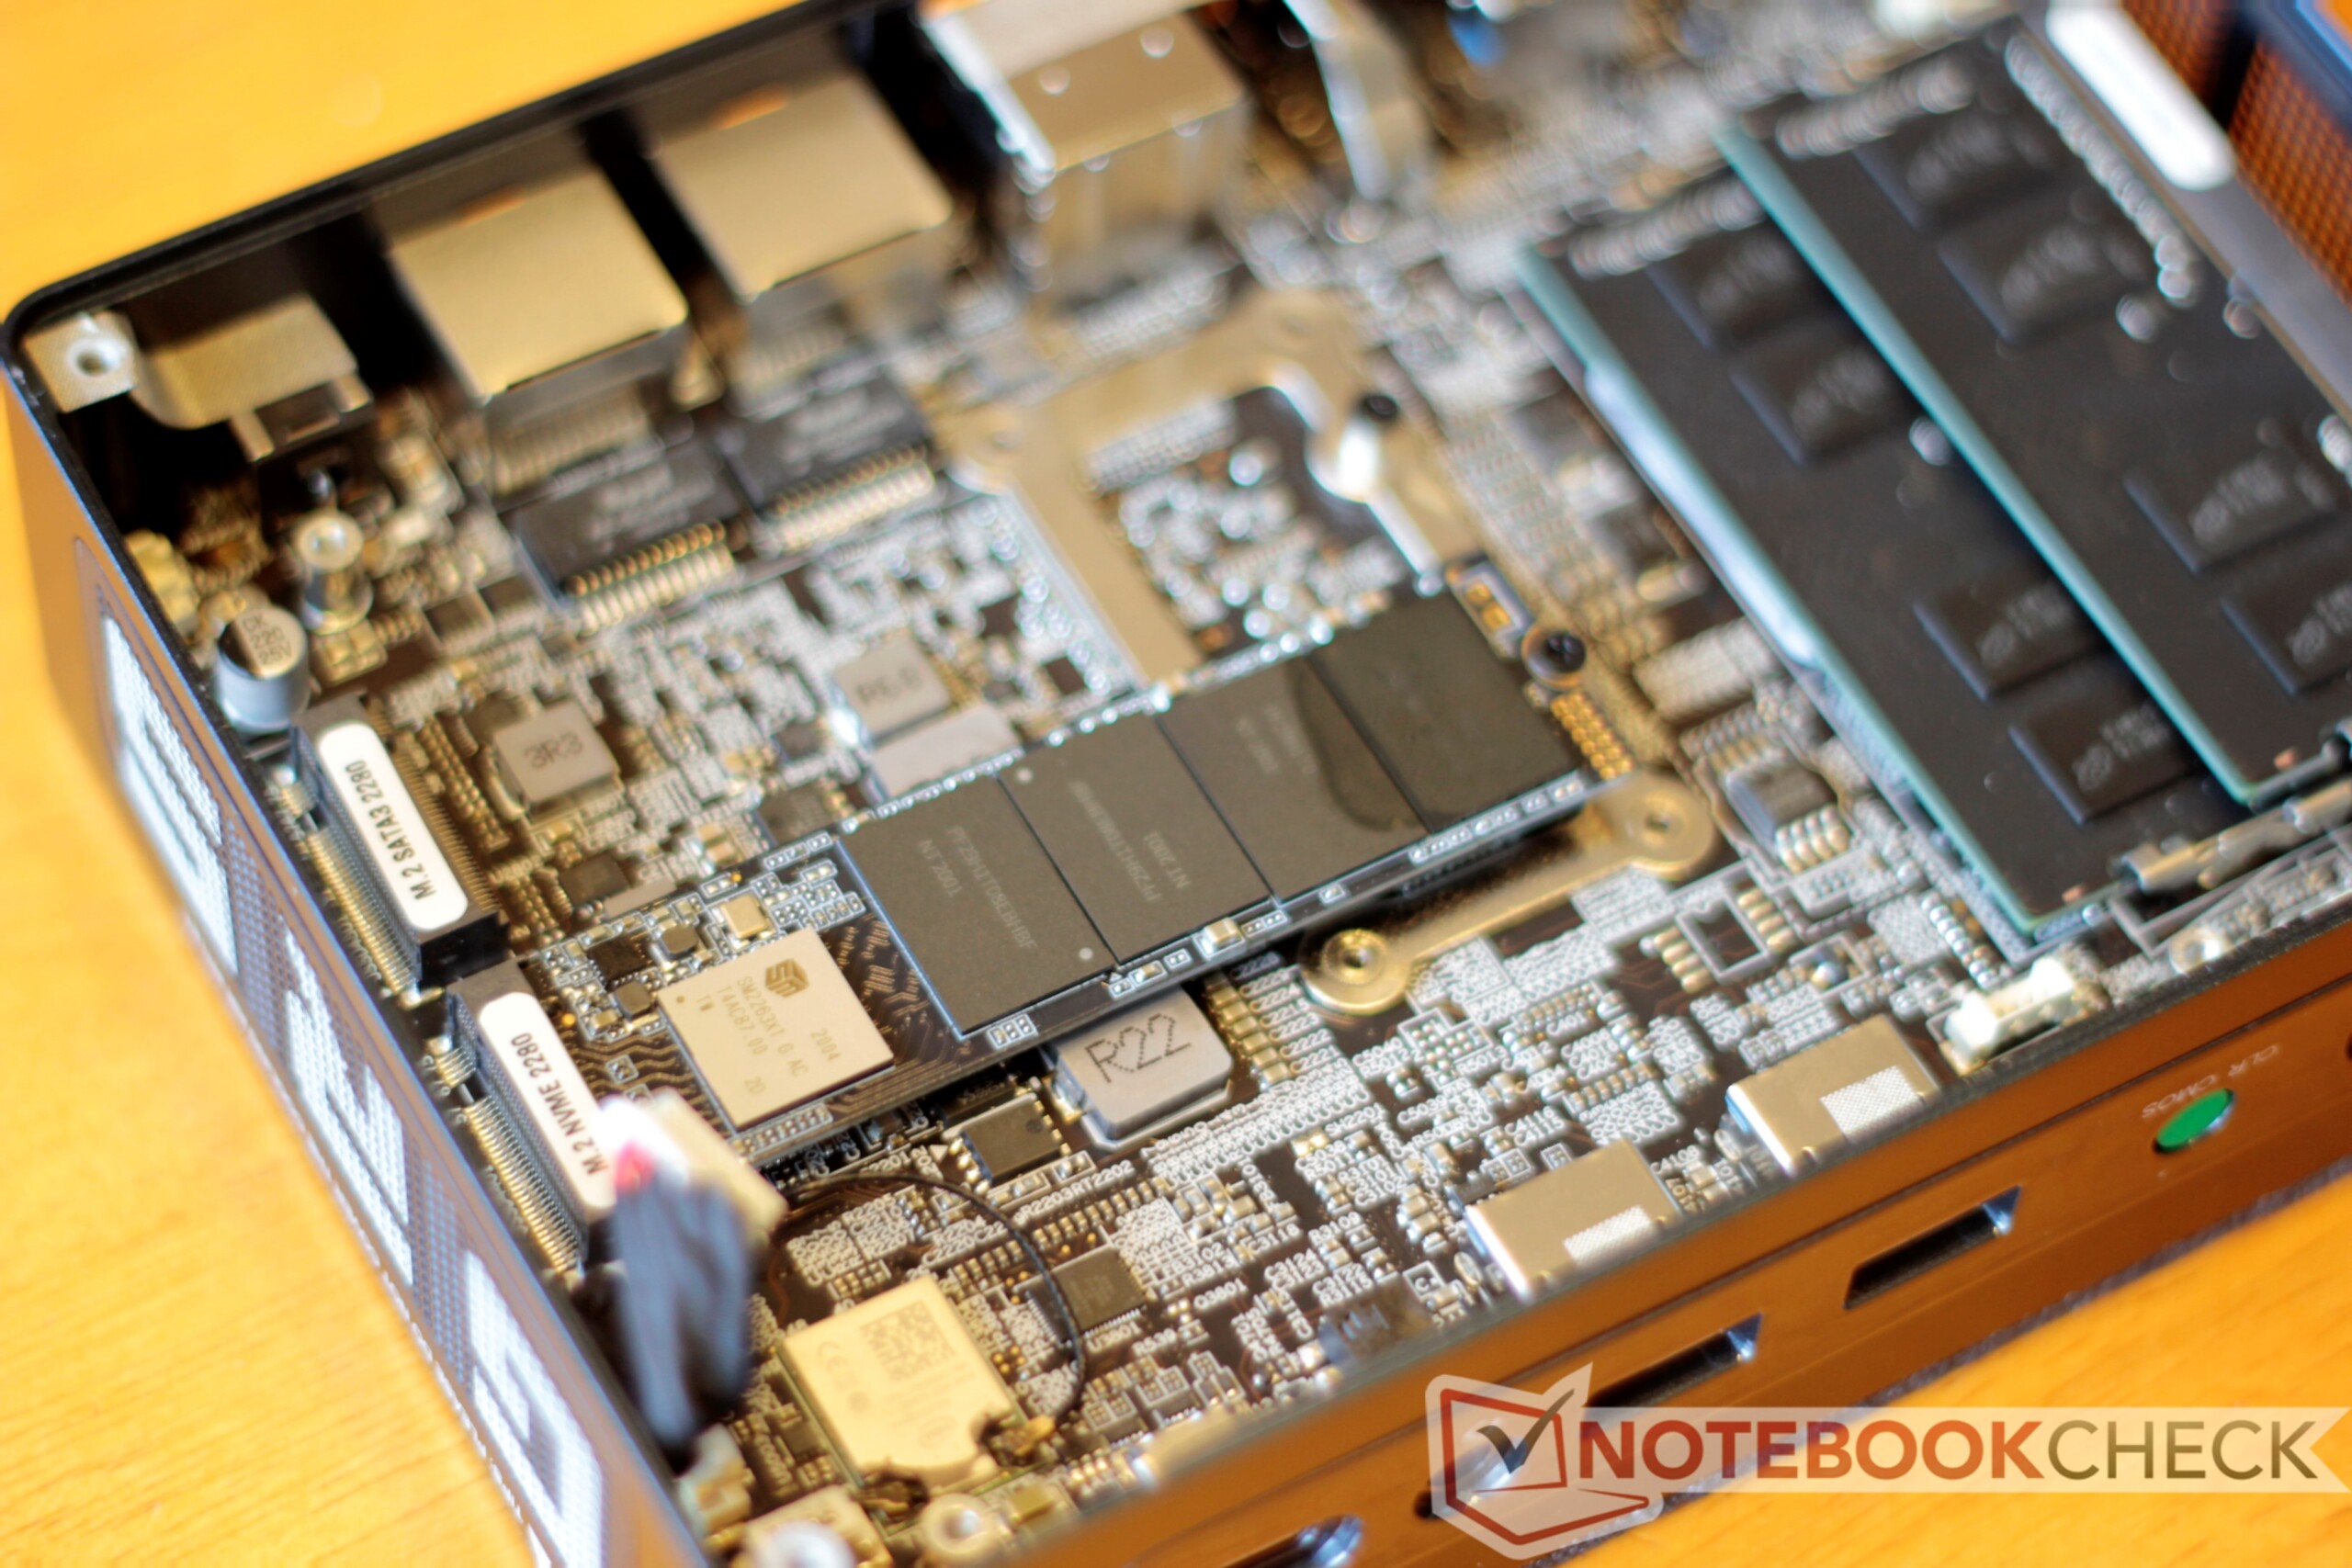
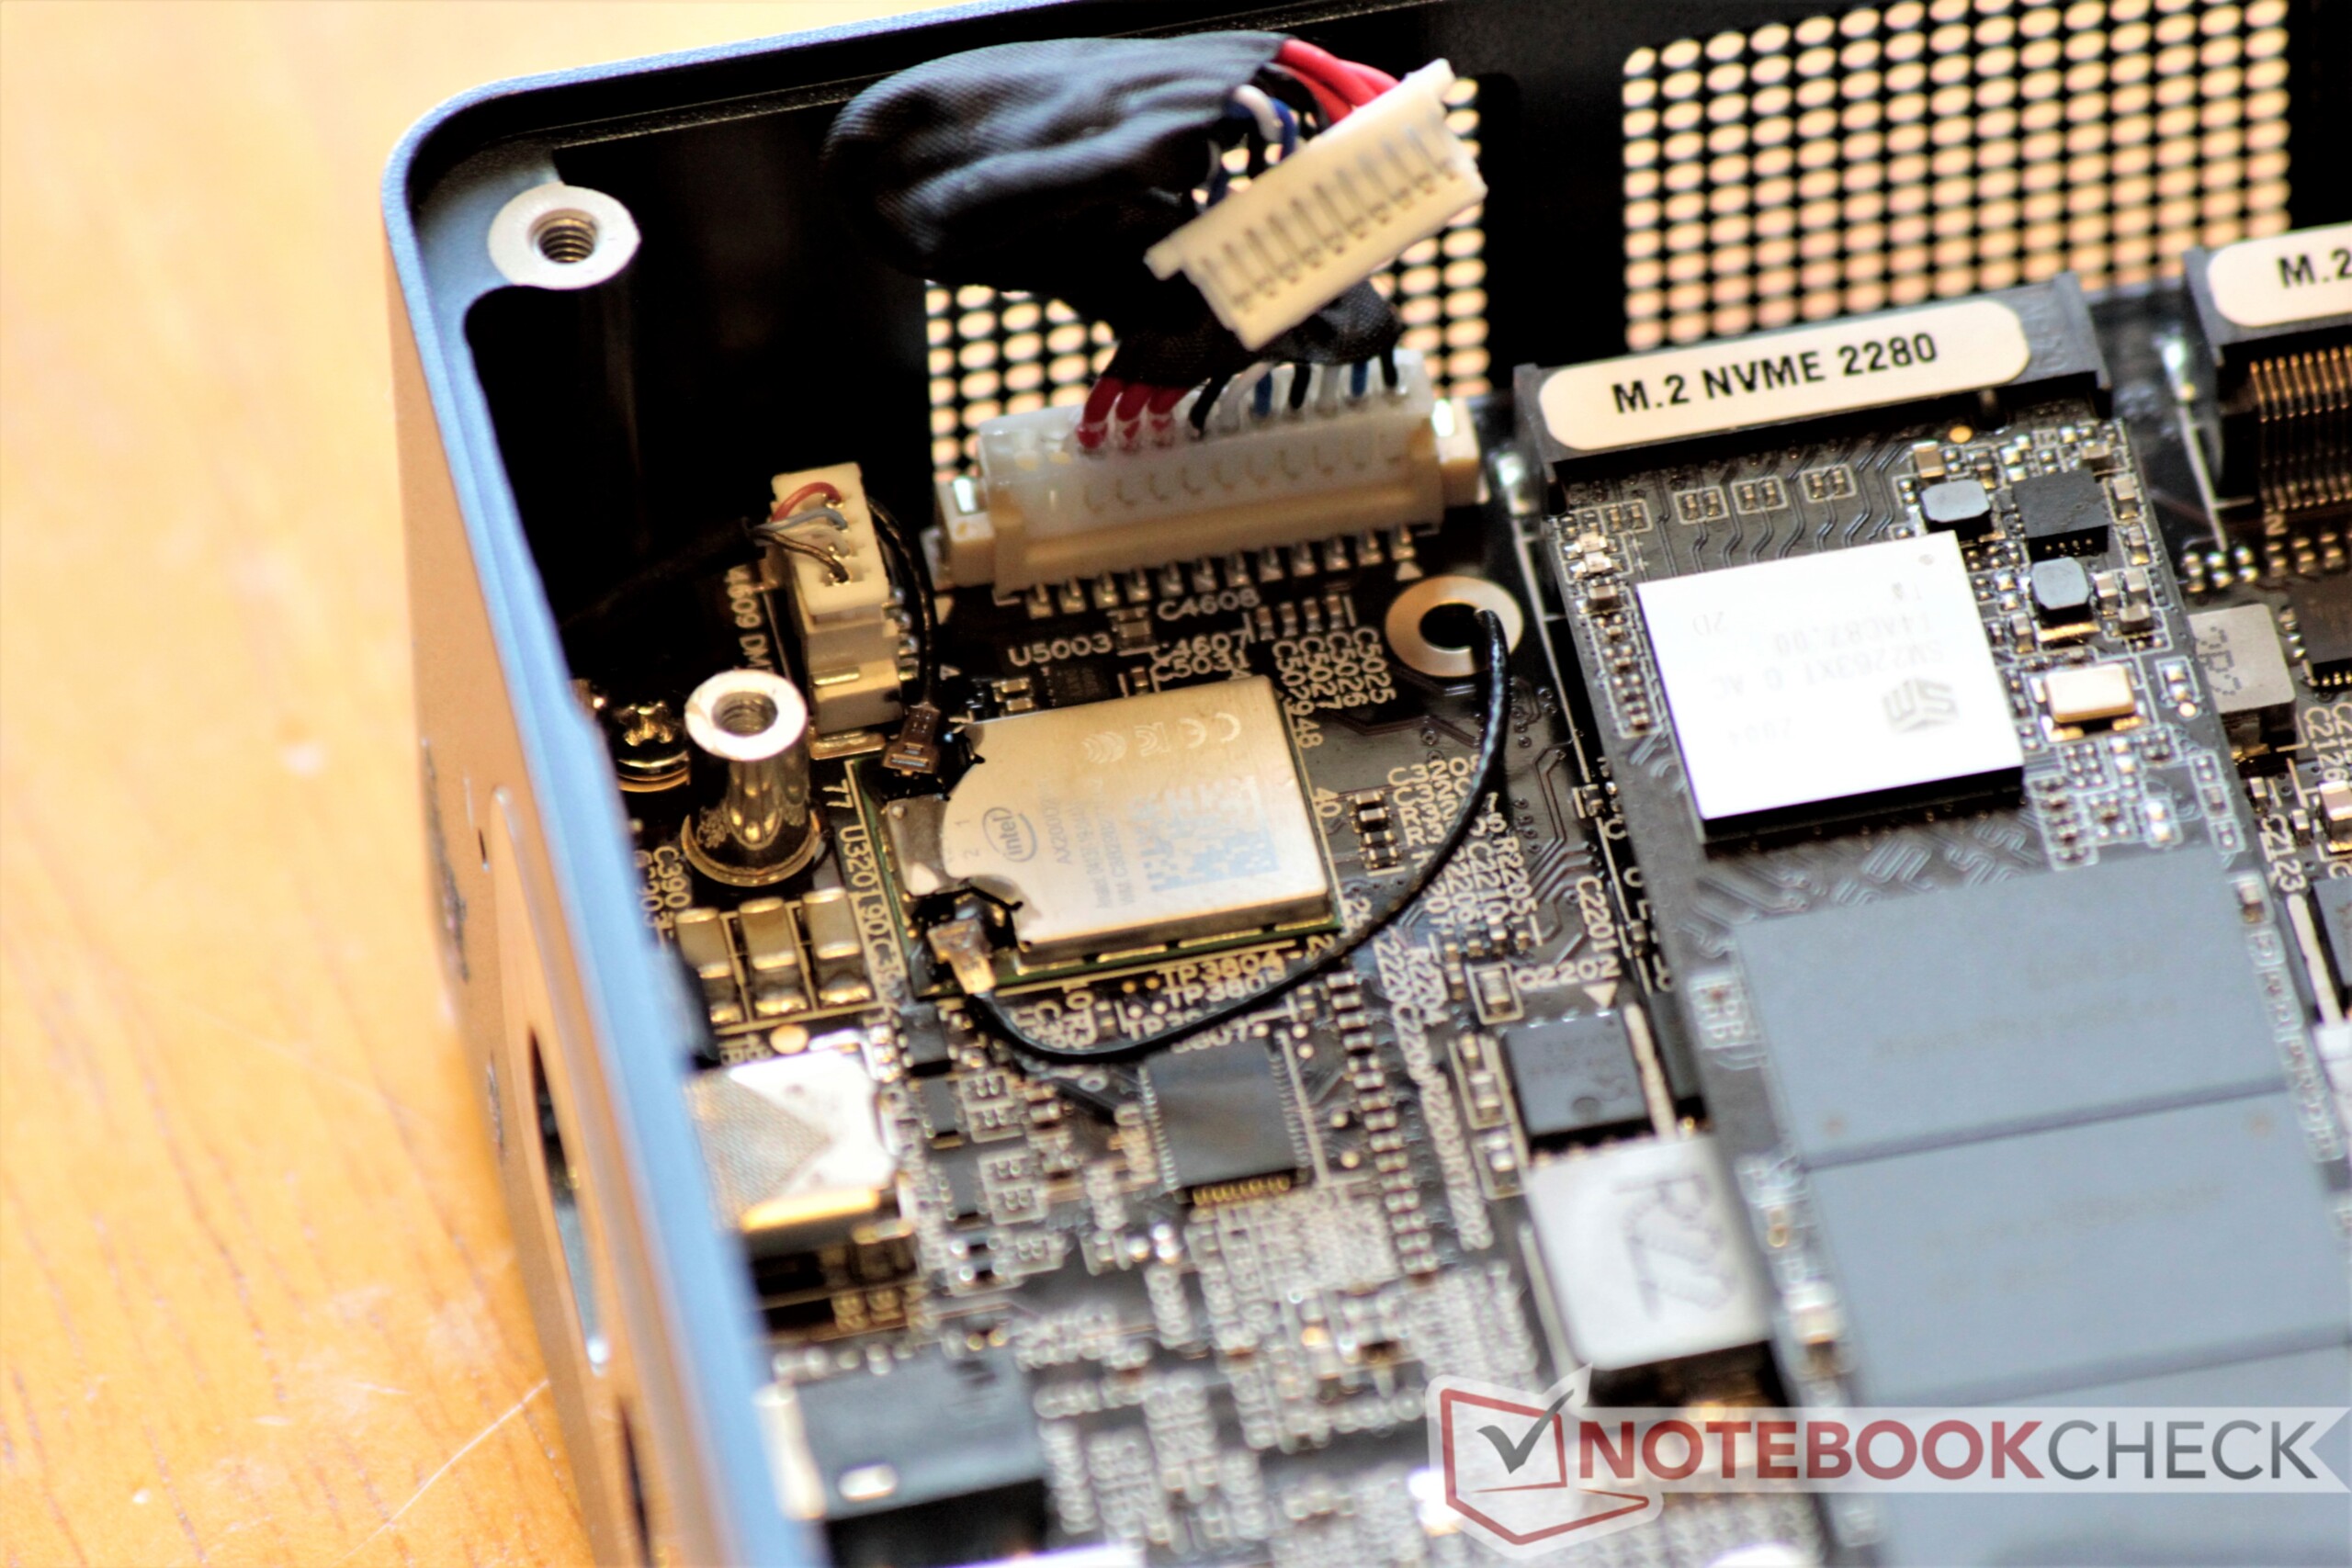
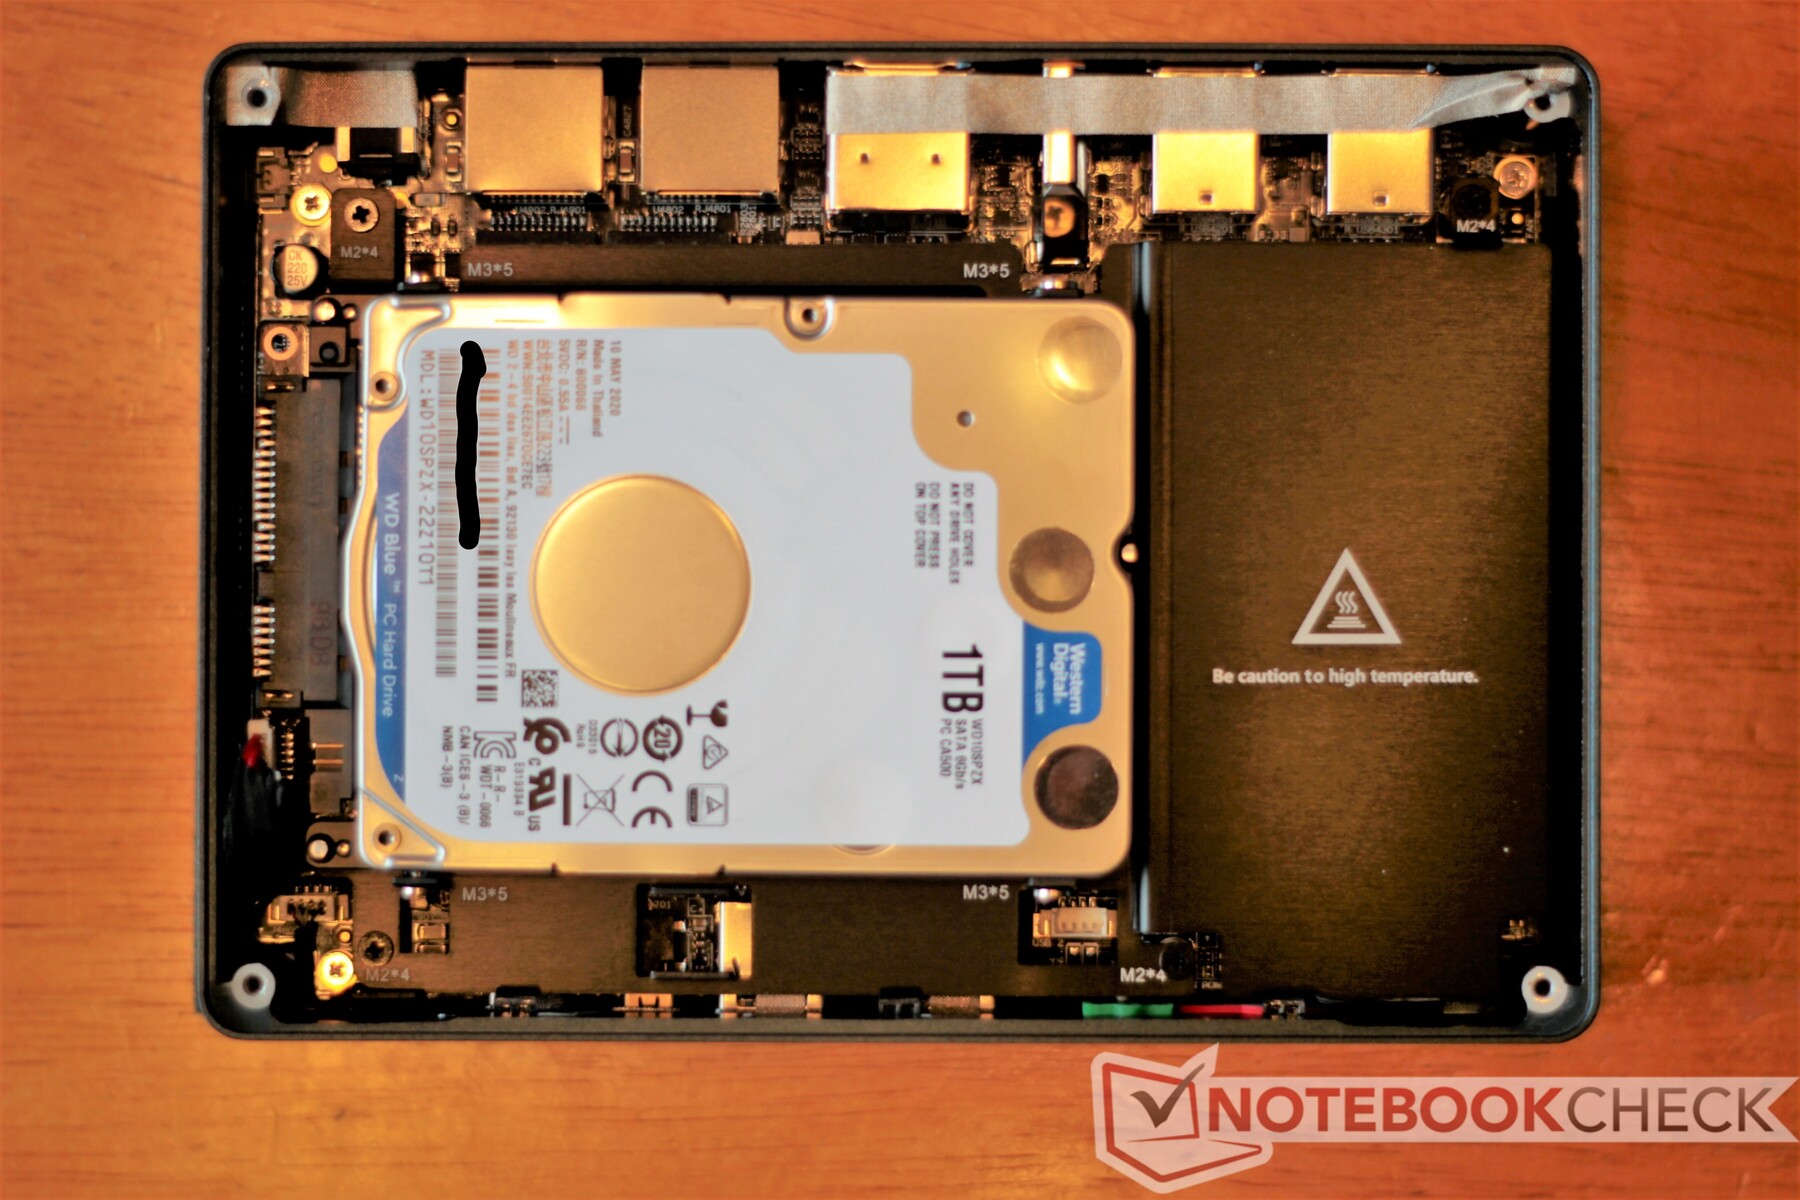
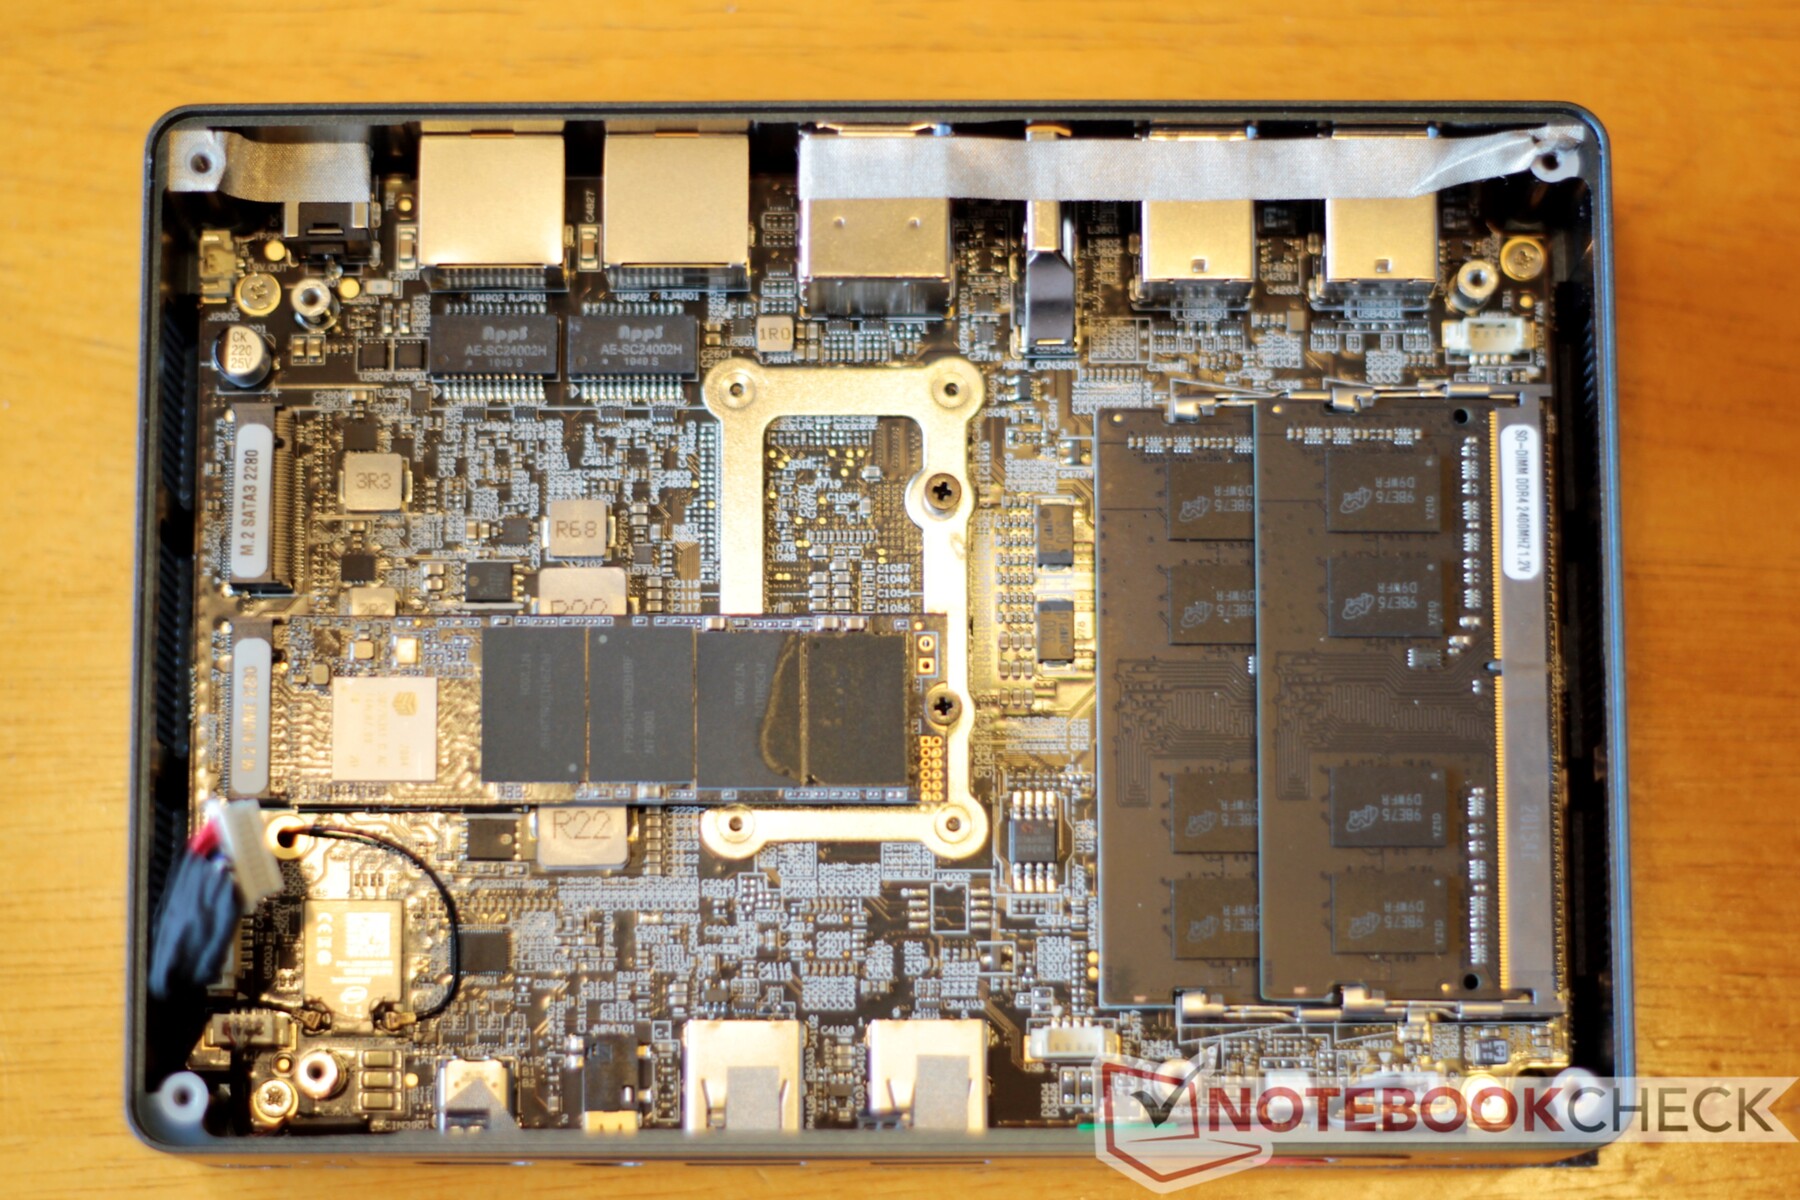
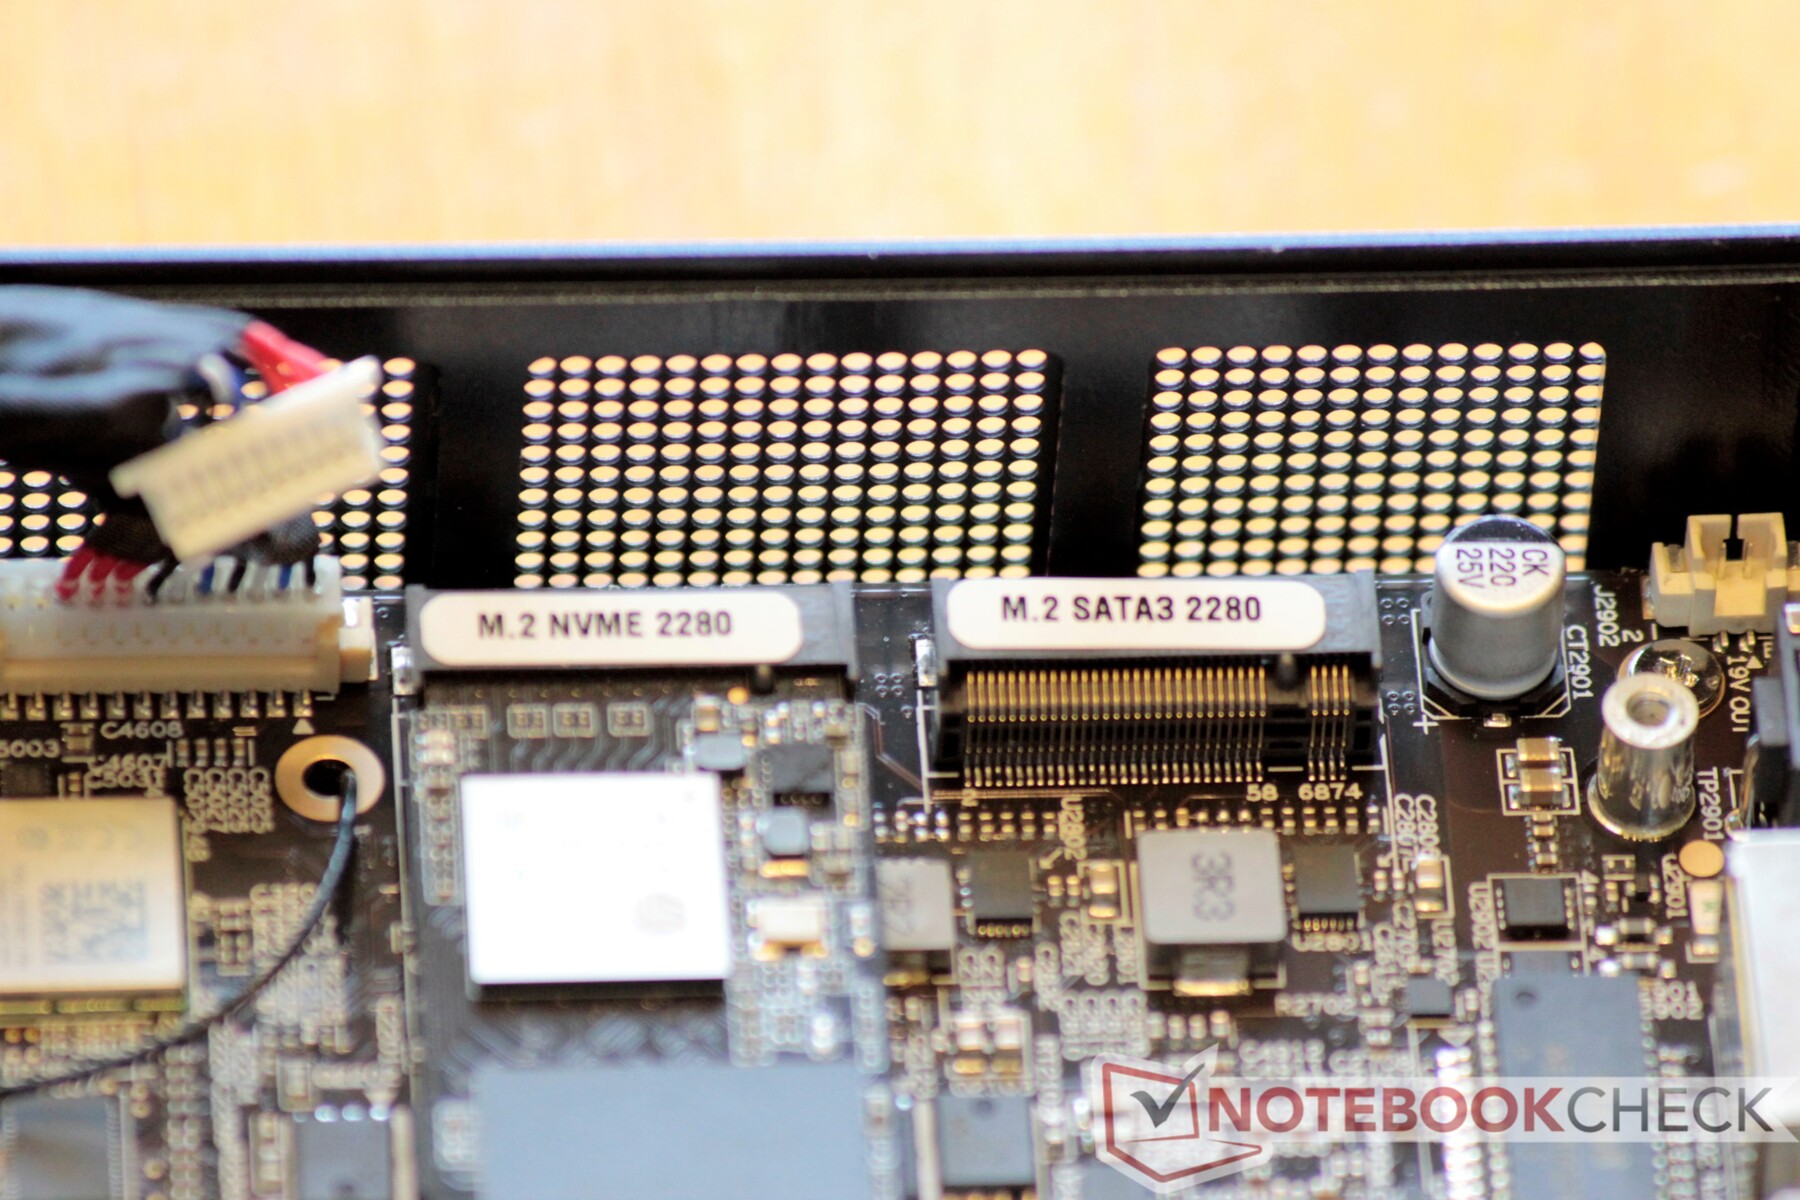
El GT-R tiene varias opciones de actualización. Después de quitar cuatro tornillos Phillips #00, el panel inferior se levanta fácilmente gracias a una práctica lengüeta de tiro incorporada. Una vez dentro, los usuarios son recibidos primero con una bahía de unidad de 2.5 pulgadas (poblada en nuestra unidad de revisión). Desenchufando un cable y quitando unos cuantos tornillos más, los usuarios pueden levantar el estante de esta unidad y acceder a dos bahías de unidades M.2 y dos ranuras de RAM DDR4. Tenga en cuenta que la ranura izquierda de la unidad M.2 es para las unidades SSD NVMe; la ranura derecha sólo admite SATA III.
La tarjeta inalámbrica parece estar soldada. El Ryzen 5 3550H también está soldado y requiere un mayor desmontaje para acceder a él.
Rendimiento
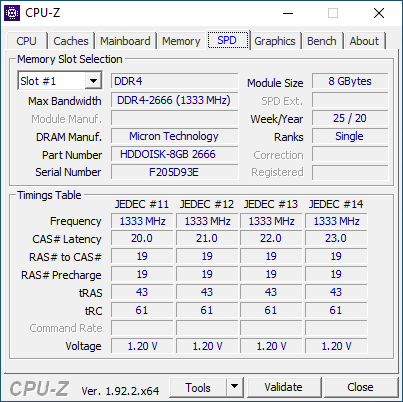
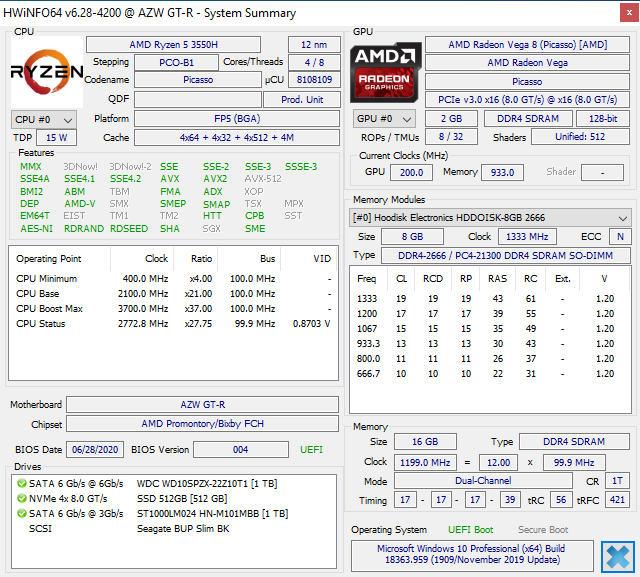
Latiendo en el corazón del Beelink GT-R hay un AMD Ryzen 5 3550H móvil APU. El chip de cuatro núcleos y 8 hilos está acoplado a una GPU Radeon RX Vega 8 y ofrece un rendimiento decente para un paquete tan pequeño. Beelink se mezcla en un rápido almacenamiento NVMe, dos bahías adicionales para unidades SATA y soporte para hasta 64 GB de RAM. En resumen, la GT-R es una máquina de oficina con algunas habilidades de medios de comunicación y juegos ligeros.
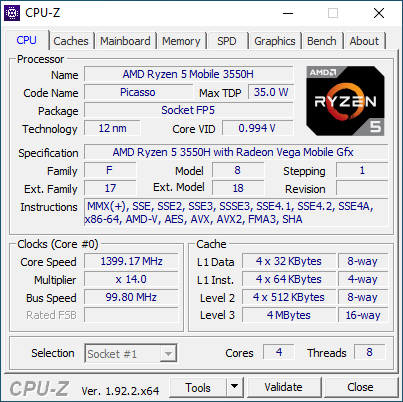
Procesador
Mientras que está diseñado para portátiles, el AMD Ryzen 5 3550H funciona bien en el mini escritorio. El 3550H utiliza cuatro núcleos Zen+ multihilo (12 nm) con una frecuencia de 2,1 GHz. La CPU puede explotar a 3,7 GHz en un solo núcleo durante cortos periodos.
El GT-R permite a los usuarios "overclockear" fácilmente el sistema a través del BIOS. Esencialmente, el BIOS contiene configuraciones para aumentar la envoltura de potencia total de la reserva de 35 vatios a 54 vatios con un solo cambio de opción. Los usuarios también pueden bajar el TDP a 12 vatios si lo desean. Mediremos el rendimiento en algunos puntos de referencia tanto en 35 Vatios como en 54 Vatios.
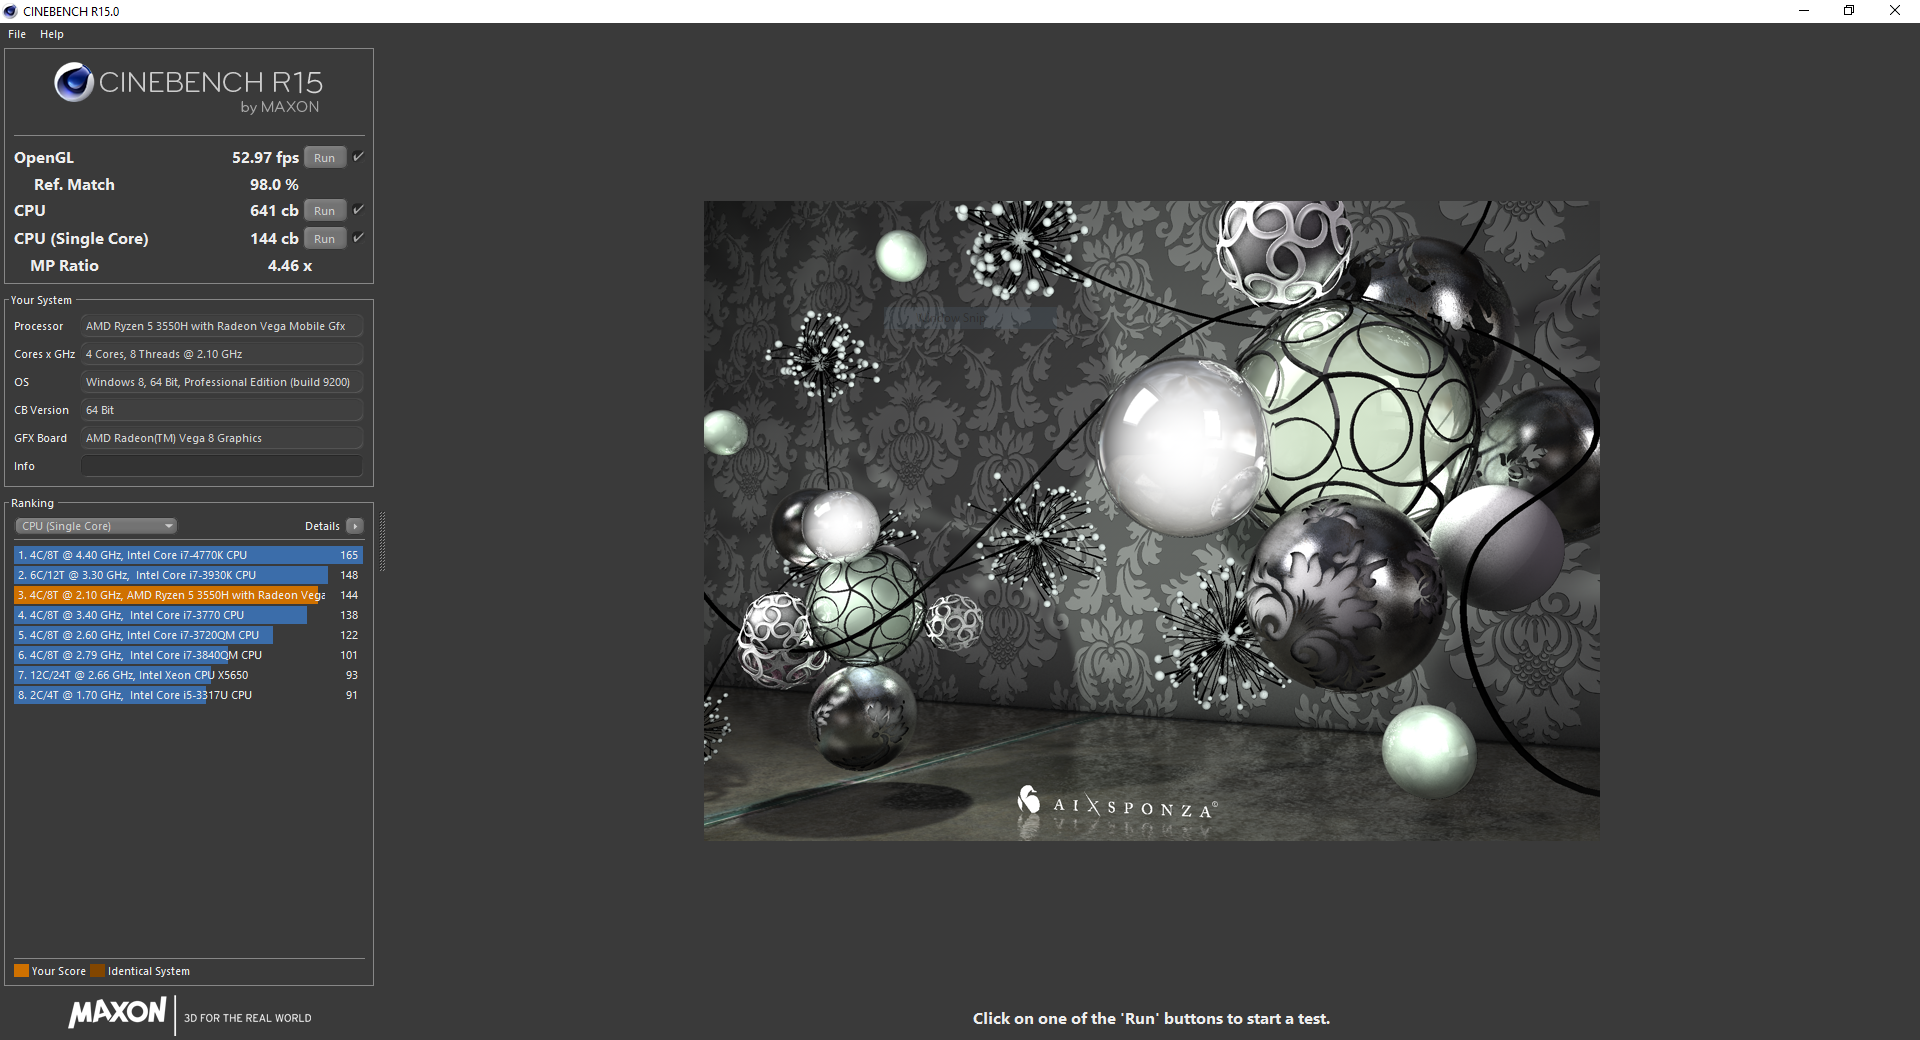
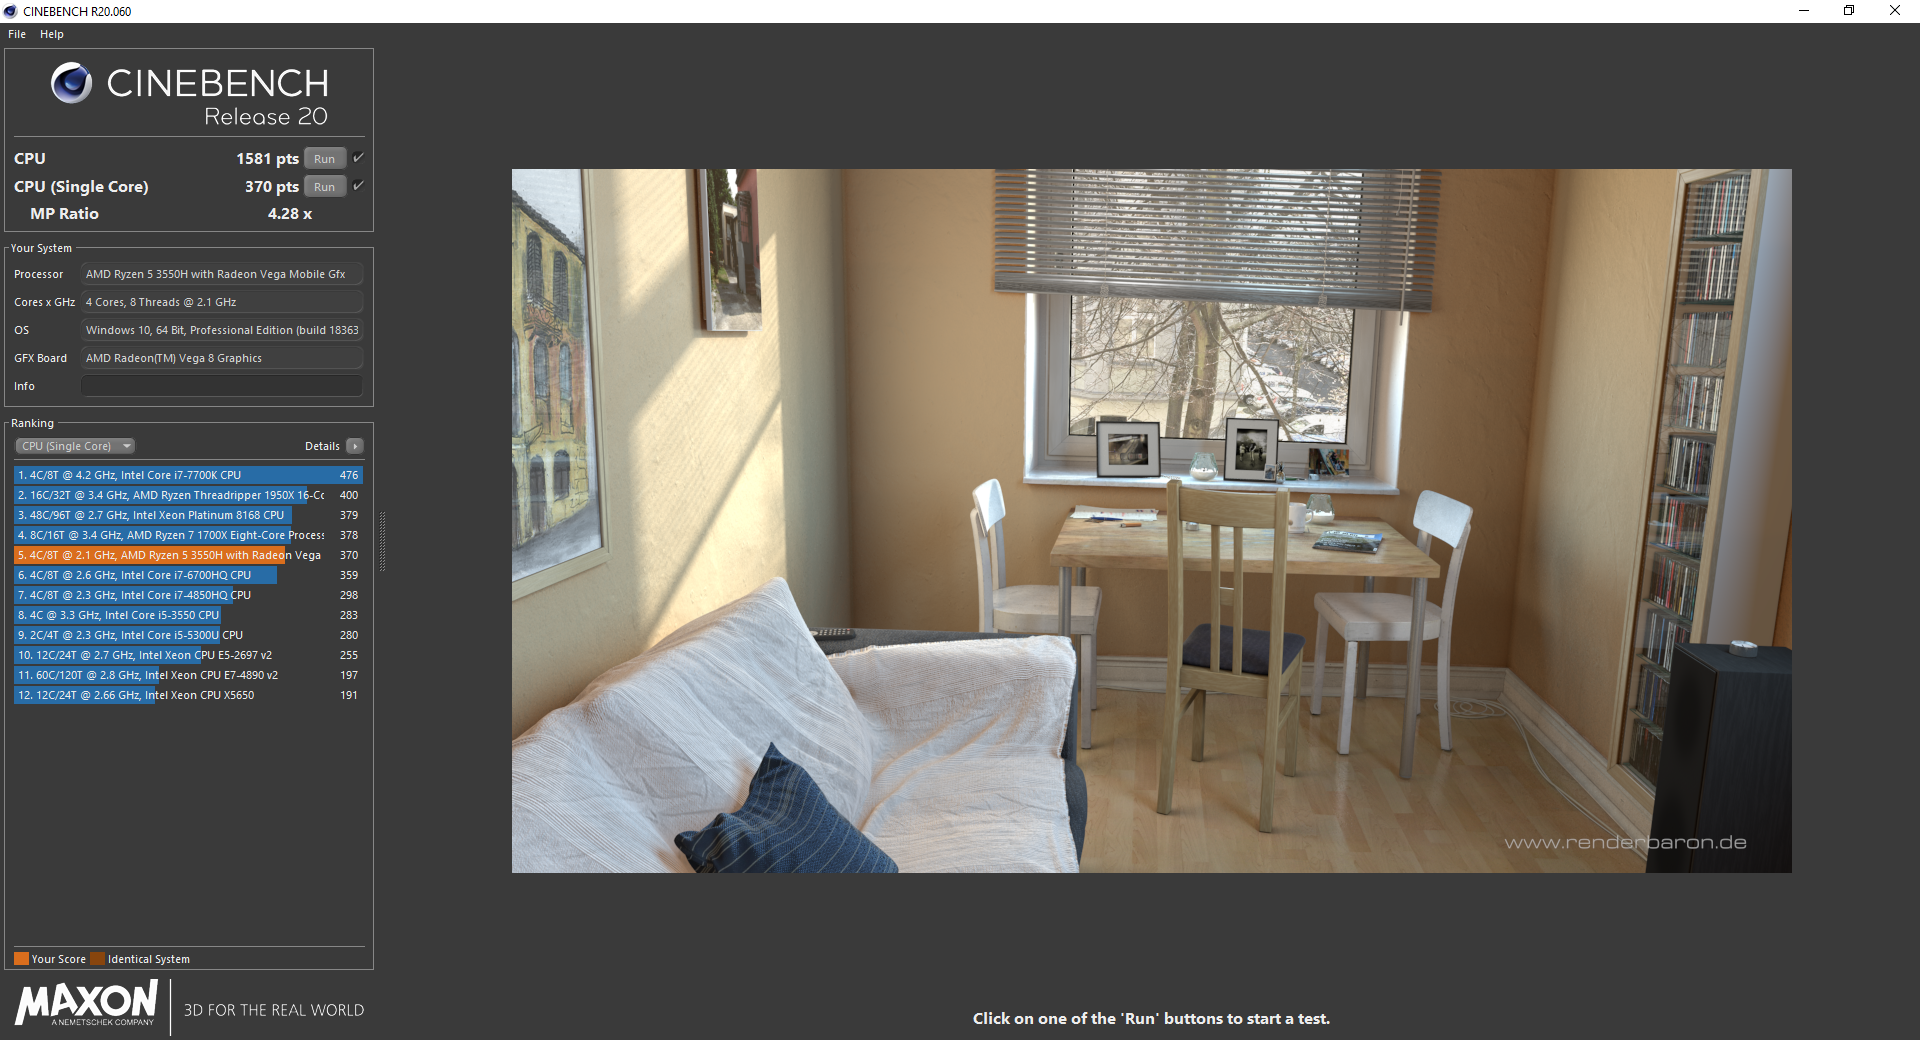
El GT-R está en línea con la mayoría de los dispositivos de 3550H en la prueba de un solo núcleo tanto en el Cinebench R20 como en el R15. Sin embargo, se queda atrás en las pruebas multi-núcleo en un 7-10%. Aumentar el límite de potencia a 54 vatios otorga un aumento del 7% en el Cinebench R15 y aproximadamente un 11% en el Cinebench R20.
Estos números se quedan atrás de la plataforma Comet Lake-U de Intel; el GT-R se desempeña entre 15 y 20% peor que el Intel Core i5-10210U en el Intel NUC10i5FNK y entre 20 y 30% peor que el Core i7-10710U usado en el Intel NUC10i7FNH.
En cargas de trabajo largas, probadas mediante un bucle en la prueba de un solo núcleo del Cinebench R15 50 veces, el GT-R ve un descenso inicial en el rendimiento antes de volver a subir a unos 670 cb y mantenerse estable. Cuando se ajusta a 54 W, la CPU se mantiene estable en unos 740 cb con una caída a mitad de la prueba.
Cinebench R15: CPU Single 64Bit | CPU Multi 64Bit
Blender: v2.79 BMW27 CPU
7-Zip 18.03: 7z b 4 -mmt1 | 7z b 4
Geekbench 5.5: Single-Core | Multi-Core
HWBOT x265 Benchmark v2.2: 4k Preset
LibreOffice : 20 Documents To PDF
R Benchmark 2.5: Overall mean
| Cinebench R20 / CPU (Single Core) | |
| Media de la clase Desktop (674 - 922, n=15, últimos 2 años) | |
| Intel NUC10i7FNH | |
| Lenovo ThinkPad X13-20UGS00800 | |
| Lenovo ThinkPad E14 Gen2-20T7S00W00 | |
| Intel NUC10i5FNK | |
| Intel Hades Canyon NUC8i7HVK | |
| Honor MagicBook 15 | |
| Beelink GTR35 II-G-16512D00W64PRO-1T 54 Watt | |
| Lenovo IdeaPad S540-13API | |
| Medio AMD Ryzen 5 3550H (331 - 370, n=8) | |
| Beelink GTR35 II-G-16512D00W64PRO-1T | |
| HP Pavilion Gaming 15-ec0002ng | |
| Cinebench R20 / CPU (Multi Core) | |
| Media de la clase Desktop (5710 - 17190, n=15, últimos 2 años) | |
| Lenovo ThinkPad X13-20UGS00800 | |
| Intel NUC10i7FNH | |
| Lenovo ThinkPad E14 Gen2-20T7S00W00 | |
| Intel Hades Canyon NUC8i7HVK | |
| Intel NUC10i5FNK | |
| HP Pavilion Gaming 15-ec0002ng | |
| Beelink GTR35 II-G-16512D00W64PRO-1T 54 Watt | |
| Medio AMD Ryzen 5 3550H (1421 - 1728, n=8) | |
| Beelink GTR35 II-G-16512D00W64PRO-1T | |
| Honor MagicBook 15 | |
| Lenovo IdeaPad S540-13API | |
| Cinebench R15 / CPU Single 64Bit | |
| Media de la clase Desktop (246 - 356, n=16, últimos 2 años) | |
| Intel NUC10i7FNH | |
| Lenovo ThinkPad X13-20UGS00800 | |
| Intel Hades Canyon NUC8i7HVK | |
| Lenovo ThinkPad E14 Gen2-20T7S00W00 | |
| Intel NUC10i5FNK | |
| Zotac ZBOX-CI660 Nano | |
| Beelink GTR35 II-G-16512D00W64PRO-1T | |
| Beelink GTR35 II-G-16512D00W64PRO-1T 54 Watt | |
| Beelink GTR35 II-G-16512D00W64PRO-1T 54 Watt | |
| HP Pavilion Gaming 15-ec0002ng | |
| Honor MagicBook 15 | |
| Lenovo IdeaPad S540-13API | |
| Medio AMD Ryzen 5 3550H (77 - 146, n=11) | |
| Cinebench R15 / CPU Multi 64Bit | |
| Media de la clase Desktop (2652 - 6656, n=16, últimos 2 años) | |
| Lenovo ThinkPad X13-20UGS00800 | |
| Intel NUC10i7FNH | |
| Lenovo ThinkPad E14 Gen2-20T7S00W00 | |
| Intel Hades Canyon NUC8i7HVK | |
| Intel NUC10i5FNK | |
| HP Pavilion Gaming 15-ec0002ng | |
| Beelink GTR35 II-G-16512D00W64PRO-1T 54 Watt | |
| Beelink GTR35 II-G-16512D00W64PRO-1T 54 Watt | |
| Medio AMD Ryzen 5 3550H (635 - 769, n=11) | |
| Zotac ZBOX-CI660 Nano | |
| Beelink GTR35 II-G-16512D00W64PRO-1T | |
| Honor MagicBook 15 | |
| Lenovo IdeaPad S540-13API | |
| Blender / v2.79 BMW27 CPU | |
| Lenovo IdeaPad S540-13API | |
| Honor MagicBook 15 | |
| Medio AMD Ryzen 5 3550H (612 - 759, n=6) | |
| Beelink GTR35 II-G-16512D00W64PRO-1T | |
| Beelink GTR35 II-G-16512D00W64PRO-1T 54 Watt | |
| Intel NUC10i5FNK | |
| Lenovo ThinkPad E14 Gen2-20T7S00W00 | |
| Intel Hades Canyon NUC8i7HVK | |
| Intel NUC10i7FNH | |
| Lenovo ThinkPad X13-20UGS00800 | |
| Media de la clase Desktop (75 - 218, n=15, últimos 2 años) | |
| 7-Zip 18.03 / 7z b 4 -mmt1 | |
| Media de la clase Desktop (5092 - 8790, n=17, últimos 2 años) | |
| Intel NUC10i7FNH | |
| Lenovo ThinkPad X13-20UGS00800 | |
| Lenovo ThinkPad E14 Gen2-20T7S00W00 | |
| Intel NUC10i5FNK | |
| Intel Hades Canyon NUC8i7HVK | |
| Medio AMD Ryzen 5 3550H (3472 - 3652, n=6) | |
| Lenovo IdeaPad S540-13API | |
| Beelink GTR35 II-G-16512D00W64PRO-1T | |
| Honor MagicBook 15 | |
| Beelink GTR35 II-G-16512D00W64PRO-1T 54 Watt | |
| 7-Zip 18.03 / 7z b 4 | |
| Media de la clase Desktop (91898 - 163125, n=17, últimos 2 años) | |
| Lenovo ThinkPad X13-20UGS00800 | |
| Intel NUC10i7FNH | |
| Lenovo ThinkPad E14 Gen2-20T7S00W00 | |
| Intel NUC10i5FNK | |
| Intel Hades Canyon NUC8i7HVK | |
| Beelink GTR35 II-G-16512D00W64PRO-1T 54 Watt | |
| Medio AMD Ryzen 5 3550H (16683 - 19409, n=6) | |
| Honor MagicBook 15 | |
| Lenovo IdeaPad S540-13API | |
| Beelink GTR35 II-G-16512D00W64PRO-1T | |
| Geekbench 5.5 / Single-Core | |
| Media de la clase Desktop (1755 - 2597, n=30, últimos 2 años) | |
| Intel NUC10i7FNH | |
| Lenovo ThinkPad X13-20UGS00800 | |
| Lenovo ThinkPad E14 Gen2-20T7S00W00 | |
| Intel NUC10i5FNK | |
| Honor MagicBook 15 | |
| Beelink GTR35 II-G-16512D00W64PRO-1T | |
| Beelink GTR35 II-G-16512D00W64PRO-1T 54 Watt | |
| Medio AMD Ryzen 5 3550H (880 - 907, n=5) | |
| HP Pavilion Gaming 15-ec0002ng | |
| Geekbench 5.5 / Multi-Core | |
| Media de la clase Desktop (12626 - 28535, n=30, últimos 2 años) | |
| Intel NUC10i7FNH | |
| Lenovo ThinkPad X13-20UGS00800 | |
| Lenovo ThinkPad E14 Gen2-20T7S00W00 | |
| Intel NUC10i5FNK | |
| HP Pavilion Gaming 15-ec0002ng | |
| Medio AMD Ryzen 5 3550H (3162 - 3486, n=5) | |
| Beelink GTR35 II-G-16512D00W64PRO-1T | |
| Honor MagicBook 15 | |
| Beelink GTR35 II-G-16512D00W64PRO-1T 54 Watt | |
| HWBOT x265 Benchmark v2.2 / 4k Preset | |
| Media de la clase Desktop (18.6 - 48.5, n=15, últimos 2 años) | |
| Lenovo ThinkPad X13-20UGS00800 | |
| Intel NUC10i7FNH | |
| Intel Hades Canyon NUC8i7HVK | |
| Lenovo ThinkPad E14 Gen2-20T7S00W00 | |
| Intel NUC10i5FNK | |
| Beelink GTR35 II-G-16512D00W64PRO-1T 54 Watt | |
| Honor MagicBook 15 | |
| Beelink GTR35 II-G-16512D00W64PRO-1T | |
| Medio AMD Ryzen 5 3550H (3.7 - 4.43, n=5) | |
| Lenovo IdeaPad S540-13API | |
| LibreOffice / 20 Documents To PDF | |
| Medio AMD Ryzen 5 3550H (73.3 - 92.7, n=4) | |
| Honor MagicBook 15 | |
| Beelink GTR35 II-G-16512D00W64PRO-1T | |
| Beelink GTR35 II-G-16512D00W64PRO-1T 54 Watt | |
| Lenovo ThinkPad E14 Gen2-20T7S00W00 | |
| Lenovo ThinkPad X13-20UGS00800 | |
| Media de la clase Desktop (35.5 - 79.2, n=16, últimos 2 años) | |
| R Benchmark 2.5 / Overall mean | |
| Honor MagicBook 15 | |
| Medio AMD Ryzen 5 3550H (0.732 - 0.752, n=4) | |
| Beelink GTR35 II-G-16512D00W64PRO-1T | |
| Beelink GTR35 II-G-16512D00W64PRO-1T 54 Watt | |
| Intel NUC10i5FNK | |
| Intel NUC10i7FNH | |
| Lenovo ThinkPad E14 Gen2-20T7S00W00 | |
| Lenovo ThinkPad X13-20UGS00800 | |
| Media de la clase Desktop (0.3299 - 0.4909, n=16, últimos 2 años) | |
* ... más pequeño es mejor
Rendimiento del sistema
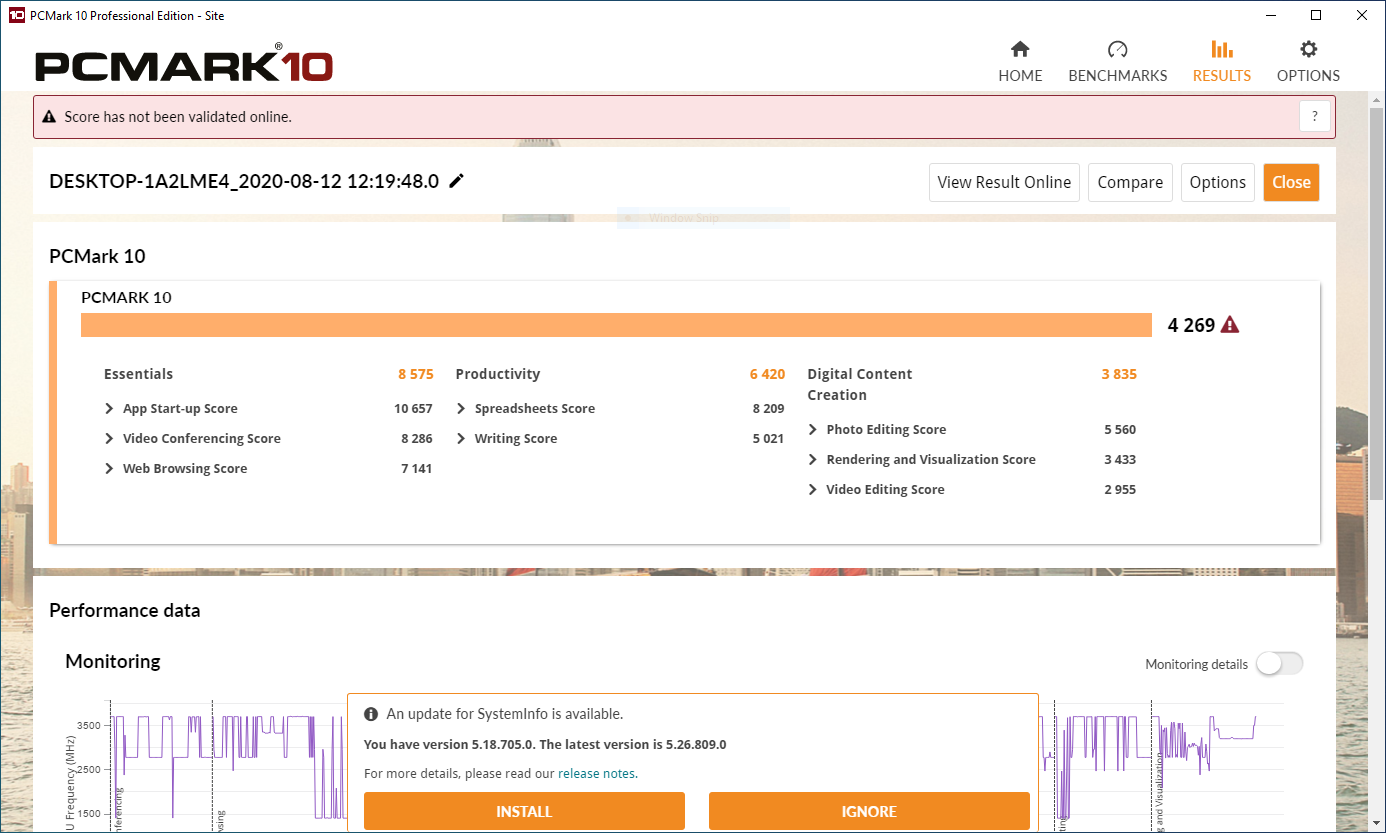
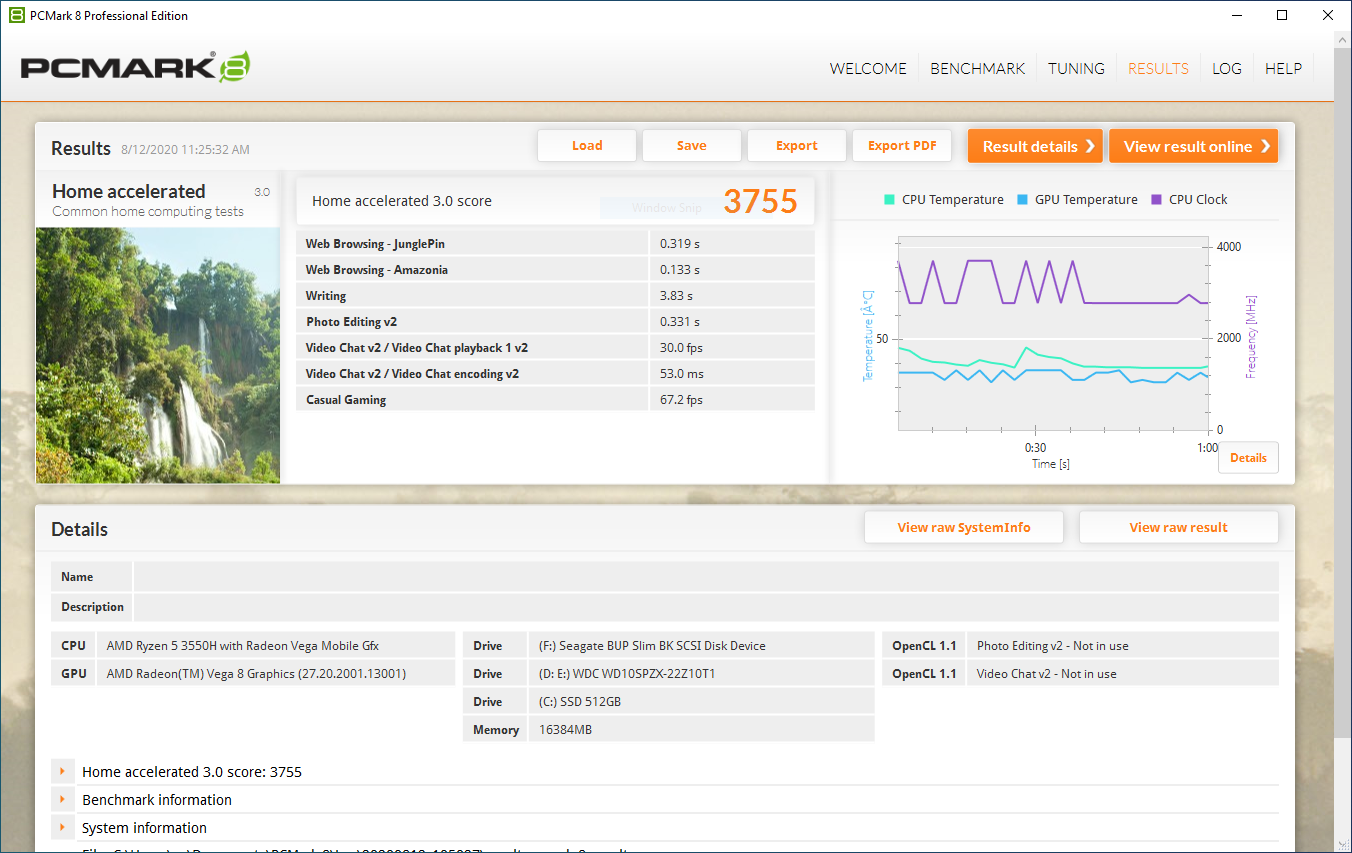
El rendimiento general del sistema es bueno. Las aplicaciones se abren rápidamente gracias a la rápida unidad NVMe, y las tareas de oficina se manejan fácilmente. El GT-R puede masticar un poco de trabajo gráfico más ligero gracias a la GPU Radeon RX Vega 8 incorporada, pero las cargas de trabajo más pesadas lo ralentizarán.
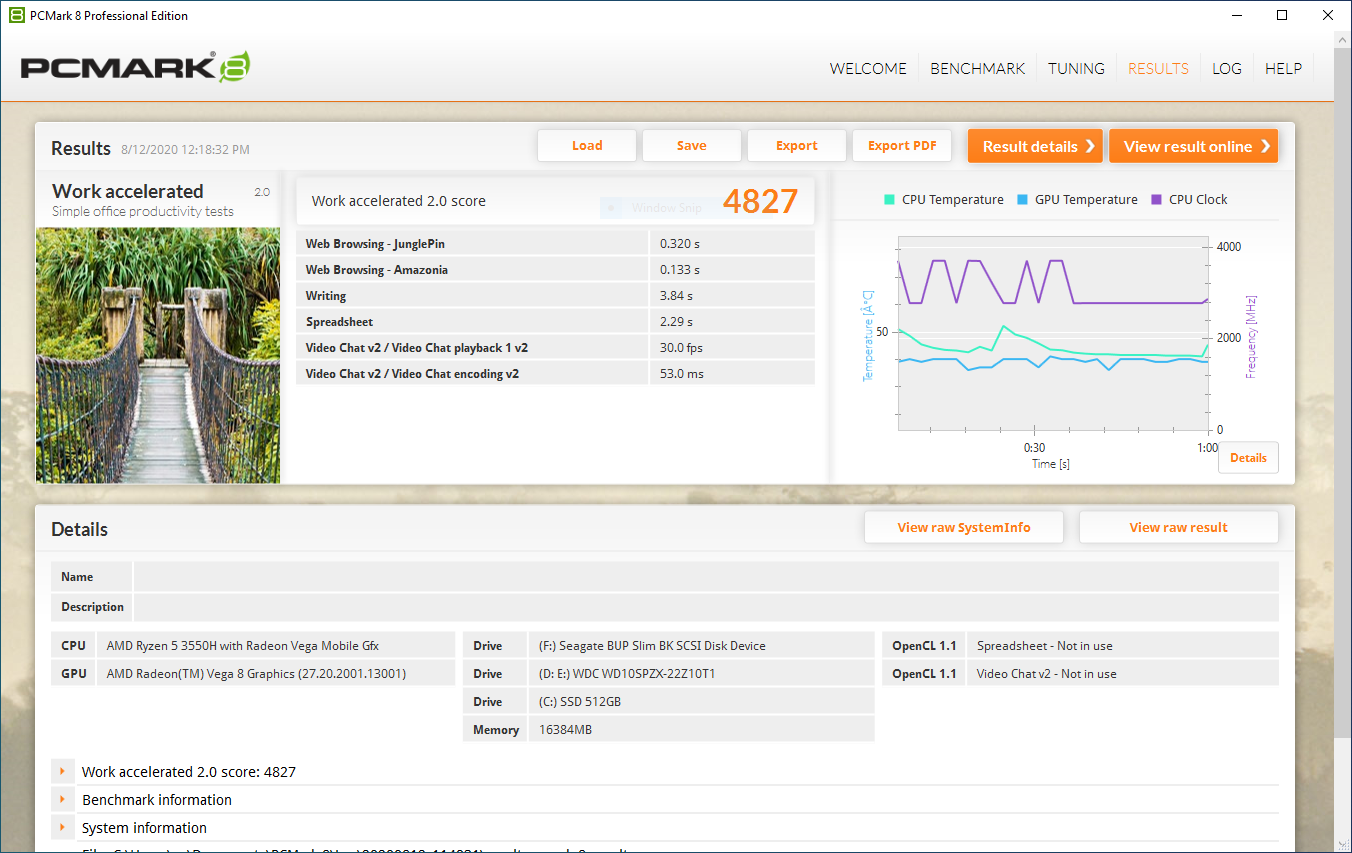
El modo de 54 vatios ofrece mejoras insignificantes en el rendimiento general del sistema según las mediciones de PCMark.
| PCMark 8 - Home Score Accelerated v2 | |
| Media de la clase Desktop (n=1últimos 2 años) | |
| Intel Hades Canyon NUC8i7HVK | |
| Intel NUC8i7BE | |
| Intel NUC10i7FNH | |
| Beelink GTR35 II-G-16512D00W64PRO-1T 54 Watt | |
| Medio AMD Ryzen 5 3550H, AMD Radeon RX Vega 8 (Ryzen 2000/3000) (3755 - 3846, n=2) | |
| Beelink GTR35 II-G-16512D00W64PRO-1T | |
| Zotac ZBOX-CI660 Nano | |
| Intel NUC10i5FNK | |
| PCMark 8 Home Score Accelerated v2 | 3755 puntos | |
| PCMark 8 Work Score Accelerated v2 | 4827 puntos | |
| PCMark 10 Score | 4269 puntos | |
ayuda | ||
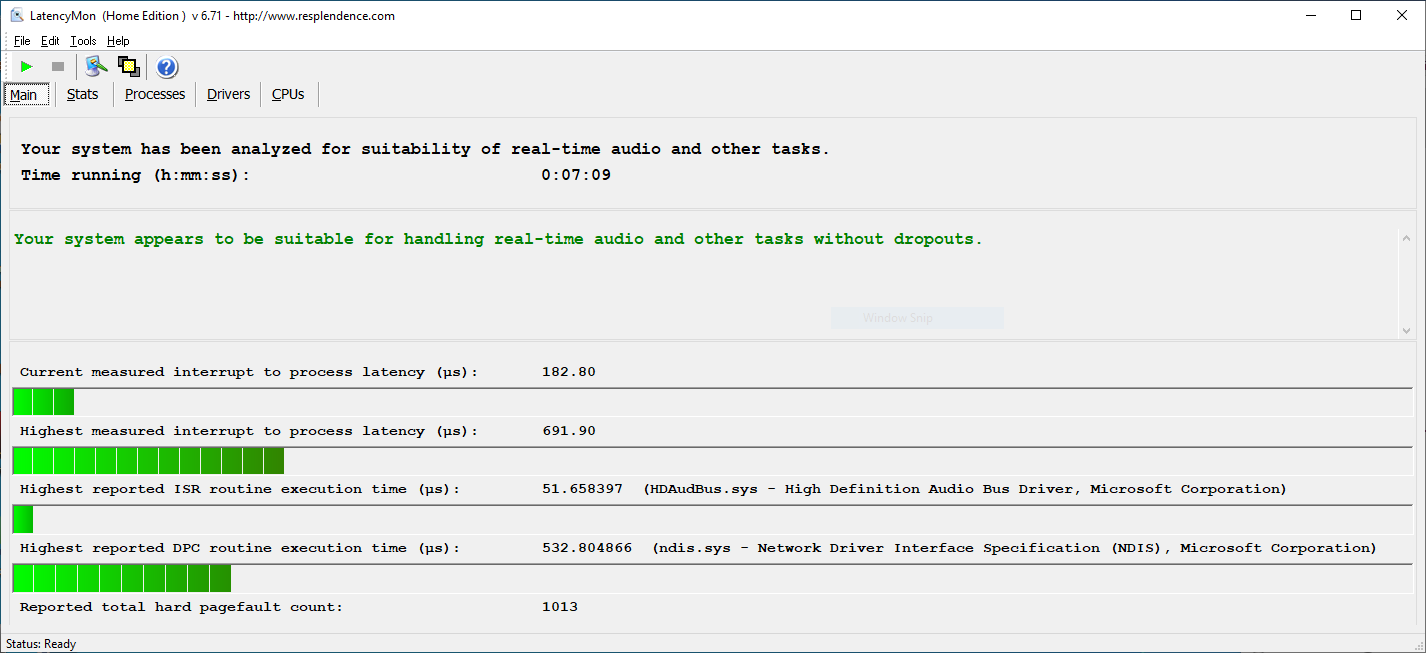
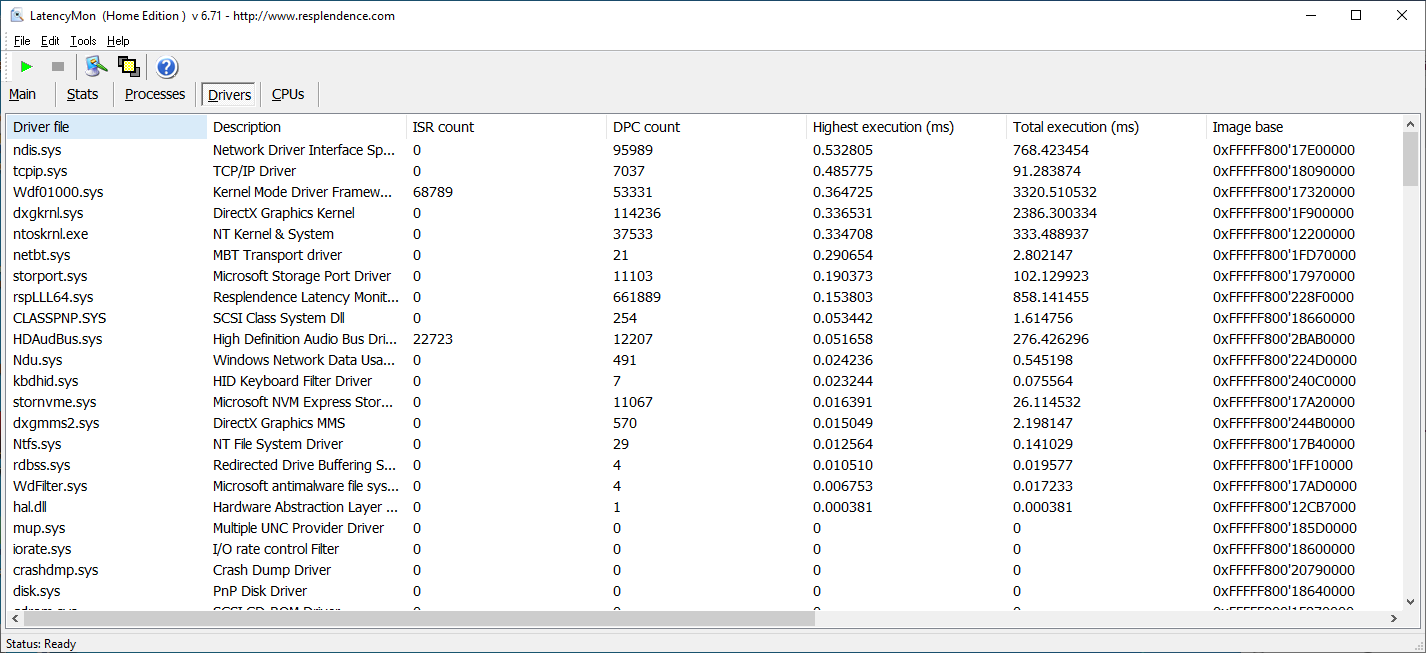
Latencia DPC
La latencia del audio no presenta un problema significativo. En nuestra prueba de latencia estandarizada (transmitiendo un video de 4K de YouTube, navegando por la web y ejecutando Prime95), el GT-R muestra números razonables. Sin embargo, el GT-R bajó 35 de los 3683 fotogramas durante nuestra prueba de transmisión de video 4K de YouTube. Por lo tanto, los usuarios pueden notar alguna interrupción en la transmisión de medios 4K.
| DPC Latencies / LatencyMon - interrupt to process latency (max), Web, Youtube, Prime95 | |
| Lenovo ThinkPad T14s-20T00044GE | |
| Lenovo ThinkPad X13-20UGS00800 | |
| Lenovo ThinkPad T14s-20UJS00K00 | |
| HP Envy x360 13-ay0010nr | |
| Dell Latitude 7410 | |
| Beelink GTR35 II-G-16512D00W64PRO-1T | |
| Lenovo IdeaPad 5 14ARE05 | |
* ... más pequeño es mejor
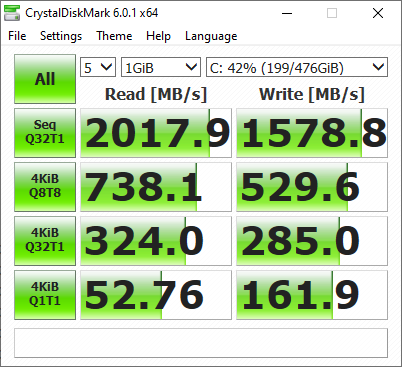
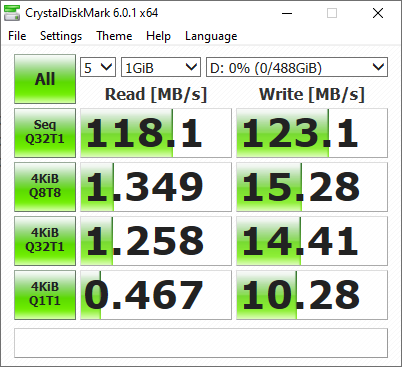
Dispositivos de almacenamiento
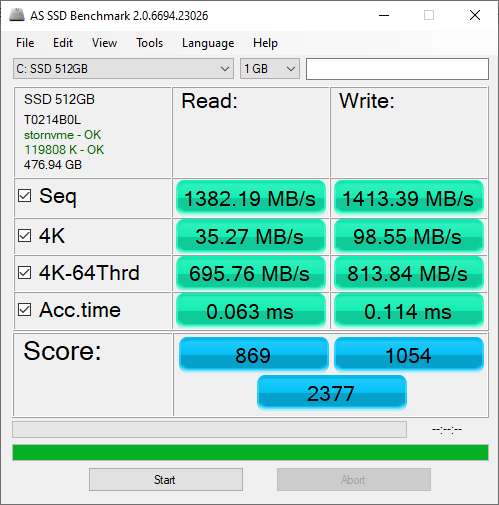
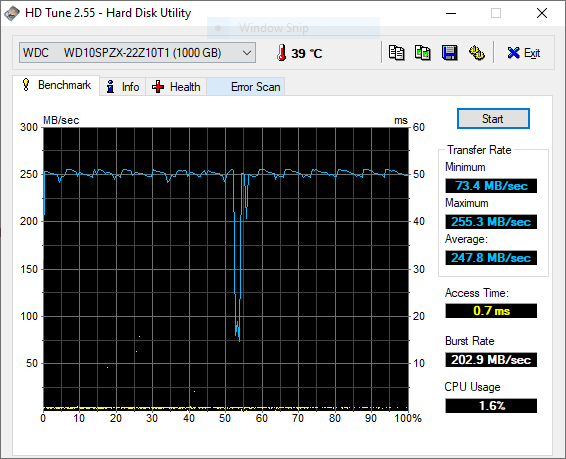
El GT-R soporta un SSD M.2 NVMe, y una unidad SATA M.2, y una unidad SATA de 2,5 pulgadas. La unidad NVMe genérica incluida en nuestra unidad de revisión es rapidísima y ofrece un rendimiento equivalente al de las unidades de gama alta de Samsung y Kingston. Beelink también incluyó una unidad de 1 TB Western Digital Blue 7200 RPM (2.5") para almacenamiento masivo. Funciona como se esperaba.
| Beelink GTR35 II-G-16512D00W64PRO-1T Silicon Motion AZW 512G NV428 | Intel NUC10i7FNH Kingston RBUSNS8154P3256GJ1 | Intel NUC10i5FNK Kingston RBUSNS8154P3256GJ1 | Intel Hades Canyon NUC8i7HVK Intel Optane 120 GB SSDPEK1W120GA | |
|---|---|---|---|---|
| CrystalDiskMark 5.2 / 6 | 91% | -16% | 23% | |
| Write 4K (MB/s) | 161.9 | 442.4 173% | 58.4 -64% | 133.7 -17% |
| Read 4K (MB/s) | 52.8 | 371.1 603% | 30.24 -43% | 178.6 238% |
| Write Seq (MB/s) | 900 | 773 | 608 | |
| Read Seq (MB/s) | 1582 | 712 | 1428 | |
| Write 4K Q32T1 (MB/s) | 285 | 373.8 31% | 448.5 57% | 323.6 14% |
| Read 4K Q32T1 (MB/s) | 324 | 374.9 16% | 391.4 21% | 282.3 -13% |
| Write Seq Q32T1 (MB/s) | 1579 | 893 -43% | 914 -42% | 627 -60% |
| Read Seq Q32T1 (MB/s) | 2018 | 1582 -22% | 1583 -22% | 1521 -25% |
| Write 4K Q8T8 (MB/s) | 530 | 399.1 -25% | 402.3 -24% | |
| Read 4K Q8T8 (MB/s) | 738 | 688 -7% | 680 -8% | |
| AS SSD | -18% | -21% | 36% | |
| Seq Read (MB/s) | 1382 | 1306 -5% | 1318 -5% | 1379 0% |
| Seq Write (MB/s) | 1413 | 611 -57% | 616 -56% | 553 -61% |
| 4K Read (MB/s) | 35.27 | 21.53 -39% | 26.44 -25% | 127.9 263% |
| 4K Write (MB/s) | 98.6 | 53.5 -46% | 61.3 -38% | 103.5 5% |
| 4K-64 Read (MB/s) | 696 | 652 -6% | 650 -7% | 1258 81% |
| 4K-64 Write (MB/s) | 814 | 648 -20% | 642 -21% | 556 -32% |
| Access Time Read * (ms) | 0.063 | 0.114 -81% | 0.11 -75% | 0.025 60% |
| Access Time Write * (ms) | 0.114 | 0.07 39% | 0.07 39% | 0.033 71% |
| Score Read (Points) | 869 | 804 -7% | 808 -7% | 1524 75% |
| Score Write (Points) | 1054 | 762 -28% | 765 -27% | 714 -32% |
| Score Total (Points) | 2377 | 1944 -18% | 1955 -18% | 3023 27% |
| Copy ISO MB/s (MB/s) | 1228 | 976 -21% | 576 -53% | 1125 -8% |
| Copy Program MB/s (MB/s) | 261.7 | 346 32% | 328.9 26% | 342.4 31% |
| Copy Game MB/s (MB/s) | 658 | 735 12% | 471.2 -28% | 768 17% |
| Media total (Programa/Opciones) | 37% /
22% | -19% /
-19% | 30% /
32% |
* ... más pequeño es mejor

Rendimiento de la GPU
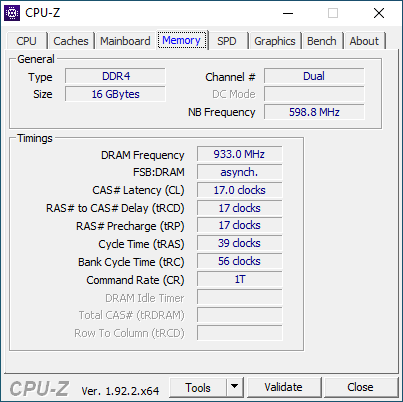
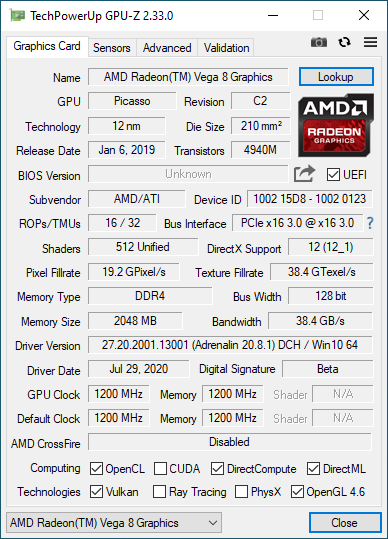
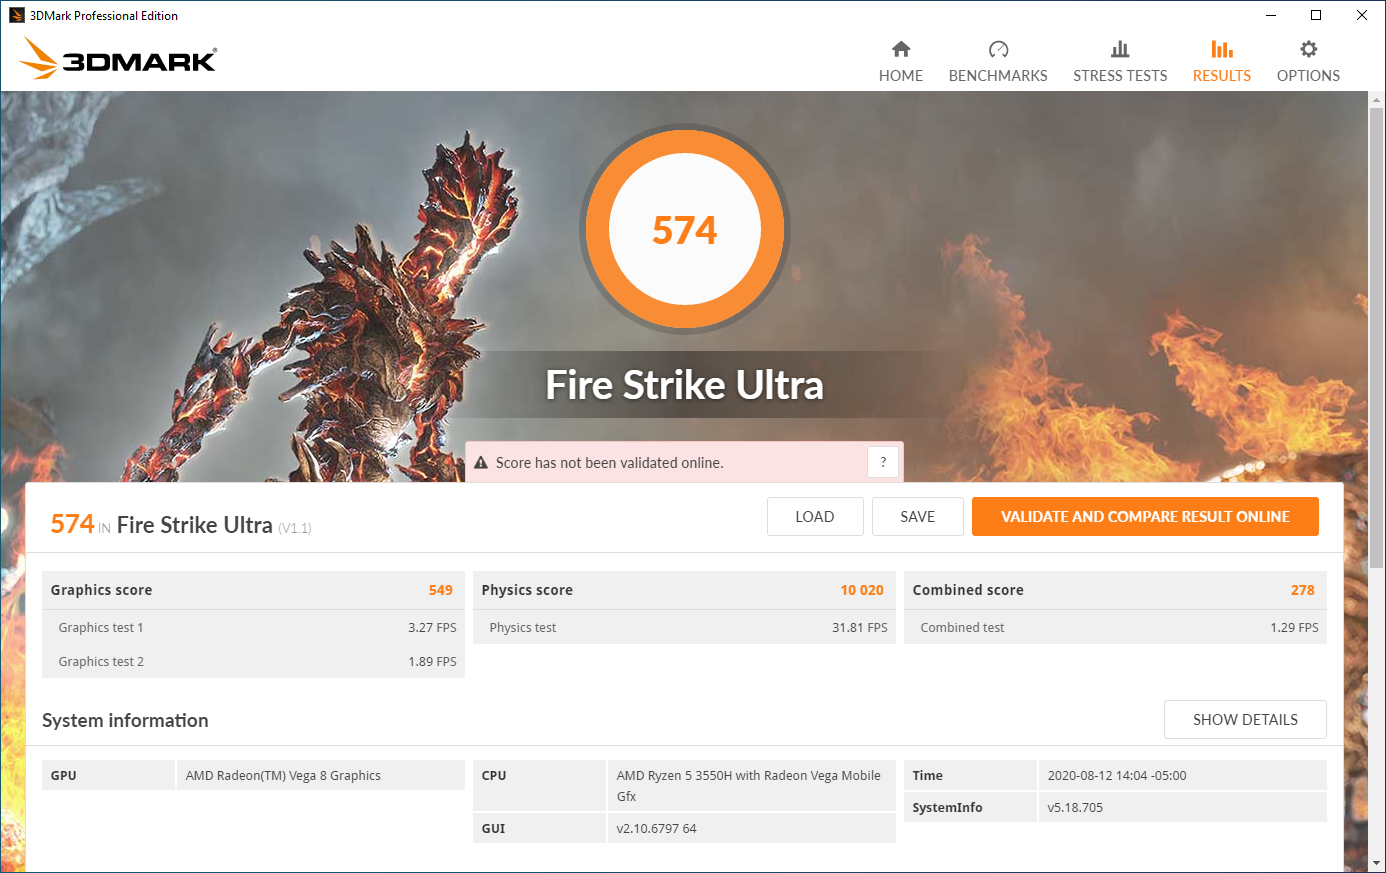
La GPU Radeon RX Vega 8 es una opción decente para un trabajo gráfico más ligero. La GPU cuenta con 8 CUs sincronizadas a 1200 MHz. Al estar construida en el dado de la CPU, la GPU Vega 8 depende de la RAM del PC para su memoria de vídeo; como tal, una RAM más rápida en una configuración de doble canal generalmente aumenta el rendimiento.
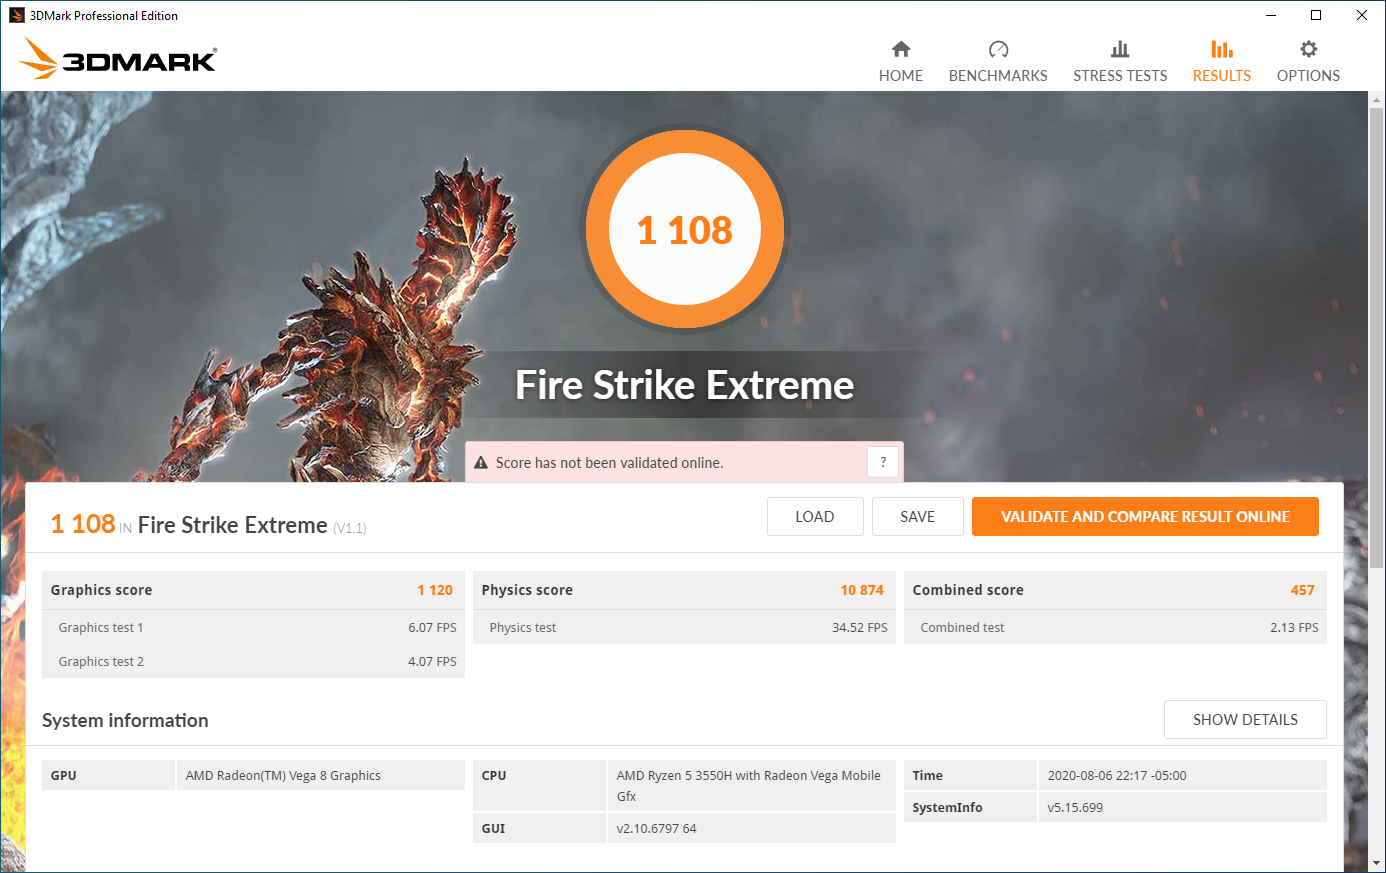
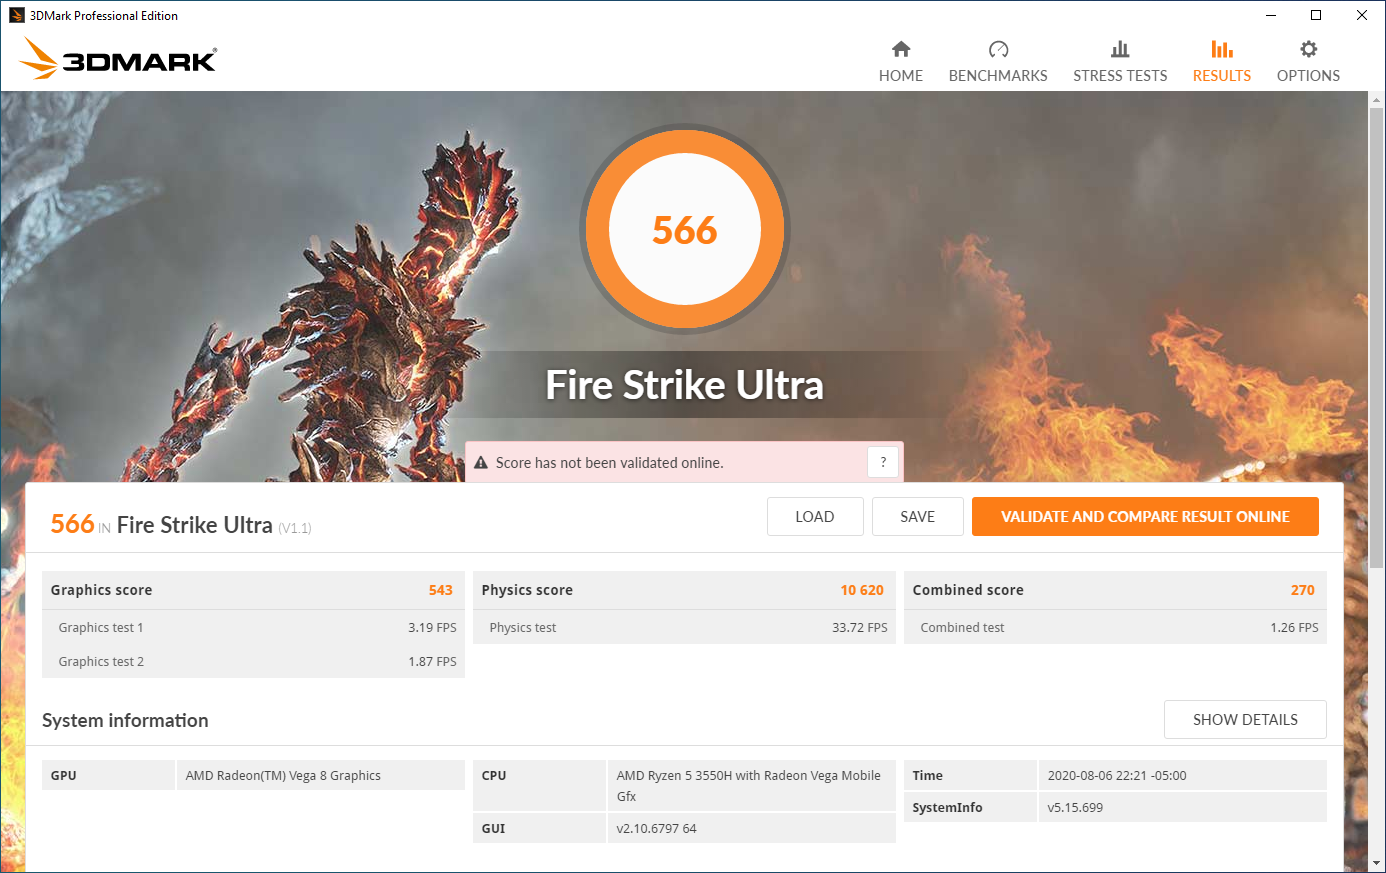
La GPU Vega 8 es aproximadamente el doble de rápida que la UHD Graphics 620 de Intel, que se utiliza en la mayoría de los Ultrabooks y NUCs de Comet Lake. Incluso supera al más potente Intel Iris Plus Graphics 655 por un buen margen (21%) en el Fire Strike de 3DMark. Sin embargo, los gráficos de Vega 8 no pueden seguir el ritmo de las GPU de nivel básico como la Nvidia GeForce MX330. GPUs más potentes, como la Radeon RX 5300M utilizada en el MSI Bravo 15, hacen volar el Vega 8 por los aires.
Curiosamente, cambiar el GT-R a su modo de 54 vatios no aumenta la potencia de la GPU de forma notable; la velocidad máxima del Vega 8 se mantiene bloqueada en 1200 MHz. De hecho, aumentar la potencia de la CPU parece dificultar el rendimiento gráfico, quizás debido a la aceleración térmica; Fire Strike registró puntuaciones más bajas cuando la CPU se fijó en 54 vatios.
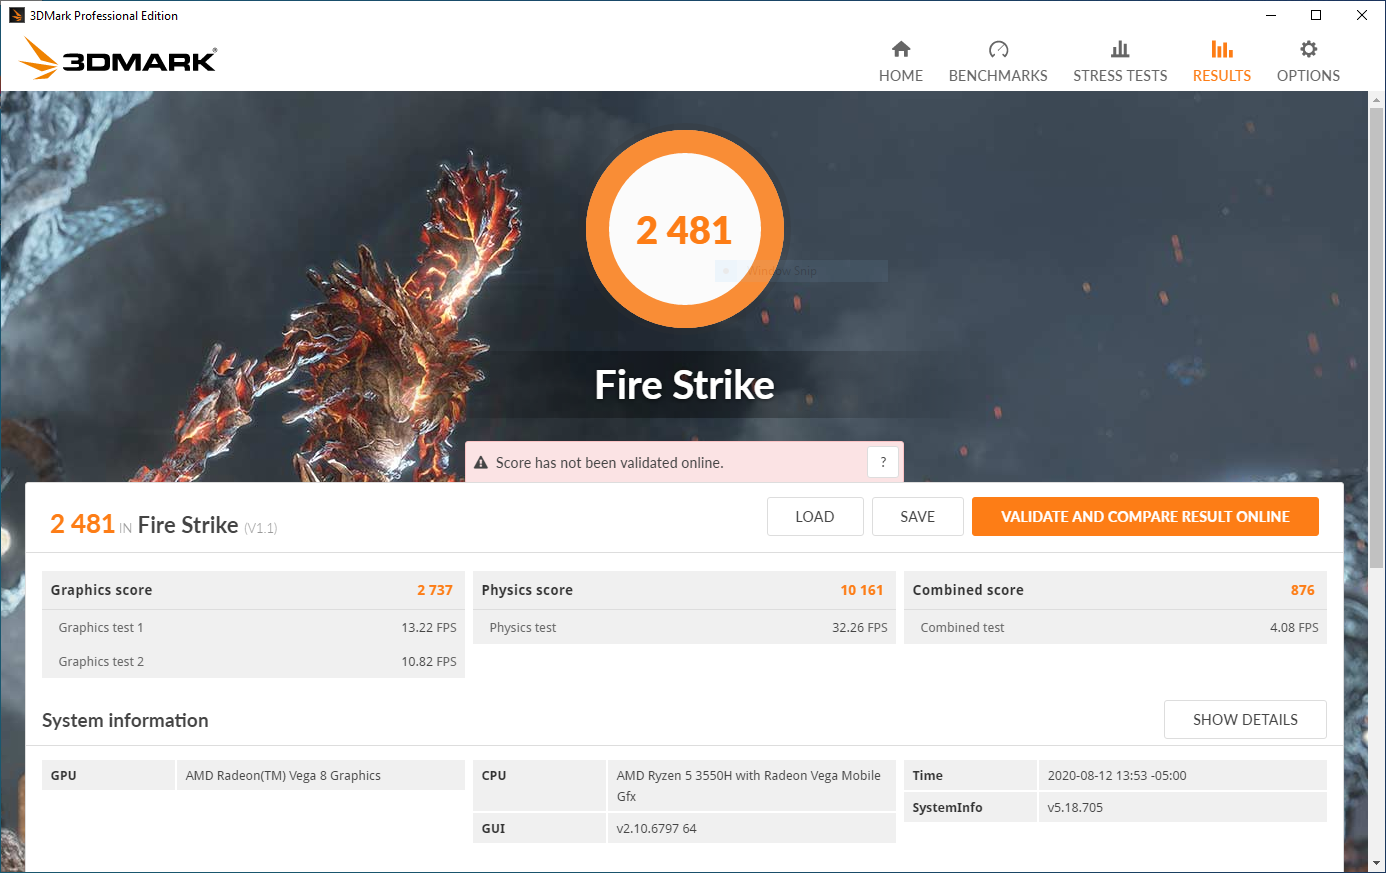


| 3DMark 11 Performance | 4138 puntos | |
| 3DMark Cloud Gate Standard Score | 13339 puntos | |
| 3DMark Fire Strike Score | 2481 puntos | |
| 3DMark Fire Strike Extreme Score | 1121 puntos | |
ayuda | ||
El rendimiento de los juegos
La GPU Radeon RX Vega 8 es adecuada para juegos ligeros. Títulos más antiguos como Bioshock Infinite pueden ser jugados en configuraciones medias/altas a 1080p y aún así alcanzar 30 fps o más. Para un sólido 60 fps, la resolución tendrá que ser bajada a 1366x768. Los títulos más ligeros como Rocket League también se pueden disfrutar en configuraciones reducidas y resoluciones más bajas. Los títulos más nuevos y exigentes como Doom Eternal struggle en el GT-R no tienen nada que ver con los ajustes más bajos.
Como ya se ha mencionado, llevar la CPU a 54 vatios no ayuda mucho, si es que ayuda en algo, a mejorar los fotogramas de los juegos. Algunos títulos que dependen de la CPU pueden beneficiarse, pero los juegos basados en la GPU no ven ningún beneficio.
La jugabilidad a largo plazo es constante, como lo demuestra la hora de juego de The Witcher 3. No hay caídas de cuadros ni tartamudeo inesperados.
| BioShock Infinite | |
| 1280x720 Very Low Preset | |
| Intel Hades Canyon NUC8i7HVK | |
| Intel NUC8i7BE | |
| Beelink GTR35 II-G-16512D00W64PRO-1T 54 Watt | |
| Beelink GTR35 II-G-16512D00W64PRO-1T | |
| Medio AMD Radeon RX Vega 8 (Ryzen 2000/3000) (68.9 - 122.8, n=29) | |
| 1366x768 Medium Preset | |
| Intel Hades Canyon NUC8i7HVK | |
| Beelink GTR35 II-G-16512D00W64PRO-1T | |
| Beelink GTR35 II-G-16512D00W64PRO-1T 54 Watt | |
| Medio AMD Radeon RX Vega 8 (Ryzen 2000/3000) (50.2 - 83, n=15) | |
| Intel NUC8i7BE | |
| 1366x768 High Preset | |
| Intel Hades Canyon NUC8i7HVK | |
| Beelink GTR35 II-G-16512D00W64PRO-1T | |
| Beelink GTR35 II-G-16512D00W64PRO-1T 54 Watt | |
| Intel NUC8i7BE | |
| Medio AMD Radeon RX Vega 8 (Ryzen 2000/3000) (17.2 - 68, n=16) | |
| 1920x1080 Ultra Preset, DX11 (DDOF) | |
| Intel Hades Canyon NUC8i7HVK | |
| Beelink GTR35 II-G-16512D00W64PRO-1T 54 Watt | |
| Beelink GTR35 II-G-16512D00W64PRO-1T | |
| Medio AMD Radeon RX Vega 8 (Ryzen 2000/3000) (7.6 - 28, n=30) | |
| Intel NUC8i7BE | |
| Rocket League | |
| 1280x720 Performance | |
| Intel NUC8i7BE | |
| Beelink GTR35 II-G-16512D00W64PRO-1T 54 Watt | |
| Beelink GTR35 II-G-16512D00W64PRO-1T | |
| Medio AMD Radeon RX Vega 8 (Ryzen 2000/3000) (52.9 - 107.3, n=6) | |
| 1920x1080 Performance | |
| Intel NUC8i7BE | |
| Beelink GTR35 II-G-16512D00W64PRO-1T | |
| Beelink GTR35 II-G-16512D00W64PRO-1T 54 Watt | |
| Medio AMD Radeon RX Vega 8 (Ryzen 2000/3000) (60 - 60, n=2) | |
| 1920x1080 Quality AA:Medium FX | |
| Intel NUC8i7BE | |
| Beelink GTR35 II-G-16512D00W64PRO-1T 54 Watt | |
| Medio AMD Radeon RX Vega 8 (Ryzen 2000/3000) (42.7 - 45.8, n=5) | |
| Beelink GTR35 II-G-16512D00W64PRO-1T | |
| 1920x1080 High Quality AA:High FX | |
| Intel Hades Canyon NUC8i7HVK | |
| Intel NUC8i7BE | |
| Beelink GTR35 II-G-16512D00W64PRO-1T 54 Watt | |
| Medio AMD Radeon RX Vega 8 (Ryzen 2000/3000) (27.9 - 32.1, n=5) | |
| Beelink GTR35 II-G-16512D00W64PRO-1T | |
| Doom Eternal | |
| 1280x720 Low Preset | |
| Beelink GTR35 II-G-16512D00W64PRO-1T | |
| Beelink GTR35 II-G-16512D00W64PRO-1T 54 Watt | |
| Medio AMD Radeon RX Vega 8 (Ryzen 2000/3000) (39.6 - 45, n=3) | |
| Intel NUC8i7BE | |
| 1920x1080 Medium Preset | |
| Beelink GTR35 II-G-16512D00W64PRO-1T 54 Watt | |
| Medio AMD Radeon RX Vega 8 (Ryzen 2000/3000) (19.9 - 25, n=3) | |
| Beelink GTR35 II-G-16512D00W64PRO-1T | |
| 1920x1080 High Preset | |
| Beelink GTR35 II-G-16512D00W64PRO-1T 54 Watt | |
| Beelink GTR35 II-G-16512D00W64PRO-1T | |
| Medio AMD Radeon RX Vega 8 (Ryzen 2000/3000) (17.6 - 21, n=3) | |
| 1920x1080 Ultra Preset | |
| Beelink GTR35 II-G-16512D00W64PRO-1T | |
| Medio AMD Radeon RX Vega 8 (Ryzen 2000/3000) (14 - 16, n=2) | |
| Beelink GTR35 II-G-16512D00W64PRO-1T 54 Watt | |
| bajo | medio | alto | ultra | |
|---|---|---|---|---|
| BioShock Infinite (2013) | 109 | 83 | 68 | 22 |
| The Witcher 3 (2015) | 46 | 29 | 13 | 9 |
| Dota 2 Reborn (2015) | 84.7 | 66.9 | 41.9 | 39.2 |
| Rocket League (2017) | 93 | 43 | 29 | |
| Final Fantasy XV Benchmark (2018) | 26.6 | 13.6 | 8.26 | |
| X-Plane 11.11 (2018) | 32.5 | 25.3 | 22.8 | |
| Doom Eternal (2020) | 45 | 22 | 20 | 16 |
Emisiones y Energía
Ruido del sistema
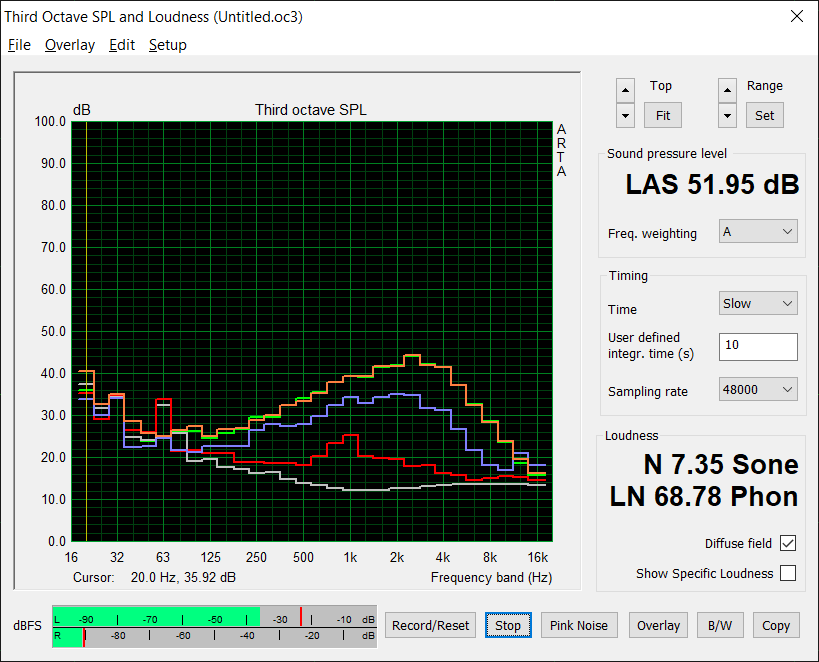
Uno de los defectos del GT-R es el fuerte ruido del ventilador. Los ventiladores duales funcionan bien para mantener el sistema frío bajo carga, pero el ruido generado es un gran costo. Cuando están estresados, los ventiladores suben agresivamente a más de 50 dB(A). Bajo carga prolongada, raramente bajan. Incluso después de una carga pesada de trabajo, los ventiladores continuarán soplando a toda velocidad durante medio minuto para agotar todo el calor. Cuando la máquina está en su modo de 54 vatios, los ventiladores suben más temprano y se mantienen fuertes por más tiempo. Peor aún, los ventiladores tienen un tono muy alto; el chillido de los ventiladores corta fácilmente el ruido ambiental de una habitación.
| Beelink GTR35 II-G-16512D00W64PRO-1T Vega 8, R5 3550H, Silicon Motion AZW 512G NV428 | Intel NUC8i7BE Iris Plus Graphics 655, i7-8559U | Intel Hades Canyon NUC8i7HVK Vega M GH, i7-8809G, Intel Optane 120 GB SSDPEK1W120GA | |
|---|---|---|---|
| Noise | 8% | 8% | |
| apagado / medio ambiente * (dB) | 25.4 | 28.7 -13% | 28.7 -13% |
| Idle Minimum * (dB) | 31.5 | 28.7 9% | 29 8% |
| Idle Average * (dB) | 31.5 | 29.3 7% | 29 8% |
| Idle Maximum * (dB) | 31.5 | 31.8 -1% | 29 8% |
| Load Average * (dB) | 43.9 | 39 11% | 36 18% |
| Witcher 3 ultra * (dB) | 51.9 | 39 25% | 42 19% |
| Load Maximum * (dB) | 52 | 41.4 20% | 49.4 5% |
* ... más pequeño es mejor
Ruido
| Ocioso |
| 31.5 / 31.5 / 31.5 dB(A) |
| Carga |
| 43.9 / 52 dB(A) |
 | ||
30 dB silencioso 40 dB(A) audible 50 dB(A) ruidosamente alto |
||
min: | ||
Temperatura
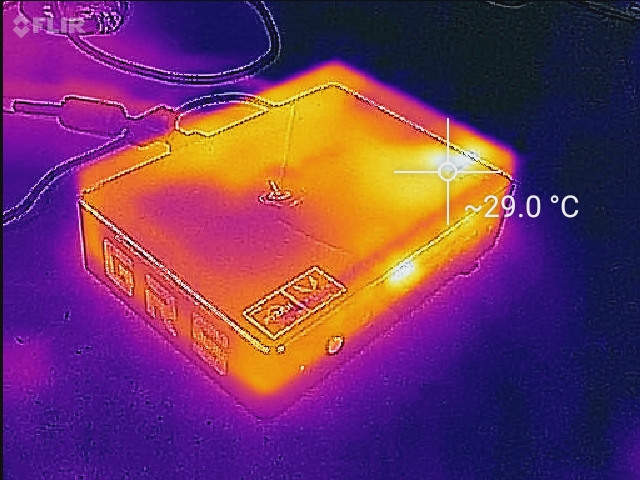
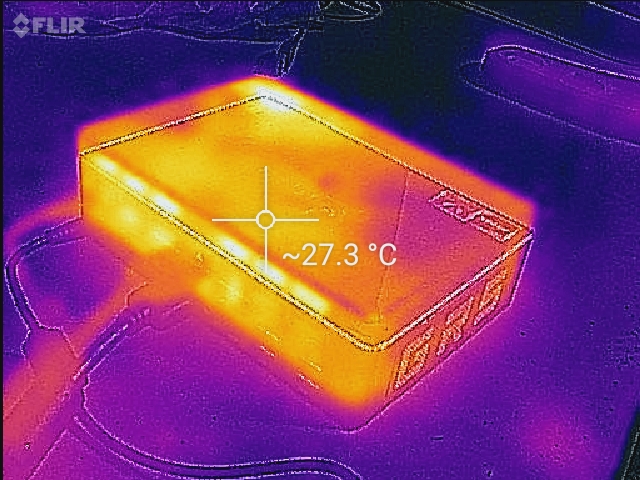
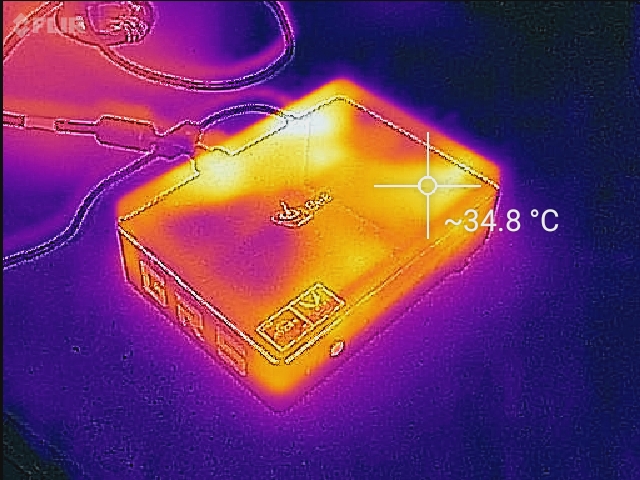
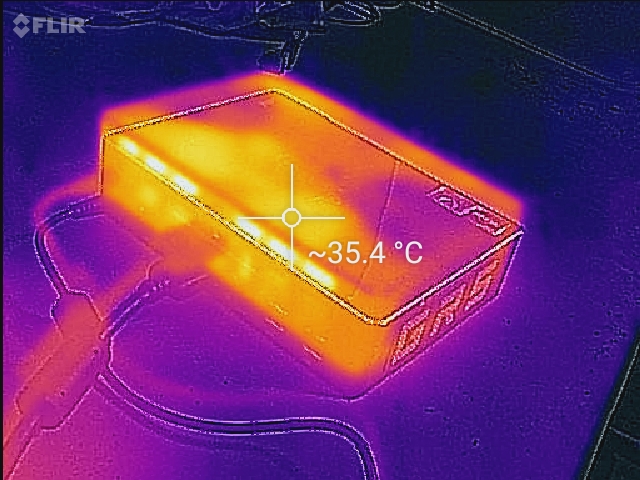
Las temperaturas en toda la carcasa se mantienen bastante frías, alcanzando un máximo de unos 35º C a plena carga.
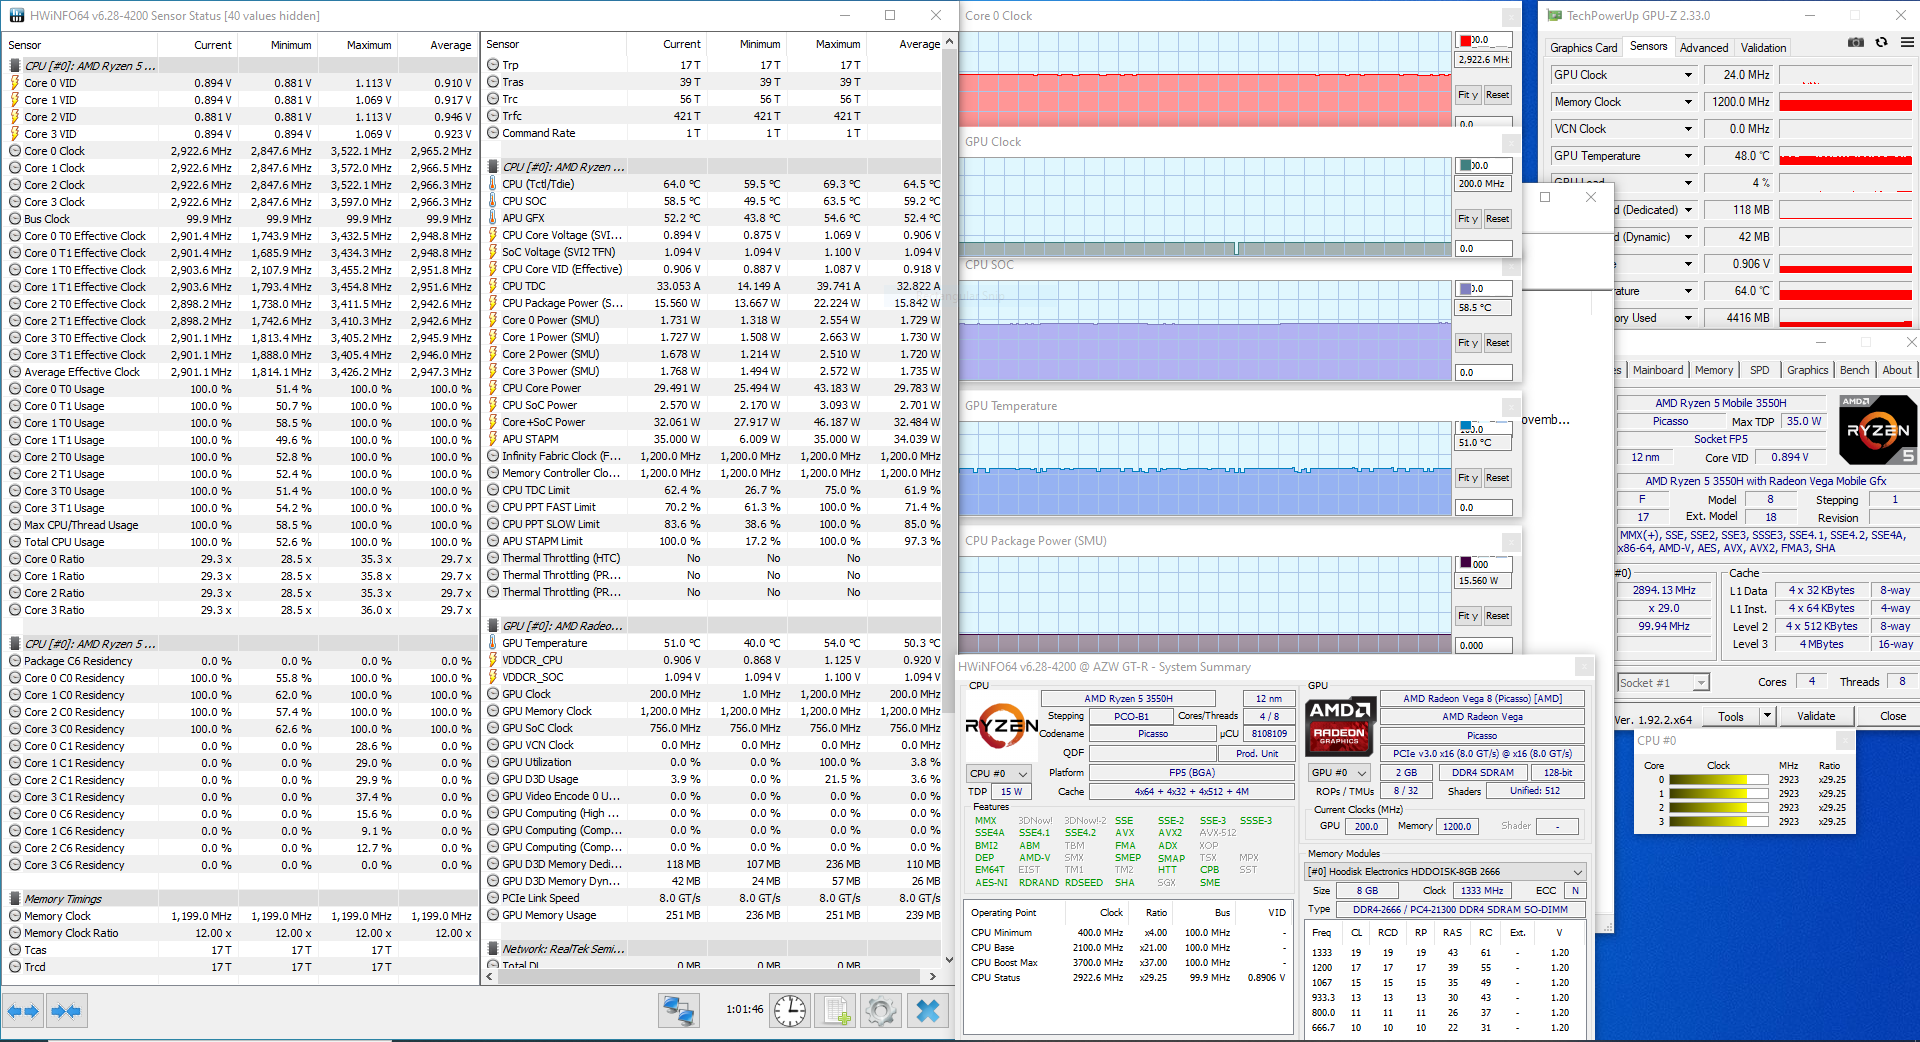
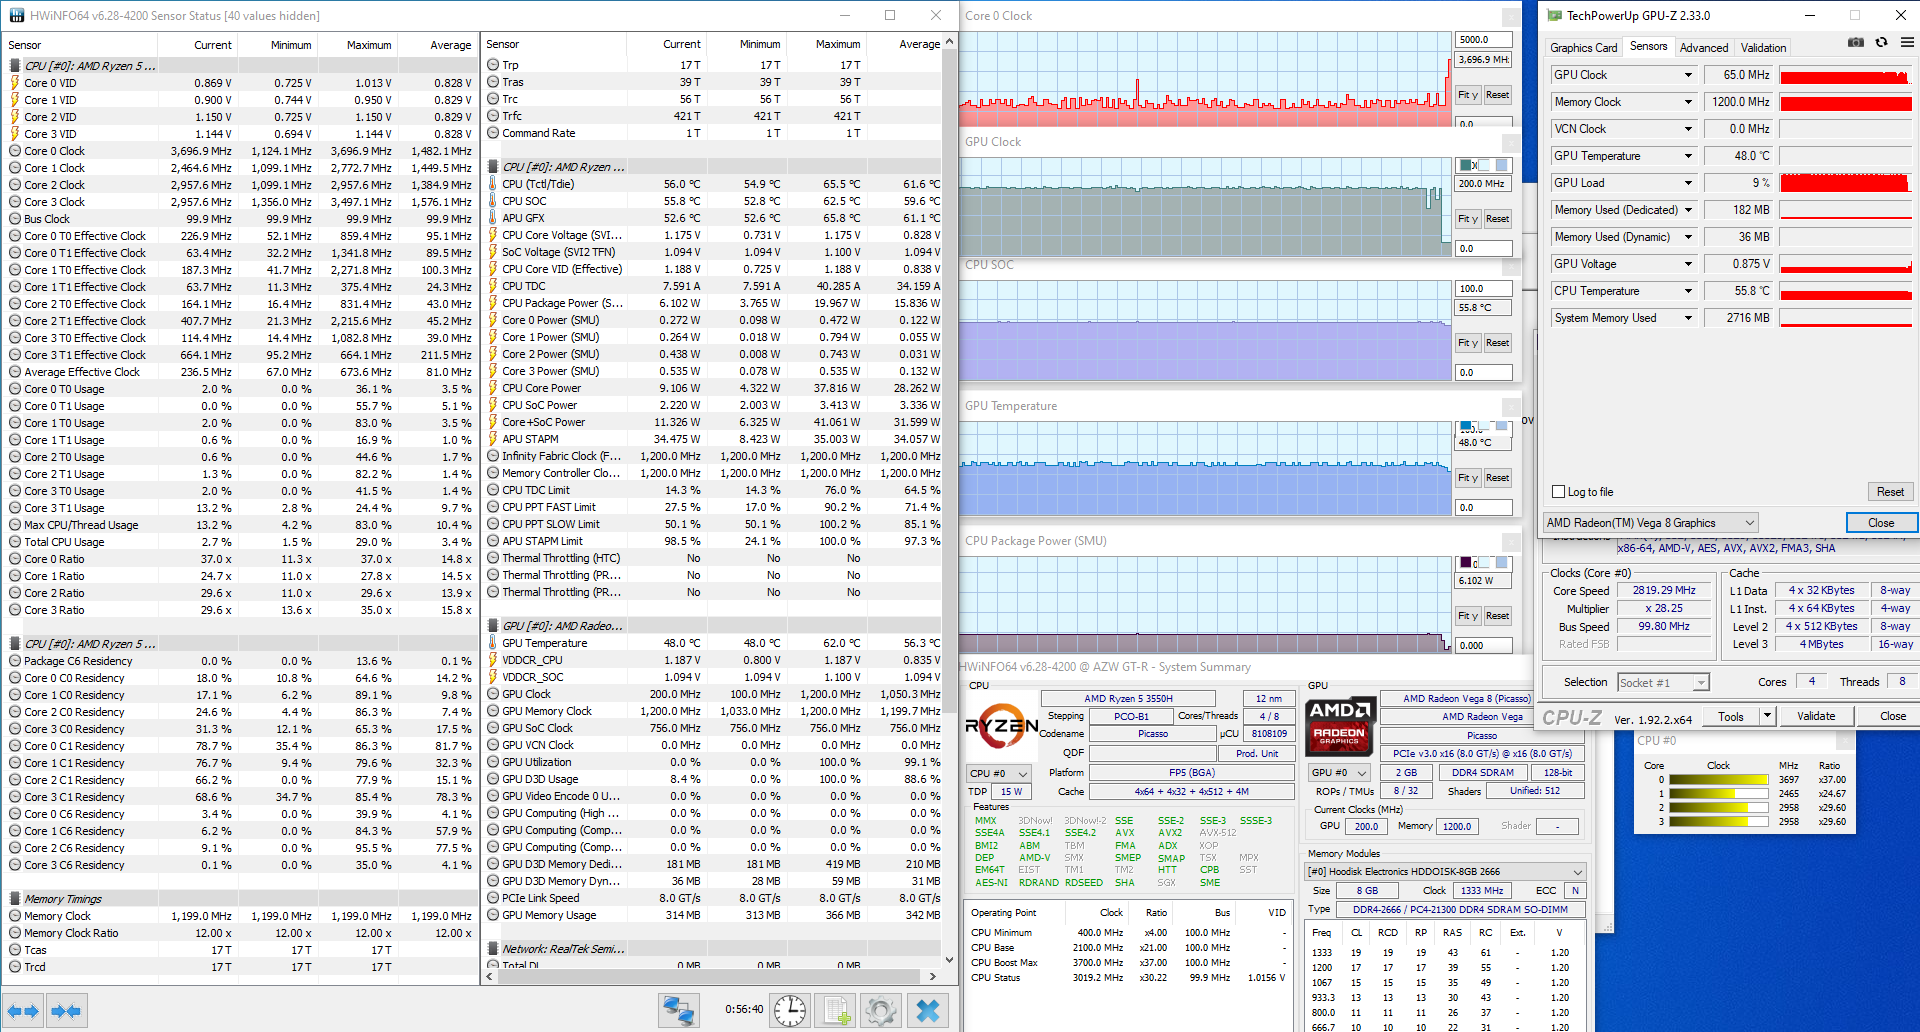
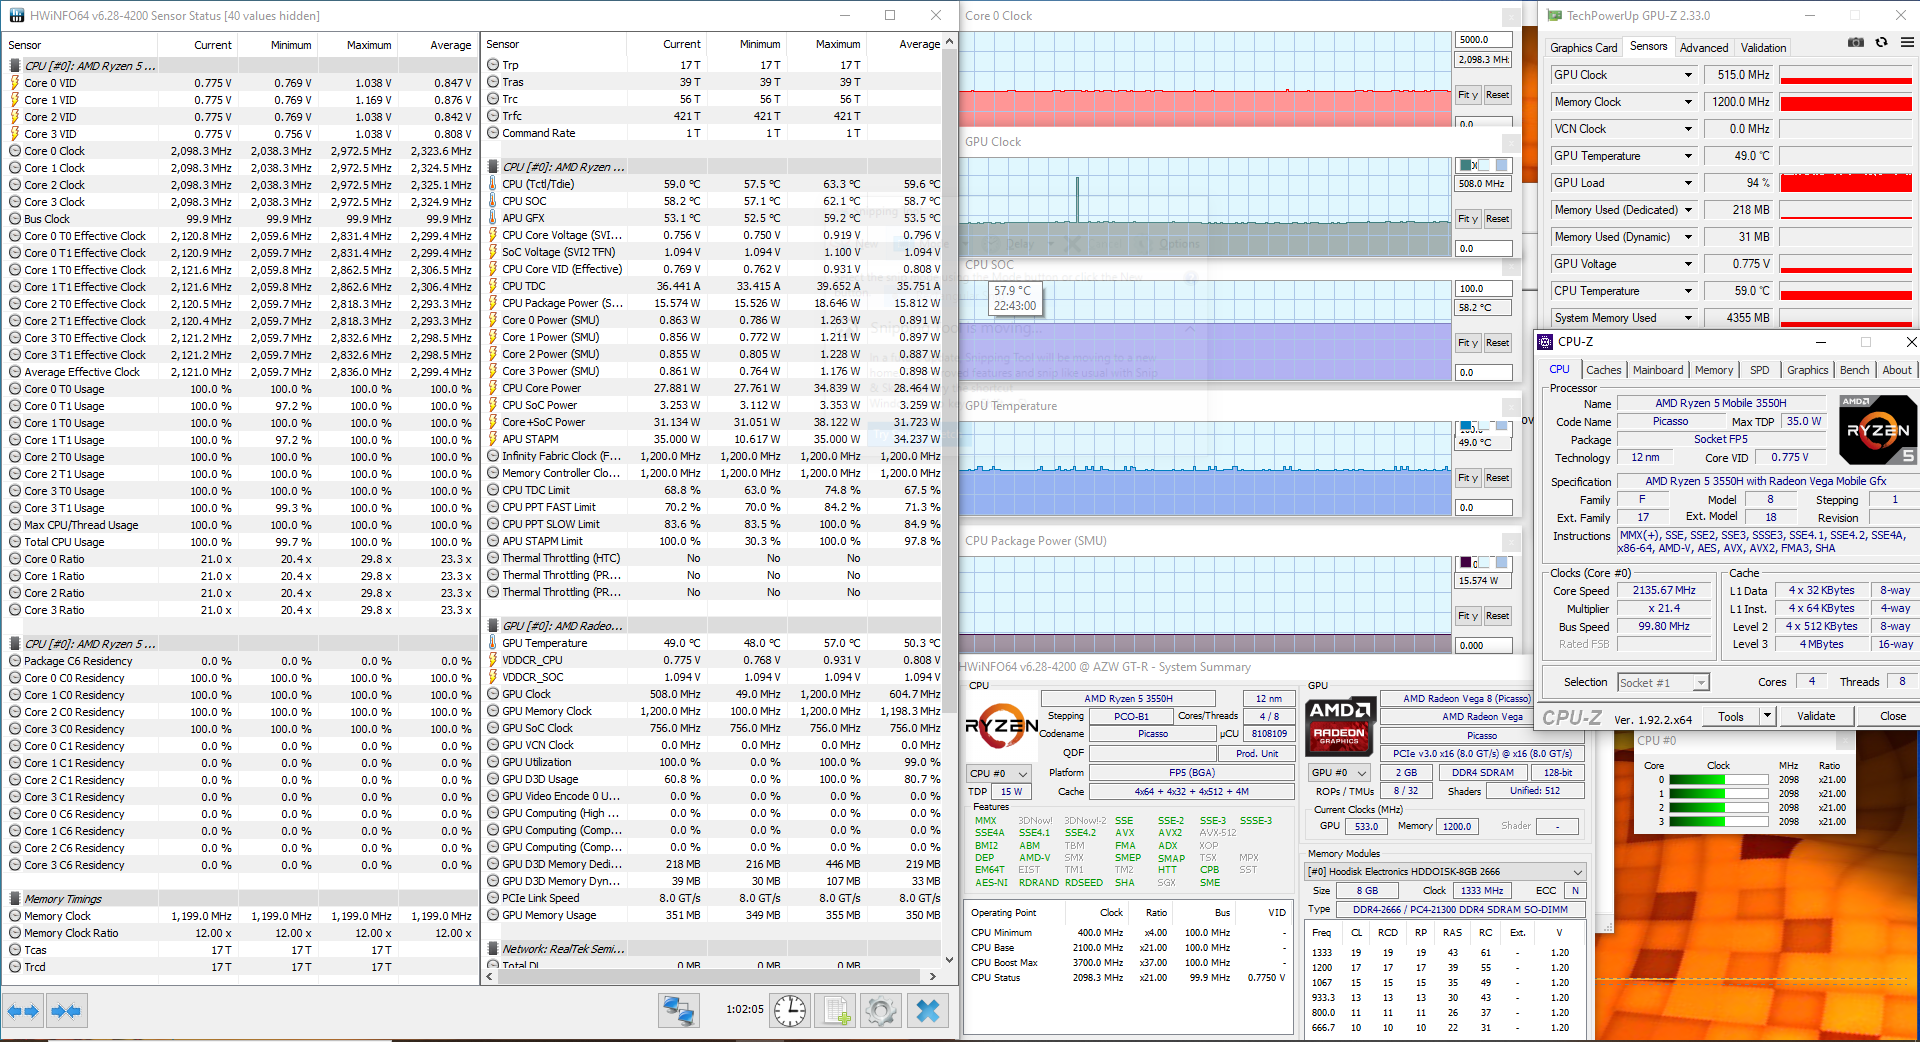
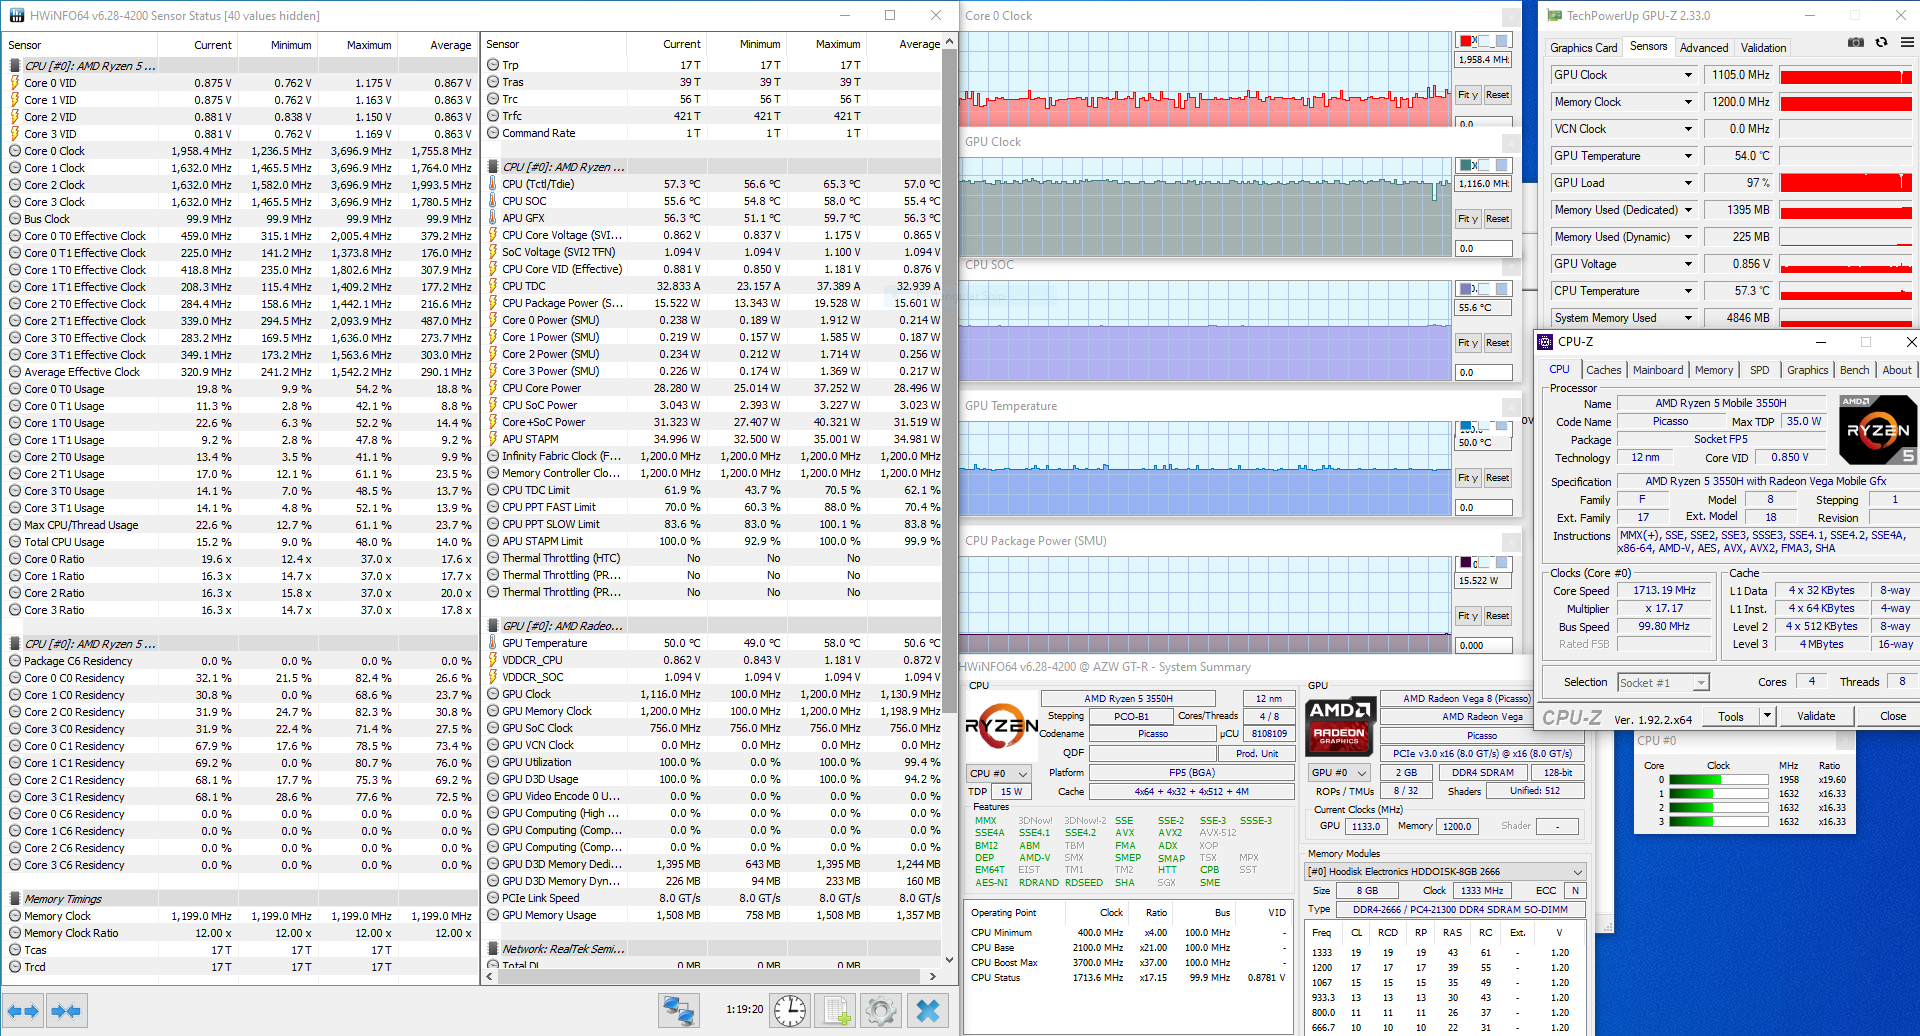
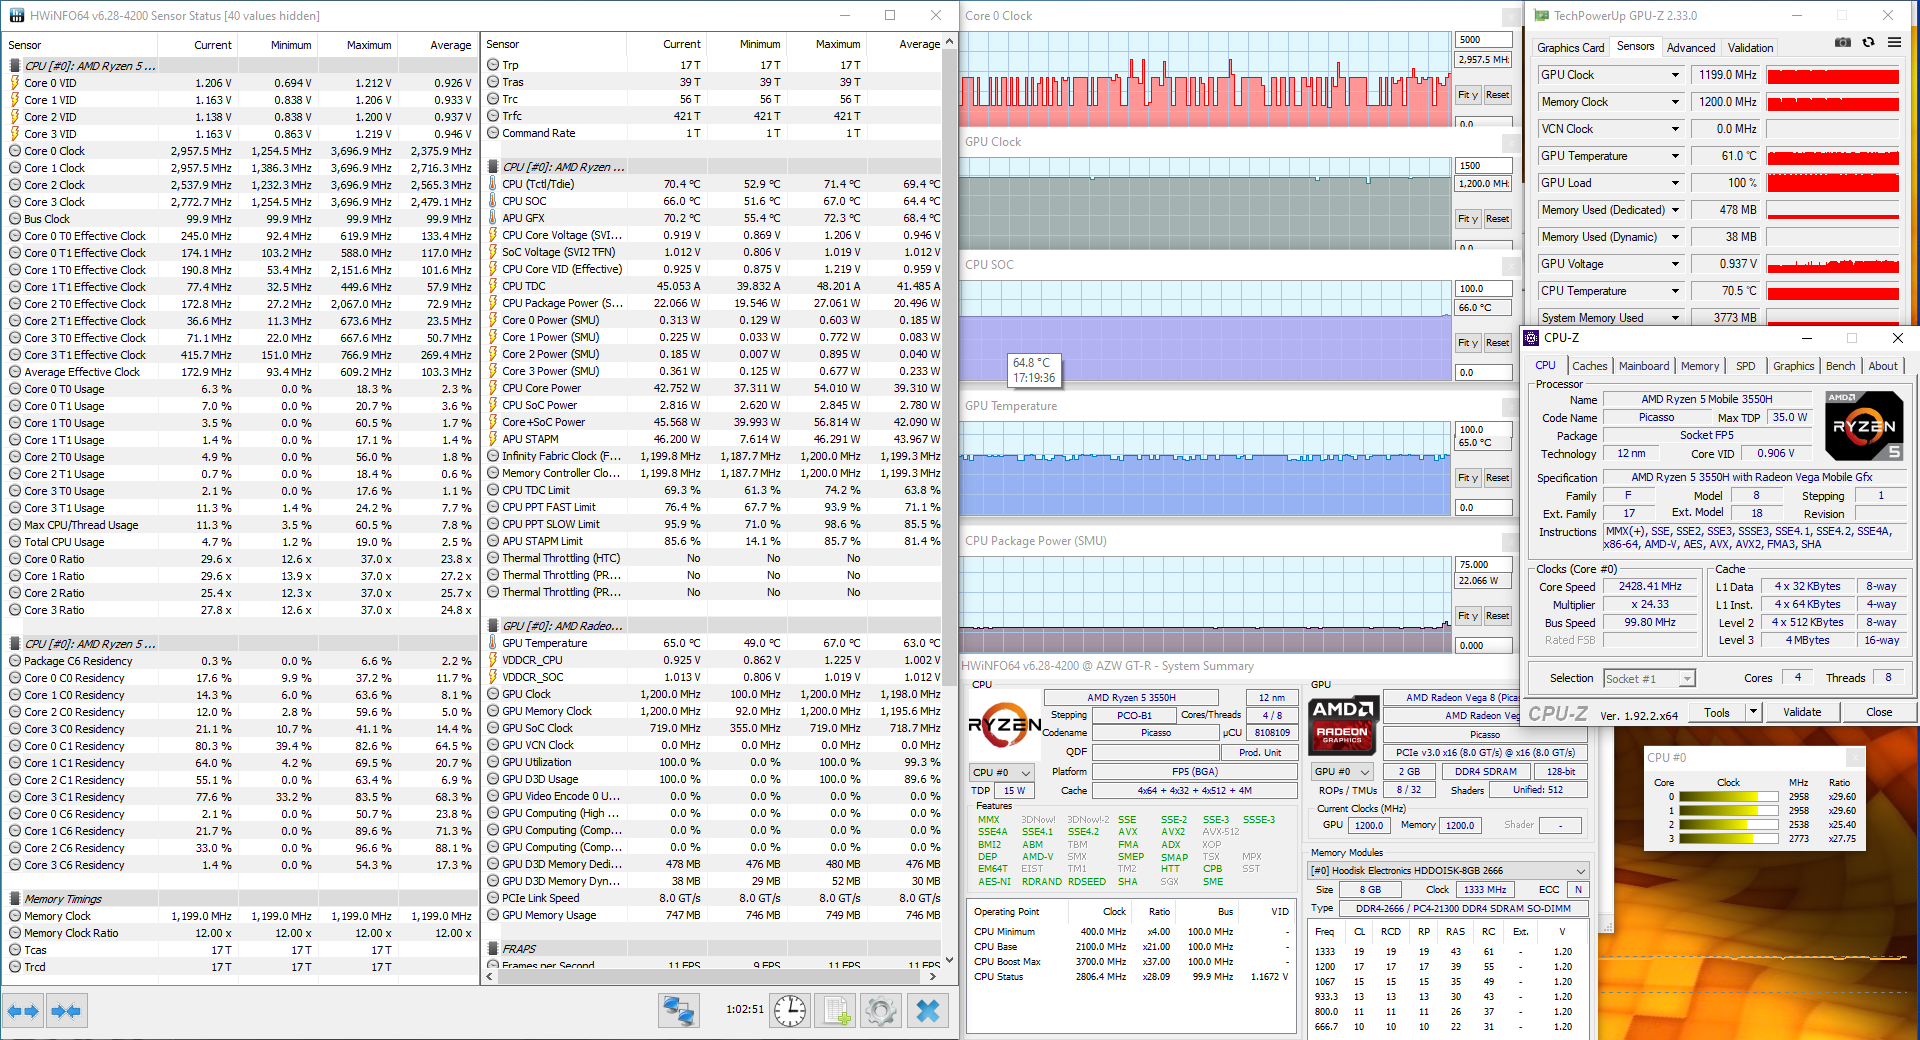
El GT-R maneja muy bien el estrés. Bajo carga sintética completa, la CPU nunca se rompe a 60° C. De la misma manera, la GPU se mantiene a o por debajo de 50° C en nuestras pruebas de estrés. Notamos algunas limitaciones térmicas, particularmente con la CPU. En nuestra hora de funcionamiento de Prime95, la CPU se las arregla para rondar los 3,0 GHz en todos los núcleos. Sin embargo, al ejecutar Prime95 y FurMark simultáneamente, la CPU es incapaz de aumentar la potencia de forma fiable. En su lugar, se mantiene en su base de 2,1 GHz. En nuestra prueba en el mundo real (ejecutando The Witcher 3 durante una hora), la CPU se mantiene entre 1,6 y 2,0 GHz. La GPU tiene un promedio de unos 1100 MHz, que está por debajo de su máximo de 1200 MHz.
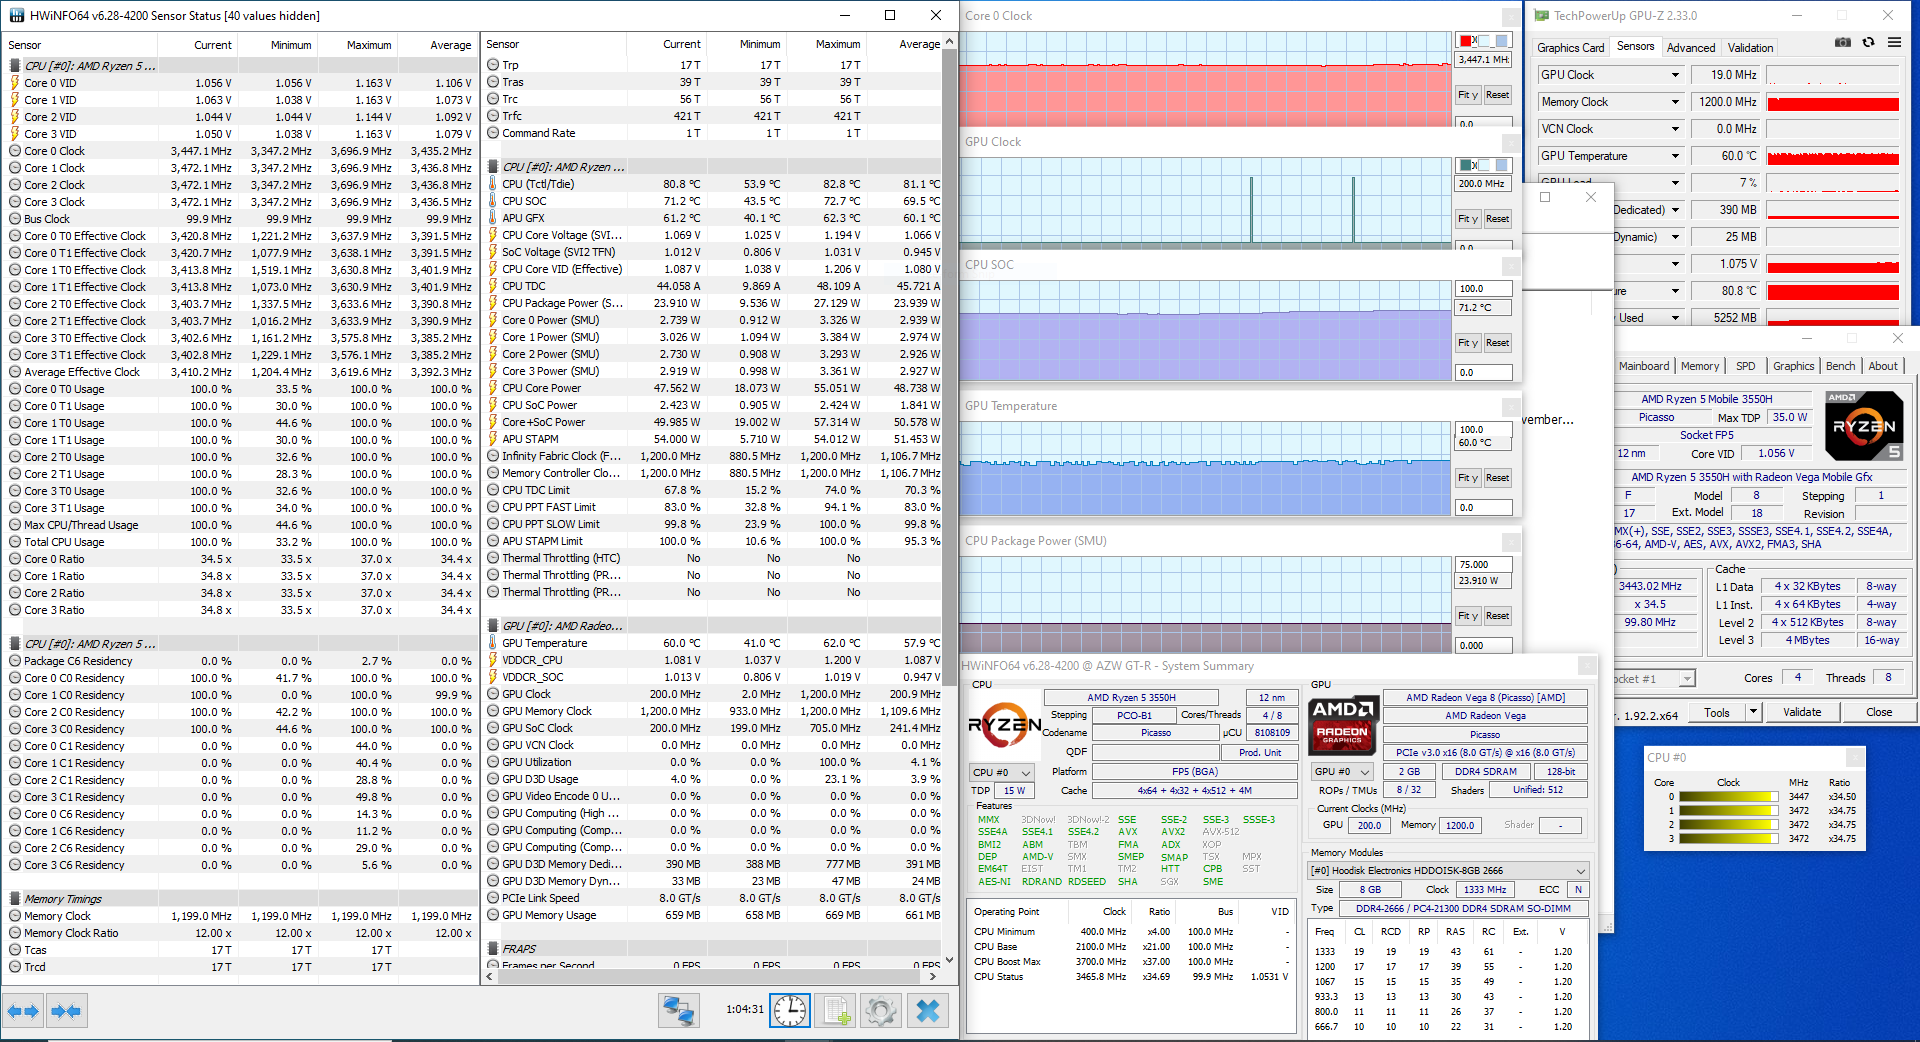
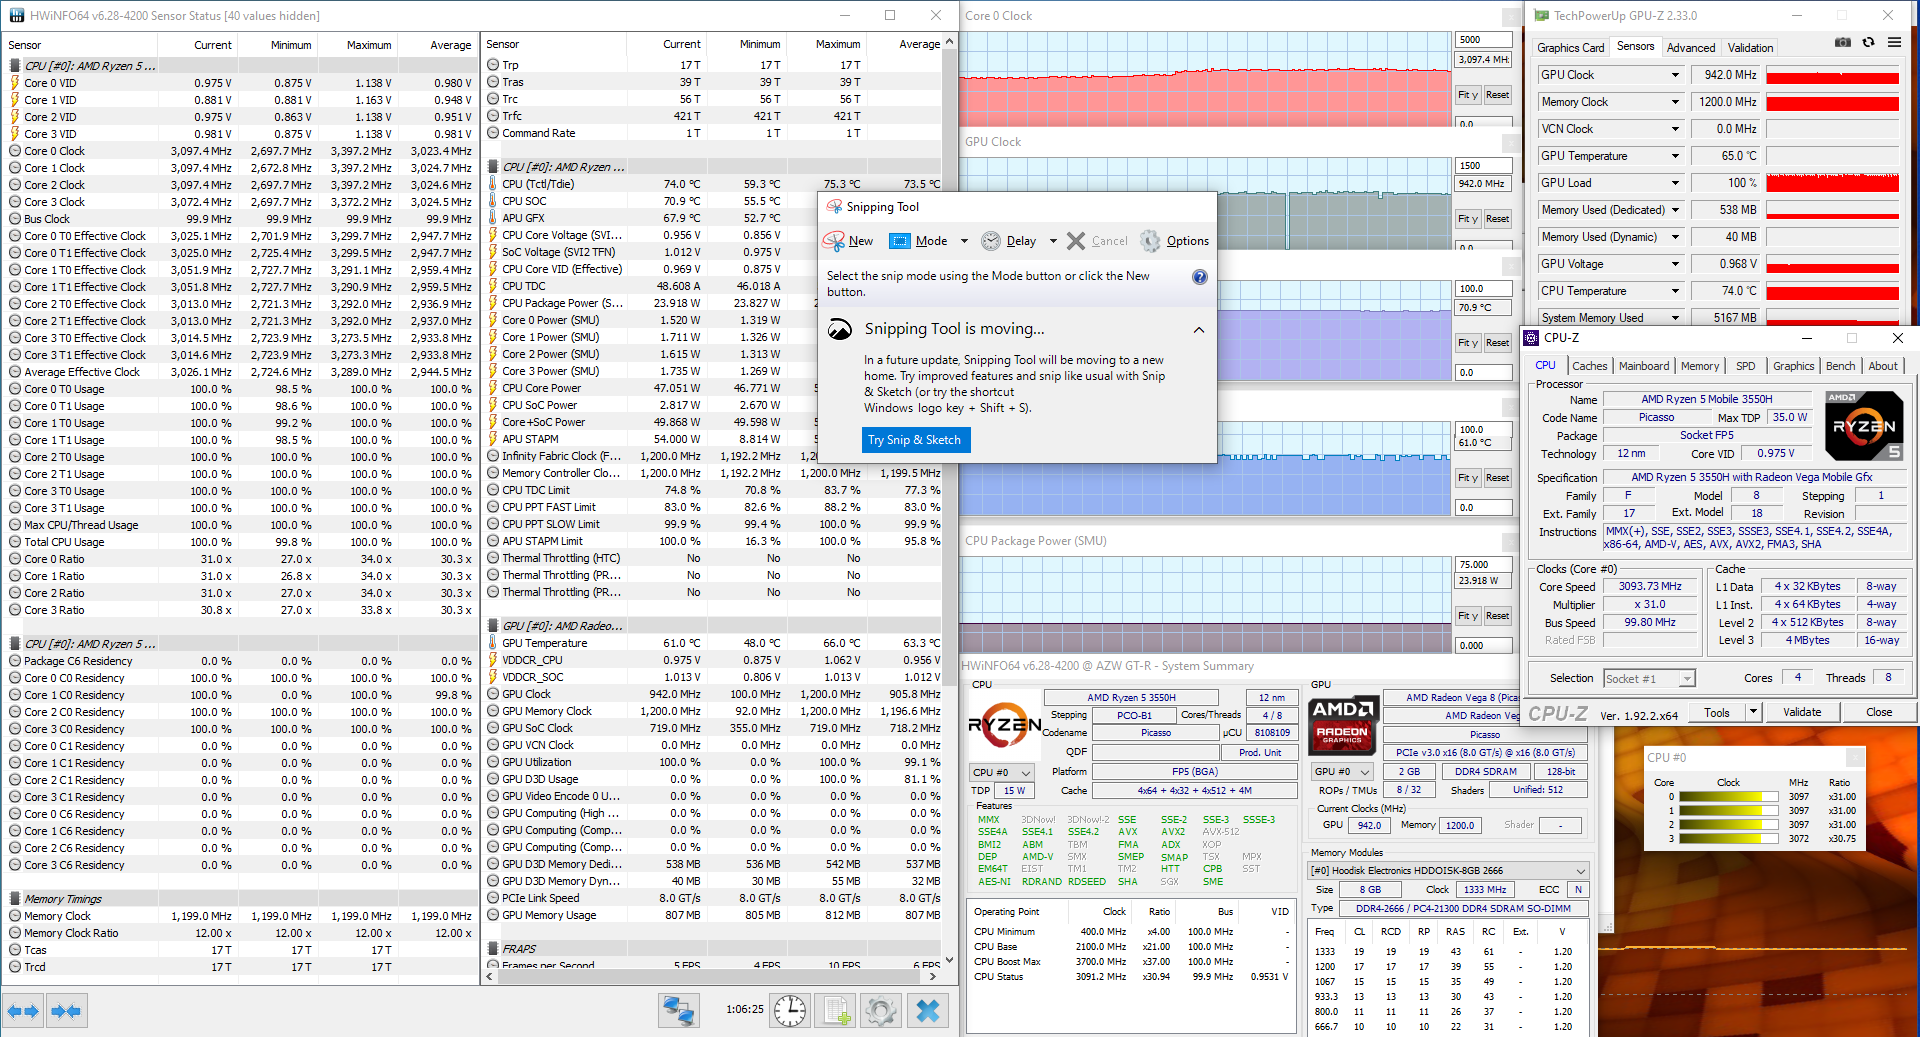
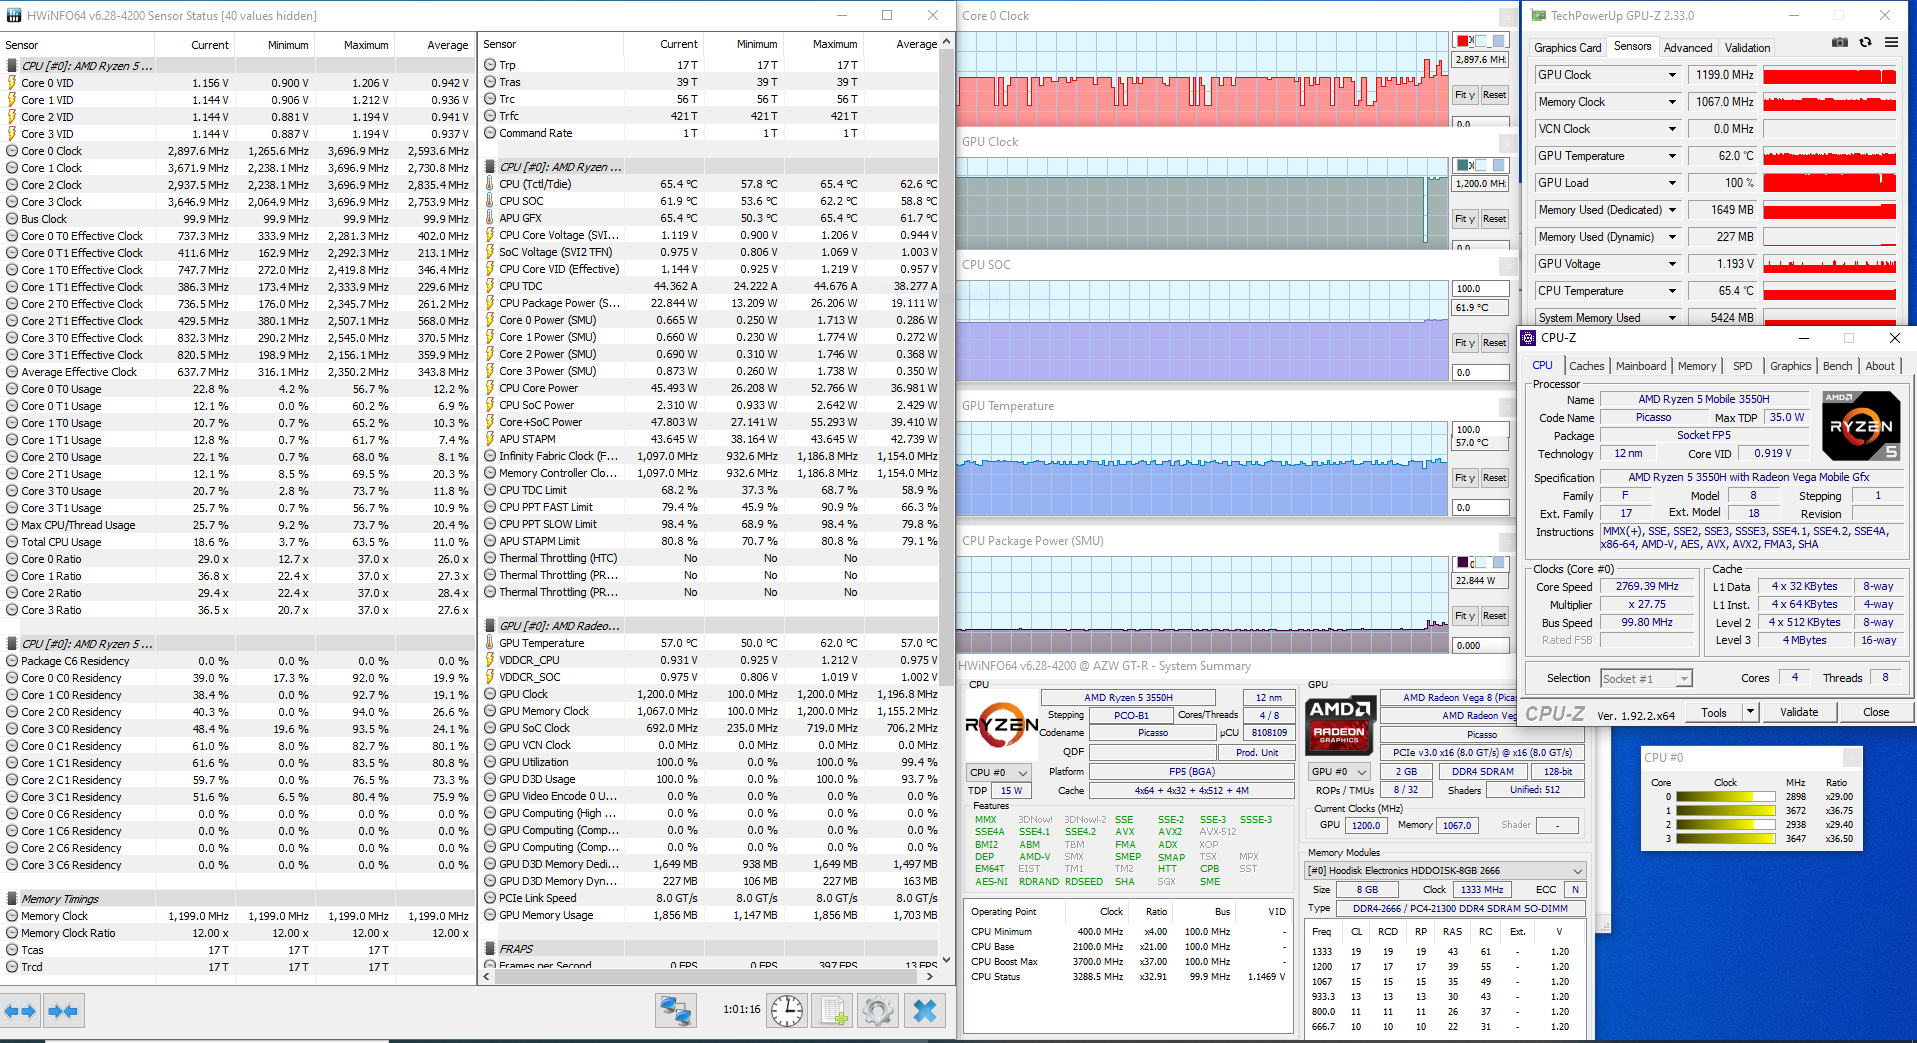
Ajustar la CPU a 54 vatios da como resultado un rendimiento mucho mejor en nuestras pruebas de esfuerzo, aunque con temperaturas más altas. La CPU logra mantener unos estables 3,45 GHz en los cuatro núcleos de Prime95, aunque la temperatura de la CPU se dispara hasta los 71° C. La 3550H logra mantenerse a unos 3,1 GHz cuando se ejecutan FurMark y Prime95 juntos. La GPU tiene un promedio de 942 MHz. Nuevamente, las temperaturas son más altas, promediando 71° C en la CPU y 61° C en la GPU. Los juegos presentan menos problemas; durante una hora de juego de The Witcher 3, la CPU es capaz de aumentar a 3,7 GHz según sea necesario. La GPU mantiene unos estables 1200 MHz. Las temperaturas se manejan mejor durante el juego; la CPU y la GPU promedian 62° C y 57° C, respectivamente, durante esta prueba.
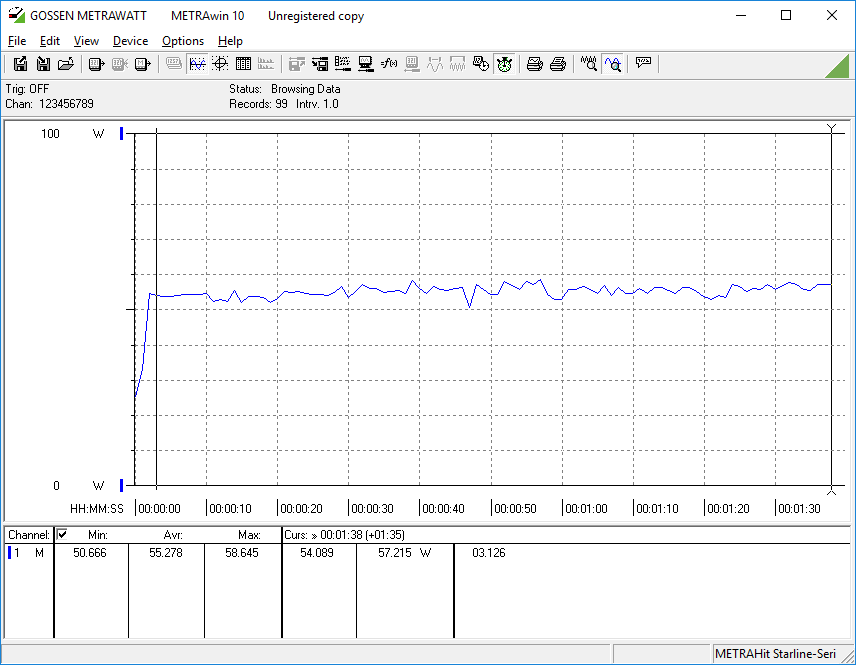
Consumo de energía
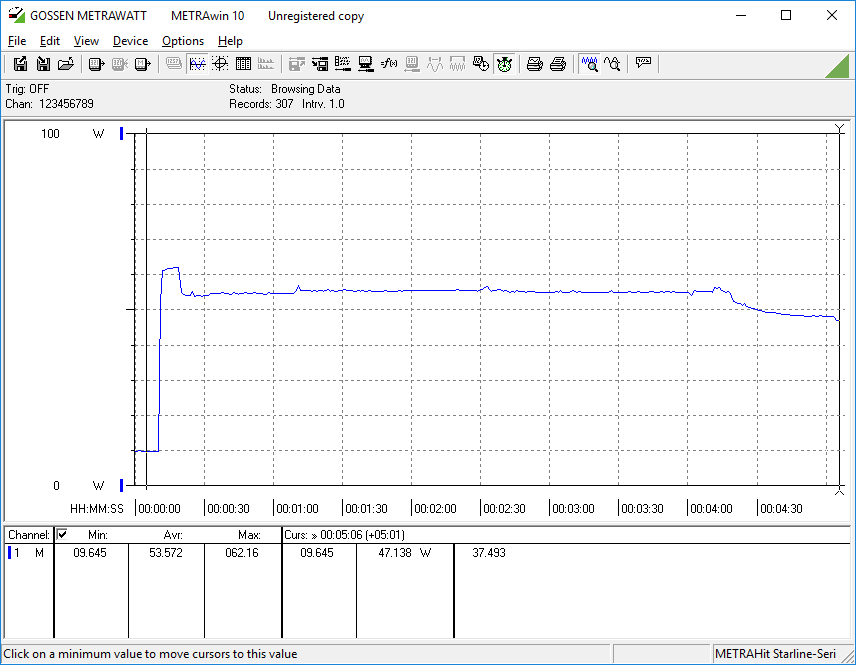
El GT-R extrae de la pared 55 vatios constantes bajo cargas pesadas sin ningún tipo de picos o caídas notables. Cuando está en reposo, el GT-R tira unos 9 vatios. No probamos el consumo del GT-R en su configuración de 54 vatios, pero es probable que consuma unos 20 vatios más bajo carga.

| Off / Standby | |
| Ocioso | |
| Carga |
|
Clave:
min: | |
Pro
Contra
Veredicto
El Beelink GT-R es un mini PC bellamente diseñado que tiene una buena capacidad de procesamiento. La máquina ofrece un montón de puertos y buenas opciones de actualización. Su tamaño compacto hace que sea fácil de colocar sobre o debajo de un escritorio. Por último, el rendimiento es decente para el uso general y los juegos ligeros, aunque hay algunas restricciones en cuanto a la potencia gráfica.
Los mayores inconvenientes son los ventiladores ruidosos, que pueden ser chirriantes durante las cargas de trabajo pesadas (por ejemplo, juegos, edición de fotos, streaming de vídeo 4K), y el alto precio teniendo en cuenta las especificaciones. Con más de 600 dólares de los EE.UU. por nuestra configuración, los usuarios están pagando un bonito centavo por un bonito diseño. Sin embargo, comparado con otros mini PCs como los NUCs de Intel, el precio del GT-R no es irrazonable.
Otras pequeñas peculiaridades, como el lector de huellas dactilares de nuestra unidad, son molestias notables pero no rompen el trato.
Dicho esto, el Beelink GT-R es un buen PC de oficina o de cine en casa. Maneja perfectamente las tareas generales, puede manejar algunos juegos ligeros, y se ve hermoso sentado en la parte superior de un escritorio o un estante.
Price comparison
