Review del Lenovo IdeaPad 330-15IKB (Core i5-7200U, Radeon 530, 8 GB RAM, 256 GB SSD, FHD)
Los modelos IdeaPad 330-15 se encuentran entre algunos de los portátiles de Lenovo. En consecuencia, la empresa ofrece el dispositivo en innumerables configuraciones con combinaciones de hardware de AMD, Intel y Nvidia.
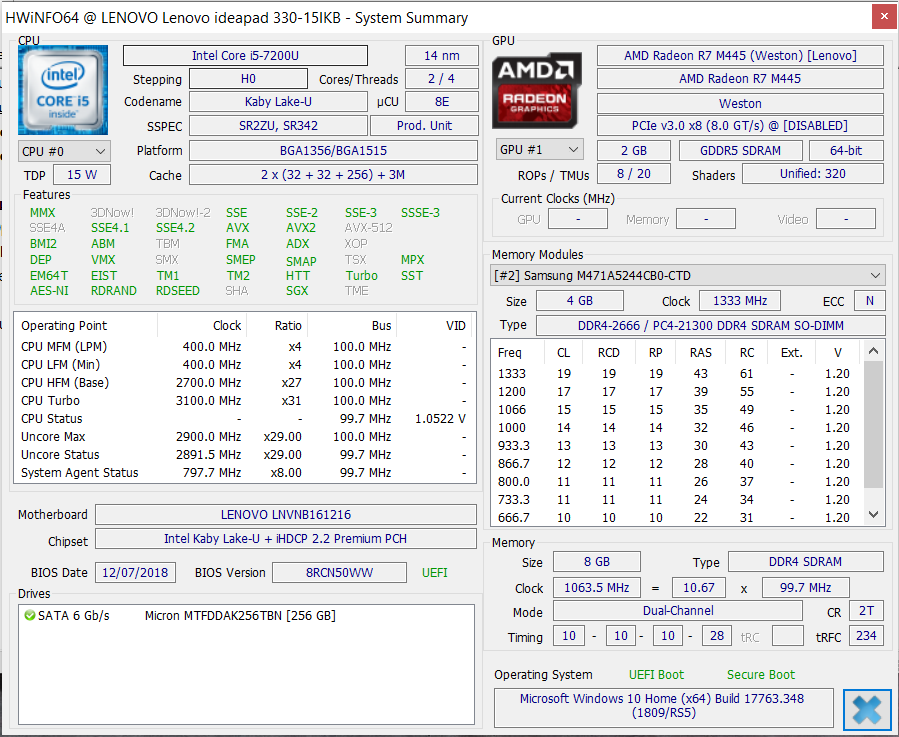
Nuestra unidad de revisión cuenta con un procesador Intel Core i5-7200U y una GPU AMD Radeon 530, ambas bastante anticuadas. El portátil también nos es conocido. Ya hemos revisado varios modelos hermanos, incluyendo el IdeaPad 330-15IGM y el IdeaPad 330-15ARR.
Hemos decidido comparar el IdeaPad 330-15IKB con otros portátiles de 15,6 pulgadas a un precio comparable. Nuestros dispositivos de comparación incluyen el Acer Swift 3 SF315-41G, Acer TravelMate P2510, ASUS VivoBook 15 X542UF, HP 15-da0405ng, y el HP Pavilion 15-cw0003ng.
Nuestra unidad de revisión comparte muchas de sus características con sus modelos hermanos. Por lo tanto, no cubriremos el caso, la conectividad, los dispositivos de entrada, la pantalla o los altavoces en profundidad en esta revisión. Por favor, consulte nuestra revisión de IdeaPad 330-15ARR para conocer nuestras opiniones sobre estas áreas.
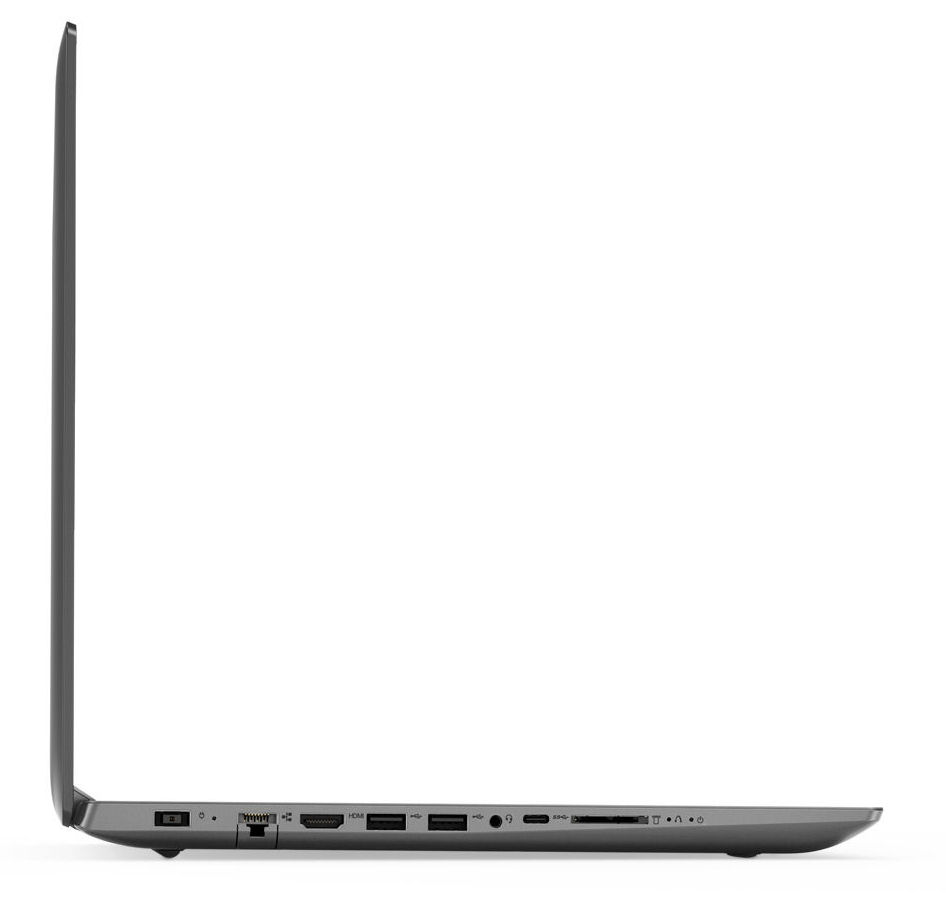
Conectividad
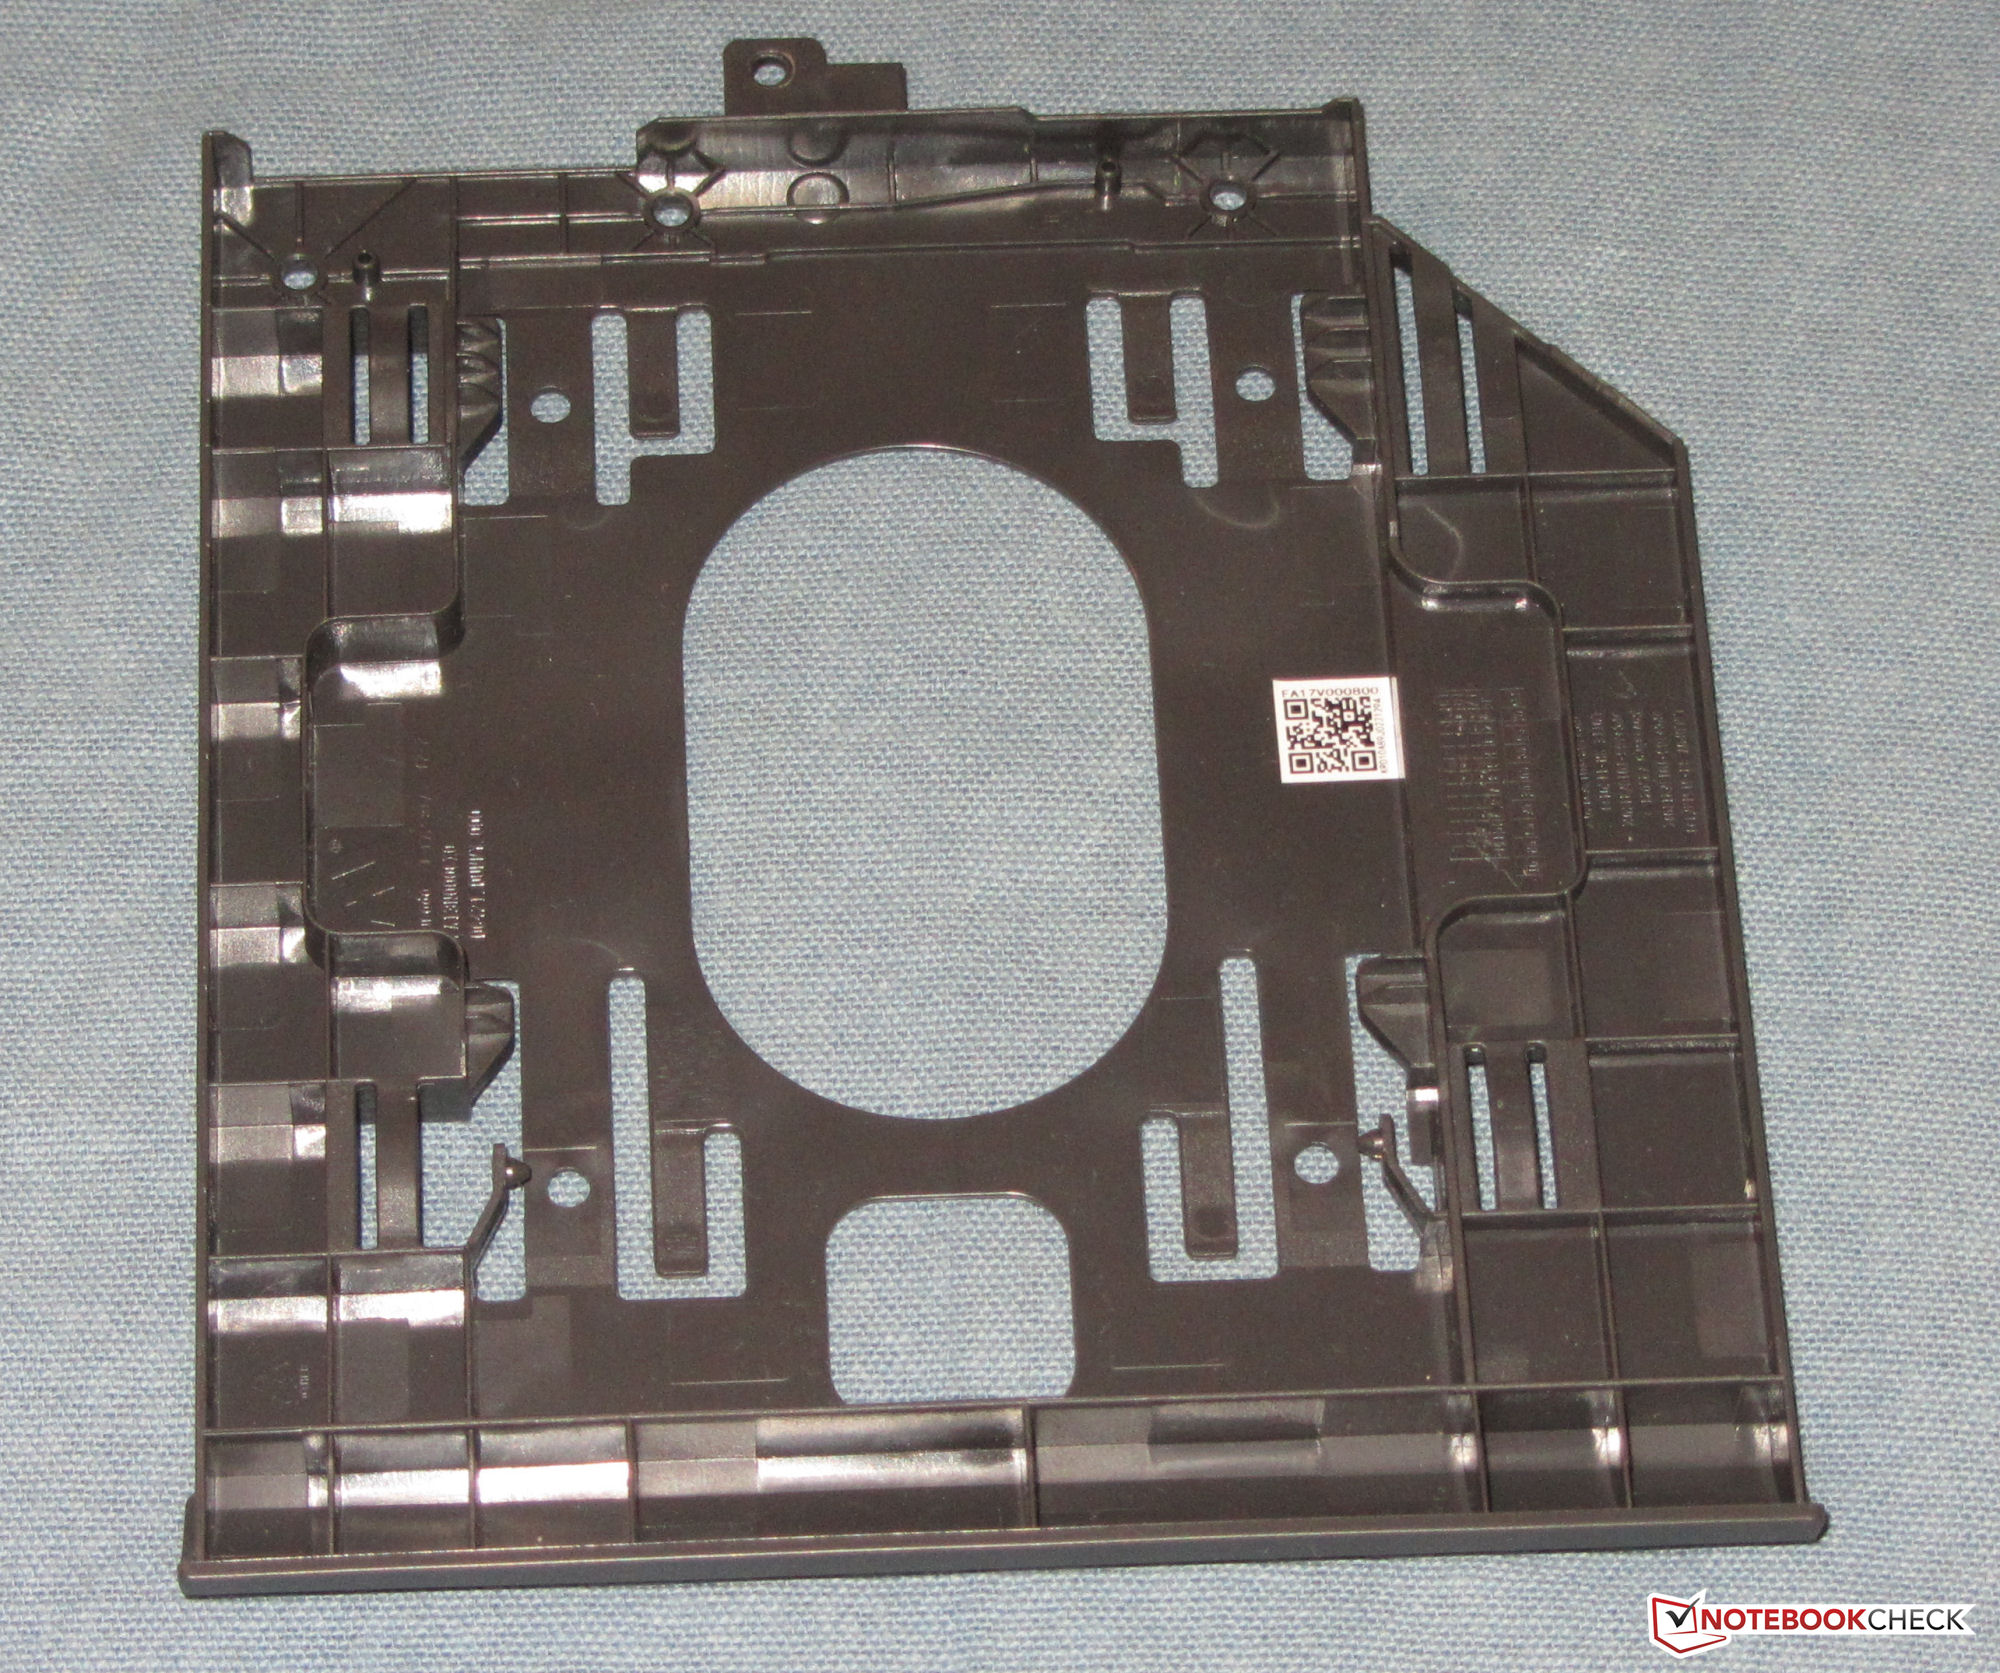
Nuestra unidad de revisión no tiene unidad de DVD, lo que en sí mismo no es algo inusual en 2019. Sin embargo, hay un dummy en la bahía de la unidad, por lo que puede actualizar una unidad de DVD si es necesario. Lenovo también vende un adaptador SATA en caso de que desee agregar almacenamiento adicional.
El dummy incorporado está incluso diseñado en principio para añadir una unidad de 2,5 pulgadas adicional. Sin embargo, Lenovo no incluyó el adaptador y el marco de montaje necesarios con nuestra unidad de revisión.
| SD Card Reader | |
| average JPG Copy Test (av. of 3 runs) | |
| Media de la clase Office (19.8 - 198.5, n=22, últimos 2 años) | |
| HP Pavilion 15-cw0003ng (Toshiba Exceria Pro SDXC 64 GB UHS-II) | |
| Lenovo IdeaPad 330-15ARR 81D2005CUS (Toshiba Exceria Pro SDXC 64 GB UHS-II) | |
| Acer Swift 3 SF315-41G-R6BR (Toshiba Exceria Pro SDXC 64 GB UHS-II) | |
| Lenovo IdeaPad 330-15ARR-81D2005JGE (Toshiba Exceria Pro SDXC 64 GB UHS-II) | |
| Asus VivoBook 15 X542UF-DM143T (Toshiba Exceria Pro SDXC 64 GB UHS-II) | |
| HP 15-da0405ng (Toshiba Exceria Pro SDXC 64 GB UHS-II) | |
| HP Pavilion 15-cs0003ng (Toshiba Exceria Pro SDXC 64 GB UHS-II) | |
| Acer TravelMate P2510-G2-MG-50WE (Toshiba Exceria Pro SDXC 64 GB UHS-II) | |
| Lenovo Ideapad 330-15IKB-81DC00SWGE (Toshiba Exceria Pro SDXC 64 GB UHS-II) | |
| Medion Akoya S6625 (Toshiba Exceria Pro SDXC 64 GB UHS-II) | |
| maximum AS SSD Seq Read Test (1GB) | |
| Media de la clase Office (27.4 - 249, n=21, últimos 2 años) | |
| Lenovo IdeaPad 330-15ARR 81D2005CUS (Toshiba Exceria Pro SDXC 64 GB UHS-II) | |
| Acer Swift 3 SF315-41G-R6BR (Toshiba Exceria Pro SDXC 64 GB UHS-II) | |
| HP Pavilion 15-cw0003ng (Toshiba Exceria Pro SDXC 64 GB UHS-II) | |
| HP Pavilion 15-cs0003ng (Toshiba Exceria Pro SDXC 64 GB UHS-II) | |
| Asus VivoBook 15 X542UF-DM143T (Toshiba Exceria Pro SDXC 64 GB UHS-II) | |
| Lenovo Ideapad 330-15IKB-81DC00SWGE (Toshiba Exceria Pro SDXC 64 GB UHS-II) | |
| Acer TravelMate P2510-G2-MG-50WE (Toshiba Exceria Pro SDXC 64 GB UHS-II) | |
| Medion Akoya S6625 (Toshiba Exceria Pro SDXC 64 GB UHS-II) | |
Display
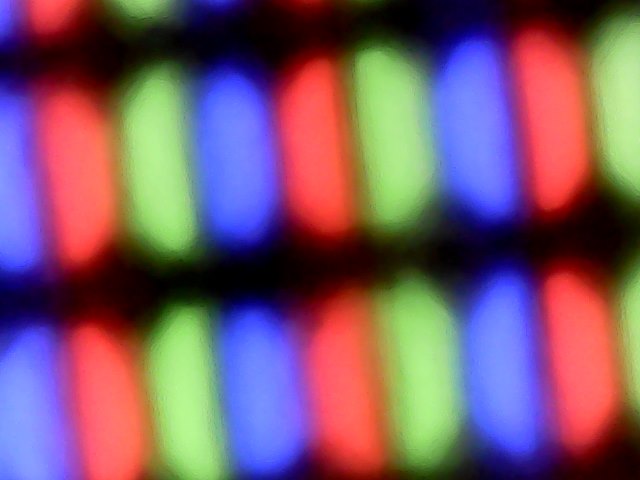
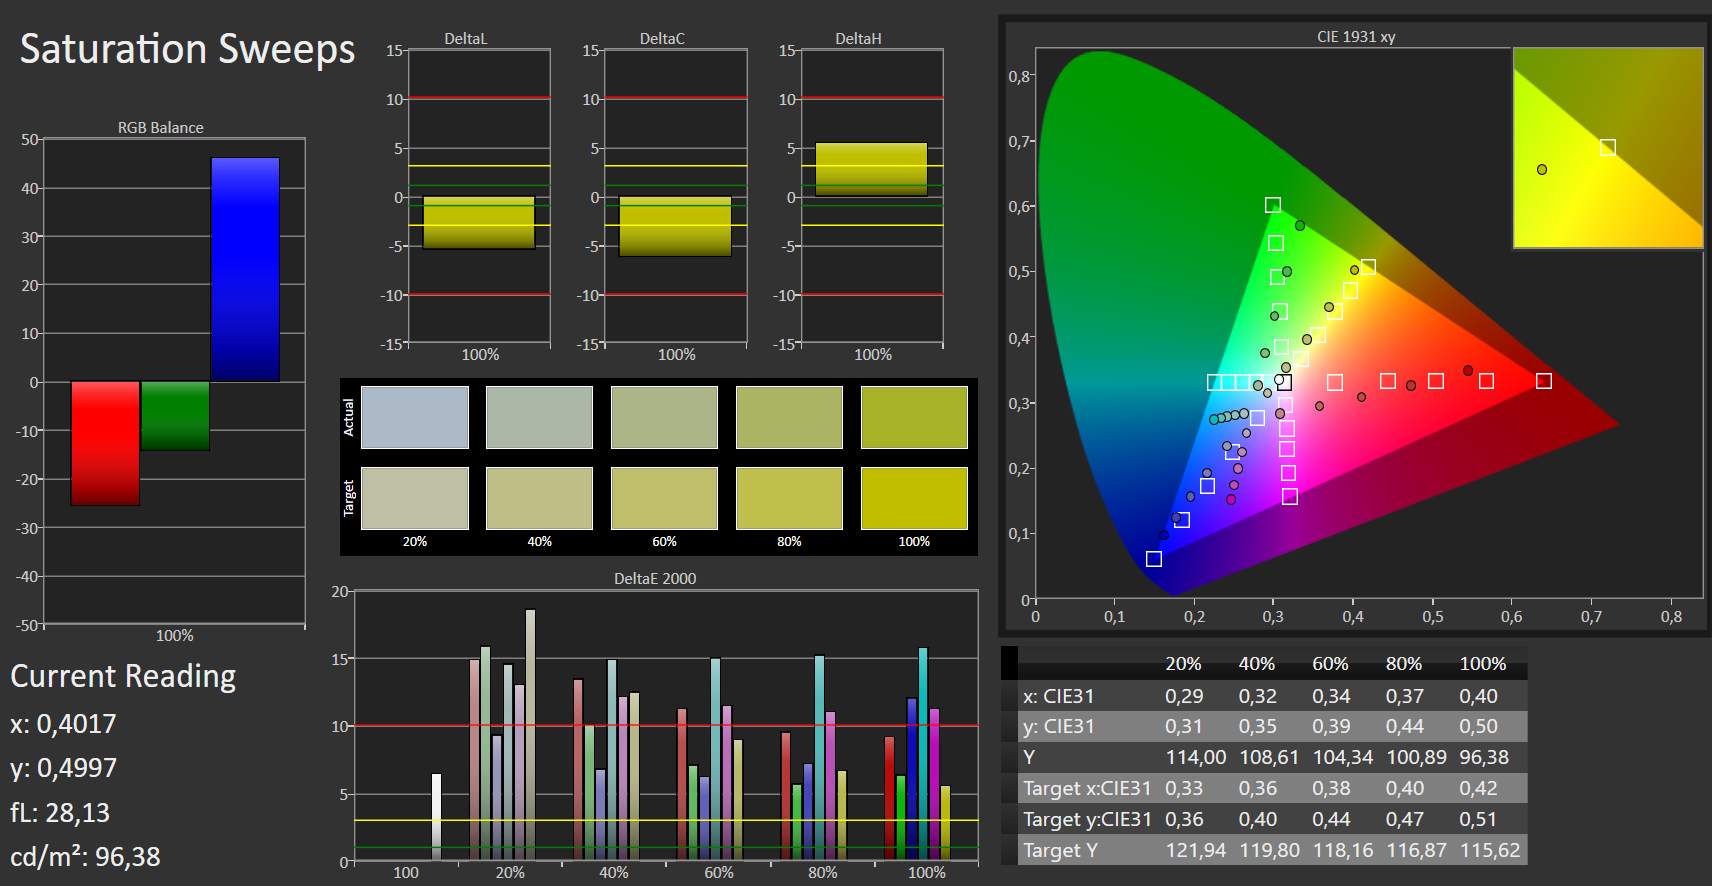
El 330-15IKB tiene una pantalla mate de 15,6 pulgadas que funciona de forma nativa a 1920x1080. Nuestra unidad de revisión logró un brillo máximo promedio de 217,1 cd/m² y una relación de contraste de 464:1, muy por debajo del brillo de 300 cd/m² y la relación de contraste de 1.000:1 que esperamos de la mayoría de los portátiles modernos. El principal problema aquí es que Lenovo ha equipado nuestra unidad de revisión con un panel TN, que tiende a ser más oscuro y menos vibrante que sus contrapartes IPS u OLED. Los paneles TN también tienen casi siempre ángulos de visión deficientes.
Desafortunadamente, el dispositivo también utiliza modulación de ancho de pulso (PWM) para regular el brillo de la pantalla, lo que puede causar fatiga ocular y dolores de cabeza para algunas personas. La pantalla parpadea a 200 Hz con un brillo del 90% y por debajo, lo cual es lo suficientemente bajo como para causar problemas a aquellos que son sensibles a PWM.
Lenovo equipa el IdeaPad 330-15IKB con la misma pantalla que con nuestra unidad de revisión IdeaPad 330-15ARR. Tenga en cuenta que no hay dos paneles iguales aunque sean del mismo modelo. Esto es un fenómeno normal, lo que explica por qué los dos modelos IdeaPad 330 lograron resultados ligeramente diferentes en nuestras pruebas.
| |||||||||||||||||||||||||
iluminación: 85 %
Brillo con batería: 241 cd/m²
Contraste: 464:1 (Negro: 0.5 cd/m²)
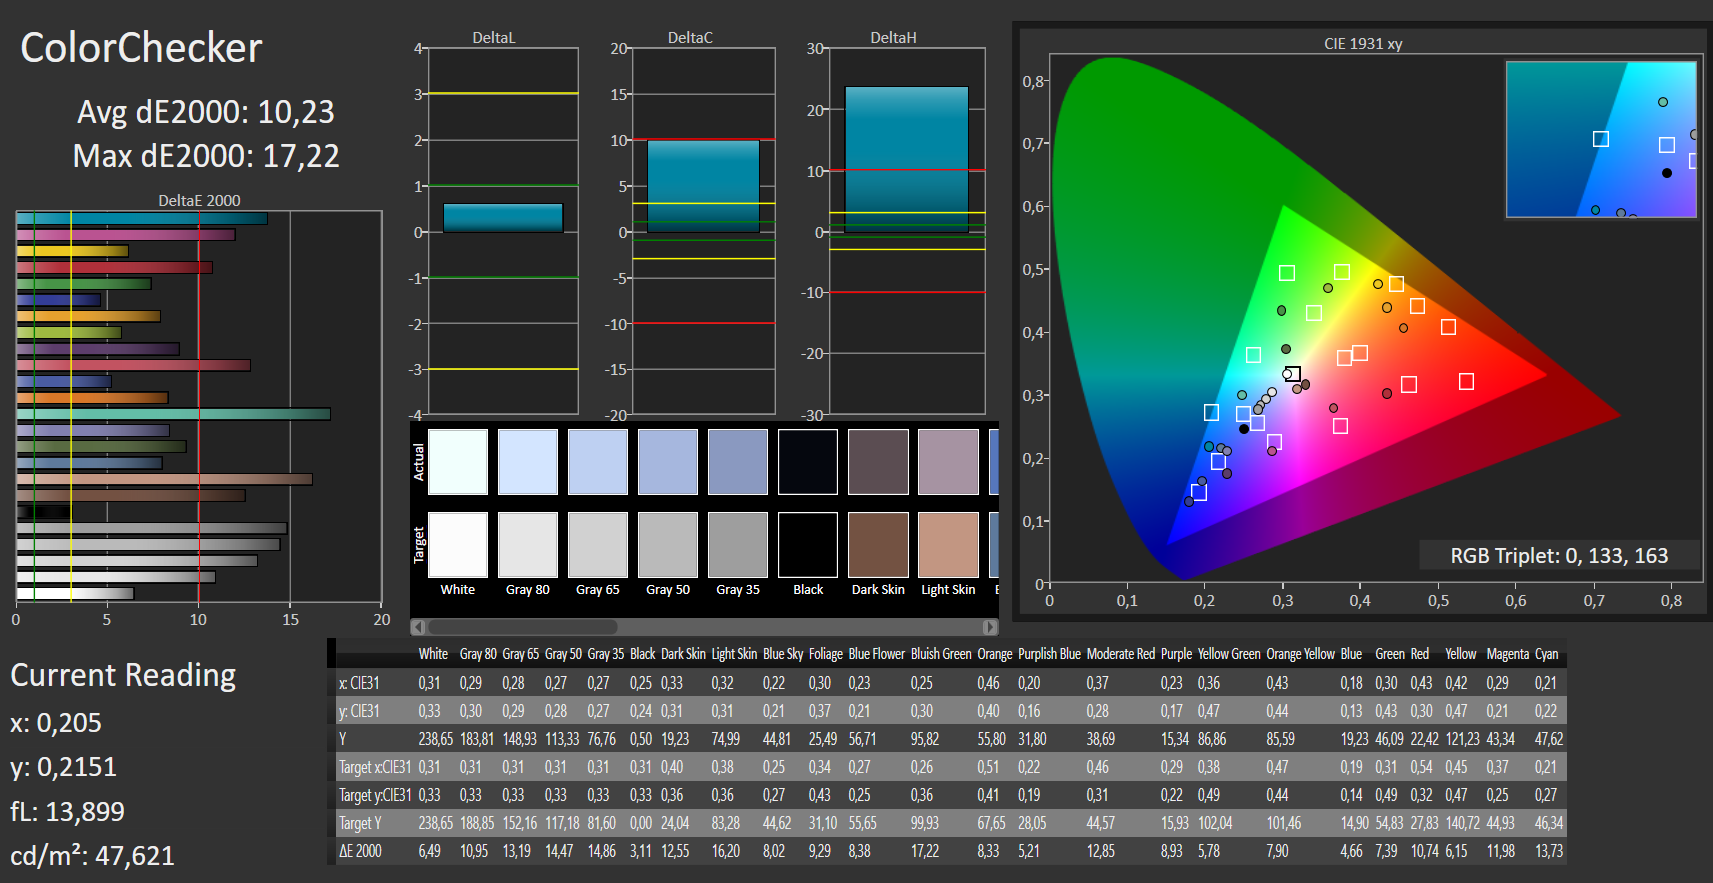
ΔE ColorChecker Calman: 10.23 | ∀{0.5-29.43 Ø4.71}
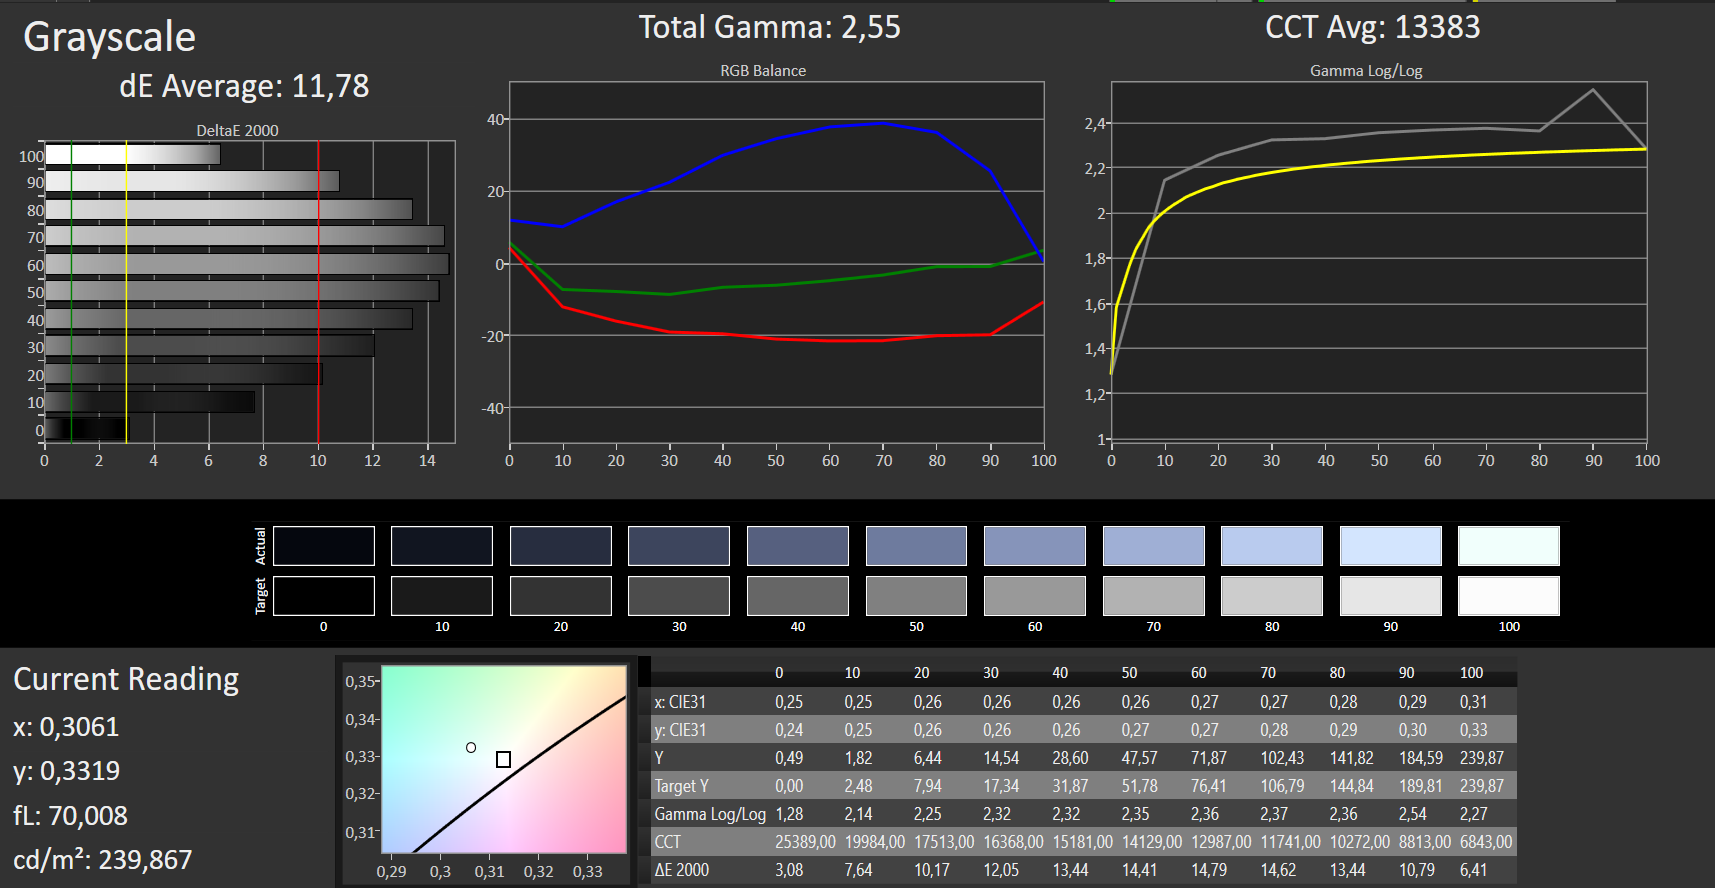
ΔE Greyscale Calman: 11.78 | ∀{0.09-98 Ø4.96}
60% sRGB (Argyll 1.6.3 3D)
38% AdobeRGB 1998 (Argyll 1.6.3 3D)
41.26% AdobeRGB 1998 (Argyll 3D)
60% sRGB (Argyll 3D)
39.93% Display P3 (Argyll 3D)
Gamma: 2.55
CCT: 13383 K
| Lenovo Ideapad 330-15IKB-81DC00SWGE TN LED, 1920x1080, 15.6" | Lenovo IdeaPad 330-15ARR-81D2005JGE IPS, 1920x1080, 15.6" | Lenovo IdeaPad 330-15ARR 81D2005CUS TN LED, 1920x1080, 15.6" | Acer TravelMate P2510-G2-MG-50WE IPS, 1920x1080, 15.6" | HP Pavilion 15-cs0003ng IPS, 1920x1080, 15.6" | Acer Swift 3 SF315-41G-R6BR IPS, 1920x1080, 15.6" | HP Pavilion 15-cw0003ng IPS, 1920x1080, 15.6" | Asus VivoBook 15 X542UF-DM143T TN LED, 1920x1080, 15.6" | HP 15-da0405ng TN LED, 1920x1080, 15.6" | |
|---|---|---|---|---|---|---|---|---|---|
| Display | -2% | -9% | 6% | -9% | -1% | -8% | -6% | -1% | |
| Display P3 Coverage (%) | 39.93 | 39.21 -2% | 36.36 -9% | 42.27 6% | 36.27 -9% | 40.1 0% | 36.7 -8% | 37.47 -6% | 39.52 -1% |
| sRGB Coverage (%) | 60 | 59.1 -1% | 54.7 -9% | 63.5 6% | 54.6 -9% | 59 -2% | 55 -8% | 56.4 -6% | 59.4 -1% |
| AdobeRGB 1998 Coverage (%) | 41.26 | 40.51 -2% | 37.57 -9% | 43.69 6% | 37.47 -9% | 41.43 0% | 37.91 -8% | 38.71 -6% | 40.83 -1% |
| Response Times | 1% | -37% | -95% | -83% | -89% | -67% | -37% | -9% | |
| Response Time Grey 50% / Grey 80% * (ms) | 41 ? | 40 ? 2% | 38.8 ? 5% | 40 ? 2% | 45 ? -10% | 43 ? -5% | 40 ? 2% | 41 ? -0% | 41 ? -0% |
| Response Time Black / White * (ms) | 11 ? | 11 ? -0% | 19.6 ? -78% | 32 ? -191% | 28 ? -155% | 30 ? -173% | 26 ? -136% | 19 ? -73% | 13 ? -18% |
| PWM Frequency (Hz) | 200 ? | 200 ? | 25000 ? | 1471 ? | 7000 ? | 29000 ? | |||
| Screen | -16% | -7% | 49% | 14% | 38% | 33% | 22% | -4% | |
| Brightness middle (cd/m²) | 232 | 222 -4% | 252.2 9% | 259 12% | 240 3% | 284 22% | 186 -20% | 230 -1% | 176 -24% |
| Brightness (cd/m²) | 217 | 200 -8% | 251 16% | 230 6% | 237 9% | 254 17% | 180 -17% | 221 2% | 164 -24% |
| Brightness Distribution (%) | 85 | 87 2% | 84 -1% | 82 -4% | 90 6% | 80 -6% | 88 4% | 91 7% | 69 -19% |
| Black Level * (cd/m²) | 0.5 | 0.57 -14% | 0.54 -8% | 0.19 62% | 0.42 16% | 0.29 42% | 0.15 70% | 0.45 10% | 0.31 38% |
| Contrast (:1) | 464 | 389 -16% | 467 1% | 1363 194% | 571 23% | 979 111% | 1240 167% | 511 10% | 568 22% |
| Colorchecker dE 2000 * | 10.23 | 14.07 -38% | 12.36 -21% | 3.13 69% | 7.43 27% | 4.22 59% | 5.94 42% | 3.6 65% | 11.4 -11% |
| Colorchecker dE 2000 max. * | 17.22 | 23.62 -37% | 24.75 -44% | 7.81 55% | 12.42 28% | 9.29 46% | 10.81 37% | 5.59 68% | 19.76 -15% |
| Greyscale dE 2000 * | 11.78 | 15.89 -35% | 12.2 -4% | 1.42 88% | 6.26 47% | 1.17 90% | 4.44 62% | 3.13 73% | 12.75 -8% |
| Gamma | 2.55 86% | 2.59 85% | 1.83 120% | 2.36 93% | 2.96 74% | 2.39 92% | 2.81 78% | 2.45 90% | 2.59 85% |
| CCT | 13383 49% | 23883 27% | 13028 50% | 6391 102% | 6661 98% | 6360 102% | 6272 104% | 7244 90% | 14899 44% |
| Color Space (Percent of AdobeRGB 1998) (%) | 38 | 37 -3% | 34.6 -9% | 40 5% | 35 -8% | 38 0% | 35 -8% | 36 -5% | 38 0% |
| Color Space (Percent of sRGB) (%) | 60 | 57 -5% | 54.5 -9% | 63 5% | 54 -10% | 59 -2% | 55 -8% | 56 -7% | 59 -2% |
| Colorchecker dE 2000 calibrated * | 2.94 | 4.43 | 3.09 | 6.07 | 2.99 | ||||
| Media total (Programa/Opciones) | -6% /
-11% | -18% /
-11% | -13% /
21% | -26% /
-3% | -17% /
13% | -14% /
11% | -7% /
9% | -5% /
-4% |
* ... más pequeño es mejor
Tiempos de respuesta del display
| ↔ Tiempo de respuesta de Negro a Blanco | ||
|---|---|---|
| 11 ms ... subida ↗ y bajada ↘ combinada | ↗ 7 ms subida | 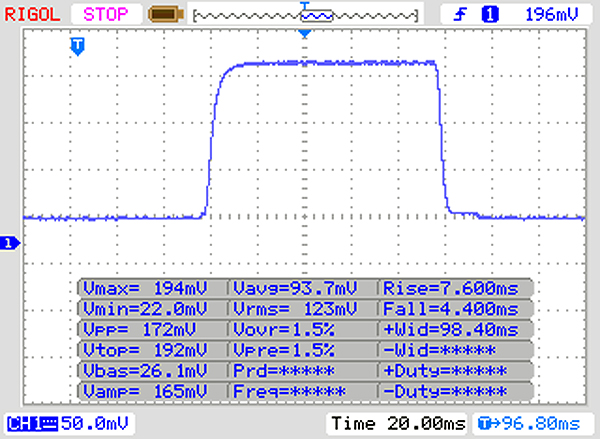 |
| ↘ 6 ms bajada | ||
| La pantalla mostró buenos tiempos de respuesta en nuestros tests pero podría ser demasiado lenta para los jugones competitivos. En comparación, todos los dispositivos de prueba van de ##min### (mínimo) a 240 (máximo) ms. » 30 % de todos los dispositivos son mejores. Esto quiere decir que el tiempo de respuesta medido es mejor que la media (19.8 ms) de todos los dispositivos testados. | ||
| ↔ Tiempo de respuesta 50% Gris a 80% Gris | ||
| 41 ms ... subida ↗ y bajada ↘ combinada | ↗ 22 ms subida | 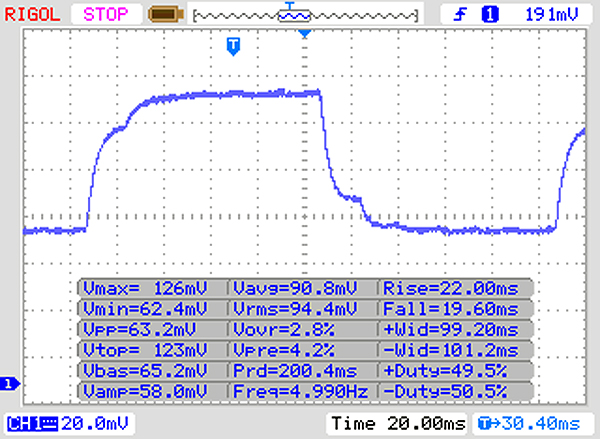 |
| ↘ 19 ms bajada | ||
| La pantalla mostró tiempos de respuesta lentos en nuestros tests y podría ser demasiado lenta para los jugones. En comparación, todos los dispositivos de prueba van de ##min### (mínimo) a 636 (máximo) ms. » 65 % de todos los dispositivos son mejores. Eso quiere decir que el tiempo de respuesta es peor que la media (30.9 ms) de todos los dispositivos testados. | ||
Parpadeo de Pantalla / PWM (Pulse-Width Modulation)
| Parpadeo de Pantalla / PWM detectado | 200 Hz | ≤ 90 % de brillo | 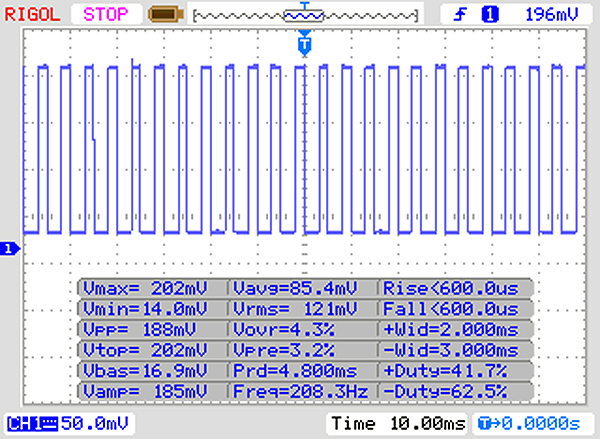 |
La retroiluminación del display parpadea a 200 Hz (seguramente usa PWM - Pulse-Width Modulation) a un brillo del 90 % e inferior. Sobre este nivel de brillo no debería darse parpadeo / PWM. La frecuencia de 200 Hz es relativamente baja, por lo que la gente sensible debería ver parpadeos y padecer fatiga visual por la pantalla (usado al brillo indicado a continuación). Comparación: 52 % de todos los dispositivos testados no usaron PWM para atenuar el display. Si se usó, medimos una media de 7744 (mínimo: 5 - máxmo: 343500) Hz. | |||
Rendimiento
El IdeaPad 330-15IKB es lo suficientemente potente para la mayoría de las aplicaciones de oficina y basadas en Internet. La GPU dedicada también es lo suficientemente potente para algunos juegos ligeros, de los que pocos portátiles de empresa son capaces. Nuestra unidad de revisión actualmente se vende al por menor por alrededor de 630 Euros (~$714), como referencia. También hay muchas otras configuraciones disponibles.
Procesador
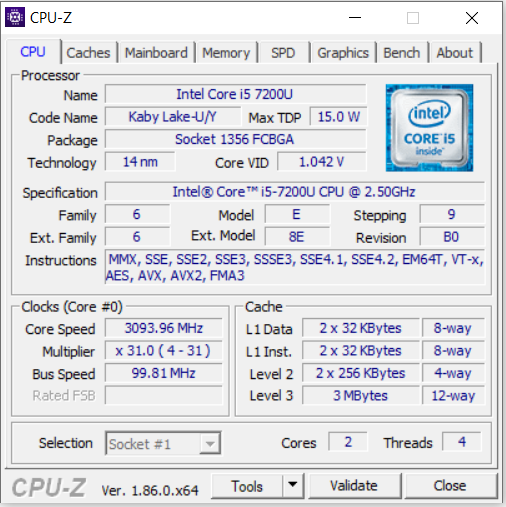
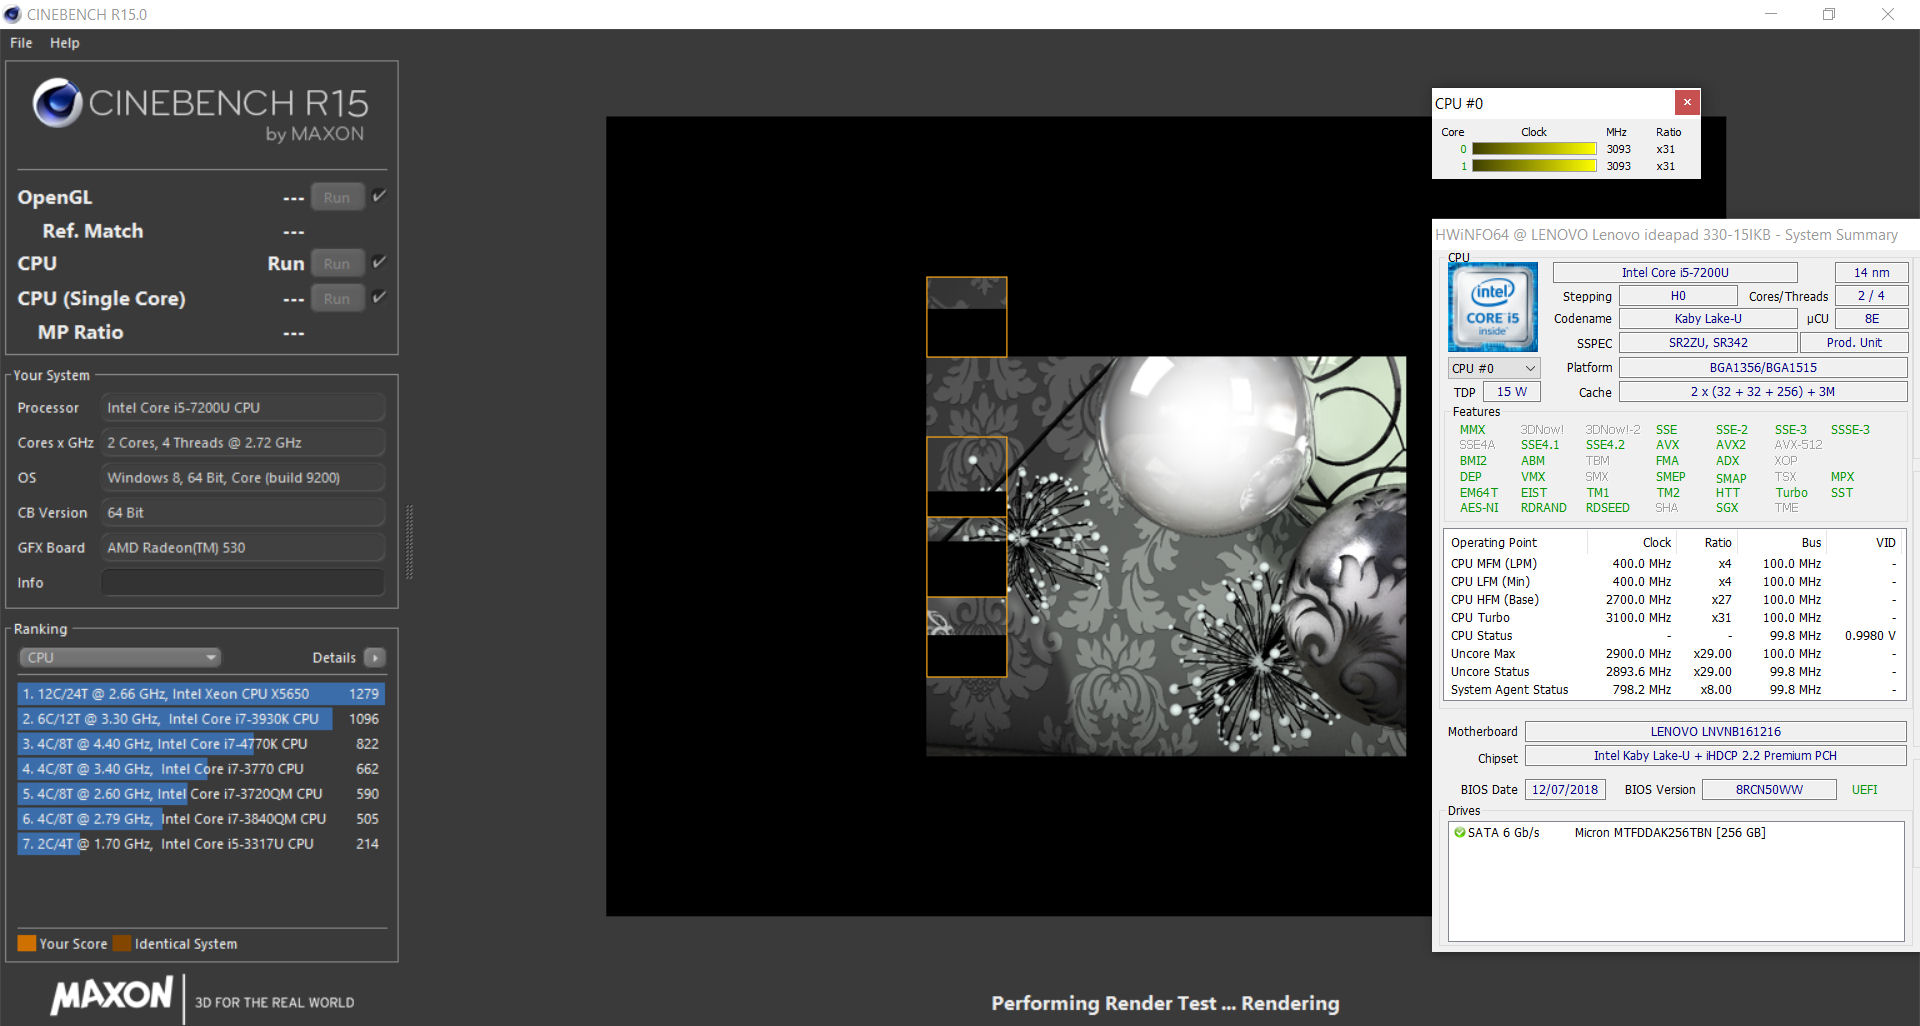
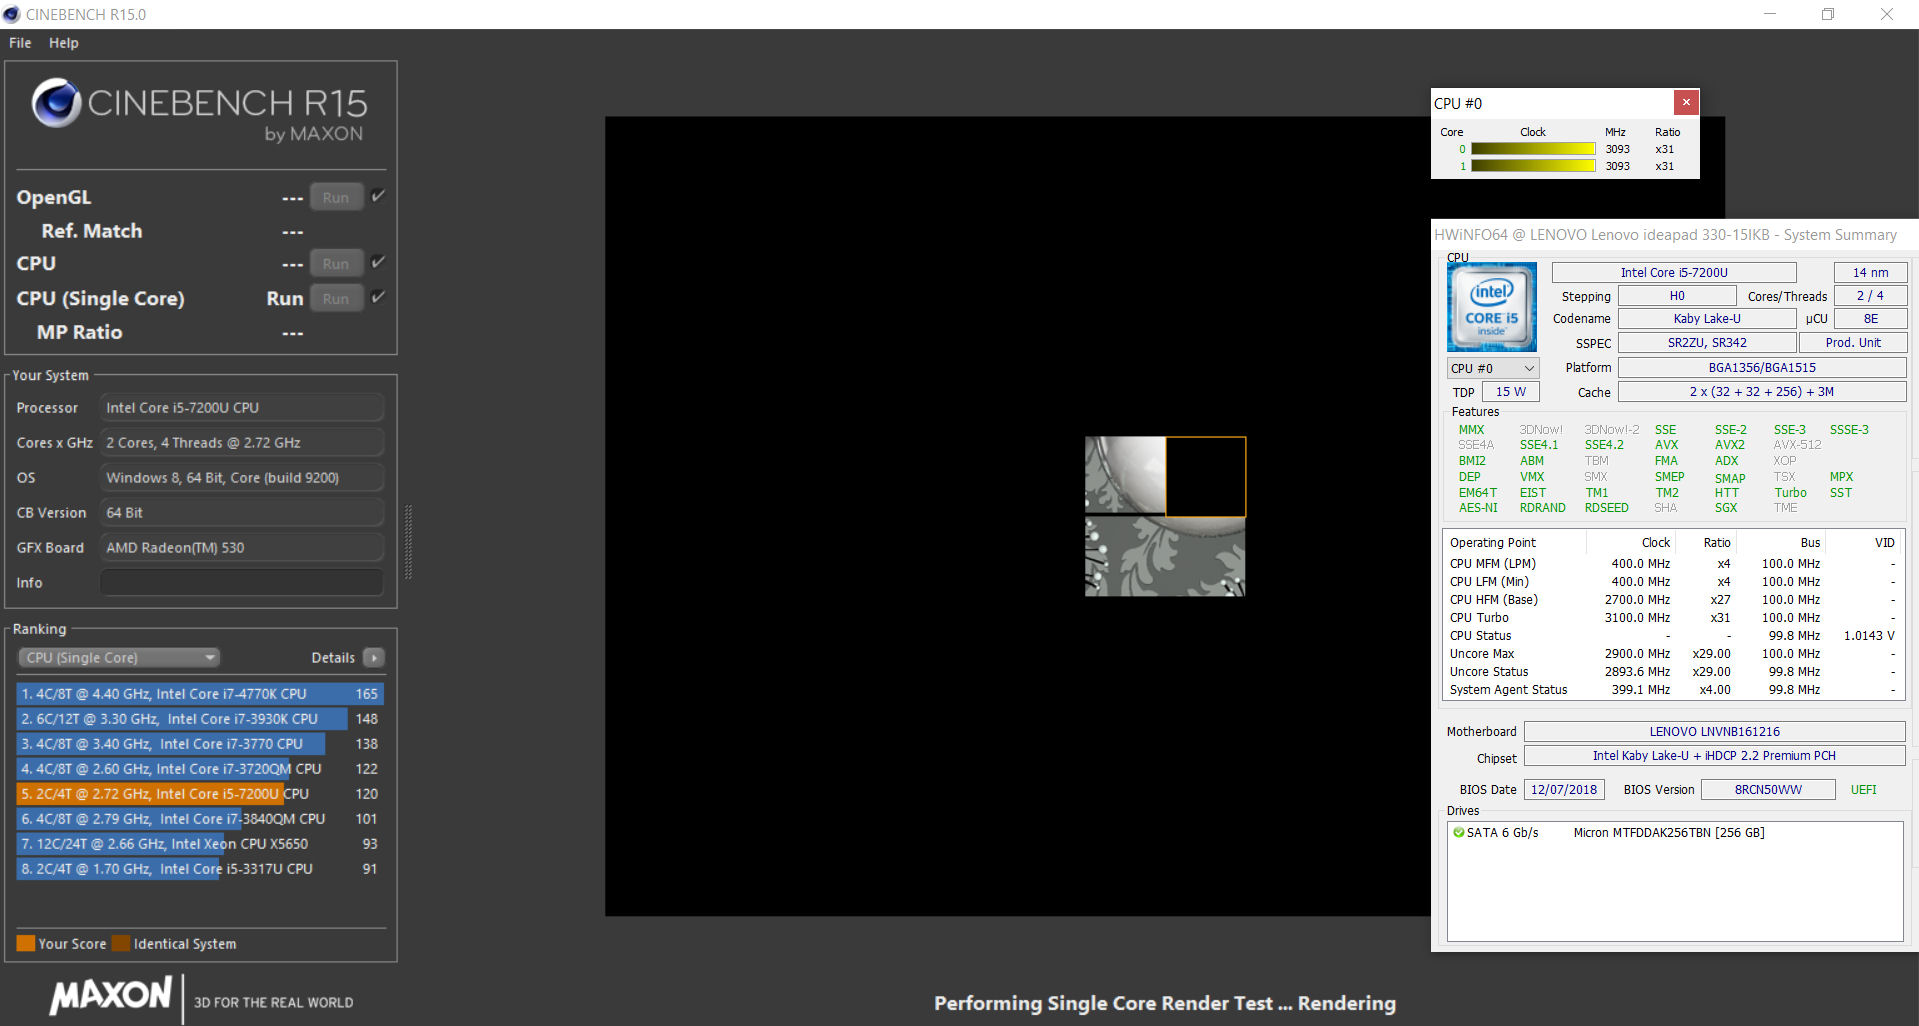
El Core i5-7200U es un procesador de doble núcleo de la generación Kaby Lake de Intel. La CPU proporciona un rendimiento más que suficiente para aplicaciones de oficina y basadas en Internet. El Core i5-7200U es un procesador de ultra bajo voltaje (ULV) con una potencia de diseño térmico (TDP) de 15 W que funciona a una velocidad de reloj base de 2,5 GHz. La CPU también puede utilizar Intel Turbo Boost para aumentar la velocidad de sus relojes a 3,1 GHz en ambos núcleos cuando sea necesario.
Nuestra unidad de revisión inicialmente operaba a aproximadamente 3.1 GHz en un Cinebench R15 multithread benchmark antes de llegar a 2.9 a 3 GHz. Por el contrario, la CPU funcionó consistentemente a 3.1 GHz durante el correspondiente benchmark de un solo hilo. El IdeaPad 330-15IKB funcionó tan bien en batería como en red.
También sometimos a nuestra unidad de revisión a una prueba de referencia CB R15 Multi de 64 bits en bucle para determinar qué tan bien se desempeña bajo carga sostenida. Realizamos nuestra prueba durante unos 30 minutos en un bucle continuo, en el que el 330-15IKB obtuvo inicialmente 348 puntos. Esto bajó a 288 puntos en el segundo punto de referencia antes de estabilizarse en el tercer punto de referencia en alrededor de 276 puntos, una puntuación que logró consistentemente para el resto de nuestro ciclo. En general, el rendimiento baja alrededor de un 20%, pero esto se debe únicamente a que la CPU ha agotado su Turbo.
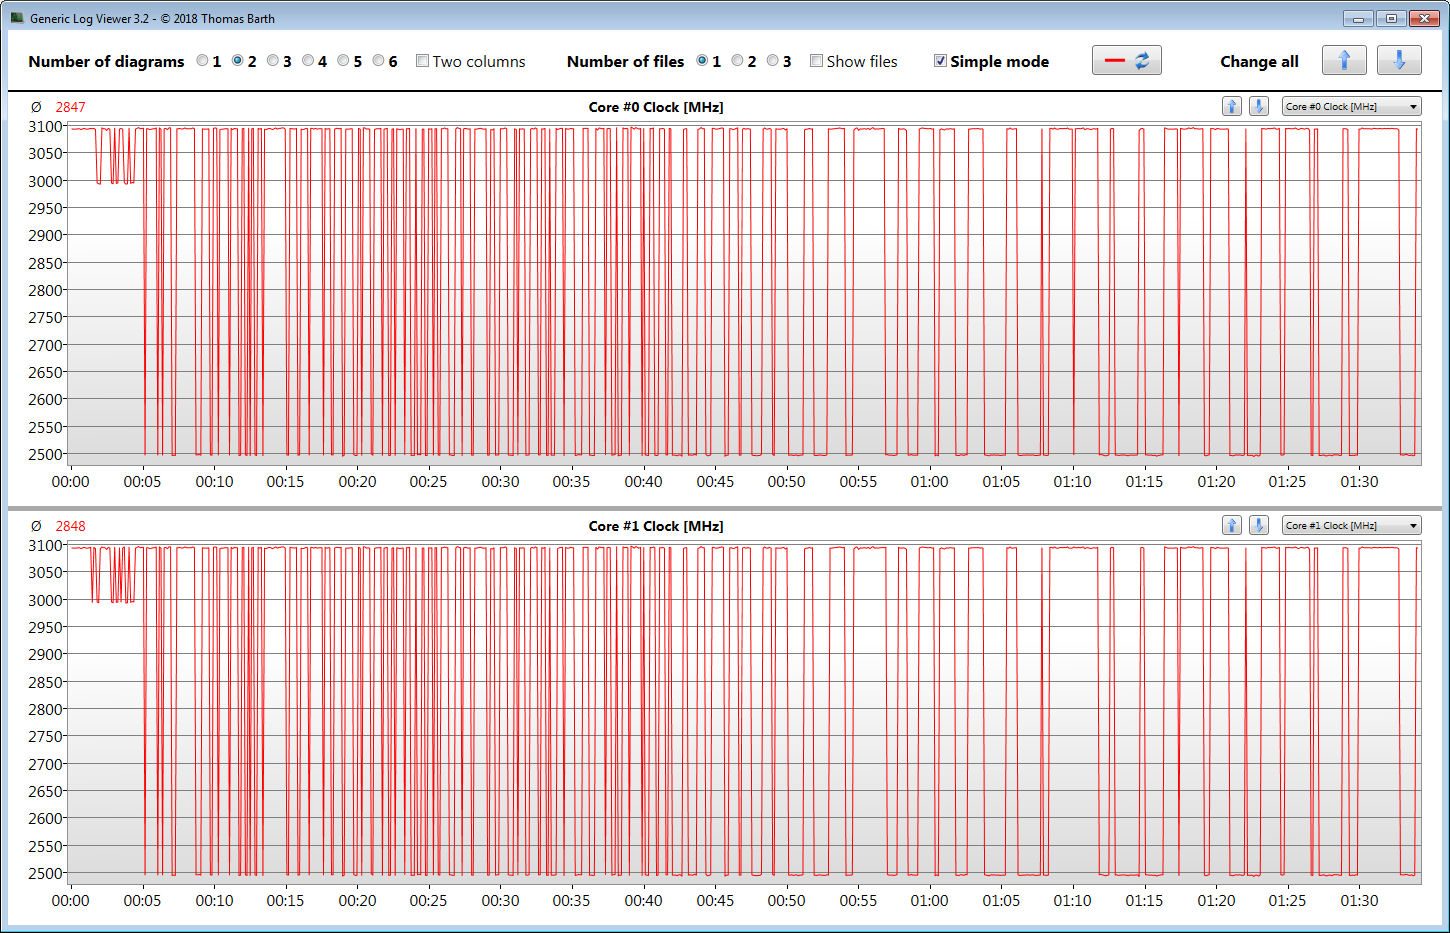
El 330-15IKB terminó detrás de todos nuestros dispositivos de comparación, excepto el IdeaPad 330-15ARR de AMD Ryzen 3 2200U, en nuestro benchmark CB R15 en bucle. Todos nuestros otros dispositivos de comparación están alimentados por procesadores de cuatro núcleos, incluyendo la versión Ryzen 5 2500U del IdeaPad 330-15ARR, que se estranguló mucho en la misma prueba. El Ryzen 5 2500U no es una CPU de cuatro núcleos sin embargo, como lo demuestran el Acer Swift 3 SF315 y el HP Pavilion 15-cw0003ng, que logró resultados consistentemente más altos que nuestra unidad de revisión.
| Cinebench R10 | |
| Rendering Single 32Bit | |
| Media de la clase Office (4212 - 10817, n=16, últimos 2 años) | |
| Medion Akoya S6625 | |
| Asus VivoBook 15 X542UF-DM143T | |
| HP 15-da0405ng | |
| Medio Intel Core i5-7200U (4787 - 5022, n=47) | |
| Lenovo Ideapad 330-15IKB-81DC00SWGE | |
| Acer Swift 3 SF315-41G-R6BR | |
| Rendering Multiple CPUs 32Bit | |
| Media de la clase Office (7657 - 60850, n=16, últimos 2 años) | |
| Asus VivoBook 15 X542UF-DM143T | |
| Medion Akoya S6625 | |
| HP 15-da0405ng | |
| Acer Swift 3 SF315-41G-R6BR | |
| Medio Intel Core i5-7200U (9213 - 11955, n=47) | |
| Lenovo Ideapad 330-15IKB-81DC00SWGE | |
| Geekbench 3 | |
| 32 Bit Multi-Core Score | |
| Asus VivoBook 15 X542UF-DM143T | |
| HP 15-da0405ng | |
| Medion Akoya S6625 | |
| Acer Swift 3 SF315-41G-R6BR | |
| Lenovo Ideapad 330-15IKB-81DC00SWGE | |
| Medio Intel Core i5-7200U (6297 - 6932, n=30) | |
| 32 Bit Single-Core Score | |
| Medion Akoya S6625 | |
| Acer Swift 3 SF315-41G-R6BR | |
| Asus VivoBook 15 X542UF-DM143T | |
| HP 15-da0405ng | |
| Lenovo Ideapad 330-15IKB-81DC00SWGE | |
| Medio Intel Core i5-7200U (2812 - 3209, n=30) | |
| Geekbench 4.4 | |
| 64 Bit Multi-Core Score | |
| Media de la clase Office (23754 - 44610, n=9, últimos 2 años) | |
| Medion Akoya S6625 | |
| Asus VivoBook 15 X542UF-DM143T | |
| HP 15-da0405ng | |
| Acer Swift 3 SF315-41G-R6BR | |
| Lenovo Ideapad 330-15IKB-81DC00SWGE | |
| Medio Intel Core i5-7200U (7066 - 7767, n=15) | |
| 64 Bit Single-Core Score | |
| Media de la clase Office (4564 - 8042, n=9, últimos 2 años) | |
| Medion Akoya S6625 | |
| Asus VivoBook 15 X542UF-DM143T | |
| HP 15-da0405ng | |
| Lenovo Ideapad 330-15IKB-81DC00SWGE | |
| Medio Intel Core i5-7200U (3648 - 3958, n=15) | |
| Acer Swift 3 SF315-41G-R6BR | |
| Mozilla Kraken 1.1 - Total | |
| Lenovo Ideapad 330-15IKB-81DC00SWGE (Edge 44) | |
| Lenovo IdeaPad 330-15ARR 81D2005CUS (Edge 41.16299.611.0) | |
| HP Pavilion 15-cw0003ng | |
| Acer Swift 3 SF315-41G-R6BR (Edge 42) | |
| Acer TravelMate P2510-G2-MG-50WE | |
| Medio Intel Core i5-7200U (1109 - 1542, n=42) | |
| Medion Akoya S6625 (Edge 42) | |
| HP Pavilion 15-cs0003ng | |
| Media de la clase Office (391 - 1297, n=78, últimos 2 años) | |
| Octane V2 - Total Score | |
| Media de la clase Office (49011 - 126830, n=20, últimos 2 años) | |
| Medion Akoya S6625 (Edge 42) | |
| HP Pavilion 15-cs0003ng | |
| Medio Intel Core i5-7200U (21890 - 32838, n=45) | |
| Acer Swift 3 SF315-41G-R6BR (Edge 42) | |
| Lenovo Ideapad 330-15IKB-81DC00SWGE (Edge 44) | |
| Lenovo IdeaPad 330-15ARR 81D2005CUS (Edge 41.16299.611.0) | |
| JetStream 1.1 - 1.1 Total | |
| Medion Akoya S6625 (Edge 42) | |
| Asus VivoBook 15 X542UF-DM143T (Edge 41) | |
| Acer TravelMate P2510-G2-MG-50WE | |
| HP 15-da0405ng (Edge 42) | |
| Medio Intel Core i5-7200U (127.7 - 223, n=69) | |
| Acer Swift 3 SF315-41G-R6BR (Edge 42) | |
| HP Pavilion 15-cw0003ng | |
| Lenovo Ideapad 330-15IKB-81DC00SWGE (Edge 44) | |
| HP Pavilion 15-cs0003ng | |
| Lenovo IdeaPad 330-15ARR 81D2005CUS (Edge 41.16299.611.0) | |
| Lenovo IdeaPad 330-15ARR-81D2005JGE | |
* ... más pequeño es mejor
Rendimiento del sistema
Nuestra unidad de revisión funcionó sin problemas en nuestras pruebas, durante las cuales no encontramos ningún choque o micro-tartamudeo. El 330-15IKB también obtuvo resultados decentes para un portátil de dos núcleos en los puntos de referencia de PCMark, aunque en general terminó por debajo de la media para un portátil de negocios moderno.
| PCMark 7 Score | 5481 puntos | |
| PCMark 8 Home Score Accelerated v2 | 3907 puntos | |
| PCMark 8 Creative Score Accelerated v2 | 4601 puntos | |
| PCMark 8 Work Score Accelerated v2 | 4631 puntos | |
| PCMark 10 Score | 3293 puntos | |
ayuda | ||
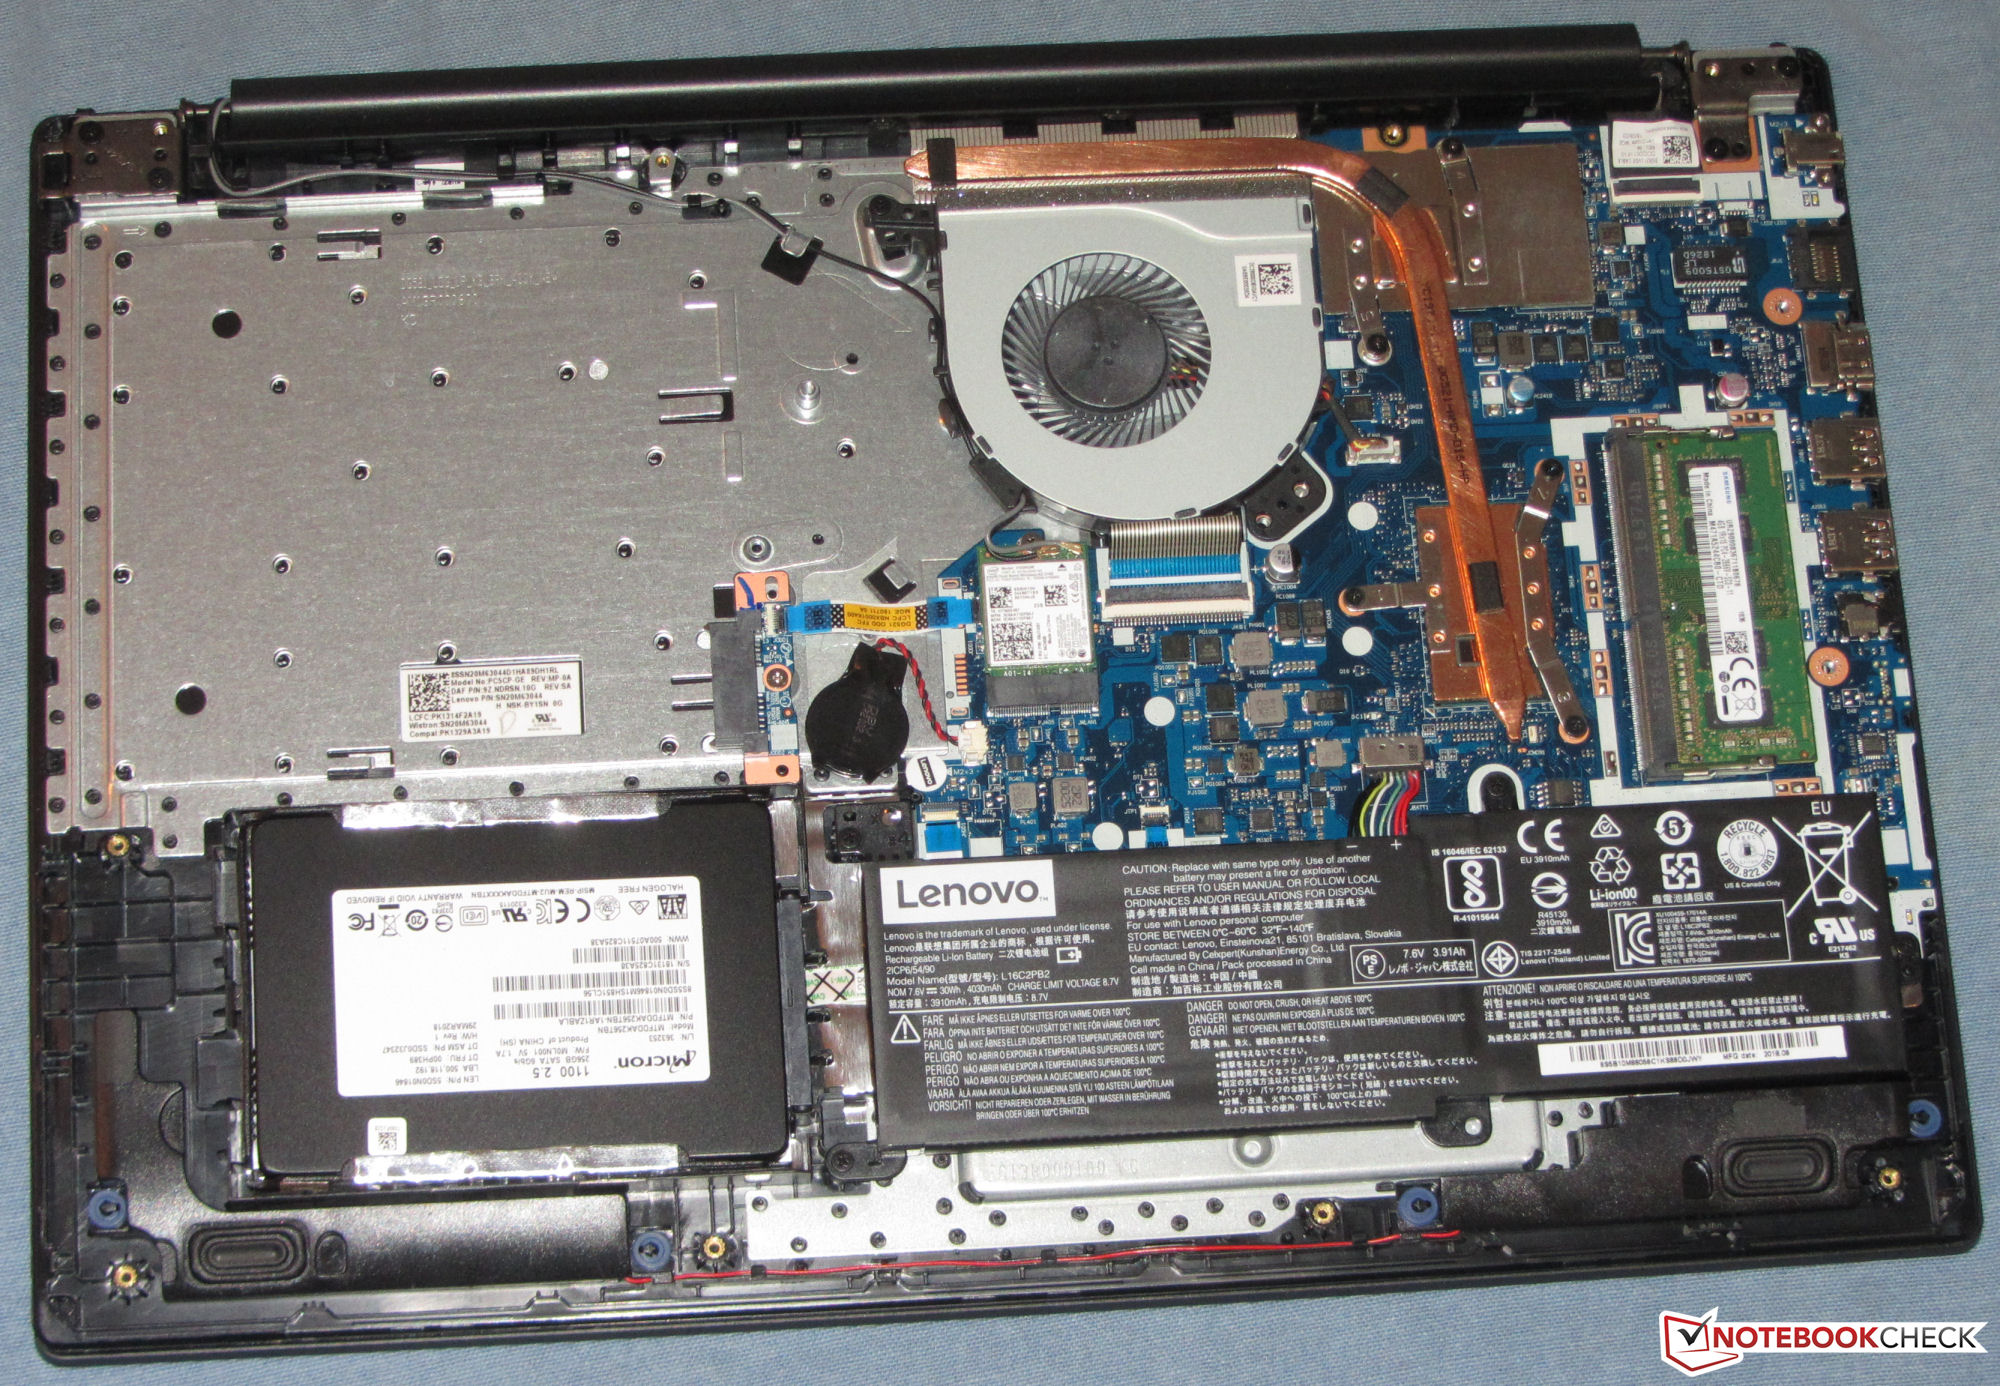
Dispositivos de almacenamiento
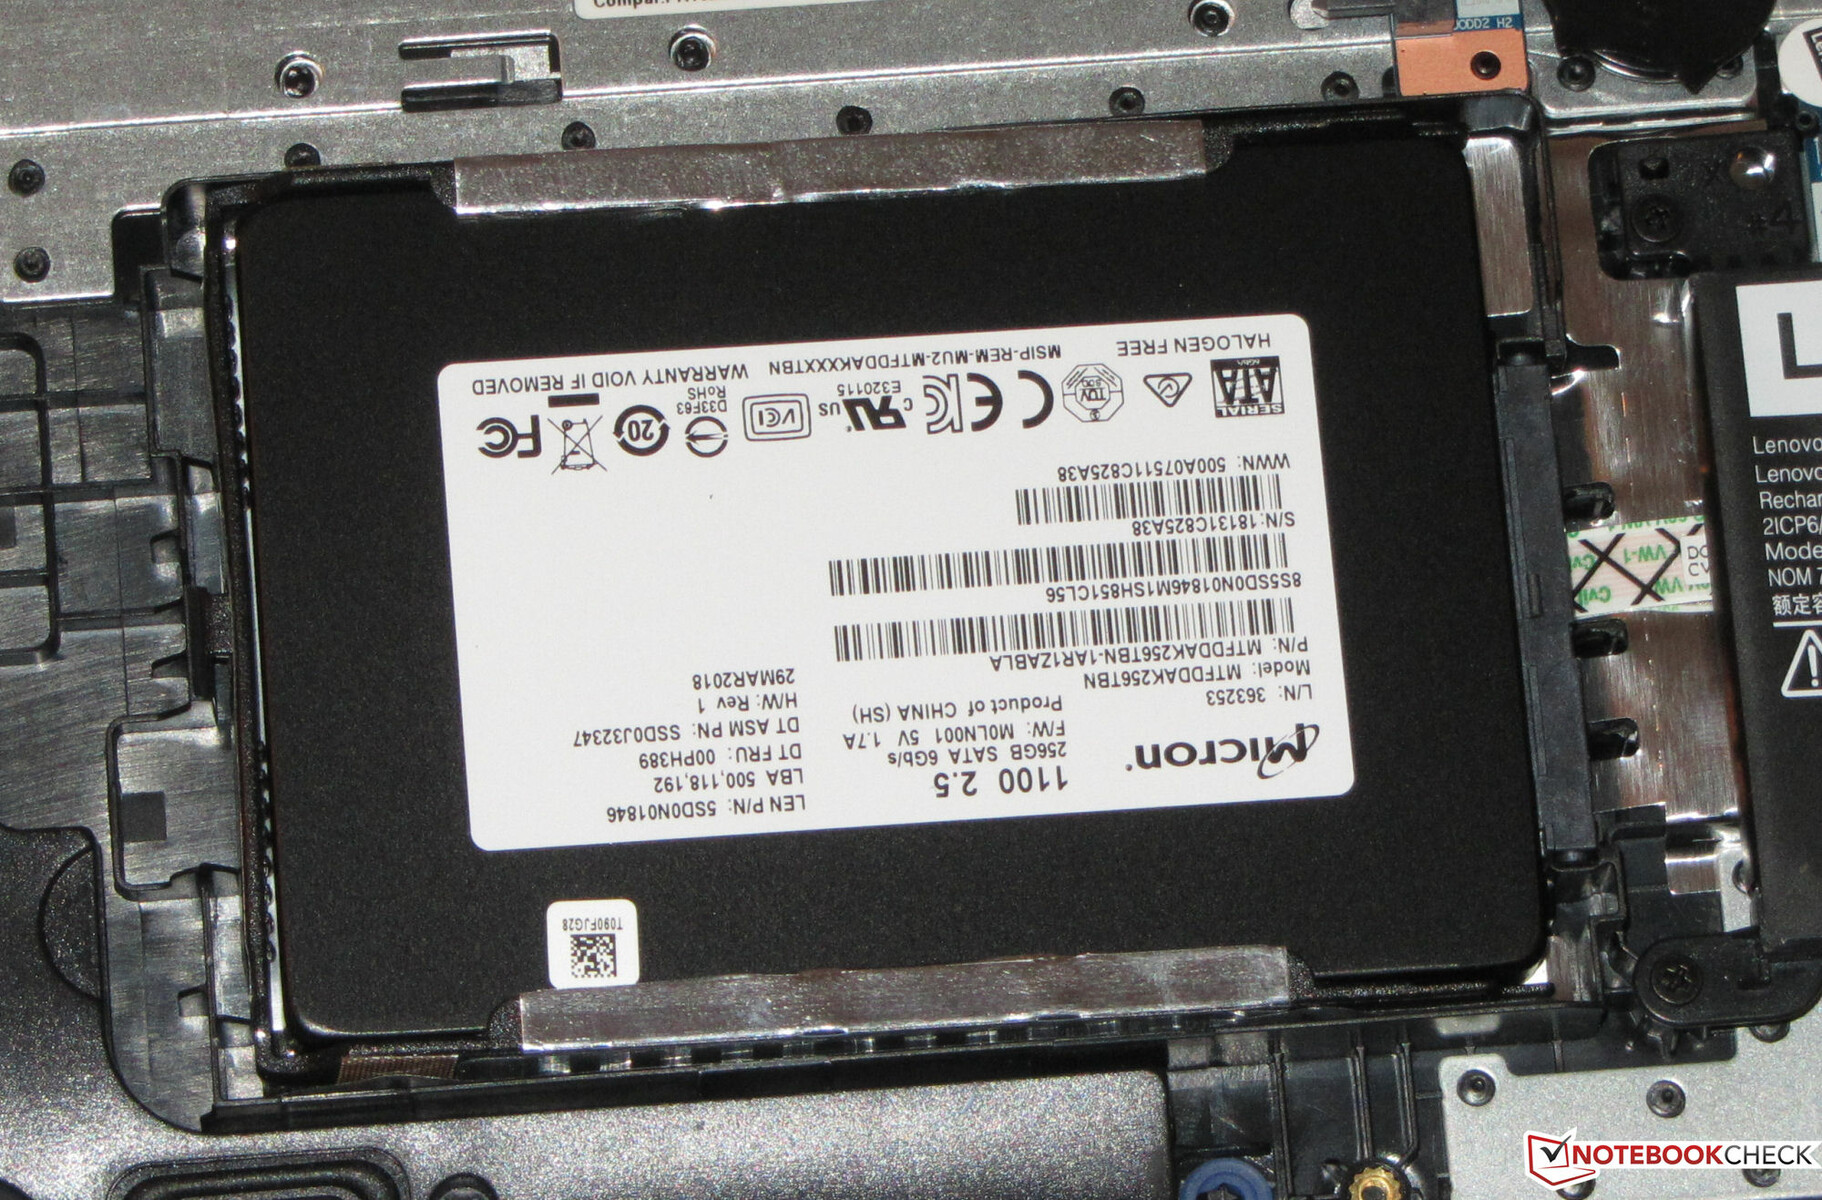
Lenovo ha equipado nuestra unidad de revisión con una unidad SSD Micron 1100 de 256 GB, que es una unidad SSD de 2,5 pulgadas que funciona con el protocolo SATA III. La unidad es mucho más lenta que las modernas unidades M.2 2280 SATA III y NVMe, pero sigue ofreciendo un rendimiento aceptable. Cabe destacar que nuestra unidad de revisión tenía aproximadamente 207 GB libres en el momento de la entrega, con el espacio restante ocupado por la partición de recuperación y Windows 10.

| Lenovo Ideapad 330-15IKB-81DC00SWGE Micron SSD 1100 SED 256GB MTFDDAK256TBN | Acer TravelMate P2510-G2-MG-50WE SK Hynix HFS256G39TND-N210A | HP Pavilion 15-cs0003ng SK Hynix SC313 HFS256G39TNF | HP Pavilion 15-cw0003ng Intel SSD 600p SSDPEKKW512G7 | Asus VivoBook 15 X542UF-DM143T Micron 1100 MTFDDAV256TBN | HP 15-da0405ng SK Hynix BC501 NVMe 256 GB | Acer Swift 3 SF315-41G-R6BR Intel SSD 600p SSDPEKKW256G7 | Lenovo IdeaPad 330-15ARR 81D2005CUS SK Hynix Canvas SC311 256GB HFS256G32TNF | Lenovo IdeaPad 330-15ARR-81D2005JGE Seagate Mobile HDD 1TB ST1000LM035 | Medio Micron SSD 1100 SED 256GB MTFDDAK256TBN | |
|---|---|---|---|---|---|---|---|---|---|---|
| CrystalDiskMark 5.2 / 6 | 50% | 73% | 147% | 82% | 168% | 157% | 68% | -88% | 28% | |
| Write 4K (MB/s) | 24.2 | 71.8 197% | 66.9 176% | 105.8 337% | 94.9 292% | 97.6 303% | 112 363% | 66.6 175% | 0.217 -99% | 48.2 ? 99% |
| Read 4K (MB/s) | 7.548 | 21.23 181% | 30.33 302% | 29.22 287% | 27.3 262% | 39.08 418% | 32.44 330% | 29.2 287% | 0.367 -95% | 16.3 ? 116% |
| Write Seq (MB/s) | 395.1 | 257.1 -35% | 447.6 13% | 581 47% | 410.4 4% | 571 45% | 598 51% | 465.6 18% | 98.8 -75% | 404 ? 2% |
| Read Seq (MB/s) | 443.3 | 476.3 7% | 534 20% | 1065 140% | 464 5% | 1110 150% | 1157 161% | 526 19% | 131.1 -70% | 466 ? 5% |
| Write 4K Q32T1 (MB/s) | 160.2 | 202.6 26% | 197.5 23% | 201 25% | 246.5 54% | 235.7 47% | 255.5 59% | 197 23% | 0.222 -100% | 160.9 ? 0% |
| Read 4K Q32T1 (MB/s) | 179 | 282 58% | 234.5 31% | 278.6 56% | 246.4 38% | 297 66% | 287.5 61% | 202.9 13% | 0.781 -100% | 181.9 ? 2% |
| Write Seq Q32T1 (MB/s) | 455.2 | 265.6 -42% | 495.6 9% | 584 28% | 451.4 -1% | 812 78% | 594 30% | 481.4 6% | 97 -79% | 444 ? -2% |
| Read Seq Q32T1 (MB/s) | 517 | 559 8% | 559 8% | 1824 253% | 532 3% | 1742 237% | 1568 203% | 537 4% | 93.3 -82% | 524 ? 1% |
Tarjeta gráfica
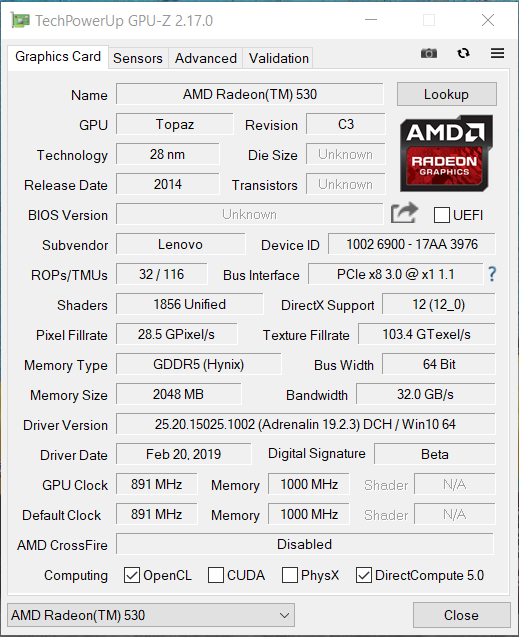
AMD introdujo la GPU Radeon 530 en 2017, pero sus orígenes se remontan a 2014. La GPU se fabrica en un proceso FinFET de 28 nm y en la arquitectura GCN 3.0 de la empresa, que vimos por primera vez con la Radeon R9 285. AMD también ha lanzado el Radeon 530 bajo diferentes nombres a lo largo de los años, como el Radeon R7 M440.
El Radeon 530 soporta DirectX 12 y opera hasta 891 MHz, que es más de 100 MHz por debajo de la velocidad máxima de AMD de 1024 MHz. La GPU compensa la menor velocidad del reloj con 2 GB de VRAM GDDR5. La GDDR5 VRAM ayuda a la Radeon 530 a superar a la Radeon 530 con DDR3 VRAM en las pruebas de 3DMark y la pone a la par con la Nvidia GeForce MX110.
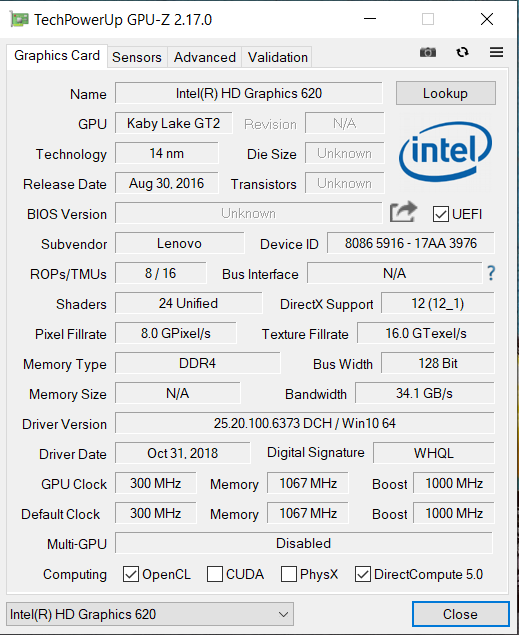
Nuestra unidad de revisión también tiene Intel HD Graphics 620, que está integrado dentro de la CPU Core i5-7200U. El sistema puede cambiar de una GPU a otra cuando lo necesita gracias a la tecnología AMD Enduro, que funciona como Nvidia Optimus. El 330-15IKB utiliza la GPU Intel cuando se ejecuta con batería y en tareas no gráficamente intensivas, pero cambia a la GPU AMD cuando juega. También puede desactivar la Radeon 530 en el BIOS si lo necesita.
| 3DMark 03 Standard | 30891 puntos | |
| 3DMark 05 Standard | 18412 puntos | |
| 3DMark 06 Standard Score | 11481 puntos | |
| 3DMark Vantage P Result | 6392 puntos | |
| 3DMark 11 Performance | 2314 puntos | |
| 3DMark Ice Storm Standard Score | 48958 puntos | |
| 3DMark Cloud Gate Standard Score | 6154 puntos | |
| 3DMark Fire Strike Score | 1386 puntos | |
| 3DMark Time Spy Score | 497 puntos | |
ayuda | ||
Rendimiento en los juegos
El Radeon 530 es lo suficientemente potente como para jugar a juegos más antiguos como BioShock Infinite o Counter-Strike Global Offensive con gráficos altos en 720p, pero los títulos modernos de triple-A están fuera de discusión. Dirt Rally 2.0 se reproducirá sin problemas con un mínimo de gráficos en 720p, pero nuestra unidad de revisión no podría ni siquiera promediar 20 FPS en Anthem, Metro Exodus o Hitman 2.
| bajo | medio | alto | ultra | |
|---|---|---|---|---|
| StarCraft 2 (2010) | 247 | 75.8 | 46.6 | 24.8 |
| The Elder Scrolls V: Skyrim (2011) | 58.8 | 42.4 | 31.4 | 17.8 |
| Counter-Strike: GO (2012) | 145.2 | 119.8 | 64.9 | 35.5 |
| Tomb Raider (2013) | 100.1 | 51.7 | 39.9 | 17.8 |
| BioShock Infinite (2013) | 97.5 | 50.5 | 42.9 | 14.8 |
| Middle-earth: Shadow of Mordor (2014) | 46.8 | 29.1 | 15.2 | |
| The Witcher 3 (2015) | 27.1 | 17.3 | 14 | 5.6 |
| Dota 2 Reborn (2015) | 62.1 | 46.9 | 29.3 | 28 |
| World of Warships (2015) | 92.9 | 61.2 | 24.6 | |
| Ashes of the Singularity (2016) | 16.5 | 8.9 | ||
| Overwatch (2016) | 69.9 | 59.3 | 27.8 | |
| Deus Ex Mankind Divided (2016) | 19.7 | 14.2 | ||
| Fortnite (2018) | 62.4 | 18.1 | ||
| Final Fantasy XV Benchmark (2018) | 15.5 | 7.2 | ||
| Kingdom Come: Deliverance (2018) | 25.8 | 10 | ||
| X-Plane 11.11 (2018) | 26.1 | 17.3 | ||
| Far Cry 5 (2018) | 22 | 9 | ||
| Monster Hunter World (2018) | 22.9 | 8.6 | ||
| F1 2018 (2018) | 29 | 18 | ||
| Shadow of the Tomb Raider (2018) | 23 | 8 | ||
| FIFA 19 (2018) | 65.8 | 34.6 | 32 | |
| Forza Horizon 4 (2018) | 31 | 20 | ||
| Assassin´s Creed Odyssey (2018) | 23 | 14 | ||
| Hitman 2 (2018) | 16.5 | 8.2 | ||
| Fallout 76 (2018) | 23.4 | 10.7 | ||
| Battlefield V (2018) | 28.6 | 13.2 | ||
| Farming Simulator 19 (2018) | 53.8 | 21.6 | 10.6 | |
| Darksiders III (2018) | 41.9 | 10.5 | ||
| Just Cause 4 (2018) | 19.6 | 11.8 | ||
| Apex Legends (2019) | 27.8 | 11.9 | ||
| Far Cry New Dawn (2019) | 21 | 9 | ||
| Metro Exodus (2019) | 13.6 | 6.4 | ||
| Anthem (2019) | 18.6 | 11 | ||
| Dirt Rally 2.0 (2019) | 45.6 | 16.1 |
| BioShock Infinite - 1366x768 Medium Preset | |
| HP Pavilion 15-cs0003ng | |
| Acer Swift 3 SF315-41G-R6BR | |
| Asus VivoBook 15 X542UF-DM143T | |
| Medion Akoya S6625 | |
| Dell Latitude 15 3590-K8JP | |
| HP 15-da0405ng | |
| Medio AMD Radeon 530 (41.7 - 60.3, n=5) | |
| Lenovo Ideapad 330-15IKB-81DC00SWGE | |
| HP 17-bs103ng | |
| The Witcher 3 - 1024x768 Low Graphics & Postprocessing | |
| Media de la clase Office (32.2 - 135, n=3, últimos 2 años) | |
| Acer Swift 3 SF315-41G-R6BR | |
| Asus VivoBook 15 X542UF-DM143T | |
| Medion Akoya S6625 | |
| Dell Latitude 15 3590-K8JP | |
| Medio AMD Radeon 530 (24 - 32.8, n=4) | |
| HP 15-da0405ng | |
| Lenovo Ideapad 330-15IKB-81DC00SWGE | |
| Lenovo IdeaPad 330-15ARR 81D2005CUS | |
| Tomb Raider - 1366x768 Normal Preset AA:FX AF:4x | |
| Asus VivoBook 15 X542UF-DM143T | |
| Acer Swift 3 SF315-41G-R6BR | |
| HP 15-da0405ng | |
| Medio AMD Radeon 530 (49.7 - 59, n=3) | |
| Lenovo Ideapad 330-15IKB-81DC00SWGE | |
| HP 17-bs103ng | |
| Dota 2 Reborn - 1366x768 med (1/3) | |
| Media de la clase Office (31.2 - 152, n=77, últimos 2 años) | |
| Asus VivoBook 15 X542UF-DM143T | |
| HP 15-da0405ng | |
| Acer Swift 3 SF315-41G-R6BR | |
| Medio AMD Radeon 530 (46.9 - 66.6, n=4) | |
| HP 17-bs103ng | |
| Lenovo Ideapad 330-15IKB-81DC00SWGE | |
| World of Warships - 1366x768 Medium Preset AF:Trilinear | |
| Asus VivoBook 15 X542UF-DM143T | |
| HP 15-da0405ng | |
| Acer Swift 3 SF315-41G-R6BR | |
| Lenovo Ideapad 330-15IKB-81DC00SWGE | |
| Medio AMD Radeon 530 (n=1) | |
| StarCraft 2 - 1360x768 high | |
| Asus VivoBook 15 X542UF-DM143T | |
| HP 15-da0405ng | |
| Lenovo Ideapad 330-15IKB-81DC00SWGE | |
| Medio AMD Radeon 530 (n=1) | |
| The Elder Scrolls V: Skyrim - 1366x768 Medium Preset AA:4x | |
| Lenovo Ideapad 330-15IKB-81DC00SWGE | |
| Medio AMD Radeon 530 (31 - 42.4, n=2) | |
| HP 17-bs103ng | |
| Counter-Strike: GO - 1366x768 High AA:2x MS AF:4x | |
| Lenovo Ideapad 330-15IKB-81DC00SWGE | |
| Medio AMD Radeon 530 (n=1) | |
Emisiones
Ruido del ventilador
El 330-15IKB es un portátil de 15,6 pulgadas relativamente silencioso. El ventilador es a menudo silencioso en reposo y sólo alcanza un máximo de 31,2 dB(A) en estas condiciones. El ventilador subió a 38,7 dB(A) durante nuestras pruebas de esfuerzo, pero esto no es excesivamente alto. Además, no hemos notado ningún quejido de la bobina o cualquier otro ruido relacionado con las interferencias eléctricas durante nuestras pruebas.
Ruido
| Ocioso |
| 30.5 / 30.5 / 31.2 dB(A) |
| Carga |
| 35.4 / 38.7 dB(A) |
 | ||
30 dB silencioso 40 dB(A) audible 50 dB(A) ruidosamente alto |
||
min: | ||
| Lenovo Ideapad 330-15IKB-81DC00SWGE i5-7200U, Radeon 530 | Lenovo IdeaPad 330-15ARR 81D2005CUS R5 2500U, Vega 8 | Lenovo IdeaPad 330-15ARR-81D2005JGE R3 2200U, Vega 3 | Acer TravelMate P2510-G2-MG-50WE i5-8250U, GeForce MX130 | HP Pavilion 15-cs0003ng i5-8250U, GeForce MX130 | HP Pavilion 15-cw0003ng R5 2500U, Vega 8 | Asus VivoBook 15 X542UF-DM143T i5-8250U, GeForce MX130 | HP 15-da0405ng i5-8250U, GeForce MX110 | Acer Swift 3 SF315-41G-R6BR R5 2500U, Radeon RX 540 | Medio AMD Radeon 530 | Media de la clase Office | |
|---|---|---|---|---|---|---|---|---|---|---|---|
| Noise | 3% | -1% | 1% | -6% | 1% | -1% | -1% | 2% | -5% | 13% | |
| apagado / medio ambiente * (dB) | 30.5 | 28.1 8% | 30.6 -0% | 30.3 1% | 30.6 -0% | 30.5 -0% | 30 2% | 30.6 -0% | 30.3 1% | 29.7 ? 3% | 24.2 ? 21% |
| Idle Minimum * (dB) | 30.5 | 28.1 8% | 31.8 -4% | 30.3 1% | 30.6 -0% | 31.4 -3% | 30.9 -1% | 30.9 -1% | 30.3 1% | 31.6 ? -4% | 24.3 ? 20% |
| Idle Average * (dB) | 30.5 | 31.6 -4% | 31.8 -4% | 30.3 1% | 30.6 -0% | 31.4 -3% | 30.9 -1% | 30.9 -1% | 30.3 1% | 31.6 ? -4% | 24.5 ? 20% |
| Idle Maximum * (dB) | 31.2 | 32.8 -5% | 31.8 -2% | 31 1% | 32.1 -3% | 31.6 -1% | 30.9 1% | 30.9 1% | 32.2 -3% | 31.8 ? -2% | 25.3 ? 19% |
| Load Average * (dB) | 35.4 | 36.5 -3% | 35.2 1% | 35.6 -1% | 43.2 -22% | 33.5 5% | 39 -10% | 36.8 -4% | 34.8 2% | 39.5 ? -12% | 34.3 ? 3% |
| Load Maximum * (dB) | 38.7 | 32.8 15% | 36.4 6% | 38.6 -0% | 43.4 -12% | 35.9 7% | 38 2% | 39 -1% | 35 10% | 42.3 ? -9% | 41.4 ? -7% |
| Witcher 3 ultra * (dB) | 32.8 |
* ... más pequeño es mejor
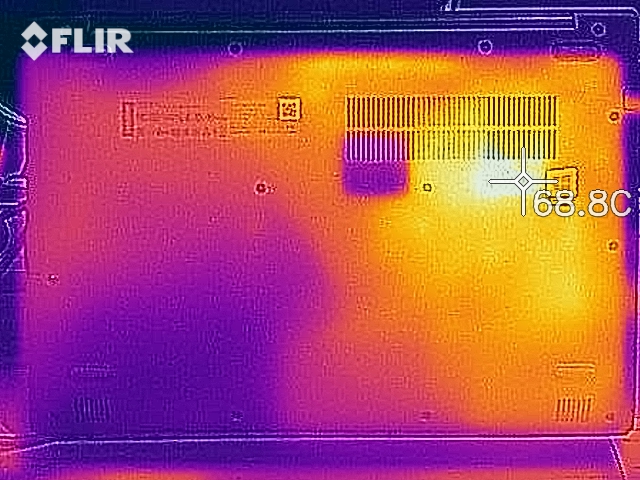
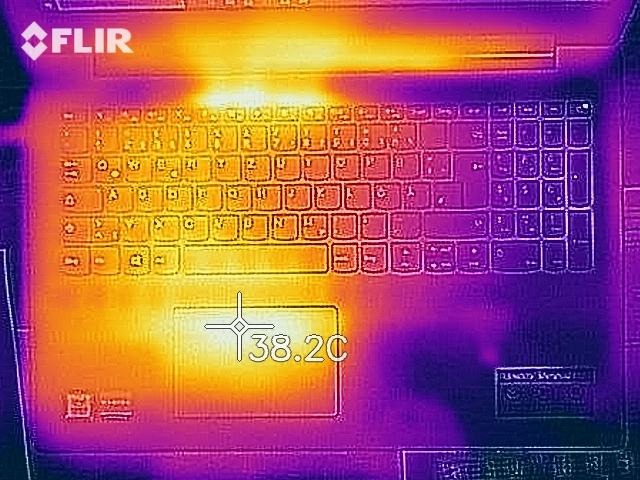
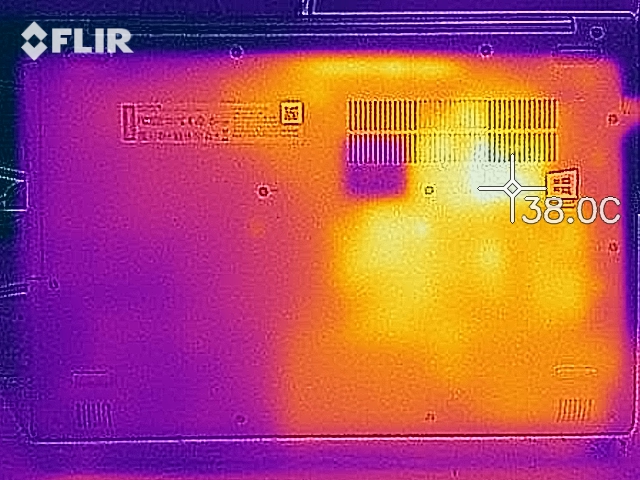
Temperatura
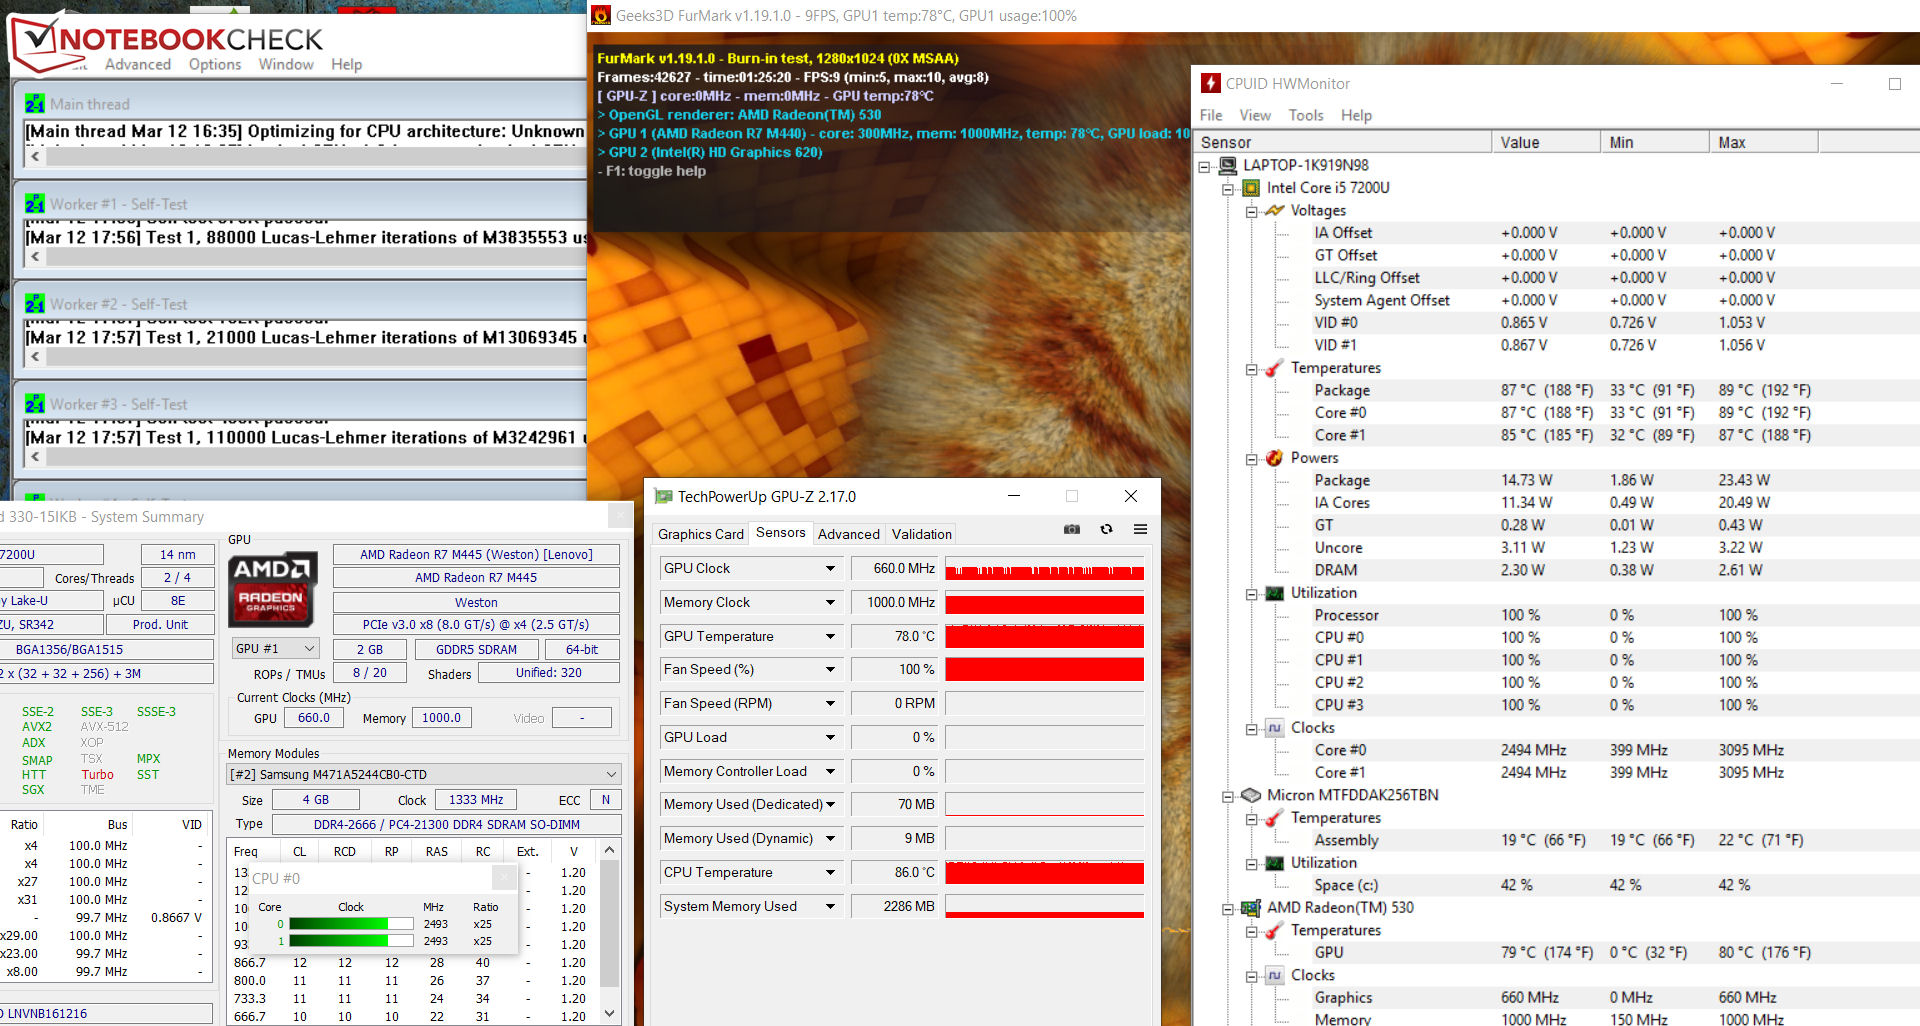
También sometimos a nuestra unidad de revisión a una prueba de esfuerzo combinada de FurMark y Prime95 que realizamos durante al menos una hora. El 330-15IKB funcionó igual de bien con la batería que con la red eléctrica, con la CPU funcionando a 2,5 GHz, mientras que la GPU fluctuó entre 300 y 660 MHz.
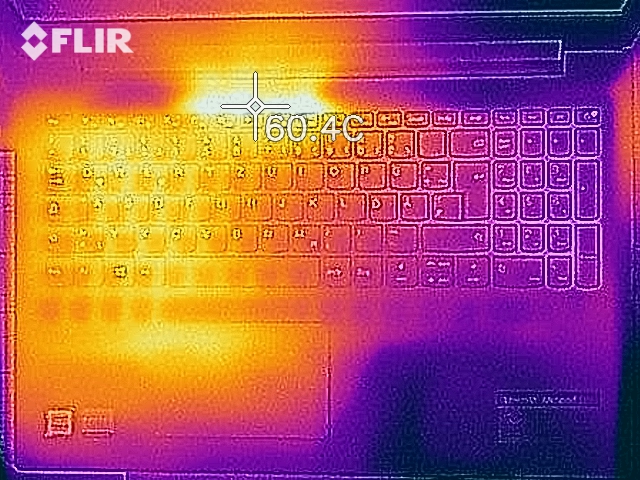
Sin embargo, nuestra unidad de revisión se calienta demasiado para una máquina equipada con una CPU ULV y una GPU dedicada de nivel básico. La caja inferior alcanzó los 53,8 °C bajo una carga sostenida, que se sentiría insoportablemente caliente en el regazo. Además, grandes partes del teclado y del apoyo de la palma de la mano superan los 40 °C, lo que también resulta incómodo al tacto.
Cabe destacar que logramos estas temperaturas superficiales durante nuestras pruebas de esfuerzo, que son un escenario extremo que no debería ocurrir en la vida diaria. Sin embargo, las temperaturas de la superficie siguen superando los 30 °C en reposo, lo que es más cálido de lo que nos gustaría ver.
(-) La temperatura máxima en la parte superior es de 46.5 °C / 116 F, frente a la media de 34.3 °C / 94 F, que oscila entre 21.2 y 62.5 °C para la clase Office.
(-) El fondo se calienta hasta un máximo de 53.8 °C / 129 F, frente a la media de 36.8 °C / 98 F
(+) En reposo, la temperatura media de la parte superior es de 26.9 °C / 80# F, frente a la media del dispositivo de 29.5 °C / 85 F.
(-) El reposamanos y el touchpad pueden calentarse mucho al tacto con un máximo de 42 °C / 107.6 F.
(-) La temperatura media de la zona del reposamanos de dispositivos similares fue de 27.6 °C / 81.7 F (-14.4 °C / -25.9 F).
| Lenovo Ideapad 330-15IKB-81DC00SWGE i5-7200U, Radeon 530 | Lenovo IdeaPad 330-15ARR 81D2005CUS R5 2500U, Vega 8 | Lenovo IdeaPad 330-15ARR-81D2005JGE R3 2200U, Vega 3 | Acer TravelMate P2510-G2-MG-50WE i5-8250U, GeForce MX130 | HP Pavilion 15-cs0003ng i5-8250U, GeForce MX130 | HP Pavilion 15-cw0003ng R5 2500U, Vega 8 | Asus VivoBook 15 X542UF-DM143T i5-8250U, GeForce MX130 | HP 15-da0405ng i5-8250U, GeForce MX110 | Acer Swift 3 SF315-41G-R6BR R5 2500U, Radeon RX 540 | Medio AMD Radeon 530 | Media de la clase Office | |
|---|---|---|---|---|---|---|---|---|---|---|---|
| Heat | 11% | 20% | 8% | 11% | 24% | 15% | 23% | 4% | 10% | 12% | |
| Maximum Upper Side * (°C) | 46.5 | 36.8 21% | 34.5 26% | 49 -5% | 48 -3% | 37.3 20% | 40.2 14% | 37.3 20% | 46.6 -0% | 41.7 ? 10% | 40.4 ? 13% |
| Maximum Bottom * (°C) | 53.8 | 42 22% | 34 37% | 47.4 12% | 49 9% | 37.3 31% | 46.6 13% | 41 24% | 45.5 15% | 42.3 ? 21% | 42.5 ? 21% |
| Idle Upper Side * (°C) | 30.5 | 29.4 4% | 27.5 10% | 26.6 13% | 24.4 20% | 23.7 22% | 25.1 18% | 22.3 27% | 30.2 1% | 28.3 ? 7% | 27.4 ? 10% |
| Idle Bottom * (°C) | 30.1 | 30.6 -2% | 28.2 6% | 26.7 11% | 24.6 18% | 23.9 21% | 25.8 14% | 23.5 22% | 30.7 -2% | 29.3 ? 3% | 28.5 ? 5% |
* ... más pequeño es mejor
Altavoces
Lenovo Ideapad 330-15IKB-81DC00SWGE análisis de audio
(-) | altavoces no muy altos (#63.3 dB)
Graves 100 - 315 Hz
(-) | casi sin bajos - de media 23.4% inferior a la mediana
(±) | la linealidad de los graves es media (12.7% delta a frecuencia anterior)
Medios 400 - 2000 Hz
(+) | medios equilibrados - a sólo 1.9% de la mediana
(±) | la linealidad de los medios es media (7.6% delta respecto a la frecuencia anterior)
Altos 2 - 16 kHz
(+) | máximos equilibrados - a sólo 1.7% de la mediana
(+) | los máximos son lineales (5.6% delta a la frecuencia anterior)
Total 100 - 16.000 Hz
(±) | la linealidad del sonido global es media (20.7% de diferencia con la mediana)
En comparación con la misma clase
» 48% de todos los dispositivos probados de esta clase eran mejores, 10% similares, 42% peores
» El mejor tuvo un delta de 7%, la media fue 21%, el peor fue ###max##%
En comparación con todos los dispositivos probados
» 56% de todos los dispositivos probados eran mejores, 8% similares, 36% peores
» El mejor tuvo un delta de 4%, la media fue 23%, el peor fue ###max##%
Asus VivoBook 15 X542UF-DM143T análisis de audio
(-) | altavoces no muy altos (#71.1 dB)
Graves 100 - 315 Hz
(-) | casi sin bajos - de media 16.9% inferior a la mediana
(±) | la linealidad de los graves es media (14.3% delta a frecuencia anterior)
Medios 400 - 2000 Hz
(+) | medios equilibrados - a sólo 1.2% de la mediana
(+) | los medios son lineales (4.5% delta a la frecuencia anterior)
Altos 2 - 16 kHz
(+) | máximos equilibrados - a sólo 2.9% de la mediana
(+) | los máximos son lineales (4.2% delta a la frecuencia anterior)
Total 100 - 16.000 Hz
(±) | la linealidad del sonido global es media (15.2% de diferencia con la mediana)
En comparación con la misma clase
» 37% de todos los dispositivos probados de esta clase eran mejores, 4% similares, 59% peores
» El mejor tuvo un delta de 5%, la media fue 17%, el peor fue ###max##%
En comparación con todos los dispositivos probados
» 22% de todos los dispositivos probados eran mejores, 4% similares, 74% peores
» El mejor tuvo un delta de 4%, la media fue 23%, el peor fue ###max##%
HP 15-da0405ng análisis de audio
(±) | la sonoridad del altavoz es media pero buena (72.1 dB)
Graves 100 - 315 Hz
(-) | casi sin bajos - de media 25.4% inferior a la mediana
(±) | la linealidad de los graves es media (11.6% delta a frecuencia anterior)
Medios 400 - 2000 Hz
(+) | medios equilibrados - a sólo 3% de la mediana
(±) | la linealidad de los medios es media (7.7% delta respecto a la frecuencia anterior)
Altos 2 - 16 kHz
(+) | máximos equilibrados - a sólo 2.3% de la mediana
(+) | los máximos son lineales (4% delta a la frecuencia anterior)
Total 100 - 16.000 Hz
(±) | la linealidad del sonido global es media (19.9% de diferencia con la mediana)
En comparación con la misma clase
» 42% de todos los dispositivos probados de esta clase eran mejores, 9% similares, 49% peores
» El mejor tuvo un delta de 7%, la media fue 21%, el peor fue ###max##%
En comparación con todos los dispositivos probados
» 51% de todos los dispositivos probados eran mejores, 7% similares, 42% peores
» El mejor tuvo un delta de 4%, la media fue 23%, el peor fue ###max##%
Acer Swift 3 SF315-41G-R6BR análisis de audio
(±) | la sonoridad del altavoz es media pero buena (74.2 dB)
Graves 100 - 315 Hz
(-) | casi sin bajos - de media 15.1% inferior a la mediana
(+) | el bajo es lineal (5% delta a la frecuencia anterior)
Medios 400 - 2000 Hz
(+) | medios equilibrados - a sólo 3.8% de la mediana
(+) | los medios son lineales (5.7% delta a la frecuencia anterior)
Altos 2 - 16 kHz
(±) | máximos más altos - de media 6.6% más altos que la mediana
(+) | los máximos son lineales (5.7% delta a la frecuencia anterior)
Total 100 - 16.000 Hz
(±) | la linealidad del sonido global es media (18.2% de diferencia con la mediana)
En comparación con la misma clase
» 54% de todos los dispositivos probados de esta clase eran mejores, 7% similares, 38% peores
» El mejor tuvo un delta de 5%, la media fue 17%, el peor fue ###max##%
En comparación con todos los dispositivos probados
» 39% de todos los dispositivos probados eran mejores, 8% similares, 53% peores
» El mejor tuvo un delta de 4%, la media fue 23%, el peor fue ###max##%
Gestión de la energía
Consumo de energía
El 330-15IKB es un dispositivo comparativamente eficiente. Nuestra unidad de revisión consume un mínimo de 3,6 W en reposo, lo que está a la par con nuestros dispositivos de comparación más económicos. El consumo de energía alcanzó un pico de 55,3 W durante nuestras pruebas de esfuerzo, con un consumo típico de alrededor de 40 W bajo carga sostenida. Esto hace que el 330-15IKB sea más eficiente que nuestros dispositivos de comparación, que también tienen GPUs dedicadas, pero también tienen componentes más potentes, algo que merece la pena tener en cuenta.
Lenovo incluye una fuente de alimentación de 65 W que es lo suficientemente potente como para mantener el 330-15IKB cargado incluso cuando el sistema está siendo empujado con fuerza.
| Off / Standby | |
| Ocioso | |
| Carga |
|
Clave:
min: | |
| Lenovo Ideapad 330-15IKB-81DC00SWGE i5-7200U, Radeon 530 | Lenovo IdeaPad 330-15ARR 81D2005CUS R5 2500U, Vega 8 | Lenovo IdeaPad 330-15ARR-81D2005JGE R3 2200U, Vega 3 | Acer TravelMate P2510-G2-MG-50WE i5-8250U, GeForce MX130 | HP Pavilion 15-cs0003ng i5-8250U, GeForce MX130 | HP Pavilion 15-cw0003ng R5 2500U, Vega 8 | Asus VivoBook 15 X542UF-DM143T i5-8250U, GeForce MX130 | HP 15-da0405ng i5-8250U, GeForce MX110 | Acer Swift 3 SF315-41G-R6BR R5 2500U, Radeon RX 540 | Medio AMD Radeon 530 | Media de la clase Office | |
|---|---|---|---|---|---|---|---|---|---|---|---|
| Power Consumption | -35% | -36% | -8% | -13% | -6% | -18% | -4% | -48% | -30% | -16% | |
| Idle Minimum * (Watt) | 3.6 | 7.6 -111% | 8 -122% | 3.3 8% | 3.3 8% | 4.5 -25% | 4.75 -32% | 3.8 -6% | 6.9 -92% | 5.34 ? -48% | 4.25 ? -18% |
| Idle Average * (Watt) | 6.4 | 10.6 -66% | 9.9 -55% | 5.6 13% | 6.1 5% | 7.3 -14% | 6.9 -8% | 6.2 3% | 9.6 -50% | 8.12 ? -27% | 7.3 ? -14% |
| Idle Maximum * (Watt) | 7.2 | 11.8 -64% | 10.4 -44% | 7.8 -8% | 8.3 -15% | 9.4 -31% | 7 3% | 6.7 7% | 11.8 -64% | 11.3 ? -57% | 8.57 ? -19% |
| Load Average * (Watt) | 39.4 | 24.1 39% | 31 21% | 54 -37% | 56 -42% | 34 14% | 53 -35% | 40.8 -4% | 50 -27% | 46.5 ? -18% | 43.8 ? -11% |
| Load Maximum * (Watt) | 55.3 | 39.4 29% | 43 22% | 63 -14% | 67 -21% | 41.9 24% | 65.3 -18% | 65.2 -18% | 60 -8% | 54.8 ? 1% | 64.5 ? -17% |
| Witcher 3 ultra * (Watt) | 30.3 |
* ... más pequeño es mejor
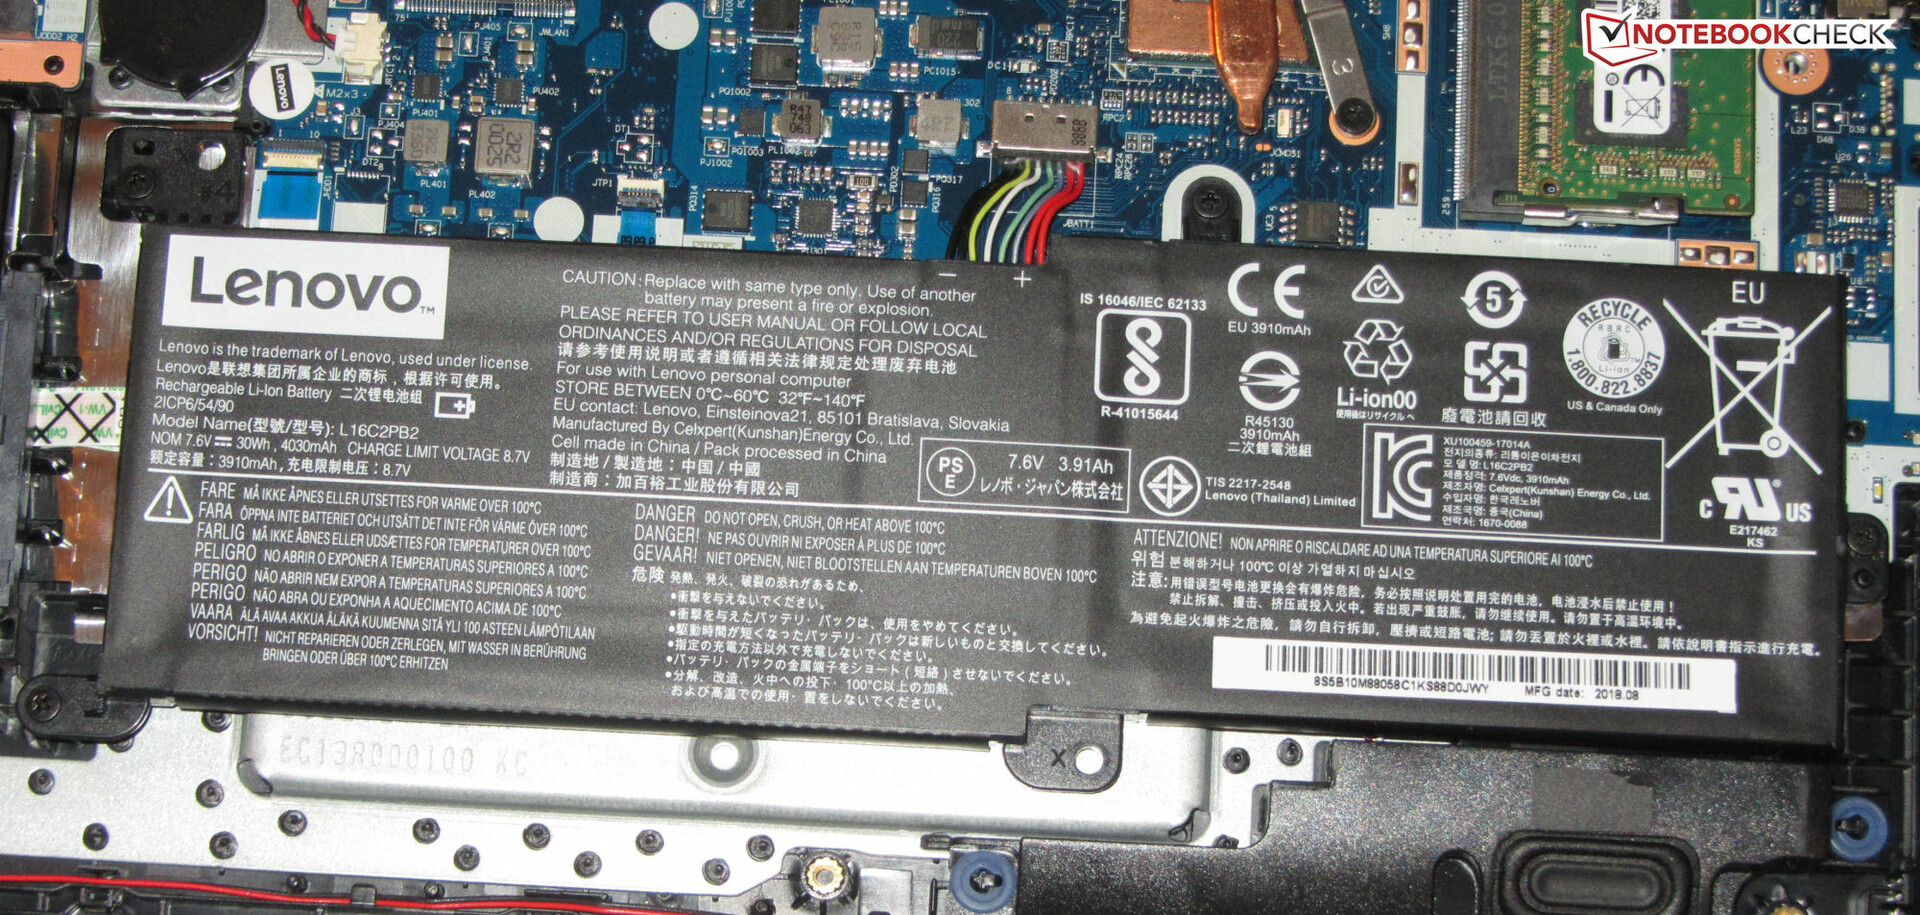
Duración de la batería
El 330-15IKB tiene una batería de 30 Wh, que es considerablemente más pequeña que las baterías de nuestros dispositivos de comparación. En consecuencia, nuestra unidad de revisión logró tiempos de funcionamiento deficientes en nuestras pruebas de duración de la batería. La batería necesitaba recargarse después de sólo 4:46 horas en nuestra práctica prueba Wi-Fi, durante la cual ejecutamos un script que simula la carga necesaria para renderizar sitios web. También configuramos el modo de alimentación de Windows 10 de forma equilibrada, desactivamos todas las funciones de ahorro de energía y ajustamos la pantalla a aproximadamente 150 cd/m². Del mismo modo, el dispositivo duró sólo 5:01 horas en pruebas de vídeo en bucle H.264, que es considerablemente peor que el Acer TravelMate P2510 y su batería de 48 Wh.
Sin embargo, el 330-15IKB se desempeñó mejor que sus hermanos de Ryzen en estas pruebas, pero eso no es mucho decir. Las tres computadoras portátiles tienen una duración de batería terrible, y esperamos que Lenovo equipe sus futuras computadoras portátiles IdeaPad de 15 pulgadas con baterías más grandes.
| Lenovo Ideapad 330-15IKB-81DC00SWGE i5-7200U, Radeon 530, 30 Wh | Acer TravelMate P2510-G2-MG-50WE i5-8250U, GeForce MX130, 48 Wh | HP Pavilion 15-cs0003ng i5-8250U, GeForce MX130, 41 Wh | HP Pavilion 15-cw0003ng R5 2500U, Vega 8, 41 Wh | Asus VivoBook 15 X542UF-DM143T i5-8250U, GeForce MX130, 38 Wh | HP 15-da0405ng i5-8250U, GeForce MX110, 41 Wh | Acer Swift 3 SF315-41G-R6BR R5 2500U, Radeon RX 540, 48 Wh | Lenovo IdeaPad 330-15ARR 81D2005CUS R5 2500U, Vega 8, 35 Wh | Lenovo IdeaPad 330-15ARR-81D2005JGE R3 2200U, Vega 3, 35 Wh | Media de la clase Office | |
|---|---|---|---|---|---|---|---|---|---|---|
| Duración de Batería | 82% | 20% | 13% | 42% | 23% | 33% | -17% | -50% | 132% | |
| Reader / Idle (h) | 13.5 | 8.2 -39% | 8.4 -38% | 12.1 -10% | 22.2 ? 64% | |||||
| H.264 (h) | 5 | 8.6 72% | 3.8 -24% | 6.1 22% | 15.4 ? 208% | |||||
| WiFi v1.3 (h) | 4.8 | 8.4 75% | 4.7 -2% | 5 4% | 6.8 42% | 5.9 23% | 6.7 40% | 4 -17% | 2.4 -50% | 13.2 ? 175% |
| Load (h) | 1 | 2 100% | 2 100% | 2.1 110% | 1.8 80% | 1.808 ? 81% |
Pro
Contra
Veredicto
El IdeaPad 330-15IKB de Lenovo es un poco anacrónico. Su procesador Core i5-7200U y su GPU Radeon 530 son obsoletos, al igual que su pantalla TN. Además, la batería es simplemente demasiado pequeña para un portátil de 15,6 pulgadas.
Además, mientras que la SSD es lo suficientemente rápida para mantener el sistema funcionando sin problemas, es considerablemente más lenta que las unidades M.2 2280 con las que la mayoría de los fabricantes de equipos originales equipan sus portátiles modernos. Además, no podemos entender por qué Lenovo no incluyó un teclado retroiluminado.
No podemos recomendar el IdeaPad 330-15IKB de Lenovo. Se queda tan corto de las expectativas en tantas áreas que le instamos a que busque en otro lugar si necesita un portátil empresarial de 15,6 pulgadas de presupuesto.
Si está interesado en el IdeaPad 330-15, entonces el modelo Ryzen 5-2500U ofrece un rendimiento comparable con una pantalla IPS pero a un precio mucho más asequible. Sin embargo, también tiene una duración de batería espantosa, por lo que es posible que desee saltarse la serie por completo hasta que Lenovo resuelva sus deficiencias.
Lenovo Ideapad 330-15IKB-81DC00SWGE
- 03/17/2019 v6 (old)
Sascha Mölck
Price comparison
