Análisis del portátil Eluktronics Mech-17 GP2: MSI GT77 Titan: rendimiento sin tamaño
El Eluktronics Mech-17 GP2 sustituye al Mech-17 GP del año pasado cambiando las opciones Intel 12th gen y Nvidia Ampere por Intel 13th gen y Nvidia Ada Lovelace, respectivamente. Destaca por ofrecer CPU de la serie Core HX y gráficos GeForce RTX 4090 de 175 W a pesar de su reducido tamaño en comparación con otros portátiles para juegos de 17 pulgadas.
El Mech-17 GP2 se basa en una versión actualizada del Schenker Neo 17 M22 diseñado por Uniwill el año pasado. En esencia, es el Neo 17 E23, aunque con la marca Eluktronics. Hay varios cambios importantes en la placa base de este año que detallaremos en nuestros análisis a continuación. Por lo demás, sus diseños exteriores siguen siendo idénticos, por lo que recomendamos consultar nuestro análisis existente sobre el Schenker Neo 17 M22 para obtener más información sobre las características físicas del Mech-17 GP2.
Nuestra configuración de prueba se ha configurado completamente con el Core i9-13900HX y RTX 4090 por aproximadamente 3400 USD. Hay SKU inferiores hasta la RTX 4070, pero todas las opciones vienen con la misma CPU y pantalla IPS de 240 Hz 2560 x 1600.
Las alternativas al Mech-17 GP2 incluyen otros portátiles para juegos de 17 pulgadas de gama alta como el Razer Blade 17, Alienware m17 R5, Asus Zephyrus S17, o el
MSITitan GT77.
Más opiniones de Eluktronics:
Posibles contendientes en la comparación
Valoración | Fecha | Modelo | Peso | Altura | Tamaño | Resolución | Precio |
|---|---|---|---|---|---|---|---|
| 89.9 % v7 (old) | 03/2023 | Eluktronics Mech-17 GP2 i9-13900HX, GeForce RTX 4090 Laptop GPU | 2.9 kg | 27 mm | 17.00" | 2560x1600 | |
| 87.6 % v7 (old) | 09/2022 | Schenker XMG Neo 17 M22 R9 6900HX, GeForce RTX 3080 Ti Laptop GPU | 2.8 kg | 27 mm | 17.00" | 2560x1600 | |
| 82.1 % v7 (old) | 02/2023 | MSI Katana 17 B13VFK i7-13620H, GeForce RTX 4060 Laptop GPU | 2.8 kg | 25.2 mm | 17.30" | 1920x1080 | |
| 89 % v7 (old) | 02/2023 | MSI Titan GT77 HX 13VI i9-13950HX, GeForce RTX 4090 Laptop GPU | 3.5 kg | 23 mm | 17.30" | 3840x2160 | |
| 86.1 % v7 (old) | 01/2023 | Alienware m17 R5 (R9 6900HX, RX 6850M XT) R9 6900HX, Radeon RX 6850M XT | 3.4 kg | 26.7 mm | 17.00" | 3840x2160 | |
| 91.4 % v7 (old) | 02/2023 | Razer Blade 18 RTX 4070 i9-13950HX, GeForce RTX 4070 Laptop GPU | 3 kg | 21.9 mm | 18.00" | 2560x1600 |
Caso
Lector de tarjetas SD
El lector de tarjetas SD es lento en relación con el elevado precio del modelo. El Razer Blade 18 y la Dell XPS tienen lectores de tarjetas entre 2 y 3 veces más rápidos.
| SD Card Reader | |
| average JPG Copy Test (av. of 3 runs) | |
| Razer Blade 18 RTX 4070 (Angelibird AV Pro V60) | |
| MSI Titan GT77 HX 13VI (Angelibird AV Pro V60) | |
| Eluktronics Mech-17 GP2 (Angelibird AV Pro V60) | |
| Schenker XMG Neo 17 M22 (AV PRO microSD 128 GB V60) | |
| maximum AS SSD Seq Read Test (1GB) | |
| Razer Blade 18 RTX 4070 (Angelibird AV Pro V60) | |
| Eluktronics Mech-17 GP2 (Angelibird AV Pro V60) | |
| MSI Titan GT77 HX 13VI (Angelibird AV Pro V60) | |
Comunicación
Un Intel AX201 viene de serie para la conectividad Wi-Fi 6 y Bluetooth 5.2. No obstante, esperábamos un AX210/211 para velocidades Wi-Fi 6E más rápidas teniendo en cuenta el precio del sistema.
| Networking | |
| iperf3 transmit AXE11000 | |
| MSI Titan GT77 HX 13VI | |
| MSI Katana 17 B13VFK | |
| Eluktronics Mech-17 GP2 | |
| Razer Blade 18 RTX 4070 | |
| Alienware m17 R5 (R9 6900HX, RX 6850M XT) | |
| Schenker XMG Neo 17 M22 | |
| iperf3 receive AXE11000 | |
| MSI Katana 17 B13VFK | |
| MSI Titan GT77 HX 13VI | |
| Razer Blade 18 RTX 4070 | |
| Eluktronics Mech-17 GP2 | |
| Alienware m17 R5 (R9 6900HX, RX 6850M XT) | |
| Schenker XMG Neo 17 M22 | |
| iperf3 transmit AXE11000 6GHz | |
| Razer Blade 18 RTX 4070 | |
| iperf3 receive AXE11000 6GHz | |
| Razer Blade 18 RTX 4070 | |
Cámara web
La webcam FHD de 2 MP y el IR vienen de serie para soportar Hello. Sin embargo, no hay interruptor de privacidad ni opción de obturador.


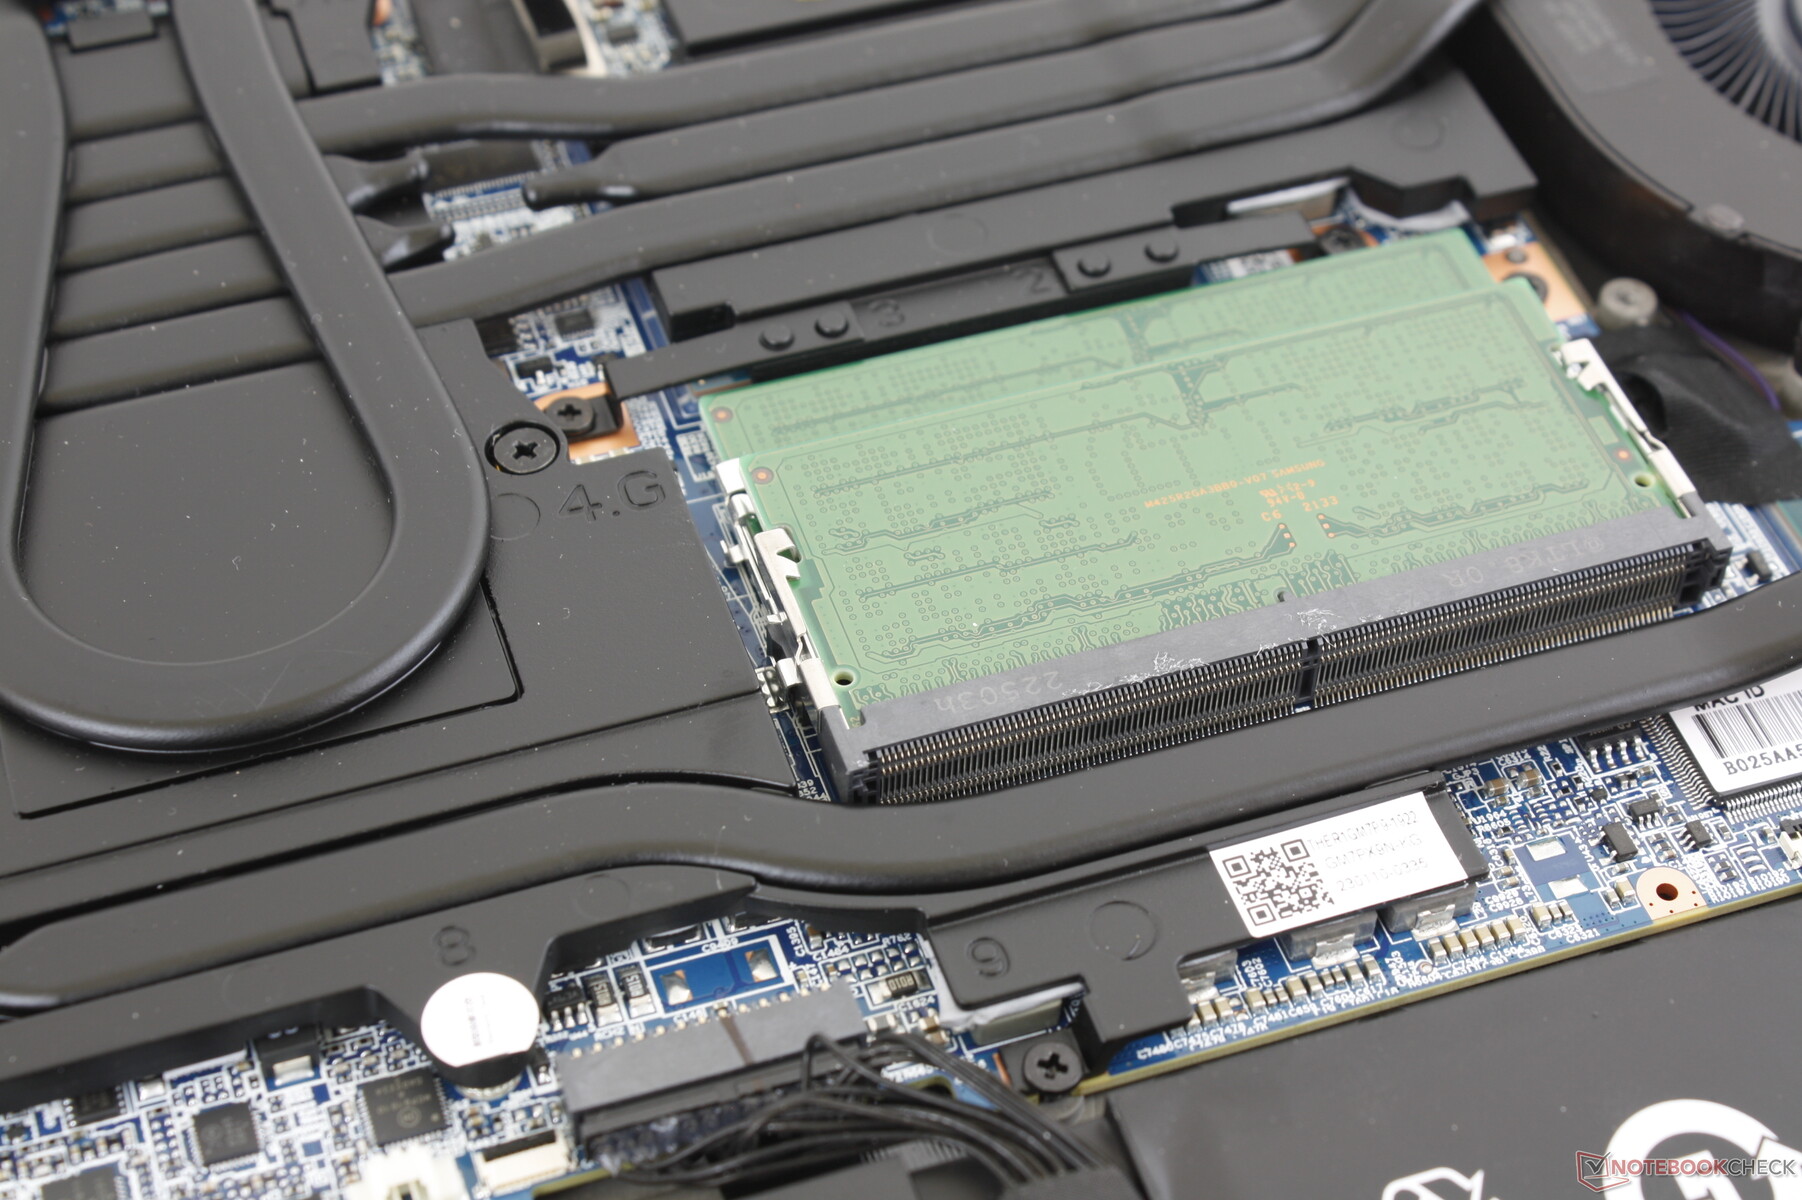
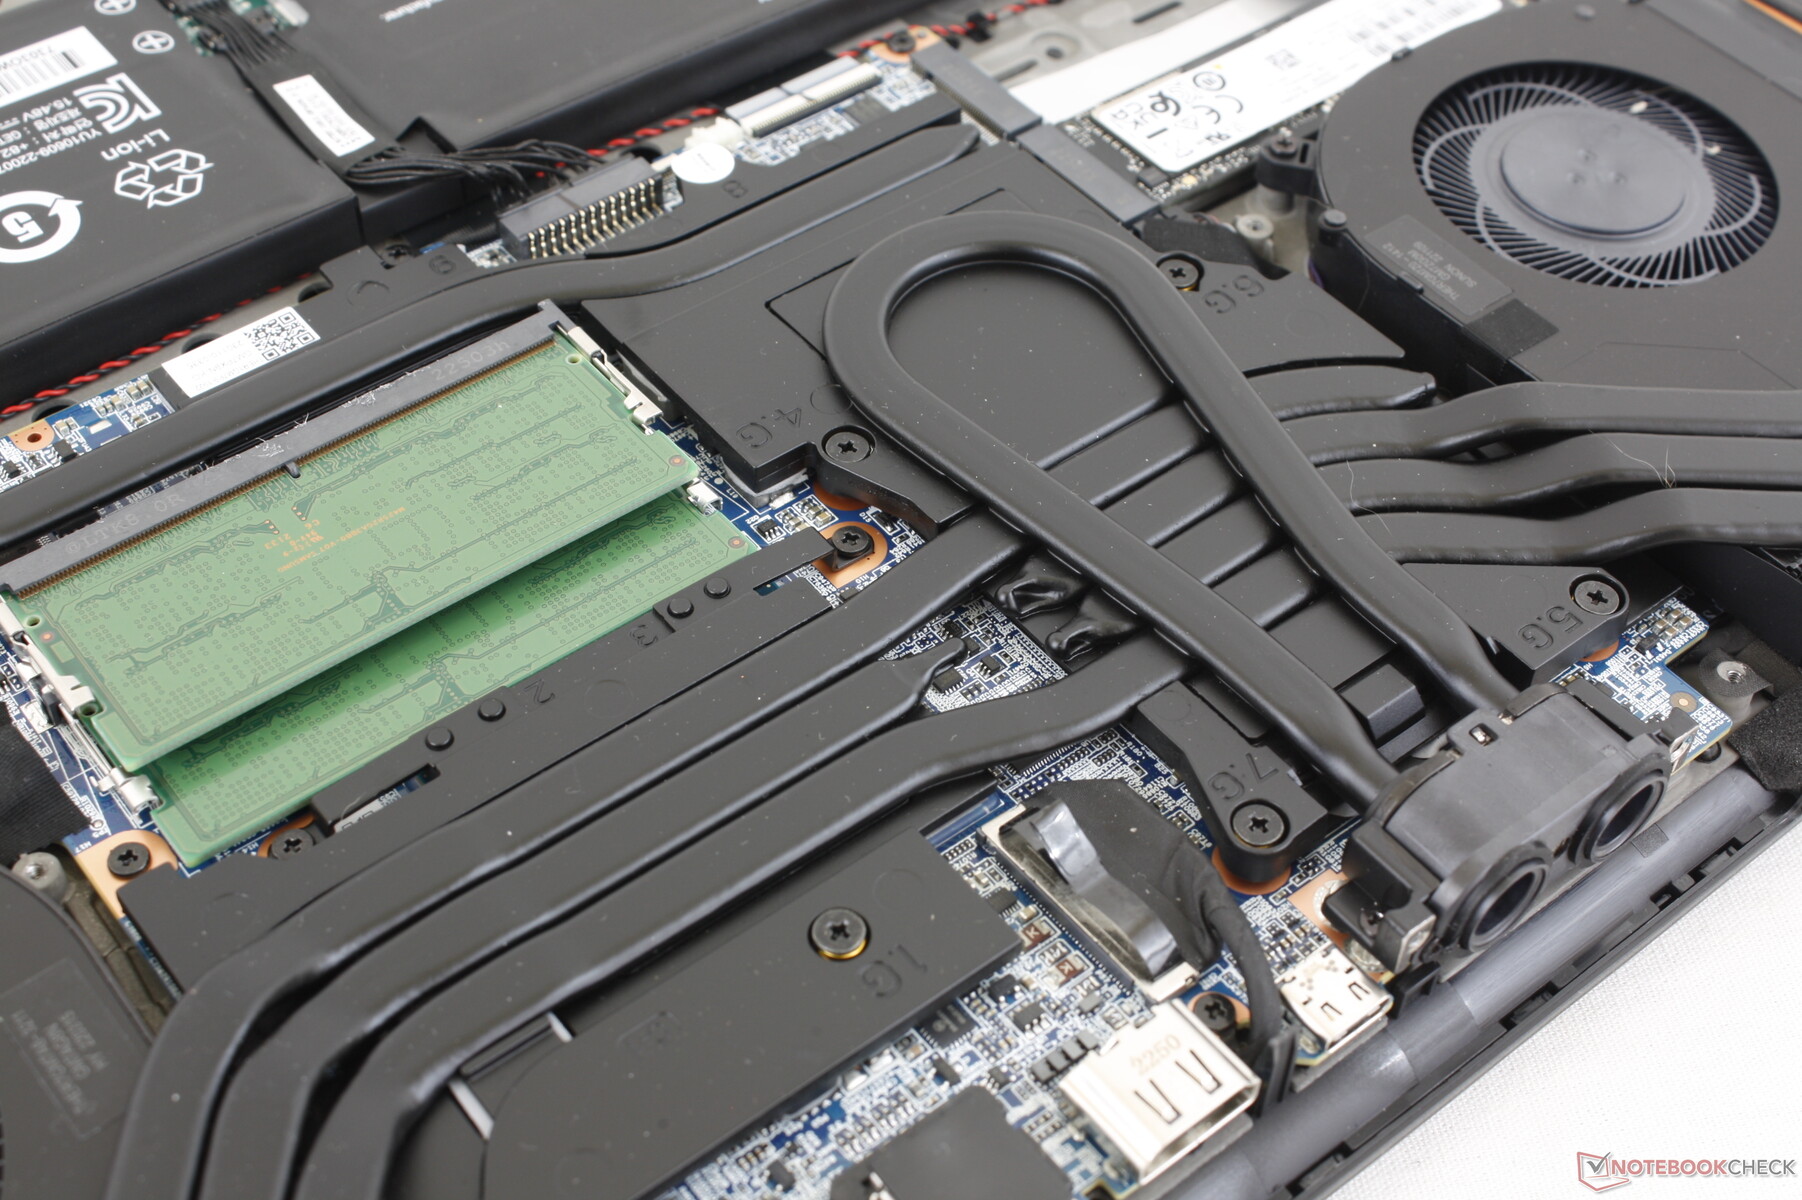
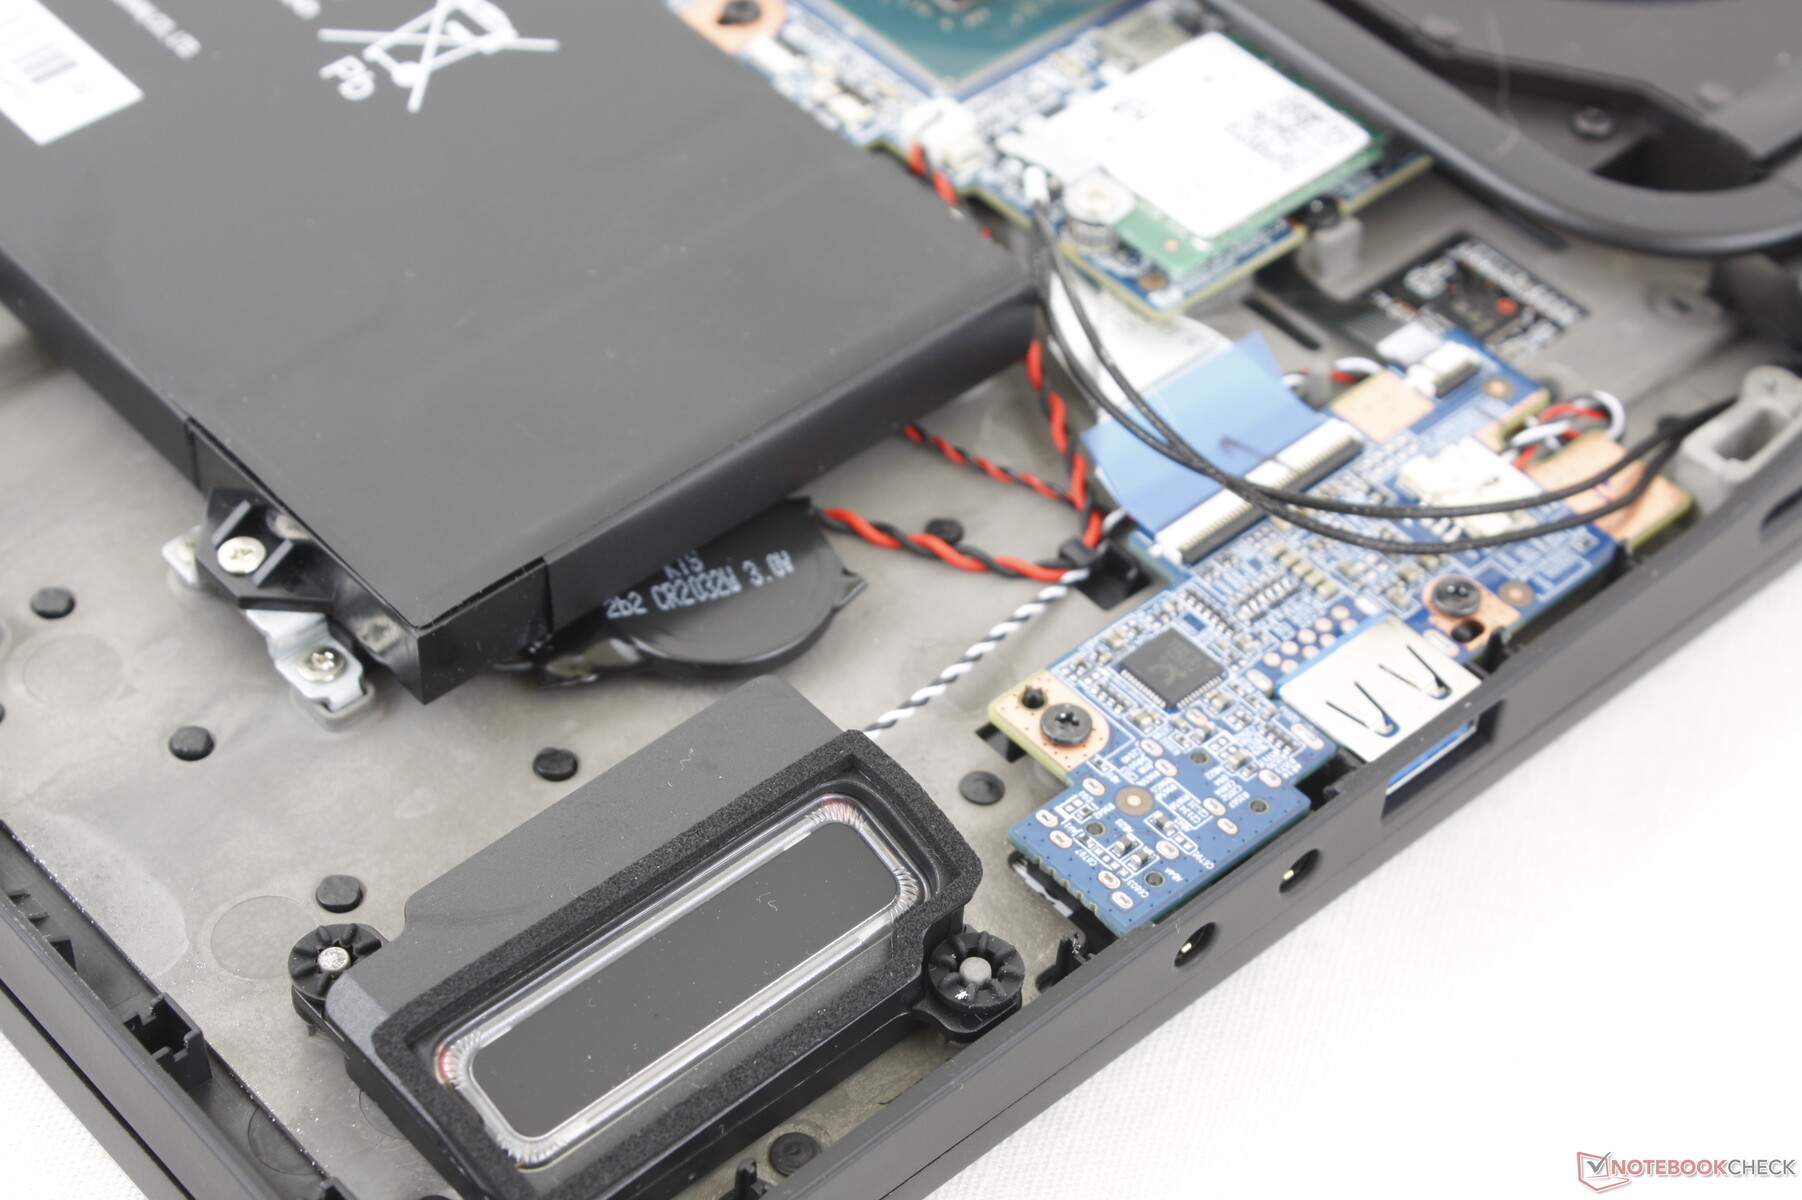
Mantenimiento
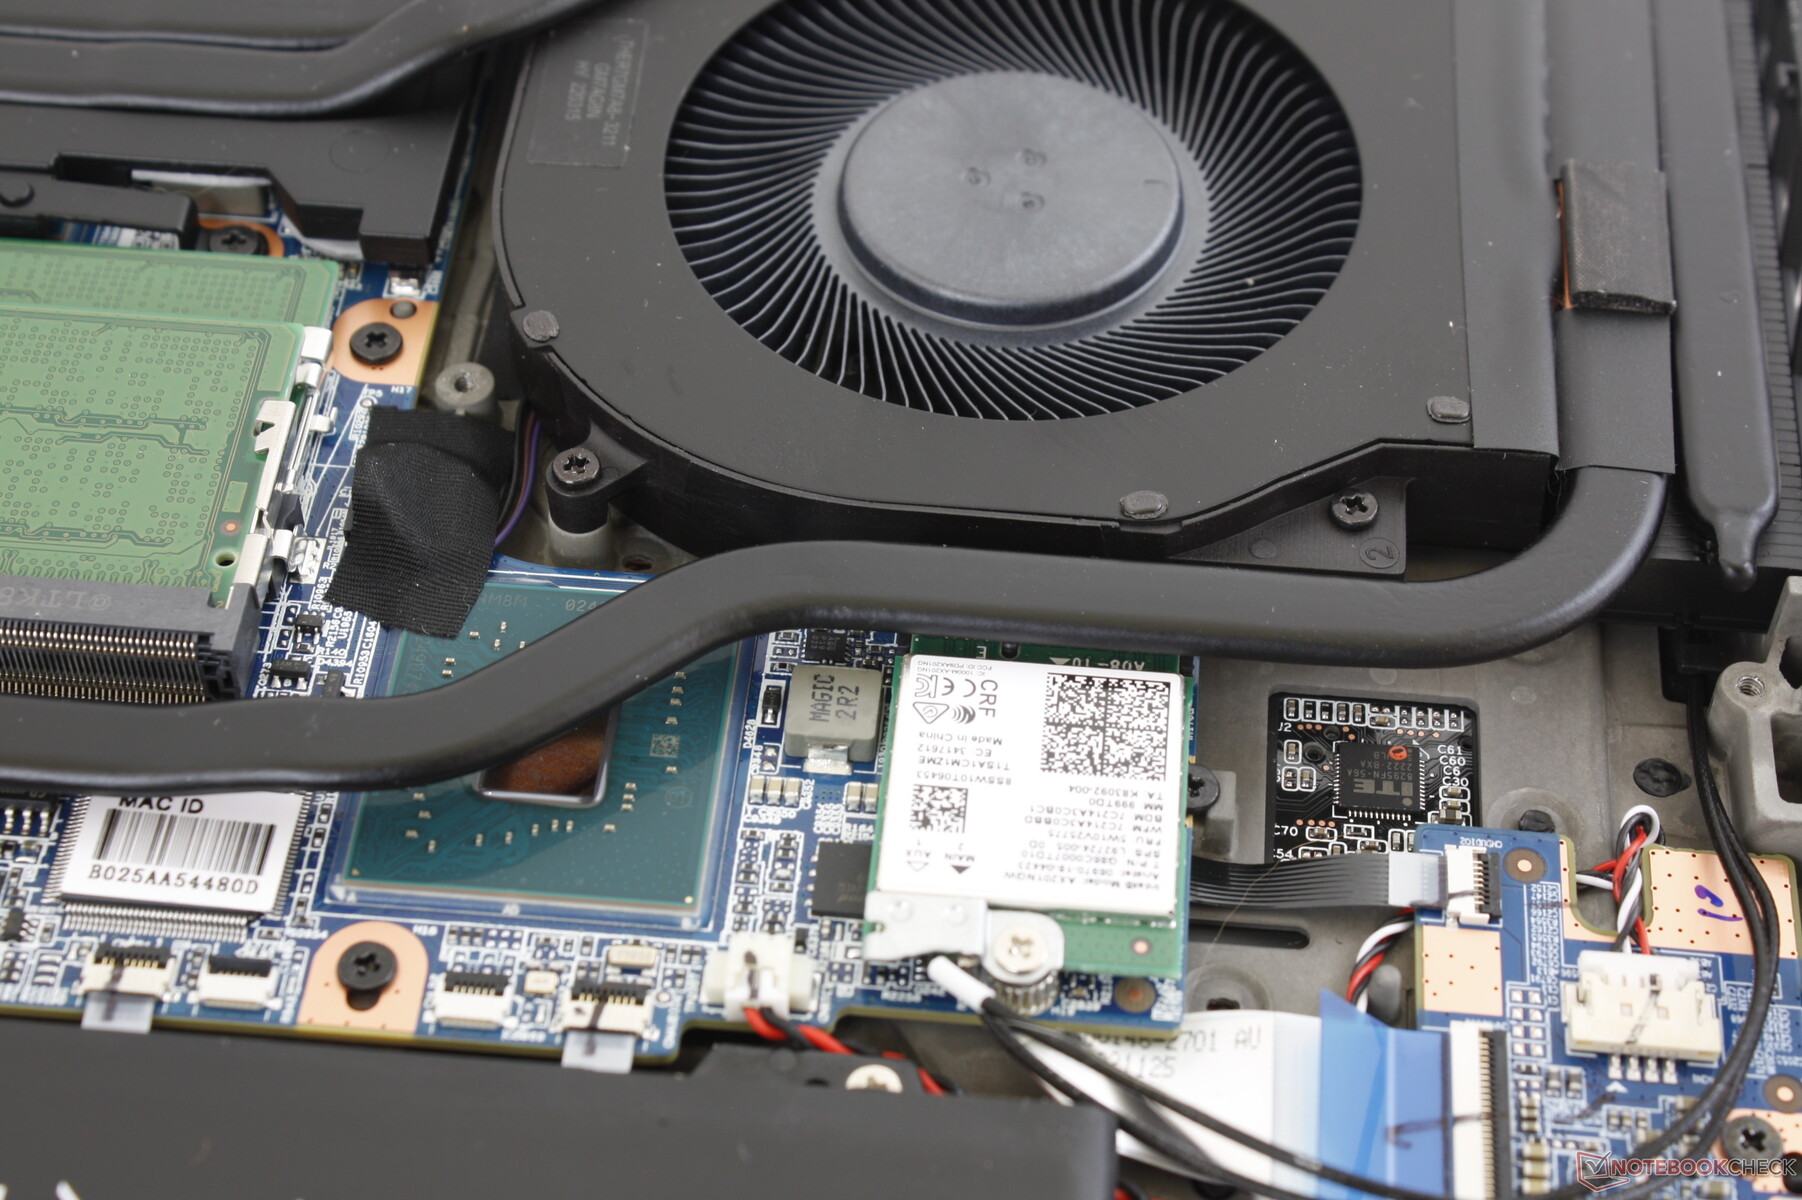
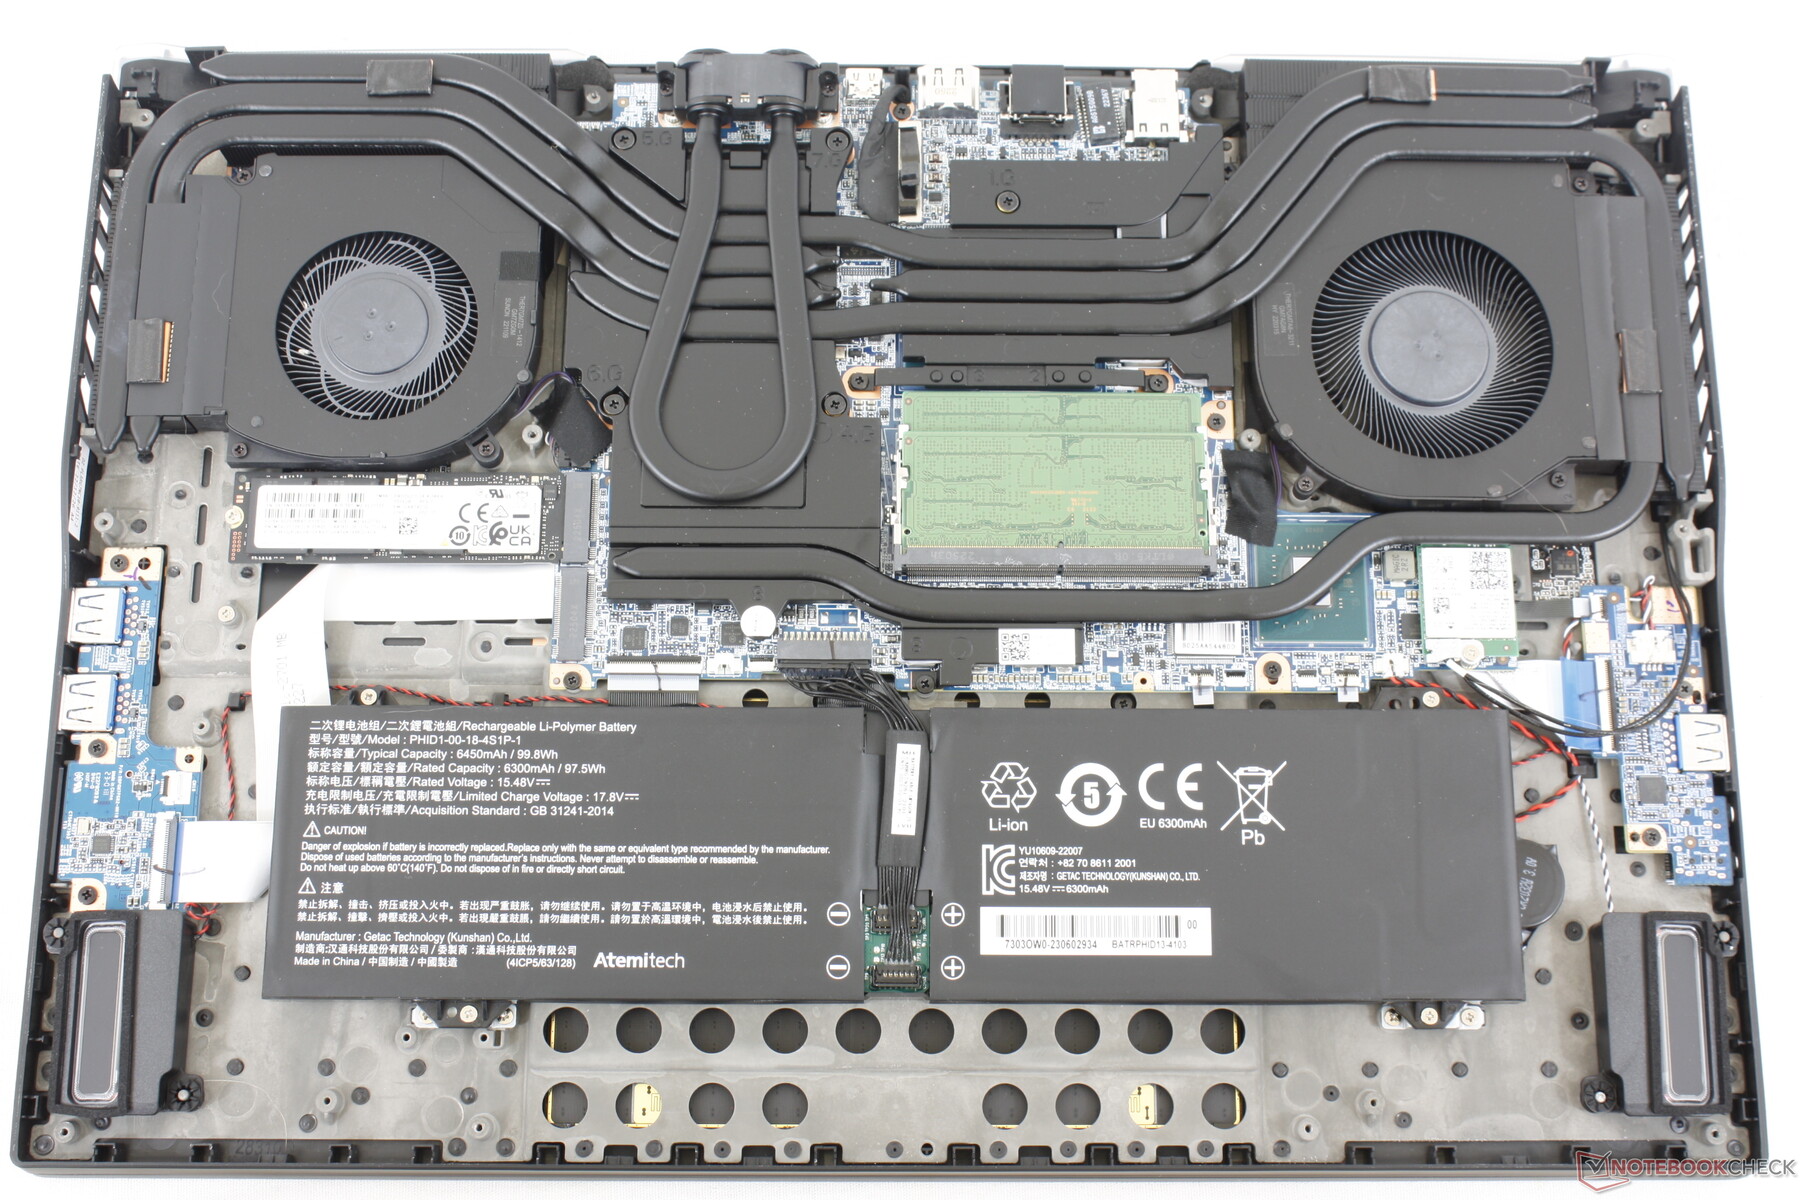
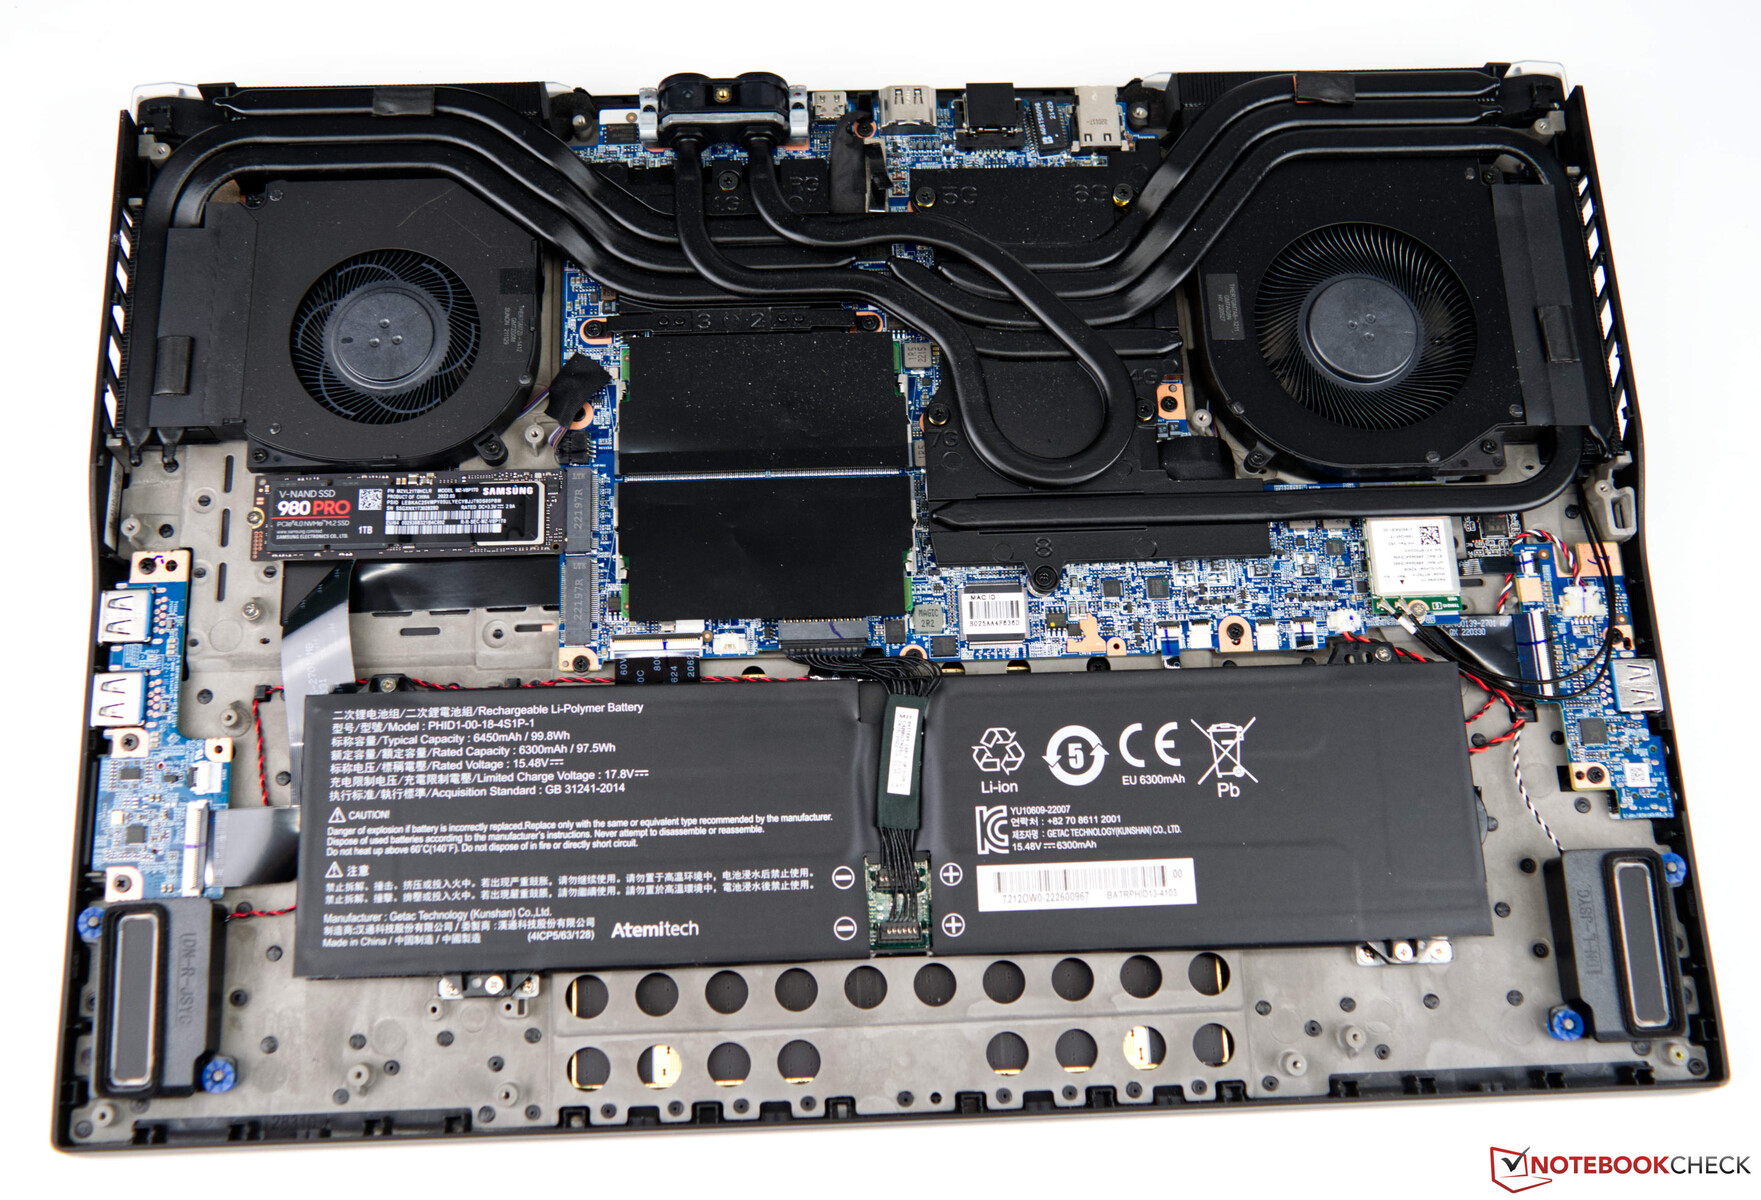
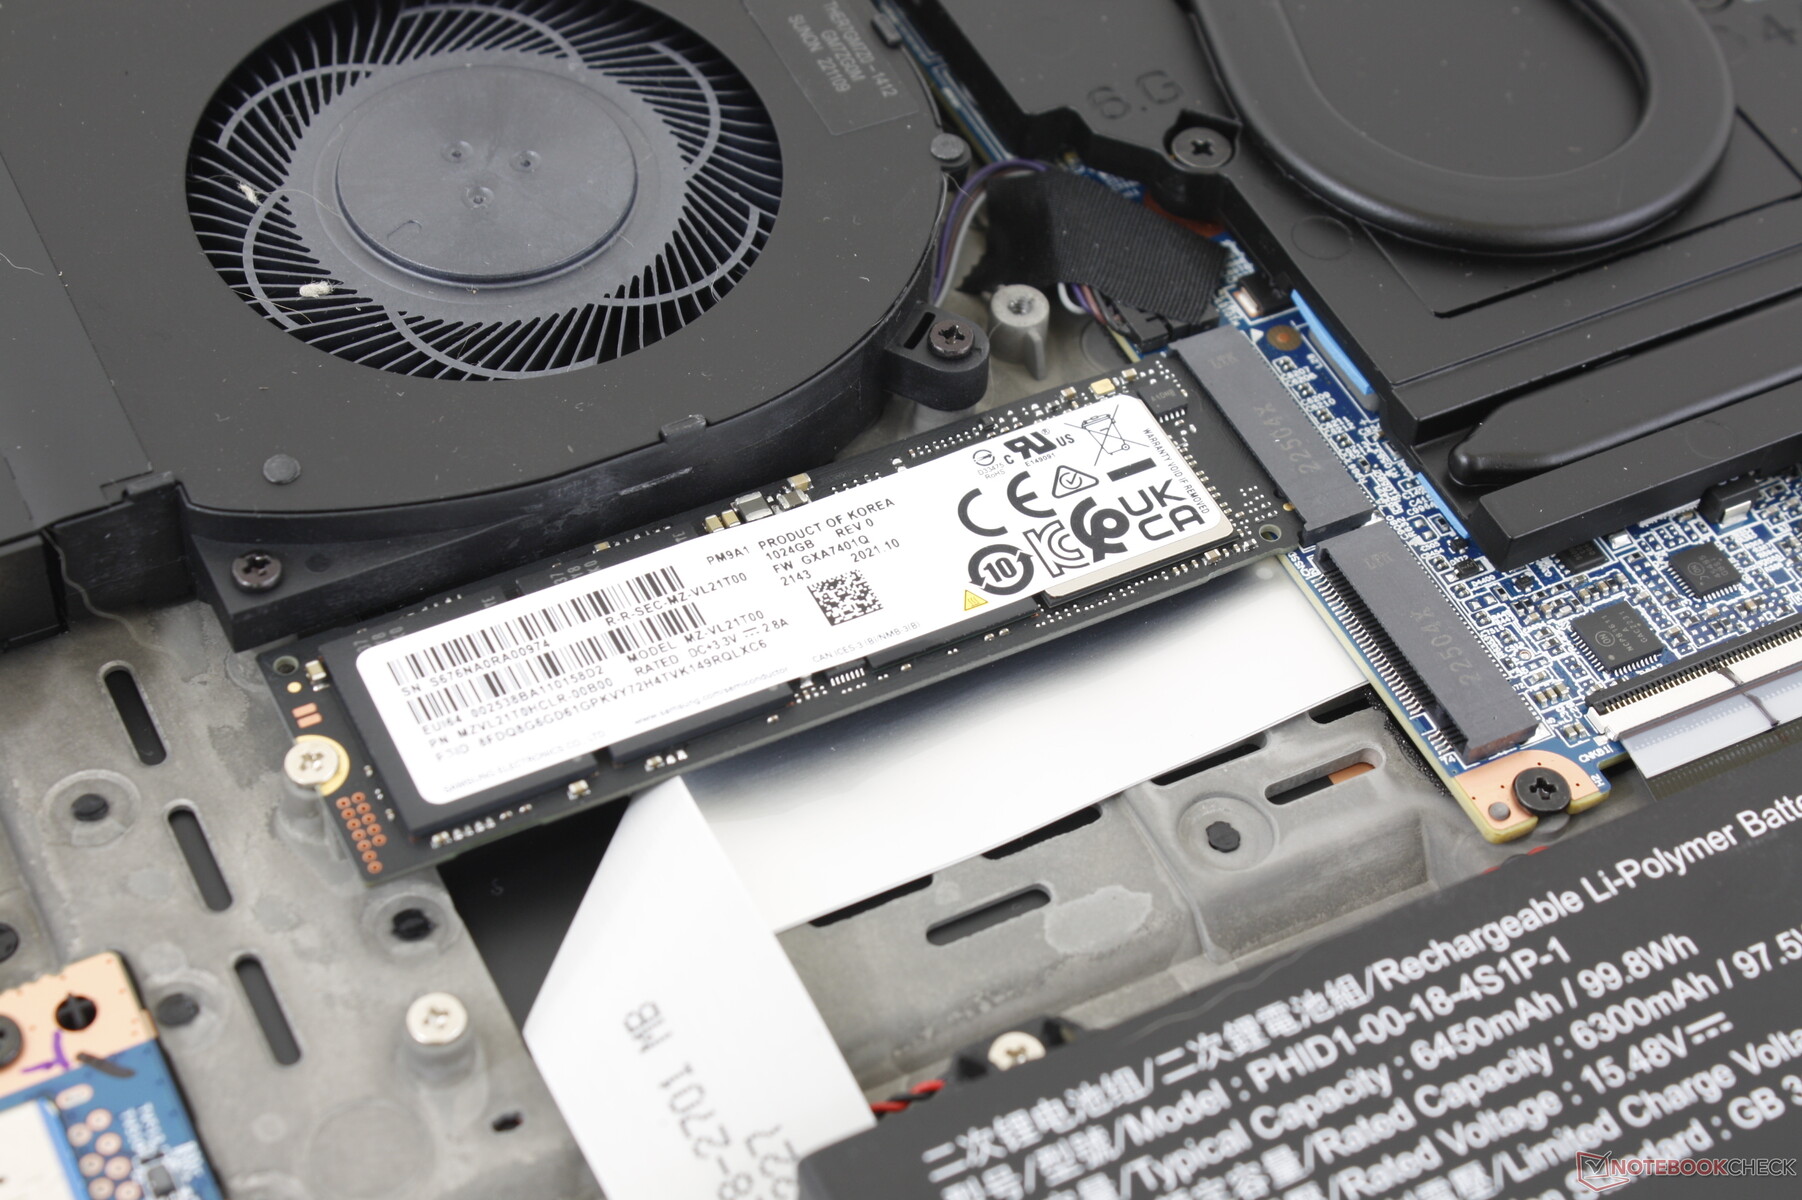
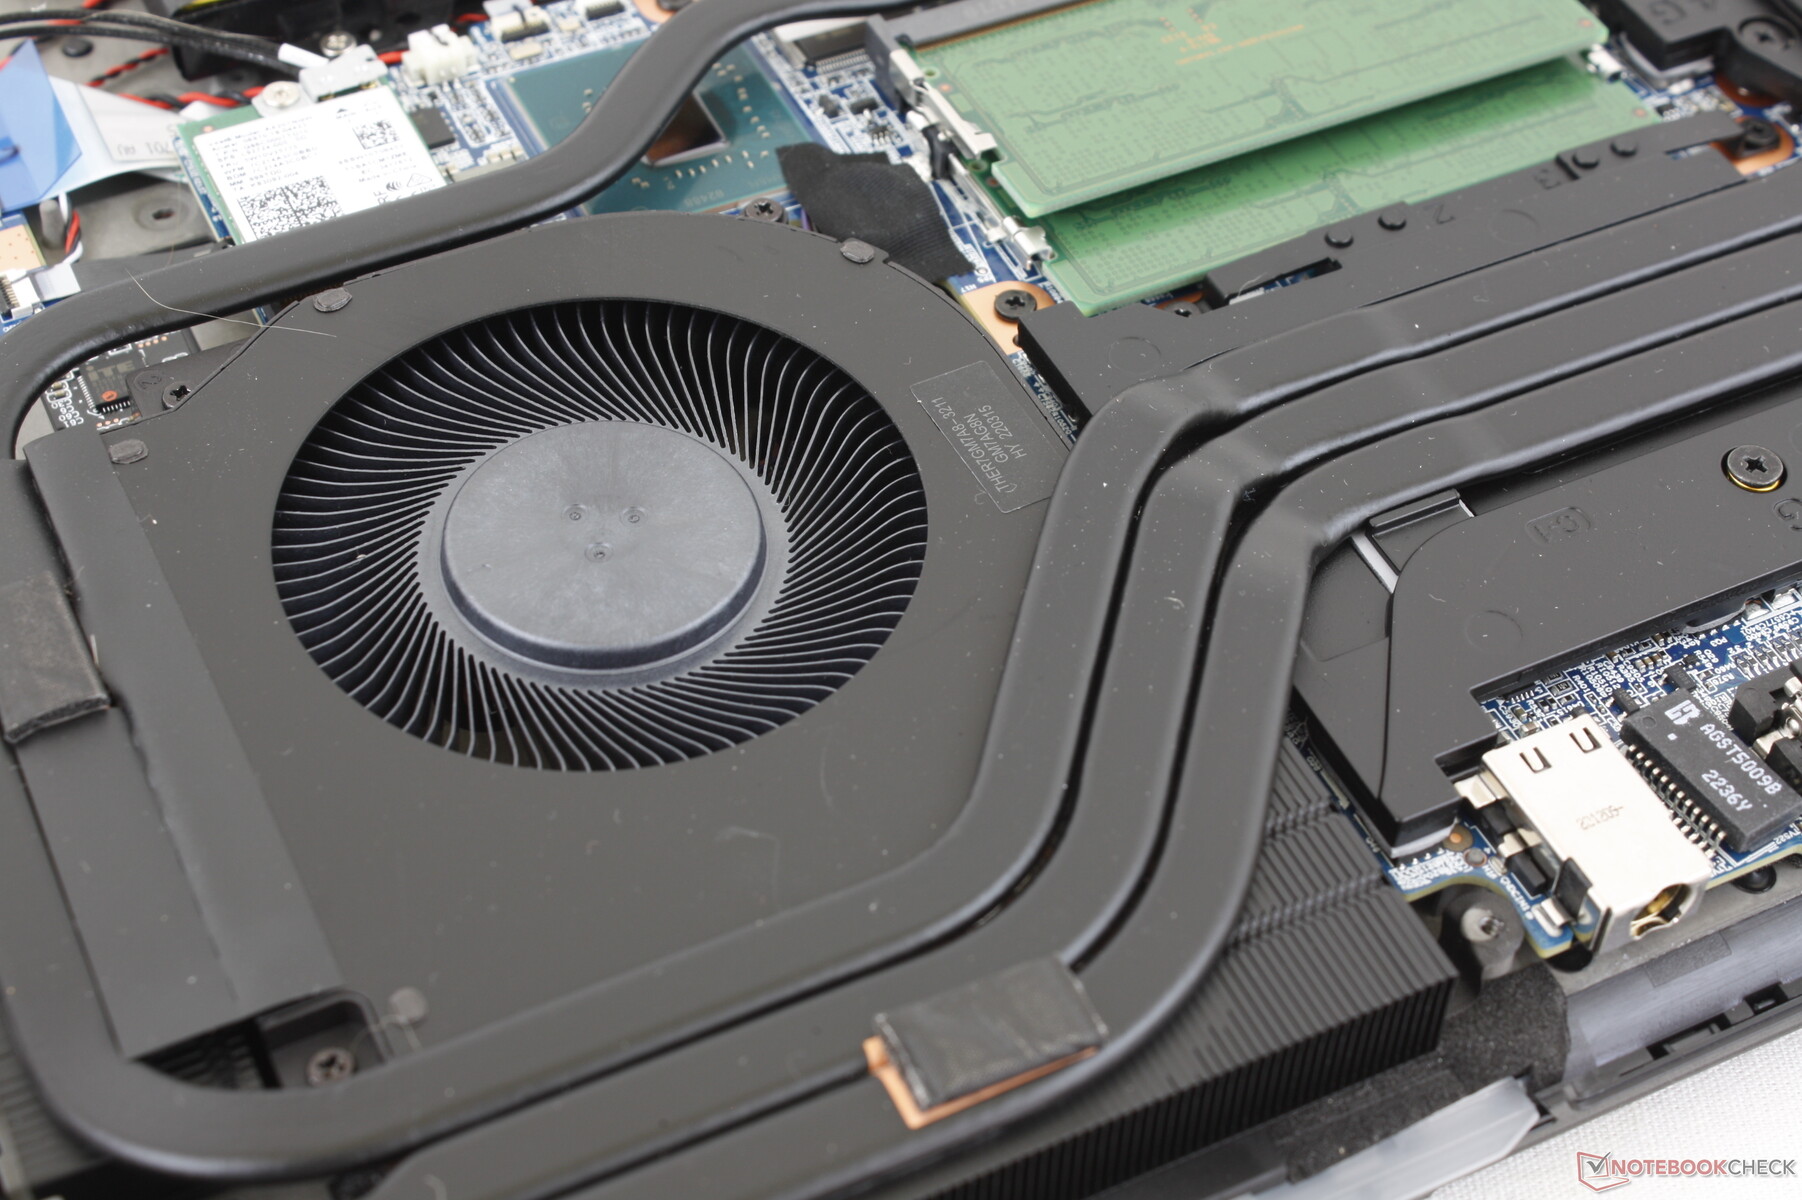
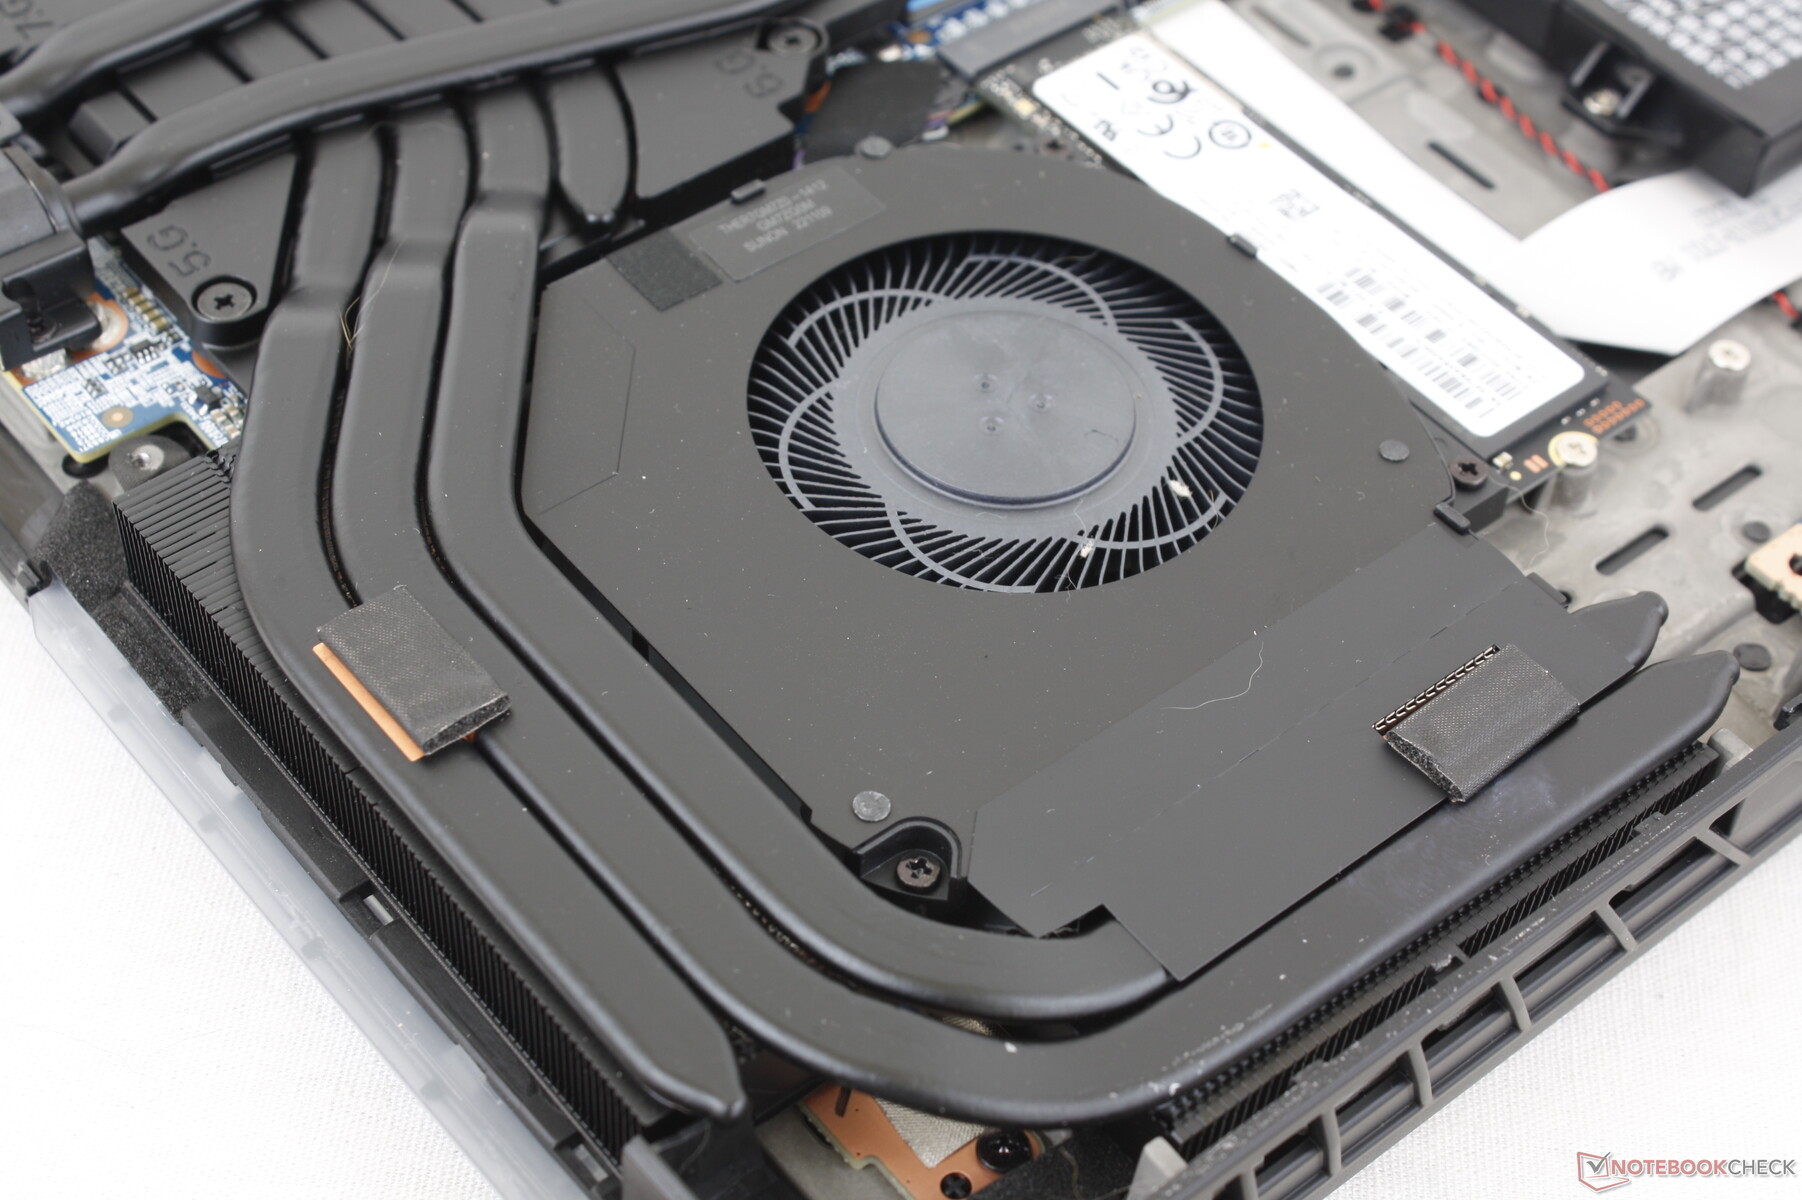
El panel inferior está asegurado por 14 tornillos Philips para un mantenimiento relativamente fácil. El fabricante ha revisado las partes internas en comparación con el modelo del año pasado, como se muestra a continuación, aunque sus diseños externos siguen siendo idénticos. Los dos módulos de RAM están ahora apilados para ahorrar espacio en la placa base, mientras que la CPU y la GPU han cambiado de posición.
Accesorios y garantía
La caja no contiene más accesorios que el adaptador de CA y la documentación. El modelo es compatible con el refrigerador externo opcional Liquid Propulsion Package (LPP G2) de segunda generación.
Se aplica la garantía estándar limitada de un año del fabricante. Se puede ampliar a tres años por 250 dólares más.
Mostrar
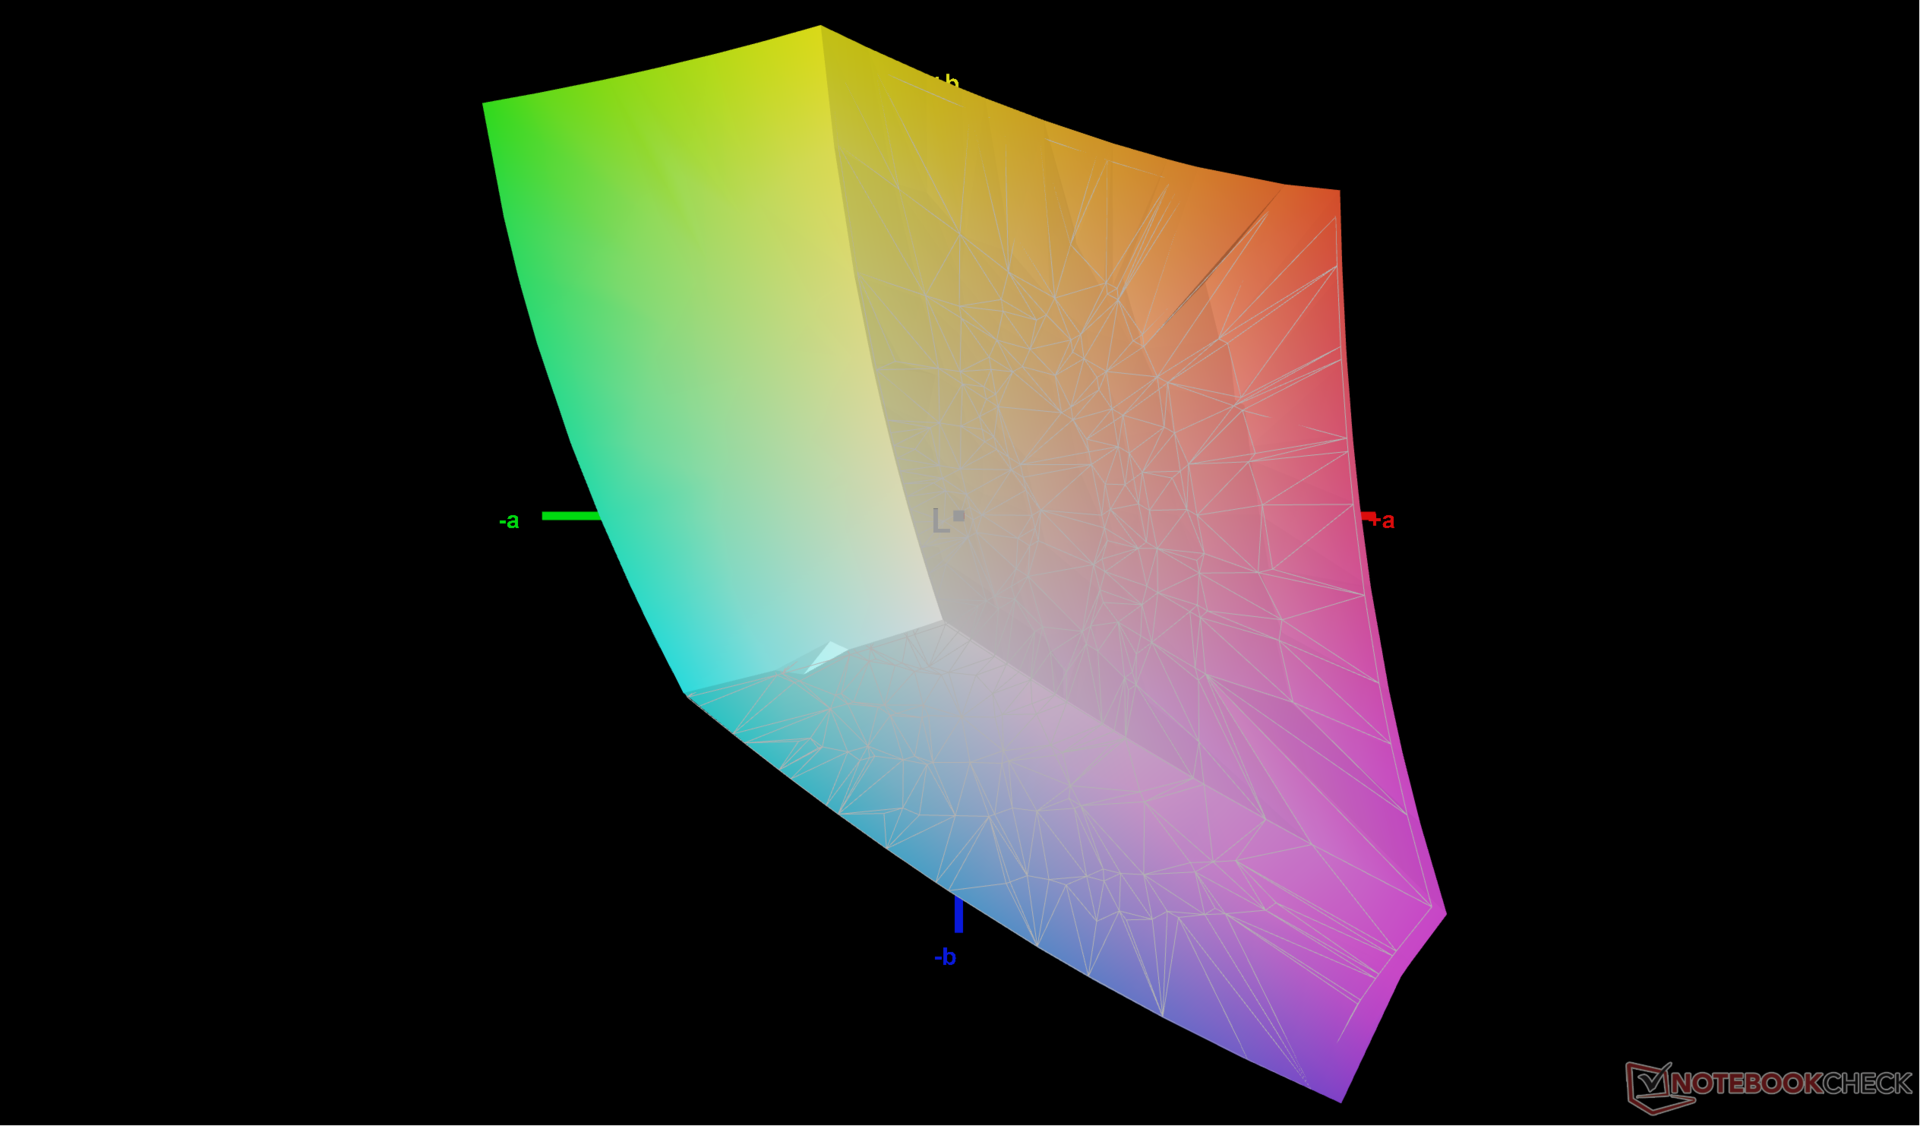
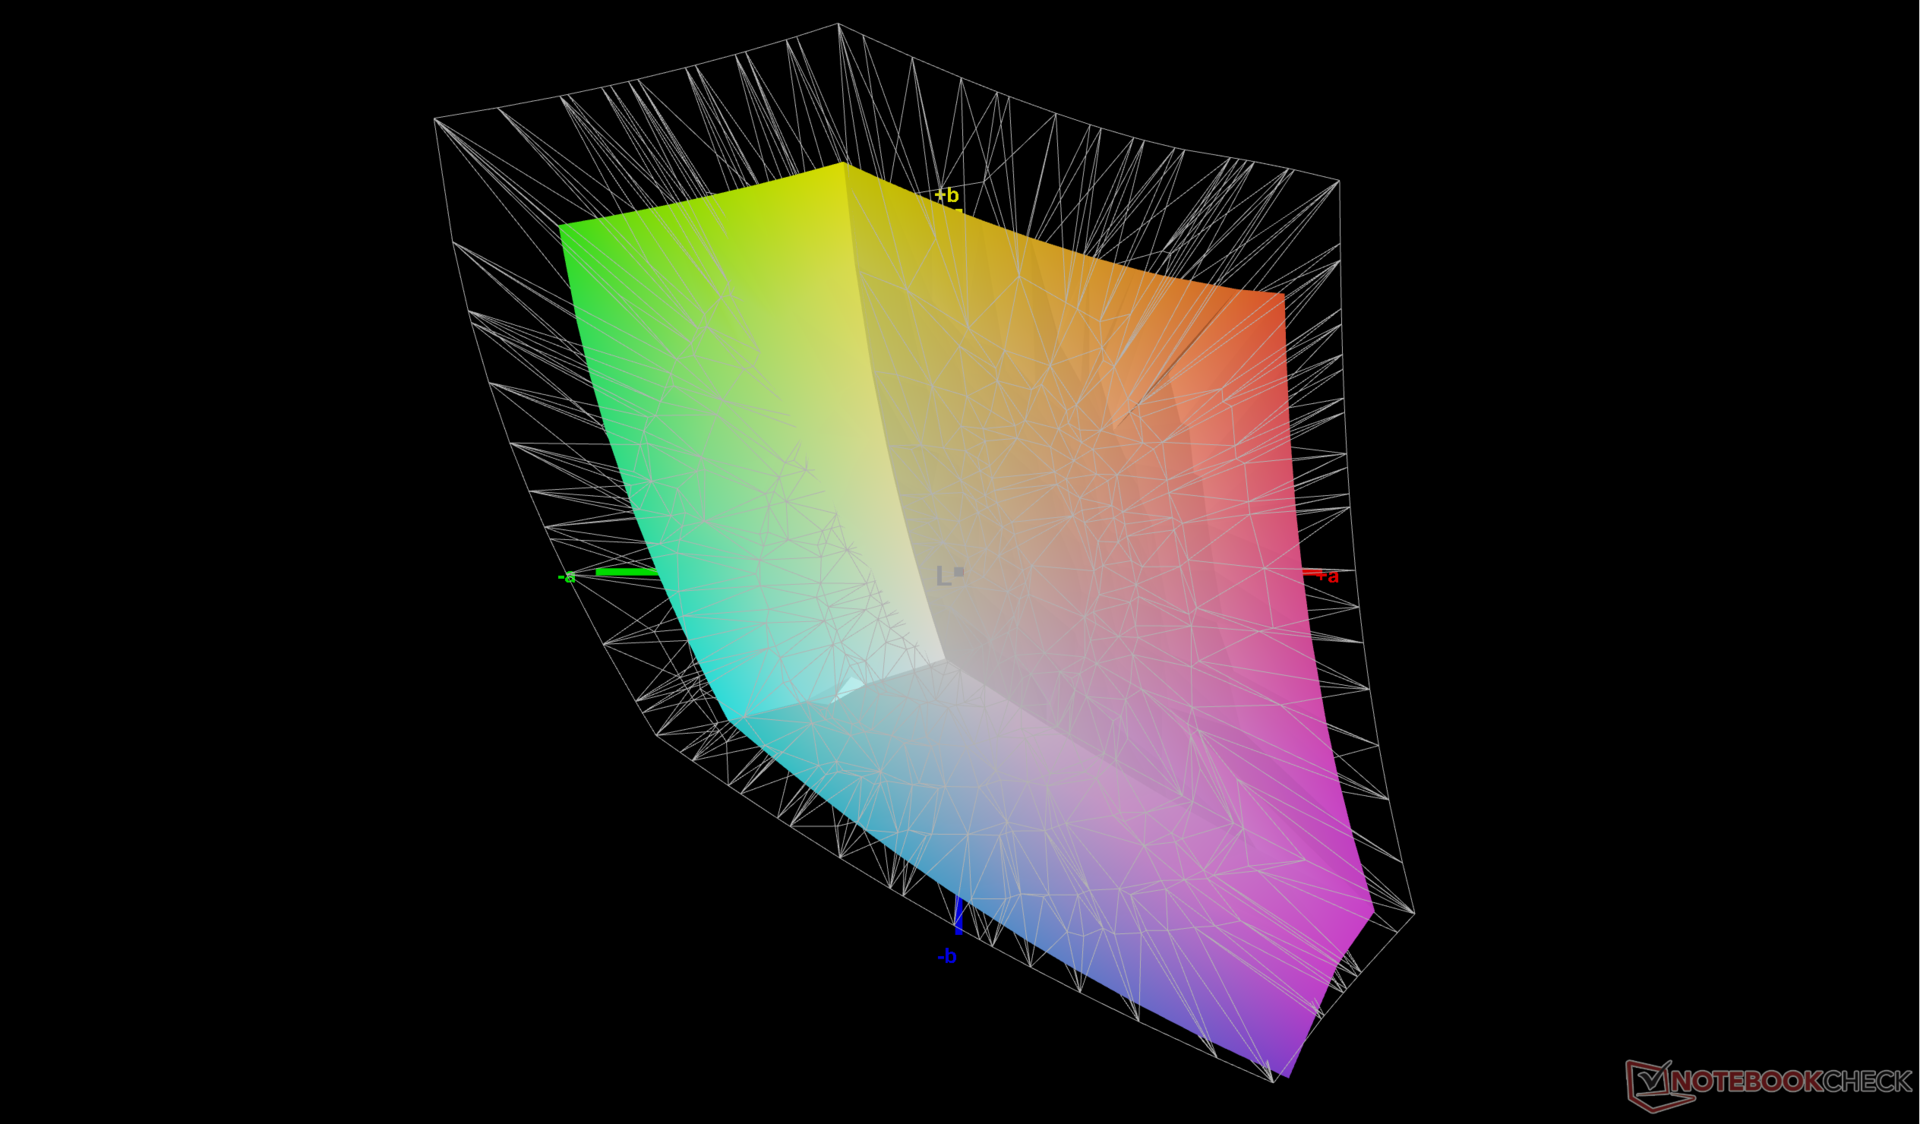
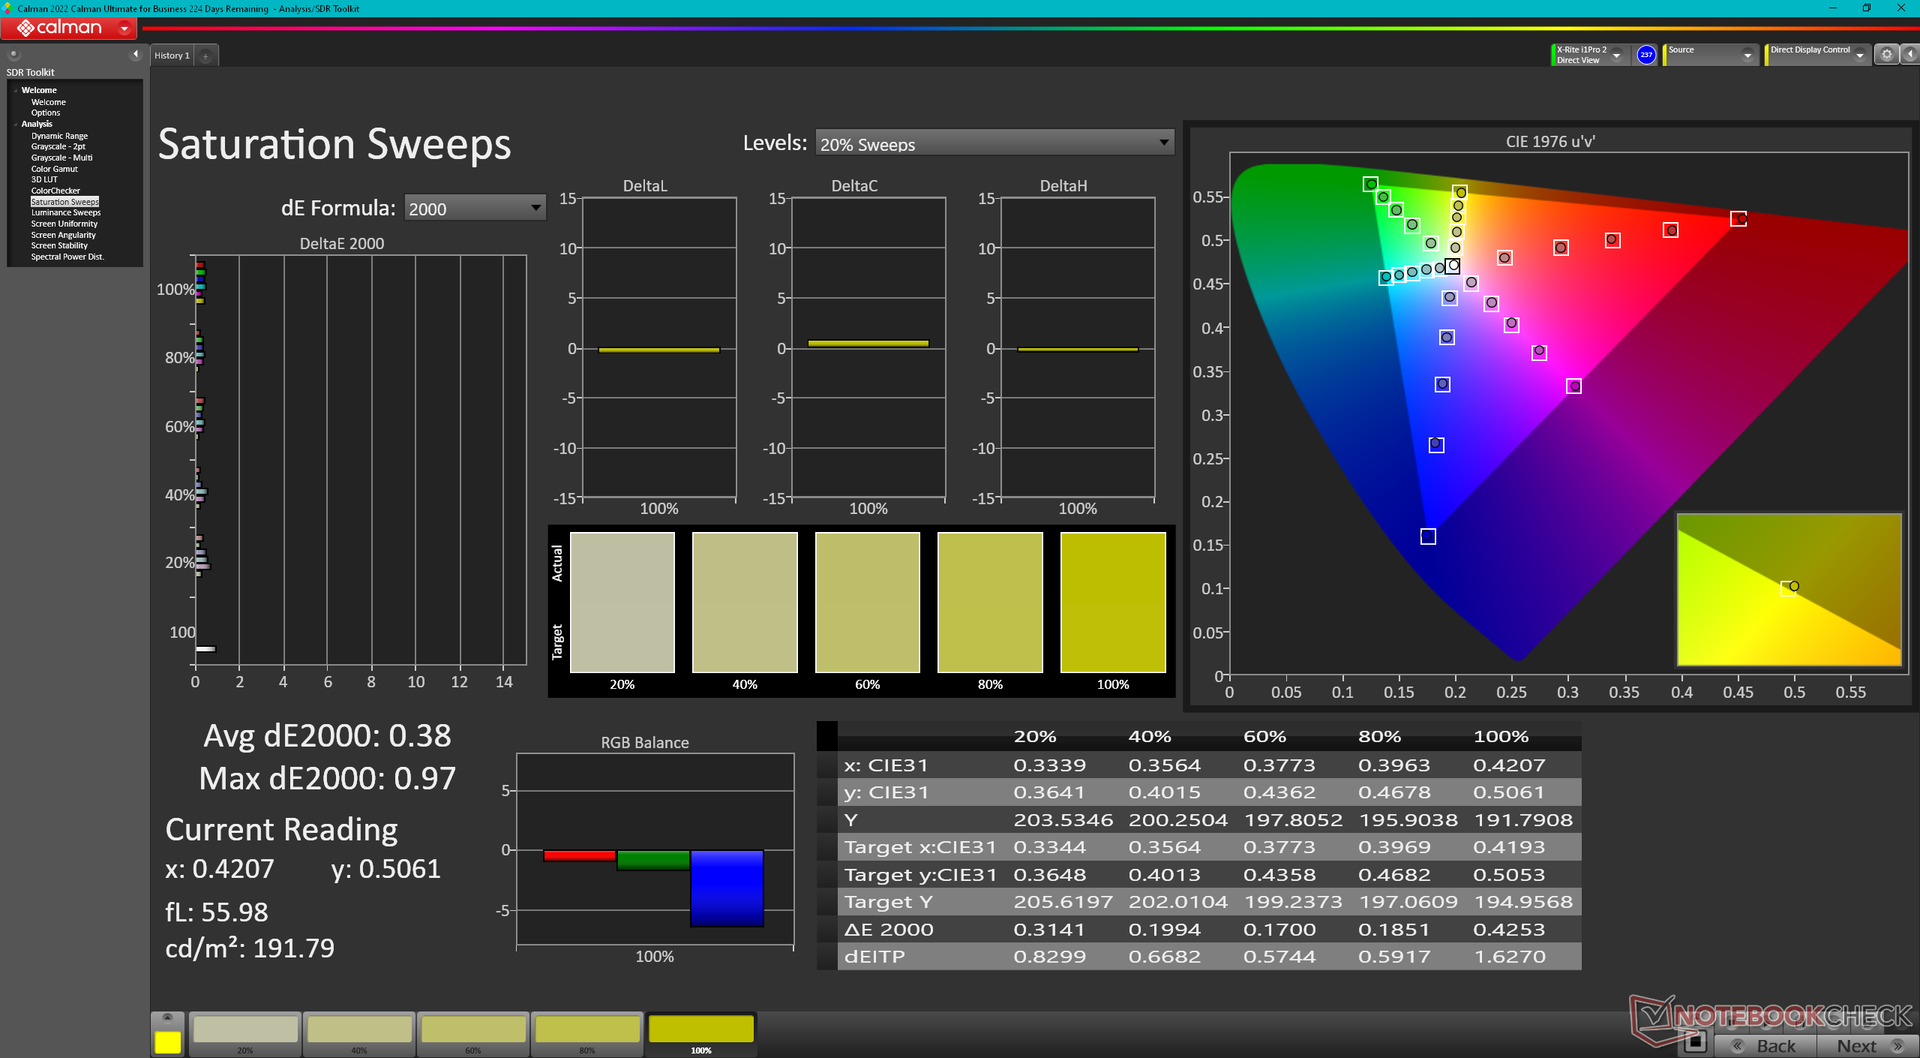
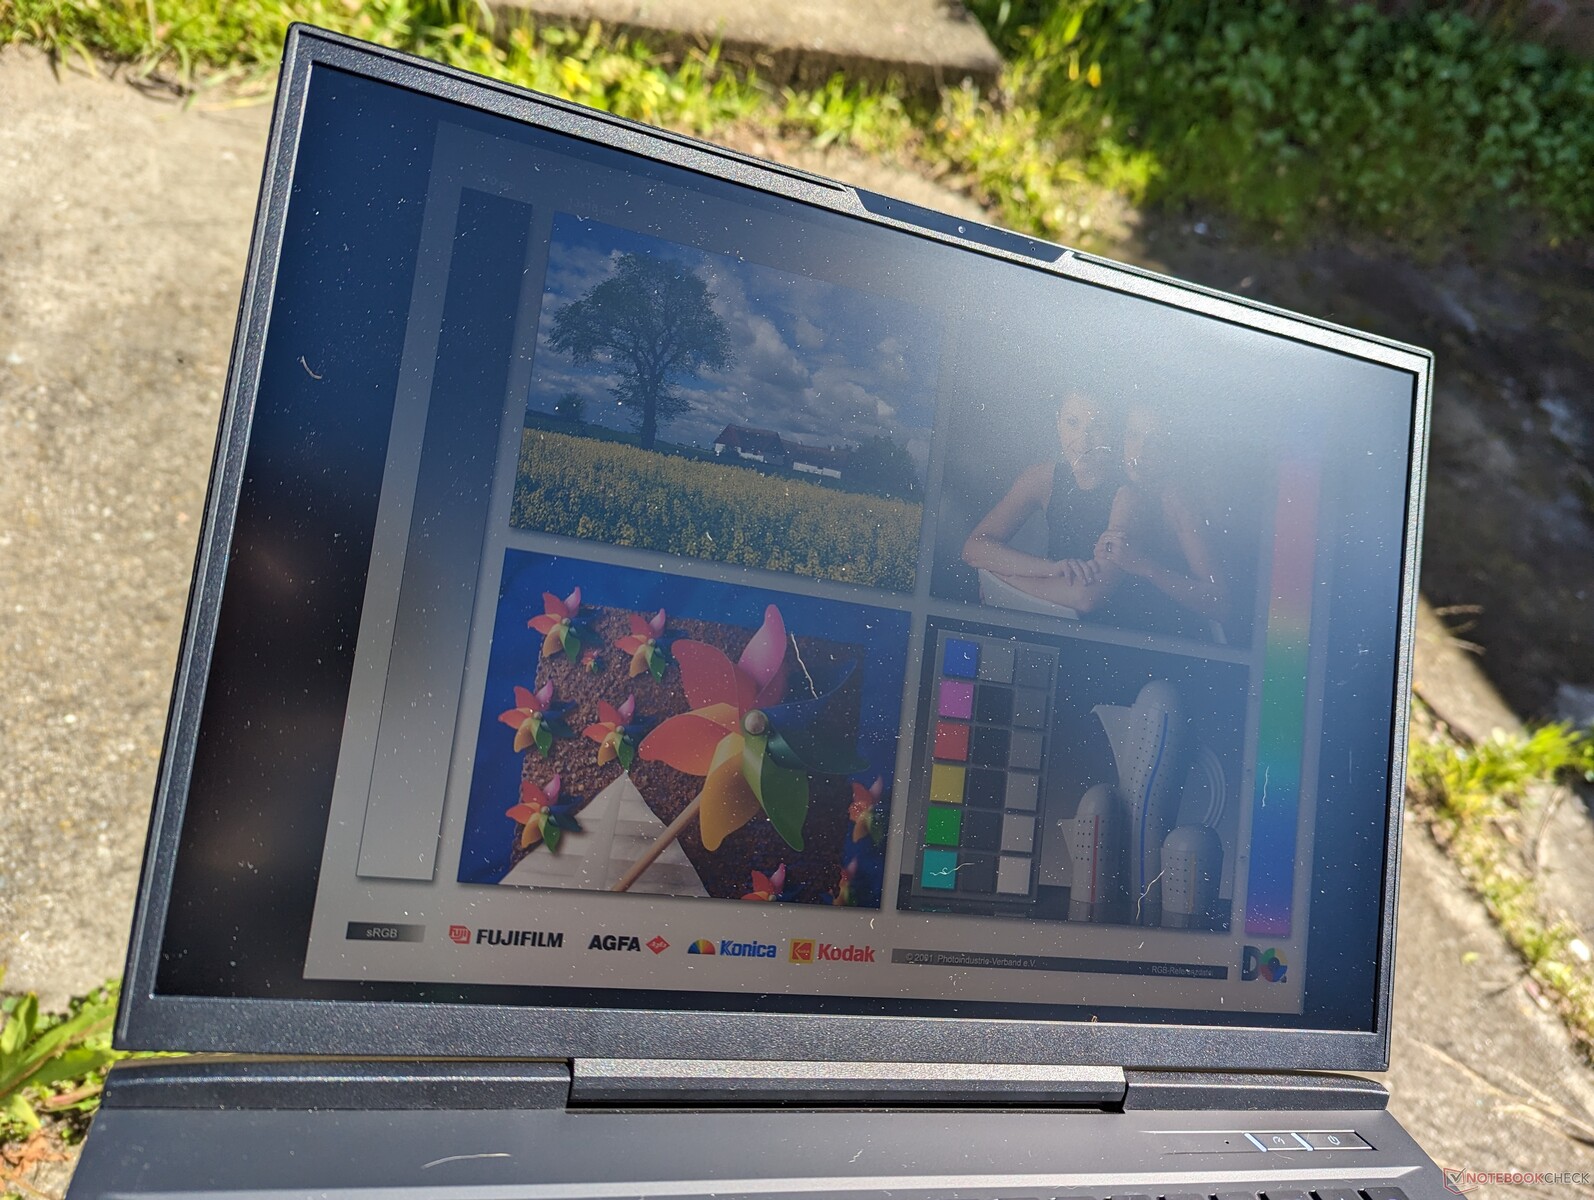
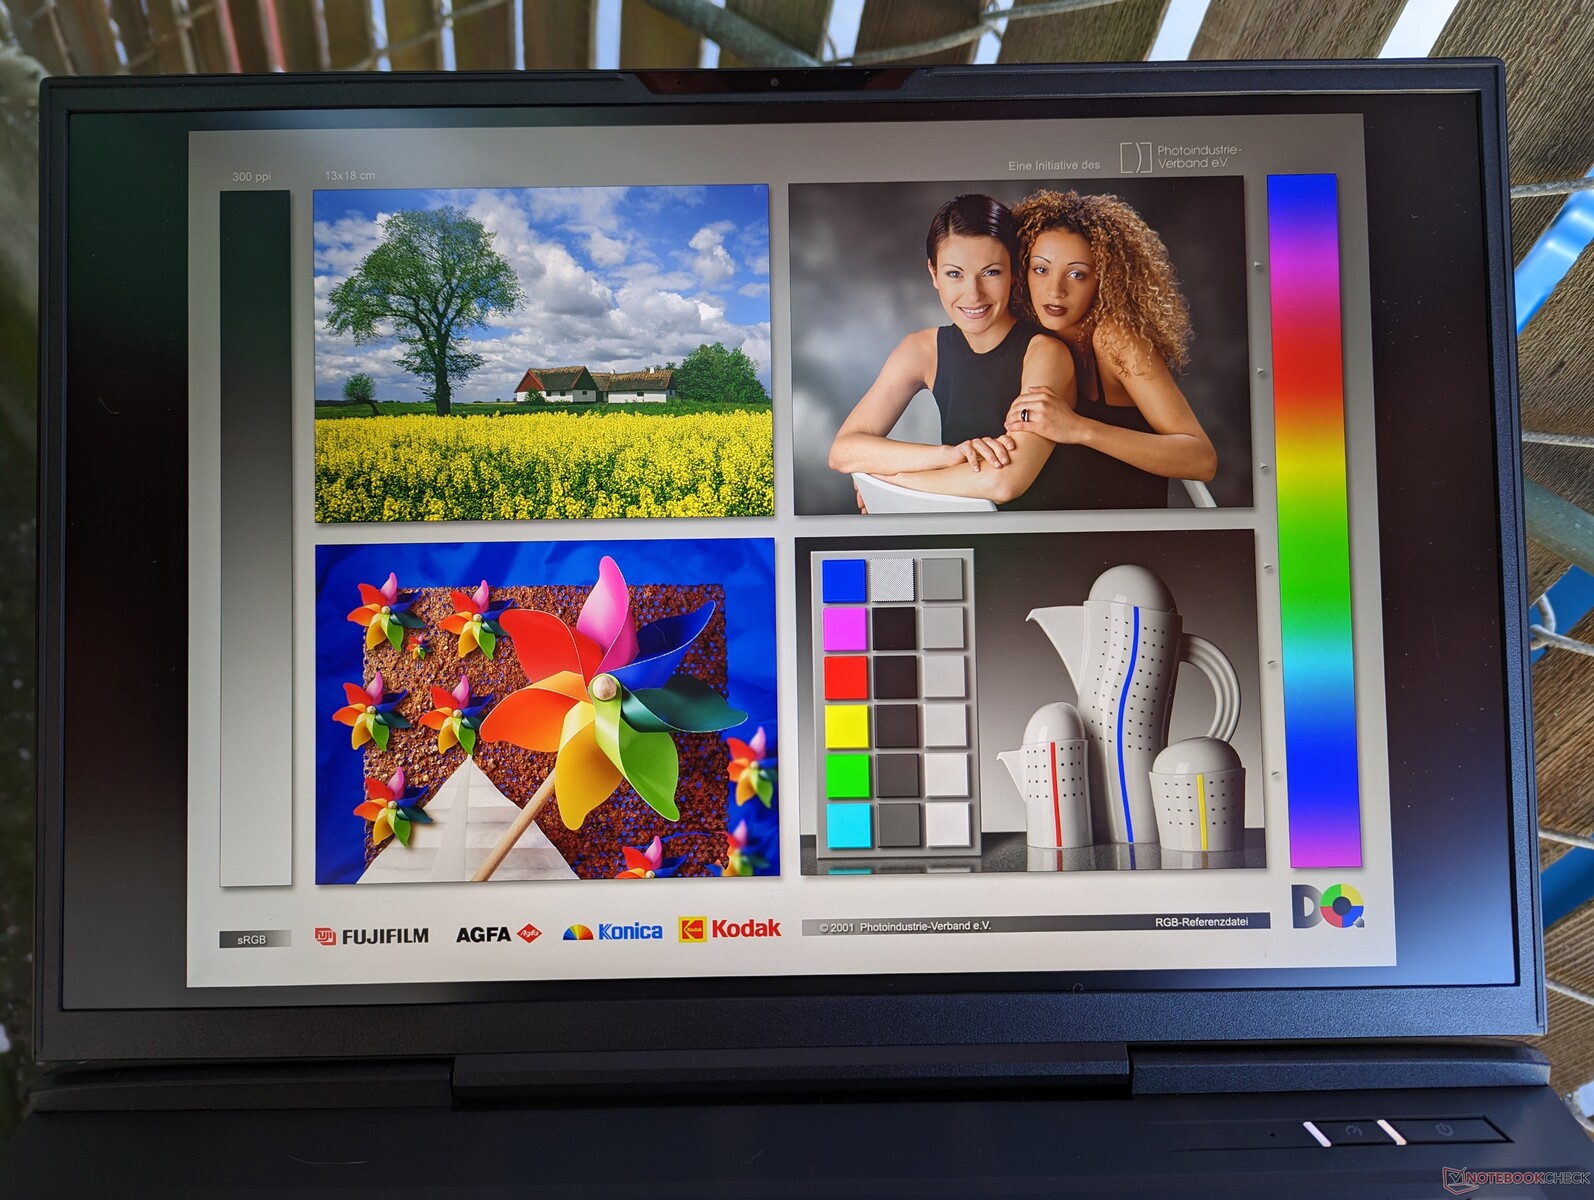
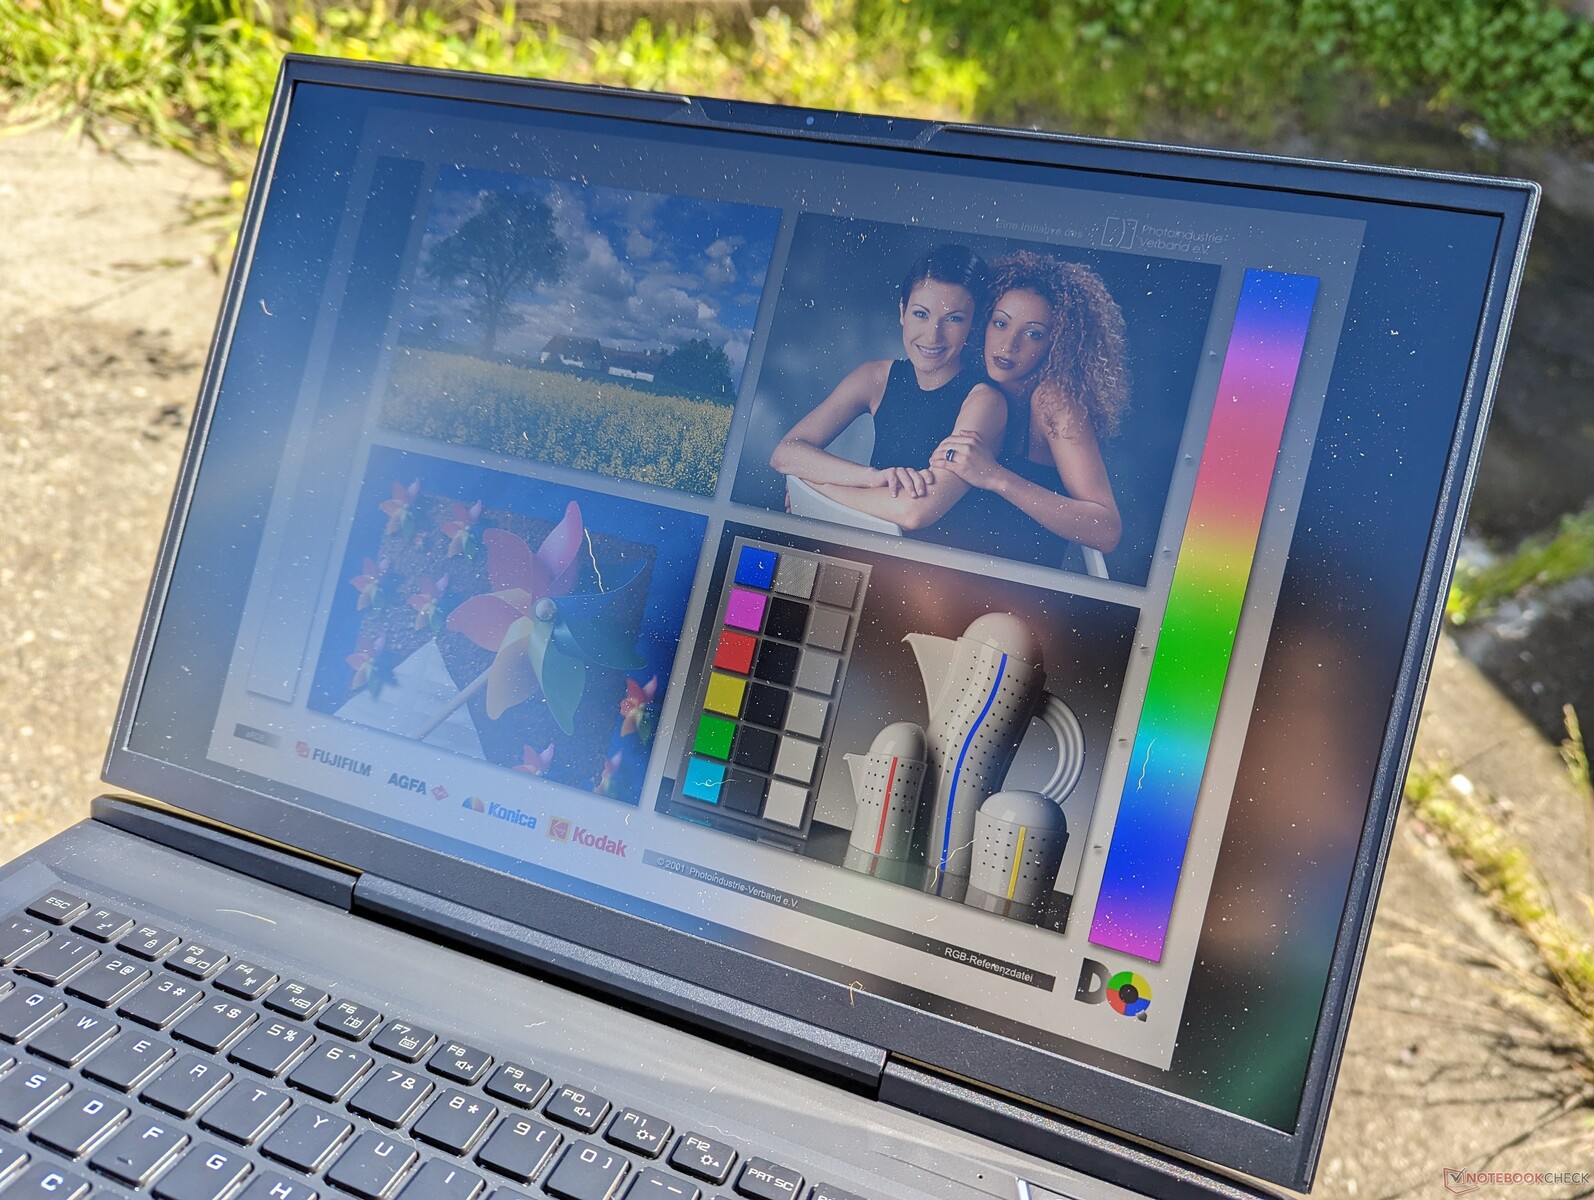
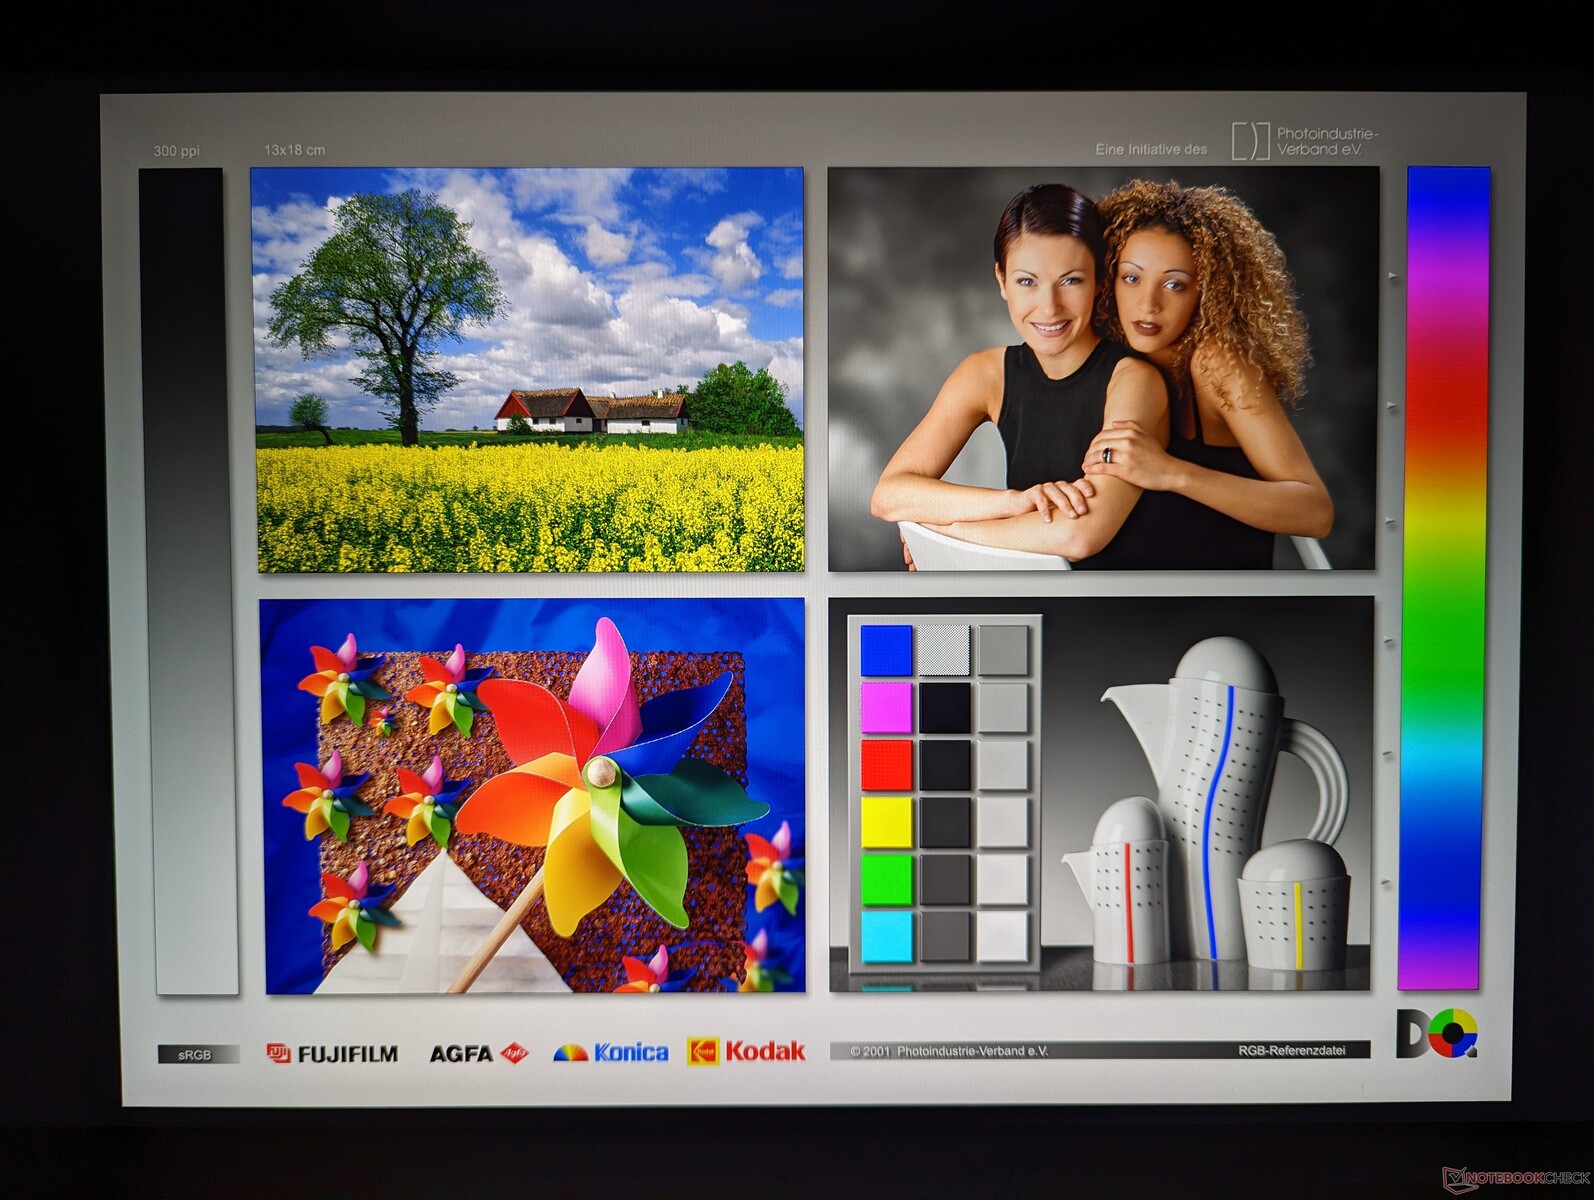
Nuestro primer modelo 2023 utiliza el mismo panel BOE NE170QDM-NZ1 y el mismo controlador BOE0A99 que el modelo 2022, lo que significa que la experiencia visual no varía de un año a otro. En consecuencia, nuestras mediciones a continuación son casi idénticas entre los modelos 2022 y 2023. Esto no es una queja, ya que el panel ofrece casi todo lo que podemos esperar de un portátil de juego de gama alta, incluyendo tasas de refresco rápidas, tiempos de respuesta rápidos, cobertura sRGB completa y soporte G-Sync. Para resoluciones más altas y colores P3 aún más profundos, sin embargo, tendrás que buscar en otra parte como el MSI GT77 o el Razer Blade 18.
| |||||||||||||||||||||||||
iluminación: 87 %
Brillo con batería: 417.3 cd/m²
Contraste: 994:1 (Negro: 0.42 cd/m²)
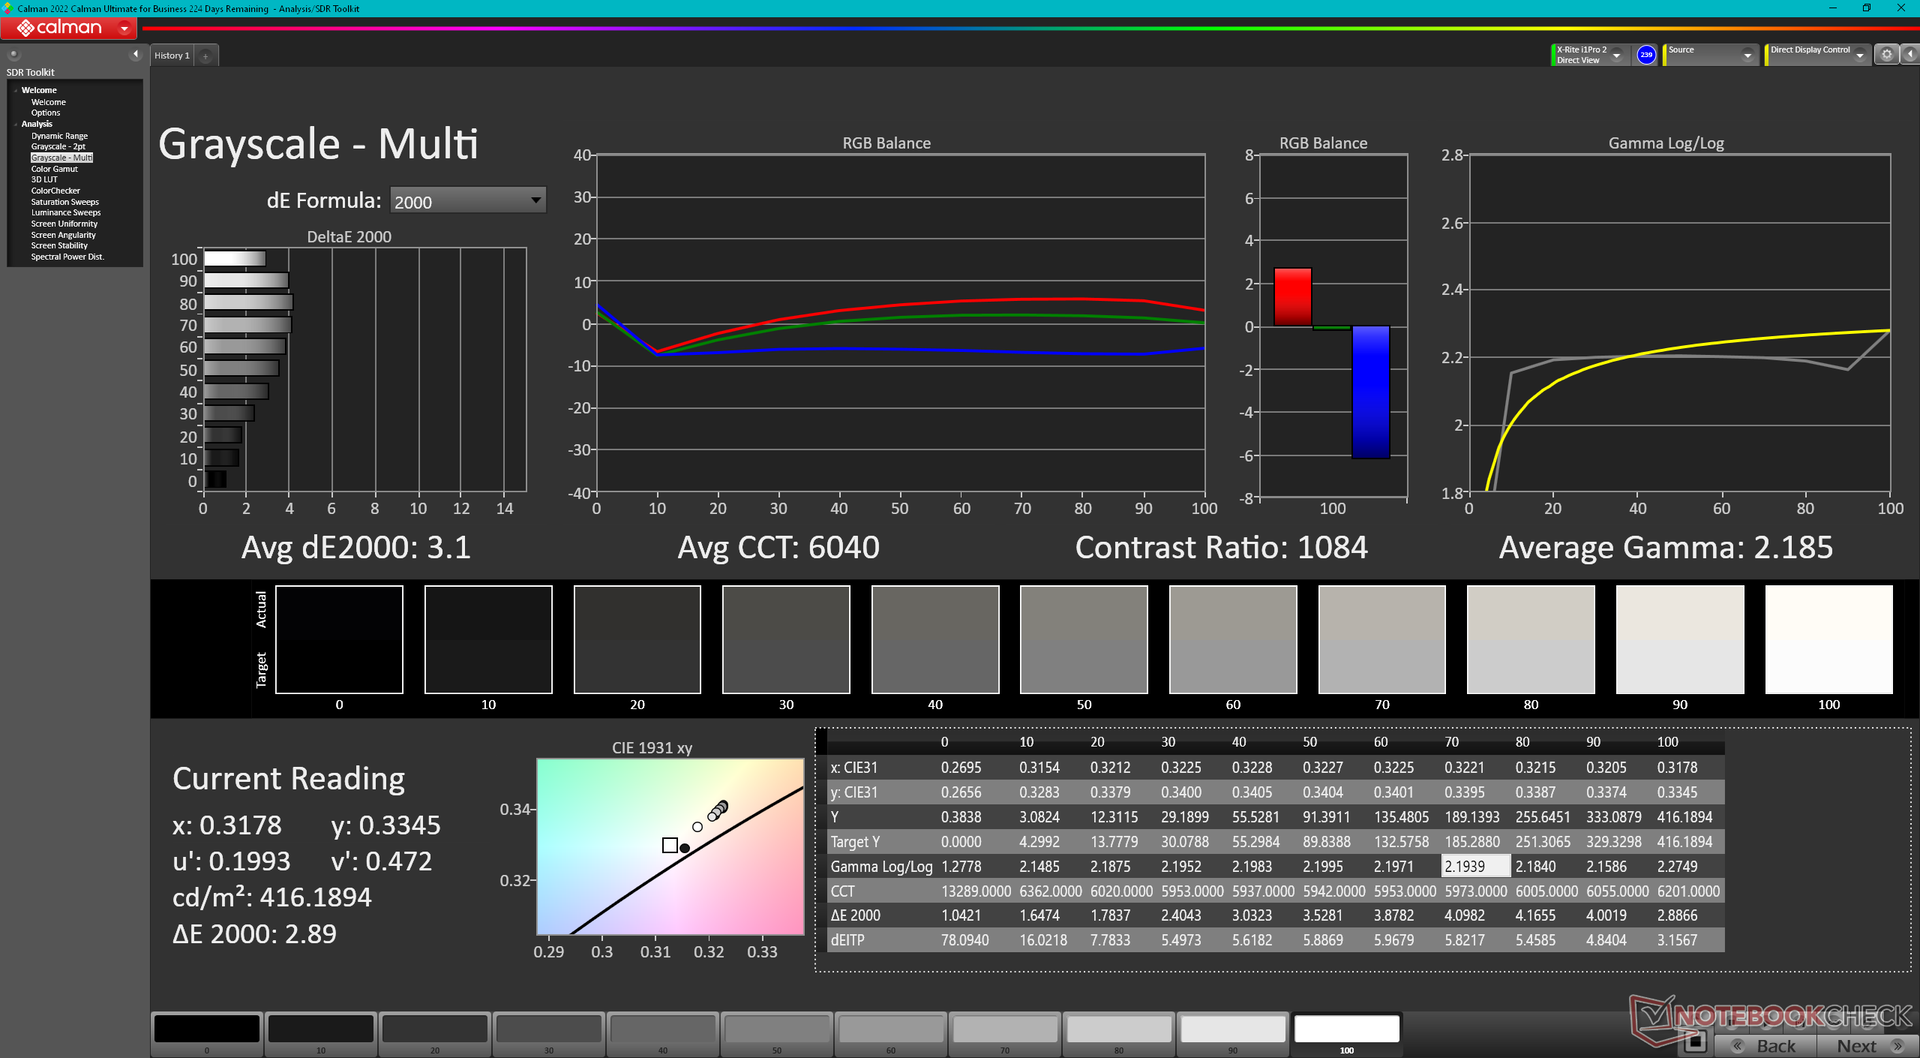
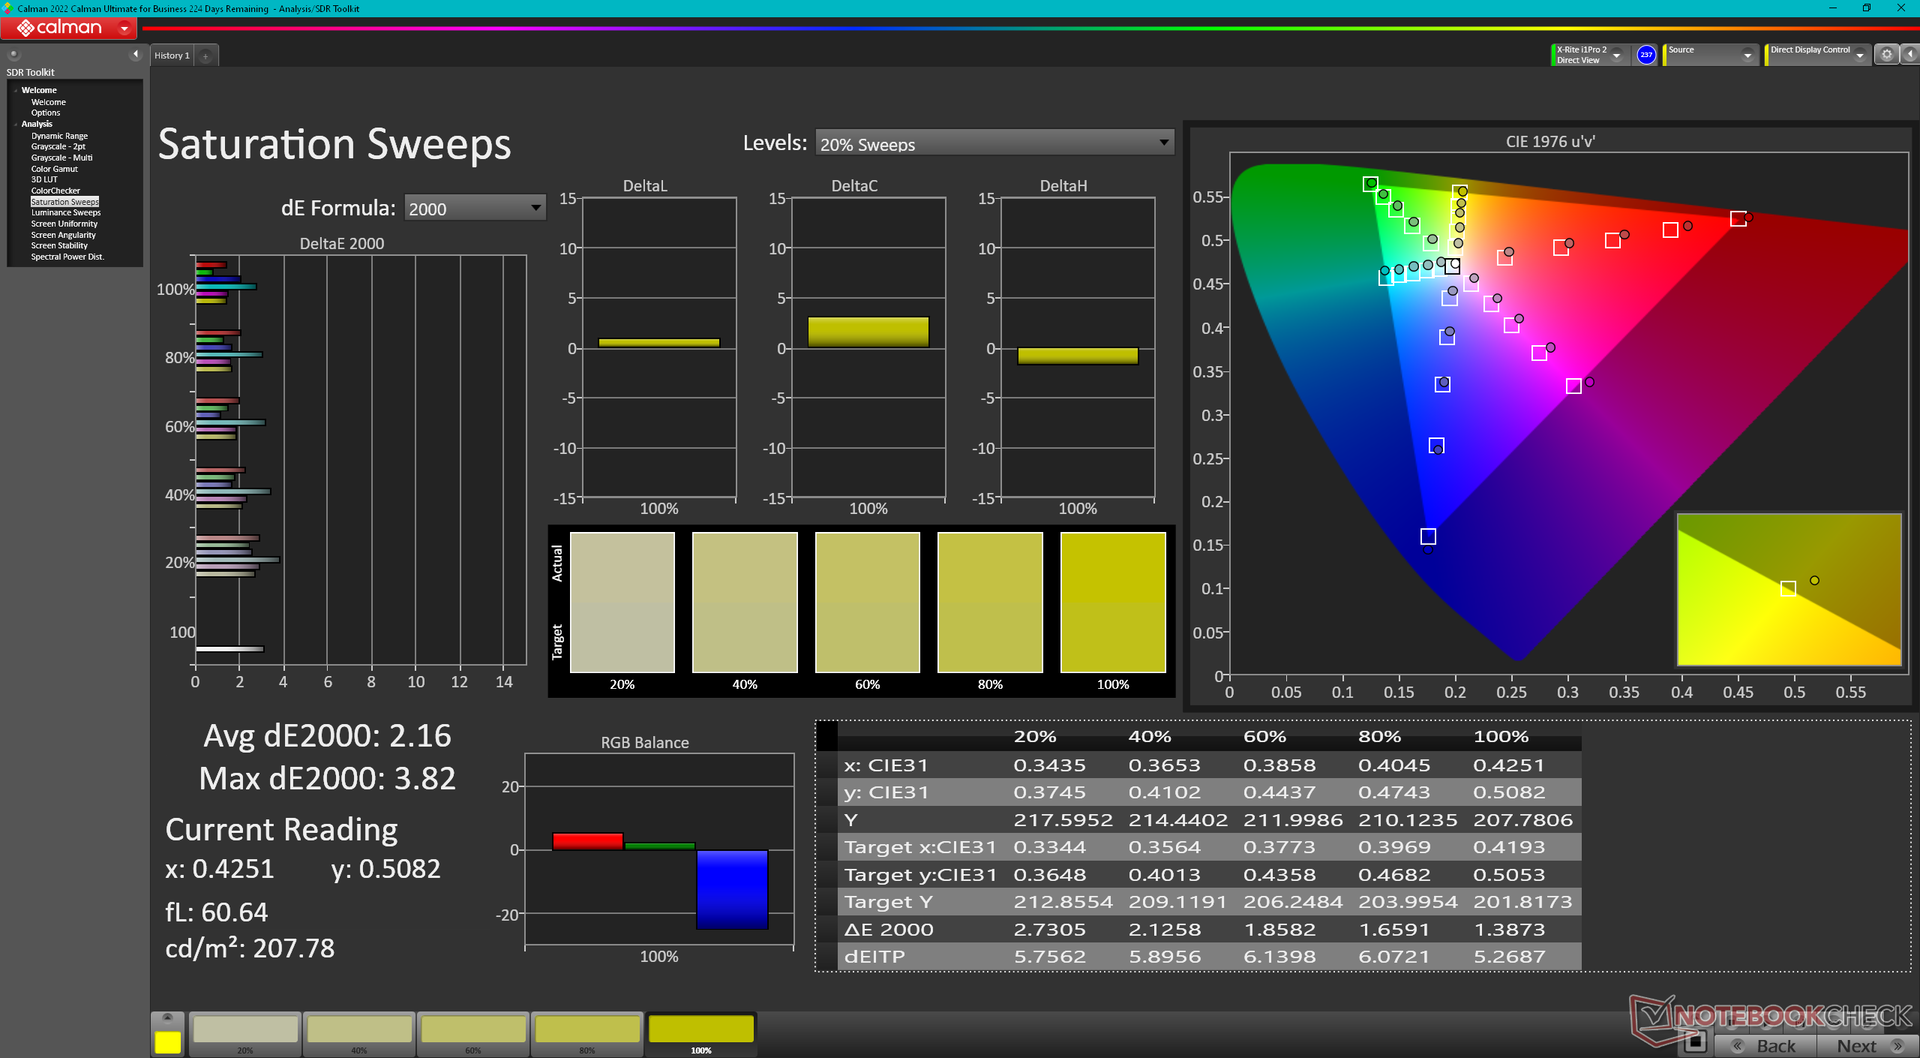
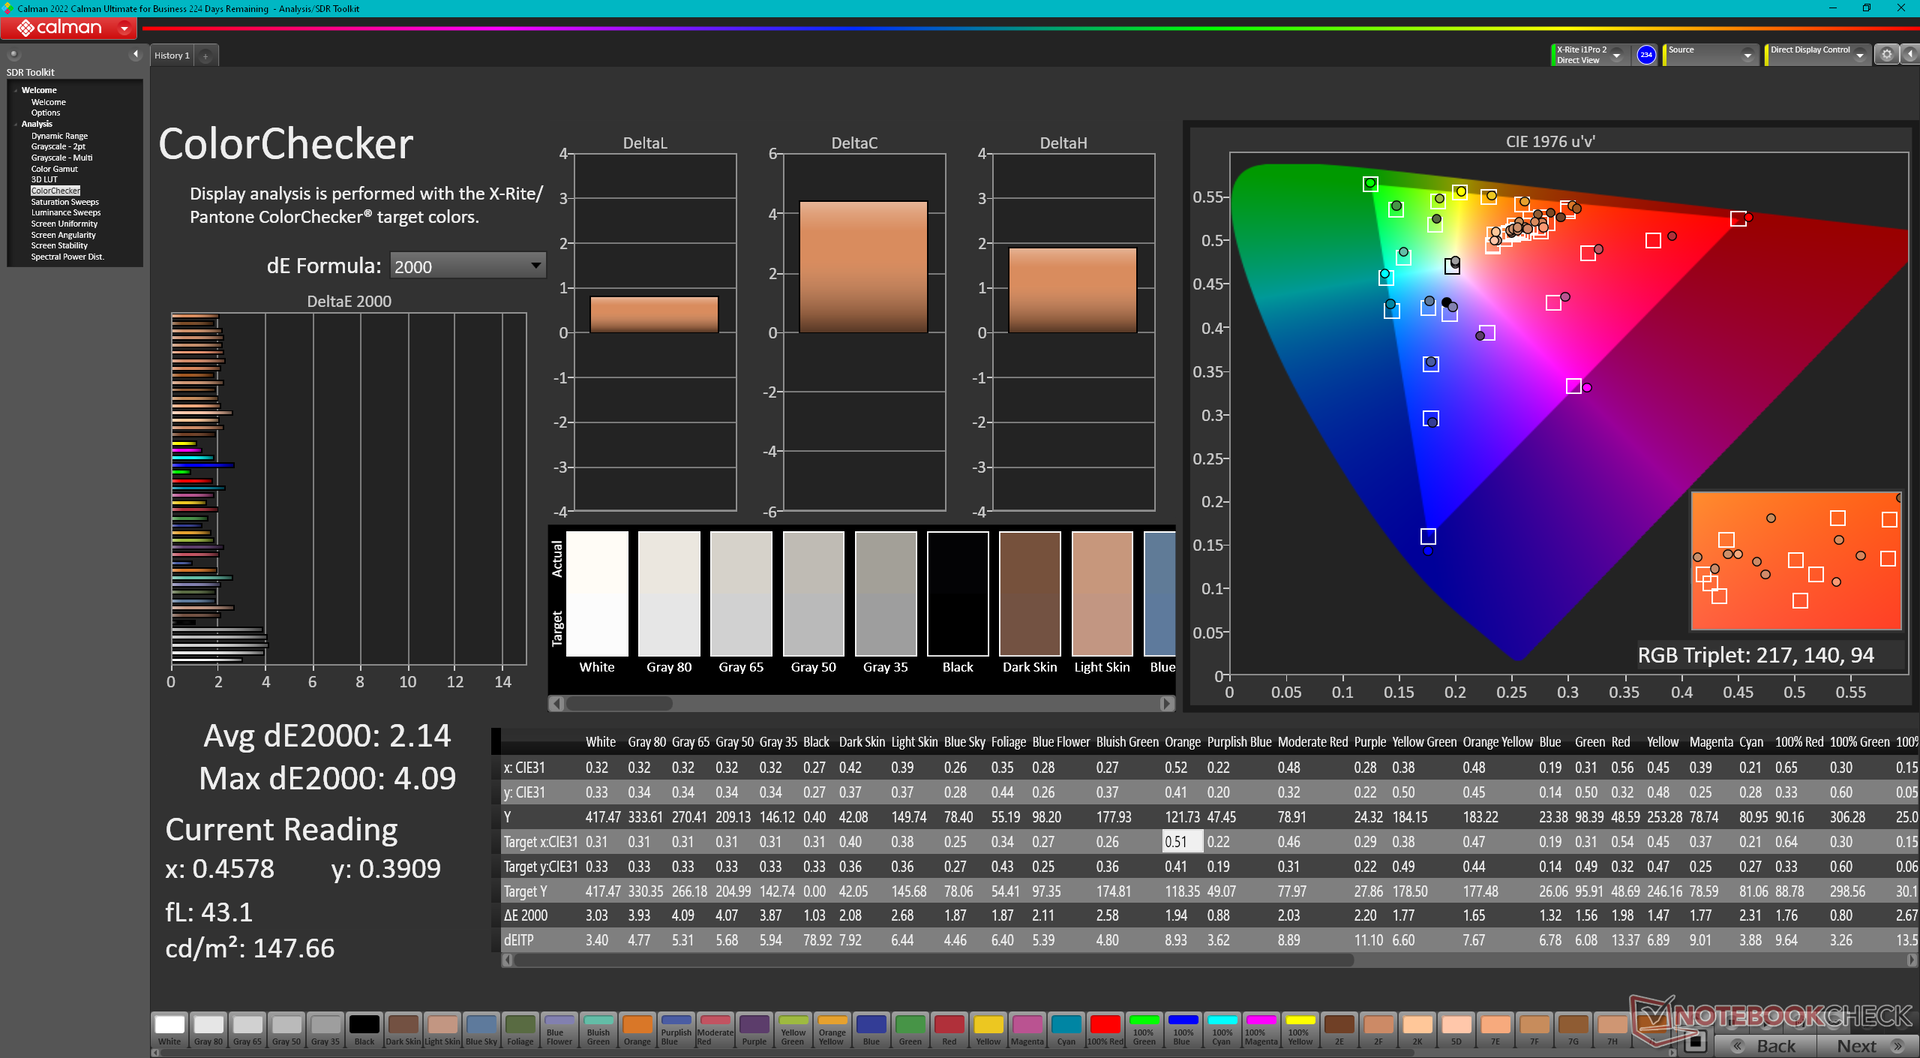
ΔE ColorChecker Calman: 2.14 | ∀{0.5-29.43 Ø4.71}
calibrated: 0.42
ΔE Greyscale Calman: 3.1 | ∀{0.09-98 Ø4.96}
69.8% AdobeRGB 1998 (Argyll 3D)
99.7% sRGB (Argyll 3D)
69.1% Display P3 (Argyll 3D)
Gamma: 2.19
CCT: 6040 K
| Eluktronics Mech-17 GP2 BOE NE170QDM-NZ1, IPS, 2560x1600, 17" | Schenker XMG Neo 17 M22 BOE0A99, IPS, 2560x1600, 17" | MSI Katana 17 B13VFK B173HAN04.9, IPS LED, 1920x1080, 17.3" | MSI Titan GT77 HX 13VI B173ZAN06.C, Mini-LED, 3840x2160, 17.3" | Alienware m17 R5 (R9 6900HX, RX 6850M XT) AU Optronics AUODBA3, IPS, 3840x2160, 17" | Razer Blade 18 RTX 4070 AU Optronics B180QAN01.0, IPS, 2560x1600, 18" | |
|---|---|---|---|---|---|---|
| Display | 0% | -40% | 23% | 23% | 21% | |
| Display P3 Coverage (%) | 69.1 | 69 0% | 40.8 -41% | 94.9 37% | 97.2 41% | 96.9 40% |
| sRGB Coverage (%) | 99.7 | 99.8 0% | 61 -39% | 99.9 0% | 99.6 0% | 99.8 0% |
| AdobeRGB 1998 Coverage (%) | 69.8 | 69.6 0% | 42.2 -40% | 92.4 32% | 88.4 27% | 85.3 22% |
| Response Times | 23% | -176% | -202% | -30% | 40% | |
| Response Time Grey 50% / Grey 80% * (ms) | 12 ? | 10.8 ? 10% | 33 ? -175% | 38.4 ? -220% | 16.4 ? -37% | 4.2 ? 65% |
| Response Time Black / White * (ms) | 9.4 ? | 6.1 ? 35% | 26 ? -177% | 26.6 ? -183% | 11.6 ? -23% | 8 ? 15% |
| PWM Frequency (Hz) | 2380 ? | |||||
| Screen | 1% | -158% | 67678% | -147% | -64% | |
| Brightness middle (cd/m²) | 417.3 | 415 -1% | 267 -36% | 606 45% | 484 16% | 549.6 32% |
| Brightness (cd/m²) | 387 | 399 3% | 256 -34% | 602 56% | 449 16% | 524 35% |
| Brightness Distribution (%) | 87 | 90 3% | 93 7% | 93 7% | 87 0% | 89 2% |
| Black Level * (cd/m²) | 0.42 | 0.43 -2% | 0.21 50% | 0.0001 100% | 0.55 -31% | 0.53 -26% |
| Contrast (:1) | 994 | 965 -3% | 1271 28% | 6060000 609558% | 880 -11% | 1037 4% |
| Colorchecker dE 2000 * | 2.14 | 1.44 33% | 4.7 -120% | 4.8 -124% | 4.8 -124% | 3.32 -55% |
| Colorchecker dE 2000 max. * | 4.09 | 2.33 43% | 20.4 -399% | 8.2 -100% | 7.48 -83% | 6.63 -62% |
| Colorchecker dE 2000 calibrated * | 0.42 | 0.89 -112% | 4.5 -971% | 1.8 -329% | 4.74 -1029% | 2.7 -543% |
| Greyscale dE 2000 * | 3.1 | 1.8 42% | 1.5 52% | 6.5 -110% | 5.5 -77% | 2 35% |
| Gamma | 2.19 100% | 2.132 103% | 2.12 104% | 2.63 84% | 2.42 91% | 2.29 96% |
| CCT | 6040 108% | 6327 103% | 6552 99% | 6596 99% | 6148 106% | 6319 103% |
| Media total (Programa/Opciones) | 8% /
4% | -125% /
-135% | 22500% /
43484% | -51% /
-94% | -1% /
-31% |
* ... más pequeño es mejor
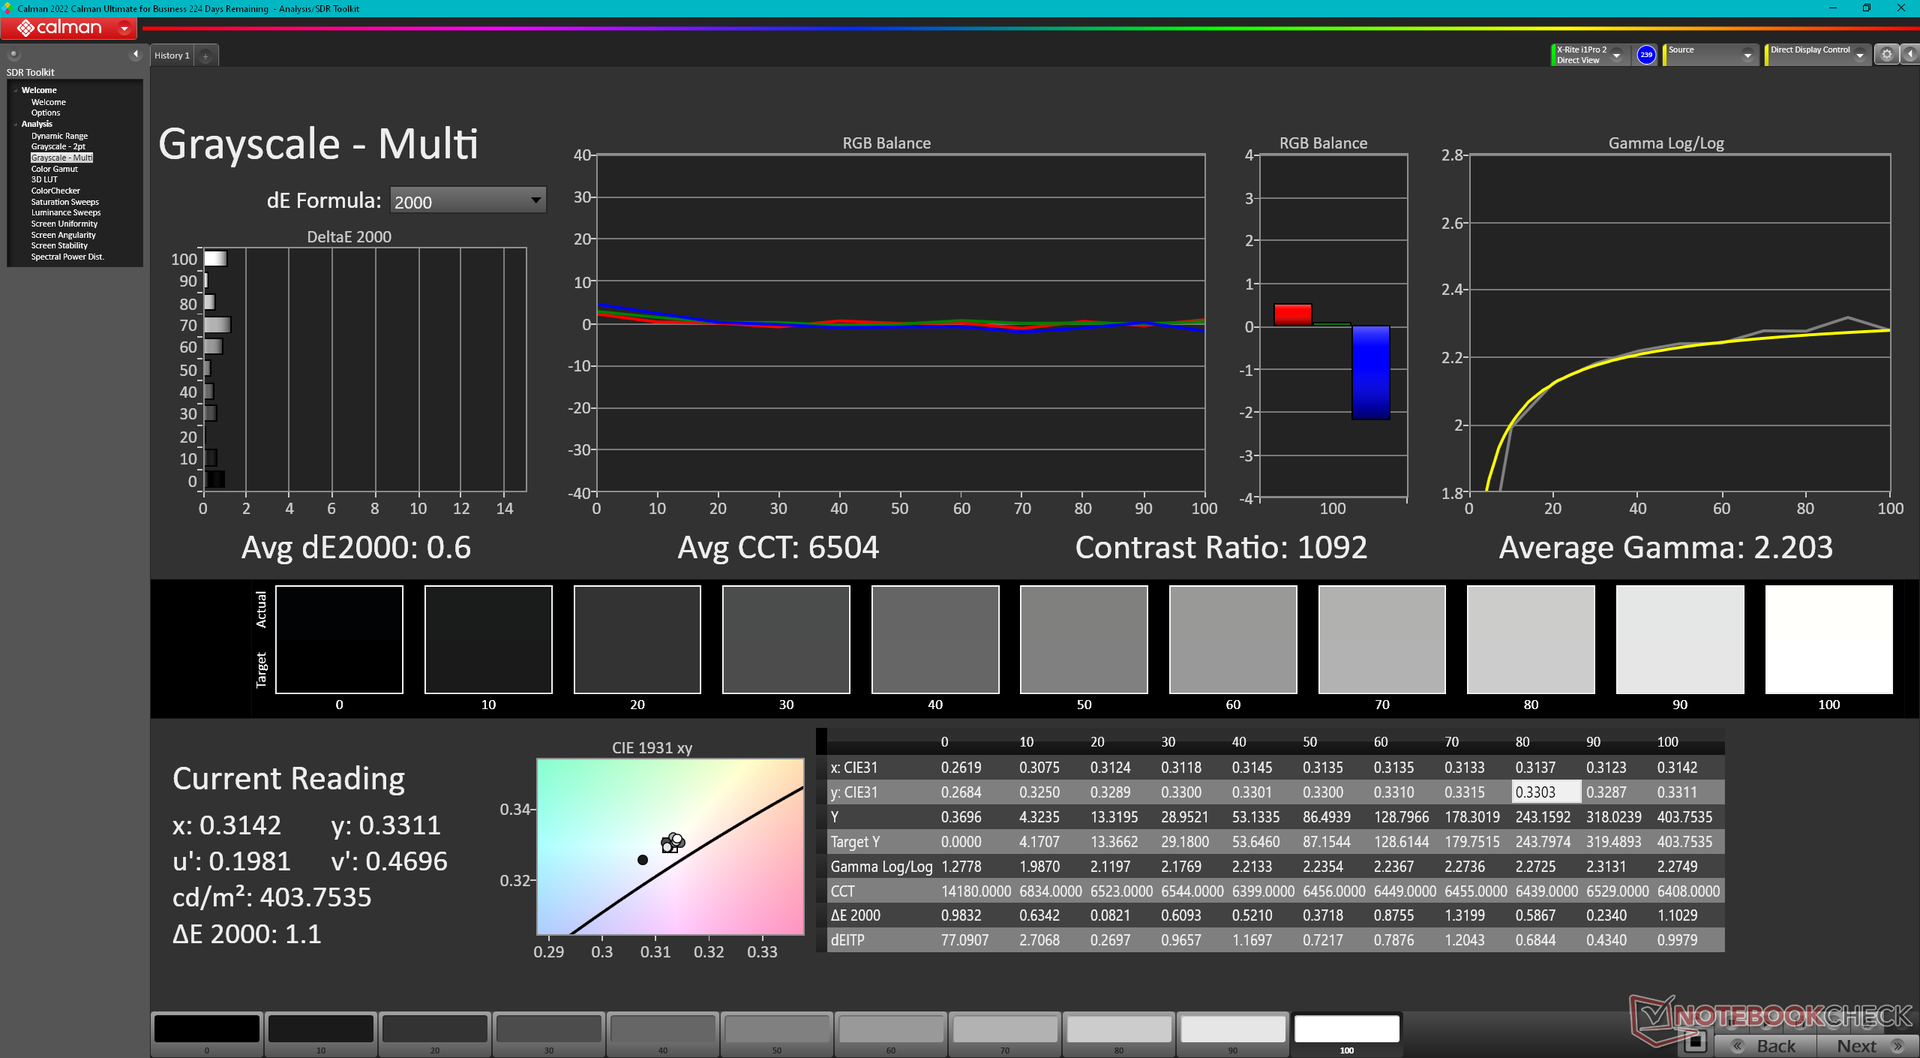
La pantalla está bien calibrada, con unos valores deltaE medios de escala de grises y color de sólo 3,1 y 2,14, respectivamente. Si la calibramos nosotros mismos, los promedios deltaE mejorarán aún más, a sólo 0,6 y 0,42 respecto al estándar sRGB. Nuestro perfil ICM calibrado está disponible para su descarga gratuita.
Tiempos de respuesta del display
| ↔ Tiempo de respuesta de Negro a Blanco | ||
|---|---|---|
| 9.4 ms ... subida ↗ y bajada ↘ combinada | ↗ 4.9 ms subida | 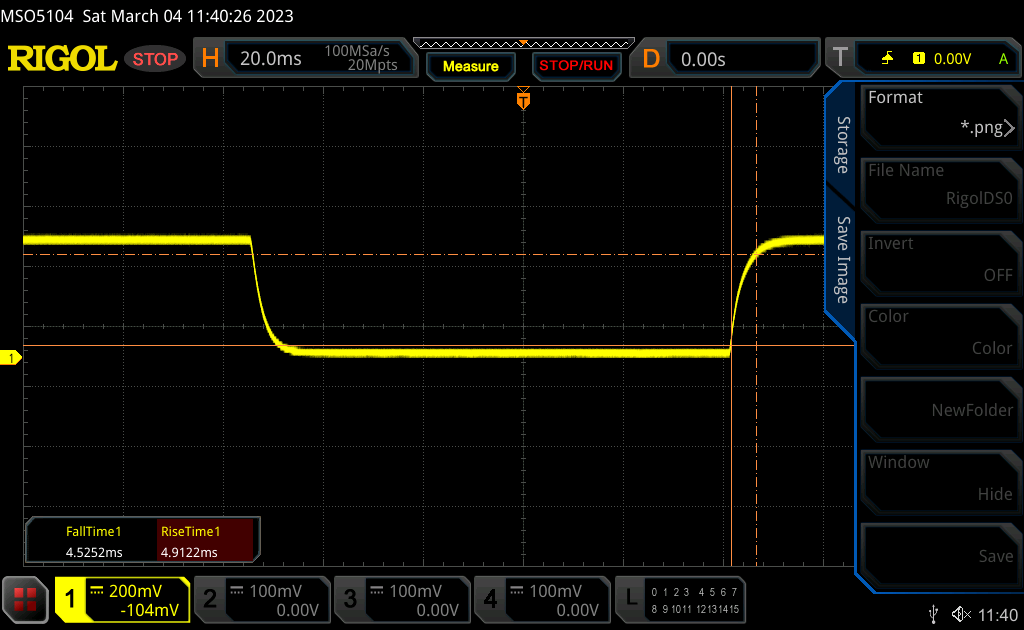 |
| ↘ 4.5 ms bajada | ||
| La pantalla mostró tiempos de respuesta rápidos en nuestros tests y debería ser adecuada para juegos. En comparación, todos los dispositivos de prueba van de ##min### (mínimo) a 240 (máximo) ms. » 26 % de todos los dispositivos son mejores. Esto quiere decir que el tiempo de respuesta medido es mejor que la media (19.8 ms) de todos los dispositivos testados. | ||
| ↔ Tiempo de respuesta 50% Gris a 80% Gris | ||
| 12 ms ... subida ↗ y bajada ↘ combinada | ↗ 5.4 ms subida | 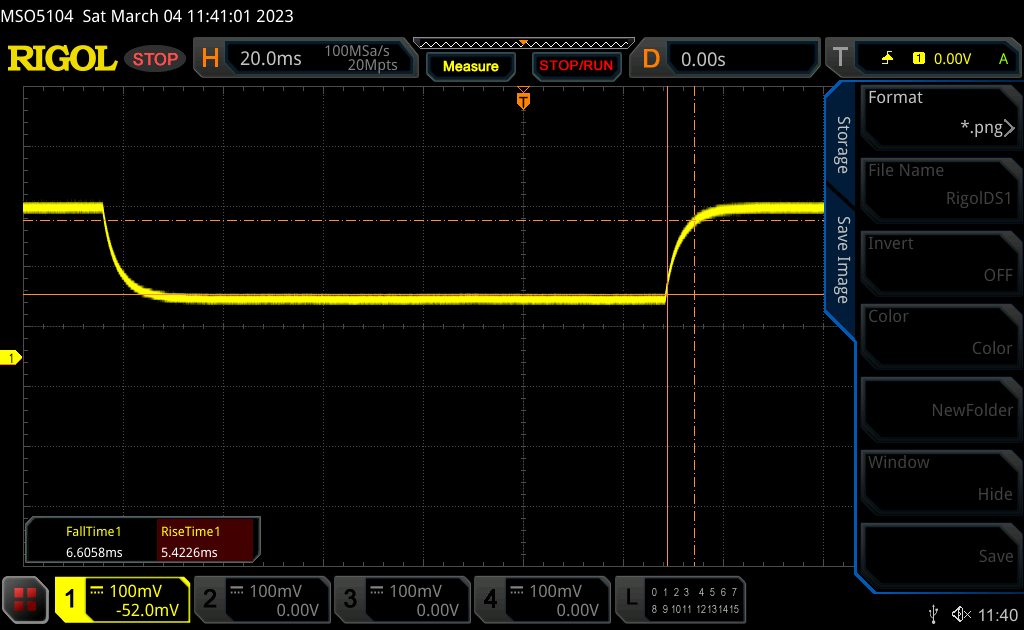 |
| ↘ 6.6 ms bajada | ||
| La pantalla mostró buenos tiempos de respuesta en nuestros tests pero podría ser demasiado lenta para los jugones competitivos. En comparación, todos los dispositivos de prueba van de ##min### (mínimo) a 636 (máximo) ms. » 25 % de todos los dispositivos son mejores. Esto quiere decir que el tiempo de respuesta medido es mejor que la media (31 ms) de todos los dispositivos testados. | ||
Parpadeo de Pantalla / PWM (Pulse-Width Modulation)
| Parpadeo de Pantalla / PWM no detectado | 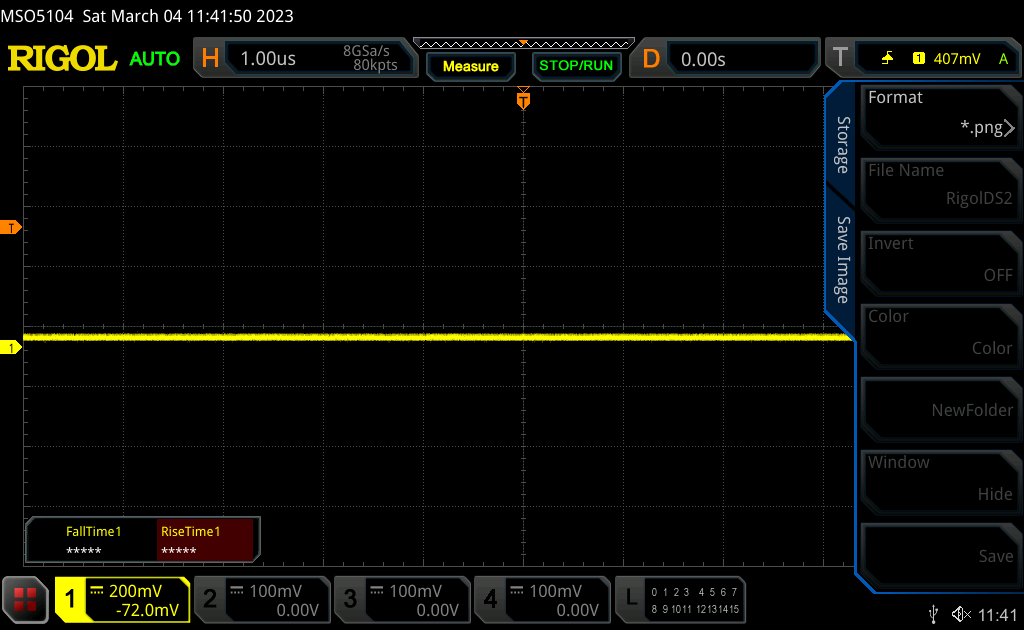 | ||
Comparación: 52 % de todos los dispositivos testados no usaron PWM para atenuar el display. Si se usó, medimos una media de 7754 (mínimo: 5 - máxmo: 343500) Hz. | |||
Rendimiento
Condiciones de ensayo
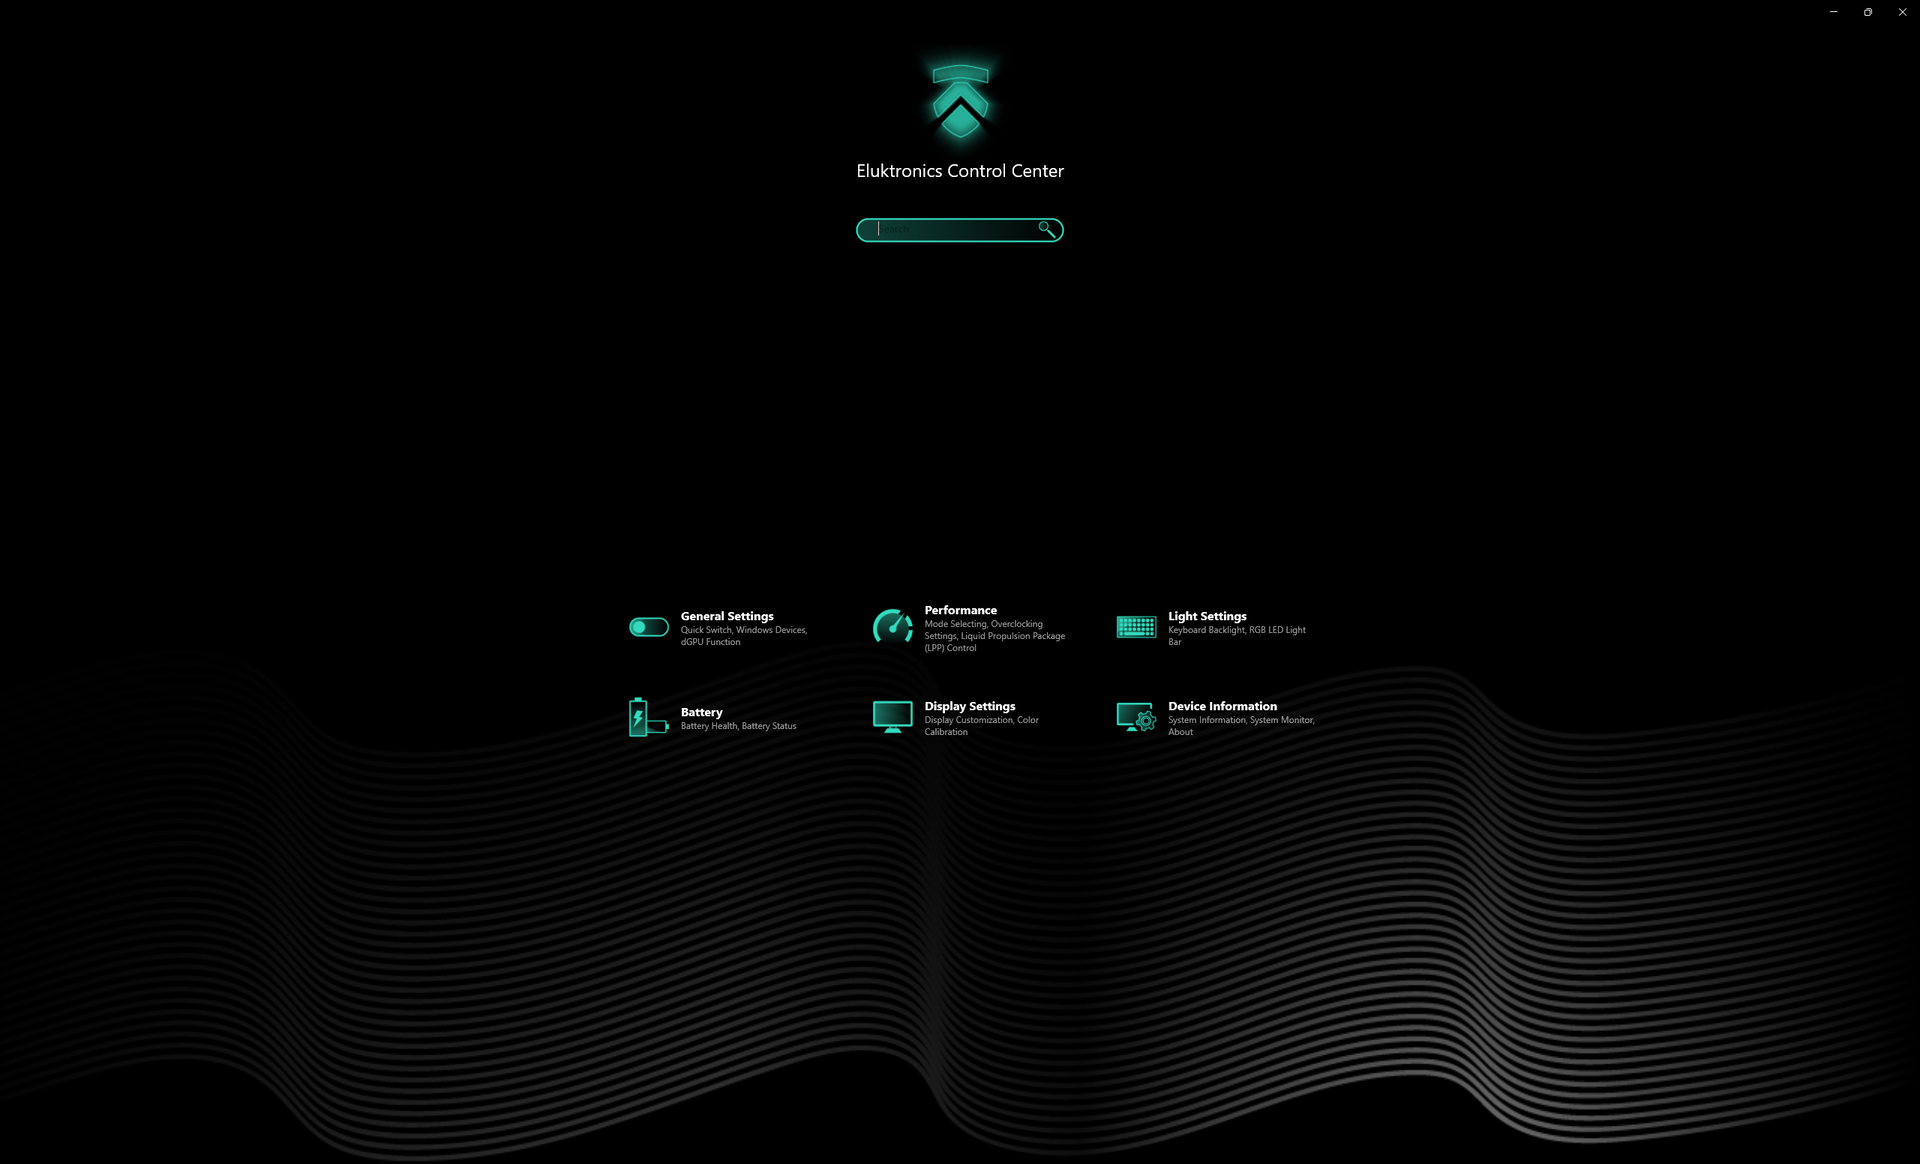
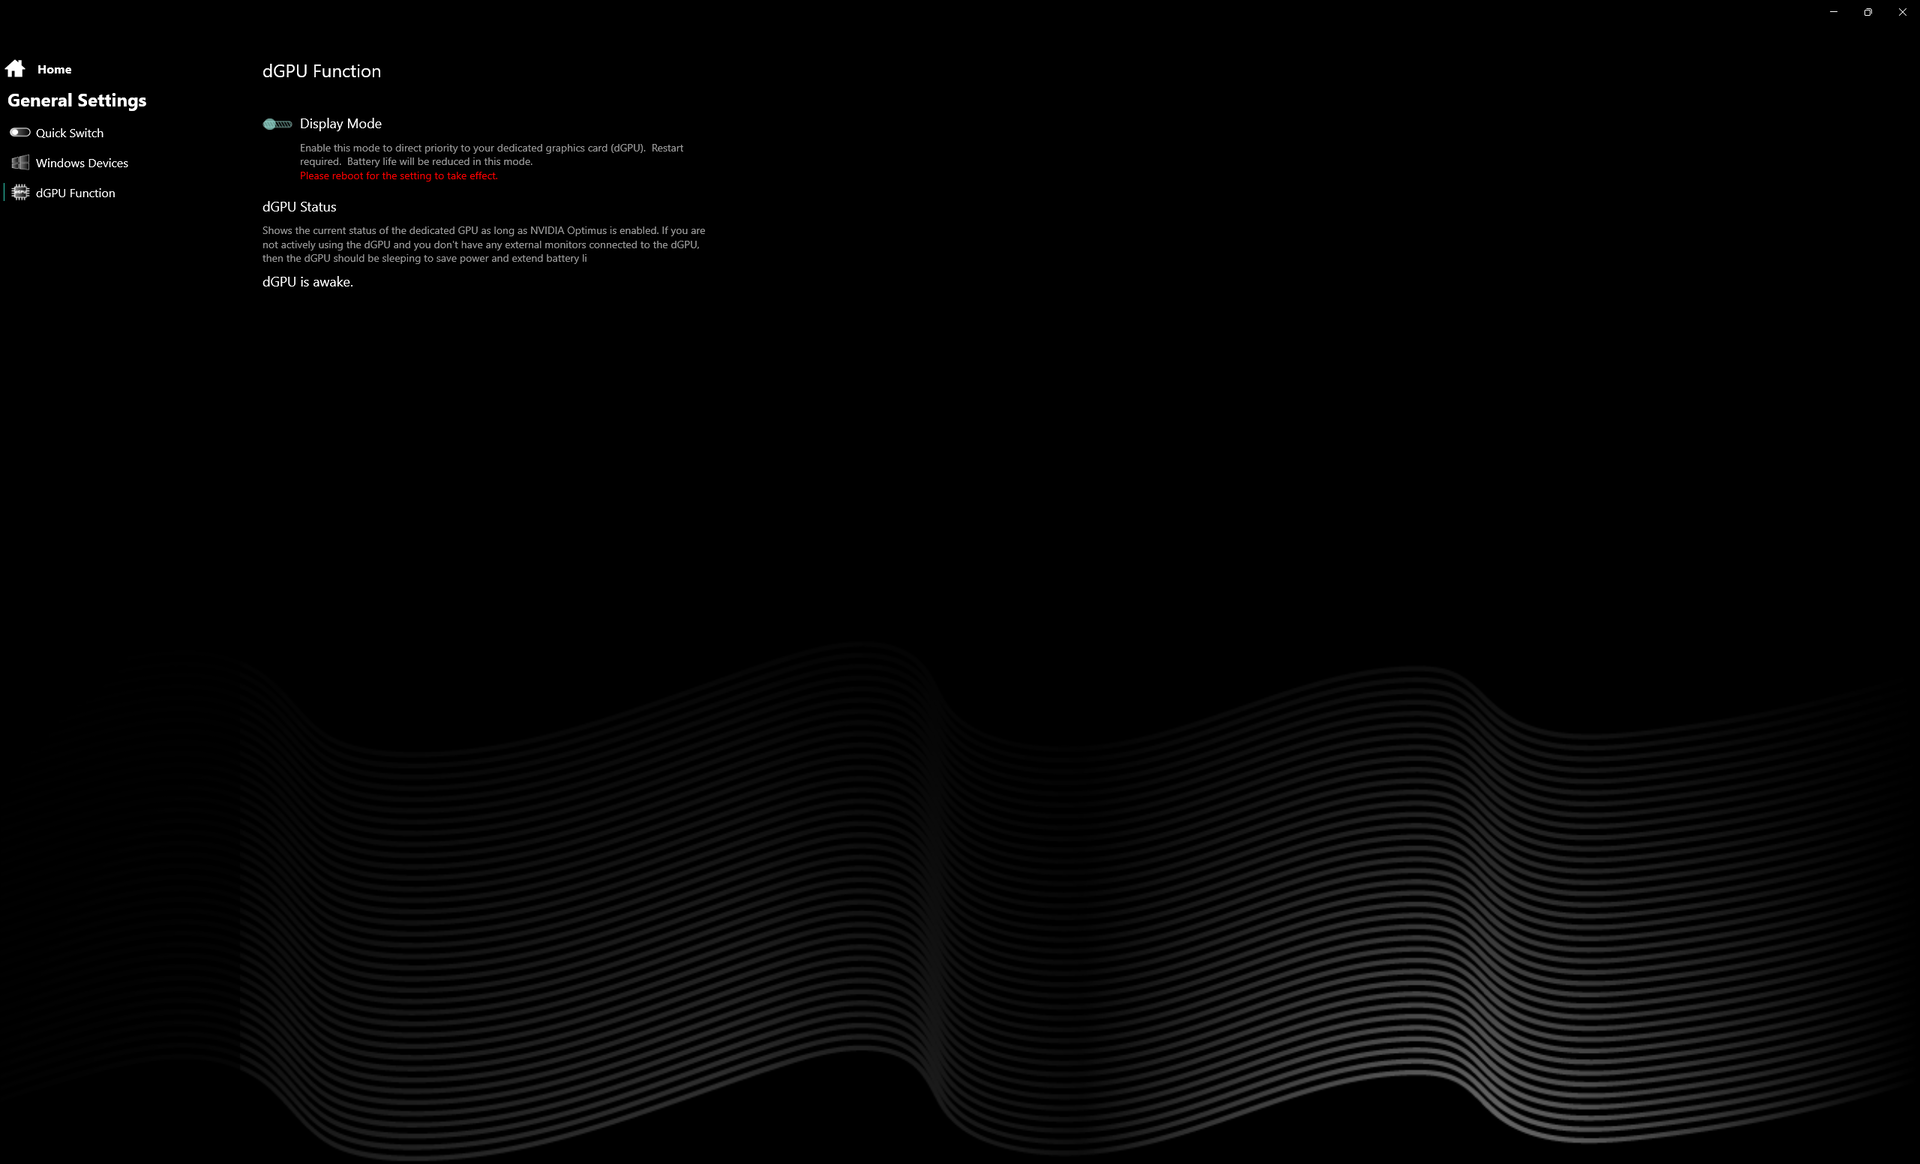
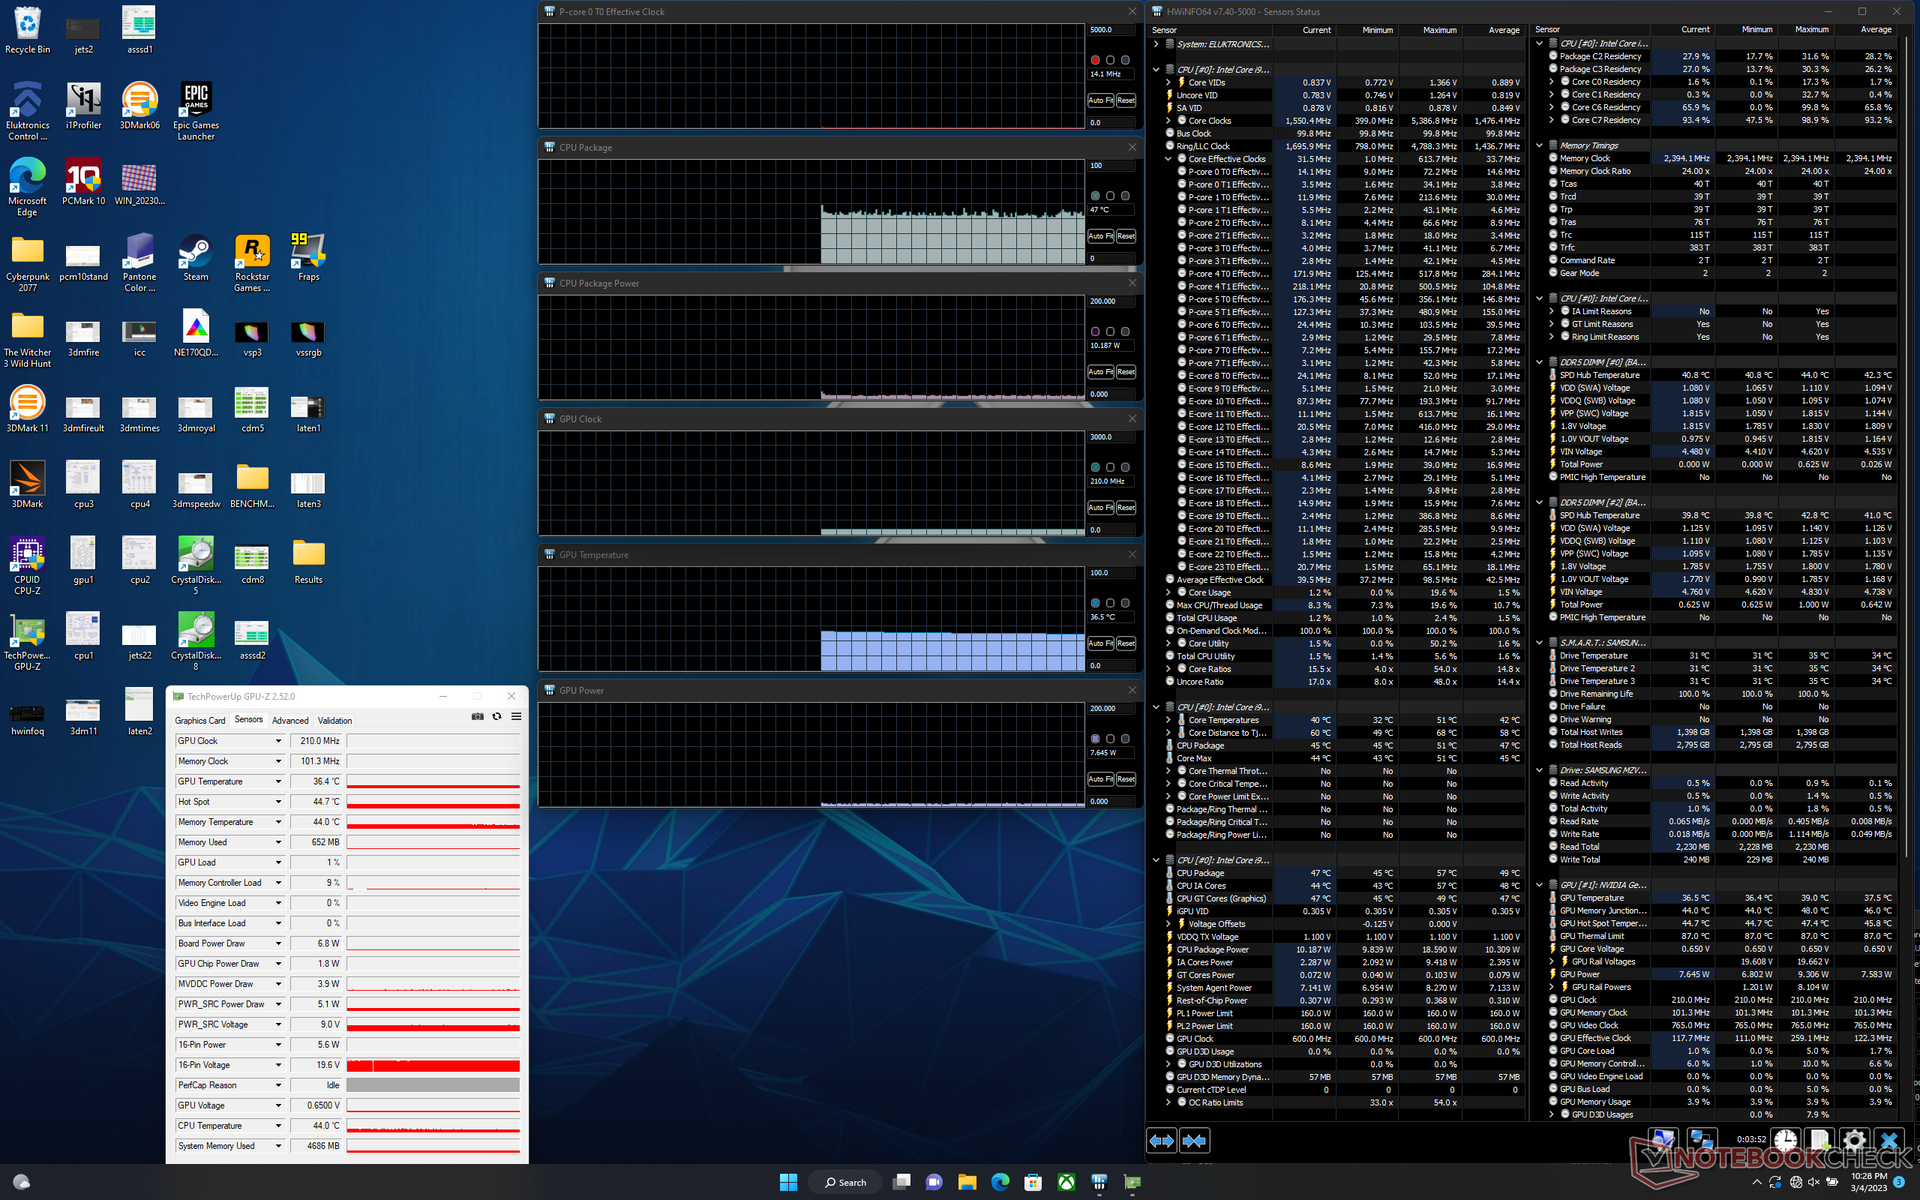
Configuramos nuestra unidad en modo Rendimiento a través de Windows y en "Modo Bestia" a través del software preinstalado Eluktronics Control Center antes de ejecutar cualquier prueba de rendimiento. También pusimos el sistema en modo dGPU a través del panel de control de Nvidia. Los propietarios deben familiarizarse con el Centro de Control, ya que es el centro para cambiar las características específicas del modelo como RGB, modos de carga de la batería, modos de rendimiento, modo de refrigeración líquida, y más. Soporta Advanced Optimus (MUX).
Experimentamos un puñado de problemas en nuestra unidad de pruebas, incluyendo pantallas de arranque en blanco, al menos un congelamiento del sistema al jugar, y reinicios automáticos cuando la CPU y la GPU están al máximo de utilización durante períodos prolongados. Solucionamos el primer problema desactivando Quick Boot en el menú de la BIOS, pero estos problemas no deberían existir en primer lugar.
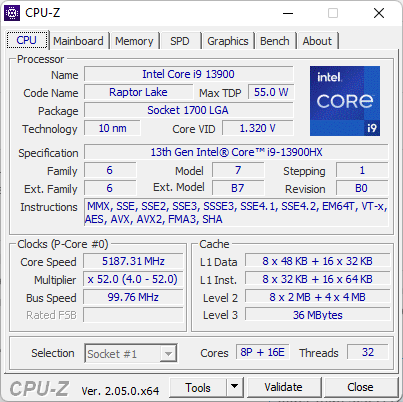
Procesador
El rendimiento bruto de la CPU está entre un 1 y un 2 por ciento por detrás de la 13ª generación del Core i9-13950HX del MSI Titan GT77, por lo que pueden ser equivalentes en la mayoría de los escenarios. Pasando del Ryzen 9 6900HX a nuestro Core i9-13900HX aumenta el rendimiento multihilo entre 2 y 2,5 veces. La 12ª generación Core i7-12700Hque sigue siendo habitual en muchos portátiles para juegos de gama media-alta, es aproximadamente un 50% más lento.
La sostenibilidad del rendimiento es excelente, sin grandes caídas de rendimiento ni comportamientos cíclicos a lo largo del tiempo.
Cinebench R15 Multi Loop
Cinebench R23: Multi Core | Single Core
Cinebench R20: CPU (Multi Core) | CPU (Single Core)
Cinebench R15: CPU Multi 64Bit | CPU Single 64Bit
Blender: v2.79 BMW27 CPU
7-Zip 18.03: 7z b 4 | 7z b 4 -mmt1
Geekbench 5.5: Multi-Core | Single-Core
HWBOT x265 Benchmark v2.2: 4k Preset
LibreOffice : 20 Documents To PDF
R Benchmark 2.5: Overall mean
| Cinebench R20 / CPU (Single Core) | |
| MSI Titan GT77 HX 13VI | |
| Eluktronics Mech-17 GP2 | |
| Razer Blade 18 RTX 4070 | |
| Medio Intel Core i9-13900HX (722 - 810, n=21) | |
| Corsair One i300 | |
| MSI Titan GT77 12UHS | |
| MSI Katana 17 B13VFK | |
| MSI Pulse GL76 12UGK | |
| MSI GS76 Stealth 11UH | |
| Schenker XMG Neo 17 M22 | |
| HP Omen 16-n0033dx | |
| Schenker XMG Core 17 (Early 2021) | |
| HWBOT x265 Benchmark v2.2 / 4k Preset | |
| Eluktronics Mech-17 GP2 | |
| MSI Titan GT77 HX 13VI | |
| Razer Blade 18 RTX 4070 | |
| Medio Intel Core i9-13900HX (23.5 - 34.4, n=22) | |
| Corsair One i300 | |
| MSI Titan GT77 12UHS | |
| MSI Pulse GL76 12UGK | |
| Schenker XMG Neo 17 M22 | |
| MSI Katana 17 B13VFK | |
| HP Omen 16-n0033dx | |
| MSI GS76 Stealth 11UH | |
| Schenker XMG Core 17 (Early 2021) | |
| LibreOffice / 20 Documents To PDF | |
| HP Omen 16-n0033dx | |
| MSI Katana 17 B13VFK | |
| Schenker XMG Core 17 (Early 2021) | |
| Schenker XMG Neo 17 M22 | |
| MSI GS76 Stealth 11UH | |
| MSI Titan GT77 HX 13VI | |
| MSI Pulse GL76 12UGK | |
| Razer Blade 18 RTX 4070 | |
| Medio Intel Core i9-13900HX (32.8 - 51.1, n=21) | |
| MSI Titan GT77 12UHS | |
| Corsair One i300 | |
| Eluktronics Mech-17 GP2 | |
* ... más pequeño es mejor
AIDA64: FP32 Ray-Trace | FPU Julia | CPU SHA3 | CPU Queen | FPU SinJulia | FPU Mandel | CPU AES | CPU ZLib | FP64 Ray-Trace | CPU PhotoWorxx
| Performance rating | |
| Eluktronics Mech-17 GP2 | |
| MSI Titan GT77 HX 13VI | |
| Razer Blade 18 RTX 4070 | |
| Medio Intel Core i9-13900HX | |
| Schenker XMG Neo 17 M22 | |
| Alienware m17 R5 (R9 6900HX, RX 6850M XT) | |
| MSI Katana 17 B13VFK | |
| AIDA64 / FP32 Ray-Trace | |
| MSI Titan GT77 HX 13VI | |
| Eluktronics Mech-17 GP2 | |
| Razer Blade 18 RTX 4070 | |
| Medio Intel Core i9-13900HX (17589 - 27615, n=22) | |
| Alienware m17 R5 (R9 6900HX, RX 6850M XT) | |
| Schenker XMG Neo 17 M22 | |
| MSI Katana 17 B13VFK | |
| AIDA64 / FPU Julia | |
| MSI Titan GT77 HX 13VI | |
| Eluktronics Mech-17 GP2 | |
| Razer Blade 18 RTX 4070 | |
| Medio Intel Core i9-13900HX (88686 - 137015, n=22) | |
| Alienware m17 R5 (R9 6900HX, RX 6850M XT) | |
| Schenker XMG Neo 17 M22 | |
| MSI Katana 17 B13VFK | |
| AIDA64 / CPU SHA3 | |
| MSI Titan GT77 HX 13VI | |
| Eluktronics Mech-17 GP2 | |
| Razer Blade 18 RTX 4070 | |
| Medio Intel Core i9-13900HX (4362 - 7029, n=22) | |
| Alienware m17 R5 (R9 6900HX, RX 6850M XT) | |
| Schenker XMG Neo 17 M22 | |
| MSI Katana 17 B13VFK | |
| AIDA64 / CPU Queen | |
| Eluktronics Mech-17 GP2 | |
| MSI Titan GT77 HX 13VI | |
| Razer Blade 18 RTX 4070 | |
| Medio Intel Core i9-13900HX (125644 - 141385, n=22) | |
| Alienware m17 R5 (R9 6900HX, RX 6850M XT) | |
| Schenker XMG Neo 17 M22 | |
| MSI Katana 17 B13VFK | |
| AIDA64 / FPU SinJulia | |
| Eluktronics Mech-17 GP2 | |
| MSI Titan GT77 HX 13VI | |
| Razer Blade 18 RTX 4070 | |
| Medio Intel Core i9-13900HX (12334 - 17179, n=22) | |
| Alienware m17 R5 (R9 6900HX, RX 6850M XT) | |
| Schenker XMG Neo 17 M22 | |
| MSI Katana 17 B13VFK | |
| AIDA64 / FPU Mandel | |
| MSI Titan GT77 HX 13VI | |
| Eluktronics Mech-17 GP2 | |
| Razer Blade 18 RTX 4070 | |
| Medio Intel Core i9-13900HX (43850 - 69202, n=22) | |
| Alienware m17 R5 (R9 6900HX, RX 6850M XT) | |
| Schenker XMG Neo 17 M22 | |
| MSI Katana 17 B13VFK | |
| AIDA64 / CPU AES | |
| Eluktronics Mech-17 GP2 | |
| Medio Intel Core i9-13900HX (89413 - 237881, n=22) | |
| MSI Titan GT77 HX 13VI | |
| Schenker XMG Neo 17 M22 | |
| Razer Blade 18 RTX 4070 | |
| MSI Katana 17 B13VFK | |
| Alienware m17 R5 (R9 6900HX, RX 6850M XT) | |
| AIDA64 / CPU ZLib | |
| MSI Titan GT77 HX 13VI | |
| Eluktronics Mech-17 GP2 | |
| Razer Blade 18 RTX 4070 | |
| Medio Intel Core i9-13900HX (1284 - 1958, n=22) | |
| Alienware m17 R5 (R9 6900HX, RX 6850M XT) | |
| Schenker XMG Neo 17 M22 | |
| MSI Katana 17 B13VFK | |
| AIDA64 / FP64 Ray-Trace | |
| MSI Titan GT77 HX 13VI | |
| Eluktronics Mech-17 GP2 | |
| Razer Blade 18 RTX 4070 | |
| Medio Intel Core i9-13900HX (9481 - 15279, n=22) | |
| Alienware m17 R5 (R9 6900HX, RX 6850M XT) | |
| Schenker XMG Neo 17 M22 | |
| MSI Katana 17 B13VFK | |
| AIDA64 / CPU PhotoWorxx | |
| Razer Blade 18 RTX 4070 | |
| Medio Intel Core i9-13900HX (42994 - 51994, n=22) | |
| Eluktronics Mech-17 GP2 | |
| MSI Titan GT77 HX 13VI | |
| MSI Katana 17 B13VFK | |
| Alienware m17 R5 (R9 6900HX, RX 6850M XT) | |
| Schenker XMG Neo 17 M22 | |
Rendimiento del sistema
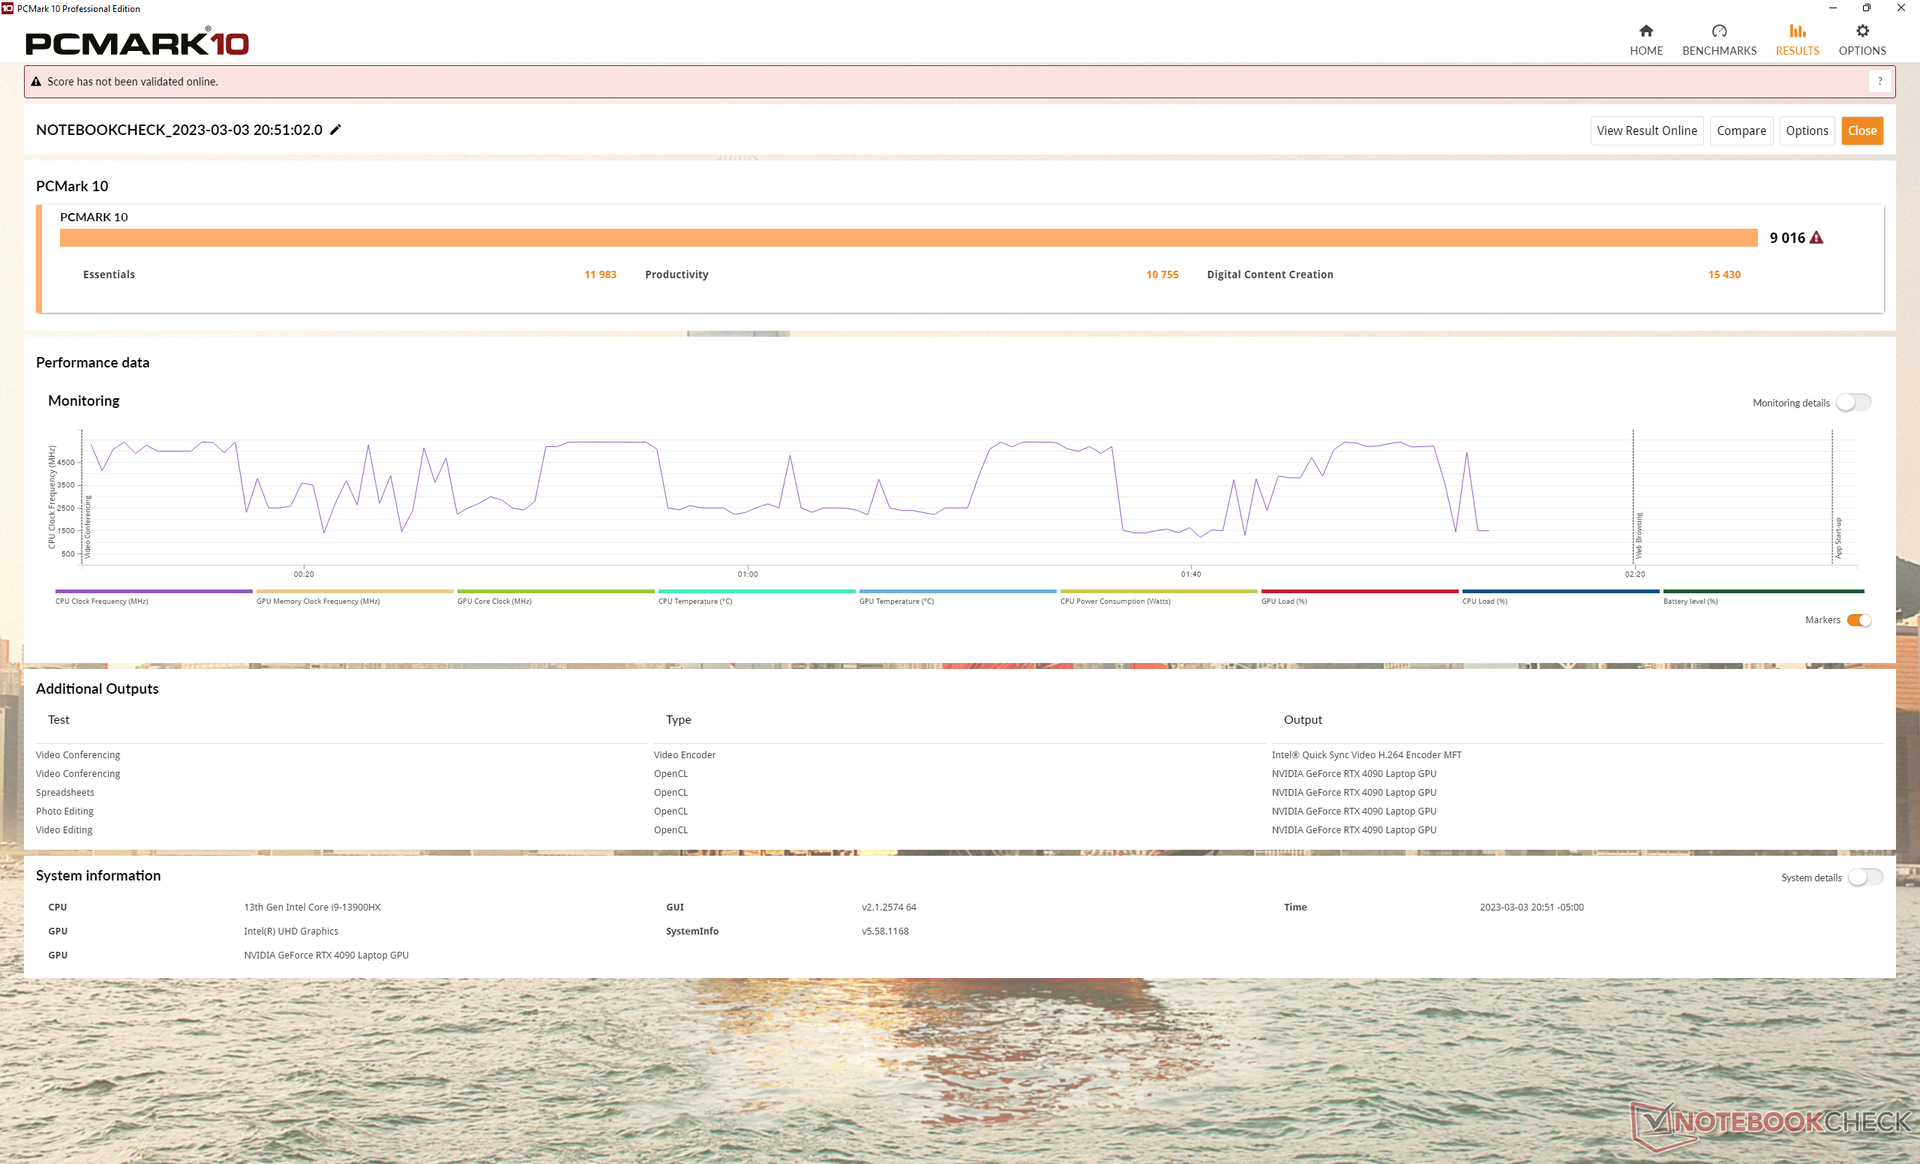
Las puntuaciones PCMark son de las más altas de nuestra base de datos, rivalizando con la MSI Titan GT77. Su puntuación en Creación de Contenidos Digitales en particular es casi un 70% superior a la del modelo RTX 3080 Ti del año pasado debido al aumento del rendimiento gráfico.
CrossMark: Overall | Productivity | Creativity | Responsiveness
| PCMark 10 / Score | |
| Eluktronics Mech-17 GP2 | |
| MSI Titan GT77 HX 13VI | |
| Medio Intel Core i9-13900HX, NVIDIA GeForce RTX 4090 Laptop GPU (7690 - 9331, n=8) | |
| Razer Blade 18 RTX 4070 | |
| Alienware m17 R5 (R9 6900HX, RX 6850M XT) | |
| MSI Katana 17 B13VFK | |
| Schenker XMG Neo 17 M22 | |
| PCMark 10 / Essentials | |
| Eluktronics Mech-17 GP2 | |
| MSI Titan GT77 HX 13VI | |
| Razer Blade 18 RTX 4070 | |
| Medio Intel Core i9-13900HX, NVIDIA GeForce RTX 4090 Laptop GPU (10972 - 11983, n=8) | |
| MSI Katana 17 B13VFK | |
| Alienware m17 R5 (R9 6900HX, RX 6850M XT) | |
| Schenker XMG Neo 17 M22 | |
| PCMark 10 / Productivity | |
| Eluktronics Mech-17 GP2 | |
| Medio Intel Core i9-13900HX, NVIDIA GeForce RTX 4090 Laptop GPU (9038 - 11680, n=8) | |
| MSI Titan GT77 HX 13VI | |
| Razer Blade 18 RTX 4070 | |
| Schenker XMG Neo 17 M22 | |
| MSI Katana 17 B13VFK | |
| Alienware m17 R5 (R9 6900HX, RX 6850M XT) | |
| PCMark 10 / Digital Content Creation | |
| MSI Titan GT77 HX 13VI | |
| Eluktronics Mech-17 GP2 | |
| Medio Intel Core i9-13900HX, NVIDIA GeForce RTX 4090 Laptop GPU (10605 - 16395, n=8) | |
| Alienware m17 R5 (R9 6900HX, RX 6850M XT) | |
| Razer Blade 18 RTX 4070 | |
| MSI Katana 17 B13VFK | |
| Schenker XMG Neo 17 M22 | |
| CrossMark / Overall | |
| Eluktronics Mech-17 GP2 | |
| MSI Titan GT77 HX 13VI | |
| Razer Blade 18 RTX 4070 | |
| Medio Intel Core i9-13900HX, NVIDIA GeForce RTX 4090 Laptop GPU (1825 - 2295, n=8) | |
| MSI Katana 17 B13VFK | |
| Schenker XMG Neo 17 M22 | |
| Alienware m17 R5 (R9 6900HX, RX 6850M XT) | |
| CrossMark / Productivity | |
| Eluktronics Mech-17 GP2 | |
| MSI Titan GT77 HX 13VI | |
| Razer Blade 18 RTX 4070 | |
| Medio Intel Core i9-13900HX, NVIDIA GeForce RTX 4090 Laptop GPU (1666 - 2166, n=8) | |
| MSI Katana 17 B13VFK | |
| Schenker XMG Neo 17 M22 | |
| Alienware m17 R5 (R9 6900HX, RX 6850M XT) | |
| CrossMark / Creativity | |
| Eluktronics Mech-17 GP2 | |
| MSI Titan GT77 HX 13VI | |
| Razer Blade 18 RTX 4070 | |
| Medio Intel Core i9-13900HX, NVIDIA GeForce RTX 4090 Laptop GPU (2162 - 2514, n=8) | |
| MSI Katana 17 B13VFK | |
| Schenker XMG Neo 17 M22 | |
| Alienware m17 R5 (R9 6900HX, RX 6850M XT) | |
| CrossMark / Responsiveness | |
| Razer Blade 18 RTX 4070 | |
| MSI Titan GT77 HX 13VI | |
| Eluktronics Mech-17 GP2 | |
| Medio Intel Core i9-13900HX, NVIDIA GeForce RTX 4090 Laptop GPU (1441 - 2275, n=8) | |
| MSI Katana 17 B13VFK | |
| Schenker XMG Neo 17 M22 | |
| Alienware m17 R5 (R9 6900HX, RX 6850M XT) | |
| PCMark 10 Score | 9016 puntos | |
ayuda | ||
| AIDA64 / Memory Copy | |
| Razer Blade 18 RTX 4070 | |
| Medio Intel Core i9-13900HX (67716 - 79193, n=22) | |
| Eluktronics Mech-17 GP2 | |
| MSI Titan GT77 HX 13VI | |
| MSI Katana 17 B13VFK | |
| Alienware m17 R5 (R9 6900HX, RX 6850M XT) | |
| Schenker XMG Neo 17 M22 | |
| AIDA64 / Memory Read | |
| Razer Blade 18 RTX 4070 | |
| Medio Intel Core i9-13900HX (73998 - 88462, n=22) | |
| Eluktronics Mech-17 GP2 | |
| MSI Titan GT77 HX 13VI | |
| MSI Katana 17 B13VFK | |
| Schenker XMG Neo 17 M22 | |
| Alienware m17 R5 (R9 6900HX, RX 6850M XT) | |
| AIDA64 / Memory Write | |
| Razer Blade 18 RTX 4070 | |
| Medio Intel Core i9-13900HX (65472 - 77045, n=22) | |
| Eluktronics Mech-17 GP2 | |
| MSI Titan GT77 HX 13VI | |
| Schenker XMG Neo 17 M22 | |
| Alienware m17 R5 (R9 6900HX, RX 6850M XT) | |
| MSI Katana 17 B13VFK | |
| AIDA64 / Memory Latency | |
| MSI Katana 17 B13VFK | |
| Alienware m17 R5 (R9 6900HX, RX 6850M XT) | |
| MSI Titan GT77 HX 13VI | |
| Schenker XMG Neo 17 M22 | |
| Eluktronics Mech-17 GP2 | |
| Medio Intel Core i9-13900HX (75.3 - 91.1, n=22) | |
| Razer Blade 18 RTX 4070 | |
* ... más pequeño es mejor
Latencia del CPD
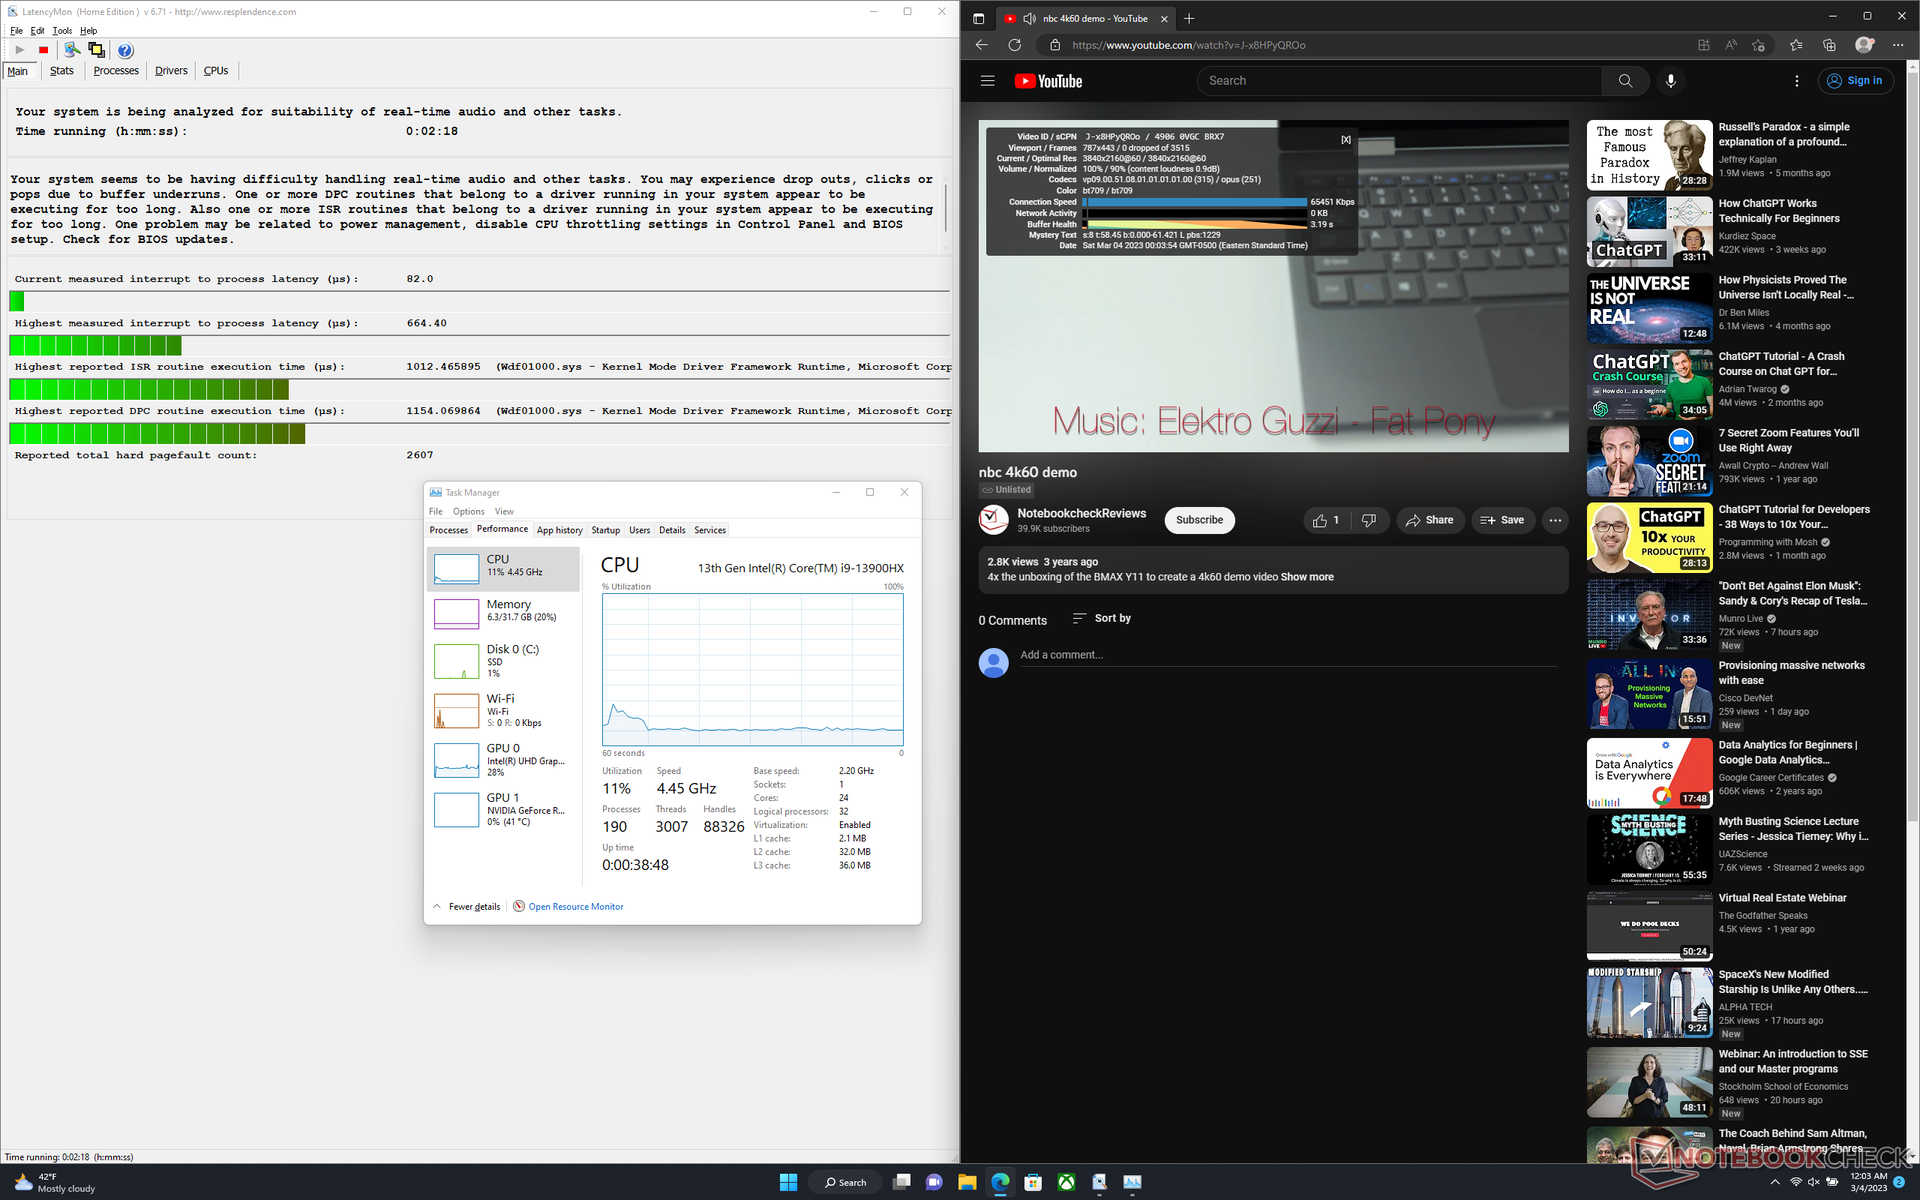
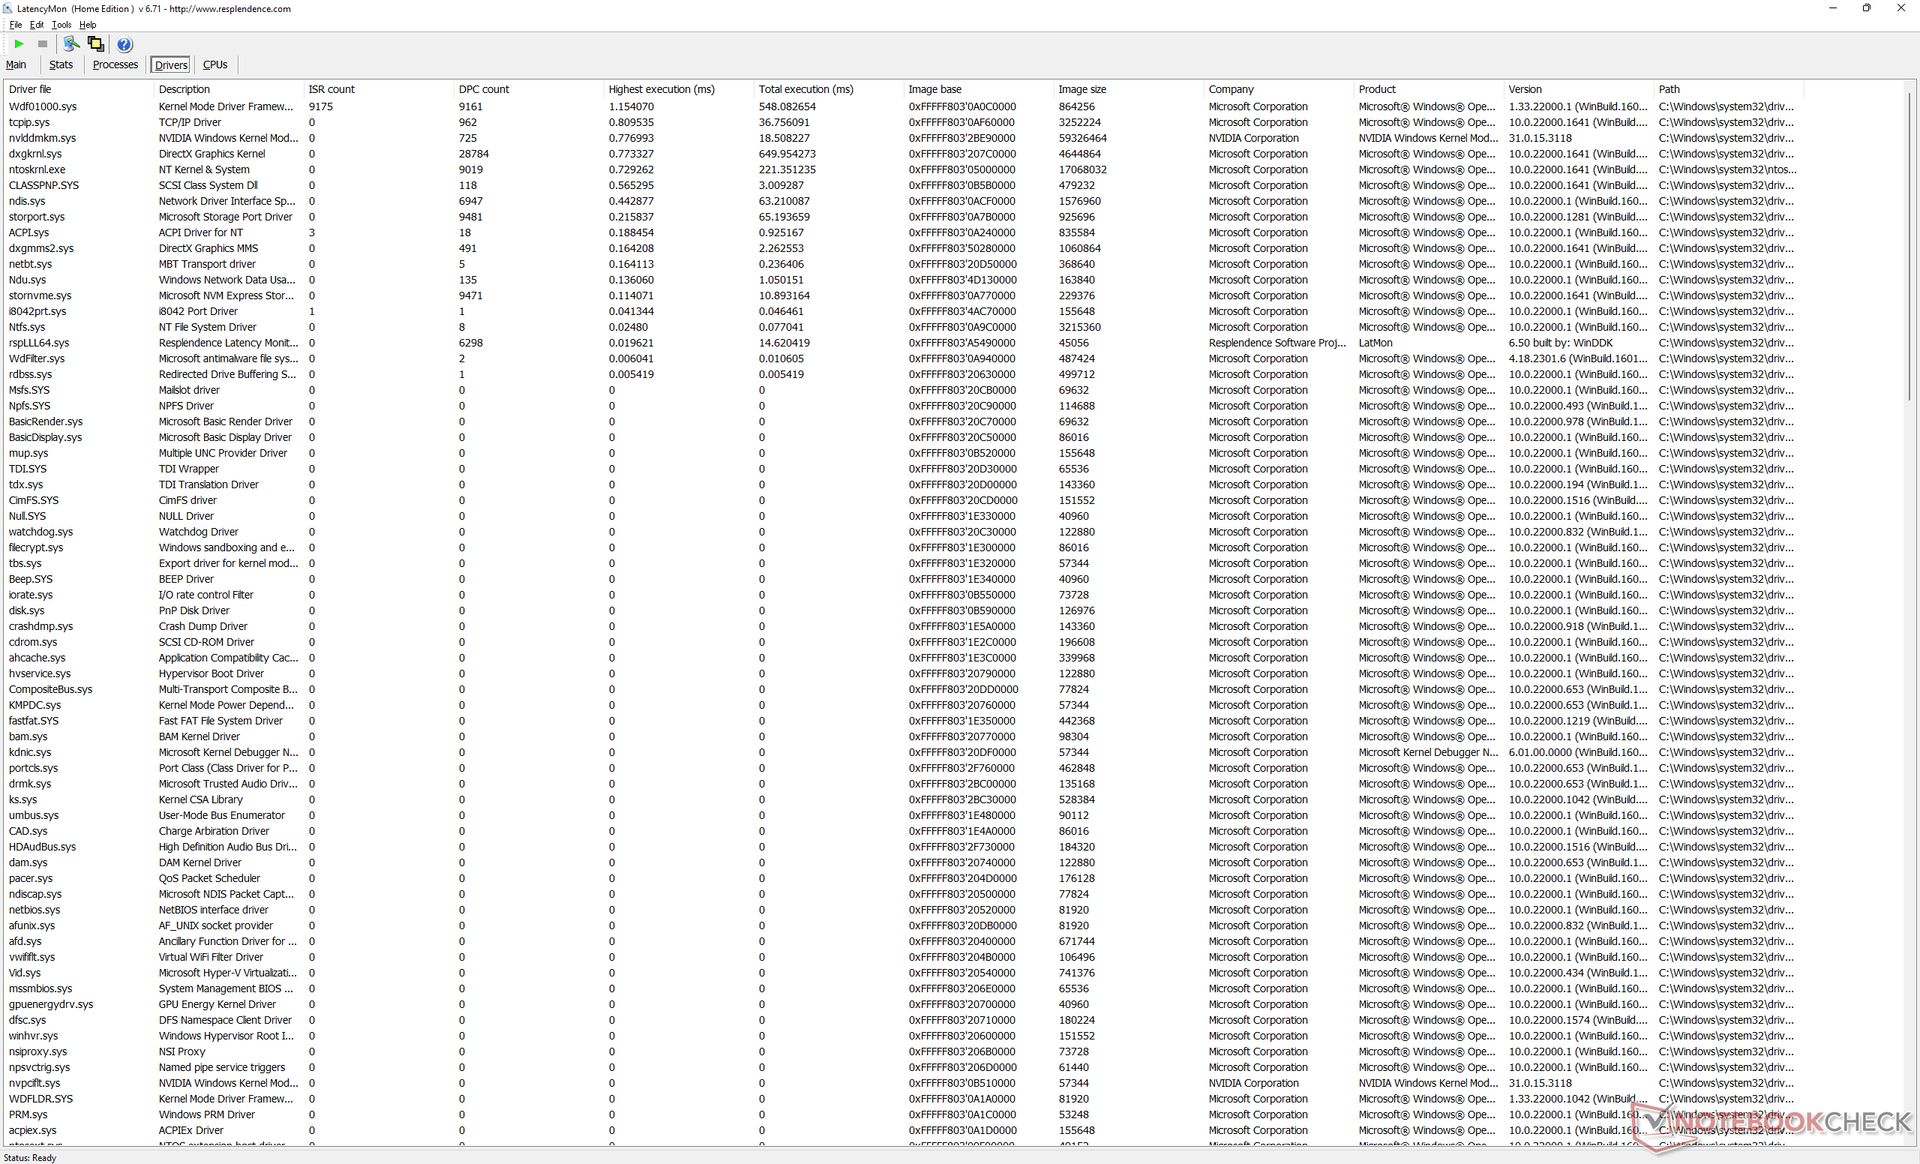
LatencyMon revela problemas menores de CPD al abrir varias pestañas de nuestra página de inicio. por lo demás, la reproducción de vídeo 4K a 60 FPS es perfecta, sin caídas de fotogramas.
| DPC Latencies / LatencyMon - interrupt to process latency (max), Web, Youtube, Prime95 | |
| MSI Titan GT77 HX 13VI | |
| Schenker XMG Neo 17 M22 | |
| MSI Katana 17 B13VFK | |
| Alienware m17 R5 (R9 6900HX, RX 6850M XT) | |
| Razer Blade 18 RTX 4070 | |
| Eluktronics Mech-17 GP2 | |
* ... más pequeño es mejor
Dispositivos de almacenamiento
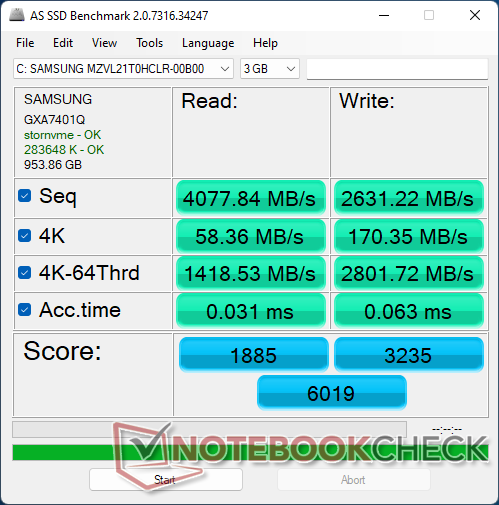
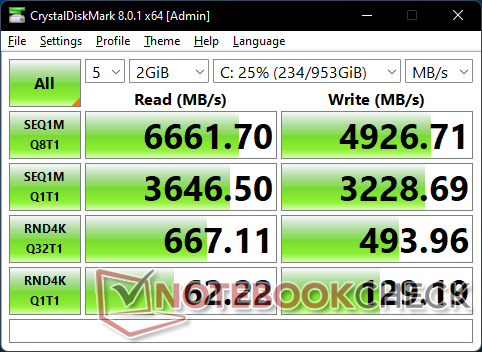
Nuestra unidad se entrega con un Samsung PM9A1 MZVL21T0HCLR que es uno de los SSD NVMe PCIe4 x4 de consumo más rápidos disponibles actualmente. Por desgracia, la unidad de nuestra unidad muestra problemas para mantener las tasas de transferencia máximas durante periodos prolongados, como muestra nuestro gráfico de prueba de estrés a continuación. En comparación, el Razer Blade 15 con la misma unidad Samsung es capaz de mantener tasas de transferencia de 6700 MB/s sin problemas.

| Drive Performance rating - Percent | |
| Schenker XMG Neo 17 M22 | |
| MSI Titan GT77 HX 13VI | |
| Razer Blade 18 RTX 4070 | |
| MSI Katana 17 B13VFK | |
| Eluktronics Mech-17 GP2 | |
| Alienware m17 R5 (R9 6900HX, RX 6850M XT) | |
* ... más pequeño es mejor
Disk Throttling: DiskSpd Read Loop, Queue Depth 8
Rendimiento de la GPU
El rendimiento general es entre un 40 y un 60 por ciento más rápido que el de la rTX 3080 Ti móvil para estar más o menos a la par con la rTX 3080 Ti de sobremesa. Activar DLSS 3 en los títulos compatibles aumenta el rendimiento aún más, entre 2 y 3 veces, aunque con posibles artefactos gráficos.
La mayoría de los juegos pueden ejecutarse a 4K nativos y 60 FPS si los efectos RT no son compatibles o están desactivados. Las excepciones son títulos muy exigentes como Cyberpunk 2077 o F1 22, en los que las frecuencias de cuadro rondarían los 40 o 50 FPS. En estos casos, G-Sync y DLSS pueden resultar útiles para reducir el tearing y aumentar el rendimiento, respectivamente.
Optar por la configuración RTX 4080 o RTX 4070 en lugar de la RTX 4090 reducirá el rendimiento gráfico entre un 10 y un 15 % y entre un 40 y un 45 %, respectivamente. Por tanto, el delta de rendimiento entre la 4090 y la 4080 es mucho menor que el delta de rendimiento entre la 4080 y la 4070, aunque la diferencia de precio sea de 500 $ fijos entre cada paso.
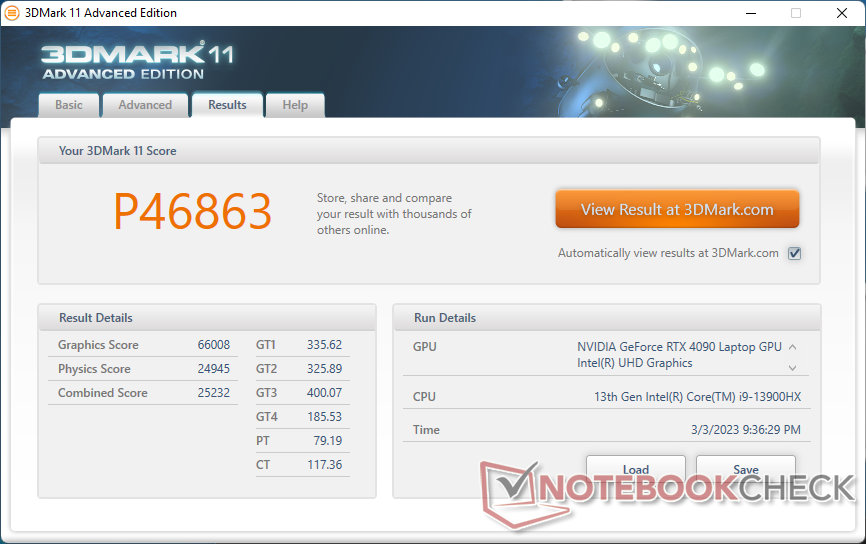
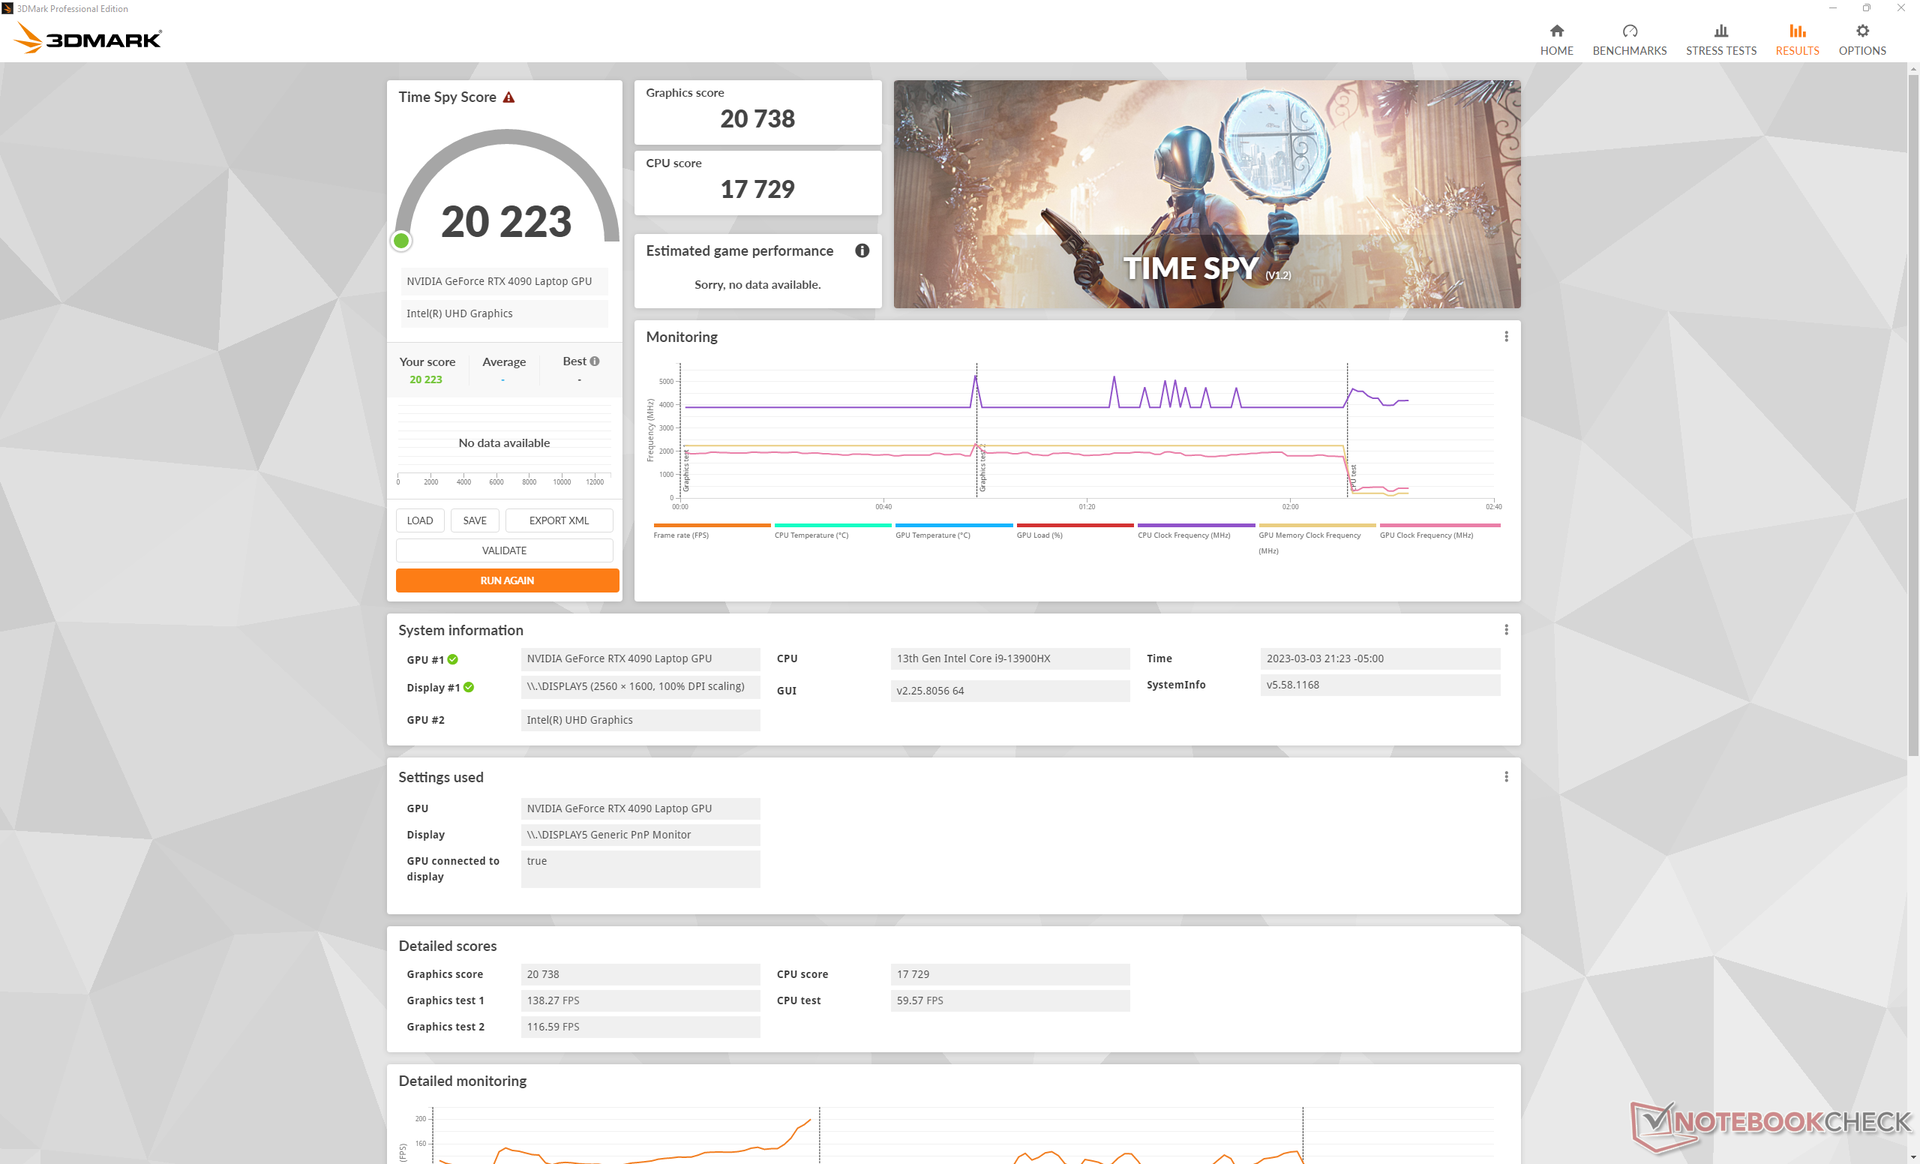
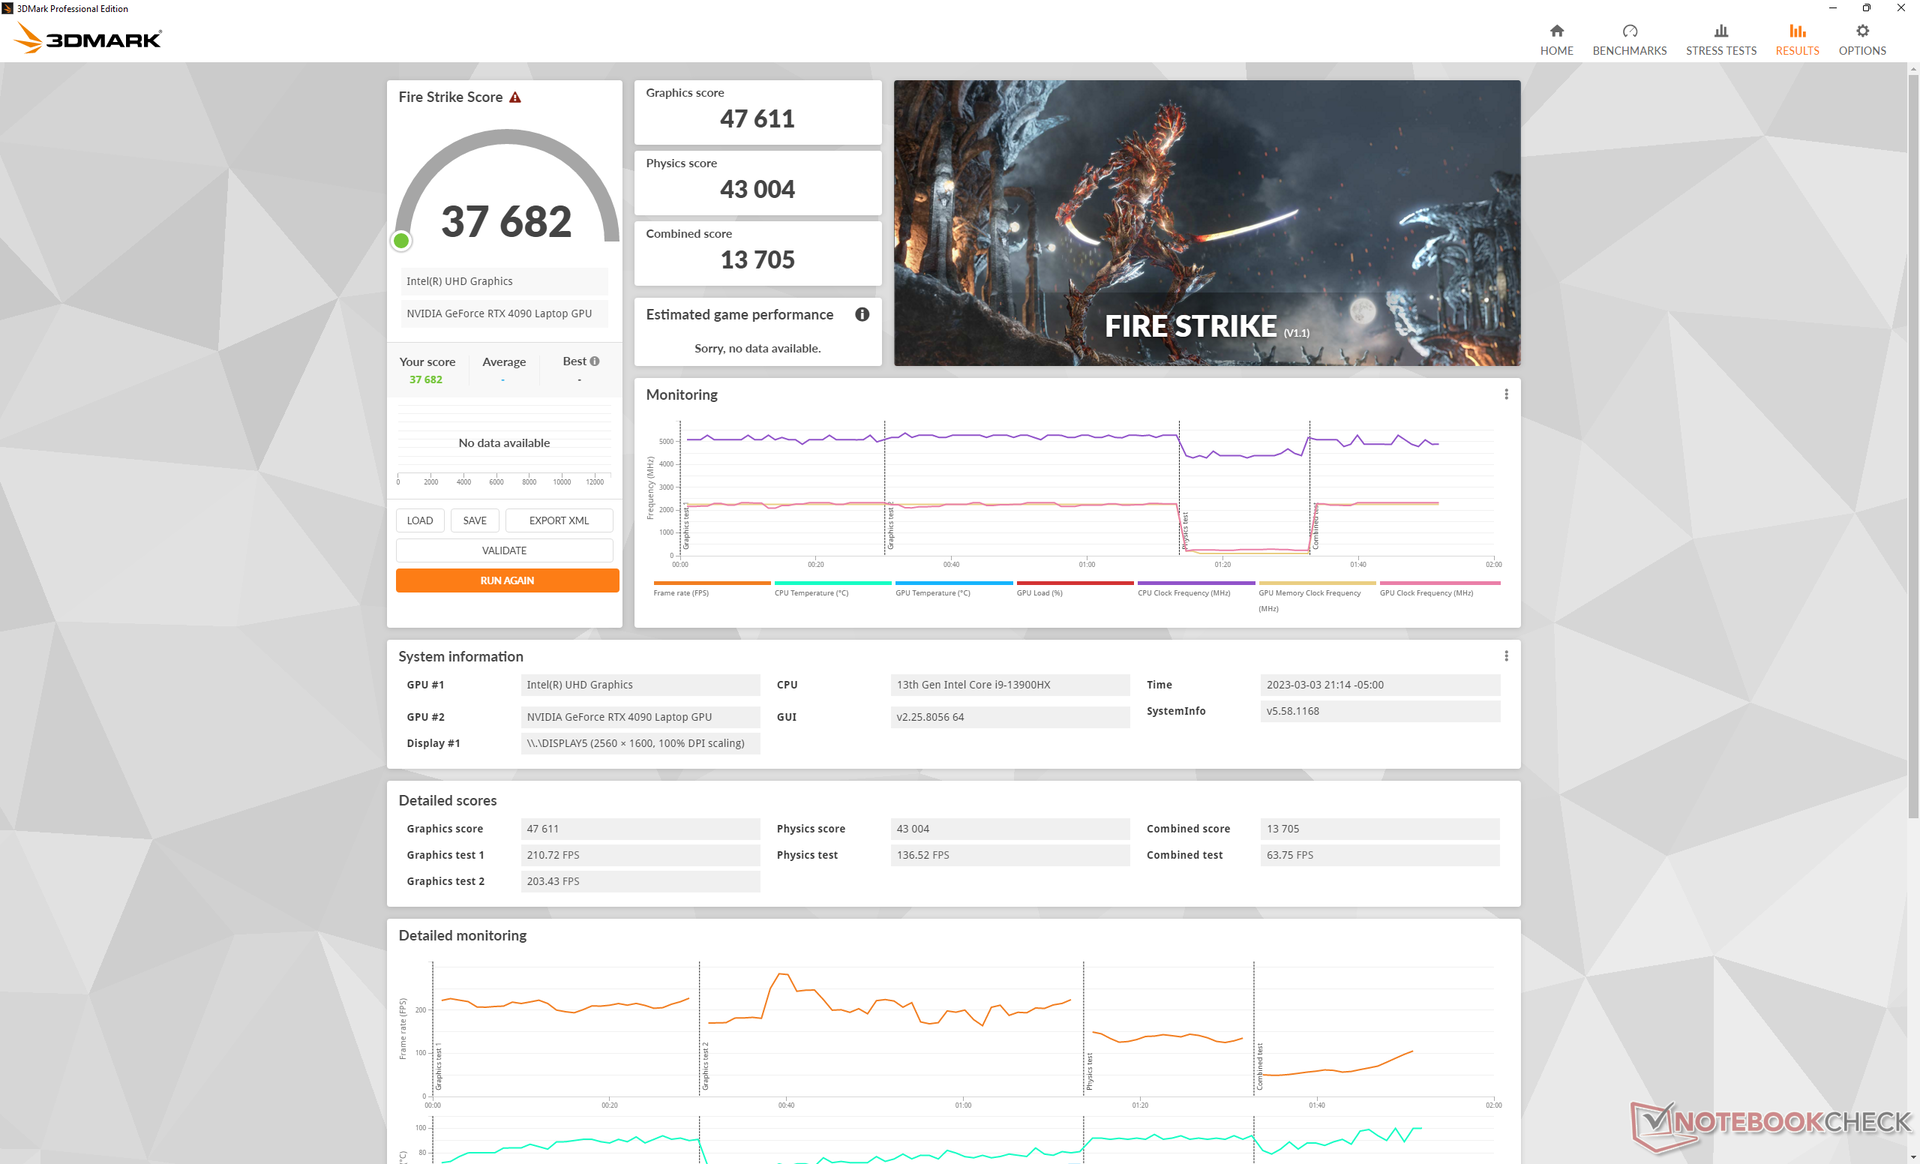
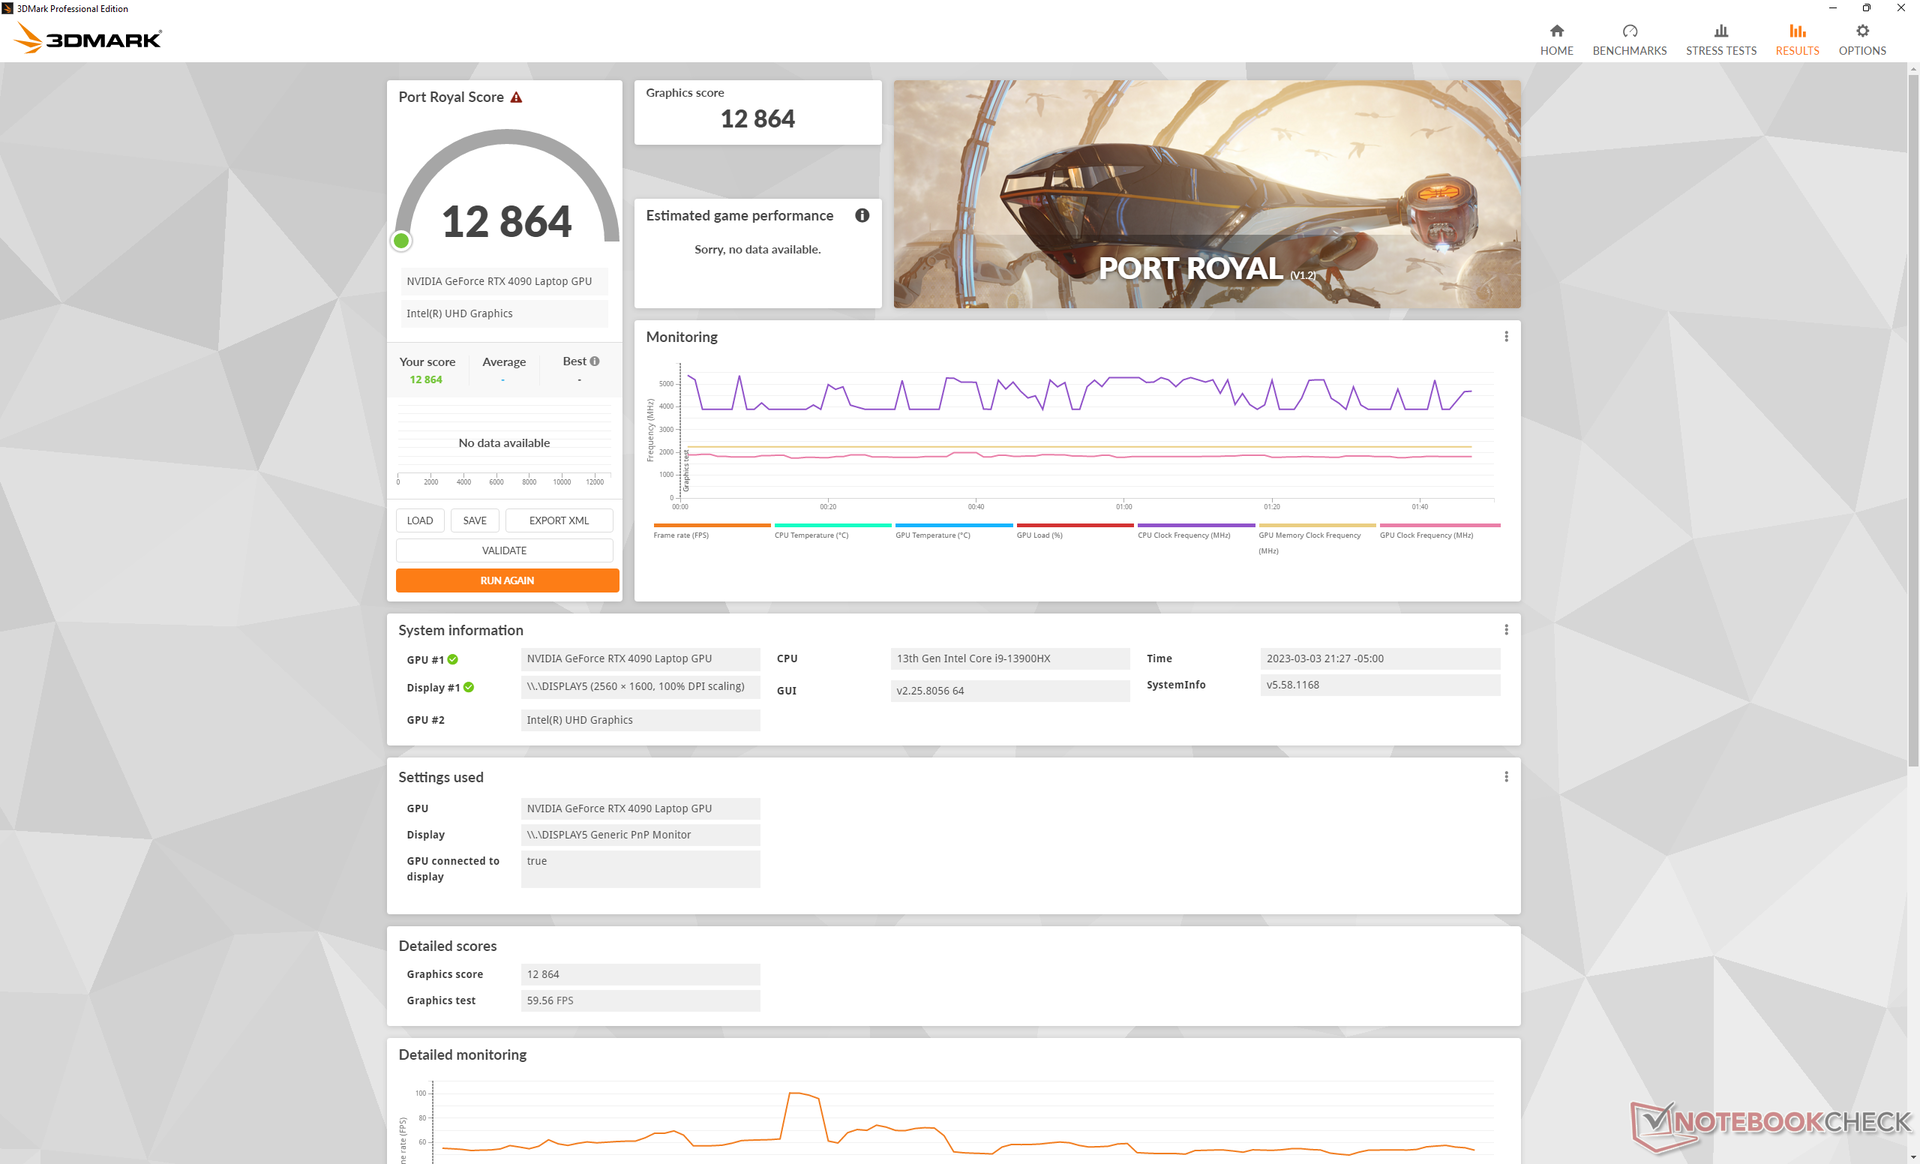
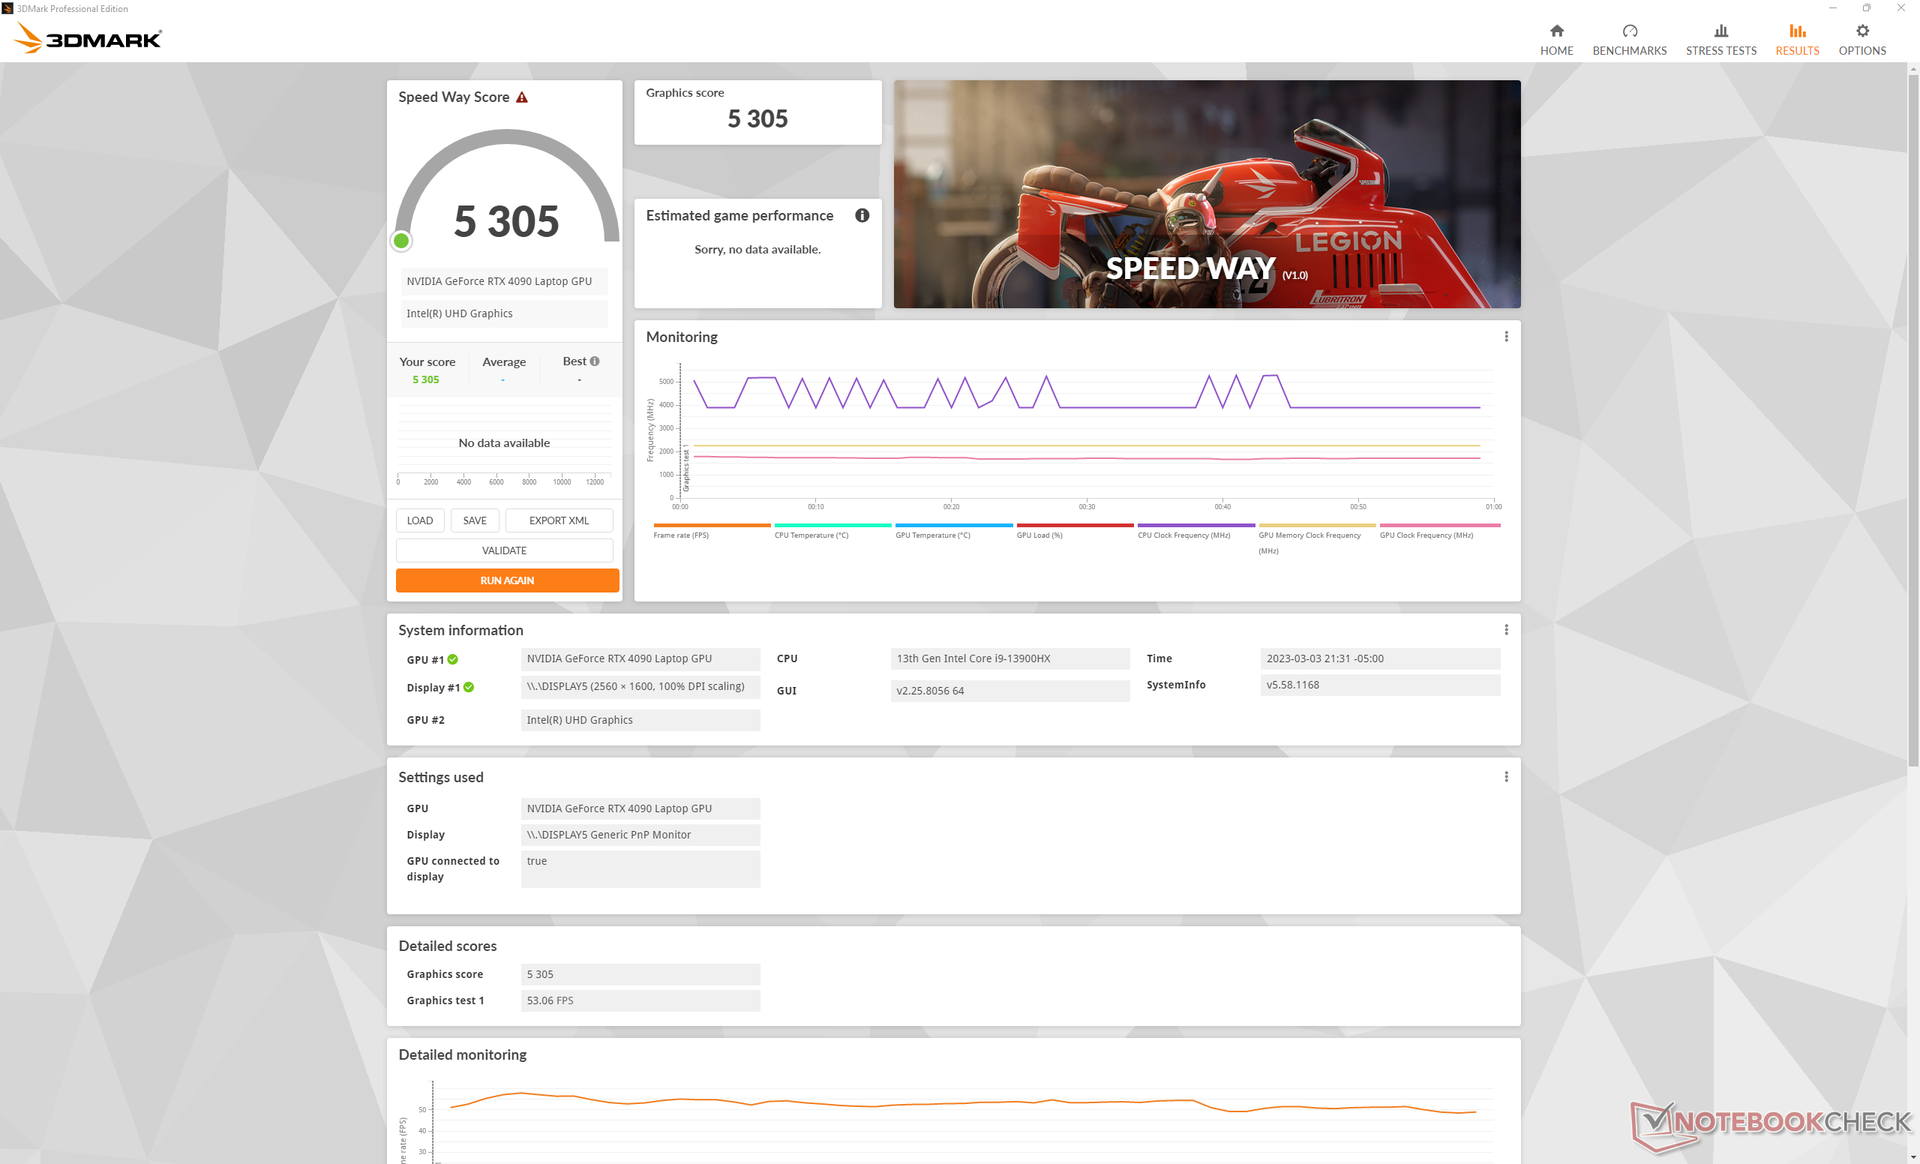
| 3DMark 11 Performance | 46863 puntos | |
| 3DMark Fire Strike Score | 37682 puntos | |
| 3DMark Time Spy Score | 20223 puntos | |
ayuda | ||
* ... más pequeño es mejor
| The Witcher 3 - 1920x1080 Ultra Graphics & Postprocessing (HBAO+) | |
| Schenker XMG SECTOR, i9 13900K, RTX 4090 | |
| Eluktronics Mech-17 GP2 | |
| Corsair One i300 | |
| MSI Titan GT77 12UHS | |
| Schenker XMG Neo 17 M22 | |
| Razer Blade 18 RTX 4070 | |
| MSI Katana 17 B13VFK | |
| MSI GS76 Stealth 11UH | |
| MSI Pulse GL76 12UGK | |
| HP Omen 16-n0033dx | |
| Schenker XMG Core 17 (Early 2021) | |
| Cyberpunk 2077 1.6 - 1920x1080 Ultra Preset | |
| Schenker XMG SECTOR, i9 13900K, RTX 4090 | |
| Eluktronics Mech-17 GP2 | |
| MSI Titan GT77 12UHS | |
| Razer Blade 18 RTX 4070 | |
| MSI Katana 17 B13VFK | |
| MSI Pulse GL76 12UGK | |
| HP Omen 16-n0033dx | |
Witcher 3 FPS Chart
| bajo | medio | alto | ultra | QHD | 4K | |
|---|---|---|---|---|---|---|
| GTA V (2015) | 187.5 | 187.2 | 186.5 | 149.8 | 146.3 | 180.2 |
| The Witcher 3 (2015) | 717.7 | 617.3 | 449 | 216.3 | 167.6 | |
| Dota 2 Reborn (2015) | 243 | 216 | 205 | 192.5 | 186.7 | |
| Final Fantasy XV Benchmark (2018) | 233 | 230 | 194.9 | 157.1 | 90.8 | |
| X-Plane 11.11 (2018) | 212 | 188.8 | 146.4 | 124.7 | ||
| Strange Brigade (2018) | 656 | 508 | 465 | 421 | 315 | 163.4 |
| Metro Exodus (2019) | 240.1 | 207.1 | 173.8 | 146.5 | 127.7 | 82.1 |
| Borderlands 3 (2019) | 284.2 | 269.7 | 238.5 | 179.7 | 129.4 | 72.2 |
| Cyberpunk 2077 1.6 (2022) | 191.1 | 178.6 | 166.9 | 159.7 | 101.3 | 47.8 |
| F1 22 (2022) | 375 | 358 | 322 | 140.6 | 91.8 | 45.3 |
Emisiones
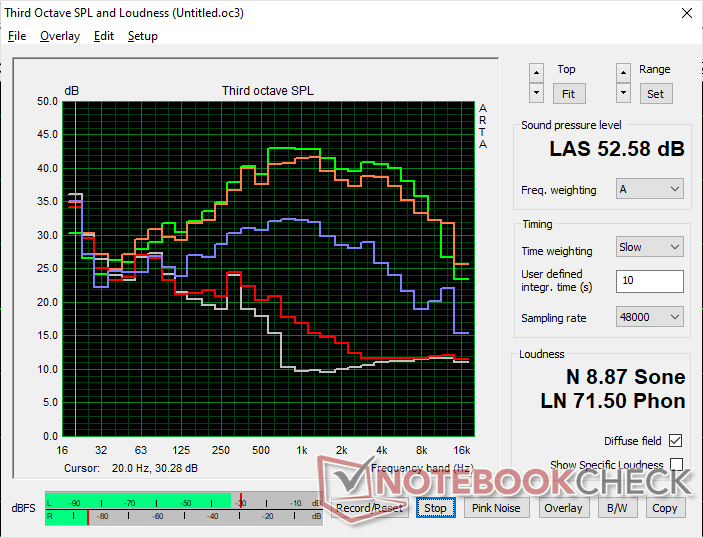
Ruido del sistema
Aunque se han realizado ajustes en la solución de refrigeración en comparación con el modelo del año pasado, el ruido general de los ventiladores sigue siendo prácticamente el mismo. Los ventiladores internos están siempre activos sin importar la configuración o la carga en pantalla. Recomendamos el modo Oficina o el modo Equilibrado si no se ejecuta ninguna aplicación intensiva, ya que los ventiladores se vuelven notablemente más silenciosos y letárgicos.
Cuando se juega en modo Rendimiento o modo "Bestia", el ruido de los ventiladores se sitúa entre 50 y 52 dB(A), similar al del Alienware m17 R5 o el Razer Blade 18 en condiciones similares. Los auriculares son casi una necesidad para el ruido del ventilador por encima de 50 dB (A) cuando se juega.
El metal líquido Thermal Grizzly viene de serie en todas las configuraciones.
Ruido
| Ocioso |
| 28 / 28 / 30.4 dB(A) |
| Carga |
| 41 / 52.6 dB(A) |
 | ||
30 dB silencioso 40 dB(A) audible 50 dB(A) ruidosamente alto |
||
min: | ||
| Eluktronics Mech-17 GP2 GeForce RTX 4090 Laptop GPU, i9-13900HX, Samsung PM9A1 MZVL21T0HCLR | Schenker XMG Neo 17 M22 GeForce RTX 3080 Ti Laptop GPU, R9 6900HX, Samsung SSD 980 Pro 1TB MZ-V8P1T0BW | MSI Katana 17 B13VFK GeForce RTX 4060 Laptop GPU, i7-13620H, Micron 2400 MTFDKBA1T0QFM | MSI Titan GT77 HX 13VI GeForce RTX 4090 Laptop GPU, i9-13950HX, Samsung PM9A1 MZVL22T0HBLB | Alienware m17 R5 (R9 6900HX, RX 6850M XT) Radeon RX 6850M XT, R9 6900HX, SSSTC CA6-8D1024 | Razer Blade 18 RTX 4070 GeForce RTX 4070 Laptop GPU, i9-13950HX, SSSTC CA6-8D1024 | |
|---|---|---|---|---|---|---|
| Noise | -8% | -6% | -7% | 10% | 9% | |
| apagado / medio ambiente * (dB) | 25.2 | 26 -3% | 24.5 3% | 24.6 2% | 23 9% | 23.5 7% |
| Idle Minimum * (dB) | 28 | 26 7% | 24.5 12% | 29.2 -4% | 23 18% | 23.8 15% |
| Idle Average * (dB) | 28 | 29 -4% | 24.5 12% | 29.2 -4% | 28.11 -0% | 23.8 15% |
| Idle Maximum * (dB) | 30.4 | 40 -32% | 40 -32% | 29.2 4% | 28.11 8% | 26.8 12% |
| Load Average * (dB) | 41 | 47 -15% | 48.3 -18% | 50.7 -24% | 30.62 25% | 37.3 9% |
| Witcher 3 ultra * (dB) | 50.7 | 52 -3% | 56 -10% | 53.3 -5% | 49.75 2% | 48 5% |
| Load Maximum * (dB) | 52.6 | 54 -3% | 59.1 -12% | 61 -16% | 50.17 5% | 53.5 -2% |
* ... más pequeño es mejor
Temperatura
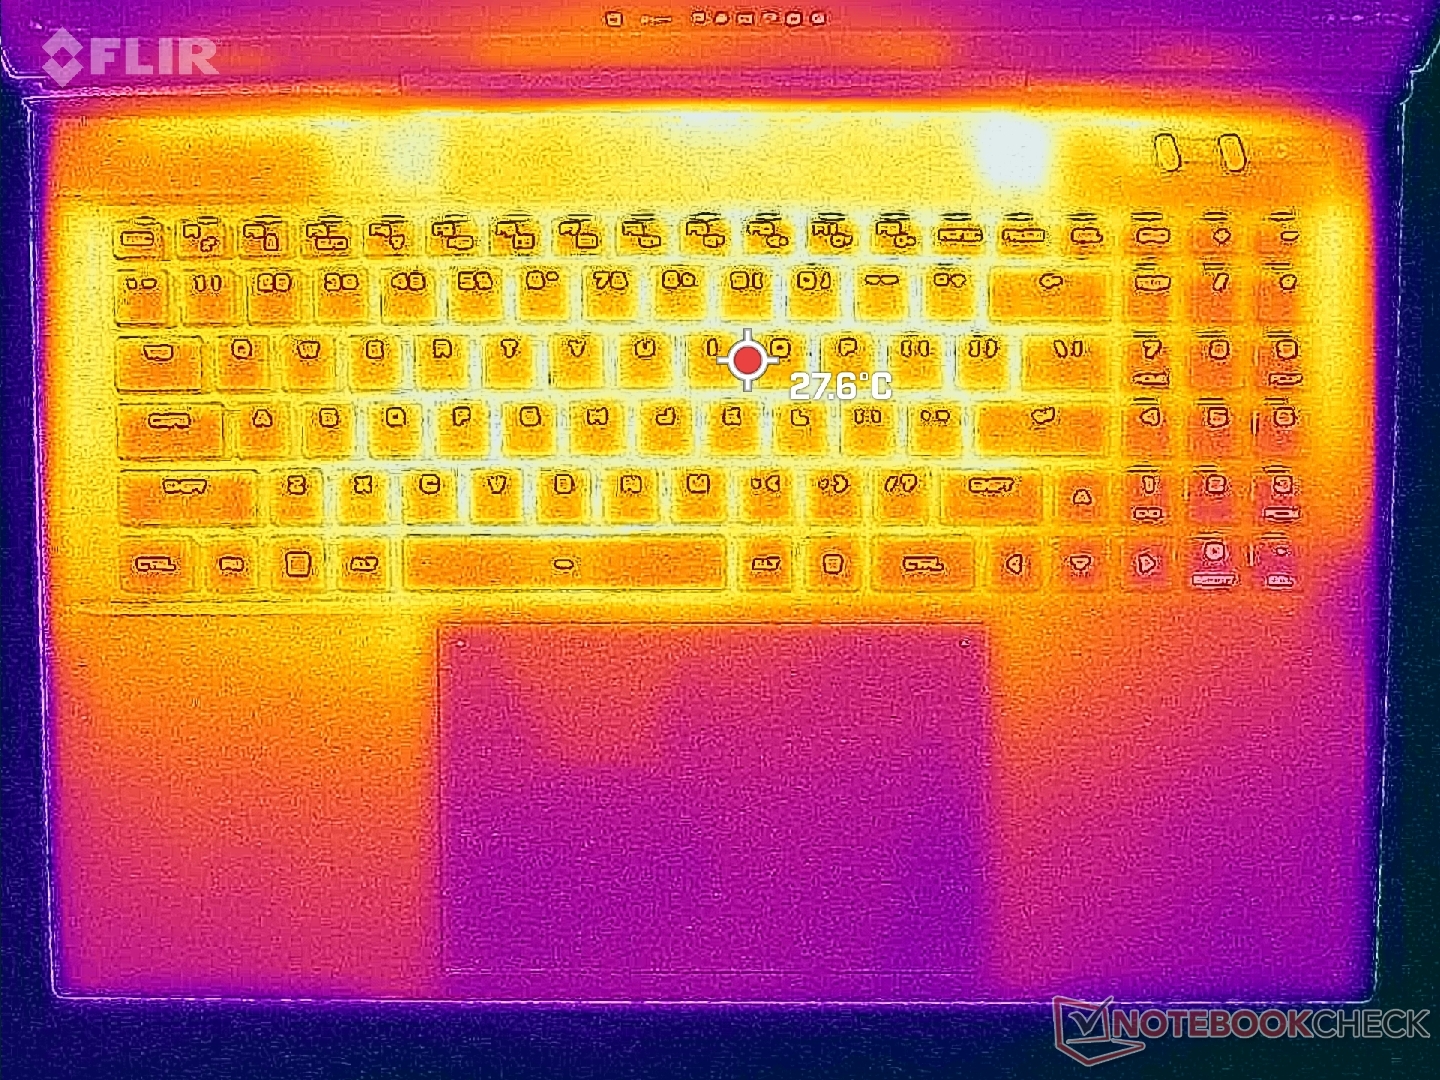
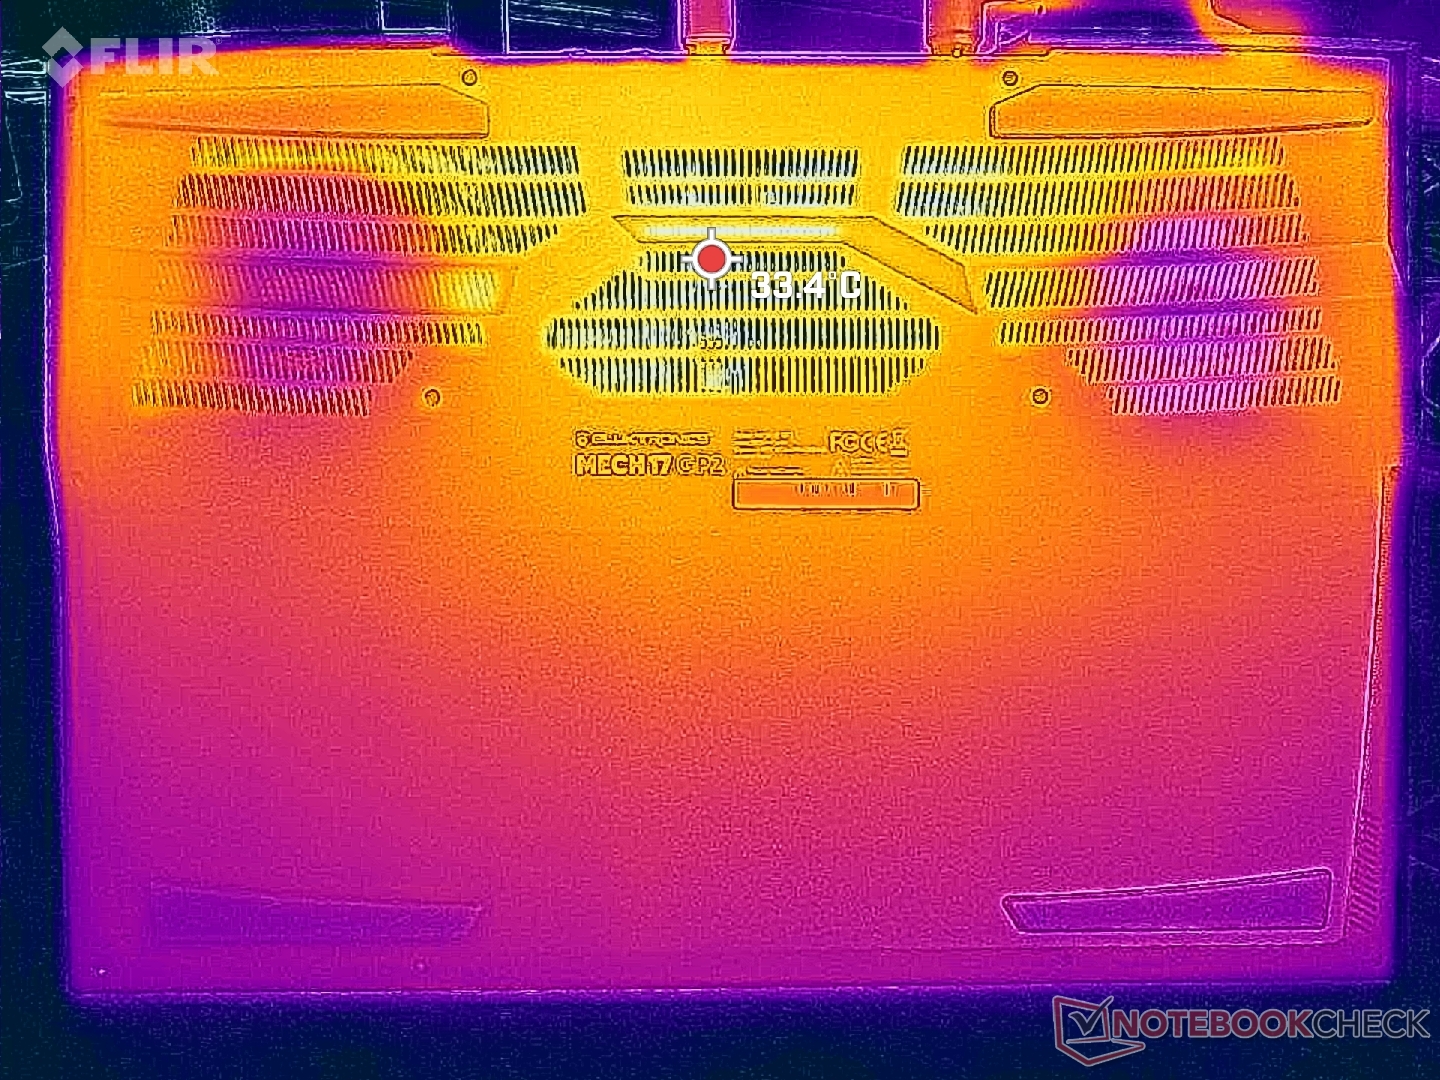
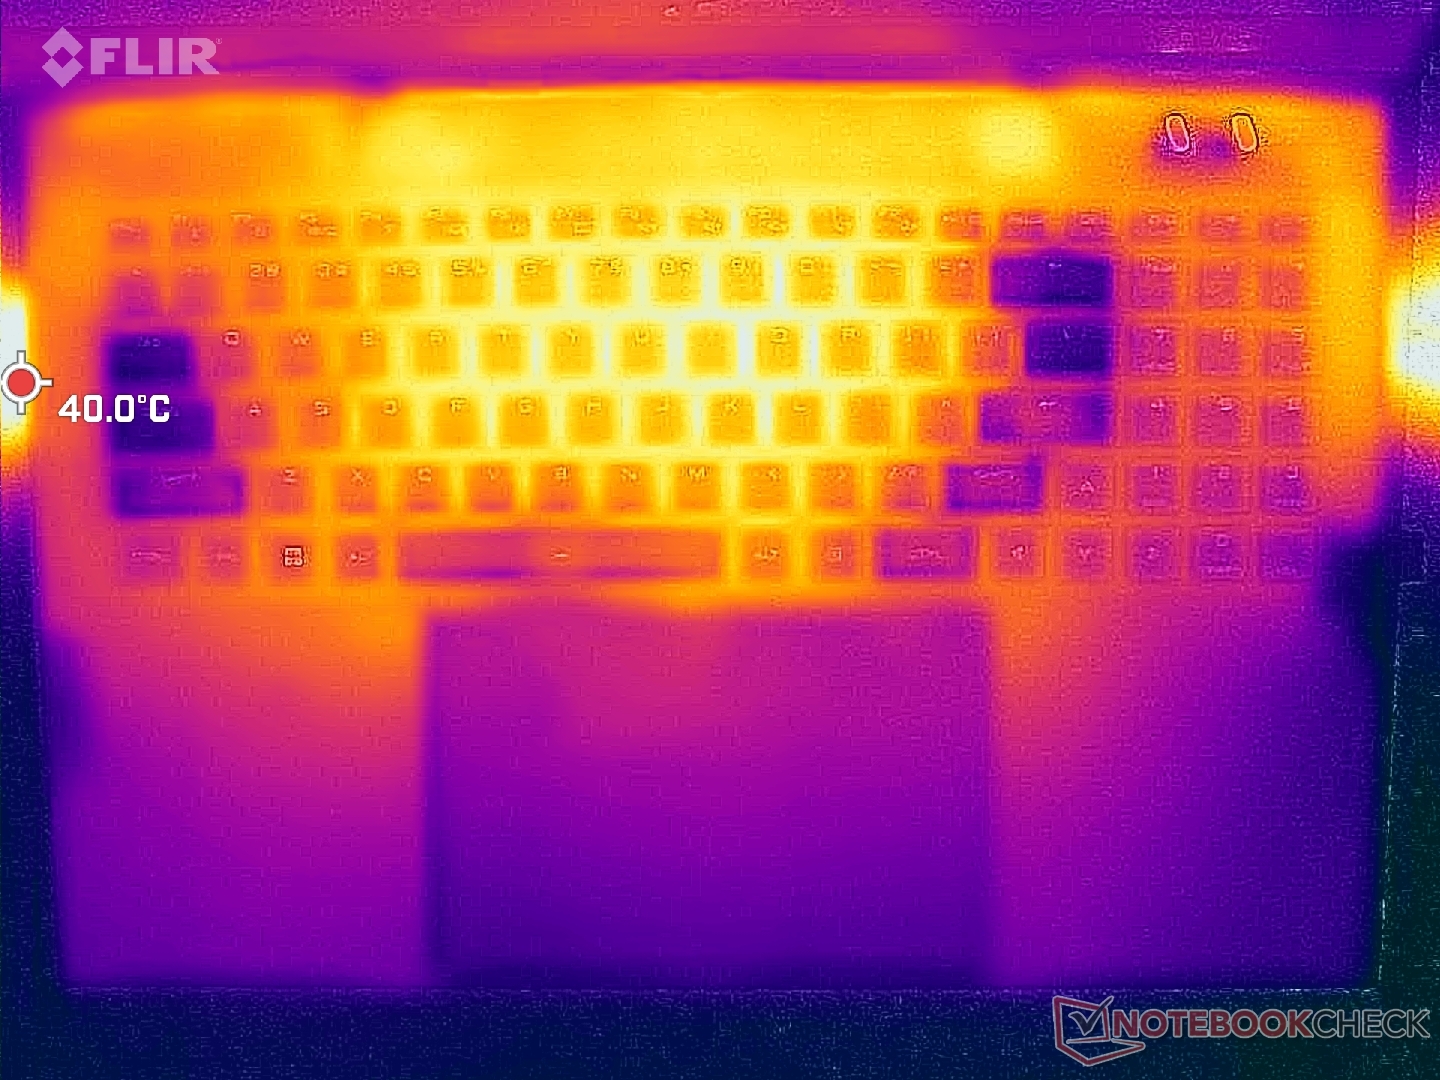
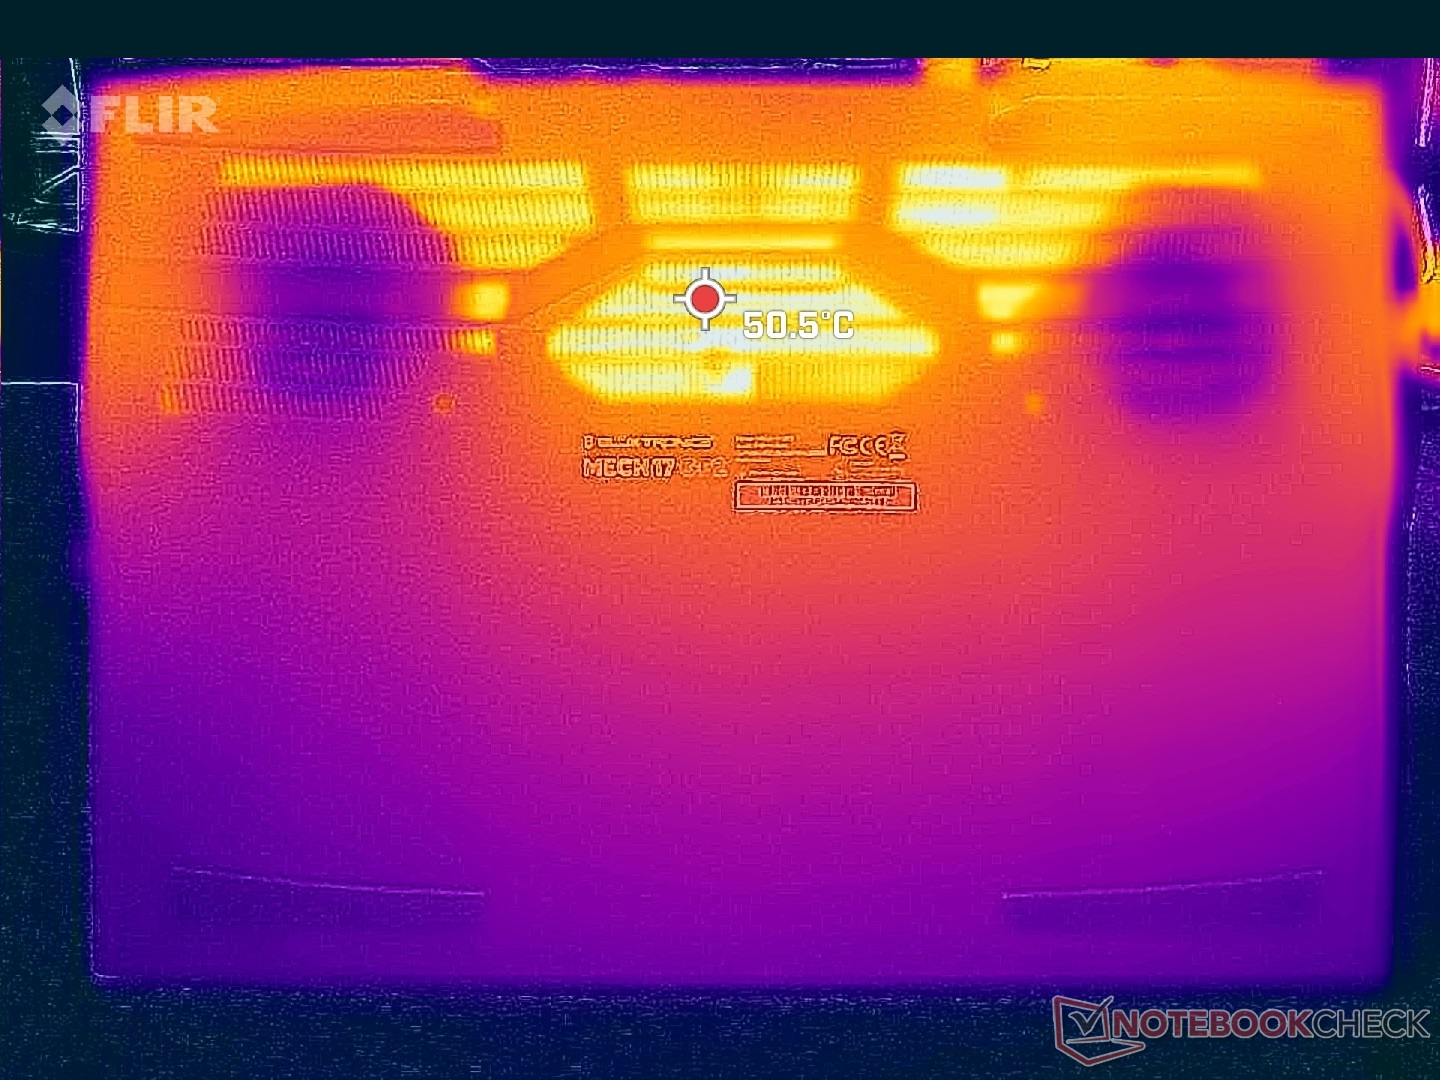
Las temperaturas de la superficie son más cálidas hacia el centro y más frías a lo largo de los laterales del teclado y los reposamuñecas. El aire fresco entra por las teclas WASD para mantener los dedos frescos mientras se juega. Los puntos calientes de 39 C a 44 C son más fríos que los que registramos en el Alienware m17 R5 donde los puntos calientes pueden alcanzar de 50 C a 57 C en condiciones de juego similares.
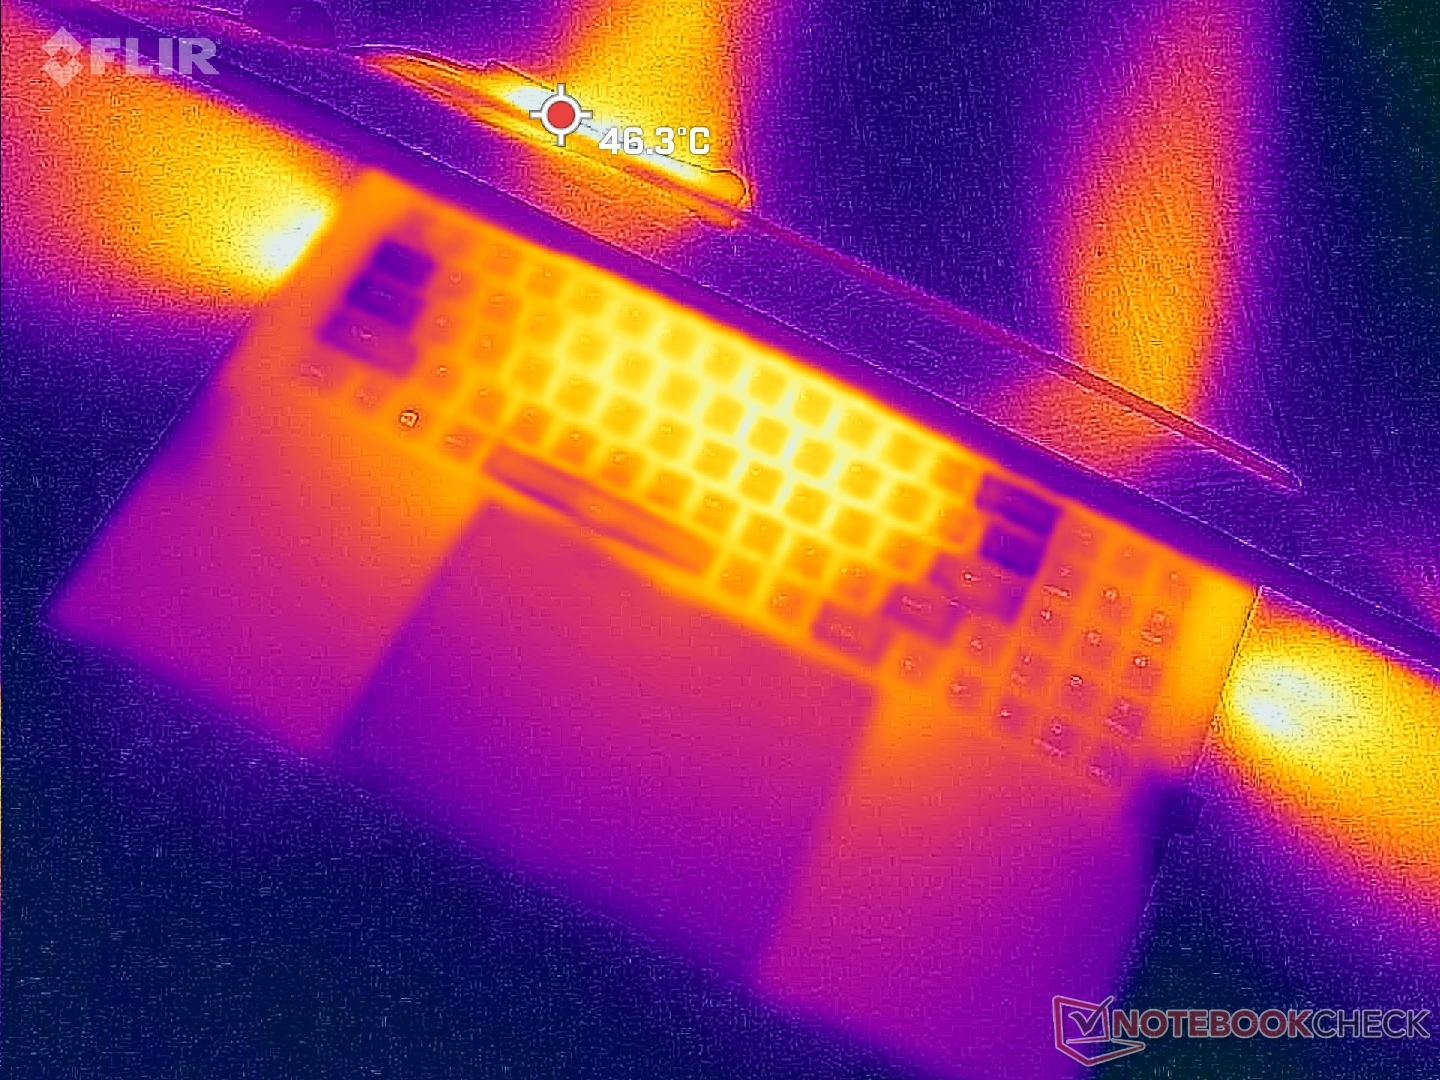
(+) La temperatura máxima en la parte superior es de 39 °C / 102 F, frente a la media de 40.4 °C / 105 F, que oscila entre 21.2 y 68.8 °C para la clase Gaming.
(±) El fondo se calienta hasta un máximo de 44 °C / 111 F, frente a la media de 43.2 °C / 110 F
(+) En reposo, la temperatura media de la parte superior es de 27.5 °C / 82# F, frente a la media del dispositivo de 33.9 °C / 93 F.
(+) El reposamanos y el panel táctil están a una temperatura inferior a la de la piel, con un máximo de 25 °C / 77 F y, por tanto, son fríos al tacto.
(+) La temperatura media de la zona del reposamanos de dispositivos similares fue de 28.8 °C / 83.8 F (+3.8 °C / 6.8 F).
| Eluktronics Mech-17 GP2 Intel Core i9-13900HX, NVIDIA GeForce RTX 4090 Laptop GPU | Schenker XMG Neo 17 M22 AMD Ryzen 9 6900HX, NVIDIA GeForce RTX 3080 Ti Laptop GPU | MSI Katana 17 B13VFK Intel Core i7-13620H, NVIDIA GeForce RTX 4060 Laptop GPU | MSI Titan GT77 HX 13VI Intel Core i9-13950HX, NVIDIA GeForce RTX 4090 Laptop GPU | Alienware m17 R5 (R9 6900HX, RX 6850M XT) AMD Ryzen 9 6900HX, AMD Radeon RX 6850M XT | Razer Blade 18 RTX 4070 Intel Core i9-13950HX, NVIDIA GeForce RTX 4070 Laptop GPU | |
|---|---|---|---|---|---|---|
| Heat | -13% | -7% | 4% | -14% | 1% | |
| Maximum Upper Side * (°C) | 39 | 49 -26% | 41.6 -7% | 40.6 -4% | 53 -36% | 39.2 -1% |
| Maximum Bottom * (°C) | 44 | 52 -18% | 43.1 2% | 41.1 7% | 56 -27% | 35.6 19% |
| Idle Upper Side * (°C) | 31 | 30 3% | 32 -3% | 26.2 15% | 30 3% | 31.8 -3% |
| Idle Bottom * (°C) | 29.8 | 33 -11% | 35.8 -20% | 30.3 -2% | 29 3% | 33.2 -11% |
* ... más pequeño es mejor
Prueba de resistencia
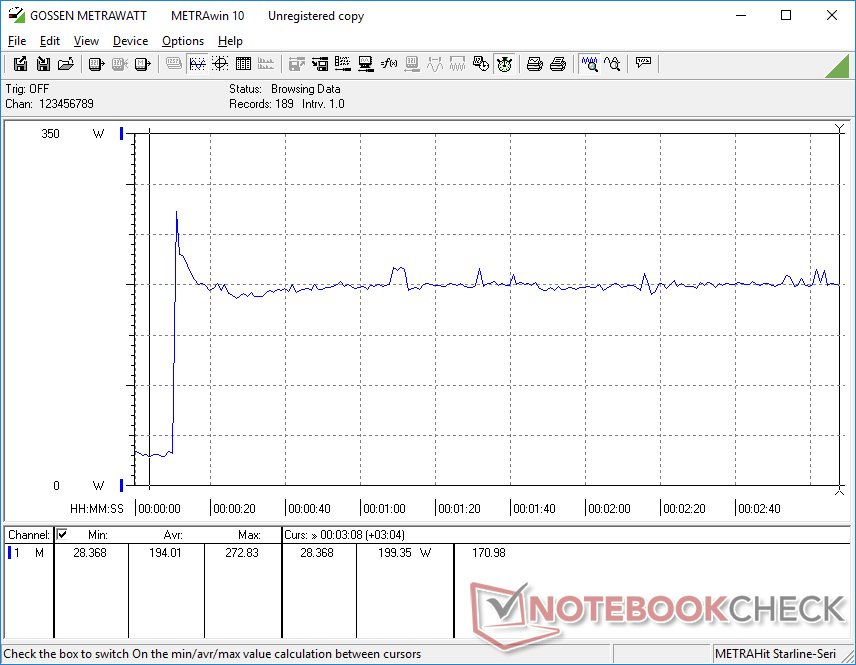
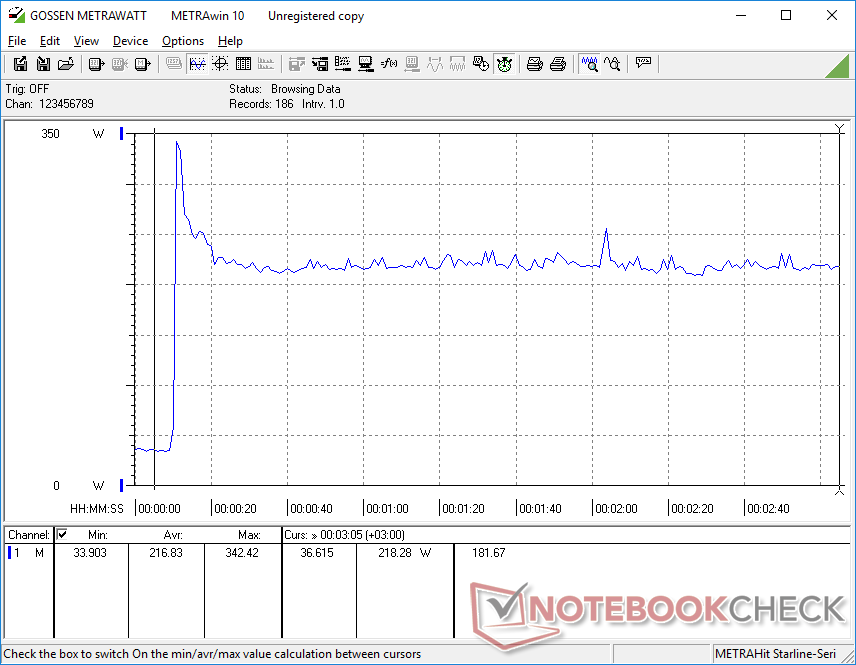
Cuando se sometió a Prime95, la CPU alcanzó los 4,7 GHz, 160 W y 96 C durante sólo uno o dos segundos antes de descender inmediatamente a 4,1 GHz y 107 W. La temperatura del núcleo, sin embargo, se mantuvo muy alta, en 96 C. Tras unos minutos más, la frecuencia de reloj descendió a 3,4 GHz con cambios mínimos en la temperatura y el consumo de la placa.
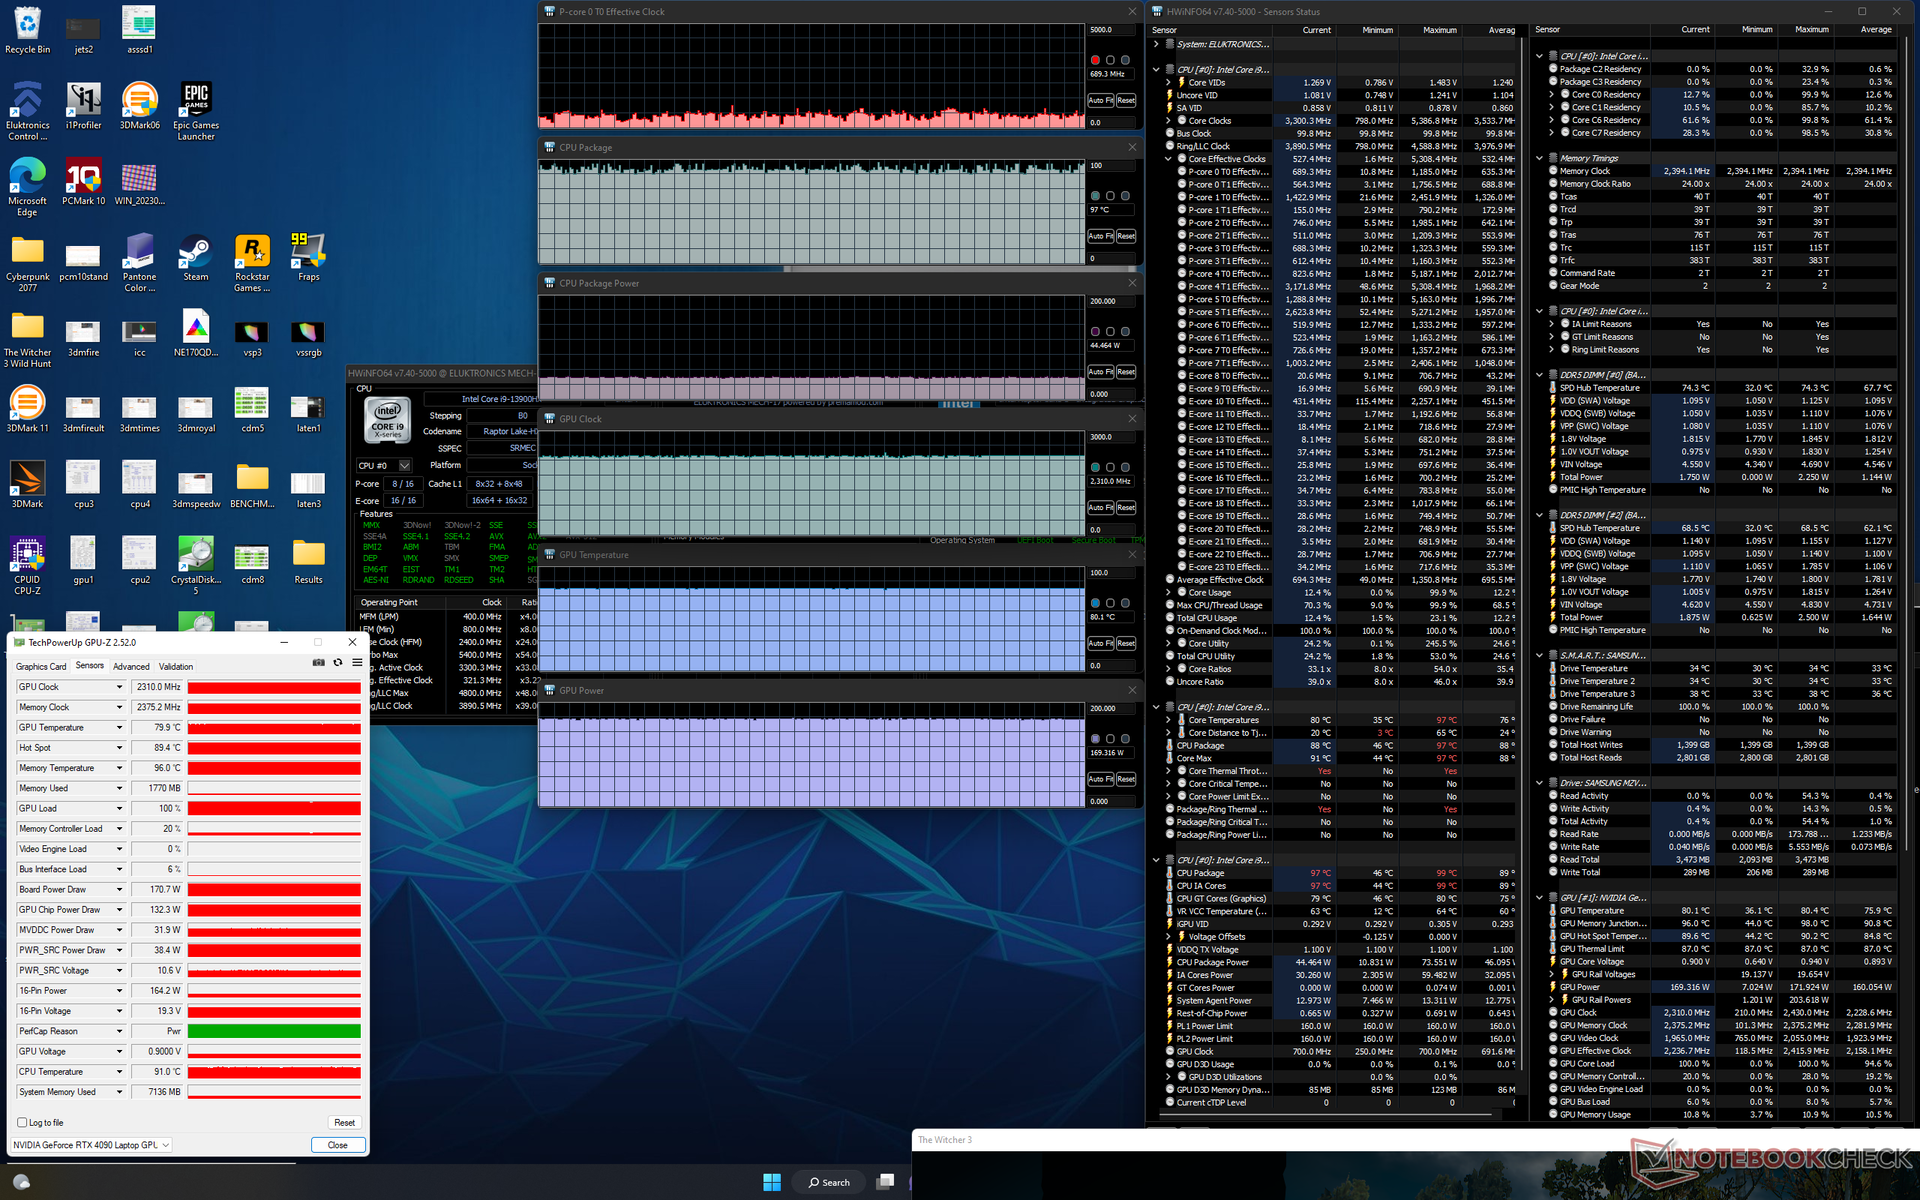
La velocidad de reloj de la GPU, la temperatura y el consumo de energía se estabilizan en 2.310 MHz, 80 C y 169 W, respectivamente, al ejecutar Witcher 3. La GPU está preparada para un TGP de 175 W, por lo que el consumo real de 169 W se aproxima bastante. Por desgracia, la temperatura de la CPU se mantendría alta, en 96 C, frente a los 85 C o 66 C del Razer Blade 18(RTX 4070) o la MSI GT77respectivamente.
Ejecutar Prime95 y FurMark simultáneamente durante más de varios minutos colapsó nuestra unidad todas y cada una de las veces. Sospechamos que las altas temperaturas del núcleo son responsables del apagado y reinicio automáticos. La mayoría de los portátiles reducirían el rendimiento bajo cargas tan extremas para evitar fallos.
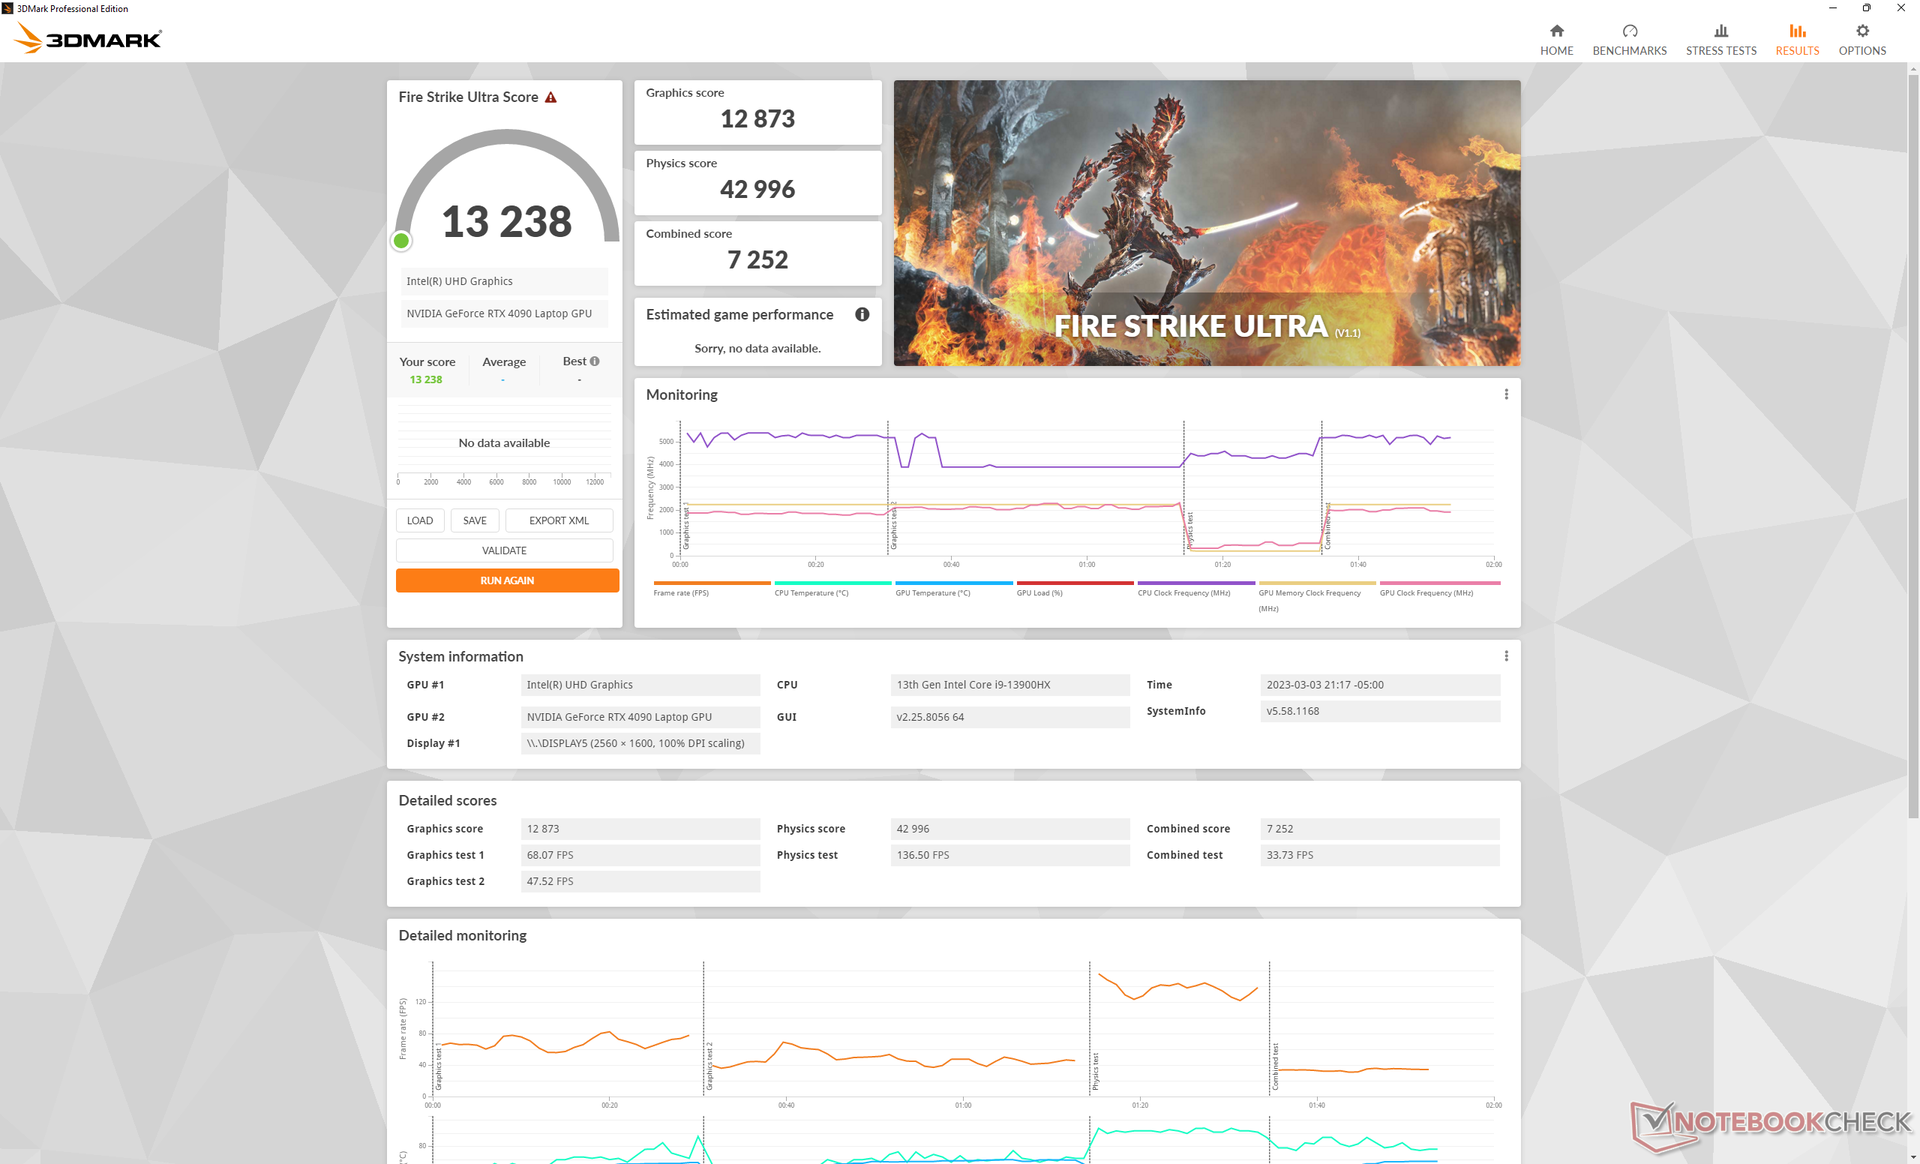
Funcionar con batería limita mucho el rendimiento. Un test Fire Strike con baterías arrojaría unas puntuaciones de Física y Gráficos de 11430 y 11496 puntos, respectivamente, comparados con los 43004 y 47611 puntos con alimentación de red.
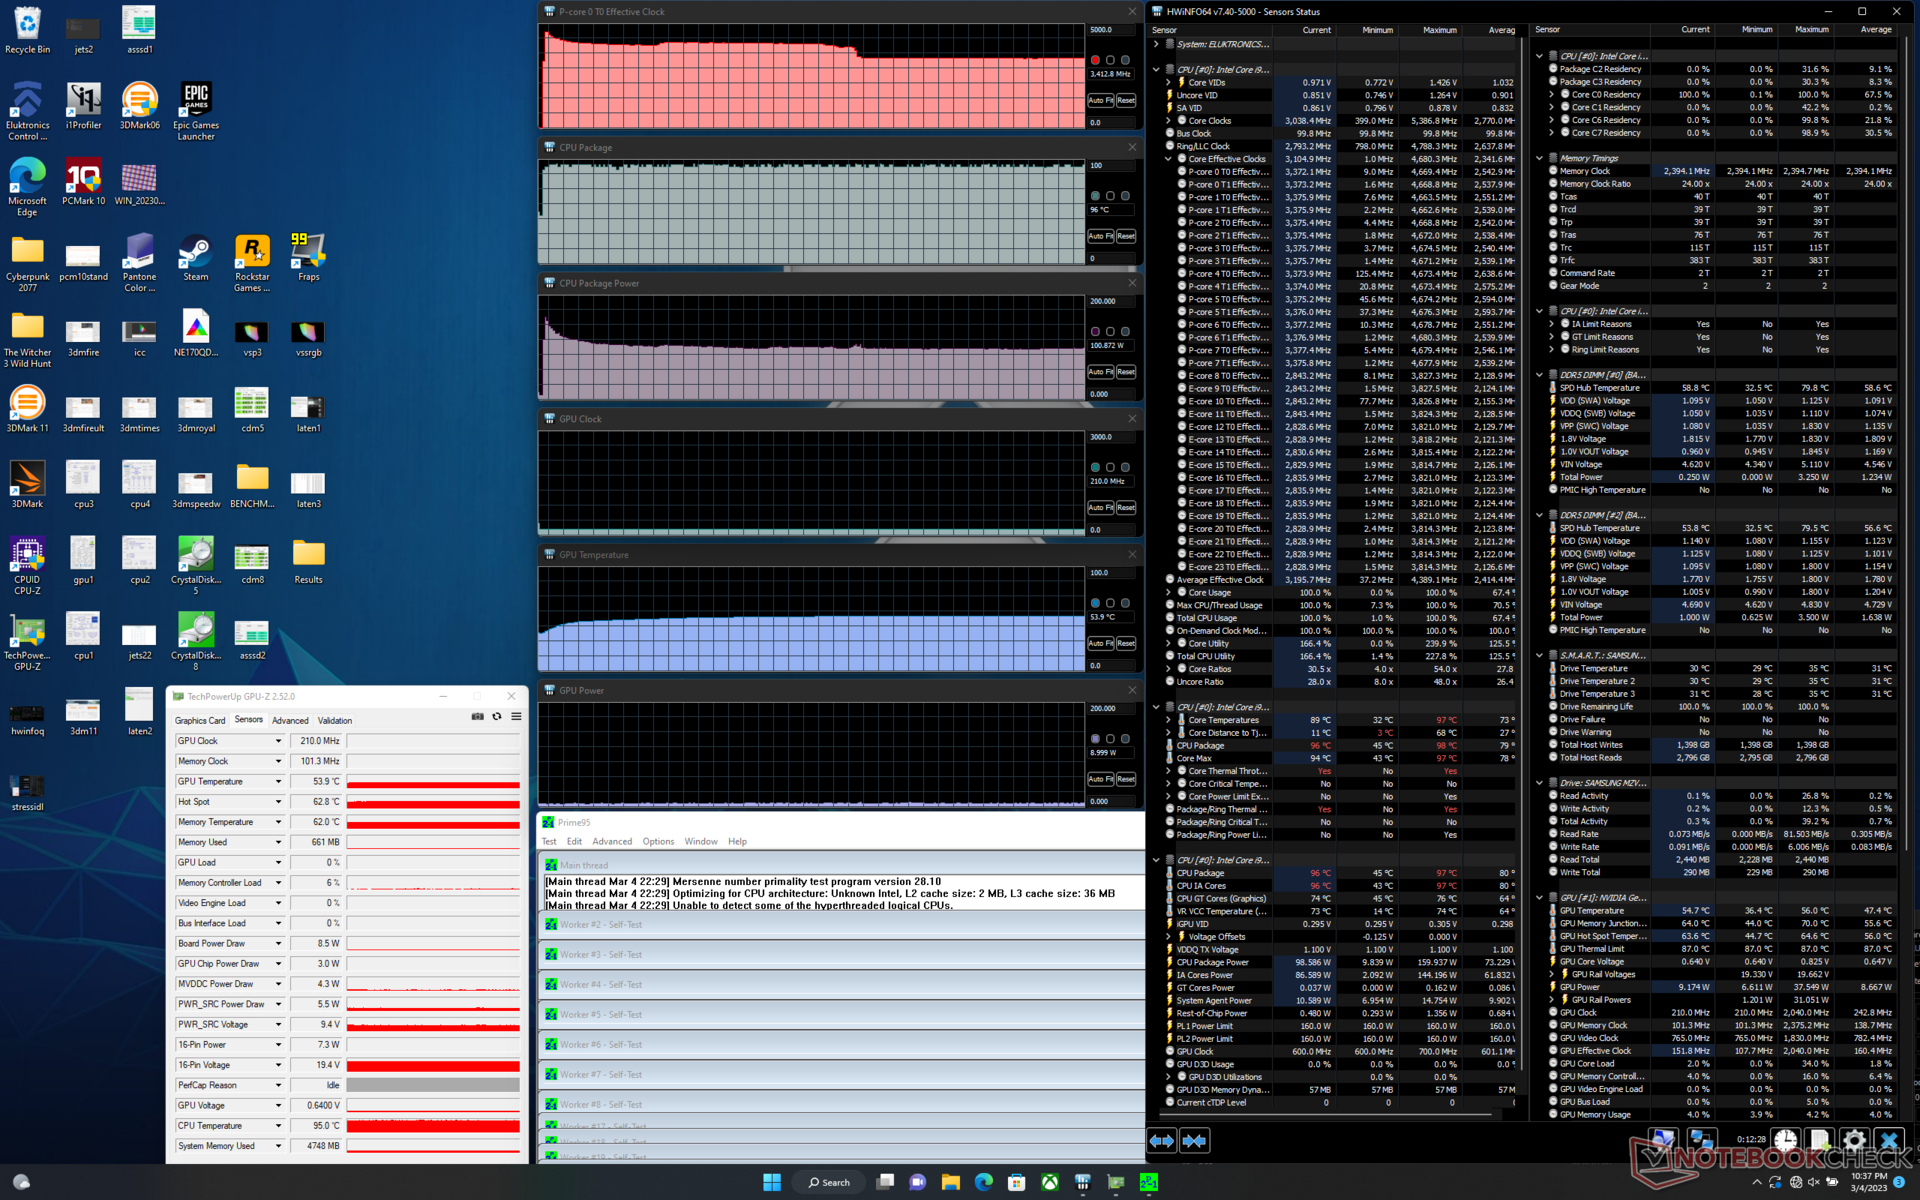
| RelojCPU (GHz) | Reloj GPU (MHz) | Temperatura mediaCPU (°C) | Temperatura media GPU (°C) | |
| Sistema en reposo | -- | -- | 47 | 37 |
| Prime95 Estrés | 3,4 | -- | 96 | 54 |
| Witcher 3 Estrés | ~0,7 | 2310 | 97 | 80 |
Altavoces
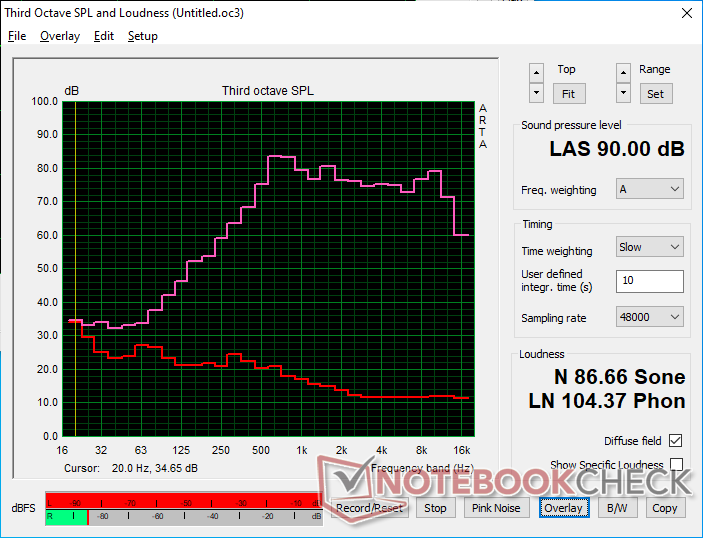
Eluktronics Mech-17 GP2 análisis de audio
(+) | los altavoces pueden reproducir a un volumen relativamente alto (#90 dB)
Graves 100 - 315 Hz
(-) | casi sin bajos - de media 22.5% inferior a la mediana
(±) | la linealidad de los graves es media (7.3% delta a frecuencia anterior)
Medios 400 - 2000 Hz
(+) | medios equilibrados - a sólo 4.4% de la mediana
(±) | la linealidad de los medios es media (7.4% delta respecto a la frecuencia anterior)
Altos 2 - 16 kHz
(+) | máximos equilibrados - a sólo 1.3% de la mediana
(+) | los máximos son lineales (2.7% delta a la frecuencia anterior)
Total 100 - 16.000 Hz
(±) | la linealidad del sonido global es media (15% de diferencia con la mediana)
En comparación con la misma clase
» 32% de todos los dispositivos probados de esta clase eran mejores, 6% similares, 62% peores
» El mejor tuvo un delta de 6%, la media fue 18%, el peor fue ###max##%
En comparación con todos los dispositivos probados
» 21% de todos los dispositivos probados eran mejores, 4% similares, 75% peores
» El mejor tuvo un delta de 4%, la media fue 23%, el peor fue ###max##%
Apple MacBook Pro 16 2021 M1 Pro análisis de audio
(+) | los altavoces pueden reproducir a un volumen relativamente alto (#84.7 dB)
Graves 100 - 315 Hz
(+) | buen bajo - sólo 3.8% lejos de la mediana
(+) | el bajo es lineal (5.2% delta a la frecuencia anterior)
Medios 400 - 2000 Hz
(+) | medios equilibrados - a sólo 1.3% de la mediana
(+) | los medios son lineales (2.1% delta a la frecuencia anterior)
Altos 2 - 16 kHz
(+) | máximos equilibrados - a sólo 1.9% de la mediana
(+) | los máximos son lineales (2.7% delta a la frecuencia anterior)
Total 100 - 16.000 Hz
(+) | el sonido global es lineal (4.6% de diferencia con la mediana)
En comparación con la misma clase
» 0% de todos los dispositivos probados de esta clase eran mejores, 0% similares, 100% peores
» El mejor tuvo un delta de 5%, la media fue 17%, el peor fue ###max##%
En comparación con todos los dispositivos probados
» 0% de todos los dispositivos probados eran mejores, 0% similares, 100% peores
» El mejor tuvo un delta de 4%, la media fue 23%, el peor fue ###max##%
Gestión de la energía
Consumo de energía
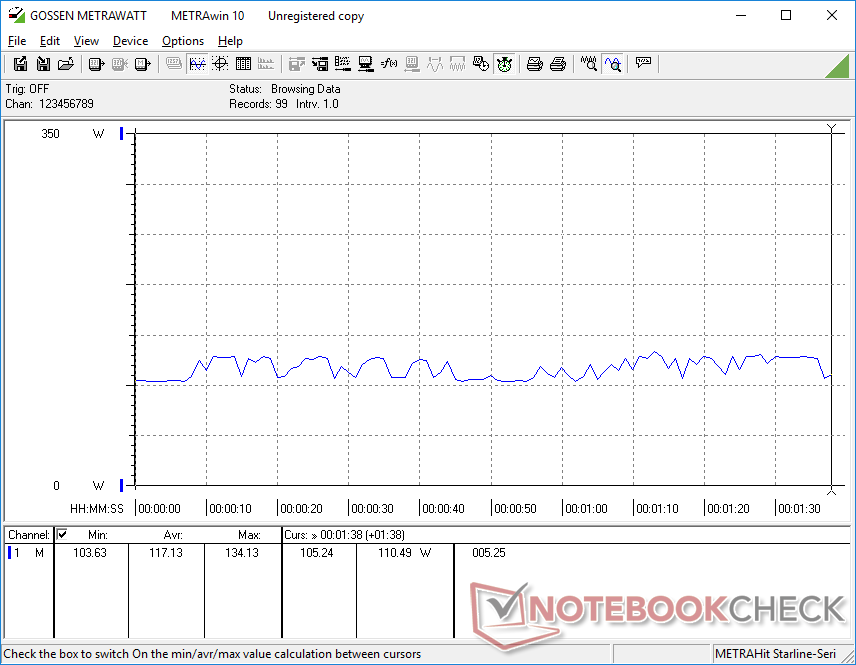
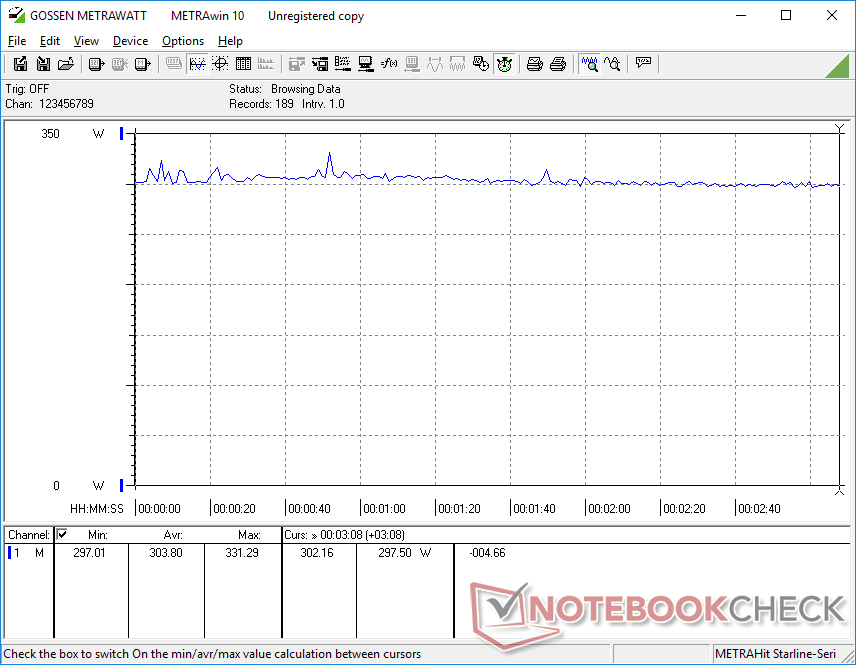
El consumo general de energía es notablemente superior en todos los ámbitos al que registramos en el modelo AMD-Ampere 2022. Por ejemplo, simplemente en reposo en el escritorio consumiría entre 14 W y 37 W, frente a los escasos 7 W a 17 W de la versión 2022. Los juegos exigen un 37 % más de energía en nuestra unidad 2023, pero el rendimiento por vatio sigue siendo muy bueno, ya que los usuarios obtienen entre un 40 y un 60 % más de rendimiento gráfico con respecto a la RTX 3080 Ti portátil.
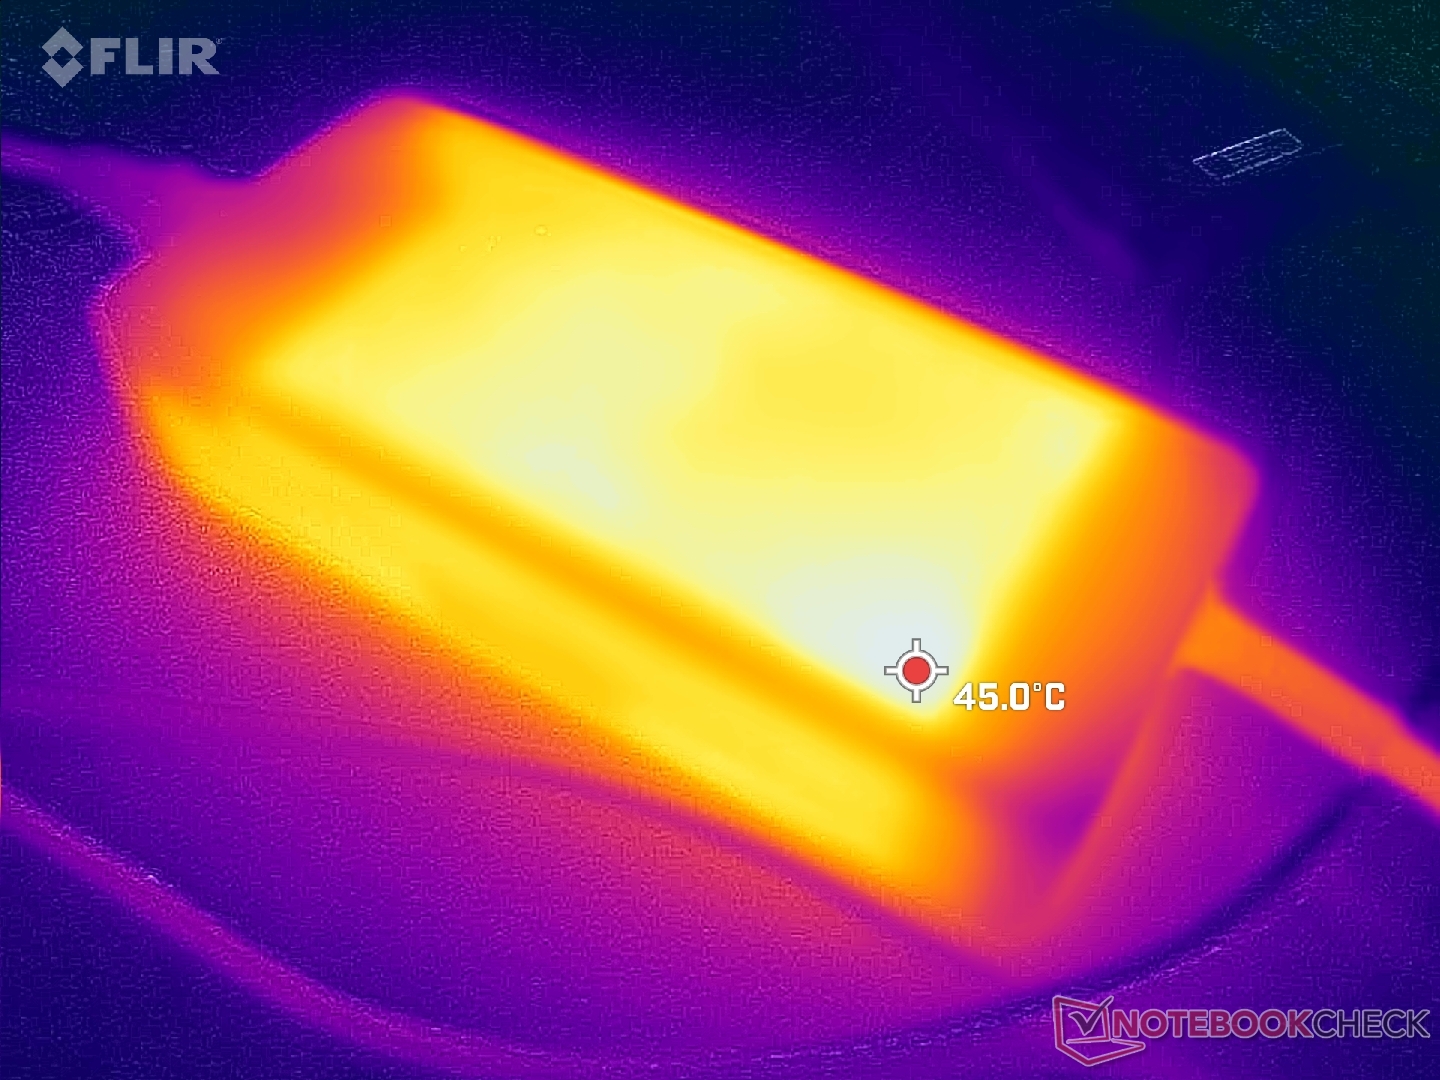
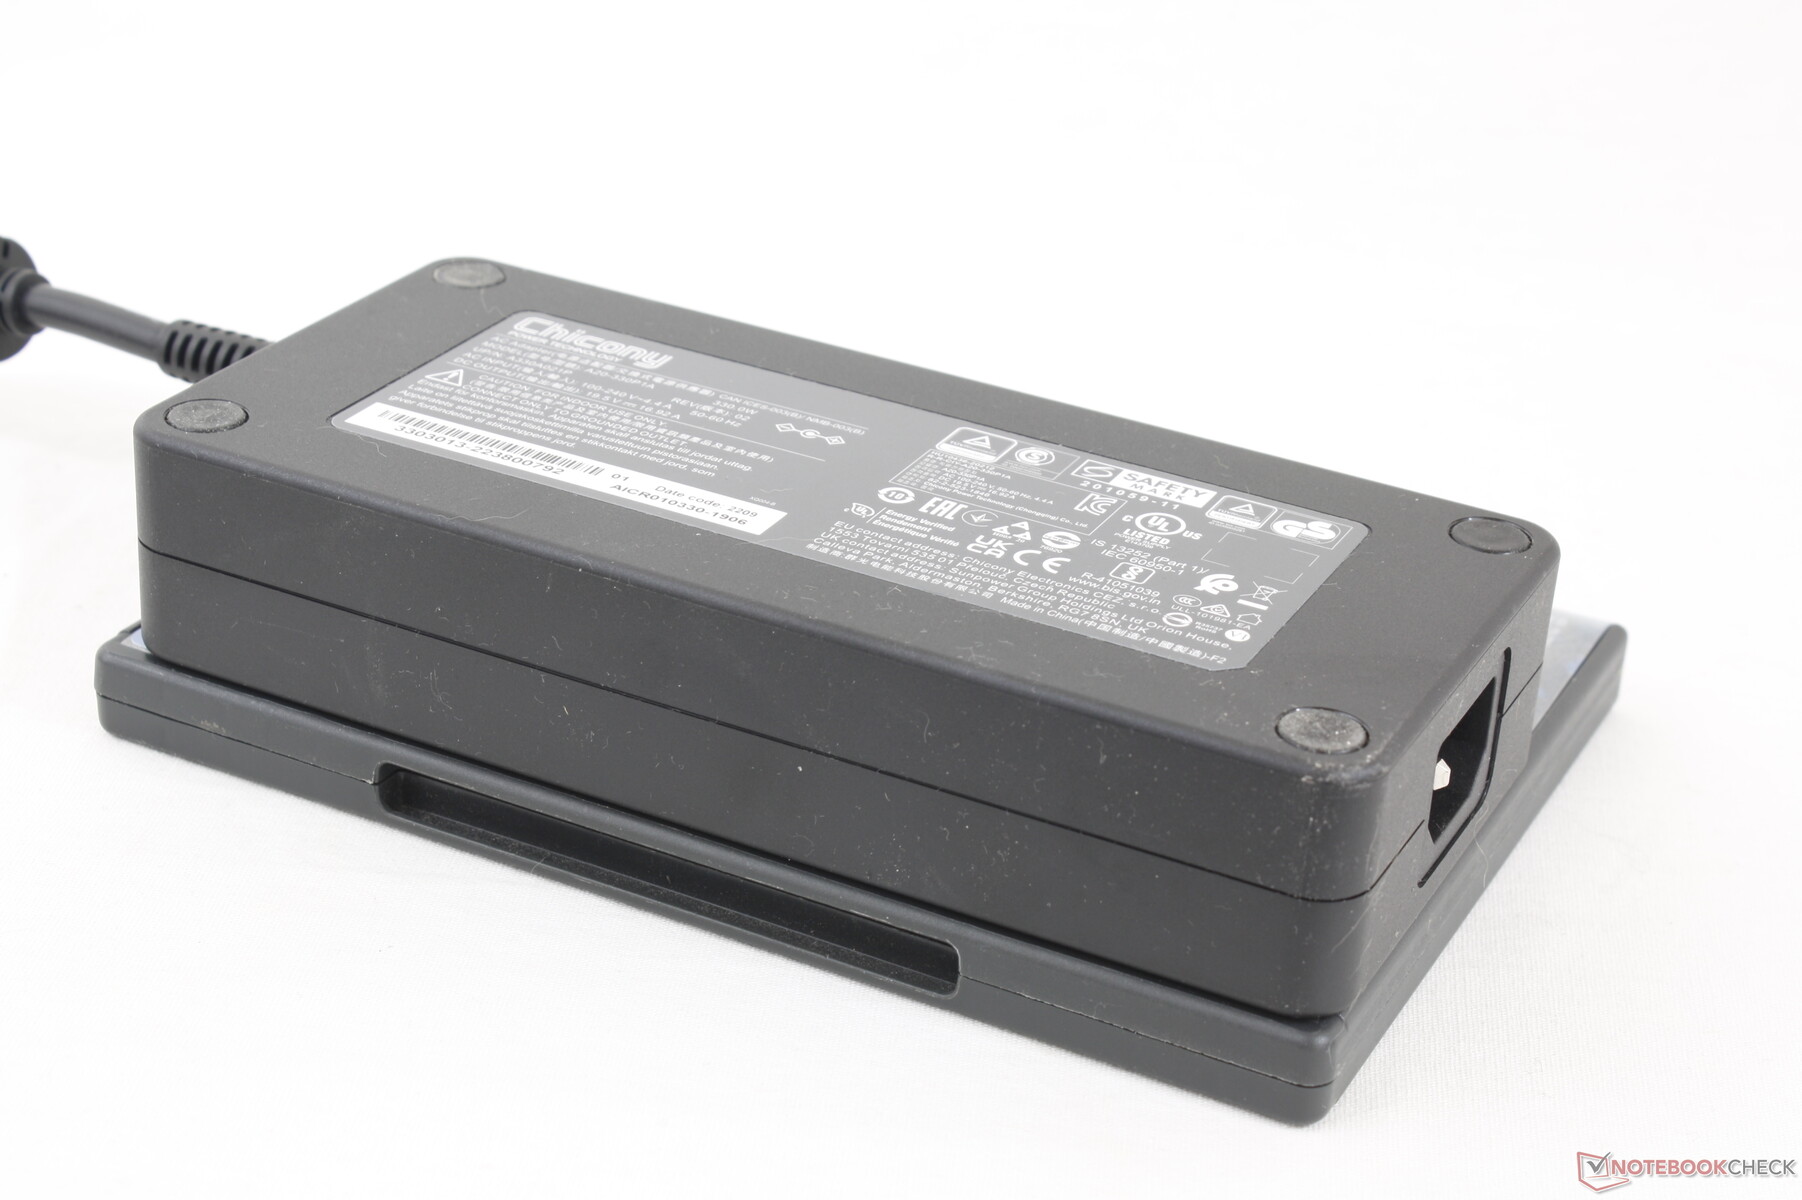
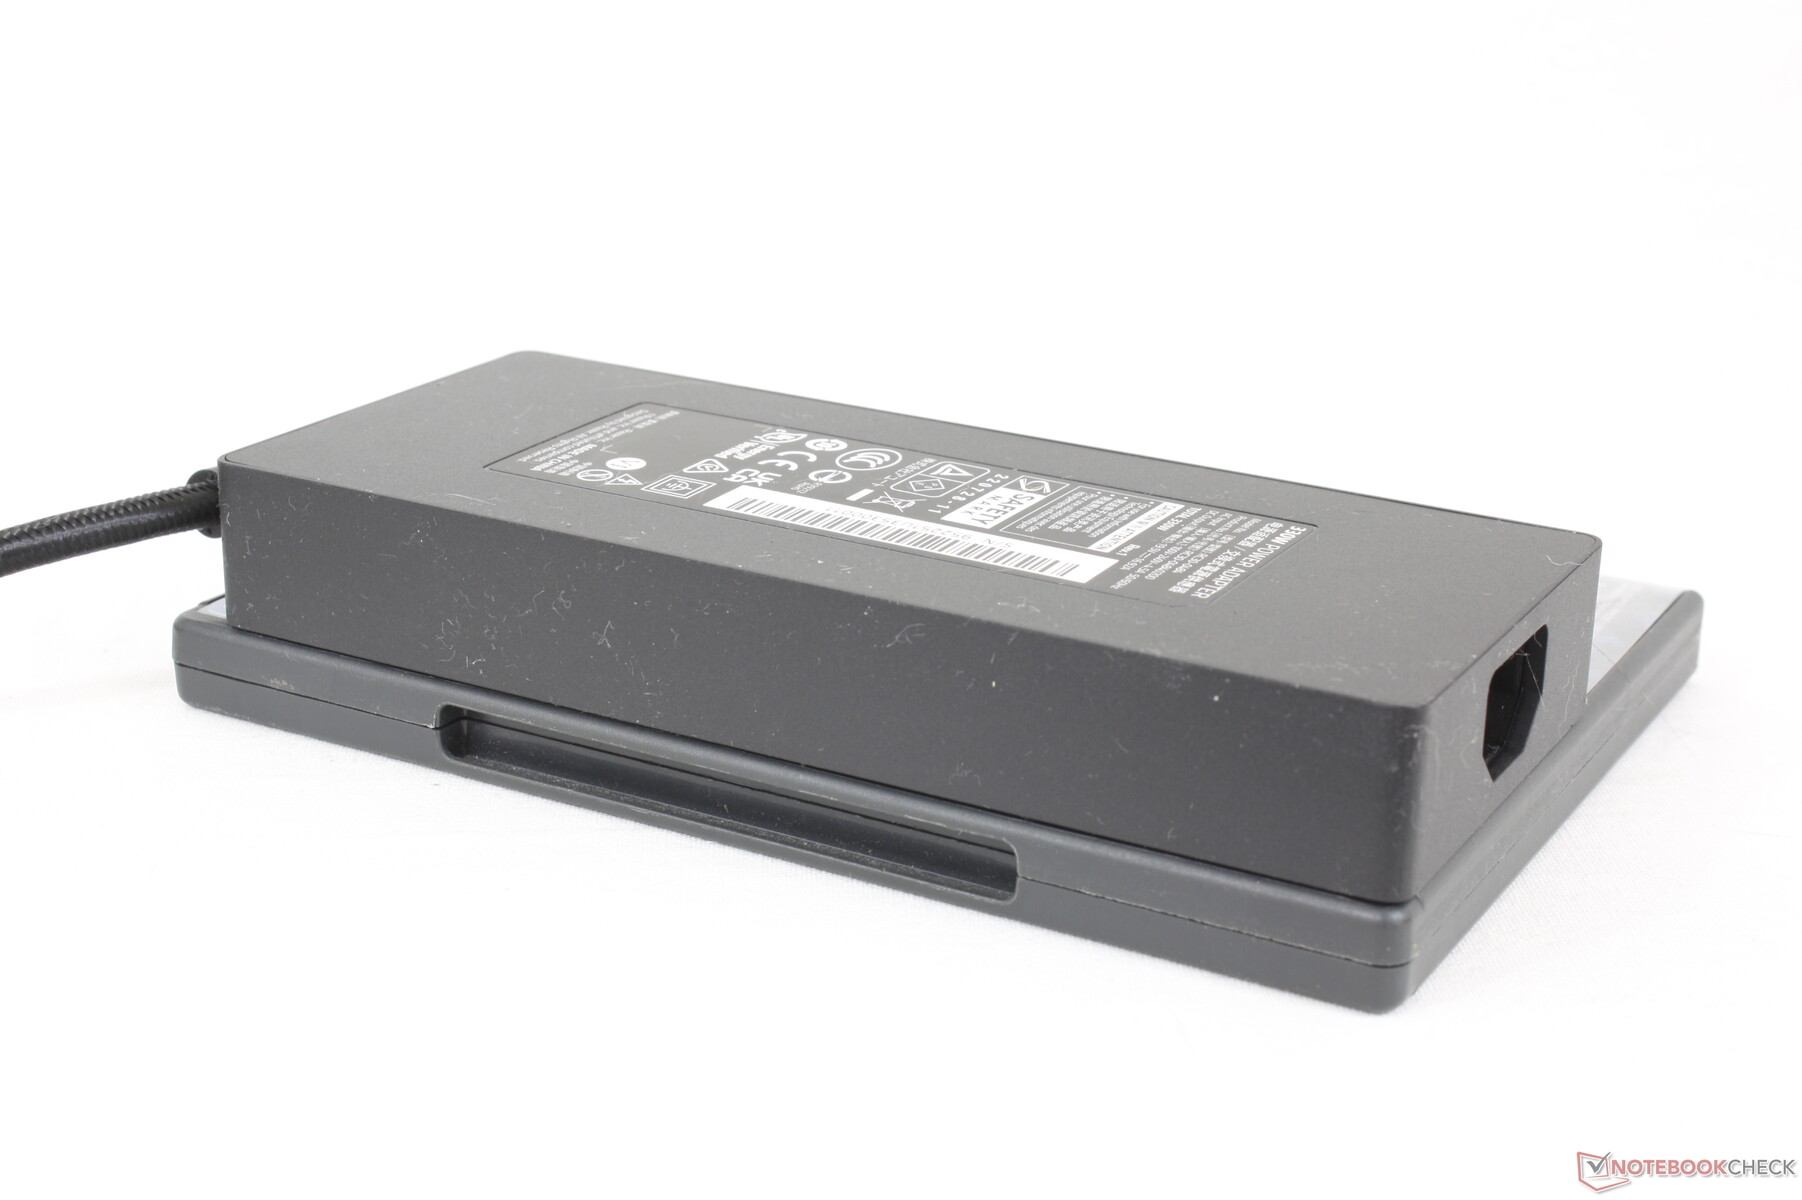
El adaptador de CA de 330 W es más grande que el adaptador de CA de 330 W del nuevo Razer Blade (~18,5 x 8,5 x 3,6 cm frente a ~18 x 7,5 x 2,5 cm) ya que Eluktronics y Uniwill aún no se han pasado a la carga GaN. Podemos registrar un consumo máximo temporal de 343 W cuando la CPU y la GPU están al 100% de uso.
| Off / Standby | |
| Ocioso | |
| Carga |
|
Clave:
min: | |
| Eluktronics Mech-17 GP2 i9-13900HX, GeForce RTX 4090 Laptop GPU, Samsung PM9A1 MZVL21T0HCLR, IPS, 2560x1600, 17" | Schenker XMG Neo 17 M22 R9 6900HX, GeForce RTX 3080 Ti Laptop GPU, Samsung SSD 980 Pro 1TB MZ-V8P1T0BW, IPS, 2560x1600, 17" | MSI Katana 17 B13VFK i7-13620H, GeForce RTX 4060 Laptop GPU, Micron 2400 MTFDKBA1T0QFM, IPS LED, 1920x1080, 17.3" | MSI Titan GT77 HX 13VI i9-13950HX, GeForce RTX 4090 Laptop GPU, Samsung PM9A1 MZVL22T0HBLB, Mini-LED, 3840x2160, 17.3" | Alienware m17 R5 (R9 6900HX, RX 6850M XT) R9 6900HX, Radeon RX 6850M XT, SSSTC CA6-8D1024, IPS, 3840x2160, 17" | Razer Blade 18 RTX 4070 i9-13950HX, GeForce RTX 4070 Laptop GPU, SSSTC CA6-8D1024, IPS, 2560x1600, 18" | |
|---|---|---|---|---|---|---|
| Power Consumption | 35% | 35% | 1% | 24% | -24% | |
| Idle Minimum * (Watt) | 14 | 7 50% | 12.2 13% | 14 -0% | 13 7% | 24.5 -75% |
| Idle Average * (Watt) | 19.3 | 11 43% | 14.9 23% | 21.6 -12% | 16.5 15% | 34.1 -77% |
| Idle Maximum * (Watt) | 36.8 | 17 54% | 15.8 57% | 24.8 33% | 17 54% | 47.7 -30% |
| Load Average * (Watt) | 117.2 | 92 22% | 85.22 27% | 122.5 -5% | 93 21% | 140 -19% |
| Witcher 3 ultra * (Watt) | 304 | 221 27% | 151.1 50% | 265 13% | 239 21% | 202 34% |
| Load Maximum * (Watt) | 342.5 | 306 11% | 212.8 38% | 418 -22% | 251 27% | 261 24% |
* ... más pequeño es mejor
Power Consumption Witcher 3 / Stresstest
Power Consumption external Monitor
Duración de la batería
La autonomía WLAN es varias horas inferior a la del Neo 17 M22 del año pasado con AMD, para un total de poco más de 5 horas. Ambas unidades de prueba se ajustaron al perfil de energía Equilibrado con Optimus activo en la iGPU.
La carga de vacío a plena capacidad tarda entre 2 y 2,5 horas. El sistema no se puede recargar por USB-C.
| Eluktronics Mech-17 GP2 i9-13900HX, GeForce RTX 4090 Laptop GPU, 99 Wh | Schenker XMG Neo 17 M22 R9 6900HX, GeForce RTX 3080 Ti Laptop GPU, 99 Wh | MSI Katana 17 B13VFK i7-13620H, GeForce RTX 4060 Laptop GPU, 53.5 Wh | MSI Titan GT77 HX 13VI i9-13950HX, GeForce RTX 4090 Laptop GPU, 99.9 Wh | Alienware m17 R5 (R9 6900HX, RX 6850M XT) R9 6900HX, Radeon RX 6850M XT, 97 Wh | Razer Blade 18 RTX 4070 i9-13950HX, GeForce RTX 4070 Laptop GPU, 91.7 Wh | |
|---|---|---|---|---|---|---|
| Duración de Batería | 76% | -43% | 4% | -6% | -22% | |
| WiFi v1.3 (h) | 5.1 | 9 76% | 2.9 -43% | 5.3 4% | 4.8 -6% | 4 -22% |
| Reader / Idle (h) | 12 | 7 | ||||
| H.264 (h) | 6.6 | 6 | 4.9 | |||
| Load (h) | 1.8 | 1 | 1.4 | 1.8 | 1.3 |
Pro
Contra
Veredicto - Sube la temperatura de forma demasiado literal
La Mech-17 GP2 es un 7% más pequeña y un 17% más ligera que la MSI GT77 HX Titan ofreciendo casi el mismo rendimiento. Está densamente empaquetado como resultado, pero quizás demasiado. Las temperaturas de la CPU son extremadamente altas incluso para un portátil de juegos cuando se ejecutan juegos. Aunque el rango de ~97 C es técnicamente "seguro" para el procesador Intel, no deja de ser más cálido que en el modelo del año pasado y no es precisamente reconfortante para el usuario final. La alta temperatura del núcleo quizá pueda aliviarse utilizando la estación de acoplamiento del refrigerador de agua externo, pero un portátil no debería tener que depender de un accesorio opcional para una refrigeración óptima.
Alto rendimiento a costa de altas temperaturas del núcleo.
Aparte de su alto rendimiento por volumen, el precio también es un factor distintivo del modelo. El Mech-17 GP2 es uno de los pocos portátiles de GeForce 40 que se comercializan con una opción básica, lo que significa que puedes ahorrarte varios cientos de dólares si te haces con tu propia RAM, SSD y sistema operativo. 2999 dólares por uno de los portátiles de juego más rápidos del mercado no está nada mal, pero hay que vigilar de cerca la temperatura del núcleo.
Precio y disponibilidad
Amazon está enviando ahora el Mech-17 GP2 con la RTX 4090 por 4400 USD, con RAM y almacenamiento. Alternativamente, los usuarios pueden comprar directamente de Eluktronics para obtener más opciones de configuración.
Eluktronics Mech-17 GP2
- 03/08/2023 v7 (old)
Allen Ngo
Transparencia
La selección de los dispositivos que se van a reseñar corre a cargo de nuestro equipo editorial. La muestra de prueba fue proporcionada al autor en calidad de préstamo por el fabricante o el minorista a los efectos de esta reseña. El prestamista no tuvo ninguna influencia en esta reseña, ni el fabricante recibió una copia de la misma antes de su publicación. No había ninguna obligación de publicar esta reseña. Como empresa de medios independiente, Notebookcheck no está sujeta a la autoridad de fabricantes, minoristas o editores.
Así es como prueba Notebookcheck
Cada año, Notebookcheck revisa de forma independiente cientos de portátiles y smartphones utilizando procedimientos estandarizados para asegurar que todos los resultados son comparables. Hemos desarrollado continuamente nuestros métodos de prueba durante unos 20 años y hemos establecido los estándares de la industria en el proceso. En nuestros laboratorios de pruebas, técnicos y editores experimentados utilizan equipos de medición de alta calidad. Estas pruebas implican un proceso de validación en varias fases. Nuestro complejo sistema de clasificación se basa en cientos de mediciones y puntos de referencia bien fundamentados, lo que mantiene la objetividad.Price comparison

