Análisis del portátil Lenovo ThinkBook 16p Gen 3 ARH: El rival del Dell XPS 15

El ThinkBook 16p Gen 3 de 16 pulgadas es el sucesor del ThinkBook 16p Gen 2 del año pasado. Viene con opciones de CPU AMD Zen 3+ mejoradas para reemplazar la serie Zen 3 en el modelo 2021. Hay otras diferencias menores como se explica en este análisis, pero el modelo 2022 es por lo demás visualmente idéntico al modelo 2021. Por tanto, recomendamos consultar nuestro análisis del ThinkBook 16p Gen 2 para saber más sobre las características físicas del Gen 3
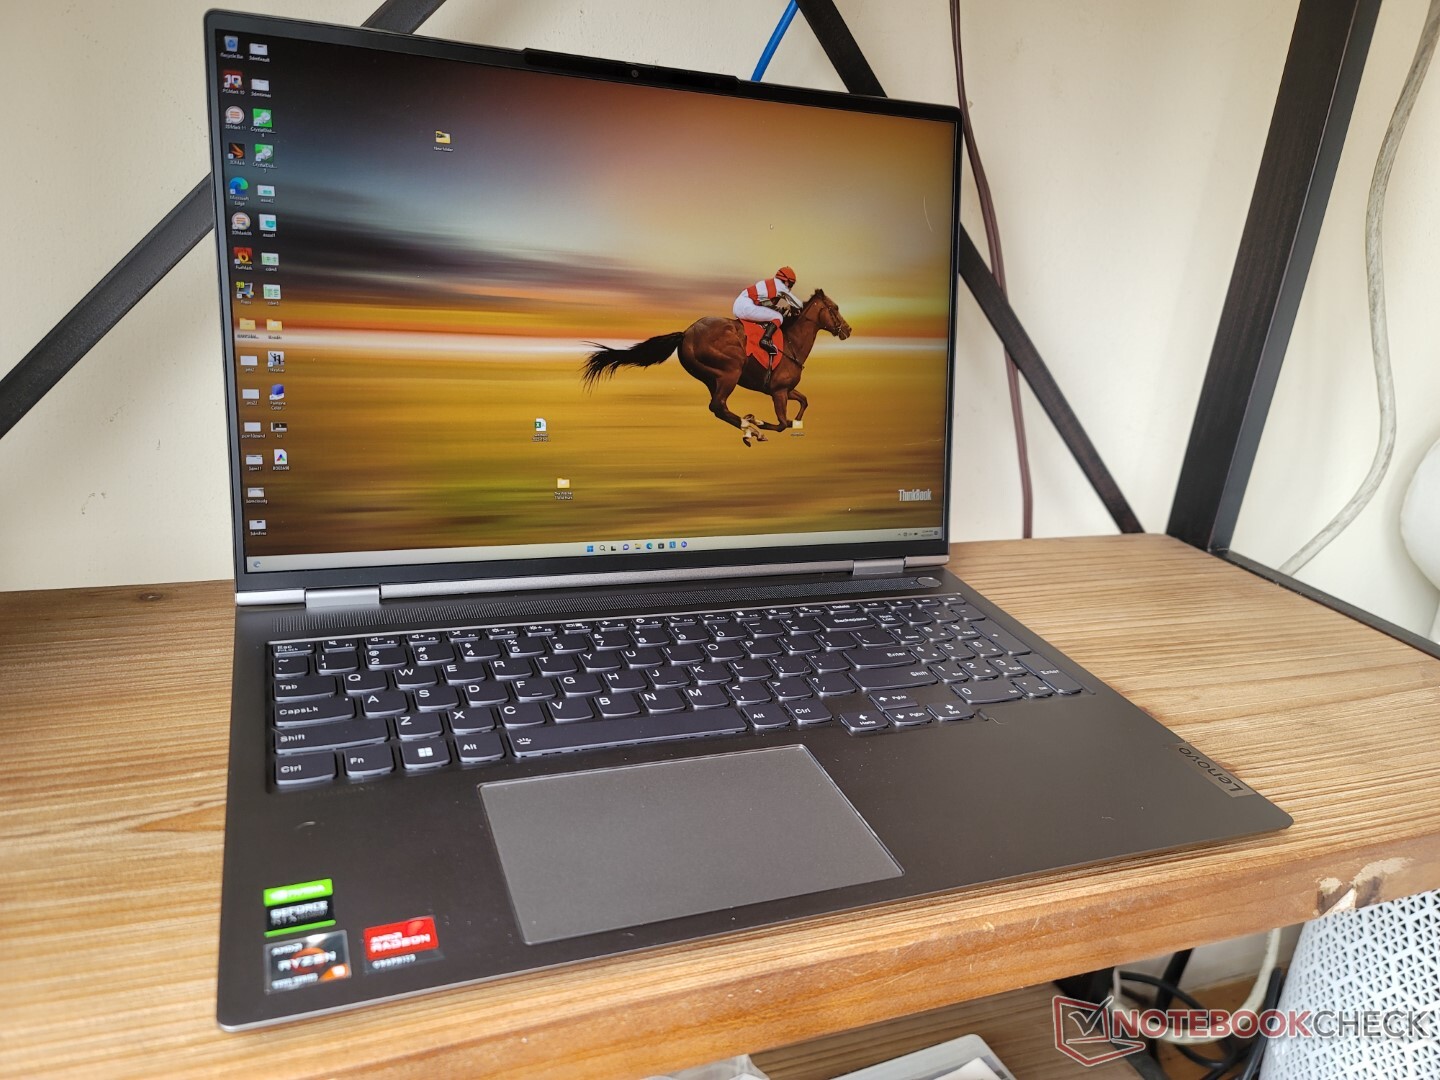
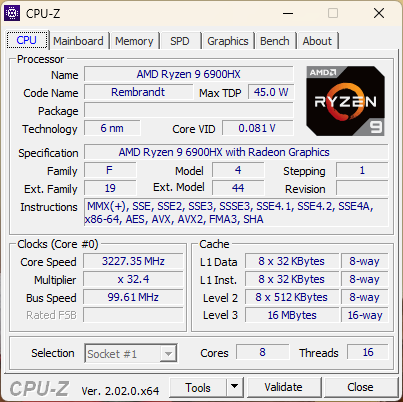
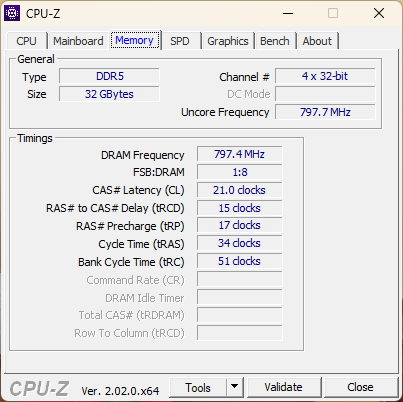
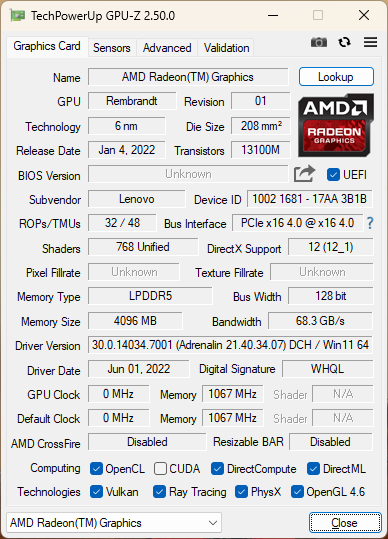
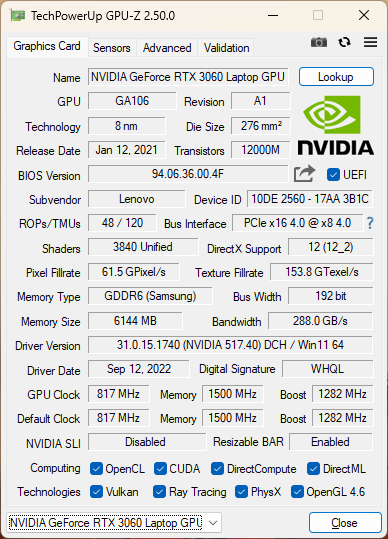
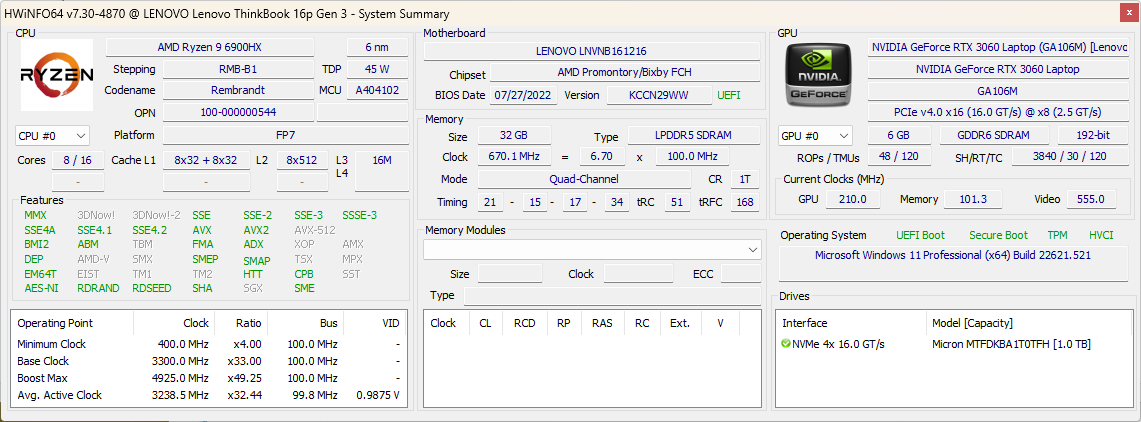
Nuestra unidad de prueba específica viene equipada con la CPU Ryzen 9 6900HX, la GPU GeForce RTX 3060 de 90 W, 32 GB de RAM LPDDR5, y una pantalla IPS de 165 Hz y 2560 x 1600 de resolución por unos 2600 dólares al por menor. También hay disponibles modelos inferiores con una pantalla de 60 Hz y una CPU Ryzen 5 6600H o Ryzen 7 6800H.
Entre los competidores directos se encuentran otros portátiles multimedia o Nvidia Studio de gama alta como el HP Envy 16, Dell Inspiron 16 Plus 7620, Acer Swift X 16o el MSI Creator Z16.
Más opiniones de Lenovo:
Posibles contendientes en la comparación
Valoración | Fecha | Modelo | Peso | Altura | Tamaño | Resolución | Precio |
|---|---|---|---|---|---|---|---|
| 87.9 % v7 (old) | 10/2022 | Lenovo ThinkBook 16p G3 ARH R9 6900HX, GeForce RTX 3060 Laptop GPU | 2.1 kg | 19.5 mm | 16.00" | 2560x1600 | |
| 86.9 % v7 (old) | 09/2022 | HP Envy 16 h0112nr i7-12700H, GeForce RTX 3060 Laptop GPU | 2.3 kg | 19.8 mm | 16.00" | 3840x2400 | |
| 87 % v7 (old) | 09/2021 | Lenovo ThinkBook 16p G2 ACH R9 5900HX, GeForce RTX 3060 Laptop GPU | 2 kg | 19.5 mm | 16.00" | 2560x1600 | |
| 85.7 % v7 (old) | 09/2022 | Lenovo IdeaPad 5 Pro 16ARH7 R5 6600HS, Radeon 660M | 1.9 kg | 18.4 mm | 16.00" | 2560x1600 | |
| 86.2 % v7 (old) | 07/2022 | Acer Swift X SFX16-51G-5388 i5-11320H, GeForce RTX 3050 4GB Laptop GPU | 1.8 kg | 18.9 mm | 16.10" | 1920x1080 | |
| 86.6 % v7 (old) | 07/2022 | Lenovo Legion 5 Pro 16IAH7H i7-12700H, GeForce RTX 3060 Laptop GPU | 2.6 kg | 27 mm | 16.00" | 2560x1600 |
Caso
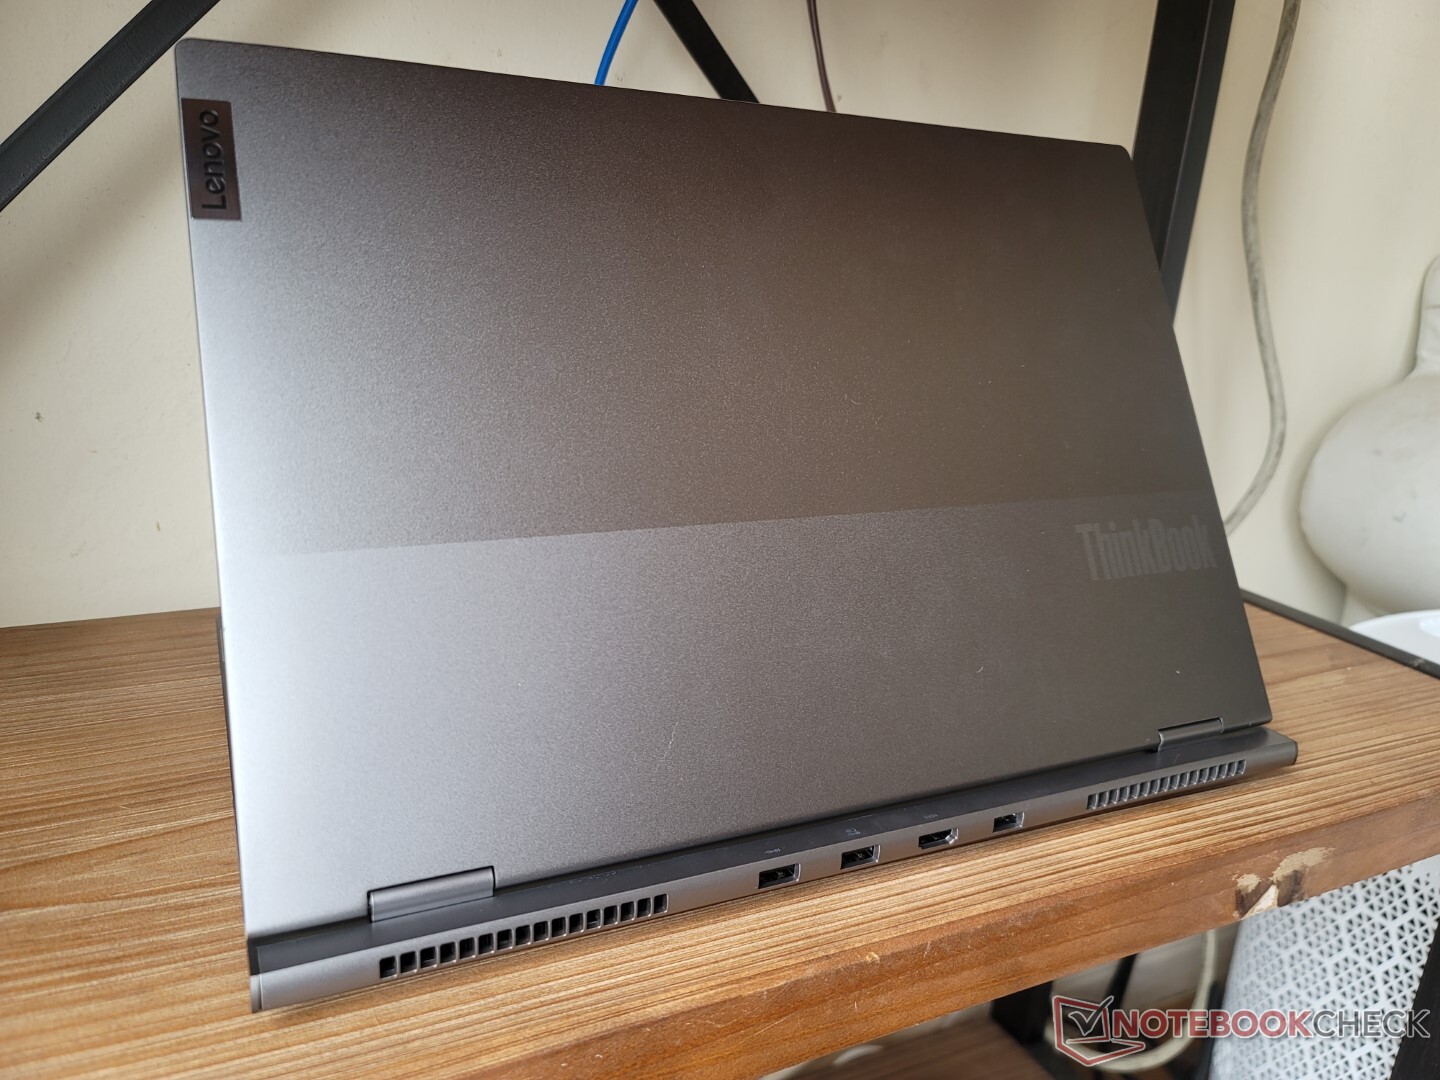
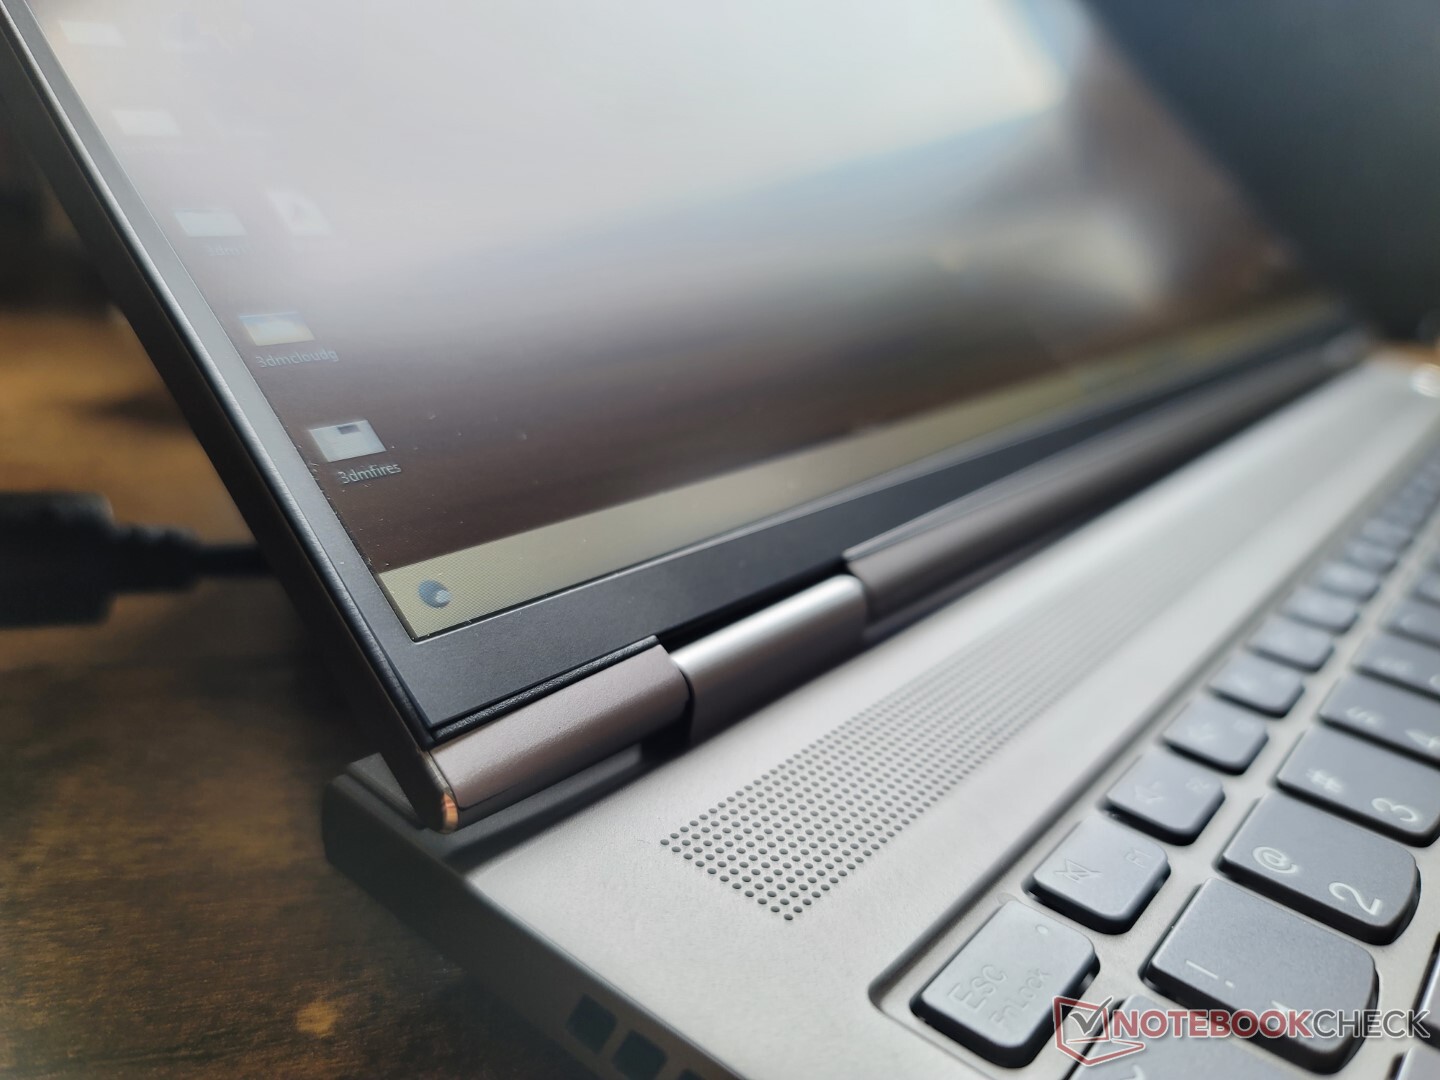
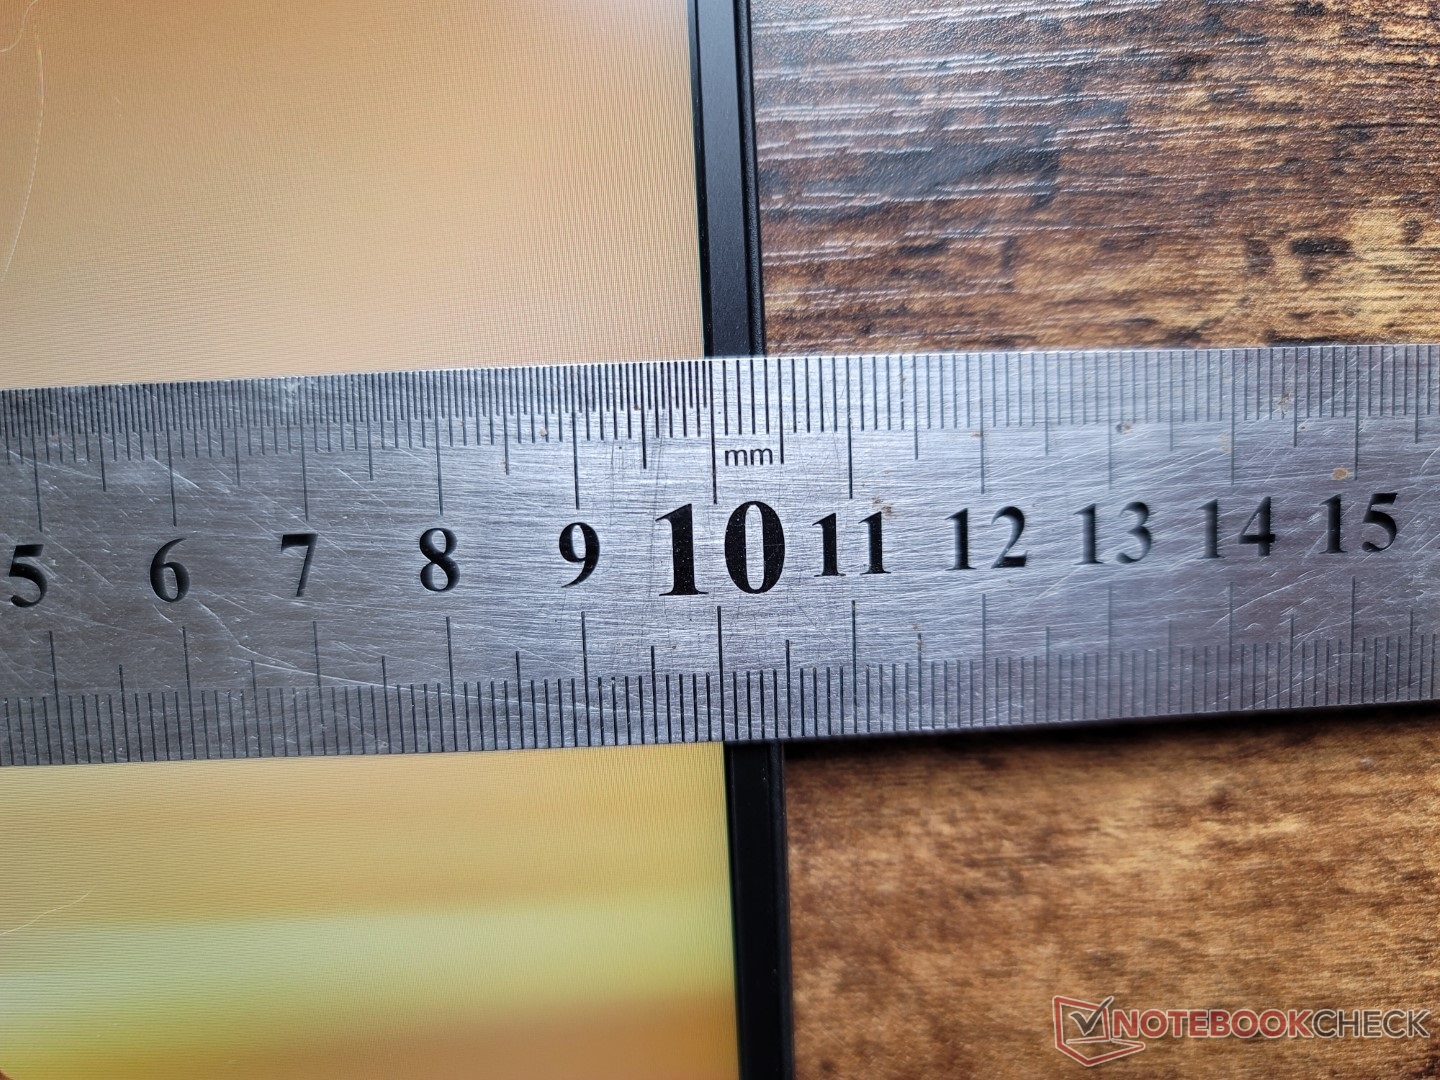
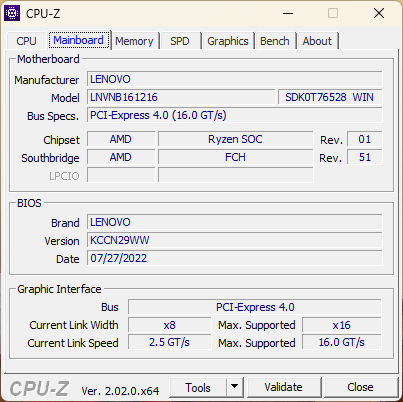
Aunque el chasis es visualmente idéntico al modelo Gen 2 del año pasado, hay una forma fácil de distinguir el modelo Gen 3 del Gen 2: la presencia de un puerto HDMI en la parte trasera. En comparación, el modelo Gen 2 no lleva ningún puerto HDMI.
Lector de tarjetas SD
| SD Card Reader | |
| average JPG Copy Test (av. of 3 runs) | |
| Lenovo IdeaPad 5 Pro 16ARH7 (AV PRO microSD 128 GB V60) | |
| Lenovo ThinkBook 16p G2 ACH | |
| Lenovo ThinkBook 16p G3 ARH (AV PRO microSD 128 GB V60) | |
| HP Envy 16 h0112nr (AV Pro SD microSD 128 GB V60) | |
| maximum AS SSD Seq Read Test (1GB) | |
| Lenovo ThinkBook 16p G2 ACH | |
| Lenovo ThinkBook 16p G3 ARH (AV PRO microSD 128 GB V60) | |
| HP Envy 16 h0112nr (AV Pro SD microSD 128 GB V60) | |
Comunicación
| Networking | |
| iperf3 transmit AX12 | |
| Acer Swift X SFX16-51G-5388 | |
| Lenovo ThinkBook 16p G2 ACH | |
| iperf3 receive AX12 | |
| Acer Swift X SFX16-51G-5388 | |
| Lenovo ThinkBook 16p G2 ACH | |
| iperf3 receive AXE11000 6GHz | |
| Lenovo Legion 5 Pro 16IAH7H | |
| HP Envy 16 h0112nr | |
| iperf3 receive AXE11000 | |
| Lenovo ThinkBook 16p G3 ARH | |
| Lenovo IdeaPad 5 Pro 16ARH7 | |
| iperf3 transmit AXE11000 6GHz | |
| Lenovo Legion 5 Pro 16IAH7H | |
| HP Envy 16 h0112nr | |
| iperf3 transmit AXE11000 | |
| Lenovo ThinkBook 16p G3 ARH | |
| Lenovo IdeaPad 5 Pro 16ARH7 | |
Cámara web


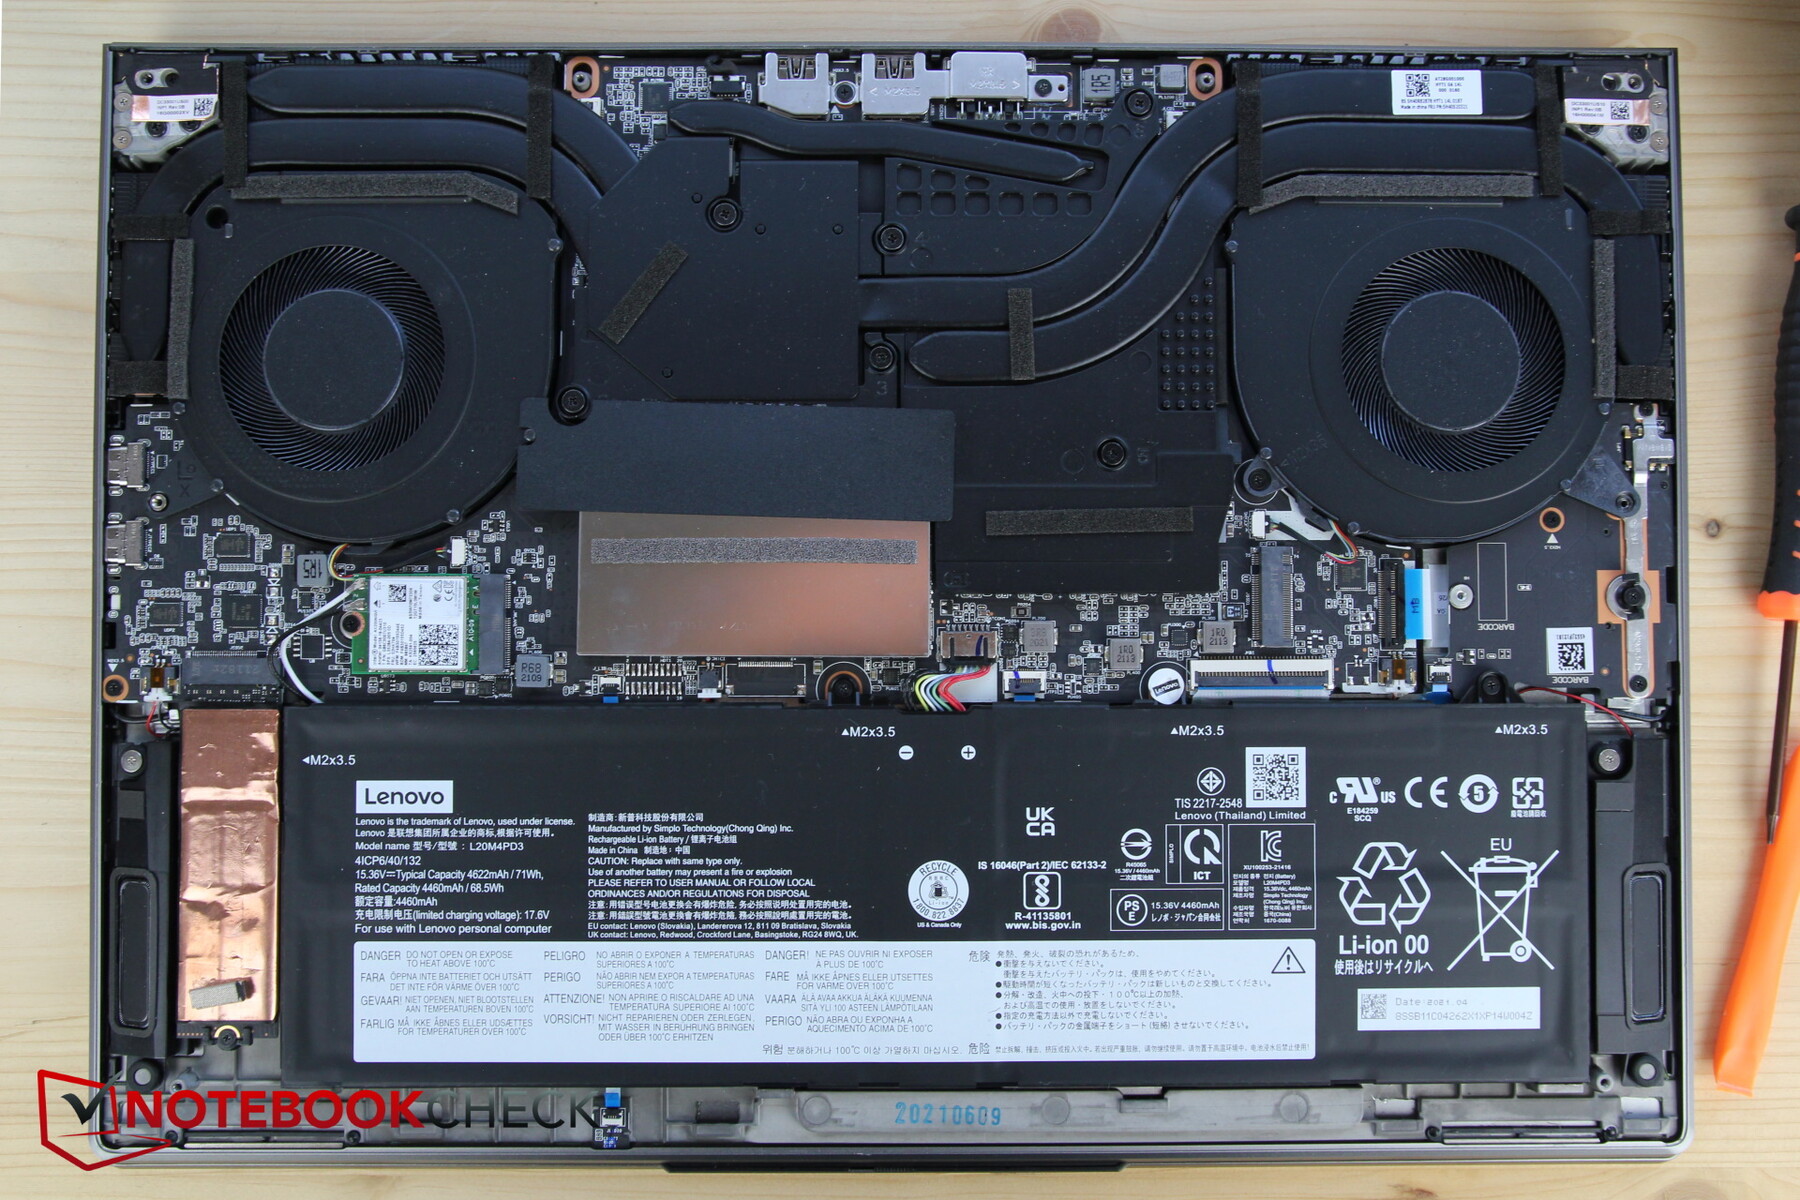
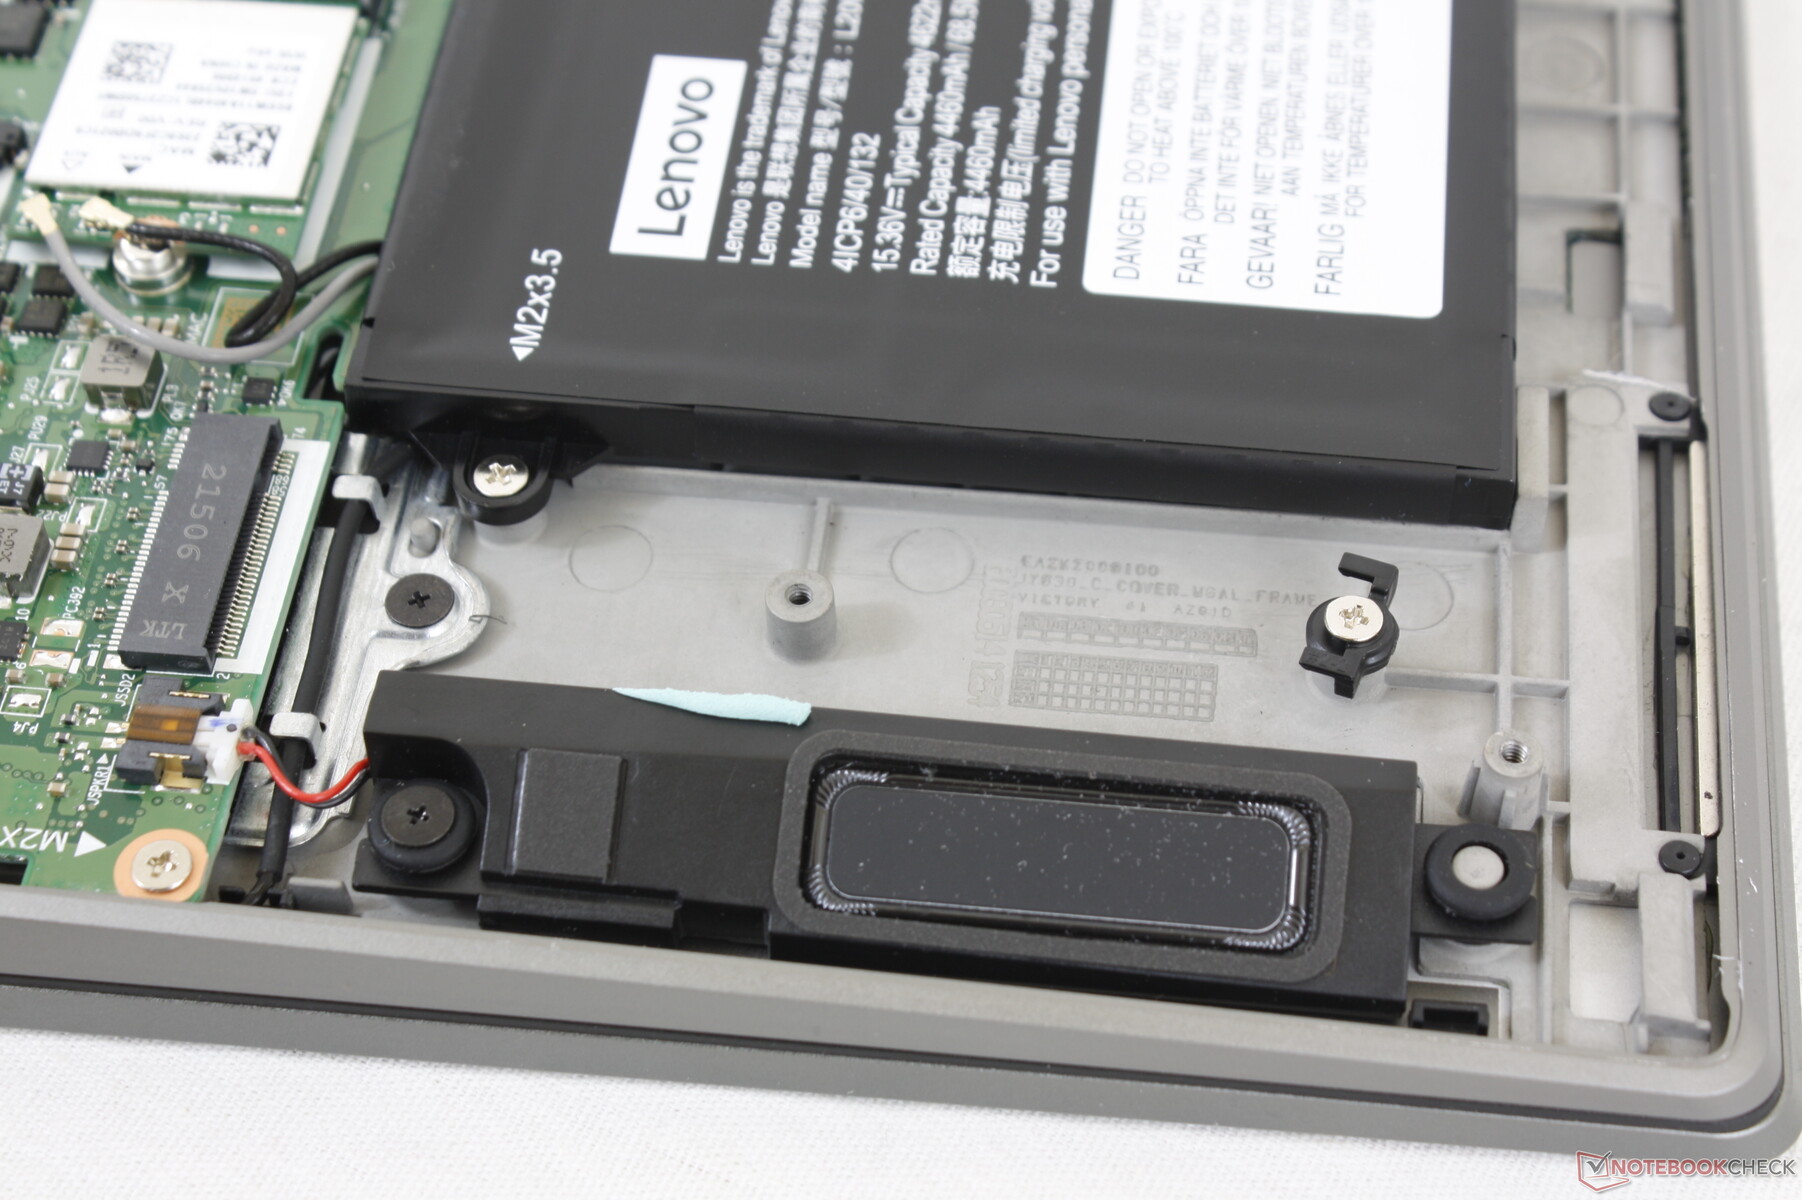
Mantenimiento
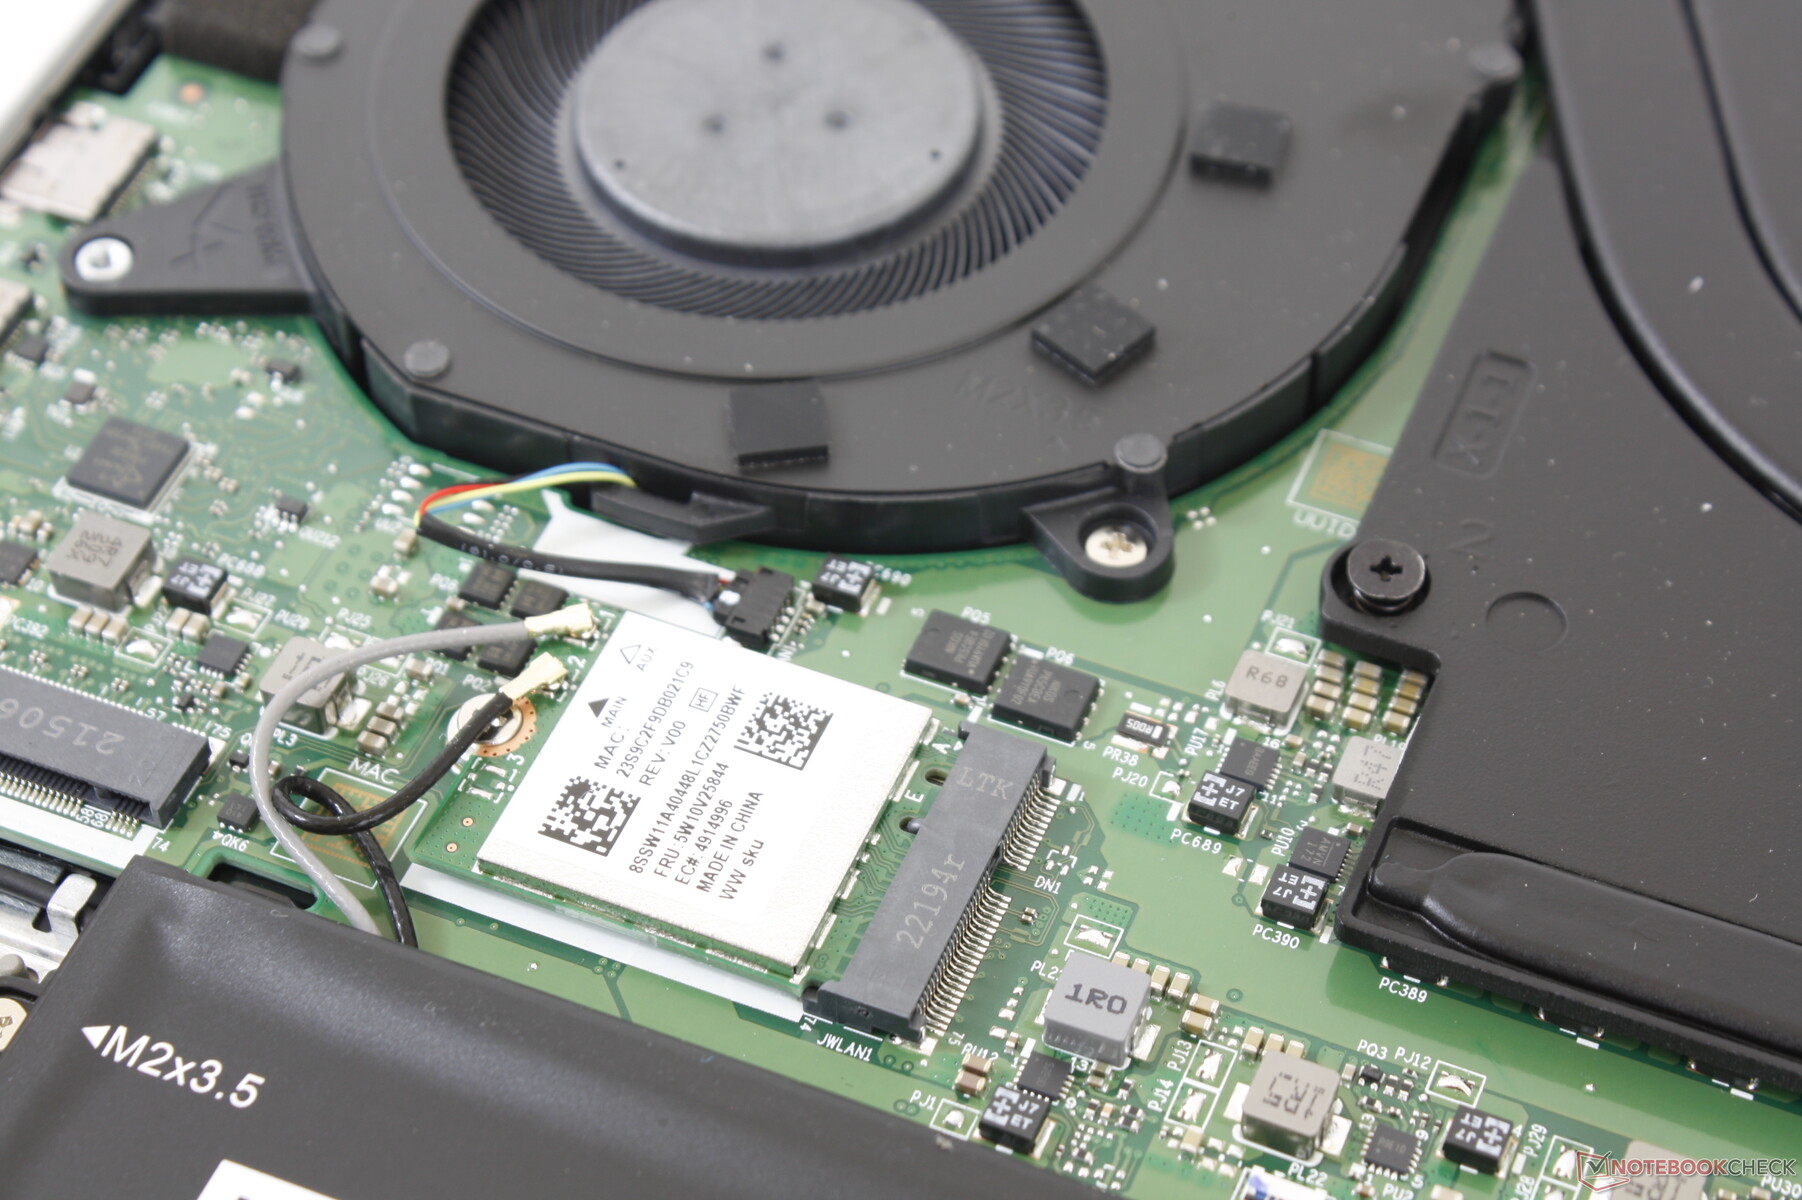
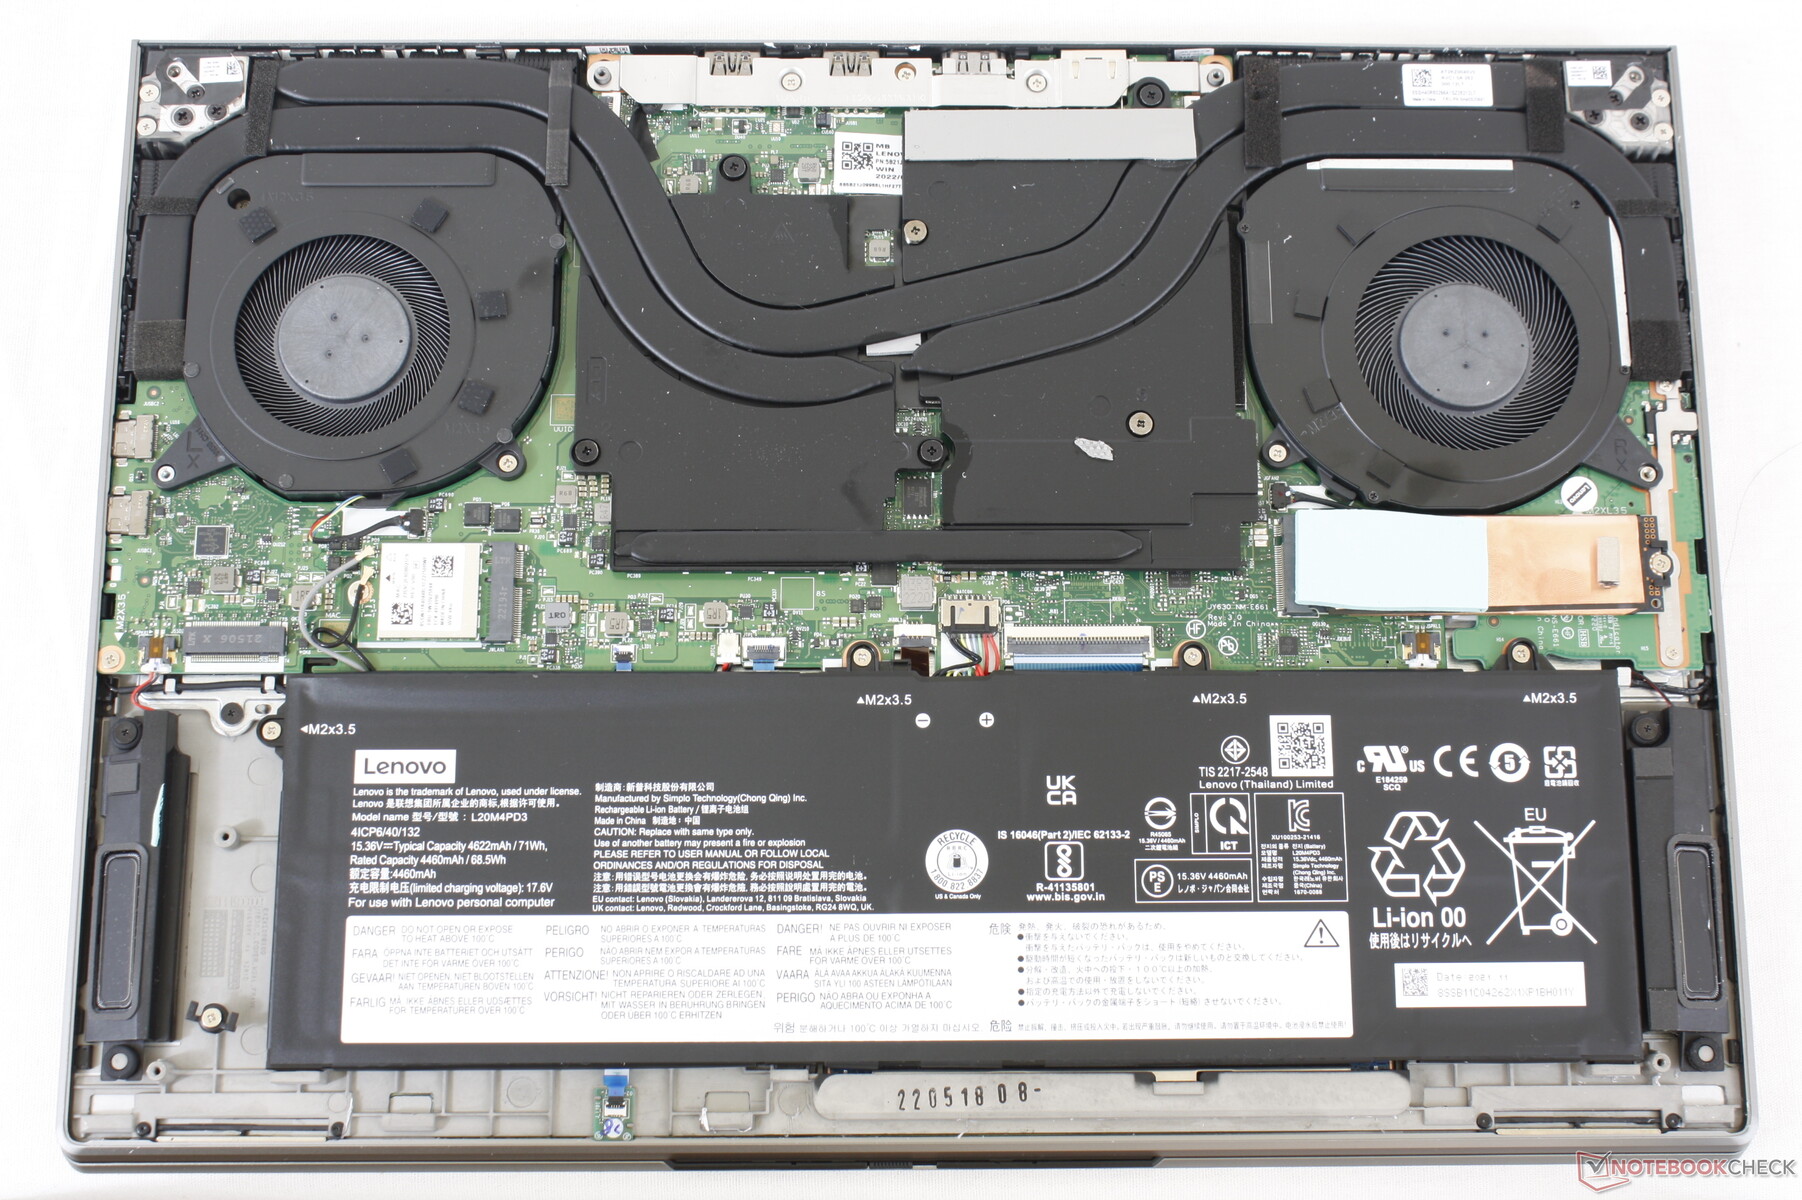
El modelo Gen 3 utiliza RAM soldada mientras que el modelo Gen 2 tiene una ranura SODIMM extraíble.
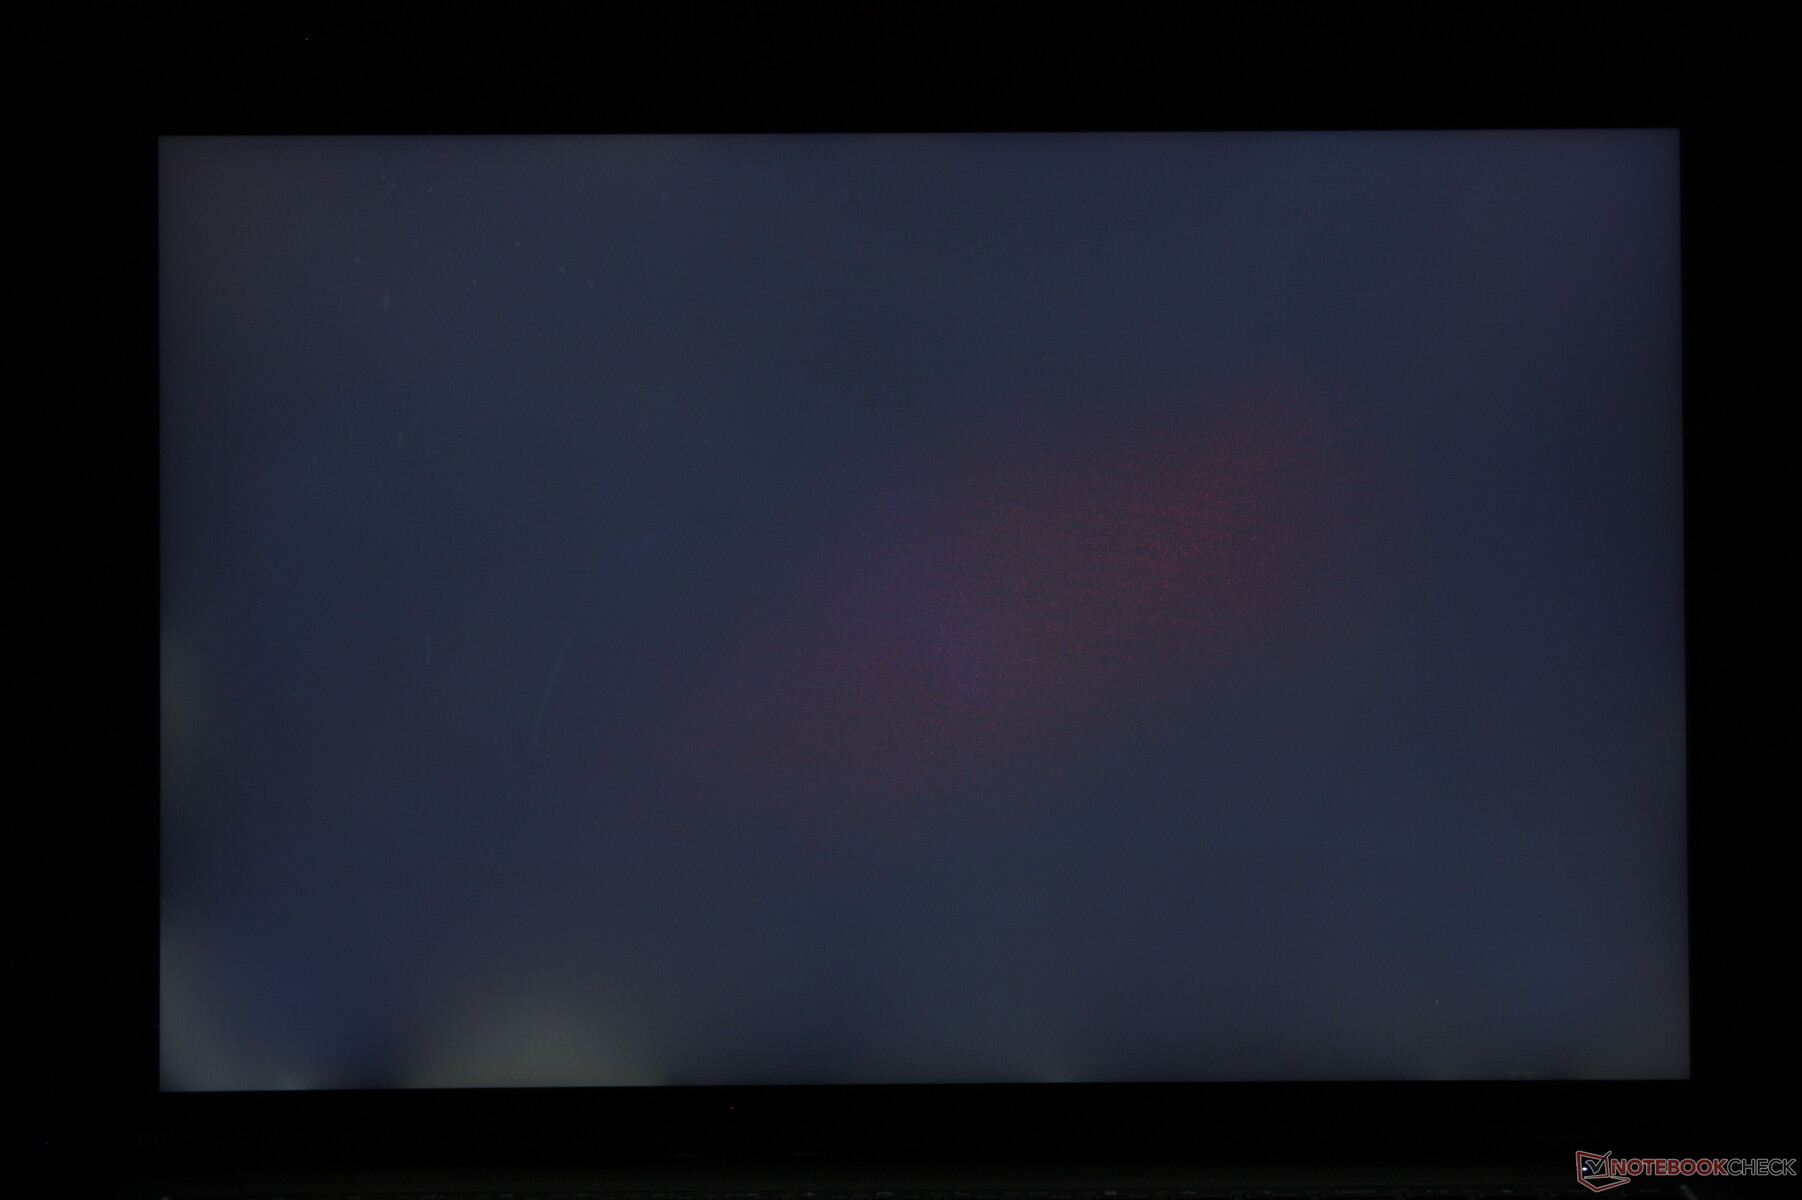
Mostrar
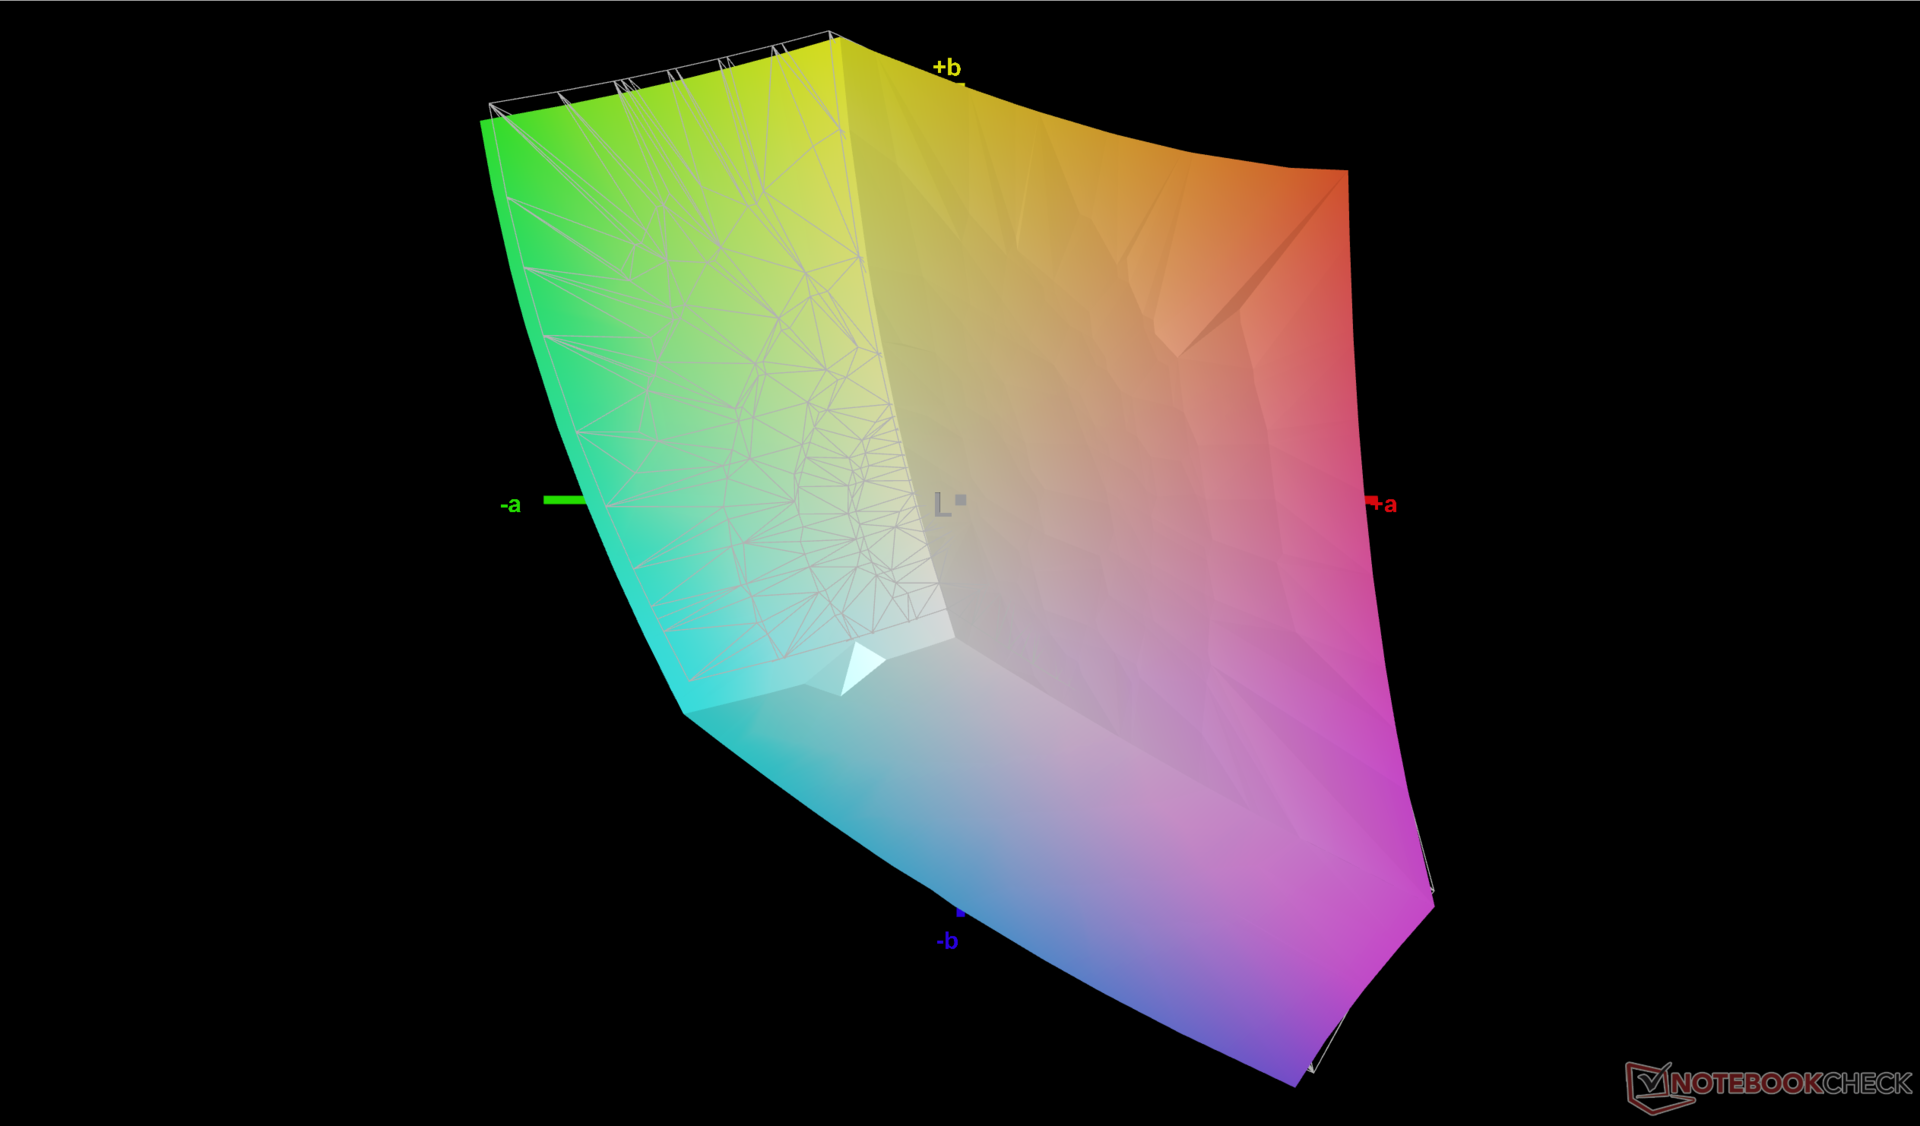
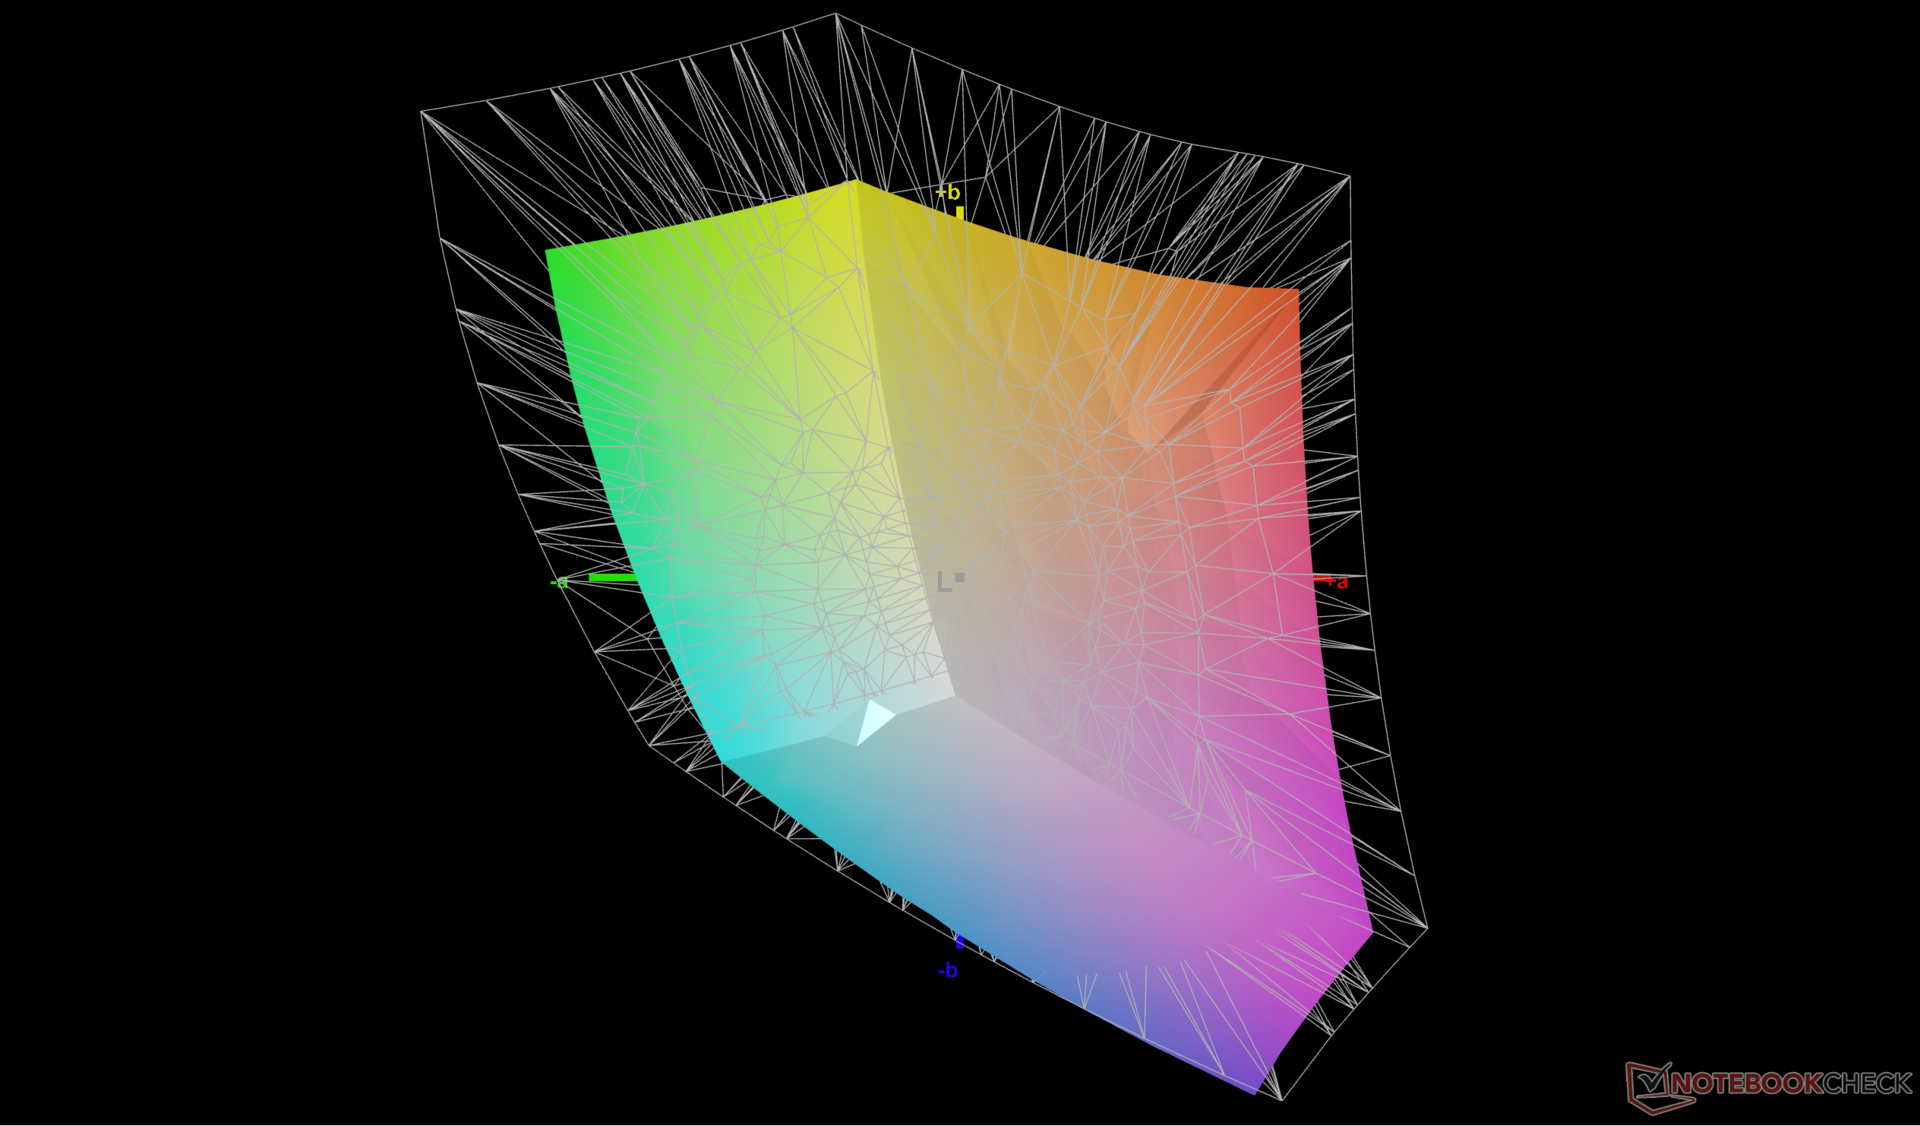
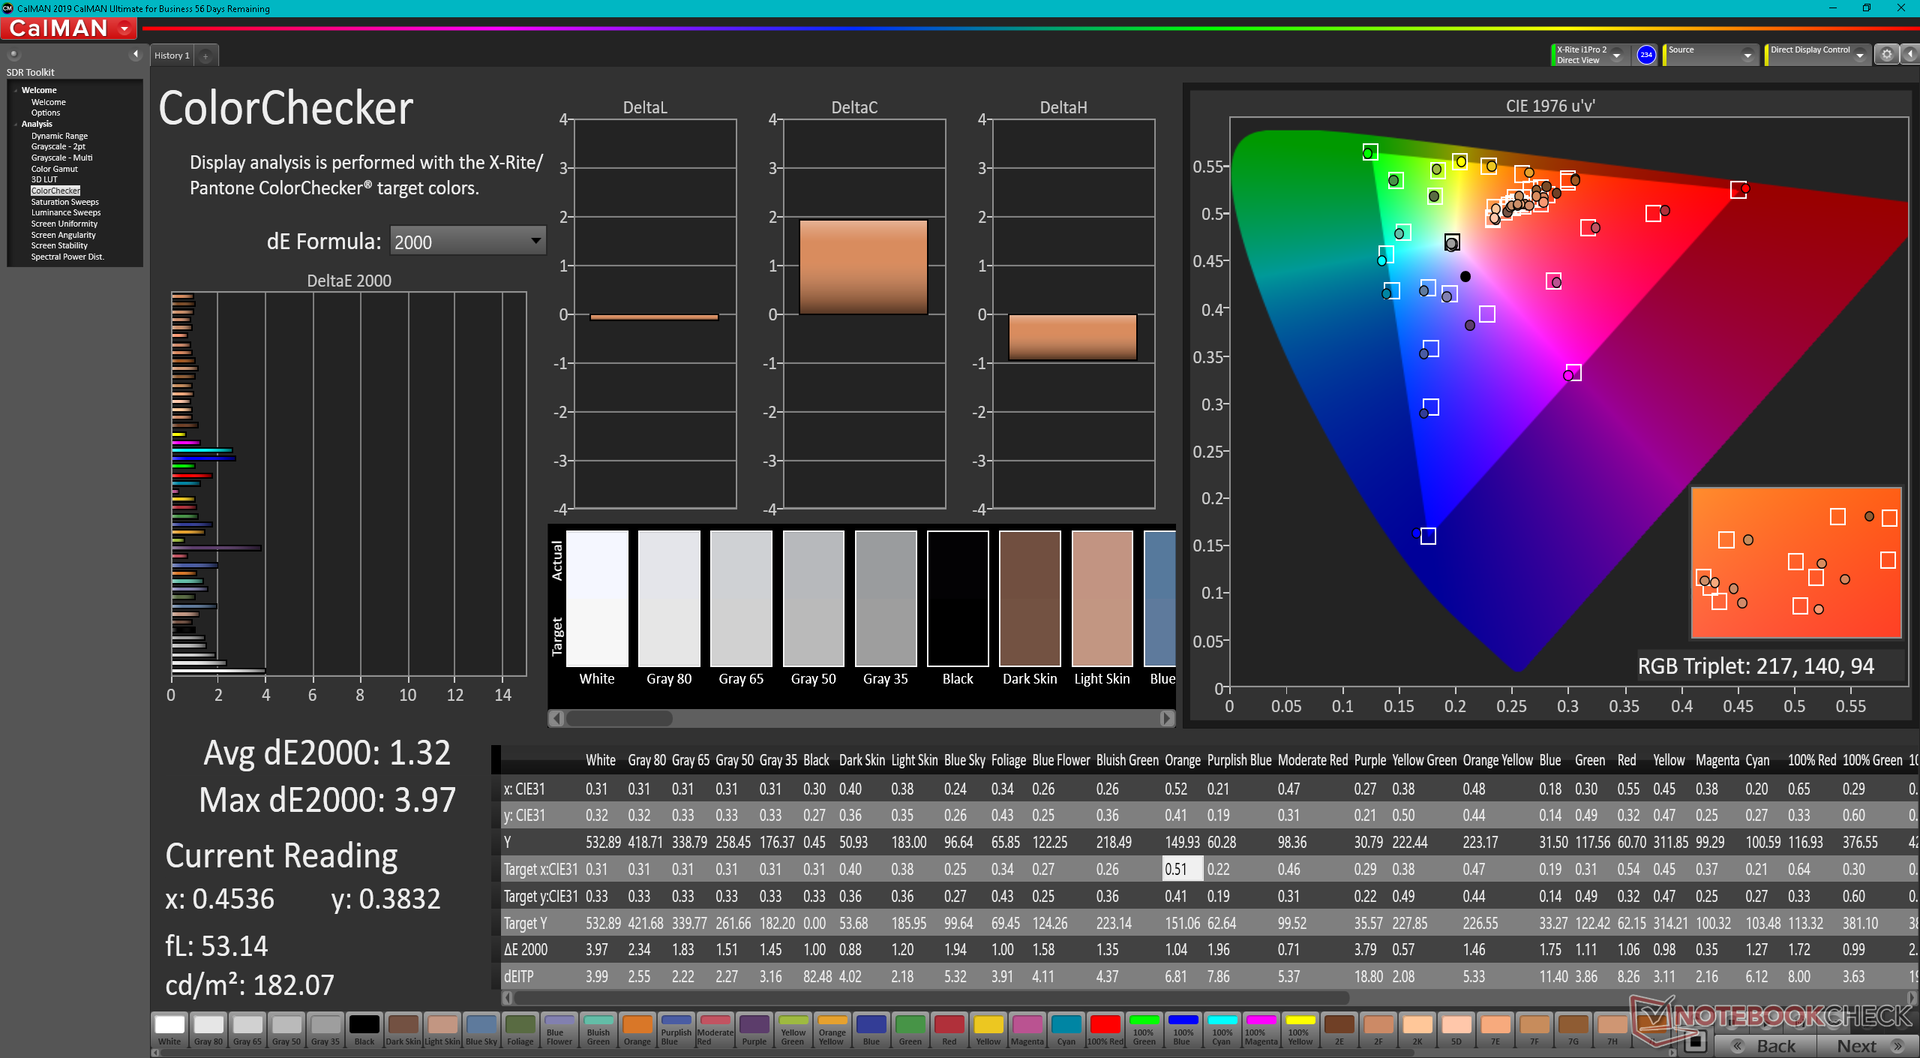
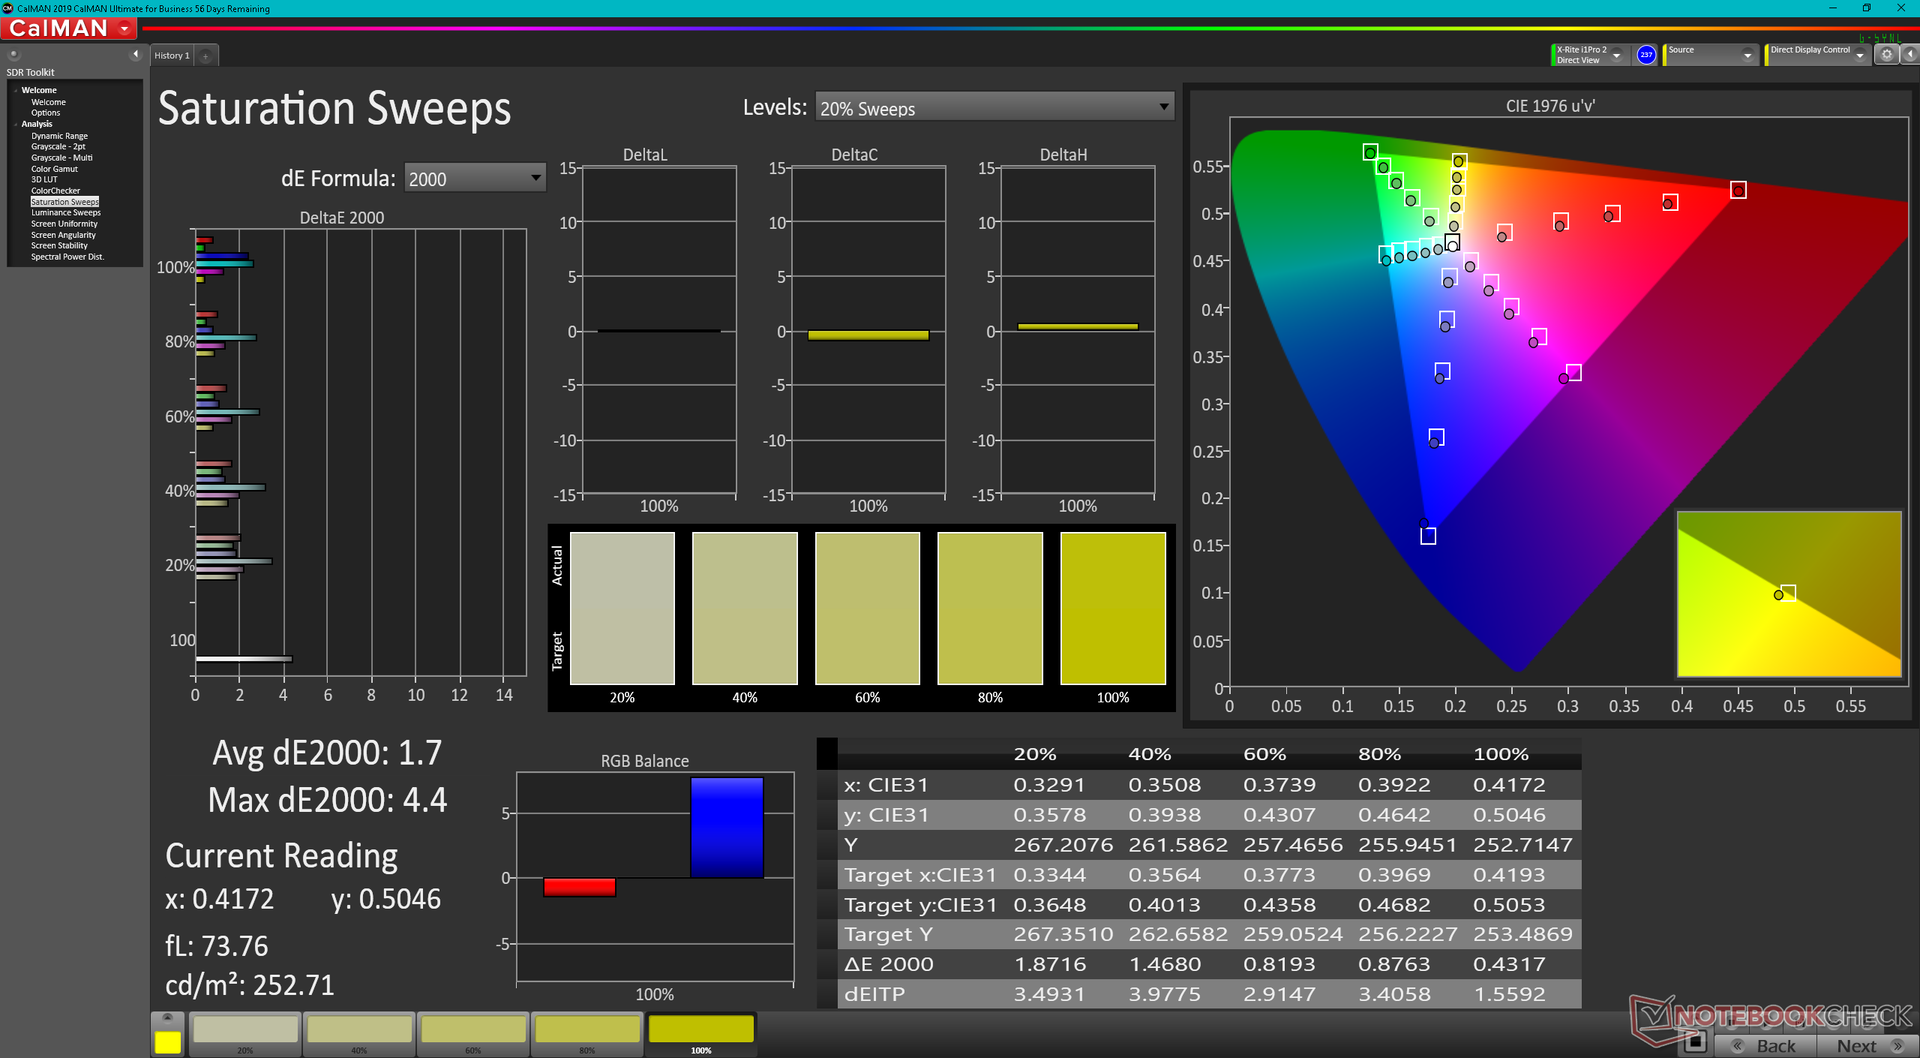
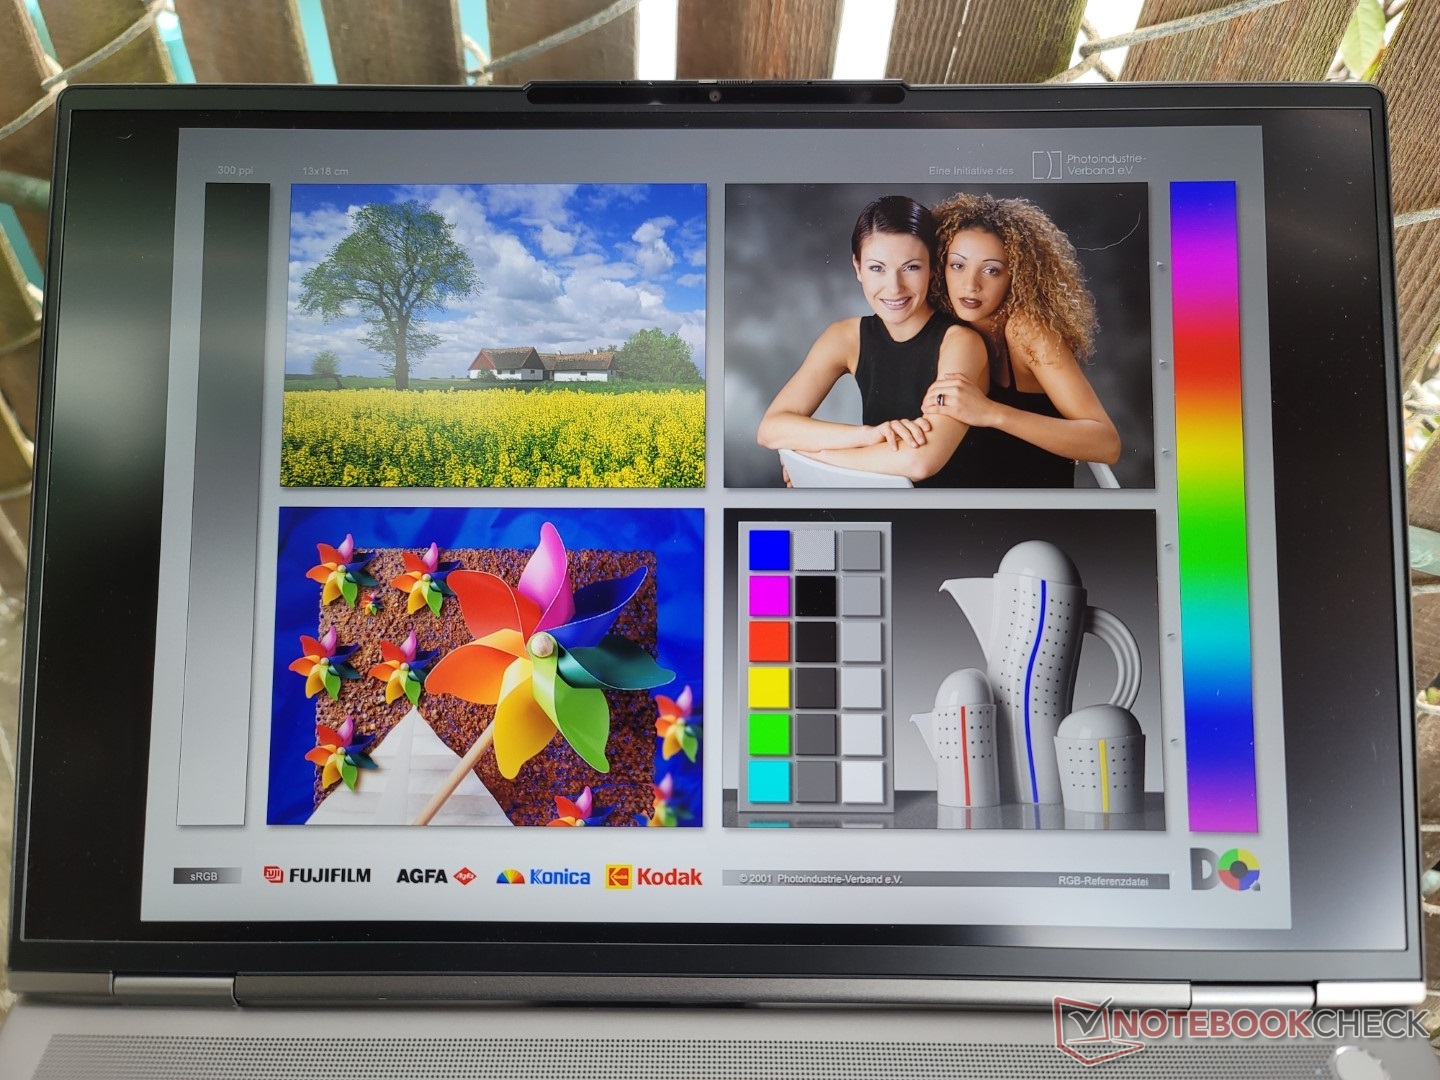
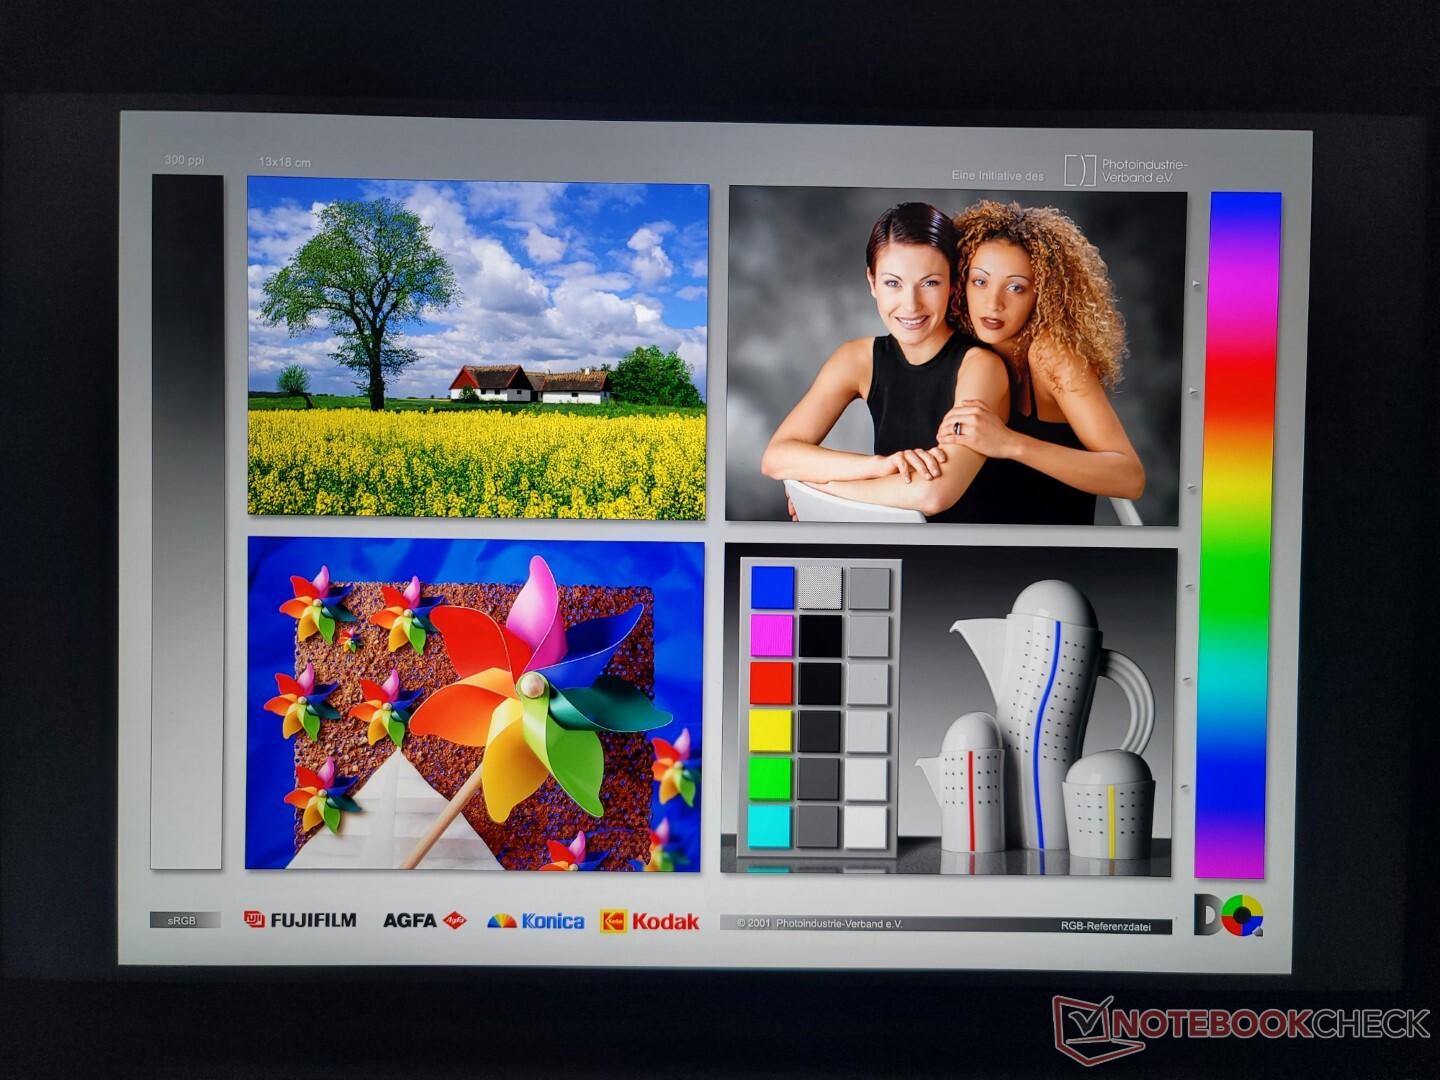
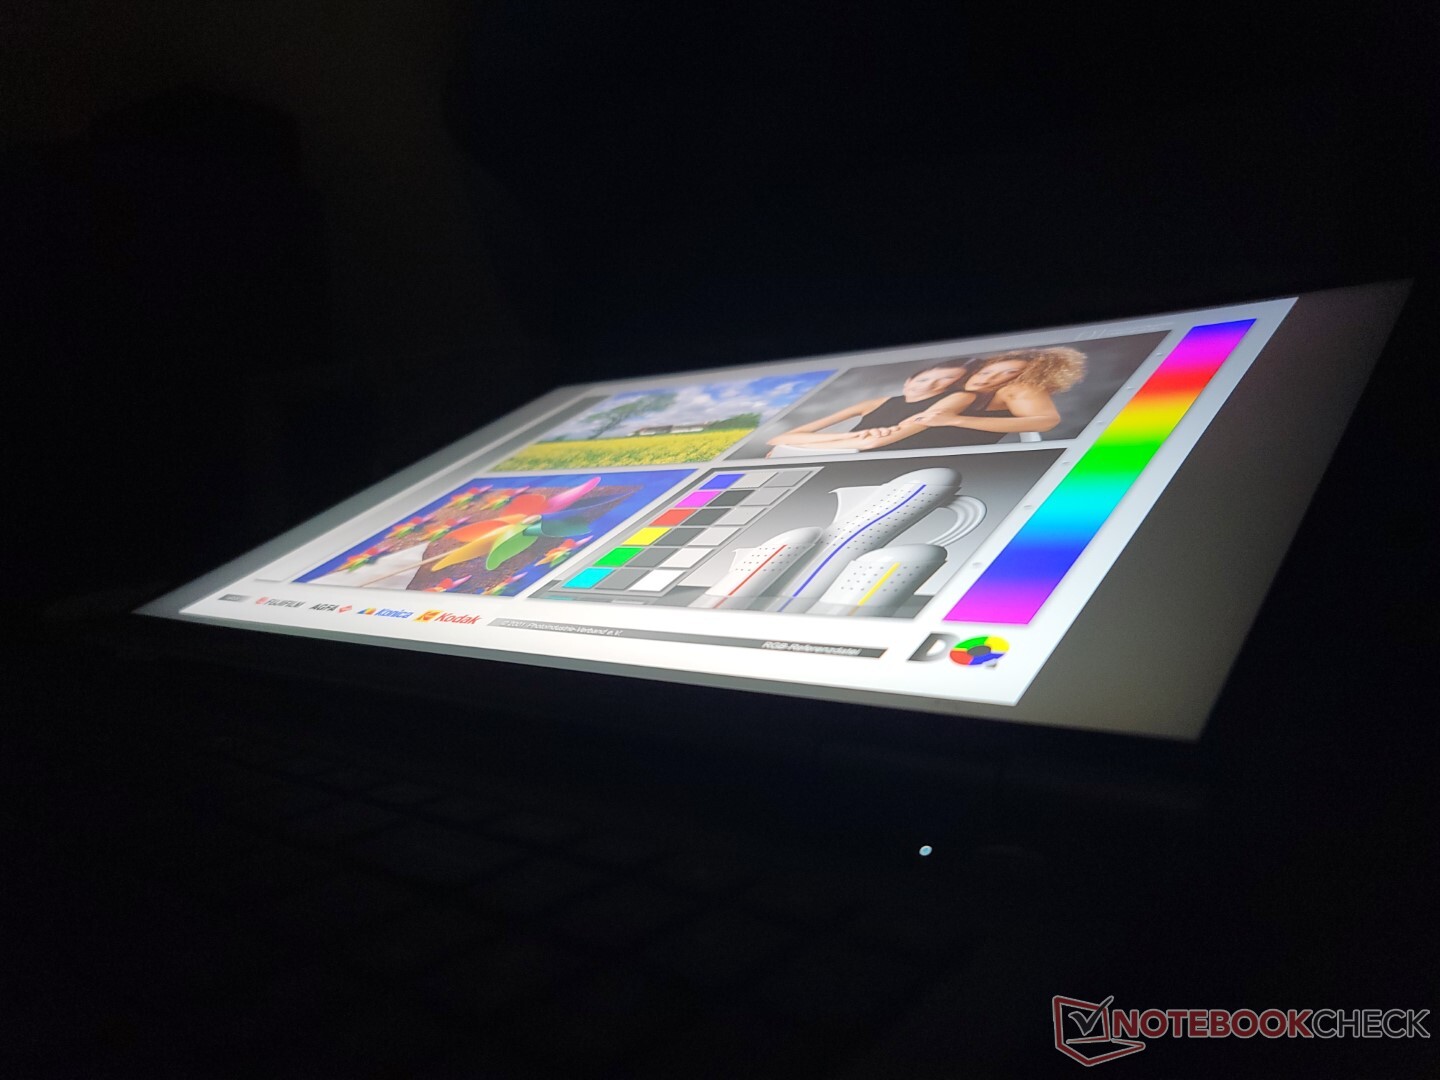
Nuestra pantalla de 165 Hz es una mejora del panel de 60 Hz de nuestra unidad de prueba Gen 2. También ofrece tiempos de respuesta más rápidos, una retroiluminación más brillante y la misma cobertura sRGB completa. Por desgracia, no hay opciones de paneles OLED o P3 por el momento.

| |||||||||||||||||||||||||
iluminación: 94 %
Brillo con batería: 532.8 cd/m²
Contraste: 969:1 (Negro: 0.55 cd/m²)
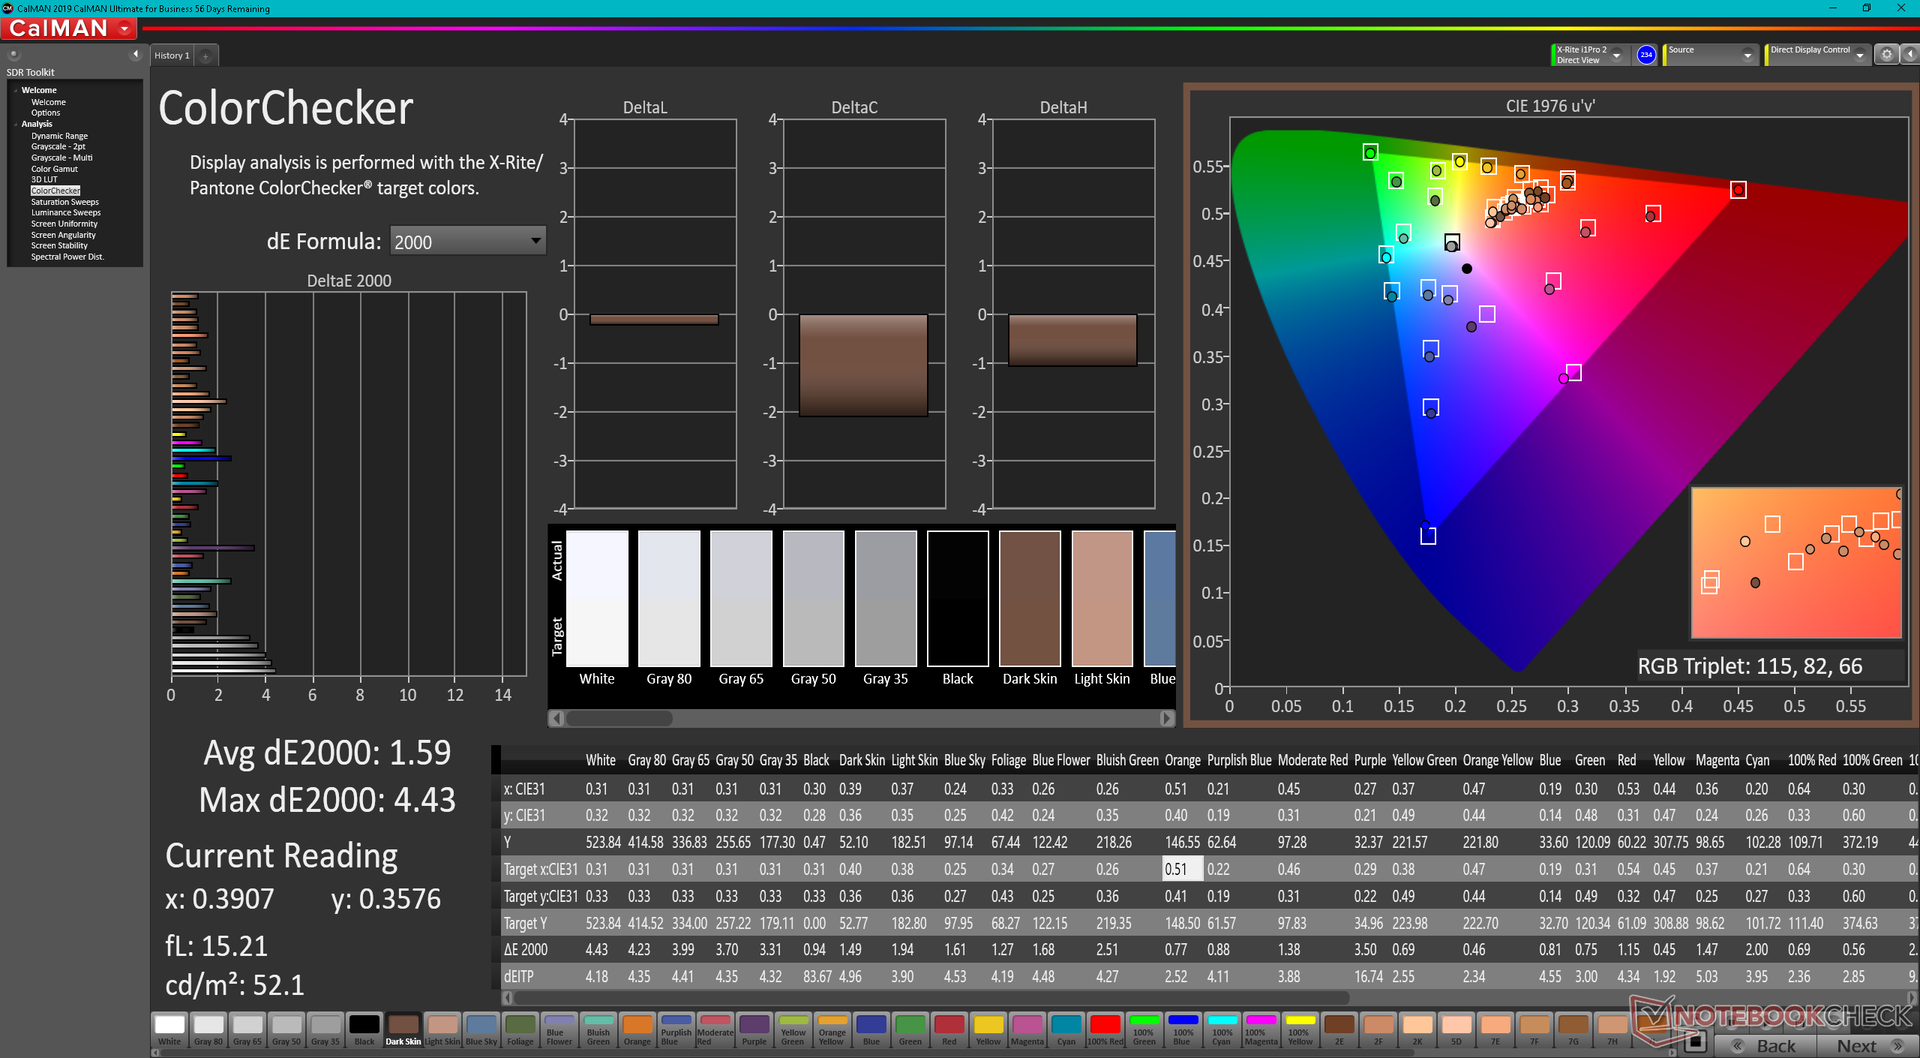
ΔE ColorChecker Calman: 1.32 | ∀{0.5-29.43 Ø4.73}
calibrated: 1.59
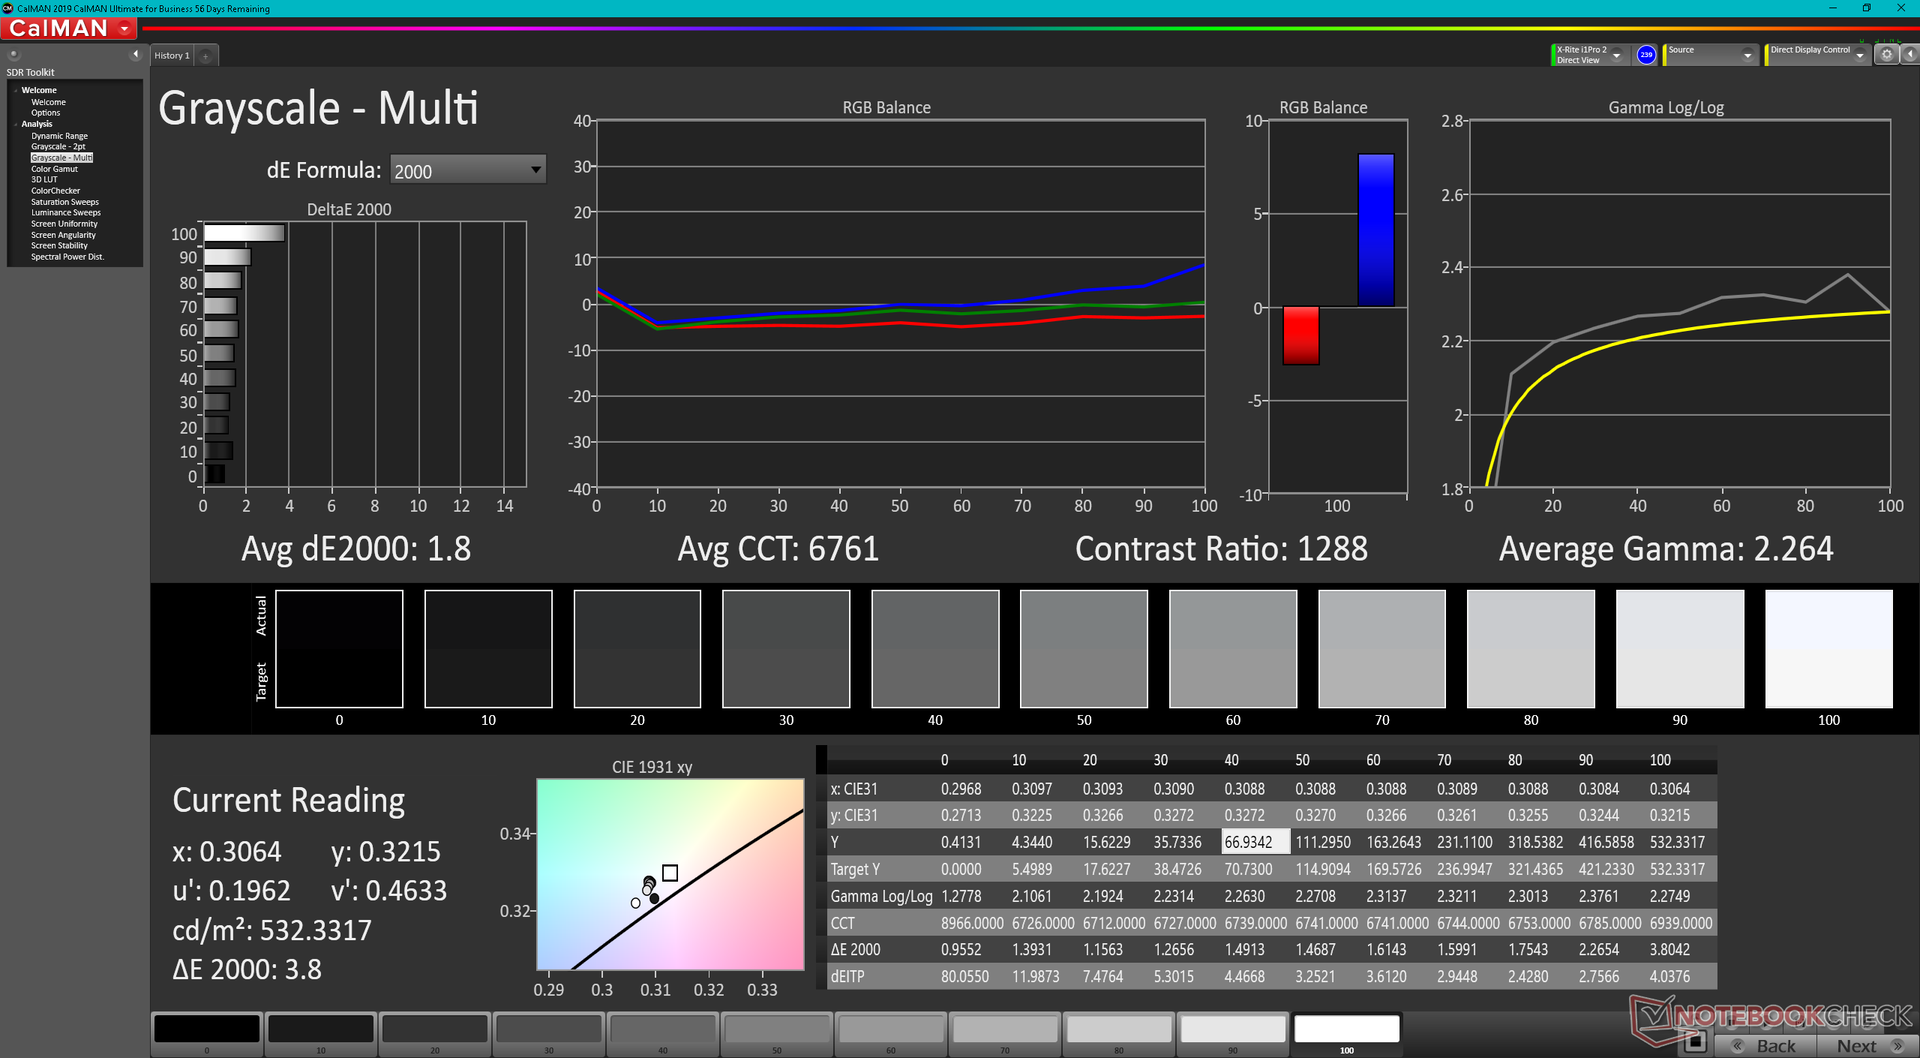
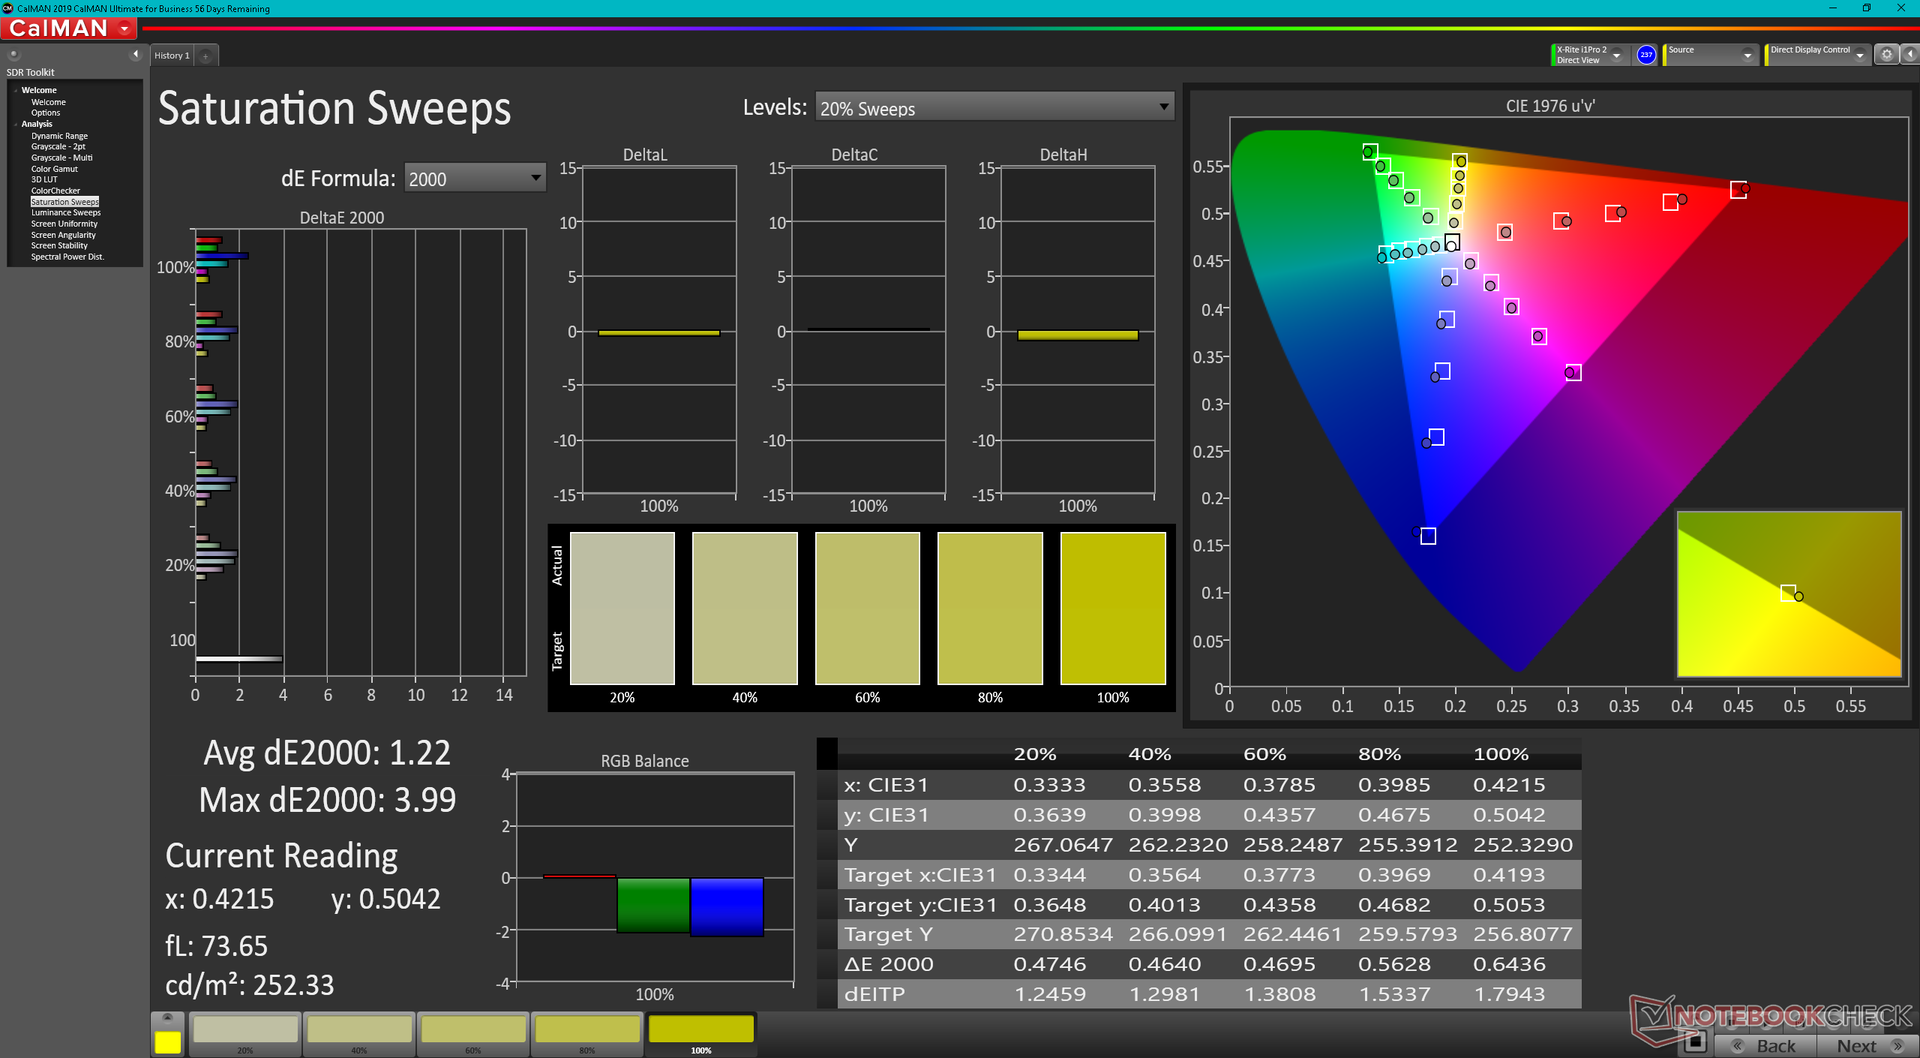
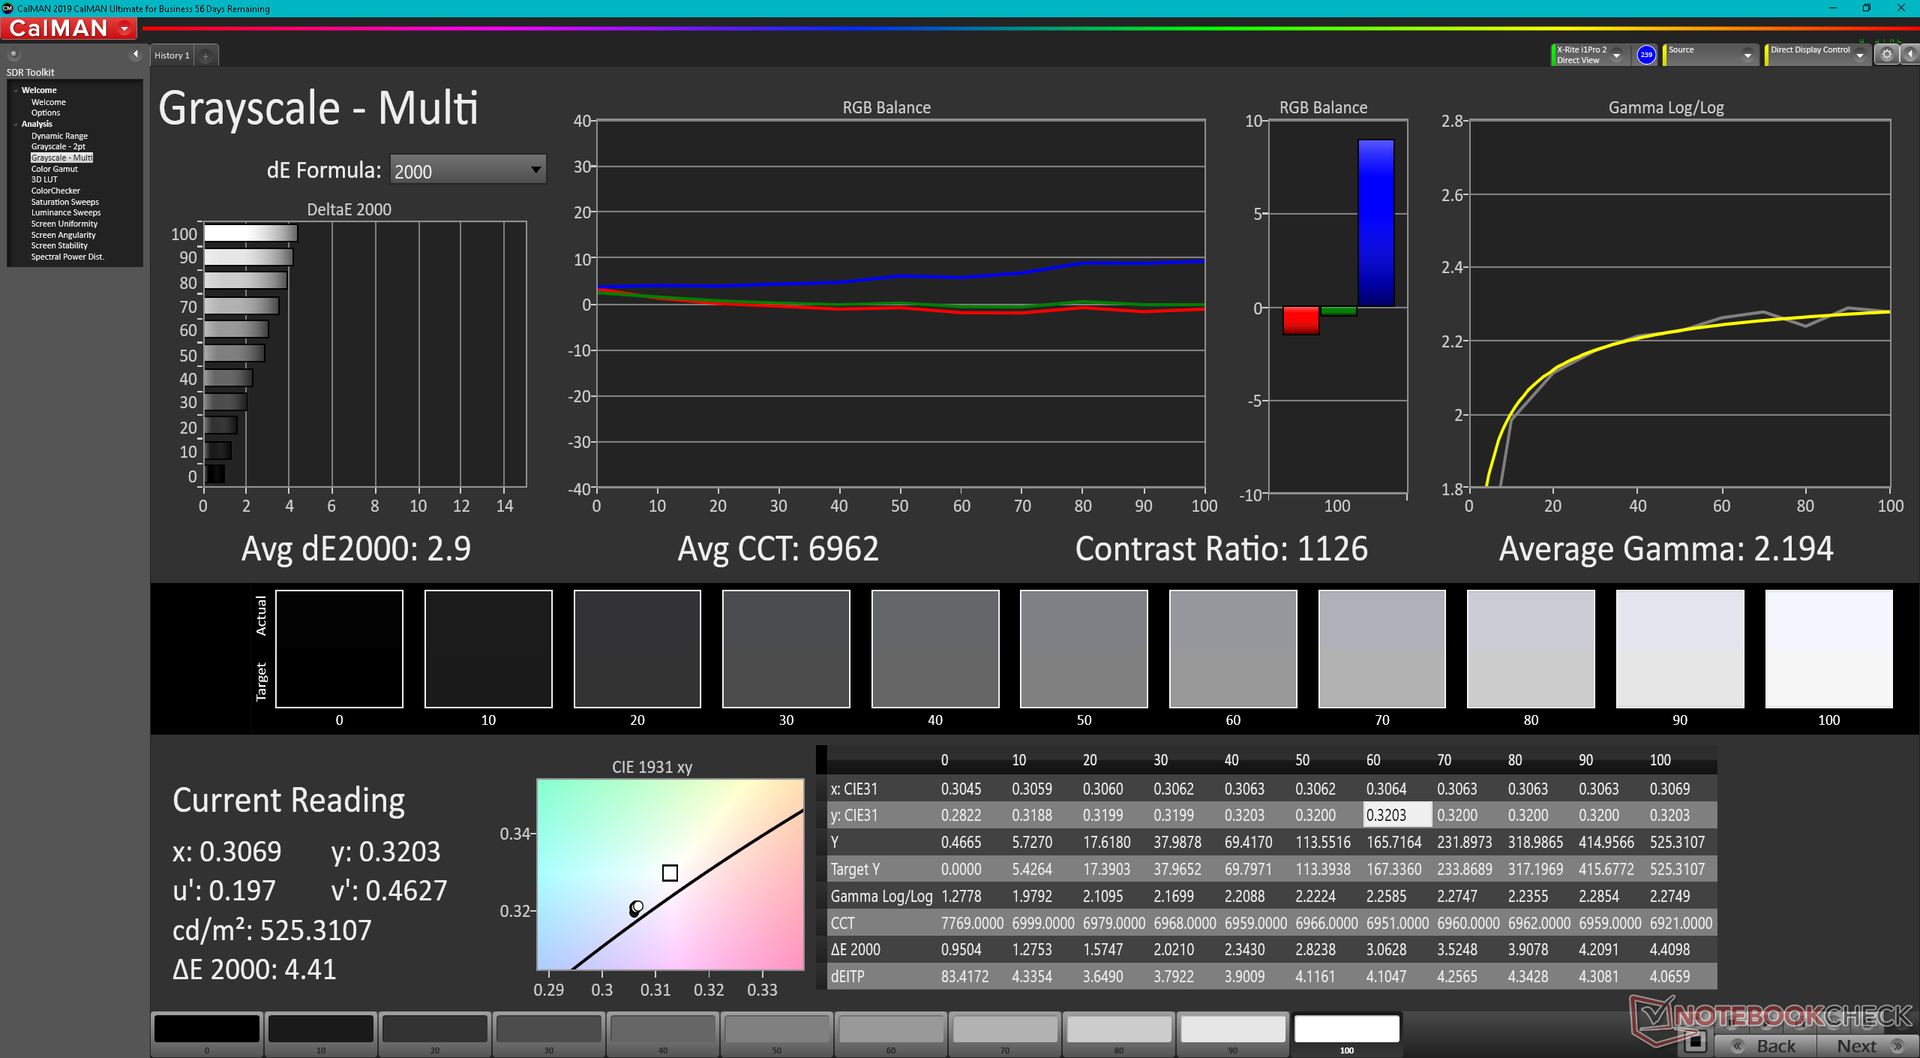
ΔE Greyscale Calman: 1.8 | ∀{0.09-98 Ø4.97}
71.4% AdobeRGB 1998 (Argyll 3D)
98.2% sRGB (Argyll 3D)
69.8% Display P3 (Argyll 3D)
Gamma: 2.64
CCT: 6761 K
| Lenovo ThinkBook 16p G3 ARH BOE CQ NE160QDM-NY1, IPS, 2560x1600, 16" | HP Envy 16 h0112nr Samsung SDC4174, OLED, 3840x2400, 16" | Lenovo ThinkBook 16p G2 ACH Lenovo LEN8A95 (AUO B160QAN02.M), IPS, 2560x1600, 16" | Lenovo IdeaPad 5 Pro 16ARH7 AUO B160QAN02.H, IPS, 2560x1600, 16" | Acer Swift X SFX16-51G-5388 Chi Mei N161HCA-EA3, , 1920x1080, 16.1" | Lenovo Legion 5 Pro 16IAH7H BOE CCQ_NE160QDM_NY1, IPS, 2560x1600, 16" | |
|---|---|---|---|---|---|---|
| Display | 22% | 6% | -4% | -6% | -1% | |
| Display P3 Coverage (%) | 69.8 | 99.3 42% | 76.4 9% | 65 -7% | 65.1 -7% | 68.53 -2% |
| sRGB Coverage (%) | 98.2 | 100 2% | 100 2% | 98 0% | 95.65 -3% | 98.38 0% |
| AdobeRGB 1998 Coverage (%) | 71.4 | 88 23% | 77.4 8% | 67.2 -6% | 66.75 -7% | 70.45 -1% |
| Response Times | 85% | -89% | 24% | -86% | 28% | |
| Response Time Grey 50% / Grey 80% * (ms) | 15.6 ? | 2 ? 87% | 36 -131% | 14.1 ? 10% | 30 ? -92% | 14 ? 10% |
| Response Time Black / White * (ms) | 11.2 ? | 1.9 ? 83% | 16.4 -46% | 7.1 ? 37% | 20 ? -79% | 6 ? 46% |
| PWM Frequency (Hz) | 240.4 ? | |||||
| Screen | -19% | -1% | -11% | 2% | -11% | |
| Brightness middle (cd/m²) | 532.8 | 328.8 -38% | 439 -18% | 415 -22% | 276 -48% | 515 -3% |
| Brightness (cd/m²) | 519 | 332 -36% | 397 -24% | 409 -21% | 264 -49% | 475 -8% |
| Brightness Distribution (%) | 94 | 97 3% | 83 -12% | 91 -3% | 85 -10% | 85 -10% |
| Black Level * (cd/m²) | 0.55 | 0.44 20% | 0.32 42% | 0.16 71% | 0.45 18% | |
| Contrast (:1) | 969 | 998 3% | 1297 34% | 1725 78% | 1144 18% | |
| Colorchecker dE 2000 * | 1.32 | 1.53 -16% | 1.68 -27% | 1.92 -45% | 1.8 -36% | 2.38 -80% |
| Colorchecker dE 2000 max. * | 3.97 | 6.04 -52% | 2.36 41% | 5.71 -44% | 3.77 5% | 4.37 -10% |
| Colorchecker dE 2000 calibrated * | 1.59 | 1.57 1% | 0.58 64% | 0.63 60% | 1.1 31% | |
| Greyscale dE 2000 * | 1.8 | 1.3 28% | 1.64 9% | 3.7 -106% | 2.76 -53% | 2.71 -51% |
| Gamma | 2.64 83% | 2.18 101% | 2.39 92% | 2.272 97% | 2.37 93% | 2.49 88% |
| CCT | 6761 96% | 6362 102% | 6616 98% | 7132 91% | 6564 99% | 6117 106% |
| Media total (Programa/Opciones) | 29% /
11% | -28% /
-12% | 3% /
-5% | -30% /
-12% | 5% /
-3% |
* ... más pequeño es mejor
La pantalla viene precalibrada con el estándar sRGB. Los valores medios de escala de grises y de color deltaE son sólo 1,8 y 1,32, respectivamente, por lo que no es necesaria una calibración por parte del usuario final.
Tiempos de respuesta del display
| ↔ Tiempo de respuesta de Negro a Blanco | ||
|---|---|---|
| 11.2 ms ... subida ↗ y bajada ↘ combinada | ↗ 6 ms subida | 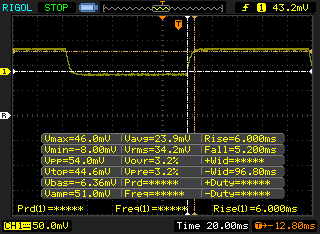 |
| ↘ 5.2 ms bajada | ||
| La pantalla mostró buenos tiempos de respuesta en nuestros tests pero podría ser demasiado lenta para los jugones competitivos. En comparación, todos los dispositivos de prueba van de ##min### (mínimo) a 240 (máximo) ms. » 30 % de todos los dispositivos son mejores. Esto quiere decir que el tiempo de respuesta medido es mejor que la media (19.9 ms) de todos los dispositivos testados. | ||
| ↔ Tiempo de respuesta 50% Gris a 80% Gris | ||
| 15.6 ms ... subida ↗ y bajada ↘ combinada | ↗ 7.2 ms subida | 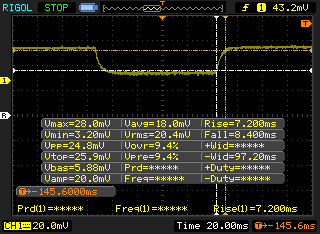 |
| ↘ 8.4 ms bajada | ||
| La pantalla mostró buenos tiempos de respuesta en nuestros tests pero podría ser demasiado lenta para los jugones competitivos. En comparación, todos los dispositivos de prueba van de ##min### (mínimo) a 636 (máximo) ms. » 30 % de todos los dispositivos son mejores. Esto quiere decir que el tiempo de respuesta medido es mejor que la media (31.1 ms) de todos los dispositivos testados. | ||
Parpadeo de Pantalla / PWM (Pulse-Width Modulation)
| Parpadeo de Pantalla / PWM no detectado | 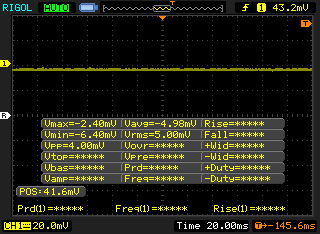 | ||
Comparación: 52 % de todos los dispositivos testados no usaron PWM para atenuar el display. Si se usó, medimos una media de 7798 (mínimo: 5 - máxmo: 343500) Hz. | |||
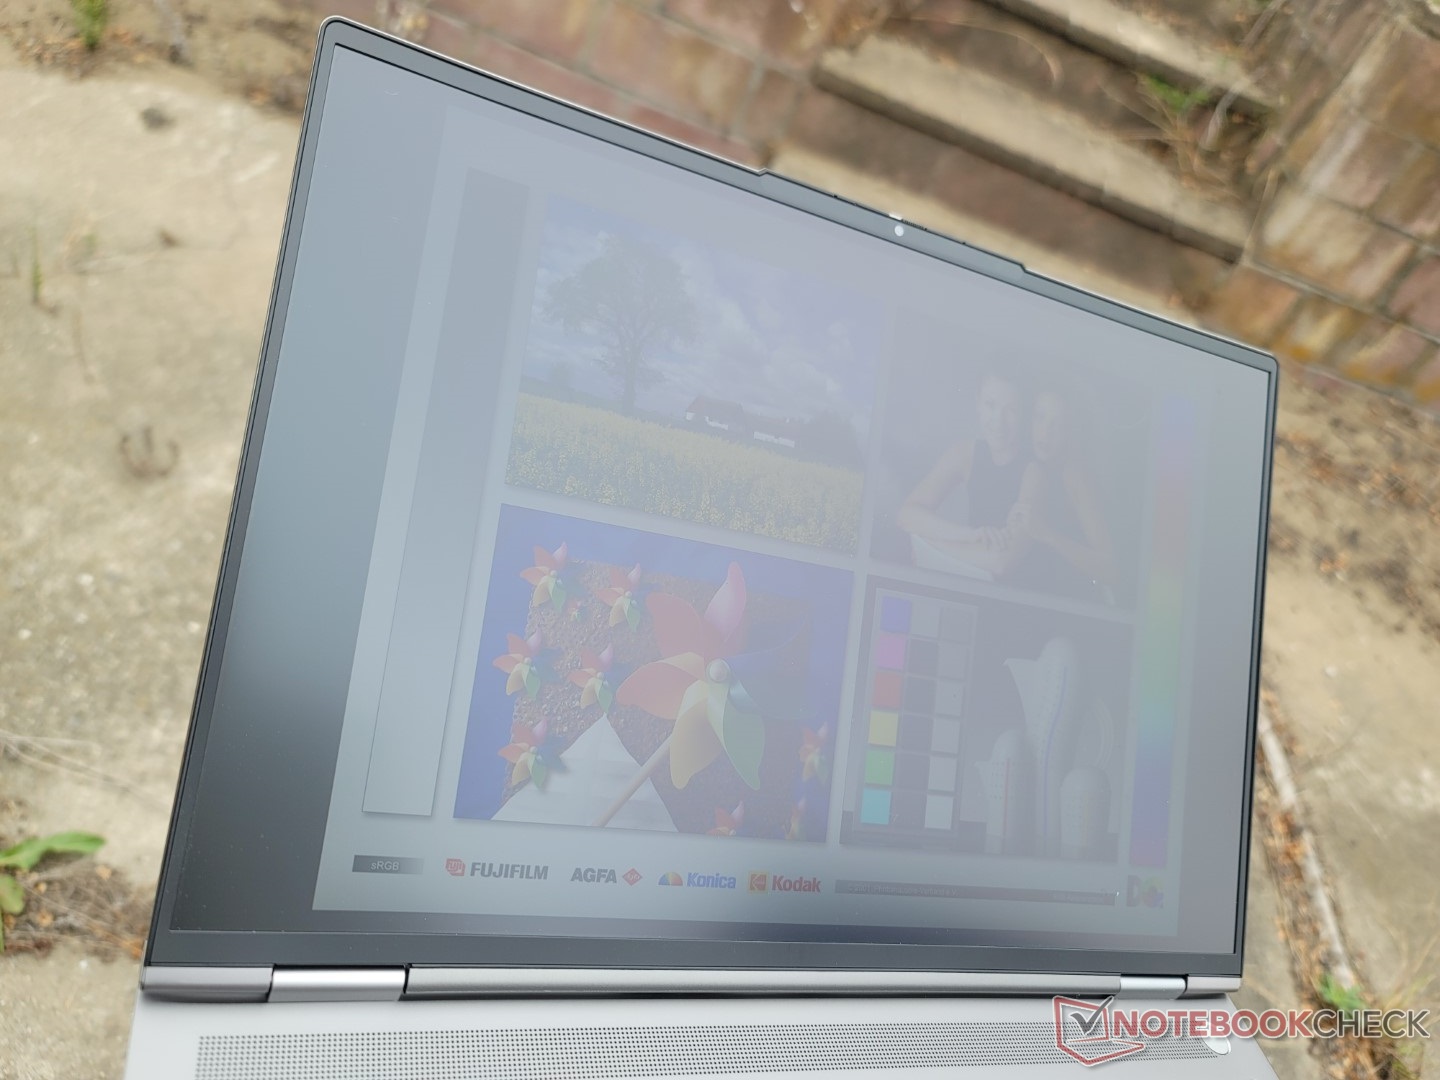
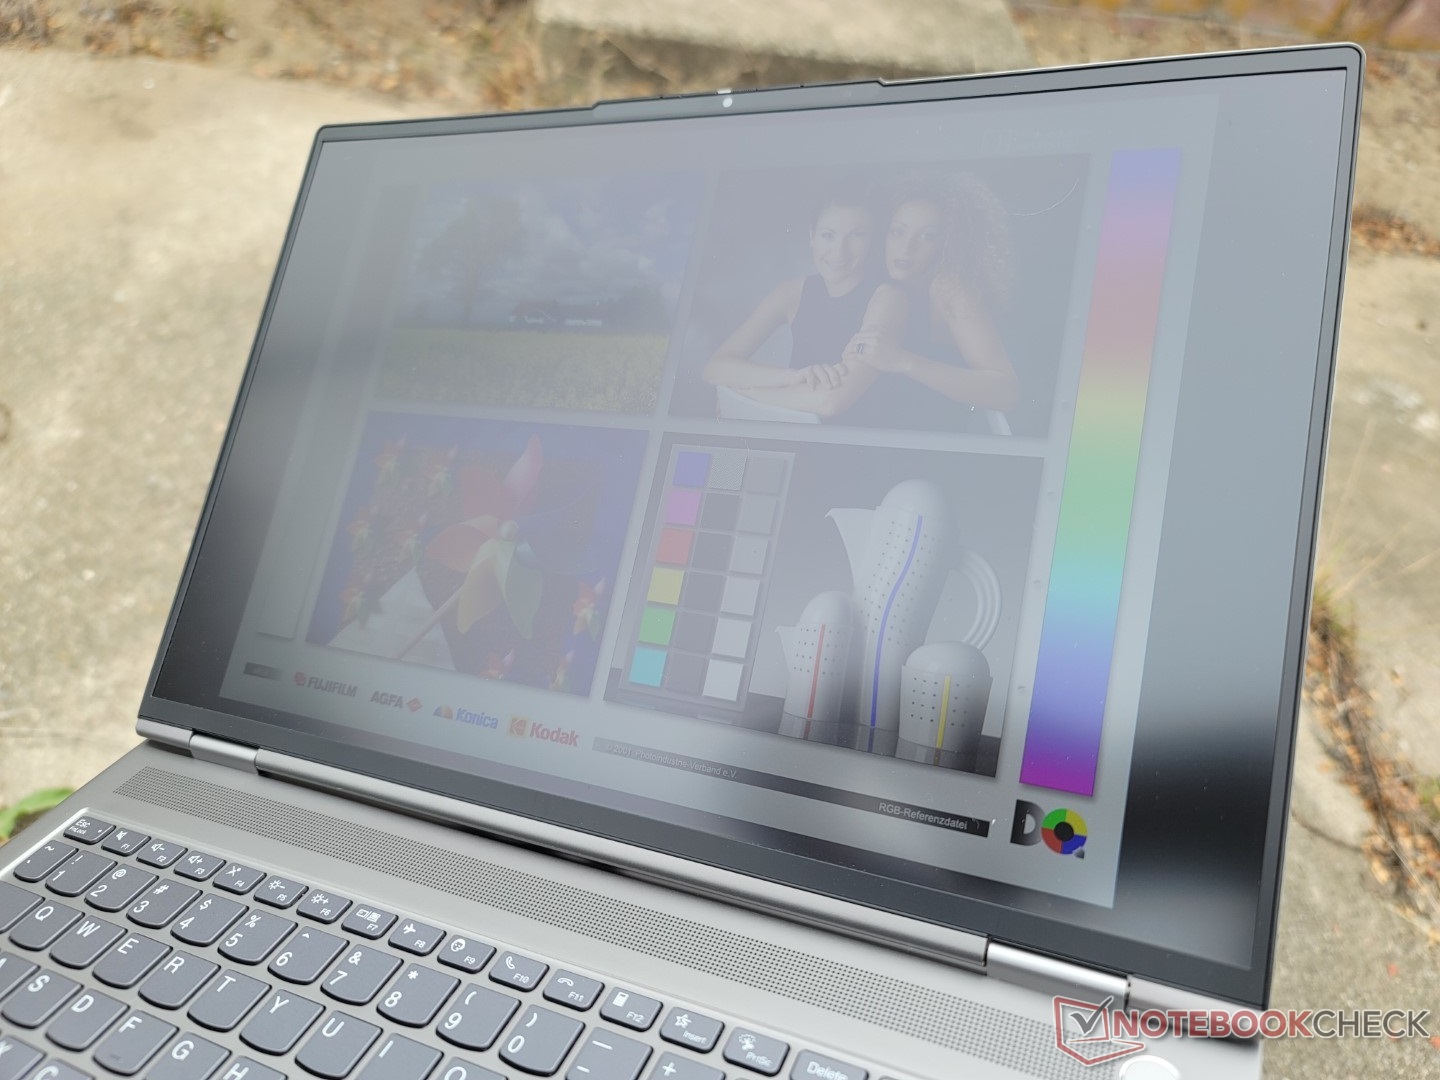
La visibilidad en exteriores es decente si está a la sombra. El revestimiento mate y la retroiluminación relativamente brillante de 500 nits ayudan a minimizar los reflejos más que con una alternativa brillante.
Rendimiento
Condiciones de la prueba
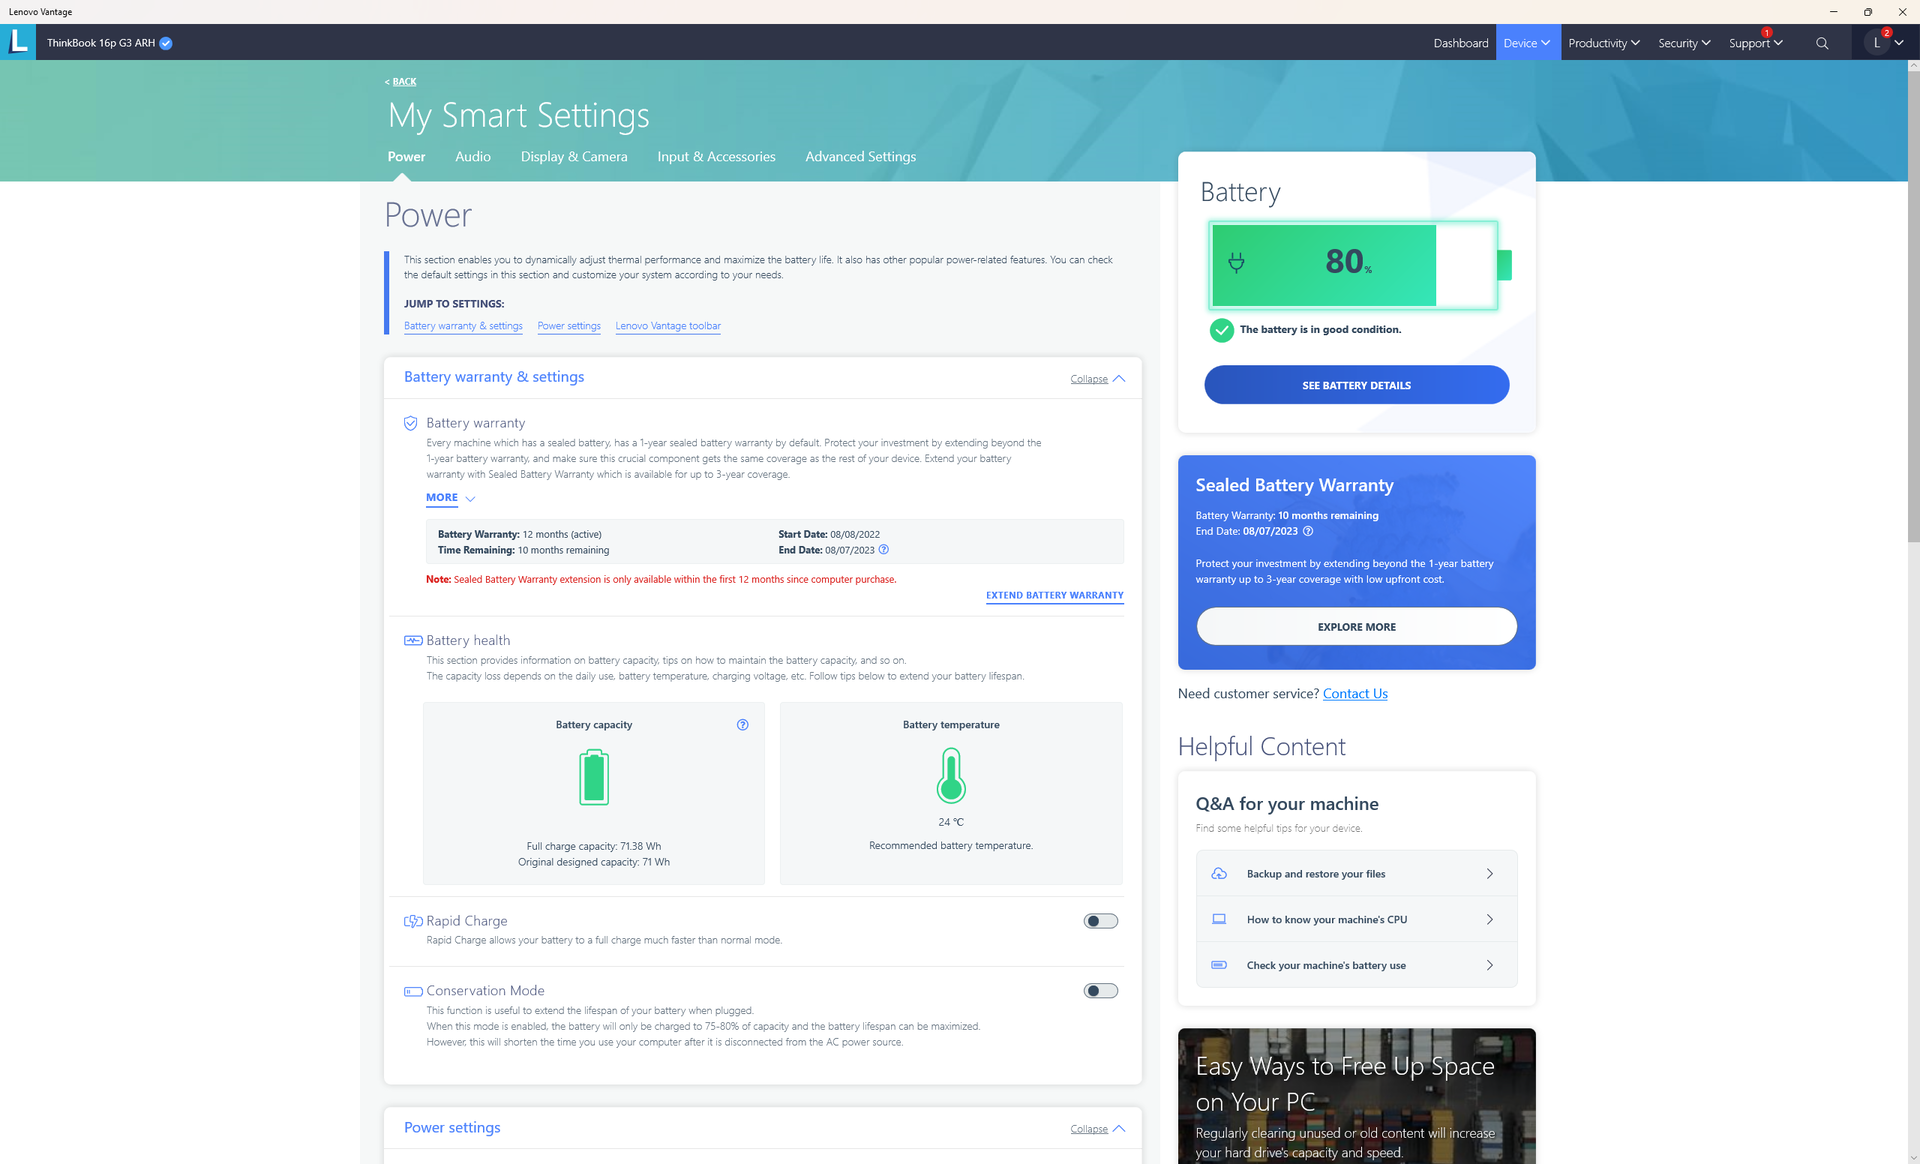
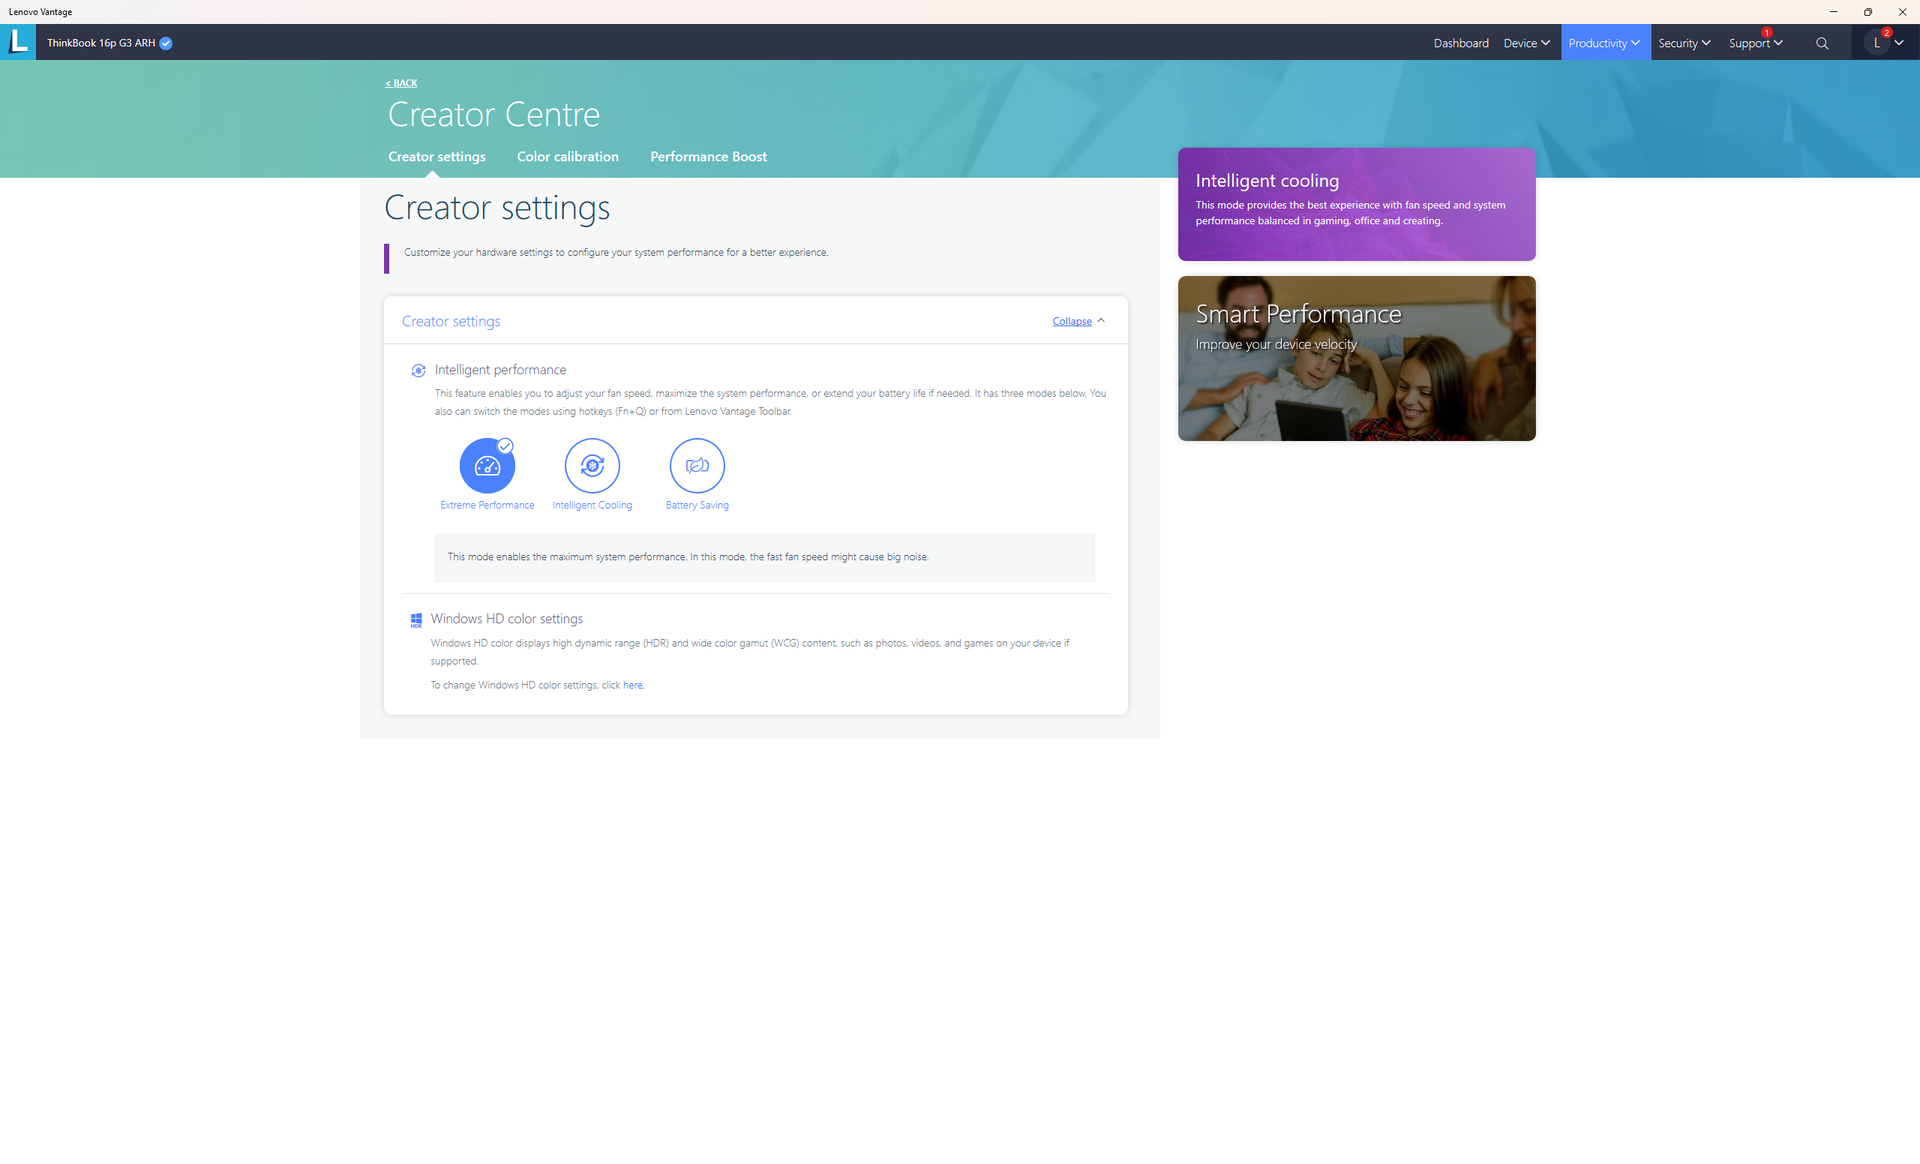
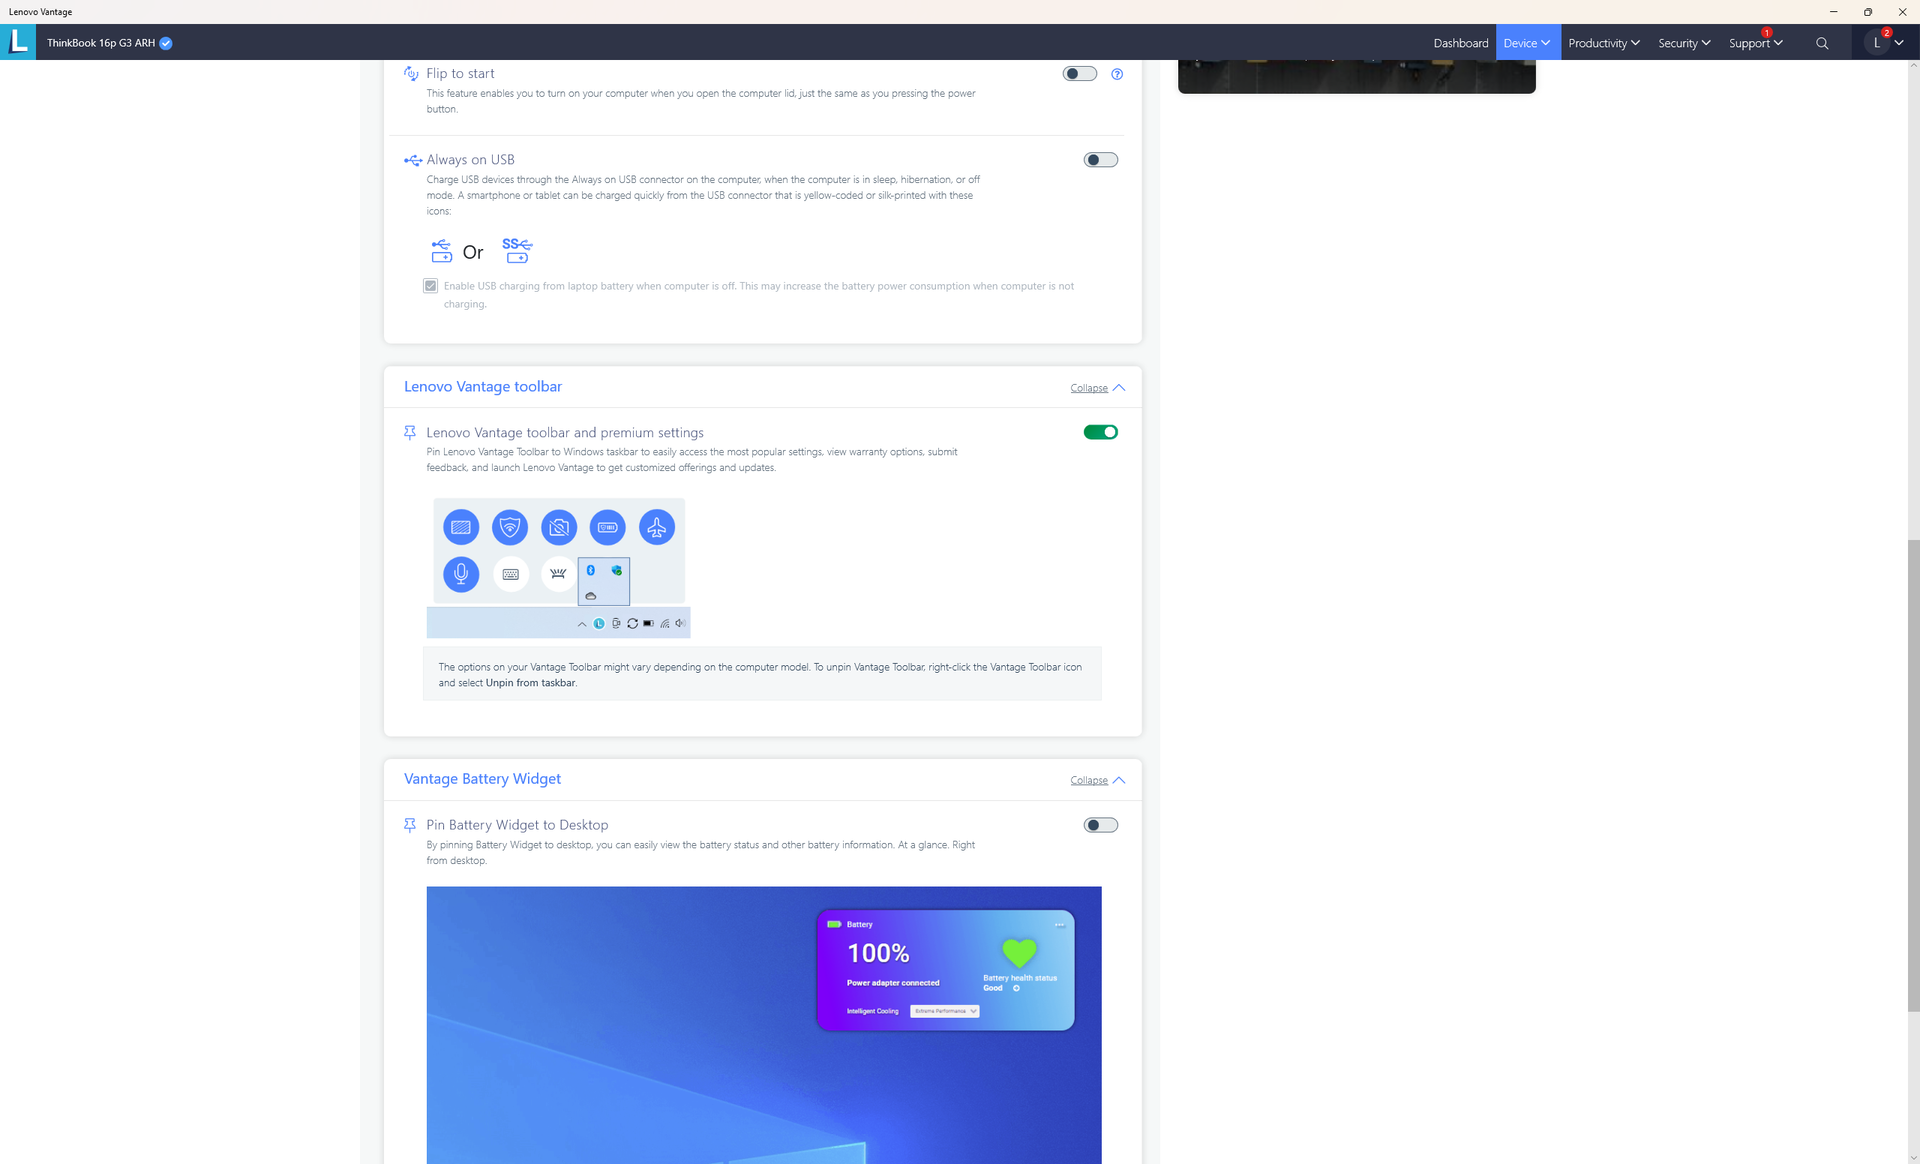
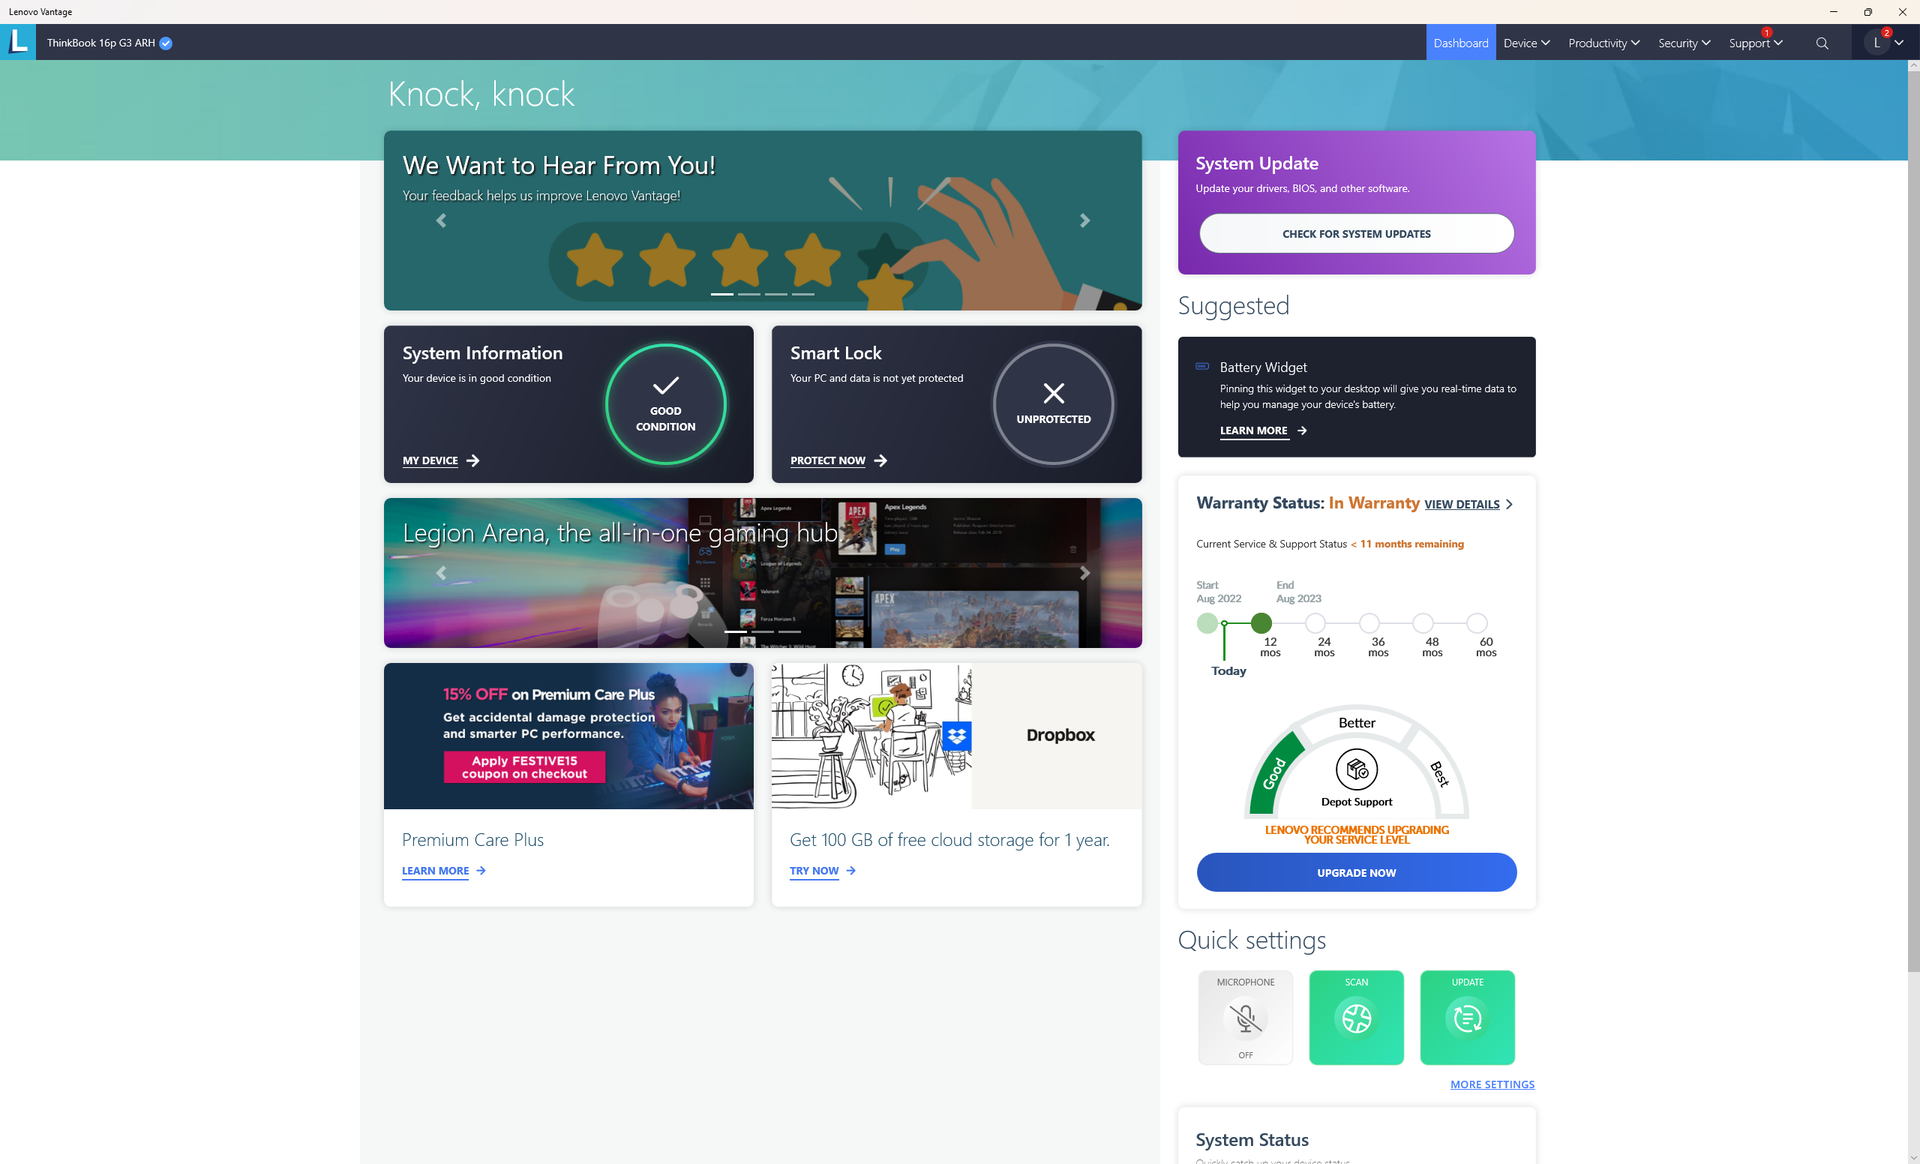
Hemos configurado nuestra unidad en el modo de rendimiento a través de Windows y en el modo de rendimiento extremo a través del software Lenovo Vantage antes de ejecutar cualquier punto de referencia a continuación. Se recomienda familiarizarse con Lenovo Vantage, ya que es el centro de control para las actualizaciones y la configuración, como se muestra en las capturas de pantalla a continuación.
Procesador
El rendimiento de la CPU es mixto. Aunque el Ryzen 9 6900HX es ciertamente una de las CPUs móviles más rápidas de AMD, el rendimiento es esencialmente idéntico al del Ryzen 9 5900HX. De hecho, apenas es más rápido que el Ryzen 7 6800H. El cambio al Ryzen 5 6600H reducirá el rendimiento de un solo hilo y de varios hilos en un 5 y un 20 por ciento, respectivamente.
Cinebench R15 Multi Loop
Cinebench R23: Multi Core | Single Core
Cinebench R15: CPU Multi 64Bit | CPU Single 64Bit
Blender: v2.79 BMW27 CPU
7-Zip 18.03: 7z b 4 | 7z b 4 -mmt1
Geekbench 5.5: Multi-Core | Single-Core
HWBOT x265 Benchmark v2.2: 4k Preset
LibreOffice : 20 Documents To PDF
R Benchmark 2.5: Overall mean
| Cinebench R20 / CPU (Multi Core) | |
| Lenovo Legion 5 Pro 16IAH7H | |
| Razer Blade 15 2022 | |
| Lenovo ThinkBook 16p G3 ARH | |
| Medio AMD Ryzen 9 6900HX (3742 - 5813, n=19) | |
| Lenovo ThinkBook 16p G2 ACH | |
| HP Envy 16 h0112nr | |
| Asus ROG Zephyrus G14 GA402RJ | |
| Lenovo IdeaPad 5 Pro 16ACH | |
| Lenovo Legion 5 Pro 16 ARH7H-82RG0047GE | |
| Aorus 15P XC | |
| Acer Swift X SFX16-51G-5388 | |
| Cinebench R20 / CPU (Single Core) | |
| Razer Blade 15 2022 | |
| HP Envy 16 h0112nr | |
| Lenovo Legion 5 Pro 16IAH7H | |
| Medio AMD Ryzen 9 6900HX (595 - 631, n=19) | |
| Lenovo ThinkBook 16p G3 ARH | |
| Lenovo ThinkBook 16p G2 ACH | |
| Lenovo Legion 5 Pro 16 ARH7H-82RG0047GE | |
| Asus ROG Zephyrus G14 GA402RJ | |
| Acer Swift X SFX16-51G-5388 | |
| Lenovo IdeaPad 5 Pro 16ACH | |
| Aorus 15P XC | |
| Cinebench R23 / Multi Core | |
| Lenovo Legion 5 Pro 16IAH7H | |
| Razer Blade 15 2022 | |
| Lenovo ThinkBook 16p G3 ARH | |
| Medio AMD Ryzen 9 6900HX (9709 - 15100, n=19) | |
| Lenovo ThinkBook 16p G2 ACH | |
| HP Envy 16 h0112nr | |
| Asus ROG Zephyrus G14 GA402RJ | |
| Lenovo IdeaPad 5 Pro 16ACH | |
| Lenovo Legion 5 Pro 16 ARH7H-82RG0047GE | |
| Aorus 15P XC | |
| Acer Swift X SFX16-51G-5388 | |
| Cinebench R23 / Single Core | |
| Razer Blade 15 2022 | |
| HP Envy 16 h0112nr | |
| Lenovo Legion 5 Pro 16IAH7H | |
| Medio AMD Ryzen 9 6900HX (1516 - 1616, n=19) | |
| Lenovo ThinkBook 16p G3 ARH | |
| Lenovo ThinkBook 16p G2 ACH | |
| Lenovo Legion 5 Pro 16 ARH7H-82RG0047GE | |
| Asus ROG Zephyrus G14 GA402RJ | |
| Lenovo IdeaPad 5 Pro 16ACH | |
| Acer Swift X SFX16-51G-5388 | |
| Aorus 15P XC | |
| Cinebench R15 / CPU Multi 64Bit | |
| Lenovo Legion 5 Pro 16IAH7H | |
| HP Envy 16 h0112nr | |
| Razer Blade 15 2022 | |
| Medio AMD Ryzen 9 6900HX (1588 - 2411, n=19) | |
| Lenovo ThinkBook 16p G3 ARH | |
| Lenovo ThinkBook 16p G2 ACH | |
| Asus ROG Zephyrus G14 GA402RJ | |
| Lenovo IdeaPad 5 Pro 16ACH | |
| Lenovo Legion 5 Pro 16 ARH7H-82RG0047GE | |
| Aorus 15P XC | |
| Acer Swift X SFX16-51G-5388 | |
| Cinebench R15 / CPU Single 64Bit | |
| Razer Blade 15 2022 | |
| HP Envy 16 h0112nr | |
| Lenovo Legion 5 Pro 16IAH7H | |
| Medio AMD Ryzen 9 6900HX (241 - 261, n=19) | |
| Lenovo ThinkBook 16p G3 ARH | |
| Lenovo ThinkBook 16p G2 ACH | |
| Lenovo Legion 5 Pro 16 ARH7H-82RG0047GE | |
| Asus ROG Zephyrus G14 GA402RJ | |
| Lenovo IdeaPad 5 Pro 16ACH | |
| Acer Swift X SFX16-51G-5388 | |
| Aorus 15P XC | |
| Blender / v2.79 BMW27 CPU | |
| Acer Swift X SFX16-51G-5388 | |
| Aorus 15P XC | |
| Lenovo Legion 5 Pro 16 ARH7H-82RG0047GE | |
| Lenovo IdeaPad 5 Pro 16ACH | |
| Asus ROG Zephyrus G14 GA402RJ | |
| HP Envy 16 h0112nr | |
| Lenovo ThinkBook 16p G3 ARH | |
| Medio AMD Ryzen 9 6900HX (212 - 357, n=21) | |
| Lenovo ThinkBook 16p G2 ACH | |
| Razer Blade 15 2022 | |
| Lenovo Legion 5 Pro 16IAH7H | |
| 7-Zip 18.03 / 7z b 4 | |
| Lenovo Legion 5 Pro 16IAH7H | |
| Razer Blade 15 2022 | |
| Medio AMD Ryzen 9 6900HX (49526 - 65336, n=20) | |
| Lenovo ThinkBook 16p G2 ACH | |
| Asus ROG Zephyrus G14 GA402RJ | |
| Lenovo ThinkBook 16p G3 ARH | |
| HP Envy 16 h0112nr | |
| Lenovo IdeaPad 5 Pro 16ACH | |
| Lenovo Legion 5 Pro 16 ARH7H-82RG0047GE | |
| Aorus 15P XC | |
| Acer Swift X SFX16-51G-5388 | |
| 7-Zip 18.03 / 7z b 4 -mmt1 | |
| Medio AMD Ryzen 9 6900HX (5090 - 6070, n=20) | |
| Lenovo ThinkBook 16p G2 ACH | |
| Razer Blade 15 2022 | |
| HP Envy 16 h0112nr | |
| Lenovo Legion 5 Pro 16 ARH7H-82RG0047GE | |
| Asus ROG Zephyrus G14 GA402RJ | |
| Lenovo Legion 5 Pro 16IAH7H | |
| Lenovo IdeaPad 5 Pro 16ACH | |
| Aorus 15P XC | |
| Lenovo ThinkBook 16p G3 ARH | |
| Acer Swift X SFX16-51G-5388 | |
| Geekbench 5.5 / Multi-Core | |
| Lenovo Legion 5 Pro 16IAH7H | |
| HP Envy 16 h0112nr | |
| Razer Blade 15 2022 | |
| Medio AMD Ryzen 9 6900HX (8313 - 10490, n=21) | |
| Lenovo ThinkBook 16p G3 ARH | |
| Asus ROG Zephyrus G14 GA402RJ | |
| Lenovo ThinkBook 16p G2 ACH | |
| Aorus 15P XC | |
| Lenovo Legion 5 Pro 16 ARH7H-82RG0047GE | |
| Lenovo IdeaPad 5 Pro 16ACH | |
| Acer Swift X SFX16-51G-5388 | |
| Geekbench 5.5 / Single-Core | |
| HP Envy 16 h0112nr | |
| Razer Blade 15 2022 | |
| Lenovo Legion 5 Pro 16IAH7H | |
| Medio AMD Ryzen 9 6900HX (1523 - 1652, n=21) | |
| Lenovo ThinkBook 16p G3 ARH | |
| Lenovo ThinkBook 16p G2 ACH | |
| Acer Swift X SFX16-51G-5388 | |
| Asus ROG Zephyrus G14 GA402RJ | |
| Lenovo Legion 5 Pro 16 ARH7H-82RG0047GE | |
| Lenovo IdeaPad 5 Pro 16ACH | |
| Aorus 15P XC | |
| HWBOT x265 Benchmark v2.2 / 4k Preset | |
| Lenovo Legion 5 Pro 16IAH7H | |
| Razer Blade 15 2022 | |
| Lenovo ThinkBook 16p G3 ARH | |
| Medio AMD Ryzen 9 6900HX (12.6 - 18.7, n=20) | |
| Lenovo ThinkBook 16p G2 ACH | |
| Asus ROG Zephyrus G14 GA402RJ | |
| HP Envy 16 h0112nr | |
| Lenovo Legion 5 Pro 16 ARH7H-82RG0047GE | |
| Lenovo IdeaPad 5 Pro 16ACH | |
| Aorus 15P XC | |
| Acer Swift X SFX16-51G-5388 | |
| LibreOffice / 20 Documents To PDF | |
| Lenovo Legion 5 Pro 16 ARH7H-82RG0047GE | |
| Lenovo ThinkBook 16p G3 ARH | |
| Asus ROG Zephyrus G14 GA402RJ | |
| Lenovo ThinkBook 16p G2 ACH | |
| Aorus 15P XC | |
| Medio AMD Ryzen 9 6900HX (44.8 - 81.7, n=20) | |
| Razer Blade 15 2022 | |
| Acer Swift X SFX16-51G-5388 | |
| Lenovo IdeaPad 5 Pro 16ACH | |
| HP Envy 16 h0112nr | |
| Lenovo Legion 5 Pro 16IAH7H | |
| R Benchmark 2.5 / Overall mean | |
| Acer Swift X SFX16-51G-5388 | |
| Aorus 15P XC | |
| Lenovo IdeaPad 5 Pro 16ACH | |
| Asus ROG Zephyrus G14 GA402RJ | |
| Lenovo Legion 5 Pro 16 ARH7H-82RG0047GE | |
| Lenovo ThinkBook 16p G2 ACH | |
| Lenovo ThinkBook 16p G3 ARH | |
| Medio AMD Ryzen 9 6900HX (0.4627 - 0.4974, n=20) | |
| Lenovo Legion 5 Pro 16IAH7H | |
| Razer Blade 15 2022 | |
| HP Envy 16 h0112nr | |
* ... más pequeño es mejor
AIDA64: FP32 Ray-Trace | FPU Julia | CPU SHA3 | CPU Queen | FPU SinJulia | FPU Mandel | CPU AES | CPU ZLib | FP64 Ray-Trace | CPU PhotoWorxx
| Performance rating | |
| Medio AMD Ryzen 9 6900HX | |
| Lenovo ThinkBook 16p G2 ACH | |
| Lenovo ThinkBook 16p G3 ARH | |
| Lenovo Legion 5 Pro 16IAH7H | |
| HP Envy 16 h0112nr | |
| Lenovo IdeaPad 5 Pro 16ARH7 | |
| Acer Swift X SFX16-51G-5388 | |
| AIDA64 / FP32 Ray-Trace | |
| Lenovo ThinkBook 16p G3 ARH | |
| Lenovo ThinkBook 16p G2 ACH | |
| Medio AMD Ryzen 9 6900HX (10950 - 17963, n=20) | |
| Lenovo Legion 5 Pro 16IAH7H | |
| Lenovo Legion 5 Pro 16IAH7H | |
| HP Envy 16 h0112nr | |
| Lenovo IdeaPad 5 Pro 16ARH7 | |
| Acer Swift X SFX16-51G-5388 | |
| AIDA64 / CPU Queen | |
| Lenovo ThinkBook 16p G3 ARH | |
| Lenovo ThinkBook 16p G2 ACH | |
| HP Envy 16 h0112nr | |
| Medio AMD Ryzen 9 6900HX (84185 - 107544, n=20) | |
| Lenovo Legion 5 Pro 16IAH7H | |
| Lenovo IdeaPad 5 Pro 16ARH7 | |
| Acer Swift X SFX16-51G-5388 | |
| AIDA64 / FP64 Ray-Trace | |
| Lenovo ThinkBook 16p G3 ARH | |
| Lenovo ThinkBook 16p G2 ACH | |
| Medio AMD Ryzen 9 6900HX (5798 - 9540, n=20) | |
| Lenovo Legion 5 Pro 16IAH7H | |
| Lenovo Legion 5 Pro 16IAH7H | |
| HP Envy 16 h0112nr | |
| Lenovo IdeaPad 5 Pro 16ARH7 | |
| Acer Swift X SFX16-51G-5388 | |
| AIDA64 / CPU PhotoWorxx | |
| HP Envy 16 h0112nr | |
| Acer Swift X SFX16-51G-5388 | |
| Lenovo Legion 5 Pro 16IAH7H | |
| Lenovo Legion 5 Pro 16IAH7H | |
| Medio AMD Ryzen 9 6900HX (26873 - 30604, n=20) | |
| Lenovo IdeaPad 5 Pro 16ARH7 | |
| Lenovo ThinkBook 16p G3 ARH | |
| Lenovo ThinkBook 16p G2 ACH | |
Rendimiento del sistema
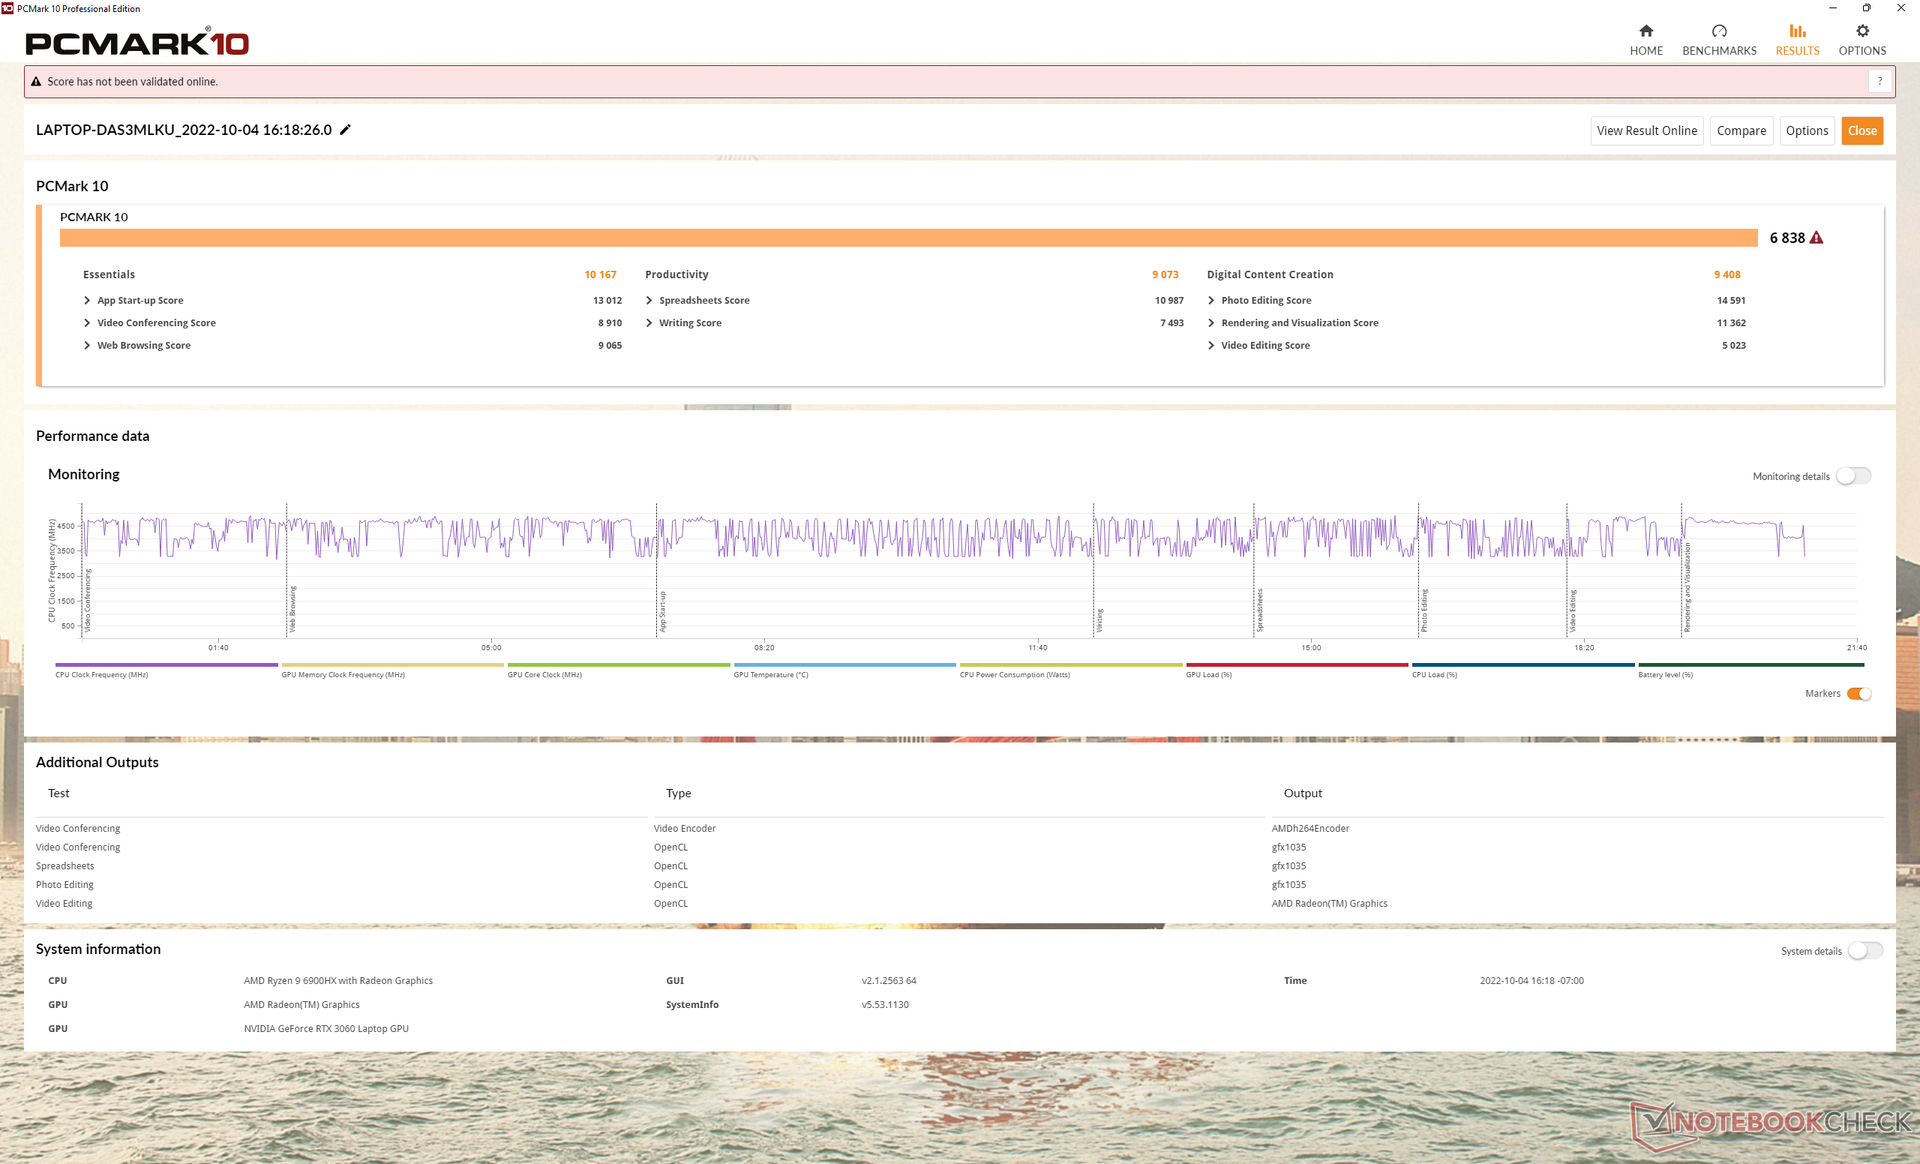
Los resultados de PCMark son casi idénticos a los del ThinkBook 16p Gen 2, ya que el rendimiento de la CPU apenas es mejor, como se ha mencionado anteriormente.
CrossMark: Overall | Productivity | Creativity | Responsiveness
| PCMark 10 / Score | |
| HP Envy 16 h0112nr | |
| Lenovo Legion 5 Pro 16IAH7H | |
| Lenovo ThinkBook 16p G3 ARH | |
| Medio AMD Ryzen 9 6900HX, NVIDIA GeForce RTX 3060 Laptop GPU (n=1) | |
| Lenovo ThinkBook 16p G2 ACH | |
| Lenovo IdeaPad 5 Pro 16ARH7 | |
| Acer Swift X SFX16-51G-5388 | |
| PCMark 10 / Essentials | |
| HP Envy 16 h0112nr | |
| Lenovo Legion 5 Pro 16IAH7H | |
| Lenovo ThinkBook 16p G2 ACH | |
| Lenovo ThinkBook 16p G3 ARH | |
| Medio AMD Ryzen 9 6900HX, NVIDIA GeForce RTX 3060 Laptop GPU (n=1) | |
| Lenovo IdeaPad 5 Pro 16ARH7 | |
| Acer Swift X SFX16-51G-5388 | |
| PCMark 10 / Productivity | |
| Lenovo Legion 5 Pro 16IAH7H | |
| HP Envy 16 h0112nr | |
| Lenovo ThinkBook 16p G2 ACH | |
| Lenovo ThinkBook 16p G3 ARH | |
| Medio AMD Ryzen 9 6900HX, NVIDIA GeForce RTX 3060 Laptop GPU (n=1) | |
| Lenovo IdeaPad 5 Pro 16ARH7 | |
| Acer Swift X SFX16-51G-5388 | |
| PCMark 10 / Digital Content Creation | |
| Lenovo Legion 5 Pro 16IAH7H | |
| HP Envy 16 h0112nr | |
| Lenovo ThinkBook 16p G3 ARH | |
| Medio AMD Ryzen 9 6900HX, NVIDIA GeForce RTX 3060 Laptop GPU (n=1) | |
| Lenovo ThinkBook 16p G2 ACH | |
| Acer Swift X SFX16-51G-5388 | |
| Lenovo IdeaPad 5 Pro 16ARH7 | |
| CrossMark / Overall | |
| HP Envy 16 h0112nr | |
| Lenovo Legion 5 Pro 16IAH7H | |
| Lenovo ThinkBook 16p G3 ARH | |
| Medio AMD Ryzen 9 6900HX, NVIDIA GeForce RTX 3060 Laptop GPU (n=1) | |
| Acer Swift X SFX16-51G-5388 | |
| CrossMark / Productivity | |
| HP Envy 16 h0112nr | |
| Lenovo Legion 5 Pro 16IAH7H | |
| Lenovo ThinkBook 16p G3 ARH | |
| Medio AMD Ryzen 9 6900HX, NVIDIA GeForce RTX 3060 Laptop GPU (n=1) | |
| Acer Swift X SFX16-51G-5388 | |
| CrossMark / Creativity | |
| HP Envy 16 h0112nr | |
| Lenovo Legion 5 Pro 16IAH7H | |
| Lenovo ThinkBook 16p G3 ARH | |
| Medio AMD Ryzen 9 6900HX, NVIDIA GeForce RTX 3060 Laptop GPU (n=1) | |
| Acer Swift X SFX16-51G-5388 | |
| CrossMark / Responsiveness | |
| Lenovo Legion 5 Pro 16IAH7H | |
| HP Envy 16 h0112nr | |
| Lenovo ThinkBook 16p G3 ARH | |
| Medio AMD Ryzen 9 6900HX, NVIDIA GeForce RTX 3060 Laptop GPU (n=1) | |
| Acer Swift X SFX16-51G-5388 | |
| PCMark 10 Score | 6838 puntos | |
ayuda | ||
| AIDA64 / Memory Latency | |
| Lenovo ThinkBook 16p G3 ARH | |
| Lenovo IdeaPad 5 Pro 16ARH7 | |
| Lenovo Legion 5 Pro 16IAH7H | |
| Lenovo Legion 5 Pro 16IAH7H | |
| Acer Swift X SFX16-51G-5388 | |
| HP Envy 16 h0112nr | |
| Medio AMD Ryzen 9 6900HX (80.7 - 120.6, n=20) | |
| Lenovo ThinkBook 16p G2 ACH | |
* ... más pequeño es mejor
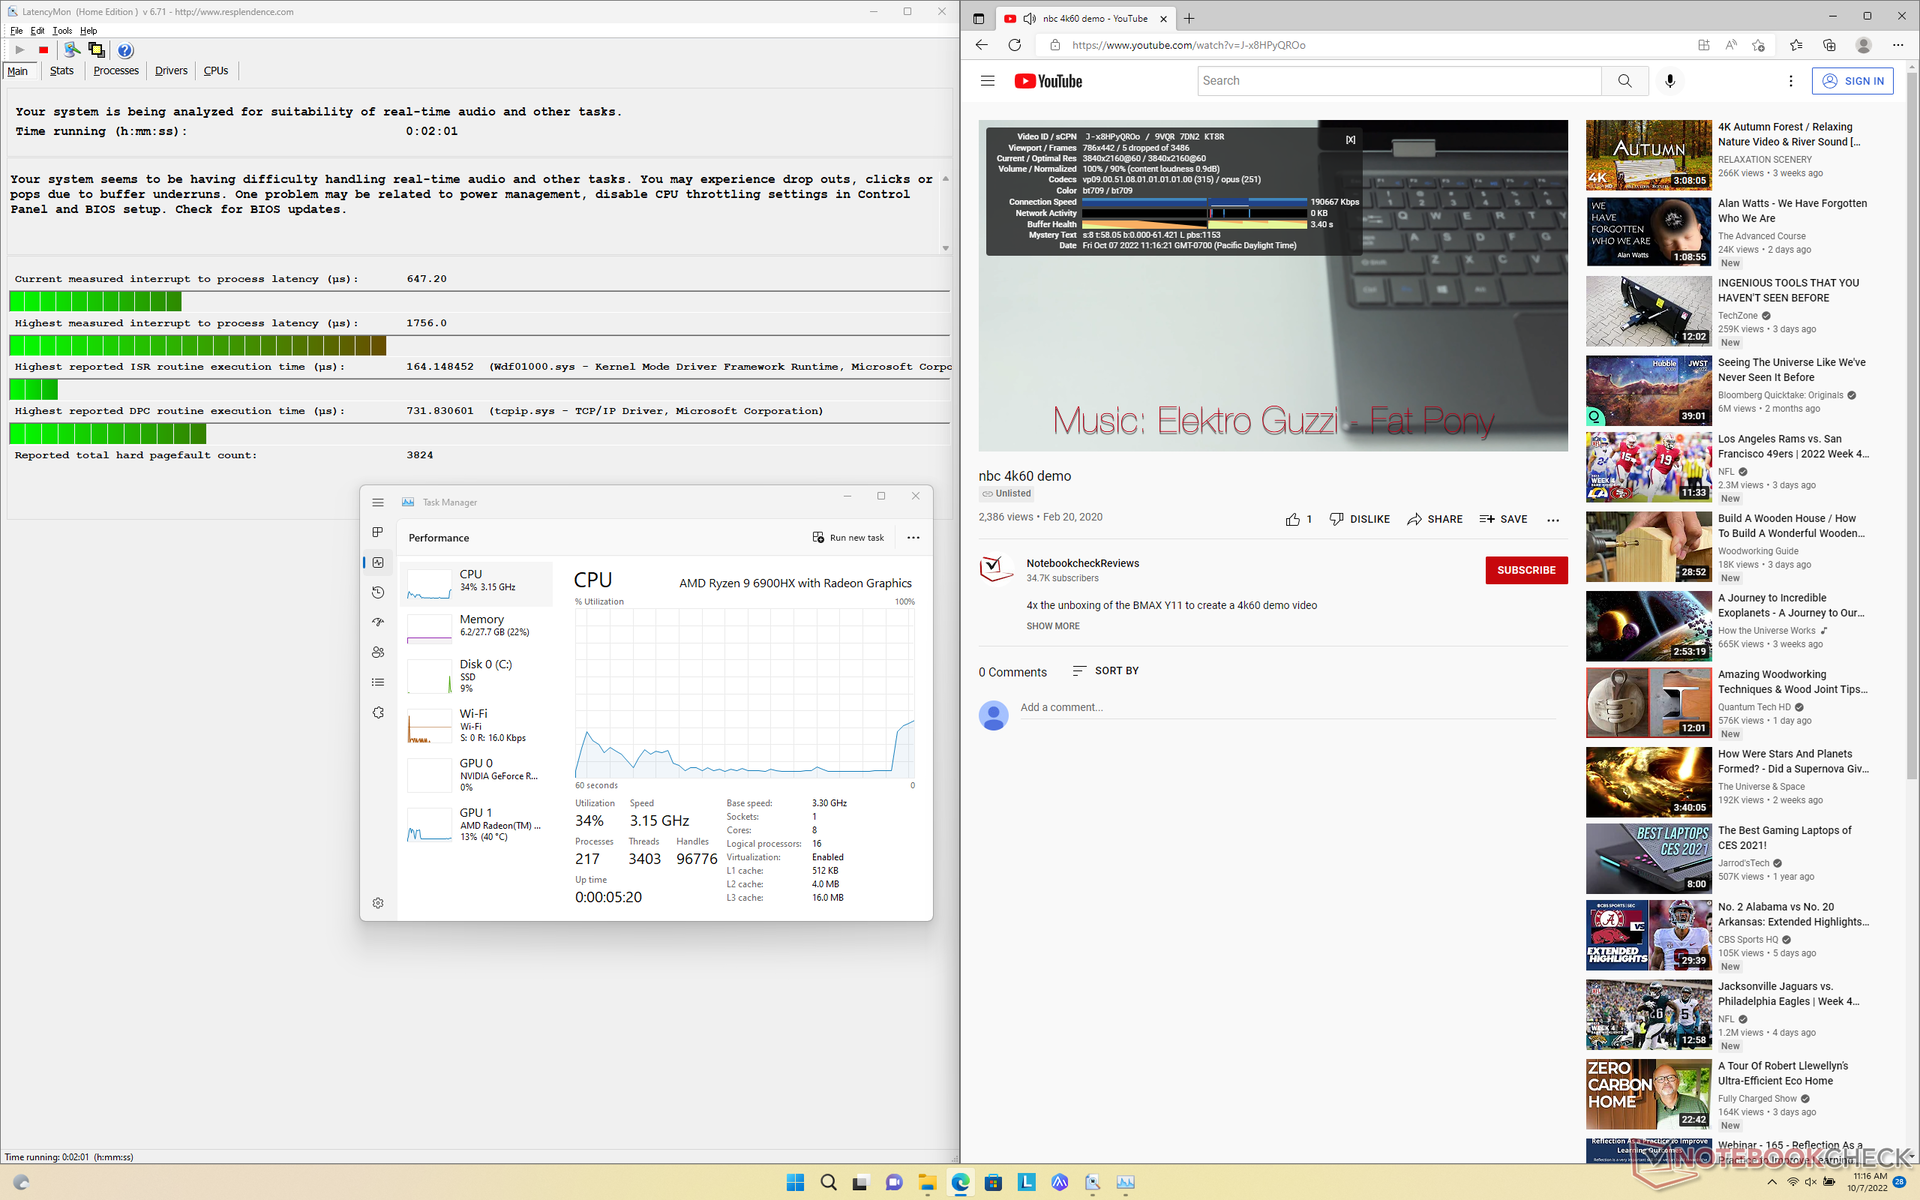
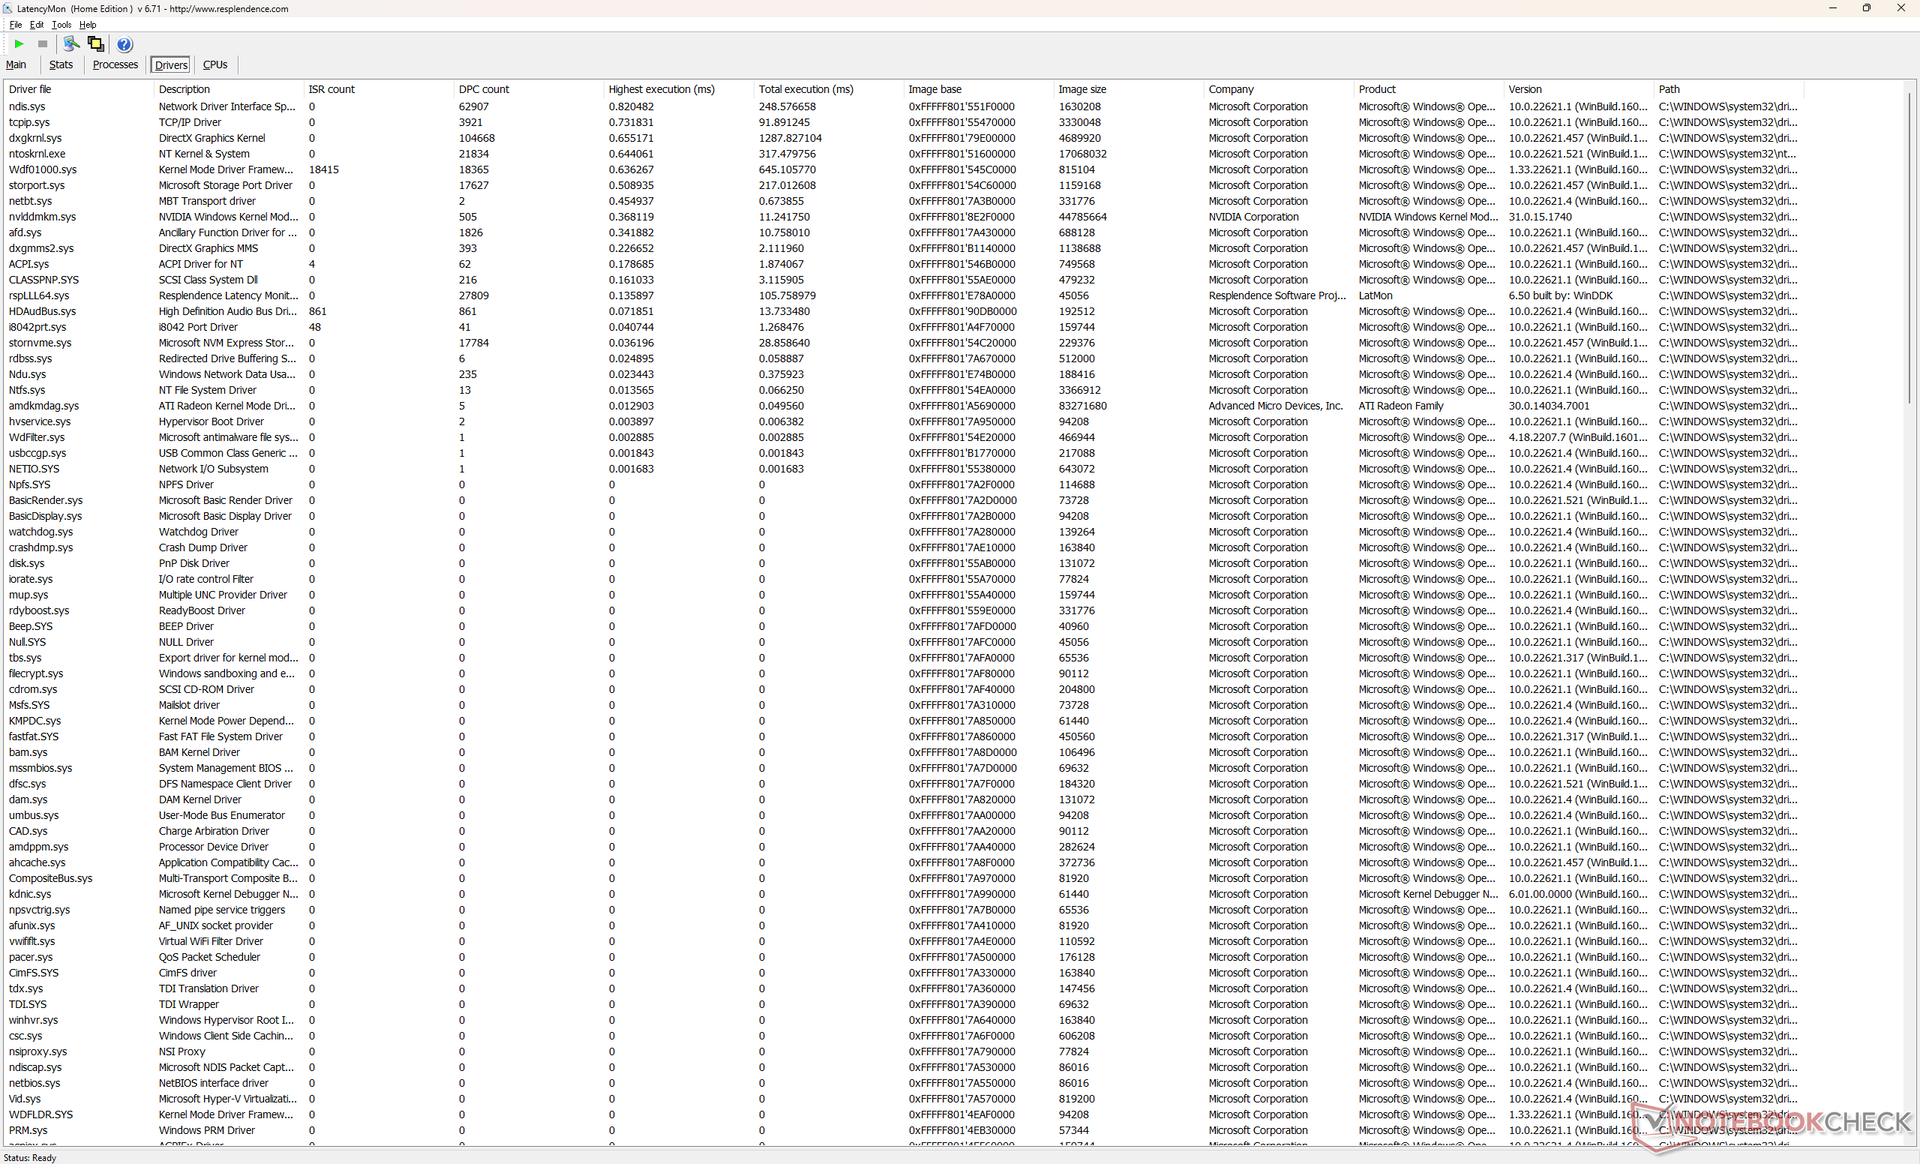
Latencia del CPD
LatencyMon revela ligeros problemas de CPD al abrir varias pestañas de nuestra página web. la reproducción de vídeo 4K a 60 FPS también es imperfecta, con 5 fotogramas perdidos durante nuestro vídeo de prueba de un minuto.
| DPC Latencies / LatencyMon - interrupt to process latency (max), Web, Youtube, Prime95 | |
| Acer Swift X SFX16-51G-5388 | |
| Lenovo ThinkBook 16p G3 ARH | |
| HP Envy 16 h0112nr | |
| Lenovo IdeaPad 5 Pro 16ARH7 | |
| Lenovo Legion 5 Pro 16IAH7H | |
| Lenovo ThinkBook 16p G2 ACH | |
* ... más pequeño es mejor
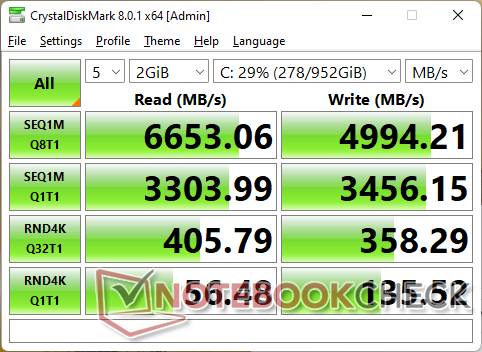
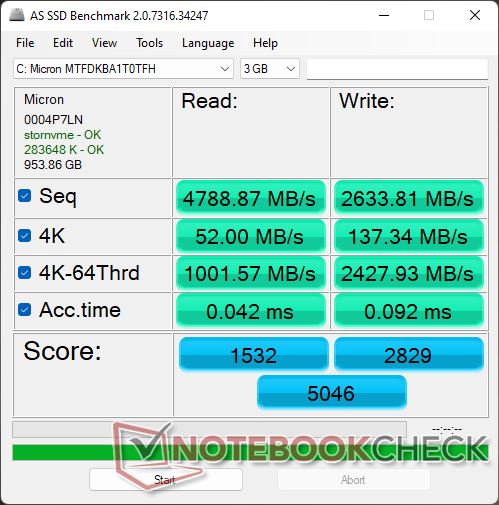
Dispositivos de almacenamiento
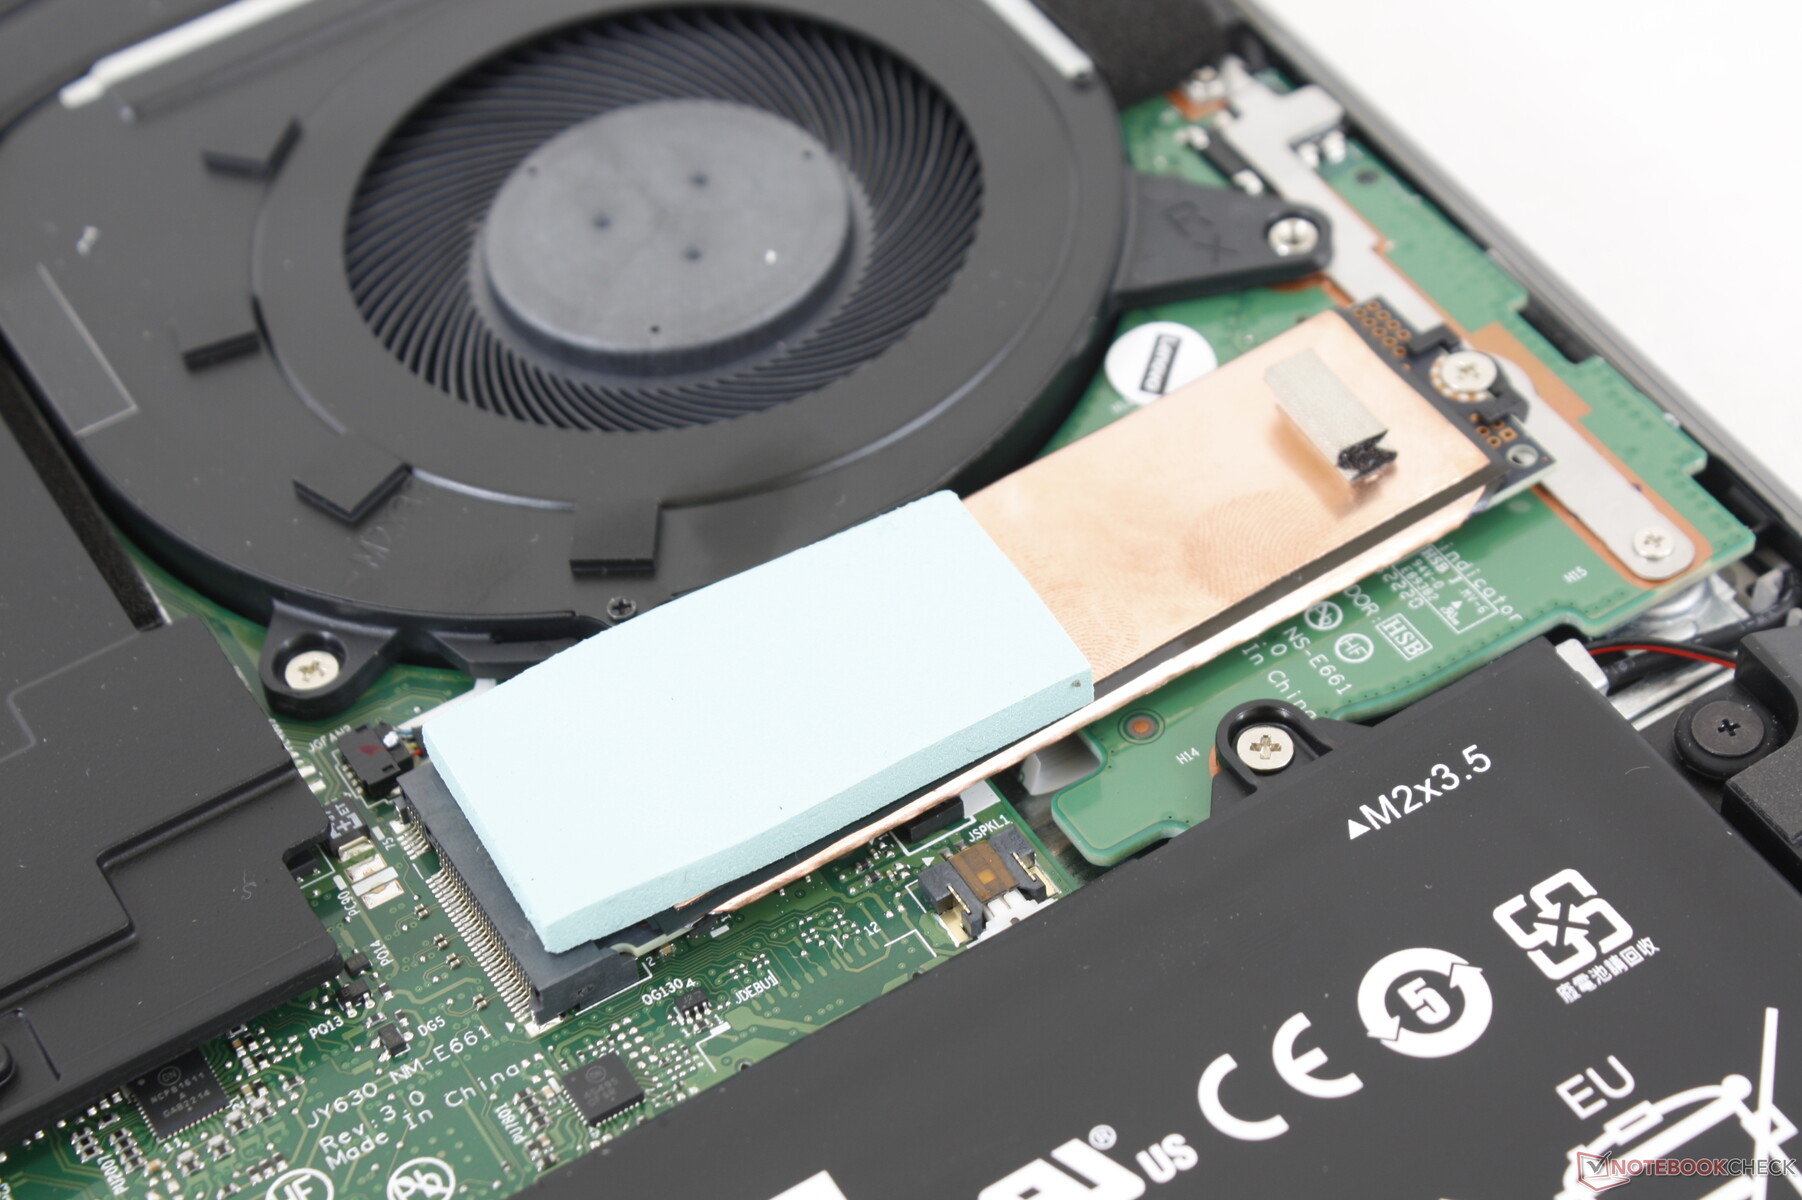
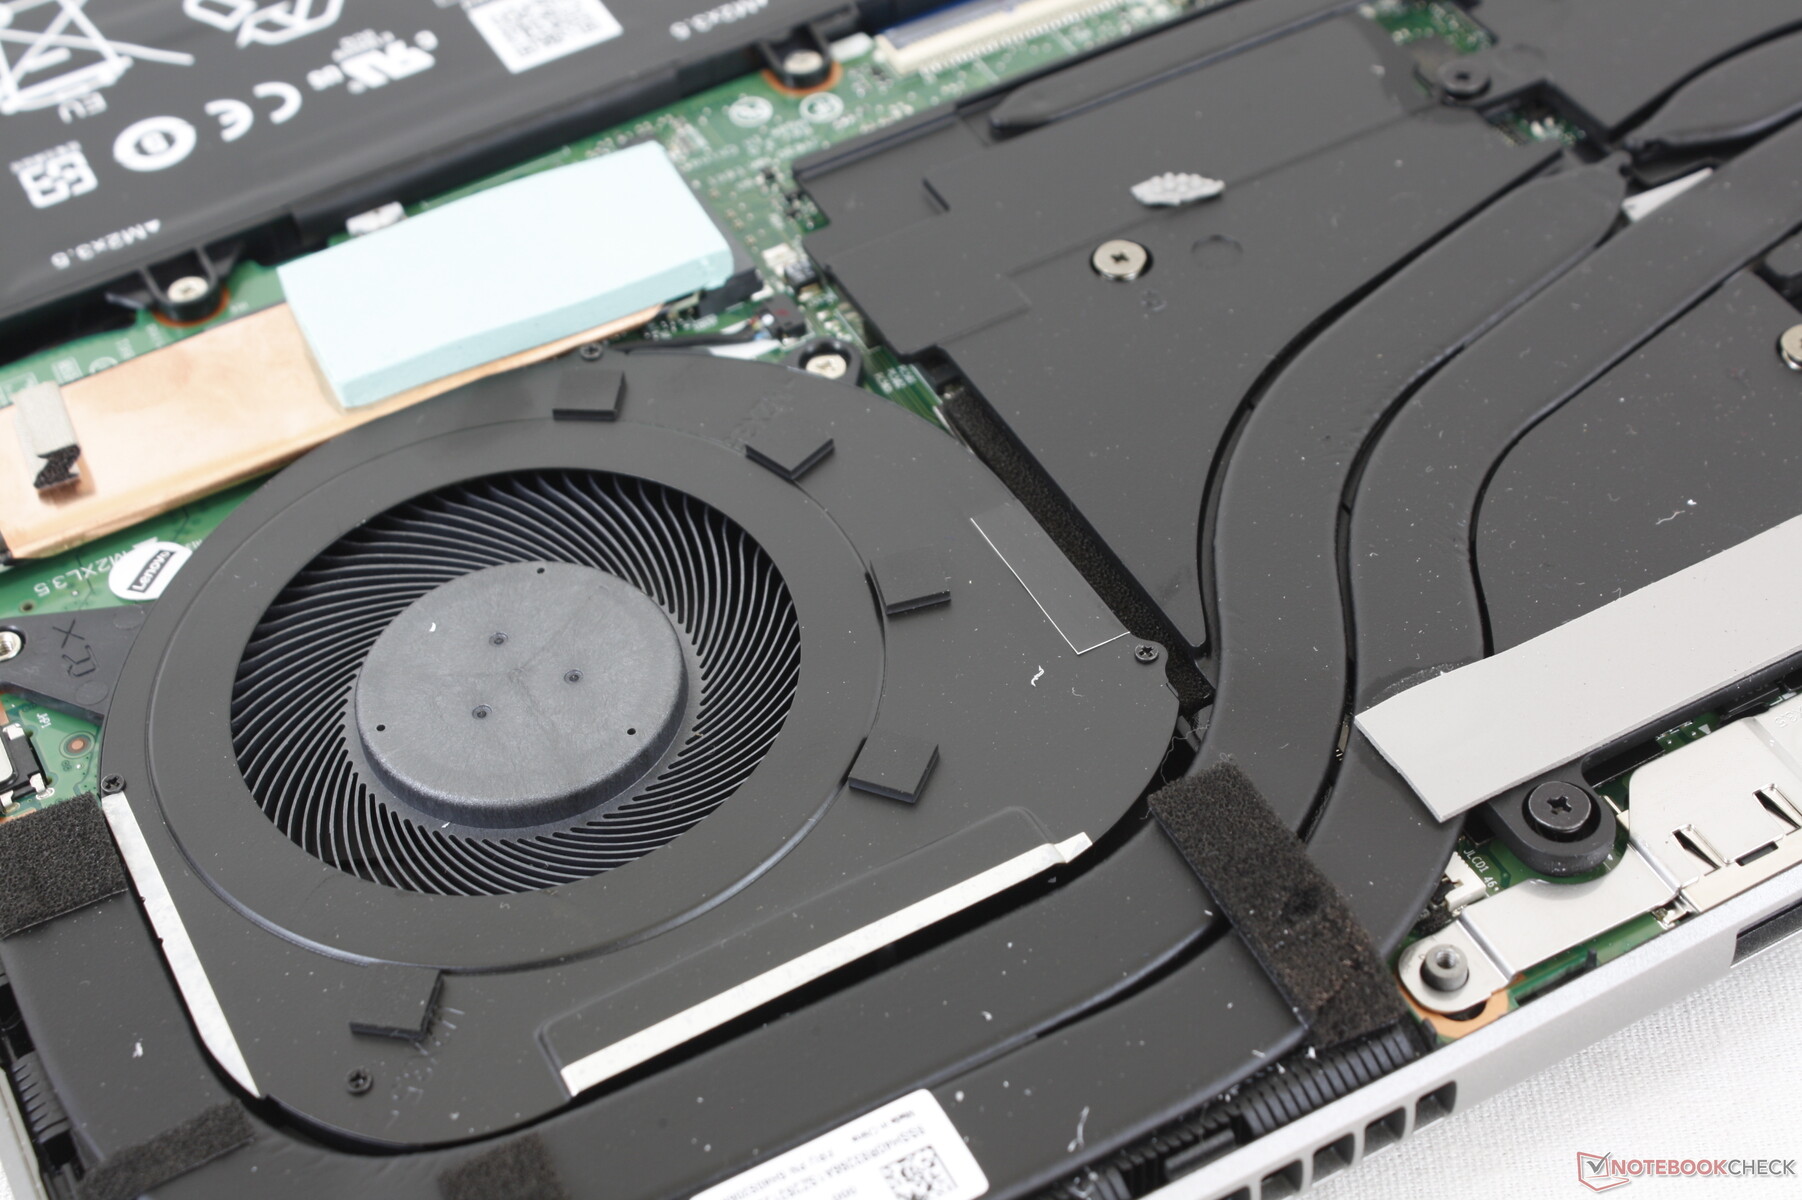
El SSD PCIe4 x4 incluido viene con su propio disipador de calor y almohadilla térmica para ayudar a la disipación del calor. Nuestra unidad no presentaba problemas de ralentización cuando se ejecutaba DiskSpd en un bucle, como se muestra en el siguiente gráfico.

| Drive Performance rating - Percent | |
| Lenovo Legion 5 Pro 16IAH7H | |
| Lenovo ThinkBook 16p G2 ACH | |
| HP Envy 16 h0112nr | |
| Lenovo ThinkBook 16p G3 ARH | |
| Lenovo IdeaPad 5 Pro 16ARH7 | |
| Acer Swift X SFX16-51G-5388 | |
* ... más pequeño es mejor
Disk Throttling: DiskSpd Read Loop, Queue Depth 8
Rendimiento de la GPU
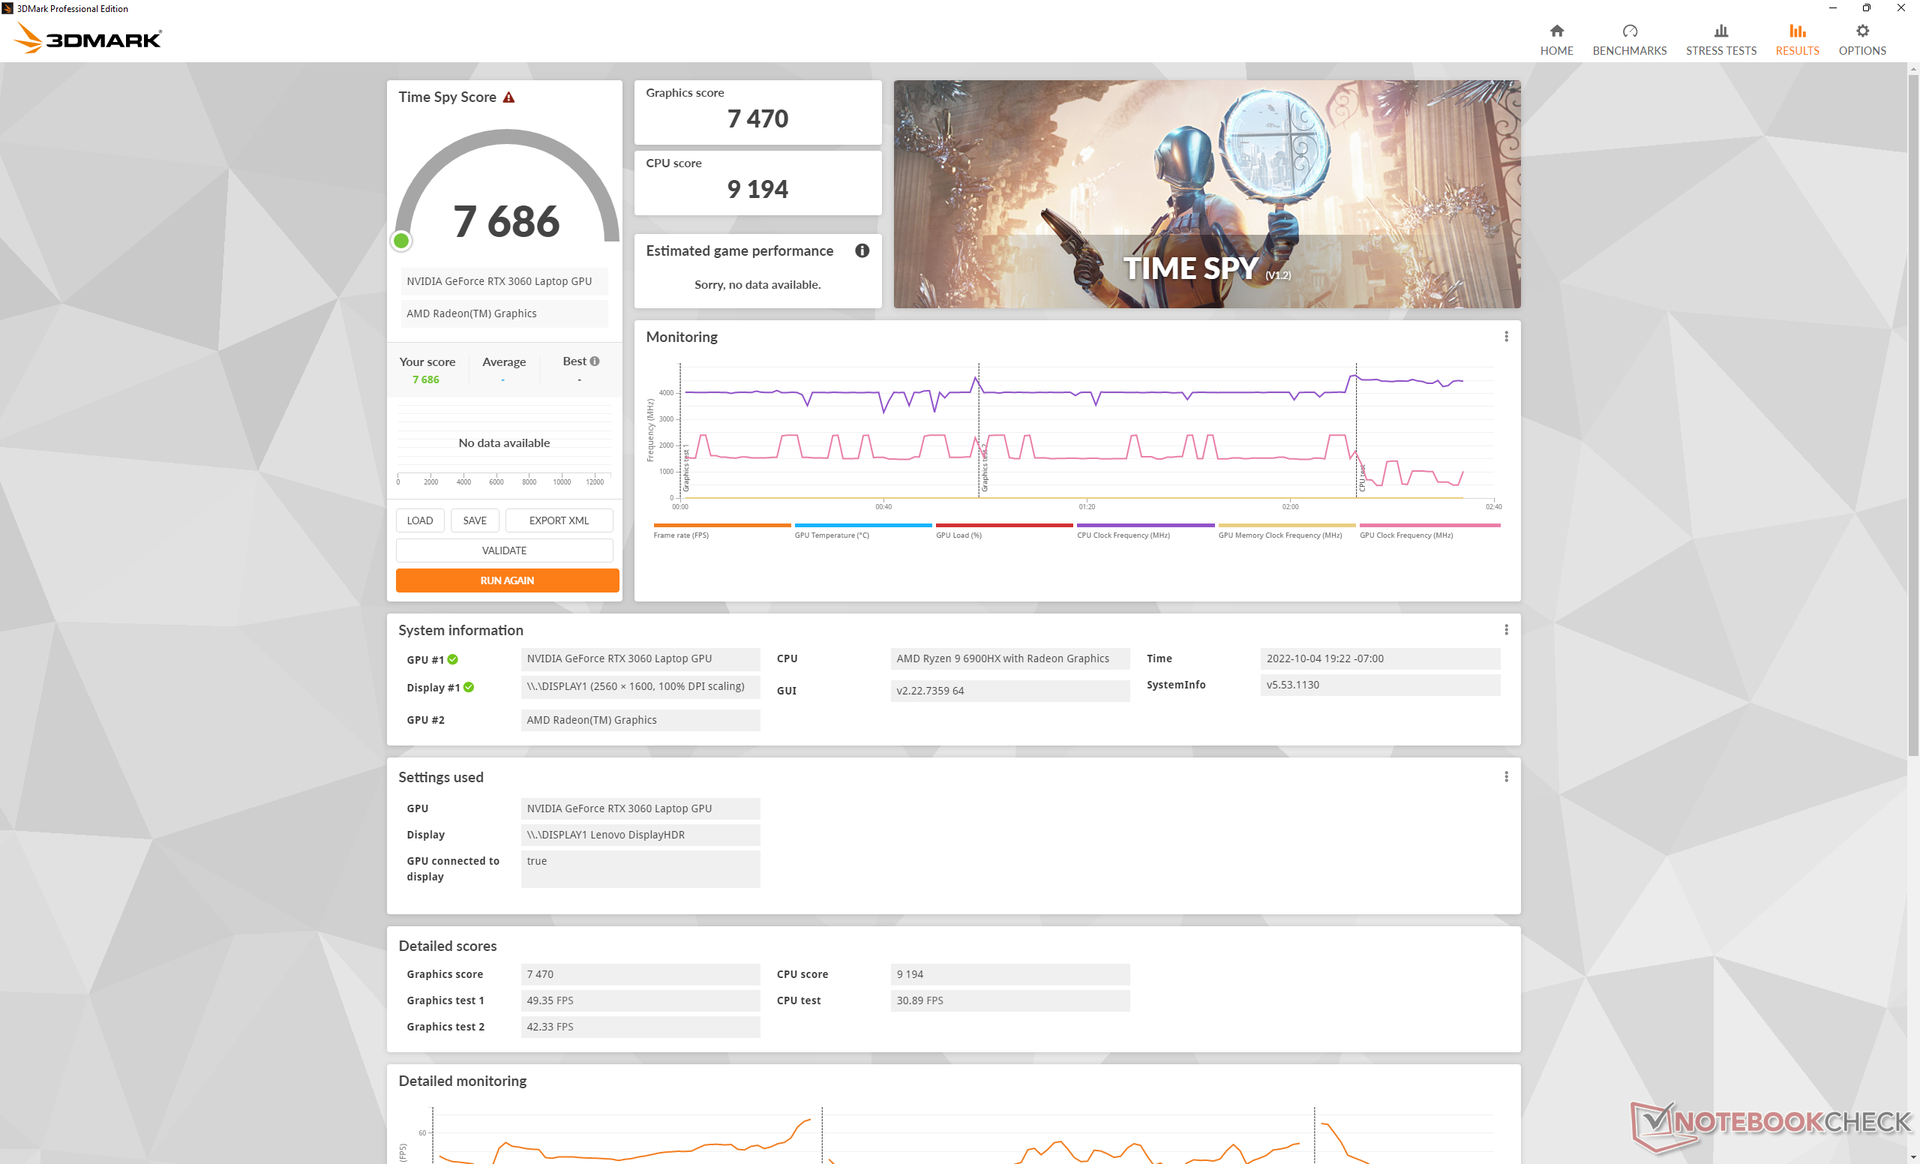
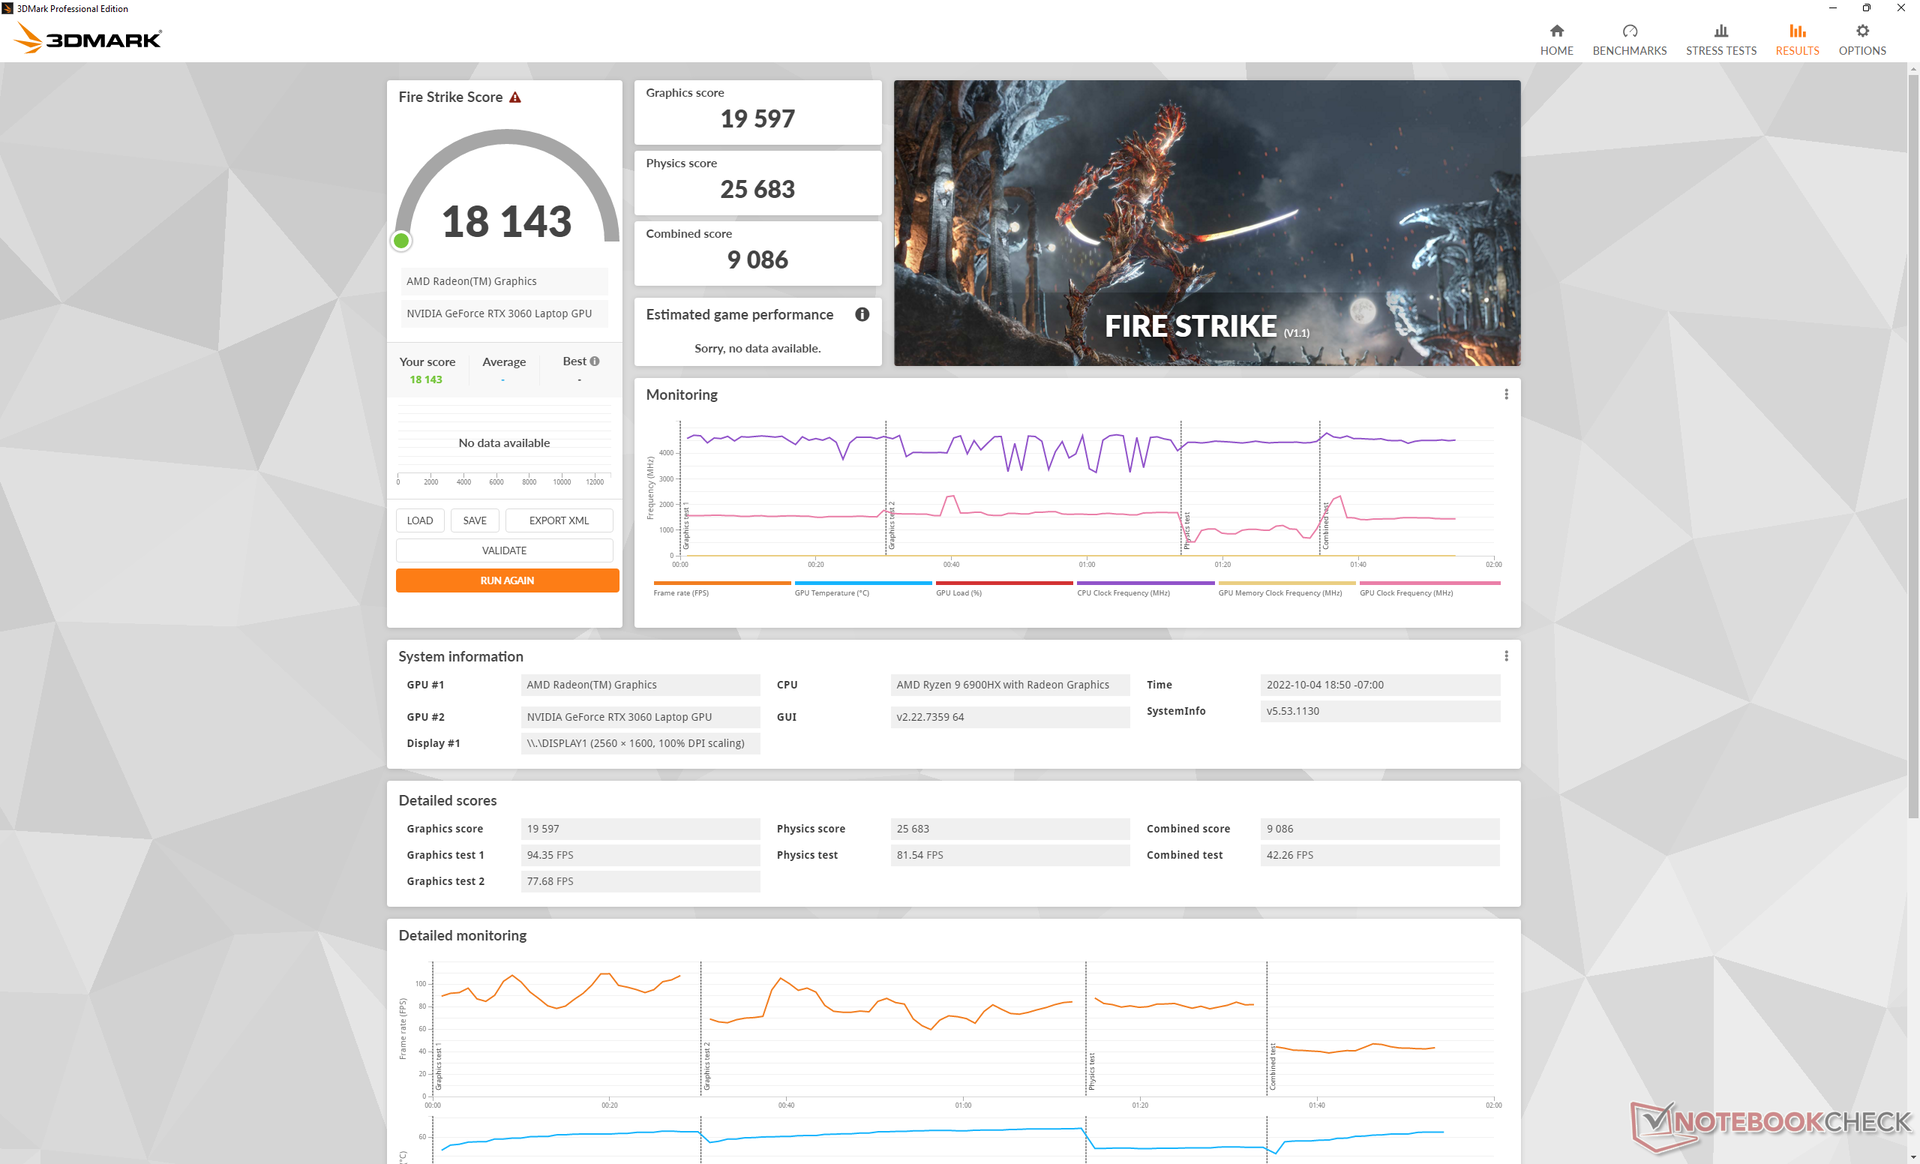
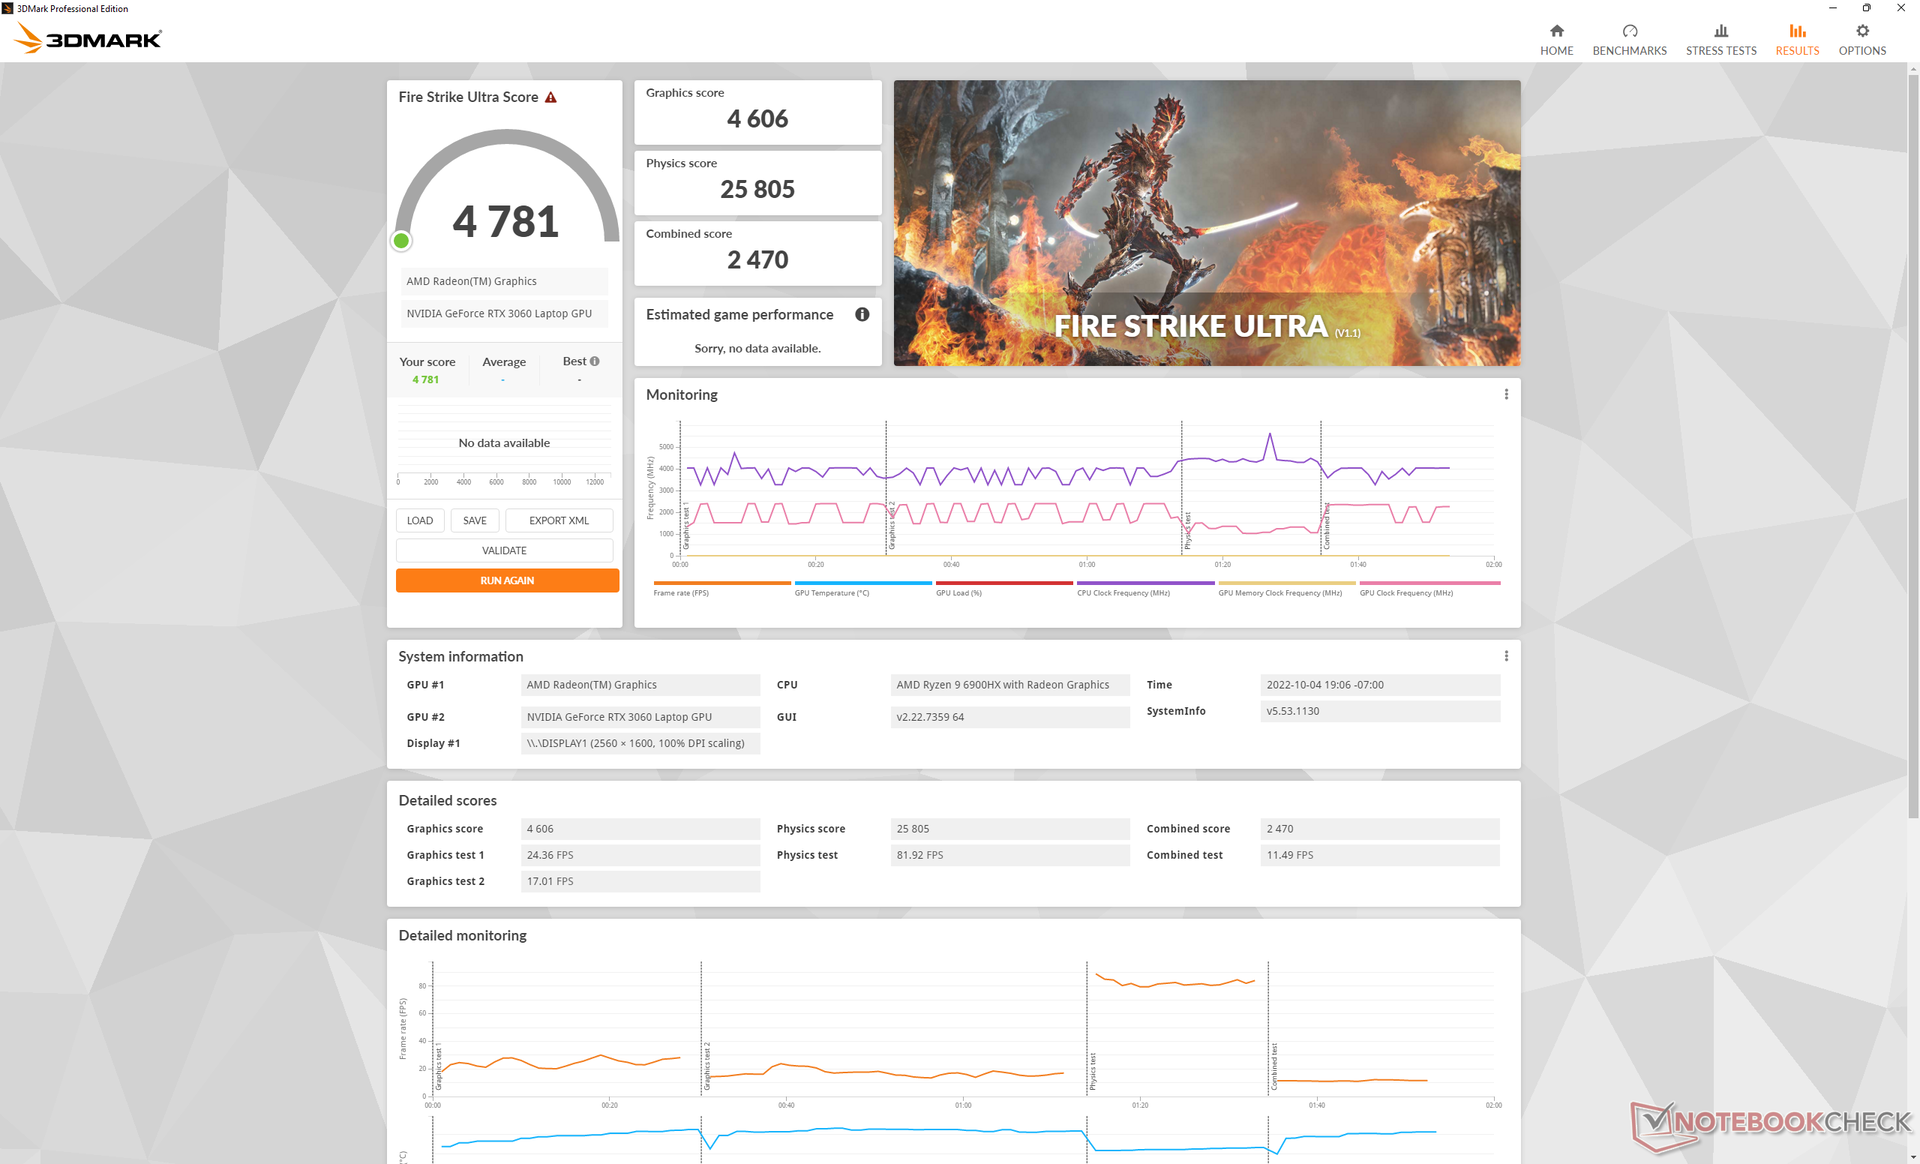
Lenovo ha subido la GeForce RTX 3060 TGP de 75 W en el ThinkBook 16p Gen 2 a 90 W en el ThinkBook 16p Gen 3. Aun así, el rendimiento es sólo un 10% más rápido en el mejor de los casos.
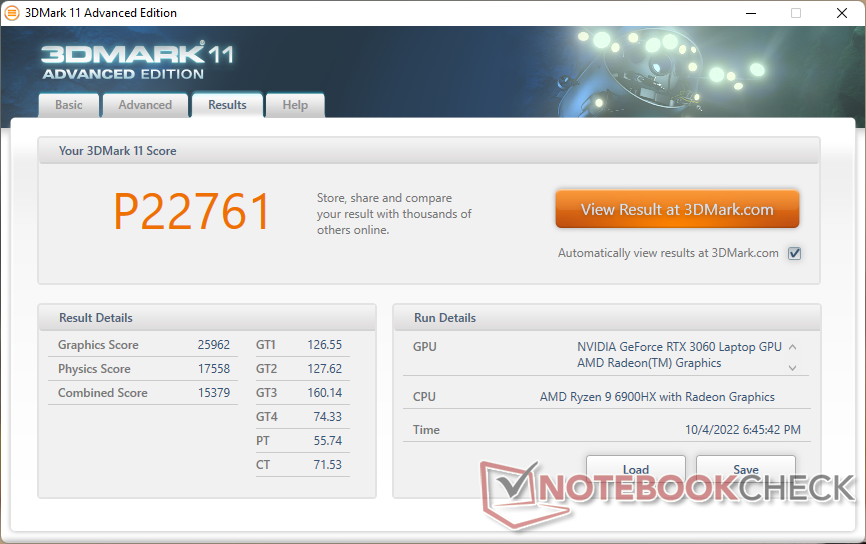
| 3DMark 11 Performance | 22761 puntos | |
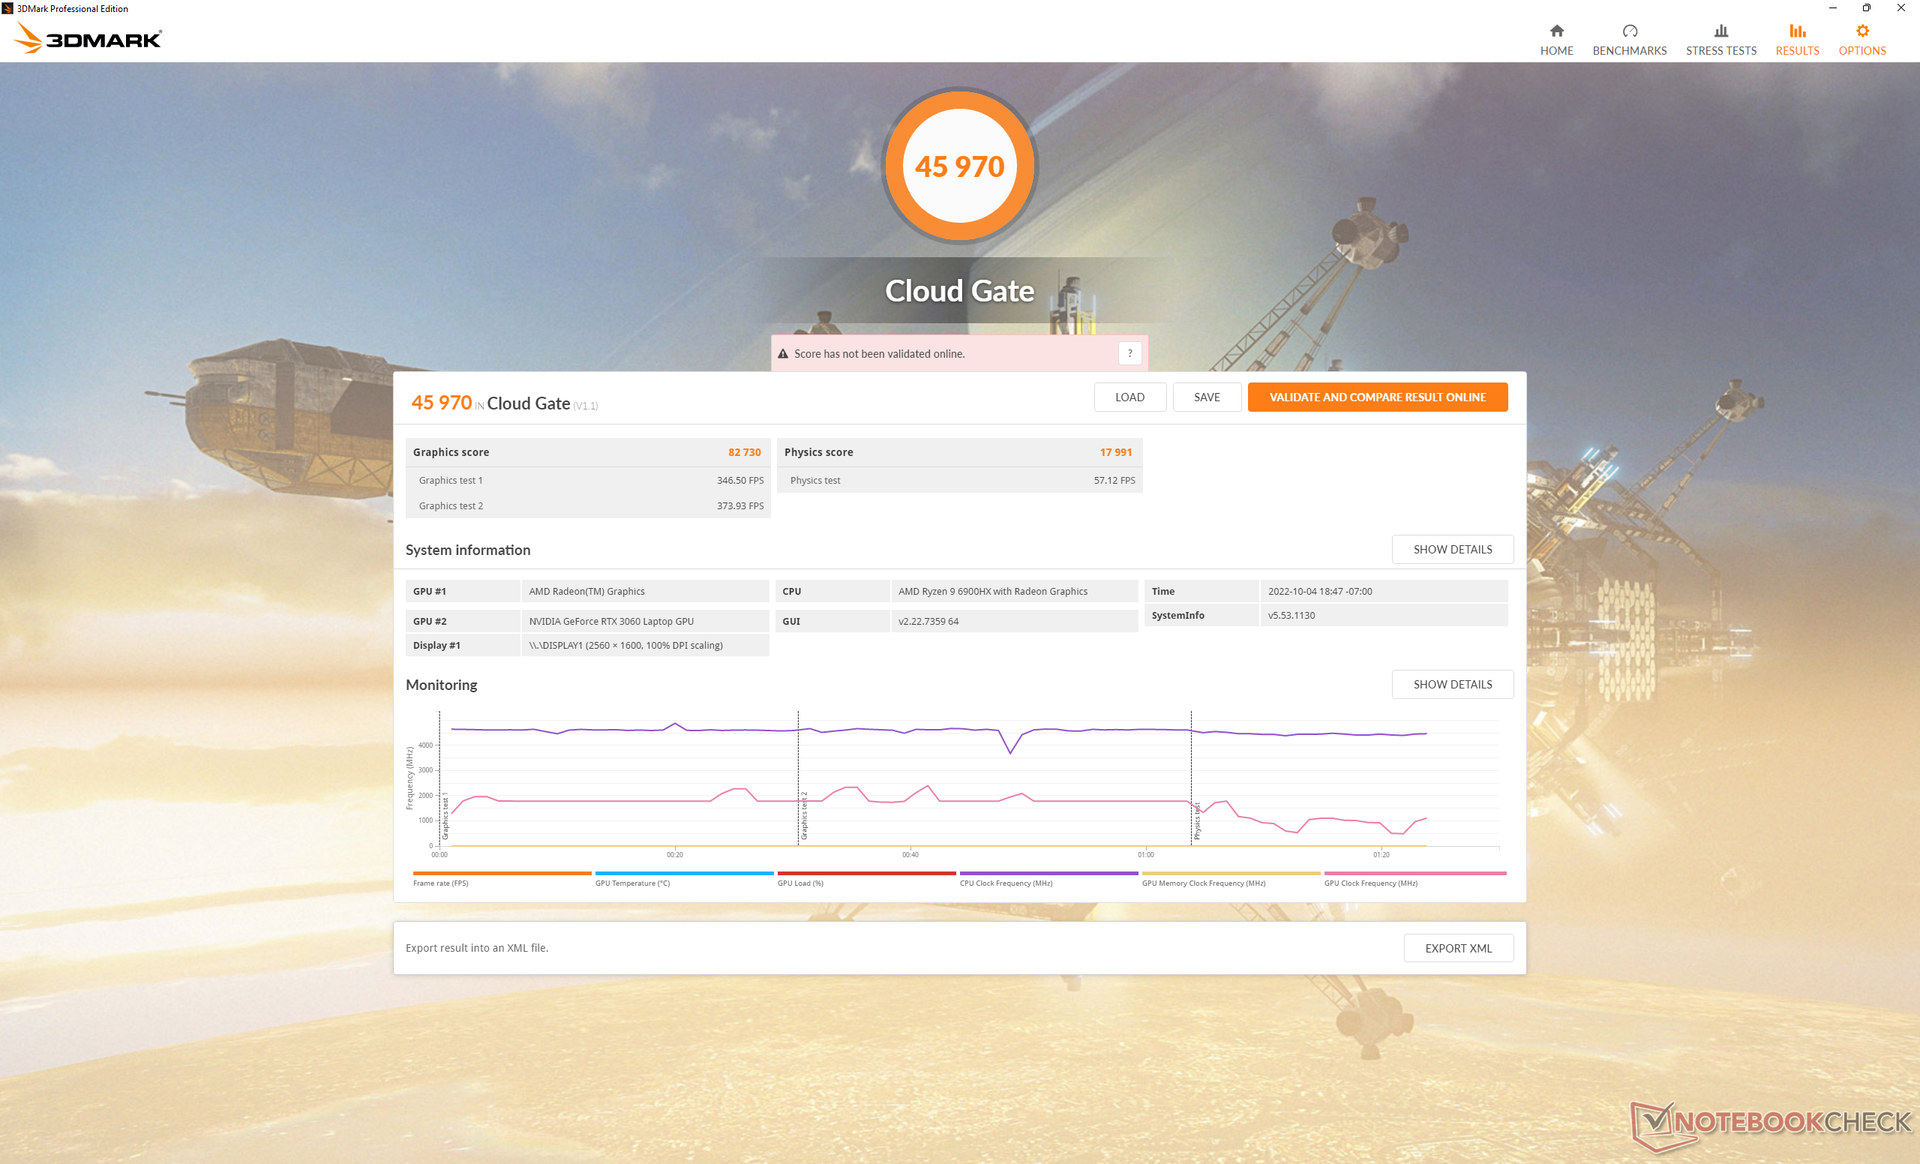
| 3DMark Cloud Gate Standard Score | 45970 puntos | |
| 3DMark Fire Strike Score | 18143 puntos | |
| 3DMark Time Spy Score | 7686 puntos | |
ayuda | ||
* ... más pequeño es mejor
| Cyberpunk 2077 1.6 | |
| 1920x1080 Low Preset | |
| Medio NVIDIA GeForce RTX 3060 Laptop GPU (80 - 135.7, n=14) | |
| Lenovo ThinkBook 16p G3 ARH | |
| Lenovo IdeaPad 5 Pro 16ARH7 | |
| 1920x1080 Medium Preset | |
| Medio NVIDIA GeForce RTX 3060 Laptop GPU (68 - 118, n=14) | |
| Lenovo ThinkBook 16p G3 ARH | |
| Lenovo IdeaPad 5 Pro 16ARH7 | |
| 1920x1080 High Preset | |
| Medio NVIDIA GeForce RTX 3060 Laptop GPU (42.2 - 87.7, n=14) | |
| Lenovo ThinkBook 16p G3 ARH | |
| Lenovo IdeaPad 5 Pro 16ARH7 | |
| 1920x1080 Ultra Preset | |
| Medio NVIDIA GeForce RTX 3060 Laptop GPU (40 - 78.8, n=16) | |
| Lenovo ThinkBook 16p G3 ARH | |
| 2560x1440 Ultra Preset | |
| Medio NVIDIA GeForce RTX 3060 Laptop GPU (23 - 45.8, n=9) | |
| Lenovo ThinkBook 16p G3 ARH | |
Witcher 3 FPS Chart
| bajo | medio | alto | ultra | QHD | |
|---|---|---|---|---|---|
| GTA V (2015) | 165.4 | 158.9 | 134.6 | 78.5 | 68.8 |
| The Witcher 3 (2015) | 259.5 | 211.4 | 138.5 | 73.4 | |
| Dota 2 Reborn (2015) | 112.5 | 106 | 98.9 | 96.8 | |
| Final Fantasy XV Benchmark (2018) | 141.8 | 104.1 | 78.2 | 58.5 | |
| X-Plane 11.11 (2018) | 90.6 | 81.8 | 64.8 | ||
| Strange Brigade (2018) | 253 | 170.9 | 147.7 | 132.5 | 99.3 |
| Cyberpunk 2077 1.6 (2022) | 100.8 | 87.7 | 67.8 | 56 | 35 |
Emisiones
Ruido del sistema
El ruido del ventilador cuando se ejecutan cargas altas es comparable al delAcer Swift X SFX16 pero más silencioso que elHP Envy 16. Los ventiladores internos no pulsan muy a menudo para una experiencia generalmente silenciosa cuando se navega por la web, se hace streaming de vídeo o se ejecutan otras cargas poco exigentes.
Ruido
| Ocioso |
| 23.1 / 23.2 / 23.6 dB(A) |
| Carga |
| 30.6 / 47.5 dB(A) |
 | ||
30 dB silencioso 40 dB(A) audible 50 dB(A) ruidosamente alto |
||
min: | ||
| Lenovo ThinkBook 16p G3 ARH GeForce RTX 3060 Laptop GPU, R9 6900HX, Micron 3400 1TB MTFDKBA1T0TFH | HP Envy 16 h0112nr GeForce RTX 3060 Laptop GPU, i7-12700H, Micron 3400 1TB MTFDKBA1T0TFH | Lenovo ThinkBook 16p G2 ACH GeForce RTX 3060 Laptop GPU, R9 5900HX, WDC PC SN730 SDBPNTY-1T00 | Lenovo IdeaPad 5 Pro 16ARH7 Radeon 660M, R5 6600HS, Samsung PM9A1 MZVL2512HCJQ | Acer Swift X SFX16-51G-5388 GeForce RTX 3050 4GB Laptop GPU, i5-11320H, Samsung PM991 MZVLQ512HBLU | Lenovo Legion 5 Pro 16IAH7H GeForce RTX 3060 Laptop GPU, i7-12700H, 2x Samsung PM9A1 MZVL21T0HCLR (RAID 0) | |
|---|---|---|---|---|---|---|
| Noise | -11% | -2% | -6% | -14% | -28% | |
| apagado / medio ambiente * (dB) | 22.7 | 22.8 -0% | 23 -1% | 25 -10% | 25.4 -12% | 24.6 -8% |
| Idle Minimum * (dB) | 23.1 | 22.9 1% | 23 -0% | 25 -8% | 25.4 -10% | 28.7 -24% |
| Idle Average * (dB) | 23.2 | 22.9 1% | 23 1% | 26 -12% | 25.4 -9% | 32 -38% |
| Idle Maximum * (dB) | 23.6 | 30.5 -29% | 23 3% | 28 -19% | 27.8 -18% | 32 -36% |
| Load Average * (dB) | 30.6 | 41.4 -35% | 35.66 -17% | 44 -44% | 41 -34% | 45.2 -48% |
| Witcher 3 ultra * (dB) | 47.6 | 51.1 -7% | 48.7 -2% | 35 26% | ||
| Load Maximum * (dB) | 47.5 | 51.4 -8% | 48.13 -1% | 35 26% | 47 1% | 54.4 -15% |
* ... más pequeño es mejor
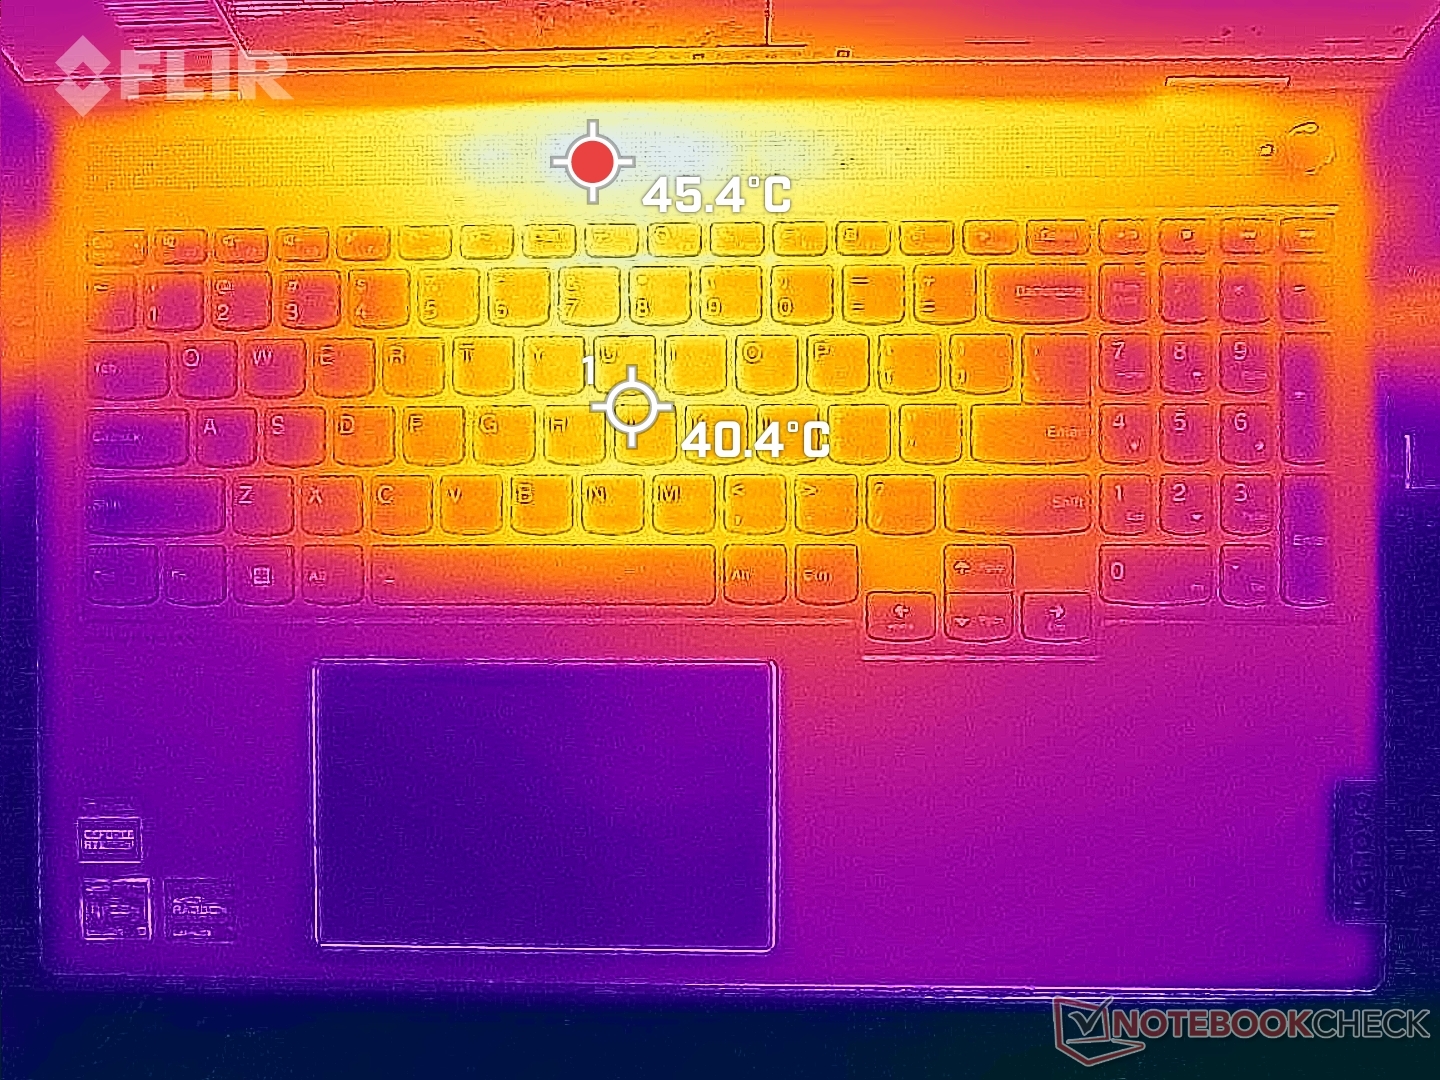
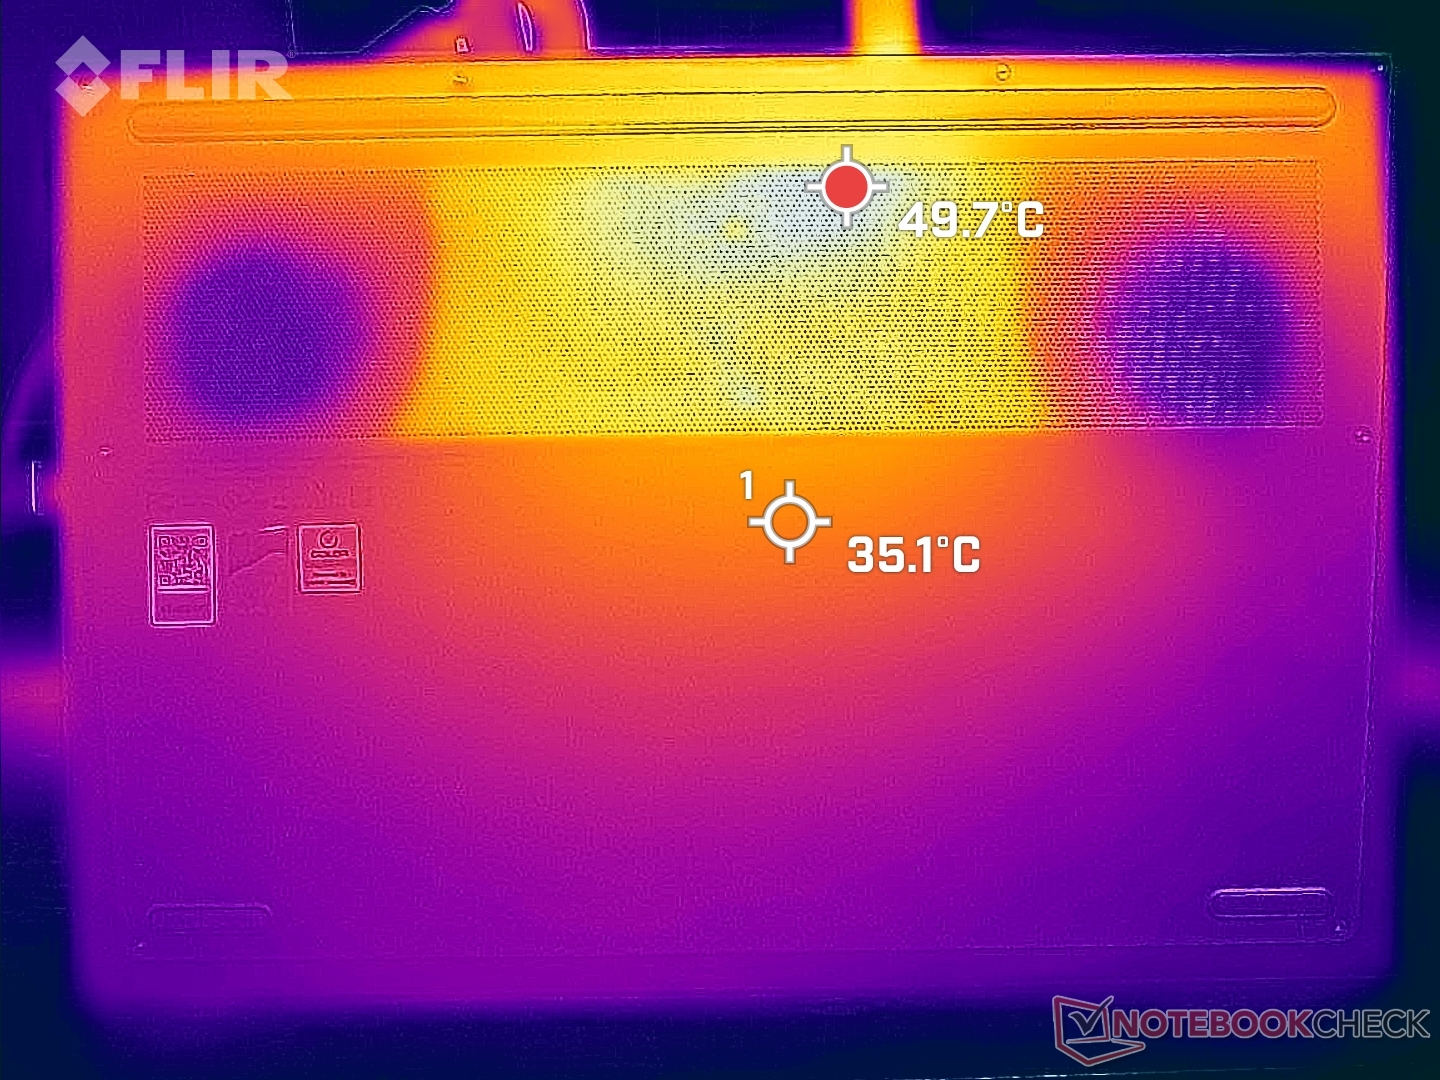
Temperatura
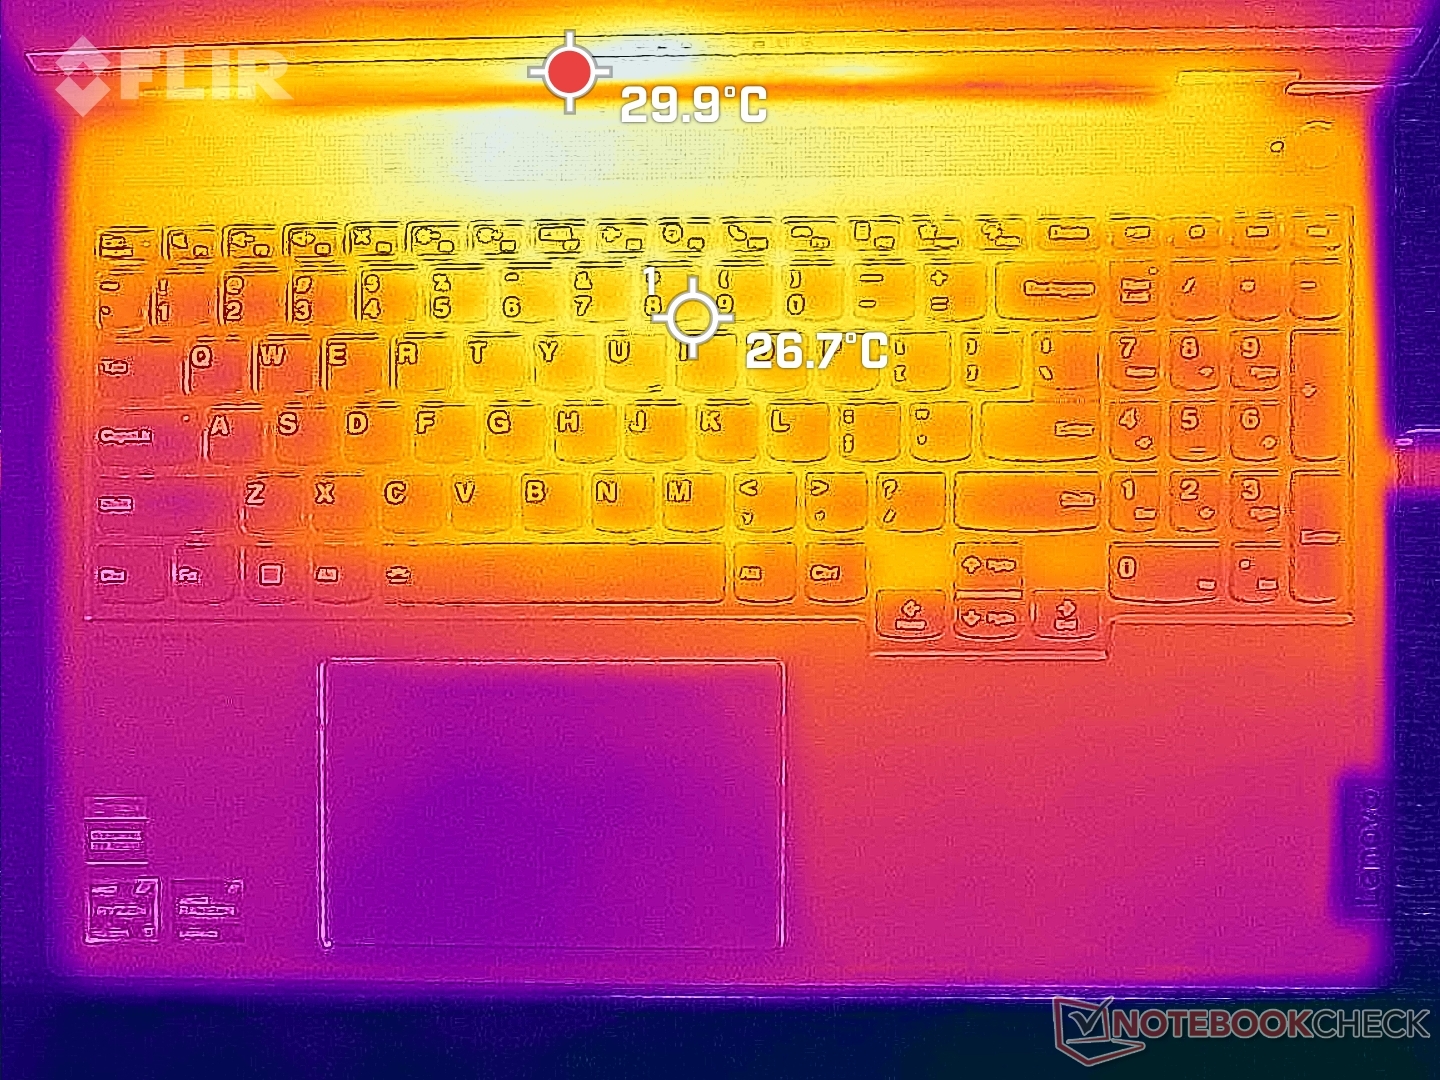
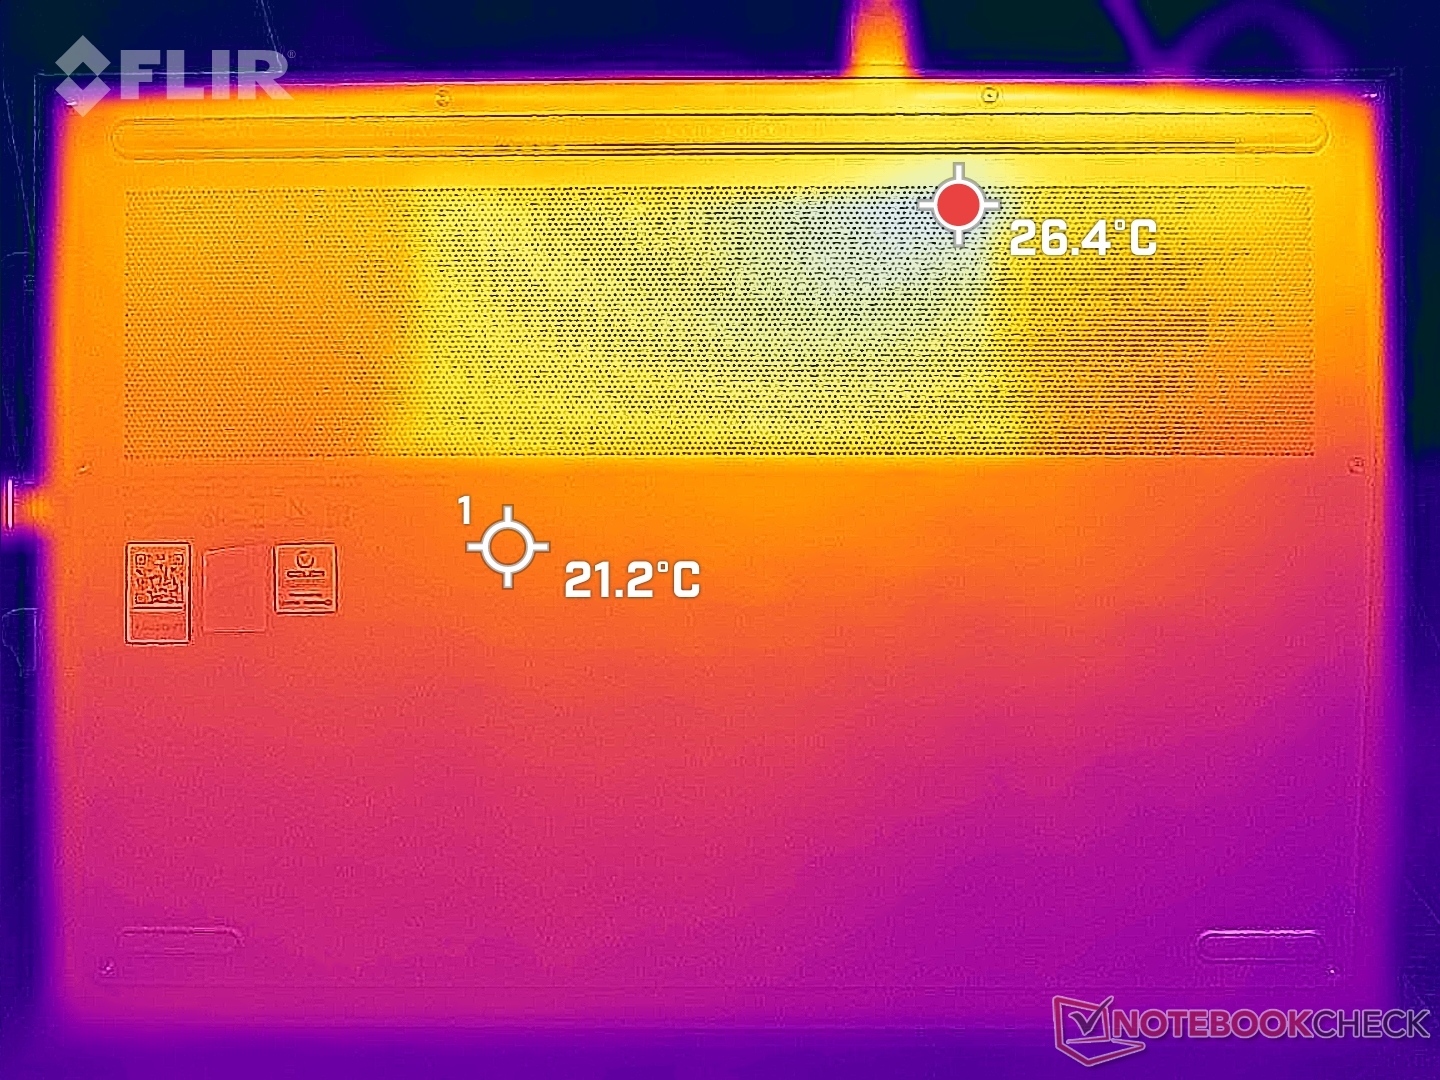
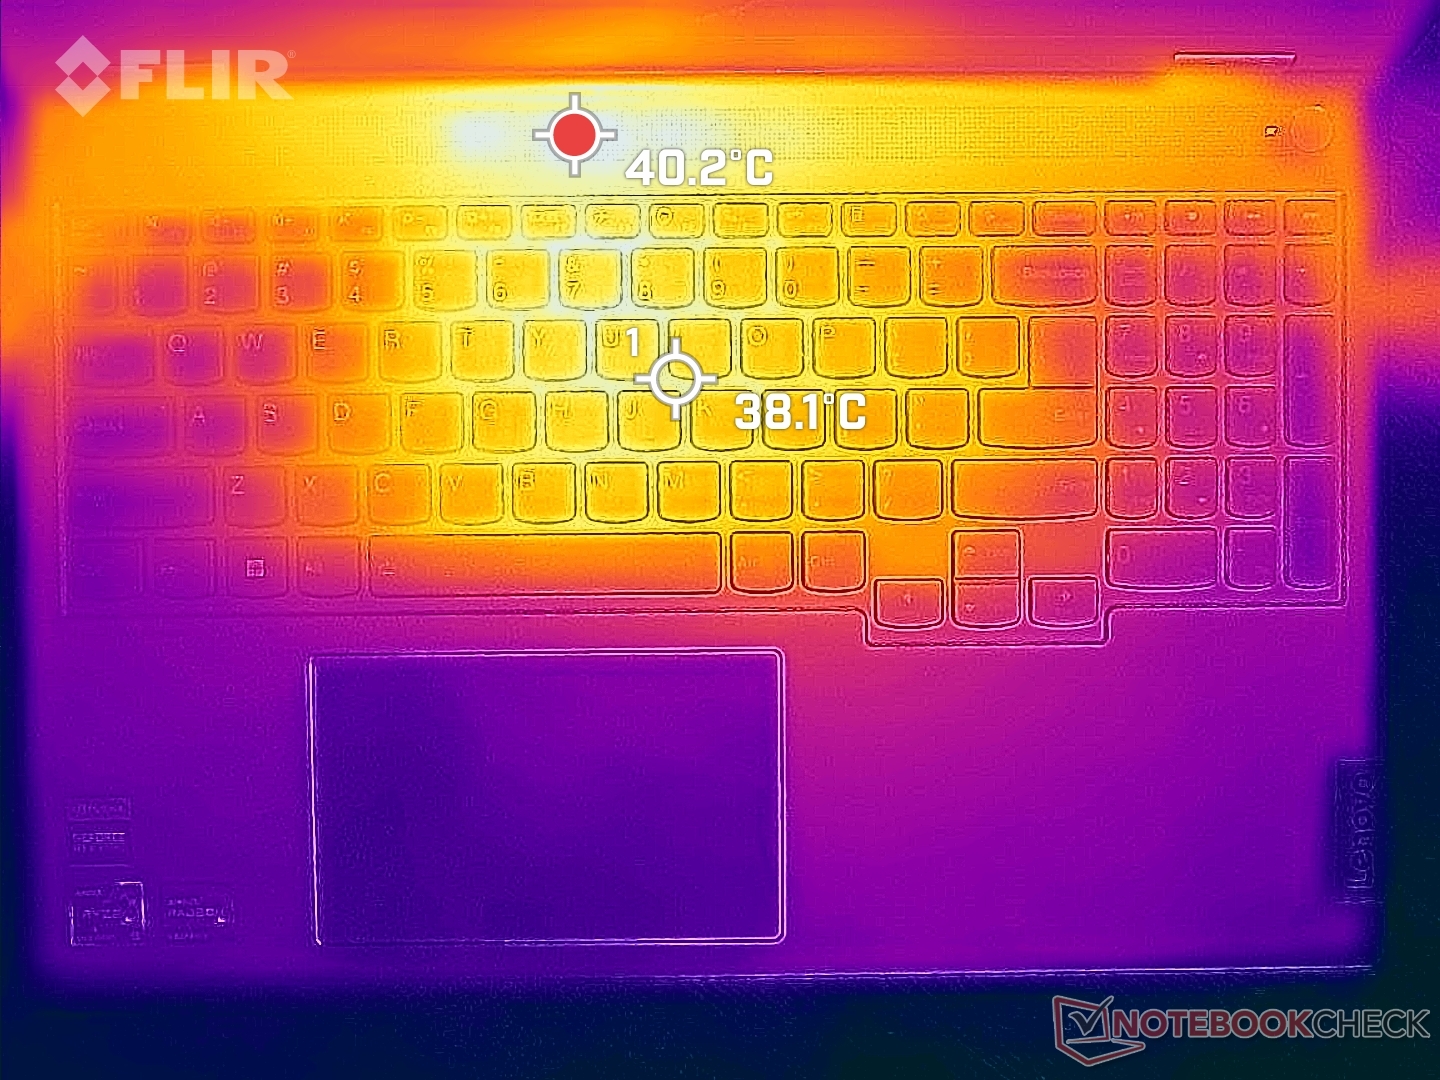
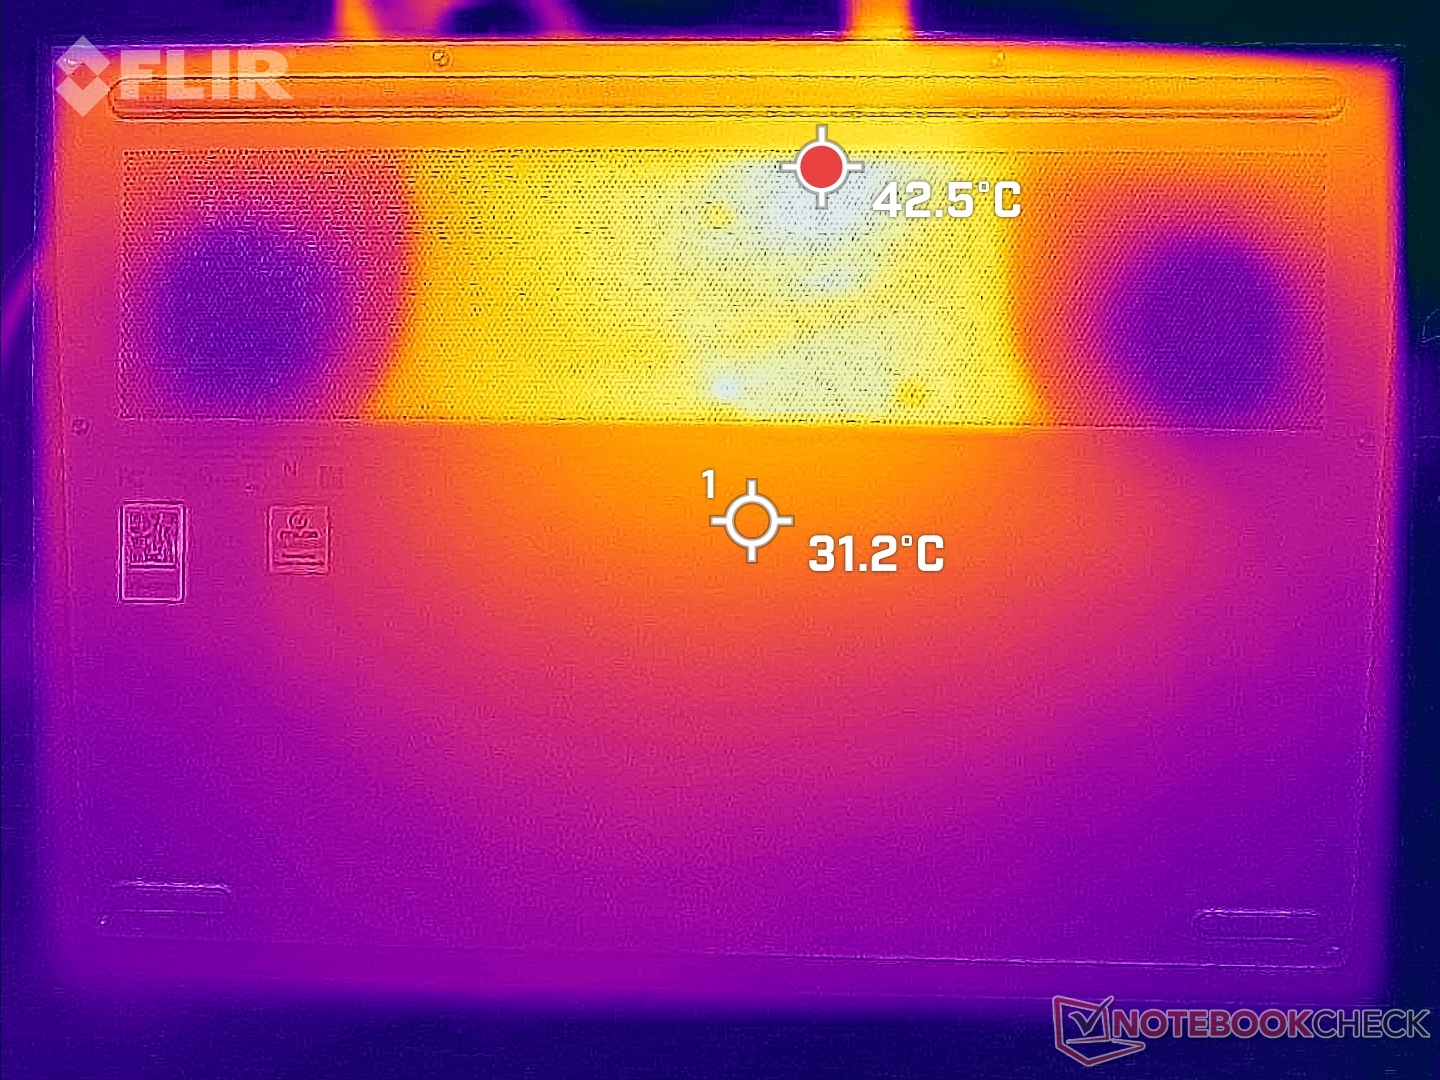
Los puntos calientes de la superficie pueden alcanzar casi 50 C en la parte superior e inferior, similar a lo que observamos en el modelo Gen 2 oDell Inspiron 16 Plus.
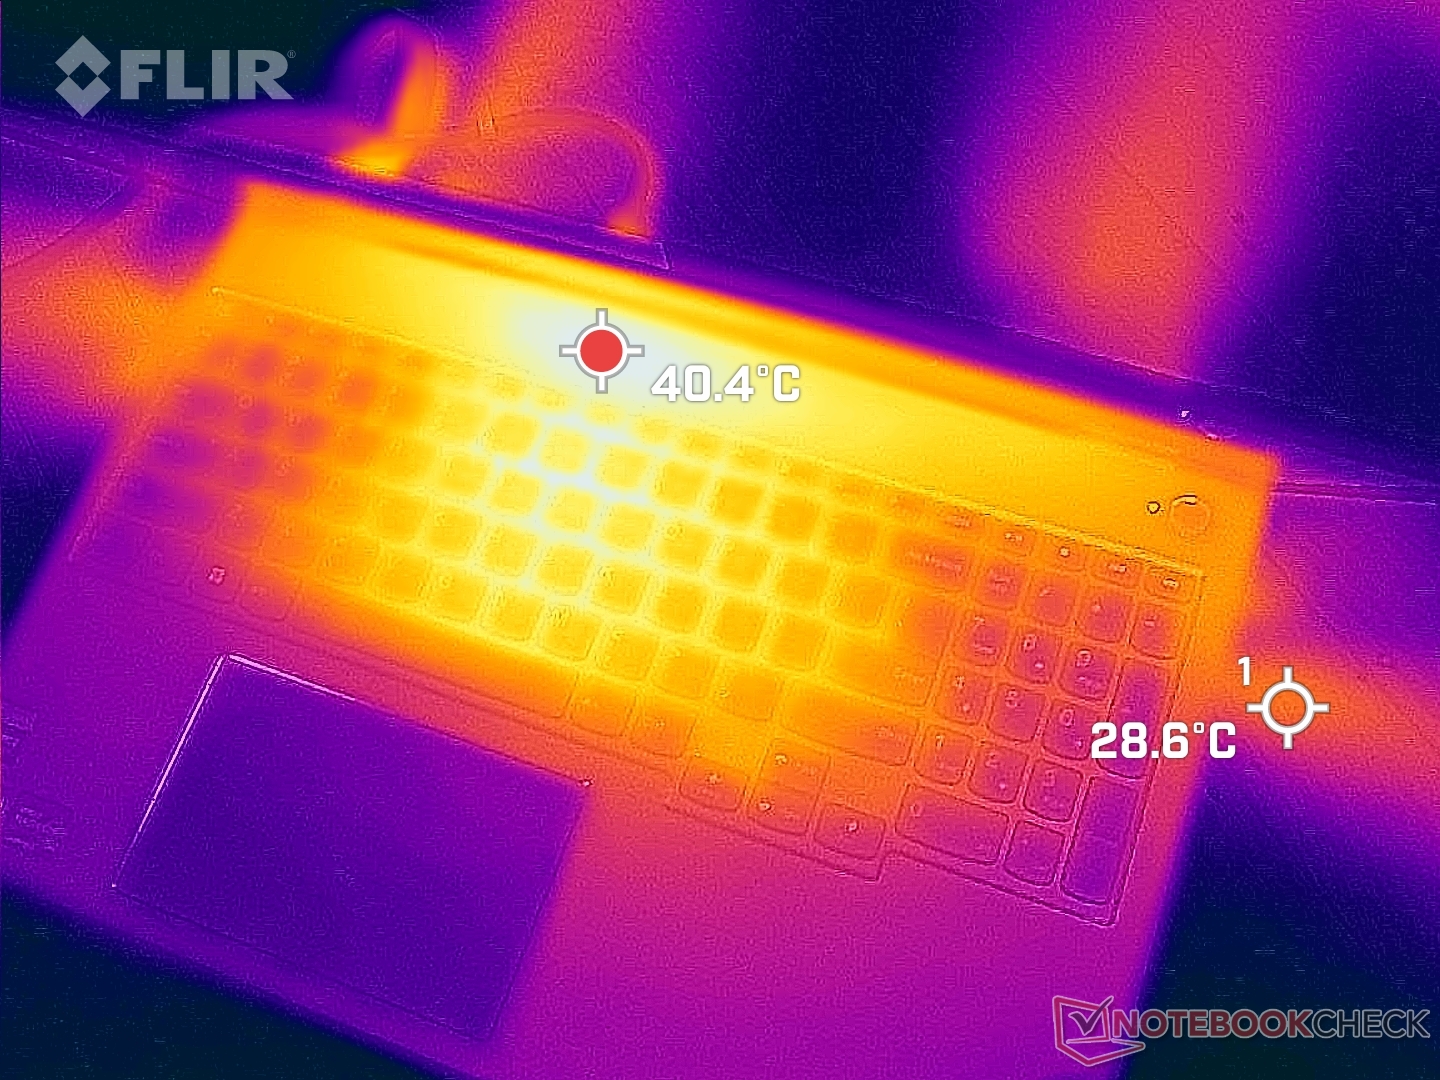
(-) La temperatura máxima en la parte superior es de 48.2 °C / 119 F, frente a la media de 36.8 °C / 98 F, que oscila entre 21 y 71 °C para la clase Multimedia.
(-) El fondo se calienta hasta un máximo de 49.6 °C / 121 F, frente a la media de 39.1 °C / 102 F
(+) En reposo, la temperatura media de la parte superior es de 29.3 °C / 85# F, frente a la media del dispositivo de 31.3 °C / 88 F.
(±) Jugando a The Witcher 3, la temperatura media de la parte superior es de 34.3 °C / 94 F, frente a la media del dispositivo de 31.3 °C / 88 F.
(+) El reposamanos y el panel táctil están a una temperatura inferior a la de la piel, con un máximo de 29.4 °C / 84.9 F y, por tanto, son fríos al tacto.
(±) La temperatura media de la zona del reposamanos de dispositivos similares fue de 28.7 °C / 83.7 F (-0.7 °C / -1.2 F).
| Lenovo ThinkBook 16p G3 ARH AMD Ryzen 9 6900HX, NVIDIA GeForce RTX 3060 Laptop GPU | HP Envy 16 h0112nr Intel Core i7-12700H, NVIDIA GeForce RTX 3060 Laptop GPU | Lenovo ThinkBook 16p G2 ACH AMD Ryzen 9 5900HX, NVIDIA GeForce RTX 3060 Laptop GPU | Lenovo IdeaPad 5 Pro 16ARH7 AMD Ryzen 5 6600HS, AMD Radeon 660M | Acer Swift X SFX16-51G-5388 Intel Core i5-11320H, NVIDIA GeForce RTX 3050 4GB Laptop GPU | Lenovo Legion 5 Pro 16IAH7H Intel Core i7-12700H, NVIDIA GeForce RTX 3060 Laptop GPU | |
|---|---|---|---|---|---|---|
| Heat | 4% | 2% | 10% | 1% | -4% | |
| Maximum Upper Side * (°C) | 48.2 | 45.2 6% | 50 -4% | 46 5% | 52.4 -9% | 45.8 5% |
| Maximum Bottom * (°C) | 49.6 | 44 11% | 53 -7% | 48 3% | 50 -1% | 66.3 -34% |
| Idle Upper Side * (°C) | 31.8 | 33.6 -6% | 29 9% | 28 12% | 30.3 5% | 30.4 4% |
| Idle Bottom * (°C) | 33.6 | 32.6 3% | 30 11% | 27 20% | 30.4 10% | 30.4 10% |
* ... más pequeño es mejor
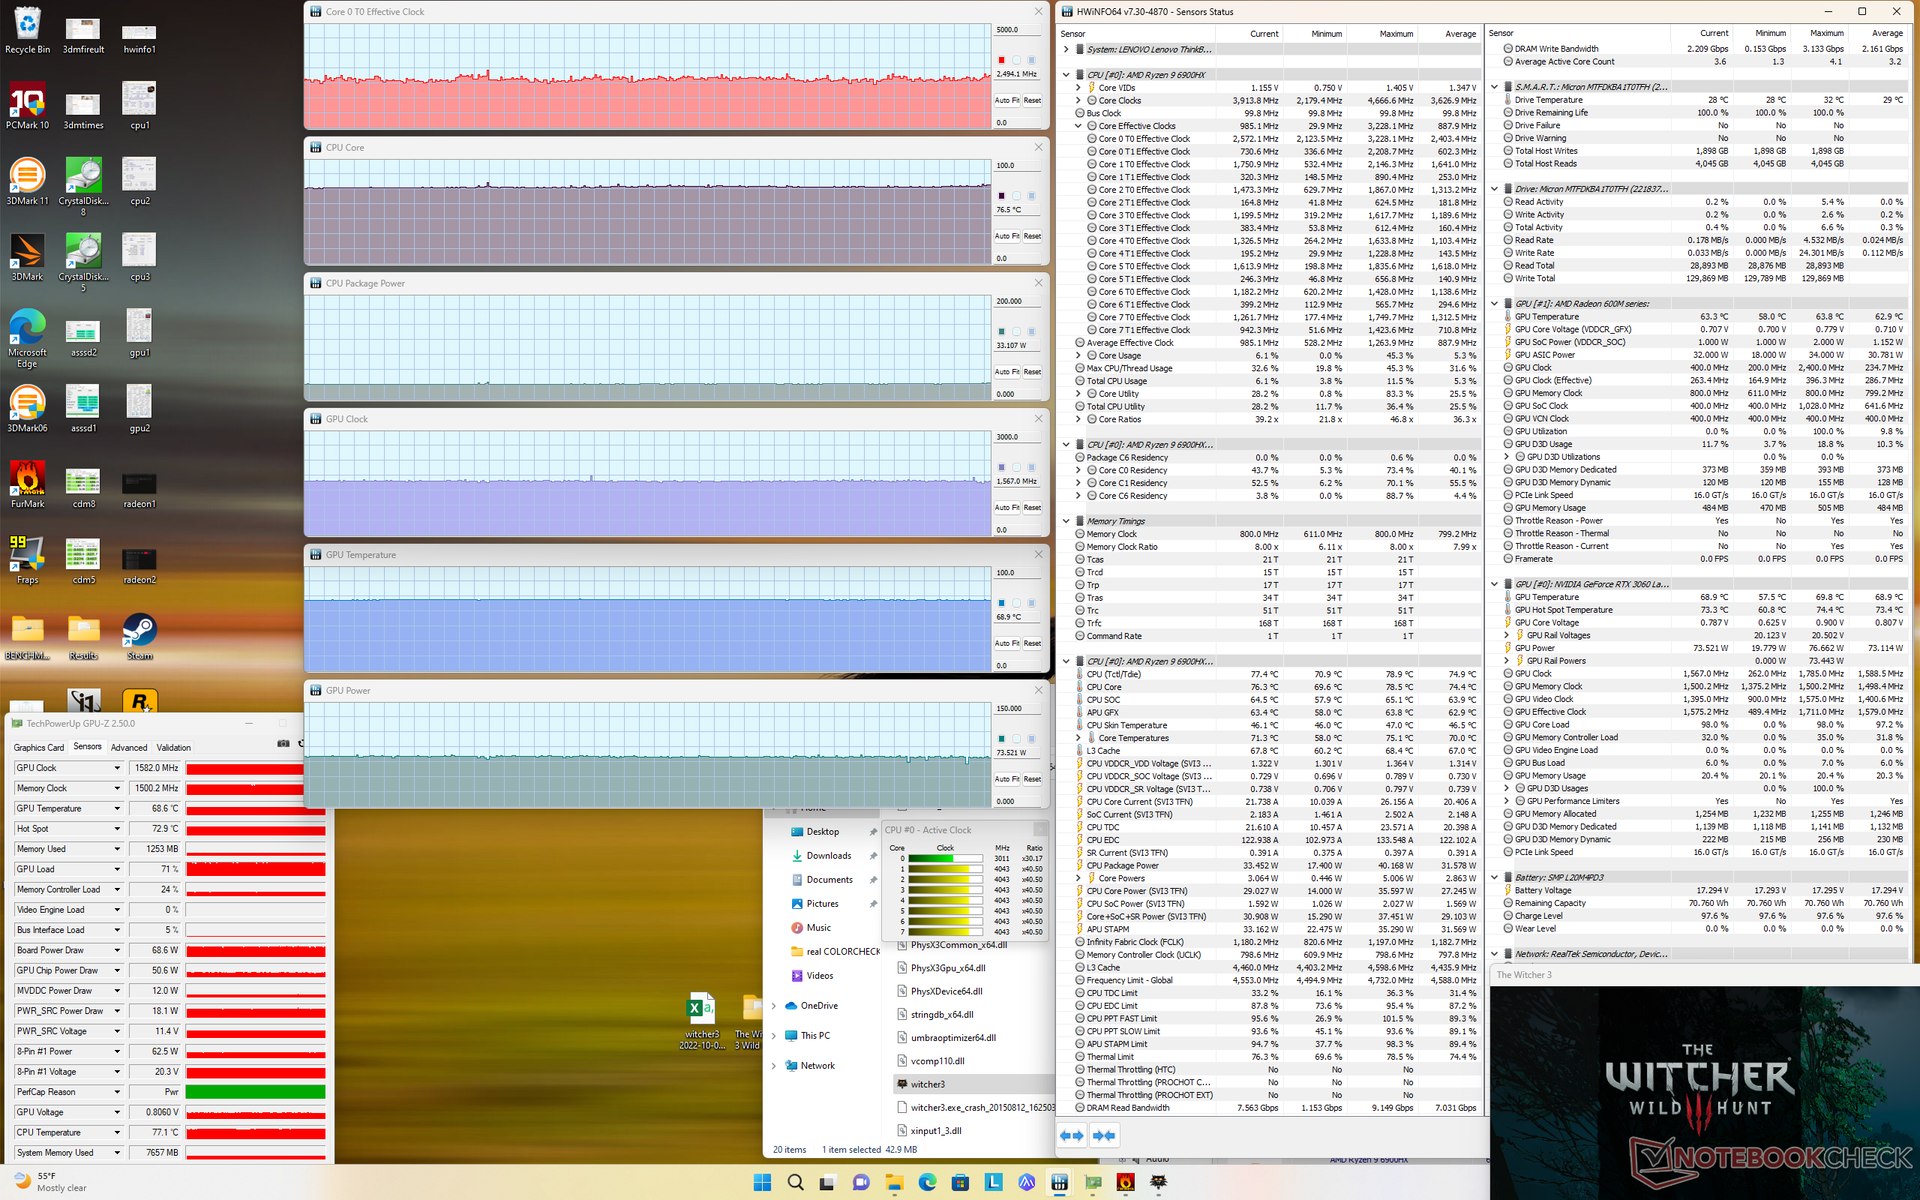
Prueba de esfuerzo
La velocidad de reloj de la CPU, la temperatura y el consumo de energía de la placa se disparaban a 4,1 GHz, 77 C y 65 W, respectivamente, al iniciar el estrés de Prime95. El procesador se estabilizó en 3,7 GHz, 82 C y 54 W poco después. En comparación, el Legion 7 16ARHA más grueso con la misma CPU Ryzen 9 6900HX se estabilizaría a 4,2 GHz, 89 C y 99 W al ejecutar la misma prueba Prime95.
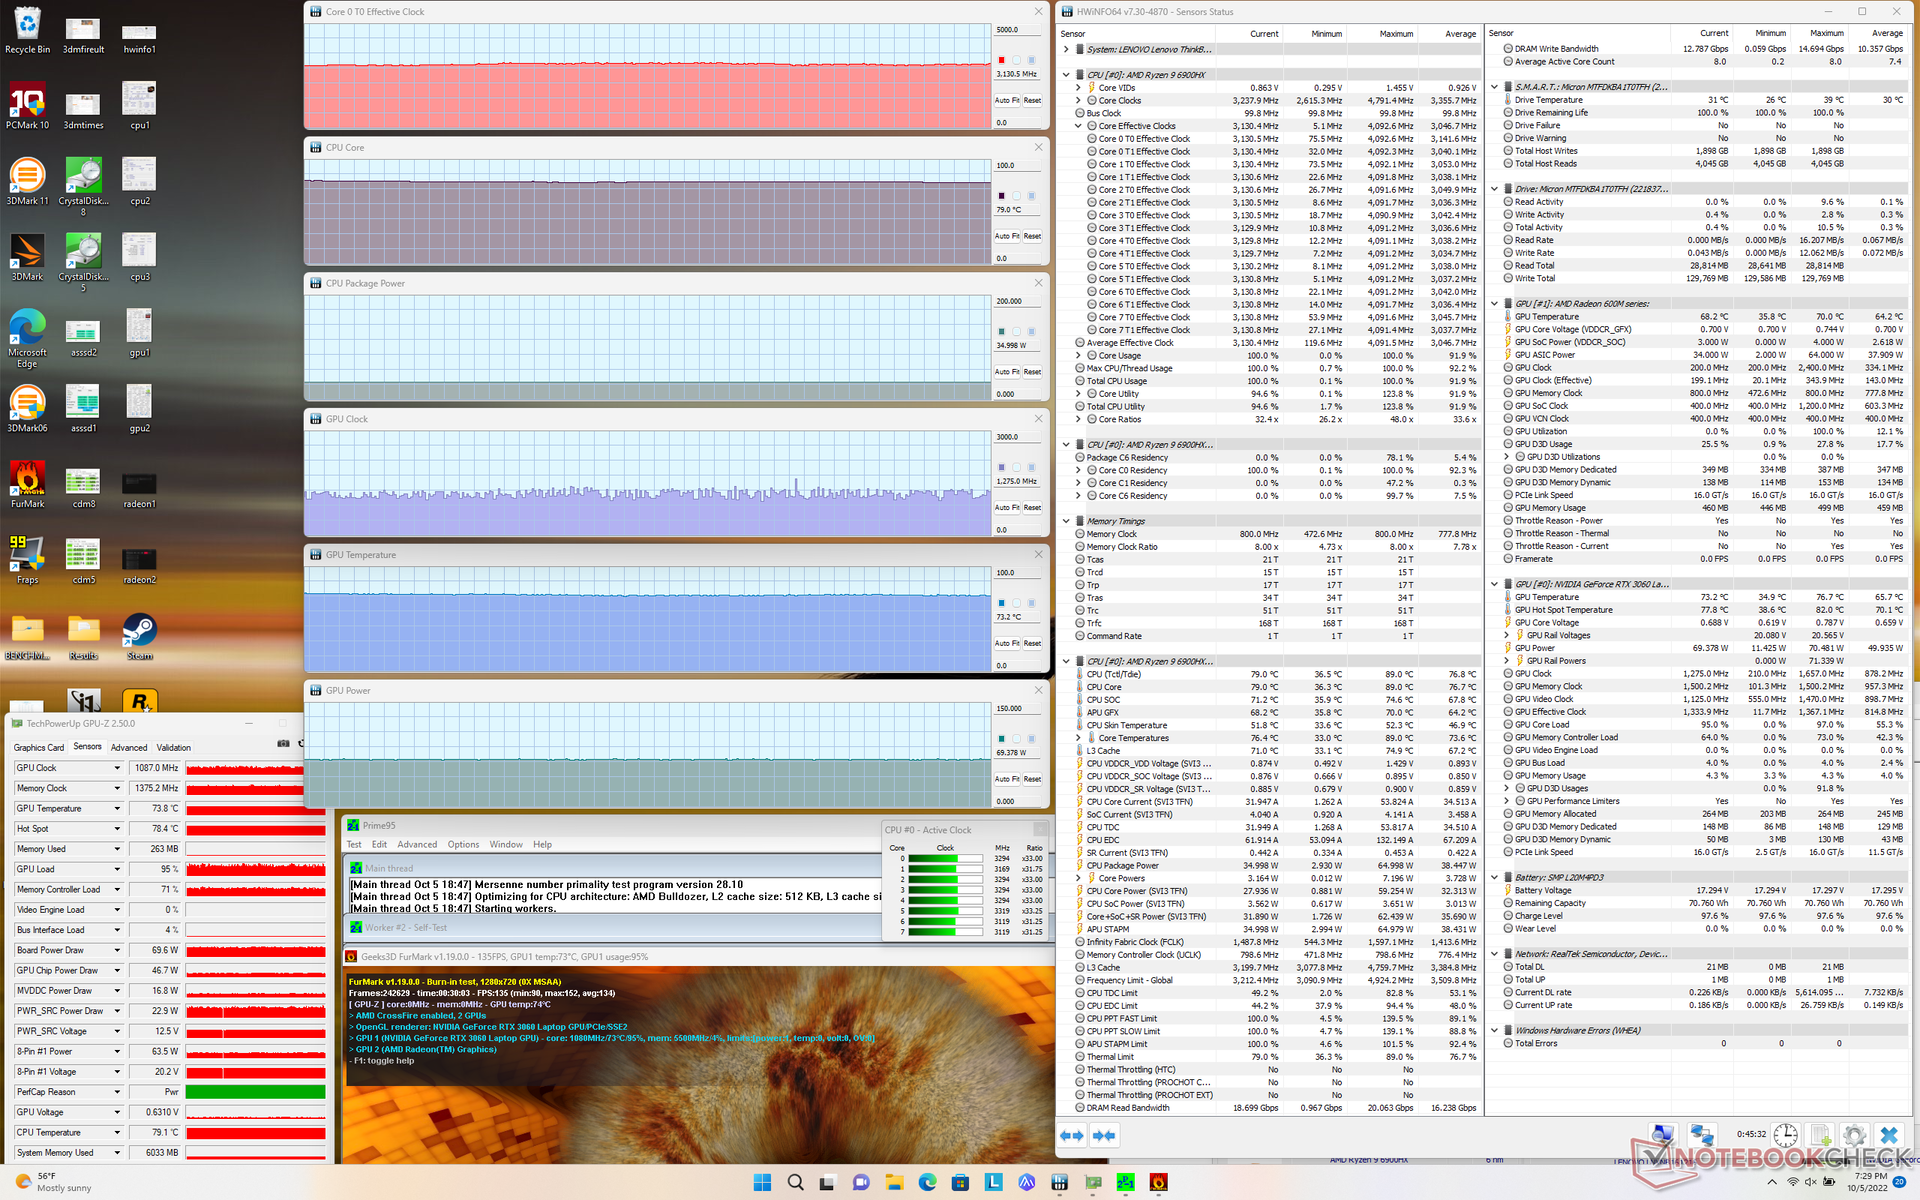
La velocidad de reloj de la GPU, la temperatura y el consumo de energía de la placa se estabilizarían en 1582 MHz, 69 C y 69 W al ejecutar Witcher 3. No conseguimos acercarnos al objetivo de 90 W del TGP al que aspira el sistema ni siquiera en el modo de rendimiento extremo.
El funcionamiento con batería reduce el rendimiento. Una prueba de Fire Strike en batería arrojaría unas puntuaciones de Física y Gráficos de 17799 y 10557 puntos, respectivamente, frente a los 25683 y 19597 puntos de la red eléctrica.
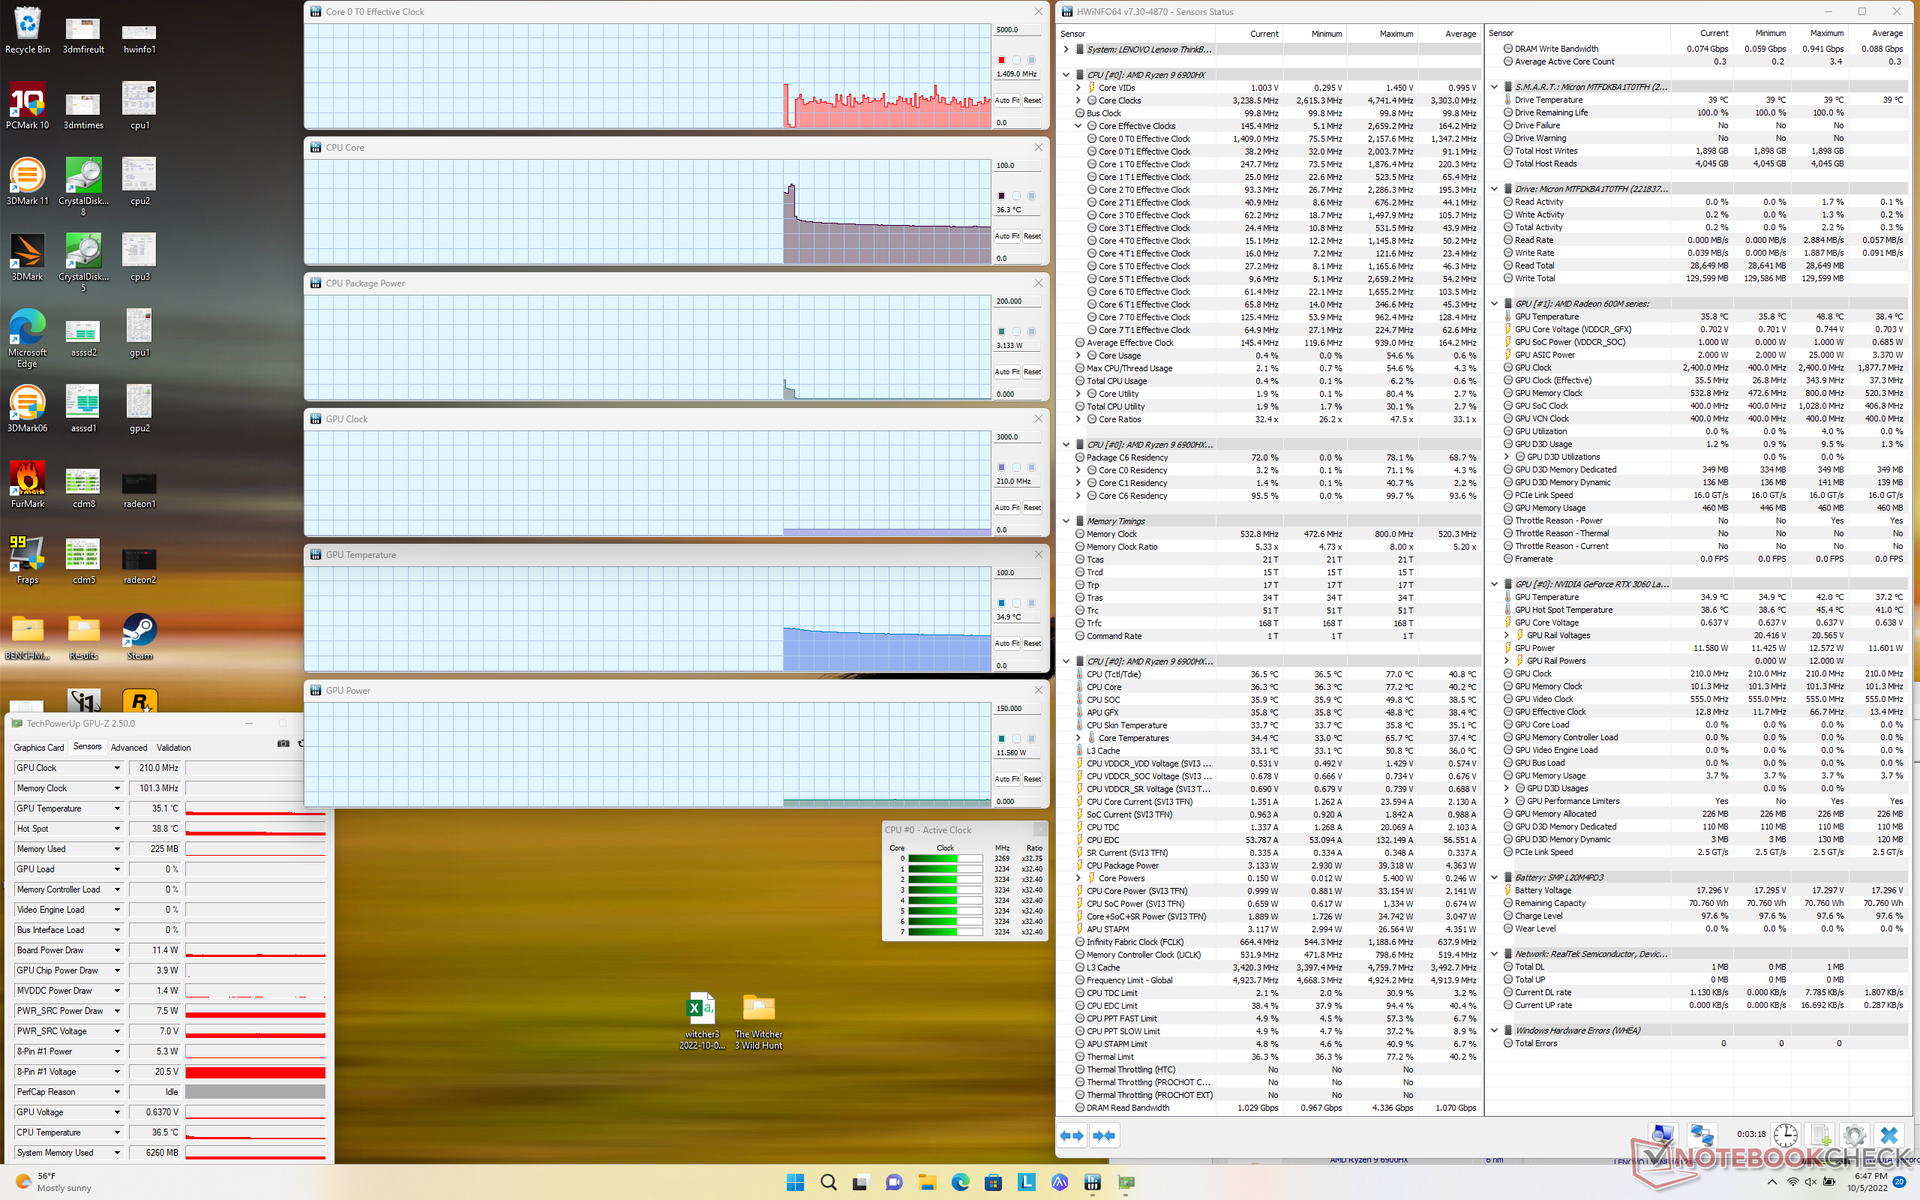
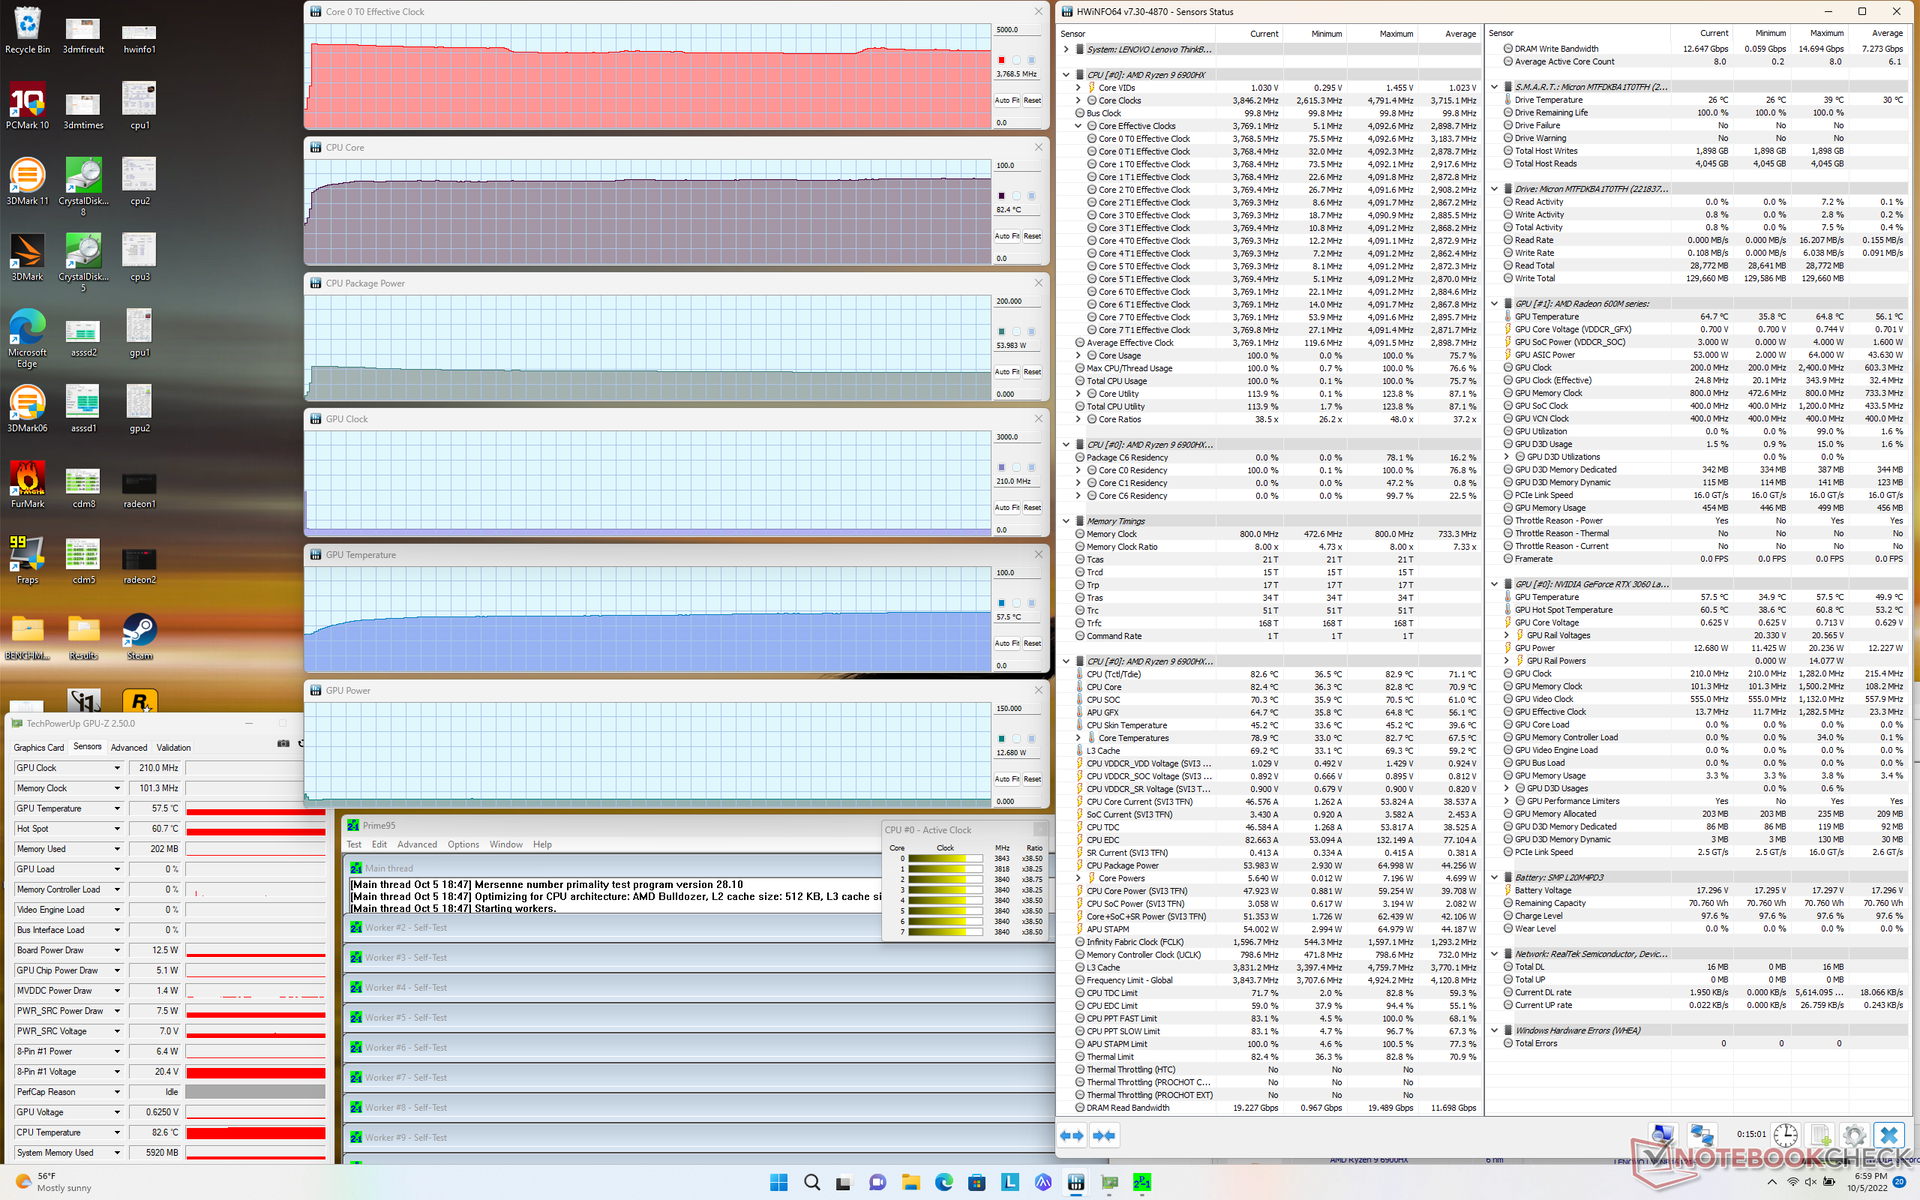
| Reloj dela CPU (GHz) | Reloj de la GPU (MHz) | Temperatura media dela CPU (°C) | Temperatura media de la GPU (°C) | |
| Sistema en reposo | -- | -- | 36 | 34 |
| Prime95Stress | 3,7 | -- | 82 | 58 |
| Prime95+ FurMark Stress | 3,1 | ~1275 | 79 | 73 |
| Witcher 3 Stress | ~2,5 | 1582 | 77 | 69 |
Altavoces
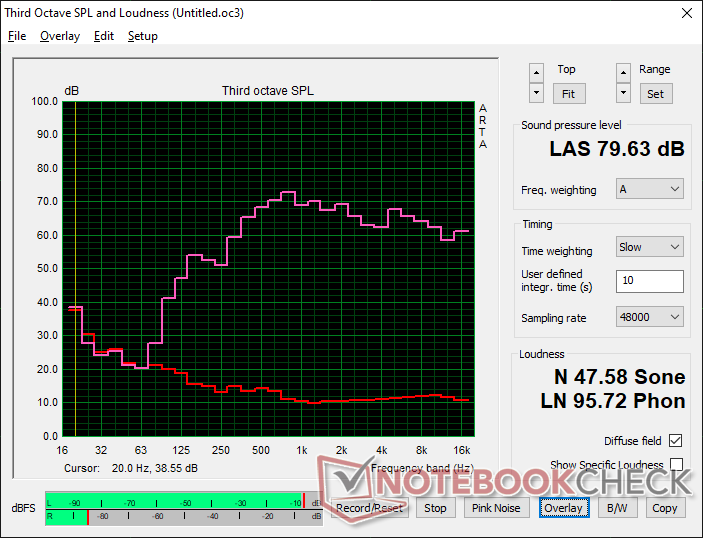
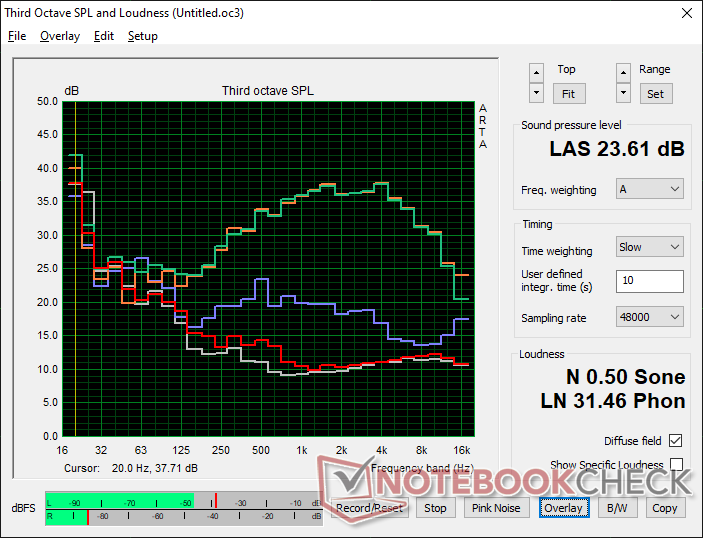
Lenovo ThinkBook 16p G3 ARH análisis de audio
(±) | la sonoridad del altavoz es media pero buena (79.6 dB)
Graves 100 - 315 Hz
(±) | lubina reducida - en promedio 13.4% inferior a la mediana
(±) | la linealidad de los graves es media (11.9% delta a frecuencia anterior)
Medios 400 - 2000 Hz
(+) | medios equilibrados - a sólo 4.8% de la mediana
(+) | los medios son lineales (5.5% delta a la frecuencia anterior)
Altos 2 - 16 kHz
(+) | máximos equilibrados - a sólo 1.6% de la mediana
(+) | los máximos son lineales (4.6% delta a la frecuencia anterior)
Total 100 - 16.000 Hz
(+) | el sonido global es lineal (13% de diferencia con la mediana)
En comparación con la misma clase
» 26% de todos los dispositivos probados de esta clase eran mejores, 5% similares, 70% peores
» El mejor tuvo un delta de 5%, la media fue 17%, el peor fue ###max##%
En comparación con todos los dispositivos probados
» 13% de todos los dispositivos probados eran mejores, 2% similares, 85% peores
» El mejor tuvo un delta de 4%, la media fue 24%, el peor fue ###max##%
Apple MacBook Pro 16 2021 M1 Pro análisis de audio
(+) | los altavoces pueden reproducir a un volumen relativamente alto (#84.7 dB)
Graves 100 - 315 Hz
(+) | buen bajo - sólo 3.8% lejos de la mediana
(+) | el bajo es lineal (5.2% delta a la frecuencia anterior)
Medios 400 - 2000 Hz
(+) | medios equilibrados - a sólo 1.3% de la mediana
(+) | los medios son lineales (2.1% delta a la frecuencia anterior)
Altos 2 - 16 kHz
(+) | máximos equilibrados - a sólo 1.9% de la mediana
(+) | los máximos son lineales (2.7% delta a la frecuencia anterior)
Total 100 - 16.000 Hz
(+) | el sonido global es lineal (4.6% de diferencia con la mediana)
En comparación con la misma clase
» 0% de todos los dispositivos probados de esta clase eran mejores, 0% similares, 100% peores
» El mejor tuvo un delta de 5%, la media fue 17%, el peor fue ###max##%
En comparación con todos los dispositivos probados
» 0% de todos los dispositivos probados eran mejores, 0% similares, 100% peores
» El mejor tuvo un delta de 4%, la media fue 24%, el peor fue ###max##%
Gestión de la energía
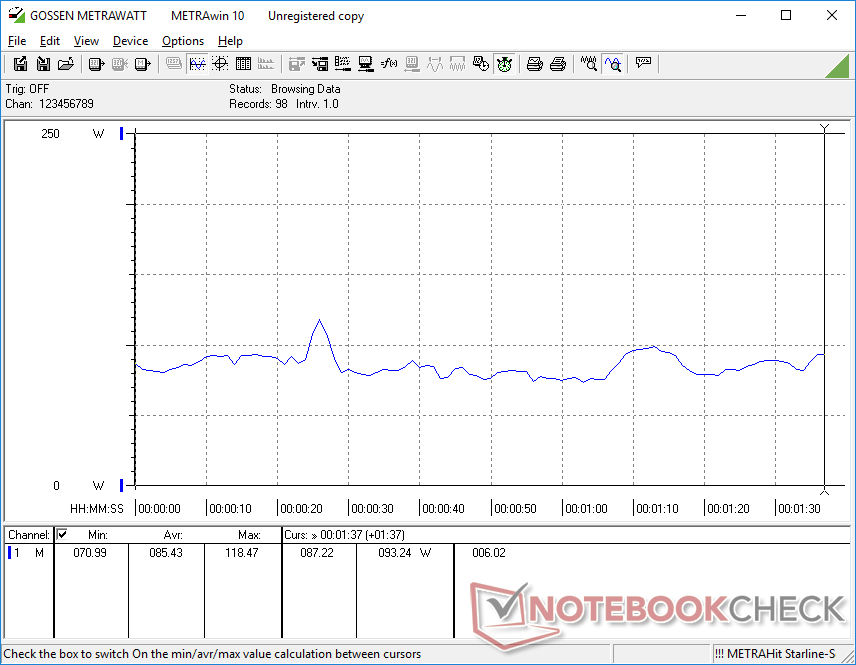
Consumo de energía
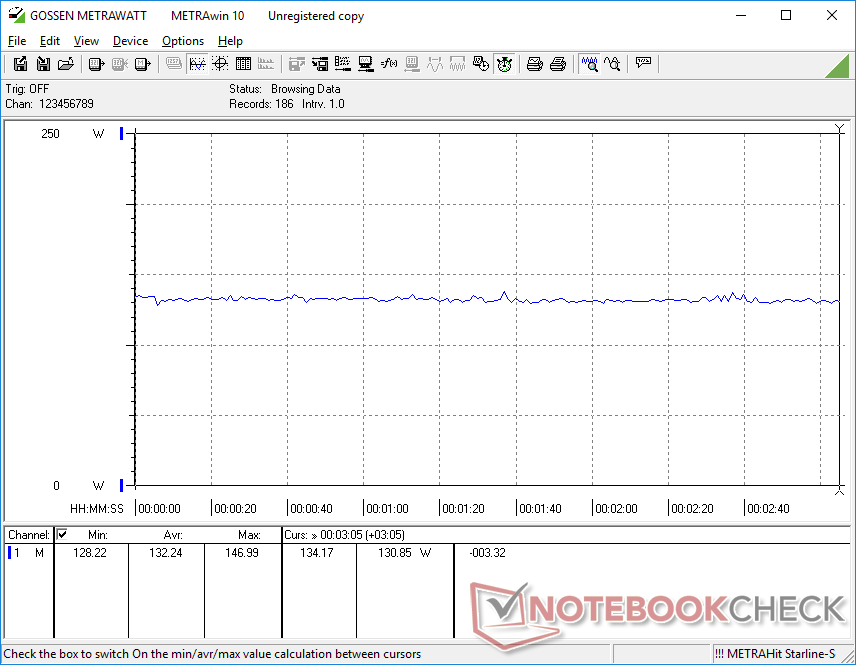
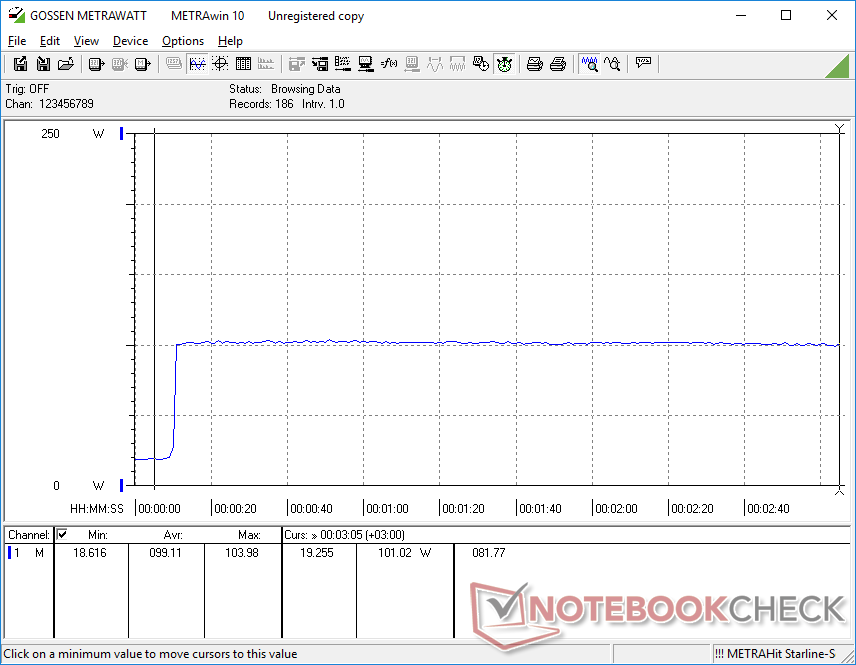
El consumo en reposo en el escritorio oscilaría entre 10 W y 24 W dependiendo del perfil de potencia y el brillo, en comparación con sólo 10 W a 19 W en el modelo Gen 2. El consumo total es significativamente menor que el del Legion 5 Pro 16 que viene con la misma GPU GeForce RTX 3060 pero con una CPU Intel Core i7 de 12ª generación más rápida
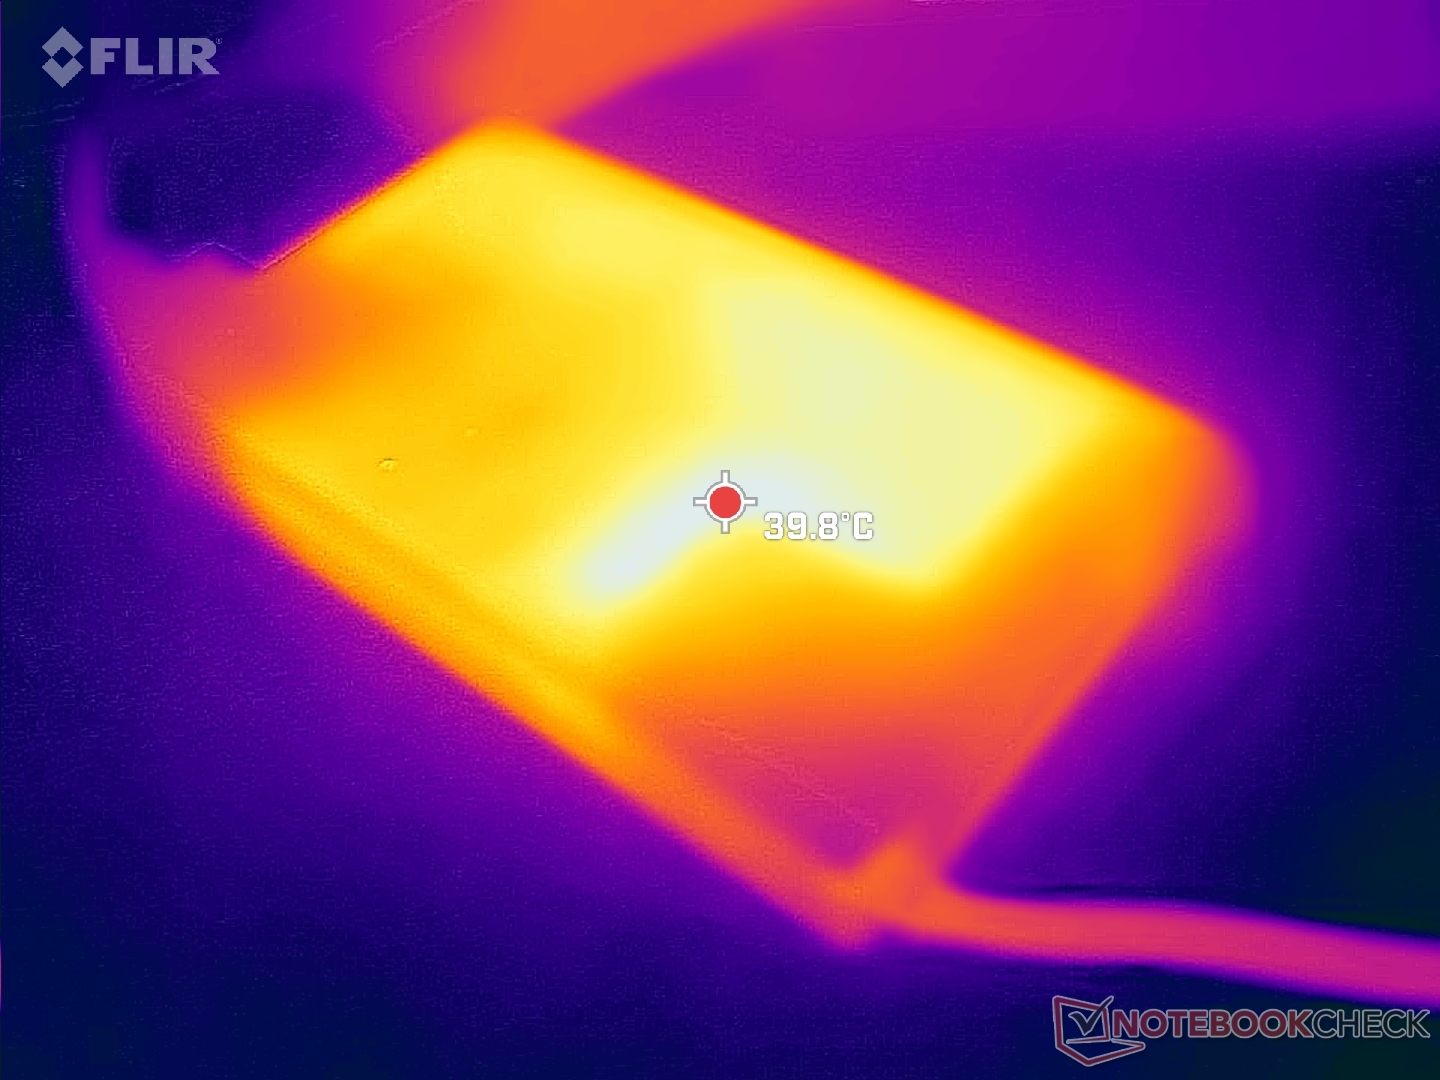
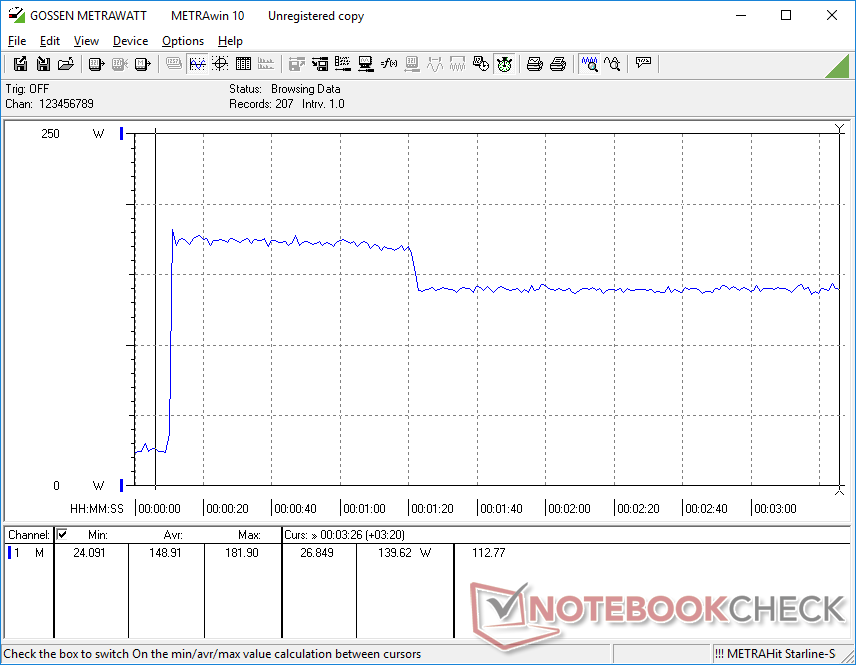
Podemos alcanzar un máximo de 182 W con el adaptador de CA de 230 W de tamaño medio (~16 x 8.8 x 2.8 cm) cuando la CPU y la GPU están al 100% de utilización.
| Off / Standby | |
| Ocioso | |
| Carga |
|
Clave:
min: | |
| Lenovo ThinkBook 16p G3 ARH R9 6900HX, GeForce RTX 3060 Laptop GPU, Micron 3400 1TB MTFDKBA1T0TFH, IPS, 2560x1600, 16" | HP Envy 16 h0112nr i7-12700H, GeForce RTX 3060 Laptop GPU, Micron 3400 1TB MTFDKBA1T0TFH, OLED, 3840x2400, 16" | Lenovo ThinkBook 16p G2 ACH R9 5900HX, GeForce RTX 3060 Laptop GPU, WDC PC SN730 SDBPNTY-1T00, IPS, 2560x1600, 16" | Lenovo IdeaPad 5 Pro 16ARH7 R5 6600HS, Radeon 660M, Samsung PM9A1 MZVL2512HCJQ, IPS, 2560x1600, 16" | Acer Swift X SFX16-51G-5388 i5-11320H, GeForce RTX 3050 4GB Laptop GPU, Samsung PM991 MZVLQ512HBLU, , 1920x1080, 16.1" | Lenovo Legion 5 Pro 16IAH7H i7-12700H, GeForce RTX 3060 Laptop GPU, 2x Samsung PM9A1 MZVL21T0HCLR (RAID 0), IPS, 2560x1600, 16" | |
|---|---|---|---|---|---|---|
| Power Consumption | -6% | 4% | 52% | 39% | -77% | |
| Idle Minimum * (Watt) | 10.3 | 10 3% | 13.2 -28% | 4 61% | 7 32% | 22.8 -121% |
| Idle Average * (Watt) | 16 | 10.9 32% | 17 -6% | 7 56% | 10.1 37% | 26.5 -66% |
| Idle Maximum * (Watt) | 24 | 27.8 -16% | 18.6 22% | 13 46% | 15 37% | 41 -71% |
| Load Average * (Watt) | 85.4 | 116.4 -36% | 88.8 -4% | 61 29% | 63.3 26% | 191 -124% |
| Witcher 3 ultra * (Watt) | 132.2 | 133.7 -1% | 123 7% 123 7% | 42.8 68% | 63.3 52% | 194.7 -47% |
| Load Maximum * (Watt) | 181.9 | 209.8 -15% | 132 27% | 88 52% | 94 48% | 238 -31% |
* ... más pequeño es mejor
Power Consumption Witcher 3 / Stresstest
Power Consumption external Monitor
Duración de la batería
La duración de la WLAN es unas 2 horas menor que la que registramos en el modelo Gen 2, aunque tengan las mismas baterías de 71 Wh. La mayor tasa de refresco de nuestra pantalla (165 Hz frente a 60 Hz) puede ser en parte responsable de la menor duración de la batería
La carga desde el vacío hasta la capacidad total tarda entre 1,5 y 2 horas. El sistema no puede recargarse por USB-C.
| Lenovo ThinkBook 16p G3 ARH R9 6900HX, GeForce RTX 3060 Laptop GPU, 71 Wh | HP Envy 16 h0112nr i7-12700H, GeForce RTX 3060 Laptop GPU, 83 Wh | Lenovo ThinkBook 16p G2 ACH R9 5900HX, GeForce RTX 3060 Laptop GPU, 71 Wh | Lenovo IdeaPad 5 Pro 16ARH7 R5 6600HS, Radeon 660M, 75 Wh | Acer Swift X SFX16-51G-5388 i5-11320H, GeForce RTX 3050 4GB Laptop GPU, 58.7 Wh | Lenovo Legion 5 Pro 16IAH7H i7-12700H, GeForce RTX 3060 Laptop GPU, 80 Wh | |
|---|---|---|---|---|---|---|
| Duración de Batería | 22% | 31% | 51% | 25% | -45% | |
| WiFi v1.3 (h) | 6.5 | 7.9 22% | 8.5 31% | 9.8 51% | 8.1 25% | 3.6 -45% |
| Reader / Idle (h) | 17.8 | |||||
| Load (h) | 1.6 | 2 | 1.5 | 0.6 | ||
| H.264 (h) | 7 | 8.4 | 4.1 | |||
| Gaming (h) | 1.1 | |||||
| Witcher 3 ultra (h) | 2.1 |
Pro
Contra
Veredicto - Considere el modelo del año pasado en su lugar
A diferencia del salto de rendimiento de la 11ª generación de Intel a la 12ª generación de Intel, el salto de AMD Zen 3 a Zen 3+ solo aporta beneficios menores en el mejor de los casos. El hecho de que el Ryzen 9 5900HX en el 2021 ThinkBook 16p Gen 2 puede rendir dentro de un 5 por ciento sobre el Ryzen 9 6900HX en el ThinkBook 16p Gen 3 de 2022 hace que este último modelo sea una recomendación más difícil si el rendimiento del procesador es lo que buscas.
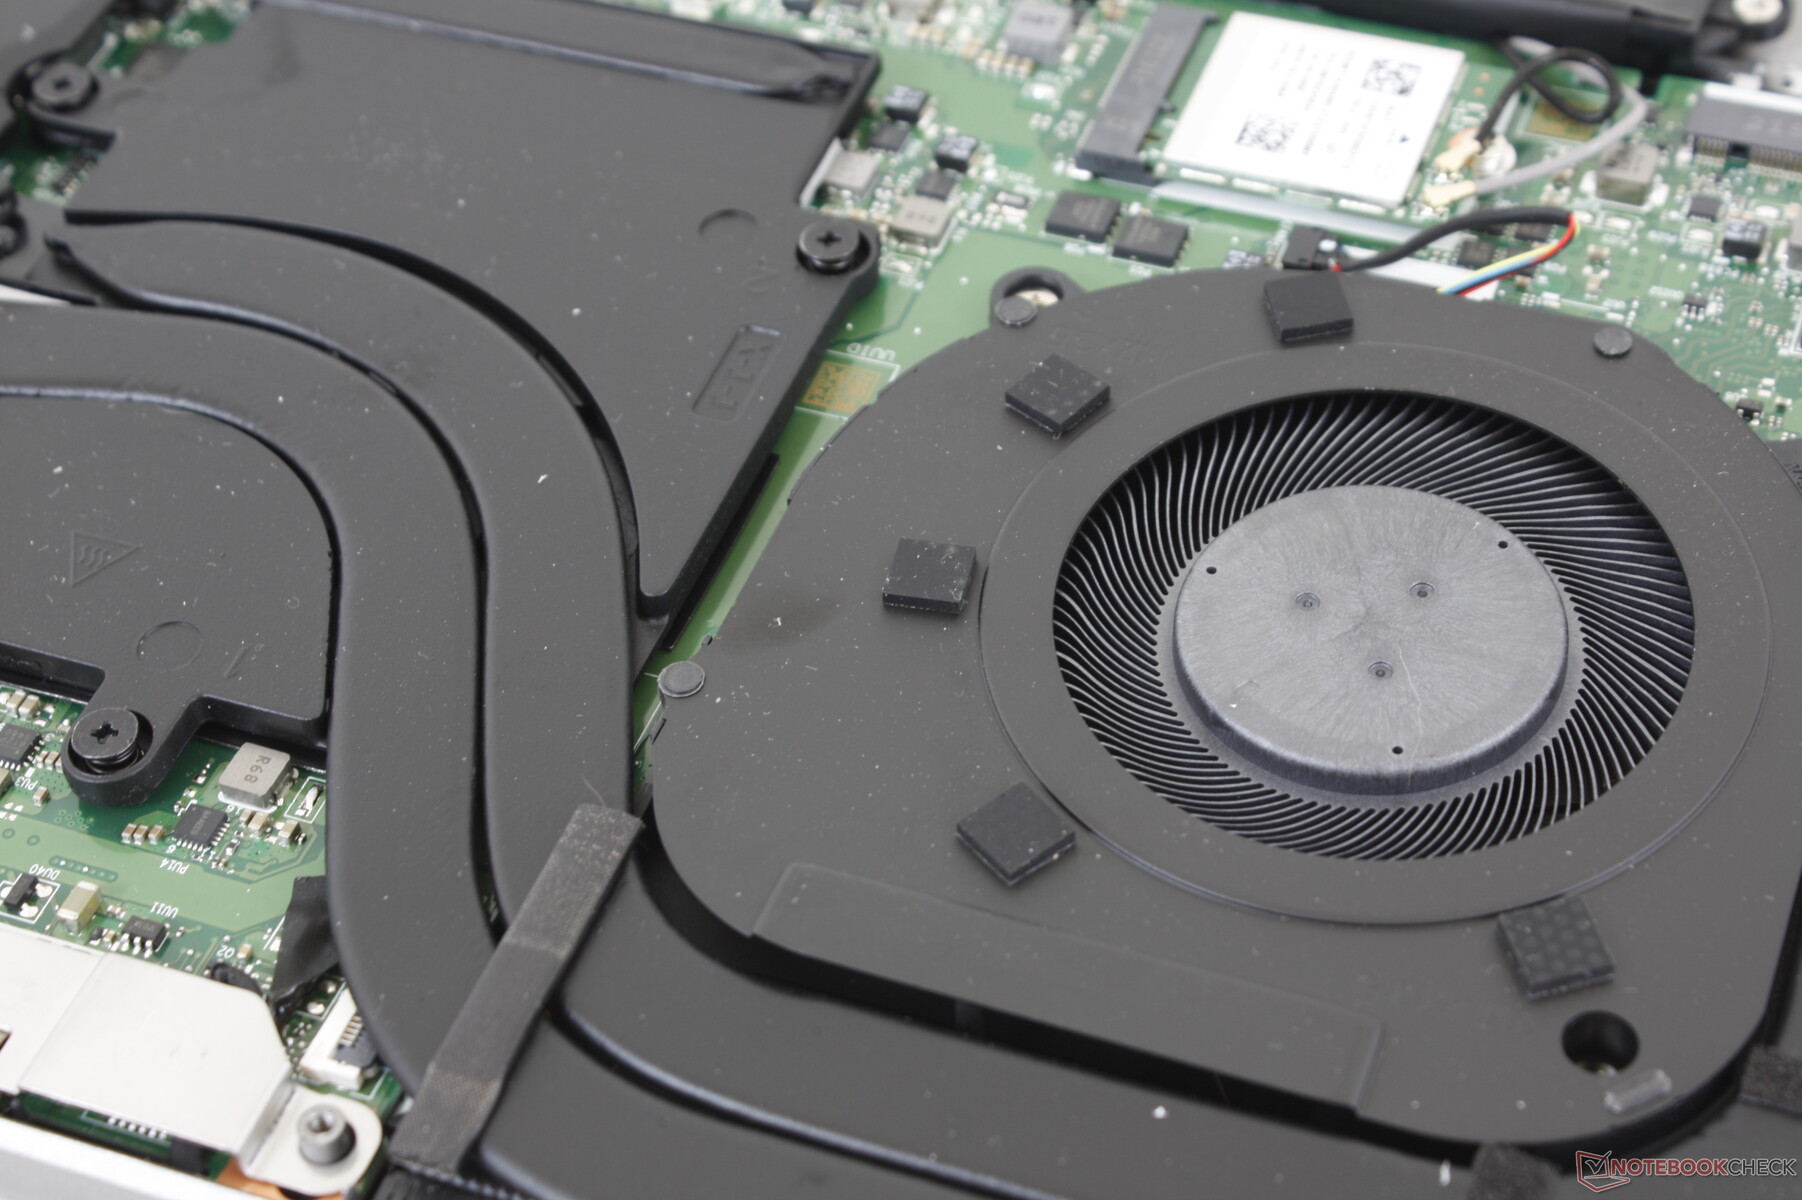
Los cambios en el modelo 2022, sin embargo, son dignos de mención. El nuevo panel G-Sync de 165 Hz, en particular, es una mejora significativa sobre el panel de 60 Hz para una experiencia de juego mucho más suave. También apreciamos el puerto HDMI añadido, pero el paso a la RAM soldada podría acabar molestando a algunos usuarios. Sospechamos que Lenovo ha optado por una memoria RAM no extraíble para permitir una solución de refrigeración ligeramente mayor para la GPU TGP de 90 W más rápida.
La actualización de rendimiento interanual del ThinkBook 16p Gen 2 es demasiado pequeña para que se note en la mayoría de circunstancias. Sin embargo, la nueva y más impresionante opción de pantalla de 165 Hz ayuda a distinguir el ThinkBook 16p Gen 3 de la mayoría de los otros portátiles de 16 pulgadas que hay actualmente en el mercado.
Los usuarios pueden ahorrar un poco de dinero y obtener casi el mismo nivel de rendimiento que el modelo Gen 3 comprando una versión Gen 2 más antigua pero visualmente idéntica. Hay que tener en cuenta que Lenovo está cobrando una prima por el ThinkBook 15p Gen 3 en este momento en comparación con el competidor Dell Inspiron 16 Plus 7620 o HP Envy 16. El modelo de Lenovo incluye la opción de panel de 165 Hz que actualmente no está disponible en las alternativas Dell o HP mencionadas.
Precio y disponibilidad
El ThinkBook 16p aún no está disponible a través de canales de terceros como Amazon, Best Buy o Newegg. Recomendamos comprar directamente a Lenovo que actualmente está distribuyendo configuraciones Ryzen 5 6600H y Ryzen 7 6800H a partir de $2460 USD.
Lenovo ThinkBook 16p G3 ARH
- 10/08/2022 v7 (old)
Allen Ngo
Price comparison

