Veredicto: Rendimiento sólido con las contrapartidas esperadas
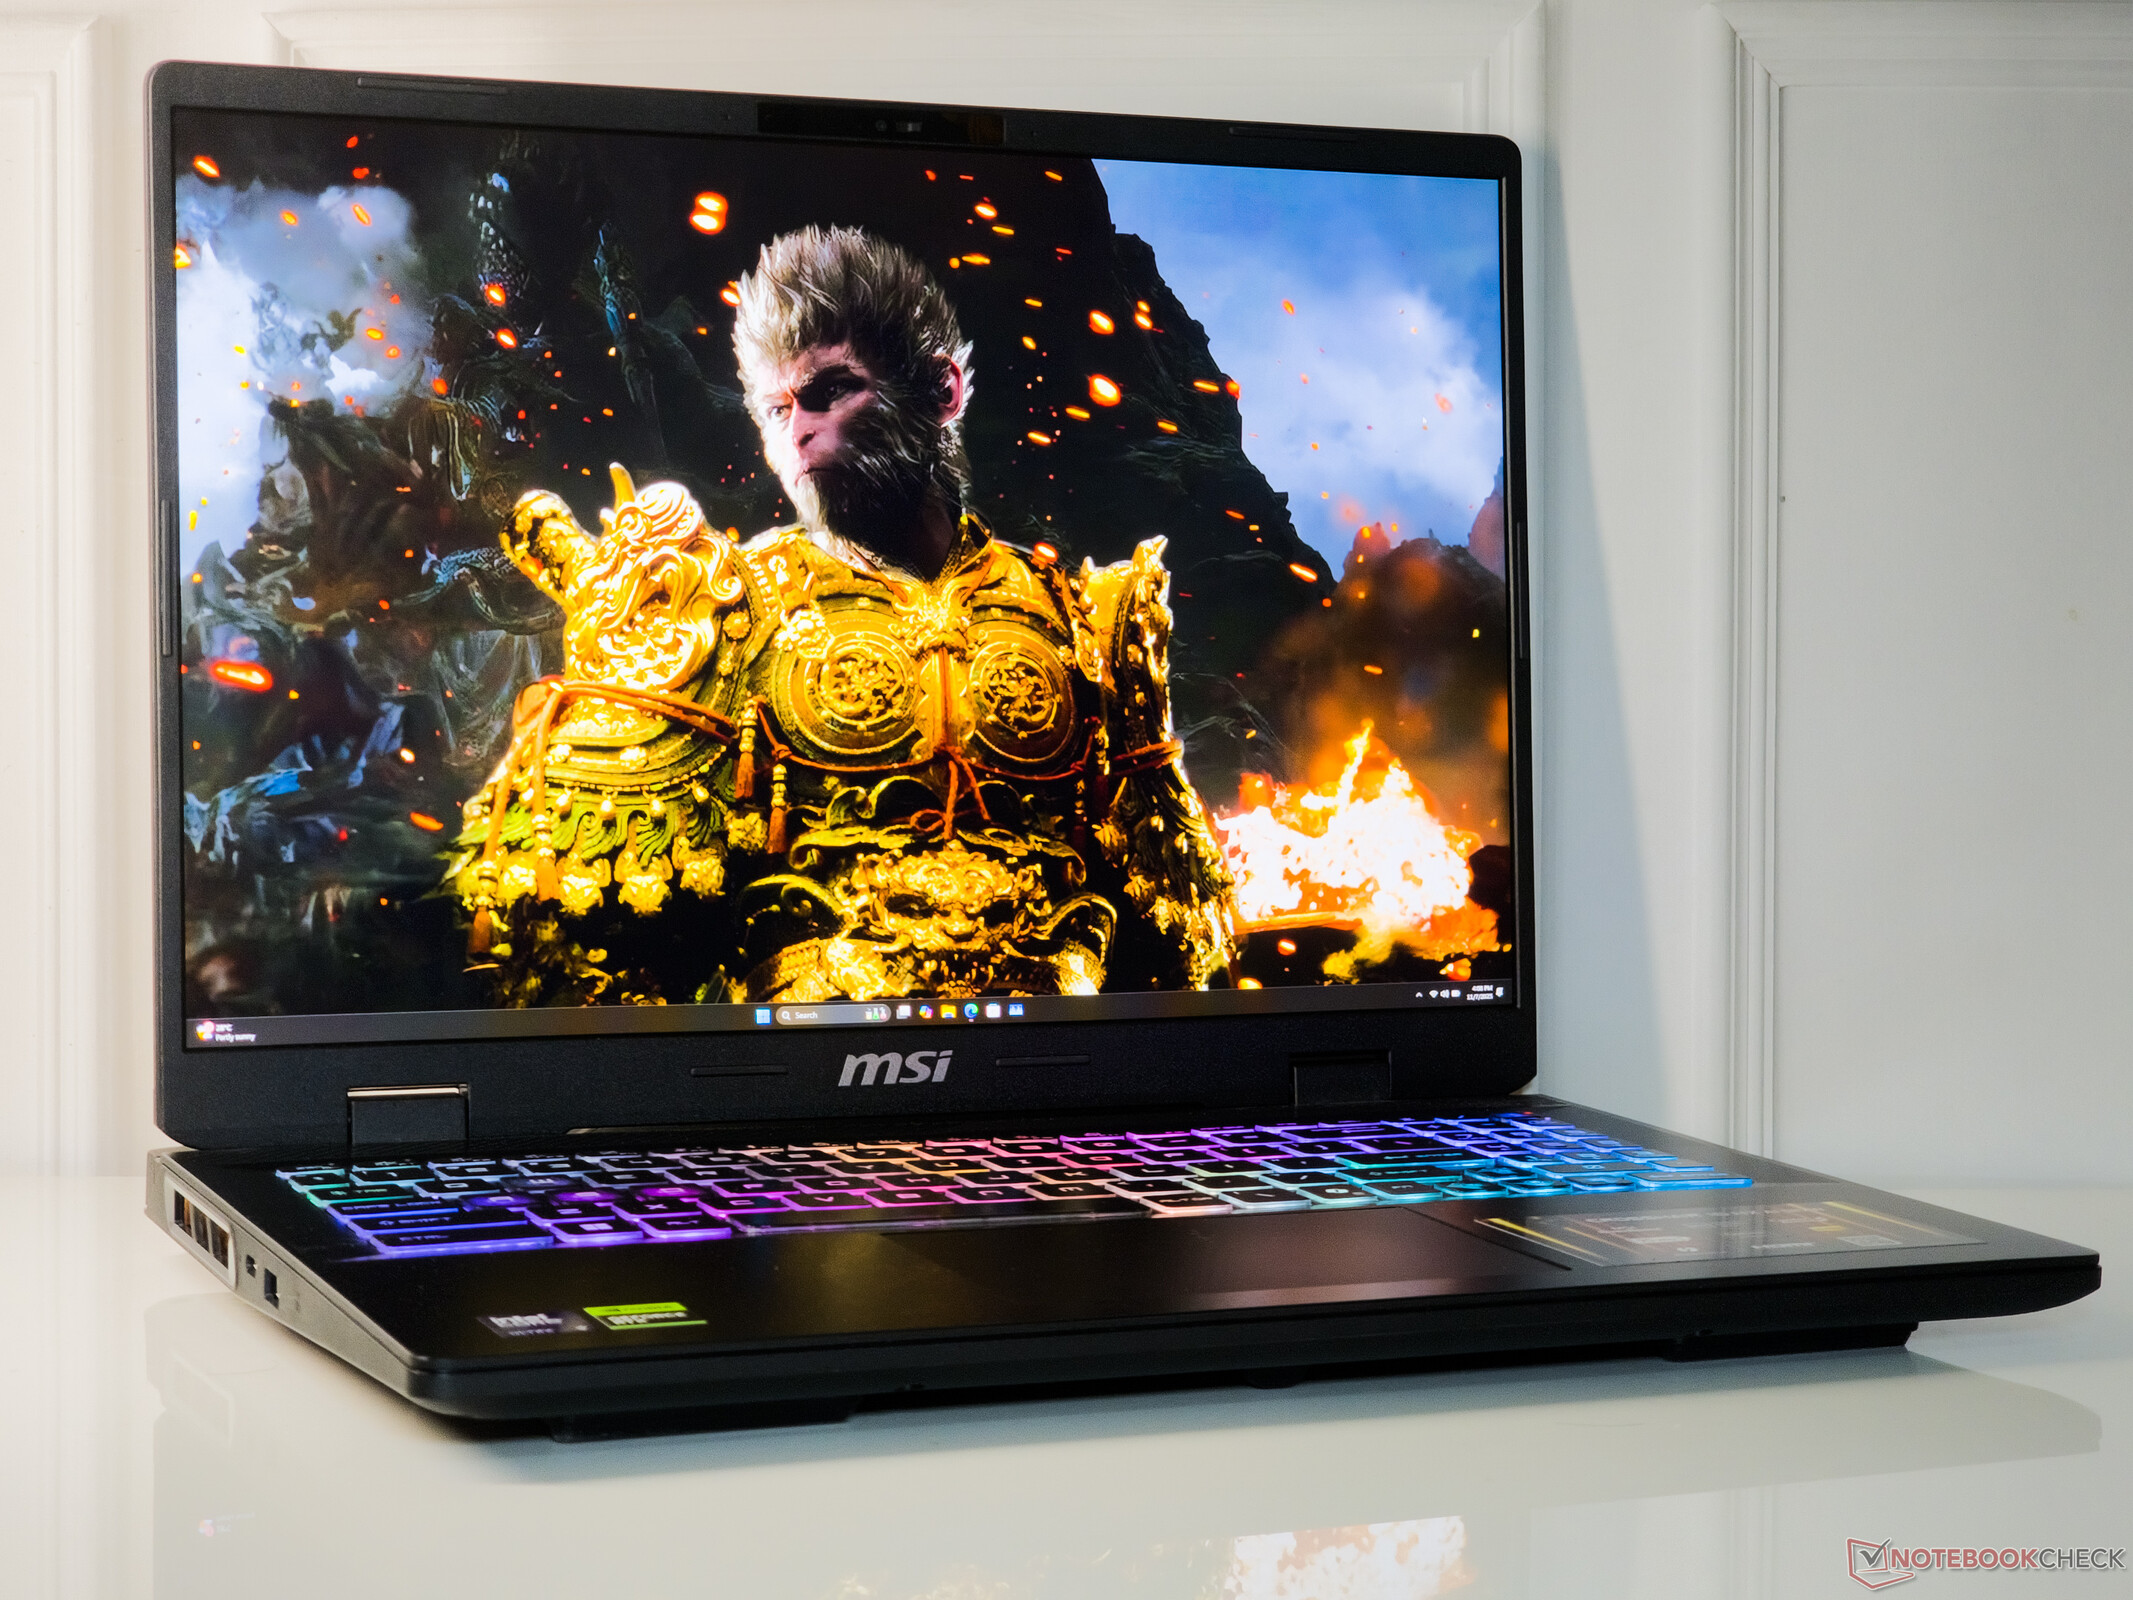
Con un Intel Core Ultra 9 275HX y una Nvidia GeForce RTX 5070 Laptop, el MSI Crosshair 16 HX AI es un portátil de juegos QHD capaz para 2025 que también es bastante apto para la creación de contenidos.
El Crosshair 16 HX AI puede manejar juegos Ultra 1440p con velocidades de fotogramas aceptables, aunque los títulos intensivos en VRAM pueden resultar un reto dados los míseros 8 GB de memoria de fotogramas del Portátil RTX 5070. DLSS4 y la generación de fotogramas múltiples pueden ayudar, pero esto no siempre es un buen augurio, especialmente para los shooters competitivos.
El modo de rendimiento extremo libera todo el potencial de la IA Crosshair 16 HX, pero esto viene con la perdición de un aumento de las emisiones de calor y ruido junto con un mayor consumo de energía.
Por lo demás, MSI no ha recortado más de lo que ya anticipábamos. Hay poco de lo que quejarse de la construcción de plástico y la conectividad es razonable, aunque nos habría gustado un puerto Thunderbolt 4/USB Type-C adicional y un mejor rendimiento de Wi-Fi 5.
La pantalla QHD+ de 240 Hz no es mini-LED ni OLED pero ofrece unos efectos visuales impresionantes, tiempos de respuesta rápidos y sin PWM.
En general, el MSI Crosshair 16 HX AI encaja a la perfección si está buscando un portátil decente para juegos y creación de contenidos a 1440p que ronde los 2.000 dólares.
Pro
Contra
Precio y disponibilidad
En EE.UU., el Crosshair 16 HX AI está disponible en Micro Center a partir de 1.499,99 dólares para la variante Core Ultra 7 255HX.
En la India, el MSI Crosshair 16 HX AI parte de ₹1.59.990 para la variante Core Ultra 9 275HX + RTX 5060 en MSI.com y otros minoristas, mientras que el combo Core Ultra 9 275HX + RTX 5070 se puede conseguir por ₹1.99.990 a través de Amazon India.
- $1,998.00MSI Crosshair 16 HX AI D2XWGKG-211US 16" Gaming Notebook - QHD+ - 240 Hz - Intel Core Ultra 7 255HX - 32 GB - 1 TB SSD - Cosmos Gray
- $1,799.99msi Crosshair 18 HX AI 18" 2560x1600 240Hz Display Gaming Laptop, Intel Core Ultra 9 275HX (24 Cores, 2.1-5.4 GHz), NVIDIA RTX 5070 8GB GDDR7, 32GB RAM, 1TB NVMe SSD, Windows 11 Home
- $1,895.64MSI Crosshair 16 HX AI D2XWFKG-210US 16" Gaming Notebook - QHD+ - 240 Hz - Intel Core Ultra 7 255HX - 32 GB - 1 TB SSD - Cosmos Gray
Índice
- Veredicto: Rendimiento sólido con las contrapartidas esperadas
- Especificaciones
- Chasis: Construcción de plástico con opciones de conectividad decentes
- Conectividad: Alto rendimiento a 6 GHz 6E
- Dispositivos de entrada: Experiencia de tecleo decente con suficiente RGB
- Pantalla: Panel QHD+ 240 Hz con buena cobertura de gama y sin PWM
- Rendimiento: Core Ultra 9 275HX y RTX 5070 no arrojan sorpresas
- Emisiones: Refrigeración robusta pero con altos niveles de decibelios y térmicos
- Consumo de energía: No es el más frugal de la comparación
- Impresiones generales de Notebookcheck sobre el MSI Crosshair 16 HX AI
- Competidores potenciales en comparación
Después de haber revisado el MSI Crosshair A17 HX y el Crosshair 18 HX AIahora dirigimos nuestra atención al MSI Crosshair 16 HX AI.
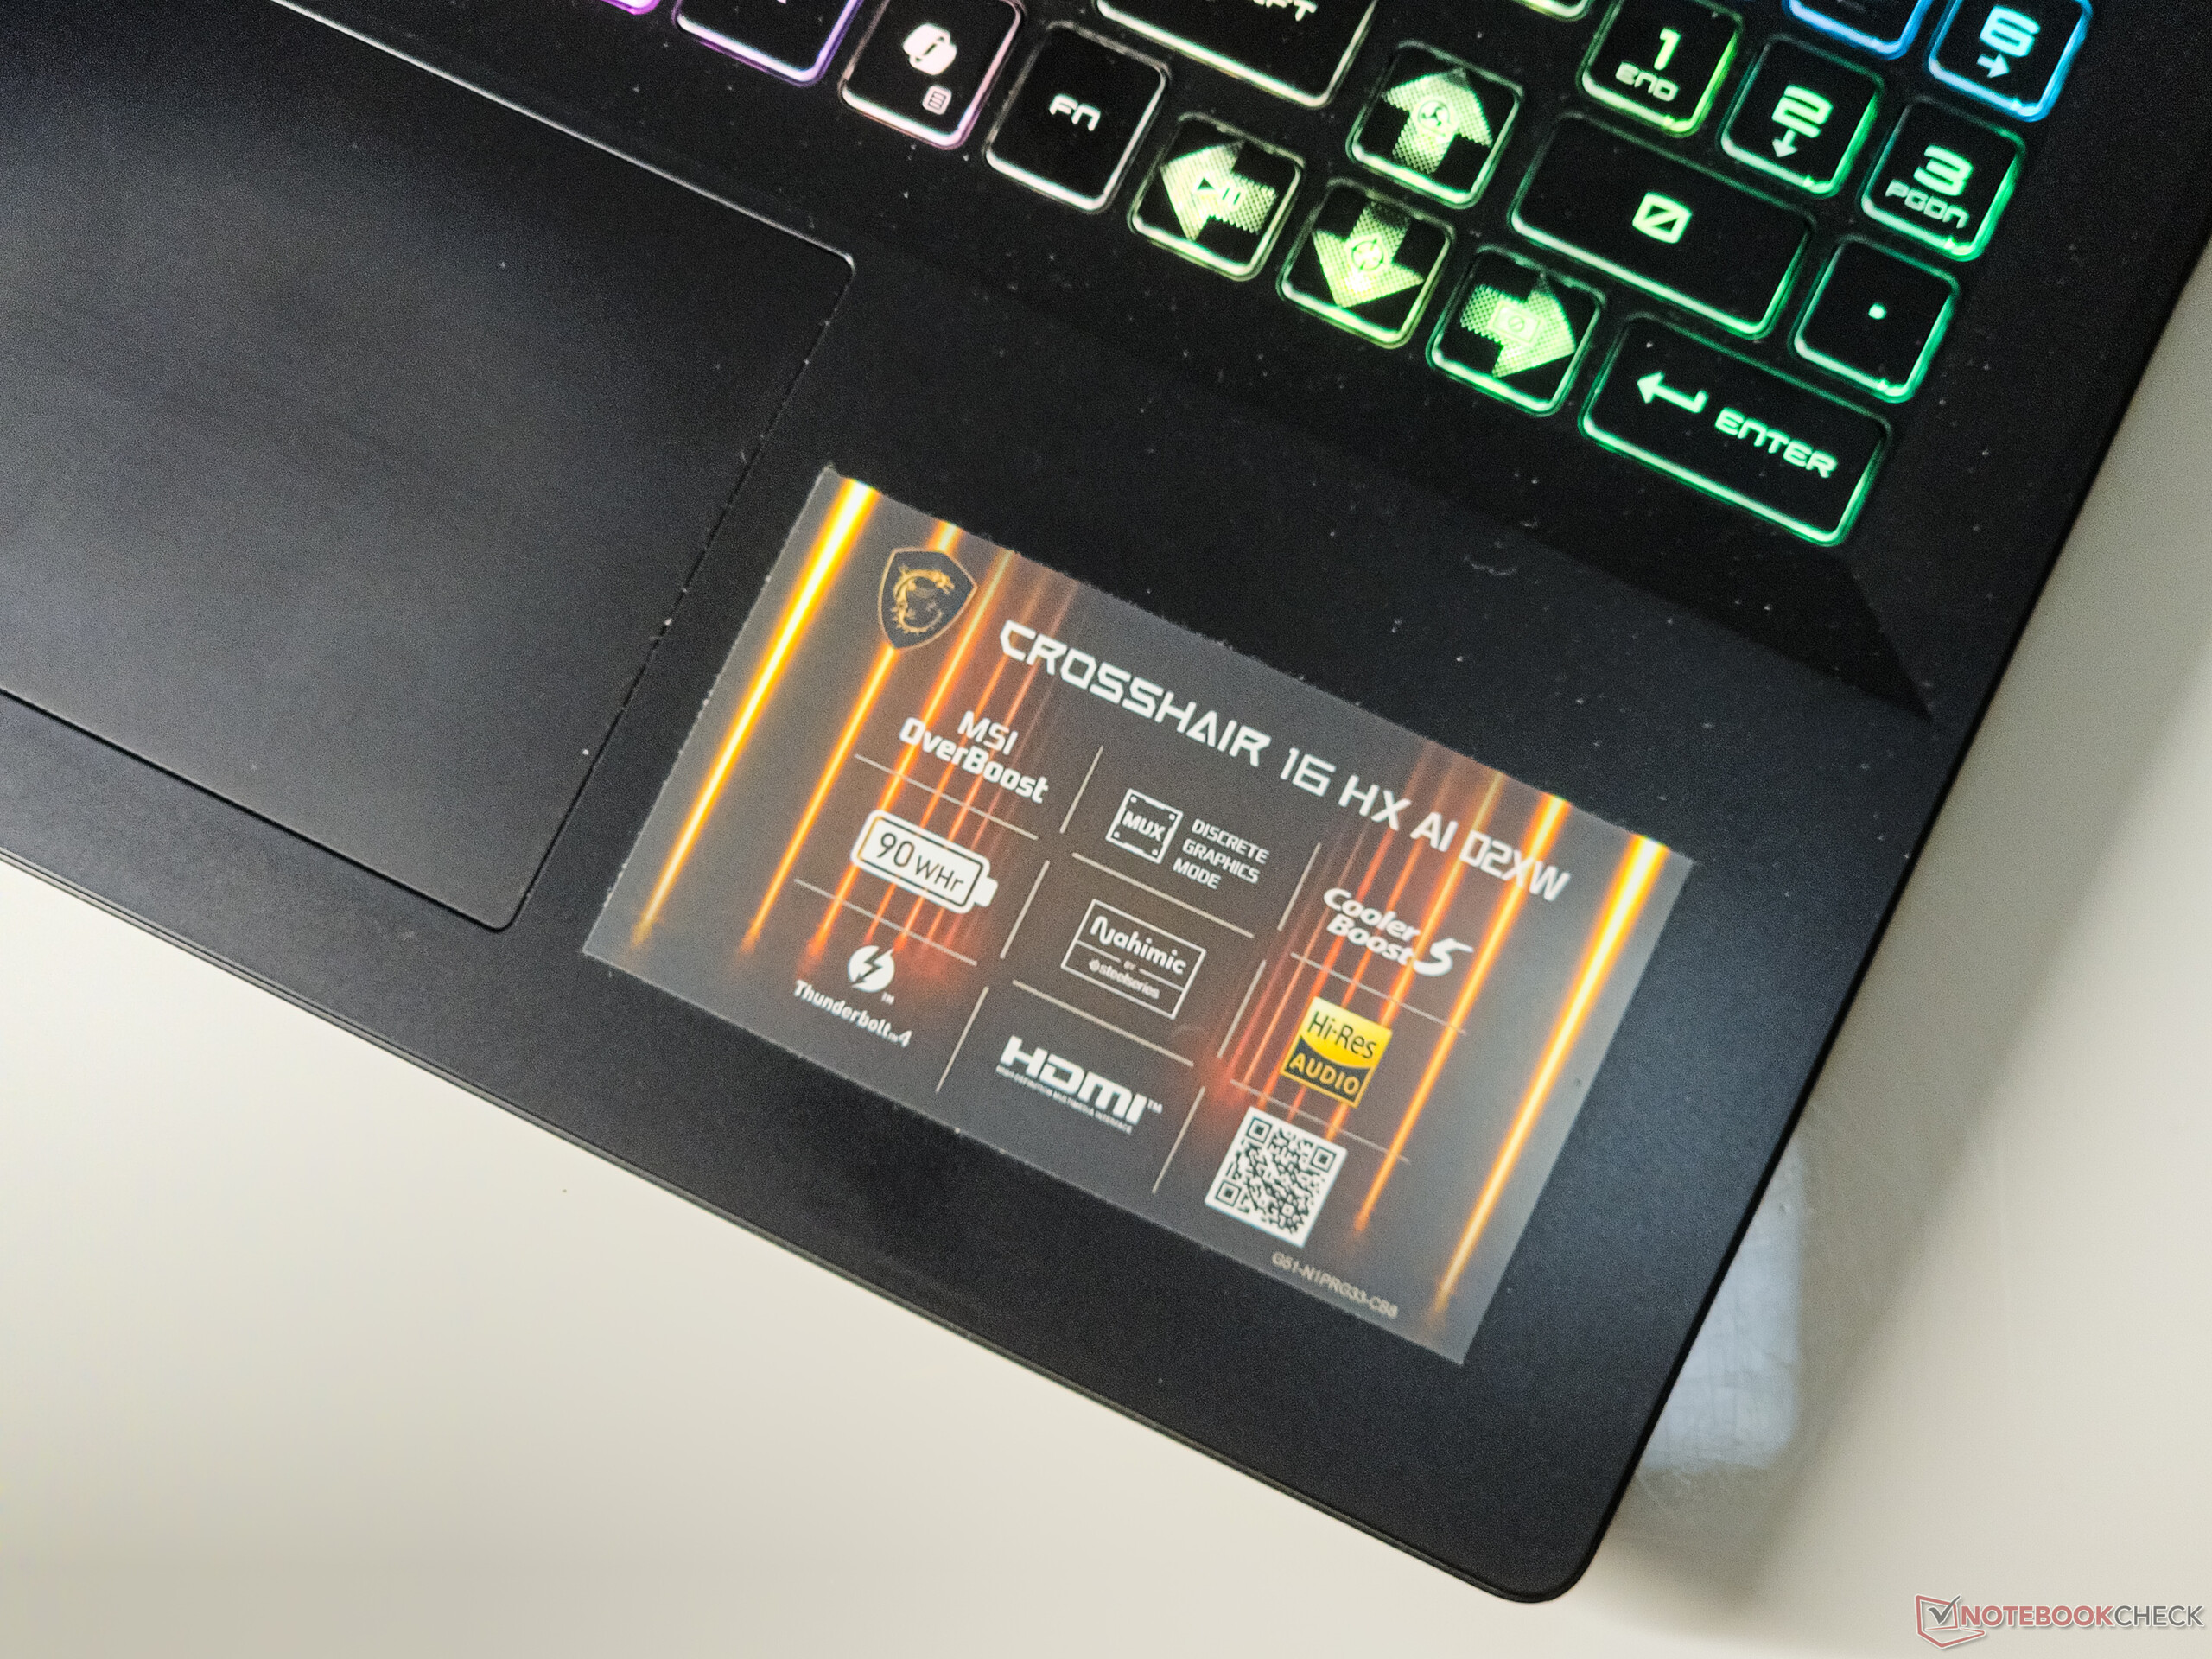
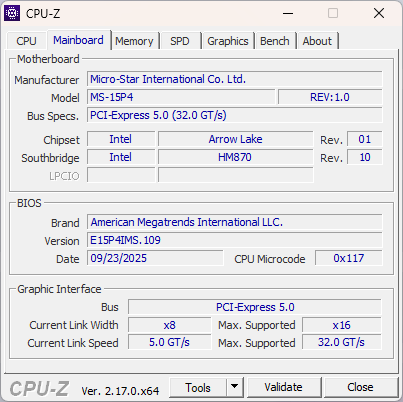
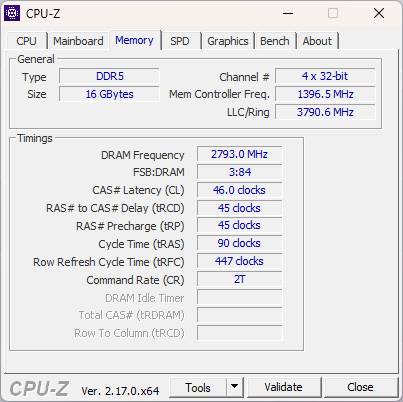
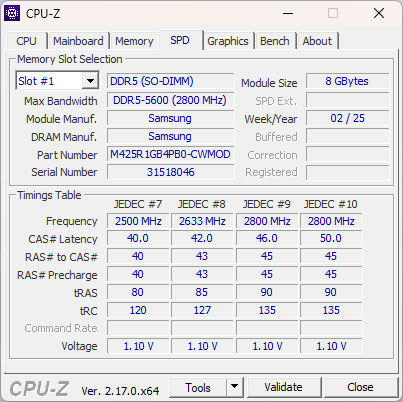
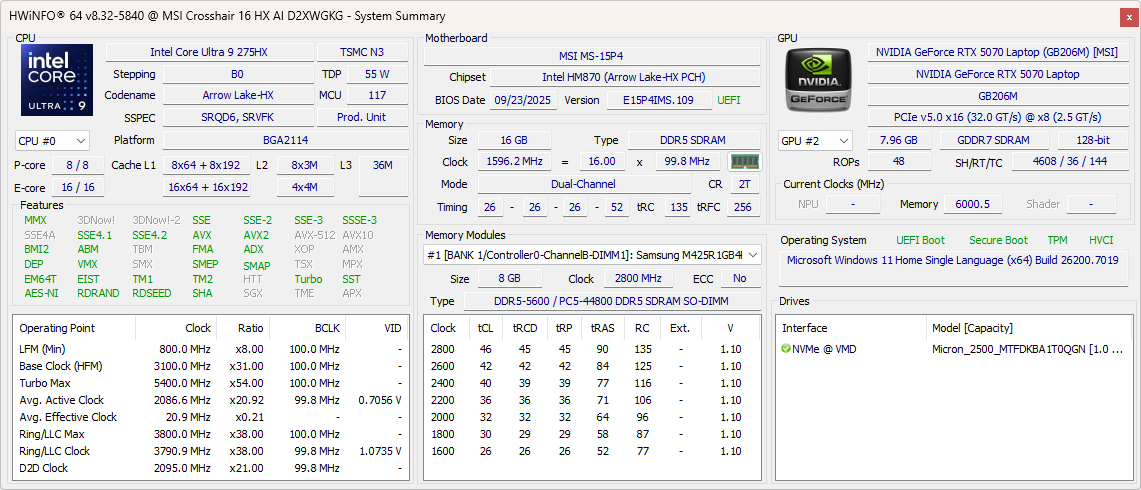
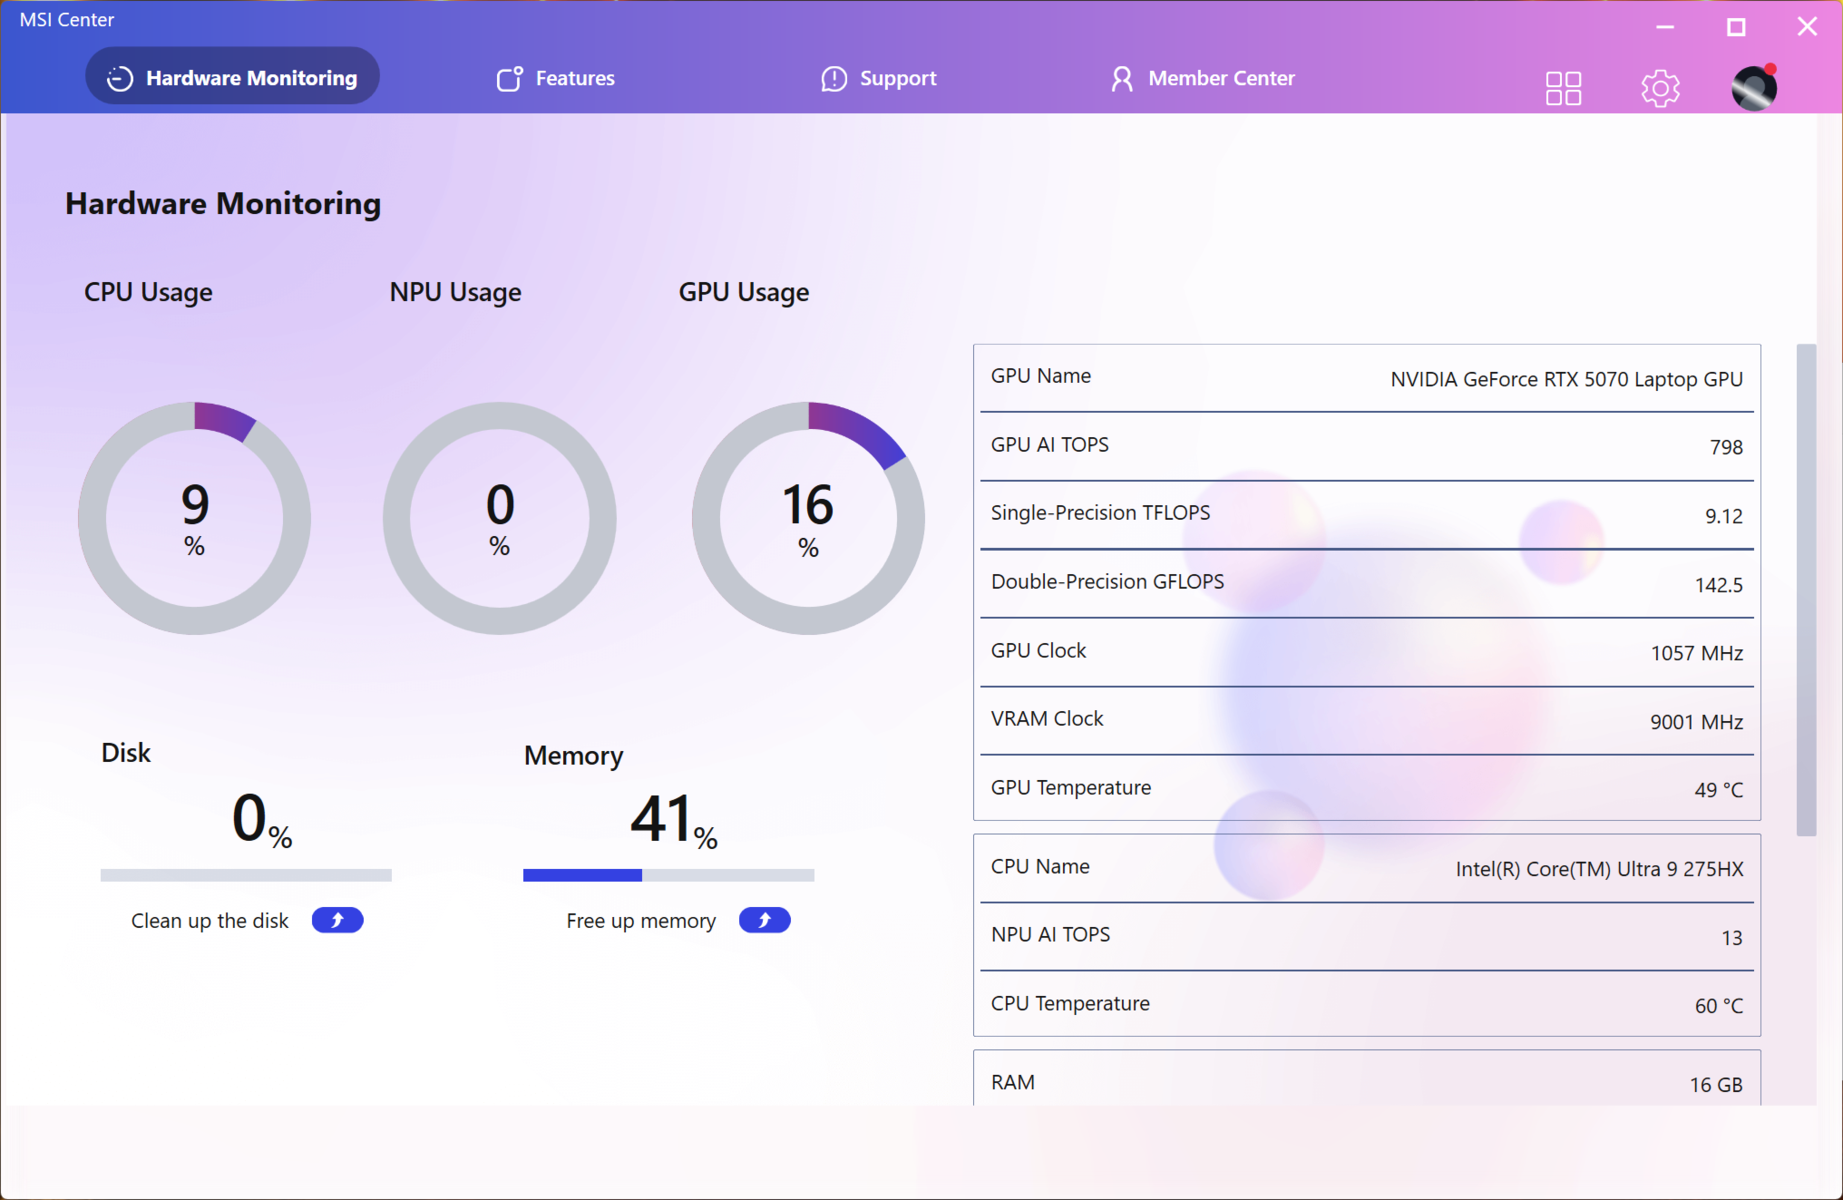
Nuestra unidad Crosshair 16 HX AI cuenta con el Core Ultra 9 275HX y una GPU RTX 5070 de 115 W para portátiles junto con 16 GB de memoria DDR5-5600, una SSD NVMe de 1 TB y una pantalla QHD+ de 240 Hz de nivel IPS en un familiar Crosshair 16 HX D14 chasis.
Especificaciones
Chasis: Construcción de plástico con opciones de conectividad decentes
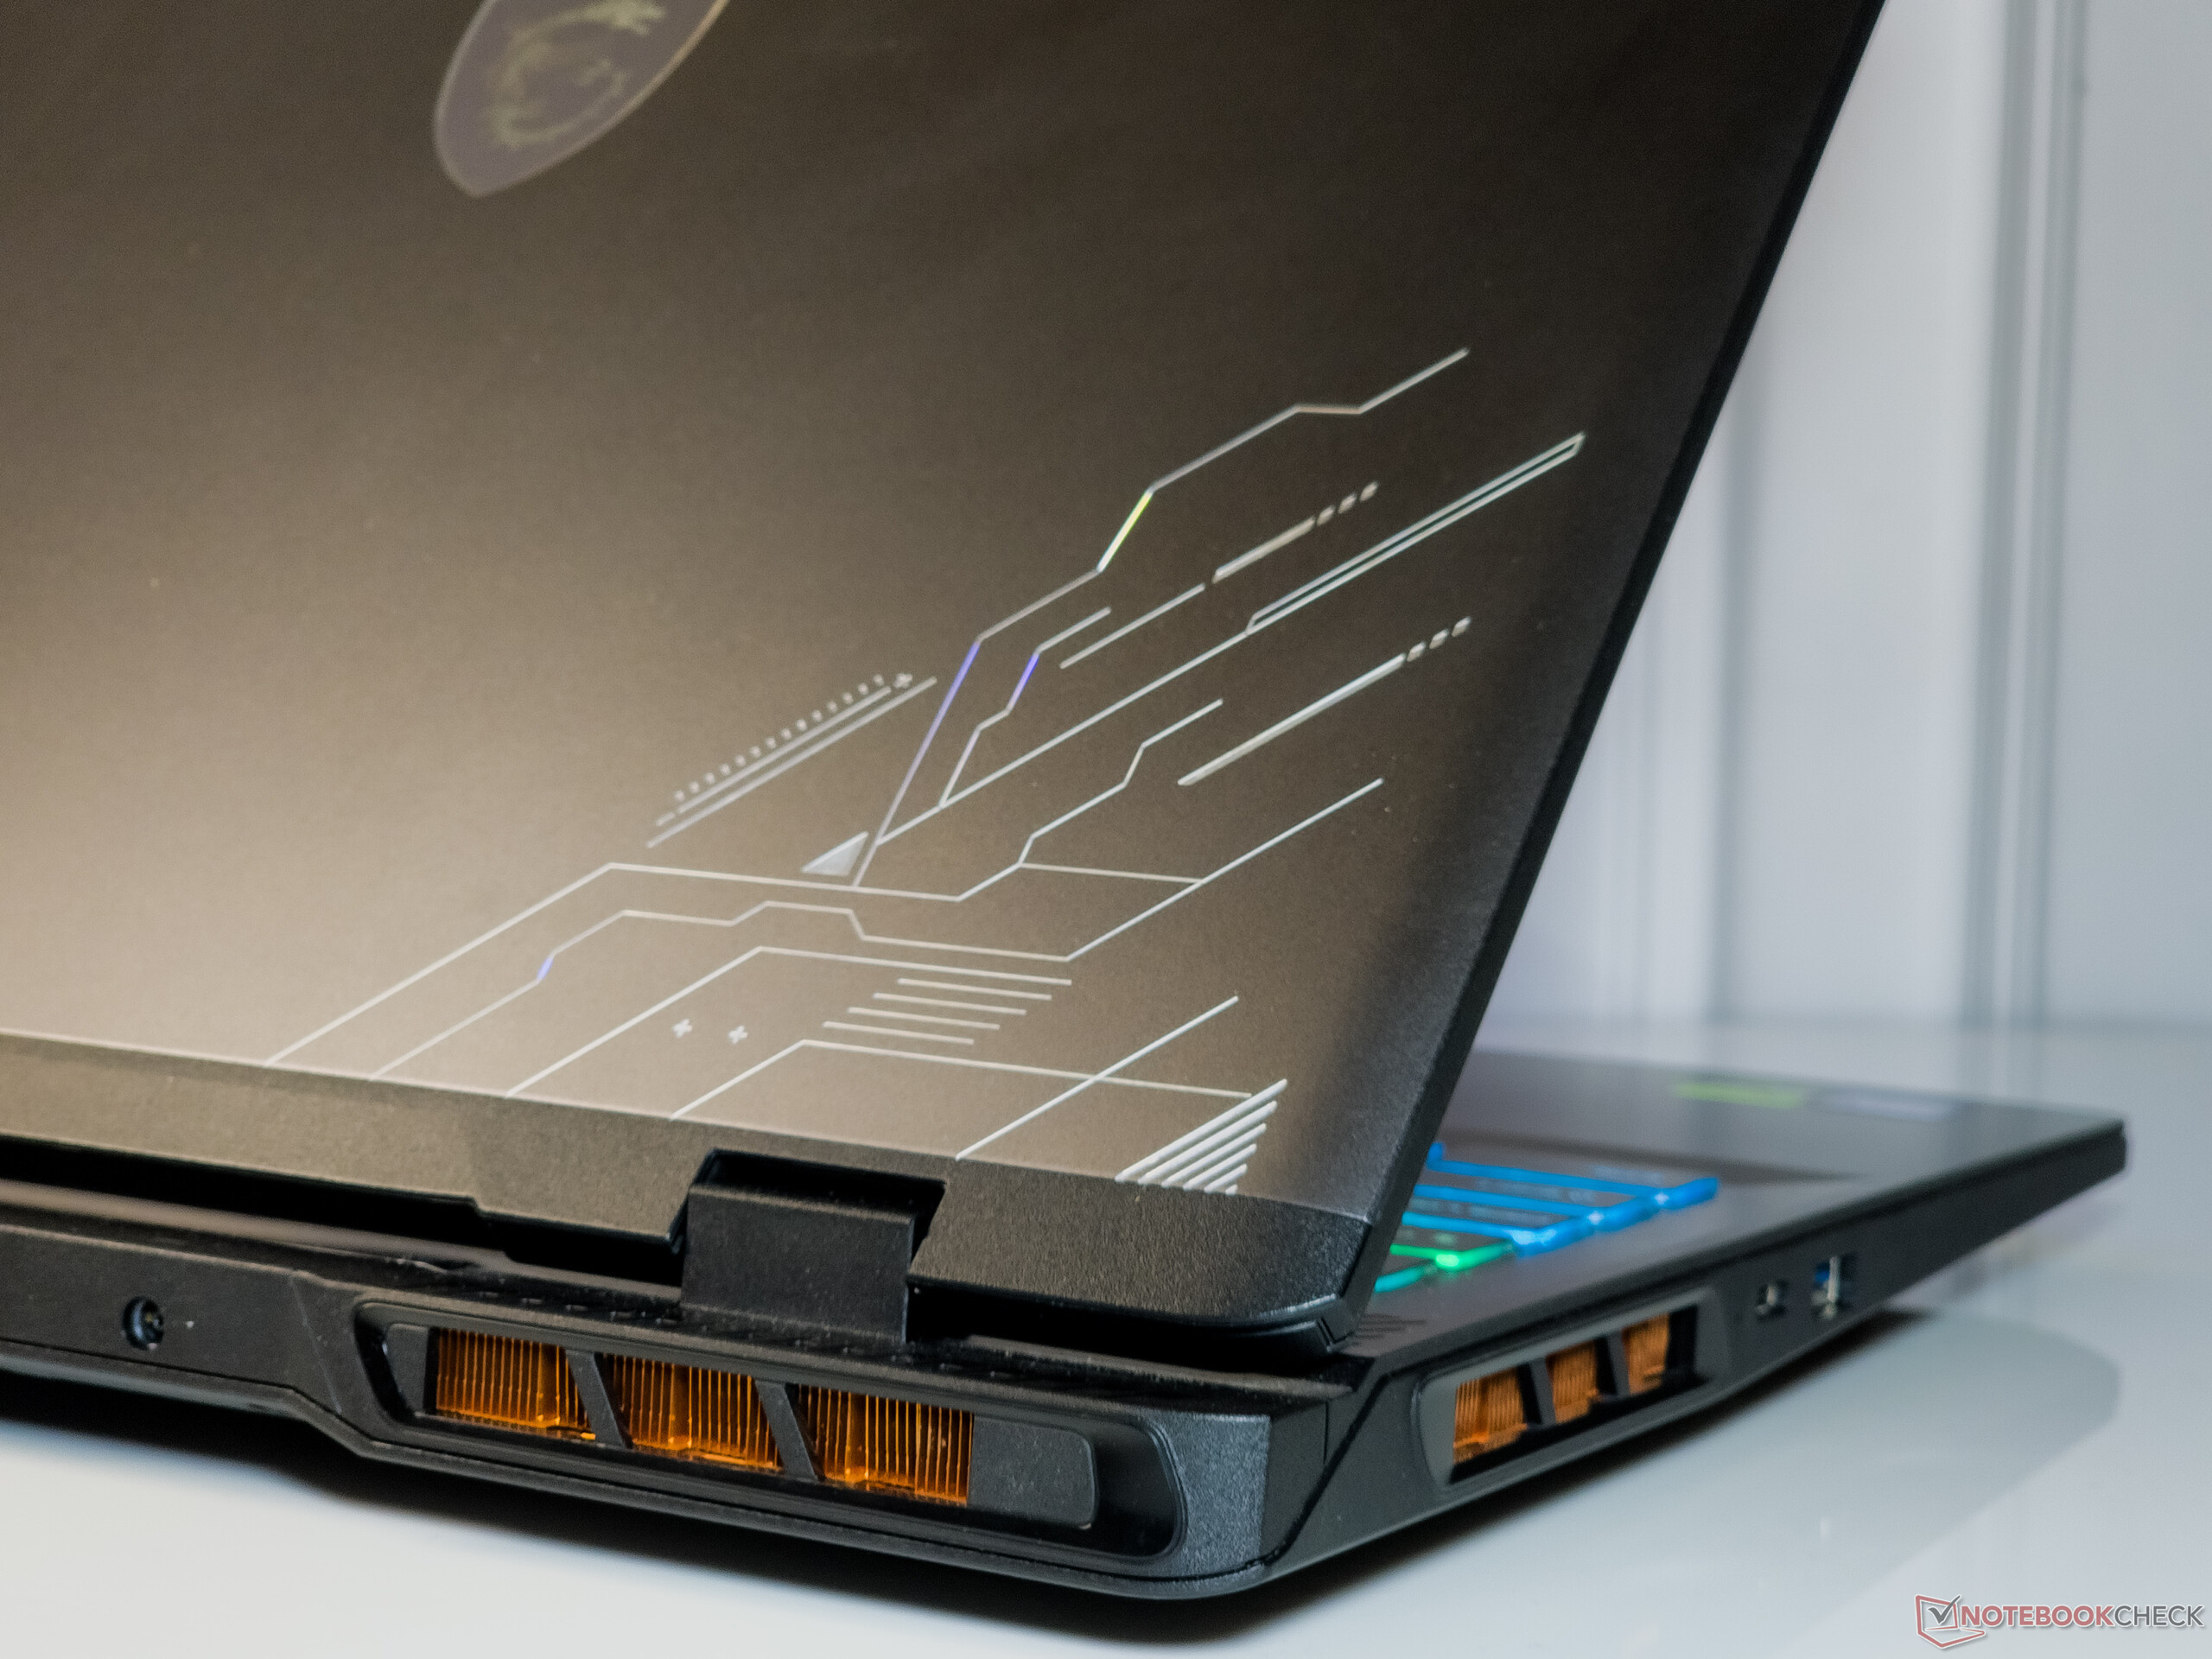
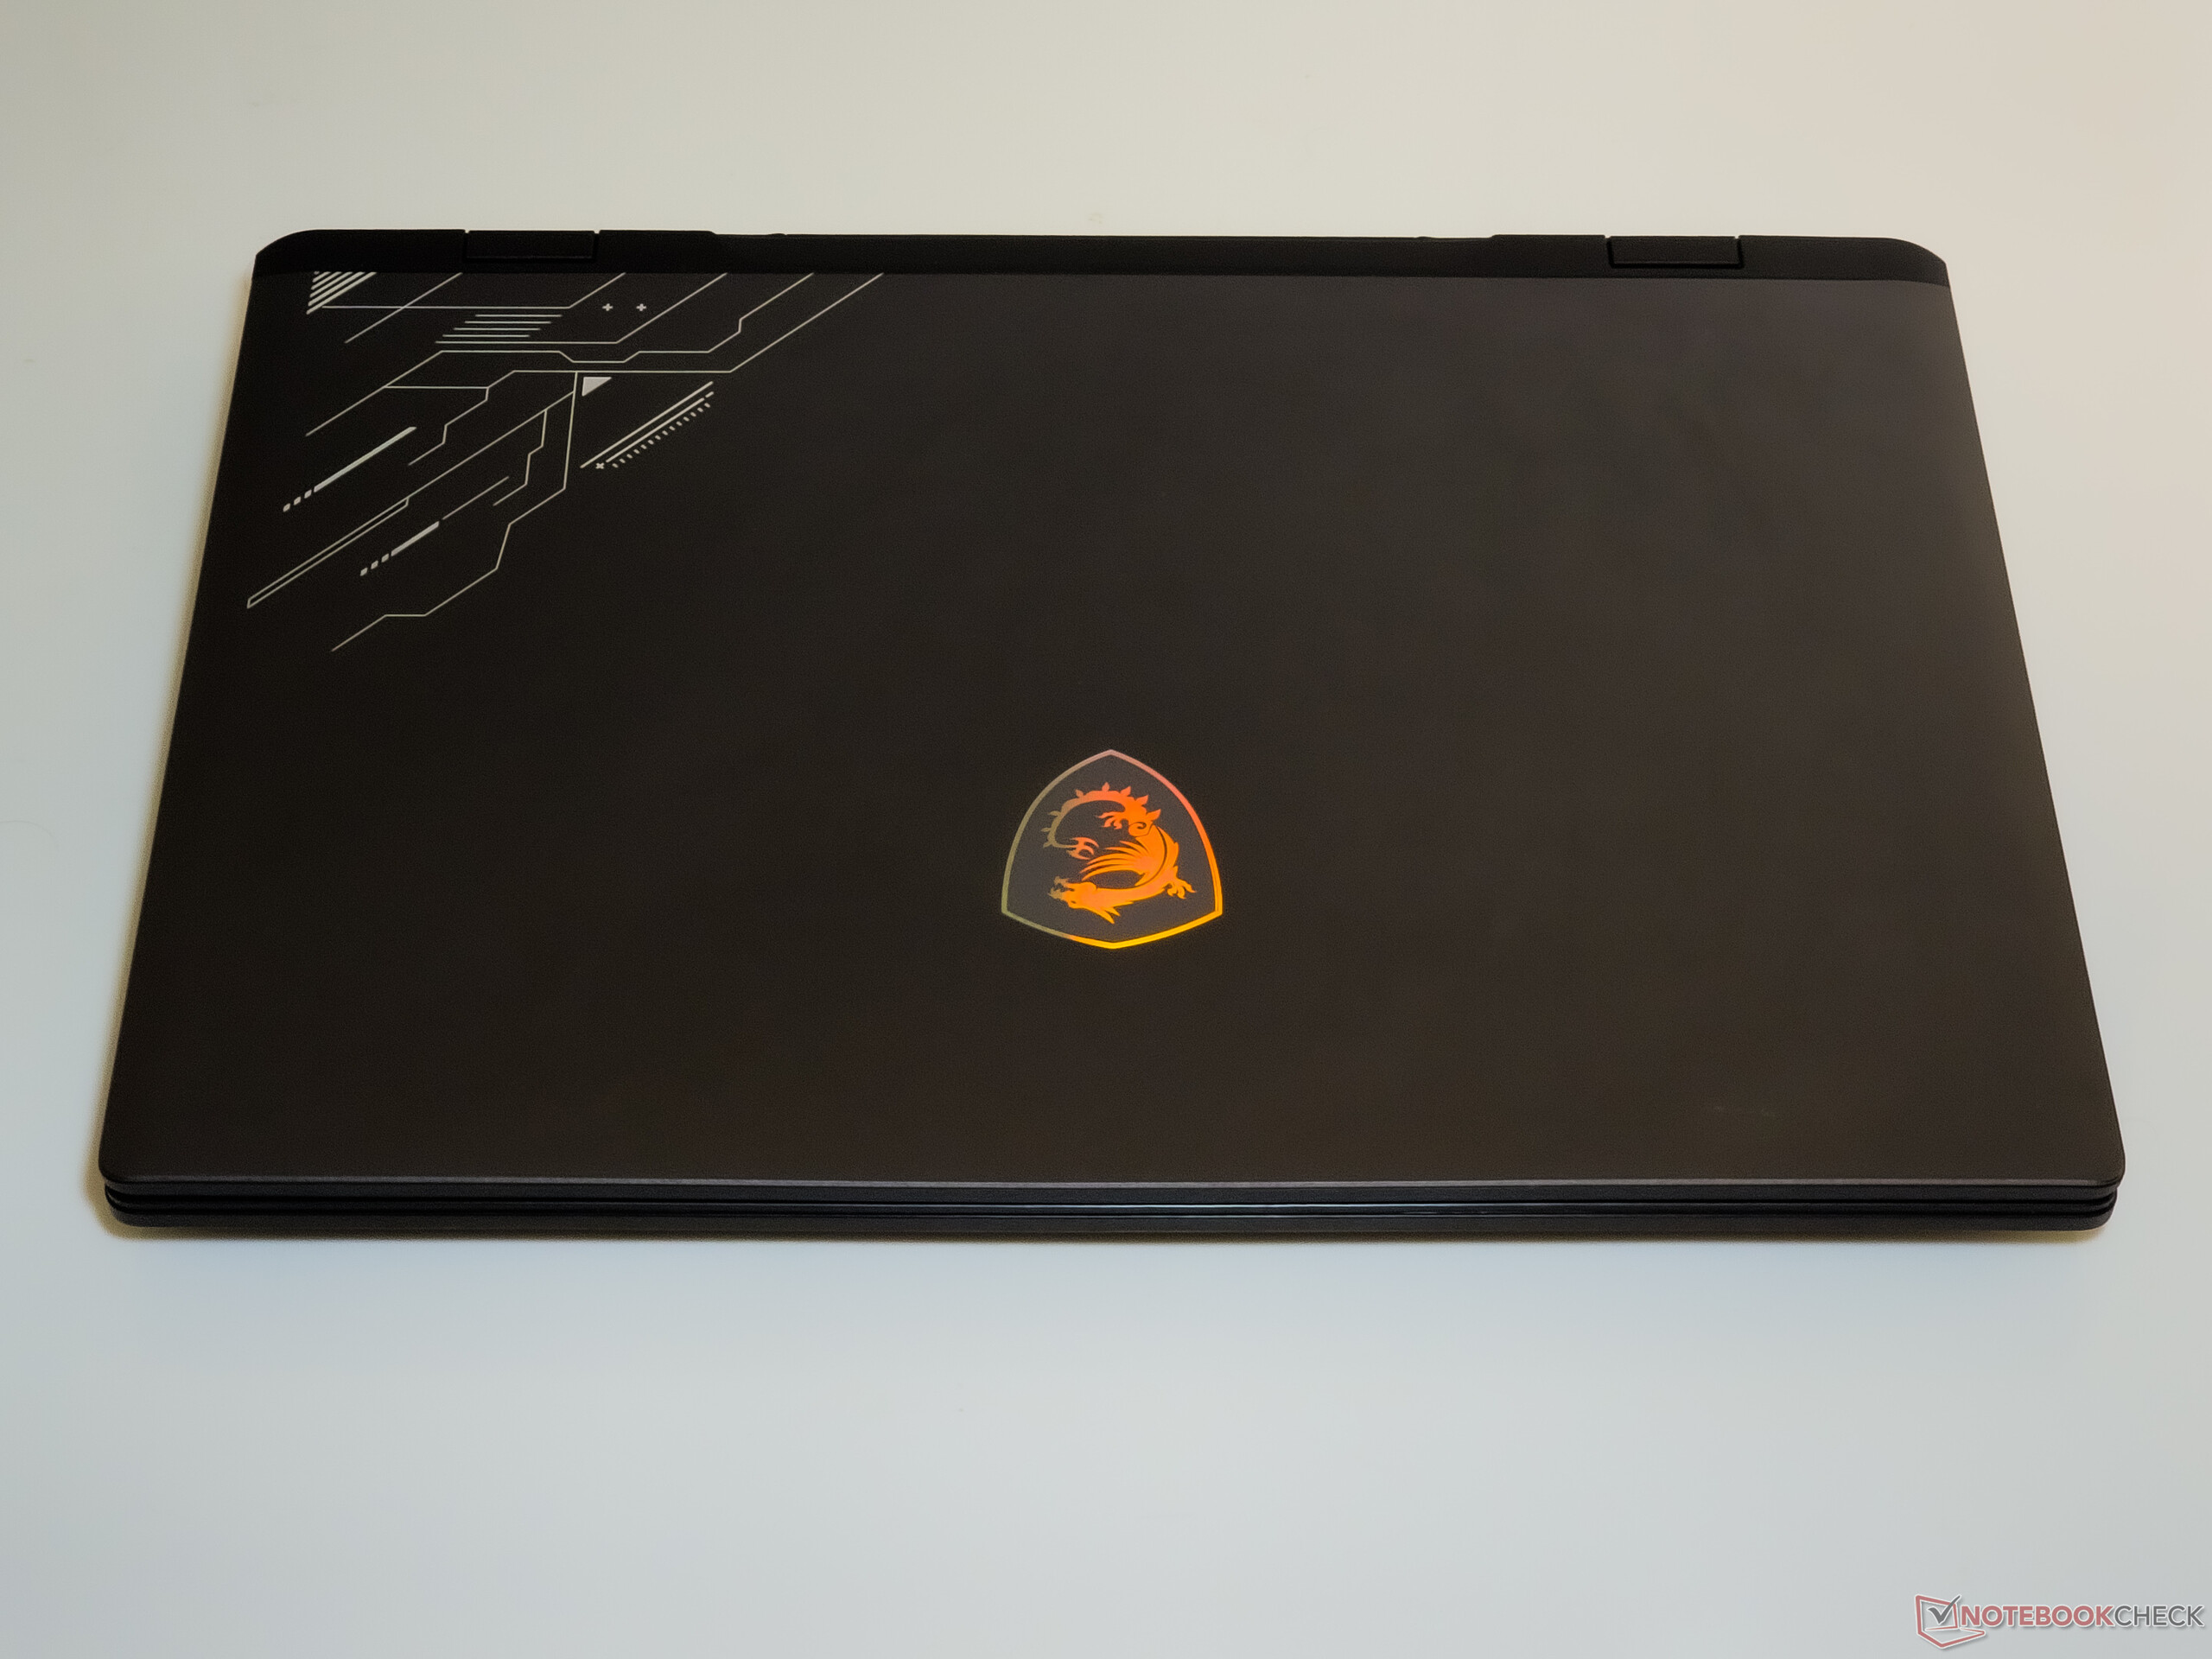
La Crosshair 16 HX AI se presenta en una construcción principalmente de plástico en un acabado gris Cosmos con una tapa metálica que puede colocarse totalmente plana en un ángulo de 180°.
La calidad de construcción es robusta con una flexión mínima en la cubierta del teclado y la tapa.
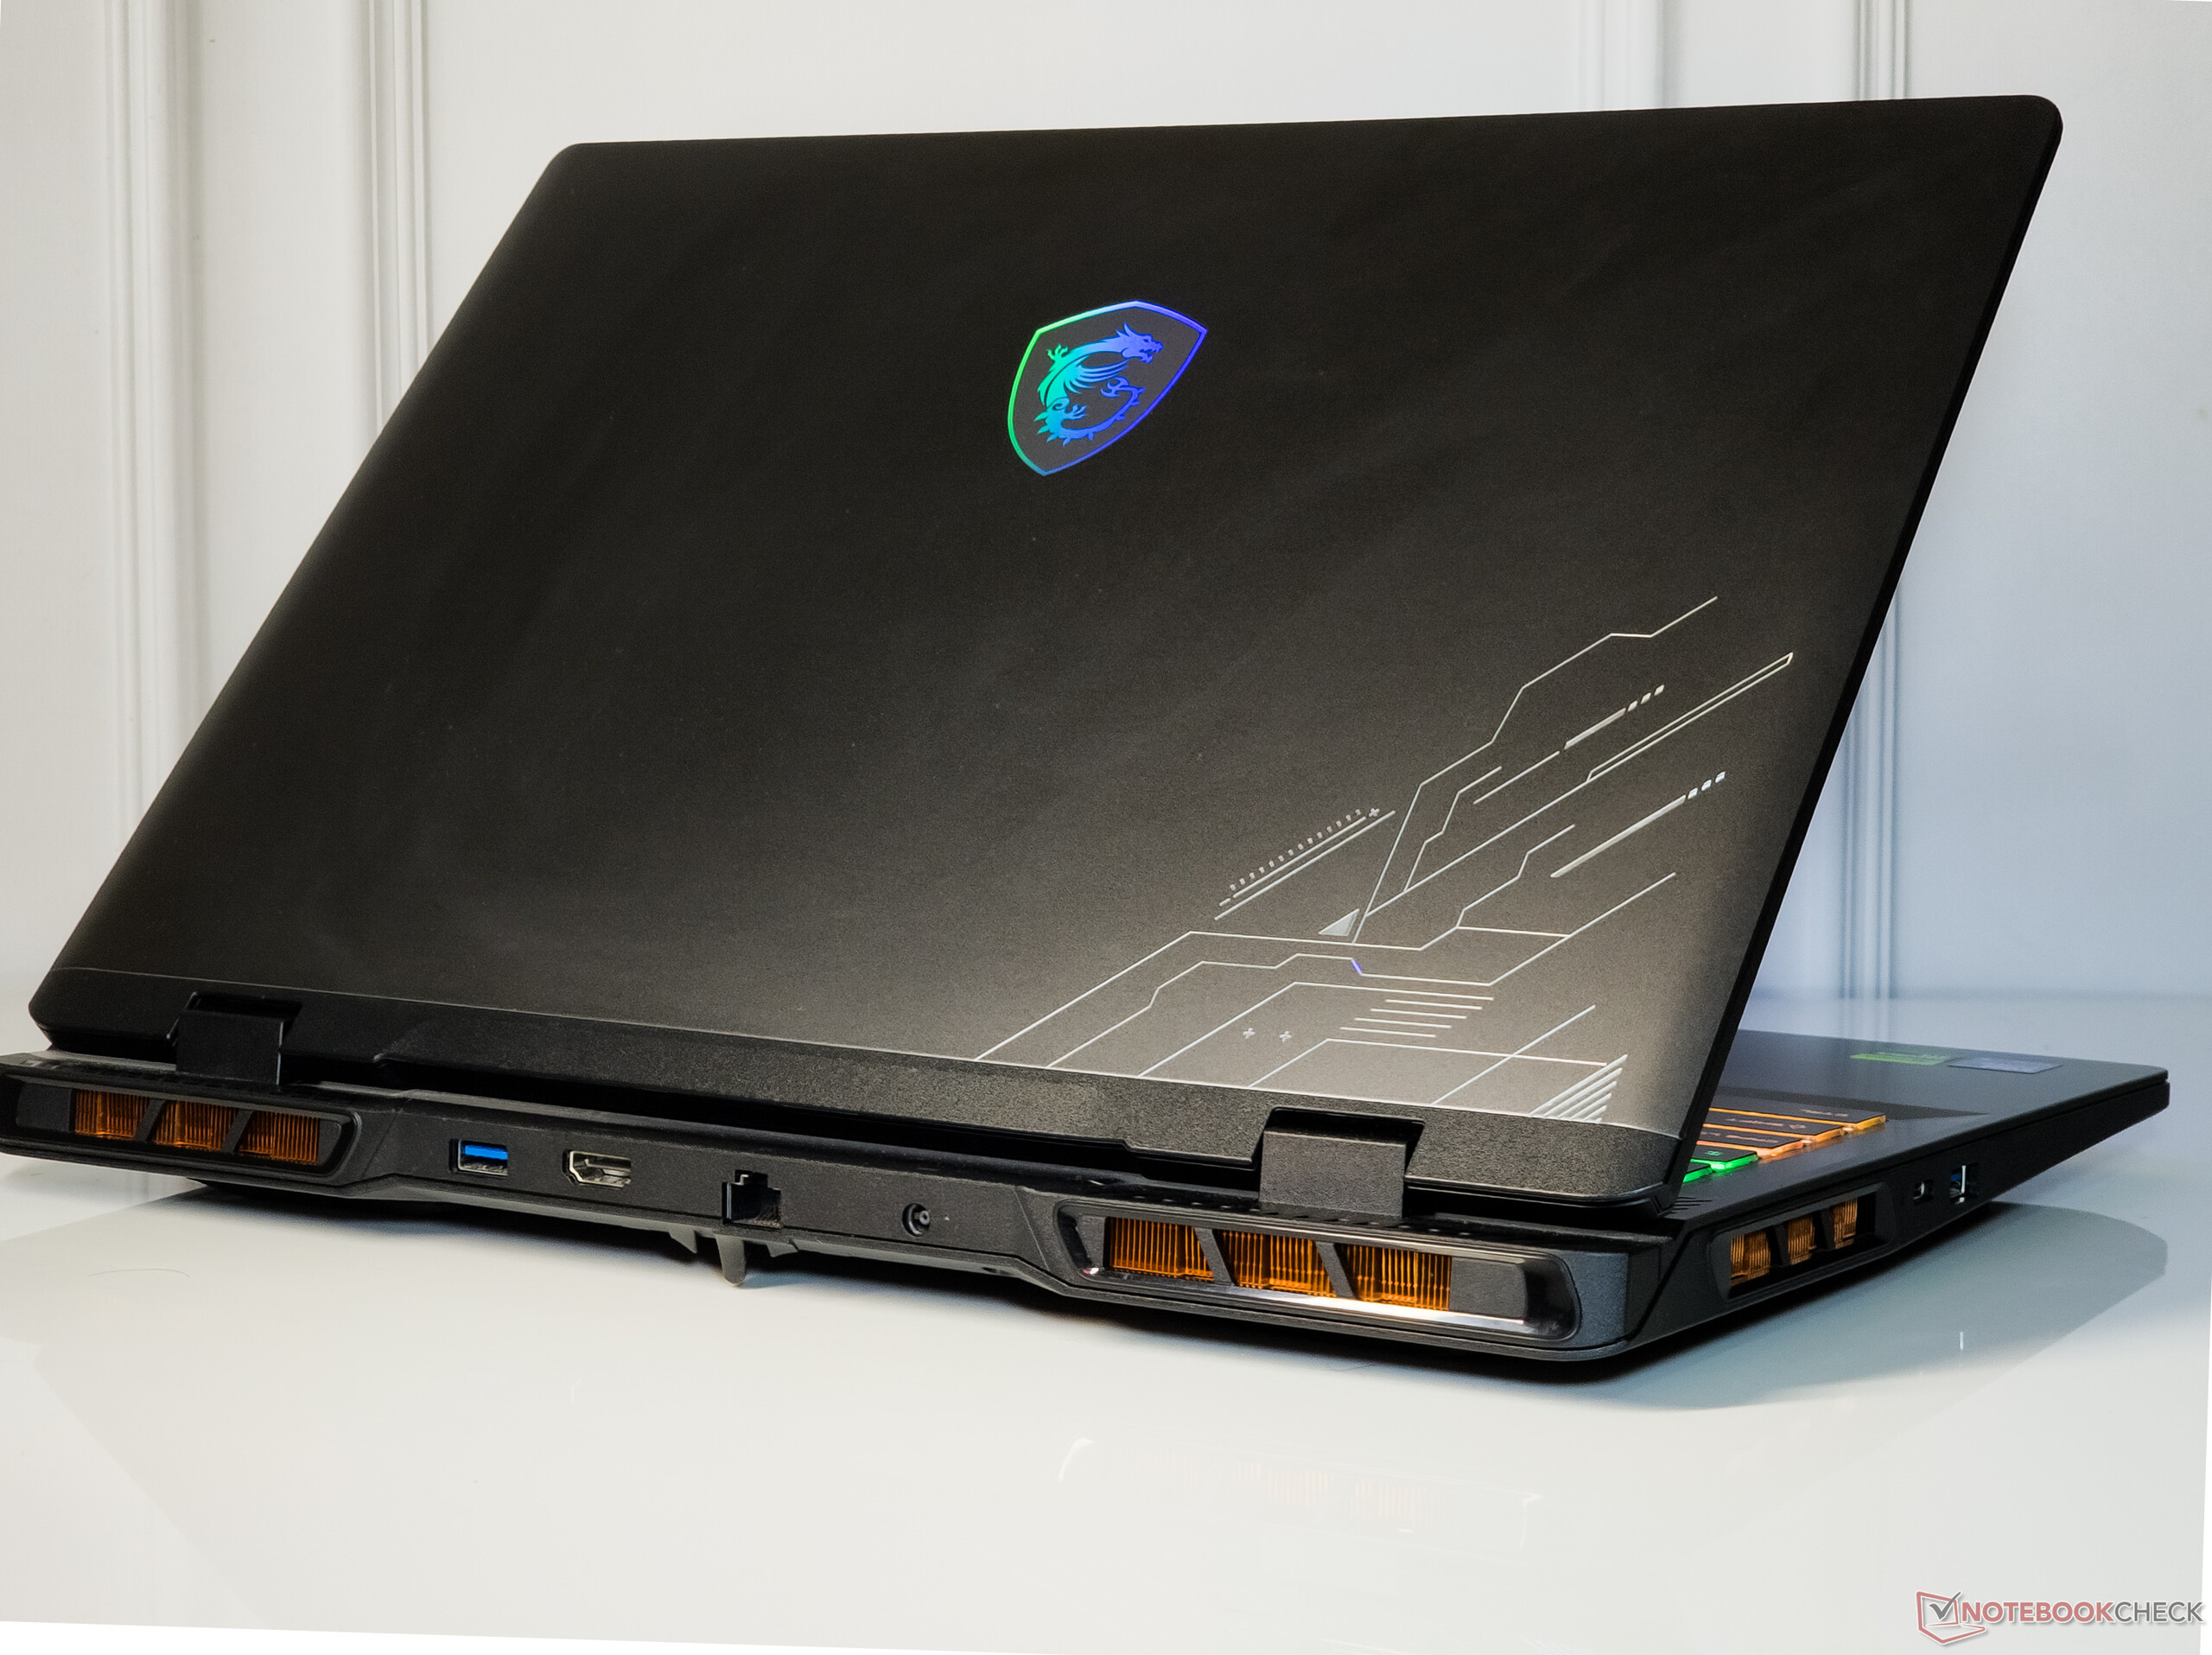
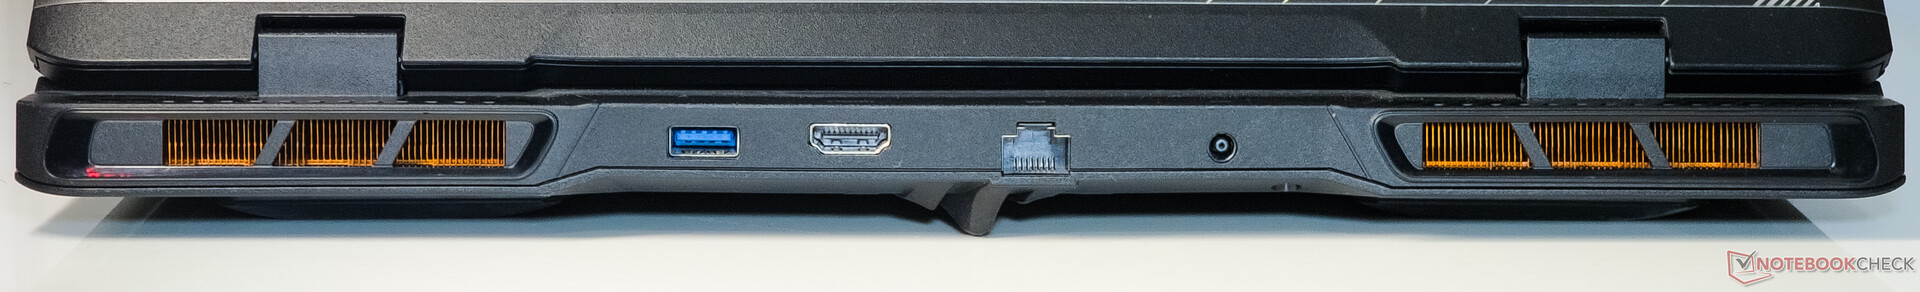
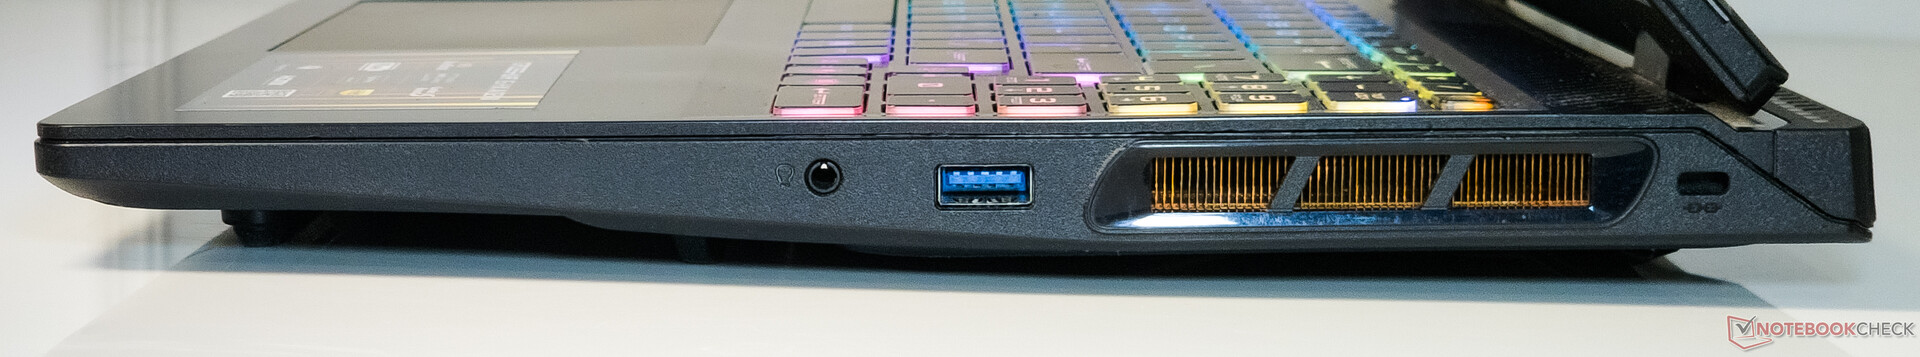
La selección de puertos es similar a la del Crosshair 18 HX AI y que incluye un puerto Thunderbolt 4, 3x puertos USB 3.2 Gen1 Tipo-A, una salida HDMI 2.1 y Gigabit Ethernet. No encontramos ningún obstáculo al conectar periféricos adyacentes.


Conectividad: Alto rendimiento a 6 GHz 6E
La tarjeta WLAN Intel Wi-Fi 6E AX211 muestra velocidades decentes en la banda de 5 GHz, pero la banda de 6 GHz 6E ofrece un alto rendimiento de transmisión y recepción de 1,7 Gbps cuando se probó con nuestro enrutador de referencia Asus ROG Rapture GT-AXE11000.
| Networking / iperf3 transmit AXE11000 | |
| Asus TUF Gaming A16 FA608UP | |
| Media de la clase Gaming (560 - 1862, n=95, últimos 2 años) | |
| Medio Intel Wi-Fi 6E AX211 (64 - 1921, n=276) | |
| Aorus Elite 16 AE6H | |
| Lenovo Legion 5 Pro 16IAX10H | |
| MSI Crosshair 16 HX AI D2XWGKG | |
| Alienware 16X Aurora, RTX 5070 | |
| Networking / iperf3 receive AXE11000 | |
| Asus TUF Gaming A16 FA608UP | |
| Aorus Elite 16 AE6H | |
| Media de la clase Gaming (680 - 1745, n=95, últimos 2 años) | |
| Medio Intel Wi-Fi 6E AX211 (582 - 1890, n=276) | |
| MSI Crosshair 16 HX AI D2XWGKG | |
| Alienware 16X Aurora, RTX 5070 | |
| Lenovo Legion 5 Pro 16IAX10H | |
| Networking / iperf3 transmit AXE11000 6GHz | |
| MSI Crosshair 16 HX AI D2XWGKG | |
| Media de la clase Gaming (723 - 2355, n=38, últimos 2 años) | |
| Medio Intel Wi-Fi 6E AX211 (385 - 1851, n=226) | |
| Alienware 16X Aurora, RTX 5070 | |
| Networking / iperf3 receive AXE11000 6GHz | |
| MSI Crosshair 16 HX AI D2XWGKG | |
| Media de la clase Gaming (975 - 1775, n=37, últimos 2 años) | |
| Medio Intel Wi-Fi 6E AX211 (700 - 1857, n=226) | |
| Alienware 16X Aurora, RTX 5070 | |
La calidad de la cámara web de 720p no es nada del otro mundo. No hay inicio de sesión por infrarrojos Windows Hello a bordo, pero un obturador de privacidad física viene de serie.


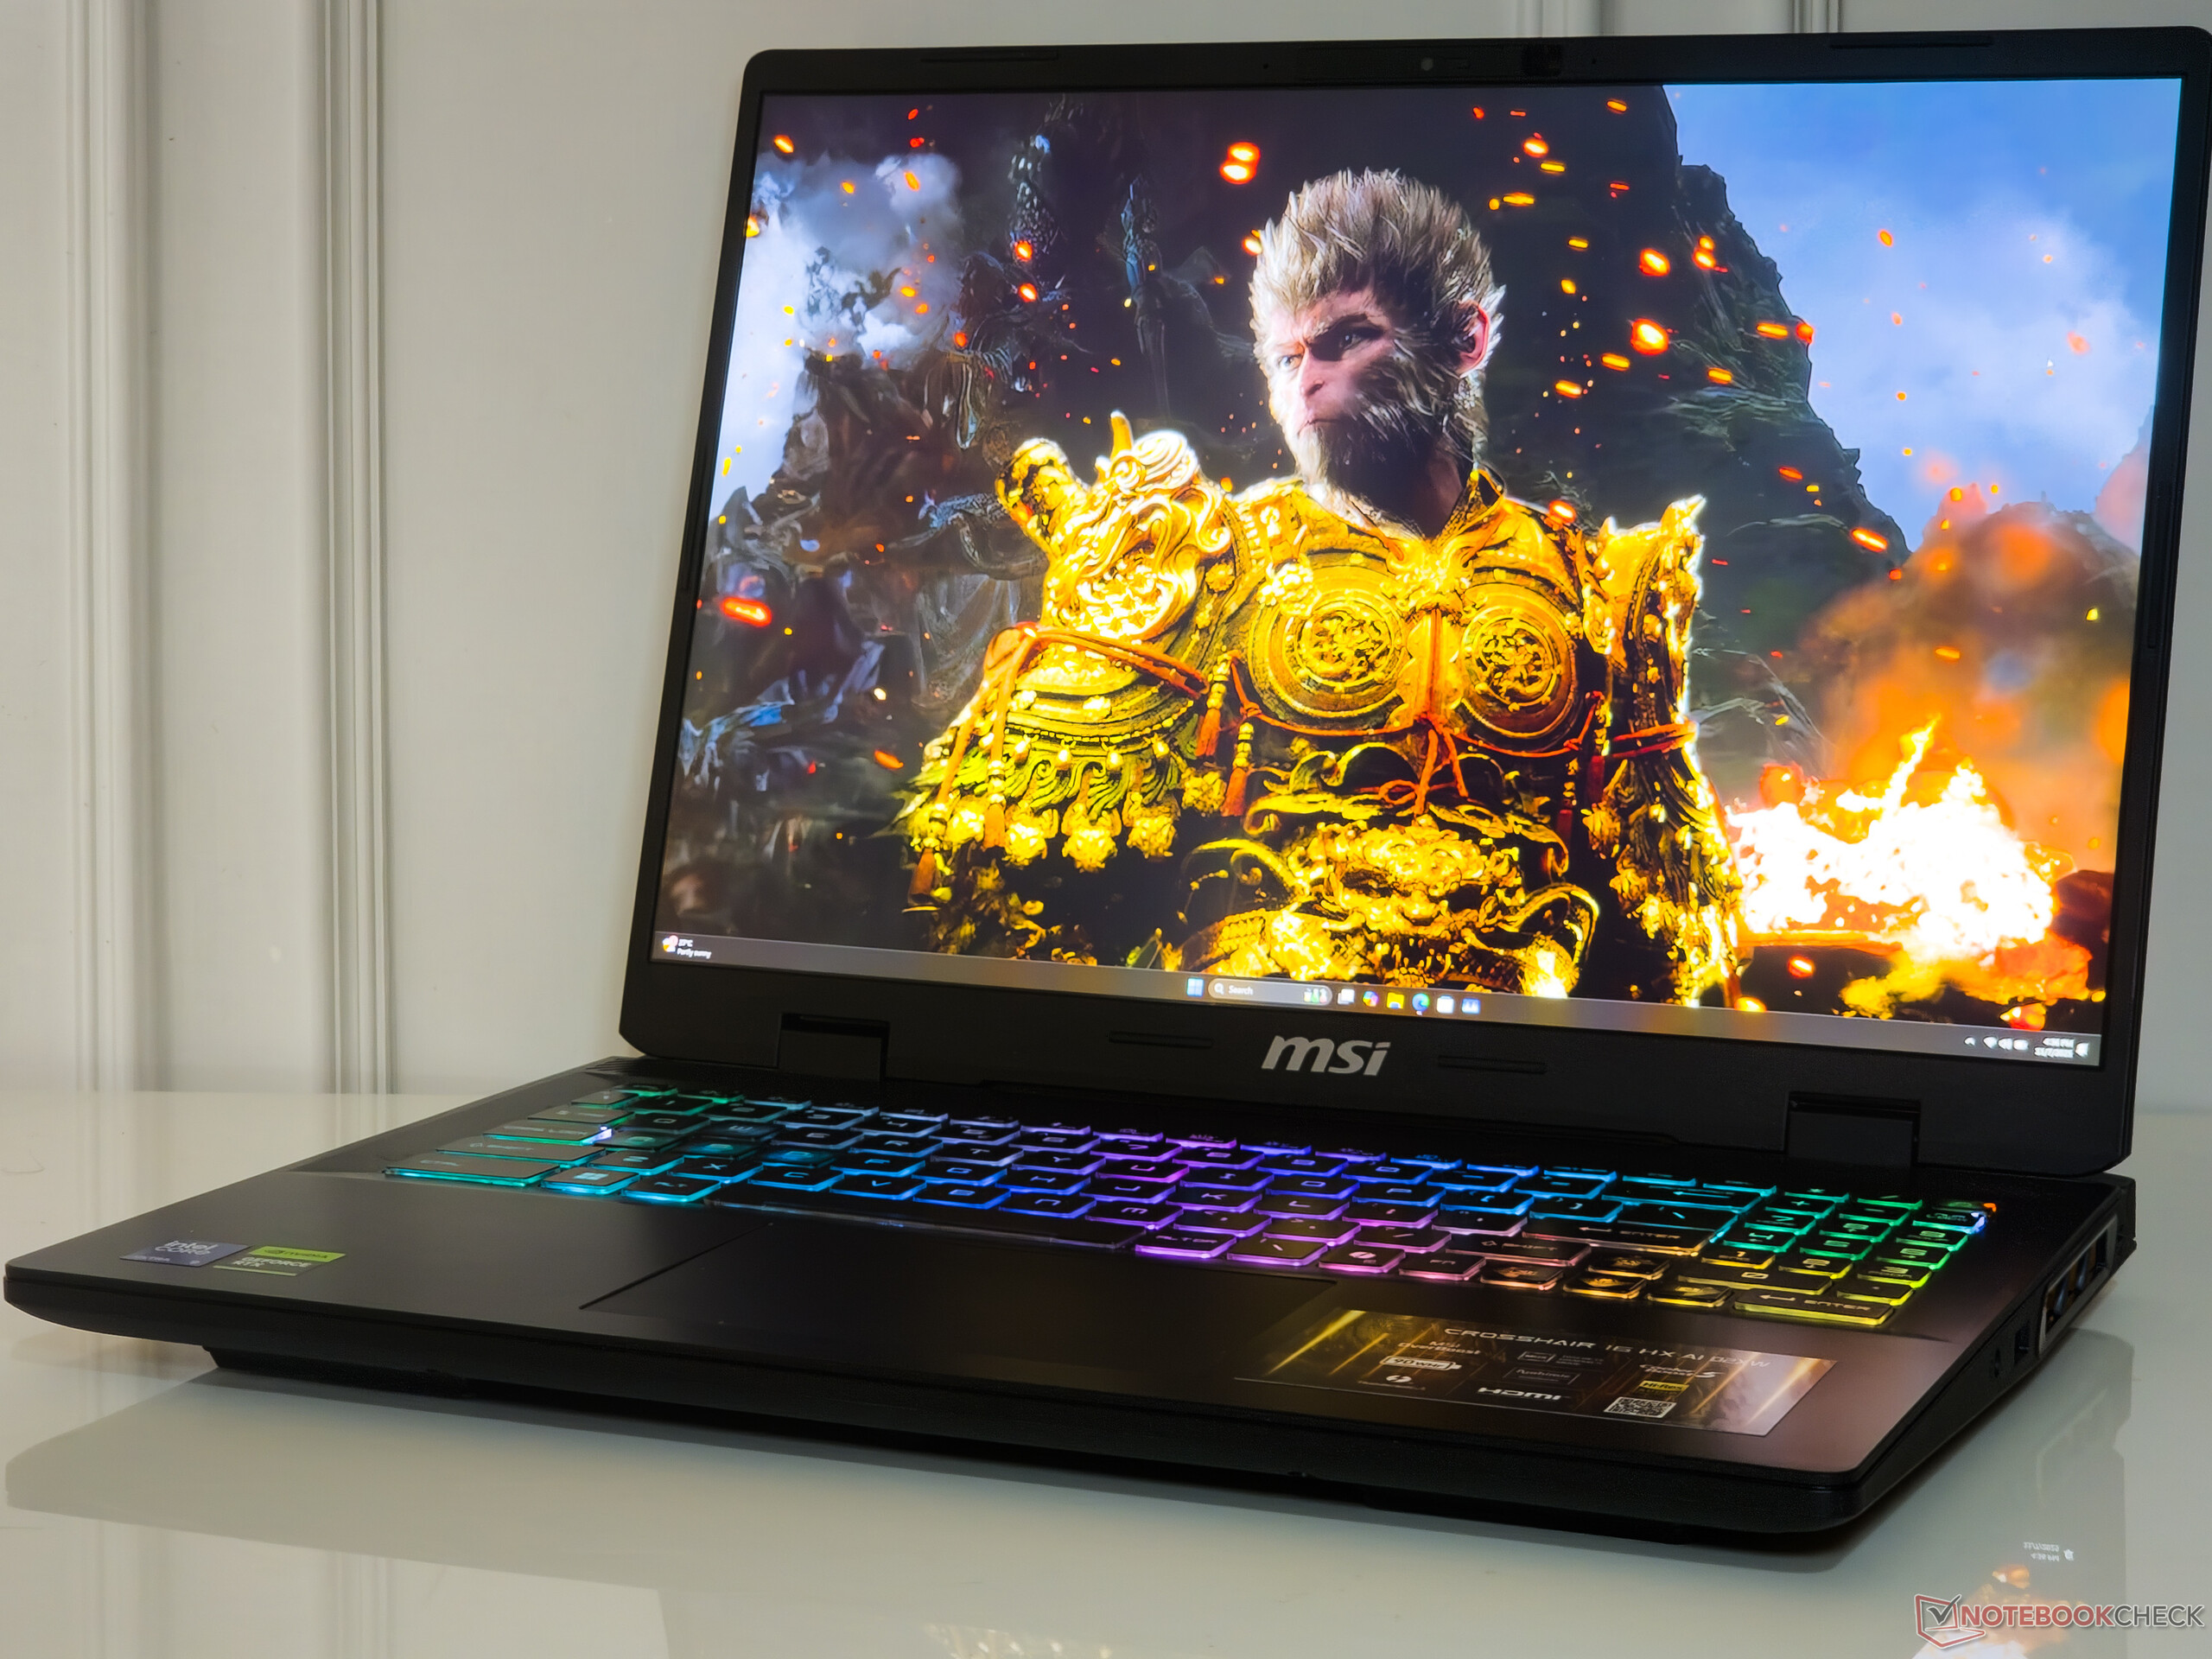
Dispositivos de entrada: Experiencia de tecleo decente con suficiente RGB
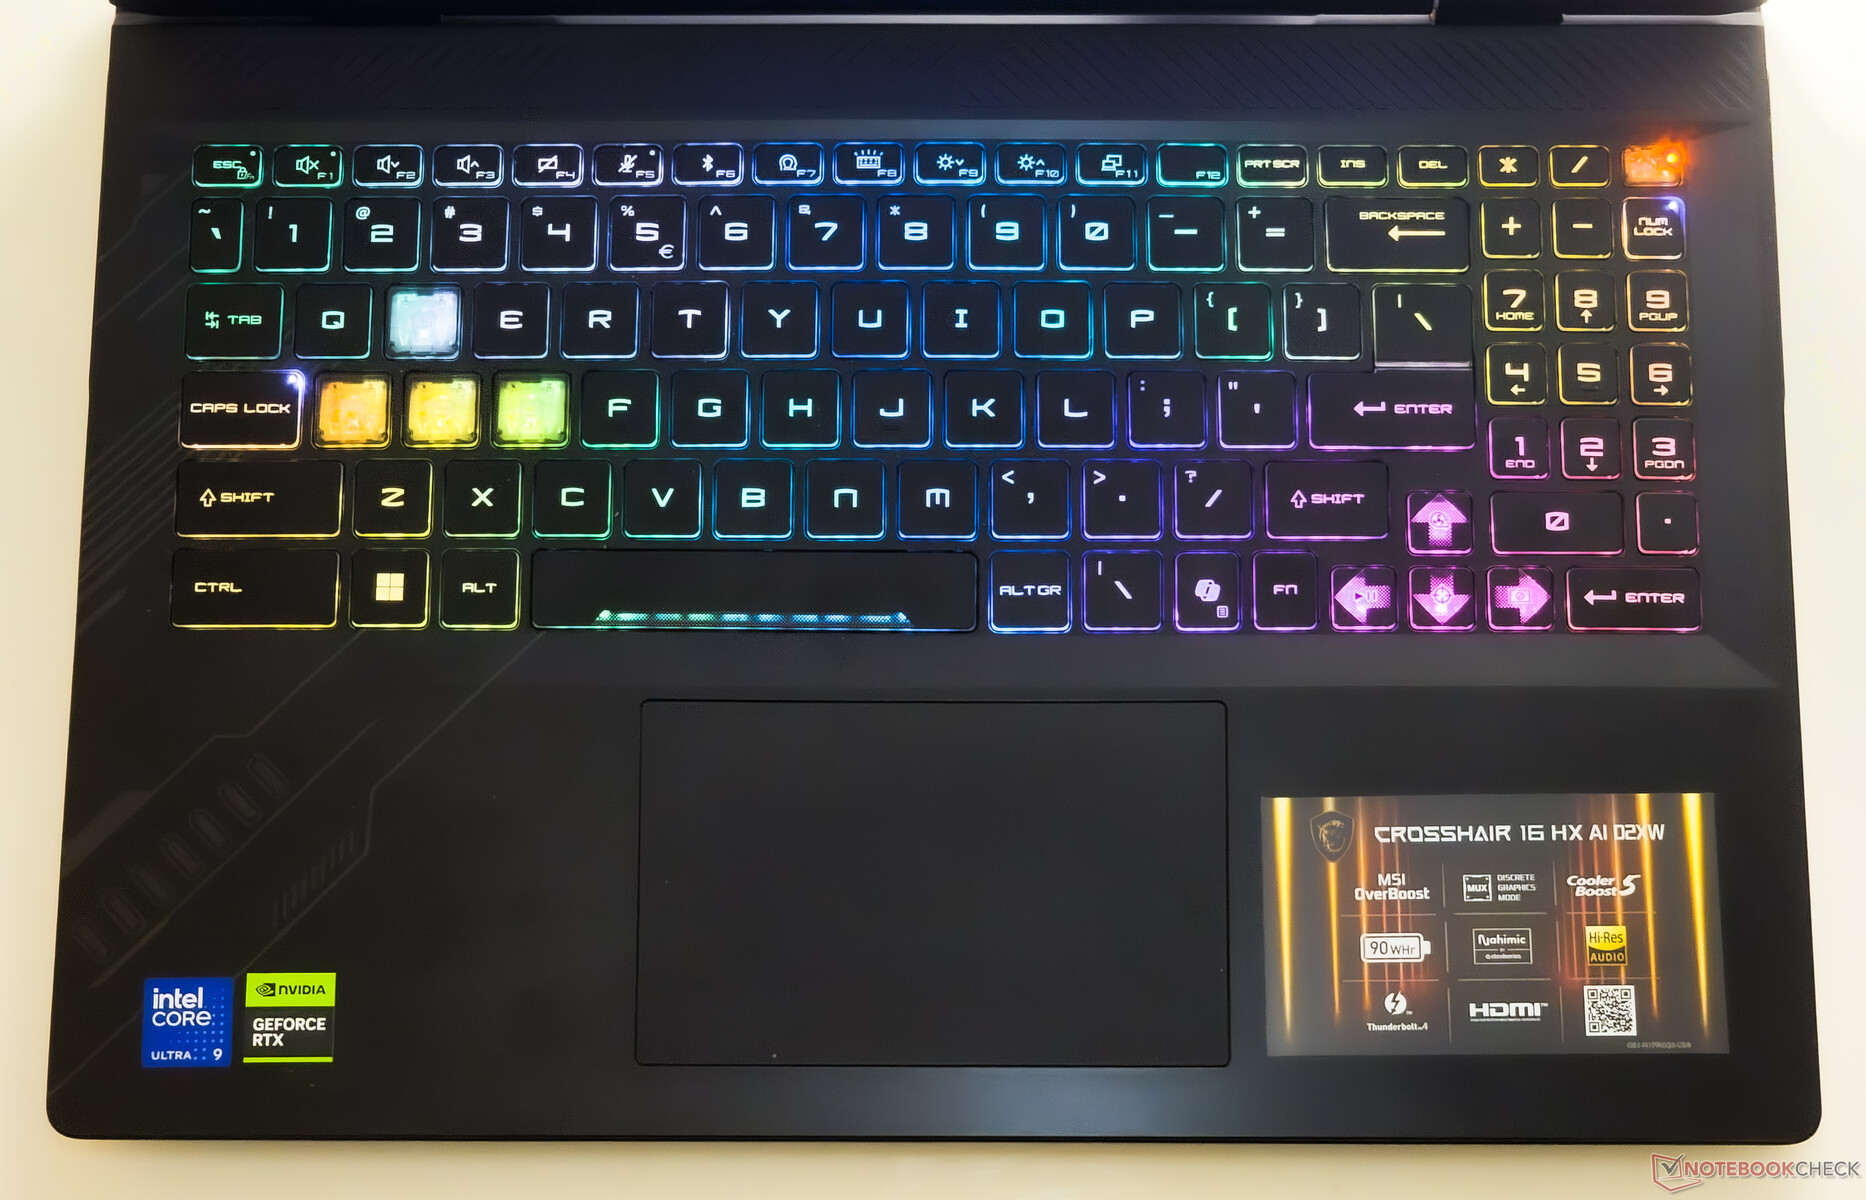
El teclado RGB de 24 zonas del Crosshair 16 HX AI ofrece una tactilidad decente con un recorrido de tecla de 1,7 mm y teclas de flecha de tamaño completo. La disposición algo atípica puede hacer que se pulse la tecla Fn más a menudo que la flecha izquierda.
El teclado numérico de tres columnas resulta práctico pero se siente estrecho y no es realmente adecuado para el cálculo rápido de números.
La retroiluminación de cuatro niveles ofrece una buena iluminación en la oscuridad y brilla bien, sobre todo a través de las teclas WASD totalmente transparentes.
El touchpad de 12 x 7,5 cm muestra buenas propiedades de deslizamiento y es compatible con los gestos de Windows Precision, aunque los clics y gestos a lo largo del borde superior pueden ser difíciles de registrar en ocasiones.
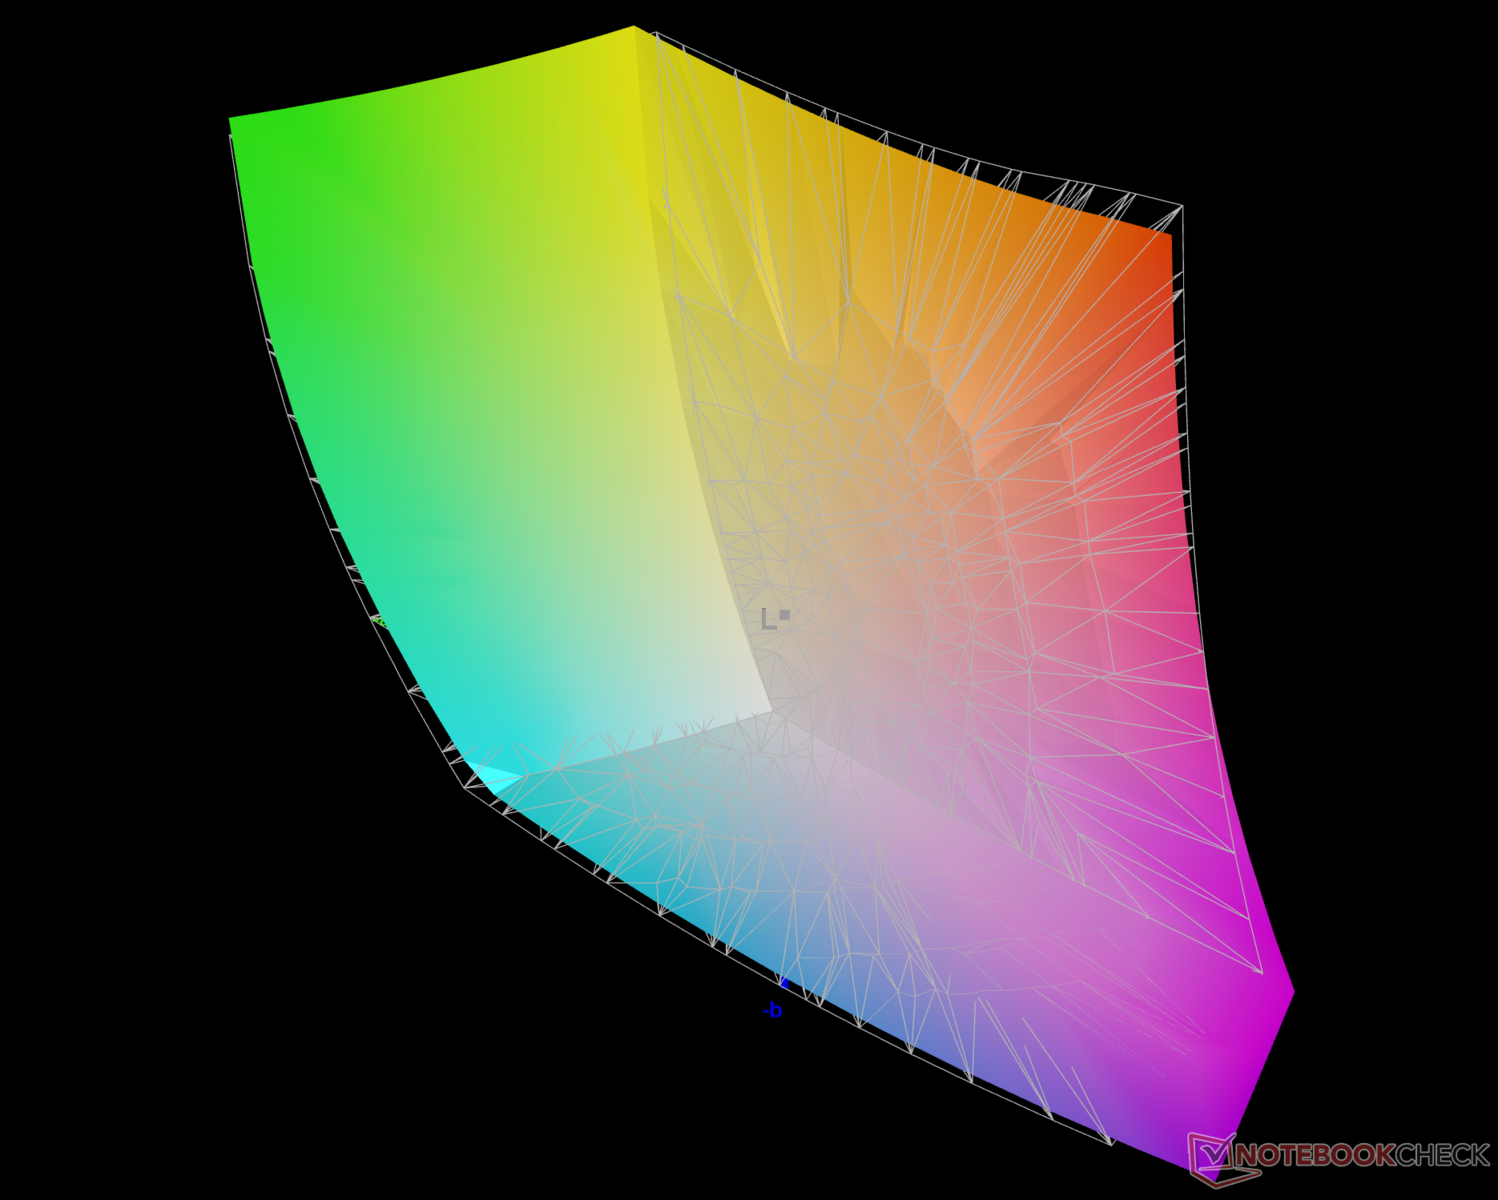
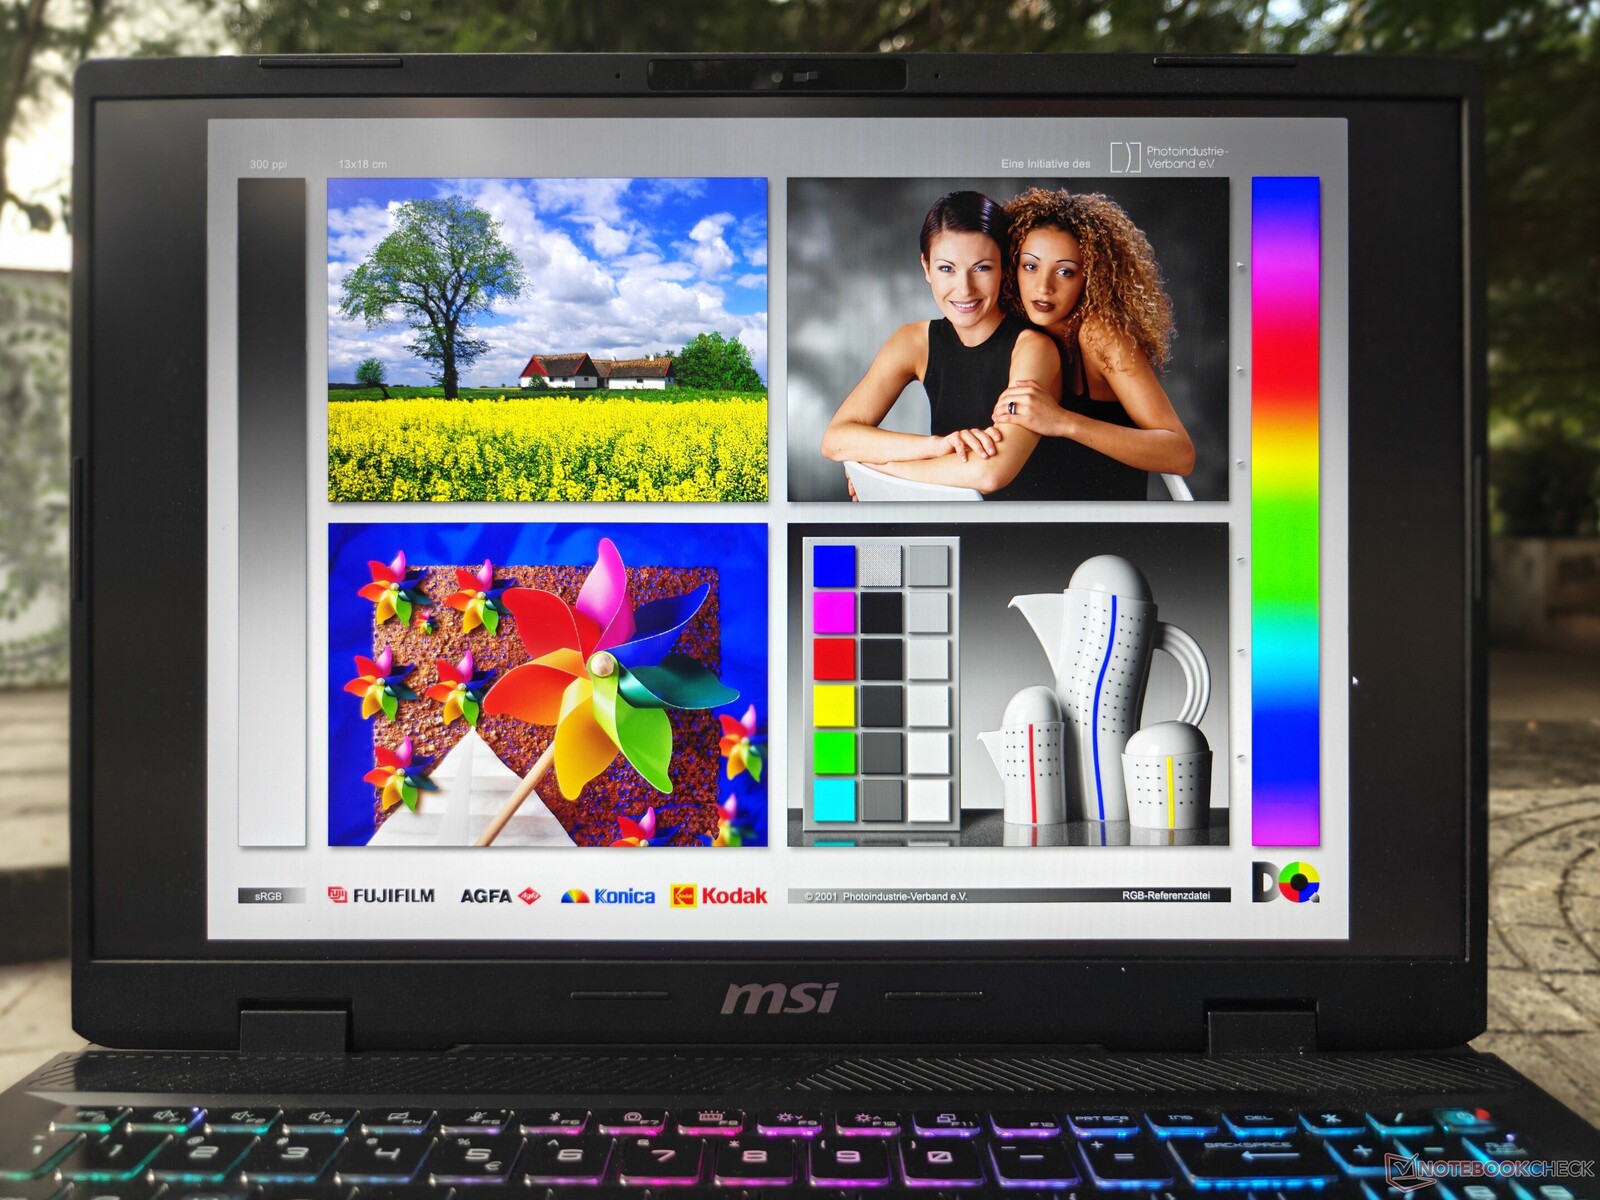
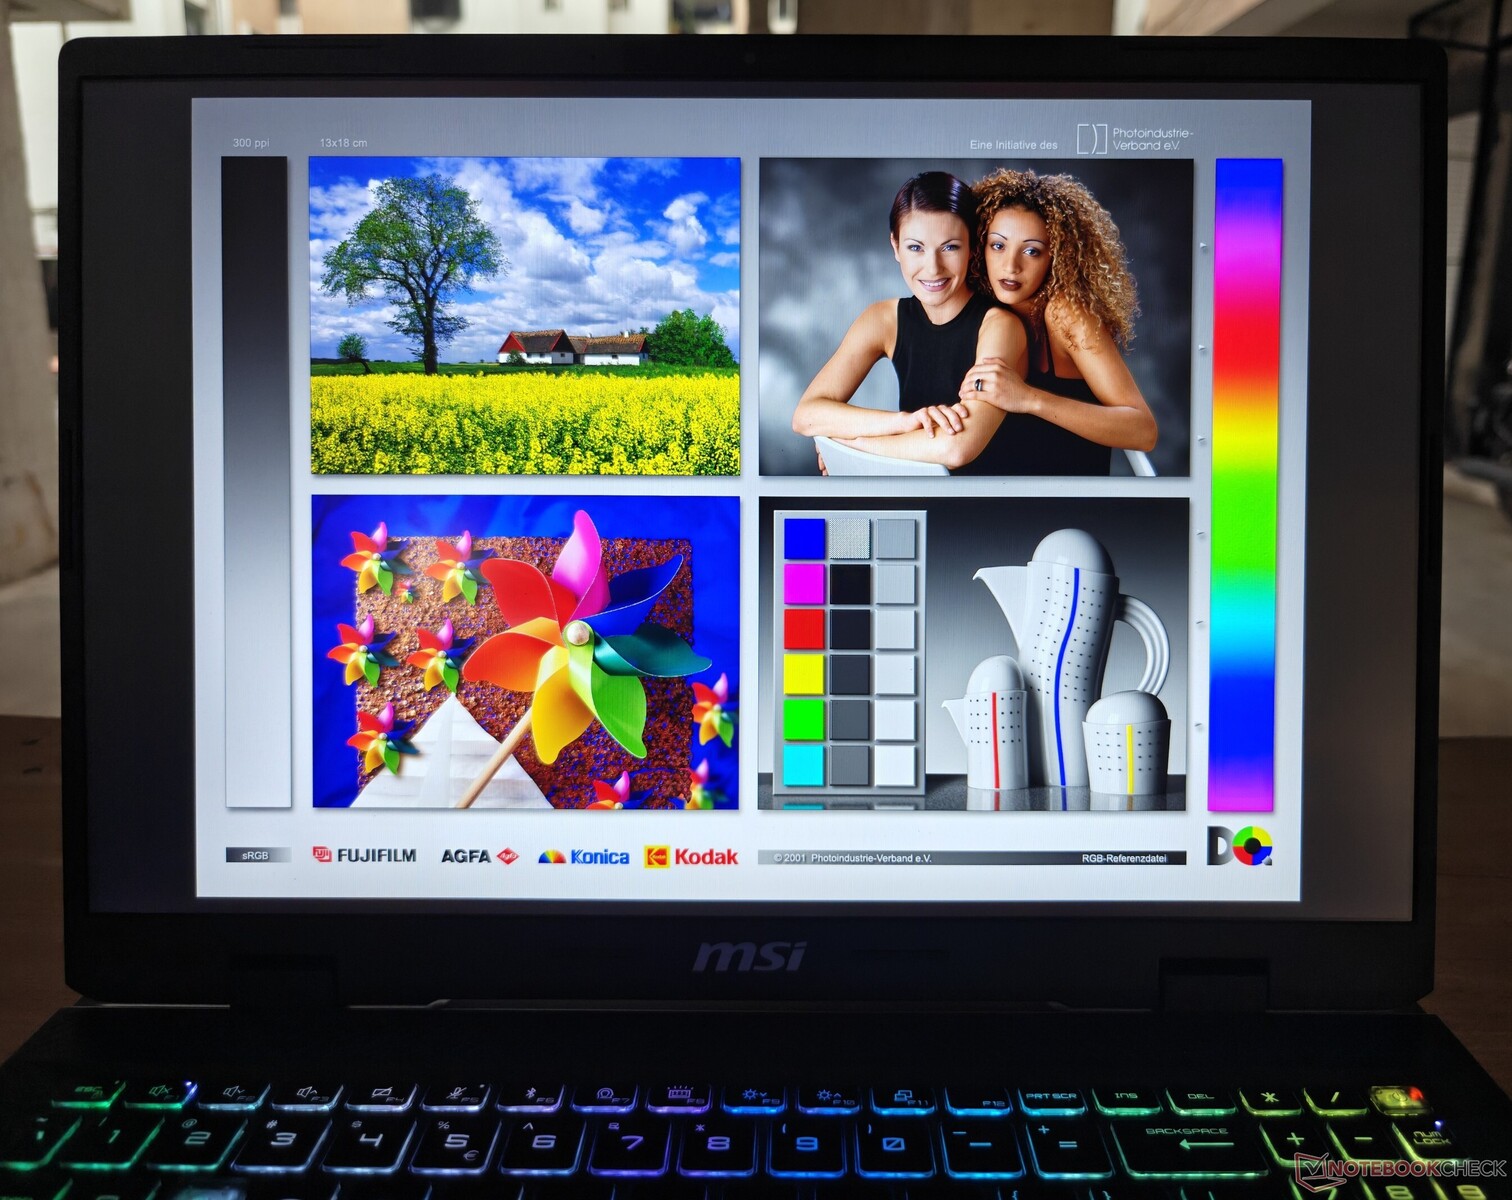
Pantalla: Panel QHD+ 240 Hz con buena cobertura de gama y sin PWM
La pantalla de nivel IPS 16:10 QHD+ 240 Hz del Crosshair 16 HX AI ofrece un brillo máximo de 472 nits con una buena uniformidad del 88%, que es un nivel decente para uso en interiores.
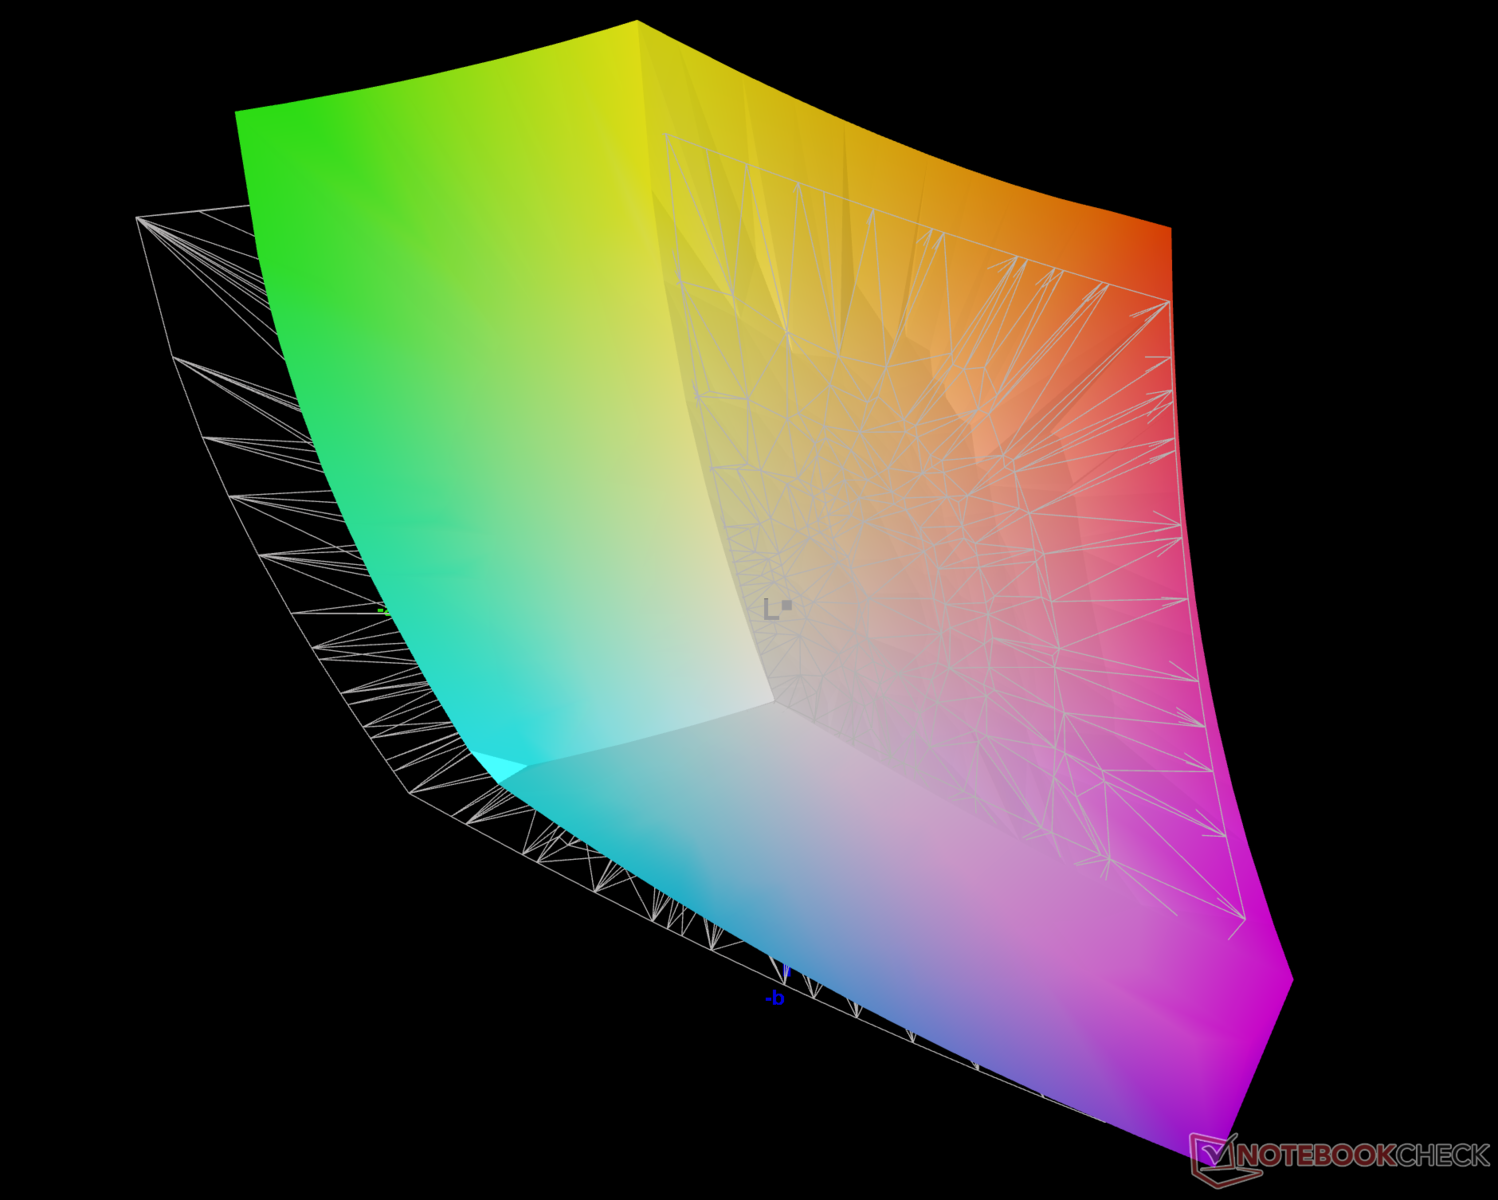
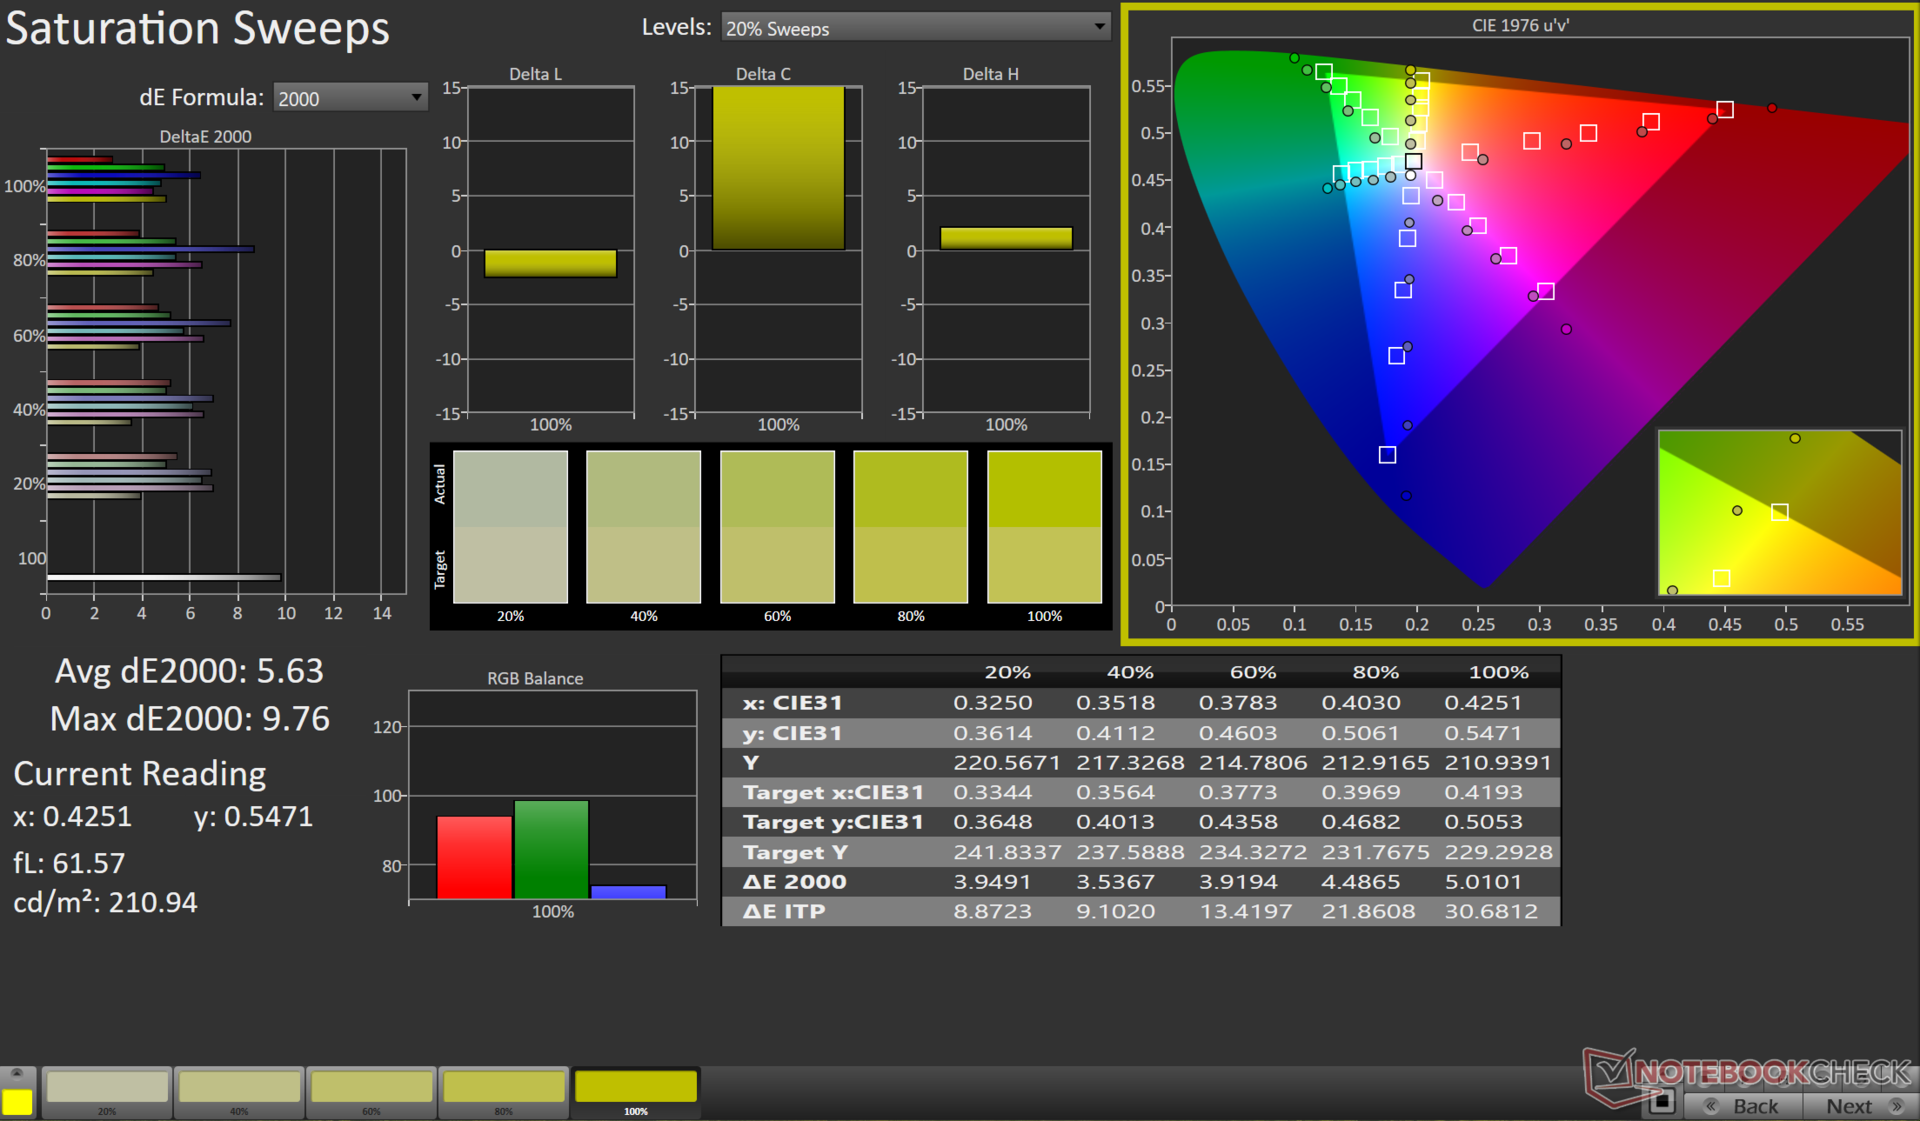
La relación de contraste medida de 1.180:1 se presta a una experiencia visual subjetivamente buena con una cobertura casi completa de la gama de colores sRGB y Display P3.
Dicho esto, la pantalla no es compatible con HDR ni con ninguna forma de sincronización adaptativa.


| |||||||||||||||||||||||||
iluminación: 88 %
Brillo con batería: 471 cd/m²
Contraste: 1180:1 (Negro: 0.4 cd/m²)
ΔE ColorChecker Calman: 6.07 | ∀{0.5-29.43 Ø4.73}
calibrated: 2.25
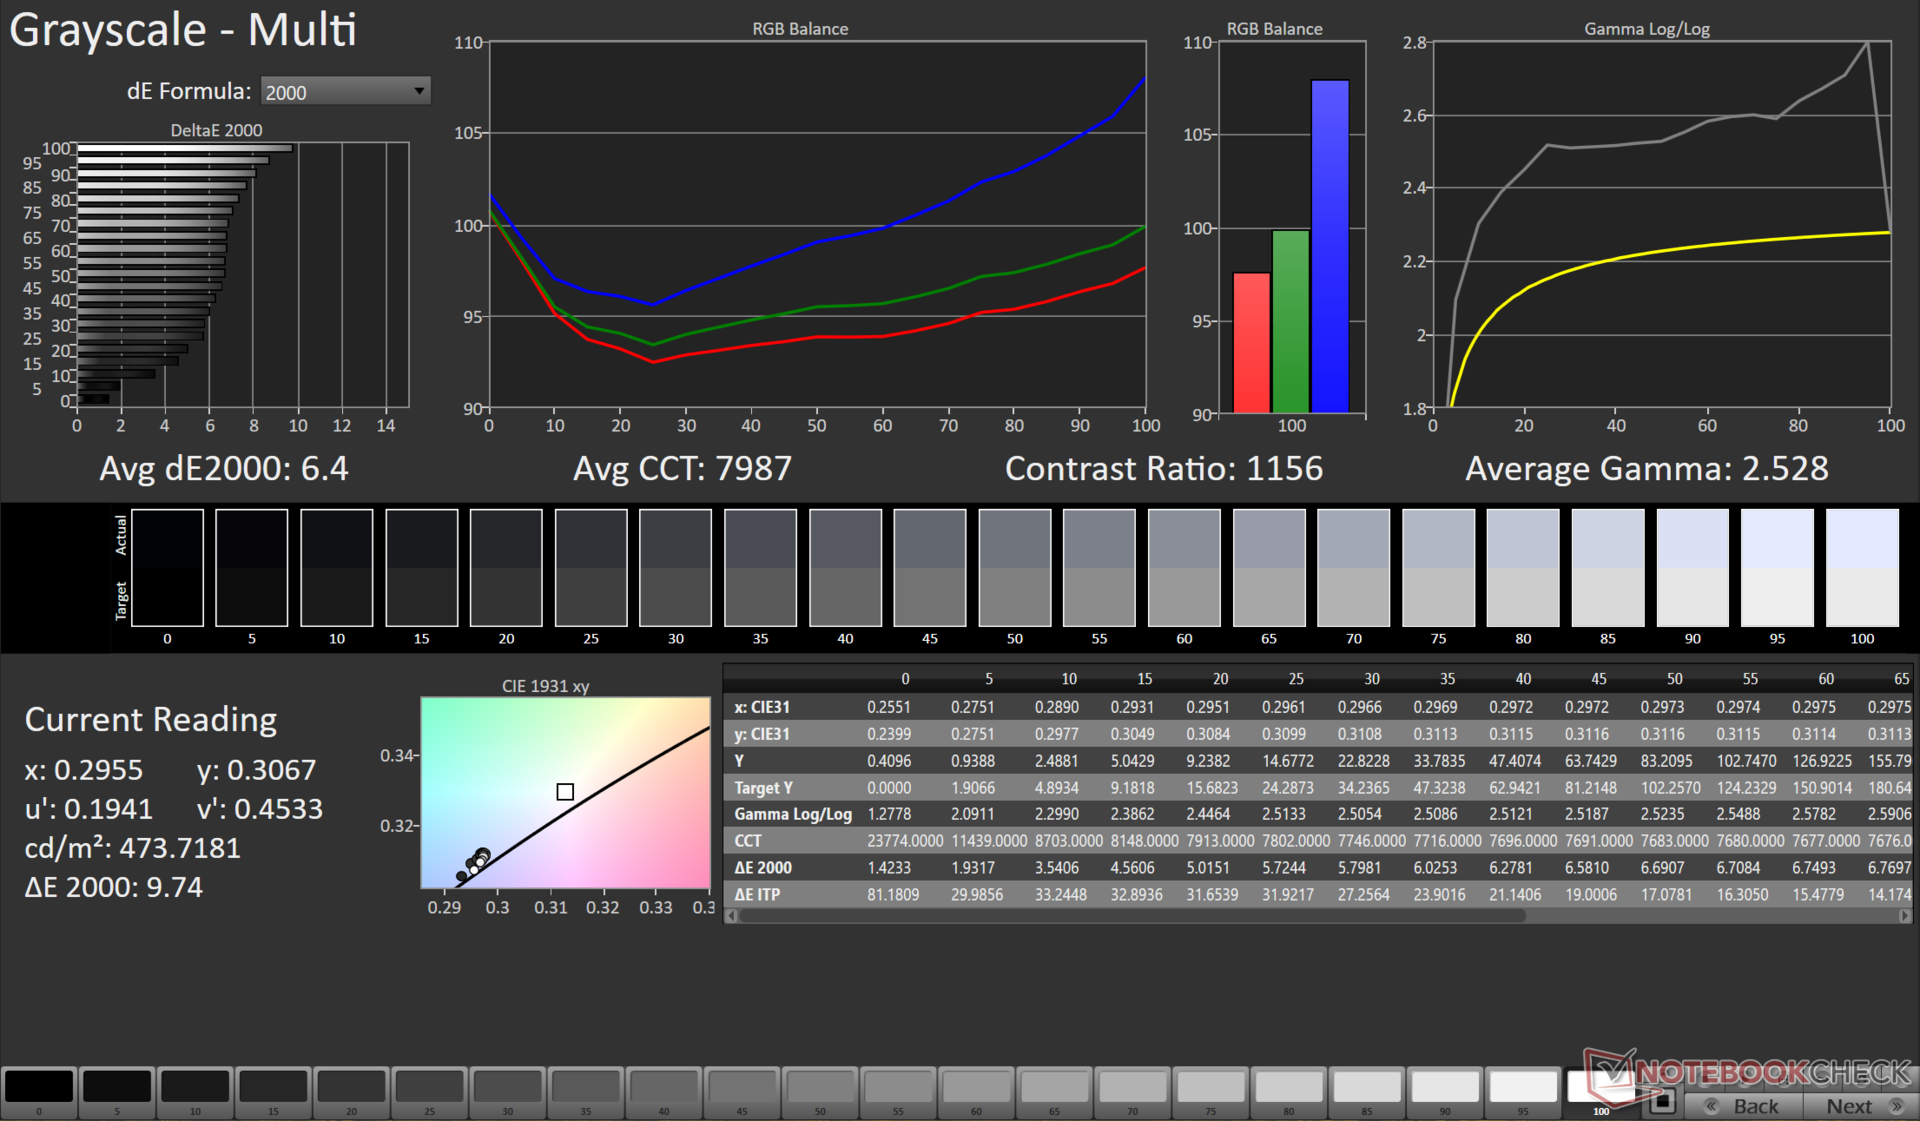
ΔE Greyscale Calman: 6.4 | ∀{0.09-98 Ø4.97}
83.9% AdobeRGB 1998 (Argyll 3D)
99.7% sRGB (Argyll 3D)
95.5% Display P3 (Argyll 3D)
Gamma: 2.52
CCT: 7987 K
| MSI Crosshair 16 HX AI D2XWGKG AUO B160QAN02.3, IPS, 2560x1600, 16", 240 Hz | Alienware 16X Aurora, RTX 5070 LG Philips 160WQG, IPS, 2560x1600, 16", 240 Hz | Aorus Elite 16 AE6H NE160QDM-NYJ, IPS, 2560x1600, 16", 165 Hz | Lenovo Legion 5 Pro 16IAX10H ATNA60HS01-0 (Samsung SDC420A), OLED, 2560x1600, 16", 165 Hz | Asus TUF Gaming A16 FA608UP MNG007DA5-3, IPS, 2560x1600, 16", 165 Hz | |
|---|---|---|---|---|---|
| Display | 3% | -13% | 6% | -15% | |
| Display P3 Coverage (%) | 95.5 | 96.9 1% | 70.8 -26% | 99.9 5% | 69.4 -27% |
| sRGB Coverage (%) | 99.7 | 99.8 0% | 99.8 0% | 100 0% | 97.2 -3% |
| AdobeRGB 1998 Coverage (%) | 83.9 | 89.7 7% | 72.6 -13% | 94.1 12% | 71.9 -14% |
| Response Times | -22% | -190% | 62% | -22% | |
| Response Time Grey 50% / Grey 80% * (ms) | 3.59 ? | 4.3 ? -20% | 16.8 ? -368% | 2 ? 44% | 6.3 ? -75% |
| Response Time Black / White * (ms) | 7.09 ? | 8.7 ? -23% | 7.9 ? -11% | 1.4 ? 80% | 4.8 ? 32% |
| PWM Frequency (Hz) | 1300 | ||||
| PWM Amplitude * (%) | 16.7 | ||||
| Screen | 18% | 10% | 29% | 37% | |
| Brightness middle (cd/m²) | 472 | 493.2 4% | 443 -6% | 518 10% | 480 2% |
| Brightness (cd/m²) | 438 | 477 9% | 433 -1% | 522 19% | 456 4% |
| Brightness Distribution (%) | 88 | 93 6% | 90 2% | 97 10% | 91 3% |
| Black Level * (cd/m²) | 0.4 | 0.5 -25% | 0.42 -5% | 0.32 20% | |
| Contrast (:1) | 1180 | 986 -16% | 1055 -11% | 1500 27% | |
| Colorchecker dE 2000 * | 6.07 | 3.57 41% | 3.82 37% | 2.49 59% | 1.4 77% |
| Colorchecker dE 2000 max. * | 9.76 | 7.03 28% | 7.61 22% | 5.25 46% | 2.5 74% |
| Colorchecker dE 2000 calibrated * | 2.25 | 0.68 70% | 1.33 41% | 2.15 4% | 1.3 42% |
| Greyscale dE 2000 * | 6.4 | 3.7 42% | 5.5 14% | 3.02 53% | 1.2 81% |
| Gamma | 2.52 87% | 2.16 102% | 2.249 98% | 2.37 93% | 2.16 102% |
| CCT | 7987 81% | 5876 111% | 6549 99% | 6426 101% | 6620 98% |
| Media total (Programa/Opciones) | -0% /
9% | -64% /
-23% | 32% /
29% | 0% /
17% |
* ... más pequeño es mejor

La precisión del color de la Crosshair 16 HX AI al sacarla de la caja está un poco apagada.
Nuestra rutina de calibración con el espectrofotómetro X-Rite i1Basic Pro 3 y el software Calman Ultimate de Portrait Displays mejora significativamente el DeltaE2000 de la escala de grises a sólo 0,5 y el DeltaE2000 medio de ColorChecker a 2,25.

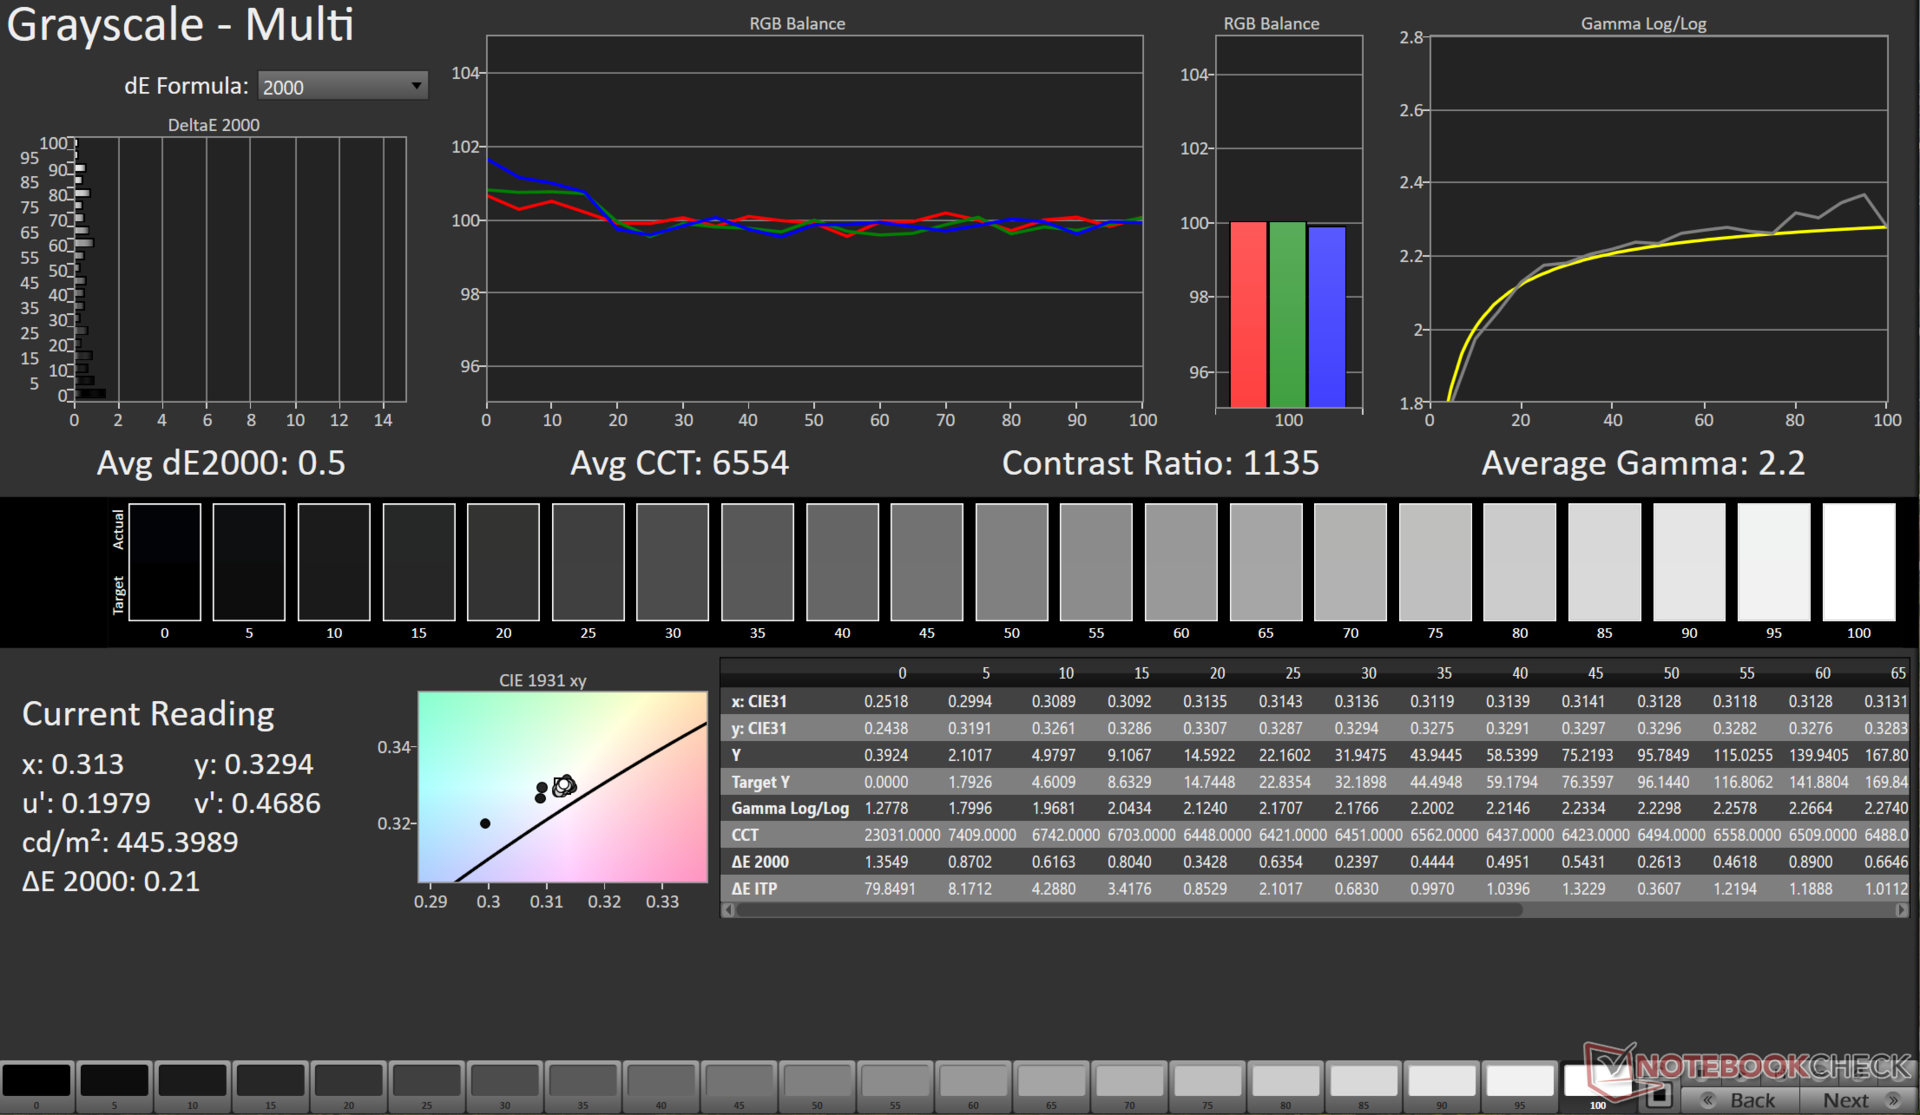


Puede descargar nuestro archivo ICC calibrado en el enlace anterior.
Tiempos de respuesta del display
| ↔ Tiempo de respuesta de Negro a Blanco | ||
|---|---|---|
| 7.09 ms ... subida ↗ y bajada ↘ combinada | ↗ 3.52 ms subida | 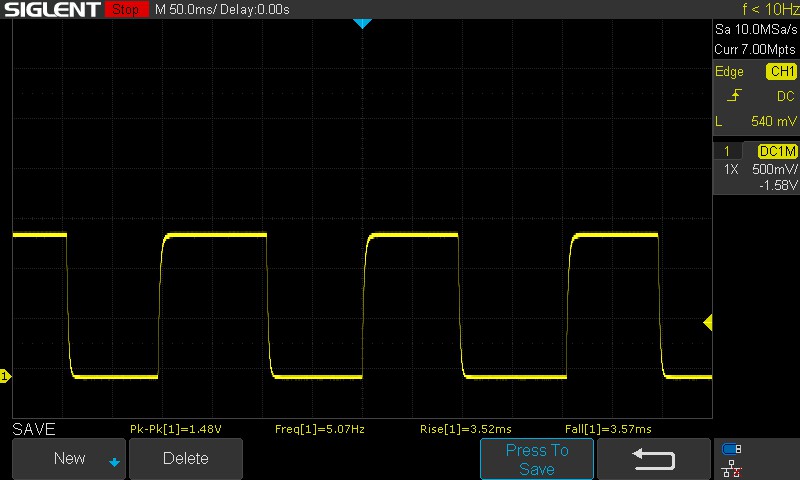 |
| ↘ 3.57 ms bajada | ||
| La pantalla mostró tiempos de respuesta muy rápidos en nuestros tests y debería ser adecuada para juegos frenéticos. En comparación, todos los dispositivos de prueba van de ##min### (mínimo) a 240 (máximo) ms. » 21 % de todos los dispositivos son mejores. Esto quiere decir que el tiempo de respuesta medido es mejor que la media (19.9 ms) de todos los dispositivos testados. | ||
| ↔ Tiempo de respuesta 50% Gris a 80% Gris | ||
| 3.59 ms ... subida ↗ y bajada ↘ combinada | ↗ 1.51 ms subida | 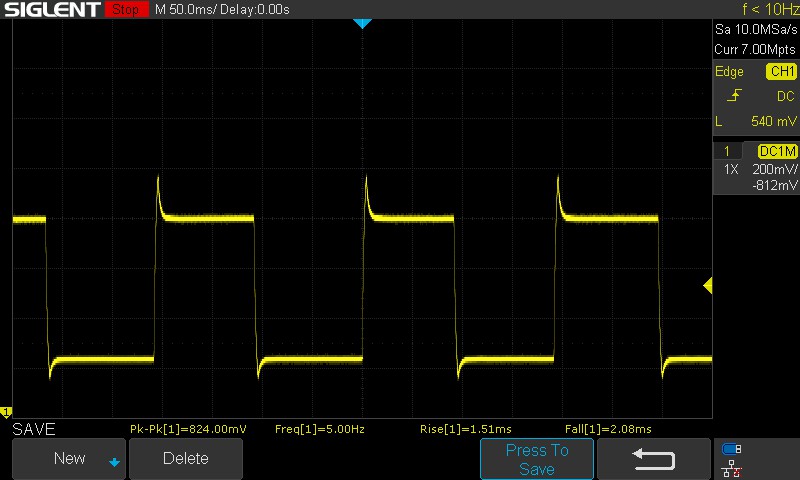 |
| ↘ 2.08 ms bajada | ||
| La pantalla mostró tiempos de respuesta muy rápidos en nuestros tests y debería ser adecuada para juegos frenéticos. En comparación, todos los dispositivos de prueba van de ##min### (mínimo) a 636 (máximo) ms. » 14 % de todos los dispositivos son mejores. Esto quiere decir que el tiempo de respuesta medido es mejor que la media (31.1 ms) de todos los dispositivos testados. | ||
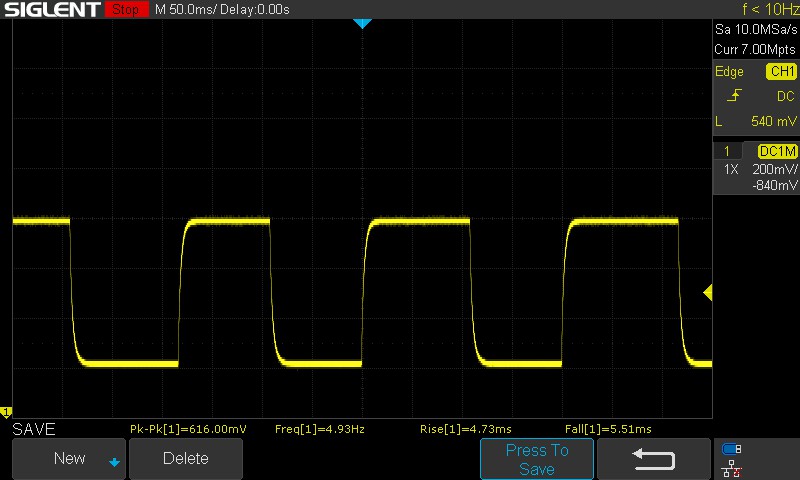
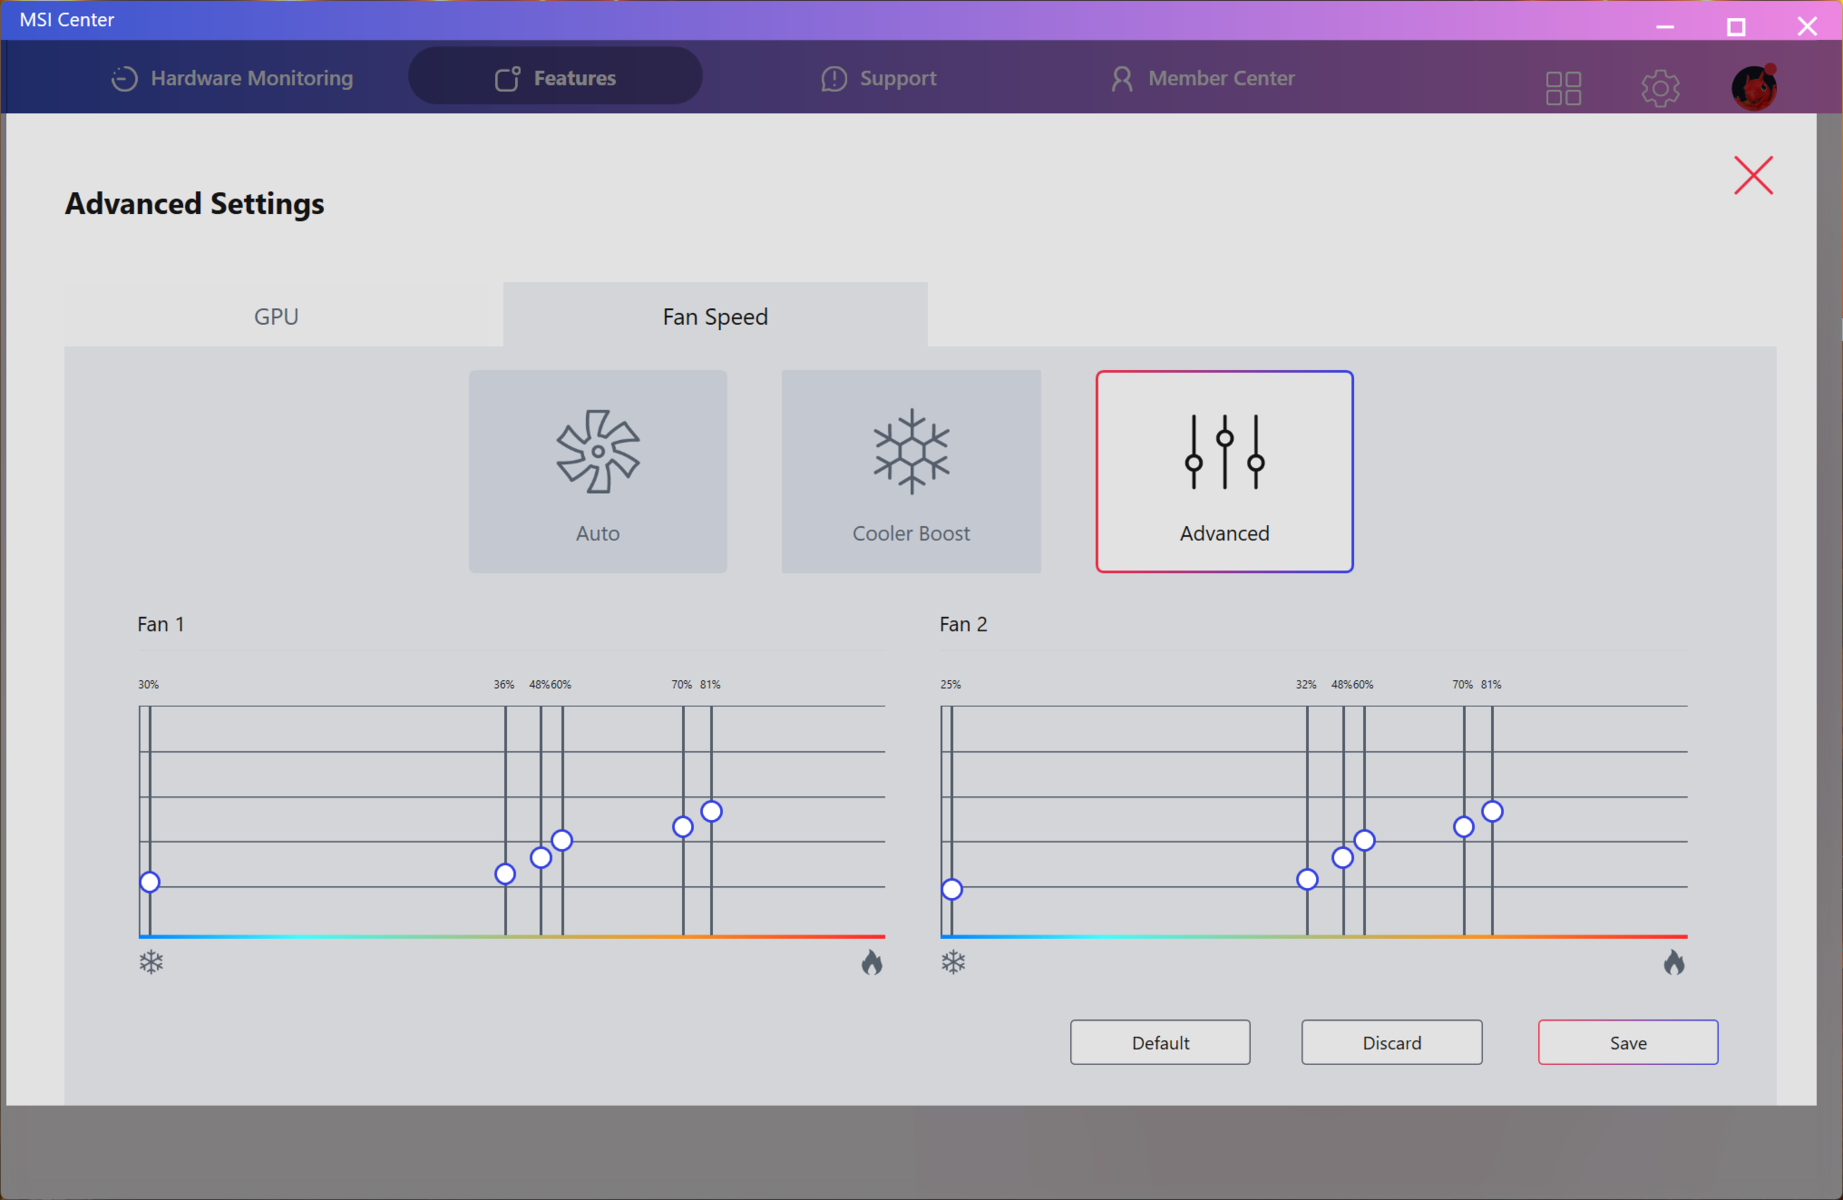
El panel utiliza overdrive por defecto.
Desactivar la sobremarcha del panel a través del Centro MSI aumenta los tiempos de respuesta del 50% de gris al 80% de gris de 3,59 ms a 10,24 ms.
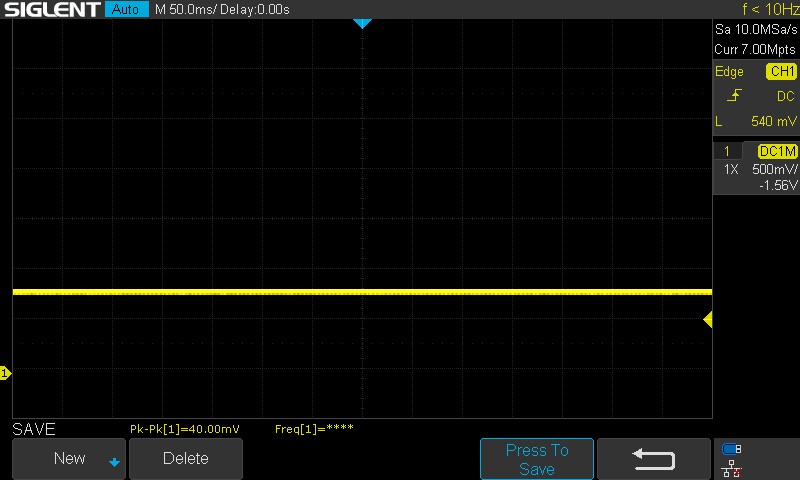
No observamos ningún parpadeo PWM en todos los niveles de brillo probados.
Parpadeo de Pantalla / PWM (Pulse-Width Modulation)
| Parpadeo de Pantalla / PWM no detectado | ≤ 100 % de brillo | 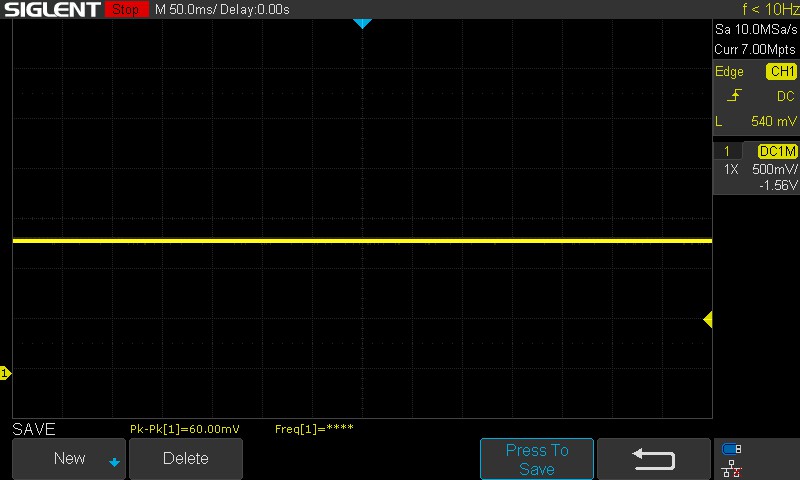 | |
Comparación: 52 % de todos los dispositivos testados no usaron PWM para atenuar el display. Si se usó, medimos una media de 7794 (mínimo: 5 - máxmo: 343500) Hz. | |||


Rendimiento: Core Ultra 9 275HX y RTX 5070 no arrojan sorpresas
MSI ofrece el Crosshair 16 HX AI en dos SKU: Core Ultra 7 255HX + RTX 5060 Portátil y Core Ultra 9 275HX + RTX 5070 Portátil.
Ambas SKU pueden equiparse con hasta 96 GB de memoria DDR5-6400, pero nuestra unidad venía con sólo 16 GB de RAM DDR5-5600 instalada.
Condiciones de prueba
Utilizamos el modo de rendimiento extremo en MSI Center con dGPU MUX para todos los benchmarks y juegos.
Las pruebas de batería se realizaron en el modo ECO-Silencioso con la GPU configurada en MSHybrid.

| Modo de rendimiento | PL1 (PBP) / Tau | PL2 (MTP) / Tau | GPU TGP (FurMark) | Cinebench R15 Puntuación múltiple | Cinebench R15 Puntuación múltiple (30 bucles) |
|---|---|---|---|---|---|
| ECO-Silencioso | 20 W / 56 s | 20 W / 2,44 ms | 13 W | 1728 (-67,8%) | 1752 (-65,05%) |
| Equilibrado | 40 W / 56 s | 60 W / 2,44 ms | 75 W | 4171 (-22,28%) | 3517 (-29,84%) |
| Rendimiento extremo | 100 W / 56 s | 130 W / 2,44 ms | 92 W | 5367 (100%) | 5013 (100%) |
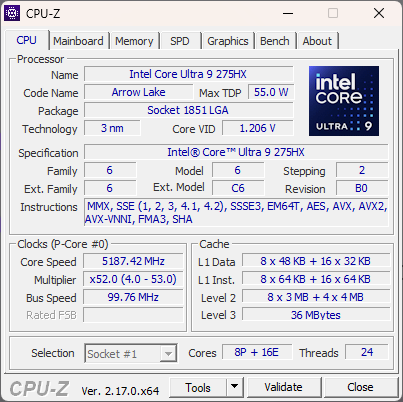
Procesador
El Crosshair 16 HX AI's Intel Core Ultra 9 275HX ofrece un rendimiento comparable al de otros portátiles equipados con la misma CPU, aunque el Lenovo Legion Pro 5es un poco más rápida en general debido a su mayor PL1/PL2.
El rendimiento sostenido multinúcleo es en general estable, salvo un bajón momentáneo en la 20ª ejecución durante un bucle multinúcleo de Cinebench R15.
Cinebench R15 Bucle multinúcleo
Cinebench R23: Multi Core | Single Core
Cinebench R20: CPU (Multi Core) | CPU (Single Core)
Cinebench R15: CPU Multi 64Bit | CPU Single 64Bit
Blender: v2.79 BMW27 CPU
7-Zip 18.03: 7z b 4 | 7z b 4 -mmt1
Geekbench 6.7: Multi-Core | Single-Core
Geekbench 5.5: Multi-Core | Single-Core
HWBOT x265 Benchmark v2.2: 4k Preset
LibreOffice : 20 Documents To PDF
R Benchmark 2.5: Overall mean
| CPU Performance rating | |
| Lenovo Legion 5 Pro 16IAX10H | |
| Aorus Elite 16 AE6H -1! | |
| Medio Intel Core Ultra 9 275HX | |
| Alienware 16X Aurora, RTX 5070 | |
| MSI Crosshair 16 HX AI D2XWGKG | |
| MSI Crosshair 18 HX AI A2XW | |
| MSI Crosshair A17 HX D8WGKG | |
| Media de la clase Gaming | |
| Schenker XMG Core 16 M25 | |
| Asus TUF Gaming A16 FA608UP | |
| Cinebench R23 / Multi Core | |
| Lenovo Legion 5 Pro 16IAX10H | |
| Medio Intel Core Ultra 9 275HX (30712 - 40970, n=31) | |
| Alienware 16X Aurora, RTX 5070 | |
| MSI Crosshair 16 HX AI D2XWGKG | |
| Aorus Elite 16 AE6H | |
| MSI Crosshair 18 HX AI A2XW | |
| MSI Crosshair A17 HX D8WGKG | |
| Media de la clase Gaming (10488 - 40970, n=112, últimos 2 años) | |
| Schenker XMG Core 16 M25 | |
| Asus TUF Gaming A16 FA608UP | |
| Cinebench R23 / Single Core | |
| Lenovo Legion 5 Pro 16IAX10H | |
| MSI Crosshair 16 HX AI D2XWGKG | |
| Medio Intel Core Ultra 9 275HX (2009 - 2267, n=31) | |
| Alienware 16X Aurora, RTX 5070 | |
| Aorus Elite 16 AE6H | |
| MSI Crosshair 18 HX AI A2XW | |
| Schenker XMG Core 16 M25 | |
| Media de la clase Gaming (1166 - 2356, n=112, últimos 2 años) | |
| MSI Crosshair A17 HX D8WGKG | |
| Asus TUF Gaming A16 FA608UP | |
| Cinebench R20 / CPU (Multi Core) | |
| Lenovo Legion 5 Pro 16IAX10H | |
| Medio Intel Core Ultra 9 275HX (12026 - 16108, n=30) | |
| Alienware 16X Aurora, RTX 5070 | |
| MSI Crosshair 16 HX AI D2XWGKG | |
| MSI Crosshair 18 HX AI A2XW | |
| Aorus Elite 16 AE6H | |
| MSI Crosshair A17 HX D8WGKG | |
| Media de la clase Gaming (4029 - 16108, n=111, últimos 2 años) | |
| Schenker XMG Core 16 M25 | |
| Asus TUF Gaming A16 FA608UP | |
| Cinebench R20 / CPU (Single Core) | |
| Lenovo Legion 5 Pro 16IAX10H | |
| MSI Crosshair 16 HX AI D2XWGKG | |
| Alienware 16X Aurora, RTX 5070 | |
| Medio Intel Core Ultra 9 275HX (774 - 870, n=30) | |
| Aorus Elite 16 AE6H | |
| MSI Crosshair 18 HX AI A2XW | |
| Schenker XMG Core 16 M25 | |
| Media de la clase Gaming (442 - 895, n=111, últimos 2 años) | |
| MSI Crosshair A17 HX D8WGKG | |
| Asus TUF Gaming A16 FA608UP | |
| Cinebench R15 / CPU Multi 64Bit | |
| Lenovo Legion 5 Pro 16IAX10H | |
| Alienware 16X Aurora, RTX 5070 | |
| Medio Intel Core Ultra 9 275HX (4737 - 6271, n=30) | |
| MSI Crosshair A17 HX D8WGKG | |
| MSI Crosshair 16 HX AI D2XWGKG | |
| Aorus Elite 16 AE6H | |
| MSI Crosshair 18 HX AI A2XW | |
| Media de la clase Gaming (1578 - 6271, n=111, últimos 2 años) | |
| Schenker XMG Core 16 M25 | |
| Asus TUF Gaming A16 FA608UP | |
| Cinebench R15 / CPU Single 64Bit | |
| Lenovo Legion 5 Pro 16IAX10H | |
| Medio Intel Core Ultra 9 275HX (306 - 343, n=31) | |
| MSI Crosshair 16 HX AI D2XWGKG | |
| Alienware 16X Aurora, RTX 5070 | |
| Aorus Elite 16 AE6H | |
| MSI Crosshair 18 HX AI A2XW | |
| Media de la clase Gaming (188.8 - 343, n=111, últimos 2 años) | |
| MSI Crosshair A17 HX D8WGKG | |
| Asus TUF Gaming A16 FA608UP | |
| Schenker XMG Core 16 M25 | |
| Blender / v2.79 BMW27 CPU | |
| Asus TUF Gaming A16 FA608UP | |
| Media de la clase Gaming (80 - 330, n=109, últimos 2 años) | |
| Schenker XMG Core 16 M25 | |
| MSI Crosshair A17 HX D8WGKG | |
| Alienware 16X Aurora, RTX 5070 | |
| MSI Crosshair 18 HX AI A2XW | |
| Lenovo Legion 5 Pro 16IAX10H | |
| MSI Crosshair 16 HX AI D2XWGKG | |
| Medio Intel Core Ultra 9 275HX (82 - 116, n=29) | |
| 7-Zip 18.03 / 7z b 4 | |
| MSI Crosshair A17 HX D8WGKG | |
| Medio Intel Core Ultra 9 275HX (98236 - 124155, n=30) | |
| Lenovo Legion 5 Pro 16IAX10H | |
| Aorus Elite 16 AE6H | |
| MSI Crosshair 18 HX AI A2XW | |
| MSI Crosshair 16 HX AI D2XWGKG | |
| Alienware 16X Aurora, RTX 5070 | |
| Media de la clase Gaming (33491 - 148086, n=110, últimos 2 años) | |
| Schenker XMG Core 16 M25 | |
| Asus TUF Gaming A16 FA608UP | |
| 7-Zip 18.03 / 7z b 4 -mmt1 | |
| MSI Crosshair A17 HX D8WGKG | |
| MSI Crosshair 16 HX AI D2XWGKG | |
| Medio Intel Core Ultra 9 275HX (6026 - 7149, n=30) | |
| Lenovo Legion 5 Pro 16IAX10H | |
| Alienware 16X Aurora, RTX 5070 | |
| Schenker XMG Core 16 M25 | |
| Aorus Elite 16 AE6H | |
| Media de la clase Gaming (4199 - 7436, n=110, últimos 2 años) | |
| MSI Crosshair 18 HX AI A2XW | |
| Asus TUF Gaming A16 FA608UP | |
| Geekbench 6.7 / Multi-Core | |
| Lenovo Legion 5 Pro 16IAX10H | |
| Medio Intel Core Ultra 9 275HX (16033 - 21668, n=33) | |
| Alienware 16X Aurora, RTX 5070 | |
| MSI Crosshair 18 HX AI A2XW | |
| Aorus Elite 16 AE6H | |
| MSI Crosshair 16 HX AI D2XWGKG | |
| MSI Crosshair A17 HX D8WGKG | |
| Schenker XMG Core 16 M25 | |
| Media de la clase Gaming (6625 - 22104, n=111, últimos 2 años) | |
| Asus TUF Gaming A16 FA608UP | |
| Geekbench 6.7 / Single-Core | |
| Lenovo Legion 5 Pro 16IAX10H | |
| Alienware 16X Aurora, RTX 5070 | |
| MSI Crosshair 16 HX AI D2XWGKG | |
| Medio Intel Core Ultra 9 275HX (2843 - 3160, n=33) | |
| Aorus Elite 16 AE6H | |
| Schenker XMG Core 16 M25 | |
| MSI Crosshair 18 HX AI A2XW | |
| MSI Crosshair A17 HX D8WGKG | |
| Media de la clase Gaming (1490 - 3259, n=111, últimos 2 años) | |
| Asus TUF Gaming A16 FA608UP | |
| Geekbench 5.5 / Multi-Core | |
| Medio Intel Core Ultra 9 275HX (19105 - 25855, n=31) | |
| Aorus Elite 16 AE6H | |
| MSI Crosshair 18 HX AI A2XW | |
| Lenovo Legion 5 Pro 16IAX10H | |
| MSI Crosshair 16 HX AI D2XWGKG | |
| Alienware 16X Aurora, RTX 5070 | |
| MSI Crosshair A17 HX D8WGKG | |
| Media de la clase Gaming (6460 - 27010, n=110, últimos 2 años) | |
| Schenker XMG Core 16 M25 | |
| Asus TUF Gaming A16 FA608UP | |
| Geekbench 5.5 / Single-Core | |
| Lenovo Legion 5 Pro 16IAX10H | |
| Alienware 16X Aurora, RTX 5070 | |
| MSI Crosshair 16 HX AI D2XWGKG | |
| Medio Intel Core Ultra 9 275HX (2033 - 2292, n=31) | |
| Aorus Elite 16 AE6H | |
| MSI Crosshair 18 HX AI A2XW | |
| Schenker XMG Core 16 M25 | |
| Media de la clase Gaming (986 - 2474, n=110, últimos 2 años) | |
| Asus TUF Gaming A16 FA608UP | |
| MSI Crosshair A17 HX D8WGKG | |
| HWBOT x265 Benchmark v2.2 / 4k Preset | |
| Lenovo Legion 5 Pro 16IAX10H | |
| Medio Intel Core Ultra 9 275HX (30.7 - 43.8, n=30) | |
| Alienware 16X Aurora, RTX 5070 | |
| MSI Crosshair A17 HX D8WGKG | |
| MSI Crosshair 16 HX AI D2XWGKG | |
| MSI Crosshair 18 HX AI A2XW | |
| Aorus Elite 16 AE6H | |
| Schenker XMG Core 16 M25 | |
| Media de la clase Gaming (11.5 - 44.3, n=110, últimos 2 años) | |
| Asus TUF Gaming A16 FA608UP | |
| LibreOffice / 20 Documents To PDF | |
| Asus TUF Gaming A16 FA608UP | |
| Schenker XMG Core 16 M25 | |
| Media de la clase Gaming (19 - 88.8, n=110, últimos 2 años) | |
| Medio Intel Core Ultra 9 275HX (33.2 - 62.1, n=30) | |
| MSI Crosshair 16 HX AI D2XWGKG | |
| MSI Crosshair A17 HX D8WGKG | |
| Aorus Elite 16 AE6H | |
| Alienware 16X Aurora, RTX 5070 | |
| MSI Crosshair 18 HX AI A2XW | |
| Lenovo Legion 5 Pro 16IAX10H | |
| R Benchmark 2.5 / Overall mean | |
| MSI Crosshair 18 HX AI A2XW | |
| Asus TUF Gaming A16 FA608UP | |
| MSI Crosshair A17 HX D8WGKG | |
| Media de la clase Gaming (0.3439 - 0.759, n=111, últimos 2 años) | |
| Aorus Elite 16 AE6H | |
| Alienware 16X Aurora, RTX 5070 | |
| Medio Intel Core Ultra 9 275HX (0.3943 - 0.4568, n=30) | |
| Lenovo Legion 5 Pro 16IAX10H | |
| MSI Crosshair 16 HX AI D2XWGKG | |
| Schenker XMG Core 16 M25 | |
* ... más pequeño es mejor
AIDA64: FP32 Ray-Trace | FPU Julia | CPU SHA3 | CPU Queen | FPU SinJulia | FPU Mandel | CPU AES | CPU ZLib | FP64 Ray-Trace | CPU PhotoWorxx
| Performance rating | |
| MSI Crosshair A17 HX D8WGKG | |
| Lenovo Legion 5 Pro 16IAX10H | |
| Medio Intel Core Ultra 9 275HX | |
| MSI Crosshair 18 HX AI A2XW | |
| MSI Crosshair 16 HX AI D2XWGKG | |
| Alienware 16X Aurora, RTX 5070 | |
| Aorus Elite 16 AE6H | |
| Schenker XMG Core 16 M25 | |
| Media de la clase Gaming | |
| Asus TUF Gaming A16 FA608UP | |
| AIDA64 / FP32 Ray-Trace | |
| MSI Crosshair A17 HX D8WGKG | |
| Schenker XMG Core 16 M25 | |
| MSI Crosshair 18 HX AI A2XW | |
| MSI Crosshair 16 HX AI D2XWGKG | |
| Medio Intel Core Ultra 9 275HX (28039 - 39895, n=30) | |
| Lenovo Legion 5 Pro 16IAX10H | |
| Alienware 16X Aurora, RTX 5070 | |
| Aorus Elite 16 AE6H | |
| Media de la clase Gaming (10227 - 85542, n=109, últimos 2 años) | |
| Asus TUF Gaming A16 FA608UP | |
| AIDA64 / FPU Julia | |
| MSI Crosshair A17 HX D8WGKG | |
| MSI Crosshair 18 HX AI A2XW | |
| Lenovo Legion 5 Pro 16IAX10H | |
| MSI Crosshair 16 HX AI D2XWGKG | |
| Medio Intel Core Ultra 9 275HX (140254 - 200744, n=30) | |
| Aorus Elite 16 AE6H | |
| Alienware 16X Aurora, RTX 5070 | |
| Schenker XMG Core 16 M25 | |
| Media de la clase Gaming (51376 - 238426, n=109, últimos 2 años) | |
| Asus TUF Gaming A16 FA608UP | |
| AIDA64 / CPU SHA3 | |
| MSI Crosshair A17 HX D8WGKG | |
| Medio Intel Core Ultra 9 275HX (6710 - 9817, n=30) | |
| Lenovo Legion 5 Pro 16IAX10H | |
| MSI Crosshair 16 HX AI D2XWGKG | |
| MSI Crosshair 18 HX AI A2XW | |
| Alienware 16X Aurora, RTX 5070 | |
| Aorus Elite 16 AE6H | |
| Media de la clase Gaming (2180 - 9817, n=109, últimos 2 años) | |
| Schenker XMG Core 16 M25 | |
| Asus TUF Gaming A16 FA608UP | |
| AIDA64 / CPU Queen | |
| MSI Crosshair A17 HX D8WGKG | |
| Lenovo Legion 5 Pro 16IAX10H | |
| Alienware 16X Aurora, RTX 5070 | |
| Medio Intel Core Ultra 9 275HX (113887 - 140937, n=30) | |
| Aorus Elite 16 AE6H | |
| MSI Crosshair 16 HX AI D2XWGKG | |
| MSI Crosshair 18 HX AI A2XW | |
| Asus TUF Gaming A16 FA608UP | |
| Media de la clase Gaming (49785 - 173351, n=100, últimos 2 años) | |
| Schenker XMG Core 16 M25 | |
| AIDA64 / FPU SinJulia | |
| MSI Crosshair A17 HX D8WGKG | |
| Schenker XMG Core 16 M25 | |
| Asus TUF Gaming A16 FA608UP | |
| Media de la clase Gaming (4424 - 33636, n=109, últimos 2 años) | |
| Lenovo Legion 5 Pro 16IAX10H | |
| Alienware 16X Aurora, RTX 5070 | |
| Medio Intel Core Ultra 9 275HX (11172 - 14425, n=30) | |
| MSI Crosshair 16 HX AI D2XWGKG | |
| Aorus Elite 16 AE6H | |
| MSI Crosshair 18 HX AI A2XW | |
| AIDA64 / FPU Mandel | |
| MSI Crosshair A17 HX D8WGKG | |
| MSI Crosshair 18 HX AI A2XW | |
| MSI Crosshair 16 HX AI D2XWGKG | |
| Medio Intel Core Ultra 9 275HX (72596 - 104508, n=30) | |
| Lenovo Legion 5 Pro 16IAX10H | |
| Aorus Elite 16 AE6H | |
| Alienware 16X Aurora, RTX 5070 | |
| Schenker XMG Core 16 M25 | |
| Media de la clase Gaming (25115 - 128721, n=109, últimos 2 años) | |
| Asus TUF Gaming A16 FA608UP | |
| AIDA64 / CPU AES | |
| MSI Crosshair A17 HX D8WGKG | |
| Lenovo Legion 5 Pro 16IAX10H | |
| Medio Intel Core Ultra 9 275HX (105608 - 247074, n=30) | |
| MSI Crosshair 16 HX AI D2XWGKG | |
| Alienware 16X Aurora, RTX 5070 | |
| MSI Crosshair 18 HX AI A2XW | |
| Schenker XMG Core 16 M25 | |
| Aorus Elite 16 AE6H | |
| Media de la clase Gaming (39258 - 247074, n=109, últimos 2 años) | |
| Asus TUF Gaming A16 FA608UP | |
| AIDA64 / CPU ZLib | |
| Lenovo Legion 5 Pro 16IAX10H | |
| MSI Crosshair A17 HX D8WGKG | |
| Medio Intel Core Ultra 9 275HX (1582 - 2263, n=30) | |
| MSI Crosshair 16 HX AI D2XWGKG | |
| Alienware 16X Aurora, RTX 5070 | |
| MSI Crosshair 18 HX AI A2XW | |
| Aorus Elite 16 AE6H | |
| Schenker XMG Core 16 M25 | |
| Media de la clase Gaming (574 - 2531, n=109, últimos 2 años) | |
| Asus TUF Gaming A16 FA608UP | |
| AIDA64 / FP64 Ray-Trace | |
| MSI Crosshair A17 HX D8WGKG | |
| Schenker XMG Core 16 M25 | |
| MSI Crosshair 18 HX AI A2XW | |
| MSI Crosshair 16 HX AI D2XWGKG | |
| Medio Intel Core Ultra 9 275HX (14847 - 21854, n=30) | |
| Lenovo Legion 5 Pro 16IAX10H | |
| Aorus Elite 16 AE6H | |
| Alienware 16X Aurora, RTX 5070 | |
| Media de la clase Gaming (5509 - 45446, n=109, últimos 2 años) | |
| Asus TUF Gaming A16 FA608UP | |
| AIDA64 / CPU PhotoWorxx | |
| Schenker XMG Core 16 M25 | |
| Medio Intel Core Ultra 9 275HX (37482 - 62916, n=30) | |
| Lenovo Legion 5 Pro 16IAX10H | |
| Alienware 16X Aurora, RTX 5070 | |
| Aorus Elite 16 AE6H | |
| MSI Crosshair 18 HX AI A2XW | |
| Media de la clase Gaming (12271 - 89891, n=109, últimos 2 años) | |
| Asus TUF Gaming A16 FA608UP | |
| MSI Crosshair 16 HX AI D2XWGKG | |
| MSI Crosshair A17 HX D8WGKG | |
Rendimiento del sistema
Tuvimos que rebajar temporalmente el controlador Nvidia a la versión 577.00 para conseguir que PCMark 10 funcionara de forma fiable.
El rendimiento general del sistema es más que adecuado para la productividad diaria y la navegación web.
PCMark 10: Score | Essentials | Productivity | Digital Content Creation
CrossMark: Overall | Productivity | Creativity | Responsiveness
AIDA64: Memory Copy | Memory Read | Memory Write | Memory Latency
WebXPRT 3: Overall
WebXPRT 4: Overall
Mozilla Kraken 1.1: Total
| Performance rating | |
| Lenovo Legion 5 Pro 16IAX10H | |
| Aorus Elite 16 AE6H | |
| Medio Intel Core Ultra 9 275HX, NVIDIA GeForce RTX 5070 Laptop | |
| Alienware 16X Aurora, RTX 5070 -4! | |
| MSI Crosshair 18 HX AI A2XW | |
| MSI Crosshair 16 HX AI D2XWGKG | |
| Schenker XMG Core 16 M25 -4! | |
| Media de la clase Gaming | |
| MSI Crosshair A17 HX D8WGKG | |
| Asus TUF Gaming A16 FA608UP -4! | |
| PCMark 10 / Score | |
| Medio Intel Core Ultra 9 275HX, NVIDIA GeForce RTX 5070 Laptop (8018 - 9667, n=4) | |
| Media de la clase Gaming (5828 - 11574, n=95, últimos 2 años) | |
| Lenovo Legion 5 Pro 16IAX10H | |
| MSI Crosshair 16 HX AI D2XWGKG | |
| MSI Crosshair A17 HX D8WGKG | |
| Aorus Elite 16 AE6H | |
| MSI Crosshair 18 HX AI A2XW | |
| PCMark 10 / Essentials | |
| MSI Crosshair A17 HX D8WGKG | |
| MSI Crosshair 18 HX AI A2XW | |
| Aorus Elite 16 AE6H | |
| MSI Crosshair 16 HX AI D2XWGKG | |
| Lenovo Legion 5 Pro 16IAX10H | |
| Medio Intel Core Ultra 9 275HX, NVIDIA GeForce RTX 5070 Laptop (10259 - 11025, n=4) | |
| Media de la clase Gaming (8810 - 12600, n=99, últimos 2 años) | |
| PCMark 10 / Productivity | |
| Medio Intel Core Ultra 9 275HX, NVIDIA GeForce RTX 5070 Laptop (8307 - 16716, n=4) | |
| Media de la clase Gaming (6845 - 18766, n=97, últimos 2 años) | |
| MSI Crosshair 18 HX AI A2XW | |
| Lenovo Legion 5 Pro 16IAX10H | |
| MSI Crosshair A17 HX D8WGKG | |
| Aorus Elite 16 AE6H | |
| MSI Crosshair 16 HX AI D2XWGKG | |
| PCMark 10 / Digital Content Creation | |
| MSI Crosshair 16 HX AI D2XWGKG | |
| Lenovo Legion 5 Pro 16IAX10H | |
| Medio Intel Core Ultra 9 275HX, NVIDIA GeForce RTX 5070 Laptop (13010 - 16417, n=4) | |
| Aorus Elite 16 AE6H | |
| Media de la clase Gaming (7602 - 19657, n=97, últimos 2 años) | |
| MSI Crosshair A17 HX D8WGKG | |
| MSI Crosshair 18 HX AI A2XW | |
| CrossMark / Overall | |
| Alienware 16X Aurora, RTX 5070 | |
| Lenovo Legion 5 Pro 16IAX10H | |
| Medio Intel Core Ultra 9 275HX, NVIDIA GeForce RTX 5070 Laptop (2084 - 2269, n=5) | |
| Aorus Elite 16 AE6H | |
| MSI Crosshair 16 HX AI D2XWGKG | |
| MSI Crosshair 18 HX AI A2XW | |
| Schenker XMG Core 16 M25 | |
| Media de la clase Gaming (1366 - 2409, n=97, últimos 2 años) | |
| MSI Crosshair A17 HX D8WGKG | |
| Asus TUF Gaming A16 FA608UP | |
| CrossMark / Productivity | |
| Alienware 16X Aurora, RTX 5070 | |
| Lenovo Legion 5 Pro 16IAX10H | |
| Aorus Elite 16 AE6H | |
| Medio Intel Core Ultra 9 275HX, NVIDIA GeForce RTX 5070 Laptop (1931 - 2173, n=5) | |
| MSI Crosshair 16 HX AI D2XWGKG | |
| MSI Crosshair 18 HX AI A2XW | |
| Media de la clase Gaming (1386 - 2254, n=97, últimos 2 años) | |
| MSI Crosshair A17 HX D8WGKG | |
| Schenker XMG Core 16 M25 | |
| Asus TUF Gaming A16 FA608UP | |
| CrossMark / Creativity | |
| Lenovo Legion 5 Pro 16IAX10H | |
| Schenker XMG Core 16 M25 | |
| Alienware 16X Aurora, RTX 5070 | |
| Medio Intel Core Ultra 9 275HX, NVIDIA GeForce RTX 5070 Laptop (2322 - 2430, n=5) | |
| MSI Crosshair 16 HX AI D2XWGKG | |
| MSI Crosshair 18 HX AI A2XW | |
| Aorus Elite 16 AE6H | |
| Media de la clase Gaming (1343 - 2729, n=97, últimos 2 años) | |
| MSI Crosshair A17 HX D8WGKG | |
| Asus TUF Gaming A16 FA608UP | |
| CrossMark / Responsiveness | |
| Alienware 16X Aurora, RTX 5070 | |
| Aorus Elite 16 AE6H | |
| Medio Intel Core Ultra 9 275HX, NVIDIA GeForce RTX 5070 Laptop (1754 - 2143, n=5) | |
| Lenovo Legion 5 Pro 16IAX10H | |
| MSI Crosshair 16 HX AI D2XWGKG | |
| MSI Crosshair 18 HX AI A2XW | |
| MSI Crosshair A17 HX D8WGKG | |
| Media de la clase Gaming (1226 - 2334, n=97, últimos 2 años) | |
| Schenker XMG Core 16 M25 | |
| Asus TUF Gaming A16 FA608UP | |
| AIDA64 / Memory Copy | |
| Aorus Elite 16 AE6H | |
| Lenovo Legion 5 Pro 16IAX10H | |
| Alienware 16X Aurora, RTX 5070 | |
| MSI Crosshair 18 HX AI A2XW | |
| Medio Intel Core Ultra 9 275HX, NVIDIA GeForce RTX 5070 Laptop (68559 - 83499, n=5) | |
| Schenker XMG Core 16 M25 | |
| Media de la clase Gaming (21750 - 129946, n=109, últimos 2 años) | |
| MSI Crosshair 16 HX AI D2XWGKG | |
| Asus TUF Gaming A16 FA608UP | |
| MSI Crosshair A17 HX D8WGKG | |
| AIDA64 / Memory Read | |
| Medio Intel Core Ultra 9 275HX, NVIDIA GeForce RTX 5070 Laptop (83924 - 93622, n=5) | |
| Lenovo Legion 5 Pro 16IAX10H | |
| Aorus Elite 16 AE6H | |
| Alienware 16X Aurora, RTX 5070 | |
| Schenker XMG Core 16 M25 | |
| MSI Crosshair 18 HX AI A2XW | |
| MSI Crosshair 16 HX AI D2XWGKG | |
| Media de la clase Gaming (22956 - 118858, n=109, últimos 2 años) | |
| MSI Crosshair A17 HX D8WGKG | |
| Asus TUF Gaming A16 FA608UP | |
| AIDA64 / Memory Write | |
| Aorus Elite 16 AE6H | |
| Asus TUF Gaming A16 FA608UP | |
| Medio Intel Core Ultra 9 275HX, NVIDIA GeForce RTX 5070 Laptop (66719 - 106063, n=5) | |
| Schenker XMG Core 16 M25 | |
| Alienware 16X Aurora, RTX 5070 | |
| Lenovo Legion 5 Pro 16IAX10H | |
| MSI Crosshair 18 HX AI A2XW | |
| Media de la clase Gaming (22297 - 135096, n=109, últimos 2 años) | |
| MSI Crosshair 16 HX AI D2XWGKG | |
| MSI Crosshair A17 HX D8WGKG | |
| AIDA64 / Memory Latency | |
| Alienware 16X Aurora, RTX 5070 | |
| Lenovo Legion 5 Pro 16IAX10H | |
| Aorus Elite 16 AE6H | |
| MSI Crosshair 16 HX AI D2XWGKG | |
| Medio Intel Core Ultra 9 275HX, NVIDIA GeForce RTX 5070 Laptop (106.8 - 116, n=5) | |
| MSI Crosshair 18 HX AI A2XW | |
| Media de la clase Gaming (75.3 - 259, n=109, últimos 2 años) | |
| Asus TUF Gaming A16 FA608UP | |
| Schenker XMG Core 16 M25 | |
| MSI Crosshair A17 HX D8WGKG | |
| WebXPRT 3 / Overall | |
| Lenovo Legion 5 Pro 16IAX10H | |
| Alienware 16X Aurora, RTX 5070 | |
| Schenker XMG Core 16 M25 | |
| Medio Intel Core Ultra 9 275HX, NVIDIA GeForce RTX 5070 Laptop (309 - 364, n=5) | |
| MSI Crosshair 16 HX AI D2XWGKG | |
| MSI Crosshair 18 HX AI A2XW | |
| Media de la clase Gaming (242 - 532, n=100, últimos 2 años) | |
| Aorus Elite 16 AE6H | |
| Asus TUF Gaming A16 FA608UP | |
| MSI Crosshair A17 HX D8WGKG | |
| WebXPRT 4 / Overall | |
| Schenker XMG Core 16 M25 | |
| Alienware 16X Aurora, RTX 5070 | |
| Aorus Elite 16 AE6H | |
| Lenovo Legion 5 Pro 16IAX10H | |
| MSI Crosshair 18 HX AI A2XW | |
| Medio Intel Core Ultra 9 275HX, NVIDIA GeForce RTX 5070 Laptop (297 - 330, n=5) | |
| MSI Crosshair 16 HX AI D2XWGKG | |
| Media de la clase Gaming (176.4 - 354, n=100, últimos 2 años) | |
| Asus TUF Gaming A16 FA608UP | |
| MSI Crosshair A17 HX D8WGKG | |
| Mozilla Kraken 1.1 / Total | |
| Asus TUF Gaming A16 FA608UP | |
| MSI Crosshair A17 HX D8WGKG | |
| Media de la clase Gaming (391 - 590, n=105, últimos 2 años) | |
| MSI Crosshair 18 HX AI A2XW | |
| Aorus Elite 16 AE6H | |
| Medio Intel Core Ultra 9 275HX, NVIDIA GeForce RTX 5070 Laptop (407 - 431, n=5) | |
| Schenker XMG Core 16 M25 | |
| Lenovo Legion 5 Pro 16IAX10H | |
| Alienware 16X Aurora, RTX 5070 | |
| MSI Crosshair 16 HX AI D2XWGKG | |
* ... más pequeño es mejor
| PCMark 10 Score | 8149 puntos | |
ayuda | ||
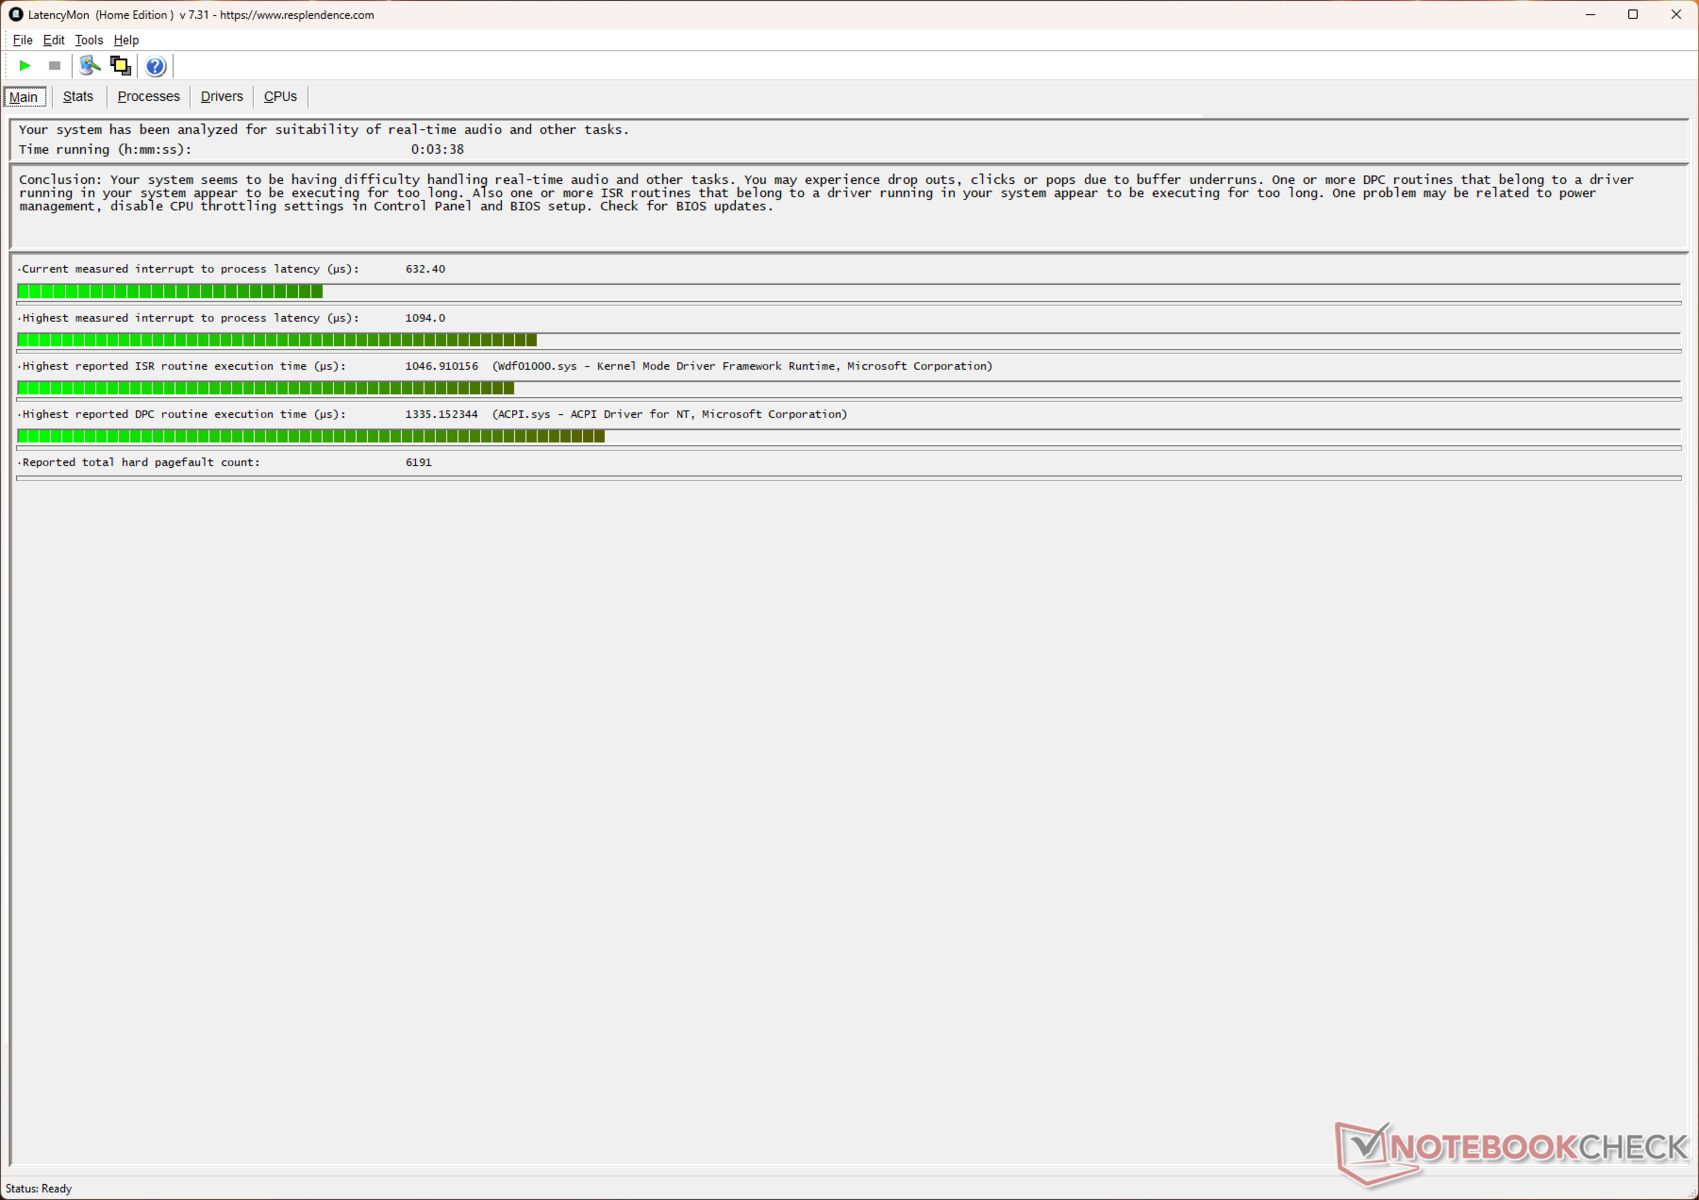
Latencia del CPD
El latencia DPC medida está en el lado más alto, lo que potencialmente puede plantear problemas durante los flujos de trabajo de audio en tiempo real.
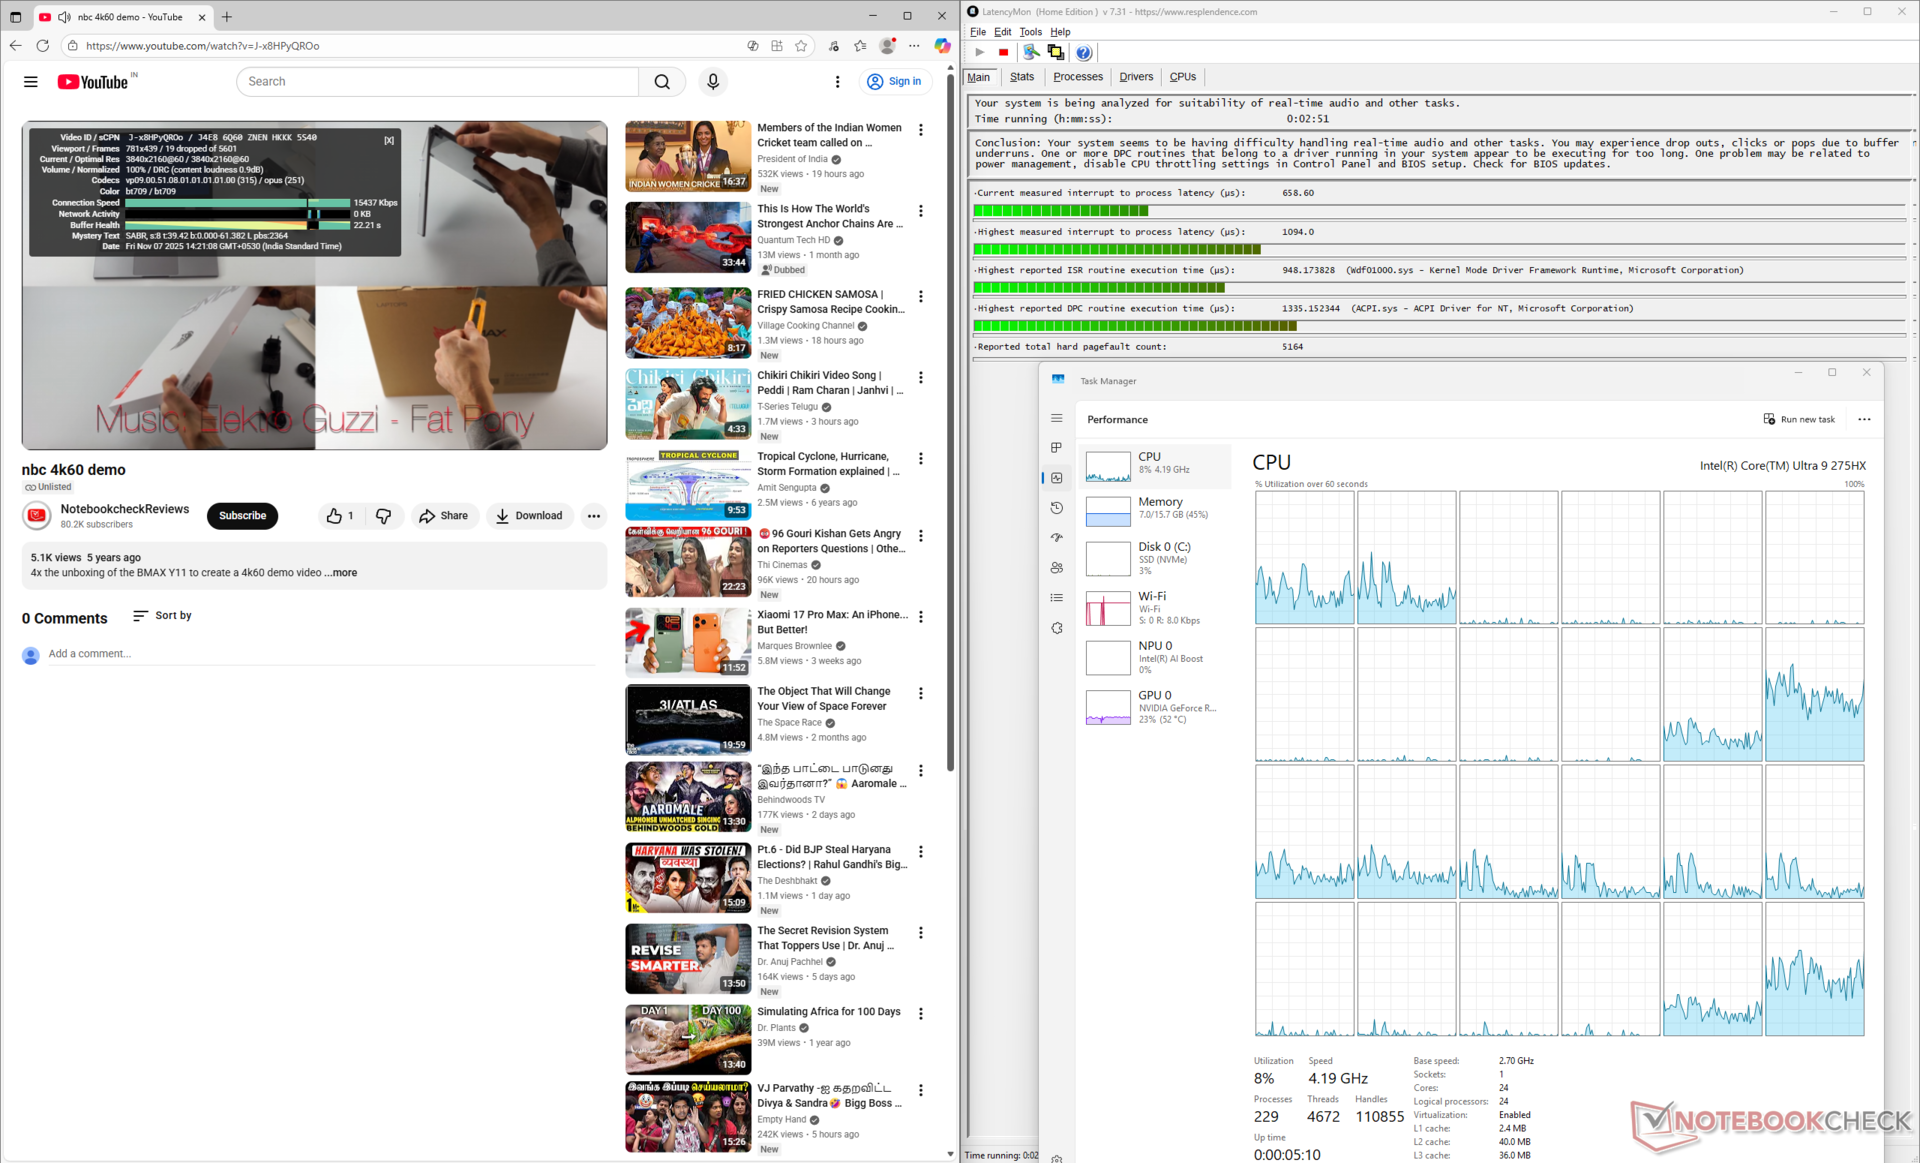

| DPC Latencies / LatencyMon - interrupt to process latency (max), Web, Youtube, Prime95 | |
| Alienware 16X Aurora, RTX 5070 | |
| Lenovo Legion 5 Pro 16IAX10H | |
| MSI Crosshair 16 HX AI D2XWGKG | |
| MSI Crosshair 18 HX AI A2XW | |
| Aorus Elite 16 AE6H | |
| MSI Crosshair A17 HX D8WGKG | |
| Schenker XMG Core 16 M25 | |
| Asus TUF Gaming A16 FA608UP | |
* ... más pequeño es mejor
Dispositivos de almacenamiento
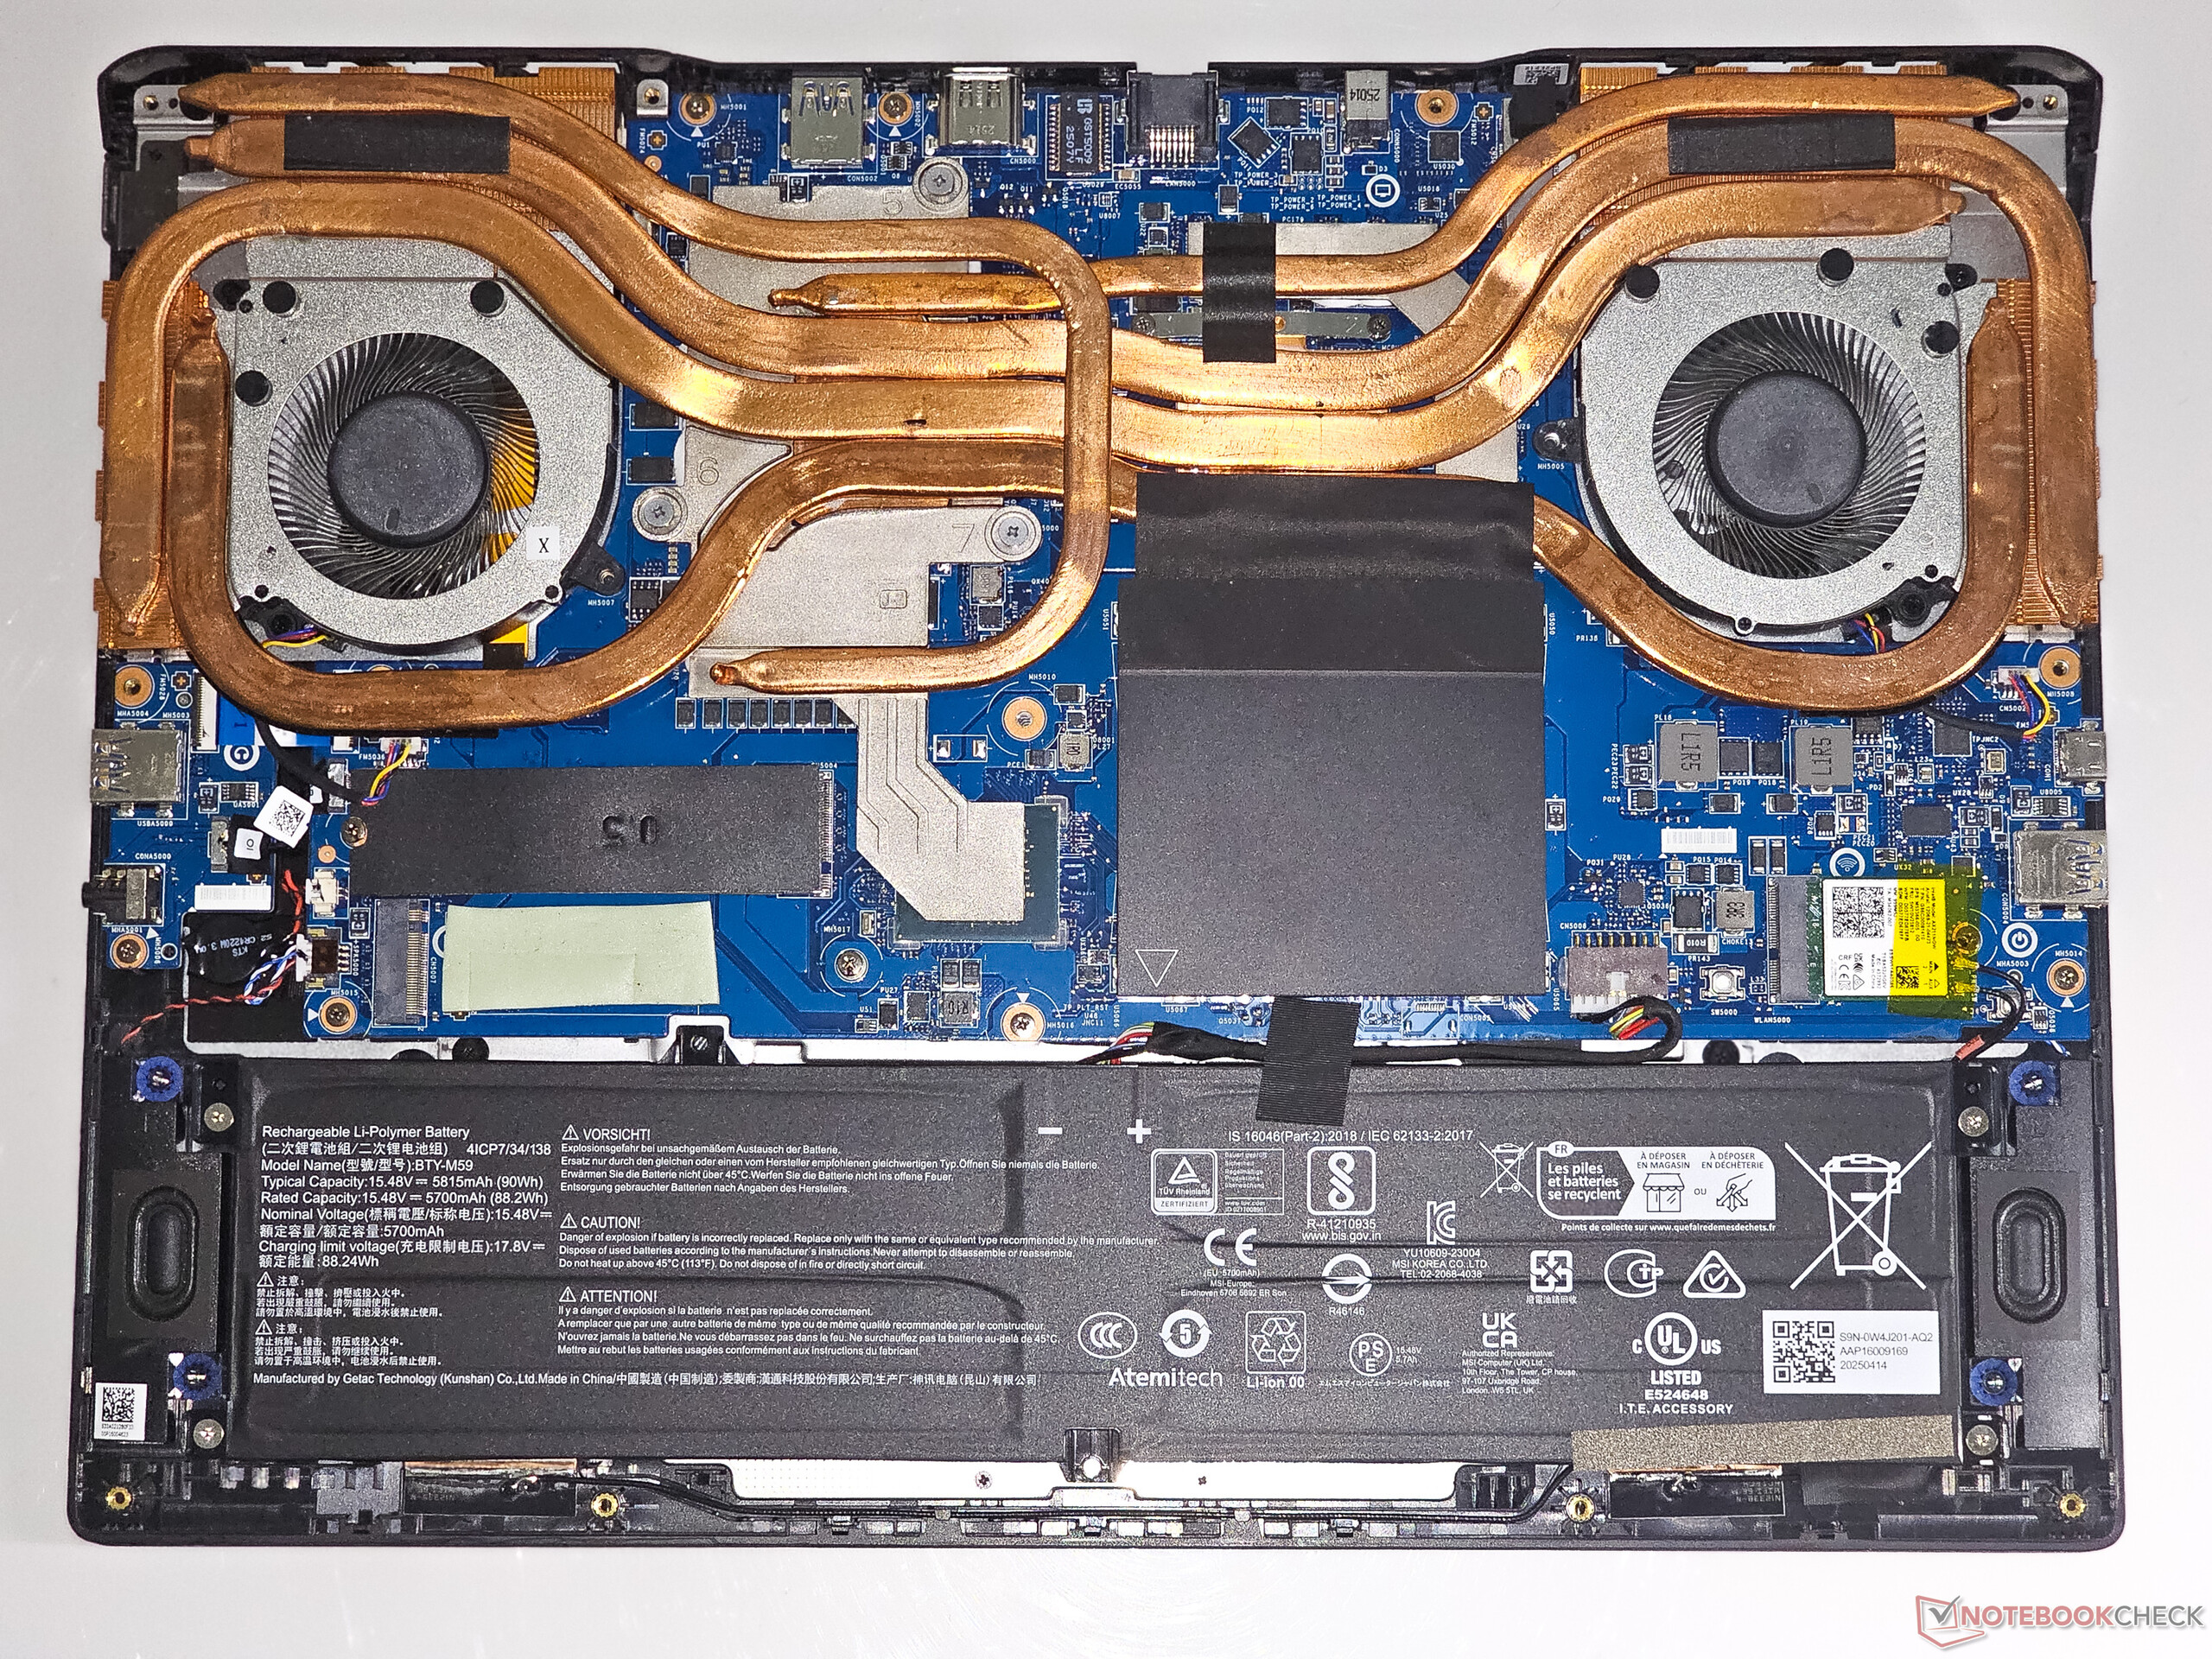
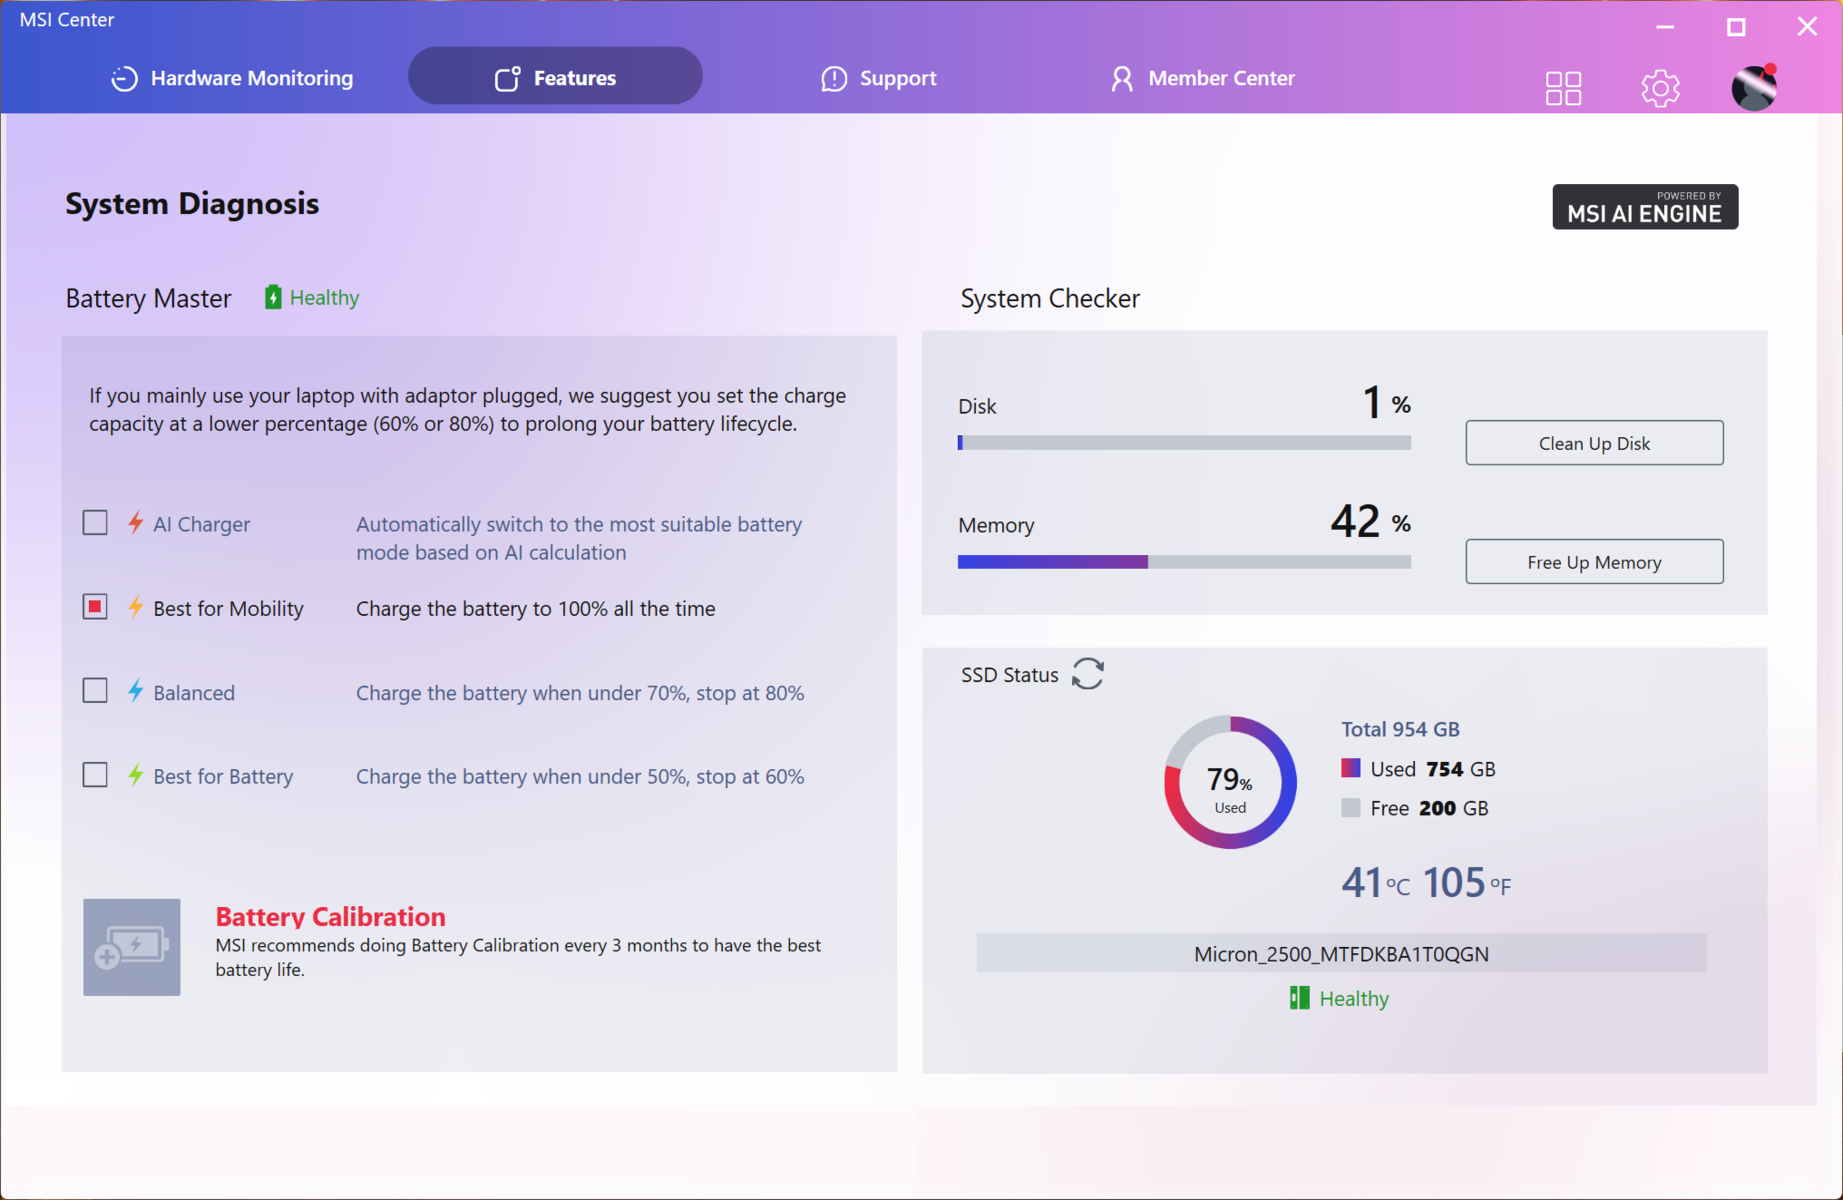
La SSD NVMe Micron 2500 de 1 TB PCIe Gen 4 ofrece un rendimiento de lectura/escritura decente, pero no puede equipararse a las Samsung PM9C1 del Crosshair A17 HX.
Dispone de una ranura M.2 adicional para ampliar el almacenamiento.

* ... más pequeño es mejor
Estrangulamiento de disco: Bucle de lectura DiskSpd, profundidad de cola 8
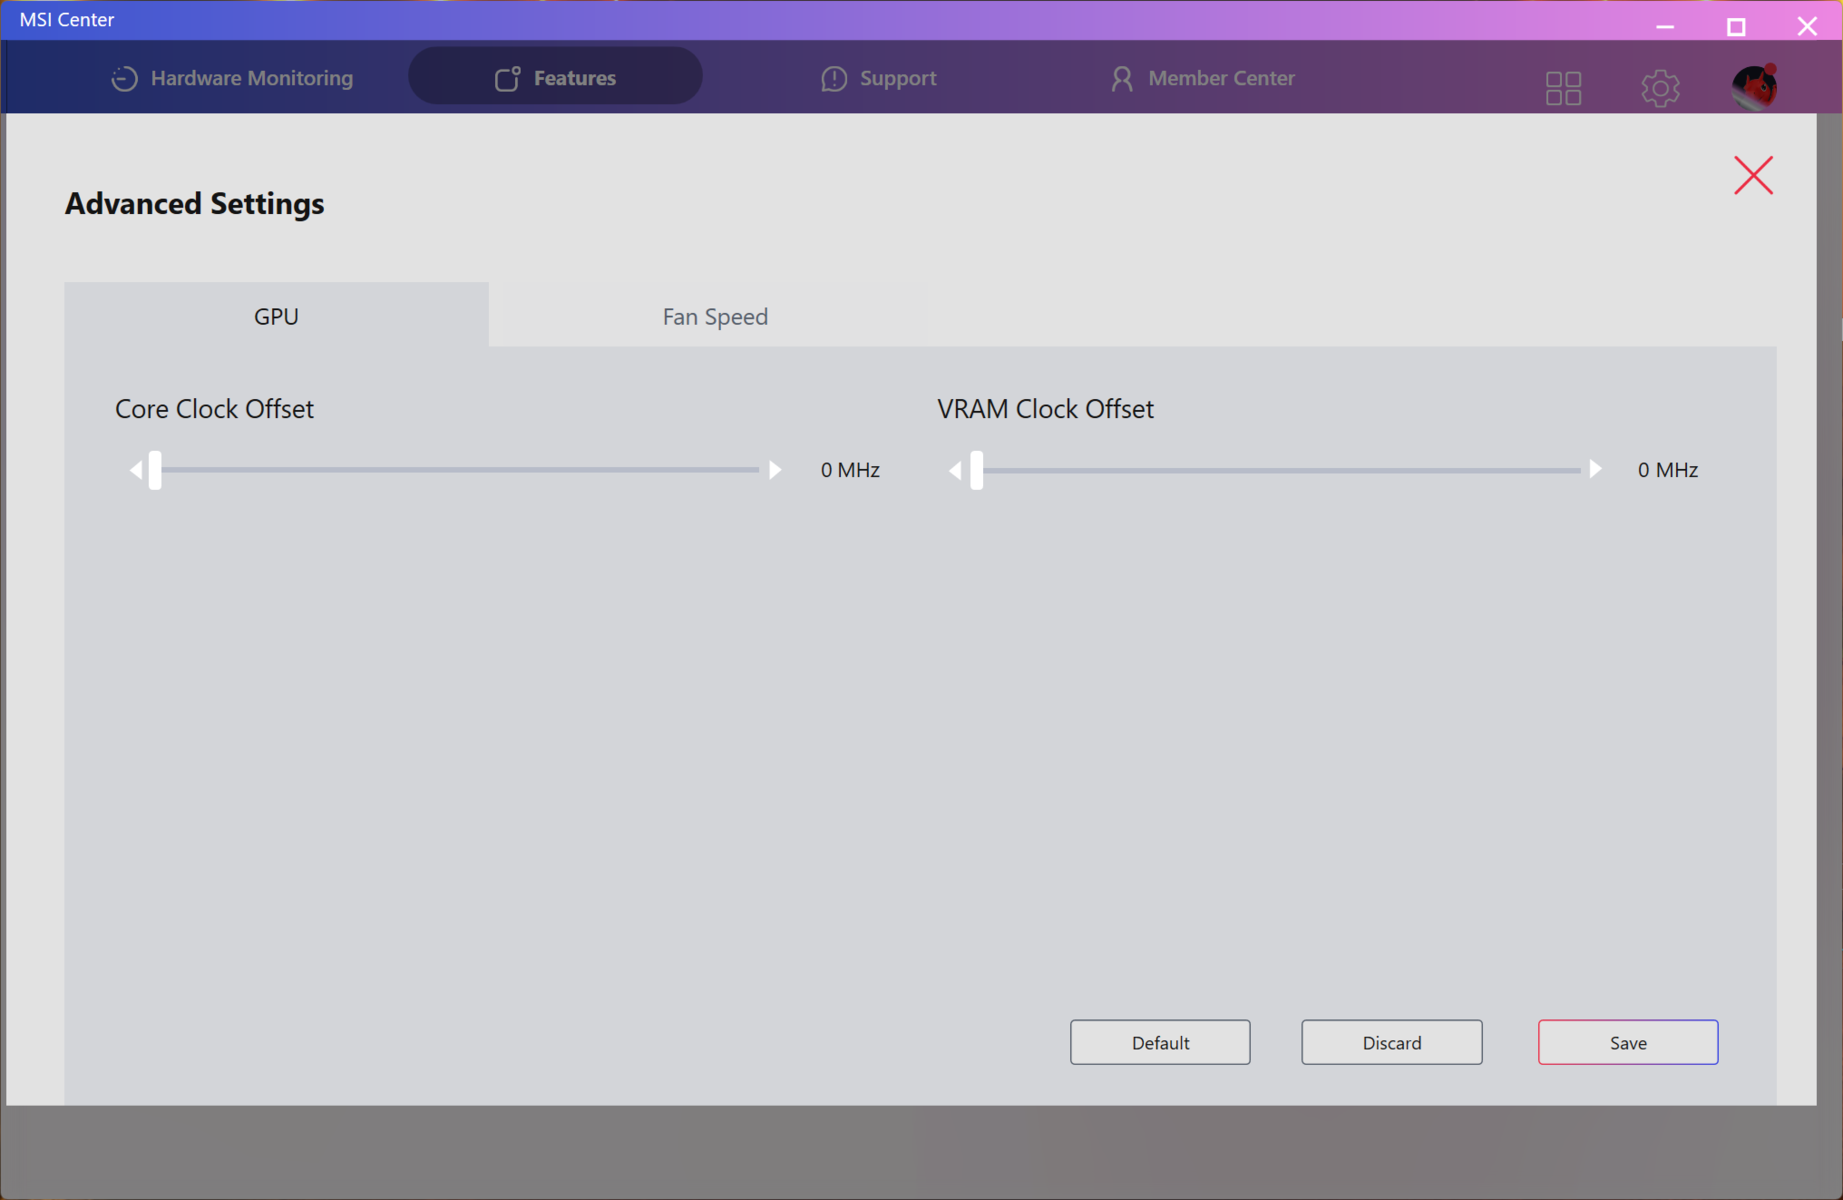
Rendimiento de la GPU
El Crosshair 16 HX AI de 115 W GPU Nvidia GeForce RTX 5070 para portátiles rinde en las líneas esperadas.
El portátil va a la zaga del Legion Pro 5 con una GPU RTX 5070 Ti para portátiles en un 22% en las pruebas 3DMark generales.
| 3DMark 11 Performance | 36966 puntos | |
| 3DMark Ice Storm Standard Score | 313398 puntos | |
| 3DMark Cloud Gate Standard Score | 67854 puntos | |
| 3DMark Fire Strike Score | 28686 puntos | |
| 3DMark Fire Strike Extreme Score | 16912 puntos | |
| 3DMark Time Spy Score | 13956 puntos | |
| 3DMark Steel Nomad Score | 3108 puntos | |
| 3DMark Steel Nomad Light Score | 14107 puntos | |
ayuda | ||
| Blender / v3.3 Classroom OPTIX/RTX | |
| Schenker XMG Core 16 M25 | |
| MSI Crosshair 16 HX AI D2XWGKG | |
| Asus TUF Gaming A16 FA608UP | |
| Medio NVIDIA GeForce RTX 5070 Laptop (17 - 24, n=27) | |
| Aorus Elite 16 AE6H | |
| MSI Crosshair 18 HX AI A2XW | |
| Media de la clase Gaming (9 - 32, n=111, últimos 2 años) | |
| Alienware 16X Aurora, RTX 5070 | |
| MSI Crosshair A17 HX D8WGKG | |
| Lenovo Legion 5 Pro 16IAX10H | |
| Blender / v3.3 Classroom CUDA | |
| Medio NVIDIA GeForce RTX 5070 Laptop (29 - 228, n=28) | |
| Schenker XMG Core 16 M25 | |
| Asus TUF Gaming A16 FA608UP | |
| Media de la clase Gaming (15 - 228, n=111, últimos 2 años) | |
| Aorus Elite 16 AE6H | |
| MSI Crosshair 16 HX AI D2XWGKG | |
| MSI Crosshair A17 HX D8WGKG | |
| MSI Crosshair 18 HX AI A2XW | |
| Alienware 16X Aurora, RTX 5070 | |
| Lenovo Legion 5 Pro 16IAX10H | |
| Blender / v3.3 Classroom CPU | |
| Asus TUF Gaming A16 FA608UP | |
| Medio NVIDIA GeForce RTX 5070 Laptop (137 - 507, n=25) | |
| Media de la clase Gaming (122 - 565, n=107, últimos 2 años) | |
| Schenker XMG Core 16 M25 | |
| Alienware 16X Aurora, RTX 5070 | |
| MSI Crosshair 18 HX AI A2XW | |
| Lenovo Legion 5 Pro 16IAX10H | |
| MSI Crosshair 16 HX AI D2XWGKG | |
* ... más pequeño es mejor
La Crosshair 16 HX AI puede ejecutar de forma convincente muchos títulos con ajustes QHD Ultra, pero la limitación de 8 GB de VRAM se hace evidente de inmediato en juegos que requieren mucha VRAM como Mito Negro: Wukong y F1 25.
Cyberpunk 2077 Gráfico de fps en ultra 1080p
No notamos ningún problema importante de ralentización durante una ejecución prolongada de Cyberpunk 2077: Phantom Liberty a 1080p Ultra.
| bajo | medio | alto | ultra | QHD DLSS | QHD | |
|---|---|---|---|---|---|---|
| GTA V (2015) | 179.8 | 174.1 | 172.4 | 142.3 | 125.9 | |
| Dota 2 Reborn (2015) | 217 | 190.5 | 183.8 | 170 | ||
| Final Fantasy XV Benchmark (2018) | 234 | 192.6 | 141.9 | 104 | ||
| X-Plane 11.11 (2018) | 148.1 | 133.9 | 111 | |||
| Strange Brigade (2018) | 536 | 362 | 302 | 259 | 171.8 | |
| Baldur's Gate 3 (2023) | 204 | 150.7 | 135.5 | 131 | 133.9 | 90.7 |
| Cyberpunk 2077 (2023) | 174.2 | 145 | 120.1 | 107.1 | 77 | 66.3 |
| F1 24 (2024) | 305 | 316 | 251 | 87.6 | 86.7 | 53.8 |
| Black Myth: Wukong (2024) | 197 | 112 | 86 | 44 | 40 | 26 |
| F1 25 (2025) | 267 | 242 | 191 | 26.5 | 29.1 | 7.69 |
| Battlefield 6 (2025) | 154 | 138.6 | 106.6 | 79.9 | 56.1 | 43.4 |
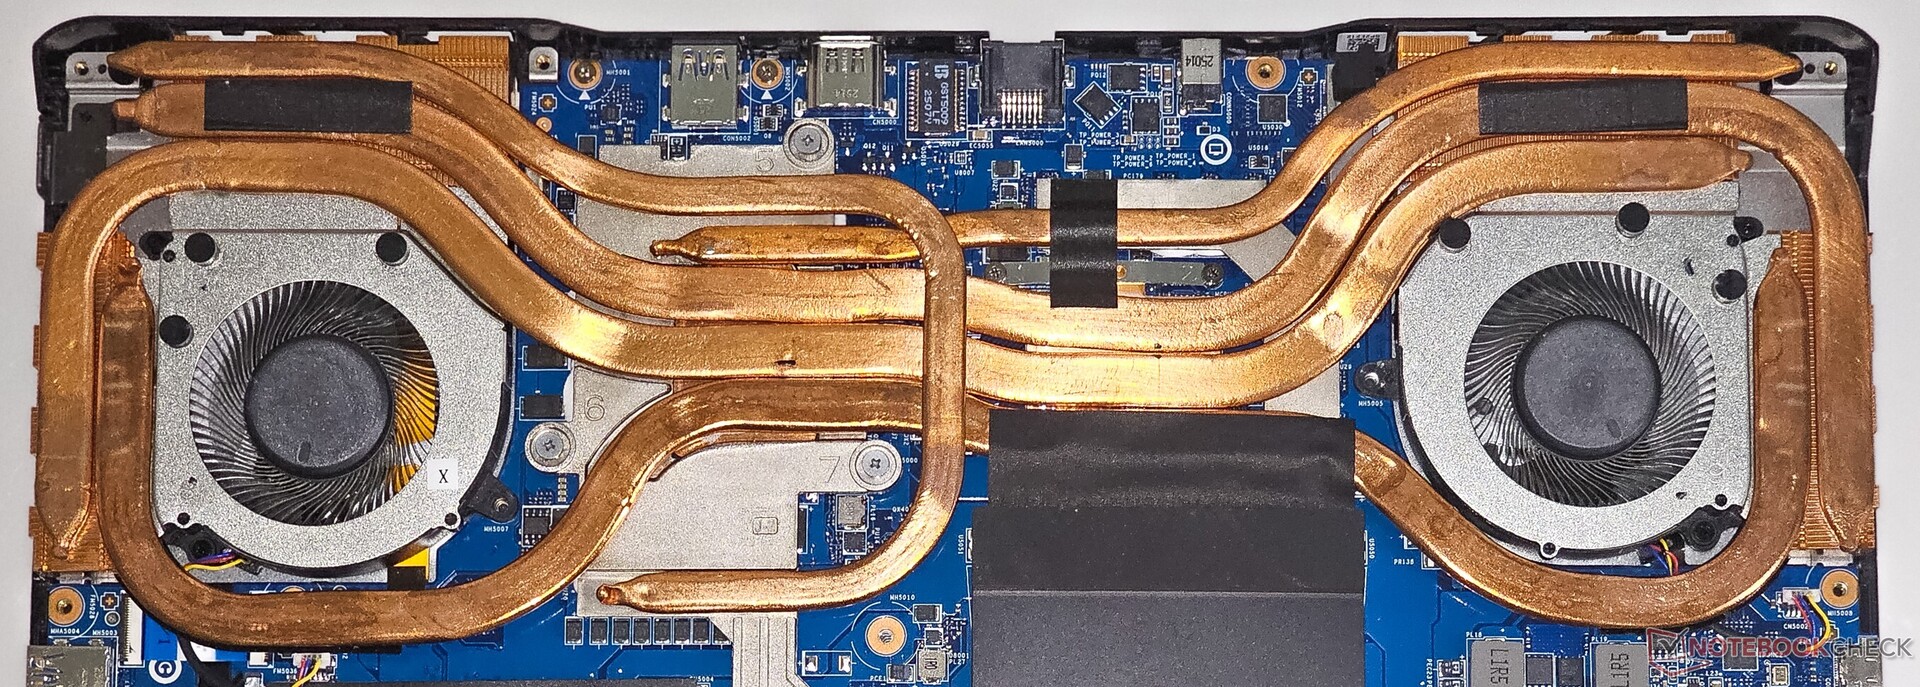
Emisiones: Refrigeración robusta pero con altos niveles de decibelios y térmicos
Ruido del sistema
El ruido del ventilador en el modo Rendimiento Extremo alcanza casi 58 db(A) a plena carga.
El perfil de Rendimiento Extremo incluye un modo de ventilador Cooler Boost, que alcanza un pico de 65 db(A), por lo que se recomienda encarecidamente el uso de auriculares mientras se juega en este modo.
Ruido
| Ocioso |
| 28.3 / 28.3 / 28.3 dB(A) |
| Carga |
| 50.26 / 57.95 dB(A) |
 | ||
30 dB silencioso 40 dB(A) audible 50 dB(A) ruidosamente alto |
||
min: | ||
| MSI Crosshair 16 HX AI D2XWGKG Ultra 9 275HX, GeForce RTX 5070 Laptop | Alienware 16X Aurora, RTX 5070 Ultra 9 275HX, GeForce RTX 5070 Laptop | Aorus Elite 16 AE6H Ultra 9 275HX, GeForce RTX 5070 Laptop | Lenovo Legion 5 Pro 16IAX10H Ultra 9 275HX, GeForce RTX 5070 Ti Laptop | Asus TUF Gaming A16 FA608UP R7 260, GeForce RTX 5070 Laptop | |
|---|---|---|---|---|---|
| Noise | 15% | -3% | 3% | -1% | |
| apagado / medio ambiente * (dB) | 25.56 | 23.7 7% | 24 6% | 24 6% | 25.1 2% |
| Idle Minimum * (dB) | 28.3 | 23.9 16% | 25 12% | 24 15% | 32.2 -14% |
| Idle Average * (dB) | 28.3 | 23.9 16% | 29 -2% | 24 15% | 32.2 -14% |
| Idle Maximum * (dB) | 28.3 | 26.1 8% | 32 -13% | 30.9 -9% | 32.2 -14% |
| Load Average * (dB) | 50.26 | 26.8 47% | 60 -19% | 55.9 -11% | 38.1 24% |
| Cyberpunk 2077 ultra * (dB) | 57.8 | 51.8 10% | 59 -2% | 56.72 2% | 53.9 7% |
| Load Maximum * (dB) | 57.95 | 58 -0% | 61 -5% | 56.72 2% | 57.1 1% |
* ... más pequeño es mejor
Temperatura
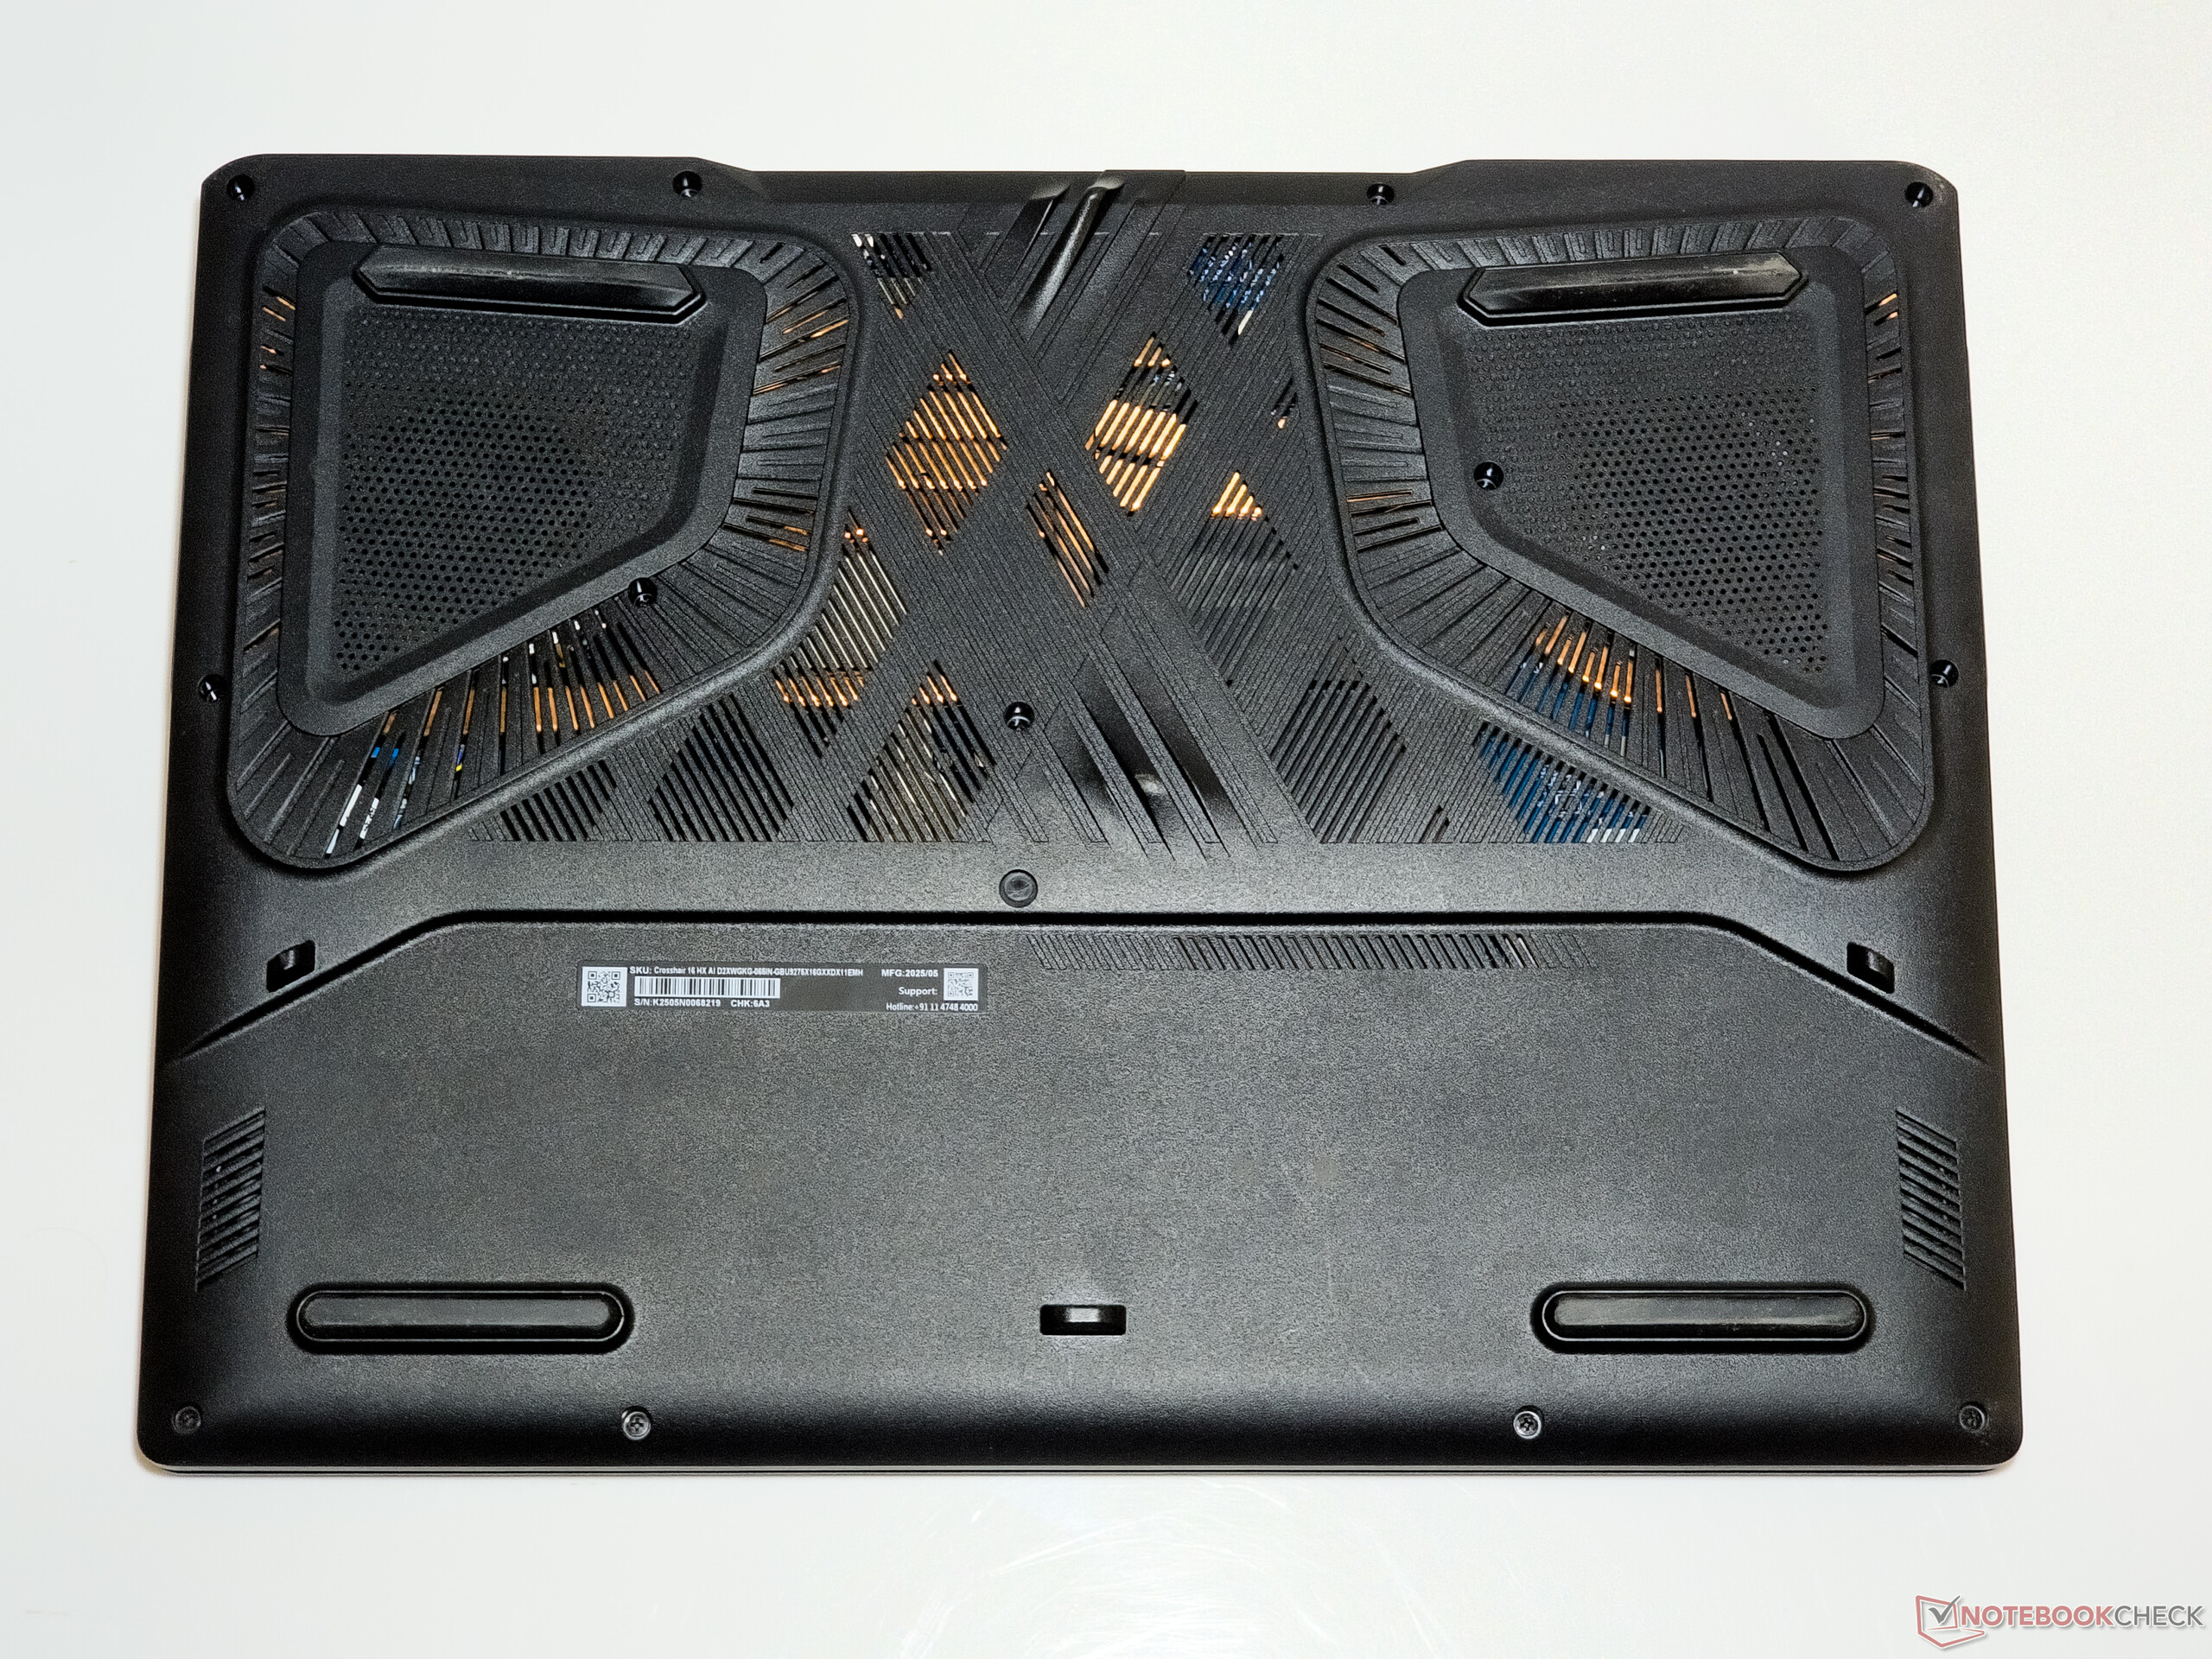
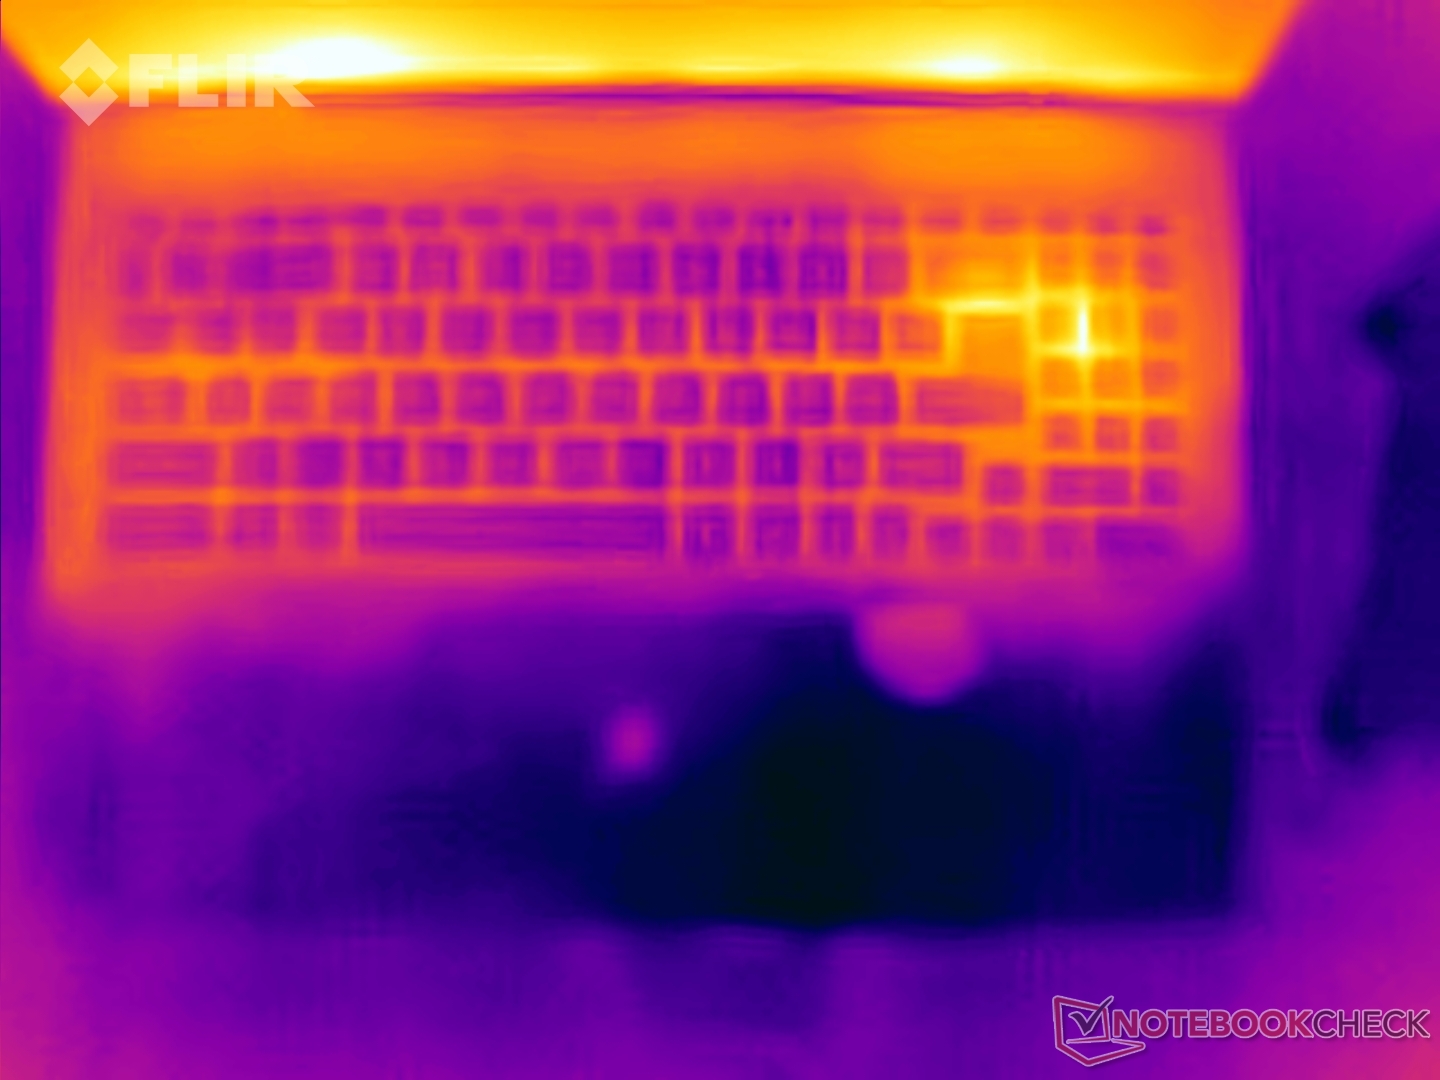
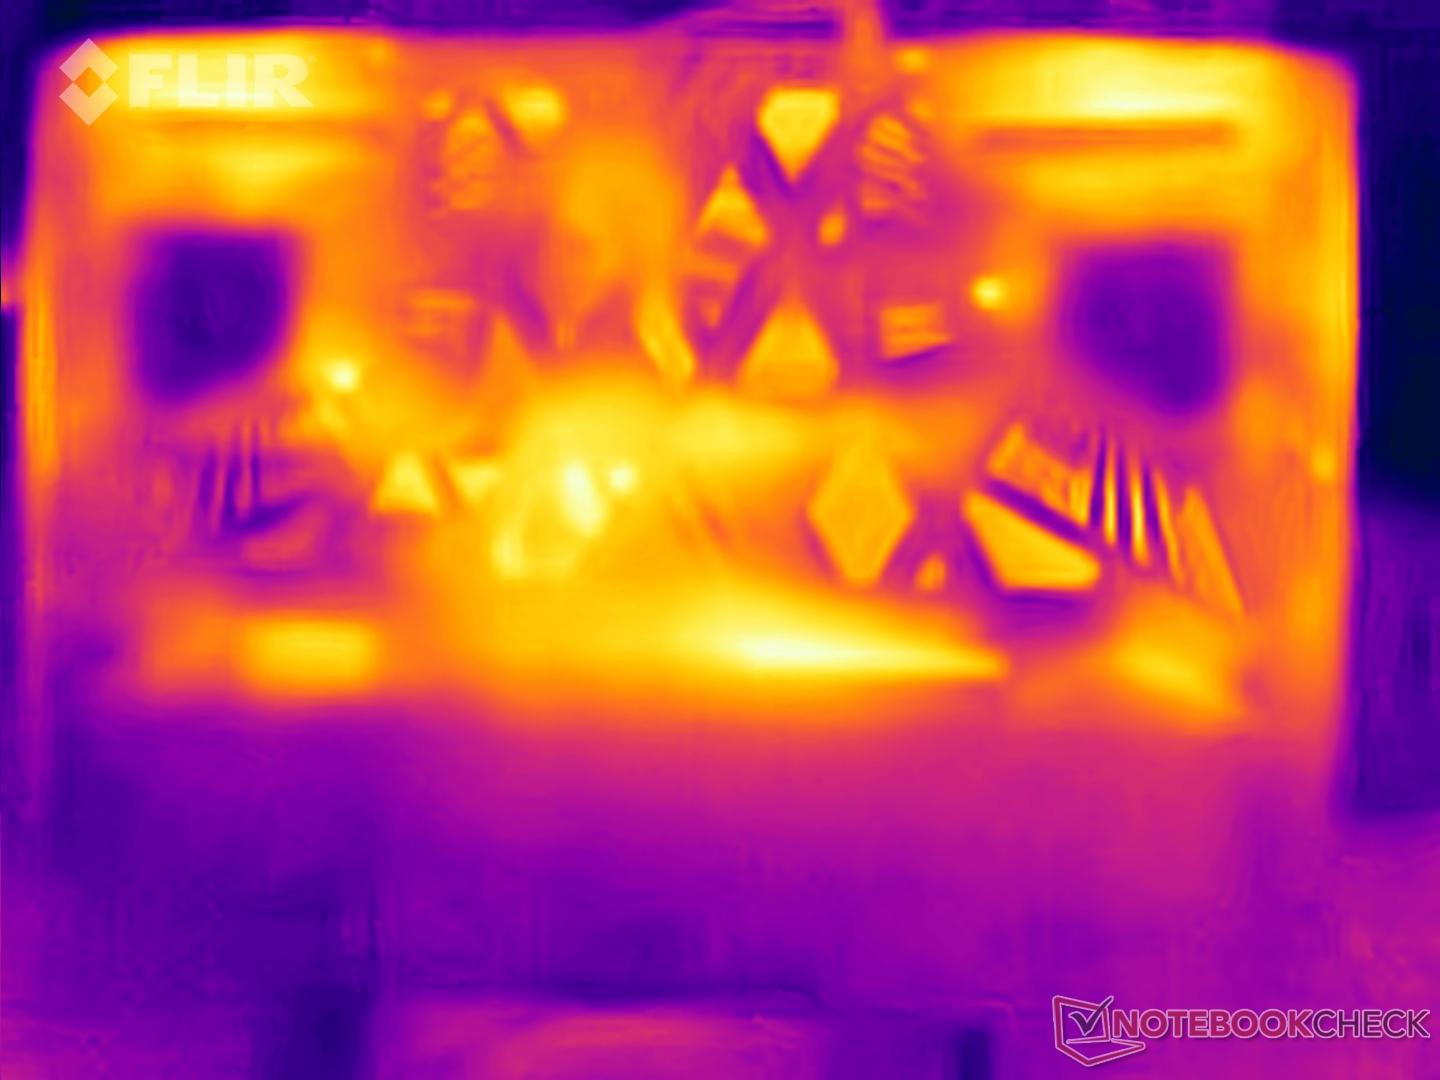
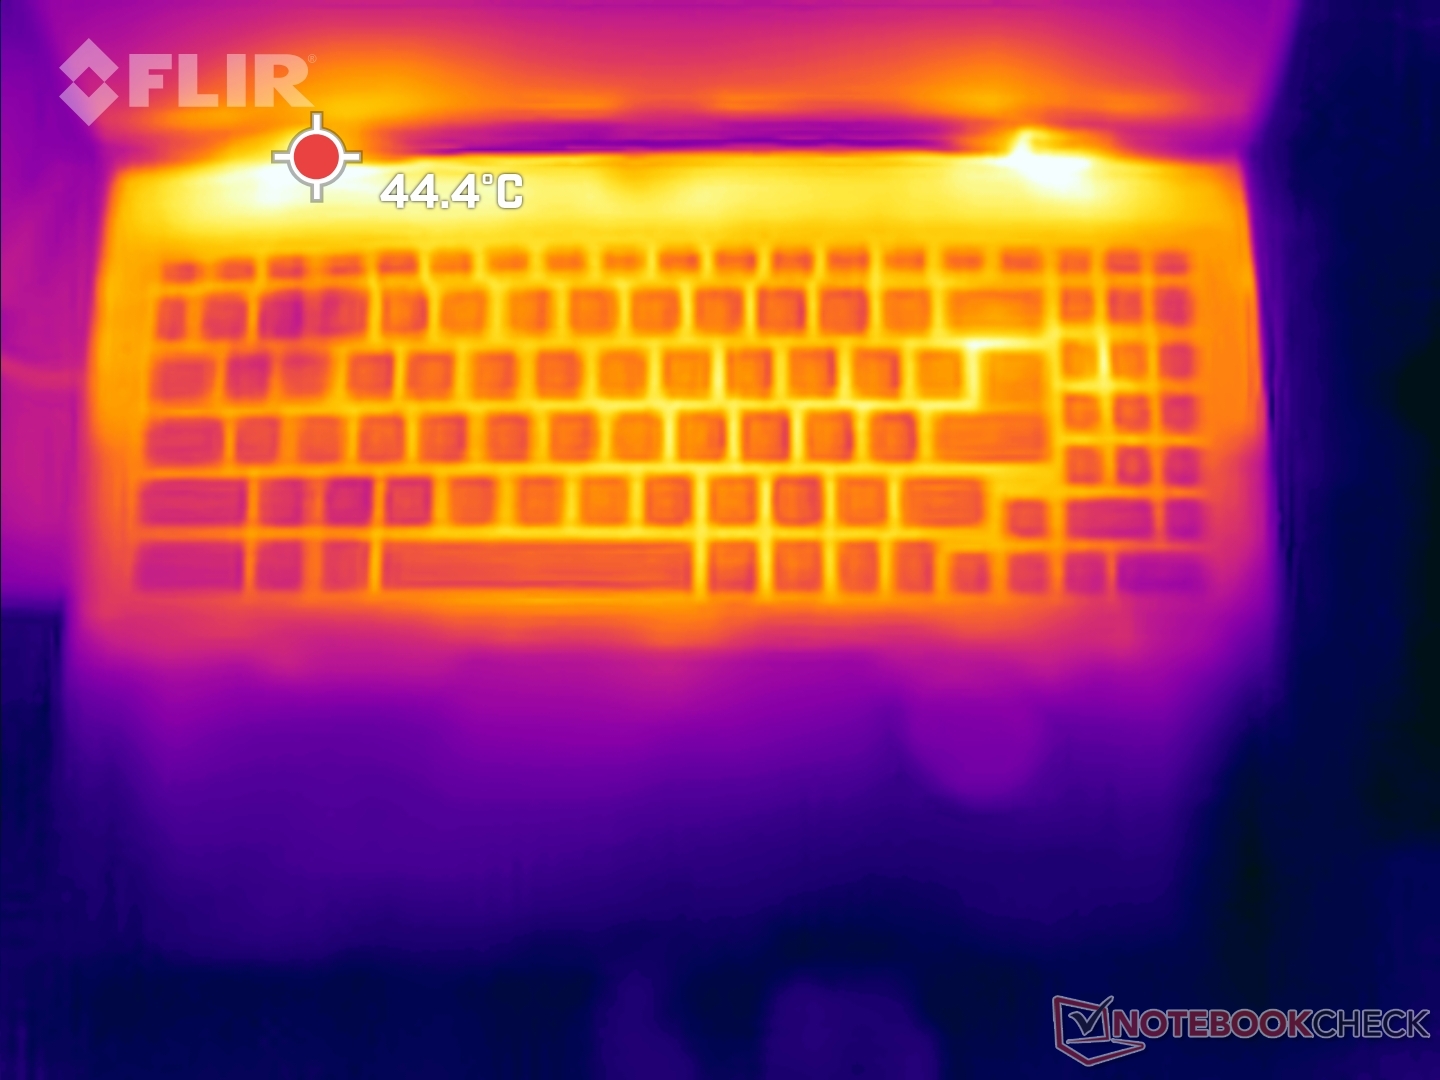
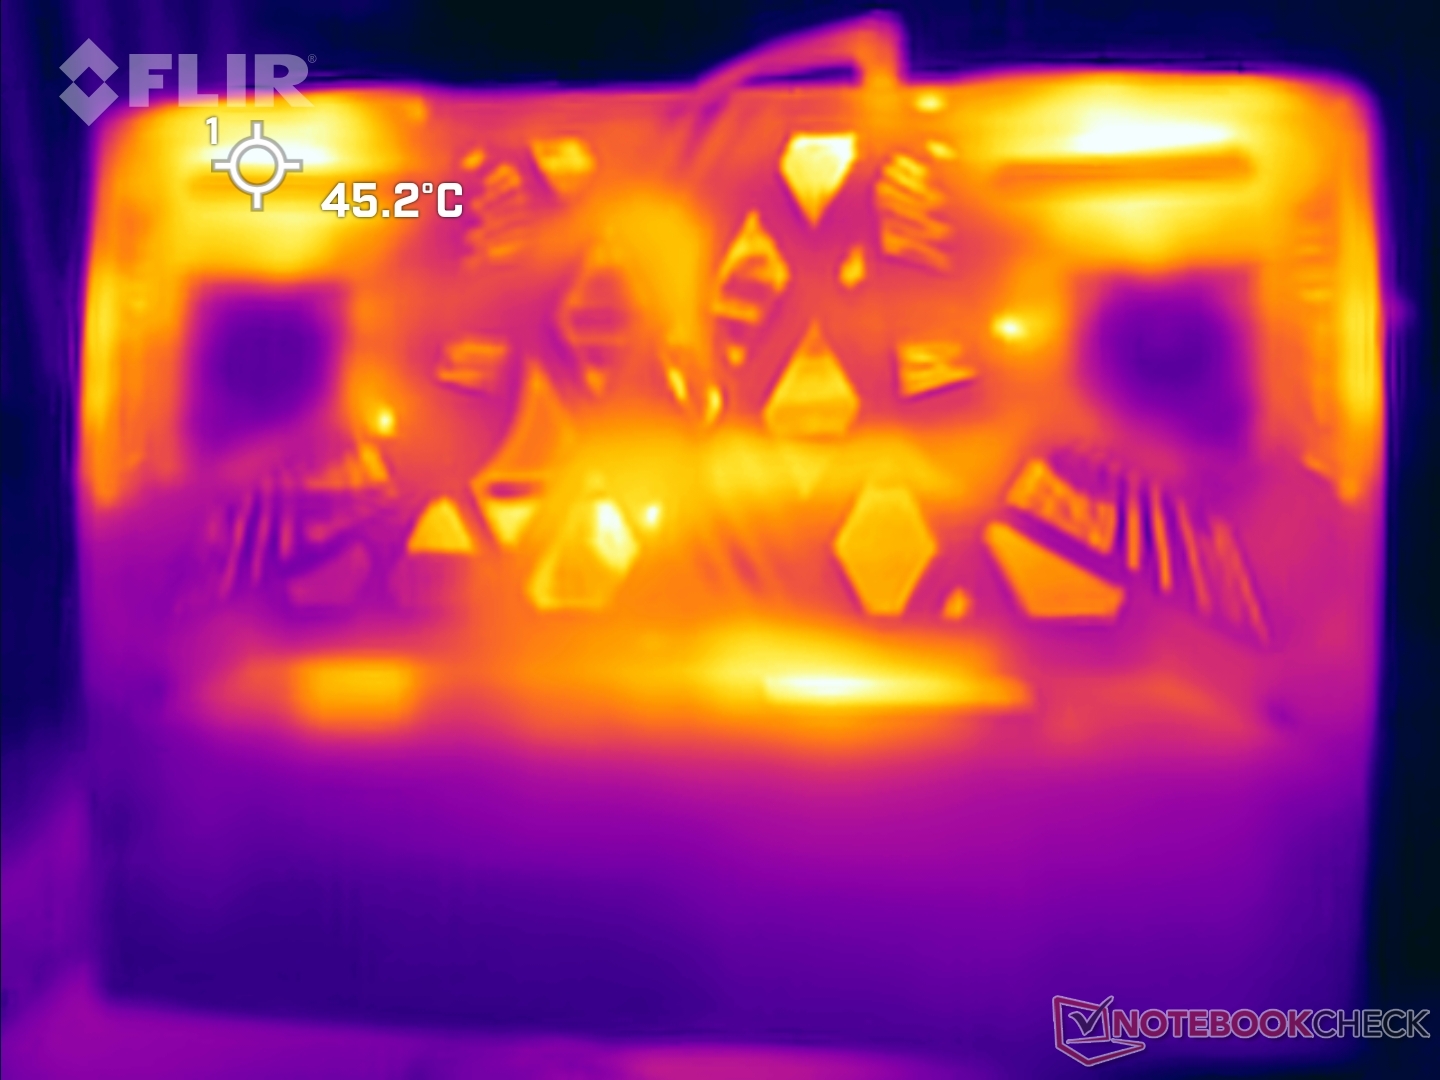
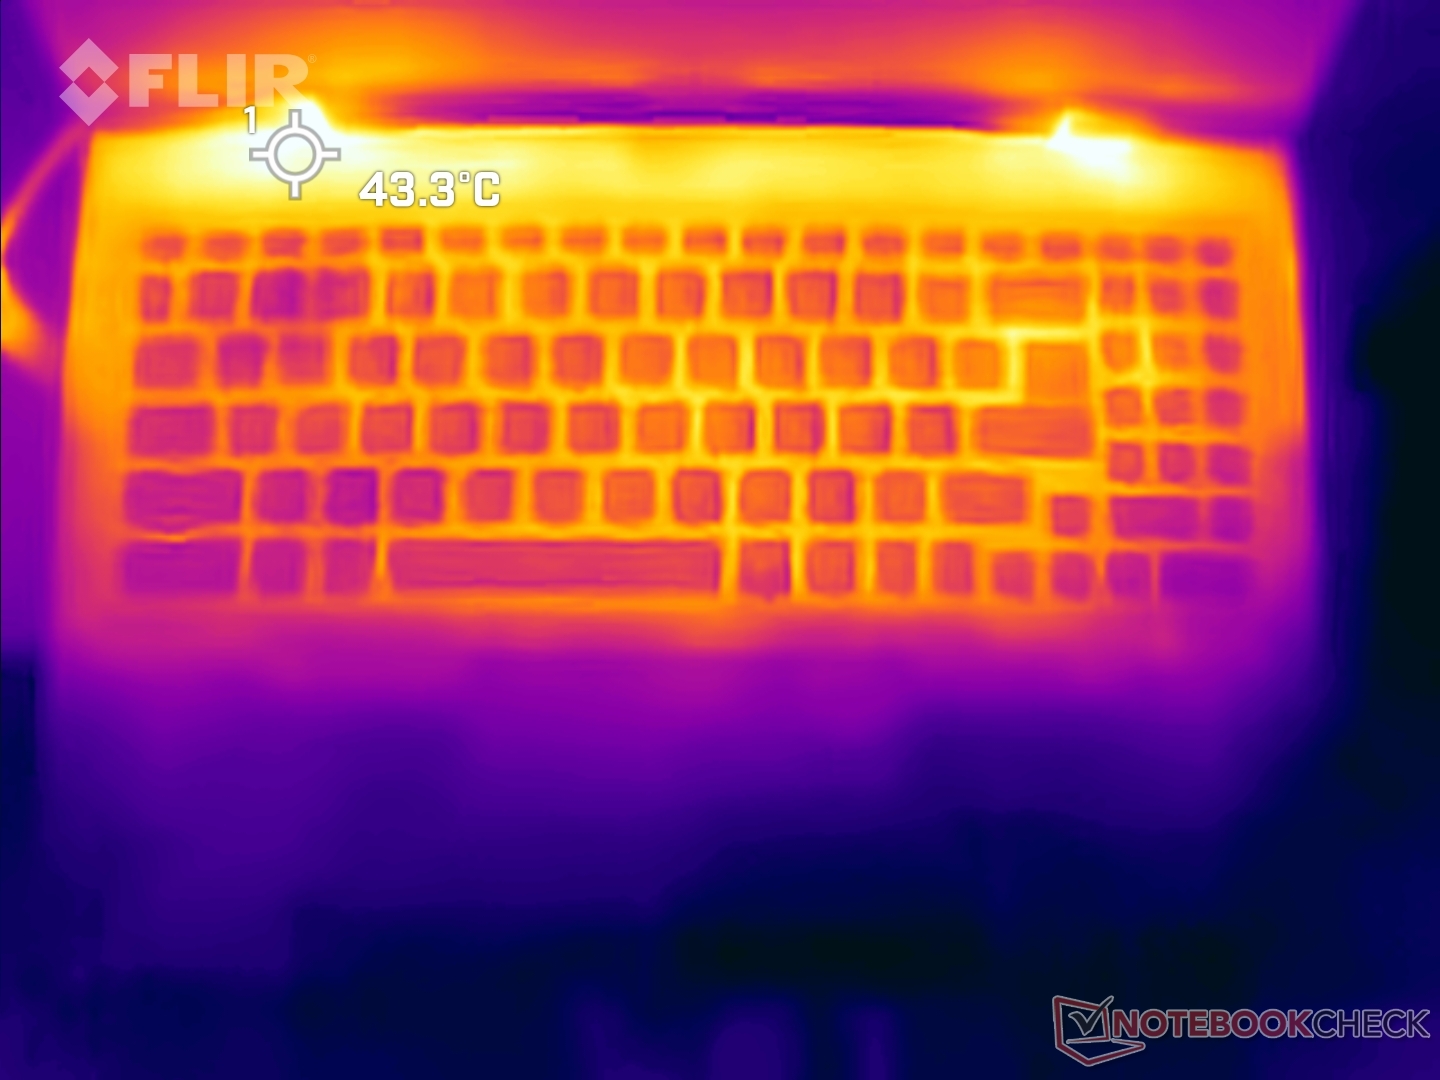
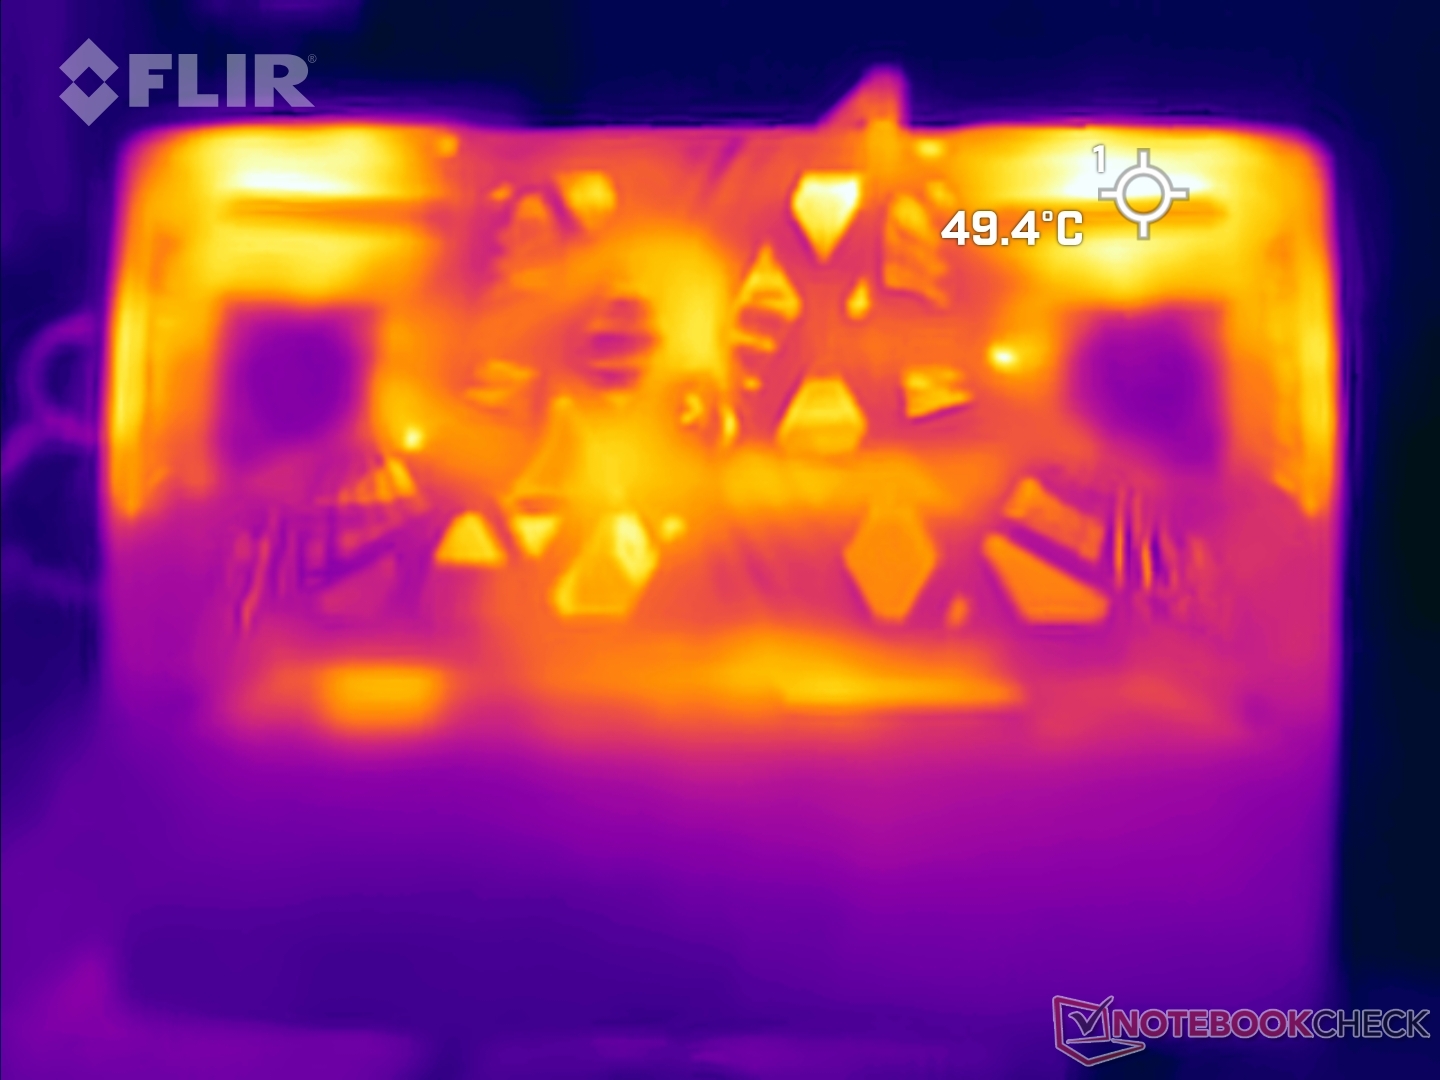
Las temperaturas de la superficie pueden alcanzar hasta 45 °C en la parte superior y casi 49 °C en la inferior bajo carga en el modo de rendimiento extremo.
Las zonas WASD, touchpad y reposamanos se mantuvieron relativamente frías durante las pruebas de estrés.
Dado que los ventiladores expulsan mucho aire por las múltiples rejillas de ventilación, quienes utilicen un ratón tal vez deseen colocarse en una posición adecuada para evitar las molestias del escape caliente.
(±) La temperatura máxima en la parte superior es de 44.8 °C / 113 F, frente a la media de 40.4 °C / 105 F, que oscila entre 21.2 y 68.8 °C para la clase Gaming.
(±) El fondo se calienta hasta un máximo de 43.4 °C / 110 F, frente a la media de 43.2 °C / 110 F
(+) En reposo, la temperatura media de la parte superior es de 28.9 °C / 84# F, frente a la media del dispositivo de 33.9 °C / 93 F.
(±) 3: The average temperature for the upper side is 36.9 °C / 98 F, compared to the average of 33.9 °C / 93 F for the class Gaming.
(+) El reposamanos y el panel táctil están a una temperatura inferior a la de la piel, con un máximo de 31 °C / 87.8 F y, por tanto, son fríos al tacto.
(-) La temperatura media de la zona del reposamanos de dispositivos similares fue de 28.8 °C / 83.8 F (-2.2 °C / -4 F).
| MSI Crosshair 16 HX AI D2XWGKG Ultra 9 275HX, GeForce RTX 5070 Laptop | Alienware 16X Aurora, RTX 5070 Ultra 9 275HX, GeForce RTX 5070 Laptop | Aorus Elite 16 AE6H Ultra 9 275HX, GeForce RTX 5070 Laptop | Lenovo Legion 5 Pro 16IAX10H Ultra 9 275HX, GeForce RTX 5070 Ti Laptop | Asus TUF Gaming A16 FA608UP R7 260, GeForce RTX 5070 Laptop | |
|---|---|---|---|---|---|
| Heat | -3% | -8% | -23% | 9% | |
| Maximum Upper Side * (°C) | 44.8 | 51 -14% | 41 8% | 48 -7% | 39.5 12% |
| Maximum Bottom * (°C) | 43.4 | 45.6 -5% | 45 -4% | 50 -15% | 45.1 -4% |
| Idle Upper Side * (°C) | 31.2 | 29.8 4% | 35 -12% | 38 -22% | 25.7 18% |
| Idle Bottom * (°C) | 28.8 | 27.4 5% | 36 -25% | 42 -46% | 25.5 11% |
* ... más pequeño es mejor
Altavoces
Los altavoces estéreo del Crosshair 16 HX AI tienen unos niveles de sonoridad decentes pero carecen de una buena respuesta de graves.
MSI Crosshair 16 HX AI D2XWGKG análisis de audio
(±) | la sonoridad del altavoz es media pero buena (81.5 dB)
Graves 100 - 315 Hz
(-) | casi sin bajos - de media 15.6% inferior a la mediana
(±) | la linealidad de los graves es media (10.5% delta a frecuencia anterior)
Medios 400 - 2000 Hz
(±) | medias más altas - de media 6.6% más altas que la mediana
(±) | la linealidad de los medios es media (7.1% delta respecto a la frecuencia anterior)
Altos 2 - 16 kHz
(+) | máximos equilibrados - a sólo 1.6% de la mediana
(+) | los máximos son lineales (5.8% delta a la frecuencia anterior)
Total 100 - 16.000 Hz
(+) | el sonido global es lineal (14.7% de diferencia con la mediana)
En comparación con la misma clase
» 28% de todos los dispositivos probados de esta clase eran mejores, 7% similares, 64% peores
» El mejor tuvo un delta de 6%, la media fue 18%, el peor fue ###max##%
En comparación con todos los dispositivos probados
» 19% de todos los dispositivos probados eran mejores, 4% similares, 77% peores
» El mejor tuvo un delta de 4%, la media fue 24%, el peor fue ###max##%
Apple MacBook Pro 16 2021 M1 Pro análisis de audio
(+) | los altavoces pueden reproducir a un volumen relativamente alto (#84.7 dB)
Graves 100 - 315 Hz
(+) | buen bajo - sólo 3.8% lejos de la mediana
(+) | el bajo es lineal (5.2% delta a la frecuencia anterior)
Medios 400 - 2000 Hz
(+) | medios equilibrados - a sólo 1.3% de la mediana
(+) | los medios son lineales (2.1% delta a la frecuencia anterior)
Altos 2 - 16 kHz
(+) | máximos equilibrados - a sólo 1.9% de la mediana
(+) | los máximos son lineales (2.7% delta a la frecuencia anterior)
Total 100 - 16.000 Hz
(+) | el sonido global es lineal (4.6% de diferencia con la mediana)
En comparación con la misma clase
» 0% de todos los dispositivos probados de esta clase eran mejores, 0% similares, 100% peores
» El mejor tuvo un delta de 5%, la media fue 17%, el peor fue ###max##%
En comparación con todos los dispositivos probados
» 0% de todos los dispositivos probados eran mejores, 0% similares, 100% peores
» El mejor tuvo un delta de 4%, la media fue 24%, el peor fue ###max##%
Consumo de energía: No es el más frugal de la comparación
El Crosshair 16 HX AI no es muy económico en lo que se refiere al consumo de energía en el modo de Rendimiento Extremo. El consumo de energía es algo mayor incluso en los estados apagado y en espera.
| Off / Standby | |
| Ocioso | |
| Carga |
|
Clave:
min: | |
| MSI Crosshair 16 HX AI D2XWGKG Ultra 9 275HX, GeForce RTX 5070 Laptop, IPS, 2560x1600, 16" | Alienware 16X Aurora, RTX 5070 Ultra 9 275HX, GeForce RTX 5070 Laptop, IPS, 2560x1600, 16" | Aorus Elite 16 AE6H Ultra 9 275HX, GeForce RTX 5070 Laptop, IPS, 2560x1600, 16" | Lenovo Legion 5 Pro 16IAX10H Ultra 9 275HX, GeForce RTX 5070 Ti Laptop, OLED, 2560x1600, 16" | Asus TUF Gaming A16 FA608UP R7 260, GeForce RTX 5070 Laptop, IPS, 2560x1600, 16" | Medio NVIDIA GeForce RTX 5070 Laptop | Media de la clase Gaming | |
|---|---|---|---|---|---|---|---|
| Power Consumption | 11% | 26% | 9% | 43% | 40% | 29% | |
| Idle Minimum * (Watt) | 26.2 | 20.1 23% | 8.5 68% | 14 47% | 4.6 82% | 10.7 ? 59% | 13.2 ? 50% |
| Idle Average * (Watt) | 33.8 | 27.6 18% | 13.6 60% | 14.3 58% | 9.8 71% | 15.3 ? 55% | 18.9 ? 44% |
| Idle Maximum * (Watt) | 34 | 31.8 6% | 22 35% | 20.1 41% | 10.2 70% | 20.2 ? 41% | 24.3 ? 29% |
| Load Average * (Watt) | 112 | 102.7 8% | 113 -1% | 177 -58% | 76.1 32% | 97.5 ? 13% | 108 ? 4% |
| Cyberpunk 2077 ultra external monitor * (Watt) | 220 | 192.3 13% | 219 -0% | 255 -16% | 198.1 10% | ||
| Cyberpunk 2077 ultra * (Watt) | 224 | 217 3% | 223 -0% | 255 -14% | 198.9 11% | ||
| Load Maximum * (Watt) | 315 | 292 7% | 257 18% | 294 7% | 235.2 25% | 216 ? 31% | 254 ? 19% |
* ... más pequeño es mejor
Consumo de energía: Cyberpunk 2077 / Prueba de estrés
Consumo de energía: Monitor externo
Duración de las pilas
Es posible una autonomía de la batería cercana a las 12 horas o más en el modo ECO-Silencioso con MSHybrid y la frecuencia de refresco ajustada a 60 Hz.
| MSI Crosshair 16 HX AI D2XWGKG Ultra 9 275HX, GeForce RTX 5070 Laptop, 90 Wh | Alienware 16X Aurora, RTX 5070 Ultra 9 275HX, GeForce RTX 5070 Laptop, 96 Wh | Aorus Elite 16 AE6H Ultra 9 275HX, GeForce RTX 5070 Laptop, 99 Wh | Lenovo Legion 5 Pro 16IAX10H Ultra 9 275HX, GeForce RTX 5070 Ti Laptop, 80 Wh | Asus TUF Gaming A16 FA608UP R7 260, GeForce RTX 5070 Laptop, 90 Wh | Media de la clase Gaming | |
|---|---|---|---|---|---|---|
| Duración de Batería | ||||||
| WiFi v1.3 (h) | 11.1 | 4.3 -61% | 8.5 -23% | 4.9 -56% | 13 17% | 7.02 ? -37% |
Impresiones generales de Notebookcheck sobre el MSI Crosshair 16 HX AI
El MSI Crosshair 16 HX AI se presenta como un portátil para juegos de gama media-alta capaz. Hay medidas visibles de recorte de costes, pero ninguna que afecte negativamente a la experiencia de juego real.
MSI Crosshair 16 HX AI D2XWGKG
- 11/11/2025 v8
Vaidyanathan Subramaniam
 Total Sustainability Score:
 Competidores potenciales en comparación
Imagen | Modelo | Precio | Peso | Altura | Pantalla |
|---|---|---|---|---|---|
1. 81.9%  | MSI Crosshair 16 HX AI D2XWGKG Intel Core Ultra 9 275HX ⎘ NVIDIA GeForce RTX 5070 Laptop ⎘ 16 GB Memoría, 1024 GB SSD | Amazon: Precio de catálogo: 2500 EUR | 2.5 kg | 27.9 mm | 16.00" 2560x1600 189 PPI IPS |
2. 84.9%  | Alienware 16X Aurora, RTX 5070 Intel Core Ultra 9 275HX ⎘ NVIDIA GeForce RTX 5070 Laptop ⎘ 32 GB Memoría | Amazon: Precio de catálogo: 1800 USD | 2.5 kg | 23.4 mm | 16.00" 2560x1600 189 PPI IPS |
3. 84.4%  | Aorus Elite 16 AE6H Intel Core Ultra 9 275HX ⎘ NVIDIA GeForce RTX 5070 Laptop ⎘ 32 GB Memoría, 1024 GB SSD | Precio de catálogo: 2300 EUR | 2.4 kg | 26 mm | 16.00" 2560x1600 189 PPI IPS |
4. 84.5%  | Lenovo Legion 5 Pro 16IAX10H Intel Core Ultra 9 275HX ⎘ NVIDIA GeForce RTX 5070 Ti Laptop ⎘ 32 GB Memoría, 1024 GB SSD | Amazon: 1. $1,749.99 Lenovo Legion Pro 5 AI Gamin... 2. $99.99 Lenovo Slim 245W AC Adapter ... 3. $2,259.99 Lenovo Legion Pro 7 16IAX10H... Precio de catálogo: 2500 Euro | 2.4 kg | 25.95 mm | 16.00" 2560x1600 189 PPI OLED |
5. 83.8%  | Asus TUF Gaming A16 FA608UP AMD Ryzen 7 260 ⎘ NVIDIA GeForce RTX 5070 Laptop ⎘ 32 GB Memoría, 1024 GB SSD | Amazon: Precio de catálogo: 2199€ | 2.2 kg | 25.7 mm | 16.00" 2560x1600 189 PPI IPS |
Transparencia
La selección de los dispositivos que se van a reseñar corre a cargo de nuestro equipo editorial. La muestra de prueba fue proporcionada al autor en calidad de préstamo por el fabricante o el minorista a los efectos de esta reseña. El prestamista no tuvo ninguna influencia en esta reseña, ni el fabricante recibió una copia de la misma antes de su publicación. No había ninguna obligación de publicar esta reseña. Como empresa de medios independiente, Notebookcheck no está sujeta a la autoridad de fabricantes, minoristas o editores.
Así es como prueba Notebookcheck
Cada año, Notebookcheck revisa de forma independiente cientos de portátiles y smartphones utilizando procedimientos estandarizados para asegurar que todos los resultados son comparables. Hemos desarrollado continuamente nuestros métodos de prueba durante unos 20 años y hemos establecido los estándares de la industria en el proceso. En nuestros laboratorios de pruebas, técnicos y editores experimentados utilizan equipos de medición de alta calidad. Estas pruebas implican un proceso de validación en varias fases. Nuestro complejo sistema de clasificación se basa en cientos de mediciones y puntos de referencia bien fundamentados, lo que mantiene la objetividad.
