Core i9 enfriado pasivamente: Review de Impact Display Solutions IMP-3654-B1-R Mini PC Review
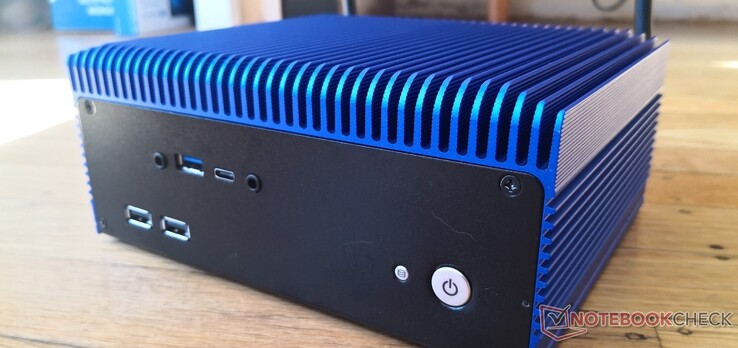
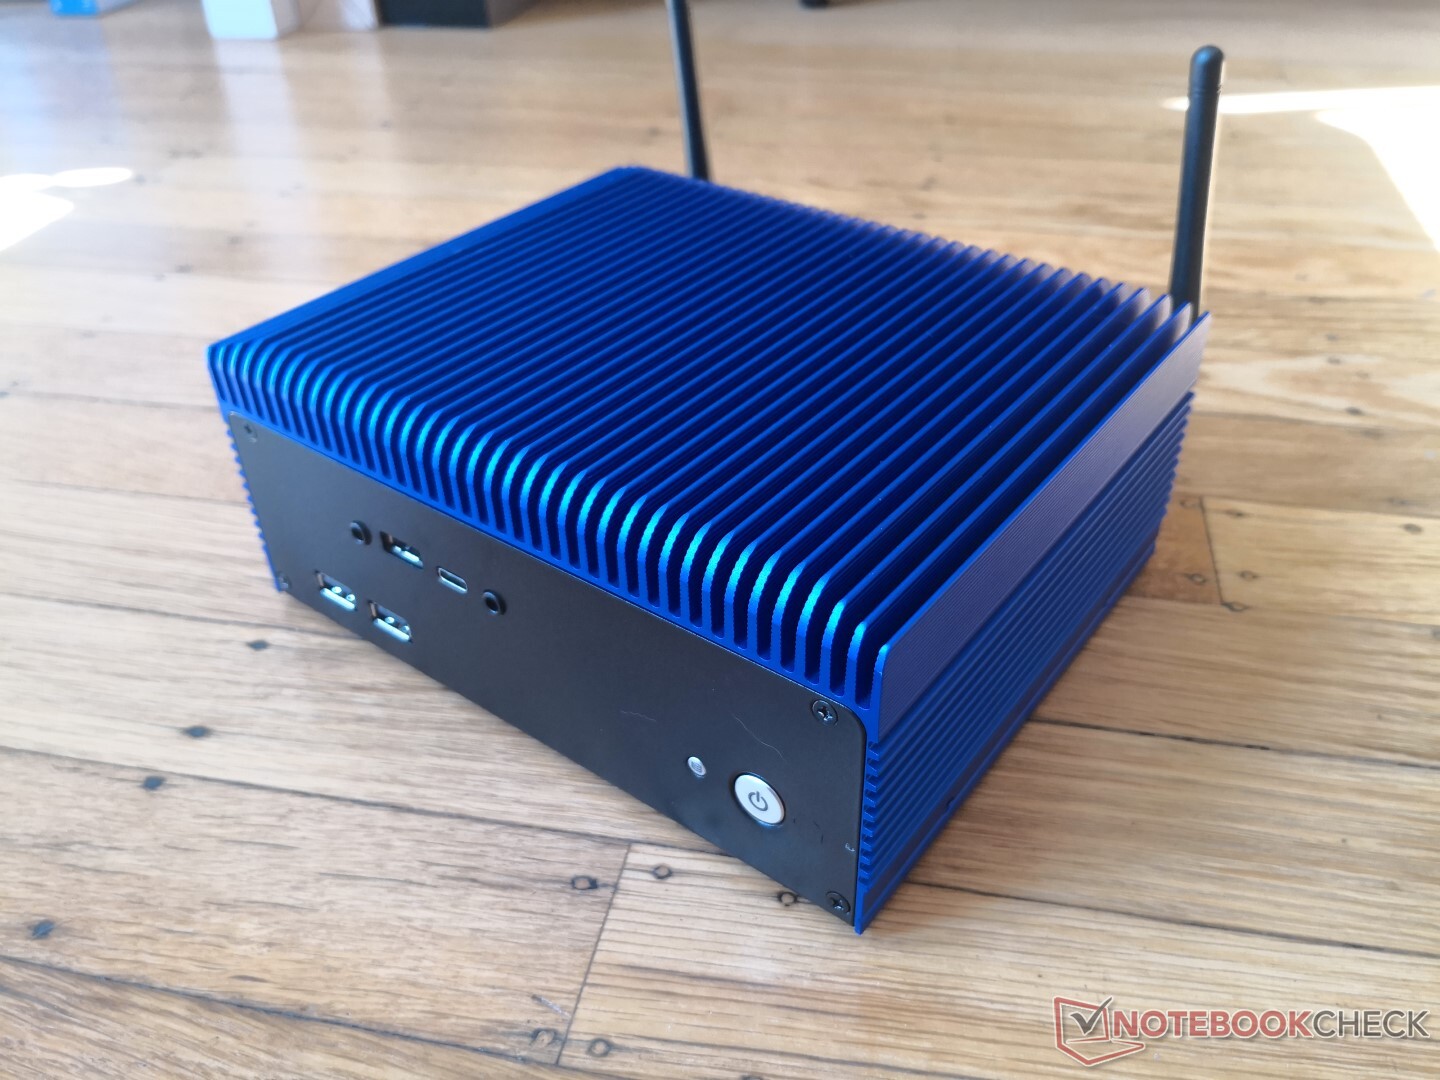
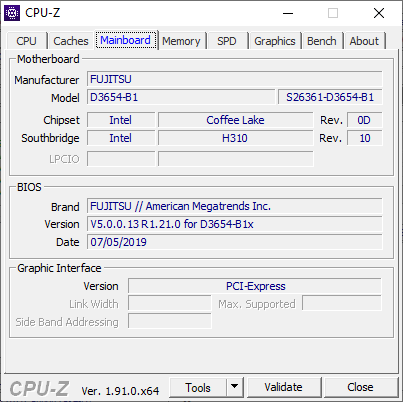
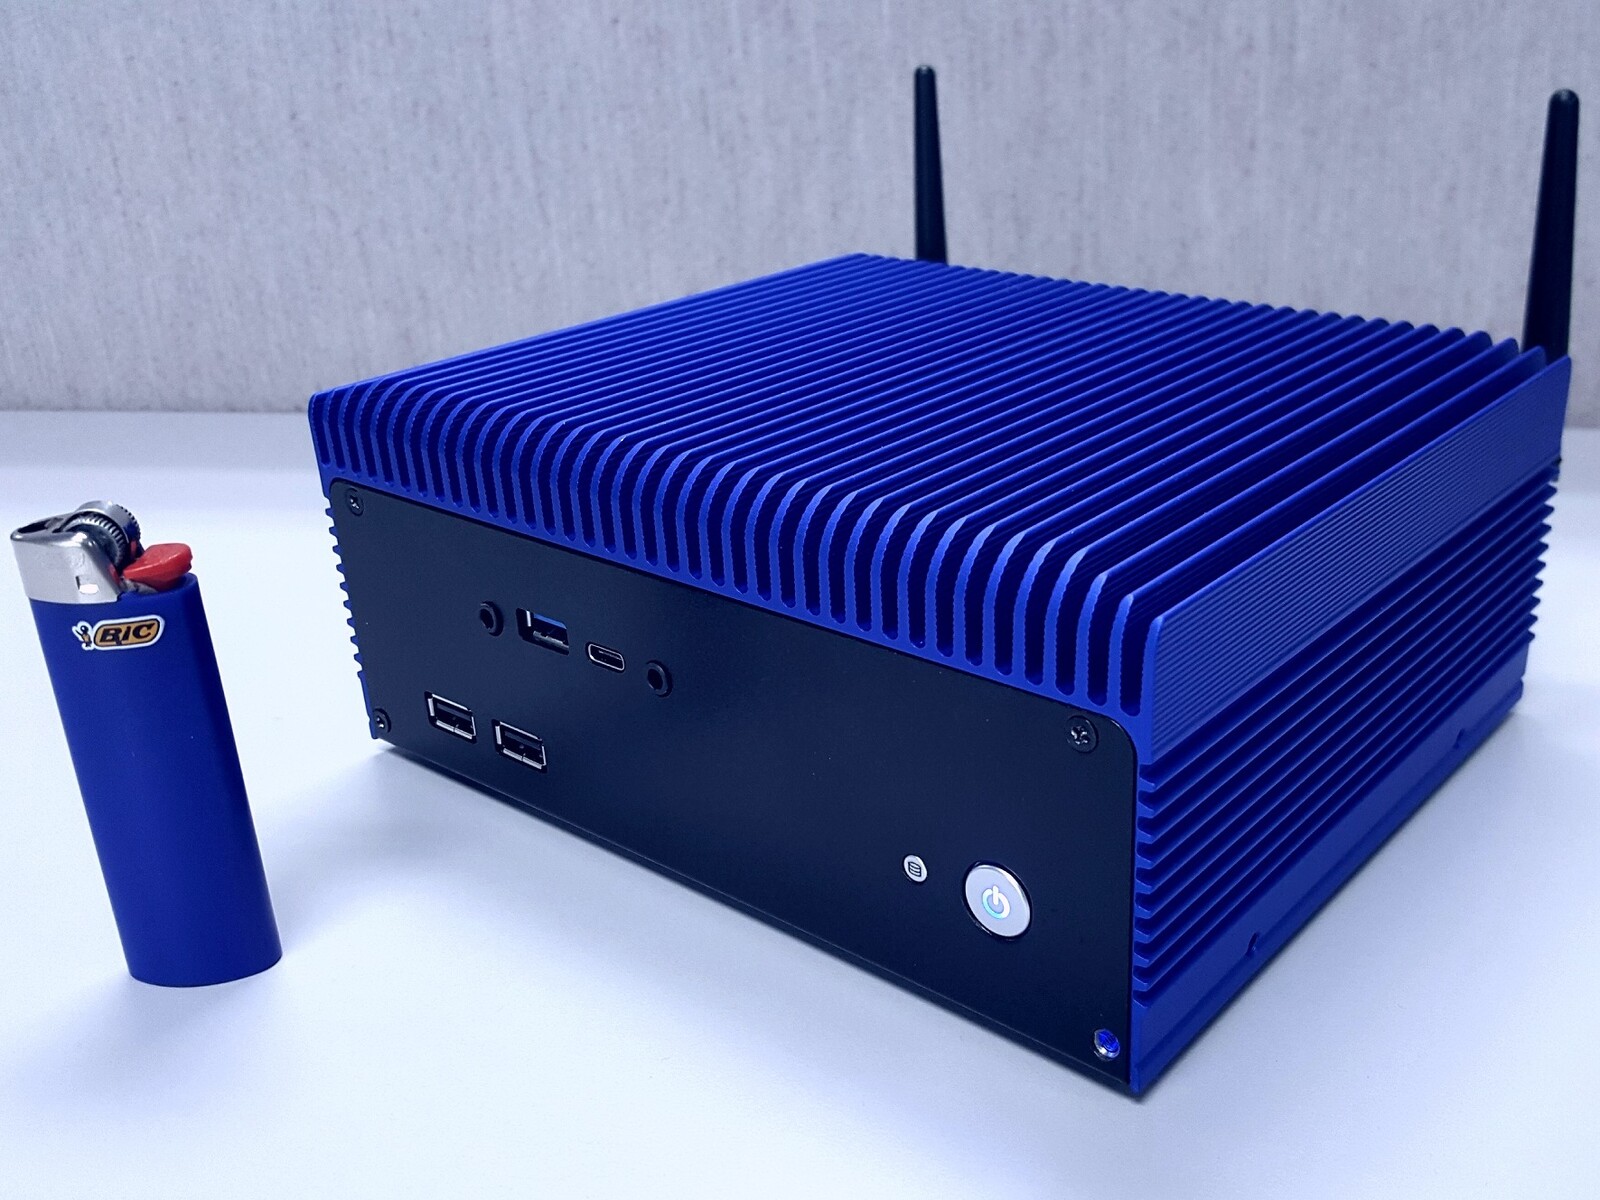
El IMP-3654-B1-B es un mini PC sin ventilador de Impact Display Solutions basado en la placa madre Kontron D3654-B mini-STX. Utiliza un gran disipador de calor en lugar de cualquier ventilador para una experiencia completamente silenciosa no muy diferente a la Zotac ZBox CI660 Nano.
Más información sobre el IMP-3654-B1-B se puede encontrar en su página de especificaciones oficiales y en la página del producto. Una lista de otros mini PCs de Impact Display Solutions se puede encontrar aquí. Para esta revisión, nos centraremos en el rendimiento del mini PC y en cómo maneja un CPU Core i9-9900T sin ningún tipo de ventilador.
Comunicación
| Networking | |
| iperf3 transmit AX12 | |
| Impact Display Solutions IMP-3654-B1-R Core i9-9900T | |
| iperf3 receive AX12 | |
| Impact Display Solutions IMP-3654-B1-R Core i9-9900T | |
Rendimiento
Procesador
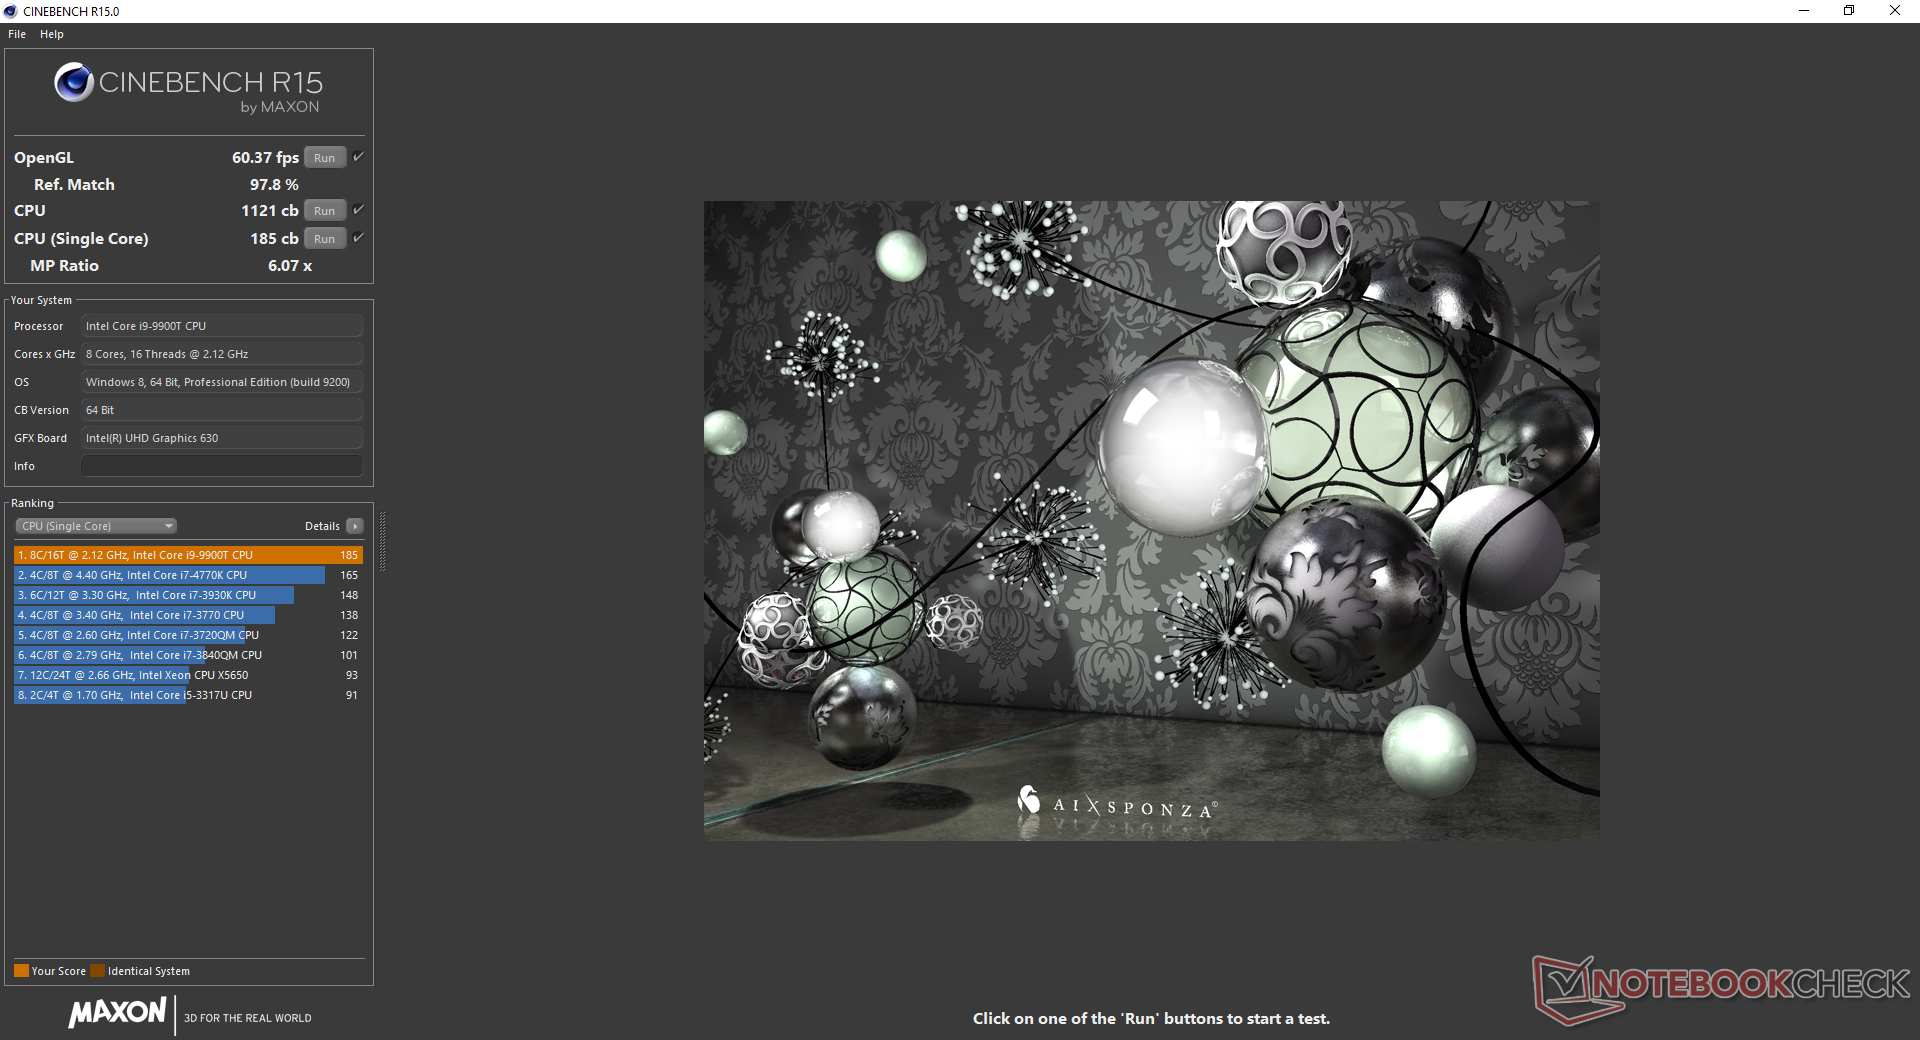
Podemos evaluar el rendimiento de la CPU con el tiempo ejecutando el CineBench R15 Multi-Thread en un bucle. El rendimiento se mantiene estable con una puntuación de unos 1100 puntos hasta una caída abrupta a 390 puntos, como muestra el siguiente gráfico. Inusualmente, el rendimiento volvería a subir a la normalidad hacia el final de la prueba. Exploramos este fenómeno más a fondo en nuestra sección de Prueba de esfuerzo.
| wPrime 2.10 - 1024m | |
| Intel Hades Canyon NUC8i7HVK | |
| Intel NUC10i7FNH | |
| Impact Display Solutions IMP-3654-B1-R Core i9-9900T | |
| Corsair One i160 | |
| Asus Zephyrus G14 GA401IV | |
* ... más pequeño es mejor
Rendimiento del sistema
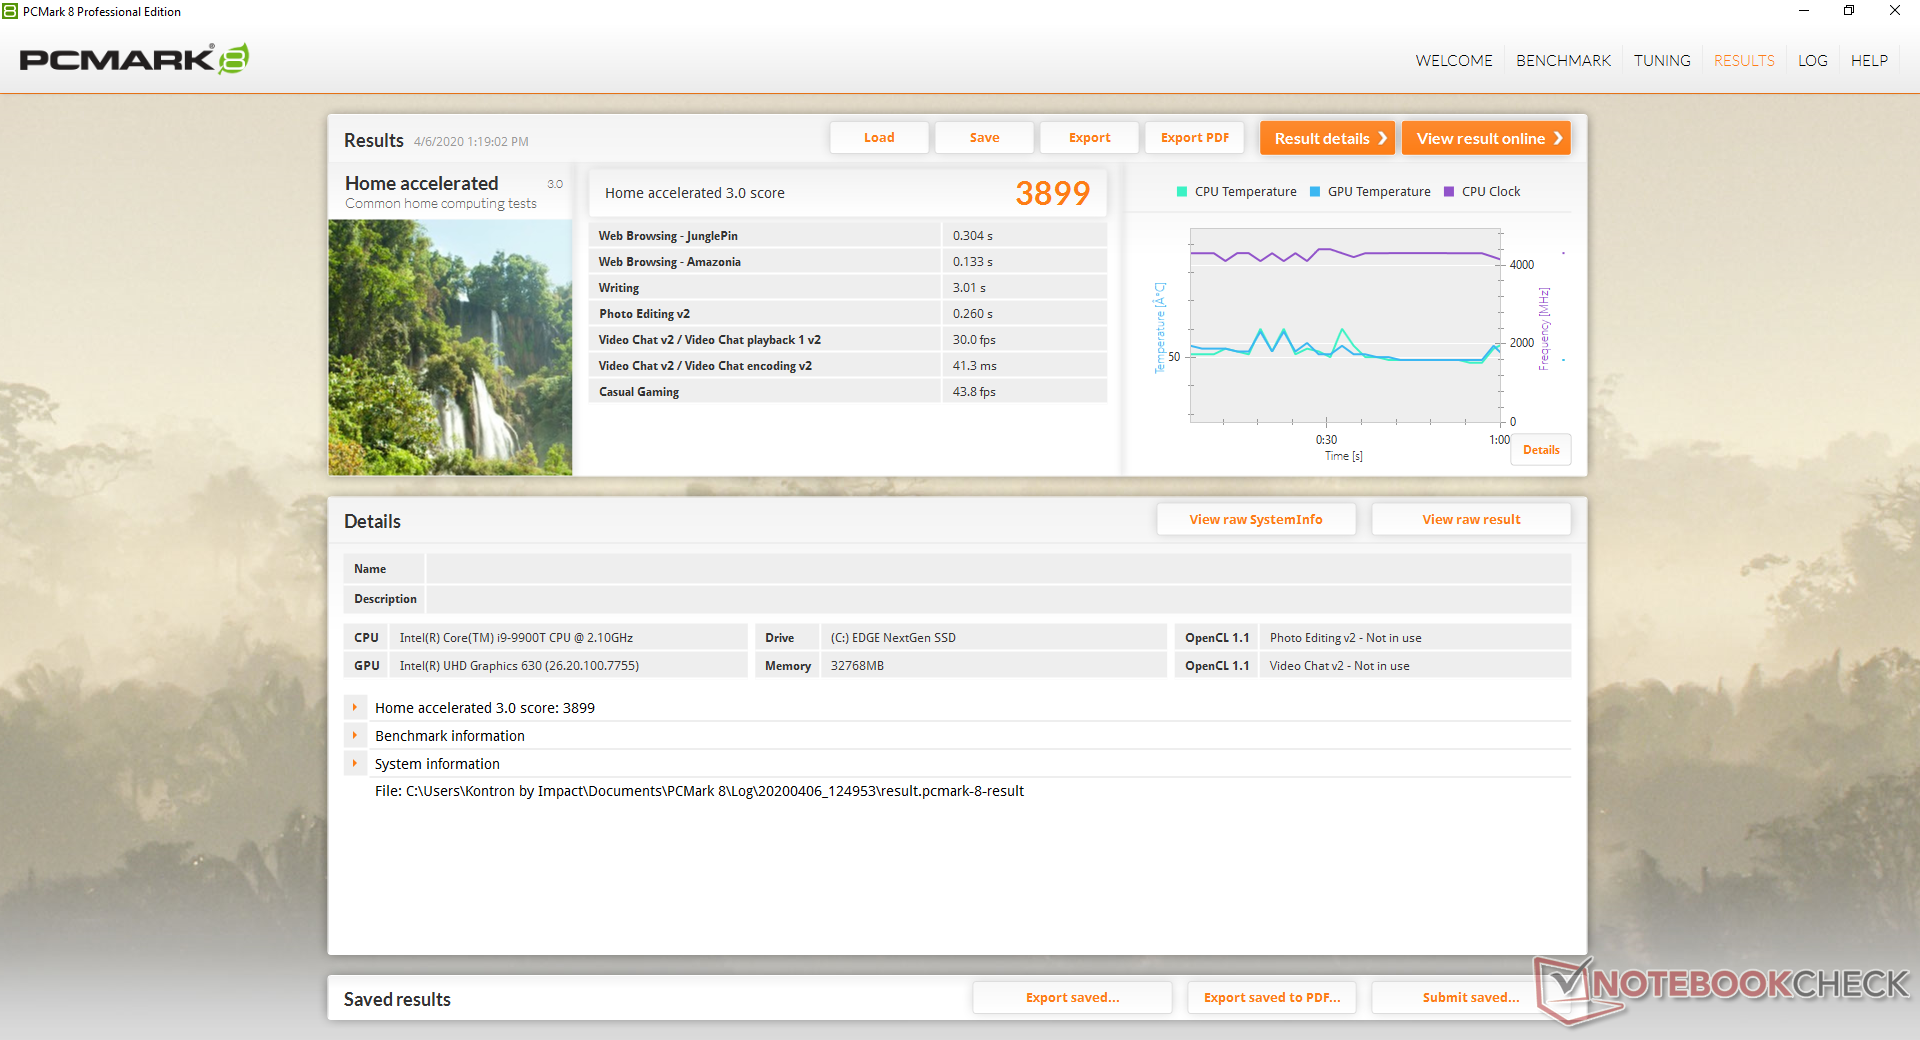
| PCMark 8 Home Score Accelerated v2 | 3899 puntos | |
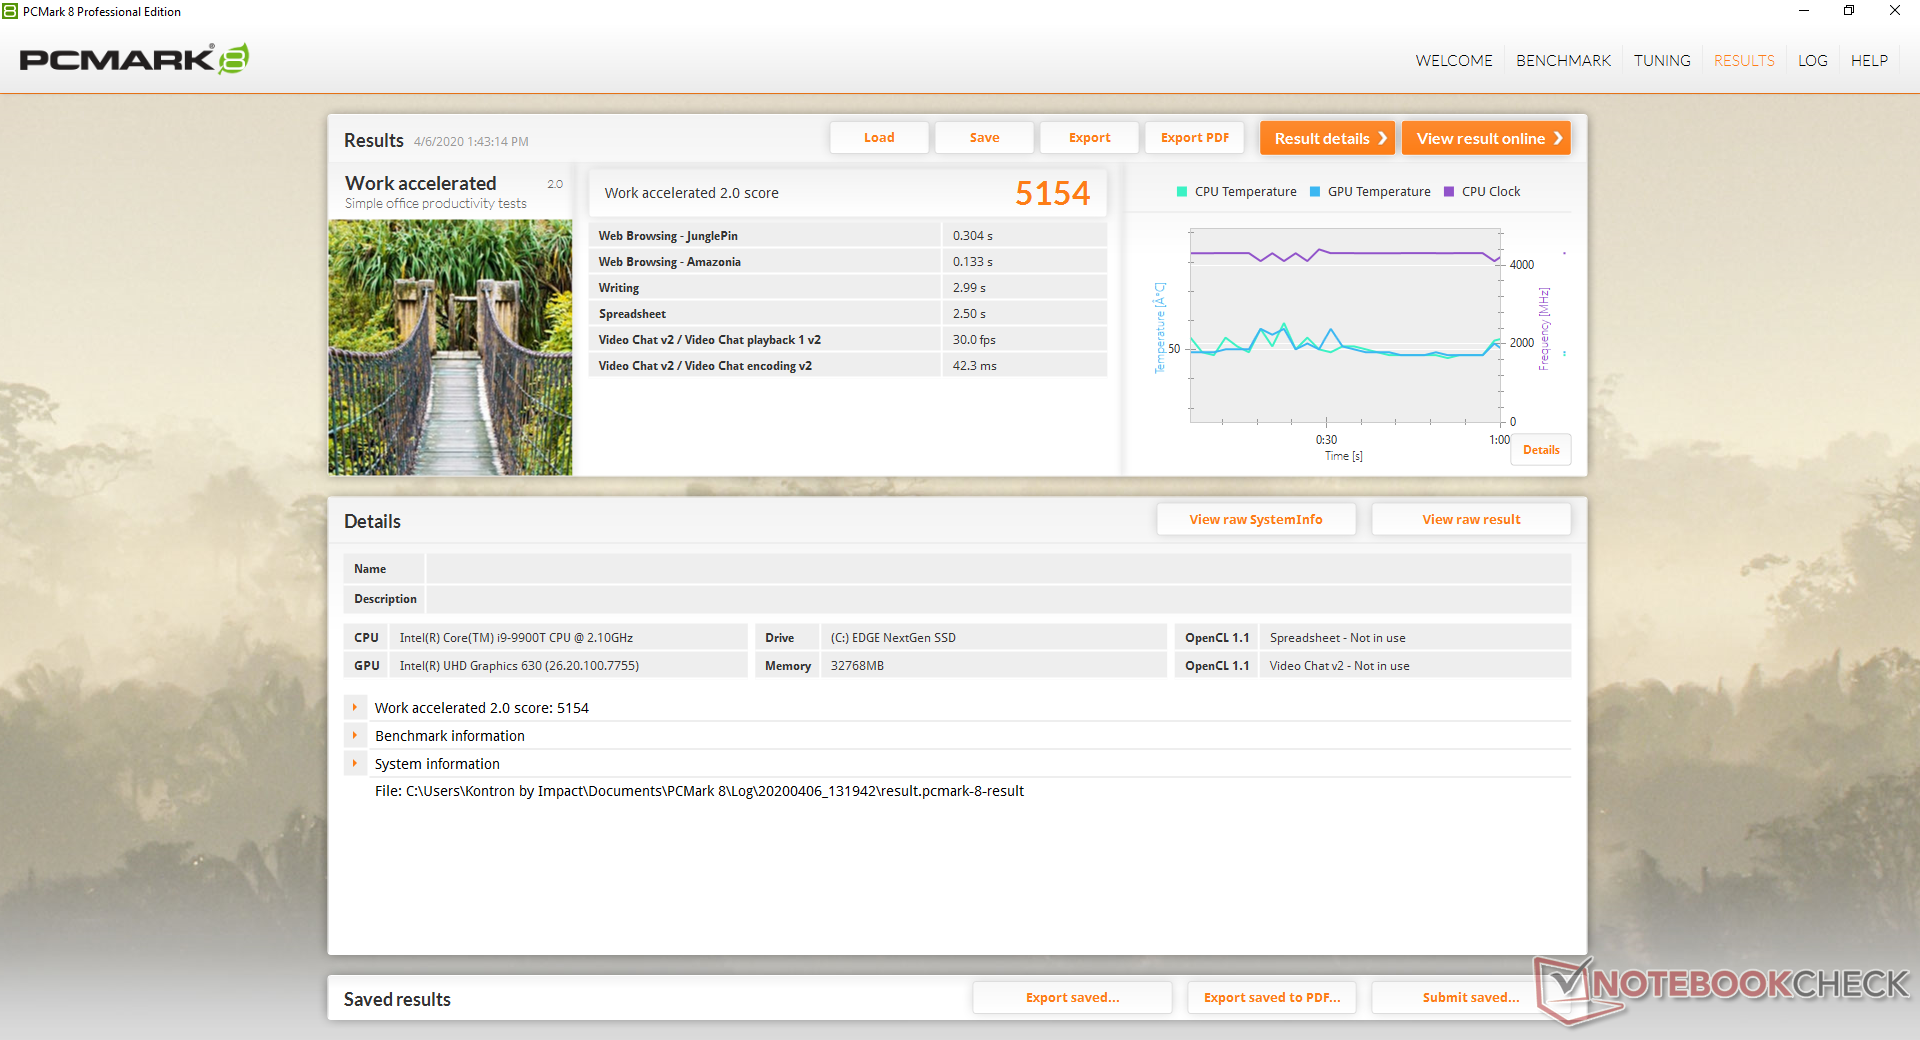
| PCMark 8 Work Score Accelerated v2 | 5154 puntos | |
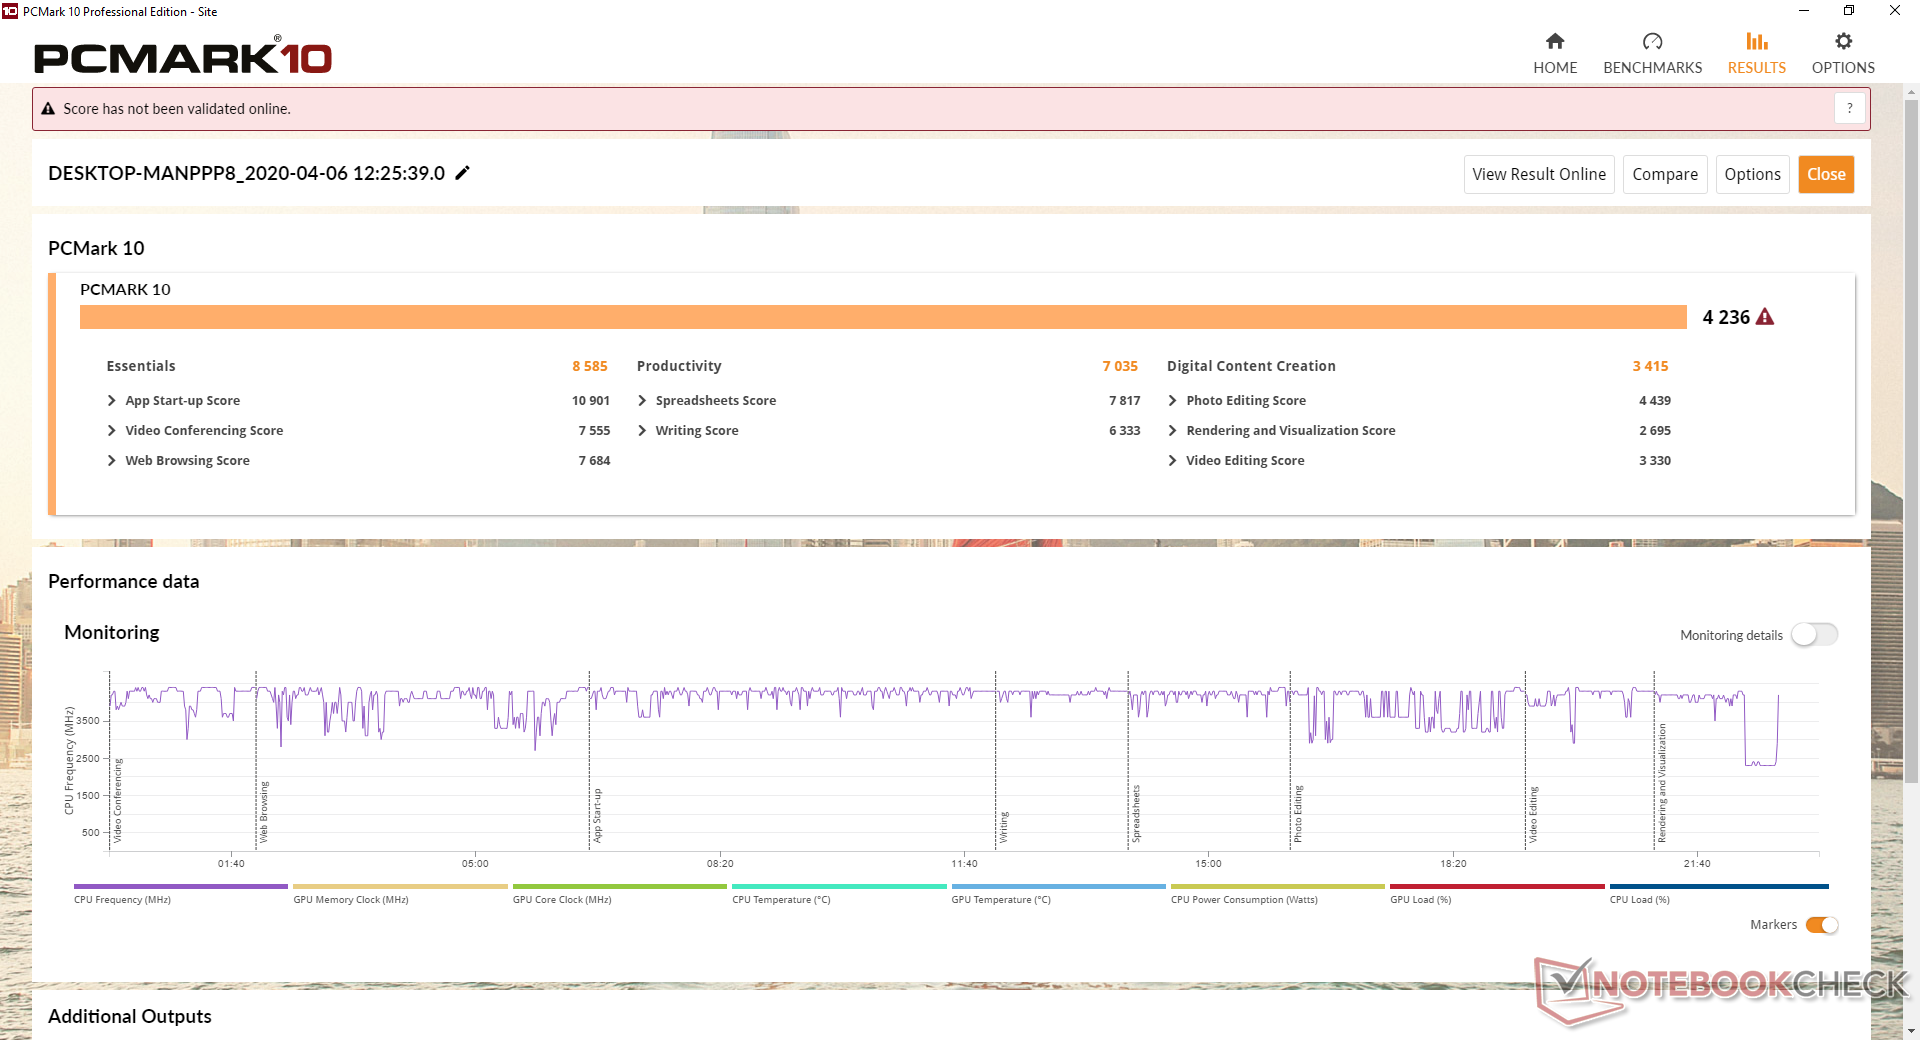
| PCMark 10 Score | 4236 puntos | |
ayuda | ||
Dispositivos de almacenamiento
| Impact Display Solutions IMP-3654-B1-R Core i9-9900T EDGE NextGen SSD 1TB | Intel Hades Canyon NUC8i7HVK Intel Optane 120 GB SSDPEK1W120GA | Intel NUC10i7FNH Kingston RBUSNS8154P3256GJ1 | Zotac ZBOX Magnus EK71080 Samsung PM961 MZVLW256HEHP | Intel NUC7CJYH SanDisk Ultra II | |
|---|---|---|---|---|---|
| AS SSD | 62% | 0% | 46% | -37% | |
| Seq Read (MB/s) | 1218 | 1379 13% | 1306 7% | 2119 74% | 480 -61% |
| Seq Write (MB/s) | 1306 | 553 -58% | 611 -53% | 1205 -8% | 464.8 -64% |
| 4K Read (MB/s) | 25.97 | 127.9 392% | 21.53 -17% | 46.69 80% | 26.98 4% |
| 4K Write (MB/s) | 43.25 | 103.5 139% | 53.5 24% | 105.2 143% | 47.43 10% |
| 4K-64 Read (MB/s) | 578 | 1258 118% | 652 13% | 1170 102% | 420.5 -27% |
| 4K-64 Write (MB/s) | 520 | 556 7% | 648 25% | 443.8 -15% | 174.6 -66% |
| Access Time Read * (ms) | 0.118 | 0.025 79% | 0.114 3% | 0.06 49% | 0.115 3% |
| Access Time Write * (ms) | 0.286 | 0.033 88% | 0.07 76% | 0.04 86% | 0.089 69% |
| Score Read (Points) | 726 | 1524 110% | 804 11% | 1429 97% | 498 -31% |
| Score Write (Points) | 694 | 714 3% | 762 10% | 669 -4% | 268 -61% |
| Score Total (Points) | 1800 | 3023 68% | 1944 8% | 2791 55% | 1025 -43% |
| Copy ISO MB/s (MB/s) | 2082 | 1125 -46% | 976 -53% | 1649 -21% | 197 -91% |
| Copy Program MB/s (MB/s) | 422.8 | 342.4 -19% | 346 -18% | 468 11% | 102 -76% |
| Copy Game MB/s (MB/s) | 1072 | 768 -28% | 735 -31% | 1010 -6% | 175.5 -84% |
| CrystalDiskMark 5.2 / 6 | 7% | 94% | 9% | -64% | |
| Write 4K (MB/s) | 111.8 | 133.7 20% | 442.4 296% | 132.7 19% | 61.1 -45% |
| Read 4K (MB/s) | 56.8 | 178.6 214% | 371.1 553% | 44.48 -22% | 31.99 -44% |
| Write Seq (MB/s) | 1148 | 608 -47% | 900 -22% | 1193 4% | 421.7 -63% |
| Read Seq (MB/s) | 1522 | 1428 -6% | 1582 4% | 1371 -10% | 427.4 -72% |
| Write 4K Q32T1 (MB/s) | 399.7 | 323.6 -19% | 373.8 -6% | 398.5 0% | 97 -76% |
| Read 4K Q32T1 (MB/s) | 570 | 282.3 -50% | 374.9 -34% | 483.5 -15% | 121.9 -79% |
| Write Seq Q32T1 (MB/s) | 1375 | 627 -54% | 893 -35% | 1202 -13% | 504 -63% |
| Read Seq Q32T1 (MB/s) | 1626 | 1521 -6% | 1582 -3% | 3388 108% | 551 -66% |
| Write 4K Q8T8 (MB/s) | 399.1 | 183.1 | |||
| Read 4K Q8T8 (MB/s) | 688 | 221.3 | |||
| Media total (Programa/Opciones) | 35% /
42% | 47% /
34% | 28% /
32% | -51% /
-47% |
* ... más pequeño es mejor

Rendimiento de la GPU
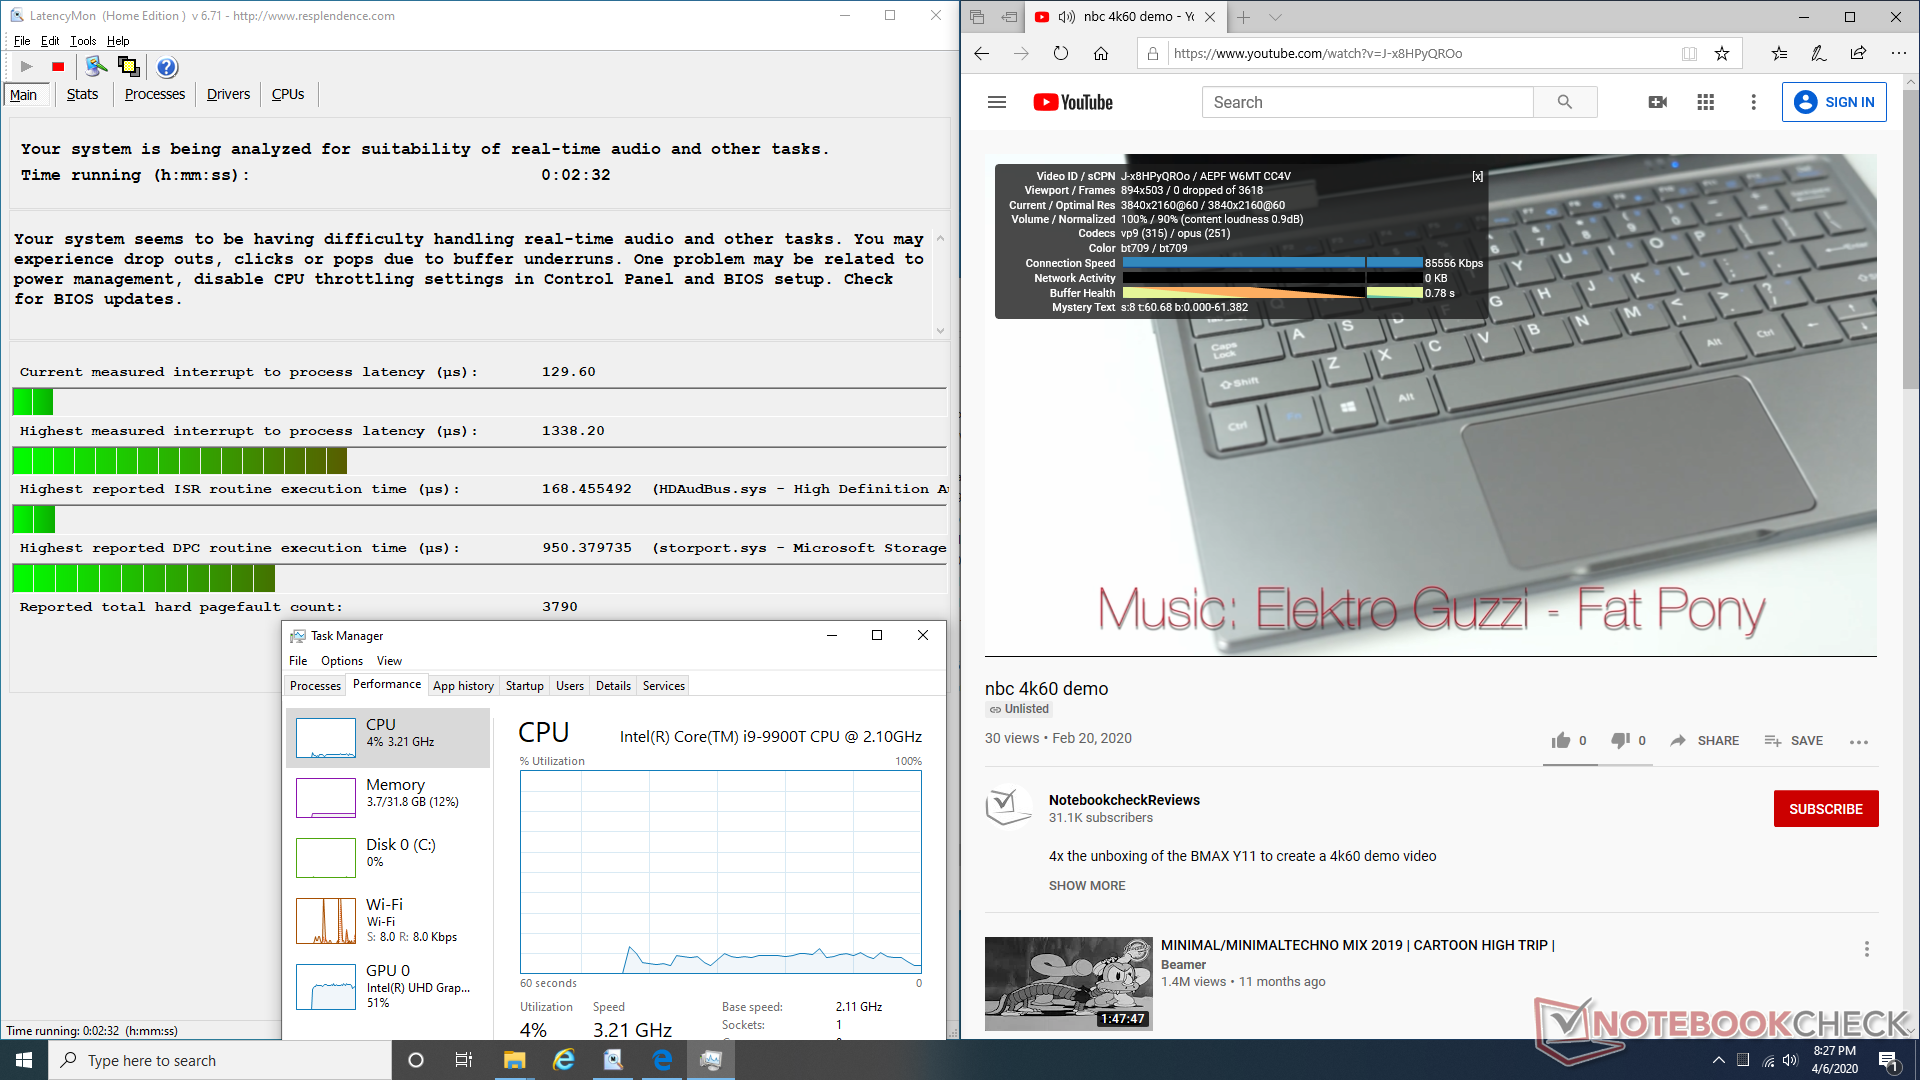
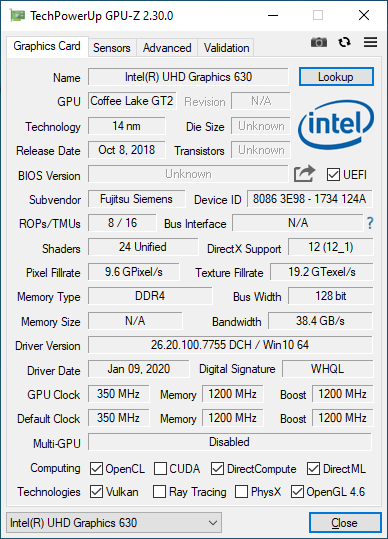
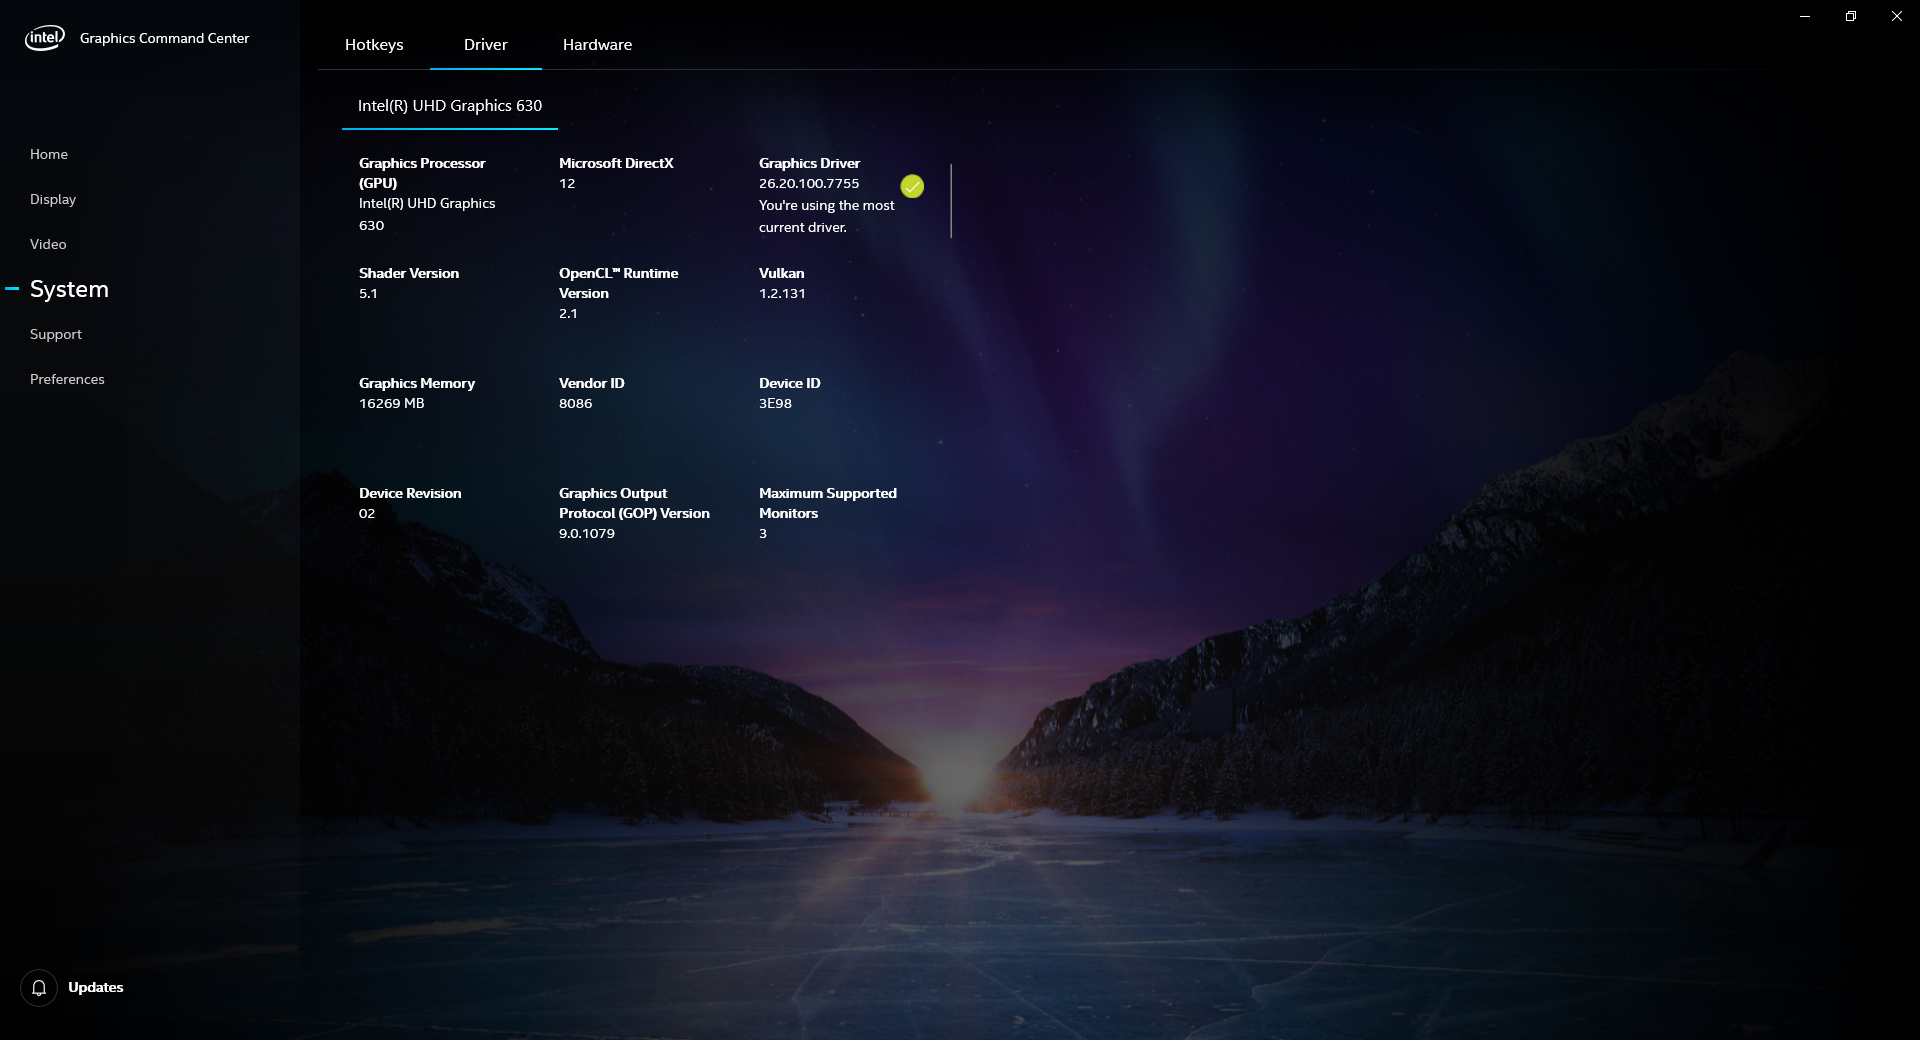
La serie UHD Graphics de Intel tiene años y está desactualizada desde el año 2020. Los usuarios que buscan una potencia gráfica más integrada deberían considerar la serie Iris Plus o la serie competidora RX Vega, que puede ofrecer casi el doble de rendimiento con la misma envoltura térmica o menor. Sin embargo, para la navegación web estándar y la reproducción 4K, los gráficos UHD serán suficientes. No podemos grabar ningún cuadro caído al reproducir nuestro video de prueba de un minuto en YouTube de 4K UHD.
| 3DMark 06 Standard Score | 13646 puntos | |
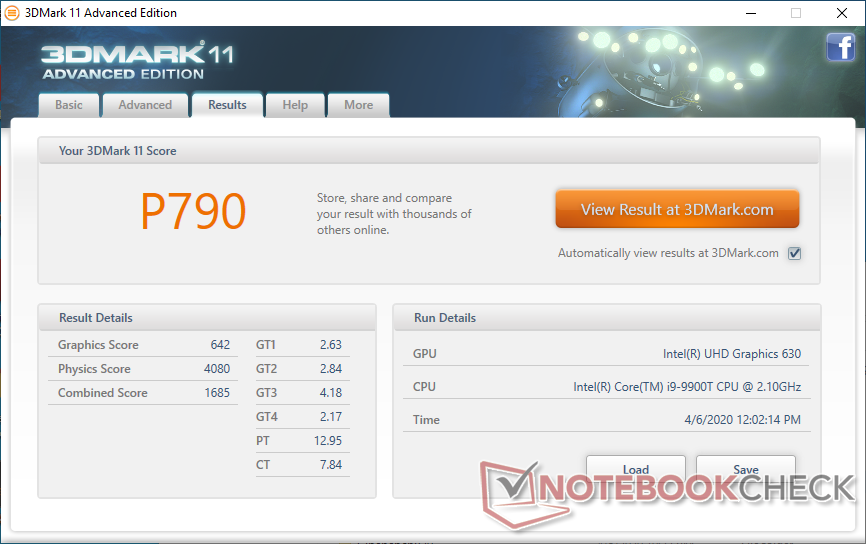
| 3DMark 11 Performance | 790 puntos | |
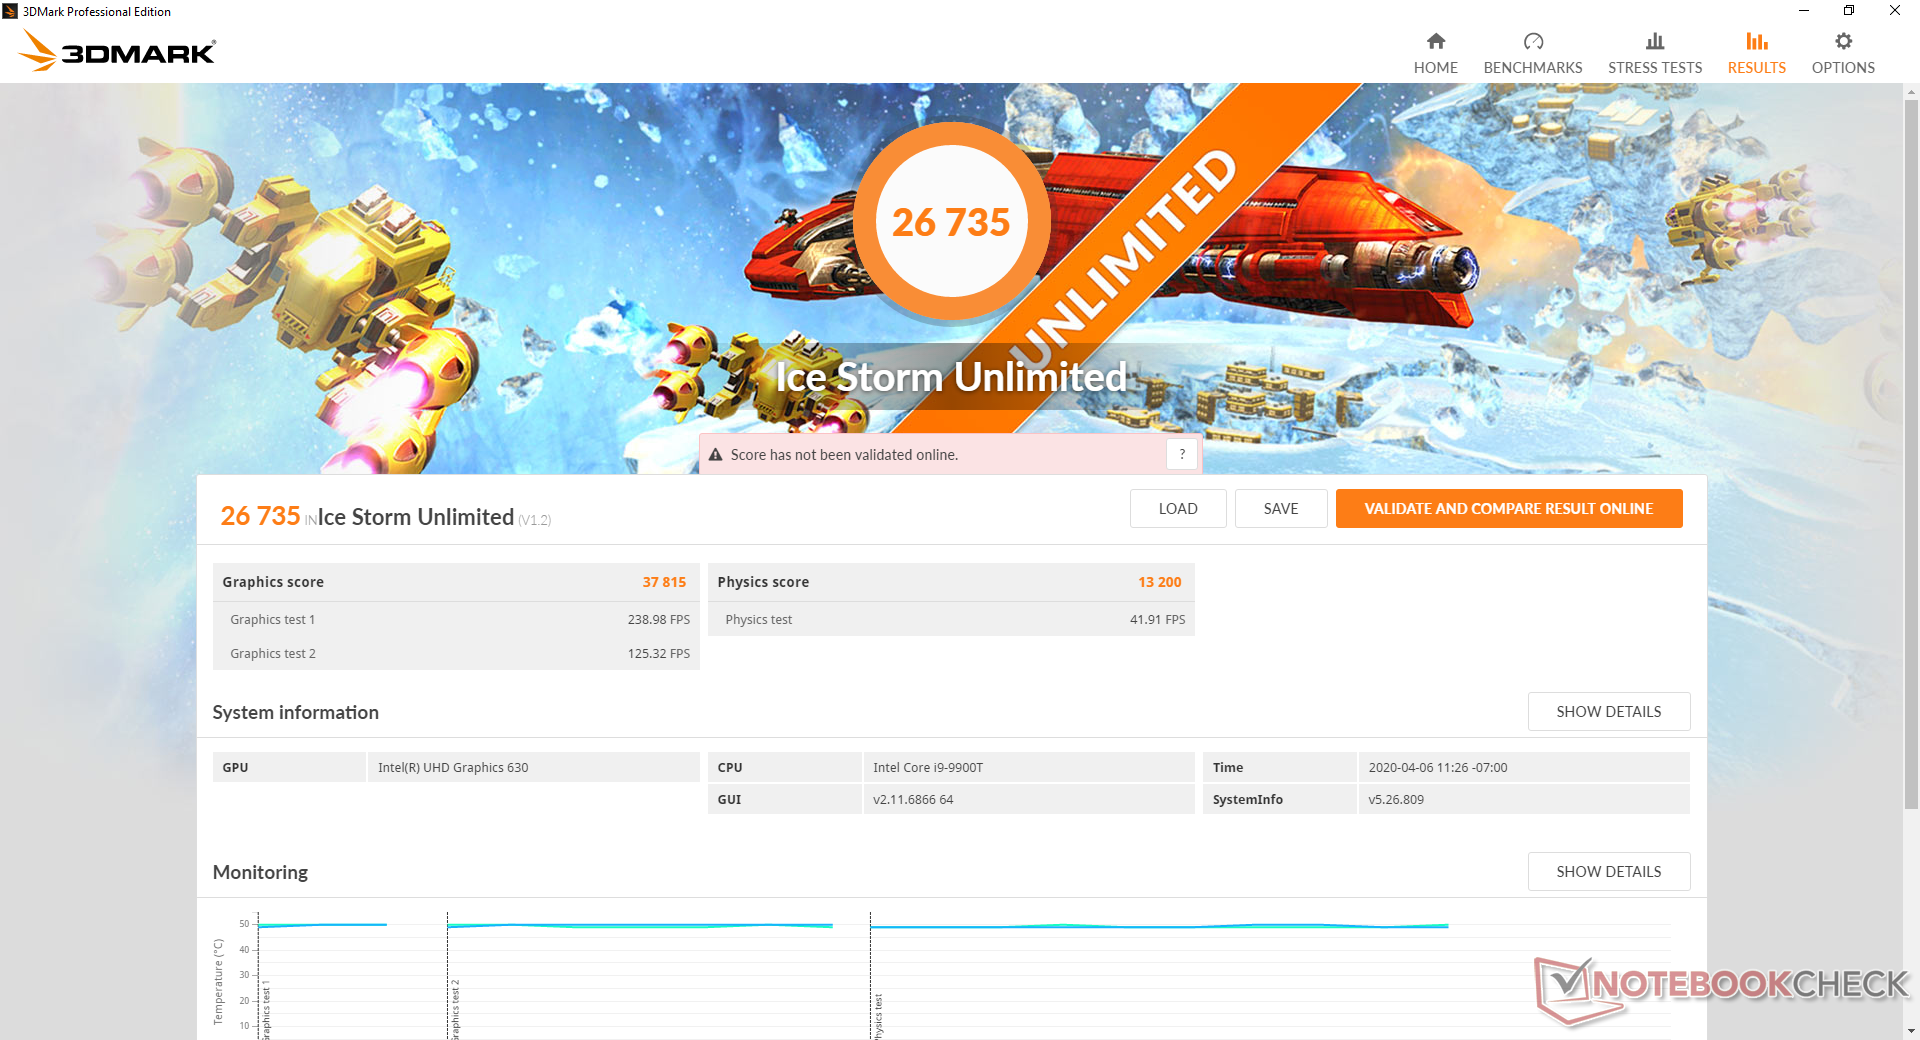
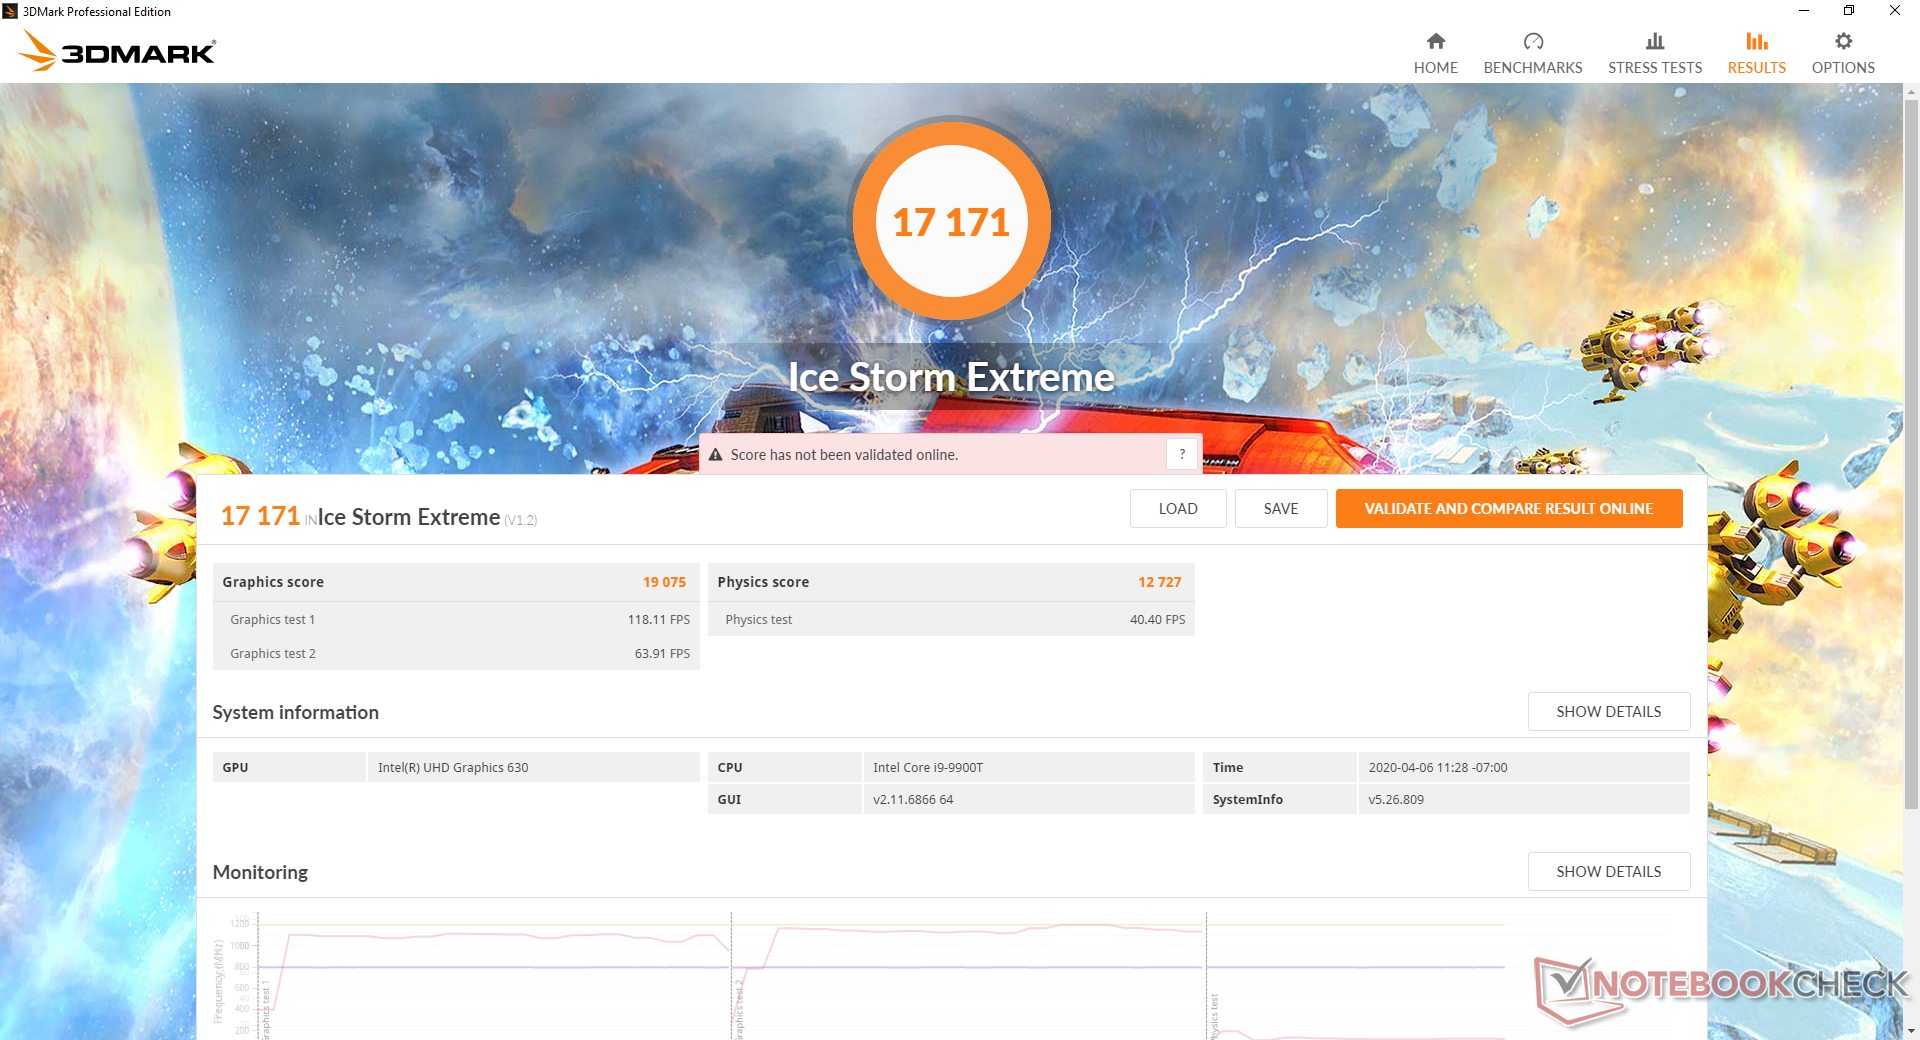
| 3DMark Ice Storm Standard Score | 28176 puntos | |
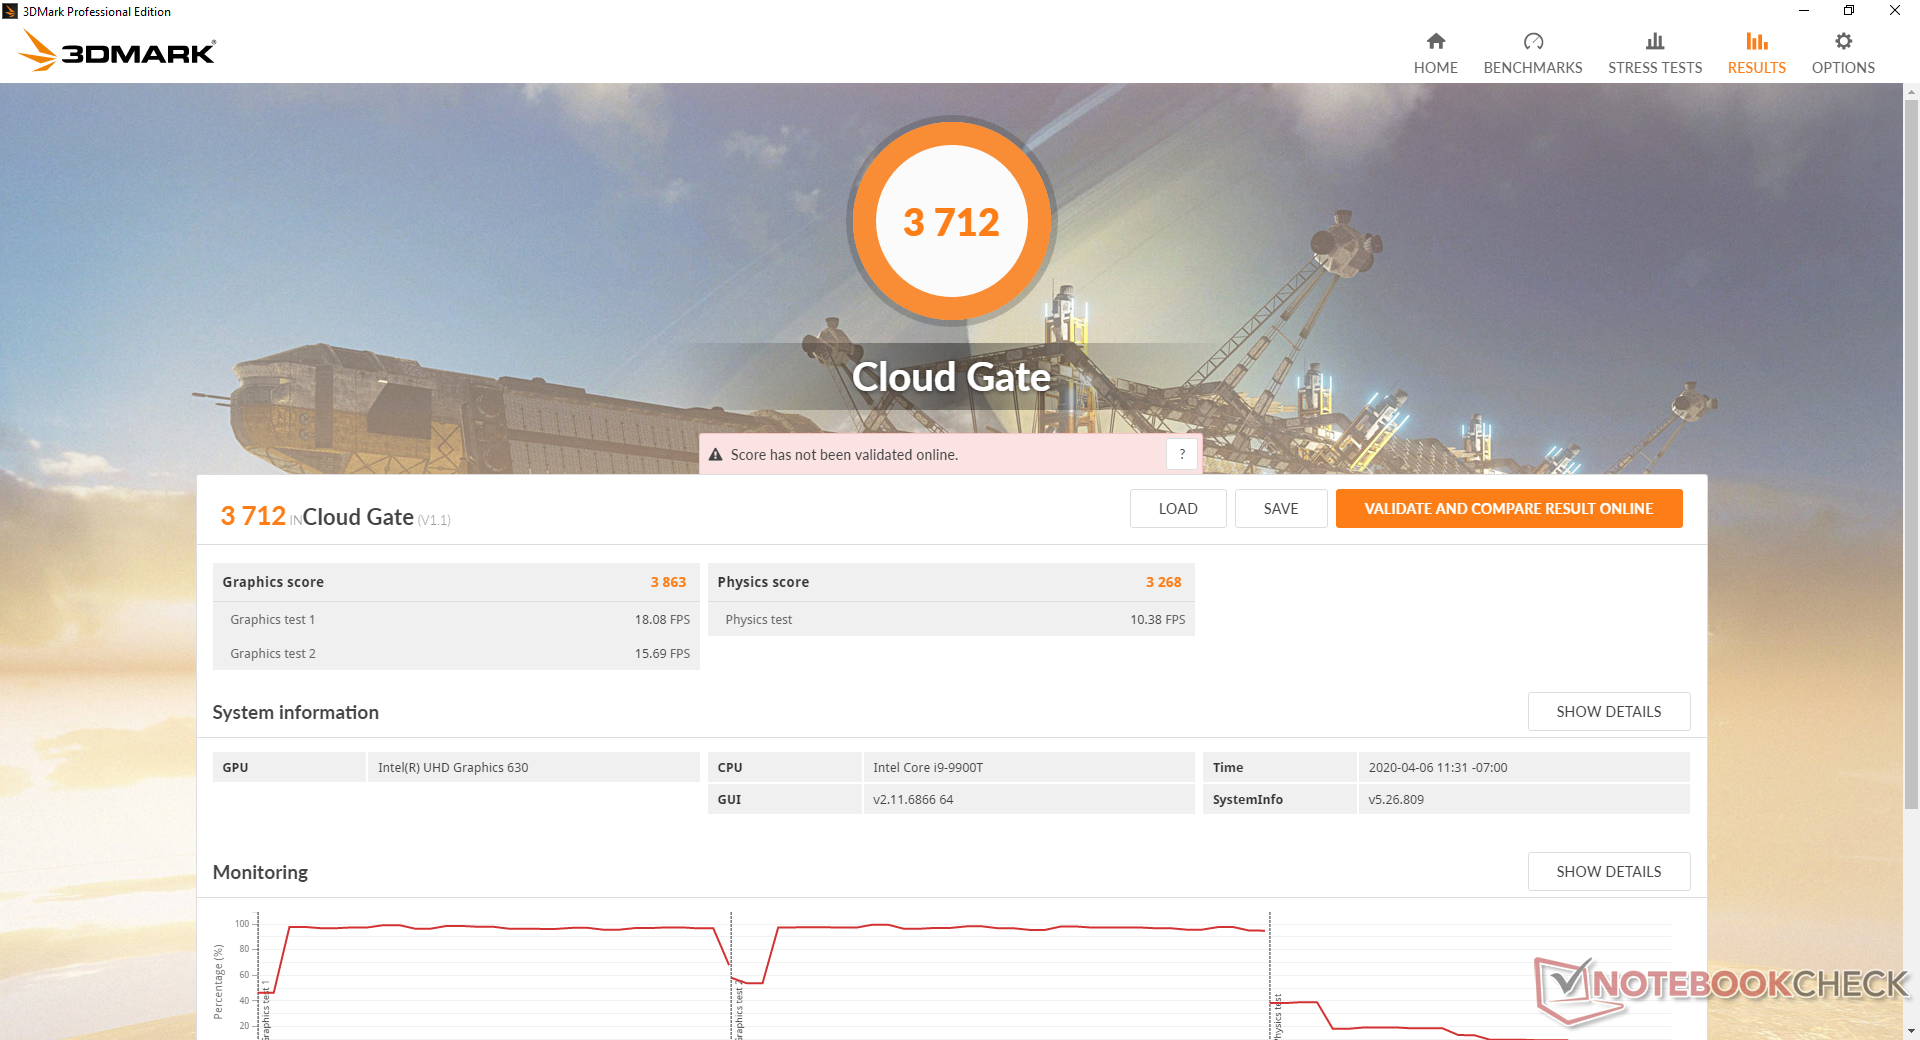
| 3DMark Cloud Gate Standard Score | 3712 puntos | |
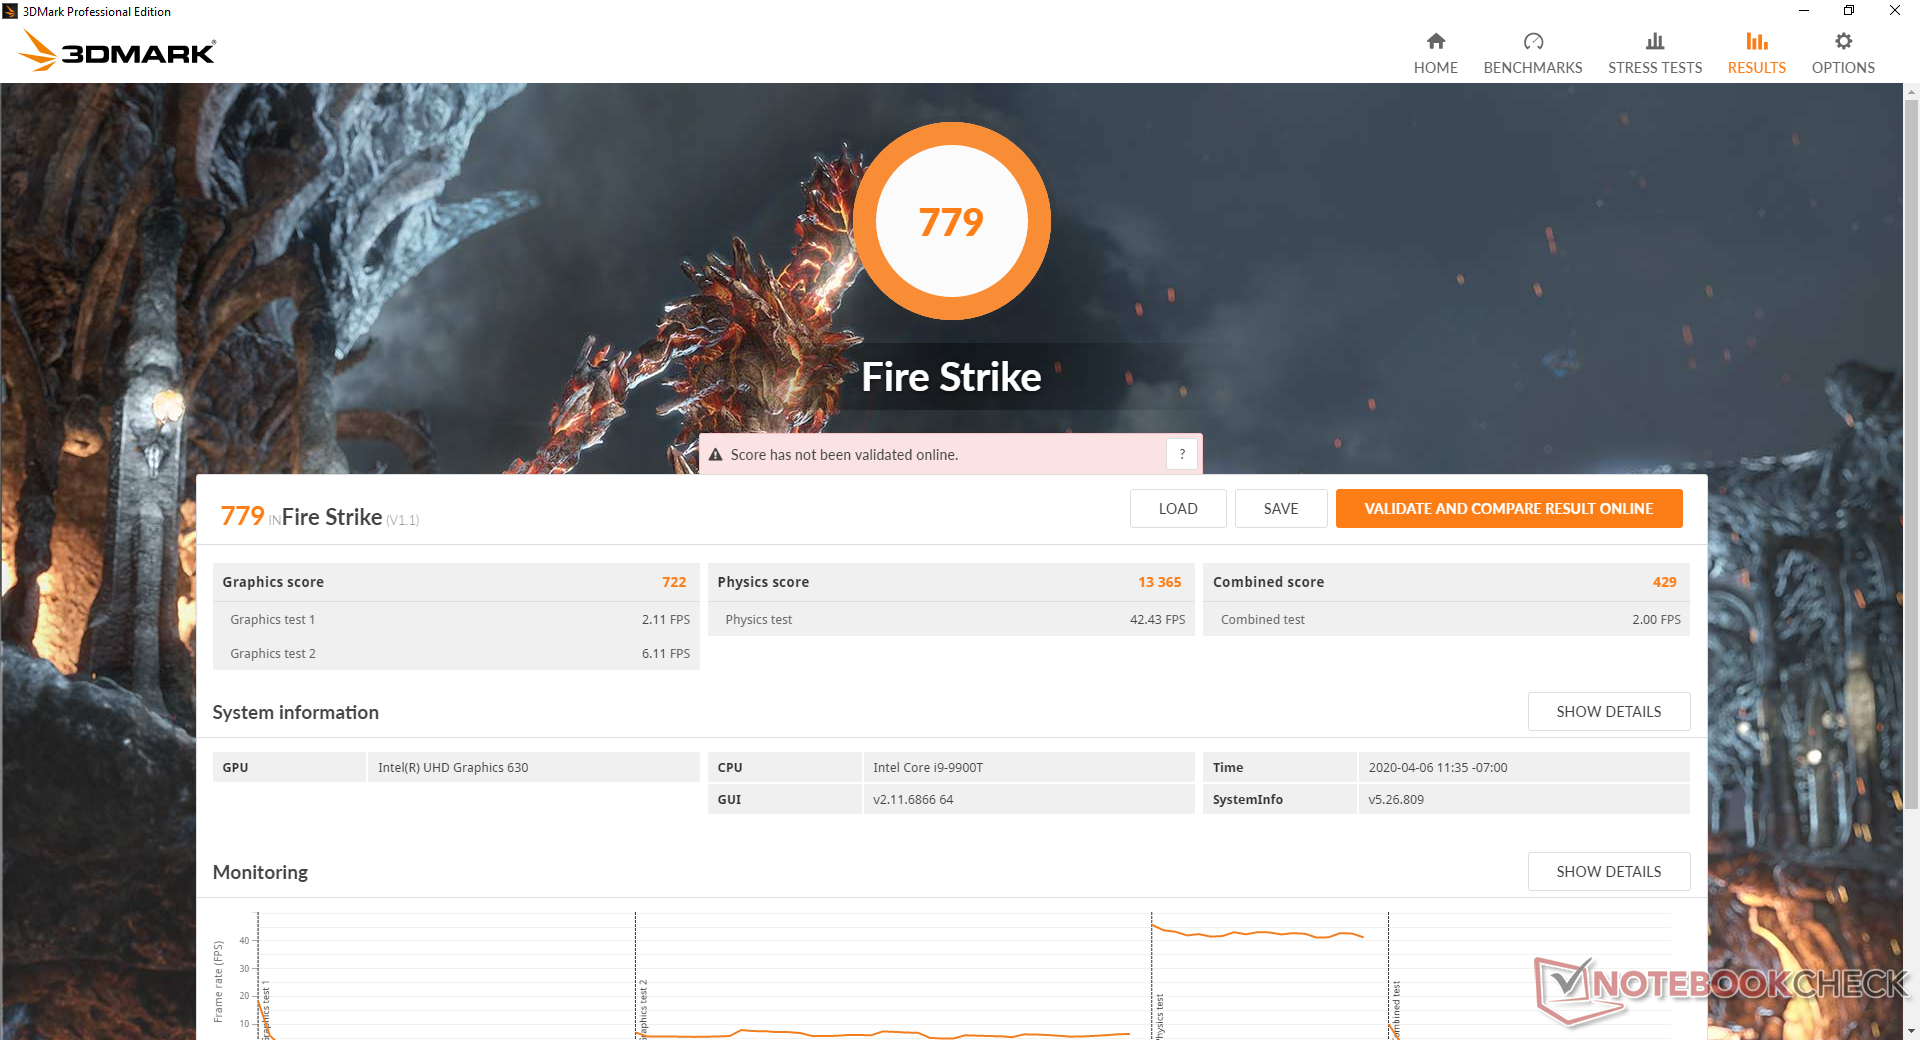
| 3DMark Fire Strike Score | 779 puntos | |
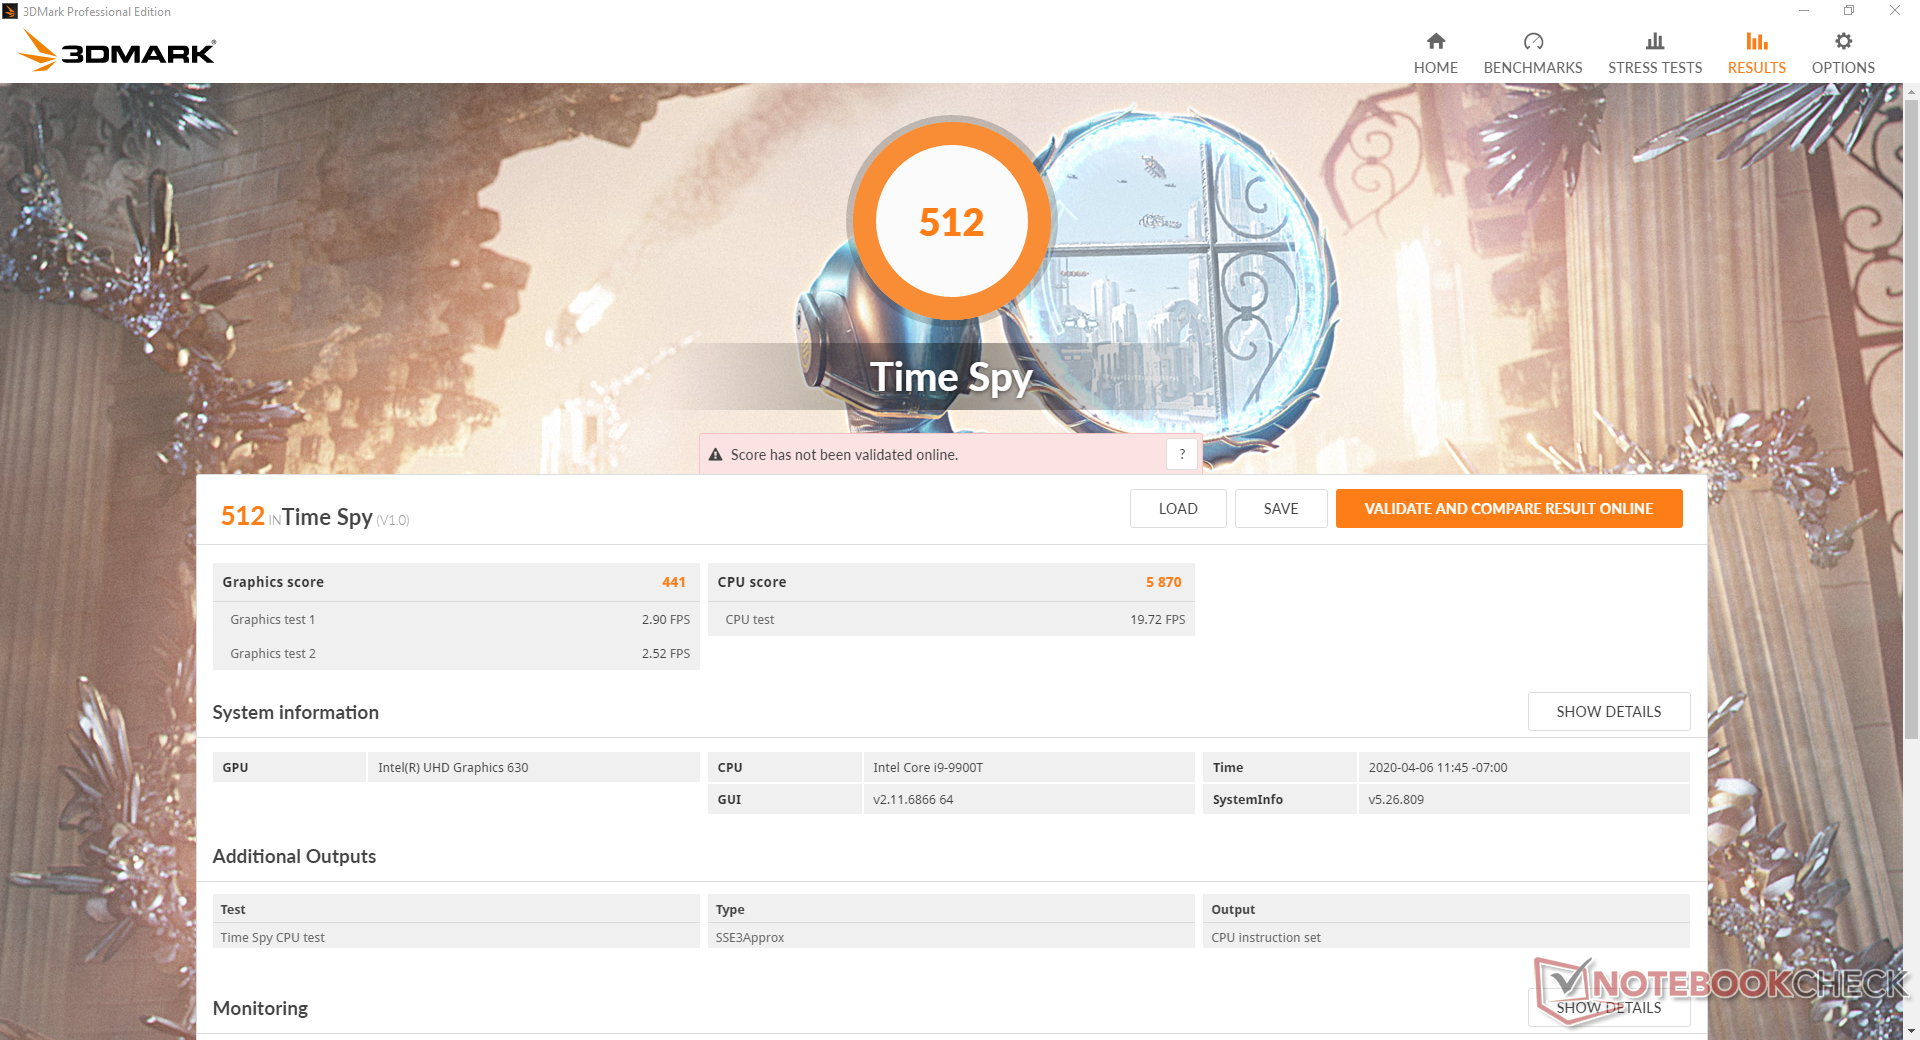
| 3DMark Time Spy Score | 512 puntos | |
ayuda | ||
| bajo | medio | alto | ultra | |
|---|---|---|---|---|
| Dota 2 Reborn (2015) | 70.4 | 44.8 | 7.8 | 6.8 |
| X-Plane 11.11 (2018) | 12.7 | 11 | 11 |
Emisiones
Temperatura
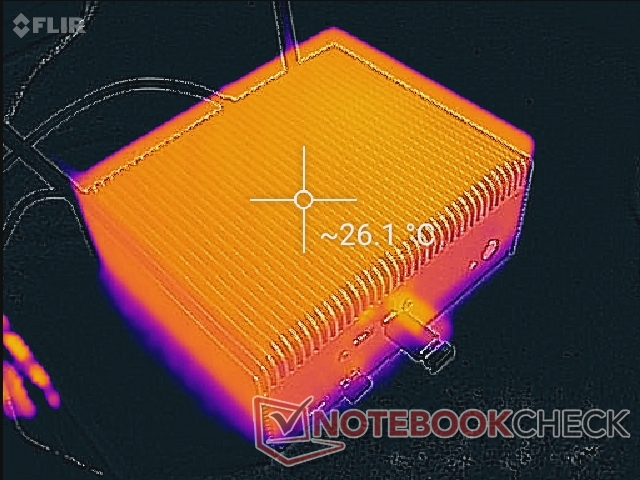
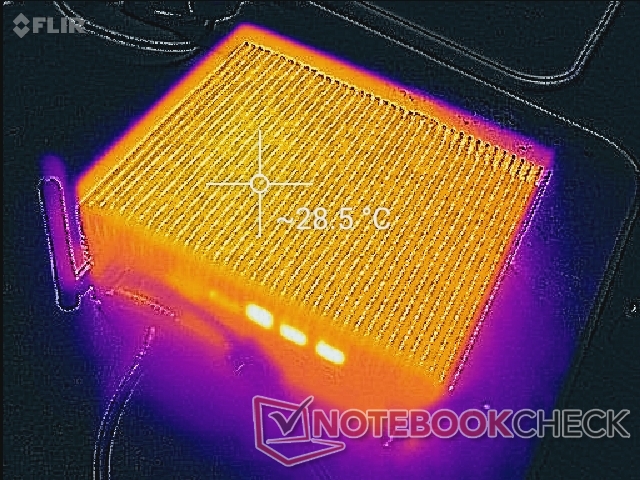
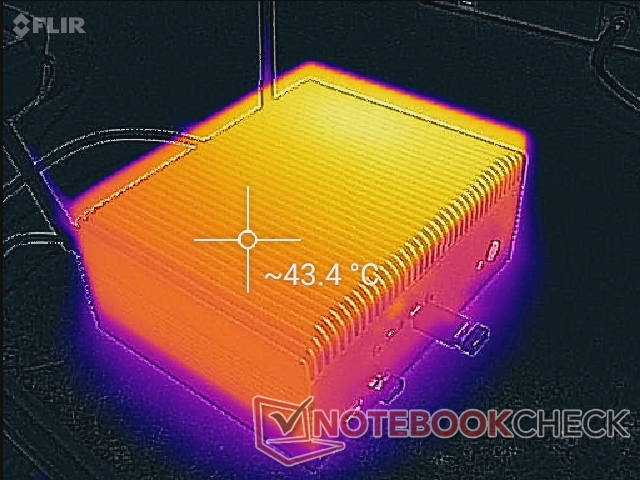
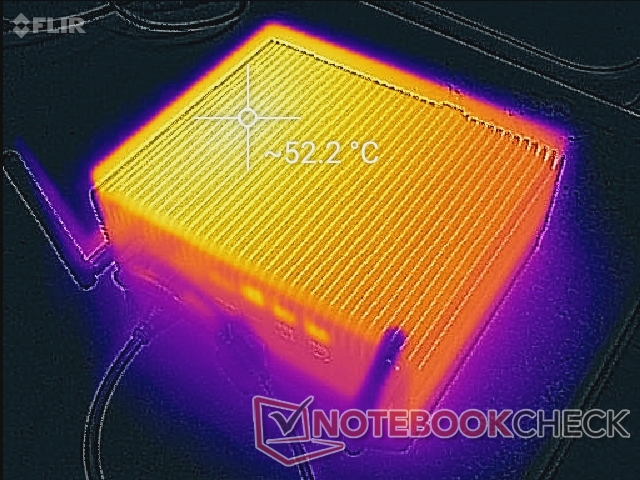
Somos capaces de registrar temperaturas de superficie de poco menos de 30 C cuando se está en reposo en el escritorio durante poco más de una hora. Cuando se está bajo el máximo esfuerzo del procesador, el gran disipador de calor puede llegar a calentarse entre 43 y 53 C, como se muestra en nuestros mapas de temperatura a continuación. El lado derecho del mini PC estará notablemente más caliente que el izquierdo debido a la posición de la CPU debajo. Por supuesto, no es recomendable colocar ningún libro o novedad encima del sistema como pueden hacer los propietarios de otros mini PCs.
Sin embargo, debido al comportamiento de aceleración del sistema, la temperatura de la superficie caerá y se estabilizará de los 53 C antes mencionados a sólo 39 C.
Prueba de estrés
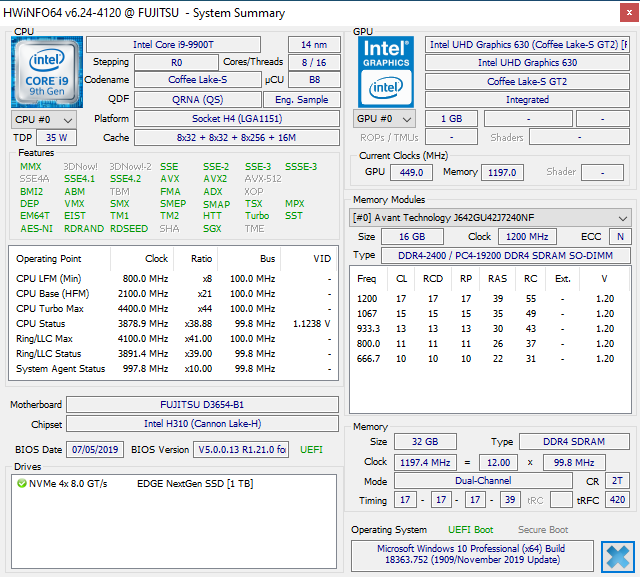
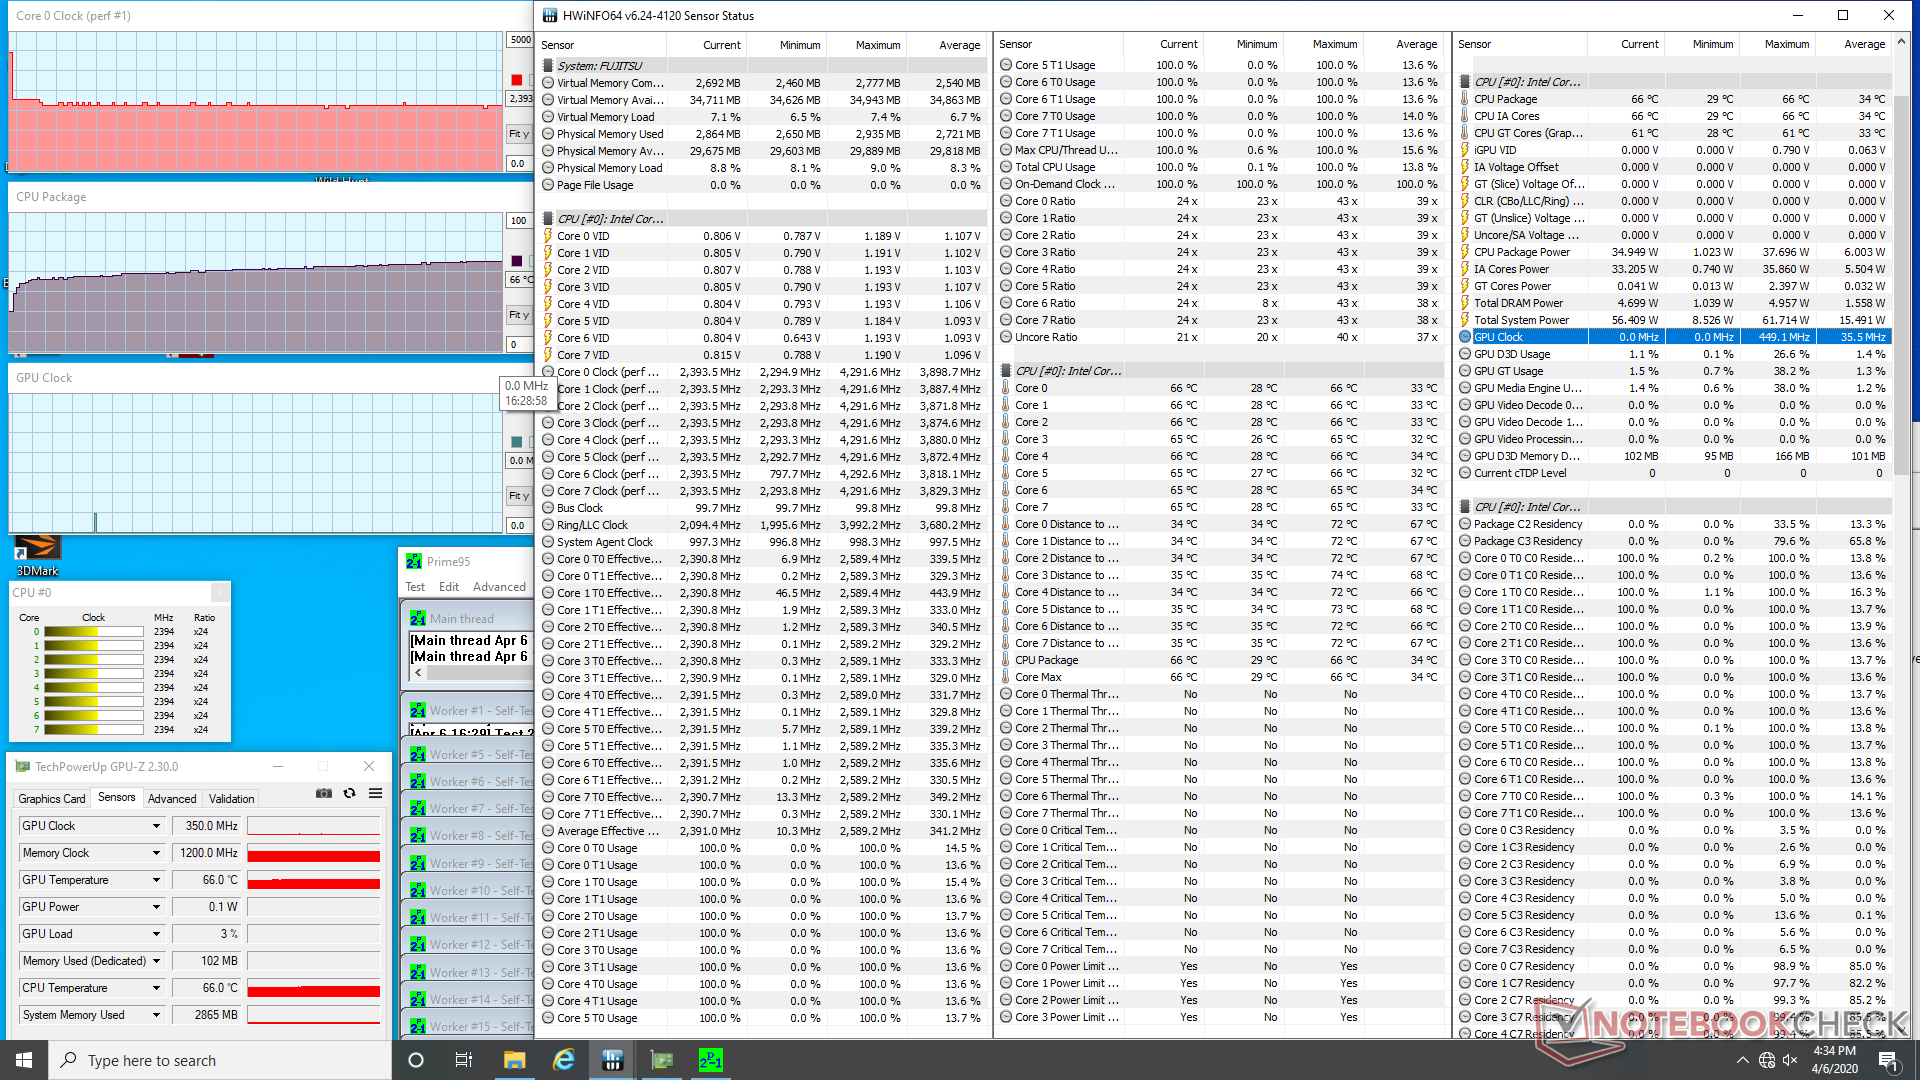
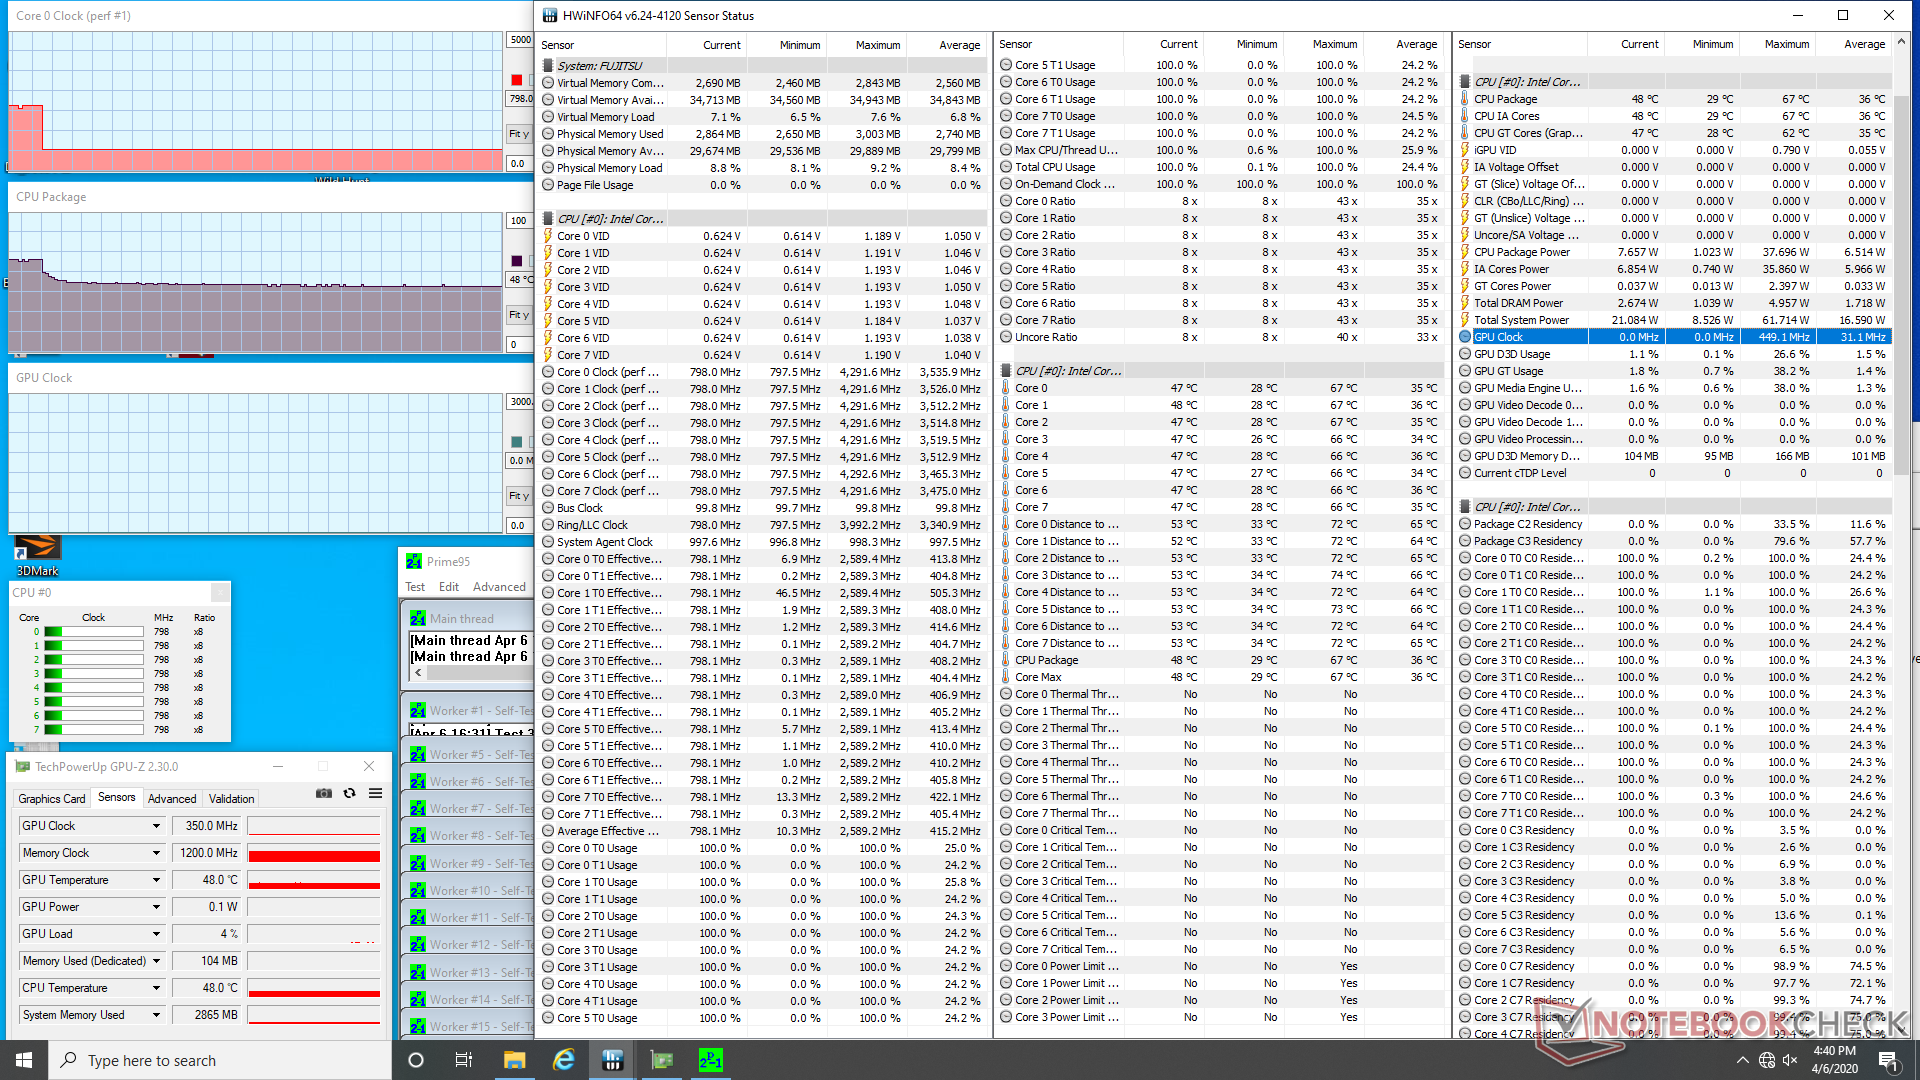
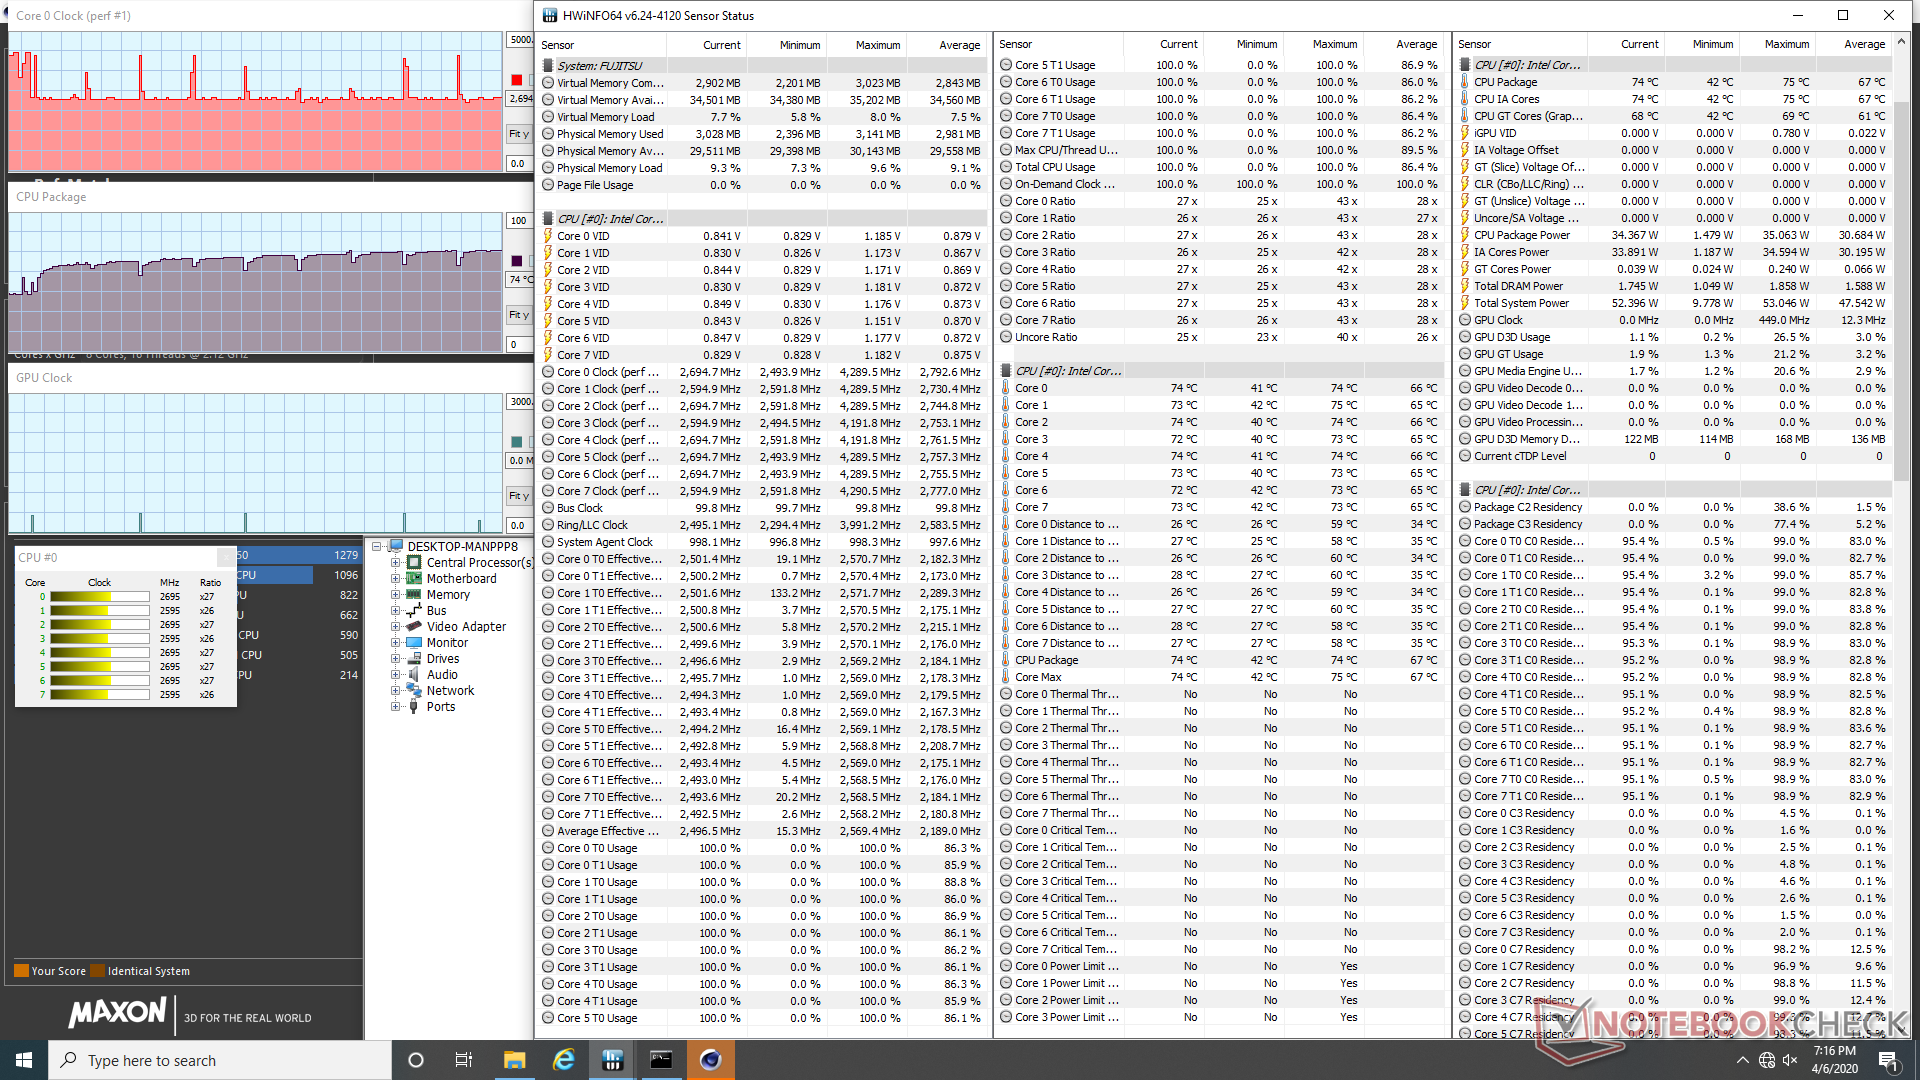
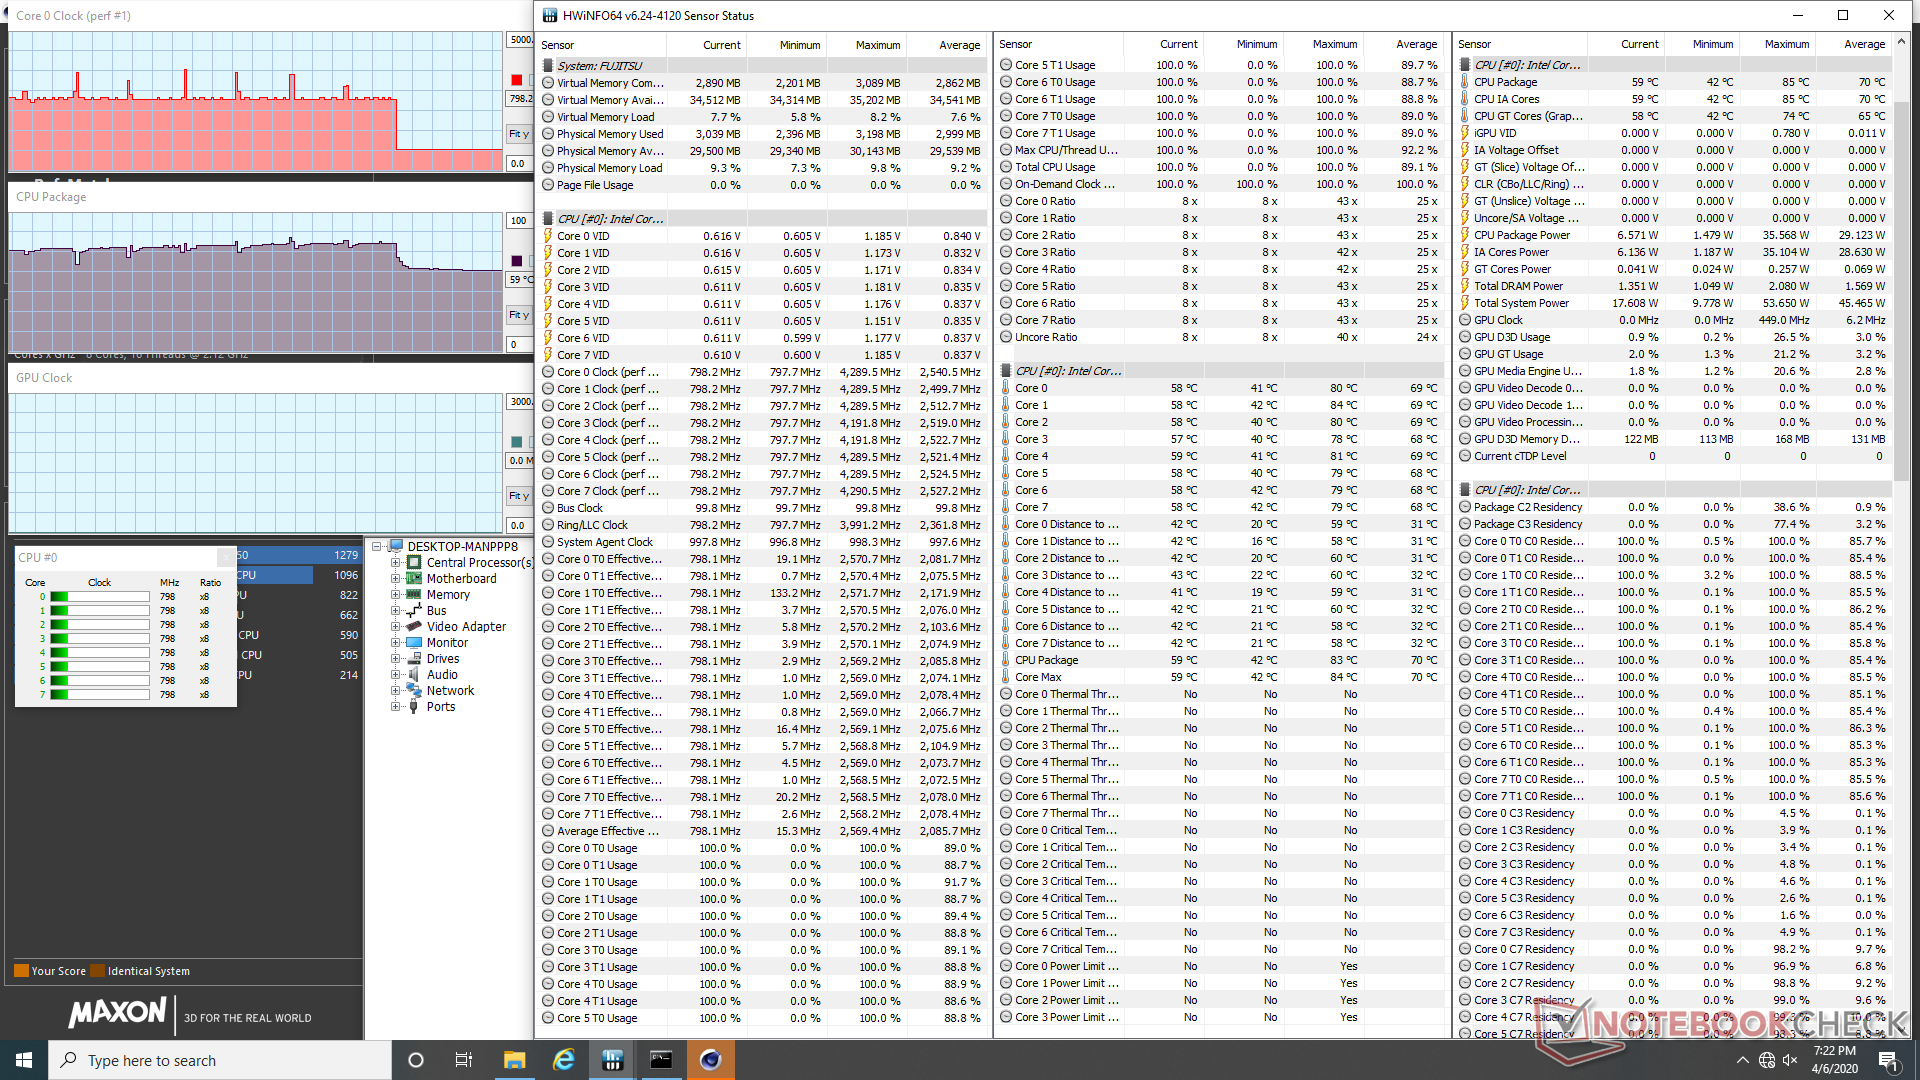
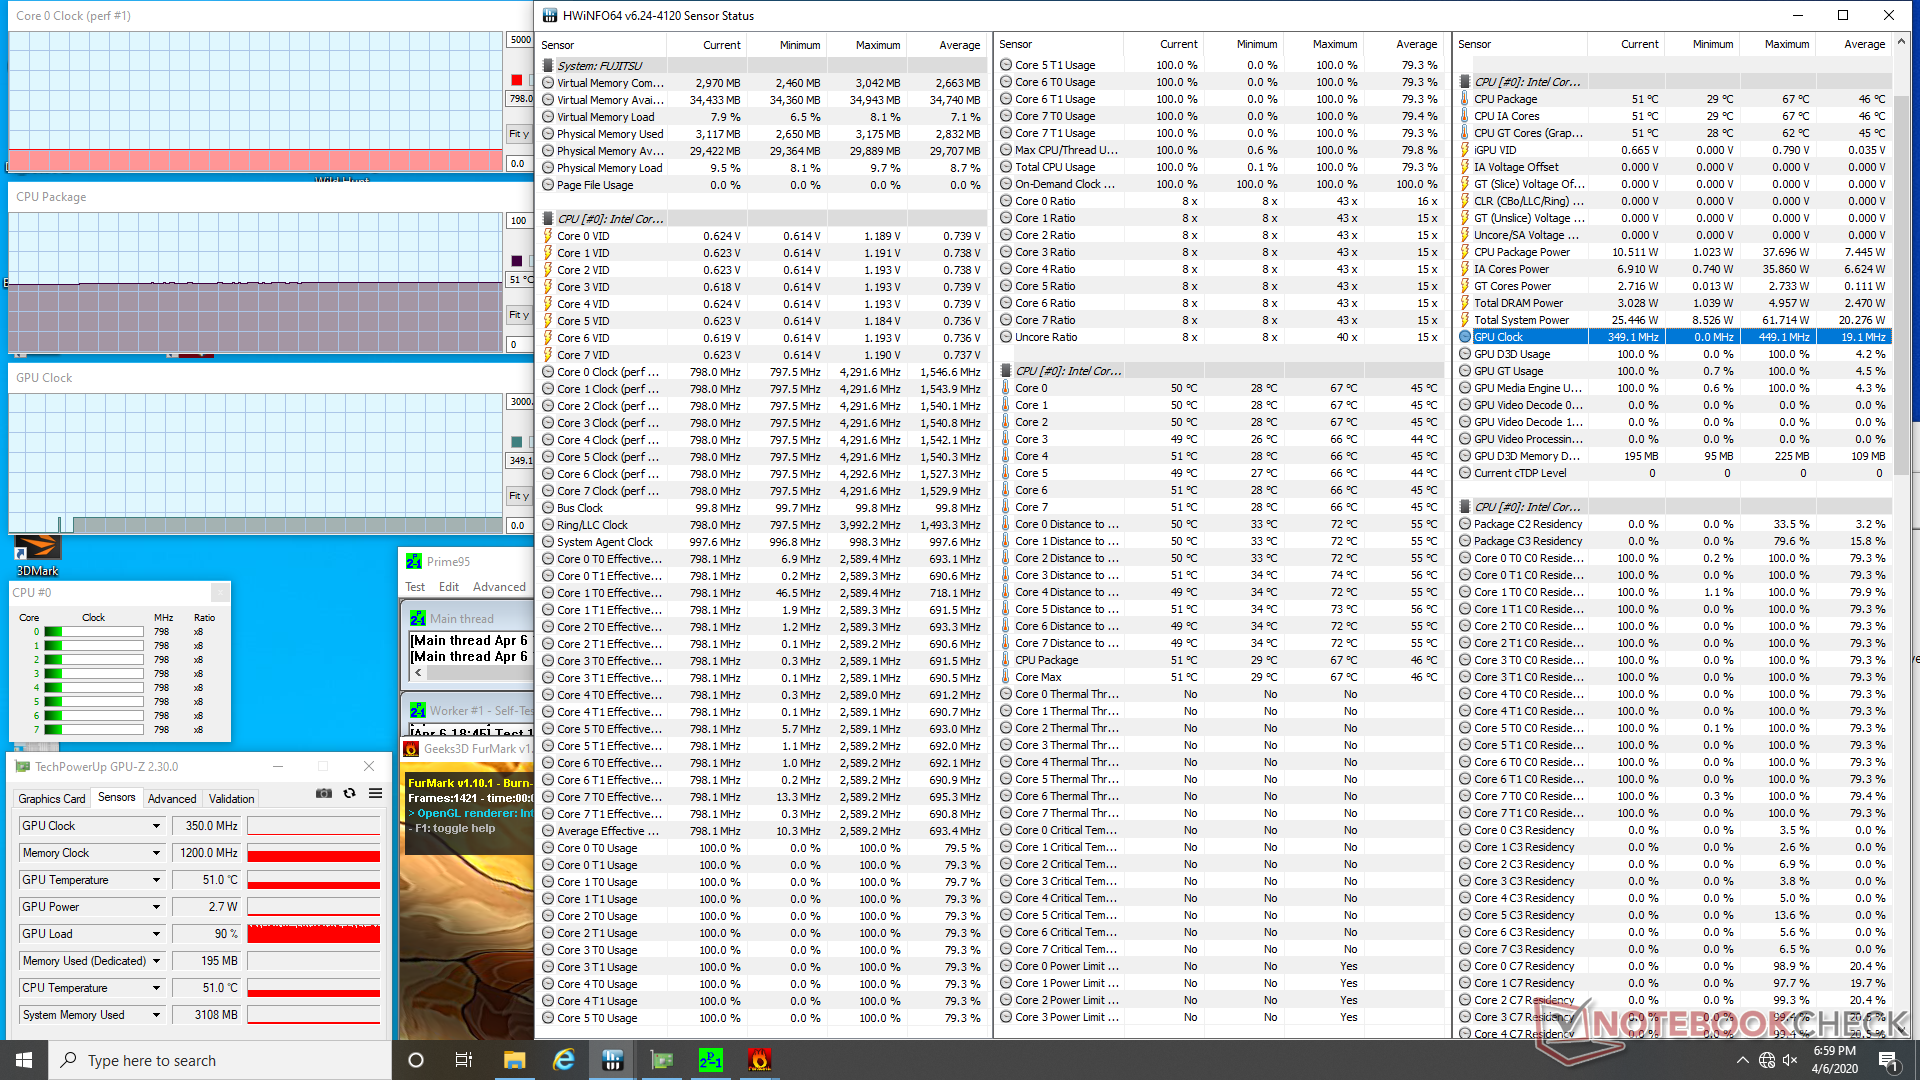
Destacamos el mini PC con cargas sintéticas y monitoreamos los signos vitales del sistema con HWiNFO para identificar cualquier problema potencial de aceleración. Cuando se ejecuta Prime95, la velocidad de reloj de la CPU aumentará hasta 2,6 GHz durante unos 20 segundos antes de caer ligeramente al rango de 2,3 a 2,4 GHz. La temperatura del núcleo aumentará lentamente hasta alcanzar los 67 C, donde la velocidad de reloj se estabilizará hasta los 800 MHz para una temperatura del núcleo más fría de 48 C. Se pueden observar resultados similares cuando se ejecuta CineBench R15 Multi-Thread en un bucle; la velocidad de reloj se mantendrá entre 2,5 y 2,7 GHz hasta alcanzar una temperatura máxima de 79 C. A partir de entonces, la velocidad de reloj se reducirá hasta los 800 MHz para mantener una temperatura del núcleo más fría.
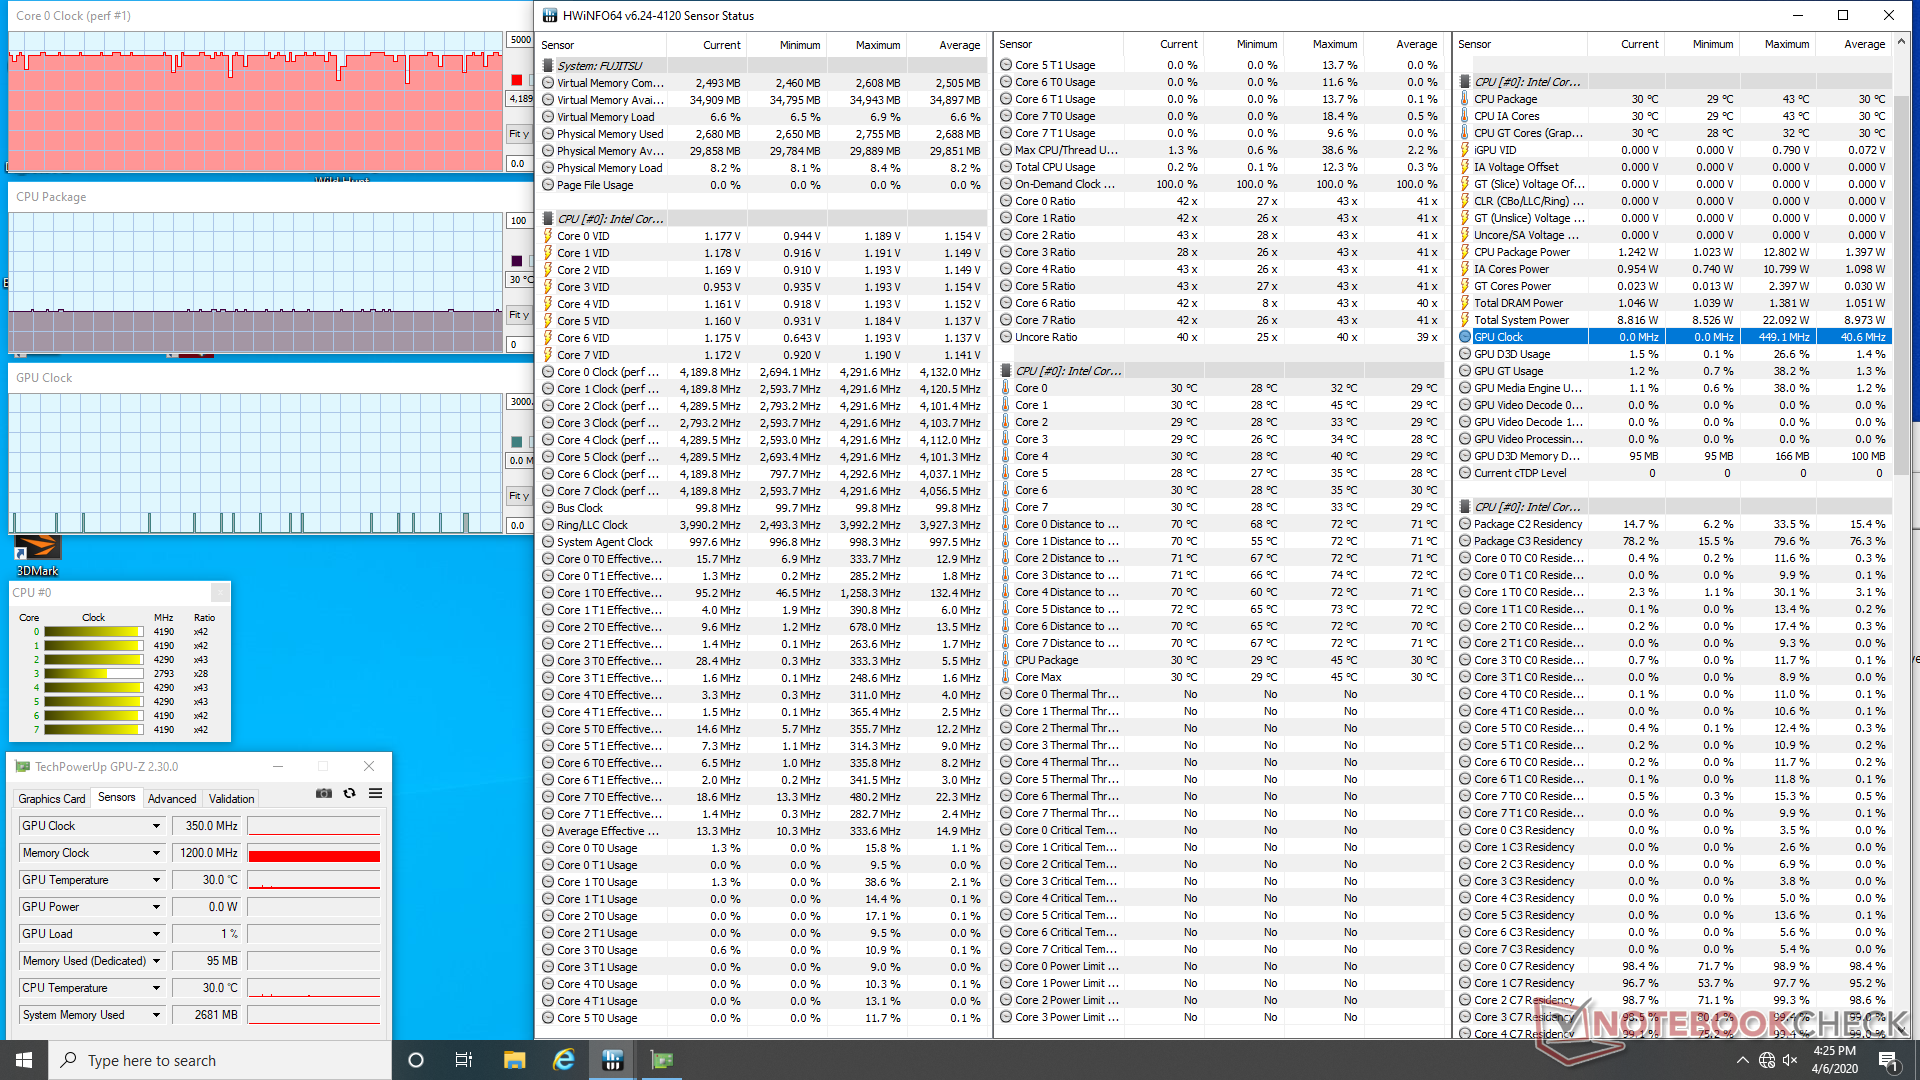
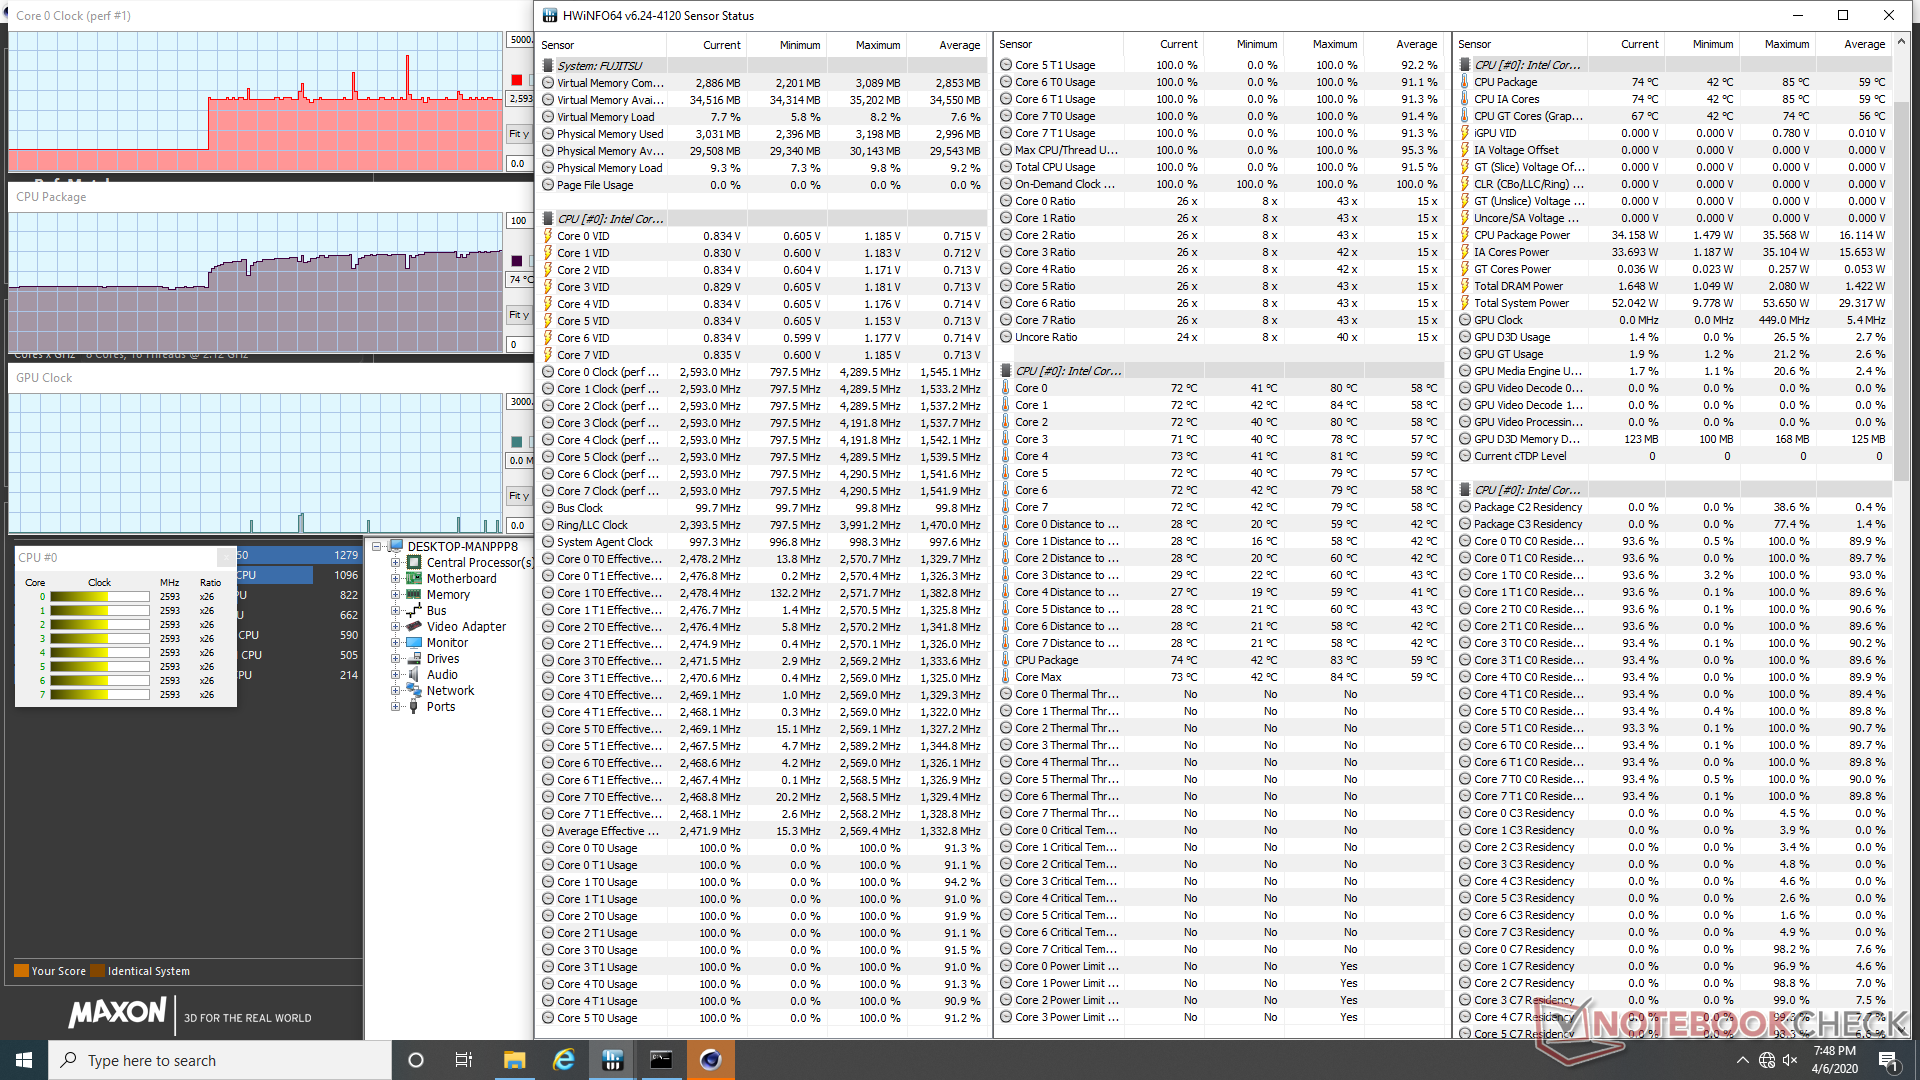
| CPU Clock (GHz) | GPU Clock (MHz) | Average CPU Temperature (°C) | |
| System Idle | -- | -- | 30 |
| Prime95 Stress | 0.8 - 2.4 | -- | 59 - 77 |
| Prime95 + FurMark Stress | 0.8 | 350 | 51 |
Gestión de la energía
Consumo de energía
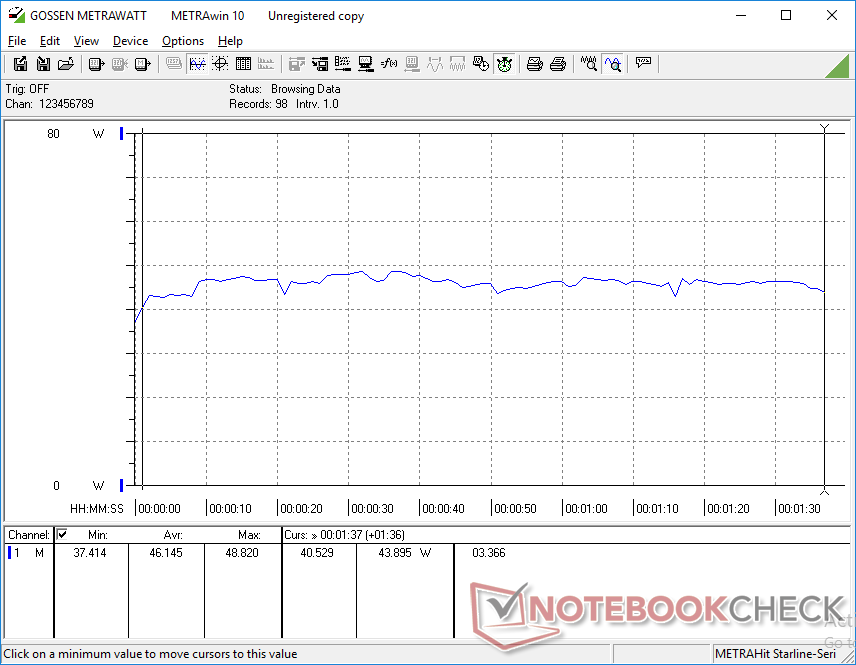
Las demandas de ociosidad entre 6 W y 9 W son muy similares a las que grabamos en el último Intel Frost Canyon NUC. Correr cargas más estresantes como 3DMark 06 producirá más de 46 W.
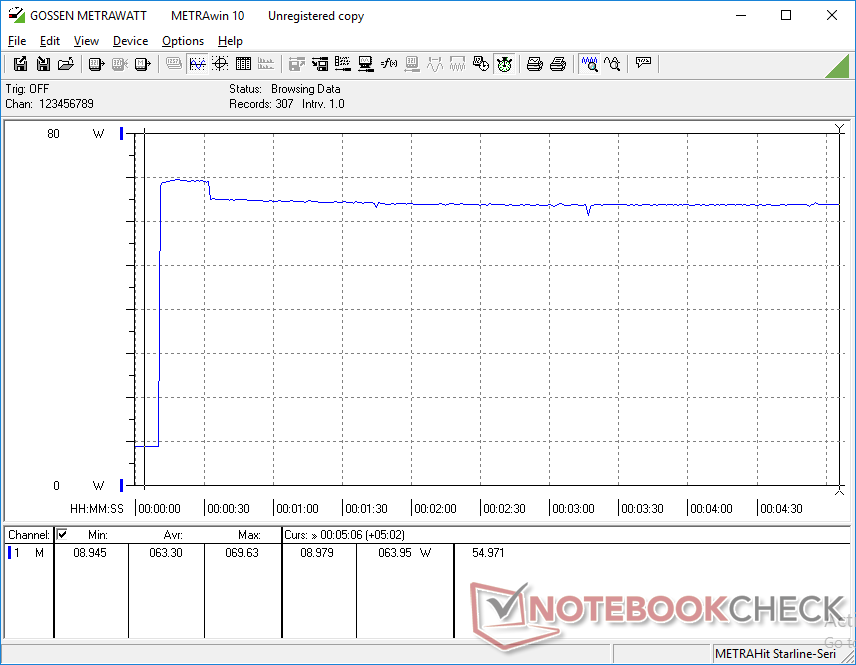
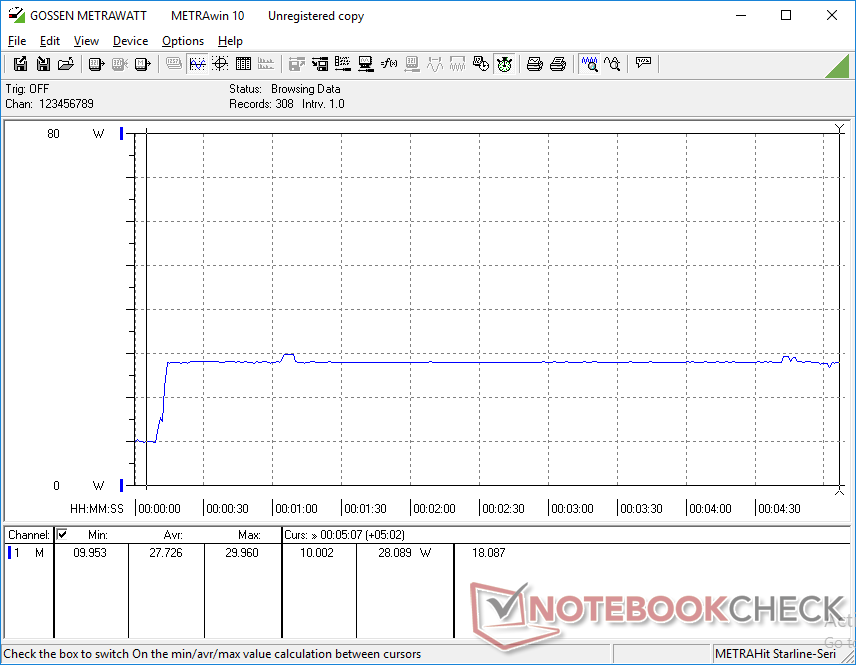
Somos capaces de grabar un consumo máximo de 69,7 W con el pequeño (10,5 x 4,5 x 3 cm) adaptador de CA de 65 W después de iniciar el Prime95. Sin embargo, este consumo máximo dura sólo 20 segundos antes de caer ligeramente a 64 C como muestran nuestros gráficos a continuación. El aumento inicial corresponde a nuestras observaciones de la prueba de esfuerzo de Prime95 arriba, donde la máxima velocidad de reloj de 2,6 GHz también sólo fue alcanzada durante unos 20 segundos.
Si la velocidad de reloj de la CPU se acelera hasta 800 MHz como se mencionó anteriormente en la revisión, el consumo de energía caerá aún más hasta sólo 28 W.
| Off / Standby | |
| Ocioso | |
| Carga |
|
Clave:
min: | |
| Impact Display Solutions IMP-3654-B1-R Core i9-9900T i9-9900T, UHD Graphics 630, EDGE NextGen SSD 1TB, , x, | Zotac ZBOX-QK7P3000 i7-7700T, Quadro P3000, Samsung SSD 960 Pro 512 GB m.2, , x, | Zotac ZBOX Magnus EK71080 i7-7700HQ, GeForce GTX 1080 (Desktop), Samsung PM961 MZVLW256HEHP, , x, 0" | Intel Hades Canyon NUC8i7HVK i7-8809G, Vega M GH, Intel Optane 120 GB SSDPEK1W120GA, , x, | Lenovo Yoga C940-15IRH i7-9750H, GeForce GTX 1650 Max-Q, Intel Optane Memory H10 with Solid State Storage 32GB + 512GB HBRPEKNX0202A(L/H), IPS, 1920x1080, 15.6" | Apple MacBook Pro 16 2019 i9 5500M i9-9880H, Radeon Pro 5500M, Apple SSD AP1024 7171, IPS, 3072x1920, 16" | |
|---|---|---|---|---|---|---|
| Power Consumption | -137% | -211% | -109% | -74% | -48% | |
| Idle Minimum * (Watt) | 6.6 | 19.9 -202% | 27.1 -311% | 15.5 -135% | 5.2 21% | 3.7 44% |
| Idle Average * (Watt) | 8.3 | 20.3 -145% | 27.4 -230% | 16.2 -95% | 10.7 -29% | 12.1 -46% |
| Idle Maximum * (Watt) | 8.8 | 27.6 -214% | 28.8 -227% | 16.5 -87% | 24.3 -176% | 17 -93% |
| Load Average * (Watt) | 46.2 | 86.2 -87% | 100.4 -117% | 83.4 -81% | 84.4 -83% | 91.5 -98% |
| Load Maximum * (Watt) | 69.7 | 96.3 -38% | 186.7 -168% | 173.5 -149% | 142.8 -105% | 102.3 -47% |
| Witcher 3 ultra * (Watt) | 114.4 | 243.1 | 121.7 | 83.9 | 103 |
* ... más pequeño es mejor
Veredicto
¿Puede el Impact IMP-3654-B1-R Mini PC hacer funcionar una CPU Core i9 con sólo un disipador de calor? La respuesta es sí, pero es sólo por un tiempo limitado. Cuando el sistema está completamente estresado por largos períodos, las velocidades del reloj eventualmente se acelerarán y caerán por un acantilado como hemos demostrado arriba en múltiples instancias. En el mejor de los casos, las velocidades de reloj se estabilizarán alrededor de 2,5 GHz para un nivel de rendimiento general de múltiples núcleos similar al del núcleo hexa de 45 W i7-9750H, aunque el núcleo i9-9900T es una pieza de 35 W de octava. Es uno de los mini PC silenciosos más rápidos que se pueden encontrar en ese sentido.
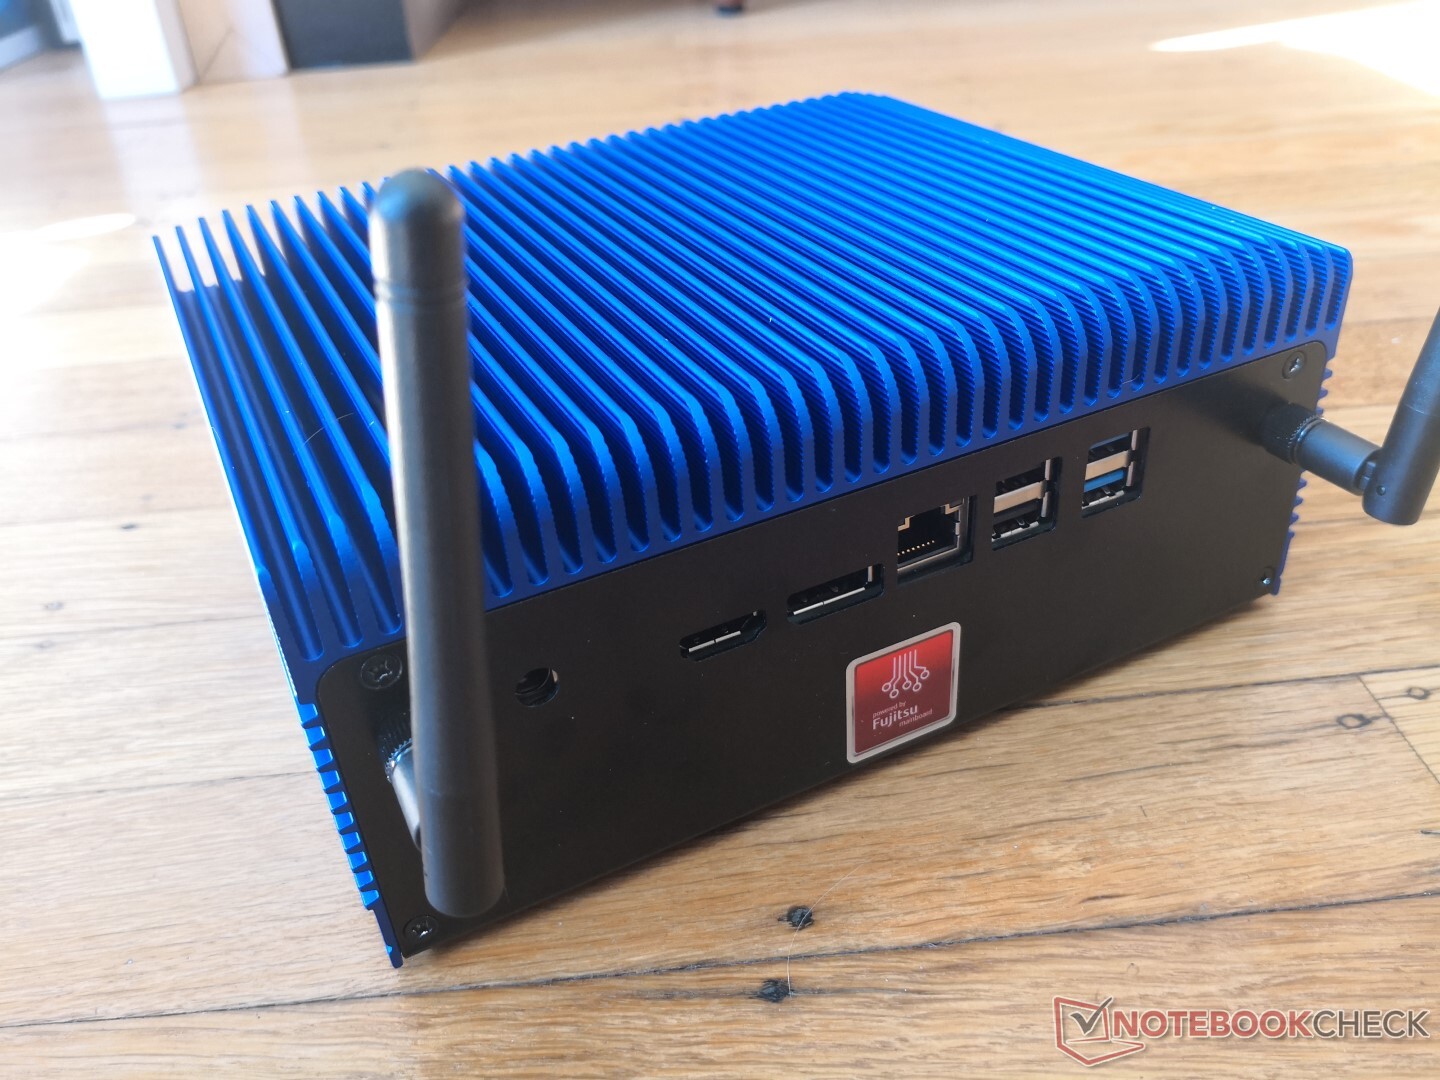
Si no planeas ejecutar cargas de procesamiento extremas durante largos períodos y sólo quieres un aumento ocasional del rendimiento de una CPU Core i9, entonces el silencioso mini PC IMP-3654-B1-R debería ser el adecuado. Un puerto Thunderbolt 3 o un lector SD habrían ampliado la versatilidad del mini PC.
