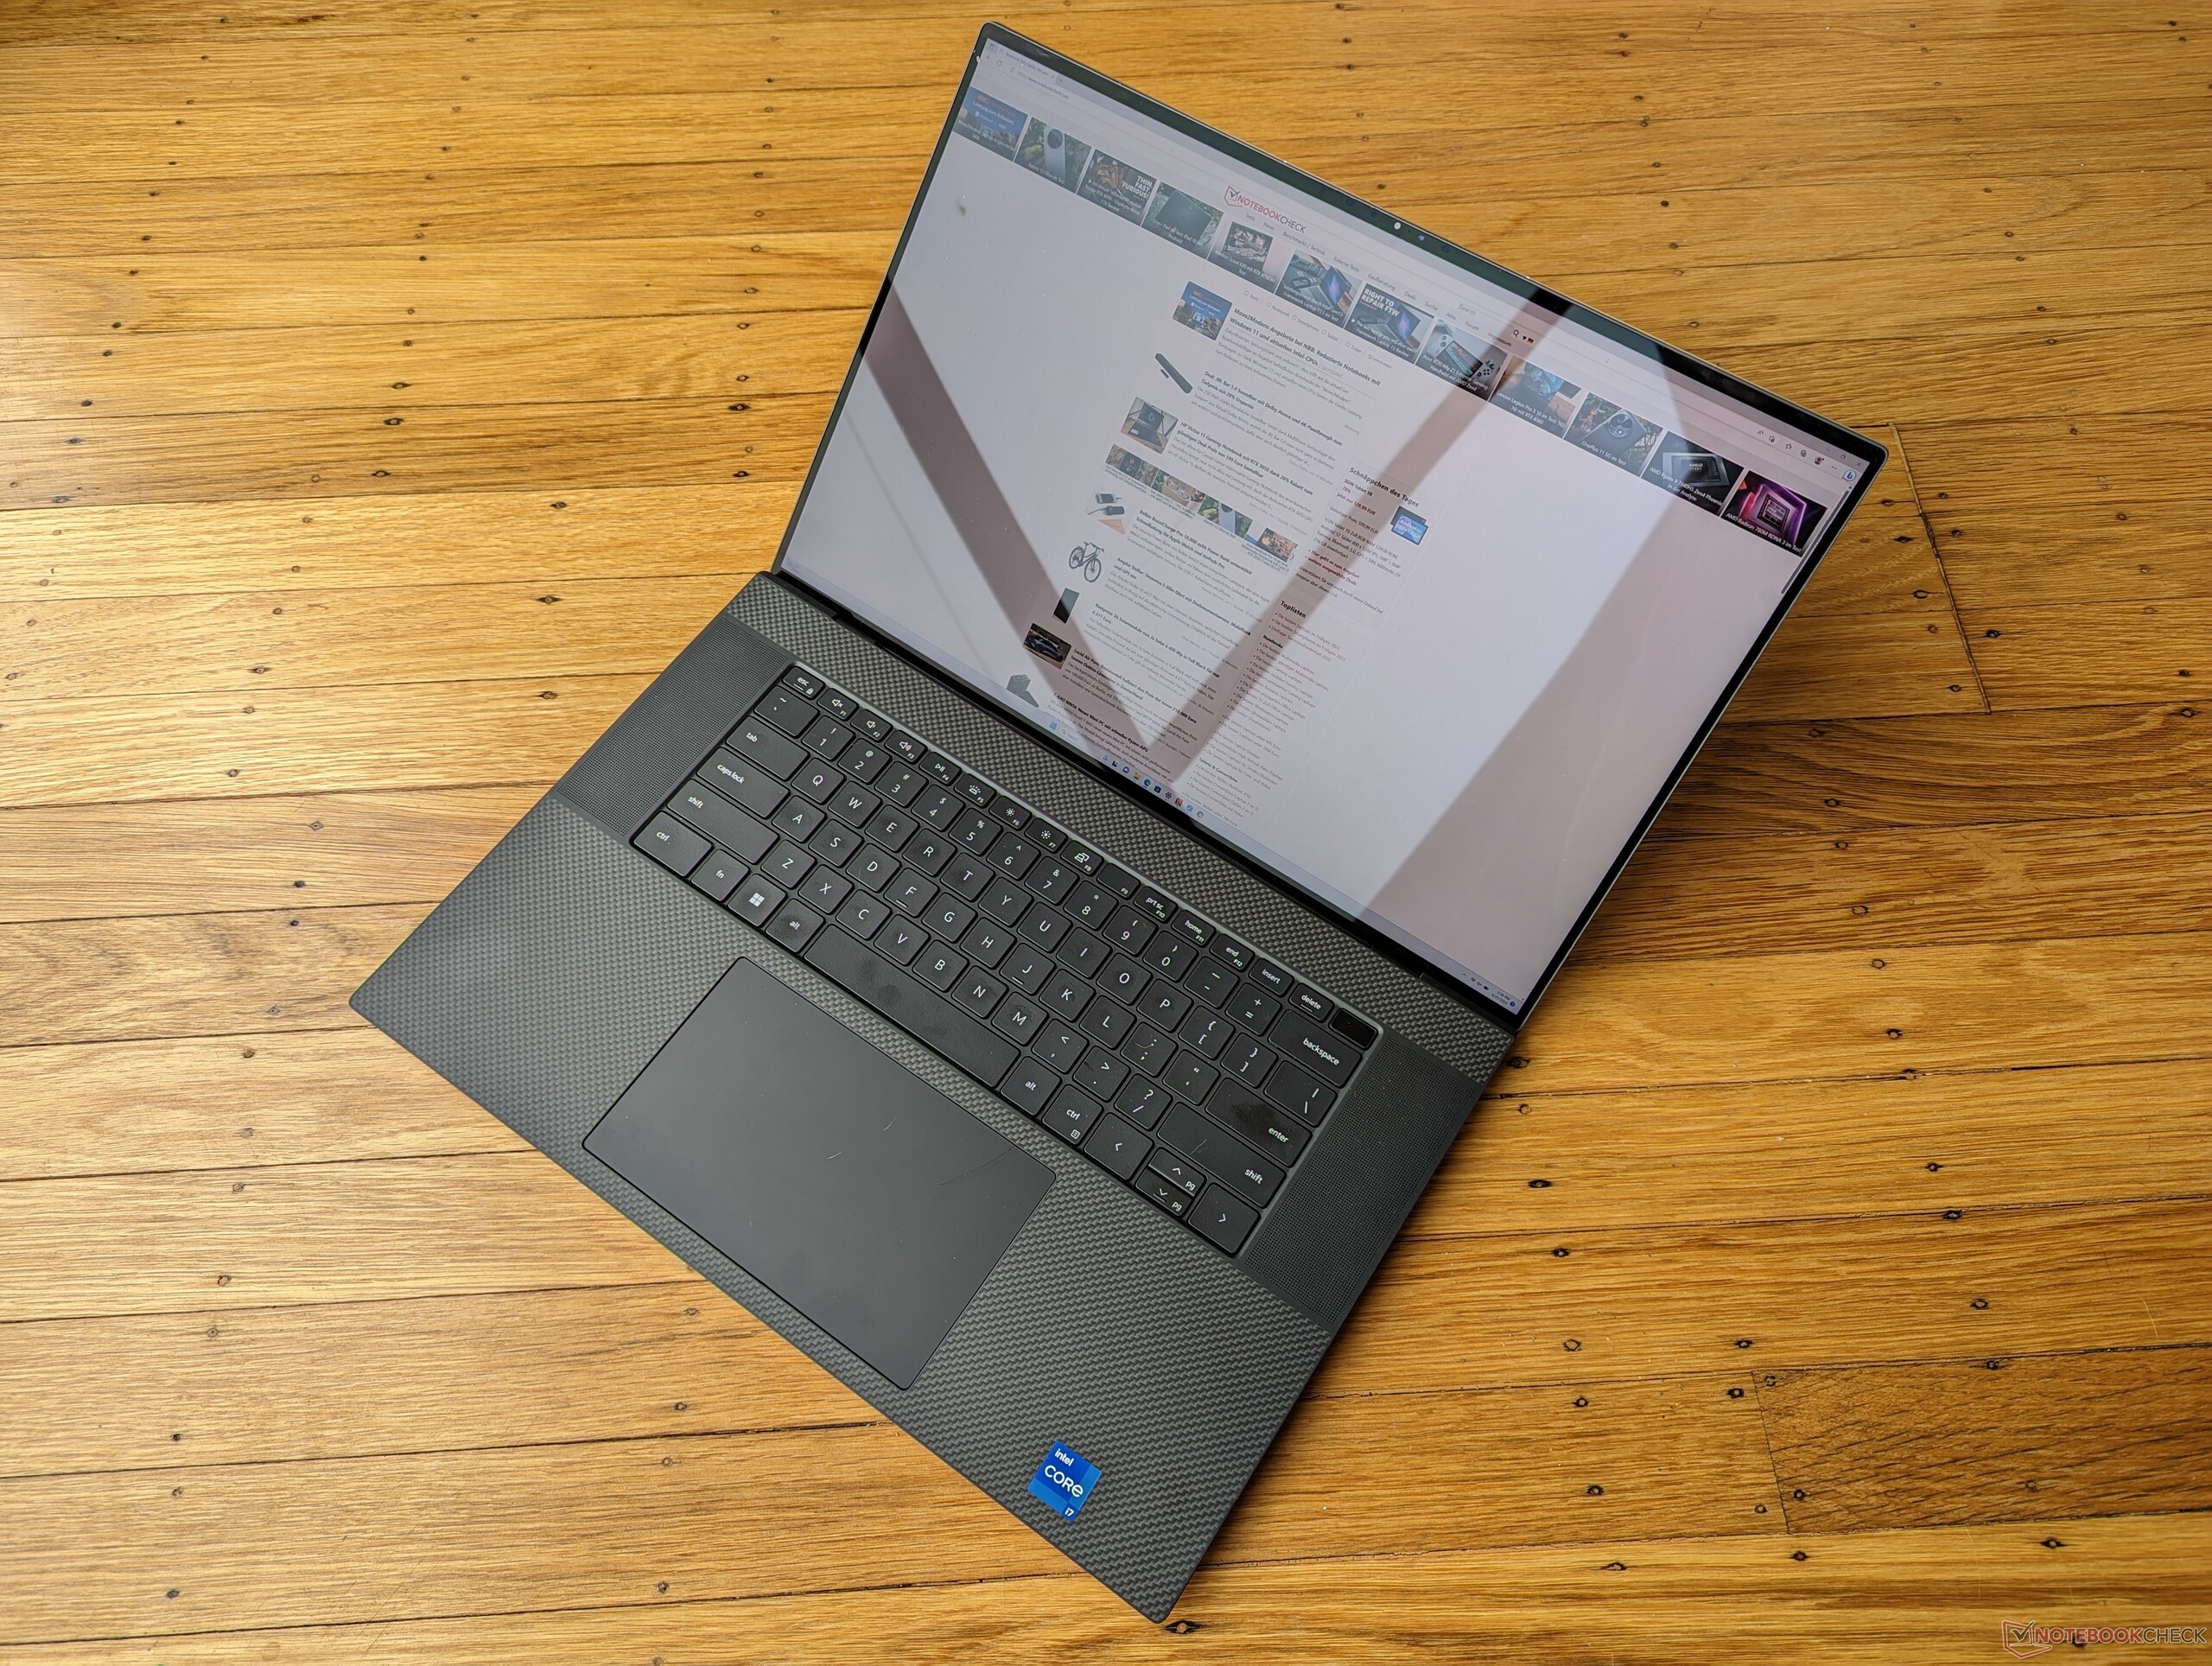
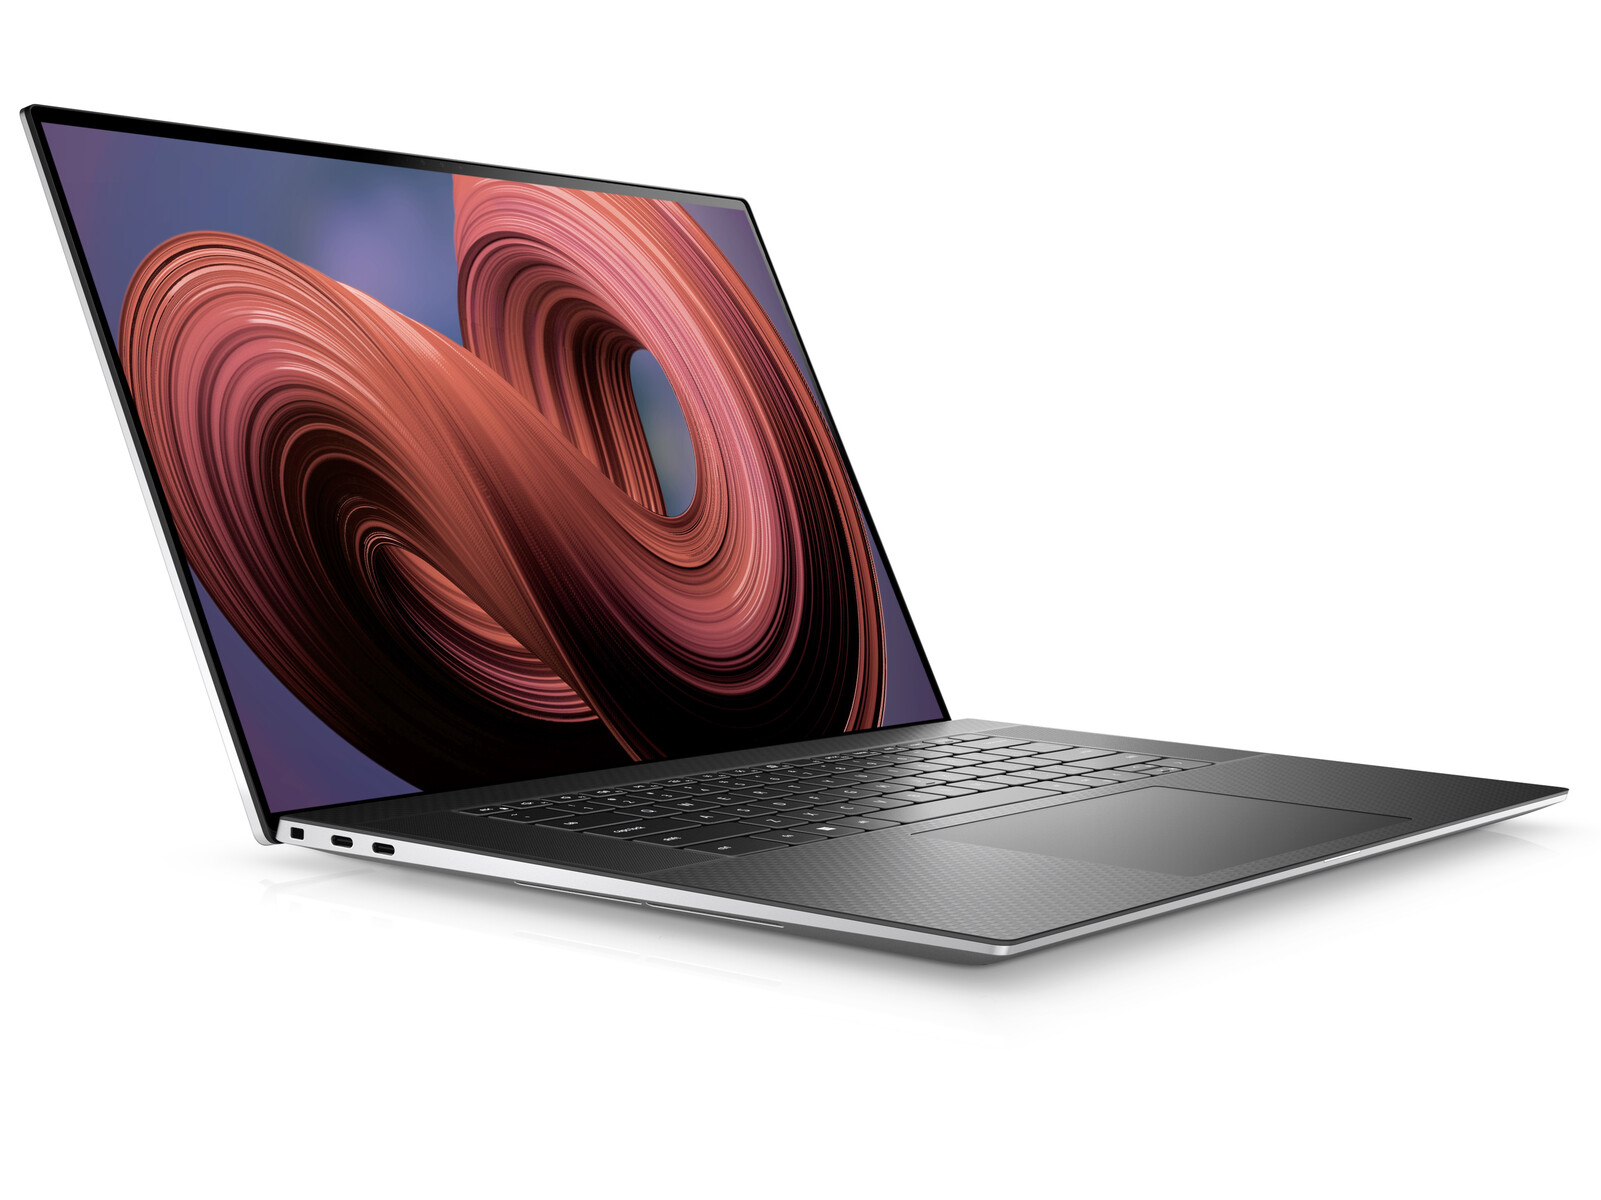
Análisis del portátil Dell XPS 17 9730: GeForce El monstruo multimedia RTX 4070

El 2023 XPS 17 9730 es la cuarta iteración del xPS 17 9700 original de 2020 de 2020. Es una actualización interna con CPUs Intel Raptor Lake-H de 13ª generación y GPUs Nvidia Ada Lovelace para reemplazar las opciones Alder Lake-H y Ampere de 12ª generación del año pasado, respectivamente. Por lo demás, no hay grandes cambios superficiales, por lo que recomendamos consultar nuestro análisis del xPS 17 9700 original para saber más sobre las características físicas del portátil. Cualquier rediseño futuro probablemente se inspirará en la reciente serie XPS 13 Plus.
Nuestra configuración específica es un modelo de gama alta con Core i7-13700H, GeForce RTX 4070 y pantalla táctil brillante UHD+ 2400p por unos 3500 dólares. Hay otras versiones disponibles con RTX 4050, RTX 4060, RTX 4080, Core i9-13900H o pantalla mate de 1200p. Curiosamente, todas las configuraciones deben venir con gráficos discretos, mientras que los modelos XPS 17 anteriores tenían opciones UHD o Iris Xe integradas más baratas.
Los competidores en este espacio incluyen otros portátiles multimedia insignia de 17 pulgadas como el LG Gram 17, HP Envy 17,MSI Creator Z17o elApple MacBook Pro 16.
Más opiniones sobre Dell:
Posibles contendientes en la comparación
Valoración | Fecha | Modelo | Peso | Altura | Tamaño | Resolución | Precio |
|---|---|---|---|---|---|---|---|
| 90 % v7 (old) | 05/2023 | Dell XPS 17 9730 RTX 4070 i7-13700H, GeForce RTX 4070 Laptop GPU | 2.5 kg | 19.5 mm | 17.00" | 3840x2400 | |
| 88.8 % v7 (old) | 06/2022 | Dell XPS 17 9720 RTX 3060 i7-12700H, GeForce RTX 3060 Laptop GPU | 2.5 kg | 19.5 mm | 17.00" | 3840x2400 | |
| 86.4 % v7 (old) | 05/2023 | LG Gram 17 (2023) i7-1360P, Iris Xe G7 96EUs | 1.4 kg | 17.8 mm | 17.00" | 2560x1600 | |
| 86.3 % v7 (old) | 04/2023 | HP Envy 17-cr0079ng i7-1255U, GeForce RTX 2050 Mobile | 2.6 kg | 19.6 mm | 17.30" | 3840x2160 | |
| 83.8 % v7 (old) | 09/2022 | MSI Creator Z17 A12UGST-054 i9-12900H, GeForce RTX 3070 Ti Laptop GPU | 2.5 kg | 19 mm | 17.00" | 2560x1600 | |
| 93.7 % v7 (old) | 03/2023 | Apple MacBook Pro 16 2023 M2 Max M2 Max, M2 Max 38-Core GPU | 2.2 kg | 16.8 mm | 16.20" | 3456x2234 |
Caso - Mismo diseño tres años seguidos
Lector de tarjetas SD
| SD Card Reader | |
| average JPG Copy Test (av. of 3 runs) | |
| Dell XPS 17 9720 RTX 3060 (Toshiba Exceria Pro SDXC 64 GB UHS-II) | |
| Dell XPS 17 9730 RTX 4070 (Toshiba Exceria Pro SDXC 64 GB UHS-II) | |
| Apple MacBook Pro 16 2023 M2 Max (Angelbird AV Pro V60) | |
| MSI Creator Z17 A12UGST-054 (AV Pro SD microSD 128 GB V60) | |
| HP Envy 17-cr0079ng (AV Pro SD microSD 128 GB V60) | |
| LG Gram 17 (2023) (AV Pro SD microSD 128 GB V60) | |
| maximum AS SSD Seq Read Test (1GB) | |
| Apple MacBook Pro 16 2023 M2 Max (Angelbird AV Pro V60) | |
| Dell XPS 17 9730 RTX 4070 (Toshiba Exceria Pro SDXC 64 GB UHS-II) | |
| Dell XPS 17 9720 RTX 3060 (Toshiba Exceria Pro SDXC 64 GB UHS-II) | |
| LG Gram 17 (2023) (AV Pro SD microSD 128 GB V60) | |
| MSI Creator Z17 A12UGST-054 (AV Pro SD microSD 128 GB V60) | |
| HP Envy 17-cr0079ng (AV Pro SD microSD 128 GB V60) | |
Comunicación - No Wi-Fi 6E
El XPS 15 y el XPS 17 siguen siendo los únicos portátiles de los últimos tiempos que se entregan con módulos WLAN Wi-Fi 6E y, sin embargo, NO son compatibles con la conectividad Wi-Fi 6E. Por lo tanto, no podrás conectarte a ninguna red Wi-Fi de 6 GHz. Esto no debería ser un gran problema para la mayoría de los usuarios, pero no deja de ser decepcionante para un portátil que cuesta más de 3.500 dólares.
| Networking | |
| iperf3 transmit AXE11000 | |
| LG Gram 17 (2023) | |
| Dell XPS 17 9720 RTX 3060 | |
| HP Envy 17-cr0079ng | |
| Dell XPS 17 9730 RTX 4070 | |
| iperf3 receive AXE11000 | |
| LG Gram 17 (2023) | |
| HP Envy 17-cr0079ng | |
| Dell XPS 17 9720 RTX 3060 | |
| Dell XPS 17 9730 RTX 4070 | |
| iperf3 transmit AXE11000 6GHz | |
| Apple MacBook Pro 16 2023 M2 Max | |
| LG Gram 17 (2023) | |
| HP Envy 17-cr0079ng | |
| MSI Creator Z17 A12UGST-054 | |
| iperf3 receive AXE11000 6GHz | |
| Apple MacBook Pro 16 2023 M2 Max | |
| MSI Creator Z17 A12UGST-054 | |
| HP Envy 17-cr0079ng | |
| LG Gram 17 (2023) | |
Webcam - Sólo 720p
El XPS 15 y el XPS 17 son probablemente los únicos portátiles insignia que siguen comercializándose con cámaras web de baja resolución de 1 MP o 720p y sin obturador de privacidad. Fabricantes de la competencia como Lenovo, HP, Asus y otros ya han pasado a soluciones de 2 MP o incluso de 8 MP. Dell afirma que el bisel superestrecho de la pantalla del diseño XPS limita la calidad del sensor de la webcam.


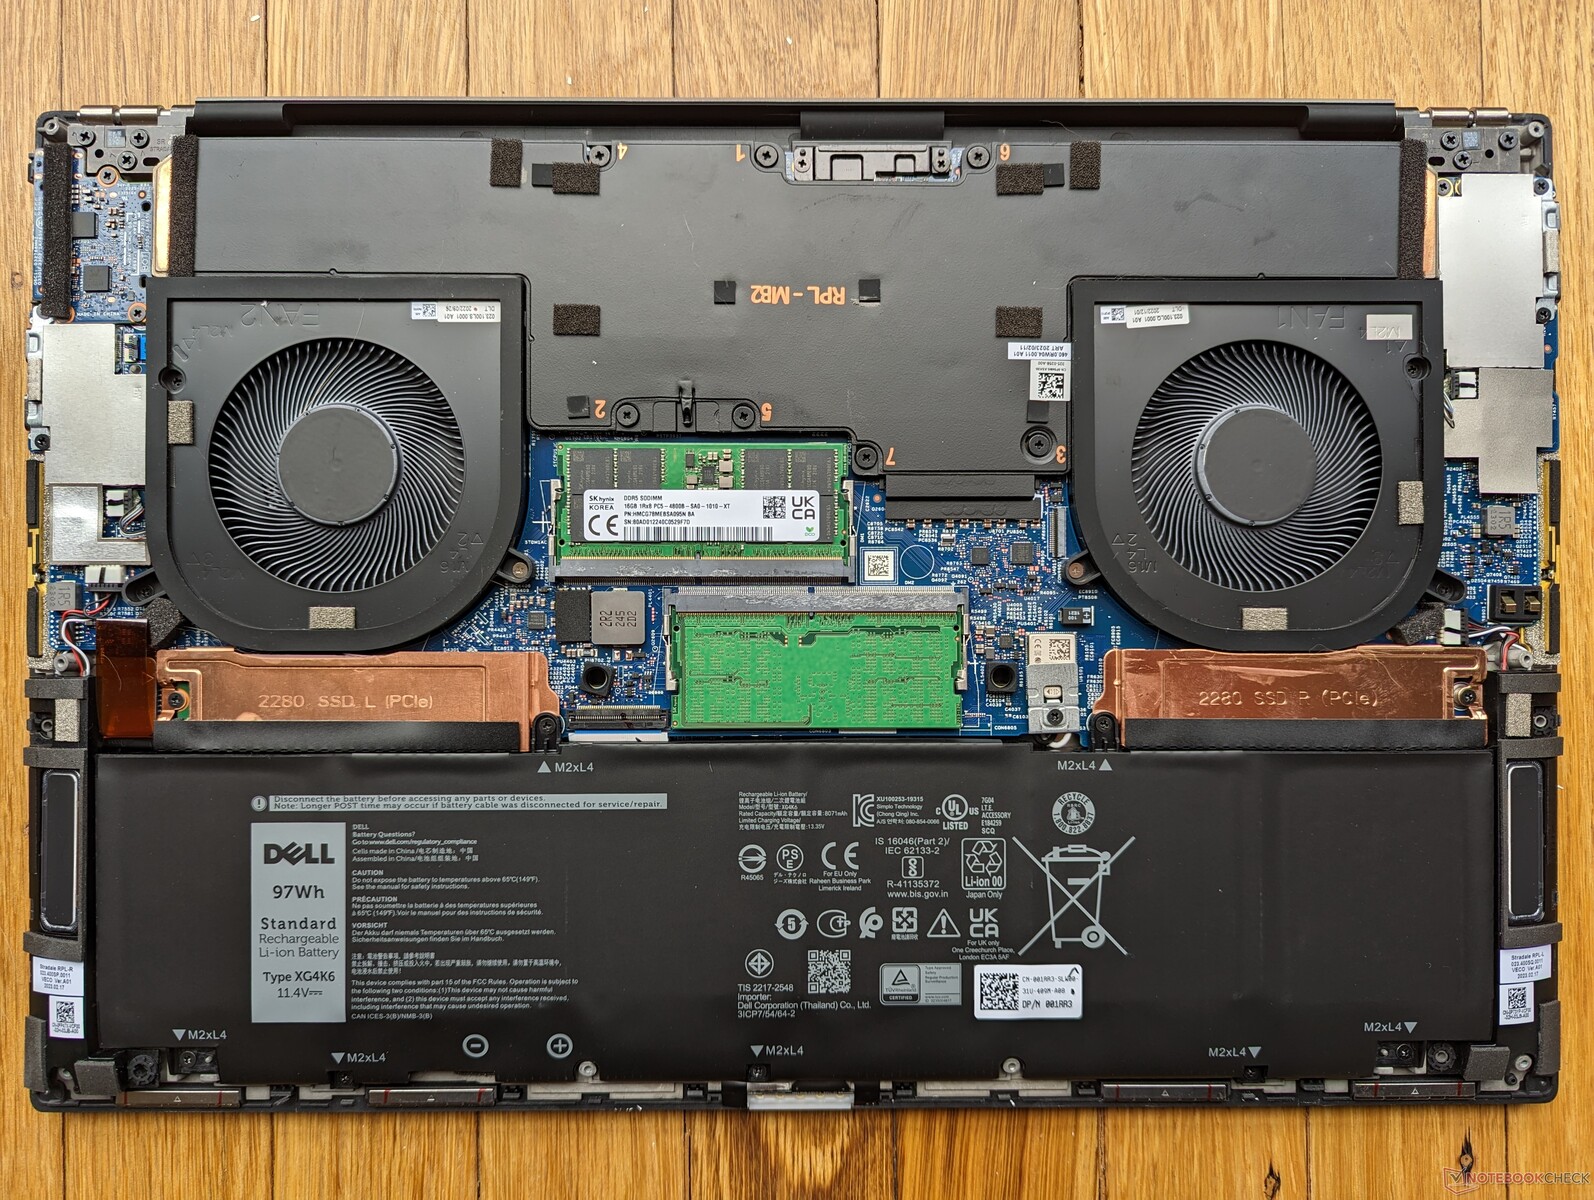
Mantenimiento
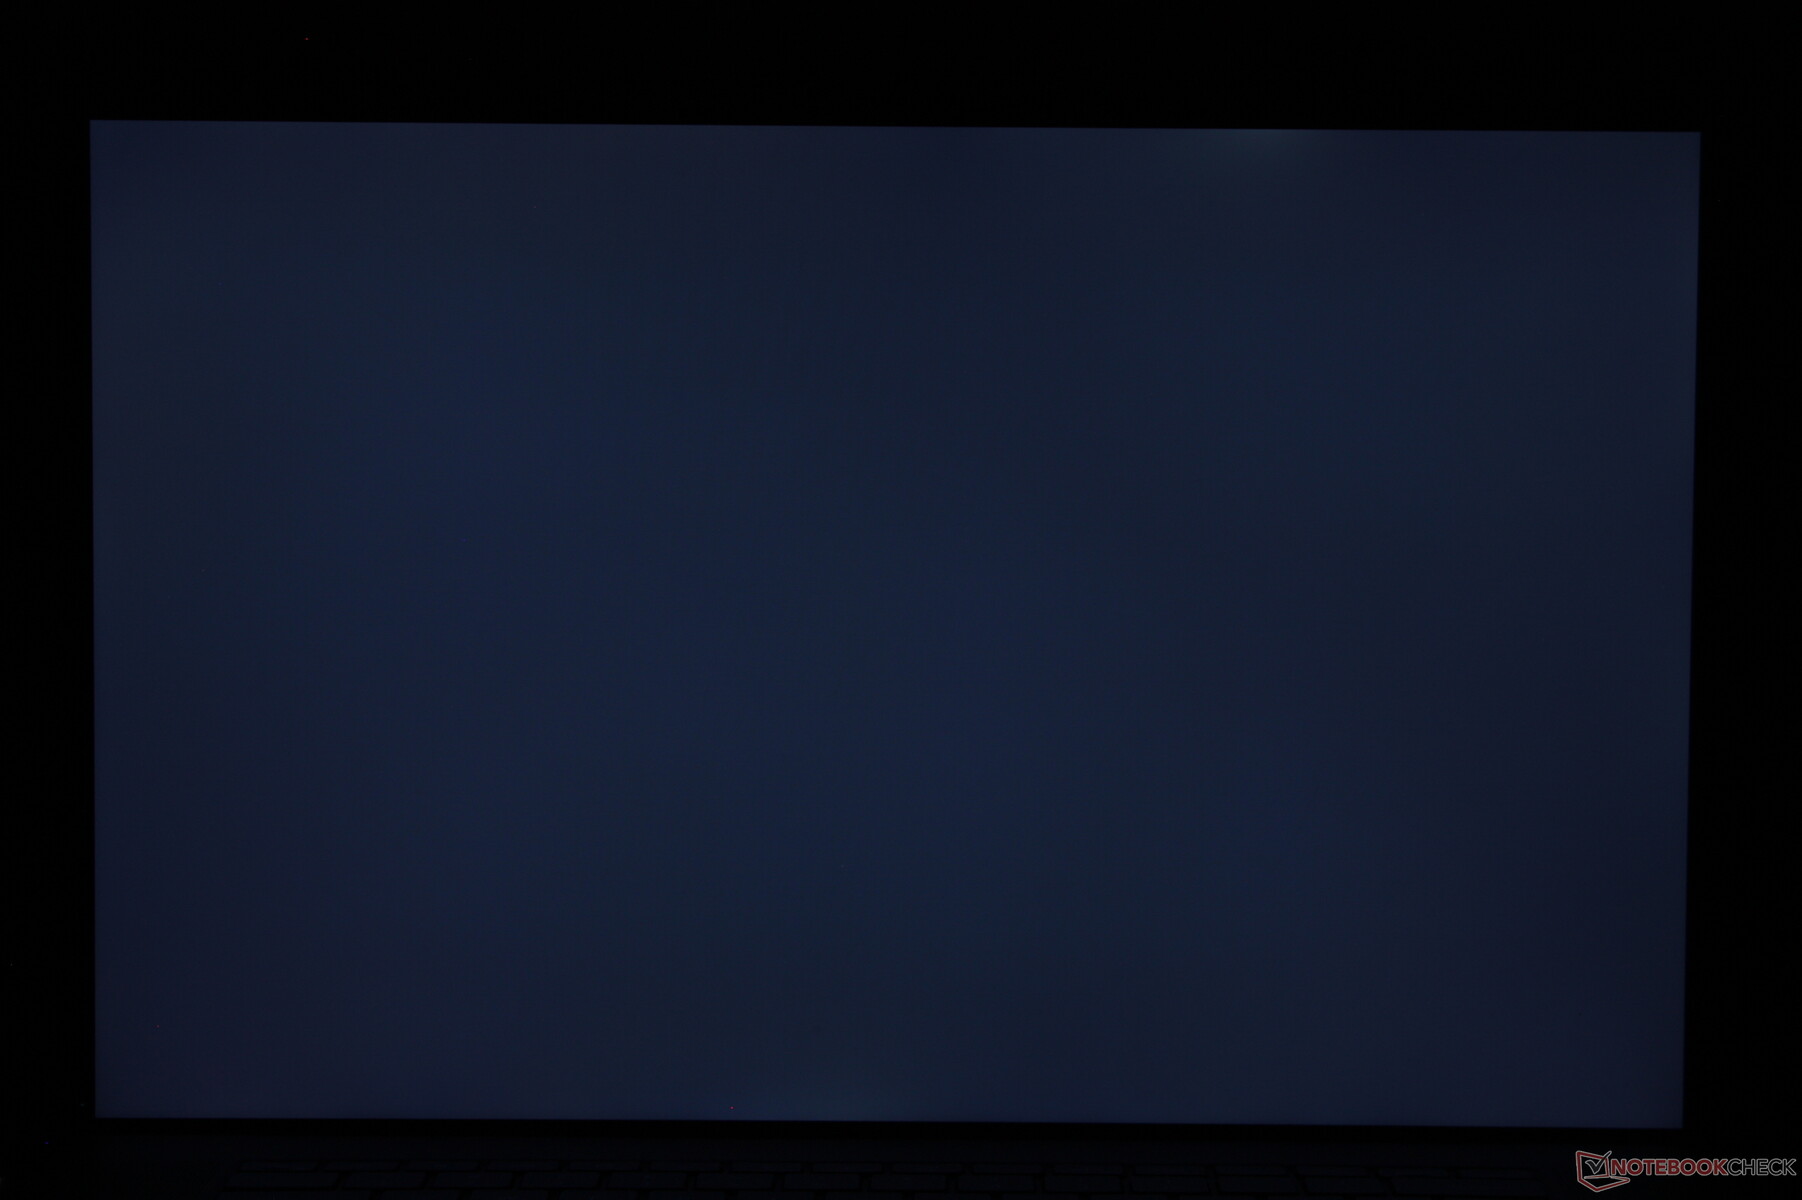
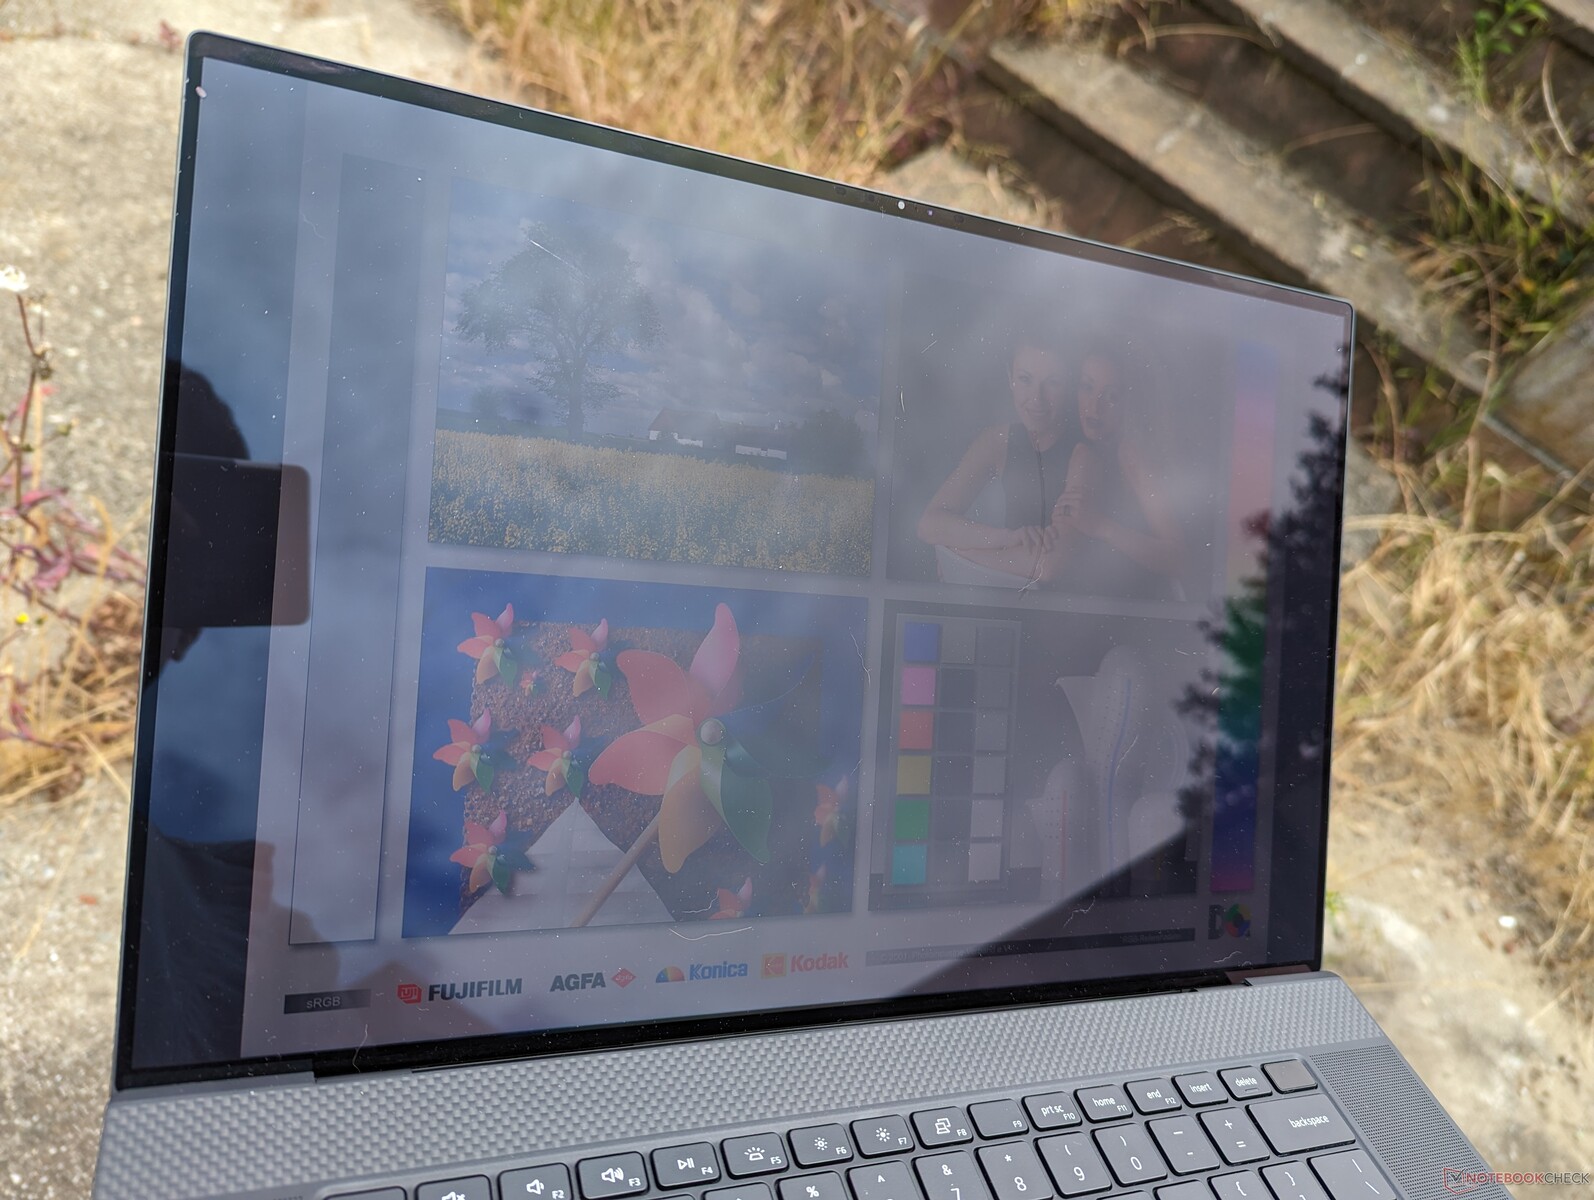
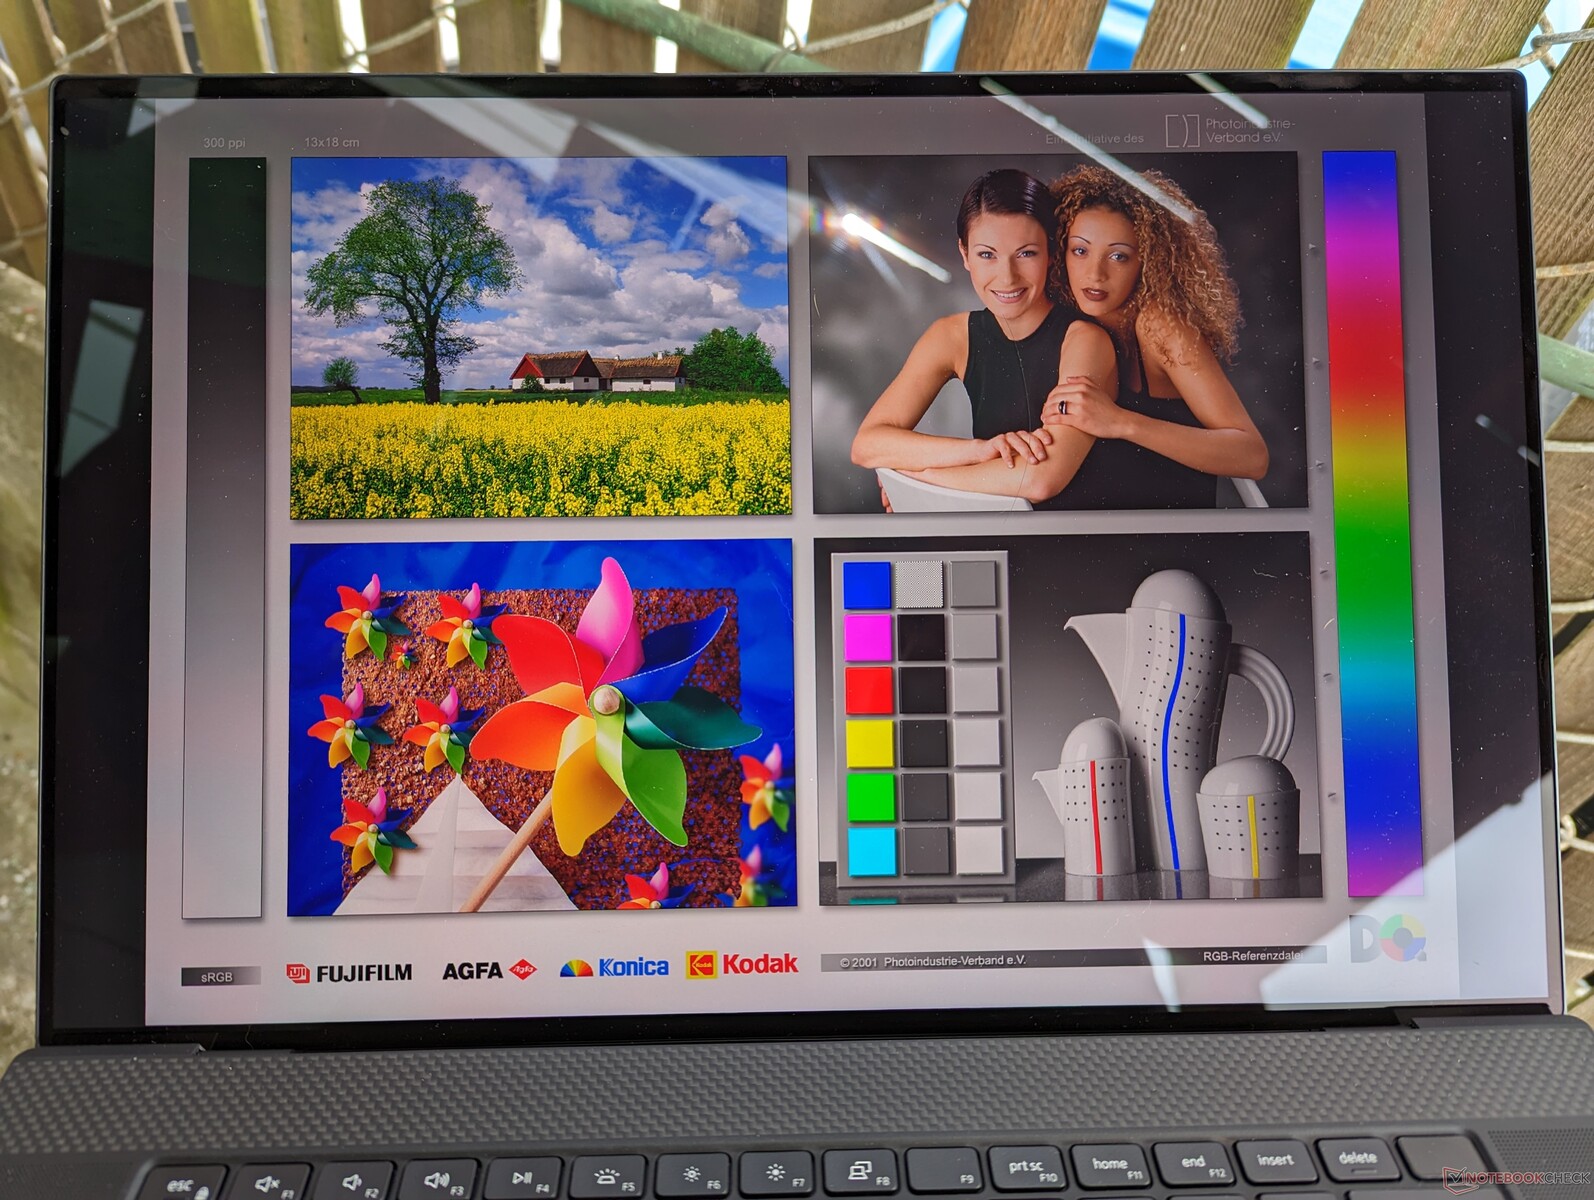
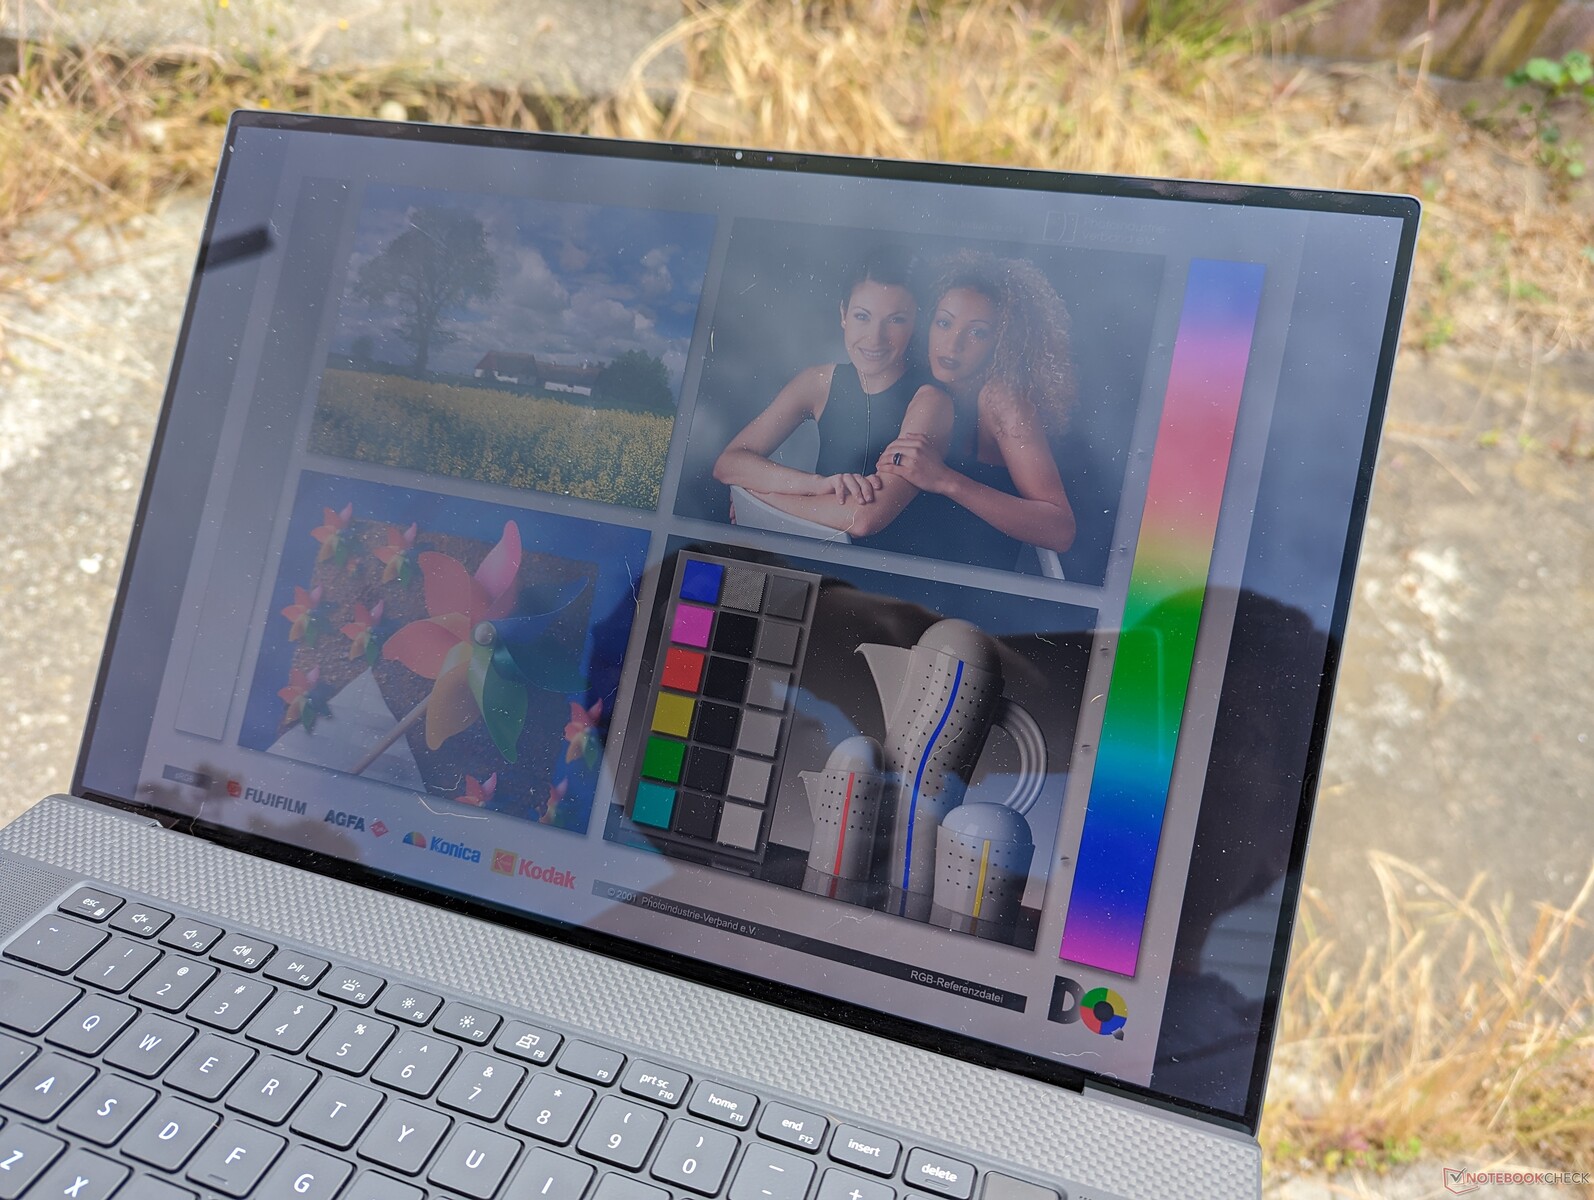
Pantalla - Sigue siendo buena, pero no hay opción de 120 Hz
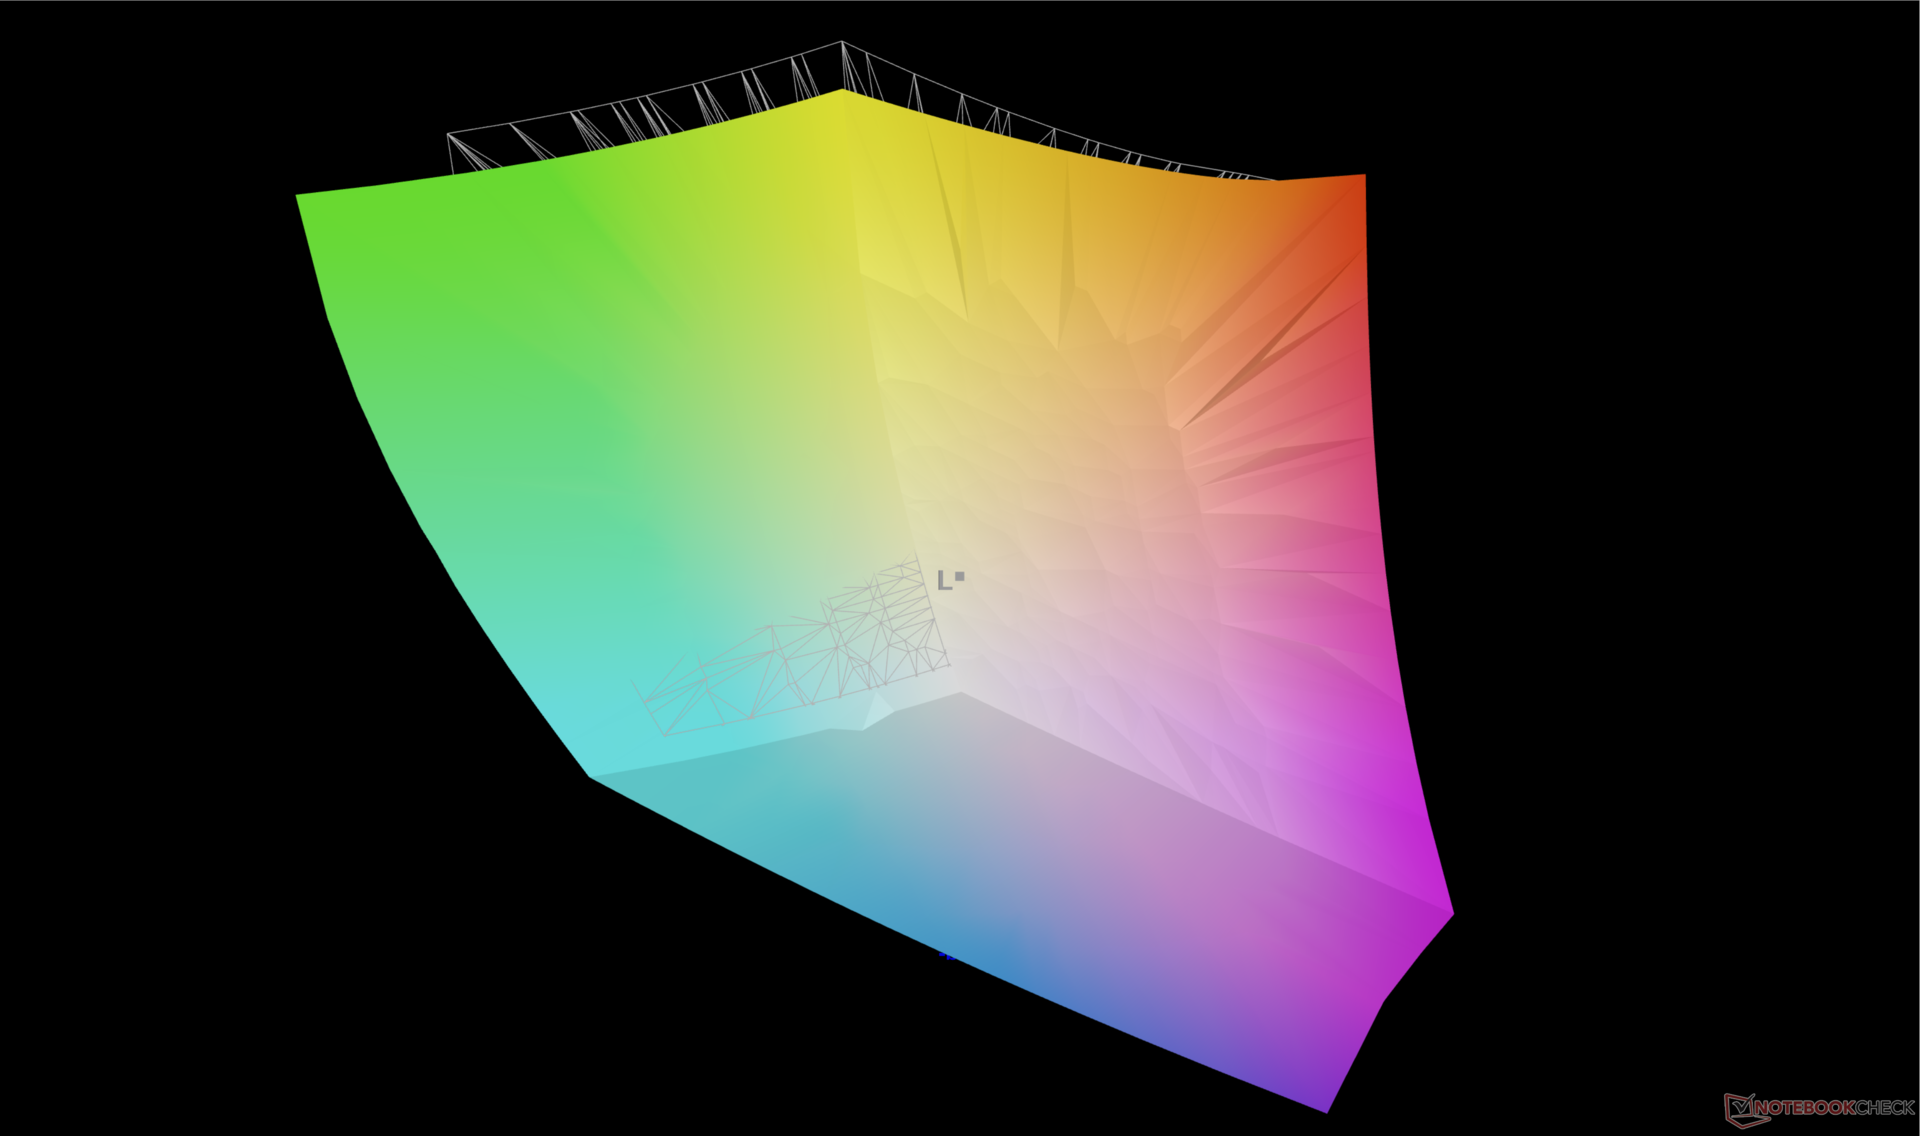
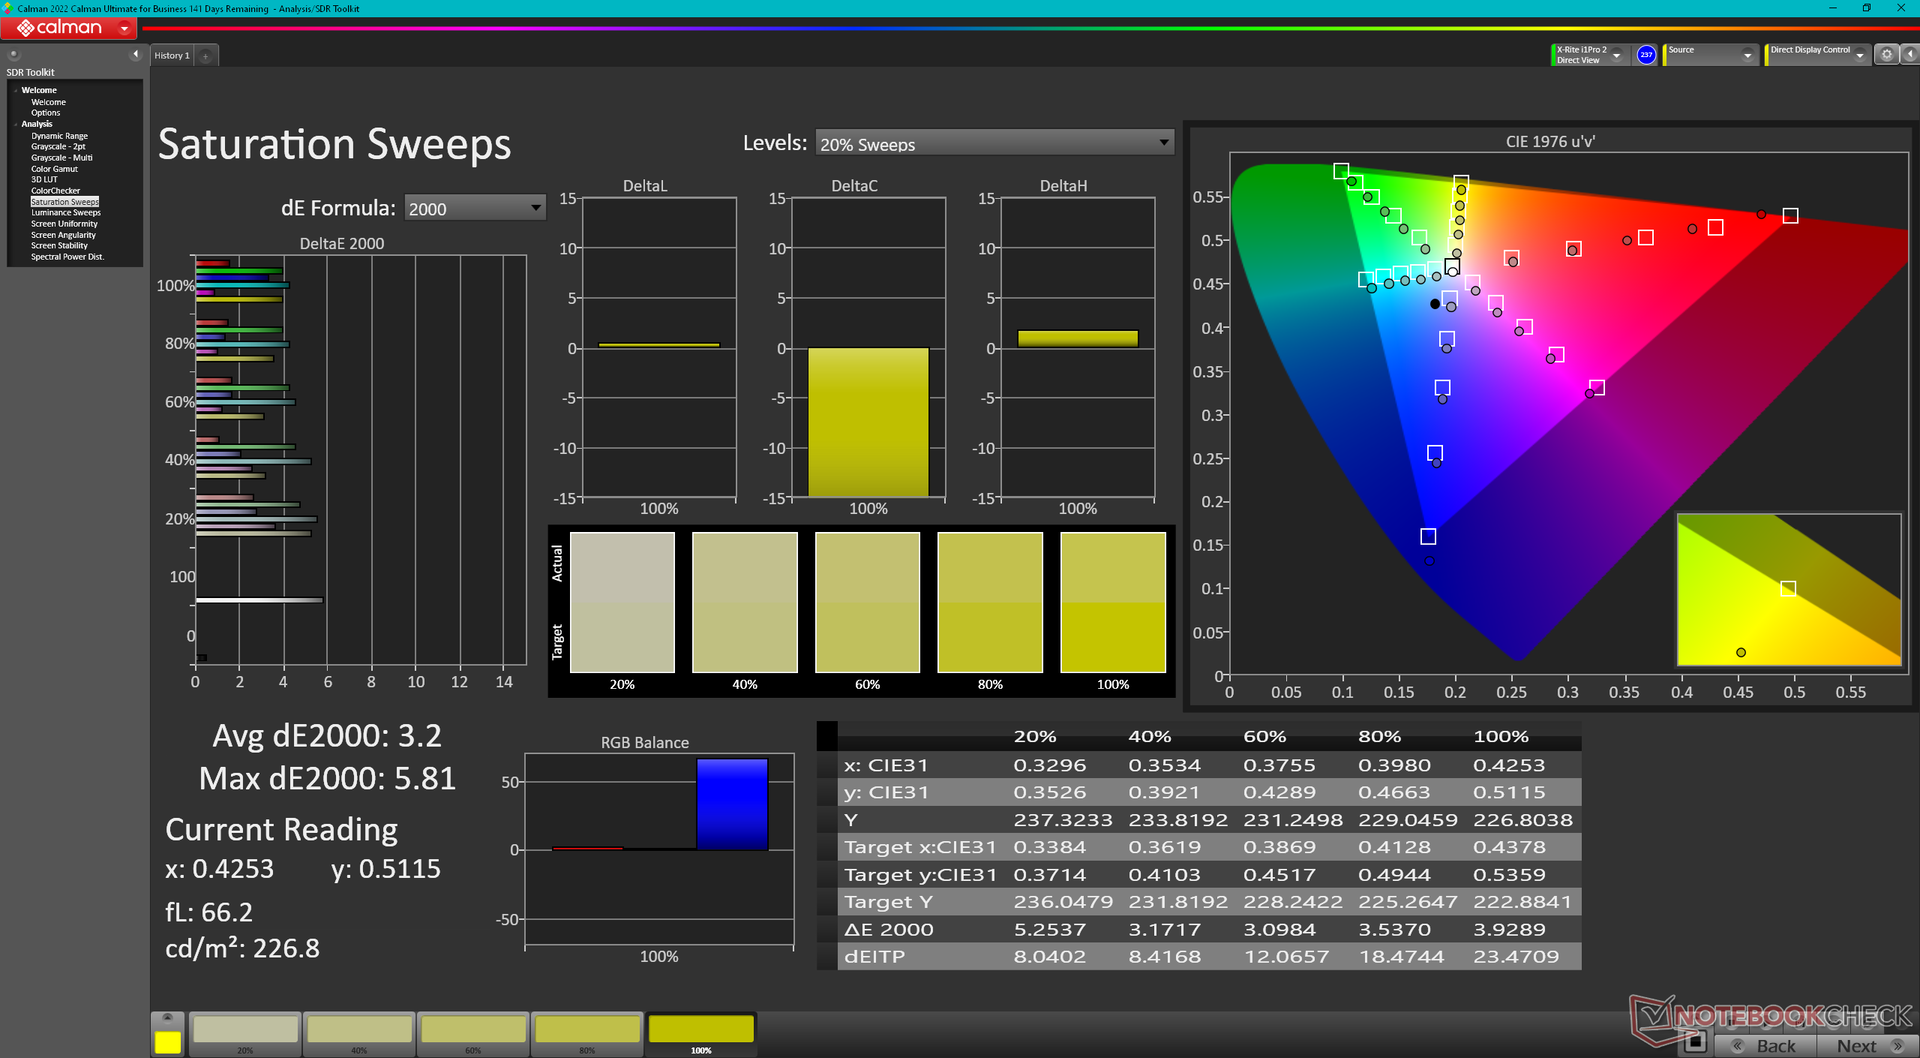
Dell lleva usando exactamente el mismo panel táctil IPS Sharp LQ170R1 de 17.0 pulgadas para su serie XPS 17 desde el modelo original de 2020. Así, la experiencia visual se ha mantenido idéntica desde entonces y recomendamos consultar nuestros análisis existentes sobre el 9720, 9710o el 9700 para obtener más información sobre la pantalla. Aunque los amplios colores DCI-P3, el buen brillo máximo, la nítida resolución UHD+ y la buena relación de contraste 1500:1 siguen siendo geniales a día de hoy, la frecuencia de refresco de 60 Hz está empezando a mostrar su edad, ya que los paneles de 90 Hz o más rápidos se están volviendo comunes en otros portátiles multimedia como el Asus ZenBook 14 o el Lenovo Slim 7i.

| |||||||||||||||||||||||||
iluminación: 85 %
Brillo con batería: 457.4 cd/m²
Contraste: 1475:1 (Negro: 0.31 cd/m²)
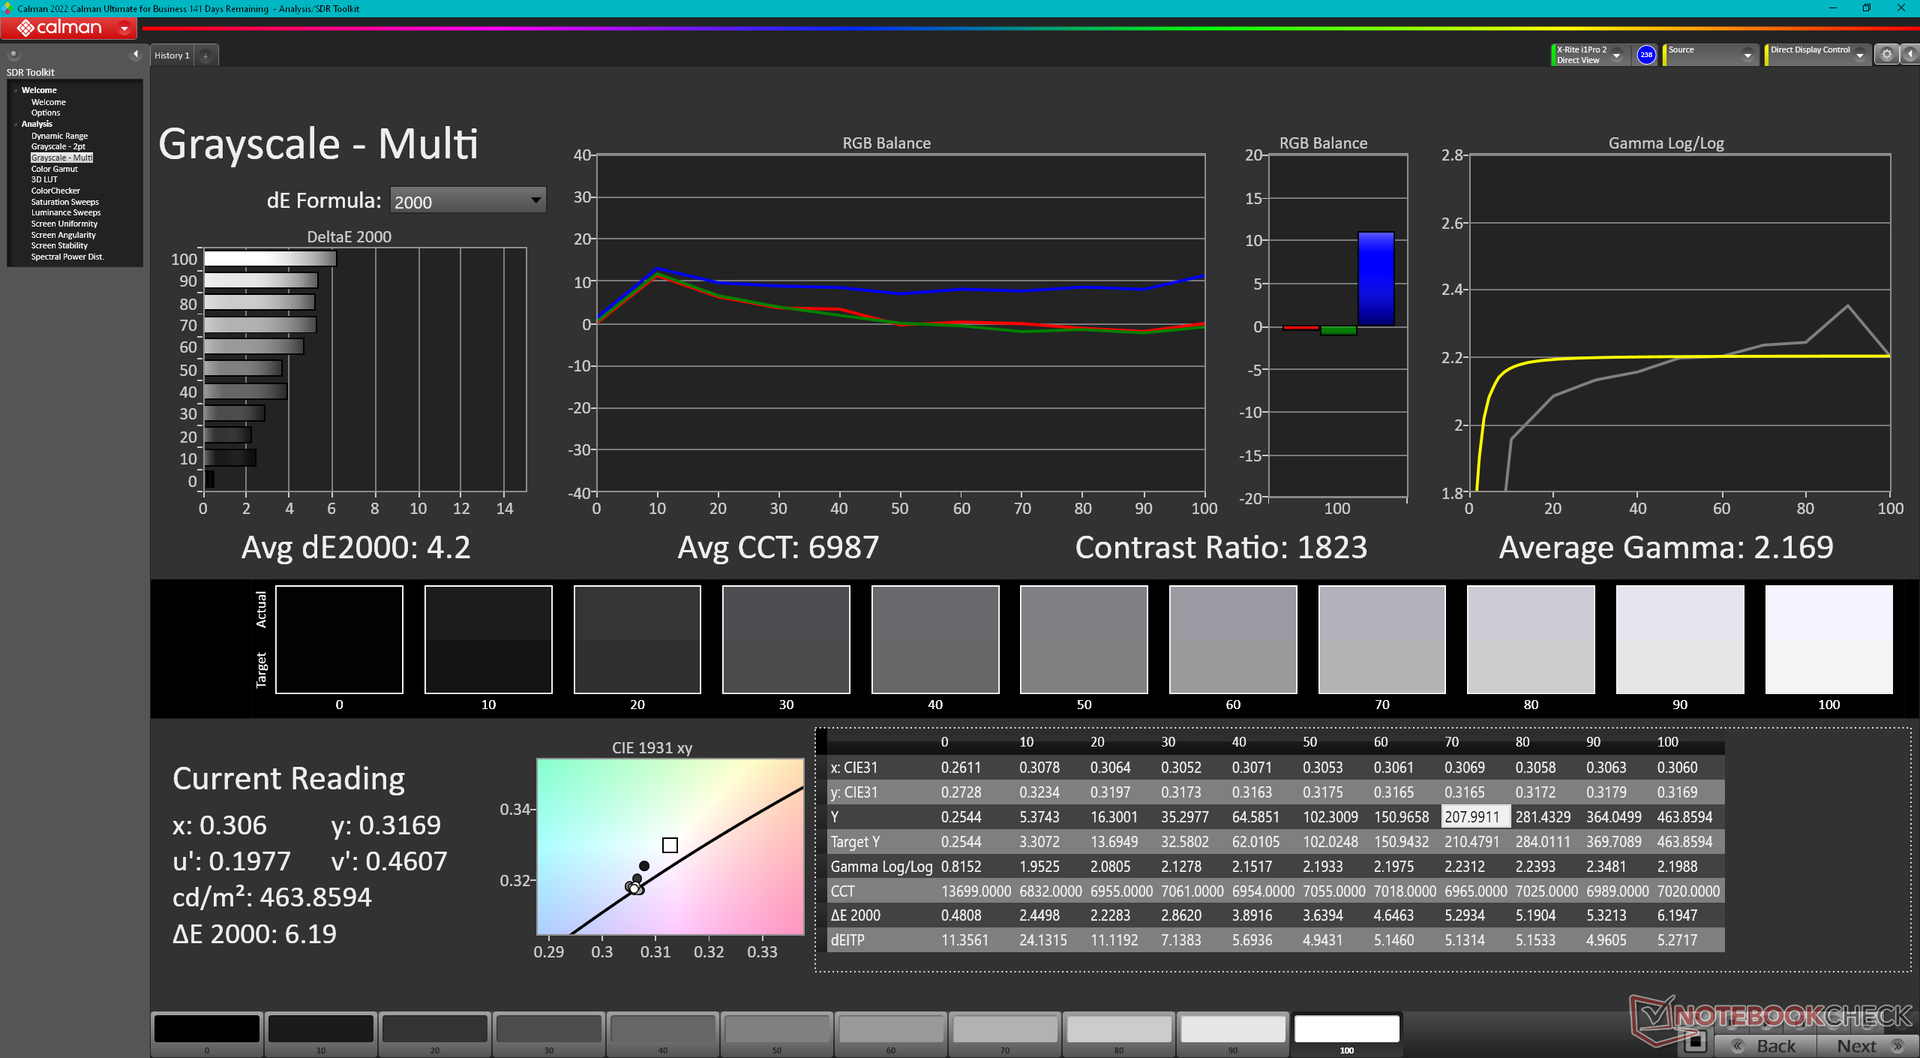
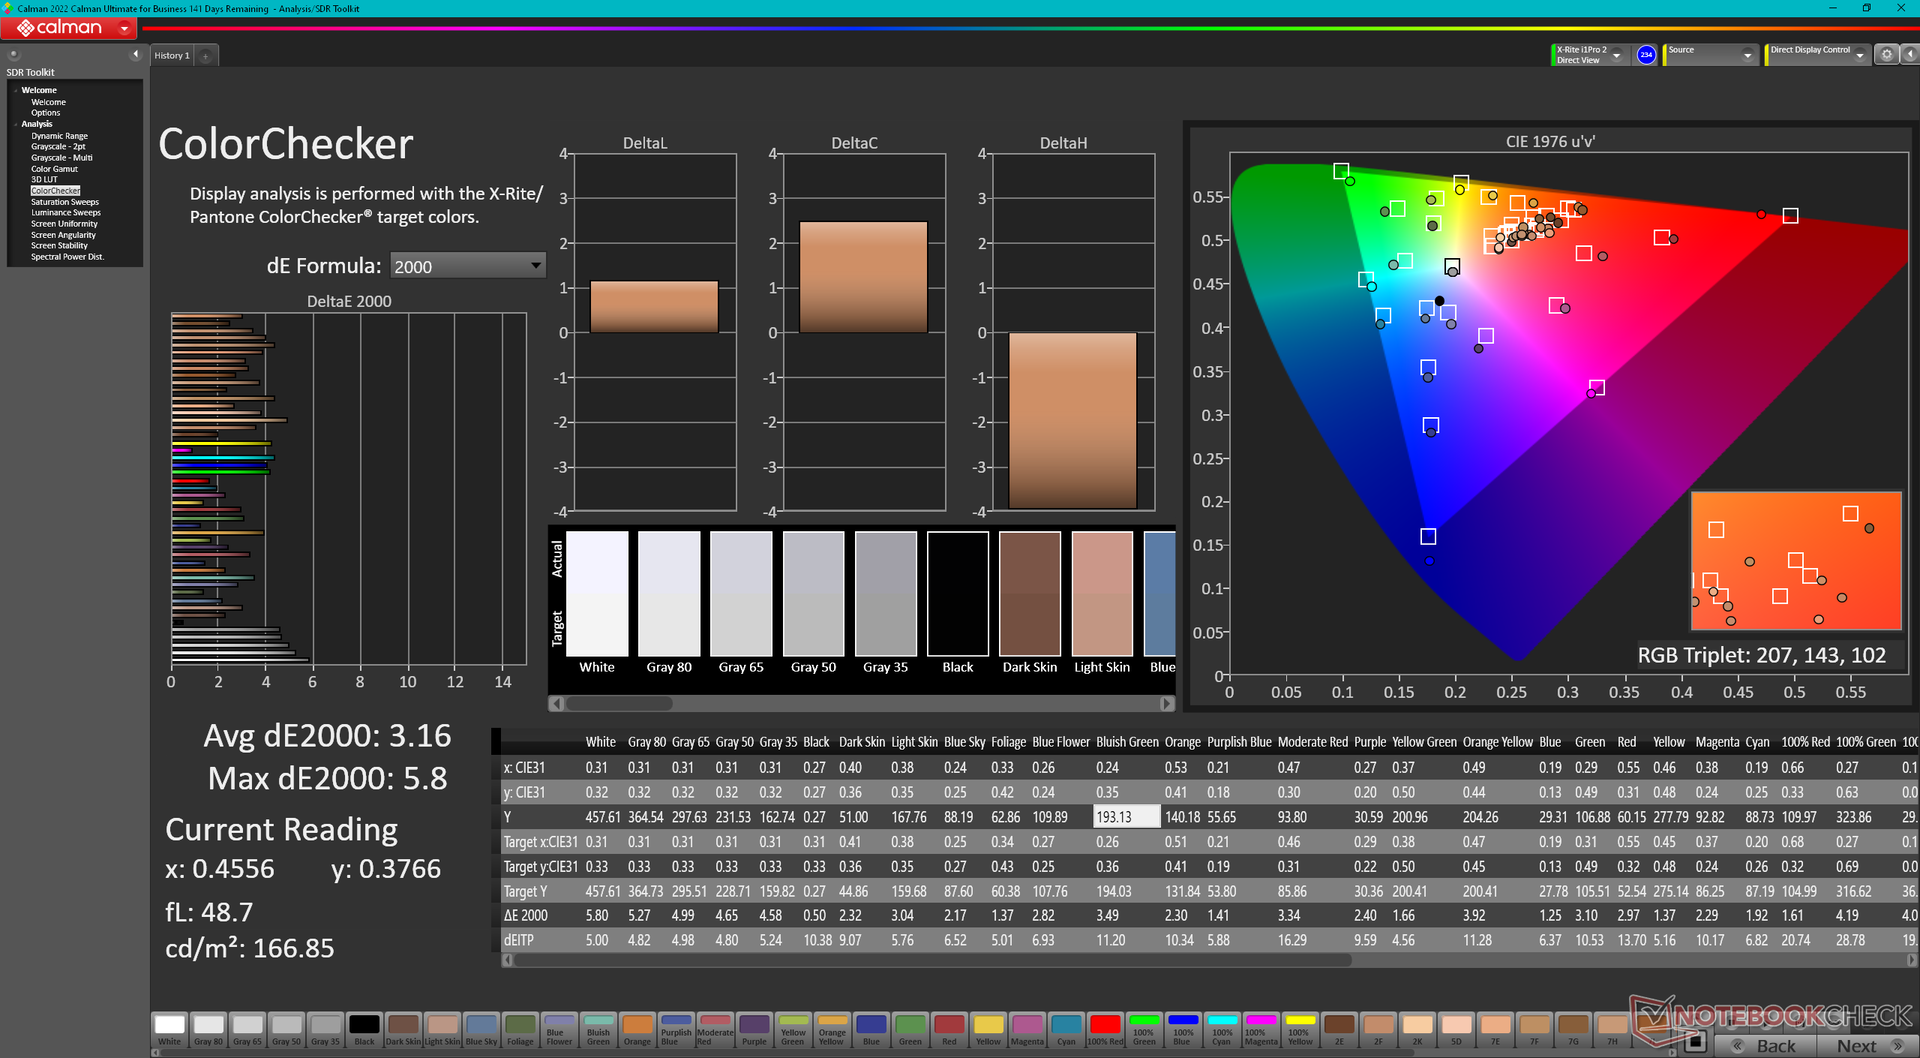
ΔE ColorChecker Calman: 3.16 | ∀{0.5-29.43 Ø4.71}
ΔE Greyscale Calman: 4.2 | ∀{0.09-98 Ø4.96}
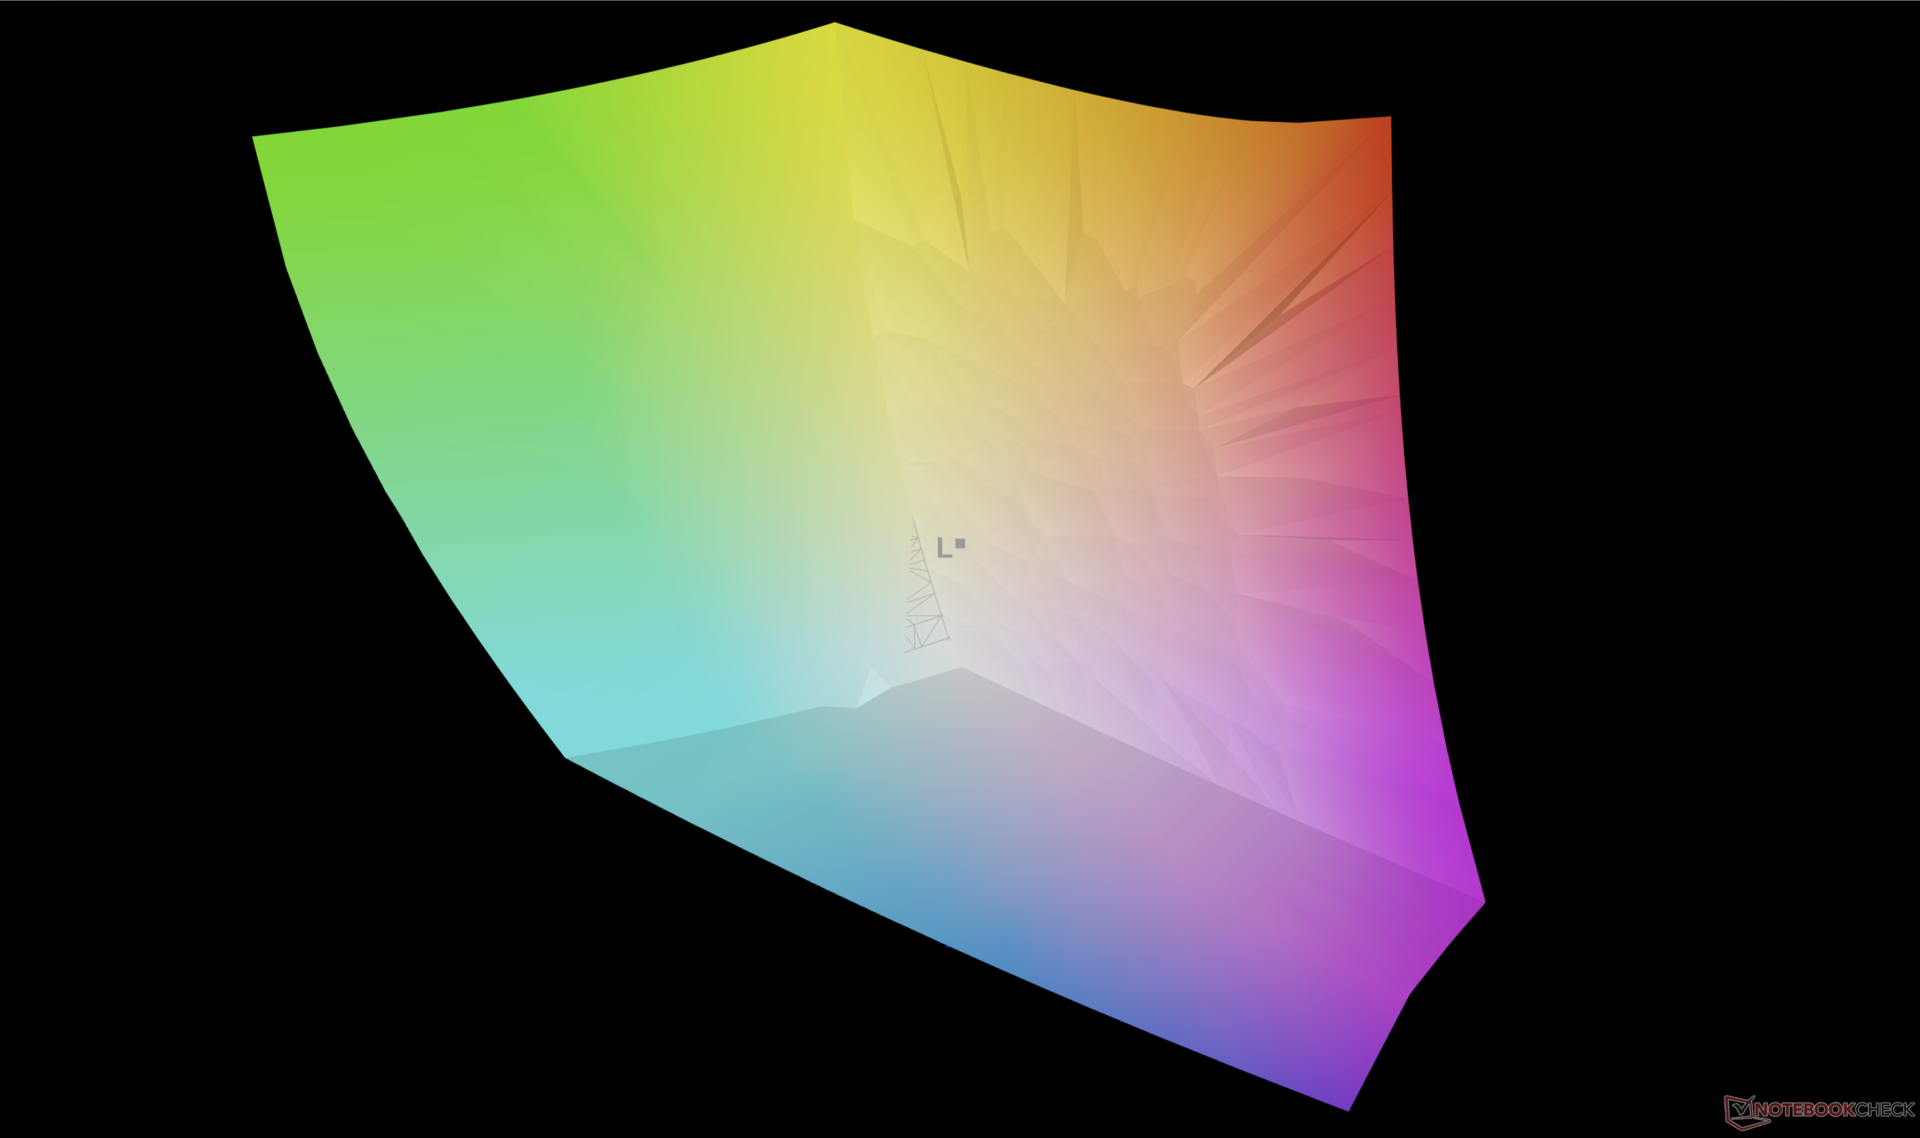
100% AdobeRGB 1998 (Argyll 3D)
100% sRGB (Argyll 3D)
95.2% Display P3 (Argyll 3D)
Gamma: 2.17
CCT: 6987 K
| Dell XPS 17 9730 RTX 4070 10-point capacitive, Sharp LQ170R1, 3840x2400, 17" | Dell XPS 17 9720 RTX 3060 Sharp LQ170R1, IPS, 3840x2400, 17" | LG Gram 17 (2023) LG Display LP170WQ1-SPF2, IPS, 2560x1600, 17" | HP Envy 17-cr0079ng BOE0A66, IPS, 3840x2160, 17.3" | MSI Creator Z17 A12UGST-054 AUO3C9B (B170QAN01.0), IPS, 2560x1600, 17" | Apple MacBook Pro 16 2023 M2 Max Mini-LED, 3456x2234, 16.2" | |
|---|---|---|---|---|---|---|
| Display | -6% | -4% | -3% | -3% | -2% | |
| Display P3 Coverage (%) | 95.2 | 92.9 -2% | 97 2% | 98.31 3% | 98.9 4% | 99 4% |
| sRGB Coverage (%) | 100 | 100 0% | 99.8 0% | 100 0% | 99.9 0% | 100 0% |
| AdobeRGB 1998 Coverage (%) | 100 | 85.3 -15% | 84.9 -15% | 87.03 -13% | 86.4 -14% | 88.5 -11% |
| Response Times | -16% | 80% | 88% | 79% | -70% | |
| Response Time Grey 50% / Grey 80% * (ms) | 42.9 ? | 51.2 ? -19% | 2 ? 95% | 1 98% | 11 ? 74% | 80.5 ? -88% |
| Response Time Black / White * (ms) | 31.3 ? | 35.2 ? -12% | 11 ? 65% | 7 ? 78% | 5 ? 84% | 47.2 ? -51% |
| PWM Frequency (Hz) | 14880 ? | |||||
| Screen | -30% | -6% | 9% | -13% | 4294% | |
| Brightness middle (cd/m²) | 457.4 | 512.7 12% | 405 -11% | 390 -15% | 444 -3% | 504 10% |
| Brightness (cd/m²) | 430 | 463 8% | 363 -16% | 385 -10% | 415 -3% | 487 13% |
| Brightness Distribution (%) | 85 | 85 0% | 82 -4% | 86 1% | 88 4% | 94 11% |
| Black Level * (cd/m²) | 0.31 | 0.32 -3% | 0.225 27% | 0.395 -27% | 0.7 -126% | 0.001 100% |
| Contrast (:1) | 1475 | 1602 9% | 1800 22% | 987 -33% | 634 -57% | 504000 34069% |
| Colorchecker dE 2000 * | 3.16 | 5.98 -89% | 3.35 -6% | 1.66 47% | 2.48 22% | 1.5 53% |
| Colorchecker dE 2000 max. * | 5.8 | 12.09 -108% | 7.96 -37% | 2.9 50% | 3.52 39% | 3.3 43% |
| Greyscale dE 2000 * | 4.2 | 7.2 -71% | 5.28 -26% | 1.83 56% | 3.33 21% | 2.1 50% |
| Gamma | 2.17 101% | 2.54 87% | 2.43 91% | 2.25 98% | 2.33 94% | 2.25 98% |
| CCT | 6987 93% | 6914 94% | 7424 88% | 6727 97% | 6230 104% | 6882 94% |
| Colorchecker dE 2000 calibrated * | 1.34 | 1.16 | 2.91 | |||
| Media total (Programa/Opciones) | -17% /
-22% | 23% /
7% | 31% /
18% | 21% /
3% | 1407% /
2631% |
* ... más pequeño es mejor
Tiempos de respuesta del display
| ↔ Tiempo de respuesta de Negro a Blanco | ||
|---|---|---|
| 31.3 ms ... subida ↗ y bajada ↘ combinada | ↗ 16.9 ms subida | 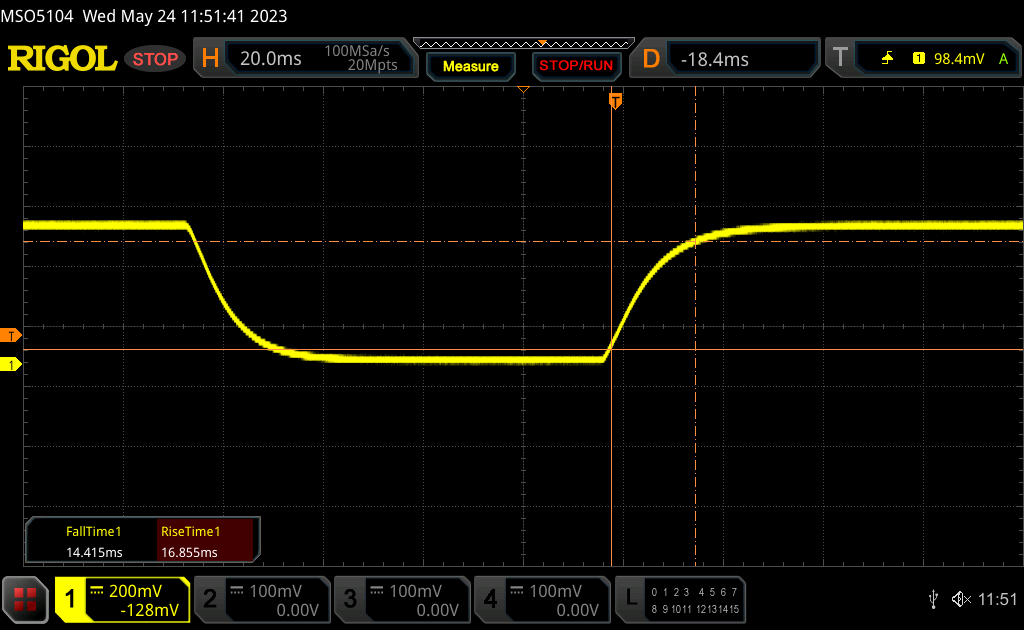 |
| ↘ 14.4 ms bajada | ||
| La pantalla mostró tiempos de respuesta lentos en nuestros tests y podría ser demasiado lenta para los jugones. En comparación, todos los dispositivos de prueba van de ##min### (mínimo) a 240 (máximo) ms. » 85 % de todos los dispositivos son mejores. Eso quiere decir que el tiempo de respuesta es peor que la media (19.8 ms) de todos los dispositivos testados. | ||
| ↔ Tiempo de respuesta 50% Gris a 80% Gris | ||
| 42.9 ms ... subida ↗ y bajada ↘ combinada | ↗ 19.9 ms subida | 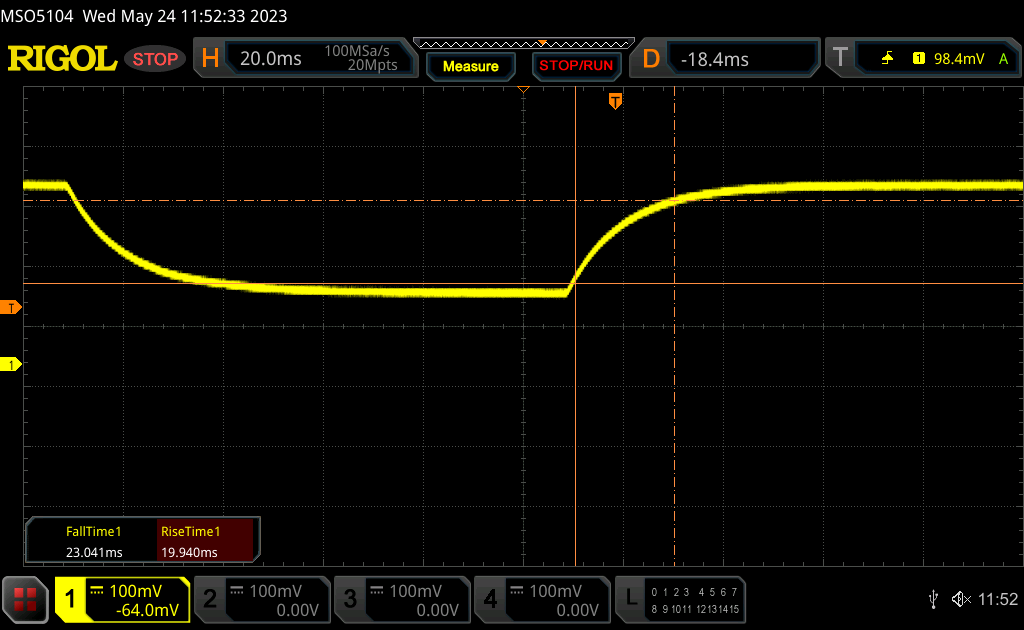 |
| ↘ 23 ms bajada | ||
| La pantalla mostró tiempos de respuesta lentos en nuestros tests y podría ser demasiado lenta para los jugones. En comparación, todos los dispositivos de prueba van de ##min### (mínimo) a 636 (máximo) ms. » 71 % de todos los dispositivos son mejores. Eso quiere decir que el tiempo de respuesta es peor que la media (31 ms) de todos los dispositivos testados. | ||
Parpadeo de Pantalla / PWM (Pulse-Width Modulation)
| Parpadeo de Pantalla / PWM no detectado | 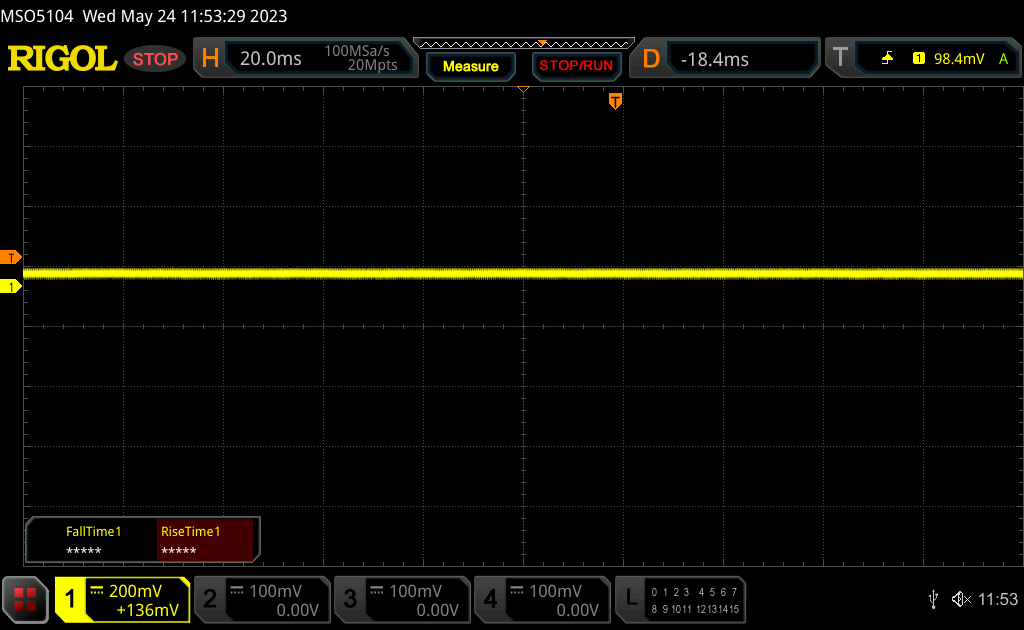 | ||
Comparación: 52 % de todos los dispositivos testados no usaron PWM para atenuar el display. Si se usó, medimos una media de 7754 (mínimo: 5 - máxmo: 343500) Hz. | |||
Rendimiento - 13ª generación Intel + Nvidia Ada Lovelace
Condiciones de ensayo
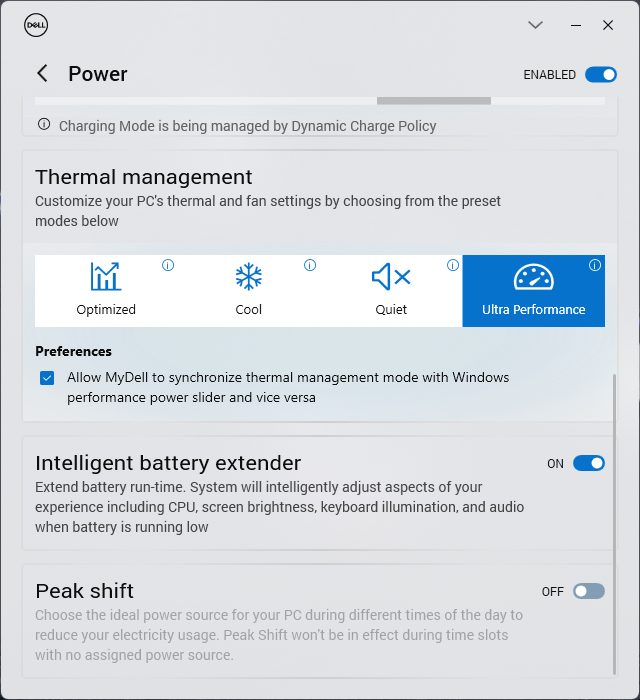
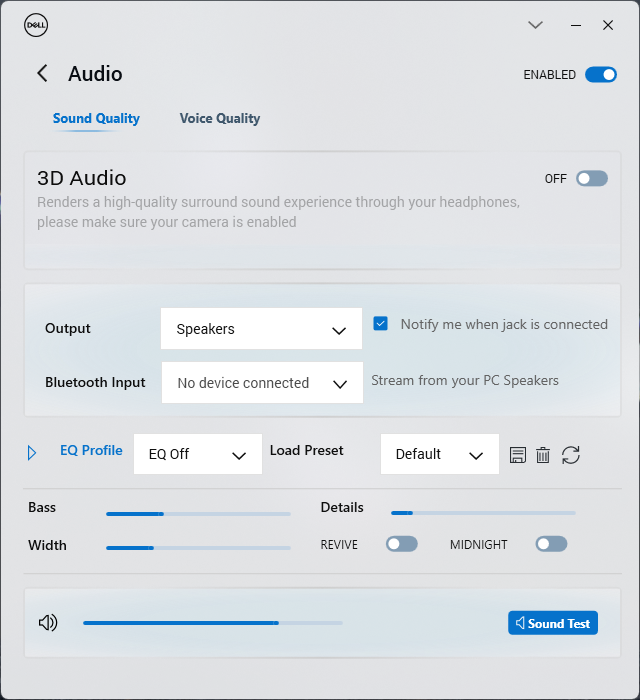
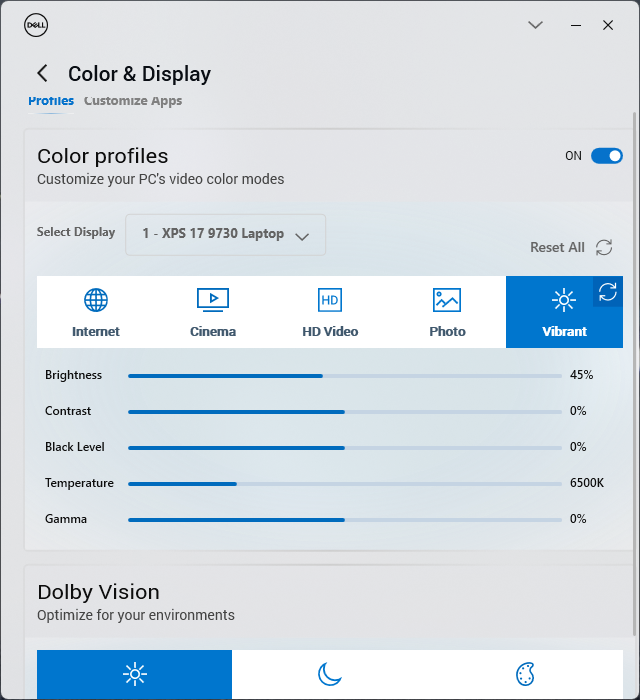
Configuramos nuestra unidad en modo Rendimiento a través del software MyDell antes de ejecutar cualquier prueba de rendimiento. La configuración del perfil de energía de Dell está convenientemente sincronizada con la configuración del perfil de energía de Windows, a diferencia de la mayoría de portátiles.
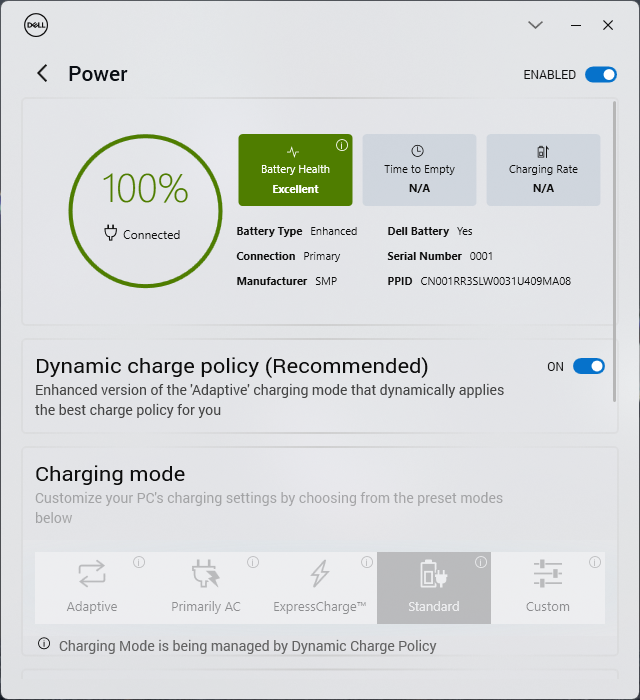
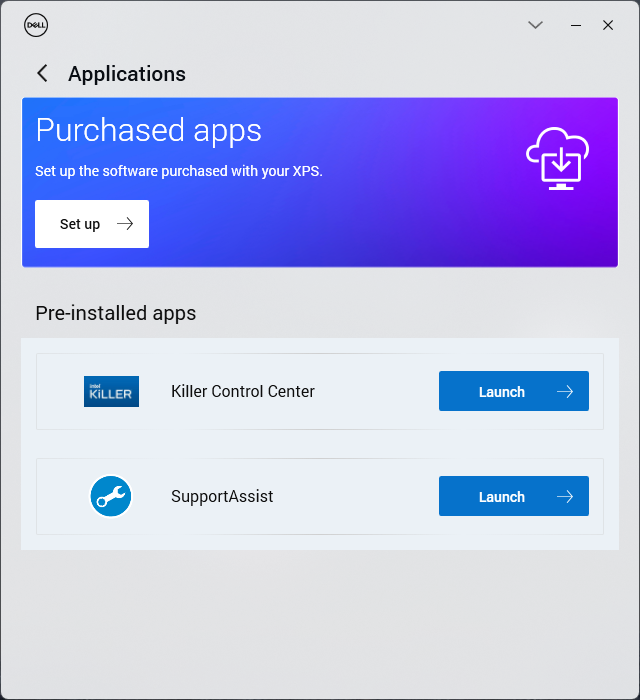
Se recomienda que los usuarios se familiaricen con MyDell, ya que es el eje central para ajustar el audio, los colores, la energía y otras aplicaciones preinstaladas de Dell como SupportAssist. Dell ha rediseñado de nuevo la interfaz de usuario de MyDell para que se parezca más al software Dell Optimizer que viene con muchos portátiles de empresa del mismo fabricante. Lamentablemente, la ventana de la aplicación es muy pequeña y no se puede maximizar.
Optimus viene de serie para el cambio automático entre la iGPU y la dGPU. No hay soporte para Advanced Optimus o MUX.
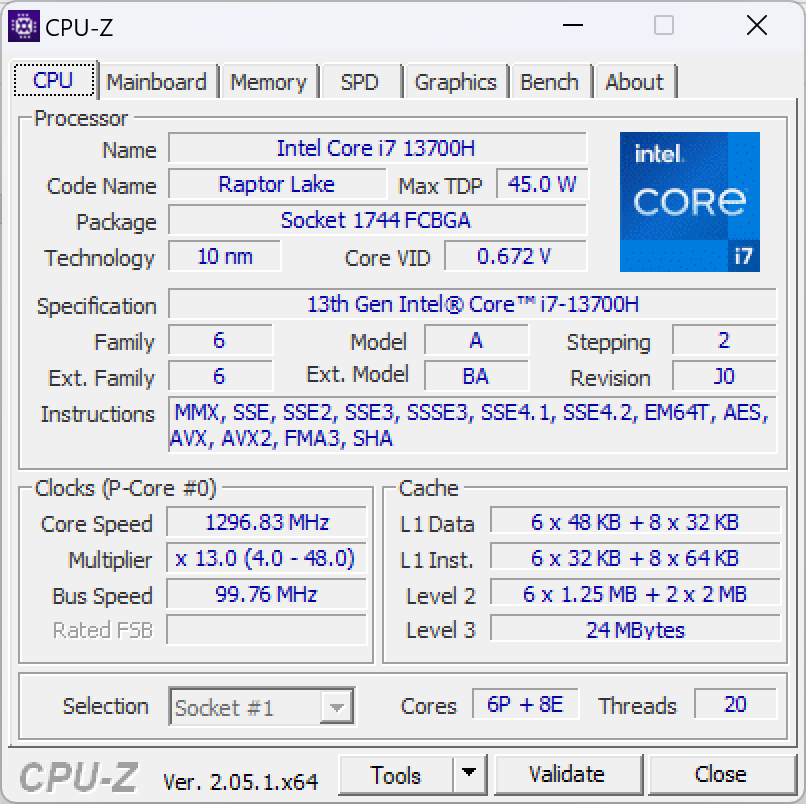
Procesador
El Core i7-13700H del XPS 17 rinde muy bien, con unos resultados en las pruebas comparativas ligeramente superiores a los de la mayoría de portátiles de nuestra base de datos equipados con el mismo procesador, incluido el reciente XPS 15 9530. Turbo Boost en particular es impresionante para una ventaja de rendimiento del 25 por ciento sobre el Core i7-12700H en el XPS 17 9720 del año pasado.
Sin embargo, hay una notable pega a tener en cuenta. El Turbo Boost de CPU no es indefinido como muestra nuestro gráfico de abajo al ejecutar CineBench R15 xT en bucle. El rendimiento se reduce en un 25 por ciento después de 9 o 10 ejecuciones, lo que es más pronunciado en relación con la mayoría de portátiles con CPU de la serie H. Teniendo en cuenta esta ralentización, el rendimiento del Core i7-13700H es casi idéntico al del Core i7-12700H. Así pues, el Core i7-13700H da lo mejor de sí cuando se necesita alto rendimiento en ráfagas cortas, como al iniciar programas, editar imágenes o codificar vídeos cortos. Por lo demás, sólo ofrece pequeñas ventajas de rendimiento respecto al Core i7-12700H del año pasado.
La actualización al Core i9-13900H se espera que aumente el rendimiento multihilo entre un 10 y un 20 por ciento, según nuestra experiencia con elMSI Stealth 17 Studio. El rendimiento monohilo, sin embargo, seguirá siendo el mismo, si no ligeramente inferior, con el Core i9.
Cinebench R15 Multi Loop
Cinebench R23: Multi Core | Single Core
Cinebench R20: CPU (Multi Core) | CPU (Single Core)
Cinebench R15: CPU Multi 64Bit | CPU Single 64Bit
Blender: v2.79 BMW27 CPU
7-Zip 18.03: 7z b 4 | 7z b 4 -mmt1
Geekbench 5.5: Multi-Core | Single-Core
HWBOT x265 Benchmark v2.2: 4k Preset
LibreOffice : 20 Documents To PDF
R Benchmark 2.5: Overall mean
* ... más pequeño es mejor
AIDA64: FP32 Ray-Trace | FPU Julia | CPU SHA3 | CPU Queen | FPU SinJulia | FPU Mandel | CPU AES | CPU ZLib | FP64 Ray-Trace | CPU PhotoWorxx
| Performance rating | |
| Dell XPS 17 9730 RTX 4070 | |
| Medio Intel Core i7-13700H | |
| MSI Creator Z17 A12UGST-054 | |
| Dell XPS 17 9720 RTX 3060 | |
| LG Gram 17 (2023) | |
| HP Envy 17-cr0079ng | |
| AIDA64 / FP32 Ray-Trace | |
| Dell XPS 17 9730 RTX 4070 | |
| Medio Intel Core i7-13700H (4986 - 18908, n=29) | |
| LG Gram 17 (2023) | |
| MSI Creator Z17 A12UGST-054 | |
| HP Envy 17-cr0079ng | |
| Dell XPS 17 9720 RTX 3060 | |
| AIDA64 / FPU Julia | |
| Dell XPS 17 9730 RTX 4070 | |
| Medio Intel Core i7-13700H (25360 - 92359, n=29) | |
| HP Envy 17-cr0079ng | |
| LG Gram 17 (2023) | |
| MSI Creator Z17 A12UGST-054 | |
| Dell XPS 17 9720 RTX 3060 | |
| AIDA64 / CPU SHA3 | |
| Dell XPS 17 9730 RTX 4070 | |
| Medio Intel Core i7-13700H (1339 - 4224, n=29) | |
| MSI Creator Z17 A12UGST-054 | |
| Dell XPS 17 9720 RTX 3060 | |
| HP Envy 17-cr0079ng | |
| LG Gram 17 (2023) | |
| AIDA64 / CPU Queen | |
| MSI Creator Z17 A12UGST-054 | |
| Dell XPS 17 9720 RTX 3060 | |
| Dell XPS 17 9730 RTX 4070 | |
| Medio Intel Core i7-13700H (59324 - 107159, n=29) | |
| LG Gram 17 (2023) | |
| HP Envy 17-cr0079ng | |
| AIDA64 / FPU SinJulia | |
| Dell XPS 17 9730 RTX 4070 | |
| MSI Creator Z17 A12UGST-054 | |
| Dell XPS 17 9720 RTX 3060 | |
| Medio Intel Core i7-13700H (4800 - 11050, n=29) | |
| LG Gram 17 (2023) | |
| HP Envy 17-cr0079ng | |
| AIDA64 / FPU Mandel | |
| Dell XPS 17 9730 RTX 4070 | |
| Medio Intel Core i7-13700H (12321 - 45118, n=29) | |
| MSI Creator Z17 A12UGST-054 | |
| LG Gram 17 (2023) | |
| Dell XPS 17 9720 RTX 3060 | |
| HP Envy 17-cr0079ng | |
| AIDA64 / CPU AES | |
| MSI Creator Z17 A12UGST-054 | |
| Dell XPS 17 9720 RTX 3060 | |
| Medio Intel Core i7-13700H (28769 - 151254, n=29) | |
| Dell XPS 17 9730 RTX 4070 | |
| LG Gram 17 (2023) | |
| HP Envy 17-cr0079ng | |
| AIDA64 / CPU ZLib | |
| Dell XPS 17 9730 RTX 4070 | |
| MSI Creator Z17 A12UGST-054 | |
| Medio Intel Core i7-13700H (389 - 1215, n=29) | |
| Dell XPS 17 9720 RTX 3060 | |
| HP Envy 17-cr0079ng | |
| LG Gram 17 (2023) | |
| AIDA64 / FP64 Ray-Trace | |
| Dell XPS 17 9730 RTX 4070 | |
| Medio Intel Core i7-13700H (2540 - 10135, n=29) | |
| LG Gram 17 (2023) | |
| MSI Creator Z17 A12UGST-054 | |
| Dell XPS 17 9720 RTX 3060 | |
| HP Envy 17-cr0079ng | |
| AIDA64 / CPU PhotoWorxx | |
| LG Gram 17 (2023) | |
| Dell XPS 17 9730 RTX 4070 | |
| Dell XPS 17 9720 RTX 3060 | |
| Medio Intel Core i7-13700H (12872 - 52727, n=29) | |
| MSI Creator Z17 A12UGST-054 | |
| HP Envy 17-cr0079ng | |
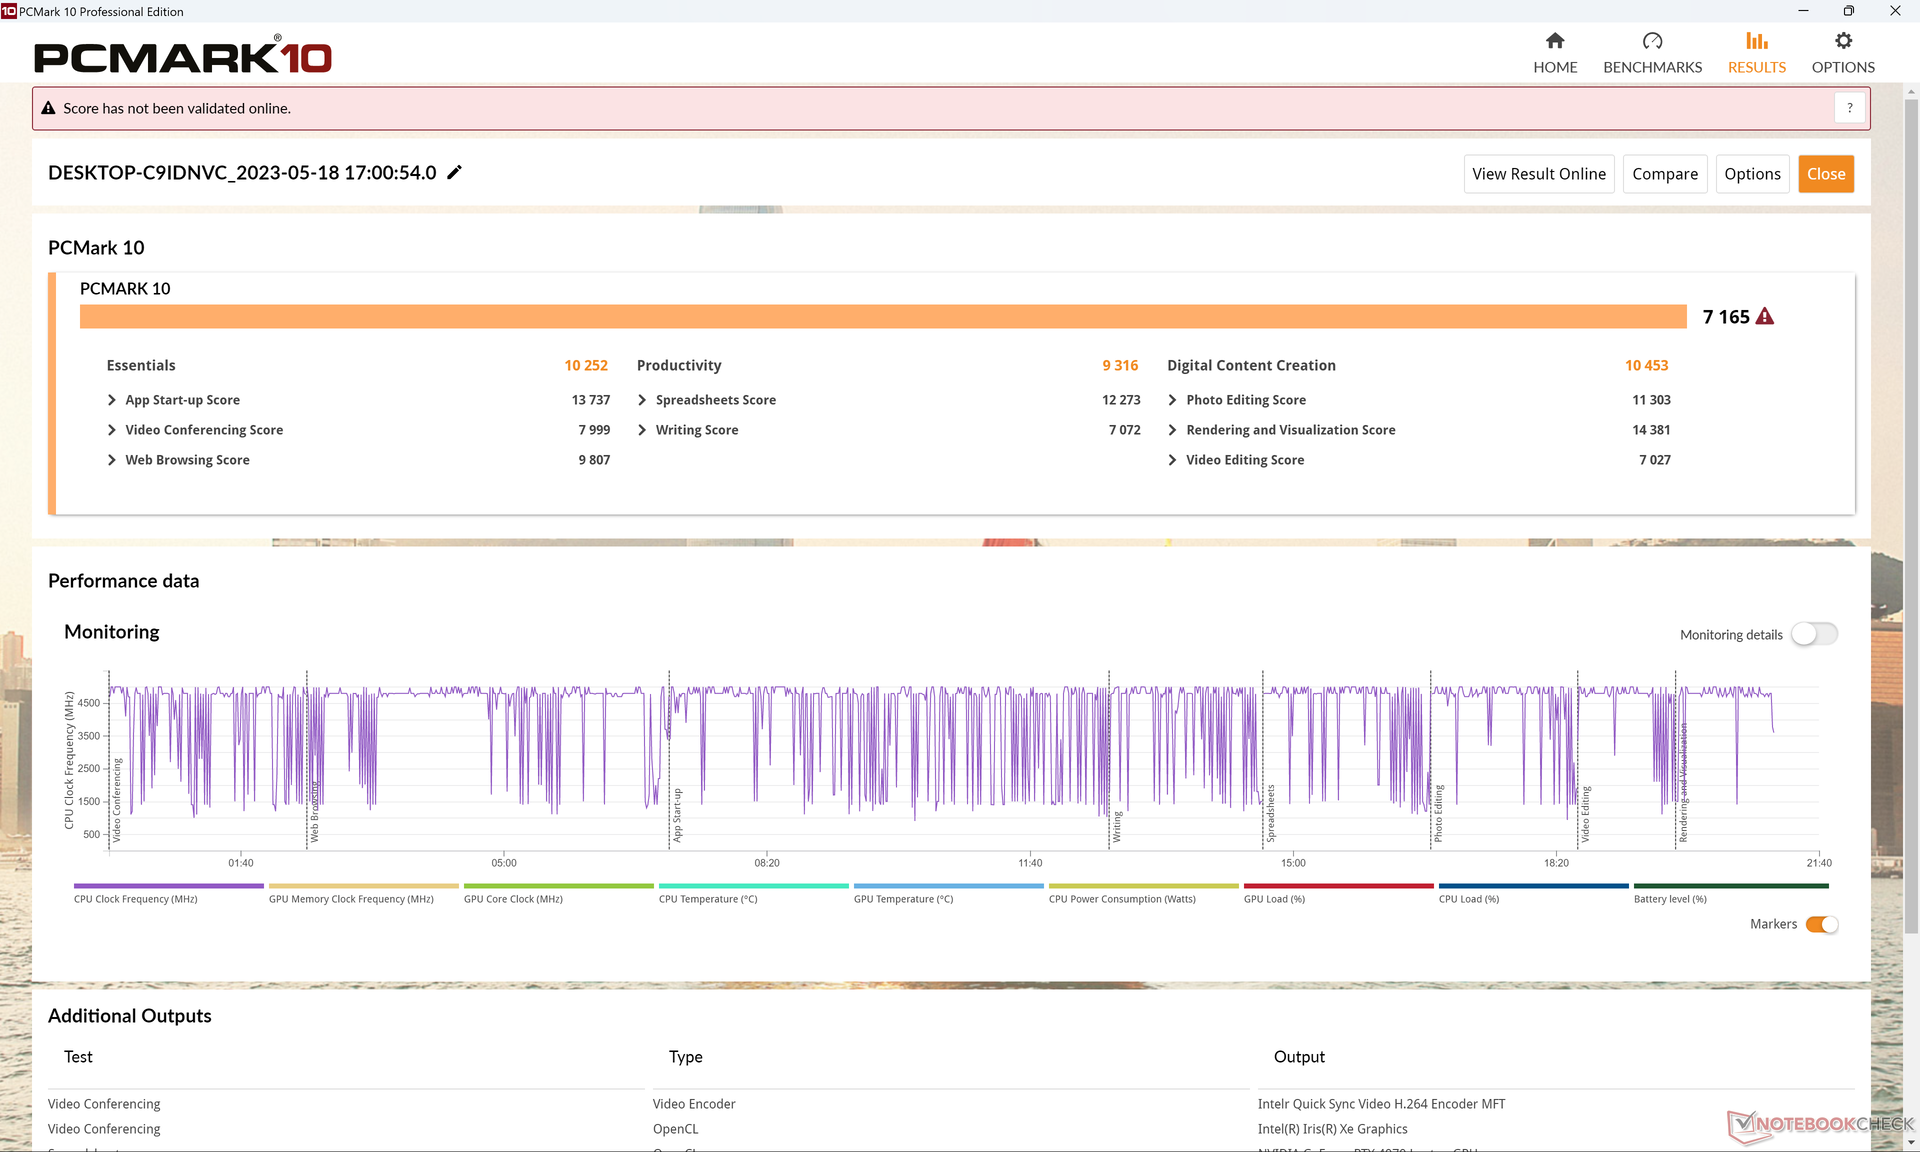
Rendimiento del sistema
Las puntuaciones PCMark son casi idénticas a las del XPS 17 9720 del año pasado a pesar de las mejoras de rendimiento año tras año. Esto sugiere que las cargas de trabajo diarias y las actividades ofimáticas ligeras no son notablemente más rápidas en el último modelo. Si tus cargas de trabajo consisten principalmente en navegación web, hojas de cálculo y procesado de textos, entonces una configuración menor del XPS 17 con la RTX 4050 puede ser más apropiada que nuestra configuración RTX 4070.
CrossMark: Overall | Productivity | Creativity | Responsiveness
| PCMark 10 / Score | |
| Medio Intel Core i7-13700H, NVIDIA GeForce RTX 4070 Laptop GPU (7158 - 7956, n=8) | |
| Dell XPS 17 9720 RTX 3060 | |
| Dell XPS 17 9730 RTX 4070 | |
| MSI Creator Z17 A12UGST-054 | |
| HP Envy 17-cr0079ng | |
| LG Gram 17 (2023) | |
| PCMark 10 / Essentials | |
| LG Gram 17 (2023) | |
| Dell XPS 17 9720 RTX 3060 | |
| Medio Intel Core i7-13700H, NVIDIA GeForce RTX 4070 Laptop GPU (10252 - 11449, n=8) | |
| HP Envy 17-cr0079ng | |
| MSI Creator Z17 A12UGST-054 | |
| Dell XPS 17 9730 RTX 4070 | |
| PCMark 10 / Productivity | |
| Medio Intel Core i7-13700H, NVIDIA GeForce RTX 4070 Laptop GPU (8501 - 10769, n=8) | |
| MSI Creator Z17 A12UGST-054 | |
| Dell XPS 17 9720 RTX 3060 | |
| Dell XPS 17 9730 RTX 4070 | |
| HP Envy 17-cr0079ng | |
| LG Gram 17 (2023) | |
| PCMark 10 / Digital Content Creation | |
| Medio Intel Core i7-13700H, NVIDIA GeForce RTX 4070 Laptop GPU (10358 - 12908, n=8) | |
| Dell XPS 17 9730 RTX 4070 | |
| Dell XPS 17 9720 RTX 3060 | |
| MSI Creator Z17 A12UGST-054 | |
| HP Envy 17-cr0079ng | |
| LG Gram 17 (2023) | |
| CrossMark / Overall | |
| MSI Creator Z17 A12UGST-054 | |
| Apple MacBook Pro 16 2023 M2 Max | |
| Medio Intel Core i7-13700H, NVIDIA GeForce RTX 4070 Laptop GPU (1768 - 2073, n=6) | |
| Dell XPS 17 9720 RTX 3060 | |
| Dell XPS 17 9730 RTX 4070 | |
| LG Gram 17 (2023) | |
| HP Envy 17-cr0079ng | |
| CrossMark / Productivity | |
| MSI Creator Z17 A12UGST-054 | |
| Medio Intel Core i7-13700H, NVIDIA GeForce RTX 4070 Laptop GPU (1645 - 2006, n=6) | |
| Dell XPS 17 9720 RTX 3060 | |
| Dell XPS 17 9730 RTX 4070 | |
| Apple MacBook Pro 16 2023 M2 Max | |
| LG Gram 17 (2023) | |
| HP Envy 17-cr0079ng | |
| CrossMark / Creativity | |
| Apple MacBook Pro 16 2023 M2 Max | |
| MSI Creator Z17 A12UGST-054 | |
| Dell XPS 17 9720 RTX 3060 | |
| Medio Intel Core i7-13700H, NVIDIA GeForce RTX 4070 Laptop GPU (1936 - 2137, n=6) | |
| Dell XPS 17 9730 RTX 4070 | |
| LG Gram 17 (2023) | |
| HP Envy 17-cr0079ng | |
| CrossMark / Responsiveness | |
| MSI Creator Z17 A12UGST-054 | |
| Medio Intel Core i7-13700H, NVIDIA GeForce RTX 4070 Laptop GPU (1451 - 2202, n=6) | |
| Dell XPS 17 9720 RTX 3060 | |
| Dell XPS 17 9730 RTX 4070 | |
| LG Gram 17 (2023) | |
| Apple MacBook Pro 16 2023 M2 Max | |
| HP Envy 17-cr0079ng | |
| PCMark 10 Score | 7165 puntos | |
ayuda | ||
| AIDA64 / Memory Copy | |
| LG Gram 17 (2023) | |
| Dell XPS 17 9730 RTX 4070 | |
| Dell XPS 17 9720 RTX 3060 | |
| MSI Creator Z17 A12UGST-054 | |
| Medio Intel Core i7-13700H (24334 - 78081, n=29) | |
| HP Envy 17-cr0079ng | |
| AIDA64 / Memory Read | |
| Dell XPS 17 9730 RTX 4070 | |
| Dell XPS 17 9720 RTX 3060 | |
| MSI Creator Z17 A12UGST-054 | |
| Medio Intel Core i7-13700H (23681 - 79656, n=29) | |
| LG Gram 17 (2023) | |
| HP Envy 17-cr0079ng | |
| AIDA64 / Memory Write | |
| LG Gram 17 (2023) | |
| Dell XPS 17 9730 RTX 4070 | |
| Medio Intel Core i7-13700H (22986 - 99898, n=29) | |
| MSI Creator Z17 A12UGST-054 | |
| Dell XPS 17 9720 RTX 3060 | |
| HP Envy 17-cr0079ng | |
| AIDA64 / Memory Latency | |
| LG Gram 17 (2023) | |
| MSI Creator Z17 A12UGST-054 | |
| Dell XPS 17 9730 RTX 4070 | |
| Medio Intel Core i7-13700H (82.4 - 136.8, n=29) | |
| Dell XPS 17 9720 RTX 3060 | |
| HP Envy 17-cr0079ng | |
* ... más pequeño es mejor
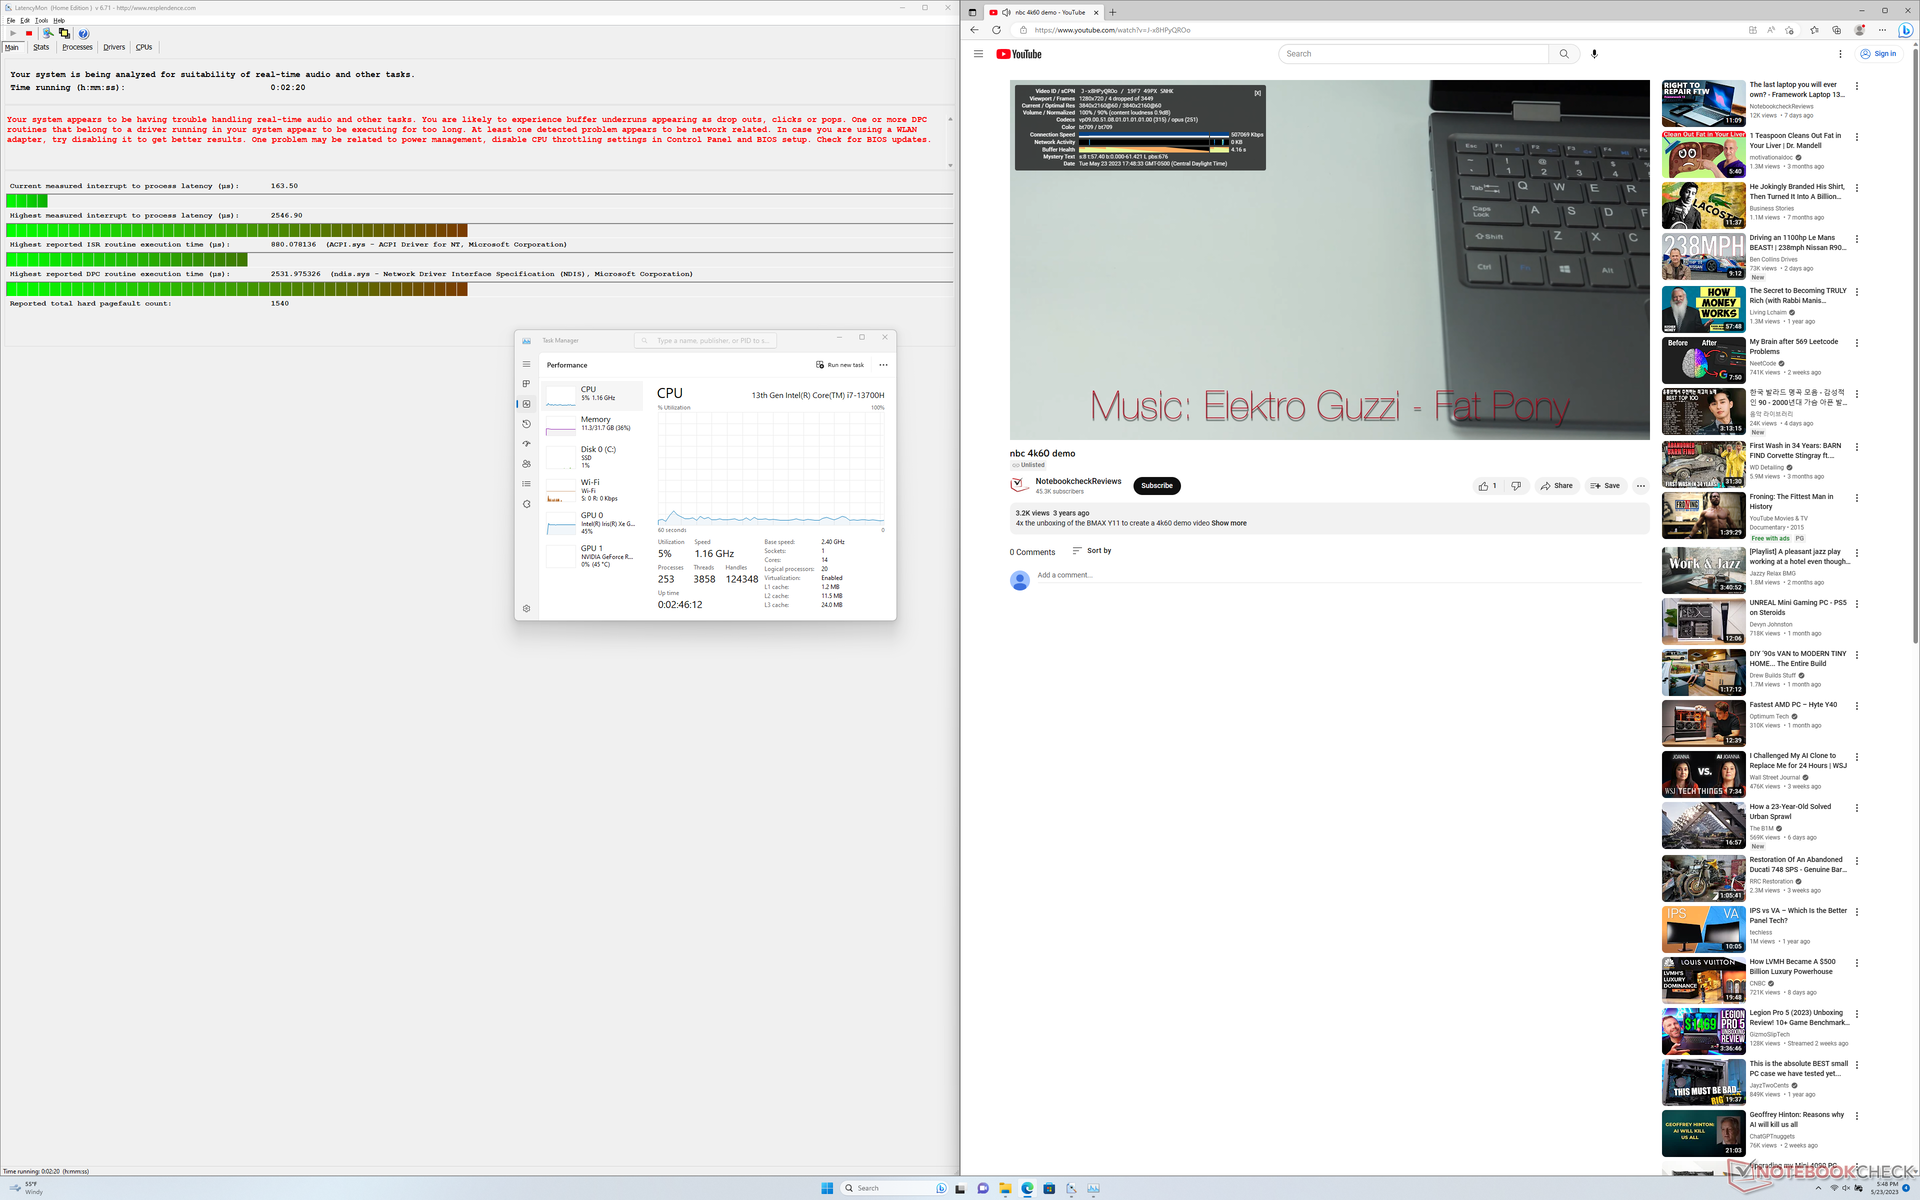
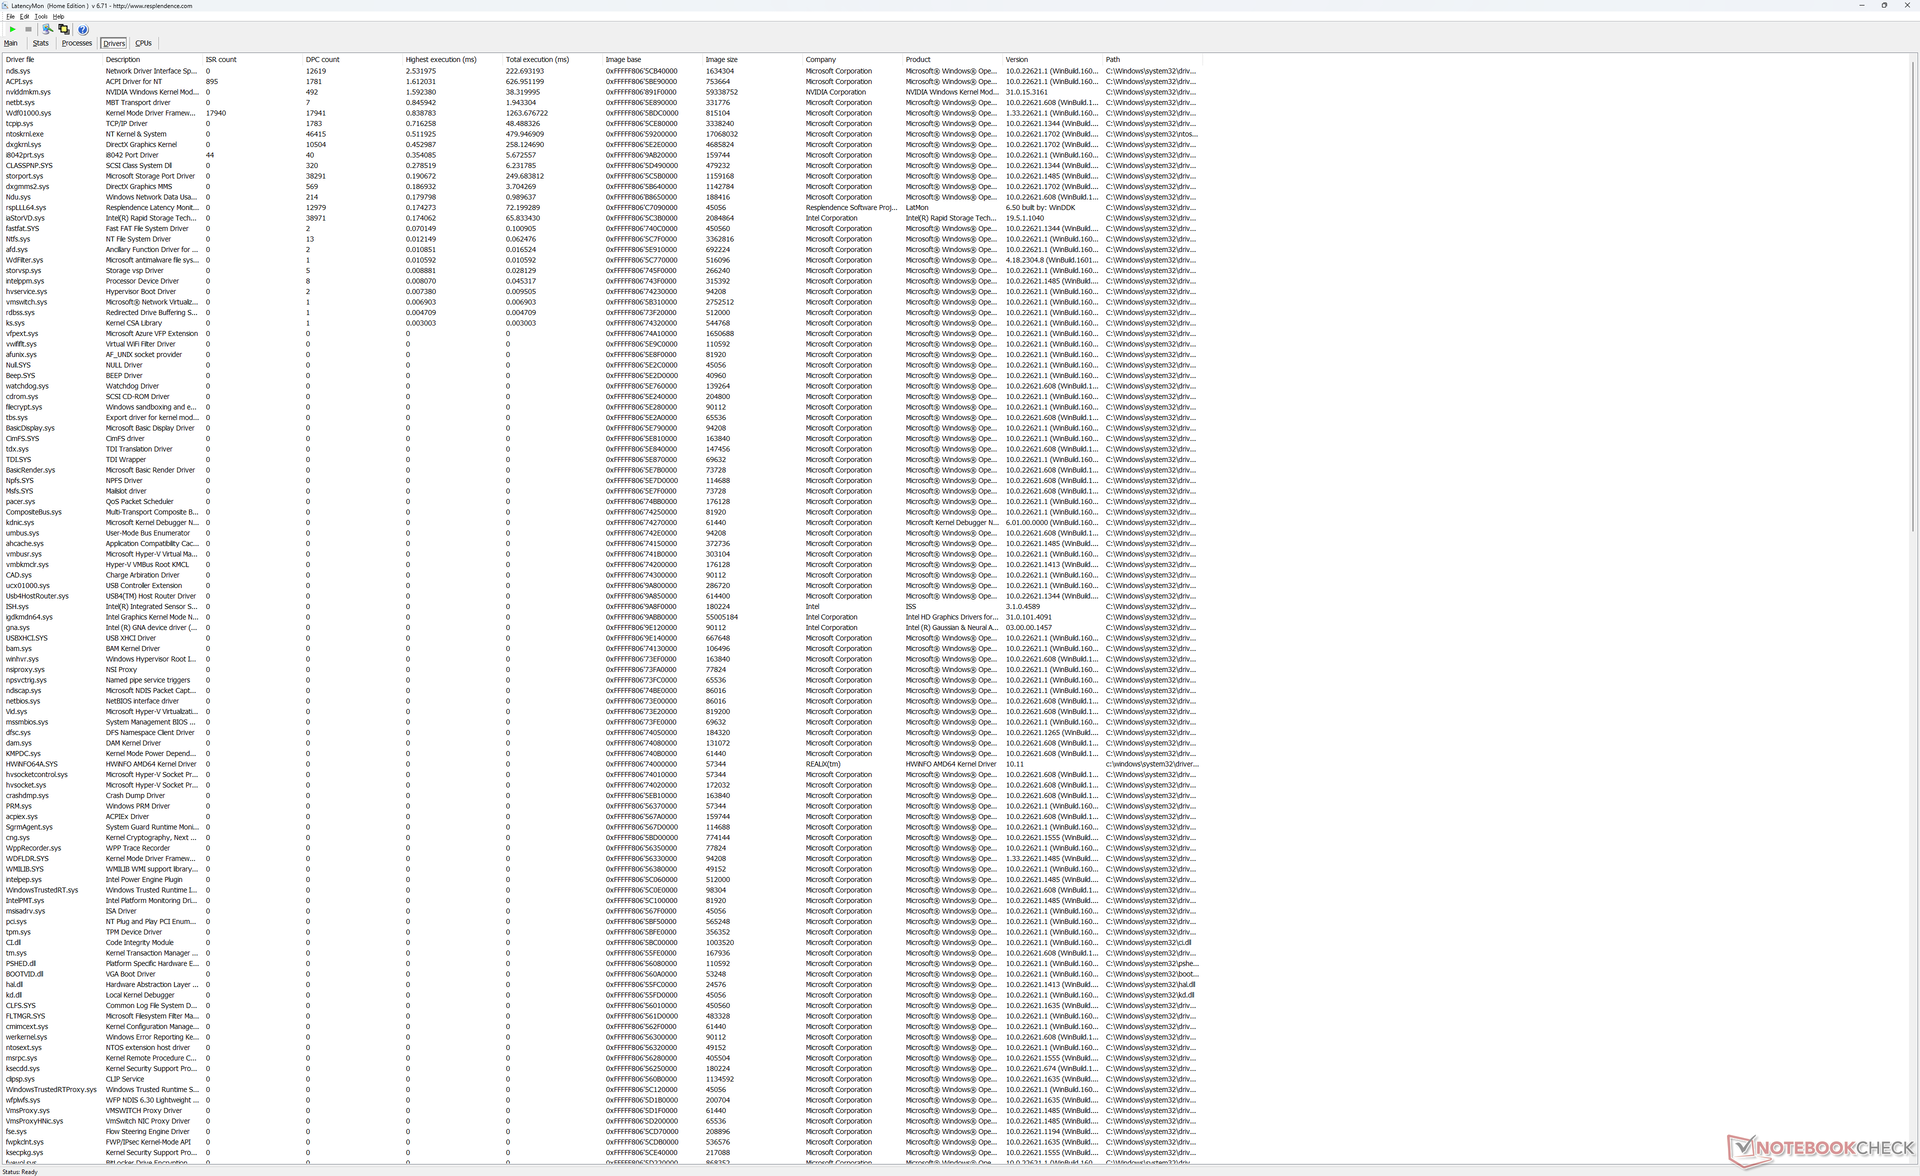
Latencia del CPD
LatencyMon revela problemas de CPD al abrir varias pestañas de nuestra página de inicio, incluso después de varios reintentos. Los resultados son decepcionantes teniendo en cuenta que no tuvimos ningún problema con el reciente XPS 15 9530 o en el XPS 17 9720 del año pasado.
la reproducción de vídeo 4K a 60 FPS es perfecta excepto al principio, donde siempre se caen 4 frames. Curiosamente, este mismo problema también aparecía en el XPS 15 9530.
| DPC Latencies / LatencyMon - interrupt to process latency (max), Web, Youtube, Prime95 | |
| HP Envy 17-cr0079ng | |
| Dell XPS 17 9730 RTX 4070 | |
| LG Gram 17 (2023) | |
| MSI Creator Z17 A12UGST-054 | |
| Dell XPS 15 9530 RTX 4070 | |
| Dell XPS 17 9720 RTX 3060 | |
* ... más pequeño es mejor
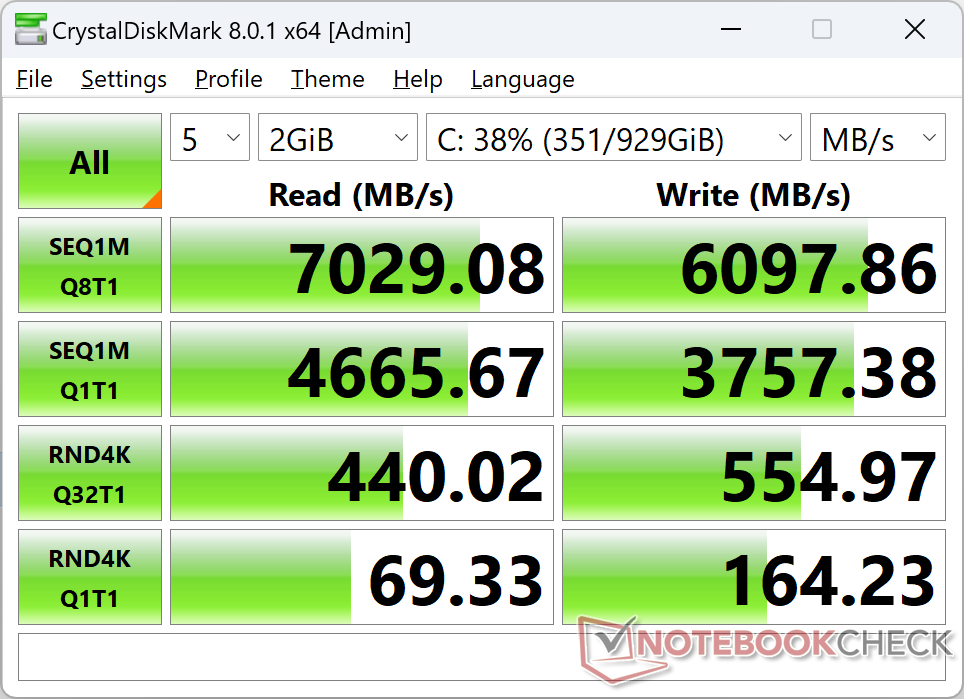
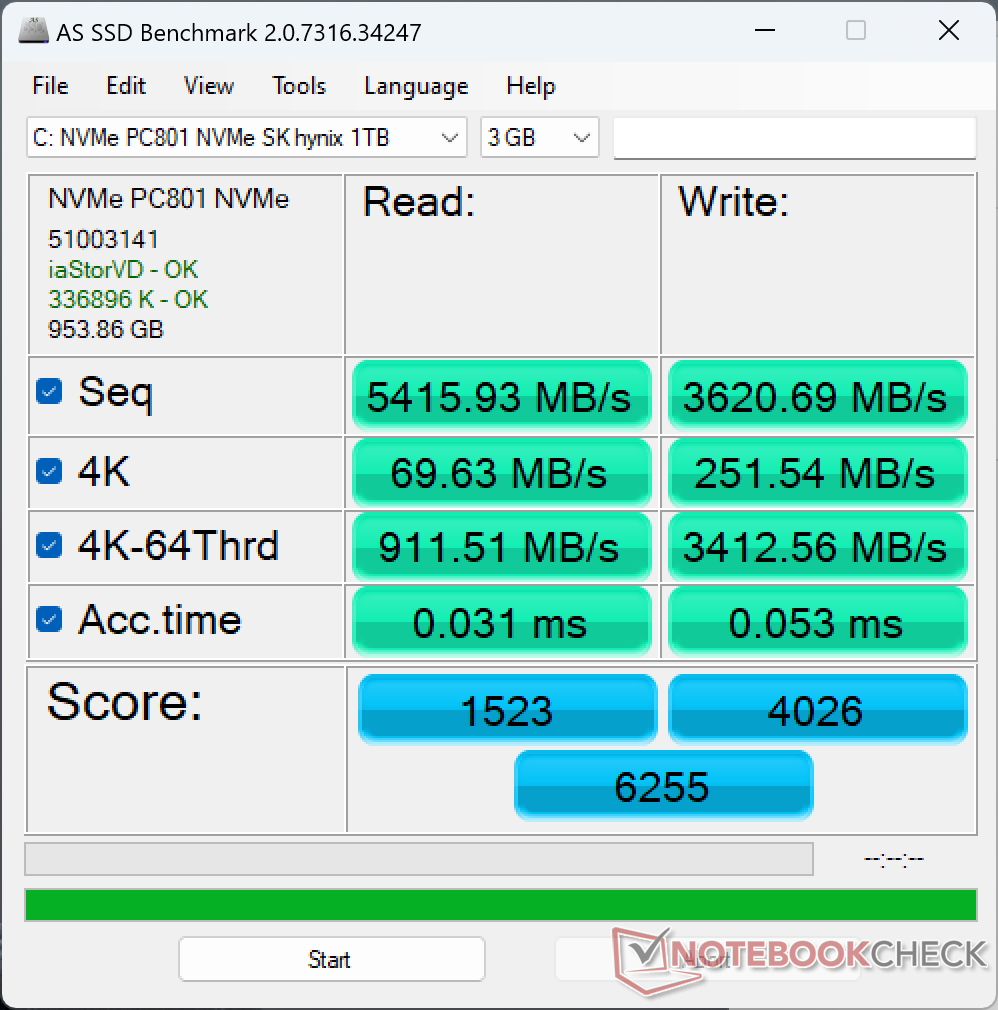
Dispositivos de almacenamiento
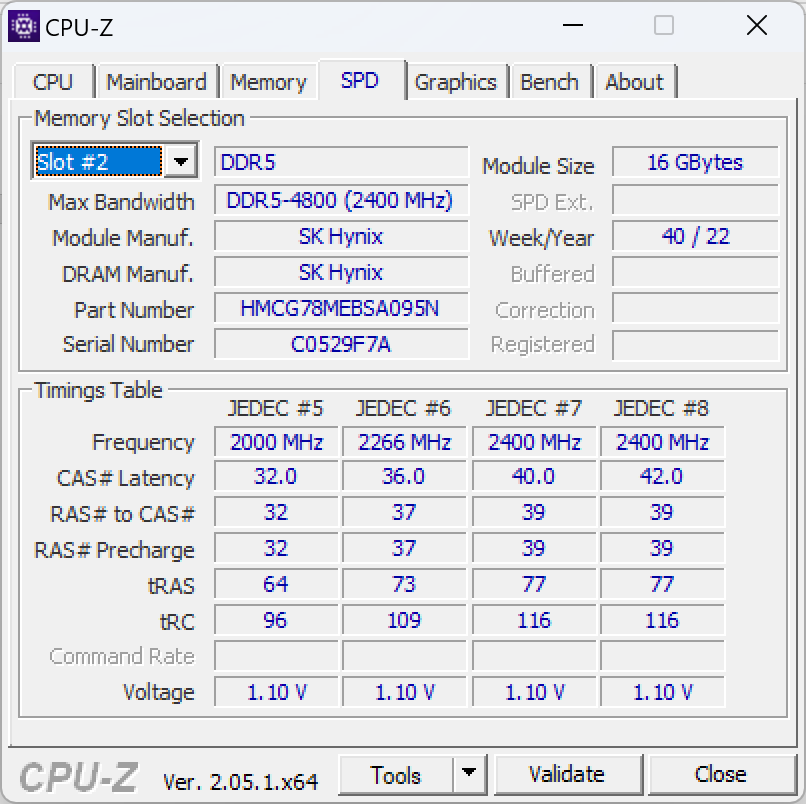
Las unidades XPS pueden venir con SSD de Samsung, Micron, Western Digital o SK Hynix. En nuestro caso particular, nuestra unidad de prueba viene con el SK Hynix PC801 PCIe4 x4 NVMe SSD. El rendimiento es excelente y comparable al de la Samsung PM9A1, sin caídas en las tasas de transferencia cuando se somete a estrés.
Se puede instalar un segundo SSD M.2 si es necesario. Cada una de las dos ranuras M.2 viene con un disipador de calor para ayudar a refrigerar las unidades.

| Drive Performance rating - Percent | |
| LG Gram 17 (2023) | |
| MSI Creator Z17 A12UGST-054 | |
| Dell XPS 17 9730 RTX 4070 | |
| Dell XPS 17 9720 RTX 3060 | |
| HP Envy 17-cr0079ng | |
* ... más pequeño es mejor
Disk Throttling: DiskSpd Read Loop, Queue Depth 8
Rendimiento de la GPU: mucho más rápido que el XPS 15 9530
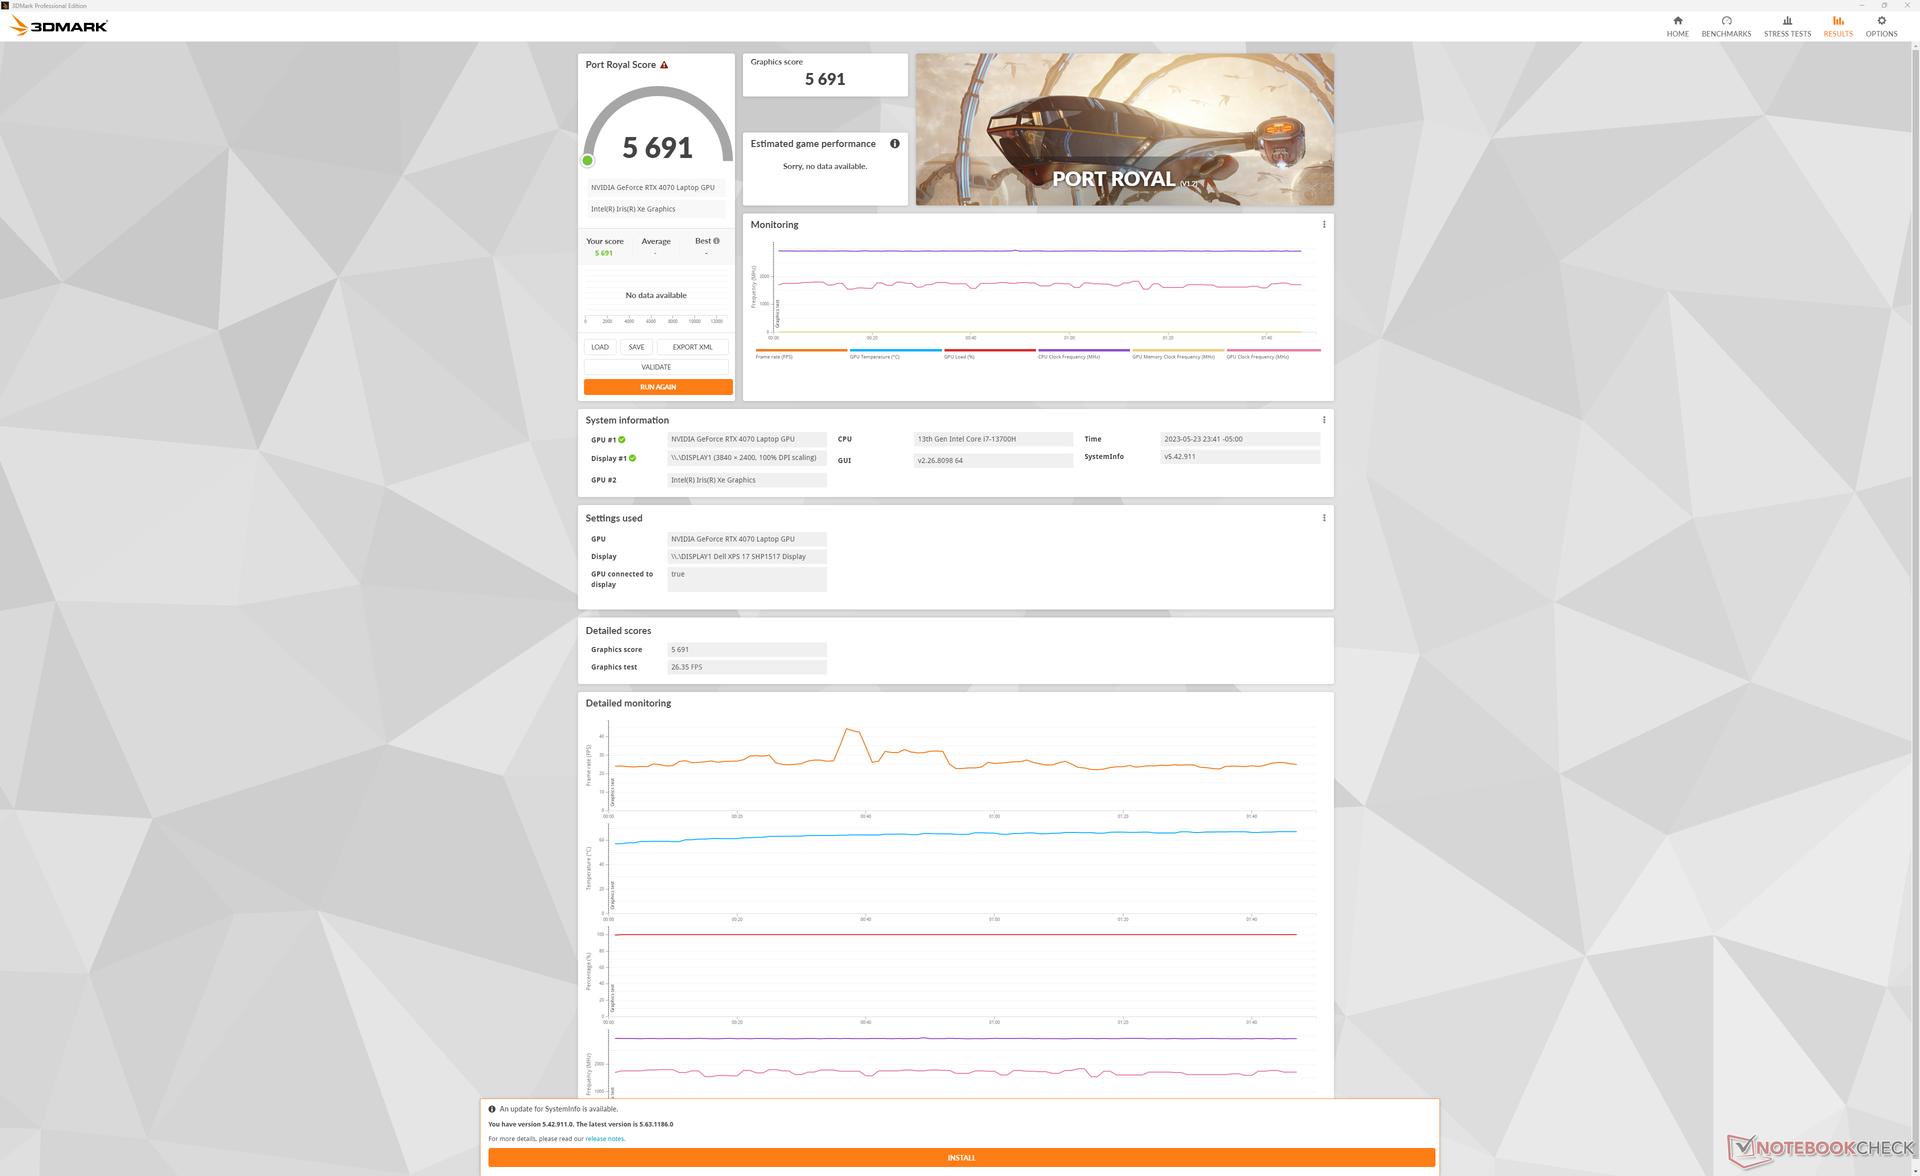
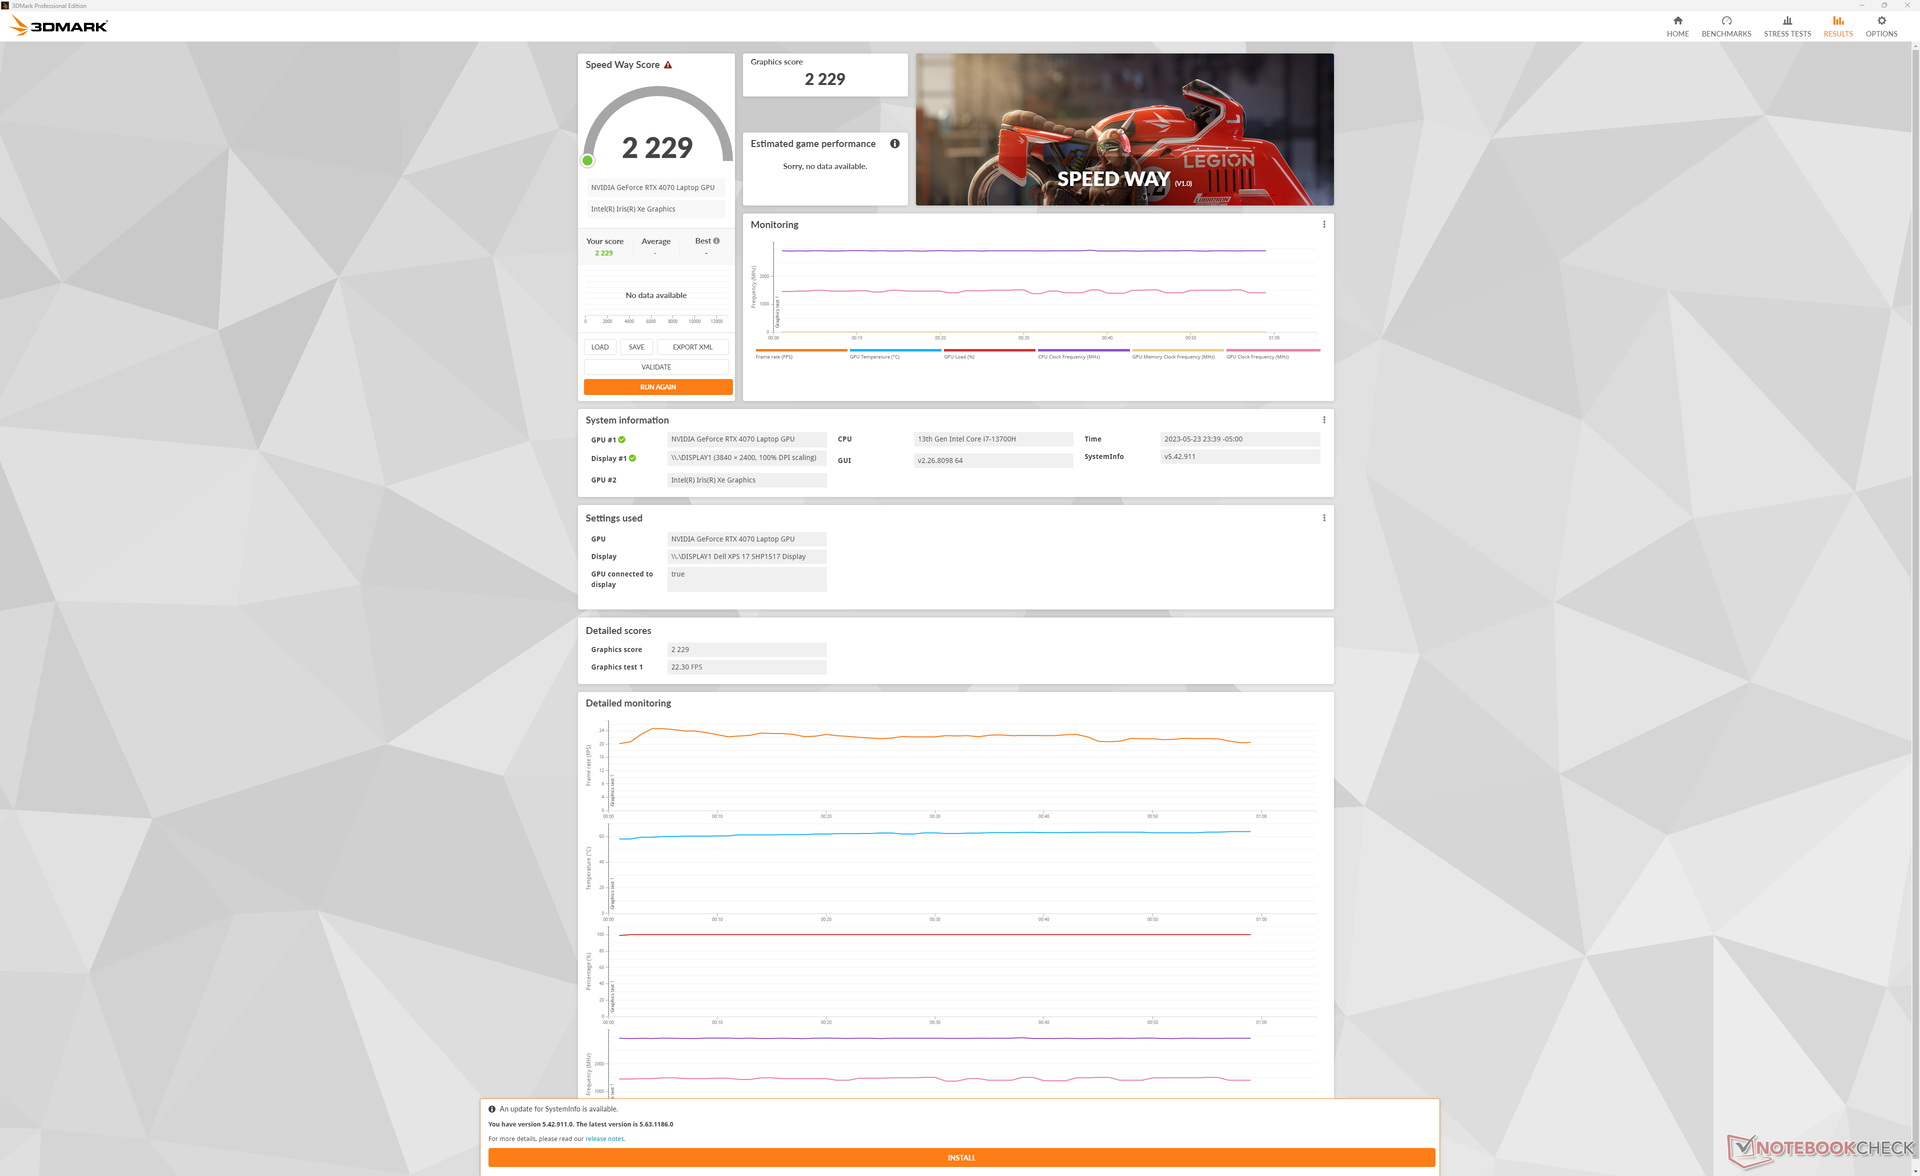
El GeForce RTX 4070 móvil del XPS 17 tiene un TGP de 60 W a 70 W, mientras que la misma GPU en el XPS 15 más pequeño tiene un TGP de 40 W. Este cambio aparentemente pequeño marca una gran diferencia, ya que las puntuaciones de 3DMark para DirectX y ray tracing son entre un 50 y un 60 por ciento más rápidas en el XPS 17 9730 en comparación con el XPS 15. El aumento de rendimiento es tan grande que la RTX 4070 del XPS 17 está solo entre un 10 y un 15 por ciento por detrás del portátil de juegos medio equipado con la misma GPU. El aumento de rendimiento es tan grande que la RTX 4070 del XPS 17 se queda solo entre un 10 % y un 15 % por detrás del portátil de juegos medio equipado con la misma GPU. Este es el rango de rendimiento que esperábamos ver en el XPS 15 9530.
La aceleración de Blender en la GPU también mejora en comparación con la misma GPU en el XPS 15. Es un aumento menor del 20 por ciento en el rendimiento. Es un pequeño aumento del 20 por ciento en el rendimiento para llevar el XPS 17 en línea con la mayoría de los otros portátiles RTX 4070.
Dell ofrece una opción RTX 4080 aún mayor para el XPS 17, pero esperamos totalmente que tenga un rendimiento inferior en comparación con la mayoría de los otros portátiles RTX 4080 debido a la limitada fuente de alimentación USB-C de 130 W. ElMSI Stealth 17 Studio, por ejemplo, ofrece la RTX 4080 aunque con un adaptador de CA de 240 W mucho más capaz.
La opción de GPU más alta para la serie XPS 17 antes del XPS 17 9730 era la RTX 3060. En comparación con esa configuración, nuestra RTX 4070 puede ofrecer un rendimiento gráfico y de creación de contenidos un 20 y un 30 por ciento más rápido, respectivamente.
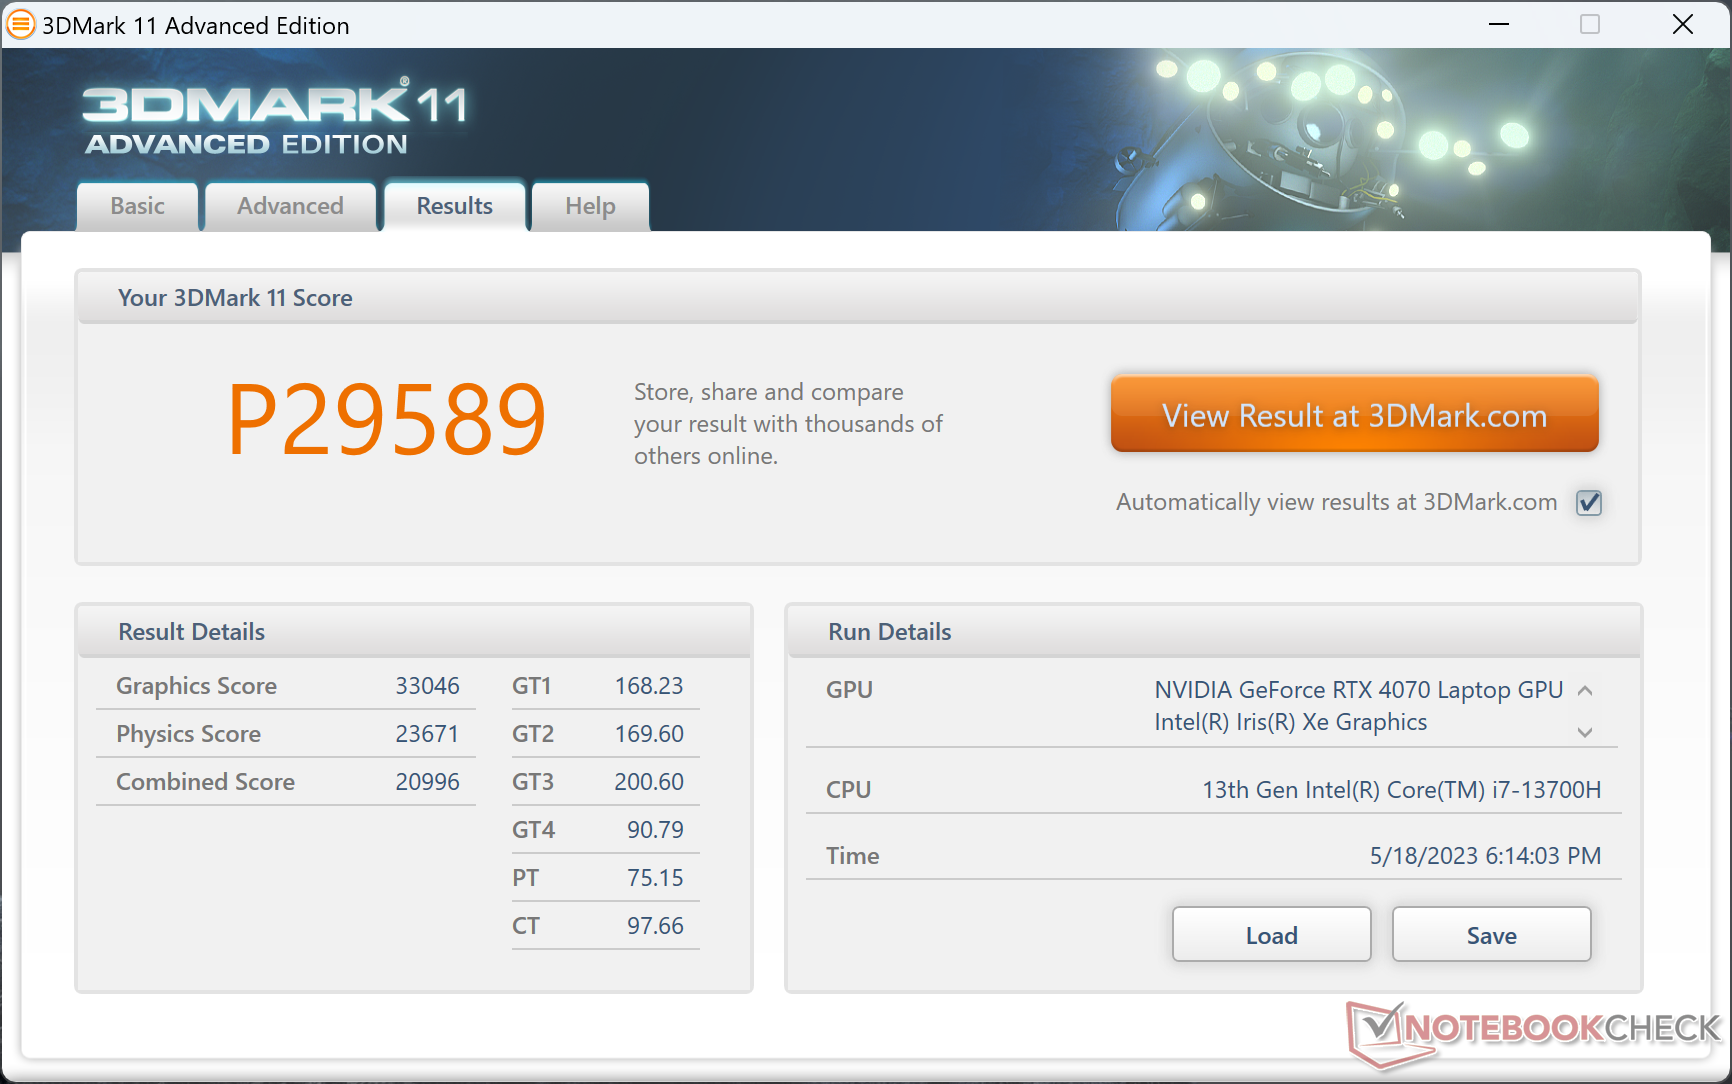
| 3DMark 11 Performance | 29589 puntos | |
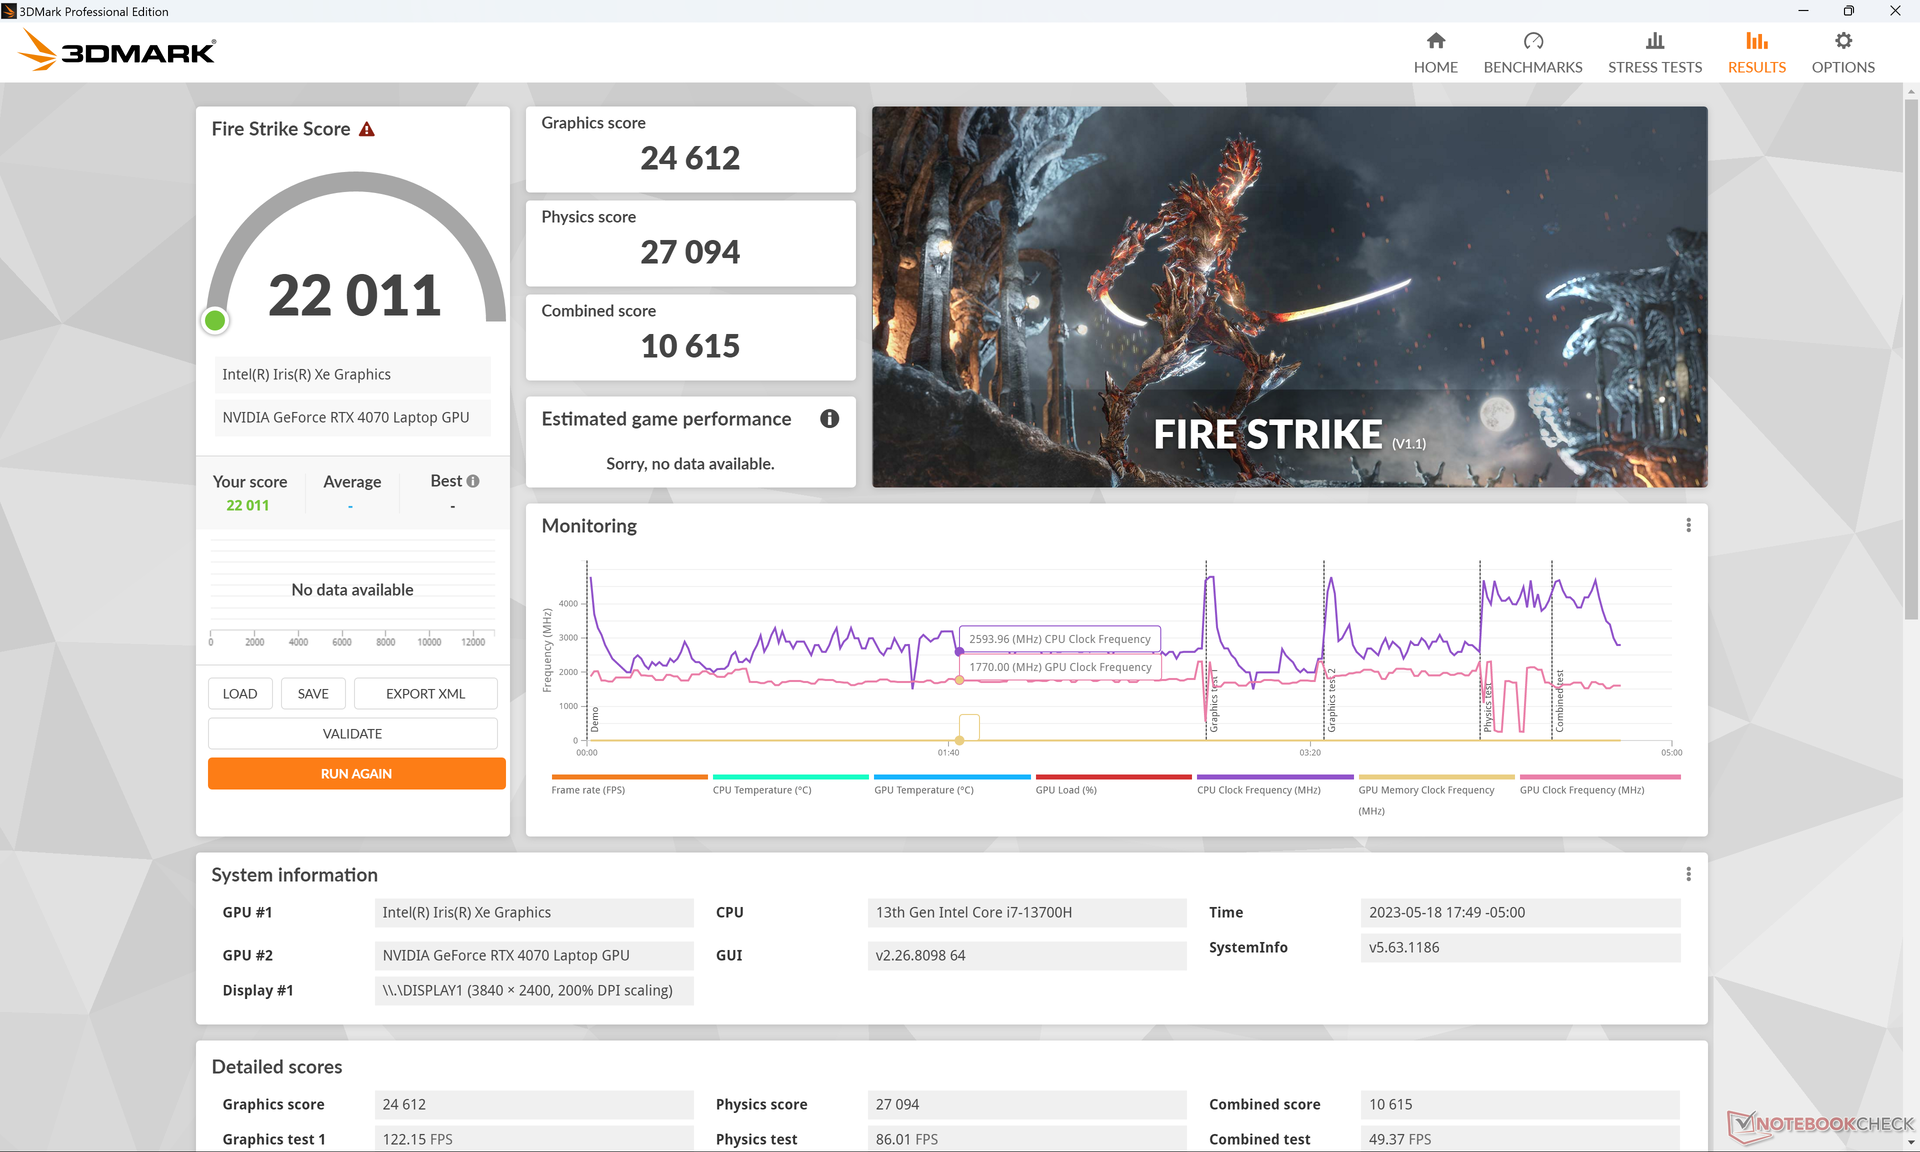
| 3DMark Fire Strike Score | 22011 puntos | |
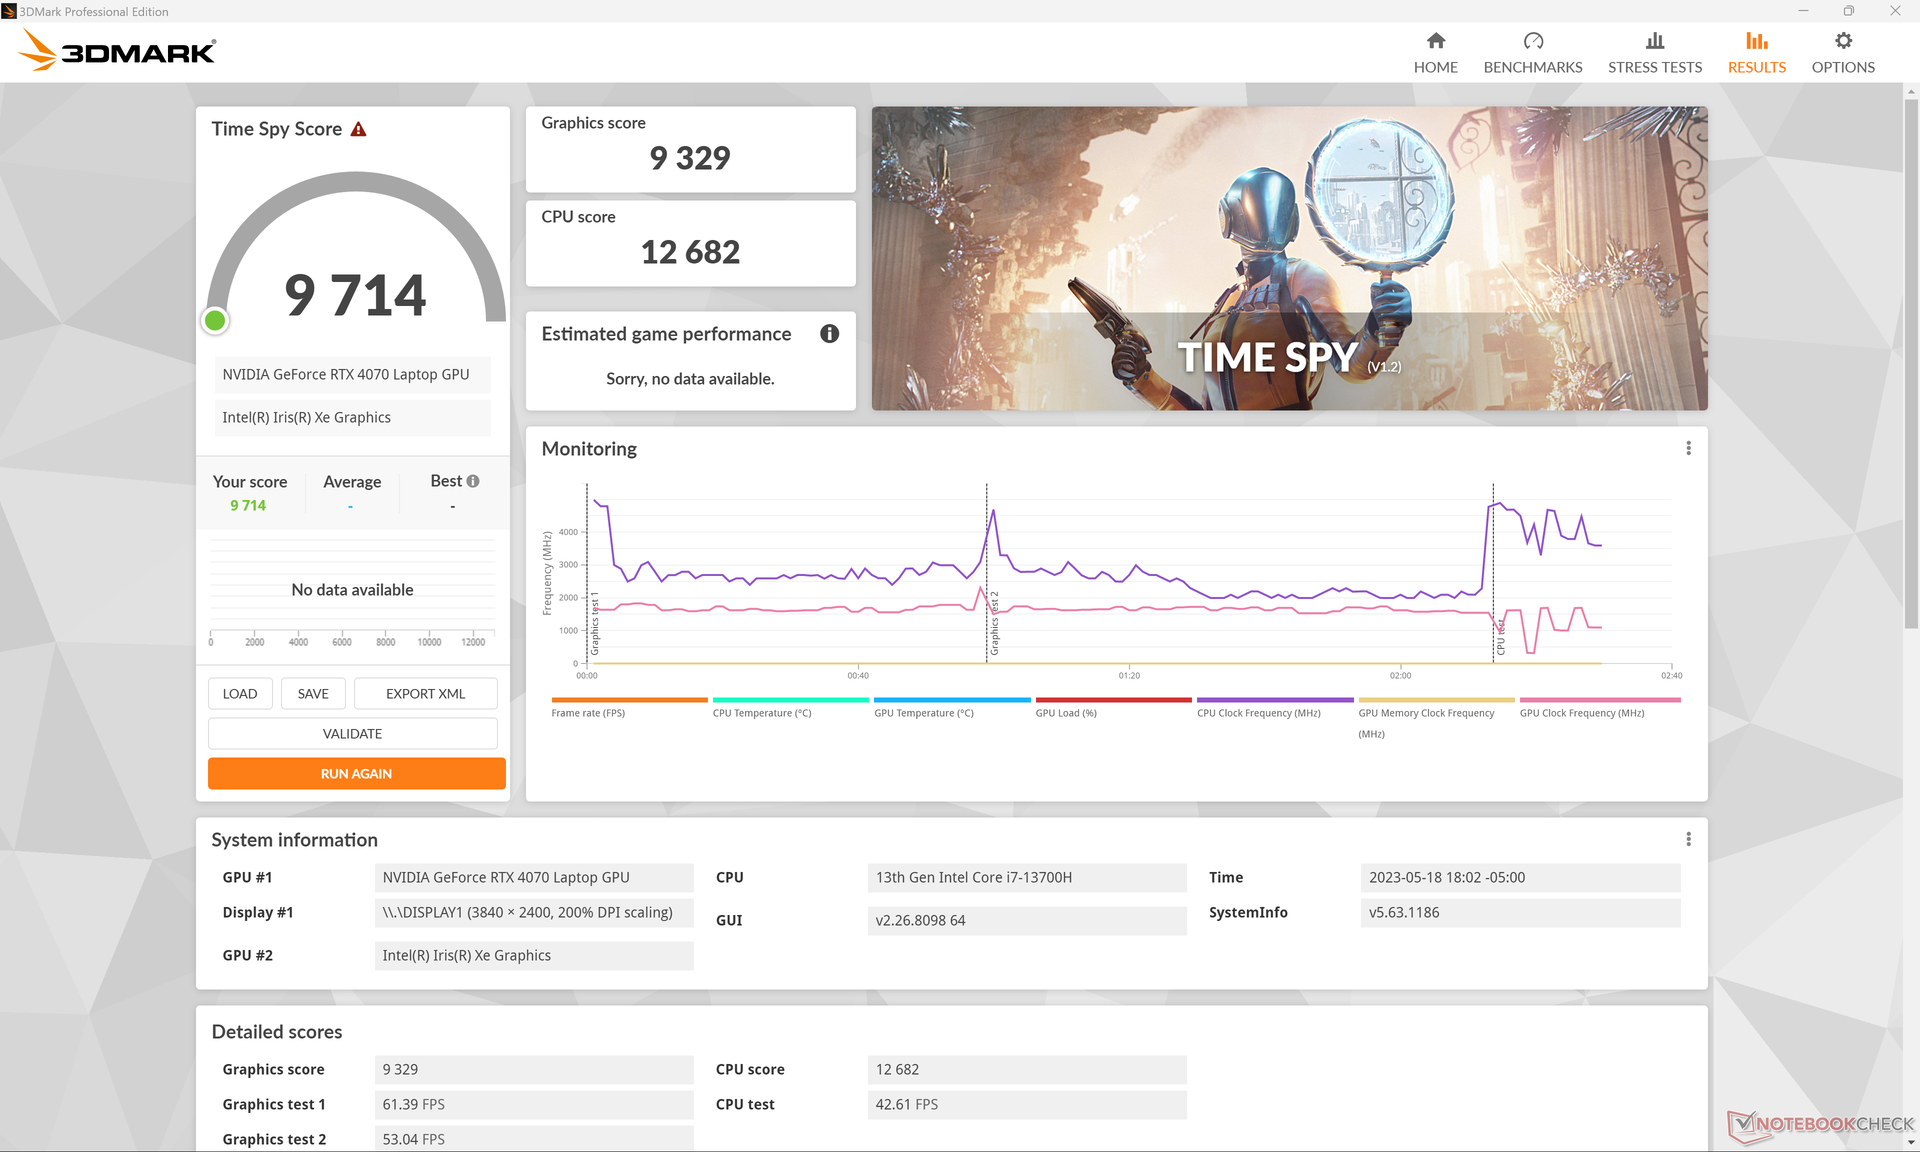
| 3DMark Time Spy Score | 9714 puntos | |
ayuda | ||
* ... más pequeño es mejor
Rendimiento en juegos
El sistema funciona bien como máquina de juego secundaria. Dado que la RTX 4070 de 70 W no es tan poco potente como la versión de 40 W del XPS 15, el XPS 17 es capaz de ejecutar los últimos juegos a resolución QHD y 60 FPS con ajustes medios y medios-altos. 4K UHD sigue estando fuera de alcance en su mayor parte, pero la GPU podría emparejarse bien con monitores externos FHD o QHD para jugar.
Quizá los dos factores notables que impiden que el XPS 17 sea un portátil de juego "adecuado" son sus tiempos de respuesta de pantalla relativamente lentos y la falta de soporte G-Sync para la pantalla interna. Las caídas de frames, el tearing de pantalla y el ghosting son, por tanto, más frecuentes cuando se juega con el XPS 17. Por supuesto, mucho de esto puede evitarse simplemente jugando en un monitor externo.
| Returnal | |
| 1280x720 Low Preset | |
| Aorus 17X AZF | |
| Medio NVIDIA GeForce RTX 4070 Laptop GPU (126 - 150, n=5) | |
| 1920x1080 Low Preset | |
| Aorus 17X AZF | |
| Medio NVIDIA GeForce RTX 4070 Laptop GPU (65 - 119, n=11) | |
| Dell XPS 17 9730 RTX 4070 | |
| 1920x1080 Medium Preset | |
| Aorus 17X AZF | |
| Medio NVIDIA GeForce RTX 4070 Laptop GPU (69 - 117, n=12) | |
| Dell XPS 17 9730 RTX 4070 | |
| 1920x1080 High Preset | |
| Aorus 17X AZF | |
| Medio NVIDIA GeForce RTX 4070 Laptop GPU (64 - 106, n=12) | |
| Dell XPS 17 9730 RTX 4070 | |
| 1920x1080 Epic Preset | |
| Aorus 17X AZF | |
| Medio NVIDIA GeForce RTX 4070 Laptop GPU (54 - 90, n=12) | |
| Dell XPS 17 9730 RTX 4070 | |
| 2560x1440 Epic Preset | |
| Aorus 17X AZF | |
| Medio NVIDIA GeForce RTX 4070 Laptop GPU (39 - 66, n=12) | |
| Dell XPS 17 9730 RTX 4070 | |
| 3840x2160 Epic Preset | |
| Aorus 17X AZF | |
| Medio NVIDIA GeForce RTX 4070 Laptop GPU (21 - 39, n=8) | |
| Dell XPS 17 9730 RTX 4070 | |
| Tiny Tina's Wonderlands | |
| 1920x1080 Low Preset (DX12) | |
| Aorus 17X AZF | |
| Medio NVIDIA GeForce RTX 4070 Laptop GPU (98.1 - 283, n=15) | |
| Dell XPS 17 9730 RTX 4070 | |
| 1920x1080 Medium Preset (DX12) | |
| Aorus 17X AZF | |
| Medio NVIDIA GeForce RTX 4070 Laptop GPU (92.5 - 231, n=15) | |
| Dell XPS 17 9730 RTX 4070 | |
| 1920x1080 High Preset (DX12) | |
| Aorus 17X AZF | |
| Medio NVIDIA GeForce RTX 4070 Laptop GPU (74.3 - 151.4, n=15) | |
| Dell XPS 17 9730 RTX 4070 | |
| 1920x1080 Badass Preset (DX12) | |
| Aorus 17X AZF | |
| Medio NVIDIA GeForce RTX 4070 Laptop GPU (58.6 - 115.9, n=18) | |
| Dell XPS 17 9730 RTX 4070 | |
| 2560x1440 Badass Preset (DX12) | |
| Aorus 17X AZF | |
| Medio NVIDIA GeForce RTX 4070 Laptop GPU (49.8 - 79.5, n=17) | |
| Dell XPS 17 9730 RTX 4070 | |
| 3840x2160 Badass Preset (DX12) | |
| Aorus 17X AZF | |
| Medio NVIDIA GeForce RTX 4070 Laptop GPU (28.3 - 39.7, n=13) | |
| Dell XPS 17 9730 RTX 4070 | |
Witcher 3 FPS Chart
| bajo | medio | alto | ultra | QHD | 4K | |
|---|---|---|---|---|---|---|
| GTA V (2015) | 186.6 | 182.5 | 167.9 | 102.7 | 75.5 | 76.9 |
| The Witcher 3 (2015) | 415.2 | 297.6 | 181.4 | 96.2 | 59 | |
| Dota 2 Reborn (2015) | 193.5 | 174.5 | 165.9 | 156.9 | 108 | |
| Final Fantasy XV Benchmark (2018) | 174.8 | 128.3 | 94.7 | 69.9 | 38.2 | |
| X-Plane 11.11 (2018) | 154.6 | 133.1 | 106.4 | 90 | ||
| Strange Brigade (2018) | 431 | 238 | 192 | 165.4 | 113.6 | 61.7 |
| Cyberpunk 2077 1.6 (2022) | 102.1 | 99.4 | 85.6 | 71 | 43 | 18.7 |
| Tiny Tina's Wonderlands (2022) | 183.5 | 153.3 | 104.9 | 82.4 | 55.7 | 28.3 |
| F1 22 (2022) | 206 | 196.4 | 158.2 | 60.7 | 39.4 | 18.8 |
| Returnal (2023) | 72 | 71 | 67 | 59 | 41 | 21 |
Emisiones
Ruido del sistema: alto sólo cuando es necesario
El ruido del ventilador no ha cambiado drásticamente a pesar de las mejoras en el rendimiento. El XPS 17 suele rondar unos apenas audibles 25.6 dB(A) contra un fondo silencioso de 22.7 dB(A) al navegar por la web o hacer streaming de vídeo. Sin embargo, si se ejecutan cargas muy exigentes como juegos, el ruido del ventilador empezaría a acercarse al nivel de algunos portátiles para juegos con hasta 50 dB(A). El modelo XPS ofrece especificaciones de nivel de juego, después de todo.
Ruido
| Ocioso |
| 22.8 / 22.8 / 22.8 dB(A) |
| Carga |
| 38.9 / 50.2 dB(A) |
 | ||
30 dB silencioso 40 dB(A) audible 50 dB(A) ruidosamente alto |
||
min: | ||
| Dell XPS 17 9730 RTX 4070 GeForce RTX 4070 Laptop GPU, i7-13700H, SK hynix PC801 HFS001TEJ9X101N | Dell XPS 17 9720 RTX 3060 GeForce RTX 3060 Laptop GPU, i7-12700H, Samsung PM9A1 MZVL21T0HCLR | LG Gram 17 (2023) Iris Xe G7 96EUs, i7-1360P, Samsung PM9A1 MZVL21T0HCLR | HP Envy 17-cr0079ng GeForce RTX 2050 Mobile, i7-1255U, Samsung PM991a MZVLQ1T0HBLB | MSI Creator Z17 A12UGST-054 GeForce RTX 3070 Ti Laptop GPU, i9-12900H, Micron 3400 1TB MTFDKBA1T0TFH | Apple MacBook Pro 16 2023 M2 Max M2 Max 38-Core GPU, M2 Max, Apple SSD AP2048Z | |
|---|---|---|---|---|---|---|
| Noise | -4% | -11% | -16% | -28% | 4% | |
| apagado / medio ambiente * (dB) | 22.7 | 23.8 -5% | 25.2 -11% | 26.5 -17% | 26 -15% | 23.9 -5% |
| Idle Minimum * (dB) | 22.8 | 24.1 -6% | 25.2 -11% | 28.5 -25% | 31.8 -39% | 23.9 -5% |
| Idle Average * (dB) | 22.8 | 24.1 -6% | 25.7 -13% | 28.5 -25% | 31.8 -39% | 23.9 -5% |
| Idle Maximum * (dB) | 22.8 | 24.1 -6% | 29.3 -29% | 29.7 -30% | 31.8 -39% | 23.9 -5% |
| Load Average * (dB) | 38.9 | 43.2 -11% | 44.4 -14% | 39.5 -2% | 53.9 -39% | 36.6 6% |
| Witcher 3 ultra * (dB) | 47.4 | 48 -1% | 53.9 -14% | 35.1 26% | ||
| Load Maximum * (dB) | 50.2 | 48 4% | 45.2 10% | 48 4% | 54.9 -9% | 43.2 14% |
* ... más pequeño es mejor
Temperatura
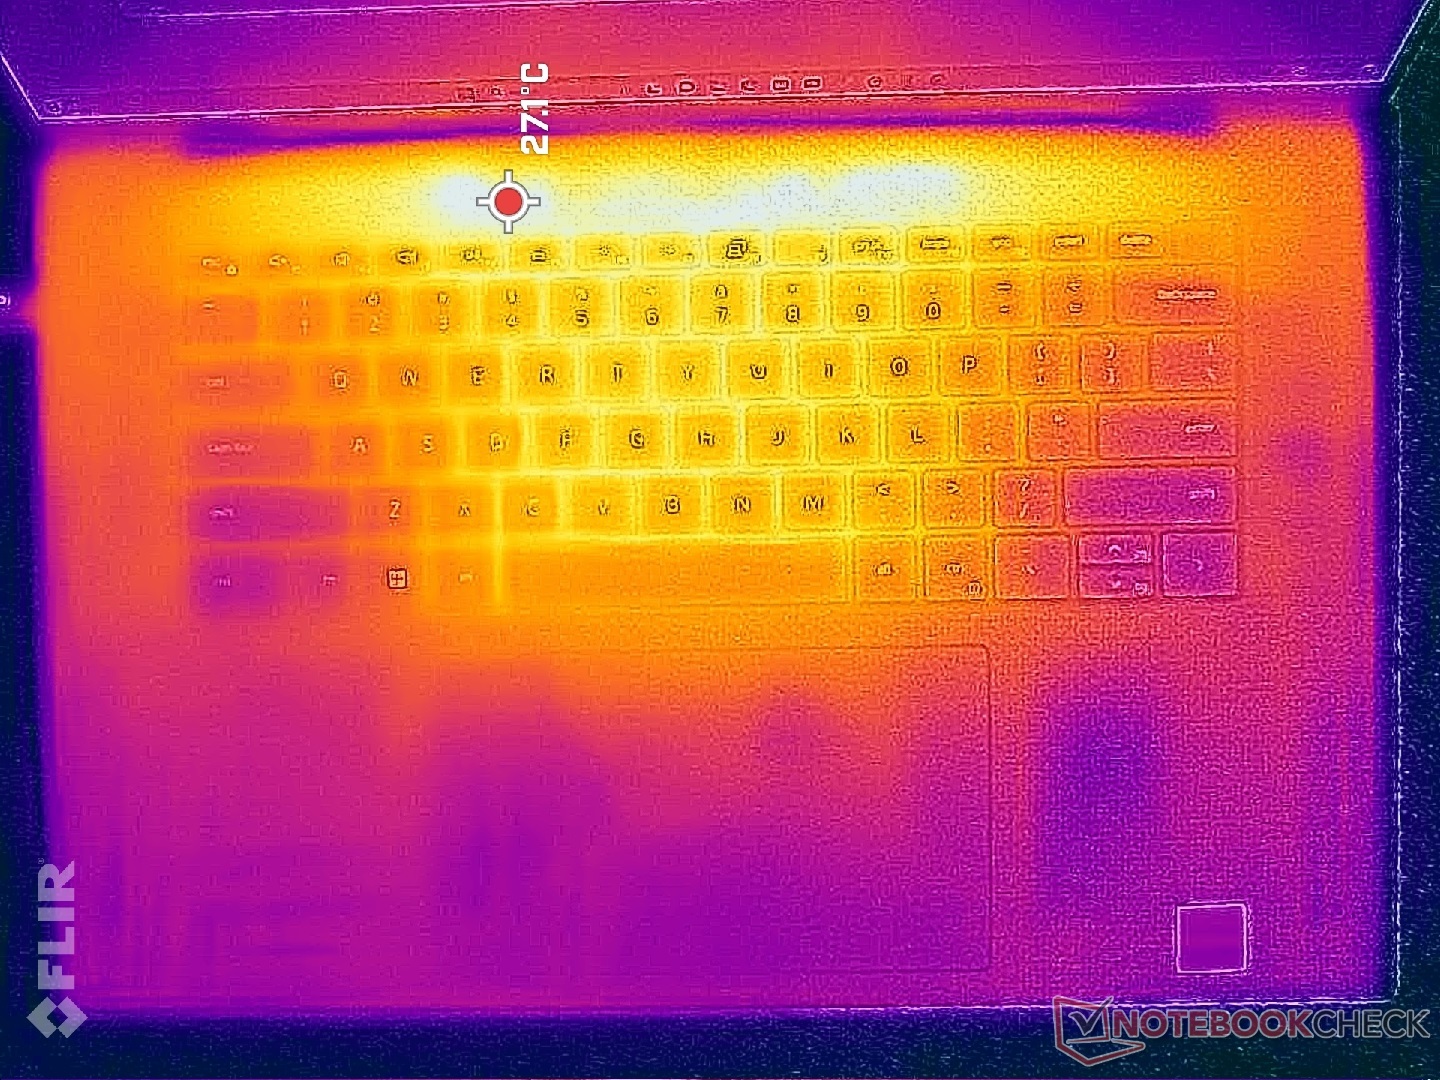
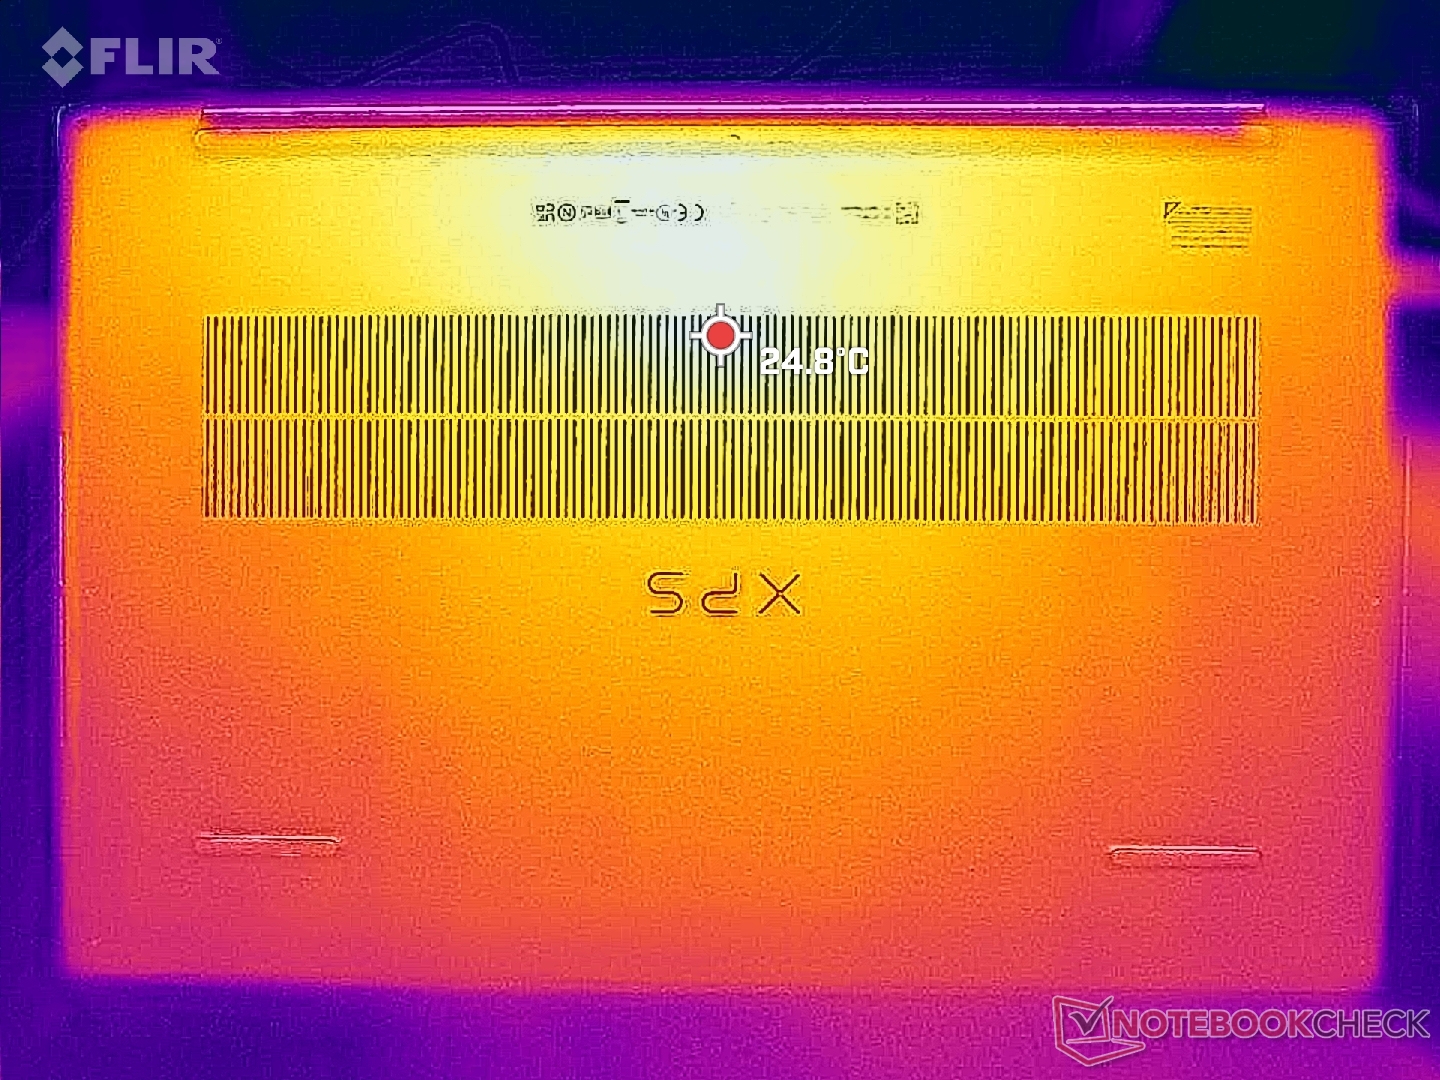
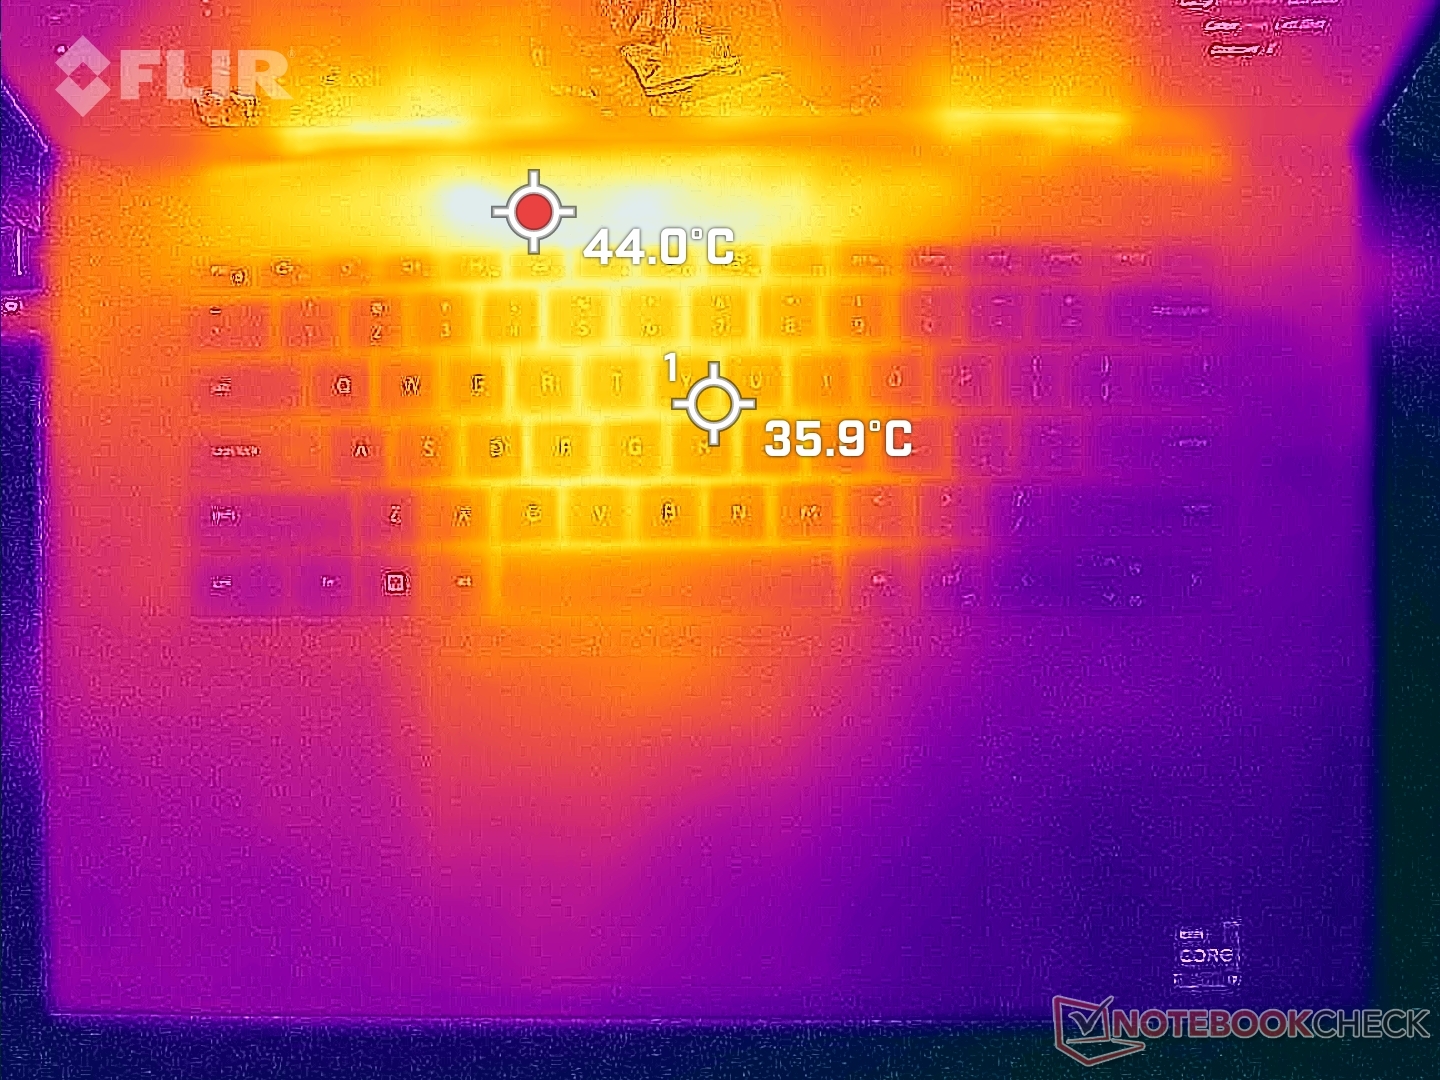
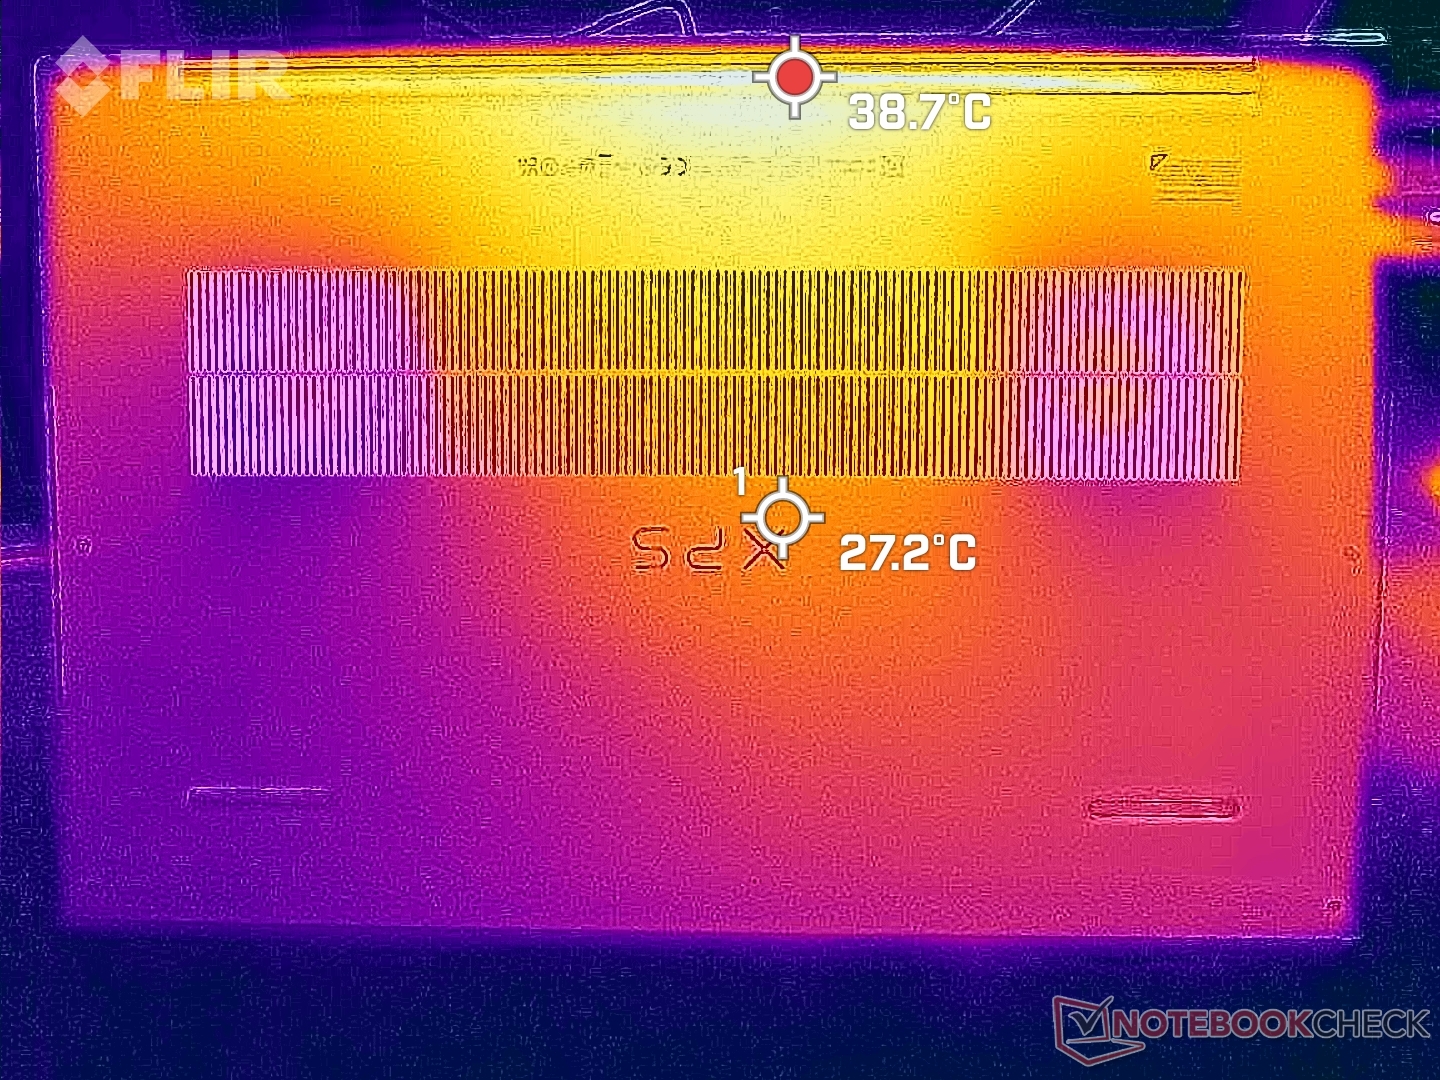
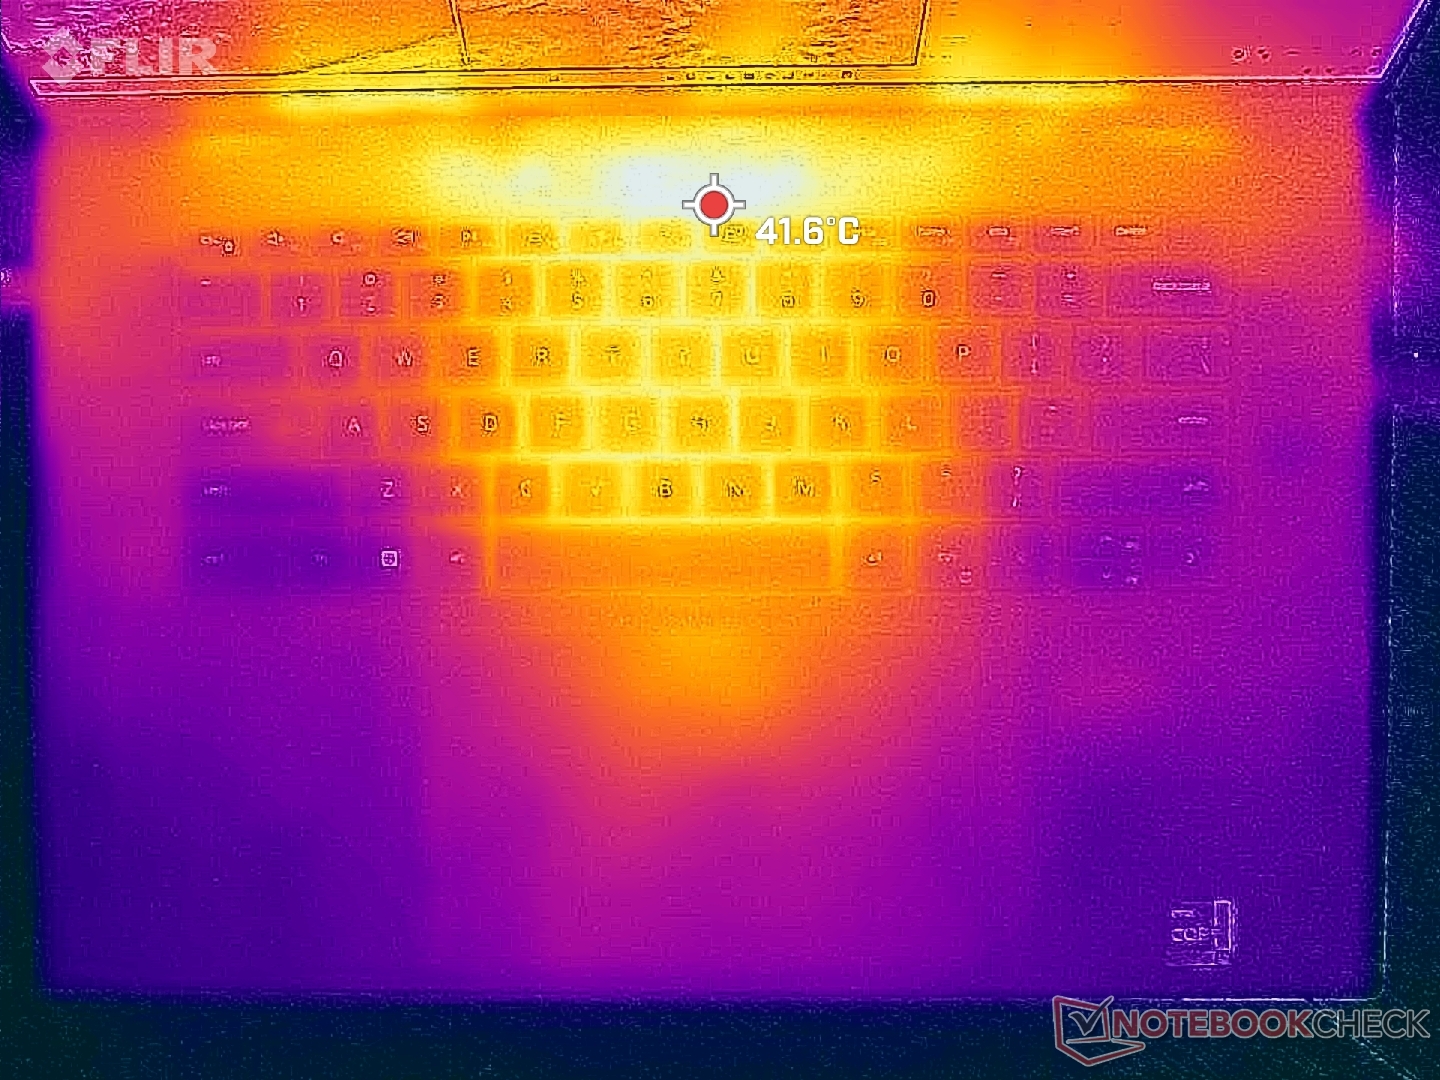
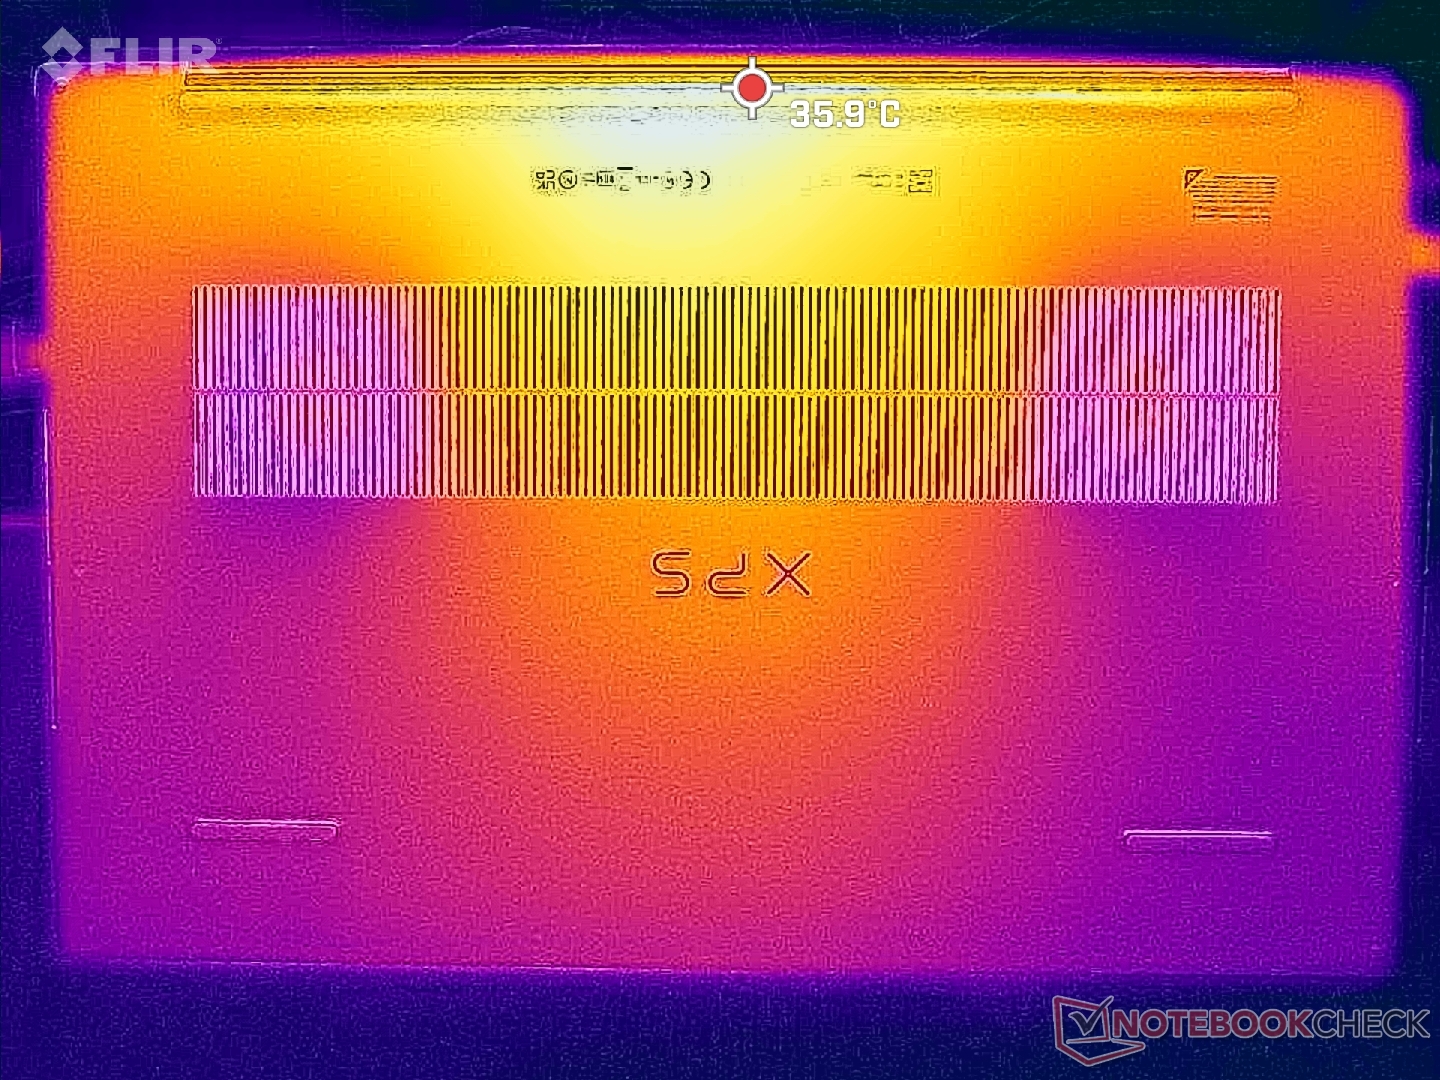
Las temperaturas del Surface son más bajas de lo esperado en comparación con otros portátiles equipados con CPU Core serie H y GPU RTX GeForce similares. El competidorMSI Creator Z17de la competencia, por ejemplo, tendría puntos calientes de hasta 60+ C mientras que nuestro Dell sólo llegaría a los 43 C con cargas pesadas similares. Las temperaturas superficiales más bajas del Dell pueden atribuirse al refrigerador de cámara de vapor, el aislamiento térmico GORE y, en general, la menor potencia disponible.
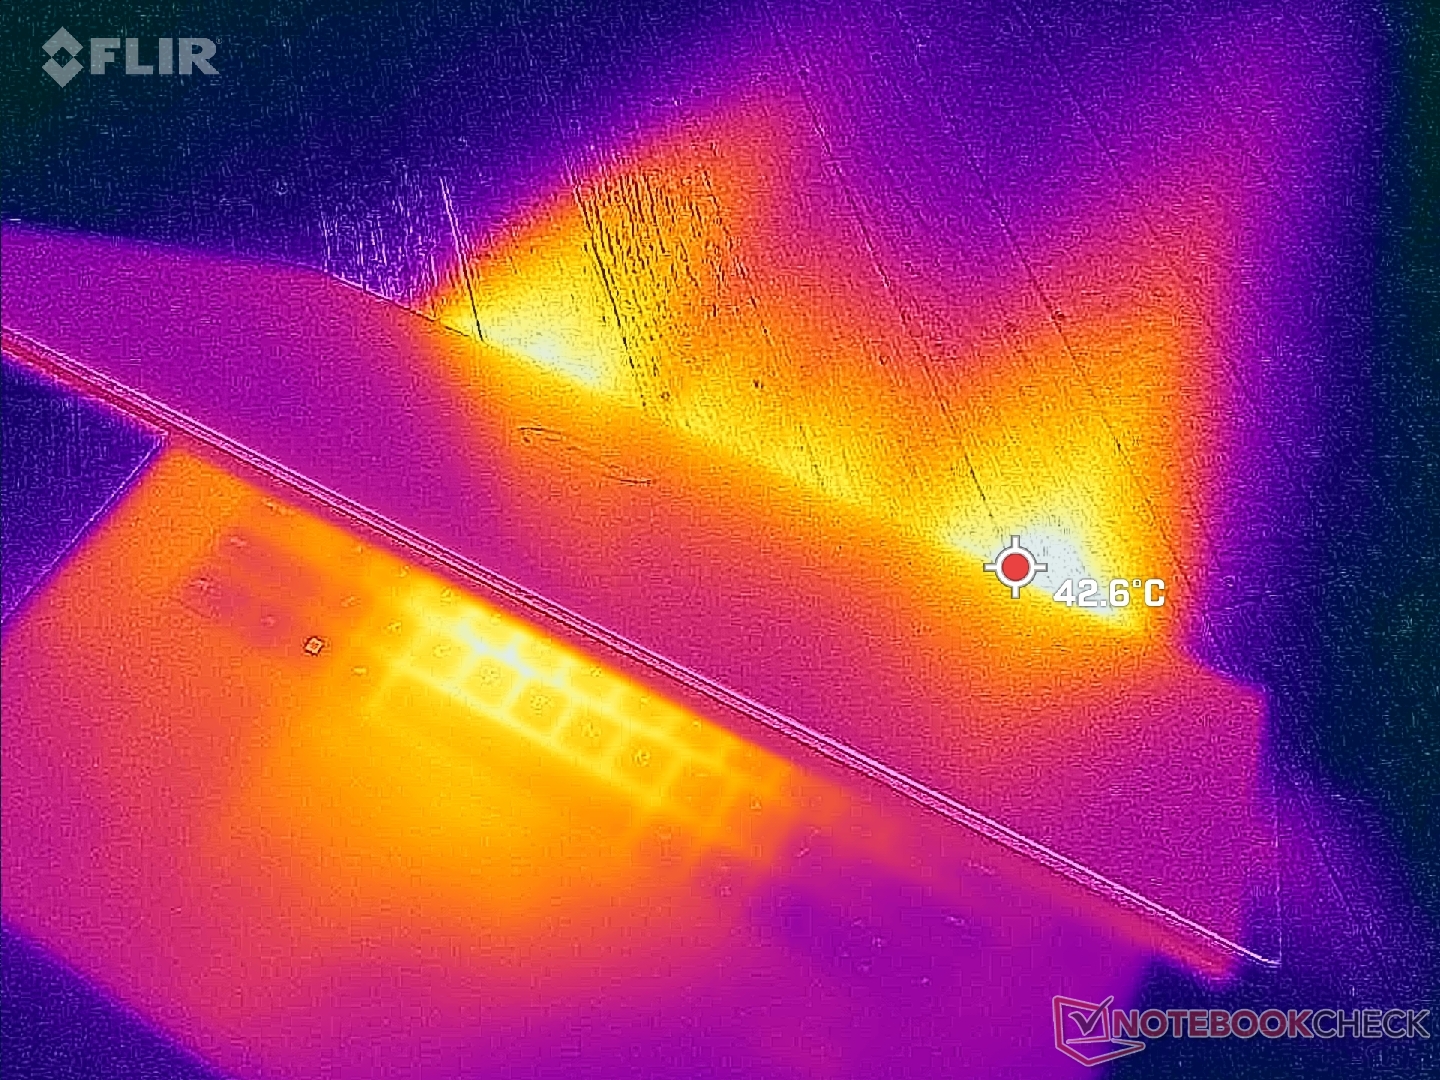
(±) La temperatura máxima en la parte superior es de 43.2 °C / 110 F, frente a la media de 36.8 °C / 98 F, que oscila entre 21 y 71 °C para la clase Multimedia.
(+) El fondo se calienta hasta un máximo de 31.8 °C / 89 F, frente a la media de 39.1 °C / 102 F
(+) En reposo, la temperatura media de la parte superior es de 28.2 °C / 83# F, frente a la media del dispositivo de 31.3 °C / 88 F.
(±) Jugando a The Witcher 3, la temperatura media de la parte superior es de 33.7 °C / 93 F, frente a la media del dispositivo de 31.3 °C / 88 F.
(+) El reposamanos y el panel táctil están a una temperatura inferior a la de la piel, con un máximo de 31 °C / 87.8 F y, por tanto, son fríos al tacto.
(-) La temperatura media de la zona del reposamanos de dispositivos similares fue de 28.7 °C / 83.7 F (-2.3 °C / -4.1 F).
| Dell XPS 17 9730 RTX 4070 Intel Core i7-13700H, NVIDIA GeForce RTX 4070 Laptop GPU | Dell XPS 17 9720 RTX 3060 Intel Core i7-12700H, NVIDIA GeForce RTX 3060 Laptop GPU | LG Gram 17 (2023) Intel Core i7-1360P, Intel Iris Xe Graphics G7 96EUs | HP Envy 17-cr0079ng Intel Core i7-1255U, NVIDIA GeForce RTX 2050 Mobile | MSI Creator Z17 A12UGST-054 Intel Core i9-12900H, NVIDIA GeForce RTX 3070 Ti Laptop GPU | Apple MacBook Pro 16 2023 M2 Max Apple M2 Max, Apple M2 Max 38-Core GPU | |
|---|---|---|---|---|---|---|
| Heat | -19% | -7% | -3% | -37% | 5% | |
| Maximum Upper Side * (°C) | 43.2 | 51.8 -20% | 43.9 -2% | 47.1 -9% | 63.9 -48% | 44.2 -2% |
| Maximum Bottom * (°C) | 31.8 | 44.2 -39% | 45.5 -43% | 43.8 -38% | 68 -114% | 42.9 -35% |
| Idle Upper Side * (°C) | 32.8 | 34.8 -6% | 28.4 13% | 25.2 23% | 28.3 14% | 22.4 32% |
| Idle Bottom * (°C) | 29.8 | 33.2 -11% | 28.2 5% | 25.9 13% | 30.2 -1% | 22.3 25% |
* ... más pequeño es mejor
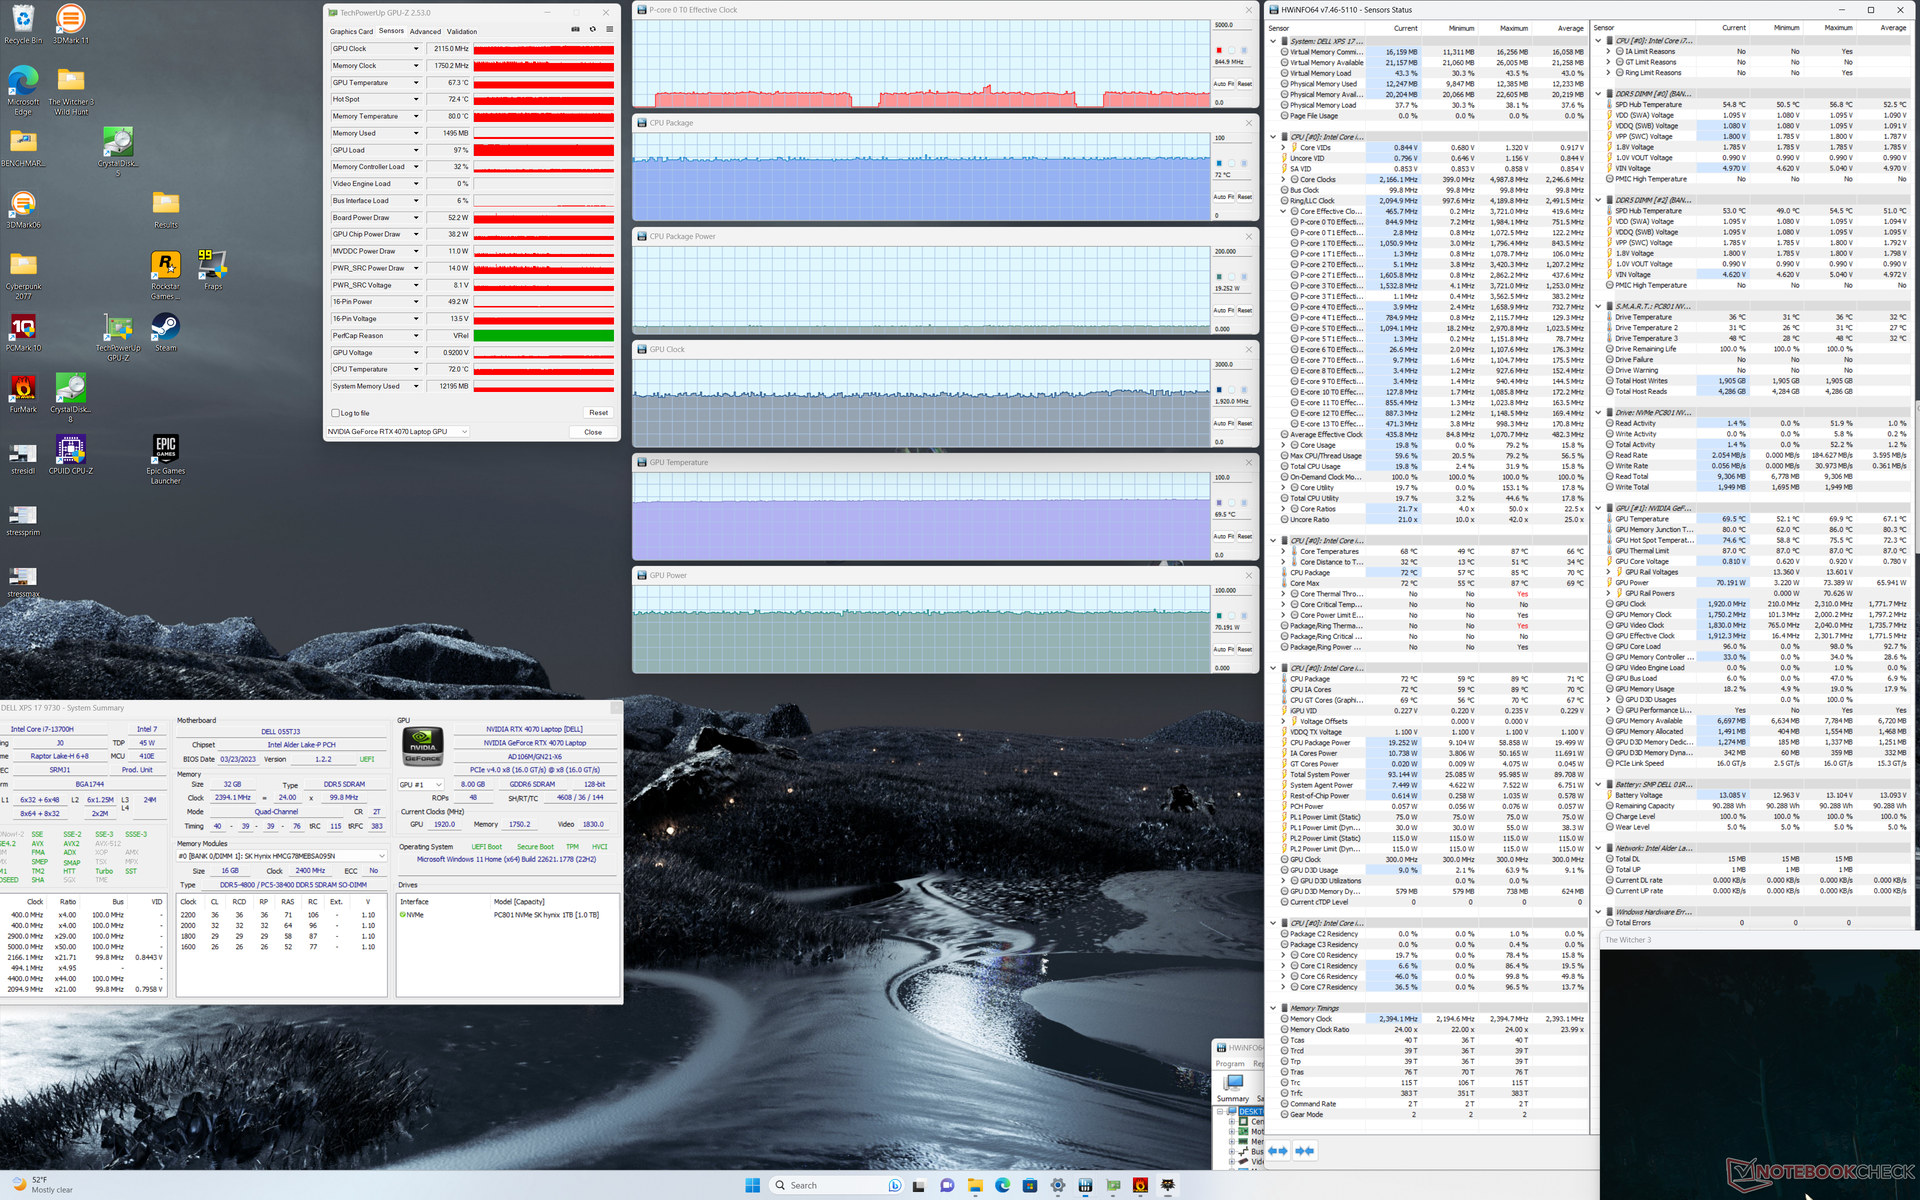
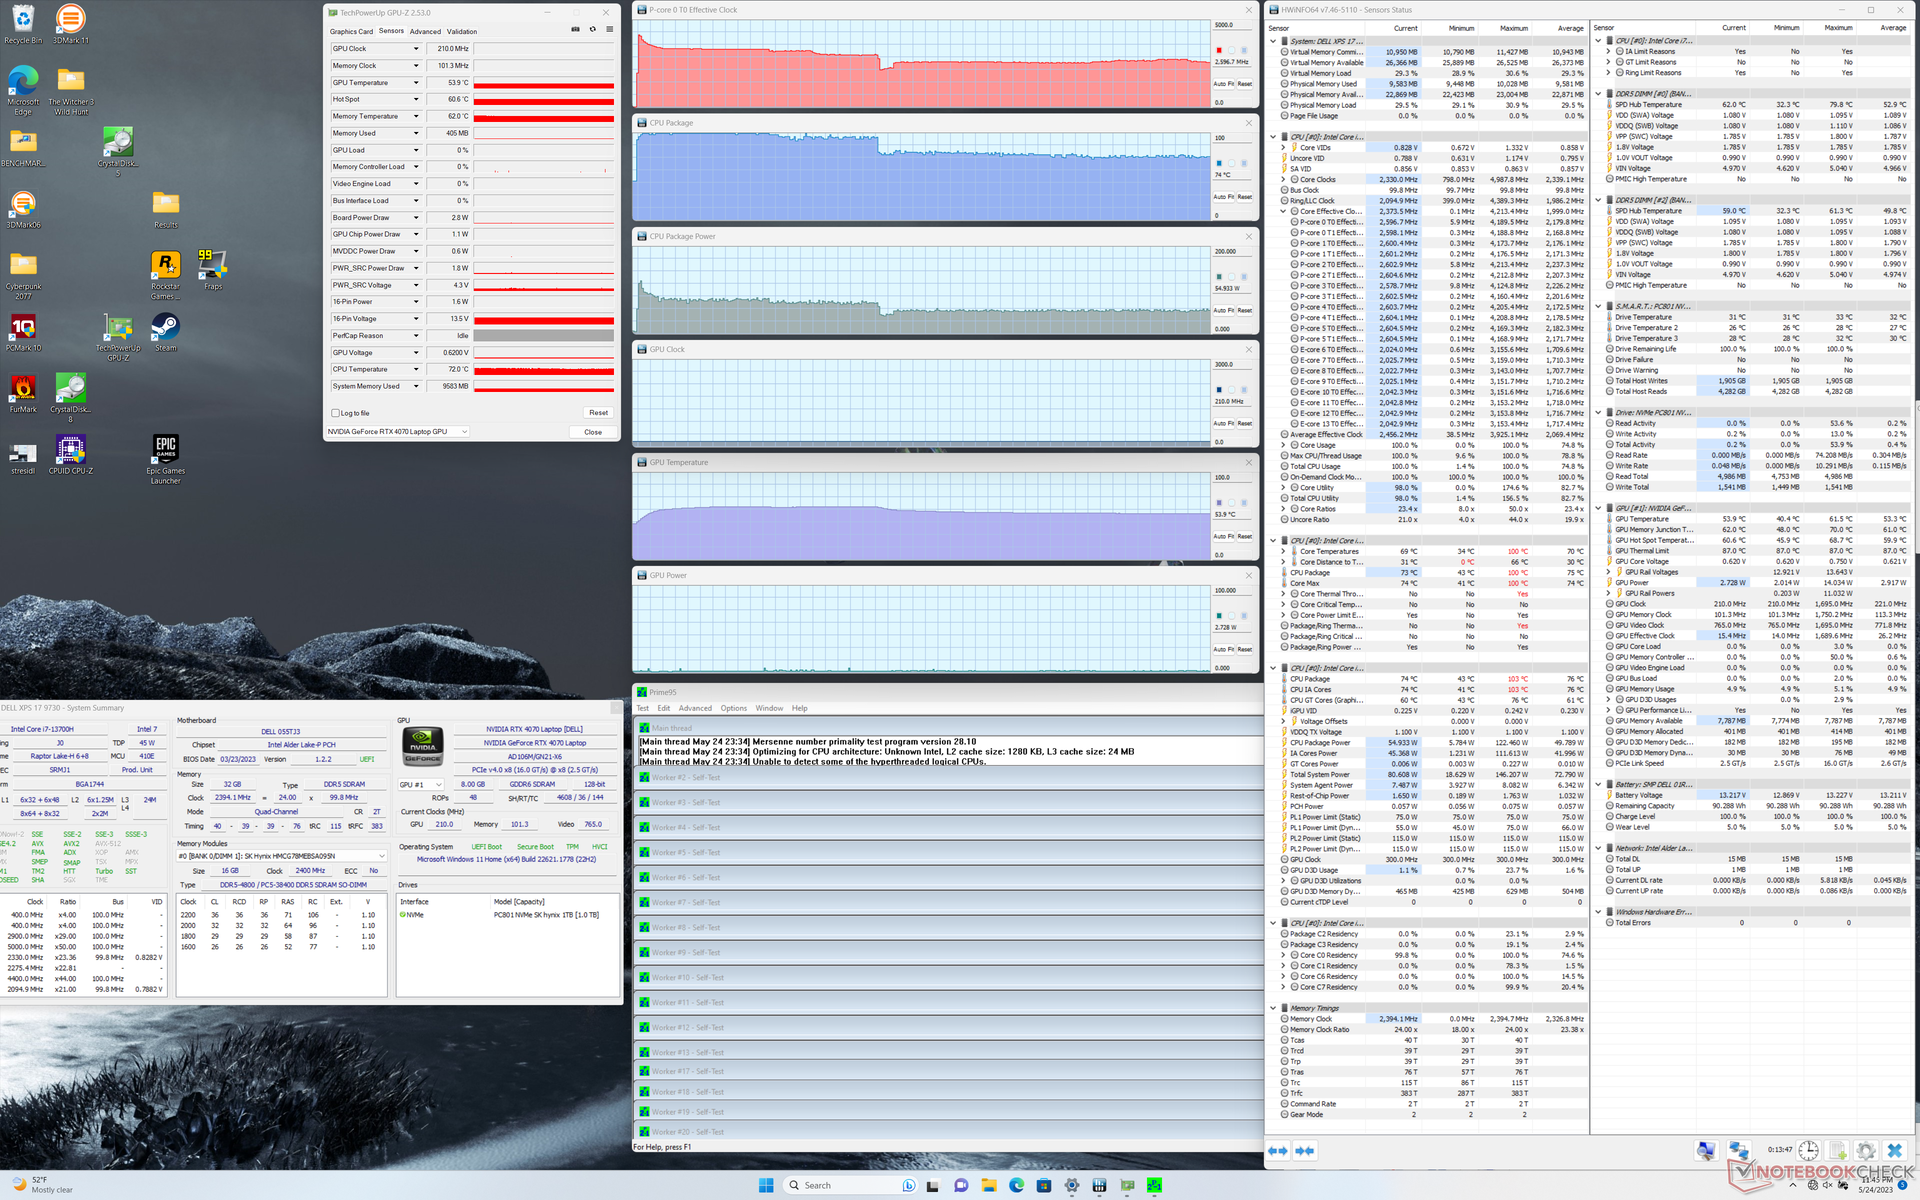
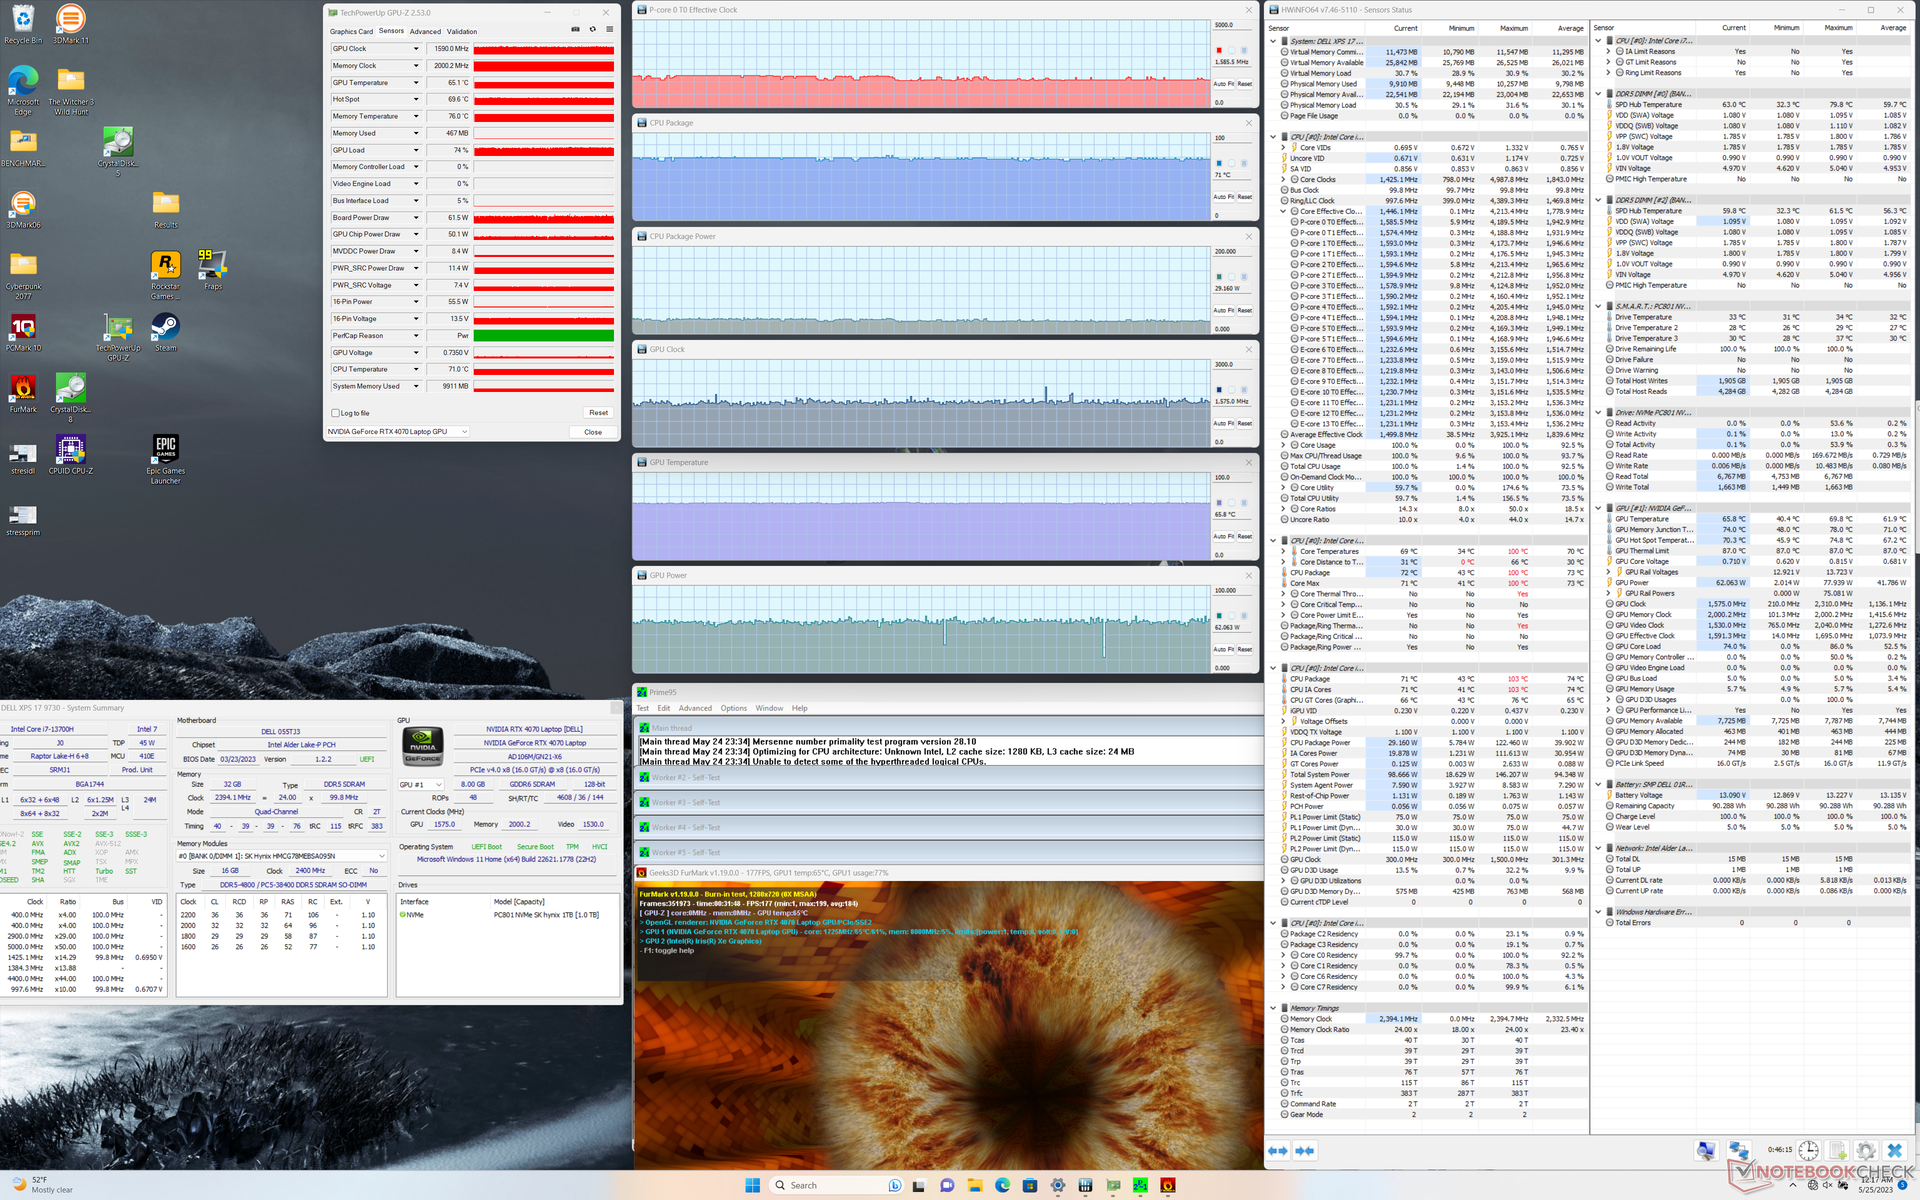
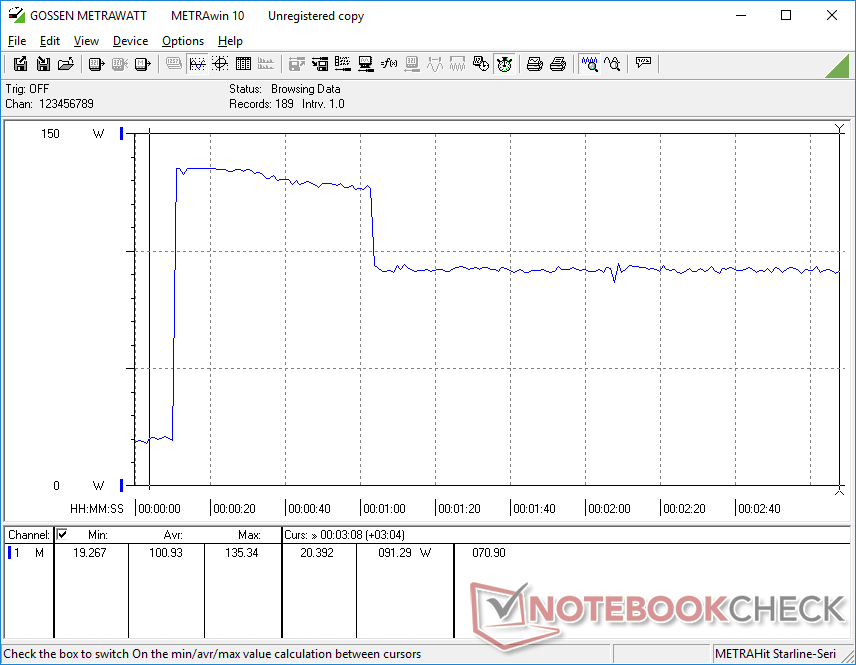
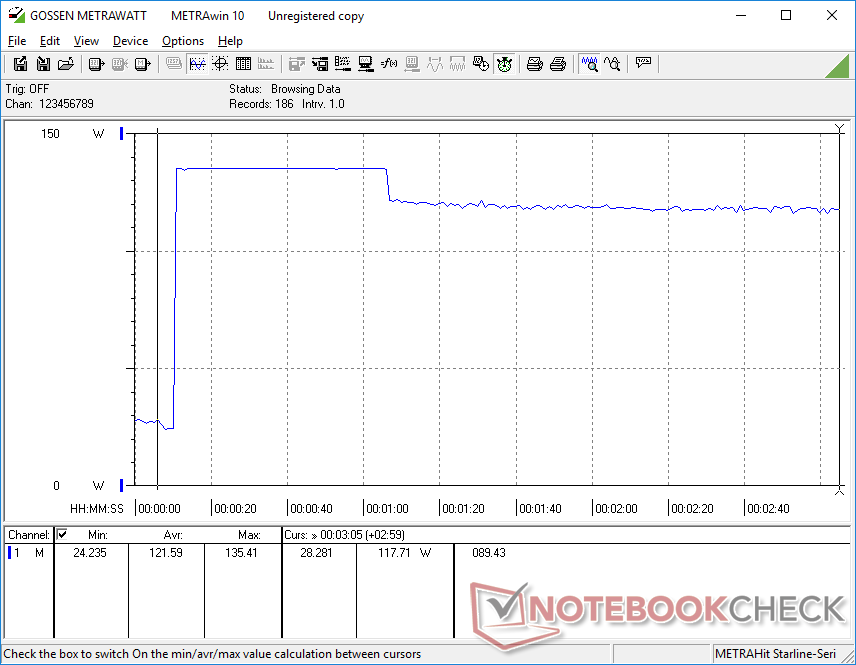
Prueba de resistencia
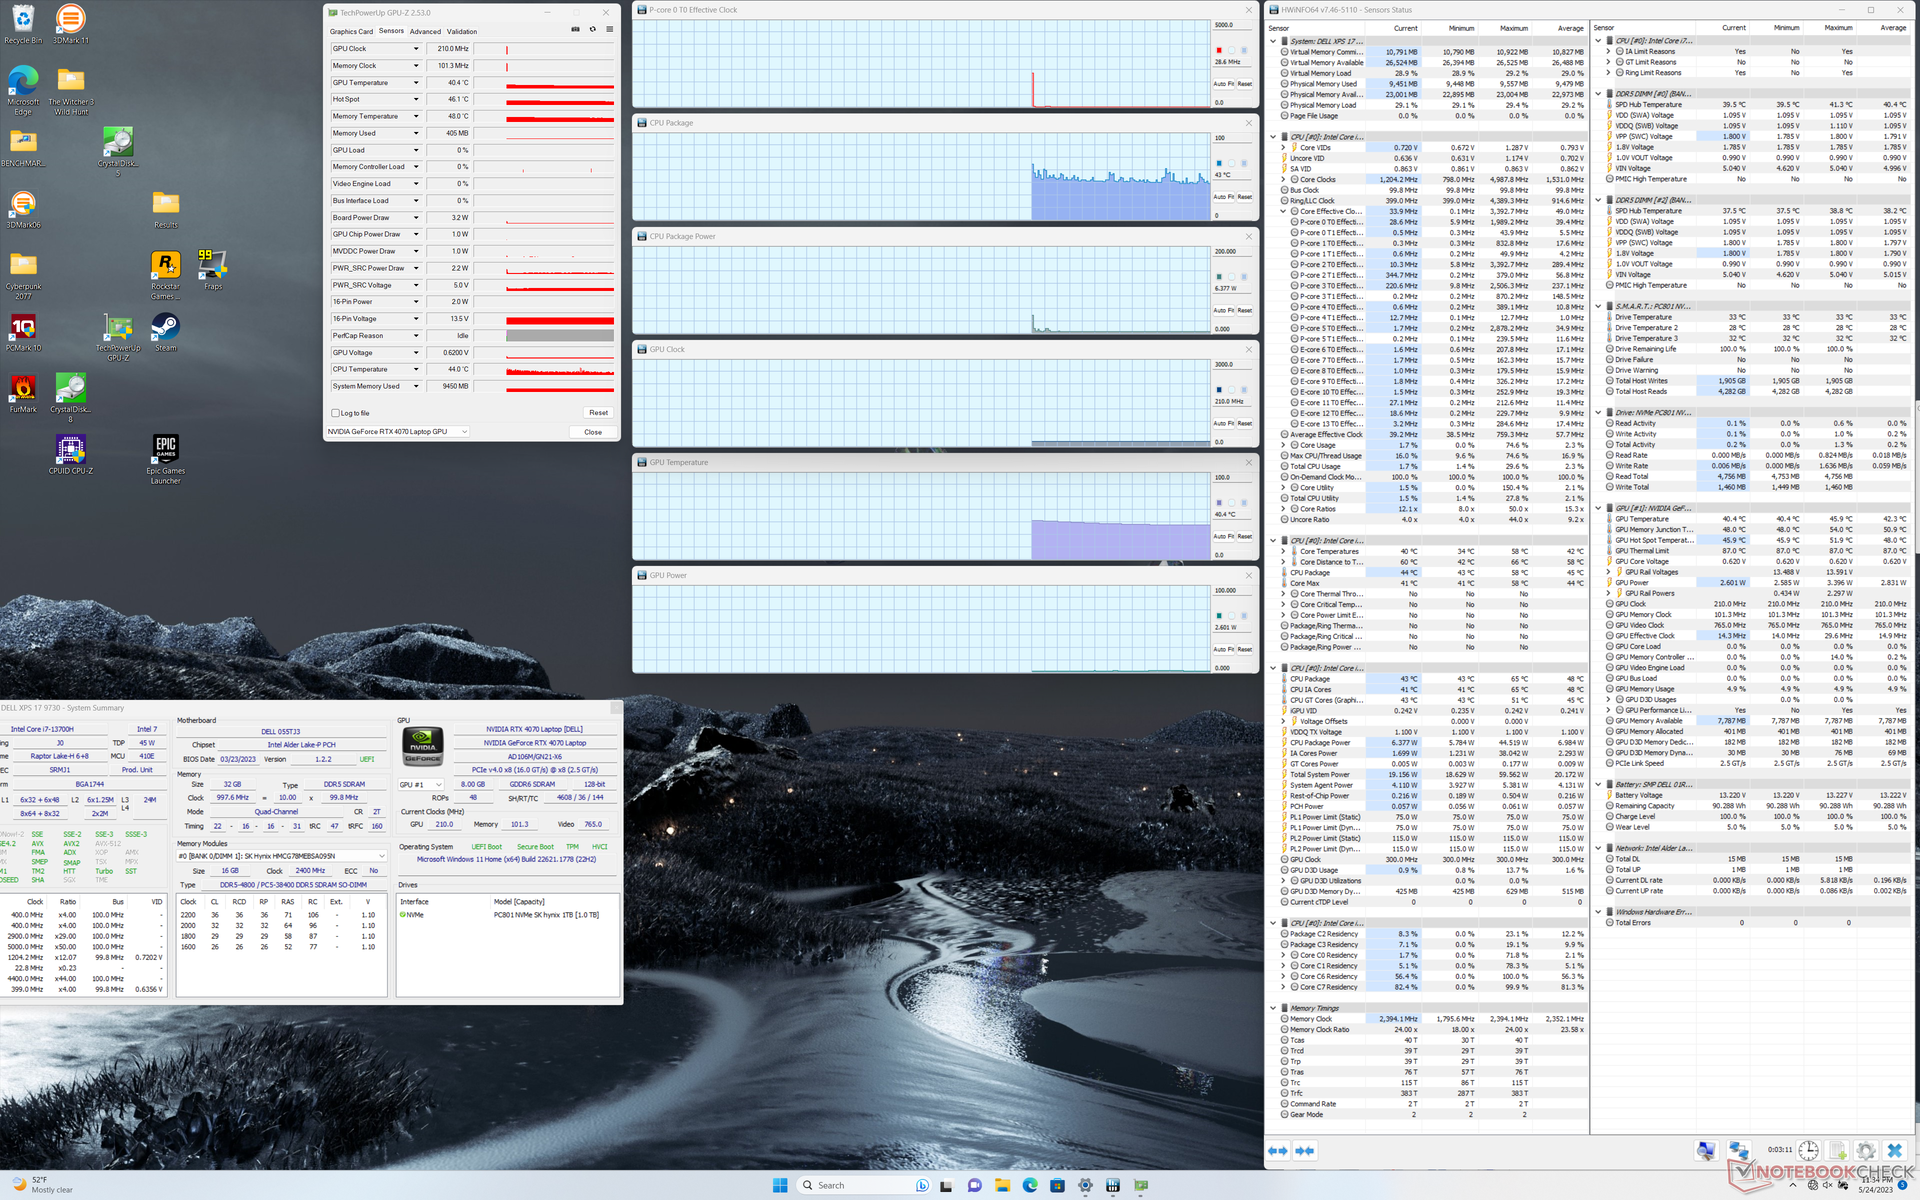
Al ejecutar Prime95 para estresar la CPU, las frecuencias de reloj y la potencia del paquete alcanzaban los 4,1 GHz y 122 W, respectivamente, durante unos pocos segundos. A continuación, el procesador descendía de forma constante hasta los 3,4 GHz y 80 W y, finalmente, hasta los 2,6 GHz y 55 W unos minutos más tarde. El consumo estable final de 55 W coincide con lo que observamos en el XPS 19 9720 lo que explicaría sus similares rendimientos de procesador tras tener en cuenta la ralentización antes mencionada. La temperatura del núcleo sería muy alta, de 95 C a 100 C durante los primeros minutos de la prueba cuando Turbo Boost está más activo antes de caer y estabilizarse en 74 C.
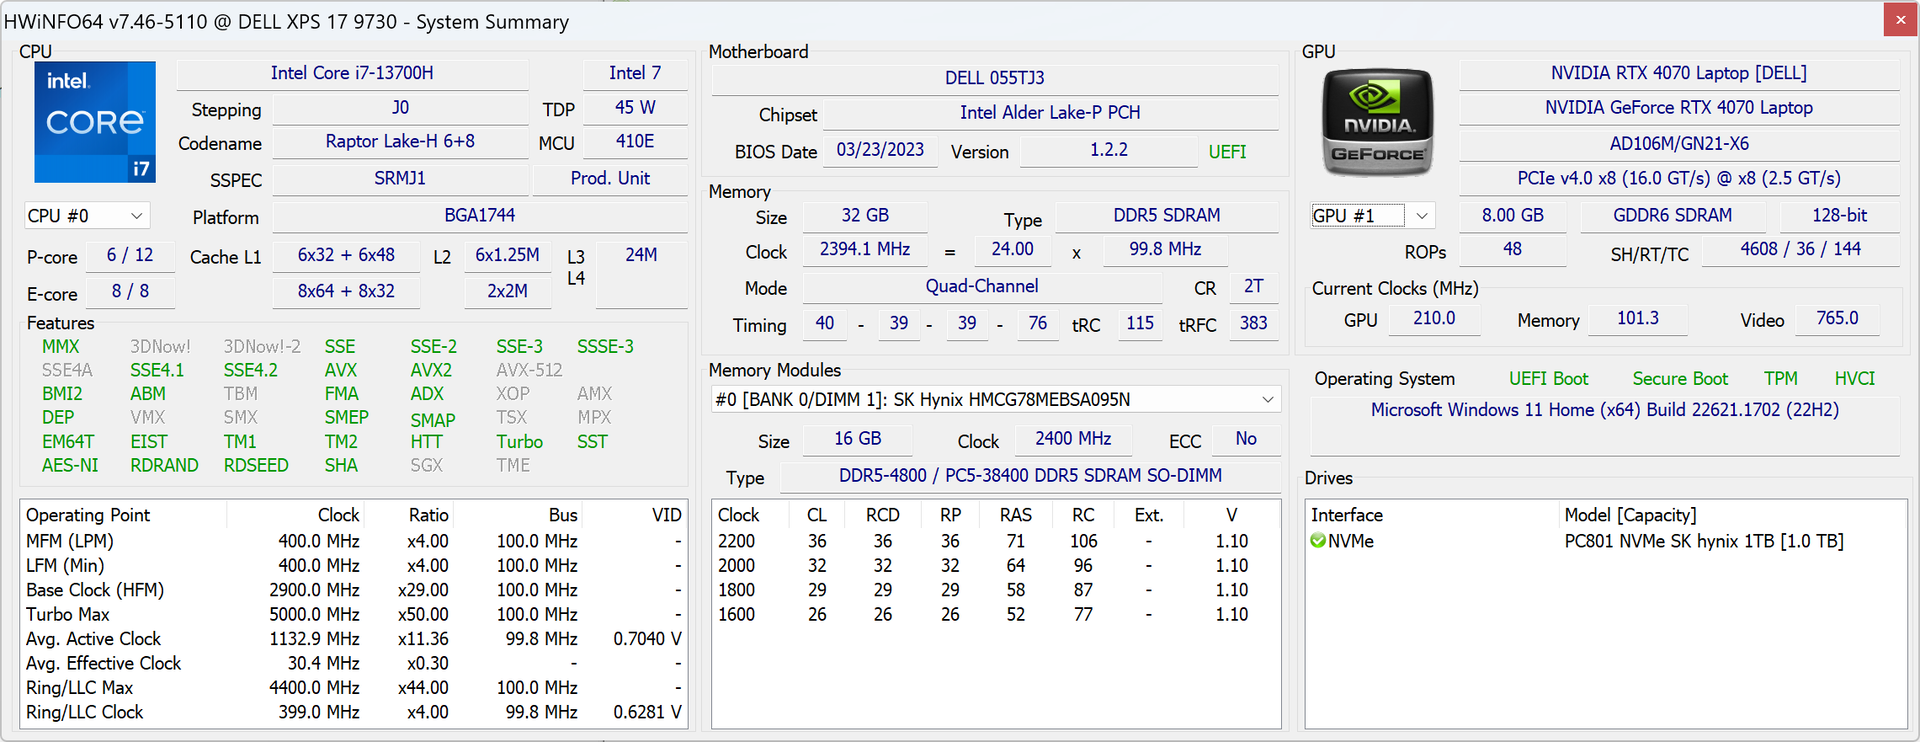
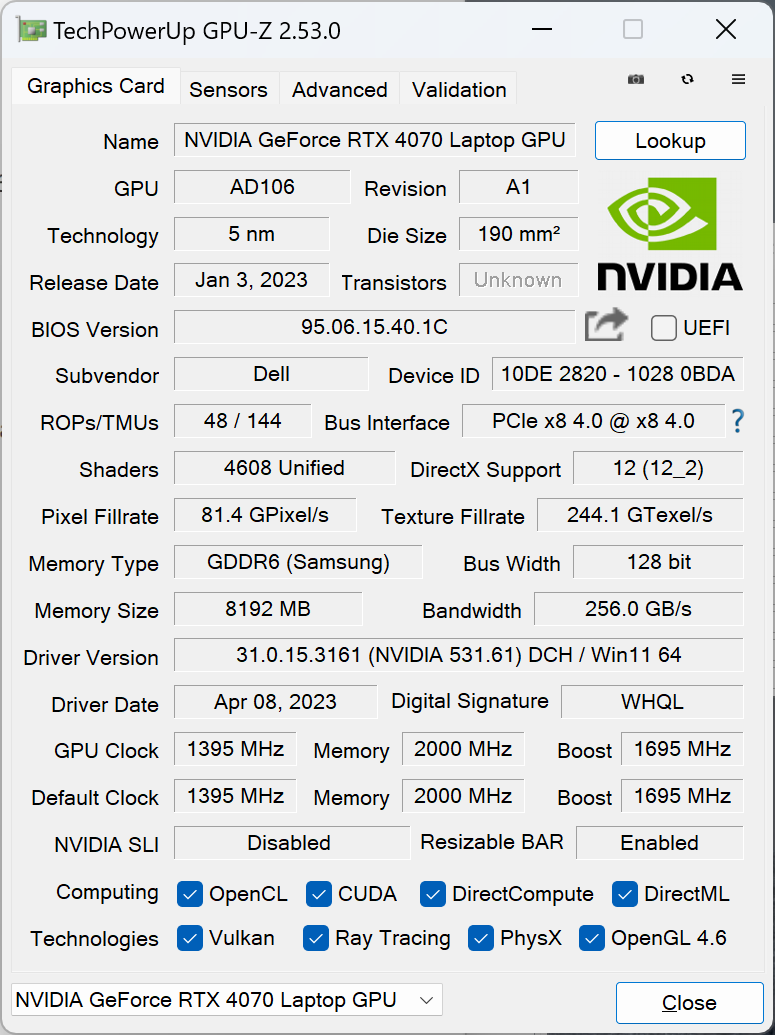
La velocidad de reloj y la temperatura de la GPU en funcionamiento Witcher 3 se estabilizarían en 2115 MHz y 67 C, respectivamente, lo que coincide con lo que observamos en el XPS 17 9720 del año pasado con RTX 3060. Curiosamente, GPU-Z informaría de un menor consumo de energía de la placa de 52 W, mientras que HWiNFO informaría de 70 W, como se muestra en nuestra captura de pantalla a continuación. No obstante, ambos valores parecen estables.
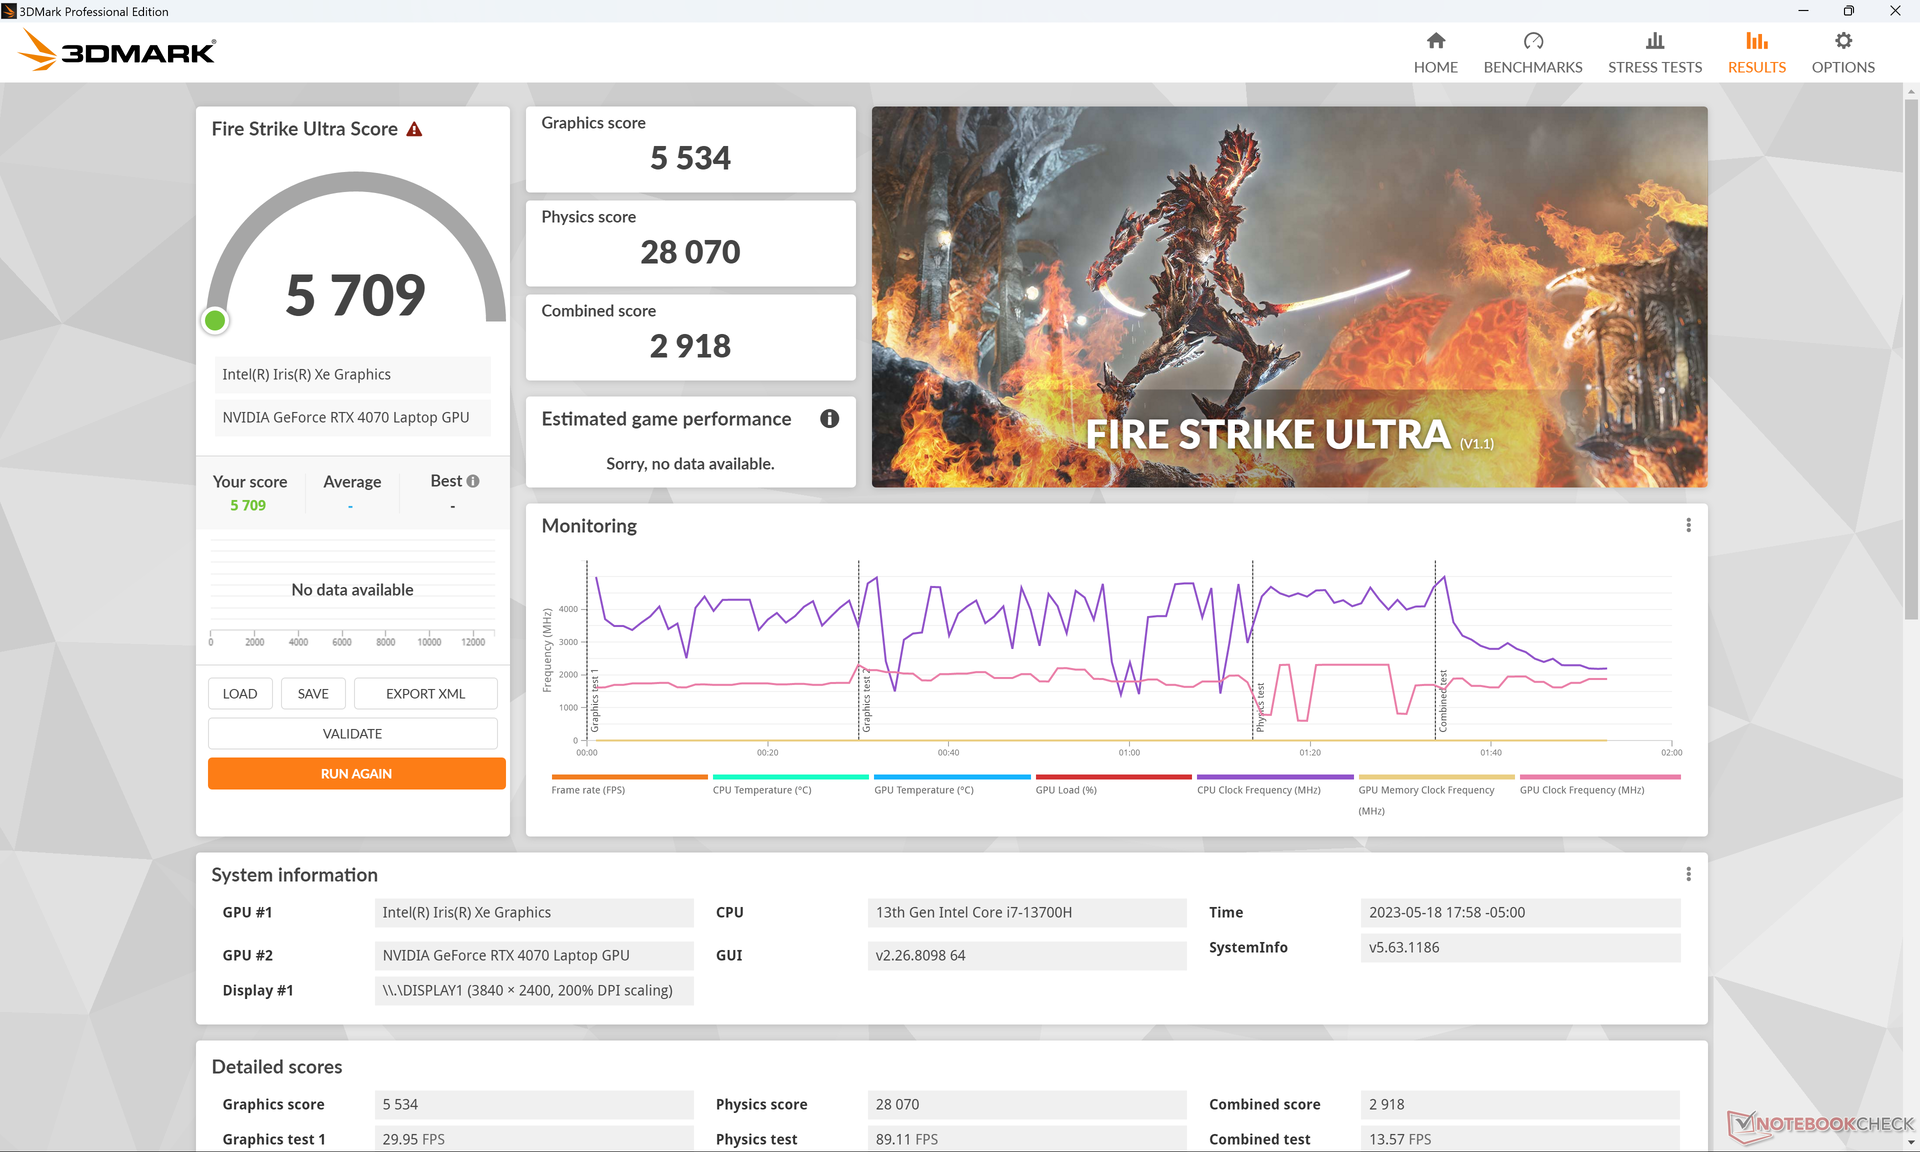
El funcionamiento con batería limita el rendimiento. Una prueba de Fire Strike en baterías arrojaría puntuaciones de Física y Gráficos de 24847 y 21172 puntos, respectivamente, en comparación con 27094 y 24612 puntos cuando está conectado a la red eléctrica.
| RelojCPU (GHz) | Reloj GPU (MHz) | Temperatura mediaCPU (°C) | Temperatura media GPU (°C) | |
| Sistema en reposo | -- | -- | 43 | 40 |
| Prime95 Stress | 2.6 | -- | 74 | 54 |
| Prime95+ FurMark Estrés | 1,6 | 1590 | 71 | 65 |
| Witcher 3 Tensión | 0,8 | 2115 | 72 | 67 |
Altavoces
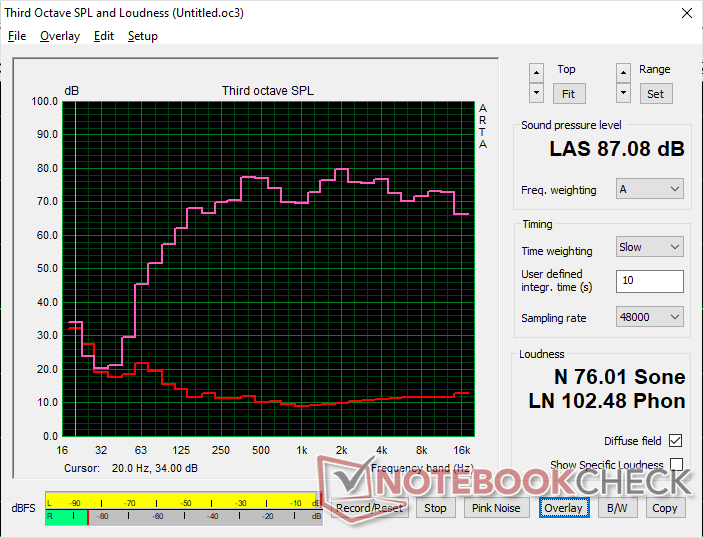
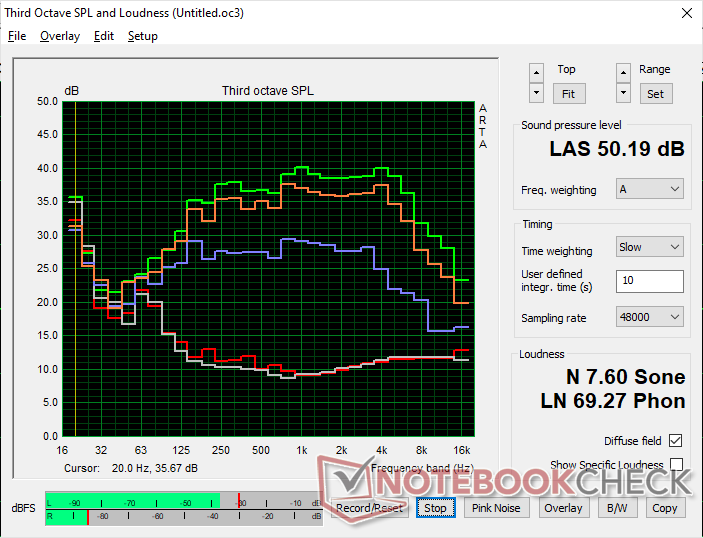
Dell XPS 17 9730 RTX 4070 análisis de audio
(+) | los altavoces pueden reproducir a un volumen relativamente alto (#87.1 dB)
Graves 100 - 315 Hz
(±) | lubina reducida - en promedio 7.2% inferior a la mediana
(+) | el bajo es lineal (5.9% delta a la frecuencia anterior)
Medios 400 - 2000 Hz
(+) | medios equilibrados - a sólo 3.3% de la mediana
(+) | los medios son lineales (5.1% delta a la frecuencia anterior)
Altos 2 - 16 kHz
(+) | máximos equilibrados - a sólo 1.9% de la mediana
(+) | los máximos son lineales (3.4% delta a la frecuencia anterior)
Total 100 - 16.000 Hz
(+) | el sonido global es lineal (7% de diferencia con la mediana)
En comparación con la misma clase
» 5% de todos los dispositivos probados de esta clase eran mejores, 1% similares, 94% peores
» El mejor tuvo un delta de 5%, la media fue 17%, el peor fue ###max##%
En comparación con todos los dispositivos probados
» 1% de todos los dispositivos probados eran mejores, 0% similares, 99% peores
» El mejor tuvo un delta de 4%, la media fue 23%, el peor fue ###max##%
Apple MacBook Pro 16 2021 M1 Pro análisis de audio
(+) | los altavoces pueden reproducir a un volumen relativamente alto (#84.7 dB)
Graves 100 - 315 Hz
(+) | buen bajo - sólo 3.8% lejos de la mediana
(+) | el bajo es lineal (5.2% delta a la frecuencia anterior)
Medios 400 - 2000 Hz
(+) | medios equilibrados - a sólo 1.3% de la mediana
(+) | los medios son lineales (2.1% delta a la frecuencia anterior)
Altos 2 - 16 kHz
(+) | máximos equilibrados - a sólo 1.9% de la mediana
(+) | los máximos son lineales (2.7% delta a la frecuencia anterior)
Total 100 - 16.000 Hz
(+) | el sonido global es lineal (4.6% de diferencia con la mediana)
En comparación con la misma clase
» 0% de todos los dispositivos probados de esta clase eran mejores, 0% similares, 100% peores
» El mejor tuvo un delta de 5%, la media fue 17%, el peor fue ###max##%
En comparación con todos los dispositivos probados
» 0% de todos los dispositivos probados eran mejores, 0% similares, 100% peores
» El mejor tuvo un delta de 4%, la media fue 23%, el peor fue ###max##%
Gestión de la energía - USB-C pone manos a la obra
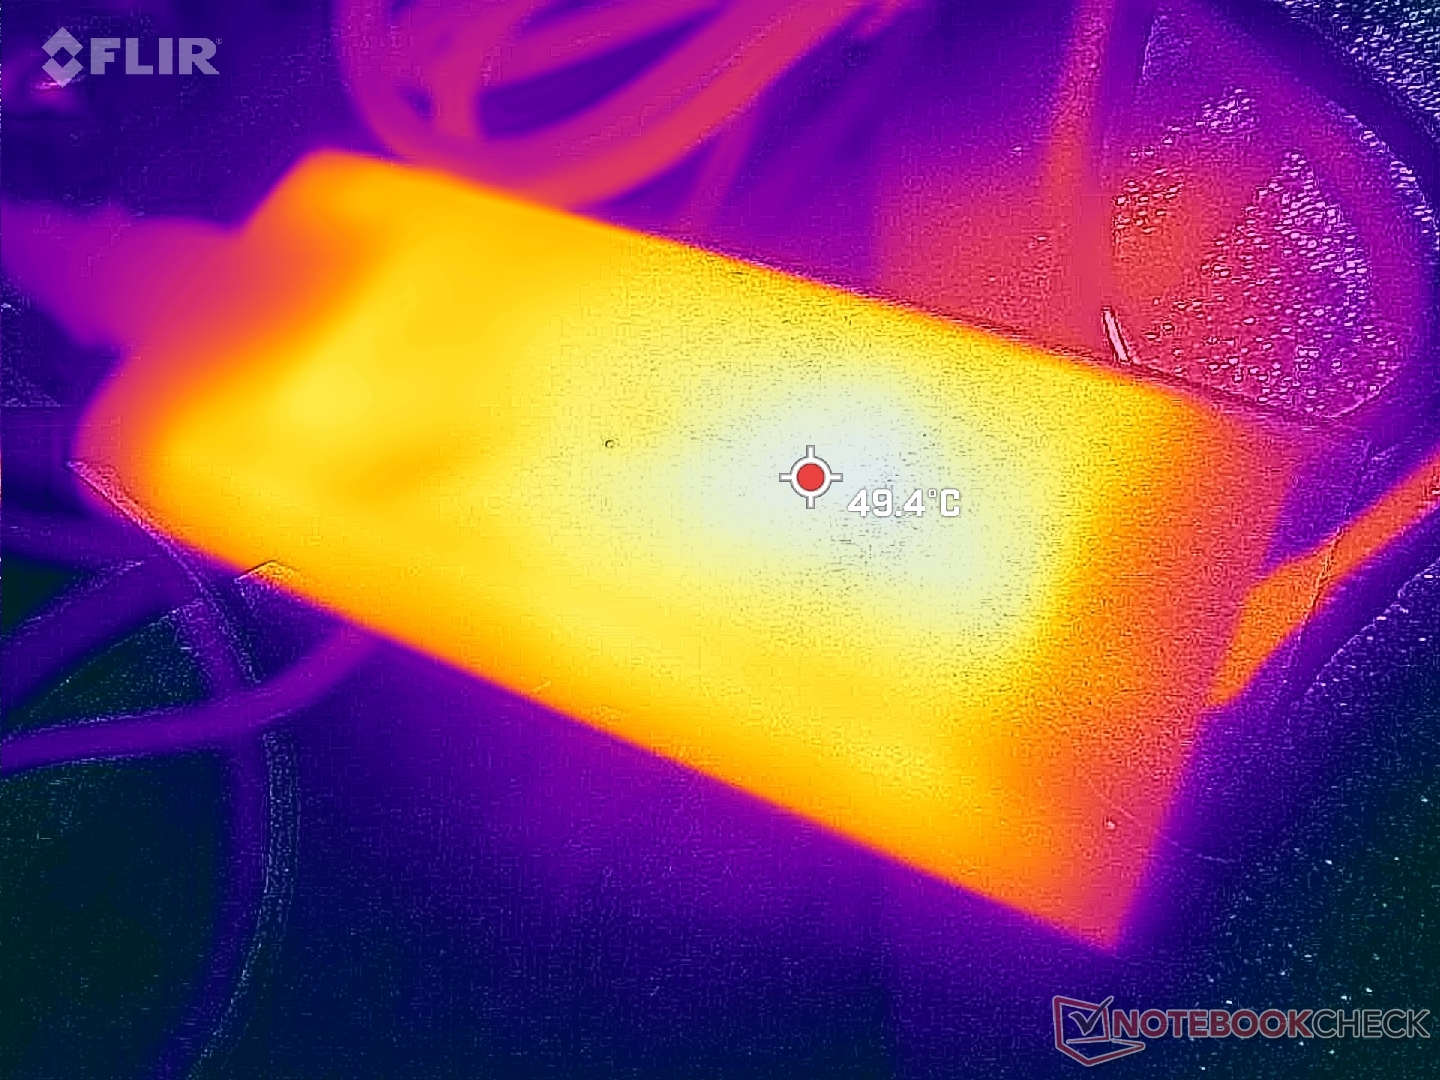
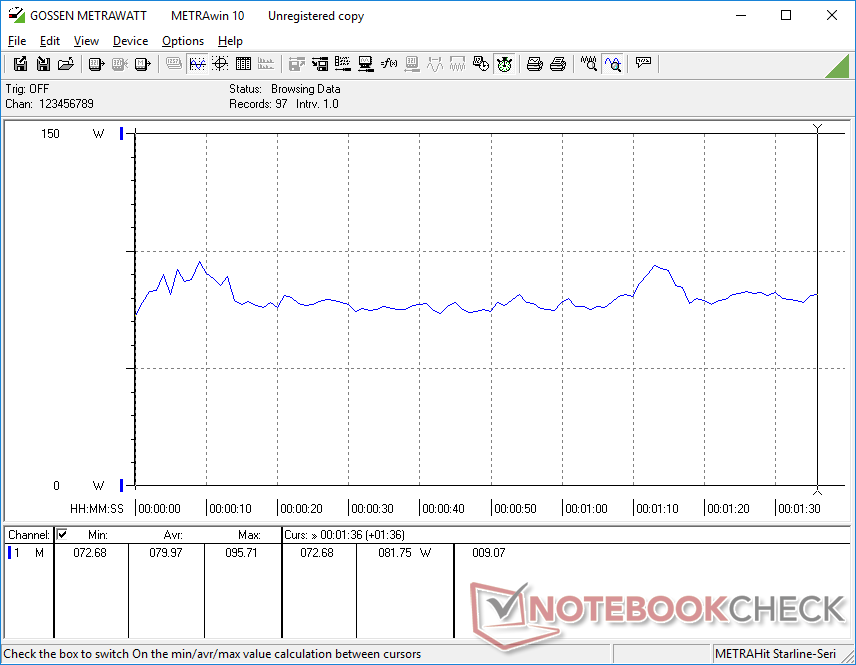
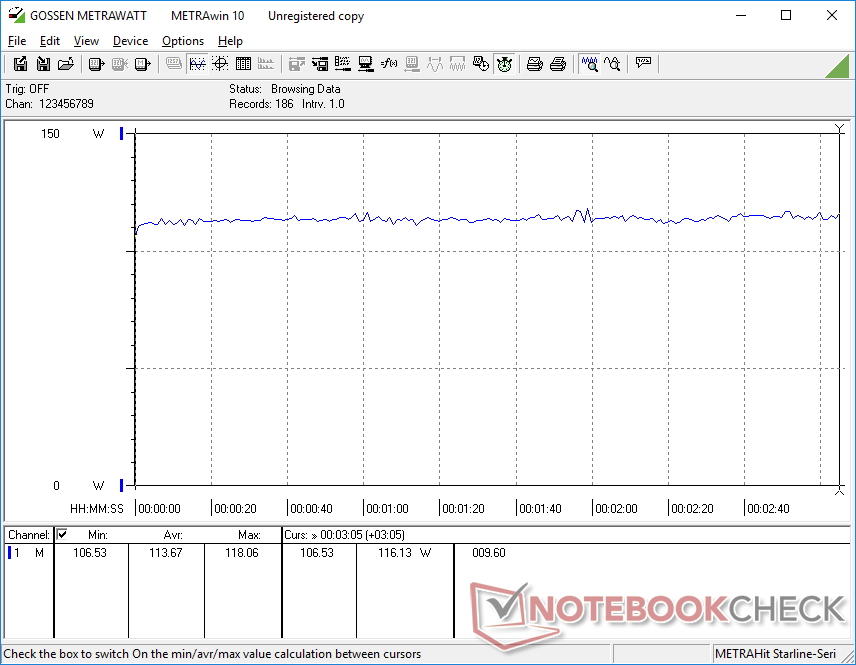
Consumo: ¿son suficientes 130 W?
El consumo de energía no ha cambiado drásticamente desde el antiguo XPS 17 9720 ya que todos los modelos XPS 17 hasta ahora vienen con el mismo adaptador USB-C de 130 W. Comparado con otros portátiles con CPUs serie H y GPU GeForce RTX, el adaptador Dell de 130 W es uno de los más pequeños tanto en tamaño como en potencia. El pequeño adaptador renuncia a un mayor rendimiento y una carga más rápida en favor de la portabilidad.
Aún así, el mayor rendimiento por vatio de Ada Lovelace frente al de Ampere sigue permitiendo al XPS 17 9730 rendir mejor que el modelo del año pasado bajo la misma potencia. Ejecutando Witcher 3por ejemplo, consume alrededor de 114 W tanto en el XPS 17 9720 como en el 9730 a pesar de que este último ofrece un rendimiento gráfico un 30 por ciento más rápido. El consumo de energía de la CPU sería más estable también con su mayor sostenibilidad Turbo Boost sobre el Core i7-12700H como se mencionó anteriormente. Dell ha optimizado la CPU y la GPU lo mejor que ha podido para ajustarse al limitado presupuesto de energía.
| Off / Standby | |
| Ocioso | |
| Carga |
|
Clave:
min: | |
| Dell XPS 17 9730 RTX 4070 i7-13700H, GeForce RTX 4070 Laptop GPU, SK hynix PC801 HFS001TEJ9X101N, Sharp LQ170R1, 3840x2400, 17" | Dell XPS 17 9720 RTX 3060 i7-12700H, GeForce RTX 3060 Laptop GPU, Samsung PM9A1 MZVL21T0HCLR, IPS, 3840x2400, 17" | LG Gram 17 (2023) i7-1360P, Iris Xe G7 96EUs, Samsung PM9A1 MZVL21T0HCLR, IPS, 2560x1600, 17" | HP Envy 17-cr0079ng i7-1255U, GeForce RTX 2050 Mobile, Samsung PM991a MZVLQ1T0HBLB, IPS, 3840x2160, 17.3" | MSI Creator Z17 A12UGST-054 i9-12900H, GeForce RTX 3070 Ti Laptop GPU, Micron 3400 1TB MTFDKBA1T0TFH, IPS, 2560x1600, 17" | Apple MacBook Pro 16 2023 M2 Max M2 Max, M2 Max 38-Core GPU, Apple SSD AP2048Z, Mini-LED, 3456x2234, 16.2" | |
|---|---|---|---|---|---|---|
| Power Consumption | 6% | 59% | 34% | -79% | 16% | |
| Idle Minimum * (Watt) | 15 | 5.9 61% | 2.2 85% | 5.8 61% | 34.6 -131% | 5.2 65% |
| Idle Average * (Watt) | 23.6 | 15.8 33% | 8.9 62% | 14.3 39% | 43 -82% | 16.5 30% |
| Idle Maximum * (Watt) | 24.3 | 26.7 -10% | 11 55% | 18.4 24% | 44.9 -85% | 16.8 31% |
| Load Average * (Watt) | 80 | 117.4 -47% | 53 34% | 70 12% | 145 -81% | 113 -41% |
| Witcher 3 ultra * (Watt) | 113.7 | 114.8 -1% | 42.5 63% | 69.4 39% | 152.4 -34% | 92 19% |
| Load Maximum * (Watt) | 135.4 | 136.6 -1% | 64 53% | 93 31% | 220 -62% | 145 -7% |
* ... más pequeño es mejor
Power Consumption Witcher 3 / Stresstest
Power Consumption external Monitor
Duración de la batería - Larga duración, carga lenta
La autonomía WLAN es aproximadamente una hora más larga que en el XPS 17 9720 del año pasado para un total de 10 horas de uso de navegación en el mundo real. Es bueno ver que la duración de la batería no se ha visto afectada a pesar de los aumentos anuales del rendimiento general.
La carga de vacío a plena capacidad es lenta, entre 2 y 2,5 horas, frente a las 1,5 horas de la mayoría de portátiles. Hay que tener en cuenta que la carga se ralentizará aún más si se ejecutan cargas exigentes como juegos debido al limitado adaptador de CA de 130 W.
Vale la pena señalar que la batería no se descarga lentamente cuando se conecta a la red eléctrica y se ejecutan juegos u otras cargas exigentes. Este problema era específico del XPS 9700 original y se resolvió a partir del XPS 17 9710.
| Dell XPS 17 9730 RTX 4070 i7-13700H, GeForce RTX 4070 Laptop GPU, 97 Wh | Dell XPS 17 9720 RTX 3060 i7-12700H, GeForce RTX 3060 Laptop GPU, 97 Wh | LG Gram 17 (2023) i7-1360P, Iris Xe G7 96EUs, 80 Wh | HP Envy 17-cr0079ng i7-1255U, GeForce RTX 2050 Mobile, 55 Wh | MSI Creator Z17 A12UGST-054 i9-12900H, GeForce RTX 3070 Ti Laptop GPU, 90 Wh | Apple MacBook Pro 16 2023 M2 Max M2 Max, M2 Max 38-Core GPU, 99.6 Wh | |
|---|---|---|---|---|---|---|
| Duración de Batería | -11% | 63% | -4% | 28% | 24% | |
| Reader / Idle (h) | 19.1 | 25.7 35% | ||||
| WiFi v1.3 (h) | 10 | 8.7 -13% | 12.8 28% | 4.7 -53% | 5.5 -45% | 14.8 48% |
| Load (h) | 1.1 | 1 -9% | 2.5 127% | 1.6 45% | 2.2 100% | 1.1 0% |
| H.264 (h) | 14.5 | 5.5 | 5.5 | 18.7 |
Pro
Contra
Veredicto - Equilibrado y optimizado
Hay un dicho que dice que no hay que lanzarse a por un producto o un diseño de primera generación porque pueden surgir problemas o problemas que hay que resolver. El xPS 17 9700 originaloriginal, por ejemplo, tenía problemas de agotamiento de la batería, de estabilidad de la velocidad de fotogramas y de rendimiento Turbo Boost de la CPU. Después de tres años completos de optimizaciones constantes, el último XPS 17 9730 ha abordado directamente todas estas deficiencias para ser una recomendación mucho más fácil. El consumo de energía ya no es un problema, las frecuencias de cuadro son estables y Turbo Boost es más duradero y consistente.
El XPS 17 9730 equilibra el alto rendimiento con un presupuesto de energía limitado de 130 W mucho mejor que en el XPS 15 9530. Equipado exactamente con la misma CPU Core i7 y GPU GeForce RTX 4070, nuestro XPS 17 superaría a su hermano pequeño en un 10 a 15 por ciento y un 50 a 60 por ciento, respectivamente. El aumento de la GPU en particular es enorme simplemente debido al mayor objetivo TGP del XPS 17. Si estás indeciso entre el XPS 15 y el XPS 17 y el rendimiento gráfico es de suma importancia, el XPS 17 es el claro ganador.
El XPS 17 9730 tiene el rendimiento, la portabilidad, la pantalla y el potencial de juego para satisfacer a la mayoría de los usuarios domésticos y de oficina. Sin embargo, ciertos aspectos del diseño de hace tres años se están quedando anticuados.
Las desventajas del modelo no se pueden ignorar. Para un portátil de más de 3000 $, la mísera webcam de 1 MP sin obturador de privacidad y sin soporte Wi-Fi 6E son vergonzosos en este rango de precios. La pantalla IPS de 60 Hz también se está quedando anticuada cuando los paneles OLED y de mayor frecuencia de refresco ya son habituales. El adaptador de CA de 130 W se siente más como un muro de ladrillos que impide que la serie XPS 17 logre tasas de carga más rápidas y objetivos TGP más altos. Hay mucho que se puede mejorar, sin duda, pero al menos el rendimiento está a un nivel cómodo teniendo en cuenta el delgado diseño.
Precio y disponibilidad
El XPS 17 9730 aún no está disponible a través de distribuidores. Para obtener las opciones más configurables y un envío inmediato, recomendamos comprarlo directamente a Dell. Los precios empiezan en $2450 USD para el SKU de gama más baja hasta $4300 a $5100 si está totalmente configurado.
Dell XPS 17 9730 RTX 4070
- 05/27/2023 v7 (old)
Allen Ngo
Transparencia
La selección de los dispositivos que se van a reseñar corre a cargo de nuestro equipo editorial. La muestra de prueba fue proporcionada al autor en calidad de préstamo por el fabricante o el minorista a los efectos de esta reseña. El prestamista no tuvo ninguna influencia en esta reseña, ni el fabricante recibió una copia de la misma antes de su publicación. No había ninguna obligación de publicar esta reseña. Como empresa de medios independiente, Notebookcheck no está sujeta a la autoridad de fabricantes, minoristas o editores.
Así es como prueba Notebookcheck
Cada año, Notebookcheck revisa de forma independiente cientos de portátiles y smartphones utilizando procedimientos estandarizados para asegurar que todos los resultados son comparables. Hemos desarrollado continuamente nuestros métodos de prueba durante unos 20 años y hemos establecido los estándares de la industria en el proceso. En nuestros laboratorios de pruebas, técnicos y editores experimentados utilizan equipos de medición de alta calidad. Estas pruebas implican un proceso de validación en varias fases. Nuestro complejo sistema de clasificación se basa en cientos de mediciones y puntos de referencia bien fundamentados, lo que mantiene la objetividad.Price comparison

