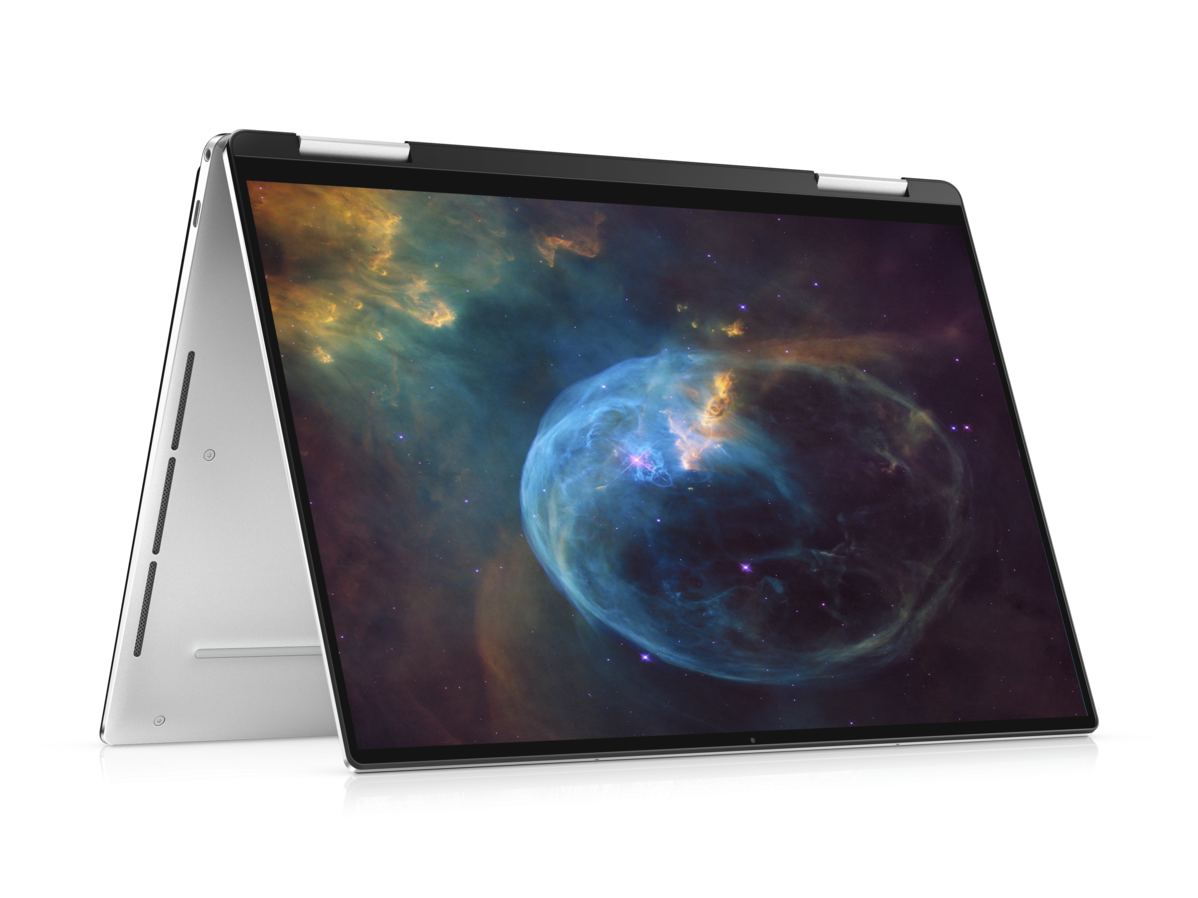
Review de la Dell XPS 13 7390 2-in-1 Core i7-1065G7: Más rápido que cualquier XPS 13 anterior
Recientemente hemos comprobado el modelo base 2 en 1.000 dólares XPS 13 7390 2 en 1 con la CPU Ice Lake Core i3-1005G1 de nivel básico y lo encontramos bastante bueno como paquete general. El rendimiento del procesador en bruto era algo mediocre si se tiene en cuenta el precio, pero la pantalla superbrillante y la calidad general del sistema compensaron el rendimiento del Core i3.
Para esta revisión, analizaremos la configuración $1700 XPS 13 7390 2 en 1 con la CPU Core i7-1065G7 de gama alta y la GPU Iris Plus integrada para ver cómo se compara con la opción Core i3 de gama baja. ¿Qué tanto aumento de rendimiento ofrece la Core i7 de cuatro núcleos en comparación con la Core i3 de dos núcleos? ¿Puedes jugar en la nueva GPU Iris Plus y hay un déficit de batería con el procesador más potente?
Vea nuestra revisión actual sobre el XPS 13 7390 2-in-1 para obtener más información sobre el chasis, la pantalla, el teclado y otras características físicas. Nos centraremos en todas las diferencias que podemos encontrar entre las configuraciones Core i3 y Core i7 para ayudar a aquellos que estén indecisos a conseguir un nuevo XPS 13 convertible.
Más comentarios de Dell:
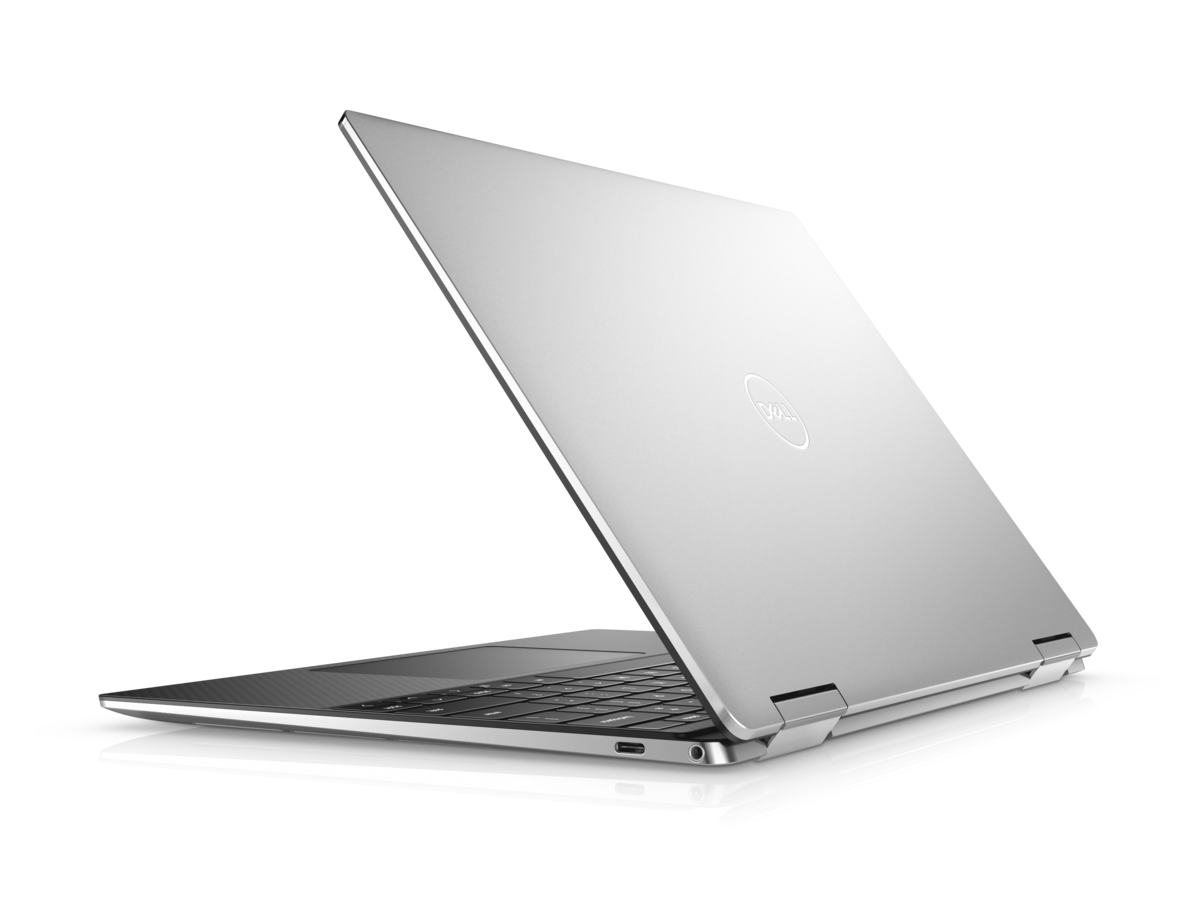
Carcasa
Lector de tarjetas SD
| SD Card Reader | |
| average JPG Copy Test (av. of 3 runs) | |
| Dell XPS 13 9380 2019 (Toshiba Exceria Pro SDXC 64 GB UHS-II) | |
| Dell XPS 13 9370 FHD i5 (Toshiba Exceria Pro M501 64 GB UHS-II) | |
| Dell XPS 13 7390 2-in-1 Core i3 (Toshiba Exceria Pro M501 64 GB UHS-II) | |
| Dell XPS 13 7390 2-in-1 Core i7 (Toshiba Exceria Pro M501 64 GB UHS-II) | |
| Dell XPS 13-9365 2-in-1 (Toshiba THN-M401S0640E2) | |
| maximum AS SSD Seq Read Test (1GB) | |
| Dell XPS 13 9370 FHD i5 (Toshiba Exceria Pro M501 64 GB UHS-II) | |
| Dell XPS 13 7390 2-in-1 Core i3 (Toshiba Exceria Pro M501 64 GB UHS-II) | |
| Dell XPS 13 9380 2019 (Toshiba Exceria Pro SDXC 64 GB UHS-II) | |
| Dell XPS 13 7390 2-in-1 Core i7 (Toshiba Exceria Pro M501 64 GB UHS-II) | |
| Dell XPS 13-9365 2-in-1 (Toshiba THN-M401S0640E2) | |
Comunicación
Extrañamente, las velocidades de transmisión son mucho más bajas de lo esperado, incluso cuando se está a sólo 1 ó 2 metros de la fuente. El Qualcomm QCA6174 más antiguo del XPS 13 9380 es capaz de superar al Killer AX1650s compatible con Wi-Fi 6, independientemente de nuestro servidor de 1 Gbps limitado. Sospechamos que esto podría ser un error o un fallo de antena en nuestra unidad.
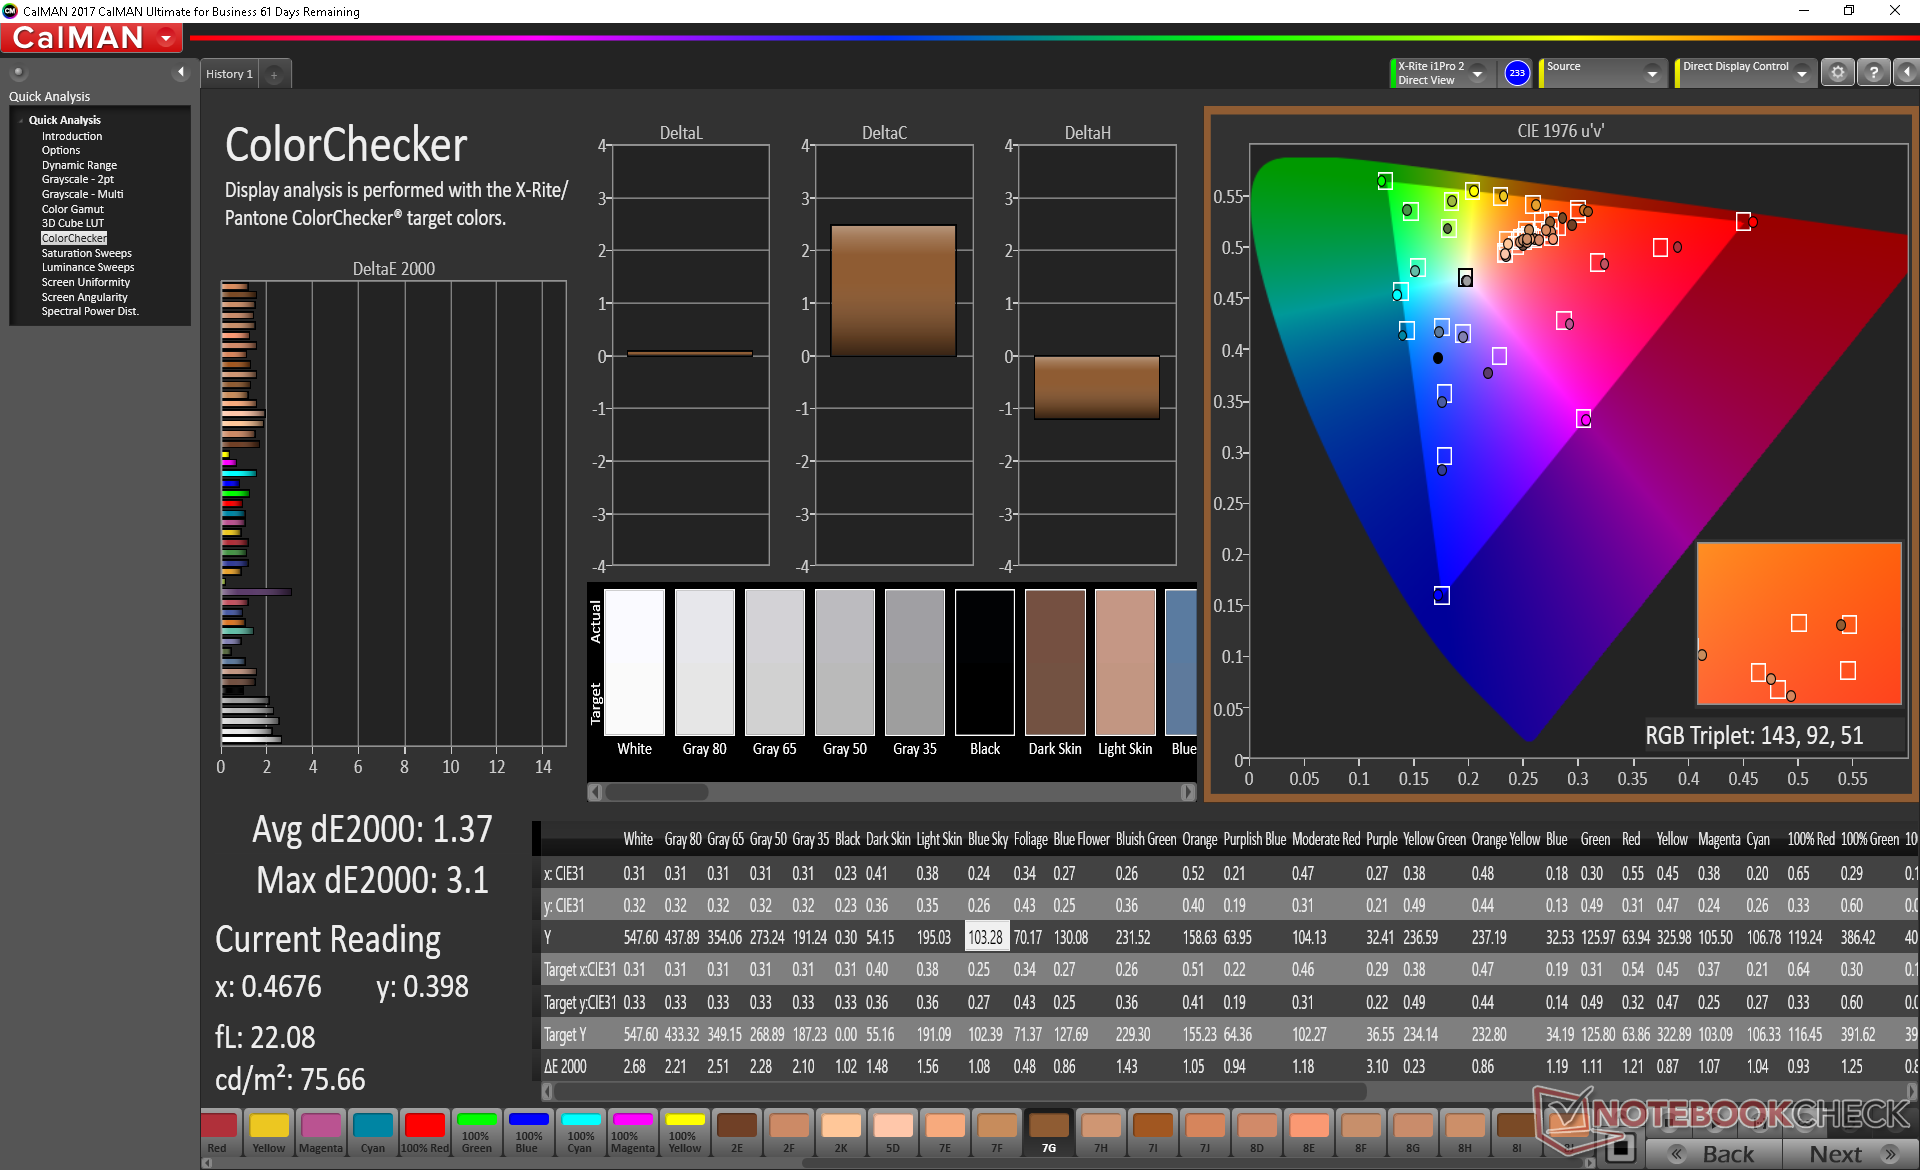
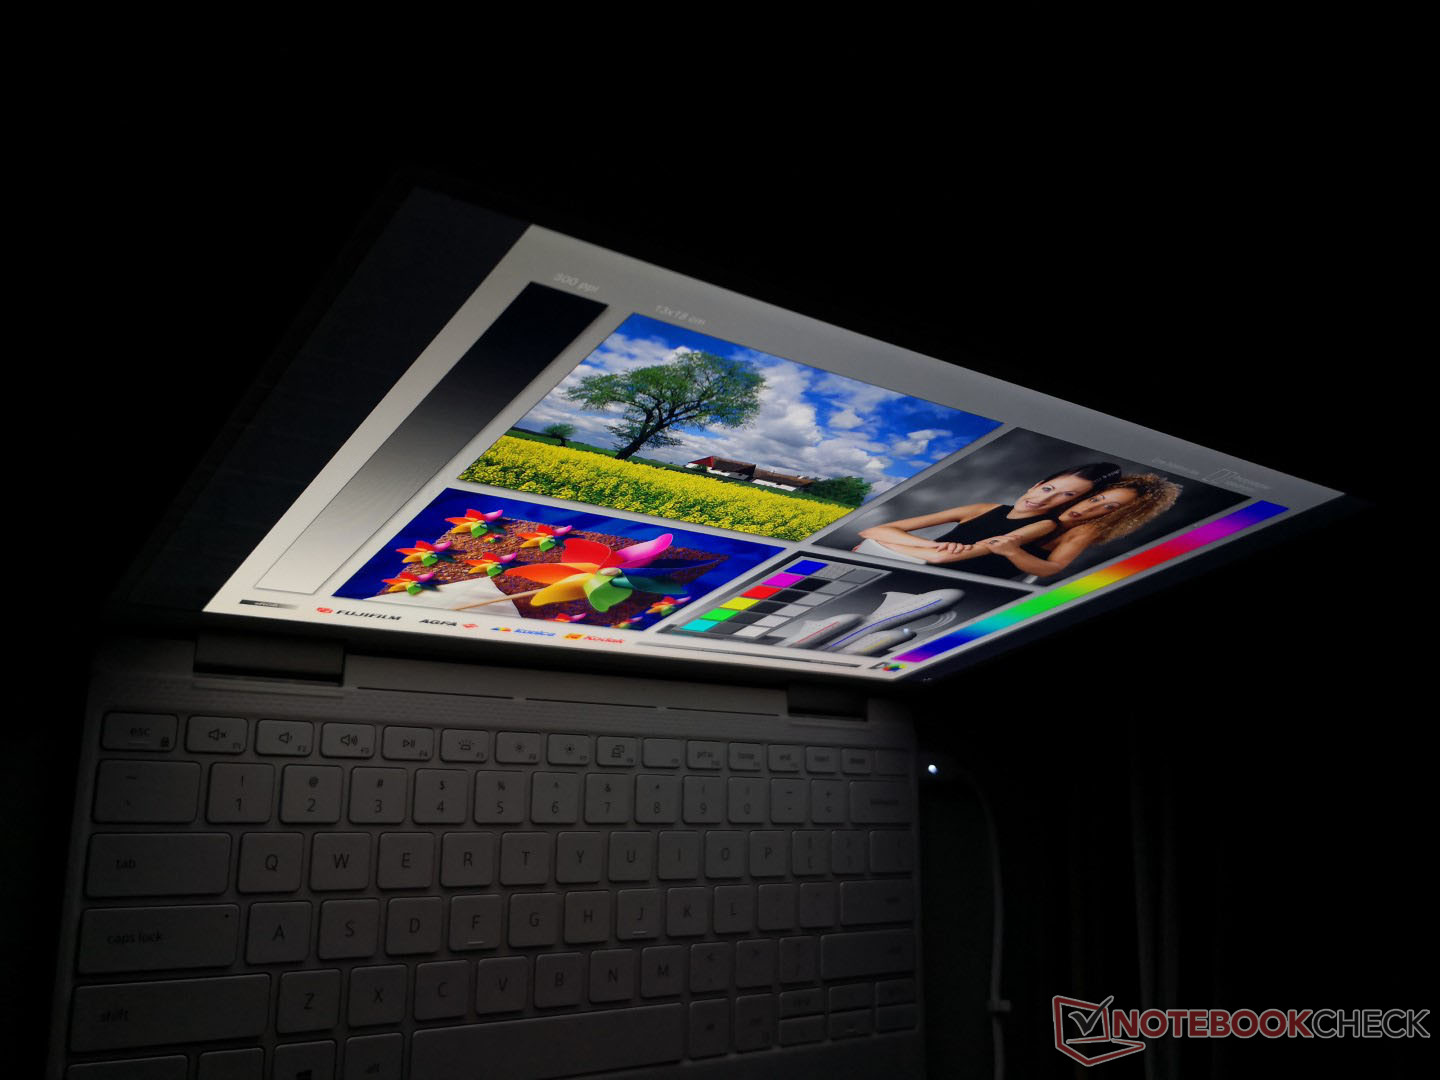
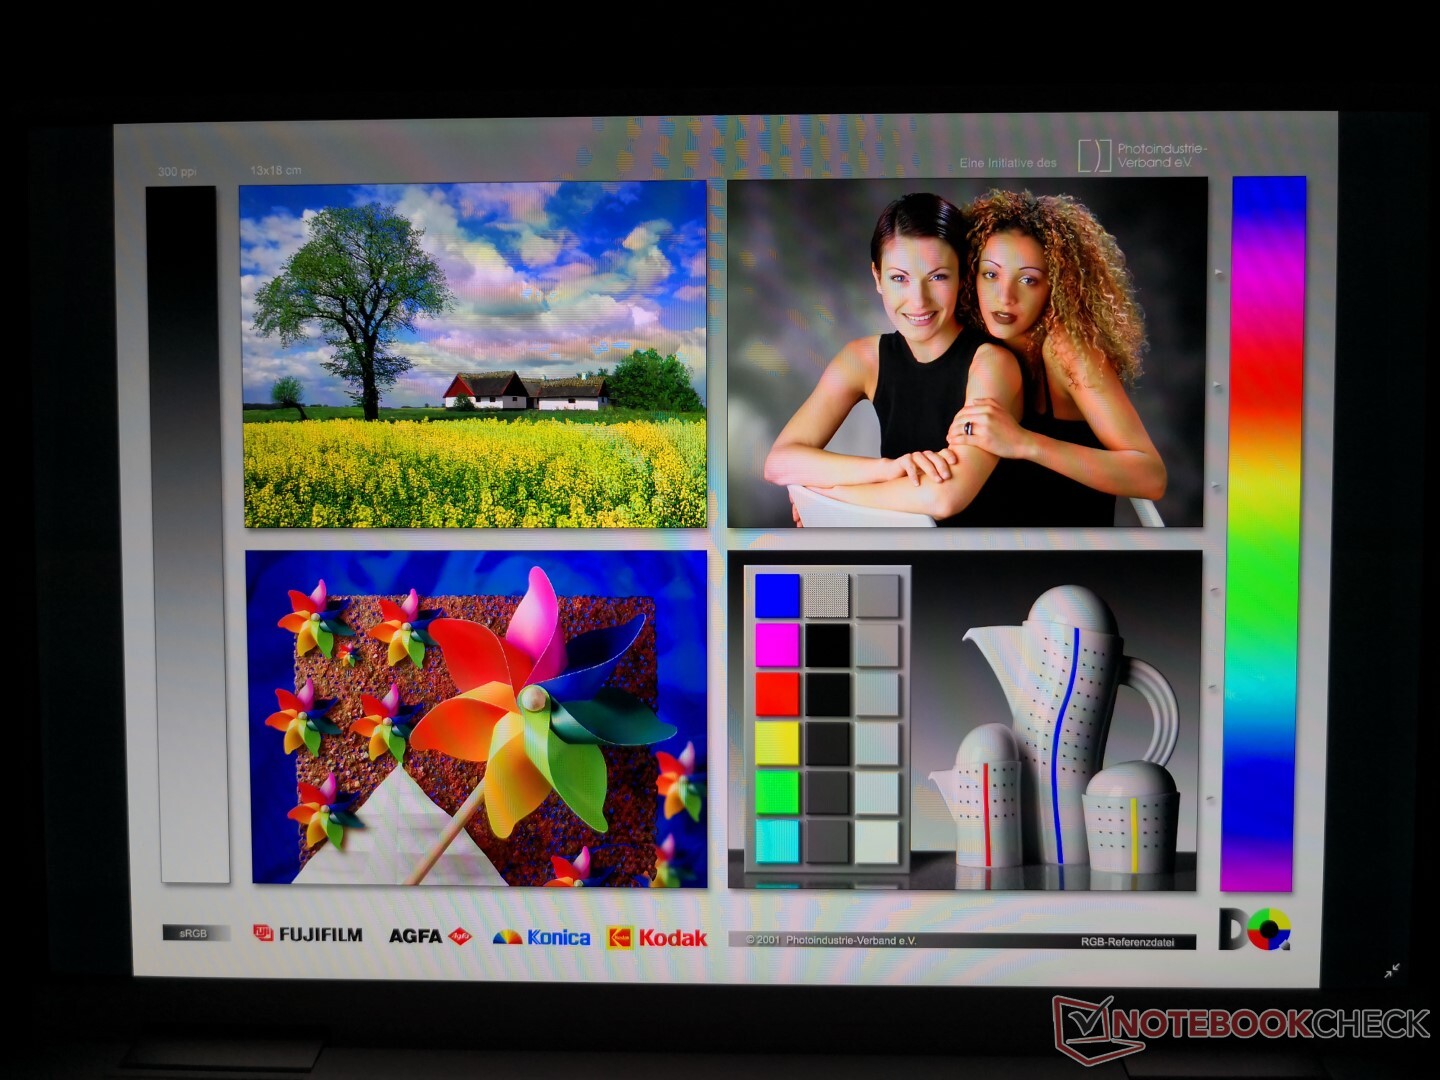
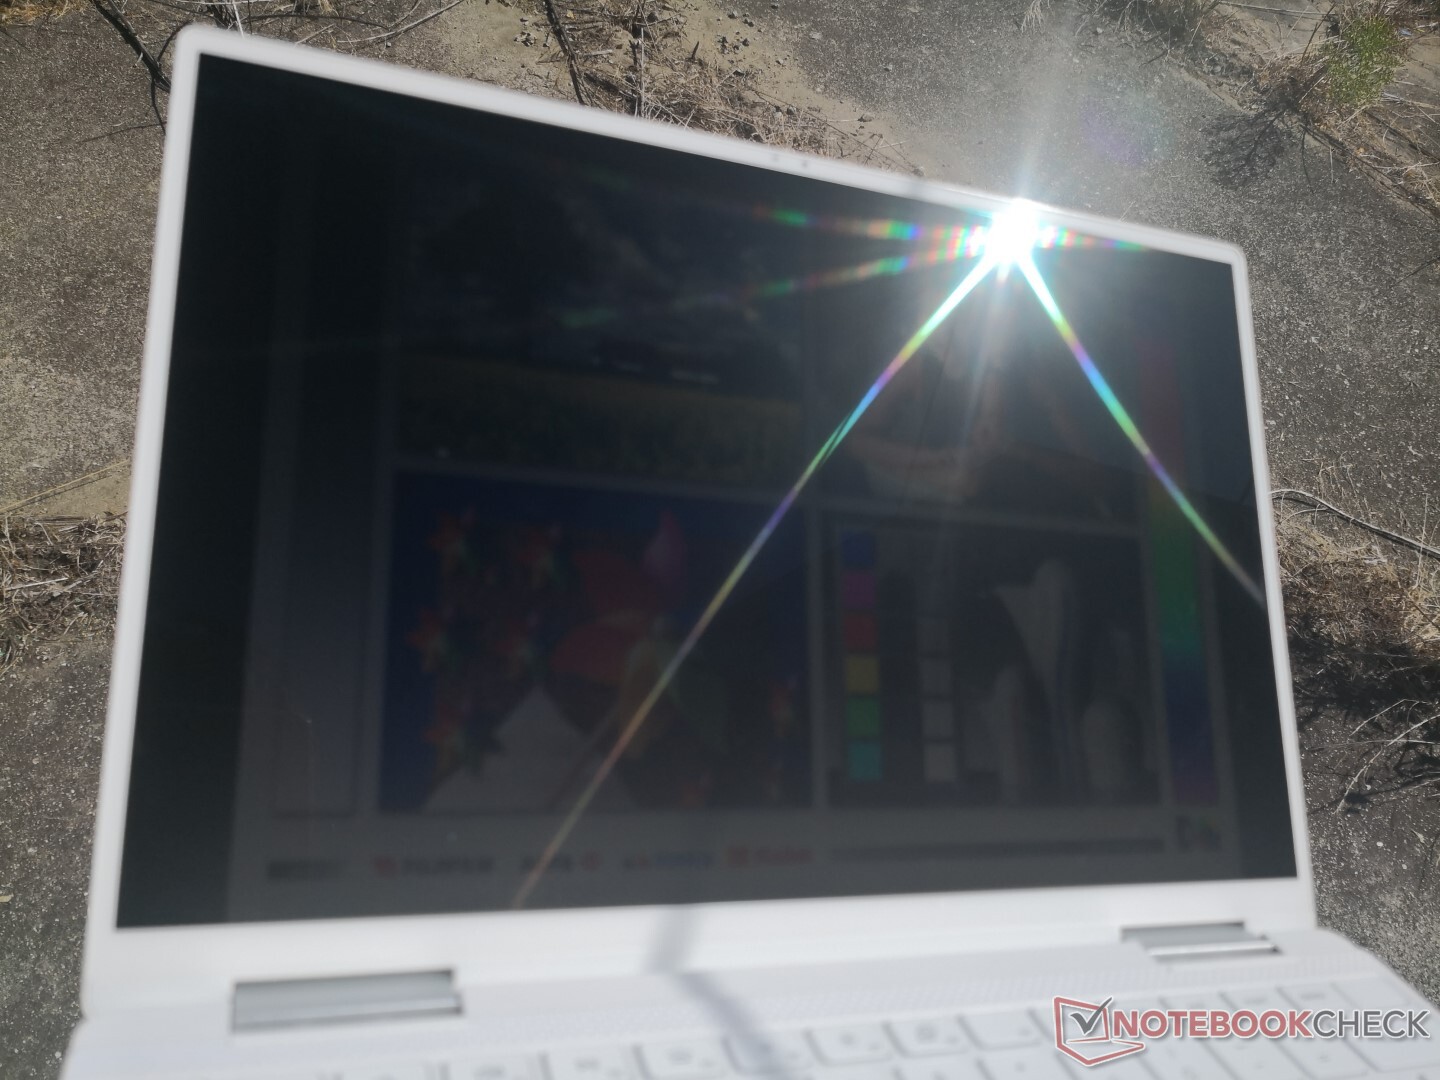
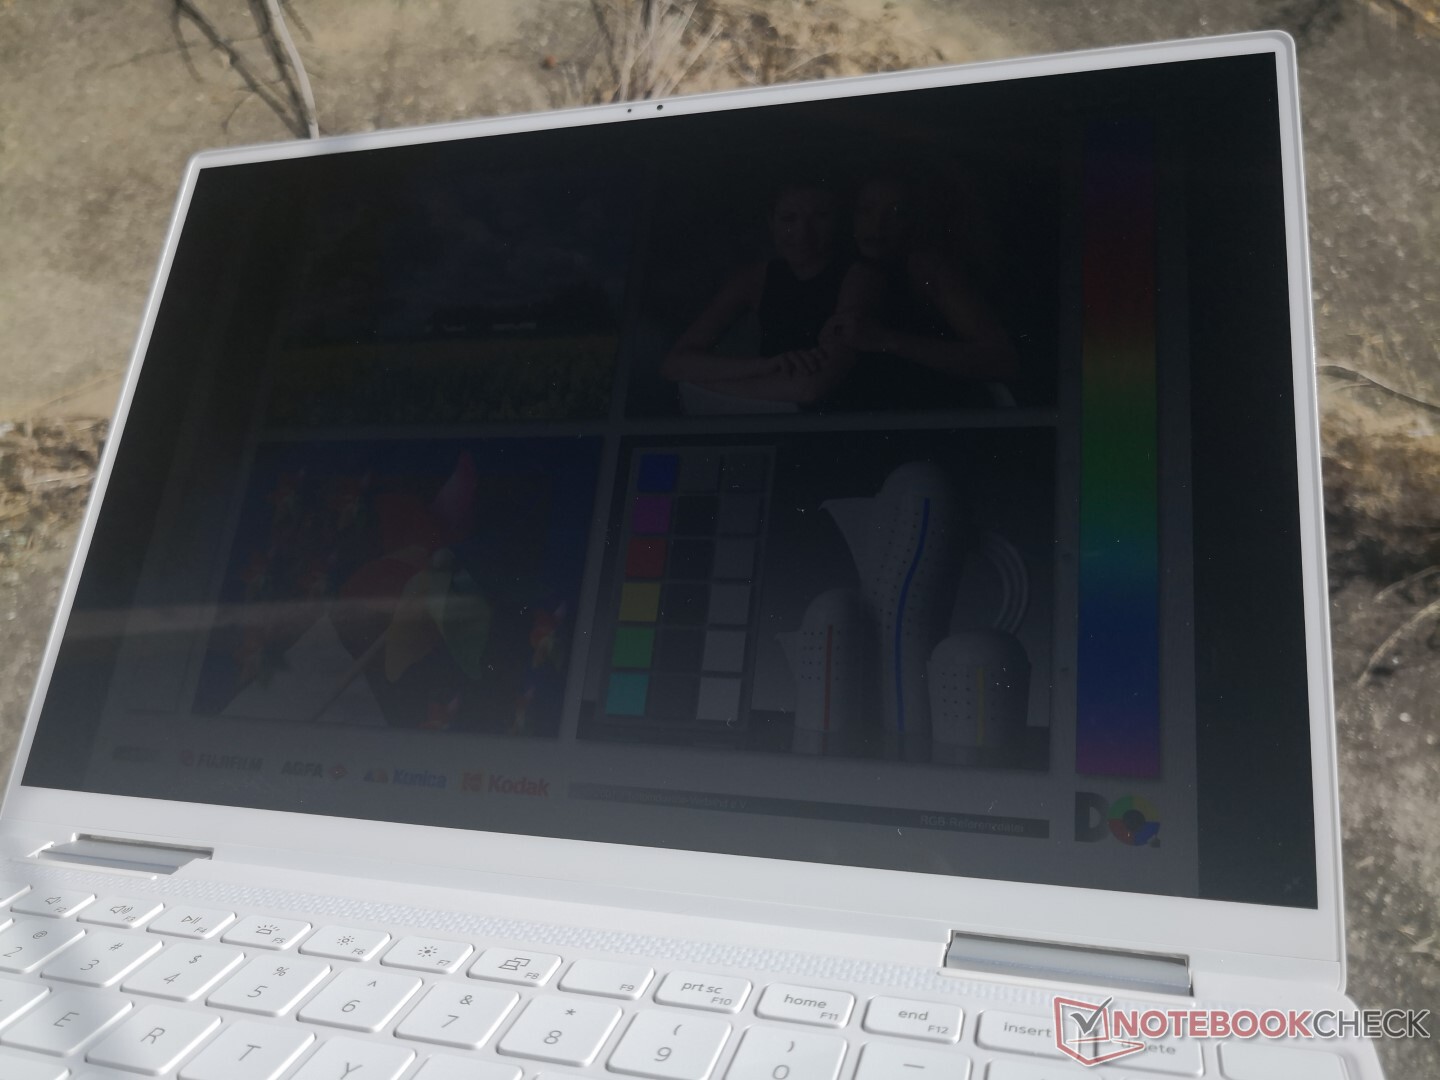
Visualizar: Más brillante que la mayoría de los Ultrabooks
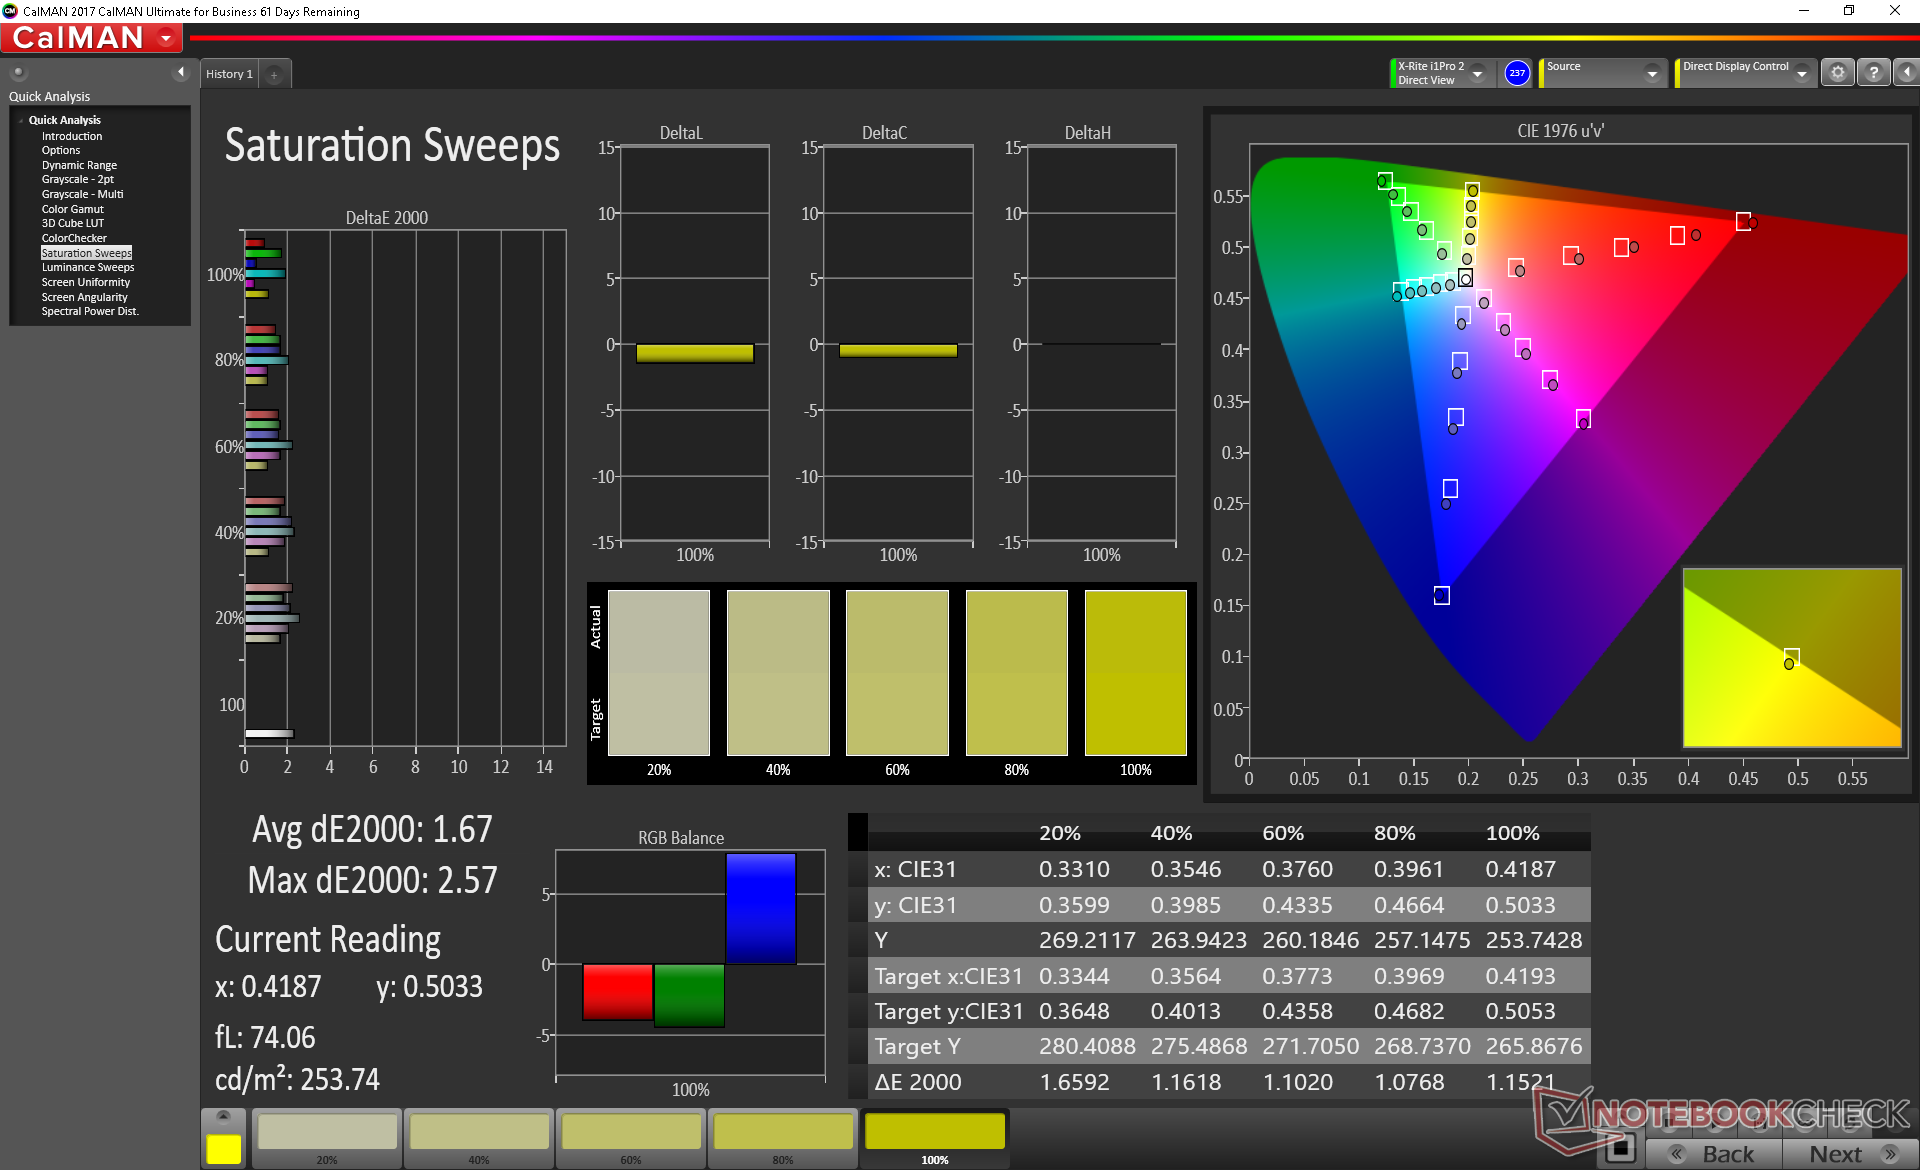
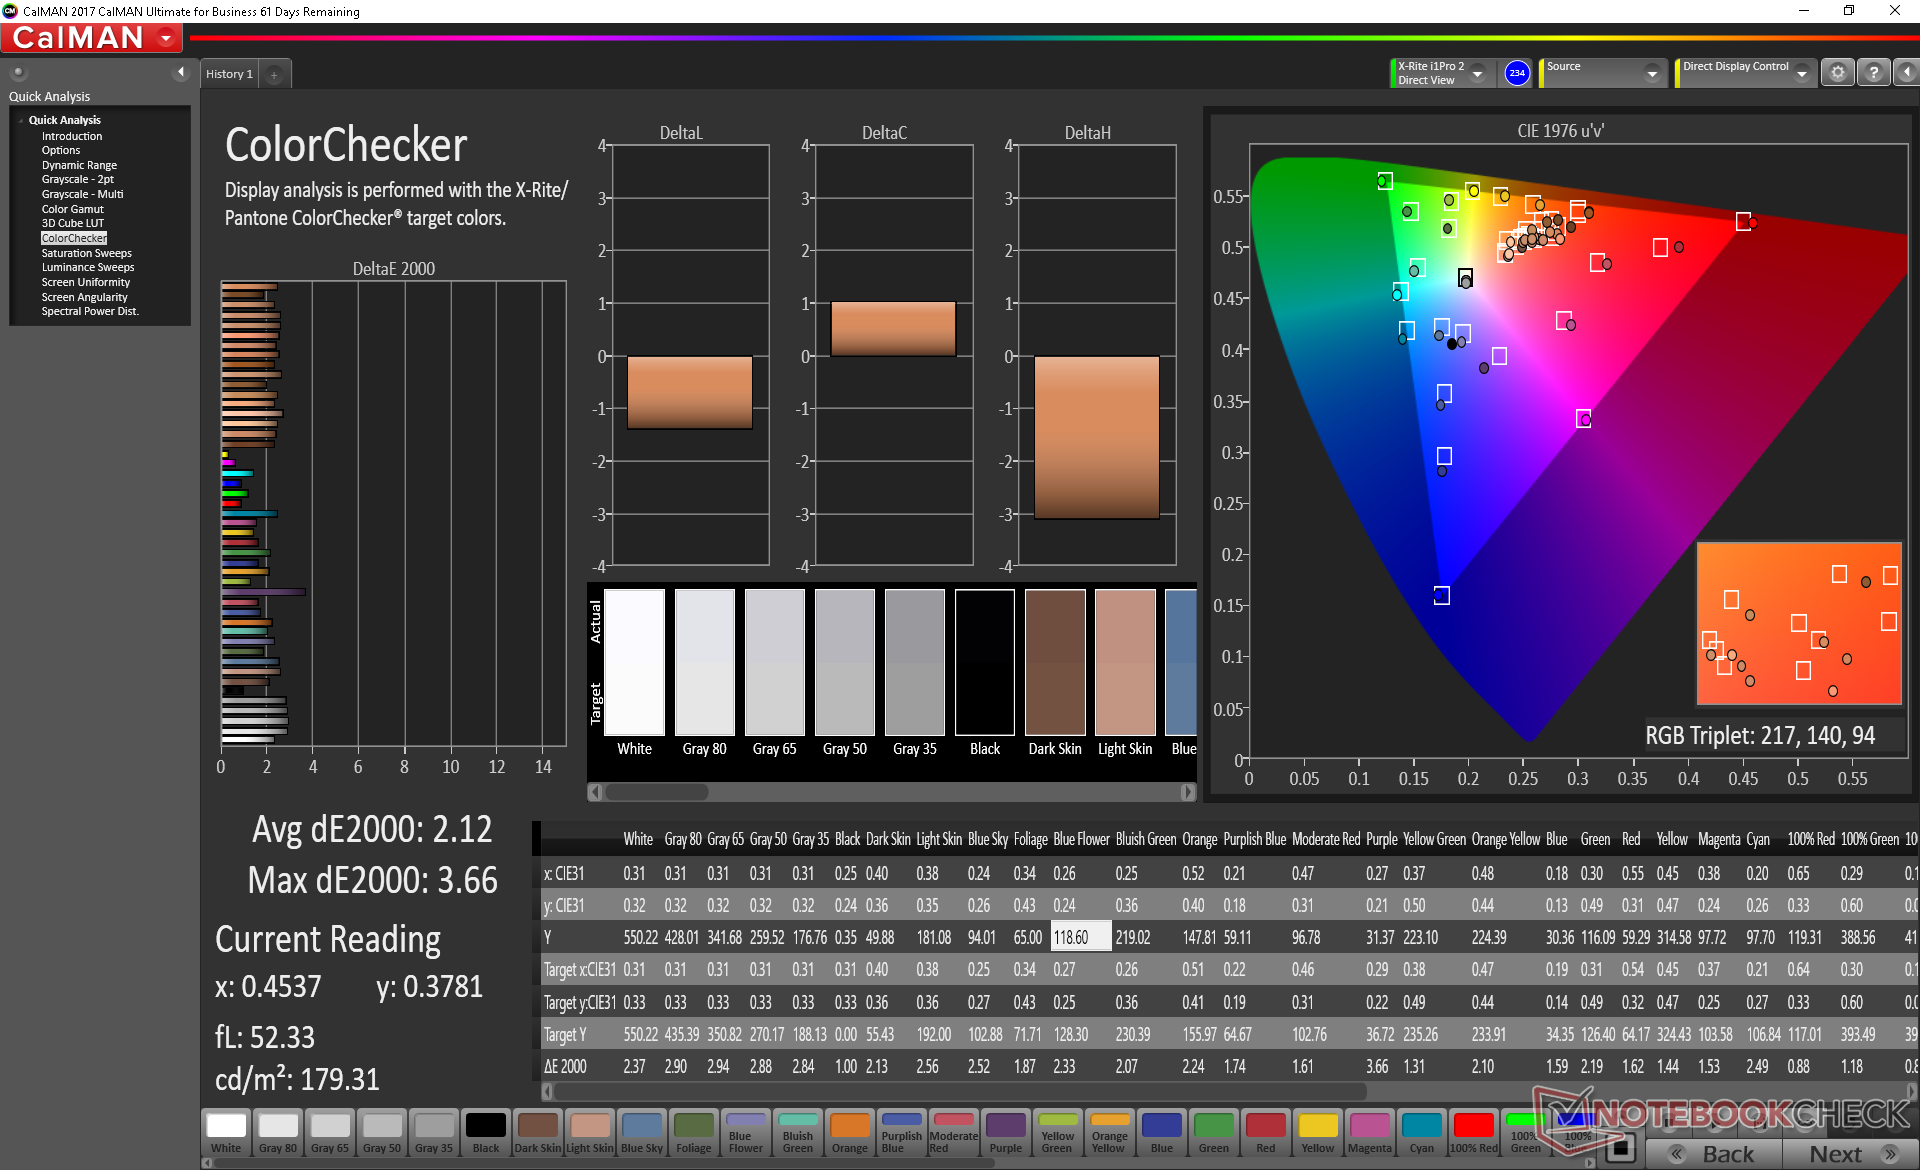
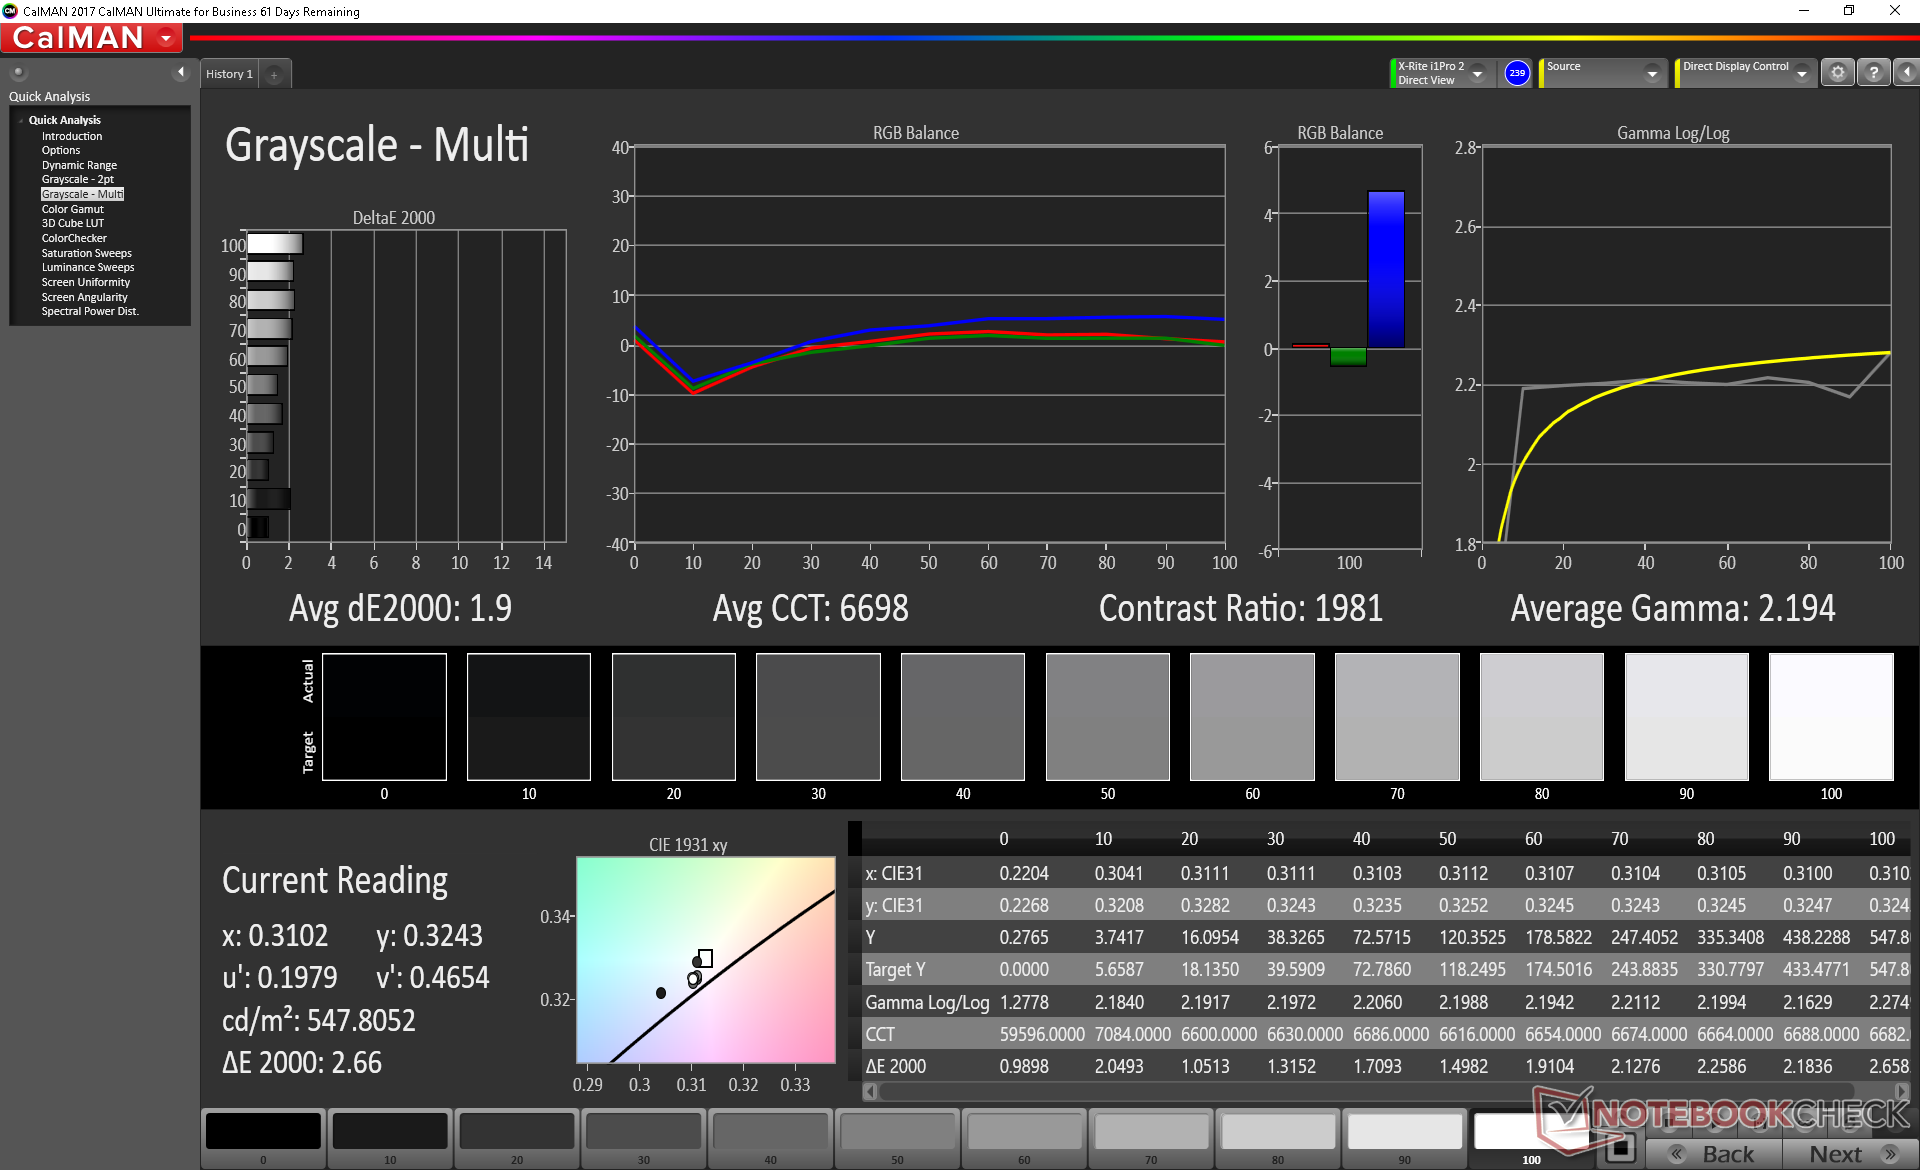
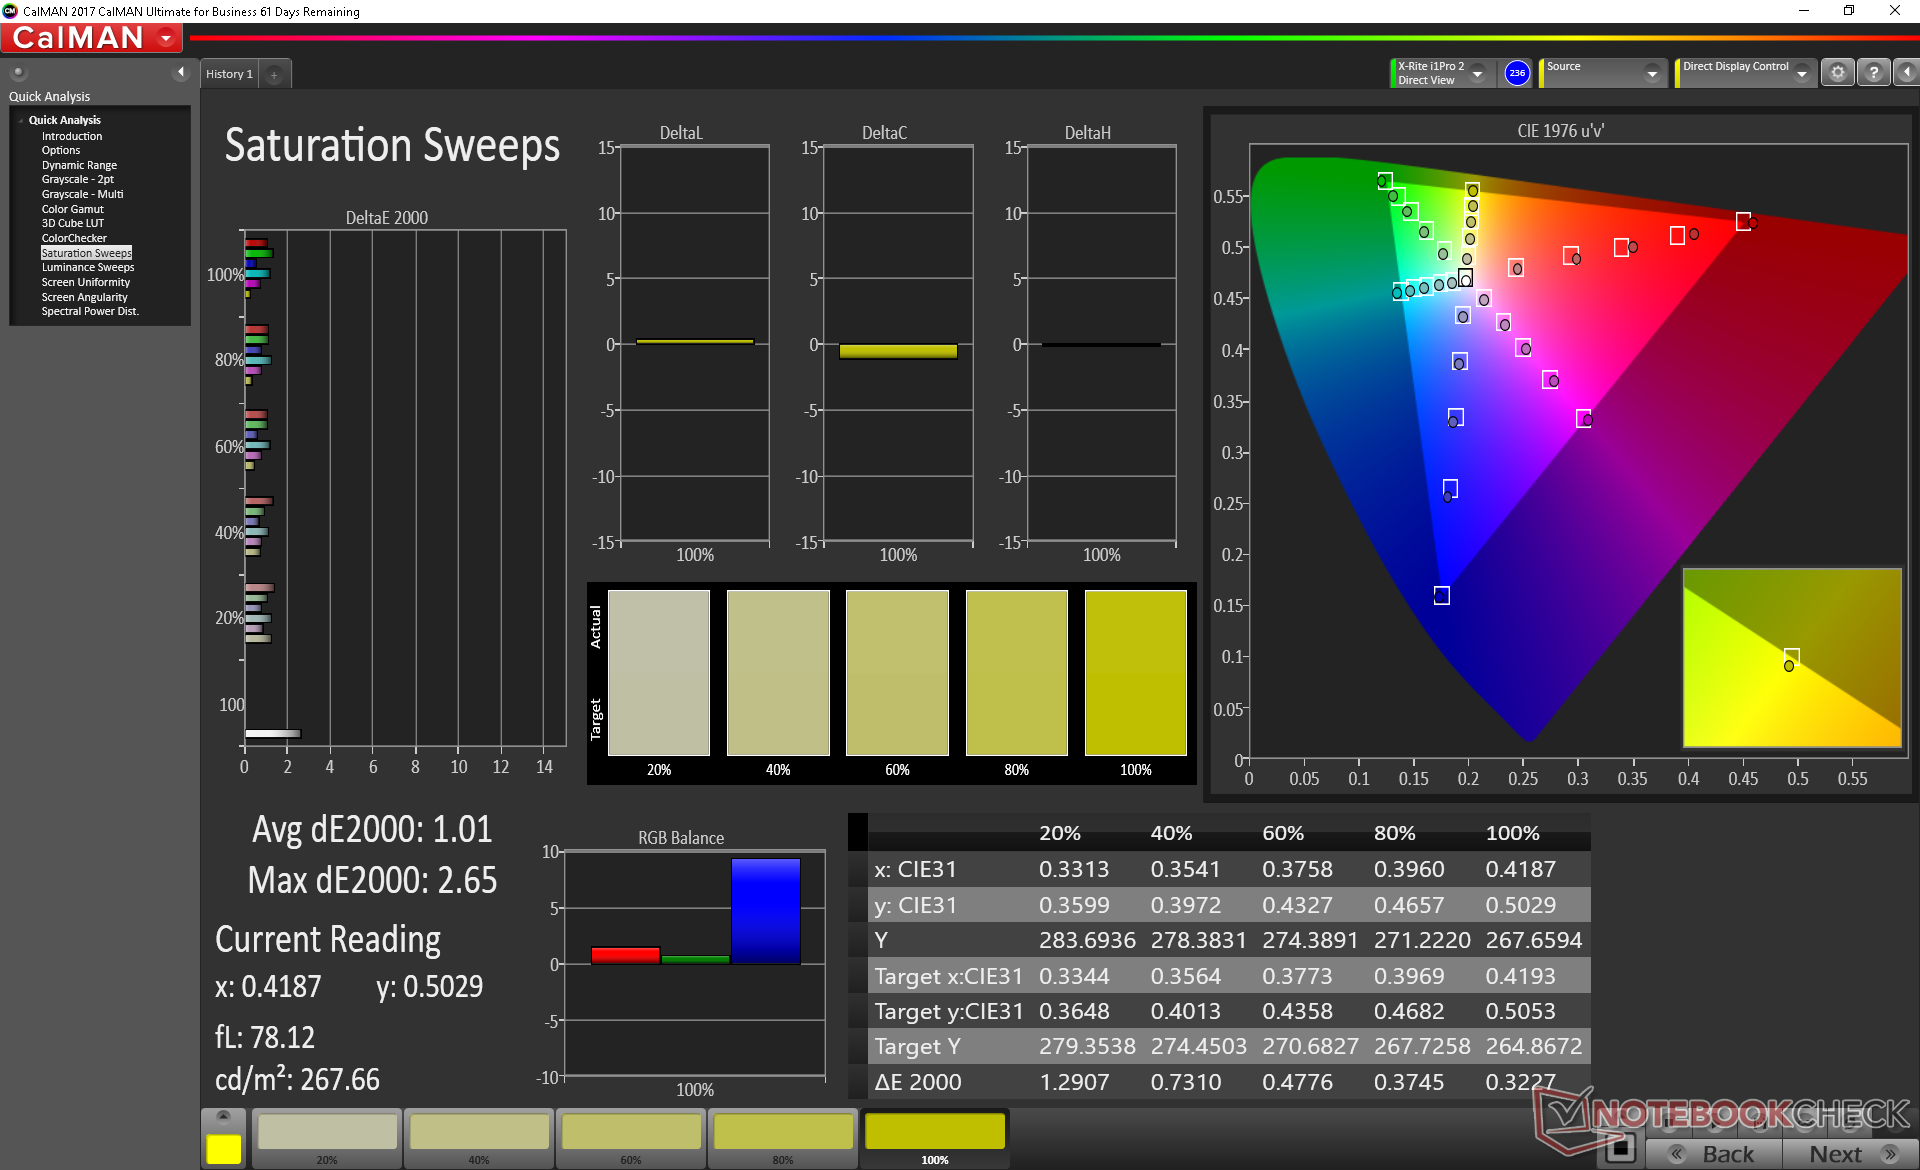
La pantalla nítida de 16:10 sigue siendo idéntica a la del modelo Core i3 hasta el nombre del panel Sharp LQ134N1. Consecuentemente, nuestras mediciones de contraste, tiempos de respuesta, brillo y gama son bastante similares entre las dos configuraciones. Tendremos que revisar el modelo 4K UHD en una fecha posterior, cuando las existencias estén más disponibles.
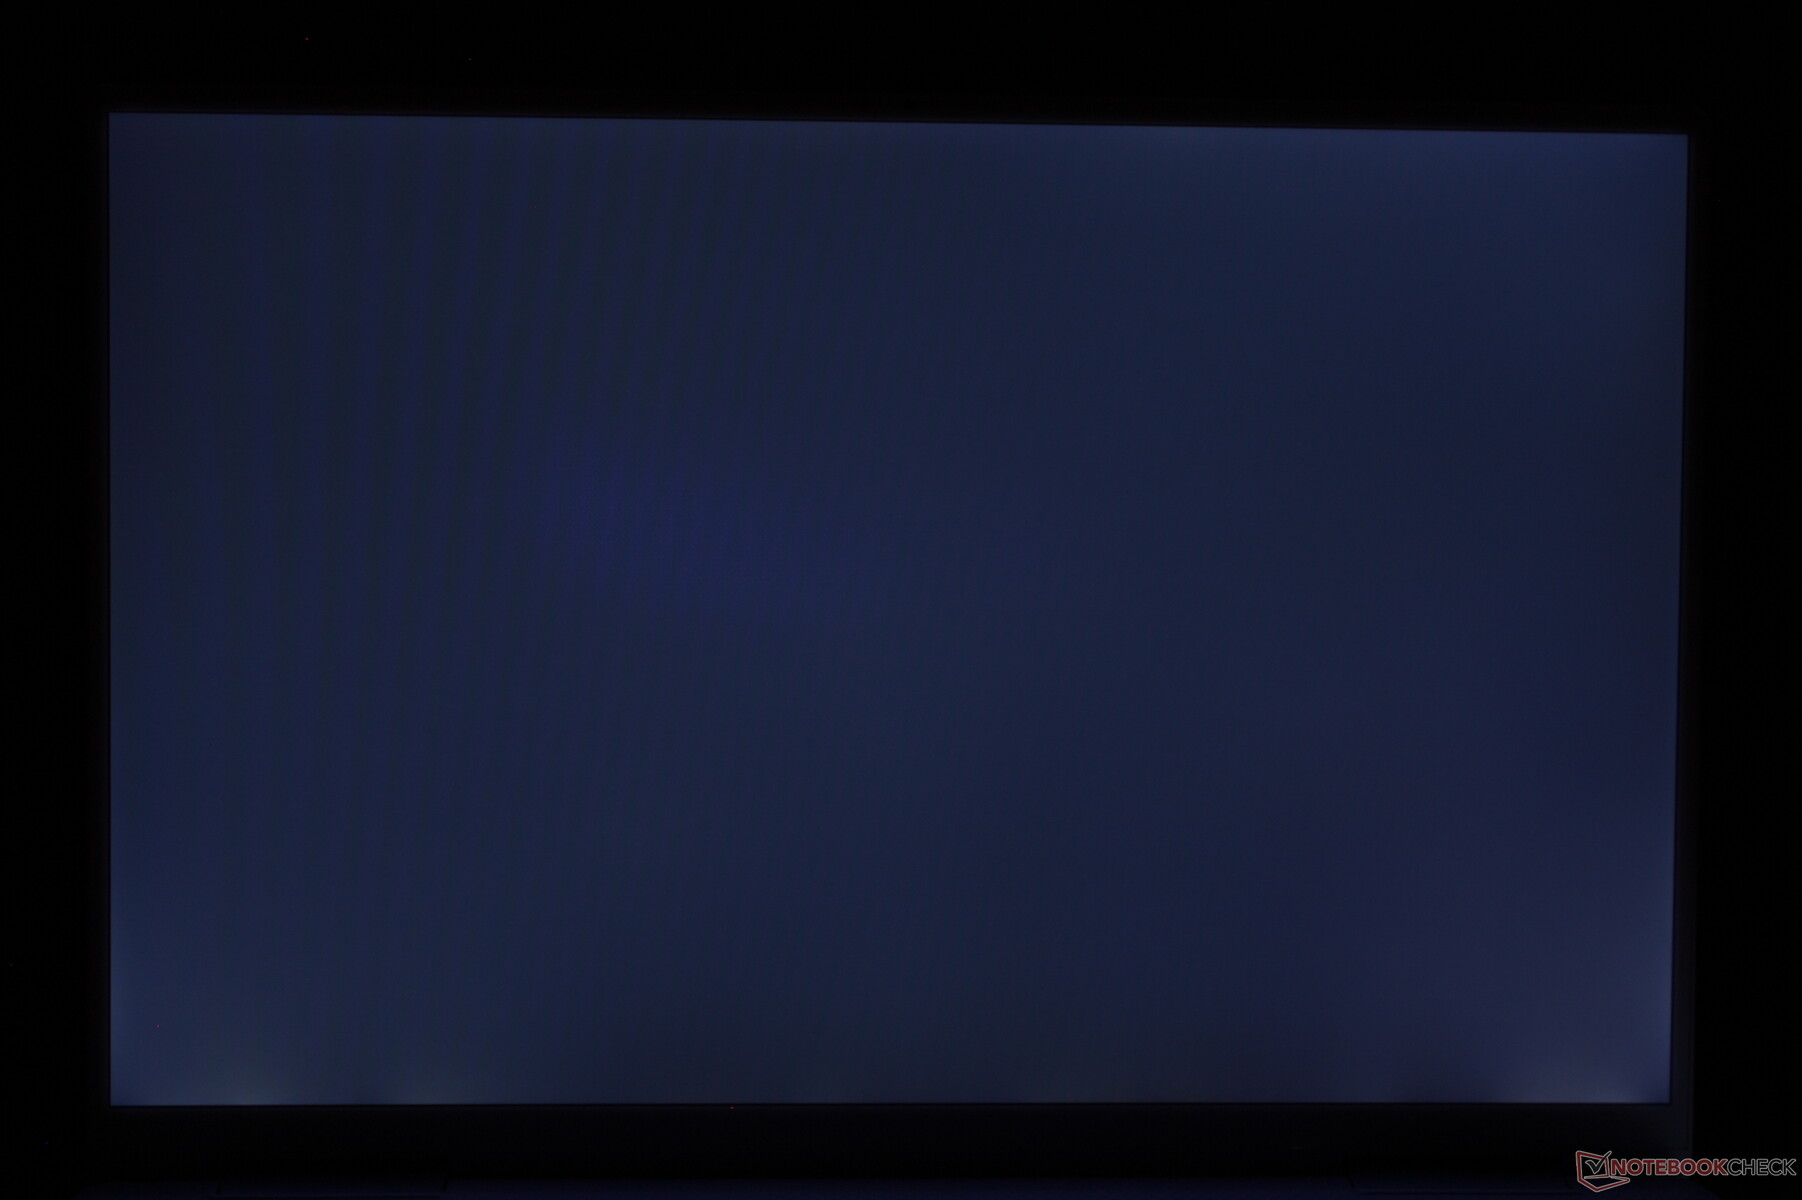
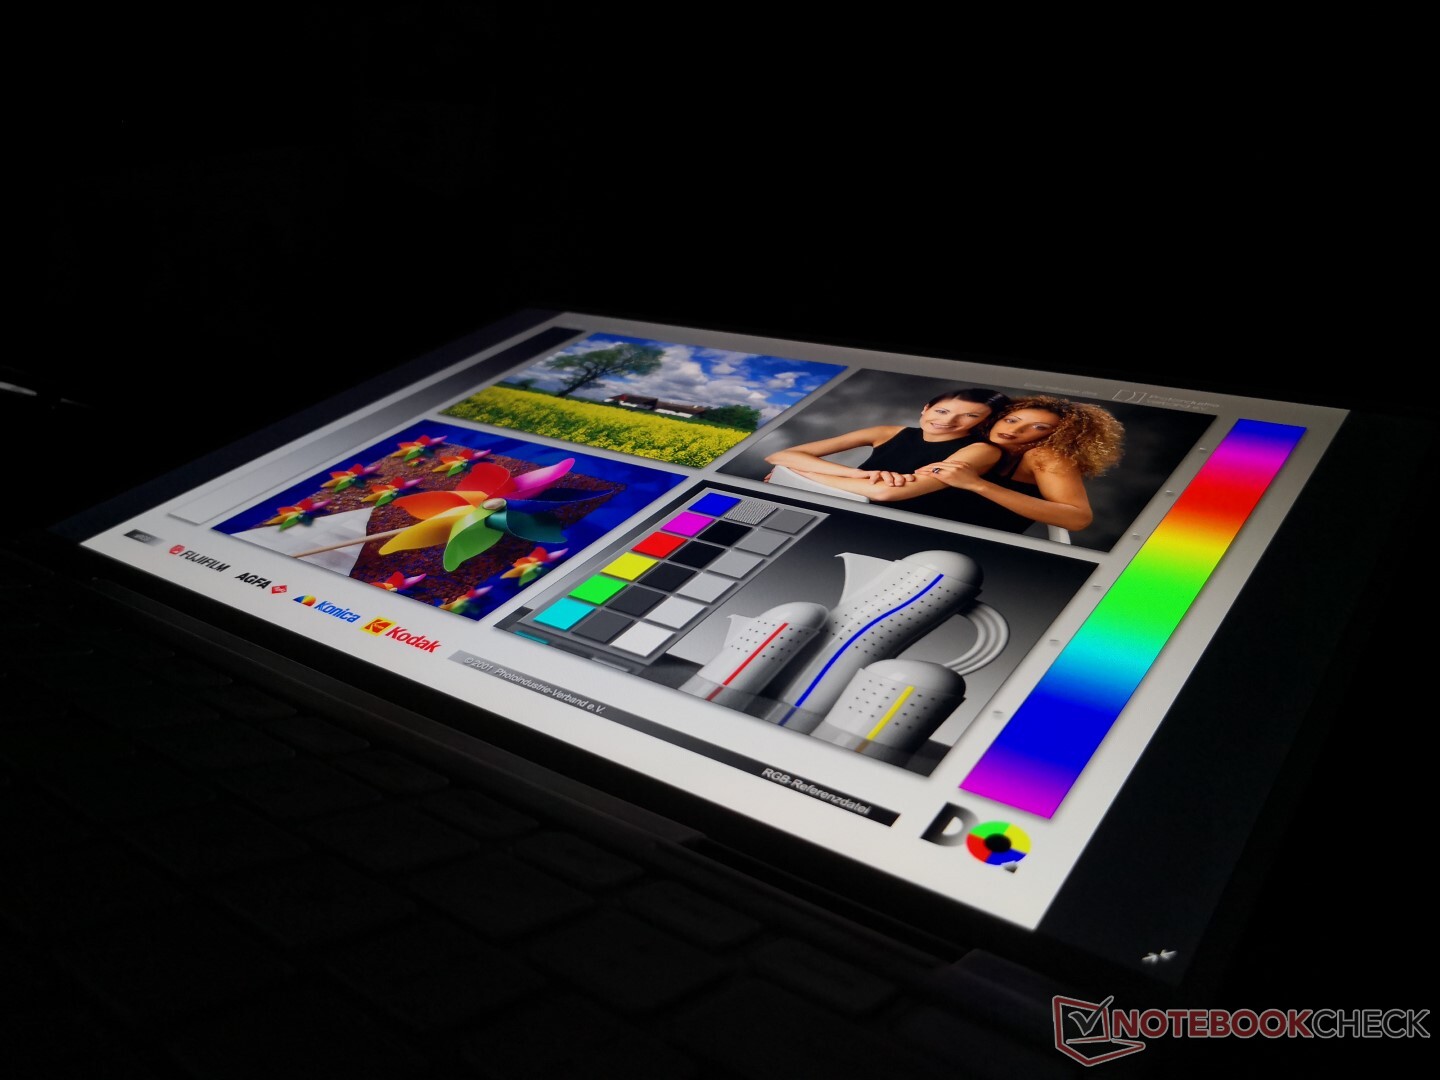
La principal diferencia que podemos notar entre nuestros modelos Core i3 y Core i7 es que este último sufre de un sangrado de luz de fondo ligeramente más irregular. Recomendamos que lo compruebe por si acaso se encuentra en el extremo receptor de una unidad particularmente mala.


| |||||||||||||||||||||||||
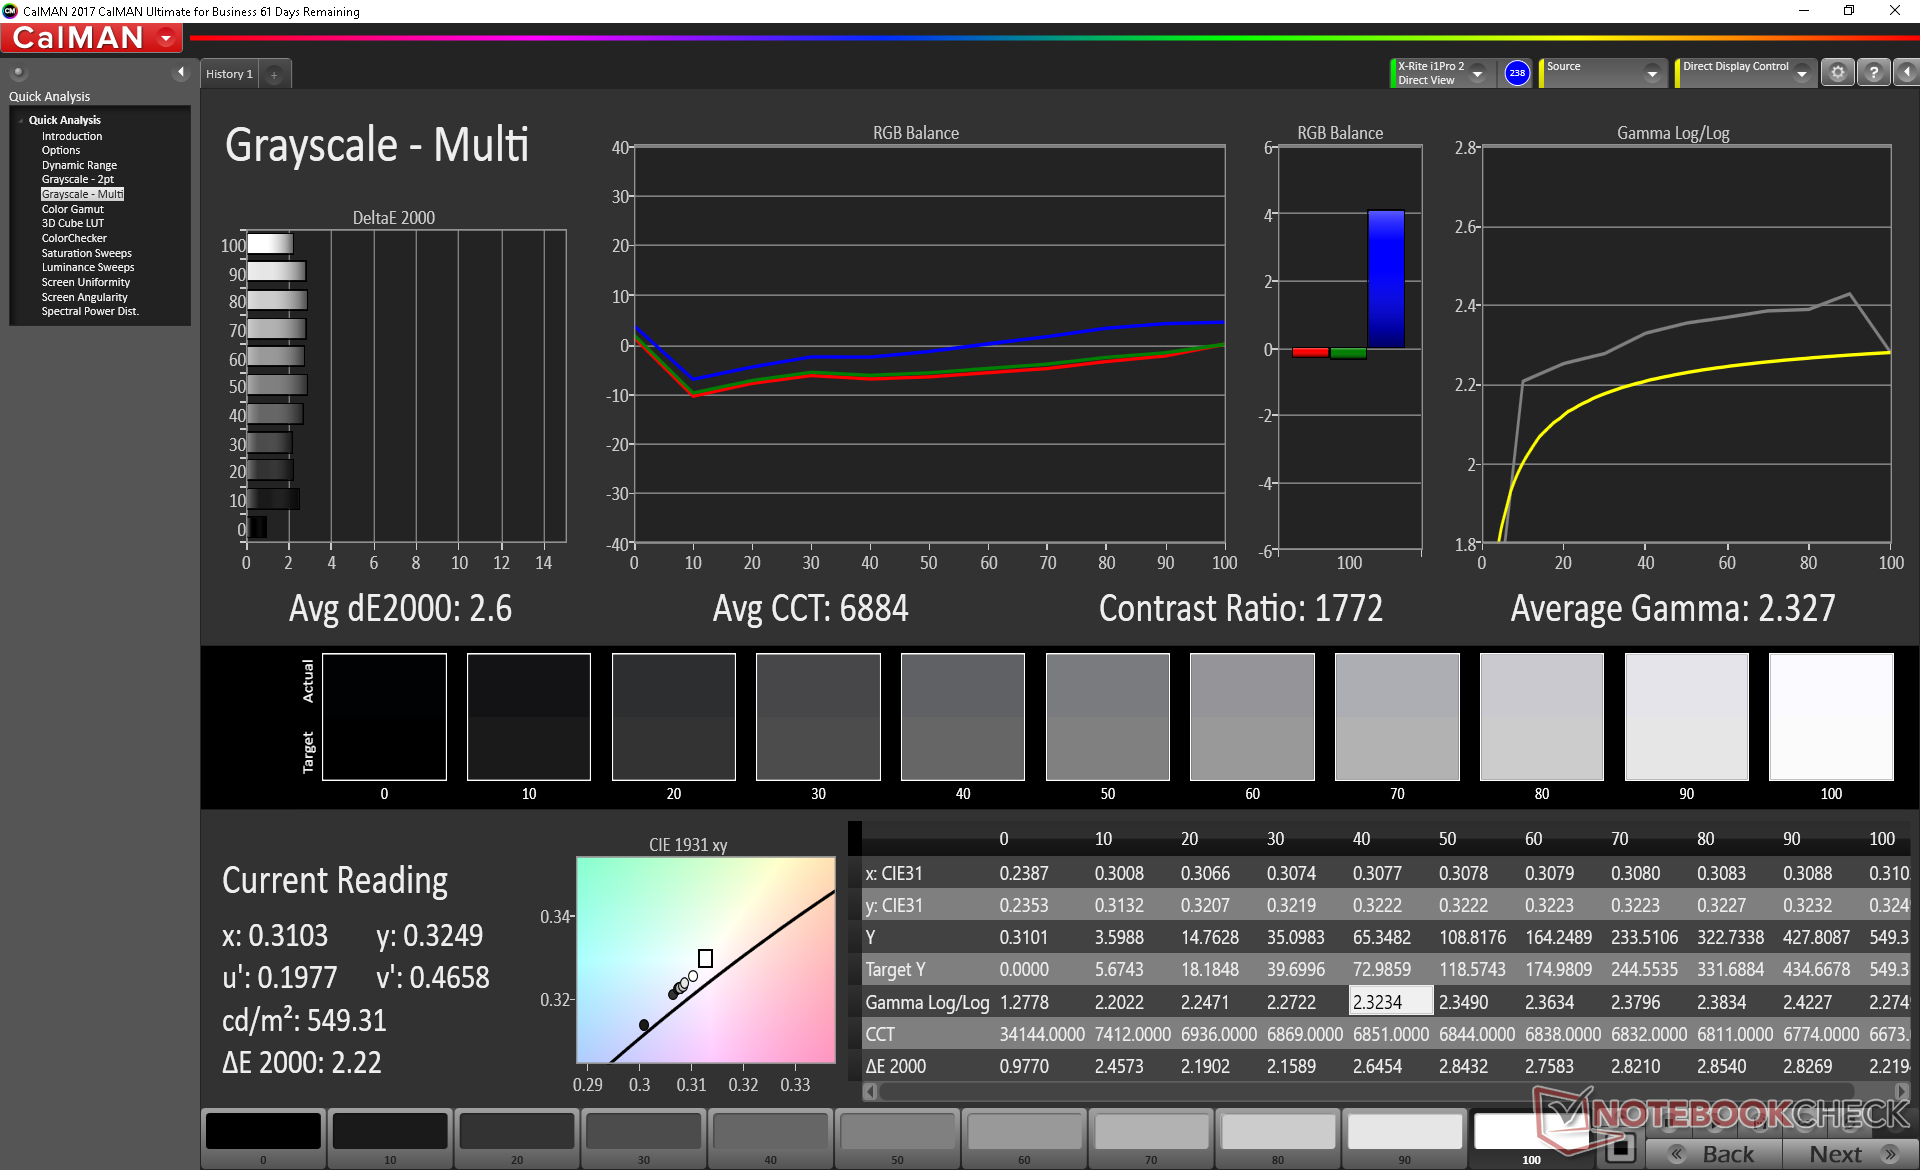
iluminación: 86 %
Brillo con batería: 549.8 cd/m²
Contraste: 1410:1 (Negro: 0.39 cd/m²)
ΔE ColorChecker Calman: 2.12 | ∀{0.5-29.43 Ø4.72}
calibrated: 1.37
ΔE Greyscale Calman: 2.6 | ∀{0.09-98 Ø4.97}
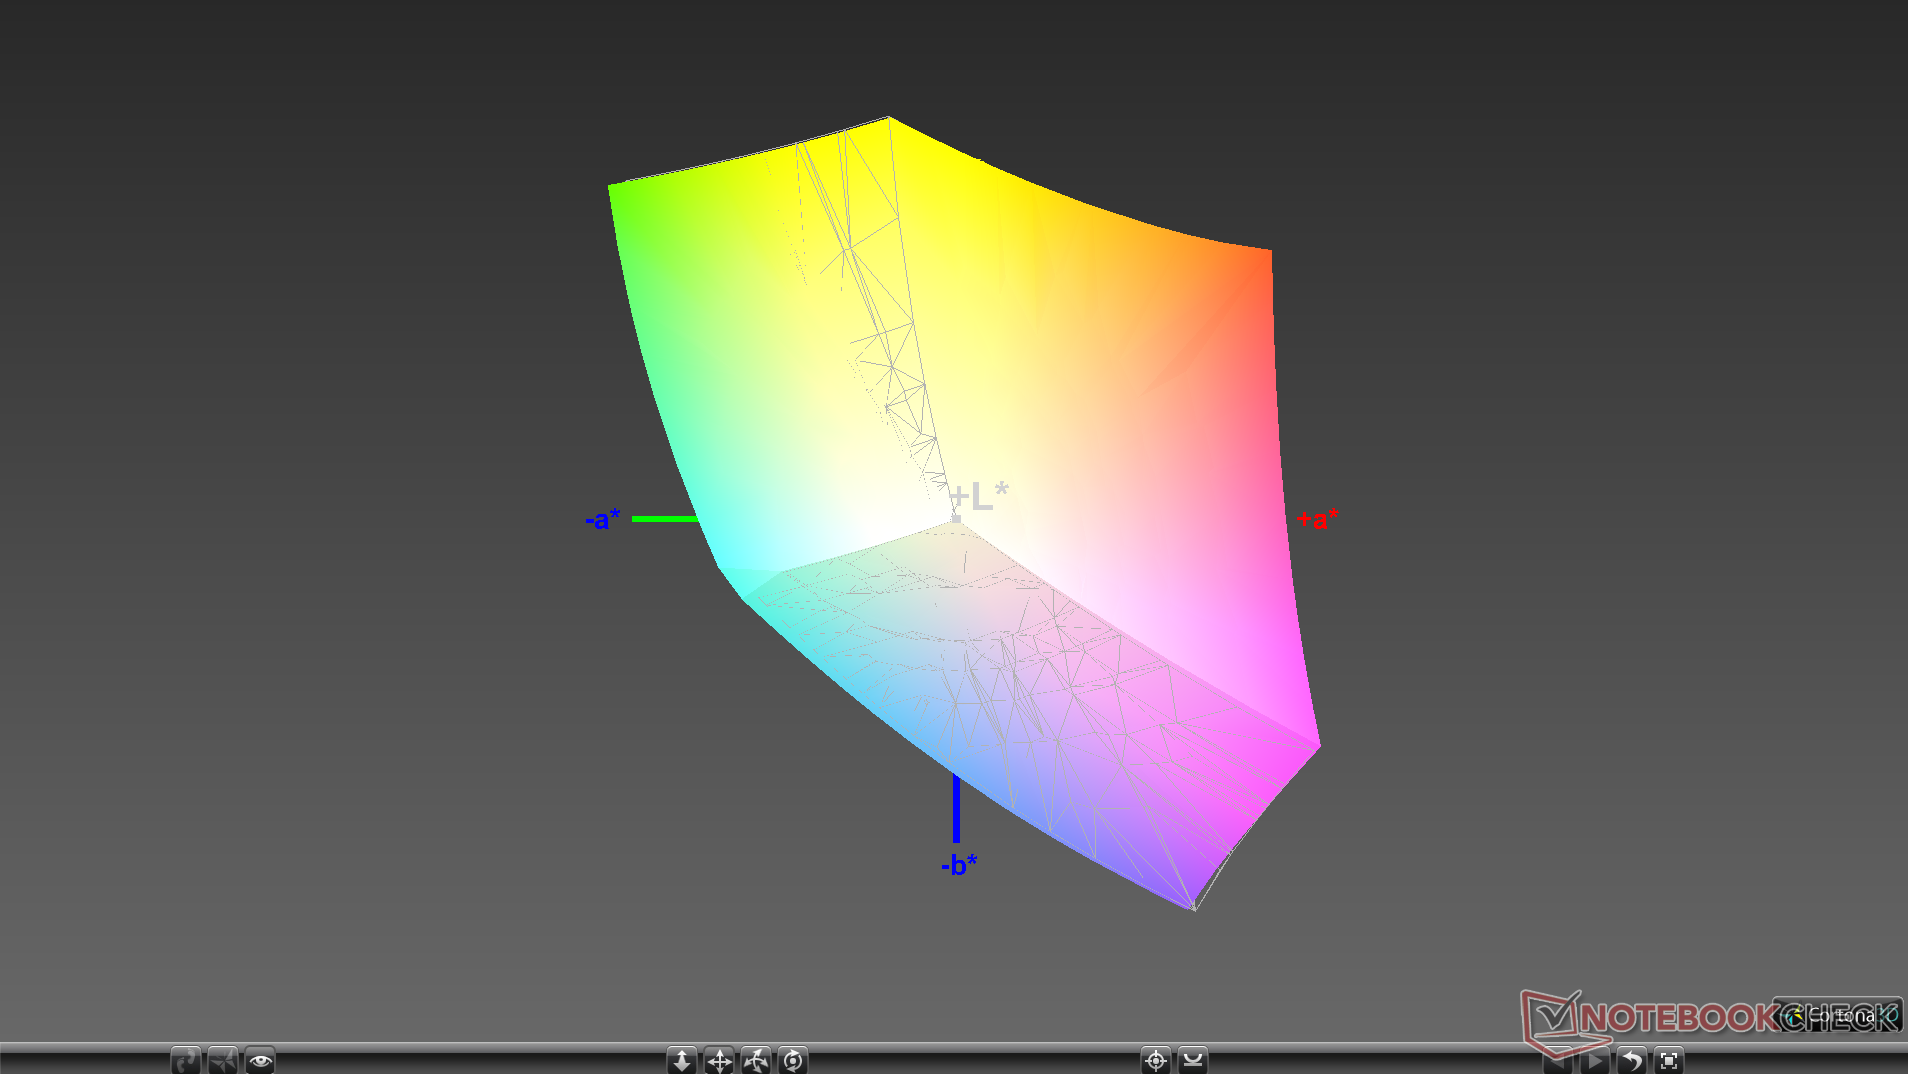
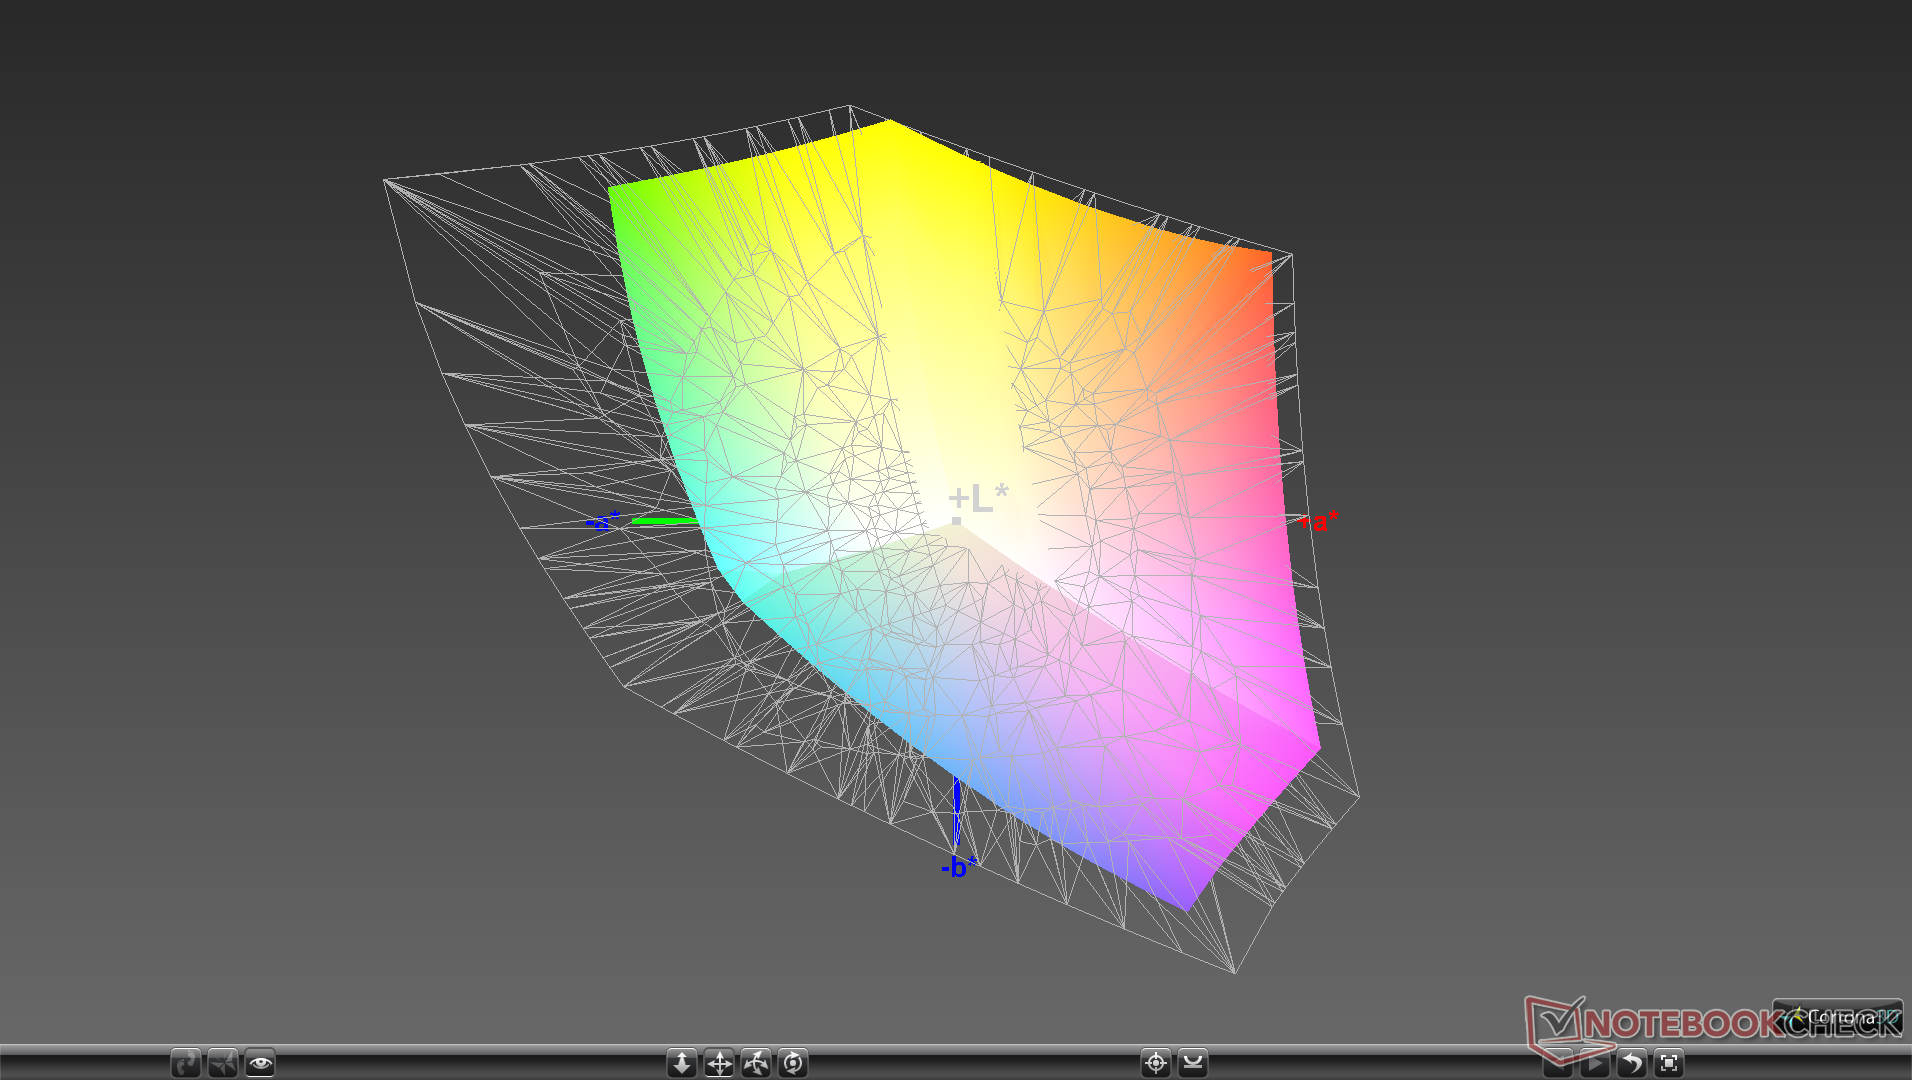
99.7% sRGB (Argyll 1.6.3 3D)
65.4% AdobeRGB 1998 (Argyll 1.6.3 3D)
71.5% AdobeRGB 1998 (Argyll 3D)
99.2% sRGB (Argyll 3D)
69.9% Display P3 (Argyll 3D)
Gamma: 2.3
CCT: 6884 K
| Dell XPS 13 7390 2-in-1 Core i7 Sharp LQ134N1, IPS, 13.4", 1920x1200 | Dell XPS 13 7390 2-in-1 Core i3 Sharp LQ134N1, IPS, 13.4", 1920x1200 | Dell XPS 13 9380 2019 ID: AUO 282B B133ZAN Dell: 90NTH, IPS, 13.3", 3840x2160 | Dell XPS 13 9370 FHD i5 SHP1484, IPS, 13.3", 1920x1080 | Dell XPS 13 9360 FHD i7 Iris SHP1449, IPS, 13.3", 1920x1080 | Dell XPS 13-9365 2-in-1 IPS, 13.3", 1920x1080 | |
|---|---|---|---|---|---|---|
| Display | -2% | -7% | -2% | -24% | -31% | |
| Display P3 Coverage (%) | 69.9 | 68.6 -2% | 64.7 -7% | 68.9 -1% | 51.6 -26% | 47.32 -32% |
| sRGB Coverage (%) | 99.2 | 98.2 -1% | 93.1 -6% | 96.6 -3% | 77.4 -22% | 71.1 -28% |
| AdobeRGB 1998 Coverage (%) | 71.5 | 70.4 -2% | 65.3 -9% | 69.6 -3% | 53.3 -25% | 48.83 -32% |
| Response Times | -6% | -23% | -44% | 5% | -7% | |
| Response Time Grey 50% / Grey 80% * (ms) | 47.6 ? | 46 ? 3% | 58 ? -22% | 62.4 ? -31% | 41.2 ? 13% | 48 ? -1% |
| Response Time Black / White * (ms) | 29.2 ? | 33.6 ? -15% | 36 ? -23% | 45.6 ? -56% | 30 ? -3% | 32.8 ? -12% |
| PWM Frequency (Hz) | 2500 ? | 2525 ? | 1008 ? | 19530 ? | 1042 ? | |
| Screen | 6% | -35% | -25% | -47% | -74% | |
| Brightness middle (cd/m²) | 549.8 | 576.3 5% | 404 -27% | 428 -22% | 461 -16% | 322.6 -41% |
| Brightness (cd/m²) | 520 | 555 7% | 389 -25% | 405 -22% | 418 -20% | 306 -41% |
| Brightness Distribution (%) | 86 | 88 2% | 85 -1% | 87 1% | 85 -1% | 91 6% |
| Black Level * (cd/m²) | 0.39 | 0.33 15% | 0.37 5% | 0.26 33% | 0.2 49% | 0.19 51% |
| Contrast (:1) | 1410 | 1746 24% | 1092 -23% | 1646 17% | 2305 63% | 1698 20% |
| Colorchecker dE 2000 * | 2.12 | 1.45 32% | 3.72 -75% | 3.8 -79% | 5.4 -155% | 7.7 -263% |
| Colorchecker dE 2000 max. * | 3.66 | 4.12 -13% | 7.38 -102% | 7.2 -97% | 12.2 -233% | 11.1 -203% |
| Colorchecker dE 2000 calibrated * | 1.37 | 1.19 13% | 2.06 -50% | |||
| Greyscale dE 2000 * | 2.6 | 3.1 -19% | 4.44 -71% | 4.4 -69% | 5.4 -108% | 7.9 -204% |
| Gamma | 2.3 96% | 2.27 97% | 2.34 94% | 2.21 100% | 2.15 102% | 2.88 76% |
| CCT | 6884 94% | 6931 94% | 7095 92% | 7067 92% | 7258 90% | 7044 92% |
| Color Space (Percent of AdobeRGB 1998) (%) | 65.4 | 64.2 -2% | 60 -8% | 62.8 -4% | 48.6 -26% | 44.1 -33% |
| Color Space (Percent of sRGB) (%) | 99.7 | 98.5 -1% | 93 -7% | 96.4 -3% | 76.9 -23% | 69.9 -30% |
| Media total (Programa/Opciones) | -1% /
3% | -22% /
-28% | -24% /
-23% | -22% /
-36% | -37% /
-56% |
* ... más pequeño es mejor
Tiempos de respuesta del display
| ↔ Tiempo de respuesta de Negro a Blanco | ||
|---|---|---|
| 29.2 ms ... subida ↗ y bajada ↘ combinada | ↗ 16 ms subida | 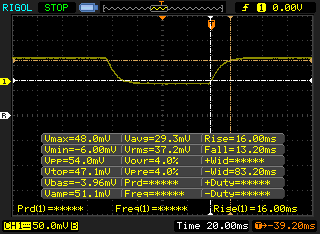 |
| ↘ 13.2 ms bajada | ||
| La pantalla mostró tiempos de respuesta relativamente lentos en nuestros tests pero podría ser demasiado lenta para los jugones. En comparación, todos los dispositivos de prueba van de ##min### (mínimo) a 240 (máximo) ms. » 78 % de todos los dispositivos son mejores. Eso quiere decir que el tiempo de respuesta es peor que la media (19.8 ms) de todos los dispositivos testados. | ||
| ↔ Tiempo de respuesta 50% Gris a 80% Gris | ||
| 47.6 ms ... subida ↗ y bajada ↘ combinada | ↗ 23.2 ms subida | 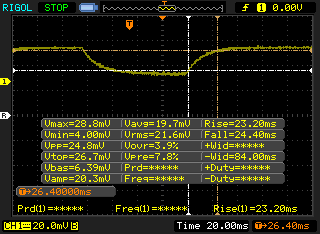 |
| ↘ 24.4 ms bajada | ||
| La pantalla mostró tiempos de respuesta lentos en nuestros tests y podría ser demasiado lenta para los jugones. En comparación, todos los dispositivos de prueba van de ##min### (mínimo) a 636 (máximo) ms. » 82 % de todos los dispositivos son mejores. Eso quiere decir que el tiempo de respuesta es peor que la media (31 ms) de todos los dispositivos testados. | ||
Parpadeo de Pantalla / PWM (Pulse-Width Modulation)
| Parpadeo de Pantalla / PWM detectado | 2500 Hz | ≤ 25 % de brillo | 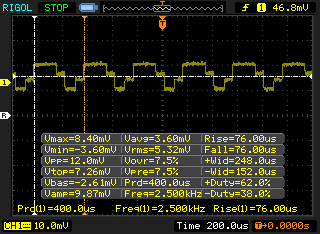 |
La retroiluminación del display parpadea a 2500 Hz (seguramente usa PWM - Pulse-Width Modulation) a un brillo del 25 % e inferior. Sobre este nivel de brillo no debería darse parpadeo / PWM. La frecuencia de 2500 Hz es bastante alta, por lo que la mayoría de gente sensible al parpadeo no debería ver parpadeo o tener fatiga visual. Comparación: 52 % de todos los dispositivos testados no usaron PWM para atenuar el display. Si se usó, medimos una media de 7769 (mínimo: 5 - máxmo: 343500) Hz. | |||

Rendimiento
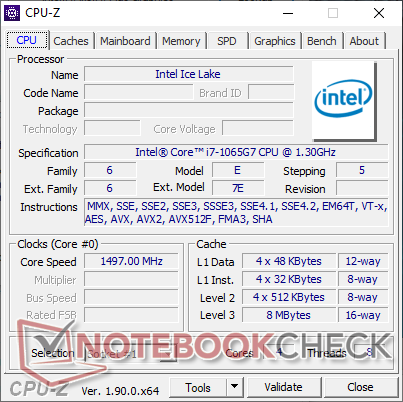
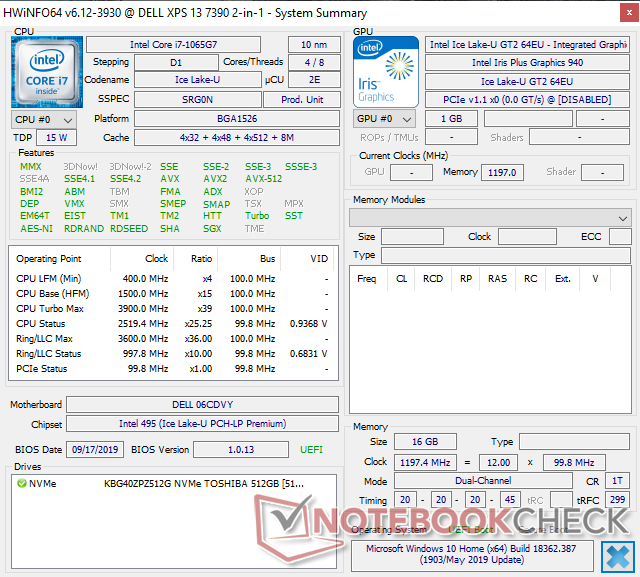
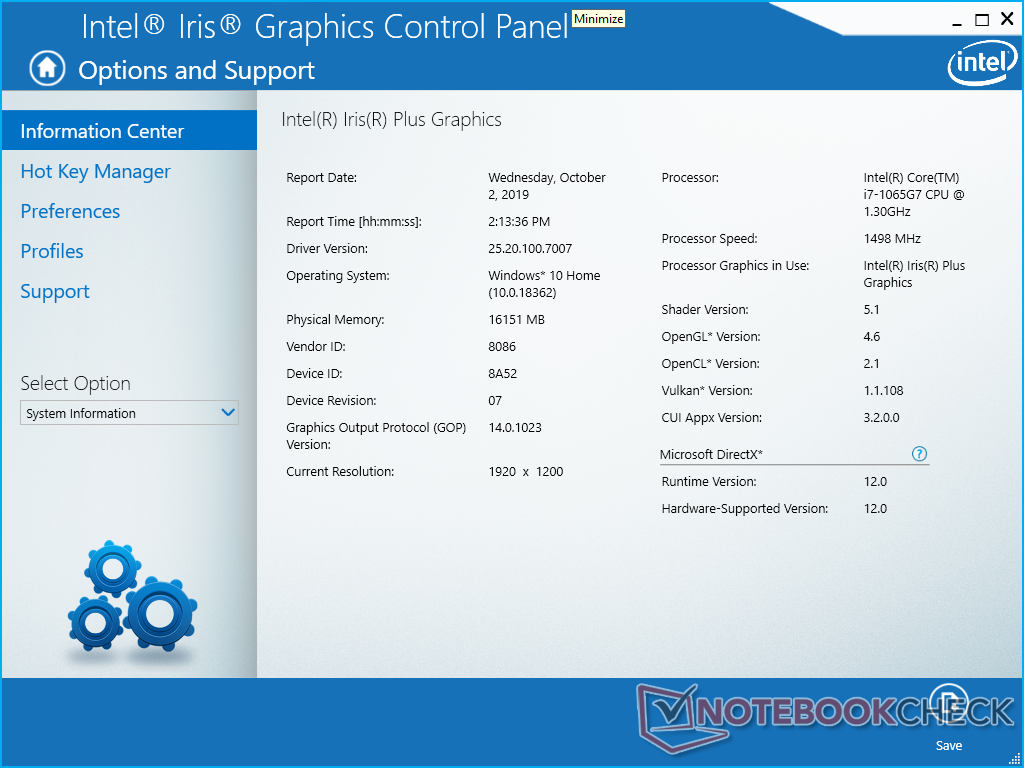
El Core i7-1065G7 de la décima generación sucede al Core i7-8565U de la novena generación al ofrecer un rendimiento de CPU más rápido y un rendimiento gráfico integrado significativamente más rápido. Los convertibles de Dell utilizan la versión más rápida de 25 W del i7-1065G7 en lugar de la versión de 15 W para aprovechar mejor lo que el procesador es capaz de hacer. Consulte nuestra descripción general del Core i7-1065G7 para obtener más información sobre la última CPU de Intel.
Los usuarios que crucen los dedos por las opciones de Comet Lake-U en el futuro no tendrán suerte, ya que el XPS 13 7390 2-in-1 fue diseñado específicamente para Ice Lake. Dell ha declarado que por el momento no hay planes de introducir opciones hexa-core Comet Lake-U en el XPS 13 2 en 1, por lo que sigue siendo exclusivo de la bivalva XPS 13 7390.
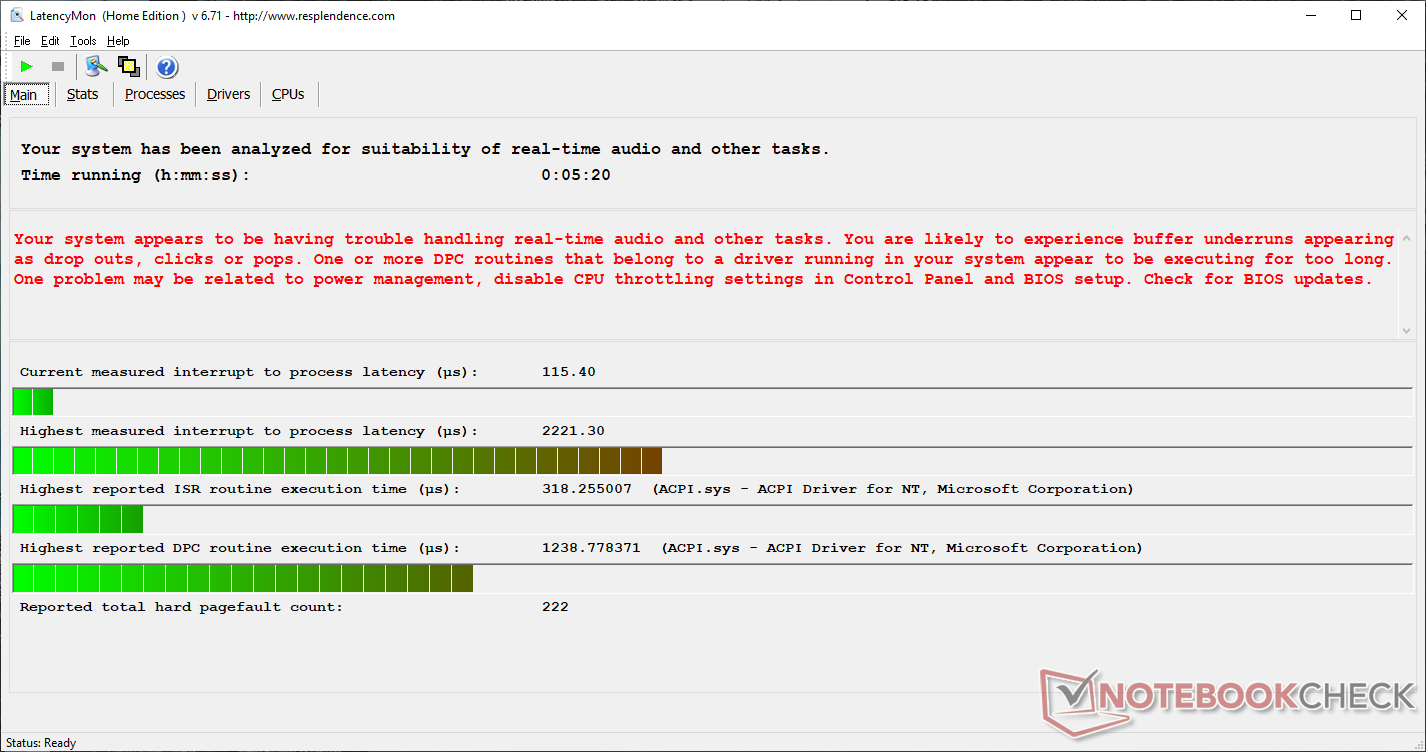
LatencyMon sigue mostrando problemas de latencia del DPC incluso cuando la conexión inalámbrica está deshabilitada.
Procesador: Un salto sobre la 9ª generación de Whiskey Lake-U
El rendimiento del procesador en bruto es muy alto en relación con el tamaño del chasis. Cuando se ejecuta CineBench R15 Multi-Thread en un bucle, los resultados están esencialmente a la par con el Core i5-9300H en el XPS 15 para los primeros cuatro bucles cuando las velocidades del reloj Turbo Boost son más altas. Eventualmente, sin embargo, la velocidad de los relojes bajará para mantener temperaturas aceptables para una disminución del rendimiento de casi el 20 por ciento. En otras palabras, el rendimiento del procesador comienza muy rápido para obtener una excelente primera impresión antes de caer de forma bastante abrupta para estar justo por debajo de la unidad Core i7-1065G7 de pre-producción que probamos hace unos meses. Por el contrario, el XPS 13 7390 2-in-1 Core i3-1005G1 no experimenta ninguna caída brusca en el rendimiento con el paso del tiempo, ya que sus frecuencias de reloj Turbo Boost son más modestas.
Incluso después de tener en cuenta cualquier estrangulamiento, el 25 W Core i7 Ice Lake sigue siendo más rápido que su predecesor de 15 W Whiskey Lake-U. El rendimiento en bruto es aproximadamente un 35 por ciento más rápido que el Core i7-8565U que se encuentra en el Dell Inspiron 7390 2-in-1 menos costoso, a la vez que es más estable que en el XPS 13 9380.
Más allá del rendimiento en bruto, Ice Lake también presenta la aceleración de la IA y Deep Learning Boost que no se encuentran en ninguna CPU de la serie Core U de generaciones anteriores o incluso en la última serie AMD Zen+ de segunda generación. No obstante, aún no se ha explorado completamente la viabilidad de esta característica en Windows para que tenga un impacto real en los escenarios de uso cotidiano.
Consulte nuestra página dedicada al Core i7-1065G7 para obtener más información técnica y comparaciones de referencia.
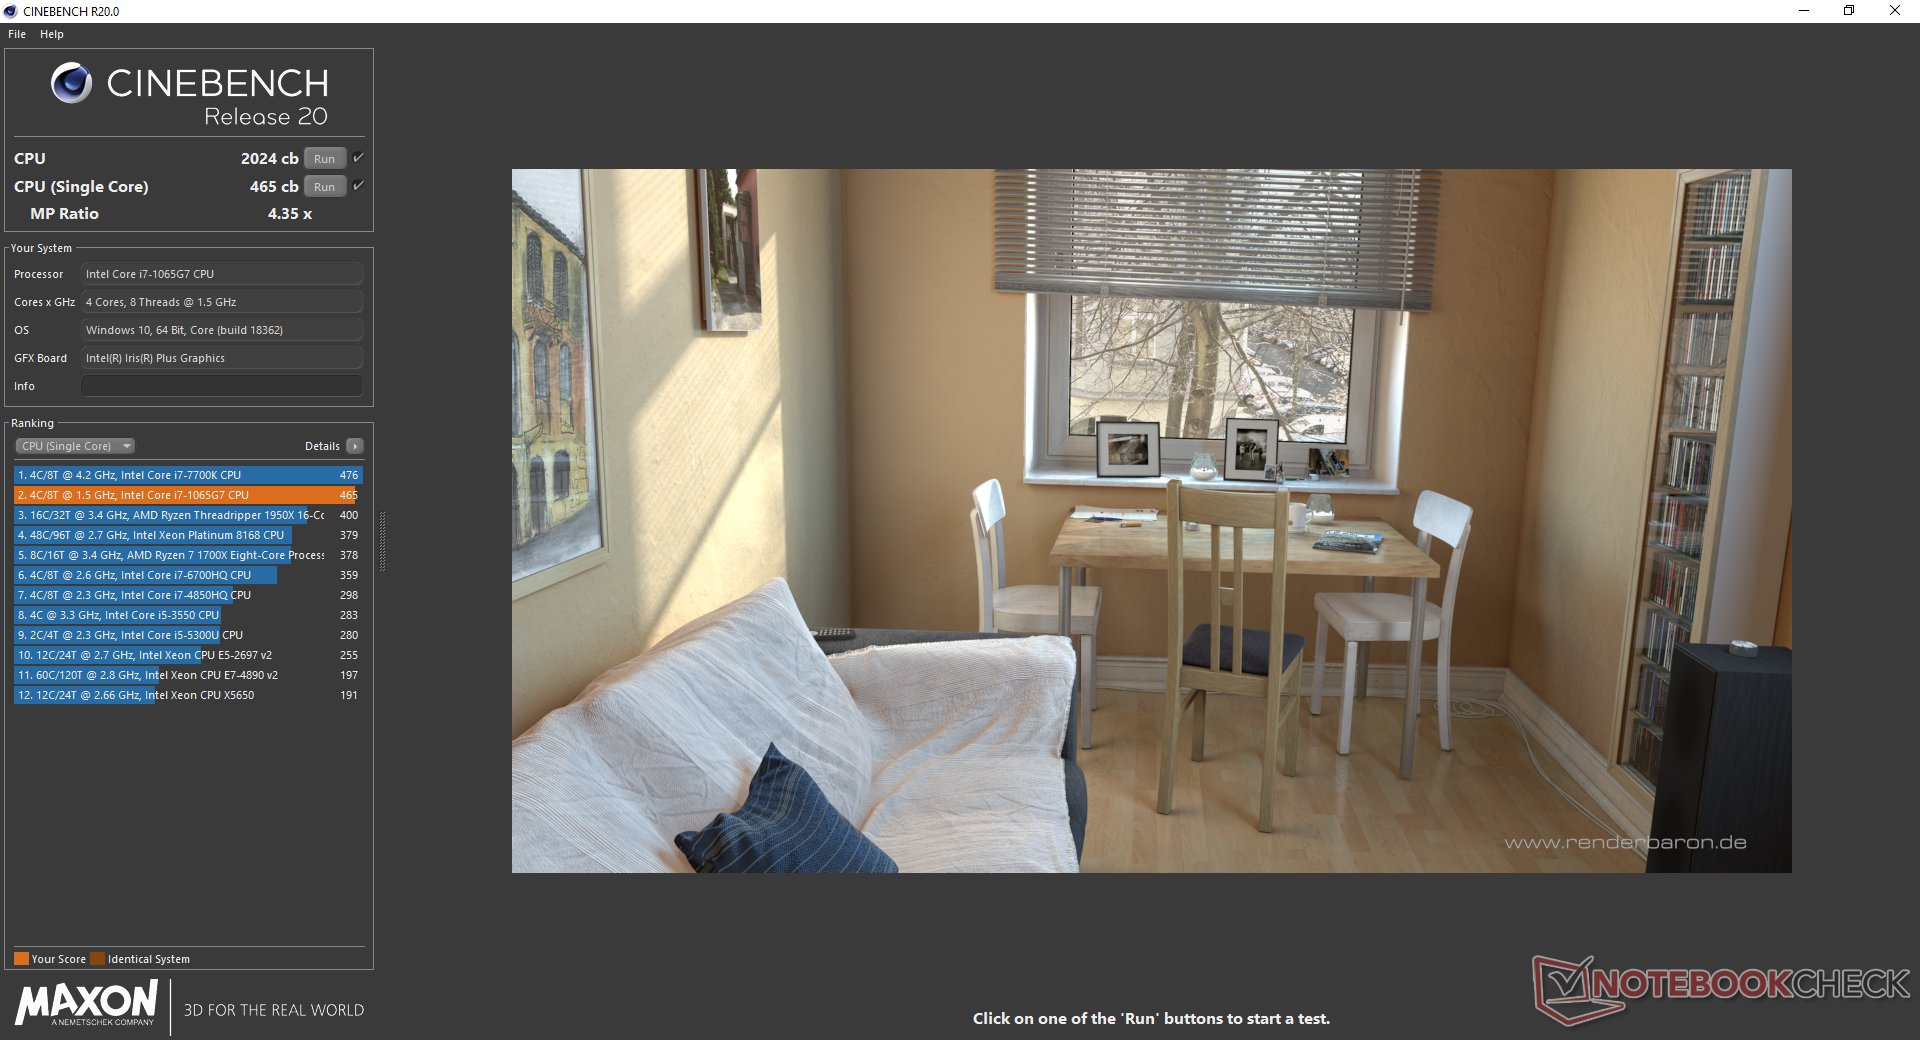
| Cinebench R20 | |
| CPU (Single Core) | |
| Dell XPS 13 7390 2-in-1 Core i7 | |
| Intel SDS Core i7-1065G7 Preliminary Sample 25 W | |
| Dell XPS 15 7590 9980HK GTX 1650 | |
| Intel SDS Core i7-1065G7 Preliminary Sample 15 W | |
| Medio Intel Core i7-1065G7 (358 - 474, n=31) | |
| Dell G5 15 5590 | |
| Dell XPS 13 7390 2-in-1 Core i3 | |
| Dell Latitude 14 5495 | |
| Dell Inspiron 15 5000 5585 | |
| CPU (Multi Core) | |
| Dell XPS 15 7590 9980HK GTX 1650 | |
| Dell G5 15 5590 | |
| Dell XPS 13 7390 2-in-1 Core i7 | |
| Intel SDS Core i7-1065G7 Preliminary Sample 25 W | |
| Medio Intel Core i7-1065G7 (1081 - 2024, n=31) | |
| Dell Inspiron 15 5000 5585 | |
| Dell Latitude 14 5495 | |
| Intel SDS Core i7-1065G7 Preliminary Sample 15 W | |
| Dell XPS 13 7390 2-in-1 Core i3 | |
Rendimiento del sistema: Más rápido de lo que parece
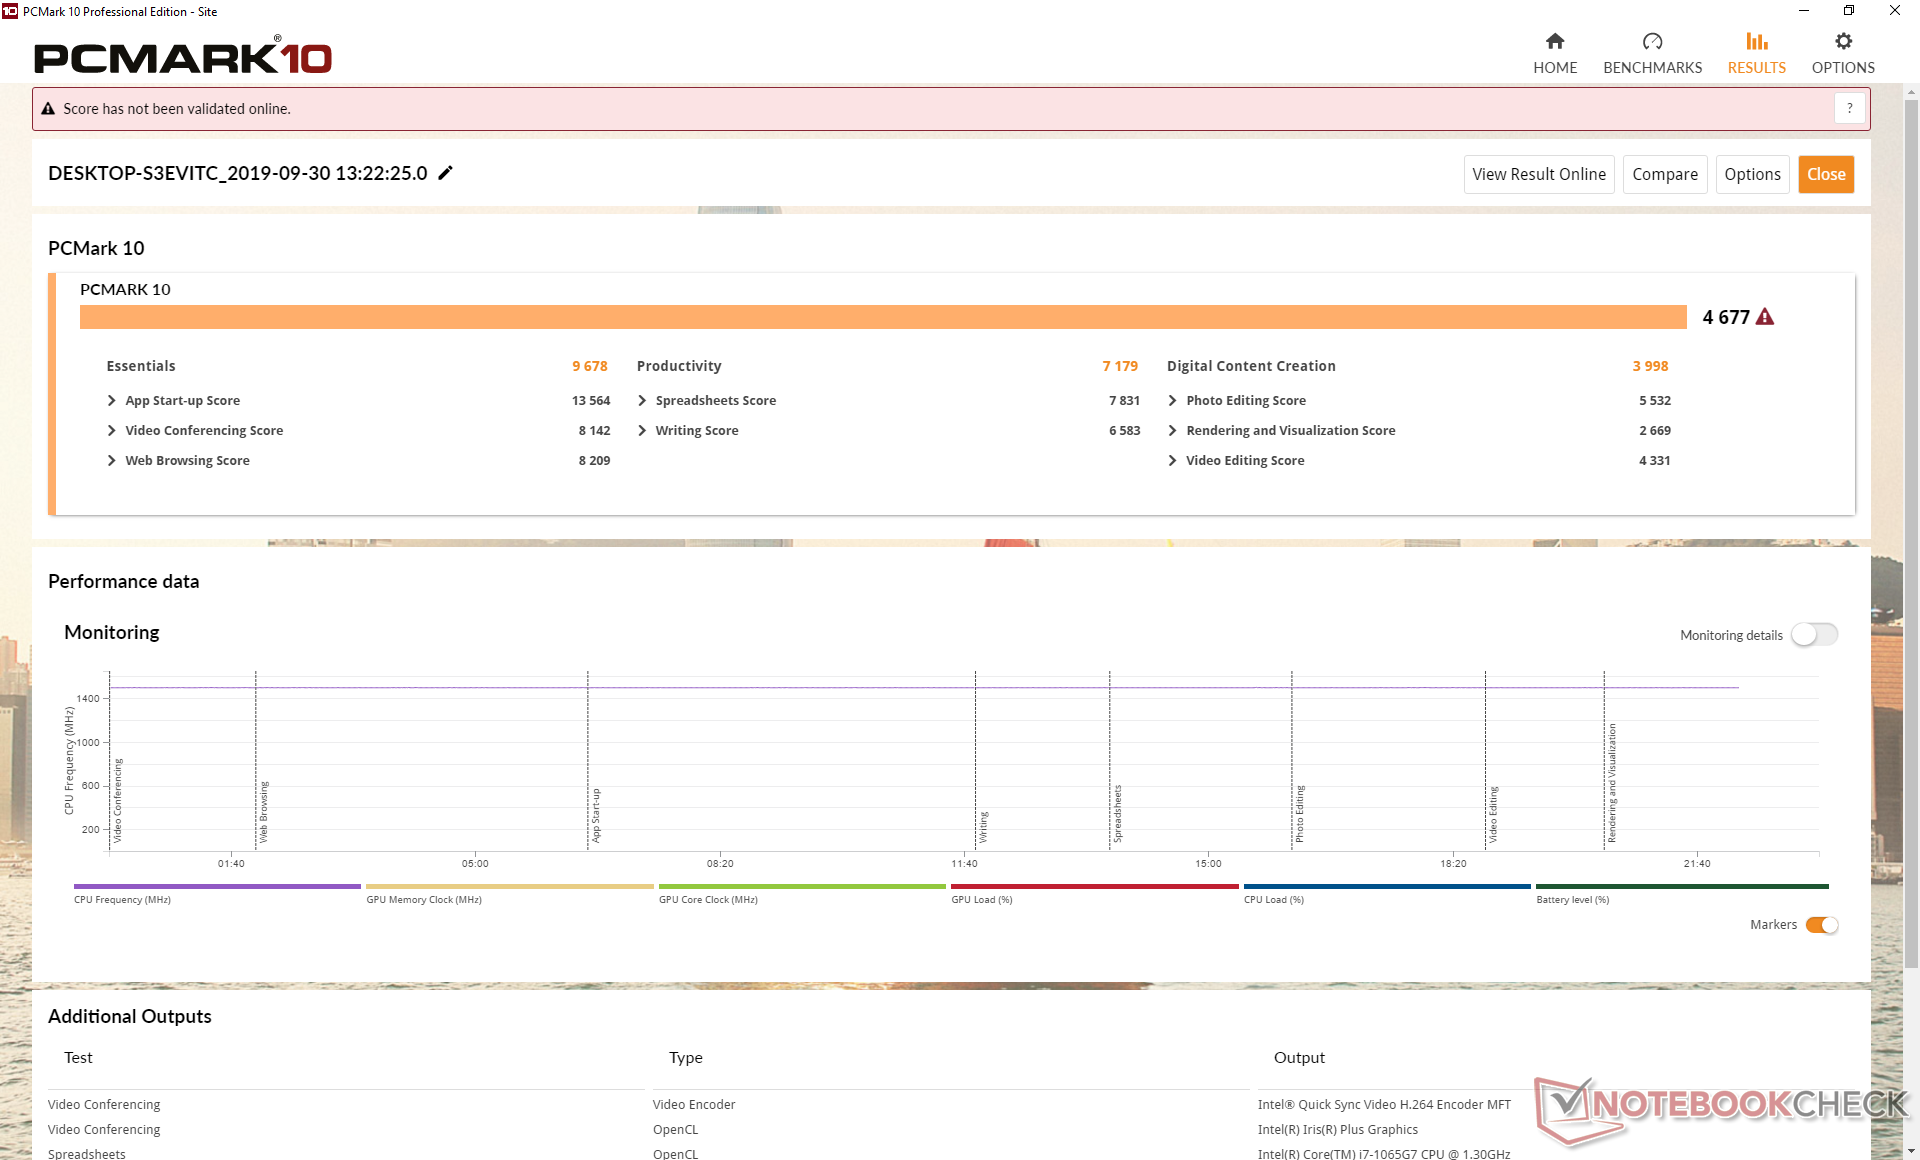
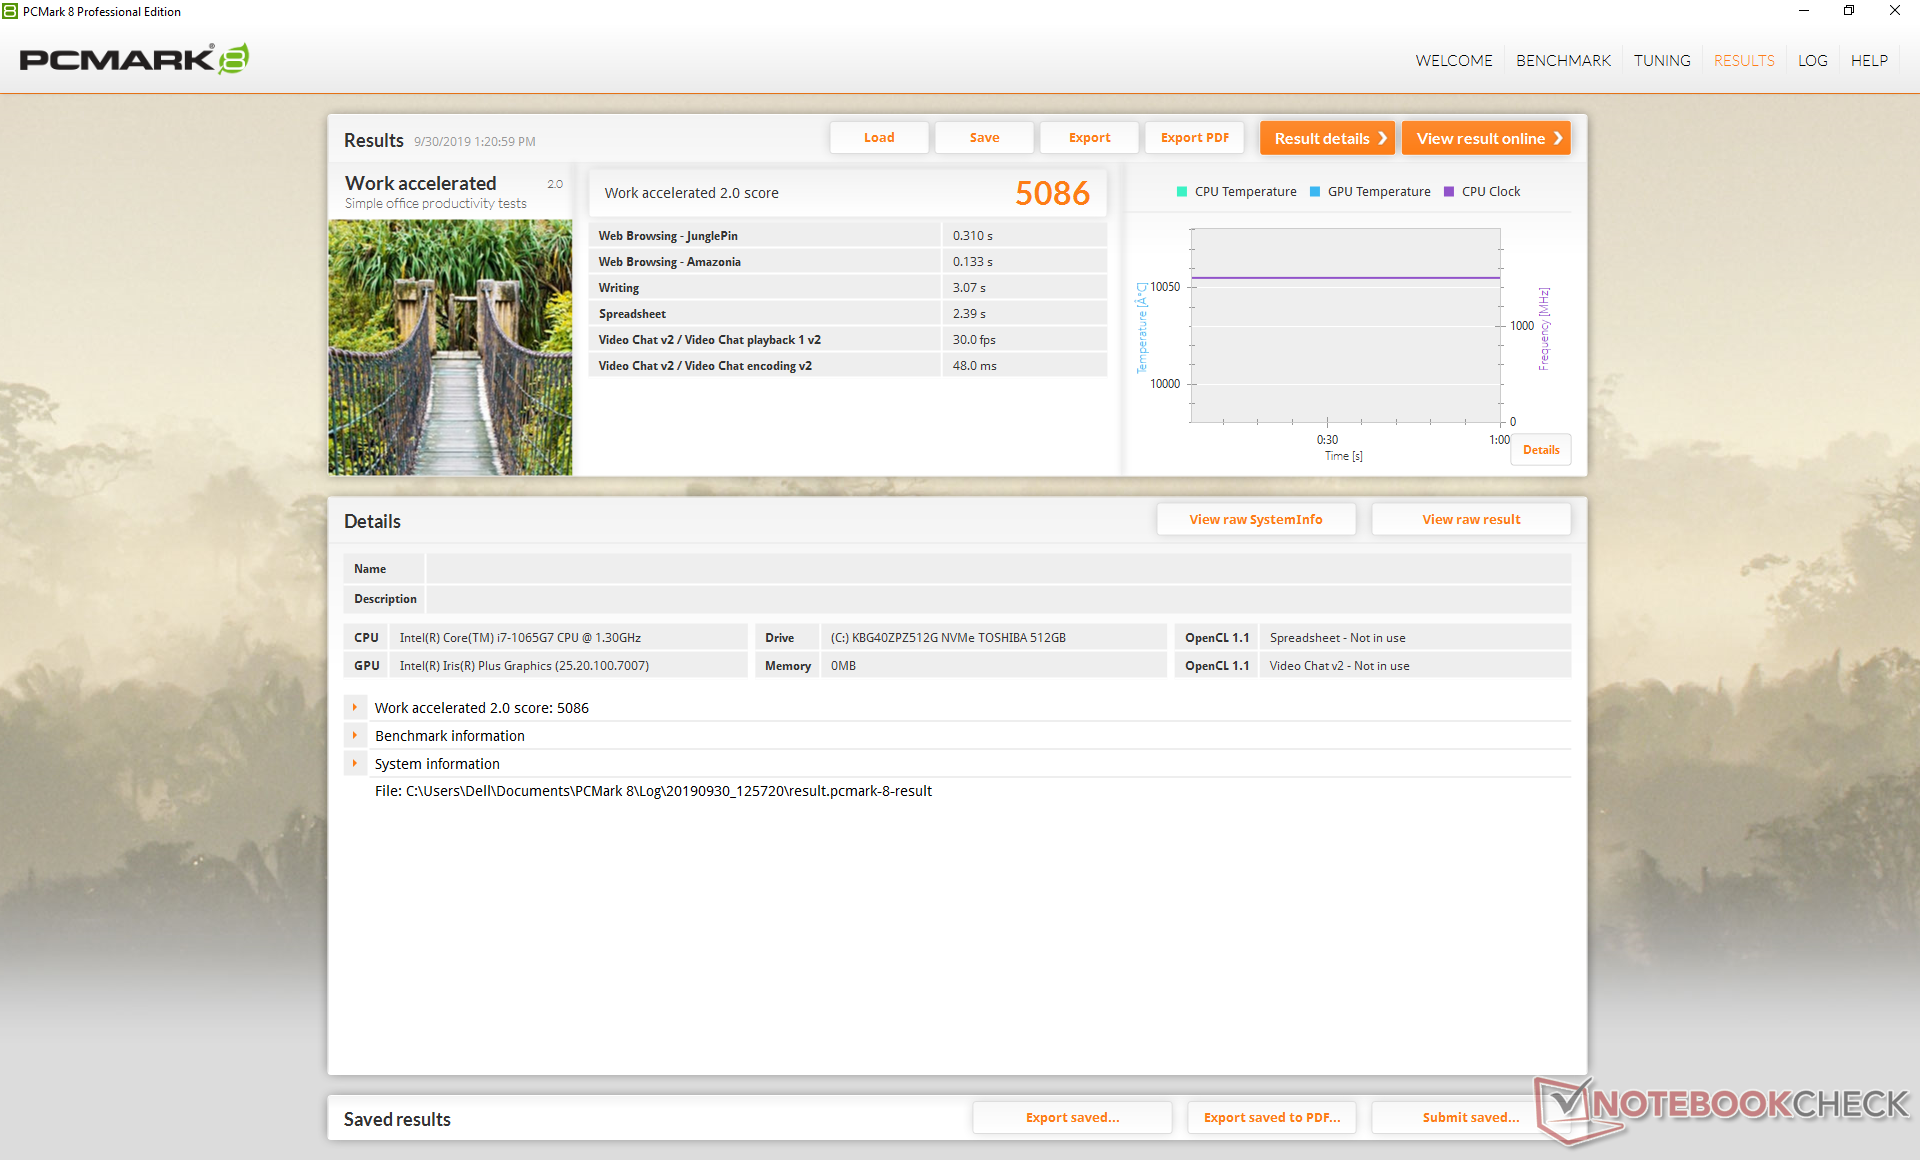
Las pruebas de rendimiento de PCMark muestran que nuestro XPS 13 7390 2-in-1 Core i7 supera al Core i3 SKU en un 20 a 50 por ciento. La mayor ventaja está en el punto de referencia de la creación digital, donde la GPU Iris Plus integrada es capaz de flexionar sus músculos sobre el UHD Graphics G1 de la versión Core i3. De hecho, los resultados generales son más rápidos que incluso la configuración más rápida disponible del XPS 13 9380.
La unidad no muestra ningún problema de audio o USB que nuestra última unidad Core i3 haya tenido.
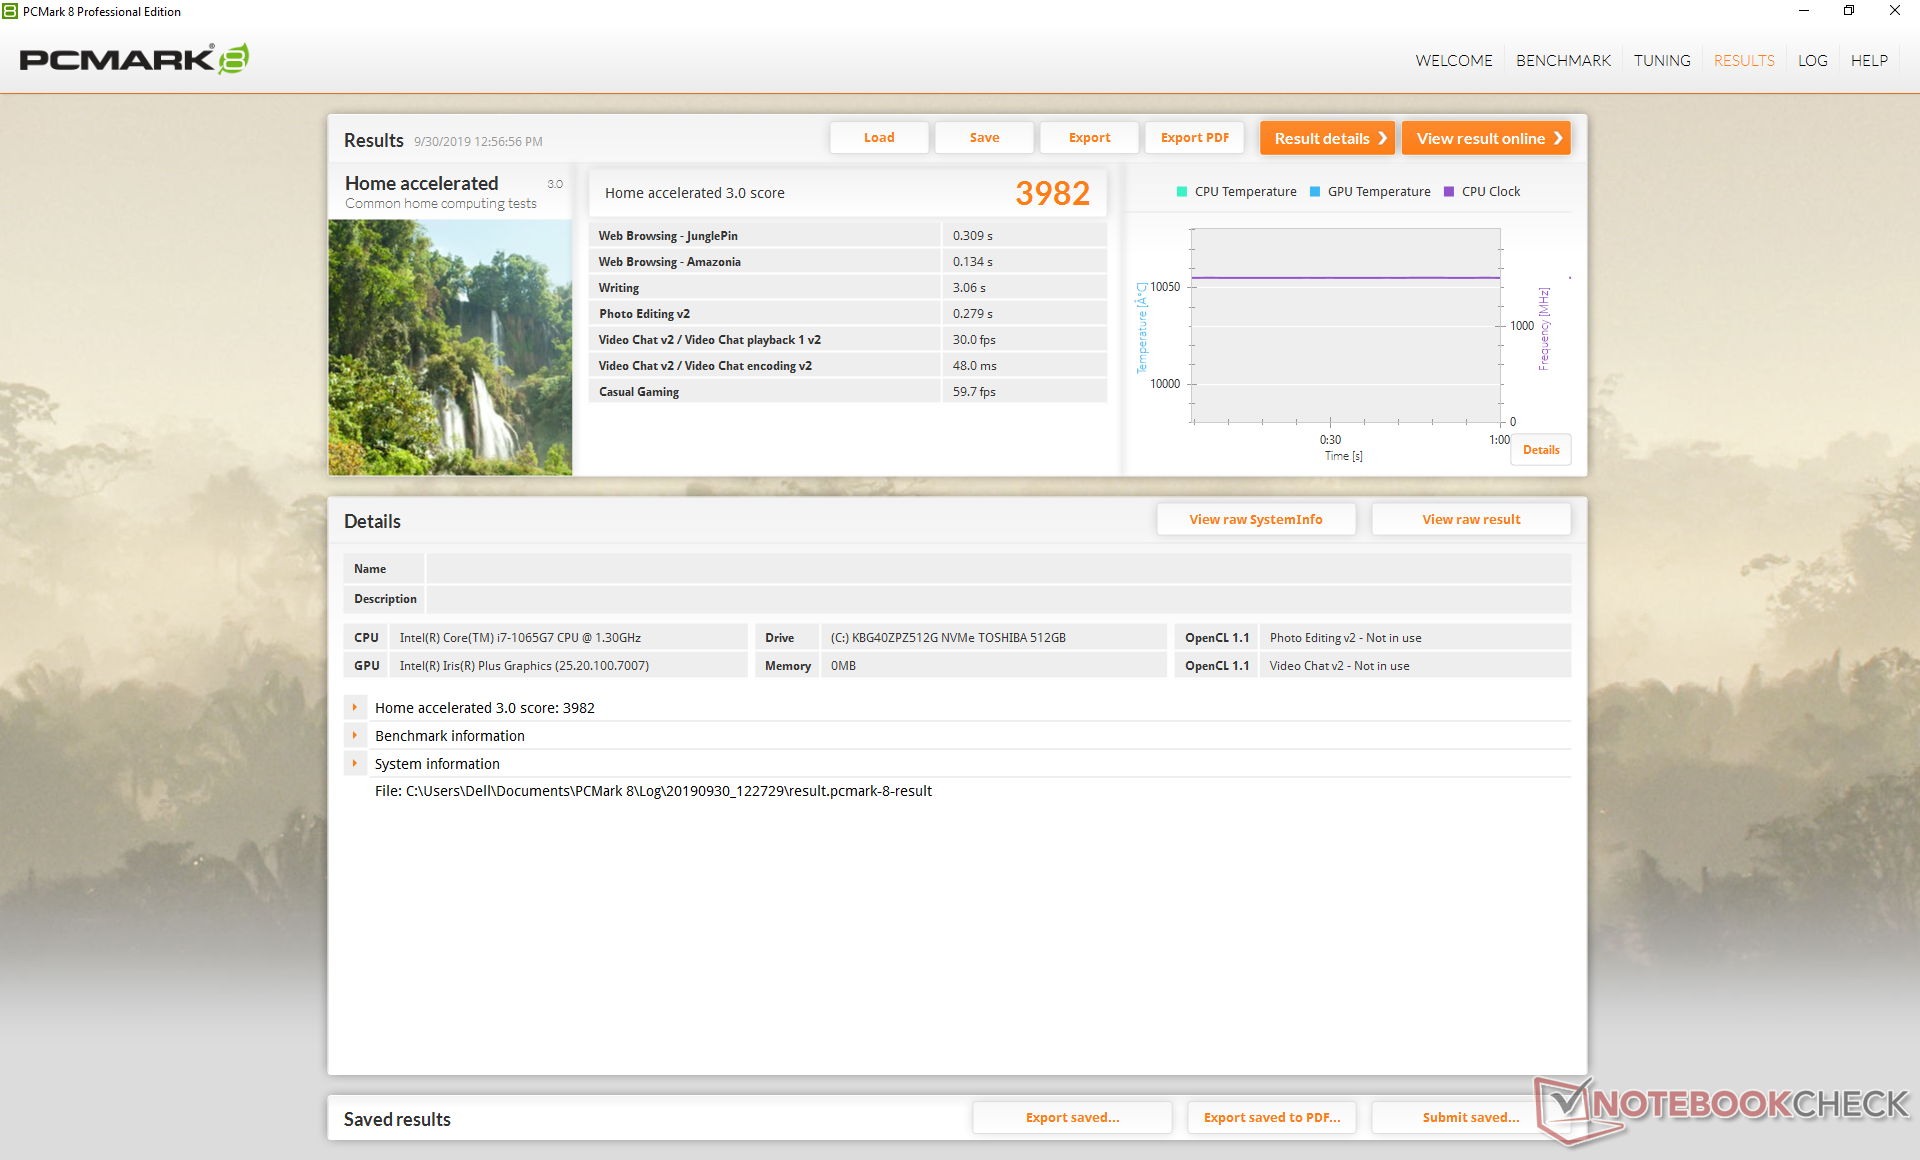
| PCMark 8 Home Score Accelerated v2 | 3982 puntos | |
| PCMark 8 Work Score Accelerated v2 | 5086 puntos | |
| PCMark 10 Score | 4677 puntos | |
ayuda | ||
Dispositivos de almacenamiento: Todo está soldado
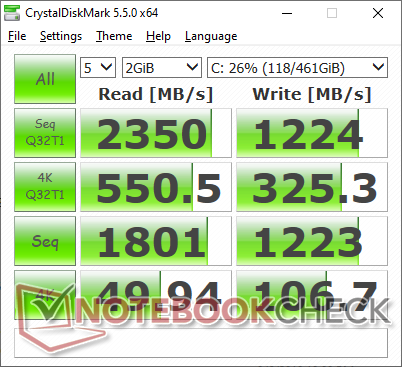
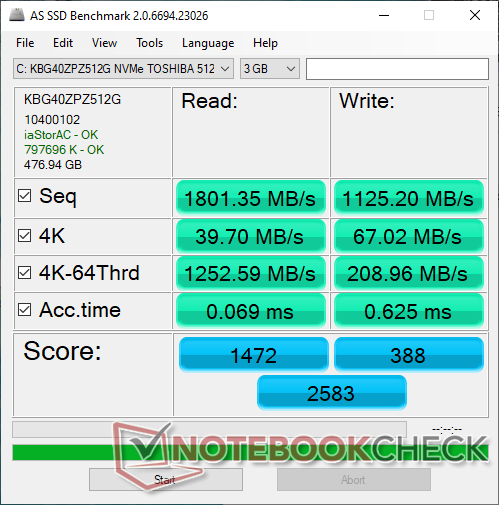
Nuestra unidad Core i7 viene con una unidad Toshiba BG4 NVMe SSD de 512 GB que es muy similar a la Toshiba BG4 NVMe SSD de 256 GB en la configuración Core i3. Los usuarios deben elegir con cuidado tanto la memoria RAM como el almacenamiento, ya que estos componentes están soldados.
| Dell XPS 13 7390 2-in-1 Core i7 Toshiba BG4 KBG40ZPZ512G | Dell XPS 13 7390 2-in-1 Core i3 Toshiba BG4 KBG40ZPZ256G | Dell XPS 13 9380 2019 SK hynix PC401 HFS256GD9TNG | Dell XPS 13-9365 2-in-1 Toshiba NVMe THNSN5256GPUK | Dell Latitude 7200 WDC PC SN520 SDAPNUW-512G | Dell Latitude 13 5300 2-in-1 SK hynix PC401 HFS256GD9TNG | |
|---|---|---|---|---|---|---|
| AS SSD | -11% | -5% | -10% | 63% | -4% | |
| Seq Read (MB/s) | 1801 | 1558 -13% | 2035 13% | 1283 -29% | 1294 -28% | 1236 -31% |
| Seq Write (MB/s) | 1125 | 1103 -2% | 658 -42% | 735 -35% | 856 -24% | 500 -56% |
| 4K Read (MB/s) | 39.7 | 37.52 -5% | 39.74 0% | 37.69 -5% | 42.52 7% | 40.1 1% |
| 4K Write (MB/s) | 67 | 59 -12% | 105.7 58% | 96.9 45% | 141 110% | 115.7 73% |
| 4K-64 Read (MB/s) | 1253 | 1684 34% | 461 -63% | 586 -53% | 983 -22% | 474.1 -62% |
| 4K-64 Write (MB/s) | 209 | 198.9 -5% | 300.1 44% | 204.7 -2% | 1183 466% | 350.4 68% |
| Access Time Read * (ms) | 0.069 | 0.099 -43% | 0.061 12% | 0.045 35% | 0.057 17% | 0.04 42% |
| Access Time Write * (ms) | 0.625 | 0.722 -16% | 0.051 92% | 0.037 94% | 0.026 96% | 0.051 92% |
| Score Read (Points) | 1472 | 1877 28% | 704 -52% | 752 -49% | 1155 -22% | 638 -57% |
| Score Write (Points) | 388 | 368 -5% | 471 21% | 375 -3% | 1410 263% | 516 33% |
| Score Total (Points) | 2583 | 3180 23% | 1479 -43% | 1495 -42% | 3142 22% | 1456 -44% |
| Copy ISO MB/s (MB/s) | 1293 | 677 -48% | 893 -31% | 950 -27% | 1387 7% | 818 -37% |
| Copy Program MB/s (MB/s) | 560 | 298.4 -47% | 287.9 -49% | 263.8 -53% | 449.5 -20% | 395.5 -29% |
| Copy Game MB/s (MB/s) | 927 | 496.1 -46% | 618 -33% | 726 -22% | 1059 14% | 452.5 -51% |
* ... más pequeño es mejor

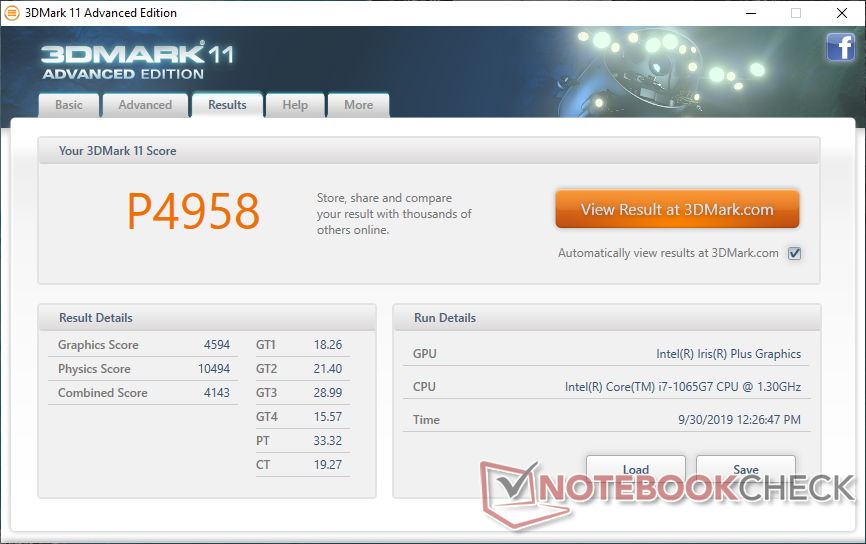
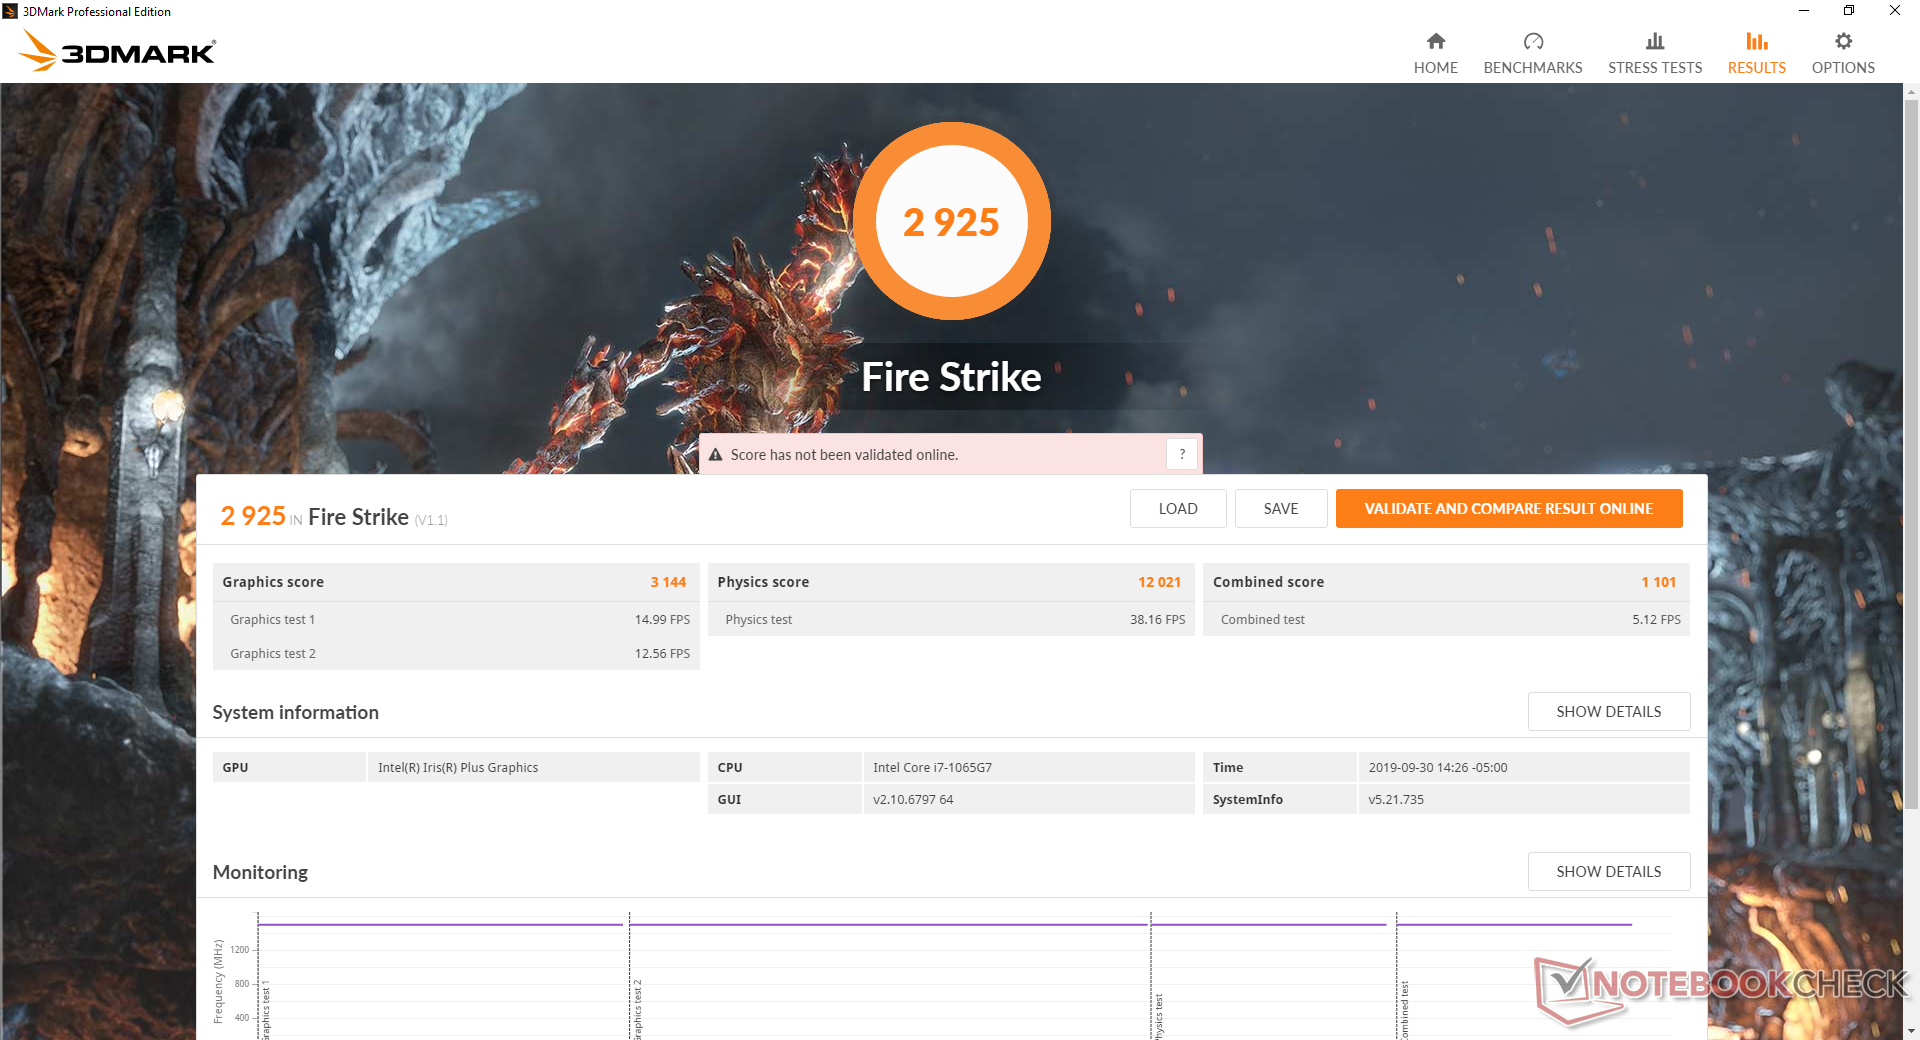
Rendimiento de la GPU: Lo suficientemente bueno para juegos multijugador poco exigentes
El rendimiento de los gráficos es donde las cosas se ponen difíciles. Es cierto que el nuevo Iris Plus integrado está más allá de la UHD Graphics 620, pero el rendimiento en el mundo real es mucho más variable dependiendo del juego, API o aplicación. Como se ha mencionado aquí, los resultados de 3DMark no se traducen en un rendimiento real de los juegos, especialmente si se comparan dos familias de GPU diferentes. La GeForce MX250, por ejemplo, es entre un 17 y un 36 por ciento más rápida que nuestra Iris Plus según los puntos de referencia de 3DMark. En realidad, el MX250 puede ofrecer velocidades de fotogramas entre un 50 y un 70 por ciento más rápidas que el Iris Plus, dependiendo del título.
Si usted es un jugador ocasional de CS:GO, Fortnite, Rocket League, o DOTA 2, entonces el Iris Plus puede hacer el trabajo a 1080p o 720p en peor. Para los títulos más exigentes como Overwatch o Destiny 2, sería mucho mejor utilizar una GeForce MX150 o MX250.
| 3DMark 06 Standard Score | 17752 puntos | |
| 3DMark 11 Performance | 4958 puntos | |
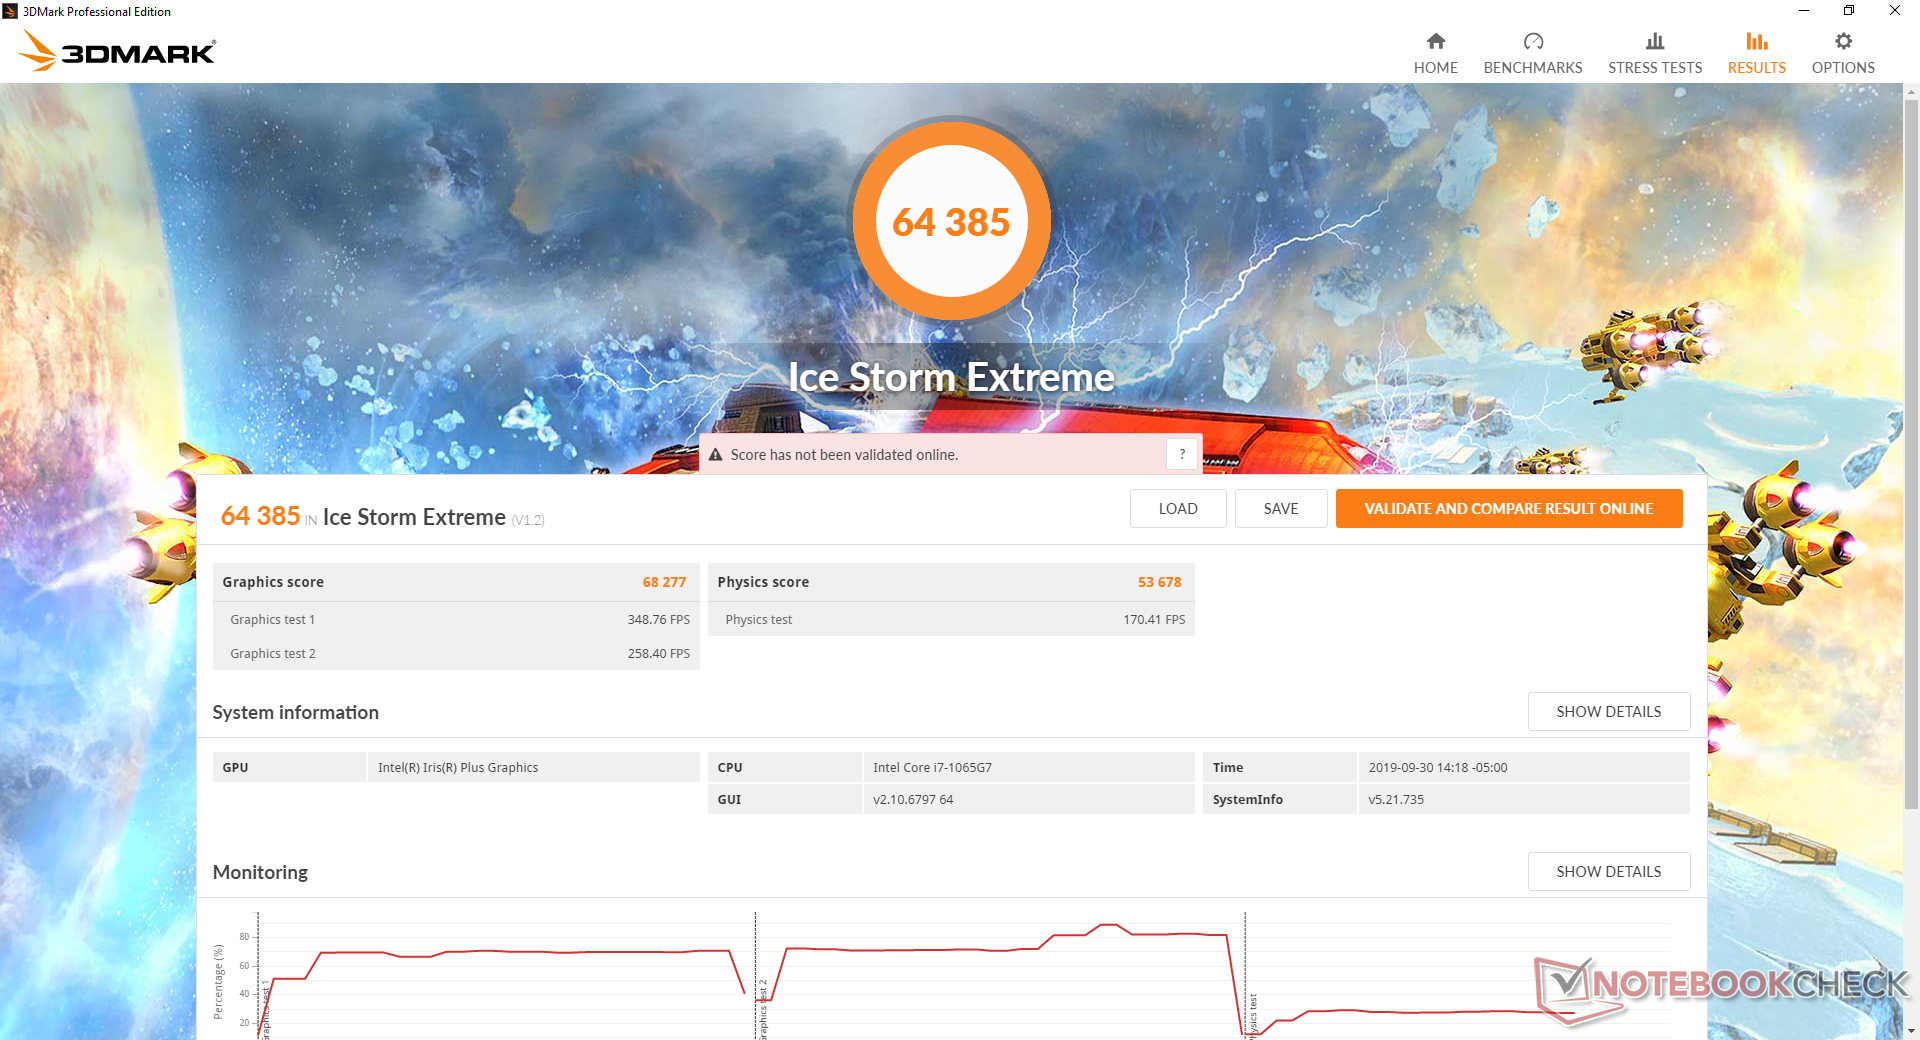
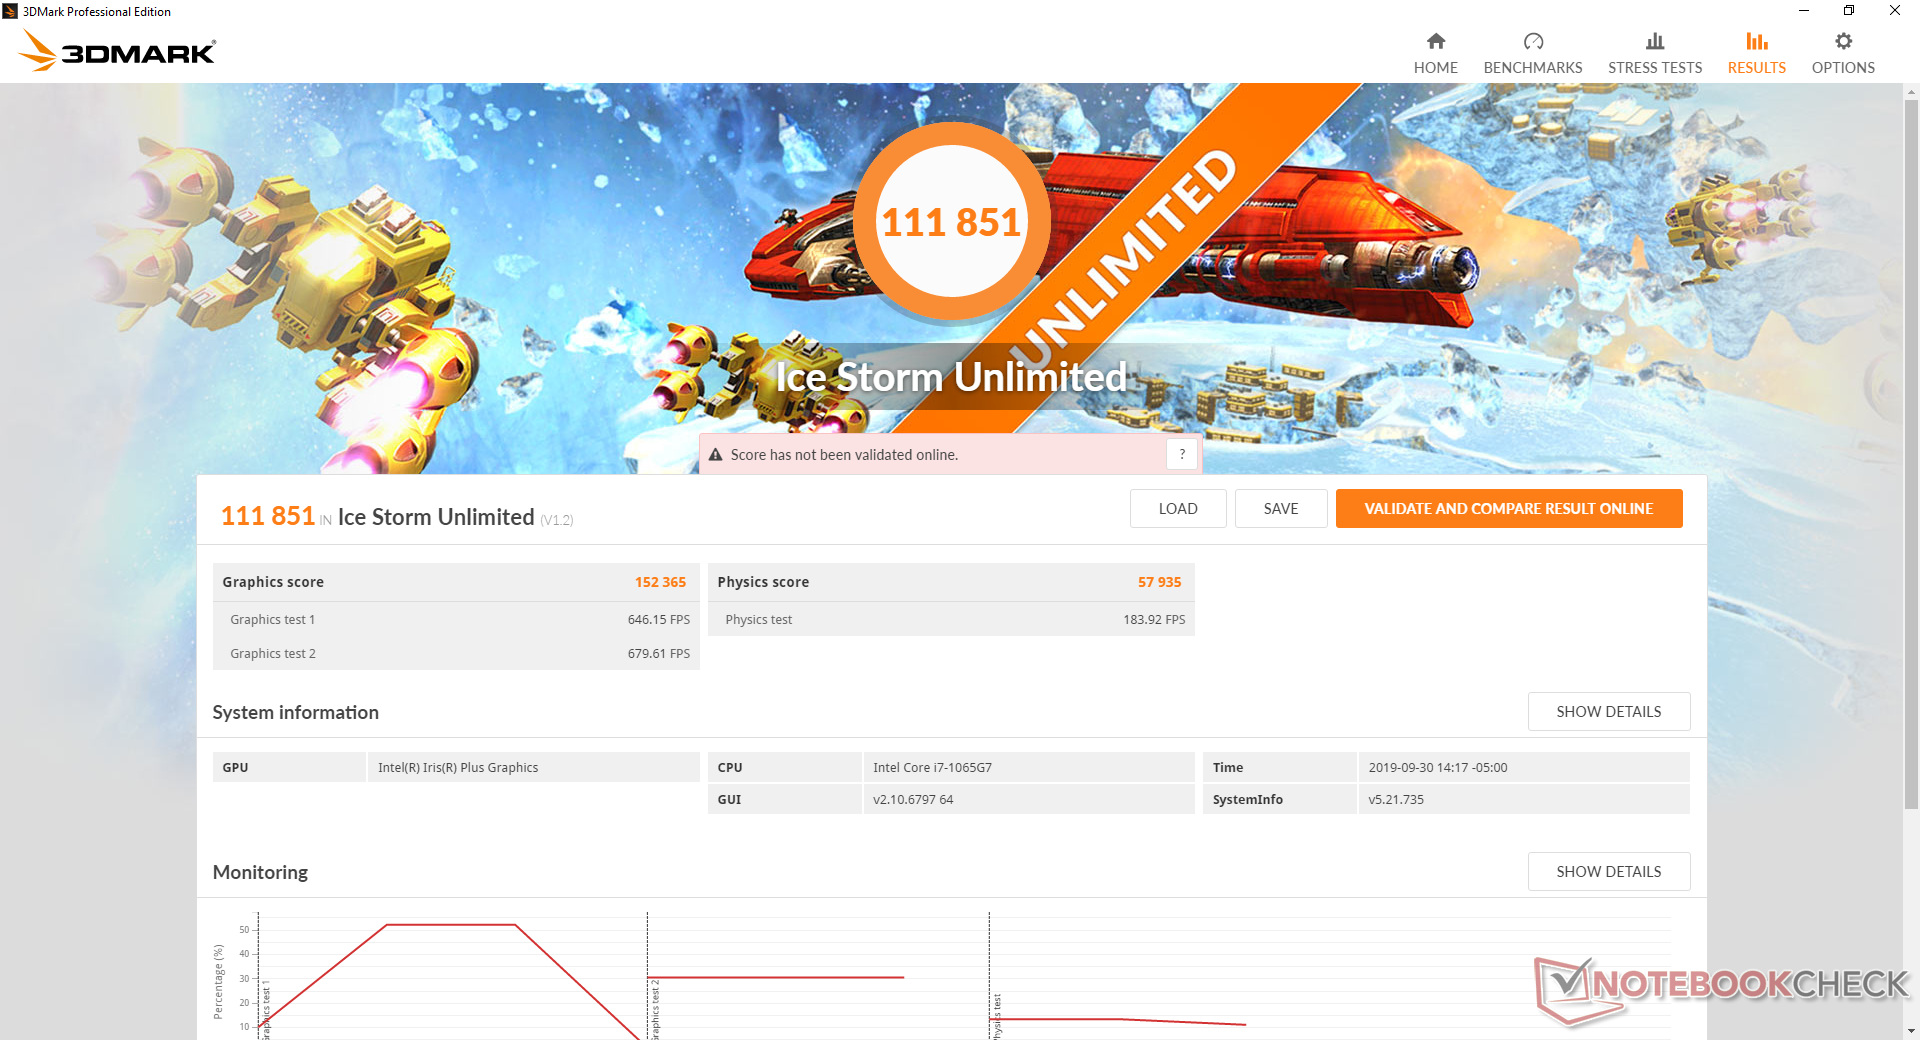
| 3DMark Ice Storm Standard Score | 77789 puntos | |
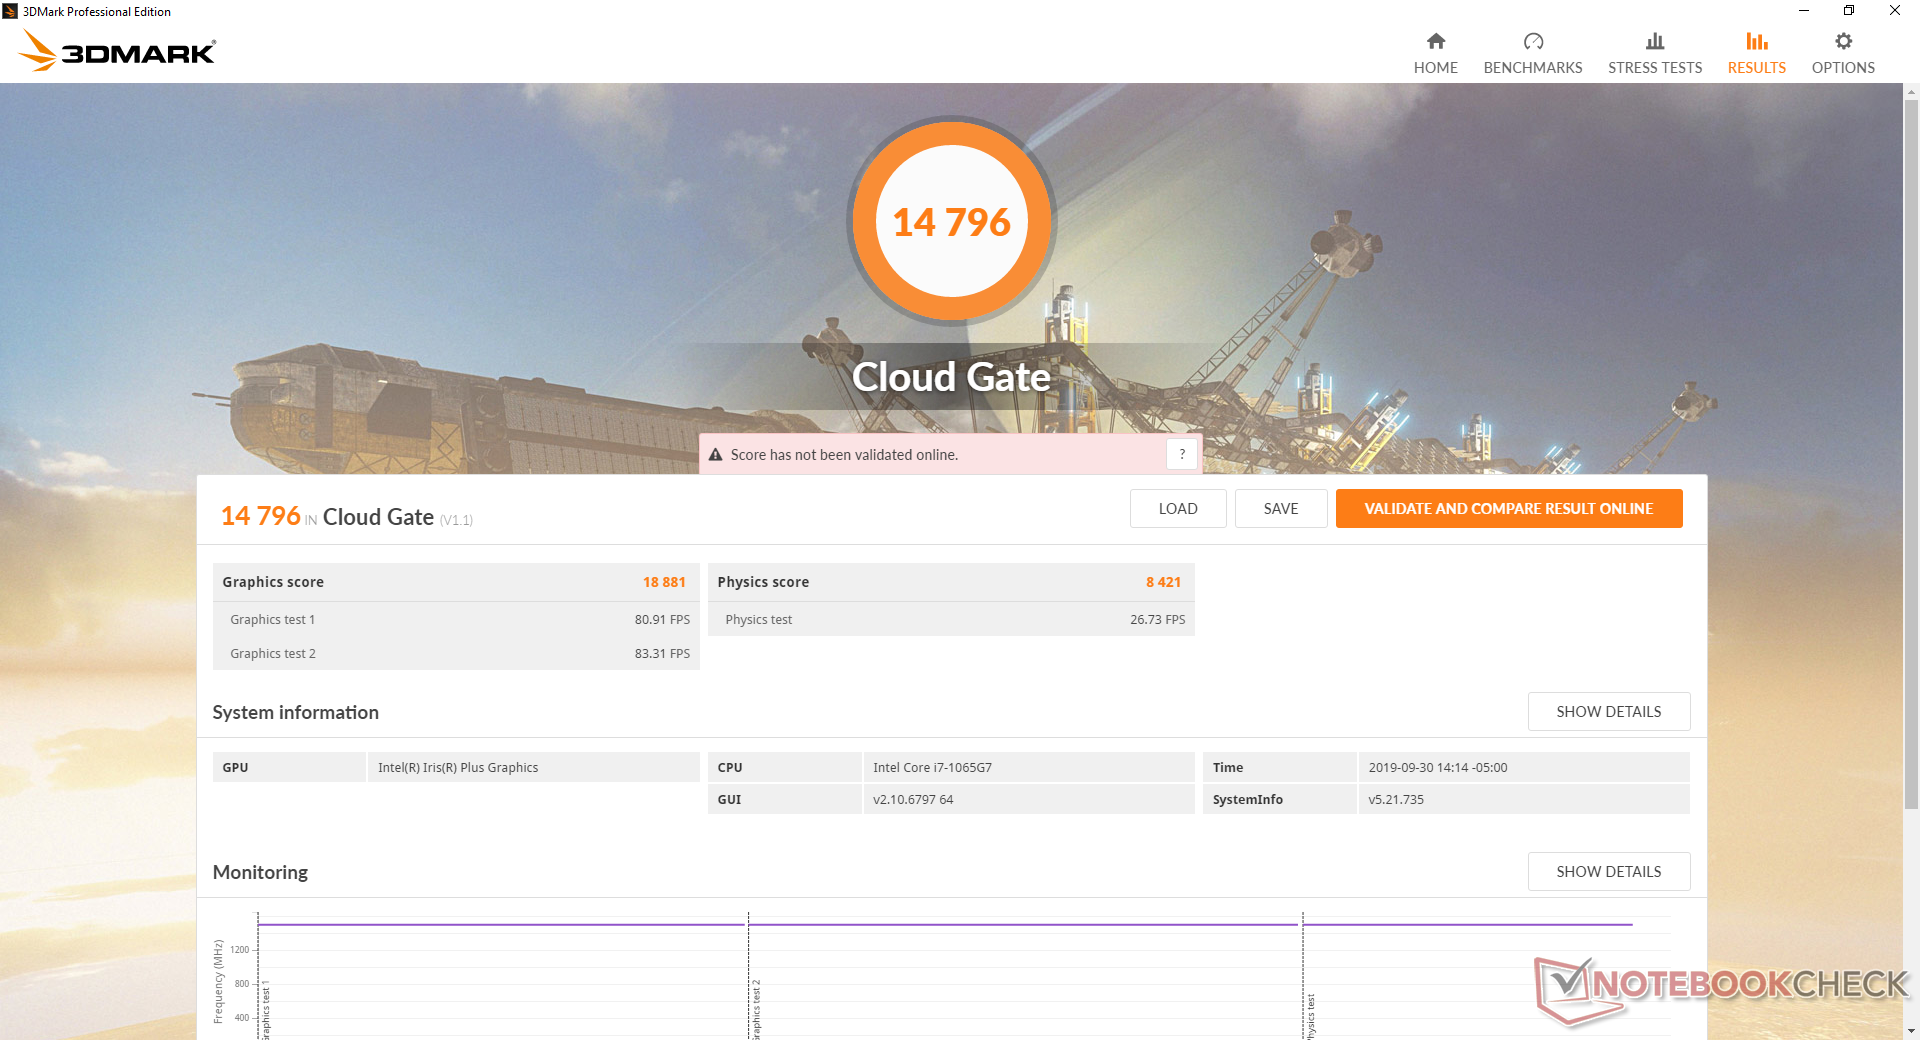
| 3DMark Cloud Gate Standard Score | 14796 puntos | |
| 3DMark Fire Strike Score | 2925 puntos | |
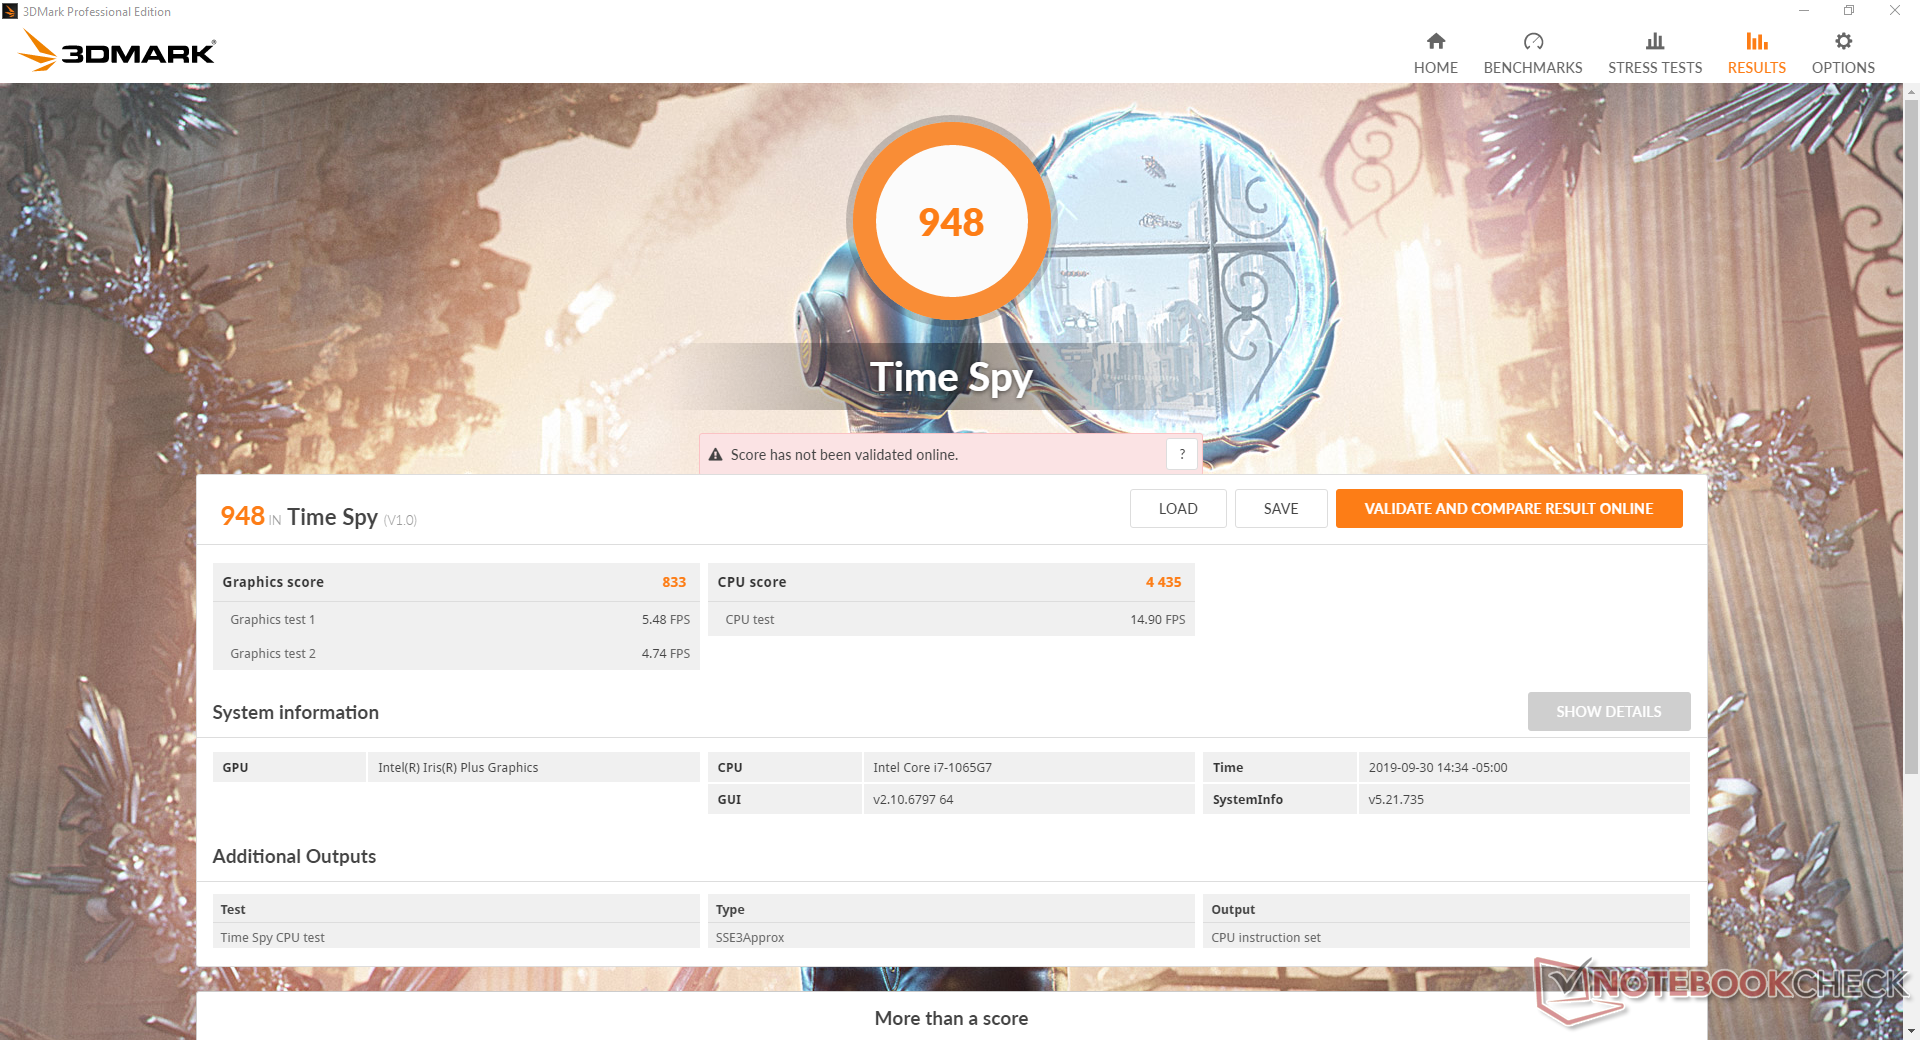
| 3DMark Time Spy Score | 948 puntos | |
ayuda | ||
| Rocket League | |
| 1920x1080 High Quality AA:High FX | |
| Dell XPS 15 7590 9980HK GTX 1650 | |
| Acer Aspire 5 A515-52G-723L | |
| Intel SDS Core i7-1065G7 Preliminary Sample 25 W | |
| Intel SDS Core i7-1065G7 Preliminary Sample 15 W | |
| Dell Inspiron 15 5000 5585 | |
| Dell XPS 13 7390 2-in-1 Core i7 | |
| Dell XPS 13 9360 FHD i7 Iris | |
| Dell XPS 13 7390 2-in-1 Core i3 | |
| Dell XPS 13 9370 FHD i5 | |
| Asus ZenBook 14 UX433FA | |
| 1920x1080 Performance | |
| Dell XPS 15 7590 9980HK GTX 1650 | |
| Dell Inspiron 15 5000 5585 | |
| Intel SDS Core i7-1065G7 Preliminary Sample 25 W | |
| Intel SDS Core i7-1065G7 Preliminary Sample 15 W | |
| Dell XPS 13 7390 2-in-1 Core i3 | |
| Dell XPS 13 7390 2-in-1 Core i7 | |
| Asus ZenBook 14 UX433FA | |
| The Witcher 3 - 1920x1080 High Graphics & Postprocessing (Nvidia HairWorks Off) | |
| Dell G5 15 5590 | |
| Dell XPS 15 7590 9980HK GTX 1650 | |
| Dell XPS 15 9575 i5-8305G | |
| Dell Inspiron 15 7000 7577 | |
| Dell XPS 15 2018 i5 FHD 97Wh | |
| Huawei MateBook 14 KLV-W29 | |
| Acer Aspire 5 A515-52G-723L | |
| Dell Inspiron 15 5000 5585 | |
| Intel SDS Core i7-1065G7 Preliminary Sample 15 W | |
| Huawei Matebook X Pro i5 | |
| Intel SDS Core i7-1065G7 Preliminary Sample 25 W | |
| Dell XPS 13 7390 2-in-1 Core i7 | |
| Dell Latitude 14 5495 | |
| Dell XPS 13 7390 2-in-1 Core i3 | |
| Shadow of the Tomb Raider - 1280x720 Lowest Preset | |
| Dell XPS 15 7590 9980HK GTX 1650 | |
| Acer Aspire 5 A515-52G-723L | |
| Dell Inspiron 15 5000 5585 | |
| Intel SDS Core i7-1065G7 Preliminary Sample 15 W | |
| Intel SDS Core i7-1065G7 Preliminary Sample 25 W | |
| Dell XPS 13 7390 2-in-1 Core i7 | |
| Dell XPS 13 9380 2019 | |
Inactivo en Witcher 3 no muestra hundimientos del cuadro a lo largo del tiempo para un rendimiento consistente y sin estrangulamiento. Recomendamos activar la sincronización en V para lograr un ritmo de fotogramas más uniforme, ya que Iris Plus tiende a funcionar entre 30 FPS y 60 FPS en los casos en que se observa un desgarro de la pantalla.
| bajo | medio | alto | ultra | |
|---|---|---|---|---|
| Guild Wars 2 (2012) | 105 | 33.2 | 13.9 | |
| StarCraft II: Heart of the Swarm (2013) | 321.1 | 98.1 | 61.6 | 30.6 |
| BioShock Infinite (2013) | 112.6 | 68.6 | 58.1 | 21.3 |
| The Witcher 3 (2015) | 54.9 | 34.4 | 17 | 7.8 |
| Metal Gear Solid V (2015) | 60 | 60 | 31.1 | 18.1 |
| Rise of the Tomb Raider (2016) | 42.4 | 26.9 | 14.7 | 10.5 |
| Doom (2016) | 41.2 | 20.4 | ||
| Overwatch (2016) | 91.4 | 56 | 29.7 | |
| Rocket League (2017) | 114 | 62.6 | 33.8 | |
| Destiny 2 (2017) | 29.4 | 20.4 | ||
| Shadow of the Tomb Raider (2018) | 27 | |||
| F1 2019 (2019) | 35 | 22 | 20 | 13 |
| Borderlands 3 (2019) | 31.8 | 13.8 | 8.7 | 6.6 |
Emisiones
Ruido del sistema: Silencio durante la navegación, tono alto durante los juegos
El ruido y el comportamiento de los ventiladores siguen siendo esencialmente los mismos que en la configuración Core i3, a pesar de sus amplias diferencias de rendimiento. El sistema es silencioso o casi silencioso cuando se navega o se transmite video. Mientras tanto, las cargas de juego golpearán lentamente a los ventiladores hasta que alcancen un máximo constante de 43,4 dB(A) para ser más ruidosos que un XPS 13 con carcasa de almeja. El alto tono de ruido en particular hace que los ventiladores sean más perceptibles de lo que deberían ser cuando el sistema está sometido a cargas estresantes.
Podemos notar un ligero gemido de la bobina o ruido electrónico cuando colocamos un oído cerca de las teclas del teclado en nuestra unidad. Esto se vuelve inaudible cuando se está sentado a una distancia normal del sistema.
| Dell XPS 13 7390 2-in-1 Core i7 Iris Plus Graphics G7 (Ice Lake 64 EU), i7-1065G7, Toshiba BG4 KBG40ZPZ512G | Dell XPS 13 7390 2-in-1 Core i3 UHD Graphics G1 (Ice Lake 32 EU), i3-1005G1, Toshiba BG4 KBG40ZPZ256G | Dell XPS 13 9380 2019 UHD Graphics 620, i5-8265U, SK hynix PC401 HFS256GD9TNG | Dell XPS 13 9370 FHD i5 UHD Graphics 620, i5-8250U, Toshiba XG5 KXG50ZNV256G | Dell XPS 13 9360 FHD i7 Iris Iris Plus Graphics 640, i7-7560U, Toshiba XG4 NVMe (THNSN5512GPUK) | Dell XPS 13-9365 2-in-1 HD Graphics 615, i7-7Y75, Toshiba NVMe THNSN5256GPUK | |
|---|---|---|---|---|---|---|
| Noise | 0% | -3% | -1% | -2% | ||
| apagado / medio ambiente * (dB) | 28.1 | 28 -0% | 30.4 -8% | 29.1 -4% | 29.9 -6% | |
| Idle Minimum * (dB) | 28.1 | 28 -0% | 30.4 -8% | 29.1 -4% | 29.9 -6% | |
| Idle Average * (dB) | 28.1 | 28 -0% | 30.4 -8% | 29.1 -4% | 29.9 -6% | |
| Idle Maximum * (dB) | 28.1 | 28 -0% | 30.4 -8% | 29.1 -4% | 30.3 -8% | |
| Load Average * (dB) | 31.7 | 31.7 -0% | 31.7 -0% | 32.2 -2% | 33.9 -7% | |
| Witcher 3 ultra * (dB) | 43.4 | |||||
| Load Maximum * (dB) | 43.4 | 43.5 -0% | 38.1 12% | 37.3 14% | 34.9 20% |
* ... más pequeño es mejor
Ruido
| Ocioso |
| 28.1 / 28.1 / 28.1 dB(A) |
| Carga |
| 31.7 / 43.4 dB(A) |
 | ||
30 dB silencioso 40 dB(A) audible 50 dB(A) ruidosamente alto |
||
min: | ||
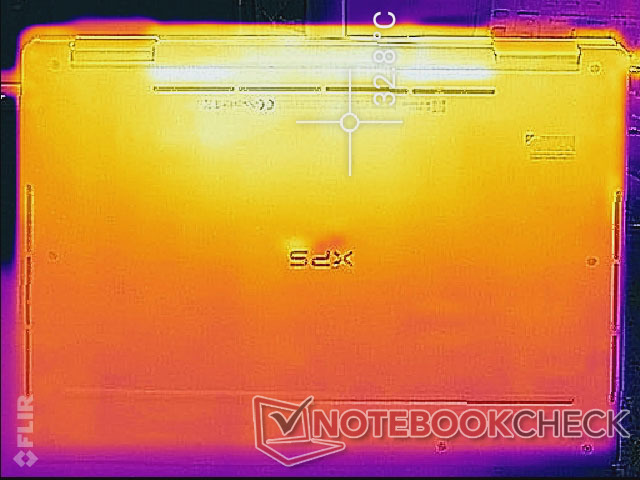
Temperatura: Casi idéntico al modelo Core i3

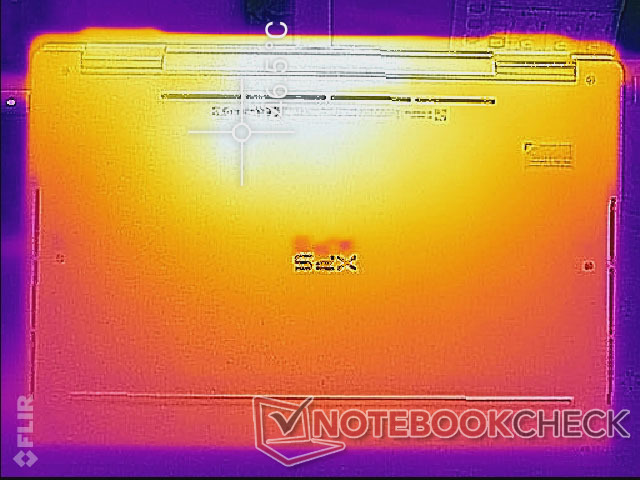
Las temperaturas superficiales siguen siendo idénticas a las que observamos en la configuración Core i7. Las superficies pueden variar entre 30 C hasta 50 C dependiendo de la carga. Los puntos calientes están hacia la parte trasera de la unidad para estar lejos del clickpad y de los apoyos de la palma de la mano.
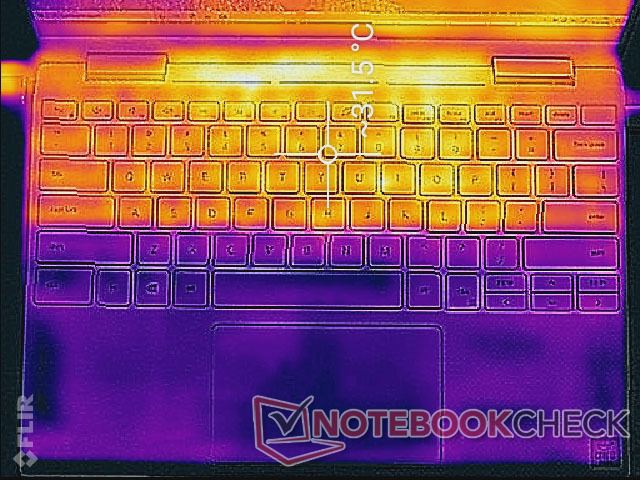
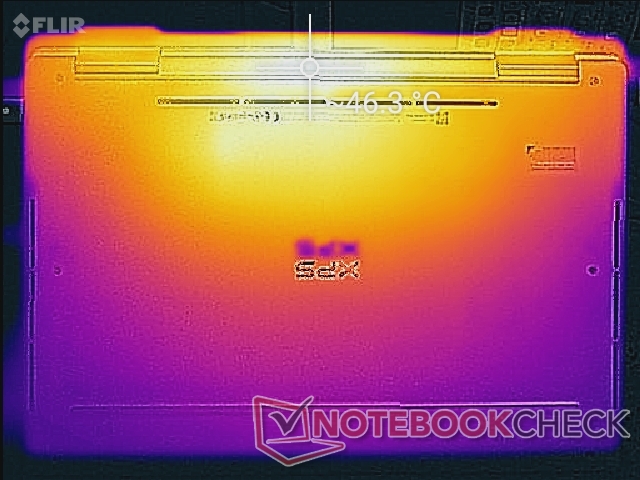
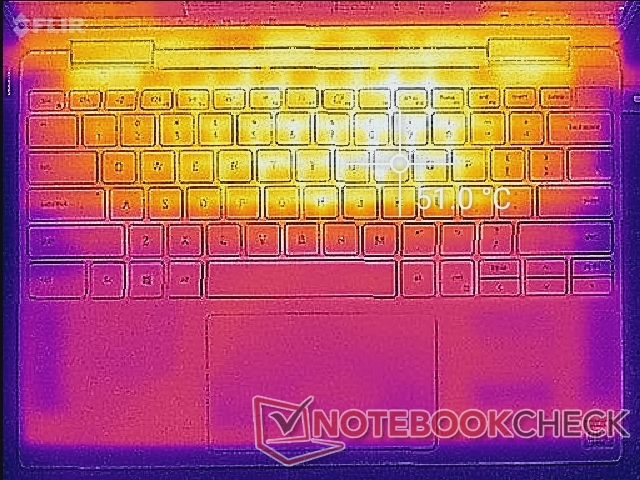
(-) La temperatura máxima en la parte superior es de 51.4 °C / 125 F, frente a la media de 35.4 °C / 96 F, que oscila entre 19.6 y 60 °C para la clase Convertible.
(-) El fondo se calienta hasta un máximo de 46.4 °C / 116 F, frente a la media de 36.9 °C / 98 F
(+) En reposo, la temperatura media de la parte superior es de 30.3 °C / 87# F, frente a la media del dispositivo de 30.3 °C / 87 F.
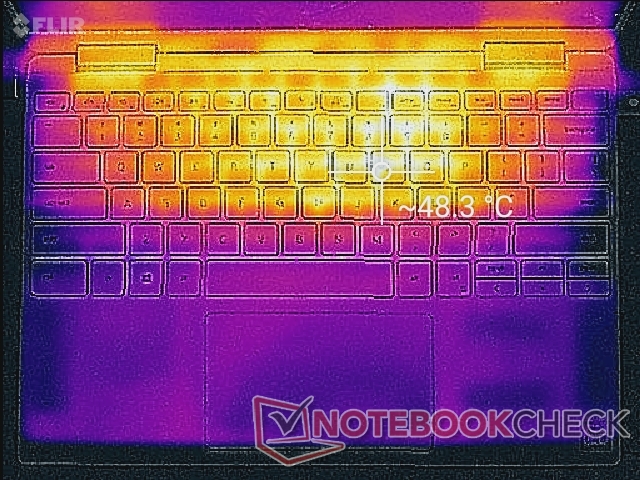
(±) Jugando a The Witcher 3, la temperatura media de la parte superior es de 37.7 °C / 100 F, frente a la media del dispositivo de 30.3 °C / 87 F.
(+) Los reposamanos y el panel táctil alcanzan como máximo la temperatura de la piel (33.8 °C / 92.8 F) y, por tanto, no están calientes.
(-) La temperatura media de la zona del reposamanos de dispositivos similares fue de 28 °C / 82.4 F (-5.8 °C / -10.4 F).
Prueba de esfuerzo: Se mantiene constante a >95 grados C
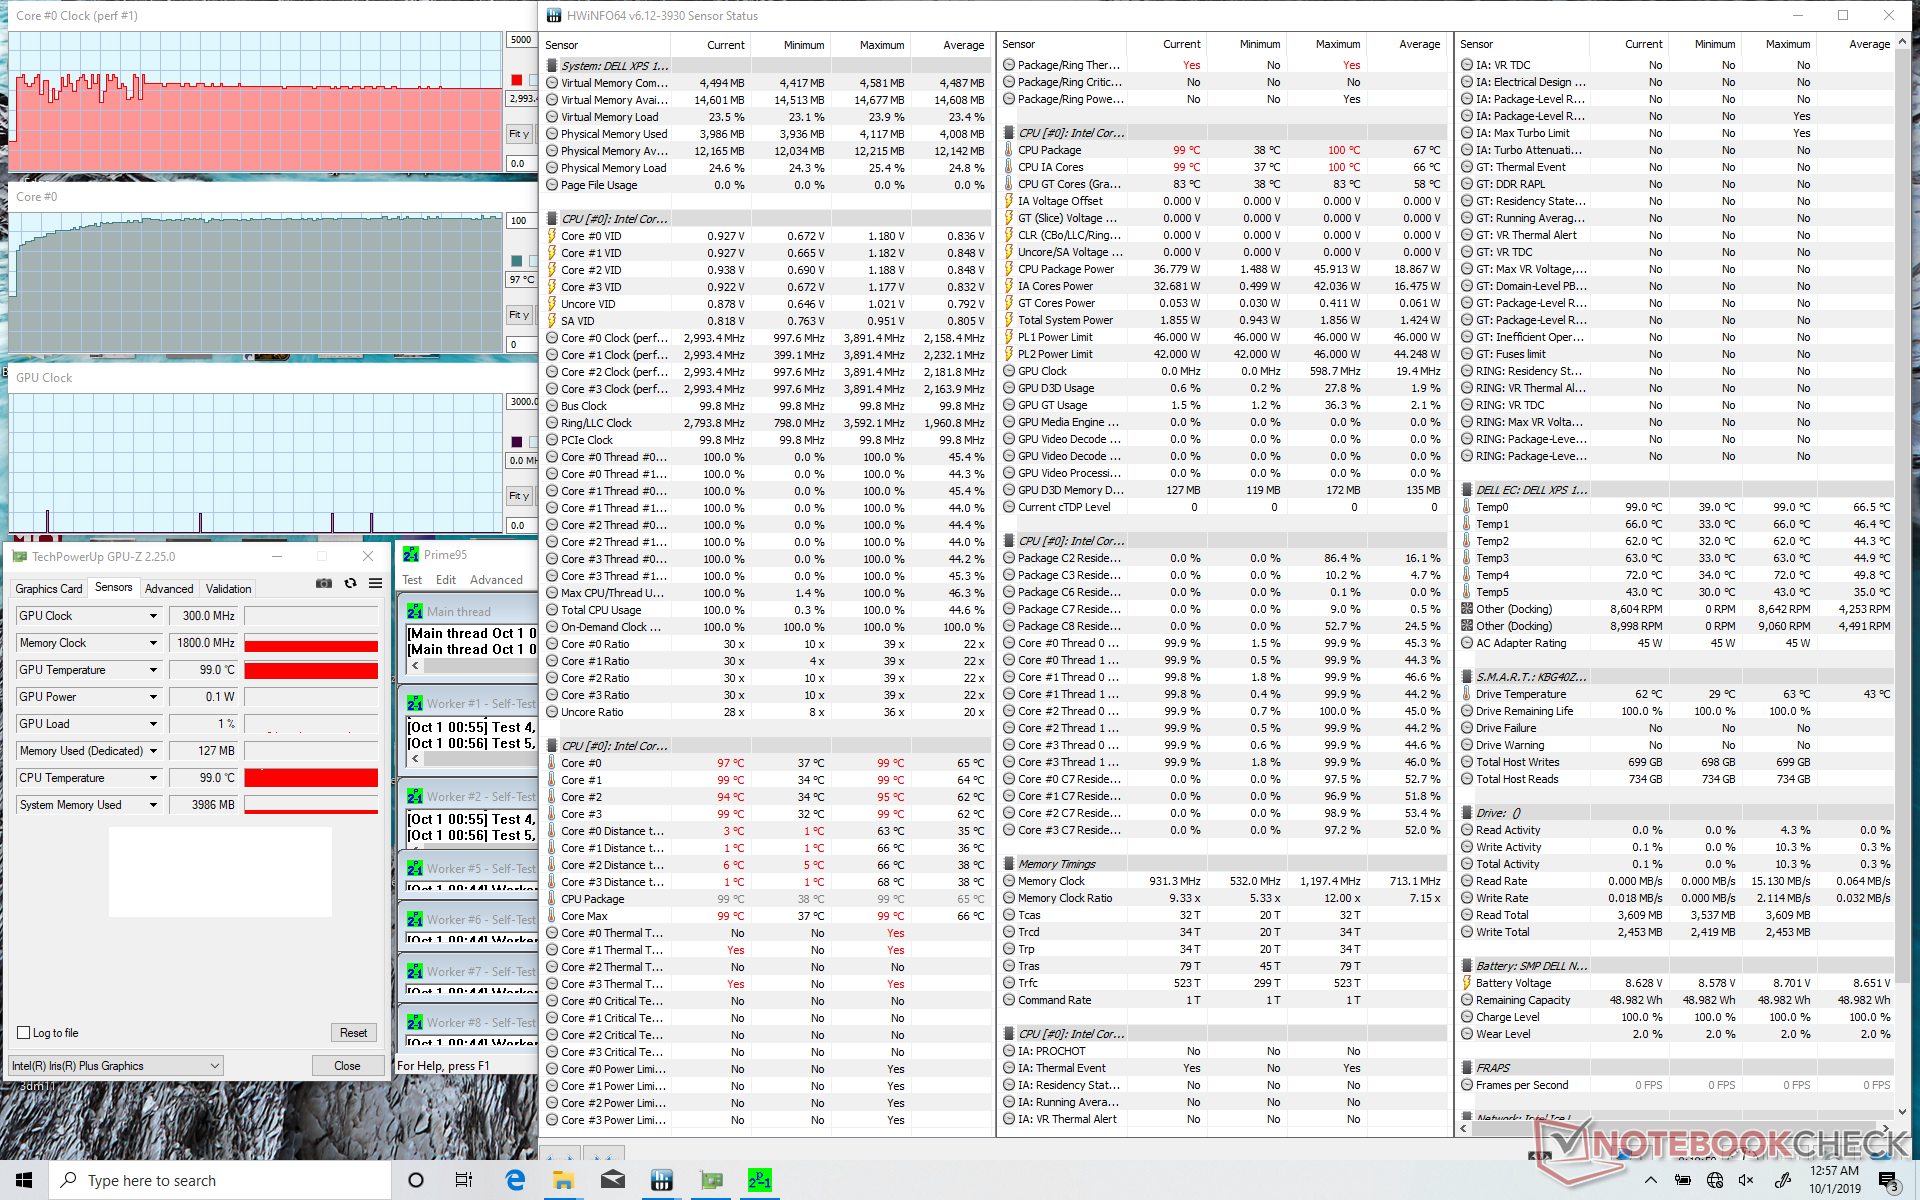
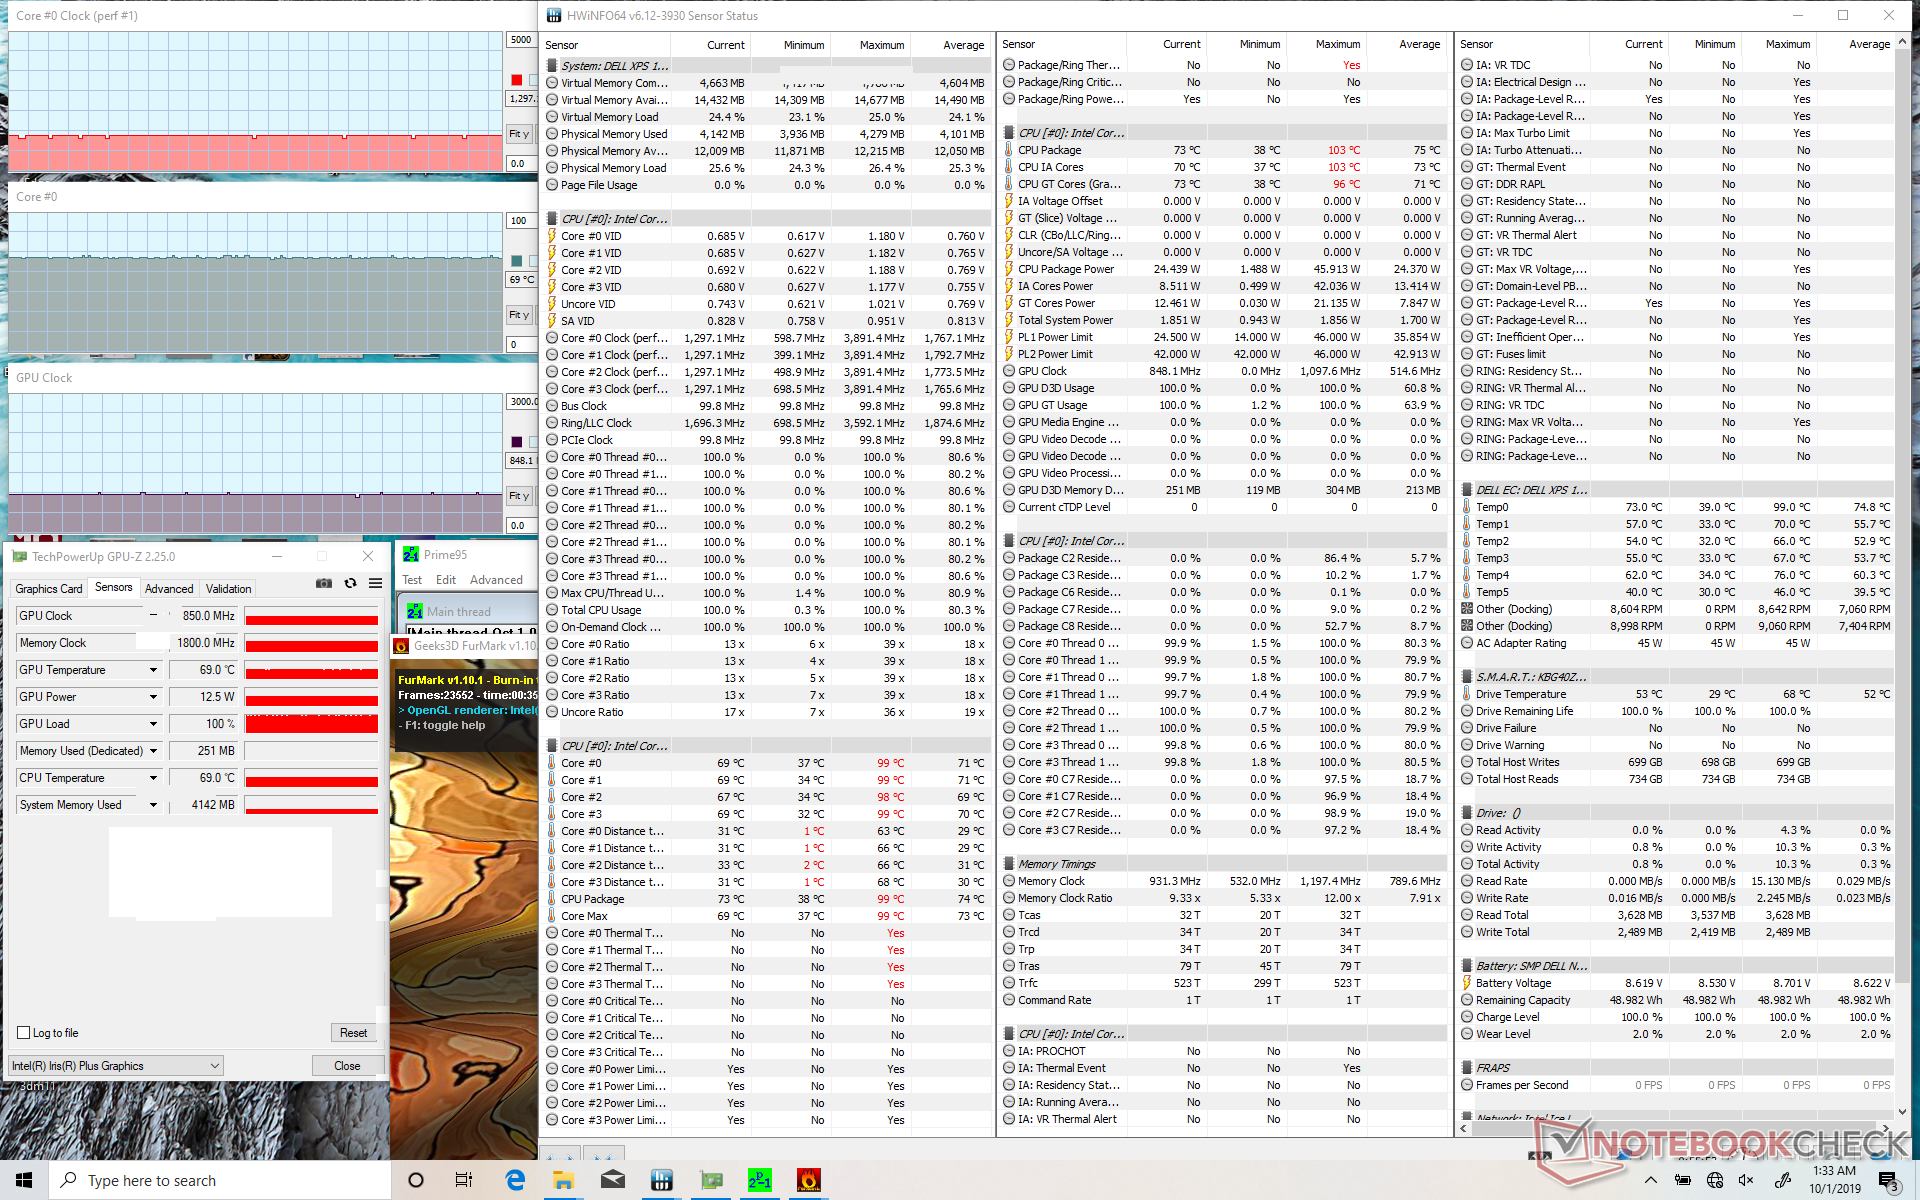
Hacemos hincapié en el sistema con cargas sintéticas para observar el comportamiento del procesador e identificar cualquier problema potencial de estrangulamiento. Cuando se ejecuta Prime95, las frecuencias de reloj oscilan entre 2,9 y 3,5 GHz durante el primer minuto más o menos antes de estabilizarse en 3,0 a 3,1 GHz a partir de entonces. La temperatura del núcleo sube lentamente hasta que se estabiliza en alrededor de 98 C para ser mucho más cálida que en la mayoría de los otros Ultrabooks. Esta temperatura muy alta es una "característica" intencional de Dell e Intel, ya que permite velocidades de reloj sostenidas más rápidas de lo habitual. El Asus ZenBook S13 con la última generación de Core i7-8565U, por ejemplo, se estabiliza a una velocidad de reloj de 60 C mucho más fría, pero a una frecuencia de reloj de 2,0 GHz más lenta cuando se encuentra en condiciones similares a las de Prime95. La ejecución simultánea de Prime95 y FurMark reducirá el procesador a sólo 1,3 GHz y 69 C, ya que hace todo lo posible por aprovechar al máximo la utilización de la CPU y la GPU.
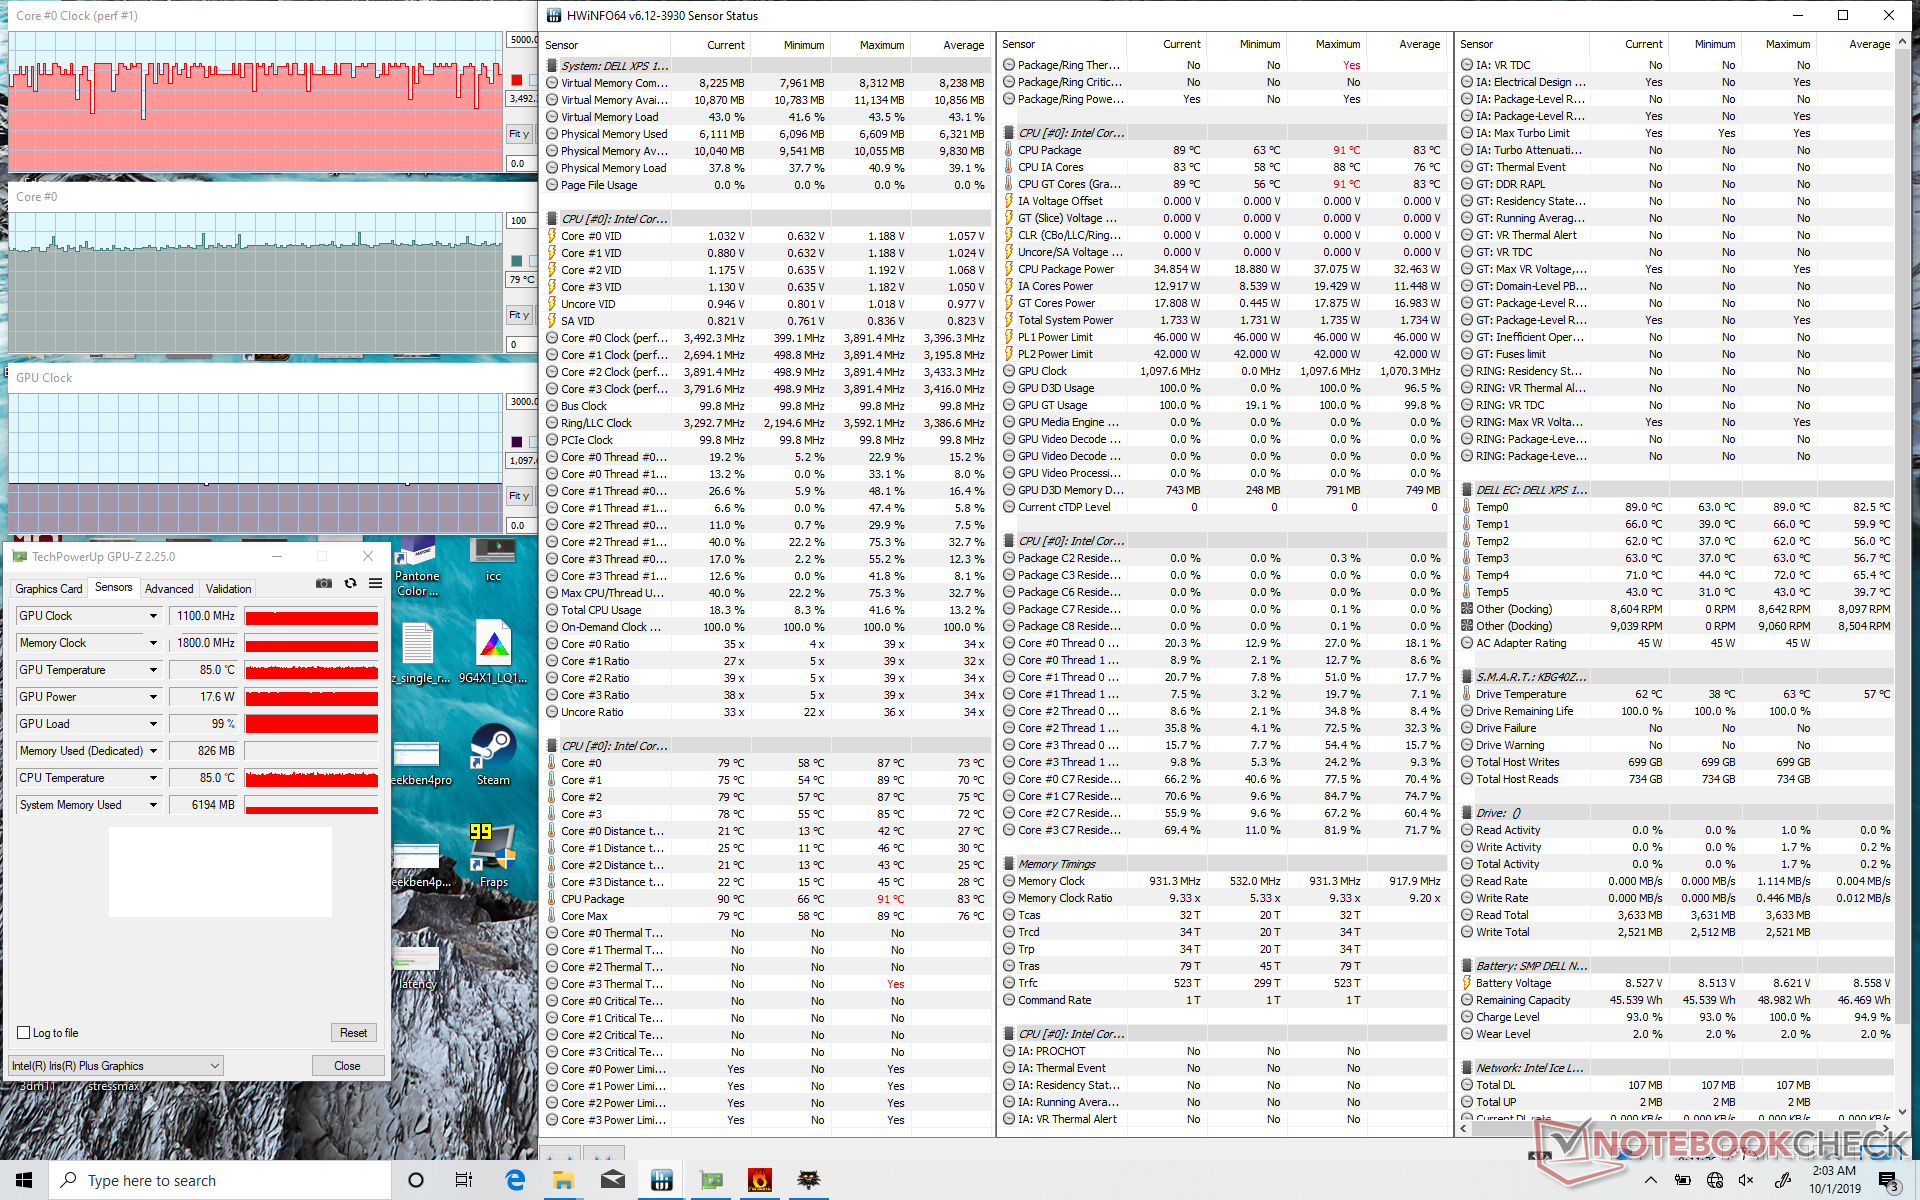
Witcher 3 es más representativo de las condiciones de juego del mundo real. La velocidad de reloj y la temperatura de la GPU se mantienen estables en 1097 MHz y de 79 C a 85 C según la GPU-Z. La CPU Core i7 Ice Lake es más cálida de lo que estamos acostumbrados a ver de las familias Kaby Lake-R o Whiskey Lake-U.
Si se ejecuta con la energía de la batería, el rendimiento de los gráficos se verá afectado. Una prueba de 3DMark Cloud Gate en baterías arroja resultados en Física y Gráficos de 8365 y 13471 puntos, respectivamente, en comparación con 8421 y 18881 puntos en la red.
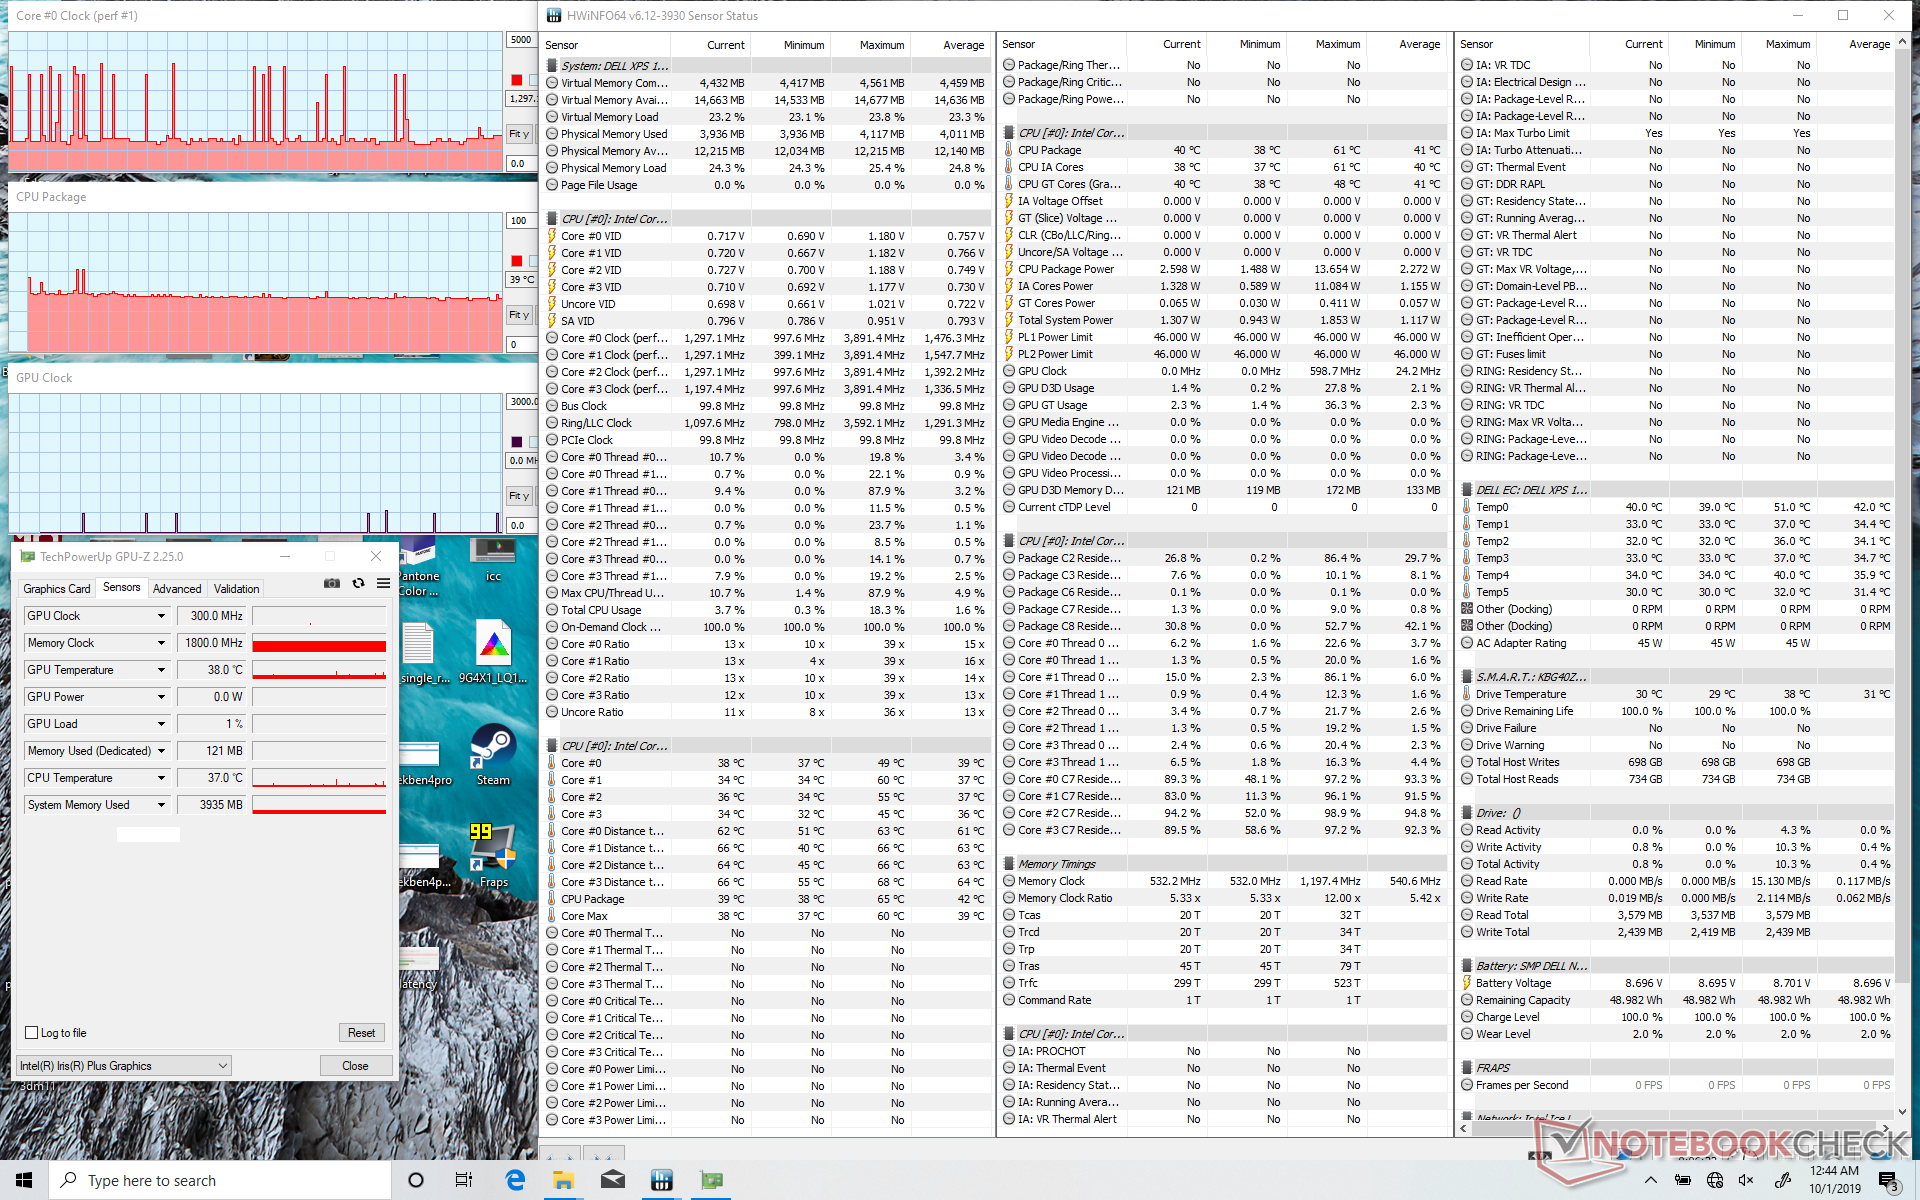
| CPU Clock (GHz) | GPU Clock (MHz) | Average CPU Temperature (°C) | |
| System Idle | -- | -- | 39 |
| Prime95 Stress | 3.0 | -- | ~99 |
| Prime95 + FurMark Stress | 1.3 | 848 | 69 |
| Witcher 3 Stress | ~3.5 | 1097 | 79 - 85 |
Altavoces
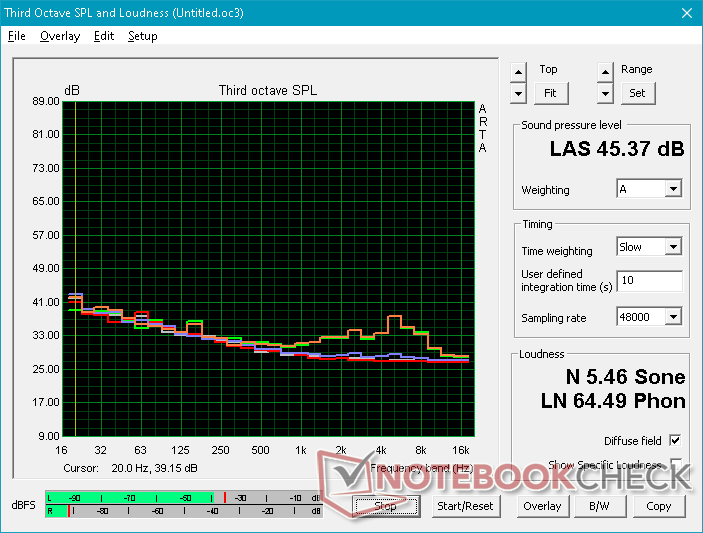
Los altavoces estéreo Waves MaxxAudio de 2 x 2 W funcionan realmente esta vez, a diferencia de lo que experimentamos en nuestra unidad Core i3. La calidad de audio es mejor de lo que se espera de un subnotebook convertible sin una caída brusca hasta aproximadamente 250 Hz. Los agudos y los graves se sienten relativamente equilibrados.


Dell XPS 13 7390 2-in-1 Core i7 análisis de audio
(±) | la sonoridad del altavoz es media pero buena (80.7 dB)
Graves 100 - 315 Hz
(±) | lubina reducida - en promedio 7.8% inferior a la mediana
(±) | la linealidad de los graves es media (12.5% delta a frecuencia anterior)
Medios 400 - 2000 Hz
(+) | medios equilibrados - a sólo 4.5% de la mediana
(+) | los medios son lineales (6.2% delta a la frecuencia anterior)
Altos 2 - 16 kHz
(+) | máximos equilibrados - a sólo 3.4% de la mediana
(±) | la linealidad de los máximos es media (10.5% delta a frecuencia anterior)
Total 100 - 16.000 Hz
(+) | el sonido global es lineal (14.8% de diferencia con la mediana)
En comparación con la misma clase
» 23% de todos los dispositivos probados de esta clase eran mejores, 4% similares, 72% peores
» El mejor tuvo un delta de 6%, la media fue 20%, el peor fue ###max##%
En comparación con todos los dispositivos probados
» 20% de todos los dispositivos probados eran mejores, 4% similares, 76% peores
» El mejor tuvo un delta de 4%, la media fue 24%, el peor fue ###max##%
Apple MacBook 12 (Early 2016) 1.1 GHz análisis de audio
(+) | los altavoces pueden reproducir a un volumen relativamente alto (#83.6 dB)
Graves 100 - 315 Hz
(±) | lubina reducida - en promedio 11.3% inferior a la mediana
(±) | la linealidad de los graves es media (14.2% delta a frecuencia anterior)
Medios 400 - 2000 Hz
(+) | medios equilibrados - a sólo 2.4% de la mediana
(+) | los medios son lineales (5.5% delta a la frecuencia anterior)
Altos 2 - 16 kHz
(+) | máximos equilibrados - a sólo 2% de la mediana
(+) | los máximos son lineales (4.5% delta a la frecuencia anterior)
Total 100 - 16.000 Hz
(+) | el sonido global es lineal (10.2% de diferencia con la mediana)
En comparación con la misma clase
» 7% de todos los dispositivos probados de esta clase eran mejores, 2% similares, 91% peores
» El mejor tuvo un delta de 5%, la media fue 18%, el peor fue ###max##%
En comparación con todos los dispositivos probados
» 5% de todos los dispositivos probados eran mejores, 1% similares, 94% peores
» El mejor tuvo un delta de 4%, la media fue 24%, el peor fue ###max##%
Gestión de la energía
Consumo de energía
El consumo en ralentí es esencialmente el mismo que el del modelo Core i3 a 3 W a 7 W, dependiendo del ajuste de brillo y del perfil de potencia. En cambio, nos interesa saber cómo puede diferir el consumo cuando el sistema está estresado.
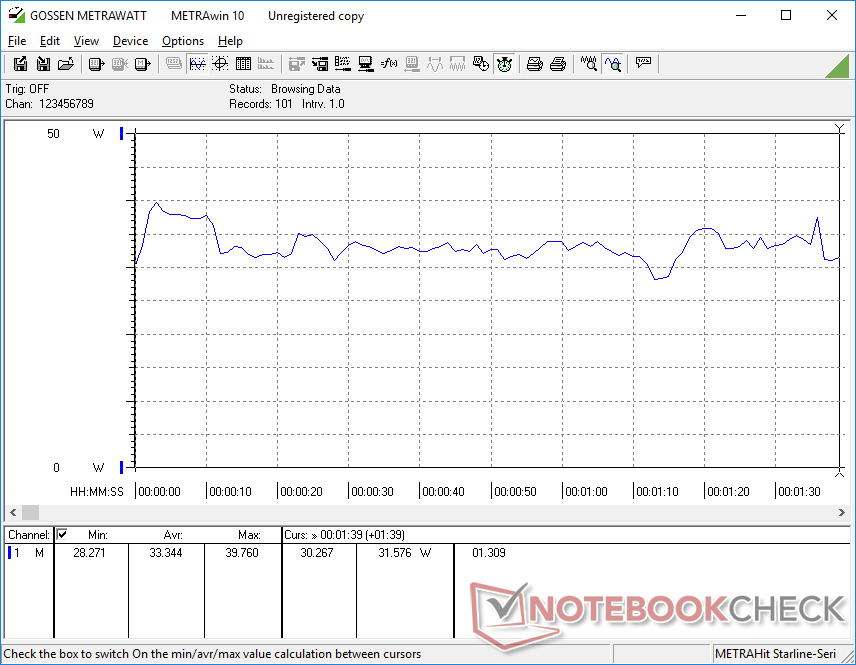
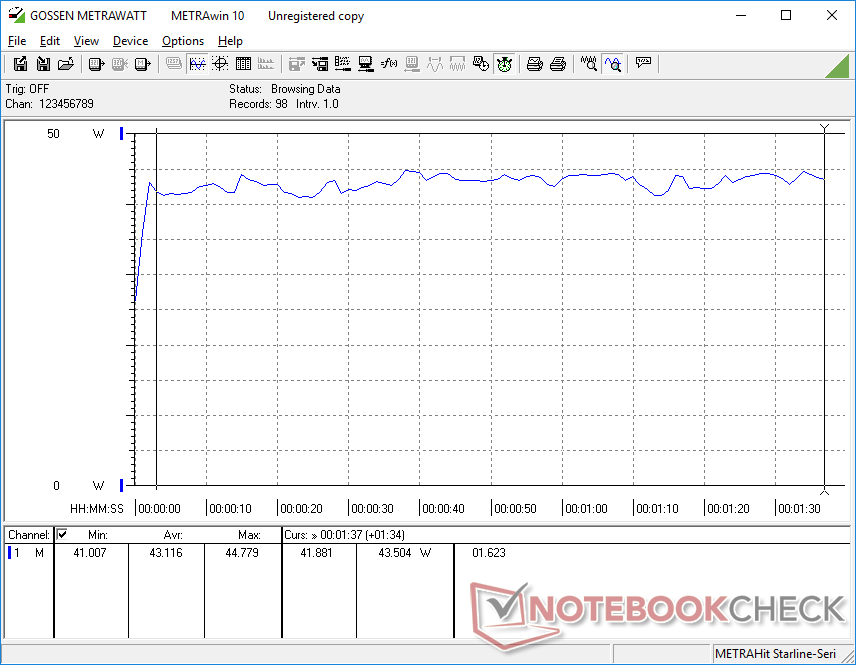
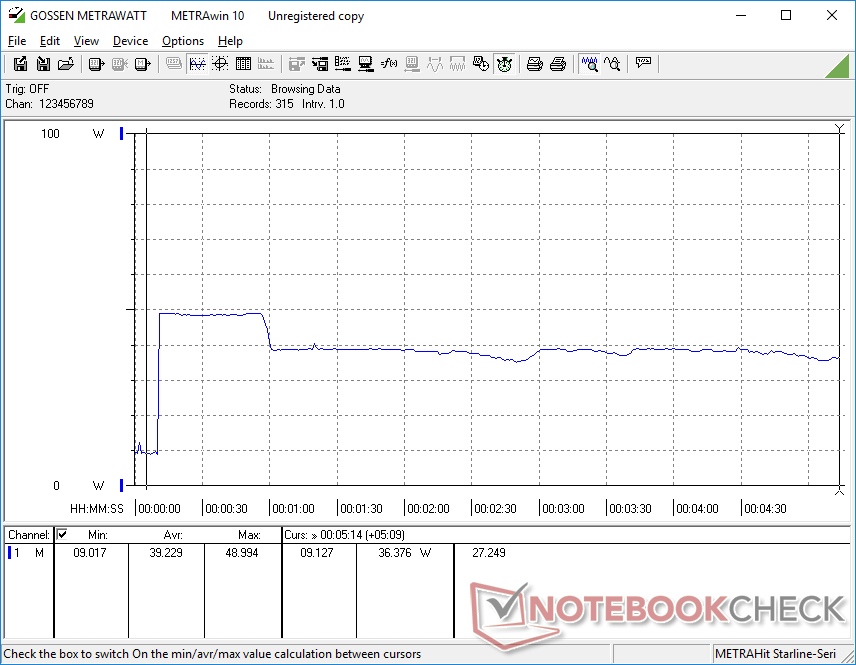
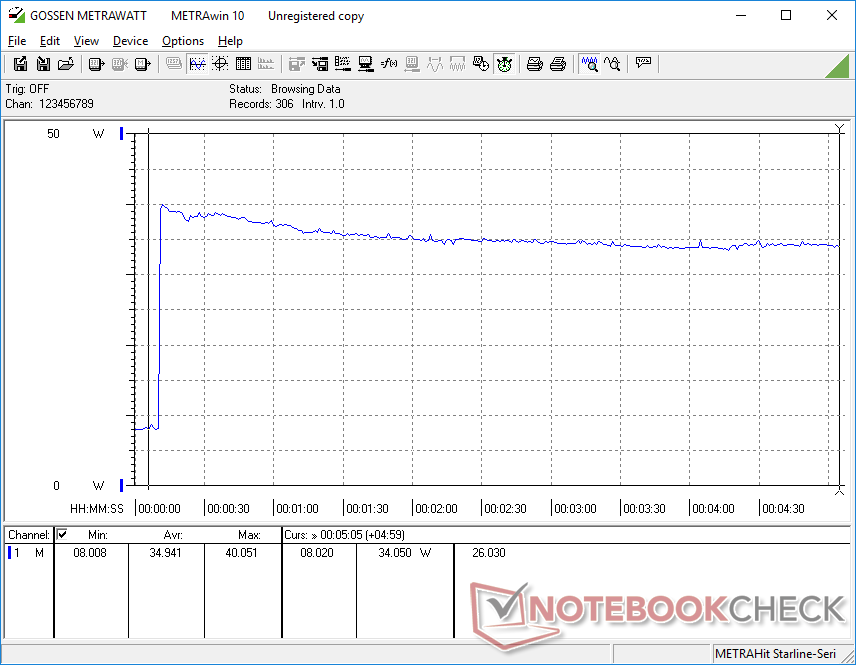
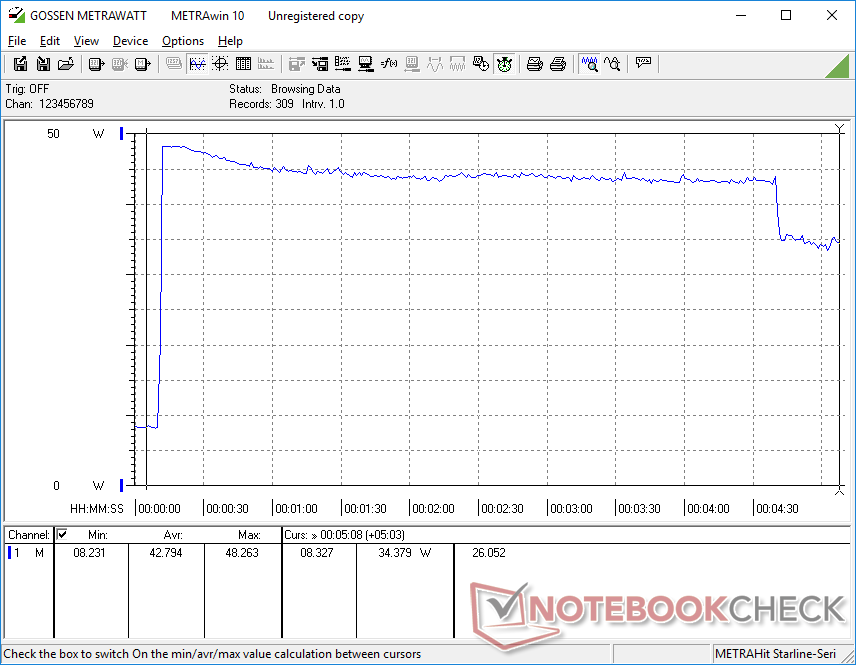
Cuando se ejecuta Prime95 en el Core i7 SKU, el consumo aumenta a 49 W durante aproximadamente 50 segundos antes de caer rápidamente y estabilizarse en unos 36 W. Por el contrario, al ejecutar Prime95 en el modelo Core i3, el consumo aumenta a sólo 40 W antes de caer y estabilizarse a unos 34 W. El modelo Core i7 es capaz de mantener las tasas de relojes de la CPU Turbo Boost durante más tiempo que en el modelo Core i3, y tanto nuestro consumo de energía como las observaciones de las pruebas de bucle de CineBench así lo reflejan.
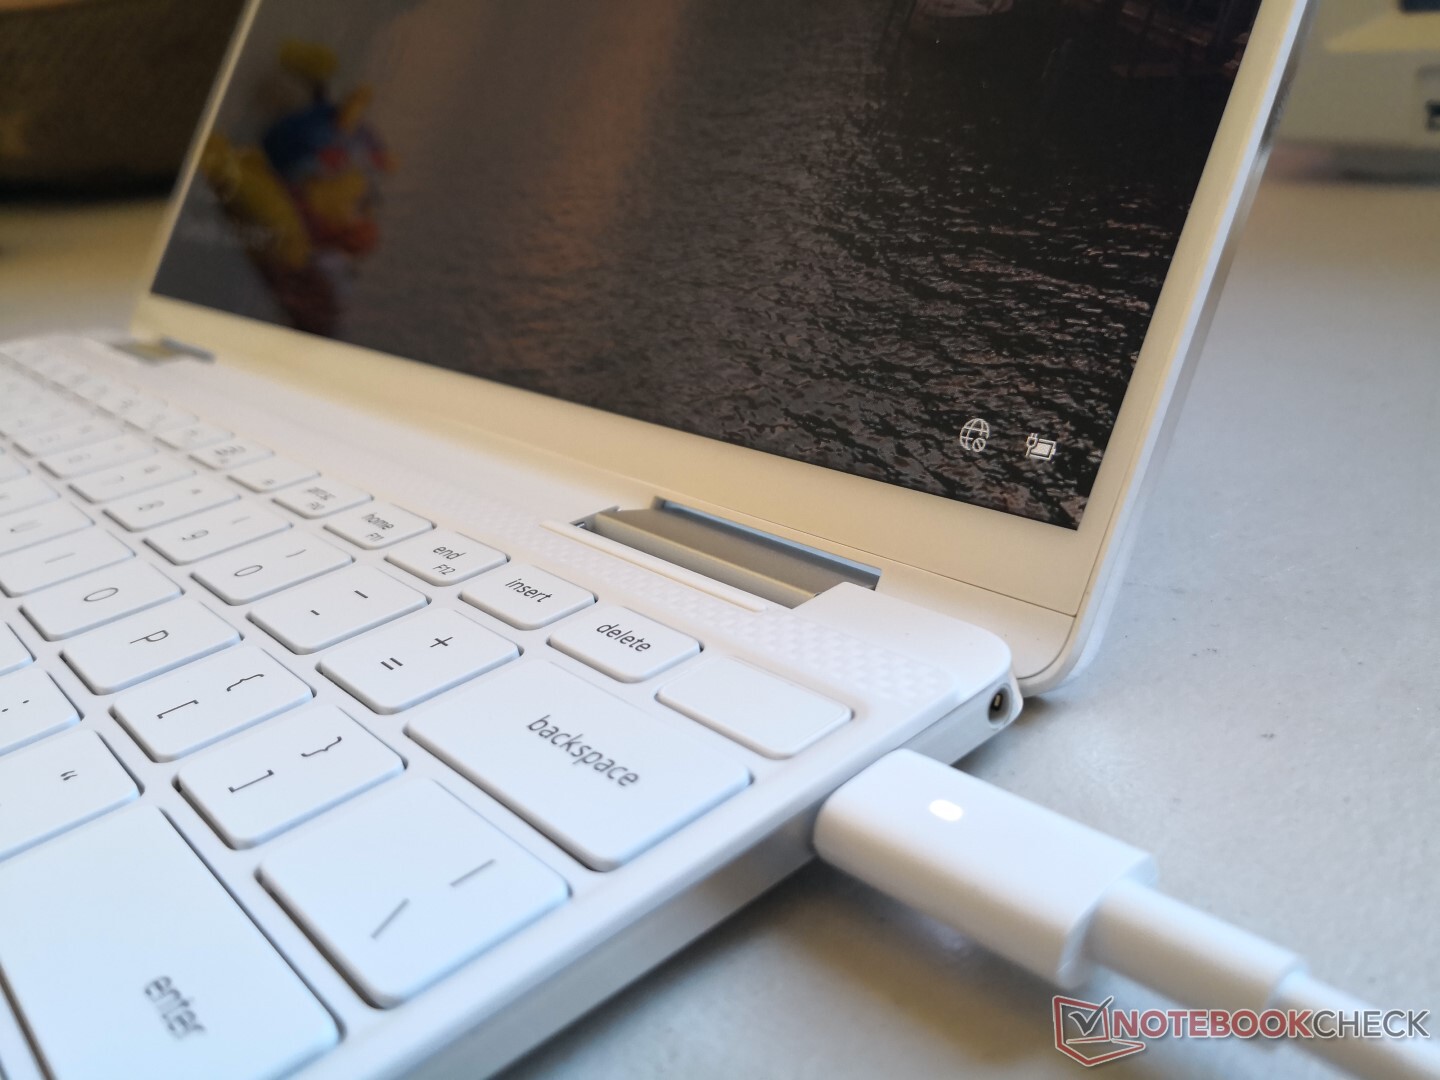
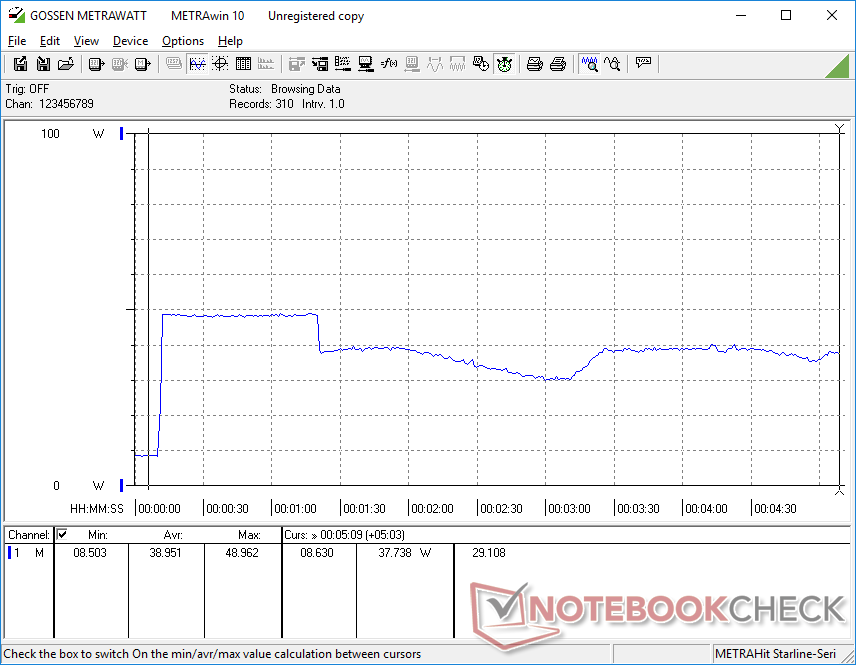
Cuando se somete a una utilización del 100 por ciento (Prime95+FurMark), el consumo aumenta a aproximadamente 49 W una vez más desde el muy pequeño (~6.0 x 5.5 x 2.3 cm) adaptador de CA 45. Esto eventualmente cae a cerca de 37 W después del primer minuto más o menos debido a los límites térmicos, como lo ejemplifican las temperaturas centrales muy altas en nuestra sección de Pruebas de Esfuerzo más arriba.
Los siguientes gráficos comparan los comportamientos de consumo de energía entre los SKUs Core i7 y Core i3 bajo diferentes escenarios. Tenga en cuenta que sus escalas no son las mismas.
| Off / Standby | |
| Ocioso | |
| Carga |
|
Clave:
min: | |
| Dell XPS 13 7390 2-in-1 Core i7 i7-1065G7, Iris Plus Graphics G7 (Ice Lake 64 EU), Toshiba BG4 KBG40ZPZ512G, IPS, 1920x1200, 13.4" | HP Envy x360 13-ar0601ng R7 3700U, Vega 10, SK Hynix BC501 HFM512GDJTNG, IPS, 120 Hz, 1920x1080, 13.3" | Dell XPS 13 7390 2-in-1 Core i3 i3-1005G1, UHD Graphics G1 (Ice Lake 32 EU), Toshiba BG4 KBG40ZPZ256G, IPS, 1920x1200, 13.4" | Dell XPS 13 9380 2019 i5-8265U, UHD Graphics 620, SK hynix PC401 HFS256GD9TNG, IPS, 3840x2160, 13.3" | Dell XPS 13 9370 FHD i5 i5-8250U, UHD Graphics 620, Toshiba XG5 KXG50ZNV256G, IPS, 1920x1080, 13.3" | Dell XPS 13-9365 2-in-1 i7-7Y75, HD Graphics 615, Toshiba NVMe THNSN5256GPUK, IPS, 1920x1080, 13.3" | |
|---|---|---|---|---|---|---|
| Power Consumption | -2% | 1% | -37% | 1% | 25% | |
| Idle Minimum * (Watt) | 2.6 | 3.2 -23% | 3 -15% | 4.8 -85% | 3.14 -21% | 3.1 -19% |
| Idle Average * (Watt) | 5.3 | 2.8 47% | 5.4 -2% | 8.6 -62% | 5.22 2% | 4.3 19% |
| Idle Maximum * (Watt) | 7 | 12.4 -77% | 7.3 -4% | 10.4 -49% | 6 14% | 4.9 30% |
| Load Average * (Watt) | 43.1 | 24.2 44% | 33.4 23% | 37.9 12% | 38.5 11% | 24.3 44% |
| Witcher 3 ultra * (Watt) | 43.1 | |||||
| Load Maximum * (Watt) | 49 | 50 -2% | 48.3 1% | 48.5 1% | 50.4 -3% | 22.8 53% |
* ... más pequeño es mejor
Duración de la batería: Navegación durante todo el día y más
Realizamos la misma prueba WLAN de 150 nits entre los modelos Core i3 y Core i7 del XPS 13 7390 2-in-1 y sus resultados son casi idénticos. Los usuarios pueden esperar apenas 9 horas de uso en el mundo real, independientemente de la opción del procesador. Ajustar la pantalla más brillante o optar por el modelo 4K UHD reducirá invariablemente la duración de la batería.
| Dell XPS 13 7390 2-in-1 Core i7 i7-1065G7, Iris Plus Graphics G7 (Ice Lake 64 EU), 51 Wh | Dell XPS 13 7390 2-in-1 Core i3 i3-1005G1, UHD Graphics G1 (Ice Lake 32 EU), 51 Wh | Dell XPS 13 9380 2019 i5-8265U, UHD Graphics 620, 52 Wh | Dell XPS 13 9370 FHD i5 i5-8250U, UHD Graphics 620, 52 Wh | Dell XPS 13 9360 FHD i7 Iris i7-7560U, Iris Plus Graphics 640, 60 Wh | Dell XPS 13-9365 2-in-1 i7-7Y75, HD Graphics 615, 46 Wh | |
|---|---|---|---|---|---|---|
| Duración de Batería | -1% | -8% | 19% | 21% | 27% | |
| WiFi v1.3 (h) | 9 | 8.9 -1% | 8.3 -8% | 10.7 19% | 10.9 21% | 11.4 27% |
| Reader / Idle (h) | 35.7 | 17.2 | 23.6 | 25.4 | 16.2 | |
| Load (h) | 2.2 | 2.4 | 2 | 2.6 | 2.9 |
Pro
Contra
Veredicto
Hay dos atributos principales a tener en cuenta para el XPS 13 7390 2 en 1: el nuevo procesador y el propio portátil. La CPU de 25 W Ice Lake es una actualización medible de la última generación de la serie Whiskey Lake-U de 15 W, tanto en potencia de la CPU como de la GPU. Los deltas son lo suficientemente anchos como para que este descapotable pueda superar a cualquier modelo de XPS 13 que le haya precedido. El hecho de que puedas ejecutar los títulos multijugador más populares en un subnotebook tan delgado y ligero ya es una hazaña notable, incluso si la CPU tiene que funcionar mucho más caliente de lo habitual para hacerlo. En este caso, Ice Lake ha logrado lo que Intel quería que hiciera: Ofrece un rendimiento en bruto comparable al del AMD Ryzen 7 3700U de 35 W con un rendimiento por vatio superior, a la vez que integra la aceleración de la IA para que la serie esté mejor preparada para el futuro.
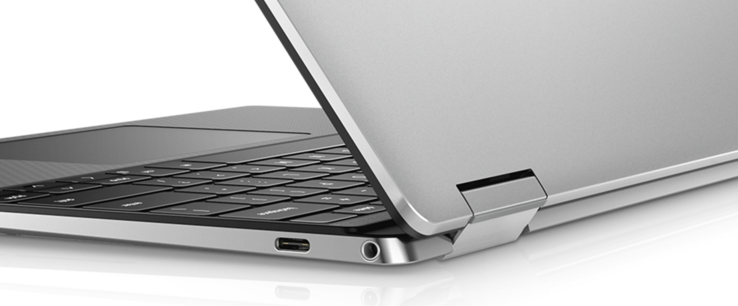
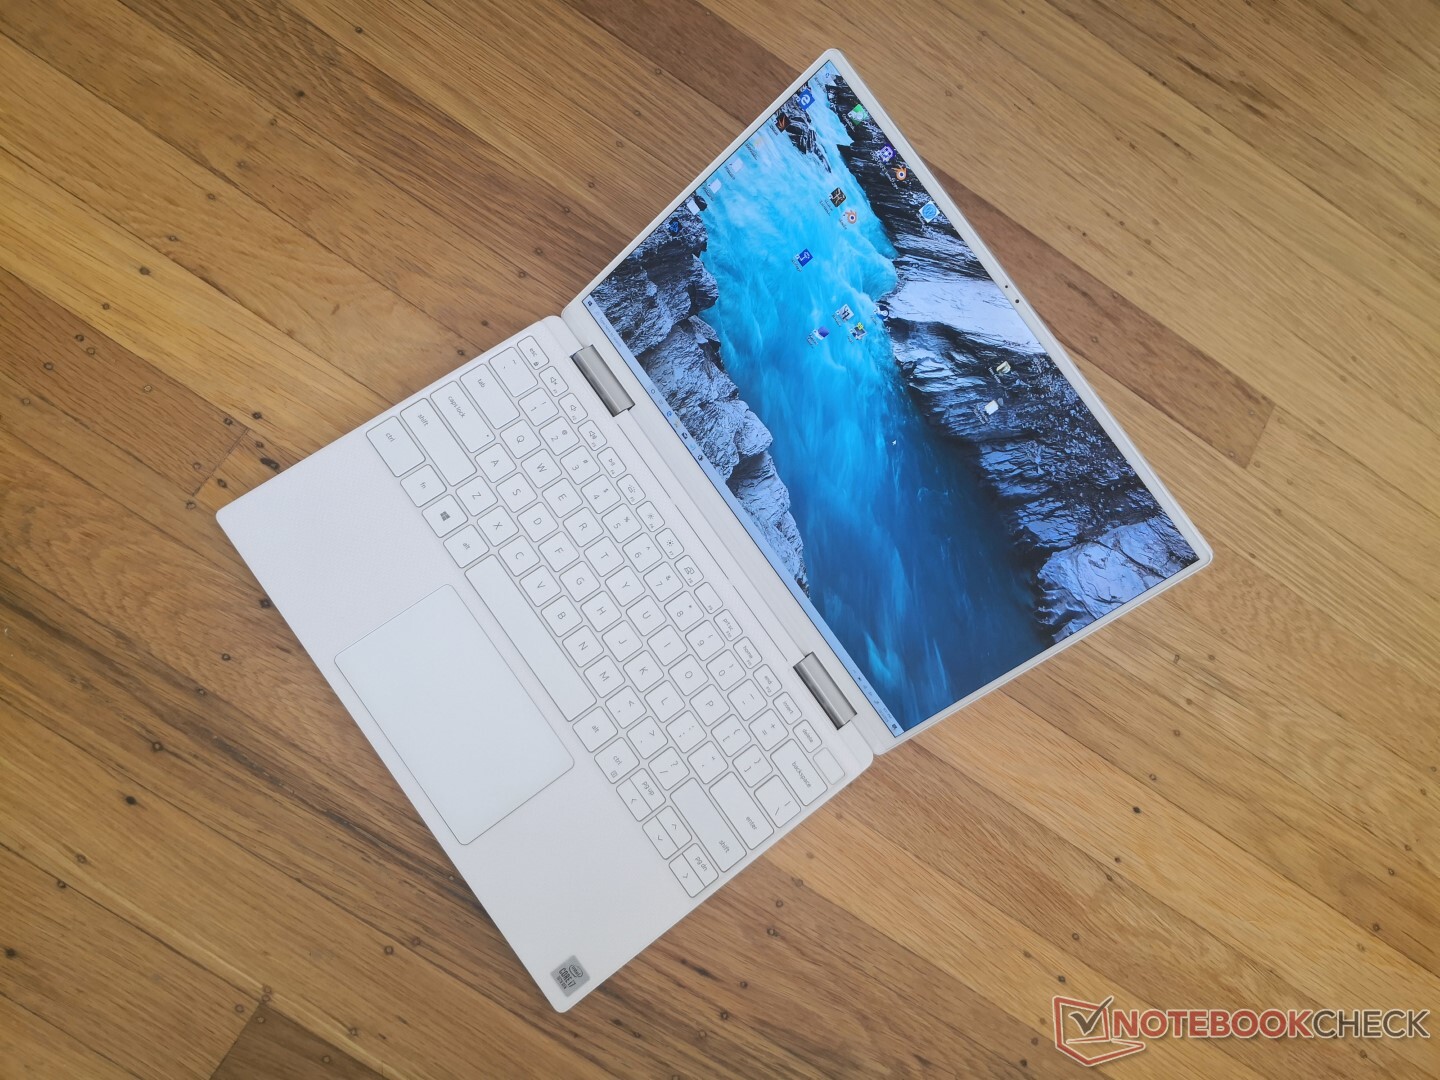
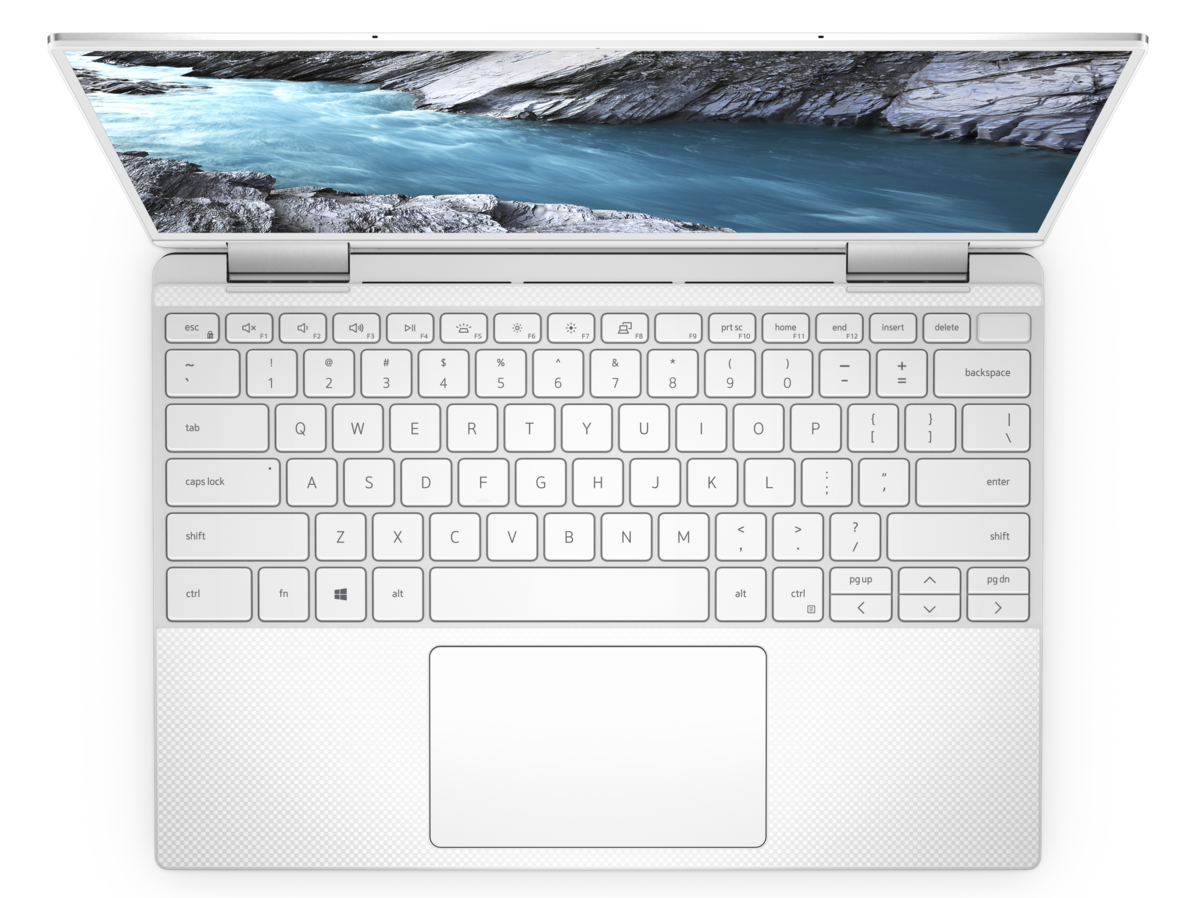
En cuanto al portátil XPS 13 7390 2 en 1, creemos que los ventiladores podrían haber sido de tono más bajo para ser más discretos durante cargas altas y las estrechas teclas de flecha podrían haber sido más grandes. De lo contrario, no hay mucho que no nos guste, ya que nos encanta el panel brillante, la amplia gama de colores, la larga duración de la batería y el factor de forma muy pequeño. La duración de la batería, el comportamiento del ventilador y las temperaturas son similares a las de la versión Core i3 a pesar de sus diferencias de rendimiento. En cambio, es lo que no está aquí lo que no nos gusta porque el descapotable se siente como si estuviera despojado de sus características. HP está a punto de lanzar su propio Ice Lake-powered Spectre x360 13 y renovó EliteBook con un puñado de características que no se encuentran en la Dell, incluyendo almacenamiento actualizable, 4G LTE, eSIM, HDMI, USB Type-A, y un panel de 1000-nit aún más brillante. Renunciarás a muchos extras sólo por la estética delgada del último XPS 13 2 en 1.
El XPS 13 7390 2 en 1 funciona más rápido de lo que su humilde apariencia podría sugerir. Por otro lado, su diseño súper delgado ha omitido varias opciones de actualización para el usuario final y características de conectividad que la mayoría de los Ultrabooks de la competencia tienden a ofrecer como estándar.
Dell XPS 13 7390 2-in-1 Core i7
- 05/15/2020 v7 (old)
Allen Ngo
Price comparison
