Análisis del portátil MSI Prestige 16 B1MG: Del Core i7 Xe al Core Ultra 7 Arc

El MSI Prestige 16 AI B1MG de 16 pulgadas es uno de los primeros portátiles del mercado con opciones de CPU Core Ultra Meteor Lake de 14ª generación. Sucede al anterior 15,6 pulgadas Prestige 15 con interiores y exteriores renovados para una experiencia de usuario totalmente nueva. La familia Prestige de MSI se compone de portátiles de gama media alta situados entre la gama baja Familia Modern y la familia Familia Summit.
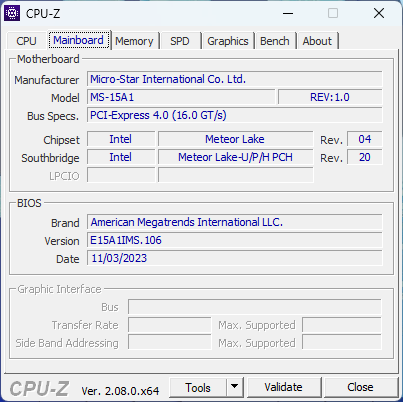
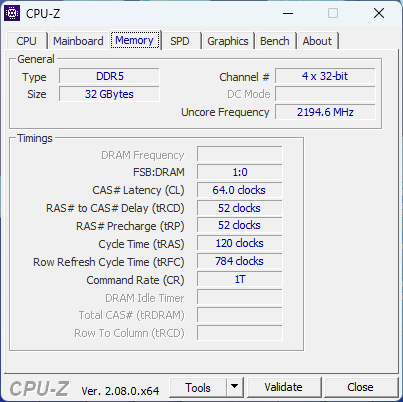
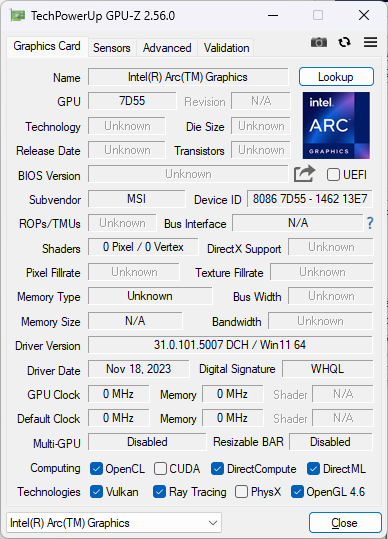
Nuestra configuración en revisión es una unidad de venta al público por 1400 USD con la CPU Core Ultra 7 155H, gráficos Arc 8 integrados, pantalla IPS 1600p, 32 GB de RAM LPDDR5-6400 MHz y SSD NVMe de 2 TB. También hay disponibles SKU de gama más alta con la Core Ultra 9 185H, gráficos GeForce RTX 4060 o 4070, gráficos Arc 370M y OLED 4K (2400p).
Entre los competidores del Prestige 16 se incluyen otros portátiles delgados y ligeros multimedia o para creadores de contenidos como la Serie Dell XPS, Asus VivoBook Pro 16,LG Gram 16 2 en 1, o el Lenovo Yoga Pro 9i 16.
Más opiniones sobre MSI:
Posibles contendientes en la comparación
Valoración | Fecha | Modelo | Peso | Altura | Tamaño | Resolución | Precio |
|---|---|---|---|---|---|---|---|
| 88.1 % v7 (old) | 12/2023 | MSI Prestige 16 B1MG-001US Ultra 7 155H, Arc 8-Core | 1.6 kg | 19.1 mm | 16.00" | 2560x1600 | |
| 85.4 % v7 (old) | 12/2022 | MSI Prestige 15 A12UD-093 i7-1280P, GeForce RTX 3050 Ti Laptop GPU | 1.8 kg | 20.1 mm | 15.60" | 3840x2160 | |
| 85.8 % v7 (old) | 11/2023 | LG Gram 2in1 16 16T90R - G.AA78G i7-1360P, Iris Xe G7 96EUs | 1.5 kg | 17.2 mm | 16.00" | 2560x1600 | |
| 85.7 % v7 (old) | 11/2023 | Lenovo ThinkBook 16 G6 ABP R5 7530U, Vega 7 | 1.8 kg | 17.5 mm | 16.00" | 1920x1200 | |
| 87.6 % v7 (old) | 11/2023 | Asus VivoBook Pro 16 K6602VU i9-13900H, GeForce RTX 4050 Laptop GPU | 1.9 kg | 19 mm | 16.00" | 3200x2000 | |
| 87.1 % v7 (old) | 08/2023 | Dell Inspiron 16 Plus 7630 i7-13700H, GeForce RTX 4060 Laptop GPU | 2.2 kg | 19.95 mm | 16.00" | 2560x1600 |
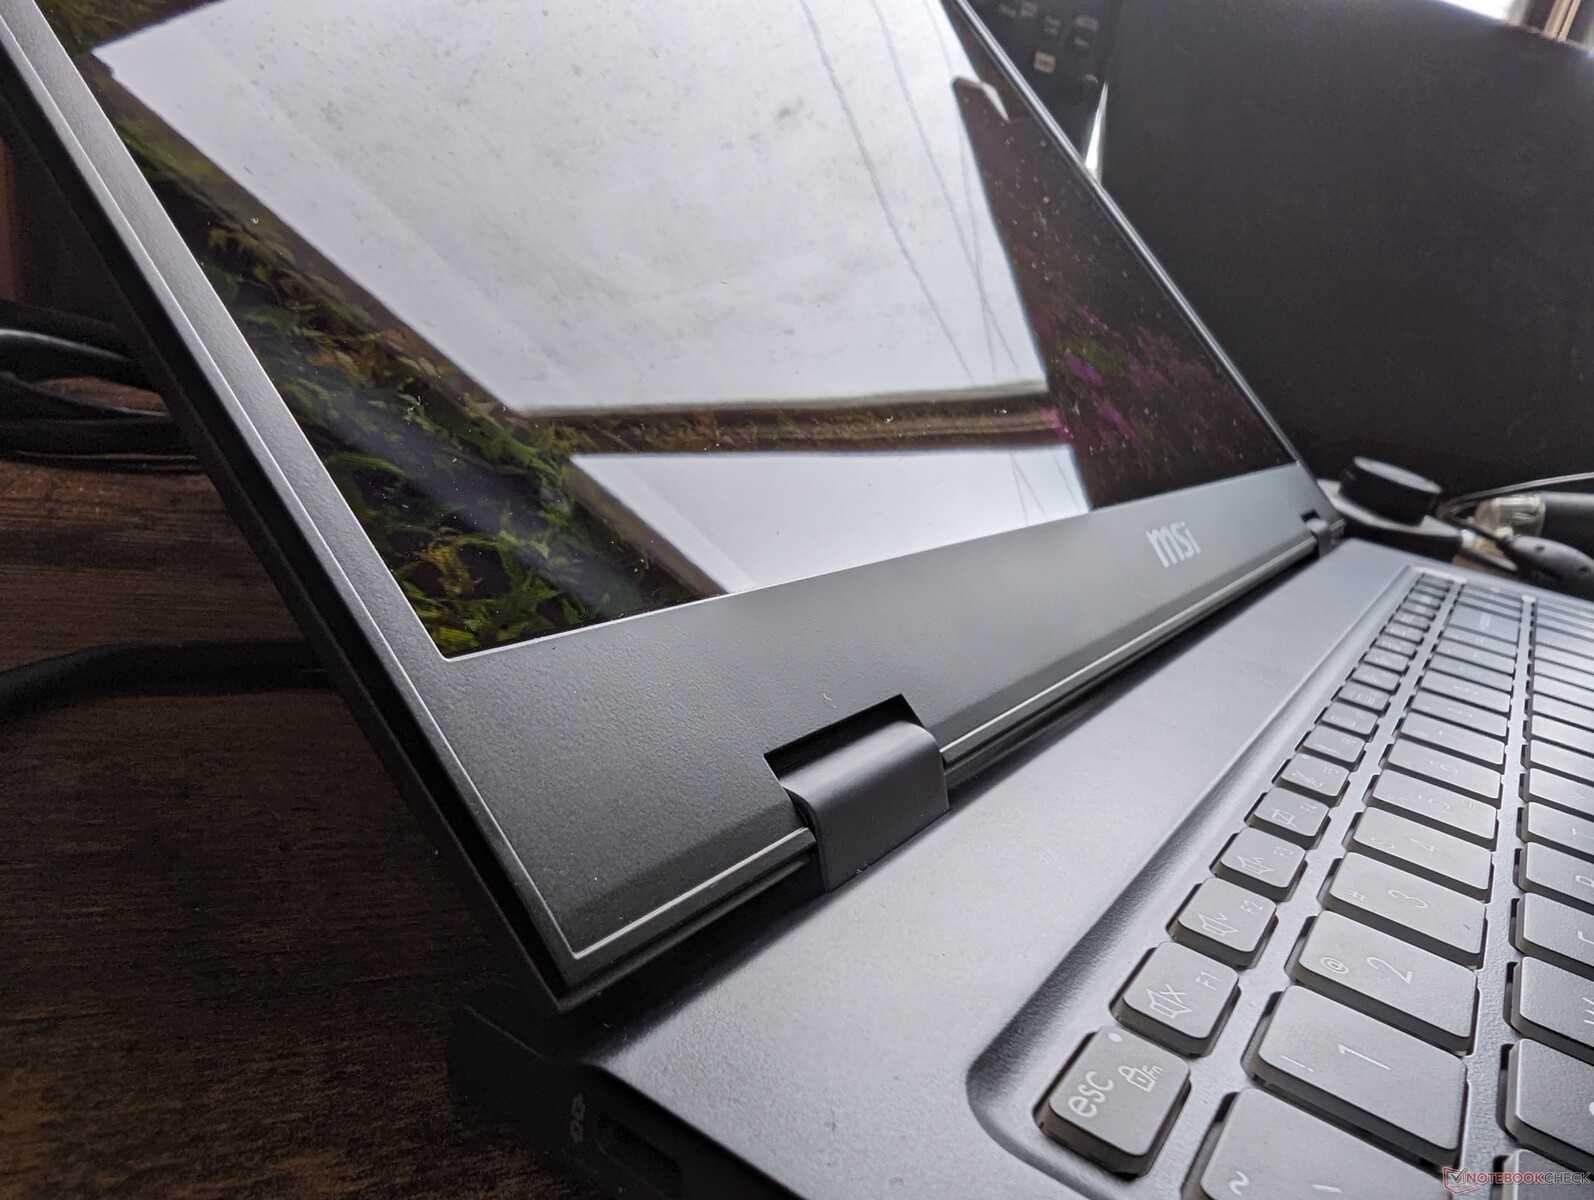
Estuche - Aspecto fino, materiales finos
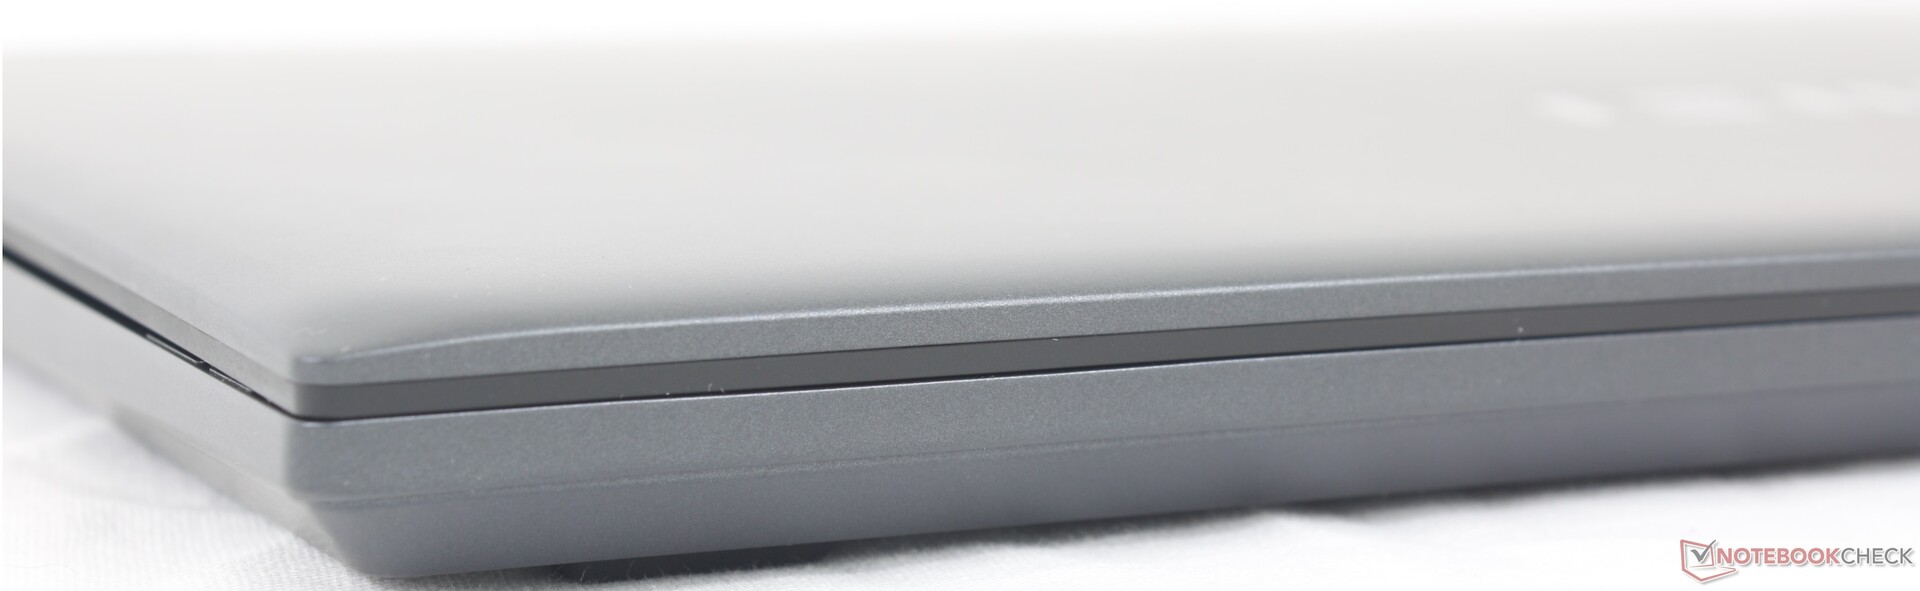
El chasis metálico es más firme y robusto que el que encontraría en un MSI Modern o en un Asus VivoBook menos caros. Aplicar presión sobre el centro del teclado, por ejemplo, apenas deformaría la superficie. La tapa es comparativamente más susceptible a torcerse y dañarse, especialmente porque carece de refuerzo Gorilla Glass. Aplicar presión en el centro de la tapa exterior deformaría su superficie más de lo que nos gustaría. En este caso, alternativas como el HP Spectre o el Razer Blade son mucho más resistentes a pesar de ser más pesados.
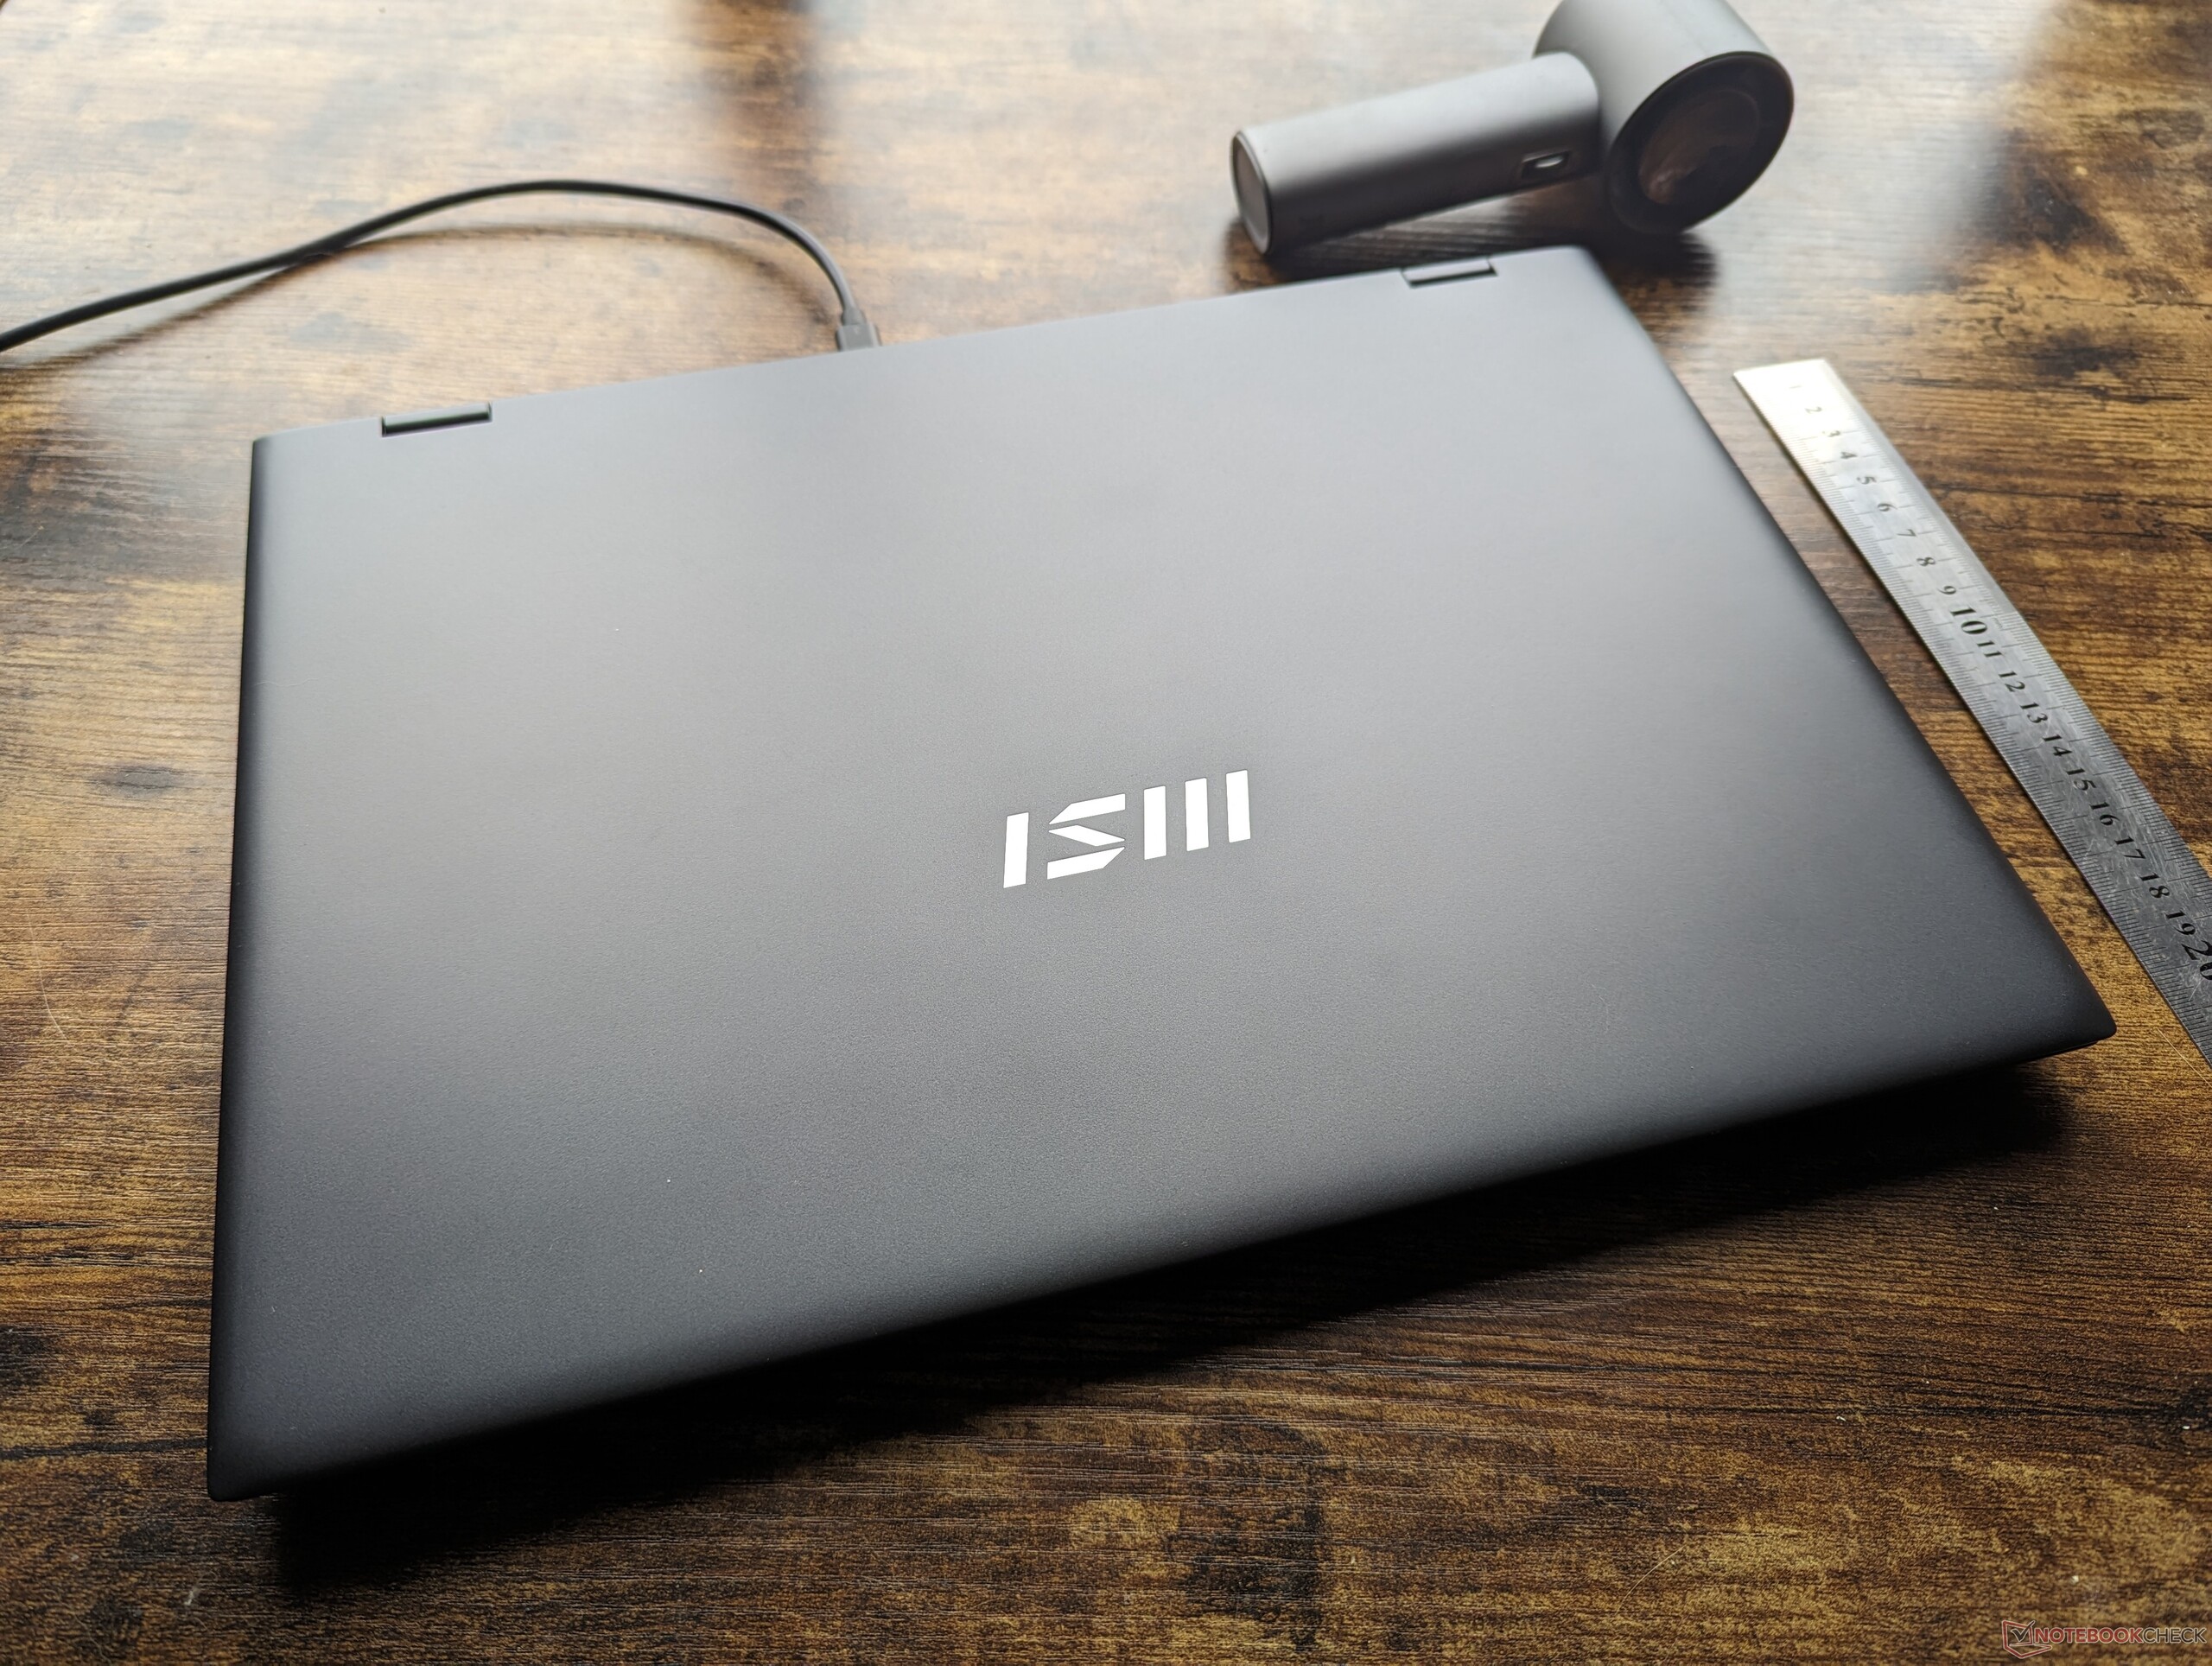
La relación de aspecto más cuadrada 16:10 hace que la Prestige 16 ocupe más espacio que la Prestige 15 saliente. Sin embargo, compensa la diferencia con un perfil más delgado y un peso más ligero. De hecho, el Prestige 16 es uno de los portátiles multimedia de 16 pulgadas más ligeros rivalizando con el LG Gram 16 2 en 1. Sin embargo, esperamos que las SKU con gráficos discretos sean un poco más pesadas.
Conectividad - Preparado para Wi-Fi 7
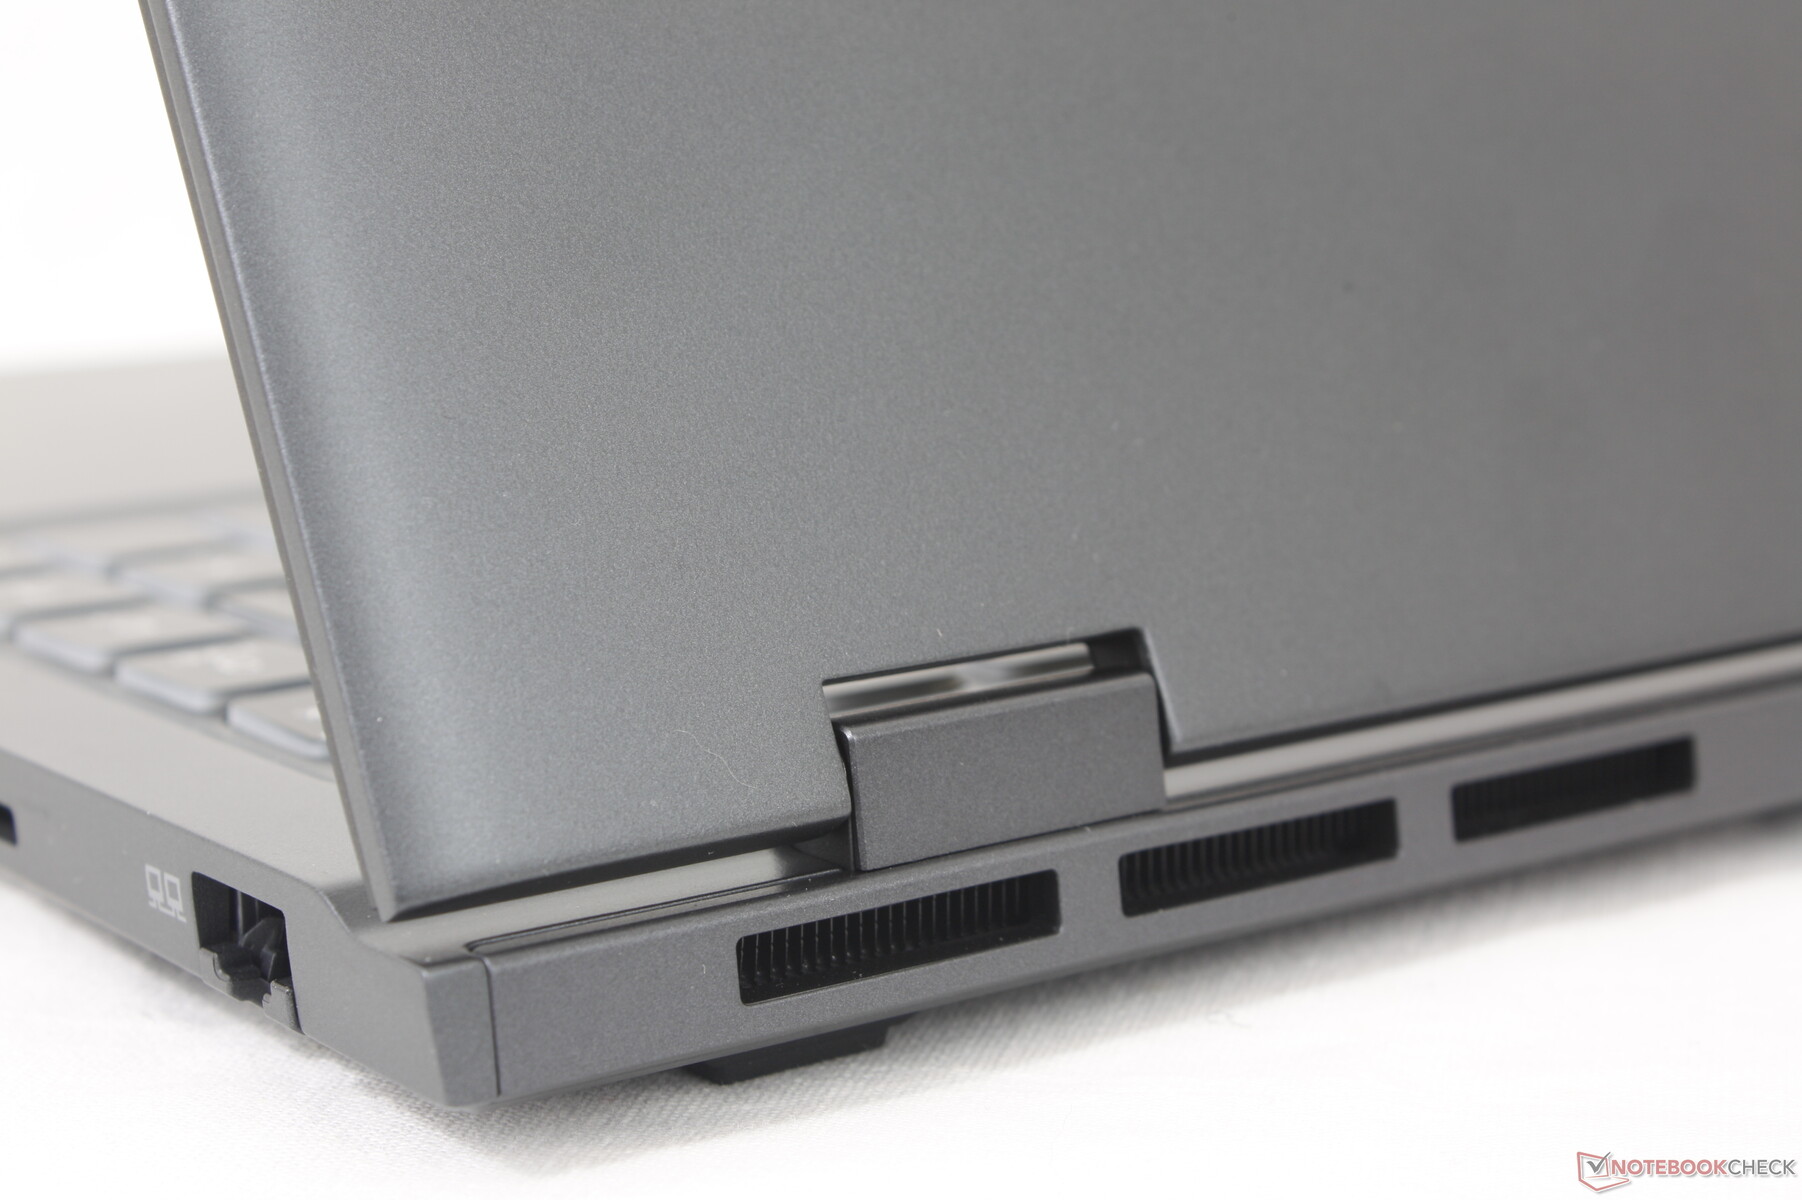
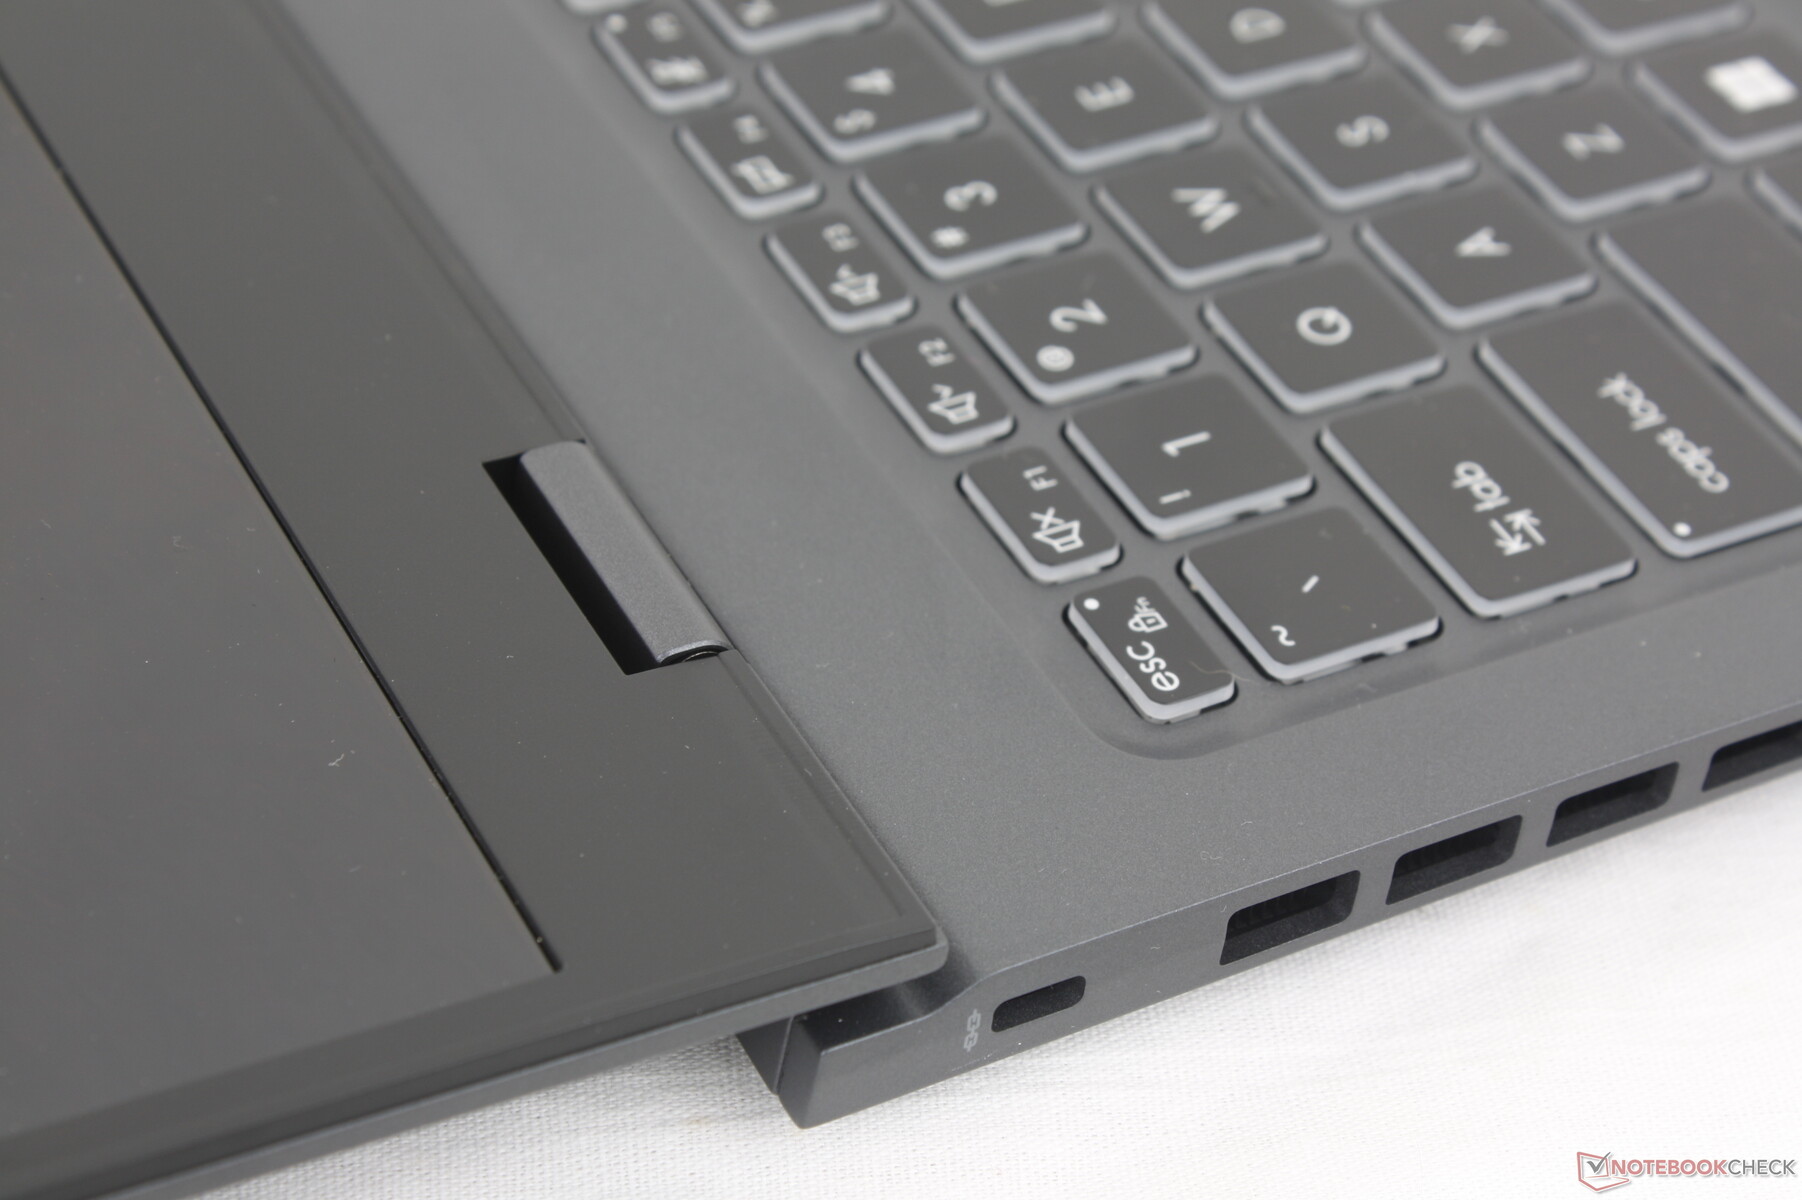
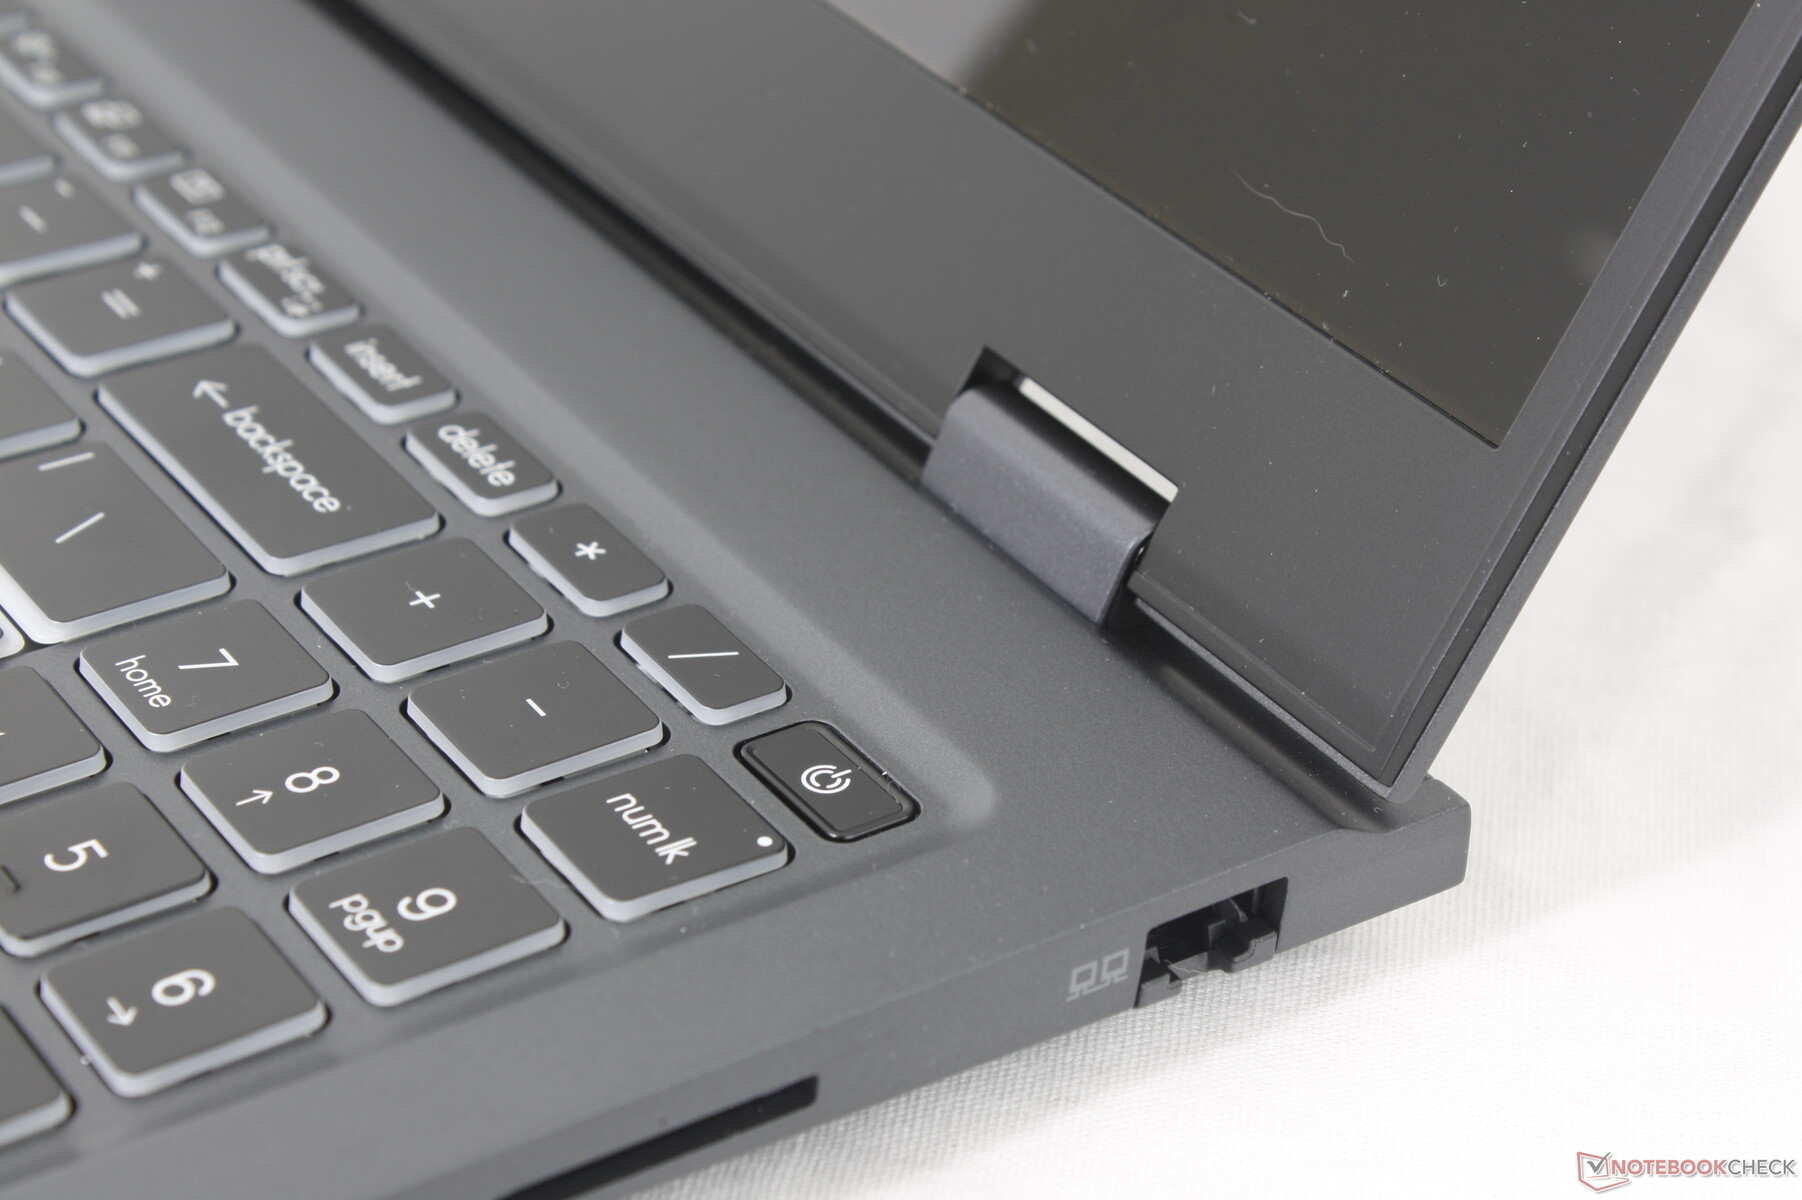
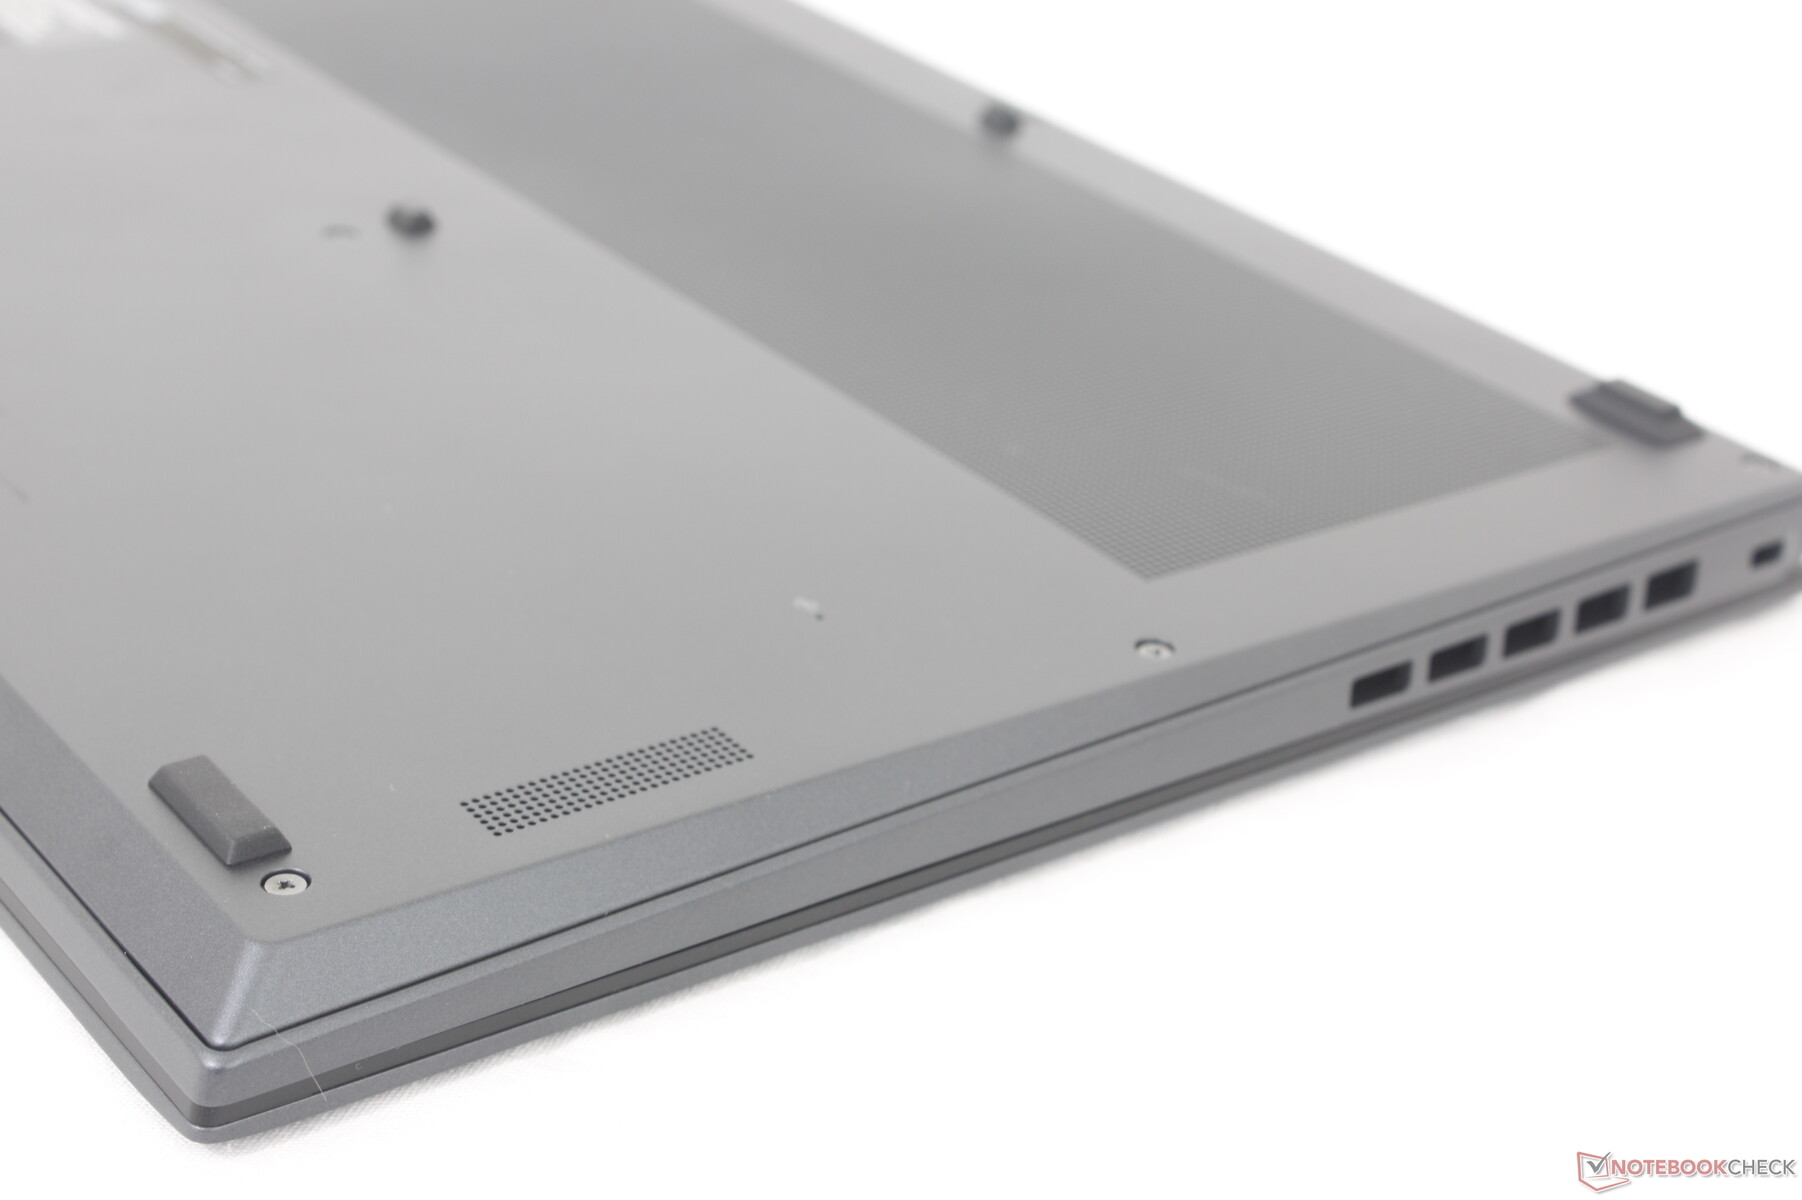
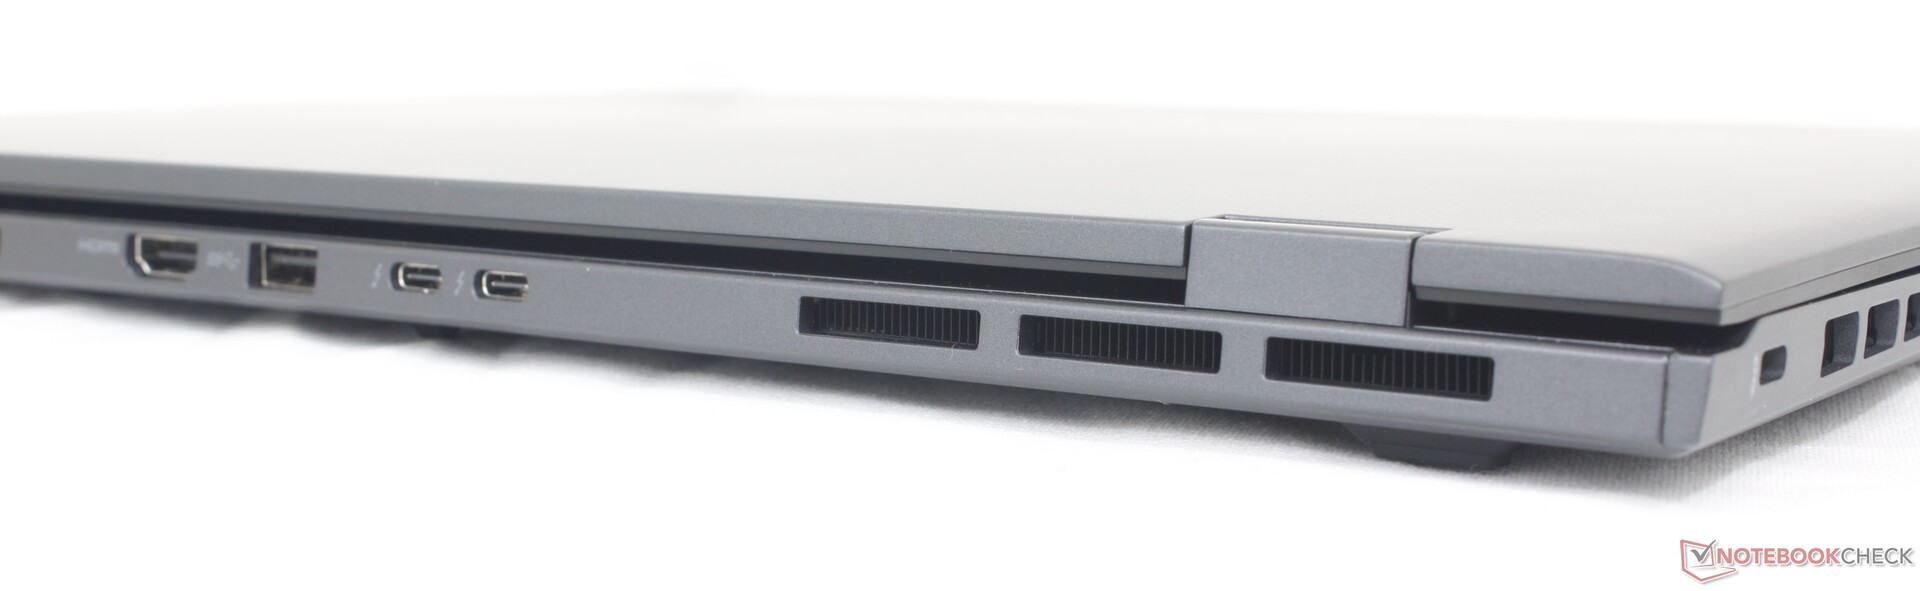
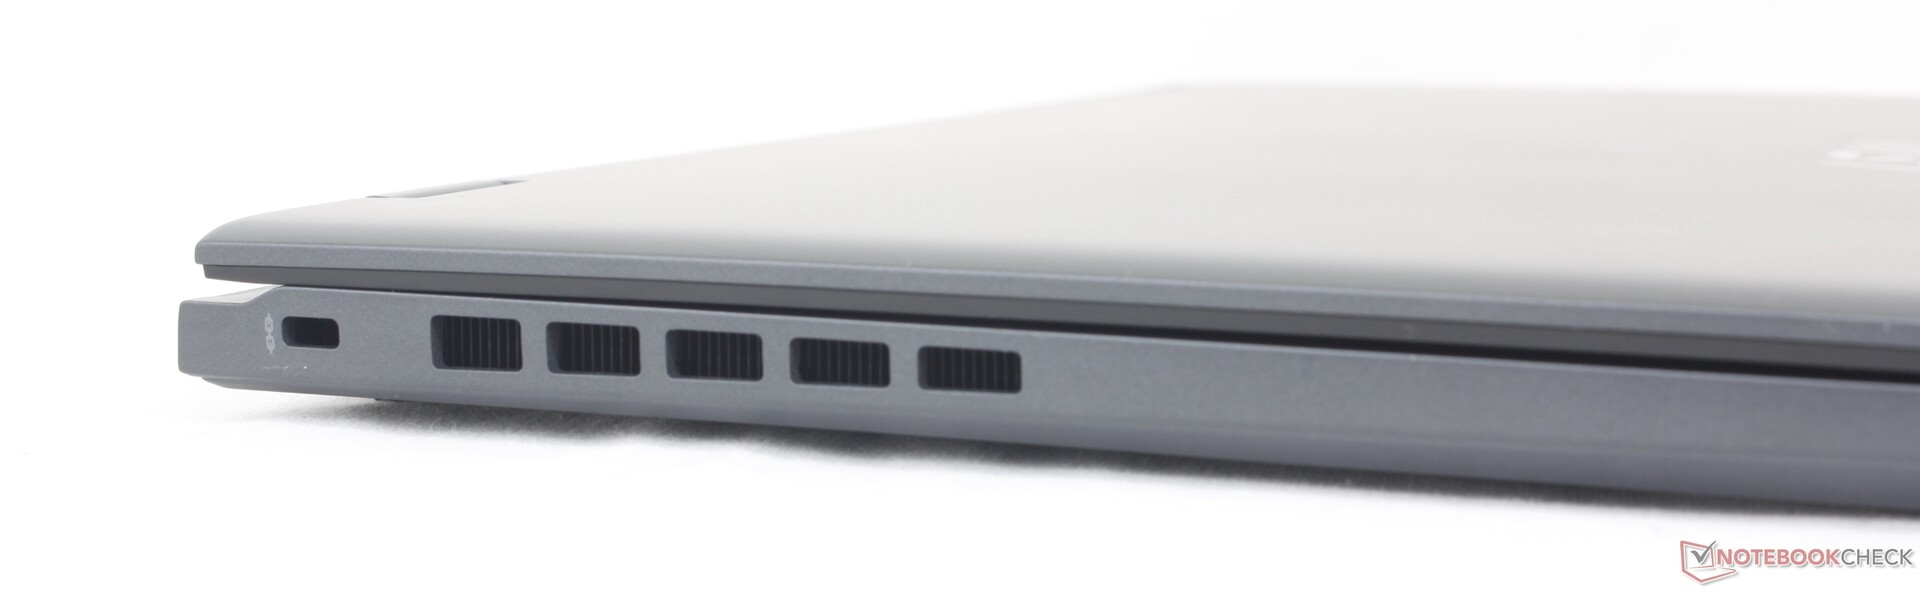
A diferencia de la mayoría de los demás Ultrabooks, los puertos de la Prestige 16 están concentrados a lo largo de la parte trasera en lugar de los laterales. Este enfoque de diseño permite una mejor ventilación a lo largo de los laterales aunque a costa de una peor accesibilidad a los puertos. Puertos de uso común como HDMI, USB-C, e incluso USB-A están todos a lo largo de la parte trasera, lo que puede no ser ideal para la mayoría de los usuarios.
En comparación con la Prestige 15, la Prestige 16 ha cambiado un puerto USB-A por un puerto RJ-45. Los dos puertos Thunderbolt 4 permanecen intactos para SKUs con sólo gráficos integrados. Si se configura con gráficos discretos, sólo uno de los dos puertos USB-C es compatible con Thunderbolt.
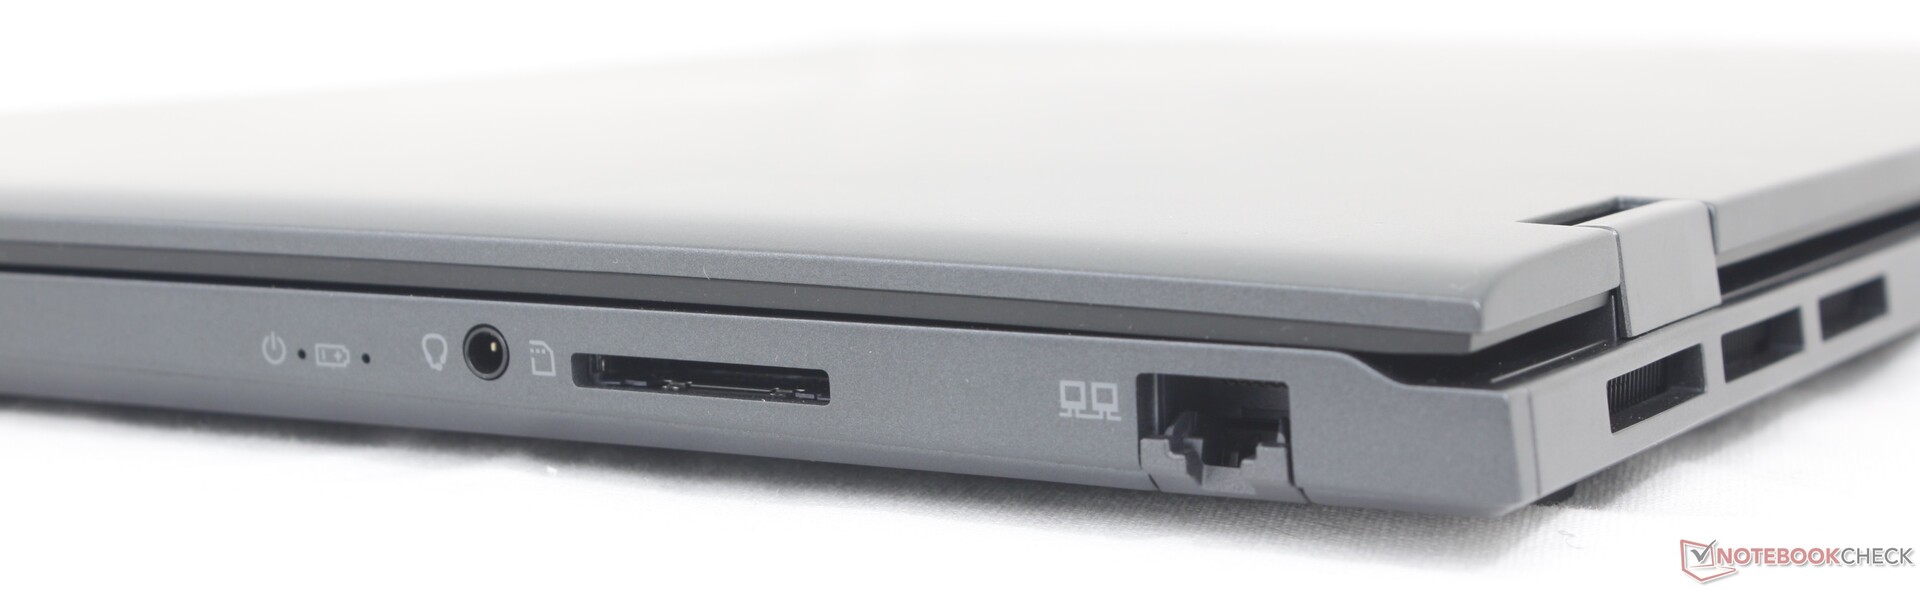
Lector de tarjetas SD
El lector de tarjetas SD integrado ha sido mejorado para ofrecer velocidades mucho más rápidas. La transferencia de 1 GB de imágenes desde nuestra tarjeta de prueba UHS-II al escritorio tardaría algo menos de 6 segundos, frente a los más de 12 segundos de la Prestige 15.
| SD Card Reader | |
| average JPG Copy Test (av. of 3 runs) | |
| MSI Prestige 16 B1MG-001US (Toshiba Exceria Pro SDXC 64 GB UHS-II) | |
| Asus VivoBook Pro 16 K6602VU (Angelbird AV Pro V60) | |
| Lenovo ThinkBook 16 G6 ABP (Angelbird AV Pro V60) | |
| MSI Prestige 15 A12UD-093 (AV Pro SD microSD 128 GB V60) | |
| LG Gram 2in1 16 16T90R - G.AA78G | |
| Dell Inspiron 16 Plus 7630 (AV Pro SD microSD 128 GB V60) | |
| maximum AS SSD Seq Read Test (1GB) | |
| Asus VivoBook Pro 16 K6602VU (Angelbird AV Pro V60) | |
| MSI Prestige 16 B1MG-001US (Toshiba Exceria Pro SDXC 64 GB UHS-II) | |
| Lenovo ThinkBook 16 G6 ABP (Angelbird AV Pro V60) | |
| MSI Prestige 15 A12UD-093 (AV Pro SD microSD 128 GB V60) | |
| Dell Inspiron 16 Plus 7630 (AV Pro SD microSD 128 GB V60) | |
| LG Gram 2in1 16 16T90R - G.AA78G | |
Comunicación
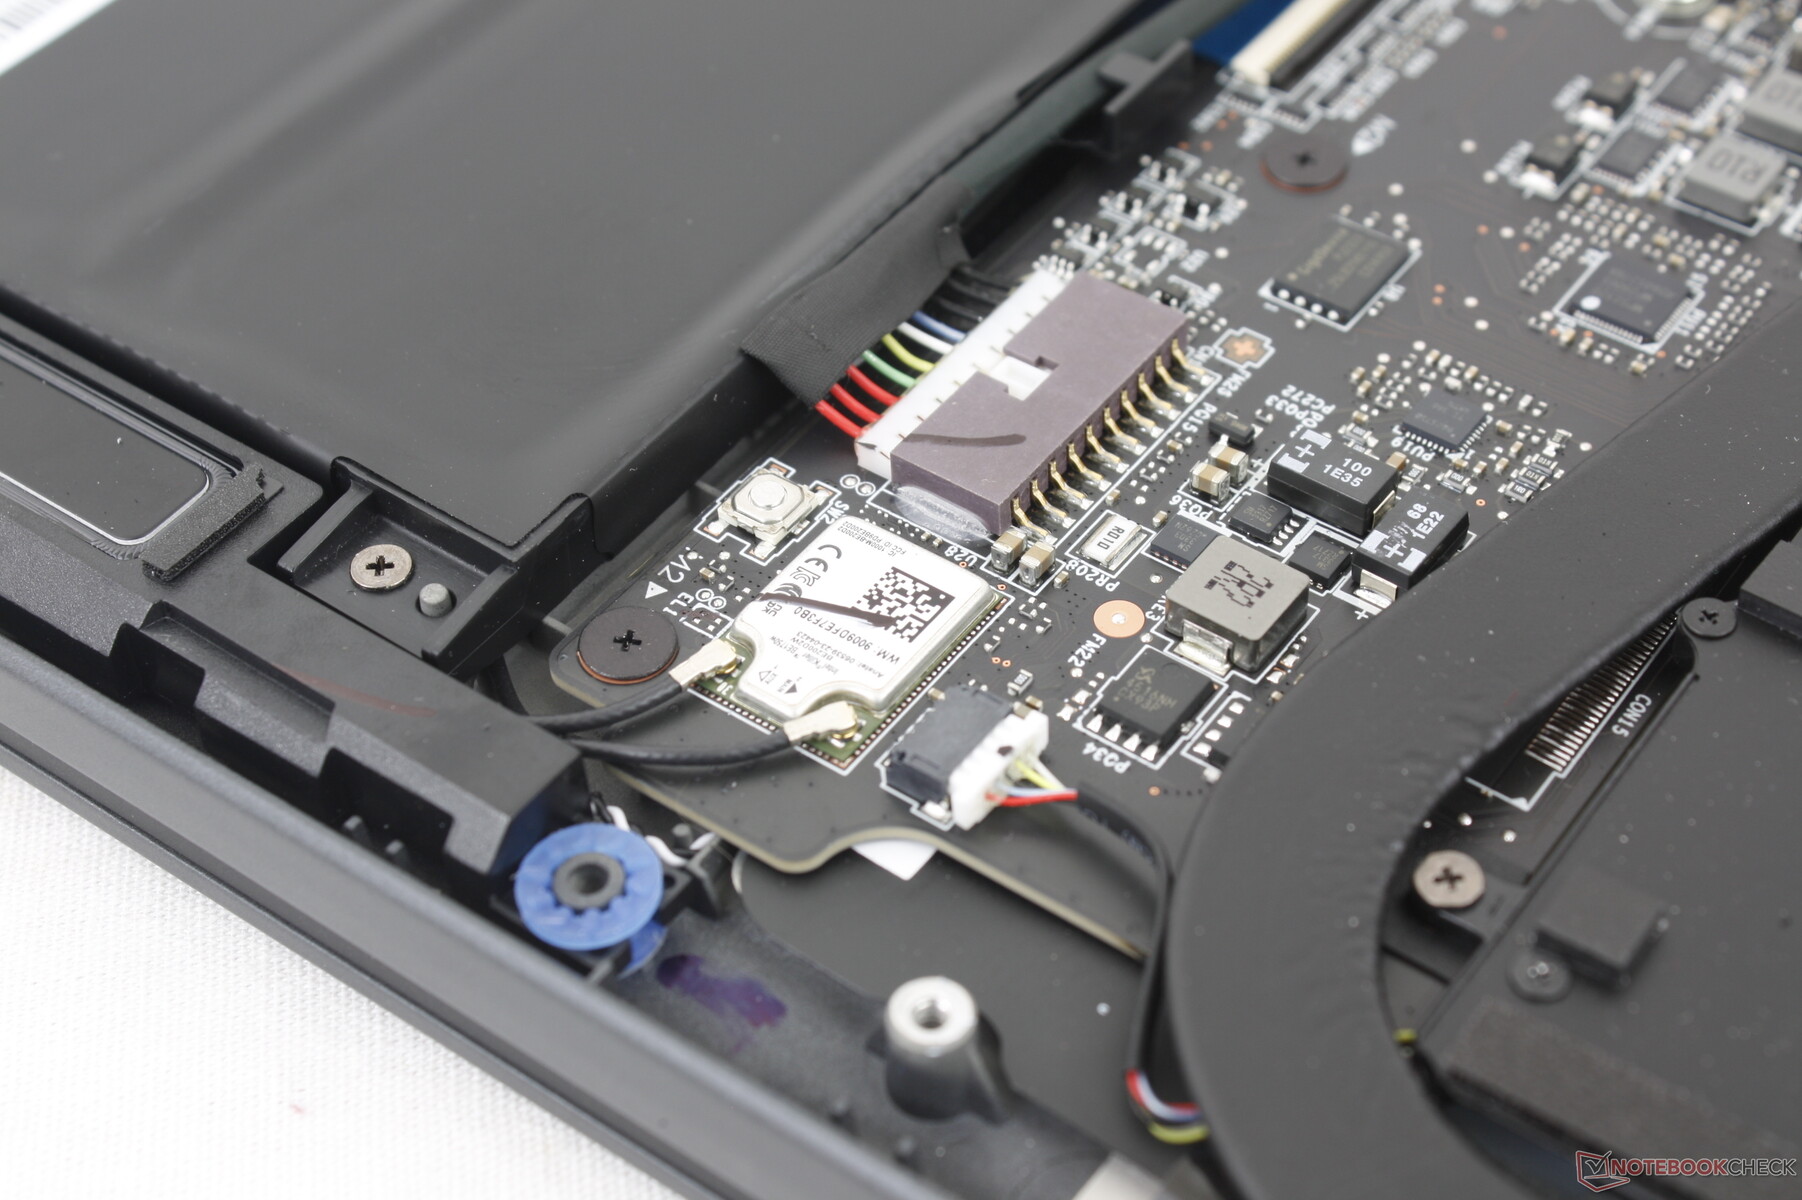
El Prestige 16 es uno de los primeros portátiles que se suministran con el módulo WLAN Killer BE1750W para compatibilidad con Wi-Fi 7. Sin embargo, los routers Wi-Fi 7 aún no están ampliamente disponibles, por lo que la inclusión de Wi-Fi 7 en este momento tiene más que ver con la preparación para el futuro que con cualquier beneficio inmediato. No obstante, no experimentamos ningún problema de conectividad cuando lo emparejamos con nuestro router de prueba Wi-Fi 6E.
Cámara web
Una webcam de 2 MP con IR y obturador físico de privacidad vienen de serie. Alternativas como el HP Spectre ya han empezado a comercializarse con sensores de 5 MP de mayor resolución.


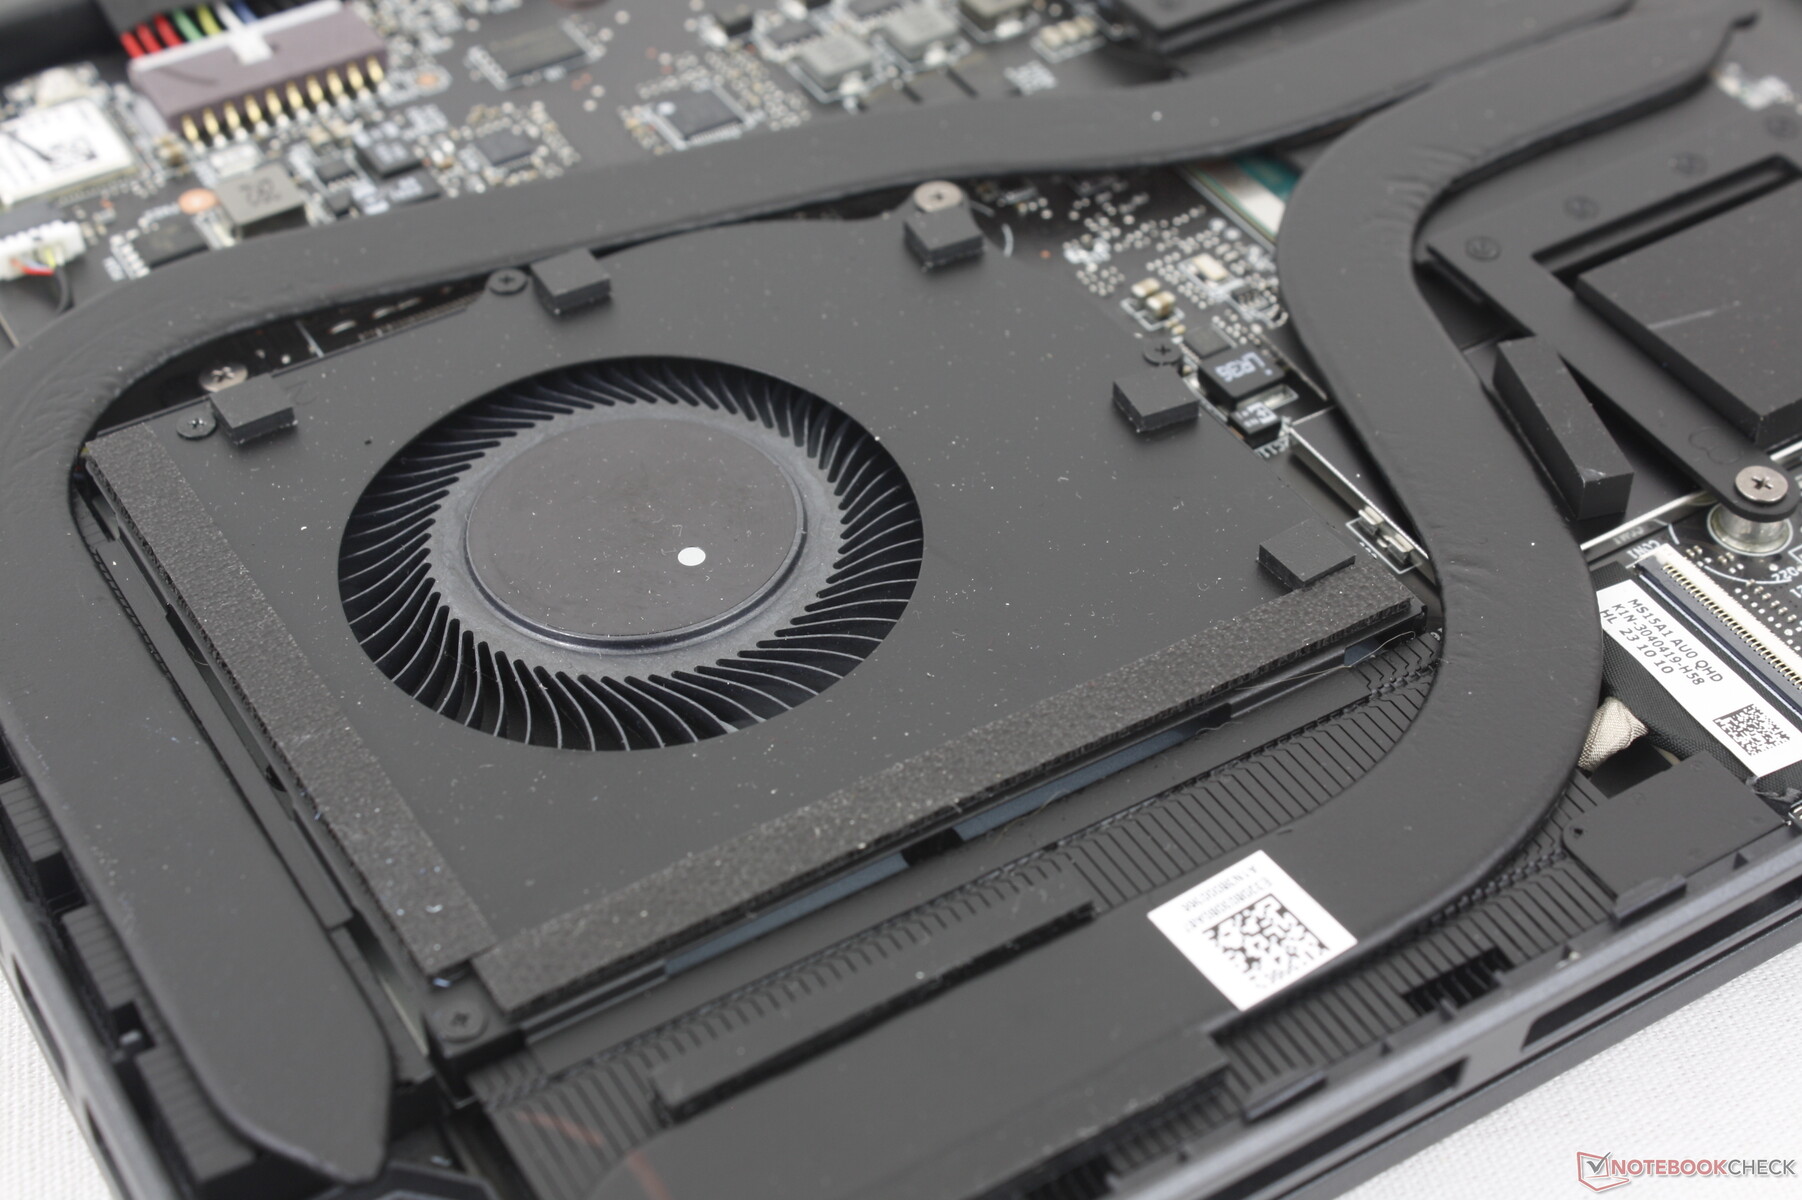
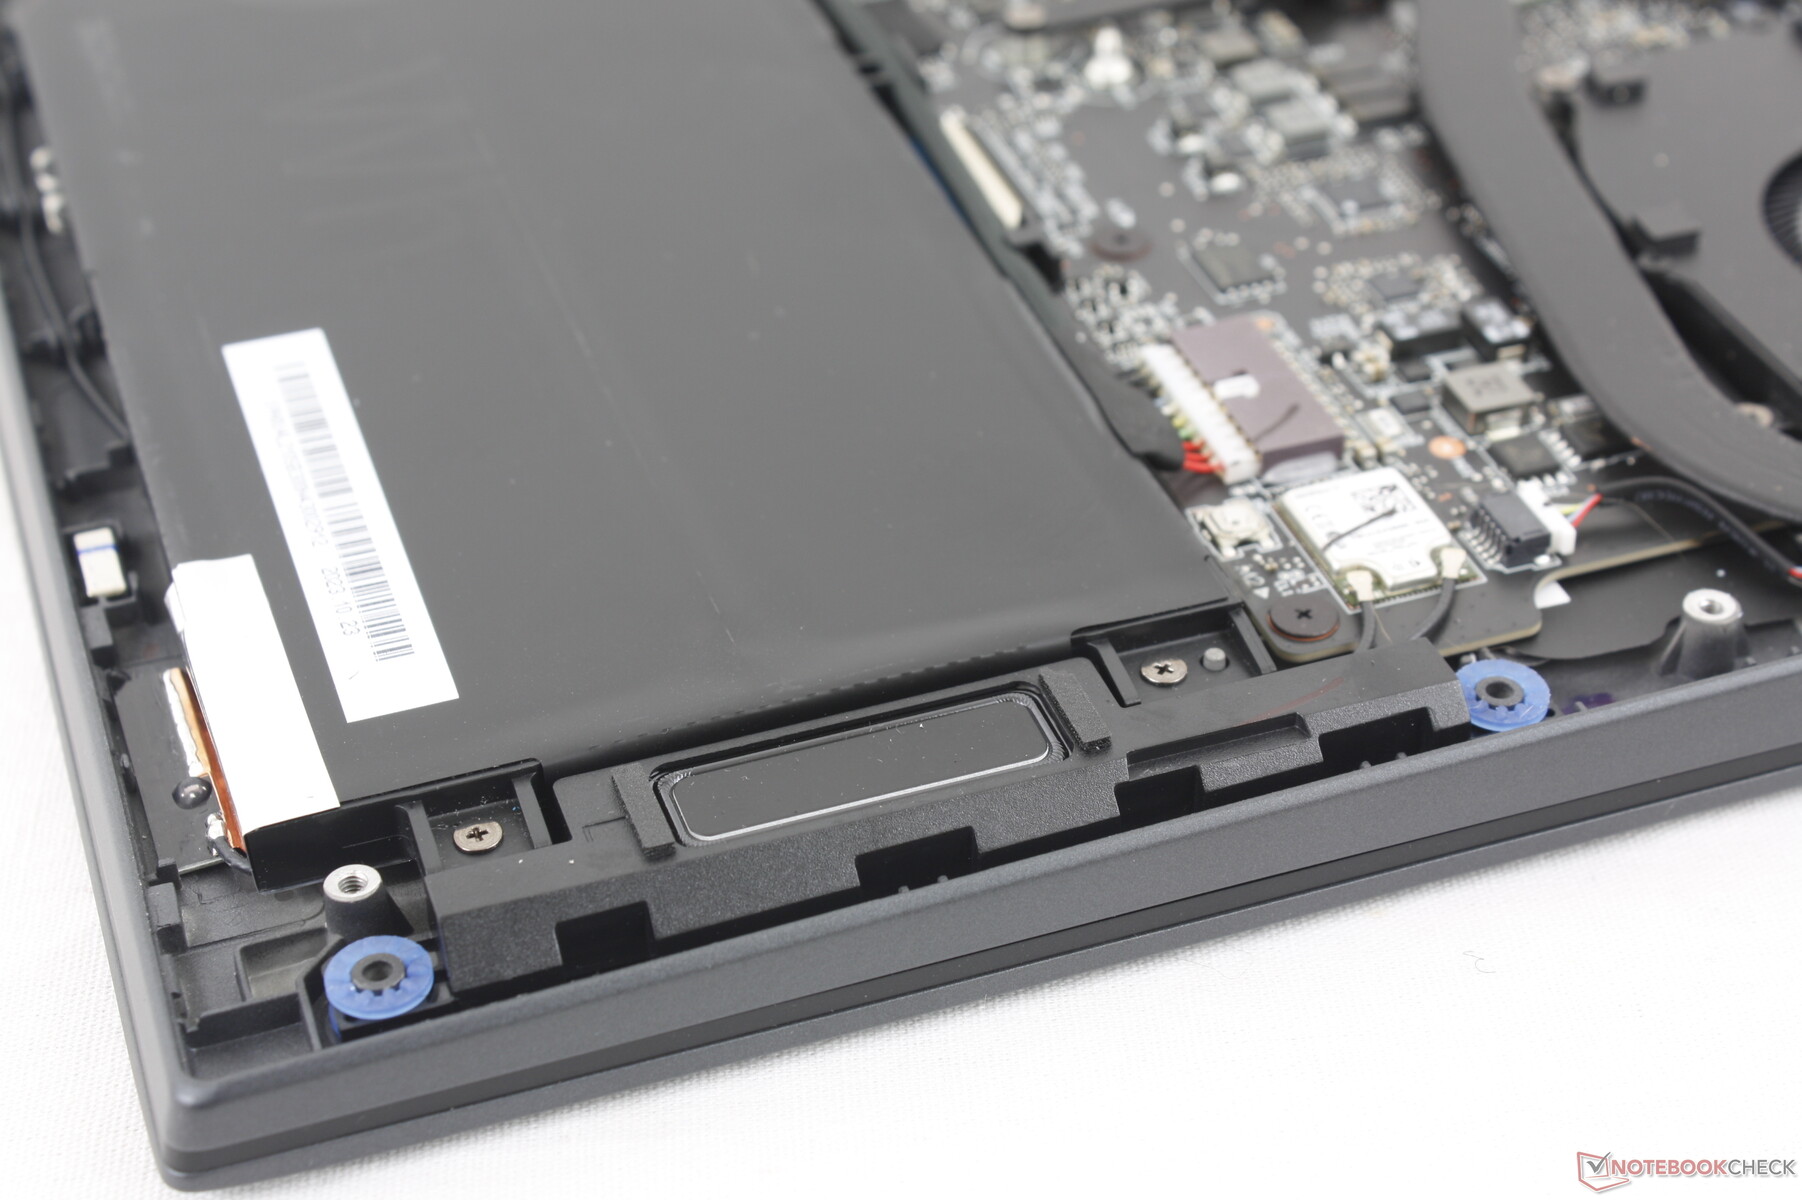
Mantenimiento
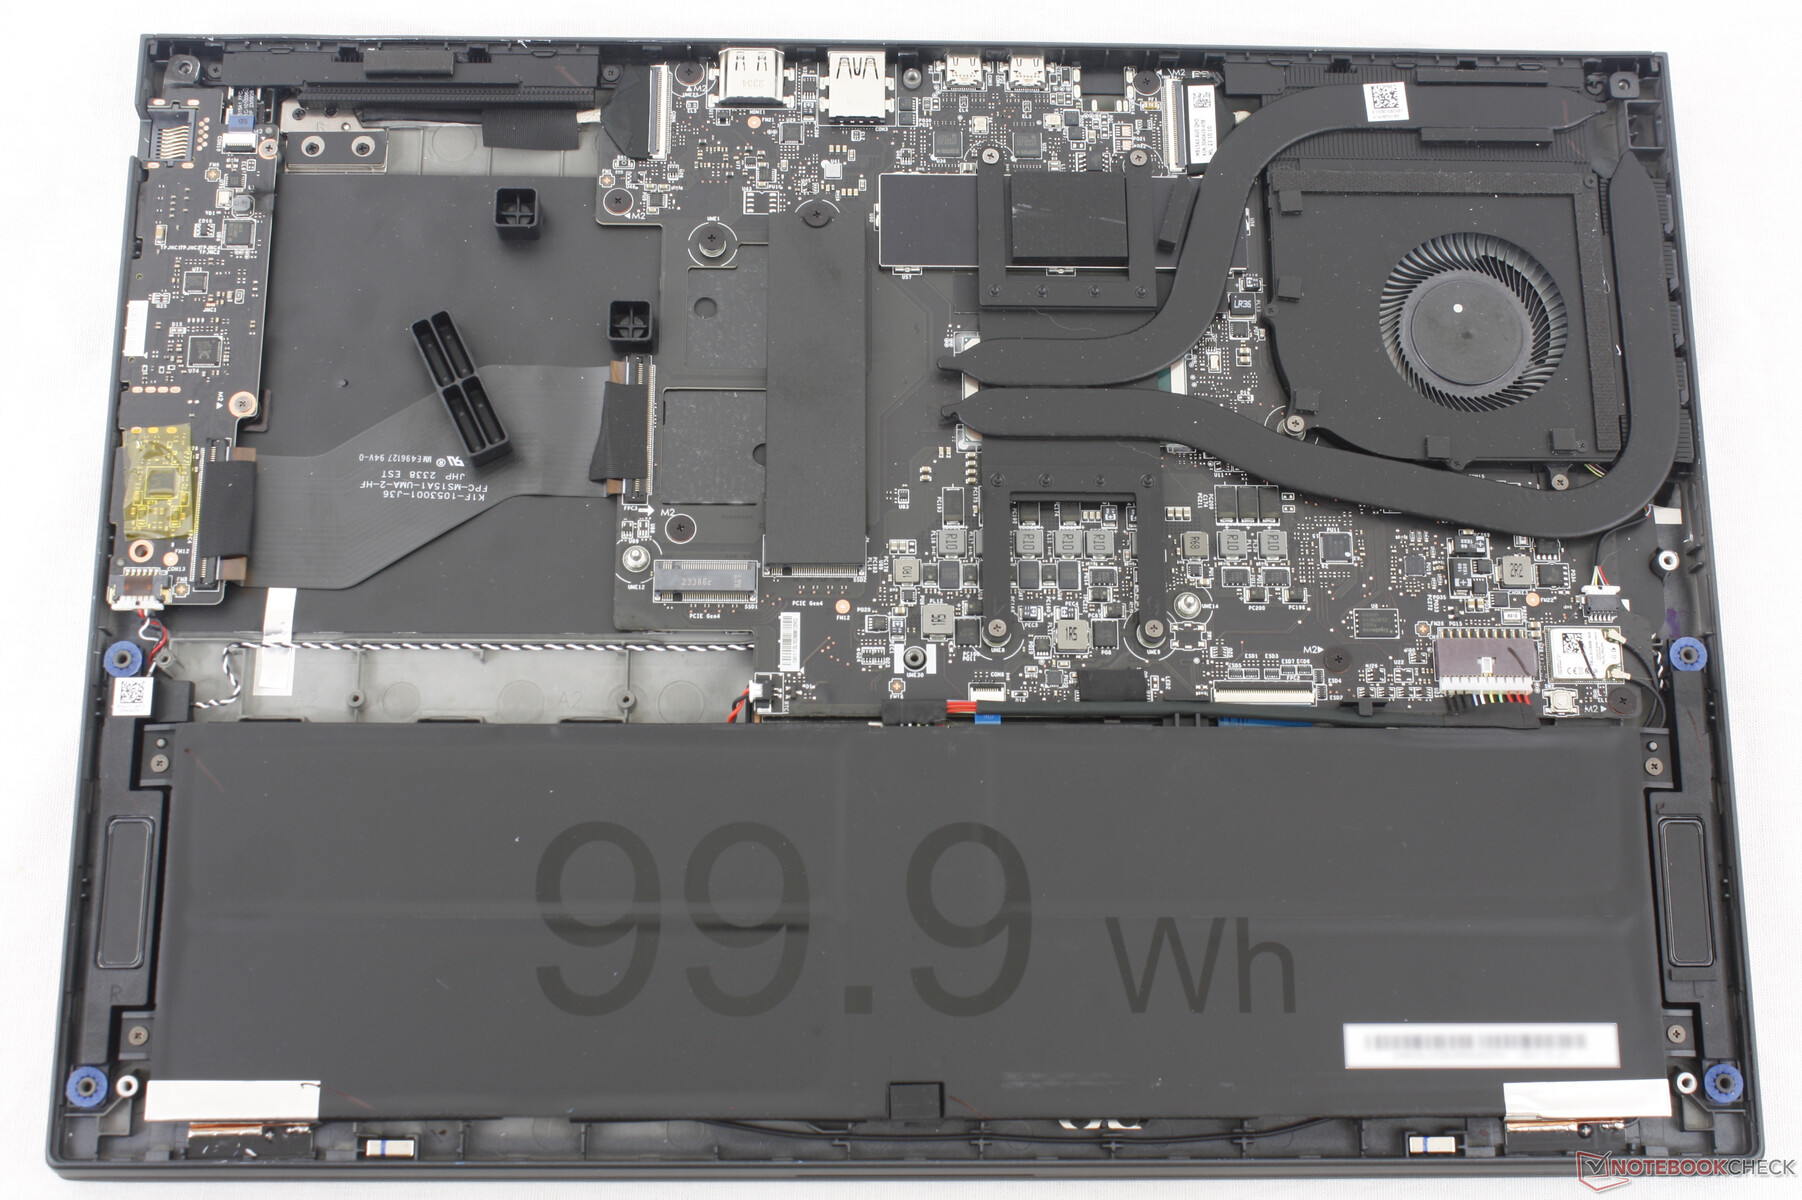
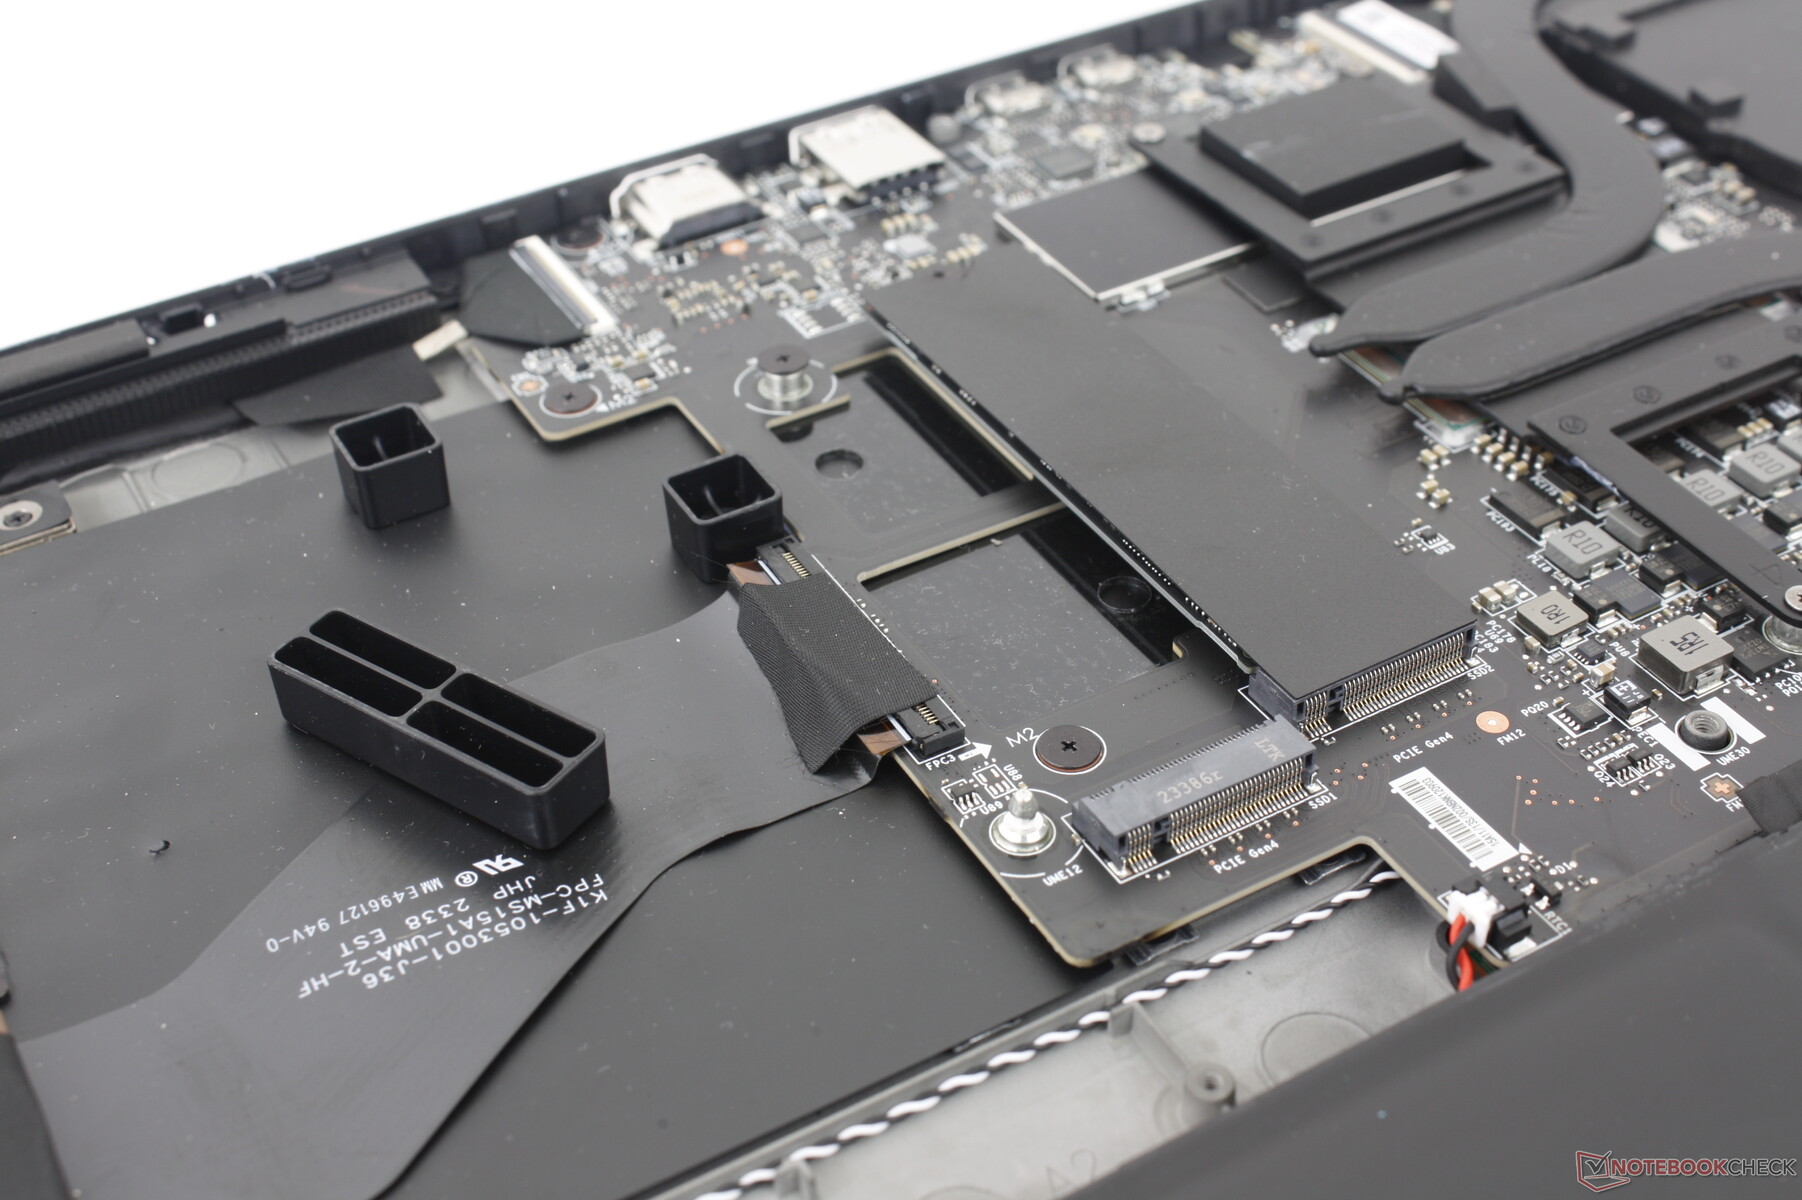
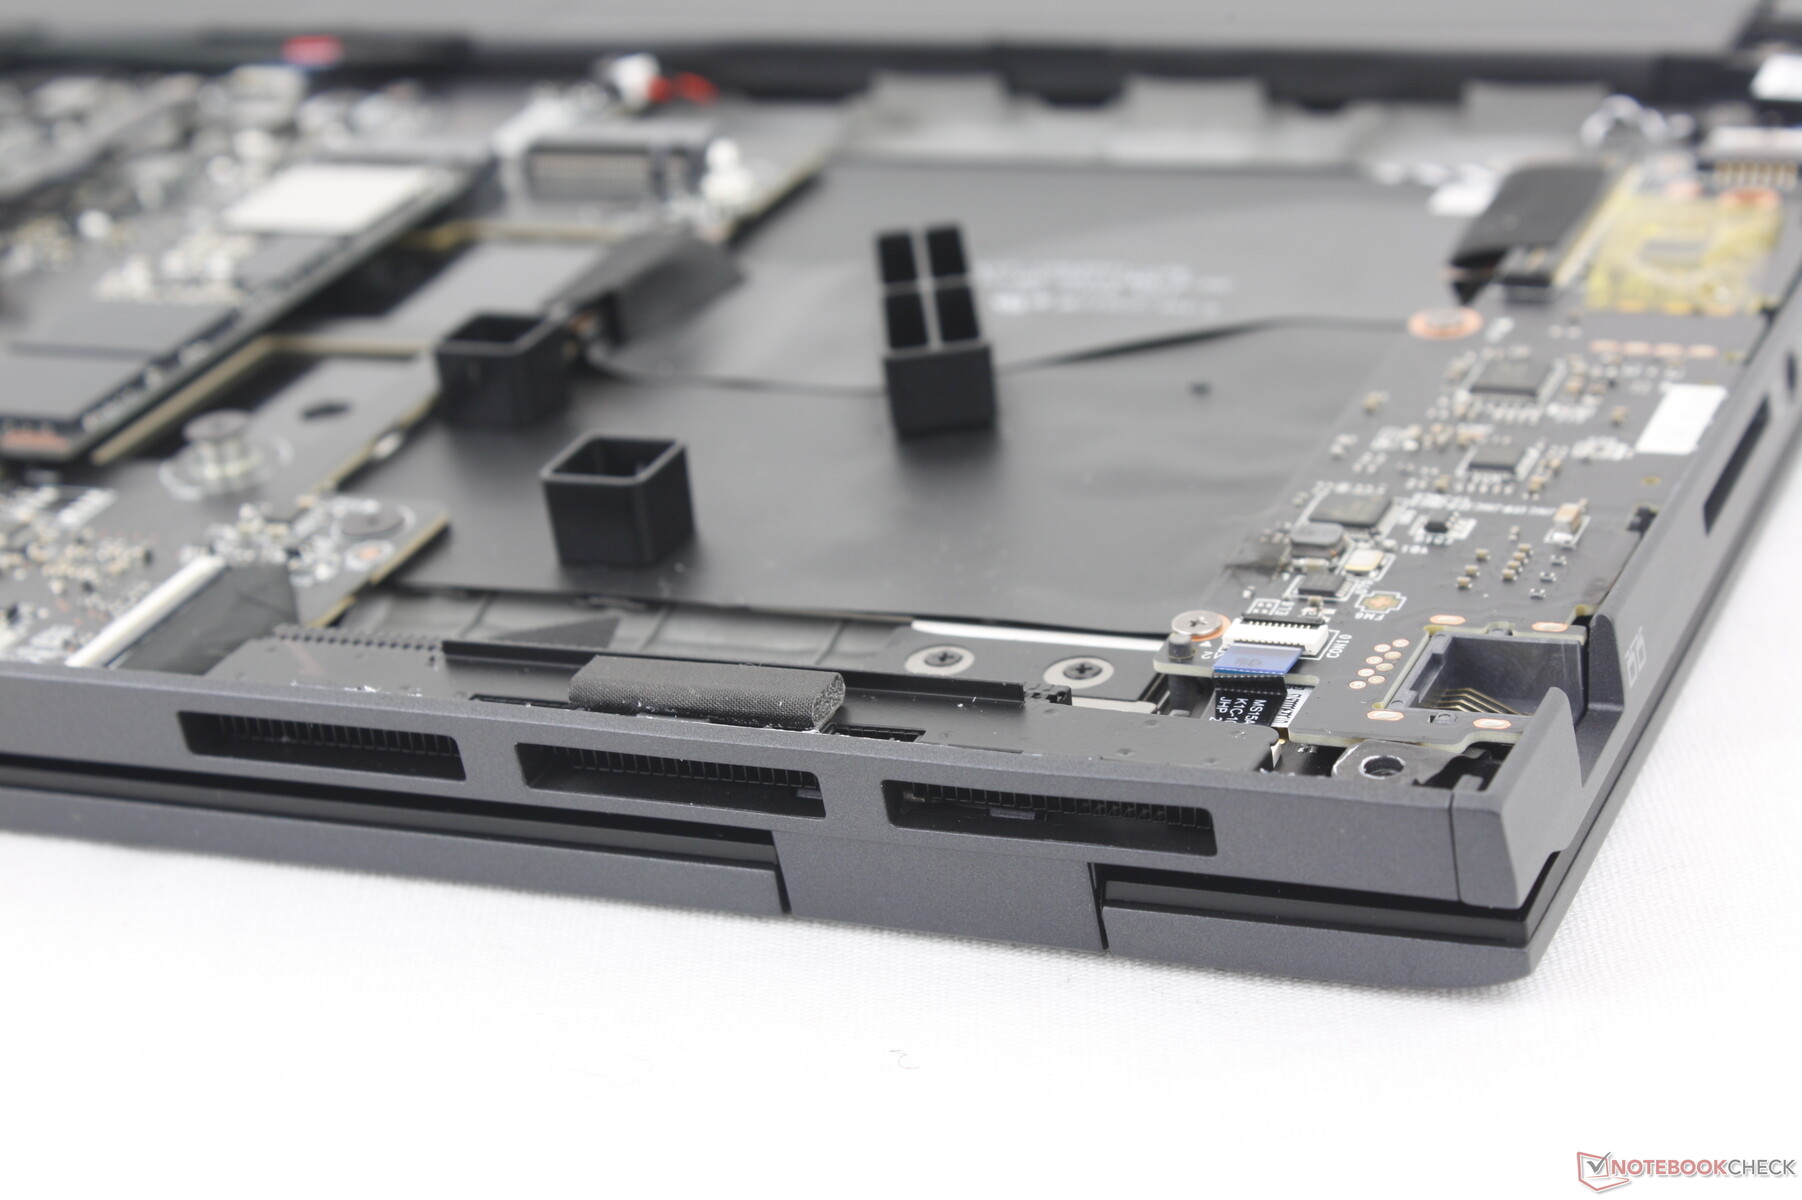
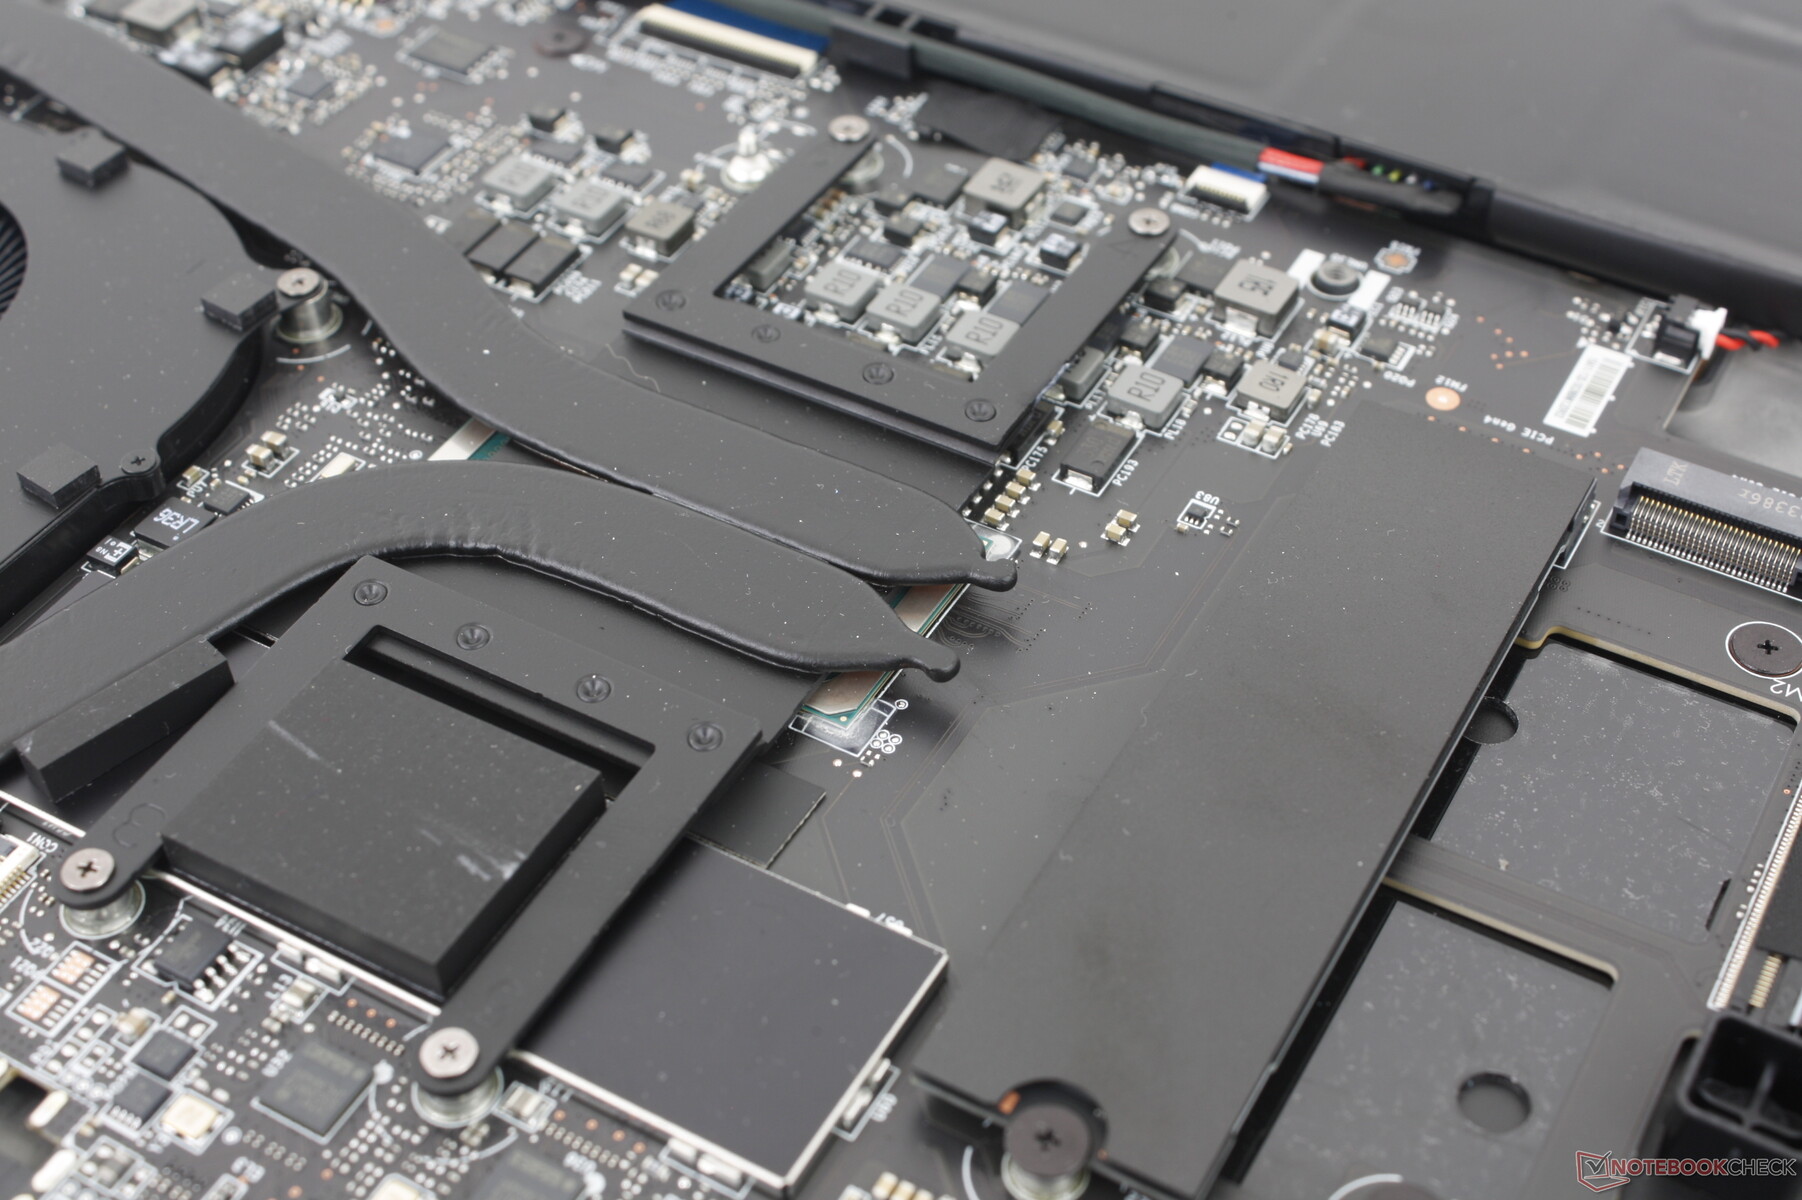
El panel inferior se desprende con bastante facilidad tras retirar los ocho tornillos Phillips. Tenga en cuenta que una pegatina de precinto de fábrica debe romperse para poder acceder a las partes internas.
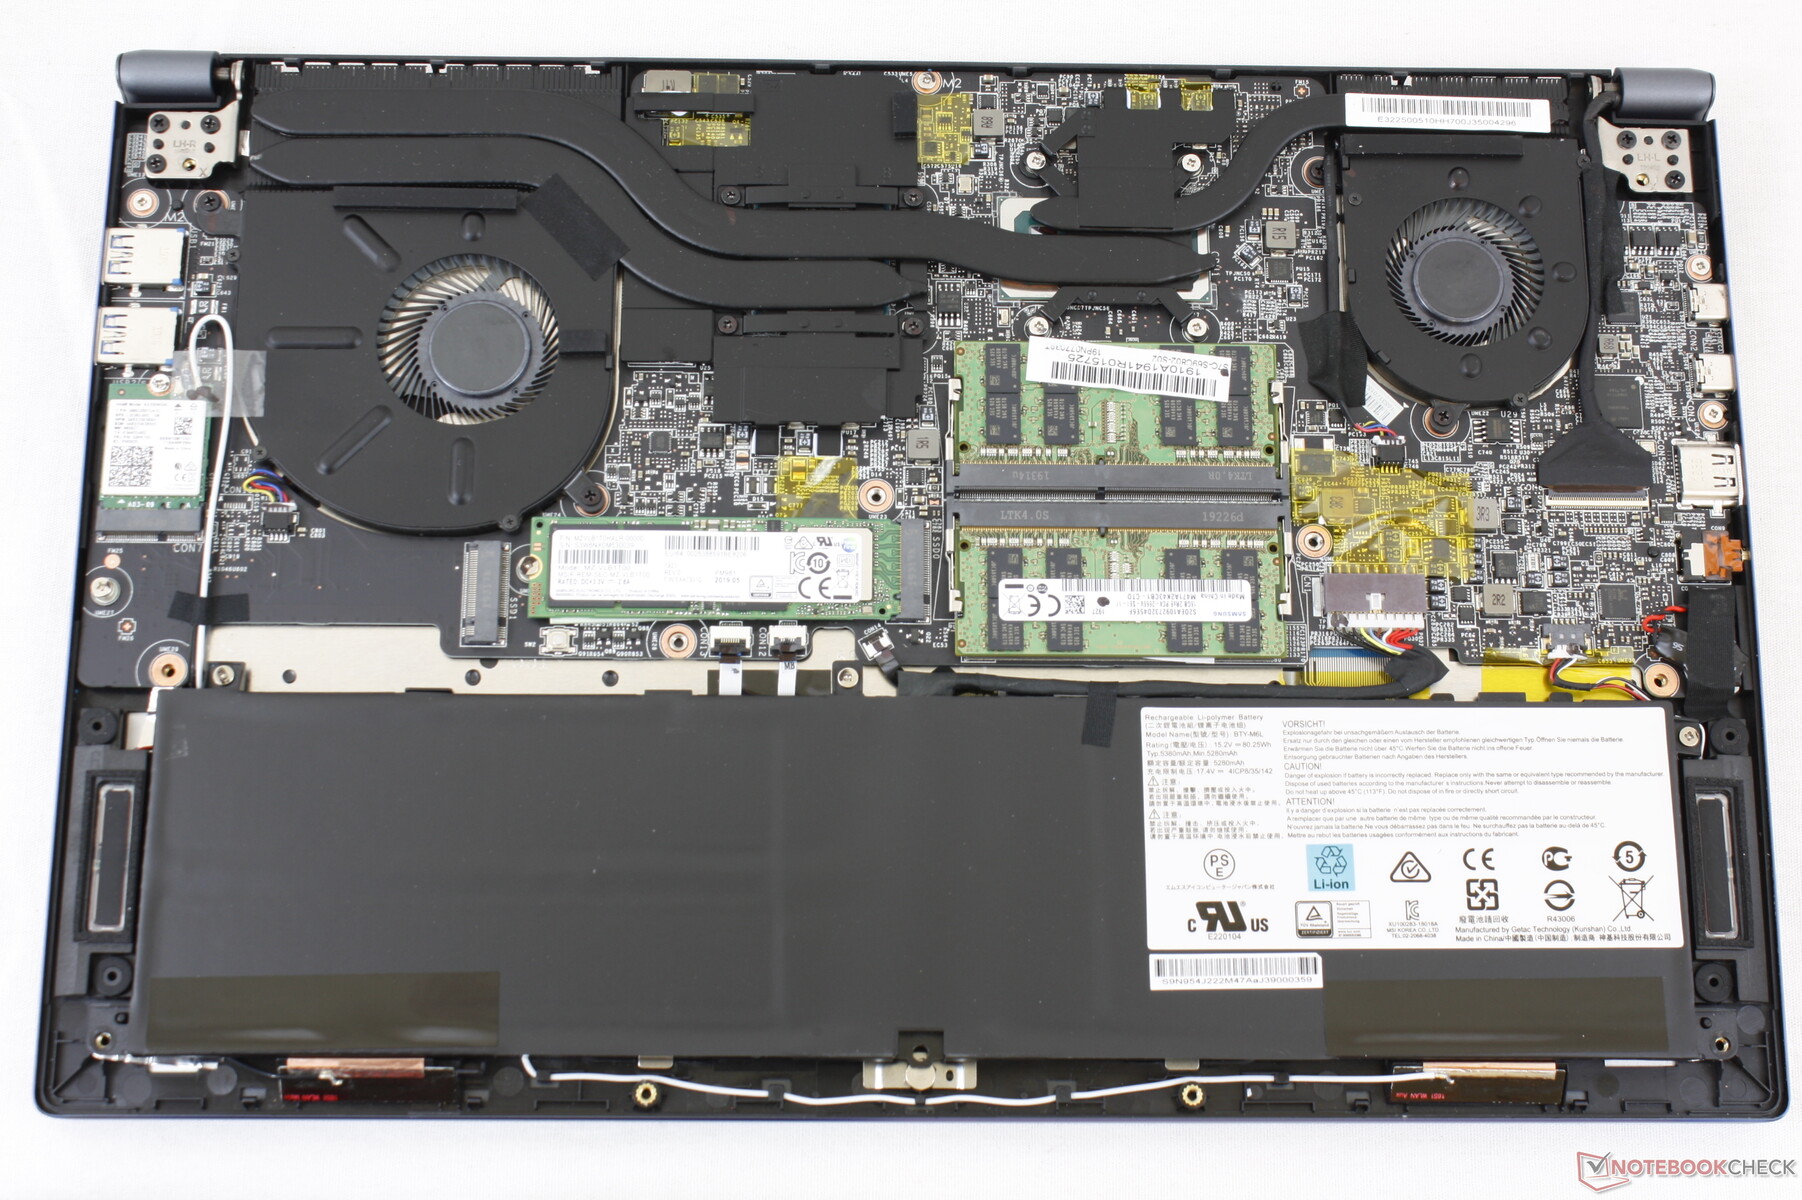
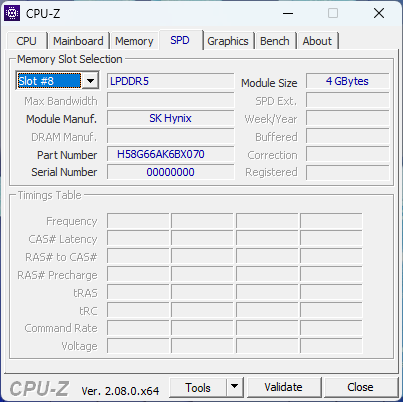
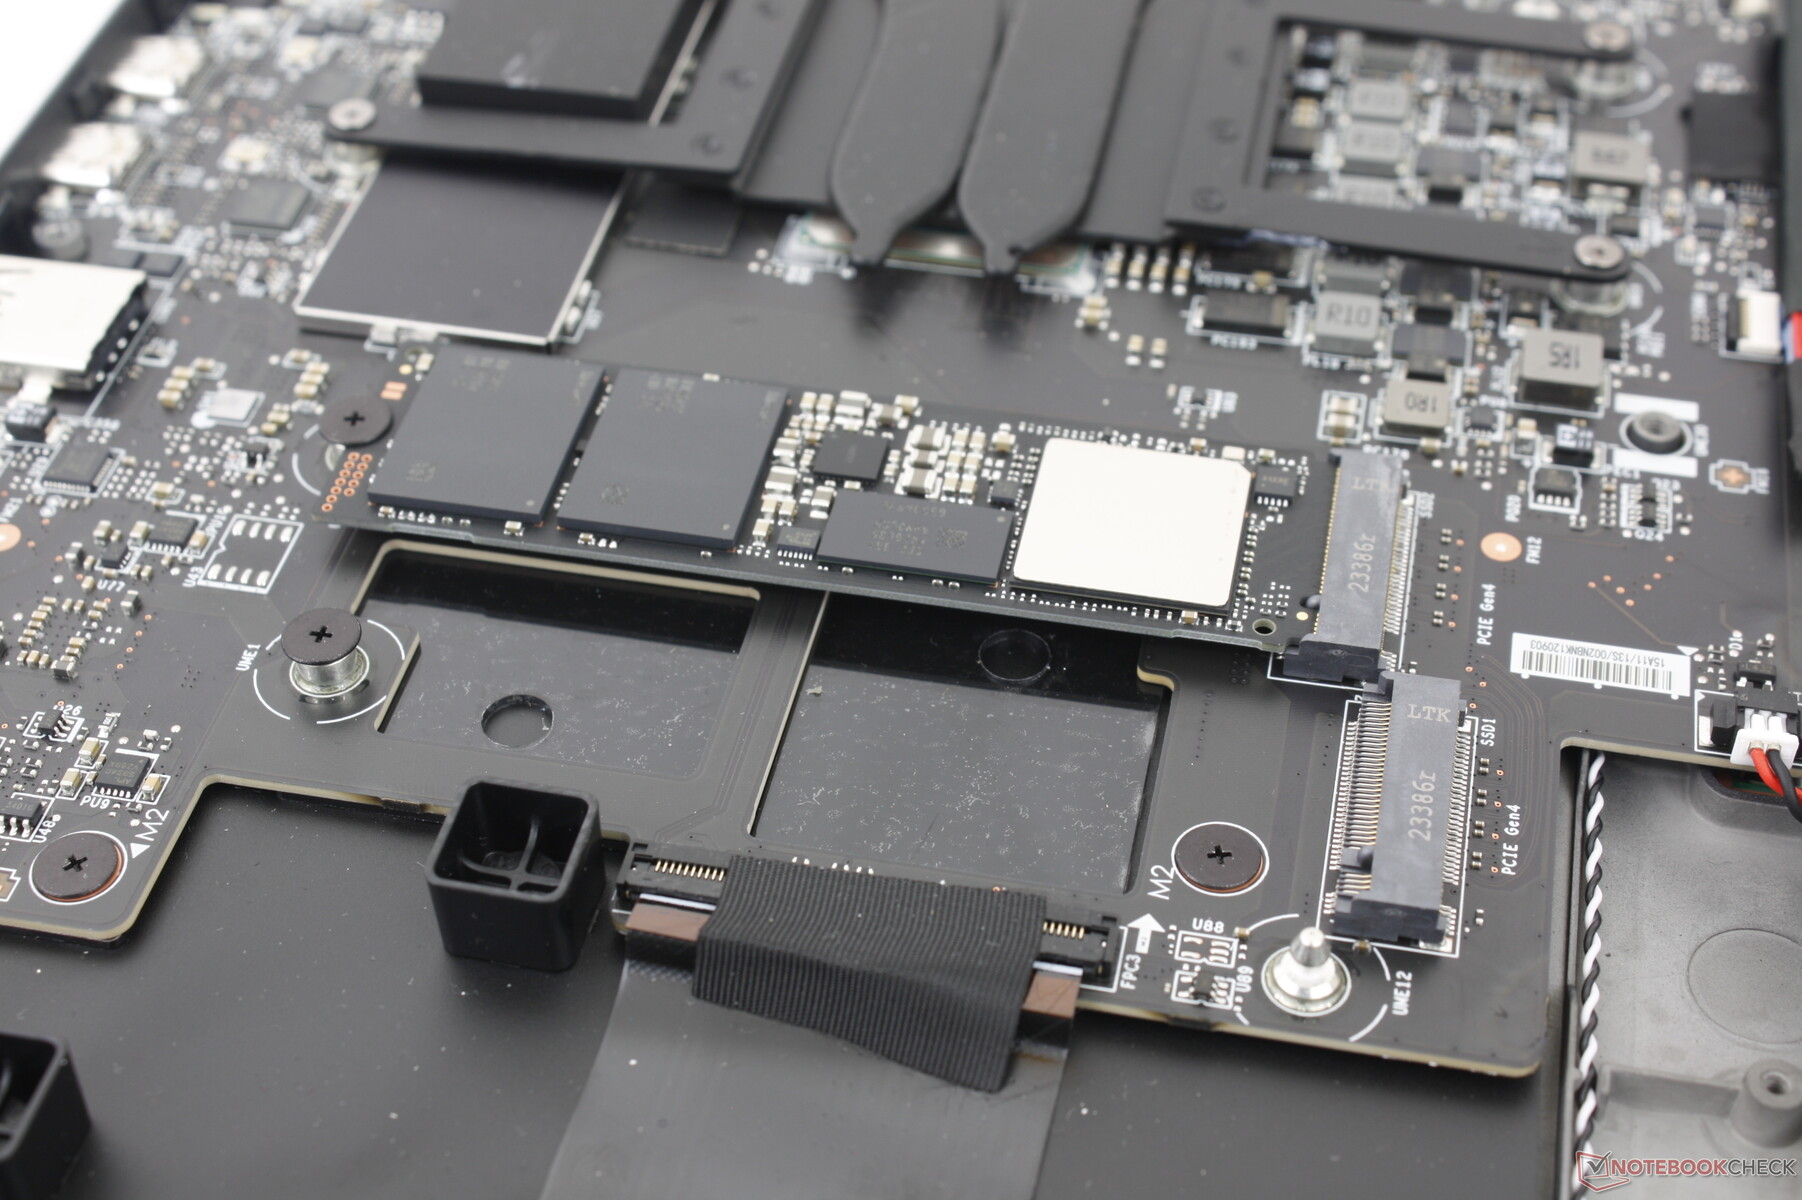
Una vez dentro, los propietarios tendrán acceso a dos ranuras SSD M.2 2280 PCIe4 x4 NVMe mientras que los módulos RAM y WLAN están todos soldados. En comparación, todos estos módulos son extraíbles en el antiguo diseño Prestige 15.
Observe el gran espacio vacío reservado para las SKU con gráficos discretos. Este modelo viene equipado con más tubos de calor, un ventilador adicional y unidades SSD M.2 reorganizadas si se configura con una GPU dedicada.
Accesorios y garantía
No hay extras en la caja más allá del adaptador de CA y la documentación. Se aplica la garantía limitada habitual de un año si se adquiere en EE.UU.
Dispositivos de entrada: más grandes que antes
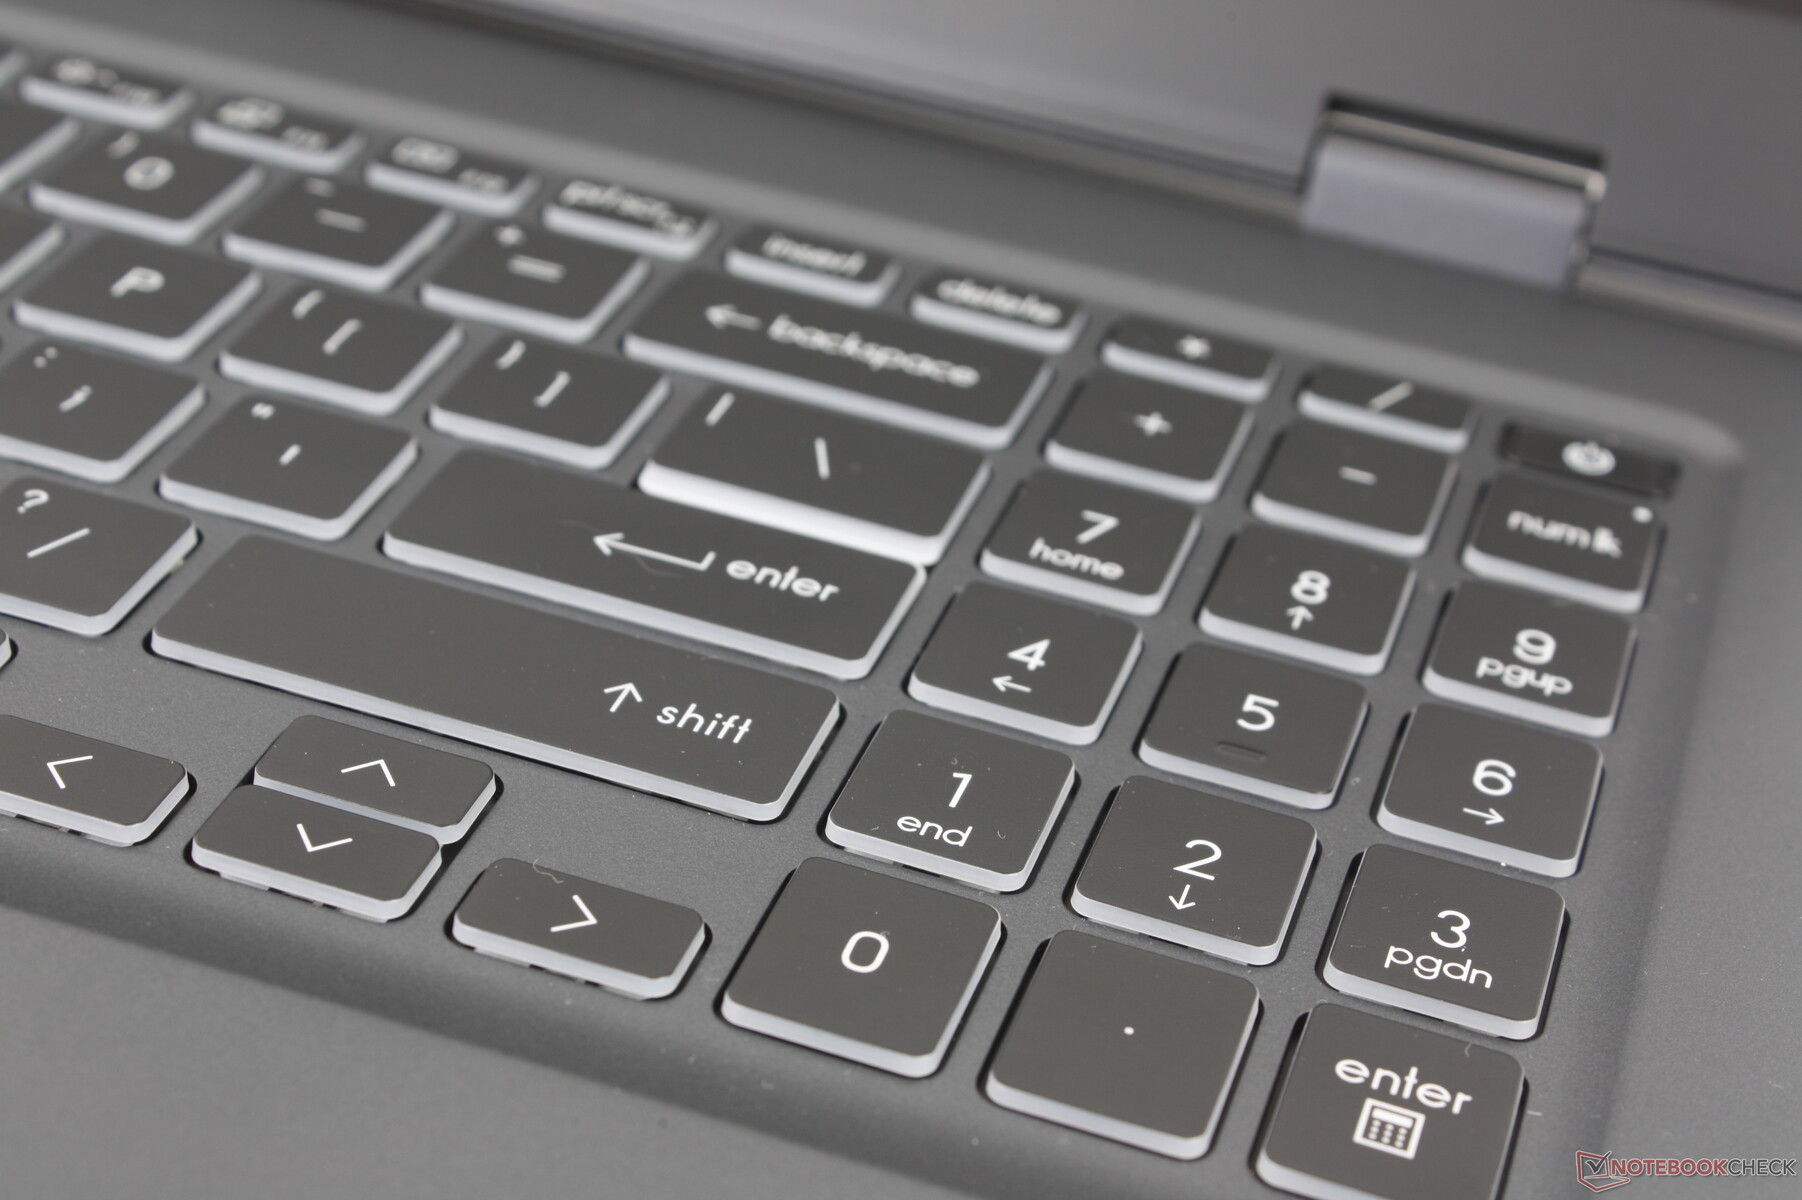
Teclado
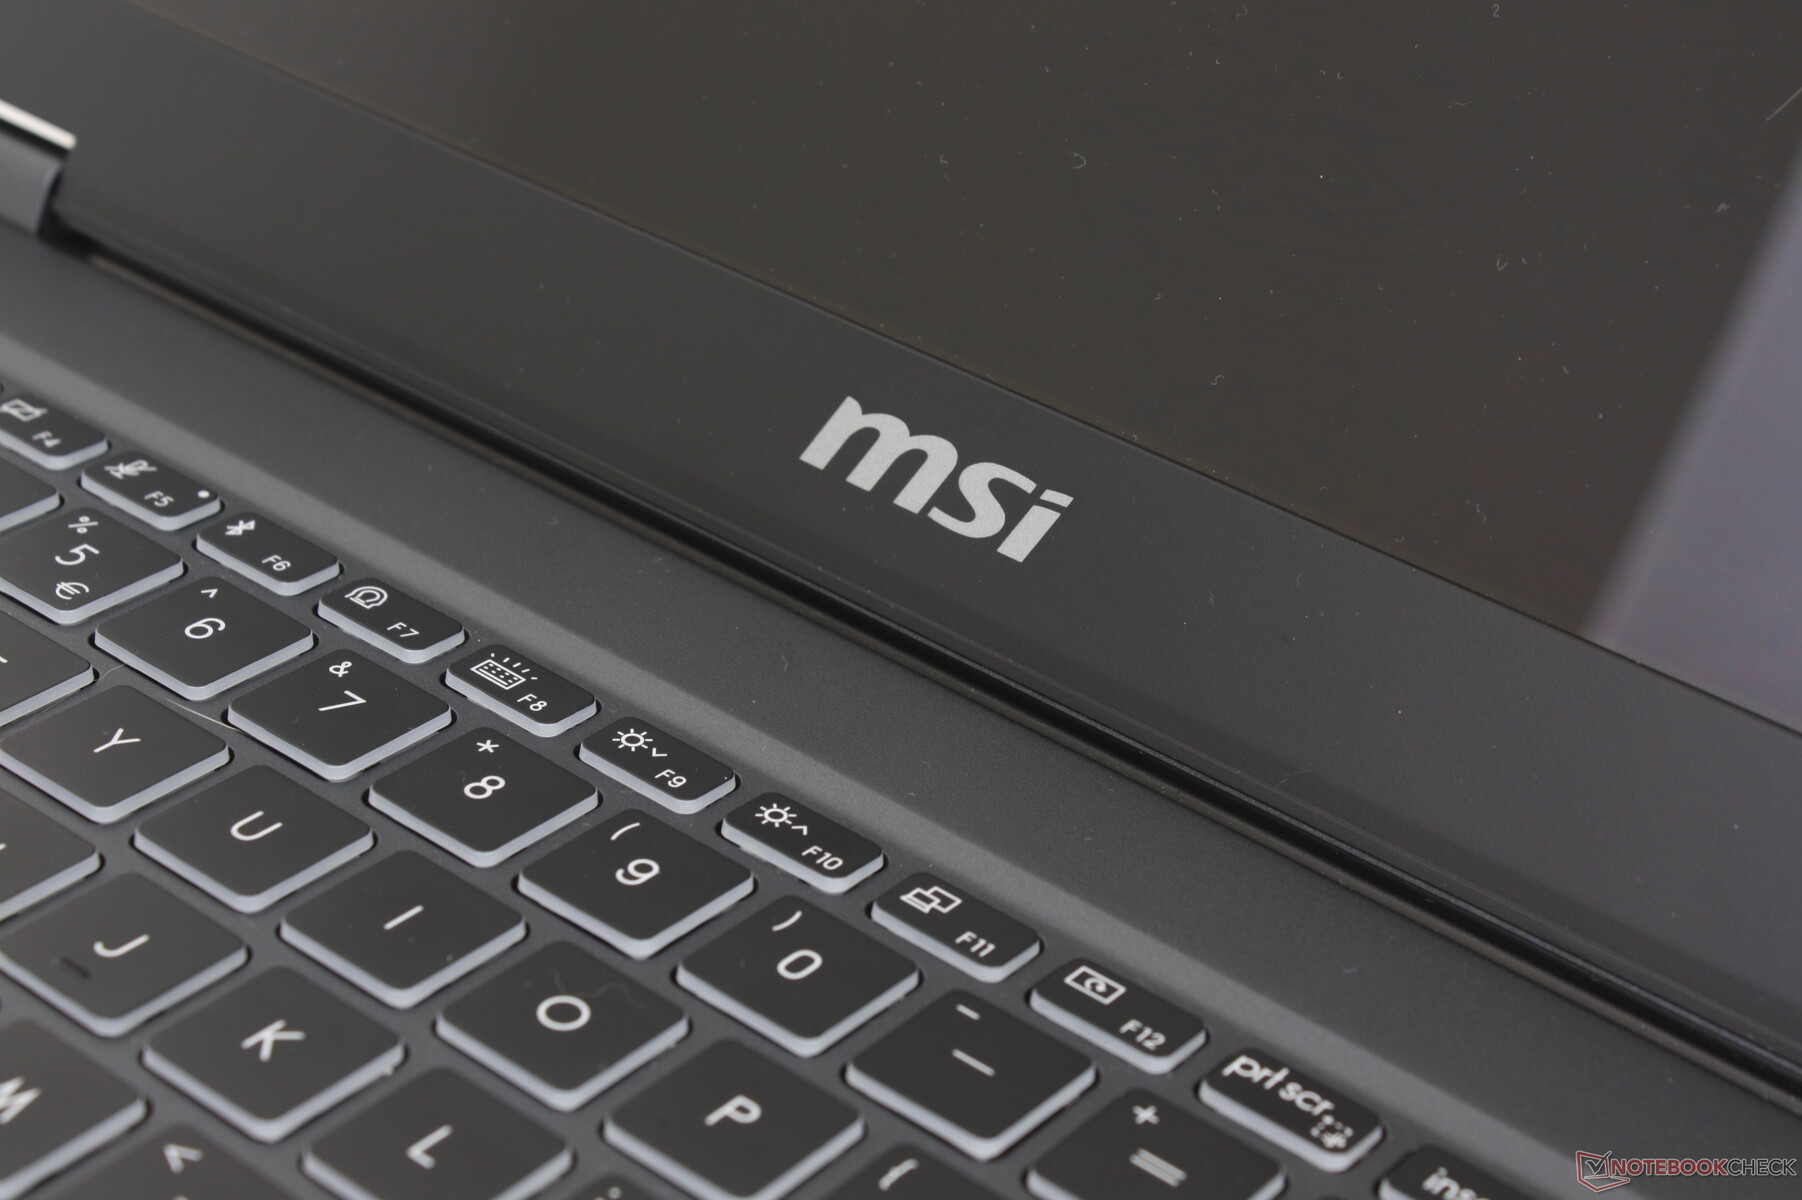
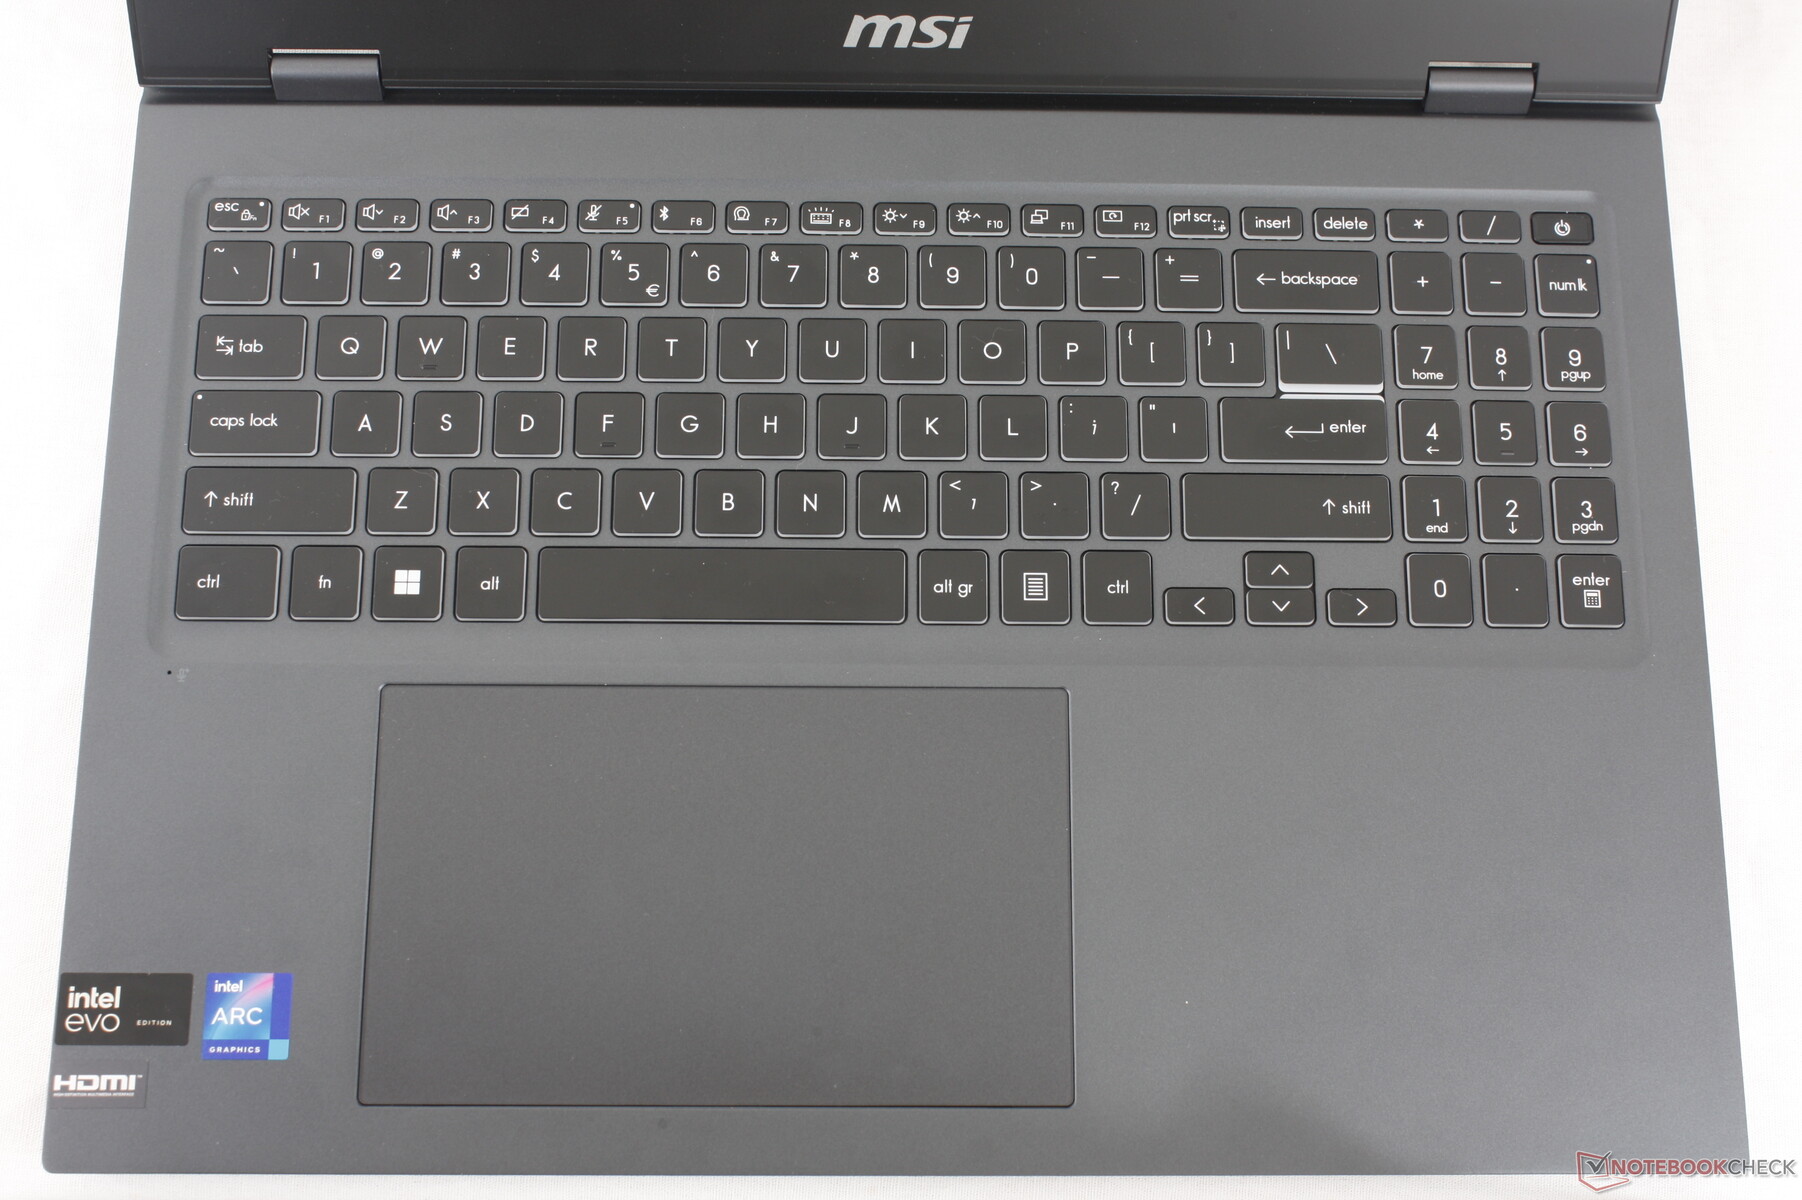
El teclado se ha renovado para incluir un teclado numérico integrado. Por lo demás, la respuesta de las teclas es la misma que en el Prestige 15 para una experiencia de tecleo similar a pesar de los cambios en la distribución. Seguimos encontrando que el recorrido de las teclas es notablemente menos profundo que el de las teclas de los portátiles para juegos de MSI o de la competidora Serie HP Spectre. No son excesivamente blandas o incómodas, pero tener una respuesta más firme o nítida en cada pulsación tampoco vendría mal.
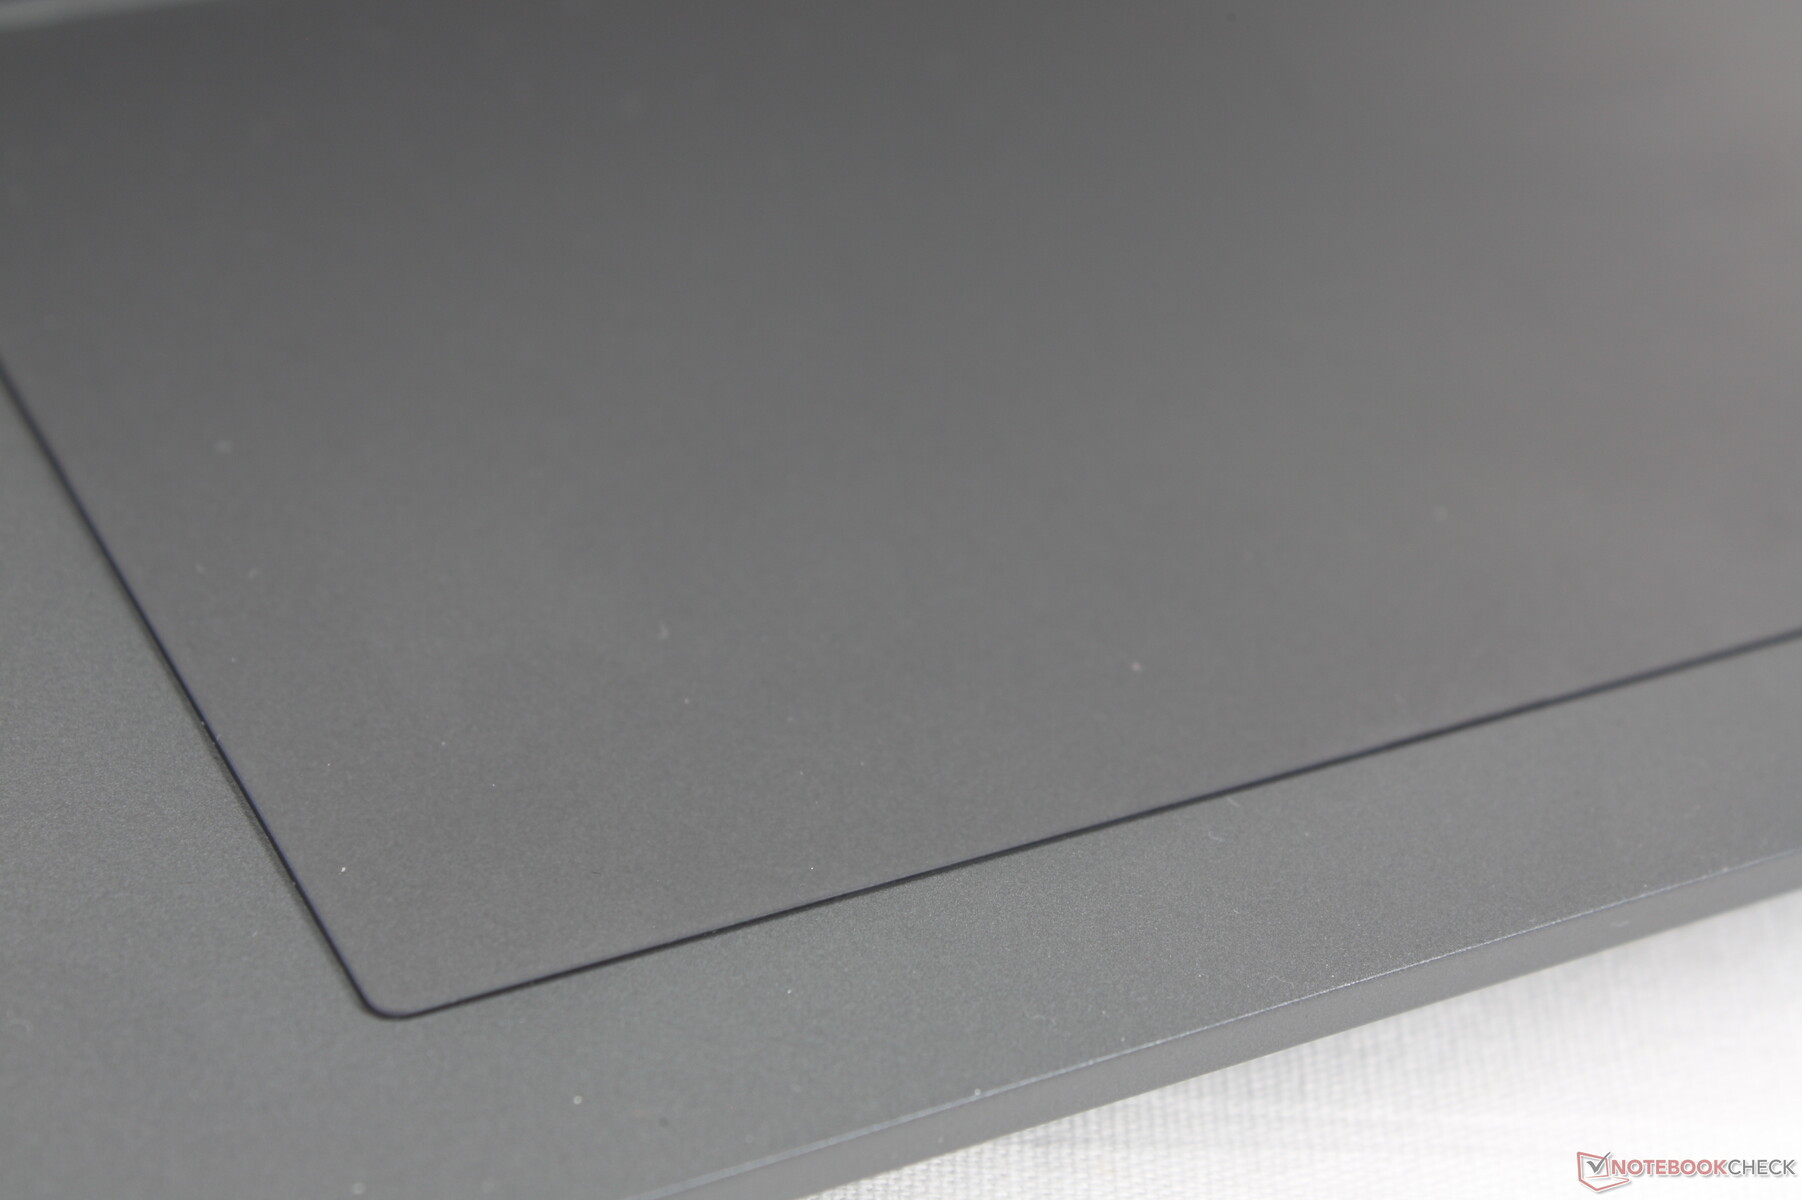
Panel táctil
El clickpad es ahora mucho más grande (15 x 9 cm) para solucionar las incómodas y estrechas dimensiones del clickpad de la antigua Prestige 15 diseño. La tracción es suave y fiable, sin adherencias incluso al deslizarse a velocidades más lentas.
La retroalimentación al hacer clic es sólo promedio si no un poco en el lado esponjoso. Presionar hacia abajo requiere mucha fuerza del dedo, por lo que las acciones pueden llegar a cansar sin un ratón externo.

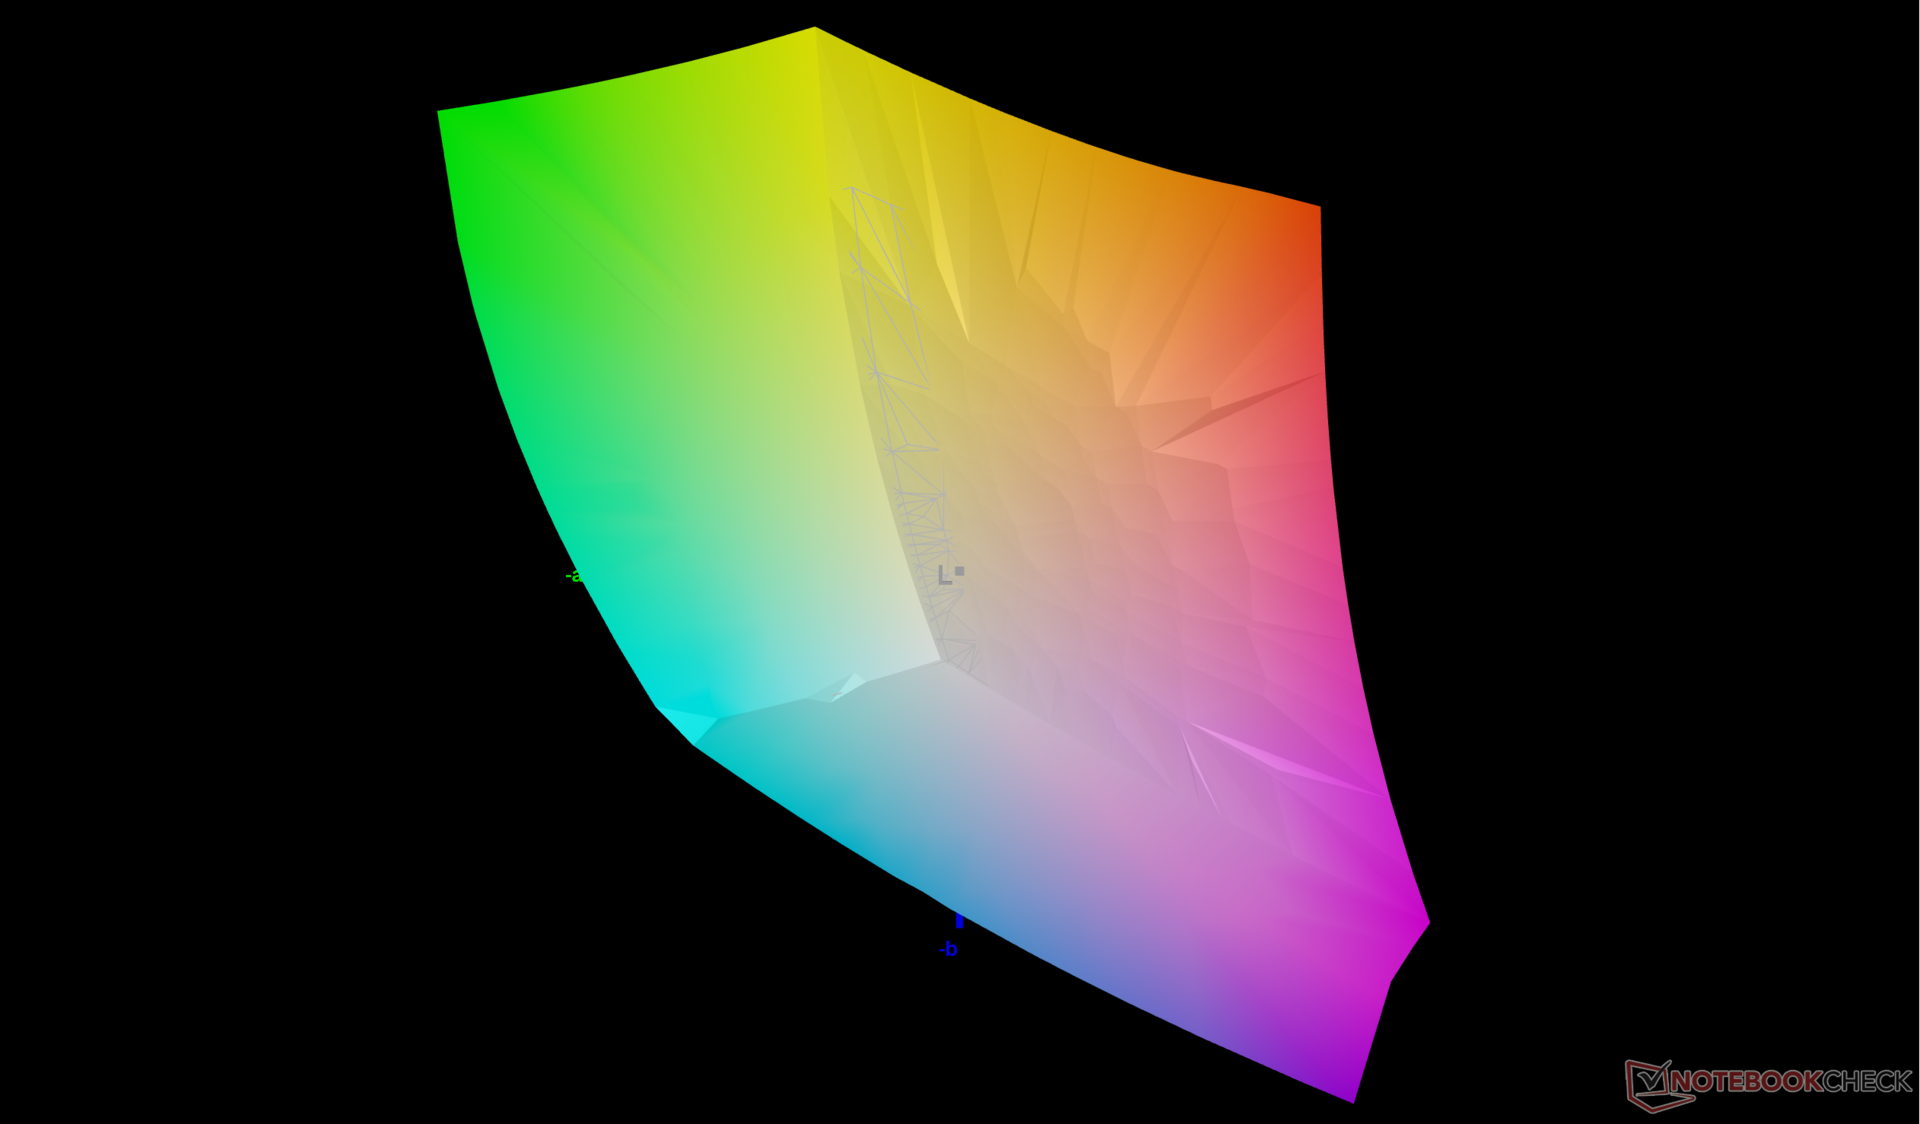
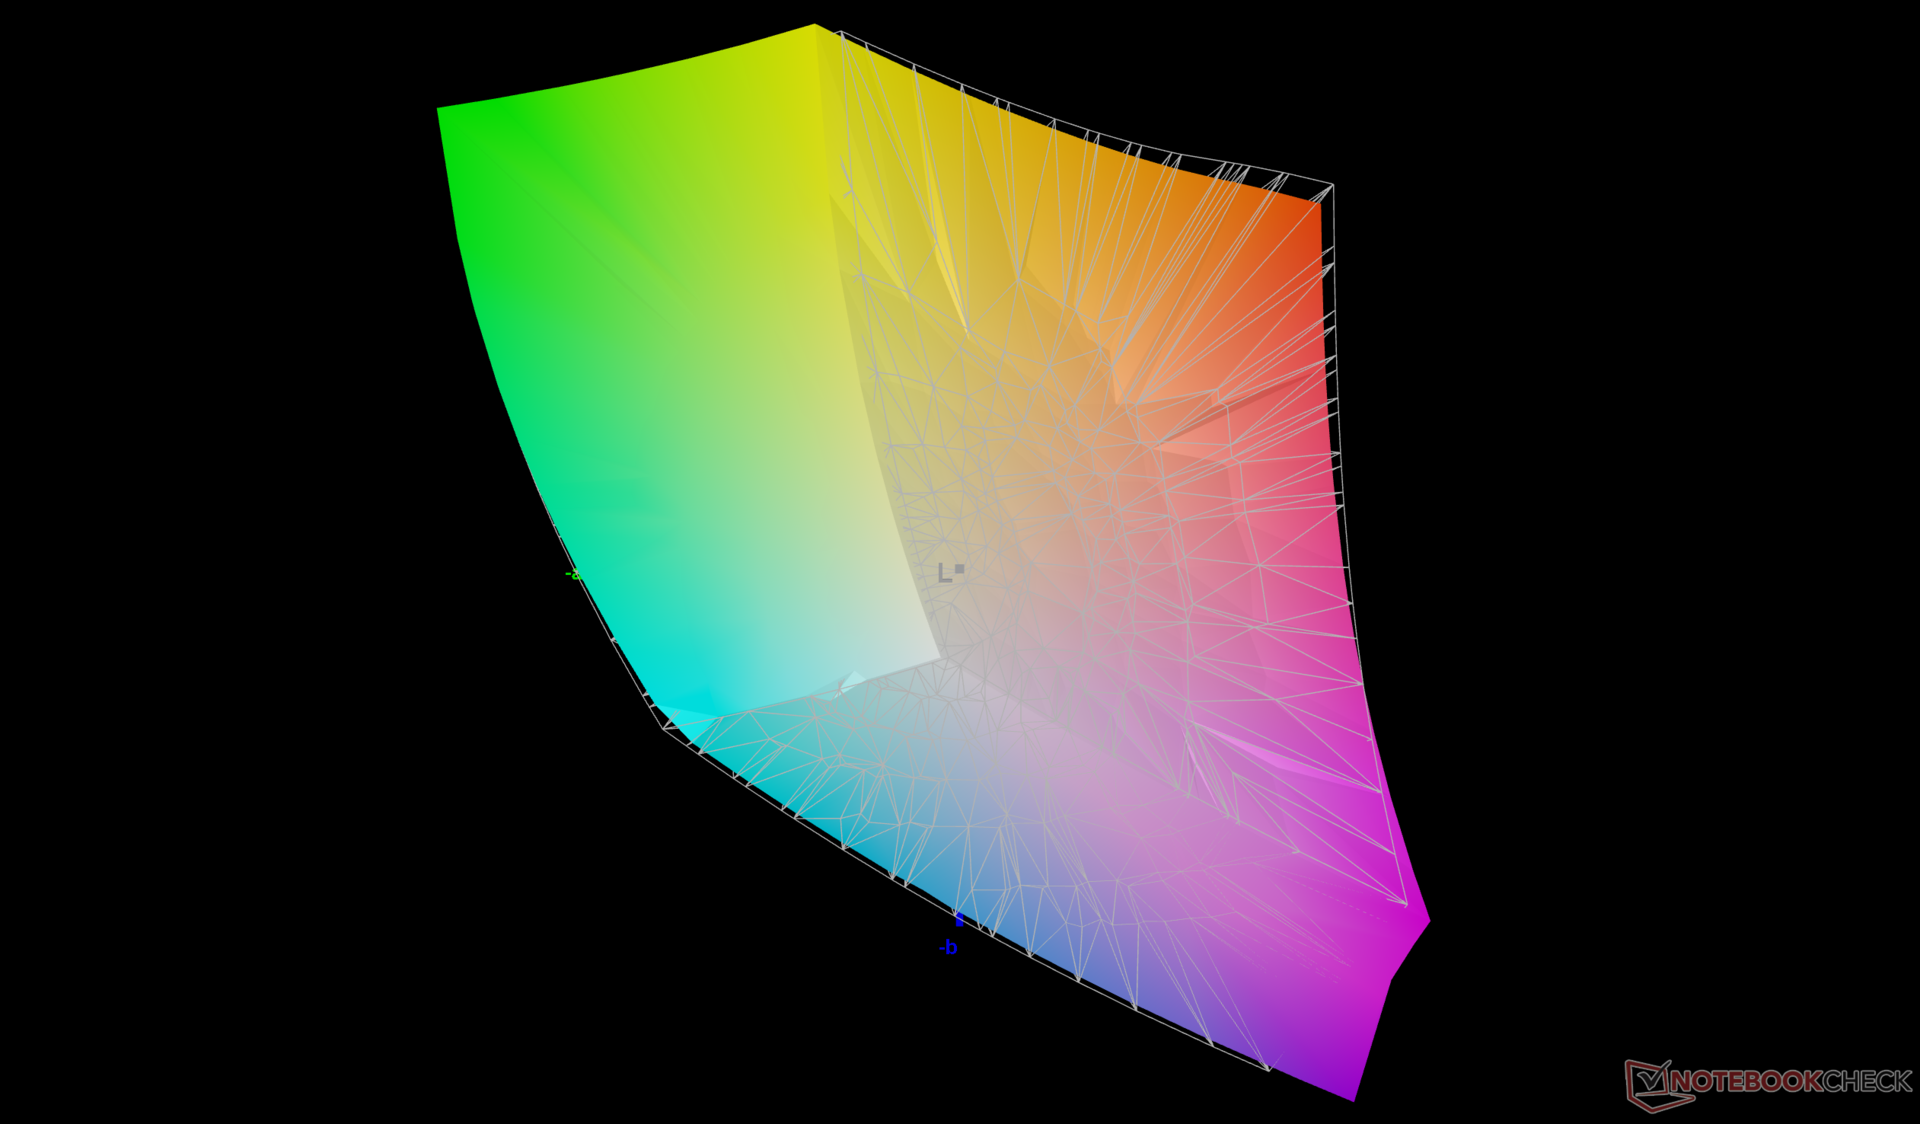
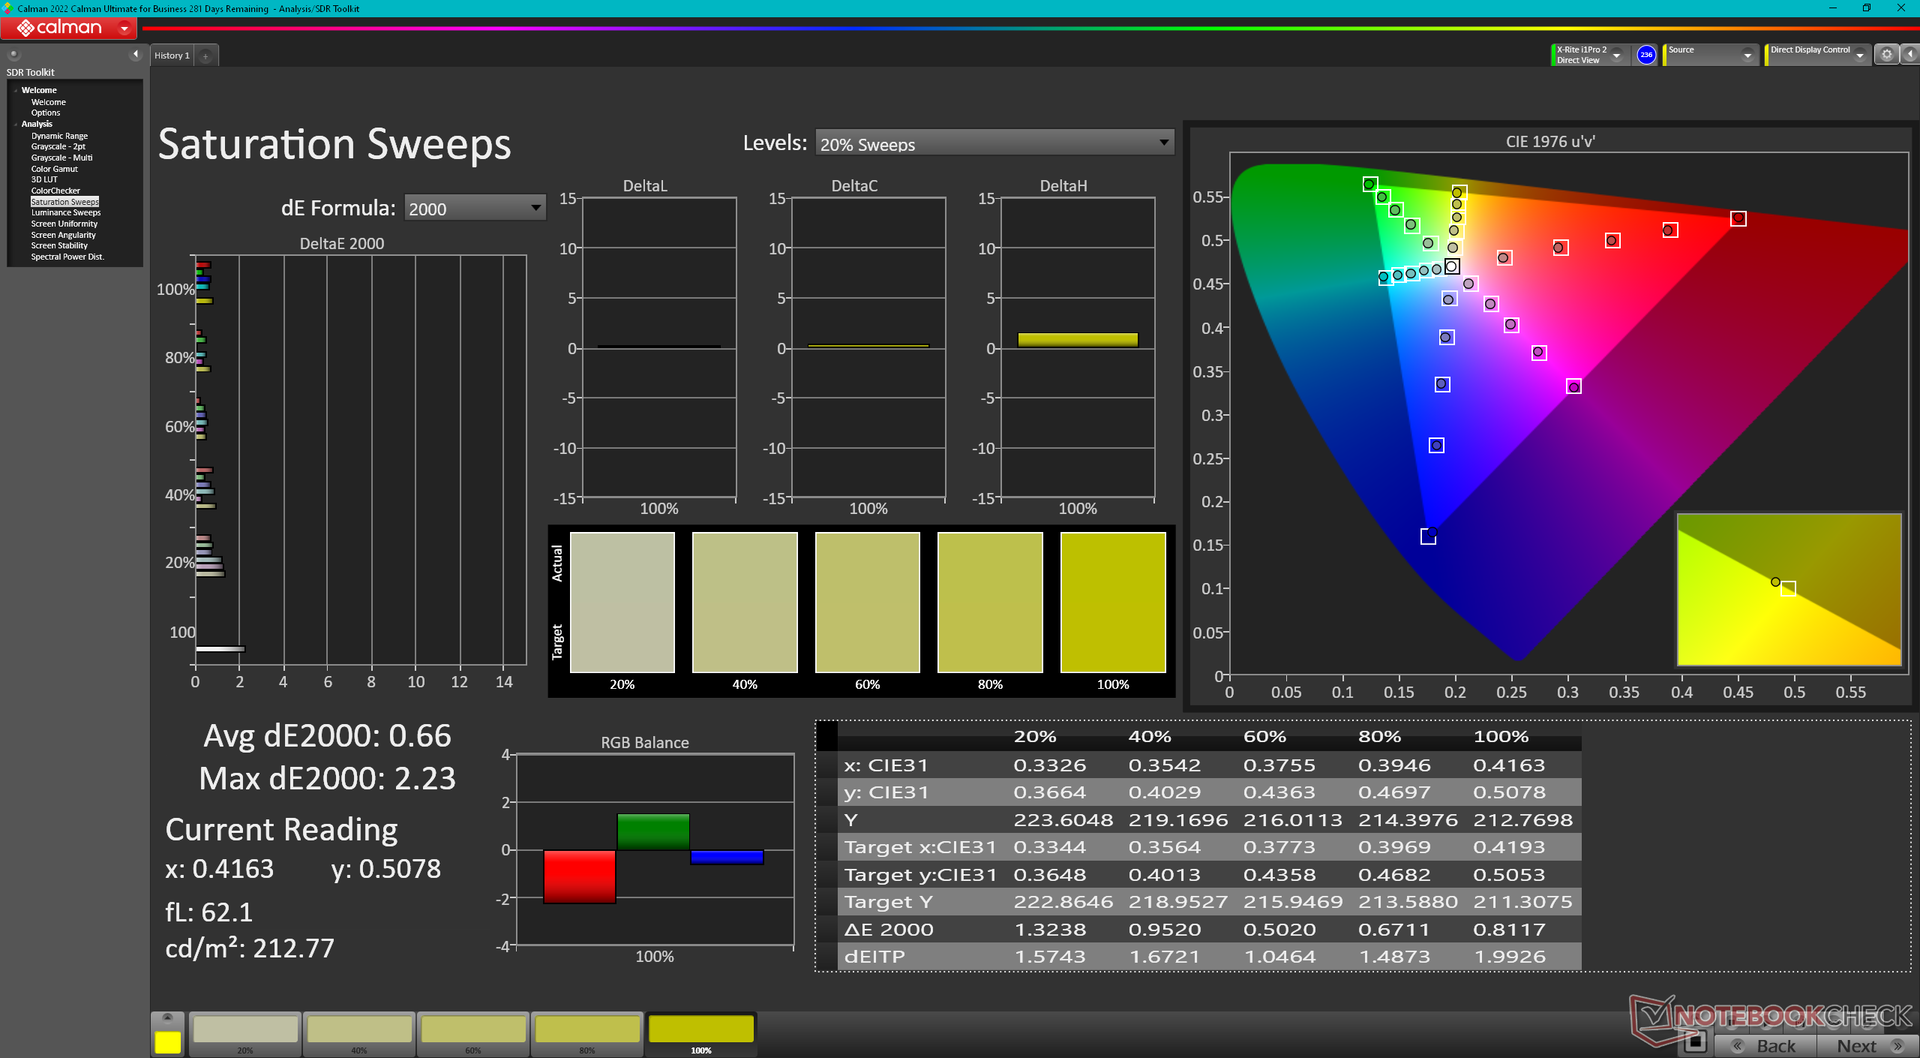
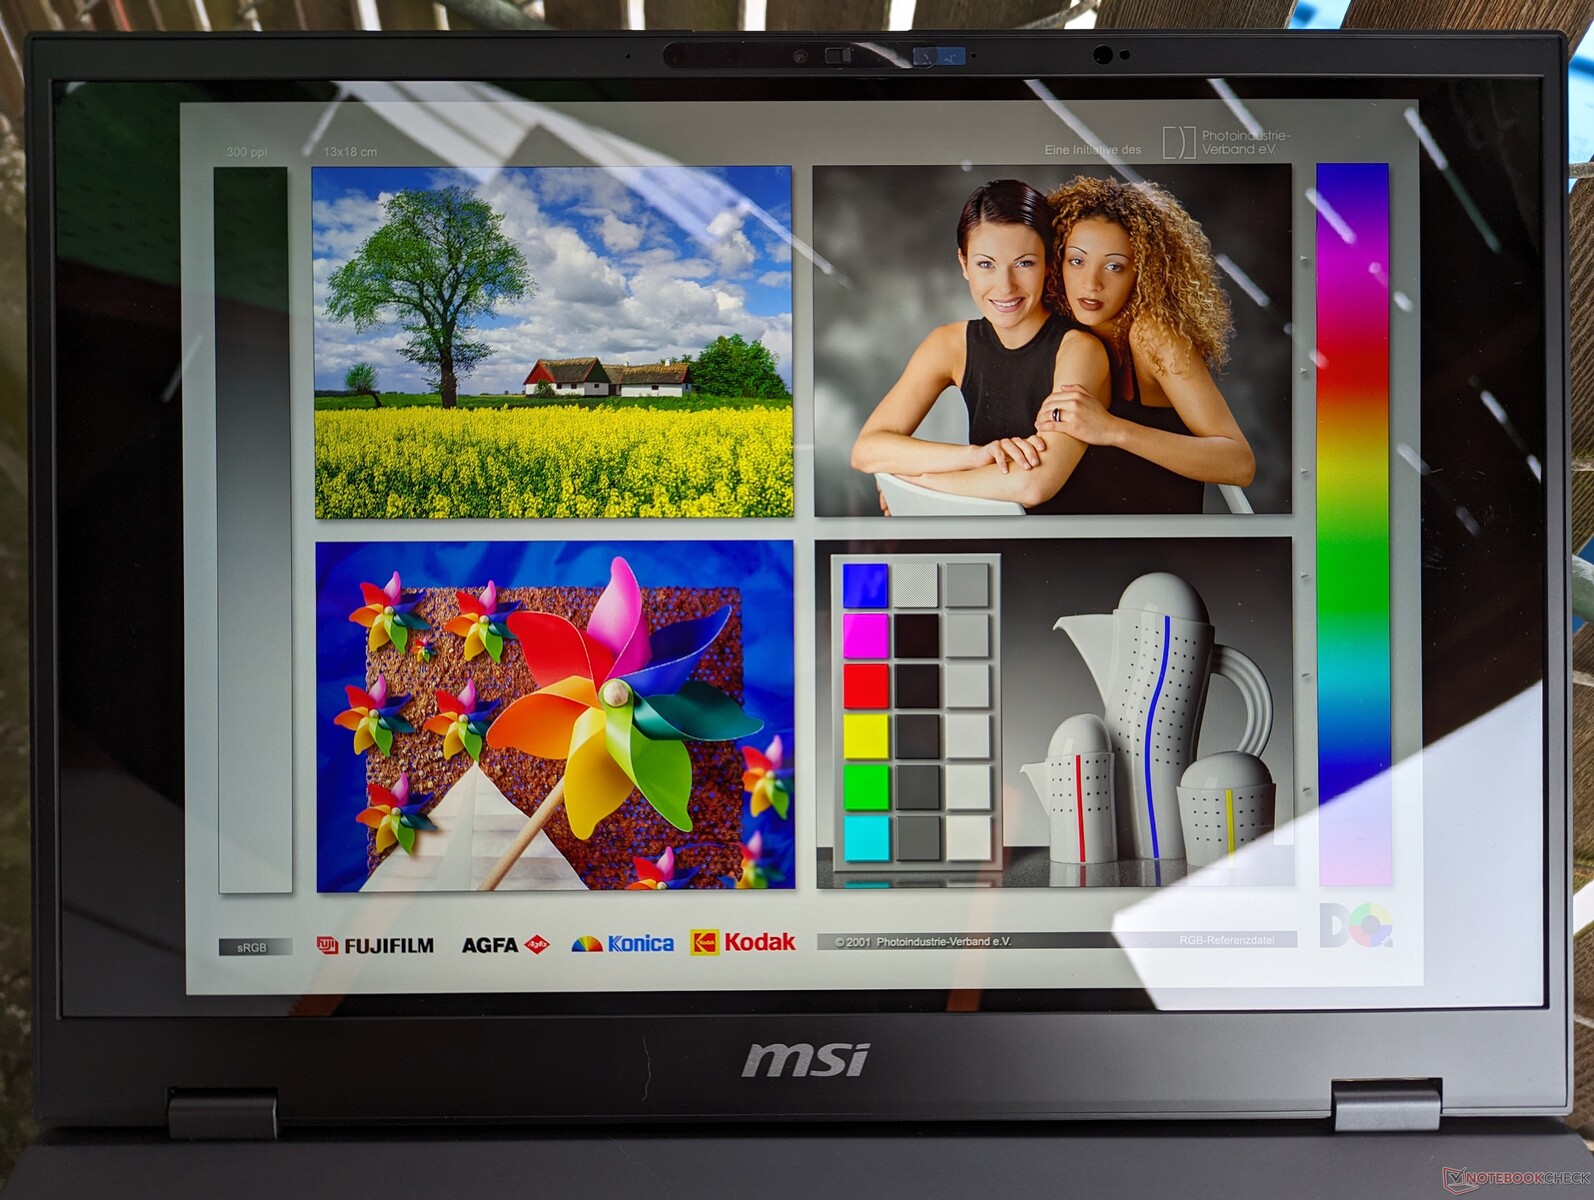
Pantalla - DCI-P3 completa en todas las SKU
El Prestige 16 es el primero de nuestra base de datos que viene con el AU Optronics B160QAN03.R. Este panel IPS brillante y lustroso es de muy alta calidad, con colores DCI-P3 plenos y sin ningún problema de granulado. Sin embargo, los lentos tiempos de respuesta en blanco y negro, la falta de sincronización adaptativa y la modesta frecuencia de refresco de 60 Hz lo hacen más adecuado para la edición de gráficos que para los juegos.
Existe una segunda opción de pantalla con OLED y una resolución nativa superior. Ninguno de los dos paneles es compatible con la funcionalidad de pantalla táctil.


| |||||||||||||||||||||||||
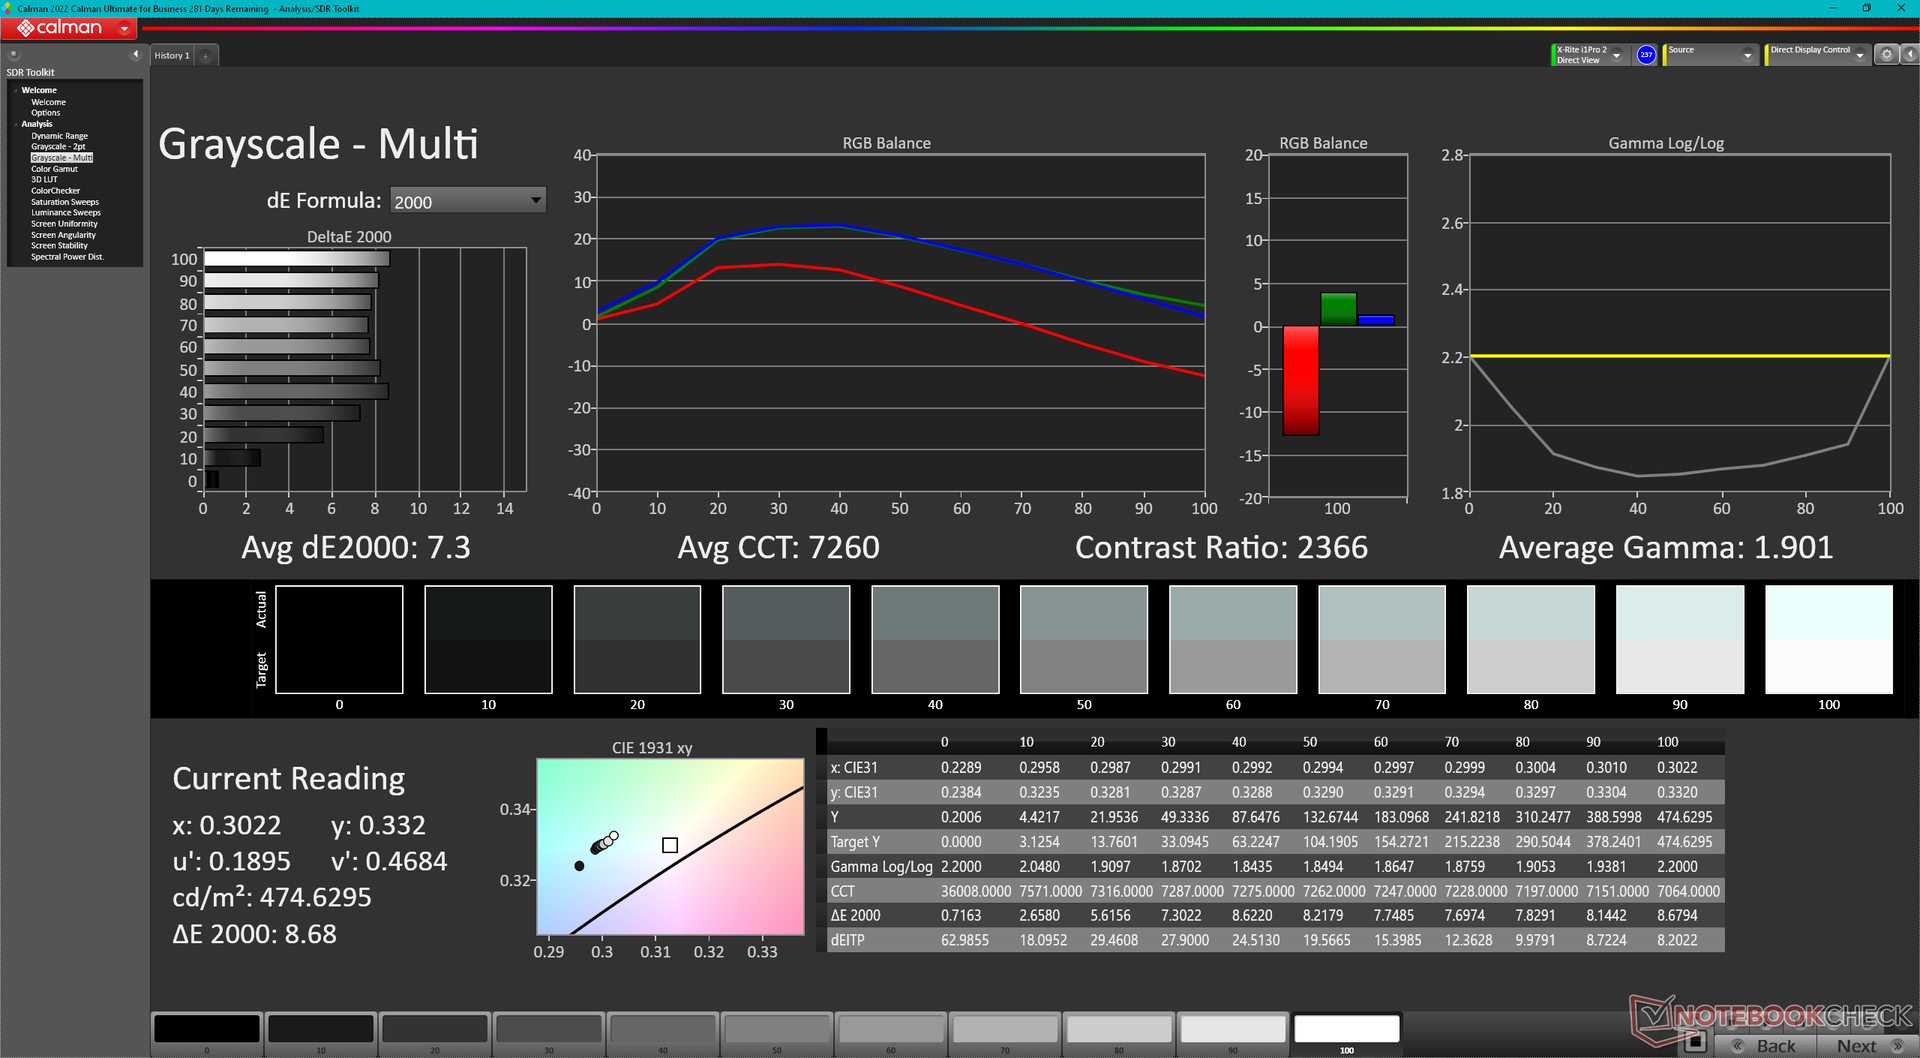
iluminación: 87 %
Brillo con batería: 473.6 cd/m²
Contraste: 2493:1 (Negro: 0.19 cd/m²)
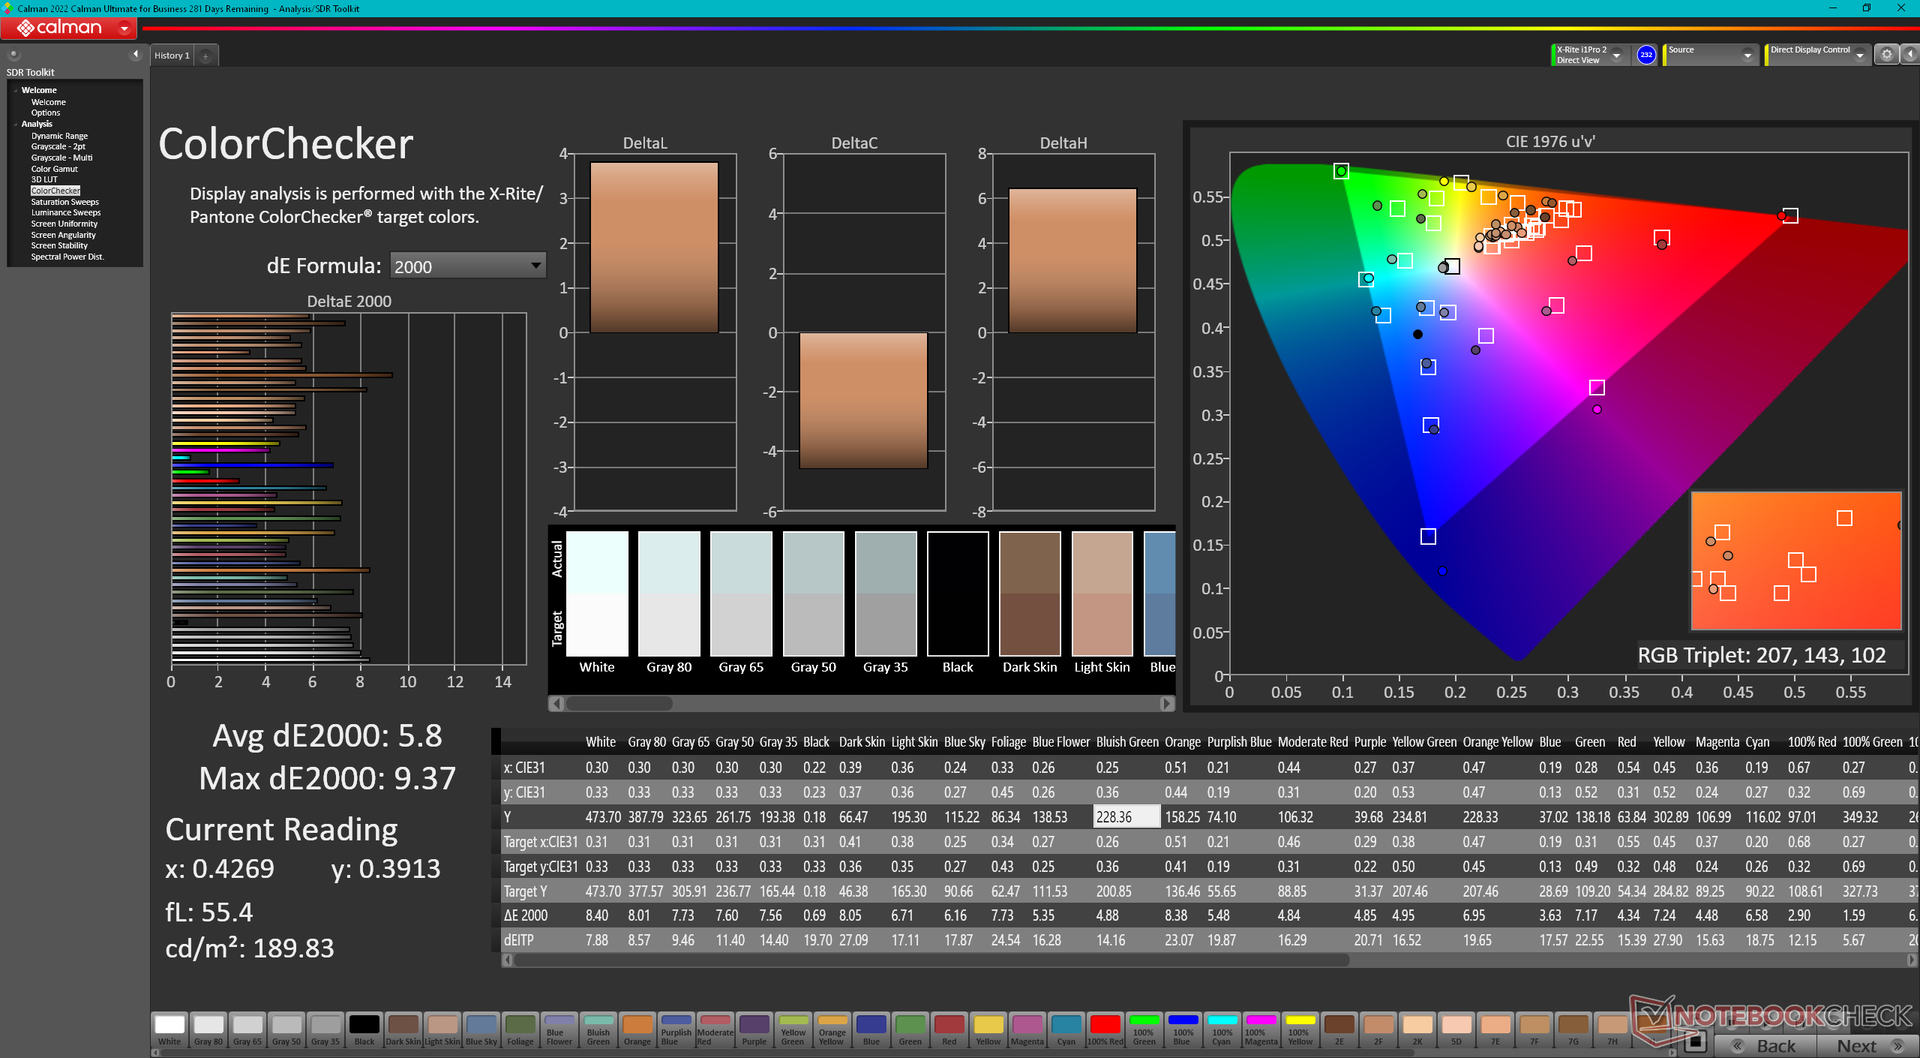
ΔE ColorChecker Calman: 5.9 | ∀{0.5-29.43 Ø4.71}
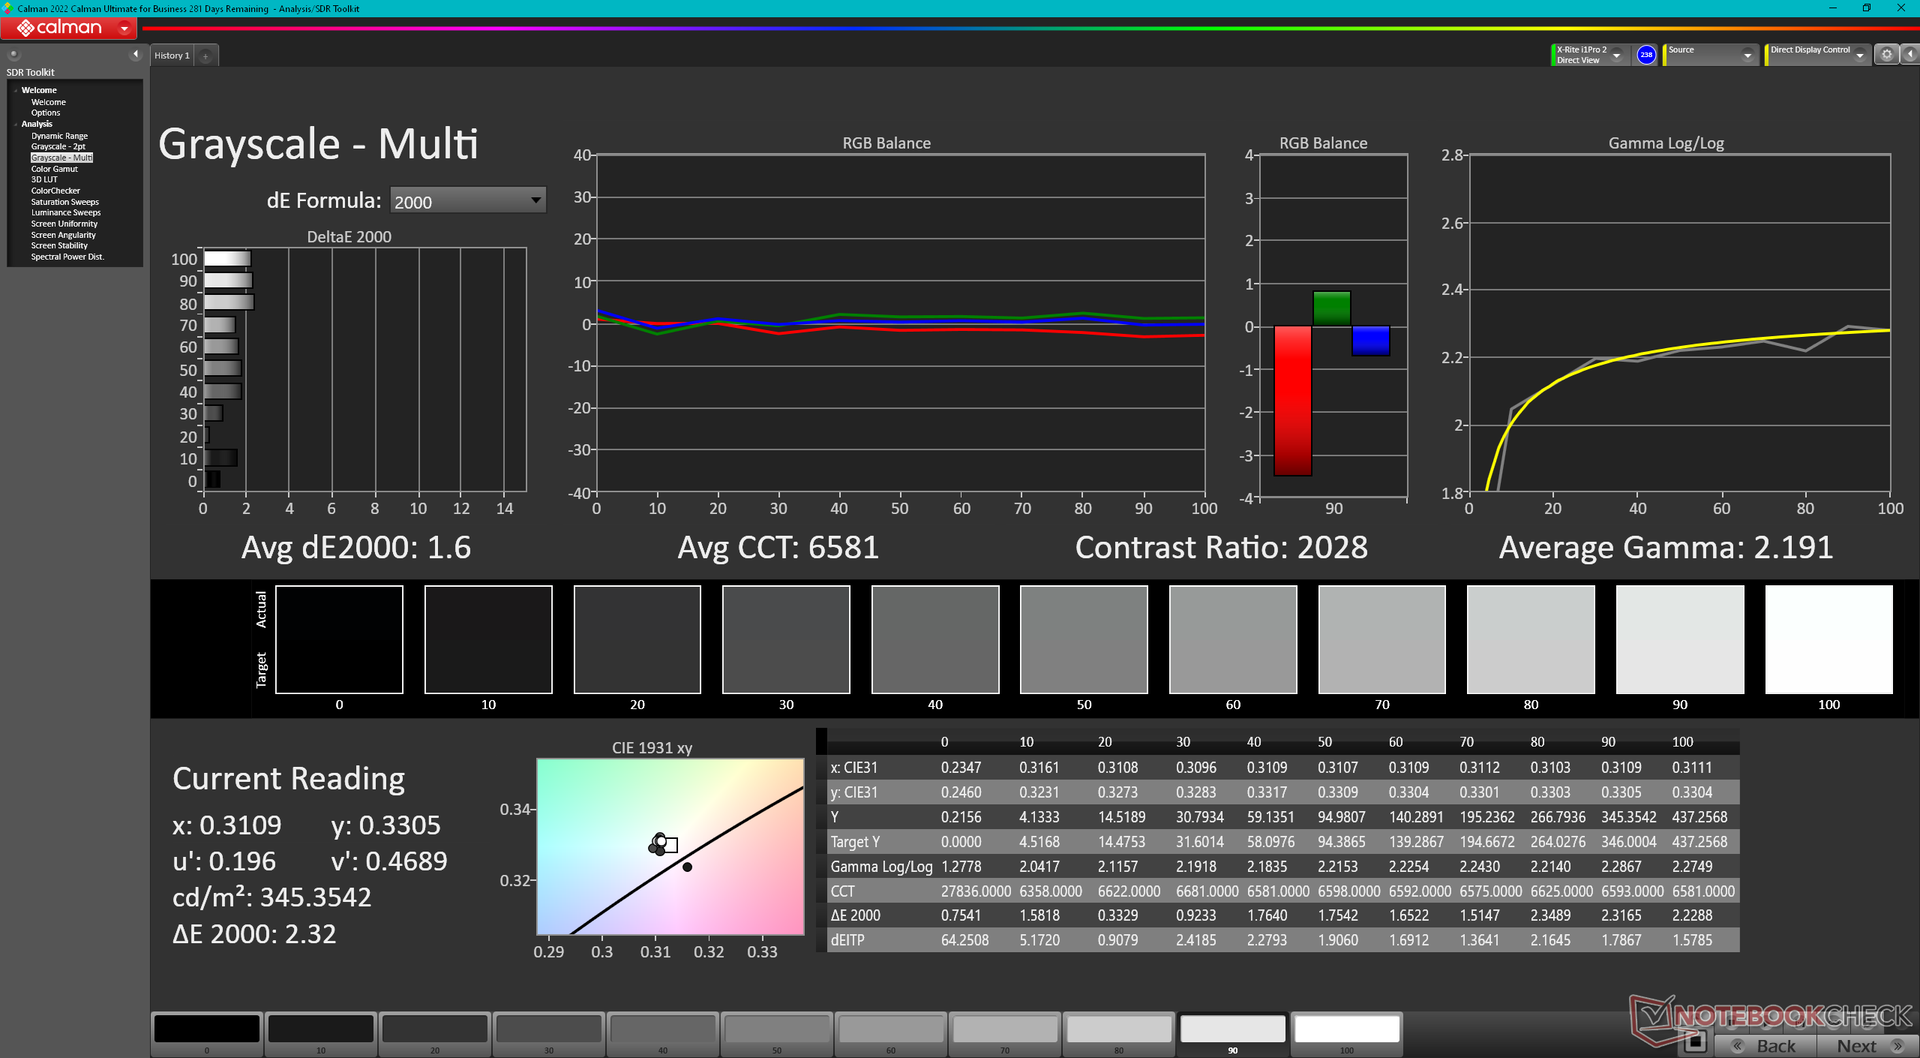
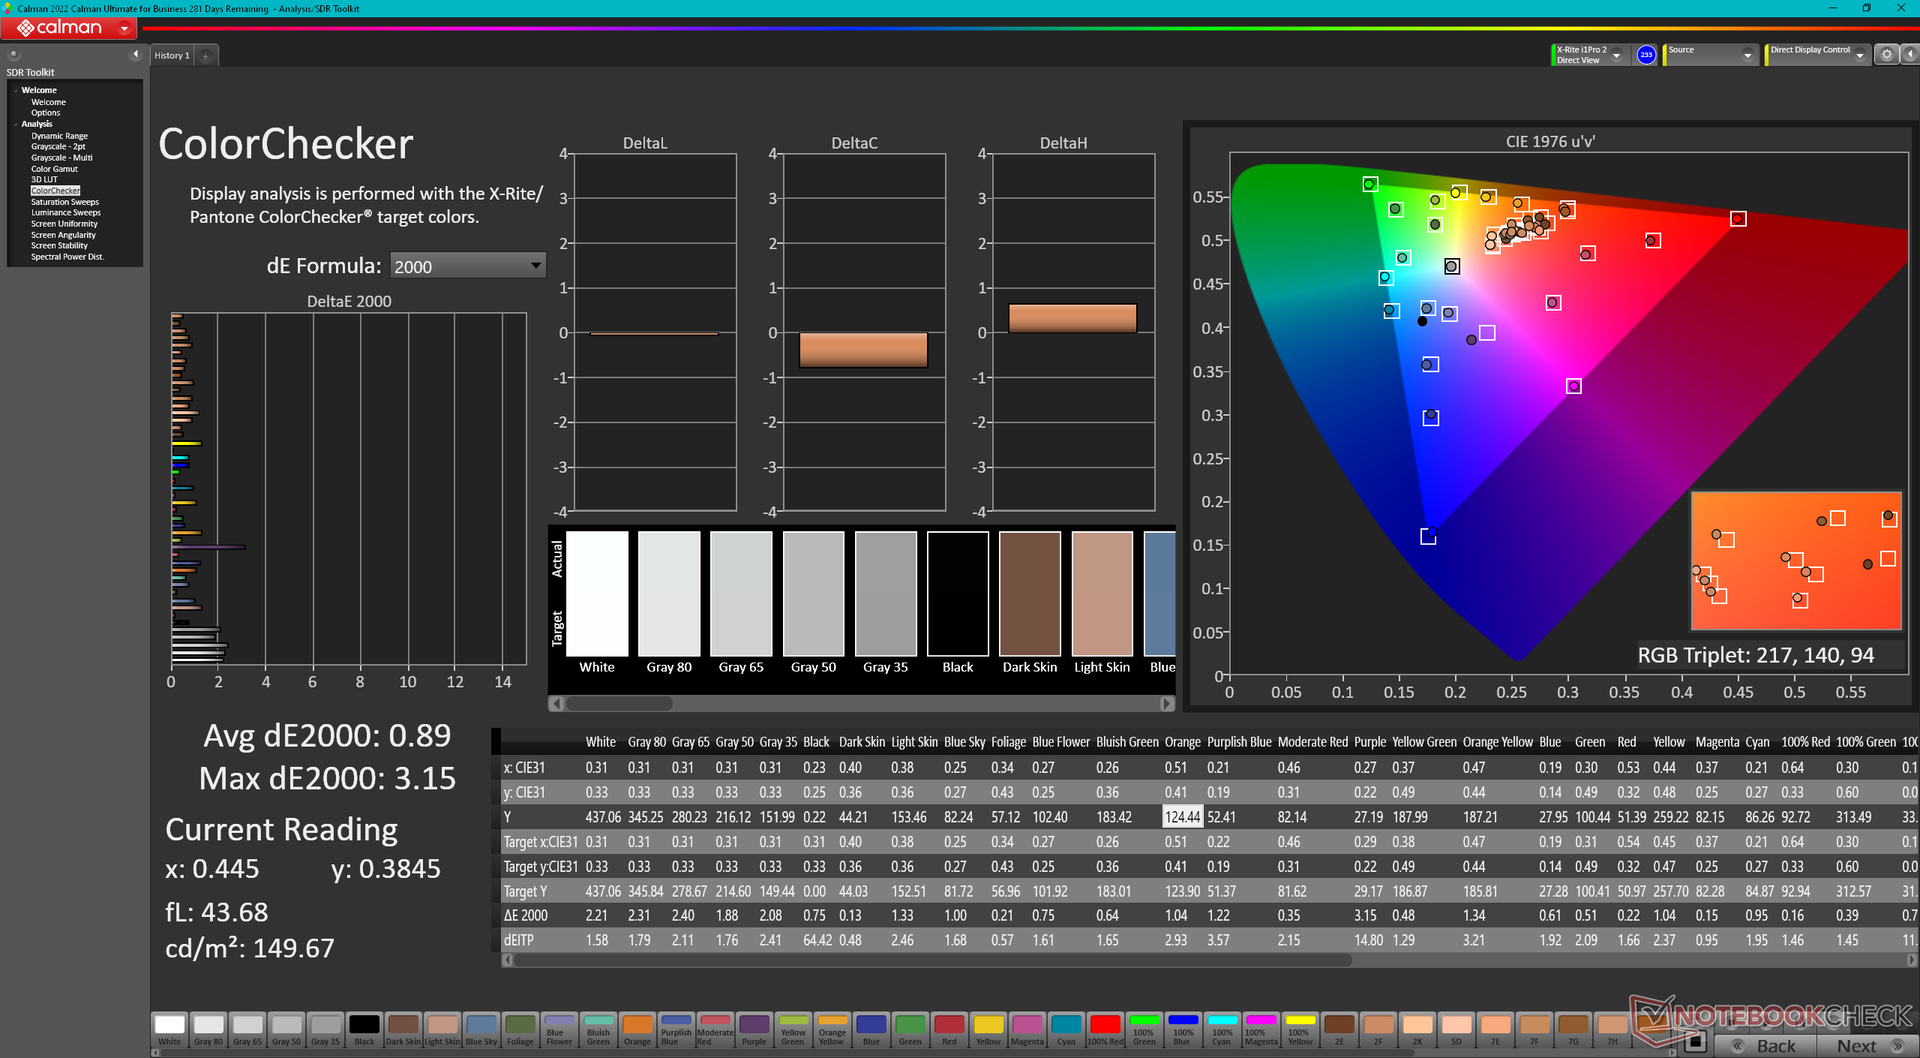
calibrated: 0.89
ΔE Greyscale Calman: 7.3 | ∀{0.09-98 Ø4.96}
84.6% AdobeRGB 1998 (Argyll 3D)
99.8% sRGB (Argyll 3D)
96.7% Display P3 (Argyll 3D)
Gamma: 1.9
CCT: 7260 K
| MSI Prestige 16 B1MG-001US AU Optronics B160QAN03.R, IPS, 2560x1600, 16" | MSI Prestige 15 A12UD-093 Sharp LQ156D1JW42, IPS, 3840x2160, 15.6" | LG Gram 2in1 16 16T90R - G.AA78G LP160WQ1-SPB2, IPS, 2560x1600, 16" | Lenovo ThinkBook 16 G6 ABP LEN160WUXGA, IPS, 1920x1200, 16" | Asus VivoBook Pro 16 K6602VU Samsung ATNA60BX01-1, OLED, 3200x2000, 16" | Dell Inspiron 16 Plus 7630 LG Philips 160WQ2, IPS, 2560x1600, 16" | |
|---|---|---|---|---|---|---|
| Display | -3% | 0% | -49% | 5% | -14% | |
| Display P3 Coverage (%) | 96.7 | 80.48 -17% | 96.5 0% | 40.4 -58% | 98.7 2% | 70.1 -28% |
| sRGB Coverage (%) | 99.8 | 96.95 -3% | 99.9 0% | 59.8 -40% | 99.7 0% | 99.6 0% |
| AdobeRGB 1998 Coverage (%) | 84.6 | 94.02 11% | 84.6 0% | 42 -50% | 96.5 14% | 72.3 -15% |
| Response Times | 10% | 30% | 32% | 80% | 29% | |
| Response Time Grey 50% / Grey 80% * (ms) | 49.4 ? | 51 ? -3% | 38.4 ? 22% | 32.8 ? 34% | 0.68 ? 99% | 35 ? 29% |
| Response Time Black / White * (ms) | 33.9 ? | 26 ? 23% | 21.4 ? 37% | 23.9 ? 29% | 13.2 ? 61% | 24.2 ? 29% |
| PWM Frequency (Hz) | 240 ? | |||||
| Screen | 27% | -19% | -83% | -13% | 0% | |
| Brightness middle (cd/m²) | 473.6 | 441 -7% | 329 -31% | 310 -35% | 353 -25% | 299.4 -37% |
| Brightness (cd/m²) | 456 | 416 -9% | 310 -32% | 290 -36% | 354 -22% | 290 -36% |
| Brightness Distribution (%) | 87 | 85 -2% | 88 1% | 86 -1% | 98 13% | 92 6% |
| Black Level * (cd/m²) | 0.19 | 0.155 18% | 0.39 -105% | 0.22 -16% | 0.21 -11% | |
| Contrast (:1) | 2493 | 2845 14% | 844 -66% | 1409 -43% | 1426 -43% | |
| Colorchecker dE 2000 * | 5.9 | 1.51 74% | 3.52 40% | 6.2 -5% | 4.23 28% | 4.25 28% |
| Colorchecker dE 2000 max. * | 9.37 | 3.56 62% | 6.96 26% | 24.7 -164% | 7.13 24% | 6.71 28% |
| Colorchecker dE 2000 calibrated * | 0.89 | 1.15 -29% | 5.3 -496% | 2.42 -172% | 0.52 42% | |
| Greyscale dE 2000 * | 7.3 | 2.49 66% | 5.75 21% | 3.8 48% | 2.5 66% | 5.5 25% |
| Gamma | 1.9 116% | 2.17 101% | 2.137 103% | 2.22 99% | 2.4 92% | 2.35 94% |
| CCT | 7260 90% | 6292 103% | 7584 86% | 6011 108% | 6642 98% | 6368 102% |
| Media total (Programa/Opciones) | 11% /
17% | 4% /
-8% | -33% /
-60% | 24% /
7% | 5% /
1% |
* ... más pequeño es mejor
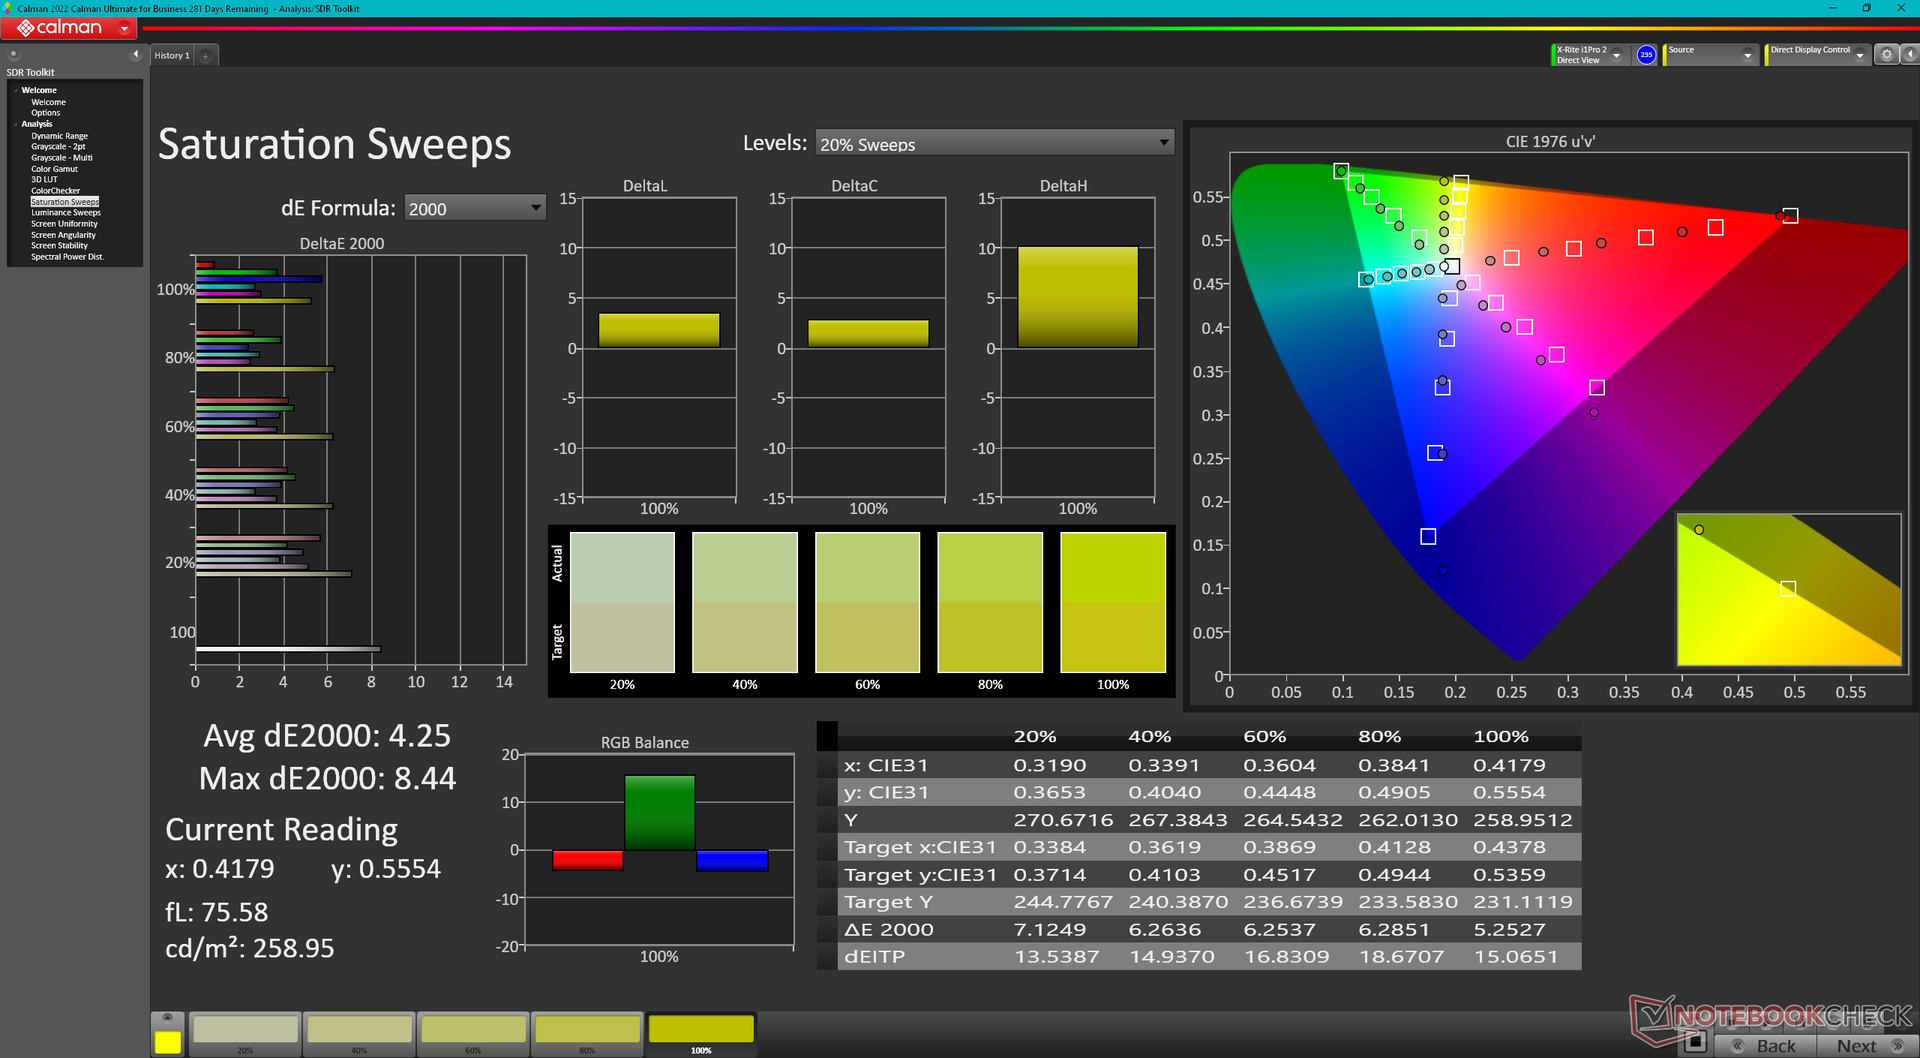
La pantalla no viene precalibrada, lo que es una pena ya que todas las SKU admiten colores DCI-P3. La temperatura de color es excesivamente fría para unos valores DeltaE de escala de grises y color medios relativamente altos de 7,3 y 5,8, respectivamente. Calibrando nosotros mismos el panel bajaríamos estos valores medios a <2 cada uno. Nuestro perfil ICM calibrado está disponible para su descarga gratuita más arriba.
Tiempos de respuesta del display
| ↔ Tiempo de respuesta de Negro a Blanco | ||
|---|---|---|
| 33.9 ms ... subida ↗ y bajada ↘ combinada | ↗ 15.6 ms subida | 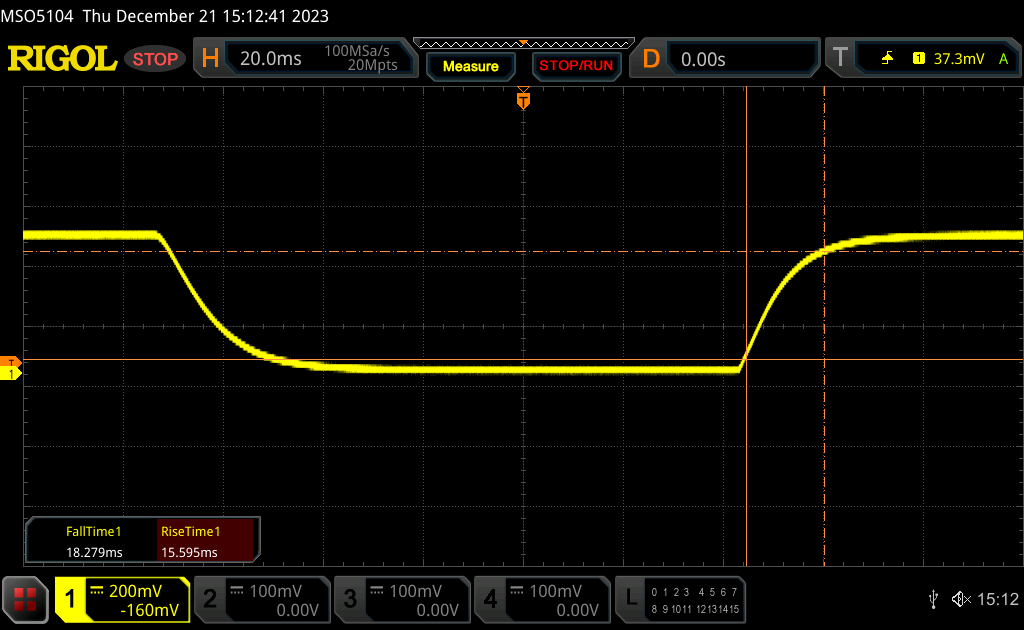 |
| ↘ 18.3 ms bajada | ||
| La pantalla mostró tiempos de respuesta lentos en nuestros tests y podría ser demasiado lenta para los jugones. En comparación, todos los dispositivos de prueba van de ##min### (mínimo) a 240 (máximo) ms. » 91 % de todos los dispositivos son mejores. Eso quiere decir que el tiempo de respuesta es peor que la media (19.8 ms) de todos los dispositivos testados. | ||
| ↔ Tiempo de respuesta 50% Gris a 80% Gris | ||
| 49.4 ms ... subida ↗ y bajada ↘ combinada | ↗ 22.6 ms subida | 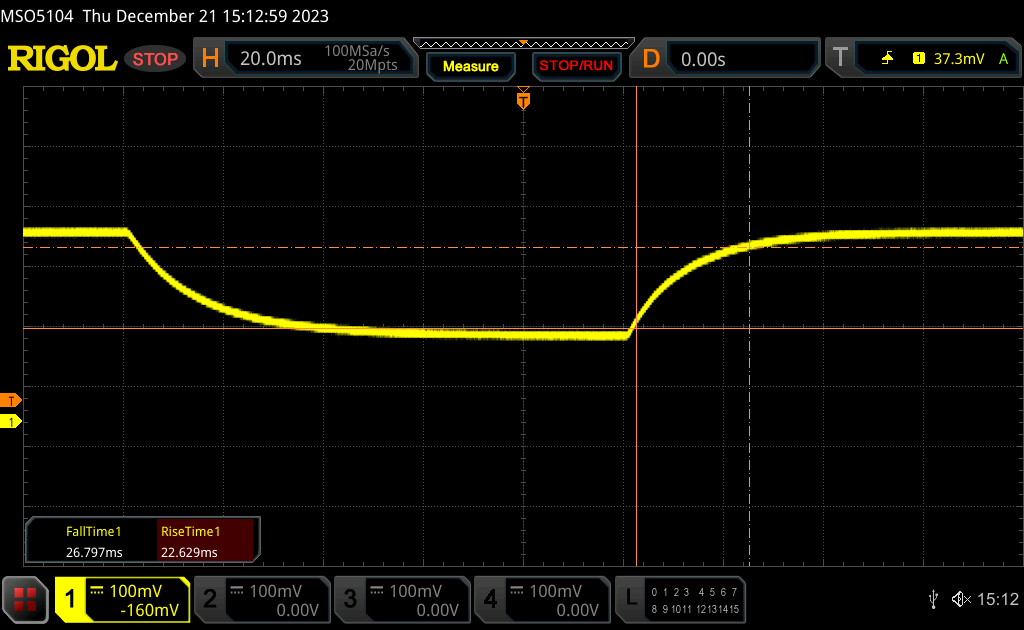 |
| ↘ 26.8 ms bajada | ||
| La pantalla mostró tiempos de respuesta lentos en nuestros tests y podría ser demasiado lenta para los jugones. En comparación, todos los dispositivos de prueba van de ##min### (mínimo) a 636 (máximo) ms. » 85 % de todos los dispositivos son mejores. Eso quiere decir que el tiempo de respuesta es peor que la media (31 ms) de todos los dispositivos testados. | ||
Parpadeo de Pantalla / PWM (Pulse-Width Modulation)
| Parpadeo de Pantalla / PWM no detectado | 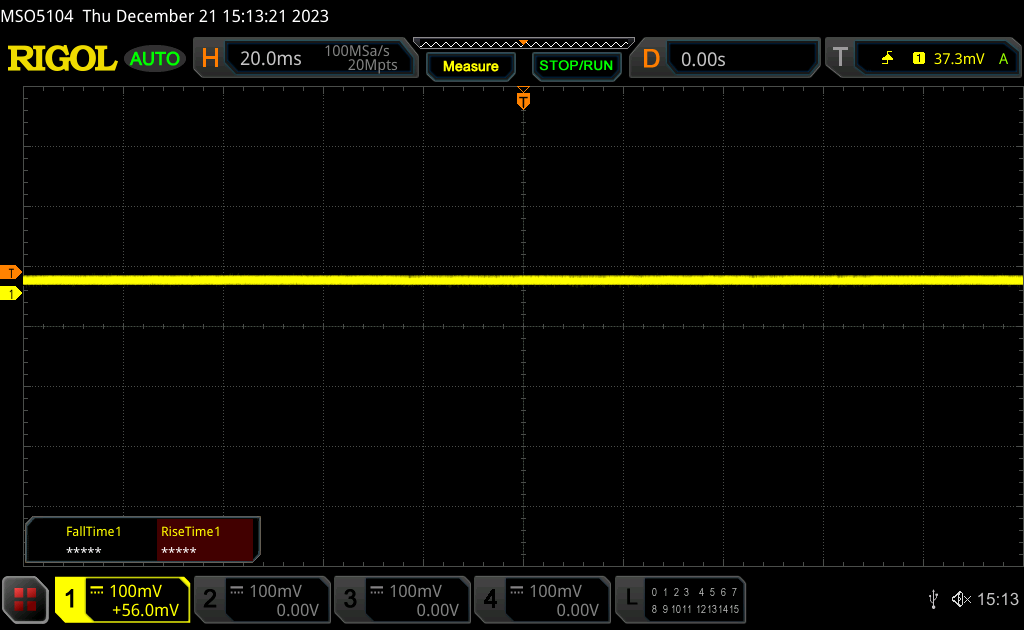 | ||
Comparación: 52 % de todos los dispositivos testados no usaron PWM para atenuar el display. Si se usó, medimos una media de 7757 (mínimo: 5 - máxmo: 343500) Hz. | |||
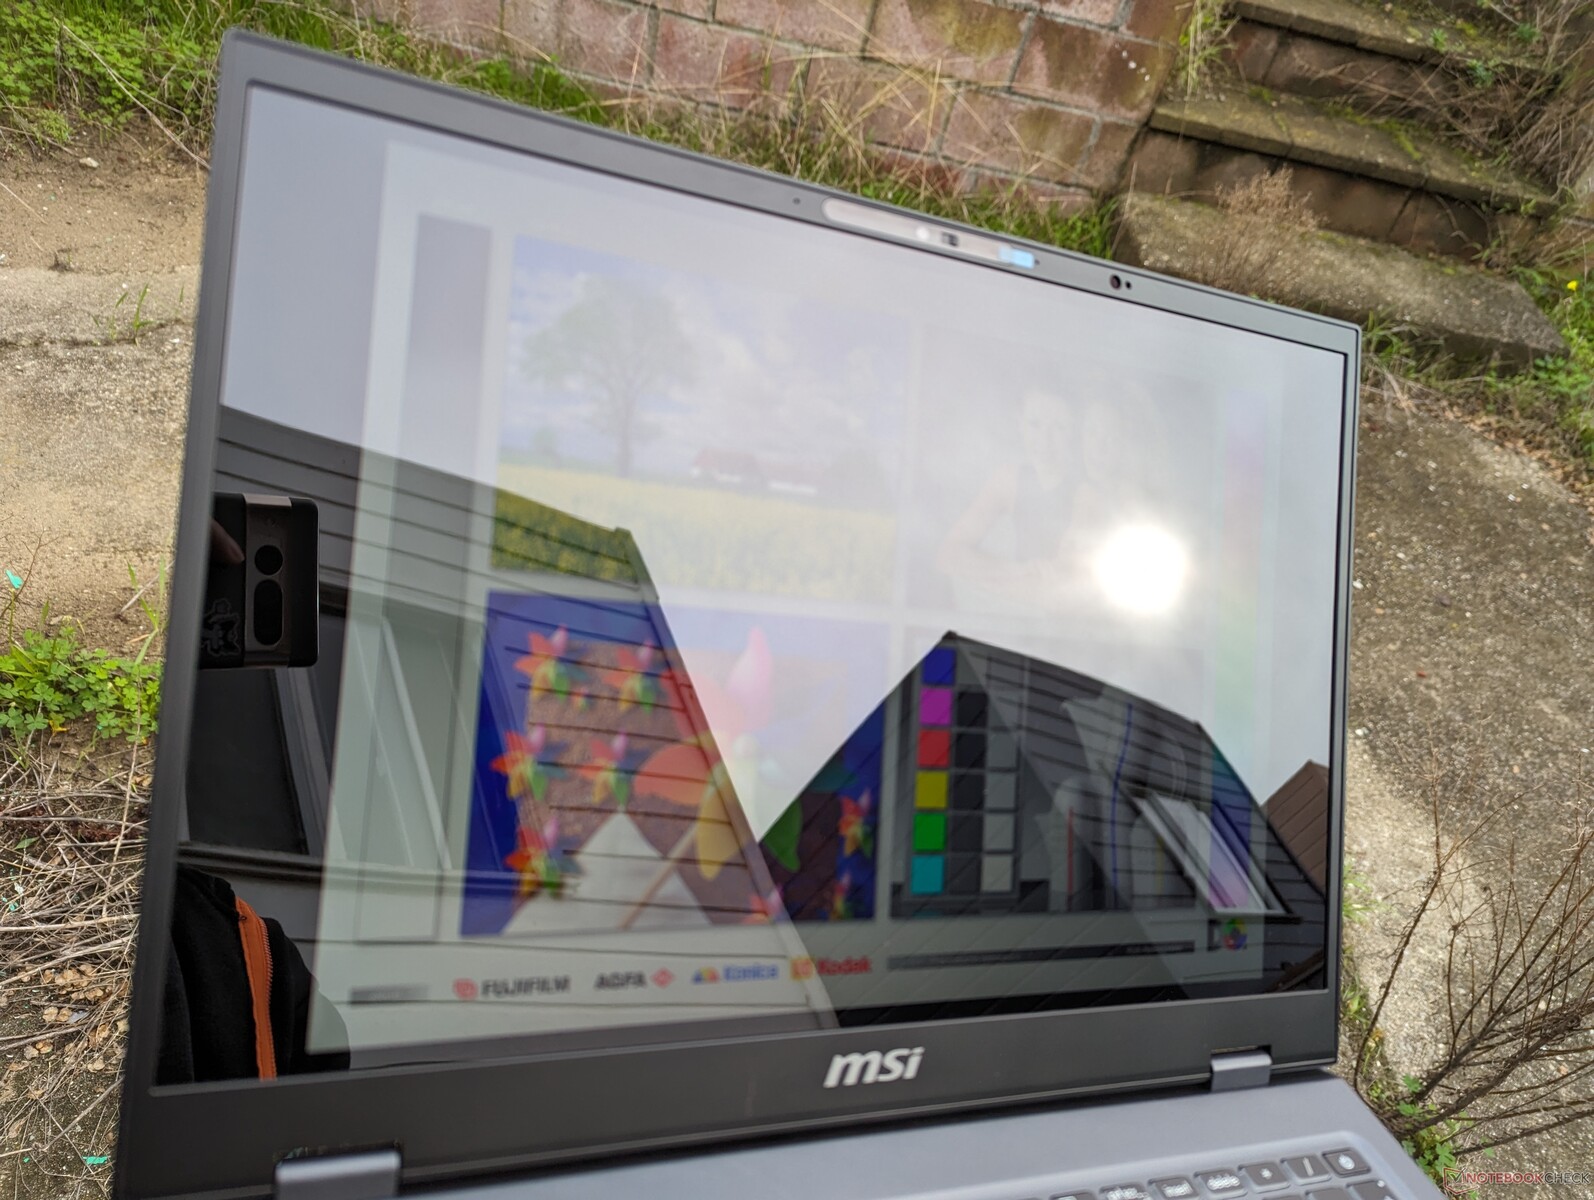
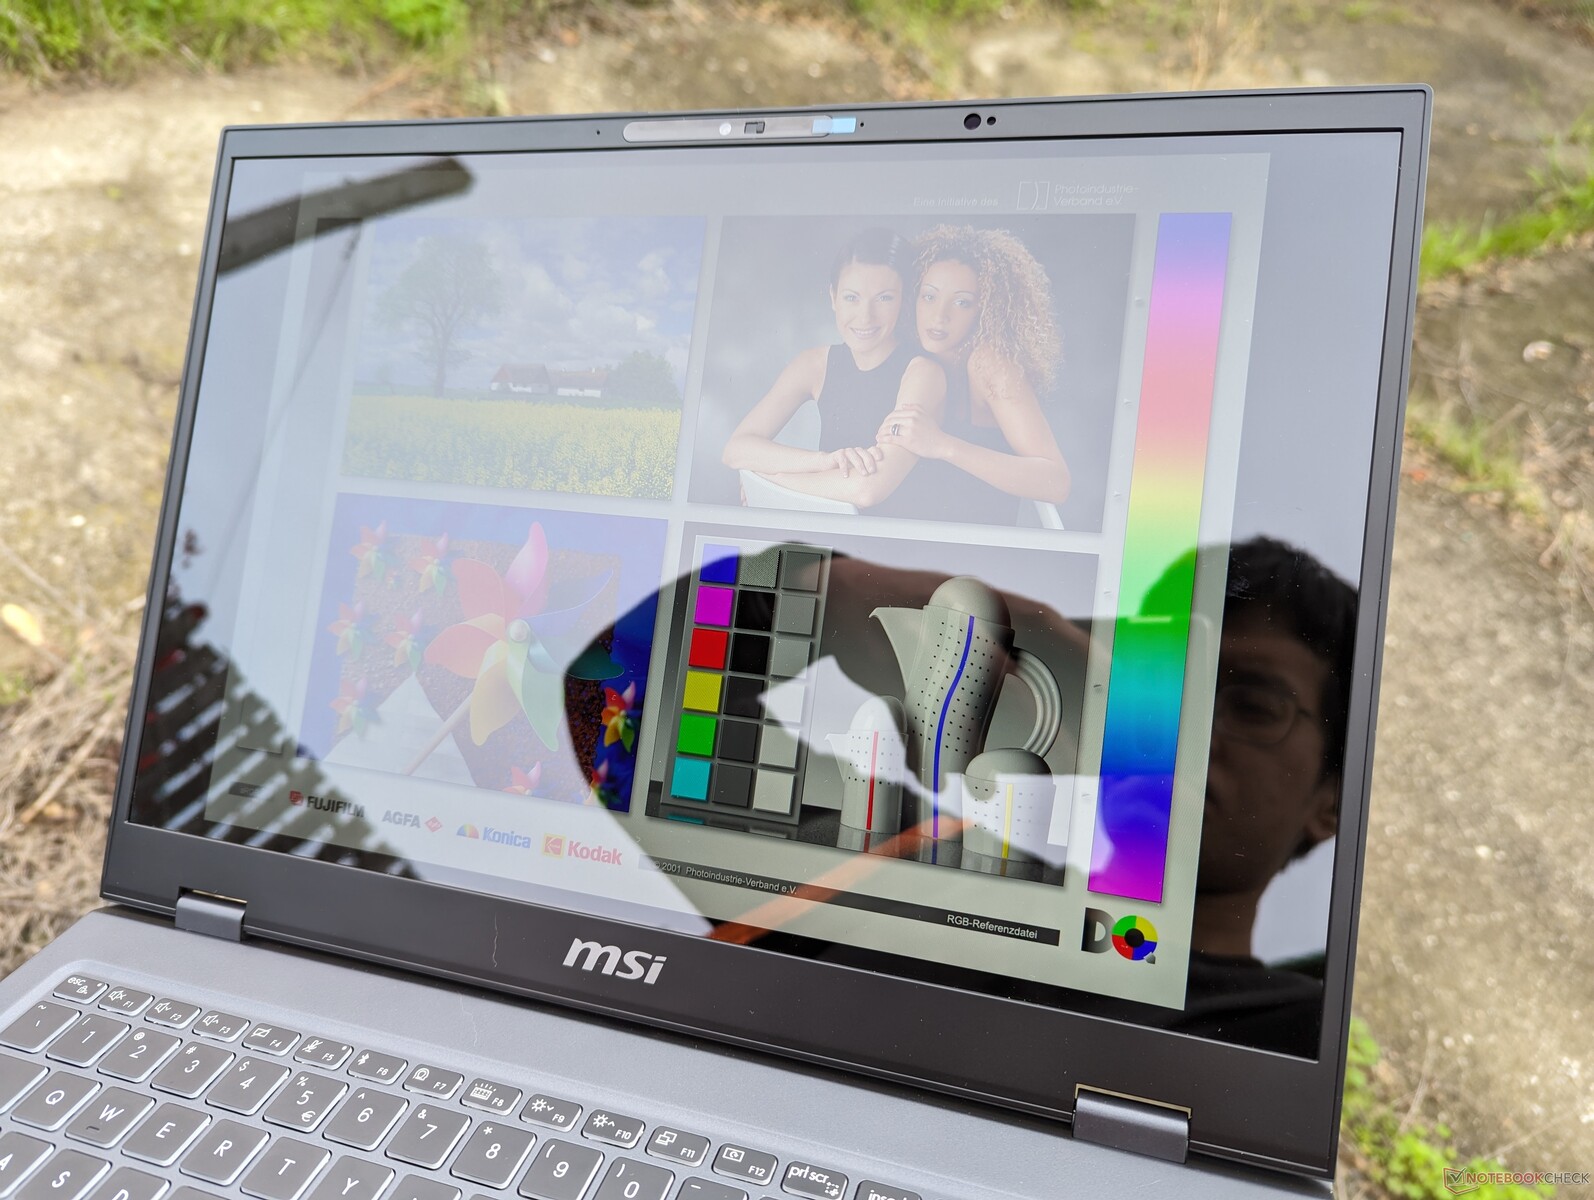
La pantalla superbrillante puede contribuir a una imagen más nítida, pero también contribuye a un deslumbramiento excesivo en la mayoría de los escenarios de uso, especialmente si se utiliza en exteriores. La pantalla Mini-LED del MacBook Pro 16 es aproximadamente un 30 por ciento más brillante que la de nuestro MSI para una visibilidad generalmente mejor si se encuentra bajo una iluminación ambiental brillante.
Rendimiento - Un ascenso meteórico
Condiciones de prueba
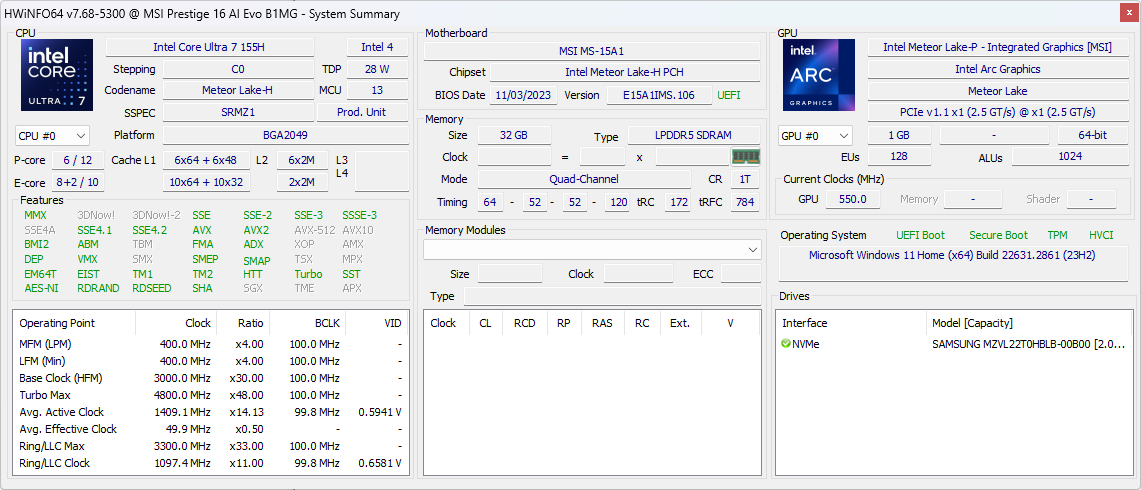
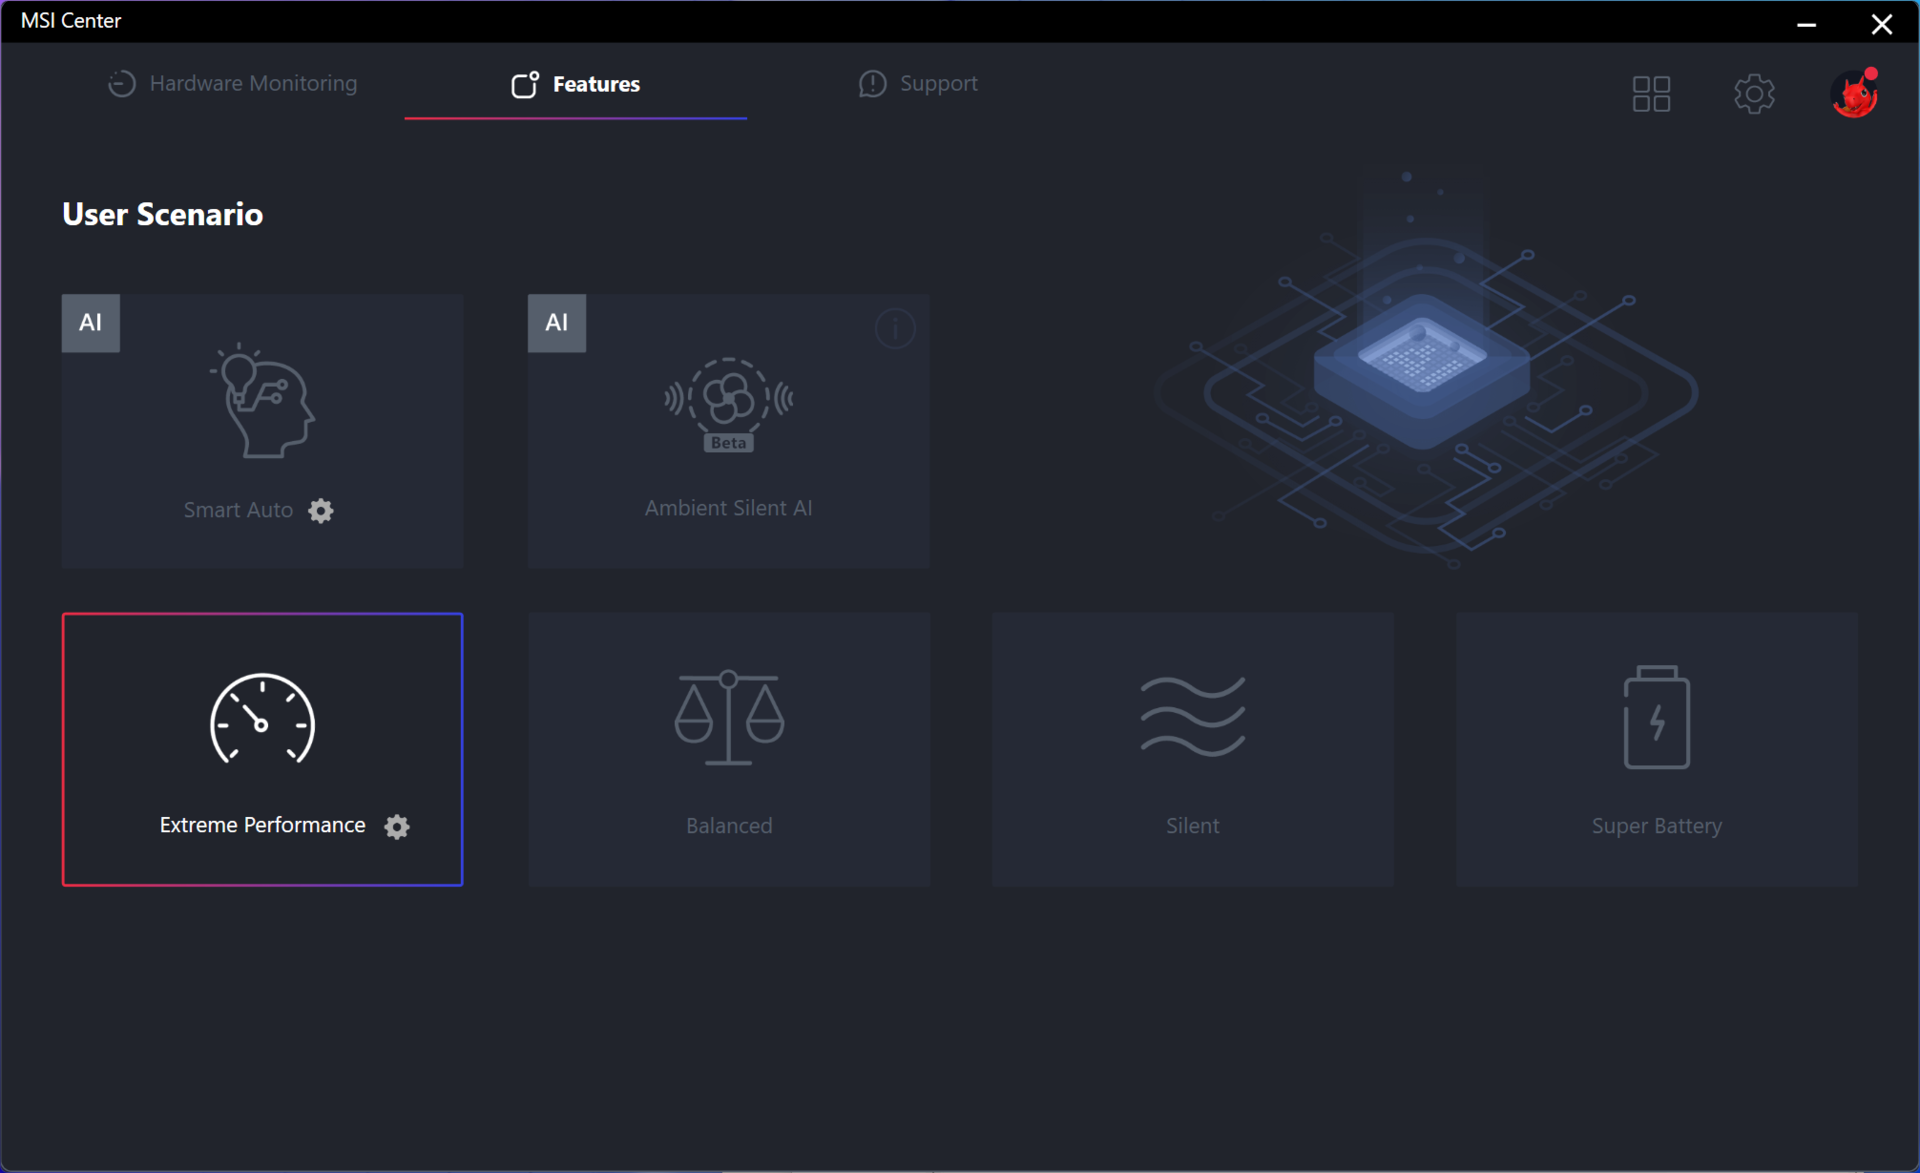
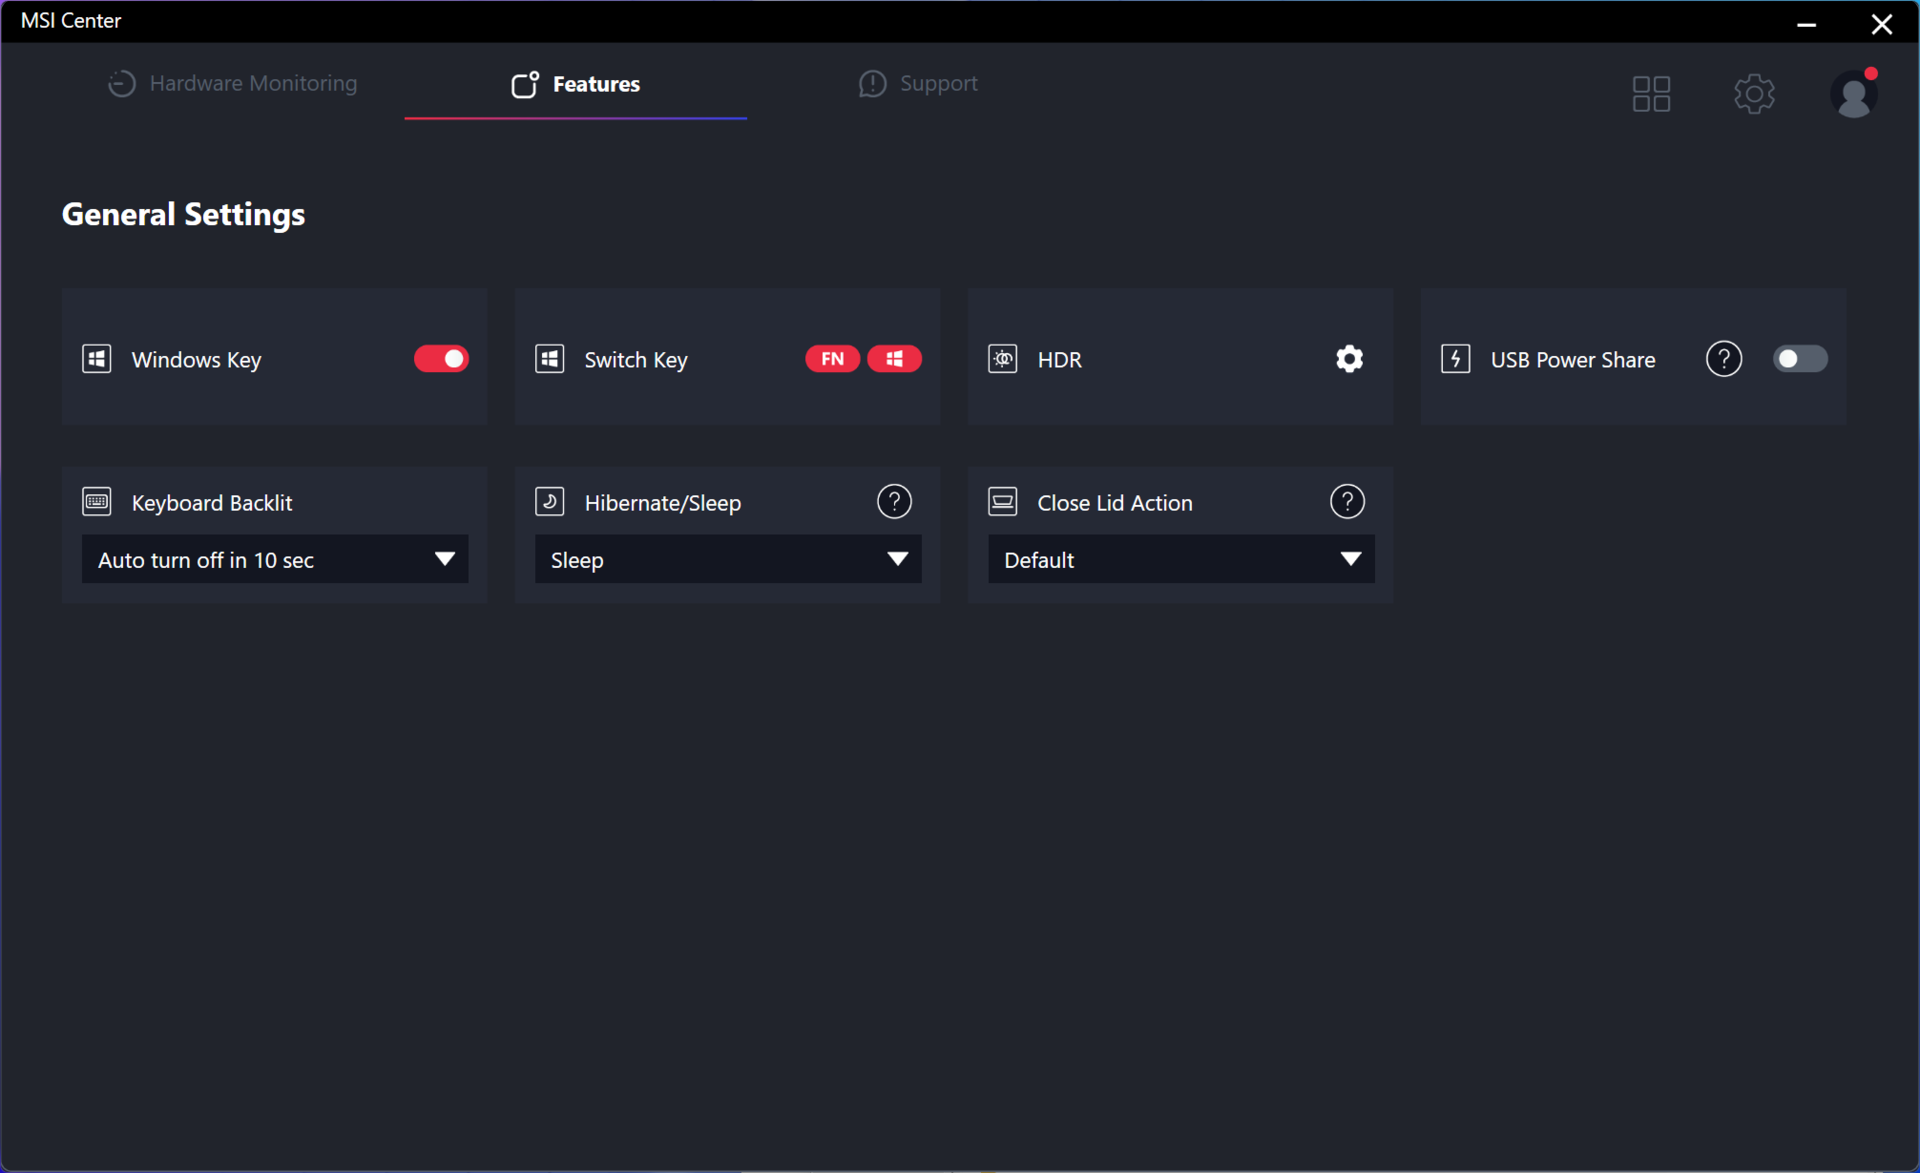
Pusimos Windows en modo Rendimiento y el Centro MSI en modo Rendimiento extremo antes de ejecutar las pruebas comparativas que se muestran a continuación. Los propietarios deberían familiarizarse con el Centro MSI ya que es el centro de actualizaciones y funciones específicas de MSI.
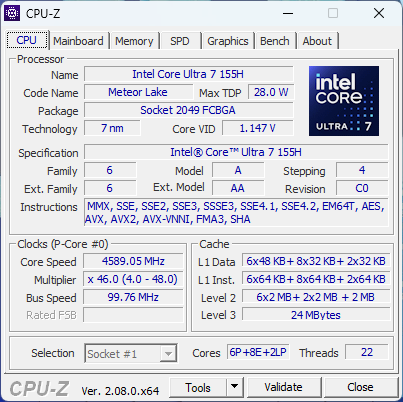
Procesador
El rendimiento de la CPU supone un enorme salto con respecto a las opciones Core U y Core P de la generación anterior. Nuestro Core Ultra 7 155H mantiene una cómoda ventaja del 20 al 25 por ciento sobre el Core i7-1360P y la opción más rápida de la serie Zen 4 U de AMD, el Ryzen 7 7840U.
Los usuarios que esperen ganancias notables con respecto a las opciones Core H de 13ª generación pueden sentirse decepcionados. Por ejemplo, el rendimiento bruto de un solo hilo y multihilo se queda un poco corto respecto al Core i7-13700H. En cambio, las mayores diferencias entre los Core H de 13ª y 14ª generación están relacionadas con la iGPU mejorada y la aceleración de IA de las opciones más recientes.
Un Core Ultra 9 185H SKU también está disponible para la Prestige 16, pero no esperamos que rinda mucho más rápido que nuestra configuración Core Ultra 7 155H ya que ambas CPU llevan exactamente el mismo número de núcleos con sólo ligeras diferencias en las velocidades de reloj.
Cinebench R15 Multi Loop
Cinebench R23: Multi Core | Single Core
Cinebench R20: CPU (Multi Core) | CPU (Single Core)
Cinebench R15: CPU Multi 64Bit | CPU Single 64Bit
Blender: v2.79 BMW27 CPU
7-Zip 18.03: 7z b 4 | 7z b 4 -mmt1
Geekbench 5.5: Multi-Core | Single-Core
HWBOT x265 Benchmark v2.2: 4k Preset
LibreOffice : 20 Documents To PDF
R Benchmark 2.5: Overall mean
* ... más pequeño es mejor
AIDA64: FP32 Ray-Trace | FPU Julia | CPU SHA3 | CPU Queen | FPU SinJulia | FPU Mandel | CPU AES | CPU ZLib | FP64 Ray-Trace | CPU PhotoWorxx
| Performance rating | |
| MSI Prestige 16 B1MG-001US | |
| Asus VivoBook Pro 16 K6602VU | |
| Medio Intel Core Ultra 7 155H | |
| Dell Inspiron 16 Plus 7630 | |
| MSI Prestige 15 A12UD-093 | |
| LG Gram 2in1 16 16T90R - G.AA78G | |
| Lenovo ThinkBook 16 G6 ABP | |
| AIDA64 / FP32 Ray-Trace | |
| MSI Prestige 16 B1MG-001US | |
| Dell Inspiron 16 Plus 7630 | |
| Asus VivoBook Pro 16 K6602VU | |
| Medio Intel Core Ultra 7 155H (6670 - 18470, n=50) | |
| Lenovo ThinkBook 16 G6 ABP | |
| MSI Prestige 15 A12UD-093 | |
| LG Gram 2in1 16 16T90R - G.AA78G | |
| LG Gram 2in1 16 16T90R - G.AA78G | |
| AIDA64 / FPU Julia | |
| MSI Prestige 16 B1MG-001US | |
| Asus VivoBook Pro 16 K6602VU | |
| Medio Intel Core Ultra 7 155H (40905 - 93181, n=50) | |
| Lenovo ThinkBook 16 G6 ABP | |
| Dell Inspiron 16 Plus 7630 | |
| MSI Prestige 15 A12UD-093 | |
| LG Gram 2in1 16 16T90R - G.AA78G | |
| AIDA64 / CPU SHA3 | |
| MSI Prestige 16 B1MG-001US | |
| Asus VivoBook Pro 16 K6602VU | |
| Medio Intel Core Ultra 7 155H (1940 - 4436, n=50) | |
| Dell Inspiron 16 Plus 7630 | |
| MSI Prestige 15 A12UD-093 | |
| LG Gram 2in1 16 16T90R - G.AA78G | |
| Lenovo ThinkBook 16 G6 ABP | |
| AIDA64 / CPU Queen | |
| Dell Inspiron 16 Plus 7630 | |
| Asus VivoBook Pro 16 K6602VU | |
| MSI Prestige 16 B1MG-001US | |
| Medio Intel Core Ultra 7 155H (64698 - 94181, n=50) | |
| LG Gram 2in1 16 16T90R - G.AA78G | |
| MSI Prestige 15 A12UD-093 | |
| Lenovo ThinkBook 16 G6 ABP | |
| AIDA64 / FPU SinJulia | |
| MSI Prestige 16 B1MG-001US | |
| Lenovo ThinkBook 16 G6 ABP | |
| Medio Intel Core Ultra 7 155H (5639 - 10647, n=50) | |
| Dell Inspiron 16 Plus 7630 | |
| Asus VivoBook Pro 16 K6602VU | |
| MSI Prestige 15 A12UD-093 | |
| LG Gram 2in1 16 16T90R - G.AA78G | |
| AIDA64 / FPU Mandel | |
| MSI Prestige 16 B1MG-001US | |
| Lenovo ThinkBook 16 G6 ABP | |
| Medio Intel Core Ultra 7 155H (18236 - 47685, n=50) | |
| Asus VivoBook Pro 16 K6602VU | |
| Dell Inspiron 16 Plus 7630 | |
| MSI Prestige 15 A12UD-093 | |
| LG Gram 2in1 16 16T90R - G.AA78G | |
| AIDA64 / CPU AES | |
| Asus VivoBook Pro 16 K6602VU | |
| MSI Prestige 15 A12UD-093 | |
| LG Gram 2in1 16 16T90R - G.AA78G | |
| Medio Intel Core Ultra 7 155H (45713 - 152179, n=50) | |
| MSI Prestige 16 B1MG-001US | |
| Dell Inspiron 16 Plus 7630 | |
| Lenovo ThinkBook 16 G6 ABP | |
| AIDA64 / CPU ZLib | |
| MSI Prestige 16 B1MG-001US | |
| Asus VivoBook Pro 16 K6602VU | |
| Medio Intel Core Ultra 7 155H (557 - 1250, n=50) | |
| Dell Inspiron 16 Plus 7630 | |
| LG Gram 2in1 16 16T90R - G.AA78G | |
| MSI Prestige 15 A12UD-093 | |
| Lenovo ThinkBook 16 G6 ABP | |
| AIDA64 / FP64 Ray-Trace | |
| MSI Prestige 16 B1MG-001US | |
| Asus VivoBook Pro 16 K6602VU | |
| Dell Inspiron 16 Plus 7630 | |
| Medio Intel Core Ultra 7 155H (3569 - 9802, n=50) | |
| Lenovo ThinkBook 16 G6 ABP | |
| MSI Prestige 15 A12UD-093 | |
| LG Gram 2in1 16 16T90R - G.AA78G | |
| AIDA64 / CPU PhotoWorxx | |
| Medio Intel Core Ultra 7 155H (32719 - 54223, n=50) | |
| MSI Prestige 16 B1MG-001US | |
| MSI Prestige 15 A12UD-093 | |
| LG Gram 2in1 16 16T90R - G.AA78G | |
| Asus VivoBook Pro 16 K6602VU | |
| Dell Inspiron 16 Plus 7630 | |
| Lenovo ThinkBook 16 G6 ABP | |
Rendimiento del sistema
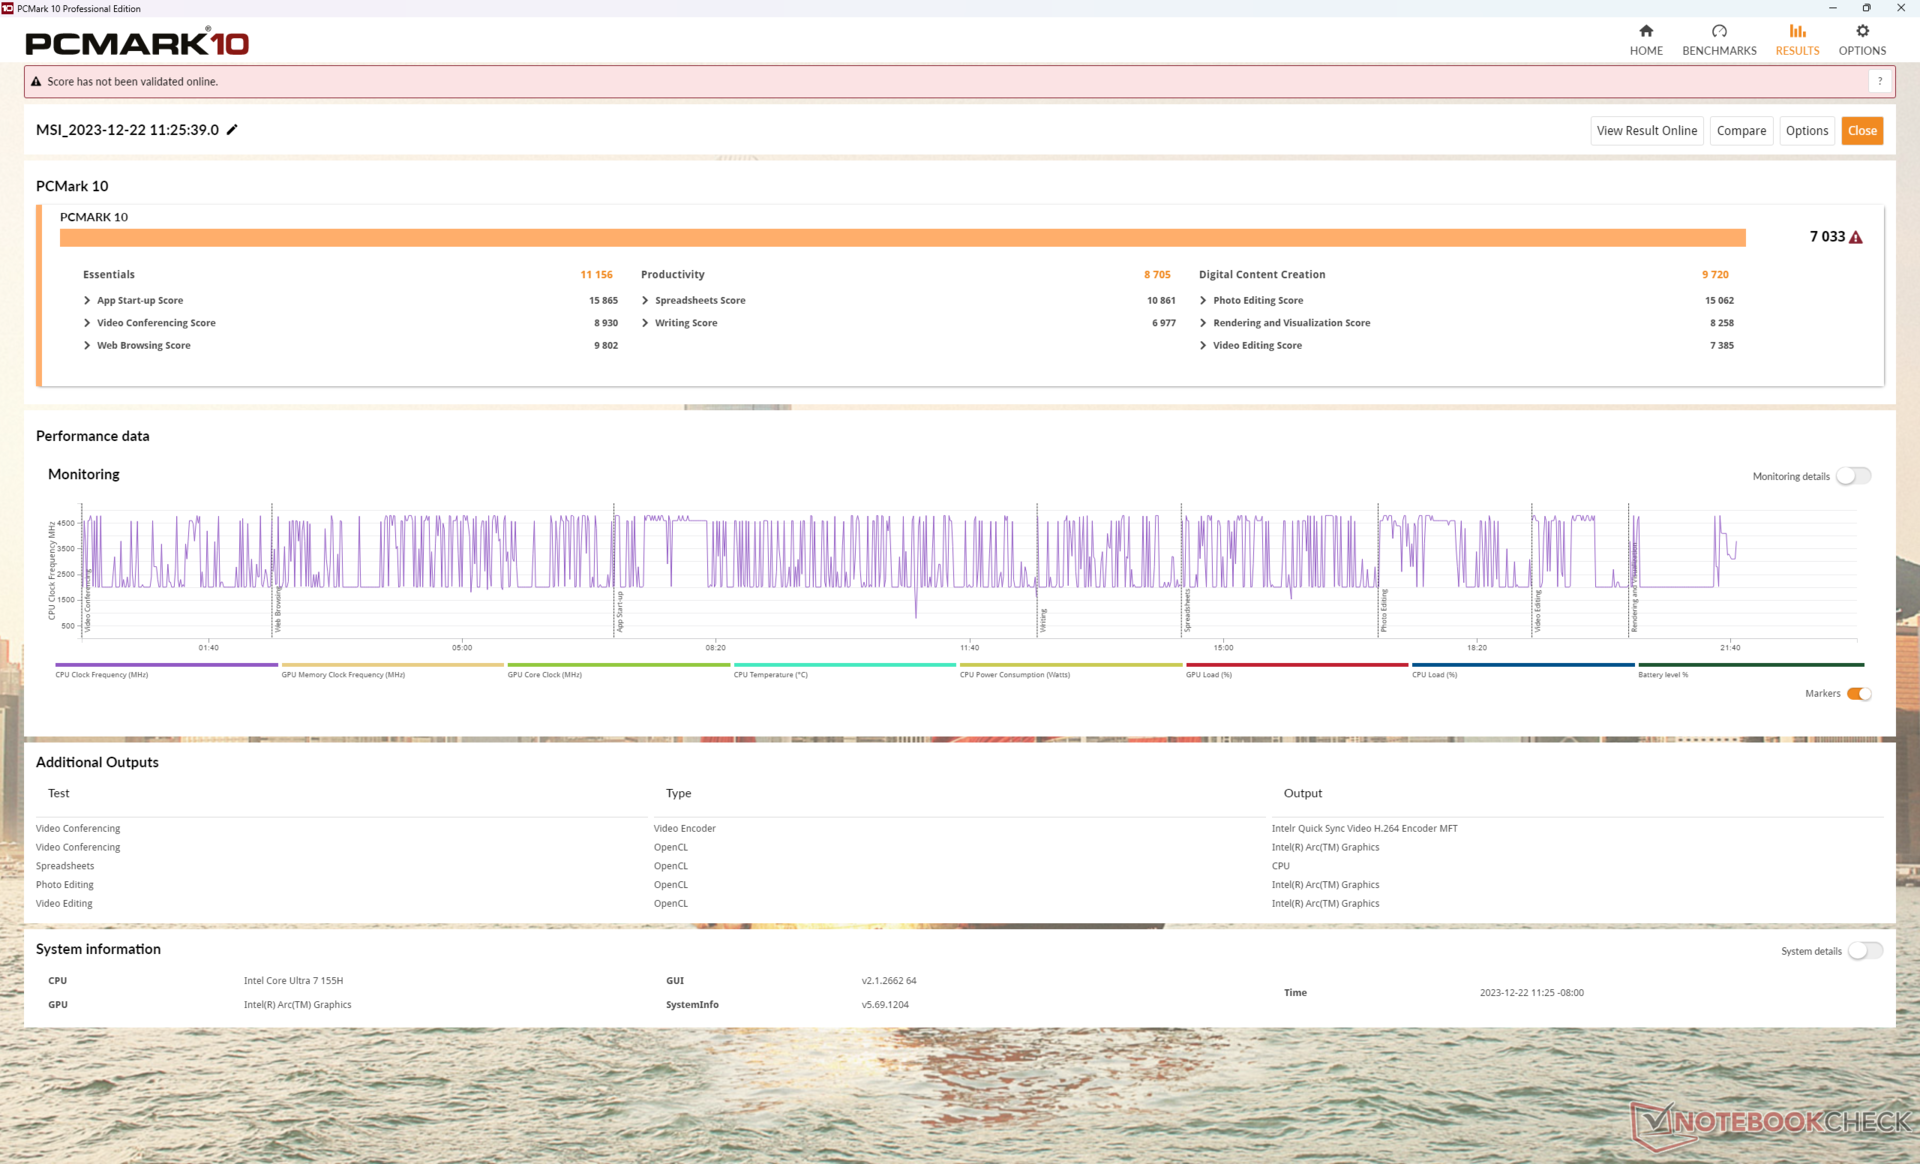
Los resultados de PCMark son comparables a los de portátiles multimedia con gráficos discretos de gama media como el Asus VivoBook Pro 16. Sin embargo, la importancia de las puntuaciones es cuestionable ya que es difícil comparar directamente las cifras entre portátiles con iGPU y dGPU.
Merece la pena mencionar la rápida RAM del sistema de 6400 MHz, especialmente porque el rendimiento de la iGPU está estrechamente ligado al rendimiento de la RAM.
CrossMark: Overall | Productivity | Creativity | Responsiveness
WebXPRT 3: Overall
WebXPRT 4: Overall
Mozilla Kraken 1.1: Total
| PCMark 10 / Score | |
| Dell Inspiron 16 Plus 7630 | |
| Asus VivoBook Pro 16 K6602VU | |
| MSI Prestige 16 B1MG-001US | |
| Medio Intel Core Ultra 7 155H, Intel Arc 8-Core iGPU (4809 - 7529, n=34) | |
| MSI Prestige 15 A12UD-093 | |
| Lenovo ThinkBook 16 G6 ABP | |
| LG Gram 2in1 16 16T90R - G.AA78G | |
| PCMark 10 / Essentials | |
| LG Gram 2in1 16 16T90R - G.AA78G | |
| Dell Inspiron 16 Plus 7630 | |
| MSI Prestige 16 B1MG-001US | |
| Lenovo ThinkBook 16 G6 ABP | |
| Medio Intel Core Ultra 7 155H, Intel Arc 8-Core iGPU (7605 - 11289, n=34) | |
| Asus VivoBook Pro 16 K6602VU | |
| MSI Prestige 15 A12UD-093 | |
| PCMark 10 / Productivity | |
| Dell Inspiron 16 Plus 7630 | |
| Lenovo ThinkBook 16 G6 ABP | |
| MSI Prestige 15 A12UD-093 | |
| MSI Prestige 16 B1MG-001US | |
| Asus VivoBook Pro 16 K6602VU | |
| Medio Intel Core Ultra 7 155H, Intel Arc 8-Core iGPU (6042 - 10591, n=34) | |
| LG Gram 2in1 16 16T90R - G.AA78G | |
| PCMark 10 / Digital Content Creation | |
| Dell Inspiron 16 Plus 7630 | |
| Asus VivoBook Pro 16 K6602VU | |
| MSI Prestige 16 B1MG-001US | |
| Medio Intel Core Ultra 7 155H, Intel Arc 8-Core iGPU (4985 - 10709, n=34) | |
| MSI Prestige 15 A12UD-093 | |
| LG Gram 2in1 16 16T90R - G.AA78G | |
| Lenovo ThinkBook 16 G6 ABP | |
| CrossMark / Overall | |
| Dell Inspiron 16 Plus 7630 | |
| MSI Prestige 16 B1MG-001US | |
| Asus VivoBook Pro 16 K6602VU | |
| MSI Prestige 15 A12UD-093 | |
| Medio Intel Core Ultra 7 155H, Intel Arc 8-Core iGPU (1366 - 1903, n=34) | |
| LG Gram 2in1 16 16T90R - G.AA78G | |
| Lenovo ThinkBook 16 G6 ABP | |
| CrossMark / Productivity | |
| Dell Inspiron 16 Plus 7630 | |
| MSI Prestige 16 B1MG-001US | |
| Asus VivoBook Pro 16 K6602VU | |
| MSI Prestige 15 A12UD-093 | |
| Medio Intel Core Ultra 7 155H, Intel Arc 8-Core iGPU (1291 - 1798, n=33) | |
| LG Gram 2in1 16 16T90R - G.AA78G | |
| Lenovo ThinkBook 16 G6 ABP | |
| CrossMark / Creativity | |
| Dell Inspiron 16 Plus 7630 | |
| MSI Prestige 16 B1MG-001US | |
| Asus VivoBook Pro 16 K6602VU | |
| Medio Intel Core Ultra 7 155H, Intel Arc 8-Core iGPU (1519 - 1929, n=33) | |
| MSI Prestige 15 A12UD-093 | |
| LG Gram 2in1 16 16T90R - G.AA78G | |
| Lenovo ThinkBook 16 G6 ABP | |
| CrossMark / Responsiveness | |
| MSI Prestige 15 A12UD-093 | |
| Dell Inspiron 16 Plus 7630 | |
| MSI Prestige 16 B1MG-001US | |
| Asus VivoBook Pro 16 K6602VU | |
| LG Gram 2in1 16 16T90R - G.AA78G | |
| Medio Intel Core Ultra 7 155H, Intel Arc 8-Core iGPU (939 - 1802, n=33) | |
| Lenovo ThinkBook 16 G6 ABP | |
| WebXPRT 3 / Overall | |
| Dell Inspiron 16 Plus 7630 | |
| MSI Prestige 16 B1MG-001US | |
| Medio Intel Core Ultra 7 155H, Intel Arc 8-Core iGPU (252 - 299, n=34) | |
| Lenovo ThinkBook 16 G6 ABP | |
| LG Gram 2in1 16 16T90R - G.AA78G | |
| MSI Prestige 15 A12UD-093 | |
| WebXPRT 4 / Overall | |
| Dell Inspiron 16 Plus 7630 | |
| MSI Prestige 16 B1MG-001US | |
| Medio Intel Core Ultra 7 155H, Intel Arc 8-Core iGPU (166.4 - 309, n=29) | |
| Asus VivoBook Pro 16 K6602VU | |
| Lenovo ThinkBook 16 G6 ABP | |
| Mozilla Kraken 1.1 / Total | |
| MSI Prestige 15 A12UD-093 | |
| LG Gram 2in1 16 16T90R - G.AA78G | |
| Lenovo ThinkBook 16 G6 ABP | |
| Asus VivoBook Pro 16 K6602VU | |
| Medio Intel Core Ultra 7 155H, Intel Arc 8-Core iGPU (517 - 614, n=35) | |
| MSI Prestige 16 B1MG-001US | |
| Dell Inspiron 16 Plus 7630 | |
* ... más pequeño es mejor
| PCMark 10 Score | 7033 puntos | |
ayuda | ||
| AIDA64 / Memory Copy | |
| Medio Intel Core Ultra 7 155H (62397 - 96791, n=50) | |
| MSI Prestige 16 B1MG-001US | |
| MSI Prestige 15 A12UD-093 | |
| LG Gram 2in1 16 16T90R - G.AA78G | |
| Dell Inspiron 16 Plus 7630 | |
| Asus VivoBook Pro 16 K6602VU | |
| Lenovo ThinkBook 16 G6 ABP | |
| AIDA64 / Memory Read | |
| Medio Intel Core Ultra 7 155H (60544 - 90647, n=50) | |
| MSI Prestige 16 B1MG-001US | |
| Dell Inspiron 16 Plus 7630 | |
| Asus VivoBook Pro 16 K6602VU | |
| MSI Prestige 15 A12UD-093 | |
| LG Gram 2in1 16 16T90R - G.AA78G | |
| Lenovo ThinkBook 16 G6 ABP | |
| AIDA64 / Memory Write | |
| LG Gram 2in1 16 16T90R - G.AA78G | |
| MSI Prestige 16 B1MG-001US | |
| Medio Intel Core Ultra 7 155H (58692 - 93451, n=50) | |
| MSI Prestige 15 A12UD-093 | |
| Asus VivoBook Pro 16 K6602VU | |
| Dell Inspiron 16 Plus 7630 | |
| Lenovo ThinkBook 16 G6 ABP | |
| AIDA64 / Memory Latency | |
| Medio Intel Core Ultra 7 155H (116.2 - 233, n=50) | |
| MSI Prestige 16 B1MG-001US | |
| LG Gram 2in1 16 16T90R - G.AA78G | |
| MSI Prestige 15 A12UD-093 | |
| Lenovo ThinkBook 16 G6 ABP | |
| Dell Inspiron 16 Plus 7630 | |
| Asus VivoBook Pro 16 K6602VU | |
* ... más pequeño es mejor
Latencia del CPD
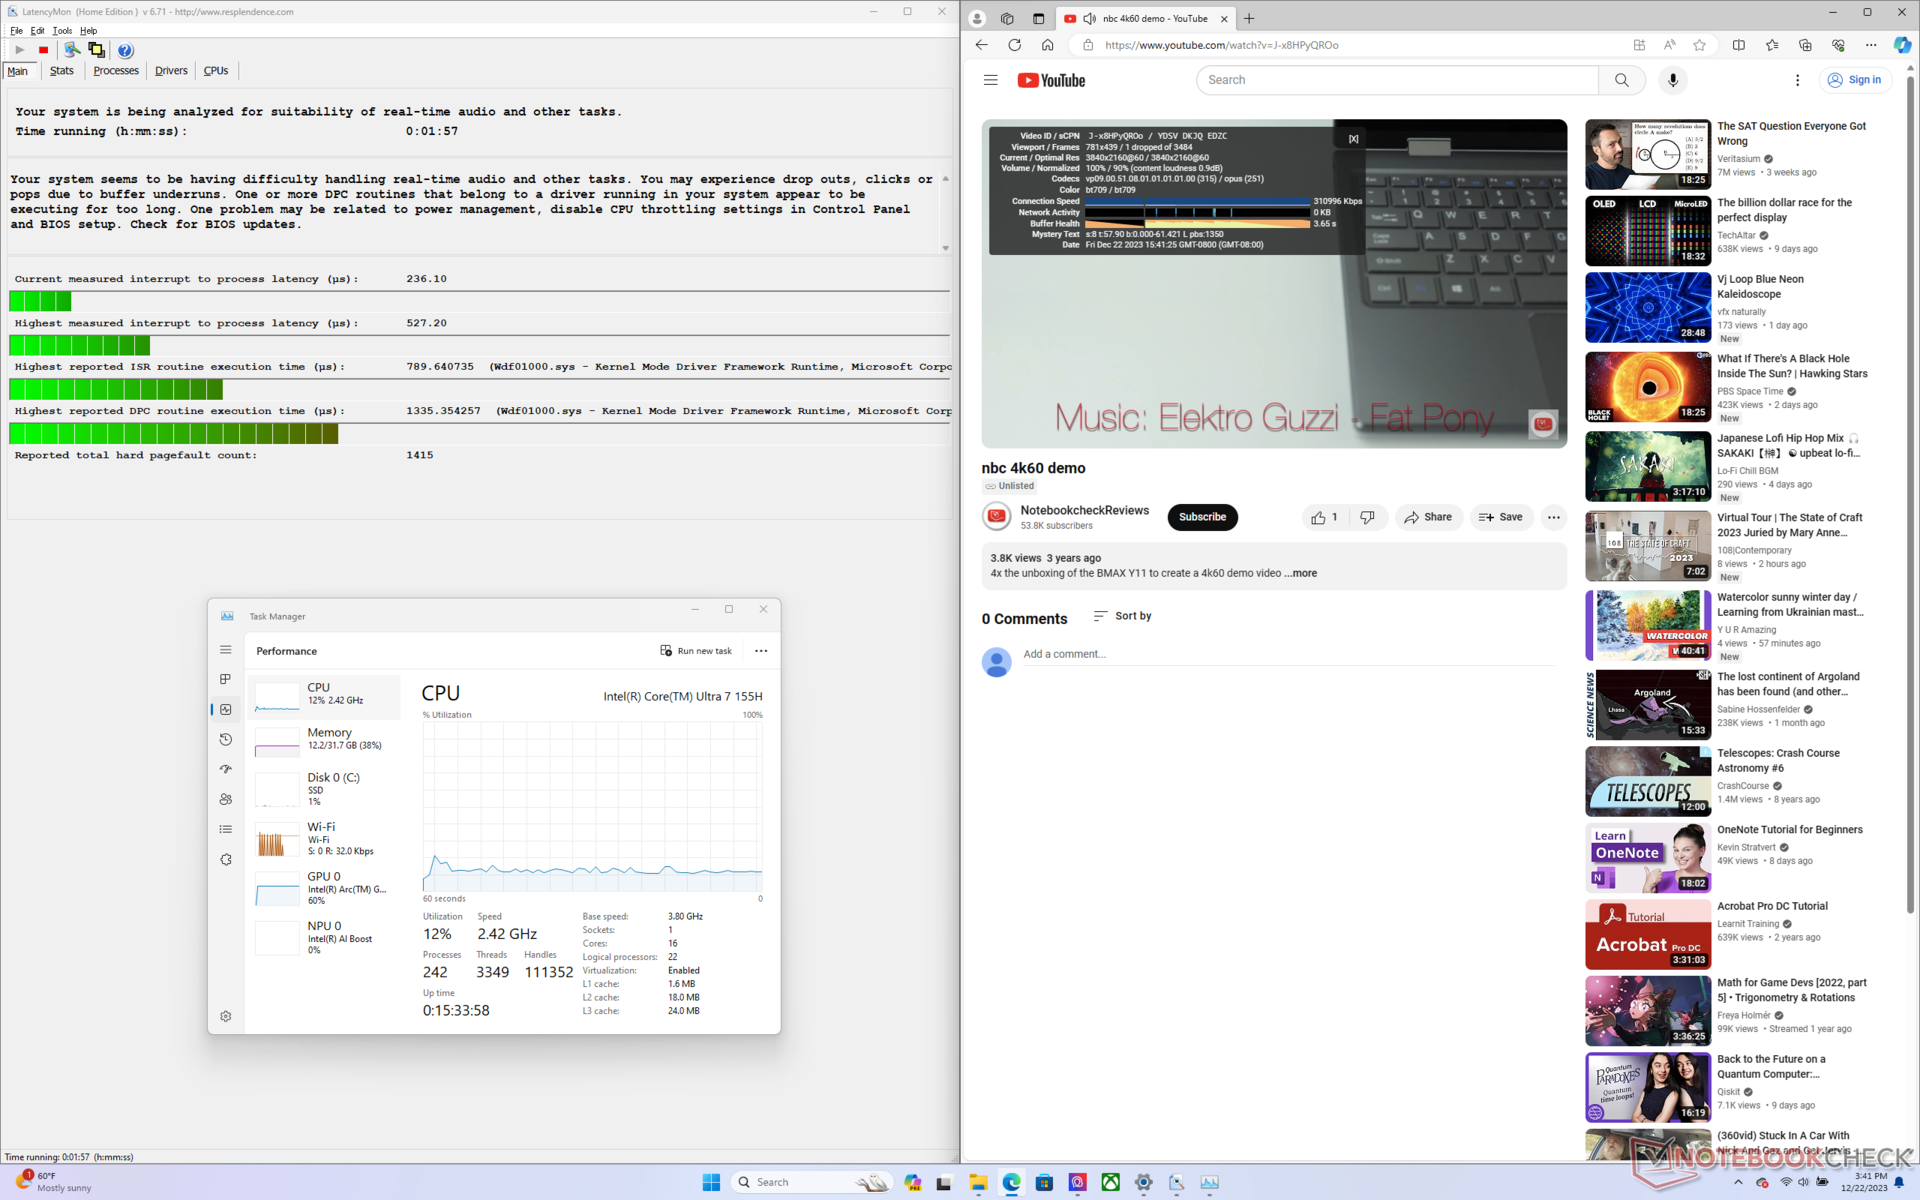
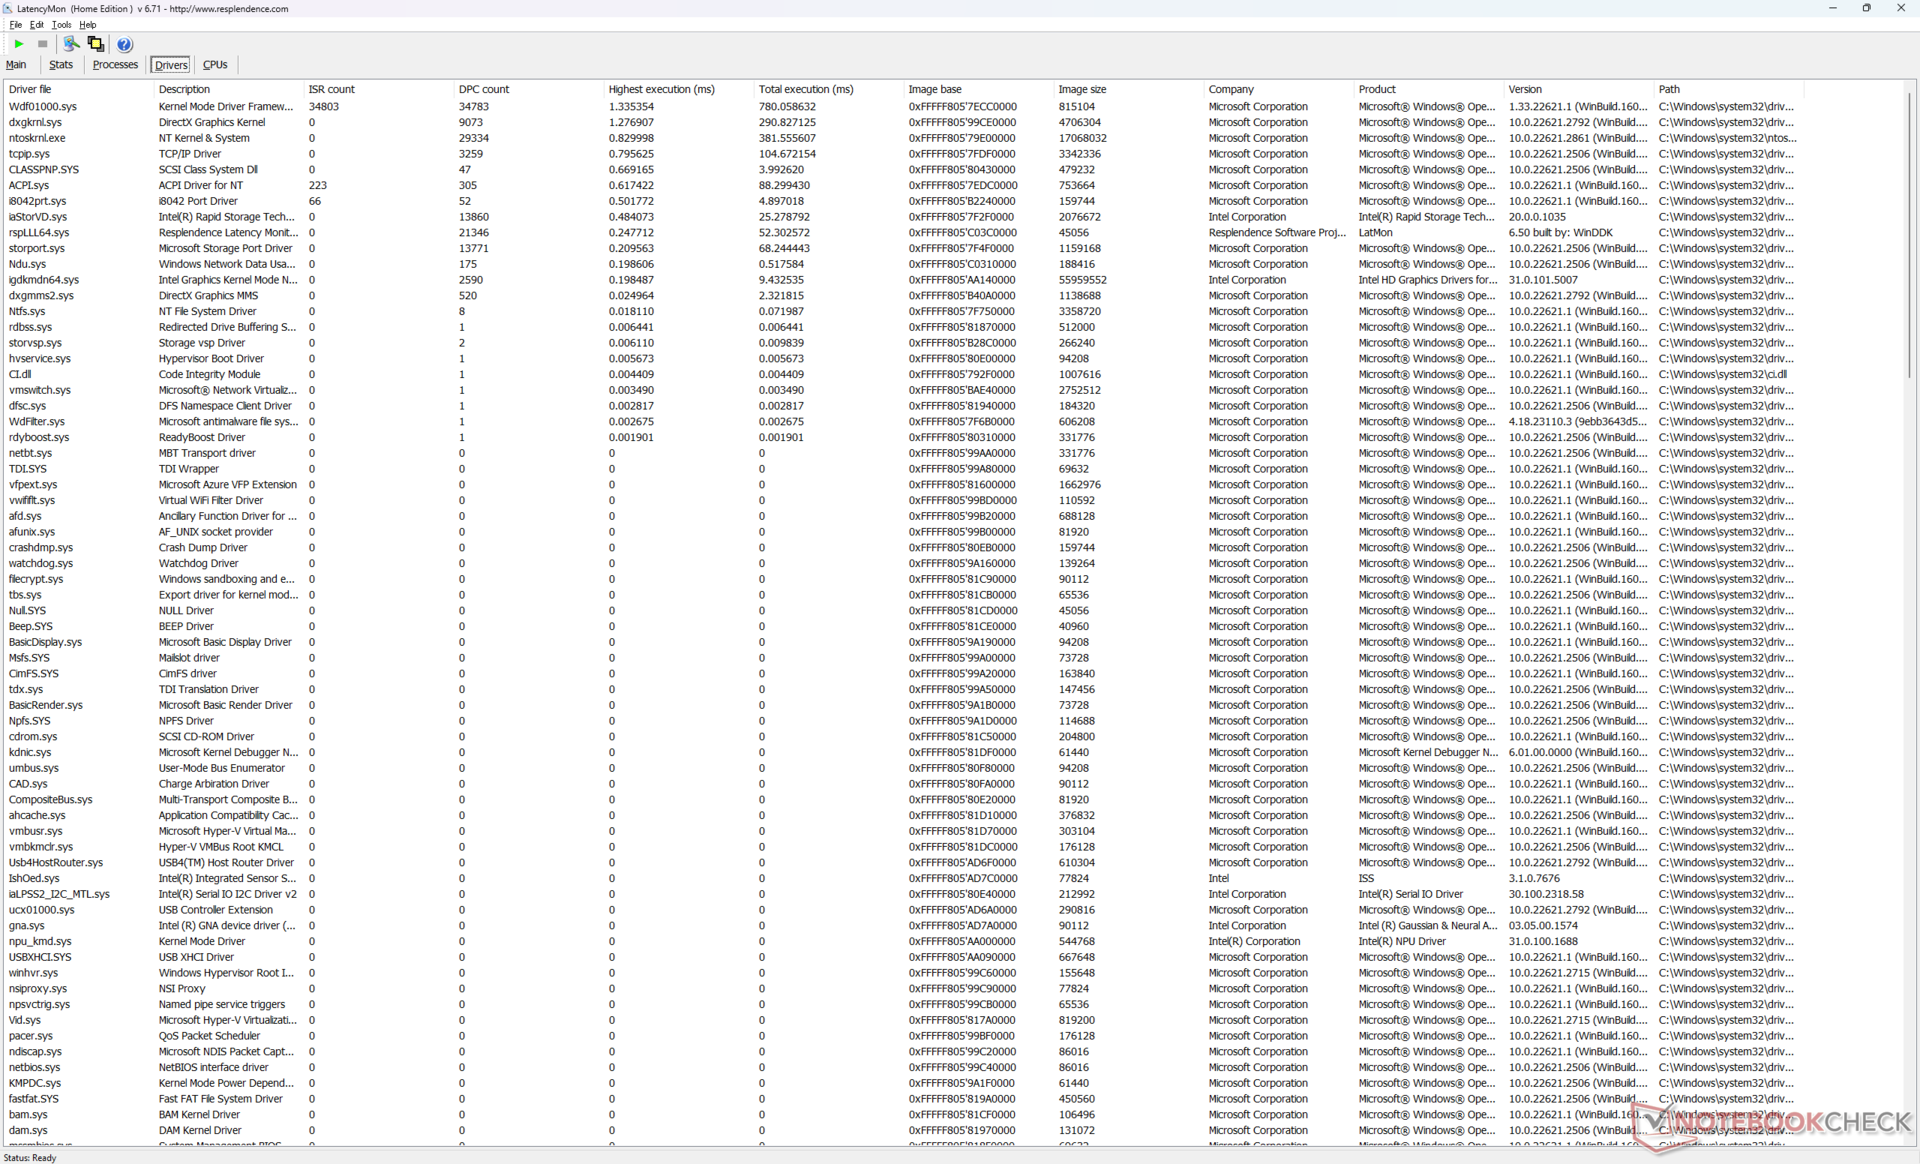
LatencyMon sólo revela problemas menores de DPC al abrir varias pestañas del navegador de nuestra página principal. la reproducción de vídeo 4K a 60 FPS es casi perfecta, con un solo fotograma caído registrado durante un vídeo de prueba de 60 segundos.
| DPC Latencies / LatencyMon - interrupt to process latency (max), Web, Youtube, Prime95 | |
| LG Gram 2in1 16 16T90R - G.AA78G | |
| Asus VivoBook Pro 16 K6602VU | |
| MSI Prestige 15 A12UD-093 | |
| Lenovo ThinkBook 16 G6 ABP | |
| Dell Inspiron 16 Plus 7630 | |
| MSI Prestige 16 B1MG-001US | |
* ... más pequeño es mejor
Dispositivos de almacenamiento
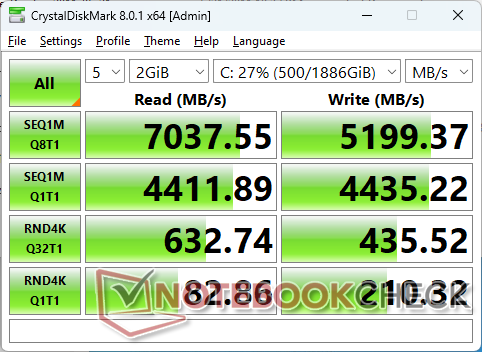
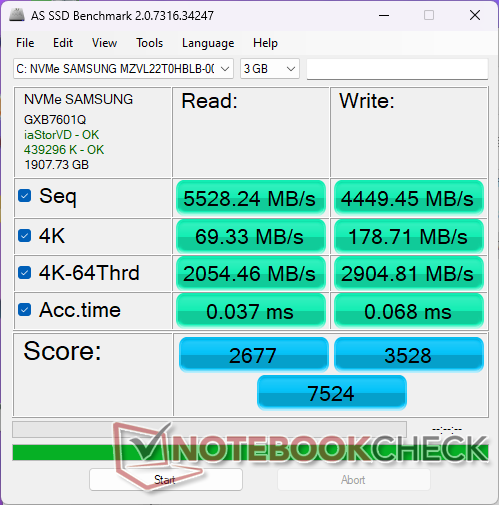
Nuestra unidad viene equipada con un Samsung PM9A1 que es una de las unidades SSD NVMe PCIe4 x4 de consumo más rápidas disponibles y una actualización de la Micron 3400 de nuestra antigua Prestige 15. La unidad es capaz de mantener velocidades de ~7100 MB/s incluso bajo tensión, lo que es impresionante teniendo en cuenta la delgadez del chasis.

| Drive Performance rating - Percent | |
| MSI Prestige 16 B1MG-001US | |
| LG Gram 2in1 16 16T90R - G.AA78G | |
| MSI Prestige 15 A12UD-093 | |
| Dell Inspiron 16 Plus 7630 | |
| Lenovo ThinkBook 16 G6 ABP | |
| Asus VivoBook Pro 16 K6602VU | |
* ... más pequeño es mejor
Disk Throttling: DiskSpd Read Loop, Queue Depth 8
Rendimiento de la GPU: recuperar la corona de los gráficos integrados
Tras un estancamiento en los últimos años, Intel ha renovado por fin su GPU integrada para ser más competitiva frente a la competidora Radeon 680M y 780M de la serie Radeon. los resultados de 3DMark enfrentan a nuestro Arc 8 por delante de la Radeon 780M en aproximadamente un 20 por ciento o incluso hasta un 50 por ciento en títulos compatibles con DX12. Los usuarios que se actualicen desde las Iris Xe 96 UE deberían esperar un aumento del rendimiento bruto de entre 1,5 y 2 veces. No está al nivel de una GeForce RTX 3050 Ti, pero los resultados se acercan definitivamente a los de una GeForce RTX 2050.
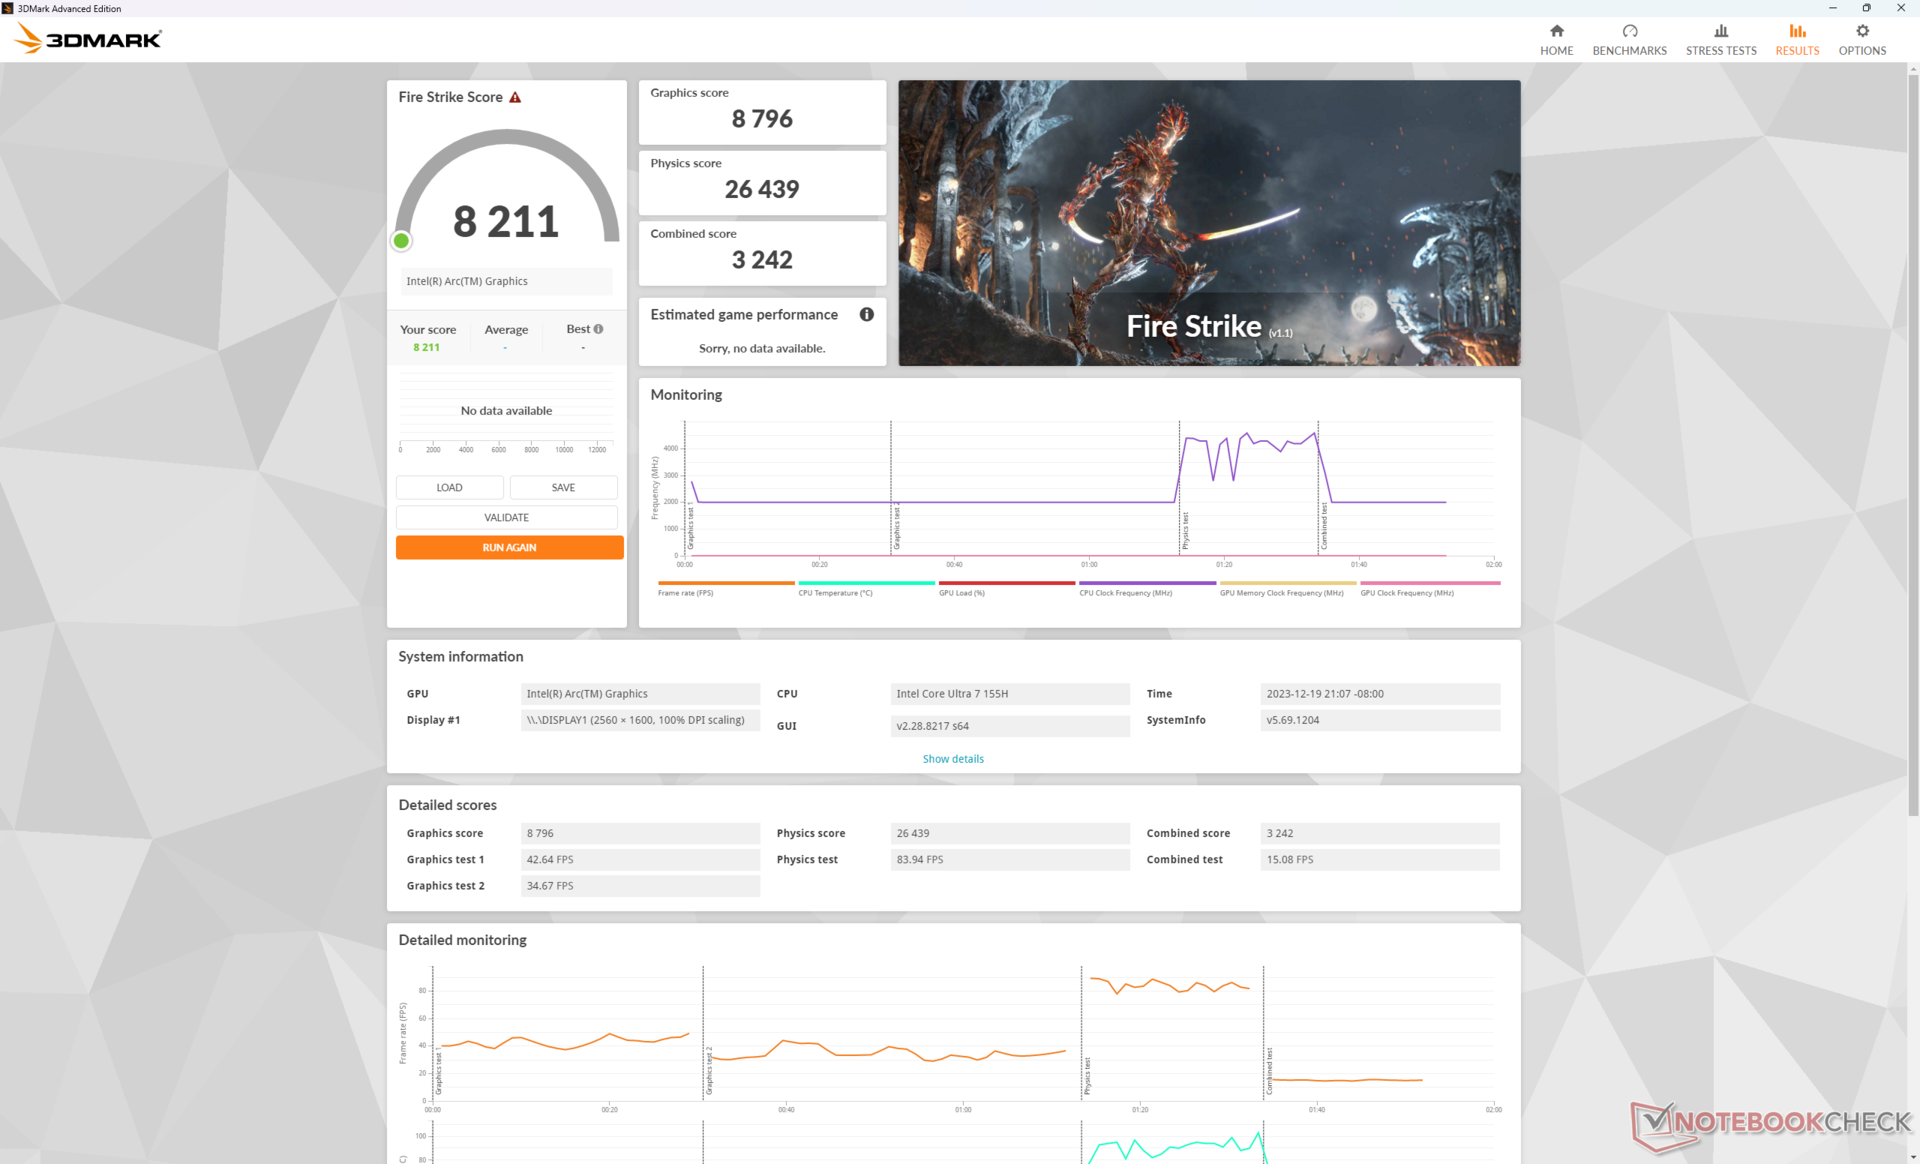
| Perfil de potencia | Puntuación física | Puntuación de gráficos | Puntuación combinada |
| Rendimiento extremo (Cooler Boost activado) | 26439 | 8796 | 3242 |
| Rendimiento extremo (Cooler Boost desactivado) | 26460 (-0%) | 8614 (-2%) | 3187 (-2%) |
| Modo equilibrado | 25110 (-5%) | 8814 (-0%) | 3306 (-0%) |
| Modo batería | 21717 (-18%) | 7425 (-16%) | 2761 (-15%) |
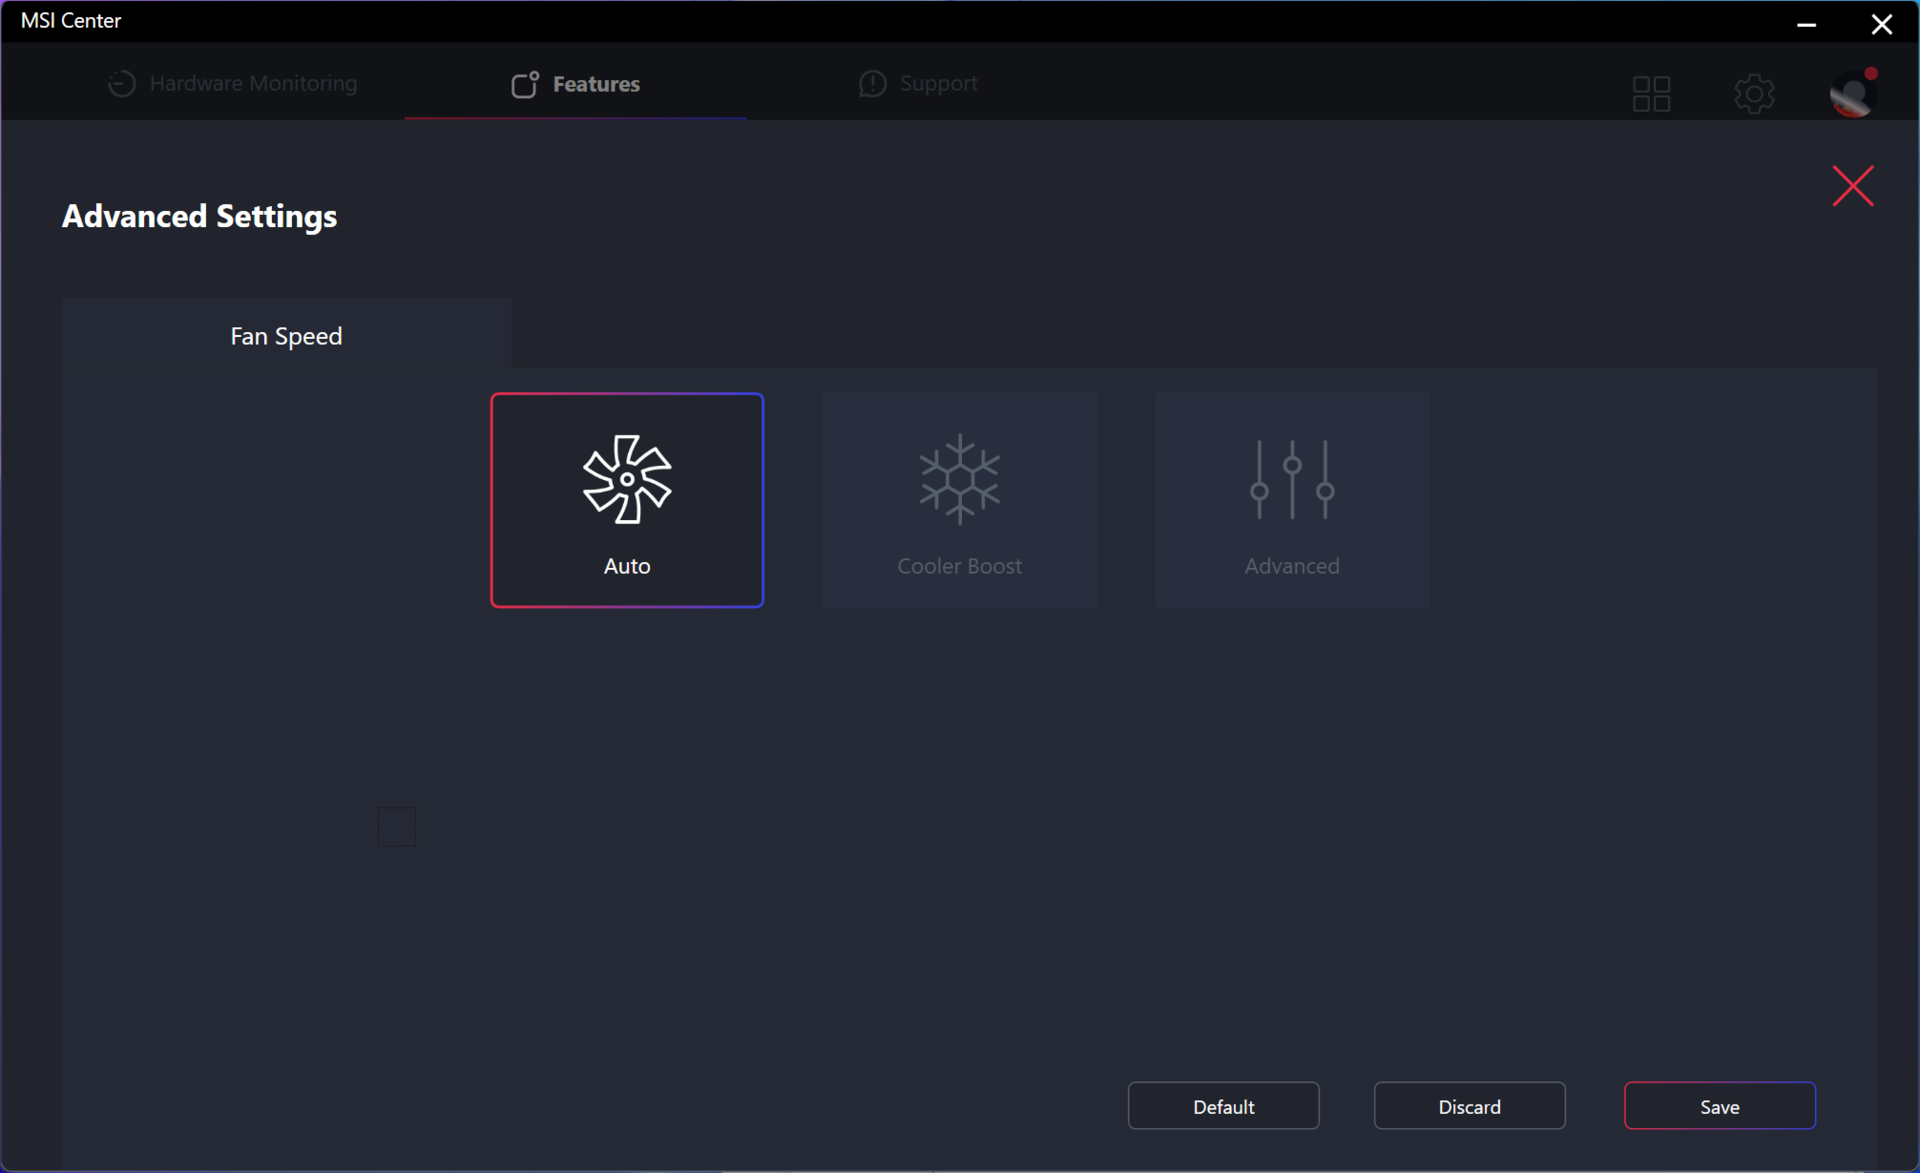
La activación de Cooler Boost no parece afectar significativamente al rendimiento según nuestra tabla de resultados Fire Strike anterior. Ejecutar en modo Equilibrado impactaría en el rendimiento de la CPU sólo ligeramente mientras que el modo Batería reduciría el rendimiento de forma más significativa en aproximadamente un 15 por ciento.
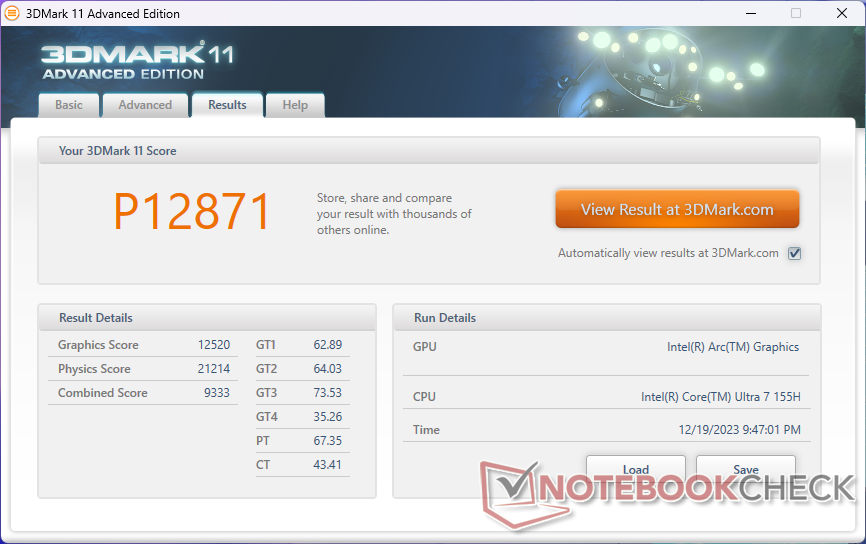
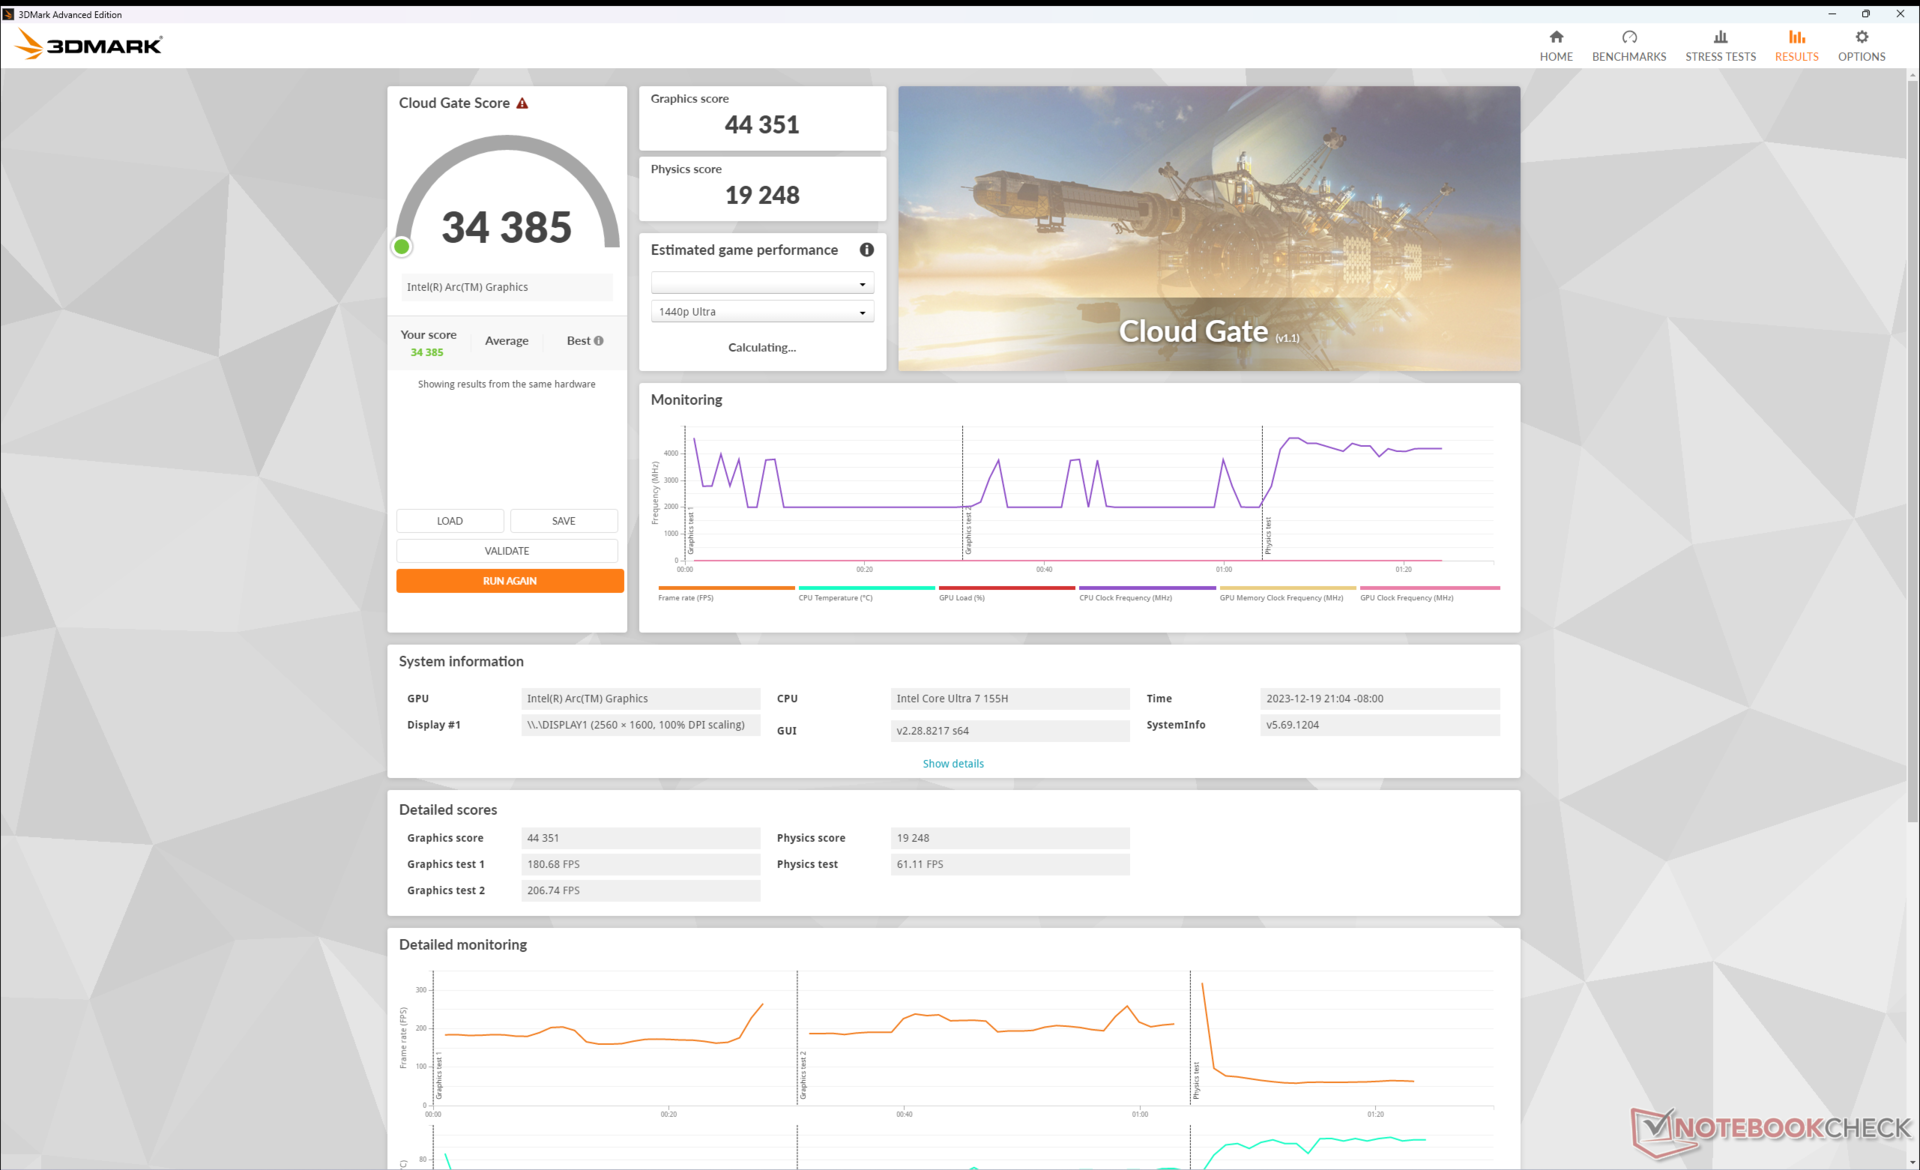
| 3DMark 11 Performance | 12871 puntos | |
| 3DMark Cloud Gate Standard Score | 34385 puntos | |
| 3DMark Fire Strike Score | 8211 puntos | |
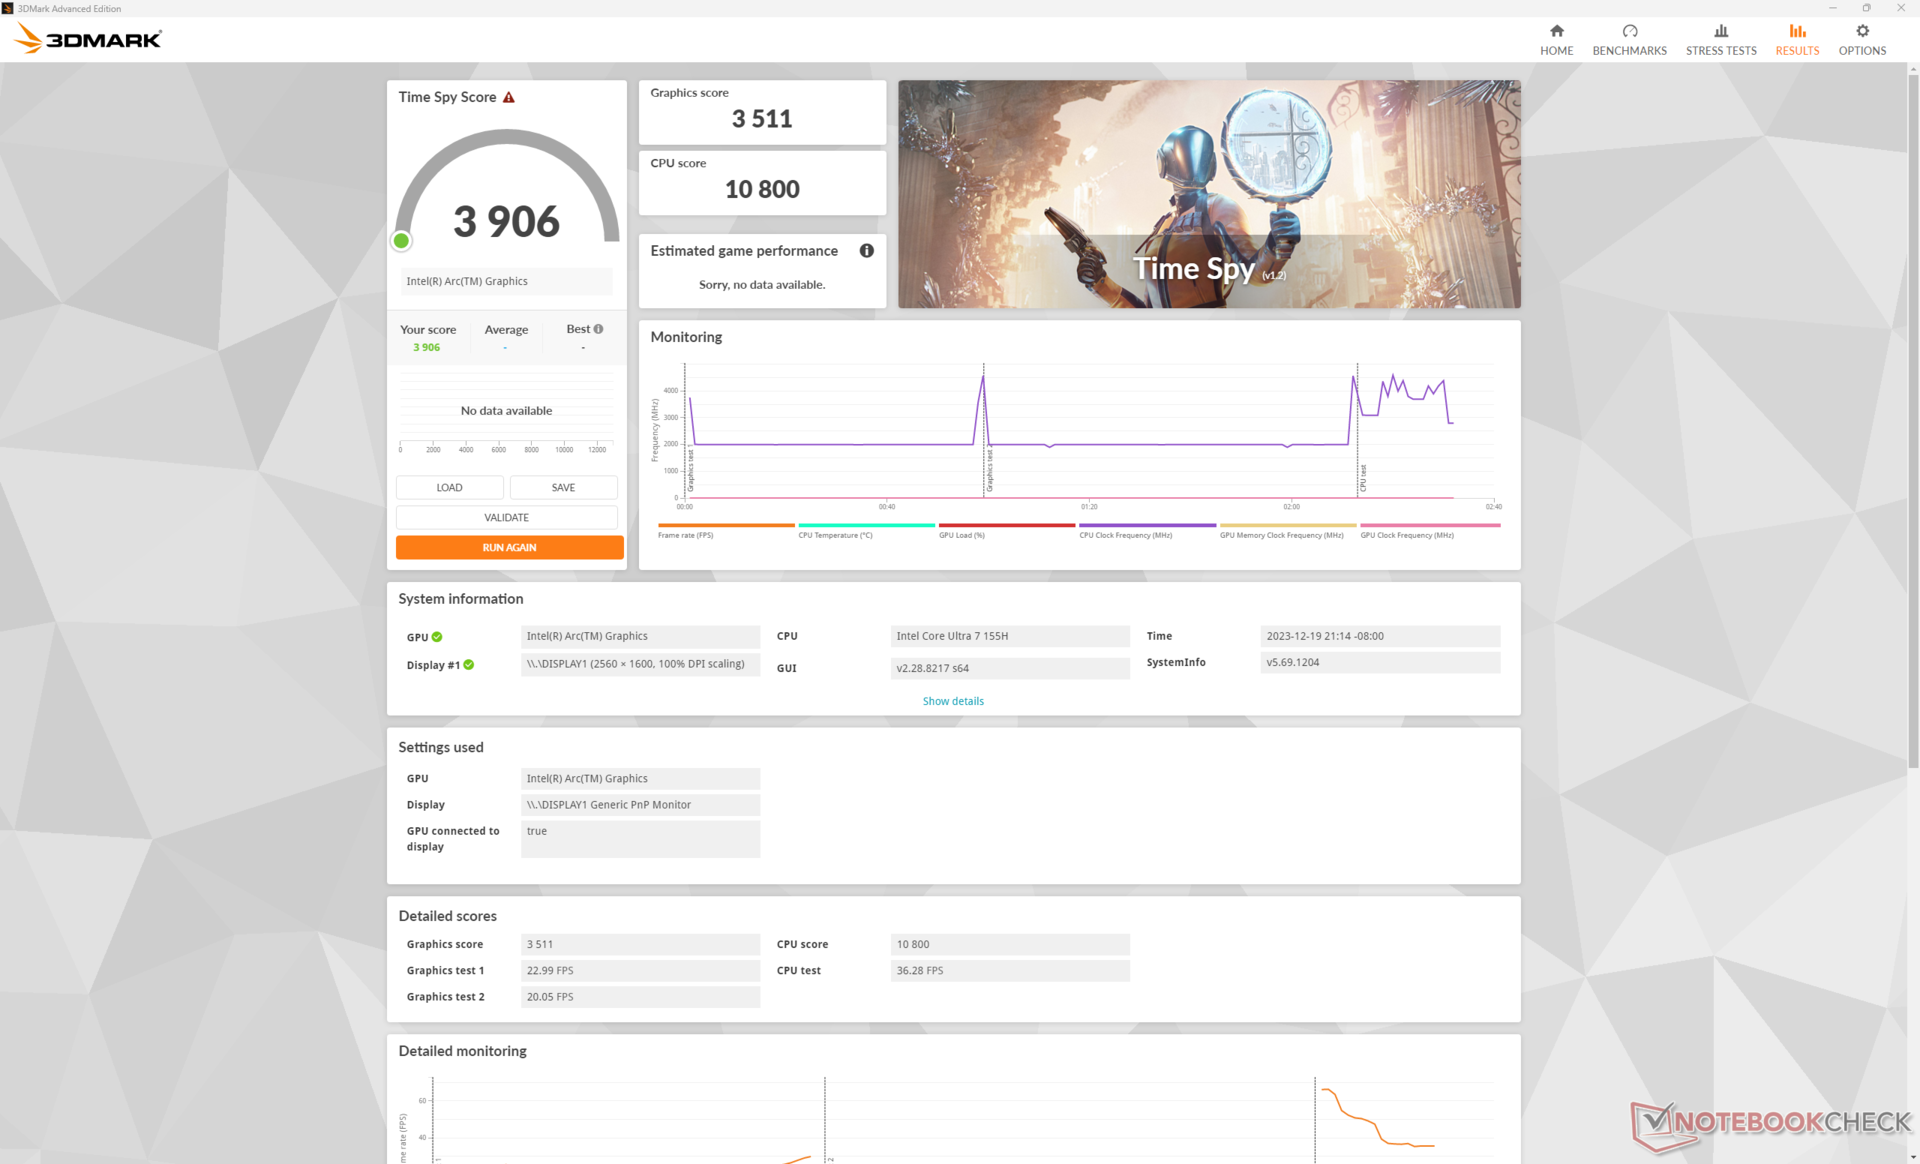
| 3DMark Time Spy Score | 3906 puntos | |
ayuda | ||
* ... más pequeño es mejor
Rendimiento en juegos
El rendimiento en el mundo real al ejecutar juegos es excelente, con resultados que rivalizan con la GeForce 3050 Ti de la Prestige 15 del año pasado, como dejan entrever los resultados sintéticos de las pruebas de rendimiento anteriores. Far Cry 5 y F1 22, por ejemplo, rinden entre un 5 y un 15 por ciento menos que la Prestige 15. Tenga en cuenta que la GPU GeForce de la Prestige 15 presentaba notables problemas de ralentización que afectaban enormemente a su rendimiento; la gran mayoría de otros portátiles GeForce RTX 3050 Ti, como el Asus Vivobook Pro 16Xseguirían ejecutando juegos significativamente más rápido que nuestro Arc 8 integrado.
No obstante, el rendimiento general es sistemáticamente mejor que el de la Radeon 780M en todos los juegos probados, entre un 5 y un 20 por ciento. Algunos juegos DX12, como Tiny Tina's Wonderlands y F1 22, incluso se ejecutarían hasta un 50 o 60 por ciento mejor en la nueva GPU Intel.
| The Witcher 3 - 1920x1080 Ultra Graphics & Postprocessing (HBAO+) | |
| Dell Inspiron 16 Plus 7630 | |
| Asus VivoBook Pro 16 K6602VU | |
| MSI Prestige 16 B1MG-001US | |
| MSI Prestige 15 A12UD-093 | |
| LG Gram 2in1 16 16T90R - G.AA78G | |
| Lenovo ThinkBook 16 G6 ABP | |
| GTA V - 1920x1080 Highest AA:4xMSAA + FX AF:16x | |
| Asus VivoBook Pro 16 K6602VU | |
| MSI Prestige 15 A12UD-093 | |
| Lenovo ThinkBook 16 G6 ABP | |
| LG Gram 2in1 16 16T90R - G.AA78G | |
| Final Fantasy XV Benchmark - 1920x1080 High Quality | |
| Dell Inspiron 16 Plus 7630 | |
| Asus VivoBook Pro 16 K6602VU | |
| MSI Prestige 16 B1MG-001US | |
| MSI Prestige 15 A12UD-093 | |
| LG Gram 2in1 16 16T90R - G.AA78G | |
| Lenovo ThinkBook 16 G6 ABP | |
| Strange Brigade - 1920x1080 ultra AA:ultra AF:16 | |
| Dell Inspiron 16 Plus 7630 | |
| Asus VivoBook Pro 16 K6602VU | |
| MSI Prestige 16 B1MG-001US | |
| MSI Prestige 15 A12UD-093 | |
| LG Gram 2in1 16 16T90R - G.AA78G | |
| Lenovo ThinkBook 16 G6 ABP | |
| Dota 2 Reborn - 1920x1080 ultra (3/3) best looking | |
| Dell Inspiron 16 Plus 7630 | |
| Asus VivoBook Pro 16 K6602VU | |
| MSI Prestige 16 B1MG-001US | |
| MSI Prestige 15 A12UD-093 | |
| LG Gram 2in1 16 16T90R - G.AA78G | |
| Lenovo ThinkBook 16 G6 ABP | |
| X-Plane 11.11 - 1920x1080 high (fps_test=3) | |
| Dell Inspiron 16 Plus 7630 | |
| Asus VivoBook Pro 16 K6602VU | |
| MSI Prestige 15 A12UD-093 | |
| LG Gram 2in1 16 16T90R - G.AA78G | |
| MSI Prestige 16 B1MG-001US | |
| Lenovo ThinkBook 16 G6 ABP | |
| Baldur's Gate 3 | |
| 1280x720 Low Preset AA:SM | |
| MSI Prestige 16 B1MG-001US | |
| Medio Intel Arc 8-Core iGPU (31.8 - 57.6, n=15) | |
| 1920x1080 Low Preset AA:SM | |
| MSI Prestige 16 B1MG-001US | |
| Medio Intel Arc 8-Core iGPU (21 - 40.3, n=27) | |
| 1920x1080 Medium Preset AA:T | |
| MSI Prestige 16 B1MG-001US | |
| Medio Intel Arc 8-Core iGPU (16.3 - 31.1, n=28) | |
| 1920x1080 High Preset AA:T | |
| MSI Prestige 16 B1MG-001US | |
| Medio Intel Arc 8-Core iGPU (15.4 - 27.7, n=27) | |
| 1920x1080 Ultra Preset AA:T | |
| MSI Prestige 16 B1MG-001US | |
| Medio Intel Arc 8-Core iGPU (14.2 - 26.2, n=26) | |
| Cyberpunk 2077 | |
| 1280x720 Low Preset (FSR off) | |
| MSI Prestige 16 B1MG-001US | |
| Medio Intel Arc 8-Core iGPU (34.5 - 58, n=20) | |
| LG Gram 2in1 16 16T90R - G.AA78G | |
| 1920x1080 Low Preset (FSR off) | |
| MSI Prestige 16 B1MG-001US | |
| Medio Intel Arc 8-Core iGPU (11.3 - 38, n=38) | |
| LG Gram 2in1 16 16T90R - G.AA78G | |
| 1920x1080 Medium Preset (FSR off) | |
| MSI Prestige 16 B1MG-001US | |
| Medio Intel Arc 8-Core iGPU (9.42 - 31.4, n=36) | |
| LG Gram 2in1 16 16T90R - G.AA78G | |
| 1920x1080 High Preset (FSR off) | |
| MSI Prestige 16 B1MG-001US | |
| Medio Intel Arc 8-Core iGPU (7.3 - 27.6, n=36) | |
| LG Gram 2in1 16 16T90R - G.AA78G | |
| 1920x1080 Ultra Preset (FSR off) | |
| MSI Prestige 16 B1MG-001US | |
| Medio Intel Arc 8-Core iGPU (13 - 24.7, n=28) | |
| LG Gram 2in1 16 16T90R - G.AA78G | |
Witcher 3 FPS Chart
| bajo | medio | alto | ultra | |
|---|---|---|---|---|
| The Witcher 3 (2015) | 135.6 | 88.2 | 54.1 | 25.2 |
| Dota 2 Reborn (2015) | 101.7 | 92.8 | 79.1 | 75.6 |
| Final Fantasy XV Benchmark (2018) | 61 | 37.3 | 24.6 | |
| X-Plane 11.11 (2018) | 52.2 | 46.7 | 37.8 | |
| Far Cry 5 (2018) | 63 | 39 | 36 | 34 |
| Strange Brigade (2018) | 179.5 | 71 | 57.8 | 46.1 |
| Tiny Tina's Wonderlands (2022) | 53.3 | 41.2 | 30.1 | 25.1 |
| F1 22 (2022) | 77.7 | 71.6 | 53.3 | 15.3 |
| Baldur's Gate 3 (2023) | 31.9 | 28.2 | 24.1 | 23.4 |
| Cyberpunk 2077 (2023) | 35.7 | 29.5 | 25.2 | 22.1 |
Emisiones - Fuertes para un portátil con gráficos integrados
Ruido del sistema
El ruido del ventilador es más silencioso que el de la Prestige 15 cuando se ejecutan cargas más bajas, mientras que ocurre lo contrario cuando se ejecutan cargas más altas. Al navegar o hacer streaming de vídeo, por ejemplo, el ruido del ventilador tiende a oscilar entre 26 y 37 dB(A) en comparación con los 31 a 42 dB(A) del modelo anterior. Ejecutar cargas exigentes como Witcher 3 aumentaría el ruido del ventilador a 46 dB(A) o incluso hasta 53 dB(A) si Cooler Boost está activo. El rango medio de 40 dB(A) es bastante ruidoso para un portátil que funciona sólo con gráficos integrados.
Esperamos que el ruido del ventilador en las SKU con gráficos discretos se comporte de forma diferente a lo que experimentamos en nuestra unidad de prueba iGPU.
Ruido
| Ocioso |
| 24.5 / 26.3 / 26.3 dB(A) |
| Carga |
| 36.5 / 52.9 dB(A) |
 | ||
30 dB silencioso 40 dB(A) audible 50 dB(A) ruidosamente alto |
||
min: | ||
| MSI Prestige 16 B1MG-001US Arc 8-Core, Ultra 7 155H, Samsung PM9A1 MZVL22T0HBLB | MSI Prestige 15 A12UD-093 GeForce RTX 3050 Ti Laptop GPU, i7-1280P, Micron 3400 1TB MTFDKBA1T0TFH | LG Gram 2in1 16 16T90R - G.AA78G Iris Xe G7 96EUs, i7-1360P, Samsung PM9A1 MZVL21T0HCLR | Lenovo ThinkBook 16 G6 ABP Vega 7, R5 7530U, SK hynix HFS512GEJ9X125N | Asus VivoBook Pro 16 K6602VU GeForce RTX 4050 Laptop GPU, i9-13900H, Micron 2400 MTFDKBA1T0QFM | Dell Inspiron 16 Plus 7630 GeForce RTX 4060 Laptop GPU, i7-13700H, WD PC SN740 SDDPTQD-1T00 | |
|---|---|---|---|---|---|---|
| Noise | -6% | 8% | 13% | -4% | 4% | |
| apagado / medio ambiente * (dB) | 24.5 | 26 -6% | 25.1 -2% | 24.3 1% | 20.96 14% | 23.2 5% |
| Idle Minimum * (dB) | 24.5 | 26 -6% | 25.1 -2% | 24.3 1% | 25.28 -3% | 23.2 5% |
| Idle Average * (dB) | 26.3 | 30.7 -17% | 25.1 5% | 24.3 8% | 25.28 4% | 23.2 12% |
| Idle Maximum * (dB) | 26.3 | 30.7 -17% | 26.1 1% | 24.3 8% | 25.28 4% | 23.2 12% |
| Load Average * (dB) | 36.5 | 41.9 -15% | 31.4 14% | 29.7 19% | 51.88 -42% | 35.1 4% |
| Witcher 3 ultra * (dB) | 46.3 | 41.1 11% | 32.1 31% | 49 -6% | 52.5 -13% | |
| Load Maximum * (dB) | 52.9 | 40.7 23% | 36.6 31% | 41.4 22% | 51.8 2% | 52.5 1% |
* ... más pequeño es mejor
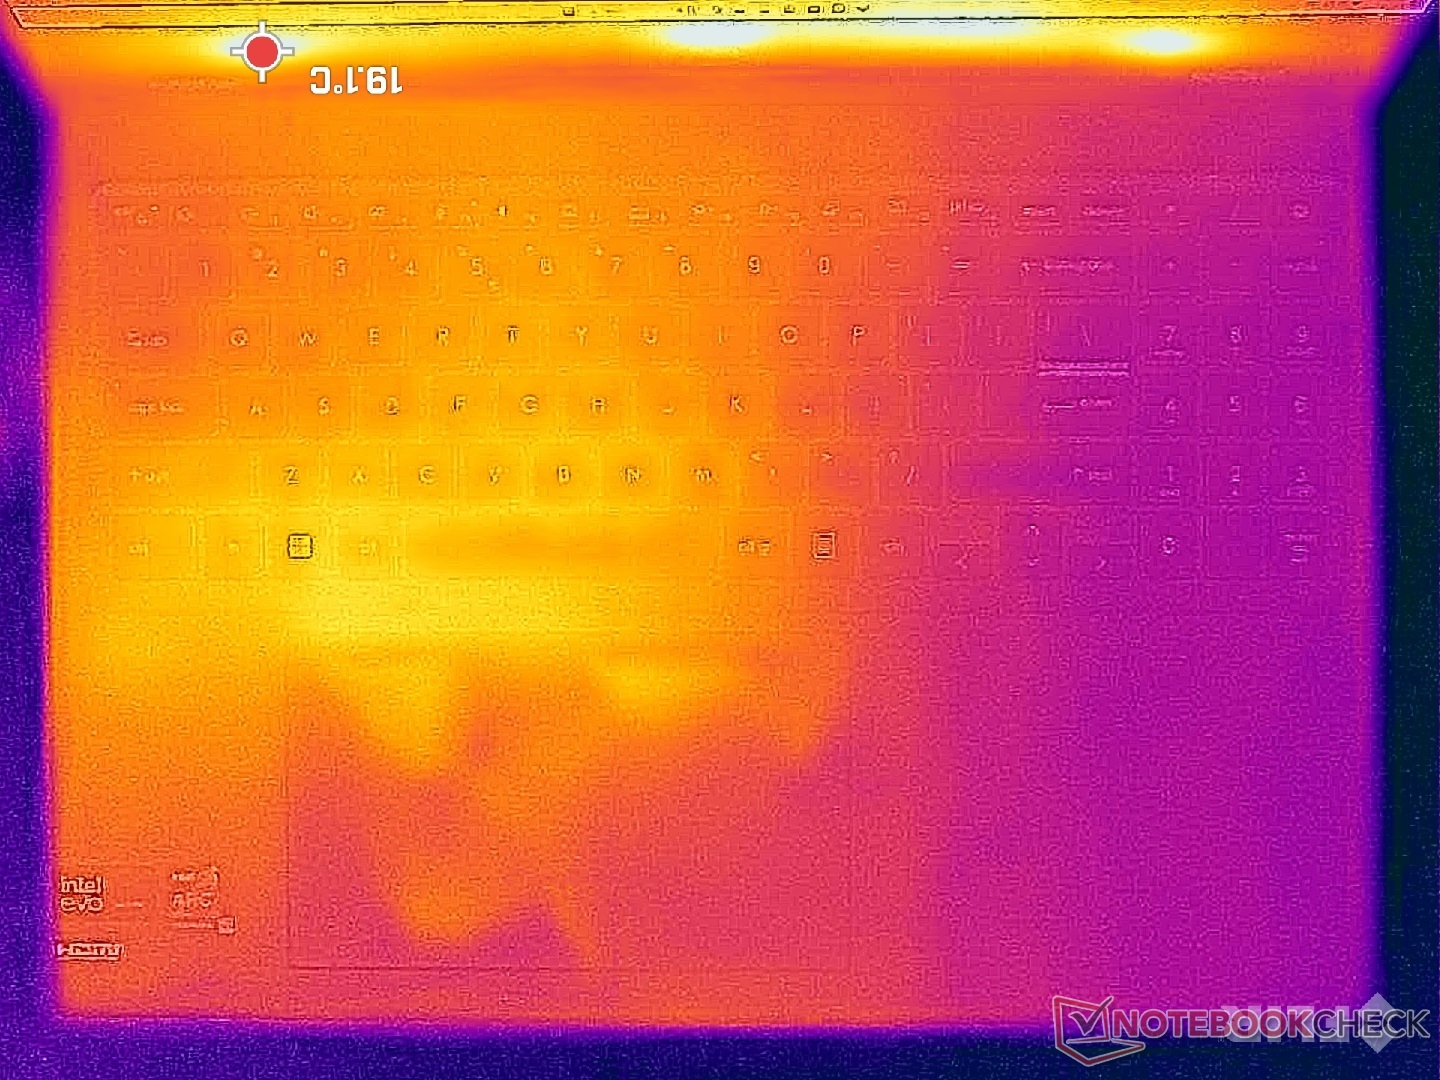
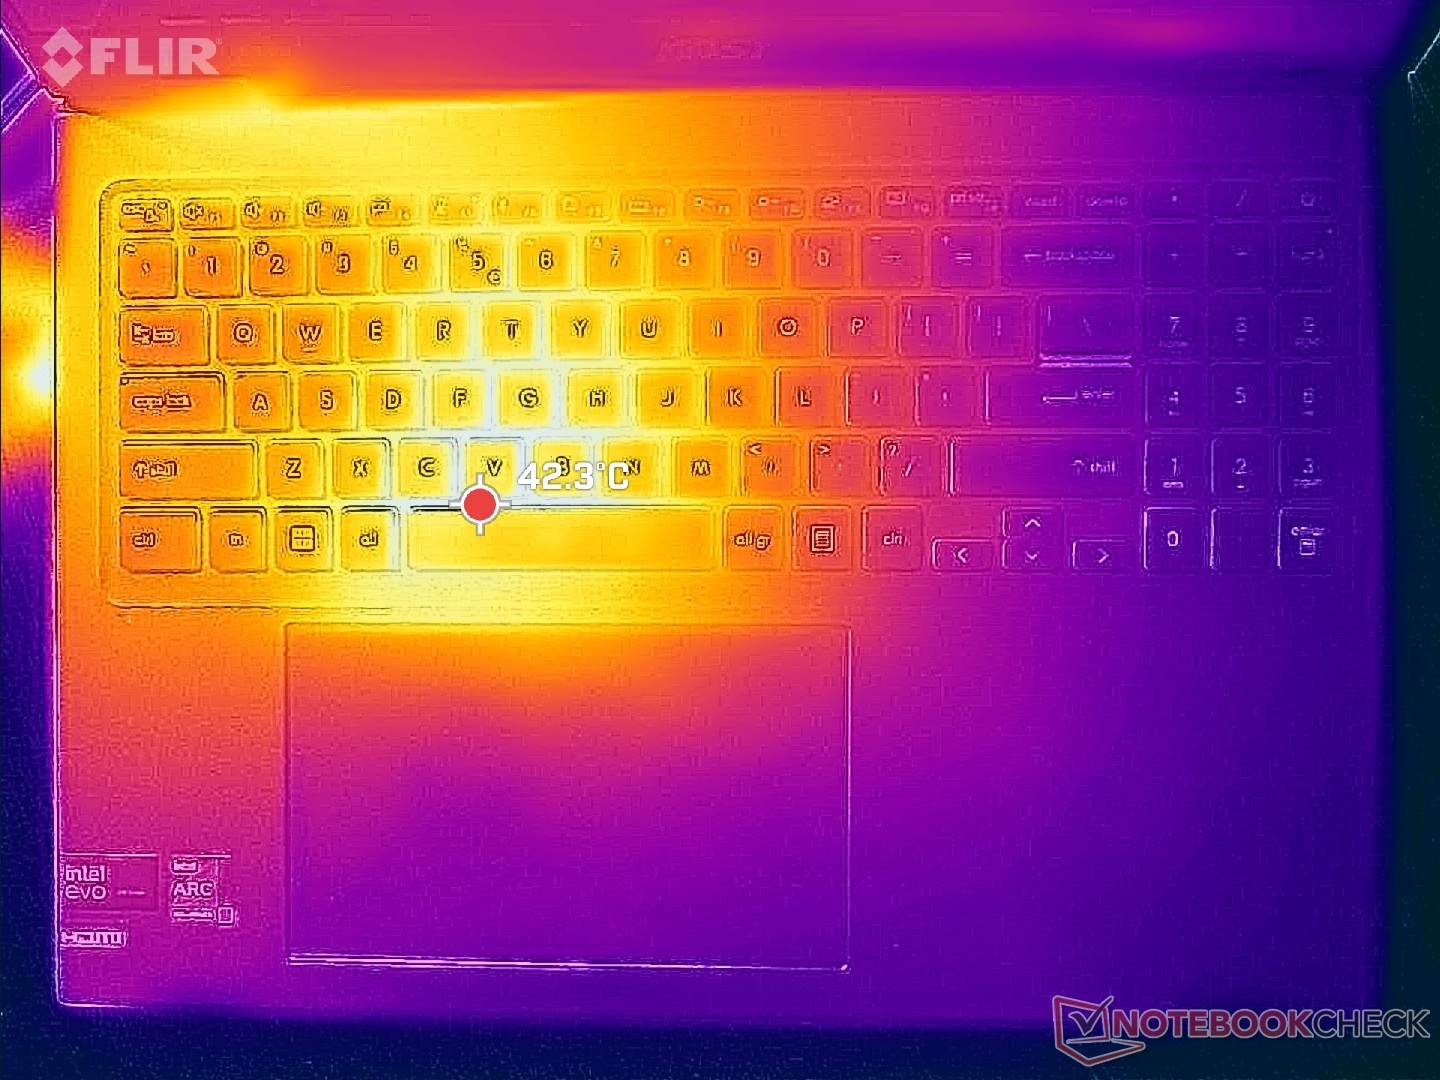
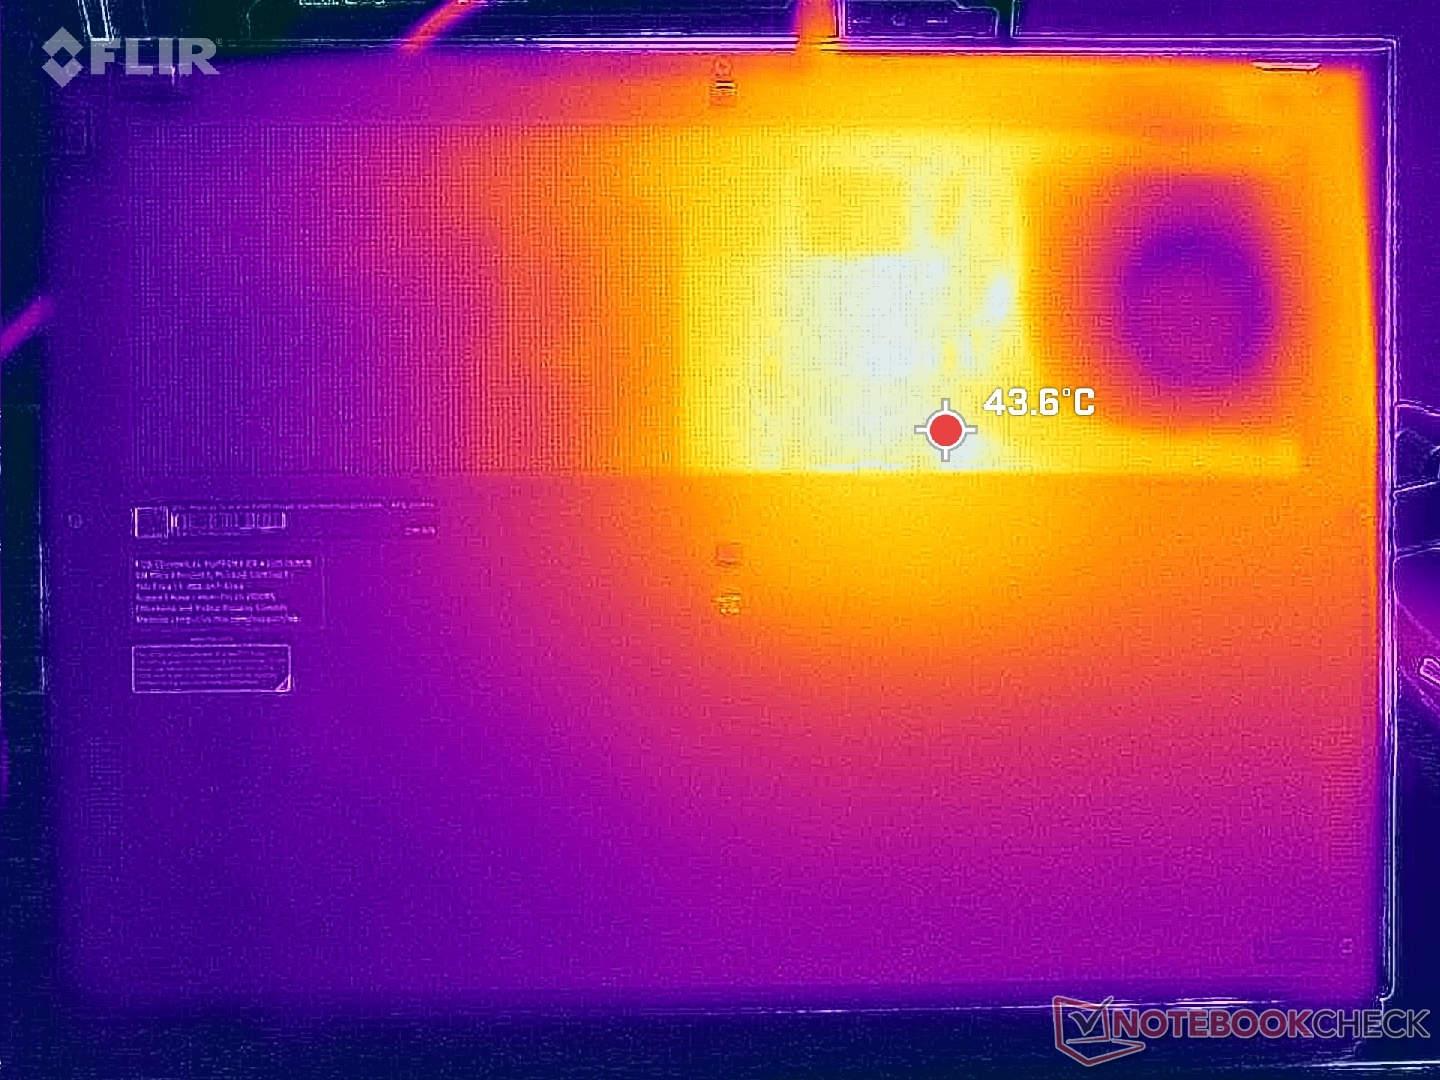
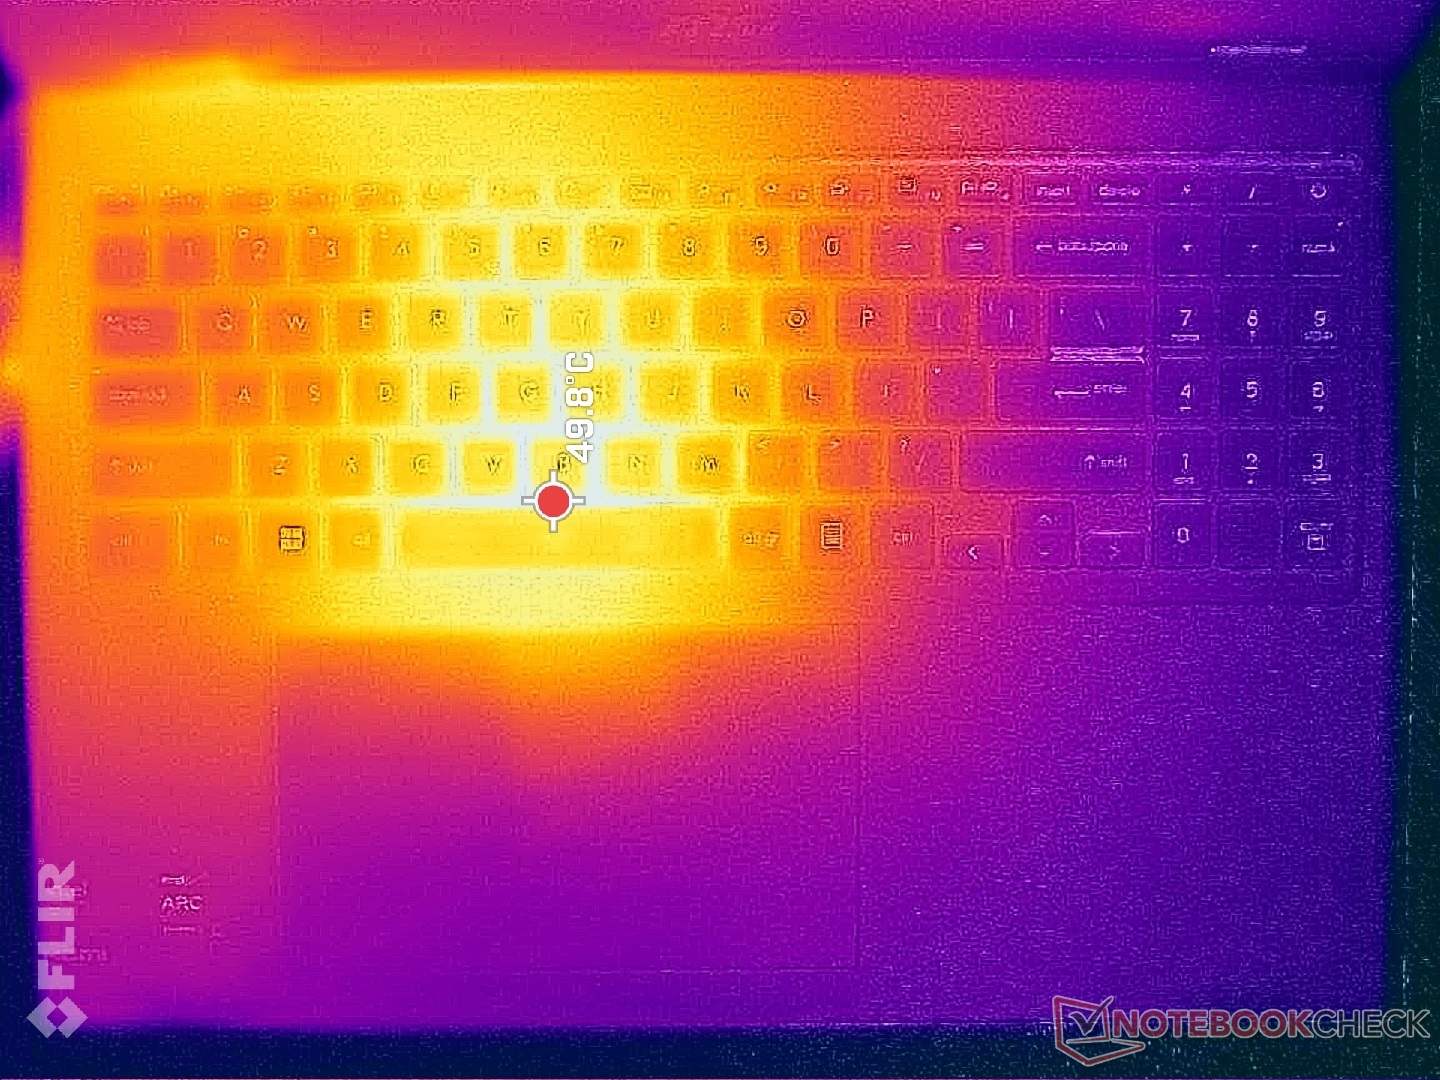
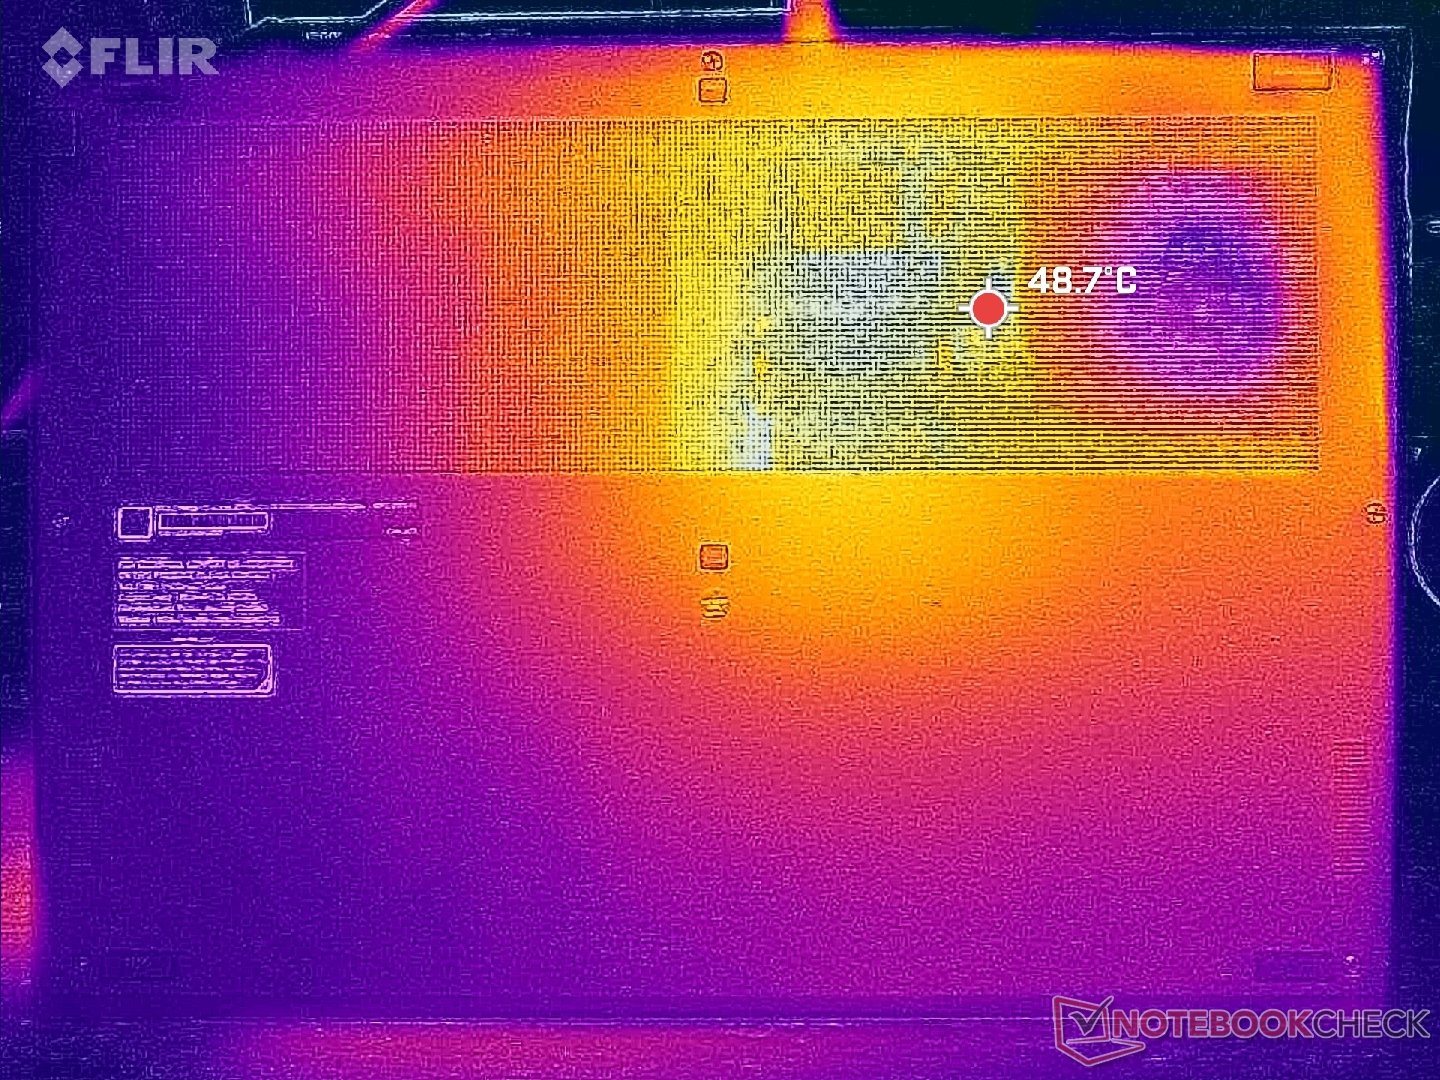
Temperatura
Las temperaturas superficiales son más cálidas en la mitad izquierda del portátil que en la derecha debido a la colocación de la CPU y la solución de refrigeración en su interior. El punto caliente cerca de la tecla Espacio puede alcanzar hasta 50 C cuando se ejecutan cargas exigentes, lo que es similar al punto caliente del Prestige 15 del año pasado con la GPU dedicada GeForce RTX. Como resultado, las teclas WASD pueden sentirse algo calientes al jugar, pero los reposamanos y las teclas de flecha permanecerían mucho más frías. Los portátiles Prestige suelen ser más cálidos que el Ultrabook medio bajo carga debido a sus diseños compactos y el Prestige 16 no es una excepción.
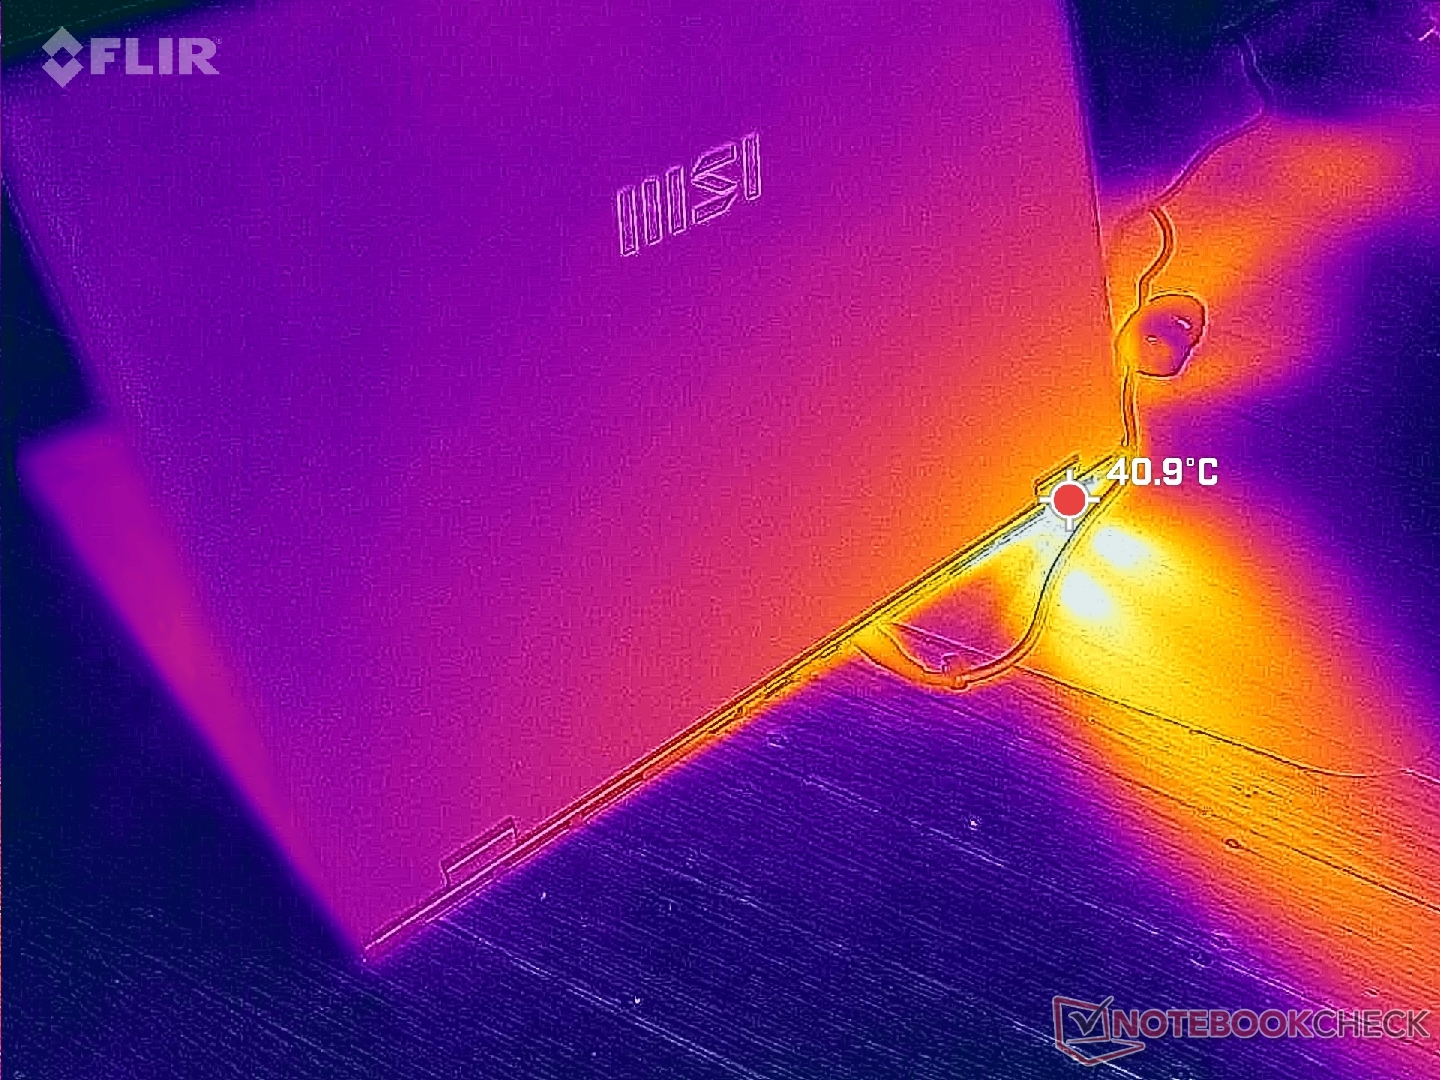
(-) La temperatura máxima en la parte superior es de 48.8 °C / 120 F, frente a la media de 36.8 °C / 98 F, que oscila entre 21 y 71 °C para la clase Multimedia.
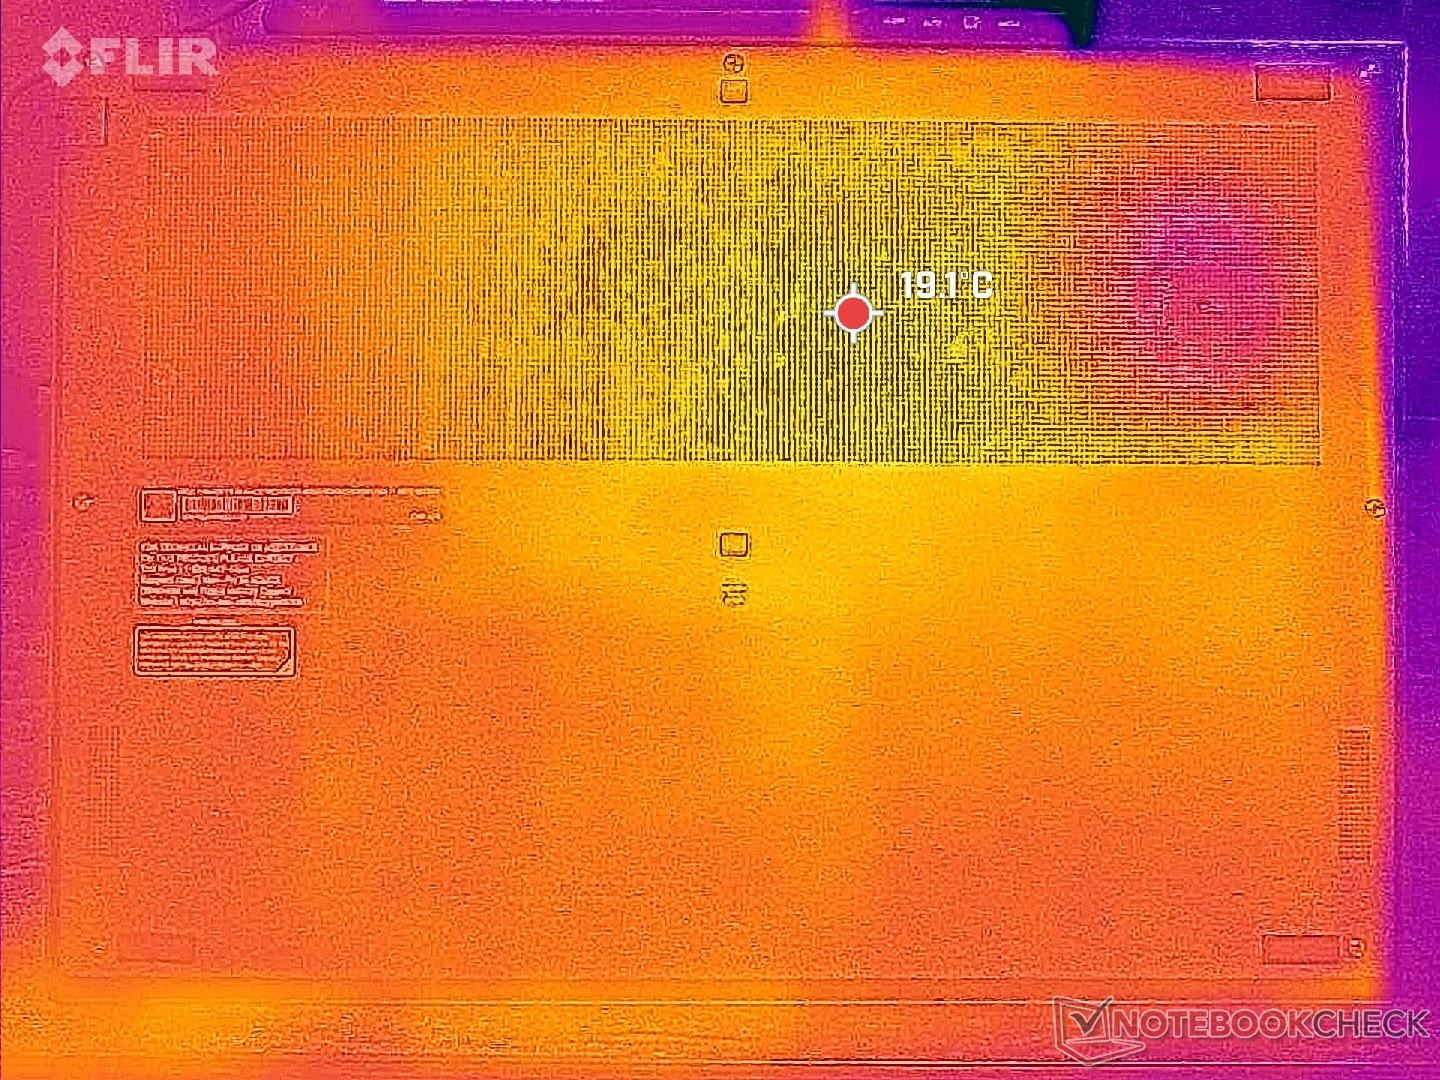
(-) El fondo se calienta hasta un máximo de 47.6 °C / 118 F, frente a la media de 39.1 °C / 102 F
(+) En reposo, la temperatura media de la parte superior es de 23 °C / 73# F, frente a la media del dispositivo de 31.3 °C / 88 F.
(±) Jugando a The Witcher 3, la temperatura media de la parte superior es de 33.3 °C / 92 F, frente a la media del dispositivo de 31.3 °C / 88 F.
(+) El reposamanos y el panel táctil están a una temperatura inferior a la de la piel, con un máximo de 30 °C / 86 F y, por tanto, son fríos al tacto.
(±) La temperatura media de la zona del reposamanos de dispositivos similares fue de 28.7 °C / 83.7 F (-1.3 °C / -2.3 F).
| MSI Prestige 16 B1MG-001US Intel Core Ultra 7 155H, Intel Arc 8-Core iGPU | MSI Prestige 15 A12UD-093 Intel Core i7-1280P, NVIDIA GeForce RTX 3050 Ti Laptop GPU | LG Gram 2in1 16 16T90R - G.AA78G Intel Core i7-1360P, Intel Iris Xe Graphics G7 96EUs | Lenovo ThinkBook 16 G6 ABP AMD Ryzen 5 7530U, AMD Radeon RX Vega 7 | Asus VivoBook Pro 16 K6602VU Intel Core i9-13900H, NVIDIA GeForce RTX 4050 Laptop GPU | Dell Inspiron 16 Plus 7630 Intel Core i7-13700H, NVIDIA GeForce RTX 4060 Laptop GPU | |
|---|---|---|---|---|---|---|
| Heat | -16% | -25% | -15% | -30% | -20% | |
| Maximum Upper Side * (°C) | 48.8 | 49 -0% | 55 -13% | 40.8 16% | 42.6 13% | 47.8 2% |
| Maximum Bottom * (°C) | 47.6 | 52.6 -11% | 55.4 -16% | 50.5 -6% | 48.4 -2% | 42.2 11% |
| Idle Upper Side * (°C) | 24.2 | 29.7 -23% | 34.9 -44% | 29.3 -21% | 39.4 -63% | 35.2 -45% |
| Idle Bottom * (°C) | 23.6 | 30.7 -30% | 30 -27% | 35.2 -49% | 39.8 -69% | 35 -48% |
* ... más pequeño es mejor
Prueba de estrés
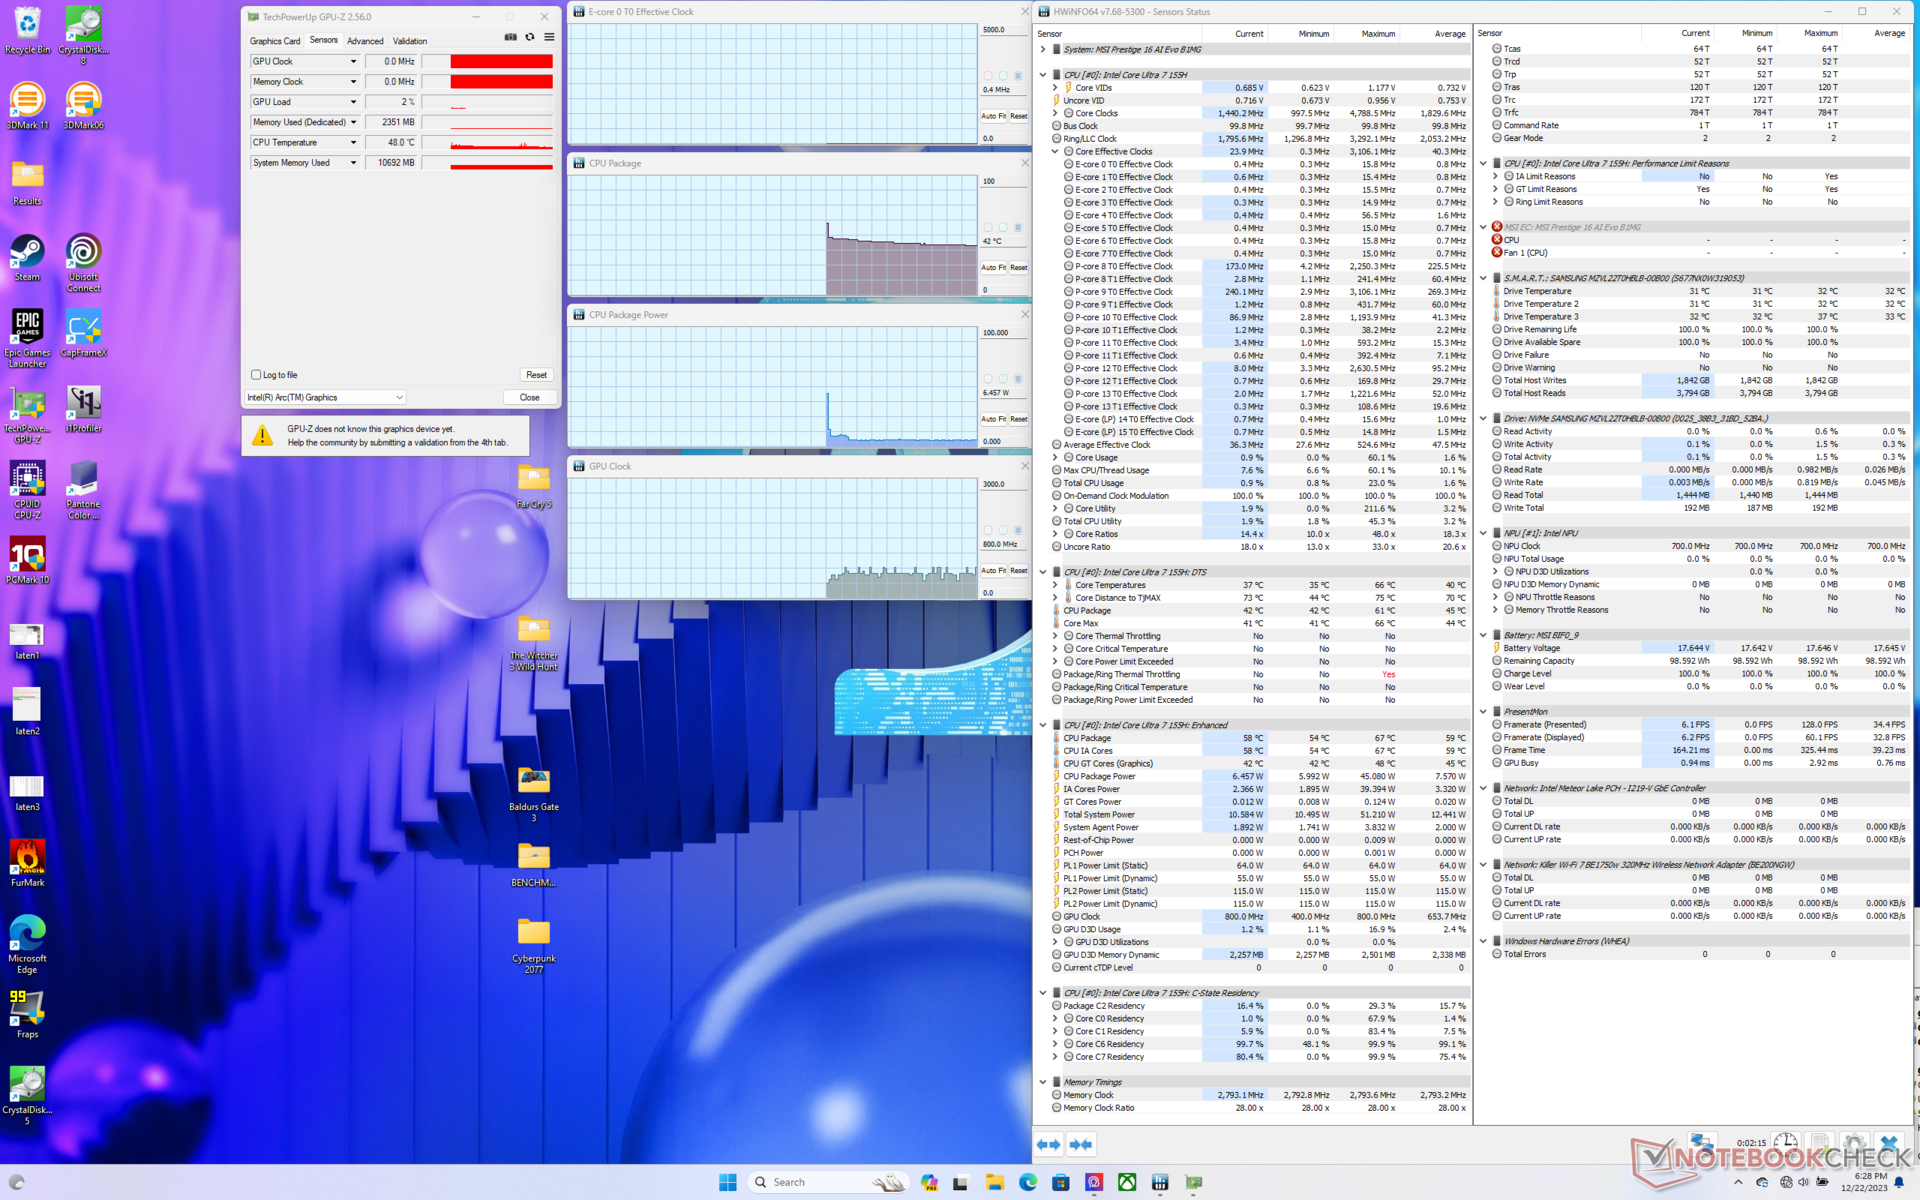
La potencia del paquete CPU se disparaba hasta 110 W, 2,8 GHz y 96 C durante sólo un par de segundos al iniciar el estrés Prime95 antes de caer rápidamente y estabilizarse en 2,2 GHz, 44 W y 83 C. Este rango es más cálido que la media para un Ultrabook, pero por lo demás es típico de un modelo Prestige. El Acer Swift Edge SFE16 con el Ryzen 7 7840U, por ejemplo, se estabilizaría en unos más frescos 64 C mientras que el Core H-powered Lenovo Slim Pro 9i 16IRP8 se estabilizarían a 77 C en condiciones similares.
Funcionar con Cooler Boost activo no parece afectar al rendimiento. Por ejemplo, la CPU se estabilizaría a 85 C cuando se ejecuta Witcher 3 con Cooler Boost desactivado frente a 77 C con Cooler Boost activado, mientras que las velocidades de reloj de la GPU permanecerían invariables. A menos que las temperaturas del núcleo sean una preocupación, el modo Cooler Boost no suele ser necesario para obtener el máximo rendimiento. Esta observación coincide con nuestras experiencias en muchos otros portátiles MSI que incorporan Cooler Boost.
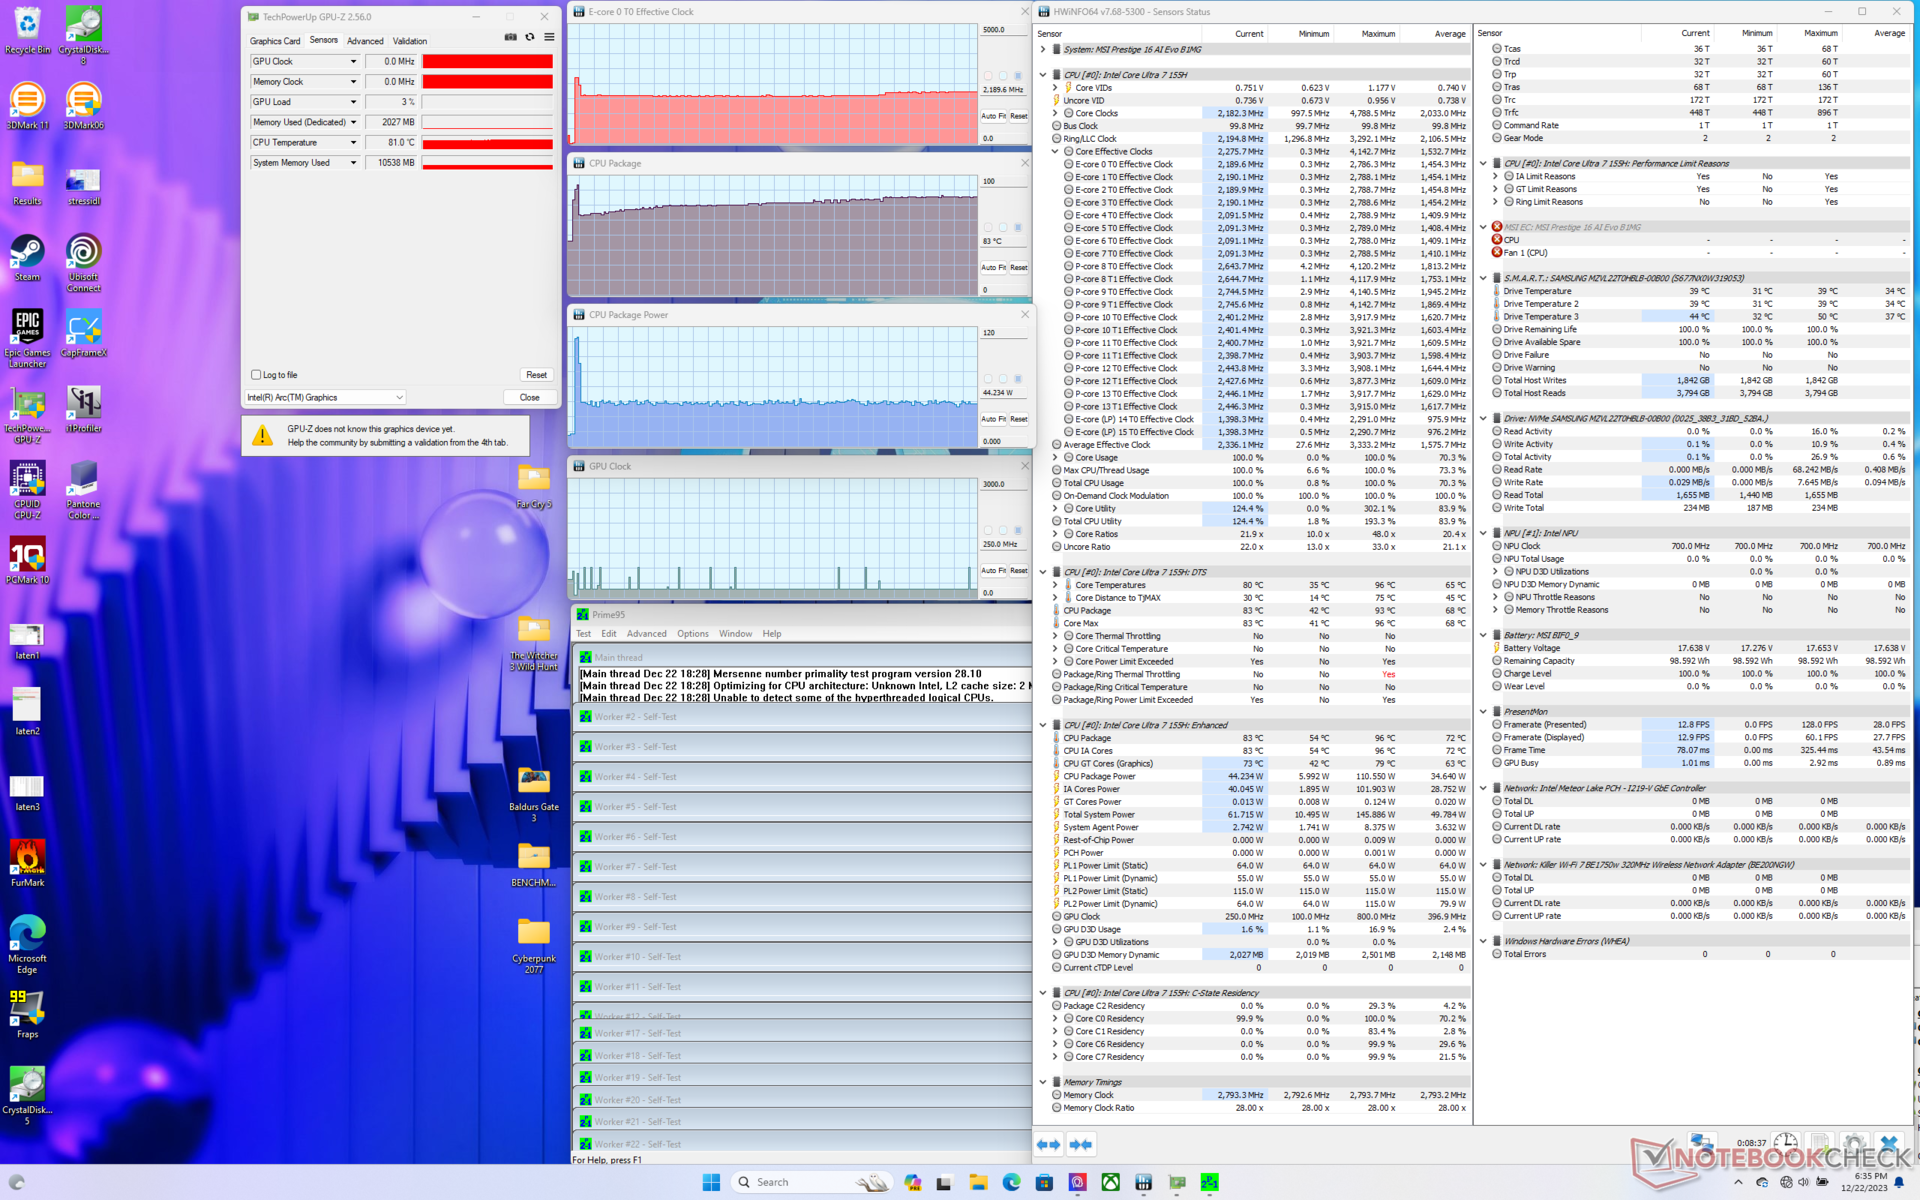
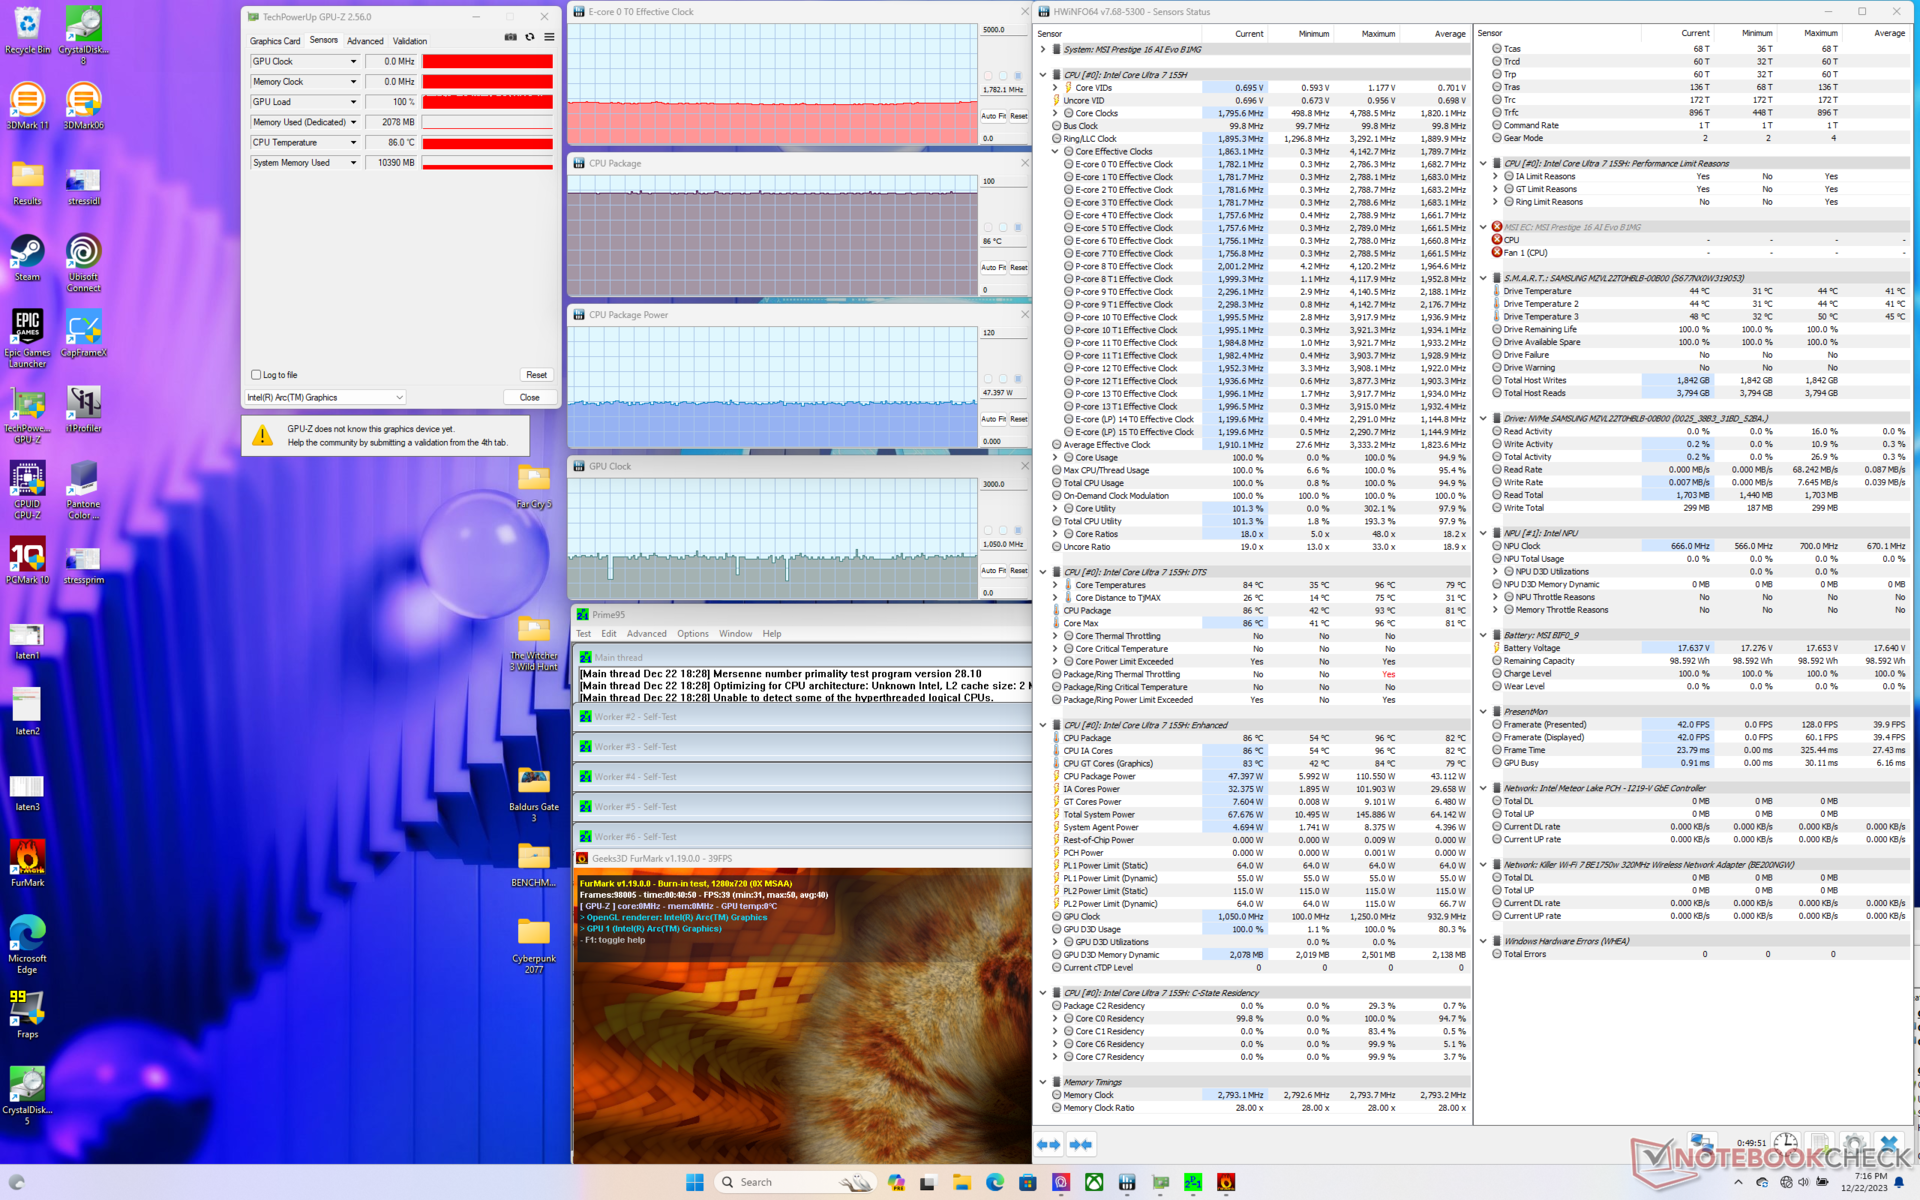
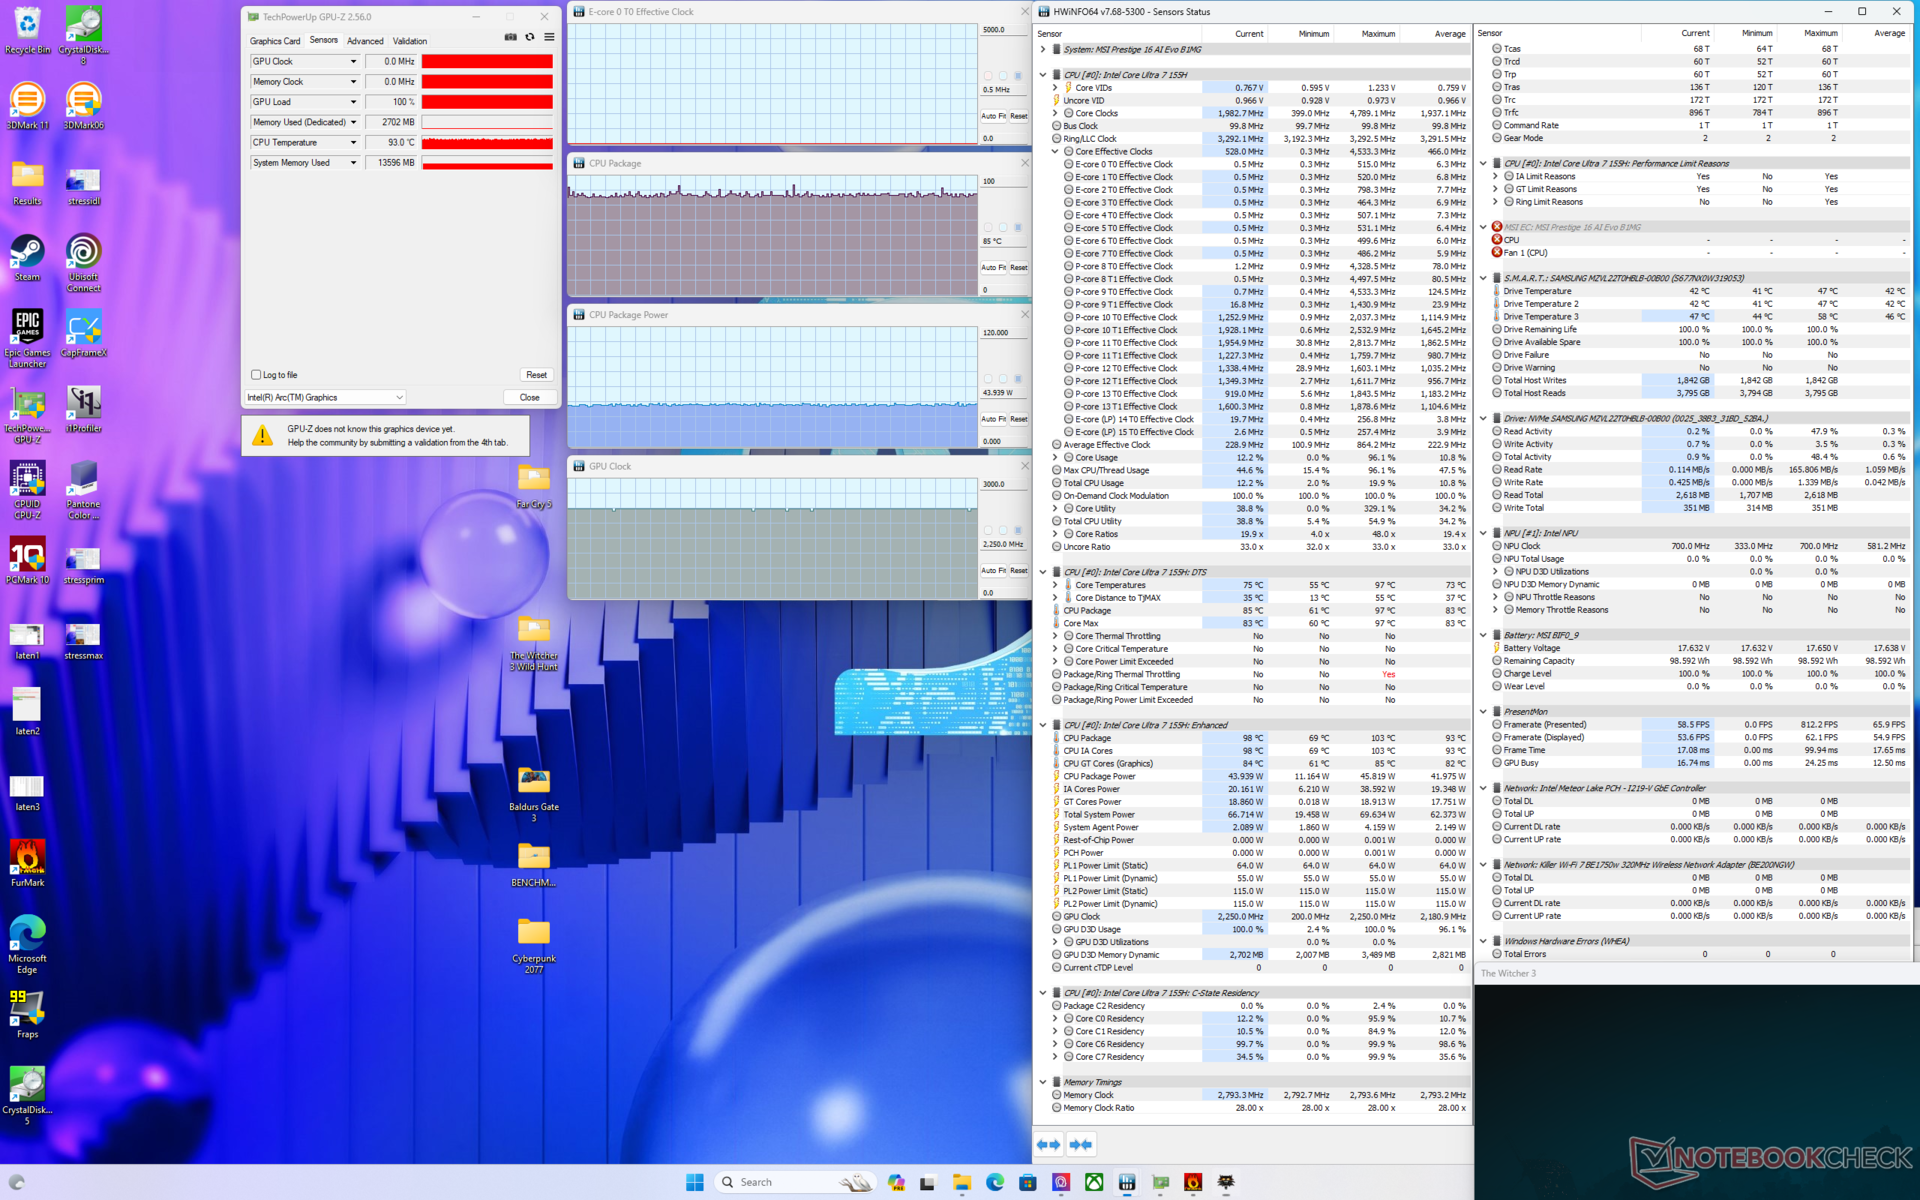

| Reloj dela CPU (GHz) | Reloj de la GPU (MHz) | Temperatura media de la CPU (°C) | |
| Sistema en reposo | -- | -- | 42 |
| Prime95 Stress | 2.2 | -- | 83 |
| Estrés Prime95+ FurMark | 1.8 | 1050 | 86 |
| Witcher 3 Estrés (Rendimiento extremo conCooler Boost desactivado) | 0,5 | 2250 | 85 |
| Witcher 3 Estrés (Rendimiento extremo conCooler Boost activado) | 0,5 | 2250 | 77 |
Altavoces
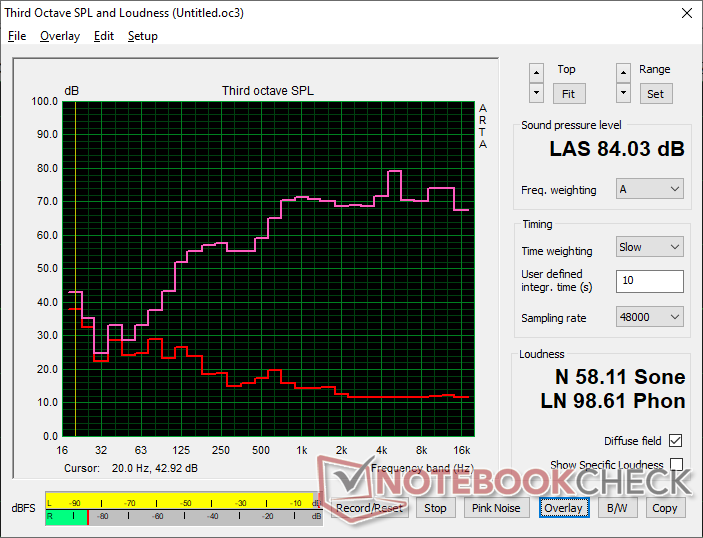
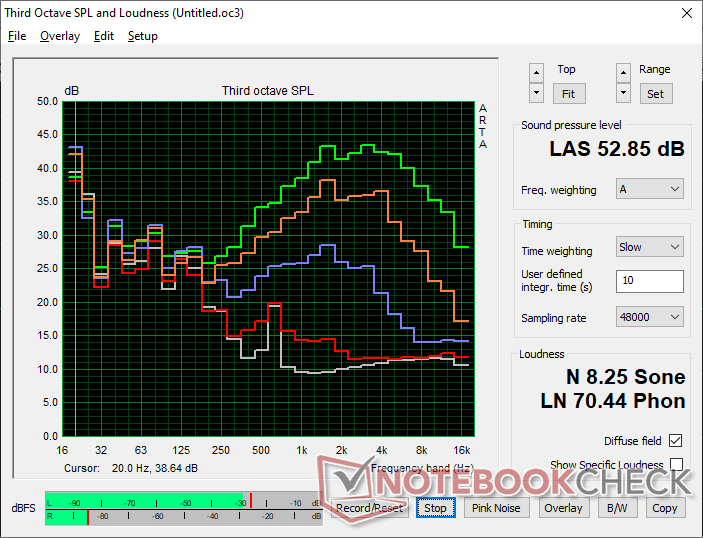
MSI Prestige 16 B1MG-001US análisis de audio
(+) | los altavoces pueden reproducir a un volumen relativamente alto (#84 dB)
Graves 100 - 315 Hz
(-) | casi sin bajos - de media 15.3% inferior a la mediana
(±) | la linealidad de los graves es media (7% delta a frecuencia anterior)
Medios 400 - 2000 Hz
(+) | medios equilibrados - a sólo 4.3% de la mediana
(+) | los medios son lineales (4.3% delta a la frecuencia anterior)
Altos 2 - 16 kHz
(+) | máximos equilibrados - a sólo 3.2% de la mediana
(+) | los máximos son lineales (6.5% delta a la frecuencia anterior)
Total 100 - 16.000 Hz
(+) | el sonido global es lineal (13.3% de diferencia con la mediana)
En comparación con la misma clase
» 28% de todos los dispositivos probados de esta clase eran mejores, 4% similares, 68% peores
» El mejor tuvo un delta de 5%, la media fue 17%, el peor fue ###max##%
En comparación con todos los dispositivos probados
» 14% de todos los dispositivos probados eran mejores, 3% similares, 83% peores
» El mejor tuvo un delta de 4%, la media fue 23%, el peor fue ###max##%
Apple MacBook Pro 16 2021 M1 Pro análisis de audio
(+) | los altavoces pueden reproducir a un volumen relativamente alto (#84.7 dB)
Graves 100 - 315 Hz
(+) | buen bajo - sólo 3.8% lejos de la mediana
(+) | el bajo es lineal (5.2% delta a la frecuencia anterior)
Medios 400 - 2000 Hz
(+) | medios equilibrados - a sólo 1.3% de la mediana
(+) | los medios son lineales (2.1% delta a la frecuencia anterior)
Altos 2 - 16 kHz
(+) | máximos equilibrados - a sólo 1.9% de la mediana
(+) | los máximos son lineales (2.7% delta a la frecuencia anterior)
Total 100 - 16.000 Hz
(+) | el sonido global es lineal (4.6% de diferencia con la mediana)
En comparación con la misma clase
» 0% de todos los dispositivos probados de esta clase eran mejores, 0% similares, 100% peores
» El mejor tuvo un delta de 5%, la media fue 17%, el peor fue ###max##%
En comparación con todos los dispositivos probados
» 0% de todos los dispositivos probados eran mejores, 0% similares, 100% peores
» El mejor tuvo un delta de 4%, la media fue 23%, el peor fue ###max##%
Gestión de la energía - Mínimos más bajos con máximos más altos
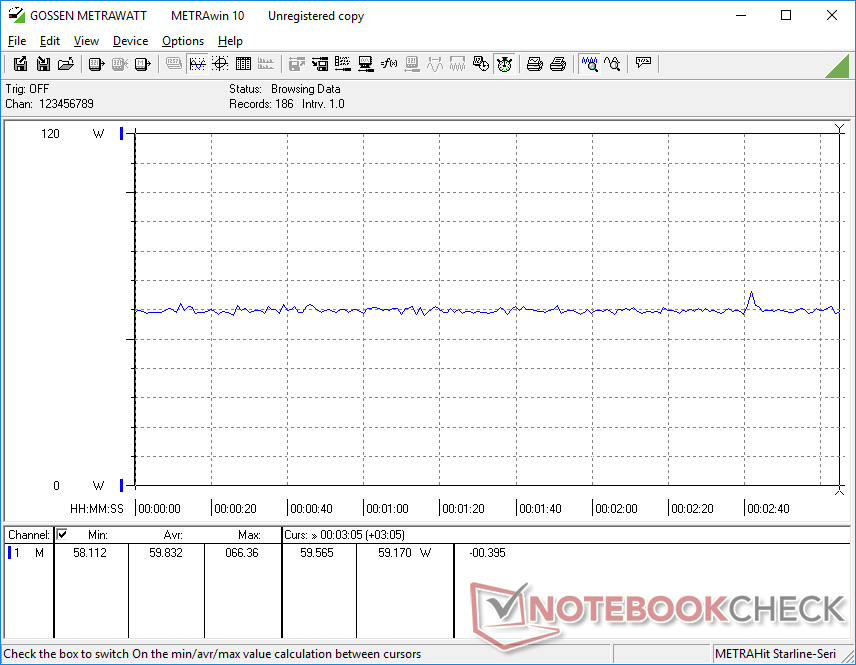
Consumo de energía
El consumo de energía puede ser tan bajo como 3 W en reposo, que es uno de los más bajos de cualquier portátil Intel de 16 pulgadas que hayamos probado. El bajísimo suelo es probablemente responsable de la duración extra-larga de la batería en la siguiente sección a continuación.
En el lado opuesto de las cosas, el consumo parece ser mayor que la mayoría de los otros portátiles de la serie U cuando se ejecutan cargas más exigentes. Ejecutar 3DMark 06 o juegos, por ejemplo, consumiría entre 60 W y 70 W en comparación con los 40 W a 55 W del MSI Prestige 15, LG Gram 16 2 en 1, Acer Swift Edge SFE16, o el Core H-powered Schenker Vision 14 en condiciones similares. Esto también es cierto cuando la CPU se estresa al máximo con Prime95. No obstante, el rendimiento por vatio sigue estando a favor de la CPU más reciente de 14ª generación, por lo que el mayor consumo de energía no es necesariamente un inconveniente.
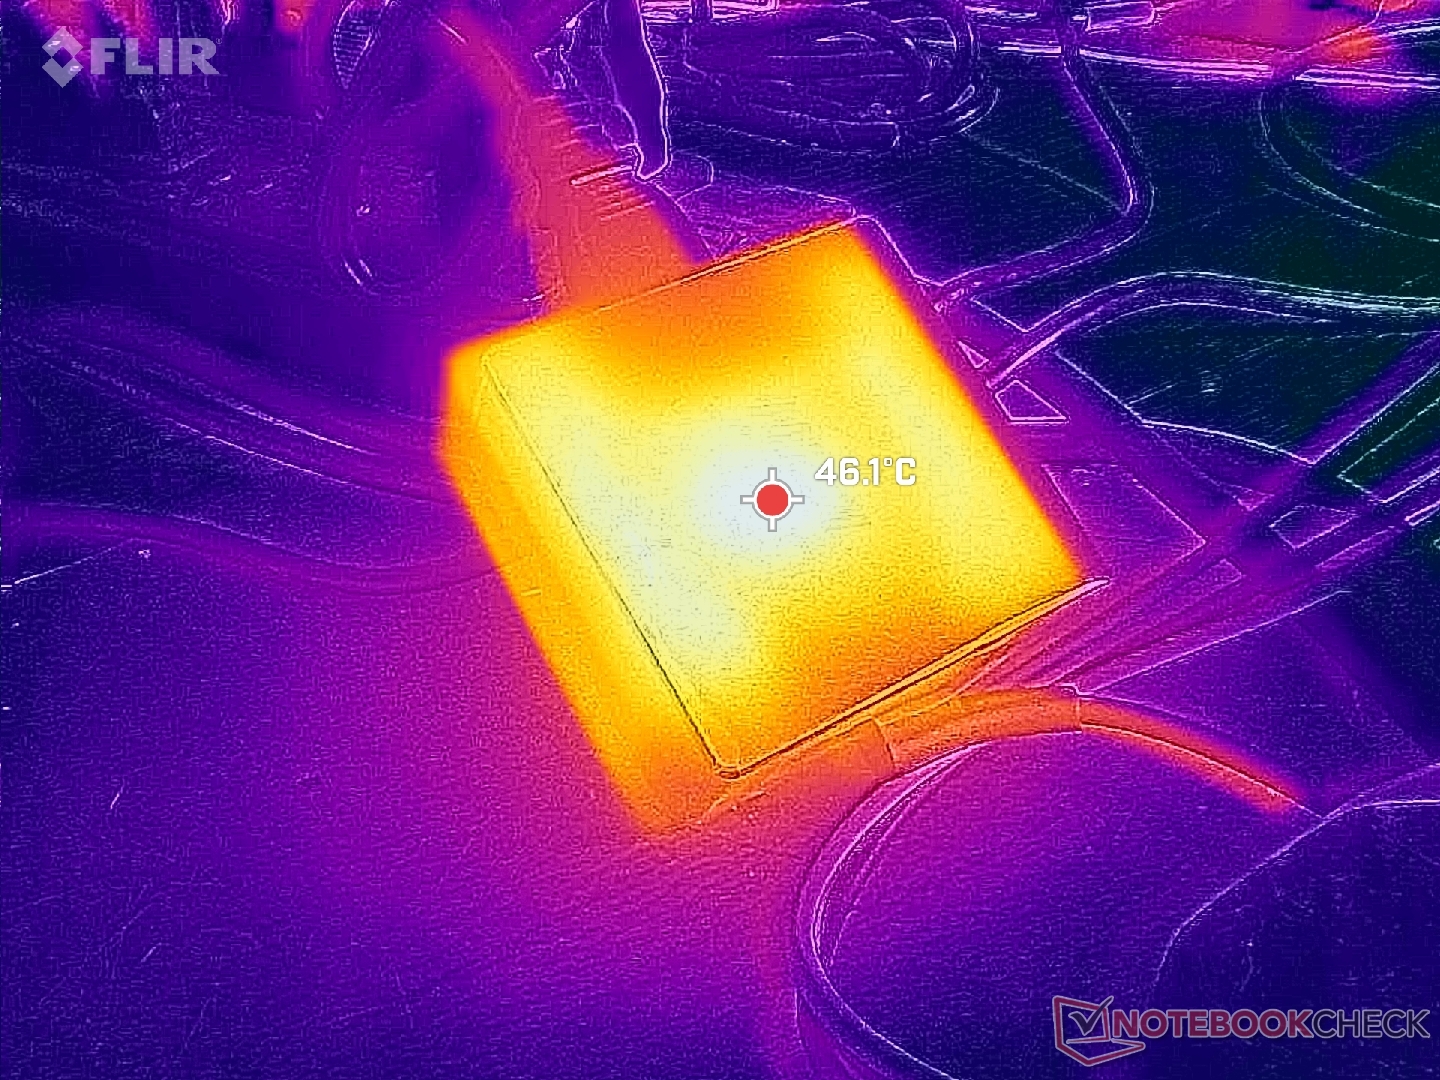
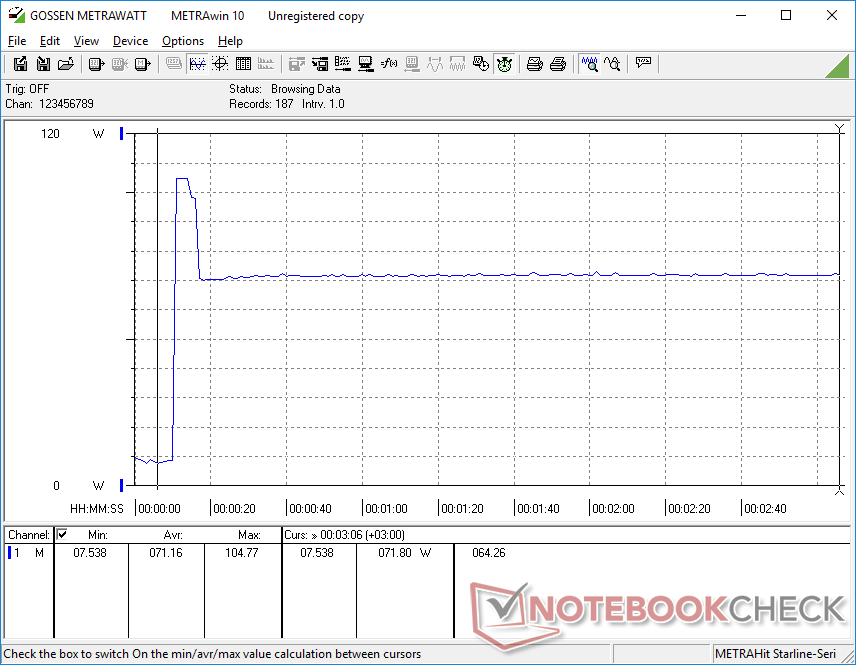
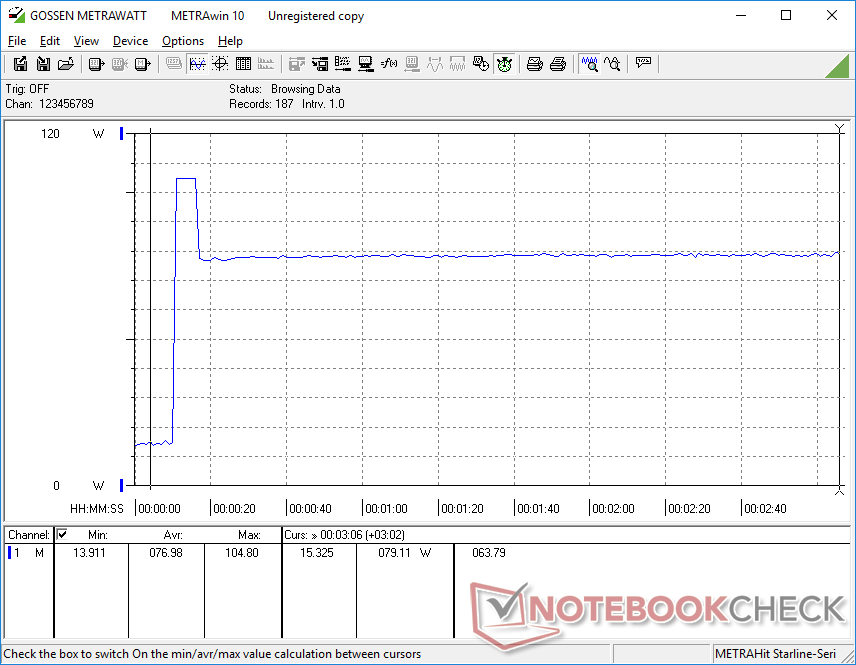
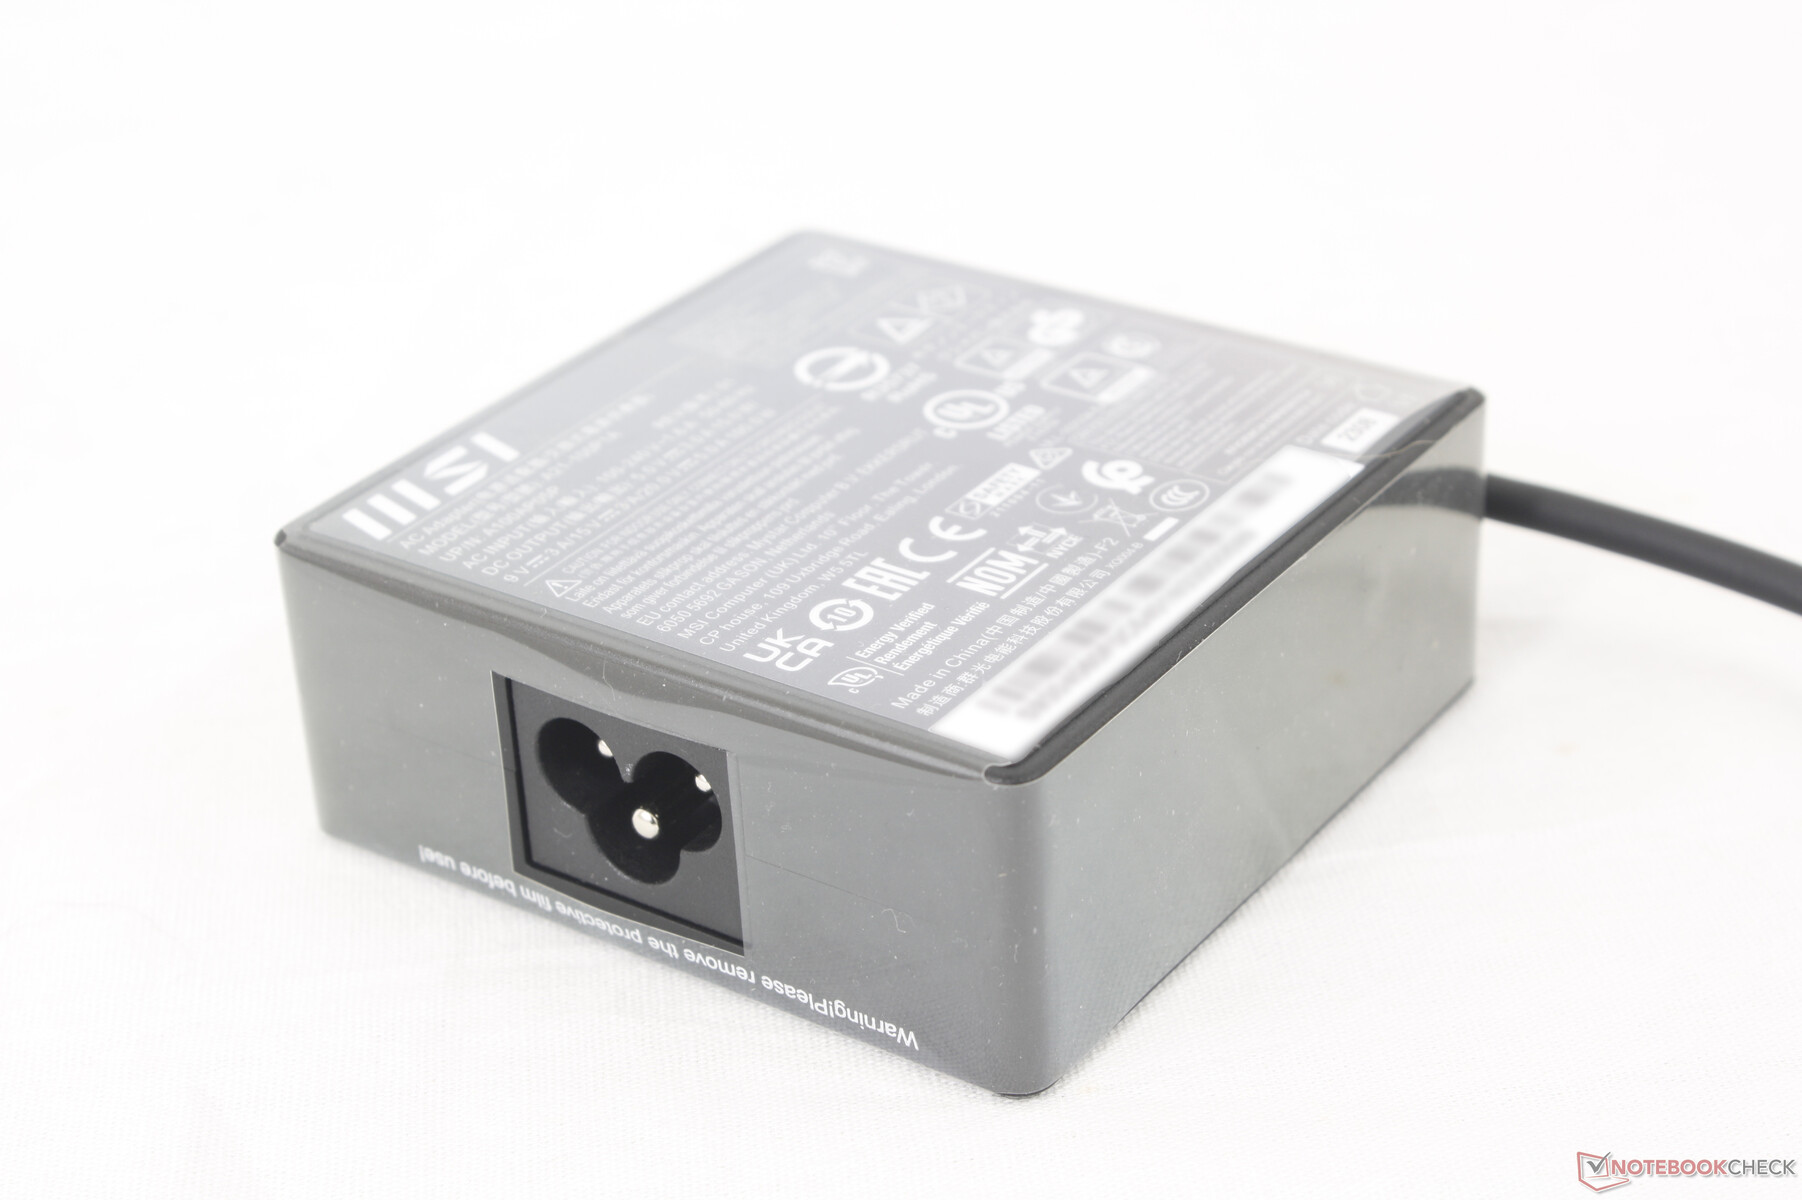
Somos capaces de registrar un consumo máximo de 105 W desde el pequeño (~ 7,5 x 7,5 x 3 cm) adaptador USB-C AC de 100 W cuando la CPU está al 100 por ciento de utilización. Esta tasa es solo temporal debido al limitado potencial de Turbo Boost, por lo que tiende a estabilizarse en torno a los 70 W cuando se ejecutan cargas pesadas. Tenga en cuenta que las SKU con gráficos discretos RTX 4060 o 4070 vienen con un adaptador de CA USB-C de 140 W más grande en su lugar.

| Off / Standby | |
| Ocioso | |
| Carga |
|
Clave:
min: | |
| MSI Prestige 16 B1MG-001US Ultra 7 155H, Arc 8-Core, Samsung PM9A1 MZVL22T0HBLB, IPS, 2560x1600, 16" | MSI Prestige 15 A12UD-093 i7-1280P, GeForce RTX 3050 Ti Laptop GPU, Micron 3400 1TB MTFDKBA1T0TFH, IPS, 3840x2160, 15.6" | LG Gram 2in1 16 16T90R - G.AA78G i7-1360P, Iris Xe G7 96EUs, Samsung PM9A1 MZVL21T0HCLR, IPS, 2560x1600, 16" | Lenovo ThinkBook 16 G6 ABP R5 7530U, Vega 7, SK hynix HFS512GEJ9X125N, IPS, 1920x1200, 16" | Asus VivoBook Pro 16 K6602VU i9-13900H, GeForce RTX 4050 Laptop GPU, Micron 2400 MTFDKBA1T0QFM, OLED, 3200x2000, 16" | Dell Inspiron 16 Plus 7630 i7-13700H, GeForce RTX 4060 Laptop GPU, WD PC SN740 SDDPTQD-1T00, IPS, 2560x1600, 16" | |
|---|---|---|---|---|---|---|
| Power Consumption | -2% | 2% | 24% | -161% | -124% | |
| Idle Minimum * (Watt) | 3 | 5.4 -80% | 5.5 -83% | 3.7 -23% | 21.06 -602% | 15.6 -420% |
| Idle Average * (Watt) | 9.5 | 11.8 -24% | 7.2 24% | 7.1 25% | 24.27 -155% | 17.7 -86% |
| Idle Maximum * (Watt) | 12 | 12.7 -6% | 12.9 -8% | 7.7 36% | 25.12 -109% | 20.6 -72% |
| Load Average * (Watt) | 68.3 | 45.9 33% | 55 19% | 43.9 36% | 52.4 23% | 87.4 -28% |
| Witcher 3 ultra * (Watt) | 59.8 | 45.7 24% | 47 21% | 40.8 32% | 110.2 -84% | 121.7 -104% |
| Load Maximum * (Watt) | 104.8 | 63 40% | 63.6 39% | 66.6 36% | 146 -39% | 138 -32% |
* ... más pequeño es mejor
Power Consumption Witcher 3 / Stresstest
Power Consumption external Monitor
Duración de las pilas
La capacidad de la batería ha aumentado de 80 Wh en la Prestige 15 a 99 Wh en nuestra Prestige 16. Combine esto con la eficiencia de la nueva CPU Intel de 14ª generación y podrá obtener tiempos de funcionamiento extremadamente largos de casi 18,5 horas de navegación WLAN en el mundo real. Este es uno de los portátiles Windows más duraderos que hemos probado con resultados que rivalizan con la serie MacBook.
La carga desde vacío a plena capacidad tarda unos 90 minutos.
| MSI Prestige 16 B1MG-001US Ultra 7 155H, Arc 8-Core, 99.9 Wh | MSI Prestige 15 A12UD-093 i7-1280P, GeForce RTX 3050 Ti Laptop GPU, 80 Wh | LG Gram 2in1 16 16T90R - G.AA78G i7-1360P, Iris Xe G7 96EUs, 80 Wh | Lenovo ThinkBook 16 G6 ABP R5 7530U, Vega 7, 45 Wh | Asus VivoBook Pro 16 K6602VU i9-13900H, GeForce RTX 4050 Laptop GPU, 96 Wh | Dell Inspiron 16 Plus 7630 i7-13700H, GeForce RTX 4060 Laptop GPU, 86 Wh | |
|---|---|---|---|---|---|---|
| Duración de Batería | -51% | -32% | -45% | -45% | -43% | |
| Reader / Idle (h) | 25.1 | 17.6 -30% | ||||
| WiFi v1.3 (h) | 18.3 | 8.9 -51% | 11.9 -35% | 10.1 -45% | 10.1 -45% | 9.4 -49% |
| Load (h) | 2.8 | 1.4 -50% | 2 -29% | 1.4 -50% | ||
| H.264 (h) | 7.1 | 11.6 | 9.8 |
Pro
Contra
Veredicto - La serie Prestige en su mejor momento
la 14ª generación de Intel debería ser una gran ayuda para los Ultrabooks como el MSI Prestige 16. Aunque el rendimiento bruto de la CPU no es mucho mayor que el de la generación anterior, las mejoras en el rendimiento de los gráficos integrados y la duración de la batería son posiblemente igual de importantes para la categoría Ultrabook. El Intel Arc 8 ha superado con éxito a la AMD Radeon 780M por márgenes notables hasta el punto de que la mayoría de los jugadores ocasionales y editores fotográficos deberían estar satisfechos con su rendimiento.
Algunos aspectos del modelo son mejorables. En primer lugar, la falta de opciones de alta frecuencia de actualización o de pantalla táctil significa que alternativas como el HP Spectre o el Asus Vivobook siguen teniendo algunas ventajas. En segundo lugar, el efecto fantasma es muy notable en la configuración IPS hasta el punto de que incluso los jugadores ocasionales podrían sentirse molestos por sus efectos. Por tanto, la SKU OLED puede merecer la pena a pesar del inevitable golpe a la duración de la batería. Y por último, el mayor rendimiento de la iGPU se produce a costa de un mayor consumo de energía y un ruido del ventilador más alto que en la mayoría de los demás Ultrabooks de la serie U cuando se ejecutan tareas que requieren un uso intensivo de la GPU.
A los estudiantes en particular les encantará que la larga duración de la batería, la nítida pantalla DCI-P3 y la amplia gama de opciones gráficas del Prestige 16 sean una alternativa que merezca la pena al MacBook Pro.
El diseño portátil, la colorida pantalla, la larga duración de la batería, los rápidos gráficos integrados y el veloz lector de tarjetas SD son los principales puntos fuertes del Prestige 16. Los usuarios querrán explotar estos puntos fuertes para sacar el máximo partido al modelo de MSI.
Precio y disponibilidad
La MSI Prestige 16 con CPU de 14ª generación ya está disponible en Amazon con OLED por $1650 USD o en Best Buy con gráficos discretos Arc A370M por $1400.
MSI Prestige 16 B1MG-001US
- 12/28/2023 v7 (old)
Allen Ngo
Transparencia
Nuestro equipo editorial se encarga de seleccionar los dispositivos que se someten a revisión. La muestra de prueba fue adquirida libremente por el autor a sus expensas. El prestamista no influyó en esta reseña, ni el fabricante recibió una copia de la misma antes de su publicación. No había ninguna obligación de publicar esta reseña. Como empresa de medios independiente, Notebookcheck no está sujeta a la autoridad de fabricantes, minoristas o editores.
Así es como prueba Notebookcheck
Cada año, Notebookcheck revisa de forma independiente cientos de portátiles y smartphones utilizando procedimientos estandarizados para asegurar que todos los resultados son comparables. Hemos desarrollado continuamente nuestros métodos de prueba durante unos 20 años y hemos establecido los estándares de la industria en el proceso. En nuestros laboratorios de pruebas, técnicos y editores experimentados utilizan equipos de medición de alta calidad. Estas pruebas implican un proceso de validación en varias fases. Nuestro complejo sistema de clasificación se basa en cientos de mediciones y puntos de referencia bien fundamentados, lo que mantiene la objetividad.Price comparison

