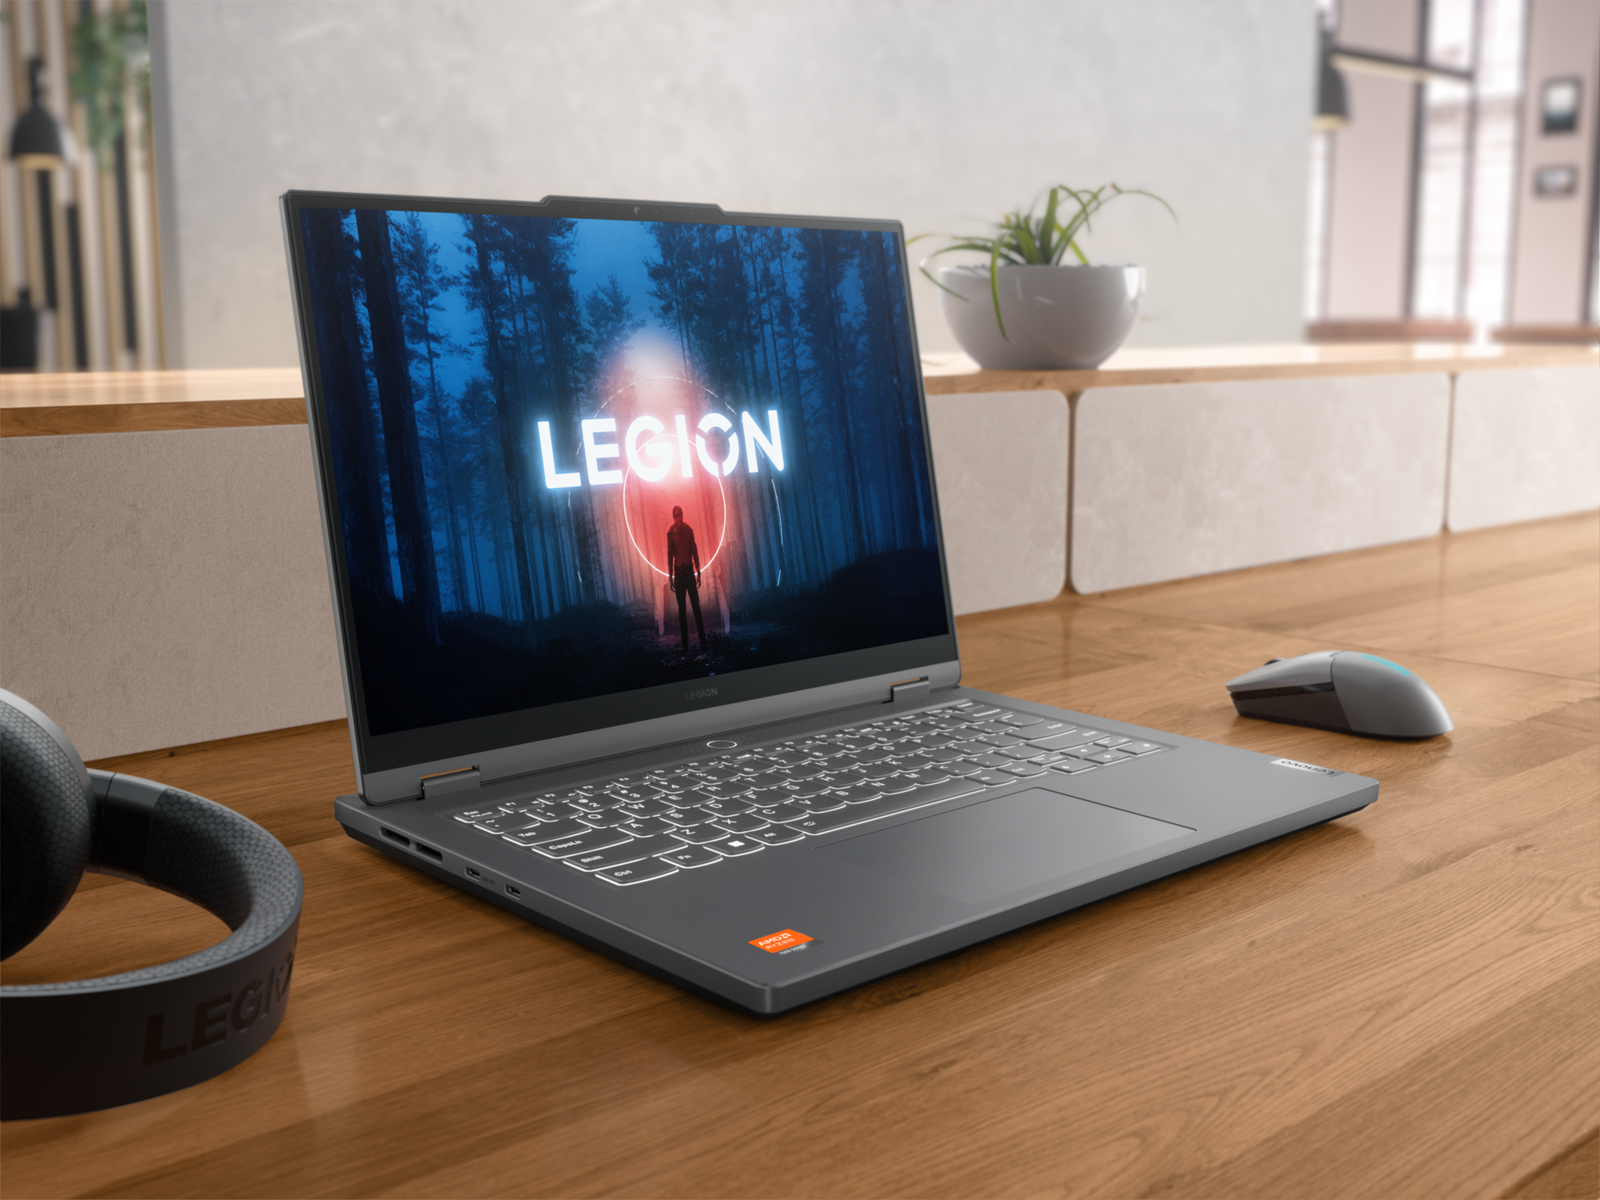
Análisis del portátil Lenovo Legion Slim 5 14APH8: el punto dulce de la OLED 2.8K de 120 Hz

El Legion Slim 5 14 es el primer y más pequeño portátil de 14 pulgadas de la familia Legion. Se distingue de los demás del mercado por su pantalla OLED de 120 Hz y un tamaño de 14,5 pulgadas ligeramente mayor, mientras que las alternativas de Razer, Acer o Asus suelen venir con paneles IPS de 14,0 pulgadas.
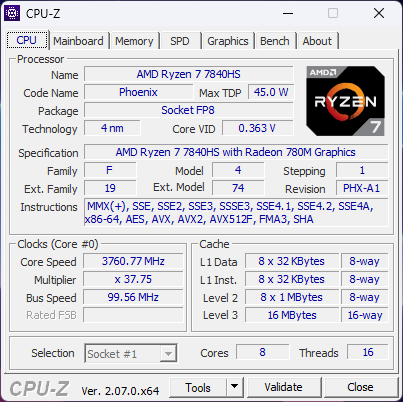
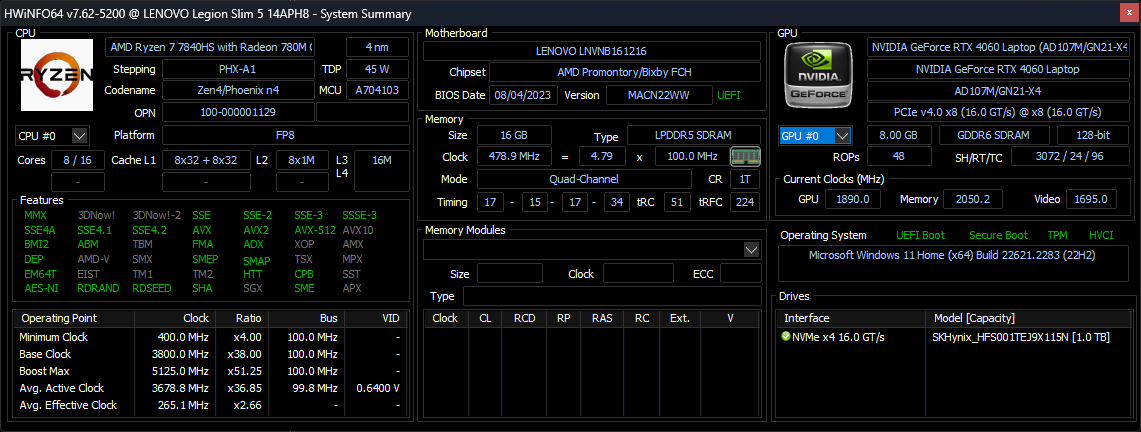
Nuestro análisis configura un modelo de gama media con el Zen 4 Ryzen 7 7840HS Y gráficos GeForce RTX 4060 de 105 W por unos 1500 dólares. Otros modelos incluyen el Ryzen 9 7940HS, más rápido, o el RTX 4050, más lento, pero la pantalla OLED no táctil de 14,5 pulgadas y 2,8K a 120 Hz es fija en todas las opciones. No se han anunciado variantes Intel en el momento de la publicación.
El modelo de Lenovo compite directamente con otros portátiles gaming de 14 pulgadas como elAcer Predator Triton 14, Razer Blade 14,Asus ROG Zephyrus G14o Alienware x14.
Más opiniones sobre Lenovo:
Posibles contendientes en la comparación
Valoración | Fecha | Modelo | Peso | Altura | Tamaño | Resolución | Precio |
|---|---|---|---|---|---|---|---|
| 87.7 % v7 (old) | 09/2023 | Lenovo Legion Slim 5 14APH8 R7 7840HS, GeForce RTX 4060 Laptop GPU | 1.7 kg | 20.79 mm | 14.50" | 2880x1600 | |
| 87.3 % v7 (old) | 07/2023 | Acer Predator Triton 14 PT14-51 i7-13700H, GeForce RTX 4050 Laptop GPU | 1.7 kg | 19.81 mm | 14.00" | 2560x1600 | |
| 88.7 % v7 (old) | 06/2023 | Razer Blade 14 RTX 4070 R9 7940HS, GeForce RTX 4070 Laptop GPU | 1.8 kg | 17.99 mm | 14.00" | 2560x1600 | |
| 90 % v7 (old) | 05/2023 | Asus ROG Zephyrus G14 GA402XY R9 7940HS, GeForce RTX 4090 Laptop GPU | 1.7 kg | 20.5 mm | 14.00" | 2560x1600 | |
| 86.7 % v7 (old) | 03/2022 | Alienware x14 i7 RTX 3060 i7-12700H, GeForce RTX 3060 Laptop GPU | 1.8 kg | 14.5 mm | 14.00" | 1920x1080 | |
| 85.7 % v7 (old) | 07/2023 | Lenovo LOQ 15APH8 R7 7840HS, GeForce RTX 4050 Laptop GPU | 2.5 kg | 25.2 mm | 15.60" | 1920x1080 |
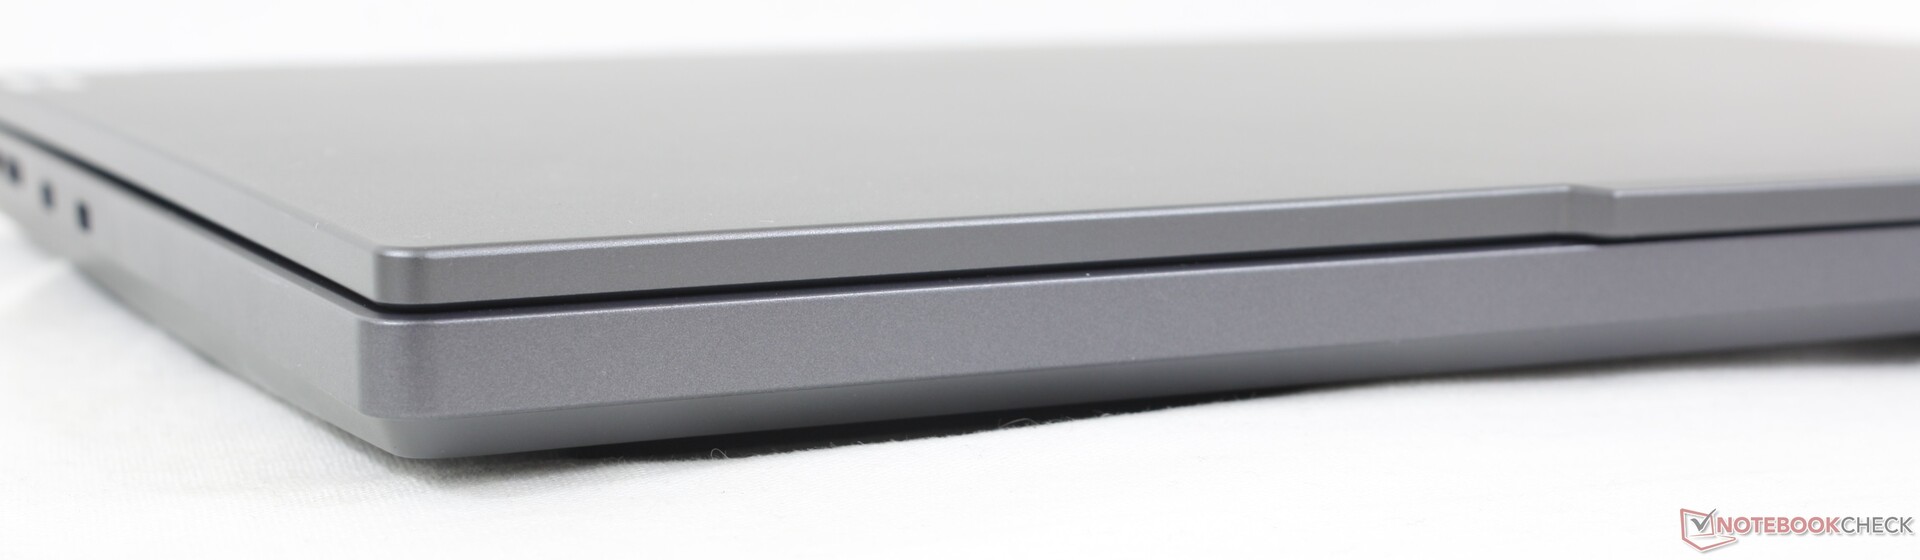
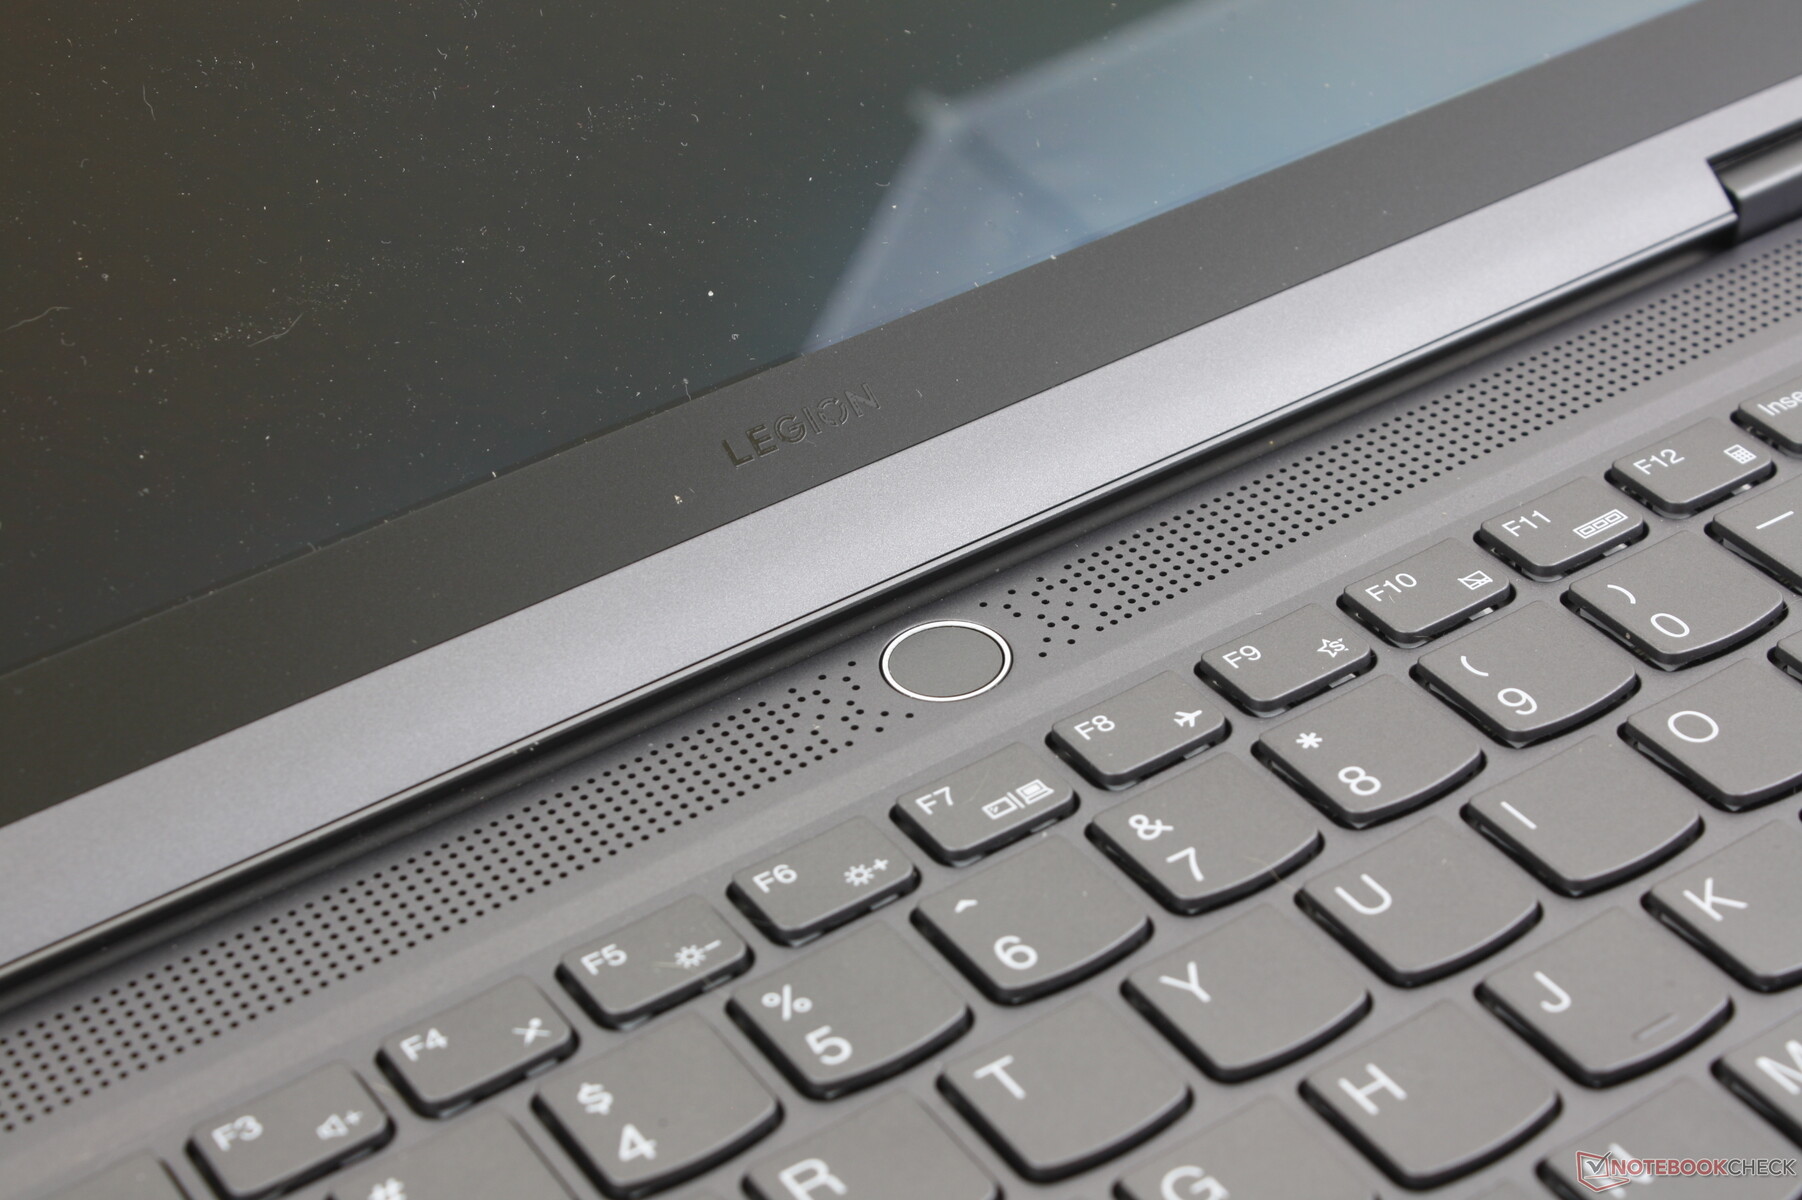
Caso - Parece un ThinkBook, juega como un Legion
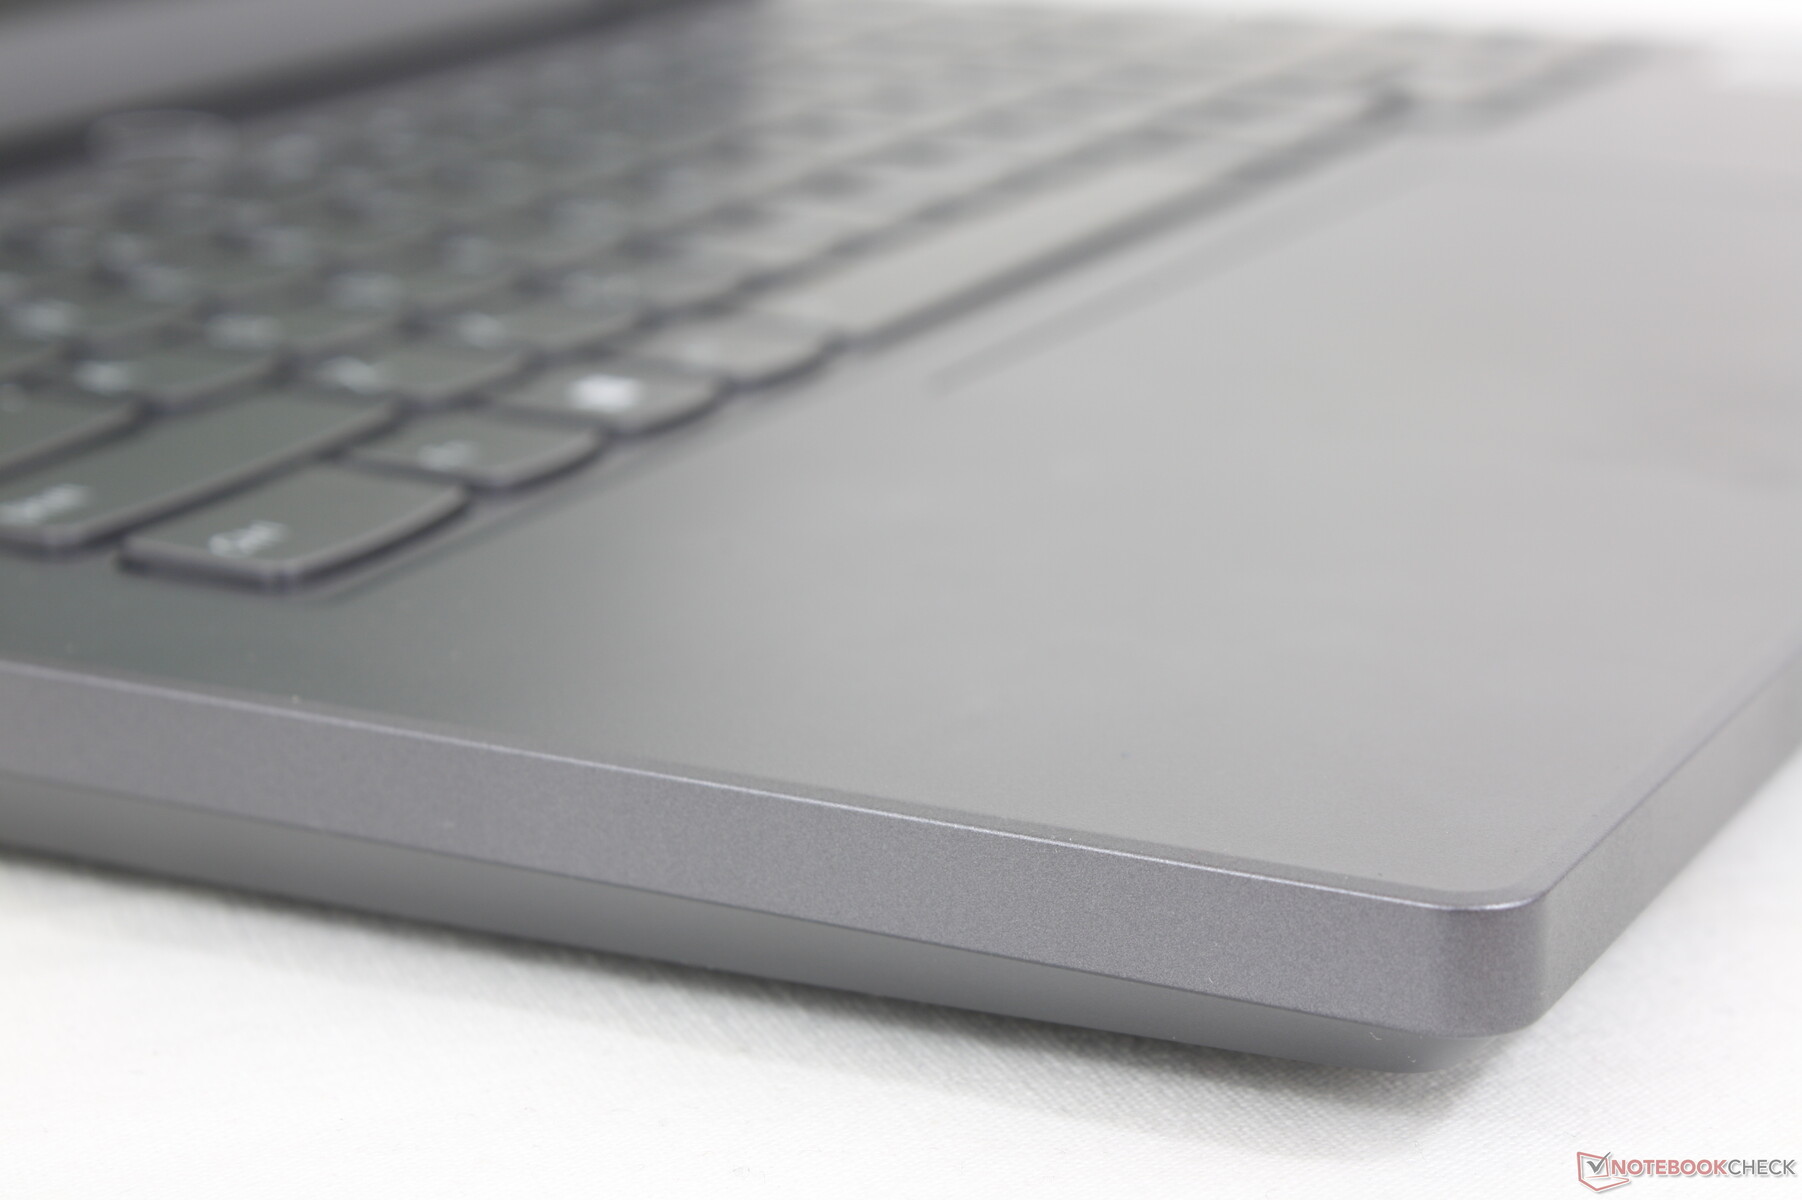
Lenovo emplea materiales metálicos lisos similares en gris monótono en muchos de sus modelos Legion y ThinkBook. Los jugadores que no se sientan atraídos por los excéntricos diseños de los portátiles Alienware o Asus ROG podrían encontrar más atractivo el diseño más plano y sin RGB del Legion Slim 5 14, especialmente para aulas y entornos no lúdicos.
La calidad del chasis es fuerte de arriba a abajo para una primera impresión sólida. Las superficies no son tan rígidas como en el Blade 14 o el Alienware x14 y esto se nota más al aplicar presión en el centro del teclado o los reposamuñecas o al girar la tapa, pero la flexión sigue siendo mínima.
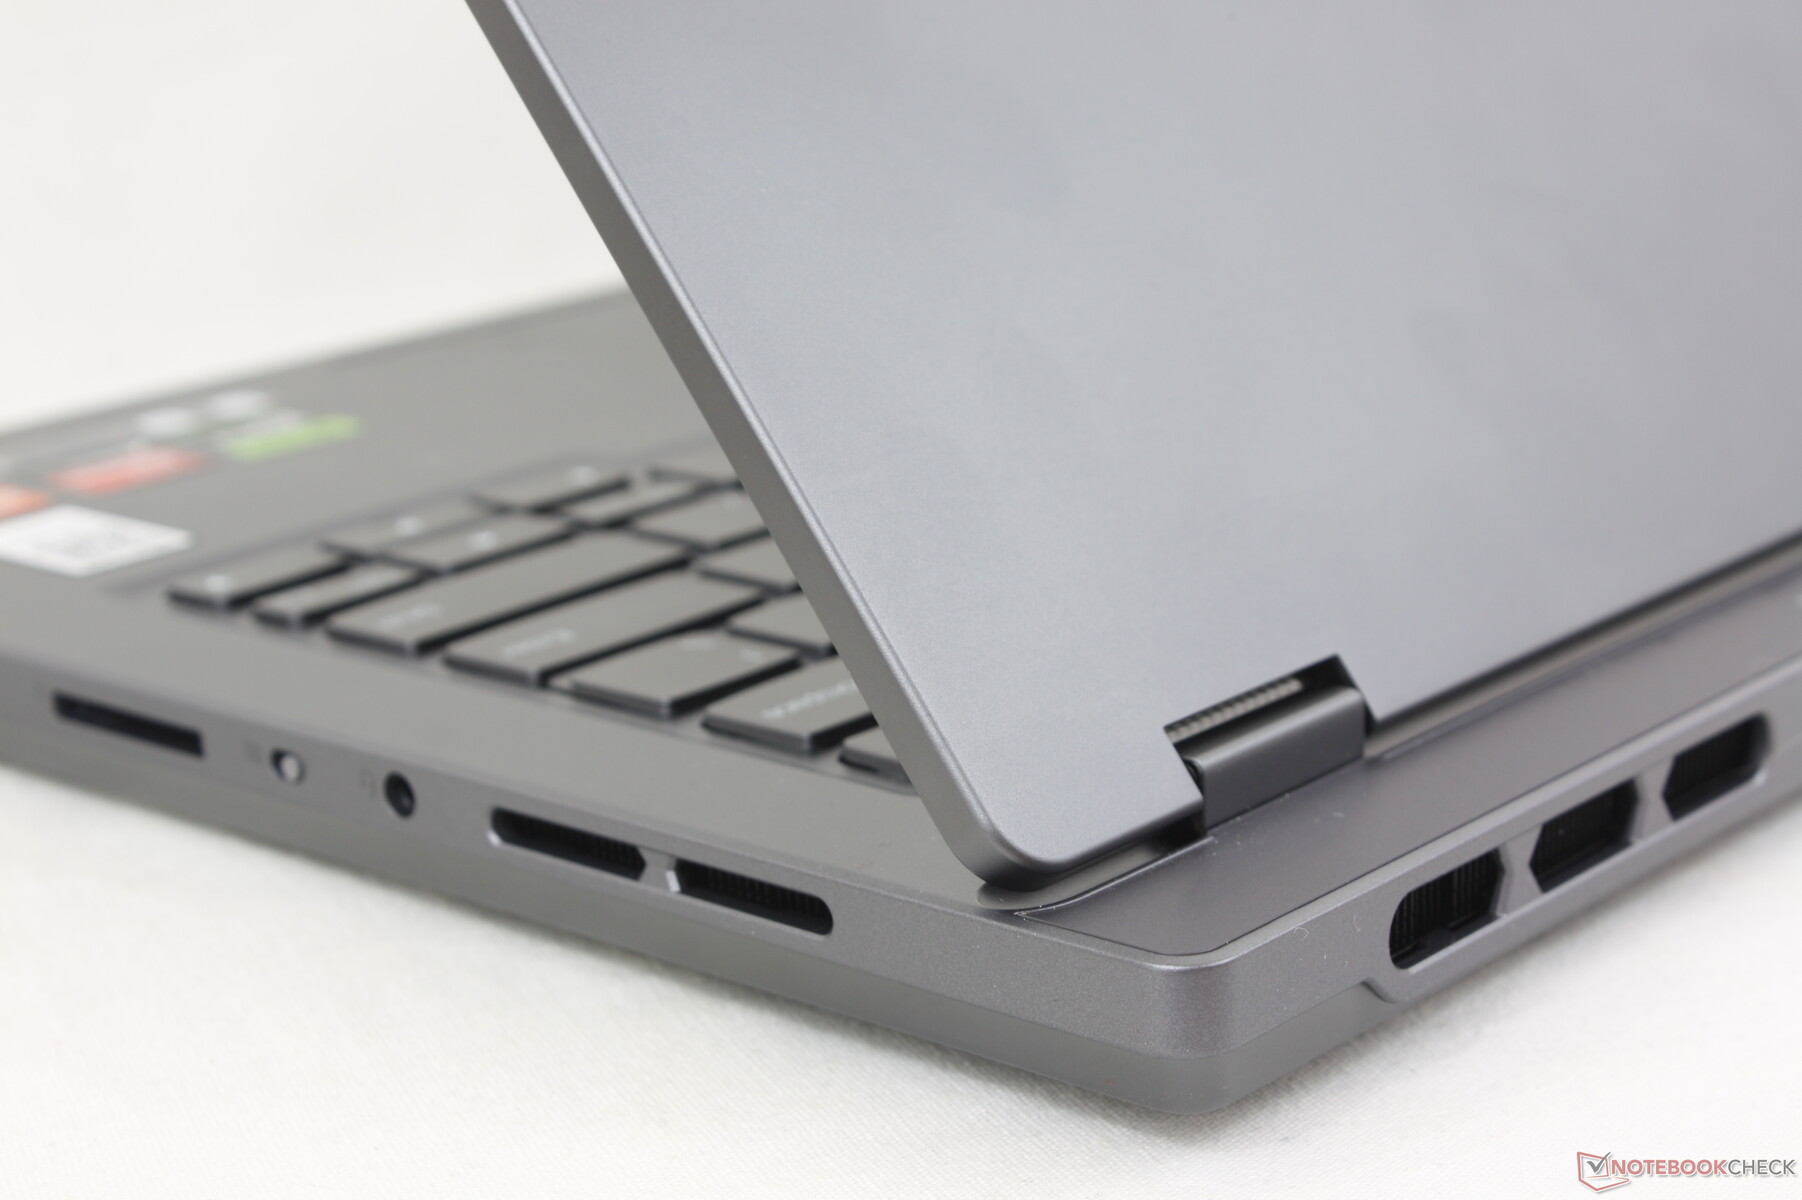
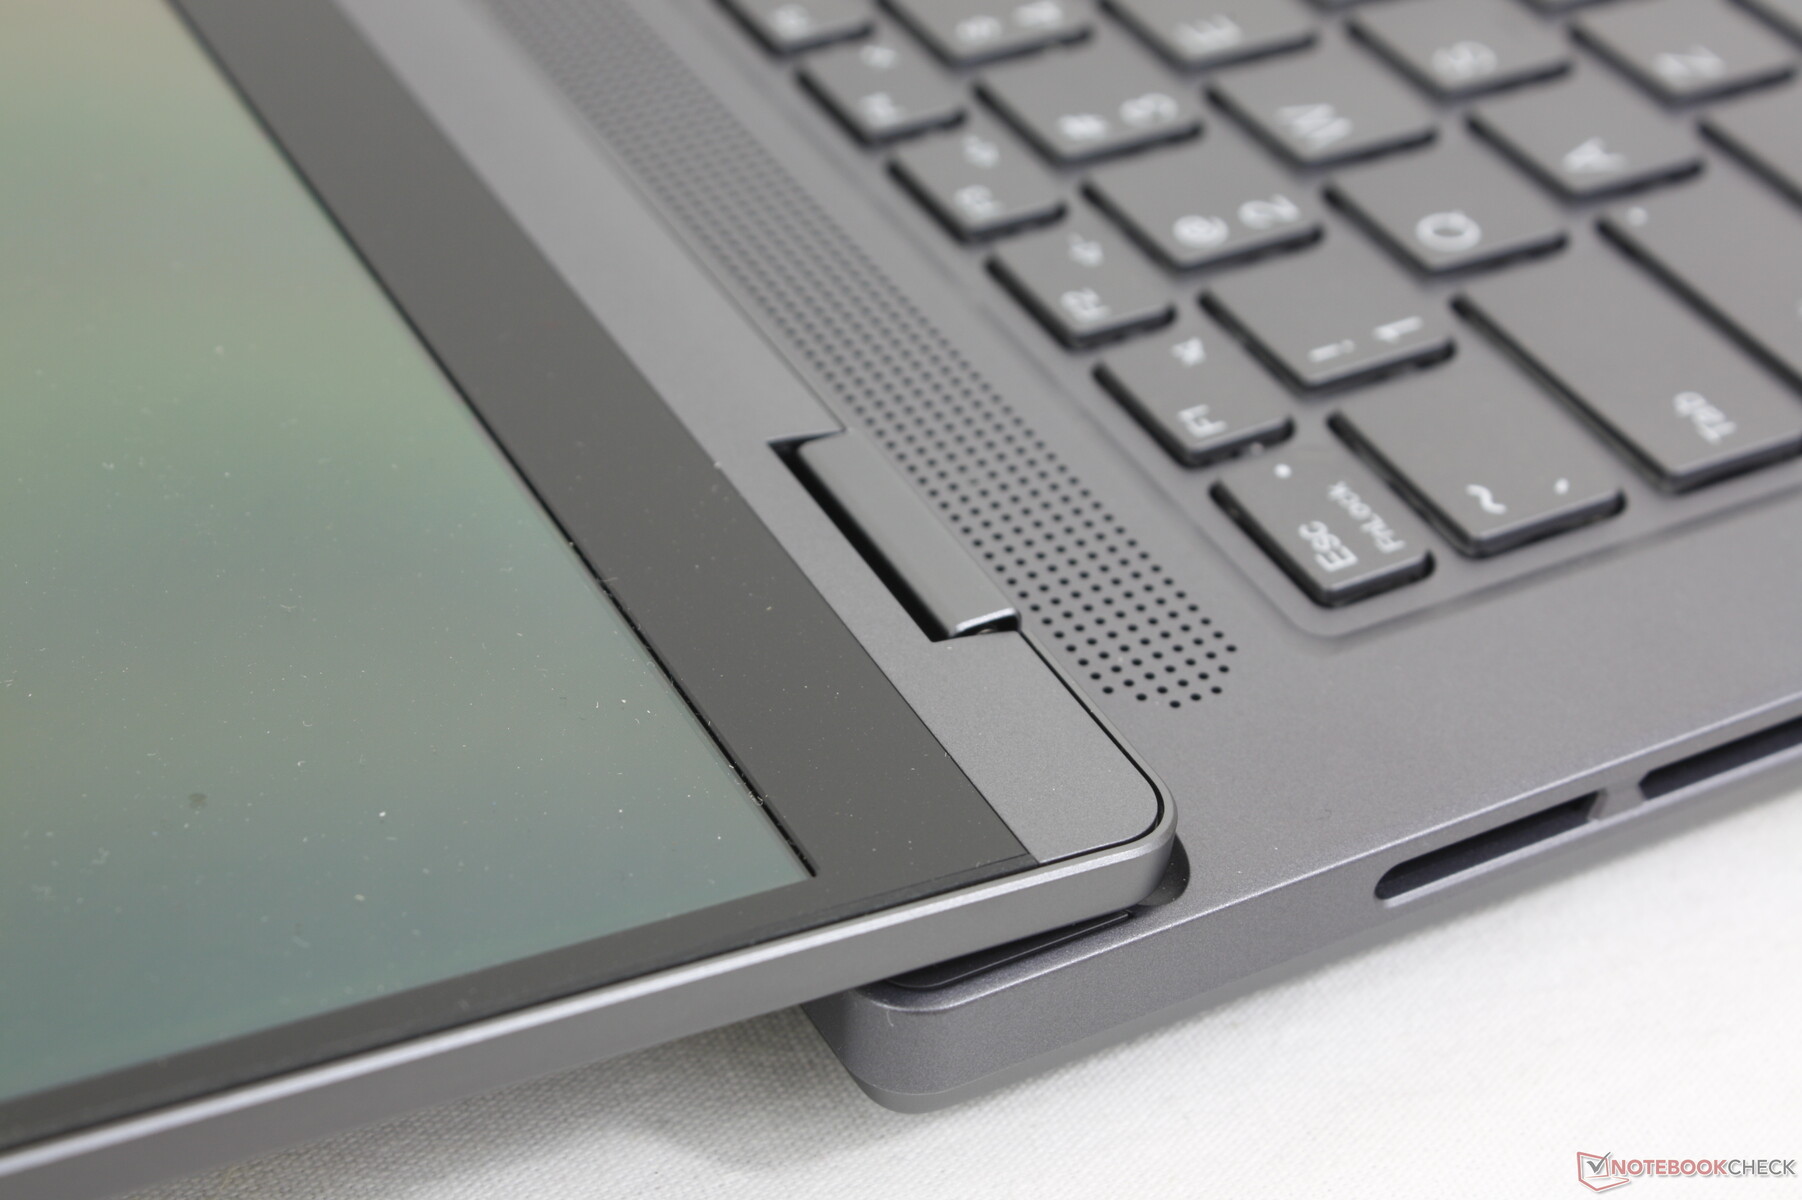
Las bisagras merecen una mención ya que pueden abrirse 180 grados a diferencia de otros portátiles de juego de 14 pulgadas. La rigidez de las bisagras es satisfactoria, pero podría haber sido más rígida en ángulos más amplios para una mejor sensación de longevidad.
El mayor tamaño de la pantalla de 14,5 pulgadas y la parte trasera extendida del diseño de Legion hacen que nuestro Legion Slim 5 14 ocupe más espacio que competidores como el Blade 14, el Zephyrus G14 o el Predator Triton 14. Sin embargo, todos pesan más o menos lo mismo, por lo que el Legion Slim 5 14 simplemente no es tan denso.
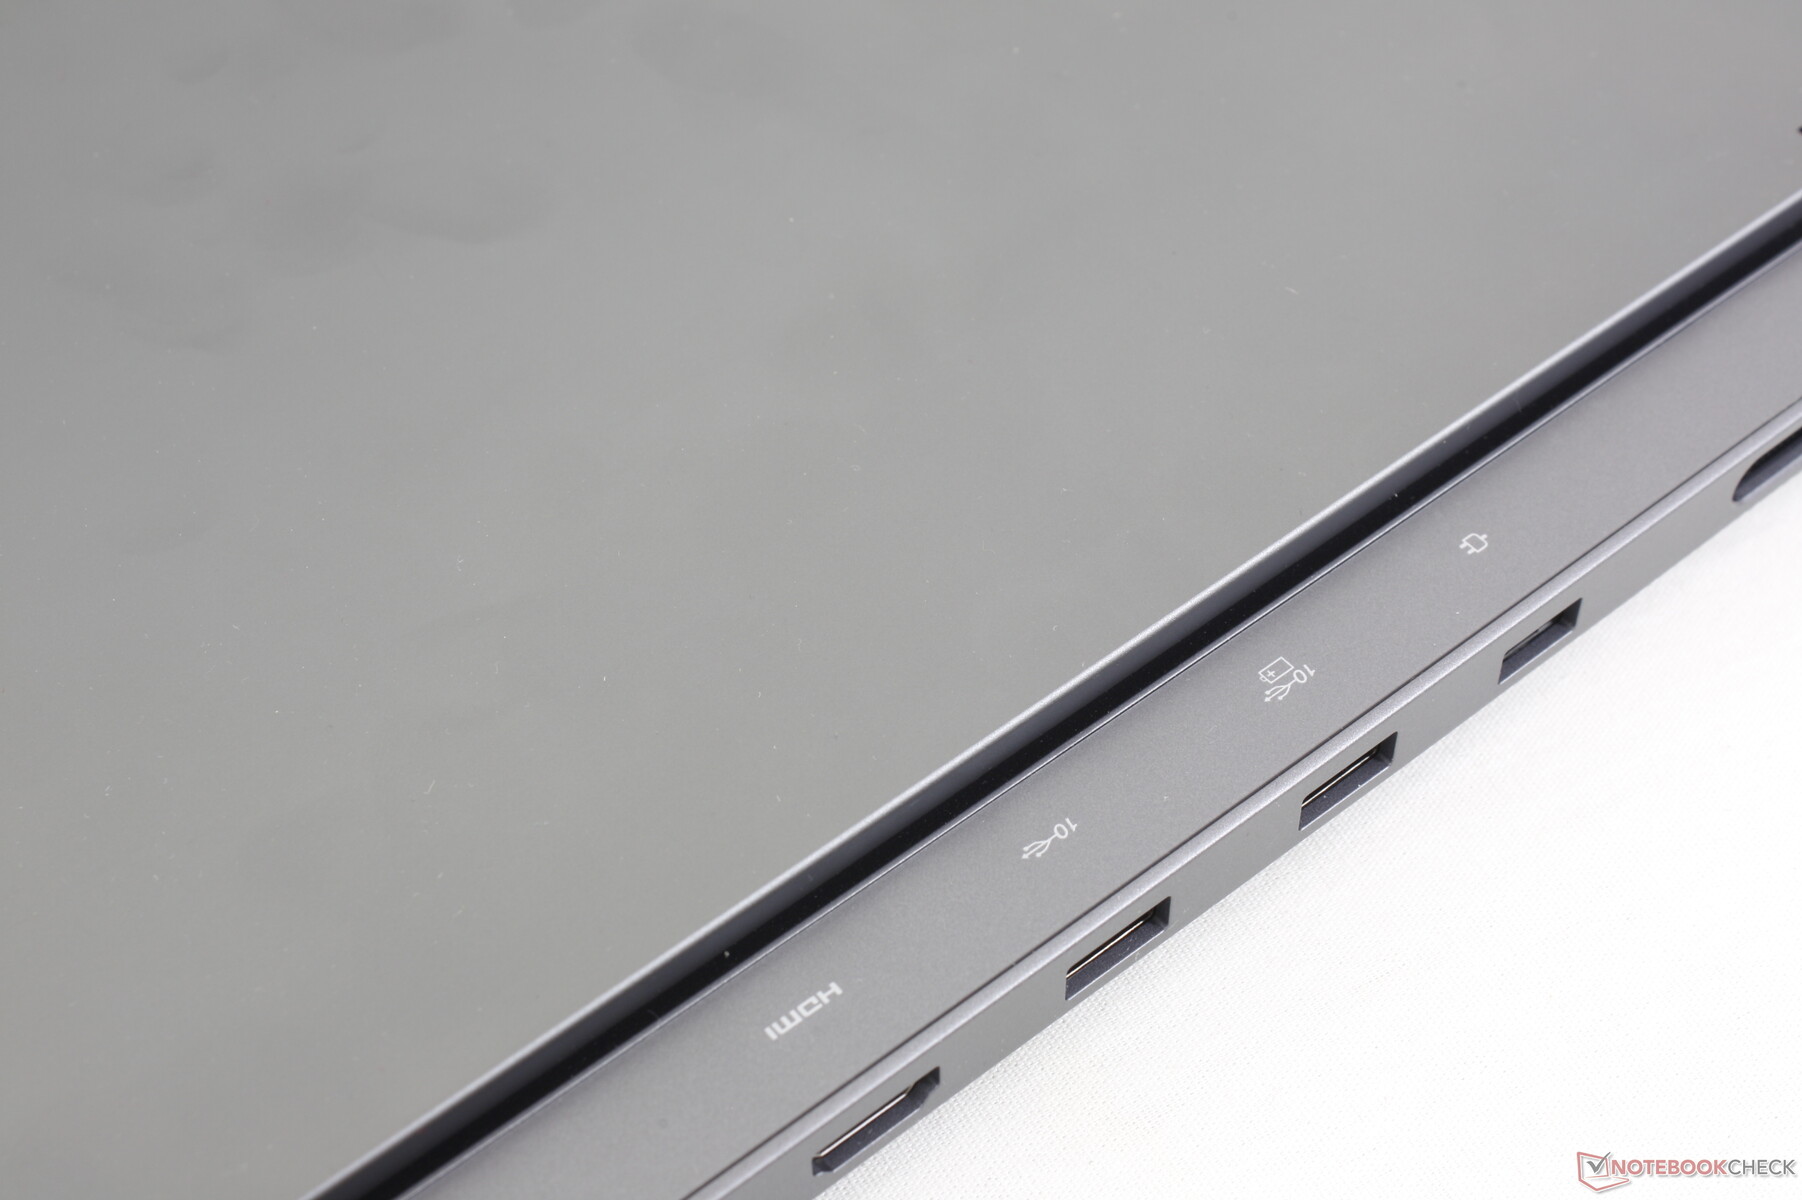
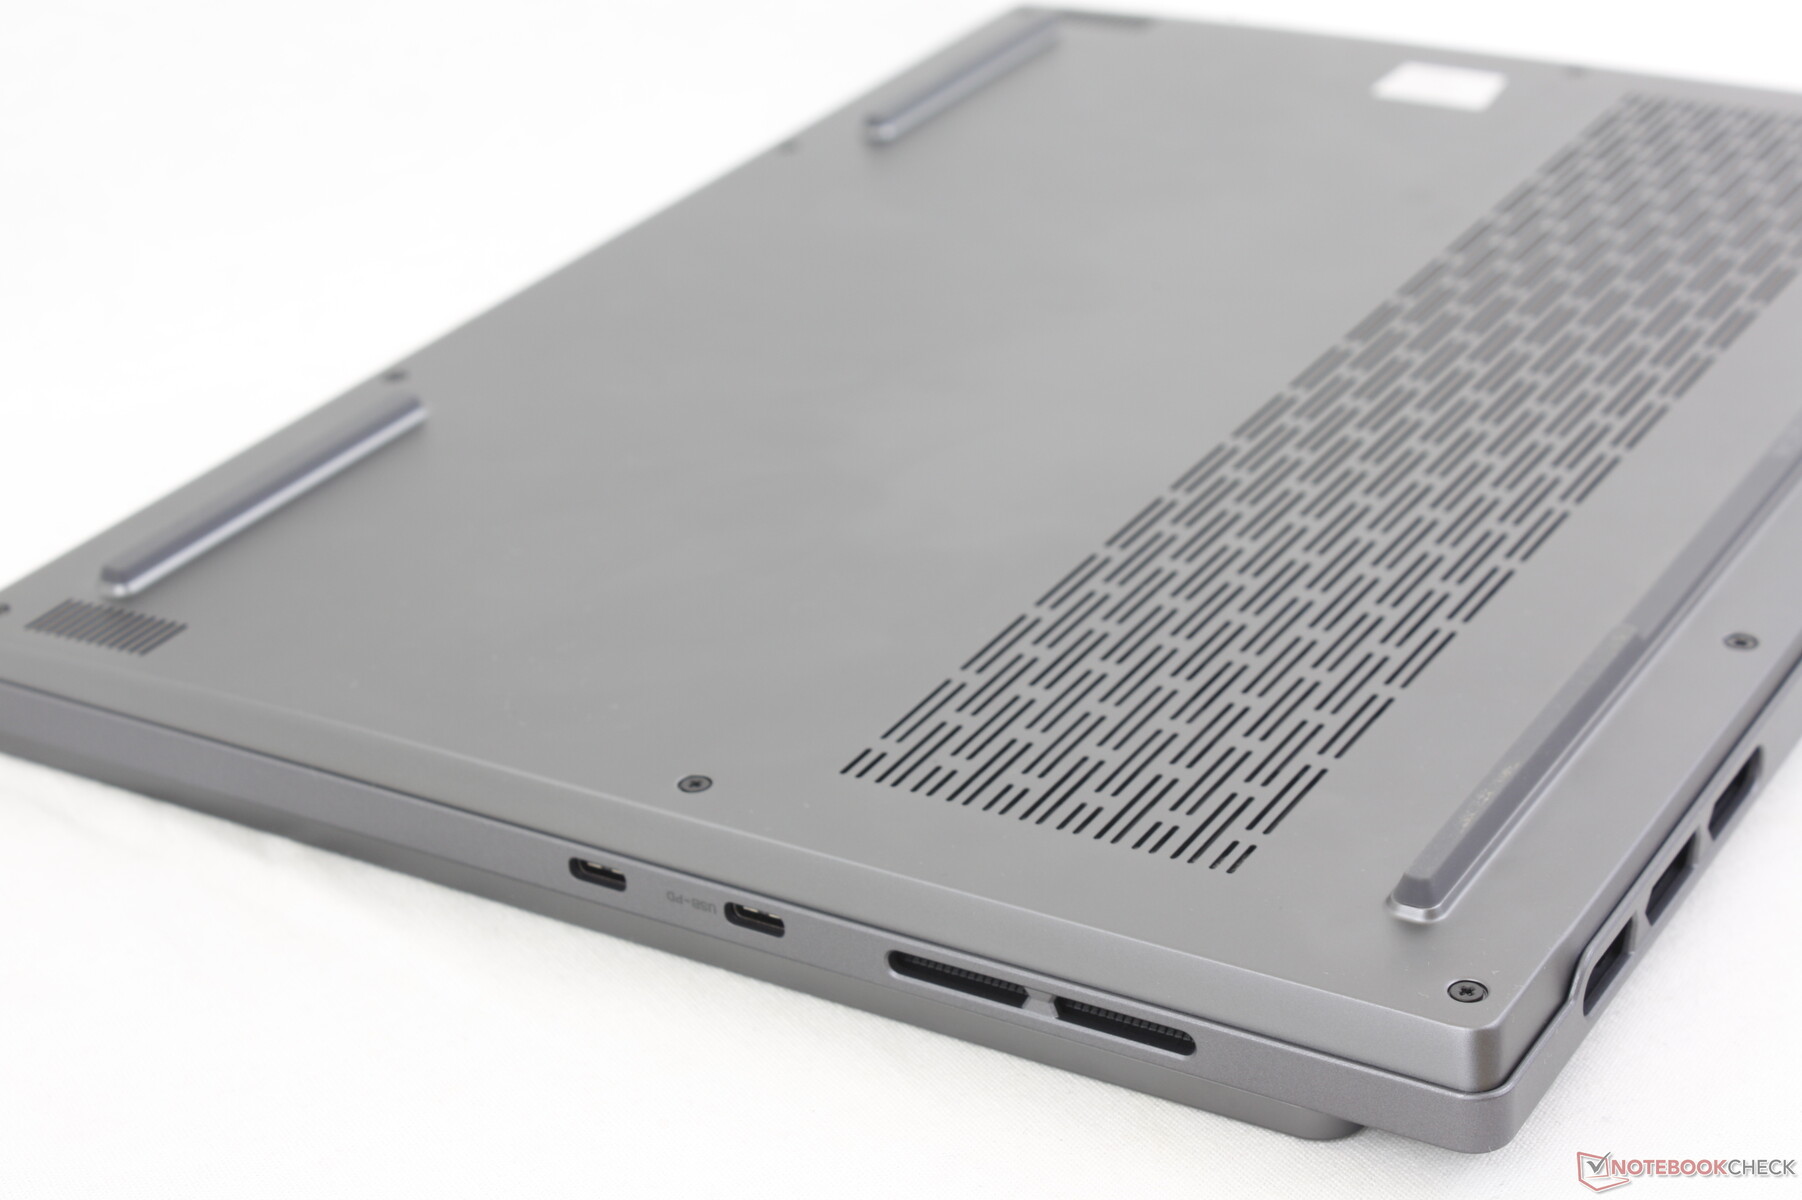
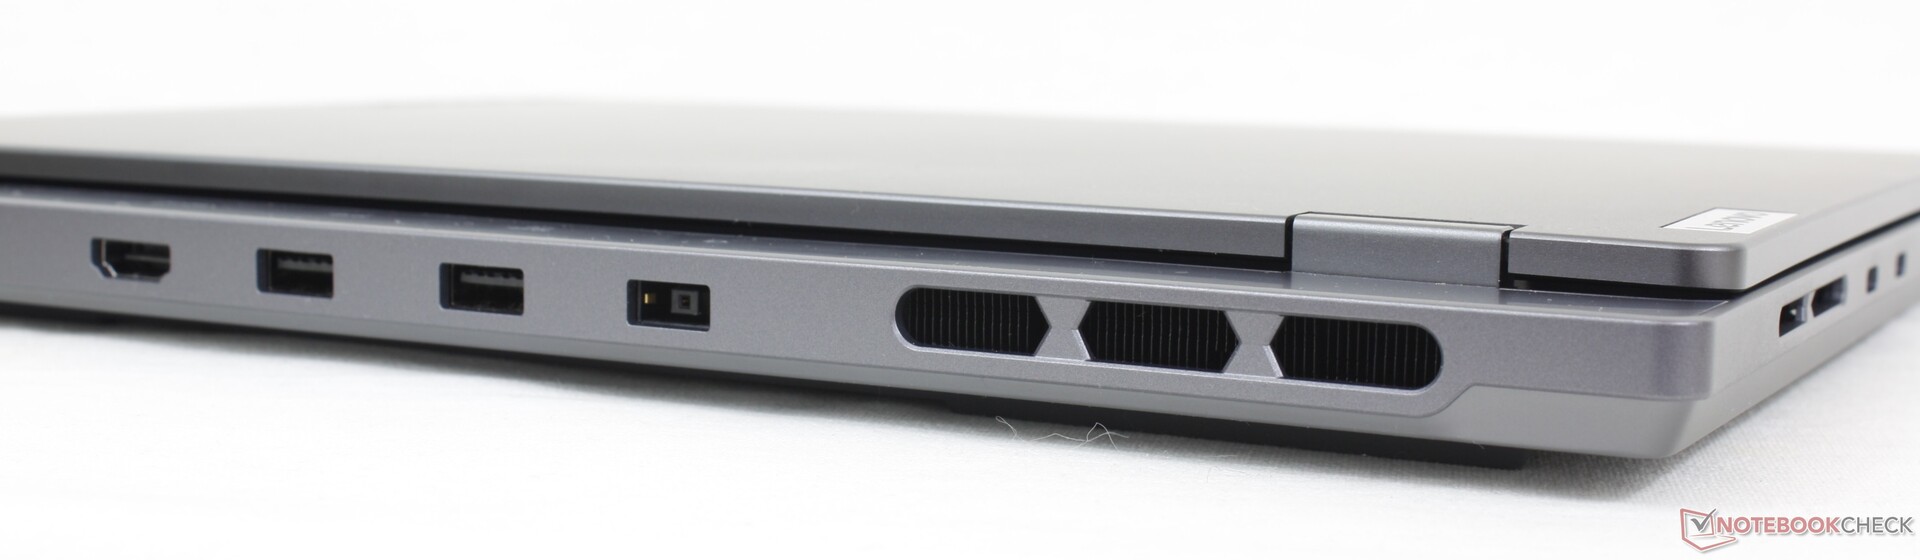
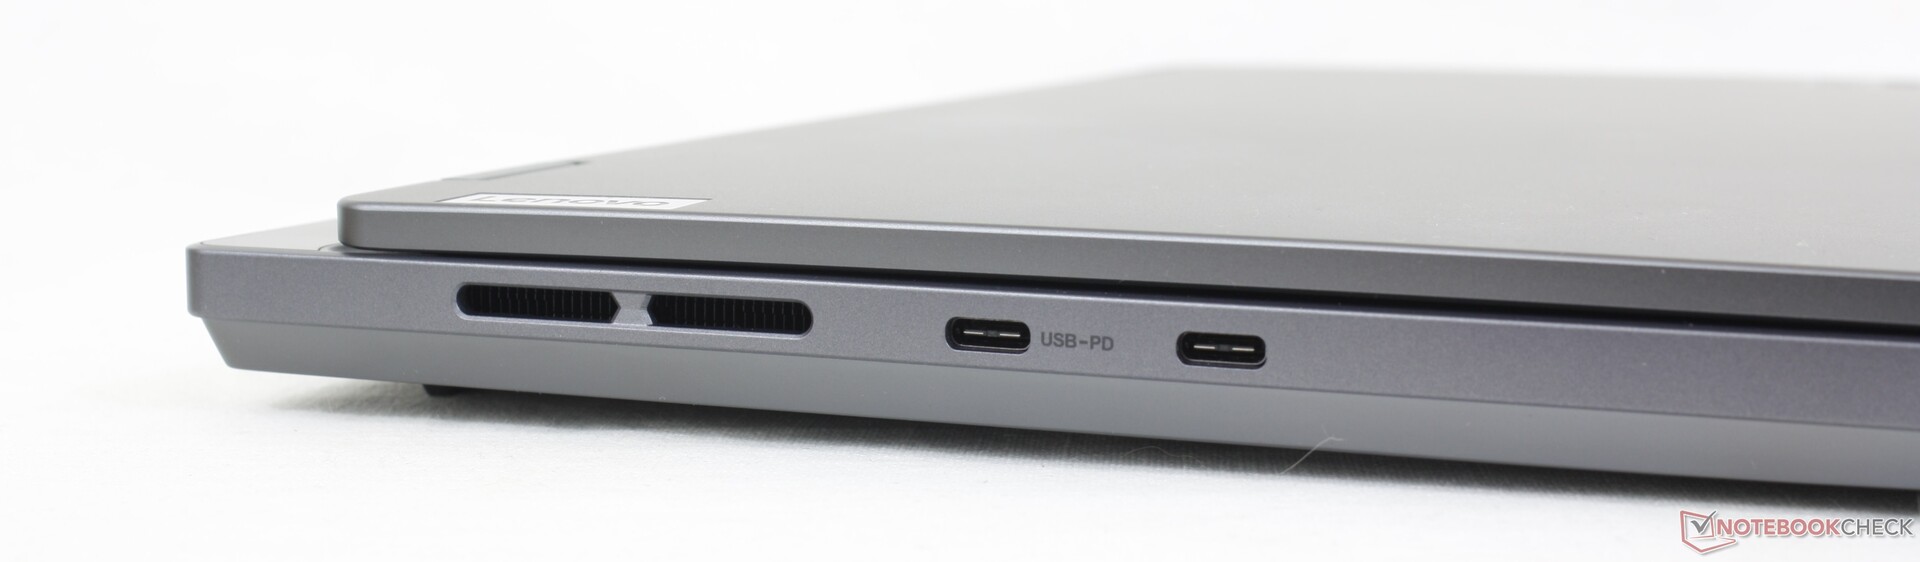
Conectividad - ¿Dónde está USB4?
Las opciones de puertos son muy similares a las del Blade 14 aunque con un posicionamiento muy diferente. Encontramos que la posición es desfavorable en el Legion Slim 5 ya que los puertos no están distribuidos uniformemente y la mayoría están en la parte trasera incluyendo los puertos USB-A. El modelo desafortunadamente carece de soporte USB4 y Thunderbolt.
Por desgracia, el modelo carece de soporte USB4 y Thunderbolt. Tampoco tiene bloqueo Kensington.
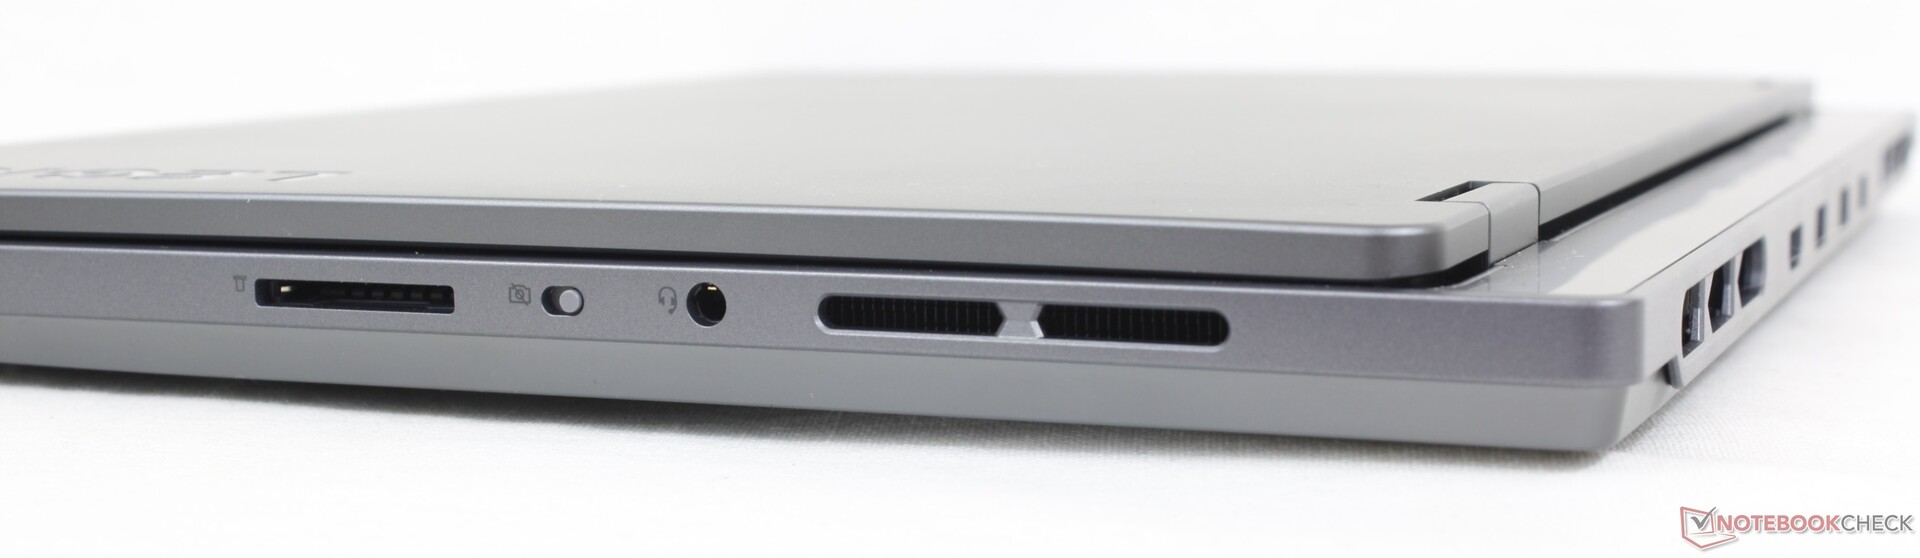
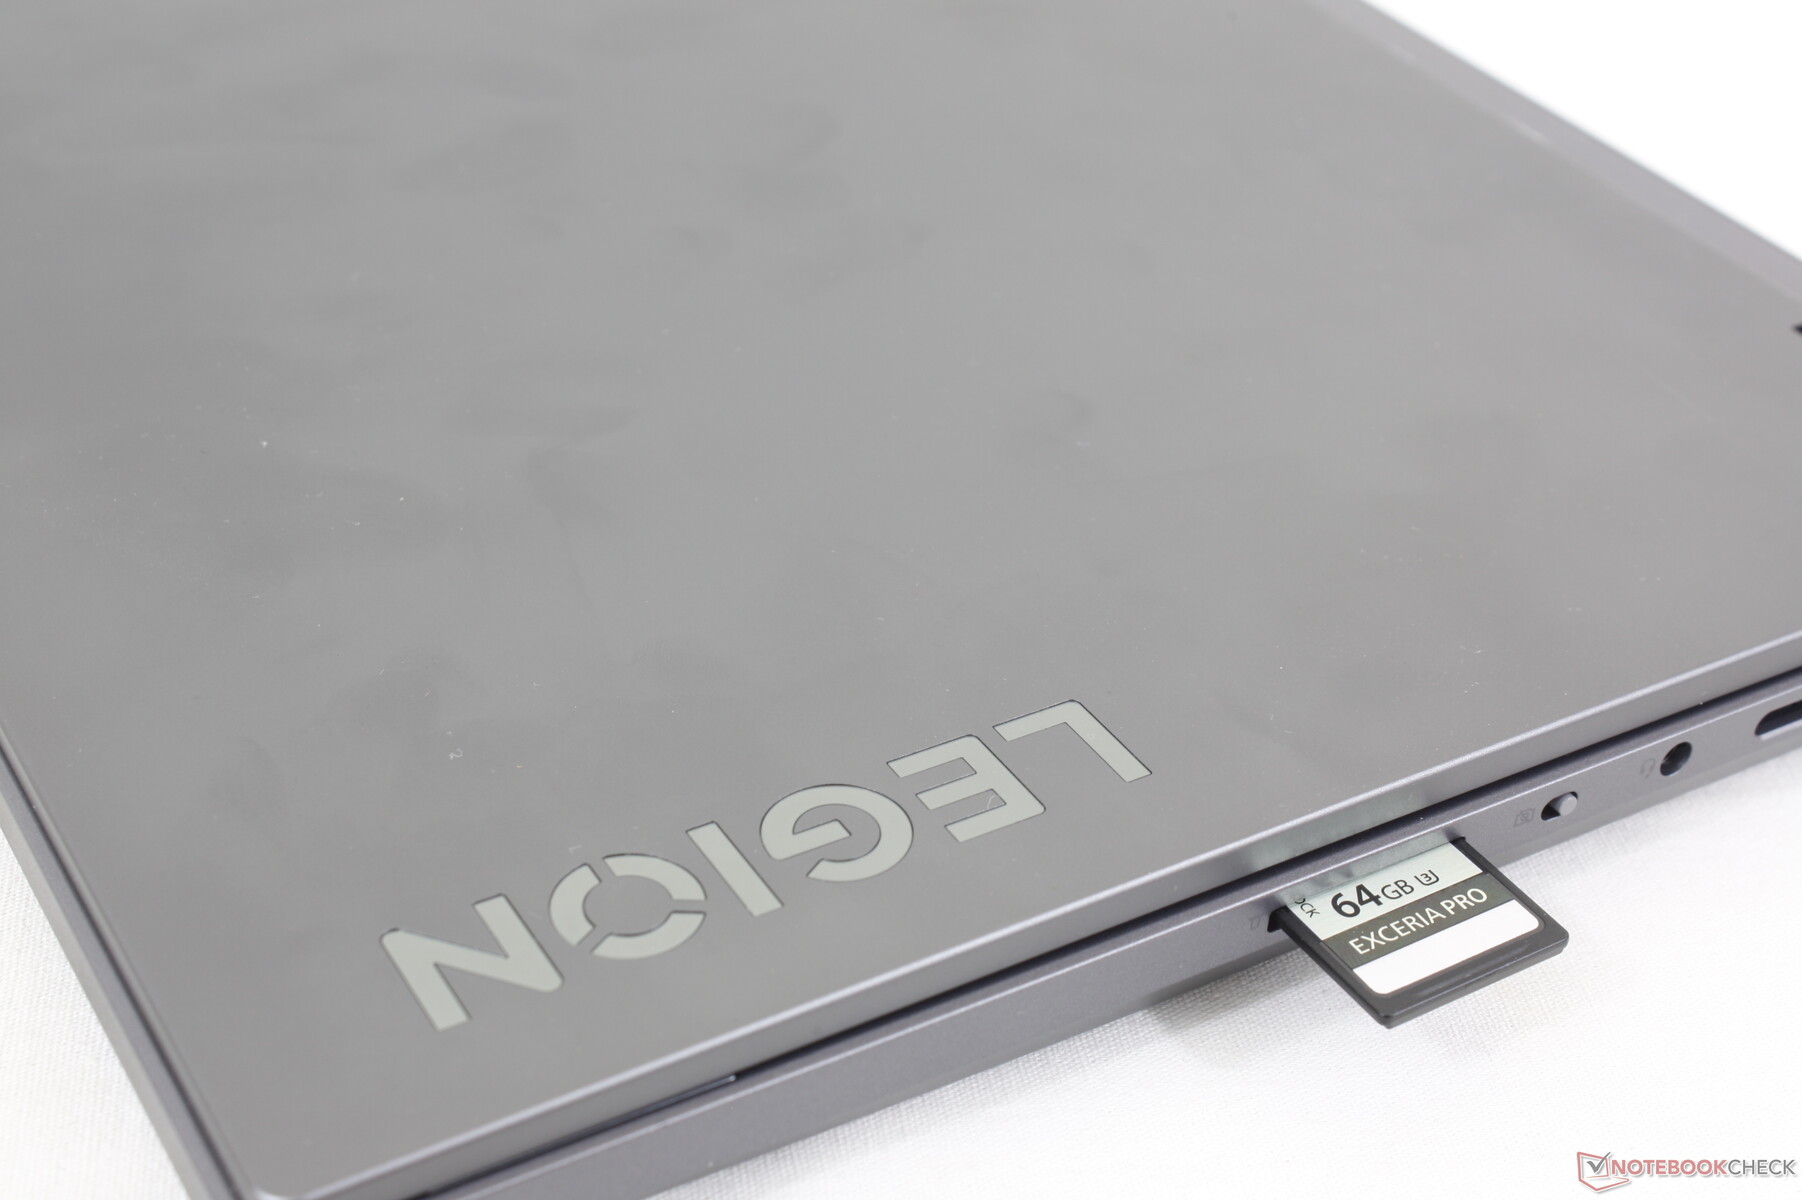
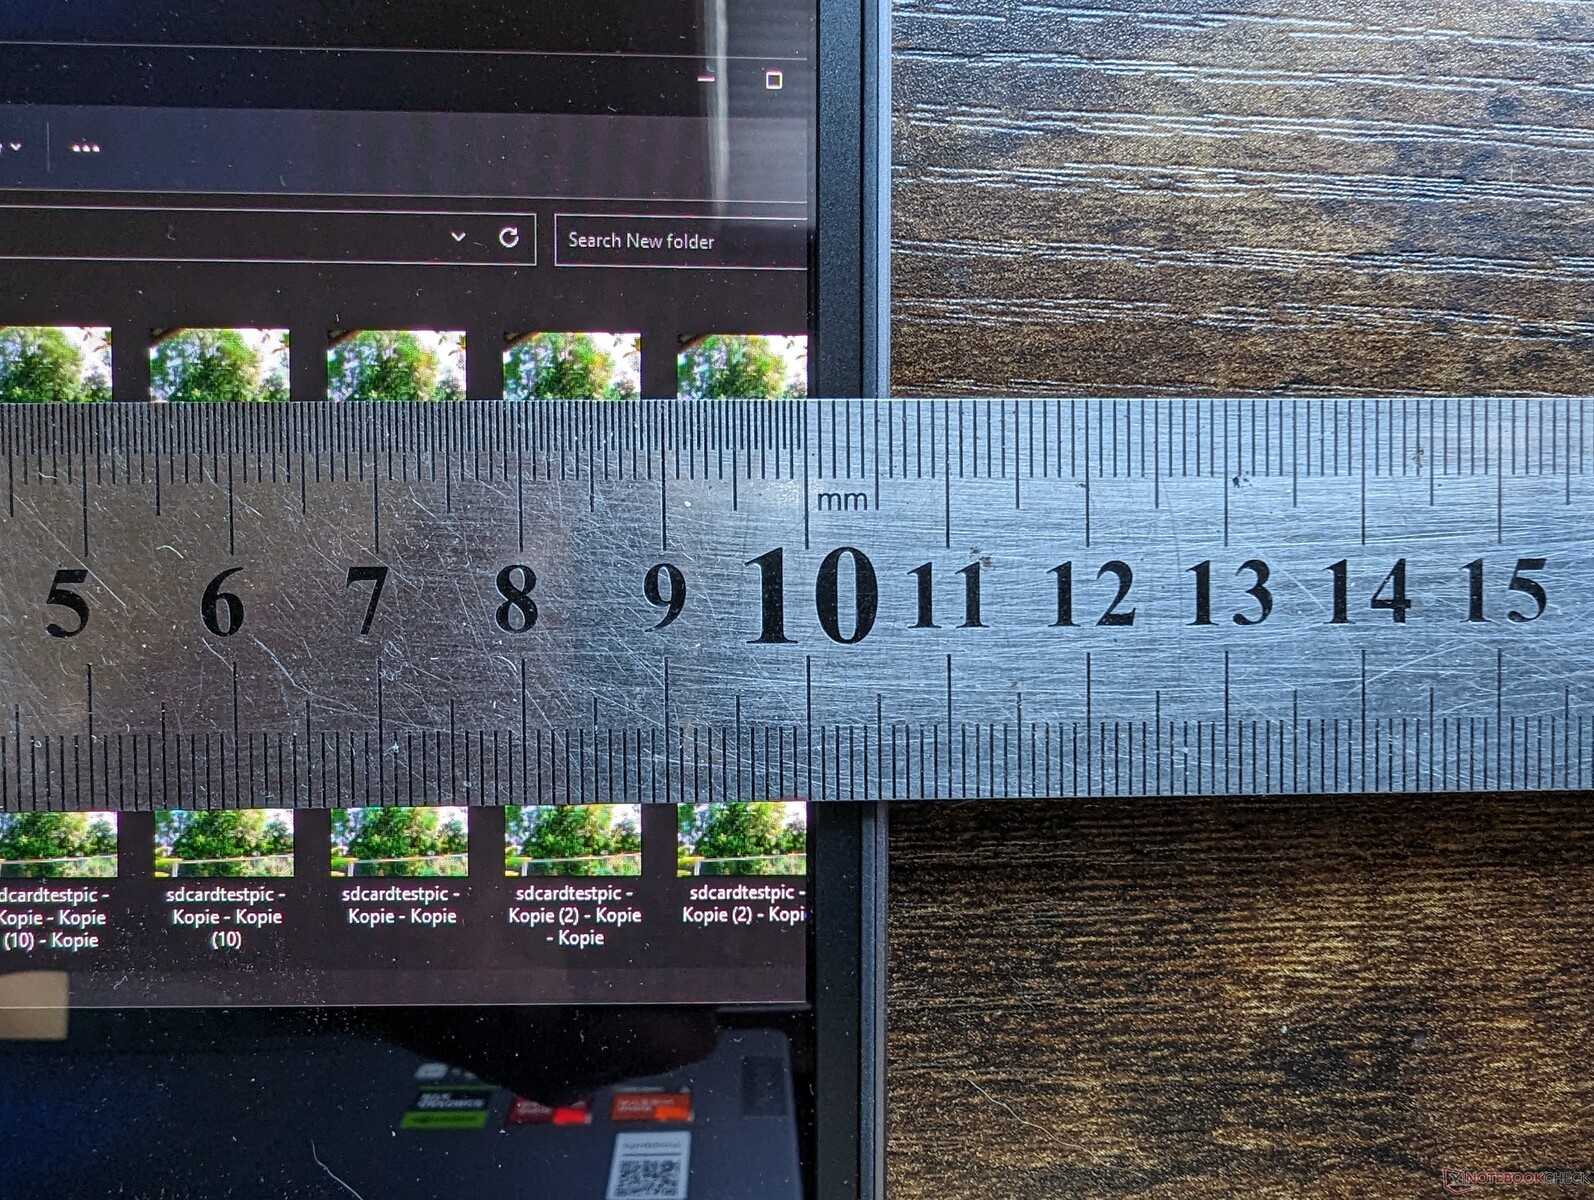
Lector de tarjetas SD
El lector SD integrado es mucho más rápido que el del Predator Triton 14 pero no tan rápido como el del Zephyrus G14 o el del Alienware x14. Mover 1 GB de imágenes desde nuestra tarjeta de pruebas UHS-II al escritorio lleva unos 12 segundos, frente a la mitad en el Alienware x14.
| SD Card Reader | |
| average JPG Copy Test (av. of 3 runs) | |
| Alienware x14 i7 RTX 3060 (Angelbird AV Pro V60) | |
| Asus ROG Zephyrus G14 GA402XY (Angelibrid AV Pro V60) | |
| Lenovo Legion Slim 5 14APH8 (Toshiba Exceria Pro SDXC 64 GB UHS-II) | |
| Acer Predator Triton 14 PT14-51 (AV PRO microSD 128 GB V60) | |
| maximum AS SSD Seq Read Test (1GB) | |
| Asus ROG Zephyrus G14 GA402XY (Angelibrid AV Pro V60) | |
| Alienware x14 i7 RTX 3060 (Angelbird AV Pro V60) | |
| Lenovo Legion Slim 5 14APH8 (Toshiba Exceria Pro SDXC 64 GB UHS-II) | |
| Acer Predator Triton 14 PT14-51 (AV PRO microSD 128 GB V60) | |
Comunicación
Un MediaTek MT7922 viene de serie en lugar del más común Intel AX211 para conectividad Wi-Fi 6E y Bluetooth 5.2. Experimentamos un rendimiento estable y sin problemas al emparejarlo con nuestra red AXE11000 de 6 GHz.
| Networking | |
| iperf3 transmit AX12 | |
| Alienware x14 i7 RTX 3060 | |
| iperf3 receive AX12 | |
| Alienware x14 i7 RTX 3060 | |
| iperf3 transmit AXE11000 | |
| Asus ROG Zephyrus G14 GA402XY | |
| Acer Predator Triton 14 PT14-51 | |
| Lenovo Legion Slim 5 14APH8 | |
| Razer Blade 14 RTX 4070 | |
| Lenovo LOQ 15APH8 | |
| iperf3 receive AXE11000 | |
| Acer Predator Triton 14 PT14-51 | |
| Asus ROG Zephyrus G14 GA402XY | |
| Razer Blade 14 RTX 4070 | |
| Lenovo Legion Slim 5 14APH8 | |
| Lenovo LOQ 15APH8 | |
| iperf3 transmit AXE11000 6GHz | |
| Lenovo Legion Slim 5 14APH8 | |
| Razer Blade 14 RTX 4070 | |
| iperf3 receive AXE11000 6GHz | |
| Razer Blade 14 RTX 4070 | |
| Lenovo Legion Slim 5 14APH8 | |
Cámara web
La webcam de 2 MP es estándar en los portátiles para juegos. Incorpora infrarrojos y un interruptor de apagado de cámara.


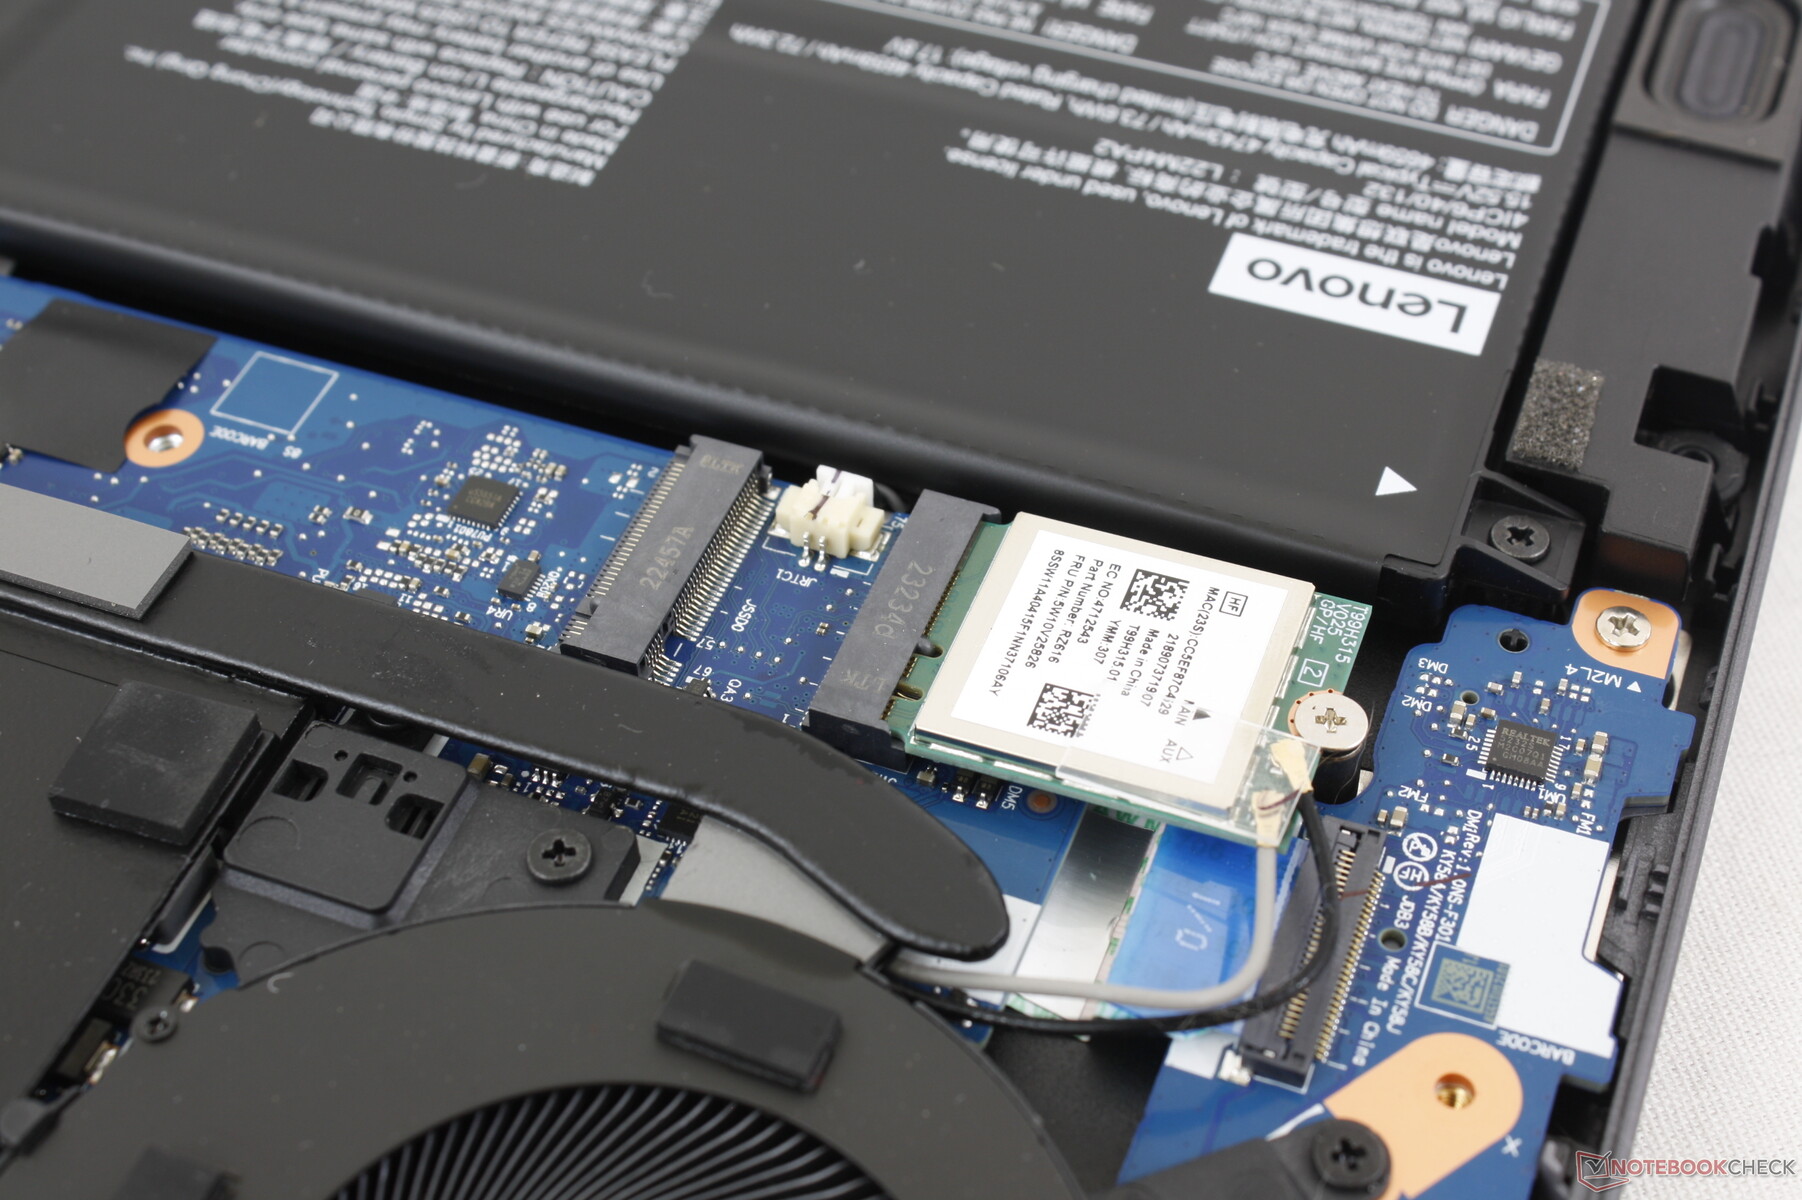
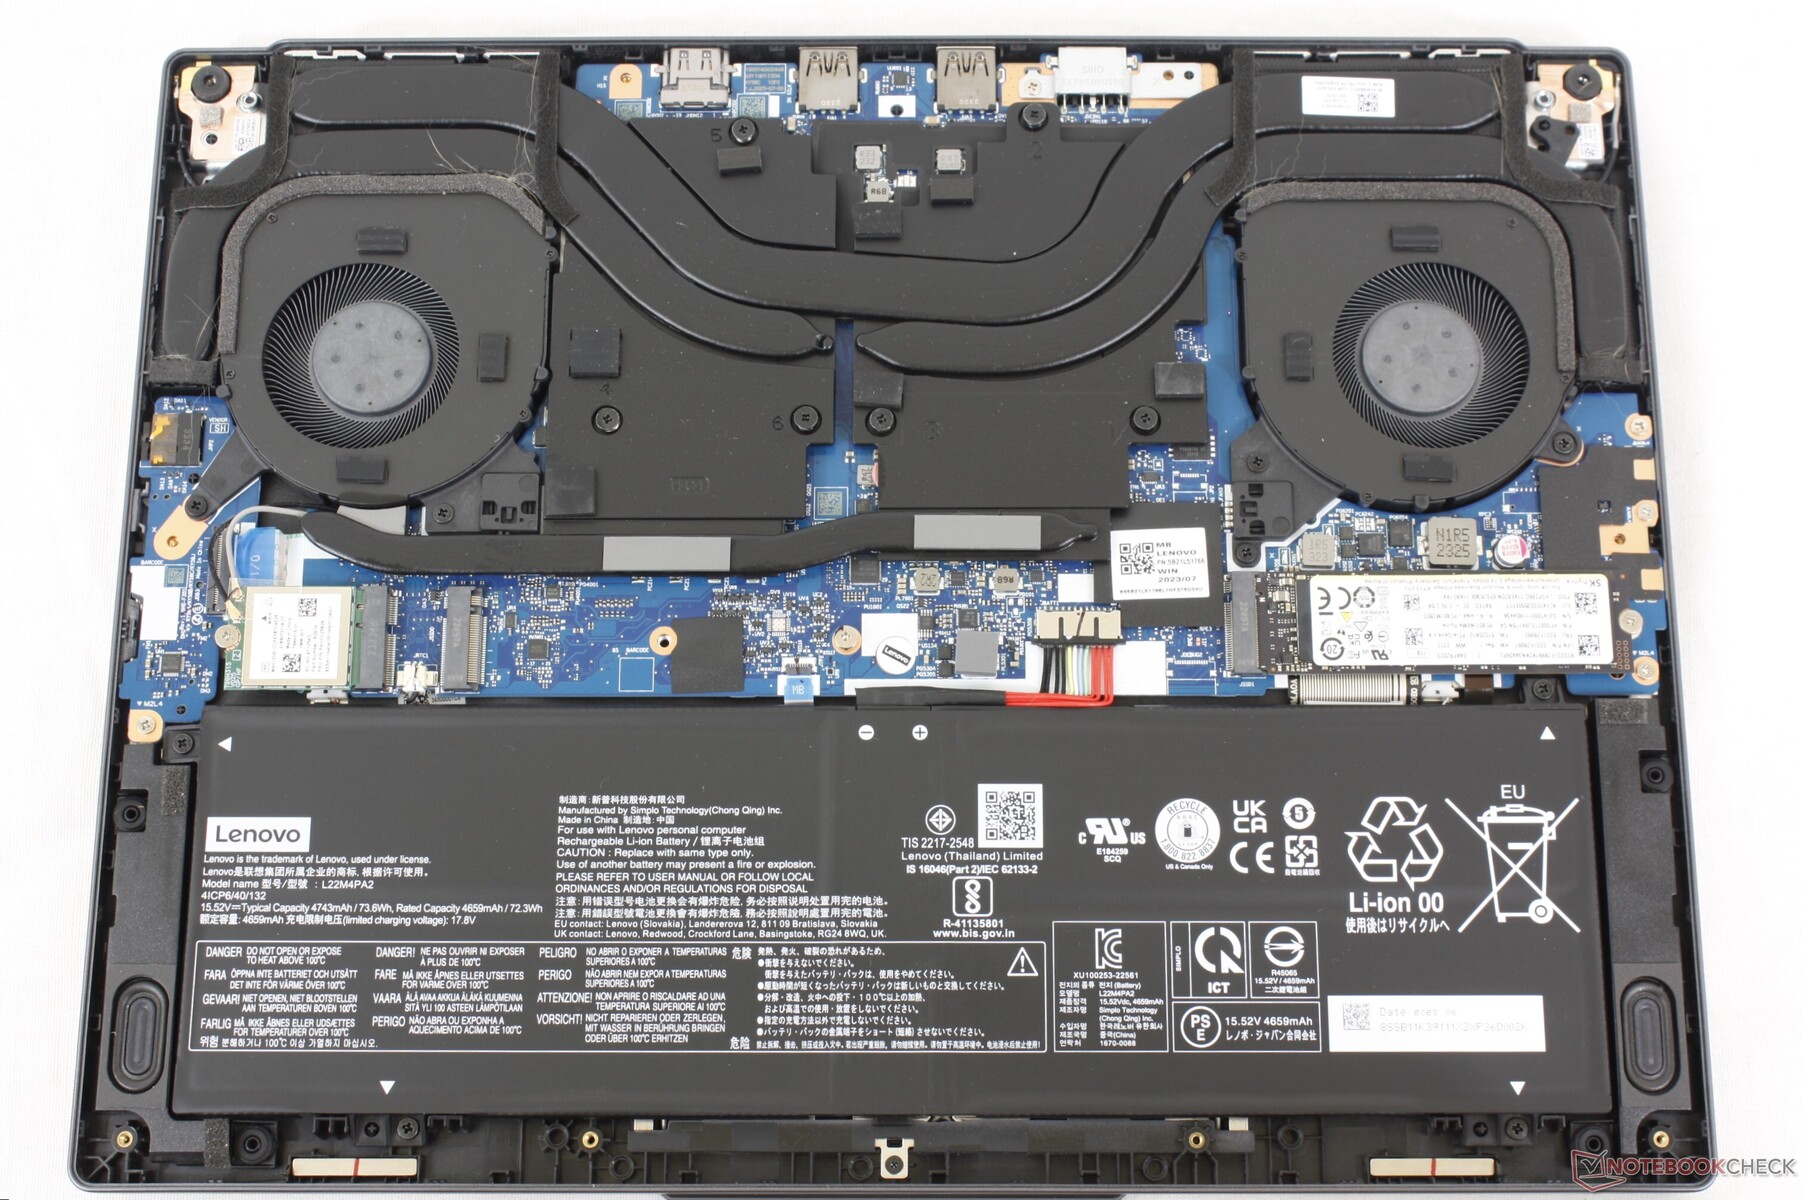
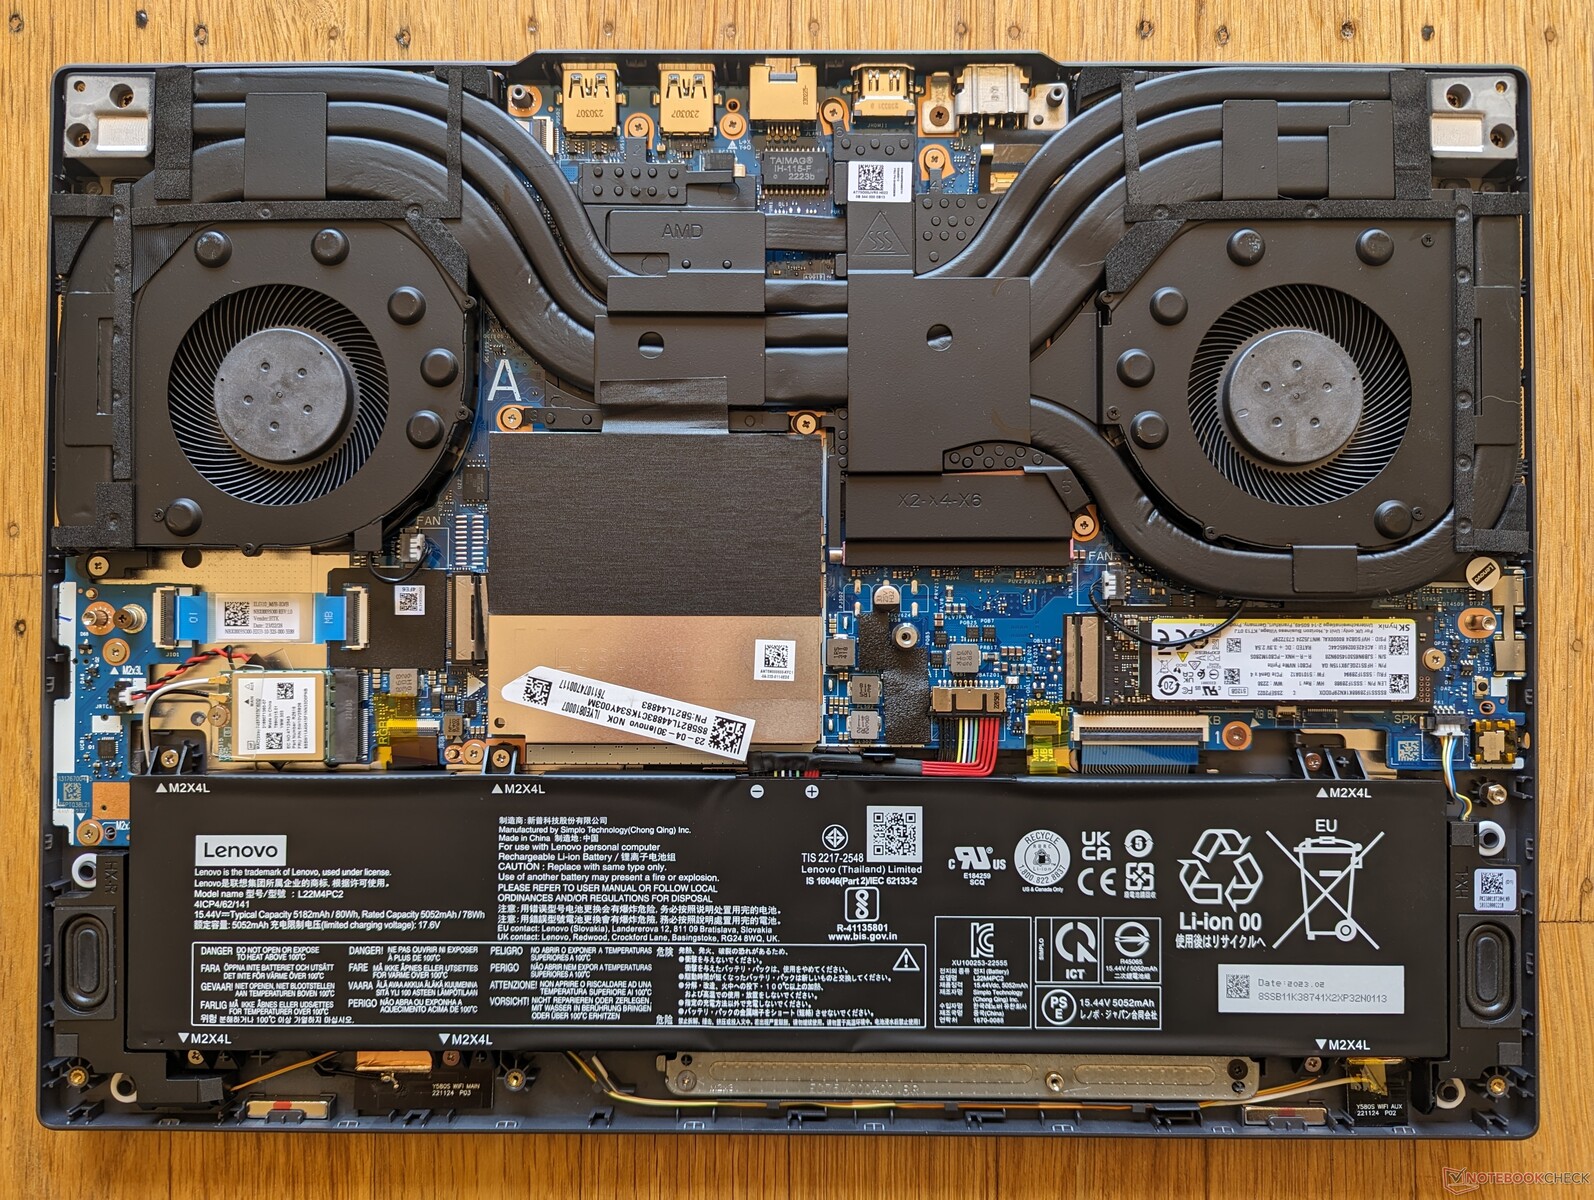
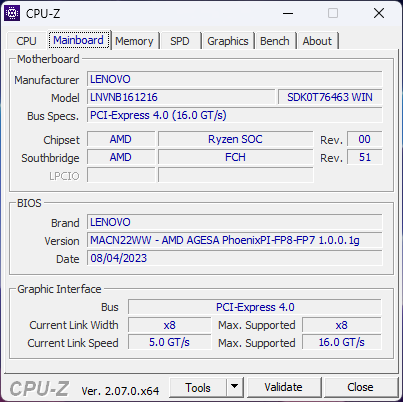
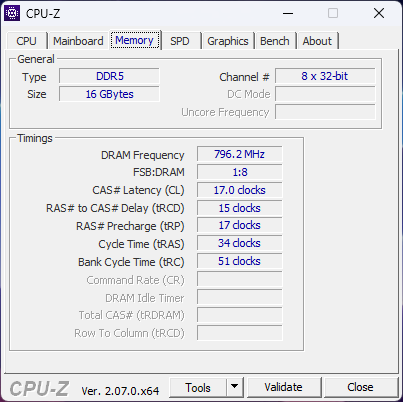
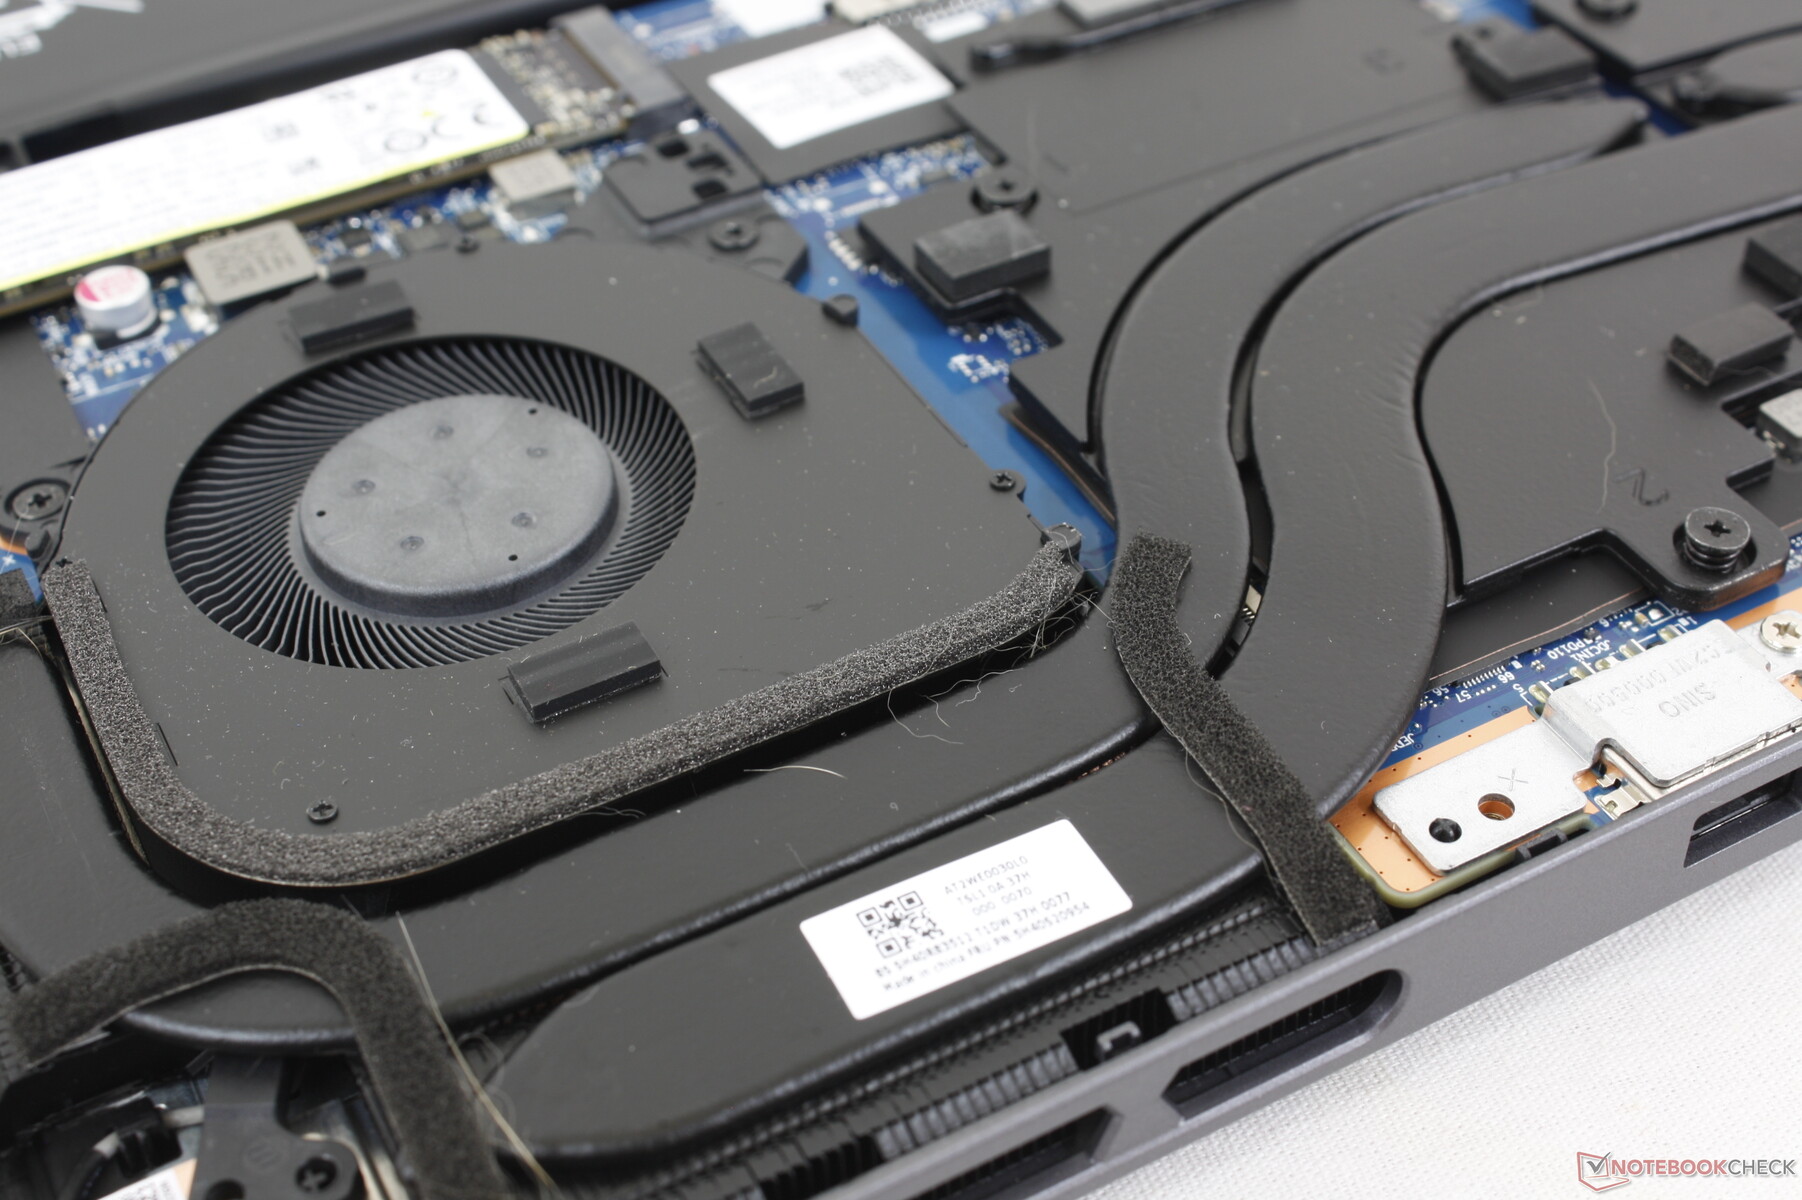
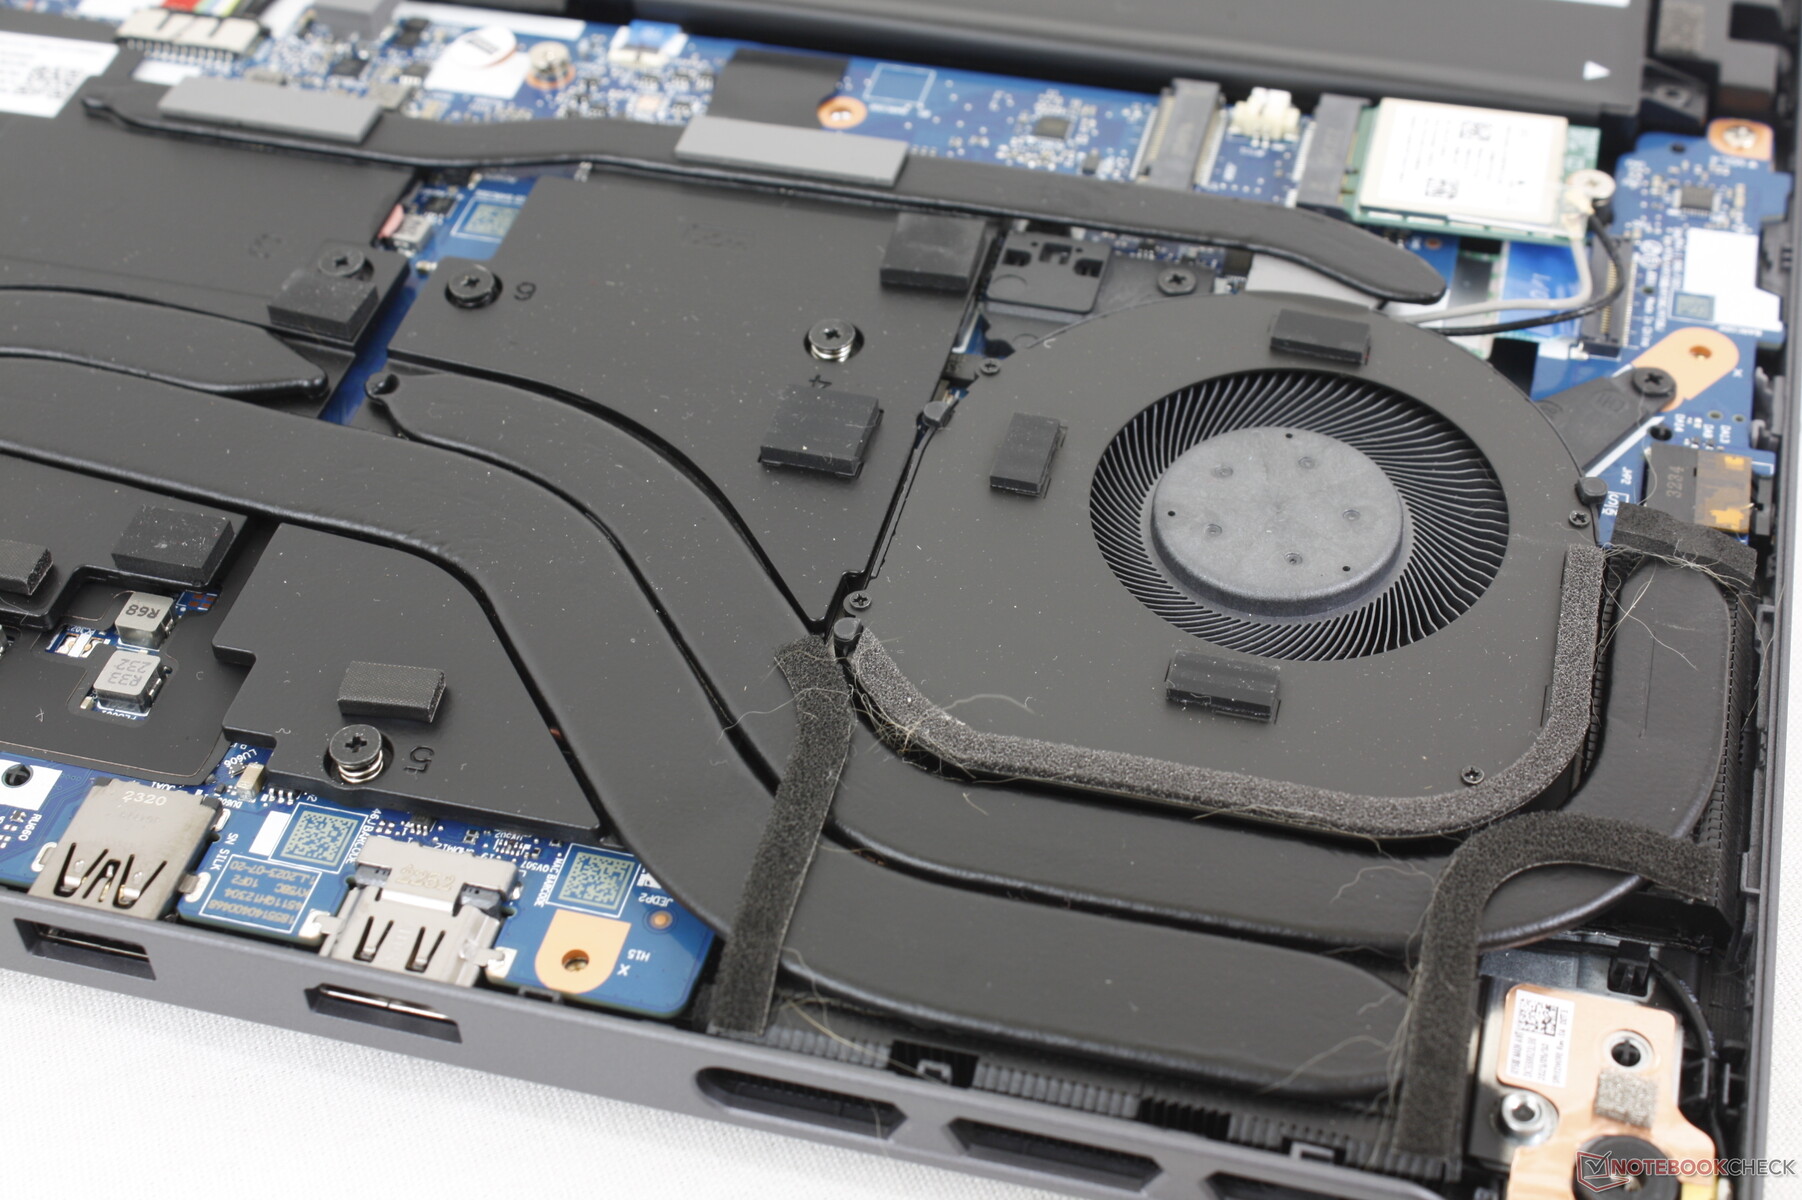
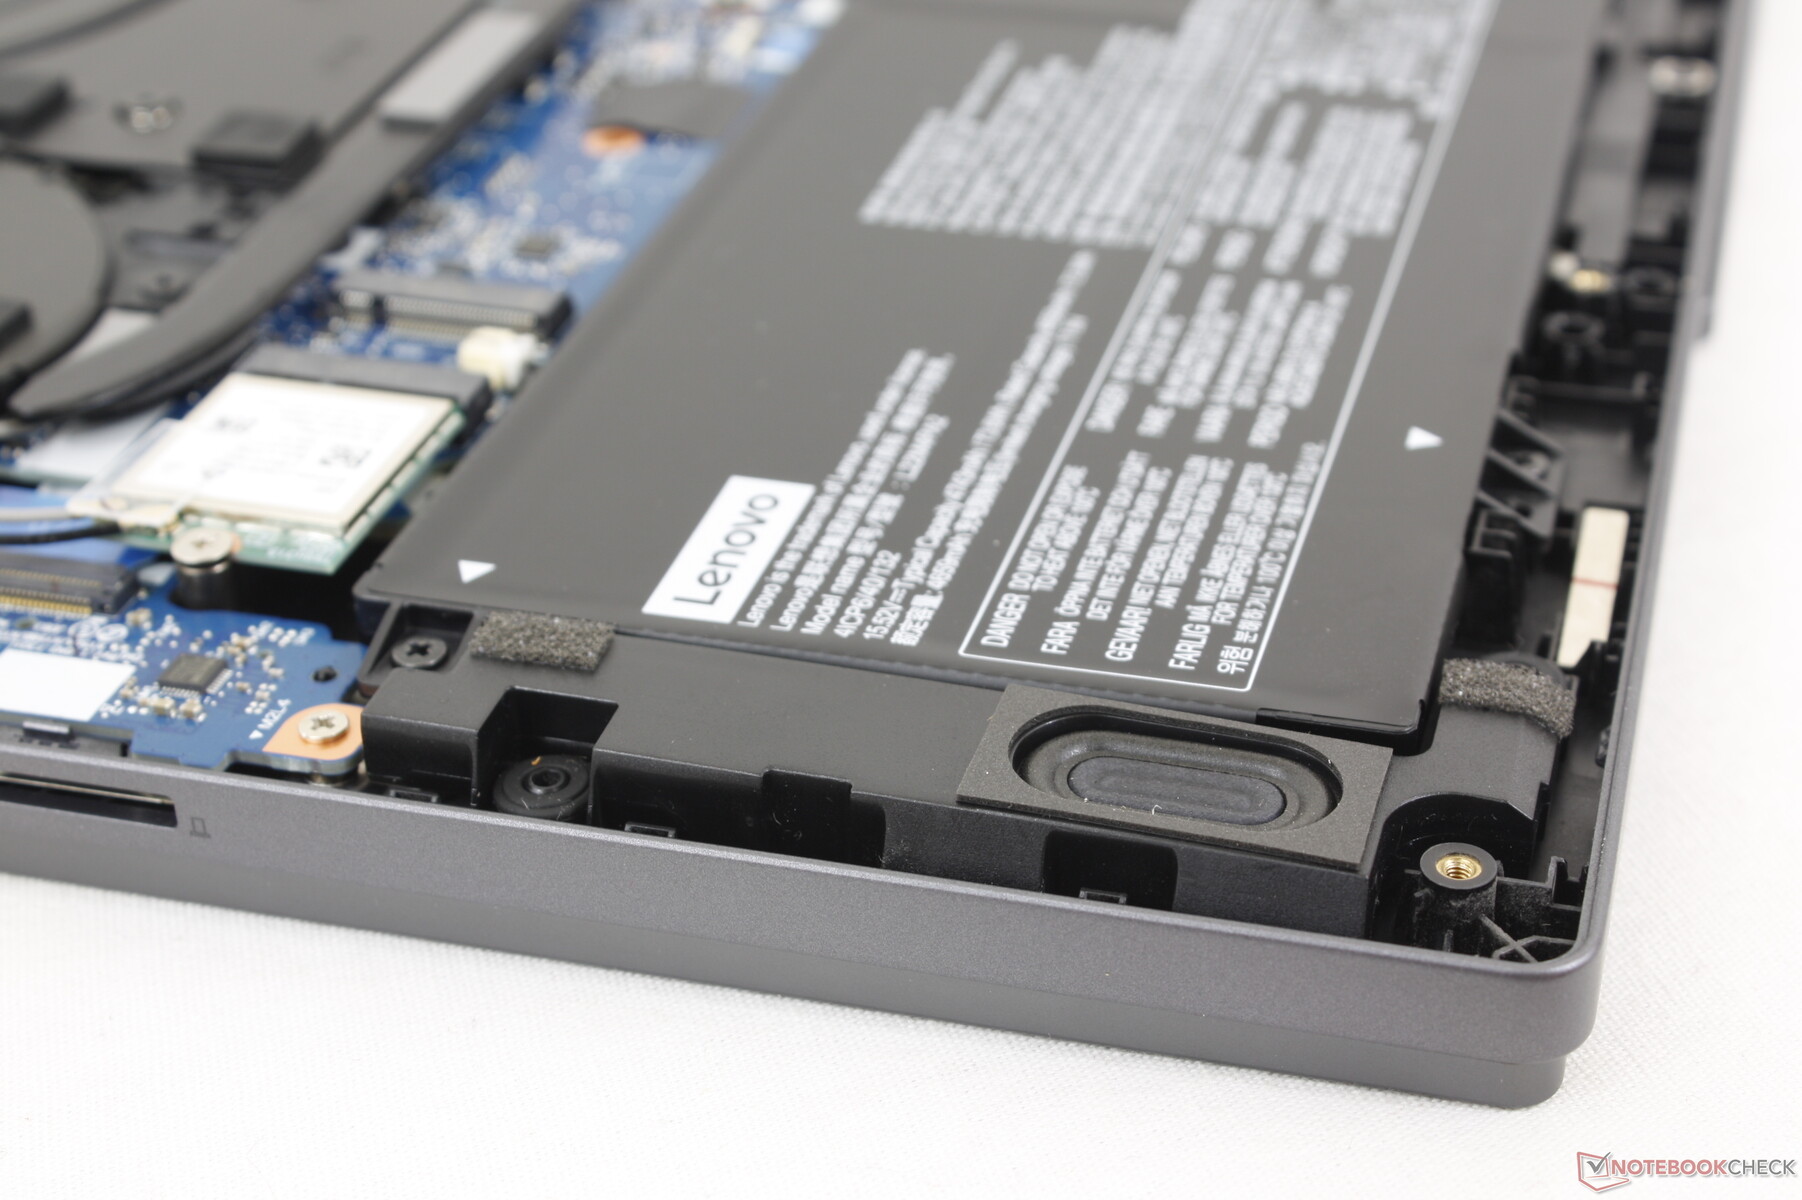
Mantenimiento
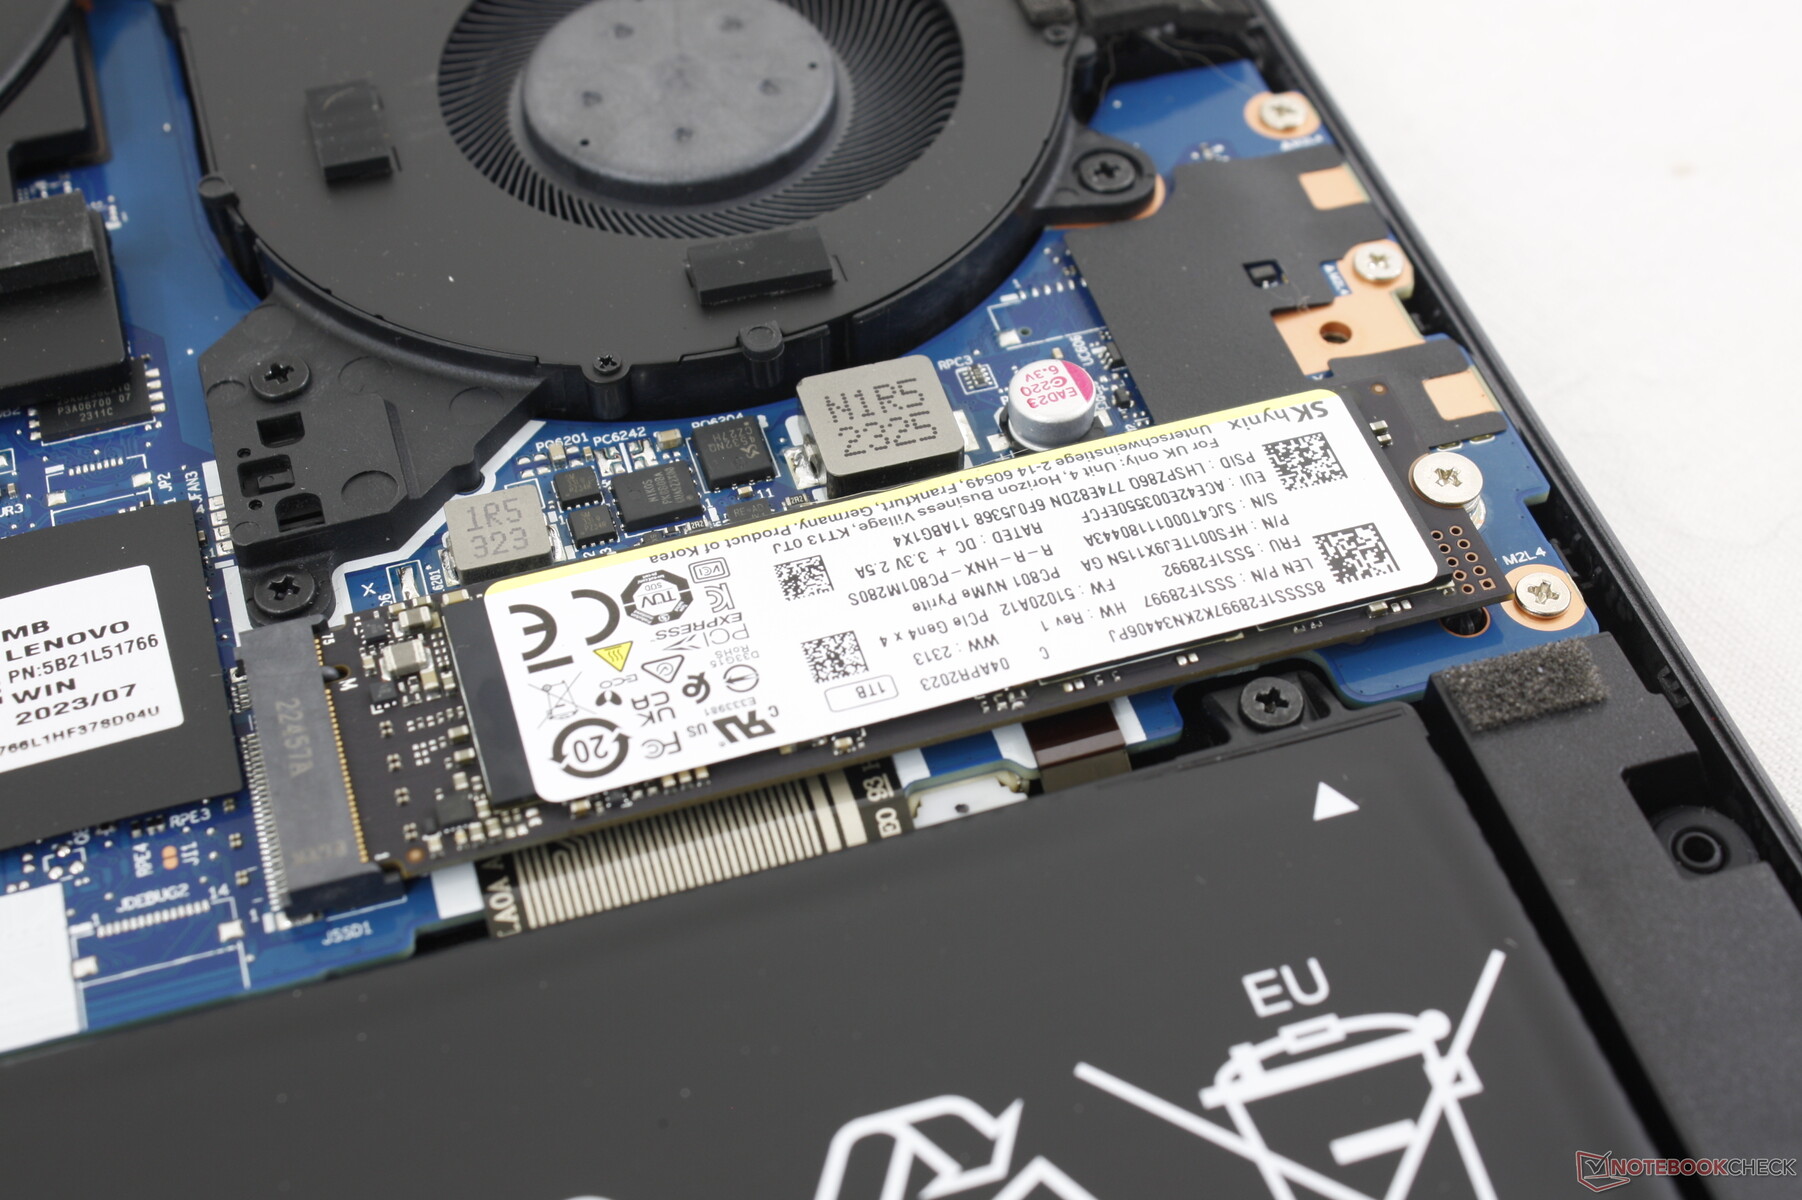
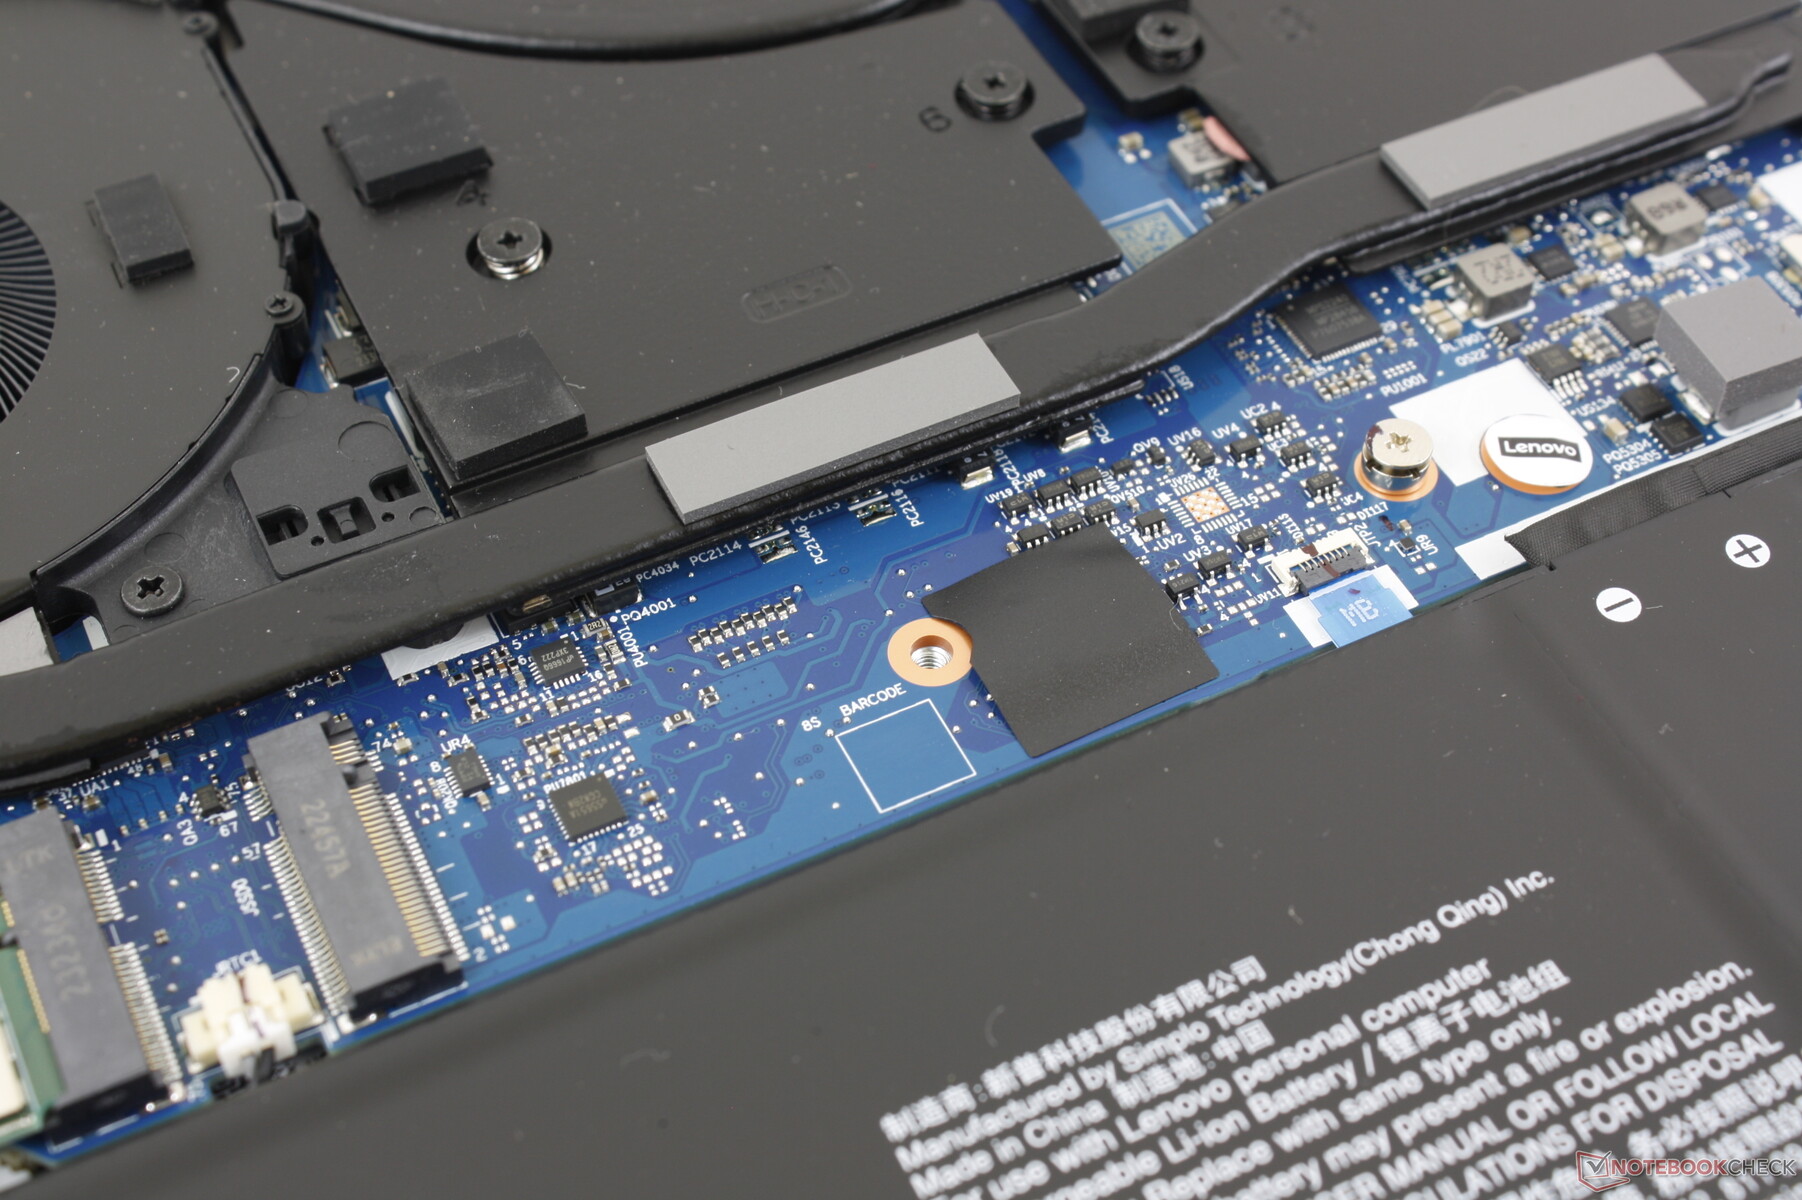
El panel inferior está asegurado por 10 tornillos Phillips para facilitar su extracción. La RAM está soldada, dejando las dos ranuras M.2 2280 SSD y el módulo WLAN como únicos componentes actualizables. En comparación, la RAM es actualizable por el usuario en el 2023 Blade 14 y el Zephyrus G14.
Accesorios y garantía
La caja de venta al público incluye el adaptador de CA y la documentación, sin extras. Si se adquiere en EE.UU., se aplica la garantía estándar limitada de un año del fabricante.
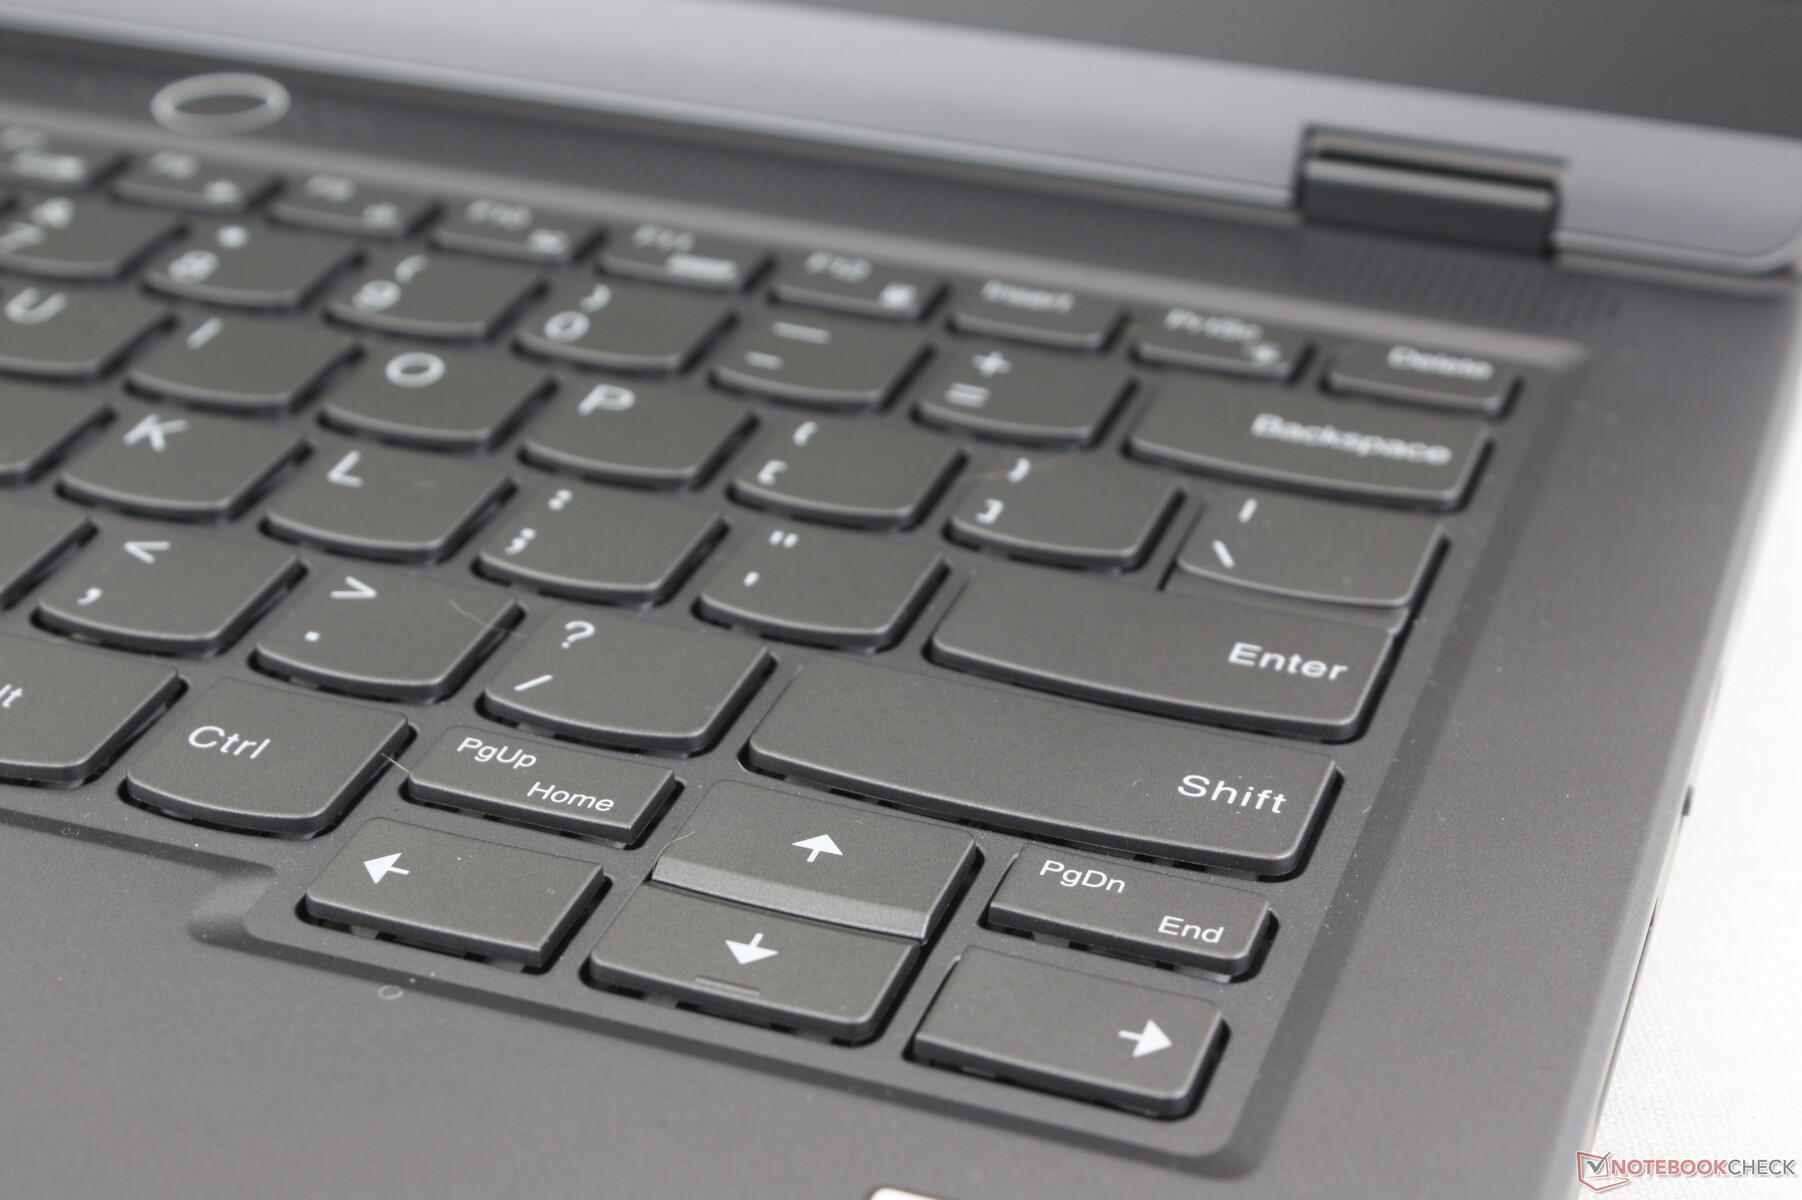
Dispositivos de entrada - Sin iluminación RGB
Teclado
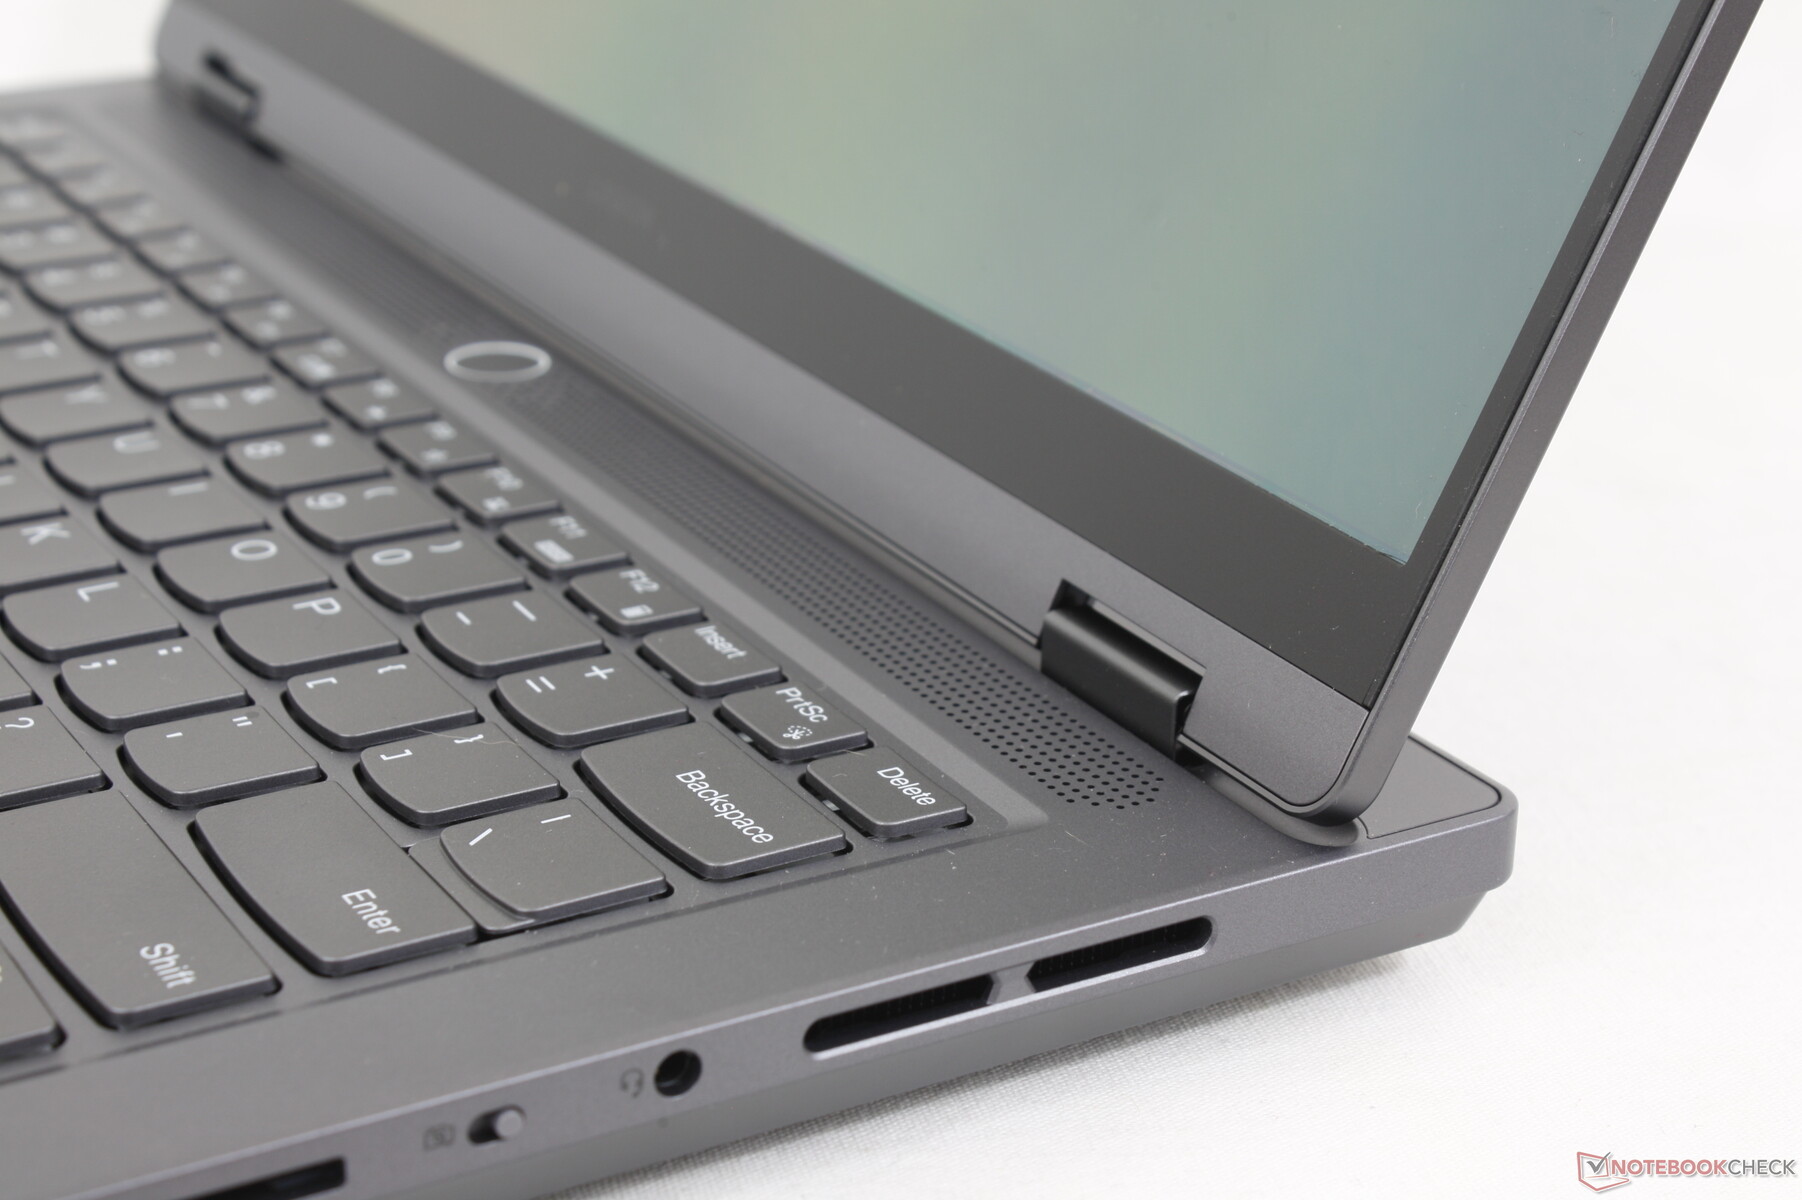
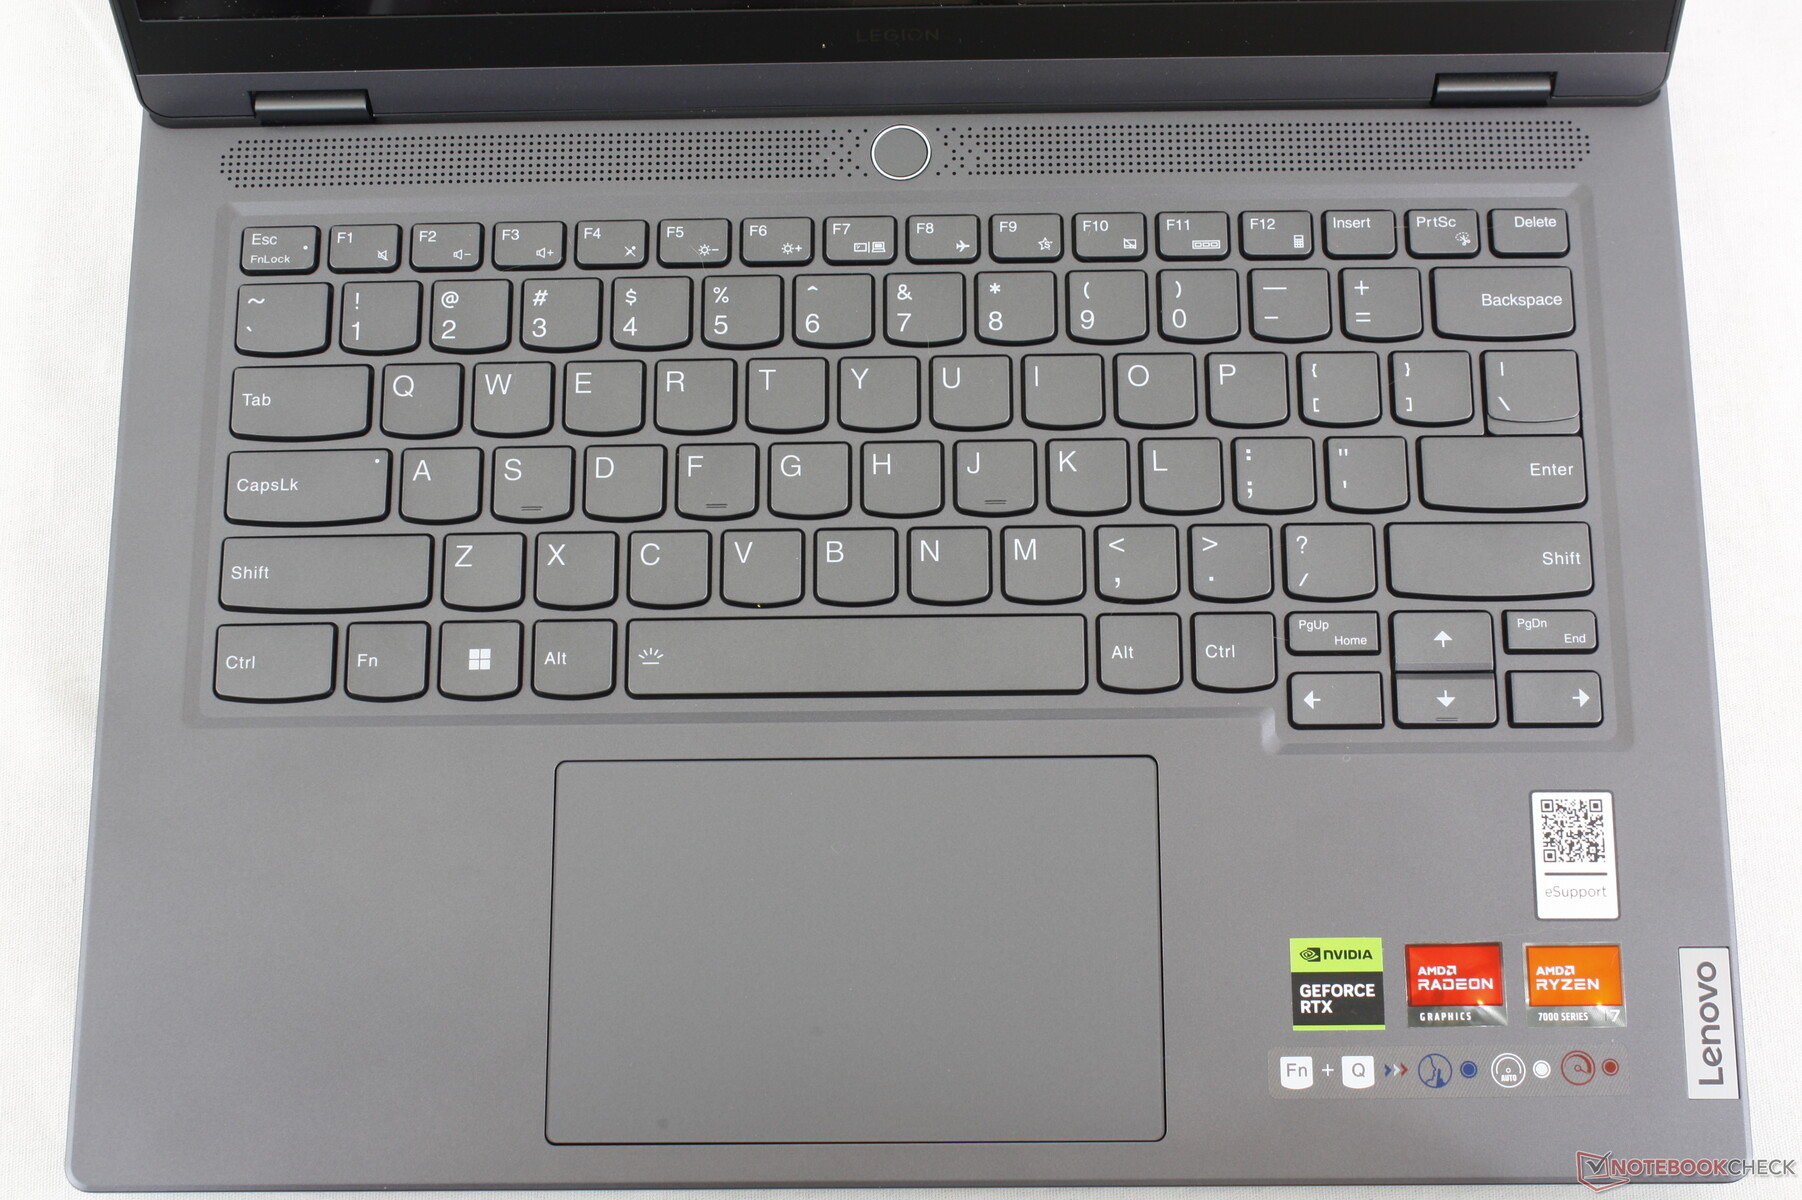
El teclado mantiene el tacto y el tamaño de las teclas QWERTY principales del Legion Slim 5 16 pero con teclas de flecha más pequeñas y un teclado numérico omitido debido a limitaciones de superficie. La sensación al teclear es firme y con una respuesta más fuerte de cada tecla en comparación con las teclas más suaves del Blade 14. Sin embargo, las estrechas teclas PgUp y PgDn están encajadas entre las teclas de dirección y son incómodas de pulsar.
Lenovo sólo ofrece retroiluminación blanca de una zona, mientras que los modelos de Razer, Asus y Alienware tienen iluminación RGB multizona.
Panel táctil
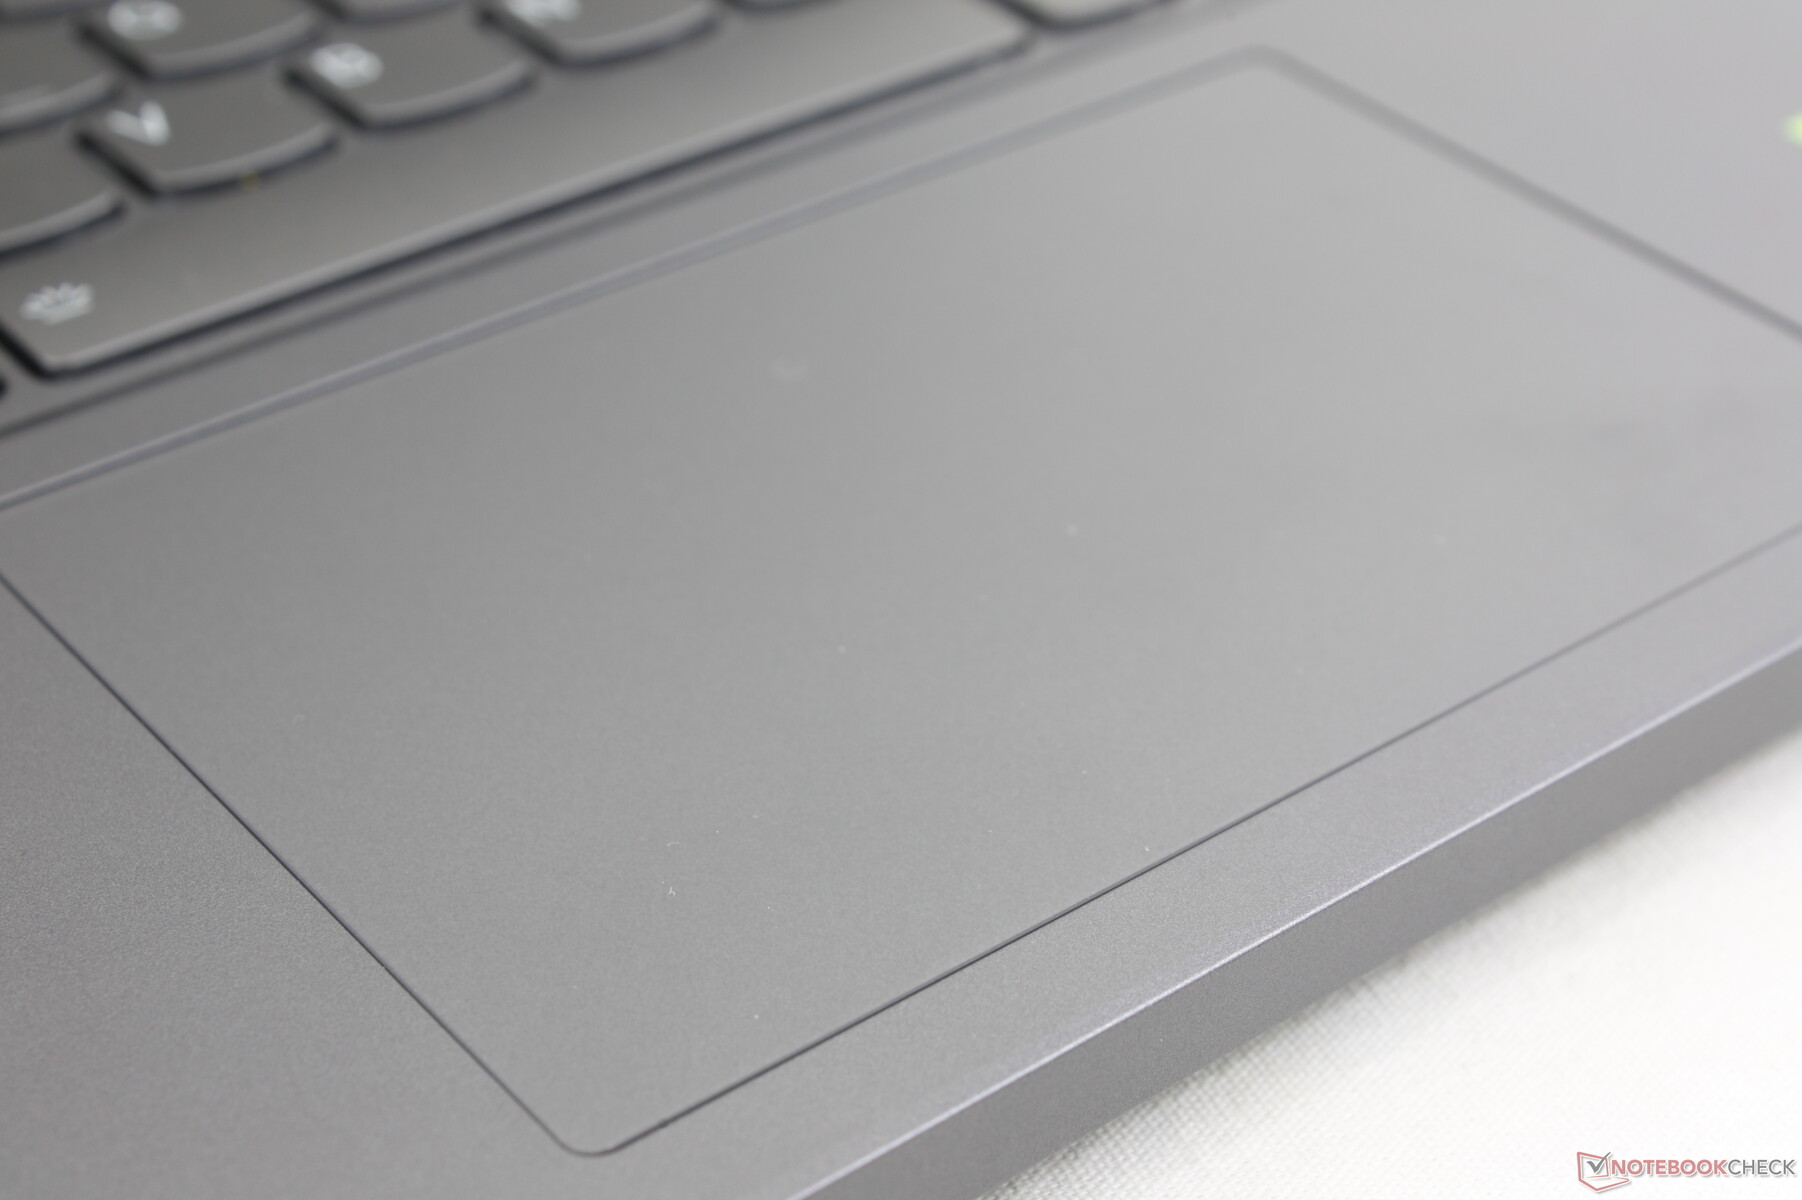
El clickpad (12 x 7,5 cm) es más grande que en el Alienware x14 (10.8 x 5.5 cm) pero más pequeño que en el Blade 14 (15 x 8.5 cm). No obstante, es suave y fiable con un repiqueteo silencioso al pulsarlo. La respuesta al introducir un clic podría ser un poco más firme, ya que está en el lado suave.
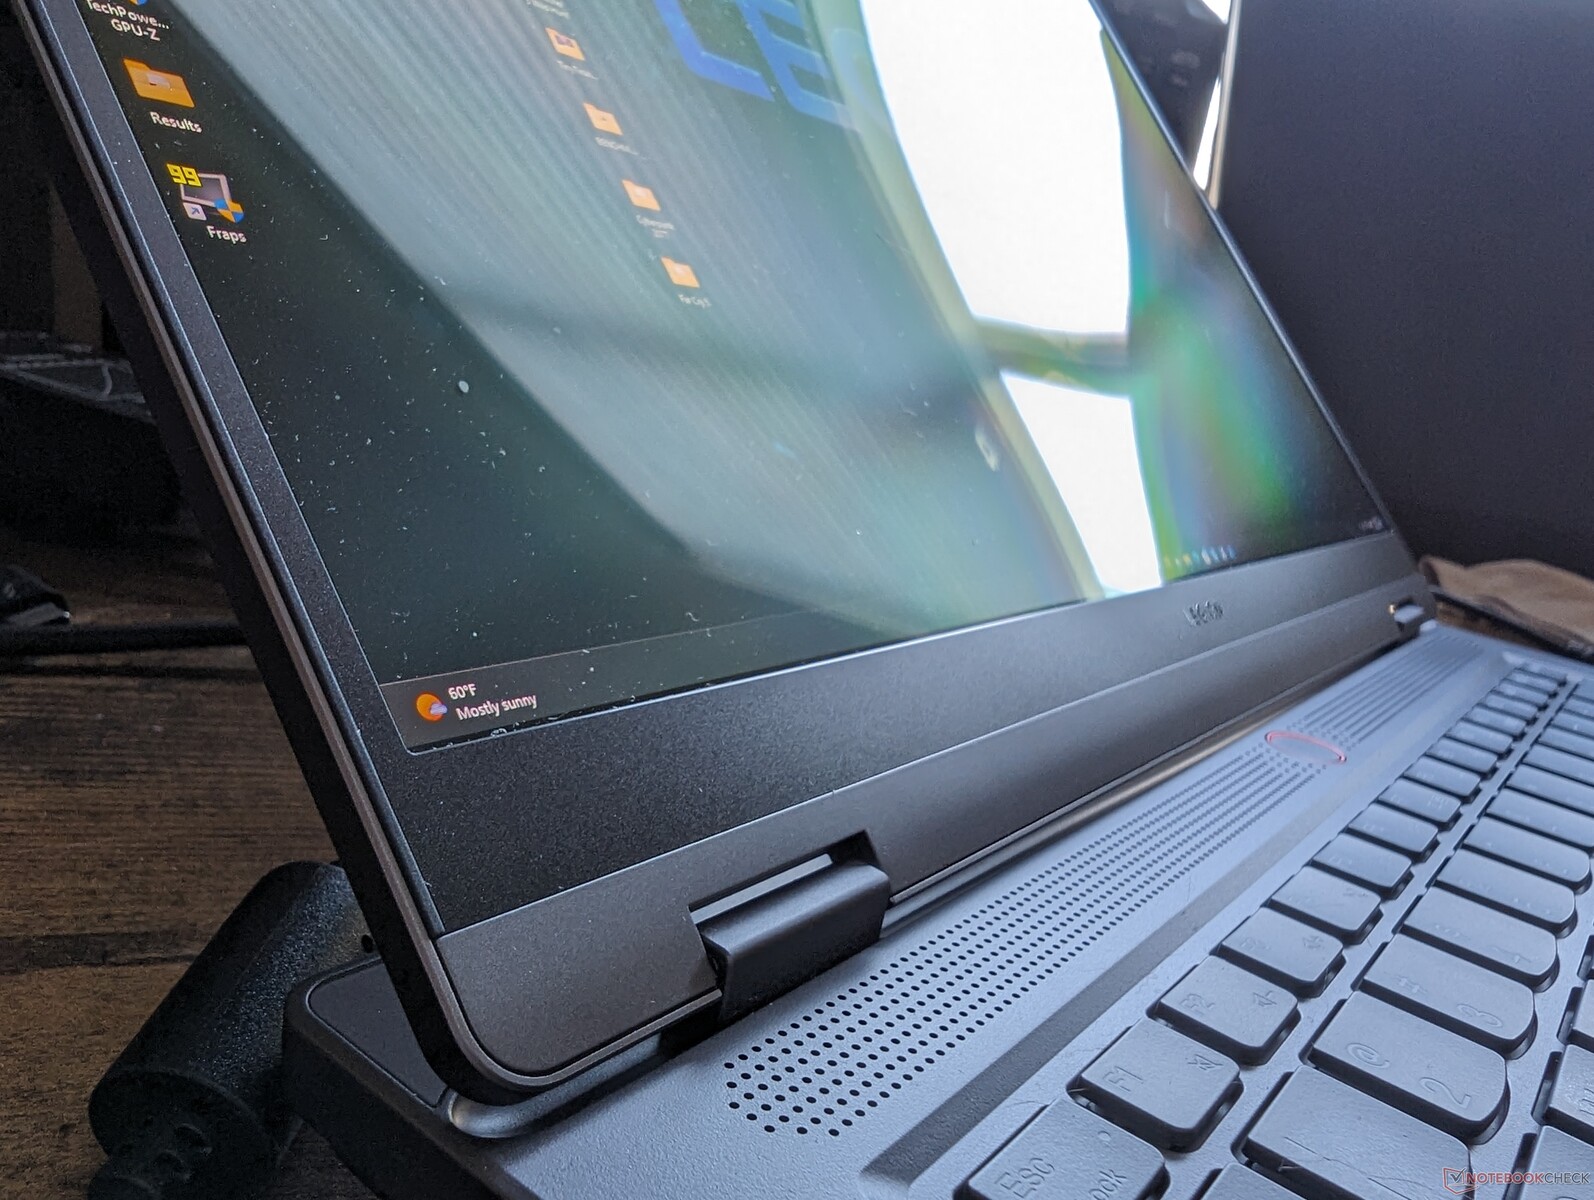
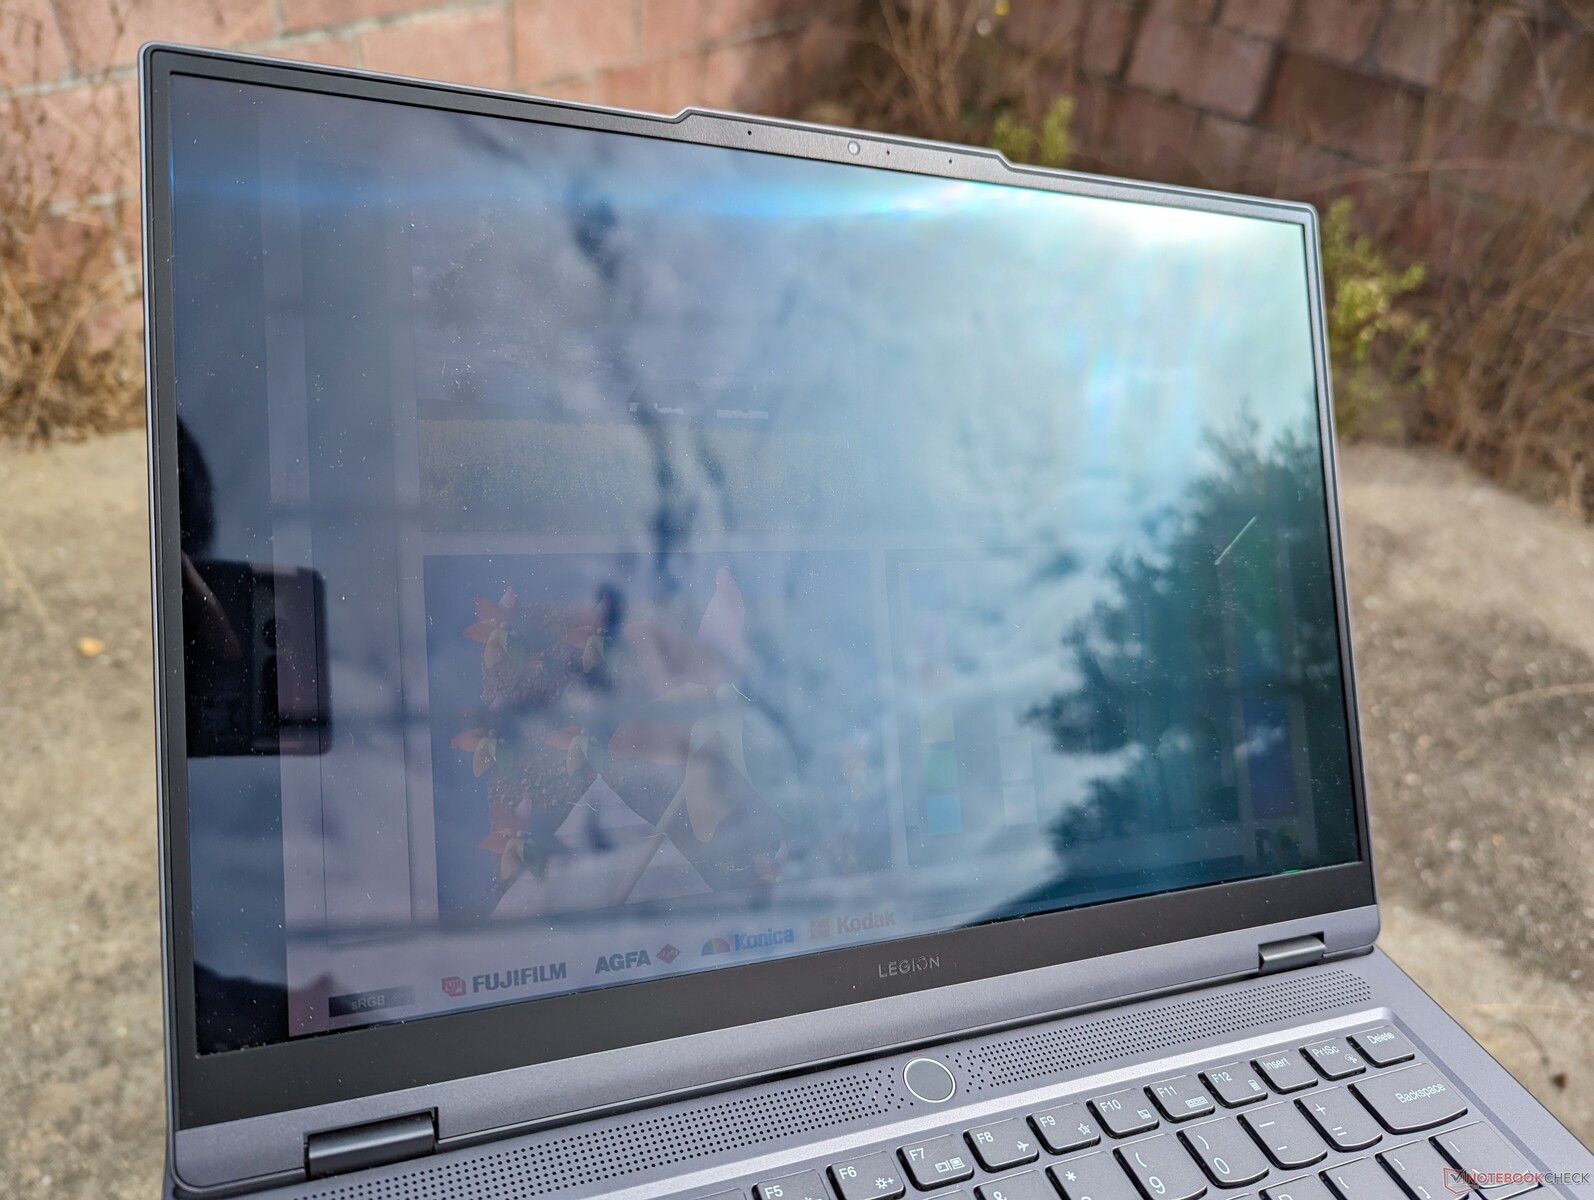
Pantalla: falta una característica importante
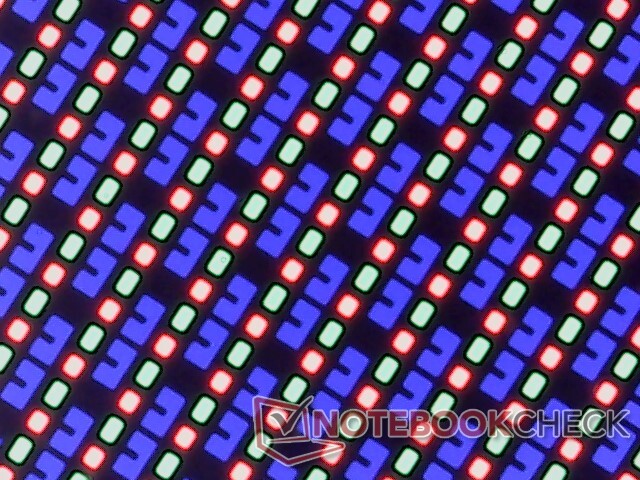
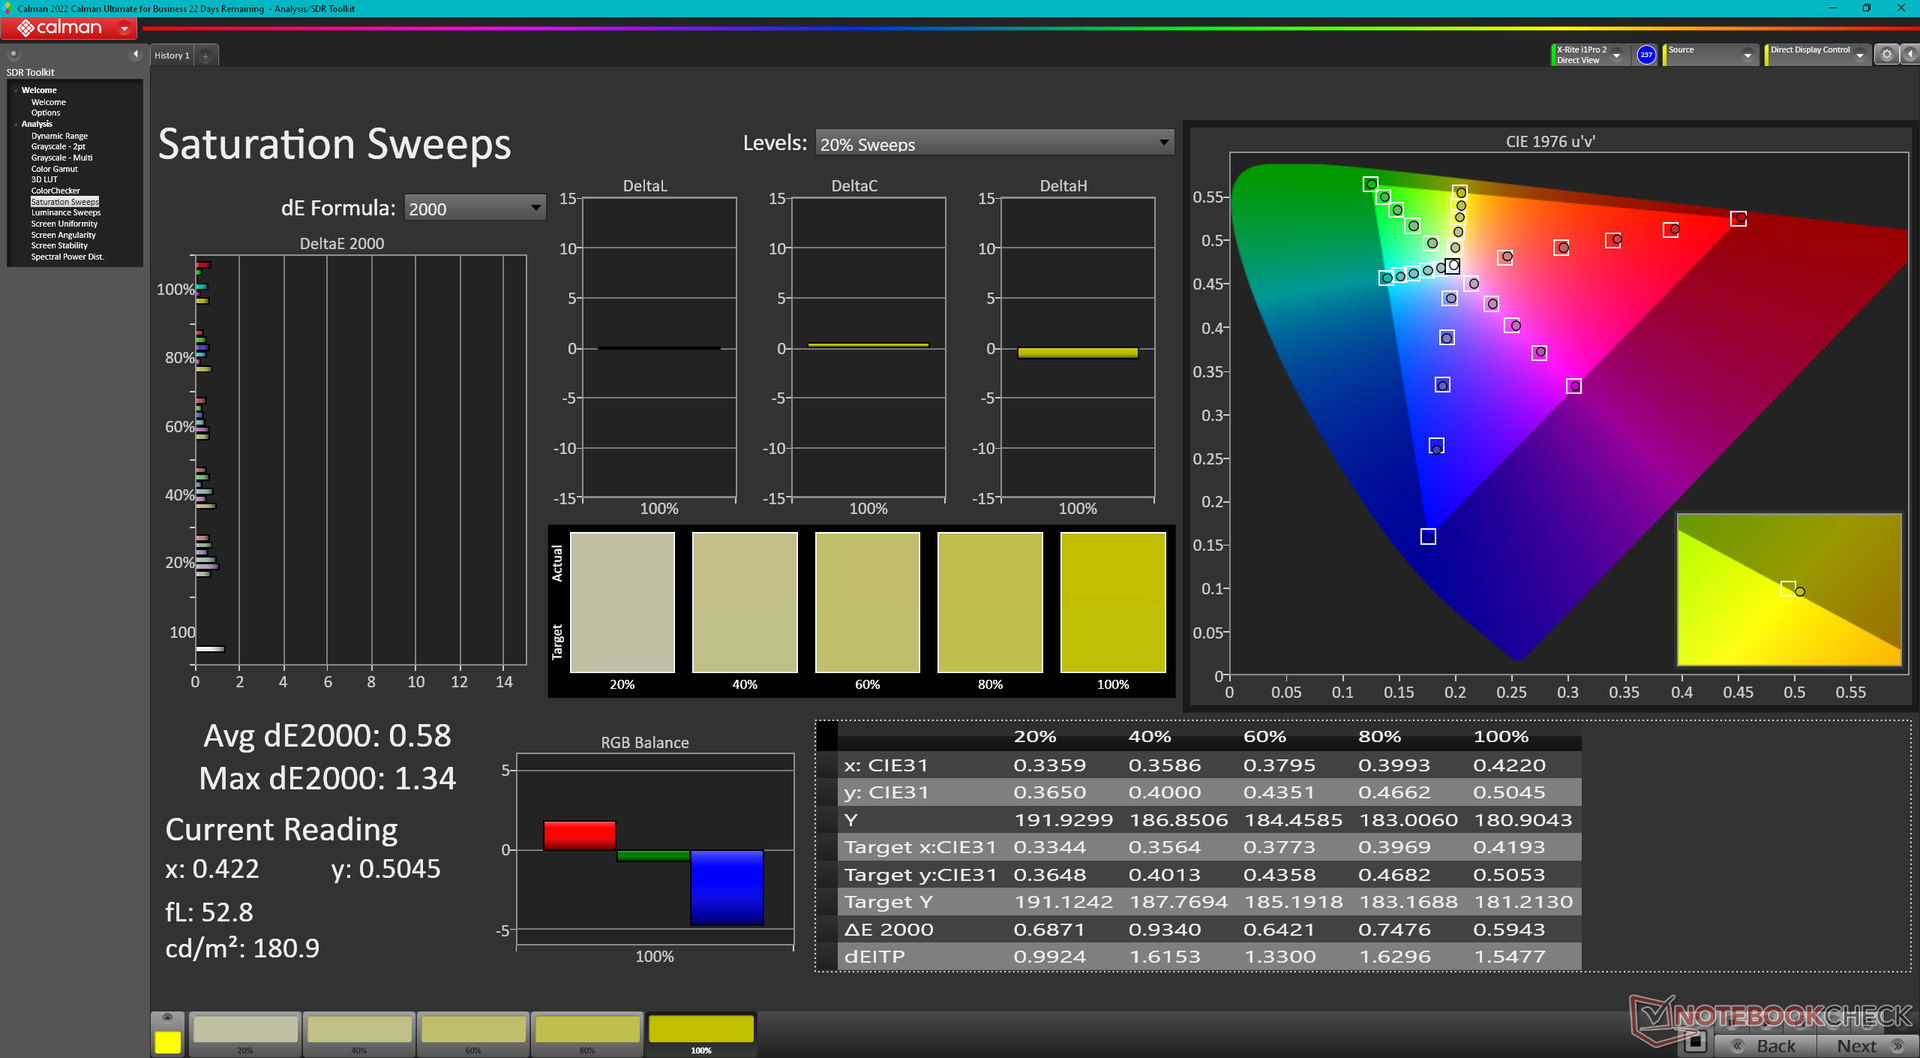
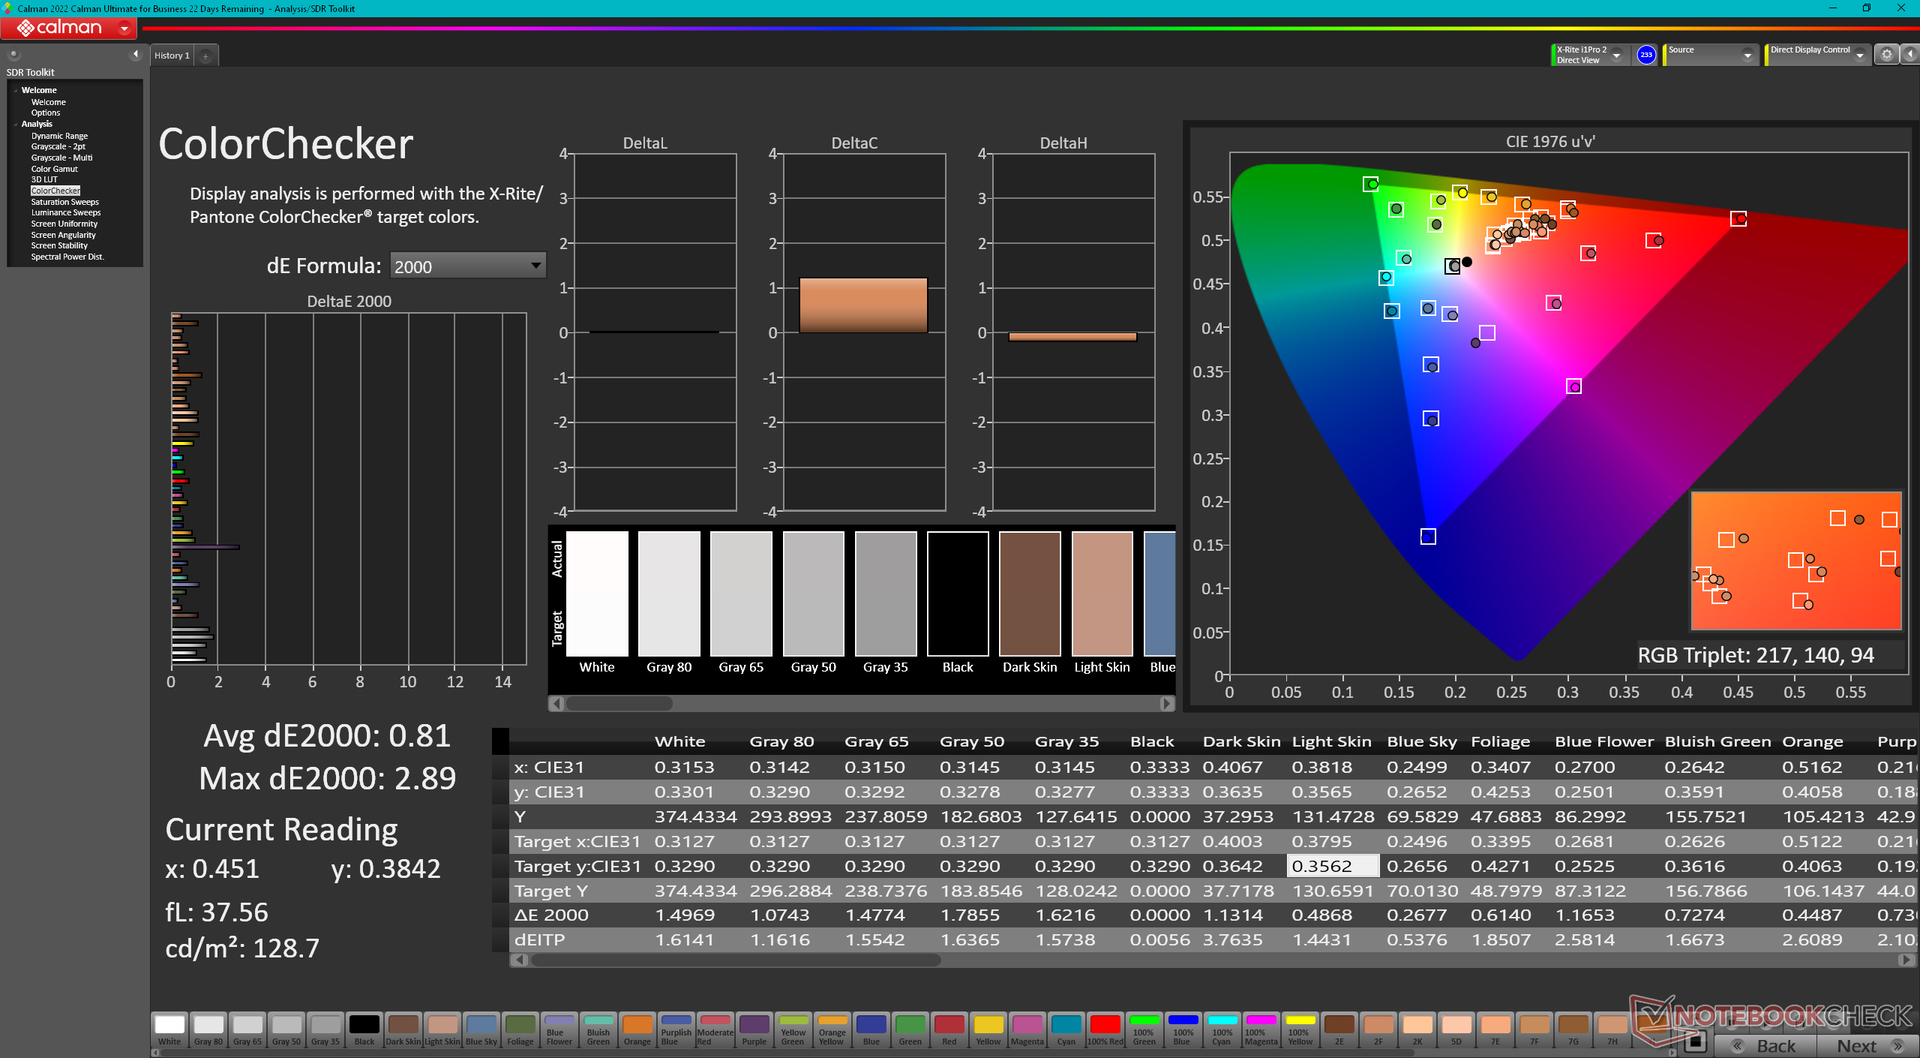
La pantalla OLED es lo más destacado del Legion Slim 5 14, ya que no se puede encontrar en ningún otro portátil para juegos de 14 pulgadas en este momento. Ofrece una frecuencia de actualización nativa de 120 Hz, una resolución densa de 2,8K y colores DCI-P3 completos para ser apto tanto para juegos como para la creación de contenidos. La mayoría de los demás paneles OLED, como los de la más barata Serie VivoBook de Asus están limitados a 60 Hz o 90 Hz en comparación. El panel aquí incluso viene con certificación Pantone, lo que no habríamos esperado de un portátil Legion diseñado principalmente para juegos.
El mayor inconveniente del display es su falta de soporte G-Sync, lo que es un fastidio para un portátil de juego caro.
| |||||||||||||||||||||||||
iluminación: 97 %
Brillo con batería: 377.5 cd/m²
Contraste: ∞:1 (Negro: 0 cd/m²)
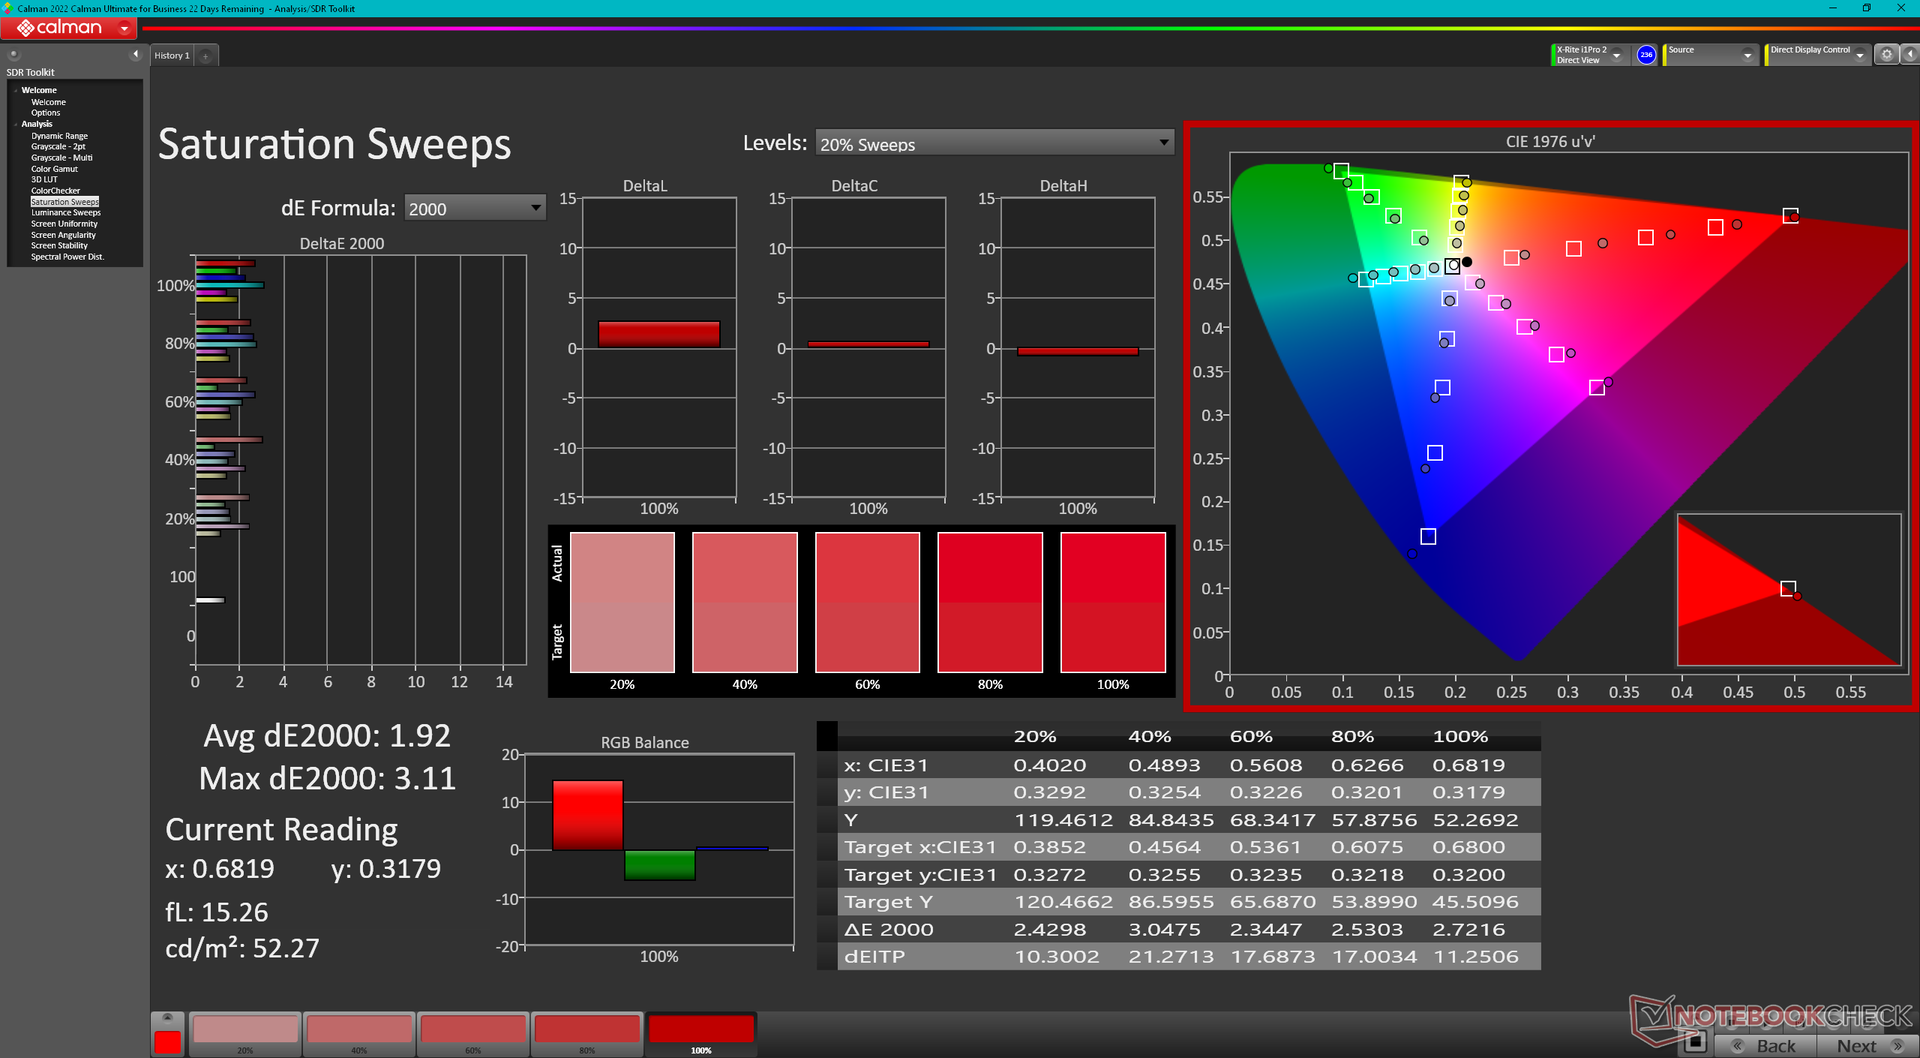
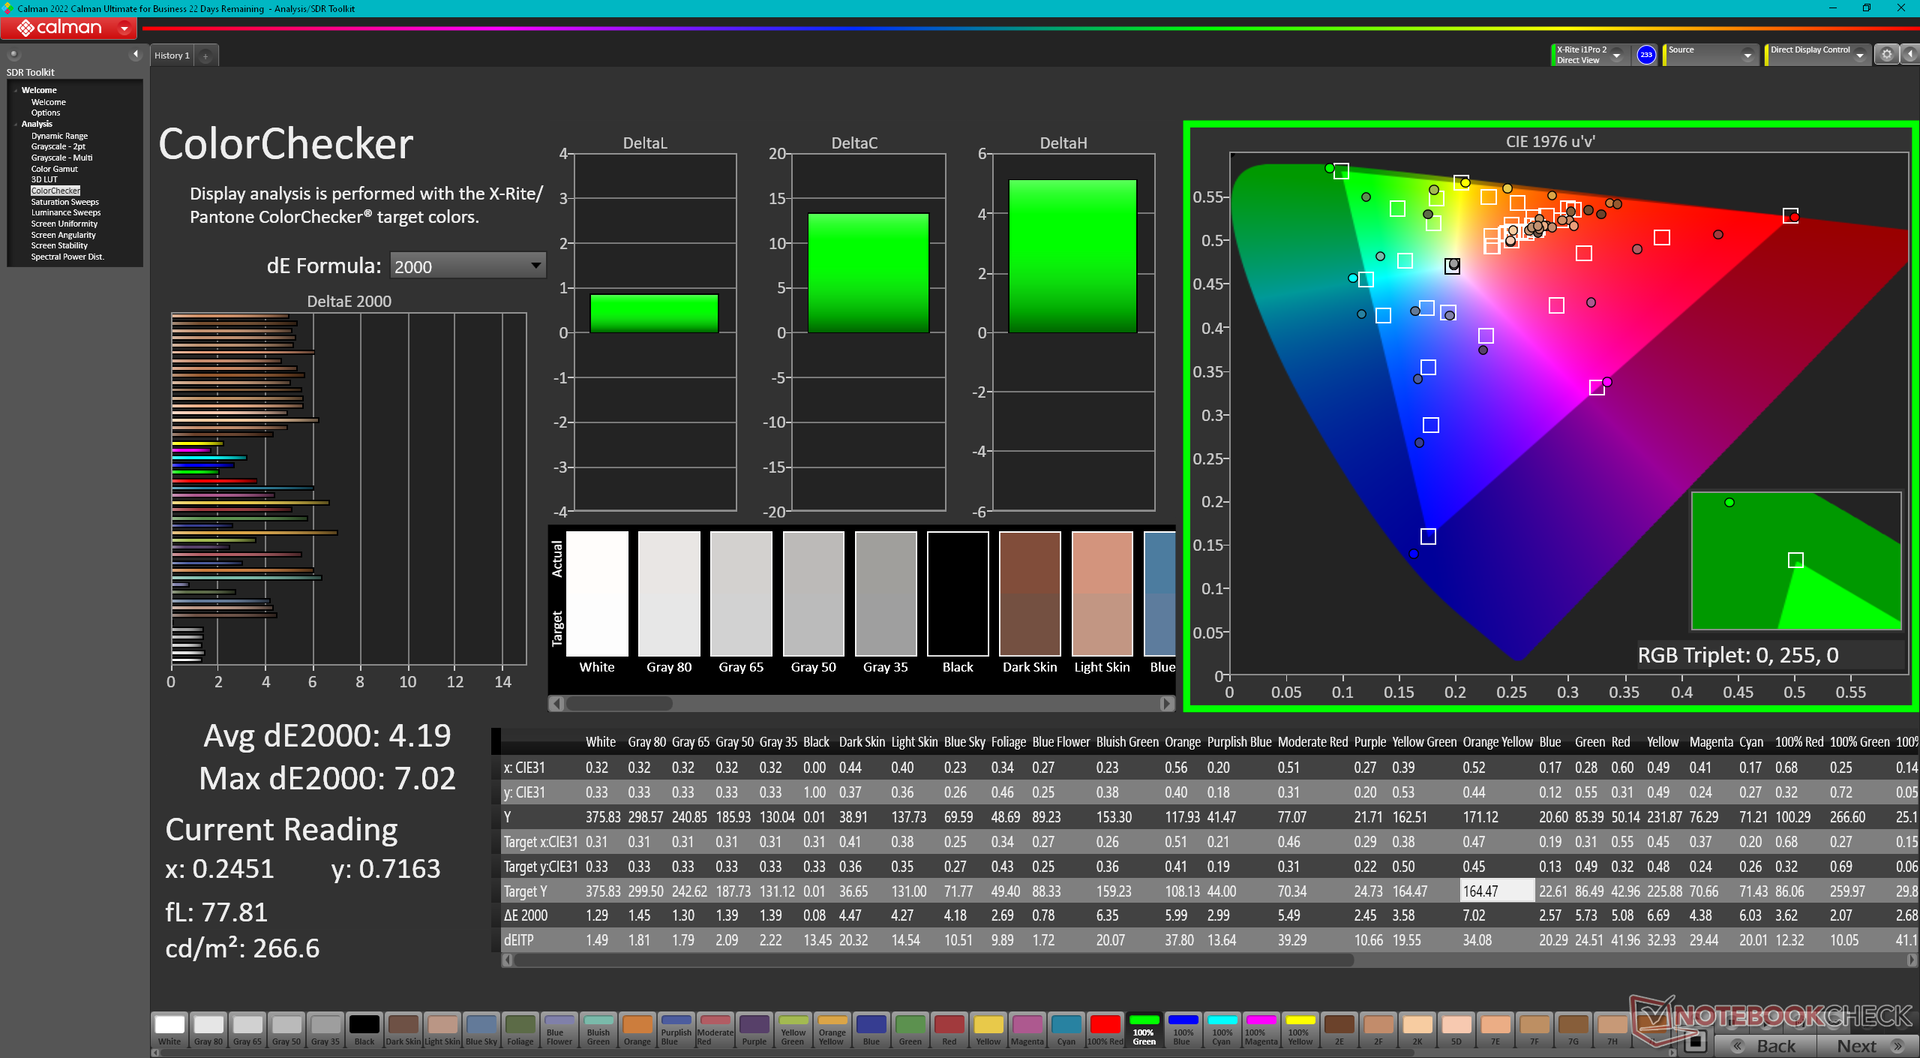
ΔE ColorChecker Calman: 4.19 | ∀{0.5-29.43 Ø4.71}
calibrated: 0.81
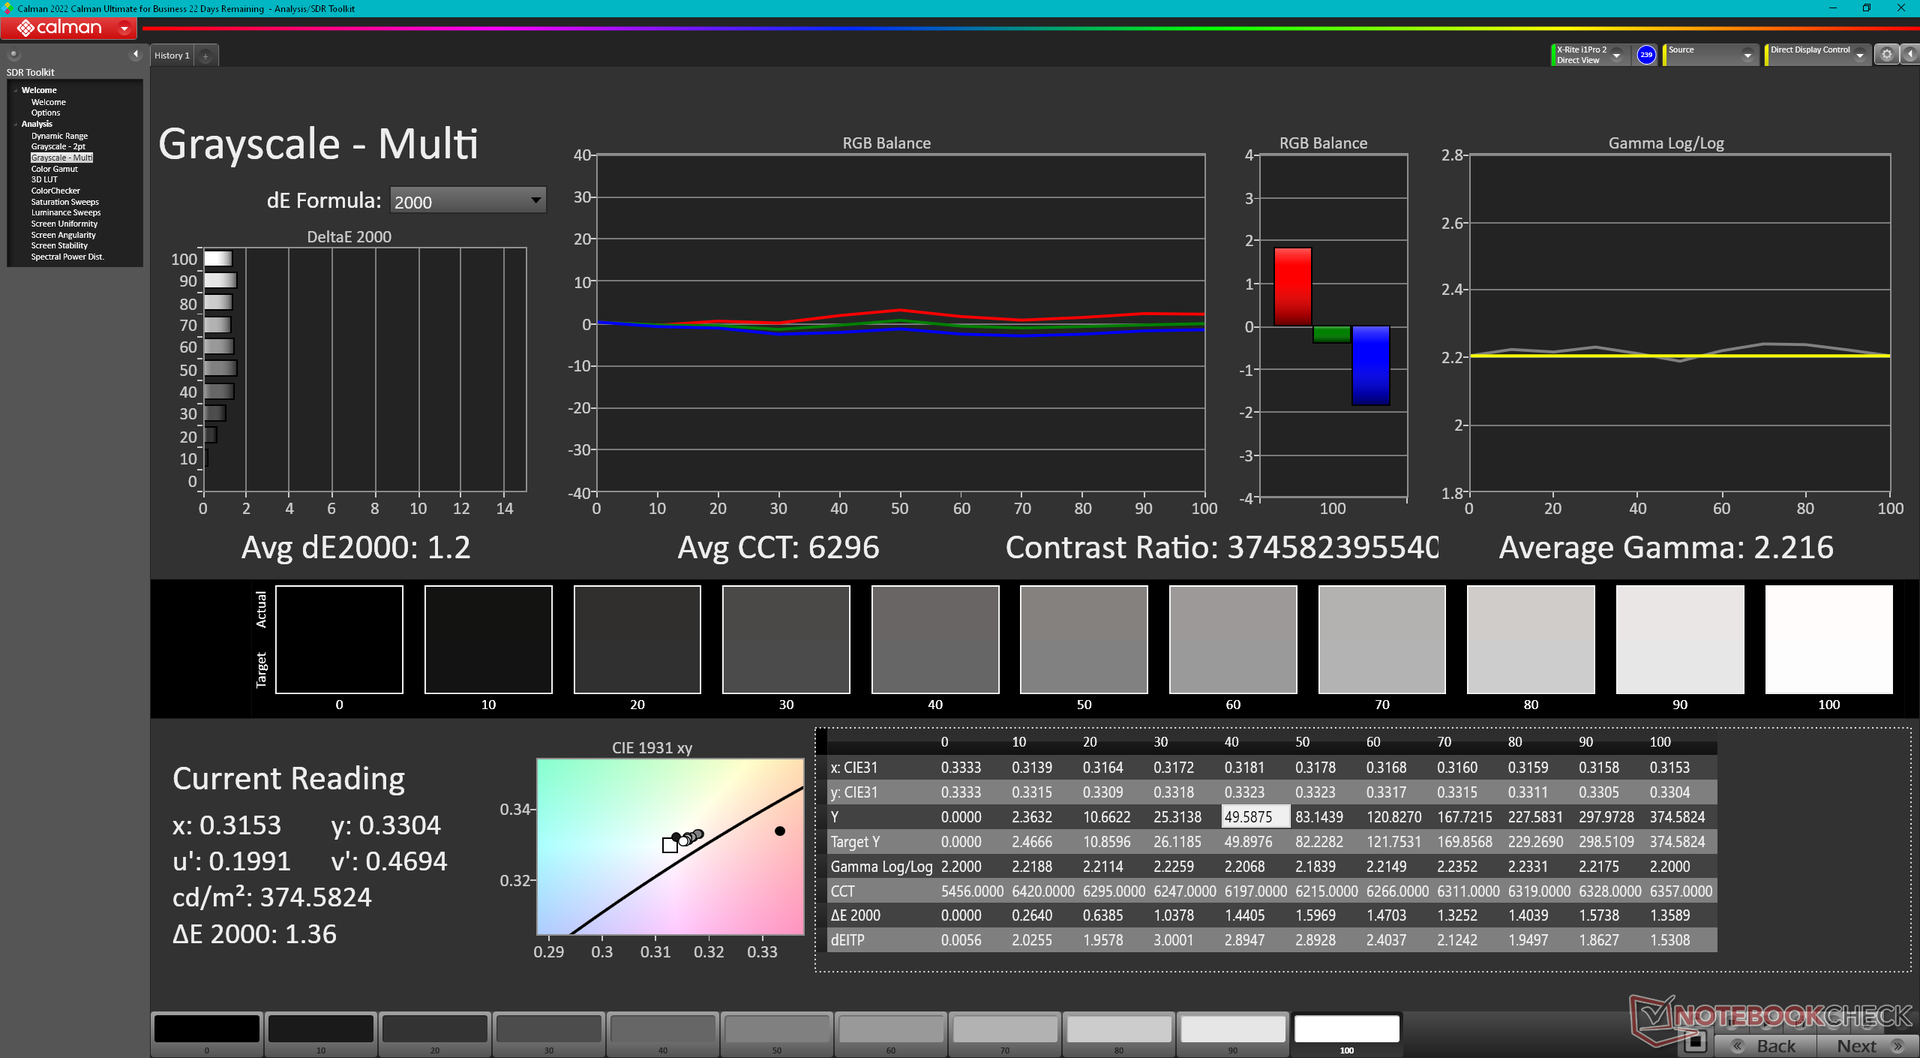
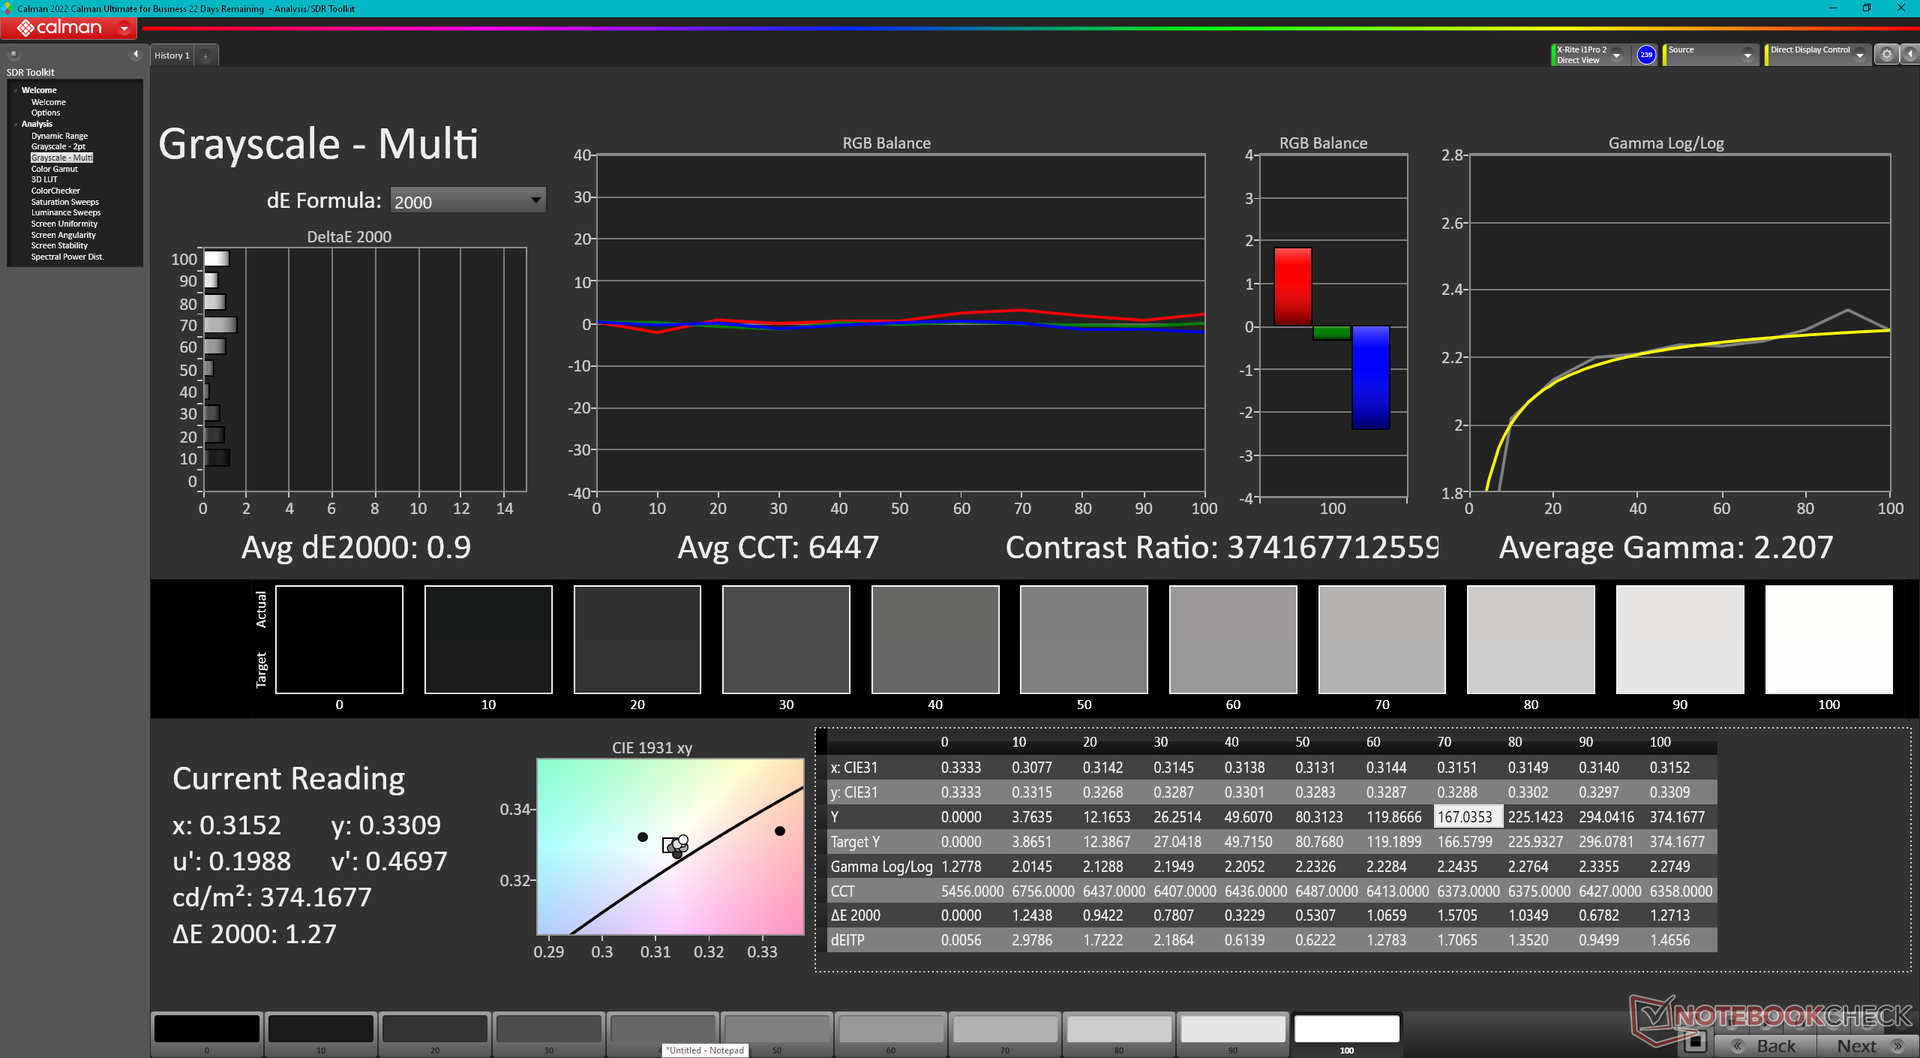
ΔE Greyscale Calman: 1.2 | ∀{0.09-98 Ø4.96}
96.5% AdobeRGB 1998 (Argyll 3D)
100% sRGB (Argyll 3D)
99.9% Display P3 (Argyll 3D)
Gamma: 2.22
CCT: 6296 K
| Lenovo Legion Slim 5 14APH8 Samsung SDC ATNA45AF02-2, OLED, 2880x1600, 14.5" | Acer Predator Triton 14 PT14-51 BOE NE140QDM-NY1, IPS, 2560x1600, 14" | Razer Blade 14 RTX 4070 AU Optronics B140QAN06.U, IPS, 2560x1600, 14" | Asus ROG Zephyrus G14 GA402XY B140QAN06.S, Mini-LED, 2560x1600, 14" | Alienware x14 i7 RTX 3060 SHP154D, IPS, 1920x1080, 14" | Lenovo LOQ 15APH8 BOE NJ NE156FHM-NX3, IPS, 1920x1080, 15.6" | |
|---|---|---|---|---|---|---|
| Display | -5% | -5% | -1% | -3% | -52% | |
| Display P3 Coverage (%) | 99.9 | 96.9 -3% | 97.3 -3% | 99.6 0% | 99.6 0% | 40.2 -60% |
| sRGB Coverage (%) | 100 | 99.9 0% | 99.8 0% | 100 0% | 100 0% | 60.2 -40% |
| AdobeRGB 1998 Coverage (%) | 96.5 | 85.5 -11% | 85.3 -12% | 93.4 -3% | 87.6 -9% | 41.5 -57% |
| Response Times | -1143% | -1049% | -1479% | -884% | -3816% | |
| Response Time Grey 50% / Grey 80% * (ms) | 0.79 ? | 15.1 ? -1811% | 11.9 ? -1406% | 17.2 ? -2077% | 9.6 ? -1115% | 42.7 ? -5305% |
| Response Time Black / White * (ms) | 1.01 ? | 5.8 ? -474% | 8 ? -692% | 9.9 ? -880% | 7.6 ? -652% | 24.5 ? -2326% |
| PWM Frequency (Hz) | 240.5 ? | 5430 | ||||
| Screen | -33% | -52% | 28% | -38% | -62% | |
| Brightness middle (cd/m²) | 377.5 | 547 45% | 559.3 48% | 535 42% | 434 15% | 346.2 -8% |
| Brightness (cd/m²) | 381 | 516 35% | 560 47% | 563 48% | 411 8% | 329 -14% |
| Brightness Distribution (%) | 97 | 88 -9% | 88 -9% | 91 -6% | 89 -8% | 81 -16% |
| Black Level * (cd/m²) | 0.56 | 0.44 | 0.25 | 0.31 | ||
| Colorchecker dE 2000 * | 4.19 | 3.28 22% | 4.44 -6% | 1 76% | 3 28% | 4.19 -0% |
| Colorchecker dE 2000 max. * | 7.02 | 8.57 -22% | 9.3 -32% | 2.8 60% | 7.1 -1% | 19.19 -173% |
| Colorchecker dE 2000 calibrated * | 0.81 | 1.09 -35% | 0.39 52% | 0.7 14% | 1.66 -105% | |
| Greyscale dE 2000 * | 1.2 | 4.4 -267% | 6.8 -467% | 1.8 -50% | 5.1 -325% | 2.6 -117% |
| Gamma | 2.22 99% | 2.168 101% | 2.3 96% | 2.24 98% | 2.19 100% | 2.19 100% |
| CCT | 6296 103% | 7767 84% | 6242 104% | 6337 103% | 6204 105% | 6749 96% |
| Contrast (:1) | 977 | 1271 | 1736 | 1117 | ||
| Media total (Programa/Opciones) | -394% /
-211% | -369% /
-207% | -484% /
-254% | -308% /
-170% | -1310% /
-685% |
* ... más pequeño es mejor
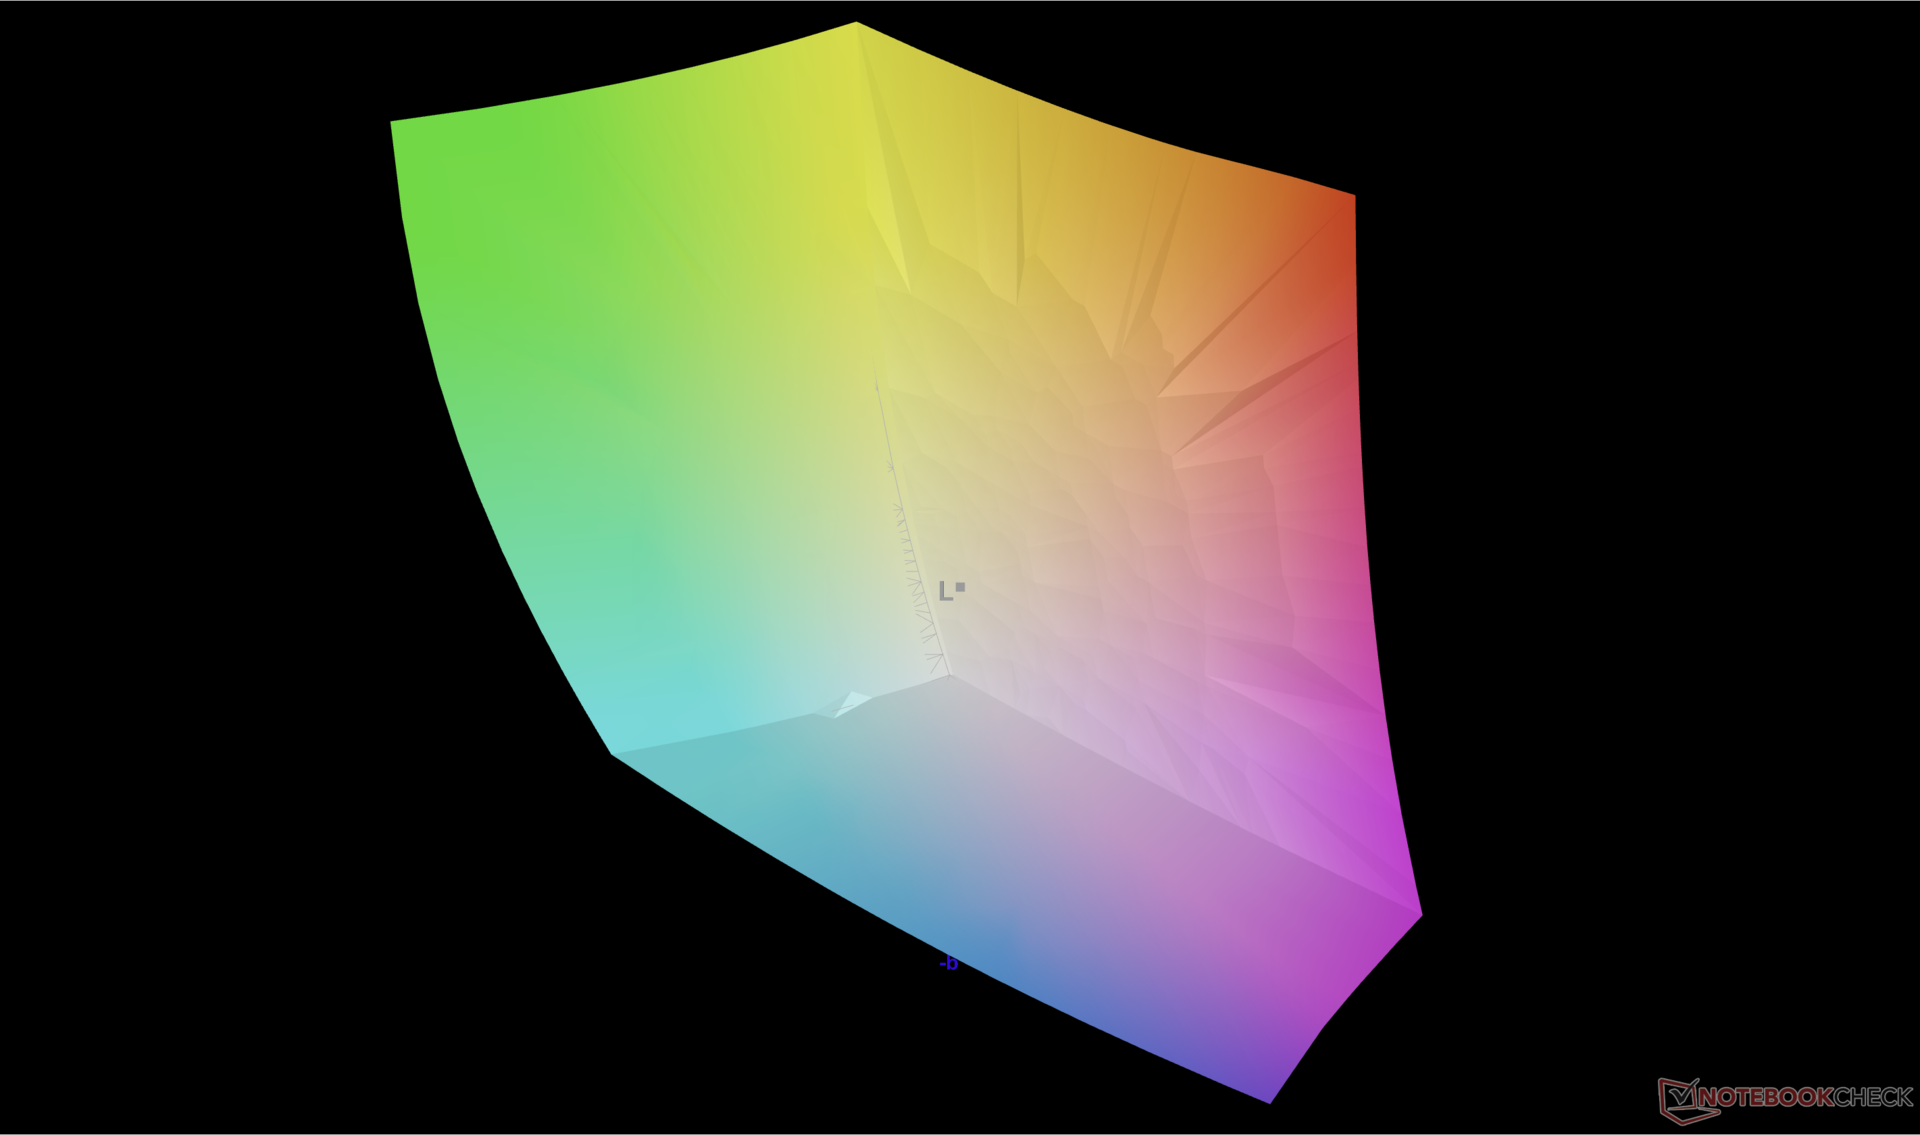
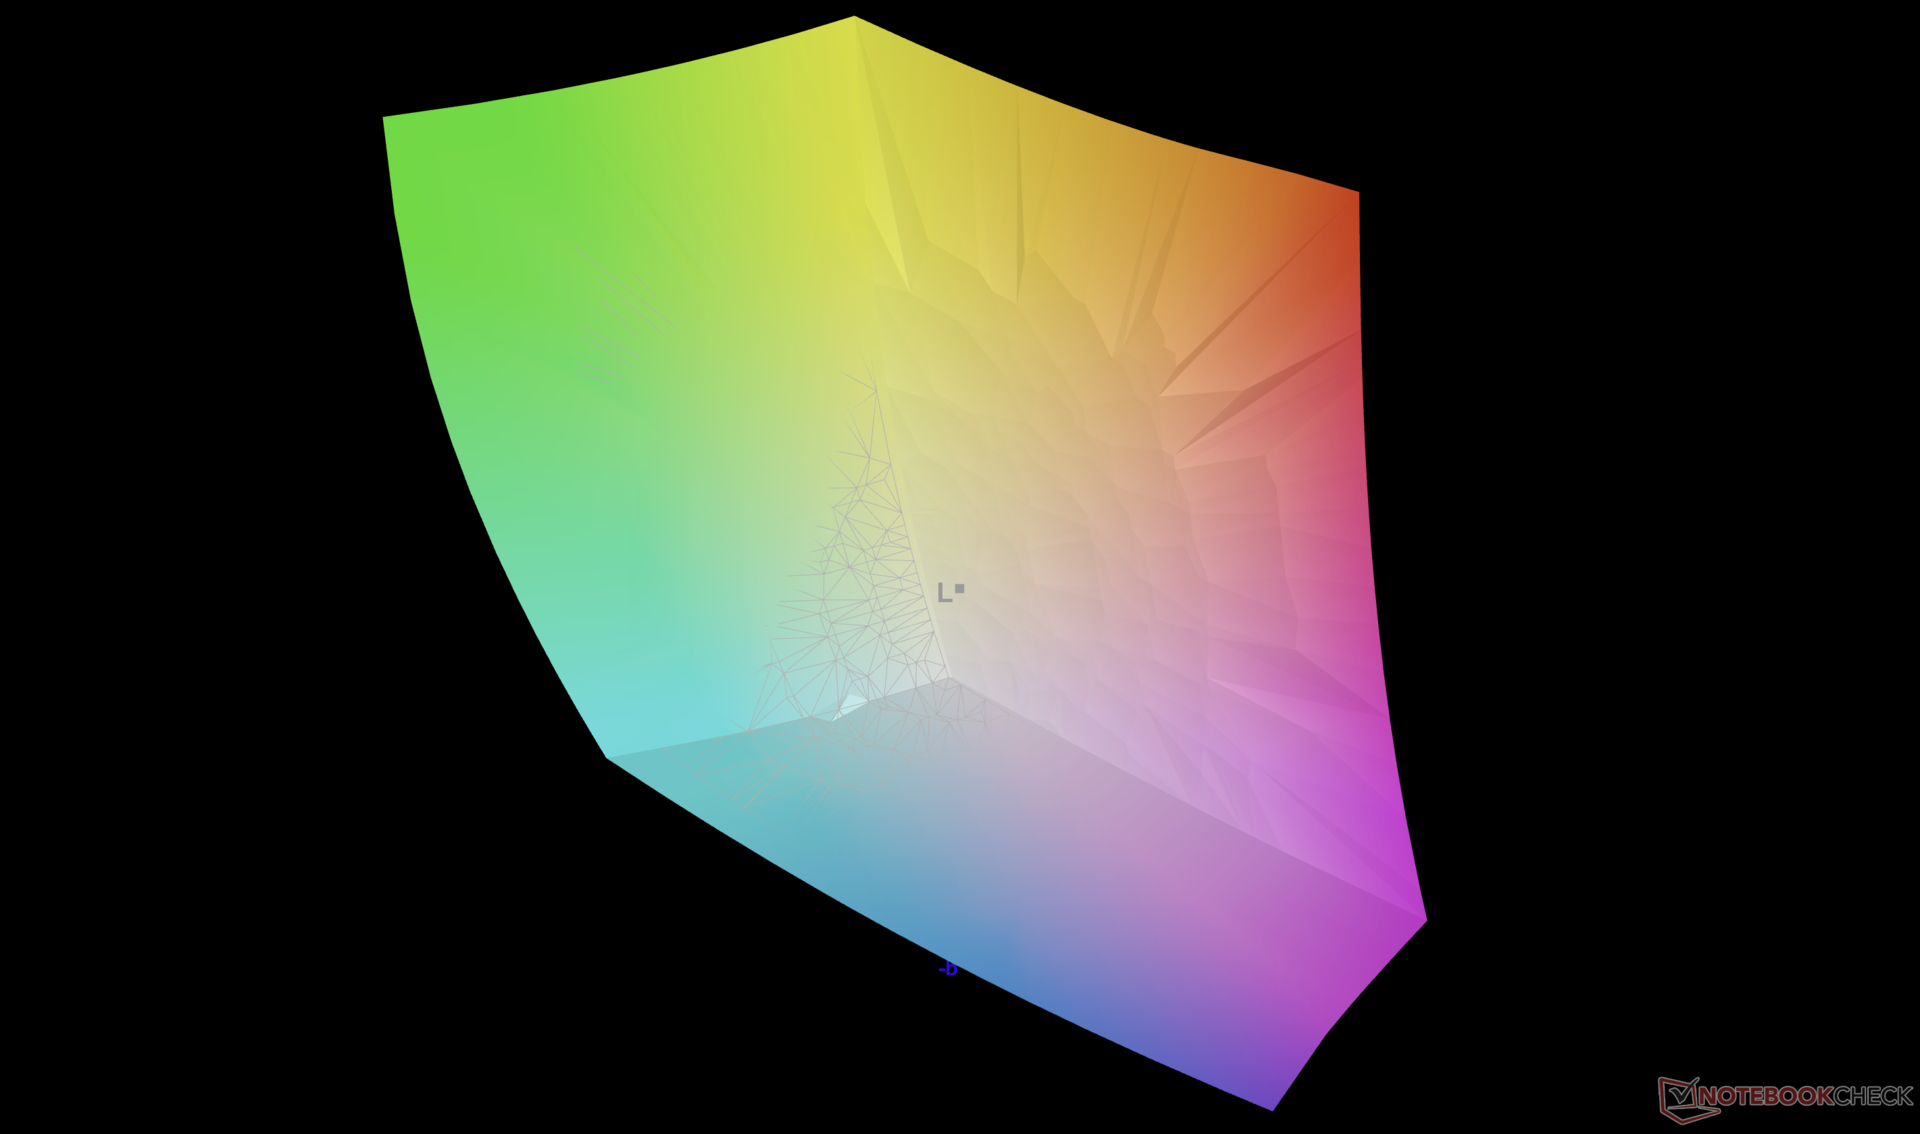
La pantalla viene bien calibrada de fábrica con el estándar DCI-P3, por lo que la mayoría de los usuarios no necesitarán calibrarla. Sin embargo, la temperatura de color es ligeramente demasiado cálida a 6300K, pero es sólo un pequeño detalle. Nuestro perfil ICM está disponible para su descarga gratuita.
Tiempos de respuesta del display
| ↔ Tiempo de respuesta de Negro a Blanco | ||
|---|---|---|
| 1.01 ms ... subida ↗ y bajada ↘ combinada | ↗ 0.64 ms subida | 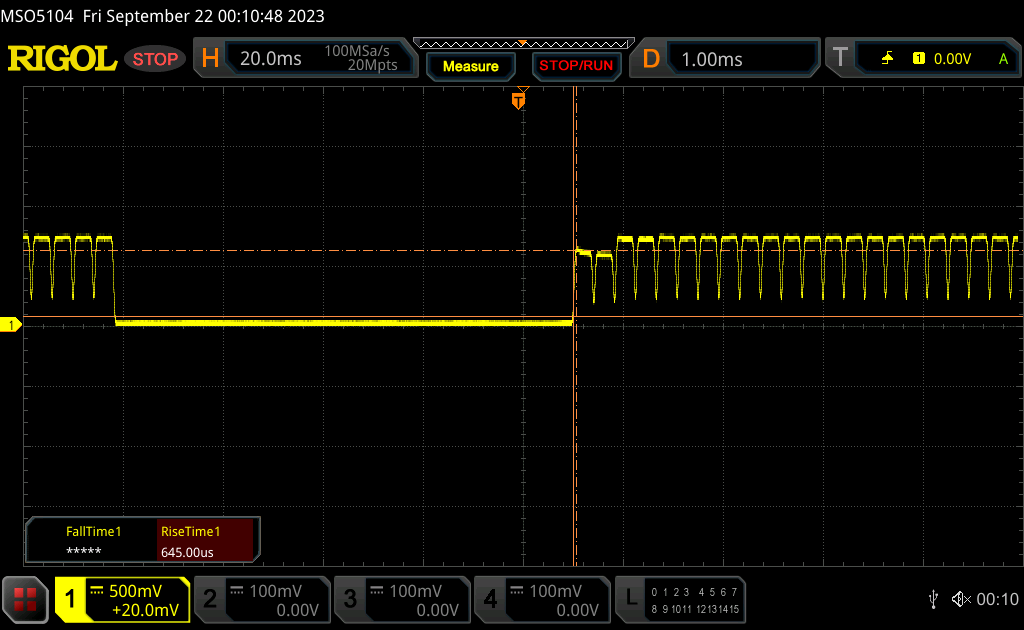 |
| ↘ 0.37 ms bajada | ||
| La pantalla mostró tiempos de respuesta muy rápidos en nuestros tests y debería ser adecuada para juegos frenéticos. En comparación, todos los dispositivos de prueba van de ##min### (mínimo) a 240 (máximo) ms. » 4 % de todos los dispositivos son mejores. Esto quiere decir que el tiempo de respuesta medido es mejor que la media (19.8 ms) de todos los dispositivos testados. | ||
| ↔ Tiempo de respuesta 50% Gris a 80% Gris | ||
| 0.79 ms ... subida ↗ y bajada ↘ combinada | ↗ 0.46 ms subida | 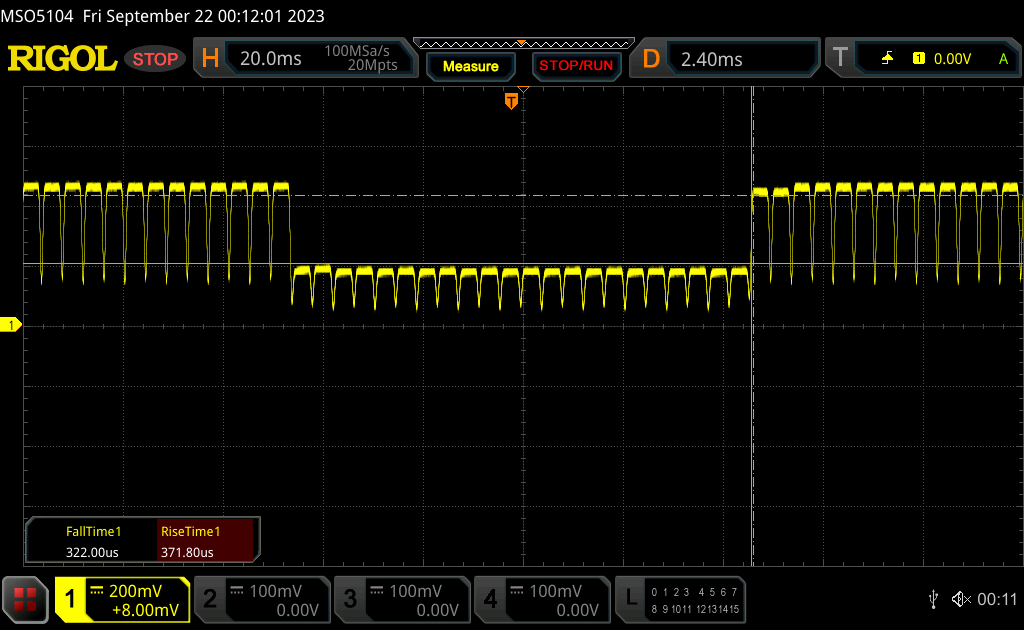 |
| ↘ 0.33 ms bajada | ||
| La pantalla mostró tiempos de respuesta muy rápidos en nuestros tests y debería ser adecuada para juegos frenéticos. En comparación, todos los dispositivos de prueba van de ##min### (mínimo) a 636 (máximo) ms. » 3 % de todos los dispositivos son mejores. Esto quiere decir que el tiempo de respuesta medido es mejor que la media (31 ms) de todos los dispositivos testados. | ||
Parpadeo de Pantalla / PWM (Pulse-Width Modulation)
| Parpadeo de Pantalla / PWM detectado | 240.5 Hz | ≤ 100 % de brillo | 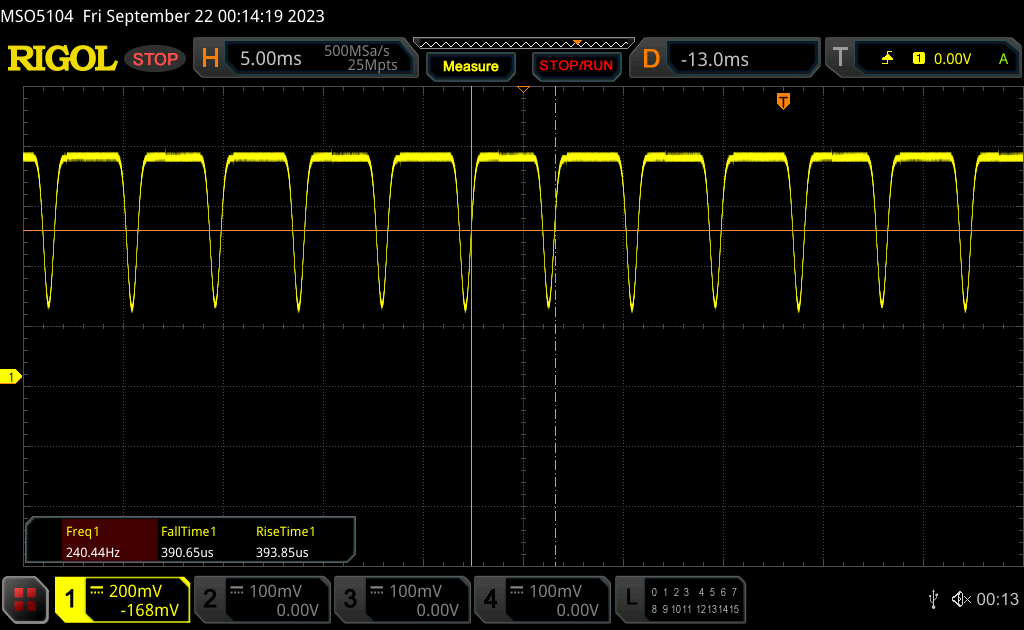 |
La retroiluminación del display parpadea a 240.5 Hz (seguramente usa PWM - Pulse-Width Modulation) a un brillo del 100 % e inferior. Sobre este nivel de brillo no debería darse parpadeo / PWM. La frecuencia de 240.5 Hz es relativamente baja, por lo que la gente sensible debería ver parpadeos y padecer fatiga visual por la pantalla (usado al brillo indicado a continuación). Comparación: 52 % de todos los dispositivos testados no usaron PWM para atenuar el display. Si se usó, medimos una media de 7757 (mínimo: 5 - máxmo: 343500) Hz. | |||
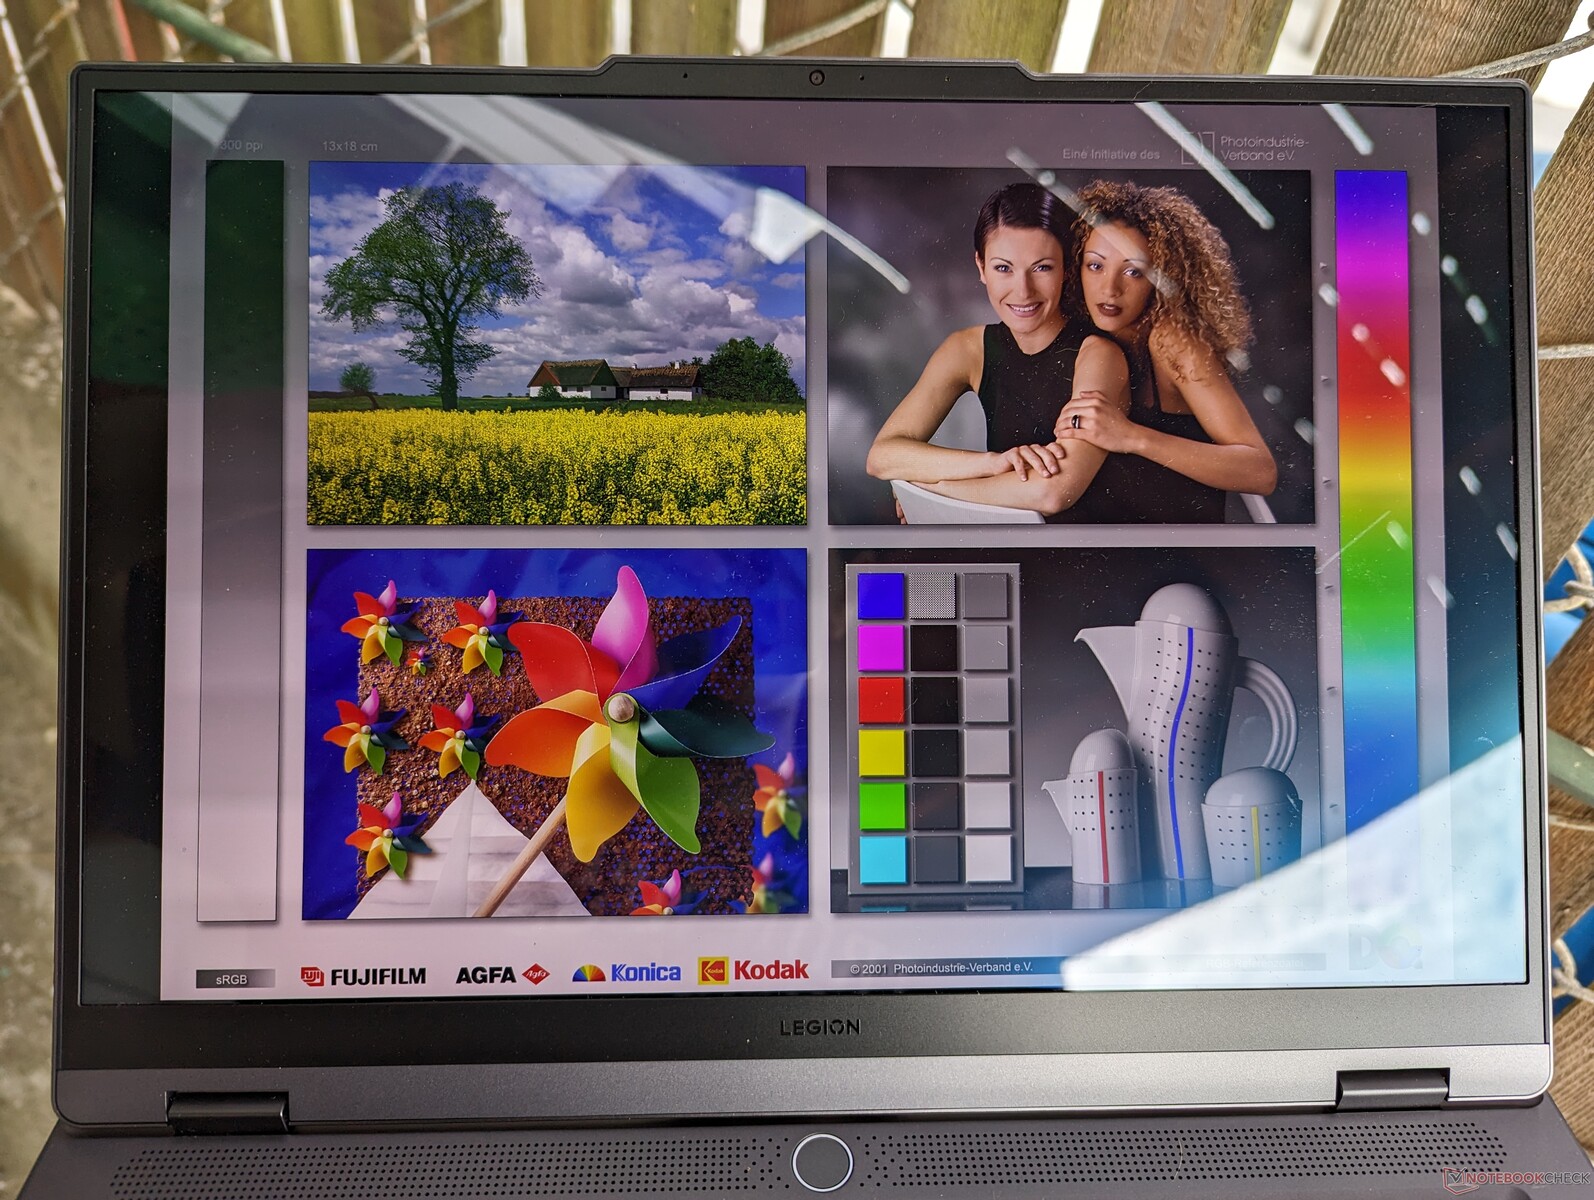
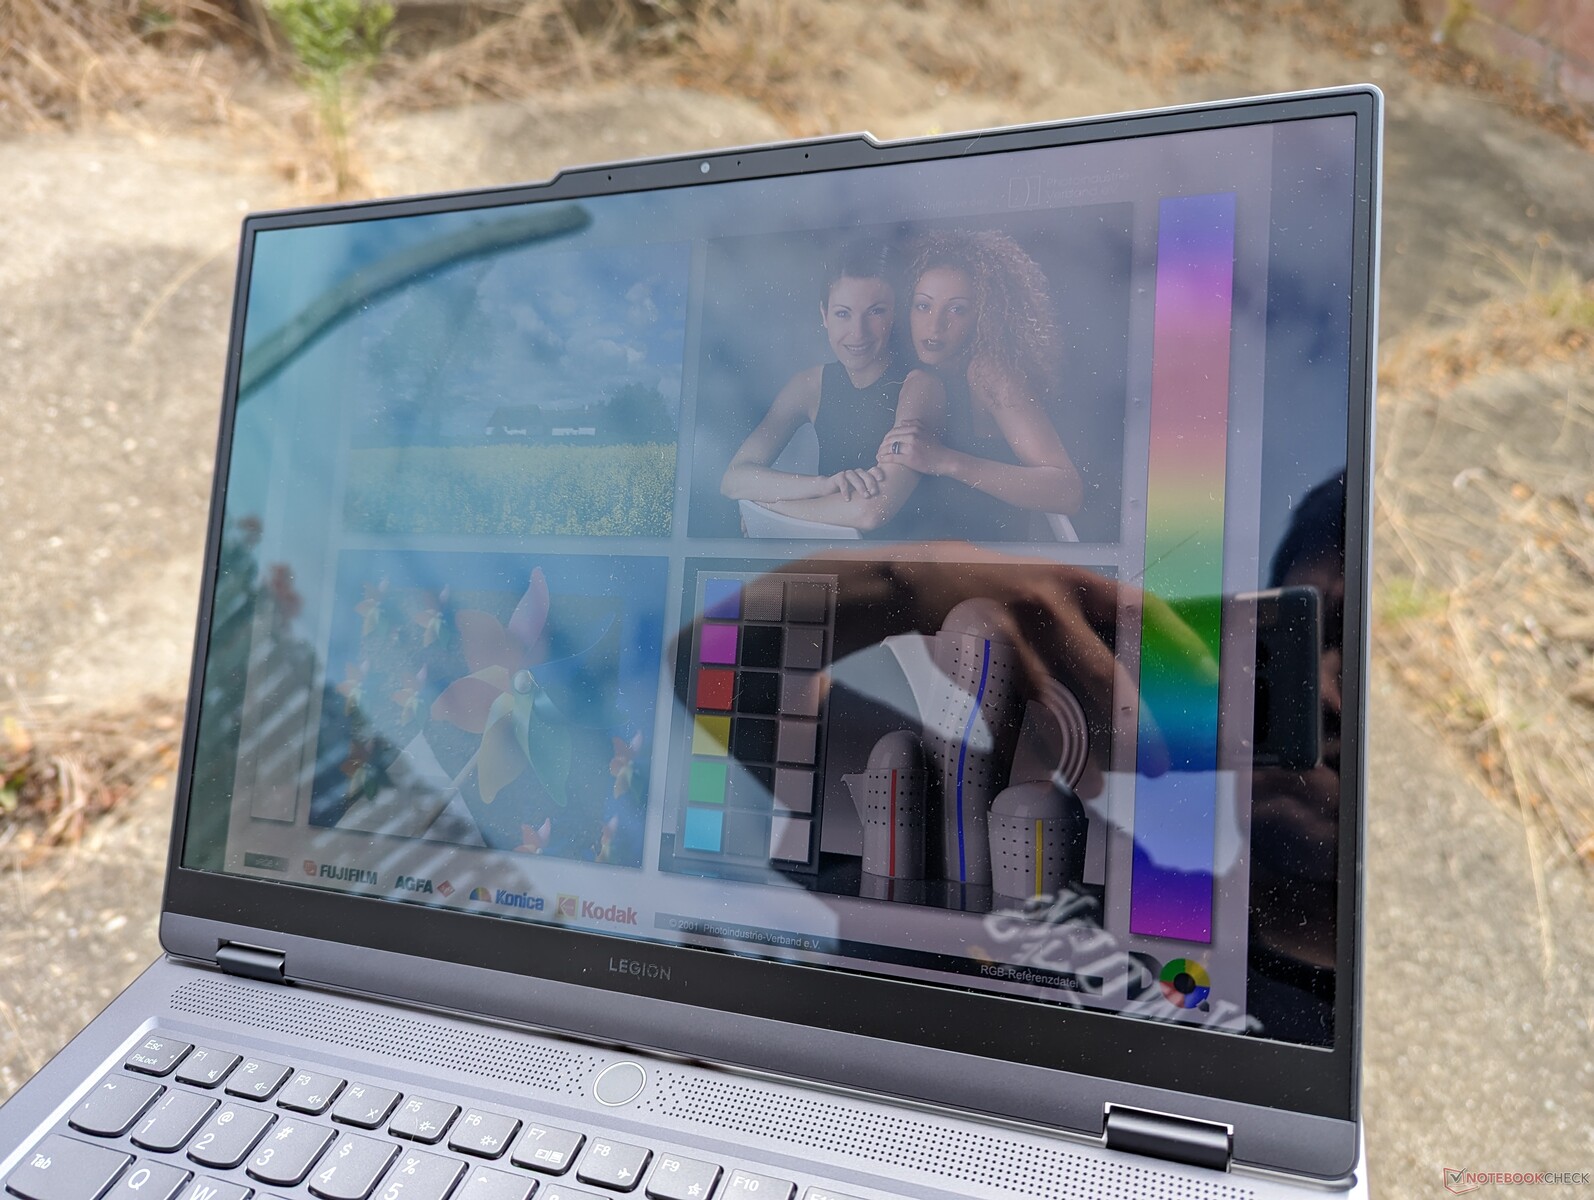
El brillo máximo en el mundo real es de unos 386 nits comparado con la afirmación de Lenovo de 400 nits para contenido SDR. Si se activa HDR, el brillo máximo llegaría a los 515 nits, lo que coincidiría con la afirmación de Lenovo de compatibilidad con HDR500. Los paneles IPS mate del Blade 14 o el Zephyrus G14 son notablemente más brillantes con unos 550 nits cada uno para contenido SDR para una mejor visibilidad en exteriores en comparación con nuestro muy lustroso modelo Lenovo.
Rendimiento - Zen 4 se complementa bien con Nvidia RTX
Condiciones de ensayo
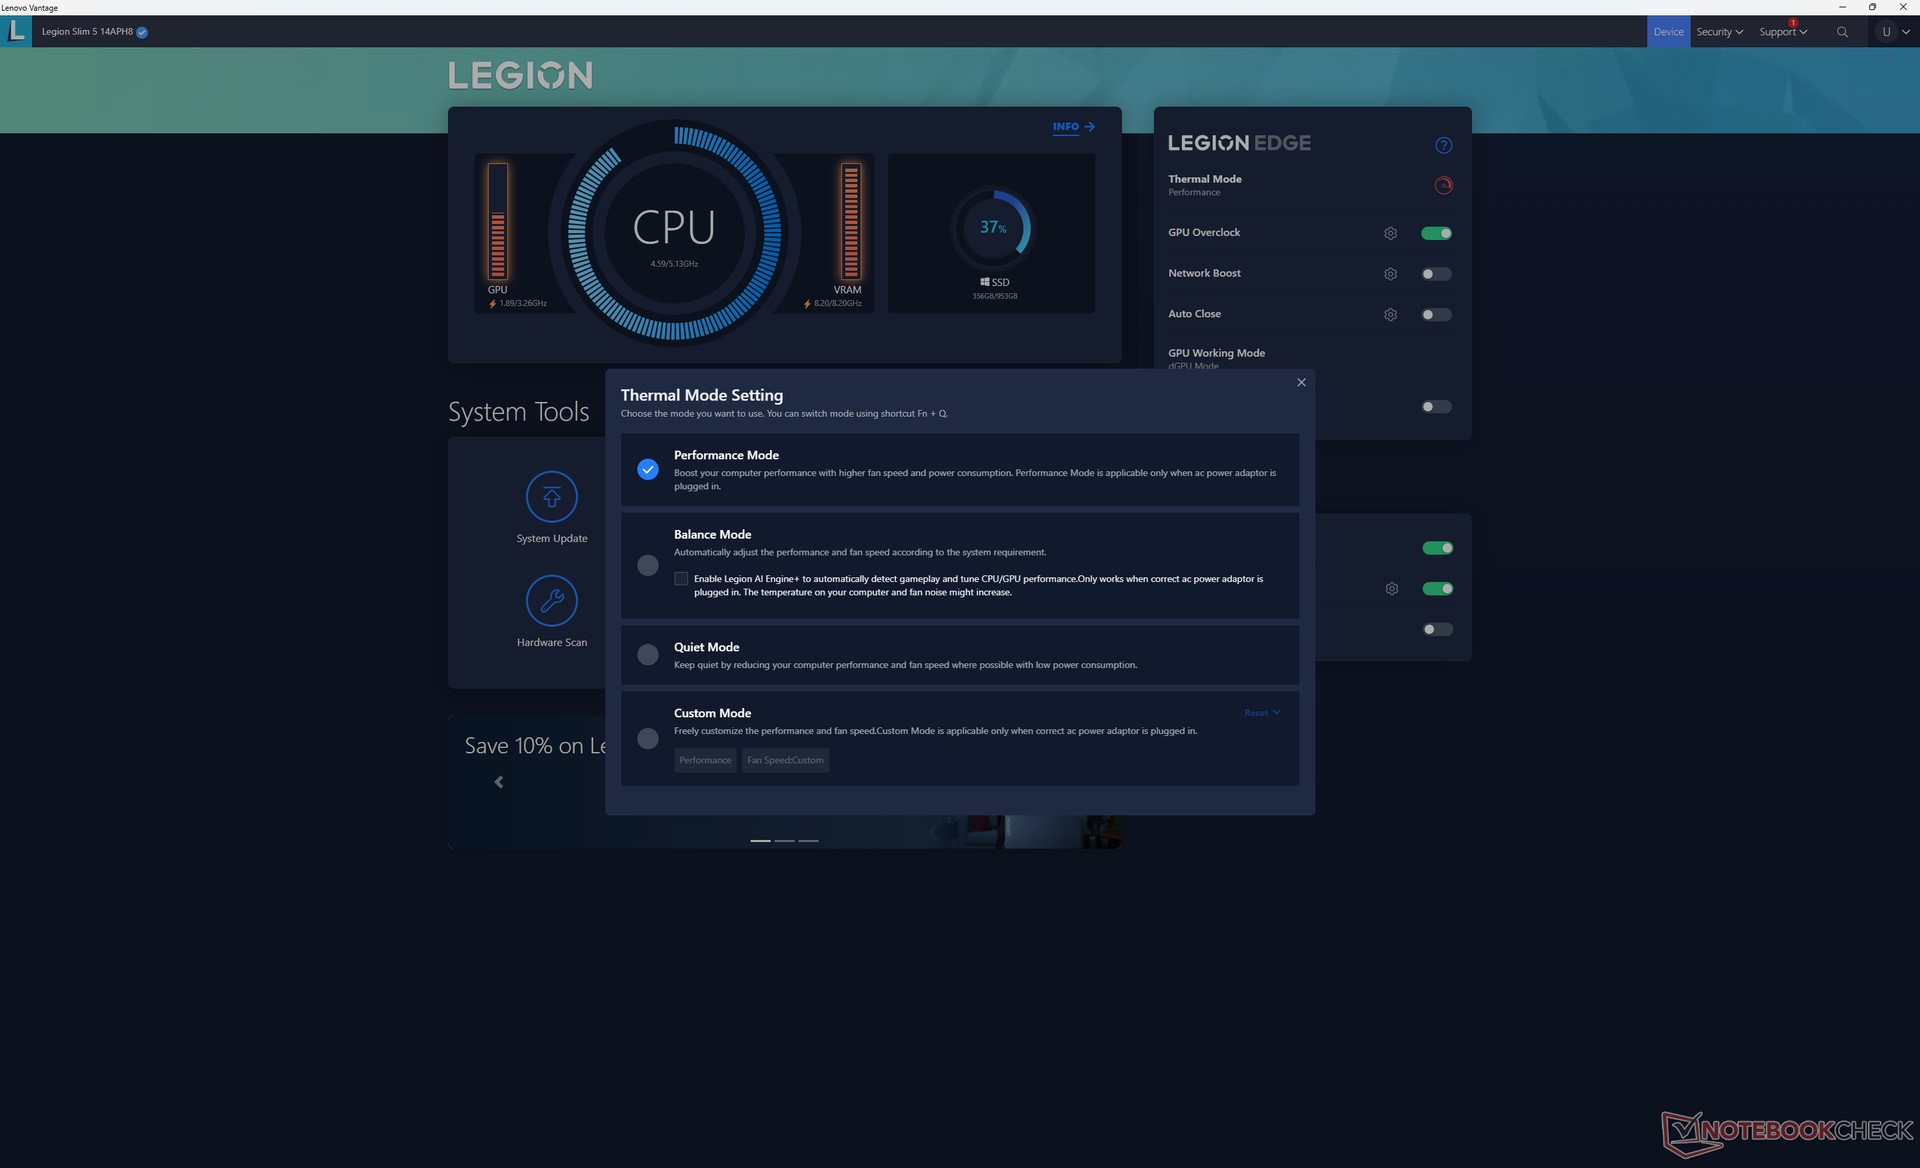
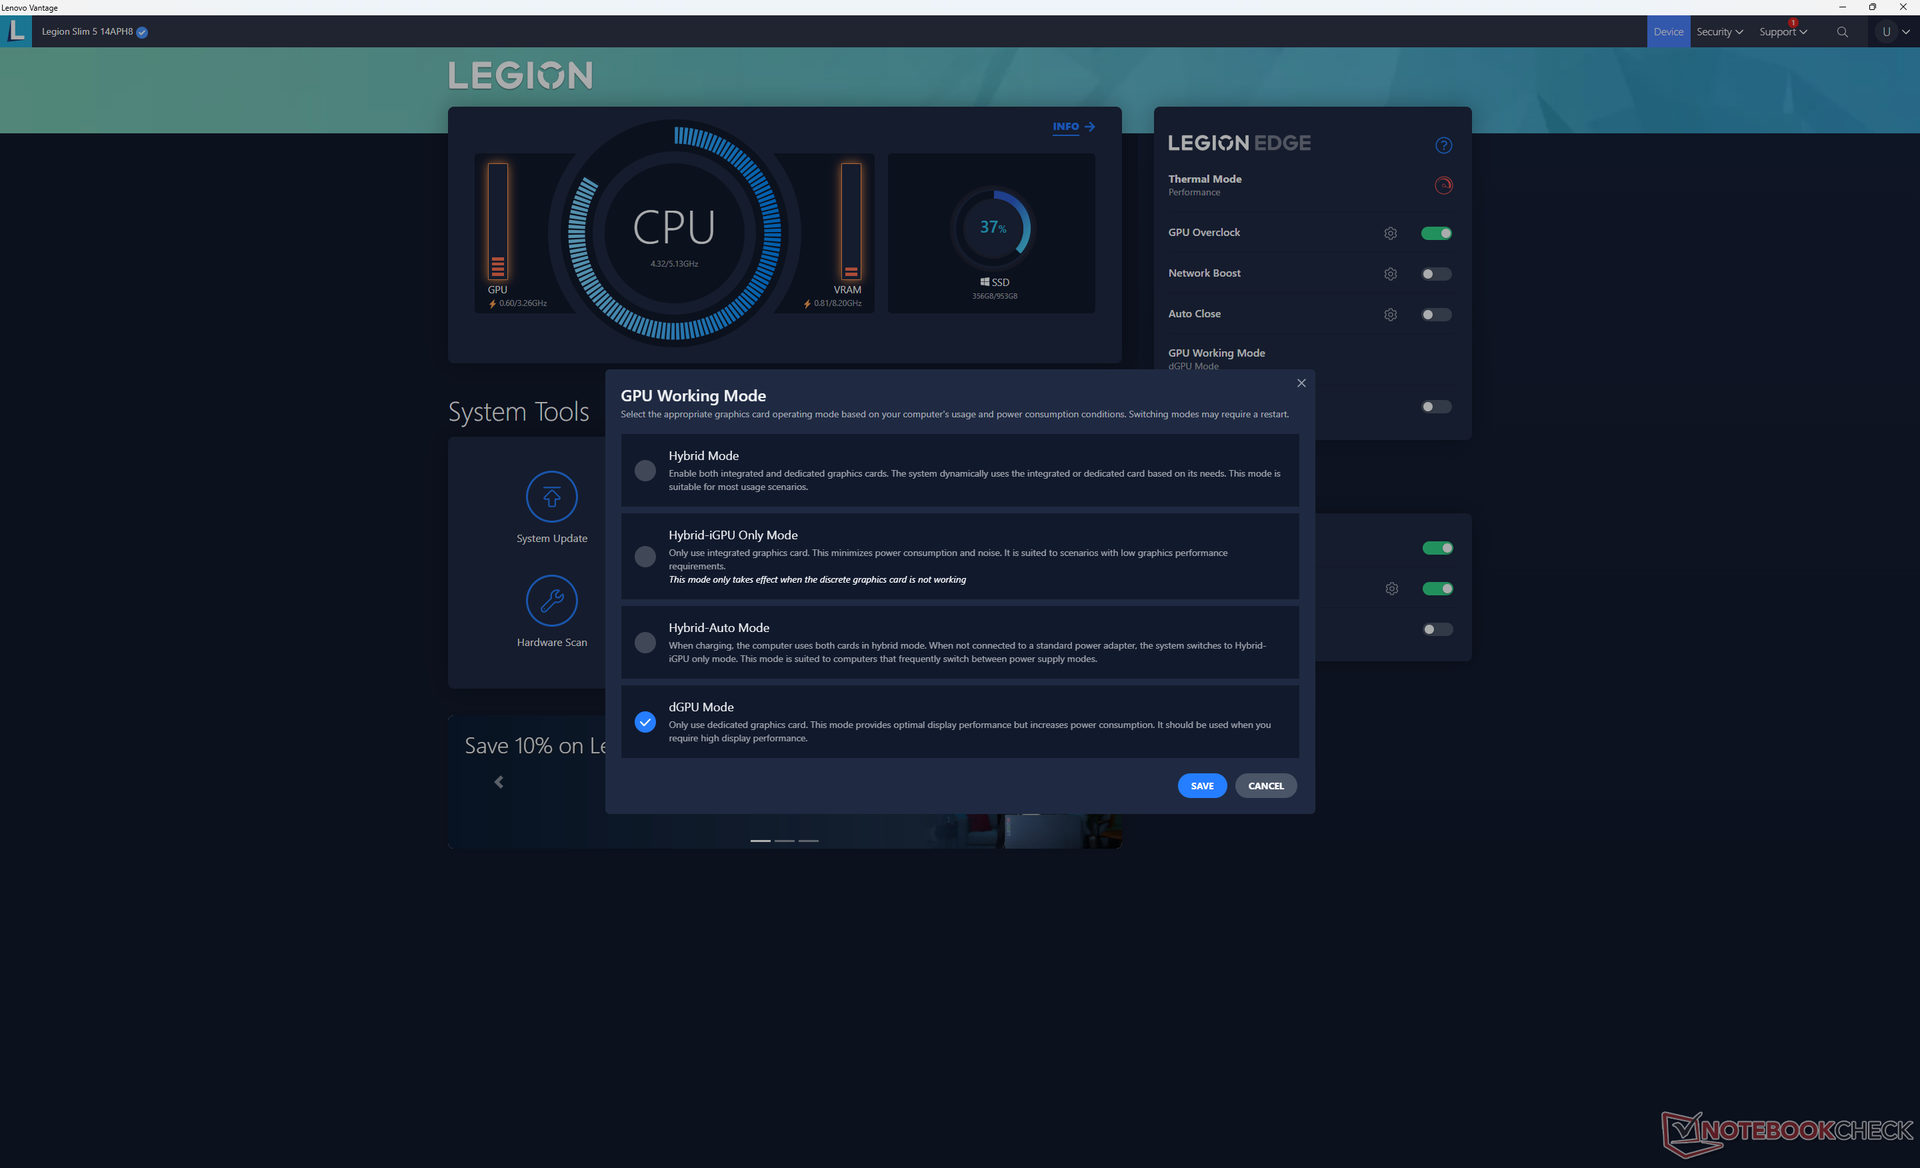
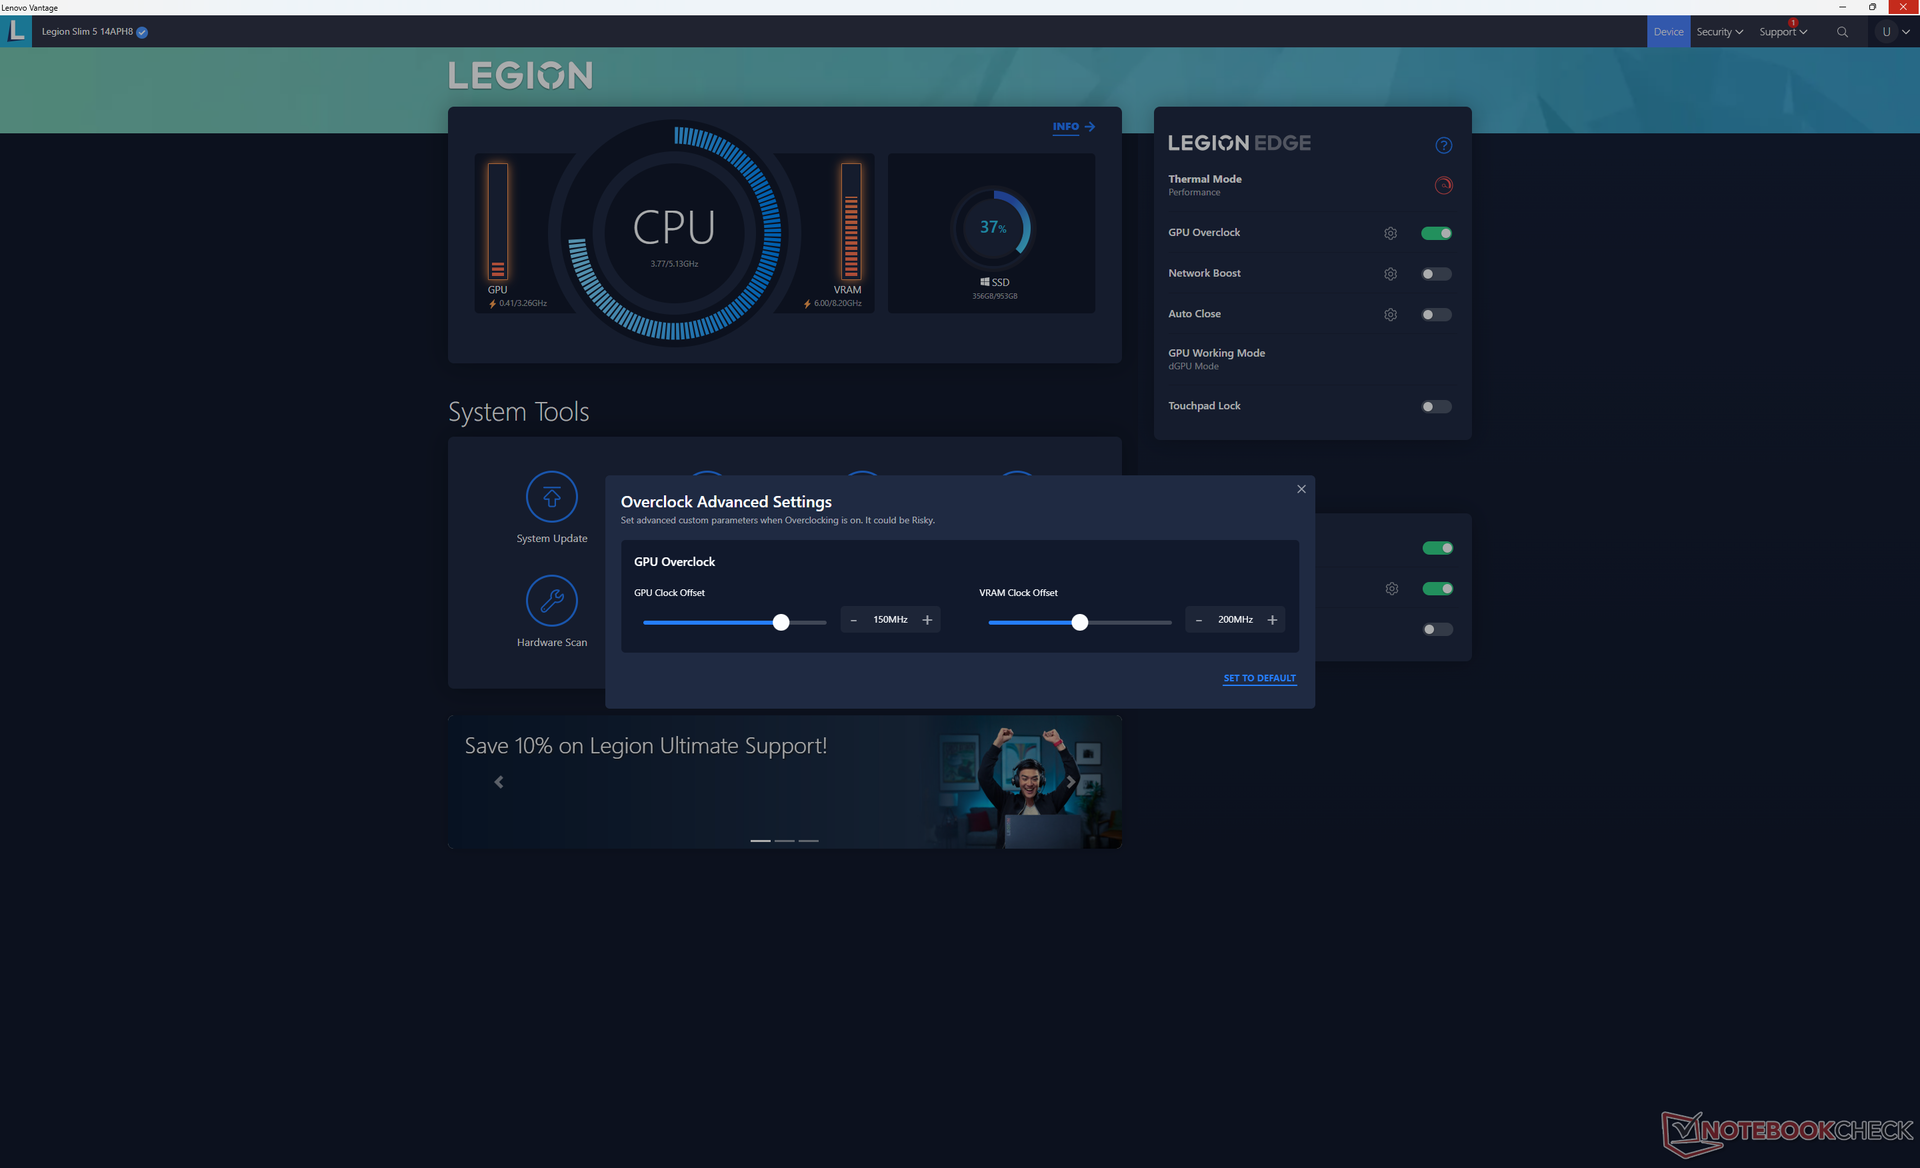
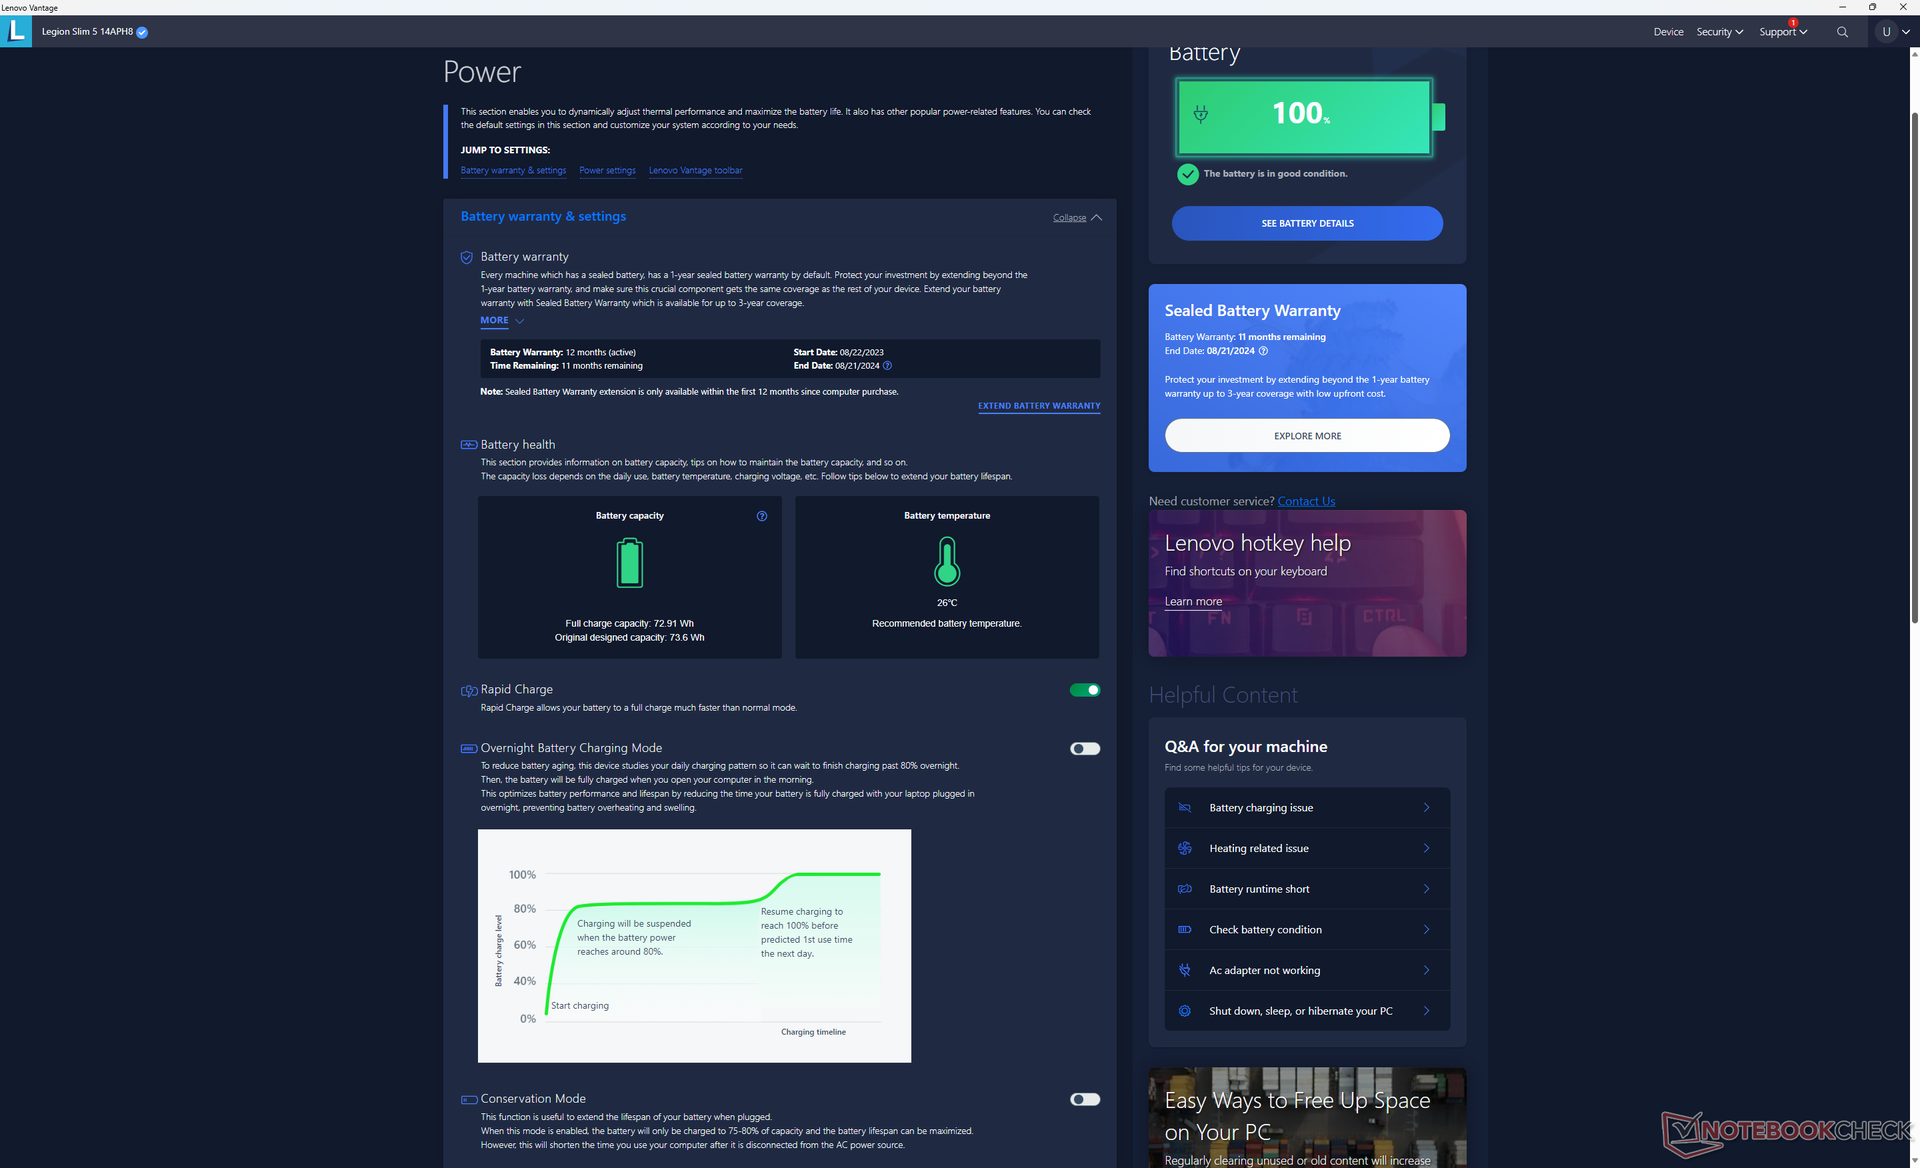
Configuramos Lenovo Vantage en modo Rendimiento y modo dGPU con GPU Overclock activo antes de ejecutar los benchmarks que se muestran a continuación. Se recomienda que los usuarios se familiaricen con Vantage, ya que es el centro de control para ajustar los perfiles de rendimiento y la configuración dGPU/iGPU.
Procesador
El Ryzen 7 7840HS rinde bien sin problemas importantes de ralentización y con resultados multihilo que están solo un 10 por ciento por detrás de la 13ª generación común deCore i7-13700H. La actualización al Ryzen 9 7940HS se espera que aumente el rendimiento en un 10%, lo que cerraría esa brecha. En otras palabras, tendrías que actualizar a la configuración Ryzen 9 si quieres la misma potencia de procesamiento que el Intel Core i7.
CPUs Ryzen de clase HX más potentes como el Ryzen 9 7945HX sólo están disponibles en tamaños de pantalla más grandes.
Cinebench R15 Multi Loop
Cinebench R23: Multi Core | Single Core
Cinebench R20: CPU (Multi Core) | CPU (Single Core)
Cinebench R15: CPU Multi 64Bit | CPU Single 64Bit
Blender: v2.79 BMW27 CPU
7-Zip 18.03: 7z b 4 | 7z b 4 -mmt1
Geekbench 5.5: Multi-Core | Single-Core
HWBOT x265 Benchmark v2.2: 4k Preset
LibreOffice : 20 Documents To PDF
R Benchmark 2.5: Overall mean
| CPU Performance rating | |
| Schenker XMG Pro 15 (E23) | |
| Dell G15 5530 | |
| Asus ROG Zephyrus G14 GA402XY | |
| Lenovo Legion Slim 5 14APH8 | |
| Acer Predator Triton 14 PT14-51 | |
| Medio AMD Ryzen 7 7840HS | |
| Acer Predator Triton 300 SE | |
| Alienware x14 i7 RTX 3060 | |
| Asus TUF A15 FA507 | |
| Asus ROG Zephyrus G14 GA402RK | |
| Asus Zephyrus G14 GA401QEC | |
| Asus ROG Strix G15 G513RW | |
| Asus Zephyrus G14 GA401IV -4! | |
| Cinebench R23 / Multi Core | |
| Schenker XMG Pro 15 (E23) | |
| Dell G15 5530 | |
| Acer Predator Triton 14 PT14-51 | |
| Asus ROG Zephyrus G14 GA402XY | |
| Lenovo Legion Slim 5 14APH8 | |
| Medio AMD Ryzen 7 7840HS (14784 - 17214, n=19) | |
| Acer Predator Triton 300 SE | |
| Alienware x14 i7 RTX 3060 | |
| Asus TUF A15 FA507 | |
| Asus ROG Strix G15 G513RW | |
| Asus Zephyrus G14 GA401QEC | |
| Asus ROG Zephyrus G14 GA402RK | |
| Cinebench R23 / Single Core | |
| Acer Predator Triton 300 SE | |
| Schenker XMG Pro 15 (E23) | |
| Dell G15 5530 | |
| Lenovo Legion Slim 5 14APH8 | |
| Asus ROG Zephyrus G14 GA402XY | |
| Medio AMD Ryzen 7 7840HS (1718 - 1812, n=19) | |
| Alienware x14 i7 RTX 3060 | |
| Acer Predator Triton 14 PT14-51 | |
| Asus ROG Zephyrus G14 GA402RK | |
| Asus TUF A15 FA507 | |
| Asus ROG Strix G15 G513RW | |
| Asus Zephyrus G14 GA401QEC | |
| Cinebench R20 / CPU (Multi Core) | |
| Schenker XMG Pro 15 (E23) | |
| Dell G15 5530 | |
| Acer Predator Triton 14 PT14-51 | |
| Asus ROG Zephyrus G14 GA402XY | |
| Lenovo Legion Slim 5 14APH8 | |
| Medio AMD Ryzen 7 7840HS (5761 - 6744, n=19) | |
| Acer Predator Triton 300 SE | |
| Alienware x14 i7 RTX 3060 | |
| Asus TUF A15 FA507 | |
| Asus Zephyrus G14 GA401QEC | |
| Asus ROG Strix G15 G513RW | |
| Asus ROG Zephyrus G14 GA402RK | |
| Asus Zephyrus G14 GA401IV | |
| Cinebench R20 / CPU (Single Core) | |
| Acer Predator Triton 300 SE | |
| Schenker XMG Pro 15 (E23) | |
| Dell G15 5530 | |
| Asus ROG Zephyrus G14 GA402XY | |
| Medio AMD Ryzen 7 7840HS (661 - 705, n=19) | |
| Alienware x14 i7 RTX 3060 | |
| Lenovo Legion Slim 5 14APH8 | |
| Acer Predator Triton 14 PT14-51 | |
| Asus ROG Zephyrus G14 GA402RK | |
| Asus TUF A15 FA507 | |
| Asus ROG Strix G15 G513RW | |
| Asus Zephyrus G14 GA401QEC | |
| Asus Zephyrus G14 GA401IV | |
| Cinebench R15 / CPU Multi 64Bit | |
| Schenker XMG Pro 15 (E23) | |
| Dell G15 5530 | |
| Acer Predator Triton 14 PT14-51 | |
| Asus ROG Zephyrus G14 GA402XY | |
| Lenovo Legion Slim 5 14APH8 | |
| Medio AMD Ryzen 7 7840HS (2300 - 2729, n=19) | |
| Alienware x14 i7 RTX 3060 | |
| Acer Predator Triton 300 SE | |
| Asus TUF A15 FA507 | |
| Asus Zephyrus G14 GA401QEC | |
| Asus ROG Strix G15 G513RW | |
| Asus ROG Zephyrus G14 GA402RK | |
| Asus Zephyrus G14 GA401IV | |
| Cinebench R15 / CPU Single 64Bit | |
| Asus ROG Zephyrus G14 GA402XY | |
| Medio AMD Ryzen 7 7840HS (270 - 286, n=19) | |
| Lenovo Legion Slim 5 14APH8 | |
| Dell G15 5530 | |
| Acer Predator Triton 300 SE | |
| Asus ROG Zephyrus G14 GA402RK | |
| Alienware x14 i7 RTX 3060 | |
| Asus TUF A15 FA507 | |
| Schenker XMG Pro 15 (E23) | |
| Asus ROG Strix G15 G513RW | |
| Acer Predator Triton 14 PT14-51 | |
| Asus Zephyrus G14 GA401QEC | |
| Asus Zephyrus G14 GA401IV | |
| Blender / v2.79 BMW27 CPU | |
| Asus Zephyrus G14 GA401IV | |
| Asus ROG Zephyrus G14 GA402RK | |
| Asus ROG Strix G15 G513RW | |
| Asus Zephyrus G14 GA401QEC | |
| Alienware x14 i7 RTX 3060 | |
| Asus TUF A15 FA507 | |
| Acer Predator Triton 300 SE | |
| Medio AMD Ryzen 7 7840HS (185 - 231, n=20) | |
| Lenovo Legion Slim 5 14APH8 | |
| Acer Predator Triton 14 PT14-51 | |
| Asus ROG Zephyrus G14 GA402XY | |
| Dell G15 5530 | |
| Schenker XMG Pro 15 (E23) | |
| 7-Zip 18.03 / 7z b 4 -mmt1 | |
| Asus ROG Zephyrus G14 GA402XY | |
| Medio AMD Ryzen 7 7840HS (6049 - 6754, n=20) | |
| Schenker XMG Pro 15 (E23) | |
| Lenovo Legion Slim 5 14APH8 | |
| Asus ROG Zephyrus G14 GA402RK | |
| Asus ROG Strix G15 G513RW | |
| Dell G15 5530 | |
| Asus Zephyrus G14 GA401QEC | |
| Asus TUF A15 FA507 | |
| Alienware x14 i7 RTX 3060 | |
| Acer Predator Triton 300 SE | |
| Acer Predator Triton 14 PT14-51 | |
| Asus Zephyrus G14 GA401IV | |
| Geekbench 5.5 / Multi-Core | |
| Schenker XMG Pro 15 (E23) | |
| Acer Predator Triton 14 PT14-51 | |
| Dell G15 5530 | |
| Alienware x14 i7 RTX 3060 | |
| Acer Predator Triton 300 SE | |
| Asus ROG Zephyrus G14 GA402XY | |
| Medio AMD Ryzen 7 7840HS (8446 - 12339, n=23) | |
| Lenovo Legion Slim 5 14APH8 | |
| Asus ROG Zephyrus G14 GA402RK | |
| Asus ROG Strix G15 G513RW | |
| Asus TUF A15 FA507 | |
| Asus Zephyrus G14 GA401QEC | |
| Asus Zephyrus G14 GA401IV | |
| Geekbench 5.5 / Single-Core | |
| Asus ROG Zephyrus G14 GA402XY | |
| Lenovo Legion Slim 5 14APH8 | |
| Medio AMD Ryzen 7 7840HS (1837 - 2017, n=23) | |
| Acer Predator Triton 300 SE | |
| Dell G15 5530 | |
| Schenker XMG Pro 15 (E23) | |
| Alienware x14 i7 RTX 3060 | |
| Acer Predator Triton 14 PT14-51 | |
| Asus ROG Zephyrus G14 GA402RK | |
| Asus ROG Strix G15 G513RW | |
| Asus Zephyrus G14 GA401QEC | |
| Asus TUF A15 FA507 | |
| Asus Zephyrus G14 GA401IV | |
| HWBOT x265 Benchmark v2.2 / 4k Preset | |
| Schenker XMG Pro 15 (E23) | |
| Dell G15 5530 | |
| Asus ROG Zephyrus G14 GA402XY | |
| Lenovo Legion Slim 5 14APH8 | |
| Acer Predator Triton 14 PT14-51 | |
| Medio AMD Ryzen 7 7840HS (11.7 - 21.8, n=20) | |
| Acer Predator Triton 300 SE | |
| Alienware x14 i7 RTX 3060 | |
| Asus TUF A15 FA507 | |
| Asus ROG Strix G15 G513RW | |
| Asus ROG Zephyrus G14 GA402RK | |
| Asus Zephyrus G14 GA401QEC | |
| Asus Zephyrus G14 GA401IV | |
| LibreOffice / 20 Documents To PDF | |
| Asus ROG Strix G15 G513RW | |
| Asus Zephyrus G14 GA401QEC | |
| Schenker XMG Pro 15 (E23) | |
| Asus TUF A15 FA507 | |
| Medio AMD Ryzen 7 7840HS (38.3 - 68.3, n=20) | |
| Asus ROG Zephyrus G14 GA402RK | |
| Acer Predator Triton 14 PT14-51 | |
| Dell G15 5530 | |
| Lenovo Legion Slim 5 14APH8 | |
| Acer Predator Triton 300 SE | |
| Alienware x14 i7 RTX 3060 | |
| Asus ROG Zephyrus G14 GA402XY | |
| R Benchmark 2.5 / Overall mean | |
| Asus Zephyrus G14 GA401QEC | |
| Asus TUF A15 FA507 | |
| Asus ROG Strix G15 G513RW | |
| Acer Predator Triton 14 PT14-51 | |
| Asus ROG Zephyrus G14 GA402RK | |
| Alienware x14 i7 RTX 3060 | |
| Schenker XMG Pro 15 (E23) | |
| Lenovo Legion Slim 5 14APH8 | |
| Medio AMD Ryzen 7 7840HS (0.4184 - 0.4739, n=20) | |
| Acer Predator Triton 300 SE | |
| Dell G15 5530 | |
| Asus ROG Zephyrus G14 GA402XY | |
Cinebench R23: Multi Core | Single Core
Cinebench R20: CPU (Multi Core) | CPU (Single Core)
Cinebench R15: CPU Multi 64Bit | CPU Single 64Bit
Blender: v2.79 BMW27 CPU
7-Zip 18.03: 7z b 4 | 7z b 4 -mmt1
Geekbench 5.5: Multi-Core | Single-Core
HWBOT x265 Benchmark v2.2: 4k Preset
LibreOffice : 20 Documents To PDF
R Benchmark 2.5: Overall mean
* ... más pequeño es mejor
AIDA64: FP32 Ray-Trace | FPU Julia | CPU SHA3 | CPU Queen | FPU SinJulia | FPU Mandel | CPU AES | CPU ZLib | FP64 Ray-Trace | CPU PhotoWorxx
| Performance rating | |
| Razer Blade 14 RTX 4070 | |
| Lenovo Legion Slim 5 14APH8 | |
| Medio AMD Ryzen 7 7840HS | |
| Lenovo LOQ 15APH8 | |
| Acer Predator Triton 14 PT14-51 | |
| Alienware x14 i7 RTX 3060 | |
| AIDA64 / FP32 Ray-Trace | |
| Razer Blade 14 RTX 4070 | |
| Lenovo Legion Slim 5 14APH8 | |
| Lenovo LOQ 15APH8 | |
| Medio AMD Ryzen 7 7840HS (22845 - 28921, n=21) | |
| Acer Predator Triton 14 PT14-51 | |
| Alienware x14 i7 RTX 3060 | |
| AIDA64 / FPU Julia | |
| Lenovo LOQ 15APH8 | |
| Razer Blade 14 RTX 4070 | |
| Lenovo Legion Slim 5 14APH8 | |
| Medio AMD Ryzen 7 7840HS (97164 - 123167, n=21) | |
| Acer Predator Triton 14 PT14-51 | |
| Alienware x14 i7 RTX 3060 | |
| AIDA64 / CPU SHA3 | |
| Razer Blade 14 RTX 4070 | |
| Lenovo Legion Slim 5 14APH8 | |
| Lenovo LOQ 15APH8 | |
| Medio AMD Ryzen 7 7840HS (4293 - 5155, n=21) | |
| Acer Predator Triton 14 PT14-51 | |
| Alienware x14 i7 RTX 3060 | |
| AIDA64 / CPU Queen | |
| Razer Blade 14 RTX 4070 | |
| Lenovo Legion Slim 5 14APH8 | |
| Lenovo LOQ 15APH8 | |
| Medio AMD Ryzen 7 7840HS (102271 - 125820, n=21) | |
| Alienware x14 i7 RTX 3060 | |
| Acer Predator Triton 14 PT14-51 | |
| AIDA64 / FPU SinJulia | |
| Razer Blade 14 RTX 4070 | |
| Lenovo Legion Slim 5 14APH8 | |
| Lenovo LOQ 15APH8 | |
| Medio AMD Ryzen 7 7840HS (13767 - 15525, n=21) | |
| Acer Predator Triton 14 PT14-51 | |
| Alienware x14 i7 RTX 3060 | |
| AIDA64 / FPU Mandel | |
| Razer Blade 14 RTX 4070 | |
| Lenovo LOQ 15APH8 | |
| Lenovo Legion Slim 5 14APH8 | |
| Medio AMD Ryzen 7 7840HS (52084 - 65812, n=21) | |
| Acer Predator Triton 14 PT14-51 | |
| Alienware x14 i7 RTX 3060 | |
| AIDA64 / CPU AES | |
| Acer Predator Triton 14 PT14-51 | |
| Medio AMD Ryzen 7 7840HS (67389 - 177158, n=21) | |
| Alienware x14 i7 RTX 3060 | |
| Razer Blade 14 RTX 4070 | |
| Lenovo Legion Slim 5 14APH8 | |
| Lenovo LOQ 15APH8 | |
| AIDA64 / CPU ZLib | |
| Acer Predator Triton 14 PT14-51 | |
| Razer Blade 14 RTX 4070 | |
| Lenovo LOQ 15APH8 | |
| Lenovo Legion Slim 5 14APH8 | |
| Medio AMD Ryzen 7 7840HS (944 - 1123, n=21) | |
| Alienware x14 i7 RTX 3060 | |
| AIDA64 / FP64 Ray-Trace | |
| Razer Blade 14 RTX 4070 | |
| Lenovo LOQ 15APH8 | |
| Lenovo Legion Slim 5 14APH8 | |
| Medio AMD Ryzen 7 7840HS (12248 - 15599, n=21) | |
| Acer Predator Triton 14 PT14-51 | |
| Alienware x14 i7 RTX 3060 | |
| AIDA64 / CPU PhotoWorxx | |
| Acer Predator Triton 14 PT14-51 | |
| Alienware x14 i7 RTX 3060 | |
| Medio AMD Ryzen 7 7840HS (17615 - 41516, n=21) | |
| Lenovo Legion Slim 5 14APH8 | |
| Razer Blade 14 RTX 4070 | |
| Lenovo LOQ 15APH8 | |
Rendimiento del sistema
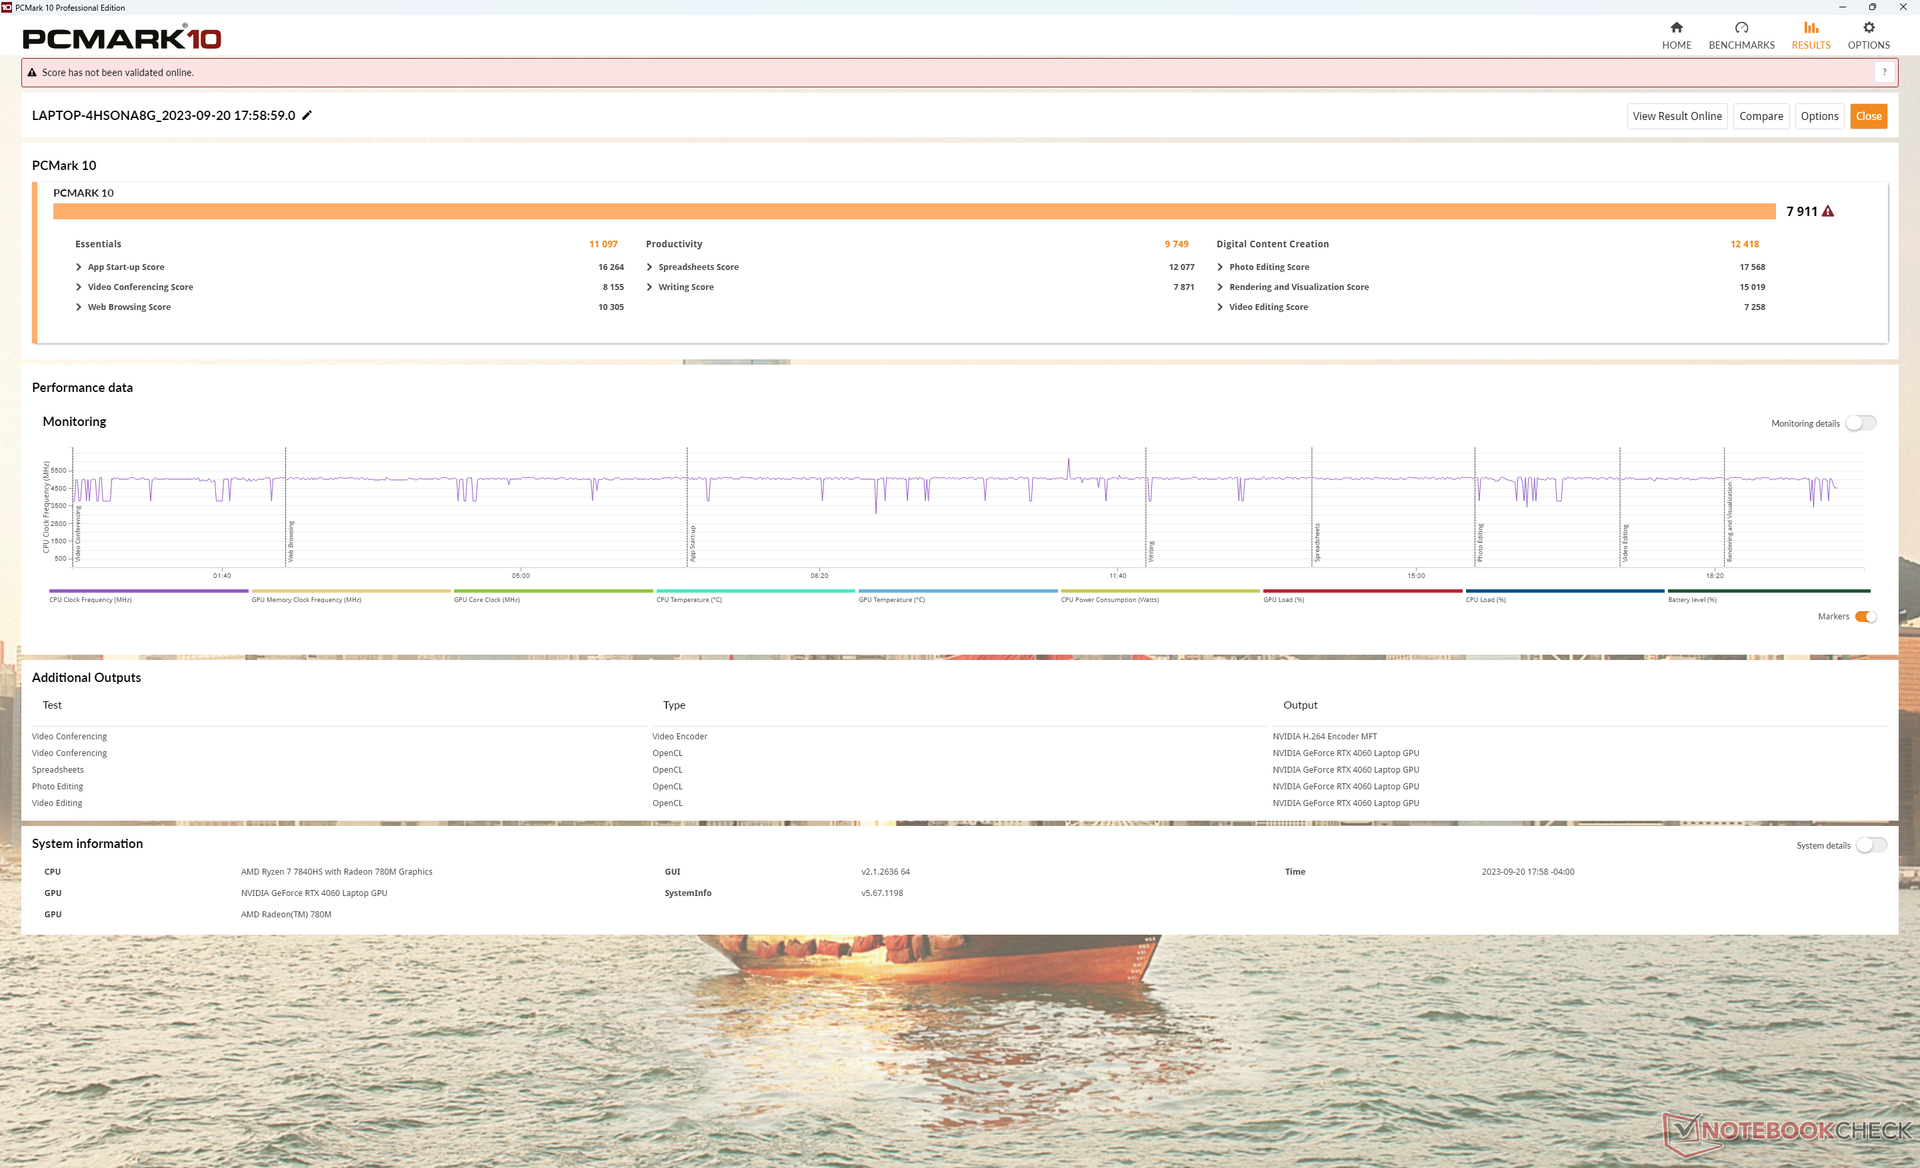
Las puntuaciones PCMark son comparables a las de otros portátiles de juego de 14 pulgadas de la competencia por apenas puntos porcentuales de un solo dígito. No experimentamos problemas notables durante nuestro tiempo con la unidad de prueba a diferencia de los recientes Legion Slim 5 16 o Alienware m16 R1.
CrossMark: Overall | Productivity | Creativity | Responsiveness
| PCMark 10 / Score | |
| Asus ROG Zephyrus G14 GA402XY | |
| Razer Blade 14 RTX 4070 | |
| Lenovo Legion Slim 5 14APH8 | |
| Medio AMD Ryzen 7 7840HS, NVIDIA GeForce RTX 4060 Laptop GPU (7502 - 7946, n=4) | |
| Lenovo LOQ 15APH8 | |
| Acer Predator Triton 14 PT14-51 | |
| Alienware x14 i7 RTX 3060 | |
| PCMark 10 / Essentials | |
| Lenovo Legion Slim 5 14APH8 | |
| Razer Blade 14 RTX 4070 | |
| Medio AMD Ryzen 7 7840HS, NVIDIA GeForce RTX 4060 Laptop GPU (10441 - 11169, n=4) | |
| Asus ROG Zephyrus G14 GA402XY | |
| Lenovo LOQ 15APH8 | |
| Acer Predator Triton 14 PT14-51 | |
| Alienware x14 i7 RTX 3060 | |
| PCMark 10 / Productivity | |
| Razer Blade 14 RTX 4070 | |
| Asus ROG Zephyrus G14 GA402XY | |
| Lenovo LOQ 15APH8 | |
| Medio AMD Ryzen 7 7840HS, NVIDIA GeForce RTX 4060 Laptop GPU (9575 - 10273, n=4) | |
| Acer Predator Triton 14 PT14-51 | |
| Lenovo Legion Slim 5 14APH8 | |
| Alienware x14 i7 RTX 3060 | |
| PCMark 10 / Digital Content Creation | |
| Asus ROG Zephyrus G14 GA402XY | |
| Razer Blade 14 RTX 4070 | |
| Lenovo Legion Slim 5 14APH8 | |
| Medio AMD Ryzen 7 7840HS, NVIDIA GeForce RTX 4060 Laptop GPU (11464 - 12418, n=4) | |
| Lenovo LOQ 15APH8 | |
| Acer Predator Triton 14 PT14-51 | |
| Alienware x14 i7 RTX 3060 | |
| CrossMark / Overall | |
| Alienware x14 i7 RTX 3060 | |
| Lenovo Legion Slim 5 14APH8 | |
| Acer Predator Triton 14 PT14-51 | |
| Asus ROG Zephyrus G14 GA402XY | |
| Medio AMD Ryzen 7 7840HS, NVIDIA GeForce RTX 4060 Laptop GPU (1800 - 1866, n=3) | |
| Razer Blade 14 RTX 4070 | |
| Lenovo LOQ 15APH8 | |
| CrossMark / Productivity | |
| Lenovo Legion Slim 5 14APH8 | |
| Alienware x14 i7 RTX 3060 | |
| Medio AMD Ryzen 7 7840HS, NVIDIA GeForce RTX 4060 Laptop GPU (1743 - 1821, n=3) | |
| Razer Blade 14 RTX 4070 | |
| Asus ROG Zephyrus G14 GA402XY | |
| Acer Predator Triton 14 PT14-51 | |
| Lenovo LOQ 15APH8 | |
| CrossMark / Creativity | |
| Asus ROG Zephyrus G14 GA402XY | |
| Alienware x14 i7 RTX 3060 | |
| Acer Predator Triton 14 PT14-51 | |
| Razer Blade 14 RTX 4070 | |
| Lenovo Legion Slim 5 14APH8 | |
| Medio AMD Ryzen 7 7840HS, NVIDIA GeForce RTX 4060 Laptop GPU (1908 - 1966, n=3) | |
| Lenovo LOQ 15APH8 | |
| CrossMark / Responsiveness | |
| Alienware x14 i7 RTX 3060 | |
| Lenovo Legion Slim 5 14APH8 | |
| Acer Predator Triton 14 PT14-51 | |
| Medio AMD Ryzen 7 7840HS, NVIDIA GeForce RTX 4060 Laptop GPU (1522 - 1776, n=3) | |
| Razer Blade 14 RTX 4070 | |
| Asus ROG Zephyrus G14 GA402XY | |
| Lenovo LOQ 15APH8 | |
| PCMark 10 Score | 7911 puntos | |
ayuda | ||
| AIDA64 / Memory Copy | |
| Alienware x14 i7 RTX 3060 | |
| Acer Predator Triton 14 PT14-51 | |
| Lenovo Legion Slim 5 14APH8 | |
| Medio AMD Ryzen 7 7840HS (30937 - 72158, n=21) | |
| Razer Blade 14 RTX 4070 | |
| Lenovo LOQ 15APH8 | |
| AIDA64 / Memory Read | |
| Alienware x14 i7 RTX 3060 | |
| Acer Predator Triton 14 PT14-51 | |
| Razer Blade 14 RTX 4070 | |
| Medio AMD Ryzen 7 7840HS (30497 - 62147, n=21) | |
| Lenovo Legion Slim 5 14APH8 | |
| Lenovo LOQ 15APH8 | |
| AIDA64 / Memory Write | |
| Lenovo Legion Slim 5 14APH8 | |
| Acer Predator Triton 14 PT14-51 | |
| Medio AMD Ryzen 7 7840HS (34590 - 93323, n=21) | |
| Razer Blade 14 RTX 4070 | |
| Alienware x14 i7 RTX 3060 | |
| Lenovo LOQ 15APH8 | |
| AIDA64 / Memory Latency | |
| Lenovo Legion Slim 5 14APH8 | |
| Alienware x14 i7 RTX 3060 | |
| Acer Predator Triton 14 PT14-51 | |
| Lenovo LOQ 15APH8 | |
| Medio AMD Ryzen 7 7840HS (85.1 - 112, n=21) | |
| Razer Blade 14 RTX 4070 | |
* ... más pequeño es mejor
Latencia del CPD
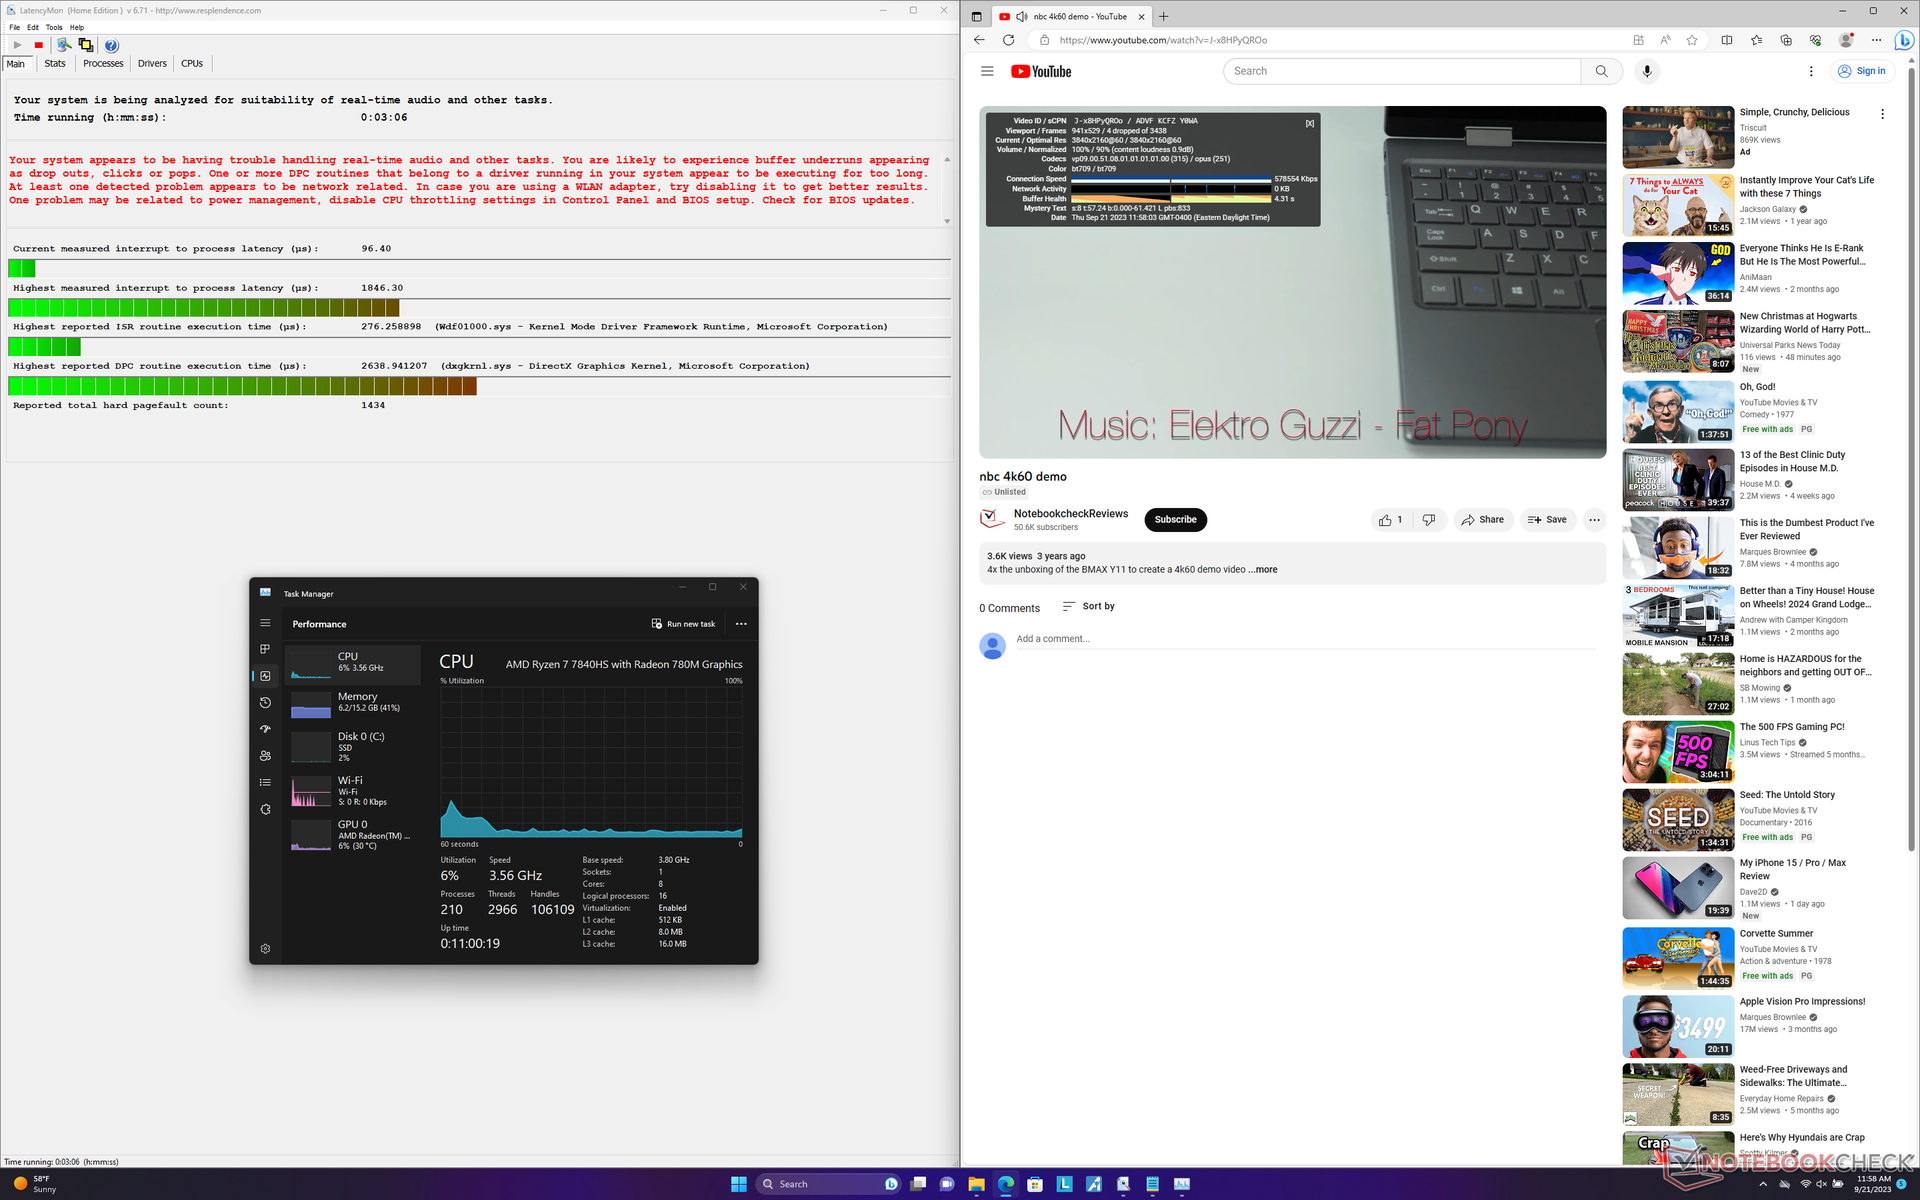
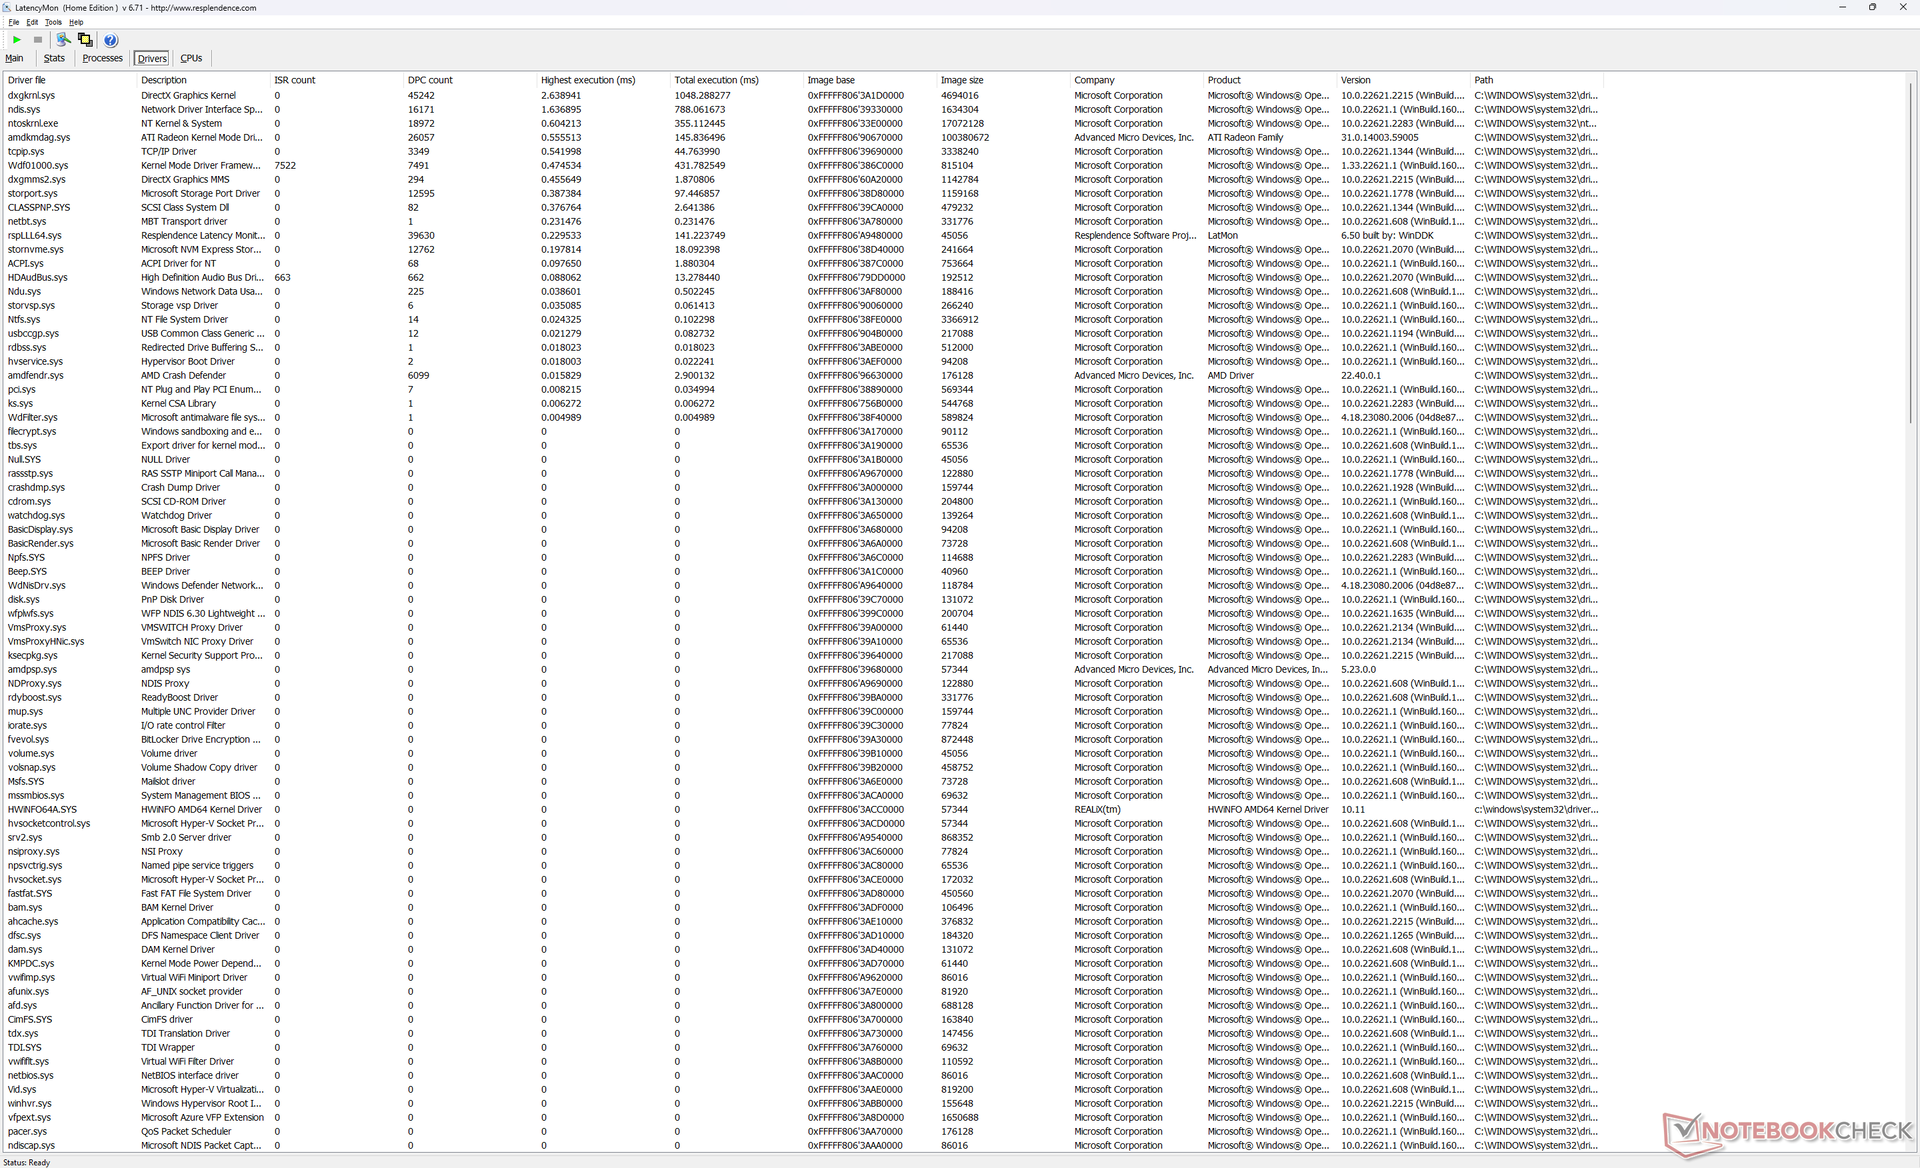
LatencyMon muestra problemas de CPD al abrir varias pestañas de nuestra página de inicio. la reproducción de vídeo 4K a 60 FPS también presenta imperfecciones, con 4 fotogramas perdidos en un minuto.
| DPC Latencies / LatencyMon - interrupt to process latency (max), Web, Youtube, Prime95 | |
| Lenovo Legion Slim 5 14APH8 | |
| Acer Predator Triton 14 PT14-51 | |
| Lenovo LOQ 15APH8 | |
| Alienware x14 i7 RTX 3060 | |
| Asus ROG Zephyrus G14 GA402XY | |
| Razer Blade 14 RTX 4070 | |
* ... más pequeño es mejor
Dispositivos de almacenamiento
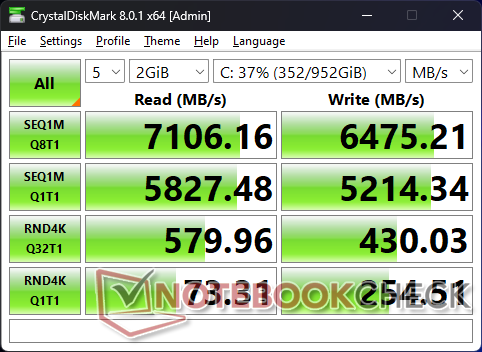
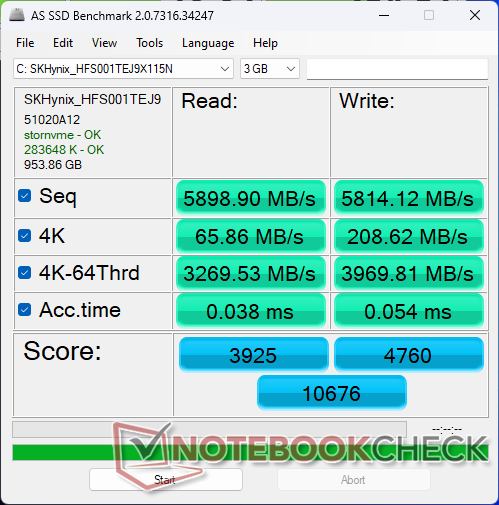
Nuestra unidad se entrega con un SK hynix HFS001TEJ9X115N Que es una unidad PCIe4 x4 de gama alta. La unidad no tuvo problemas para mantener tasas de transferencia muy rápidas de casi 7100 MB/s bajo estrés para demostrar que no hay problemas de ralentización a pesar del factor de forma más pequeño Legion Slim.

| Drive Performance rating - Percent | |
| Lenovo Legion Slim 5 14APH8 | |
| Razer Blade 14 RTX 4070 | |
| Alienware x14 i7 RTX 3060 | |
| Asus ROG Zephyrus G14 GA402XY | |
| Acer Predator Triton 14 PT14-51 | |
| Lenovo LOQ 15APH8 | |
* ... más pequeño es mejor
Disk Throttling: DiskSpd Read Loop, Queue Depth 8
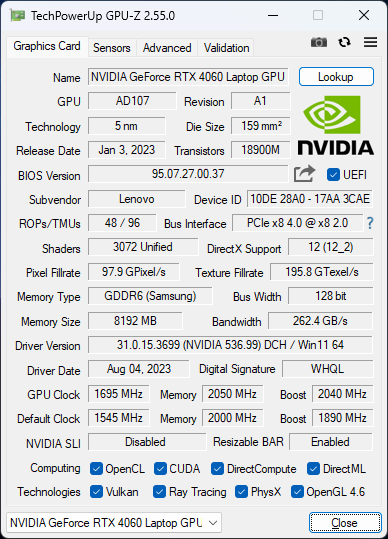
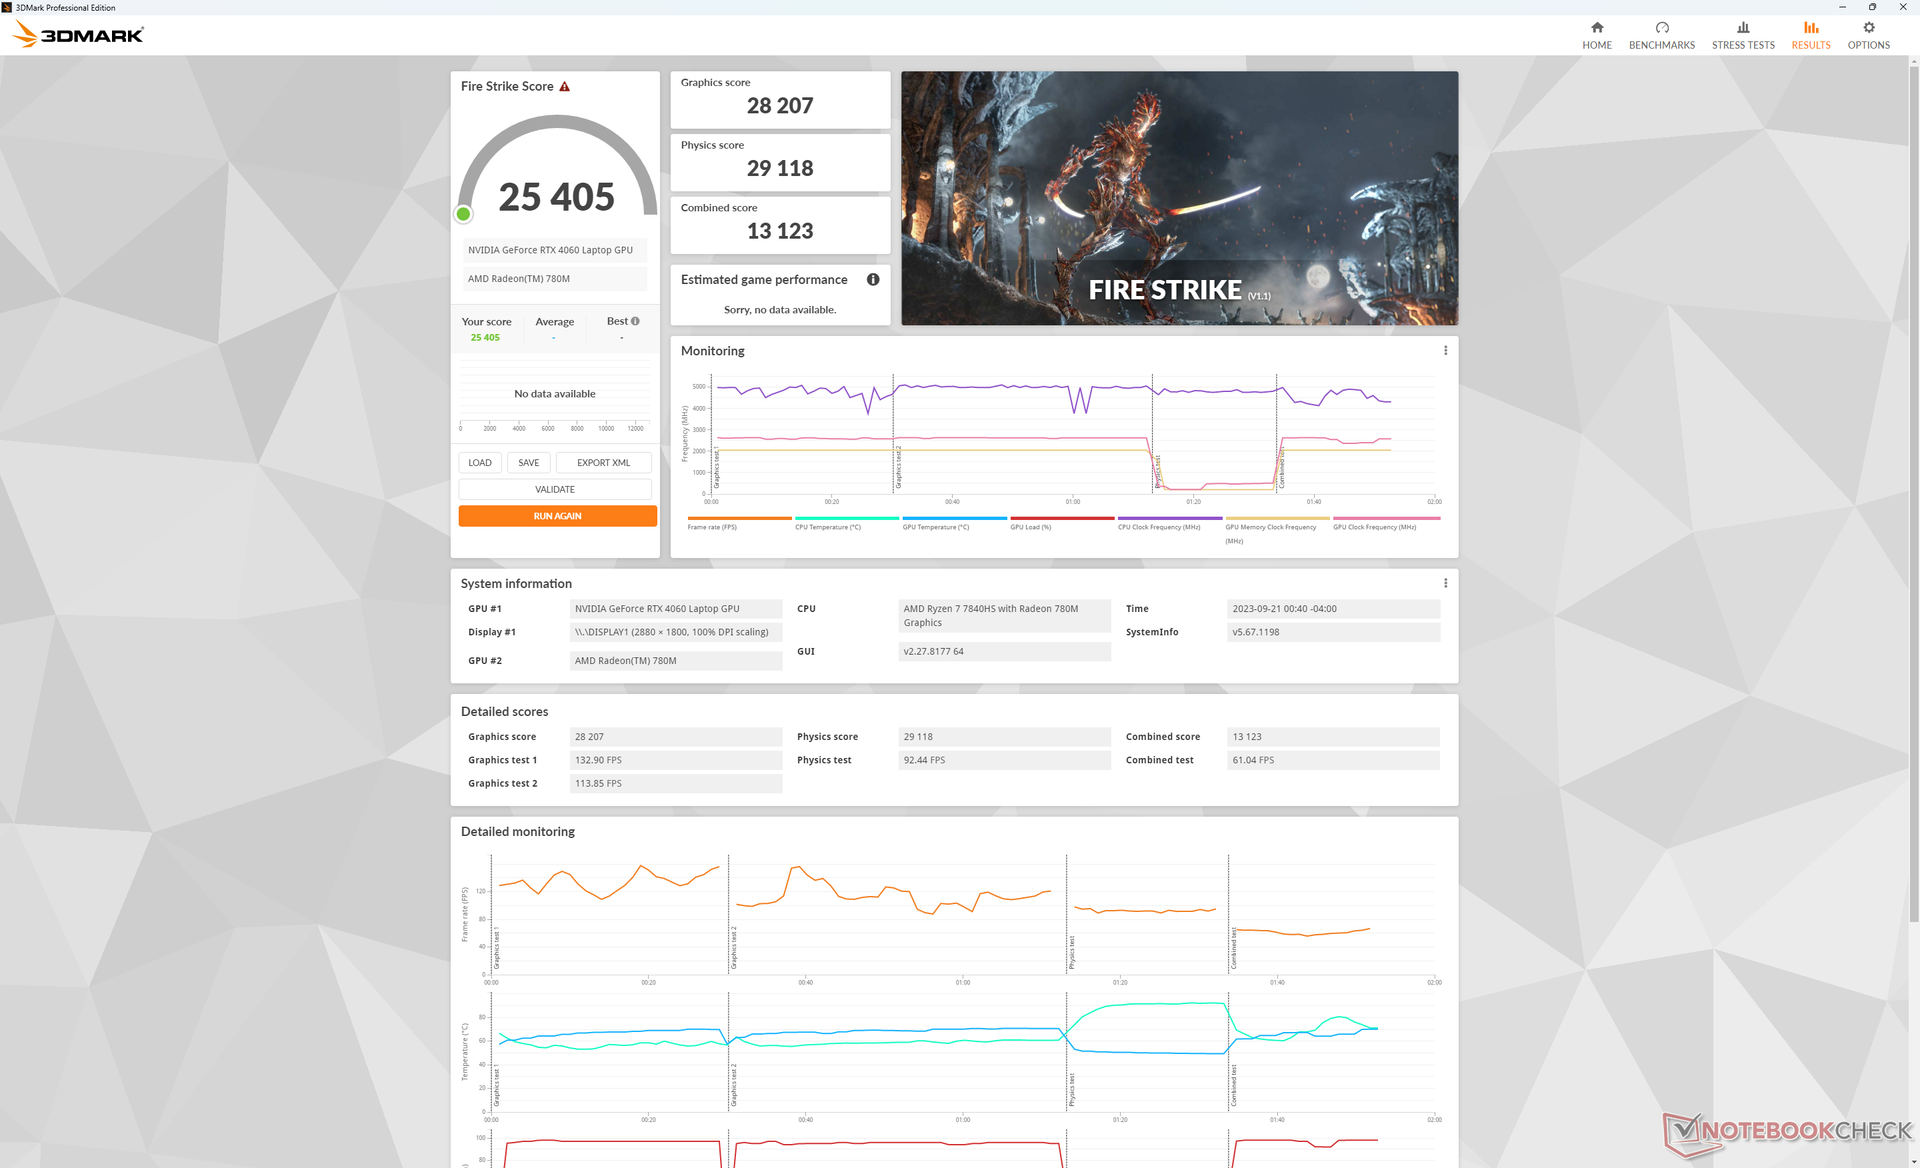
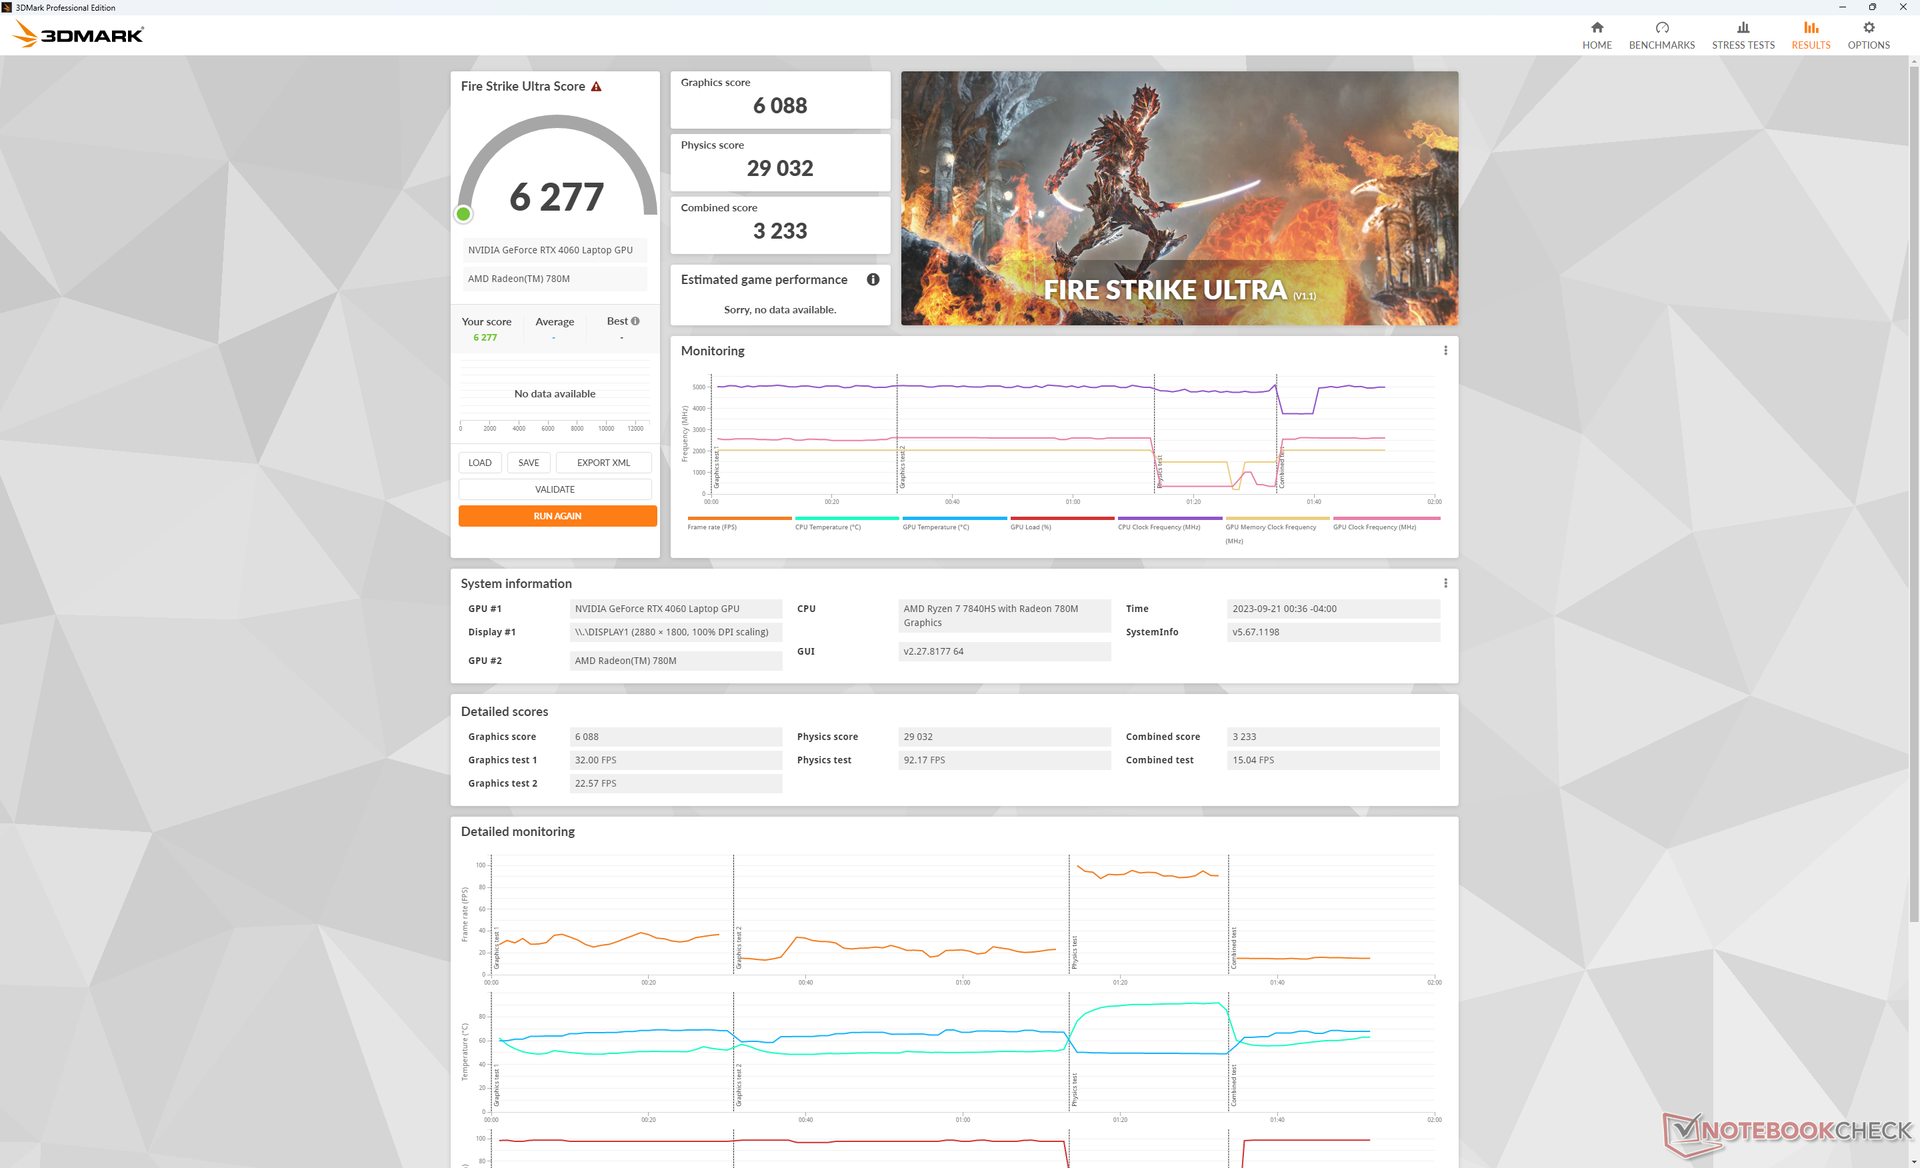
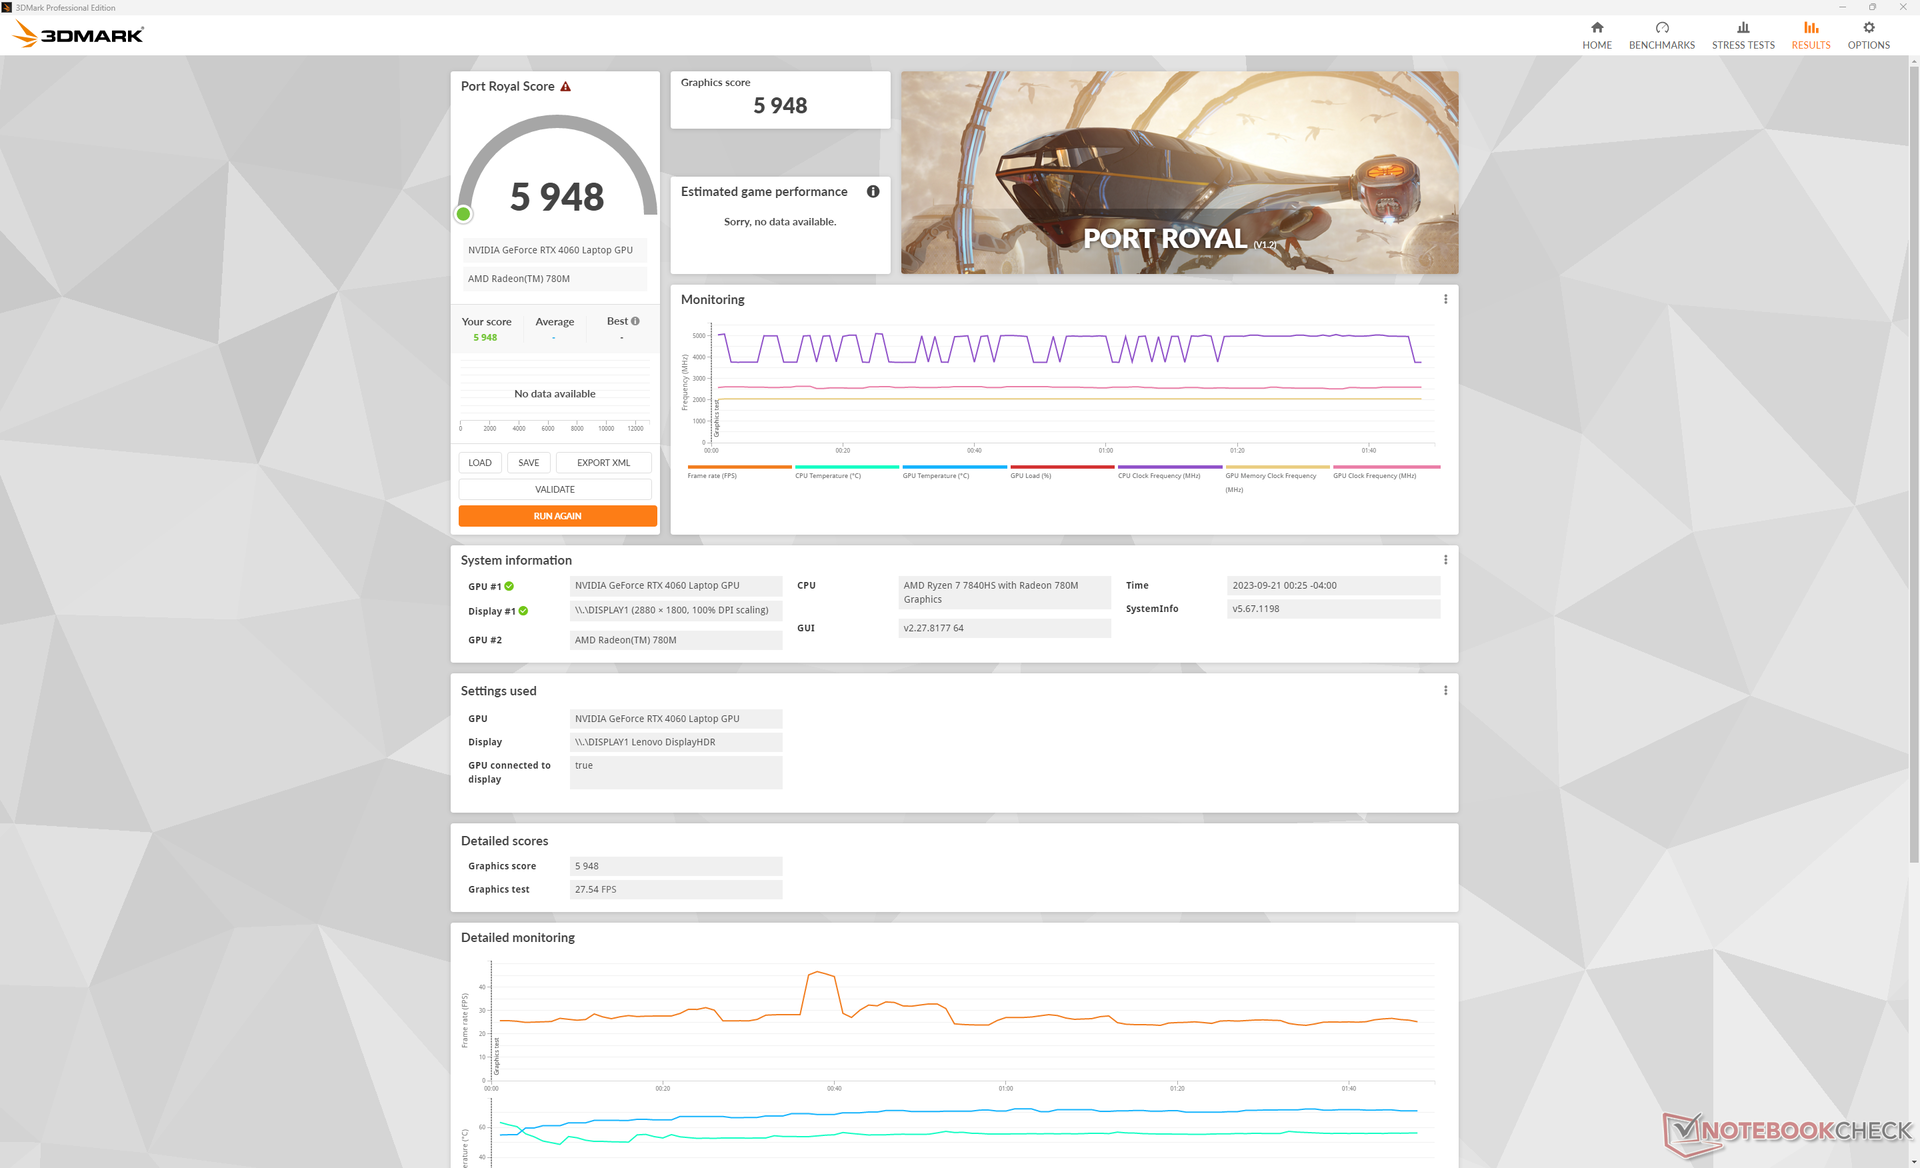
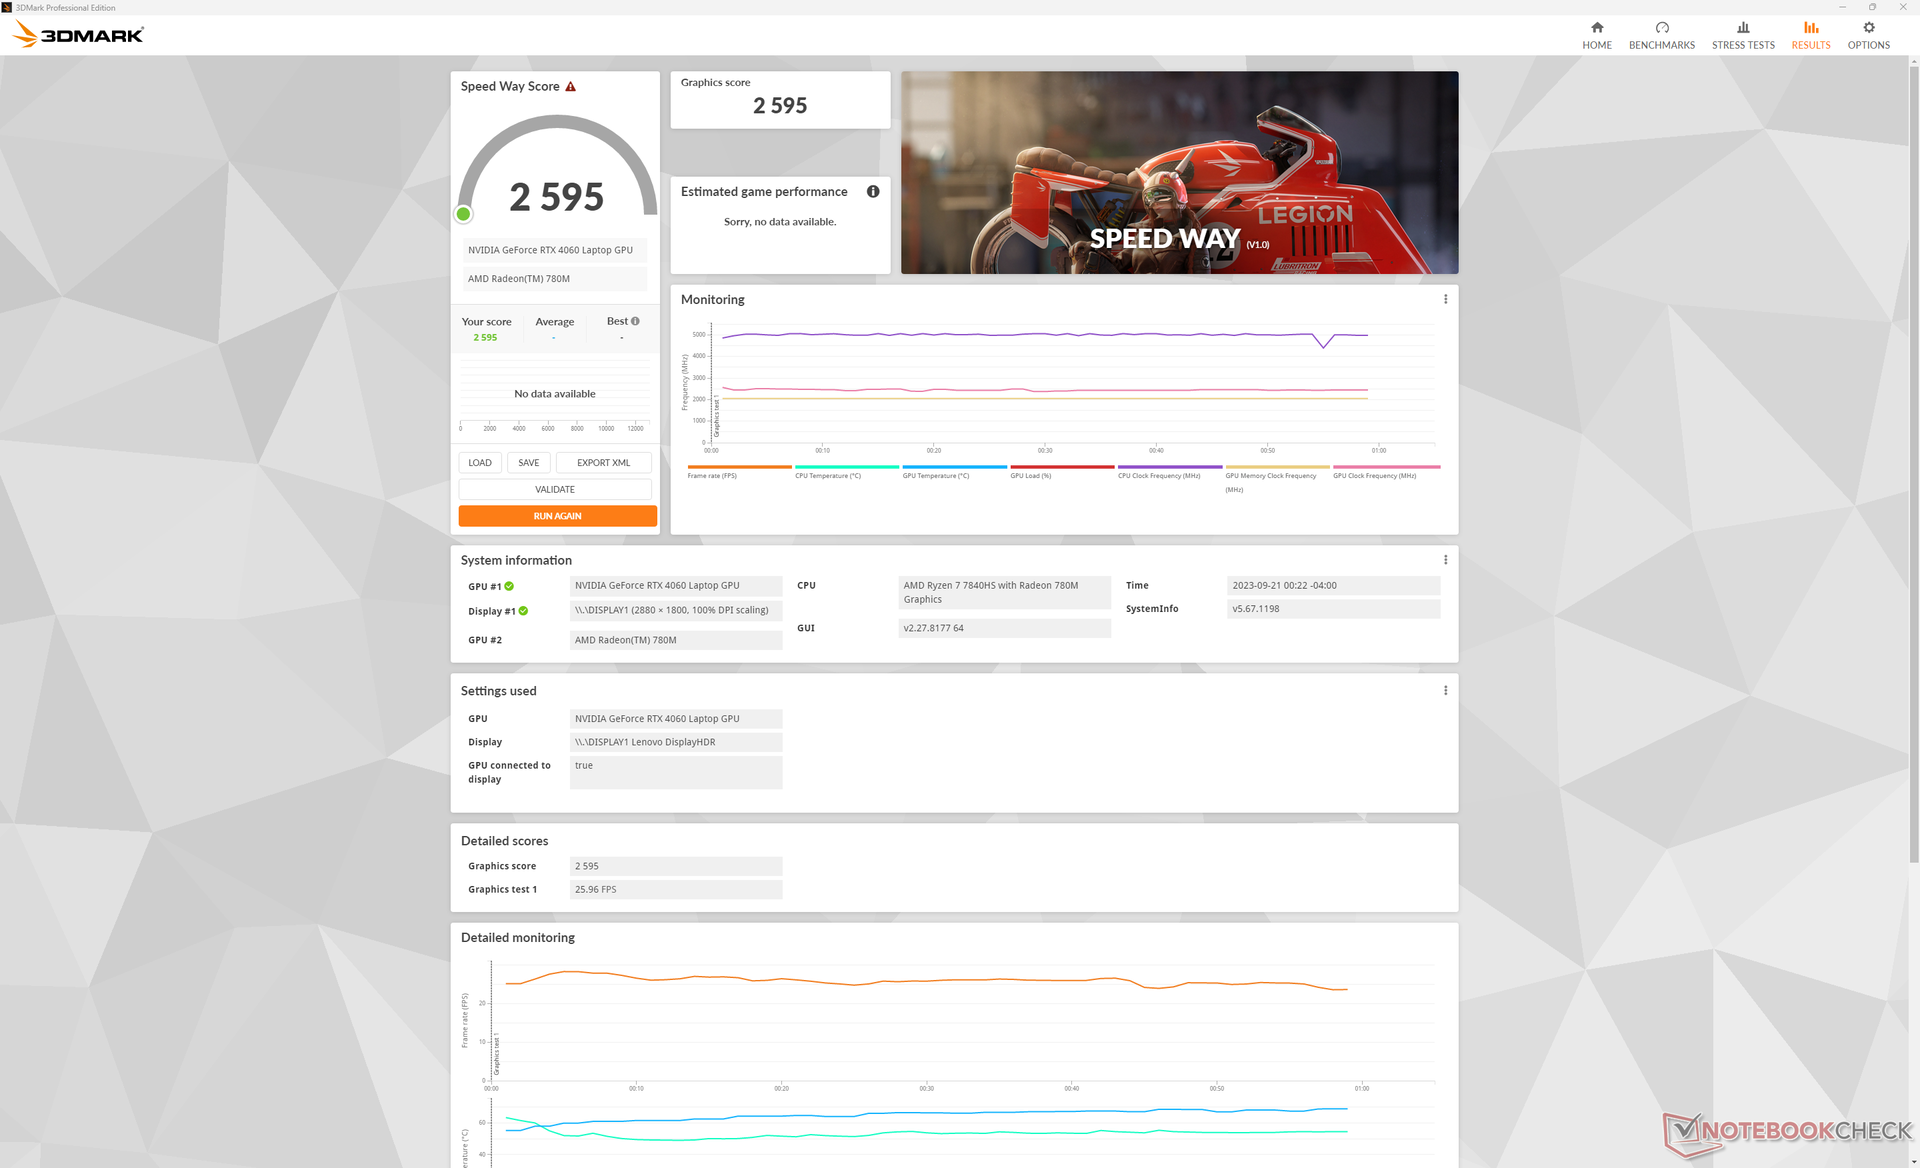
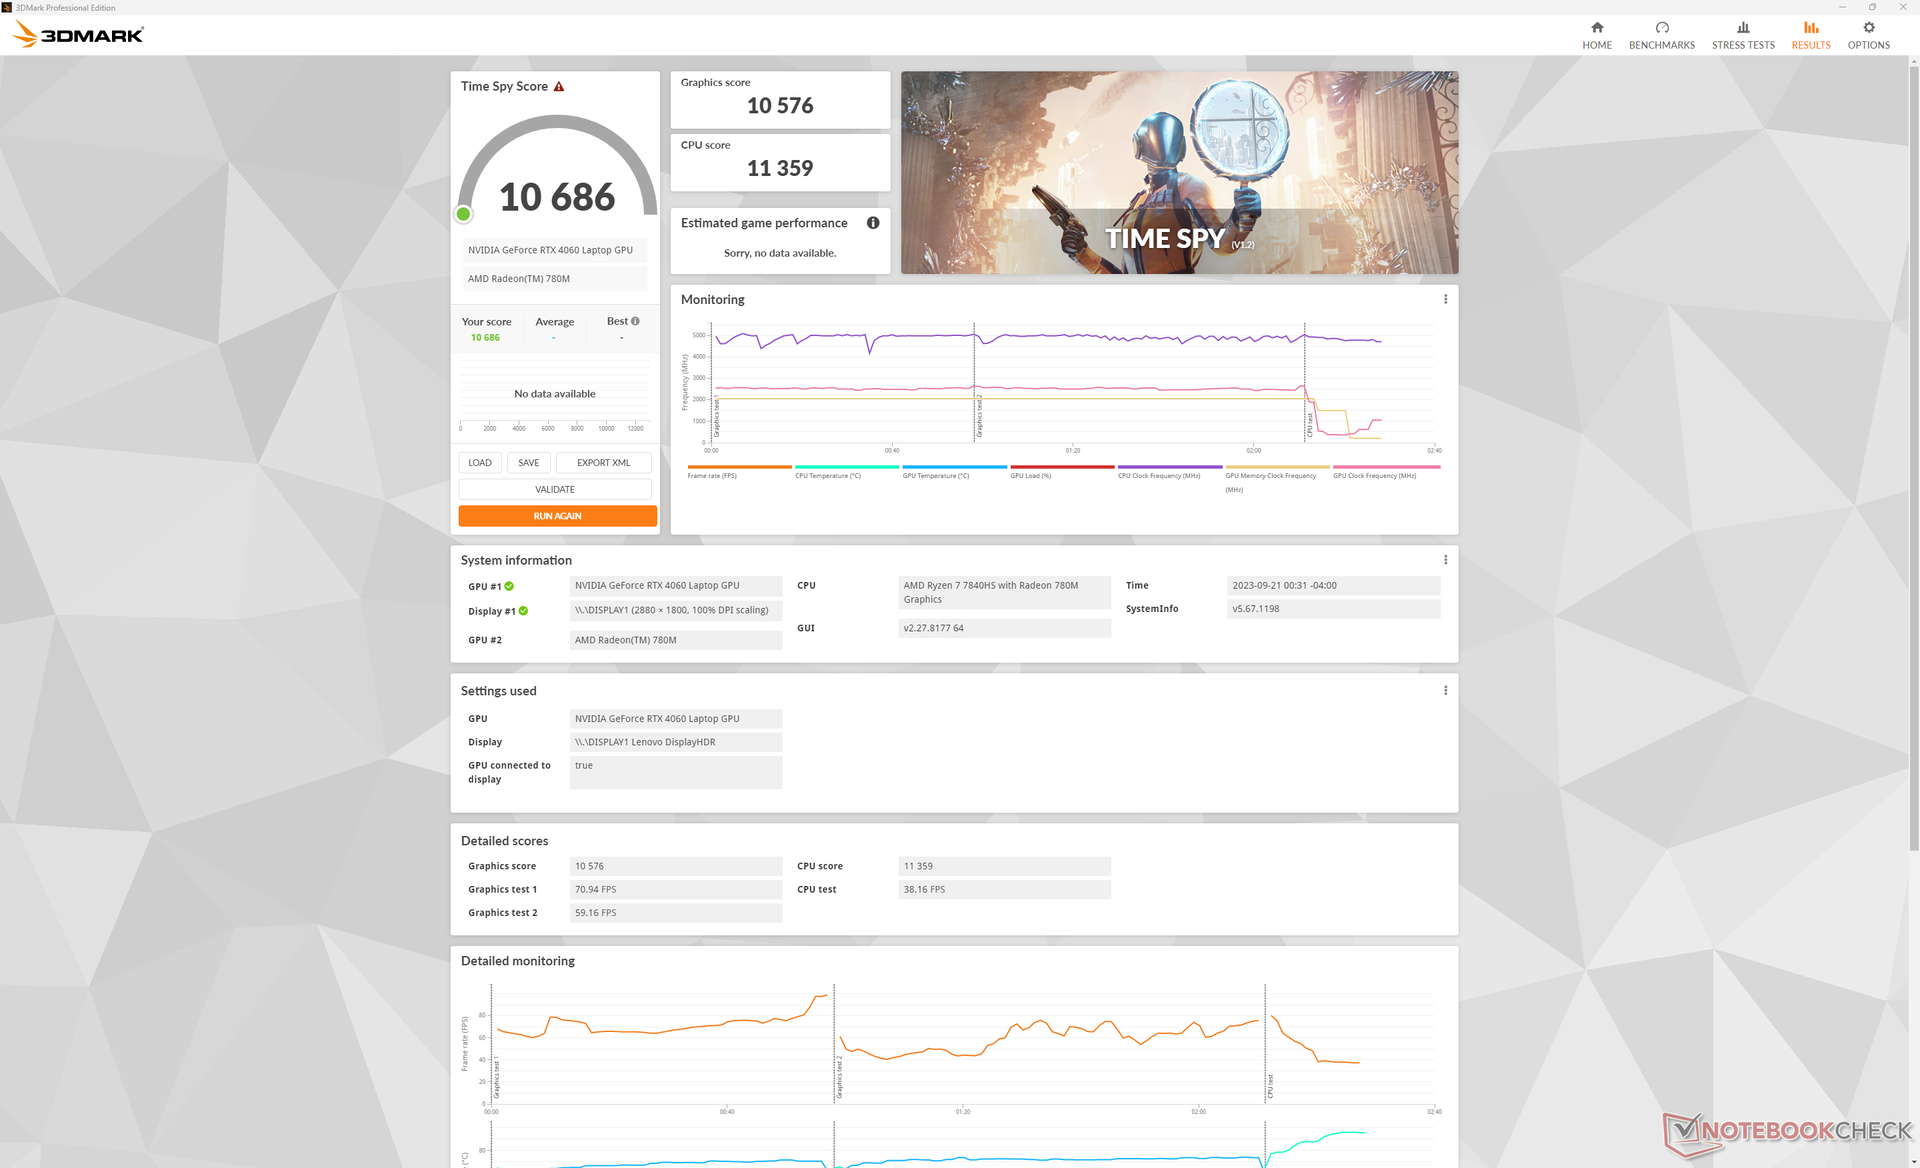
Rendimiento de la GPU - 105 W GeForce RTX 4060
El rendimiento gráfico es excelente con resultados que están en línea con otros portátiles equipados con la misma GPU RTX 4060 Lo que sugiere que no hay problemas de ralentización. La RTX 4070 del Blade 14 es un 15% más rápida, pero esta opción no está disponible en el modelo actual Legion Slim 5 14.
Pasar a la configuración RTX 4050 afectará al rendimiento entre un 20 y un 25 por ciento, según el tiempo que hemos pasado con el Acer Predator Triton 14. Ejecutar en modo Equilibrado en lugar de en modo Rendimiento también afectaría al rendimiento gráfico hasta en un 15 por ciento, como se muestra en nuestra tabla de resultados Fire Strike a continuación. Sin embargo, el modo Equilibrado es un poco más silencioso para compensar la reducción de rendimiento.
| Perfil de potencia | Puntuación gráfica | Puntuación física | Puntuación combinada |
| Modo Rendimiento | 28207 | 29118 | 13123 |
| Modo equilibrado (con Turbo desactivado) | 24505 (-13%) | 28015 (-4%) | 11701 (-11%) |
| Batería | 22396 (-21%) | 26867 (-8%) | 10136 (-23%) |
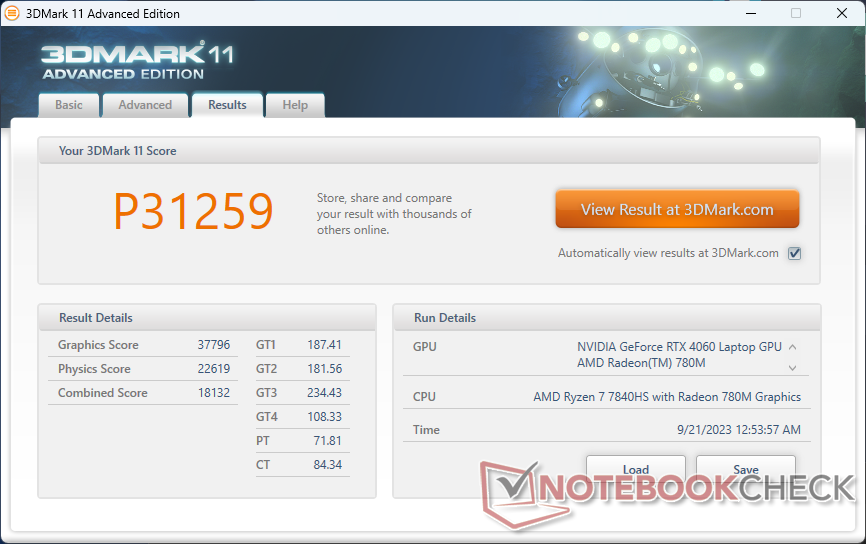
| 3DMark 11 Performance | 31259 puntos | |
| 3DMark Fire Strike Score | 24304 puntos | |
| 3DMark Time Spy Score | 10514 puntos | |
ayuda | ||
* ... más pequeño es mejor
Rendimiento en juegos
Todos los juegos probados funcionan bien en el Legion Slim 5 14 incluso con la resolución nativa de 2.8K. Sin embargo, recomendamos ajustar la configuración a Media si se juega a títulos exigentes como Star Wars Jedi Survivor o Returnal para mantener frame rates iguales o superiores a 60 FPS especialmente dado que el display principal carece de G-Sync.
| Far Cry 6 | |
| 1920x1080 High Graphics Quality AA:T | |
| Medio NVIDIA GeForce RTX 4060 Laptop GPU (101 - 120, n=2) | |
| Asus ROG Zephyrus G14 GA402RK | |
| Asus ROG Zephyrus G14 GA402XY | |
| Inno3D GeForce RTX 3060 Twin X2 | |
| Lenovo Legion Slim 5 14APH8 | |
| 1920x1080 Ultra Graphics Quality + HD Textures AA:T | |
| Razer Blade 14 RTX 4070 | |
| Medio NVIDIA GeForce RTX 4060 Laptop GPU (76 - 117, n=5) | |
| Asus ROG Zephyrus G14 GA402RK | |
| Asus ROG Zephyrus G14 GA402XY | |
| Lenovo Legion Slim 5 14APH8 | |
| Inno3D GeForce RTX 3060 Twin X2 | |
| 2560x1440 Ultra Graphics Quality + HD Textures AA:T | |
| Asus ROG Zephyrus G14 GA402XY | |
| Razer Blade 14 RTX 4070 | |
| Lenovo Legion Slim 5 14APH8 | |
| Asus ROG Zephyrus G14 GA402RK | |
| Inno3D GeForce RTX 3060 Twin X2 | |
| Medio NVIDIA GeForce RTX 4060 Laptop GPU (32.6 - 83, n=5) | |
| F1 22 | |
| 1920x1080 High Preset AA:T AF:16x | |
| Asus ROG Zephyrus G14 GA402XY | |
| Lenovo Legion Slim 5 14APH8 | |
| Razer Blade 14 RTX 4070 | |
| Medio NVIDIA GeForce RTX 4060 Laptop GPU (124.7 - 217, n=23) | |
| Acer Predator Triton 14 PT14-51 | |
| 1920x1080 Ultra High Preset AA:T AF:16x | |
| Asus ROG Zephyrus G14 GA402XY | |
| Razer Blade 14 RTX 4070 | |
| Lenovo Legion Slim 5 14APH8 | |
| Medio NVIDIA GeForce RTX 4060 Laptop GPU (48.7 - 71.4, n=23) | |
| Acer Predator Triton 14 PT14-51 | |
| 2560x1440 Ultra High Preset AA:T AF:16x | |
| Asus ROG Zephyrus G14 GA402XY | |
| Razer Blade 14 RTX 4070 | |
| Lenovo Legion Slim 5 14APH8 | |
| Medio NVIDIA GeForce RTX 4060 Laptop GPU (31 - 45.2, n=18) | |
| Acer Predator Triton 14 PT14-51 | |
| Call of Duty Modern Warfare 2 2022 | |
| 1920x1080 Ultra Quality Preset AA:T2X Filmic SM | |
| Asus ROG Zephyrus G14 GA402XY | |
| Lenovo Legion Slim 5 14APH8 | |
| Medio NVIDIA GeForce RTX 4060 Laptop GPU (70 - 104, n=4) | |
| 1920x1080 Extreme Quality Preset AA:T2X Filmic SM | |
| Asus ROG Zephyrus G14 GA402XY | |
| Razer Blade 14 RTX 4070 | |
| Lenovo Legion Slim 5 14APH8 | |
| Medio NVIDIA GeForce RTX 4060 Laptop GPU (68 - 94, n=9) | |
| 2560x1440 Extreme Quality Preset AA:T2X Filmic SM | |
| Asus ROG Zephyrus G14 GA402XY | |
| Razer Blade 14 RTX 4070 | |
| Lenovo Legion Slim 5 14APH8 | |
| Medio NVIDIA GeForce RTX 4060 Laptop GPU (49 - 66, n=7) | |
Witcher 3 FPS Chart
| bajo | medio | alto | ultra | QHD | |
|---|---|---|---|---|---|
| GTA V (2015) | 178.9 | 171.6 | 162.3 | 102.1 | 86.6 |
| The Witcher 3 (2015) | 355 | 313.5 | 209.8 | 101.4 | |
| Dota 2 Reborn (2015) | 146 | 141.9 | 137.2 | 131.8 | |
| Final Fantasy XV Benchmark (2018) | 199.9 | 145.9 | 104.3 | 76.3 | |
| X-Plane 11.11 (2018) | 124.4 | 107.8 | 84.9 | ||
| Strange Brigade (2018) | 353 | 282 | 230 | 197.9 | 131.7 |
| Shadow of the Tomb Raider (2018) | 144 | 132 | 93 | ||
| Assassin´s Creed Valhalla (2020) | 117 | 99 | 72 | ||
| Far Cry 6 (2021) | 101 | 94 | 79 | ||
| Cyberpunk 2077 1.6 (2022) | 83.68 | 78.08 | 48.54 | ||
| Tiny Tina's Wonderlands (2022) | 114.65 | 88.15 | 59.69 | ||
| F1 22 (2022) | 218 | 217 | 193.1 | 65.8 | 42.4 |
| Call of Duty Modern Warfare 2 2022 (2022) | 104 | 94 | 65 | ||
| Returnal (2023) | 73 | 67 | 45 | ||
| Star Wars Jedi Survivor (2023) | 67.6 | 65 | 39.9 |
Emisiones - Pequeño jugador ruidoso
Ruido del sistema
Los ventiladores internos tienden a pulsar incluso en modo equilibrado. El ruido del ventilador oscila entre 23 y 31 dB(A) con sólo navegar por Internet o ver vídeos. Por tanto, se recomienda usar el modo silencioso si se desea un ruido de ventilador más bajo.
Jugar en modo Equilibrado en lugar de Rendimiento reduciría ligeramente el ruido del ventilador de 52,8 dB(A) a 49,3 dB(A). En cualquier caso, el Legion Slim 5 14 sigue siendo una máquina de juego muy ruidosa similar al Blade 14,Zephyrus G14o el Alienware x14.
Ruido
| Ocioso |
| 22.8 / 27.3 / 30.7 dB(A) |
| Carga |
| 41.6 / 52.6 dB(A) |
 | ||
30 dB silencioso 40 dB(A) audible 50 dB(A) ruidosamente alto |
||
min: | ||
| Lenovo Legion Slim 5 14APH8 GeForce RTX 4060 Laptop GPU, R7 7840HS, SK Hynix HFS001TEJ9X115N | Acer Predator Triton 14 PT14-51 GeForce RTX 4050 Laptop GPU, i7-13700H, Micron 3400 MTFDKBA512TFH 512GB | Razer Blade 14 RTX 4070 GeForce RTX 4070 Laptop GPU, R9 7940HS, Samsung PM9A1 MZVL21T0HCLR | Asus ROG Zephyrus G14 GA402XY GeForce RTX 4090 Laptop GPU, R9 7940HS, Samsung PM9A1 MZVL21T0HCLR | Alienware x14 i7 RTX 3060 GeForce RTX 3060 Laptop GPU, i7-12700H, WDC PC SN810 1TB | Lenovo LOQ 15APH8 GeForce RTX 4050 Laptop GPU, R7 7840HS, Micron 2450 512GB MTFDKCD512TFK | |
|---|---|---|---|---|---|---|
| Noise | -0% | 7% | -2% | 0% | 6% | |
| apagado / medio ambiente * (dB) | 22.8 | 25 -10% | 22.7 -0% | 23.3 -2% | 24.7 -8% | 23.1 -1% |
| Idle Minimum * (dB) | 22.8 | 27 -18% | 23.4 -3% | 23.6 -4% | 24.7 -8% | 23.1 -1% |
| Idle Average * (dB) | 27.3 | 29 -6% | 23.4 14% | 23.6 14% | 24.7 10% | 23.1 15% |
| Idle Maximum * (dB) | 30.7 | 31 -1% | 23.4 24% | 33 -7% | 30.9 -1% | 25.2 18% |
| Load Average * (dB) | 41.6 | 42 -1% | 33 21% | 49.5 -19% | 40 4% | 44.3 -6% |
| Witcher 3 ultra * (dB) | 52.8 | 43 19% | 51.8 2% | 52.2 1% | 51.5 2% | 45.8 13% |
| Load Maximum * (dB) | 52.6 | 45 14% | 55.6 -6% | 52.2 1% | 51.5 2% | 52 1% |
* ... más pequeño es mejor
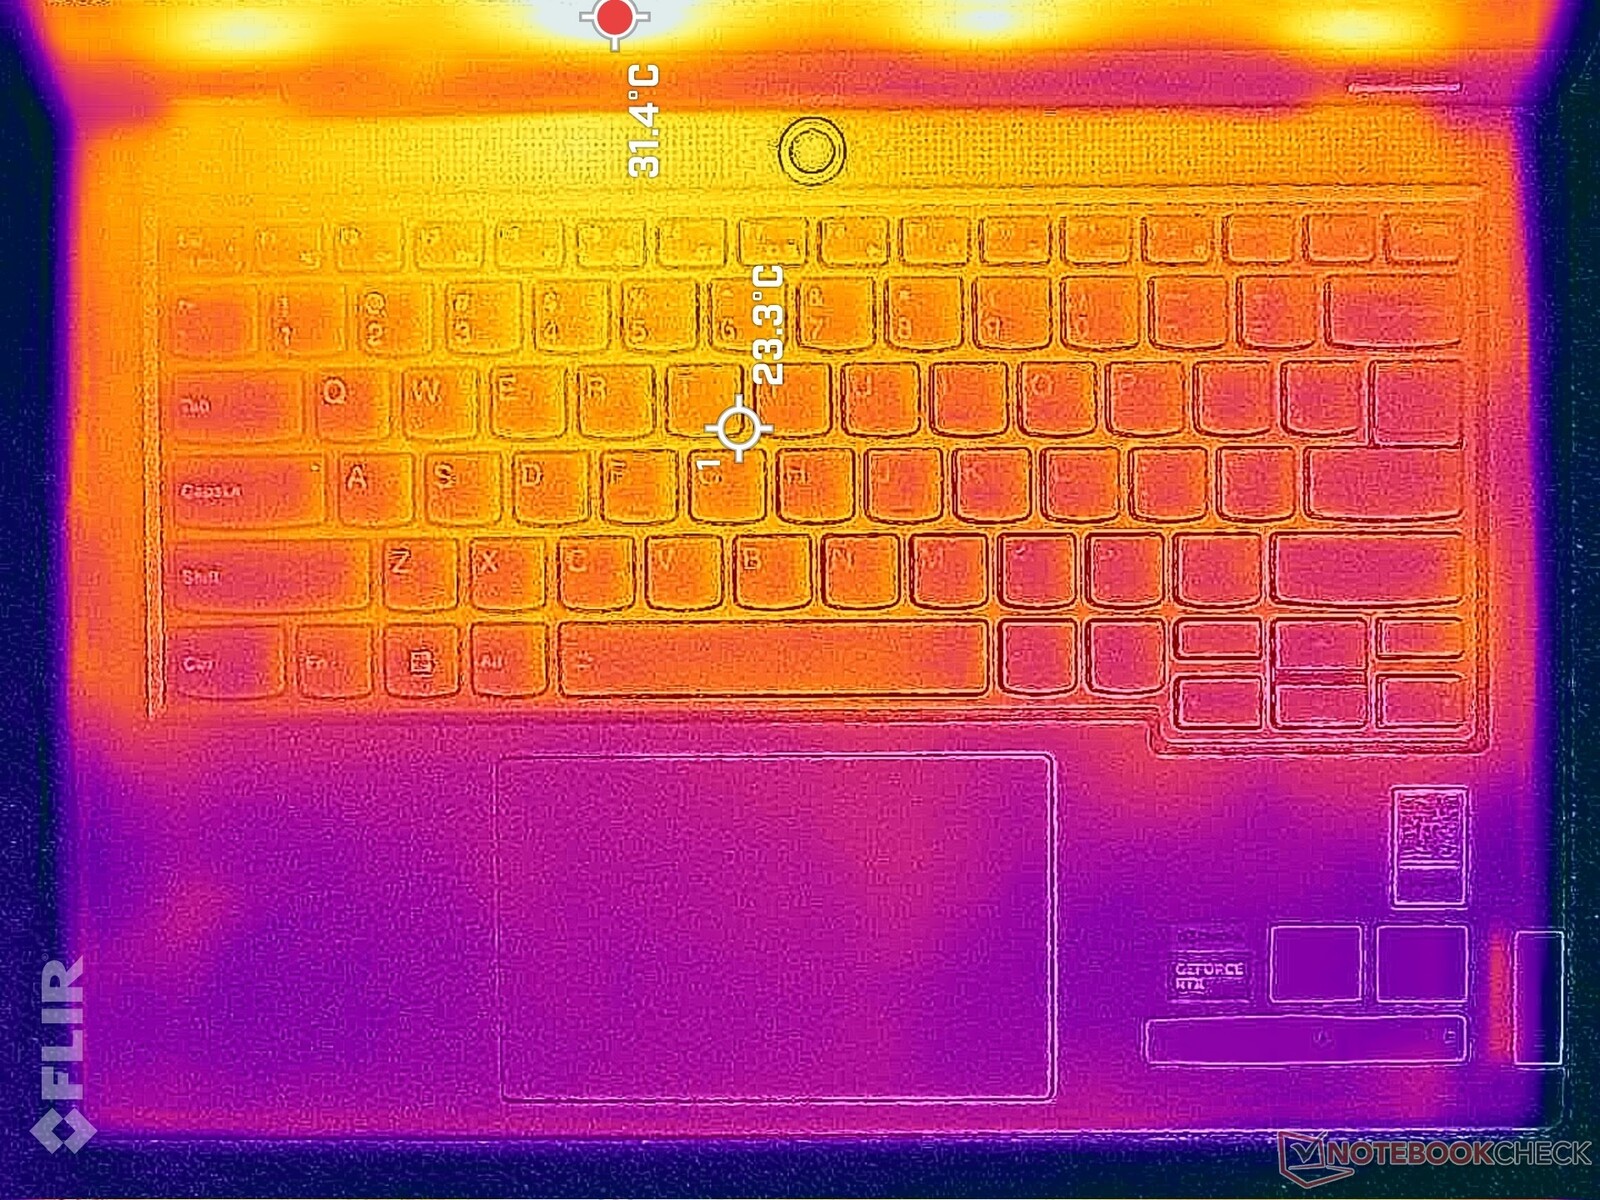
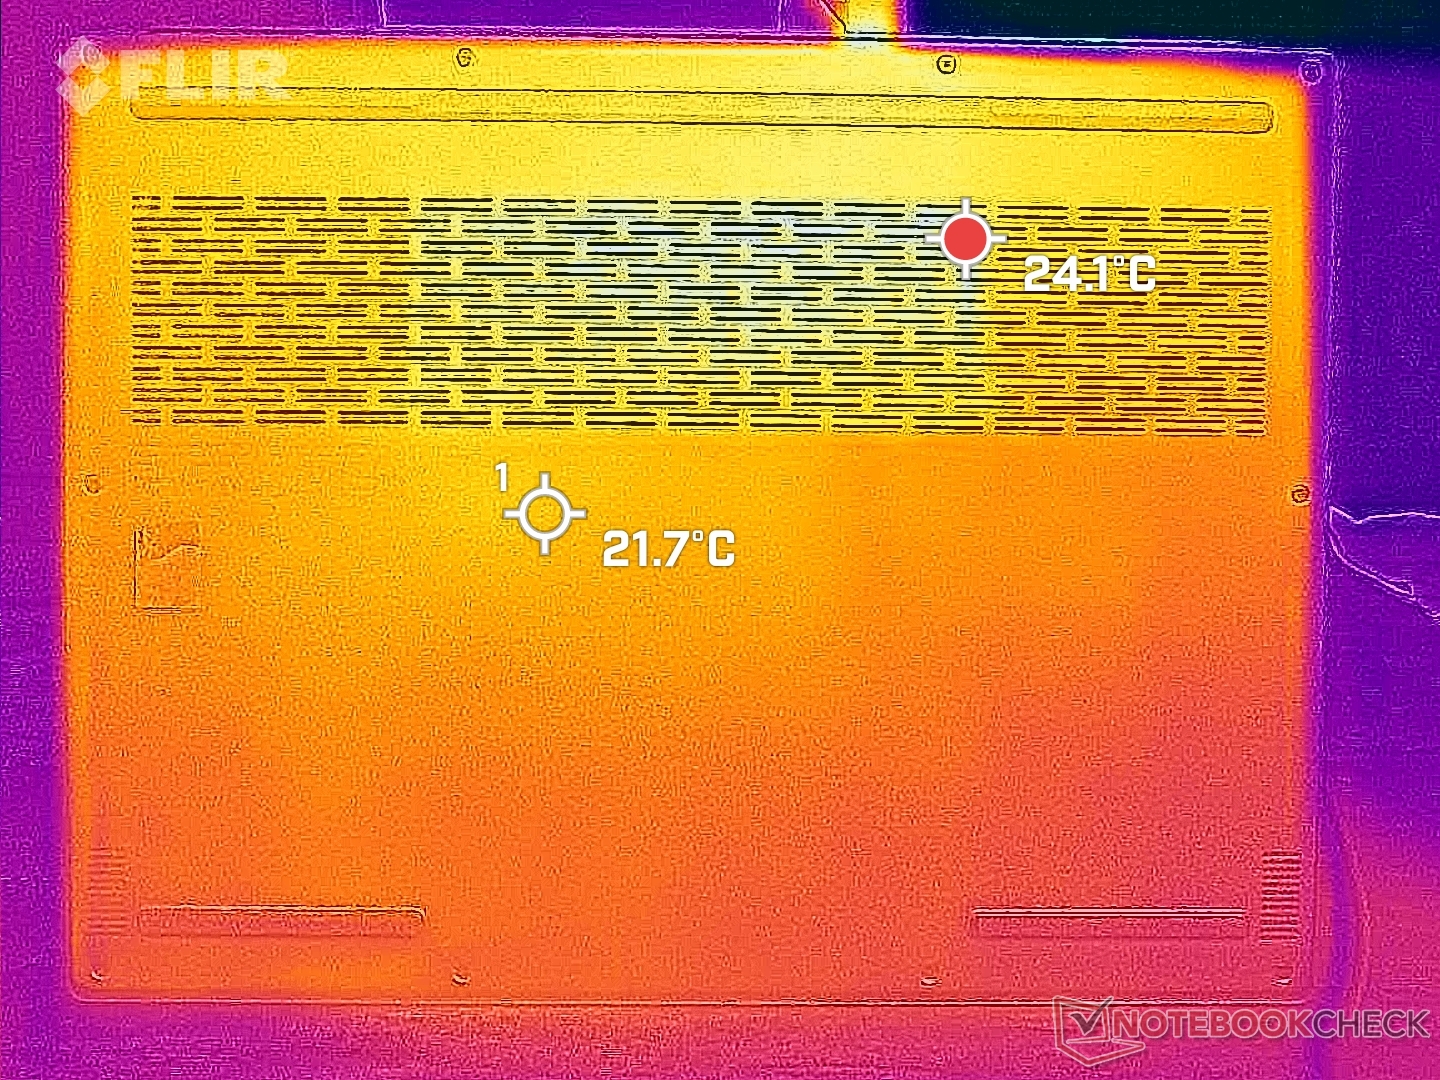
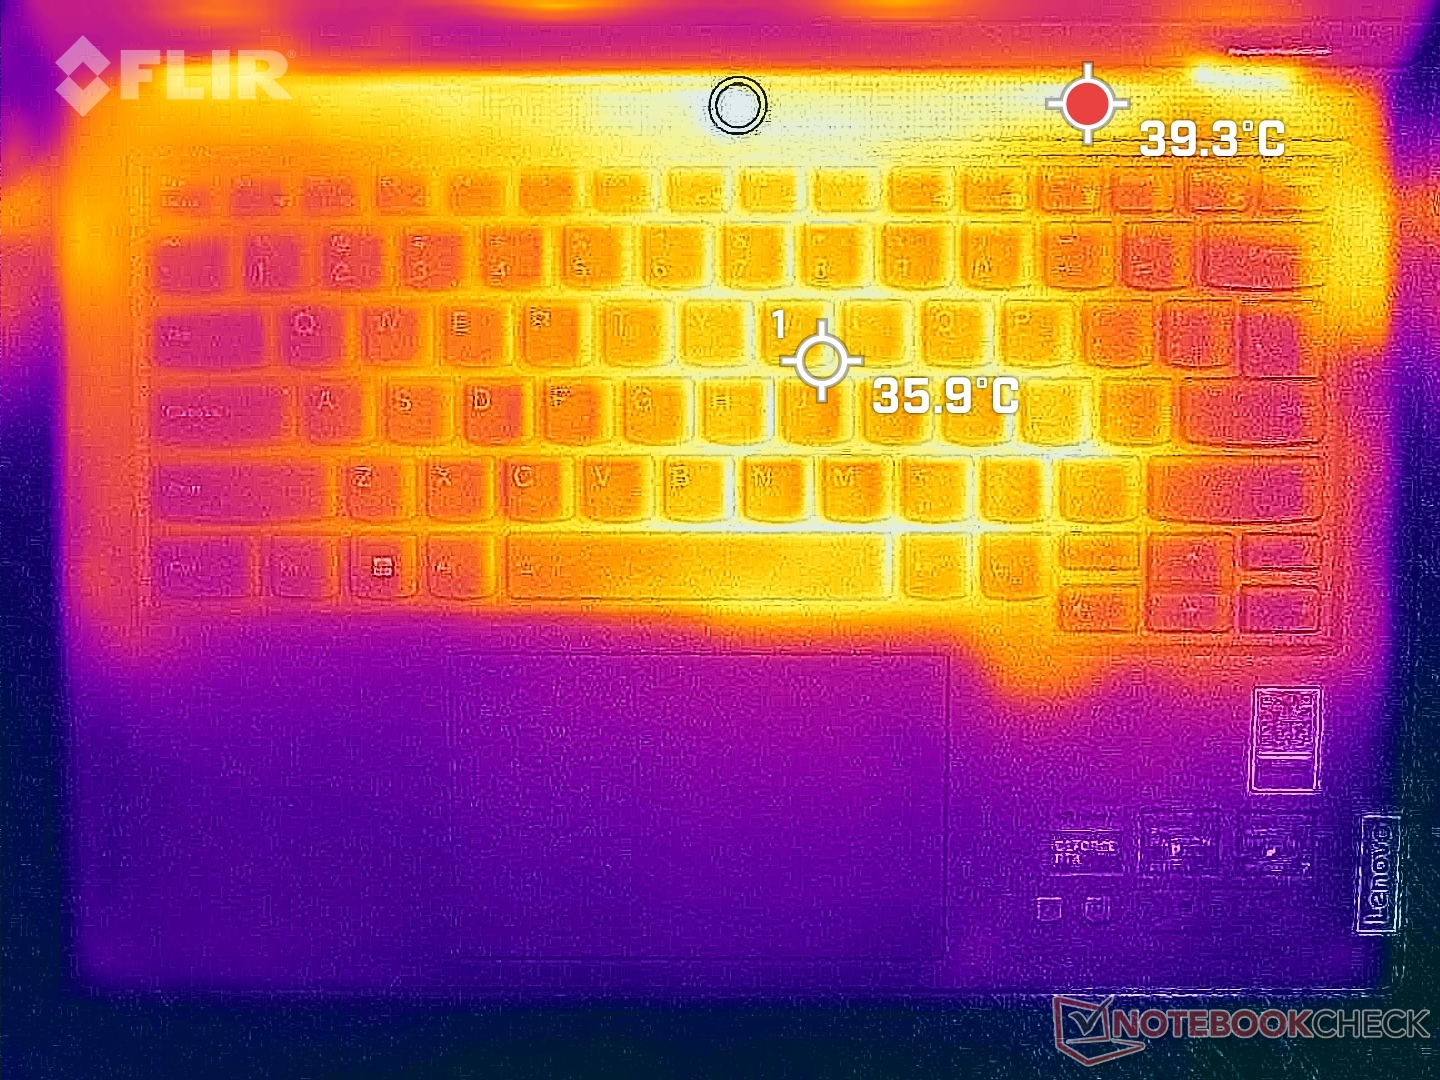
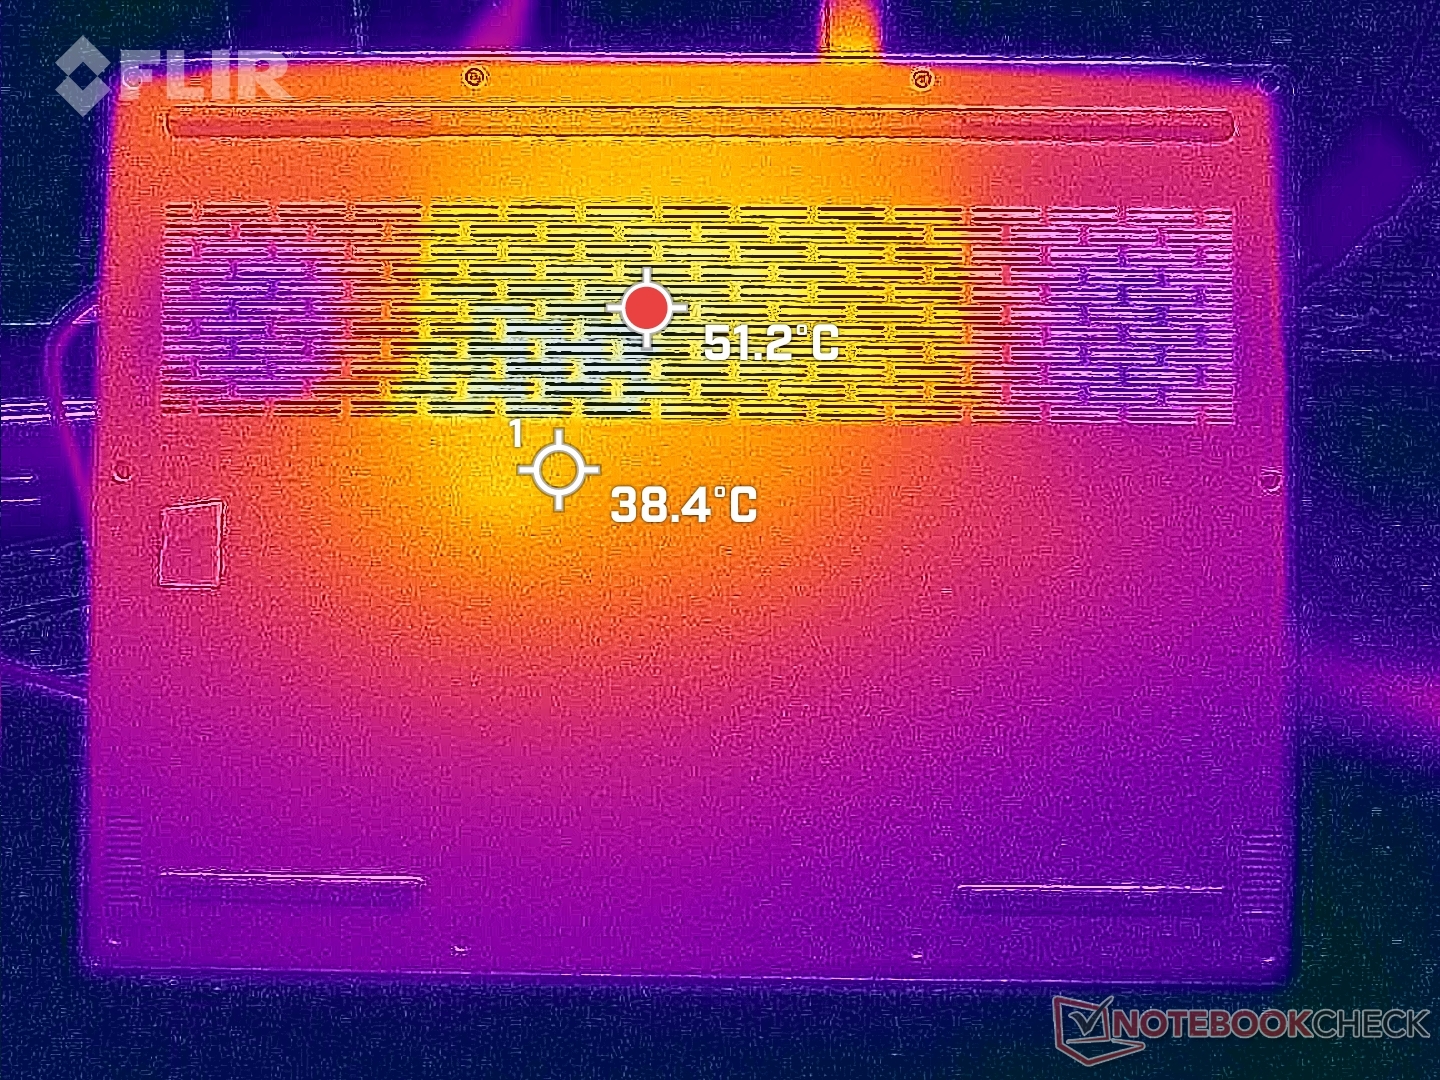
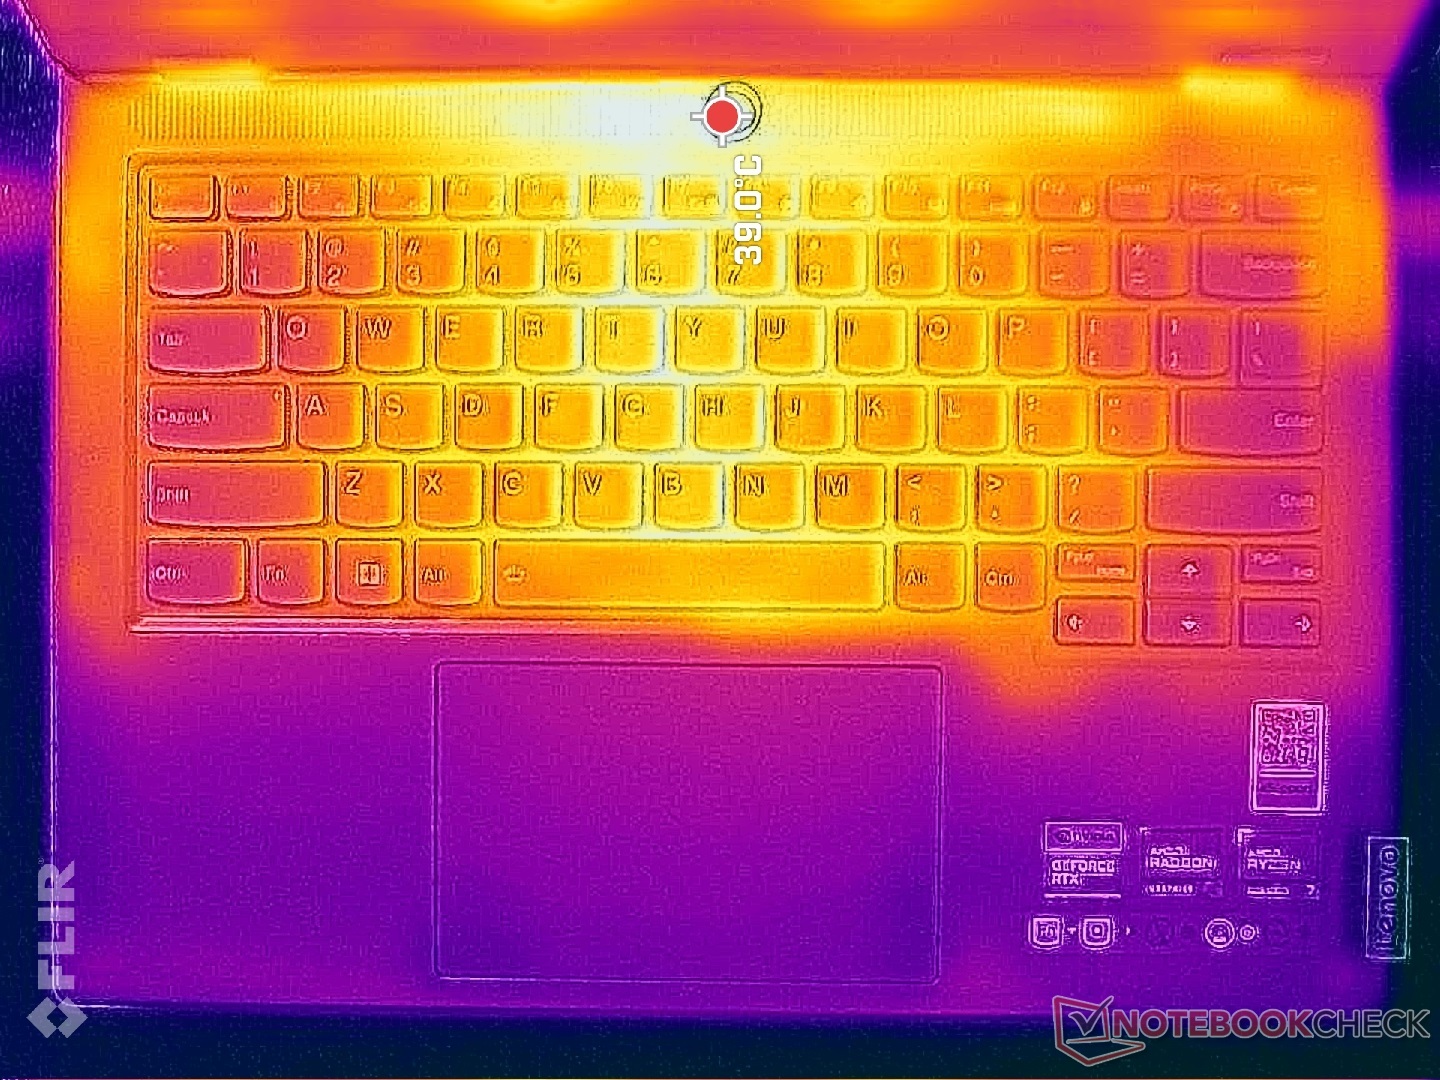
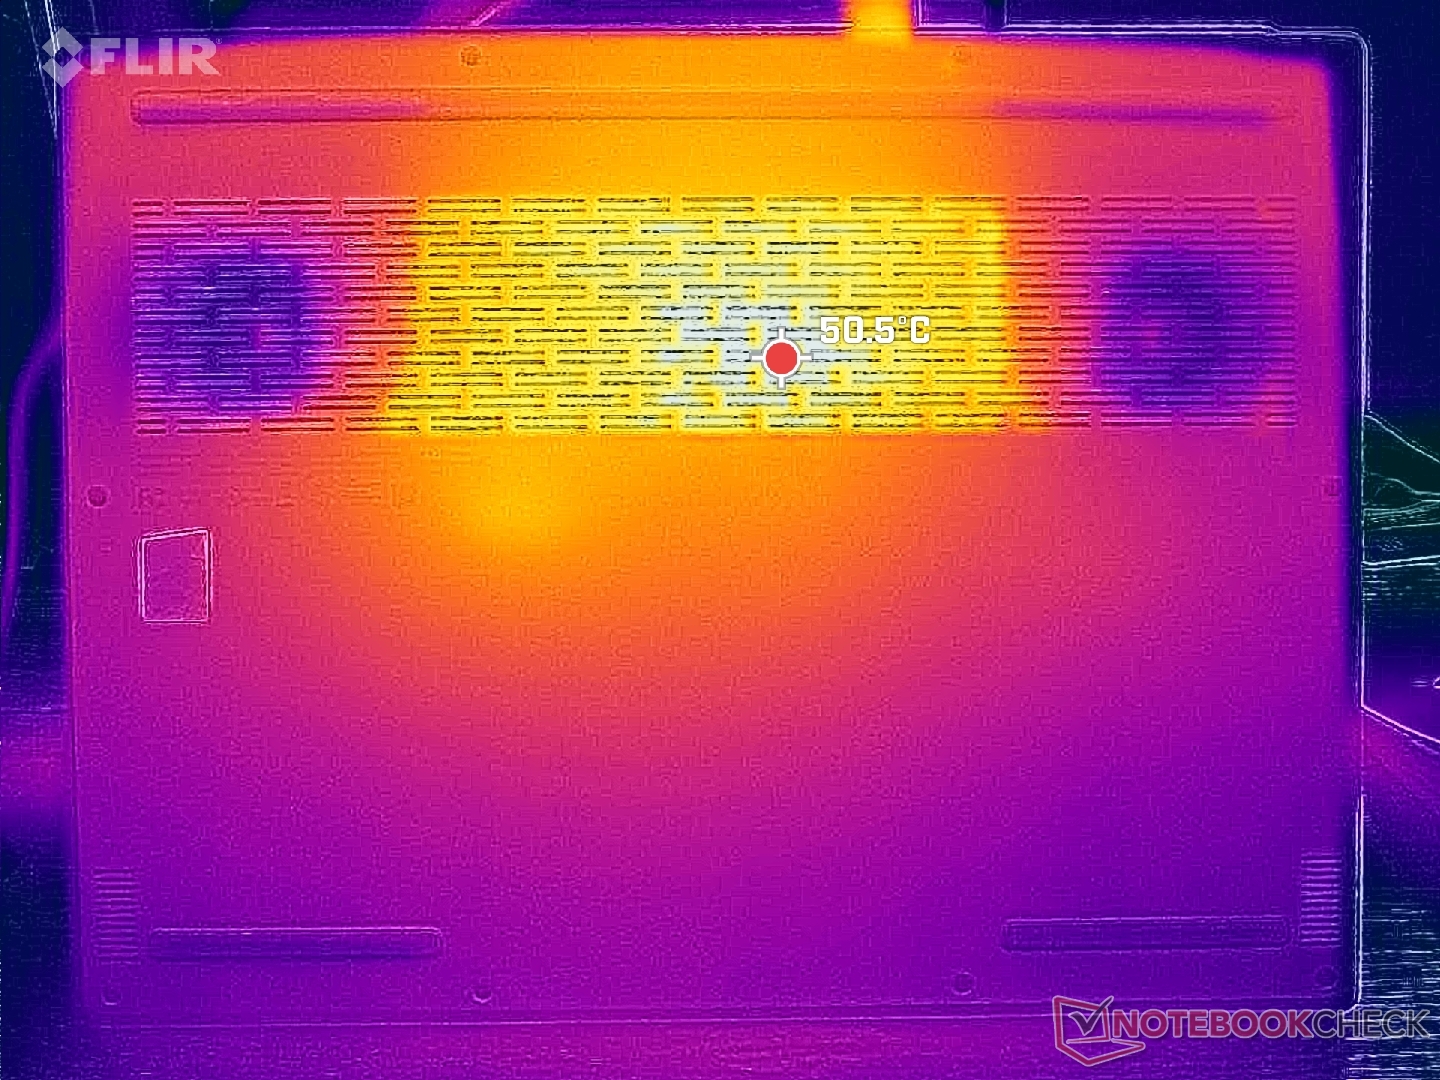
Temperatura
Las temperaturas superficiales son más cálidas hacia el centro del teclado y la parte trasera, donde pueden alcanzar hasta 36 C y 52 C, respectivamente, cuando se ejecutan cargas exigentes como juegos. El sistema es ligeramente más cálido que el Blade 14 a pesar de que el diseño de Lenovo incorpora más rejillas de ventilación. Los reposamanos y el clickpad permanecen más frescos y cómodos al tacto.
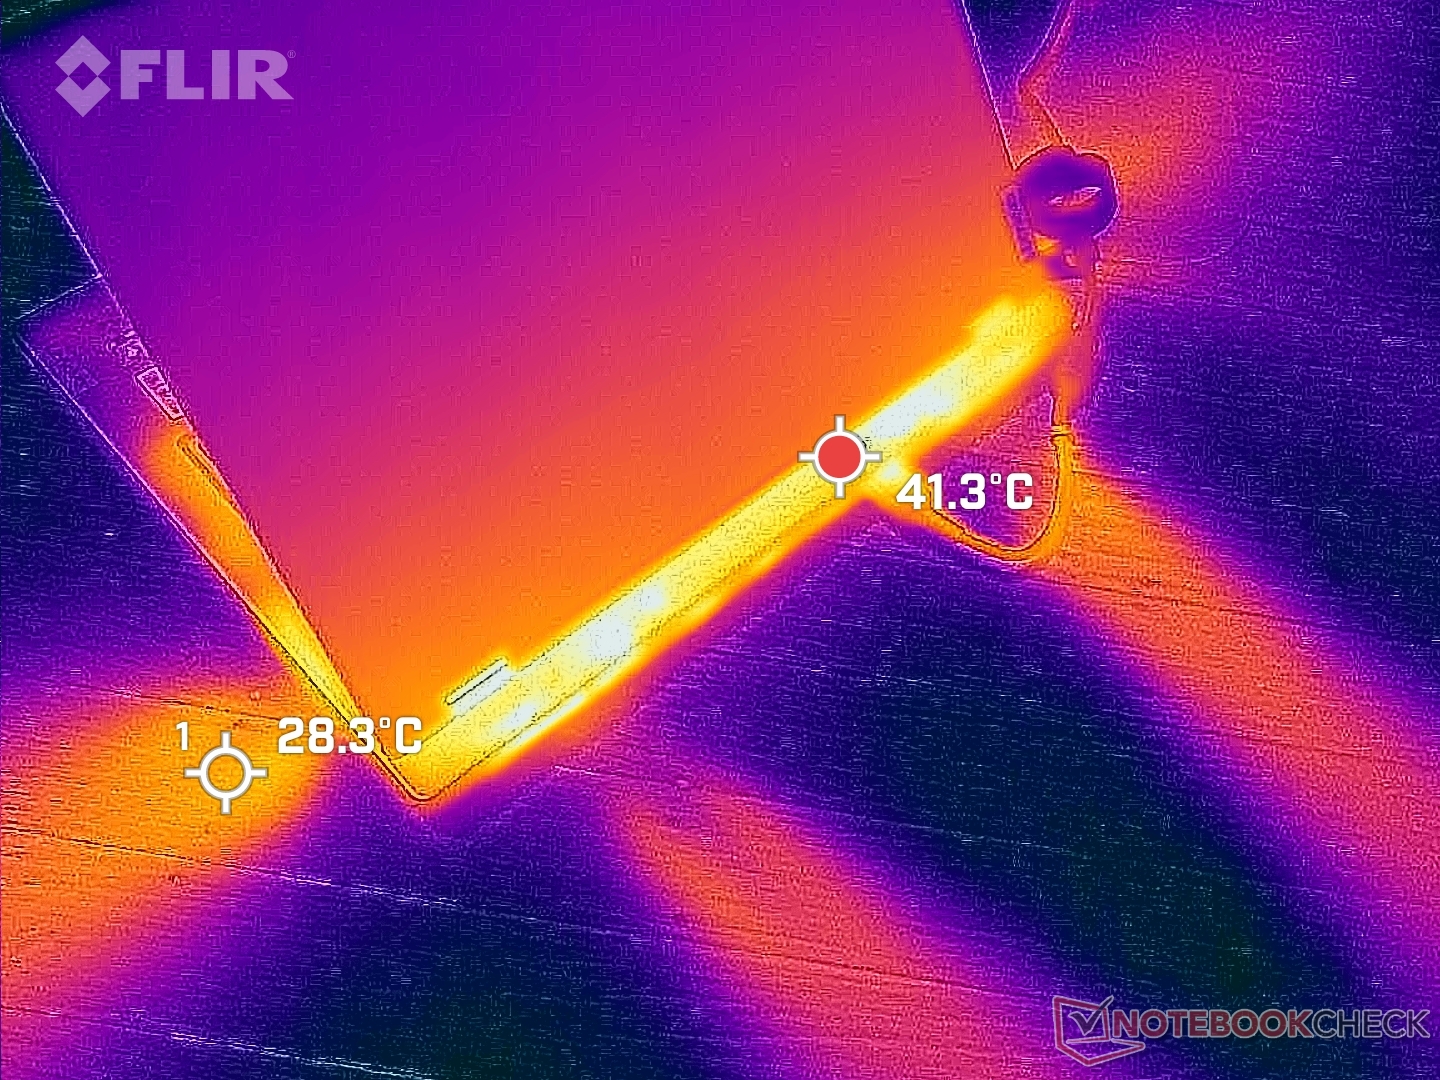
(±) La temperatura máxima en la parte superior es de 40.4 °C / 105 F, frente a la media de 40.4 °C / 105 F, que oscila entre 21.2 y 68.8 °C para la clase Gaming.
(-) El fondo se calienta hasta un máximo de 49.4 °C / 121 F, frente a la media de 43.2 °C / 110 F
(+) En reposo, la temperatura media de la parte superior es de 26.7 °C / 80# F, frente a la media del dispositivo de 33.9 °C / 93 F.
(±) Jugando a The Witcher 3, la temperatura media de la parte superior es de 34.8 °C / 95 F, frente a la media del dispositivo de 33.9 °C / 93 F.
(+) El reposamanos y el panel táctil están a una temperatura inferior a la de la piel, con un máximo de 29.2 °C / 84.6 F y, por tanto, son fríos al tacto.
(±) La temperatura media de la zona del reposamanos de dispositivos similares fue de 28.8 °C / 83.8 F (-0.4 °C / -0.8 F).
| Lenovo Legion Slim 5 14APH8 AMD Ryzen 7 7840HS, NVIDIA GeForce RTX 4060 Laptop GPU | Acer Predator Triton 14 PT14-51 Intel Core i7-13700H, NVIDIA GeForce RTX 4050 Laptop GPU | Razer Blade 14 RTX 4070 AMD Ryzen 9 7940HS, NVIDIA GeForce RTX 4070 Laptop GPU | Asus ROG Zephyrus G14 GA402XY AMD Ryzen 9 7940HS, NVIDIA GeForce RTX 4090 Laptop GPU | Alienware x14 i7 RTX 3060 Intel Core i7-12700H, NVIDIA GeForce RTX 3060 Laptop GPU | Lenovo LOQ 15APH8 AMD Ryzen 7 7840HS, NVIDIA GeForce RTX 4050 Laptop GPU | |
|---|---|---|---|---|---|---|
| Heat | -15% | -1% | 1% | -1% | -3% | |
| Maximum Upper Side * (°C) | 40.4 | 54 -34% | 37.4 7% | 47 -16% | 51.3 -27% | 44.4 -10% |
| Maximum Bottom * (°C) | 49.4 | 56 -13% | 35.2 29% | 46.5 6% | 44.4 10% | 52 -5% |
| Idle Upper Side * (°C) | 28.2 | 31 -10% | 33.2 -18% | 25.9 8% | 27.2 4% | 28 1% |
| Idle Bottom * (°C) | 29.8 | 31 -4% | 36.2 -21% | 28 6% | 26.6 11% | 29.6 1% |
* ... más pequeño es mejor
Prueba de resistencia
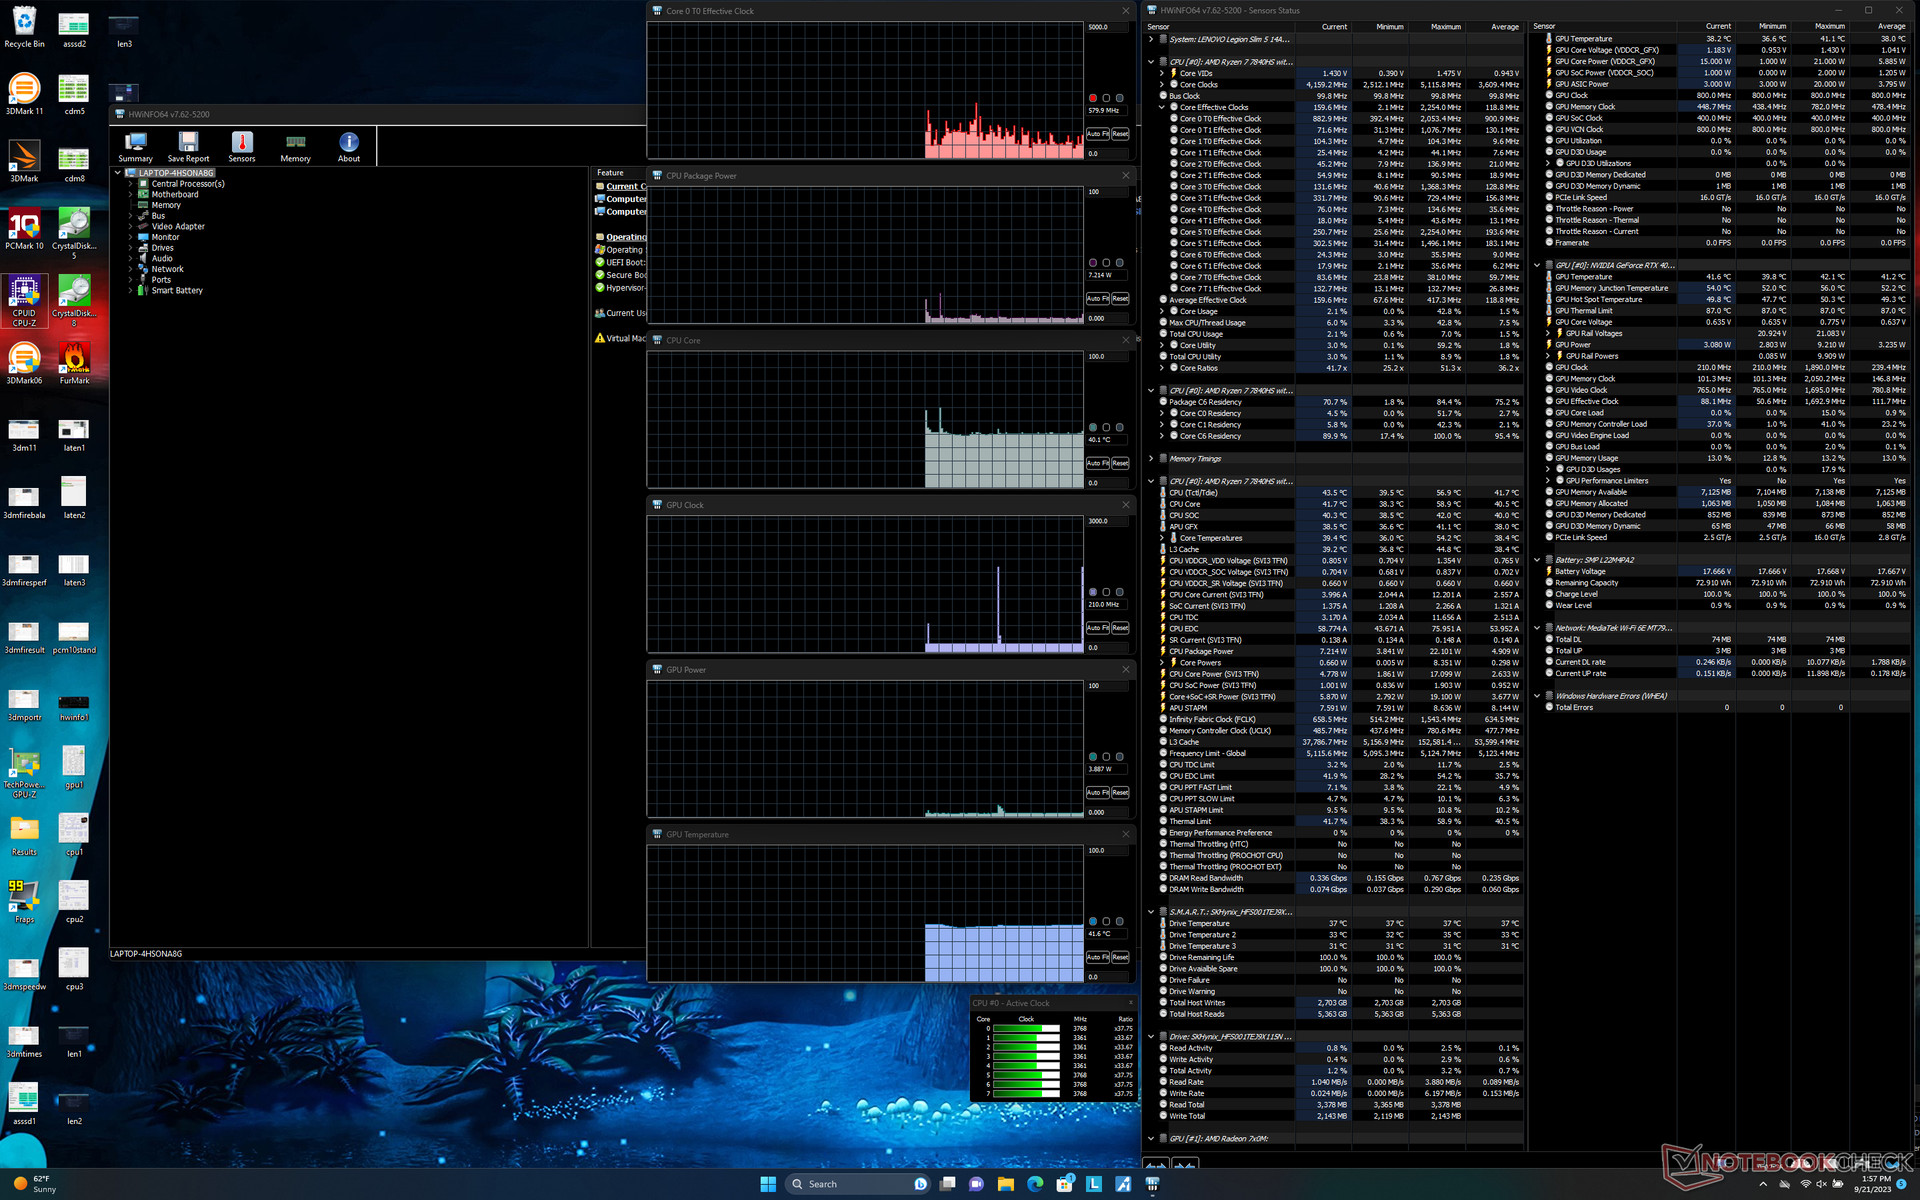
La CPU se disparaba a 3,8 GHz y 92 W al iniciar el estrés Prime95 antes de caer y estabilizarse en 4,6 GHz y 84 W unos segundos después. La temperatura del núcleo era muy alta, 100 C, lo que sugiere que el procesador AMD está llevando al límite la capacidad de refrigeración del Legion Slim 5 14. Repitiendo esta prueba en el Blade 14 con una CPU similar de clase Zen 4 resultaría en una temperatura de núcleo más fría de 90 C en comparación.
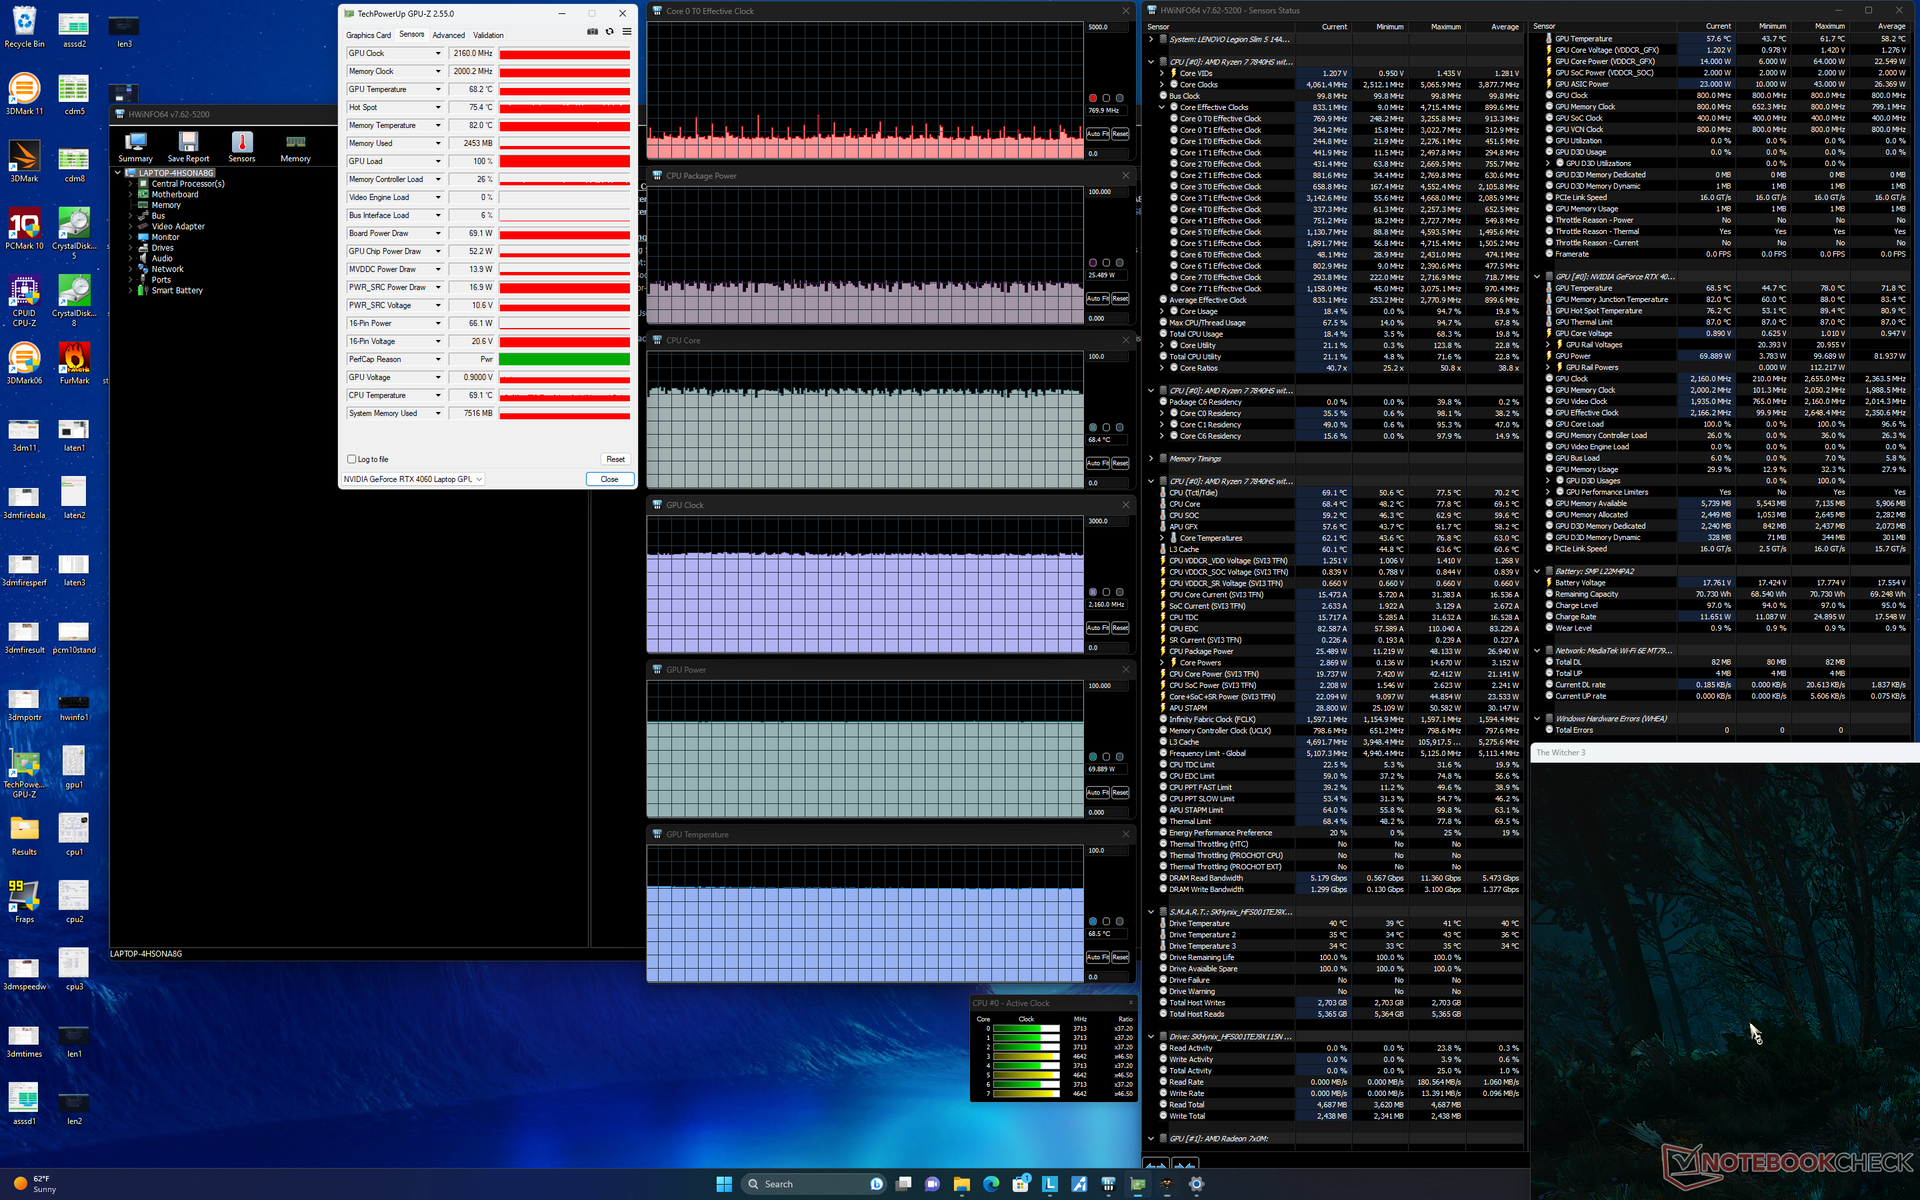
La GPU Nvidia se estabilizaría en 2625 MHz, 78 C, y 99 W de consumo de energía cuando se ejecuta en el modo de rendimiento en comparación con sólo 2160 MHz Witcher 3 en modo Rendimiento frente a los 2160 MHz, 69 C y 69 W del mismo juego en modo Equilibrado. El menor rendimiento viene acompañado de una reducción del ruido del ventilador, como ya se ha mencionado.

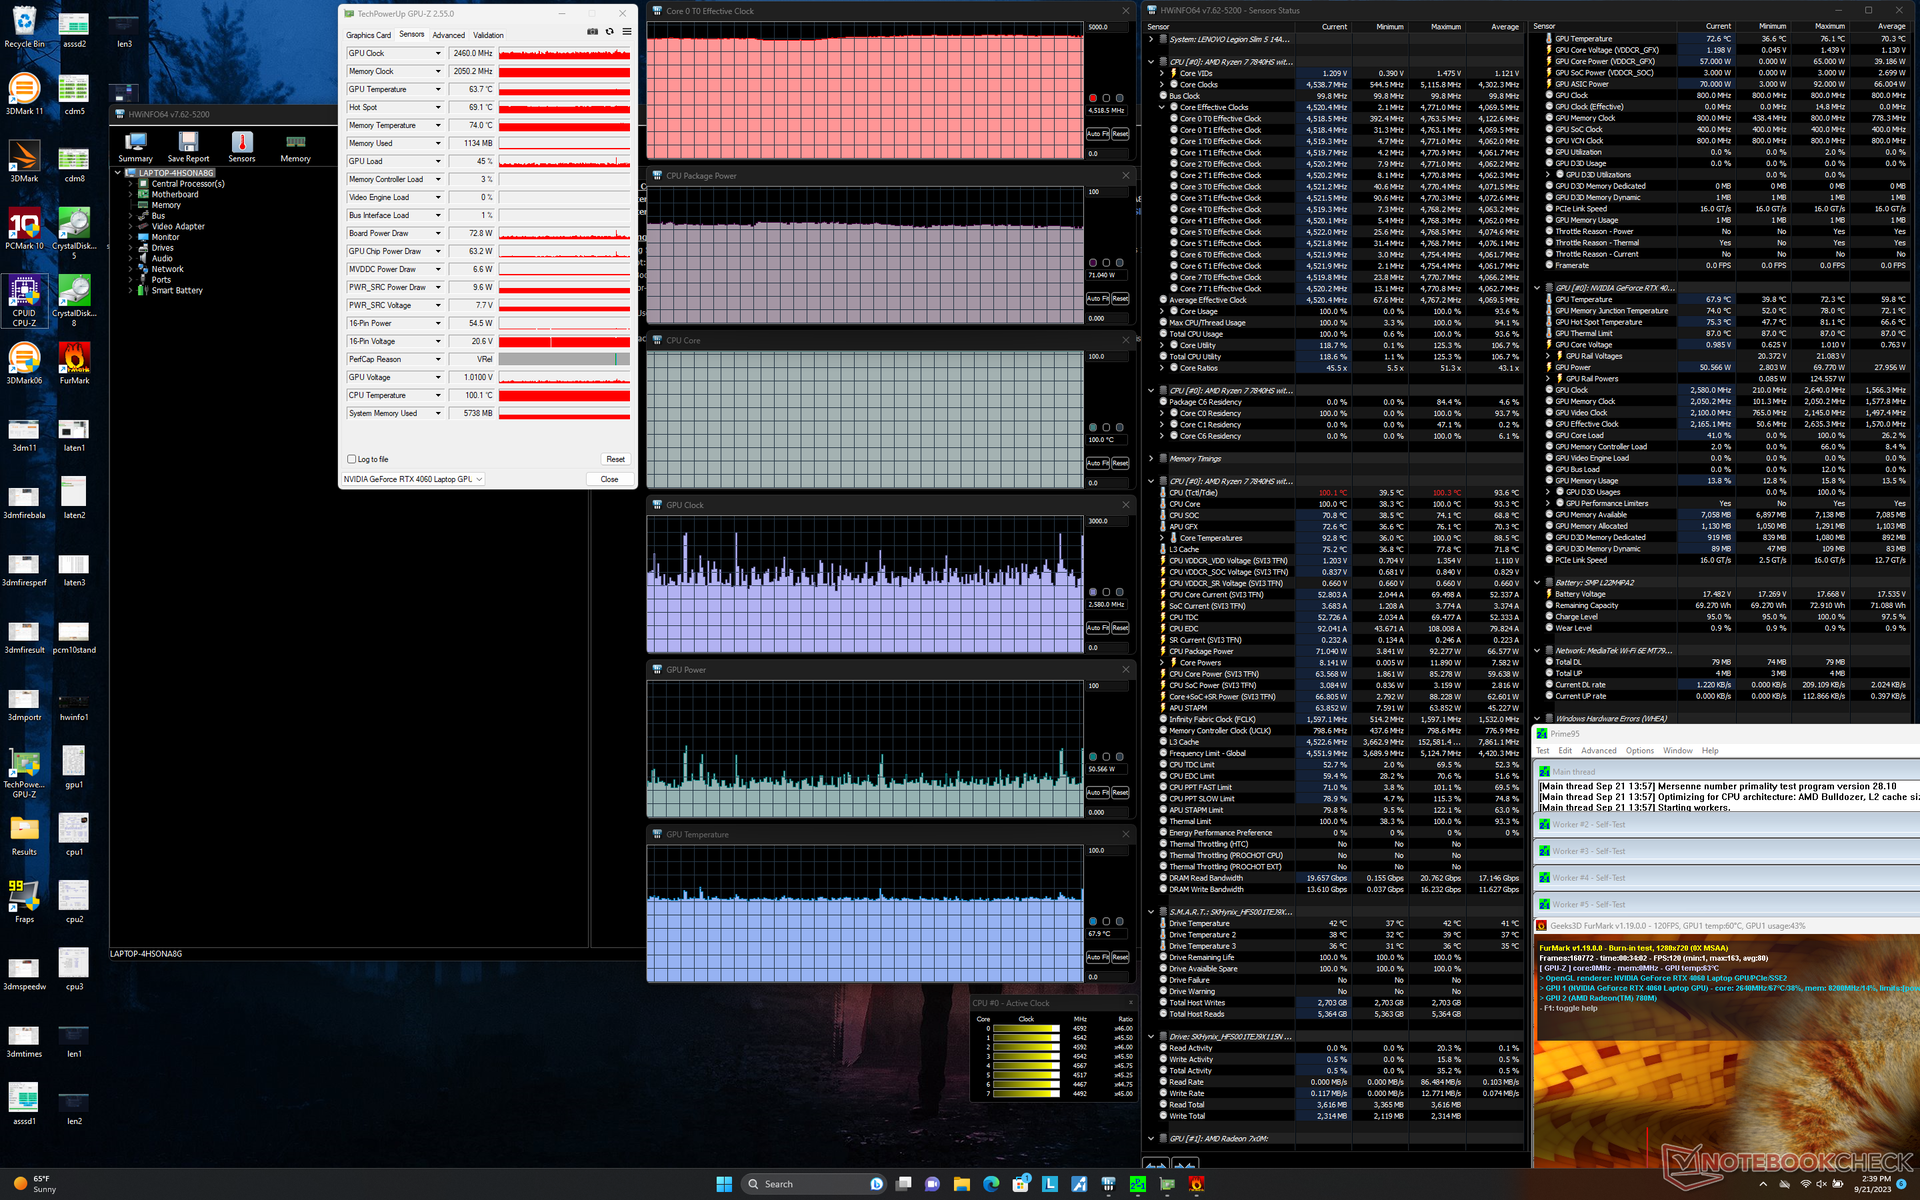
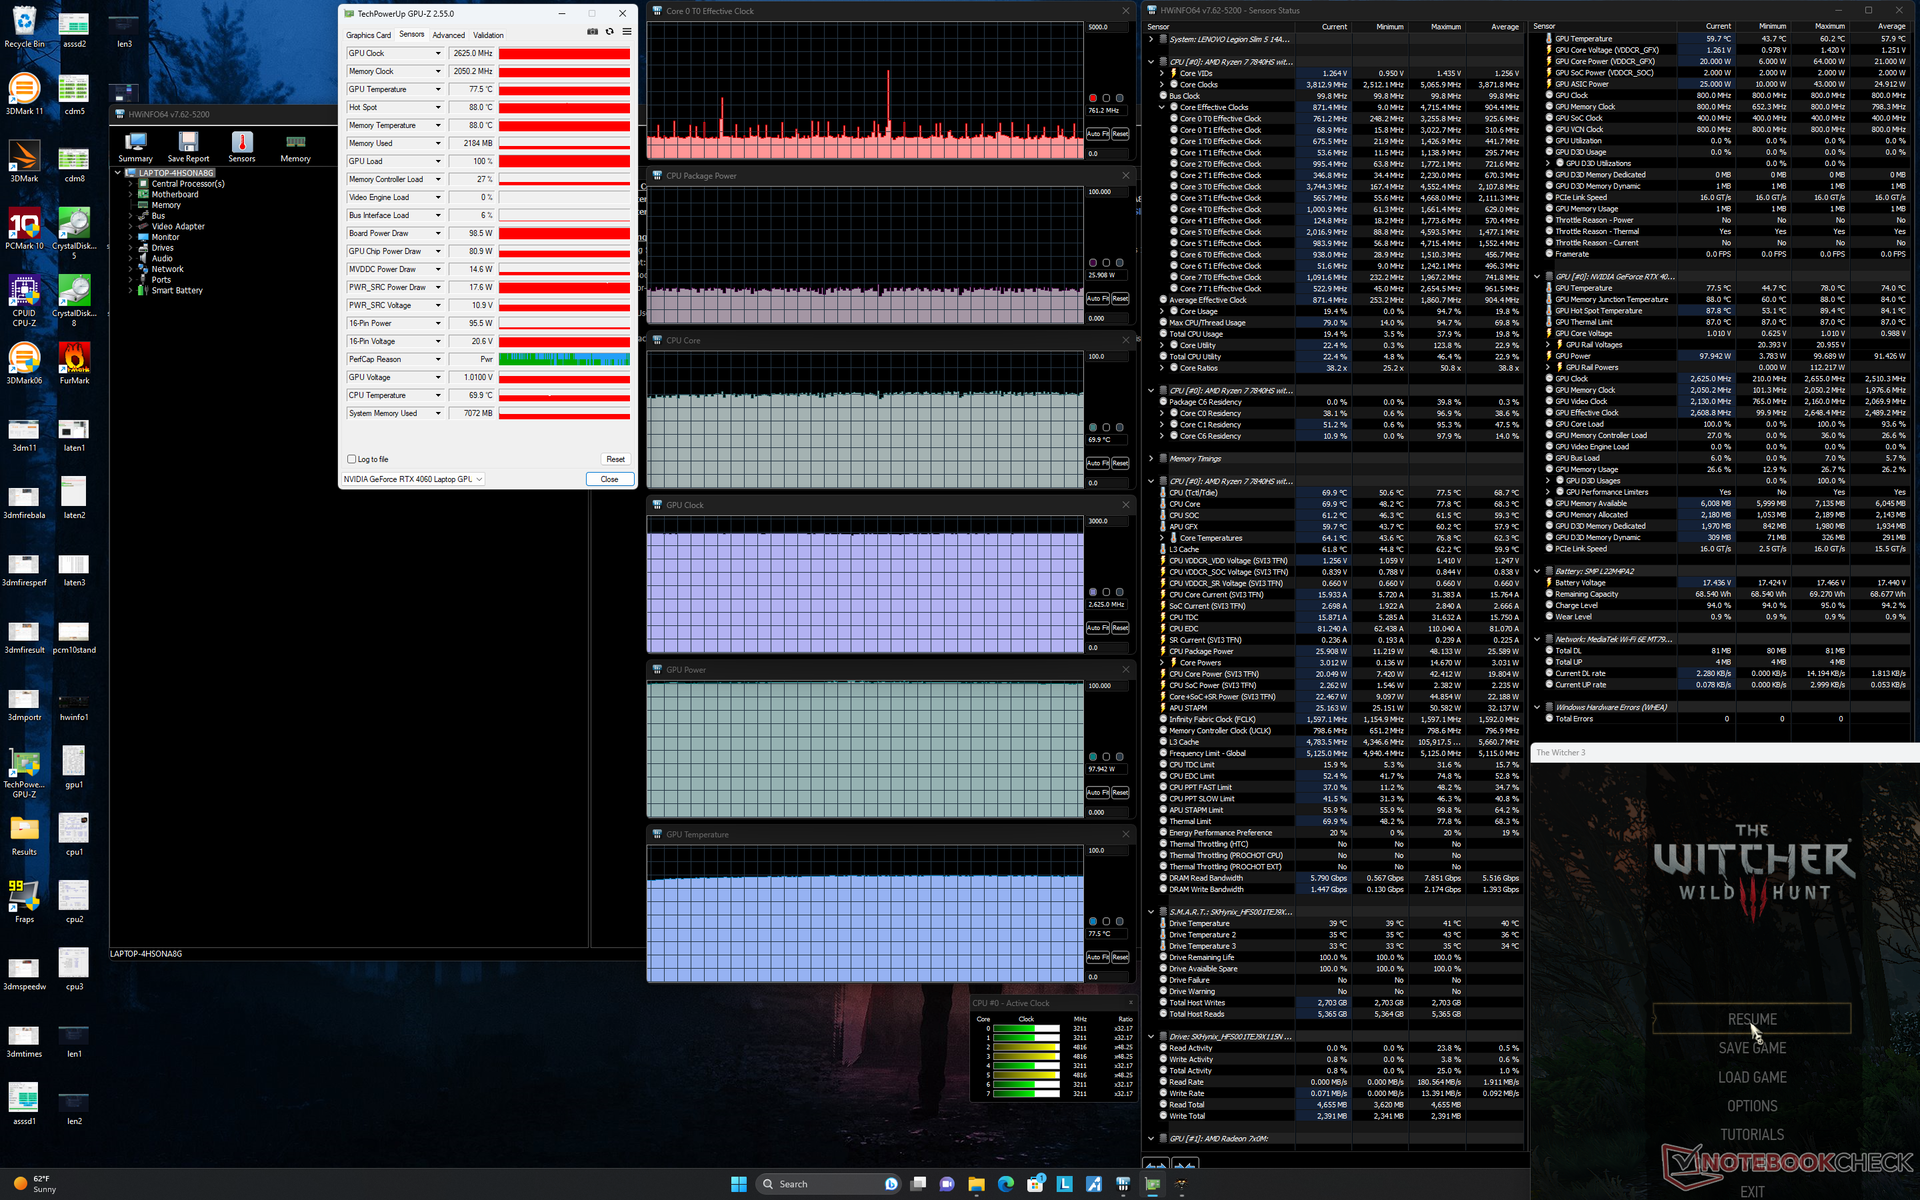
| Relojdela CPU (GHz) | Reloj de la GPU (MHz) | Temperatura media dela CPU (°C) | Temperatura media de la GPU (°C) | |
| Sistema en reposo | ||||
| Prime95Stress | 4.4 | -- | 100 | 50 |
| Prime95+ FurMark Stress | 4.5 | ~2460 | 100 | 68 |
| Witcher 3 Estrés (modoequilibrado) | ~0,8 | 2160 | 69 | 69 |
| Witcher 3 Estrés (modoRendimiento) | ~0,8 | 2625 | 70 | 78 |
Altavoces
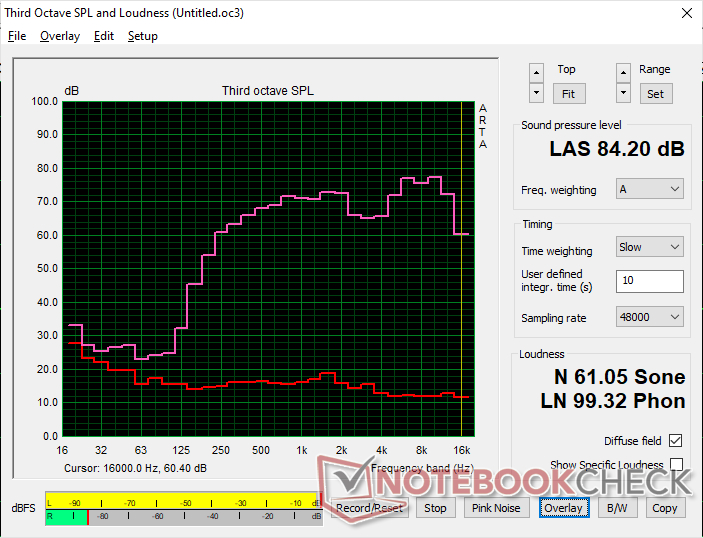
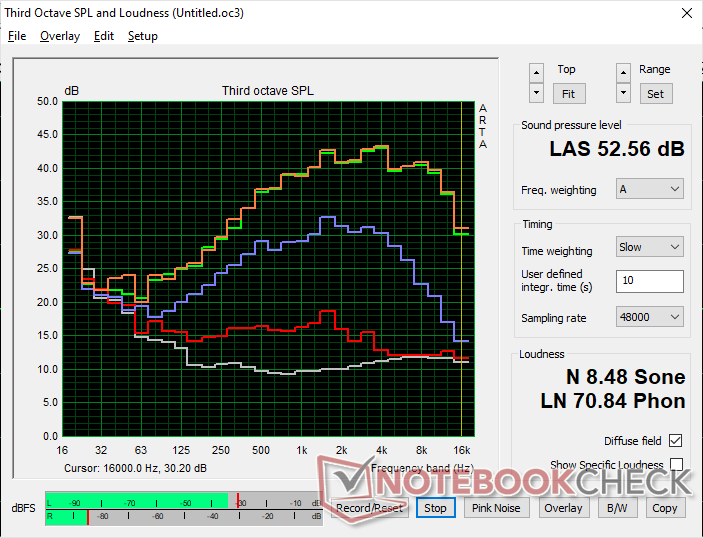
Lenovo Legion Slim 5 14APH8 análisis de audio
(+) | los altavoces pueden reproducir a un volumen relativamente alto (#84.2 dB)
Graves 100 - 315 Hz
(-) | casi sin bajos - de media 21.4% inferior a la mediana
(±) | la linealidad de los graves es media (12.4% delta a frecuencia anterior)
Medios 400 - 2000 Hz
(+) | medios equilibrados - a sólo 2.7% de la mediana
(+) | los medios son lineales (2.9% delta a la frecuencia anterior)
Altos 2 - 16 kHz
(±) | máximos más altos - de media 5.3% más altos que la mediana
(+) | los máximos son lineales (6.1% delta a la frecuencia anterior)
Total 100 - 16.000 Hz
(±) | la linealidad del sonido global es media (16.9% de diferencia con la mediana)
En comparación con la misma clase
» 44% de todos los dispositivos probados de esta clase eran mejores, 11% similares, 44% peores
» El mejor tuvo un delta de 6%, la media fue 18%, el peor fue ###max##%
En comparación con todos los dispositivos probados
» 30% de todos los dispositivos probados eran mejores, 8% similares, 62% peores
» El mejor tuvo un delta de 4%, la media fue 23%, el peor fue ###max##%
Apple MacBook Pro 16 2021 M1 Pro análisis de audio
(+) | los altavoces pueden reproducir a un volumen relativamente alto (#84.7 dB)
Graves 100 - 315 Hz
(+) | buen bajo - sólo 3.8% lejos de la mediana
(+) | el bajo es lineal (5.2% delta a la frecuencia anterior)
Medios 400 - 2000 Hz
(+) | medios equilibrados - a sólo 1.3% de la mediana
(+) | los medios son lineales (2.1% delta a la frecuencia anterior)
Altos 2 - 16 kHz
(+) | máximos equilibrados - a sólo 1.9% de la mediana
(+) | los máximos son lineales (2.7% delta a la frecuencia anterior)
Total 100 - 16.000 Hz
(+) | el sonido global es lineal (4.6% de diferencia con la mediana)
En comparación con la misma clase
» 0% de todos los dispositivos probados de esta clase eran mejores, 0% similares, 100% peores
» El mejor tuvo un delta de 5%, la media fue 17%, el peor fue ###max##%
En comparación con todos los dispositivos probados
» 0% de todos los dispositivos probados eran mejores, 0% similares, 100% peores
» El mejor tuvo un delta de 4%, la media fue 23%, el peor fue ###max##%
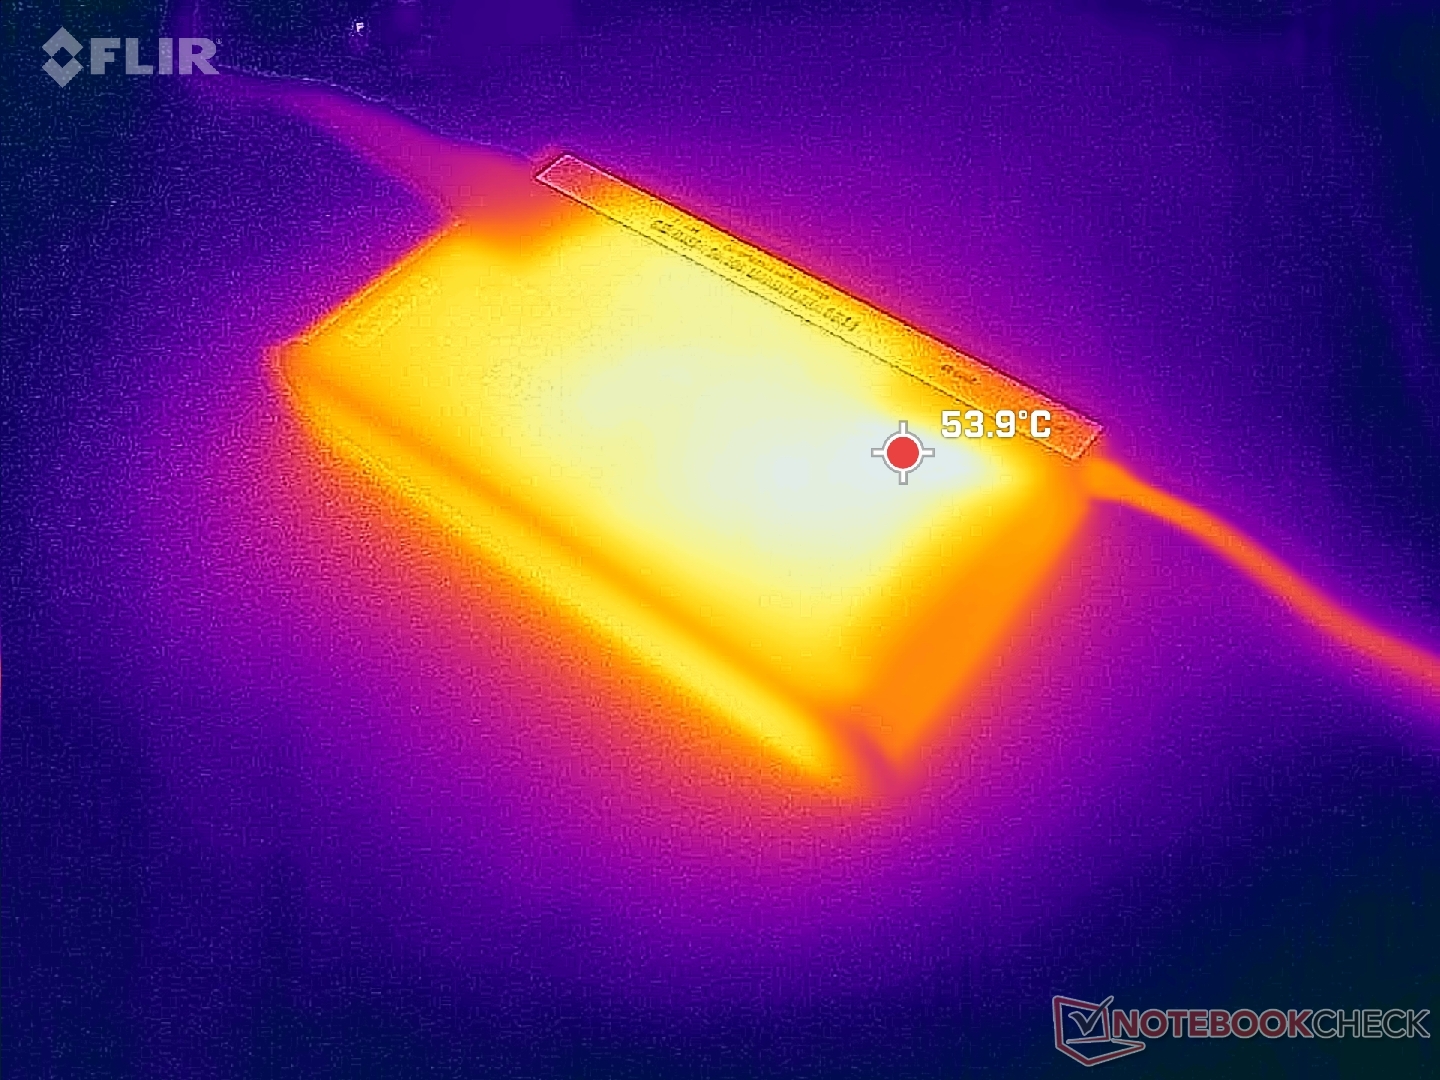
Gestión de la energía - Alto rendimiento por vatio
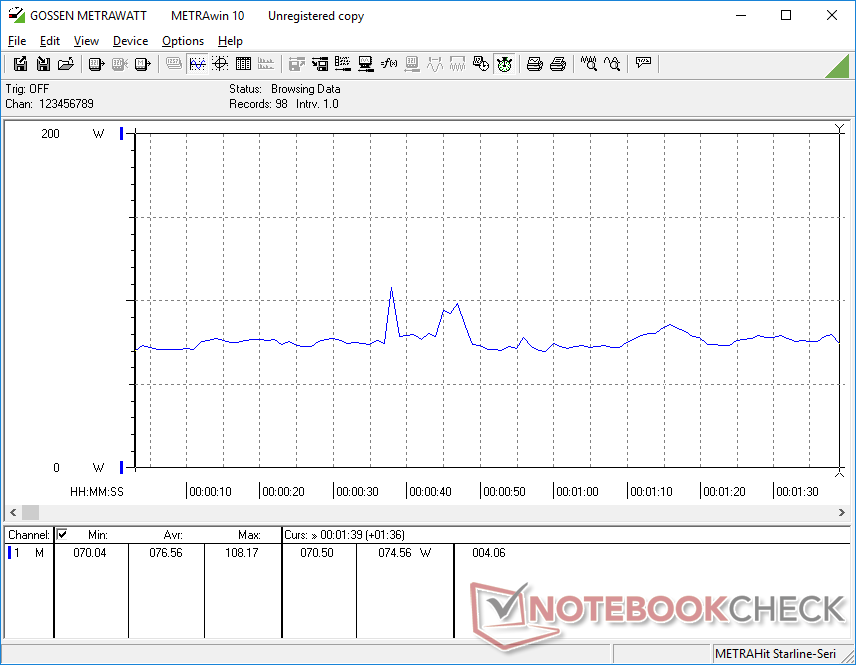
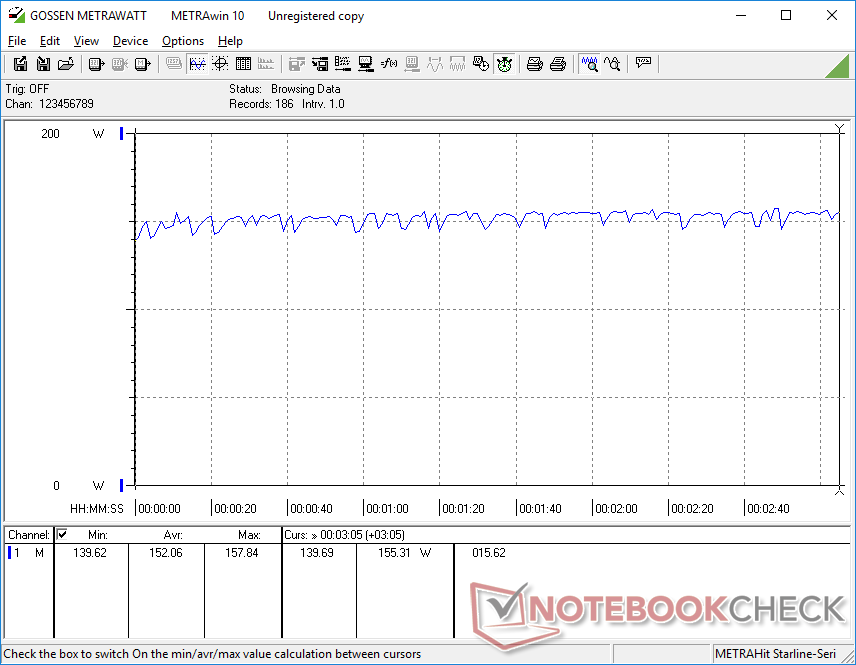
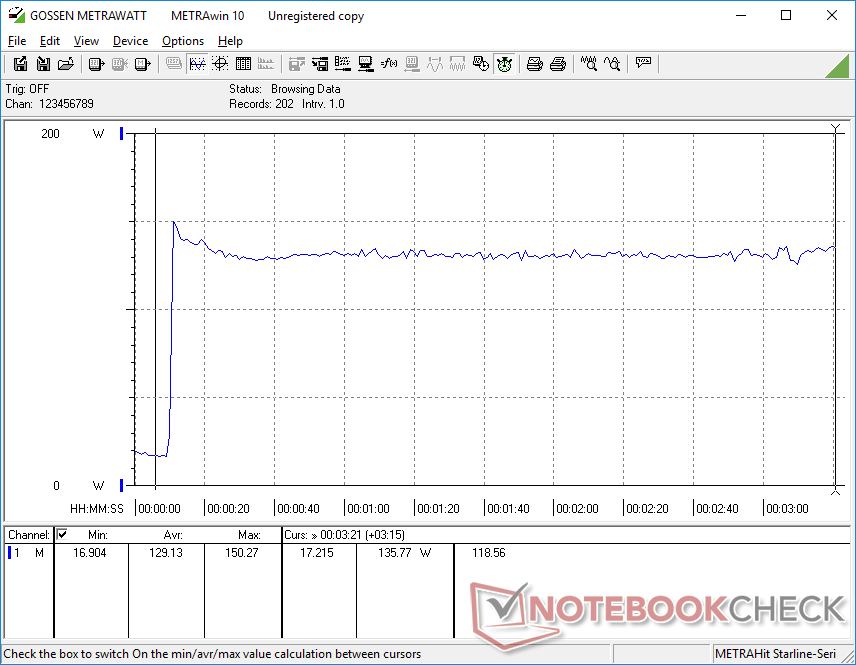
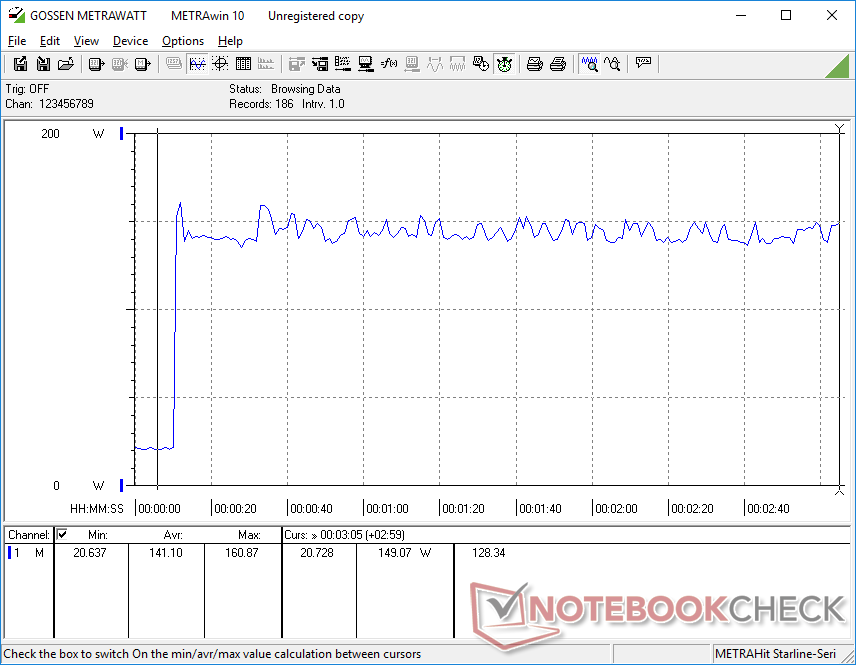
Consumo de energía
Nuestro Legion Slim 5 14 consume algo menos que nuestro Blade 14, que viene con una CPU Ryzen 9 más rápida y una GPU RTX 4070. El rendimiento por vatio sigue siendo excelente, especialmente si lo comparamos con portátiles de juego Intel con la misma GPU RTX 4060 como elLegion Pro 5 16 que exige notablemente más energía a pesar de que su rendimiento es ligeramente superior.
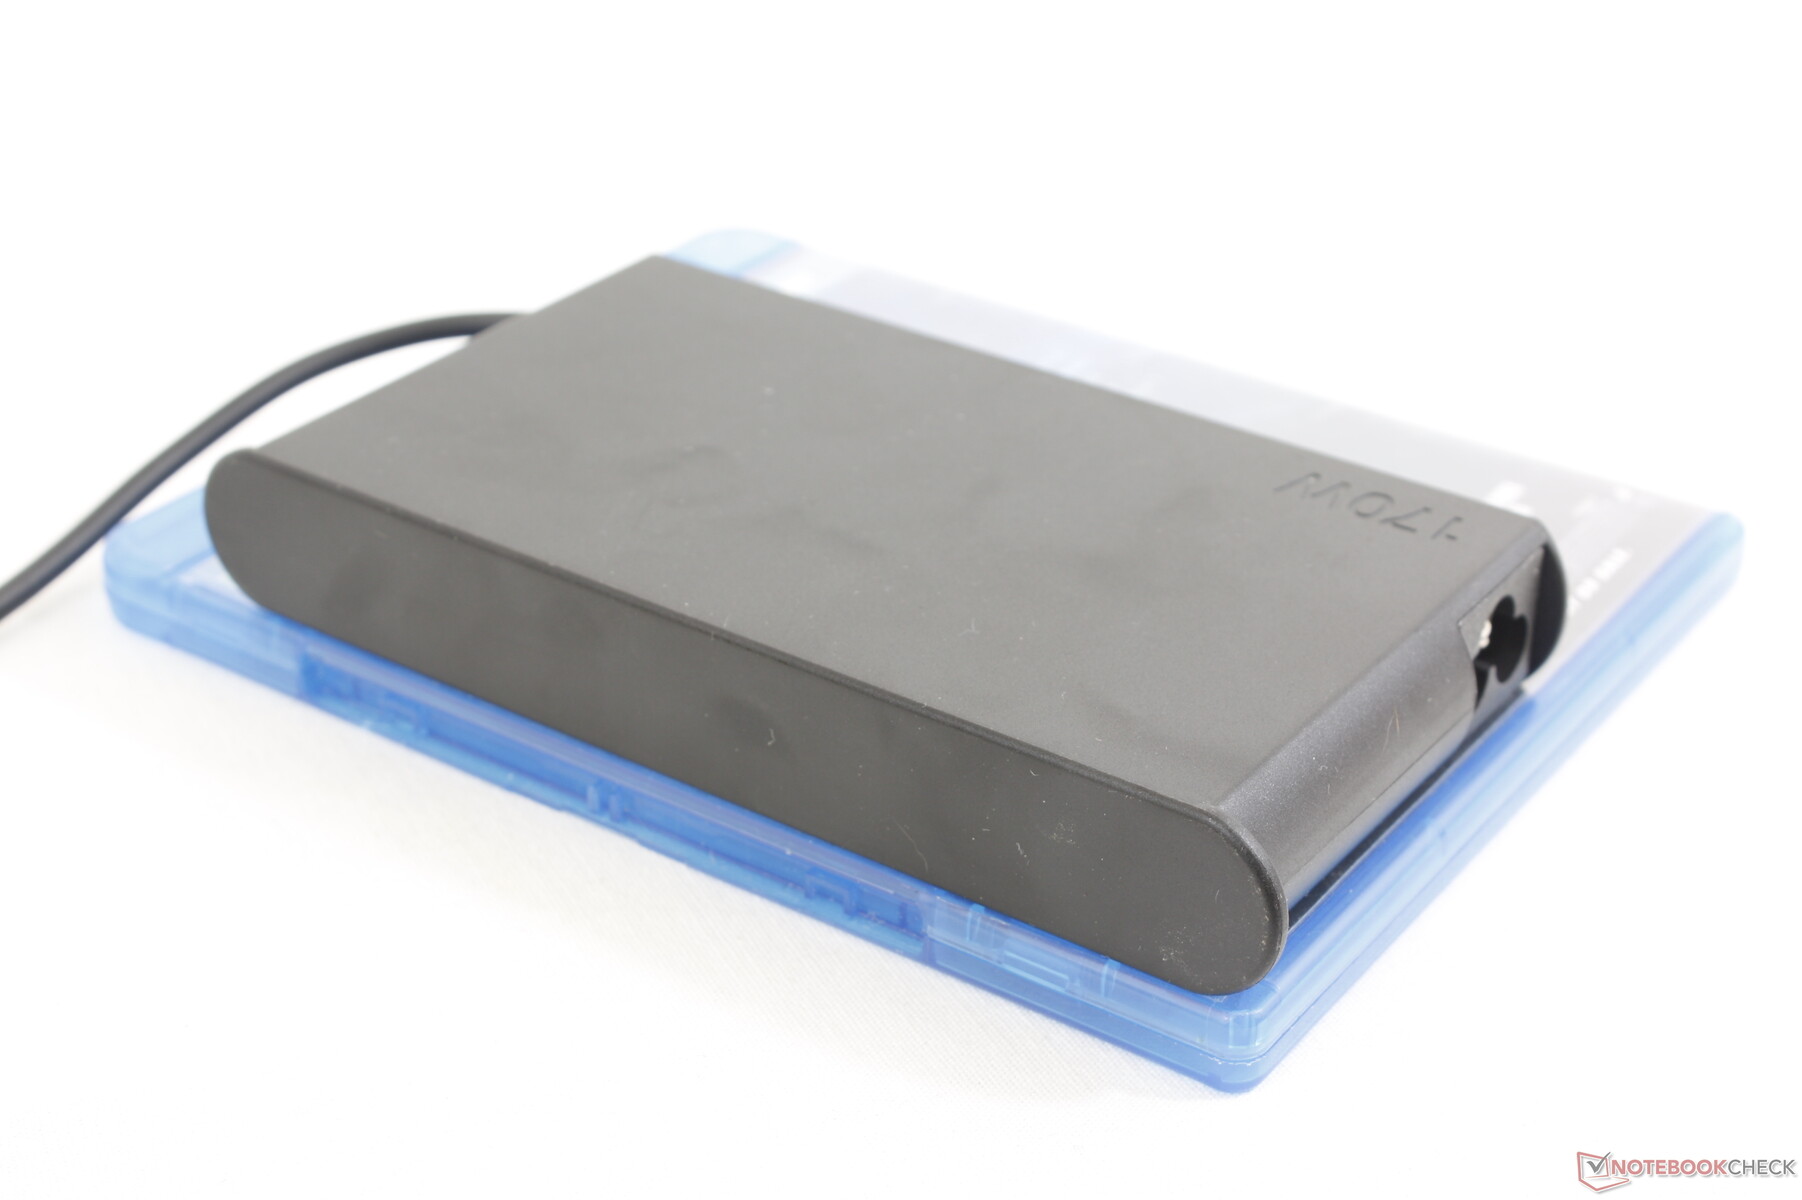
Registramos un consumo máximo de 161 W con el adaptador de CA de tamaño medio (17 x 7.6 x 2.1 cm) y 170 W. Los competidores Blade 14 y Zephyrus G14 vienen con adaptadores de CA más grandes y capaces de 230 W y 240 W, respectivamente. El modelo de Lenovo se carga más lentamente si se ejecutan cargas exigentes simultáneamente.
| Off / Standby | |
| Ocioso | |
| Carga |
|
Clave:
min: | |
| Lenovo Legion Slim 5 14APH8 R7 7840HS, GeForce RTX 4060 Laptop GPU, SK Hynix HFS001TEJ9X115N, OLED, 2880x1600, 14.5" | Acer Predator Triton 14 PT14-51 i7-13700H, GeForce RTX 4050 Laptop GPU, Micron 3400 MTFDKBA512TFH 512GB, IPS, 2560x1600, 14" | Razer Blade 14 RTX 4070 R9 7940HS, GeForce RTX 4070 Laptop GPU, Samsung PM9A1 MZVL21T0HCLR, IPS, 2560x1600, 14" | Asus ROG Zephyrus G14 GA402XY R9 7940HS, GeForce RTX 4090 Laptop GPU, Samsung PM9A1 MZVL21T0HCLR, Mini-LED, 2560x1600, 14" | Alienware x14 i7 RTX 3060 i7-12700H, GeForce RTX 3060 Laptop GPU, WDC PC SN810 1TB, IPS, 1920x1080, 14" | Lenovo LOQ 15APH8 R7 7840HS, GeForce RTX 4050 Laptop GPU, Micron 2450 512GB MTFDKCD512TFK, IPS, 1920x1080, 15.6" | |
|---|---|---|---|---|---|---|
| Power Consumption | -31% | -71% | -19% | 1% | -35% | |
| Idle Minimum * (Watt) | 7.3 | 12 -64% | 19.5 -167% | 9.4 -29% | 7.9 -8% | 15 -105% |
| Idle Average * (Watt) | 9.6 | 14 -46% | 24.7 -157% | 14.2 -48% | 11.1 -16% | 17.7 -84% |
| Idle Maximum * (Watt) | 17.3 | 26 -50% | 27 -56% | 14.5 16% | 11.8 32% | 21.5 -24% |
| Load Average * (Watt) | 76.6 | 88 -15% | 83.2 -9% | 79 -3% | 107.4 -40% | 73.5 4% |
| Witcher 3 ultra * (Watt) | 152 | 114.9 24% | 165.8 -9% | 172 -13% | 111 27% | 138.6 9% |
| Load Maximum * (Watt) | 160.9 | 213 -32% | 204.5 -27% | 220.8 -37% | 140.4 13% | 176.5 -10% |
* ... más pequeño es mejor
Power Consumption Witcher 3 / Stresstest
Power Consumption external Monitor
Duración de la batería
La capacidad de la batería es grande para un portátil de 14 pulgadas con 74 Wh. Las duraciones son posteriormente largas con casi 7.5 horas de navegación real en modo equilibrado para ser lo más parecido al Zephyrus G14.
La carga de vacío a plena capacidad es muy rápida con sólo 45 minutos cuando la carga rápida de Lenovo está activada. La mayoría de los portátiles tardan el doble o incluso más en cargarse por completo. El sistema también se puede cargar por USB-C, pero Lenovo recomienda cargarlo con un adaptador de CA USB-C de 140 W opcional de la marca Lenovo, ya que la mayoría de otros adaptadores no son compatibles.
| Lenovo Legion Slim 5 14APH8 R7 7840HS, GeForce RTX 4060 Laptop GPU, 73.6 Wh | Acer Predator Triton 14 PT14-51 i7-13700H, GeForce RTX 4050 Laptop GPU, 76.3 Wh | Razer Blade 14 RTX 4070 R9 7940HS, GeForce RTX 4070 Laptop GPU, 68 Wh | Asus ROG Zephyrus G14 GA402XY R9 7940HS, GeForce RTX 4090 Laptop GPU, 76 Wh | Alienware x14 i7 RTX 3060 i7-12700H, GeForce RTX 3060 Laptop GPU, 80 Wh | Lenovo LOQ 15APH8 R7 7840HS, GeForce RTX 4050 Laptop GPU, 60 Wh | |
|---|---|---|---|---|---|---|
| Duración de Batería | 4% | -19% | -12% | -10% | -8% | |
| Reader / Idle (h) | 10.5 | 11.2 7% | 8.6 -18% | 9.8 -7% | ||
| WiFi v1.3 (h) | 7.5 | 5 -33% | 6.2 -17% | 7.5 0% | 8.9 19% | 7.4 -1% |
| Load (h) | 1.3 | 1.8 38% | 1 -23% | 1 -23% | 0.8 -38% | 1.1 -15% |
| H.264 (h) | 9 | 7.2 | 9.4 | |||
| Witcher 3 ultra (h) | 0.8 |
Pro
Contra
Veredicto - No sólo es bueno para jugar
Un par de aspectos ayudan al Legion Slim 5 14 a destacar sobre la competencia. En primer lugar, su diseño similar al de un ThinkBook y su exterior sin RGB aportan una estética más profesional que los agresivos estilos del Acer Predator Triton o Zephyrus G14. Por tanto, los usuarios a los que les gusta tener un portátil tanto para jugar como para reuniones de negocios pueden preferir el diseño del Legion Slim 5 14 frente a otros. En segundo lugar, su pantalla OLED de 120 Hz supera fácilmente a las pantallas IPS de otros portátiles para juegos de 14 pulgadas en lo que se refiere a niveles de negro, tiempos de respuesta y calidad de imagen.
El primer portátil para juegos de 14 pulgadas de Lenovo Legion empieza con buen pie gracias a su pantalla OLED de 2,8K y 120 Hz. Su falta de G-Sync y retroiluminación RGB del teclado, sin embargo, son extrañas omisiones en un portátil de juego que se vende por más de mil dólares.
Hay un puñado de desventajas que los compradores potenciales deberían tener en cuenta. La más flagrante es la falta de compatibilidad con G-Sync para la pantalla OLED, lo que significa que se recomienda activar v-sync o apuntar a 120 FPS constantes con ajustes reducidos para limitar el tearing de la pantalla. El siguiente paso es la ausencia de iluminación RGB en el teclado y de opciones de GPU superiores a la RTX 4060. Aunque la RTX 4060 sigue siendo muy buena, Lenovo está perdiendo a los entusiastas que podrían querer la RTX 4070 o superior. El Asus Zephyrus G14 y el Razer Blade 14 son más pequeños y vienen con RAM ampliable y opciones de GPU más rápidas.
El fuerte ruido del ventilador y las altas temperaturas del núcleo son otras desventajas notables, pero esos rasgos los comparten otros portátiles de juego de 14".
El Legion Slim 5 14 es el mejor compañero de viaje para juegos, procesamiento gráfico y edición. Sin embargo, para fines puramente lúdicos, las alternativas de Razer, Asus o Alienware suelen ofrecer GPU de gama más alta y funciones auxiliares que los jugadores empedernidos sabrán apreciar.
Precio y disponibilidad
Lenovo está comercializando actualmente su modelo Legion Slim 5 14 Gen 8 a partir de 1440 USD para la configuración base de Ryzen 7 y RTX 4050 hasta más de 1700 USD si se configura con Ryzen 9 y RTX 4060.
Lenovo Legion Slim 5 14APH8
- 09/25/2023 v7 (old)
Allen Ngo
Transparencia
La selección de los dispositivos que se van a reseñar corre a cargo de nuestro equipo editorial. La muestra de prueba fue proporcionada al autor en calidad de préstamo por el fabricante o el minorista a los efectos de esta reseña. El prestamista no tuvo ninguna influencia en esta reseña, ni el fabricante recibió una copia de la misma antes de su publicación. No había ninguna obligación de publicar esta reseña. Como empresa de medios independiente, Notebookcheck no está sujeta a la autoridad de fabricantes, minoristas o editores.
Así es como prueba Notebookcheck
Cada año, Notebookcheck revisa de forma independiente cientos de portátiles y smartphones utilizando procedimientos estandarizados para asegurar que todos los resultados son comparables. Hemos desarrollado continuamente nuestros métodos de prueba durante unos 20 años y hemos establecido los estándares de la industria en el proceso. En nuestros laboratorios de pruebas, técnicos y editores experimentados utilizan equipos de medición de alta calidad. Estas pruebas implican un proceso de validación en varias fases. Nuestro complejo sistema de clasificación se basa en cientos de mediciones y puntos de referencia bien fundamentados, lo que mantiene la objetividad.Price comparison

